Use these links to rapidly review the document
TABLE OF CONTENTS
PART IV
Table of Contents
UNITED STATES
SECURITIES AND EXCHANGE COMMISSION
WASHINGTON, D.C. 20549
FORM 10K
| | |
| (Mark One) | | |
ý |
|
ANNUAL REPORT PURSUANT TO SECTION 13 OR 15(d) OF THE SECURITIES EXCHANGE ACT OF 1934 |
For the fiscal year ended January 29, 2011 |
OR |
o |
|
TRANSITION REPORT PURSUANT TO SECTION 13 OR 15(d) OF THE SECURITIES EXCHANGE ACT OF 1934 |
For the transition period from to
|
Commission file number 1-3381
The Pep Boys—Manny, Moe & Jack
(Exact name of registrant as specified in its charter)
| | |
Pennsylvania
(State or other jurisdiction of
incorporation or organization) | | 23-0962915
(I.R.S. employer identification no.) |
3111 West Allegheny Avenue, Philadelphia, PA
(Address of principal executive office) |
|
19132
(Zip code) |
215-430-9000
(Registrant's telephone number, including area code)
Securities registered pursuant to Section 12(b) of the Act:
| | |
| Title of each class | | Name of each exchange on which registered |
|---|
| Common Stock, $1.00 par value | | New York Stock Exchange |
Securities registered pursuant to Section 12(g) of the Act:
None
Indicate by check mark whether the Registrant is a well-known seasoned issuer, as defined in Rule 405 of the Securities Act. Yes o No ý
Indicate by check mark if the Registrant is not required to file reports pursuant to Section 13 or Section 15(d) of the Act. Yes o No ý
Indicate by check mark whether the registrant (1) has filed all reports required to be filed by Section 13 or 15(d) of the Securities Exchange Act of 1934 during the preceding 12 months (or for such shorter period that the registrant was required to file such reports) and (2) has been subject to such filing requirements for the past 90 days. Yes ý No o
Indicate by check mark whether the registrant has submitted electronically and posted on its corporate Website, if any, every Interactive Data File required to be submitted and posted pursuant to Rule 405 of Regulation S-T (§232.405 of this chapter) during the preceding 12 months (or for such shorter period that the registrant was required to submit and post such files). Yes o No o
Indicate by check mark if disclosure of delinquent filers pursuant to Item 405 of Regulation S-K is not contained herein, and will not be contained, to the best of registrant's knowledge, in definitive proxy or information statements incorporated by reference in Part III of this Form 10-K or any amendment to this Form 10-K. ý
Indicate by check mark whether the registrant is a large accelerated filer, an accelerated filer, a non-accelerated filer, or a smaller reporting company. See definitions of "large accelerated filer," "accelerated filer," and "smaller reporting company" in Rule 12b-2 of the Exchange Act. (Check one):
| | | | | | |
| Large accelerated filer o | | Accelerated filer ý | | Non-accelerated filer o
(Do not check if a
smaller reporting company) | | Smaller reporting company o |
Indicate by check mark whether the registrant is a shell company (as defined in Rule 12b-2 of the Act) Yes o No ý
As of the close of business on July 31, 2010 the aggregate market value of the voting stock held by non-affiliates of the registrant was approximately $446,917,000.
As of April 1, 2011, there were 52,633,029 shares of the registrant's common stock outstanding.
DOCUMENTS INCORPORATED BY REFERENCE
Portions of the registrant's definitive proxy statement, which will be filed with the Securities and Exchange Commission pursuant to Regulation 14A not later than 120 days after the end of the Company's fiscal year, for the Company's 2011 Annual Meeting of Shareholders are incorporated by reference into Part III of this Form 10-K.
TABLE OF CONTENTS
| | | | |
| |
| | Page |
|---|
PART I | | | | |
Item 1. | | Business | |
1 |
Item 1A. | | Risk Factors | |
11 |
Item 1B. | | Unresolved Staff Comments | |
14 |
Item 2. | | Properties | |
14 |
Item 3. | | Legal Proceedings | |
15 |
Item 4. | | (Removed and Reserved) | |
16 |
PART II | | | | |
Item 5. | | Market for Registrant's Common Equity, Related Stockholder Matters and Issuer Purchases of Equity Securities | |
17 |
Item 6. | | Selected Financial Data | |
19 |
Item 7. | | Management's Discussion and Analysis of Financial Condition and Results of Operations | |
21 |
Item 7A. | | Quantitative and Qualitative Disclosures About Market Risk | |
36 |
Item 8. | | Financial Statements and Supplementary Data | |
38 |
Item 9. | | Changes in and Disagreements with Accountants on Accounting and Financial Disclosure | |
85 |
Item 9A. | | Controls and Procedures | |
85 |
Item 9B. | | Other Information | |
88 |
PART III | | | | |
Item 10. | | Directors, Executive Officers and Corporate Governance | |
88 |
Item 11. | | Executive Compensation | |
88 |
Item 12. | | Security Ownership of Certain Beneficial Owners and Management and Related Stockholder Matters | |
88 |
Item 13. | | Certain Relationships and Related Transactions and Director Independence | |
88 |
Item 14. | | Principal Accounting Fees and Services | |
88 |
PART IV | | | | |
Item 15. | | Exhibits and Financial Statement Schedules | |
89 |
| | Signatures | |
92 |
i
Table of Contents
PART I
ITEM 1 BUSINESS
GENERAL
The Pep Boys—Manny, Moe & Jack and subsidiaries ("the Company") began operations in 1921 and is the only national chain offering automotive service, tires, parts and accessories. This positioning allows us to streamline the distribution channel and pass the savings on to our customer facilitating our vision to be the automotive solutions provider of choice for the value-oriented customer. Our primary operating unit is our Supercenter format (averaging 20,600 sq.ft.), which serves both "do-it-for-me" ("DIFM", which includes service labor, installed merchandise and tires) and retail (which includes "do-it-yourself", or "DIY", and commercial) customers with the highest quality service offerings and merchandise. Most of our Supercenters have a commercial sales program that provides commercial credit and prompt delivery of tires, parts and other products to local, regional and national repair shops and dealers. In 2009, as part of our long-term strategy to lead with automotive service, we began complementing our existing Supercenter store base with Service & Tire Centers (averaging 5,800 sq.ft.). The Service & Tire Centers are designed to capture market share and leverage our existing Supercenters and support infrastructure. In 2010, we introduced new, smaller format (14,000 sq.ft.) Supercenters. The new, smaller Supercenters are designed to provide our customers with our complete offering of automotive service, tires, parts and accessories in a more efficient and cost-effective footprint. In total, as of January 29, 2011, the Company operated approximately 11,930,000 of gross square feet of retail space, including service bays.
In fiscal 2010, we opened 28 new Service & Tire Centers and seven new Supercenters. We are targeting a total of 50 new Service & Tire Centers and five Supercenters in fiscal 2011, and 75 new Service & Tire Centers and ten Supercenters in fiscal 2012. We expect to lease new Service & Tire Center and Supercenter locations, as we believe that there are sufficient existing available locations in the marketplace with attractive lease terms to enable our expansion.
The following table sets forth the percentage of total revenues from continuing operations contributed by each class of similar products or services for the Company and should be read in conjunction with the Consolidated Financial Statements and Notes thereto included elsewhere herein:
| | | | | | | | | | |
| | Year ended | |
|---|
| | January 29,
2011 | | January 30,
2010 | | January 31,
2009 | |
|---|
Parts and accessories | | | 63.5 | % | | 63.9 | % | | 65.1 | % |
Tires | | | 16.9 | | | 16.4 | | | 16.3 | |
| | | | | | | | |
Total merchandise sales | | | 80.4 | | | 80.3 | | | 81.4 | |
Service labor | | | 19.6 | | | 19.7 | | | 18.6 | |
| | | | | | | | |
Total revenues | | | 100.0 | % | | 100.0 | % | | 100.0 | % |
| | | | | | | | |
As of January 29, 2011, the Company operated its stores in 35 states and Puerto Rico. The following table indicates, by state, the number of stores the Company had in operation at the end of
1
Table of Contents
each of the last four fiscal years, and the number of stores opened and closed by the Company during each of the last three fiscal years:
NUMBER OF STORES AT END OF FISCAL YEARS 2007 THROUGH 2010
| | | | | | | | | | | | | | | | | | | | | | | | | | | | | | | |
State | | 2010
Year End | | Opened | | Closed | | 2009
Year End | | Opened | | Closed | | 2008
Year End | | Opened | | Closed | | 2007
Year End | |
|---|
Alabama | | | 1 | | | — | | | — | | | 1 | | | — | | | — | | | 1 | | | — | | | — | | | 1 | |
Arizona | | | 22 | | | — | | | — | | | 22 | | | — | | | — | | | 22 | | | — | | | — | | | 22 | |
Arkansas | | | 1 | | | — | | | — | | | 1 | | | — | | | — | | | 1 | | | — | | | — | | | 1 | |
California | | | 129 | | | 6 | | | 1 | | | 124 | | | 6 | | | — | | | 118 | | | — | | | — | | | 118 | |
Colorado | | | 7 | | | — | | | — | | | 7 | | | — | | | — | | | 7 | | | — | | | — | | | 7 | |
Connecticut | | | 7 | | | — | | | — | | | 7 | | | — | | | — | | | 7 | | | — | | | — | | | 7 | |
Delaware | | | 7 | | | — | | | — | | | 7 | | | 1 | | | — | | | 6 | | | — | | | — | | | 6 | |
Florida | | | 60 | | | 7 | | | — | | | 53 | | | 10 | | | — | | | 43 | | | — | | | — | | | 43 | |
Georgia | | | 25 | | | 3 | | | — | | | 22 | | | — | | | — | | | 22 | | | — | | | — | | | 22 | |
Illinois | | | 29 | | | 4 | | | — | | | 25 | | | 3 | | | — | | | 22 | | | — | | | — | | | 22 | |
Indiana | | | 7 | | | — | | | — | | | 7 | | | — | | | — | | | 7 | | | — | | | — | | | 7 | |
Kentucky | | | 4 | | | — | | | — | | | 4 | | | — | | | — | | | 4 | | | — | | | — | | | 4 | |
Louisiana | | | 8 | | | — | | | — | | | 8 | | | — | | | — | | | 8 | | | — | | | — | | | 8 | |
Maine | | | 1 | | | — | | | — | | | 1 | | | — | | | — | | | 1 | | | — | | | — | | | 1 | |
Maryland | | | 19 | | | 1 | | | — | | | 18 | | | — | | | — | | | 18 | | | — | | | — | | | 18 | |
Massachusetts | | | 7 | | | 1 | | | — | | | 6 | | | — | | | — | | | 6 | | | — | | | — | | | 6 | |
Michigan | | | 5 | | | — | | | — | | | 5 | | | — | | | — | | | 5 | | | — | | | — | | | 5 | |
Minnesota | | | 3 | | | — | | | — | | | 3 | | | — | | | — | | | 3 | | | — | | | — | | | 3 | |
Missouri | | | 1 | | | — | | | — | | | 1 | | | — | | | — | | | 1 | | | — | | | — | | | 1 | |
Nevada | | | 12 | | | — | | | — | | | 12 | | | — | | | — | | | 12 | | | — | | | — | | | 12 | |
New Hampshire | | | 4 | | | — | | | — | | | 4 | | | — | | | — | | | 4 | | | — | | | — | | | 4 | |
New Jersey | | | 32 | | | 1 | | | — | | | 31 | | | 2 | | | — | | | 29 | | | — | | | — | | | 29 | |
New Mexico | | | 8 | | | — | | | — | | | 8 | | | — | | | — | | | 8 | | | — | | | — | | | 8 | |
New York | | | 31 | | | 2 | | | — | | | 29 | | | — | | | — | | | 29 | | | — | | | — | | | 29 | |
North Carolina | | | 8 | | | — | | | — | | | 8 | | | — | | | — | | | 8 | | | — | | | — | | | 8 | |
Ohio | | | 12 | | | 2 | | | — | | | 10 | | | — | | | — | | | 10 | | | — | | | — | | | 10 | |
Oklahoma | | | 5 | | | — | | | — | | | 5 | | | — | | | — | | | 5 | | | — | | | — | | | 5 | |
Pennsylvania | | | 51 | | | 6 | | | — | | | 45 | | | 3 | | | — | | | 42 | | | — | | | — | | | 42 | |
Puerto Rico | | | 27 | | | — | | | — | | | 27 | | | — | | | — | | | 27 | | | — | | | — | | | 27 | |
Rhode Island | | | 2 | | | — | | | — | | | 2 | | | — | | | — | | | 2 | | | — | | | — | | | 2 | |
South Carolina | | | 6 | | | — | | | — | | | 6 | | | — | | | — | | | 6 | | | — | | | — | | | 6 | |
Tennessee | | | 7 | | | — | | | — | | | 7 | | | — | | | — | | | 7 | | | — | | | — | | | 7 | |
Texas | | | 49 | | | 2 | | | — | | | 47 | | | — | | | — | | | 47 | | | — | | | — | | | 47 | |
Utah | | | 6 | | | — | | | — | | | 6 | | | — | | | — | | | 6 | | | — | | | — | | | 6 | |
Virginia | | | 16 | | | — | | | — | | | 16 | | | — | | | — | | | 16 | | | — | | | — | | | 16 | |
Washington | | | 2 | | | — | | | — | | | 2 | | | — | | | — | | | 2 | | | — | | | — | | | 2 | |
| | | | | | | | | | | | | | | | | | | | | | |
Total | | | 621 | | | 35 | | | 1 | (1) | | 587 | | | 25 | | | — | | | 562 | | | — | | | — | | | 562 | |
| | | | | | | | | | | | | | | | | | | | | | |
- (1)
- During fiscal 2010 the lease at one of our nine Pep Express locations expired and was not renewed.
INDUSTRY OVERVIEW
The automotive aftermarket retail and service industry is in the mature stage of its life cycle and while the retail space is dominated by a small number of companies with large market shares, the automotive service business is highly fragmented. Over the past decade, consumers have moved away from DIY and toward DIFM due to increasing vehicle complexity and electronic content, and
2
Table of Contents
decreasing availability of diagnostic equipment and know-how. In addition, while this needs-based industry has a dedicated DIY customer base, the number of consumers who would prefer to have a professional fix their vehicle fluctuates with economic cycles. The drop in disposable income during the most recent recession forced some former DIFM consumers to work on their own vehicles. Weak labor and credit markets, depressed new vehicles sales and the increasing average length of vehicle ownership compounded this trend. The broader economic recovery is expected to increase disposable income, which will likely result in the reversal of this recent trend.
We expect the shift away from DIY and toward DIFM to increase as the economy recovers, and continue for the foreseeable future. In anticipation of the change in consumer behavior we have adopted a long-term strategy of leading with our automotive service offerings and aggressively expanding our commercial business, while maintaining our DIY customer base through our innovative marketing programs in order to capitalize on the forecasted long-term growth of the DIFM industry and decline of the DIY business.
BUSINESS STRATEGY
Our vision for Pep Boys is to take our industry-leading position in automotive services and accessories and to be the automotive solutions provider of choice for the value-oriented customer. Our brand positioning—"PEP BOYS DOES EVERYTHING. FOR LESS" is designed to convey to customers the breadth of the automotive services and merchandise that we offer and our value proposition. The four strategies to achieve our vision are to: (i) Earn the trust of our customers every day, (ii) Lead with our service business and grow through our Service & Tire Centers, (iii) Establish a differentiated DIY experience by leveraging our Automotive Superstore and (iv) Leverage our Automotive Superstore to provide the most complete offering for our commercial customers.
Earn the TRUST of our Customers every day. We do this by delivering a customer experience that is based on Speed, Expertise, Respect and Value. We start with our associates and our goal to be the preferred employer in our industry by focusing on associate hiring practices, training and development, and rewarding associate performance through performance-based compensation plans. In our stores, we strive to continuously improve the customer experience by providing better looking and easier to shop stores and more consistent execution of our simplified and streamlined operations. We have developed a specific tailored marketing plan for each of our markets to maximize our reach and efficiencies. These marketing programs focus on TV and radio promotions scheduled around traditional shopping holidays that focus on the most frequently needed services. These promotions are supplemented by extensive direct marketing and grass-roots campaigns and occasional print campaigns. We have a rewards program that benefits customers whether they choose to do it themselves or have us do it for them and helps to drive customer count increases and repeat business through discounted towing, free services and rewards points for purchases.
Lead with our Service business and grow through our Service & Tire Centers. We do this by being a full service—tire, maintenance and repair—shop thatDOES EVERYTHING. FOR LESS. Our full service capabilities, ASE (Automotive Service Excellence) certified technicians and continuous investment in training and equipment allow customers to rely on us for all of their automotive service and maintenance needs. We can provide these services at highly-competitive prices because our size and business model allow us to buy quality parts at lower prices and pass those savings onto our customers. We believe that offering a broad assortment of private label and branded tires at competitive prices provides a competitive advantage to the Company since DIY competitors do not sell tires and related services. In order to further leverage our tire business, we are in the process of introducing a new interactive web application which allows customers to shop for the tire that best fits their needs and simultaneously schedule installation services at one of our stores.
3
Table of Contents
Our store growth plans are centered on a "hub and spoke" model, which calls for adding smaller neighborhood Service & Tire Centers to our existing Supercenter store base in order to further leverage our existing inventories, distribution network, operations infrastructure and advertising spend. We opened 35 new stores in 2010—28 Service & Tire Centers and seven Supercenters. Our plans call for 55 new locations in 2011, followed by 85 in 2012. The typical Service & Tire Center is full service with approximately six service bays and $1.0 million in expected annual sales. Our Service & Tire Centers offer customer convenience, allowing us to be close to our customers' home or work and generally serve a higher demographic customer than our Supercenters. To further leverage our store investment, we are focused on expanding our vehicle fleet business by communicating our value offering to local and national fleet accounts through targeted marketing, improving store execution and expanding our dedicated fleet resources.
Establish a differentiated Retail experience by leveraging our Automotive Superstore. The size of our stores allows us to provide the highest level of replacement parts coverage and the broadest range of maintenance, performance and appearance products and accessories in the industry. We are able to leverage our Superhub stores, which have a larger assortment of product than our normal Supercenter, to satisfy customer needs for slow-moving product by delivering this product to requesting Supercenters on demand. As part of our commitment to carry the best assortment of automotive aftermarket merchandise, we make assortment decisions by examining every merchandise category using market and demographic data to assure we have the best product in the right place. This category management process ensures our assortment includes the appropriate coverage for service, DIY and commercial consumers as well as allowing us to make good, sound decisions about price, product and promotions.
Leverage our Automotive Superstore to provide the most complete offering for our Commercial customers. To further leverage our inventory and automotive aftermarket expertise, we continue to expand our commercial operations. In addition to offering these customers parts and fluids, we enjoy a competitive advantage of also being able to offer tires, equipment, accessories and services.
STORE IMPROVEMENTS
In fiscal 2010, the Company's capital expenditures totaled $70.3 million which, in addition to our regularly-scheduled facility improvements, included the addition of 35 stores and the upgrade of our store computer systems hardware. Our fiscal 2011 capital expenditures are expected to be approximately $80.0 million, which includes the addition of approximately 50 Service & Tire Centers, five Supercenters and the conversion of 24 Supercenters into Superhubs. These expenditures are expected to be funded from cash on hand and net cash generated from operating activities. Additional capacity, if needed, exists under our revolving credit facility.
SERVICES AND PRODUCTS
The Company operates a total of 6,259 service bays in 613 of its 621 locations. Each service location performs a full range of automotive repair and maintenance services (except body work) and installs tires, hard parts and accessories.
Each Pep Boys Supercenter and Pep Express store carries a similar product line, with variations based on the number and type of cars in the markets where the store is located, while a Pep Boys Service & Tire Center carries tires and a limited selection of our other products. A full complement of inventory at a typical Supercenter includes an average of approximately 26,000 items, while Service & Tire Centers average approximately 3,400 items. The Company's product lines include: tires (not stocked at Pep Express stores); batteries; new and remanufactured parts for domestic and import vehicles; chemicals and maintenance items; fashion, electronic, and performance accessories; and a limited amount of select non-automotive merchandise that appeals to automotive "Do-It-Yourself" customers, such as generators, power tools, personal transportation products and canopies.
4
Table of Contents
In addition to offering a wide variety of high quality name brand products, the Company sells an array of high quality products under various private label names. The Company sells tires under the names DEFINITY, FUTURA® and CORNELL®, and batteries under the name PROSTART®. The Company also sells wheel covers under the name FUTURA®; water pumps and cooling system parts under the name PROCOOL®; air filters, anti-freeze, chemicals, cv axles, lubricants, oil, oil filters, oil treatments, transmission fluids, wheel rims and wiper blades under the name PROLINE®; alternators, battery booster packs, alkaline type batteries and starters under the name PROSTART®; power steering hoses, chassis parts and power steering pumps under the name PROSTEER®; brakes under the name PROSTOP® and brakes, batteries, starters, and ignitions under the name VALUEGRADE. All products sold by the Company under various private label names were approximately 31% of the Company's merchandise sales in fiscal 2010 and 2009, and 28% in fiscal 2008.
The Company's commercial automotive parts delivery program, branded PEP EXPRESS PARTS®, is designed to increase the Company's market share with the professional installer and to leverage inventory investment. The program satisfies the commercial customer's automotive inventory needs by taking advantage of the breadth and quality of the Company's parts inventory as well as its experience supplying its own service bays and mechanics. As of January 29, 2011, approximately 80% or 454 of the Company's 568 Supercenters and Pep Express stores provided commercial parts delivery as compared to approximately 80% or 451 stores at the end of fiscal 2009.
In 2009, the Company began a 20-store pilot program designed to fulfill the Company's goal to be the automotive solutions provider of choice for mobile electronics and installation services. The Company re-organized its automotive audio product lines to include radios, speakers, amplifiers, remote starters and alarm systems from the most popular brands. The key to this program is the addition of expert sales and installation technicians to service our customers' needs. As of January 29, 2011, the installation program was available at 110 stores and the Company expects to double the number of stores offering this service in fiscal 2011. We also added five new Speed Shops to existing Supercenters during fiscal 2010, bringing our total number of Speed Shops to seven. Speed Shops create a differentiated retail experience for automotive enthusiasts by stocking high-performance and specialty products.
The Company has a point-of-sale system in all of its stores, which gathers sales and inventory data by stock-keeping unit from each store on a daily basis. This information is then used by the Company to help formulate its pricing, inventory, marketing, and merchandising strategies. The Company has an electronic parts catalog that allows our employees to efficiently look up the parts that our customers need and to provide complete job solutions, advice and information for customer vehicles. The Company has an electronic work order system in all of its service centers. This system creates a service history for each vehicle, provides customers with a comprehensive sales document and enables the Company to maintain a service customer database.
The Company primarily uses an "Everyday Low Price" (EDLP) strategy in establishing its selling prices. Management believes that EDLP provides better value to its customers on a day-to-day basis, helps level customer demand and allows more efficient management of inventories. On a periodic basis, the Company employs a promotional pricing strategy on select items and service offers to drive increased customer traffic.
We believe that targeted advertising and promotions play important roles in succeeding in today's environment. We are constantly working to understand our customers' wants and needs so that we can build long-lasting, loyal relationships. We utilize promotions, advertising, and loyalty card programs to promote our service and repair capabilities, merchandise offerings and our commitment to customer service and satisfaction. The Company is committed to an effective promotional schedule with TV and radio promotions that focus on the most frequently needed services and are scheduled around periods of time when automotive repair and preventative maintenance are top of mind and relevant to our
5
Table of Contents
customers. These promotions will be supplemented by extensive direct marketing and grass-roots campaigns and occasional print campaigns. Finally, we utilize in-store signage, creative product placement and promotions to help educate customers about products that fit their needs.
The Company maintains a web site located at www.pepboys.com. It serves as a portal to our Company, allowing consumers the freedom and convenience to access more information about the organization, our stores and our service, tires, parts and accessories offerings. Consumers can schedule a service appointment on our web site with our eServe application, as well as keep track of all their maintenance and service records electronically through our online Glovebox application. The site also provides consumers with general and seasonal car care tips, do-it-yourself vehicle maintenance and light repair guidance, and safe driving pointers. Exclusive online coupons are available to site visitors who register their e-mail addresses with us. These coupons cover special discounts on services and products at Pep Boys.
STORE OPERATIONS AND MANAGEMENT
Most Pep Boys stores are open seven days a week. Each Supercenter has a Retail Manager and Service Manager (Service & Tire Centers only have a Service Manager while Pep Express stores only have a Retail Manager) who report to geographic-specific Area Directors and Division Vice Presidents. The Division Vice Presidents report to the Executive Vice President of Stores who in turn reports to the President and Chief Executive Officer. As of January 29, 2011, a Retail Manager's and a Service Manager's average length of service with the Company is approximately 8.6 and 5.5 years, respectively.
Supervision and control over individual stores is facilitated by Area Directors and Divisional Vice Presidents making regular visits to stores and utilizing the Company's computer system and operational handbooks. All of the Company's advertising, accounting, purchasing, information technology, and most of its administrative functions are conducted at its corporate headquarters in Philadelphia, Pennsylvania. Certain administrative functions for the Company's regional operations are performed at various regional offices of the Company. See "Item 2 Properties."
INVENTORY CONTROL AND DISTRIBUTION
Most of the Company's merchandise is distributed to its stores from its warehouses by dedicated and contract carriers. Target levels of inventory for each product are established for each warehouse and store based upon prior shipment history, sales trends and seasonal demand. Inventory on hand is compared to the target levels on a weekly basis at each warehouse, potentially triggering re-ordering of merchandise from suppliers. In addition, each Pep Boys store has an automated inventory replenishment system that orders additional inventory, generally from a warehouse, when a store's inventory on-hand falls below the target levels. Recently, we consolidated certain of our slow-moving hard parts inventory that had previously been stocked at each of our five warehouses into our centrally-located Indianapolis warehouse that can service each of our stores with overnight delivery of these parts, when necessary.
The Company also operates certain of its Supercenters as Superhubs, which have a larger assortment of auto parts than our normal Supercenter. Implementation of the Superhub concept enabled local expansion of our auto parts product assortment in a cost effective manner. We are now able to satisfy customer needs for slow-moving auto parts by carrying limited amounts of this product at Superhub locations. These Superhubs then deliver this product to requesting Supercenters to fulfill customer demand. Superhubs are generally replenished from distribution centers multiple times per week. As of January 29, 2011, the Company operated 19 Superhubs within existing Supercenters, with plans to convert an additional 24 Superhubs in fiscal 2011.
6
Table of Contents
SUPPLIERS
During fiscal 2010, the Company's ten largest suppliers accounted for approximately 53% of the merchandise purchased. No single supplier accounted for more than 20% of the Company's purchases. The Company has no long-term contracts under which it is required to purchase merchandise. Management believes that the relationships the Company has established with its suppliers are generally good.
In the past, the Company has not experienced difficulty in obtaining satisfactory sources of supply and believes that adequate alternative sources of supply exist, at similar cost, for the types of merchandise sold in its stores. Recently, however, due to industry-wide supply constraints, the Company has experienced some difficulty in obtaining the full amount of its desired tire supply from its current suppliers and, accordingly, is pursuing relationships with supplemental suppliers.
COMPETITION
The Company operates in a highly competitive environment. The Company encounters competition from nationwide and regional chains and from local independent service providers and merchants. The Company's competitors include general, full range, discount or traditional department stores which carry automotive parts and accessories and/or have automotive service centers, as well as specialized automotive retailers. Generally, the specialized automotive retailers focus on either the "do-it-yourself" or "do-it-for-me" areas of the business. The Company believes that its operation in both the "do-it-for-me" and "do-it-yourself" areas of the business positively differentiates it from most of its competitors. However, certain competitors are larger in terms of sales volume, store size, and/or number of stores. Therefore, these competitors have access to greater capital and management resources and have been operating longer or have more stores in particular geographic areas than the Company. The principal methods of competition in our industry include store location, customer service, product offerings, quality and price.
REGULATION
The Company is subject to various federal, state and local laws and governmental regulations relating to the operation of its business, including those governing the handling, storage and disposal of hazardous substances contained in the products it sells and uses in its service bays, the recycling of batteries, tires and used lubricants, the sale of small engine merchandise and the ownership and operation of real property.
EMPLOYEES
At January 29, 2011, the Company employed 18,279 persons as follows:
| | | | | | | | | | | | | | | | | | | |
Description | | Full-time | | % | | Part-time | | % | | Total | | % | |
|---|
Retail | | | 3,945 | | | 31.7 | | | 4,093 | | | 70.1 | | | 8,038 | | | 44.0 | |
Service center | | | 7,201 | | | 57.9 | | | 1,668 | | | 28.6 | | | 8,869 | | | 48.5 | |
| | | | | | | | | | | | | | |
Store total | | | 11,146 | | | 89.6 | | | 5,761 | | | 98.7 | | | 16,907 | | | 92.5 | |
Warehouses | | | 539 | | | 4.3 | | | 71 | | | 1.2 | | | 610 | | | 3.3 | |
Offices | | | 756 | | | 6.1 | | | 6 | | | 0.1 | | | 762 | | | 4.2 | |
| | | | | | | | | | | | | | |
Total employees | | | 12,441 | | | 100.0 | | | 5,838 | | | 100.0 | | | 18,279 | | | 100.0 | |
| | | | | | | | | | | | | | |
The Company had no union employees as of January 29, 2011. At January 30, 2010, the Company employed 11,881 full-time and 5,837 part-time employees.
7
Table of Contents
SPECIAL NOTE REGARDING FORWARD-LOOKING STATEMENTS
Certain statements contained herein, including in "Item 1 Business" and "Item 7 Management's Discussion and Analysis of Financial Condition and Results of Operations", constitute "forward-looking statements" within the meaning of The Private Securities Litigation Reform Act of 1995. The words "guidance," "expects," "anticipates," "estimates," "forecasts" and similar expressions are intended to identify these forward-looking statements. Forward-looking statements include management's expectations regarding implementation of its long-term strategic plan, future financial performance, automotive aftermarket trends, levels of competition, business development activities, future capital expenditures, financing sources and availability and the effects of regulation and litigation. Although we believe that the expectations reflected in these forward-looking statements are based on reasonable assumptions, we can give no assurance that our expectations will be achieved. Our actual results may differ materially from the results discussed in the forward-looking statements due to factors beyond our control, including the strength of the national and regional economies, retail and commercial consumers' ability to spend, the health of the various sectors of the automotive aftermarket, the weather in geographical regions with a high concentration of our stores, competitive pricing, the location and number of competitors' stores, product and labor costs and the additional factors described in our filings with the Securities and Exchange Commission ("SEC"). See "Item 1A Risk Factors." We assume no obligation to update or supplement forward-looking statements that become untrue because of subsequent events.
SEC REPORTING
We electronically file certain documents with, or furnish such documents to, the SEC, including annual reports on Form 10-K, quarterly reports on Form 10-Q, and current reports on Form 8-K, along with any related amendments to those reports filed or furnished pursuant to Section 13(a) or 15(d) of the Exchange Act. From time-to-time, we may also file registration and related statements pertaining to equity or debt offerings. The SEC maintains an Internet website at www.sec.gov that contains reports, proxy and information statements, and other information regarding issuers that file or furnish documents electronically with the SEC. All our filings can be accessed through the Securities and Exchange Commission website at www.sec.gov and searching with our ticker symbol "PBY".
We provide free electronic access to our annual, quarterly and current reports (and all amendments to these reports) on our Internet website, www.pepboys.com, under the Investor Relations/Financial Information/SEC Filings link. These reports are available on our website as soon as reasonably practicable after we electronically file or furnish such materials with or to the SEC. Information on our website does not constitute part of this Annual Report, and any references to our website herein are intended as inactive textual references only.
Copies of our SEC reports are also available free of charge. Please call our investor relations department at 215-430-9459 or write Pep Boys, Investor Relations, 3111 West Allegheny Avenue, Philadelphia, PA 19132 to request copies.
8
Table of Contents
EXECUTIVE OFFICERS OF THE COMPANY
The following table indicates the name, age, tenure with the Company and position (together with the year of election to such position) of the executive officers of the Company:
| | | | | | | |
Name | | Age | | Tenure with
Company as of
April 2011 | | Position with the Company and Date of Election to Position |
|---|
Michael R. Odell | | | 47 | | 4 years | | President and Chief Executive Officer since June 2010 |
Raymond L. Arthur | | | 52 | | 3 years | | Executive Vice President—Chief Financial Officer since May 2008 |
William E. Shull III | | | 52 | | 3 years | | Executive Vice President—Stores since June 2010 |
Scott A. Webb | | | 47 | | 4 years | | Executive Vice President—Merchandising & Marketing since June 2010 |
Joseph A. Cirelli | | | 52 | | 34 years | | Senior Vice President—Business Development since November 2007 |
Troy E. Fee | | | 42 | | 4 years | | Senior Vice President—Human Resources since July 2007 |
Brian D. Zuckerman | | | 41 | | 12 years | | Senior Vice President—General Counsel & Secretary since March 2009 |
Michael R. Odell was named Chief Executive Officer on September 22, 2008, after serving as Interim Chief Executive Officer since April 23, 2008. Mr. Odell received the additional title of President on June 17, 2010. Mr. Odell joined the Company in September 2007 as Executive Vice President—Chief Operating Officer, after having most recently served as the Executive Vice President and General Manager of Sears Retail & Specialty Stores. Mr. Odell joined Sears in its finance department in 1994 where he served until he joined Sears' operations team in 1998. There he served in various executive operations positions of increasing seniority, including as Vice President, Stores—Sears Automotive Group.
Raymond L. Arthur joined Pep Boys in May 2008 after serving as Executive Vice President and Chief Financial Officer of Toys "R" Us Inc., from 2004 to 2006, where he oversaw its strategic review and restructuring of company-wide operations, as well as managing the leveraged buy-out of the company. During his seven year tenure at Toys "R" Us, Mr. Arthur also served as President and Chief Financial Officer of toysrus.com from 2000 to 2003 and as Corporate Controller of Toys "R" Us from 1999 to 2000. Prior to that, he worked in a variety of roles of increasing responsibility for General Signal, American Home Products, American Cyanamid and in public accounting.
William E. Shull III was named Executive Vice President—Stores on June 17, 2010 after having joined the Company in September 2008 as Senior Vice President—Stores. Over the last 25 years Mr. Shull has held several senior management positions with a variety of retail and service companies where his focus was on building and integrating store management teams into successfully profitable and cohesive units. In his 13 years at AutoZone he was instrumental in building the foundation of the retail chain in 4 geographic regions and responsible for store communications, training, and served on several strategic initiative committees.
Scott A. Webb was named Executive Vice President—Merchandising & Marketing on June 17, 2010 after having joined the Company in September 2007 as Senior Vice President—Merchandising & Marketing. Prior to joining Pep Boys, Mr. Webb served as the Vice President, Merchandising and Customer Satisfaction of AutoZone. Mr. Webb joined AutoZone in 1986 where he began his service in field management before transitioning, in 1992, to the Merchandising function.
Joseph A. Cirelli was named Senior Vice President—Corporate Development in November 2007. Since March 1977, Mr. Cirelli has served the Company in positions of increasing seniority, including
9
Table of Contents
Senior Vice President—Service, Vice President—Real Estate and Development, Vice President—Operations Administration, and Vice President—Customer Satisfaction.
Troy E. Fee, Senior Vice President—Human Resources, joined the Company in July 2007, after having most recently served as the Senior Vice President of Human Resources Shared Services for TBC Corporation, then the parent company of Big O Tires, Tire Kingdom and National Tire & Battery. Mr. Fee has over 20 years experience in operations and human resources in the tire and automotive service and repair business.
Brian D. Zuckerman was named Senior Vice President—General Counsel & Secretary on March 1, 2009 after having most recently served as Vice President—General Counsel & Secretary since 2003. Mr. Zuckerman joined the Company as a staff attorney in 1999. Prior to joining Pep Boys, Mr. Zuckerman practiced corporate and securities law with two firms in Philadelphia.
Each of the executive officers serves at the pleasure of the Board of Directors of the Company.
10
Table of Contents
ITEM 1A RISK FACTORS
The following section discloses all known material risks that we face. However, it does not include risks that may arise in the future that are yet unknown nor existing risks that we do not judge material to the presentation of our financial statements. If any of the events or circumstances described as risk below actually occurs, our business, results of operations and/or financial condition could be materially and adversely affected.
Risks Related to Pep Boys
We may not be able to successfully implement our business strategy, which could adversely affect our business, financial condition, results of operations and cash flows.
Our long-term strategic plan, which we update annually, includes numerous initiatives to increase sales, enhance our margins and increase our return on invested capital in order to increase our earnings and cash flow. If these initiatives are unsuccessful, or if we are unable to implement the initiatives efficiently and effectively, our business, financial condition, results of operations and cash flows could be adversely affected.
Successful implementation of our business strategy also depends on factors specific to the automotive aftermarket industry, many of which may be beyond our control (see "Risks Related to Our Industry").
If we are unable to generate sufficient cash flows from our operations, our liquidity will suffer and we may be unable to satisfy our obligations.
We require significant capital to fund our business. While we believe we have the ability to sufficiently fund our planned operations and capital expenditures for the next fiscal year, circumstances could arise that would materially affect our liquidity. For example, cash flows from our operations could be affected by changes in consumer spending habits or the failure to maintain favorable vendor payment terms or our inability to successfully implement sales growth initiatives. We may be unsuccessful in securing alternative financing when needed, on terms that we consider acceptable, or at all.
The degree to which we are leveraged could have important consequences to your investment in our securities, including the following risks:
- •
- our ability to obtain additional financing for working capital, capital expenditures, acquisitions or general corporate purposes may be impaired in the future;
- •
- a substantial portion of our cash flow from operations must be dedicated to the payment of rent and the principal and interest on our debt, thereby reducing the funds available for other purposes;
- •
- our failure to comply with financial and operating restrictions placed on us and our subsidiaries by our credit facilities could result in an event of default that, if not cured or waived, could have a material adverse effect on our business or our prospects; and
- •
- if we are substantially more leveraged than some of our competitors, we might be at a competitive disadvantage to those competitors that have lower debt service obligations and significantly greater operating and financial flexibility than we do.
11
Table of Contents
We depend on our relationships with our vendors and a disruption of these relationships or of our vendors' operations could have a material adverse effect on our business and results of operations.
Our business depends on developing and maintaining productive relationships with our vendors. Many factors outside our control may harm these relationships. For example, financial difficulties that some of our vendors may face may increase the cost of the products we purchase from them or may interrupt our source of supply. In addition, our failure to promptly pay, or order sufficient quantities of inventory from our vendors may increase the cost of products we purchase or may lead to vendors refusing to sell products to us at all.
Some of the most important vendor relationships that we maintain are with our tire vendors. Recently, due to industry-wide supply constraints, the Company has experienced some difficulty in obtaining the full amount of its desired tire supply from its current vendors and, accordingly, is pursuing relationships with supplemental vendors.
A disruption of our vendor relationships or a disruption in our vendors' operations could have a material adverse effect on our business and results of operations.
We depend on our senior management team and our other personnel, and we face substantial competition for qualified personnel.
Our success depends in part on the efforts of our senior management team. Our continued success will also depend upon our ability to retain existing, and attract additional, qualified field personnel to meet our needs. We face substantial competition, both from within and outside of the automotive aftermarket to retain and attract qualified personnel. In addition, we believe that the number of qualified automotive service technicians in the industry is generally insufficient to meet demand.
We are subject to environmental laws and may be subject to environmental liabilities that could have a material adverse effect on us in the future.
We are subject to various federal, state and local environmental laws and governmental regulations relating to the operation of our business, including those governing the handling, storage and disposal of hazardous substances contained in the products we sell and use in our service bays, the recycling of batteries, tires and used lubricants, the ownership and operation of real property and the sale of small engine merchandise. When we acquire or dispose of real property or enter into financings secured by real property, we undertake investigations that may reveal soil and/or groundwater contamination at the subject real property. All such known contamination has either been remediated, or is in the process of being remediated. Any costs expected to be incurred related to such contamination are either covered by insurance or financial reserves provided for in the consolidated financial statements. However, there exists the possibility of additional soil and/or groundwater contamination on our real property where we have not undertaken an investigation. A failure by us to comply with environmental laws and regulations could have a material adverse effect on us.
12
Table of Contents
Risks Related to Our Industry
Our industry is highly competitive, and price competition in some segments of the automotive aftermarket or a loss of trust in our participation in the "do-it-for-me" market, could cause a material decline in our revenues and earnings.
The automotive aftermarket retail and service industry is highly competitive and subjects us to a wide variety of competitors. We compete primarily with the following types of businesses in each segment of the automotive aftermarket:
Retail
Do-It-Yourself
- •
- automotive parts and accessories stores;
- •
- automobile dealers that supply manufacturer replacement parts and accessories; and
- •
- mass merchandisers and wholesale clubs that sell automotive products and select non-automotive merchandise that appeals to automotive "Do-It-Yourself" customers, such as generators, power tools and canopies.
Commercial
- •
- mass merchandisers, wholesalers and jobbers (some of which are associated with national parts distributors or associations).
Service
Do-It-For-Me
- •
- regional and local full service automotive repair shops;
- •
- automobile dealers that provide repair and maintenance services;
- •
- national and regional (including franchised) tire retailers that provide additional automotive repair and maintenance services; and
- •
- national and regional (including franchised) specialized automotive (such as oil change, brake and transmission) repair facilities that provide additional automotive repair and maintenance services.
Tires
- •
- national and regional (including franchised) tire retailers; and
- •
- mass merchandisers and wholesale clubs that sell tires.
A number of our competitors have more financial resources, are more geographically diverse, have a higher geographic market concentration or have better name recognition than we do, which might place us at a competitive disadvantage to those competitors. Because we seek to offer competitive prices, if our competitors reduce their prices we may also be forced to reduce our prices, which could cause a material decline in our revenues and earnings.
With respect to the service labor category, the majorities of consumers are unfamiliar with their vehicle's mechanical operation and, as a result, often select a service provider based on trust. Potential occurrences of negative publicity associated with the Pep Boys brand, the products we sell or installation or repairs performed in our service bays, whether or not factually accurate, could cause
13
Table of Contents
consumers to lose confidence in our products and services in the short or long term, and cause them to choose our competitors for their automotive service needs.
Vehicle miles driven may decrease, resulting in a decline of our revenues and negatively affecting our results of operations.
Our industry depends on the number of vehicle miles driven. Factors that may cause the number of vehicle miles and our revenues and our results of operations to decrease include:
- •
- the weather—as vehicle maintenance may be deferred during periods of inclement weather;
- •
- the economy—as during periods of poor economic conditions, customers may defer vehicle maintenance or repair, and during periods of good economic conditions, consumers may opt to purchase new vehicles rather than service the vehicles they currently own and replace worn or damaged parts;
- •
- gas prices—as increases in gas prices may deter consumers from using their vehicles; and
- •
- travel patterns—as changes in travel patterns may cause consumers to rely more heavily on mass transportation.
Economic factors affecting consumer spending habits may continue, resulting in a decline in revenues and may negatively impact our business.
Many economic and other factors outside our control, including consumer confidence, consumer spending levels, employment levels, consumer debt levels and inflation, as well as the availability of consumer credit, affect consumer spending habits. A significant deterioration in the global financial markets and economic environment, recessions or an uncertain economic outlook could adversely affect consumer spending habits and can result in lower levels of economic activity. The domestic and international political situation also affects consumer confidence. Any of these events and factors could cause consumers to curtail spending, especially with respect to our more discretionary merchandise offerings, such as automotive accessories, tools and personal transportation products.
During fiscal 2009, there was significant deterioration in the global financial markets and economic environment, which negatively impacted consumer spending and our revenues. While the economic climate improved somewhat in fiscal 2010, consumer spending has not returned to pre-recession levels. If the economy does not continue to strengthen, or if our efforts to counteract the impacts of these trends are not sufficiently effective, our revenues could decline, negatively affecting our results of operations.
Consolidation among our competitors may negatively impact our business.
Our industry has experienced consolidation over time. If this trend continues or if our competitors are able to achieve efficiencies in their mergers, the Company may face greater competitive pressures in the market in which they operate.
ITEM 1B UNRESOLVED STAFF COMMENTS
None.
ITEM 2 PROPERTIES
The Company owns its five-story, approximately 300,000 square foot corporate headquarters in Philadelphia, Pennsylvania and a 60,000 square foot office building in Los Angeles, California. The Company also owns the following administrative regional offices—approximately 4,000 square feet of
14
Table of Contents
space in each of Melrose Park, Illinois and Bayamon, Puerto Rico. The Company leases an administrative regional office of approximately 4,000 square feet in Carrollton, Texas.
Of the 621 store locations operated by the Company at January 29, 2011, 232 are owned and 389 are leased. As of January 29, 2011, 126 of the 232 stores owned by the Company are currently used as collateral under our Senior Secured Term Loan, due October 2013.
The following table sets forth certain information regarding the owned and leased warehouse space utilized by the Company to replenish its store locations at January 29, 2011:
| | | | | | | | | | | | |
Warehouse Locations | | Products Warehoused | | Approximate Square Footage | | Owned or Leased | | Stores Serviced | | States Serviced |
|---|
San Bernardino, CA | | All | | | 600,000 | | Leased | | | 172 | | AZ, CA, NM, NV, UT, WA |
McDonough, GA | | All | | | 392,000 | | Owned | | | 141 | | AL, FL, GA, LA, NC, PR, SC, TN |
Mesquite, TX | | All | | | 244,000 | | Owned | | | 71 | | AR, CO, LA, MO, NM,
OK, TX |
Plainfield, IN | | All | | | 403,000 | | Owned | | | 70 | | IL, IN, KY, MI, MN, OH, PA |
Chester, NY | | All | | | 402,000 | | Owned | | | 167 | | CT, DE, MA, MD, ME, NH, NJ, NY, PA, RI, VA |
Philadelphia, PA | | Tires & Batteries | | | 74,000 | | Leased | | | 64 | | DE, NJ, PA, VA, MD |
McDonough, GA | | All except tires | | | 30,000 | | Leased | | | — | | Auxiliary warehouse space |
| | | | | | | | | | | | |
Total | | | | | 2,145,000 | | | | | | | |
| | | | | | | | | | | | |
In addition to the distribution centers above, the Company leases three satellite warehouses comprising a total of 60,500 square feet. These satellite warehouses stock approximately 37,000 Stock-Keeping Units (SKUs), serve an average of 10–30 stores and have retail capabilities. Subsequently in fiscal 2011, the lease for auxiliary warehouse space in McDonough, GA expired and was not renewed. The Company anticipates that its existing and future warehouse space and its access to outside storage will accommodate inventory necessary to support future store expansion and any increase in SKUs through the end of fiscal 2011.
ITEM 3 LEGAL PROCEEDINGS
In September 2006, the United States Environmental Protection Agency ("EPA") requested certain information from the Company as part of an investigation to determine whether the Company had violated the Clean Air Act and its non-road engine regulations. The information requested concerned certain generator and personal transportation merchandise offered for sale by the Company. In the fourth quarter of fiscal 2008, the United States Environmental Protection Agency ("EPA") informed the Company that it believed that the Company had violated the Clean Air Act by virtue of the fact that certain of this merchandise did not conform to their corresponding EPA Certificates of Conformity. During the third quarter of fiscal 2009, the Company and the EPA reached a settlement in principle of this matter requiring that the Company (i) pay a monetary penalty of $5.0 million, (ii) take certain corrective action with respect to certain inventory that had been restricted from sale during the course of the investigation, (iii) implement a formal compliance program and (iv) participate in certain non-monetary emission offset activities. The Company had previously accrued an amount equal to the agreed upon civil penalty and a $3.0 million contingency accrual with respect to the restricted inventory. During fiscal 2009, the Company reversed approximately $2.0 million of the inventory accrual as a portion of the subject inventory was released for sale by the EPA as remediation efforts had been completed. During the second quarter of fiscal 2010, the Company completed the remediation efforts and accordingly reversed approximately $1.0 million of the inventory accrual. Further, the Company reached an agreement with the merchandise vendor to cover the entire cost of retrofitting a portion of the remaining subject merchandise and to accept the balance of the subject inventory for return for full
15
Table of Contents
credit. During the second quarter of fiscal 2010, the formal settlement agreement between the Company and the EPA became effective and the Company paid the monetary penalty.
The Company is also party to various other actions and claims arising in the normal course of business. The Company believes that amounts accrued for awards or assessments in connection with all such matters are adequate and that the ultimate resolution of these matters will not have a material adverse effect on the Company's financial position. However, there exists a possibility of loss in excess of the amounts accrued, the amount of which cannot currently be estimated. While the Company does not believe that the amount of such excess loss could be material to the Company's financial position, any such loss could have a material adverse effect on the Company's results of operations in the period(s) during which the underlying matters are resolved.
ITEM 4 (REMOVED AND RESERVED)
16
Table of Contents
PART II
ITEM 5 MARKET FOR THE REGISTRANT'S COMMON EQUITY, RELATED STOCKHOLDER MATTERS AND ISSUER PURCHASES OF EQUITY SECURITIES
The common stock of The Pep Boys—Manny, Moe & Jack is listed on the New York Stock Exchange under the symbol "PBY." There were 4,634 registered shareholders as of April 1, 2011. The following table sets forth for the periods listed, the high and low sale prices and the cash dividends paid on the Company's common stock.
MARKET PRICE PER SHARE
| | | | | | | | | | |
| | Market Price Per Share | |
| |
|---|
| | Cash Dividends
Per Share | |
|---|
| | High | | Low | |
|---|
Fiscal 2010 | | | | | | | | | | |
Fourth quarter | | $ | 15.96 | | $ | 11.37 | | $ | 0.03 | |
Third quarter | | | 12.00 | | | 8.82 | | | 0.03 | |
Second quarter | | | 13.26 | | | 7.86 | | | 0.03 | |
First quarter | | | 13.42 | | | 8.08 | | | 0.03 | |
Fiscal 2009 | | | | | | | | | | |
Fourth quarter | | $ | 9.29 | | $ | 7.76 | | $ | 0.03 | |
Third quarter | | | 10.69 | | | 8.40 | | | 0.03 | |
Second quarter | | | 10.83 | | | 5.87 | | | 0.03 | |
First quarter | | | 8.52 | | | 2.76 | | | 0.03 | |
On March 12, 2009, the Board of Directors reduced the quarterly cash dividend to $0.03 per share. It is the present intention of the Board of Directors to continue to pay this quarterly cash dividend; however, the declaration and payment of future dividends will be determined by the Board of Directors in its sole discretion and will depend upon the earnings, financial condition, and capital needs of the Company and other factors which the Board of Directors deems relevant.
On January 26, 2010, the Company terminated the flexible employee benefits trust (the "Trust") that was established on April 29, 1994 to fund a portion of the Company's obligations arising from various employee compensation and benefit plans. In accordance with the terms of the Trust, upon its termination, the Trust's sole asset, consisting of 2,195,270 shares of the Company's common stock, was transferred to the Company in exchange for the full satisfaction and discharge of all intercompany indebtedness then owed by the Trust to the Company. The termination of the Trust had no impact on the Company's consolidated financial statements, except for the reclassification of the shares within the shareholders equity section of the Company's Consolidated Balance Sheets.
EQUITY COMPENSATION PLANS
The following table sets forth the Company's shares authorized for issuance under its equity compensation plans at January 29, 2011:
| | | | | | | | | | |
| | Number of
securities to be
issued upon
exercise of
outstanding
options,
warrants and
rights (a) | | Weighted
average
exercise price
of outstanding
options,
warrants and
rights (b) | | Number of securities
remaining available
for future issuance
under equity
compensation plans
(excluding securities
reflected in the first
column (a)) | |
|---|
Equity compensation plans approved by security holders | | | 2,493,181 | | $ | 6.28 | | | 1,818,706 | |
17
Table of Contents
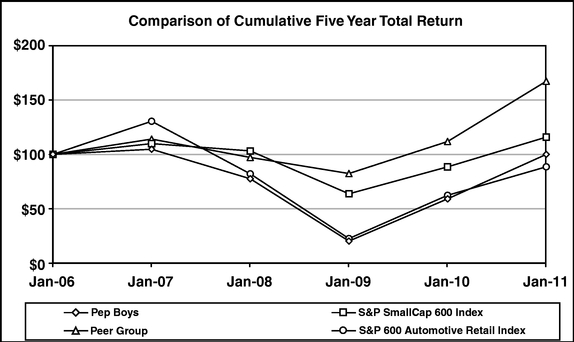
STOCK PRICE PERFORMANCE
The following graph compares the cumulative total return on shares of Pep Boys stock over the past five years with the cumulative total return on shares of companies in (1) the Standard & Poor's SmallCap 600 Index, (2) the S&P 600 Automotive Retail Index and (3) an index of peer and comparable companies as determined by the Company. The comparison assumes that $100 was invested in January 2006 in Pep Boys Stock and in each of the indices and assumes reinvestment of dividends. The S&P 600 Automotive Retail Index consists of companies in the S&P SmallCap 600 index that meet the definition of the automotive retail classification, and is currently comprised of: Group 1 Automotive, Inc.; Lithia Motors, Inc.; Midas, Inc.; Monro Muffler Brake, Inc.; Sonic Automotive, Inc.; and The Pep Boys—Manny, Moe & Jack. The companies currently comprising the Peer Group are: Aaron's, Inc.; Advance Auto Parts, Inc.; AutoZone, Inc.; Big 5 Sporting Goods Corp.; Cabelas, Inc.; Conn's, Inc.; Dick's Sporting Goods, Inc.; HHGregg, Inc.; Midas, Inc.; Monro Muffler Brake, Inc.; O'Reilly Automotive, Inc.; PetSmart, Inc.; RadioShack Corp.; Rent-A-Center, Inc.; Tractor Supply Co.; West Marine, Inc.
| | | | | | | | | | | | | | | | | | | |
Company/Index | | Jan. 2006 | | Jan. 2007 | | Jan. 2008 | | Jan. 2009 | | Jan. 2010 | | Jan. 2011 | |
|---|
Pep Boys | | $ | 100.00 | | $ | 104.71 | | $ | 77.54 | | $ | 20.14 | | $ | 59.04 | | $ | 99.97 | |
S&P SmallCap 600 Index | | $ | 100.00 | | $ | 109.90 | | $ | 103.18 | | $ | 63.68 | | $ | 88.49 | | $ | 115.87 | |
Peer Group | | $ | 100.00 | | $ | 114.07 | | $ | 97.16 | | $ | 82.35 | | $ | 111.82 | | $ | 167.33 | |
S&P 600 Automotive Retail Index | | $ | 100.00 | | $ | 130.47 | | $ | 82.07 | | $ | 22.48 | | $ | 62.30 | | $ | 88.54 | |
18
Table of Contents
ITEM 6 SELECTED FINANCIAL DATA
The following tables set forth the selected financial data for the Company and should be read in conjunction with the Consolidated Financial Statements and Notes thereto included elsewhere herein.
| | | | | | | | | | | | | | | | | |
Fiscal Year Ended | | Jan. 29, 2011 | | Jan. 30, 2010 | | Jan. 31, 2009 | | Feb. 2, 2008 | | Feb. 3, 2007 | |
|---|
| | (dollar amounts are in thousands, except per share data)
| |
|---|
STATEMENT OF OPERATIONS DATA(6) | | | | | | | | | | | | | | | | |
Merchandise sales | | $ | 1,598,168 | | $ | 1,533,619 | | $ | 1,569,664 | | $ | 1,749,578 | | $ | 1,853,077 | |
Service revenue | | | 390,473 | | | 377,319 | | | 358,124 | | | 388,497 | | | 390,778 | |
Total revenues | | | 1,988,641 | | | 1,910,938 | | | 1,927,788 | | | 2,138,075 | | | 2,243,855 | |
Gross profit from merchandise sales(7) | | | 487,788 | (1) | | 448,815 | (2) | | 440,502 | (3) | | 443,626 | (4) | | 533,276 | |
Gross profit from service revenue(7) | | | 34,564 | (1) | | 37,292 | (2) | | 24,930 | (3) | | 42,611 | (4) | | 33,004 | |
Total gross profit | | | 522,352 | (1) | | 486,107 | (2) | | 465,432 | (3) | | 486,237 | (4) | | 566,280 | |
Selling, general and administrative expenses | | | 442,239 | | | 430,261 | | | 485,044 | | | 518,373 | | | 546,399 | |
Net gain from disposition of assets | | | 2,467 | | | 1,213 | | | 9,716 | | | 15,151 | | | 8,968 | |
Operating profit (loss) | | | 82,580 | | | 57,059 | | | (9,896 | ) | | (16,985 | ) | | 28,849 | |
Non-operating income | | | 2,609 | | | 2,261 | | | 1,967 | | | 5,246 | | | 7,023 | |
Interest expense | | | 26,745 | | | 21,704 | (5) | | 27,048 | (5) | | 51,293 | | | 49,342 | |
Earnings (loss) from continuing operations before income taxes, discontinued operations and cumulative effect of change in accounting principle | | | 58,444 | (1) | | 37,616 | (2) | | (34,977 | )(3) | | (63,032 | )(4) | | (13,470 | ) |
Earnings (loss) from continuing operations before discontinued operations and cumulative effect of change in accounting principle | | | 37,171 | | | 24,113 | | | (28,838 | ) | | (37,438 | ) | | (7,071 | ) |
Discontinued operations, net of tax | | | (540 | ) | | (1,077 | )(2) | | (1,591 | )(3) | | (3,601 | )(4) | | 4,333 | |
Cumulative effect of change in accounting principle, net of tax | | | — | | | — | | | — | | | — | | | 189 | |
Net earnings (loss) | | | 36,631 | | | 23,036 | | | (30,429 | ) | | (41,039 | ) | | (2,549 | ) |
BALANCE SHEET DATA | | | | | | | | | | | | | | | | |
Working capital | | $ | 203,367 | | $ | 205,525 | | $ | 179,233 | | $ | 195,343 | | $ | 163,960 | |
Current ratio | | | 1.36 to 1 | | | 1.40 to 1 | | | 1.33 to 1 | | | 1.35 to 1 | | | 1.27 to 1 | |
Merchandise inventories | | $ | 564,402 | | $ | 559,118 | | $ | 564,931 | | $ | 561,152 | | $ | 607,042 | |
Property and equipment-net | | $ | 700,981 | | $ | 706,450 | | $ | 740,331 | | $ | 780,779 | | $ | 906,247 | |
Total assets | | $ | 1,556,672 | | $ | 1,499,086 | | $ | 1,552,389 | | $ | 1,583,920 | | $ | 1,767,199 | |
Long-term debt, excluding current maturities | | $ | 295,122 | | $ | 306,201 | | $ | 352,382 | | $ | 400,016 | | $ | 535,031 | |
Total stockholders' equity | | $ | 478,460 | | $ | 443,295 | | $ | 423,156 | | $ | 470,712 | | $ | 567,755 | |
DATA PER COMMON SHARE | | | | | | | | | | | | | | | | |
Basic earnings (loss) from continuing operations before discontinued operations and cumulative effect of change in accounting principle | | $ | 0.71 | | $ | 0.46 | | $ | (0.55 | ) | $ | (0.72 | ) | $ | (0.13 | ) |
Basic earnings (loss) | | | 0.70 | | | 0.44 | | | (0.58 | ) | | (0.79 | ) | | (0.05 | ) |
Diluted earnings (loss) from continuing operations before discontinued operations and cumulative effect of change in accounting principle | | | 0.70 | | | 0.46 | | | (0.55 | ) | | (0.72 | ) | | (0.13 | ) |
Diluted earnings (loss) | | | 0.69 | | | 0.44 | | | (0.58 | ) | | (0.79 | ) | | (0.05 | ) |
Cash dividends declared | | | 0.12 | | | 0.12 | | | 0.27 | | | 0.27 | | | 0.27 | |
Book value | | | 9.10 | | | 8.46 | | | 8.10 | | | 9.10 | | | 10.53 | |
Common share price range: | | | | | | | | | | | | | | | | |
| | High | | | 15.96 | | | 10.83 | | | 12.56 | | | 22.49 | | | 16.55 | |
| | Low | | | 7.86 | | | 2.76 | | | 2.62 | | | 8.25 | | | 9.33 | |
OTHER STATISTICS | | | | | | | | | | | | | | | | |
Return on average stockholders' equity(8) | | | 7.9 | % | | 5.3 | % | | (6.8 | )% | | (7.9 | )% | | (0.4 | )% |
Common shares issued and outstanding | | | 52,585,131 | | | 52,392,967 | | | 52,237,750 | | | 51,752,677 | | | 53,934,084 | |
Capital expenditures | | $ | 70,252 | | $ | 43,214 | | $ | 151,883 | (9) | $ | 43,116 | | $ | 53,903 | |
Number of stores | | | 621 | | | 587 | | | 562 | | | 562 | | | 593 | |
Number of service bays | | | 6,259 | | | 6,027 | | | 5,845 | | | 5,845 | | | 6,162 | |
- (1)
- Includes a pretax benefit of $5.9 million due to the reduction in reserve for excess inventory which reduced merchandise cost of sales and an aggregate pretax charge of $1.0 million for asset impairment, of which $0.8 million was charged to merchandise cost of sales and $0.2 million was charged to service cost of sales.
- (2)
- Includes an aggregate pretax charge of $3.1 million for asset impairment, of which $2.2 million was charged to merchandise cost of sales, $0.7 million was charged to service cost of sales and $0.2 million (pretax) was charged to discontinued operations.
19
Table of Contents
- (3)
- Includes an aggregate pretax charge of $5.4 million for asset impairment, of which $2.8 million was charged to merchandise cost of sales, $0.6 million was charged to service cost of sales and $1.9 million (pretax) was charged to discontinued operations.
- (4)
- Includes an aggregate pretax charge of $11.0 million for the asset impairment and closure of 31 stores, of which $5.4 million was charged to merchandise cost of sales, $1.8 million was charged to service cost of sales and $3.8 million (pretax) was charged to discontinued operations. In addition, we recorded a pretax $32.8 million inventory impairment charge to cost of merchandise sales for the discontinuance of certain product offerings.
- (5)
- Fiscal 2009 includes a gain from debt retirement of $6.2 million. Fiscal 2008 includes a gain from debt retirement of $3.5 million, partially offset by a $1.2 million charge for deferred financing costs.
- (6)
- Statement of operations data reflects 53 weeks for the fiscal year ended February 3, 2007 while the other fiscal years reflect 52 weeks.
- (7)
- Gross profit from merchandise sales includes the cost of products sold, buying, warehousing and store occupancy costs. Gross profit from service revenue includes the cost of installed products sold, buying, warehousing, service payroll and related employee benefits and occupancy costs. Occupancy costs include utilities, rents, real estate and property taxes, repairs and maintenance and depreciation and amortization expenses. Our gross profit may not be comparable to those of our competitors due to differences in industry practice regarding the classification of certain costs.
- (8)
- Return on average stockholders' equity is calculated by taking the net earnings (loss) for the period divided by average stockholders' equity for the year.
- (9)
- Includes the purchase of master lease assets for $117.1 million.
20
Table of Contents
ITEM 7 MANAGEMENT'S DISCUSSION AND ANALYSIS OF FINANCIAL CONDITION AND RESULTS OF OPERATIONS
OVERVIEW
The following discussion and analysis explains the results of our operations for fiscal 2010 and 2009 and developments affecting our financial condition as of January 29, 2011. This discussion and analysis below should be read in conjunction with Item 6 "Selected Consolidated Financial Data," and our consolidated financial statements and the notes included elsewhere in this report. The discussion and analysis contains "forward looking statements" within the meaning of The Private Securities Litigation Reform Act of 1995. Forward looking statements include management's expectations regarding implementation of its long-term strategic plan, future financial performance, automotive aftermarket trends, levels of competition, business development activities, future capital expenditures, financing sources and availability and the effects of regulation and litigation. Actual results may differ materially from the results discussed in the forward looking statements due to a number of factors beyond our control, including those set forth under the section entitled "Item 1A Risk Factors" elsewhere in this report.
Introduction
The Pep Boys—Manny, Moe & Jack is the only national chain offering automotive service, tires, parts and accessories. This positioning allows us to streamline the distribution channel and pass the savings on to our customers facilitating our vision to be the automotive solutions provider of choice for the value-oriented customer. The majority of our stores are in a Supercenter format, which serves both "do-it-for-me" ("DIFM", which includes service labor, installed merchandise and tires) and "do-it-yourself" ("DIY") customers with the highest quality service offerings and merchandise. Most of our Supercenters also have a commercial sales program that provides delivery of tires, parts and other products to automotive repair shops and dealers. In 2009, as part of our long-term strategy to lead with automotive service, we began complementing our existing Supercenter store base with Service & Tire Centers. These Service & Tire Centers are designed to capture market share and leverage our existing Supercenter and support infrastructure. During fiscal 2010, we opened 28 new Service & Tire Centers and seven new Supercenters. We are targeting a total of 50 new Service & Tire Centers and five Supercenters in fiscal 2011 and 75 Service & Tire Centers and 10 Supercenters in fiscal 2012. As of January 29, 2011, we operated 560 Supercenters and 53 Service & Tire Centers, as well as 8 legacy Pep Express (retail only) stores throughout 35 states and Puerto Rico.
EXECUTIVE SUMMARY
Fiscal 2010 was our second consecutive profitable year marked by an increase in net earnings of $13.6 million, or 59%. Fiscal 2010 net earnings were $36.6 million as compared to $23.0 million in fiscal 2009. Our diluted earnings per share for fiscal 2010 were $0.69 as compared to $0.44 in fiscal 2009. The increase in profitability was the result of positive comparable store sales across all lines of business and improved total gross profit margins partially offset by higher selling, general and administrative expenses and higher interest expense.
Total revenue for fiscal 2010 increased 4.1% compared to the prior year. For fiscal 2010, our comparable store sales (sales generated by locations in operation during the same period of the prior year) increased by 2.7% compared to a decrease of 1.2% for the prior year. The increase in comparable store sales was comprised of a 1.1% increase in comparable store service revenue and a 3.1% increase in comparable store merchandise sales.
Sales of services and non-discretionary products are primarily impacted by miles driven, which had returned to pre-recession low single-digit growth rates from March 2010 through November 2010, in part due to lower gasoline prices. As gasoline prices in recent months have been trending higher, we
21
Table of Contents
expect to see a negative impact on miles driven. However, we cannot predict future fluctuations in gasoline prices, nor the ultimate impact of such fluctuations on miles driven in future periods. There are also various factors occurring within the current economy that affect both our consumer and our industry, including the impact of the recent recession, higher unemployment and a tighter credit environment, which we believe have aided our sales of non-discretionary product and services as customers have focused on maintaining their existing vehicles rather than purchasing new vehicles. Despite the recent increase in new car sales (which still remain significantly below historical levels), the median age of the U.S. light vehicle fleet continues to trend in our industry's favor. Given the nature of these macroeconomic factors, we cannot predict whether or for how long these trends will continue, nor can we predict to what degree these trends will impact us in the future. However, these same trends have negatively impacted sales in our discretionary product categories like accessories and complementary merchandise since fiscal 2009, although the rate of decline has moderated significantly since then.
In 2010, we continued our "surround sound" media campaign that utilizes television, radio and direct mail advertising to communicate our "DOES EVERYTHING. FOR LESS." brand vision and focused on "execution excellence" in our stores in order earn the TRUST of our customers every day. We believe these efforts are responsible for increased customer traffic in our stores in all lines of business for fiscal 2010.
RESULTS OF OPERATIONS
The following discussion explains the material changes in our results of operations for the years ended January 29, 2011 and January 30, 2010 and January 31, 2009.
22
Table of Contents
Analysis of Statement of Operations
The following table presents, for the periods indicated, certain items in the consolidated statements of operations as a percentage of total revenues (except as otherwise provided) and the percentage change in dollar amounts of such items compared to the indicated prior period.
| | | | | | | | | | | | | | | | |
| | Percentage of Total Revenues | | Percentage Change | |
|---|
Year ended | | Jan 29, 2011
(Fiscal 2010) | | Jan 30, 2010
(Fiscal 2009) | | Jan 31, 2009
(Fiscal 2008) | | Fiscal 2010 vs.
Fiscal 2009 | | Fiscal 2009 vs.
Fiscal 2008 | |
|---|
Merchandise sales | | | 80.4 | % | | 80.3 | % | | 81.4 | % | | 4.2 | % | | (2.3 | )% |
Service revenue(1) | | | 19.6 | | | 19.7 | | | 18.6 | | | 3.5 | | | 5.4 | |
| | | | | | | | | | | | | | |
Total revenues | | | 100.0 | | | 100.0 | | | 100.0 | | | 4.1 | | | (0.9 | ) |
| | | | | | | | | | | | | | |
Costs of merchandise sales(2) | | | 69.5 | (3) | | 70.7 | (3) | | 71.9 | (3) | | (2.4 | ) | | 3.9 | |
Costs of service revenue(2) | | | 91.1 | (3) | | 90.1 | (3) | | 93.0 | (3) | | (4.7 | ) | | (2.1 | ) |
Total costs of revenues | | | 73.7 | | | 74.6 | | | 75.9 | | | (2.9 | ) | | 2.6 | |
Gross profit from merchandise sales | | | 30.5 | (3) | | 29.3 | (3) | | 28.1 | (3) | | 8.7 | | | 1.9 | |
Gross profit from service revenue | | | 8.9 | (3) | | 9.9 | (3) | | 7.0 | (3) | | (7.3 | ) | | 49.6 | |
Total gross profit | | | 26.3 | | | 25.4 | | | 24.1 | | | 7.5 | | | 4.4 | |
Selling, general and administrative expenses | | | 22.2 | | | 22.5 | | | 25.2 | | | (2.8 | ) | | 11.3 | |
Net gain from disposition of assets | | | 0.1 | | | 0.1 | | | 0.5 | | | 103.4 | | | (87.5 | ) |
Operating profit (loss) | | | 4.2 | | | 3.0 | | | (0.5 | ) | | 44.7 | | | 676.6 | |
Non-operating income | | | 0.1 | | | 0.1 | | | 0.1 | | | 15.4 | | | 14.9 | |
Interest expense | | | 1.3 | | | 1.1 | | | 1.4 | | | (23.2 | ) | | 19.8 | |
Earnings (loss) from continuing operations before income taxes | | | 2.9 | | | 2.0 | | | (1.8 | ) | | 55.4 | | | 207.5 | |
Income tax expense (benefit) | | | 36.4 | (4) | | 35.9 | (4) | | 17.6 | (4) | | (57.5 | ) | | (320.0 | ) |
Earnings (loss) from continuing operations | | | 1.9 | | | 1.3 | | | (1.5 | ) | | 54.2 | | | 183.6 | |
Discontinued operations, net of tax | | | — | | | (0.1 | ) | | (0.1 | ) | | 49.9 | | | 32.3 | |
| | | | | | | | | | | | | | |
Net earnings (loss) | | | 1.8 | | | 1.2 | | | (1.6 | ) | | 59.0 | | | 175.7 | |
| | | | | | | | | | | | | | |
- (1)
- Service revenue consists of the labor charge for installing merchandise or maintaining or repairing vehicles, excluding the sale of any installed parts or materials.
- (2)
- Costs of merchandise sales include the cost of products sold, buying, warehousing and store occupancy costs. Costs of service revenue include service center payroll and related employee benefits and service center occupancy costs. Occupancy costs include utilities, rents, real estate and property taxes, repairs and maintenance and depreciation and amortization expenses.
- (3)
- As a percentage of related sales or revenue, as applicable.
- (4)
- As a percentage of earnings (loss) from continuing operations before income taxes.
Fiscal 2010 vs. Fiscal 2009
Total revenue and comparable store sales for fiscal 2010 increased 4.1% and 2.7%, respectively, over the prior year. Total revenue for fiscal 2010 increased by $77.7 million to $1,988.6 million from $1,910.9 million in fiscal 2009. The 2.7% increase in comparable store revenues consisted of a 1.1% increase in comparable store service revenue and a 3.1% increase in comparable store merchandise sales. While our total revenue figures were favorably impacted by our opening of 35 new stores in fiscal
23
Table of Contents
2010, a new store is not added to our comparable store sales base until it reaches its 13th month of operation. Non-comparable store sales contributed an additional $25.9 million of total revenues in fiscal 2010 as compared to fiscal 2009. Total comparable store sales increased due to growth in customer counts in all three lines of business combined with an increase in the total average transaction amount per customer.
Total merchandise sales increased 4.2%, or $64.5 million, to $1,598.2 million in fiscal 2010 as compared to $1,533.6 million in fiscal 2009. Comparable store merchandise sales increased 3.1%, or $47.7 million, as compared to the prior year, driven primarily by increased customer counts across all lines of business as well as an increase in the average transaction amount per customer. The balance of the increase in merchandise sales was due to the contribution from our non-comparable stores. Total service revenue increased 3.5%, or $13.2 million, to $390.5 million in fiscal 2010 compared to $377.3 million in fiscal 2009. Comparable store service revenue increased 1.1%, or $4.2 million, as compared to the prior year, due to higher customer counts partially offset by a decrease in average transaction amount per customer. The balance of the increase in service revenue was primarily due to the contribution from our non-comparable store base which accounted for an additional $9.0 million of service revenue.
In fiscal 2010, comparable customer count increased versus fiscal 2009 in all lines of business due to our traffic-driving promotional events and rewards program and our improved customer experience resulting from better store execution. Our core automotive parts and tires categories, which make up approximately 79% of our merchandise sales, experienced a 3.6% increase in comparable store sales. We believe that utilizing innovative marketing programs to communicate our value-priced, differentiated merchandise assortment will continue to drive increased customer counts and that our continued focus on delivering a better customer experience than our competitors will convert those increased customer counts into sales improvements consistently over all lines of business.
Gross profit from merchandise sales increased by $39.0 million, or 8.7%, to $487.8 million in fiscal 2010 from $448.8 million in fiscal 2009. Gross profit margin from merchandise sales increased to 30.5% for fiscal 2010 from 29.3% for fiscal 2009. Gross profit from merchandise sales for fiscal 2010 included a net benefit of $6.2 million comprised of a $5.9 million reduction in our reserve for excess inventory (see below) and the reversal of an inventory related accrual of approximately $1.0 million partially offset by an $0.8 million asset impairment charge. Gross profit from merchandise sales for fiscal 2009 included a net benefit of $0.4 million comprised of the reversal of inventory related accruals of approximately $2.0 million and a $0.6 million gain from an insurance settlement, largely offset by a $2.2 million asset impairment charge. Excluding these items from both years, gross profit margin from merchandise sales improved by 90 basis points to 30.1% in fiscal 2010 from 29.2% in the prior year. This improvement was primarily due to less inventory shrinkage, lower defective product expense and increased merchandise sales, which better leveraged fixed store occupancy costs such as rent and utilities and warehousing costs such as payroll and out bound freight-costs.
In fiscal 2010 we reduced our reserve for excess inventory by $5.9 million, of which $4.6 million was recorded in the fourth quarter, as a result of significant improvements in the quality of our inventory, including: (i) improving inventory management, including timely return of excess product to vendors for full credit; (ii) maintaining relatively flat inventory levels despite the investment in new stores; (iii) reducing inventory lead times and safety stock requirements, including consolidating slow-moving hard parts inventory into one centrally located warehouse, which led to significant reductions in slower moving parts inventory at our distribution centers; and (iv) increasing our inventory turnover ratio, which is reflected in our increased comparable store sales.
Gross profit from service revenue decreased by $2.7 million, or 7.3%, to $34.6 million in fiscal 2010 from $37.3 million in the prior year. Gross profit margin from service revenue decreased to 8.9% for fiscal 2010 from 9.9% for fiscal 2009. Gross profit from service revenue for fiscal 2010 included a
24
Table of Contents
$0.2 million asset impairment charge related to previously closed stores. Gross profit from service revenue for fiscal 2009 included a $0.7 million asset impairment charge related to previously closed stores. Excluding these items from both years, gross profit margin from service revenue decreased to 8.9% for fiscal 2010 from 10.1% in the prior year. The decrease in gross profit from service revenue was due to the opening of new Service & Tire Centers, which while in their ramp up stage for sales incur their full amount of fixed expenses, including payroll and occupancy costs (rent, utilities and building maintenance). Our new Service & Tire Centers negatively impacted gross margins by 134 basis points in fiscal 2010. Excluding the impact of new Service & Tire Centers and the impairment charges described above, gross profit from service revenue increased to 10.7% for fiscal 2010 from 10.5% for fiscal 2009. The increase in gross profit, exclusive of new locations, was primarily due to increased service revenues which better leveraged fixed store occupancy costs and, to a lesser extent, labor costs.
Selling, general and administrative expenses as a percentage of revenue decreased to 22.2% in fiscal 2010 from 22.5% in fiscal 2009. Selling, general and administrative expenses increased $12.0 million, or 2.8%, to $442.2 million. The increase was primarily due to higher payroll and related expenses of $5.6 million, higher media expense of $4.9 million and increased travel costs of $1.4 million. The reduction as a percentage of sales reflects improved leverage of selling, general and administrative expenses achieved through increased sales in fiscal 2010.
Net gains from the disposition of assets increased by $1.3 million to $2.5 million in fiscal 2010 from $1.2 million in fiscal 2009. Fiscal 2010 includes $2.1 million in net settlement proceeds from the disposition of a previously closed property, while fiscal 2009 reflects an aggregate gain of $1.3 million from three store sale and leaseback transactions.
Interest expense for fiscal 2010 was $26.7 million, an increase of $5.0 million, compared to $21.7 million in fiscal 2009. Interest expense for fiscal 2009 included a $6.2 million gain from the retirement of debt. Excluding this item, interest expense decreased by $1.2 million in fiscal 2010 compared to fiscal 2009 primarily due to reduced debt levels.
Income tax expense for fiscal 2010 was $21.3 million, or an effective rate of 36.4%, as compared to $13.5 million, or an effective rate of 35.9%, for fiscal 2009. The fiscal 2010 effective tax rate includes a $2.1 million benefit related to the reduction of a valuation allowance on certain state net operating losses and credits. The fiscal 2009 effective tax rate includes a $1.2 million benefit due to the allocation of additional costs to certain jurisdictions thereby reducing past and future tax liabilities.
As a result of the foregoing, we reported net earnings of $36.6 million for fiscal 2010, an increase of $13.6 million, or 59%, as compared to net earnings of $23.0 million for fiscal 2009. Our diluted earnings per share were $0.69 for fiscal 2010 as compared to $0.44 for fiscal 2009.
Fiscal 2009 vs. Fiscal 2008
Total revenue and comparable sales for fiscal 2009 decreased 0.9% and 1.2%, respectively as compared to the prior year. The 1.2% decrease in comparable store revenues consisted of a 4.7% increase in comparable service revenue offset by a 2.6% decrease in comparable merchandise sales. While our total revenue figures were favorably impacted by our opening of 25 new stores in fiscal 2009, a new store is not added to our comparable store sales base until it reaches its 13th month of operation.
Total merchandise sales decreased 2.3% to $1,533.6 million compared to $1,569.7 million in fiscal 2008. Total service revenue increased 5.4% to $377.3 million from $358.1 million in the prior year. The decrease in merchandise sales was primarily due to weaker sales in our retail business stemming from less discretionary spending by our customers and lower DIY customer counts. Excluding sales of discretionary products such as generators, electronics and transportation products, our DIY core
25
Table of Contents
automotive sales remained relatively flat year over year. Service revenues increased in fiscal 2009 as compared to fiscal 2008 primarily due to increased customer counts.
During fiscal 2009, customer traffic generated by improved store execution, promotional events and an improved hard parts inventory position resulted in an increase in service and commercial customer count. However, total customer count declined as a result of a decrease in DIY customer count. We believe the decrease in retail customer count is due to reduced spending as a result of the current economic environment and our competitors continuing to open new stores as well as the result of the long-term industry decline in the DIY business, as discussed in the "Business" section of our Form 10-K. In addition, we carry a large assortment of more discretionary retail product that is more susceptible to consumer spending deferrals. We continue to believe that providing a differentiated merchandise assortment, better customer experience, low-price value proposition and innovative marketing will stem the overall decline in customer counts and sales over the long-term. In fact, customer count in our DIY space declined at a much lower rate in fiscal 2009 as compared to the prior year and we experienced our first increase in total customer count and sales in our third fiscal quarter since the first quarter of fiscal 2004, and the fourth quarter of fiscal 2006, respectively.
Gross profit from merchandise sales increased by $8.3 million to $448.8 million for fiscal 2009 from $440.5 million in the prior year. Gross profit from merchandise sales increased to 29.3% for fiscal 2009 from 28.1% for fiscal 2008. Gross profit from merchandise sales in fiscal 2009 includes the reversal of inventory accruals of approximately $2.0 million established in the prior year related to our temporarily restricting the sale of certain small engine merchandise that was subject to an ongoing EPA inquiry and a gain from insurance settlements of $0.6 million, mostly offset by an asset impairment charge of $2.2 million as a result of continued declines in real estate values of previously closed locations. In the prior year, gross profit from merchandise sales included an asset impairment charge of $2.8 million and a $3.0 million inventory accrual due to the EPA inquiry referred to above. Excluding these adjustments from both years, gross profit from merchandise sales increased to 29.2% for fiscal 2009 from 28.4% in the prior year. Gross profit from merchandise sales increased despite a 2.3% decrease in merchandise sales as discussed above, primarily as a result of an improvement in inventory shrinkage, lower in-bound freight costs, lower warehousing costs (which declined by 40 basis points to 3.7% of merchandise sales) and lower store occupancy costs (which declined by 20 basis points to 11.4% of merchandise sales.) Warehousing costs declined primarily due to lower out-bound freight costs to stores and occupancy costs declined due to lower building maintenance costs and the elimination of equipment leasing costs.
Gross profit from service revenue increased to 9.9% for fiscal 2009 from 7.0% in fiscal 2008. Gross profit from service revenue increased by $12.4 million, or 49.6%. Both the current year and the prior year gross profit from service revenue included an asset impairment charge related to previously closed stores of $0.7 million and $0.6 million, respectively. Excluding these adjustments from both years, gross profit from service revenues increased to 10.1% for fiscal 2009 from 7.1% in the prior year. The increase in gross profit was primarily due to increased service revenue which resulted in higher absorption of fixed expenses such as occupancy costs and, to a certain extent, labor costs.
Selling, general and administrative expenses, decreased to 22.5% of total revenues in fiscal 2009 from 25.2% in fiscal 2008. Selling, general and administrative expenses decreased $54.8 million or 11.4%. The decrease was primarily due to lower media expense of $21.2 million, lower legal expenses and professional services fees of $13.3 million, reduced payroll and related expenses of $7.5 million, lower travel expenses of $2.3 million and improved general liability claims expense of $1.3 million.
Net gains from the disposition of assets for fiscal 2009 and fiscal 2008 reflect gains of $1.2 million and $9.7 million, respectively, primarily as a result of sale leaseback transactions. The Company completed sale leaseback transactions on four stores during fiscal 2009, as compared to sale leaseback transactions on approximately 70 stores in fiscal 2008.
26
Table of Contents
Interest expense was $21.7 million in fiscal 2009, a decline of $5.3 million compared to the prior year. Fiscal 2009 and 2008 included gains from the retirement of debt of $6.2 million and $3.5 million, respectively. Fiscal 2008 also included a $1.2 million charge for deferred financing costs related to our revolving credit facility that was replaced. Excluding these items, interest expense declined by $1.4 million from fiscal 2008 to fiscal 2009 primarily due to reduced debt levels.
Income tax expense was $13.5 million, or an effective rate of 35.9%, for fiscal 2009 as compared to an income tax benefit of $6.1 million, or an effective rate of 17.6%, for fiscal 2008. The current year effective tax rate includes a benefit of $1.2 million due to the allocation of additional costs to certain jurisdictions thereby reducing past and future tax liabilities. The prior year effective tax rate was impacted by the non-deductibility of certain expenses for tax purposes, the recognition of gain for tax on surrender of life insurance policies and the establishment of a valuation allowance on certain state net operating losses and credits.
Loss from discontinued operations, net of tax, was $1.1 million in fiscal 2009 versus $1.6 million in fiscal 2008. Fiscal 2009 and 2008 included, on a pre-tax basis, impairment charges of $0.2 million and $1.9 million, respectively.
As a result of the foregoing, we reported net earnings of $23.0 million for fiscal 2009, an increase of $53.5 million from our net loss of $30.4 million in fiscal 2008. Our basic and diluted earnings per share were $0.44 for fiscal 2009 as compared to our basic and diluted loss per share of $0.58 in the prior year.
Discontinued Operations
The analysis of our results of continuing operations excludes the operating results of closed stores, where the customer base could not be maintained, which have been classified as discontinued operations for all periods presented.
Industry Comparison
We operate in the U.S. automotive aftermarket, which has two general lines of business: (1) the Service business, defined as Do-It-For-Me (service labor, installed merchandise and tires) and (2) the Retail business, defined as Do-It-Yourself (retail merchandise) and commercial. Generally, specialized automotive retailers focus on either the Service or Retail area of the business. We believe that operation in both the Service and Retail areas positively differentiates us from most of our competitors. Although we manage our performance at a store level in aggregation, we believe that the following presentation, which includes the reclassification of revenue from merchandise that we install in customer vehicles to service center revenue, shows an accurate comparison against competitors within the two sales arenas. We compete in the Retail area of the business through our retail sales floor and
27
Table of Contents
commercial sales business. Our Service Center business competes in the Service area of the industry. The following table presents the revenues and gross profit for each area of the business.
| | | | | | | | | | |
| | Fiscal Year ended | |
|---|
(dollar amounts in thousands) | | January 29,
2011 | | January 30,
2010 | | January 31,
2009 | |
|---|
Retail sales(1) | | $ | 1,046,772 | | $ | 1,013,308 | | $ | 1,058,021 | |
Service center revenue(2) | | | 941,869 | | | 897,630 | | | 869,767 | |
| | | | | | | | |
Total revenues | | $ | 1,988,641 | | $ | 1,910,938 | | $ | 1,927,788 | |
| | | | | | | | |
Gross profit from retail sales(3) | | $ | 306,176 | | $ | 275,051 | | $ | 273,262 | |
Gross profit from service center revenue(4) | | | 216,176 | | | 211,056 | | | 192,170 | |
| | | | | | | | |
Total gross profit | | $ | 522,352 | | $ | 486,107 | | $ | 465,432 | |
| | | | | | | | |
- (1)
- Excludes revenues from installed products.
- (2)
- Includes revenues from installed products.
- (3)
- Gross profit from retail sales includes the cost of products sold, buying, warehousing and store occupancy costs. Occupancy costs include utilities, rents, real estate and property taxes, repairs and maintenance and depreciation and amortization expenses.
- (4)
- Gross profit from service center revenue includes the cost of installed products sold, buying, warehousing, service center payroll and related employee benefits and service center occupancy costs. Occupancy costs include utilities, rents, real estate and property taxes, repairs and maintenance and depreciation and amortization expenses.
CAPITAL & LIQUIDITY
Capital Resources and Needs
Our cash requirements arise principally from (1) the purchase of inventory and capital expenditures related to existing and new stores, offices and distribution centers, (2) debt service and (3) contractual obligations. Cash flows realized through the sales of automotive services, tires, parts and accessories are our primary source of liquidity. Net cash provided by operating activities was $117.2 million for fiscal 2010, as compared to $87.2 million for fiscal 2009. The $30.0 million improvement was due to increased net earnings (net of non-cash adjustments) of $24.9 million and a favorable change in operating assets and liabilities of $5.9 million, offset by an increase in cash used in discontinued operations of $0.9 million. The change in operating assets and liabilities was primarily due to a favorable change in merchandise inventories net of accounts payable of $4.8 million. Taking into consideration changes in our trade payable program liability (shown as cash flows from financing activities on the consolidated statement of cash flows), inventory net of accounts payable improved by $24.8 million primarily due to increased inventory purchases and an improvement in our vendor trade payable terms. The ratio of accounts payable, including our trade payable program, to inventory was 47.3% at January 29, 2011, and 42.4% at January 30, 2010. The favorable change in all other long-term assets and liabilities was due to increased accruals for payroll tax in the current year due to timing of payments to taxing authorities mostly offset by a discretionary contribution to our defined benefit pension plan of $5.0 million (see Note 13 to the consolidated financial statements) in the current year.
Cash used in investing activities was $72.1 million for fiscal 2010 as compared to $29.9 million for fiscal 2009. Capital expenditures were $70.3 million and $43.2 million, for fiscal 2010 and fiscal 2009, respectively. Capital expenditures for fiscal 2010, in addition to our regularly-scheduled store and distribution center improvements, included the addition of seven new Supercenters and 28 new Service & Tire Centers and the upgrade of our store systems hardware. During fiscal 2010, we sold
28
Table of Contents
seven properties classified as held for disposal for net proceeds of $4.3 million, of which $0.6 million is included in discontinued operations, completed one sale leaseback transaction for net proceeds of $1.6 million and received $2.1 million in net settlement proceeds from the disposition of a previously closed property. During fiscal 2009, we sold four properties classified as held for disposal for net proceeds of $3.6 million, of which $1.8 million is reported in discontinued operations, and completed four leaseback transactions for net proceeds of $12.9 million. During fiscal 2009, we acquired substantially all of the assets (other than real property) of Florida Tire, Inc. for $2.7 million. In connection with the acquisition, we recorded a contingent liability of $1.7 million, of which $0.3 million was paid in fiscal 2010. During fiscal 2010, we used $9.6 million as collateral for retained liabilities included within existing insurance programs in lieu of previously outstanding letters of credit. This collateral is recorded within Other Long-Term Assets on the Consolidated Balance Sheet as of January 29, 2011.
Our targeted capital expenditures for fiscal 2011 are expected to be approximately $80.0 million. Our fiscal 2011 capital expenditures include the addition of approximately 50 Service & Tire Centers, five Supercenters and the conversion of 24 Supercenters into Superhubs. These expenditures are expected to be funded by cash on hand and net cash generated from operating activities. Additional capacity, if needed, exists under our existing line of credit.
In fiscal 2010, cash provided by financing activities was $5.8 million, as compared to cash used in financing activities of $39.4 million in the prior year. The $45.2 million improvement was primarily due to increased net borrowings under our trade payable program of $20.0 million combined with the net repayment, in fiscal 2009, of $23.9 million of borrowings under our credit facility. The trade payable program is funded by various bank participants who have the ability, but not the obligation, to purchase, directly from our vendors, account receivables owed by Pep Boys. In fiscal 2010, we increased the availability under this financing program to $100.0 million from $50.0 million in fiscal 2009. As of January 29, 2011 and January 30, 2010, we had an outstanding balance (classified as trade payable program liability on the consolidated balance sheet) of $56.3 million and $34.1 million, respectively. Additionally, in fiscal 2010, we repurchased $10.0 million of our outstanding 7.50% Senior Subordinated Notes for $10.2 million. In fiscal 2009 we repurchased $17.0 million of the 7.50% Senior Subordinated Notes for $10.7 million.
We anticipate that cash on hand and cash generated by operating activities will exceed our expected cash requirements in fiscal year 2010. In addition, we expect to have excess availability under our existing revolving credit agreement during the entirety of fiscal year 2011. As of January 29, 2011, we had no borrowings on our revolving credit facility and undrawn availability of $138.2 million.
Our working capital was $203.4 million and $205.5 million at January 29, 2011 and January 30, 2010, respectively. Our long-term debt less current maturities, as a percentage of our total capitalization, was 38.2% and 40.9% at January 29, 2011 and January 30, 2010, respectively.
29
Table of Contents
The following chart represents our total contractual obligations and commercial commitments as of January 29, 2011:
| | | | | | | | | | | | | | | | |
Contractual Obligations | | Total | | Within 1 year | | From 1 to 3
years | | From 3 to 5
years | | After 5
years | |
|---|
| | (dollars amounts in thousands)
| |
|---|
Long-term debt(1) | | $ | 296,201 | | $ | 1,079 | | $ | 147,557 | | $ | 147,565 | | $ | — | |
Operating leases | | | 747,617 | | | 86,730 | | | 166,052 | | | 147,435 | | | 347,400 | |
Expected scheduled interest payments on long-term debt | | | 71,526 | | | 21,498 | | | 40,234 | | | 9,794 | | | — | |
Other long-term obligations(2) | | | 20,830 | | | — | | | — | | | — | | | — | |
| | | | | | | | | | | | |
Total contractual obligations | | $ | 1,136,174 | | $ | 109,307 | | $ | 353,843 | | $ | 304,794 | | $ | 347,400 | |
| | | | | | | | | | | | |
- (1)
- Long-term debt includes current maturities.
- (2)
- Primarily includes pension obligation of $12.4 million, income tax liabilities and asset retirement obligations. We made voluntary contributions of $5.0 million and $19.9 million to our pension plans in fiscal 2010 and 2008, respectively. Future plan contributions are dependent upon actual plan asset returns and interest rates. See Note 13 of the Notes to Consolidated Financial Statements in "Item 8 Financial Statements and Supplementary Data" for further discussion of our pension plans. The above table does not reflect the timing of projected settlements for our recorded asset retirement obligation costs of $5.6 million, income tax liabilities of $2.8 million and pension obligation of $12.4 million because we cannot make a reliable estimate of the timing of the related cash payments.
| | | | | | | | | | | | | | | | |
Commercial Commitments | | Total | | Within 1
year | | From 1 to 3
years | | From 3 to 5
years | | After 5
years | |
|---|
| | (dollar amounts in thousands)
| |
|---|
Commercial letters of credit | | $ | 259 | | $ | 259 | | $ | — | | $ | — | | $ | — | |
Standby letters of credit | | | 107,583 | | | 107,331 | | | 252 | | | — | | | — | |
Surety bonds | | | 10,256 | | | 10,256 | | | — | | | — | | | — | |
Purchase obligations(1)(2) | | | 5,048 | | | 5,048 | | | — | | | — | | | — | |
| | | | | | | | | | | | |
Total commercial commitments | | $ | 123,146 | | $ | 122,894 | | $ | 252 | | $ | — | | $ | — | |
| | | | | | | | | | | | |
- (1)
- Our open purchase orders are based on current inventory or operational needs and are fulfilled by our vendors within short periods of time. We currently do not have minimum purchase commitments under our vendor supply agreements and generally, our open purchase orders (orders that have not been shipped) are not binding agreements. Those purchase obligations that are in transit from our vendors at January 29, 2011 that we do not have legal title to are considered commercial commitments.
- (2)
- In fiscal 2010, we entered into a commercial commitment to purchase 1.5 million gallons of oil products at various prices over a one-year period. At January 29, 2011, we expect to meet the cumulative minimum purchase requirements under this contract and to completely satisfy and terminate this contract during fiscal 2011.
Long-term Debt
7.50% Senior Subordinated Notes, due December 2014
On December 14, 2004, we issued $200.0 million aggregate principal amount of 7.50% Senior Subordinated Notes (the "Notes") due December 15, 2014. During fiscal 2010 and 2009, the Company repurchased Notes in the principal amount of $10.0 million and $17.0 million, respectively. On January 29, 2011, the outstanding balance of these Notes was $147.6 million.
30
Table of Contents
Senior Secured Term Loan Facility, due October 2013
Our Senior Secured Term Loan (the "Term Loan") is due October, 2013. This facility is secured by a collateral pool consisting of real property and improvements associated with our stores, which is adjusted periodically based upon real estate values and borrowing levels. Interest accrues at the London Interbank Offered Rate (LIBOR) plus 2.0% on this facility.
As of January 29, 2011, 126 stores collateralized the Senior Secured Term Loan. The outstanding balance under the Term Loan at the end of fiscal 2010 was $148.6 million. The $1.1 million decline in the outstanding balance was due to quarterly principal payments of $0.3 million.
Revolving Credit Agreement, through January 2014
On January 16, 2009, we entered into a Revolving Credit Agreement (the "Agreement") with available borrowings up to $300.0 million. Our ability to borrow under the Revolving Credit Agreement is based on a specific borrowing base consisting of inventory and accounts receivable. Total incurred fees of $6.8 million were capitalized and are being amortized over the five year life of the facility. The interest rate on this credit line is LIBOR or Prime plus 2.75% to 3.25% based upon the then current availability under the Agreement. Fees based on the unused portion of the Agreement range from 37.5 to 75.0 basis points. As of January 29, 2011, there were no outstanding borrowings under the Agreement.
The weighted average interest rate on all debt borrowings during fiscal 2010 and 2009 was 6.3% and 4.2%, respectively.
Several of our debt agreements require compliance with covenants. The most restrictive of these requirements is contained in our Revolving Credit Agreement. During any period when the availability under the Revolving Credit Agreement drops below the greater of $50.0 million or 17.5% of the borrowing base, we are required to maintain a consolidated fixed charge coverage ratio of at least 1.1:1.0, calculated as the ratio of (a) EBITDA (net income plus interest charges, provision for taxes, depreciation and amortization expense, non-cash stock compensation expenses and other non-recurring, non-cash items) minus capital expenditures and income taxes paid to (b) the sum of debt service charges and restricted payments made. The failure to satisfy this covenant would constitute an event of default under the Revolving Credit Agreement, which would result in a cross-default under our 7.50% Senior Subordinated Notes and Senior Secured Term Loan.
As of January 29, 2011, the Company had no borrowings outstanding under the Revolving Credit Agreement, additional availability of approximately $138.2 million and was in compliance with its financial covenants.
We have a vendor financing program which is funded by various bank participants who have the ability, but not the obligation, to purchase account receivables owed by us directly from our vendors. The total availability under the new program was $100.0 million as of January 29, 2011. There was an outstanding balance of $56.3 million and $34.1 million under this program as of January 29, 2011 and January 30, 2010, respectively.
We have letter of credit arrangements in connection with our risk management, import merchandising and vendor financing programs. We were contingently liable for $0.3 million in outstanding commercial letters of credit as of January 29, 2011, and $107.6 million and $103.3 million in outstanding standby letters of credit as of January 29, 2011 and January 30, 2010, respectively.
31
Table of Contents
We are also contingently liable for surety bonds in the amount of approximately $10.3 million and $10.2 million as of January 29, 2011 and January 30, 2010, respectively. The surety bonds guarantee certain of our payments (for example utilities, easement repairs, licensing requirements and customs fees).
We lease certain property and equipment under operating leases and lease financings which contain renewal and escalation clauses, step rent provisions, capital improvements funding and other lease concessions. These provisions are considered in the calculation of our minimum lease payments which are recognized as expense on a straight-line basis over the applicable lease term. Any lease payments that are based upon an existing index or rate are included in our minimum lease payment calculations. Total operating lease commitments as of January 29, 2011 were $747.6 million.
The Company has a Supplemental Executive Retirement Plan (SERP). This unfunded plan had a defined benefit component that provided key employees designated by the Board of Directors with retirement and death benefits. Retirement benefits were based on salary and bonuses; death benefits were based on salary. Benefits paid to a participant under the defined pension plan are deducted from the benefits otherwise payable under the defined benefit portion of the SERP. On January 31, 2004, we amended and restated our SERP. This amendment converted the defined benefit portion of the SERP to a defined contribution portion for certain unvested participants and all future participants. On December 31, 2008, the Company terminated the defined benefit portion of the SERP with a $14.4 million payment and recorded a charge of $6.0 million. The SERP currently consists of only the defined contribution plan which we refer to as our "Account Plan."
The Company has a qualified 401(k) savings plan and a separate savings plan for employees residing in Puerto Rico, which cover all full-time employees who are at least 21 years of age with one or more years of service. The Company contributes the lesser of 50% of the first 6% of a participant's contributions or 3% of the participant's compensation. For fiscal 2010 and 2009, the Company's contributions were conditional upon the achievement of certain pre-established financial performance goals which were met. The Company's savings plans' contribution expense was $3.0 million, $3.1 million and $3.3 million in fiscal 2010, 2009 and 2008, respectively.
We also have a defined benefit pension plan covering our full-time employees hired on or before February 1, 1992. As of December 31, 1996, the Company froze the accrued benefits under the plan and active participants became fully vested. The plan's trustee will continue to maintain and invest plan assets and will administer benefits payments. Pension plan assets are stated at fair market value and are composed primarily of money market funds and collective trust funds primarily invested in equity and fixed income investments.
The expense under these plans for fiscal 2010, 2009 and 2008 was $6.3 million, $6.4 million and $11.9 million, respectively. The fiscal 2008 pension expense includes a SERP settlement charge of $6.0 million. Pension expense is calculated based upon a number of actuarial assumptions, including an expected return on plan assets of 6.95% and a discount rate of 6.1%. In developing the expected return on asset assumptions, we evaluated input from our actuaries, including their review of asset class return expectations. The discount rate utilized for the pension plans is based on a model bond portfolio with durations that match the expected payment patterns of the plans. We continue to evaluate our actuarial assumptions and make adjustments as necessary for the existing plans. While we had no minimum funding requirement during fiscal 2010, we made a $5.0 million discretionary contribution to the defined benefit pension plan in October 2010. In fiscal 2008, we contributed an aggregate of $19.9 million to our pension plans to fund the retirement obligations and for the termination of the
32
Table of Contents
defined benefit portion of the SERP. Based upon the current status of the plans, we do not expect to make any cash contributions in fiscal 2011. See Note 13 of Notes to Consolidated Financial Statements in "Item 8 Financial Statements and Supplementary Data" for further discussion of our pension plans.
CRITICAL ACCOUNTING POLICIES AND ESTIMATES
Management's Discussion and Analysis of Financial Condition and Results of Operations discusses our consolidated financial statements, which have been prepared in accordance with accounting principles generally accepted in the United States of America. The preparation of these financial statements requires management to make estimates and assumptions that affect the reported amounts of assets and liabilities, the disclosure of contingent assets and liabilities at the date of the consolidated financial statements and the amounts of revenues and expenses during the reporting period. On an on-going basis, management evaluates its estimates and judgments, including those related to customer incentives, product returns and warranty obligations, bad debts, inventories, income taxes, financing operations, restructuring costs, retirement benefits, share-based compensation, risk participation agreements, contingencies and litigation. Management bases its estimates and judgments on historical experience and on various other factors that are believed to be reasonable under the circumstances, the results of which form the basis for making judgments about the carrying values of assets and liabilities that are not readily apparent from other sources. Actual results may differ from these estimates under different assumptions or conditions.
We believe that the following represent our more critical estimates and assumptions used in the preparation of the consolidated financial statements:
- •
- Inventory is stated at lower of cost, as determined under the last-in, first-out (LIFO) method, or market. Our inventory, consisting primarily of auto parts and accessories, is used on vehicles typically having longer lives. Because of this, along with our historical experience of returning most excess inventory to our vendors for full credit, the risk of obsolescence is minimal. We establish a reserve for excess inventory for instances where less than full credit will be received for such returns and where we anticipate items will be sold at retail prices that are less than recorded costs. The reserve is based on management's judgment, including estimates and assumptions regarding marketability of products, the market value of inventory to be sold in future periods and on historical experiences where we received less than full credit from vendors for product returns.
In fiscal 2010, we reduced our reserve for excess inventory by $5.9 million to $5.4 million from $11.3 million primarily due to improvement in inventory management practices, including timely return of product to vendors for full credit. However, in future periods we may be exposed to material losses should our vendors alter their policy with regard to accepting excess inventory returns.
A 10% difference in our inventory reserves as of January 29 2011, would have affected net income by approximately $0.3 million in fiscal 2010.
- •
- We record reserves for future sales returns, customer incentives, warranty claims and inventory shrinkage. The reserves are based on expected returns of products and historical claims and inventory shrinkage experience. If actual experience differs from historical levels, revisions in our estimates may be required. A 10% change in these reserves at January 29, 2011 would have affected net earnings by approximately $0.8 million for fiscal 2010.
- •
- We have risk participation arrangements with respect to workers' compensation, general liability, automobile liability, other casualty coverages and health care insurance, including stop loss coverage with third party insurers to limit our total exposure. A reserve for the liabilities associated with these agreements is established using generally accepted actuarial methods
33
Table of Contents
followed in the insurance industry and our historical claims experience. The amounts included in our costs related to these arrangements are estimated and can vary based on changes in assumptions, claims experience or the providers included in the associated insurance programs. A 10% change in our self-insurance liabilities at January 29, 2011 would have affected net earnings by approximately $4.5 million for fiscal 2010.
- •
- We have significant pension costs and liabilities that are developed from actuarial valuations. Inherent in these valuations are key assumptions including discount rates, expected return on plan assets and mortality rates. We are required to consider current market conditions, including changes in interest rates, in selecting these assumptions. Changes in the related pension costs or liabilities may occur in the future due to changes in the assumptions. The following table highlights the sensitivity of our pension obligation and expense to changes in these assumptions, assuming all other assumptions remain constant:
| | | | | | | |
Change in Assumption (dollars in thousands) | | Impact on Annual
Pension Expense | | Impact on Projected
Benefit Obligation | |
|---|
0.50 percentage point decrease in discount rate | | | Increase $405 | | | Increase $3,095 | |
0.50 percentage point increase in discount rate | | | Decrease $405 | | | Decrease $3,095 | |
5.00 percentage point decrease in expected rate of return on assets | | | Increase $135 | | | — | |
5.00 percentage point increase in expected rate of return on assets | | | Decrease $135 | | | — | |
- •
- We periodically evaluate our long-lived assets for indicators of impairment. Management's judgments, including judgments related to store cash flows, are based on market and operating conditions at the time of evaluation. Future events could cause management's conclusion on impairment to change, requiring an adjustment of these assets to their then current fair market value.
- •
- We have a share-based compensation plan, which includes stock options and restricted stock units, or RSUs. We account for our share-based compensation plans on a fair value basis. We determine the fair value of our stock options at the date of the grant using the Black-Scholes option-pricing model. The RSUs are awarded at a price equal to the market price of our underlying stock on the date of the grant. In situations where we have granted stock options and RSUs with market conditions, we have used Monte Carlo simulations in estimating the fair value of the award. The pricing model and generally accepted valuation techniques require management to make assumptions and to apply judgment to determine the fair value of our awards. These assumptions and judgments include the expected life of stock options, expected stock price volatility, future employee stock option exercise behaviors and the estimate of award forfeitures. We do not believe there is a reasonable likelihood that there will be a material change in the future estimates or assumptions we use to determine stock-based compensation expense. However, if actual results are different from these assumptions, the share-based compensation expense reported in our financial statements may not be representative of the actual economic cost of the share-based compensation. In addition, significant changes in these assumptions could materially impact our share-based compensation expense on future awards. A 10% change in our share-based compensation expense for fiscal 2010 would have affected net earnings by approximately $0.2 million.
- •
- We are required to estimate our income taxes in each of the jurisdictions in which we operate. This requires us to estimate our actual current tax exposure together with assessing temporary differences resulting from differing treatment of items, such as depreciation of property and equipment and valuation of inventories, for tax and accounting purposes. We determine our provision for income taxes based on federal and state tax laws and regulations currently in
34
Table of Contents
effect. Legislation changes currently proposed by certain states in which we operate, if enacted, could increase our transactions or activities subject to tax. Any such legislation that becomes law could result in an increase in our state income tax expense and our state income taxes paid, which could have a material effect on our net earnings.
At any one time our tax returns for many tax years are subject to examination by U.S. Federal, commonwealth, and state taxing jurisdictions. For income tax benefits related to uncertain tax positions to be recognized, a tax position must be more-likely-than-not to be sustained upon examination by taxing authorities. The amount recognized is measured as the largest amount of benefit that is greater than 50 percent likely of being realized upon ultimate settlement. An uncertain income tax position will not be recognized in the financial statements unless it is more-likely-than-not to be sustained. We adjust these tax liabilities, as well as the related interest and penalties, based on the latest facts and circumstances, including recently published rulings, court cases, and outcomes of tax audits. To the extent our actual tax liability differs from our established tax liabilities for unrecognized tax benefits, our effective tax rate may be materially impacted. While it is often difficult to predict the final outcome of, the timing of, or the tax treatment of any particular tax position or deduction, we believe that our tax balances reflect the more-likely-than-not outcome of known tax contingencies.
The temporary differences between the book and tax treatment of income and expenses result in deferred tax assets and liabilities, which are included within our consolidated balance sheets. We must then assess the likelihood that our deferred tax assets will be recovered from future taxable income. To the extent we believe that recovery is not more-likely-than-not, we must establish a valuation allowance. To the extent we establish a valuation allowance or change the allowance in a future period, income tax expense will be impacted. Actual results could differ from this assessment if adequate taxable income is not generated in future periods from either operations or projected tax planning strategies. We had net deferred tax assets of $9.7 million at January 29, 2011.
RECENT ACCOUNTING STANDARDS
In March 2007, the FASB issued guidance on accounting for split dollar life insurance arrangements which was included in ASC 718 "Compensation—Stock Compensation." This ASC provides guidance on determining whether a liability for the postretirement benefit associated with a collateral assignment split-dollar life insurance arrangement should be recorded. ASC 718 also provides guidance on how a company should recognize and measure the asset in a collateral assignment split-dollar life insurance contract. The original guidance for accounting for split dollar life insurance arrangements was effective for fiscal years beginning after December 15, 2007. The adoption of ASC 718 resulted in a $1.2 million net of tax charge to retained earnings on February 3, 2008.
In October 2009, the FASB issued Accounting Standards Update ("ASU") 2009-13 "Revenue Recognition (Topic 605)—Multiple-Deliverable Revenue Arrangements a consensus of the FASB Emerging Issues Task Force," ("ASU 2009-13"). This update eliminates the residual method of allocation and requires that consideration be allocated to all deliverables using the relative selling price method. ASU 2009-13 is effective for material revenue arrangements entered into or materially modified in fiscal years beginning on or after June 15, 2010. The adoption of ASU 2009-13 did not have a material impact on the consolidated financial statements.
In January 2010, the FASB issued ASU 2010-06 "Fair Value Measurements—Improving Disclosures on Fair Value Measurements" ("ASU 2010-06"). This guidance requires new disclosures surrounding transfers in and out of level 1 or 2 in the fair value hierarchy and also requires that the reconciliation of level 3 inputs includes separately reported information on purchases, sales, issuances and settlements. The increased disclosures should be reported for each class of assets or liabilities.
35
Table of Contents
ASU 2010-06 also clarifies existing disclosures for the level of disaggregating, disclosures about valuation techniques and inputs used to determine level 2 or 3 fair value measurements and includes conforming amendments to the guidance on employers' disclosures about postretirement benefit plan assets. ASU 2010-06 was effective for interim and annual reporting periods beginning after December 15, 2009 except for the disclosures about purchases, sales, issuances or settlements in the roll forward activity for level 3 fair value measurements which are effective for interim and annual periods beginning after December 15, 2010. The adoption of ASU 2010-06 did not have a material impact on the Company's consolidated financial statements.
In December 2010, the FASB issued ASU 2010-29 "Business Combinations (Topic 805)—Disclosure of Supplementary Pro Forma Information for Business Combinations" (ASU 2010-29). This accounting standard update clarifies that SEC registrants presenting comparative financial statements should disclose in their pro forma information revenue and earnings of the combined entity as though the current period business combinations had occurred as of the beginning of the comparable prior annual reporting period only. The update also expands the supplemental pro forma disclosures to include a description of the nature and amount of material, nonrecurring pro forma adjustments directly attributable to the business combination included in the reported pro forma revenue and earnings. ASU 2010-29 is effective prospectively for material (either on an individual or aggregate basis) business combinations entered into in fiscal years beginning on or after December 15, 2010 with early adoption permitted. The Company does not believe the adoption of those requirements of ASU 2010-29 will have a material impact on the consolidated results of operations and financial condition.
ITEM 7A QUANTITATIVE AND QUALITATIVE DISCLOSURES ABOUT MARKET RISK
The Company has market rate exposure in its financial instruments due to changes in interest rates and prices.
Variable and Fixed Rate Debt
The Company's Revolving Credit Agreement bears interest at LIBOR or Prime plus 2.75% to 3.25% based upon the then current availability under the facility. At January 29, 2011, there were no outstanding borrowings under the agreement. Additionally, the Company has a Senior Secured Term Loan facility with a balance of $148.6 million at January 29, 2011, that bears interest at three month LIBOR plus 2.00%. Excluding our interest rate swap, a one percent change in the LIBOR rate would have affected net earnings by approximately $1.0 million for fiscal 2010. The risk related to changes in the three month LIBOR rate are substantially mitigated by our interest rate swap.
At January 29, 2011, the fair value of the Company's fixed rate debt instruments, principally the $147.6 million 7.50% Senior Subordinated Notes, due December 15, 2014, was $149.8 million. At January 30, 2010, the fair value of the Company's fixed rate debt instruments, principally the $157.6 million 7.50% Senior Subordinated Notes, due December 15, 2014, was $148.9 million. The Company determines fair value on its fixed rate debt by using quoted market prices and current interest rates.
Interest Rate Swaps
The Company entered into an interest rate swap for a notional amount of $145.0 million that is designated as a cash flow hedge on the first $145.0 million of the Company's Senior Secured Term Loan facility. The interest rate swap converts the variable LIBOR portion of the interest payments to a fixed rate of 5.036% and terminates in October 2013. As of January 29, 2011 and January 30, 2010, the fair value of the swap was a net $16.4 million payable recorded within other long-term liabilities on the balance sheet.
36
Table of Contents
Other
In the second quarter of fiscal 2010, the Company entered into a price stability agreement ("Agreement") that is also designated as a cash flow hedge. This Agreement is intended to hedge the price risks associated with the market volatility of retail gasoline. This hedge is deemed to be fully effective and all adjustments in the hedge's fair value have been recorded to accumulated other comprehensive loss. The effect of this Agreement on the Company's condensed consolidated financial statements is immaterial. This Agreement expired on January 31, 2011.
37
Table of Contents
ITEM 8 FINANCIAL STATEMENTS AND SUPPLEMENTARY DATA
REPORT OF INDEPENDENT REGISTERED PUBLIC ACCOUNTING FIRM
To the Board of Directors and Stockholders of
The Pep Boys—Manny, Moe & Jack
Philadelphia, Pennsylvania
We have audited the accompanying consolidated balance sheets of The Pep Boys—Manny, Moe & Jack and subsidiaries (the "Company") as of January 29, 2011 and January 30, 2010, and the related consolidated statements of operations, stockholders' equity, and cash flows for each of the three fiscal years in the period ended January 29, 2011. Our audits also included the financial statement schedule listed in the Index at Item 15. These financial statements and financial statement schedule are the responsibility of the Company's management. Our responsibility is to express an opinion on the financial statements and financial statement schedule based on our audits.
We conducted our audits in accordance with the standards of the Public Company Accounting Oversight Board (United States). Those standards require that we plan and perform the audit to obtain reasonable assurance about whether the financial statements are free of material misstatement. An audit includes examining, on a test basis, evidence supporting the amounts and disclosures in the financial statements. An audit also includes assessing the accounting principles used and significant estimates made by management, as well as evaluating the overall financial statement presentation. We believe that our audits provide a reasonable basis for our opinion.
In our opinion, such consolidated financial statements present fairly, in all material respects, the financial position of The Pep Boys—Manny, Moe & Jack and subsidiaries as of January 29, 2011 and January 30, 2010, and the results of their operations and their cash flows for each of the three fiscal years in the period ended January 29, 2011, in conformity with accounting principles generally accepted in the United States of America. Also, in our opinion, such financial statement schedule, when considered in relation to the basic consolidated financial statements taken as a whole, presents fairly, in all material respects, the information set forth therein.
We have also audited, in accordance with the standards of the Public Company Accounting Oversight Board (United States), the Company's internal control over financial reporting as of January 29, 2011, based on the criteria established inInternal Control—Integrated Framework issued by the Committee of Sponsoring Organizations of the Treadway Commission and our report dated April 11, 2011 expressed an unqualified opinion on the Company's internal control over financial reporting.
DELOITTE & TOUCHE LLP
Philadelphia, Pennsylvania
April 11, 2011
38
Table of Contents
CONSOLIDATED BALANCE SHEETS
The Pep Boys—Manny, Moe & Jack and Subsidiaries
(dollar amounts in thousands, except share data)
| | | | | | | | |
| | January 29,
2011 | | January 30,
2010 | |
|---|
ASSETS | | | | | | | |
Current assets: | | | | | | | |
| | Cash and cash equivalents | | $ | 90,240 | | $ | 39,326 | |
| | Accounts receivable, less allowance for uncollectible accounts of $1,551 and $1,488 | | | 19,540 | | | 22,983 | |
| | Merchandise inventories | | | 564,402 | | | 559,118 | |
| | Prepaid expenses | | | 28,542 | | | 24,784 | |
| | Other current assets | | | 60,337 | | | 65,428 | |
| | Assets held for disposal | | | 475 | | | 4,438 | |
| | | | | | |
| | Total current assets | | | 763,536 | | | 716,077 | |
| | | | | | |
Property and equipment—net | | |
700,981 | | |
706,450 | |
Deferred income taxes | | | 66,019 | | | 58,171 | |
Other long-term assets | | | 26,136 | | | 18,388 | |
| | | | | | |
Total assets | | $ | 1,556,672 | | $ | 1,499,086 | |
| | | | | | |
LIABILITIES AND STOCKHOLDERS' EQUITY | | | | | | | |
Current liabilities: | | | | | | | |
| | Accounts payable | | $ | 210,440 | | $ | 202,974 | |
| | Trade payable program liability | | | 56,287 | | | 34,099 | |
| | Accrued expenses | | | 236,028 | | | 242,416 | |
| | Deferred income taxes | | | 56,335 | | | 29,984 | |
| | Current maturities of long-term debt | | | 1,079 | | | 1,079 | |
| | | | | | |
| | Total current liabilities | | | 560,169 | | | 510,552 | |
| | | | | | |
Long-term debt less current maturities | | |
295,122 | | |
306,201 | |
Other long-term liabilities | | | 70,046 | | | 73,933 | |
Deferred gain from asset sales | | | 152,875 | | | 165,105 | |
Commitments and contingencies | | | | | | | |
Stockholders' equity: | | | | | | | |
| | Common stock, par value $1 per share: authorized 500,000,000 shares; issued 68,557,041 shares | | | 68,557 | | | 68,557 | |
| | Additional paid-in capital | | | 295,361 | | | 293,810 | |
| | Retained earnings | | | 402,600 | | | 374,836 | |
| | Accumulated other comprehensive loss | | | (17,028 | ) | | (17,691 | ) |
| | Treasury stock, at cost—15,971,910 shares and 16,164,074 shares | | | (271,030 | ) | | (276,217 | ) |
| | | | | | |
| | Total stockholders' equity | | | 478,460 | | | 443,295 | |
| | | | | | |
Total liabilities and stockholders' equity | | $ | 1,556,672 | | $ | 1,499,086 | |
| | | | | | |
See notes to the consolidated financial statements
39
Table of Contents
CONSOLIDATED STATEMENTS OF OPERATIONS
The Pep Boys—Manny, Moe & Jack and Subsidiaries
(dollar amounts in thousands, except per share data)
| | | | | | | | | | |
Year ended | | January 29,
2011 | | January 30,
2010 | | January 31,
2009 | |
|---|
Merchandise sales | | $ | 1,598,168 | | $ | 1,533,619 | | $ | 1,569,664 | |
Service revenue | | | 390,473 | | | 377,319 | | | 358,124 | |
| | | | | | | | |
Total revenues | | | 1,988,641 | | | 1,910,938 | | | 1,927,788 | |
| | | | | | | | |
Costs of merchandise sales | | | 1,110,380 | | | 1,084,804 | | | 1,129,162 | |
Costs of service revenue | | | 355,909 | | | 340,027 | | | 333,194 | |
| | | | | | | | |
Total costs of revenues | | | 1,466,289 | | | 1,424,831 | | | 1,462,356 | |
| | | | | | | | |
Gross profit from merchandise sales | | | 487,788 | | | 448,815 | | | 440,502 | |
Gross profit from service revenue | | | 34,564 | | | 37,292 | | | 24,930 | |
| | | | | | | | |
Total gross profit | | | 522,352 | | | 486,107 | | | 465,432 | |
| | | | | | | | |
Selling, general and administrative expenses | | | 442,239 | | | 430,261 | | | 485,044 | |
Net gain from disposition of assets | | | 2,467 | | | 1,213 | | | 9,716 | |
| | | | | | | | |
Operating profit (loss) | | | 82,580 | | | 57,059 | | | (9,896 | ) |
Non-operating income | | | 2,609 | | | 2,261 | | | 1,967 | |
Interest expense | | | 26,745 | | | 21,704 | | | 27,048 | |
| | | | | | | | |
Earnings (loss) from continuing operations before income taxes and discontinued operations | | | 58,444 | | | 37,616 | | | (34,977 | ) |
Income tax expense (benefit) | | | 21,273 | | | 13,503 | | | (6,139 | ) |
| | | | | | | | |
Earnings (loss) from continuing operations before discontinued operations | | | 37,171 | | | 24,113 | | | (28,838 | ) |
Loss from discontinued operations, net of tax benefit of $(291), $(580) and $(857) | | | (540 | ) | | (1,077 | ) | | (1,591 | ) |
| | | | | | | | |
Net earnings (loss) | | $ | 36,631 | | $ | 23,036 | | $ | (30,429 | ) |
| | | | | | | | |
Basic earnings (loss) per share: | | | | | | | | | | |
Earnings (loss) from continuing operations before discontinued operations | | $ | 0.71 | | $ | 0.46 | | $ | (0.55 | ) |
Loss from discontinued operations, net of tax | | | (0.01 | ) | | (0.02 | ) | | (0.03 | ) |
| | | | | | | | |
Basic earnings (loss) per share | | $ | 0.70 | | $ | 0.44 | | $ | (0.58 | ) |
| | | | | | | | |
Diluted earnings (loss) per share: | | | | | | | | | | |
Earnings (loss) from continuing operations before discontinued operations | | $ | 0.70 | | $ | 0.46 | | $ | (0.55 | ) |
Loss from discontinued operations, net of tax | | | (0.01 | ) | | (0.02 | ) | | (0.03 | ) |
| | | | | | | | |
Diluted earnings (loss) per share | | $ | 0.69 | | $ | 0.44 | | $ | (0.58 | ) |
| | | | | | | | |
See notes to the consolidated financial statements
40
Table of Contents
CONSOLIDATED STATEMENTS OF STOCKHOLDERS' EQUITY
The Pep Boys—Manny, Moe & Jack and Subsidiaries
(dollar amounts in thousands, except share data)
| | | | | | | | | | | | | | | | | | | | | | | | | | | | | |
| | Common Stock | |
| |
| | Treasury Stock | | Accumulated
Other
Comprehensive
Loss | |
| |
| |
|---|
| | Additional
Paid-in
Capital | | Retained
Earnings | | Benefit
Trust | | Total
Stockholders'
Equity | |
|---|
| | Shares | | Amount | | Shares | | Amount | |
|---|
Balance, February 2, 2008 | | | 68,557,041 | | $ | 68,557 | | $ | 296,074 | | $ | 406,819 | | | (14,609,094 | ) | $ | (227,291 | ) | $ | (14,183 | ) | $ | (59,264 | ) | $ | 470,712 | |
| | | | | | | | | | | | | | | | | | | | |
Effect of Split Dollar accounting, net of tax | | | | | | | | | | | | (1,165 | ) | | | | | | | | | | | | | | (1,165 | ) |
Comprehensive loss: | | | | | | | | | | | | | | | | | | | | | | | | | | | | |
| | Net loss | | | | | | | | | | | | (30,429 | ) | | | | | | | | | | | | | | (30,429 | ) |
| | Changes in net unrecognized other postretirement benefit costs, net of tax of ($566) | | | | | | | | | | | | | | | | | | | | | (958 | ) | | | | | (958 | ) |
| | Fair market value adjustment on derivatives, net of tax of ($1,734) | | | | | | | | | | | | | | | | | | | | | (2,934 | ) | | | | | (2,934 | ) |
| | | | | | | | | | | | | | | | | | | | | | | | | | | | |
Total comprehensive loss | | | | | | | | | | | | | | | | | | | | | | | | | | | (34,321 | ) |
Cash dividends ($.27 per share) | | | | | | | | | | | | (14,111 | ) | | | | | | | | | | | | | | (14,111 | ) |
Effect of stock options and related tax benefits | | | | | | | | | (1,154 | ) | | (37 | ) | | 3,750 | | | 60 | | | | | | | | | (1,131 | ) |
Effect of restricted stock unit conversions | | | | | | | | | (4,935 | ) | | | | | 279,458 | | | 4,512 | | | | | | | | | (423 | ) |
Stock compensation expense | | | | | | | | | 2,743 | | | | | | | | | | | | | | | | | | 2,743 | |
Dividend reinvestment plan | | | | | | | | | | | | (2,407 | ) | | 201,865 | | | 3,259 | | | | | | | | | 852 | |
| | | | | | | | | | | | | | | | | | | | |
Balance, January 31, 2009 | | | 68,557,041 | | | 68,557 | | | 292,728 | | | 358,670 | | | (14,124,021 | ) | | (219,460 | ) | | (18,075 | ) | | (59,264 | ) | | 423,156 | |
| | | | | | | | | | | | | | | | | | | | |
Comprehensive income: | | | | | | | | | | | | | | | | | | | | | | | | | | | | |
| | Net earnings | | | | | | | | | | | | 23,036 | | | | | | | | | | | | | | | 23,036 | |
| | Changes in net unrecognized other postretirement benefit costs, net of tax of $352 | | | | | | | | | | | | | | | | | | | | | 595 | | | | | | 595 | |
| | Fair market value adjustment on derivatives, net of tax of ($125) | | | | | | | | | | | | | | | | | | | | | (211 | ) | | | | | (211 | ) |
| | | | | | | | | | | | | | | | | | | | | | | | | | | | |
Total comprehensive income | | | | | | | | | | | | | | | | | | | | | | | | | | | 23,420 | |
Cash dividends ($.12 per share) | | | | | | | | | | | | (6,286 | ) | | | | | | | | | | | | | | (6,286 | ) |
Reclassification of Benefits Trust | | | | | | | | | | | | | | | (2,195,270 | ) | | (59,264 | ) | | | | | 59,264 | | | — | |
Effect of stock options and related tax benefits | | | | | | | | | | | | (209 | ) | | 22,000 | | | 355 | | | | | | | | | 146 | |
Effect of restricted stock unit conversions | | | | | | | | | (1,493 | ) | | | | | 81,726 | | | 1,321 | | | | | | | | | (172 | ) |
Stock compensation expense | | | | | | | | | 2,575 | | | | | | | | | | | | | | | | | | 2,575 | |
Dividend reinvestment plan | | | | | | | | | | | | (375 | ) | | 51,491 | | | 831 | | | | | | | | | 456 | |
| | | | | | | | | | | | | | | | | | | | |
Balance, January 30, 2010 | | | 68,557,041 | | | 68,557 | | | 293,810 | | | 374,836 | | | (16,164,074 | ) | | (276,217 | ) | | (17,691 | ) | | — | | | 443,295 | |
| | | | | | | | | | | | | | | | | | | | |
Comprehensive income: | | | | | | | | | | | | | | | | | | | | | | | | | | | | |
| | Net earnings | | | | | | | | | | | | 36,631 | | | | | | | | | | | | | | | 36,631 | |
| | Changes in net unrecognized other postretirement benefit costs, net of tax of $344 | | | | | | | | | | | | | | | | | | | | | 582 | | | | | | 582 | |
| | Fair market value adjustment on derivatives, net of tax of $48 | | | | | | | | | | | | | | | | | | | | | 81 | | | | | | 81 | |
| | | | | | | | | | | | | | | | | | | | | | | | | | | | |
Total comprehensive income | | | | | | | | | | | | | | | | | | | | | | | | | | | 37,294 | |
Cash dividends ($.12 per share) | | | | | | | | | | | | (6,323 | ) | | | | | | | | | | | | | | (6,323 | ) |
Effect of stock options and related tax benefits | | | | | | | | | | | | (2,023 | ) | | 96,590 | | | 2,608 | | | | | | | | | 585 | |
Effect of restricted stock unit conversions | | | | | | | | | (1,946 | ) | | | | | 61,042 | | | 1,647 | | | | | | | | | (299 | ) |
Stock compensation expense | | | | | | | | | 3,497 | | | | | | | | | | | | | | | | | | 3,497 | |
Dividend reinvestment plan | | | | | | | | | | | | (521 | ) | | 34,532 | | | 932 | | | | | | | | | 411 | |
| | | | | | | | | | | | | | | | | | | | |
Balance, January 29, 2011 | | | 68,557,041 | | $ | 68,557 | | $ | 295,361 | | $ | 402,600 | | | (15,971,910 | ) | $ | (271,030 | ) | $ | (17,028 | ) | $ | — | | $ | 478,460 | |
| | | | | | | | | | | | | | | | | | | | |
See notes to the consolidated financial statements
41
Table of Contents
CONSOLIDATED STATEMENTS OF CASH FLOWS
The Pep Boys—Manny, Moe & Jack and Subsidiaries
(dollar amounts in thousands)
| | | | | | | | | | | | | |
| | Year Ended | |
|---|
| | January 29,
2011 | | January 30,
2010 | | January 31,
2009 | |
|---|
Cash flows from operating activities: | | | | | | | | | | |
| | Net earnings (loss) | | $ | 36,631 | | $ | 23,036 | | $ | (30,429 | ) |
| | | Adjustments to reconcile net earnings (loss) to net cash provided by (used in) continuing operations: | | | | | | | | | | |
| | | | Net loss from discontinued operations | | | 540 | | | 1,077 | | | 1,591 | |
| | | | Depreciation and amortization | | | 74,151 | | | 70,529 | | | 73,207 | |
| | | | Amortization of deferred gain from asset sales | | | (12,602 | ) | | (12,325 | ) | | (10,285 | ) |
| | | | Stock compensation expense | | | 3,497 | | | 2,575 | | | 2,743 | |
| | | | Loss (gain) from debt retirement | | | 200 | | | (6,248 | ) | | (3,460 | ) |
| | | | Deferred income taxes | | | 18,572 | | | 13,446 | | | (6,258 | ) |
| | | | Net gain from dispositions of assets | | | (2,467 | ) | | (1,213 | ) | | (9,716 | ) |
| | | | Loss from asset impairment | | | 970 | | | 2,884 | | | 3,427 | |
| | | | Other | | | (479 | ) | | 345 | | | 537 | |
| | Changes in operating assets and liabilities: | | | | | | | | | | |
| | | | Decrease in accounts receivable, prepaid expenses and other | | | 7,060 | | | 7,175 | | | 23,904 | |
| | | | (Increase) decrease in merchandise inventories | | | (5,284 | ) | | 7,039 | | | (3,779 | ) |
| | | | Increase (decrease) in accounts payable | | | 7,466 | | | (9,640 | ) | | (33,083 | ) |
| | | | Decrease in accrued expenses | | | (8,394 | ) | | (13,238 | ) | | (34,993 | ) |
| | | | (Decrease) increase in other long-term liabilities | | | (1,200 | ) | | 2,384 | | | (11,992 | ) |
| | | | | | | | |
| | Net cash provided by (used in) continuing operations | | | 118,661 | | | 87,826 | | | (38,586 | ) |
| | Net cash used in discontinued operations | | | (1,466 | ) | | (603 | ) | | (921 | ) |
| | | | | | | | |
Net cash provided by (used in) operating activities | | | 117,195 | | | 87,223 | | | (39,507 | ) |
| | | | | | | | |
Cash flows from investing activities: | | | | | | | | | | |
| | | | Cash paid for master lease property | | | — | | | — | | | (117,121 | ) |
| | | | Cash paid for property and equipment | | | (70,252 | ) | | (43,214 | ) | | (34,762 | ) |
| | | | Proceeds from dispositions of assets | | | 7,515 | | | 14,776 | | | 210,635 | |
| | | | Life insurance proceeds received | | | — | | | — | | | 15,588 | |
| | | | Acquisition of Florida Tire, Inc. | | | (288 | ) | | (2,695 | ) | | — | |
| | | | Collateral investment and other | | | (9,638 | ) | | (500 | ) | | — | |
| | | | | | | | |
| | Net cash (used in) provided by continuing operations | | | (72,663 | ) | | (31,633 | ) | | 74,340 | |
| | Net cash provided by discontinued operations | | | 569 | | | 1,762 | | | 4,386 | |
| | | | | | | | |
Net cash (used in) provided by investing activities | | | (72,094 | ) | | (29,871 | ) | | 78,726 | |
| | | | | | | | |
Cash flows from financing activities: | | | | | | | | | | |
| | | | Borrowings under line of credit agreements | | | 21,795 | | | 249,704 | | | 205,162 | |
| | | | Payments under line of credit agreements | | | (21,795 | ) | | (273,566 | ) | | (223,345 | ) |
| | | | Borrowings on trade payable program liability | | | 347,068 | | | 192,324 | | | 196,680 | |
| | | | Payments on trade payable program liability | | | (324,880 | ) | | (190,155 | ) | | (179,004 | ) |
| | | | Payments for finance issuance costs | | | — | | | — | | | (6,936 | ) |
| | | | Proceeds from lease financing | | | — | | | — | | | 8,661 | |
| | | | Long-term debt and capital lease obligation payments | | | (11,279 | ) | | (11,990 | ) | | (26,798 | ) |
| | | | Dividends paid | | | (6,323 | ) | | (6,286 | ) | | (14,111 | ) |
| | | | Other | | | 1,227 | | | 611 | | | 878 | |
| | | | | | | | |
Net cash provided by (used in) financing activities | | | 5,813 | | | (39,358 | ) | | (38,813 | ) |
| | | | | | | | |
Net increase in cash and cash equivalents | | | 50,914 | | | 17,994 | | | 406 | |
Cash and cash equivalents at beginning of year | | | 39,326 | | | 21,332 | | | 20,926 | |
| | | | | | | | |
Cash and cash equivalents at end of year | | $ | 90,240 | | $ | 39,326 | | $ | 21,332 | |
| | | | | | | | |
Supplemental cash flow information: | | | | | | | | | | |
| | | | Cash paid for interest, net of amounts capitalized | | $ | 23,098 | | $ | 24,509 | | $ | 26,548 | |
| | | | Cash received from income tax refunds | | $ | 195 | | $ | 921 | | $ | — | |
| | | | Cash paid for income taxes | | $ | 890 | | $ | 4,768 | | $ | 1,330 | |
Non-cash investing activities: | | | | | | | | | | |
| | | | Accrued purchases of property and equipment | | $ | 2,926 | | $ | 1,738 | | $ | 1,214 | |
See notes to the consolidated financial statements
42
Table of Contents
THE PEP BOYS—MANNY, MOE & JACK AND SUBSIDIARIES
NOTES TO CONSOLIDATED FINANCIAL STATEMENTS
Years ended January 29, 2011, January 30, 2010 and January 31, 2009
NOTE 1—SUMMARY OF SIGNIFICANT ACCOUNTING POLICIES
The Pep Boys—Manny, Moe & Jack and subsidiaries (the "Company") consolidated financial statements have been prepared in accordance with accounting principles generally accepted in the United States of America ("U.S. GAAP"). The preparation of the Company's financial statements requires the Company to make estimates and assumptions that affect the reported amounts of assets, liabilities, net sales, costs and expenses, as well as the disclosure of contingent assets and liabilities and other related disclosures. The Company bases its estimates on historical experience and on various other assumptions that management believes to be reasonable under the circumstances, the results of which form the basis for making judgments about carrying values of the Company's assets and liabilities that are not readily apparent from other sources. Actual results could differ from those estimates, and the Company includes any revisions to its estimates in the results for the period in which the actual amounts become known.
The Company believes the significant accounting policies described below affect the more significant judgments and estimates used in the preparation of its consolidated financial statements. Accordingly, these are the policies the Company believes are the most critical to aid in fully understanding and evaluating the historical consolidated financial condition and results of operations.
BUSINESS The Company operates in the U.S. automotive aftermarket, which has two general lines of business: (1) the Service business, defined as Do-It-For-Me, or "DIFM" (service labor, installed merchandise and tires) and (2) the Retail business, defined as Do-It-Yourself, or "DIY" (retail merchandise) and commercial. The Company's primary store format is the Supercenter, which houses both retail and repair services in one building. The Company currently operates stores in 35 states and Puerto Rico.
FISCAL YEAR END The Company's fiscal year ends on the Saturday nearest to January 31. Fiscal 2010, which ended January 29, 2011, fiscal 2009, which ended January 30, 2010, and fiscal 2008 which ended January 31, 2009 were all comprised of 52 weeks.
PRINCIPLES OF CONSOLIDATION The consolidated financial statements include the accounts of the Company and its wholly owned subsidiaries. All intercompany balances and transactions have been eliminated.
CASH AND CASH EQUIVALENTS Cash equivalents include all short-term, highly liquid investments with an initial maturity of three months or less when purchased. All credit and debit card transactions that settle in less than seven days are also classified as cash and cash equivalents.
ACCOUNTS RECEIVABLE Accounts receivable are primarily comprised of amounts due from commercial customers. The Company records an allowance for doubtful accounts based upon an evaluation of the credit worthiness of its customers. The allowance is reviewed for adequacy at least quarterly, and adjusted as necessary. Specific accounts are written off against the allowance when management determines the account is uncollectible.
MERCHANDISE INVENTORIES Merchandise inventories are valued at the lower of cost or market. Cost is determined by using the last-in, first-out (LIFO) method. If the first-in, first-out (FIFO) method of costing inventory had been used by the Company, inventory would have been $486.0 million
43
Table of Contents
THE PEP BOYS—MANNY, MOE & JACK AND SUBSIDIARIES
NOTES TO CONSOLIDATED FINANCIAL STATEMENTS (Continued)
Years ended January 29, 2011, January 30, 2010 and January 31, 2009
NOTE 1—SUMMARY OF SIGNIFICANT ACCOUNTING POLICIES (Continued)
and $482.0 million as of January 29, 2011 and January 30, 2010, respectively. During fiscal 2010, 2009 and 2008, the effect of LIFO layer liquidations on gross profit was immaterial.
The Company's inventory, consisting primarily of auto parts and accessories, is used on vehicles typically having longer lives. Because of this, along with the Company's historical experience of returning excess inventory to the Company's vendors for full credit, the risk of obsolescence is minimal. The Company establishes a reserve for excess inventory for instances where less than full credit will be received for such returns and where the Company anticipates items will be sold at retail prices that are less than recorded costs. The reserve is based on management's judgment, including estimates and assumptions regarding marketability of products, the market value of inventory to be sold in future periods and on historical experiences where the Company received less than full credit from vendors for product returns.
In fiscal 2010, the Company reduced its reserve for excess inventory by $5.9 million to $5.4 million from $11.3 million primarily due to improved inventory management, including timely return of excess product to vendors for credit. However, in future periods the Company may be exposed to material losses should the Company's vendors alter their policy with regard to accepting excess inventory returns.
PROPERTY AND EQUIPMENT Property and equipment are recorded at cost. Depreciation and amortization are computed using the straight-line method over the following estimated useful lives: building and improvements, 5 to 40 years, and furniture, fixtures and equipment, 3 to 10 years. Maintenance and repairs are charged to expense as incurred. Upon retirement or sale, the cost and accumulated depreciation are eliminated and the gain or loss, if any, is included in the determination of net income. Property and equipment information follows:
| | | | | | | |
(dollar amounts in thousands) | | January 29,
2011 | | January 30,
2010 | |
|---|
Land | | $ | 204,023 | | $ | 204,709 | |
Buildings and improvements | | | 848,268 | | | 826,804 | |
Furniture, fixtures and equipment | | | 685,481 | | | 695,072 | |
Construction in progress | | | 8,781 | | | 1,550 | |
Accumulated depreciation and amortization | | | (1,045,572 | ) | | (1,021,685 | ) |
| | | | | | |
Property and equipment—net | | $ | 700,981 | | $ | 706,450 | |
| | | | | | |
LEASES The Company amortizes leasehold improvements over the lesser of the lease term or the economic life of those assets. Generally, for stores the lease term is the base lease term and for distribution centers the lease term includes the base lease term plus certain renewal option periods for which renewal is reasonably assured and for which failure to exercise the renewal option would result in an economic penalty to the Company. The calculation of straight-line rent expense is based on the same lease term with consideration for step rent provisions, escalation clauses, rent holidays and other lease concessions. The Company expenses rent during the construction or build-out phase of the lease.
SOFTWARE CAPITALIZATION The Company capitalizes certain direct development costs associated with internal-use software, including external direct costs of material and services, and
44
Table of Contents
THE PEP BOYS—MANNY, MOE & JACK AND SUBSIDIARIES
NOTES TO CONSOLIDATED FINANCIAL STATEMENTS (Continued)
Years ended January 29, 2011, January 30, 2010 and January 31, 2009
NOTE 1—SUMMARY OF SIGNIFICANT ACCOUNTING POLICIES (Continued)
payroll costs for employees devoting time to the software projects. These costs are amortized over a period not to exceed five years beginning when the asset is substantially ready for use. Costs incurred during the preliminary project stage, as well as maintenance and training costs are expensed as incurred.
TRADE PAYABLE PROGRAM LIABILITY In April 2009, the Company replaced the previously existing trade payable program with a new program which is funded by various bank participants who have the ability, but not the obligation, to purchase account receivables owed by the Company directly from its vendors. The Company, in turn, makes the regularly scheduled full vendor payments to the bank participants.
INCOME TAXES The Company uses the asset and liability method of accounting for income taxes. Deferred income taxes are determined based upon enacted tax laws and rates applied to the differences between the financial statement and tax bases of assets and liabilities.
The Company recognizes taxes payable for the current year, as well as deferred tax assets and liabilities for the future tax consequences of events that have been recognized in the Company's financial statements or tax returns. The Company must assess the likelihood that any recorded deferred tax assets will be recovered against future taxable income. To the extent the Company believes it is more likely than not that the asset will not be recoverable, a valuation allowance must be established. To the extent the Company establishes a valuation allowance or changes the allowance in a future period, income tax expense will be impacted.
In evaluating income tax positions, the Company records liabilities for potential exposures. These tax liabilities are adjusted in the period actual developments give rise to such change. Those developments could be, but are not limited to, settlement of tax audits, expiration of the statute of limitations, and changes in the tax code and regulations, along with varying application of tax policy and administration within those jurisdictions. Refer to Note 8 for further discussion of income taxes and changes in unrecognized tax benefit during fiscal 2010.
SALES TAXES The Company presents sales net of sales taxes in its consolidated statements of operations.
REVENUE RECOGNITION The Company recognizes revenue from the sale of merchandise at the time the merchandise is sold and the product is delivered to the customer. Service revenues are recognized upon completion of the service. Service revenue consists of the labor charged for installing merchandise or maintaining or repairing vehicles, excluding the sale of any installed parts or materials. The Company records revenue net of an allowance for estimated future returns. The Company establishes reserves for sales returns and allowances based on current sales levels and historical return rates. Revenue from gift card sales is recognized upon gift card redemption. The Company's gift cards do not have expiration dates. The Company recognizes breakage on gift cards when, among other things, sufficient gift card history is available to estimate potential breakage and the Company determines there are no legal obligations to remit the value of unredeemed gift cards to the relevant jurisdictions. Estimated breakage revenue is immaterial for all periods presented.
In the first quarter of fiscal 2009, the Company launched a Customer Loyalty program. The program allows members to earn points for each qualifying purchase. Points earned allow members to
45
Table of Contents
THE PEP BOYS—MANNY, MOE & JACK AND SUBSIDIARIES
NOTES TO CONSOLIDATED FINANCIAL STATEMENTS (Continued)
Years ended January 29, 2011, January 30, 2010 and January 31, 2009
NOTE 1—SUMMARY OF SIGNIFICANT ACCOUNTING POLICIES (Continued)
receive a certificate that may be redeemed on future purchases within 90 days of issuance. The retail value of points earned by loyalty program members is included in accrued liabilities as deferred income and recorded as a reduction of revenue at the time the points are earned, based on the historic and projected rate of redemption. The Company recognizes deferred revenue and the cost of the free products distributed to loyalty program members when the awards are redeemed. The cost of the free products distributed to program members is recorded within costs of revenues.
A portion of the Company's transactions includes the sale of auto parts that contain a core component. These components represent the recyclable portion of the auto part. Customers are not charged for the core component of the new part if a used core is returned at the point of sale of the new part; otherwise the Company charges customers a specified amount for the core component. The Company refunds that same amount upon the customer returning a used core to the store at a later date. The Company does not recognize sales or cost of sales for the core component of these transactions when a used part is returned by the customer.
COSTS OF REVENUES Costs of merchandise sales include the cost of products sold, buying, warehousing and store occupancy costs. Costs of service revenue include service center payroll and related employee benefits, service center occupancy costs and cost of providing free or discounted towing services to customers. Occupancy costs include utilities, rents, real estate and property taxes, repairs, maintenance, depreciation and amortization expenses.
VENDOR SUPPORT FUNDS The Company receives various incentives in the form of discounts and allowances from its vendors based on purchases or for services that the Company provides to the vendors. These incentives received from vendors include rebates, allowances and promotional funds and are generally based upon a percentage of the gross amount purchased. Funds are recorded when title of goods purchased have transferred to the Company as the amount is known and not contingent on future events. The amount of funds to be received are subject to vendor agreements and ongoing negotiations that may be impacted in the future based on changes in market conditions, vendor marketing strategies and changes in the profitability or sell-through of the related merchandise for the Company.
Generally vendor support funds are earned based on purchases or product sales. These incentives are treated as a reduction of inventories and are recognized as a reduction to cost of sales as the inventories are sold. Certain vendor allowances are used exclusively for promotions and to offset certain other direct expenses if the Company determines the allowances are for specific, identifiable incremental expenses. Such allowances were immaterial for all periods presented.
WARRANTY RESERVE The Company provides warranties for both its merchandise sales and service labor. Warranties for merchandise are generally covered by the respective vendors, with the Company covering any costs above the vendor's stipulated allowance. Service labor is warranted in full by the Company for a limited specific time period. The Company establishes its warranty reserves based on historical experience. These costs are included in either costs of merchandise sales or costs of service revenue in the consolidated statement of operations.
46
Table of Contents
THE PEP BOYS—MANNY, MOE & JACK AND SUBSIDIARIES
NOTES TO CONSOLIDATED FINANCIAL STATEMENTS (Continued)
Years ended January 29, 2011, January 30, 2010 and January 31, 2009
NOTE 1—SUMMARY OF SIGNIFICANT ACCOUNTING POLICIES (Continued)
The reserve for warranty activity for the years ended January 29, 2011 and January 30, 2010, respectively, are as follows:
| | | | |
(dollar amounts in thousands) | |
| |
|---|
Balance, January 31, 2009 | | $ | 797 | |
Additions related to sales in the current year | | | 15,572 | |
Warranty costs incurred in the current year | | | (15,675 | ) |
| | | | |
Balance, January 30, 2010 | | | 694 | |
Additions related to sales in the current year | | | 12,261 | |
Warranty costs incurred in the current year | | | (12,282 | ) |
| | | | |
Balance, January 29,2011 | | $ | 673 | |
| | | | |
ADVERTISING The Company expenses the costs of advertising the first time the advertising takes place. Gross advertising expense for fiscal 2010, 2009 and 2008 was $57.5 million, $52.6 million and $73.7 million, respectively, and is recorded in selling, general and administrative expenses. No advertising costs were recorded as assets as of January 29, 2011 or January 30, 2010.
STORE OPENING COSTS The costs of opening new stores are expensed as incurred.
IMPAIRMENT OF LONG-LIVED ASSETS The Company evaluates the ability to recover long-lived assets whenever events or circumstances indicate that the carrying value of the asset may not be recoverable. In the event assets are impaired, losses are recognized to the extent the carrying value exceeds fair value. In addition, the Company reports assets to be disposed of at the lower of the carrying amount or the fair market value less selling costs. See discussion of current year impairments in Note 11, "Store Closures and Asset Impairments."
EARNINGS PER SHARE Basic earnings per share are computed by dividing earnings by the weighted average number of common shares outstanding during the year. Diluted earnings per share are computed by dividing earnings by the weighted average number of common shares outstanding during the year plus incremental shares that would have been outstanding upon the assumed exercise of dilutive stock options.
DISCONTINUED OPERATIONS The Company's discontinued operations reflect the operating results for closed stores where the customer base could not be maintained. Loss from discontinued operations relates to expenses for previously closed stores and principally includes costs for rent, taxes, payroll, repairs and maintenance, asset impairments, and gains or losses on disposal.
ACCOUNTING FOR STOCK-BASED COMPENSATION At January 29, 2011, the Company has two stock-based employee compensation plans, which are described in Note 14, "Equity Compensation Plans." Compensation costs relating to share-based payment transactions are recognized in the financial statements. The cost is measured at the grant date, based on the calculated fair value of the award, and is recognized as an expense over the employee's requisite service period (generally the vesting period of the equity award).
47
Table of Contents
THE PEP BOYS—MANNY, MOE & JACK AND SUBSIDIARIES
NOTES TO CONSOLIDATED FINANCIAL STATEMENTS (Continued)
Years ended January 29, 2011, January 30, 2010 and January 31, 2009
NOTE 1—SUMMARY OF SIGNIFICANT ACCOUNTING POLICIES (Continued)
COMPREHENSIVE LOSS Other comprehensive loss includes pension liability and fair market value of cash flow hedges.
DERIVATIVE INSTRUMENTS AND HEDGING ACTIVITIES The Company may enter into interest rate swap agreements to hedge the exposure to increasing rates with respect to its certain variable rate debt agreements. The Company recognizes all derivatives as either assets or liabilities in the statement of financial position and measures those instruments at fair value.
SEGMENT INFORMATION The Company has six operating segments defined by geographic regions which are Northeast, Mid-Atlantic, Southeast, Central, West and Southern CA. Each segment serves both DIY and DIFM lines of business. The Company aggregates all of its operating segments and has one reportable segment. Sales by major product categories are as follows:
| | | | | | | | | | |
| | Year ended | |
|---|
(dollar amounts in thousands) | | January 29,
2011 | | January 30,
2010 | | January 31,
2009 | |
|---|
Parts and accessories | | $ | 1,261,678 | | $ | 1,219,396 | | $ | 1,255,975 | |
Tires | | | 336,490 | | | 314,223 | | | 313,689 | |
Service labor | | | 390,473 | | | 377,319 | | | 358,124 | |
| | | | | | | | |
Total revenues | | $ | 1,988,641 | | $ | 1,910,938 | | $ | 1,927,788 | |
| | | | | | | | |
SIGNIFICANT SUPPLIERS During fiscal 2010, the Company's ten largest suppliers accounted for approximately 53% of merchandise purchased. No single supplier accounted for more than 20% of the Company's purchases. The Company has no long-term contracts or minimum purchase commitments under which the Company is required to purchase merchandise. Open purchase orders are based on current inventory or operational needs and are fulfilled by vendors within short periods of time and generally are not binding agreements.
SELF INSURANCE The Company has risk participation arrangements with respect to workers' compensation, general liability, automobile liability, and other casualty coverages. The Company has a wholly owned captive insurance subsidiary through which it reinsures this retained exposure. This subsidiary uses both risk sharing treaties and third party insurance to manage this exposure. In addition, the Company self insures certain employee-related health care benefit liabilities. The Company maintains stop loss coverage with third party insurers through which it reinsures certain of its casualty and health care benefit liabilities. The Company records both liabilities and reinsurance receivables using actuarial methods utilized in the insurance industry based upon historical claims experience.
RECLASSIFICATION Certain prior period amounts have been reclassified to conform to current period presentation. These reclassifications had no effect on reported totals for assets, liabilities, shareholders' equity, cash flows or net income.
48
Table of Contents
THE PEP BOYS—MANNY, MOE & JACK AND SUBSIDIARIES
NOTES TO CONSOLIDATED FINANCIAL STATEMENTS (Continued)
Years ended January 29, 2011, January 30, 2010 and January 31, 2009
NOTE 1—SUMMARY OF SIGNIFICANT ACCOUNTING POLICIES (Continued)
RECENT ACCOUNTING STANDARDS
In March 2007, the FASB issued guidance on accounting for split dollar life insurance arrangements which was included in ASC 718 "Compensation—Stock Compensation." This ASC provides guidance on determining whether a liability for the postretirement benefit associated with a collateral assignment split-dollar life insurance arrangement should be recorded. ASC 718 also provides guidance on how a company should recognize and measure the asset in a collateral assignment split-dollar life insurance contract. The original guidance for accounting for split dollar life insurance arrangements was effective for fiscal years beginning after December 15, 2007. The adoption of ASC 718 resulted in a $1.2 million net of tax charge to retained earnings on February 3, 2008.
In October 2009, the FASB issued Accounting Standards Update ("ASU") 2009-13 "Revenue Recognition (Topic 605)—Multiple-Deliverable Revenue Arrangements a consensus of the FASB Emerging Issues Task Force," ("ASU 2009-13"). This update eliminates the residual method of allocation and requires that consideration be allocated to all deliverables using the relative selling price method. ASU 2009-13 is effective for material revenue arrangements entered into or materially modified in fiscal years beginning on or after June 15, 2010. The adoption of ASU 2009-13 did not have a material impact on the consolidated financial statements.
In January 2010, the FASB issued ASU 2010-06 "Fair Value Measurements—Improving Disclosures on Fair Value Measurements" ("ASU 2010-06"). This guidance requires new disclosures surrounding transfers in and out of level 1 or 2 in the fair value hierarchy and also requires that the reconciliation of level 3 inputs includes separately reported information on purchases, sales, issuances and settlements. The increased disclosures should be reported for each class of assets or liabilities. ASU 2010-06 also clarifies existing disclosures for the level of disaggregating, disclosures about valuation techniques and inputs used to determine level 2 or 3 fair value measurements and includes conforming amendments to the guidance on employers' disclosures about postretirement benefit plan assets. ASU 2010-06 was effective for interim and annual reporting periods beginning after December 15, 2009 except for the disclosures about purchases, sales, issuances or settlements in the roll forward activity for level 3 fair value measurements which are effective for interim and annual periods beginning after December 15, 2010. The adoption of ASU 2010-06 did not have a material impact on the Company's consolidated financial statements.
In December 2010, the FASB issued ASU 2010-29 "Business Combinations (Topic 805)—Disclosure of Supplementary Pro Forma Information for Business Combinations" (ASU 2010-29). This accounting standard update clarifies that SEC registrants presenting comparative financial statements should disclose in their pro forma information revenue and earnings of the combined entity as though the current period business combinations had occurred as of the beginning of the comparable prior annual reporting period only. The update also expands the supplemental pro forma disclosures to include a description of the nature and amount of material, nonrecurring pro forma adjustments directly attributable to the business combination included in the reported pro forma revenue and earnings. ASU 2010-29 is effective prospectively for material (either on an individual or aggregate basis) business combinations entered into in fiscal years beginning on or after December 15, 2010 with early adoption permitted. The Company does not believe the adoption of those requirements of ASU 2010-29 will have a material impact on the consolidated results of operations and financial condition.
49
Table of Contents
THE PEP BOYS—MANNY, MOE & JACK AND SUBSIDIARIES
NOTES TO CONSOLIDATED FINANCIAL STATEMENTS (Continued)
Years ended January 29, 2011, January 30, 2010 and January 31, 2009
NOTE 2—BUSINESS COMBINATIONS
On October 31, 2009, the Company acquired substantially all of the assets (other than real property) and certain liabilities of Florida Tire, Inc. ("Florida Tire"), a privately held automotive service and tire business located in the Orlando Florida area consisting of 10 service locations. The Company agreed to pay up to $4.4 million for Florida Tire including contingent consideration of $1.7 million. The Company has completed the purchase accounting for the Florida Tire acquisition and has recorded net assets of $4.4 million, including goodwill of $2.5 million.
NOTE 3—OTHER CURRENT ASSETS
The following are the components of other current assets:
| | | | | | | |
(dollar amounts in thousands) | | January 29,
2011 | | January 30,
2010 | |
|---|
Reinsurance receivable | | $ | 57,532 | | $ | 61,599 | |
Income taxes receivable | | | 1,608 | | | 3,600 | |
Other | | | 1,197 | | | 229 | |
| | | | | | |
Total | | $ | 60,337 | | $ | 65,428 | |
| | | | | | |
NOTE 4—ACCRUED EXPENSES
The following are the components of accrued expenses:
| | | | | | | |
(dollar amounts in thousands) | | January 29,
2011 | | January 30,
2010 | |
|---|
Casualty and medical risk insurance | | $ | 146,667 | | $ | 150,006 | |
Accrued compensation and related taxes | | | 31,990 | | | 33,832 | |
Sales tax payable | | | 12,809 | | | 11,813 | |
Other | | | 44,563 | | | 46,765 | |
| | | | | | |
Total | | $ | 236,029 | | $ | 242,416 | |
| | | | | | |
NOTE 5—DEBT AND FINANCING ARRANGEMENTS
The following are the components of debt and financing arrangements:
| | | | | | | |
(dollar amounts in thousands) | | January 29,
2011 | | January 30,
2010 | |
|---|
7.50% Senior Subordinated Notes, due December 2014 | | $ | 147,565 | | $ | 157,565 | |
Senior Secured Term Loan, due October 2013 | | | 148,636 | | | 149,715 | |
Revolving Credit Agreement, through January 2014 | | | — | | | — | |
| | | | | | |
| | | 296,201 | | | 307,280 | |
Current maturities | | | (1,079 | ) | | (1,079 | ) |
| | | | | | |
Total | | $ | 295,122 | | $ | 306,201 | |
| | | | | | |
50
Table of Contents
THE PEP BOYS—MANNY, MOE & JACK AND SUBSIDIARIES
NOTES TO CONSOLIDATED FINANCIAL STATEMENTS (Continued)
Years ended January 29, 2011, January 30, 2010 and January 31, 2009
NOTE 5—DEBT AND FINANCING ARRANGEMENTS (Continued)
7.50% Senior Subordinated Notes, due December 2014
On December 14, 2004, the Company issued $200.0 million aggregate principal amount of 7.50% Senior Subordinated Notes (the "Notes") due December 2014. During fiscal 2010 and 2009, the Company repurchased Notes in the principal amount of $10.0 million and $17.0 million, respectively, resulting in a loss from debt repurchases of $0.2 million and a gain from debt repurchases of $6.2 million, respectively.
Senior Secured Term Loan Facility, due October 2013
The Company has a Senior Secured Term Loan facility (the "Term Loan") due October 2013. This facility is secured by a collateral pool consisting of real property and improvements associated with stores, which is adjusted periodically based upon real estate values and borrowing levels. Interest accrues at the London Interbank Offered Rate (LIBOR) plus 2.0% on this facility. As of January 29, 2011, 126 stores collateralized the Term Loan.
Revolving Credit Agreement, through January 2014
On January 16, 2009, the Company entered into a new Revolving Credit Agreement (the "Agreement") with available borrowings up to $300.0 million. The Company's ability to borrow under the Revolving Credit Agreement is based on a specific borrowing base consisting of inventory and accounts receivable. Total fees of $6.8 million were capitalized and are being amortized over the five year life of the Agreement. The interest rate on this credit line is LIBOR or Prime plus 2.75% to 3.25% based upon the then current availability under the Agreement. Fees based on the unused portion of the facility range from 37.5 to 75.0 basis points. As of January 29, 2011, there were no outstanding borrowings under the Agreement.
The weighted average interest rate on all debt borrowings during fiscal 2010 and 2009 was 6.3% and 4.2%, respectively.
Several of the Company's debt agreements require compliance with covenants. The most restrictive of these requirements is contained in the Revolving Credit Agreement. During any period the availability under the Agreement drops below the greater of $50,000 or 17.5% of the borrowing base, the Company is required to maintain a consolidated fixed charge coverage ratio of at least 1.1:1.0, calculated as the ratio of (a) EBITDA (net income plus interest charges, provision for taxes, depreciation and amortization expense, non-cash stock compensation expenses and other non-recurring, non-cash items) minus capital expenditures and income taxes paid to (b) the sum of debt service charges and restricted payments made. The failure to satisfy this covenant would constitute an event of default under the Agreement, which would result in a cross-default under the Notes and Term Loan.
As of January 29, 2011, the Company had no borrowings outstanding under the Revolving Credit Agreement, additional availability of approximately $138.2 million and was in compliance with its financial covenants.
51
Table of Contents
THE PEP BOYS—MANNY, MOE & JACK AND SUBSIDIARIES
NOTES TO CONSOLIDATED FINANCIAL STATEMENTS (Continued)
Years ended January 29, 2011, January 30, 2010 and January 31, 2009
NOTE 5—DEBT AND FINANCING ARRANGEMENTS (Continued)
On April 6, 2009, the Company entered into a vendor financing program with availability up to $50.0 million which is funded by various bank participants who have the ability, but not the obligation, to purchase account receivables owed by the Company directly from vendors. The Company, in turn, makes the regularly scheduled full vendor payments to the bank participants. The availability under the program was subsequently increased to $100.0 million in December, 2010. There was an outstanding balance of $56.3 million and $34.1 million under the program as of January 29, 2011 and January 30, 2010, respectively.
The Company has letter of credit arrangements in connection with its risk management, import merchandising and vendor financing programs. The Company was contingently liable for $0.3 million in outstanding commercial letters of credit as of January 29, 2011, and $107.6 million and $103.3 million in outstanding standby letters of credit as of January 29, 2011 and January 30, 2010, respectively.
The Company is also contingently liable for surety bonds in the amount of approximately $10.3 million and $10.2 million as of January 29, 2011 and January 30, 2010, respectively. The surety bonds guarantee certain payments (for example utilities, easement repairs, licensing requirements and customs fees).
The annual maturities of all long-term debt for the next five fiscal years are:
| | | | | | |
(dollar amounts in thousands)
Fiscal Year | | Long-Term Debt | |
|---|
| 2011 | | Senior Secured Term Loan, due October 2013 | | $ | 1,079 | |
| 2012 | | Senior Secured Term Loan, due October 2013 | | | 1,079 | |
| 2013 | | Senior Secured Term Loan, due October 2013 | | | 146,478 | |
| 2014 | | 7.50% Senior Subordinated Notes, due December 2014 | | | 147,565 | |
| Thereafter | | | — | |
| | | | | | |
| | | Total | | $ | 296,201 | |
| | | | | | |
Interest rates that are currently available to the Company for issuance of debt with similar terms and remaining maturities are used to estimate fair value for debt issues that are not quoted on an exchange. The estimated fair value of long-term debt including current maturities was $298.3 million and $290.8 million as of January 29, 2011 and January 30, 2010.
NOTE 6—LEASE AND OTHER COMMITMENTS
During 2008, the Company sold 63 owned properties to an independent third party, and concurrent with the sale, entered into agreements to lease the properties back from the purchaser. Net proceeds from this sale were $211.5 million. Each lease has an initial term of 15 years, four five-year renewal options, and annual incremental rental increases that are 1.5% of the prior year's rentals. The Company immediately recognized a $7.7 million gain on the sale of these properties and deferred an $89.9 million gain. The Company determined that it had continuing involvement in two properties relating to an environmental indemnity and recorded $8.5 million of the transaction's total net proceeds as a borrowing and as a financing activity in the Statement of Cash Flows. Subsequently, during fiscal
52
Table of Contents
THE PEP BOYS—MANNY, MOE & JACK AND SUBSIDIARIES
NOTES TO CONSOLIDATED FINANCIAL STATEMENTS (Continued)
Years ended January 29, 2011, January 30, 2010 and January 31, 2009
NOTE 6—LEASE AND OTHER COMMITMENTS (Continued)
2008, the Company provided the necessary documentation to satisfy its indemnity and removed its continuing involvement with these properties. The Company then recorded the sale of these two properties as sale-leaseback transactions and recorded a $4.0 million deferred gain. Of the total net proceeds for these properties, $76.0 million together with $41.2 million of cash on hand were used to finance the purchase of 29 properties for $117.1 million that were previously leased under a master operating lease.
In fiscal 2009, the Company sold four properties to unrelated third parties. Net proceeds from these sales were $12.9 million. Concurrent with these sales, the Company entered into agreements to lease the properties back from the purchasers over minimum lease terms of 15 years. Each property has a separate lease with an initial term of 15 years and four five-year renewal options. Every five years, the leases have rent increases of an amount equal to the lesser of 8% of the monthly rent due in the immediately preceding lease year or the percentage of the CPI increase between five year anniversaries. The Company classified these leases as operating leases, actively uses these properties and considers the leases as normal leasebacks. The Company recognized a gain of $1.2 million on the sale of these properties and recorded a deferred gain of $6.4 million.
In fiscal 2010, the Company sold one property to an unrelated third party. Net proceeds from this sale were $1.6 million. Concurrent with this sale, the Company entered into an agreement to lease the property back from the purchaser over a minimum lease term of 15 years. The Company classified this lease as an operating lease. The Company actively uses this property and considers the lease as a normal leaseback. The Company recorded a deferred gain of $0.4 million.
The aggregate minimum rental payments for all leases having initial terms of more than one year are as follows:
| | | | |
(dollar amounts in thousands)
Fiscal Year | | Operating
Leases | |
|---|
2011 | | $ | 86,730 | |
2012 | | | 84,883 | |
2013 | | | 81,169 | |
2014 | | | 76,845 | |
2015 | | | 70,590 | |
Thereafter | | | 347,400 | |
| | | | |
Aggregate minimum lease payments | | $ | 747,617 | |
| | | | |
Rental expenses incurred for operating leases in fiscal 2010, 2009, and 2008 were $79.7 million, $75.3 million and $77.2 million, respectively, and are recorded primarily in cost of revenues. The deferred gain for all sale leaseback transactions is being recognized in costs of merchandise sales and costs of service revenues over the minimum term of these leases.
NOTE 7—ASSET RETIREMENT OBLIGATIONS
The Company records asset retirement obligations as incurred and when reasonably estimable, including obligations for which the timing and/or method of settlement are conditional on a future event that may or may not be within the control of the Company. The obligation principally represents
53
Table of Contents
THE PEP BOYS—MANNY, MOE & JACK AND SUBSIDIARIES
NOTES TO CONSOLIDATED FINANCIAL STATEMENTS (Continued)
Years ended January 29, 2011, January 30, 2010 and January 31, 2009
NOTE 7—ASSET RETIREMENT OBLIGATIONS (Continued)
the removal of leasehold improvements from stores upon termination of store leases. The obligations are recorded as liabilities at fair value using discounted cash flows and are accreted over the lease term. Costs associated with the obligations are capitalized and amortized over the estimated remaining useful life of the asset.
The Company has recorded a liability pertaining to the asset retirement obligation in accrued expenses and other long-term liabilities on its consolidated balance sheet. Changes in assumptions reflect favorable experience with the rate of occurrence of obligations and expected settlement dates. The liability for asset retirement obligations activity from January 31, 2009 through January 29, 2011 is as follows:
| | | | |
(dollar amounts in thousands) | |
| |
|---|
Asset retirement obligation at January 31, 2009 | | $ | 7,130 | |
Change in assumptions | | | (466 | ) |
Settlements | | | (154 | ) |
Accretion expense | | | 214 | |
| | | | |
Asset retirement obligation at January 30, 2010 | | | 6,724 | |
Change in assumptions | | | (1,192 | ) |
Settlements | | | (120 | ) |
Accretion expense | | | 194 | |
| | | | |
Asset retirement obligation at January 29, 2011 | | $ | 5,606 | |
| | | | |
NOTE 8—INCOME TAXES
The provision (benefit) for income taxes includes the following:
| | | | | | | | | | | |
| | Year Ended | |
|---|
(dollar amounts in thousands) | | January 29,
2011 | | January 30,
2010 | | January 31,
2009 | |
|---|
Current: | | | | | | | | | | |
| | Federal | | $ | — | | $ | 398 | | $ | (464 | ) |
| | State | | | 491 | | | (511 | ) | | 1,276 | |
| | Foreign | | | 2,210 | | | 149 | | | 433 | |
Deferred: | | | | | | | | | | |
| | Federal(1) | | | 20,309 | | | 13,820 | | | (8,717 | ) |
| | State | | | (1,818 | ) | | 42 | | | 754 | |
| | Foreign | | | 81 | | | (395 | ) | | 579 | |
| | | | | | | | |
Total income tax expense/(benefit) from continuing operations(a) | | $ | 21,273 | | $ | 13,503 | | $ | (6,139 | ) |
| | | | | | | | |
- (1)
- Excludes tax benefit recorded to discontinued operations of $0.3 million, $0.6 million and $0.9 million in fiscal 2010, 2009 and 2008, respectively.
54
Table of Contents
THE PEP BOYS—MANNY, MOE & JACK AND SUBSIDIARIES
NOTES TO CONSOLIDATED FINANCIAL STATEMENTS (Continued)
Years ended January 29, 2011, January 30, 2010 and January 31, 2009
NOTE 8—INCOME TAXES (Continued)
A reconciliation of the statutory federal income tax rate to the effective rate for income tax expense (benefit) follows:
| | | | | | | | | | |
| | Year Ended | |
|---|
| | January 29,
2011 | | January 30,
2010 | | January 31,
2009 | |
|---|
Statutory tax rate | | | 35.0 | % | | 35.0 | % | | (35.0 | )% |
State income taxes, net of federal tax | | | 2.4 | | | 2.4 | | | (1.2 | ) |
Job credits | | | (0.3 | ) | | (0.9 | ) | | (1.5 | ) |
Texas law change impact | | | — | | | — | | | (6.4 | ) |
Tax uncertainty adjustment | | | 0.2 | | | (0.5 | ) | | (1.3 | ) |
Valuation allowance | | | (3.5 | ) | | — | | | 8.9 | |
Non deductible expenses | | | 0.5 | | | 0.3 | | | 5.3 | |
Stock compensation | | | 0.2 | | | 0.8 | | | 3.9 | |
Foreign taxes, net of federal | | | 2.4 | | | (0.7 | ) | | 2.0 | |
Officer's life insurance gain on surrender value | | | 0.0 | | | 0.0 | | | 4.3 | |
Other, net | | | (0.5 | ) | | (0.5 | ) | | 3.4 | |
| | | | | | | | |
| | | 36.4 | % | | 35.9 | % | | (17.6 | )% |
| | | | | | | | |
55
Table of Contents
THE PEP BOYS—MANNY, MOE & JACK AND SUBSIDIARIES
NOTES TO CONSOLIDATED FINANCIAL STATEMENTS (Continued)
Years ended January 29, 2011, January 30, 2010 and January 31, 2009
NOTE 8—INCOME TAXES (Continued)
Items that gave rise to the deferred tax accounts are as follows:
| | | | | | | | |
(dollar amounts in thousands) | | January 29,
2011 | | January 30,
2010 | |
|---|
Deferred tax assets: | | | | | | | |
| | Employee compensation | | $ | 3,060 | | $ | 3,293 | |
| | Store closing reserves | | | 1,064 | | | 1,741 | |
| | Legal reserve | | | 569 | | | 769 | |
| | Benefit accruals | | | 3,576 | | | 4,628 | |
| | Net operating loss carryforwards—Federal | | | 2,527 | | | 911 | |
| | Net operating loss carryforwards—State | | | 107,941 | | | 105,375 | |
| | Tax credit carryforwards | | | 17,086 | | | 18,503 | |
| | Accrued leases | | | 12,107 | | | 12,078 | |
| | Interest rate derivatives | | | 5,960 | | | 5,872 | |
| | Deferred gain on sale leaseback | | | 61,904 | | | 66,613 | |
| | Deferred revenue | | | 5,871 | | | 5,332 | |
| | Other | | | 2,570 | | | 2,523 | |
| | | | | | |
| | Gross deferred tax assets | | | 224,235 | | | 227,638 | |
| | Valuation allowance | | | (104,486 | ) | | (108,416 | ) |
| | | | | | |
| | | 119,749 | | | 119,222 | |
| | | | | | |
Deferred tax liabilities: | | | | | | | |
| | Depreciation | | $ | 44,634 | | $ | 34,601 | |
| | Inventories | | | 57,538 | | | 49,364 | |
| | Real estate tax | | | 3,132 | | | 2,885 | |
| | Insurance and other | | | 2,574 | | | 1,998 | |
| | Gain on debt buyback | | | 2,187 | | | 2,187 | |
| | | | | | |
| | | 110,065 | | | 91,035 | |
| | | | | | |
Net deferred tax asset | | $ | 9,684 | | $ | 28,187 | |
| | | | | | |
As of January 29, 2011 and January 30, 2010, the Company had available tax net operating losses that can be carried forward to future years. The Company has $2.5 million of deferred tax assets related to federal net operating loss carryforwards which begin to expire in 2027. The Company has $4.5 million of deferred tax assets related to state tax net operating loss carryforwards related to unitary filings of which 8% will expire in the next five years for which a full valuation allowance has been recorded. The balance of the Company's net operating loss carryforwards relate to separate company filing jurisdictions that will expire in various years beginning in 2011 for which full valuation allowances have been recorded.
The tax credit carryforward at January 29, 2011 consists of $7.3 million of alternative minimum tax credits, $3.4 million of work opportunity credits and $6.4 million of state and Puerto Rico tax credits of which $3.3 million have full valuation allowances recorded against them. The tax credit carryforward at January 30, 2010 consists of $7.2 million of alternative minimum tax credits, $3.3 million of work
56
Table of Contents
THE PEP BOYS—MANNY, MOE & JACK AND SUBSIDIARIES
NOTES TO CONSOLIDATED FINANCIAL STATEMENTS (Continued)
Years ended January 29, 2011, January 30, 2010 and January 31, 2009
NOTE 8—INCOME TAXES (Continued)
opportunity credits and $8.0 million of state and Puerto Rico tax credits of which $5.5 million have full valuation allowances recorded against them.
The temporary differences between the book and tax treatment of income and expenses result in deferred tax assets and liabilities, which are included within the consolidated balance sheets. The Company must assess the likelihood that any recorded deferred tax assets will be recovered against future taxable income. To the extent the Company believes it is more likely than not that the asset will not be recoverable, a valuation allowance must be established. The Company considers future projections of income and tax planning strategies, such as the potential sale of real estate to generate taxable income sufficient to utilize the deferred tax assets. To the extent the Company establishes a valuation allowance or changes the allowance in a future period, income tax expense will be impacted. After considering all this evidence, the Company released $3.2 million of gross valuation allowances on certain state net operating loss carryforwards and state credits during fiscal 2010.
The Company and its subsidiaries file income tax returns in the U.S. federal, various states and Puerto Rico jurisdictions. The Company's U.S. federal returns for tax years 2004 and forward are subject to examination. State and local income tax returns are generally subject to examination for a period of three to five years after filing of the respective return. In Puerto Rico, the 2004 through 2010 tax years are subject to examination by the Puerto Rico tax authorities. The Company has various state income tax returns in the process of examination.
A reconciliation of the beginning and ending amount of unrecognized tax benefits is as follows:
| | | | | | | | | | |
(dollar amounts in thousands) | | January 29,
2011 | | January 30,
2010 | | January 31,
2009 | |
|---|
Unrecognized tax benefit balance at the beginning of the year | | $ | 2,411 | | $ | 2,458 | | $ | 3,847 | |
Gross increases for tax positions taken in prior years | | | 1,331 | | | 646 | | | 147 | |
Gross decreases for tax positions taken in prior years | | | — | | | (526 | ) | | (831 | ) |
Gross increases for tax positions taken in current year | | | 389 | | | 296 | | | 313 | |
Settlements taken in current year | | | — | | | (271 | ) | | (311 | ) |
Lapse of statute of limitations | | | — | | | (192 | ) | | (707 | ) |
| | | | | | | | |
Unrecognized tax benefit balance at the end of the year | | $ | 4,131 | | $ | 2,411 | | $ | 2,458 | |
| | | | | | | | |
The Company recognizes potential interest and penalties for unrecognized tax benefits in income tax expense and, accordingly, the Company recognized no material income tax expense in fiscal 2010 and an income tax benefit of $0.4 million during fiscal 2009 related to potential interest and penalties associated with uncertain tax positions. At January 29, 2011, January 30, 2010, and January 31, 2009, the Company has recorded $0.2 million, $0.2 million, and $1.0 million, respectively, for the payment of interest and penalties which are excluded from the unrecognized tax benefit noted above.
Unrecognized tax benefits include $1.4 million, $1.3 million, and $1.5 million, at January 29, 2011, January 30, 2010 and January 31, 2009, respectively, of tax benefits that, if recognized, would affect the Company's annual effective tax rate. The Company believes it is reasonably possible that the amount will increase or decrease within the next twelve months; however, it is not currently possible to estimate the impact of the change.
57
Table of Contents
THE PEP BOYS—MANNY, MOE & JACK AND SUBSIDIARIES
NOTES TO CONSOLIDATED FINANCIAL STATEMENTS (Continued)
Years ended January 29, 2011, January 30, 2010 and January 31, 2009
NOTE 9—STOCKHOLDERS' EQUITY
On January 26, 2010, the Company terminated the flexible employee benefits trust (the "Trust") that was established on April 29, 1994 to fund a portion of the Company's obligations arising from various employee compensation and benefit plans. In accordance with the terms of the Trust, upon its termination, the Trust's sole asset, consisting of 2,195,270 shares of the Company's common stock, was transferred to the Company in exchange for the full satisfaction and discharge of all intercompany indebtedness then owed by the Trust to the Company. The termination of the Trust had no impact on the Company's consolidated financial statements, except for the reclassification of the shares within the shareholders equity section of the Company's Consolidated Balance Sheets. The Company uses its treasury shares to satisfy share requirements to its employees under its compensation plans and dividend reinvestment program.
NOTE 10—ACCUMULATED OTHER COMPREHENSIVE INCOME (LOSS)
The following are the components of other comprehensive income (loss):
| | | | | | | | | | | |
| | Year Ended | |
|---|
(dollar amounts in thousands) | | January 29,
2011 | | January 30,
2010 | | January 31,
2009 | |
|---|
Net earnings (loss) | | $ | 36,631 | | $ | 23,036 | | $ | (30,429 | ) |
Other comprehensive income (loss), net of tax: | | | | | | | | | | |
| | Defined benefit plan adjustment | | | 582 | | | 595 | | | (958 | ) |
| | Derivative financial instrument adjustment | | | 81 | | | (211 | ) | | (2,934 | ) |
| | | | | | | | |
Comprehensive income (loss) | | $ | 37,294 | | $ | 23,420 | | $ | (34,321 | ) |
| | | | | | | | |
The components of accumulated other comprehensive loss are:
| | | | | | | | | | |
| | Year Ended | |
|---|
(dollar amounts in thousands) | | January 29,
2011 | | January 30,
2010 | | January 31,
2009 | |
|---|
Defined benefit plan adjustment, net of tax | | $ | (6,576 | ) | $ | (7,158 | ) | $ | (7,753 | ) |
Derivative financial instrument adjustment, net of tax | | | (10,452 | ) | | (10,533 | ) | | (10,322 | ) |
| | | | | | | | |
Accumulated other comprehensive loss | | $ | (17,028 | ) | $ | (17,691 | ) | $ | (18,075 | ) |
| | | | | | | | |
NOTE 11—STORE CLOSURES AND ASSET IMPAIRMENTS
During fiscal 2010, the Company recorded an $0.8 million impairment charge related to two stores classified as held and used. The Company used a probability-weighted approach and estimates of expected future cash flows to determine the fair value of these stores. Discount and growth rate assumptions were derived from current economic conditions, management's expectations and projected trends of current operating results. The fair market value estimate is classified as a Level 3 measure within the fair value hierarchy. Of the $0.8 million impairment charge, $0.6 million was charged to merchandise cost of sales, and $0.2 million was charged to service cost of sales.
During fiscal 2007, the Company recorded charges of $15.6 million related to store closures. The reserve balance includes remaining rent on leases net of sublease income, other contractual obligations
58
Table of Contents
THE PEP BOYS—MANNY, MOE & JACK AND SUBSIDIARIES
NOTES TO CONSOLIDATED FINANCIAL STATEMENTS (Continued)
Years ended January 29, 2011, January 30, 2010 and January 31, 2009
NOTE 11—STORE CLOSURES AND ASSET IMPAIRMENTS (Continued)
associated with leased properties and employee severance. The following details the reserve activity for the three years in the period ended January 29, 2011.
| | | | | | | | | | |
(dollar amounts in thousands) | | Severance and
other costs | | Lease
Expenses | | Total | |
|---|
Balance, February 2, 2008 | | $ | 167 | | $ | 3,574 | | $ | 3,741 | |
Accretion of present value of liabilities | | | — | | | 300 | | | 300 | |
Change in assumptions about future sublease income, lease termination, contractual obligations and severance | | | (109 | ) | | 102 | | | (7 | ) |
Cash payments | | | (58 | ) | | (1,864 | ) | | (1,922 | ) |
| | | | | | | | |
Balance, January 31, 2009 | | | — | | | 2,112 | | | 2,112 | |
Accretion of present value of liabilities | | | — | | | 111 | | | 111 | |
Change in assumptions about future sublease income, lease termination | | | — | | | 1,122 | | | 1,122 | |
Cash payments | | | — | | | (1,095 | ) | | (1,095 | ) |
| | | | | | | | |
Balance, January 30, 2010 | | | — | | | 2,250 | | | 2,250 | |
Accretion of present value of liabilities | | | — | | | 81 | | | 81 | |
Change in assumptions about future sublease income, lease termination | | | — | | | 163 | | | 163 | |
Cash payments | | | — | | | (1,253 | ) | | (1,253 | ) |
| | | | | | | | |
Balance, January 29, 2011 | | $ | — | | $ | 1,241 | | $ | 1,241 | |
| | | | | | | | |
A store is classified as "held for disposal" when (i) the Company has committed to a plan to sell, (ii) the building is vacant and the property is available for sale, (iii) the Company is actively marketing the property for sale, (iv) the sale price is reasonable in relation to its current fair value and (v) the Company expects to complete the sale within one year. Assets held for disposal have been valued at the lower of their carrying amount or their estimated fair value, net of disposal costs. The fair value of these assets is estimated using market appraisals for comparable properties and is classified as a Level 2 (as described in Note 16) measure within the fair value hierarchy. No depreciation expense is recognized during the period the asset is held for disposal. Assets held for disposal follows:
| | | | | | | |
(dollar amounts in thousands) | | January 29,
2011 | | January 30,
2010 | |
|---|
Land | | $ | 190 | | $ | 2,980 | |
Buildings and improvements | | | 285 | | | 5,453 | |
Accumulated depreciation | | | — | | | (3,995 | ) |
| | | | | | |
Property and equipment—net | | $ | 475 | | $ | 4,438 | |
| | | | | | |
Number of properties | | | 1 | | | 8 | |
During fiscal 2010, the Company sold seven stores for $4.3 million and recorded a net gain of $0.5 million in earnings from continuing operations. The Company classifies the one remaining property as held for disposal as it continues to actively market the property at a price the Company believes reasonable given current market conditions and expects to sell this property within the next twelve months. In addition, during fiscal 2010, the Company recorded a $0.2 million impairment charge related to a store classified as held for disposal. The Company lowered its selling price reflecting declines in the commercial real estate market. Substantially all of this impairment was charged to merchandise cost of sales.
59
Table of Contents
THE PEP BOYS—MANNY, MOE & JACK AND SUBSIDIARIES
NOTES TO CONSOLIDATED FINANCIAL STATEMENTS (Continued)
Years ended January 29, 2011, January 30, 2010 and January 31, 2009
NOTE 11—STORE CLOSURES AND ASSET IMPAIRMENTS (Continued)
During fiscal 2009, the Company sold four stores for $3.6 million and recorded a net gain of $0.2 million of which $0.1 million is reported in discontinued operations. The Company also decided to reopen one store and moved the carrying value of $1.7 million to property and equipment. During fiscal 2009 in response to a continuing weak real estate market, the Company reduced its prices for certain properties and recorded a $3.1 million impairment charge, of which $2.2 million was charged to merchandise cost of sales, $0.7 million was charged to service cost of sales and $0.2 million (pretax) was charged to discontinued operations.
During fiscal 2008, the Company sold six stores for $6.7 million and recorded a net gain of $0.4 million of which $0.1 million is reported in discontinued operations. During fiscal 2008 in response to a continuing weak real estate market, the Company reduced its prices for certain properties and recorded a $5.4 million impairment charge, of which $2.8 million was charged to merchandise cost of sales, $0.6 million was charged to service cost of sales and $1.9 million (pretax) was charged to discontinued operations.
NOTE 12—EARNINGS PER SHARE
Basic earnings per share is based on net earnings divided by the weighted average number of shares outstanding during the period. Stock options were dilutive in fiscal 2010 and 2009 and as such were included in the diluted earnings per share calculation. Stock options were anti-dilutive in fiscal 2008, as the Company generated a net loss, and are excluded from the diluted earnings per share calculation.
60
Table of Contents
THE PEP BOYS—MANNY, MOE & JACK AND SUBSIDIARIES
NOTES TO CONSOLIDATED FINANCIAL STATEMENTS (Continued)
Years ended January 29, 2011, January 30, 2010 and January 31, 2009
NOTE 12—EARNINGS PER SHARE (Continued)
The following schedule presents the calculation of basic and diluted earnings per share for earnings (loss) from continuing operations:
| | | | | | | | | | | | |
| |
| | Year Ended | |
|---|
(dollar amounts in thousands, except per share amounts) | | January 29,
2011 | | January 30,
2010 | | January 31,
2009 | |
|---|
(a) | | Earnings (loss) from continuing operations before discontinued operations | | $ | 37,171 | | $ | 24,113 | | $ | (28,838 | ) |
| | Loss from discontinued operations, net of tax benefit of $(291), $(580) and $(857) | | | (540 | ) | | (1,077 | ) | | (1,591 | ) |
| | | | | | | | | | |
| | Net earnings (loss) | | $ | 36,631 | | $ | 23,036 | | $ | (30,429 | ) |
| | | | | | | | | | |
(b) | | Basic average number of common shares outstanding during period | | | 52,677 | | | 52,397 | | | 52,136 | |
| | Common shares assumed issued upon exercise of dilutive stock options, net of assumed repurchase, at the average market price | | | 485 | | | 270 | | | — | |
| | | | | | | | | | |
(c) | | Diluted average number of common shares assumed outstanding during period | | | 53,162 | | | 52,667 | | | 52,136 | |
| | | | | | | | | | |
| | Basic earnings (loss) per share: | | | | | | | | | | |
| | Earnings (loss) from continuing operations (a/b) | | $ | 0.71 | | $ | 0.46 | | $ | (0.55 | ) |
| | Discontinued operations, net of tax | | | (0.01 | ) | | (0.02 | ) | | (0.03 | ) |
| | | | | | | | | | |
| | Basic earnings (loss) per share | | $ | 0.70 | | $ | 0.44 | | $ | (0.58 | ) |
| | | | | | | | | | |
| | Diluted earnings (loss) per share: | | | | | | | | | | |
| | Earnings (loss) from continuing operations (a/c) | | $ | 0.70 | | $ | 0.46 | | $ | (0.55 | ) |
| | Discontinued operations, net of tax | | | (0.01 | ) | | (0.02 | ) | | (0.03 | ) |
| | | | | | | | | | |
| | Diluted earnings (loss) per share | | $ | 0.69 | | $ | 0.44 | | $ | (0.58 | ) |
| | | | | | | | | | |
Certain stock options were excluded from the calculations of diluted earnings per share because their exercise prices were greater than the average market price of the common shares for the period then ended and therefore would be anti-dilutive. The total number of such shares excluded from the diluted earnings per share calculation were 978,000 and 1,125,000 as of January 29, 2011, and January 30, 2010, respectively. In fiscal 2008, all outstanding stock options and non-vested restricted stock units were excluded because they were anti-dilutive.
NOTE 13—BENEFIT PLANS
DEFINED BENEFIT AND CONTRIBUTION PLANS
On December 31, 2008, the Company paid $14.4 million to terminate the defined benefit portion of its Supplemental Executive Retirement Plan (SERP) and recorded a $6.0 million settlement charge. The Company continues to maintain the non-qualified defined contribution portion of the SERP plan (Account Plan) for key employees designated by the Board of Directors. The Company's contribution
61
Table of Contents
THE PEP BOYS—MANNY, MOE & JACK AND SUBSIDIARIES
NOTES TO CONSOLIDATED FINANCIAL STATEMENTS (Continued)
Years ended January 29, 2011, January 30, 2010 and January 31, 2009
NOTE 13—BENEFIT PLANS (Continued)
expense for the Account Plan was $1.2 million, $0.8 million and $0.2 million for fiscal 2010, 2009 and 2008, respectively.
The Company has a qualified 401(k) savings plan and a separate savings plan for employees residing in Puerto Rico, which cover all full-time employees who are at least 21 years of age with one or more years of service. The Company contributes the lesser of 50% of the first 6% of a participant's contributions or 3% of the participant's compensation under both savings plans. The Company's savings plans' contribution expense was $3.0 million, $3.1 million and $3.3 million in fiscal 2010, 2009 and 2008, respectively.
The Company also has a defined benefit pension plan covering full-time employees hired on or before February 1, 1992. As of December 31, 1996, the Company froze the accrued benefits under the plan and active participants became fully vested. The plan's trustee will continue to maintain and invest plan assets and will administer benefits payments. The Company uses a fiscal year end measurement date for determining benefit obligations and the fair value of plan assets of its plans. The actuarial computations are made using the "projected unit credit method." Variances between actual experience and assumptions for costs and returns on assets are amortized over the remaining service lives of employees under the plan.
Pension expense follows:
| | | | | | | | | | |
| | Year Ended | |
|---|
(dollar amounts in thousands) | | January 29,
2011 | | January 30,
2010 | | January 31,
2009 | |
|---|
Service cost | | $ | — | | $ | — | | $ | 110 | |
Interest cost | | | 2,561 | | | 2,539 | | | 3,346 | |
Expected return on plan assets | | | (2,151 | ) | | (1,804 | ) | | (2,450 | ) |
Amortization of transitional obligation | | | — | | | — | | | 150 | |
Amortization of prior service cost | | | 14 | | | 14 | | | 340 | |
Recognized actuarial loss | | | 1,672 | | | 1,766 | | | 975 | |
| | | | | | | | |
Net periodic benefit cost | | | 2,096 | | | 2,515 | | | 2,471 | |
Settlement charge | | | — | | | — | | | 6,005 | |
| | | | | | | | |
Total pension expense | | $ | 2,096 | | $ | 2,515 | | $ | 8,476 | |
| | | | | | | | |
62
Table of Contents
THE PEP BOYS—MANNY, MOE & JACK AND SUBSIDIARIES
NOTES TO CONSOLIDATED FINANCIAL STATEMENTS (Continued)
Years ended January 29, 2011, January 30, 2010 and January 31, 2009
NOTE 13—BENEFIT PLANS (Continued)
The following actuarial assumptions were used to determine benefit obligation and pension expense:
| | | | | | | | | | |
| | Year Ended | |
|---|
| | January 29,
2011 | | January 30,
2010 | | January 31,
2009 | |
|---|
Benefit obligation assumptions: | | | | | | | | | | |
Discount rate | | | 5.70 | % | | 6.10 | % | | 7.00 | % |
Rate of compensation increase | | | N/A | | | N/A | | | N/A | |
Pension expense assumptions: | | | | | | | | | | |
Discount rate | | | 6.10 | % | | 7.00 | % | | 6.50 | % |
Expected return on plan assets | | | 6.95 | % | | 6.70 | % | | 6.70 | % |
Rate of compensation expense | | | N/A | | | N/A | | | 4.00 | %(1) |
- (1)
- Bonuses are assumed to be 25% of base pay for the SERP.
The Company selected the discount rate for the benefit obligation at January 29, 2011 to reflect a rate commensurate with a model bond portfolio with durations that match the expected payment patterns of the plans. To develop the expected long-term rate of return on assets assumption, the Company considered the historical returns and the future expectations for returns for each asset class, as well as the target asset allocation of the pension portfolio. This resulted in the selection of a long-term rate of return on assets of 6.95% for fiscal 2010 and 6.70% for fiscal 2009 and 2008.
63
Table of Contents
THE PEP BOYS—MANNY, MOE & JACK AND SUBSIDIARIES
NOTES TO CONSOLIDATED FINANCIAL STATEMENTS (Continued)
Years ended January 29, 2011, January 30, 2010 and January 31, 2009
NOTE 13—BENEFIT PLANS (Continued)
The following table sets forth the reconciliation of the benefit obligation, fair value of plan assets and funded status of the Company's defined benefit plans:
| | | | | | | |
| | Year ended | |
|---|
(dollar amounts in thousands) | | January 29,
2011 | | January 30,
2010 | |
|---|
Change in benefit obligation: | | | | | | | |
Benefit obligation at beginning of year | | $ | 42,744 | | $ | 36,996 | |
Interest cost | | | 2,561 | | | 2,539 | |
Actuarial loss | | | 2,454 | | | 4,626 | |
Benefits paid | | | (1,641 | ) | | (1,417 | ) |
| | | | | | |
Benefit obligation at end of year | | $ | 46,118 | | $ | 42,744 | |
| | | | | | |
Change in plan assets: | | | | | | | |
Fair value of plan assets at beginning of year | | $ | 31,857 | | $ | 27,692 | |
Actual return on plan assets (net of expenses) | | | 3,847 | | | 5,582 | |
Employer contributions | | | 5,000 | | | — | |
Benefits paid | | | (1,641 | ) | | (1,417 | ) |
| | | | | | |
Fair value of plan assets at end of year | | $ | 39,063 | | $ | 31,857 | |
| | | | | | |
Unfunded status at fiscal year end | | $ | (7,055 | ) | $ | (10,887 | ) |
| | | | | | |
Net amounts recognized on consolidated balance sheet at fiscal year end | | | | | | | |
Noncurrent benefit liability (included in other long-term liabilities) | | $ | (7,055 | ) | $ | (10,887 | ) |
| | | | | | |
Net amount recognized at fiscal year end | | $ | (7,055 | ) | $ | (10,887 | ) |
| | | | | | |
Amounts recognized in accumulated other comprehensive income (pre-tax) at fiscal year end | | | | | | | |
Actuarial loss | | $ | 10,402 | | $ | 11,316 | |
Prior service cost | | | 40 | | | 54 | |
| | | | | | |
Net amount recognized at fiscal year end | | $ | 10,442 | | $ | 11,370 | |
| | | | | | |
Other comprehensive (income) loss attributable to change in pension liability recognition | | $ | (928 | ) | $ | (932 | ) |
Accumulated benefit obligation at fiscal year end | | $ | 46,118 | | $ | 42,744 | |
Other information | | | | | | | |
Employer contributions expected in fiscal 2011 | | $ | — | | $ | — | |
Estimated actuarial loss and prior service cost amortization in fiscal 2011 | | $ | 1,530 | | $ | 1,642 | |
64
Table of Contents
THE PEP BOYS—MANNY, MOE & JACK AND SUBSIDIARIES
NOTES TO CONSOLIDATED FINANCIAL STATEMENTS (Continued)
Years ended January 29, 2011, January 30, 2010 and January 31, 2009
NOTE 13—BENEFIT PLANS (Continued)
Benefit payments, including amounts to be paid from Company assets, as appropriate, are expected to be paid as follows:
| | | | |
(dollar amounts in thousands) | |
| |
|---|
2012 | | $ | 1,869 | |
2013 | | | 1,984 | |
2014 | | | 2,114 | |
2015 | | | 2,232 | |
2016 | | | 2,358 | |
2017–2021 | | | 13,857 | |
Investment policies are established in accordance with the Company's Benefits Committee (the "Committee") responsibilities to the participants of the Plan and its beneficiaries, and in accordance with the Employee Retirement Income Security Act of 1974, as amended (ERISA). The objective of the plan is to meet current and future benefit payment needs within the constraints of diversification and prudent risk taking. The Plan is diversified across asset classes to achieve an optimal balance between risk and return and between income and growth of assets through capital appreciation. Investment objectives for each asset class are determined based on specific risks and investment opportunities identified. The Company believes that the diversification of its assets minimizes the risk due to concentration of the Plan assets.
The Company updates its long-term, strategic asset allocations annually using various analytics to determine the optimal asset mix and consideration of plan liability characteristics, liquidity characteristics, funding requirements, expected rates of return and the distribution of returns. Actual allocations to each asset class vary from target allocations due to periodic investment strategy changes, market value fluctuations, the length of time it takes to fully implement investment allocation positions (such as private equity and real estate), and the timing of benefit payments and contributions. Short term investments and exchange-traded derivatives are used to rebalance the actual asset allocation to the target asset allocation. The asset allocation is monitored and rebalanced on a monthly basis.
The manager of the investments provides advice and recommendations to help the Committee discharge its fiduciary responsibilities in furtherance of the Plan's goals and objectives. The manager has the discretion to allocate assets among funds within each asset class to conform to strategic targets and ranges established by the Committee. The target asset allocation is 50% equity securities and 50% fixed income. The investment policy requires that the asset allocation be maintained within certain
65
Table of Contents
THE PEP BOYS—MANNY, MOE & JACK AND SUBSIDIARIES
NOTES TO CONSOLIDATED FINANCIAL STATEMENTS (Continued)
Years ended January 29, 2011, January 30, 2010 and January 31, 2009
NOTE 13—BENEFIT PLANS (Continued)
ranges. The weighted average asset allocations and asset allocation ranges by asset category are as follows:
Weighted Average Asset Allocations
| | | | | | | | | | | |
| | January 29,
2011 | | January 30,
2010 | | Asset
Allocation
Ranges | |
|---|
Total equities | �� | | 52 | % | | 48 | % | | 45–55 | % |
| | Domestic equities | | | 31 | % | | 32 | % | | 28–38 | % |
| | Non-US equities | | | 21 | % | | 17 | % | | 12–22 | % |
Fixed income | | | 48 | % | | 52 | % | | 45–55 | % |
The table below provides the fair values of the Company's pension plan assets at January 29, 2011, by asset category. The table also identifies the level of inputs used to determine the fair value of assets in each category (see Note 16 for definition of levels). The significant amount of Level 2 investments in the table results from including in this category, investments in pooled funds that contain investments with values based on quoted market prices, but for which the funds are not valued on a quoted market basis, and fixed income securities that are valued using model based pricing services.
| | | | | | | | | | | | | | | |
(dollar amounts in thousands)
Asset Category | | Fair Value at
January 29,
2011 | | Level 1 | | Level 2 | | Level 3 | |
|---|
Money market fund | | $ | 48 | | $ | 48 | | $ | — | | $ | — | |
Domestic equities | | | | | | | | | | | | | |
| | US Small/Mid Cap Growth | | | 1,299 | | | — | | | 1,299 | | | — | |
| | US Small/Mid Cap Value | | | 1,298 | | | — | | | 1,298 | | | — | |
| | US Large Cap Passive | | | 9,566 | | | — | | | 9,566 | | | — | |
Non-U.S. equities | | | | | | | | | | | | | |
| | Non-US Core Equity | | | 8,087 | | | — | | | 8,087 | | | — | |
Fixed income | | | | | | | | | | | | | |
| | Long Duration | | | 13,271 | | | — | | | 13,271 | | | — | |
| | Long Duration Passive | | | 4,244 | | | — | | | 4,244 | | | — | |
| | Guaranteed annuity contracts | | | 1,250 | | | — | | | — | | | 1,250 | |
| | | | | | | | | | |
| | | Total | | $ | 39,063 | | $ | 48 | | $ | 37,765 | | $ | 1,250 | |
| | | | | | | | | | |
66
Table of Contents
THE PEP BOYS—MANNY, MOE & JACK AND SUBSIDIARIES
NOTES TO CONSOLIDATED FINANCIAL STATEMENTS (Continued)
Years ended January 29, 2011, January 30, 2010 and January 31, 2009
NOTE 13—BENEFIT PLANS (Continued)
| | | | | | | | | | | | | | | |
(dollar amounts in thousands)
Asset Category | | Fair Value at
January 30,
2010 | | Level 1 | | Level 2 | | Level 3 | |
|---|
Money market fund | | $ | 36 | | $ | 36 | | $ | — | | $ | — | |
Domestic equities | | | | | | | | | | | | | |
| | US Small/Mid Cap Growth | | | 988 | | | — | | | 988 | | | — | |
| | US Small/Mid Cap Value | | | 996 | | | — | | | 996 | | | — | |
| | US Large Cap Passive | | | 8,110 | | | — | | | 8,110 | | | — | |
Non-U.S. equities | | | | | | | | | | | | | |
| | Non-US Core Equity | | | 5,279 | | | — | | | 5,279 | | | — | |
Fixed income | | | | | | | | | | | | | |
| | Long Duration | | | 6,702 | | | — | | | 6,702 | | | — | |
| | Long Duration Passive | | | 8,538 | | | — | | | 8,538 | | | — | |
| | Guaranteed annuity contracts | | | 1,208 | | | — | | | — | | | 1,208 | |
| | | | | | | | | | |
| | | Total | | $ | 31,857 | | $ | 36 | | $ | 30,613 | | $ | 1,208 | |
| | | | | | | | | | |
Generally, investments are valued based on information in financial publications of general circulation, statistical and valuation services, records of security exchanges, appraisal by qualified persons, transactions and bona fide offers. Money market funds are valued using a market approach based on the quoted market prices of identical instruments. These investments are classified within Level 1 of the fair value hierarchy.
Domestic equities, non-US equities, and both long duration fixed income securities consist of collective trust (CT) funds. CTs are comprised of shares or units in commingled funds that are not publicly traded. The underlying assets in these funds (equity securities and fixed income securities) are publicly traded on exchanges and price quotes for the assets held by these funds are readily available. CTs are valued at their net asset values (NAVs) that are calculated by the investment manager of the fund and have daily or monthly liquidity. These investments are classified within Level 2 of the fair value hierarchy.
Guaranteed annuity contracts (GACs) are annuity insurance contracts. GACs are primarily invested in public bonds with some small placement in common stock, private placement bonds and commercial mortgage products. The GACs are valued based on unobservable inputs, as observable inputs are not available, using valuation methodologies to determine fair value. GACs are deemed to be Level 3 investments.
67
Table of Contents
THE PEP BOYS—MANNY, MOE & JACK AND SUBSIDIARIES
NOTES TO CONSOLIDATED FINANCIAL STATEMENTS (Continued)
Years ended January 29, 2011, January 30, 2010 and January 31, 2009
NOTE 13—BENEFIT PLANS (Continued)
The following table provides a summary of changes in fair value of Level 3 financial assets during fiscal 2010:
| | | | |
(dollar amounts in thousands) | | Fair Value | |
|---|
Balance, January 30, 2010 | | $ | 1,208 | |
Transfers from other investments | | | 1,610 | |
Interest income and gains | | | 131 | |
Administrative fees | | | (58 | ) |
Benefits paid during the period | | | (1,641 | ) |
| | | | |
Balance, January 29, 2011 | | $ | 1,250 | |
| | | | |
DEFERRED COMPENSATION PLAN
The Company maintains a non-qualified deferred compensation plan that allows its officers and certain other employees to defer up to 20% of their annual salary and 100% of their annual bonus. Additionally, the first 20% of an officer's bonus deferred into the Company's stock is matched by the Company on a one-for-one basis with Company stock that vests and is expensed over three years. The shares required to satisfy distributions of voluntary bonus deferrals and the accompanying match in the Company's stock are issued from its treasury account.
RABBI TRUST
The Company establishes and maintains a deferred liability for the non-qualified deferred compensation plan and the Account Plan. The Company plans to fund this liability by remitting the officers' deferrals to a Rabbi Trust where these deferrals are invested in variable life insurance policies. These assets are included in non-current other assets. Accordingly, all gains and losses on these underlying investments, which are held in the Rabbi Trust to fund the deferred liability, are recognized in the Company's Consolidated Statement of Operations. Under these plans, there were liabilities of $6.2 million at January 29, 2011 and $3.4 million at January 30, 2010, respectively, which are recorded primarily in other long-term liabilities.
NOTE 14—EQUITY COMPENSATION PLANS
The Company has a stock-based compensation plan originally approved by the stockholders on May 21, 1990 under which it has previously granted non-qualified stock options and incentive stock options to key employees and members of its Board of Directors. There are no awards remaining available for grant under the 1990 Plan. The Company has a stock-based compensation plan originally approved by the stockholders on June 2, 1999 under which it has previously granted and may continue to grant non-qualified stock options, incentive stock options and restricted stock units (RSUs) to key employees and members of its Board of Directors. On June 24, 2009, the stockholders renamed the 1999 Plan to the 2009 Plan, extended its terms to December 31, 2014 and increased the number of shares issuable thereunder by 1,500,000. As of January 29, 2011, there were 2,493,181 awards outstanding and 1,818,706 awards available for grant under the 2009 Plan.
68
Table of Contents
THE PEP BOYS—MANNY, MOE & JACK AND SUBSIDIARIES
NOTES TO CONSOLIDATED FINANCIAL STATEMENTS (Continued)
Years ended January 29, 2011, January 30, 2010 and January 31, 2009
NOTE 14—EQUITY COMPENSATION PLANS (Continued)
Incentive stock options and non-qualified stock options previously granted under the 1990 and 2009 plans (i) to non-officers, vest fully on the third anniversary of their grant date and (ii) to officers, vest in equal tranches over three or four year periods. Generally, all options granted prior to March 3, 2004 carry an expiration date of ten years and options granted on or after March 3, 2004 carry an expiration date of seven years. RSUs previously granted to non-officers vest fully on the third anniversary of their grant date. RSUs previously granted to officers vest in equal tranches over three or four year periods.
The Company has also granted RSUs under the 2009 plan in conjunction with its non-qualified deferred compensation plan. Under the deferred compensation plan, the first 20% of an officer's bonus deferred into the Company's stock fund is matched by the Company on a one-for-one basis with RSUs that vest over a three-year period, with one third vesting on each of the first three anniversaries of the grant date.
The exercise price, term and other conditions applicable to future stock option and RSU grants under the 2009 plan are generally determined by the Board of Directors; provided that the exercise price of stock options must be at least 100% of the quoted market price of the common stock on the grant date. The Company currently satisfies all share requirements resulting from RSU conversions and option exercises from its treasury stock. The Company believes its treasury share balance at January 29, 2011 is adequate to satisfy such activity during the next twelve-month period.
The following table summarizes the options under the plans:
| | | | | | | |
| | Fiscal Year 2010 | |
|---|
| | Shares | | Weighted Average
Exercise Price | |
|---|
Outstanding—beginning of year | | | 1,682,325 | | $ | 8.14 | |
Granted | | | 307,653 | | | 10.30 | |
Exercised | | | (96,590 | ) | | 6.05 | |
Forfeited | | | (26,477 | ) | | 5.97 | |
Expired | | | (35,109 | ) | | 13.24 | |
| | | | | | |
Outstanding—end of year | | | 1,831,802 | | | 8.55 | |
| | | | | | |
Vested and expected to vest options—end of year | | | 1,785,734 | | | 8.56 | |
| | | | | | |
Options exercisable—end of year | | | 849,614 | | $ | 10.66 | |
| | | | | | |
The following table summarizes information about options during the last three fiscal years (dollars in thousands except per option):
| | | | | | | | | | |
| | Fiscal 2010 | | Fiscal 2009 | | Fiscal 2008 | |
|---|
Weighted average fair value at grant date per option | | $ | 4.28 | | $ | 2.10 | | $ | 3.47 | |
Intrinsic value of options exercised | | $ | 609 | | $ | 43 | | $ | 8 | |
The aggregate intrinsic value of outstanding options, exercisable options and expected to vest options at January 29, 2011 was $10.9 million, $3.8 million and $6.9 million, respectively. At January 29,
69
Table of Contents
THE PEP BOYS—MANNY, MOE & JACK AND SUBSIDIARIES
NOTES TO CONSOLIDATED FINANCIAL STATEMENTS (Continued)
Years ended January 29, 2011, January 30, 2010 and January 31, 2009
NOTE 14—EQUITY COMPENSATION PLANS (Continued)
2011, the weighted average remaining contractual term of outstanding options, exercisable options and expected to vest options was 4.5 years, 3.2 years and 5.5 years, respectively. At January 29, 2011, there was approximately $1.6 million of total unrecognized pre-tax compensation cost related to non-vested stock options, which is expected to be recognized over a weighted average period of 1.3 years.
The following table summarizes information about non-vested stock awards (RSUs) since January 30, 2010:
| | | | | | | |
| | Number of
RSUs | | Weighted Average
Fair Value | |
|---|
Nonvested at January 30, 2010 | | | 232,593 | | $ | 13.76 | |
Granted | | | 362,283 | | | 9.32 | |
Forfeited | | | (11,962 | ) | | 12.78 | |
Vested | | | (150,583 | ) | | 12.36 | |
| | | | | | | |
Nonvested at January 29, 2011 | | | 432,331 | | $ | 10.16 | |
| | | | | | | |
The following table summarizes information about RSUs during the last three fiscal years:
| | | | | | | | | | |
(dollar amounts in thousands) | | Fiscal 2010 | | Fiscal 2009 | | Fiscal 2008 | |
|---|
Weighted average fair value at grant date per unit | | $ | 9.32 | | $ | 9.18 | | $ | 11.25 | |
Fair value at vesting date | | $ | 1,861 | | $ | 1,455 | | $ | 5,441 | |
Intrinsic value at conversion date | | $ | 809 | | $ | 675 | | $ | 1,586 | |
Tax benefits realized from conversions | | $ | 301 | | $ | 251 | | $ | 589 | |
At January 29, 2011, there was approximately $2.7 million of total unrecognized pre-tax compensation cost related to non-vested RSUs, which is expected to be recognized over a weighted-average period of 1.9 years.
The Company recognized approximately $1.4 million, $1.0 million, and $0.6 million of compensation expense related to stock options, and approximately $2.1 million, $1.6 million, and $2.1 million of compensation expense related to restricted stock units, included in selling, general and administrative expenses for fiscal 2010, 2009, and 2008, respectively. The related tax benefit recognized was approximately $1.3 million, $1.0 million and $1.0 million for fiscal 2010, 2009 and 2008, respectively.
Expected volatility is based on historical volatilities for a time period similar to that of the expected term and the expected term of the options is based on actual experience. The risk-free rate is based on the U.S. treasury yield curve for issues with a remaining term equal to the expected term. The fair value of each option granted during fiscal 2010, 2009 and 2008 is estimated on the date of grant using the Black-Scholes option-pricing model and, in certain situations where the grant includes
70
Table of Contents
THE PEP BOYS—MANNY, MOE & JACK AND SUBSIDIARIES
NOTES TO CONSOLIDATED FINANCIAL STATEMENTS (Continued)
Years ended January 29, 2011, January 30, 2010 and January 31, 2009
NOTE 14—EQUITY COMPENSATION PLANS (Continued)
both a market and a service condition, the Month Carlo simulation model is used. The following are the weighted-average assumptions:
| | | | | | | | | | |
| | Year ended | |
|---|
| | January 29,
2011 | | January 30,
2010 | | January 31,
2009 | |
|---|
Dividend yield | | | 1.35 | % | | 2.3 | % | | 2.93 | % |
Expected volatility | | | 56 | % | | 65 | % | | 45 | % |
Risk-free interest rate range: | | | | | | | | | | |
High | | | 2.0 | % | | 2.3 | % | | 3.2 | % |
Low | | | 0.9 | % | | 1.6 | % | | 2.7 | % |
Ranges of expected lives in years | | | 4–5 | | | 4–5 | | | 3–4 | |
During fiscal 2010, the Company granted approximately 105,000 restricted stock units that will vest if the employees remain continuously employed through the third anniversary date of the grant and the Company achieves certain financial targets for fiscal year 2012. The number of underlying shares that may be issued upon vesting will range from 0% to 150%, depending upon the Company achieving a return on invested capital target for fiscal year 2012. The fair value of these awards was $10.34 at the date of the grant. The Company also granted approximately 52,000 restricted stock units that will vest if the employees remain continuously employed through the third anniversary date of the grant and will become exercisable if the Company achieves a total shareholder return target in fiscal 2012. The number of underlying shares that may become exercisable will range from 0% to 175% depending upon whether the market condition is achieved. The Company used a Monte Carlo simulation to estimate a $12.99 grant date fair value. The non-vested stock award table reflects the maximum vesting of underlying shares for performance and market based awards granted in 2010.
During fiscal 2010, the Company granted approximately 52,000 restricted stock units to its non-employee directors of the board that vested immediately. In the first quarter of 2010, the Company granted approximately 61,000 restricted stock units related to officer's deferred bonus match under the Company's non-qualified deferred compensation plan, which vest over a three year period.
The Company reflects in its consolidated statement of cash flows any tax benefits realized upon the exercise of stock options or issuance of RSUs in excess of that which is associated with the expense recognized for financial reporting purposes. The amounts reflected as financing cash inflows and operating cash outflows in the Consolidated Statement of Cash Flows for fiscal 2010, 2009 and 2008 are immaterial.
NOTE 15—INTEREST RATE SWAP AGREEMENT
The Company entered into an interest rate swap for a notional amount of $145.0 million that is designated as a cash flow hedge on the first $145.0 million of the Company's Senior Secured Term Loan facility. The interest rate swap converts the variable LIBOR portion of the interest payments to a fixed rate of 5.036% and terminates in October 2013. As of January 29, 2011 and January 30, 2010, the fair value of the swap was a net $16.4 million payable recorded within other long-term liabilities on the balance sheet.
71
Table of Contents
THE PEP BOYS—MANNY, MOE & JACK AND SUBSIDIARIES
NOTES TO CONSOLIDATED FINANCIAL STATEMENTS (Continued)
Years ended January 29, 2011, January 30, 2010 and January 31, 2009
NOTE 16—FAIR VALUE MEASUREMENTS
The Company's fair value measurements consist of (a) non-financial assets and liabilities that are recognized or disclosed at fair value in the Company's financial statements on a recurring basis (at least annually) and (b) all financial assets and liabilities.
Fair value is defined as the exit price, or the amount that would be received to sell an asset or paid to transfer a liability in an orderly transaction between market participants as of the measurement date. There is a hierarchy for inputs used in measuring fair value that maximizes the use of observable inputs and minimizes the use of unobservable inputs by requiring that the most observable inputs be used when available. Observable inputs are inputs market participants would use in valuing the asset or liability developed based on market data obtained from sources independent of the Company. Unobservable inputs are inputs that reflect the Company's assumptions about the factors market participants would use in valuing the asset or liability developed based upon the best information available in the circumstances. The hierarchy is broken down into three levels. Level 1 inputs are quoted prices (unadjusted) in active markets for identical assets or liabilities. Level 2 inputs include quoted prices for similar assets or liabilities in active markets. Level 3 inputs are unobservable inputs for the asset or liability. Categorization within the valuation hierarchy is based upon the lowest level of input that is significant to the fair value measurement.
The Company's long-term investments, interest rate swap agreements and contingent consideration are measured at fair value on a recurring basis. The information in the following paragraphs and tables primarily addresses matters relative to these assets and liabilities.
Cash equivalents, other than credit card receivables, include highly liquid investments with an original maturity of three months or less at acquisition. The Company carries these investments at fair value. As a result, the Company has determined that its cash equivalents in their entirety are classified as a Level 1 measure within the fair value hierarchy.
Collateral investments include monies on deposit that are restricted. The Company carries these investments at fair value. As a result, the Company has determined that its collateral investments are classified as a Level 1 measure within the fair value hierarchy.
The Company has one interest rate swap designated as a cash flow hedge on $145.0 million of the Company's Senior Secured Term Loan facility that expires in October 2013. The Company values this swap using observable market data to discount projected cash flows and for credit risk adjustments. The inputs used to value derivatives fall within Level 2 of the fair value hierarchy.
72
Table of Contents
THE PEP BOYS—MANNY, MOE & JACK AND SUBSIDIARIES
NOTES TO CONSOLIDATED FINANCIAL STATEMENTS (Continued)
Years ended January 29, 2011, January 30, 2010 and January 31, 2009
NOTE 16—FAIR VALUE MEASUREMENTS (Continued)
The Company has recorded contingent consideration as a result of the acquisition of Florida Tire. The consideration may be paid to the seller on each six month anniversary of the closing date until the deferred purchase price is paid in full, subject to acceleration or cancellation clauses. The calculation of the contingent consideration is based on a weighted average probability scenario that includes management's assumptions on expected future cash flows. As a result, the Company has determined that contingent considerations are classified as a Level 3 measure within the fair value hierarchy.
The following table provides information by level for assets and liabilities that are measured at fair value, on a recurring basis.
| | | | | | | | | | | | | | |
| |
| | Fair Value Measurements
Using Inputs Considered as | |
|---|
| | Fair Value at
January 29,
2011 | |
|---|
(dollar amounts in thousands)
Description | | Level 1 | | Level 2 | | Level 3 | |
|---|
Assets: | | | | | | | | | | | | | |
| | Cash and cash equivalents | | $ | 90,240 | | $ | 90,240 | | $ | — | | $ | — | |
| | Collateral investments(1) | | | 9,638 | | | 9,638 | | | — | | | — | |
Liabilities: | | | | | | | | | | | | | |
Current liabilities | | | | | | | | | | | | | |
| | Contingent consideration(2) | | | 288 | | | — | | | — | | | 288 | |
Other liabilities | | | | | | | | | | | | | |
| | Derivative liability(3) | | | 16,424 | | | — | | | 16,424 | | | | |
| | Contingent consideration(3) | | | 1,224 | | | — | | | — | | | 1,224 | |
- (1)
- included in other long-term assets
- (2)
- included in accrued liabilities
- (3)
- included in other long-term liabilities
| | | | | | | | | | | | | | |
| |
| | Fair Value Measurements
Using Inputs Considered as | |
|---|
| | Fair Value at
January 30,
2010 | |
|---|
Description | | Level 1 | | Level 2 | | Level 3 | |
|---|
Assets: | | | | | | | | | | | | | |
| | Cash and cash equivalents | | $ | 39,326 | | $ | 39,326 | | $ | — | | $ | — | |
Liabilities: | | | | | | | | | | | | | |
Other long-term liabilities | | | | | | | | | | | | | |
| | Derivative liability(1) | | | 16,401 | | | — | | | 16,401 | | | — | |
| | Contingent consideration | | | 1,660 | | | — | | | — | | | 1,660 | |
- (1)
- included in other long-term assets
73
Table of Contents
THE PEP BOYS—MANNY, MOE & JACK AND SUBSIDIARIES
NOTES TO CONSOLIDATED FINANCIAL STATEMENTS (Continued)
Years ended January 29, 2011, January 30, 2010 and January 31, 2009
NOTE 16—FAIR VALUE MEASUREMENTS (Continued)
The following represents the impact of fair value accounting for the Company's derivative liability on its consolidated financial statements:
| | | | | | | | | |
(dollar amounts in thousands) | | Amount of Loss
in Other
Comprehensive
Income
(Effective Portion) | | Earnings
Statement
Classification | | Amount of Loss
Recognized in
Earnings
(Effective Portion) | |
|---|
Fiscal 2010 | | $ | 14 | | Interest expense | | $ | 6,905 | |
Fiscal 2009 | | $ | 373 | | Interest expense | | $ | 5,796 | |
Certain assets are measured at fair value on a non-recurring basis, that is, the assets are subject to fair value adjustments in certain circumstances such as when there is evidence of impairment. In response to a continuing weak real estate market, the Company reduced its prices for certain properties held for disposal and recorded impairment charges of $0.2 million, $3.1 million and $5.4 million in fiscal 2010, 2009 and 2008, respectively. The fair values were based on selling prices of comparable properties, net of expected disposal costs. These measures of fair value, and related inputs, are considered level 2 measures under the fair value hierarchy.
NOTE 17—LEGAL MATTERS
In September 2006, the United States Environmental Protection Agency ("EPA") requested certain information from the Company as part of an investigation to determine whether the Company had violated the Clean Air Act and its non-road engine regulations. The information requested concerned certain generator and personal transportation merchandise offered for sale by the Company. In the fourth quarter of fiscal 2008, the United States Environmental Protection Agency ("EPA") informed the Company that it believed that the Company had violated the Clean Air Act by virtue of the fact that certain of this merchandise did not conform to their corresponding EPA Certificates of Conformity. During the third quarter of fiscal 2009, the Company and the EPA reached a settlement in principle of this matter requiring that the Company (i) pay a monetary penalty of $5.0 million, (ii) take certain corrective action with respect to certain inventory that had been restricted from sale during the course of the investigation, (iii) implement a formal compliance program and (iv) participate in certain non-monetary emission offset activities. The Company had previously accrued an amount equal to the agreed upon civil penalty and a $3.0 million contingency accrual with respect to the restricted inventory. During fiscal 2009, the Company reversed approximately $2.0 million of the inventory accrual as a portion of the subject inventory was released for sale by the EPA as remediation efforts had been completed. During the second quarter of fiscal 2010, the Company completed the remediation efforts and accordingly reversed approximately $1.0 million of the inventory accrual. Further, the Company reached an agreement with the merchandise vendor to cover the entire cost of retrofitting a portion of the remaining subject merchandise and to accept the balance of the subject inventory for return for full credit. During the second quarter of fiscal 2010, the formal settlement agreement between the Company and the EPA became effective and the Company paid the monetary penalty.
74
Table of Contents
THE PEP BOYS—MANNY, MOE & JACK AND SUBSIDIARIES
NOTES TO CONSOLIDATED FINANCIAL STATEMENTS (Continued)
Years ended January 29, 2011, January 30, 2010 and January 31, 2009
NOTE 17—LEGAL MATTERS (Continued)
The Company is also party to various other actions and claims arising in the normal course of business. The Company believes that amounts accrued for awards or assessments in connection with all such matters are adequate and that the ultimate resolution of these matters will not have a material adverse effect on the Company's financial position. However, there exists a possibility of loss in excess of the amounts accrued, the amount of which cannot currently be estimated. While the Company does not believe that the amount of such excess loss could be material to the Company's financial position, any such loss could have a material adverse effect on the Company's results of operations in the period(s) during which the underlying matters are resolved.
NOTE 18—QUARTERLY FINANCIAL DATA (UNAUDITED)
| | | | | | | | | | | | | | | | | | | | | | | | | | | | | | | | | | | | | |
| |
| |
| |
| |
| |
| | Earnings
Per Share from
Continuing
Operations | |
| |
| |
| |
| |
| |
|---|
| |
| |
| |
| |
| |
| | Earnings
Per Share | |
| | Market Price
Per Share | |
|---|
| |
| |
| |
| | Earnings
from
Continuing
Operations | |
| |
| |
|---|
| | Total
Revenues | | Gross
Profit | | Operating
Profit | |
| | Cash
Dividends
Per Share | |
|---|
| | Earnings | | Basic | | Diluted | | Basic | | Diluted | | High | | Low | |
|---|
Year Ended January 29, 2011 | | | | | | | | | | | | | | | | | | | | | | | | | | | | | | | | | | | | | |
4th quarter | | $ | 477,389 | | $ | 124,400 | | $ | 17,605 | | $ | 8,538 | | $ | 8,365 | | $ | 0.16 | | $ | 0.16 | | $ | 0.16 | | $ | 0.16 | | $ | 0.0300 | | $ | 15.96 | | $ | 11.37 | |
3rd quarter | | | 496,364 | | | 125,856 | | | 15,125 | | | 5,674 | | | 5,718 | | | 0.11 | | | 0.11 | | | 0.11 | | | 0.11 | | | 0.0300 | | | 12.00 | | | 8.82 | |
2nd quarter | | | 504,855 | | | 134,501 | | | 23,842 | | | 10,799 | | | 10,598 | | | 0.21 | | | 0.20 | | | 0.20 | | | 0.20 | | | 0.0300 | | | 13.26 | | | 7.86 | |
1st quarter | | | 510,033 | | | 137,595 | | | 26,008 | | | 12,160 | | | 11,950 | | | 0.23 | | | 0.23 | | | 0.23 | | | 0.23 | | | 0.0300 | | | 13.42 | | | 8.08 | |
Year Ended January 30, 2010 | | | | | | | | | | | | | | | | | | | | | | | | | | | | | | | | | | | | | |
4th quarter | | $ | 452,896 | | $ | 110,047 | | $ | 6,760 | | $ | 2,835 | | $ | 2,268 | | $ | 0.05 | | $ | 0.06 | | $ | 0.04 | | $ | 0.04 | | $ | 0.0300 | | $ | 9.29 | | $ | 7.76 | |
3rd quarter | | | 472,643 | | | 118,269 | | | 10,056 | | | 2,357 | | | 2,124 | | | 0.05 | | | 0.04 | | | 0.04 | | | 0.04 | | | 0.0300 | | | 10.69 | | | 8.40 | |
2nd quarter | | | 488,911 | | | 128,190 | | | 18,692 | | | 7,858 | | | 7,735 | | | 0.15 | | | 0.15 | | | 0.15 | | | 0.15 | | | 0.0300 | | | 10.83 | | | 5.87 | |
1st quarter | | | 496,488 | | | 129,601 | | | 21,551 | | | 11,063 | | | 10,909 | | | 0.21 | | | 0.21 | | | 0.21 | | | 0.21 | | | 0.0300 | | | 8.52 | | | 2.76 | |
In the fourth quarter of 2010, the Company recorded a $4.6 million reduction to its reserve for excess inventory and an income tax benefit of $1.0 million related to the reduction of a valuation allowance on certain state net operating loss carryforwards and credits.
NOTE 19—SUPPLEMENTAL GUARANTOR INFORMATION
The Company's Notes are fully and unconditionally and joint and severally guaranteed by certain of the Company's direct and indirectly wholly-owned subsidiaries—namely, The Pep Boys Manny Moe & Jack of California, The Pep Boys—Manny Moe & Jack of Delaware, Inc. (the "Pep Boys of Delaware"), Pep Boys—Manny Moe & Jack of Puerto Rico, Inc. and PBY Corporation (as of January 29, 2011), (collectively, the "Subsidiary Guarantors"). The Notes are not guaranteed by the Company's wholly owned subsidiary, Colchester Insurance Company.
The following condensed consolidating information presents, in separate columns, the condensed consolidating balance sheets as of January 29, 2011 and January 30, 2010 and the related condensed consolidating statements of operations and condensed consolidating statements of cash flows for fiscal 2010, 2009 and 2008 for (i) the Company ("Pep Boys") on a parent only basis, with its investment in
75
Table of Contents
THE PEP BOYS—MANNY, MOE & JACK AND SUBSIDIARIES
NOTES TO CONSOLIDATED FINANCIAL STATEMENTS (Continued)
Years ended January 29, 2011, January 30, 2010 and January 31, 2009
NOTE 19—SUPPLEMENTAL GUARANTOR INFORMATION (Continued)
subsidiaries recorded under the equity method, (ii) the Subsidiary Guarantors on a combined basis including the consolidation by PBY Corporation of its wholly owned subsidiary, The Pep Boys Manny Moe & Jack of California, (iii) the subsidiary of the Company that does not guarantee the Notes, and (iv) the Company on a consolidated basis.
On January 29, 2011, The Pep Boys—Manny, Moe & Jack of Pennsylvania made a capital contribution of $264.0 million to Pep Boys of Delaware consisting of intercompany receivables due from the latter. This contribution resulted in an increase in the Pep Boys' investment in subsidiaries and the Subsidiary Guarantors' stockholders' equity. On January 30, 2011, the Company merged PBY Corporation into Pep Boys of Delaware and accordingly, The Pep Boys Manny Moe & Jack of California became the wholly owned subsidiary of Pep Boys of Delaware. Had this merger occurred
76
Table of Contents
THE PEP BOYS—MANNY, MOE & JACK AND SUBSIDIARIES
NOTES TO CONSOLIDATED FINANCIAL STATEMENTS (Continued)
Years ended January 29, 2011, January 30, 2010 and January 31, 2009
NOTE 19—SUPPLEMENTAL GUARANTOR INFORMATION (Continued)
prior to the end of fiscal year 2010, it would not have affected the presentation of the following condensed consolidating information.
CONDENSED CONSOLIDATING BALANCE SHEET
| | | | | | | | | | | | | | | | |
(dollar amounts in thousands)
As of January 29, 2011 | | Pep Boys | | Subsidiary
Guarantors | | Subsidiary
Non-Guarantors | | Consolidation/
Elimination | | Consolidated | |
|---|
ASSETS | | | | | | | | | | | | | | | | |
Current assets: | | | | | | | | | | | | | | | | |
Cash and cash equivalents | | $ | 52,214 | | $ | 28,477 | | $ | 9,549 | | $ | — | | $ | 90,240 | |
Accounts receivable, net | | | 8,976 | | | 10,564 | | | — | | | — | | | 19,540 | |
Merchandise inventories | | | 198,062 | | | 366,340 | | | — | | | — | | | 564,402 | |
Prepaid expenses | | | 11,839 | | | 17,649 | | | 16,202 | | | (17,148 | ) | | 28,542 | |
Other current assets | | | 2,260 | | | 461 | | | 62,655 | | | (5,039 | ) | | 60,337 | |
Assets held for disposal | | | — | | | 475 | | | — | | | — | | | 475 | |
| | | | | | | | | | | | |
Total current assets | | | 273,351 | | | 423,966 | | | 88,406 | | | (22,187 | ) | | 763,536 | |
| | | | | | | | | | | | |
Property and equipment—net | | | 236,853 | | | 452,230 | | | 30,862 | | | (18,964 | ) | | 700,981 | |
Investment in subsidiaries | | | 2,093,479 | | | — | | | — | | | (2,093,479 | ) | | — | |
Intercompany receivable | | | — | | | 1,375,958 | | | 79,270 | | | (1,455,228 | ) | | — | |
Deferred income taxes | | | 15,749 | | | 50,270 | | | — | | | — | | | 66,019 | |
Other long-term assets | | | 24,941 | | | 1,195 | | | — | | | — | | | 26,136 | |
| | | | | | | | | | | | |
Total assets | | $ | 2,644,373 | | $ | 2,303,619 | | $ | 198,538 | | $ | (3,589,858 | ) | $ | 1,556,672 | |
| | | | | | | | | | | | |
LIABILITIES AND STOCKHOLDERS' EQUITY | | | | | | | | | | | | | | | | |
Current liabilities: | | | | | | | | | | | | | | | | |
Accounts payable | | $ | 210,440 | | $ | — | | $ | — | | $ | — | | $ | 210,440 | |
Trade payable program liability | | | 56,287 | | | — | | | — | | | — | | | 56,287 | |
Accrued expenses | | | 23,341 | | | 62,168 | | | 167,667 | | | (17,148 | ) | | 236,028 | |
Deferred income taxes | | | 23,024 | | | 38,350 | | | — | | | (5,039 | ) | | 56,335 | |
Current maturities of long-term debt | | | 1,079 | | | — | | | — | | | — | | | 1,079 | |
| | | | | | | | | | | | |
Total current liabilities | | | 314,171 | | | 100,518 | | | 167,667 | | | (22,187 | ) | | 560,169 | |
| | | | | | | | | | | | |
Long-term debt less current maturities | | | 295,122 | | | — | | | — | | | — | | | 295,122 | |
Other long-term liability | | | 35,870 | | | 34,176 | | | — | | | — | | | 70,046 | |
Deferred gain from asset sales | | | 65,522 | | | 106,317 | | | — | | | (18,964 | ) | | 152,875 | |
Intercompany liabilities | | | 1,455,228 | | | — | | | — | | | (1,455,228 | ) | | — | |
Total stockholders' equity | | | 478,460 | | | 2,062,608 | | | 30,871 | | | (2,093,479 | ) | | 478,460 | |
| | | | | | | | | | | | |
Total liabilities and stockholders' equity | | $ | 2,644,373 | | $ | 2,303,619 | | $ | 198,538 | | $ | (3,589,858 | ) | $ | 1,556,672 | |
| | | | | | | | | | | | |
77
Table of Contents
THE PEP BOYS—MANNY, MOE & JACK AND SUBSIDIARIES
NOTES TO CONSOLIDATED FINANCIAL STATEMENTS (Continued)
Years ended January 29, 2011, January 30, 2010 and January 31, 2009
NOTE 19—SUPPLEMENTAL GUARANTOR INFORMATION (Continued)
CONDENSED CONSOLIDATING BALANCE SHEET
| | | | | | | | | | | | | | | | |
(dollar amounts in thousands)
As of January 30, 2010 | | Pep Boys | | Subsidiary
Guarantors | | Subsidiary
Non-Guarantors | | Consolidation/
Elimination | | Consolidated | |
|---|
ASSETS | | | | | | | | | | | | | | | | |
Current assets: | | | | | | | | | | | | | | | | |
Cash and cash equivalents | | $ | 25,844 | | $ | 10,279 | | $ | 3,203 | | $ | — | | $ | 39,326 | |
Accounts receivable, net | | | 13,032 | | | 9,951 | | | — | | | — | | | 22,983 | |
Merchandise inventories | | | 195,314 | | | 363,804 | | | — | | | — | | | 559,118 | |
Prepaid expenses | | | 12,607 | | | 15,070 | | | 14,255 | | | (17,148 | ) | | 24,784 | |
Other current assets | | | 1,101 | | | 2,667 | | | 67,038 | | | (5,378 | ) | | 65,428 | |
Assets held for disposal | | | 1,045 | | | 3,393 | | | — | | | — | | | 4,438 | |
| | | | | | | | | | | | |
Total current assets | | | 248,943 | | | 405,164 | | | 84,496 | | | (22,526 | ) | | 716,077 | |
| | | | | | | | | | | | |
Property and equipment—net | | | 232,115 | | | 462,128 | | | 31,544 | | | (19,337 | ) | | 706,450 | |
Investment in subsidiaries | | | 1,755,426 | | | — | | | — | | | (1,755,426 | ) | | — | |
Intercompany receivable | | | — | | | 1,058,132 | | | 83,953 | | | (1,142,085 | ) | | — | |
Deferred income taxes | | | 11,200 | | | 46,971 | | | — | | | — | | | 58,171 | |
Other long-term assets | | | 17,566 | | | 822 | | | — | | | — | | | 18,388 | |
| | | | | | | | | | | | |
Total assets | | $ | 2,265,250 | | $ | 1,973,217 | | $ | 199,993 | | $ | (2,939,374 | ) | $ | 1,499,086 | |
| | | | | | | | | | | | |
LIABILITIES AND STOCKHOLDERS' EQUITY | | | | | | | | | | | | | | | | |
Current liabilities: | | | | | | | | | | | | | | | | |
Accounts payable | | $ | 202,974 | | $ | — | | $ | — | | $ | — | | $ | 202,974 | |
Trade payable program liability | | | 34,099 | | | — | | | — | | | — | | | 34,099 | |
Accrued expenses | | | 24,042 | | | 62,106 | | | 173,429 | | | (17,161 | ) | | 242,416 | |
Deferred income taxes | | | 6,626 | | | 28,723 | | | — | | | (5,365 | ) | | 29,984 | |
Current maturities of long-term debt | | | 1,079 | | | — | | | — | | | — | | | 1,079 | |
| | | | | | | | | | | | |
Total current liabilities | | | 268,820 | | | 90,829 | | | 173,429 | | | (22,526 | ) | | 510,552 | |
| | | | | | | | | | | | |
Long-term debt less current maturities | | | 306,201 | | | — | | | — | | | — | | | 306,201 | |
Other long-term liability | | | 35,125 | | | 38,808 | | | — | | | — | | | 73,933 | |
Deferred gain from asset sales | | | 69,724 | | | 114,718 | | | — | | | (19,337 | ) | | 165,105 | |
Intercompany liabilities | | | 1,142,085 | | | — | | | — | | | (1,142,085 | ) | | — | |
Total stockholders' equity | | | 443,295 | | | 1,728,862 | | | 26,564 | | | (1,755,426 | ) | | 443,295 | |
| | | | | | | | | | | | |
Total liabilities and stockholders' equity | | $ | 2,265,250 | | $ | 1,973,217 | | $ | 199,993 | | $ | (2,939,374 | ) | $ | 1,499,086 | |
| | | | | | | | | | | | |
78
Table of Contents
THE PEP BOYS—MANNY, MOE & JACK AND SUBSIDIARIES
NOTES TO CONSOLIDATED FINANCIAL STATEMENTS (Continued)
Years ended January 29, 2011, January 30, 2010 and January 31, 2009
NOTE 19—SUPPLEMENTAL GUARANTOR INFORMATION (Continued)
CONDENSED CONSOLIDATING STATEMENT OF OPERATIONS
| | | | | | | | | | | | | | | | |
(dollar amounts in thousands)
Year ended January 29, 2011 | | Pep Boys | | Subsidiary
Guarantors | | Subsidiary
Non-Guarantors | | Consolidation/
Elimination | | Consolidated | |
|---|
Merchandise sales | | $ | 550,017 | | $ | 1,048,151 | | $ | — | | $ | — | | $ | 1,598,168 | |
Service revenue | | | 140,716 | | | 249,757 | | | — | | | — | | | 390,473 | |
Other revenue | | | — | | | — | | | 22,944 | | | (22,944 | ) | | — | |
| | | | | | | | | | | | |
Total revenues | | | 690,733 | | | 1,297,908 | | | 22,944 | | | (22,944 | ) | | 1,988,641 | |
| | | | | | | | | | | | |
Costs of merchandise sales | | | 387,425 | | | 724,586 | | | — | | | (1,631 | ) | | 1,110,380 | |
Costs of service revenue | | | 124,675 | | | 231,387 | | | — | | | (153 | ) | | 355,909 | |
Costs of other revenue | | | — | | | — | | | 16,709 | | | (16,709 | ) | | — | |
| | | | | | | | | | | | |
Total costs of revenues | | | 512,100 | | | 955,973 | | | 16,709 | | | (18,493 | ) | | 1,466,289 | |
| | | | | | | | | | | | |
Gross profit from merchandise sales | | | 162,592 | | | 323,565 | | | — | | | 1,631 | | | 487,788 | |
Gross profit from service revenue | | | 16,041 | | | 18,370 | | | — | | | 153 | | | 34,564 | |
Gross profit from other revenue | | | — | | | — | | | 6,235 | | | (6,235 | ) | | — | |
| | | | | | | | | | | | |
Total gross profit | | | 178,633 | | | 341,935 | | | 6,235 | | | (4,451 | ) | | 522,352 | |
Selling, general and administrative expenses | | | 158,699 | | | 290,111 | | | 346 | | | (6,917 | ) | | 442,239 | |
Net gain from dispositions of assets | | | 1,873 | | | 594 | | | — | | | — | | | 2,467 | |
| | | | | | | | | | | | |
Operating profit | | | 21,807 | | | 52,418 | | | 5,889 | | | 2,466 | | | 82,580 | |
Non-operating (expenses) income | | | (16,271 | ) | | 81,965 | | | 2,468 | | | (65,553 | ) | | 2,609 | |
Interest expenses (income) | | | 65,422 | | | 26,497 | | | (2,087 | ) | | (63,087 | ) | | 26,745 | |
| | | | | | | | | | | | |
(Loss) earnings from continuing operations before income taxes | | | (59,886 | ) | | 107,886 | | | 10,444 | | | — | | | 58,444 | |
Income tax (benefit) expenses | | | (20,064 | ) | | 37,666 | | | 3,671 | | | — | | | 21,273 | |
Equity in earnings of subsidiaries | | | 76,519 | | | — | | | — | | | (76,519 | ) | | — | |
| | | | | | | | | | | | |
Earnings (loss) from continuing operations | | | 36,697 | | | 70,220 | | | 6,773 | | | (76,519 | ) | | 37,171 | |
Loss from discontinued operations, net of tax | | | (66 | ) | | (474 | ) | | — | | | — | | | (540 | ) |
| | | | | | | | | | | | |
Net earnings (loss) | | $ | 36,631 | | $ | 69,746 | | $ | 6,773 | | $ | (76,519 | ) | $ | 36,631 | |
| | | | | | | | | | | | |
79
Table of Contents
THE PEP BOYS—MANNY, MOE & JACK AND SUBSIDIARIES
NOTES TO CONSOLIDATED FINANCIAL STATEMENTS (Continued)
Years ended January 29, 2011, January 30, 2010 and January 31, 2009
NOTE 19—SUPPLEMENTAL GUARANTOR INFORMATION (Continued)
CONDENSED CONSOLIDATING STATEMENT OF OPERATIONS
| | | | | | | | | | | | | | | | |
(dollar amounts in thousands)
Year ended January 30, 2010 | | Pep Boys | | Subsidiary
Guarantors | | Subsidiary
Non-Guarantors | | Consolidation/
Elimination | | Consolidated | |
|---|
Merchandise sales | | $ | 521,428 | | $ | 1,012,191 | | $ | — | | $ | — | | $ | 1,533,619 | |
Service revenue | | | 133,240 | | | 244,079 | | | — | | | — | | | 377,319 | |
Other revenue | | | — | | | — | | | 22,904 | | | (22,904 | ) | | — | |
| | | | | | | | | | | | |
Total revenues | | | 654,668 | | | 1,256,270 | | | 22,904 | | | (22,904 | ) | | 1,910,938 | |
| | | | | | | | | | | | |
Costs of merchandise sales | | | 363,320 | | | 723,116 | | | — | | | (1,632 | ) | | 1,084,804 | |
Costs of service revenue | | | 115,123 | | | 225,057 | | | — | | | (153 | ) | | 340,027 | |
Costs of other revenue | | | — | | | — | | | 19,821 | | | (19,821 | ) | | — | |
| | | | | | | | | | | | |
Total costs of revenues | | | 478,443 | | | 948,173 | | | 19,821 | | | (21,606 | ) | | 1,424,831 | |
| | | | | | | | | | | | |
Gross profit from merchandise sales | | | 158,108 | | | 289,075 | | | — | | | 1,632 | | | 448,815 | |
Gross profit from service revenue | | | 18,117 | | | 19,022 | | | — | | | 153 | | | 37,292 | |
Gross profit from other revenue | | | — | | | — | | | 3,083 | | | (3,083 | ) | | — | |
| | | | | | | | | | | | |
Total gross profit | | | 176,225 | | | 308,097 | | | 3,083 | | | (1,298 | ) | | 486,107 | |
Selling, general and administrative expenses | | | 151,008 | | | 282,700 | | | 318 | | | (3,765 | ) | | 430,261 | |
Net gain from dispositions of assets | | | 886 | | | 327 | | | — | | | — | | | 1,213 | |
| | | | | | | | | | | | |
Operating profit | | | 26,103 | | | 25,724 | | | 2,765 | | | 2,467 | | | 57,059 | |
Non-operating (expenses) income | | | (15,516 | ) | | 86,810 | | | 2,473 | | | (71,506 | ) | | 2,261 | |
Interest expenses (income) | | | 63,477 | | | 29,353 | | | (2,087 | ) | | (69,039 | ) | | 21,704 | |
| | | | | | | | | | | | |
(Loss) earnings from continuing operations before income taxes | | | (52,890 | ) | | 83,181 | | | 7,325 | | | — | | | 37,616 | |
Income tax (benefit) expenses | | | (17,638 | ) | | 28,559 | | | 2,582 | | | — | | | 13,503 | |
Equity in earnings of subsidiaries | | | 58,325 | | | — | | | — | | | (58,325 | ) | | — | |
| | | | | | | | | | | | |
Earnings (loss) from continuing operations | | | 23,073 | | | 54,622 | | | 4,743 | | | (58,325 | ) | | 24,113 | |
Loss from discontinued operations, net of tax | | | (37 | ) | | (1,040 | ) | | — | | | — | | | (1,077 | ) |
| | | | | | | | | | | | |
Net earnings (loss) | | $ | 23,036 | | $ | 53,582 | | $ | 4,743 | | $ | (58,325 | ) | $ | 23,036 | |
| | | | | | | | | | | | |
80
Table of Contents
THE PEP BOYS—MANNY, MOE & JACK AND SUBSIDIARIES
NOTES TO CONSOLIDATED FINANCIAL STATEMENTS (Continued)
Years ended January 29, 2011, January 30, 2010 and January 31, 2009
NOTE 19—SUPPLEMENTAL GUARANTOR INFORMATION (Continued)
CONDENSED CONSOLIDATING STATEMENT OF OPERATIONS
| | | | | | | | | | | | | | | | |
(dollar amounts in thousands)
Year ended January 31, 2009 | | Pep Boys | | Subsidiary
Guarantors | | Subsidiary
Non-Guarantors | | Consolidation/
Elimination | | Consolidated | |
|---|
Merchandise sales | | $ | 531,068 | | $ | 1,038,596 | | $ | — | | $ | — | | $ | 1,569,664 | |
Service revenue | | | 124,206 | | | 233,918 | | | — | | | — | | | 358,124 | |
Other revenue | | | — | | | — | | | 22,939 | | | (22,939 | ) | | — | |
| | | | | | | | | | | | |
Total revenues | | | 655,274 | | | 1,272,514 | | | 22,939 | | | (22,939 | ) | | 1,927,788 | |
| | | | | | | | | | | | |
Costs of merchandise sales | | | 391,186 | | | 739,608 | | | — | | | (1,632 | ) | | 1,129,162 | |
Costs of service revenue | | | 110,515 | | | 222,831 | | | — | | | (152 | ) | | 333,194 | |
Costs of other revenue | | | — | | | — | | | 19,621 | | | (19,621 | ) | | — | |
| | | | | | | | | | | | |
Total costs of revenues | | | 501,701 | | | 962,439 | | | 19,621 | | | (21,405 | ) | | 1,462,356 | |
| | | | | | | | | | | | |
Gross profit from merchandise sales | | | 139,882 | | | 298,988 | | | — | | | 1,632 | | | 440,502 | |
Gross profit from service revenue | | | 13,691 | | | 11,087 | | | — | | | 152 | | | 24,930 | |
Gross profit from other revenue | | | — | | | — | | | 3,318 | | | (3,318 | ) | | — | |
| | | | | | | | | | | | |
Total gross profit | | | 153,573 | | | 310,075 | | | 3,318 | | | (1,534 | ) | | 465,432 | |
Selling, general and administrative expenses | | | 178,650 | | | 310,098 | | | 296 | | | (4,000 | ) | | 485,044 | |
Net gain from dispositions of assets | | | 3,392 | | | 6,324 | | | — | | | — | | | 9,716 | |
| | | | | | | | | | | | |
Operating (loss) profit | | | (21,685 | ) | | 6,301 | | | 3,022 | | | 2,466 | | | (9,896 | ) |
Non-operating (expense) income | | | (15,383 | ) | | 111,434 | | | 2,543 | | | (96,627 | ) | | 1,967 | |
Interest expense (income) | | | 90,313 | | | 34,281 | | | (3,385 | ) | | (94,161 | ) | | 27,048 | |
| | | | | | | | | | | | |
(Loss) earnings from continuing operations before income taxes | | | (127,381 | ) | | 83,454 | | | 8,950 | | | — | | | (34,977 | ) |
Income tax (benefit) expense | | | (41,417 | ) | | 32,192 | | | 3,086 | | | — | | | (6,139 | ) |
Equity in earnings of subsidiaries | | | 55,683 | | | — | | | — | | | (55,683 | ) | | — | |
| | | | | | | | | | | | |
(Loss) earnings from continuing operations | | | (30,281 | ) | | 51,262 | | | 5,864 | | | (55,683 | ) | | (28,838 | ) |
Loss from discontinued operations, net of tax | | | (148 | ) | | (1,443 | ) | | — | | | — | | | (1,591 | ) |
| | | | | | | | | | | | |
Net (loss) earnings | | $ | (30,429 | ) | $ | 49,819 | | $ | 5,864 | | $ | (55,683 | ) | $ | (30,429 | ) |
| | | | | | | | | | | | |
81
Table of Contents
THE PEP BOYS—MANNY, MOE & JACK AND SUBSIDIARIES
NOTES TO CONSOLIDATED FINANCIAL STATEMENTS (Continued)
Years ended January 29, 2011, January 30, 2010 and January 31, 2009
NOTE 19—SUPPLEMENTAL GUARANTOR INFORMATION (Continued)
CONDENSED CONSOLIDATING STATEMENT OF CASH FLOWS
| | | | | | | | | | | | | | | | |
(dollar amounts in thousands)
January 29, 2011 | | Pep Boys | | Subsidiary
Guarantors | | Subsidiary
Non-Guarantors | | Consolidation
Elimination | | Consolidated | |
|---|
Cash flows from operating activities: | | | | | | | | | | | | | | | | |
Net earnings (loss) | | $ | 36,631 | | $ | 69,746 | | $ | 6,773 | | $ | (76,519 | ) | $ | 36,631 | |
Adjustments to reconcile net earnings (loss) to net cash provided by (used in) continuing operations: | | | | | | | | | | | | | | | | |
Net loss from discontinued operations | | | 66 | | | 474 | | | — | | | — | | | 540 | |
Depreciation and amortization | | | 28,143 | | | 45,699 | | | 682 | | | (373 | ) | | 74,151 | |
Amortization of deferred gain from asset sales | | | (4,202 | ) | | (8,773 | ) | | — | | | 373 | | | (12,602 | ) |
Stock compensation expense | | | 3,497 | | | — | | | — | | | — | | | 3,497 | |
Equity in earnings of subsidiaries | | | (76,519 | ) | | — | | | — | | | 76,519 | | | — | |
Loss on debt retirement | | | 200 | | | — | | | — | | | — | | | 200 | |
Deferred income taxes | | | 11,918 | | | 6,328 | | | 326 | | | — | | | 18,572 | |
Gain from disposition of assets | | | (1,873 | ) | | (594 | ) | | — | | | — | | | (2,467 | ) |
Loss from asset impairments | | | 970 | | | — | | | — | | | — | | | 970 | |
Dividends received from subsidiary | | | 2,466 | | | — | | | — | | | (2,466 | ) | | — | |
Other | | | (272 | ) | | (207 | ) | | — | | | — | | | (479 | ) |
Changes in operating assets and liabilities: | | | | | | | | | | | | | | | | |
Decrease (increase) in accounts receivable, prepaid expenses and other | | | 6,322 | | | (1,359 | ) | | 2,110 | | | (13 | ) | | 7,060 | |
Increase in merchandise inventories | | | (2,748 | ) | | (2,536 | ) | | — | | | — | | | (5,284 | ) |
Increase in accounts payable | | | 7,466 | | | — | | | — | | | — | | | 7,466 | |
(Decrease) in accrued expenses | | | (2,210 | ) | | (435 | ) | | (5,762 | ) | | 13 | | | (8,394 | ) |
Increase (decrease) in other long-term liabilities | | | 1,694 | | | (2,894 | ) | | — | | | — | | | (1,200 | ) |
| | | | | | | | | | | | |
Net cash provided by (used in) continuing operations | | | 11,549 | | | 105,449 | | | 4,129 | | | (2,466 | ) | | 118,661 | |
Net cash used in discontinued operations | | | (64 | ) | | (1,402 | ) | | — | | | — | | | (1,466 | ) |
Net cash provided by (used in) operating activities | | | 11,485 | | | 104,047 | | | 4,129 | | | (2,466 | ) | | 117,195 | |
| | | | | | | | | | | | |
Cash flows from investing activities: | | | | | | | | | | | | | | | | |
Cash paid for property and equipment | | | (33,182 | ) | | (37,070 | ) | | — | | | — | | | (70,252 | ) |
Proceeds from disposition of assets | | | 2,957 | | | 4,558 | | | — | | | — | | | 7,515 | |
Acquisition of Florida Tire, Inc. | | | (288 | ) | | — | | | — | | | — | | | (288 | ) |
Collateral investments | | | (9,638 | ) | | — | | | — | | | — | | | (9,638 | ) |
| | | | | | | | | | | | |
Net cash used in continuing operations | | | (40,151 | ) | | (32,512 | ) | | — | | | — | | | (72,663 | ) |
Net cash provided by discontinued operations | | | — | | | 569 | | | — | | | — | | | 569 | |
| | | | | | | | | | | | |
Net cash used in investing activities | | | (40,151 | ) | | (31,943 | ) | | — | | | — | | | (72,094 | ) |
| | | | | | | | | | | | |
Cash flows from financing activities: | | | | | | | | | | | | | | | | |
Borrowings under line of credit agreements | | | 7,606 | | | 14,189 | | | — | | | — | | | 21,795 | |
Payments under line of credit agreements | | | (7,606 | ) | | (14,189 | ) | | — | | | — | | | (21,795 | ) |
Borrowings on trade payable program liability | | | 347,068 | | | — | | | — | | | — | | | 347,068 | |
Payments on trade payable program liability | | | (324,880 | ) | | — | | | — | | | — | | | (324,880 | ) |
Long-term debt and capital lease obligation payments | | | (11,279 | ) | | — | | | — | | | — | | | (11,279 | ) |
Intercompany borrowings (payments) | | | 49,223 | | | (53,906 | ) | | 4,683 | | | — | | | — | |
Dividends paid | | | (6,323 | ) | | — | | | (2,466 | ) | | 2,466 | | | (6,323 | ) |
Other | | | 1,227 | | | — | | | — | | | — | | | 1,227 | |
| | | | | | | | | | | | |
Net cash provided by (used in) financing activities | | | 55,036 | | | (53,906 | ) | | 2,217 | | | 2,466 | | | 5,813 | |
| | | | | | | | | | | | |
Net increase in cash | | | 26,370 | | | 18,198 | | | 6,346 | | | — | | | 50,914 | |
| | | | | | | | | | | | |
Cash and cash equivalents at beginning of year | | | 25,844 | | | 10,279 | | | 3,203 | | | — | | | 39,326 | |
| | | | | | | | | | | | |
Cash and cash equivalents at end of year | | $ | 52,214 | | $ | 28,477 | | $ | 9,549 | | $ | — | | $ | 90,240 | |
| | | | | | | | | | | | |
82
Table of Contents
THE PEP BOYS—MANNY, MOE & JACK AND SUBSIDIARIES
NOTES TO CONSOLIDATED FINANCIAL STATEMENTS (Continued)
Years ended January 29, 2011, January 30, 2010 and January 31, 2009
NOTE 19—SUPPLEMENTAL GUARANTOR INFORMATION (Continued)
CONDENSED CONSOLIDATING STATEMENT OF CASH FLOWS
| | | | | | | | | | | | | | | | |
(dollar amounts in thousands)
January 30, 2010 | | Pep Boys | | Subsidiary
Guarantors | | Subsidiary
Non-Guarantors | | Consolidation
Elimination | | Consolidated | |
|---|
Cash flows from operating activities: | | | | | | | | | | | | | | | | |
Net earnings (loss) | | $ | 23,036 | | $ | 53,582 | | $ | 4,743 | | $ | (58,325 | ) | $ | 23,036 | |
Adjustments to reconcile net earnings (loss) to net cash (used in) provided by continuing operations: | | | | | | | | | | | | | | | | |
Net loss from discontinued operations | | | 37 | | | 1,040 | | | — | | | — | | | 1,077 | |
Depreciation and amortization | | | 25,405 | | | 44,815 | | | 682 | | | (373 | ) | | 70,529 | |
Amortization of deferred gain from asset sales | | | (4,078 | ) | | (8,620 | ) | | — | | | 373 | | | (12,325 | ) |
Stock compensation expense | | | 2,575 | | | — | | | — | | | — | | | 2,575 | |
Equity in earnings of subsidiaries | | | (58,325 | ) | | — | | | — | | | 58,325 | | | — | |
Gain on debt retirement | | | (6,248 | ) | | — | | | — | | | — | | | (6,248 | ) |
Deferred income taxes | | | 2,919 | | | 10,147 | | | 380 | | | — | | | 13,446 | |
Gain from disposition of assets | | | (886 | ) | | (327 | ) | | — | | | — | | | (1,213 | ) |
Loss from asset impairments | | | 785 | | | 2,099 | | | — | | | — | | | 2,884 | |
Dividends received from subsidiary | | | 2,467 | | | — | | | — | | | (2,467 | ) | | — | |
Other | | | 204 | | | 141 | | | — | | | — | | | 345 | |
Changes in operating assets and liabilities: | | | | | | | | | | | | | | | | |
Decrease (increase) in accounts receivable, prepaid expenses and other | | | 8,232 | | | 520 | | | (957 | ) | | (620 | ) | | 7,175 | |
Decrease in merchandise inventories | | | 5,216 | | | 1,823 | | | — | | | — | | | 7,039 | |
Decrease in accounts payable | | | (9,640 | ) | | — | | | — | | | — | | | (9,640 | ) |
Decrease in accrued expenses | | | (5,303 | ) | | (5,999 | ) | | (2,556 | ) | | 620 | | | (13,238 | ) |
(Decrease) increase in other long-term liabilities | | | (790 | ) | | 3,174 | | | — | | | — | | | 2,384 | |
| | | | | | | | | | | | |
Net cash (used in) provided by continuing operations | | | (14,394 | ) | | 102,395 | | | 2,292 | | | (2,467 | ) | | 87,826 | |
Net cash used in discontinued operations | | | (37 | ) | | (566 | ) | | — | | | — | | | (603 | ) |
Net cash (used in) provided by operating activities | | | (14,431 | ) | | 101,829 | | | 2,292 | | | (2,467 | ) | | 87,223 | |
| | | | | | | | | | | | |
Cash flows from investing activities: | | | | | | | | | | | | | | | | |
Cash paid for property and equipment | | | (18,132 | ) | | (25,082 | ) | | — | | | — | | | (43,214 | ) |
Proceeds from disposition of assets | | | 4,845 | | | 9,931 | | | — | | | — | | | 14,776 | |
Acquisition of Florida Tire, Inc. | | | (2,695 | ) | | — | | | — | | | — | | | (2,695 | ) |
Other | | | (500 | ) | | — | | | — | | | — | | | (500 | ) |
| | | | | | | | | | | | |
Net cash used in continuing operations | | | (16,482 | ) | | (15,151 | ) | | — | | | — | | | (31,633 | ) |
Net cash provided by discontinued operations | | | — | | | 1,762 | | | — | | | — | | | 1,762 | |
| | | | | | | | | | | | |
Net cash used in investing activities | | | (16,482 | ) | | (13,389 | ) | | — | | | — | | | (29,871 | ) |
| | | | | | | | | | | | |
Cash flows from financing activities: | | | | | | | | | | | | | | | | |
Borrowings under line of credit agreements | | | 88,237 | | | 161,467 | | | — | | | — | | | 249,704 | |
Payments under line of credit agreements | | | (96,669 | ) | | (176,897 | ) | | — | | | — | | | (273,566 | ) |
Borrowings on trade payable program liability | | | 192,324 | | | — | | | — | | | — | | | 192,324 | |
Payments on trade payable program liability | | | (190,155 | ) | | — | | | — | | | — | | | (190,155 | ) |
Long-term debt and capital lease obligation payments | | | (11,930 | ) | | (60 | ) | | — | | | — | | | (11,990 | ) |
Intercompany borrowings (payments) | | | 67,872 | | | (69,064 | ) | | 1,192 | | | — | | | — | |
Dividends paid | | | (6,286 | ) | | — | | | (2,467 | ) | | 2,467 | | | (6,286 | ) |
Other | | | 611 | | | — | | | — | | | — | | | 611 | |
| | | | | | | | | | | | |
Net cash provided by (used in) financing activities | | | 44,004 | | | (84,554 | ) | | (1,275 | ) | | 2,467 | | | (39,358 | ) |
| | | | | | | | | | | | |
Net increase in cash | | | 13,091 | | | 3,886 | | | 1,017 | | | — | | | 17,994 | |
| | | | | | | | | | | | |
Cash and cash equivalents at beginning of year | | | 12,753 | | | 6,393 | | | 2,186 | | | — | | | 21,332 | |
| | | | | | | | | | | | |
Cash and cash equivalents at end of year | | $ | 25,844 | | $ | 10,279 | | $ | 3,203 | | $ | — | | $ | 39,326 | |
| | | | | | | | | | | | |
83
Table of Contents
THE PEP BOYS—MANNY, MOE & JACK AND SUBSIDIARIES
NOTES TO CONSOLIDATED FINANCIAL STATEMENTS (Continued)
Years ended January 29, 2011, January 30, 2010 and January 31, 2009
NOTE 19—SUPPLEMENTAL GUARANTOR INFORMATION (Continued)
CONDENSED CONSOLIDATING STATEMENT OF CASH FLOWS
| | | | | | | | | | | | | | | | |
(dollar amounts in thousands)
January 31, 2009 | | Pep Boys | | Subsidiary
Guarantors | | Subsidiary
Non-Guarantors | | Consolidation
Elimination | | Consolidated | |
|---|
Cash flows from operating activities: | | | | | | | | | | | | | | | | |
Net (loss) earnings | | $ | (30,429 | ) | $ | 49,819 | | $ | 5,864 | | $ | (55,683 | ) | $ | (30,429 | ) |
Adjustments to reconcile net (loss) earnings to net cash (used in) provided by continuing operations: | | | | | | | | | | | | | | | | |
Net loss from discontinued operations | | | 148 | | | 1,443 | | | — | | | — | | | 1,591 | |
Depreciation and amortization | | | 25,442 | | | 47,427 | | | 682 | | | (344 | ) | | 73,207 | |
Amortization of deferred gain from asset sale | | | (3,468 | ) | | (7,161 | ) | | — | | | 344 | | | (10,285 | ) |
Stock compensation expense | | | 2,743 | | | — | | | — | | | — | | | 2,743 | |
Equity in earnings of subsidiaries | | | (55,683 | ) | | — | | | — | | | 55,683 | | | — | |
Gain on debt retirement | | | (3,460 | ) | | — | | | — | | | — | | | (3,460 | ) |
Deferred income taxes | | | 10,733 | | | (17,190 | ) | | 199 | | | — | | | (6,258 | ) |
Gain from disposition of assets | | | (3,394 | ) | | (6,322 | ) | | — | | | — | | | (9,716 | ) |
Loss from asset impairments | | | 531 | | | 2,896 | | | — | | | — | | | 3,427 | |
Other | | | 365 | | | 172 | | | — | | | — | | | 537 | |
Dividends received from subsidiary | | | 2,464 | | | — | | | — | | | (2,464 | ) | | — | |
Changes in operating assets and liabilities: | | | | | | | | | | | | | | | | |
Decrease in accounts receivable, prepaid expenses and other | | | 17,926 | | | 2,211 | | | 5,079 | | | (1,312 | ) | | 23,904 | |
Increase in merchandise inventories | | | (328 | ) | | (3,451 | ) | | — | | | — | | | (3,779 | ) |
Decrease in accounts payable | | | (33,083 | ) | | — | | | — | | | — | | | (33,083 | ) |
(Decrease) increase in accrued expenses | | | (28,591 | ) | | 211 | | | (7,925 | ) | | 1,312 | | | (34,993 | ) |
Decrease in other long-term liabilities | | | (10,154 | ) | | (1,838 | ) | | — | | | — | | | (11,992 | ) |
| | | | | | | | | | | | |
Net cash (used in) provided by continuing operations | | | (108,238 | ) | | 68,217 | | | 3,899 | | | (2,464 | ) | | (38,586 | ) |
Net cash used in discontinued operations | | | (82 | ) | | (839 | ) | | — | | | — | | | (921 | ) |
Net cash (used in) provided by operating activities | | | (108,320 | ) | | 67,378 | | | 3,899 | | | (2,464 | ) | | (39,507 | ) |
| | | | | | | | | | | | |
Cash flows from investing activities: | | | | | | | | | | | | | | | | |
Cash paid for property and equipment | | | (44,727 | ) | | (107,156 | ) | | — | | | — | | | (151,883 | ) |
Proceeds from disposition of assets | | | 64,876 | | | 145,759 | | | — | | | — | | | 210,635 | |
Life insurance proceeds received | | | 15,588 | | | — | | | — | | | — | | | 15,588 | |
| | | | | | | | | | | | |
Net cash provided by continuing operations | | | 35,737 | | | 38,603 | | | — | | | — | | | 74,340 | |
Net cash provided by discontinued operations | | | 3,047 | | | 1,339 | | | — | | | — | | | 4,386 | |
| | | | | | | | | | | | |
Net cash provided by investing activities | | | 38,784 | | | 39,942 | | | — | | | — | | | 78,726 | |
| | | | | | | | | | | | |
Cash flows from financing activities: | | | | | | | | | | | | | | | | |
Borrowings under line of credit agreements | | | 87,659 | | | 117,503 | | | — | | | — | | | 205,162 | |
Payments under line of credit agreements | | | (95,428 | ) | | (127,917 | ) | | — | | | — | | | (223,345 | ) |
Borrowings on trade payable program liability | | | 196,680 | | | — | | | — | | | — | | | 196,680 | |
Payments on trade payable program liability | | | (179,004 | ) | | — | | | — | | | — | | | (179,004 | ) |
Payments for finance issuance costs | | | (6,847 | ) | | (89 | ) | | — | | | — | | | (6,936 | ) |
Proceeds from lease financing | | | 4,676 | | | 3,985 | | | — | | | — | | | 8,661 | |
Long-term debt and capital lease obligation payments | | | (26,459 | ) | | (339 | ) | | — | | | — | | | (26,798 | ) |
Intercompany borrowings (payments) | | | 102,037 | | | (100,725 | ) | | (1,312 | ) | | — | | | — | |
Dividends paid | | | (14,111 | ) | | — | | | (2,464 | ) | | 2,464 | | | (14,111 | ) |
Other | | | 878 | | | — | | | — | | | — | | | 878 | |
| | | | | | | | | | | | |
Net cash provided by (used in) financing activities | | | 70,081 | | | (107,582 | ) | | (3,776 | ) | | 2,464 | | | (38,813 | ) |
| | | | | | | | | | | | |
Net increase (decrease) in cash | | | 545 | | | (262 | ) | | 123 | | | — | | | 406 | |
| | | | | | | | | | | | |
Cash and cash equivalents at beginning of year | | | 12,208 | | | 6,655 | | | 2,063 | | | — | | | 20,926 | |
| | | | | | | | | | | | |
Cash and cash equivalents at end of year | | $ | 12,753 | | $ | 6,393 | | $ | 2,186 | | $ | — | | $ | 21,332 | |
| | | | | | | | | | | | |
84
Table of Contents
ITEM 9 CHANGES IN AND DISAGREEMENTS WITH ACCOUNTANTS ON ACCOUNTING AND FINANCIAL DISCLOSURE
None.
ITEM 9A CONTROLS AND PROCEDURES
Disclosure Controls and Procedures Our disclosure controls and procedures (as defined in Rule 13a-15 of the Securities Exchange Act of 1934, as amended (the "Exchange Act")) are designed to provide reasonable assurance that the information required to be disclosed is accumulated and communicated to our management, including our principal executive and principal financial officers, as appropriate to allow timely decisions regarding required disclosure. The term disclosure controls and procedures means controls and other procedures of an issuer that are designed to ensure that information required to be disclosed by the issuer in the reports that it files or submits under the Exchange Act (15 U.S.C. 78a et seq.) is recorded, processed, summarized and reported, within the time periods specified in the SEC's rules and forms. Disclosure controls and procedures include, without limitation, controls and procedures designed to ensure that information required to be disclosed by an issuer in the reports that it files or submits under the Exchange Act is accumulated and communicated to the issuer's management, including its principal executive and principal financial officers, or persons performing similar functions, as appropriate to allow timely decisions regarding required disclosure. The Company's management, with the participation of the Company's chief executive officer and chief financial officer, evaluated the effectiveness of the Company's disclosure controls and procedures as of the end of the period covered by this report. Based on that evaluation, the chief executive officer and chief financial officer concluded that our disclosure controls and procedures as of the end of the period covered by this report were effective in providing reasonable assurance that the information required to be disclosed by the Company in reports filed under the Exchange Act is recorded, processed, summarized and reported within the time periods specified in the SEC's rules and forms and is accumulated and communicated to management, including our principal executive and principal financial officers, as appropriate to allow timely decisions regarding required disclosure.
There were no changes to the Company's internal control over financial reporting that occurred during the quarter ended January 29, 2011 that have materially affected, or are reasonably likely to materially affect, the Company's internal control over financial reporting.
MANAGEMENT'S REPORT ON INTERNAL CONTROL OVER FINANCIAL REPORTING
Management of The Pep Boys—Manny, Moe and Jack (the Company) is responsible for establishing and maintaining adequate internal control over financial reporting. The Company's internal control over financial reporting is a process designed under the supervision of the Company's principal executive officer and principal financial officer to provide reasonable assurance regarding the reliability of financial reporting and the preparation of the Company's financial statements for external purposes in accordance with accounting principles generally accepted in the United States of America.
The Company's internal control over financial reporting includes policies and procedures that (1) pertain to the maintenance of records that, in reasonable detail, accurately and fairly reflect the transactions and dispositions of the assets of the Company; (2) provide reasonable assurance that transactions are recorded as necessary to permit preparation of financial statements in accordance with generally accepted accounting principles, and that receipts and expenditures of the Company are being made only in accordance with authorizations of management and directors of the Company; and (3) provide reasonable assurance regarding prevention or timely detection of unauthorized acquisition, use, or disposition of the Company's assets that could have a material effect on the financial statements.
85
Table of Contents
Management assessed the effectiveness of the Company's internal control over financial reporting as of January 29, 2011 based on the criteria established in Internal Control—Integrated Framework issued by the Committee of Sponsoring Organizations of the Treadway Commission (COSO). Based on this assessment, management determined that the Company's internal control over financial reporting as of January 29, 2011 was effective.
Deloitte & Touche LLP, the Company's independent registered public accounting firm, has issued an attestation report, which is included on page 67 herein, on the Company's internal control over financial reporting as of January 29, 2011.
86
Table of Contents
REPORT OF INDEPENDENT REGISTERED PUBLIC ACCOUNTING FIRM
To the Board of Directors and Stockholders of
The Pep Boys—Manny, Moe & Jack
Philadelphia, Pennsylvania
We have audited the internal control over financial reporting of The Pep Boys—Manny, Moe & Jack and subsidiaries (the "Company") as of January 29, 2011, based on criteria established inInternal Control—Integrated Framework issued by the Committee of Sponsoring Organizations of the Treadway Commission. The Company's management is responsible for maintaining effective internal control over financial reporting and for its assessment of the effectiveness of internal control over financial reporting, included in the accompanying Management's Report on Internal Control over Financial Reporting. Our responsibility is to express an opinion on the Company's internal control over financial reporting based on our audit.
We conducted our audit in accordance with the standards of the Public Company Accounting Oversight Board (United States). Those standards require that we plan and perform the audit to obtain reasonable assurance about whether effective internal control over financial reporting was maintained in all material respects. Our audit included obtaining an understanding of internal control over financial reporting, assessing the risk that a material weakness exists, testing and evaluating the design and operating effectiveness of internal control based on the assessed risk, and performing such other procedures as we considered necessary in the circumstances. We believe that our audit provides a reasonable basis for our opinion.
A company's internal control over financial reporting is a process designed by, or under the supervision of, the company's principal executive and principal financial officers, or persons performing similar functions, and effected by the company's board of directors, management, and other personnel to provide reasonable assurance regarding the reliability of financial reporting and the preparation of financial statements for external purposes in accordance with generally accepted accounting principles. A company's internal control over financial reporting includes those policies and procedures that (1) pertain to the maintenance of records that, in reasonable detail, accurately and fairly reflect the transactions and dispositions of the assets of the company; (2) provide reasonable assurance that transactions are recorded as necessary to permit preparation of financial statements in accordance with generally accepted accounting principles, and that receipts and expenditures of the company are being made only in accordance with authorizations of management and directors of the company; and (3) provide reasonable assurance regarding prevention or timely detection of unauthorized acquisition, use, or disposition of the company's assets that could have a material effect on the financial statements.
Because of the inherent limitations of internal control over financial reporting, including the possibility of collusion or improper management override of controls, material misstatements due to error or fraud may not be prevented or detected on a timely basis. Also, projections of any evaluation of the effectiveness of the internal control over financial reporting to future periods are subject to the risk that the controls may become inadequate because of changes in conditions, or that the degree of compliance with the policies or procedures may deteriorate.
In our opinion, the Company maintained, in all material respects, effective internal control over financial reporting as of January 29, 2011, based on the criteria established inInternal Control—Integrated Framework issued by the Committee of Sponsoring Organizations of the Treadway Commission.
We have also audited, in accordance with the standards of the Public Company Accounting Oversight Board (United States), the consolidated financial statements and financial statement schedule as of and for the fiscal year ended January 29, 2011 of the Company and our report dated April 11, 2011 expressed an unqualified opinion on those financial statements and financial statement schedule.
DELOITTE & TOUCHE LLP
Philadelphia, Pennsylvania
April 11, 2011
87
Table of Contents
ITEM 9B OTHER INFORMATION
None.
PART III
ITEM 10 DIRECTORS, EXECUTIVE OFFICERS AND CORPORATE GOVERNANCE
The material contained in the Company's definitive proxy statement, which will be filed pursuant to Regulation 14A not later than 120 days after the end of the Company's 2010 fiscal year (the "Proxy Statement"), under the captions "—Nominees for Election", "—Corporate Governance" and "SECTION 16(A) BENEFICIAL OWNERSHIP REPORTING COMPLIANCE" is hereby incorporated herein by reference.
The information regarding executive officers called for by Item 401 of Regulation S-K is included in Part I of this Form 10-K, in accordance with General Instruction G (3).
The Company has adopted a Code of Ethics applicable to all of its associates including its executive officers. The Code of Ethics, together with any amendments thereto or waivers thereof, are posted on the Company's website www.pepboys.com under the "Investor Relations—Corporate Governance" section.
In addition, the Board of Directors Code of Conduct and the charters of our audit, human resources and nominating and governance committees may also be found under the "Investor Relations—Corporate Governance" section of our website. As required by the New York Stock Exchange ("NYSE"), promptly following our 2010 Annual Meeting, our Chief Executive Officer certified to the NYSE that he was not aware of any violation by Pep Boys of NYSE corporate governance listing standards. Copies of our corporate governance materials are available free of charge from our investor relations department. Please call 215-430-9459 or write Pep Boys, Investor Relations, 3111 West Allegheny Avenue, Philadelphia, PA 19132.
ITEM 11 EXECUTIVE COMPENSATION
The material contained in the Proxy Statement under the captions "—How are Directors Compensated?", "—Director Compensation Table" and "EXECUTIVE COMPENSATION" other than the material under "—Compensation Committee Report" is hereby incorporated herein by reference.
The information regarding equity compensation plans called for by Item 201(d) of Regulation S-K is included in Item 5 of this Form 10-K.
ITEM 12 SECURITY OWNERSHIP OF CERTAIN BENEFICIAL OWNERS AND MANAGEMENT AND RELATED STOCKHOLDER MATTERS
The material contained in the Proxy Statement under the caption "SHARE OWNERSHIP" is hereby incorporated herein by reference.
ITEM 13 CERTAIN RELATIONSHIPS AND RELATED TRANSACTIONS AND DIRECTOR INDEPENDENCE
The material contained in the Proxy Statement under the caption "—Certain Relationships and Related Transactions" and "—Corporate Governance" is hereby incorporated herein by reference.
ITEM 14 PRINCIPAL ACCOUNTANT FEES AND SERVICES
The material contained in the Proxy Statement under the caption "—Registered Public Accounting Firm's Fees" is hereby incorporated herein by reference.
88
Table of Contents
PART IV
ITEM 15 EXHIBITS, FINANCIAL STATEMENT SCHEDULES
- (a)
- The following documents are filed as part of this report:
| | | | | | |
| |
| |
| | Page |
|---|
| 1. | | The following consolidated financial statements of The Pep Boys—Manny, Moe & Jack are included in Item 8 | | |
| | | | | Report of Independent Registered Public Accounting Firm | | 38 |
| | | | | Consolidated Balance Sheets—January 29, 2011 and January 30, 2010 | | 39 |
| | | | | Consolidated Statements of Operations—Years ended January 29, 2011, January 30, 2010 and January 31, 2009 | | 40 |
| | | | | Consolidated Statements of Stockholders' Equity—Years ended January 29, 2011, January 30, 2010 and January 31, 2009 | | 41 |
| | | | | Consolidated Statements of Cash Flows—Years ended January 29, 2011, January 30, 2010 and January 31, 2009 | | 42 |
| | | | | Notes to Consolidated Financial Statements | | 43 |
| 2. | | The following consolidated financial statement schedule of The Pep Boys—Manny, Moe & Jack is included | | |
| | | | | Schedule II Valuation and Qualifying Accounts and Reserves | | 94 |
| | | | | All other schedules have been omitted because they are not applicable or not required or the required information is included in the consolidated financial statements or notes thereto. | | |
| | | | | |
| | 3. Exhibits | | |
|
(3.1) |
|
Amended and Restated Articles of Incorporation |
|
Incorporated by reference from the Company's 10-K dated February 14, 2009. |
| | (3.2) | | By-Laws amended and restated | | Incorporated by reference from the Company's 8-K dated February 17, 2010. |
| | (4.1) | | Indenture, dated December 14, 2004, between the Company and Wachovia Bank, National Association, as trustee, including form of security. | | Incorporated by reference from the Company's Form 8-K dated December 15, 2004. |
| | (4.2) | | Supplemental Indenture, dated December 14, 2004, between the Company and Wachovia Bank, National Association, as trustee. | | Incorporated by reference from the Company's Form 8-K dated December 15, 2004. |
| | (4.3) | | Dividend Reinvestment and Stock Purchase Plan dated January 4, 1990 | | Incorporated by reference from the Registration Statement on Form S-3 (File No. 33-32857). |
| | (10.1)* | | Medical Reimbursement Plan of the Company | | Incorporated by reference from the Company's Form 10-K for the fiscal year ended January 31, 1982. |
| | (10.2)* | | Form of Change of Control between the Company and certain officers of the Company. | | Filed herewith |
89
Table of Contents
| | | | | |
| | (10.3)* | | Form of Non-Competition Agreement between the Company and certain officers of the Company. | | Filed herewith |
| | (10.4)* | | The Pep Boys—Manny, Moe & Jack 1990 Stock Incentive Plan—Amended and Restated as of March 26, 2001. | | Incorporated by reference from the Company's Form 10-K for the year ended February 1, 2003. |
| | (10.5)* | | The Pep Boys—Manny, Moe & Jack 2009 Stock Incentive Plan. | | Incorporated by reference from the Company's 8-K dated June 24, 2009. |
| | (10.6)* | | The Pep Boys—Manny, Moe & Jack Pension Plan—Amended and Restated as of January 1, 2010. | | Filed herewith |
| | (10.7)* | | Long-Term Disability Salary Continuation Plan amended and restated as of March 26, 2002. | | Incorporated by reference from the Company's Form 10-K for the fiscal year ended February 1, 2003. |
| | (10.8)* | | Amendment and restatement as of January 1, 2010 of The Pep Boys Savings Plan. | | Filed herewith |
| | (10.9)* | | Amendment and restatement as of September 3, 2002 of The Pep Boys Savings Plan—Puerto Rico. | | Incorporated by reference from the Company's Form 10-Q for the quarter ended November 2, 2002. |
| | (10.10)* | | The Pep Boys Deferred Compensation Plan, as amended and restated | | Incorporated by reference from the Company's Form 8-K dated December 23, 2008. |
| | (10.11)* | | The Pep Boys Annual Incentive Bonus Plan (amended and restated as of January 31, 2009) | | Incorporated by reference from the Company's Form 10-K for the fiscal year ended January 31, 2009. |
| | (10.12)* | | Account Plan | | Filed herewith |
| | (10.13)* | | Flexible Employee Benefits Trust | | Incorporated by reference from the Company's Form 8-K filed May 6, 1994. |
| | (10.14)* | | The Pep Boys Grantor Trust Agreement | | Incorporated by reference from the Company's Form 10-K for the fiscal year ended February 3, 2007. |
| | (10.15) | | Credit Agreement, dated January 16, 2009, by and among the Company, as Lead Borrower, Bank of America, N.A., as Administrative Agent and the other parties thereto. | | Filed herewith |
| | (10.16) | | Amended and Restated Credit Agreement, dated October 27, 2006, among the Company, Wachovia Bank, National Association, as Administrative Agent, and the other parties thereto. | | Filed herewith |
90
Table of Contents
| | | | | |
| | (10.17) | | First Amendment dated February 15, 2007 to Amended and Restated Credit Agreement, dated October 27, 2006, among the Company, Wachovia Bank, National Association, as Administrative Agent, and the other parties thereto. | | Filed herewith |
| | (10.18) | | Second Amendment dated April 5, 2011 to Amended and Restated Credit Agreement, dated October 27, 2006, among the Company, Wachovia Bank, National Association, as Administrative Agent, and the other parties thereto. | | Filed herewith |
| | (12.00) | | Computation of Ratio of Earnings to Fixed Charges | | Filed herewith |
| | (21) | | Subsidiaries of the Company | | Filed herewith |
| | (23) | | Consent of Independent Registered Public Accounting Firm | | Filed herewith |
| | (31.1) | | Certification of Principal Executive Officer Pursuant to Section 302 of the Sarbanes-Oxley Act of 2002 | | Filed herewith |
| | (31.2) | | Certification of Principal Financial Officer Pursuant to Section 302 of the Sarbanes-Oxley Act of 2002 | | Filed herewith |
| | (32.1) | | Principal Executive Officer Certification pursuant to 18 U.S.C. Section 1350, as adopted pursuant to Section 906 of the Sarbanes-Oxley Act of 2002 | | Filed herewith |
| | (32.2) | | Principal Financial Officer Certification pursuant to 18 U.S.C. Section 1350, as adopted pursuant to Section 906 of the Sarbanes-Oxley Act of 2002 | | Filed herewith |
- *
- Management contract or compensatory plan or arrangement.
91
Table of Contents
SIGNATURES
Pursuant to the requirements of Section 13 or 15(d) of the Securities Exchange Act of 1934, the Registrant has duly caused this Annual Report on Form 10-K to be signed on its behalf by the undersigned, thereunto duly authorized.
| | | | |
| Dated: April 11, 2011 | | THE PEP BOYS—MANNY, MOE & JACK
(REGISTRANT) |
|
|
By: |
|
/s/ RAYMOND L. ARTHUR |
| | | | |
Raymond L. Arthur
Executive Vice President and
Chief Financial Officer
(Principal Financial Officer) |
Pursuant to the requirements of the Securities Exchange Act of 1934, this report has been signed below by the following persons on behalf of the Registrant and in the capacities and on the dates indicated.
| | | | |
Signature | | Capacity | | Date |
|---|
|
|
|
|
|
/s/ MICHAEL R. ODELL
Michael R. Odell | | President and Chief Executive Officer; Director (Principal Executive Officer) | | April 11, 2011 |
/s/ RAYMOND L. ARTHUR
Raymond L. Arthur |
|
Executive Vice President and Chief Financial Officer (Principal Financial Officer) |
|
April 11, 2011 |
/s/ SANJAY SOOD
Sanjay Sood |
|
Vice President and Corporate Controller (Chief Accounting Officer) |
|
April 11, 2011 |
/s/ MAX LUKENS
Max Lukens |
|
Chairman of the Board |
|
April 11, 2011 |
/s/ M. SHÂN ATKINS
M. Shân Atkins |
|
Director |
|
April 11, 2011 |
/s/ ROBERT H. HOTZ
Robert H. Hotz |
|
Director |
|
April 11, 2011 |
/s/ JAMES MITAROTONDA
James Mitarotonda |
|
Director |
|
April 11, 2011 |
92
Table of Contents
| | | | |
Signature | | Capacity | | Date |
|---|
|
|
|
|
|
/s/ DR. IRVIN D. REID
Dr. Irvin D. Reid | | Director | | April 11, 2011 |
/s/ JANE SCACCETTI
Jane Scaccetti |
|
Director |
|
April 11, 2011 |
/s/ JOHN T. SWEETWOOD
John T. Sweetwood |
|
Director |
|
April 11, 2011 |
/s/ NICK WHITE
Nick White |
|
Director |
|
April 11, 2011 |
/s/ JAMES A. WILLIAMS
James A. Williams |
|
Director |
|
April 11, 2011 |
93
Table of Contents
FINANCIAL STATEMENT SCHEDULES FURNISHED PURSUANT TO
THE REQUIREMENTS OF FORM 10-K
THE PEP BOYS—MANNY, MOE & JACK AND SUBSIDIARIES
SCHEDULE II—VALUATION AND QUALIFYING ACCOUNTS AND RESERVES
(dollar amounts in thousands)
| | | | | | | | | | | | | | | | |
| Column A | | Column B | | Column C | | Column D | | Column E | |
|---|
Description | | Balance at
Beginning
of Period | | Additions Charged
to Costs
and Expenses | | Additions Charged
to Other
Accounts | | Deductions(1) | | Balance at
End of Period | |
|---|
| | (in thousands)
| |
|---|
ALLOWANCE FOR DOUBTFUL ACCOUNTS: | | | | | | | | | | | | | | | | |
Year ended January 29, 2011 | | $ | 1,488 | | $ | 2,595 | | $ | — | | $ | 2,532 | | $ | 1,551 | |
Year ended January 30, 2010 | | $ | 1,912 | | $ | 1,705 | | $ | — | | $ | 2,129 | | $ | 1,488 | |
Year ended January 31, 2009 | | $ | 1,937 | | $ | 4,679 | | $ | — | | $ | 4,704 | | $ | 1,912 | |
- (1)
- Uncollectible accounts written off.
| | | | | | | | | | | | | | | | |
| Column A | | Column B | | Column C | | Column D | | Column E | |
|---|
Description | | Balance at
Beginning
of Period | | Additions Charged
to Costs
and Expenses | | Additions Charged
to Other
Accounts(2) | | Deductions(2) | | Balance at
End of Period | |
|---|
| | (in thousands)
| |
|---|
SALES RETURNS AND ALLOWANCES: | | | | | | | | | | | | | | | | |
Year ended January 29, 2011 | | $ | 1,031 | | $ | — | | $ | 60,740 | | $ | 60,715 | | $ | 1,056 | |
Year ended January 30, 2010 | | $ | 1,144 | | $ | — | | $ | 60,603 | | $ | 60,716 | | $ | 1,031 | |
Year ended January 31, 2009 | | $ | 1,232 | | $ | — | | $ | 57,899 | | $ | 57,987 | | $ | 1,144 | |
- (2)
- Sales return and allowance activity is recorded through a reduction of merchandise sales and costs of merchandise sales.
94