UNITED STATES SECURITIES AND EXCHANGE COMMISSION
WASHINGTON, D.C. 20549
FORM 10-Q
(Mark One)
x | QUARTERLY REPORT PURSUANT TO SECTION 13 OR 15(d) OF THE SECURITIES EXCHANGE ACT OF 1934 |
For the quarterly period ended September 3, 2005 (36 weeks)
OR
¨ | TRANSITION REPORT PURSUANT TO SECTION 13 OR 15(d) OF THE SECURITIES EXCHANGE ACT OF 1934 |
For the transition period from to
Commission file number 1-1183

PepsiCo, Inc.
(Exact name of registrant as specified in its charter)
| | |
| North Carolina | | 13-1584302 |
(State or Other jurisdiction of Incorporation or Organization) | | (I.R.S. Employer Identification No.) |
| 700 Anderson Hill Road, Purchase, New York | | 10577 |
| (Address of Principal Executive Offices) | | (Zip Code) |
914-253-2000
(Registrant’s telephone number, including area code)
N/A
(Former Name, Former Address and Former Fiscal Year, if Changed Since Last Report.)
Indicate by check mark whether the registrant: (1) has filed all reports required to be filed by Section 13 or 15(d) of the Securities Exchange Act of 1934 during the preceding 12 months (or for such shorter period that the registrant was required to file such reports), and (2) has been subject to such filing requirements for the past 90 days. YESx NO¨
Indicate by check mark whether the registrant is an accelerated filer (as defined in rule 12b-2 of the Exchange Act.) YESx NO¨
Indicate by check mark whether the registrant is a shell company (as defined in Rule 12b-2 of the Exchange Act). YES¨ NOx
Number of shares of Common Stock outstanding as of September 23, 2005: 1,659,193,974
PEPSICO, INC. AND SUBSIDIARIES
INDEX
2
PART I FINANCIAL INFORMATION
ITEM 1. | Financial Statements |
PEPSICO, INC. AND SUBSIDIARIES
CONDENSED CONSOLIDATED STATEMENT OF INCOME
(in millions except per share amounts, unaudited)
| | | | | | | | | | | | |
| | | 12 Weeks Ended
| | | 36 Weeks Ended
| |
| | | 9/3/05
| | | 9/4/04
| | | 9/3/05
| | | 9/4/04
| |
Net Revenue | | $8,184 | | | $7,257 | | | $22,466 | | | $20,458 | |
| | | | |
Cost of sales | | 3,733 | | | 3,300 | | | 10,255 | | | 9,324 | |
Selling, general and administrative expenses | | 2,734 | | | 2,410 | | | 7,625 | | | 6,974 | |
Amortization of intangible assets | | 37 | | | 35 | | | 103 | | | 100 | |
| | |
|
| |
|
| |
|
| |
|
|
| | | | |
Operating Profit | | 1,680 | | | 1,512 | | | 4,483 | | | 4,060 | |
| | | | |
Bottling equity income | | 209 | | | 147 | | | 430 | | | 292 | |
Interest expense | | (58 | ) | | (41 | ) | | (161 | ) | | (113 | ) |
Interest income | | 37 | | | 15 | | | 88 | | | 37 | |
| | |
|
| |
|
| |
|
| |
|
|
| | | | |
Income before income taxes | | 1,868 | | | 1,633 | | | 4,840 | | | 4,276 | |
| | | | |
Provision for income taxes | | 1,004 | | | 269 | | | 1,870 | | | 1,049 | |
| | |
|
| |
|
| |
|
| |
|
|
Net Income | | $ 864 | | | $1,364 | | | $ 2,970 | | | $ 3,227 | |
| | |
|
| |
|
| |
|
| |
|
|
| | | | |
Net Income Per Common Share | | | | | | | | | | | | |
Basic | | $ 0.52 | | | $ 0.80 | | | $ 1.77 | | | $ 1.89 | |
Diluted | | $ 0.51 | | | $ 0.79 | | | $ 1.74 | | | $ 1.86 | |
| | | | |
Cash Dividends Declared Per Common Share | | $ 0.26 | | | $ 0.23 | | | $ 0.75 | | | $ 0.62 | |
See accompanyingNotes to the Condensed Consolidated Financial Statements.
3
PEPSICO, INC. AND SUBSIDIARIES
CONDENSED CONSOLIDATED STATEMENT OF CASH FLOWS
(in millions, unaudited)
| | | | | | |
| | | 36 Weeks Ended
| |
| | | 9/3/05
| | | 9/4/04
| |
Operating Activities | | | | | | |
Net income | | $ 2,970 | | | $ 3,227 | |
Adjustments | | | | | | |
Depreciation and amortization | | 896 | | | 863 | |
Stock-based compensation expense | | 215 | | | 261 | |
Cash payments for merger-related and other restructuring charges | | (21 | ) | | (57 | ) |
Bottling equity income, net of dividends | | (345 | ) | | (248 | ) |
Deferred income taxes | | 101 | | | 62 | |
Net change in operating working capital | | 251 | | | (659 | ) |
Other, net | | 491 | | | 268 | |
| | |
|
| |
|
|
Net Cash Provided by Operating Activities | | 4,558 | | | 3,717 | |
| | |
|
| |
|
|
Investing Activities | | | | | | |
Snack Ventures Europe (SVE) minority interest acquisition | | (750 | ) | | — | |
Capital spending | | (796 | ) | | (700 | ) |
Sales of property, plant and equipment | | 65 | | | 15 | |
Other acquisitions and investments in noncontrolled affiliates | | (302 | ) | | (28 | ) |
Cash proceeds from sale of The Pepsi Bottling Group (PBG) stock | | 177 | | | — | |
Divestitures | | 3 | | | — | |
Short-term investments, by original maturity More than three months—purchases | | (82 | ) | | (28 | ) |
More than three months—maturities | | 56 | | | 34 | |
Three months or less, net | | (1,832 | ) | | (92 | ) |
| | |
|
| |
|
|
Net Cash Used for Investing Activities | | (3,461 | ) | | (799 | ) |
| | |
|
| |
|
|
Financing Activities | | | | | | |
Proceeds from issuances of long-term debt | | 13 | | | 504 | |
Payments of long-term debt | | (145 | ) | | (175 | ) |
Short-term borrowings, by original maturity | | | | | | |
More than three months—proceeds | | 51 | | | 94 | |
More than three months—payments | | (66 | ) | | (111 | ) |
Three months or less, net | | 1,236 | | | 32 | |
Cash dividends paid | | (1,209 | ) | | (940 | ) |
Share repurchases—common | | (2,085 | ) | | (2,475 | ) |
Share repurchases—preferred | | (14 | ) | | (20 | ) |
Proceeds from exercises of stock options | | 707 | | | 846 | |
| | |
|
| |
|
|
Net Cash Used for Financing Activities | | (1,512 | ) | | (2,245 | ) |
Effect of Exchange Rate Changes on Cash and Cash Equivalents | | (21 | ) | | (12 | ) |
| | |
|
| |
|
|
Net (Decrease)/Increase in Cash and Cash Equivalents | | (436 | ) | | 661 | |
Cash and Cash Equivalents—Beginning of year | | 1,280 | | | 820 | |
| | |
|
| |
|
|
Cash and Cash Equivalents—End of period | | $ 844 | | | $ 1,481 | |
| | |
|
| |
|
|
See accompanyingNotes to the Condensed Consolidated Financial Statements.
4
PEPSICO, INC. AND SUBSIDIARIES
CONDENSED CONSOLIDATED BALANCE SHEET
(in millions)
| | | | | | |
| | | (Unaudited) | | | | |
| | | 9/3/05
| | | 12/25/04
| |
Assets | | | | | | |
Current Assets | | | | | | |
Cash and cash equivalents | | $ 844 | | | $ 1,280 | |
Short-term investments | | 4,028 | | | 2,165 | |
| | |
|
| |
|
|
| | | 4,872 | | | 3,445 | |
| | |
Accounts and notes receivable, less allowance: 9/05—$74, 12/04—$97 | | 3,757 | | | 2,999 | |
| | |
Inventories | | | | | | |
Raw materials | | 716 | | | 665 | |
Work-in-process | | 180 | | | 156 | |
Finished goods | | 768 | | | 720 | |
| | |
|
| |
|
|
| | | 1,664 | | | 1,541 | |
Prepaid expenses and other current assets | | 498 | | | 654 | |
| | |
|
| |
|
|
Total Current Assets | | 10,791 | | | 8,639 | |
| | |
Property, Plant and Equipment | | 16,427 | | | 15,930 | |
Accumulated Depreciation | | (8,264 | ) | | (7,781 | ) |
| | |
|
| |
|
|
| | | 8,163 | | | 8,149 | |
| | |
Amortizable Intangible Assets, net | | 530 | | | 598 | |
| | |
Goodwill | | 3,893 | | | 3,909 | |
Other Nonamortizable Intangible Assets | | 898 | | | 933 | |
| | |
|
| |
|
|
| | | 4,791 | | | 4,842 | |
| | |
Investments in Noncontrolled Affiliates | | 3,450 | | | 3,284 | |
Other Assets | | 3,173 | | | 2,475 | |
| | |
|
| |
|
|
Total Assets | | $30,898 | | | $27,987 | |
| | |
|
| |
|
|
Continued on next page.
5
PEPSICO, INC. AND SUBSIDIARIES
CONDENSED CONSOLIDATED BALANCE SHEET (continued)
(in millions except per share amounts)
| | | | | | |
| | | (Unaudited) | | | | |
| | | 9/3/05
| | | 12/25/04
| |
Liabilities and Shareholders’ Equity | | | | | | |
Current Liabilities | | | | | | |
Short-term borrowings obligations | | $ 2,266 | | | $ 1,054 | |
Accounts payable and other current liabilities | | 5,860 | | | 5,599 | |
Income taxes payable | | 890 | | | 99 | |
| | |
|
| |
|
|
Total Current Liabilities | | 9,016 | | | 6,752 | |
| | |
Long-term Debt Obligations | | 2,300 | | | 2,397 | |
| | |
Other Liabilities | | 4,144 | | | 4,099 | |
| | |
Deferred Income Taxes | | 1,338 | | | 1,216 | |
| | |
|
| |
|
|
Total Liabilities | | 16,798 | | | 14,464 | |
| | |
Preferred Stock, no par value | | 41 | | | 41 | |
Repurchased Preferred Stock | | (104 | ) | | (90 | ) |
| | |
Common Shareholders’ Equity | | | | | | |
Common stock, par value 1 2/3 cents per share: Authorized 3,600 shares, issued 9/05 and 12/04—1,782 shares | | 30 | | | 30 | |
Capital in excess of par value | | 641 | | | 618 | |
Retained earnings | | 20,441 | | | 18,730 | |
Accumulated other comprehensive loss | | (921 | ) | | (886 | ) |
| | |
|
| |
|
|
| | | 20,191 | | | 18,492 | |
| | |
Less: Repurchased shares, at cost: 9/05—121 shares, 12/04—103 shares | | (6,028 | ) | | (4,920 | ) |
| | |
|
| |
|
|
| | |
Total Common Shareholders’ Equity | | 14,163 | | | 13,572 | |
| | |
|
| |
|
|
| | |
Total Liabilities and Shareholders’ Equity | | $30,898 | | | $27,987 | |
| | |
|
| |
|
|
See accompanyingNotes to the Condensed Consolidated Financial Statements.
6
PEPSICO, INC. AND SUBSIDIARIES
CONDENSED CONSOLIDATED STATEMENT
OF COMPREHENSIVE INCOME
(in millions, unaudited)
| | | | | | | | | | | | |
| | | 12 Weeks Ended
| | | 36 Weeks Ended
| |
| | | 9/3/05
| | | 9/4/04
| | | 9/3/05
| | | 9/4/04
| |
Net Income | | $864 | | | $1,364 | | | $2,970 | | | $3,227 | |
| | | | |
Other Comprehensive Income/(Loss) | | | | | | | | | | | | |
Currency translation adjustment | | 95 | | | 3 | | | (81 | ) | | (73 | ) |
Cash flow hedges, net of related taxes: | | | | | | | | | | | | |
Net derivative gains(a) | | 18 | | | 9 | | | 41 | | | 11 | |
Reclassification of (gains)/losses to net income | | (4 | ) | | (4 | ) | | 5 | | | — | |
Other | | — | | | — | | | — | | | 2 | |
| | |
|
| |
|
| |
|
| |
|
|
| | | | |
| | | 109 | | | 8 | | | (35 | ) | | (60 | ) |
| | |
|
| |
|
| |
|
| |
|
|
Comprehensive Income | | $973 | | | $1,372 | | | $2,935 | | | $3,167 | |
| | |
|
| |
|
| |
|
| |
|
|
(a) | Net derivative gains for the 12 weeks ended and 36 weeks ended September 3, 2005 include $25 million and $41 million of net commodity gains. |
See accompanyingNotes to the Condensed Consolidated Financial Statements.
7
PEPSICO, INC. AND SUBSIDIARIES
NOTES TO CONDENSED CONSOLIDATED FINANCIAL STATEMENTS
Basis of Presentation and Our Divisions
Basis of Presentation
Our Condensed Consolidated Balance Sheet as of September 3, 2005, the Condensed Consolidated Statements of Income and Comprehensive Income for the 12 and 36 weeks ended September 3, 2005 and September 4, 2004, and the Condensed Consolidated Statement of Cash Flows for the 36 weeks ended September 3, 2005 and September 4, 2004 have not been audited. These statements have been prepared on a basis that is substantially consistent with the accounting principles applied in our Annual Report on Form 10-K for the year ended December 25, 2004. In connection with our ongoing Business Process Transformation (BPT) initiative, we aligned certain accounting policies across our divisions. In the first quarter of 2005, we conformed our methodology for calculating our bad debt reserves and modified our policy for recognizing revenue for products shipped to customers by third-party carriers. In the third quarter of 2005, we conformed our method of accounting for certain freight, distribution, and employee benefits costs. These changes reduced our net revenue by $7 million and $47 million and our operating profit by $45 million and $52 million in the 12 and 36 weeks ended September 3, 2005. In our opinion, these financial statements include all normal and recurring adjustments necessary for a fair presentation. The results for the 12 and 36 weeks are not necessarily indicative of the results expected for the year.
Our significant interim accounting policies include the recognition of a pro rata share of certain estimated annual sales incentives, and certain advertising and marketing costs, generally in proportion to revenue, and the recognition of income taxes using an estimated annual effective tax rate.
Bottling equity income includes our share of the net income or loss of our noncontrolled bottling affiliates and any changes in our ownership interests of these affiliates. In 2005, bottling equity income includes $41 million and $105 million of pre-tax gains on our sales of PBG stock in the 12 and 36 weeks ended September 3, 2005.
The following information is unaudited. Tabular dollars are in millions, except per share amounts. All per share amounts reflect common per share amounts, assume dilution unless noted and are based on unrounded amounts. Certain reclassifications were made to prior year amounts to conform to the 2005 presentation. This report should be read in conjunction with our Annual Report on Form 10-K for the fiscal year ended December 25, 2004.
8
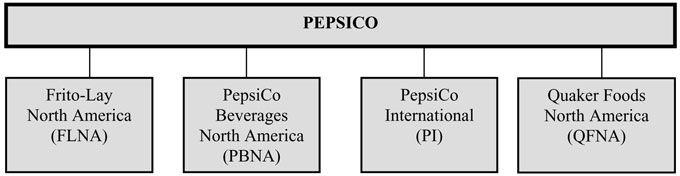
Our Divisions
| | | | | | | | | | | | |
| | | 12 Weeks Ended
| | | 36 Weeks Ended
| |
| | | 9/3/05
| | | 9/4/04
| | | 9/3/05
| | | 9/4/04
| |
NET REVENUE | | | | | | | | | | | | |
FLNA | | $2,461 | | | $2,325 | | | $ 7,097 | | | $ 6,704 | |
PBNA | | 2,520 | | | 2,147 | | | 6,522 | | | 5,999 | |
PI | | 2,839 | | | 2,430 | | | 7,716 | | | 6,719 | |
QFNA | | 364 | | | 355 | | | 1,131 | | | 1,036 | |
| | |
|
| |
|
| |
|
| |
|
|
| | | $8,184 | | | $7,257 | | | $22,466 | | | $20,458 | |
| | |
|
| |
|
| |
|
| |
|
|
OPERATING PROFIT | | | | | | | | | | | | |
FLNA | | $ 655 | | | $ 616 | | | $ 1,788 | | | $ 1,686 | |
PBNA | | 628 | | | 542 | | | 1,598 | | | 1,460 | |
PI | | 473 | | | 370 | | | 1,232 | | | 995 | |
QFNA | | 111 | | | 111 | | | 369 | | | 325 | |
| | |
|
| |
|
| |
|
| |
|
|
Total division | | 1,867 | | | 1,639 | | | 4,987 | | | 4,466 | |
Corporate | | (187 | ) | | (127 | ) | | (504 | ) | | (406 | ) |
| | |
|
| |
|
| |
|
| |
|
|
| | | $1,680 | | | $1,512 | | | $ 4,483 | | | $ 4,060 | |
| | |
|
| |
|
| |
|
| |
|
|
| | | | |
| | | | | | | | | 9/3/05
| | | 12/25/04
| |
TOTAL ASSETS | | | | | | | | | | | | |
FLNA | | | | | | | | $ 5,539 | | | $ 5,476 | |
PBNA | | | | | | | | 6,298 | | | 6,048 | |
PI | | | | | | | | 9,925 | | | 8,921 | |
QFNA | | | | | | | | 952 | | | 978 | |
| | | | | | | | |
|
| |
|
|
Total division | | | | | | | | 22,714 | | | 21,423 | |
Corporate | | | | | | | | 5,055 | | | 3,569 | |
Investments in bottling affiliates | | | | | | | | 3,129 | | | 2,995 | |
| | | | | | | | |
|
| |
|
|
| | | | | | | | | $30,898 | | | $27,987 | |
| | | | | | | | |
|
| |
|
|
9
Intangible Assets
| | | | | | |
| | | 9/3/05
| | | 12/25/04
| |
Amortizable intangible assets, net | | | | | | |
Brands | | $1,035 | | | $1,008 | |
Other identifiable intangibles | | 230 | | | 225 | |
| | |
|
| |
|
|
| | | 1,265 | | | 1,233 | |
Accumulated amortization | | (735 | ) | | (635 | ) |
| | |
|
| |
|
|
| | | $ 530 | | | $ 598 | |
| | |
|
| |
|
|
The change in the book value of nonamortizable intangible assets is as follows:
| | | | | | | | | |
| | | Balance
12/25/04
| | Acquisitions
| | Translation
& Other
| | | Balance
9/3/05
|
FLNA | | | | | | | | | |
Goodwill | | $ 138 | | $— | | $4 | | | $ 142 |
| | |
| |
| |
|
| |
|
PBNA | | | | | | | | | |
Goodwill | | 2,161 | | — | | 2 | | | 2,163 |
Brands | | 59 | | — | | — | | | 59 |
| | |
| |
| |
|
| |
|
| | | 2,220 | | — | | 2 | | | 2,222 |
| | |
| |
| |
|
| |
|
PI | | | | | | | | | |
Goodwill | | 1,435 | | 10 | | (32 | ) | | 1,413 |
Brands | | 869 | | — | | (35 | ) | | 834 |
| | |
| |
| |
|
| |
|
| | | 2,304 | | 10 | | (67 | ) | | 2,247 |
| | |
| |
| |
|
| |
|
QFNA | | | | | | | | | |
Goodwill | | 175 | | — | | — | | | 175 |
| | |
| |
| |
|
| |
|
Corporate | | | | | | | | | |
Pension intangible | | 5 | | — | | — | | | 5 |
| | |
| |
| |
|
| |
|
| | | | |
Total goodwill | | $3,909 | | 10 | | (26 | ) | | $3,893 |
Total brands | | 928 | | — | | (35 | ) | | 893 |
Total pension intangible | | 5 | | — | | — | | | 5 |
| | |
| |
| |
|
| |
|
| | | $4,842 | | $ 10 | | $(61 | ) | | $4,791 |
| | |
| |
| |
|
| |
|
10
Stock-Based Compensation
We account for employee stock options under the fair value method of accounting using a Black-Scholes valuation model. For the 12 weeks, we recognized stock-based compensation expense of $68 million in 2005 and $86 million in 2004. For the 36 weeks, we recognized stock-based compensation expense of $215 million in 2005 and $261 million in 2004. These amounts are reflected in selling, general and administrative expenses.
We are currently evaluating the impact of Statement of Financial Accounting Standards (SFAS) 123R,Share-Based Payment. We will adopt this Standard no later than in the first quarter of 2006. In addition, two of our anchor bottlers, PBG and PepsiAmericas, Inc., will adopt SFAS 123R no later than in the first quarter of 2006 which will negatively impact our bottling equity income upon their adoption.
We currently recognize stock-based compensation cost for employees eligible to retire over the three-year standard vesting period of the grants. Upon adoption of SFAS 123R, we will amortize new option grants to such retirement eligible employees over a shorter period, consistent with the retirement vesting acceleration provisions of these grants. If we had historically recognized stock-based compensation cost for these employees under this accelerated method, $32 million of compensation cost would have been accelerated and cumulatively recognized through September 3, 2005. The impact of recognizing stock-based compensation under this accelerated method for the 12 and 36 weeks ended September 3, 2005 would have been immaterial.
Our weighted average Black-Scholes fair value assumptions are as follows:
| | | | | | |
| | | 12 and 36 Weeks Ended
| |
| | | 9/3/05
| | | 9/4/04
| |
Expected life | | 6 yrs. | | | 6 yrs. | |
Risk free interest rate | | 3.8 | % | | 3.3 | % |
Expected volatility | | 24 | % | | 26 | % |
Expected dividend yield | | 1.8 | % | | 1.8 | % |
11
Pension and Retiree Medical Benefits
The components of net periodic benefit cost for pension and retiree medical plans are as follows:
| | | | | | | | | | | | |
| | | 12 Weeks Ended
| |
| | | 9/3/05
| | | 9/4/04
| | | 9/3/05
| | | 9/4/04
| |
| | | Pension
| | | Retiree Medical
| |
Service cost | | $57 | | | $51 | | | $ 9 | | | $ 9 | |
Interest cost | | 81 | | | 73 | | | 18 | | | 17 | |
Expected return on plan assets | | (96 | ) | | (90 | ) | | — | | | — | |
Amortization of prior service cost/(benefit) | | 1 | | | 2 | | | (2 | ) | | (2 | ) |
Amortization of experience loss | | 28 | | | 21 | | | 6 | | | 4 | |
| | |
|
| |
|
| |
|
| |
|
|
Total expense | | $71 | | | $57 | | | $31 | | | $28 | |
| | |
|
| |
|
| |
|
| |
|
|
| | | | | | | | | | | | |
| | | 36 Weeks Ended
| |
| | | 9/3/05
| | | 9/4/04
| | | 9/3/05
| | | 9/4/04
| |
| | | Pension
| | | Retiree Medical
| |
Service cost | | $171 | | | $152 | | | $27 | | | $27 | |
Interest cost | | 244 | | | 219 | | | 54 | | | 50 | |
Expected return on plan assets | | (289 | ) | | (269 | ) | | — | | | — | |
Amortization of prior service cost/(benefit) | | 3 | | | 5 | | | (6 | ) | | (6 | ) |
Amortization of experience loss | | 84 | | | 63 | | | 18 | | | 13 | |
| | |
|
| |
|
| |
|
| |
|
|
Total expense | | $213 | | | $170 | | | $93 | | | $84 | |
| | |
|
| |
|
| |
|
| |
|
|
12
Net Income Per Common Share
The computations of basic and diluted net income per common share are as follows:
| | | | | | | | | | |
| | | 12 Weeks Ended
|
| | | 9/3/05
| | 9/4/04
|
| | | Income
| | | Shares(a)
| | Income
| | | Shares(a)
|
Net income | | $ 864 | | | | | $1,364 | | | |
Preferred shares: | | | | | | | | | | |
Dividends | | (1 | ) | | | | (1 | ) | | |
Redemption premium | | (2 | ) | | | | (2 | ) | | |
| | |
|
| | | |
|
| | |
Net income available for common shareholders | | $ 861 | | | 1,668 | | $1,361 | | | 1,692 |
| | |
|
| | | |
|
| | |
Basic net income per common share | | $0.52 | | | | | $ 0.80 | | | |
| | |
|
| | | |
|
| | |
Net income available for common shareholders | | $ 861 | | | 1,668 | | $1,361 | | | 1,692 |
Dilutive securities: | | | | | | | | | | |
Stock options and restricted stock units(b) | | — | | | 33 | | — | | | 33 |
ESOP convertible preferred stock | | 3 | | | 2 | | 3 | | | 2 |
| | |
|
| |
| |
|
| |
|
Diluted | | $ 864 | | | 1,703 | | $1,364 | | | 1,727 |
| | |
|
| |
| |
|
| |
|
Diluted net income per common share | | $0.51 | | | | | $ 0.79 | | | |
| | |
|
| | | |
|
| | |
| | | | | | | | | | |
| | | 36 Weeks Ended
|
| | | 9/3/05
| | 9/4/04
|
| | | Income
| | | Shares(a)
| | Income
| | | Shares(a)
|
Net income | | $2,970 | | | | | $3,227 | | | |
Preferred shares: | | | | | | | | | | |
Dividends | | (2 | ) | | | | (2 | ) | | |
Redemption premium | | (11 | ) | | | | (16 | ) | | |
| | |
|
| | | |
|
| | |
Net income available for common shareholders | | $2,957 | | | 1,674 | | $3,209 | | | 1,701 |
| | |
|
| | | |
|
| | |
Basic net income per common share | | $ 1.77 | | | | | $ 1.89 | | | |
| | |
|
| | | |
|
| | |
Net income available for common shareholders | | $2,957 | | | 1,674 | | $3,209 | | | 1,701 |
Dilutive securities: | | | | | | | | | | |
Stock options and restricted stock units(b) | | — | | | 33 | | — | | | 31 |
ESOP convertible preferred stock | | 13 | | | 2 | | 18 | | | 3 |
| | |
|
| |
| |
|
| |
|
Diluted | | $2,970 | | | 1,709 | | $3,227 | | | 1,735 |
| | |
|
| |
| |
|
| |
|
Diluted net income per common share | | $ 1.74 | | | | | $ 1.86 | | | |
| | |
|
| | �� | |
|
| | |
(a) | Weighted average common shares outstanding. |
(b) | Out-of-the money options for the 12 weeks in 2005 were nominal. Options to purchase 4.0 million shares for the 36 weeks in 2005 and 0.5 million shares for the 12 weeks and 9.7 million shares for the 36 weeks in 2004 were not included in the calculation of earnings per share because these options were out-of-the-money. Out-of-the-money options had average exercise prices of $54.75 for the 12 weeks and $53.77 for the 36 weeks in 2005 and $51.98 for the 12 weeks and $51.70 for the 36 weeks in 2004. |
13
Income Taxes
As noted in our 2004 Form 10-K, the American Jobs Creation Act of 2004 (AJCA) creates a one-time incentive for U.S. corporations to repatriate undistributed international earnings by providing an 85% dividends received deduction. As approved by our Board of Directors in July 2005, we plan to repatriate approximately $7.5 billion in earnings previously considered indefinitely reinvested outside the U.S. in the fourth quarter of 2005. In the third quarter of 2005, we recorded income tax expense of $468 million associated with this planned repatriation. Other than the earnings to be repatriated, we intend to continue to reinvest earnings outside the U.S. for the foreseeable future and therefore have not recognized any U.S. tax expense on these earnings.
Supplemental Cash Flow Information
| | | | | | |
| | | 36 Weeks Ended
| |
| | | 9/3/05
| | | 9/4/04
| |
Interest paid | | $ 133 | | | $ 91 | |
Income taxes paid, net of refunds | | $ 668 | | | $1,268 | (a) |
| | |
Acquisitions(b): | | | | | | |
Fair value of assets acquired | | $ 929 | | | $ 30 | |
Less: Cash paid and debt assumed | | (1,052 | ) | | (28 | ) |
Add: SVE minority interest eliminated | | 216 | | | — | |
| | |
|
| |
|
|
Liabilities assumed | | $ 93 | | | $ 2 | |
| | |
|
| |
|
|
(a) | The 36 weeks in 2004 include a tax payment of $760 million as a result of our 2003 settlement with the Internal Revenue Service. |
(b) | In 2005, these amounts include the impact of our first quarter acquisition of General Mills, Inc.’s 40.5% ownership interest in SVE for $750 million. The excess of our purchase price over the preliminary estimate of the fair value of net assets acquired is $534 million. This amount is reflected inOther Assets in ourCondensed Consolidated Balance Sheet as of September 3, 2005, pending finalization of our purchase accounting in the fourth quarter of 2005. |
Recent Accounting Pronouncements
In May 2005, the Financial Accounting Standards Board (FASB) issued SFAS 151,Inventory Costs – an amendment of ARB No. 43, Chapter 4,which relates to inventory costs and the treatment of abnormal amounts of idle facility expense, freight, handling costs and spoilage. The provisions of SFAS 151 are effective for inventory costs incurred beginning in the first quarter of 2006. We are currently evaluating the impact of adopting SFAS 151 on our financial statements, but we do not expect the impact to be significant.
14
ITEM 2. Management’s Discussion and Analysis
FINANCIAL REVIEW
Our discussion and analysis is an integral part of understanding our financial results. Also refer toBasis of Presentation and Our Divisions in the Notes to the Condensed Consolidated Financial Statements. Tabular dollars are presented in millions, except per share amounts. All per share amounts reflect common per share amounts, assume dilution unless noted, and are based on unrounded amounts. Percentage changes are based on unrounded amounts.
Our Critical Accounting Policies
In addition to the critical accounting policies disclosed in our Annual Report on Form 10-K for the fiscal year ended December 25, 2004, the following should be considered. In connection with our ongoing Business Process Transformation (BPT) initiative, we aligned certain accounting policies across our divisions. In the first quarter of 2005, we conformed our methodology for calculating our bad debt reserves and modified our policy for recognizing revenue for products shipped to customers by third-party carriers. In the third quarter of 2005, we conformed our method of accounting for certain freight, distribution, and employee benefits costs. These changes reduced our net revenue by $7 million and $47 million and our operating profit by $45 million and $52 million in the 12 and 36 weeks ended September 3, 2005.
Sales Incentives and Advertising and Marketing Costs
We offer sales incentives through various programs to our customers and to consumers. These incentives are recorded as a reduction of the sales price of our products. Certain sales incentives are recognized at the time of sale while other incentives, such as bottler funding and customer volume rebates, are recognized during the year incurred, generally in proportion to revenue, based on annual targets. Anticipated payments are estimated based on historical experience with similar programs and require management judgment with respect to estimating customer participation and performance levels. In addition, certain advertising and marketing costs are also recognized during the year incurred, generally in proportion to revenue.
Effective Tax Rate
In determining our quarterly provision for income taxes, we use an estimated annual effective tax rate which is based on our expected annual income, statutory tax rates and tax planning opportunities available to us in the various jurisdictions in which we operate. Our estimated annual effective tax rate also reflects our best estimate of the ultimate outcome of tax audits. Significant or unusual items are separately recognized in the quarter in which they occur.
15
Stock-Based Compensation
We account for stock options under the fair value method of accounting using a Black-Scholes valuation model. For the 12 weeks, we recognized stock-based compensation of $68 million in 2005 and $86 million in 2004. For the 36 weeks, we recognized stock-based compensation of $215 million in 2005 and $261 million in 2004. These amounts are reflected in selling, general and administrative expenses.
We are currently evaluating the impact that SFAS 123R could have on our financial statements. We will adopt this Standard no later than in the first quarter of 2006. In addition, two of our anchor bottlers, PBG and PepsiAmericas, Inc., will adopt SFAS 123R no later than in the first quarter of 2006 which will negatively impact our bottling equity income upon their adoption.
We currently recognize stock-based compensation cost for employees eligible to retire over the three-year standard vesting period of the grants. Upon adoption of SFAS 123R, we will amortize new option grants to such retirement eligible employees over a shorter period, consistent with the accelerated retirement vesting provisions of these grants. If we had historically recognized stock-based compensation cost for these employees under this accelerated method, $32 million of compensation cost would have been accelerated and cumulatively recognized through September 3, 2005. The impact of recognizing stock-based compensation under this accelerated method for the 12 and 36 weeks ended September 3, 2005 would have been immaterial.
For our 2005 Black-Scholes assumptions, seeStock-Based Compensationin the Notes to Condensed Consolidated Financial Statements.
Recent Accounting Pronouncements
In May 2005, the Financial Accounting Standards Board (FASB) issued SFAS 151,Inventory Costs – an amendment of ARB No. 43, Chapter 4,which relates to inventory costs and the treatment of abnormal amounts of idle facility expense, freight, handling costs and spoilage. The provisions of SFAS 151 are effective for inventory costs incurred beginning in the first quarter of 2006. We are currently evaluating the impact of adopting SFAS 151 on our financial statements, but we do not expect the impact to be significant.
Our Business Risks
We discuss expectations regarding our future performance, such as our business outlook, in our annual and quarterly reports, press releases, and other written and oral statements. These “forward-looking statements” are based on currently available competitive, financial and economic data and our operating plans. They are inherently uncertain, and investors must recognize that events could turn out to be significantly different from our expectations.
Our operations outside of the United States generate approximately 40% of our net revenue. As a result, we are exposed to foreign currency risks, including unforeseen economic changes and political unrest. During the 36 weeks, net favorable foreign currency, primarily increases in the Canadian dollar, Brazilian real, Mexican peso, and euro contributed over 1 percentage point to net revenue growth. Currency declines which are not offset could adversely impact our future results.
16
The impact of Hurricane Katrina on our third quarter volume and revenue was not material. Write-offs for inventory and receivables, losses from property damage, increased operating costs, and support for affected PepsiCo employees reduced operating profit by approximately $9 million in the third quarter. We expect the recent hurricanes to negatively impact our energy and raw materials costs and, potentially, consumer spending, in the fourth quarter and into 2006.
Cautionary statements regarding our trends and future results were included in Management’s Discussion and Analysis in our Annual Report on Form 10-K for the fiscal year ended December 25, 2004.
Results of Operations—Consolidated Review
In the discussions of net revenue and operating profit below, effective net pricing reflects the year-over-year impact of discrete pricing actions, sales incentive activities and mix resulting from selling varying products in different package sizes and in different countries.
Volume
Since our divisions each use different measures of physical unit volume, a common servings metric is necessary to reflect our consolidated physical unit volume. Total servings increased 8% for the 12 weeks, with worldwide beverages growing 10% and worldwide snacks growing 4.5%. For the 36 weeks, total servings increased 6%, with worldwide beverages growing 7% and worldwide snacks growing 4%.
We discuss volume for our beverage businesses on a bottler case sales (BCS) basis in which all beverage volume is converted to an 8 ounce case metric. A portion of our volume is sold by our bottlers, and that portion is based on our bottlers’ sales to retailers and independent distributors. The remainder of our volume is based on our shipments to customers. BCS is reported to us by our bottlers on a monthly basis. Our third quarter beverage volume includes bottler sales for June, July and August.
Consolidated Results
Total Net Revenue and Operating Profit
| | | | | | | | | | | | | | | | | | |
| | | 12 Weeks Ended
| | | 36 Weeks Ended
| |
| | | 9/3/05
| | | 9/4/04
| | | Change
| | | 9/3/05
| | | 9/4/04
| | | Change
| |
Total net revenue | | $8,184 | | | $7,257 | | | 13 | % | | $22,466 | | | $20,458 | | | 10 | % |
| | | | | | |
Division operating profit | | $1,867 | | | $1,639 | | | 14 | % | | $ 4,987 | | | $ 4,466 | | | 12 | % |
Corporate unallocated | | (187 | ) | | (127 | ) | | 48 | % | | (504 | ) | | (406 | ) | | 24 | % |
| | |
|
| |
|
| | | | |
|
| |
|
| | | |
Total operating profit | | $1,680 | | | $1,512 | | | 11 | % | | $ 4,483 | | | $ 4,060 | | | 10 | % |
| | |
|
| |
|
| | | | |
|
| |
|
| | | |
Division operating profit Margin | | 22.8 | % | | 22.6 | % | | 0.2 | | | 22.2 | % | | 21.8 | % | | 0.4 | |
Total operating profit Margin | | 20.5 | % | | 20.8 | % | | (0.3 | ) | | 20.0 | % | | 19.8 | % | | 0.1 | |
17
12 Weeks
Net revenue increased 13% reflecting strong volume increases, primarily at PI and PBNA, favorable effective net pricing across all divisions, net favorable foreign currency movements, and the impact of acquisitions by PI. The volume increases contributed over 6 percentage points to revenue growth, effective net pricing contributed nearly 4 percentage points, net favorable foreign currency movements added almost 2 percentage points, and the impact of acquisitions by PI contributed almost 1 percentage point.
Total operating profit increased 11% while margin declined 0.3 percentage points. Division operating profit increased 14% and margin increased 0.2 percentage points. The increases in division operating profit and margin reflect leverage from the revenue growth, partially offset by increased selling and delivery (S&D) expenses and cost of sales, largely due to higher raw materials, energy and S&D labor costs. Higher advertising and marketing expenses, primarily at PBNA, also partially offset the operating profit increases. In addition, total operating profit and margin reflect increased Corporate unallocated expenses.
Corporate unallocated expenses increased 48%. This increase primarily reflects conforming our method of accounting across all divisions for certain freight, distribution, and employee benefits costs, described in Our Critical Accounting Policies above, which contributed 35 percentage points to the increase. Increased support behind health and wellness and innovation initiatives contributed 8 percentage points, and higher costs associated with our BPT initiative and higher employee-related costs each contributed 5 percentage points to the increase. Corporate departmental expenses contributed 2 percentage points to the increase. These increases were partially offset by a gain related to the settlement of a class action lawsuit related to our purchases of high fructose corn syrup from 1991 to 1995 which reduced corporate unallocated expenses by 18 percentage points.
36 Weeks
Net revenue increased 10% reflecting, across all divisions, favorable effective net pricing, increased volume and net favorable foreign currency movements. The effective net pricing and the volume gains each contributed 4 percentage points to the increase and the net favorable foreign currency movements contributed over 1 percentage point.
Total operating profit increased 10% and margin increased 0.1 percentage points. Division operating profit increased 12% and margin increased 0.4 percentage points. These gains reflect leverage from the revenue growth, partially offset by increased cost of sales and S&D expenses, largely due to higher raw materials, energy, and S&D labor costs.
Corporate unallocated expenses increased 24%. This increase primarily reflects conforming our method of accounting across all divisions for certain freight, distribution and employee benefits costs, described in Our Critical Accounting Policies above, which contributed 11 percentage points to the increase, and higher costs associated with our BPT initiative which contributed 7 percentage points. Increased support behind health and wellness and innovation initiatives contributed 4 percentage points to the increase, and higher employee-related costs contributed 3 percentage points. Corporate departmental expenses contributed 2 percentage points to the increase. These increases were partially offset by a gain related to the settlement of a class action lawsuit related to our purchases of high fructose corn syrup from 1991 to 1995, which reduced corporate unallocated expenses by 6 percentage points.
18
Other Consolidated Results
| | | | | | | | | | | | | | | | | | |
| | | 12 Weeks Ended
| | | 36 Weeks Ended
| |
| | | 9/3/05
| | | 9/4/04
| | | Change
| | | 9/3/05
| | | 9/4/04
| | | Change
| |
Bottling equity income | | $ 209 | | | $ 147 | | | 42 | % | | $ 430 | | | $ 292 | | | 47 | % |
| | | | | | |
Interest expense, net | | $ (21 | ) | | $ (26 | ) | | (21 | )% | | $ (73 | ) | | (76 | ) | | (5 | )% |
| | | | | | |
Tax rate | | 53.8 | % | | 16.5 | % | | | | | 38.6 | % | | 24.5 | % | | | |
| | | | | | |
Net income | | $ 864 | | | $1,364 | | | (37 | )% | | $2,970 | | | $3,227 | | | (8 | )% |
| | | | | | |
Net income per common share—diluted | | $0.51 | | | $ 0.79 | | | (36 | )% | | $ 1.74 | | | $ 1.86 | | | (7 | )% |
12 Weeks
Bottling equity income increased 42% reflecting $41 million of pre-tax gains on our sales of PBG stock, as well as stronger bottler results.
Net interest expense decreased 21% reflecting the impact of higher investment rates and cash balances, substantially offset by the impact of higher debt levels.
The tax rate increased 37.3 percentage points primarily reflecting the $468 million tax charge recorded in the third quarter of 2005 related to our planned repatriation of undistributed international earnings, as well as the absence of income tax benefits of $221 million recorded in the prior year related to a reduction in foreign tax accruals following the resolution of certain open tax items with foreign tax authorities and a refund claim related to prior U.S. tax settlements. This increase was partially offset by increased international profit which is taxed at a lower rate.
Net income decreased 37% and the related net income per share decreased 36%. These decreases reflect the impact of the tax items discussed above, partially offset by our operating profit growth, increased bottling equity income, which includes the gain on our PBG stock sale, and, for net income per share, the impact of our share repurchases.
36 Weeks
Bottling equity income increased 47% reflecting $105 million of pre-tax gains on our sales of PBG stock, as well as stronger bottler results.
Net interest expense decreased 5% reflecting the impact of higher investment rates and cash balances, substantially offset by the impact of higher debt levels.
19
The tax rate increased 14.1 percentage points primarily reflecting the $468 million tax charge recorded in the third quarter of 2005 related to our planned repatriation of undistributed international earnings, as well as the absence of income tax benefits of $221 million recorded in the prior year related to a reduction in foreign tax accruals following the resolution of certain open tax items with foreign tax authorities and a refund claim related to prior U.S. tax settlements. This increase was partially offset by increased international profit which is taxed at a lower rate.
Net income decreased 8% and the related net income per share decreased 7%. These decreases reflect the impact of the tax items discussed above, partially offset by our operating profit growth, increased bottling equity income, which includes the gain on our PBG stock sale, and, for net income per share, the impact of our share repurchases.
Results of Operations—Division Review
The results and discussions below are based on how our Chief Executive Officer monitors the performance of our divisions. For additional information on our divisions, seeOur Divisionsin the Notes to our Condensed Consolidated Financial Statements.
Division Net Revenue
| | | | | | | | | | | | | | | |
12 Weeks Ended
| | FLNA
| | | PBNA
| | | PI
| | | QFNA
| | | Total
| |
Q3, 2005 | | $2,461 | | | $2,520 | | | $2,839 | | | $ 364 | | | $8,184 | |
Q3, 2004 | | $2,325 | | | $2,147 | | | $2,430 | | | $ 355 | | | $7,257 | |
| | | | | |
% Impact of: | | | | | | | | | | | | | | | |
Volume | | 2 | % | | 9 | %(a) | | 9 | %(a) | | — | % | | 6 | % |
Effective net pricing | | 3 | | | 8 | | | 1 | | | 2 | | | 4 | |
Foreign exchange | | 1 | | | 1 | | | 4 | | | 1 | | | 2 | |
Acquisitions/divestitures | | — | | | — | | | 2 | | | — | | | 1 | |
% Change(b) | | 6 | % | | 17 | % | | 17 | % | | 2 | % | | 13 | % |
Division Net Revenue
| | | | | | | | | | | | | | | | | | | | |
36 Weeks Ended
| | FLNA
| | | PBNA
| | | PI
| | | QFNA
| | | Total
| |
Q3, 2005 | | $ | 7,097 | | | $ | 6,522 | | | $ | 7,716 | | | $ | 1,131 | | | $ | 22,466 | |
Q3, 2004 | | $ | 6,704 | | | $ | 5,999 | | | $ | 6,719 | | | $ | 1,036 | | | $ | 20,458 | |
| | | | | |
% Impact of: | | | | | | | | | | | | | | | | | | | | |
Volume | | | 2 | % | | | 2 | %(a) | | | 7 | %(a) | | | 6 | % | | | 4 | % |
Effective net pricing | | | 3 | | | | 6 | | | | 3 | | | | 2 | | | | 4 | |
Foreign exchange | | | 1 | | | | — | | | | 3 | | | | 1 | | | | 1 | |
Acquisitions/divestitures | | | — | | | | — | | | | 1 | | | | — | | | | — | |
% Change(b) | | | 6 | % | | | 9 | % | | | 15 | % | | | 9 | % | | | 10 | % |
(a) | For beverages sold to our bottlers, net revenue volume growth is based on our concentrate shipments and equivalents. |
(b) | Amounts may not foot due to rounding. |
20
Frito-Lay North America
| | | | | | | | | | | | | | |
| | | 12 Weeks Ended
| | | 36 Weeks Ended
| |
| | | 9/3/05
| | 9/4/04
| | Change
| | | 9/3/05
| | 9/4/04
| | Change
| |
Net revenue | | $2,461 | | $2,325 | | 6 | % | | $7,097 | | $6,704 | | 6 | % |
| | | | | | |
Operating profit | | $ 655 | | $ 616 | | 6 | % | | $1,788 | | $1,686 | | 6 | % |
12 Weeks
Net revenue grew 6% reflecting volume growth of 2% and positive effective net pricing due to salty snack pricing actions, favorable mix on both salty and convenience food products, and the favorable settlement of prior year trade spending accruals. Pound volume grew primarily due to double-digit growth in Santitas, low single-digit growth in Lay’s Classic potato chips, mid single-digit growth in Cheetos, and double-digit growth in Chewy Granola and Sun Chips. These gains were partially offset by the discontinuance of Toastables and a double-digit decline in Doritos Rollitos. Overall, salty snacks revenue grew 5% with volume growth of 2%, and convenience food products revenue grew 10%, with a 1% increase in volume.
Operating profit grew 6% primarily driven by revenue growth. This growth was reduced by higher S&D costs reflecting increased labor and benefit charges, increased advertising and marketing costs, and the impact of Hurricane Katrina, which resulted in inventory and receivable losses and property damage. In addition, the favorable settlement of prior year trade accruals contributed to operating profit growth.
Products qualifying for our Smart Spot program represented 12% of net revenue. These products experienced double-digit revenue growth, while the balance of the portfolio had mid single-digit revenue growth.
36 Weeks
Net revenue grew 6% reflecting volume growth of 2.5% and positive effective net pricing due to salty snack pricing actions and favorable mix on both salty and convenience food products. Pound volume grew primarily due to low single-digit growth in Lay’s Classic potato chips, double-digit growth in Santitas and Sun Chips, and mid single-digit growth in Cheetos, Dips, Fritos and Tostitos. These gains were partially offset by the discontinuance of Toastables and a double-digit decline in Doritos Rollitos. Overall, salty snacks revenue grew 5% with volume growth of 3%, and convenience food products revenue grew 11%, with volume declines of 2%.
Operating profit grew 6% primarily driven by revenue growth. This growth was partially offset by higher S&D costs reflecting increased labor and benefit charges and higher cost of sales, driven by raw materials, natural gas and freight. The impact of these increased costs was reduced by a favorable casualty insurance actuarial adjustment made in the second quarter to reflect improved safety performance.
Products qualifying for our Smart Spot program represented nearly 13% of net revenue. These products experienced double-digit revenue growth, while the balance of the portfolio had mid single-digit revenue growth.
21
PepsiCo Beverages North America
| | | | | | | | | | | | | | |
| | | 12 Weeks Ended
| | | 36 Weeks Ended
| |
| | | 9/3/05
| | 9/4/04
| | Change
| | | 9/3/05
| | 9/4/04
| | Change
| |
Net revenue | | $2,520 | | $2,147 | | 17 | % | | $6,522 | | $5,999 | | 9 | % |
| | | | | | |
Operating profit | | $ 628 | | $ 542 | | 16 | % | | $1,598 | | $1,460 | | 10 | % |
12 weeks
Net revenue increased 17% reflecting volume growth of 8%. The volume increase was driven by a 24% increase in non-carbonated beverages, while carbonated soft drink volume was unchanged from the prior year. The non-carbonated beverage growth was fueled by double-digit growth in Gatorade, Trademark Aquafina, and Propel. Above average temperatures across the country, as well as the launch of new products such as Aquafina Flavorsplash and Gatorade Lemonade earlier in the year, drove Gatorade growth and Trademark Aquafina growth. Trademark Aquafina also benefited from lower retail pricing. Tropicana Pure Premium experienced a low single-digit decline resulting from price increases taken in the first quarter. Within carbonated soft drinks (CSDs), Trademark Pepsi and Trademark Mountain Dew experienced low single-digit declines, while Trademark Sierra Mist achieved mid single-digit growth. Across the trademarks, regular CSDs experienced a low single-digit decline, while diet CSDs achieved mid single-digit growth, boosted by product relaunches.
Net revenue also benefited from nearly 8 percentage points of favorable effective net pricing, primarily reflecting the continued migration from CSDs to non-carbonated beverages and price increases taken in the first quarter, primarily on concentrate and Tropicana Pure Premium. Favorable Canadian foreign exchange rates contributed almost 1 percentage point to net revenue growth.
Operating profit increased 16%, primarily reflecting the net revenue growth. This increase was partially offset by higher raw material, energy, and transportation costs and increased advertising and marketing expenses.
Products qualifying for our Smart Spot program represented approximately 70% of net revenue. These products experienced double-digit revenue growth, while the balance of the portfolio grew in the mid single-digit range.
36 weeks
Net revenue grew 9% and volume grew 3.5%. The volume increase was driven by a 13% increase in non-carbonated beverages, partially offset by a more than 1% decline in CSDs. Within non-carbonated beverages, Gatorade, Trademark Aquafina and Propel all experienced double-digit growth. Above average summer temperatures across the country, as well as the launch of new products such as Aquafina Flavorsplash and Gatorade Lemonade earlier in the year, drove Gatorade growth and Trademark Aquafina growth. Tropicana Pure Premium experienced a mid single-digit decline resulting from the higher pricing. The decline in CSDs reflects low single-digit declines in
22
Trademark Pepsi and Trademark Mountain Dew, slightly offset by low single-digit growth in Sierra Mist. Across the brands, diet CSDs achieved low single-digit growth, while regular CSDs declined in the low single-digit range.
Net revenue also benefited from 6 percentage points of favorable effective net pricing, reflecting the continued migration from CSDs to non-carbonated beverages, price increases taken in the first quarter, primarily on concentrate and Tropicana Pure Premium, and a favorable comparison to prior year trade spending, including the settlement of prior year accruals.
Operating profit increased 10%, primarily reflecting the net revenue growth, the favorable resolution of prior year estimated accruals, including the favorable trade spending settlement, and the absence of restructuring costs recorded in the prior year. This increase was partially offset by higher raw material, energy, and transportation costs, as well as increased advertising and marketing expenses.
Products qualifying for our Smart Spot program represented approximately 70% of net revenue. These products experienced double-digit revenue growth, while the balance of the portfolio grew in the low single-digit range.
PepsiCo International
| | | | | | | | | | | | | | |
| | | 12 Weeks Ended
| | | 36 Weeks Ended
| |
| | | 9/3/05
| | 9/4/04
| | Change
| | | 9/3/05
| | 9/4/04
| | Change
| |
Net revenue | | $2,839 | | $2,430 | | 17 | % | | $7,716 | | $6,719 | | 15 | % |
| | | | | | |
Operating profit | | $ 473 | | $ 370 | | 28 | % | | $1,232 | | $ 995 | | 24 | % |
12 Weeks
International snacks volume grew 7%, driven principally by growth of 14% in the Europe, Middle East & Africa region, 3% in the Latin America Region and 3.5% in the Asia Region. Acquisition and divestiture activity, principally the divesture last year of our interest in a South Korea joint venture, reduced Asia region volume by 15 percentage points. The acquisition of a business in Romania late in 2004 increased the Europe, Middle East & Africa region volume growth by 4 percentage points. Cumulatively, our divestiture and acquisition activity had no net impact on the reported total PepsiCo International snack volume growth rate. The overall gains for the third quarter were driven by double-digit growth in India, Turkey, Russia and China along with low single-digit growth at Gamesa in Mexico. These gains were partially offset by less than 1% declines at Sabritas in Mexico and Walkers in the United Kingdom. The decline at Sabritas was principally due to pricing actions taken in late 2004. Although volume is down for the quarter at Walkers, the volume trend has improved quarter over quarter.
Beverage volume grew 13%, comprised of 15% in the Europe, Middle East & Africa region, 13% in the Asia Pacific region and 8% in the Latin America region. Acquisitions increased the reported Europe, Middle East & Africa region growth rate by 1 percentage point while contributing half a percentage point to the reported total PepsiCo International beverage volume growth rate. Broad-based
23
increases were led by double-digit growth in the Middle East, China, Russia, Venezuela and Argentina. Carbonated soft drinks and non-carbonated beverages both grew at a double-digit rate.
Net revenue grew 17%, driven by the broad-based volume growth. Foreign currency impact contributed 4 percentage points of growth, reflecting the favorable Mexican peso and Brazilian real, partially offset by the unfavorable British pound. Acquisitions contributed 2 percentage points of growth.
Operating profit grew 28% driven largely by the broad-based volume growth, partially offset by increased energy and raw material costs. Foreign currency impact contributed 6 percentage points of growth, primarily due to favorability in the Mexican peso and Brazilian real, partially offset by the unfavorable British pound. The net favorable impact from acquisition and divestiture activity, primarily the acquisition of General Mills’ interest in Snack Ventures Europe in Q1 2005, contributed 3 percentage points of growth.
36 Weeks
International snacks volume grew 4%, reflecting growth of 9% in the Europe, Middle East & Africa region, 2% in the Latin America region and 1.5% in the Asia Pacific region. Acquisition and divestiture activity, principally the divesture last year of our interest in a South Korea joint venture, reduced Asia region volume by 15 percentage points. The acquisition of a business in Romania late in 2004 increased the Europe, Middle East & Africa region volume growth by 3 percentage points. Cumulatively, our divestiture and acquisition activity had no net impact on the reported total PepsiCo International snack volume growth rate. The overall gains reflected double-digit growth in India, Turkey, Russia, China and Australia, partially offset by a single-digit decline at Walkers in the United Kingdom. The decline at Walkers is due principally to marketplace pressures.
Beverage volume grew 11%, comprised of 13% in the Europe, Middle East & Africa region, 11% in the Asia Pacific region and 6% in the Latin America region. Acquisitions had no significant impact on the reported total PepsiCo International beverage volume growth rate. Broad-based increases were led by double-digit growth in the Middle East, China, Argentina, Venezuela and Russia. Carbonated soft drinks and non-carbonated beverages both grew at a double-digit rate.
Net revenue grew 15%, primarily as a result of the broad-based volume growth and favorable effective net pricing. Foreign currency contributed 3 percentage points of growth reflecting the favorable Brazilian real, Mexican peso, euro and British pound. Acquisitions contributed 1 percentage point of growth.
Operating profit grew 24% driven largely by the broad-based volume growth and favorable effective net pricing, partially offset by increased energy and raw material costs. Foreign currency contributed 4 percentage points of growth based on the favorable Mexican peso, Brazilian real, British pound and euro. The net favorable impact from acquisition and divestiture activity, primarily the acquisition of General Mills’ interest in Snack Ventures Europe in Q1 2005, contributed 2 percentage points of growth.
24
Quaker Foods North America
| | | | | | | | | | | | | | |
| | | 12 Weeks Ended
| | | 36 Weeks Ended
| |
| | | 9/3/05
| | 9/4/04
| | Change
| | | 9/3/05
| | 9/4/04
| | Change
| |
Net revenue | | $364 | | $355 | | 2 | % | | $1,131 | | $1,036 | | 9 | % |
| | | | | | |
Operating profit | | $111 | | $111 | | — | | | $ 369 | | $ 325 | | 13 | % |
12 Weeks
Net revenue increased 2% and volume was flat. The flat volume reflects double-digit growth in Rice-A-Roni, high single-digit growth in Life and low single-digit growth in Cap’n Crunch and Oatmeal. These gains were offset by a low single-digit decline in Aunt Jemima syrup and mix, as well as declines in other breakfast foods. Higher effective net pricing contributed almost 2 percentage points of growth to net revenue primarily reflecting favorable product mix and price increases on ready-to-eat cereals taken in August 2004. Favorable Canadian foreign exchange rates contributed nearly 1 percentage point to net revenue growth.
Operating profit was flat as increased advertising and marketing costs behind programs for innovation and core brands, as well as higher cost of sales, offset net revenue growth.
Products qualifying for our Smart Spot program represented approximately half of net revenue and had low single-digit revenue growth. The balance of the portfolio experienced mid single-digit revenue growth.
36 Weeks
Net revenue grew 9% and volume increased 6%. The volume increase reflects double-digit growth in Oatmeal and Rice-A-Roni, and high single-digit growth in Aunt Jemima syrup and mix and Cap’n Crunch. Higher effective net pricing contributed over 2 percentage points of growth primarily reflecting the settlement of prior year trade spending accruals, favorable product mix and price increases on ready-to-eat cereals taken in the third quarter of 2004. Favorable Canadian foreign exchange rates contributed nearly 1 percentage point to net revenue growth.
Operating profit increased 13% reflecting the net revenue growth and favorable cost of sales comparisons, partially offset by increased advertising and marketing costs behind programs for innovation and core brands.
Products qualifying for our Smart Spot program represented approximately half of net revenue and had double-digit revenue growth. The balance of the portfolio experienced high single-digit revenue growth.
25
OUR LIQUIDITY AND CAPITAL RESOURCES
Operating Activities
During the 36 weeks, our operations provided $4.6 billion of cash primarily reflecting our solid business results. The prior year reflects a $760 million tax payment related to our 2003 settlement with the IRS.
We make periodic regulatory contributions to our qualified pension plans during the course of the year. We also make annual discretionary contributions to these plans. For the full year 2005, we expect total contributions to these plans to be approximately $800 million, substantially all of which will be included in our fourth quarter operating cash flows. As a result of these contributions, we expect the assets for these plans to meet or exceed the liabilities for service to date as of September 30, 2005.
Investing Activities
During the 36 weeks, we used $3.5 billion, primarily reflecting net purchases of short-term investments of $1.9 billion, primarily internationally, acquisitions of $1.1 billion, primarily the $750 million acquisition of SVE, and capital spending of $796 million. These amounts were partially offset by the proceeds from our sale of PBG stock of $177 million. We continue to expect full year capital spending to approximate 5% of net revenue.
Financing Activities
During the 36 weeks, we used $1.5 billion, primarily reflecting common share repurchases of $2.1 billion and dividend payments of $1.2 billion, partially offset by net proceeds from short-term borrowings of $1.2 billion, primarily in the U.S., and stock option proceeds of $707 million.
Management Operating Cash Flow
Management operating cash flow is the primary measure management uses to monitor cash flow performance. However, it is not a measure provided by accounting principles generally accepted in the U.S. Since net capital spending is essential to our product innovation initiatives and maintaining our operational capabilities, we believe that it is a recurring and necessary use of cash. As such, we believe investors should also consider net capital spending when evaluating our cash from operating activities. The table below reconciles net cash provided by operating activities as reflected in our Condensed Consolidated Statement of Cash Flows to our management operating cash flow.
| | | | | | |
| | | 36 Weeks Ended
| |
| | | 9/3/05
| | | 9/4/04
| |
Net cash provided by operating activities | | $4,558 | | | $3,717 | |
Capital spending | | (796 | ) | | (700 | ) |
Sales of property, plant and equipment | | 65 | | | 15 | |
| | |
|
| |
|
|
Management operating cash flow | | $3,827 | | | $3,032 | |
| | |
|
| |
|
|
Management operating cash flow was used primarily to repurchase shares and pay dividends, and we expect to continue to return approximately all of our management operating cash flow to our shareholders. We also continue to expect management operating cash flow for the full year to exceed $4.1 billion reflecting our underlying business growth, and expect share repurchases to be approximately $3.0 billion this year. SeeOur Business Risks for certain factors that may impact our operating cash flows.
26
We plan to fund our $7.5 billion repatriation of undistributed international earnings in the fourth quarter with existing international cash and increased borrowings. Our Board of Directors has approved a Domestic Reinvestment Plan to use the amount in accordance with the requirements of the AJCA.
We expect the fourth quarter repatriation, as well as planned repayments of domestic debt, to increase total debt and total short-term investments by approximately the same amount.
Upon adoption of SFAS 123R, we will be required to record tax benefits related to stock-based compensation exercises in excess of the tax benefits initially recorded as a cash inflow from financing activities rather than as a reduction in operating cash outflows. We are currently evaluating the impact on the classification of our cash flows of the adoption of SFAS 123R.
27
Report of Independent Registered Public Accounting Firm
The Board of Directors
PepsiCo, Inc.
We have reviewed the accompanying Condensed Consolidated Balance Sheet of PepsiCo, Inc. and Subsidiaries as of September 3, 2005 and the related Condensed Consolidated Statements of Income and Comprehensive Income for the twelve and thirty-six weeks ended September 3, 2005 and September 4, 2004 and the Condensed Consolidated Statement of Cash Flows for the thirty-six weeks ended September 3, 2005 and September 4, 2004. These interim condensed consolidated financial statements are the responsibility of PepsiCo, Inc.’s management.
We conducted our review in accordance with the standards of the Public Company Accounting Oversight Board (United States). A review of interim financial information consists principally of applying analytical procedures and making inquiries of persons responsible for financial and accounting matters. It is substantially less in scope than an audit conducted in accordance with the standards of the Public Company Accounting Oversight Board, the objective of which is the expression of an opinion regarding the financial statements taken as a whole. Accordingly, we do not express such an opinion.
Based on our review, we are not aware of any material modifications that should be made to the accompanying interim condensed consolidated financial statements referred to above for them to be in conformity with U.S. generally accepted accounting principles.
We have previously audited, in accordance with the standards of the Public Company Accounting Oversight Board (United States), the Consolidated Balance Sheet of PepsiCo, Inc. and Subsidiaries as of December 25, 2004, and the related Consolidated Statements of Income, Common Shareholders’ Equity and Cash Flows for the year then ended not presented herein; and in our report dated February 24, 2005, we expressed an unqualified opinion on those consolidated financial statements. In our opinion, the information set forth in the accompanying Condensed Consolidated Balance Sheet as of December 25, 2004, is fairly presented, in all material respects, in relation to the Consolidated Balance Sheet from which it has been derived.
/s/ KPMG LLP
New York, New York
September 29, 2005
28
ITEM 4. | Controls and Procedures |
As of the end of the period covered by this report, we carried out an evaluation, under the supervision and with the participation of our management, including our Chief Executive Officer and Chief Financial Officer, of the effectiveness of the design and operation of our disclosure controls and procedures pursuant to Rule 13a-14 of the Exchange Act. Based upon that evaluation, our Chief Executive Officer and Chief Financial Officer concluded that our disclosure controls and procedures are effective in alerting them on a timely basis to information required to be included in our submissions and filings with the SEC.
In addition, there were no changes in our internal control over financial reporting during our third fiscal quarter of 2005 that have materially affected, or are reasonably likely to materially affect, our internal control over financial reporting.
29
PART II OTHER INFORMATION
We are party to a variety of legal proceedings arising in the normal course of business, including the matters discussed below. While the results of proceedings cannot be predicted with certainty, management believes that the final outcome of these proceedings will not have a material adverse effect on our consolidated financial statements, results of operations or cash flows.
On April 30, 2004, we announced that Frito-Lay and Pepsi-Cola Company received notification from the Securities and Exchange Commission (the “SEC”) indicating that the SEC staff was proposing to recommend that the SEC bring a civil action alleging that a non-executive employee at Pepsi-Cola and another at Frito-Lay signed documents in early 2001 prepared by Kmart acknowledging payments in the amount of $3 million from Pepsi-Cola and $2.8 million from Frito-Lay. Kmart allegedly used these documents to prematurely recognize the $3 million and $2.8 million in revenue. Frito-Lay and Pepsi-Cola have cooperated fully with this investigation and provided written responses to the SEC staff notices setting forth the factual and legal bases for their belief that no enforcement actions should be brought against Frito-Lay or Pepsi-Cola.
Based on an internal review of the Kmart matters, no officers of PepsiCo, Pepsi-Cola or Frito-Lay are involved. Neither of these matters involves any allegations regarding PepsiCo’s accounting for its transactions with Kmart or PepsiCo’s financial statements.
30
ITEM 2. | Unregistered Sale of Equity Securities and Use of Proceeds |
A summary of our repurchases (in millions, except average price per share) during the quarter under the $7 billion repurchase program authorized by our Board of Directors and publicly announced on March 29, 2004, and expiring on March 31, 2007, is as follows:
| | | | | | | |
| | | Shares Repurchased
| | Average Price Per Share
| | Authorization Remaining
| |
6/11/05 | | | | | | $3,598 | |
6/12/05—7/9/05 | | 4.9 | | $54.51 | | (265 | ) |
| | | | | | |
|
|
| | | | | | | 3,333 | |
7/10/05—8/6/05 | | 5.7 | | 54.72 | | (314 | ) |
| | | | | | |
|
|
| | | | | | | 3,019 | |
8/7/05—9/3/05 | | 4.5 | | 54.64 | | (248 | ) |
| | |
| | | |
|
|
| | | 15.1 | | $54.63 | | $2,771 | |
| | |
| |
| |
|
|
SeeIndex to Exhibits on page 33.
31
Pursuant to the requirements of the Securities Exchange Act of 1934, the registrant has duly caused this report to be signed on its behalf by the undersigned.
| | | | | | |
| | | | | | | PepsiCo, Inc. |
| | | | | | | (Registrant) |
| | | |
Date: | | September 30, 2005 | | | | /S/ PETER A. BRIDGMAN |
| | | | | | | Peter A. Bridgman |
| | | | | | | Senior Vice President and |
| | | | | | | Controller |
| | | |
Date: | | September 30, 2005 | | | | /S/ ROBERT E. COX |
| | | | | | | Robert E. Cox |
| | | | | | | Vice President, Deputy General |
| | | | | | | Counsel and Assistant Secretary |
| | | | | | | (Duly Authorized Officer) |
32
INDEX TO EXHIBITS
ITEM 6 (a)
| | |
| EXHIBITS | | |
| |
Exhibit 3.2 | | By-laws of PepsiCo, Inc., as amended, effective October 1, 2005. |
| |
Exhibit 10 | | PepsiCo, Inc., 2003 Long-Term Incentive Plan, as amended and restated effective October 1, 2005 |
| |
Exhibit 12 | | Computation of Ratio of Earnings to Fixed Charges |
| |
Exhibit 15 | | Letter re: Unaudited Interim Financial Information |
| |
Exhibit 31 | | Certifications of Chief Executive Officer and Chief Financial Officer pursuant to Section 302 of the Sarbanes-Oxley Act of 2002 |
| |
Exhibit 32 | | Certifications of Chief Executive Officer and Chief Financial Officer pursuant to Section 906 of the Sarbanes-Oxley Act of 2002, 18 U.S.C. Section 1350 |
33