FORM 10-Q
UNITED STATES SECURITIES AND EXCHANGE COMMISSION
WASHINGTON, D.C. 20549
(Mark One)
X | QUARTERLY REPORT PURSUANT TO SECTION 13 OR 15(d) OF THE SECURITIES EXCHANGE ACT OF 1934 |
For the quarterly period endedJune 17, 2006 (24 weeks)
OR
| TRANSITION REPORT PURSUANT TO SECTION 13 OR 15(d) OF THE SECURITIES EXCHANGE ACT OF 1934 |
For the transition period from to
Commission file number1-1183

PepsiCo, Inc.
(Exact name of registrant as specified in its charter)
| | |
North Carolina | | 13-1584302 |
(State or Other Jurisdiction of | | (I.R.S. Employer |
Incorporation or Organization) | | Identification No.) |
| | |
700 Anderson Hill Road, Purchase, New York | | 10577 |
(Address of Principal Executive Offices) | | (Zip Code) |
914-253-2000
(Registrant’s Telephone Number, Including Area Code)
N/A
(Former Name, Former Address and Former Fiscal Year, if Changed Since Last Report)
Indicate by check mark whether the registrant (1) has filed all reports required to be filed by Section 13 or 15(d) of the Securities Exchange Act of 1934 during the preceding 12 months (or for such shorter period that the registrant was required to file such reports), and (2) has been subject to such filing requirements for the past 90 days. YES X NO
Indicate by check mark whether the registrant is a large accelerated filer, an accelerated filer, or a non-accelerated filer. See definition of “accelerated filer and large accelerated filer” in Rule 12b-2 of the Exchange Act. (Check one):
Large accelerated filer X Accelerated filer Non-accelerated filer
Indicate by check mark whether the registrant is a shell company (as defined in Rule 12b-2 of the Exchange Act). Yes No X
Number of shares of Common Stock outstanding as of July 7, 2006: 1,648,680,085
PEPSICO, INC. AND SUBSIDIARIES
INDEX
2
PART I FINANCIAL INFORMATION
ITEM 1. Condensed Consolidated Financial Statements
PEPSICO, INC. AND SUBSIDIARIES
CONDENSED CONSOLIDATED STATEMENT OF INCOME
(in millions except per share amounts, unaudited)
| | | | | | | | |
| | | 12 Weeks Ended | | 24 Weeks Ended |
| | | 6/17/06 | | 6/11/05 | | 6/17/06 | | 6/11/05 |
| | | | |
Net Revenue | | $8,599 | | $7,697 | | $15,804 | | $14,282 |
| | | | |
Cost of sales | | 3,809 | | 3,314 | | 6,988 | | 6,184 |
Selling, general and administrative expenses | | 2,992 | | 2,790 | | 5,639 | | 5,229 |
Amortization of intangible assets | | 36 | | 37 | | 67 | | 66 |
| | | | | | | | |
| | | | |
Operating Profit | | 1,762 | | 1,556 | | 3,110 | | 2,803 |
| | | | |
Bottling equity income | | 176 | | 156 | | 260 | | 221 |
Interest expense | | (59) | | (53) | | (121) | | (103) |
Interest income | | 26 | | 28 | | 71 | | 51 |
| | | | | | | | |
| | | | |
Income before income taxes | | 1,905 | | 1,687 | | 3,320 | | 2,972 |
| | | | |
Provision for income taxes | | 547 | | 493 | | 943 | | 866 |
| | | | | | | | |
| | | | |
Net Income | | $1,358 | | $1,194 | | $ 2,377 | | $ 2,106 |
| | | | | | | | |
| | | | |
Net Income Per Common Share | | | | | | | | |
Basic | | $0.82 | | $0.71 | | $1.43 | | $1.25 |
Diluted | | $0.80 | | $0.70 | | $1.41 | | $1.23 |
| | | | |
Cash Dividends Declared Per Common Share | | $0.30 | | $0.26 | | $0.56 | | $0.49 |
See accompanyingNotes to the Condensed Consolidated Financial Statements.
3
PEPSICO, INC. AND SUBSIDIARIES
CONDENSED CONSOLIDATED STATEMENT OF CASH FLOWS
(in millions, unaudited)
| | | | |
| | | 24 Weeks Ended |
| | | 6/17/06 | | 6/11/05 |
Operating Activities | | | | |
Net income | | $ 2,377 | | $ 2,106 |
Depreciation and amortization | | 610 | | 588 |
Stock-based compensation expense | | 128 | | 147 |
Excess tax benefits from share-based payment arrangements | | (64) | | – |
Cash payments for merger-related costs and restructuring charges | | – | | (19) |
Pension and retiree medical plan contributions | | (60) | | (78) |
Pension and retiree medical plan expenses | | 248 | | 204 |
Bottling equity income, net of dividends | | (220) | | (159) |
Deferred income taxes and other tax charges and credits | | 14 | | 66 |
Change in accounts and notes receivable | | (753) | | (587) |
Change in inventories | | (396) | | (282) |
Change in prepaid expenses and other current assets | | (29) | | 12 |
Change in accounts payable and other current liabilities | | – | | (206) |
Change in income taxes payable | | (6) | | 549 |
Other, net | | (19) | | 22 |
| | | | |
Net Cash Provided by Operating Activities | | 1,830 | | 2,363 |
| | | | |
Investing Activities | | | | |
Snack Ventures Europe (SVE) minority interest acquisition | | – | | (750) |
Capital spending | | (708) | | (478) |
Sales of property, plant and equipment | | 23 | | 42 |
Other acquisitions and investments in noncontrolled affiliates | | (434) | | (214) |
Cash proceeds from sale of The Pepsi Bottling Group (PBG) stock | | 180 | | 107 |
Divestitures | | – | | 3 |
Short-term investments, by original maturity | | | | |
More than three months – purchases | | (9) | | (42) |
More than three months – maturities | | 20 | | 24 |
Three months or less, net | | 897 | | (1,144) |
| | | | |
Net Cash Used for Investing Activities | | (31) | | (2,452) |
| | | | |
Financing Activities | | | | |
Proceeds from issuances of long-term debt | | 109 | | 13 |
Payments of long-term debt | | (135) | | (85) |
Short-term borrowings, by original maturity | | | | |
More than three months – proceeds | | 14 | | 44 |
More than three months – payments | | (229) | | (10) |
Three months or less, net | | (1,285) | | 902 |
Cash dividends paid | | (863) | | (774) |
Share repurchases – common | | (1,469) | | (1,240) |
Share repurchases – preferred | | (5) | | (11) |
Proceeds from exercises of stock options | | 697 | | 590 |
Excess tax benefits from share-based payment arrangements | | 64 | | – |
| | | | |
Net Cash Used for Financing Activities | | (3,102) | | (571) |
Effect of Exchange Rate Changes on Cash and Cash Equivalents | | 6 | | (25) |
| | | | |
Net Decrease in Cash and Cash Equivalents | | (1,297) | | (685) |
Cash and Cash Equivalents – Beginning of year | | 1,716 | | 1,280 |
| | | | |
Cash and Cash Equivalents – End of period | | $ 419 | | $ 595 |
| | | | |
See accompanyingNotes to the Condensed Consolidated Financial Statements.
4
PEPSICO, INC. AND SUBSIDIARIES
CONDENSED CONSOLIDATED BALANCE SHEET
(in millions)
| | | | |
| | (Unaudited) | | |
| | | 6/17/06 | | 12/31/05 |
Assets | | | | |
Current Assets | | | | |
Cash and cash equivalents | | $ 419 | | $ 1,716 |
| | |
Short-term investments | | 2,259 | | 3,166 |
| | |
Accounts and notes receivable, less
allowance: 6/06 – $77, 12/05 – $75 | | 4,104 | | 3,261 |
| | |
Inventories | | | | |
Raw materials | | 865 | | 738 |
Work-in-process | | 228 | | 112 |
Finished goods | | 1,007 | | 843 |
| | | | |
| | 2,100 | | 1,693 |
| | |
Prepaid expenses and other current assets | | 648 | | 618 |
| | | | |
Total Current Assets | | 9,530 | | 10,454 |
| | |
Property, Plant and Equipment | | 17,821 | | 17,145 |
Accumulated Depreciation | | (8,884) | | (8,464) |
| | | | |
| | 8,937 | | 8,681 |
| | |
Amortizable Intangible Assets, net | | 548 | | 530 |
| | |
Goodwill | | 4,271 | | 4,088 |
Other Nonamortizable Intangible Assets | | 1,156 | | 1,086 |
| | | | |
Nonamortizable Intangible Assets | | 5,427 | | 5,174 |
| | |
Investments in Noncontrolled Affiliates | | 3,509 | | 3,485 |
Other Assets | | 3,475 | | 3,403 |
| | | | |
| | |
Total Assets | | $31,426 | | $31,727 |
| | | | |
Continued on next page.
5
PEPSICO, INC. AND SUBSIDIARIES
CONDENSED CONSOLIDATED BALANCE SHEET (continued)
(in millions except per share amounts)
| | | | |
| | | (Unaudited) | | |
| | | 6/17/06 | | 12/31/05 |
Liabilities and Shareholders’ Equity | | | | |
Current Liabilities | | | | |
Short-term obligations | | $ 1,161 | | $ 2,889 |
Accounts payable and other current liabilities | | 6,184 | | 5,971 |
Income taxes payable | | 449 | | 546 |
| | | | |
Total Current Liabilities | | 7,794 | | 9,406 |
| | |
Long-term Debt Obligations | | 2,542 | | 2,313 |
| | |
Other Liabilities | | 4,430 | | 4,323 |
| | |
Deferred Income Taxes | | 1,427 | | 1,434 |
| | | | |
Total Liabilities | | 16,193 | | 17,476 |
| | |
Commitments and Contingencies | | | | |
| | |
Preferred Stock, no par value | | 41 | | 41 |
Repurchased Preferred Stock | | (114) | | (110) |
| | |
Common Shareholders’ Equity | | | | |
Common stock, par value 1 2/3 cents per share: | | | | |
Authorized 3,600 shares, issued 6/06 and 12/05 – 1,782 shares | | 30 | | 30 |
Capital in excess of par value | | 552 | | 614 |
Retained earnings | | 22,563 | | 21,116 |
Accumulated other comprehensive loss | | (902) | | (1,053) |
| | | | |
| | 22,243 | | 20,707 |
| | |
Less: repurchased common stock, at cost: | | | | |
6/06 – 133 shares, 12/05 – 126 shares | | (6,937) | | (6,387) |
| | | | |
| | |
Total Common Shareholders’ Equity | | 15,306 | | 14,320 |
| | | | |
| | |
Total Liabilities and Shareholders’ Equity | | $31,426 | | $31,727 |
| | | | |
See accompanyingNotes to the Condensed Consolidated Financial Statements.
6
PEPSICO, INC. AND SUBSIDIARIES
CONDENSED CONSOLIDATED STATEMENT
OF COMPREHENSIVE INCOME
(in millions, unaudited)
| | | | | | | | |
| | | 12 Weeks Ended | | 24 Weeks Ended |
| | | 6/17/06 | | 6/11/05 | | 6/17/06 | | 6/11/05 |
| | | | |
Net Income | | $1,358 | | $1,194 | | $2,377 | | $2,106 |
| | | | |
Other Comprehensive Income/(Loss) | | | | | | | | |
Currency translation adjustment | | 107 | | (190) | | 172 | | (176) |
Cash flow hedges, net of tax: | | | | | | | | |
Net derivative (losses)/gains | | (16) | | 11 | | (12) | | 23 |
Reclassification of (gains)/losses to net income | | (1) | | 1 | | (7) | | 9 |
Unrealized loss on securities, net of tax | | (3) | | (1) | | (6) | | (4) |
Other | | – | | 2 | | 4 | | 4 |
| | | | | | | | |
| | | | |
| | 87 | | (177) | | 151 | | (144) |
| | | | | | | | |
| | | | |
Comprehensive Income | | $1,445 | | $1,017 | | $2,528 | | $1,962 |
| | | | | | | | |
See accompanyingNotes to the Condensed Consolidated Financial Statements.
7
PEPSICO, INC. AND SUBSIDIARIES
NOTES TO THE CONDENSED CONSOLIDATED FINANCIAL STATEMENTS
Basis of Presentation and Our Divisions
Basis of Presentation
Our Condensed Consolidated Balance Sheet as of June 17, 2006, the Condensed Consolidated Statements of Income and Comprehensive Income for the 12 and 24 weeks ended June 17, 2006 and June 11, 2005, and the Condensed Consolidated Statement of Cash Flows for the 24 weeks ended June 17, 2006 and June 11, 2005 have not been audited. These statements have been prepared on a basis that is substantially consistent with the accounting principles applied in our Annual Report on Form 10-K for the fiscal year ended December 31, 2005. In our opinion, these financial statements include all normal and recurring adjustments necessary for a fair presentation. The results for the 12 and 24 weeks are not necessarily indicative of the results expected for the year.
Our significant interim accounting policies include the recognition of a pro rata share of certain estimated annual sales incentives, and certain advertising and marketing costs, generally in proportion to revenue, and the recognition of income taxes using an estimated annual effective tax rate. Raw materials, direct labor and plant overhead, as well as purchasing and receiving costs, costs directly related to production planning, inspection costs and raw material handling facilities, are included in cost of sales. The costs of moving, storing and delivering finished product are included in selling, general and administrative expenses.
Bottling equity income includes our share of the net income or loss of our noncontrolled bottling affiliates and the impact of any changes in our ownership interests in these affiliates. Bottling equity income includes pre-tax gains on our sale of PBG stock of $56 million and $106 million in the 12 and 24 weeks ended June 17, 2006, respectively, and pre-tax gains of $35 million and $64 million in the 12 and 24 weeks ended June 11, 2005, respectively.
The following information is unaudited. Tabular dollars are in millions, except per share amounts. All per share amounts reflect common per share amounts, assume dilution unless noted and are based on unrounded amounts. Certain reclassifications were made to prior year amounts to conform to the 2006 presentation. This report should be read in conjunction with our Annual Report on Form 10-K for the fiscal year ended December 31, 2005.
8
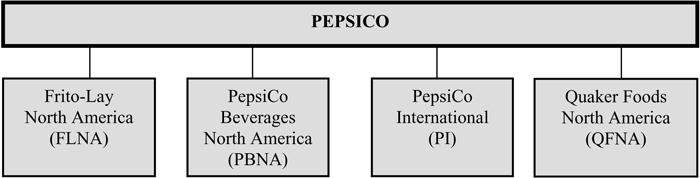
Our Divisions
| | | | | | | | |
| | | 12 Weeks Ended | | 24 Weeks Ended |
| | | 6/17/06 | | 6/11/05 | | 6/17/06 | | 6/11/05 |
Net Revenue | | | | | | | | |
FLNA | | $2,567 | | $2,373 | | $ 4,960 | | $ 4,636 |
PBNA | | 2,505 | | 2,218 | | 4,496 | | 4,002 |
PI | | 3,154 | | 2,756 | | 5,532 | | 4,877 |
QFNA | | 373 | | 350 | | 816 | | 767 |
| | | | | | | | |
| | $8,599 | | $7,697 | | $15,804 | | $14,282 |
| | | | | | | | |
Operating Profit | | | | | | | | |
FLNA | | $ 634 | | $ 594 | | $1,203 | | $1,133 |
PBNA | | 626 | | 555 | | 1,054 | | 970 |
PI | | 546 | | 452 | | 917 | | 759 |
QFNA | | 115 | | 113 | | 266 | | 258 |
| | | | | | | | |
Total division | | 1,921 | | 1,714 | | 3,440 | | 3,120 |
Corporate | | (159) | | (158) | | (330) | | (317) |
| | | | | | | | |
| | $1,762 | | $1,556 | | $3,110 | | $2,803 |
| | | | | | | | |
| | | | |
| | | | | | | 6/17/06 | | 12/31/05 |
Total Assets | | | | | | | | |
FLNA | | | | | | $ 6,257 | | $ 5,948 |
PBNA | | | | | | 6,895 | | 6,316 |
PI | | | | | | 10,920 | | 9,983 |
QFNA | | | | | | 988 | | 989 |
| | | | | | | | |
Total division | | | | | | 25,060 | | 23,236 |
Corporate | | | | | | 3,188 | | 5,331 |
Investments in bottling affiliates | | | | | | 3,178 | | 3,160 |
| | | | | | | | |
| | | | | | $31,426 | | $31,727 |
| | | | | | | | |
9
Intangible Assets
| | | | |
| | | 6/17/06 | | 12/31/05 |
Amortizable intangible assets, net | | | | |
Brands | | $1,130 | | $1,054 |
Other identifiable intangibles | | 263 | | 257 |
| | | | |
| | 1,393 | | 1,311 |
Accumulated amortization | | (845) | | (781) |
| | | | |
| | $ 548 | | $ 530 |
| | | | |
The change in the book value of nonamortizable intangible assets is as follows:
| | | | | | | | | | | | |
| | |
| Balance
12/31/05 | | | Acquisitions | |
| Translation
& Other | |
| Balance
6/17/06 |
FLNA | | | | | | | | | | | | |
Goodwill | | $ | 145 | | $ | – | | $ | 6 | | $ | 151 |
| | | | | | | | | | | | |
| | | | |
PBNA | | | | | | | | | | | | |
Goodwill | | | 2,164 | | | – | | | 3 | | | 2,167 |
Brands | | | 59 | | | – | | | – | | | 59 |
| | | | | | | | | | | | |
| | | 2,223 | | | – | | | 3 | | | 2,226 |
| | | | | | | | | | | | |
| | | | |
PI | | | | | | | | | | | | |
Goodwill | | | 1,604 | | | 104 | | | 70 | | | 1,778 |
Brands | | | 1,026 | | | – | | | 70 | | | 1,096 |
| | | | | | | | | | | | |
| | | 2,630 | | | 104 | | | 140 | | | 2,874 |
| | | | | | | | | | | | |
| | | | |
QFNA | | | | | | | | | | | | |
Goodwill | | | 175 | | | – | | | – | | | 175 |
| | | | | | | | | | | | |
| | | | |
Corporate | | | | | | | | | | | | |
Pension intangible | | | 1 | | | – | | | – | | | 1 |
| | | | | | | | | | | | |
| | | | |
Total goodwill | | | 4,088 | | | 104 | | | 79 | | | 4,271 |
Total brands | | | 1,085 | | | – | | | 70 | | | 1,155 |
Total pension intangible | | | 1 | | | – | | | – | | | 1 |
| | | | | | | | | | | | |
| | $ | 5,174 | | $ | 104 | | $ | 149 | | $ | 5,427 |
| | | | | | | | | | | | |
10
Stock-Based Compensation
On January 1, 2006, we adopted Statement of Financial Accounting Standards (SFAS) 123R,Share-Based Payment, under the modified prospective method. Since we had previously accounted for our stock-based compensation plans under the fair value provisions of SFAS 123, our adoption did not significantly impact our financial position or our results of operations. Under SFAS 123R, actual tax benefits recognized in excess of tax benefits previously established upon grant are reported as a financing cash inflow. Prior to adoption, such excess tax benefits were reported as an increase to operating cash flows.
We account for our employee stock options, which include grants under our executive program and broad-based SharePower program, under the fair value method of accounting using a Black-Scholes valuation model to measure stock option expense at the date of grant. All stock option grants have an exercise price equal to the fair market value of our common stock on the date of grant and generally have a 10-year term. The fair value of stock option grants is amortized to expense over the vesting period, generally three years. Executives who are awarded long-term incentives based on their performance are offered the choice of stock options or restricted stock units (RSUs). Executives who elect RSUs receive one RSU for every four stock options that would have otherwise been granted. Senior officers do not have a choice and are granted 50% stock options and 50% RSUs. RSU expense is based on the fair value of PepsiCo stock on the date of grant and is amortized over the vesting period, generally three years. Each RSU is settled in a share of our stock after the vesting period. Vesting of RSU awards for senior officers is contingent upon the achievement of pre-established performance targets. As of June 17, 2006, 37 million shares were available for future stock-based compensation grants.
For the 12 weeks, we recognized stock-based compensation expense of $60 million in 2006 and $70 million in 2005, as well as related income tax benefits recognized in earnings of $17 million and $20 million, respectively. For the 24 weeks, we recognized stock-based compensation expense of $128 million in 2006 and $147 million in 2005, as well as related income tax benefits recognized in earnings of $36 million and $41 million, respectively. For the 12 weeks, stock-based compensation cost of $1 million in 2006 and $1 million in 2005 was capitalized in connection with our Business Process Transformation (BPT) initiative. For the 24 weeks, stock-based compensation cost of $2 million in 2006 and $2 million in 2005 was capitalized in connection with our BPT initiative.
Our weighted average Black-Scholes fair value assumptions are as follows:
| | | | |
| | | 24 Weeks Ended |
| | | 6/17/06 | | 6/11/05 |
| | |
Expected life | | 6 yrs. | | 6 yrs. |
Risk free interest rate | | 4.5% | | 3.8% |
Expected volatility(a) | | 18% | | 24% |
Expected dividend yield | | 1.9% | | 1.8% |
(a) | Reflects movements in our stock price over the most recent historical period equivalent to the |
11
A summary of option activity for the 24 weeks ended June 17, 2006 is presented below:
Our Stock Option Activity(a)
| | | | | | | | |
| | | Options | | Average Price(b) | | Average Life (years)(c) | | Aggregate Intrinsic
Value(d) |
| | | | |
Outstanding at January 1, 2006 | | 150,149 | | $42.03 | | | | |
Granted | | 11,786 | | 57.50 | | | | |
Exercised | | (11,438) | | 38.18 | | | | |
Forfeited/expired | | (845) | | 47.40 | | | | |
| | | | | | | | |
Outstanding at March 25, 2006 | | 149,652 | | 43.48 | | | | |
Granted | | 166 | | 57.81 | | | | |
Exercised | | (6,965) | | 37.54 | | | | |
Forfeited/expired | | (750) | | 49.02 | | | | |
| | | | | | | | |
Outstanding at June 17, 2006 | | 142,103 | | $43.80 | | 5.75 | | $2,254,878 |
| | | | | | | | |
Exercisable at June 17, 2006 | | 102,894 | | $40.71 | | 4.78 | | $1,948,253 |
| | |
(a) | | Options are in thousands and include options previously granted under Quaker plans. No additional options or shares may be granted under the Quaker plans. |
(b) | | Weighted-average exercise price. |
(c) | | Weighted-average contractual life remaining. |
(d) | | In thousands. |
A summary of RSU activity for the 24 weeks ended June 17, 2006 is presented below:
Our RSU Activity(a)
| | | | | | | | |
| | | RSUs | | Average Intrinsic Value(b) | | Average Life (years)(c) | | Aggregate Intrinsic
Value(d) |
| | | | |
Outstanding at January 1, 2006 | | 5,669 | | $50.70 | | | | |
Granted | | 2,576 | | 57.54 | | | | |
Converted | | (62) | | 49.70 | | | | |
Forfeited/expired | | (159) | | 50.30 | | | | |
| | | | | | | | |
Outstanding at March 25, 2006 | | 8,024 | | 52.88 | | | | |
Granted | | 103 | | 58.27 | | | | |
Converted | | (54) | | 49.85 | | | | |
Forfeited/expired | | (151) | | 52.54 | | | | |
| | | | | | | | |
Outstanding at June 17, 2006 | | 7,922 | | $53.01 | | 1.85 | | $472,967 |
| | | | | | | | |
__________________________________________
(a) | RSUs are in thousands. |
(b) | Weighted-average intrinsic value at grant date. |
(c) | Weighted-average contractual life remaining. |
12
Other Stock-Based Compensation Data
| | | | | | | | |
| | | 12 Weeks Ended | | 24 Weeks Ended |
| | | 6/17/06 | | 6/11/05 | | 6/17/06 | | 6/11/05 |
| | | | |
Stock Options | | | | | | | | |
Weighted-average fair value of options granted | | $13.06 | | $13.76 | | $12.77 | | $13.48 |
Total intrinsic value of options exercised(a) | | $153,585 | | $198,340 | | $389,655 | | $337,876 |
| | | | |
RSUs | | | | | | | | |
Total intrinsic value of RSUs converted(a) | | $3,194 | | $1,418 | | $6,873 | | $2,648 |
__________________________ | |
As of June 17, 2006, there was $431 million of total unrecognized compensation cost related to nonvested share-based compensation grants. This unrecognized compensation is expected to be recognized over a weighted-average period of 1.7 years.
Pension and Retiree Medical Benefits
The components of net periodic benefit cost for pension and retiree medical plans are as follows:
| | | | | | | | | | | | |
| | | 12 Weeks Ended |
| | | Pension | | Retiree Medical |
| | | 6/17/06 6/11/05 | | 6/17/06 6/11/05 | | 6/17/06 6/11/05 |
| | | U.S. | | International | | | | |
| | | | | | |
Service cost | | $ 56 | | $ 49 | | $ 14 | | $ 8 | | $11 | | $ 9 |
Interest cost | | 73 | | 67 | | 15 | | 14 | | 17 | | 18 |
Expected return on plan assets | | (90) | | (79) | | (18) | | (17) | | – | | – |
Amortization of prior service
cost/(benefit) | | 1 | | 1 | | – | | – | | (3) | | (2) |
Amortization of experience
loss | | 38 | | 24 | | 6 | | 4 | | 5 | | 6 |
| | | | | | | | | | | | |
Total expense | | $ 78 | | $ 62 | | $ 17 | | $ 9 | | $30 | | $31 |
| | | | | | | | | | | | |
| |
| | | 24 Weeks Ended |
| | | Pension | | Retiree Medical |
| | | 6/17/06 6/11/05 | | 6/17/06 6/11/05 | | 6/17/06 6/11/05 |
| | | U.S. | | International | | | | |
| | | | | | |
Service cost | | $ 112 | | $ 98 | | $ 26 | | $ 16 | | $22 | | $18 |
Interest cost | | 146 | | 135 | | 30 | | 28 | | 34 | | 36 |
Expected return on plan assets | | (180) | | (159) | | (36) | | (34) | | – | | – |
Amortization of prior service
cost/(benefit) | | 2 | | 2 | | – | | – | | (6) | | (4) |
Amortization of experience
loss | | 76 | | 48 | | 12 | | 8 | | 10 | | 12 |
| | | | | | | | | | | | |
Total expense | | $ 156 | | $ 124 | | $ 32 | | $ 18 | | $60 | | $62 |
| | | | | | | | | | | | |
13
Net Income Per Common Share
The computations of basic and diluted net income per common share are as follows:
| | | | | | | | |
| | | 12 Weeks Ended |
| | | 6/17/06 | | 6/11/05 |
| | | Income | | Shares(a) | | Income | | Shares(a) |
Net income | | $1,358 | | | | $1,194 | | |
Preferred shares: | | | | | | | | |
Dividends | | (1) | | | | – | | |
Redemption premium | | (2) | | | | (5) | | |
| | | | | | | | |
Net income available for common shareholders | | $1,355 | | 1,652 | | $1,189 | | 1,676 |
| | | | | | | | |
Basic net income per common share | | $0.82 | | | | $0.71 | | |
| | | | | | | | |
Net income available for common shareholders | | $1,355 | | 1,652 | | $1,189 | | 1,676 |
Dilutive securities: | | | | | | | | |
Stock options and RSUs(b) | | – | | 35 | | – | | 34 |
ESOP convertible preferred stock | | 3 | | 2 | | 5 | | 2 |
| | | | | | | | |
Diluted | | $1,358 | | 1,689 | | $1,194 | | 1,712 |
| | | | | | | | |
Diluted net income per common share | | $0.80 | | | | $0.70 | | |
| | | | | | | | |
| |
| | | 24 Weeks Ended |
| | | 6/17/06 | | 6/11/05 |
| | | Income | | Shares(a) | | Income | | Shares(a) |
Net income | | $2,377 | | | | $2,106 | | |
Preferred shares: | | | | | | | | |
Dividends | | (1) | | | | (1) | | |
Redemption premium | | (4) | | | | (9) | | |
| | | | | | | | |
Net income available for common shareholders | | $2,372 | | 1,654 | | $2,096 | | 1,677 |
| | | | | | | | |
Basic net income per common share | | $1.43 | | | | $1.25 | | |
| | | | | | | | |
Net income available for common shareholders | | $2,372 | | 1,654 | | $2,096 | | 1,677 |
Dilutive securities: | | | | | | | | |
Stock options and RSUs(b) | | – | | 36 | | – | | 33 |
ESOP convertible preferred stock | | 5 | | 2 | | 10 | | 2 |
| | | | | | | | |
Diluted | | $2,377 | | 1,692 | | $2,106 | | 1,712 |
| | | | | | | | |
Diluted net income per common share | | $1.41 | | | | $1.23 | | |
| | | | | | | | |
|
(a) Weighted average common shares outstanding. (b)There were no out-of-the-money options for the 12 or 24 weeks in 2006 or for the 12 weeks in 2005. Options to purchase 6.0 million shares for the 24 weeks in 2005 were not included in the calculation of earnings per share because these options were out-of-the-money. Out-of-the-money options had an average exercise price of $53.77 for the 24 weeks in 2005. |
14
Debt Obligations and Commitments
In the second quarter, we entered into a new unsecured revolving credit agreement which enables us to borrow up to $1.5 billion subject to customary terms and conditions. Funds borrowed under this agreement may be used for general corporate purposes, including supporting our outstanding commercial paper issuances. The agreement terminates in May 2011 and replaces our previous $2.1 billion of credit facilities. As of June 17, 2006, we have reclassified $1.4 billion of short-term debt to long-term based on our intent and ability to refinance on a long-term basis.
Supplemental Cash Flow Information
| | | | |
| | | 24 Weeks Ended |
| | | 6/17/06 | | 6/11/05 |
| | |
Interest paid | | $113 | | $88 |
Income taxes paid, net of refunds | | $935 | | $252 |
| | |
Acquisitions(a): | | | | |
Fair value of assets acquired | | $492 | | $ 784 |
Less: Cash paid and debt assumed | | (434) | | (964) |
Add: Minority interest eliminated | | – | | 208 |
| | | | |
Liabilities assumed | | $ 58 | | $ 28 |
| | | | |
| | |
(a) | | In 2005, these amounts include the impact of our first quarter acquisition of General Mills, Inc.’s 40.5% ownership interest in SVE for $750 million. |
Recent Accounting Pronouncements
In July 2006, the Financial Accounting Standards Board (FASB) issued FASB Interpretation No. 48,Accounting for Uncertainty in Income Taxes—an interpretation of FASB Statement No. 109 (FIN 48), which clarifies the accounting for uncertainty in tax positions. This Interpretation requires that we recognize in our financial statements, the impact of a tax position, if that position is more likely than not of being sustained on audit, based on the technical merits of the position. The provisions of FIN 48 are effective as of the beginning of our 2007 fiscal year, with the cumulative effect of the change in accounting principle recorded as an adjustment to opening retained earnings. We are currently evaluating the impact of adopting FIN 48 on our financial statements.
15
ITEM 2. Management’s Discussion and Analysis of Financial Condition and Results of Operations
FINANCIAL REVIEW
Our discussion and analysis is an integral part of understanding our financial results. Also refer toBasis of Presentation and Our Divisions in the Notes to the Condensed Consolidated Financial Statements. Tabular dollars are presented in millions, except per share amounts. All per share amounts reflect common per share amounts, assume dilution unless noted, and are based on unrounded amounts. Percentage changes are based on unrounded amounts.
Our Critical Accounting Policies
Sales Incentives and Advertising and Marketing Costs
We offer sales incentives through various programs to our customers and to consumers. These incentives are recorded as a reduction of the sales price of our products. Certain sales incentives are recognized at the time of sale while other incentives, such as bottler funding and customer volume rebates, are recognized during the year incurred, generally in proportion to revenue, based on annual targets. Anticipated payments are estimated based on historical experience with similar programs and require management judgment with respect to estimating customer participation and performance levels. Differences between estimated expenses and actual incentive costs are normally insignificant and are recognized in earnings in the period such differences are determined. In addition, certain advertising and marketing costs are also recognized during the year incurred, generally in proportion to revenue.
Income Taxes
In determining our quarterly provision for income taxes, we use an estimated annual effective tax rate which is based on our expected annual income, statutory tax rates and tax planning opportunities available to us in the various jurisdictions in which we operate. The IRS audits of our tax returns for the years 1998 through 2002 may be concluded in 2006. Significant or unusual items are separately recognized in the quarter in which they occur.
Stock-Based Compensation
On January 1, 2006, we adopted SFAS 123R under the modified prospective method. Since we had previously accounted for our stock-based compensation plans under the fair value provisions of SFAS 123, our adoption did not significantly impact our financial position or our results of operations. Under SFAS 123R, actual tax benefits recognized in excess of tax benefits previously established upon grant are reported as a financing cash inflow. Prior to adoption, such excess tax benefits were reported as an increase to operating cash flows.
We account for our employee stock options under the fair value method of accounting using a Black-Scholes valuation model to measure stock option expense at the date of grant. All stock option grants have an exercise price equal to the fair market value of our common stock on the date of grant and generally have a 10-year term. The fair value of stock option grants is amortized to expense over the vesting period, generally three years. RSU expense is based on the fair value of PepsiCo stock on the date of grant and is amortized over the vesting period, generally three years.
16
Expected volatility reflects movements in our stock price over the most recent historical period equivalent to the expected life.
For our 2006 Black-Scholes assumptions and other stock-based compensation required disclosures, seeStock-Based Compensationin the Notes to the Condensed Consolidated Financial Statements.
Recent Accounting Pronouncements
In July 2006, the FASB issued FIN 48,which clarifies the accounting for uncertainty in tax positions. This Interpretation requires that we recognize in our financial statements, the impact of a tax position, if that position is more likely than not of being sustained on audit, based on the technical merits of the position. The provisions of FIN 48 are effective as of the beginning of our 2007 fiscal year, with the cumulative effect of the change in accounting principle recorded as an adjustment to opening retained earnings. We are currently evaluating the impact of adopting FIN 48 on our financial statements.
Our Business Risks
We discuss expectations regarding our future performance, such as our business outlook, in our annual and quarterly reports, press releases, and other written and oral statements. These “forward-looking statements” are based on currently available competitive, financial and economic data and our operating plans. They are inherently uncertain, and investors must recognize that events could turn out to be significantly different from our expectations. We undertake no obligation to update any forward-looking statement.
Our operations outside of the United States generate approximately 40% of our net revenue. As a result, we are exposed to foreign currency risks, including unforeseen economic changes and political unrest. During the 24 weeks, net favorable foreign currency contributed slightly to net revenue growth, primarily due to increases in the Canadian dollar, Brazilian real and the Mexican peso, partially offset by declines in the euro and the British pound. Currency declines which are not offset could adversely impact our future results.
While there is continued pricing pressure on our raw materials and energy costs, we expect to be able to mitigate the impact of these increased costs through our hedging strategies and ongoing productivity initiatives.
Cautionary statements included in Management’s Discussion and Analysis and in Item 1A. in our Annual Report on Form 10-K for the fiscal year ended December 31, 2005 should be considered when evaluating our trends and future results.
Results of Operations – Consolidated Review
In the discussions of net revenue and operating profit below, “effective net pricing” reflects the year-over-year impact of discrete pricing actions, sales incentive activities and mix resulting from selling varying products in different package sizes and in different countries.
17
Volume
Since our divisions each use different measures of physical unit volume, a common servings metric is necessary to reflect our consolidated physical unit volume. For the 12 weeks, total servings increased 9%, with worldwide beverages growing 10% and worldwide snacks growing 8%. For the 24 weeks, total servings increased 8%, with worldwide beverages growing 9% and worldwide snacks growing 6%.
We discuss volume for our beverage businesses on a bottler case sales (BCS) basis in which all beverage volume is converted to an 8 ounce case metric. A portion of our volume is sold by our bottlers, and that portion is based on our bottlers’ sales to retailers and independent distributors. The remainder of our volume is based on our shipments to customers. BCS is reported to us by our bottlers on a monthly basis. Our second quarter beverage volume includes PBNA bottler sales for April and May and PI bottler sales for March, April, and May.
Consolidated Results
Total Net Revenue and Operating Profit
| | | | | | | | | | | | |
| | | 12 Weeks Ended | | 24 Weeks Ended |
| | | 6/17/06 | | 6/11/05 | | Change | | 6/17/06 | | 6/11/05 | | Change |
| | | | | | |
Total net revenue | | $8,599 | | $7,697 | | 12% | | $15,804 | | $14,282 | | 11% |
| | | | | | |
Operating profit | | | | | | | | | | | | |
FLNA | | $ 634 | | $ 594 | | 7% | | $1,203 | | $1,133 | | 6% |
PBNA | | 626 | | 555 | | 13% | | 1,054 | | 970 | | 9% |
PI | | 546 | | 452 | | 21% | | 917 | | 759 | | 21% |
QFNA | | 115 | | 113 | | 2% | | 266 | | 258 | | 3% |
Corporate unallocated | | (159) | | (158) | | 1% | | (330) | | (317) | | 4% |
| | | | | | | | | | | | |
Total operating profit | | $1,762 | | $1,556 | | 13% | | $3,110 | | $2,803 | | 11% |
| | | | | | | | | | | | |
| | | | | | |
Total operating profit margin | | 20.5% | | 20.2% | | 0.3 | | 19.7% | | 19.6% | | 0.1 |
12 Weeks
Net revenue increased 12% primarily reflecting higher volume and positive effective net pricing across all divisions. The volume gains contributed over 6 percentage points to net revenue growth and the effective net pricing contributed 4 percentage points. The impact of acquisitions contributed 1 percentage point to net revenue growth.
Total operating profit increased 13% and margin increased 0.3 percentage points. The operating profit performance reflects leverage from the revenue growth, partially offset by the impact of higher raw material and energy costs.
Corporate unallocated expenses increased 1%. This increase primarily reflects higher costs associated with our BPT initiative which contributed 6 percentage points, partially offset by lower
18
employee-related costs and net gains from certain mark-to-market derivatives which reduced corporate unallocated expenses by 3 percentage points and 2 percentage points, respectively. Corporate departmental expenses contributed almost 1 percentage point to the increase.
24 Weeks
Net revenue increased 11% primarily reflecting higher volume and positive effective net pricing across all divisions. The volume gains contributed 6 percentage points to net revenue growth and the effective net pricing contributed over 3 percentage points. The impact of acquisitions contributed 1 percentage point to net revenue growth.
Total operating profit increased 11% and margin increased 0.1 percentage points. The operating profit performance reflects leverage from the revenue growth, partially offset by the impact of higher raw material and energy costs.
Corporate unallocated expenses increased 4%. This increase primarily reflects higher costs associated with our BPT initiative which contributed 5 percentage points, higher employee-related costs which contributed 3 percentage points, and net losses from certain mark-to-market derivatives which contributed 2 percentage points to the increase. These increases were partially offset by the absence of foundation contributions made in the prior year which reduced corporate unallocated expenses by 3 percentage points. In 2006, corporate unallocated expenses also reflect a gain of $11 million related to the revaluation of an asset held for sale. Corporate departmental expenses were flat.
Other Consolidated Results
| | | | | | | | | | | | |
| | | 12 Weeks Ended | | 24 Weeks Ended |
| | | 6/17/06 | | 6/11/05 | | Change | | 6/17/06 | | 6/11/05 | | Change |
| | | | | | |
Bottling equity income | | $176 | | $156 | | 13% | | $260 | | $221 | | 18% |
| | | | | | |
Interest expense, net | | $(33) | | $(25) | | 32% | | $(50) | | $(52) | | (4)% |
| | | | | | |
Tax rate | | 28.7% | | 29.3% | | | | 28.4% | | 29.1% | | |
| | | | | | |
Net income | | $1,358 | | $1,194 | | 14% | | $2,377 | | $2,106 | | 13% |
| | | | | | |
Net income per common share – diluted | | $0.80 | | $0.70 | | 15% | | $1.41 | | $1.23 | | 14% |
12 Weeks
Bottling equity income increased 13% primarily reflecting a $56 million pre-tax gain on our sale of PBG stock in the quarter, which compared favorably to a $35 million pre-tax gain in the prior year.
Net interest expense increased 32% primarily reflecting lower cash balances and higher average rates on our borrowings, partially offset by the impact of higher interest rates on our investments.
The tax rate decreased 0.6 percentage points compared to prior year primarily reflecting changes in our concentrate sourcing around the world, which is taxed at lower rates.
19
Net income increased 14% and the related net income per share increased 15%. These increases primarily reflect our solid operating profit growth, the increased gains on our sale of PBG stock and the decrease in our effective tax rate. Net income per share was also favorably impacted by our share repurchases.
24 Weeks
Bottling equity income increased 18% primarily reflecting a $106 million pre-tax gain on our sale of PBG stock, which compared favorably to a $64 million pre-tax gain in the prior year.
Net interest expense decreased 4% primarily reflecting higher interest rates on our investments, mostly offset by the impact of lower investment balances and higher average rates on our borrowings.
The tax rate decreased 0.7 percentage points compared to prior year primarily reflecting changes in our concentrate sourcing around the world, which is taxed at lower rates.
Net income increased 13% and the related net income per share increased 14%. These increases primarily reflect our solid operating profit growth, the increased gains on our sale of PBG stock and the decrease in our effective tax rate. Net income per share was also favorably impacted by our share repurchases.
Results of Operations – Division Review
The results and discussions below are based on how our Chief Executive Officer monitors the performance of our divisions. For additional information on our divisions, seeOur Divisionsin the Notes to the Condensed Consolidated Financial Statements.
| | | | | | | | | | |
Net Revenue 12 Weeks Ended | | FLNA | | PBNA | | PI | | QFNA | | Total |
Q2, 2006 | | $2,567 | | $2,505 | | $3,154 | | $373 | | $8,599 |
Q2, 2005 | | $2,373 | | $2,218 | | $2,756 | | $350 | | $7,697 |
| | | | | |
% Impact of: | | | | | | | | | | |
Volume | | 3% | | 8%(a) | | 8%(a) | | 3% | | 6% |
Effective net pricing | | 3 | | 4 | | 4 | | 3 | | 4 |
Foreign exchange | | 1 | | 1 | | – | | 1 | | – |
Acquisitions/divestitures | | 1 | | – | | 3 | | – | | 1 |
% Change(b) | | 8% | | 13% | | 14% | | 7% | | 12% |
(a) | For beverages sold to our bottlers, net revenue volume growth is based on our concentrate shipments and equivalents. |
(b) | Amounts may not sum due to rounding. |
20
| | | | | | | | | | | |
Net Revenue 24 Weeks Ended | | FLNA | | | PBNA | | PI | | QFNA | | Total |
Q2, 2006 | | $4,960 | | | $4,496 | | $5,532 | | $816 | | $15,804 |
Q2, 2005 | | $4,636 | | | $4,002 | | $4,877 | | $767 | | $14,282 |
| | | | | |
% Impact of: | | | | | | | | | | | |
Volume | | 2.5 | % | | 8%(a) | | 8%(a) | | 3% | | 6% |
Effective net pricing | | 3 | | | 4 | | 3 | | 3 | | 3 |
Foreign exchange | | 1 | | | 0.5 | | – | | 1 | | – |
Acquisitions/divestitures | | 0.5 | | | – | | 2 | | – | | 1 |
% Change(b) | | 7 | % | | 12% | | 13% | | 7% | | 11% |
(a) | For beverages sold to our bottlers, net revenue volume growth is based on our concentrate shipments and equivalents. |
(b) | Amounts may not sum due to rounding. |
Frito-Lay North America
| | | | | | | | | | | | |
| | | 12 Weeks Ended | | 24 Weeks Ended |
| | | 6/17/06 | | 6/11/05 | | Change | | 6/17/06 | | 6/11/05 | | Change |
| | | | | | |
Net revenue | | $2,567 | | $2,373 | | 8% | | $4,960 | | $4,636 | | 7% |
| | | | | | |
Operating profit | | $634 | | $594 | | 7% | | $1,203 | | $1,133 | | 6% |
12 Weeks
Net revenue grew 8% reflecting volume growth of 4% and positive effective net pricing due to salty snack pricing actions and favorable mix. Favorable Canadian exchange rates also contributed almost 1 percentage point to net revenue growth. Pound volume grew primarily due to double-digit growth in Dips, Sun Chips and Chewy granola bars, high-single-digit growth in trademark Tostitos and low-single-digit growth in trademark Lay’s potato chips. These volume gains were partially offset by a mid-single-digit decline in trademark Doritos. Overall, salty snacks revenue grew 7% with volume growth of 3.5%, and other macro snacks revenue grew 16% with volume growth of 10%. The Stacy’s Pita Chip Company (Stacy’s) acquisition contributed over 0.5 percentage points to volume growth and almost 1 percentage point to revenue growth.
Operating profit grew 7% primarily reflecting the revenue growth. This growth was partially offset by higher commodity costs, primarily cooking oil and energy, and the impact of a favorable casualty insurance actuarial adjustment recorded in the prior year.
Smart Spot eligible products represented approximately 16% of net revenue. These products experienced double-digit revenue growth, while the balance of the portfolio had mid-single-digit revenue growth.
24 Weeks
Net revenue grew 7% reflecting volume growth of 3% and positive effective net pricing due to salty snack pricing actions and favorable mix. Favorable Canadian exchange rates also contributed almost 1 percentage point to net revenue growth. Pound volume grew primarily due to double-digit growth in Chewy granola bars and Sun Chips, high-single-digit growth in Dips, mid-single-digit growth in trademark Tostitos and double-digit growth in Quakes rice cakes and Multipack. These
21
volume gains were partially offset by a mid-single-digit decline in trademark Doritos. Overall, salty snacks revenue grew 6% with volume growth of 2%, and other macro snacks revenue grew 14% with volume growth of 11%. The Stacy’s acquisition contributed approximately 0.5 percentage points to both revenue and volume growth.
Operating profit grew 6% primarily reflecting the revenue growth. This growth was partially offset by higher commodity costs, primarily cooking oil and energy, and the impact of a favorable casualty insurance actuarial adjustment recorded in the prior year.
Smart Spot eligible products represented approximately 16% of net revenue. These products experienced double-digit revenue growth, while the balance of the portfolio had mid-single-digit revenue growth.
PepsiCo Beverages North America
| | | | | | | | | | | | |
| | | 12 Weeks Ended | | 24 Weeks Ended |
| | | 6/17/06 | | 6/11/05 | | Change | | 6/17/06 | | 6/11/05 | | Change |
| | | | | | |
Net revenue | | $2,505 | | $2,218 | | 13% | | $4,496 | | $4,002 | | 12% |
| | | | | | |
Operating profit | | $626 | | $555 | | 13% | | $1,054 | | $970 | | 9% |
12 Weeks
Net revenue grew 13% and BCS volume grew 8%. The volume increase was driven by a 23% increase in non-carbonated beverages, partially offset by a 1% decline in carbonated soft drinks (CSDs). The non-carbonated portfolio performance was driven by double-digit growth in Gatorade, trademark Aquafina, Lipton ready-to-drink teas, Tropicana juice drinks and Propel. Tropicana Pure Premium experienced a mid-single-digit increase in volume. The decline in CSDs reflects a low-single-digit decline in trademark Pepsi, partially offset by a low-single-digit increase in trademark Mountain Dew and a mid-single-digit increase in trademark Sierra Mist. Across the brands, both regular and diet CSDs experienced low-single-digit declines.
Net revenue also benefited from positive effective net pricing which reflected the strength of non-carbonated beverages, partially offset by more-favorable settlements of trade spending accruals in 2005. Favorable Canadian foreign exchange rates contributed nearly one percentage point to net revenue growth.
Operating profit increased 13% which reflects the net revenue growth, partially offset by higher energy and raw material costs, primarily orange juice and PET resin.The impact of a favorable insurance settlement of $29 million was mostly offset by the more-favorable settlements of trade spending accruals in 2005.
Smart Spot eligible products represented over 70% of net revenue. These products experienced double-digit revenue growth, while the balance of the portfolio grew in the low-single-digit range.
24 Weeks
Net revenue grew 12% and BCS volume grew 6%. The volume increase was driven by a 21% increase in non-carbonated beverages, partially offset by a 1% decline in CSDs. The non-
22
carbonated portfolio performance was driven by double-digit growth in Gatorade, trademark Aquafina, Tropicana juice drinks, Lipton ready-to-drink teas and Propel. Tropicana Pure Premium experienced a low-single-digit increase in volume. The decline in CSDs reflects a low-single-digit decline in trademark Pepsi, partially offset by low-single-digit increases in both trademark Mountain Dew and trademark Sierra Mist. Across the brands, both regular and diet CSDs experienced low-single-digit declines.
Net revenue also benefited from positive effective net pricing which reflected the strength of non-carbonated beverages, partially offset by more-favorable settlements of trade spending accruals in 2005. Favorable Canadian foreign exchange rates contributed approximately one-half of a percentage point to net revenue growth.
Operating profit increased 9%, which reflects the net revenue growth, partially offset by higher energy and raw material costs, primarily orange juice and PET resin.The impact of a favorable insurance settlement of $29 million was fully offset by the more-favorable settlements of trade spending accruals in 2005.
Smart Spot eligible products represented over 70% of net revenue. These products experienced double-digit revenue growth, while the balance of the portfolio grew in the mid-single-digit range.
PepsiCo International
| | | | | | | | | | | | |
| | | 12 Weeks Ended | | 24 Weeks Ended |
| | | 6/17/06 | | 6/11/05 | | Change | | 6/17/06 | | 6/11/05 | | Change |
| | | | | | |
Net revenue | | $3,154 | | $2,756 | | 14% | | $5,532 | | $4,877 | | 13% |
| | | | | | |
Operating profit | | $546 | | $452 | | 21% | | $917 | | $759 | | 21% |
12 Weeks
International snacks volume grew 11%, reflecting growth of 18% in the Europe, Middle East & Africa region, 6% in the Latin America region and 14% in the Asia Pacific region. The acquisition of a business in Poland in early 2006 increased the Europe, Middle East & Africa region volume growth by 4 percentage points. The acquisition of a business in Australia increased the Asia region volume by 2 percentage points. Cumulatively, acquisitions contributed 2 percentage points to the reported total PepsiCo International snack volume growth rate. Broad-based gains reflected high-single-digit growth at Sabritas in Mexico and double-digit growth in Russia, Turkey, Egypt and Australia.
Beverage volume grew 10%, reflecting growth of 12% in the Europe, Middle East & Africa region, 11% in the Asia Pacific region and 7% in the Latin America region. Acquisitions contributed 1 percentage point to the Europe, Middle East & Africa region volume growth rate and almost 1 percentage point to the reported total PepsiCo International beverage volume growth rate. Broad-based increases were led by double-digit growth in the Middle East, China, Argentina, Thailand and Russia, and mid-single-digit growth in Mexico. CSDs grew at a high-single-digit rate while non-carbonated beverages grew at a double-digit rate.
23
Net revenue grew 14%, primarily as a result of the broad-based volume growth and favorable effective net pricing. Acquisitions contributed 3 percentage points of growth. Foreign currency had no impact on the growth rate.
Operating profit grew 21% driven primarily by the net revenue growth, slightly offset by increased raw material costs. Acquisitions and foreign currency had no impact on the growth rate.
24 Weeks
International snacks volume grew 9%, reflecting growth of 17% in the Europe, Middle East & Africa region, 4% in the Latin America region and 15% in the Asia Pacific region. The acquisition of a business in Poland in early 2006 increased the Europe, Middle East & Africa region volume growth by 4 percentage points. The acquisition of a business in Australia increased the Asia region volume by 2 percentage points. Cumulatively, acquisitions contributed 1 percentage point to the reported total PepsiCo International snack volume growth rate. The overall gains reflected mid-single-digit growth at both Sabritas in Mexico and Walkers in the United Kingdom, and double-digit growth in Russia, Turkey, Egypt and Australia.
Beverage volume grew 12%, reflecting growth of 13% in the Europe, Middle East & Africa region, 15% in the Asia Pacific region and 9% in the Latin America region. Acquisitions contributed 1.5 percentage points to the Europe, Middle East & Africa region volume growth rate and almost 1 percentage point to the reported total PepsiCo International beverage volume growth rate. Broad-based increases were led by double-digit growth in China, the Middle East, Argentina, Thailand and Venezuela, and mid-single-digit growth in Mexico. CSDs and non-carbonated beverages each grew at a double-digit rate.
Net revenue grew 13%, primarily as a result of the broad-based volume growth and favorable effective net pricing. Acquisitions contributed 2 percentage points of growth. Foreign currency had no impact on the growth rate.
Operating profit grew 21%, driven primarily by the net revenue growth, slightly offset by increased raw material costs. Acquisitions and foreign currency each had a slightly favorable impact on the growth rate.
Quaker Foods North America
| | | | | | | | | | | | |
| | | 12 Weeks Ended | | 24 Weeks Ended |
| | | 6/17/06 | | 6/11/05 | | Change | | 6/17/06 | | 6/11/05 | | Change |
| | | | | | |
Net revenue | | $373 | | $350 | | 7% | | $816 | | $767 | | 7% |
| | | | | | |
Operating profit | | $115 | | $113 | | 2% | | $266 | | $258 | | 3% |
24
12 Weeks
Net revenue increased 7% and volume increased 3%. The volume increase reflects high-single-digit growth in Oatmeal, double-digit growth in Life cereal and high-single-digit growth in Cap’n Crunch cereal. This increase was partially offset by a high-single-digit decline in Rice-A-Roni. Higher effective net pricing contributed nearly 3 percentage points of revenue growth reflecting favorable product mix, partially offset by the impact of more favorable settlements of trade spending accruals in 2005. Favorable Canadian foreign exchange rates contributed approximately 1 percentage point to net revenue growth.
Operating profit increased 2% primarily reflecting the net revenue growth. This growth was partially offset by increased cost of sales, primarily due to higher raw material and energy costs, as well as the impact of more favorable settlements of trade spending accruals in 2005.
Smart Spot eligible products represented approximately half of net revenue and had double-digit revenue growth. The balance of the portfolio experienced a low-single-digit decline.
24 Weeks
Net revenue grew 7% and volume increased almost 3%. The volume increase reflects mid-single-digit growth in Oatmeal, double-digit growth in Life cereal and low-single-digit growth in Cap’n Crunch cereal, Pasta Roni and Rice-A-Roni. Higher effective net pricing contributed approximately 3 percentage points of growth primarily reflecting favorable product mix. Favorable Canadian foreign exchange rates contributed approximately 1 percentage point to net revenue growth.
Operating profit increased 3% primarily reflecting the net revenue growth. This growth was partially offset by increased cost of sales primarily due to higher raw material and energy costs.
Smart Spot eligible products represented approximately half of net revenue and had double-digit revenue growth. The balance of the portfolio experienced a low-single-digit increase.
OUR LIQUIDITY AND CAPITAL RESOURCES
Operating Activities
During the 24 weeks, our operations provided $1.8 billion of cash primarily reflecting our solid business results. Our operating cash flow in 2006 also reflects a tax payment of $420 million related to our repatriation of international cash in 2005 in connection with the American Jobs Creation Act (AJCA).
Investing Activities
During the 24 weeks, we used $31 million for our investing activities, driven by capital spending of $708 million and acquisitions of $434 million, which were offset by net sales of short-term investments of $908 million and proceeds from our sale of PBG stock of $180 million. Capital spending reflects our increased investments in support of our ongoing BPT initiative and our North
25
American Gatorade business, as well as increased investments in manufacturing capacity to support growth in our China snack and beverage operations.
We anticipate net capital spending of approximately $2.2 billion in 2006, which is above our long-term target of approximately 5% of net revenue.
Financing Activities
During the 24 weeks, we used $3.1 billion, primarily reflecting common share repurchases and net repayments of short-term borrowings of $1.5 billion each. Dividend payments of $863 million were largely offset by stock option proceeds of $697 million.
Management Operating Cash Flow
We focus on management operating cash flow as a key element in achieving maximum shareholder value, and it is the primary measure we use to monitor cash flow performance. However, it is not a measure provided by accounting principles generally accepted in the U.S. Since net capital spending is essential to our product innovation initiatives and maintaining our operational capabilities, we believe that it is a recurring and necessary use of cash. As such, we believe investors should also consider net capital spending when evaluating our cash from operating activities. The table below reconciles net cash provided by operating activities as reflected in our Condensed Consolidated Statement of Cash Flows to our management operating cash flow.
| | | | |
| | | 24 Weeks Ended |
| | | 6/17/06 | | 6/11/05 |
Net cash provided by operating activities | | $1,830 | | $2,363 |
Capital spending | | (708) | | (478) |
Sales of property, plant and equipment | | 23 | | 42 |
| | | | |
Management operating cash flow | | $1,145 | | $1,927 |
| | | | |
In the current year, management operating cash flow reflects our tax payment of $420 million related to our repatriation of international cash in 2005 in connection with the AJCA, as well as increased capital spending. During 2006, we expect to return approximately all of our management operating cash flow to our shareholders through dividends and share repurchases. However, see “Risk Factors” in Item 1A. and “Our Business Risks” in our Annual Report on Form 10-K for the fiscal year ended December 31, 2005 for certain factors that may impact our operating cash flows.
Debt Obligations and Commitments
See Debt Obligations and Commitments in the Notes to the Condensed Consolidated Financial Statements.
26
Report of Independent Registered Public Accounting Firm
The Board of Directors and Shareholders
PepsiCo, Inc.:
We have reviewed the accompanying Condensed Consolidated Balance Sheet of PepsiCo, Inc. and Subsidiaries as of June 17, 2006, the related Condensed Consolidated Statements of Income and Comprehensive Income for the twelve and twenty-four weeks ended June 17, 2006 and June 11, 2005, and the Condensed Consolidated Statements of Cash Flows for the twenty-four weeks ended June 17, 2006 and June 11, 2005. These interim condensed consolidated financial statements are the responsibility of PepsiCo, Inc.’s management.
We conducted our reviews in accordance with the standards of the Public Company Accounting Oversight Board (United States). A review of interim financial information consists principally of applying analytical procedures and making inquiries of persons responsible for financial and accounting matters. It is substantially less in scope than an audit conducted in accordance with the standards of the Public Company Accounting Oversight Board (United States), the objective of which is the expression of an opinion regarding the financial statements taken as a whole. Accordingly, we do not express such an opinion.
Based on our review, we are not aware of any material modifications that should be made to the accompanying interim condensed consolidated financial statements referred to above for them to be in conformity with U.S. generally accepted accounting principles.
We have previously audited, in accordance with the standards of the Public Company Accounting Oversight Board (United States), the Consolidated Balance Sheet of PepsiCo, Inc. and Subsidiaries as of December 31, 2005, and the related Consolidated Statements of Income, Common Shareholders’ Equity and Cash Flows for the year then ended not presented herein; and in our report dated February 24, 2006, we expressed an unqualified opinion on those consolidated financial statements. In our opinion, the information set forth in the accompanying Condensed Consolidated Balance Sheet as of December 31, 2005, is fairly stated, in all material respects, in relation to the Consolidated Balance Sheet from which it has been derived.
/s/ KPMG LLP
New York, New York
July 13, 2006
27
ITEM 4. Controls and Procedures
As of the end of the period covered by this report, we carried out an evaluation, under the supervision and with the participation of our management, including our Chief Executive Officer and Chief Financial Officer, of the effectiveness of the design and operation of our disclosure controls and procedures, as such term is defined in Rules 13a-15(e) and 15d-15(e) of the Exchange Act. Based upon that evaluation, our Chief Executive Officer and Chief Financial Officer concluded that as of the end of the period covered by this report our disclosure controls and procedures were effective to ensure that information required to be disclosed by us in reports we file or submit under the Exchange Act is (1) recorded, processed, summarized and reported within the time periods specified in Securities and Exchange Commission rules and forms, and (2) accumulated and communicated to our management, including our Chief Executive Officer and Chief Financial Officer, to allow timely decisions regarding required disclosure.
In addition, there were no changes in our internal control over financial reporting during our second fiscal quarter of 2006 that have materially affected, or are reasonably likely to materially affect, our internal control over financial reporting.
28
PART II OTHER INFORMATION
ITEM 1. Legal Proceedings
We are party to a variety of legal proceedings arising in the normal course of business, including the matters discussed below. While the results of proceedings cannot be predicted with certainty, management believes that the final outcome of these proceedings will not have a material adverse effect on our consolidated financial statements, results of operations or cash flows.
On April 30, 2004, we announced that Frito-Lay and Pepsi-Cola Company received notification from the Securities and Exchange Commission (the “SEC”) indicating that the SEC staff was proposing to recommend that the SEC bring a civil action alleging that a non-executive employee at Pepsi-Cola and another at Frito-Lay signed documents in early 2001 prepared by Kmart acknowledging payments in the amount of $3 million from Pepsi-Cola and $2.8 million from Frito-Lay. Kmart allegedly used these documents to prematurely recognize the $3 million and $2.8 million in revenue. Frito-Lay and Pepsi-Cola have cooperated fully with this investigation and provided written responses to the SEC staff notices setting forth the factual and legal bases for their belief that no enforcement actions should be brought against Frito-Lay or Pepsi-Cola.
Based on an internal review of the Kmart matters, no officers of PepsiCo, Pepsi-Cola or Frito-Lay are involved. Neither of these matters involves any allegations regarding PepsiCo’s accounting for its transactions with Kmart or PepsiCo’s financial statements.
ITEM 1A. Risk Factors
There have been no material changes with respect to the risk factors disclosed in our Annual Report on Form 10-K for the fiscal year ended December 31, 2005.
29
ITEM 2. Unregistered Sales of Equity Securities and Use of Proceeds
A summary of our common stock repurchases (in millions, except average price per share) during the second quarter under the $7 billion repurchase program authorized by our Board of Directors and publicly announced on March 29, 2004, and expiring on March 31, 2007, is set forth in the following table. All such shares of common stock were repurchased pursuant to open market transactions.
Issuer Purchases of Common Stock
| | | | | | | | |
| Period | | (a) Total
Number of
Shares
Repurchased | | (b) Average
Price Paid Per
Share | | (c) Total
Number of
Shares
Purchased as
Part of Publicly
Announced
Plans or
Programs | | (d) Maximum
Number (or
Approximate
Dollar Value) of
Shares that may
Yet Be
Purchased
Under the Plans
or Programs |
| | | | |
3/25/06 | | | | | | | | $1,175 |
3/26/06 – 4/22/06 | | 4.6 | | $58.00 | | 4.6 | | (269) |
| | | | | | | | |
| | | | | | | | 906 |
4/23/06 – 5/20/06 | | 5.3 | | 58.58 | | 5.3 | | (306) |
| | | | | | | | |
| | | | | | | | 600 |
5/21/06 – 6/17/06 | | 3.8 | | 59.94 | | 3.8 | | (230) |
| | | | | | | | |
Total | | 13.7 | | $58.76 | | 13.7 | | $370 |
| | | | | | | | |
In addition, PepsiCo repurchases shares of its convertible preferred stock from an employee stock ownership plan (ESOP) fund established by Quaker in connection with share redemptions by ESOP participants. The following table summarizes our convertible preferred share repurchases during the second quarter:
Issuer Purchases of Convertible Preferred Stock
| | | | | | | | |
| Period | | (a) Total
Number of
Shares
Repurchased | | (b) Average
Price Paid Per
Share | | (c) Total
Number of
Shares
Purchased as
Part of Publicly
Announced
Plans or
Programs | | (d) Maximum
Number (or
Approximate
Dollar Value) of
Shares that may
Yet Be
Purchased
Under the Plans
or Programs |
| | | | |
3/25/06 | | | | | | | | |
3/26/06 – 4/22/06 | | – | | $ – | | N/A | | N/A |
| | | | |
4/23/06 – 5/20/06 | | 4,100 | | 291.73 | | N/A | | N/A |
| | | | |
5/21/06 – 6/17/06 | | 3,900 | | 300.53 | | N/A | | N/A |
| | | | | | | | |
Total | | 8,000 | | $296.02 | | N/A | | N/A |
| | | | | | | | |
30
ITEM 4. Submission of Matters to a Vote of Security Holders
The following matters were submitted to a vote of security holders at PepsiCo’s Annual Meeting of Shareholders held on May 3, 2006.
Election of Directors
| | | | |
Nominee | | For | | Withheld |
John F. Akers | | 1,395,181,699 | | 39,744,822 |
Robert E. Allen | | 1,395,136,840 | | 39,789,681 |
Dina Dublon | | 1,411,648,847 | | 23,277,674 |
Victor J. Dzau, MD | | 1,412,091,447 | | 22,835,074 |
Ray L. Hunt | | 1,407,540,019 | | 27,386,502 |
Alberto Ibargüen | | 1,412,270,652 | | 22,655,869 |
Arthur C. Martinez | | 1,408,345,280 | | 26,581,241 |
Indra K. Nooyi | | 1,365,167,195 | | 69,759,326 |
Steven S Reinemund | | 1,396,791,262 | | 38,135,259 |
Sharon Percy Rockefeller | | 1,396,325,381 | | 38,601,140 |
James J. Schiro | | 1,412,667,781 | | 22,258,740 |
Franklin A. Thomas | | 1,397,425,694 | | 37,500,827 |
Cynthia M. Trudell | | 1,412,483,092 | | 22,443,429 |
Daniel Vasella | | 1,412,467,677 | | 22,458,844 |
Michael D. White | | 1,399,292,660 | | 35,633,861 |
The fifteen directors listed above were elected to a one-year term expiring in 2007.
Description of Proposals
| | | | | | | | |
| | | For | | Against | | Abstain | | Broker Non- Votes |
Ratification of appointment of KPMG LLP as
independent registered public accounting firm | | 1,399,607,964 | | 25,516,845 | | 9,801,712 | | |
| | | | |
Political Contributions | | 34,560,413 | | 1,022,017,322 | | 108,686,358 | | 269,662,428 |
| | | | |
Charitable Contributions | | 61,689,445 | | 998,868,523 | | 104,706,125 | | 269,662,428 |
31
ITEM 6. Exhibits
SeeIndex to Exhibits on page 34.
32
Pursuant to the requirements of the Securities Exchange Act of 1934, the registrant has duly caused this report to be signed on its behalf by the undersigned.
| | |
| | | PepsiCo, Inc. |
| | (Registrant) |
| |
Date: July 13, 2006 | | /S/ PETER A. BRIDGMAN |
| | Peter A. Bridgman |
| | Senior Vice President and |
| | Controller |
| |
Date: July 13, 2006 | | /S/ ROBERT E. COX |
| | Robert E. Cox |
| | Vice President, Deputy General |
| | Counsel and Assistant Secretary |
| | (Duly Authorized Officer) |
33
INDEX TO EXHIBITS
ITEM 6 (a)
EXHIBITS
| | |
Exhibit 10.1 | | U.S. $1,500,000,000 Five-Year Credit Agreement Dated as of May 22, 2006 among PepsiCo, Inc., as Borrower, the Lenders named therein, and Citibank, N.A., as Administrative Agent |
| |
Exhibit 12 | | Computation of Ratio of Earnings to Fixed Charges |
| |
Exhibit 15 | | Letter re: Unaudited Interim Financial Information |
| |
Exhibit 31 | | Certifications of Chief Executive Officer and Chief Financial Officer pursuant to Section 302 of the Sarbanes-Oxley Act of 2002 |
| |
Exhibit 32 | | Certifications of Chief Executive Officer and Chief Financial Officer pursuant to Section 906 of the Sarbanes-Oxley Act of 2002, 18 U.S.C. Section 1350 |
34