UNITED STATES SECURITIES AND EXCHANGE COMMISSION
Washington, D.C. 20549
FORM N-CSR
CERTIFIED SHAREHOLDER REPORT OF REGISTERED MANAGEMENT
INVESTMENT COMPANIES
| Investment Company Act file number: | | 811-04413 |
| | | |
| Exact name of registrant as specified in charter: | | Delaware Group® Equity Funds IV |
| | | |
| Address of principal executive offices: | | 610 Market Street |
| | Philadelphia, PA 19106 |
| | | |
| Name and address of agent for service: | | David F. Connor, Esq. |
| | 610 Market Street |
| | Philadelphia, PA 19106 |
| | | |
| Registrant’s telephone number, including area code: | | (800) 523-1918 |
| | | |
| Date of fiscal year end: | | March 31 |
| | | |
| Date of reporting period: | | March 31, 2022 |
Item 1. Reports to Stockholders
Table of Contents
Annual report
Alternative / specialty mutual fund
Delaware Healthcare Fund
March 31, 2022
Carefully consider the Fund's investment objectives, risk factors, charges, and expenses before investing. This and other information can be found in the Fund's prospectus and its summary prospectus, which may be obtained by visiting delawarefunds.com/literature or calling 800 523-1918. Investors should read the prospectus and the summary prospectus carefully before investing.
You can obtain shareholder reports and prospectuses online instead of in the mail.
Visit delawarefunds.com/edelivery.
Table of Contents
Experience Delaware Funds by Macquarie®
Macquarie Asset Management (MAM) is a global asset manager that aims to deliver positive impact for everyone. MAM Public Investments traces its roots to 1929 and partners with institutional and individual clients to deliver specialist active investment capabilities across global equities, fixed income, and multi-asset solutions using a conviction-based, long-term approach to investing. In the US, retail investors recognize our Delaware Funds by Macquarie family of funds as one of the oldest mutual fund families.
If you are interested in learning more about creating an investment plan, contact your financial advisor.
You can learn more about Delaware Funds or obtain a prospectus for Delaware Healthcare Fund at delawarefunds.com/literature.
| Manage your account online |
| ● | Check your account balance and transactions |
| ● | View statements and tax forms |
| ● | Make purchases and redemptions |
Visit delawarefunds.com/account-access.
Macquarie Asset Management (MAM) is the asset management division of Macquarie Group. MAM is a full-service asset manager offering a diverse range of products across public and private markets including fixed income, equities, multi-asset solutions, private credit, infrastructure, renewables, natural assets, real estate, and asset finance. The Public Investments business is a part of MAM and includes the following investment advisers: Macquarie Investment Management Business Trust (MIMBT), Macquarie Funds Management Hong Kong Limited, Macquarie Investment Management Austria Kapitalanlage AG, Macquarie Investment Management Global Limited, Macquarie Investment Management Europe Limited, and Macquarie Investment Management Europe S.A.
The Fund is distributed by Delaware Distributors, L.P. (DDLP), an affiliate of MIMBT and Macquarie Group Limited.
Other than Macquarie Bank Limited ABN 46 008 583 542 ("Macquarie Bank"), any Macquarie Group entity noted in this document is not an authorized deposit-taking institution for the purposes of the Banking Act 1959 (Commonwealth of Australia). The obligations of these other Macquarie Group entities do not represent deposits or other liabilities of Macquarie Bank. Macquarie Bank does not guarantee or otherwise provide assurance in respect of the obligations of these other Macquarie Group entities. In addition, if this document relates to an investment, (a) the investor is subject to investment risk including possible delays in repayment and loss of income and principal invested and (b) none of Macquarie Bank or any other Macquarie Group entity guarantees any particular rate of return on or the performance of the investment, nor do they guarantee repayment of capital in respect of the investment.
The Fund is governed by US laws and regulations.
Table of contents
Unless otherwise noted, views expressed herein are current as of March 31, 2022, and subject to change for events occurring after such date.
The Fund is not FDIC insured and is not guaranteed. It is possible to lose the principal amount invested.
Advisory services provided by Delaware Management Company, a series of MIMBT, a US registered investment advisor.
All third-party marks cited are the property of their respective owners.
© 2022 Macquarie Management Holdings, Inc.
Table of Contents
| Portfolio management review |
| Delaware Healthcare Fund | March 31, 2022 (Unaudited) |
Performance preview (for the year ended March 31, 2022)| Delaware Healthcare Fund (Institutional Class shares) | | 1-year return | | +4.69 | % |
| Delaware Healthcare Fund (Class A shares) | | 1-year return | | +4.44 | % |
| Russell 3000® Healthcare Index (benchmark) | | 1-year return | | +10.83 | % |
Past performance does not guarantee future results.
For complete, annualized performance for Delaware Healthcare Fund, please see the table on page 4.Institutional Class shares are not subject to a sales charge and are offered for sale exclusively to certain eligible investors. In addition, Institutional Class shares pay no distribution and service fee.
The performance of Class A shares excludes the applicable sales charge. The performance of both Institutional Class shares and Class A shares reflects the reinvestment of all distributions.
Please see page 6 for a description of the index. Index performance returns do not reflect any management fees, transaction costs, or expenses. Indices are unmanaged and one cannot invest directly in an index.
Investment objective
The Fund seeks maximum long-term capital growth through capital appreciation.
Market review
The healthcare sector continued to experience significant challenges during the fiscal year ended March 31, 2022. The measurement period began with a rebound for the broader healthcare sector as regulatory concerns diminished and virus-related disruptions receded. Subsequent waves of COVID-19 variants resulted in an uneven pace of healthcare-utilization recovery, while supporting stocks with exposure to COVID-19 vaccination, testing, and treatment. The biotechnology sector lagged markedly as merger and acquisition (M&A) activity remained subdued.
Within the Fund
For the fiscal year ended March 31, 2022, Delaware Healthcare Fund advanced, although it underperformed its benchmark, the Russell 3000 Healthcare Index. The Fund’s Institutional Class shares gained 4.69%. The Fund’s Class A shares advanced 4.44% at net asset value and declined 1.57% at maximum offer price. These figures reflect all
“We believe healthcare remains one of the few growth sectors in the US economy. We continue to see what we view as many attractive opportunities in the healthcare sector, particularly within the biotechnology sector.”
1
Table of Contents
Portfolio management review
Delaware Healthcare Fund
distributions reinvested. During the same period, the benchmark gained 10.83%. For complete, annualized performance of Delaware Healthcare Fund, please see the table on page 4.
Among sectors, our holdings in biotechnology detracted the most from relative performance as unfavorable asset allocation outweighed favorable stock selection. Shares of MorphoSys AG detracted from performance due to a slower-than-expected rollout of its lymphoma drug, Monjuvi®, and the acquisition of a development-stage biotechnology company focused on oncology treatments. Despite this near-term underperformance, MorphoSys remains one of the few antibody-technology platforms that a large pharmaceutical company has not acquired. We think MorphoSys has demonstrated continued progress on its own proprietary cancer pipeline.
The Fund’s overweight position in uniQure NV underperformed due to a delay in the approval timeline of its hemophilia drug by the US Food and Drug Administration (FDA). Inconclusive trial results for uniQure’s AMT-130 treatment for Huntington’s disease also affected performance. Despite this near-term underperformance, we think uniQure remains a market leader in gene therapy. Recent clinical trials indicate promise for its gene therapy platform, in our view.
The Fund’s lack of a position in vaccine-maker Moderna Inc. was a meaningful drag on relative performance early in the measurement period. Later in the fiscal year, as investors grew concerned with the lack of depth in Moderna’s pipeline and began questioning the company’s sources of revenue beyond its COVID-19 mRNA vaccine, the negative effect of the Fund’s lack of position was significantly reduced.
Finally, shares of MacroGenics Inc. underperformed as one of its pipeline drugs aroused concerns about dosing safety. The company also recently announced earnings results that were below investors’ expectations. We continue to believe that MacroGenics is undervalued and trades at a significant discount to its intrinsic value.
In contrast, the Fund’s holdings in Arena Pharmaceuticals Inc. were a bright spot in the sector. Its shares rose after Pfizer announced a deal to acquire Arena Pharmaceuticals at a 100% premium. The acquisition was completed in March 2022. Within the biotechnology sector, the Fund’s overweight position in Regeneron Pharmaceuticals Inc. also contributed to relative performance on the strength of sales of its Eylea® and Dupixent® drugs.
Among non-healthcare companies, an overweight position in US-based Micron Technology Inc. detracted from the Fund’s performance. As COVID-19 disrupted supply chains, shortages for specific types of non-memory semiconductor chips contributed to slowing demand for certain products such as personal computers. In turn, the demand outlook for complementary components such as memory chips also softened during the fiscal year. Despite this near-term underperformance, we continue to believe the company is well positioned for long-term secular growth.
Elsewhere, the blue-chip medical products sector also detracted from relative performance. Stock selection and asset allocation were both unfavorable. The Fund’s overweight position in Chugai Pharmaceutical Co. Ltd. detracted from relative performance due to lack of near-term catalysts. Chugai Pharmaceutical is among the strongest franchises in Japan. It is also
2
Table of Contents
partnered with Roche Holding AG, which allows Chugai to benefit from both companies’ pipelines. We believe that Chugai continues to have an attractive platform of hemophilia and oncology drugs. Its underperformance during the fiscal year was somewhat mitigated by the Fund’s overweight position in Roche. Shares of Roche performed well during the Fund’s fiscal year due to positive sentiment for the company’s Alzheimer’s drugs currently in development, positive clinical data, as well as announcements for several other drugs in the company’s pipeline, and approval for its at-home antigen test for COVID-19.
In contrast, the Fund’s small- and mid-cap medical products holdings contributed slightly to relative performance, driven mainly by a position in Intra-Cellular Therapies Inc. Shares of Intra-Cellular outperformed after the company announced that the FDA had approved its patented drug, Caplyta®, to treat bipolar depression.
The Fund used derivatives, foreign currency exchange contracts, during the fiscal year. However, these had a minimal effect on performance.
For global healthcare investors, there appear to be risks that short-term legislative and judicial action could possibly overshadow the positive long-term fundamentals of the sector and specific companies. We continue to see what we think are tremendous long-term opportunities in the global healthcare asset class. The baby-boomer generation in the US is aging, implying expanding demand for healthcare products and services for decades to come. At the same time, middle classes in countries with emerging economies (notably India and China) are growing rapidly, creating big appetites for Western-style medicine. We remain positive on the sector and its growth opportunities.
We believe healthcare remains one of the few growth sectors in the US economy. We continue to see what we view as many attractive opportunities in the healthcare sector, particularly within biotechnology sector, where we see potential for continued innovation in cancer treatments and gene-therapy technology. We remain overweight in the biotechnology sector, particularly in small to mid-cap companies, where we see potential for technological breakthroughs.
We continue putting a premium on disciplined, intensive research when analyzing investment opportunities for the Fund. We favor companies that exhibit such traits as:
| ● | Proven competitiveness |
| ● | Seasoned management teams |
| ● | Stock valuations that are discounted meaningfully from our estimates of intrinsic value. |
These characteristics are part of our daily considerations as we follow our conservative, stock-by-stock approach to portfolio management.
3
Table of Contents
| Performance summary | | |
| Delaware Healthcare Fund | | March 31, 2022 (Unaudited) |
The performance quoted represents past performance and does not guarantee future results. Investment return and principal value of an investment will fluctuate so that shares, when redeemed, may be worth more or less than their original cost. Current performance may be lower or higher than the performance quoted. Performance data current to the most recent month end may be obtained by calling 800 523-1918 or visiting delawarefunds.com/performance.
| Fund and benchmark performance1,2 | | Average annual total returns through March 31, 2022 |
| | 1 year | | 5 year | | 10 year | | Lifetime |
| Class A (Est. September 28, 2007) | | | | | | | | | | | | |
| Excluding sales charge | | +4.44 | % | | +12.51 | % | | +14.07 | % | | +15.01 | % |
| Including sales charge | | -1.57 | % | | +11.18 | % | | +13.39 | % | | +14.54 | % |
| Class C (Est. January 28, 2010) | | | | | | | | | | | | |
| Excluding sales charge | | +3.66 | % | | +11.67 | % | | +13.22 | % | | +13.70 | % |
| Including sales charge | | +2.69 | % | | +11.67 | % | | +13.22 | % | | +13.70 | % |
| Class R (Est. January 28, 2010) | | | | | | | | | | | | |
| Excluding sales charge | | +4.18 | % | | +12.23 | % | | +13.80 | % | | +14.26 | % |
| Including sales charge | | +4.18 | % | | +12.23 | % | | +13.80 | % | | +14.26 | % |
| Institutional Class (Est. September 28, 2007) | | | | | | | | | | | | |
| Excluding sales charge | | +4.69 | % | | +12.79 | % | | +14.36 | % | | +15.25 | % |
| Including sales charge | | +4.69 | % | | +12.79 | % | | +14.36 | % | | +15.25 | % |
| Russell 3000 Healthcare Index | | +10.83 | % | | +14.53 | % | | +15.73 | % | | +12.06 | %* |
| * | The benchmark lifetime return is for Institutional Class share comparison only and is calculated using the last business day in the month of the Fund's Institutional Class inception date. |
| 1 | Returns reflect the reinvestment of all distributions and are presented both with and without the applicable sales charges described below. Returns do not reflect the deduction of taxes the shareholder would pay on Fund distributions or redemptions of Fund shares. |
Expense limitations were in effect for certain classes during some or all of the periods shown in the “Fund and benchmark performance” table. Expenses for each class are listed on the “Fund expense ratios” table on page 5. Performance would have been lower had expense limitations not been in effect.
Class A shares are sold with a maximum front-end sales charge of 5.75%, and have an annual 12b-1 fee of 0.25% of average daily net assets. Performance for Class A shares, excluding sales charges, assumes that no front-end sales charge applied.
Class C shares are sold with a contingent deferred sales charge (CDSC) of 1.00% if redeemed during the first 12 months. They are also subject to an annual 12b-1 fee of 1.00% of average daily net assets. Performance for Class C shares, excluding sales charges, assumes either that CDSCs did not apply or that the investment was not redeemed.
4
Table of Contents
Institutional Class shares are not subject to a sales charge and are offered for sale exclusively to certain eligible investors. In addition, Institutional Class shares pay no distribution and service (12b-1) fee.
Class R shares are available only for certain retirement plan products. They are sold without a sales charge and have an annual 12b-1 fee of 0.50% of average daily net assets.
Narrowly focused investments may exhibit higher volatility than investments in multiple industry sectors.
Healthcare companies are subject to extensive government regulation and their profitability can be affected by restrictions on government reimbursement for medical expenses, rising costs of medical products and services, pricing pressure, and malpractice or other litigation.
International investments entail risks including fluctuation in currency values, differences in accounting principles, or economic or political instability. Investing in emerging markets can be riskier than investing in established foreign markets due to increased volatility, lower trading volume, and higher risk of market closures. In many emerging markets, there is substantially less publicly available information and the available information may be incomplete or misleading. Legal claims are generally more difficult to pursue.
“Non-diversified” funds may allocate more of their net assets to investments in single securities than “diversified” funds. Resulting adverse effects may subject these funds to greater risks and volatility.
The disruptions caused by natural disasters, pandemics, or similar events could prevent the Fund from executing advantageous investment decisions in a timely manner and could negatively impact the Fund’s ability to achieve its investment objective and the value of the Fund’s investments.
| 2 | The Fund’s expense ratios, as described in the most recent prospectus, are disclosed in the following “Fund expense ratios” table. Please see the “Financial highlights” section in this report for the most recent expense ratios. |
| | | | | | | | | | | Institutional |
| Fund expense ratios | | Class A | | Class C | | Class R | | Class |
| Total annual operating expenses | | | | | | | | | | | | | | |
| (without fee waivers) | | 1.23 | % | | 1.98 | % | | 1.48 | % | | | 0.98 | % | |
| Net expenses (including fee | | | | | | | | | | | | | | |
| waivers, if any) | | 1.23 | % | | 1.98 | % | | 1.48 | % | | | 0.98 | % | |
| Type of waiver | | n/a | | | n/a | | | n/a | | | | n/a | | |
5
Table of Contents
Performance summary
Delaware Healthcare Fund
Performance of a $10,000 investment1
Average annual total returns from March 31, 2012 through March 31, 2022
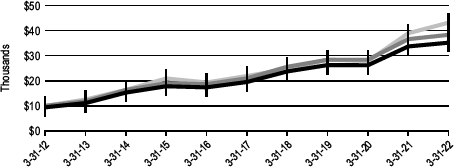
| For period beginning March 31, 2012 through March 31, 2022 | | Starting value | | Ending value |
 | Russell 3000 Healthcare Index | | | $10,000 | | | | $43,103 | |
 | Delaware Healthcare Fund — Institutional Class shares | | | $10,000 | | | | $38,263 | |
 | Delaware Healthcare Fund — Class A shares | | | $9,425 | | | | $35,142 | |
| 1 | The “Performance of a $10,000 investment” graph assumes $10,000 invested in Institutional Class and Class A shares of the Fund on March 31, 2012, and includes the effect of a 5.75% front-end sales charge (for Class A shares) and the reinvestment of all distributions. The graph does not reflect the deduction of taxes the shareholders would pay on Fund distributions or redemptions of Fund shares. Expense limitations were in effect for some or all of the periods shown. Performance would have been lower had expense limitations not been in effect. Expenses are listed in the “Fund expense ratios” table on page 5. Please note additional details on pages 4 through 7. |
The graph also assumes $10,000 invested in the Russell 3000 Healthcare Index as of March 31, 2012. The Russell 3000 Healthcare Index measures the performance of all healthcare holdings included in the Russell 3000 Index, which represents the 3,000 largest US companies based on total market capitalization.
Frank Russell Company is the source and owner of the trademarks, service marks and copyrights related to the Russell Indexes. Russell® is a trademark of Frank Russell Company.
Index performance returns do not reflect any management fees, transaction costs, or expenses. Indices are unmanaged and one cannot invest directly in an index. Past performance does not guarantee future results.
Performance of other Fund classes will vary due to different charges and expenses.
6
Table of Contents
| | Nasdaq symbols | | CUSIPs |
| Class A | | DLHAX | | 24610E101 |
| Class C | | DLHCX | | 24610E200 |
| Class R | | DLRHX | | 24610E309 |
| Institutional Class | | DLHIX | | 24610E408 |
7
Table of Contents
Disclosure of Fund expenses
For the six-month period from October 1, 2021 to March 31, 2022 (Unaudited)
As a shareholder of the Fund, you incur two types of costs: (1) transaction costs, including sales charges (loads) on purchase payments, reinvested dividends, or other distributions; redemption fees; and exchange fees; and (2) ongoing costs, including management fees; distribution and service (12b-1) fees; and other Fund expenses. This example is intended to help you understand your ongoing costs (in dollars) of investing in the Fund and to compare these costs with the ongoing costs of investing in other mutual funds.
The example is based on an investment of $1,000 invested at the beginning of the period and held for the entire six-month period from October 1, 2021 to March 31, 2022.
Actual expenses
The first section of the table shown, “Actual Fund return,” provides information about actual account values and actual expenses. You may use the information in this section of the table, together with the amount you invested, to estimate the expenses that you paid over the period. Simply divide your account value by $1,000 (for example, an $8,600 account value divided by $1,000 = 8.6), then multiply the result by the number in the first section under the heading entitled “Expenses Paid During Period” to estimate the expenses you paid on your account during this period.
Hypothetical example for comparison purposes
The second section of the table shown, “Hypothetical 5% return,” provides information about hypothetical account values and hypothetical expenses based on the Fund’s actual expense ratio and an assumed rate of return of 5% per year before expenses, which is not the Fund’s actual return. The hypothetical account values and expenses may not be used to estimate the actual ending account balance or expenses you paid for the period. You may use this information to compare the ongoing costs of investing in the Fund and other funds. To do so, compare this 5% hypothetical example with the 5% hypothetical examples that appear in the shareholder reports of the other funds.
Please note that the expenses shown in the table are meant to highlight your ongoing costs only and do not reflect any transactional costs, such as sales charges (loads), redemption fees, or exchange fees. Therefore, the second section of the table is useful in comparing ongoing costs only, and will not help you determine the relative total costs of owning different funds. In addition, if these transactional costs were included, your costs would have been higher. The Fund’s expenses shown in the table assume reinvestment of all dividends and distributions.
8
Table of Contents
Delaware Healthcare Fund
Expense analysis of an investment of $1,000
| | Beginning | | Ending | | | | | | Expenses |
| | Account Value | | Account Value | | Annualized | | Paid During Period |
| | 10/1/21 | | 3/31/22 | | Expense Ratio | | 10/1/21 to 3/31/22* |
| Actual Fund return† | | | | | | | | | | | | | | | | | | | |
| Class A | | | $ | 1,000.00 | | | | $ | 1,032.50 | | | | 1.25% | | | | $ | 6.33 | |
| Class C | | | | 1,000.00 | | | | | 1,029.10 | | | | 2.00% | | | | | 10.12 | |
| Class R | | | | 1,000.00 | | | | | 1,031.60 | | | | 1.50% | | | | | 7.60 | |
| Institutional Class | | | | 1,000.00 | | | | | 1,033.90 | | | | 1.00% | | | | | 5.07 | |
| Hypothetical 5% return (5% return before expenses) | | | | | | | | | | |
| Class A | | | $ | 1,000.00 | | | | $ | 1,018.70 | | | | 1.25% | | | | $ | 6.29 | |
| Class C | | | | 1,000.00 | | | | | 1,014.96 | | | | 2.00% | | | | | 10.05 | |
| Class R | | | | 1,000.00 | | | | | 1,017.45 | | | | 1.50% | | | | | 7.54 | |
| Institutional Class | | | | 1,000.00 | | | | | 1,019.95 | | | | 1.00% | | | | | 5.04 | |
| * | “Expenses Paid During Period” are equal to the Fund's annualized expense ratio, multiplied by the average account value over the period, multiplied by 182/365 (to reflect the one-half year period). |
| † | Because actual returns reflect only the most recent six-month period, the returns shown may differ significantly from fiscal year returns. |
In addition to the Fund’s expenses reflected above, the Fund also indirectly bears its portion of the fees and expenses of the investment companies (Underlying Funds) in which it invests. The table above does not reflect the expenses of the Underlying Funds.
9
Table of Contents
| Security type / sector allocation and top 10 equity holdings |
|
| Delaware Healthcare Fund | As of March 31, 2022 (Unaudited) |
Sector designations may be different from the sector designations presented in other Fund materials. The sector designations may represent the investment manager’s internal sector classifications.
| Security type / sector | | Percentage of net assets |
| Common Stocks◆ | | | 98.40% | |
| Biotechnology* | | | 27.65% | |
| Blue Chip Medical Products* | | | 47.07% | |
| Healthcare Services | | | 12.84% | |
| Other | | | 0.96% | |
| Small- / Mid-Cap Medical Products | | | 9.88% | |
| Rights | | | 0.00% | |
| Short-Term Investments | | | 1.50% | |
| Total Value of Securities | | | 99.90% | |
| Receivables and Other Assets Net of Liabilities | | | 0.10% | |
| Total Net Assets | | | 100.00% | |
| ◆ | Narrow industries are utilized for compliance purposes for diversification whereas broad sectors are used for financial reporting. |
| * | To monitor compliance with the Fund’s concentration guidelines as described in the Fund’s prospectus and Statement of Additional Information, the Biotechnology and Blue Chip Medical Products sector (as disclosed herein for financial reporting purposes) is subdivided into a variety of “industries” (in accordance with the requirements of the Investment Company Act of 1940, as amended). The Biotechnology sector consisted of Biotechnology, Healthcare-Products, and Pharmaceuticals. As of March 31, 2022, such amounts, as a percentage of total net assets were 21.92%, 0.71%, and 5.02% respectively. The Blue Chip Medical Products sector consisted of Biotechnology, Healthcare-Products, and Medical-Drugs. As of March 31, 2022, such amounts, as a percentage of total net assets were 8.54%, 3.29%, and 35.24% respectively. The percentage in any such single industry will comply with the Fund’s concentration policy even if the percentage in the Biotechnology and Blue Chip Medical Products sector for financial reporting purposes may exceed 25%. |
10
Table of Contents
Holdings are for informational purposes only and are subject to change at any time. They are not a recommendation to buy, sell, or hold any security.
| Top 10 equity holdings | | Percentage of net assets |
| Regeneron Pharmaceuticals | | | 6.65 | % | |
| UnitedHealth Group | | | 6.47 | % | |
| Amgen | | | 6.32 | % | |
| Sanofi ADR | | | 5.97 | % | |
| Roche Holding | | | 5.44 | % | |
| Anthem | | | 4.54 | % | |
| Eli Lilly & Co. | | | 3.94 | % | |
| AbbVie | | | 3.88 | % | |
| Pfizer | | | 3.31 | % | |
| Illumina | | | 2.96 | % | |
11
Table of Contents
| Schedule of investments | |
| Delaware Healthcare Fund | March 31, 2022 |
| | | Number of | | | |
| | | | shares | | Value (US $) |
| Common Stocks – 98.40% ◆ | | | | | |
| Biotechnology – 27.65% | | | | | |
| ACADIA Pharmaceuticals † | | 160,000 | | $ | 3,875,200 |
| Alkermes † | | 423,142 | | | 11,132,866 |
| Allogene Therapeutics † | | 146,779 | | | 1,337,157 |
| Alnylam Pharmaceuticals † | | 41,000 | | | 6,694,890 |
| Amarin ADR † | | 190,000 | | | 625,100 |
| AnaptysBio † | | 93,732 | | | 2,318,930 |
| Arcus Biosciences † | | 379,100 | | | 11,964,396 |
| Atea Pharmaceuticals † | | 70,000 | | | 505,400 |
| Athenex † | | 70,000 | | | 58,065 |
| BioMarin Pharmaceutical † | | 124,000 | | | 9,560,400 |
| Cellectis ADR † | | 226,875 | | | 1,030,012 |
| Clovis Oncology † | | 250,200 | | | 505,404 |
| Coherus Biosciences † | | 430,000 | | | 5,551,300 |
| Compugen † | | 690,000 | | | 2,221,800 |
| Dynavax Technologies † | | 760,000 | | | 8,238,400 |
| Epizyme † | | 203,200 | | | 233,680 |
| Exact Sciences † | | 96,353 | | | 6,737,002 |
| Forma Therapeutics Holdings † | | 92,786 | | | 862,910 |
| Fortress Biotech † | | 100,000 | | | 136,000 |
| Galmed Pharmaceuticals † | | 306,010 | | | 486,556 |
| Incyte † | | 80,000 | | | 6,353,600 |
| Intellia Therapeutics † | | 20,000 | | | 1,453,400 |
| Intercept Pharmaceuticals † | | 27,000 | | | 439,290 |
| Karyopharm Therapeutics † | | 380,000 | | | 2,800,600 |
| Landos Biopharma † | | 147,182 | | | 217,093 |
| MacroGenics † | | 420,000 | | | 3,700,200 |
| Madrigal Pharmaceuticals † | | 28,500 | | | 2,796,420 |
| MEI Pharma † | | 600,000 | | | 361,500 |
| Mersana Therapeutics † | | 150,000 | | | 598,500 |
| Mirati Therapeutics † | | 60,000 | | | 4,933,200 |
| MorphoSys † | | 300,000 | | | 8,129,767 |
| Mustang Bio † | | 120,000 | | | 121,200 |
| Myriad Genetics † | | 135,000 | | | 3,402,000 |
| Nektar Therapeutics † | | 256,385 | | | 1,381,915 |
| Neurocrine Biosciences † | | 110,000 | | | 10,312,500 |
| NextCure † | | 150,000 | | | 729,000 |
| ProQR Therapeutics † | | 620,000 | | | 561,224 |
| Provention Bio † | | 70,000 | | | 512,400 |
| Puma Biotechnology † | | 61,255 | | | 176,414 |
| Regeneron Pharmaceuticals † | | 90,000 | | | 62,857,800 |
| REGENXBIO † | | 149,000 | | | 4,945,310 |
12
Table of Contents
| | | Number of | | | |
| | | | shares | | Value (US $) |
| Common Stocks ◆ (continued) | | | | | |
| Biotechnology (continued) | | | | | |
| Rigel Pharmaceuticals † | | 1,600,000 | | $ | 4,784,000 |
| Rocket Pharmaceuticals † | | 58,000 | | | 919,880 |
| Sangamo Therapeutics † | | 400,000 | | | 2,324,000 |
| Sarepta Therapeutics † | | 13,000 | | | 1,015,560 |
| Seagen † | | 80,000 | | | 11,524,000 |
| Sio Gene Therapies † | | 64,171 | | | 42,995 |
| Surface Oncology † | | 350,000 | | | 1,029,000 |
| Syndax Pharmaceuticals † | | 180,000 | | | 3,128,400 |
| Theravance Biopharma † | | 208,783 | | | 1,995,965 |
| Ultragenyx Pharmaceutical † | | 70,000 | | | 5,083,400 |
| uniQure † | | 706,166 | | | 12,760,420 |
| United Therapeutics † | | 80,000 | | | 14,352,800 |
| Vascular Biogenics † | | 200,000 | | | 338,000 |
| Vertex Pharmaceuticals † | | 25,000 | | | 6,524,250 |
| Viking Therapeutics † | | 330,100 | | | 990,300 |
| Voyager Therapeutics † | | 5,700 | | | 43,434 |
| WaVe Life Sciences † | | 81,955 | | | 163,910 |
| Xencor † | | 129,191 | | | 3,446,816 |
| XOMA † | | 3,466 | | | 96,979 |
| Yumanity Therapeutics = | | 750,000 | | | 0 |
| Yumanity Therapeutics † | | 37,500 | | | 56,250 |
| | | | | | 261,479,160 |
| Blue Chip Medical Products – 47.07% | | | | | |
| AbbVie | | 226,559 | | | 36,727,479 |
| Amgen | | 246,964 | | | 59,720,834 |
| AstraZeneca | | 131,243 | | | 17,404,534 |
| Biogen † | | 45,000 | | | 9,477,000 |
| Boston Scientific † | | 380,000 | | | 16,830,200 |
| Chugai Pharmaceutical | | 700,000 | | | 23,357,898 |
| Eli Lilly & Co. | | 130,000 | | | 37,228,100 |
| Gilead Sciences | | 195,000 | | | 11,592,750 |
| GlaxoSmithKline | | 313,421 | | | 6,781,476 |
| Johnson & Johnson | | 100,000 | | | 17,723,000 |
| Merck & Co. | | 295,000 | | | 24,204,750 |
| Organon & Co. | | 29,500 | | | 1,030,435 |
| Pfizer | | 604,600 | | | 31,300,142 |
| Roche Holding | | 130,000 | | | 51,436,042 |
| Sanofi | | 200,000 | | | 20,447,931 |
| Sanofi ADR | | 1,100,000 | | | 56,474,000 |
| Stryker | | 15,000 | | | 4,010,250 |
| UCB | | 76,000 | | | 9,089,373 |
13
Table of Contents
Schedule of investments
Delaware Healthcare Fund
| | | | Number of | | | |
| | | | | shares | | Value (US $) |
| Common Stocks ◆ (continued) | | | | | |
| Blue Chip Medical Products (continued) | | | | | |
| Zimmer Biomet Holdings | | 80,000 | | $ | 10,232,000 |
| | | | | | | 445,068,194 |
| Healthcare Services – 12.84% | | | | | |
| Anthem | | 87,500 | | | 42,981,750 |
| Change Healthcare † | | 25,532 | | | 556,598 |
| CVS Health | | 100,000 | | | 10,121,000 |
| Quest Diagnostics | | 48,000 | | | 6,569,280 |
| UnitedHealth Group | | 120,000 | | | 61,196,400 |
| | | | | | | 121,425,028 |
| Other – 0.96% | | | | | |
| Cia de Minas Buenaventura ADR † | | 66,353 | | | 668,175 |
| Fannie Mae † | | 1,300,000 | | | 1,020,500 |
| Federal Home Loan Mortgage † | | 1,050,000 | | | 824,250 |
| Sohu.com ADR † | | 390,722 | | | 6,571,944 |
| | | | | | | 9,084,869 |
| Small- / Mid-Cap Medical Products – 9.88% | | | | | |
| Aerie Pharmaceuticals † | | 5,100 | | | 46,410 |
| Halozyme Therapeutics † | | 230,000 | | | 9,172,400 |
| Illumina † | | 80,000 | | | 27,952,000 |
| InnoCare Pharma 144A #, † | | 17,000 | | | 26,212 |
| Inspire Medical Systems † | | 30,000 | | | 7,700,700 |
| Intra-Cellular Therapies † | | 450,000 | | | 27,535,500 |
| Perrigo | | 210,000 | | | 8,070,300 |
| Viatris | | 1,170,018 | | | 12,729,796 |
| Zimvie † | | 8,000 | | | 182,720 |
| | | | | | | 93,416,038 |
| Total Common Stocks (cost $698,884,110) | | | | | 930,473,289 |
| | | |
| Rights – 0.00% | | | | | |
| Ambit Bioscience = | | 76,500 | | | 0 |
| Total Rights (cost $0) | | | | | 0 |
| | | |
| Short-Term Investments – 1.50% | | | | | |
| Money Market Mutual Funds – 1.50% | | | | | |
| BlackRock FedFund – Institutional Shares (seven-day | | | | | |
| | effective yield 0.23%) | | 3,556,077 | | | 3,556,077 |
| Fidelity Investments Money Market Government Portfolio – | | | | | |
| | Class I (seven-day effective yield 0.12%) | | 3,556,077 | | | 3,556,077 |
14
Table of Contents
| | | | Number of | | | |
| | | | | shares | | Value (US $) |
| Short-Term Investments (continued) | | | | | |
| Money Market Mutual Funds (continued) | | | | | |
| GS Financial Square Government Fund – Institutional | | | | | |
| | Shares (seven-day effective yield 0.25%) | | 3,556,077 | | $ | 3,556,077 |
| Morgan Stanley Government Portfolio – Institutional Share | | | | | |
| | Class (seven-day effective yield 0.23%) | | 3,556,078 | | | 3,556,078 |
| Total Short-Term Investments (cost $14,224,309) | | | | | 14,224,309 |
| Total Value of Securities–99.90% | | | | | |
| (cost $713,108,419) | | | | $ | 944,697,598 |
| ◆ | Narrow industries are utilized for compliance purposes for diversification whereas broad sectors are used for financial reporting. |
| † | Non-income producing security. |
| = | The value of this security was determined using significant unobservable inputs and is reported as a Level 3 security in the disclosure table located in Note 3 in “Notes to financial statements.” |
| # | Security exempt from registration under Rule 144A of the Securities Act of 1933, as amended. At March 31, 2022, the aggregate value of Rule 144A securities was $26,212, which represents 0.00% of the Fund's net assets. See Note 10 in “Notes to financial statements.” |
| Summary of abbreviations: |
| ADR – American Depositary Receipt |
| GS – Goldman Sachs |
See accompanying notes, which are an integral part of the financial statements.
15
Table of Contents
| Statement of assets and liabilities | |
| Delaware Healthcare Fund | March 31, 2022 |
| Assets: | | | |
| | Investments, at value* | | $ | 944,697,598 |
| Foreign currencies, at valueΔ | | | 128 |
| Foreign tax reclaims receivable | | | 1,500,376 |
| Receivable for fund shares sold | | | 1,245,105 |
| Dividends receivable | | | 515,723 |
| Other assets | | | 7,050 |
| Total Assets | | | 947,965,980 |
| Liabilities: | | | |
| Payable for fund shares redeemed | | $ | 1,147,227 |
| Investment management fees payable to affiliates | | | 651,285 |
| Dividend disbursing and transfer agent fees and expenses payable to | | | |
| | non-affiliates | | | 166,493 |
| Distribution fees payable to affiliates | | | 138,789 |
| Other accrued expenses | | | 136,555 |
| Reports and statements to shareholders expenses payable to non-affiliates | | | 40,706 |
| Audit and tax fees payable | | | 33,030 |
| Dividend disbursing and transfer agent fees and expenses payable to | | | |
| | affiliates | | | 7,291 |
| Trustees’ fees and expenses payable to affiliates | | | 4,357 |
| Accounting and administration expenses payable to affiliates | | | 2,534 |
| Legal fees payable to affiliates | | | 1,666 |
| Reports and statements to shareholders expenses payable to affiliates | | | 481 |
| Distribution payable | | | 34 |
| Total Liabilities | | | 2,330,448 |
| Total Net Assets | | $ | 945,635,532 |
| | |
| Net Assets Consist of: | | | |
| Paid-in capital | | $ | 646,343,180 |
| Total distributable earnings (loss) | | | 299,292,352 |
| Total Net Assets | | $ | 945,635,532 |
16
Table of Contents
| Net Asset Value | | | | |
| | | | | | |
| Class A: | | | | |
| Net assets | | $ | 311,814,809 | |
| Shares of beneficial interest outstanding, unlimited authorization, no par | | | 11,398,922 | |
| Net asset value per share | | $ | 27.35 | |
| Sales charge | | | 5.75 | % |
| Offering price per share, equal to net asset value per share / (1 - sales | | | | |
| charge) | | $ | 29.02 | |
| Class C: | | | | |
| Net assets | | $ | 86,748,015 | |
| Shares of beneficial interest outstanding, unlimited authorization, no par | | | 3,440,064 | |
| Net asset value per share | | $ | 25.22 | |
| Class R: | | | | |
| Net assets | | $ | 4,129,844 | |
| Shares of beneficial interest outstanding, unlimited authorization, no par | | | 154,058 | |
| Net asset value per share | | $ | 26.81 | |
| Institutional Class: | | | | |
| Net assets | | $ | 542,942,864 | |
| Shares of beneficial interest outstanding, unlimited authorization, no par | | | 19,670,655 | |
| Net asset value per share | | $ | 27.60 | |
| ____________________ |
| *Investments, at cost | | $ | 713,108,419 | |
| ΔForeign currencies, at cost | | | 129 | |
See accompanying notes, which are an integral part of the financial statements.
17
Table of Contents
| Statement of operations | |
| Delaware Healthcare Fund | Year ended March 31, 2022 |
| Investment Income: | | | | |
| Dividends | | $ | 16,227,240 | |
| Foreign tax withheld | | | (926,932 | ) |
| | | | | 15,300,308 | |
| | | |
| Expenses: | | | | |
| Management fees | | | 8,737,191 | |
| Distribution expenses – Class A | | | 827,274 | |
| Distribution expenses – Class C | | | 1,007,906 | |
| Distribution expenses – Class R | | | 21,868 | |
| Dividend disbursing and transfer agent fees and expenses | | | 1,043,044 | |
| Accounting and administration expenses | | | 206,032 | |
| Reports and statements to shareholders expenses | | | 155,861 | |
| Registration fees | | | 118,956 | |
| Custodian fees | | | 117,510 | |
| Legal fees | | | 50,511 | |
| Audit and tax services | | | 33,791 | |
| Trustees’ fees and expenses | | | 31,044 | |
| Other | | | 35,914 | |
| Total operating expenses | | | 12,386,902 | |
| Net Investment Income | | | 2,913,406 | |
| Net Realized and Unrealized Gain (Loss): | | | | |
| Net realized gain (loss) on: | | | | |
| | Investments | | | 123,209,197 | |
| | Foreign currencies | | | 50,746 | |
| | Foreign currency exchange contracts | | | (73,516 | ) |
| Net realized gain | | | 123,186,427 | |
| Net change in unrealized appreciation (depreciation) of: | | | | |
| | Investments | | | (80,700,318 | ) |
| | Foreign currencies | | | 2,474 | |
| Net change in unrealized appreciation (depreciation) | | | (80,697,844 | ) |
| Net Realized and Unrealized Gain | | | 42,488,583 | |
| Net Increase in Net Assets Resulting from Operations | | $ | 45,401,989 | |
See accompanying notes, which are an integral part of the financial statements.
18
Table of Contents
Statements of changes in net assets
Delaware Healthcare Fund
| | | | Year ended |
| | | | 3/31/22 | | 3/31/21 |
| Increase (Decrease) in Net Assets from Operations: | | | | | | | | |
| Net investment income | | $ | 2,913,406 | | | $ | 2,192,880 | |
| Net realized gain | | | 123,186,427 | | | | 41,522,314 | |
| Net change in unrealized appreciation (depreciation) | | | (80,697,844 | ) | | | 227,055,458 | |
| Net increase in net assets resulting from operations | | | 45,401,989 | | | | 270,770,652 | |
| | | |
| Dividends and Distributions to Shareholders from: | | | | | | | | |
| Distributable earnings: | | | | | | | | |
| | | Class A | | | (16,759,306 | ) | | | (18,672,006 | ) |
| | Class C | | | (5,329,804 | ) | | | (6,749,762 | ) |
| | Class R | | | (231,131 | ) | | | (251,007 | ) |
| | Institutional Class | | | (32,245,403 | ) | | | (41,992,451 | ) |
| | | | | (54,565,644 | ) | | | (67,665,226 | ) |
| | | |
| Capital Share Transactions: | | | | | | | | |
| Proceeds from shares sold: | | | | | | | | |
| | Class A | | | 32,758,898 | | | | 69,442,617 | |
| | Class C | | | 3,939,559 | | | | 21,953,241 | |
| | Class R | | | 744,943 | | | | 1,265,503 | |
| | Institutional Class | | | 103,514,982 | | | | 287,315,606 | |
| Net asset value of shares issued upon reinvestment of | | | | | | | | |
| | dividends and distributions: | | | | | | | | |
| | Class A | | | 16,396,716 | | | | 18,050,063 | |
| | Class C | | | 5,255,468 | | | | 6,636,552 | |
| | Class R | | | 229,282 | | | | 249,130 | |
| | Institutional Class | | | 29,874,548 | | | | 38,712,295 | |
| | | | | 192,714,396 | | | | 443,625,007 | |
19
Table of Contents
Statements of changes in net assets
Delaware Healthcare Fund
| | | | Year ended |
| | | | | 3/31/22 | | 3/31/21 |
| Capital Share Transactions (continued): | | | | | | | | |
| Cost of shares redeemed: | | | | | | | | |
| | Class A | | $ | (79,389,803 | ) | | $ | (75,426,756 | ) |
| | Class C | | | (32,807,082 | ) | | | (37,378,394 | ) |
| | Class R | | | (1,682,070 | ) | | | (2,942,339 | ) |
| | Institutional Class | | | (270,277,103 | ) | | | (280,391,146 | ) |
| | | | | (384,156,058 | ) | | | (396,138,635 | ) |
| Increase (decrease) in net assets derived from capital | | | | | | | | |
| | share transactions | | | (191,441,662 | ) | | | 47,486,372 | |
| Net Increase (Decrease) in Net Assets | | | (200,605,317 | ) | | | 250,591,798 | |
| Net Assets: | | | | | | | | |
| Beginning of year | | | 1,146,240,849 | | | | 895,649,051 | |
| End of year | | $ | 945,635,532 | | | $ | 1,146,240,849 | |
See accompanying notes, which are an integral part of the financial statements.
20
Table of Contents
Financial highlights
Delaware Healthcare Fund Class A
Selected data for each share of the Fund outstanding throughout each period were as follows:
| Net asset value, beginning of period |
| |
| Income (loss) from investment operations: |
| Net investment income (loss)1 |
| Net realized and unrealized gain |
| Total from investment operations |
| |
| Less dividends and distributions from: |
| Net investment income |
| Net realized gain |
| Total dividends and distributions |
| |
| Net asset value, end of period |
| |
| Total return2 |
| |
| Ratios and supplemental data: |
| Net assets, end of period (000 omitted) |
| Ratio of expenses to average net assets3 |
| Ratio of net investment income (loss) to average net assets |
| Portfolio turnover |
| 1 | Calculated using average shares outstanding. |
| 2 | Total return is based on the change in net asset value of a share during the period and assumes reinvestment of dividends and distributions at net asset value and does not reflect the impact of a sales charge. |
| 3 | Expense ratios do not include expenses of the Underlying Funds in which the Fund invests. |
See accompanying notes, which are an integral part of the financial statements.
22
Table of Contents
| Year ended | |
| 3/31/22 | | 3/31/21 | | 3/31/20 | | 3/31/19 | | 3/31/18 | |
| $ | 27.71 | | | $ | 22.75 | | | $ | 24.63 | | | $ | 22.63 | | | $ | 19.19 | | |
| | | | | | | | | | | | | | | | | | | | |
| | | | | | | | | | | | | | | | | | | | |
| | 0.06 | | | | 0.03 | | | | 0.03 | | | | (0.03 | ) | | | 0.04 | | |
| | 1.06 | | | | 6.49 | | | | 0.11 | | | | 2.44 | | | | 4.08 | | |
| | 1.12 | | | | 6.52 | | | | 0.14 | | | | 2.41 | | | | 4.12 | | |
| | | | | | | | | | | | | | | | | | | | |
| | | | | | | | | | | | | | | | | | | | |
| | — | | | | (0.06 | ) | | | — | | | | (0.15 | ) | | | (0.68 | ) | |
| | (1.48 | ) | | | (1.50 | ) | | | (2.02 | ) | | | (0.26 | ) | | | — | | |
| | (1.48 | ) | | | (1.56 | ) | | | (2.02 | ) | | | (0.41 | ) | | | (0.68 | ) | |
| | | | | | | | | | | | | | | | | | | | |
| $ | 27.35 | | | $ | 27.71 | | | $ | 22.75 | | | $ | 24.63 | | | $ | 22.63 | | |
| | | | | | | | | | | | | | | | | | | | |
| | 4.44% | | | | 28.55% | | | | (0.27% | ) | | | 10.74% | | | | 21.56% | | |
| | | | | | | | | | | | | | | | | | | | |
| | | | | | | | | | | | | | | | | | | | |
| $ | 311,815 | | | $ | 344,531 | | | $ | 272,911 | | | $ | 319,993 | | | $ | 212,838 | | |
| | 1.24% | | | | 1.23% | | | | 1.27% | | | | 1.28% | | | | 1.31% | | |
| | 0.20% | | | | 0.11% | | | | 0.13% | | | | (0.10% | ) | | | 0.18% | | |
| | 1% | | | | 22% | | | | 24% | | | | 33% | | | | 28% | | |
23
Table of Contents
Financial highlights
Delaware Healthcare Fund Class C
Selected data for each share of the Fund outstanding throughout each period were as follows:
| Net asset value, beginning of period |
| |
| Income (loss) from investment operations: |
| Net investment loss1 |
| Net realized and unrealized gain |
| Total from investment operations |
| |
| Less dividends and distributions from: |
| Net investment income |
| Net realized gain |
| Total dividends and distributions |
| |
| Net asset value, end of period |
| |
| Total return2 |
| |
| Ratios and supplemental data: |
| Net assets, end of period (000 omitted) |
| Ratio of expenses to average net assets3 |
| Ratio of net investment loss to average net assets |
| Portfolio turnover |
| 1 | Calculated using average shares outstanding. |
| 2 | Total return is based on the change in net asset value of a share during the period and assumes reinvestment of dividends and distributions at net asset value and does not reflect the impact of a sales charge. |
| 3 | Expense ratios do not include expenses of the Underlying Funds in which the Fund invests. |
See accompanying notes, which are an integral part of the financial statements.
24
Table of Contents
| Year ended | |
| 3/31/22 | | 3/31/21 | | 3/31/20 | | 3/31/19 | | 3/31/18 | |
| $ | 25.86 | | | $ | 21.42 | | | $ | 23.47 | | | $ | 21.61 | | | $ | 18.36 | | |
| | | | | | | | | | | | | | | | | | | | |
| | | | | | | | | | | | | | | | | | | | |
| | (0.14 | ) | | | (0.17 | ) | | | (0.15 | ) | | | (0.20 | ) | | | (0.12 | ) | |
| | 0.98 | | | | 6.11 | | | | 0.12 | | | | 2.33 | | | | 3.90 | | |
| | 0.84 | | | | 5.94 | | | | (0.03 | ) | | | 2.13 | | | | 3.78 | | |
| | | | | | | | | | | | | | | | | | | | |
| | | | | | | | | | | | | | | | | | | | |
| | — | | | | — | | | | — | | | | (0.01 | ) | | | (0.53 | ) | |
| | (1.48 | ) | | | (1.50 | ) | | | (2.02 | ) | | | (0.26 | ) | | | — | | |
| | (1.48 | ) | | | (1.50 | ) | | | (2.02 | ) | | | (0.27 | ) | | | (0.53 | ) | |
| | | | | | | | | | | | | | | | | | | | |
| $ | 25.22 | | | $ | 25.86 | | | $ | 21.42 | | | $ | 23.47 | | | $ | 21.61 | | |
| | | | | | | | | | | | | | | | | | | | |
| | 3.66% | | | | 27.62% | | | | (1.02% | ) | | | 9.91% | | | | 20.67% | | |
| | | | | | | | | | | | | | | | | | | | |
| | | | | | | | | | | | | | | | | | | | |
| $ | 86,748 | | | $ | 112,012 | | | $ | 99,376 | | | $ | 115,843 | | | $ | 76,033 | | |
| | 1.99% | | | | 1.98% | | | | 2.02% | | | | 2.03% | | | | 2.06% | | |
| | (0.55% | ) | | | (0.64% | ) | | | (0.62% | ) | | | (0.85% | ) | | | (0.57% | ) | |
| | 1% | | | | 22% | | | | 24% | | | | 33% | | | | 28% | | |
25
Table of Contents
Financial highlights
Delaware Healthcare Fund Class R
Selected data for each share of the Fund outstanding throughout each period were as follows:
| Net asset value, beginning of period |
| |
| Income (loss) from investment operations: |
| Net investment loss1 |
| Net realized and unrealized gain |
| Total from investment operations |
| |
| Less dividends and distributions from: |
| Net investment income |
| Net realized gain |
| Total dividends and distributions |
| |
| Net asset value, end of period |
| |
| Total return2 |
| |
| Ratios and supplemental data: |
| Net assets, end of period (000 omitted) |
| Ratio of expenses to average net assets3 |
| Ratio of net investment loss to average net assets |
| Portfolio turnover |
| 1 | Calculated using average shares outstanding. |
| 2 | Total return is based on the change in net asset value of a share during the period and assumes reinvestment of dividends and distributions at net asset value. |
| 3 | Expense ratios do not include expenses of the Underlying Funds in which the Fund invests. |
See accompanying notes, which are an integral part of the financial statements.
26
Table of Contents
| Year ended | |
| | 3/31/22 | | | | 3/31/21 | | | | 3/31/20 | | | | 3/31/19 | | | | 3/31/18 | | |
| $ | 27.26 | | | $ | 22.40 | | | $ | 24.34 | | | $ | 22.37 | | | $ | 18.98 | | |
| | |
| | | | | | | | | | | | | | | | | | | | | |
| | (0.01 | ) | | | (0.04 | ) | | | (0.03 | ) | | | (0.08 | ) | | | (0.02 | ) | |
| | 1.04 | | | | 6.40 | | | | 0.11 | | | | 2.40 | | | | 4.04 | | |
| | 1.03 | | | | 6.36 | | | | 0.08 | | | | 2.32 | | | | 4.02 | | |
| | | |
| | | |
| | — | | | | — | | | | — | | | | (0.09 | ) | | | (0.63 | ) | |
| | (1.48 | ) | | | (1.50 | ) | | | (2.02 | ) | | | (0.26 | ) | | | — | | |
| | (1.48 | ) | | | (1.50 | ) | | | (2.02 | ) | | | (0.35 | ) | | | (0.63 | ) | |
| | | |
| $ | 26.81 | | | $ | 27.26 | | | $ | 22.40 | | | $ | 24.34 | | | $ | 22.37 | | |
| | | |
| | 4.18% | | | | 28.30% | | | | (0.52% | ) | | | 10.44% | | | | 21.26% | | |
| | | |
| | | | | | | | | | | | | | | | | | | | | |
| $ | 4,130 | | | $ | 4,867 | | | $ | 5,269 | | | $ | 7,080 | | | $ | 5,683 | | |
| | 1.49% | | | | 1.48% | | | | 1.52% | | | | 1.53% | | | | 1.56% | | |
| | (0.05% | ) | | | (0.14% | ) | | | (0.12% | ) | | | (0.35% | ) | | | (0.07% | ) | |
| | 1% | | | | 22% | | | | 24% | | | | 33% | | | | 28% | | |
27
Table of Contents
Financial highlights
Delaware Healthcare Fund Institutional Class
Selected data for each share of the Fund outstanding throughout each period were as follows:
| Net asset value, beginning of period |
| |
| Income from investment operations: |
| Net investment income1 |
| Net realized and unrealized gain |
| Total from investment operations |
| |
| Less dividends and distributions from: |
| Net investment income |
| Net realized gain |
| Total dividends and distributions |
| |
| Net asset value, end of period |
| |
| Total return2 |
| |
| Ratios and supplemental data: |
| Net assets, end of period (000 omitted) |
| Ratio of expenses to average net assets3 |
| Ratio of net investment income to average net assets |
| Portfolio turnover |
| 1 | Calculated using average shares outstanding. |
| 2 | Total return is based on the change in net asset value of a share during the period and assumes reinvestment of dividends and distributions at net asset value. |
| 3 | Expense ratios do not include expenses of the Underlying Funds in which the Fund invests. |
See accompanying notes, which are an integral part of the financial statements.
28
Table of Contents
| Year ended | |
| | 3/31/22 | | | | 3/31/21 | | | | 3/31/20 | | | | 3/31/19 | | | | 3/31/18 | | |
| $ | 27.93 | | | $ | 22.91 | | | $ | 24.75 | | | $ | 22.74 | | | $ | 19.28 | | |
| | | |
| | | | | | | | | | | | | | | | | | | | | |
| | 0.13 | | | | 0.10 | | | | 0.09 | | | | 0.04 | | | | 0.09 | | |
| | 1.06 | | | | 6.55 | | | | 0.12 | | | | 2.43 | | | | 4.10 | | |
| | 1.19 | | | | 6.65 | | | | 0.21 | | | | 2.47 | | | | 4.19 | | |
| | | |
| | | |
| | (0.04 | ) | | | (0.13 | ) | | | (0.03 | ) | | | (0.20 | ) | | | (0.73 | ) | |
| | (1.48 | ) | | | (1.50 | ) | | | (2.02 | ) | | | (0.26 | ) | | | — | | |
| | (1.52 | ) | | | (1.63 | ) | | | (2.05 | ) | | | (0.46 | ) | | | (0.73 | ) | |
| | | |
| $ | 27.60 | | | $ | 27.93 | | | $ | 22.91 | | | $ | 24.75 | | | $ | 22.74 | | |
| | | |
| | 4.69% | | | | 28.91% | | | | (0.01% | ) | | | 10.98% | | | | 21.84% | | |
| | | |
| | | | | | | | | | | | | | | | | | | | | |
| $ | 542,943 | | | $ | 684,831 | | | $ | 518,093 | | | $ | 585,911 | | | $ | 282,585 | | |
| | 0.99% | | | | 0.98% | | | | 1.02% | | | | 1.03% | | | | 1.06% | | |
| | 0.45% | | | | 0.36% | | | | 0.38% | | | | 0.14% | | | | 0.43% | | |
| | 1% | | | | 22% | | | | 24% | | | | 33% | | | | 28% | | |
29
Table of Contents
| Notes to financial statements |
| Delaware Healthcare Fund | March 31, 2022 |
Delaware Group® Equity Funds IV (Trust) is organized as a Delaware statutory trust and offers 12 series. These financial statements and the related notes pertain to Delaware Healthcare Fund (Fund). The Trust is an open-end investment company. The Fund is considered non-diversified under the Investment Company Act of 1940, as amended, and offers Class A, Class C, Class R, and Institutional Class shares. Class A shares are sold with a maximum front-end sales charge of 5.75%. There is no front-end sales charge when you purchase $1,000,000 or more of Class A shares. However, if Delaware Distributors, L.P. (DDLP) paid your financial intermediary a commission on your purchase of $1,000,000 or more of Class A shares, for shares purchased prior to July 1, 2020, you will have to pay a limited contingent deferred sales charge (Limited CDSC) of 1.00% if you redeem these shares within the first year after your purchase and 0.50% if you redeem shares within the second year; and for shares purchased on or after July 1, 2020, you will have to pay a Limited CDSC of 1.00% if you redeem these shares within the first 18 months after your purchase, unless a specific waiver of the Limited CDSC applies. Class C shares are sold with a contingent deferred sales charge ("CDSC") of 1.00%, which will be incurred if redeemed during the first 12 months. Class R and Institutional Class shares are not subject to a sales charge and are offered for sale exclusively to certain eligible investors.
1. Significant Accounting Policies
The Fund follows accounting and reporting guidance under Financial Accounting Standards Board (FASB) Accounting Standards Codification Topic 946, Financial Services — Investment Companies. The following accounting policies are in accordance with US generally accepted accounting principles (US GAAP) and are consistently followed by the Fund.
Security Valuation — Equity securities, except those traded on the Nasdaq Stock Market LLC (Nasdaq), are valued at the last quoted sales price as of the time of the regular close of the New York Stock Exchange on the valuation date. Equity securities traded on the Nasdaq are valued in accordance with the Nasdaq Official Closing Price, which may not be the last sales price. If, on a particular day, an equity security does not trade, the mean between the bid and ask prices will be used, which approximates fair value. Equity securities listed on a foreign exchange are normally valued at the last quoted sales price on the valuation date. Open-end investment companies are valued at their published net asset value (NAV). Foreign currency exchange contracts are valued at the mean between the bid and ask prices, which approximates fair value. Interpolated values are derived when the settlement date of the contract is an interim date for which quotations are not available. Generally, other securities and assets for which market quotations are not readily available are valued at fair value as determined in good faith under the direction of the Trust’s Board of Trustees (Board). In determining whether market quotations are readily available or fair valuation will be used, various factors will be taken into consideration, such as market closures or suspension of trading in a security. The Fund may use fair value pricing more frequently for securities traded primarily in non-US markets because, among other things, most foreign markets close well before the Fund values its securities, generally as of 4:00pm Eastern time. The earlier close of these foreign markets gives rise to the possibility that significant events, including broad market moves, government actions or pronouncements, aftermarket trading, or
30
Table of Contents
news events may have occurred in the interim. Whenever such a significant event occurs, the Fund may value foreign securities using fair value prices based on third-party vendor modeling tools (international fair value pricing). Restricted securities are valued at fair value using methods approved by the Board.
Federal and Foreign Income Taxes — No provision for federal income taxes has been made as the Fund intends to continue to qualify for federal income tax purposes as a regulated investment company under Subchapter M of the Internal Revenue Code of 1986, as amended, and make the requisite distributions to shareholders. The Fund evaluates tax positions taken or expected to be taken in the course of preparing the Fund’s tax returns to determine whether the tax positions are “more-likely-than-not” of being sustained by the applicable tax authority. Tax positions not deemed to meet the “more-likely-than-not” threshold are recorded as a tax benefit or expense in the current year. Management has analyzed the Fund’s tax positions taken or expected to be taken on the Fund’s federal income tax returns through the year ended March 31, 2022 and for all open tax years (years ended March 31, 2019–March 31, 2021), and has concluded that no provision for federal income tax is required in the Fund’s financial statements. In regard to foreign taxes only, the Fund has open tax years in certain foreign countries in which it invests that may date back to the inception of the Fund. If applicable, the Fund recognizes interest accrued on unrecognized tax benefits in interest expense and penalties in "Other" on the “Statement of operations.” During the year ended March 31, 2022, the Fund did not incur any interest or tax penalties.
Class Accounting — Investment income, common expenses, and realized and unrealized gain (loss) on investments are allocated to the various classes of the Fund on the basis of daily net assets of each class. Distribution expenses relating to a specific class are charged directly to that class.
Foreign Currency Transactions — Transactions denominated in foreign currencies are recorded at the prevailing exchange rates on the valuation date in accordance with the Fund’s prospectus. The value of all assets and liabilities denominated in foreign currencies is translated daily into US dollars at the exchange rate of such currencies against the US dollar. Transaction gains or losses resulting from changes in exchange rates during the reporting period or upon settlement of the foreign currency transaction are reported in operations for the current period. The Fund generally does not bifurcate that portion of realized gains and losses on investments which is due to changes in foreign exchange rates from that which is due to changes in market prices. These gains and losses are included on the “Statement of operations” under “Net realized gain (loss) on investments.” The Fund reports certain foreign currency related transactions as components of realized gains (losses) for financial reporting purposes, whereas such components are treated as ordinary income (loss) for federal income tax purposes.
Use of Estimates — The preparation of financial statements in conformity with US GAAP requires management to make estimates and assumptions that affect the fair value of investments, the reported amounts of assets and liabilities and disclosure of contingent assets and liabilities at the date of the financial statements, and the reported amounts of revenues and
31
Table of Contents
Notes to financial statements
Delaware Healthcare Fund
1. Significant Accounting Policies (continued)
expenses during the reporting period. Actual results could differ from those estimates and the differences could be material.
Other — Expenses directly attributable to the Fund are charged directly to the Fund. Other expenses common to various funds within the Delaware Funds by Macquarie® (Delaware Funds) are generally allocated among such fund on the basis of average net assets. Management fees and certain other expenses are paid monthly. Security transactions are recorded on the date the securities are purchased or sold (trade date) for financial reporting purposes. Costs used in calculating realized gains and losses on the sale of investment securities are those of the specific securities sold. Dividend income is recorded on the ex-dividend date and interest income is recorded on the accrual basis. Foreign dividends are also recorded on the ex-dividend date or as soon after the ex-dividend date that the Fund is aware of such dividends, net of all tax withholdings, a portion of which may be reclaimable. Withholding taxes and reclaims on foreign dividends have been recorded in accordance with the Fund’s understanding of the applicable country’s tax rules and rates. The Fund declares and pays dividends from net investment income and distributions from net realized gain on investments, if any, annually. The Fund may distribute more frequently, if necessary for tax purposes. Dividends and distributions, if any, are recorded on the ex-dividend date.
The Fund receives earnings credits from its custodian when positive cash balances are maintained, which may be used to offset custody fees. The expenses paid under this arrangement are included on the “Statement of operations” under “Custodian fees” with the corresponding expenses offset included under “Less expenses paid indirectly.” There were no such earnings credits for the year ended March 31, 2022.
The Fund receives earnings credits from its transfer agent when positive cash balances are maintained, which may be used to offset transfer agent fees. If the amount earned is greater than $1, the expenses paid under this arrangement are included on the “Statement of operations” under “Dividend disbursing and transfer agent fees and expenses” with the corresponding expenses offset included under “Less expenses paid indirectly.” For the year ended March 31, 2022, the Fund earned $433 under this arrangement.
2. Investment Management, Administration Agreements, and Other Transactions with Affiliates
In accordance with the terms of its investment management agreement, the Fund pays Delaware Management Company (DMC), a series of Macquarie Investment Management Business Trust and the investment manager, an annual fee which is calculated daily and paid monthly at the rates of 0.85% on the first $500 million of average daily net assets of the Fund, 0.80% on the next $500 million, 0.75% on the next $1.5 billion, and 0.70% on average daily net assets in excess of $2.5 billion.
DMC may permit its affiliates, Macquarie Investment Management Global Limited (MIMGL) and Macquarie Funds Management Hong Kong Limited (together, the “Affiliated Sub-Advisors”), to
32
Table of Contents
execute Fund equity security trades on its behalf. DMC may also seek quantitative support from MIMGL. Although the Affiliated Sub-Advisors serve as sub-advisors, DMC has ultimate responsibility for all investment advisory services. For these services, DMC, not the Fund, may pay each Affiliated Sub-Advisor a portion of its investment management fee.
Delaware Investments Fund Services Company (DIFSC), an affiliate of DMC, provides fund accounting and financial administrative oversight services to the Fund. For these services, DIFSC’s fees are calculated daily and paid monthly, based on the aggregate daily net assets of all funds within the Delaware Funds at the following annual rates: 0.00475% of the first $35 billion; 0.0040% of the next $10 billion; and 0.0025% of aggregate average daily net assets in excess of $45 billion (Total Fee). Each fund in the Delaware Funds pays a minimum of $4,000, which, in aggregate, is subtracted from the Total Fee. Each fund then pays its portion of the remainder of the Total Fee on a relative NAV basis. This amount is included on the “Statement of operations” under “Accounting and administration expenses.” For the year ended March 31, 2022, the Fund was charged $41,173 for these services.
DIFSC is also the transfer agent and dividend disbursing agent of the Fund. For these services, DIFSC’s fees are calculated daily and paid monthly, based on the aggregate daily net assets of the retail funds within the Delaware Funds at the following annual rates: 0.014% of the first $20 billion; 0.011% of the next $5 billion; 0.007% of the next $5 billion; 0.005% of the next $20 billion; and 0.0025% of average daily net assets in excess of $50 billion. The fees payable to DIFSC under the shareholder services agreement described above are allocated among all retail funds in the Delaware Funds on a relative NAV basis. This amount is included on the “Statement of operations” under “Dividend disbursing and transfer agent fees and expenses.” For the year ended March 31, 2022, the Fund was charged $91,800 for these services. Pursuant to a sub-transfer agency agreement between DIFSC and BNY Mellon Investment Servicing (US) Inc. (BNYMIS), BNYMIS provides certain sub-transfer agency services to the Fund. Sub-transfer agency fees are paid by the Fund and are also included on the “Statement of operations” under “Dividend disbursing and transfer agent fees and expenses.” The fees are calculated daily and paid as invoices are received on a monthly or quarterly basis.
Pursuant to a distribution agreement and distribution plan, the Fund pays DDLP, the distributor and an affiliate of DMC, annual 12b-1 fees of 0.25%, 1.00%, and 0.50% of the average daily net assets of the Class A, Class C, and Class R shares, respectively. The fees are calculated daily and paid monthly. Institutional class shares do not pay a 12b-1 fee.
As provided in the investment management agreement, the Fund bears a portion of the cost of certain resources shared with DMC, including the cost of internal personnel of DMC and/or its affiliates that provide legal and regulatory reporting services to the Fund. For the year ended March 31, 2022, the Fund was charged $30,041 for internal legal and regulatory reporting services provided by DMC and/or its affiliates’ employees. This amount is included on the “Statement of operations” under “Legal fees.”
For the year ended March 31, 2022, DDLP earned $63,228 for commissions on sales of the Fund’s Class A shares. For the year ended March 31, 2022, DDLP received gross CDSC
33
Table of Contents
Notes to financial statements
Delaware Healthcare Fund
2. Investment Management, Administration Agreements, and Other Transactions with Affiliates (continued)
commissions of $2,727 and $6,432 on redemptions of the Fund’s Class A and Class C shares, respectively, and these commissions were entirely used to offset upfront commissions previously paid by DDLP to broker/dealers on sales of those shares.
Trustees’ fees include expenses accrued by the Fund for each Trustee’s retainer and meeting fees. Certain officers of DMC, DIFSC, and DDLP are officers and/or Trustees of the Trust. These officers and Trustees are paid no compensation by the Fund.
In addition to the management fees and other expenses of the Fund, the Fund indirectly bears the investment management fees and other expenses of the investment companies (Underlying Funds) in which it invests. The amount of these fees and expenses incurred indirectly by the Fund will vary based upon the expense and fee levels of the Underlying Funds and the number of shares that are owned of the Underlying Funds at different times.
3. Investments
For the year ended March 31, 2022, the Fund made purchases and sales of investment securities other than short-term investments as follows:
| Purchases | | $ | 8,487,778 |
| Sales | | | 283,570,615 |
The tax cost of investments includes adjustments to net unrealized appreciation (depreciation), which may not necessarily be the final tax cost basis adjustments but which approximate the tax basis unrealized gains and losses that may be realized and distributed to shareholders. At March 31, 2022, the cost and unrealized appreciation (depreciation) of investments for federal income tax purposes for the Fund were as follows:
| Cost of investments | | $ | 721,162,258 | |
| Aggregate unrealized appreciation of investments | | $ | 369,421,151 | |
| Aggregate unrealized depreciation of investments | | | (145,885,811 | ) |
| Net unrealized appreciation of investments | | $ | 223,535,340 | |
US GAAP defines fair value as the price that the Fund would receive to sell an asset or pay to transfer a liability in an orderly transaction between market participants at the measurement date under current market conditions. A three-level hierarchy for fair value measurements has been established based upon the transparency of inputs to the valuation of an asset or liability. Inputs may be observable or unobservable and refer broadly to the assumptions that market participants would use in pricing the asset or liability. Observable inputs reflect the assumptions market participants would use in pricing the asset or liability based on market data obtained from sources independent of the reporting entity. Unobservable inputs reflect the reporting entity’s own assumptions about the assumptions that market participants would use in pricing the asset or liability based on the best information available under the circumstances. The Fund's
34
Table of Contents
investment in its entirety is assigned a level based upon the observability of the inputs which are significant to the overall valuation. The three-level hierarchy of inputs is summarized as follows:
| Level 1 – | Inputs are quoted prices in active markets for identical investments. (Examples: equity securities, open-end investment companies, futures contracts, and exchange-traded options contracts) |
| | |
| Level 2 – | Other observable inputs, including, but not limited to: quoted prices for similar assets or liabilities in markets that are active, quoted prices for identical or similar assets or liabilities in markets that are not active, inputs other than quoted prices that are observable for the assets or liabilities (such as interest rates, yield curves, volatilities, prepayment speeds, loss severities, credit risks, and default rates) or other market-corroborated inputs. (Examples: debt securities, government securities, swap contracts, foreign currency exchange contracts, foreign securities utilizing international fair value pricing, broker-quoted securities, and fair valued securities) |
| | |
| Level 3 – | Significant unobservable inputs, including the Fund's own assumptions used to determine the fair value of investments. (Examples: broker-quoted securities and fair valued securities) |
| | |
Level 3 investments are valued using significant unobservable inputs. The Fund may also use an income-based valuation approach in which the anticipated future cash flows of the investment are discounted to calculate fair value. Discounts may also be applied due to the nature or duration of any restrictions on the disposition of the investments. Valuations may also be based upon current market prices of securities that are comparable in coupon, rating, maturity, and industry. The derived value of a Level 3 investment may not represent the value which is received upon disposition and this could impact the results of operations.
The following table summarizes the valuation of the Fund's investments by fair value hierarchy levels as of March 31, 2022:
| | Level 1 | | Level 2 | | Level 3 | | Total |
| Securities | | | | | | | | | | | | | | |
| Assets: | | | | | | | | | | | | | | |
| Common Stocks | | $ | 793,800,056 | | $ | 136,673,233 | | $ | — | | $ | 930,473,289 |
| Rights | | | — | | | — | | | | — | | | — |
| Short-Term Investments | | | 14,224,309 | | | — | | | | — | | | 14,224,309 |
| Total Value of Securities | | $ | 808,024,365 | | $ | 136,673,233 | | $ | — | | $ | 944,697,598 |
The securities that have been valued at zero on the “Schedule of investments” are considered to be Level 3 investments in this table.
During the year ended March 31, 2022, there were no transfers into or out of Level 3 investments. The Fund’s policy is to recognize transfers into or out of Level 3 investments based on fair value at the beginning of the reporting period.
35
Table of Contents
Notes to financial statements
Delaware Healthcare Fund
3. Investments (continued)
A reconciliation of Level 3 investments is presented when the Fund has a significant amount of Level 3 investments at the beginning or end of the year in relation to the Fund’s net assets. Management has determined not to provide a reconciliation of Level 3 investments as the Level 3 investments were not considered significant to the Fund’s net assets at the beginning or end of the year. Management has determined not to provide additional disclosure on Level 3 inputs since the Level 3 investments were not considered significant to the Fund’s net assets at the end of the year.
4. Dividend and Distribution Information
Income and long-term capital gain distributions are determined in accordance with federal income tax regulations, which may differ from US GAAP. Additionally, distributions from net gains on foreign currency transactions and net short-term gains on sales of investment securities are treated as ordinary income for federal income tax purposes. The tax character of dividends and distributions paid during the years ended March 31, 2022 and 2021 were as follows:
| | Year ended |
| | 3/31/22 | | 3/31/21 |
| Ordinary income | | $ | 7,946,243 | | $ | 31,320,443 |
| Long-term capital gains | | | 46,619,401 | | | 36,344,783 |
| Total | | $ | 54,565,644 | | $ | 67,665,226 |
5. Components of Net Assets on a Tax Basis
As of March 31, 2022, the components of net assets on a tax basis were as follows:
| Shares of beneficial interest | | $ | 646,343,180 |
| Undistributed ordinary income | | | 1,159,361 |
| Undistributed long-term capital gains | | | 74,597,651 |
| Unrealized appreciation (depreciation) of investments | | | 223,535,340 |
| Net assets | | $ | 945,635,532 |
The differences between book basis and tax basis components of net assets are primarily attributable to tax deferral of losses on wash sales and tax treatment of securities no longer considered passive foreign investment companies.
For financial reporting purposes, capital accounts are adjusted to reflect the tax character of permanent book/tax differences. Results of operations and net assets were not affected by these reclassifications. For the year ended March 31, 2022, the Fund had no reclassifications.
36
Table of Contents
6. Capital Shares
Transactions in capital shares were as follows:
| | | Year ended |
| | | | 3/31/22 | | 3/31/21 |
| Shares sold: | | | | | | |
| Class A | | 1,171,832 | | | 2,507,628 | |
| Class C | | 151,719 | | | 861,818 | |
| Class R | | 27,220 | | | 46,355 | |
| Institutional Class | | 3,679,774 | | | 10,544,285 | |
| | | | | | | | |
| Shares issued upon reinvestment of dividends and distributions: | | | | | | |
| Class A | | 645,792 | | | 643,955 | |
| Class C | | 224,018 | | | 253,207 | |
| Class R | | 9,208 | | | 9,033 | |
| Institutional Class | | 1,166,975 | | | 1,371,804 | |
| | | 7,076,538 | | | 16,238,085 | |
| | | | | | | |
| Shares redeemed: | | | | | | |
| Class A | | (2,850,892 | ) | | (2,717,239 | ) |
| Class C | | (1,267,922 | ) | | (1,423,056 | ) |
| Class R | | (60,935 | ) | | (112,004 | ) |
| Institutional Class | | (9,699,629 | ) | | (10,008,677 | ) |
| | | (13,879,378 | ) | | (14,260,976 | ) |
| Net increase (decrease) | | (6,802,840 | ) | | 1,977,109 | |
Certain shareholders may exchange shares of one class for shares of another class in the same Fund. These exchange transactions are included as subscriptions and redemptions in the table above and on the “Statements of changes in net assets.” For the years ended March 31, 2022 and 2021, the Fund had the following exchange transactions:
| | Exchange Redemptions | | Exchange Subscriptions | | | |
| | | | | | Institutional | | | | Institutional | | | |
| | Class A | | Class C | | Class | | Class A | | Class | | | |
| | Shares | | Shares | | Shares | | Shares | | Shares | | Value |
| Year ended | | | | | | | | | | | | | | | | | |
| 3/31/22 | | 55,730 | | 11,390 | | | 377 | | | 10,446 | | | 55,771 | | | $ | 1,903,692 |
| 3/31/21 | | 30,727 | | 36,941 | | | — | | | 25,288 | | | 39,764 | | | | 1,878,288 |
7. Line of Credit
The Fund, along with certain other funds in the Delaware Funds (Participants), was a participant in a $225,000,000 revolving line of credit (Agreement) intended to be used for temporary or emergency purposes as an additional source of liquidity to fund redemptions of investor shares. Under the Agreement, the Participants were charged an annual commitment fee of 0.15% with
37
Table of Contents
Notes to financial statements
Delaware Healthcare Fund
7. Line of Credit (continued)
the addition of an upfront fee of 0.05%, which was allocated across the Participants based on a weighted average of the respective net assets of each Participant. The Participants were permitted to borrow up to a maximum of one-third of their net assets under the Agreement. Each Participant was individually, and not jointly, liable for its particular advances, if any, under the line of credit. The line of credit available under the Agreement expired on November 1, 2021.
On November 1, 2021, the Fund, along with the other Participants, entered into an amendment to the agreement for a $355,000,000 revolving line of credit to be used as described above and operates in substantially the same manner as the original Agreement. Under the amendment to the agreement, the Participants are charged an annual commitment fee of 0.15%, with the addition of an upfront fee of 0.05%, which is allocated across the Participants based on a weighted average of the respective net assets of each Participant. The line of credit available under the agreement expires on October 31, 2022.
The Fund had no amounts outstanding as of March 31, 2022, or at any time during the year then ended.
8. Derivatives
US GAAP requires disclosures that enable investors to understand: (1) how and why an entity uses derivatives; (2) how they are accounted for; and (3) how they affect an entity’s results of operations and financial position.
Foreign Currency Exchange Contracts — The Fund may enter into foreign currency exchange contracts as a way of managing foreign exchange rate risk. The Fund may enter into these contracts to fix the US dollar value of a security that it has agreed to buy or sell for the period between the date the trade was entered into and the date the security is delivered and paid for. The Fund may also enter into these contracts to hedge the US dollar value of securities it already owns that are denominated in foreign currencies. In addition, the Fund may enter into these contracts to facilitate or expedite the settlement of portfolio transactions. The change in value is recorded as an unrealized gain or loss. When the contract is closed, a realized gain or loss is recorded equal to the difference between the value of the contract at the time it was opened and the value at the time it was closed.
The use of foreign currency exchange contracts does not eliminate fluctuations in the underlying prices of the securities, but does establish a rate of exchange that can be achieved in the future. Although foreign currency exchange contracts limit the risk of loss due to an unfavorable change in the value of the hedged currency, they also limit any potential gain that might result should the value of the currency change favorably. In addition, the Fund could be exposed to risks if the counterparties to the contracts are unable to meet the terms of their contracts. The Fund’s maximum risk of loss from counterparty credit risk is the value of its currency exchanged with the counterparty. The risk is generally mitigated by having a netting arrangement between the Fund
38
Table of Contents
and the counterparty and by the posting of collateral by the counterparty to the Fund to cover the Fund’s exposure to the counterparty. No foreign currency exchange contracts were outstanding at March 31, 2022.
During the year ended March 31, 2022, the Fund entered into foreign currency exchange contracts to facilitate or expedite the settlement of portfolio transactions.
During the year ended March 31, 2022, the Fund experienced net realized gains or losses attributable to foreign currency holdings, which is disclosed on the “Statement of operations.”
The table below summarizes the average daily balance of derivative holdings by the Fund during the year ended March 31, 2022:
| | Long Derivative | | Short Derivative |
| | Volume | | Volume |
| Foreign currency exchange contracts (average cost) | | $— | | $75,392 |
9. Securities Lending
The Fund, along with other funds in the Delaware Funds, may lend its securities pursuant to a security lending agreement (Lending Agreement) with The Bank of New York Mellon (BNY Mellon). At the time a security is loaned, the borrower must post collateral equal to the required percentage of the market value of the loaned security, including any accrued interest. The required percentage is: (1) 102% with respect to US securities and foreign securities that are denominated and payable in US dollars; and (2) 105% with respect to foreign securities. With respect to each loan, if on any business day the aggregate market value of securities collateral plus cash collateral held is less than the aggregate market value of the securities which are the subject of such loan, the borrower will be notified to provide additional collateral by the end of the following business day, which, together with the collateral already held, will be not less than the applicable initial collateral requirements for such security loan. If the aggregate market value of securities collateral and cash collateral held with respect to a security loan exceeds the applicable initial collateral requirement, upon the request of the borrower, BNY Mellon must return enough collateral to the borrower by the end of the following business day to reduce the value of the remaining collateral to the applicable initial collateral requirement for such security loan. As a result of the foregoing, the value of the collateral held with respect to a loaned security on any particular day, may be more or less than the value of the security on loan. The collateral percentage with respect to the market value of the loaned security is determined by the security lending agent.
Cash collateral received by each fund of the Trust is generally invested in a series of individual separate accounts, each corresponding to a fund. The investment guidelines permit each separate account to hold certain securities that would be considered eligible securities for a money market fund. Cash collateral received is generally invested in government securities; certain obligations issued by government sponsored enterprises; repurchase agreements collateralized by US Treasury securities; obligations issued by the central government of any Organization for Economic Cooperation and Development (OECD) country or its agencies,
39
Table of Contents
Notes to financial statements
Delaware Healthcare Fund
9. Securities Lending (continued)
instrumentalities, or establishments; obligations of supranational organizations; commercial paper, notes, bonds, and other debt obligations; certificates of deposit, time deposits, and other bank obligations; certain money market funds; and asset-backed securities. The Fund can also accept US government securities and letters of credit (non-cash collateral) in connection with securities loans.
In the event of default or bankruptcy by the lending agent, realization and/or retention of the collateral may be subject to legal proceedings. In the event the borrower fails to return loaned securities and the collateral received is insufficient to cover the value of the loaned securities and provided such collateral shortfall is not the result of investment losses, the lending agent has agreed to pay the amount of the shortfall to the Fund or, at the discretion of the lending agent, replace the loaned securities. The Fund continues to record dividends or interest, as applicable, on the securities loaned and is subject to changes in value of the securities loaned that may occur during the term of the loan. The Fund has the right under the Lending Agreement to recover the securities from the borrower on demand. With respect to security loans collateralized by non-cash collateral, the Fund receives loan premiums paid by the borrower. With respect to security loans collateralized by cash collateral, the earnings from the collateral investments are shared among the Fund, the security lending agent, and the borrower. The Fund records security lending income net of allocations to the security lending agent and the borrower.
The Fund may incur investment losses as a result of investing securities lending collateral. This could occur if an investment in the collateral investment account defaulted or became impaired. Under those circumstances, the value of the Fund's cash collateral account may be less than the amount the Fund would be required to return to the borrowers of the securities and the Fund would be required to make up for this shortfall.
During the year ended March 31, 2022, the Fund had no securities out on loan.
10. Credit and Market Risk
Beginning in January 2020, global financial markets have experienced and may continue to experience significant volatility resulting from the spread of a novel coronavirus known as COVID-19. The outbreak of COVID-19 has resulted in travel and border restrictions, quarantines, supply chain disruptions, lower consumer demand, and general market uncertainty. The effects of COVID-19 have and may continue to adversely affect the global economy, the economies of certain nations, and individual issuers, all of which may negatively impact the Fund’s performance.
Investments in equity securities in general are subject to market risks that may cause their prices to fluctuate over time. Fluctuations in the value of equity securities in which the Fund invests will cause the NAV of the Fund to fluctuate.
The Fund invests a significant portion of its assets in small companies and may be subject to certain risks associated with ownership of securities of such companies. Investments in small-
40
Table of Contents
sized companies may be more volatile than investments in larger companies for a number of reasons, which include limited financial resources or a dependence on narrow product lines.
Some countries in which the Fund may invest require governmental approval for the repatriation of investment income, capital, or the proceeds of sales of securities by foreign investors. In addition, if there is deterioration in a country’s balance of payments or for other reasons, a country may impose temporary restrictions on foreign capital remittances abroad.
The securities exchanges of certain foreign markets are substantially smaller, less liquid, and more volatile than the major securities markets in the US. Consequently, acquisition and disposition of securities by the Fund may be inhibited. In addition, a significant portion of the aggregate market value of equity securities listed on the major securities exchanges in emerging markets is held by a smaller number of investors. This may limit the number of shares available for acquisition or disposition by the Fund.
The Fund is a nondiversified fund that concentrates its investments in the healthcare industry and is subject to the risks associated with that industry. The value of the Fund’s shares will be affected by factors particular to the healthcare and related sectors (such as government regulation) and may fluctuate more widely than that of a fund that invests in a broad range of industries.
The Fund may invest up to 15% of its net assets in illiquid securities, which may include securities with contractual restrictions on resale, securities exempt from registration under Rule 144A promulgated under the Securities Act of 1933, as amended, and other securities which may not be readily marketable. The relative illiquidity of these securities may impair the Fund from disposing of them in a timely manner and at a fair price when it is necessary or desirable to do so. While maintaining oversight, the Board has delegated to DMC, the day-to-day functions of determining whether individual securities are liquid for purposes of the Fund’s limitation on investments in illiquid securities. Securities eligible for resale pursuant to Rule 144A, which are determined to be liquid, are not subject to the Fund’s 15% limit on investments in illiquid securities. As of March 31, 2022, there were no Rule 144A securities held by the Fund.
11. Contractual Obligations
The Fund enters into contracts in the normal course of business that contain a variety of indemnifications. The Fund's maximum exposure under these arrangements is unknown. However, the Fund has not had prior claims or losses pursuant to these contracts. Management has reviewed the Fund's existing contracts and expects the risk of loss to be remote.
12. Subsequent Events
Management has determined that no material events or transactions occurred subsequent to March 31, 2022, that would require recognition or disclosure in the Fund's financial statements.
41
Table of Contents
Report of independent
registered public accounting firm
To the Board of Trustees of Delaware Group® Equity Funds IV and Shareholders of Delaware Healthcare Fund
Opinion on the Financial Statements
We have audited the accompanying statement of assets and liabilities, including the schedule of investments, of Delaware Healthcare Fund (one of the funds constituting Delaware Group® Equity Funds IV, referred to hereafter as the “Fund”) as of March 31, 2022, the related statement of operations for the year ended March 31, 2022, the statements of changes in net assets for each of the two years in the period ended March 31, 2022, including the related notes, and the financial highlights for each of the five years in the period ended March 31, 2022 (collectively referred to as the “financial statements”). In our opinion, the financial statements present fairly, in all material respects, the financial position of the Fund as of March 31, 2022, the results of its operations for the year then ended, the changes in its net assets for each of the two years in the period ended March 31, 2022 and the financial highlights for each of the five years in the period ended March 31, 2022 in conformity with accounting principles generally accepted in the United States of America.
Basis for Opinion
These financial statements are the responsibility of the Fund’s management. Our responsibility is to express an opinion on the Fund’s financial statements based on our audits. We are a public accounting firm registered with the Public Company Accounting Oversight Board (United States) (PCAOB) and are required to be independent with respect to the Fund in accordance with the U.S. federal securities laws and the applicable rules and regulations of the Securities and Exchange Commission and the PCAOB.
We conducted our audits of these financial statements in accordance with the standards of the PCAOB. Those standards require that we plan and perform the audit to obtain reasonable assurance about whether the financial statements are free of material misstatement, whether due to error or fraud.
Our audits included performing procedures to assess the risks of material misstatement of the financial statements, whether due to error or fraud, and performing procedures that respond to those risks. Such procedures included examining, on a test basis, evidence regarding the amounts and disclosures in the financial statements. Our audits also included evaluating the accounting principles used and significant estimates made by management, as well as evaluating the overall presentation of the financial statements. Our procedures included confirmation of securities owned as of March 31, 2022 by correspondence with the custodian and transfer agents. We believe that our audits provide a reasonable basis for our opinion.
/s/PricewaterhouseCoopers LLP
Philadelphia, Pennsylvania
May 31, 2022
We have served as the auditor of one or more investment companies in Delaware Funds by Macquarie® since 2010.
42
Table of Contents
Other Fund information (Unaudited)
Tax Information
The information set forth below is for the Fund’s fiscal year as required by federal income tax laws. Shareholders, however, must report distributions on a calendar year basis for income tax purposes, which may include distributions for portions of two fiscal years of the Fund. Accordingly, the information needed by shareholders for income tax purposes will be sent to them in January of each year. Please consult your tax advisor for proper treatment of this information.
All disclosures are based on financial information available as of the date of this annual report and, accordingly are subject to change. For any and all items requiring reporting, it is the intention of the Fund to report the maximum amount permitted under the Internal Revenue Code and the regulations thereunder.
For the fiscal year ended March 31, 2022, the Fund reports distributions paid during the year as follows:
| (A) Long-Term Capital Gain Distributions (Tax Basis) | 85.44 | % |
| (B) Ordinary Income Distributions (Tax Basis)* | 14.56 | % |
| Total Distributions (Tax Basis) | 100.00 | % |
| (C) Qualifying Dividends1 | 100.00 | % |
____________________
(A) and (B) are based on a percentage of the Fund’s total distributions. |
| 1Qualified dividends represent dividends which qualify for the corporate dividends received deduction. |
| * For the fiscal year ended March 31, 2022, certain dividends paid by the Fund may be subject to a maximum tax rate of 20%. The percentage of dividends paid by the Fund from ordinary income reported as qualified dividend income is 100.00%. Complete information will be computed and reported in conjunction with your 2022 Form 1099-DIV. |
For the fiscal year ended March 31, 2022, certain dividends paid by the Fund, determined to be Qualified Short-Term Capital Gains, may be subject to relief from US withholding for foreign shareholders, as provided by the American Jobs Creation Act of 2004; the Tax Relief, Unemployment Insurance Reauthorization, and Job Creation Act of 2010; and as extended by the American Taxpayer Relief Act of 2012. For the fiscal year ended March 31, 2022, the Fund has reported maximum distributions of Qualified Short-Term Capital Gains of $6,996,462.
43
Table of Contents
Board of trustees / directors and officers addendum
Delaware Funds by Macquarie®
A mutual fund is governed by a Board of Trustees/Directors (“Trustees”), which has oversight responsibility for the management of a fund’s business affairs. Trustees establish procedures and oversee and review the performance of the investment manager, the distributor, and others who perform services for the fund. The independent fund trustees, in particular, are advocates for shareholder interests. Each trustee has served in that capacity since he or she was elected to or appointed to the Board of Trustees, and will continue to serve until his or her retirement or the election of a new trustee in his or her place. The following is a list of the Trustees and Officers with certain background and related information.
| | | | | | | | Number of | | Other |
| | | | | | Principal | | Portfolios in Fund | | Directorships |
| Name, | | Position(s) | | | | Occupation(s) | | Complex Overseen | | Held by |
| Address, | | Held with | | Length of Time | | During the | | by Trustee | | Trustee |
| and Birth Date | | Fund(s) | | Served | | Past Five Years | | or Officer | | or Officer |
| Interested Trustee |
| |
| Shawn K. Lytle1 | | President, | | President and | | Global Head of Macquarie Asset | | 146 | | Trustee — UBS Relationship |
| 610 Market Street | | Chief Executive | | Chief Executive | | Management2 | | | | Funds, SMA Relationship Trust, |
| Philadelphia, PA | | Officer, | | Officer | | (January 2019–Present) | | | | and UBS Funds |
| 19106-2354 | | and Trustee | | since August 2015 | | Head of Americas of | | | | (May 2010–April 2015) |
| February 1970 | | | | Trustee since | | Macquarie Group | | | | |
| | | | September 2015 | | (December 2017–Present) | | | | |
| | | | | | Deputy Global Head of Macquarie | | | | |
| | | | | | Asset Management | | | | |
| | | | | | (2017–2019) | | | | |
| | | | | | Head of Macquarie Asset | | | | |
| | | | | | Management Americas | | | | |
| | | | | | (2015–2017) | | | | |
44
Table of Contents
| | | | | | | | Number of | | Other |
| | | | | | Principal | | Portfolios in Fund | | Directorships |
| Name, | | Position(s) | | | | Occupation(s) | | Complex Overseen | | Held by |
| Address, | | Held with | | Length of Time | | During the | | by Trustee | | Trustee |
| and Birth Date | | Fund(s) | | Served | | Past Five Years | | or Officer | | or Officer |
| Independent Trustees |
| |
| Jerome D. Abernathy | | Trustee | | Since January 2019 | | Managing Member, Stonebrook | | 146 | | None |
| 610 Market Street | | | | | | Capital Management, LLC | | | | |
| Philadelphia, PA | | | | | | (financial technology: macro | | | | |
| 19106-2354 | | | | | | factors and databases) | | | | |
| July 1959 | | | | | | (January 1993-Present) | | | | |
| |
| Thomas L. Bennett | | Chair and Trustee | | Trustee since March | | Private Investor | | 146 | | None |
| 610 Market Street | | | | 2005 | | (March 2004–Present) | | | | |
| Philadelphia, PA | | | | Chair since March | | | | | | |
| 19106-2354 | | | | 2015 | | | | | | |
| October 1947 | | | | | | | | | | |
| |
| Ann D. Borowiec | | Trustee | | Since March 2015 | | Chief Executive Officer, Private | | 146 | | Director — Banco Santander |
| 610 Market Street | | | | | | Wealth Management (2011–2013) | | | | International |
| Philadelphia, PA | | | | | | and Market Manager, New Jersey | | | | (October 2016–December 2019) |
| 19106-2354 | | | | | | Private Bank (2005–2011) — J.P. | | | | Director — Santander Bank, N.A. |
| November 1958 | | | | | | Morgan Chase & Co. | | | | (December 2016–December |
| | | | | | | | | | 2019) |
45
Table of Contents
Board of trustees / directors and officers addendum
Delaware Funds by Macquarie®
| | | | | | | | Number of | | Other |
| | | | | | Principal | | Portfolios in Fund | | Directorships |
| Name, | | Position(s) | | | | Occupation(s) | | Complex Overseen | | Held by |
| Address, | | Held with | | Length of Time | | During the | | by Trustee | | Trustee |
| and Birth Date | | Fund(s) | | Served | | Past Five Years | | or Officer | | or Officer |
| | | | | | | | | | | |
| Joseph W. Chow | | Trustee | | Since January 2013 | | Private Investor | | 146 | | Director and Audit Committee |
| 610 Market Street | | | | | | (April 2011–Present) | | | | Member — Hercules Technology |
| Philadelphia, PA | | | | | | | | | | Growth Capital, Inc. |
| 19106-2354 | | | | | | | | | | (July 2004–July 2014) |
| January 1953 | | | | | | | | | | |
46
Table of Contents
| | | | | | | | Number of | | Other |
| | | | | | Principal | | Portfolios in Fund | | Directorships |
| Name, | | Position(s) | | | | Occupation(s) | | Complex Overseen | | Held by |
| Address, | | Held with | | Length of Time | | During the | | by Trustee | | Trustee |
| and Birth Date | | Fund(s) | | Served | | Past Five Years | | or Officer | | or Officer |
| |
| H. Jeffrey Dobbs3 | | Trustee | | Since December 2021 | | Global Sector Chairman, | | 146 | | Director, Valparaiso University |
| 610 Market Street | | | | | | Industrial Manufacturing, | | | | (2012–Present) |
| Philadelphia, PA | | | | | | KPMG LLP | | | | Director, TechAccel LLC |
| 19106-2354 | | | | | | (2010-2015) | | | | (2015–Present) (Tech R&D) |
| May 1955 | | | | | | | | | | Board Member, Kansas City |
| | | | | | | | | | Repertory Theatre |
| | | | | | | | | | (2015–Present) |
| | | | | | | | | | Board Member, Patients |
| | | | | | | | | | Voices, Inc. (healthcare) |
| | | | | | | | | | (2018–Present) |
| | | | | | | | | | Kansas City Campus for Animal |
| | | | | | | | | | Care (2018–Present) |
| | | | | | | | | | Director, National Association of |
| | | | | | | | | | Manufacturers (2010–2015) |
| | | | | | | | | | Director, The Children’s Center |
| | | | | | | | | | (2003–2015) |
| | | | | | | | | | Director, Metropolitan Affairs |
| | | | | | | | | | Coalition (2003–2015) |
| | | | | | | | | | Director, Michigan Roundtable for |
| | | | | | | | | | Diversity and Inclusion |
| | | | | | | | | | (2003–2015) |
| | | | | | | | | | Trustee, Ivy Funds Complex |
| | | | | | | | | | (2019–2021) |
47
Table of Contents
Board of trustees / directors and officers addendum
Delaware Funds by Macquarie®
| | | | | | | | Number of | | Other |
| | | | | | Principal | | Portfolios in Fund | | Directorships |
| Name, | | Position(s) | | | | Occupation(s) | | Complex Overseen | | Held by |
| Address, | | Held with | | Length of Time | | During the | | by Trustee | | Trustee |
| and Birth Date | | Fund(s) | | Served | | Past Five Years | | or Officer | | or Officer |
| |
| John A. Fry | | Trustee | | Since January 2001 | | Drexel University | | 146 | | Director; Compensation |
| 610 Market Street | | | | | | (August 2010–Present) | | | | Committee and Governance |
| Philadelphia, PA | | | | | | President — Franklin & Marshall | | | | Committee Member — |
| 19106-2354 | | | | | | College | | | | Community Health Systems |
| May 1960 | | | | | | (July 2002–June 2010) | | | | (May 2004–Present) |
| | | | | | | | | | Director — Drexel Morgan & Co. |
| | | | | | | | | | (2015–2019) |
| | | | | | | | | | Director, Audit and Compensation |
| | | | | | | | | | Committee Member — vTv |
| | | | | | | | | | Therapeutics Inc. (2017–Present) |
| | | | | | | | | | Director and Audit Committee |
| | | | | | | | | | Member — FS Credit Real Estate |
| | | | | | | | | | Income Trust, Inc. (2018–Present) |
| | | | | | | | | | Director — Federal Reserve |
| | | | | | | | | | Bank of Philadelphia |
| | | | | | | | | | (January 2020–Present) |
48
Table of Contents
| | | | | | | | Number of | | Other |
| | | | | | Principal | | Portfolios in Fund | | Directorships |
| Name, | | Position(s) | | | | Occupation(s) | | Complex Overseen | | Held by |
| Address, | | Held with | | Length of Time | | During the | | by Trustee | | Trustee |
| and Birth Date | | Fund(s) | | Served | | Past Five Years | | or Officer | | or Officer |
| |
| Joseph Harroz, Jr.3 | | Trustee | | Since December 2021 | | President (2020–Present), Interim | | 146 | | Director, OU Medicine, Inc. |
| 610 Market Street | | | | | | President (2019–2020), Vice | | | | (2020–Present) |
| Philadelphia, PA | | | | | | President (2010–2019) and Dean | | | | Director and Shareholder, |
| 19106-2354 | | | | | | (2010–2019), College of Law, | | | | Valliance Bank |
| January 1967 | | | | | | University of Oklahoma; | | | | (2007–Present) |
| | | | | | Managing Member, Harroz | | | | Director, Foundation Healthcare |
| | | | | | Investments, LLC, (commercial | | | | (formerly Graymark HealthCare) |
| | | | | | enterprises) (1998–2019); | | | | (2008–2017) |
| | | | | | Managing Member, St. Clair, LLC | | | | Trustee, the Mewbourne Family |
| | | | | | (commercial enterprises) | | | | Support Organization |
| | | | | | (2019–Present) | | | | (2006–Present) (non-profit) |
| | | | | | | | | | Independent Director, LSQ |
| | | | | | | | | | Manager, Inc. (real estate) |
| | | | | | | | | | (2007–2016) |
| | | | | | | | | | Director, Oklahoma Foundation |
| | | | | | | | | | for Excellence (non-profit) |
| | | | | | | | | | (2008–Present) |
| | | | | | | | | | Trustee, Ivy Funds Complex |
| | | | | | | | | | (1998–2021) |
49
Table of Contents
Board of trustees / directors and officers addendum
Delaware Funds by Macquarie®
| | | | | | | | Number of | | Other |
| | | | | | Principal | | Portfolios in Fund | | Directorships |
| Name, | | Position(s) | | | | Occupation(s) | | Complex Overseen | | Held by |
| Address, | | Held with | | Length of Time | | During the | | by Trustee | | Trustee |
| and Birth Date | | Fund(s) | | Served | | Past Five Years | | or Officer | | or Officer |
| |
| Sandra A.J. | | Trustee | | Since December 2021 | | Chief Administrative Officer, | | 146 | | Director, Hall Family Foundation |
| Lawrence3 | | | | | | Children’s Mercy Hospitals and | | | | (1993–Present) |
| 610 Market Street | | | | | | Clinics | | | | Director, Westar Energy (utility) |
| Philadelphia, PA | | | | | | (2016–2019); | | | | (2004–2018) |
| 19106-2354 | | | | | | CFO, Children’s Mercy Hospitals | | | | Trustee, Nelson-Atkins Museum |
| September 1957 | | | | | | and Clinics | | | | of Art (non-profit) (2021–Present) |
| | | | | | (2005–2016) | | | | (2007–2020) |
| | | | | | | | | | Director, Turn the Page KC |
| | | | | | | | | | (non-profit) (2012–2016) |
| | | | | | | | | | Director, Kansas Metropolitan |
| | | | | | | | | | Business and Healthcare |
| | | | | | | | | | Coalition (non-profit) (2017–2019) |
| | | | | | | | | | Director, National Association of |
| | | | | | | | | | Corporate Directors (non-profit) |
| | | | | | | | | | National Board (2022–Present); |
| | | | | | | | | | Regional Board (2017–2021) |
| | | | | | | | | | Director, American Shared |
| | | | | | | | | | Hospital Services (medical |
| | | | | | | | | | device) (2017–2021) |
| | | | | | | | | | Director, Evergy, Inc., Kansas City |
| | | | | | | | | | Power & Light Company, KCP&L |
| | | | | | | | | | Greater Missouri Operations |
| | | | | | | | | | Company, Westar Energy, Inc. |
| | | | | | | | | | and Kansas Gas and Electric |
| | | | | | | | | | Company (related utility |
| | | | | | | | | | companies) (2018–Present) |
50
Table of Contents
| | | | | | | | Number of | | Other |
| | | | | | Principal | | Portfolios in Fund | | Directorships |
| Name, | | Position(s) | | | | Occupation(s) | | Complex Overseen | | Held by |
| Address, | | Held with | | Length of Time | | During the | | by Trustee | | Trustee |
| and Birth Date | | Fund(s) | | Served | | Past Five Years | | or Officer | | or Officer |
| | | | | | | | | | | |
| Sandra A.J. | | Trustee | | Since December 2021 | | Chief Administrative Officer, | | 146 | | Director, Stowers (research) |
| Lawrence3 | | | | | | Children’s Mercy Hospitals and | | | | (2018) |
| (continued) | | | | | | Clinics | | | | Co-Chair, Women Corporate |
| 610 Market Street | | | | | | (2016–2019); | | | | Directors (director education) |
| Philadelphia, PA | | | | | | CFO, Children’s Mercy Hospitals | | | | (2018–2020) |
| 19106-2354 | | | | | | and Clinics | | | | Trustee, Ivy Funds Complex |
| September 1957 | | | | | | (2005–2016) | | | | (2019-2021) |
| | | | | | | | | | Director, Brixmor Property |
| | | | | | | | | | Group Inc. |
| | | | | | | | | | (2021–Present) |
| | | | | | | | | | Director, Sera Prognostics Inc. |
| | | | | | | | | | (biotechnology) |
| | | | | | | | | | (2021–Present) |
| | | | | | | | | | Director, Recology (resource |
| | | | | | | | | | recovery) |
| | | | | | | | | | (2021–Present) |
51
Table of Contents
Board of trustees / directors and officers addendum
Delaware Funds by Macquarie®
| | | | | | | | Number of | | Other |
| | | | | | Principal | | Portfolios in Fund | | Directorships |
| Name, | | Position(s) | | | | Occupation(s) | | Complex Overseen | | Held by |
| Address, | | Held with | | Length of Time | | During the | | by Trustee | | Trustee |
| and Birth Date | | Fund(s) | | Served | | Past Five Years | | or Officer | | or Officer |
| | | | | | | | | | | |
| Frances A. | | Trustee | | Since September 2011 | | Private Investor | | 146 | | Trust Manager and Audit |
| Sevilla-Sacasa | | | | | | (January 2017–Present) | | | | Committee Chair — Camden |
| 610 Market Street | | | | | | Chief Executive Officer — Banco | | | | Property Trust |
| Philadelphia, PA | | | | | | Itaú International | | | | (August 2011–Present) |
| 19106-2354 | | | | | | (April 2012–December 2016) | | | | Director; Audit |
| January 1956 | | | | | | Executive Advisor to Dean | | | | and Compensation |
| | | | | | (August 2011–March 2012) and | | | | Committee Member — |
| | | | | | Interim Dean | | | | Callon Petroleum Company |
| | | | | | (January 2011–July 2011) — | | | | (December 2019–Present) |
| | | | | | University of Miami School of | | | | Director — New Senior |
| | | | | | Business Administration | | | | Investment Group Inc. |
| | | | | | President — U.S. Trust, Bank of | | | | (January 2021–September 2021) |
| | | | | | America Private Wealth | | | | Director; Audit Committee |
| | | | | | Management (Private Banking) | | | | Member — Carrizo Oil & Gas, |
| | | | | | (July 2007-December 2008) | | | | Inc. (March 2018–December |
| | | | | | | | | | 2019) |
52
Table of Contents
| | | | | | | | Number of | | Other |
| | | | | | Principal | | Portfolios in Fund | | Directorships |
| Name, | | Position(s) | | | | Occupation(s) | | Complex Overseen | | Held by |
| Address, | | Held with | | Length of Time | | During the | | by Trustee | | Trustee |
| and Birth Date | | Fund(s) | | Served | | Past Five Years | | or Officer | | or Officer |
| | | | | | | | | | | |
| Thomas K. Whitford | | Trustee | | Since January 2013 | | Vice Chairman — PNC Financial | | 146 | | Director — HSBC North America |
| 610 Market Street | | | | | | Services Group | | | | Holdings Inc. |
| Philadelphia, PA | | | | | | (2010–April 2013) | | | | (December 2013–Present) |
| 19106-2354 | | | | | | | | | | Director — HSBC USA Inc. |
| March 1956 | | | | | | | | | | (July 2014–Present) |
| | | | | | | | | | Director — HSBC Bank USA, |
| | | | | | | | | | National Association |
| | | | | | | | | | (July 2014–March 2017) |
| | | | | | | | | | Director — HSBC Finance |
| | | | | | | | | | Corporation |
| | | | | | | | | | (December 2013–April 2018) |
53
Table of Contents
Board of trustees / directors and officers addendum
Delaware Funds by Macquarie®
| | | | | | | | Number of | | Other |
| | | | | | Principal | | Portfolios in Fund | | Directorships |
| Name, | | Position(s) | | | | Occupation(s) | | Complex Overseen | | Held by |
| Address, | | Held with | | Length of Time | | During the | | by Trustee | | Trustee |
| and Birth Date | | Fund(s) | | Served | | Past Five Years | | or Officer | | or Officer |
| | | | | | | | | | | |
| Christianna Wood | | Trustee | | Since January 2019 | | Chief Executive Officer and | | 146 | | Director; Finance Committee and |
| 610 Market Street | | | | | | President — Gore Creek Capital, | | | | Audit Committee Member — H&R |
| Philadelphia, PA | | | | | | Ltd. (August 2009–Present) | | | | Block Corporation |
| 19106-2354 | | | | | | | | | | (July 2008–Present) |
| August 1959 | | | | | | | | | | Director; Investments Committee, |
| | | | | | | | | | Capital and Finance Committee, |
| | | | | | | | | | and Audit Committee Member — |
| | | | | | | | | | Grange Insurance |
| | | | | | | | | | (2013–Present) |
| | | | | | | | | | Trustee; Chair of Nominating and |
| | | | | | | | | | Governance Committee and Audit |
| | | | | | | | | | Committee Member — |
| | | | | | | | | | The Merger Fund |
| | | | | | | | | | (2013–October 2021), |
| | | | | | | | | | The Merger Fund VL |
| | | | | | | | | | (2013–October 2021); WCM |
| | | | | | | | | | Alternatives: Event-Driven Fund |
| | | | | | | | | | (2013–October 2021), and WCM |
| | | | | | | | | | Alternatives: Credit Event Fund |
| | | | | | | | | | (December 2017–October 2021) |
| | | | | | | | | | Director; Chair of Governance |
| | | | | | | | | | Committee and Audit Committee |
| | | | | | | | | | Member — International |
| | | | | | | | | | Securities Exchange (2010–2016) |
54
Table of Contents
| | | | | | | | Number of | | Other |
| | | | | | Principal | | Portfolios in Fund | | Directorships |
| Name, | | Position(s) | | | | Occupation(s) | | Complex Overseen | | Held by |
| Address, | | Held with | | Length of Time | | During the | | by Trustee | | Trustee |
| and Birth Date | | Fund(s) | | Served | | Past Five Years | | or Officer | | or Officer |
| | | | | | | | | | |
| Janet L. Yeomans | | Trustee | | Since April 1999 | | Vice President and Treasurer | | 146 | | Director; Personnel and |
| 610 Market Street | | | | | | (January 2006–July 2012), Vice | | | | Compensation Committee Chair; |
| Philadelphia, PA | | | | | | President — Mergers & | | | | Member of Nominating, |
| 19106-2354 | | | | | | Acquisitions | | | | Investments, and Audit |
| July 1948 | | | | | | (January 2003–January 2006), | | | | Committees for various periods |
| | | | | | and Vice President and Treasurer | | | | throughout directorship — |
| | | | | | (July 1995–January 2003) — 3M | | | | Okabena Company (2009–2017) |
| | | | | | Company | | | | |
| | | | | | | | | | | |
| Officers | | | | | | | | | | |
| | | | | | | | | | | |
| David F. Connor | | Senior Vice President, | | Senior Vice President, | | David F. Connor has served in | | 146 | | None4 |
| 610 Market Street | | General Counsel, and | | since May 2013; | | various capacities at different | | | | |
| Philadelphia, PA | | Secretary | | General Counsel | | times at Macquarie Asset | | | | |
| 19106-2354 | | | | since May 2015; | | Management. | | | | |
| December 1963 | | | | Secretary since | | | | | | |
| | | | October 2005 | | | | | | |
| | | | | | | | | | | |
| Daniel V. Geatens | | Senior Vice President | | Senior Vice President | | Daniel V. Geatens has served in | | 146 | | None4 |
| 610 Market Street | | and Treasurer | | and Treasurer since | | various capacities at different | | | | |
| Philadelphia, PA | | | | October 2007 | | times at Macquarie Asset | | | | |
| 19106-2354 | | | | | | Management. | | | | |
| October 1972 | | | | | | | | | | |
55
Table of Contents
Board of trustees / directors and officers addendum
Delaware Funds by Macquarie®
| | | | | | | | Number of | | Other |
| | | | | | Principal | | Portfolios in Fund | | Directorships |
| Name, | | Position(s) | | | | Occupation(s) | | Complex Overseen | | Held by |
| Address, | | Held with | | Length of Time | | During the | | by Trustee | | Trustee |
| and Birth Date | | Fund(s) | | Served | | Past Five Years | | or Officer | | or Officer |
| | | | | | | | | | |
| Richard Salus | | Senior Vice President | | Senior Vice President | | Richard Salus has served in | | 146 | | None |
| 610 Market Street | | and Chief Financial | | and Chief Financial | | various capacities at different | | | | |
| Philadelphia, PA | | Officer | | Officer since | | times at Macquarie Asset | | | | |
| 19106-2354 | | | | November 2006 | | Management. | | | | |
| October 1963 | | | | | | | | | | |
| 1 | Shawn K. Lytle is considered to be an “Interested Trustee” because he is an executive officer of the Fund’s(s’) investment advisor. |
| 2 | Macquarie Asset Management is the marketing name for Macquarie Management Holdings, Inc. and its subsidiaries, including the Fund’s(s’) investment advisor, principal underwriter, and its transfer agent. |
| 3 | Messrs. Dobbs and Harroz and Ms. Lawrence were elected as Trustees of the Trust effective December 17, 2021. |
| 4 | David F. Connor and Daniel V. Geatens serve in similar capacities for the six portfolios of the Optimum Fund Trust, which have the same investment advisor, principal underwriter, and transfer agent as the registrant. Mr. Geatens also serves as the Chief Financial Officer of the Optimum Fund Trust and he is the Chief Financial Officer and Treasurer for Macquarie Global Infrastructure Total Return Fund Inc. |
The Statement of Additional Information for the Fund(s) includes additional information about the Trustees and Officers and is available, without charge, upon request by calling 800 523-1918.
56
Table of Contents
About the organization
| Board of trustees | | | |
| Shawn K. Lytle | Ann D. Borowiec | John A. Fry | Frances A. |
| President and | Former Chief Executive | President | Sevilla-Sacasa |
| Chief Executive Officer | Officer | Drexel University | Former Chief Executive |
| Delaware Funds | Private Wealth Management | | Officer |
| by Macquarie® | J.P. Morgan Chase & Co. | Joseph Harroz, Jr. | Banco Itaú International |
| | President | |
| Jerome D. Abernathy | Joseph W. Chow | University of Oklahoma | Thomas K. Whitford |
| Managing Member | Private Investor | | Former Vice Chairman |
| Stonebrook Capital | | Sandra A.J. Lawrence | PNC Financial Services |
| Management, LLC | H. Jeffrey Dobbs | Former Chief Administrative | Group |
| Former Global Sector | Officer | |
| Thomas L. Bennett | Chairman | Children's Mercy Hospitals | Christianna Wood |
| Chairman of the Board | Industrial Manufacturing, | and Clinics | Chief Executive Officer |
| Delaware Funds | KPMG, LLP | | and President |
| by Macquarie | | | Gore Creek Capital, Ltd. |
| Private Investor | | | |
| | | Janet L. Yeomans |
| | | Former Vice President and |
| | | Treasurer |
| | | 3M Company |
| | | | |
| Affiliated officers | | | |
| David F. Connor | Daniel V. Geatens | Richard Salus | |
| Senior Vice President, | Senior Vice President and | Senior Vice President and | |
| General Counsel, | Treasurer | Chief Financial Officer | |
| and Secretary | Delaware Funds | Delaware Funds | |
| Delaware Funds | by Macquarie | by Macquarie | |
| by Macquarie | | | |
This annual report is for the information of Delaware Healthcare Fund shareholders, but it may be used with prospective investors when preceded or accompanied by the Delaware Fund fact sheet for the most recently completed calendar quarter. These documents are available at delawarefunds.com/literature. |
The Fund files its complete schedule of portfolio holdings with the Securities and Exchange Commission (SEC) for the first and third quarters of each fiscal year on Form N-PORT. The Fund’s Forms N-PORT, as well as a description of the policies and procedures that the Fund uses to determine how to vote proxies (if any) relating to portfolio securities, are available without charge (i) upon request, by calling 800 523-1918; and (ii) on the SEC’s website at sec.gov. In addition, a description of the policies and procedures that the Fund uses to determine how to vote proxies (if any) relating to portfolio securities and the Schedule of Investments included in the Fund’s most recent Form N-PORT are available without charge on the Fund’s website at delawarefunds.com/literature. The Fund’s Forms N-PORT may be reviewed and copied at the SEC’s Public Reference Room in Washington, D.C.; information on the operation of the Public Reference Room may be obtained by calling 800 SEC-0330.
Information (if any) regarding how the Fund voted proxies relating to portfolio securities during the most recently disclosed 12-month period ended June 30 is available without charge (i) through the Fund’s website at delawarefunds.com/proxy; and (ii) on the SEC’s website at sec.gov.
57
Table of Contents
Annual report
US equity mutual fund
Delaware Small Cap Growth Fund
March 31, 2022
Carefully consider the Fund's investment objectives, risk factors, charges, and expenses before investing. This and other information can be found in the Fund's prospectus and its summary prospectus, which may be obtained by visiting delawarefunds.com/literature or calling 800 523-1918. Investors should read the prospectus and the summary prospectus carefully before investing.
You can obtain shareholder reports and prospectuses online instead of in the mail.
Visit delawarefunds.com/edelivery.
Table of Contents
Experience Delaware Funds by Macquarie®
Macquarie Asset Management (MAM) is a global asset manager that aims to deliver positive impact for everyone. MAM Public Investments traces its roots to 1929 and partners with institutional and individual clients to deliver specialist active investment capabilities across global equities, fixed income, and multi-asset solutions using a conviction-based, long-term approach to investing. In the US, retail investors recognize our Delaware Funds by Macquarie family of funds as one of the oldest mutual fund families.
If you are interested in learning more about creating an investment plan, contact your financial advisor.
You can learn more about Delaware Funds or obtain a prospectus for Delaware Small Cap Growth Fund at delawarefunds.com/literature.
Manage your account online
| ● | Check your account balance and transactions |
| ● | View statements and tax forms |
| ● | Make purchases and redemptions |
Visit delawarefunds.com/account-access.
Macquarie Asset Management (MAM) is the asset management division of Macquarie Group. MAM is a full-service asset manager offering a diverse range of products across public and private markets including fixed income, equities, multi-asset solutions, private credit, infrastructure, renewables, natural assets, real estate, and asset finance. The Public Investments business is a part of MAM and includes the following investment advisers: Macquarie Investment Management Business Trust (MIMBT), Macquarie Funds Management Hong Kong Limited, Macquarie Investment Management Austria Kapitalanlage AG, Macquarie Investment Management Global Limited, Macquarie Investment Management Europe Limited, and Macquarie Investment Management Europe S.A.
The Fund is distributed by Delaware Distributors, L.P. (DDLP), an affiliate of MIMBT and Macquarie Group Limited.
Other than Macquarie Bank Limited ABN 46 008 583 542 ("Macquarie Bank"), any Macquarie Group entity noted in this document is not an authorized deposit-taking institution for the purposes of the Banking Act 1959 (Commonwealth of Australia). The obligations of these other Macquarie Group entities do not represent deposits or other liabilities of Macquarie Bank. Macquarie Bank does not guarantee or otherwise provide assurance in respect of the obligations of these other Macquarie Group entities. In addition, if this document relates to an investment, (a) the investor is subject to investment risk including possible delays in repayment and loss of income and principal invested and (b) none of Macquarie Bank or any other Macquarie Group entity guarantees any particular rate of return on or the performance of the investment, nor do they guarantee repayment of capital in respect of the investment.
The Fund is governed by US laws and regulations.
Unless otherwise noted, views expressed herein are current as of March 31, 2022, and subject to change for events occurring after such date.
The Fund is not FDIC insured and is not guaranteed. It is possible to lose the principal amount invested.
Advisory services provided by Delaware Management Company, a series of MIMBT, a US registered investment advisor.
All third-party marks cited are the property of their respective owners.
© 2022 Macquarie Management Holdings, Inc.
Table of Contents
| Portfolio management review | | |
| Delaware Small Cap Growth Fund | | March 31, 2022 (Unaudited) |
| Performance preview (for the year ended March 31, 2022) | | | | | |
| Delaware Small Cap Growth Fund (Institutional Class shares) | | 1-year return | | -22.42 | % |
| Delaware Small Cap Growth Fund (Class A shares) | | 1-year return | | -22.65 | % |
| Russell 2000® Growth Index (benchmark) | | 1-year return | | -14.33 | % |
Past performance does not guarantee future results.
For complete, annualized performance for Delaware Small Cap Growth Fund, please see the table on page 5.
Institutional Class shares are not subject to a sales charge and are offered for sale exclusively to certain eligible investors. In addition, Institutional Class shares pay no distribution and service fee.
The performance of Class A shares excludes the applicable sales charge. The performance of both Institutional Class shares and Class A shares reflects the reinvestment of all distributions.
Please see page 7 for a description of the index. Index performance returns do not reflect any management fees, transaction costs, or expenses. Indices are unmanaged and one cannot invest directly in an index.
Investment objective
The Fund seeks long-term capital appreciation.
Market review
The fiscal year ended March 31, 2022, was especially trying for small-cap growth as investors rotated from growth to value and from small companies to large. Both shifts are traceable directly back to the start of the pandemic in 2020 and are finally beginning to show signs of waning.
As we reported in 2021, the onset of the COVID-19 pandemic sent markets into a severe selloff as global economies shut down, sending value-oriented stocks, including travel and leisure, energy, materials, and banking, into a depression. In contrast, growth companies performed well as the pandemic-imposed restrictions boosted ecommerce, mobile banking, digital payments, and software, which all enable remote workers. Fast-forward to the end of 2020, when the COVID-19 vaccines became available. Suddenly, the value companies that had been barely afloat sprung to life. Almost overnight, it was all right to go out, travel, see a movie, or go to the ballgame. And just as suddenly, we
| ● | Market rotation out of growth to value and from small-caps to large-caps created a challenge for small-cap growth investing. |
| ● | The Russian invasion of Ukraine in February added to investor concerns. |
| ● | The Fund maintains its long-term focus on disruptive trends and industries, such as mobile banking and digital payments, and sees remote working as here to stay. |
1
Table of Contents
Portfolio management review
Delaware Small Cap Growth Fund
witnessed the largest rotation from growth to value in more than 20 years.
In much the same way, large-cap equities outperformed small-caps throughout the pandemic. Investors often find it easier to buy large-caps, usually perceived as safe havens, in a difficult economic environment.
While this was a difficult period for small-cap growth investors, it was by almost all other measures a strong period for the economy. The US unemployment rate dropped below 4%, housing prices soared, and equities performed well overall.
Still, as the period drew to a close, several large clouds loomed. The Russian invasion of Ukraine, the sanctions the West imposed, and the potential disruption of oil and gas supplies have raised concerns about a possible recession in Europe. In the US, investors seem more focused on inflation, though ultimately that is more a question of rates. We’ve already seen the 30-year mortgage rate rise from 3% to 5%. This means a house purchased with debt will cost 15% more today than it did just four months ago.
On March 14, the Federal Reserve adopted a more aggressive stance, raising rates for the first time in more than three years, and indicating that six or seven more increases are likely before the end of the year. That would raise the federal funds rate to about 2.0%. Markets rallied after the announcement, a sign that investors were buoyed by the Fed getting tough on inflation. In a sign that growth investors may find encouraging, growth stocks have outperformed value since the Fed announcement. Although it is too early to be sure, investors may be looking at a cyclical rotation back to growth as the war in Ukraine, rising energy costs, higher interest rates, inflation, and increased housing costs act to decelerate economic growth.
Within the Fund
For the fiscal period ended March 31, 2022, Delaware Small Cap Growth Fund underperformed its benchmark, the Russell 2000 Growth Index. The Fund’s Institutional Class shares returned -22.42%. The Fund’s Class A shares returned -22.65% at net asset value and -27.11% at maximum offering price (both figures reflect all distributions). During the same period, the benchmark returned -14.33%. For complete, annualized performance of Delaware Small Cap Growth Fund, please see the table on page 5.
While we focus mainly on individual stock selection, on a sector level, advantageous stock selection contributed to strong relative performance in the healthcare and financials sectors. The consumer staples, industrials, and communication services sectors were the largest detractors from performance, also due to stock selection. The Fund did not have any positions in the energy, materials, or real estate sectors, which detracted from performance relative to the benchmark.
The Fund pursues a pure growth strategy, focusing on disruptions that are often induced by innovation or technology. Now that we’ve reached the end of the second full year of the pandemic, it’s clear that life and society as we knew it will not return to the way things were. The pandemic has permanently altered the economic landscape. For example, remote working is here to stay. Perhaps one-third of people will return to full-time office work, another third may take a hybrid approach, splitting their time between the office and home, and the remainder will be full-time remote workers. Some of the opportunities that creates may seem obvious – video conferencing systems and software, for example. But if people are spending more time
2
Table of Contents
at home, it will also expand the market for businesses providing home improvement.
Some changes are happening on a broad scale. People have demanded, for some time, but particularly in the last several years, that corporations take more responsibility for their community and become more involved in society. That has now manifested in companies engaging in community outreach, committing to environmentally sound practices, seeking more diversity and inclusion, and providing employees with more benefits.
Progyny Inc. benefited from that trend and contributed to the Fund’s performance during the fiscal year. Progyny is the leading pure-play benefits manager specializing in fertility and family-building benefits solutions for self-insured employers. Though it often receives little attention, infertility is a significant problem affecting one in eight women, a prevalence higher than many chronic conditions, including diabetes and depression. For those in need, Progyny’s insurance benefit can reduce the cost of an in vitro procedure from $100,000 to a deductible of less than $10,000. Over the past year, Progyny has demonstrated that it can grow regardless of the economy, profiting from both the value of its offering and corporations’ desire to enhance employee benefits.
Sprout Social Inc. was another significant contributor during the period. Sprout provides social media management and analytic tools to corporations via software as a service (SaaS). With Sprout’s software, businesses can monitor and manage their online presence. On websites, this includes how long people are viewing your web page, whether they’re leaving things unpurchased in shopping carts, and what key words they’re using. Sprout also monitors activity on social media sites such as Facebook, LinkedIn®, and Twitter. Although such analytic services have been available for many years, Sprout is the first to leverage SaaS. We think this provides the company with a significant advantage over its competitors. Via SaaS, Sprout can add services and functionality and provide updates and fixes in real time. SaaS also enables Sprout to charge people in a recurring way, which provides a steadier stream of revenue than traditional software packages that are sold upfront. Sprout demonstrated strong growth throughout the period, and we think the company will become the must-have service, the standard in its niche.
The economic environment did take a toll on several of our holdings during the fiscal year. Invitae Corp. has incredible technology used to make medical diagnoses based on an individual’s genetic code. Until recently, the high cost of genetic testing has limited its use. Invitae’s lower-cost technology opens genetic testing to a wide range of medical specialties, including oncology, neurology, pediatrics, and rare diseases, without sacrificing quality or turnaround time. Shares of Invitae have underperformed, however. To date, the company has no earnings but does have significant debt. Therefore, in a world that’s nervous about where interest rates are headed, investors, including us, have decided to look elsewhere.
We also exited our position in Amplitude Inc., a software company that enables manufacturers to build better products by measuring and analyzing customer behavior. In the final quarter of the fiscal year, Amplitude reported disappointing results and guidance. At the same time, management guided to lower-than-expected topline growth, which implied a deceleration in the business. Management also guided to higher-than-expected operating expenses. In a demanding
3
Table of Contents
Portfolio management review
Delaware Small Cap Growth Fund
earnings season for software, a report with multiple negative surprises sparked a significant selloff. With less visibility into the strength of the business, lower confidence in management, and a stock move that violated our sell discipline, we, too, decided there were better opportunities elsewhere.
At the close of the Fund’s fiscal year, we remain invested in the same disruptive trends and industries that carried us through the period. We continue to believe, for example, that mobile banking and digital payments will grow over time and as mentioned earlier, remote working is here to stay.
We do see changes, however. At fiscal year end, our largest thematic exposure was to healthcare procedures. This provides the Fund with several advantages, in our opinion. The market is fully domestic and since it is less exposed to inflation and cyclicality, it is largely insulated from international concerns. Additionally, the healthcare system continues to normalize. During the pandemic, many hospitals curtailed elective procedures. People now have the ability, the time, and the desire to fix things that they had put off. We think this is a sector of the market that’s not only levered well toward the end of the pandemic but that’s also insulated from the war in Ukraine and inflation.
We’ve reduced our housing-oriented companies. While we do not own home builders, we do own several housing-related companies. We expect some areas of the market to do well: home improvements is one area. Inflation and higher rates may affect others.
In technology, we think semiconductors will be more cyclical than software companies. We have acted accordingly, reducing our semiconductor exposure and adding to software. And as before, within software, we are partial to those companies that provide product via SaaS.
We’re also seeing change in the consumer world. As the pandemic fades from consciousness, people are spending more money on experiences, such as travel, restaurants, and shows. After spending nearly two years shut in and acquiring “stuff,” people now want to get out and do things. So rather than buying a new pair of sweatpants, they’ll go out to the ballgame.
4
Table of Contents
| Performance summary | |
| Delaware Small Cap Growth Fund | March 31, 2022 (Unaudited) |
The performance quoted represents past performance and does not guarantee future results. Investment return and principal value of an investment will fluctuate so that shares, when redeemed, may be worth more or less than their original cost. Current performance may be lower or higher than the performance quoted. Performance data current to the most recent month end may be obtained by calling 800 523-1918 or visiting delawarefunds.com/performance.
| Fund and benchmark performance1,2 | | Average annual total returns through March 31, 2022 |
| | 1 year | | 3 year | | 5 year | | Lifetime |
| Class A (Est. June 30, 2016) | | | | | | | | |
| Excluding sales charge | | -22.65%* | | +16.84% | | +21.31% | | +20.77% |
| Including sales charge | | -27.11% | | +14.57% | | +19.89% | | +19.53% |
| Class C (Est. June 30, 2016) | | | | | | | | |
| Excluding sales charge | | -23.18% | | +15.93% | | +20.37% | | +19.85% |
| Including sales charge | | -23.84% | | +15.93% | | +20.37% | | +19.85% |
| Class R (Est. June 30, 2016) | | | | | | | | |
| Excluding sales charge | | -22.82% | | +16.52% | | +20.96% | | +20.45% |
| Including sales charge | | -22.82% | | +16.52% | | +20.96% | | +20.45% |
| Institutional Class (Est. June 30, 2016) | | | | | | | | |
| Excluding sales charge | | -22.42% | | +17.10% | | +21.58% | | +21.05% |
| Including sales charge | | -22.42% | | +17.10% | | +21.58% | | +21.05% |
| Russell 2000 Growth Index | | -14.33% | | +9.88% | | — | | +12.29%** |
| * | Total returns for the report period presented in the table differs from the return in “Financial highlights.” The total returns presented in the above table are calculated based on the net asset value (NAV) at which shareholder transactions were processed. The total returns presented in “Financial highlights” are calculated in the same manner, but also takes into account certain adjustments that are necessary under US generally accepted accounting principles required in the annual report. |
| ** | The benchmark lifetime return is for Institutional Class share comparison only and is calculated using the Fund’s Institutional Class inception date. |
| 1 | Returns reflect the reinvestment of all distributions and are presented both with and without the applicable sales charges described below. Returns do not reflect the deduction of taxes the shareholder would pay on Fund distributions or redemptions of Fund shares. |
Expense limitations were in effect for certain classes during some or all of the periods shown in the “Fund and benchmark performance” table. Expenses for each class are listed on the “Fund expense ratios” table on page 6. Performance would have been lower had expense limitations not been in effect.
Institutional Class shares are not subject to a sales charge and are offered for sale exclusively to certain eligible investors. In
5
Table of Contents
Performance summary
Delaware Small Cap Growth Fund
addition, Institutional Class shares pay no distribution and service (12b-1) fee.
Class A shares are sold with a maximum front-end sales charge of 5.75%, and have an annual 12b-1 fee of 0.25% of average daily net assets. Performance for Class A shares, excluding sales charges, assumes that no front-end sales charge applied.
Class C shares are sold with a contingent deferred sales charge (CDSC) of 1.00% if redeemed during the first 12 months. They are also subject to an annual 12b-1 fee of 1.00% of average daily net assets. Performance for Class C shares, excluding sales charges, assumes either that contingent deferred sales charges (CDSCs) did not apply or that the investment was not redeemed.
Class R shares are available only for certain retirement plan products. They are sold without a sales charge and have an annual 12b-1 fee of 0.50% of average daily net assets.
Investments in small and/or medium-sized companies typically exhibit greater risk and higher volatility than larger, more established companies.
Risk is increased in a concentrated portfolio since it holds a limited number of securities with each investment having a greater effect on the overall performance.
The disruptions caused by natural disasters, pandemics, or similar events could prevent the Fund from executing advantageous investment decisions in a timely manner and could negatively impact the Fund’s ability to achieve its investment objective and the value of the Fund’s investments.
| 2 | The Fund’s expense ratios, as described in the most recent prospectus, are disclosed in the following “Fund expense ratios” table. Delaware Management Company has agreed to reimburse certain expenses and/or waive certain fees in order to prevent total annual fund operating expenses (excluding any 12b-1 fees, acquired fund fees and expenses, taxes, interest, short sale dividend and interest expenses, brokerage fees, certain insurance costs, and nonroutine expenses or costs, including, but not limited to, those relating to reorganizations, litigation, conducting shareholder meetings, and liquidations from exceeding 1.05% of the Fund’s average daily net assets from April 1, 2021 to March 31, 2022.* Please see the most recent prospectus and any applicable supplement(s) for additional information on these fee waivers and/or reimbursements. Please see the “Financial highlights” section in this report for the most recent expense ratios. |
| | | | | | | | Institutional |
| Fund expense ratios | | Class A | | Class C | | Class R | | Class |
| Total annual operating expenses | | | | | | | | |
| (without fee waivers) | | 1.31% | | 2.06% | | 1.56% | | 1.06% |
| Net expenses (including fee | | | | | | | | |
| waivers, if any) | | 1.30% | | 2.05% | | 1.55% | | 1.05% |
| |
| Type of waiver | | Contractual | | Contractual | | Contractual | | Contractual |
| * | The aggregate contractual waiver period covering this report is from July 29, 2020 through July 29, 2022. |
6
Table of Contents
Performance of a $10,000 investment1
Average annual total returns from June 30, 2016 (Fund’s inception) through March 31, 2022
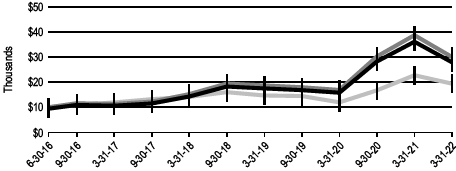
For period beginning June 30, 2016 through March 31, 2022 | | Starting value | | Ending value |
 | Delaware Small Cap Growth Fund — Institutional Class shares | | | $ | 10,000 | | | | $ | 29,998 | |
 | Delaware Small Cap Growth Fund — Class A shares | | | $ | 9,425 | | | | $ | 27,900 | |
 | Russell 2000 Growth Index | | | $ | 10,000 | | | | $ | 19,391 | |
| 1 | The “Performance of a $10,000 investment” graph assumes $10,000 invested in Institutional Class and Class A shares of the Fund on June 30, 2016, and includes the effect of a 5.75% front-end sales charge (for Class A shares) and the reinvestment of all distributions. The graph does not reflect the deduction of taxes the shareholders would pay on Fund distributions or redemptions of Fund shares. Expense limitations were in effect for some or all of the periods shown. Performance would have been lower had expense limitations not been in effect. Expenses are listed in the “Fund expense ratios” table on page 6. Please note additional details on pages 5 through 8. |
The graph also assumes $10,000 invested in the Russell 2000 Growth Index as of June 30, 2016. The Russell 2000 Growth Index measures the performance of the small-cap growth segment of the US equity universe. It includes those Russell 2000 companies with higher price-to-book ratios and higher forecasted growth values.
Frank Russell Company is the source and owner of the trademarks, service marks and copyrights related to the Russell Indexes. Russell® is a trademark of Frank Russell Company.
Index performance returns do not reflect any management fees, transaction costs, or expenses. Indices are unmanaged and one cannot invest directly in an index. Past performance does not guarantee future results.
Performance of other Fund classes will vary due to different charges and expenses.
7
Table of Contents
Performance summary
Delaware Small Cap Growth Fund
| | Nasdaq symbols | | CUSIPs |
| Class A | | DSGDX | | 24610A604 |
| Class C | | DSGEX | | 24610A703 |
| Class R | | DSGFX | | 24610A885 |
| Institutional Class | | DSGGX | | 24610A802 |
8
Table of Contents
Disclosure of Fund expenses
For the six-month period from October 1, 2021 to March 31, 2022 (Unaudited)
As a shareholder of the Fund, you incur two types of costs: (1) transaction costs, including sales charges (loads) on purchase payments, reinvested dividends, or other distributions; redemption fees; and exchange fees; and (2) ongoing costs, including management fees; distribution and service (12b-1) fees; and other Fund expenses. This example is intended to help you understand your ongoing costs (in dollars) of investing in the Fund and to compare these costs with the ongoing costs of investing in other mutual funds.
The example is based on an investment of $1,000 invested at the beginning of the period and held for the entire six-month period from October 1, 2021 to March 31, 2022.
Actual expenses
The first section of the table shown, “Actual Fund return,” provides information about actual account values and actual expenses. You may use the information in this section of the table, together with the amount you invested, to estimate the expenses that you paid over the period. Simply divide your account value by $1,000 (for example, an $8,600 account value divided by $1,000 = 8.6), then multiply the result by the number in the first section under the heading entitled “Expenses Paid During Period” to estimate the expenses you paid on your account during this period.
Hypothetical example for comparison purposes
The second section of the table shown, “Hypothetical 5% return,” provides information about hypothetical account values and hypothetical expenses based on the Fund’s actual expense ratio and an assumed rate of return of 5% per year before expenses, which is not the Fund’s actual return. The hypothetical account values and expenses may not be used to estimate the actual ending account balance or expenses you paid for the period. You may use this information to compare the ongoing costs of investing in the Fund and other funds. To do so, compare this 5% hypothetical example with the 5% hypothetical examples that appear in the shareholder reports of the other funds.
Please note that the expenses shown in the table are meant to highlight your ongoing costs only and do not reflect any transactional costs, such as sales charges (loads), redemption fees, or exchange fees. Therefore, the second section of the table is useful in comparing ongoing costs only, and will not help you determine the relative total costs of owning different funds. In addition, if these transactional costs were included, your costs would have been higher.
9
Table of Contents
Disclosure of Fund expenses
For the six-month period from October 1, 2021 to March 31, 2022 (Unaudited)
Delaware Small Cap Growth Fund
Expense analysis of an investment of $1,000
| | Beginning | | Ending | | | | | | | Expenses |
| | Account Value | | Account Value | | Annualized | | Paid During Period |
| | 10/1/21 | | 3/31/22 | | Expense Ratio | | 10/1/21 to 3/31/22* |
| Actual Fund return† | | | | | | | | | | | | | | | | | | | | |
| Class A | | | $ | 1,000.00 | | | | $ | 772.00 | | | | 1.32 | % | | | | $ | 5.83 | |
| Class C | | | | 1,000.00 | | | | | 768.70 | | | | 2.07 | % | | | | | 9.13 | |
| Class R | | | | 1,000.00 | | | | | 770.90 | | | | 1.57 | % | | | | | 6.93 | |
| Institutional Class | | | | 1,000.00 | | | | | 772.80 | | | | 1.07 | % | | | | | 4.73 | |
| Hypothetical 5% return (5% return before expenses) | | | | | | | | | | | | | | | | | | | | |
| Class A | | | $ | 1,000.00 | | | | $ | 1,018.35 | | | | 1.32 | % | | | | $ | 6.64 | |
| Class C | | | | 1,000.00 | | | | | 1,014.61 | | | | 2.07 | % | | | | | 10.40 | |
| Class R | | | | 1,000.00 | | | | | 1,017.10 | | | | 1.57 | % | | | | | 7.90 | |
| Institutional Class | | | | 1,000.00 | | | | | 1,019.60 | | | | 1.07 | % | | | | | 5.39 | |
| * | “Expenses Paid During Period” are equal to the Fund's annualized expense ratio, multiplied by the average account value over the period, multiplied by 182/365 (to reflect the one-half year period). |
| † | Because actual returns reflect only the most recent six-month period, the returns shown may differ significantly from fiscal year returns. |
10
Table of Contents
| Security type / sector allocation and top 10 |
| equity holdings | |
| Delaware Small Cap Growth Fund | As of March 31, 2022 (Unaudited) |
Sector designations may be different from the sector designations presented in other Fund materials. The sector designations may represent the investment manager’s internal sector classifications.
| Security type / sector | | Percentage of net assets |
| Common Stocks ◆ | | | 99.90 | % | |
| Communication Services | | | 5.06 | % | |
| Consumer Discretionary | | | 21.74 | % | |
| Consumer Staples | | | 6.68 | % | |
| Financials | | | 3.14 | % | |
| Healthcare* | | | 36.92 | % | |
| Industrials | | | 3.97 | % | |
| Information Technology | | | 22.39 | % | |
| Total Value of Securities | | | 99.90 | % | |
| Receivables and Other Assets Net of Liabilities | | | 0.10 | % | |
| Total Net Assets | | | 100.00 | % | |
| ◆ | Narrow industries are utilized for compliance purposes for diversification whereas broad sectors are used for financial reporting. |
| * | To monitor compliance with the Fund’s concentration guidelines as described in the Fund’s prospectus and Statement of Additional Information, the Healthcare sector (as disclosed herein for financial reporting purposes) is subdivided into a variety of “industries” (in accordance with the requirements of the Investment Company Act of 1940, as amended). The Healthcare sector consisted of Healthcare Products, Pharmaceuticals, Commercial Services, and Internet. As of March 31, 2022, such amounts, as a percentage of total net assets were 21.23%, 5.93%, 5.79%, and 3.97%, respectively. The percentage in any such single industry will comply with the Fund’s concentration policy even if the percentage in the Healthcare sector for financial reporting purposes may exceed 25%. |
Holdings are for informational purposes only and are subject to change at any time. They are not a recommendation to buy, sell, or hold any security.
| Top 10 equity holdings | | Percentage of net assets |
| Inspire Medical Systems | | | 6.08 | % | |
| Inari Medical | | | 5.97 | % | |
| Pacira BioSciences | | | 5.93 | % | |
| Progyny | | | 5.79 | % | |
| Sprout Social Class A | | | 4.88 | % | |
| Rapid7 | | | 4.64 | % | |
| Lattice Semiconductor | | | 4.61 | % | |
| Shockwave Medical | | | 4.45 | % | |
| Freshpet | | | 4.29 | % | |
| Figs Class A | | | 3.97 | % | |
11
Table of Contents
| Schedule of investments | |
| Delaware Small Cap Growth Fund | March 31, 2022 |
| | | | Number of | | | |
| | | shares | | Value (US $) |
| Common Stocks – 99.90% ◆ | | | | | |
| Communication Services – 5.06% | | | | | |
| Eventbrite Class A † | | 269,130 | | $ | 3,975,050 |
| PubMatic Class A † | | 263,810 | | | 6,890,717 |
| | | | | | 10,865,767 |
| Consumer Discretionary – 21.74% | | | | | |
| Crocs † | | 20,384 | | | 1,557,338 |
| Deckers Outdoor † | | 10,692 | | | 2,927,149 |
| Dutch Bros Class A † | | 118,558 | | | 6,552,701 |
| Lovesac † | | 126,996 | | | 6,865,404 |
| On Holding Class A † | | 234,394 | | | 5,916,104 |
| Planet Fitness Class A † | | 53,159 | | | 4,490,872 |
| TopBuild † | | 31,281 | | | 5,674,061 |
| Warby Parker Class A † | | 91,242 | | | 3,084,892 |
| Wingstop | | 24,413 | | | 2,864,865 |
| YETI Holdings † | | 111,887 | | | 6,710,982 |
| | | | | | 46,644,368 |
| Consumer Staples – 6.68% | | | | | |
| Chefs' Warehouse † | | 157,402 | | | 5,131,305 |
| Freshpet † | | 89,613 | | | 9,197,879 |
| | | | | | 14,329,184 |
| Financials – 3.14% | | | | | |
| Trupanion † | | 75,693 | | | 6,745,760 |
| | | | | | 6,745,760 |
| Healthcare – 36.92% | | | | | |
| Figs Class A † | | 395,900 | | | 8,519,768 |
| Inari Medical † | | 141,365 | | | 12,813,324 |
| Inspire Medical Systems † | | 50,796 | | | 13,038,825 |
| Novocure † | | 62,585 | | | 5,185,167 |
| Pacira BioSciences † | | 166,793 | | | 12,729,642 |
| Progyny † | | 241,750 | | | 12,425,950 |
| Quanterix † | | 169,964 | | | 4,961,249 |
| Shockwave Medical † | | 46,060 | | | 9,551,002 |
| | | | | | 79,224,927 |
| Industrials – 3.97% | | | | | |
| AZEK † | | 125,397 | | | 3,114,862 |
| SiteOne Landscape Supply † | | 33,364 | | | 5,394,625 |
| | | | | | 8,509,487 |
12
Table of Contents
| | | | Number of | | | |
| | | shares | | Value (US $) |
| Common Stocks ◆ (continued) | | | | | |
| Information Technology – 22.39% | | | | | |
| Five9 † | | 39,855 | | $ | 4,399,992 |
| Lattice Semiconductor † | | 162,451 | | | 9,901,388 |
| nCino † | | 120,551 | | | 4,940,180 |
| Rapid7 † | | 89,504 | | | 9,956,425 |
| Shift4 Payments Class A † | | 135,246 | | | 8,375,785 |
| Sprout Social Class A † | | 130,825 | | | 10,481,699 |
| | | | | | 48,055,469 |
| Total Common Stocks (cost $218,758,013) | | | | | 214,374,962 |
| Total Value of Securities–99.90% | | | | | |
| (cost $218,758,013) | | | | $ | 214,374,962 |
| ◆ | Narrow industries are utilized for compliance purposes for diversification whereas broad sectors are used for financial reporting. |
| † | Non-income producing security. |
See accompanying notes, which are an integral part of the financial statements.
13
Table of Contents
| Statement of assets and liabilities | | |
| Delaware Small Cap Growth Fund | | March 31, 2022 |
| Assets: | | | | |
| | Investments, at value* | | $ | 214,374,962 | |
| Cash | | | 190,657 | |
| Receivable for securities sold | | | 4,264,925 | |
| Receivable for fund shares sold | | | 4,026,837 | |
| Dividends receivable | | | 129,079 | |
| Other assets | | | 1,460 | |
| Total Assets | | | 222,987,920 | |
| Liabilities: | | | | |
| Payable for fund shares redeemed | | | 5,235,014 | |
| Payable for securities purchased | | | 2,895,552 | |
| Investment management fees payable to affiliates | | | 131,726 | |
| Other accrued expenses | | | 89,183 | |
| Audit and tax fees payable | | | 27,783 | |
| Distribution fees payable to affiliates | | | 9,911 | |
| Dividend disbursing and transfer agent fees and expenses payable to | | | | |
| affiliates | | | 1,625 | |
| Trustees' fees and expenses payable | | | 975 | |
| Accounting and administration expenses payable to affiliates | | | 829 | |
| Legal fees payable to affiliates | | | 511 | |
| Reports and statements to shareholders expenses payable to affiliates | | | 109 | |
| Total Liabilities | | | 8,393,218 | |
| Total Net Assets | | $ | 214,594,702 | |
| | |
| Net Assets Consist of: | | | | |
| Paid-in capital | | $ | 238,005,901 | |
| Total distributable earnings (loss) | | | (23,411,199 | ) |
| Total Net Assets | | $ | 214,594,702 | |
14
Table of Contents
| Net Asset Value | | | | |
| | | | | |
| Class A: | | | | |
| Net assets | | $ | 19,179,940 | |
| Shares of beneficial interest outstanding, unlimited authorization, no par | | | 1,620,527 | |
| Net asset value per share | | $ | 11.84 | |
| Sales charge | | | 5.75 | % |
| Offering price per share, equal to net asset value per share / (1 - sales | | | | |
| charge) | | $ | 12.56 | |
| | | | | |
| Class C: | | | | |
| Net assets | | $ | 6,154,643 | |
| Shares of beneficial interest outstanding, unlimited authorization, no par | | | 558,799 | |
| Net asset value per share | | $ | 11.01 | |
| | | | | |
| Class R: | | | | |
| Net assets | | $ | 1,851,334 | |
| Shares of beneficial interest outstanding, unlimited authorization, no par | | | 160,536 | |
| Net asset value per share | | $ | 11.53 | |
| | | | | |
| Institutional Class: | | | | |
| Net assets | | $ | 187,408,785 | |
| Shares of beneficial interest outstanding, unlimited authorization, no par | | | 15,523,387 | |
| Net asset value per share | | $ | 12.07 | |
____________________ |
| *Investments, at cost | | $ | 218,758,013 | |
See accompanying notes, which are an integral part of the financial statements.
15
Table of Contents
| Statement of operations | | |
| Delaware Small Cap Growth Fund | | Year ended March 31, 2022 |
| Investment Income: | | | | |
| | Dividends | | $ | 150,879 | |
| |
| Expenses: | | | | |
| Management fees | | | 1,607,810 | |
| Distribution expenses — Class A | | | 60,724 | |
| Distribution expenses — Class C | | | 74,409 | |
| Distribution expenses — Class R | | | 14,185 | |
| Dividend disbursing and transfer agent fees and expenses | | | 273,837 | |
| Registration fees | | | 125,103 | |
| Accounting and administration expenses | | | 72,532 | |
| Reports and statements to shareholders expenses | | | 55,797 | |
| Audit and tax fees | | | 27,844 | |
| Legal fees | | | 11,725 | |
| Custodian fees | | | 8,958 | |
| Trustees’ fees and expenses | | | 6,143 | |
| Other | | | 15,256 | |
| Total operating expenses | | | 2,354,323 | |
| Net Investment Loss | | | (2,203,444 | ) |
| Net Realized and Unrealized Loss: | | | | |
| Net realized loss on investments | | | (12,104,958 | ) |
| Net change in unrealized appreciation (depreciation) of investments | | | (36,699,506 | ) |
| Net Realized and Unrealized Loss | | | (48,804,464 | ) |
| Net Decrease in Net Assets Resulting from Operations | | $ | (51,007,908 | ) |
See accompanying notes, which are an integral part of the financial statements.
16
Table of Contents
Statements of changes in net assets
Delaware Small Cap Growth Fund
| | | | Year ended |
| | | | 3/31/22 | | 3/31/21 |
| Increase (Decrease) in Net Assets from Operations: | | | | | | | | |
| | Net investment loss | | $ | (2,203,444 | ) | | $ | (1,227,221 | ) |
| Net realized gain (loss) | | | (12,104,958 | ) | | | 39,881,360 | |
| Net change in unrealized appreciation (depreciation) | | | (36,699,506 | ) | | | 35,883,085 | |
| Net increase (decrease) in net assets resulting from | | | | | | | | |
| | operations | | | (51,007,908 | ) | | | 74,537,224 | |
| | | |
| Dividends and Distributions to Shareholders from: | | | | | | | | |
| Distributable earnings: | | | | | | | | |
| | Class A | | | (2,986,734 | ) | | | (2,519,287 | ) |
| | Class C | | | (1,039,635 | ) | | | (557,897 | ) |
| | Class R | | | (369,655 | ) | | | (394,711 | ) |
| | Institutional Class | | | (20,410,617 | ) | | | (15,928,765 | ) |
| | | | | (24,806,641 | ) | | | (19,400,660 | ) |
| | | |
| Capital Share Transactions: | | | | | | | | |
| Proceeds from shares sold: | | | | | | | | |
| | Class A | | | 12,494,617 | | | | 26,283,347 | |
| | Class C | | | 4,341,430 | | | | 7,061,376 | |
| | Class R | | | 530,458 | | | | 559,998 | |
| | Institutional Class | | | 235,257,135 | | | | 119,191,021 | |
| Net asset value of shares issued upon reinvestment of | | | | | | | | |
| | dividends and distributions: | | | | | | | | |
| | Class A | | | 2,986,091 | | | | 2,518,531 | |
| | Class C | | | 1,039,635 | | | | 557,892 | |
| | Class R | | | 369,655 | | | | 394,706 | |
| | Institutional Class | | | 20,158,132 | | | | 15,668,302 | |
| | | | | 277,177,153 | | | | 172,235,173 | |
17
Table of Contents
Statements of changes in net assets
Delaware Small Cap Growth Fund
| | | | Year ended |
| | | | | 3/31/22 | | 3/31/21 |
| Capital Share Transactions (continued): | | | | | | | | |
| Cost of shares redeemed: | | | | | | | | |
| | Class A | | $ | (13,044,029 | ) | | $ | (7,844,758 | ) |
| | Class C | | | (3,704,262 | ) | | | (1,399,308 | ) |
| | Class R | | | (951,382 | ) | | | (99,388 | ) |
| | Institutional Class | | | (147,781,843 | ) | | | (102,183,304 | ) |
| | | | | (165,481,516 | ) | | | (111,526,758 | ) |
| Increase in net assets derived from capital share | | | | | | | | |
| | transactions | | | 111,695,637 | | | | 60,708,415 | |
| Net Increase in Net Assets | | | 35,881,088 | | | | 115,844,979 | |
| | | | | | | | | |
| Net Assets: | | | | | | | | |
| Beginning of year | | | 178,713,614 | | | | 62,868,635 | |
| End of year | | $ | 214,594,702 | | | $ | 178,713,614 | |
See accompanying notes, which are an integral part of the financial statements.
18
Table of Contents
Financial highlights
Delaware Small Cap Growth Fund Class A
Selected data for each share of the Fund outstanding throughout each period were as follows:
| Net asset value, beginning of period |
| |
| Income (loss) from investment operations: |
| Net investment loss1 |
| Net realized and unrealized gain (loss) |
| Total from investment operations |
| |
| Less dividends and distributions from: |
| Net realized gain |
| Total dividends and distributions |
| |
| Net asset value, end of period |
| |
| Total return2 |
| |
| Ratios and supplemental data: |
| Net assets, end of period (000 omitted) |
| Ratio of expenses to average net assets4 |
| Ratio of expenses to average net assets prior to fees waived4 |
| Ratio of net investment loss to average net assets |
| Ratio of net investment loss to average net assets prior to fees waived |
| Portfolio turnover |
| 1 | Calculated using average shares outstanding. |
| 2 | Total return is based on the change in net asset value of a share during the period and assumes reinvestment of dividends and distributions at net asset value and does not reflect the impact of a sales charge. |
| 3 | Total return during the period reflects waiver by the manager and/or distributor. Performance would have been lower had waiver not been in effect. |
| 4 | Expense ratios do not include expenses of the Underlying Funds in which the Fund invests. |
See accompanying notes, which are an integral part of the financial statements.
20
Table of Contents
| | Year ended | |
| | | 3/31/22 | | 3/31/21 | | 3/31/20 | | 3/31/19 | | 3/31/18 | |
| | $ | 17.63 | | | $ | 9.23 | | | $ | 10.39 | | | $ | 11.59 | | | $ | 9.22 | | |
| | | | | | | | | | | | | | | | | | | | | |
| | | | | | | | | | | | | | | | | | | | | | |
| | | (0.19 | ) | | | (0.21 | ) | | | (0.13 | ) | | | (0.14 | ) | | | (0.13 | ) | |
| | | (3.51 | ) | | | 11.79 | | | | (0.88 | ) | | | 2.33 | | | | 3.22 | | |
| | | (3.70 | ) | | | 11.58 | | | | (1.01 | ) | | | 2.19 | | | | 3.09 | | |
| | | | | | | | | | | | | | | | | | | | | |
| | | | | | | | | | | | | | | | | | | | | |
| | | (2.09 | ) | | | (3.18 | ) | | | (0.15 | ) | | | (3.39 | ) | | | (0.72 | ) | |
| | | (2.09 | ) | | | (3.18 | ) | | | (0.15 | ) | | | (3.39 | ) | | | (0.72 | ) | |
| | | | | | | | | | | | | | | | | | | | | |
| | $ | 11.84 | | | $ | 17.63 | | | $ | 9.23 | | | $ | 10.39 | | | $ | 11.59 | | |
| | | | | | | | | | | | | | | | | | | | | |
| | | (22.58% | ) | | | 128.96% | 3 | | | (9.93% | )3 | | | 22.47% | 3 | | | 34.47% | 3 | |
| | | | | | | | | | | | | | | | | | | | | |
| | | | | | | | | | | | | | | | | | | | | | |
| | $ | 19,180 | | | $ | 25,560 | | | $ | 2,053 | | | $ | 2,330 | | | $ | 432 | | |
| | | 1.28% | | | | 1.30% | | | | 1.30% | | | | 1.30% | | | | 1.30% | | |
| | | 1.28% | | | | 1.31% | | | | 1.65% | | | | 2.68% | | | | 3.33% | | |
| | | (1.21% | ) | | | (1.21% | ) | | | (1.26% | ) | | | (1.19% | ) | | | (1.20% | ) | |
| | | (1.21% | ) | | | (1.22% | ) | | | (1.61% | ) | | | (2.57% | ) | | | (3.23% | ) | |
| | | 115% | | | | 118% | | | | 139% | | | | 158% | | | | 151% | | |
21
Table of Contents
Financial highlights
Delaware Small Cap Growth Fund Class C
Selected data for each share of the Fund outstanding throughout each period were as follows:
| Net asset value, beginning of period |
| |
| Income (loss) from investment operations: |
| Net investment loss1 |
| Net realized and unrealized gain (loss) |
| Total from investment operations |
| |
| Less dividends and distributions from: |
| Net realized gain |
| Total dividends and distributions |
| |
| Net asset value, end of period |
| |
| Total return2 |
| |
| Ratios and supplemental data: |
| Net assets, end of period (000 omitted) |
| Ratio of expenses to average net assets4 |
| Ratio of expenses to average net assets prior to fees waived4 |
| Ratio of net investment loss to average net assets |
| Ratio of net investment loss to average net assets prior to fees waived |
| Portfolio turnover |
| 1 | Calculated using average shares outstanding. |
| 2 | Total return is based on the change in net asset value of a share during the period and assumes reinvestment of dividends and distributions at net asset value and does not reflect the impact of a sales charge. |
| 3 | Total return during the period reflects waiver by the manager and/or distributor. Performance would have been lower had waiver not been in effect. |
| 4 | Expense ratios do not include expenses of the Underlying Funds in which the Fund invests. |
See accompanying notes, which are an integral part of the financial statements.
22
Table of Contents
| | Year ended | |
| | | 3/31/22 | | 3/31/21 | | 3/31/20 | | 3/31/19 | | 3/31/18 | |
| | $ | 16.68 | | | $ | 8.88 | | | $ | 10.08 | | | $ | 11.43 | | | $ | 9.17 | | |
| | | | | | | | | | | | | | | | | | | | | |
| | | | | | | | | | | | | | | | | | | | | |
| | | (0.29 | ) | | | (0.32 | ) | | | (0.20 | ) | | | (0.21 | ) | | | (0.20 | ) | |
| | | (3.29 | ) | | | 11.30 | | | | (0.85 | ) | | | 2.25 | | | | 3.18 | | |
| | | (3.58 | ) | | | 10.98 | | | | (1.05 | ) | | | 2.04 | | | | 2.98 | | |
| | | | | | | | | | | | | | | | | | | | | |
| | | | | | | | | | | | | | | | | | | | | |
| | | (2.09 | ) | | | (3.18 | ) | | | (0.15 | ) | | | (3.39 | ) | | | (0.72 | ) | |
| | | (2.09 | ) | | | (3.18 | ) | | | (0.15 | ) | | | (3.39 | ) | | | (0.72 | ) | |
| | | | | | | | | | | | | | | | | | | | | |
| | $ | 11.01 | | | $ | 16.68 | | | $ | 8.88 | | | $ | 10.08 | | | $ | 11.43 | | |
| | | | | | | | | | | | | | | | | | | | | |
| | | (23.18% | ) | | | 127.18% | 3 | | | (10.64% | )3 | | | 21.42% | 3 | | | 33.44% | 3 | |
| | | | | | | | | | | | | | | | | | | | | | |
| | | | | | | | | | | | | | | | | | | | | |
| | $ | 6,155 | | | $ | 7,564 | | | $ | 773 | | | $ | 478 | | | $ | 61 | | |
| | | 2.03% | | | | 2.05% | | | | 2.05% | | | | 2.05% | | | | 2.05% | | |
| | | 2.03% | | | | 2.06% | | | | 2.40% | | | | 3.43% | | | | 4.08% | | |
| | | (1.96% | ) | | | (1.96% | ) | | | (2.01% | ) | | | (1.94% | ) | | | (1.95% | ) | |
| | | (1.96% | ) | | | (1.97% | ) | | | (2.36% | ) | | | (3.32% | ) | | | (3.98% | ) | |
| | | 115% | | | | 118% | | | | 139% | | | | 158% | | | | 151% | | |
23
Table of Contents
Financial highlights
Delaware Small Cap Growth Fund Class R
Selected data for each share of the Fund outstanding throughout each period were as follows:
| Net asset value, beginning of period |
| |
| Income (loss) from investment operations: |
| Net investment loss1 |
| Net realized and unrealized gain (loss) |
| Total from investment operations |
| |
| Less dividends and distributions from: |
| Net realized gain |
| Total dividends and distributions |
| |
| Net asset value, end of period |
| |
| Total return2 |
| |
| Ratios and supplemental data: |
| Net assets, end of period (000 omitted) |
| Ratio of expenses to average net assets4 |
| Ratio of expenses to average net assets prior to fees waived4 |
| Ratio of net investment loss to average net assets |
| Ratio of net investment loss to average net assets prior to fees waived |
| Portfolio turnover |
| 1 | Calculated using average shares outstanding. |
| 2 | Total return is based on the change in net asset value of a share during the period and assumes reinvestment of dividends and distributions at net asset value. |
| 3 | Total return during the period reflects waiver by the manager and/or distributor. Performance would have been lower had waiver not been in effect. |
| 4 | Expense ratios do not include expenses of the Underlying Funds in which the Fund invests. |
See accompanying notes, which are an integral part of the financial statements.
24
Table of Contents
| Year ended | |
| 3/31/22 | | 3/31/21 | | 3/31/20 | | 3/31/19 | | 3/31/18 | |
| $ | 17.28 | | | $ | 9.10 | | | $ | 10.27 | | | $ | 11.53 | | | $ | 9.20 | | |
| | | | | | | | | | | | | | | | | | | | | |
| | | |
| | (0.23 | ) | | | (0.23 | ) | | | (0.16 | ) | | | (0.17 | ) | | | (0.15 | ) | |
| | (3.43 | ) | | | 11.59 | | | | (0.86 | ) | | | 2.30 | | | | 3.20 | | |
| | (3.66 | ) | | | 11.36 | | | | (1.02 | ) | | | 2.13 | | | | 3.05 | | |
| | | |
| | | |
| | (2.09 | ) | | | (3.18 | ) | | | (0.15 | ) | | | (3.39 | ) | | | (0.72 | ) | |
| | (2.09 | ) | | | (3.18 | ) | | | (0.15 | ) | | | (3.39 | ) | | | (0.72 | ) | |
| | | |
| $ | 11.53 | | | $ | 17.28 | | | $ | 9.10 | | | $ | 10.27 | | | $ | 11.53 | | |
| | | |
| | (22.82% | ) | | | 128.36% | 3 | | | (10.15% | )3 | | | 22.05% | 3 | | | 34.10% | 3 | |
| | | |
| | | |
| $ | 1,851 | | | $ | 2,975 | | | $ | 1,120 | | | $ | 1,577 | | | $ | 8 | | |
| | 1.53% | | | | 1.55% | | | | 1.55% | | | | 1.55% | | | | 1.55% | | |
| | 1.53% | | | | 1.56% | | | | 1.90% | | | | 2.93% | | | | 3.58% | | |
| | (1.46% | ) | | | (1.46% | ) | | | (1.51% | ) | | | (1.44% | ) | | | (1.45% | ) | |
| | (1.46% | ) | | | (1.47% | ) | | | (1.86% | ) | | | (2.82% | ) | | | (3.48% | ) | |
| | 115% | | | | 118% | | | | 139% | | | | 158% | | | | 151% | | |
25
Table of Contents
Financial highlights
Delaware Small Cap Growth Fund Institutional Class
Selected data for each share of the Fund outstanding throughout each period were as follows:
| Net asset value, beginning of period |
| |
| Income (loss) from investment operations: |
| Net investment loss1 |
| Net realized and unrealized gain (loss) |
| Total from investment operations |
| |
| Less dividends and distributions from: |
| Net realized gain |
| Total dividends and distributions |
| |
| Net asset value, end of period |
| |
| Total return2 |
| |
| Ratios and supplemental data: |
| Net assets, end of period (000 omitted) |
| Ratio of expenses to average net assets4 |
| Ratio of expenses to average net assets prior to fees waived4 |
| Ratio of net investment loss to average net assets |
| Ratio of net investment loss to average net assets prior to fees waived |
| Portfolio turnover |
| 1 | Calculated using average shares outstanding. |
| 2 | Total return is based on the change in net asset value of a share during the period and assumes reinvestment of dividends and distributions at net asset value. |
| 3 | Total return during the period reflects waiver by the manager and/or distributor. Performance would have been lower had waiver not been in effect. |
| 4 | Expense ratios do not include expenses of the Underlying Funds in which the Fund invests. |
See accompanying notes, which are an integral part of the financial statements.
26
Table of Contents
| | Year ended | |
| 3/31/22 | | 3/31/21 | | 3/31/20 | | 3/31/19 | | 3/31/18 | |
| $ | 17.89 | | | $ | 9.33 | | | $ | 10.47 | | | $ | 11.64 | | | $ | 9.24 | | |
| | |
| | | |
| | (0.15 | ) | | | (0.15 | ) | | | (0.11 | ) | | | (0.11 | ) | | | (0.10 | ) | |
| | (3.58 | ) | | | 11.89 | | | | (0.88 | ) | | | 2.33 | | | | 3.22 | | |
| | (3.73 | ) | | | 11.74 | | | | (0.99 | ) | | | 2.22 | | | | 3.12 | | |
| | |
| | |
| | (2.09 | ) | | | (3.18 | ) | | | (0.15 | ) | | | (3.39 | ) | | | (0.72 | ) | |
| | (2.09 | ) | | | (3.18 | ) | | | (0.15 | ) | | | (3.39 | ) | | | (0.72 | ) | |
| | |
| $ | 12.07 | | | $ | 17.89 | | | $ | 9.33 | | | $ | 10.47 | | | $ | 11.64 | | |
| | |
| | (22.42% | ) | | | 129.33% | 3 | | | (9.66% | )3 | | | 22.68% | 3 | | | 34.73% | 3 | |
| | |
| | | |
| $ | 187,409 | | | $ | 142,615 | | | $ | 58,923 | | | $ | 8,931 | | | $ | 7,605 | | |
| | 1.03% | | | | 1.05% | | | | 1.05% | | | | 1.05% | | | | 1.05% | | |
| | 1.03% | | | | 1.06% | | | | 1.40% | | | | 2.43% | | | | 3.08% | | |
| | (0.96% | ) | | | (0.96% | ) | | | (1.01% | ) | | | (0.94% | ) | | | (0.95% | ) | |
| | (0.96% | ) | | | (0.97% | ) | | | (1.36% | ) | | | (2.32% | ) | | | (2.98% | ) | |
| | 115% | | | | 118% | | | | 139% | | | | 158% | | | | 151% | | |
27
Table of Contents
| Notes to financial statements | |
| Delaware Small Cap Growth Fund | March 31, 2022 |
Delaware Group® Equity Funds IV (Trust) is organized as a Delaware statutory trust and offers 12 series. These financial statements and the related notes pertain to Delaware Small Cap Growth Fund (Fund). The Trust is an open-end investment company. The Fund is considered diversified under the Investment Company Act of 1940, as amended, and offers Class A, Class C, Class R, and Institutional Class shares. Class A shares are sold with a maximum front-end sales charge of 5.75%. There is no front-end sales charge when you purchase $1,000,000 or more of Class A shares. However, if Delaware Distributors, L.P. (DDLP) paid your financial intermediary a commission on your purchase of $1,000,000 or more of Class A shares, for shares purchased prior to July 1, 2020, you will have to pay a limited contingent deferred sales charge (Limited CDSC) of 1.00% if you redeem these shares within the first year after your purchase and 0.50% if you redeem shares within the second year; and for shares purchased on or after July 1, 2020, you will have to pay a Limited CDSC of 1.00% if you redeem these shares within the first 18 months after your purchase; unless a specific waiver of the Limited CDSC applies. Class C shares are sold with a contingent deferred sales charge (CDSC) of 1.00%, which will be incurred if redeemed during the first 12 months. Class R and Institutional Class shares are not subject to a sales charge and are offered for sale exclusively to certain eligible investors.
1. Significant Accounting Policies
The Fund follows accounting and reporting guidance under Financial Accounting Standards Board (FASB) Accounting Standards Codification Topic 946, Financial Services — Investment Companies. The following accounting policies are in accordance with US generally accepted accounting principles (US GAAP) and are consistently followed by the Fund.
Security Valuation — Equity securities, except those traded on the Nasdaq Stock Market LLC (Nasdaq), are valued at the last quoted sales price as of the time of the regular close of the New York Stock Exchange on the valuation date. Equity securities traded on the Nasdaq are valued in accordance with the Nasdaq Official Closing Price, which may not be the last sales price. If, on a particular day, an equity security does not trade, the mean between the bid and ask prices will be used, which approximates fair value. Open-end investment companies are valued at their published net asset value (NAV). Generally, other securities and assets for which market quotations are not readily available are valued at fair value as determined in good faith under the direction of the Trust’s Board of Trustees (Board). In determining whether market quotations are readily available or fair valuation will be used, various factors will be taken into consideration, such as market closures or suspension of trading in a security. Restricted securities are valued at fair value using methods approved by the Board.
Federal Income Taxes — No provision for federal income taxes has been made as the Fund intends to continue to qualify for federal income tax purposes as a regulated investment company under Subchapter M of the Internal Revenue Code of 1986, as amended, and make the requisite distributions to shareholders. The Fund evaluates tax positions taken or expected to be taken in the course of preparing the Fund's tax returns to determine whether the tax positions are “more-likely-than-not” of being sustained by the applicable tax authority. Tax positions not
28
Table of Contents
deemed to meet the “more-likely-than-not” threshold are recorded as a tax benefit or expense in the current year. Management has analyzed the Fund's tax positions taken or expected to be taken on the Fund's federal income tax returns through the year ended March 31, 2022, and for all open tax years (years ended March 31, 2019–March 31, 2021), and has concluded that no provision for federal income tax is required in the Fund's financial statements. If applicable, the Fund recognizes interest accrued on unrecognized tax benefits in interest expense and penalties in “Other” on the “Statement of operations.” During the year ended March 31, 2022, the Fund did not incur any interest or tax penalties.
Class Accounting — Investment income, common expenses, and realized and unrealized gain (loss) on investments are allocated to the various classes of the Fund on the basis of daily net assets of each class. Distribution expenses relating to a specific class are charged directly to that class.
Use of Estimates — The preparation of financial statements in conformity with US GAAP requires management to make estimates and assumptions that affect the fair value of investments, the reported amounts of assets and liabilities and disclosure of contingent assets and liabilities at the date of the financial statements, and the reported amounts of revenues and expenses during the reporting period. Actual results could differ from those estimates and the differences could be material.
Other — Expenses directly attributable to the Fund are charged directly to the Fund. Other expenses common to various funds within the Delaware Funds by Macquarie® (Delaware Funds) are generally allocated among such fund on the basis of average net assets. Management fees and certain other expenses are paid monthly. Security transactions are recorded on the date the securities are purchased or sold (trade date) for financial reporting purposes. Costs used in calculating realized gains and losses on the sale of investment securities are those of the specific securities sold. Dividend income is recorded on the ex-dividend date and interest income is recorded on the accrual basis. Distributions received from investments in real estate investment trusts (REITs) are recorded as dividend income on the ex-dividend date, subject to reclassification upon notice of the character of such distributions by the issuer. The Fund declares and pays dividends from net investment income and distributions from net realized gain on investments, if any, annually. The Fund may distribute more frequently, if necessary for tax purposes. Dividends and distributions, if any, are recorded on the ex-dividend date.
The Fund receives earnings credits from its custodian when positive cash balances are maintained, which may be used to offset custody fees. The expenses paid under this arrangement are included on the “Statements of operations” under “Custodian fees” with the corresponding expenses offset included under “Less expenses paid indirectly.” There were no such earnings credits for the year ended March 31, 2022.
The Fund receives earnings credits from its transfer agent when positive cash balances are maintained, which may be used to offset transfer agent fees. If the amount earned is greater than $1, the expenses paid under this arrangement are included on the “Statement of operations” under “Dividend disbursing and transfer agent fees and expenses” with the corresponding
29
Table of Contents
Notes to financial statements
Delaware Small Cap Growth Fund
1. Significant Accounting Policies (continued)
expenses offset included under “Less expenses paid indirectly.” For the year ended March 31, 2022, the Fund earned $63 under this arrangement.
2. Investment Management, Administration Agreements, and Other Transactions with Affiliates
In accordance with the terms of its investment management agreement, the Fund pays Delaware Management Company (DMC), a series of Macquarie Investment Management Business Trust and the investment manager, an annual fee which is calculated daily and paid monthly at the rates of 0.75% on the first $500 million of average daily net assets of the Fund, 0.70% on the next $500 million, 0.65% on the next $1.5 billion, and 0.60% on average daily net assets in excess of $2.5 billion.
DMC has contractually agreed to waive all or a portion, if any, of its management fee and/or pay/reimburse expenses (excluding any distribution and service (12b-1) fees, acquired fund fees and expenses, taxes, interest, short sale dividend and interest expenses, brokerage fees, certain insurance costs, and nonroutine expenses or costs, including, but not limited to, those relating to reorganizations, litigation, conducting shareholder meetings, and liquidations), in order to prevent total annual fund operating expenses from exceeding 1.05% of the Fund's average daily net assets from April 1, 2021 through March 31, 2022.* These waivers and reimbursements may only be terminated by agreement of DMC and the Fund. The waivers and reimbursements are accrued daily and received monthly.
DMC may permit its affiliates, Macquarie Investment Management Global Limited (MIMGL) and Macquarie Funds Management Hong Kong Limited (together, the “Affiliated Sub-Advisors”), to execute Fund equity security trades on its behalf. DMC may also seek quantitative support from MIMGL. Although the Affiliated Sub-Advisors serve as sub-advisors, DMC has ultimate responsibility for all investment advisory services. For these services, DMC, not the Fund, may pay each Affiliated Sub-Advisor a portion of its investment management fee.
Delaware Investments Fund Services Company (DIFSC), an affiliate of DMC, provides fund accounting and financial administrative oversight services to the Fund. For these services, DIFSC’s fees are calculated daily and paid monthly, based on the aggregate daily net assets of all funds within the Delaware Funds at the following annual rates: 0.00475% of the first $35 billion; 0.0040% of the next $10 billion; and 0.0025% of aggregate average daily net assets in excess of $45 billion (Total Fee). Each fund in the Delaware Funds pays a minimum of $4,000, which, in aggregate, is subtracted from the Total Fee. Each fund then pays its portion of the remainder of the Total Fee on a relative NAV basis. This amount is included on the “Statement of operations” under “Accounting and administration expenses.” For the year ended March 31, 2022, the Fund was charged $11,475 for these services.
30
Table of Contents
DIFSC is also the transfer agent and dividend disbursing agent of the Fund. For these services, DIFSC’s fees are calculated daily and paid monthly, based on the aggregate daily net assets of the retail funds within the Delaware Funds at the following annual rates: 0.014% of the first $20 billion; 0.011% of the next $5 billion; 0.007% of the next $5 billion; 0.005% of the next $20 billion; and 0.0025% of average daily net assets in excess of $50 billion. The fees payable to DIFSC under the shareholder services agreement described above are allocated among all retail funds in the Delaware Funds on a relative NAV basis. This amount is included on the “Statement of operations” under “Dividend disbursing and transfer agent fees and expenses.” For the year ended March 31, 2022, the Fund was charged $18,493 for these services. Pursuant to a sub-transfer agency agreement between DIFSC and BNY Mellon Investment Servicing (US) Inc. (BNYMIS), BNYMIS provides certain sub-transfer agency services to the Fund. Sub-transfer agency fees are paid by the Fund and are also included on the “Statement of operations” under “Dividend disbursing and transfer agent fees and expenses.” The fees are calculated daily and paid as invoices are received on a monthly or quarterly basis.
Pursuant to a distribution agreement and distribution plan, the Fund pays DDLP, the distributor and an affiliate of DMC, an annual 12b-1 fee of 0.25%, 1.00%, and 0.50% of average daily net assets of the Class A, Class C, and Class R shares, respectively. These fees are calculated daily and paid monthly. Institutional Class shares do not pay 12b-1 fee.
As provided in the investment management agreement, the Fund bears a portion of the cost of certain resources shared with DMC, including the cost of internal personnel of DMC and/or its affiliates that provide legal and regulatory reporting services to the Fund. For the year ended March 31, 2022, the Fund was charged $7,667 for internal legal and regulatory reporting services provided by DMC and/or its affiliates’ employees. This amount is included on the “Statement of operations” under “Legal fees.”
For the year ended March 31, 2022, DDLP earned $30,365 for commissions on sales of the Fund’s Class A shares. For the year ended March 31, 2022, DDLP received gross CDSC commissions of $17,566 and $5,257 on redemptions of the Fund’s Class A and Class C shares, respectively, and these commissions were entirely used to offset upfront commissions previously paid by DDLP to broker/dealers on sales of those shares.
Trustees’ fees include expenses accrued by the Fund for each Trustee’s retainer and meeting fees. Certain officers of DMC, DIFSC, and DDLP are officers and/or Trustees of the Trust. These officers and Trustees are paid no compensation by the Fund.
In addition to the management fees and other expenses of the Fund, the Fund indirectly bears the investment management fees and other expenses of the investment companies (Underlying Funds) in which it invests. The amount of these fees and expenses incurred indirectly by the Fund will vary based upon the expense and fee levels of the Underlying Funds and the number of shares that are owned of the Underlying Funds at different times.
31
Table of Contents
Notes to financial statements
Delaware Small Cap Growth Fund
2. Investment Management, Administration Agreements, and Other Transactions with Affiliates (continued)
Cross trades for the six months ended March 31, 2022 were executed by the Fund pursuant to procedures adopted by the Board designed to ensure compliance with Rule 17a-7 under the 1940 Act. Cross trading is the buying or selling of portfolio securities between funds of investment companies, or between a fund of an investment company and another entity, that are or could be considered affiliates by virtue of having a common investment advisor (or affiliated investment advisors), common directors/trustees and/or common officers. At their regularly scheduled meetings, the Board reviews a report related to the Fund's compliance with the procedures adopted by the Board. Pursuant to these procedures, for the year ended March 31, 2022, the Fund engaged in Rule 17a-7 securities purchases of $13,021,500. The Fund engaged in Rule 17a-7 securities sales of $3,761,910 for the year ended March 31, 2022, resulting in gains of $2,209,418.
____________________
| * | The aggregate contractual waiver period covering this report is from July 29, 2020 through July 29, 2022. |
3. Investments
For the year ended March 31, 2022, the Fund made purchases and sales of investment securities other than short-term investments as follows:
| Purchases | | $ | 332,312,591 |
| Sales | | | 247,609,611 |
The tax cost of investments includes adjustments to net unrealized appreciation (depreciation), which may not necessarily be the final tax cost basis adjustments but which approximate the tax basis unrealized gains and losses that may be realized and distributed to shareholders. At March 31, 2022, the cost and unrealized appreciation (depreciation) of investments for federal income tax purposes for the Series were as follows:
| Cost of investments | | $ | 226,158,648 | |
| Aggregate unrealized appreciation of investments | | $ | 18,040,795 | |
| Aggregate unrealized depreciation of investments | | | (29,824,481 | ) |
| Net unrealized depreciation of investments | | $ | (11,783,686 | ) |
US GAAP defines fair value as the price that the Fund would receive to sell an asset or pay to transfer a liability in an orderly transaction between market participants at the measurement date under current market conditions. A three-level hierarchy for fair value measurements has been established based upon the transparency of inputs to the valuation of an asset or liability. Inputs may be observable or unobservable and refer broadly to the assumptions that market participants would use in pricing the asset or liability. Observable inputs reflect the assumptions market participants would use in pricing the asset or liability based on market data obtained from sources independent of the reporting entity. Unobservable inputs reflect the reporting entity’s
32
Table of Contents
own assumptions about the assumptions that market participants would use in pricing the asset or liability based on the best information available under the circumstances. The Fund's investment in its entirety is assigned a level based upon the observability of the inputs which are significant to the overall valuation. The three-level hierarchy of inputs is summarized as follows:
| Level 1 – | Inputs are quoted prices in active markets for identical investments. (Examples: equity securities, open-end investment companies, futures contracts, and exchange-traded options contracts) |
| | |
| Level 2 – | Other observable inputs, including, but not limited to: quoted prices for similar assets or liabilities in markets that are active, quoted prices for identical or similar assets or liabilities in markets that are not active, inputs other than quoted prices that are observable for the assets or liabilities (such as interest rates, yield curves, volatilities, prepayment speeds, loss severities, credit risks, and default rates) or other market-corroborated inputs. (Examples: debt securities, government securities, swap contracts, foreign currency exchange contracts, foreign securities utilizing international fair value pricing, broker-quoted securities, and fair valued securities) |
| | |
| Level 3 – | Significant unobservable inputs, including the Fund's own assumptions used to determine the fair value of investments. (Examples: broker-quoted securities and fair valued securities) |
Level 3 investments are valued using significant unobservable inputs. The Fund may also use an income-based valuation approach in which the anticipated future cash flows of the investment are discounted to calculate fair value. Discounts may also be applied due to the nature or duration of any restrictions on the disposition of the investments. Valuations may also be based upon current market prices of securities that are comparable in coupon, rating, maturity, and industry. The derived value of a Level 3 investment may not represent the value which is received upon disposition and this could impact the results of operations.
| | Level 1 |
| Securities | | | |
| Assets: | | | |
| Common Stocks | | $ | 214,374,962 |
| Total Value of Securities | | $ | 214,374,962 |
During the year ended March 31, 2022, there were no transfers into or out of Level 3 investments. The Fund's policy is to recognize transfers into or out of Level 3 investments based on fair value at the beginning of the reporting period.
A reconciliation of Level 3 investments is presented when the Fund has a significant amount of Level 3 investments at the beginning or end of the year in relation to the Fund's net assets. During the year ended March 31, 2022, there were no Level 3 investments.
33
Table of Contents
Notes to financial statements
Delaware Small Cap Growth Fund
4. Dividend and Distribution Information
Income and long-term capital gain distributions are determined in accordance with federal income tax regulations, which may differ from US GAAP. Additionally, distributions from net short-term gains on sales of investment securities are treated as ordinary income for federal income tax purposes. The tax character of dividends and distributions paid during the years ended March 31, 2022 and 2021 were as follows:
| | Year ended |
| | 3/31/22 | | 3/31/21 |
| Ordinary income | | $ | 12,143,076 | | $ | 18,612,909 |
| Long-term capital gains | | | 12,663,565 | | | 787,751 |
| Total | | $ | 24,806,641 | | $ | 19,400,660 |
5. Components of Net Assets on a Tax Basis
As of March 31, 2022, the components of net assets on a tax basis were as follows:
| Shares of beneficial interest | | $ | 238,005,901 | |
| Undistributed long-term capital gains | | | 52,771 | |
| Qualified late year loss deferrals | | | (11,680,284 | ) |
| Unrealized appreciation (depreciation) of investments | | | (11,783,686 | ) |
| Net assets | | $ | 214,594,702 | |
The differences between book basis and tax basis components of net assets are primarily attributable to tax deferral of losses on wash sales.
Qualified late year losses represent ordinary losses realized from January 1, 2022 through March 31, 2022 and capital losses realized from November 1, 2021 through March 31, 2022, that in accordance with federal income tax regulations, the Fund has elected to defer and treat as having arisen in the following fiscal year.
For financial reporting purposes, capital accounts are adjusted to reflect the tax character of permanent book/tax differences. Reclassifications are primarily due to tax treatment of net operating losses. Results of operations and net assets were not affected by these reclassifications. For the year ended March 31, 2022, the adjustments were to increase total distributable earnings and decrease paid-in capital in excess of par by $2,279,499.
34
Table of Contents
6. Capital Shares
Transactions in capital shares were as follows:
| | | Year ended |
| | | 3/31/22 | | 3/31/21 |
| Shares sold: | | | | | | |
| | Class A | | 782,299 | | | 1,533,631 | |
| Class C | | 289,557 | | | 411,450 | |
| Class R | | 35,512 | | | 30,112 | |
| Institutional Class | | 15,407,600 | | | 6,850,080 | |
| | | | | | | | |
| Shares issued upon reinvestment of dividends and distributions: | | | | | | |
| Class A | | 218,122 | | | 157,507 | |
| Class C | | 81,412 | | | 36,776 | |
| Class R | | 27,689 | | | 25,173 | |
| Institutional Class | | 1,443,992 | | | 966,583 | |
| | | 18,286,183 | | | 10,011,312 | |
| | |
| Shares redeemed: | | | | | | |
| Class A | | (829,955 | ) | | (463,482 | ) |
| Class C | | (265,535 | ) | | (81,829 | ) |
| Class R | | (74,880 | ) | | (6,145 | ) |
| Institutional Class | | (9,299,932 | ) | | (6,162,802 | ) |
| | | (10,470,302 | ) | | (6,714,258 | ) |
| Net increase | | 7,815,881 | | | 3,297,054 | |
Certain shareholders may exchange shares of one class for shares of another class in the same Fund. These exchange transactions are included as subscriptions and redemptions in the table above and on the “Statements of changes in net assets.” For the years ended March 31, 2022 and March 31, 2021, the Fund had the following exchange transactions:
| | Exchange Redemptions | | Exchange Subscriptions | | | |
| | Class C | | Class A | | | |
| | Shares | | Shares | | Value |
| Year ended | | | | | | | |
| 3/31/22 | | 3,161 | | 2,979 | | $ | 53,814 |
| 3/31/21 | | 4,986 | | 4,728 | | | 90,835 |
7. Line of Credit
The Fund, along with certain other funds in the Delaware Funds (Participants), was a participant in a $225,000,000 revolving line of credit (Agreement) intended to be used for temporary or emergency purposes as an additional source of liquidity to fund redemptions of investor shares. Under the Agreement, the Participants were charged an annual commitment fee of 0.15% with the addition of an upfront fee of 0.05%, which was allocated across the Participants based on a
35
Table of Contents
Notes to financial statements
Delaware Small Cap Growth Fund
7. Line of Credit (continued)
weighted average of the respective net assets of each Participant. The Participants were permitted to borrow up to a maximum of one-third of their net assets under the Agreement. Each Participant was individually, and not jointly, liable for its particular advances, if any, under the line of credit. The line of credit available under the Agreement expired on November 1, 2021.
On November 1, 2021, the Fund, along with the other Participants, entered into an amendment to the agreement for a $355,000,000 revolving line of credit to be used as described above and operates in substantially the same manner as the original Agreement. Under the amendment to the agreement, the Participants are charged an annual commitment fee of 0.15%, with the addition of an upfront fee of 0.05%, which is allocated across the Participants based on a weighted average of the respective net assets of each Participant. The line of credit available under the agreement expires on October 31, 2022.
The Fund had no amounts outstanding as of March 31, 2022, or at any time during the year then ended.
8. Securities Lending
The Fund, along with other funds in the Delaware Funds, may lend its securities pursuant to a security lending agreement (Lending Agreement) with The Bank of New York Mellon (BNY Mellon). At the time a security is loaned, the borrower must post collateral equal to the required percentage of the market value of the loaned security, including any accrued interest. The required percentage is: (1) 102% with respect to US securities and foreign securities that are denominated and payable in US dollars; and (2) 105% with respect to foreign securities. With respect to each loan, if on any business day the aggregate market value of securities collateral plus cash collateral held is less than the aggregate market value of the securities which are the subject of such loan, the borrower will be notified to provide additional collateral by the end of the following business day, which, together with the collateral already held, will be not less than the applicable initial collateral requirements for such security loan. If the aggregate market value of securities collateral and cash collateral held with respect to a security loan exceeds the applicable initial collateral requirement, upon the request of the borrower, BNY Mellon must return enough collateral to the borrower by the end of the following business day to reduce the value of the remaining collateral to the applicable initial collateral requirement for such security loan. As a result of the foregoing, the value of the collateral held with respect to a loaned security on any particular day, may be more or less than the value of the security on loan. The collateral percentage with respect to the market value of the loaned security is determined by the security lending agent.
Cash collateral received by each fund of the Trust is generally invested in a series of individual separate accounts, each corresponding to a fund. The investment guidelines permit each separate account to hold certain securities that would be considered eligible securities for a money market fund. Cash collateral received is generally invested in government securities; certain obligations issued by government sponsored enterprises; repurchase agreements
36
Table of Contents
collateralized by US Treasury securities; obligations issued by the central government of any Organization for Economic Cooperation and Development (OECD) country or its agencies, instrumentalities, or establishments; obligations of supranational organizations; commercial paper, notes, bonds, and other debt obligations; certificates of deposit, time deposits, and other bank obligations; certain money market funds; and asset-backed securities. The Fund can also accept US government securities and letters of credit (non-cash collateral) in connection with securities loans.
In the event of default or bankruptcy by the lending agent, realization and/or retention of the collateral may be subject to legal proceedings. In the event the borrower fails to return loaned securities and the collateral received is insufficient to cover the value of the loaned securities and provided such collateral shortfall is not the result of investment losses, the lending agent has agreed to pay the amount of the shortfall to the Fund or, at the discretion of the lending agent, replace the loaned securities. The Fund continues to record dividends or interest, as applicable, on the securities loaned and is subject to changes in value of the securities loaned that may occur during the term of the loan. The Fund has the right under the Lending Agreement to recover the securities from the borrower on demand. With respect to security loans collateralized by non-cash collateral, the Fund receives loan premiums paid by the borrower. With respect to security loans collateralized by cash collateral, the earnings from the collateral investments are shared among the Fund, the security lending agent, and the borrower. The Fund records security lending income net of allocations to the security lending agent and the borrower.
The Fund may incur investment losses as a result of investing securities lending collateral. This could occur if an investment in the collateral investment account defaulted or became impaired. Under those circumstances, the value of the Fund's cash collateral account may be less than the amount the Fund would be required to return to the borrowers of the securities and the Fund would be required to make up for this shortfall.
During the year ended March 31, 2022, the Fund had no securities out on loan.
9. Credit and Market Risk
Beginning in January 2020, global financial markets have experienced and may continue to experience significant volatility resulting from the spread of a novel coronavirus known as COVID-19. The outbreak of COVID-19 has resulted in travel and border restrictions, quarantines, supply chain disruptions, lower consumer demand, and general market uncertainty. The effects of COVID-19 have and may continue to adversely affect the global economy, the economies of certain nations, and individual issuers, all of which may negatively impact the Fund's performance.
Beginning in late February 2022, global financial markets have experienced and may continue to experience significant volatility related to military action by Russia in Ukraine. As a result of this military action, the US and many other countries have imposed sanctions on Russia and certain Russian individuals, banks and corporations. The ongoing hostilities and resulting sanctions are expected to have a severe adverse effect on the region’s economies and more globally, including
37
Table of Contents
Notes to financial statements
Delaware Small Cap Growth Fund
9. Credit and Market Risk (continued)
significant negative impact on markets for certain securities and commodities, such as oil and natural gas. Any cessation of trading on the Russian securities markets will impact the value and liquidity of certain portfolio holdings. The extent and duration of military action, sanctions, and resulting market disruptions are impossible to predict, but could be substantial and prolonged and impact your Fund’s performance.
Investments in equity securities in general are subject to market risks that may cause their prices to fluctuate over time. Fluctuations in the value of equity securities in which the Fund invests will cause the NAV of the Fund to fluctuate.
The Fund invests in growth stocks (such as those in the technology sector), which reflect projections of future earnings and revenue. These prices may rise or fall dramatically depending on whether those projections are met. These companies’ stock prices may be more volatile, particularly over the short term.
The Fund invests a significant portion of its assets in small companies and may be subject to certain risks associated with ownership of securities of such companies. Investments in small-sized companies may be more volatile than investments in larger companies for a number of reasons, which include limited financial resources or a dependence on narrow product lines.
The Fund may invest up to 15% of its net assets in illiquid securities, which may include securities with contractual restrictions on resale, securities exempt from registration under Rule 144A promulgated under the Securities Act of 1933, as amended, and other securities which may not be readily marketable. The relative illiquidity of these securities may impair the Fund from disposing of them in a timely manner and at a fair price when it is necessary or desirable to do so. While maintaining oversight, the Board has delegated to DMC, the day-to-day functions of determining whether individual securities are liquid for purposes of the Fund’s limitation on investments in illiquid securities. Securities eligible for resale pursuant to Rule 144A, which are determined to be liquid, are not subject to the Fund’s 15% limit on investments in illiquid securities. As of March 31, 2022, there were no Rule 144A securities held by the Fund.
10. Contractual Obligations
The Fund enters into contracts in the normal course of business that contain a variety of indemnifications. The Fund's maximum exposure under these arrangements is unknown. However, the Fund has not had prior claims or losses pursuant to these contracts. Management has reviewed the Fund's existing contracts and expects the risk of loss to be remote.
11. Subsequent Events
Management has determined that no material events or transactions occurred subsequent to March 31, 2022, that would require recognition or disclosure in the Fund's financial statements.
38
Table of Contents
Report of independent
registered public accounting firm
To the Board of Trustees of Delaware Group® Equity Funds IV and Shareholders of Delaware Small Cap Growth Fund
Opinion on the Financial Statements
We have audited the accompanying statement of assets and liabilities, including the schedule of investments, of Delaware Small Cap Growth Fund (one of the funds constituting Delaware Group® Equity Funds IV, referred to hereafter as the “Fund”) as of March 31, 2022, the related statement of operations for the year ended March 31, 2022, the statements of changes in net assets for each of the two years in the period ended March 31, 2022, including the related notes, and the financial highlights for each of the five years in the period ended March 31, 2022 (collectively referred to as the “financial statements”). In our opinion, the financial statements present fairly, in all material respects, the financial position of the Fund as of March 31, 2022, the results of its operations for the year then ended, the changes in its net assets for each of the two years in the period ended March 31, 2022 and the financial highlights for each of the five years in the period ended March 31, 2022 in conformity with accounting principles generally accepted in the United States of America.
Basis for Opinion
These financial statements are the responsibility of the Fund’s management. Our responsibility is to express an opinion on the Fund’s financial statements based on our audits. We are a public accounting firm registered with the Public Company Accounting Oversight Board (United States) (PCAOB) and are required to be independent with respect to the Fund in accordance with the U.S. federal securities laws and the applicable rules and regulations of the Securities and Exchange Commission and the PCAOB.
We conducted our audits of these financial statements in accordance with the standards of the PCAOB. Those standards require that we plan and perform the audit to obtain reasonable assurance about whether the financial statements are free of material misstatement, whether due to error or fraud.
Our audits included performing procedures to assess the risks of material misstatement of the financial statements, whether due to error or fraud, and performing procedures that respond to those risks. Such procedures included examining, on a test basis, evidence regarding the amounts and disclosures in the financial statements. Our audits also included evaluating the accounting principles used and significant estimates made by management, as well as evaluating the overall presentation of the financial statements. Our procedures included confirmation of securities owned as of March 31, 2022 by correspondence with the custodian, transfer agents and brokers; when replies were not received from brokers, we performed other auditing procedures. We believe that our audits provide a reasonable basis for our opinion.
/s/PricewaterhouseCoopers LLP
Philadelphia, Pennsylvania
May 31, 2022
We have served as the auditor of one or more investment companies in Delaware Funds by Macquarie® since 2010.
39
Table of Contents
Other Fund information (Unaudited)
Tax Information
The information set forth below is for the Fund’s fiscal year as required by federal income tax laws. Shareholders, however, must report distributions on a calendar year basis for income tax purposes, which may include distributions for portions of two fiscal years of the Fund. Accordingly, the information needed by shareholders for income tax purposes will be sent to them in January of each year. Please consult your tax advisor for proper treatment of this information.
All disclosures are based on financial information available as of the date of this annual report and, accordingly are subject to change. For any and all items requiring reporting, it is the intention of the Fund to report the maximum amount permitted under the Internal Revenue Code and the regulations thereunder.
For the fiscal year ended March 31, 2022, the Fund reports distributions paid during the year as follows:
| (A) Long-Term Capital Gain Distributions (Tax Basis) | | 51.05 | % |
| (B) Ordinary Income Distributions (Tax Basis) | | 48.95 | % |
| Total Distributions (Tax Basis) | | 100.00 | % |
____________________
(A) and (B) are based on a percentage of the Fund’s total distributions.
40
Table of Contents
Board of trustees / directors and officers addendum
Delaware Funds by Macquarie®
A mutual fund is governed by a Board of Trustees/Directors (“Trustees”), which has oversight responsibility for the management of a fund’s business affairs. Trustees establish procedures and oversee and review the performance of the investment manager, the distributor, and others who perform services for the fund. The independent fund trustees, in particular, are advocates for shareholder interests. Each trustee has served in that capacity since he or she was elected to or appointed to the Board of Trustees, and will continue to serve until his or her retirement or the election of a new trustee in his or her place. The following is a list of the Trustees and Officers with certain background and related information.
| | | | | | | | Number of | | Other |
| | | | | | Principal | | Portfolios in Fund | | Directorships |
| Name, | | Position(s) | | | | Occupation(s) | | Complex Overseen | | Held by |
| Address, | | Held with | | Length of Time | | During the | | by Trustee | | Trustee |
| and Birth Date | | Fund(s) | | Served | | Past Five Years | | or Officer | | or Officer |
| Interested Trustee | | | | | | | | | | |
| |
| Shawn K. Lytle1 | | President, | | President and | | Global Head of Macquarie Asset | | 146 | | Trustee — UBS Relationship |
| 610 Market Street | | Chief Executive | | Chief Executive | | Management2 | | | | Funds, SMA Relationship Trust, |
| Philadelphia, PA | | Officer, | | Officer | | (January 2019–Present) | | | | and UBS Funds |
| 19106-2354 | | and Trustee | | since August 2015 | | Head of Americas of | | | | (May 2010–April 2015) |
| February 1970 | | | | Trustee since | | Macquarie Group | | | | |
| | | | September 2015 | | (December 2017–Present) | | | | |
| | | | | | Deputy Global Head of Macquarie | | | | |
| | | | | | Asset Management | | | | |
| | | | | | (2017–2019) | | | | |
| | | | | | Head of Macquarie Asset | | | | |
| | | | | | Management Americas | | | | |
| | | | | | (2015–2017) | | | | |
41
Table of Contents
Board of trustees / directors and officers addendum
Delaware Funds by Macquarie®
| | | | | | | | Number of | | Other |
| | | | | | Principal | | Portfolios in Fund | | Directorships |
| Name, | | Position(s) | | | | Occupation(s) | | Complex Overseen | | Held by |
| Address, | | Held with | | Length of Time | | During the | | by Trustee | | Trustee |
| and Birth Date | | Fund(s) | | Served | | Past Five Years | | or Officer | | or Officer |
| Independent Trustees | | | | | | | | | | |
| |
| Jerome D. Abernathy | | Trustee | | Since January 2019 | | Managing Member, Stonebrook | | 146 | | None |
| 610 Market Street | | | | | | Capital Management, LLC | | | | |
| Philadelphia, PA | | | | | | (financial technology: macro | | | | |
| 19106-2354 | | | | | | factors and databases) | | | | |
| July 1959 | | | | | | (January 1993-Present) | | | | |
| |
| Thomas L. Bennett | | Chair and Trustee | | Trustee since March | | Private Investor | | 146 | | None |
| 610 Market Street | | | | 2005 | | (March 2004–Present) | | | | |
| Philadelphia, PA | | | | Chair since March | | | | | | |
| 19106-2354 | | | | 2015 | | | | | | |
| October 1947 | | | | | | | | | | |
| |
| Ann D. Borowiec | | Trustee | | Since March 2015 | | Chief Executive Officer, Private | | 146 | | Director — Banco Santander |
| 610 Market Street | | | | | | Wealth Management (2011–2013) | | | | International |
| Philadelphia, PA | | | | | | and Market Manager, New Jersey | | | | (October 2016–December 2019) |
| 19106-2354 | | | | | | Private Bank (2005–2011) — J.P. | | | | Director — Santander Bank, N.A. |
| November 1958 | | | | | | Morgan Chase & Co. | | | | (December 2016–December |
| | | | | | | | | | 2019) |
42
Table of Contents
| | | | | | | | Number of | | Other |
| | | | | | Principal | | Portfolios in Fund | | Directorships |
| Name, | | Position(s) | | | | Occupation(s) | | Complex Overseen | | Held by |
| Address, | | Held with | | Length of Time | | During the | | by Trustee | | Trustee |
| and Birth Date | | Fund(s) | | Served | | Past Five Years | | or Officer | | or Officer |
| |
| Joseph W. Chow | | Trustee | | Since January 2013 | | Private Investor | | 146 | | Director and Audit Committee |
| 610 Market Street | | | | | | (April 2011–Present) | | | | Member — Hercules Technology |
| Philadelphia, PA | | | | | | | | | | Growth Capital, Inc. |
| 19106-2354 | | | | | | | | | | (July 2004–July 2014) |
| January 1953 | | | | | | | | | | |
43
Table of Contents
Board of trustees / directors and officers addendum
Delaware Funds by Macquarie®
| | | | | | | | Number of | | Other |
| | | | | | Principal | | Portfolios in Fund | | Directorships |
| Name, | | Position(s) | | | | Occupation(s) | | Complex Overseen | | Held by |
| Address, | | Held with | | Length of Time | | During the | | by Trustee | | Trustee |
| and Birth Date | | Fund(s) | | Served | | Past Five Years | | or Officer | | or Officer |
| |
| H. Jeffrey Dobbs3 | | Trustee | | Since December 2021 | | Global Sector Chairman, | | 146 | | Director, Valparaiso University |
| 610 Market Street | | | | | | Industrial Manufacturing, | | | | (2012–Present) |
| Philadelphia, PA | | | | | | KPMG LLP | | | | Director, TechAccel LLC |
| 19106-2354 | | | | | | (2010-2015) | | | | (2015–Present) (Tech R&D) |
| May 1955 | | | | | | | | | | Board Member, Kansas City |
| | | | | | | | | | Repertory Theatre |
| | | | | | | | | | (2015–Present) |
| | | | | | | | | | Board Member, Patients |
| | | | | | | | | | Voices, Inc. (healthcare) |
| | | | | | | | | | (2018–Present) |
| | | | | | | | | | Kansas City Campus for Animal |
| | | | | | | | | | Care (2018–Present) |
| | | | | | | | | | Director, National Association of |
| | | | | | | | | | Manufacturers (2010–2015) |
| | | | | | | | | | Director, The Children’s Center |
| | | | | | | | | | (2003–2015) |
| | | | | | | | | | Director, Metropolitan Affairs |
| | | | | | | | | | Coalition (2003–2015) |
| | | | | | | | | | Director, Michigan Roundtable for |
| | | | | | | | | | Diversity and Inclusion |
| | | | | | | | | | (2003–2015) |
| | | | | | | | | | Trustee, Ivy Funds Complex |
| | | | | | | | | | (2019–2021) |
44
Table of Contents
| | | | | | | | Number of | | Other |
| | | | | | Principal | | Portfolios in Fund | | Directorships |
| Name, | | Position(s) | | | | Occupation(s) | | Complex Overseen | | Held by |
| Address, | | Held with | | Length of Time | | During the | | by Trustee | | Trustee |
| and Birth Date | | Fund(s) | | Served | | Past Five Years | | or Officer | | or Officer |
| | | | | | | | | | | |
| John A. Fry | | Trustee | | Since January 2001 | | Drexel University | | 146 | | Director; Compensation |
| 610 Market Street | | | | | | (August 2010–Present) | | | | Committee and Governance |
| Philadelphia, PA | | | | | | President — Franklin & Marshall | | | | Committee Member — |
| 19106-2354 | | | | | | College | | | | Community Health Systems |
| May 1960 | | | | | | (July 2002–June 2010) | | | | (May 2004–Present) |
| | | | | | | | | | Director — Drexel Morgan & Co. |
| | | | | | | | | | (2015–2019) |
| | | | | | | | | | Director, Audit and Compensation |
| | | | | | | | | | Committee Member — vTv |
| | | | | | | | | | Therapeutics Inc. (2017–Present) |
| | | | | | | | | | Director and Audit Committee |
| | | | | | | | | | Member — FS Credit Real Estate |
| | | | | | | | | | Income Trust, Inc. (2018–Present) |
| | | | | | | | | | Director — Federal Reserve |
| | | | | | | | | | Bank of Philadelphia |
| | | | | | | | | | (January 2020–Present) |
45
Table of Contents
Board of trustees / directors and officers addendum
Delaware Funds by Macquarie®
| | | | | | | | Number of | | Other |
| | | | | | Principal | | Portfolios in Fund | | Directorships |
| Name, | | Position(s) | | | | Occupation(s) | | Complex Overseen | | Held by |
| Address, | | Held with | | Length of Time | | During the | | by Trustee | | Trustee |
| and Birth Date | | Fund(s) | | Served | | Past Five Years | | or Officer | | or Officer |
| | | | | | | | | | | |
| Joseph Harroz, Jr.3 | | Trustee | | Since December 2021 | | President (2020–Present), Interim | | 146 | | Director, OU Medicine, Inc. |
| 610 Market Street | | | | | | President (2019–2020), Vice | | | | (2020–Present) |
| Philadelphia, PA | | | | | | President (2010–2019) and Dean | | | | Director and Shareholder, |
| 19106-2354 | | | | | | (2010–2019), College of Law, | | | | Valliance Bank |
| January 1967 | | | | | | University of Oklahoma; | | | | (2007–Present) |
| | | | | | Managing Member, Harroz | | | | Director, Foundation Healthcare |
| | | | | | Investments, LLC, (commercial | | | | (formerly Graymark HealthCare) |
| | | | | | enterprises) (1998–2019); | | | | (2008–2017) |
| | | | | | Managing Member, St. Clair, LLC | | | | Trustee, the Mewbourne Family |
| | | | | | (commercial enterprises) | | | | Support Organization |
| | | | | | (2019–Present) | | | | (2006–Present) (non-profit) |
| | | | | | | | | | Independent Director, LSQ |
| | | | | | | | | | Manager, Inc. (real estate) |
| | | | | | | | | | (2007–2016) |
| | | | | | | | | | Director, Oklahoma Foundation |
| | | | | | | | | | for Excellence (non-profit) |
| | | | | | | | | | (2008–Present) |
| | | | | | | | | | Trustee, Ivy Funds Complex |
| | | | | | | | | | (1998–2021) |
46
Table of Contents
| | | | | | | | Number of | | Other |
| | | | | | Principal | | Portfolios in Fund | | Directorships |
| Name, | | Position(s) | | | | Occupation(s) | | Complex Overseen | | Held by |
| Address, | | Held with | | Length of Time | | During the | | by Trustee | | Trustee |
| and Birth Date | | Fund(s) | | Served | | Past Five Years | | or Officer | | or Officer |
| | | | | | | | | | | |
| Sandra A.J. | | Trustee | | Since December 2021 | | Chief Administrative Officer, | | 146 | | Director, Hall Family Foundation |
| Lawrence3 | | | | | | Children’s Mercy Hospitals and | | | | (1993–Present) |
| 610 Market Street | | | | | | Clinics | | | | Director, Westar Energy (utility) |
| Philadelphia, PA | | | | | | (2016–2019); | | | | (2004–2018) |
| 19106-2354 | | | | | | CFO, Children’s Mercy Hospitals | | | | Trustee, Nelson-Atkins Museum |
| September 1957 | | | | | | and Clinics | | | | of Art (non-profit) (2021–Present) |
| | | | | | (2005–2016) | | | | (2007–2020) |
| | | | | | | | | | Director, Turn the Page KC |
| | | | | | | | | | (non-profit) (2012–2016) |
| | | | | | | | | | Director, Kansas Metropolitan |
| | | | | | | | | | Business and Healthcare |
| | | | | | | | | | Coalition (non-profit) (2017–2019) |
| | | | | | | | | | Director, National Association of |
| | | | | | | | | | Corporate Directors (non-profit) |
| | | | | | | | | | National Board (2022–Present); |
| | | | | | | | | | Regional Board (2017–2021) |
| | | | | | | | | | Director, American Shared |
| | | | | | | | | | Hospital Services (medical |
| | | | | | | | | | device) (2017–2021) |
| | | | | | | | | | Director, Evergy, Inc., Kansas City |
| | | | | | | | | | Power & Light Company, KCP&L |
| | | | | | | | | | Greater Missouri Operations |
| | | | | | | | | | Company, Westar Energy, Inc. |
| | | | | | | | | | and Kansas Gas and Electric |
| | | | | | | | | | Company (related utility |
| | | | | | | | | | companies) (2018–Present) |
47
Table of Contents
Board of trustees / directors and officers addendum
Delaware Funds by Macquarie®
| | | | | | | | Number of | | Other |
| | | | | | Principal | | Portfolios in Fund | | Directorships |
| Name, | | Position(s) | | | | Occupation(s) | | Complex Overseen | | Held by |
| Address, | | Held with | | Length of Time | | During the | | by Trustee | | Trustee |
| and Birth Date | | Fund(s) | | Served | | Past Five Years | | or Officer | | or Officer |
| | | | | | | | | | | |
| Sandra A.J. | | Trustee | | Since December 2021 | | Chief Administrative Officer, | | 146 | | Director, Stowers (research) |
| Lawrence3 | | | | | | Children’s Mercy Hospitals and | | | | (2018) |
| (continued) | | | | | | Clinics | | | | Co-Chair, Women Corporate |
| 610 Market Street | | | | | | (2016–2019); | | | | Directors (director education) |
| Philadelphia, PA | | | | | | CFO, Children’s Mercy Hospitals | | | | (2018–2020) |
| 19106-2354 | | | | | | and Clinics | | | | Trustee, Ivy Funds Complex |
| September 1957 | | | | | | (2005–2016) | | | | (2019-2021) |
| | | | | | | | | | Director, Brixmor Property |
| | | | | | | | | | Group Inc. |
| | | | | | | | | | (2021–Present) |
| | | | | | | | | | Director, Sera Prognostics Inc. |
| | | | | | | | | | (biotechnology) |
| | | | | | | | | | (2021–Present) |
| | | | | | | | | | Director, Recology (resource |
| | | | | | | | | | recovery) |
| | | | | | | | | | (2021–Present) |
48
Table of Contents
| | | | | | | | Number of | | Other |
| | | | | | Principal | | Portfolios in Fund | | Directorships |
| Name, | | Position(s) | | | | Occupation(s) | | Complex Overseen | | Held by |
| Address, | | Held with | | Length of Time | | During the | | by Trustee | | Trustee |
| and Birth Date | | Fund(s) | | Served | | Past Five Years | | or Officer | | or Officer |
| | | | | | | | | | | |
| Frances A. | | Trustee | | Since September 2011 | | Private Investor | | 146 | | Trust Manager and Audit |
| Sevilla-Sacasa | | | | | | (January 2017–Present) | | | | Committee Chair — Camden |
| 610 Market Street | | | | | | Chief Executive Officer — Banco | | | | Property Trust |
| Philadelphia, PA | | | | | | Itaú International | | | | (August 2011–Present) |
| 19106-2354 | | | | | | (April 2012–December 2016) | | | | Director; Audit |
| January 1956 | | | | | | Executive Advisor to Dean | | | | and Compensation |
| | | | | | (August 2011–March 2012) and | | | | Committee Member — |
| | | | | | Interim Dean | | | | Callon Petroleum Company |
| | | | | | (January 2011–July 2011) — | | | | (December 2019–Present) |
| | | | | | University of Miami School of | | | | Director — New Senior |
| | | | | | Business Administration | | | | Investment Group Inc. |
| | | | | | President — U.S. Trust, Bank of | | | | (January 2021–September 2021) |
| | | | | | America Private Wealth | | | | Director; Audit Committee |
| | | | | | Management (Private Banking) | | | | Member — Carrizo Oil & Gas, |
| | | | | | (July 2007-December 2008) | | | | Inc. (March 2018–December |
| | | | | | | | | | 2019) |
49
Table of Contents
Board of trustees / directors and officers addendum
Delaware Funds by Macquarie®
| | | | | | | | Number of | | Other |
| | | | | | Principal | | Portfolios in Fund | | Directorships |
| Name, | | Position(s) | | | | Occupation(s) | | Complex Overseen | | Held by |
| Address, | | Held with | | Length of Time | | During the | | by Trustee | | Trustee |
| and Birth Date | | Fund(s) | | Served | | Past Five Years | | or Officer | | or Officer |
| | | | | | | | | | | |
| Thomas K. Whitford | | Trustee | | Since January 2013 | | Vice Chairman — PNC Financial | | 146 | | Director — HSBC North America |
| 610 Market Street | | | | | | Services Group | | | | Holdings Inc. |
| Philadelphia, PA | | | | | | (2010–April 2013) | | | | (December 2013–Present) |
| 19106-2354 | | | | | | | | | | Director — HSBC USA Inc. |
| March 1956 | | | | | | | | | | (July 2014–Present) |
| | | | | | | | | | Director — HSBC Bank USA, |
| | | | | | | | | | National Association |
| | | | | | | | | | (July 2014–March 2017) |
| | | | | | | | | | Director — HSBC Finance |
| | | | | | | | | | Corporation |
| | | | | | | | | | (December 2013–April 2018) |
50
Table of Contents
| | | | | | | | Number of | | Other |
| | | | | | Principal | | Portfolios in Fund | | Directorships |
| Name, | | Position(s) | | | | Occupation(s) | | Complex Overseen | | Held by |
| Address, | | Held with | | Length of Time | | During the | | by Trustee | | Trustee |
| and Birth Date | | Fund(s) | | Served | | Past Five Years | | or Officer | | or Officer |
| | | | | | | | | | | |
| Christianna Wood | | Trustee | | Since January 2019 | | Chief Executive Officer and | | 146 | | Director; Finance Committee and |
| 610 Market Street | | | | | | President — Gore Creek Capital, | | | | Audit Committee Member — H&R |
| Philadelphia, PA | | | | | | Ltd. (August 2009–Present) | | | | Block Corporation |
| 19106-2354 | | | | | | | | | | (July 2008–Present) |
| August 1959 | | | | | | | | | | Director; Investments Committee, |
| | | | | | | | | | Capital and Finance Committee, |
| | | | | | | | | | and Audit Committee Member — |
| | | | | | | | | | Grange Insurance |
| | | | | | | | | | (2013–Present) |
| | | | | | | | | | Trustee; Chair of Nominating and |
| | | | | | | | | | Governance Committee and Audit |
| | | | | | | | | | Committee Member — |
| | | | | | | | | | The Merger Fund |
| | | | | | | | | | (2013–October 2021), |
| | | | | | | | | | The Merger Fund VL |
| | | | | | | | | | (2013–October 2021); WCM |
| | | | | | | | | | Alternatives: Event-Driven Fund |
| | | | | | | | | | (2013–October 2021), and WCM |
| | | | | | | | | | Alternatives: Credit Event Fund |
| | | | | | | | | | (December 2017–October 2021) |
| | | | | | | | | | Director; Chair of Governance |
| | | | | | | | | | Committee and Audit Committee |
| | | | | | | | | | Member — International |
| | | | | | | | | | Securities Exchange (2010–2016) |
51
Table of Contents
Board of trustees / directors and officers addendum
Delaware Funds by Macquarie®
| | | | | | | | Number of | | Other |
| | | | | | Principal | | Portfolios in Fund | | Directorships |
| Name, | | Position(s) | | | | Occupation(s) | | Complex Overseen | | Held by |
| Address, | | Held with | | Length of Time | | During the | | by Trustee | | Trustee |
| and Birth Date | | Fund(s) | | Served | | Past Five Years | | or Officer | | or Officer |
| | | | | | | | | | | |
| Janet L. Yeomans | | Trustee | | Since April 1999 | | Vice President and Treasurer | | 146 | | Director; Personnel and |
| 610 Market Street | | | | | | (January 2006–July 2012), Vice | | | | Compensation Committee Chair; |
| Philadelphia, PA | | | | | | President — Mergers & | | | | Member of Nominating, |
| 19106-2354 | | | | | | Acquisitions | | | | Investments, and Audit |
| July 1948 | | | | | | (January 2003–January 2006), | | | | Committees for various periods |
| | | | | | and Vice President and Treasurer | | | | throughout directorship — |
| | | | | | (July 1995–January 2003) — 3M | | | | Okabena Company (2009–2017) |
| | | | | | Company | | | | |
| | | | | | | | | | | |
| Officers | | | | | | | | | | |
| | | | | | | | | | | |
| David F. Connor | | Senior Vice President, | | Senior Vice President, | | David F. Connor has served in | | 146 | | None4 |
| 610 Market Street | | General Counsel, and | | since May 2013; | | various capacities at different | | | | |
| Philadelphia, PA | | Secretary | | General Counsel | | times at Macquarie Asset | | | | |
| 19106-2354 | | | | since May 2015; | | Management. | | | | |
| December 1963 | | | | Secretary since | | | | | | |
| | | | October 2005 | | | | | | |
| | | | | | | | | | | |
| Daniel V. Geatens | | Senior Vice President | | Senior Vice President | | Daniel V. Geatens has served in | | 146 | | None4 |
| 610 Market Street | | and Treasurer | | and Treasurer since | | various capacities at different | | | | |
| Philadelphia, PA | | | | October 2007 | | times at Macquarie Asset | | | | |
| 19106-2354 | | | | | | Management. | | | | |
| October 1972 | | | | | | | | | | |
52
Table of Contents
| | | | | | | | Number of | | Other |
| | | | | | Principal | | Portfolios in Fund | | Directorships |
| Name, | | Position(s) | | | | Occupation(s) | | Complex Overseen | | Held by |
| Address, | | Held with | | Length of Time | | During the | | by Trustee | | Trustee |
| and Birth Date | | Fund(s) | | Served | | Past Five Years | | or Officer | | or Officer |
| | | | | | | | | | | |
| Richard Salus | | Senior Vice President | | Senior Vice President | | Richard Salus has served in | | 146 | | None |
| 610 Market Street | | and Chief Financial | | and Chief Financial | | various capacities at different | | | | |
| Philadelphia, PA | | Officer | | Officer since | | times at Macquarie Asset | | | | |
| 19106-2354 | | | | November 2006 | | Management. | | | | |
| October 1963 | | | | | | | | | | |
| 1 | Shawn K. Lytle is considered to be an “Interested Trustee” because he is an executive officer of the Fund’s(s’) investment advisor. |
| 2 | Macquarie Asset Management is the marketing name for Macquarie Management Holdings, Inc. and its subsidiaries, including the Fund’s(s’) investment advisor, principal underwriter, and its transfer agent. |
| 3 | Messrs. Dobbs and Harroz and Ms. Lawrence were elected as Trustees of the Trust effective December 17, 2021. |
| 4 | David F. Connor serves as Senior Vice President and Secretary, and Daniel V. Geatens serves as Senior Vice President, Treasurer, and Chief Financial Officer, for the six portfolios of the Optimum Fund Trust, which have the same investment advisor, principal underwriter, and transfer agent as the registrant. Mr. Geatens also serves as the Chief Financial Officer and Treasurer for Macquarie Global Infrastructure Total Return Fund Inc. |
The Statement of Additional Information for the Fund(s) includes additional information about the Trustees and Officers and is available, without charge, upon request by calling 800 523-1918.
53
Table of Contents
About the organization
Board of trustees | | | | | | |
Shawn K. Lytle
President and
Chief Executive Officer
Delaware Funds
by Macquarie® Jerome D. Abernathy
Managing Member
Stonebrook Capital
Management, LLC Thomas L. Bennett
Chairman of the Board
Delaware Funds
by Macquarie
Private Investor | | Ann D. Borowiec
Former Chief Executive
Officer
Private Wealth Management
J.P. Morgan Chase & Co. Joseph W. Chow
Private Investor H. Jeffrey Dobbs
Former Global Sector
Chairman
Industrial Manufacturing,
KPMG, LLP | | John A. Fry
President
Drexel University Joseph Harroz, Jr.
President
University of Oklahoma Sandra A.J. Lawrence
Former Chief Administrative
Officer
Children's Mercy Hospitals
and Clinics | | Frances A.
Sevilla-Sacasa
Former Chief Executive
Officer
Banco Itaú International Thomas K. Whitford
Former Vice Chairman
PNC Financial Services
Group Christianna Wood
Chief Executive Officer
and President
Gore Creek Capital, Ltd. Janet L. Yeomans
Former Vice President and
Treasurer
3M Company |
| | | | | | | |
| Affiliated officers | | | | | | |
David F. Connor
Senior Vice President,
General Counsel,
and Secretary
Delaware Funds
by Macquarie | | Daniel V. Geatens
Senior Vice President and
Treasurer
Delaware Funds
by Macquarie | | Richard Salus
Senior Vice President and
Chief Financial Officer
Delaware Funds
by Macquarie | | |
This annual report is for the information of Delaware Small Cap Growth Fund shareholders, but it may be used with prospective investors when preceded or accompanied by the Delaware Fund fact sheet for the most recently completed calendar quarter. These documents are available at delawarefunds.com/literature. |
The Fund files its complete schedule of portfolio holdings with the Securities and Exchange Commission (SEC) for the first and third quarters of each fiscal year on Form N-PORT. The Fund’s Forms N-PORT, as well as a description of the policies and procedures that the Fund uses to determine how to vote proxies (if any) relating to portfolio securities, are available without charge (i) upon request, by calling 800 523-1918; and (ii) on the SEC’s website at sec.gov. In addition, a description of the policies and procedures that the Fund uses to determine how to vote proxies (if any) relating to portfolio securities and the Schedule of Investments included in the Fund’s most recent Form N-PORT are available without charge on the Fund’s website at delawarefunds.com/literature. The Fund’s Forms N-PORT may be reviewed and copied at the SEC’s Public Reference Room in Washington, D.C.; information on the operation of the Public Reference Room may be obtained by calling 800 SEC-0330.
Information (if any) regarding how the Fund voted proxies relating to portfolio securities during the most recently disclosed 12-month period ended June 30 is available without charge (i) through the Fund’s website at delawarefunds.com/proxy; and (ii) on the SEC’s website at sec.gov.
54
Table of Contents
Annual report
US equity mutual fund
Delaware Smid Cap Growth Fund
March 31, 2022
Carefully consider the Fund's investment objectives, risk factors, charges, and expenses before investing. This and other information can be found in the Fund's prospectus and its summary prospectus, which may be obtained by visiting delawarefunds.com/literature or calling 800 523-1918. Investors should read the prospectus and the summary prospectus carefully before investing.
You can obtain shareholder reports and prospectuses online instead of in the mail.
Visit delawarefunds.com/edelivery.
Table of Contents
Experience Delaware Funds by Macquarie®
Macquarie Asset Management (MAM) is a global asset manager that aims to deliver positive impact for everyone. MAM Public Investments traces its roots to 1929 and partners with institutional and individual clients to deliver specialist active investment capabilities across global equities, fixed income, and multi-asset solutions using a conviction-based, long-term approach to investing. In the US, retail investors recognize our Delaware Funds by Macquarie family of funds as one of the oldest mutual fund families.
If you are interested in learning more about creating an investment plan, contact your financial advisor.
You can learn more about Delaware Funds or obtain a prospectus for Delaware Smid Cap Growth Fund at delawarefunds.com/literature.
Manage your account online
| ● | Check your account balance and transactions |
| ● | View statements and tax forms |
| ● | Make purchases and redemptions |
Visit delawarefunds.com/account-access.
Macquarie Asset Management (MAM) is the asset management division of Macquarie Group. MAM is a full-service asset manager offering a diverse range of products across public and private markets including fixed income, equities, multi-asset solutions, private credit, infrastructure, renewables, natural assets, real estate, and asset finance. The Public Investments business is a part of MAM and includes the following investment advisers: Macquarie Investment Management Business Trust (MIMBT), Macquarie Funds Management Hong Kong Limited, Macquarie Investment Management Austria Kapitalanlage AG, Macquarie Investment Management Global Limited, Macquarie Investment Management Europe Limited, and Macquarie Investment Management Europe S.A.
The Fund is distributed by Delaware Distributors, L.P. (DDLP), an affiliate of MIMBT and Macquarie Group Limited.
Other than Macquarie Bank Limited ABN 46 008 583 542 ("Macquarie Bank"), any Macquarie Group entity noted in this document is not an authorized deposit-taking institution for the purposes of the Banking Act 1959 (Commonwealth of Australia). The obligations of these other Macquarie Group entities do not represent deposits or other liabilities of Macquarie Bank. Macquarie Bank does not guarantee or otherwise provide assurance in respect of the obligations of these other Macquarie Group entities. In addition, if this document relates to an investment, (a) the investor is subject to investment risk including possible delays in repayment and loss of income and principal invested and (b) none of Macquarie Bank or any other Macquarie Group entity guarantees any particular rate of return on or the performance of the investment, nor do they guarantee repayment of capital in respect of the investment.
The Fund is governed by US laws and regulations.
Table of contents
Unless otherwise noted, views expressed herein are current as of March 31, 2022, and subject to change for events occurring after such date.
The Fund is not FDIC insured and is not guaranteed. It is possible to lose the principal amount invested.
Advisory services provided by Delaware Management Company, a series of MIMBT, a US registered investment advisor.
All third-party marks cited are the property of their respective owners.
© 2022 Macquarie Management Holdings, Inc.
Table of Contents
| Portfolio management review | |
| Delaware Smid Cap Growth Fund | March 31, 2022 (Unaudited) |
Performance preview (for the year ended March 31, 2022) | | | | | |
| Delaware Smid Cap Growth Fund (Institutional Class shares) | | 1-year return | | -21.45 | % |
| Delaware Smid Cap Growth Fund (Class A shares) | | 1-year return | | -21.65 | % |
| Russell 2500™ Growth Index (benchmark) | | 1-year return | | -10.12 | % |
Past performance does not guarantee future results.
For complete, annualized performance for Delaware Smid Cap Growth Fund, please see the table on page 5.
Institutional Class shares are not subject to a sales charge and are offered for sale exclusively to certain eligible investors. In addition, Institutional Class shares pay no distribution and service fee.
The performance of Class A shares excludes the applicable sales charge. The performance of both Institutional Class shares and Class A shares reflects the reinvestment of all distributions.
Please see page 7 for a description of the index. Index performance returns do not reflect any management fees, transaction costs, or expenses. Indices are unmanaged and one cannot invest directly in an index.
Investment objective
The Fund seeks long-term capital appreciation.
Market review
The fiscal year ended March 31, 2022, was especially trying for small- and mid-cap growth as investors rotated from growth to value and from small companies to large. Both shifts are traceable directly back to the start of the pandemic in 2020 and are finally beginning to show signs of waning.
As we reported in 2021, the onset of the COVID-19 pandemic sent markets into a severe selloff as global economies shut down, sending value-oriented stocks including travel and leisure, energy, materials, and banking into a depression. In contrast, growth companies performed well as the pandemic-imposed restrictions boosted ecommerce, mobile banking, digital payments, and software, which all enable remote workers. Fast-forward to the end of 2020, when the COVID-19 vaccines became available. Suddenly, the value companies that had been barely afloat sprung to life. Almost overnight, it was all right to go out, travel, see a movie, or go to the ballgame. And just as suddenly, we
| ● | Market rotation out of growth to value and from small-caps to large-caps created a challenge for small-cap growth investing. |
| ● | The Russian invasion of Ukraine in February added to investor concerns. |
| ● | The Fund maintains its long-term focus on disruptive trends and industries, such as mobile banking and digital payments, and sees remote working as here to stay. |
1
Table of Contents
Portfolio management review
Delaware Smid Cap Growth Fund
witnessed the largest rotation from growth to value in more than 20 years.
In much the same way, large-cap equities outperformed small- and mid-caps throughout the pandemic. Investors often find it easier to buy large-caps, usually perceived as safe havens, in a difficult economic environment.
While this was a difficult period for small- and mid-cap growth investors, it was by almost all other measures a strong period for the economy. The US unemployment rate dropped below 4%, housing prices soared, and equities performed well overall.
Still, as the period drew to a close, several large clouds loomed. The Russian invasion of Ukraine, the sanctions the West imposed, and the potential disruption of oil and gas supplies have raised concerns about a possible recession in Europe. In the US, investors seem more focused on inflation, though ultimately that is more a question of rates. We’ve already seen the 30-year mortgage rate rise from 3% to 5%. This means a house purchased with debt will cost 15% more today than it did just four months ago.
On March 14, the Federal Reserve adopted a more aggressive stance, raising rates for the first time in more than three years, and indicating that six or seven more increases are likely before the end of the year. That would raise the federal funds rate to about 2.0%. Markets rallied after the announcement, a sign that investors were buoyed by the Fed getting tough on inflation. In a sign that growth investors may find encouraging, growth stocks have outperformed value since the Fed announcement. Although it is too early to be sure, investors may be looking at a cyclical rotation back to growth as the war in Ukraine, rising energy costs, higher interest rates, inflation, and increased housing costs act to decelerate economic growth.
Within the Fund
For the fiscal period ended March 31, 2022, Delaware Smid Cap Growth Fund underperformed its benchmark, the Russell 2500 Growth Index. The Fund’s Institutional Class shares returned -21.45%. The Fund’s Class A shares returned -21.65% at net asset value and -26.16% at maximum offering price (both figures reflect all distributions). During the same period, the benchmark returned -10.12%. For complete, annualized performance of Delaware Smid Cap Growth Fund, please see the table on page 5.
On a sector level, information technology and communication services contributed to relative performance, while the consumer discretionary, industrials, and consumer staples sectors detracted from relative performance. The Fund did not have any positions in the energy, materials, real estate, or utilities sectors, which detracted from performance relative to the benchmark.
The Fund pursues a pure growth strategy, focusing on disruptions that are often induced by innovation or technology. Now that we’ve reached the end of the second full year of the pandemic, it’s clear that life and society as we knew it will not return to the way things were. The pandemic has permanently altered the economic landscape. For example, remote working is here to stay. Perhaps one-third of people will return to full-time office work, another third may take a hybrid approach, splitting their time between the office and home, and the remainder will be full-time remote workers. Some of the opportunities that creates may seem obvious – video conferencing systems and software, for example. But if people are going to be spending more time at home, it will also
2
Table of Contents
expand the market for businesses providing home improvement.
Some changes are happening on a broad scale. For some time, but particularly in the last several years, people have demanded that corporations take more responsibility for their community and become more involved in society. That has now manifested in companies engaging in community outreach, committing to environmentally sound practices, seeking more diversity and inclusion, and providing employees with more benefits.
Progyny Inc. benefited from that trend and contributed to the Fund’s performance during the fiscal year. Progyny is the leading pure-play benefits manager specializing in fertility and family-building benefits solutions for self-insured employers. Though it often receives little attention, infertility is a significant problem affecting one in eight women, a prevalence higher than many chronic conditions, including diabetes and depression. For those in need, Progyny’s insurance benefit can reduce the cost of an in vitro procedure from $100,000 to a deductible of less than $10,000. Over the past year, Progyny has demonstrated that it can grow regardless of the economy, profiting from both the value of its offering and corporations’ desire to enhance employee benefits.
Bill.com Holdings Inc. was another significant contributor to the Fund for the fiscal year. It is the leading provider of back-office financial solutions for small and medium-sized businesses. Smaller companies have been slower to introduce automation into accounts receivable and payable and bookkeeping. By leveraging software as a service (SaaS), Bill.com has an advantage over its competitors. SaaS enables Bill.com not only to add services and functionality but also to provide updates and fixes in real time. Customers can operate their accounting and back-office areas more efficiently, without making large investments in hardware or technology personnel. Bill.com also benefits from the SaaS model via its regular subscription revenue. Bill.com is an example of companies that are disrupting the existing way of doing things by creating new efficiencies. We believe customers will gravitate to the company because it has a better way of managing the back office. Although its business may be volatile at times, and it may be upset by worries about Russia or rates, longer term, we think the fundamentals are in place for sustained growth over time.
The economic environment did take a toll on several of our holdings during the fiscal year.
Exact Sciences Corp., marketer of the Cologuard colon-cancer diagnostic test, detracted from the Fund during the fiscal year, largely because of a slowdown in procedures. Office visits to doctors were down significantly during the period; Exact Sciences cited the resurgence in COVID-19 cases throughout the country, driven by the emergence of the Delta and Omicron variants. Exact Sciences also markets the leading noninvasive genetic test for breast cancer. Shares of the company were down in the middle of the period as Exact Sciences reported results that were in line with expectations but offered lowered guidance for the remainder of 2021. We think the company has a significant opportunity, given that colorectal cancer is among the most preventable, yet least prevented cancers. The company has been reinvesting for growth, and the shares have been dramatically compressed, from as much as 14 times earnings in years past to 6 times revenue today. We continue to own the company.
3
Table of Contents
Portfolio management review
Delaware Smid Cap Growth Fund
Chewy Inc., an online provider of all things pets, including food and treats, supplies, medications, health products, and services, was a detractor from performance during the fiscal year. Chewy initially benefited from the pandemic as people, forced to stay home, adopted pets, and lavished more attention on their existing ones. Now that the company has annualized the terrific news, its fundamental characteristics indicate a slowdown. Sensing trouble ahead, many investors have sold the stock. We continue to own it, however, in the belief that many people will continue to work from home, pamper their pets, and choose the convenience of online shopping for them.
At the close of the Fund’s fiscal year, we remain invested in the same disruptive trends and industries that carried us through the period. We continue to believe, for example, that mobile banking and digital payments will grow over time and as mentioned earlier, remote working is here to stay.
We do see changes, however. At fiscal year end, our largest thematic exposure was to healthcare procedures. This provides the Fund with several advantages, in our opinion. The market is fully domestic and since it is less exposed to inflation and cyclicality, it is largely insulated from international concerns. Additionally, the healthcare system continues to normalize. During the pandemic, many hospitals curtailed elective procedures. People now have the ability, the time, and the desire to fix things that they had put off. We think this is a sector of the market that’s not only levered toward the end of the pandemic but that’s also insulated from the war in Ukraine and inflation.
We’ve reduced our housing-oriented companies. While we do not own home builders, we do own several housing-related companies. We expect some areas of the market to do well: home improvements is one area. Inflation and higher rates may affect others.
In technology, we think semiconductors will be more cyclical than software companies. We have acted accordingly, reducing our semiconductor exposure and adding to software. And as we’ve mentioned before, within software, we are partial to those companies that provide product via SaaS.
We’re also seeing change in the consumer world. As the pandemic fades from consciousness, people are spending more money on experiences, such as travel, restaurants, and shows. After spending nearly two years shut in and acquiring “stuff,” people now want to get out and do things. So rather than buying a new pair of sweatpants, they’ll go out to the ballgame.
4
Table of Contents
| Performance summary | |
| Delaware Smid Cap Growth Fund | March 31, 2022 (Unaudited) |
The performance quoted represents past performance and does not guarantee future results. Investment return and principal value of an investment will fluctuate so that shares, when redeemed, may be worth more or less than their original cost. Current performance may be lower or higher than the performance quoted. Performance data current to the most recent month end may be obtained by calling 800 523-1918 or visiting delawarefunds.com/performance.
| Fund and benchmark performance1,2 | | Average annual total returns through March 31, 2022 |
| | 1 year | | 5 year | | 10 year | | Lifetime |
| Class A (Est. March 27, 1986) | | | | | | | | |
| Excluding sales charge | | -21.65% | | +20.42% | | +14.25% | | +13.96% |
| Including sales charge | | -26.16% | | +19.01% | | +13.58% | | +13.77% |
| Class C (Est. November 28, 1995) | | | | | | | | |
| Excluding sales charge | | -22.33% | | +19.50% | | +13.39% | | +10.24% |
| Including sales charge | | -22.53% | | +19.50% | | +13.39% | | +10.24% |
| Class R (Est. June 2, 2003) | | | | | | | | |
| Excluding sales charge | | -21.84% | | +20.13% | | +13.97% | | +12.50% |
| Including sales charge | | -21.84% | | +20.13% | | +13.97% | | +12.50% |
| Institutional Class (Est. November 9, 1992) | | | | | | | | |
| Excluding sales charge | | -21.45% | | +20.73% | | +14.54% | | +11.60% |
| Including sales charge | | -21.45% | | +20.73% | | +14.54% | | +11.60% |
| Class R6 (Est. May 2, 2016) | | | | | | | | |
| Excluding sales charge | | -21.39% | | +20.82% | | — | | +17.52% |
| Including sales charge | | -21.39% | | +20.82% | | — | | +17.52% |
| Russell 2500 Growth Index | | -10.12% | | +13.22% | | +12.69% | | +9.72%* |
| * | The benchmark lifetime returns are for Institutional Class share comparison only and are calculated using the last business day in the month of the Fund’s Institutional Class inception date. |
| 1 | Returns reflect the reinvestment of all distributions and are presented both with and without the applicable sales charges described below. Returns do not reflect the deduction of taxes the shareholder would pay on Fund distributions or redemptions of Fund shares. |
Expense limitations were in effect for certain classes during some or all of the periods shown in the “Fund and benchmark performance” table. Expenses for each class are listed on the “Fund expense ratios” table on page 6. Performance would have been lower had expense limitations not been in effect.
Institutional Class shares are not subject to a sales charge and are offered for sale exclusively to certain eligible investors. In addition, Institutional Class shares pay no distribution and service (12b-1) fee.
Class A shares are sold with a maximum front-end sales charge of 5.75%, and have an annual 12b-1 fee of 0.25% of average daily net
5
Table of Contents
Performance summary
Delaware Smid Cap Growth Fund
assets. The Board has adopted a formula for calculating 12b-1 plan fees for the Fund’s Class A shares. The Fund’s Class A shares are currently subject to a blended 12b-1 fee equal to the sum of: (i) 0.10% of average daily net assets representing shares acquired prior to June 1, 1992, and (ii) 0.25% of average daily net assets representing shares acquired on or after June 1, 1992. All Class A shares currently bear 12b-1 fees at the same rate, the blended rate, currently 0.25% of average daily net assets, based on the formula described above. This method of calculating Class A 12b-1 fees may be discontinued at the sole discretion of the Board. Performance for Class A shares, excluding sales charges, assumes that no front-end sales charge applied.
Class C shares are sold with a contingent deferred sales charge (CDSC) of 1.00% if redeemed during the first 12 months. They are also subject to an annual 12b-1 fee of 1.00% of average daily net assets. Performance for Class C shares, excluding sales charges, assumes either that CDSCs did not apply or that the investment was not redeemed.
Class R shares are available only for certain retirement plan products. They are sold without a sales charge and have an annual 12b-1 fee of 0.50% of average daily net assets.
Class R6 shares are available only to certain investors. In addition, Class R6 shares do not pay any service fees, sub-accounting fees, and/or sub-transfer agency fees to any brokers, dealers, or other financial intermediaries. Class R6 shares pay no 12b-1 fee.
Investments in small and/or medium-sized companies typically exhibit greater risk and higher volatility than larger, more established companies.
Risk is increased in a concentrated portfolio since it holds a limited number of securities with each investment having a greater effect on the overall performance.
The disruptions caused by natural disasters, pandemics, or similar events could prevent the Fund from executing advantageous investment decisions in a timely manner and could negatively impact the Fund’s ability to achieve its investment objective and the value of the Fund’s investments.
| 2 | The Fund’s expense ratios, as described in the most recent prospectus, are disclosed in the following “Fund expense ratios” table. Please see the “Financial highlights” section in this report for the most recent expense ratios. |
| | | | | | | | | Institutional | | |
| Fund expense ratios | | Class A | | Class C | | Class R | | Class | | Class R6 |
| Total annual operating expenses | | | | | | | | | | |
| | (without fee waivers) | | 1.05% | | 1.80% | | 1.30% | | 0.80% | | 0.73% |
| Net expenses (including fee | | | | | | | | | | |
| waivers, if any) | | 1.05% | | 1.80% | | 1.30% | | 0.80% | | 0.73% |
| Type of waiver | | n/a | | n/a | | n/a | | n/a | | n/a |
6
Table of Contents
Performance of a $10,000 investment1
Average annual total returns from March 31, 2012 through March 31, 2022

For period beginning March 31, 2012 through March 31, 2022 | | Starting value | | Ending value |
 | Delaware Smid Cap Growth Fund — Institutional Class shares | | | $ | 10,000 | | | | $ | 38,860 | |
 | Delaware Smid Cap Growth Fund — Class A shares | | | | $9,425 | | | | $ | 35,723 | |
 | Russell 2500 Growth Index | | | $ | 10,000 | | | | $ | 33,033 | |
| 1 | The “Performance of a $10,000 investment” graph assumes $10,000 invested in Institutional Class and Class A shares of the Fund on March 31, 2012, and includes the effect of a 5.75% front-end sales charge (for Class A shares) and the reinvestment of all distributions. The graph does not reflect the deduction of taxes the shareholders would pay on Fund distributions or redemptions of Fund shares. Expense limitations were in effect for some or all of the periods shown. Performance would have been lower had expense limitations not been in effect. Expenses are listed in the “Fund expense ratios” table on page 6. Please note additional details on pages 5 through 8. |
The graph also assumes $10,000 invested in the Russell 2500 Growth Index as of March 31, 2012. The Russell 2500 Growth Index measures the performance of the small-to mid-cap growth segment of the US equity universe. It includes those Russell 2500 companies with higher price-to-book ratios and higher forecasted growth values.
Frank Russell Company is the source and owner of the trademarks, service marks, and copyrights related to the Russell Indexes. Russell® is a trademark of Frank Russell Company.
Index performance returns do not reflect any management fees, transaction costs, or expenses. Indices are unmanaged and one cannot invest directly in an index.
Past performance does not guarantee future results.
Performance of other Fund classes will vary due to different charges and expenses.
7
Table of Contents
Performance summary
Delaware Smid Cap Growth Fund
| | Nasdaq symbols | | CUSIPs |
| Class A | | DFCIX | | 245906102 |
| Class C | | DEEVX | | 245906409 |
| Class R | | DFRIX
| | 245906508 |
| Institutional Class | | DFDIX | | 245906201 |
| Class R6 | | DFZRX | | 24610A505 |
8
Table of Contents
Disclosure of Fund expenses
For the six-month period from October 1, 2021 to March 31, 2022 (Unaudited)
As a shareholder of the Fund, you incur two types of costs: (1) transaction costs, including sales charges (loads) on purchase payments, reinvested dividends, or other distributions; redemption fees; and exchange fees; and (2) ongoing costs, including management fees; distribution and service (12b-1) fees; and other Fund expenses. This example is intended to help you understand your ongoing costs (in dollars) of investing in the Fund and to compare these costs with the ongoing costs of investing in other mutual funds.
The example is based on an investment of $1,000 invested at the beginning of the period and held for the entire six-month period from October 1, 2021 to March 31, 2022.
Actual expenses
The first section of the table shown, “Actual Fund return,” provides information about actual account values and actual expenses. You may use the information in this section of the table, together with the amount you invested, to estimate the expenses that you paid over the period. Simply divide your account value by $1,000 (for example, an $8,600 account value divided by $1,000 = 8.6), then multiply the result by the number in the first section under the heading entitled “Expenses Paid During Period” to estimate the expenses you paid on your account during this period.
Hypothetical example for comparison purposes
The second section of the table shown, “Hypothetical 5% return,” provides information about hypothetical account values and hypothetical expenses based on the Fund’s actual expense ratio and an assumed rate of return of 5% per year before expenses, which is not the Fund’s actual return. The hypothetical account values and expenses may not be used to estimate the actual ending account balance or expenses you paid for the period. You may use this information to compare the ongoing costs of investing in the Fund and other funds. To do so, compare this 5% hypothetical example with the 5% hypothetical examples that appear in the shareholder reports of the other funds.
Please note that the expenses shown in the table are meant to highlight your ongoing costs only and do not reflect any transactional costs, such as sales charges (loads), redemption fees, or exchange fees. Therefore, the second section of the table is useful in comparing ongoing costs only, and will not help you determine the relative total costs of owning different funds. In addition, if these transactional costs were included, your costs would have been higher. The Fund’s expenses shown in the table assume reinvestment of all dividends and distributions.
9
Table of Contents
Disclosure of Fund expenses
For the six-month period from October 1, 2021 to March 31, 2022 (Unaudited)
Delaware Smid Cap Growth Fund
Expense analysis of an investment of $1,000
| | Beginning | | Ending | | | | Expenses |
| | Account Value | | Account Value | | Annualized | | Paid During Period |
| | 10/1/21 | | 3/31/22 | | Expense Ratio | | 10/1/21 to 3/31/22* |
| Actual Fund return† | | | | | | | | | | | | | | | | | |
| Class A | | | $ | 1,000.00 | | | | $ | 805.40 | | | 1.05% | | | $ | 4.73 | |
| Class C | | | | 1,000.00 | | | | | 801.50 | | | 1.80% | | | | 8.08 | |
| Class R | | | | 1,000.00 | | | | | 804.50 | | | 1.30% | | | | 5.85 | |
| Institutional Class | | | | 1,000.00 | | | | | 806.50 | | | 0.80% | | | | 3.60 | |
| Class R6 | | | | 1,000.00 | | | | | 806.70 | | | 0.71% | | | | 3.20 | |
| Hypothetical 5% return (5% return before expenses) | | | | | | | | |
| Class A | | | $ | 1,000.00 | | | | $ | 1,019.70 | | | 1.05% | | | $ | 5.29 | |
| Class C | | | | 1,000.00 | | | | | 1,015.96 | | | 1.80% | | | | 9.05 | |
| Class R | | | | 1,000.00 | | | | | 1,018.45 | | | 1.30% | | | | 6.54 | |
| Institutional Class | | | | 1,000.00 | | | | | 1,020.94 | | | 0.80% | | | | 4.03 | |
| Class R6 | | | | 1,000.00 | | | | | 1,021.39 | | | 0.71% | | | | 3.58 | |
| * | “Expenses Paid During Period” are equal to the Fund's annualized expense ratio, multiplied by the average account value over the period, multiplied by 182/365 (to reflect the one-half year period). |
| † | Because actual returns reflect only the most recent six-month period, the returns shown may differ significantly from fiscal year returns. |
10
Table of Contents
| Security type / sector allocations and top 10 equity holdings |
| Delaware Smid Cap Growth Fund | As of March 31, 2022 (Unaudited) |
Sector designations may be different from the sector designations presented in other Fund materials. The sector designations may represent the investment manager’s internal sector classifications.
| Security type / sector | | Percentage of net assets |
| Common Stocks ◆ | | | 100.24% | | |
| Communication Services | | | 2.54% | | |
| Consumer Discretionary | | | 16.35% | | |
| Consumer Staples | | | 1.52% | | |
| Financials | | | 2.01% | | |
| Healthcare* | | | 37.25% | | |
| Industrials | | | 4.78% | | |
| Information Technology* | | | 35.79% | | |
| Total Value of Securities | | | 100.24% | | |
| Liabilities Net of Receivables and Other Assets | | | (0.24% | ) | |
| Total Net Assets | | | 100.00% | | |
| ◆ | Narrow industries are utilized for compliance purposes for diversification whereas broad sectors are used for financial reporting. |
| * | To monitor compliance with the Fund's concentration guidelines as described in the Fund's Prospectus and Statement of Additional Information, the Healthcare and Information Technology sector (as disclosed herein for financial reporting purposes) is subdivided into a variety of “industries” (in accordance with the requirements of the Investment Company Act of 1940, as amended). The Healthcare sector consisted of Healthcare Products, Pharmaceuticals, Commercial Services, and Internet. As of March 31, 2022, such amounts, as a percentage of total net assets were 20.48%, 5.94%, 6.74%, and 4.09%, respectively. The Information Technology sector consisted of Software, Semiconductors, Commercial Services, Telecommunications, Advertising, and Internet. As of March 31, 2022, such amounts, as a percentage of total net assets were 13.09%, 8.30%, 4,26%, 4.06%, 3.85%, and 2.23%, respectively. The percentage in any such single industry will comply with the Fund's concentration policy even if the percentage in the Healthcare and Information Technology sector for financial reporting purposes may exceed 25%. |
11
Table of Contents
Security type / sector allocations and top 10 equity holdings
Delaware Smid Cap Growth Fund
Holdings are for informational purposes only and are subject to change at any time. They are not a recommendation to buy, sell, or hold any security.
| Top 10 equity holdings | | Percentage of net assets |
| Progyny | | 6.74% |
| Inari Medical | | 6.18% |
| Inspire Medical Systems | | 6.02% |
| Pacira BioSciences | | 5.94% |
| Bill.com Holdings | | 5.04% |
| Lattice Semiconductor | | 4.84% |
| Sprout Social Class A | | 4.53% |
| Shift4 Payments Class A | | 4.26% |
| Figs Class A | | 4.09% |
| Exact Sciences | | 4.08% |
12
Table of Contents
| Schedule of investments | |
| Delaware Smid Cap Growth Fund | March 31, 2022 |
| | | | Number of | | | |
| | | shares | | Value (US $) |
| Common Stocks – 100.24%◆ | | | | | |
| Communication Services – 2.54% | | | | | |
| Live Nation Entertainment † | | 404,064 | | $ | 47,534,089 |
| Match Group † | | 272,763 | | | 29,660,249 |
| | | | | | 77,194,338 |
| Consumer Discretionary – 16.35% | | | | | |
| Chewy Class A † | | 2,412,854 | | | 98,396,186 |
| Etsy † | | 575,663 | | | 71,543,398 |
| On Holding Class A † | | 3,355,035 | | | 84,681,083 |
| Planet Fitness Class A † | | 643,490 | | | 54,362,035 |
| TopBuild † | | 424,161 | | | 76,938,564 |
| Ulta Beauty † | | 1,760 | | | 700,867 |
| YETI Holdings † | | 1,823,864 | | | 109,395,363 |
| | | | | | 496,017,496 |
| Consumer Staples – 1.52% | | | | | |
| Freshpet † | | 450,700 | | | 46,259,848 |
| | | | | | 46,259,848 |
| Financials – 2.01% | | | | | |
| Trupanion † | | 683,276 | | | 60,893,557 |
| | | | | | 60,893,557 |
| Healthcare – 37.25% | | | | | |
| Exact Sciences † | | 1,768,811 | | | 123,675,265 |
| Figs Class A † | | 5,759,916 | | | 123,953,392 |
| Inari Medical † | | 2,069,573 | | | 187,586,097 |
| Inspire Medical Systems † | | 711,323 | | | 182,589,501 |
| Pacira BioSciences <<, † | | 2,360,818 | | | 180,177,630 |
| Progyny † | | 3,977,870 | | | 204,462,518 |
| Quanterix <<, † | | 2,441,824 | | | 71,276,842 |
| Shockwave Medical † | | 270,300 | | | 56,049,408 |
| | | | | | 1,129,770,653 |
| Industrials – 4.78% | | | | | |
| Lyft Class A † | | 107,234 | | | 4,117,785 |
| SiteOne Landscape Supply † | | 501,658 | | | 81,113,082 |
| Trex † | | 915,475 | | | 59,807,982 |
| | | | | | 145,038,849 |
| Information Technology – 35.79% | | | | | |
| Arista Networks † | | 886,863 | | | 123,256,220 |
| Bill.com Holdings † | | 674,494 | | | 152,968,494 |
| Cloudflare Class A † | | 889,710 | | | 106,498,287 |
| Lattice Semiconductor † | | 2,409,385 | | | 146,852,016 |
13
Table of Contents
Schedule of investments
Delaware Smid Cap Growth Fund
| | | | Number of | | | |
| | | shares | | Value (US $) |
| Common Stocks◆ (continued) | | | | | |
| Information Technology (continued) | | | | | |
| Monolithic Power Systems | | 147,019 | | $ | 71,404,188 |
| Okta † | | 447,293 | | | 67,523,351 |
| ON Semiconductor † | | 536,549 | | | 33,593,333 |
| Shift4 Payments Class A † | | 2,084,333 | | | 129,082,743 |
| Sprout Social Class A † | | 1,715,526 | | | 137,447,943 |
| Trade Desk Class A † | | 1,688,681 | | | 116,941,159 |
| | | | | | 1,085,567,734 |
| Total Common Stocks (cost $3,050,089,309) | | | | | 3,040,742,475 |
| Total Value of Securities – 100.24% | | | | | |
| (cost $3,050,089,309) | | | | $ | 3,040,742,475 |
| ◆ | Narrow industries are utilized for compliance purposes for diversification whereas broad sectors are used for financial reporting. |
| † | Non-income producing security. |
| << | Affiliated company. See Note 2 in "Notes to financial statements." |
See accompanying notes, which are an integral part of the financial statements.
14
Table of Contents
| Statement of assets and liabilities | |
| Delaware Smid Cap Growth Fund | March 31, 2022 |
| Assets: | | | |
| | Investments, at value* | | $ | 2,789,288,003 |
| Affiliated investments, at value** | | | 251,454,472 |
| Receivable for securities sold | | | 41,903,345 |
| Receivable for fund shares sold | | | 12,298,102 |
| Dividends receivable | | | 110,498 |
| Other assets | | | 27,856 |
| Total Assets | | | 3,095,082,276 |
| Liabilities: | | | |
| Due to custodian | | | 12,679,352 |
| Payable for securities purchased | | | 26,592,692 |
| Payable for fund shares redeemed | | | 19,494,030 |
| Investment management fees payable to affiliates | | | 1,692,293 |
| Other accrued expenses | | | 862,111 |
| Distribution fees payable to affiliates | | | 333,447 |
| Audit and tax fees payable | | | 33,030 |
| Dividend disbursing and transfer agent fees and expenses payable to | | | |
| affiliates | | | 23,490 |
| Trustees' fees and expenses payable to affiliates | | | 14,984 |
| Legal fees payable to affiliates | | | 7,852 |
| Accounting and administration expenses payable to affiliates | | | 7,409 |
| Reports and statements to shareholders expenses payable to affiliates | | | 1,546 |
| Total Liabilities | | | 61,742,236 |
| Total Net Assets | | $ | 3,033,340,040 |
| |
| Net Assets Consist of: | | | |
| Paid-in capital | | $ | 2,857,407,201 |
| Total distributable earnings (loss) | | | 175,932,839 |
| Total Net Assets | | $ | 3,033,340,040 |
15
Table of Contents
Statement of assets and liabilities
Delaware Smid Cap Growth Fund
| Net Asset Value | | | | |
| | | | | |
| Class A: | | | | |
| Net assets | | $ | 1,212,012,971 | |
| Shares of beneficial interest outstanding, unlimited authorization, no par | | | 48,355,075 | |
| Net asset value per share | | $ | 25.06 | |
| Sales charge | | | 5.75 | % |
| Offering price per share, equal to net asset value per share / (1 - sales | | | | |
| charge) | | $ | 26.59 | |
| | | | | |
| Class C: | | | | |
| Net assets | | $ | 93,375,464 | |
| Shares of beneficial interest outstanding, unlimited authorization, no par | | | 31,850,777 | |
| Net asset value per share | | $ | 2.93 | |
| | | | | |
| Class R: | | | | |
| Net assets | | $ | 13,230,312 | |
| Shares of beneficial interest outstanding, unlimited authorization, no par | | | 622,881 | |
| Net asset value per share | | $ | 21.24 | |
| | | | | |
| Institutional Class: | | | | |
| Net assets | | $ | 1,590,990,454 | |
| Shares of beneficial interest outstanding, unlimited authorization, no par | | | 39,081,742 | |
| Net asset value per share | | $ | 40.71 | |
| | | | | |
| Class R6: | | | | |
| Net assets | | $ | 123,730,839 | |
| Shares of beneficial interest outstanding, unlimited authorization, no par | | | 3,025,037 | |
| Net asset value per share | | $ | 40.90 | |
| ____________________ |
| *Investments of unaffiliated issuers, at cost | | $ | 2,821,407,949 | |
| **Investments of affiliated issuers, at cost | | | 228,681,360 | |
See accompanying notes, which are an integral part of the financial statements.
16
Table of Contents
| Statement of operations | |
| Delaware Smid Cap Growth Fund | Year ended March 31, 2022 |
| Investment Income: | | | | |
| Dividends | | $ | 1,035,002 | |
| | |
| Expenses: | | | | |
| Management fees | | | 28,708,127 | |
| Distribution expenses — Class A | | | 3,955,202 | |
| Distribution expenses — Class C | | | 1,506,127 | |
| Distribution expenses — Class R | | | 96,853 | |
| Dividend disbursing and transfer agent fees and expenses | | | 4,312,539 | |
| Accounting and administration expenses | | | 743,086 | |
| Reports and statements to shareholders expenses | | | 553,421 | |
| Legal fees | | | 268,932 | |
| Custodian fees | | | 188,347 | |
| Trustees’ fees and expenses | | | 130,448 | |
| Audit and tax fees | | | 36,039 | |
| Registration fees | | | 17,634 | |
| Other | | | 105,308 | |
| Total operating expenses | | | 40,622,063 | |
| Net Investment Loss | | | (39,587,061 | ) |
| Net Realized and Unrealized Gain (Loss): | | | | |
| Net realized gain on: | | | | |
| Investments | | | 635,069,574 | |
| Affiliated investments | | | 38,426,007 | |
| Net realized gain | | | 673,495,581 | |
| Net change in unrealized appreciation (depreciation) of: | | | | |
| Investments | | | (1,634,383,090 | ) |
| Affiliated investments | | | 22,773,112 | |
| Net change in unrealized appreciation (depreciation) | | | (1,611,609,978 | ) |
| Net Realized and Unrealized Loss | | | (938,114,397 | ) |
| Net Decrease in Net Assets Resulting from Operations | | $ | (977,701,458 | ) |
See accompanying notes, which are an integral part of the financial statements.
17
Table of Contents
Statements of changes in net assets
Delaware Smid Cap Growth Fund
| | | | Year ended |
| | | | 3/31/22 | | 3/31/21 |
| Increase (Decrease) in Net Assets from Operations: | | | | | | | | |
| | Net investment loss | | $ | (39,587,061 | ) | | $ | (32,963,421 | ) |
| Net realized gain | | | 673,495,581 | | | | 818,640,121 | |
| Net change in unrealized appreciation (depreciation) | | | (1,611,609,978 | ) | | | 1,365,811,869 | |
| Net increase (decrease) in net assets resulting from | | | | | | | | |
| | operations | | | (977,701,458 | ) | | | 2,151,488,569 | |
| | | | | | | | | | | |
| Dividends and Distributions to Shareholders from: | | | | | | | | |
| Distributable earnings: | | | | | | | | |
| | Class A | | | (388,029,232 | ) | | | (133,621,441 | ) |
| | Class C | | | (102,904,882 | ) | | | (31,560,195 | ) |
| | Class R | | | (5,515,016 | ) | | | (1,665,932 | ) |
| | Institutional Class | | | (425,430,118 | ) | | | (142,466,698 | ) |
| | Class R6 | | | (24,966,099 | ) | | | (6,835,014 | ) |
| | | | | | (946,845,347 | ) | | | (316,149,280 | ) |
| | | | | | | | | | | |
| Capital Share Transactions: | | | | | | | | |
| Proceeds from shares sold: | | | | | | | | |
| | Class A | | | 126,050,746 | | | | 330,425,505 | |
| | Class C | | | 30,632,274 | | | | 78,968,559 | |
| | Class R | | | 7,935,252 | | | | 8,619,305 | |
| | Institutional Class | | | 994,225,661 | | | | 1,936,048,733 | |
| | Class R6 | | | 85,769,968 | | | | 126,363,906 | |
| Net asset value of shares issued upon reinvestment of | | | | | | | | |
| | dividends and distributions: | | | | | | | | |
| | Class A | | | 379,171,004 | | | | 130,025,509 | |
| | Class C | | | 101,391,167 | | | | 31,203,476 | |
| | Class R | | | 5,511,563 | | | | 1,663,251 | |
| | Institutional Class | | | 390,013,279 | | | | 129,783,966 | |
| | Class R6 | | | 24,568,483 | | | | 6,734,029 | |
| | | | | 2,145,269,397 | | | | 2,779,836,239 | |
18
Table of Contents
| | | | Year ended |
| | | | 3/31/22 | | 3/31/21 |
| Capital Share Transactions (continued): | | | | | | | | |
| | Cost of shares redeemed: | | | | | | | | |
| | Class A | | $ | (327,446,410 | ) | | $ | (271,575,591 | ) |
| | Class C | | | (77,825,426 | ) | | | (47,030,331 | ) |
| | Class R | | | (8,774,750 | ) | | | (8,060,187 | ) |
| | Institutional Class | | | (1,770,386,297 | ) | | | (784,803,669 | ) |
| | Class R6 | | | (73,145,079 | ) | | | (35,297,251 | ) |
| | | | | (2,257,577,962 | ) | | | (1,146,767,029 | ) |
| Increase (decrease) in net assets derived from capital | | | | | | | | |
| | share transactions | | | (112,308,565 | ) | | | 1,633,069,210 | |
| Net Increase (Decrease) in Net Assets | | | (2,036,855,370 | ) | | | 3,468,408,499 | |
| Net Assets: | | | | | | | | |
| Beginning of year | | | 5,070,195,410 | | | | 1,601,786,911 | |
| End of year | | $ | 3,033,340,040 | | | $ | 5,070,195,410 | |
See accompanying notes, which are an integral part of the financial statements.
19
Table of Contents
Financial highlights
Delaware Smid Cap Growth Fund Class A
Selected data for each share of the Fund outstanding throughout each period were as follows:
| Net asset value, beginning of period |
| |
| Income (loss) from investment operations: |
| Net investment loss1 |
| Net realized and unrealized gain (loss) |
| Total from investment operations |
| |
| Less dividends and distributions from: |
| Net realized gain |
| Total dividends and distributions |
| |
| Net asset value, end of period |
| |
| Total return2 |
| |
| Ratios and supplemental data: |
| Net assets, end of period (000 omitted) |
| Ratio of expenses to average net assets3 |
| Ratio of net investment loss to average net assets |
| Portfolio turnover |
| 1 | Calculated using average shares outstanding. |
| 2 | Total return is based on the change in net asset value of a share during the period and assumes reinvestment of dividends and distributions at net asset value and does not reflect the impact of a sales charge. |
| 3 | Expense ratios do not include expenses of the Underlying Funds in which the Fund invests. |
See accompanying notes, which are an integral part of the financial statements.
20
Table of Contents
| Year ended | |
| | | 3/31/22 | | | | 3/31/21 | | | | 3/31/20 | | | | 3/31/19 | | | | 3/31/18 | | |
| $ | 43.06 | | | $ | 21.93 | | | $ | 23.85 | | | $ | 22.83 | | | $ | 17.59 | | |
| | | | | | | | | | | | | | | | | | | | | |
| | | | | | | | | | | | | | | | | | | | | |
| | (0.37 | ) | | | (0.38 | ) | | | (0.26 | ) | | | (0.20 | ) | | | (0.20 | ) | |
| | (7.51 | ) | | | 25.13 | | | | (0.58 | ) | | | 4.35 | | | | 5.74 | | |
| | (7.88 | ) | | | 24.75 | | | | (0.84 | ) | | | 4.15 | | | | 5.54 | | |
| | | | | | | | | | | | | | | | | | | | | |
| | | | | | | | | | | | | | | | | | | | | |
| | (10.12 | ) | | | (3.62 | ) | | | (1.08 | ) | | | (3.13 | ) | | | (0.30 | ) | |
| | (10.12 | ) | | | (3.62 | ) | | | (1.08 | ) | | | (3.13 | ) | | | (0.30 | ) | |
| | | | | | | | | | | | | | | | | | | | | |
| $ | 25.06 | | | $ | 43.06 | | | $ | 21.93 | | | $ | 23.85 | | | $ | 22.83 | | |
| | | | | | | | | | | | | | | | | | | | | |
| | (21.65% | ) | | | 113.53% | | | | (3.96% | ) | | | 19.68% | | | | 31.68% | | |
| | | | | | | | | | | | | | | | | | | | | |
| | | | | | | | | | | | | | | | | | | | | |
| $ | 1,212,013 | | | $ | 1,773,669 | | | $ | 805,989 | | | $ | 901,171 | | | $ | 776,647 | | |
| | 1.04% | | | | 1.05% | | | | 1.10% | | | | 1.12% | | | | 1.17% | | |
| | (1.01% | ) | | | (1.01% | ) | | | (1.04% | ) | | | (0.82% | ) | | | (1.00% | ) | |
| | 81% | | | | 79% | | | | 113% | | | | 96% | | | | 101% | | |
21
Table of Contents
Financial highlights
Delaware Smid Cap Growth Fund Class C
Selected data for each share of the Fund outstanding throughout each period were as follows:
| Net asset value, beginning of period |
| |
| Income (loss) from investment operations: |
| Net investment loss1 |
| Net realized and unrealized gain (loss) |
| Total from investment operations |
| |
| Less dividends and distributions from: |
| Net realized gain |
| Total dividends and distributions |
| |
| Net asset value, end of period |
| |
| Total return2 |
| |
| Ratios and supplemental data: |
| Net assets, end of period (000 omitted) |
| Ratio of expenses to average net assets3 |
| Ratio of net investment loss to average net assets |
| Portfolio turnover |
| 1 | Calculated using average shares outstanding. |
| 2 | Total return is based on the change in net asset value of a share during the period and assumes reinvestment of dividends and distributions at net asset value and does not reflect the impact of a sales charge. |
| 3 | Expense ratios do not include expenses of the Underlying Funds in which the Fund invests. |
See accompanying notes, which are an integral part of the financial statements.
22
Table of Contents
| Year ended | |
| 3/31/22 | | 3/31/21 | | 3/31/20 | | 3/31/19 | | 3/31/18 | |
| | $ | 14.90 | | | $ | 8.81 | | | $ | 10.26 | | | $ | 11.55 | | | $ | 9.09 | | |
| | | |
| | | |
| | (0.14 | ) | | | (0.25 | ) | | | (0.19 | ) | | | (0.18 | ) | | | (0.18 | ) | |
| | (1.71 | ) | | | 9.96 | | | | (0.18 | ) | | | 2.02 | | | | 2.94 | | |
| | (1.85 | ) | | | 9.71 | | | | (0.37 | ) | | | 1.84 | | | | 2.76 | | |
| | | |
| | | |
| | (10.12 | ) | | | (3.62 | ) | | | (1.08 | ) | | | (3.13 | ) | | | (0.30 | ) | |
| | (10.12 | ) | | | (3.62 | ) | | | (1.08 | ) | | | (3.13 | ) | | | (0.30 | ) | |
| | | |
| $ | 2.93 | | | $ | 14.90 | | | $ | 8.81 | | | $ | 10.26 | | | $ | 11.55 | | |
| | | |
| | (22.33% | ) | | | 111.78% | | | | (4.63% | ) | | | 18.83% | | | | 30.71% | | |
| | | |
| | | |
| $ | 93,375 | | | $ | 173,533 | | | $ | 63,090 | | | $ | 56,065 | | | $ | 46,508 | | |
| | 1.79% | | | | 1.80% | | | | 1.85% | | | | 1.87% | | | | 1.92% | | |
| | (1.77% | ) | | | (1.76% | ) | | | (1.79% | ) | | | (1.57% | ) | | | (1.75% | ) | |
| | 81% | | | | 79% | | | | 113% | | | | 96% | | | | 101% | | |
23
Table of Contents
Financial highlights
Delaware Smid Cap Growth Fund Class R
Selected data for each share of the Fund outstanding throughout each period were as follows:
| Net asset value, beginning of period |
| |
| Income (loss) from investment operations: |
| Net investment loss1 |
| Net realized and unrealized gain (loss) |
| Total from investment operations |
| |
| Less dividends and distributions from: |
| Net realized gain |
| Total dividends and distributions |
| |
| Net asset value, end of period |
| |
| Total return2 |
| |
| Ratios and supplemental data: |
| Net assets, end of period (000 omitted) |
| Ratio of expenses to average net assets3 |
| Ratio of net investment loss to average net assets |
| Portfolio turnover |
| 1 | Calculated using average shares outstanding. |
| 2 | Total return is based on the change in net asset value of a share during the period and assumes reinvestment of dividends and distributions at net asset value. |
| 3 | Expense ratios do not include expenses of the Underlying Funds in which the Fund invests. |
See accompanying notes, which are an integral part of the financial statements.
24
Table of Contents
| Year ended | |
| | 3/31/22 | | | | 3/31/21 | | | | 3/31/20 | | | | 3/31/19 | | | | 3/31/18 | | |
| | $ | 38.27 | | | $ | 19.74 | | | $ | 21.62 | | | $ | 21.01 | | | $ | 16.25 | | |
| | | |
| | | |
| | (0.41 | ) | | | (0.43 | ) | | | (0.29 | ) | | | (0.24 | ) | | | (0.23 | ) | |
| | (6.50 | ) | | | 22.58 | | | | (0.51 | ) | | | 3.98 | | | | 5.29 | | |
| | (6.91 | ) | | | 22.15 | | | | (0.80 | ) | | | 3.74 | | | | 5.06 | | |
| | | |
| | | |
| | (10.12 | ) | | | (3.62 | ) | | | (1.08 | ) | | | (3.13 | ) | | | (0.30 | ) | |
| | (10.12 | ) | | | (3.62 | ) | | | (1.08 | ) | | | (3.13 | ) | | | (0.30 | ) | |
| | | |
| $ | 21.24 | | | $ | 38.27 | | | $ | 19.74 | | | $ | 21.62 | | | $ | 21.01 | | |
| | | |
| | (21.84% | ) | | | 112.94% | | | | (4.18% | ) | | | 19.42% | | | | 31.34% | | |
| | | |
| | | |
| $ | 13,230 | | | $ | 18,905 | | | $ | 8,477 | | | $ | 14,143 | | | $ | 13,068 | | |
| | 1.29% | | | | 1.30% | | | | 1.35% | | | | 1.37% | | | | 1.42% | | |
| | (1.27% | ) | | | (1.26% | ) | | | (1.29% | ) | | | (1.07% | ) | | | (1.25% | ) | |
| | 81% | | | | 79% | | | | 113% | | | | 96% | | | | 101% | | |
25
Table of Contents
Financial highlights
Delaware Smid Cap Growth Fund Institutional Class
Selected data for each share of the Fund outstanding throughout each period were as follows:
| Net asset value, beginning of period |
| |
| Income (loss) from investment operations: |
| Net investment loss1 |
| Net realized and unrealized gain (loss) |
| Total from investment operations |
| |
| Less dividends and distributions from: |
| Net realized gain |
| Total dividends and distributions |
| |
| Net asset value, end of period |
| |
| Total return2 |
| |
| Ratios and supplemental data: |
| Net assets, end of period (000 omitted) |
| Ratio of expenses to average net assets3 |
| Ratio of net investment loss to average net assets |
| Portfolio turnover |
| 1 | Calculated using average shares outstanding. |
| 2 | Total return is based on the change in net asset value of a share during the period and assumes reinvestment of dividends and distributions at net asset value. |
| 3 | Expense ratios do not include expenses of the Underlying Funds in which the Fund invests. |
See accompanying notes, which are an integral part of the financial statements.
26
Table of Contents
| Year ended | |
| 3/31/22 | | 3/31/21 | | 3/31/20 | | 3/31/19 | | 3/31/18 | | |
| | $ | 62.88 | | | $ | 31.14 | | | $ | 33.35 | | | $ | 30.69 | | | $ | 23.50 | | |
| | |
| | | |
| | (0.43 | ) | | | (0.43 | ) | | | (0.28 | ) | | | (0.19 | ) | | | (0.20 | ) | |
| | (11.62 | ) | | | 35.79 | | | | (0.85 | ) | | | 5.98 | | | | 7.69 | | |
| | (12.05 | ) | | | 35.36 | | | | (1.13 | ) | | | 5.79 | | | | 7.49 | | |
| | |
| | |
| | (10.12 | ) | | | (3.62 | ) | | | (1.08 | ) | | | (3.13 | ) | | | (0.30 | ) | |
| | (10.12 | ) | | | (3.62 | ) | | | (1.08 | ) | | | (3.13 | ) | | | (0.30 | ) | |
| | | |
| $ | 40.71 | | | $ | 62.88 | | | $ | 31.14 | | | $ | 33.35 | | | $ | 30.69 | | |
| | |
| | (21.45% | ) | | | 114.04% | | | | (3.70% | ) | | | 19.99% | | | | 32.01% | | |
| | | |
| | | |
| $ | 1,590,990 | | | $ | 2,959,703 | | | $ | 706,785 | | | $ | 585,344 | | | $ | 231,474 | | |
| | 0.79% | | | | 0.80% | | | | 0.85% | | | | 0.87% | | | | 0.92% | | |
| | (0.76% | ) | | | (0.76% | ) | | | (0.79% | ) | | | (0.57% | ) | | | (0.75% | ) | |
| | 81% | | | | 79% | | | | 113% | | | | 96% | | | | 101% | | |
27
Table of Contents
Financial highlights
Delaware Smid Cap Growth Fund Class R6
Selected data for each share of the Fund outstanding throughout each period were as follows:
| Net asset value, beginning of period |
| |
| Income (loss) from investment operations: |
| Net investment loss1 |
| Net realized and unrealized gain (loss) |
| Total from investment operations |
| |
| Less dividends and distributions from: |
| Net realized gain |
| Total dividends and distributions |
| |
| Net asset value, end of period |
| |
| Total return2 |
| |
| Ratios and supplemental data: |
| Net assets, end of period (000 omitted) |
| Ratio of expenses to average net assets3 |
| Ratio of net investment loss to average net assets |
| Portfolio turnover |
| 1 | Calculated using average shares outstanding. |
| 2 | Total return is based on the change in net asset value of a share during the period and assumes reinvestment of dividends and distributions at net asset value. |
| 3 | Expense ratios do not include expenses of the Underlying Funds in which the Fund invests. |
See accompanying notes, which are an integral part of the financial statements.
28
Table of Contents
| | | | | | | | | | | | | | | | | | | | | |
| Year ended | |
| 3/31/22 | | 3/31/21 | | 3/31/20 | | 3/31/19 | | 3/31/18 | |
| $ | 63.08 | | | $ | 31.21 | | | $ | 33.40 | | | $ | 30.71 | | | $ | 23.50 | | |
| | | |
| | | |
| | (0.38 | ) | | | (0.41 | ) | | | (0.25 | ) | | | (0.16 | ) | | | (0.19 | ) | |
| | (11.68 | ) | | | 35.90 | | | | (0.86 | ) | | | 5.98 | | | | 7.70 | | |
| | (12.06 | ) | | | 35.49 | | | | (1.11 | ) | | | 5.82 | | | | 7.51 | | |
| | | |
| | | |
| | (10.12 | ) | | | (3.62 | ) | | | (1.08 | ) | | | (3.13 | ) | | | (0.30 | ) | |
| | (10.12 | ) | | | (3.62 | ) | | | (1.08 | ) | | | (3.13 | ) | | | (0.30 | ) | |
| | | |
| $ | 40.90 | | | $ | 63.08 | | | $ | 31.21 | | | $ | 33.40 | | | $ | 30.71 | | |
| | | |
| | (21.39% | ) | | | 114.20% | | | | (3.63% | ) | | | 20.08% | | | | 32.10% | | |
| | | |
| | | | | | | | | | | | | | | | | | | | | |
| $ | 123,731 | | | $ | 144,385 | | | $ | 17,446 | | | $ | 9,005 | | | $ | 1,186 | | |
| | 0.71% | | | | 0.73% | | | | 0.77% | | | | 0.80% | | | | 0.84% | | |
| | (0.69% | ) | | | (0.69% | ) | | | (0.71% | ) | | | (0.50% | ) | | | (0.67% | ) | |
| | 81% | | | | 79% | | | | 113% | | | | 96% | | | | 101% | | |
29
Table of Contents
| Notes to financial statements | |
| Delaware Smid Cap Growth Fund | March 31, 2022 |
Delaware Group® Equity Funds IV (Trust) is organized as a Delaware statutory trust and offers 12 series. These financial statements and the related notes pertain to Delaware Smid Cap Growth Fund (Fund). The Trust is an open-end investment company. The Fund is considered diversified under the Investment Company Act of 1940, as amended, and offers Class A, Class C, Class R, Institutional Class, and Class R6 shares. Class A shares are sold with a maximum front-end sales charge of 5.75%. There is no front-end sales charge when you purchase $1,000,000 or more of Class A shares. However, if Delaware Distributors, L.P. (DDLP) paid your financial intermediary a commission on your purchase of $1,000,000 or more of Class A shares, for shares purchased prior to July 1, 2020, you will have to pay a limited contingent deferred sales charge (Limited CDSC) of 1.00% if you redeem these shares within the first year after your purchase and 0.50% if you redeem shares within the second year; and for shares purchased on or after July 1, 2020, you will have to pay a Limited CDSC of 1.00% if you redeem these shares within the first 18 months after your purchase; unless a specific waiver of the Limited CDSC applies. Class C shares are sold with a contingent deferred sales charge (CDSC) of 1.00%, which will be incurred if redeemed during the first 12 months. Class R, Institutional Class, and Class R6 shares are not subject to a sales charge and are offered for sale exclusively to certain eligible investors. In addition, Class R6 shares do not pay any service fees, sub-accounting fees, and/or sub-transfer agency fees to any brokers, dealers, or other financial intermediaries.
1. Significant Accounting Policies
The Fund follows accounting and reporting guidance under Financial Accounting Standards Board (FASB) Accounting Standards Codification Topic 946, Financial Services — Investment Companies. The following accounting policies are in accordance with US generally accepted accounting principles (US GAAP) and are consistently followed by the Fund.
Security Valuation — Equity securities, except those traded on the Nasdaq Stock Market LLC (Nasdaq), are valued at the last quoted sales price as of the time of the regular close of the New York Stock Exchange on the valuation date. Equity securities traded on the Nasdaq are valued in accordance with the Nasdaq Official Closing Price, which may not be the last sales price. If, on a particular day, an equity security does not trade, the mean between the bid and ask prices will be used, which approximates fair value. Open-end investment companies are valued at their published net asset value (NAV). Generally, other securities and assets for which market quotations are not readily available are valued at fair value as determined in good faith under the direction of the Trust’s Board of Trustees (Board). In determining whether market quotations are readily available or fair valuation will be used, various factors will be taken into consideration, such as market closures or suspension of trading in a security. Restricted securities are valued at fair value using methods approved by the Board.
Federal Income Taxes — No provision for federal income taxes has been made as the Fund intends to continue to qualify for federal income tax purposes as a regulated investment company under Subchapter M of the Internal Revenue Code of 1986, as amended, and make the requisite distributions to shareholders. The Fund evaluates tax positions taken or expected to
30
Table of Contents
be taken in the course of preparing the Fund's tax returns to determine whether the tax positions are “more-likely-than-not” of being sustained by the applicable tax authority. Tax positions not deemed to meet the “more-likely-than-not” threshold are recorded as a tax benefit or expense in the current year. Management has analyzed the Fund's tax positions taken or expected to be taken on the Fund's federal income tax returns through the year ended March 31, 2022, and for all open tax years (years ended March 31, 2019–March 31, 2021), and has concluded that no provision for federal income tax is required in the Fund's financial statements. If applicable, the Fund recognizes interest accrued on unrecognized tax benefits in interest expense and penalties in “Other” on the “Statement of operations.” During the year ended March 31, 2022, the Fund did not incur any interest or tax penalties.
Class Accounting — Investment income, common expenses, and realized and unrealized gain (loss) on investments are allocated to the various classes of the Fund on the basis of daily net assets of each class. Distribution expenses relating to a specific class are charged directly to that class. Class R6 shares will not be allocated any expenses related to service fees, sub-accounting fees, and/or sub-transfer agency fees paid to brokers, dealers, or other financial intermediaries.
Use of Estimates — The preparation of financial statements in conformity with US GAAP requires management to make estimates and assumptions that affect the fair value of investments, the reported amounts of assets and liabilities and disclosure of contingent assets and liabilities at the date of the financial statements, and the reported amounts of revenues and expenses during the reporting period. Actual results could differ from those estimates and the differences could be material.
Other — Expenses directly attributable to the Fund are charged directly to the Fund. Other expenses common to various funds within the Delaware Funds by Macquarie® (Delaware Funds) are generally allocated among such funds on the basis of average net assets. Management fees and certain other expenses are paid monthly. Security transactions are recorded on the date the securities are purchased or sold (trade date) for financial reporting purposes. Costs used in calculating realized gains and losses on the sale of investment securities are those of the specific securities sold. Dividend income is recorded on the ex-dividend date and interest income is recorded on the accrual basis. Taxable non-cash dividends are recorded as dividend income. Distributions received from investments in real estate investment trusts (REITs) are recorded as dividend income on the ex-dividend date, subject to reclassification upon notice of the character of such distributions by the issuer. The Fund declares and pays dividends from net investment income and distributions from net realized gain on investments, if any, annually. The Fund may distribute more frequently, if necessary for tax purposes. Dividends and distributions, if any, are recorded on the ex-dividend date.
The Fund receives earnings credits from its custodian when positive cash balances are maintained, which may be used to offset custody fees. The expenses paid under this arrangement are included on the “Statements of operations” under “Custodian fees” with the
31
Table of Contents
Notes to financial statements
Delaware Smid Cap Growth Fund
1. Significant Accounting Policies (continued)
corresponding expenses offset included under “Less expenses paid indirectly.” There were no such earnings credits for the year ended March 31, 2022.
The Fund receives earnings credits from its transfer agent when positive cash balances are maintained, which may be used to offset transfer agent fees. If the amount earned is greater than $1, the expenses paid under this arrangement are included on the “Statement of operations” under “Dividend disbursing and transfer agent fees and expenses” with the corresponding expenses offset included under “Less expenses paid indirectly.” For the year ended March 31, 2022, the Fund earned $1,123 under this arrangement.
2. Investment Management, Administration Agreements, and Other Transactions with Affiliates
In accordance with the terms of its investment management agreement, the Fund pays Delaware Management Company (DMC), a series of Macquarie Investment Management Business Trust and the investment manager, an annual fee which is calculated daily and paid monthly at the rates of 0.75% on the first $500 million of average daily net assets of the Fund, 0.70% on the next $500 million, 0.65% on the next $1.5 billion, and 0.60% on average daily net assets in excess of $2.5 billion.
DMC may permit its affiliates, Macquarie Investment Management Global Limited (MIMGL) and Macquarie Funds Management Hong Kong Limited (together, the “Affiliated Sub-Advisors”), to execute Fund equity security trades on its behalf. DMC may also seek quantitative support from MIMGL. Although the Affiliated Sub-Advisors serve as sub-advisors, DMC has ultimate responsibility for all investment advisory services. For these services, DMC, not the Fund, may pay each Affiliated Sub-Advisor a portion of its investment management fee.
Delaware Investments Fund Services Company (DIFSC), an affiliate of DMC, provides fund accounting and financial administrative oversight services to the Fund. For these services, DIFSC’s fees are calculated daily and paid monthly, based on the aggregate daily net assets of all funds within the Delaware Funds at the following annual rates: 0.00475% of the first $35 billion; 0.0040% of the next $10 billion; and 0.0025% of aggregate average daily net assets in excess of $45 billion (Total Fee). Each fund in the Delaware Funds pays a minimum of $4,000, which, in aggregate, is subtracted from the Total Fee. Each fund then pays its portion of the remainder of the Total Fee on a relative NAV basis. This amount is included on the “Statement of operations” under “Accounting and administration expenses.” For the year ended March 31, 2022, the Fund was charged $159,693 for these services.
DIFSC is also the transfer agent and dividend disbursing agent of the Fund. For these services, DIFSC’s fees are calculated daily and paid monthly, based on the aggregate daily net assets of the retail funds within the Delaware Funds at the following annual rates: 0.014% of the first $20 billion; 0.011% of the next $5 billion; 0.007% of the next $5 billion; 0.005% of the next $20 billion; and 0.0025% of average daily net assets in excess of $50 billion. The fees payable to DIFSC under the shareholder services agreement described above are allocated among all retail
32
Table of Contents
funds in the Delaware Funds on a relative NAV basis. This amount is included on the “Statement of operations” under “Dividend disbursing and transfer agent fees and expenses.” For the year ended March 31, 2022, the Fund was charged $382,490 for these services. Pursuant to a sub-transfer agency agreement between DIFSC and BNY Mellon Investment Servicing (US) Inc. (BNYMIS), BNYMIS provides certain sub-transfer agency services to the Fund. Sub-transfer agency fees are paid by the Fund and are also included on the “Statement of operations” under “Dividend disbursing and transfer agent fees and expenses.” The fees are calculated daily and paid as invoices are received on a monthly or quarterly basis.
Pursuant to a distribution agreement and distribution plan, the Fund pays DDLP, the distributor and an affiliate of DMC, an annual 12b-1 fee of 0.25%, 1.00%, and 0.50% of average daily net assets of the Class A, Class C, and Class R shares, respectively. The Board has adopted a formula for calculating 12b-1 fees for the Fund’s Class A shares. The total 12b-1 fees to be paid by Class A shareholders of the Fund will be the sum of: (i) 0.10% of average daily net assets representing shares that were acquired prior to June 1, 1992, and (ii) 0.25% of average daily net assets representing shares that were acquired on or after June 1, 1992. All Class A shareholders currently bear 12b-1 fees at the same rate, the blended rate, currently 0.25% of average daily net assets, based on formula described above. This method of calculating Class A 12b-1 fees may be discontinued at the sole discretion of the Board. The fees are calculated daily and paid monthly. Institutional Class and Class R6 shares do not pay 12b-1 fees.
As provided in the investment management agreement, the Fund bears a portion of the cost of certain resources shared with DMC, including the cost of internal personnel of DMC and/or its affiliates that provide legal and regulatory reporting services to the Fund. For the year ended March 31, 2022, the Fund was charged $160,774 for internal legal and regulatory reporting services provided by DMC and/or its affiliates’ employees. This amount is included on the “Statement of operations” under “Legal fees.”
For the year ended March 31, 2022, DDLP earned $132,304 for commissions on sales of the Fund’s Class A shares. For the year ended March 31, 2022, DDLP received gross CDSC commissions of $44,228 and $44,700 on redemptions of the Fund’s Class A and Class C shares, respectively, and these commissions were entirely used to offset upfront commissions previously paid by DDLP to broker/dealers on sales of those shares.
Trustees’ fees include expenses accrued by the Fund for each Trustee’s retainer and meeting fees. Certain officers of DMC, DIFSC, and DDLP are officers and/or Trustees of the Trust. These officers and Trustees are paid no compensation by the Fund.
In addition to the management fees and other expenses of the Fund, the Fund indirectly bears the investment management fees and other expenses of the investment companies (Underlying Funds) in which it invests. The amount of these fees and expenses incurred indirectly by the Fund will vary based upon the expense and fee levels of the Underlying Funds and the number of shares that are owned of the Underlying Funds at different times.
33
Table of Contents
Notes to financial statements
Delaware Smid Cap Growth Fund
2. Investment Management, Administration Agreements, and Other Transactions with Affiliates (continued)
Cross trades for the year ended March 31, 2022 were executed by the Fund pursuant to procedures adopted by the Board designed to ensure compliance with Rule 17a-7 under the 1940 Act. Cross trading is the buying or selling of portfolio securities between funds of investment companies, or between a fund of an investment company and another entity, that are or could be considered affiliates by virtue of having a common investment advisor (or affiliated investment advisors), common directors/trustees and/or common officers. At their regularly scheduled meetings, the Board reviews a report related to the Fund's compliance with the procedures adopted by the Board. Pursuant to these procedures, for the year ended March 31, 2022, the Fund engaged in Rule 17a-7 securities sales of $458,732,646 which resulted in realized gain of $219,034,890. The Fund did not engage in Rule 17a-7 securities purchases for the year ended March 31, 2022.
A summary of the transactions in affiliated companies during the year ended March 31, 2022 as follows:
| | | | | | | | | | | | Net | | | | | | | | | | | |
| | | | | | | | | | | | realized | | Net change in | | | | | |
| | | | | | | | | | | | gain (loss) | | unrealized | | | | | |
| | Value, | | | | | | | | | on | | appreciation | | Value, | | |
| | beginning | | Gross | | Gross | | affiliated | | (depreciation) | | end of | | |
| | of period | | additions | | reductions(1) | | securities | | on affiliated securities(2) | | period | | Shares |
| Common Stocks—8.3% | | | | | | | | | | | | | | | | | | | | | | | |
| Pacira | | | | | | | | | | | | | | | | | | | | | | | | | | |
| BioSciences† | | $ | 216,856,638 | | $ | — | | $ | (11,280,658 | ) | | | $ | — | | | | $ | (25,398,350 | ) | | | $ | 180,177,630 | | 2,360,818 |
| Quanterix† | | | 86,001,593 | | | 52,723,128 | | | — | | | | | — | | | | | (67,447,879 | ) | | | | 71,276,842 | | 2,441,824 |
| Total | | $ | 302,858,231 | | $ | 52,723,128 | | $ | (11,280,658 | ) | | | $ | — | | | | $ | (92,846,229 | ) | | | $ | 251,454,472 | | |
| (1) | The amount shown included return of capital. |
| (2) | Does not tie to Net change in unrealized appreciation (depreciation) on affiliated investments on the Statements of operations as a result of previously unaffiliated securities moving to affiliated. |
| † | Non-income producing security. |
3. Investments
For the year ended March 31, 2022, the Fund made purchases and sales of investment securities other than short-term investments as follows:
| Purchases | | $ | 3,608,597,229 |
| Sales | | | 4,702,545,703 |
34
Table of Contents
The tax cost of investments includes adjustments to net unrealized appreciation (depreciation), which may not necessarily be the final tax cost basis adjustments but which approximate the tax basis unrealized gains and losses that may be realized and distributed to shareholders. At March 31, 2022, the cost and unrealized appreciation (depreciation) of investments for federal income tax purposes for the Fund were as follows:
| Cost of investments | | $ | 3,128,841,233 | |
| Aggregate unrealized appreciation of investments | | $ | 427,024,448 | |
| Aggregate unrealized depreciation of investments | | | (515,123,206 | ) |
| Net unrealized depreciation of investments | | $ | (88,098,758 | ) |
US GAAP defines fair value as the price that the Fund would receive to sell an asset or pay to transfer a liability in an orderly transaction between market participants at the measurement date under current market conditions. A three-level hierarchy for fair value measurements has been established based upon the transparency of inputs to the valuation of an asset or liability. Inputs may be observable or unobservable and refer broadly to the assumptions that market participants would use in pricing the asset or liability. Observable inputs reflect the assumptions market participants would use in pricing the asset or liability based on market data obtained from sources independent of the reporting entity. Unobservable inputs reflect the reporting entity’s own assumptions about the assumptions that market participants would use in pricing the asset or liability based on the best information available under the circumstances. The Fund's investment in its entirety is assigned a level based upon the observability of the inputs which are significant to the overall valuation. The three-level hierarchy of inputs is summarized as follows:
| Level 1 – | Inputs are quoted prices in active markets for identical investments. (Examples: equity securities, open-end investment companies, futures contracts, and exchange-traded options contracts) |
| | |
| Level 2 – | Other observable inputs, including, but not limited to: quoted prices for similar assets or liabilities in markets that are active, quoted prices for identical or similar assets or liabilities in markets that are not active, inputs other than quoted prices that are observable for the assets or liabilities (such as interest rates, yield curves, volatilities, prepayment speeds, loss severities, credit risks, and default rates) or other market-corroborated inputs. (Examples: debt securities, government securities, swap contracts, foreign currency exchange contracts, foreign securities utilizing international fair value pricing, broker-quoted securities, and fair valued securities) |
| | |
| Level 3 – | Significant unobservable inputs, including the Fund's own assumptions used to determine the fair value of investments. (Examples: broker-quoted securities and fair valued securities) |
Level 3 investments are valued using significant unobservable inputs. The Fund may also use an income-based valuation approach in which the anticipated future cash flows of the investment are discounted to calculate fair value. Discounts may also be applied due to the nature or duration of any restrictions on the disposition of the investments. Valuations may also be based
35
Table of Contents
Notes to financial statements
Delaware Smid Cap Growth Fund
3. Investments (continued)
upon current market prices of securities that are comparable in coupon, rating, maturity, and industry. The derived value of a Level 3 investment may not represent the value which is received upon disposition and this could impact the results of operations.
The following table summarizes the valuation of the Fund’s investments by fair value hierarchy levels as of March 31, 2022:
| | Level 1 |
| Securities | | | |
| Assets: | | | |
| Common Stocks | | $ | 3,040,742,475 |
During the year ended March 31, 2022, there were no transfers into or out of Level 3 investments. The Fund’s policy is to recognize transfers into or out of Level 3 investments based on fair value at the beginning of the reporting period.
A reconciliation of Level 3 investments is presented when the Fund has a significant amount of Level 3 investments at the beginning or end of the period in relation to the Fund's net assets. During the year ended March 31, 2022, there were no Level 3 investments.
4. Dividend and Distribution Information
Income and long-term capital gain distributions are determined in accordance with federal income tax regulations, which may differ from US GAAP. Additionally, distributions from net short-term gains on sales of investment securities are treated as ordinary income for federal income tax purposes. The tax character of dividends and distributions paid during the years ended March 31, 2022 and 2021 were as follows:
| | Year ended |
| | 3/31/22 | | 3/31/21 |
| Ordinary income | | $ | 221,884,395 | | $ | 170,120,916 |
| Long-term capital gains | | | 724,960,952 | | | 146,028,364 |
| Total | | $ | 946,845,347 | | $ | 316,149,280 |
5. Components of Net Assets on a Tax Basis
As of March 31, 2022, the components of net assets on a tax basis were as follows:
| Shares of beneficial interest | | $ | 2,857,407,201 | |
| Undistributed long-term capital gains | | | 271,393,363 | |
| Qualified late year loss deferrals | | | (7,361,766 | ) |
| Unrealized appreciation (depreciation) of investments | | | (88,098,758 | ) |
| Net assets | | $ | 3,033,340,040 | |
36
Table of Contents
The differences between book basis and tax basis components of net assets are primarily attributable to tax deferral of losses on wash sales.
Qualified late year losses represent ordinary losses realized from January 1, 2022 through March 31, 2022 and capital losses realized from November 1, 2021 through March 31, 2022, that in accordance with federal income tax regulations, the Fund has elected to defer and treat as having arisen in the following fiscal year.
For financial reporting purposes, capital accounts are adjusted to reflect the tax character of permanent book/tax differences. Reclassifications are primarily due to tax treatment of net operating losses. Results of operations and net assets were not affected by these reclassifications. For the year ended March 31, 2022, the adjustments were to increase total distributable earnings and decrease paid-in capital in excess of par by $32,225,295.
6. Capital Shares
Transactions in capital shares were as follows:
| | Year ended | |
| | 3/31/22 | | 3/31/21 |
| Shares sold: | | | | | | |
| Class A | | 3,432,145 | | | 8,355,267 | |
| Class C | | 4,039,516 | | | 5,475,039 | |
| Class R | | 221,570 | | | 253,118 | |
| Institutional Class | | 18,132,394 | | | 36,304,882 | |
| Class R6 | | 1,552,815 | | | 2,202,150 | |
| | | | | | | |
| Shares issued upon reinvestment of dividends and distributions: | | | | | | |
| Class A | | 12,976,420 | | | 3,140,713 | |
| Class C | | 29,560,107 | | | 2,172,944 | |
| Class R | | 222,420 | | | 45,172 | |
| Institutional Class | | 8,224,658 | | | 2,148,741 | |
| Class R6 | | 515,819 | | | 111,178 | |
| | 78,877,864 | | | 60,209,204 | |
| |
| Shares redeemed: | | | | | | |
| Class A | | (9,242,186 | ) | | (7,053,999 | ) |
| Class C | | (13,394,575 | ) | | (3,167,099 | ) |
| Class R | | (315,120 | ) | | (233,779 | ) |
| Institutional Class | | (34,345,493 | ) | | (14,080,379 | ) |
| Class R6 | | (1,332,637 | ) | | (583,289 | ) |
| | (58,630,011 | ) | | (25,118,545 | ) |
| Net increase | | 20,247,853 | | | 35,090,659 | |
37
Table of Contents
Notes to financial statements
Delaware Smid Cap Growth Fund
6. Capital Shares (continued)
Certain shareholders may exchange shares of one class for shares of another class in the same Fund. These exchange transactions are included as subscriptions and redemptions in the table above and on the “Statements of changes in net assets.” For the years ended March 31, 2022 and 2021, the Fund had the following exchange transactions:
| | Exchange Redemptions | | Exchange Subscriptions | | | |
| | | | | | | | | | Institutional | | | | | | Institutional | | | | | | | |
| | Class A | | Class C | | Class | | Class A | | Class | | Class R6 | | | |
| | Shares Shares | | Shares | | Shares | | Shares | | Shares | | Shares | | Value |
| Year ended | | | | | | | | | | | | | | | | | | | | | | | | | | | |
| 3/31/22 | | | 89,594 | | | | 73,490 | | | | 30 | | | | 11,309 | | | | 66,443 | | | | — | | | $ | 4,591,642 |
| 3/31/21 | | | 489,160 | | | | 159,265 | | | | 3,659 | | | | 41,493 | | | | 96,218 | | | | 261,800 | | | | 21,929,292 |
7. Line of Credit
The Fund, along with certain other funds in the Delaware Funds (Participants), was a participant in a $225,000,000 revolving line of credit (Agreement) intended to be used for temporary or emergency purposes as an additional source of liquidity to fund redemptions of investor shares. Under the Agreement, the Participants were charged an annual commitment fee of 0.15% with the addition of an upfront fee of 0.05%, which was allocated across the Participants based on a weighted average of the respective net assets of each Participant. The Participants were permitted to borrow up to a maximum of one-third of their net assets under the Agreement. Each Participant was individually, and not jointly, liable for its particular advances, if any, under the line of credit. The line of credit available under the Agreement expired on November 1, 2021.
On November 1, 2021, the Fund, along with the other Participants, entered into an amendment to the agreement for a $355,000,000 revolving line of credit to be used as described above and operates in substantially the same manner as the original Agreement. Under the amendment to the agreement, the Participants are charged an annual commitment fee of 0.15%, with the addition of an upfront fee of 0.05%, which is allocated across the Participants based on a weighted average of the respective net assets of each Participant. The line of credit available under the agreement expires on October 31, 2022.
The Fund had no amounts outstanding as of March 31, 2022, or at any time during the year then ended.
8. Securities Lending
The Fund, along with other funds in Delaware Funds, may lend its securities pursuant to a security lending agreement (Lending Agreement) with The Bank of New York Mellon (BNY Mellon). At the time a security is loaned, the borrower must post collateral equal to the required percentage of the market value of the loaned security, including any accrued interest. The required percentage is: (1) 102% with respect to US securities and foreign securities that are denominated and payable in US dollars; and (2) 105% with respect to foreign securities. With respect to each loan, if on any business day the aggregate market value of securities collateral
38
Table of Contents
plus cash collateral held is less than the aggregate market value of the securities which are the subject of such loan, the borrower will be notified to provide additional collateral by the end of the following business day, which, together with the collateral already held, will be not less than the applicable initial collateral requirements for such security loan. If the aggregate market value of securities collateral and cash collateral held with respect to a security loan exceeds the applicable initial collateral requirement, upon the request of the borrower, BNY Mellon must return enough collateral to the borrower by the end of the following business day to reduce the value of the remaining collateral to the applicable initial collateral requirement for such security loan. As a result of the foregoing, the value of the collateral held with respect to a loaned security on any particular day, may be more or less than the value of the security on loan. The collateral percentage with respect to the market value of the loaned security is determined by the security lending agent.
Cash collateral received by the Fund of the Trust is generally invested in a series of individual separate accounts, each corresponding to a fund. The investment guidelines permit each separate account to hold certain securities that would be considered eligible securities for a money market fund. Cash collateral received is generally invested in government securities; certain obligations issued by government sponsored enterprises; repurchase agreements collateralized by US Treasury securities; obligations issued by the central government of any Organization for Economic Cooperation and Development (OECD) country or its agencies, instrumentalities, or establishments; obligations of supranational organizations; commercial paper, notes, bonds, and other debt obligations; certificates of deposit, time deposits, and other bank obligations; and asset-backed securities. The Fund can also accept US government securities and letters of credit (non-cash collateral) in connection with securities loans.
In the event of default or bankruptcy by the lending agent, realization and/or retention of the collateral may be subject to legal proceedings. In the event the borrower fails to return loaned securities and the collateral received is insufficient to cover the value of the loaned securities and provided such collateral shortfall is not the result of investment losses, the lending agent has agreed to pay the amount of the shortfall to the Fund or, at the discretion of the lending agent, replace the loaned securities. The Fund continues to record dividends or interest, as applicable, on the securities loaned and is subject to changes in value of the securities loaned that may occur during the term of the loan. The Fund has the right under the Lending Agreement to recover the securities from the borrower on demand. With respect to security loans collateralized by non-cash collateral, the Fund receives loan premiums paid by the borrower. With respect to security loans collateralized by cash collateral, the earnings from the collateral investments are shared among the Fund, the security lending agent, and the borrower. The Fund records security lending income net of allocations to the security lending agent and the borrower.
The Fund may incur investment losses as a result of investing securities lending collateral. This could occur if an investment in the collateral investment account defaulted or became impaired. Under those circumstances, the value of the Fund's cash collateral account may be less than the amount the Fund would be required to return to the borrowers of the securities and the Fund would be required to make up for this shortfall.
39
Table of Contents
Notes to financial statements
Delaware Smid Cap Growth Fund
8. Securities Lending (continued)
During the year ended March 31, 2022, the Fund had no securities out on loan.
9. Credit and Market Risk
Beginning in January 2020, global financial markets have experienced and may continue to experience significant volatility resulting from the spread of a novel coronavirus known as COVID-19. The outbreak of COVID-19 has resulted in travel and border restrictions, quarantines, supply chain disruptions, lower consumer demand, and general market uncertainty. The effects of COVID-19 have and may continue to adversely affect the global economy, the economies of certain nations, and individual issuers, all of which may negatively impact the Fund’s performance.
Investments in equity securities in general are subject to market risks that may cause their prices to fluctuate over time. Fluctuations in the value of equity securities in which the Fund invests will cause the NAV of the Fund to fluctuate.
The Fund invests in growth stocks (such as those in the technology sector), which reflect projections of future earnings and revenue. These prices may rise or fall dramatically depending on whether those projections are met. These companies’ stock prices may be more volatile, particularly over the short term.
The Fund invests a significant portion of its assets in small- and mid-sized companies and may be subject to certain risks associated with ownership of securities of such companies. Investments in small- or mid-sized companies may be more volatile than investments in larger companies for a number of reasons, which include limited financial resources or a dependence on narrow product lines.
The Fund invests in REITs and is subject to the risks associated with that industry. If the Fund holds real estate directly or receives rental income directly from real estate holdings, its tax status as a regulated investment company may be jeopardized. There were no direct real estate holdings during the year ended March 31, 2022. The Fund’s REIT holdings are also affected by interest rate changes, particularly if the REITs it holds use floating rate debt to finance their ongoing operations.
The Fund may invest up to 15% of its net assets in illiquid securities, which may include securities with contractual restrictions on resale, securities exempt from registration under Rule 144A promulgated under the Securities Act of 1933, as amended, and other securities which may not be readily marketable. The relative illiquidity of these securities may impair the Fund from disposing of them in a timely manner and at a fair price when it is necessary or desirable to do so. While maintaining oversight, the Board has delegated to DMC, the day-to-day functions of determining whether individual securities are liquid for purposes of the Fund’s limitation on investments in illiquid securities. Securities eligible for resale pursuant to Rule 144A,
40
Table of Contents
which are determined to be liquid, are not subject to the Fund’s 15% limit on investments in illiquid securities. As of March 31, 2022, there were no Rule 144A securities held by the Fund.
10. Contractual Obligations
The Fund enters into contracts in the normal course of business that contain a variety of indemnifications. The Fund's maximum exposure under these arrangements is unknown. However, the Fund has not had prior claims or losses pursuant to these contracts. Management has reviewed the Fund's existing contracts and expects the risk of loss to be remote.
11. Subsequent Events
Management has determined that no material events or transactions occurred subsequent to March 31, 2022, that would require recognition or disclosure in the Fund's financial statements.
41
Table of Contents
Report of independent
registered public accounting firm
To the Board of Trustees of Delaware Group® Equity Funds IV and Shareholders of Delaware
Smid Cap Growth Fund
Opinion on the Financial Statements
We have audited the accompanying statement of assets and liabilities, including the schedule of investments, of Delaware Smid Cap Growth Fund (one of the funds constituting Delaware Group® Equity Funds IV, referred to hereafter as the “Fund”) as of March 31, 2022, the related statement of operations for the year ended March 31, 2022, the statements of changes in net assets for each of the two years in the period ended March 31, 2022, including the related notes, and the financial highlights for each of the five years in the period ended March 31, 2022 (collectively referred to as the “financial statements”). In our opinion, the financial statements present fairly, in all material respects, the financial position of the Fund as of March 31, 2022, the results of its operations for the year then ended, the changes in its net assets for each of the two years in the period ended March 31, 2022 and the financial highlights for each of the five years in the period ended March 31, 2022 in conformity with accounting principles generally accepted in the United States of America.
Basis for Opinion
These financial statements are the responsibility of the Fund’s management. Our responsibility is to express an opinion on the Fund’s financial statements based on our audits. We are a public accounting firm registered with the Public Company Accounting Oversight Board (United States) (PCAOB) and are required to be independent with respect to the Fund in accordance with the U.S. federal securities laws and the applicable rules and regulations of the Securities and Exchange Commission and the PCAOB.
We conducted our audits of these financial statements in accordance with the standards of the PCAOB. Those standards require that we plan and perform the audit to obtain reasonable assurance about whether the financial statements are free of material misstatement, whether due to error or fraud.
Our audits included performing procedures to assess the risks of material misstatement of the financial statements, whether due to error or fraud, and performing procedures that respond to those risks. Such procedures included examining, on a test basis, evidence regarding the amounts and disclosures in the financial statements. Our audits also included evaluating the accounting principles used and significant estimates made by management, as well as evaluating the overall presentation of the financial statements. Our procedures included confirmation of securities owned as of March 31, 2022 by correspondence with the custodian, transfer agents and brokers; when replies were not received from brokers, we performed other auditing procedures. We believe that our audits provide a reasonable basis for our opinion.
/s/PricewaterhouseCoopers LLP
Philadelphia, Pennsylvania
May 31, 2022
We have served as the auditor of one or more investment companies in Delaware Funds by Macquarie® since 2010.
42
Table of Contents
Other Fund information (Unaudited)
Tax Information
The information set forth below is for the Fund’s fiscal year as required by federal income tax laws. Shareholders, however, must report distributions on a calendar year basis for income tax purposes, which may include distributions for portions of two fiscal years of the Fund. Accordingly, the information needed by shareholders for income tax purposes will be sent to them in January of each year. Please consult your tax advisor for proper treatment of this information.
All disclosures are based on financial information available as of the date of this annual report and, accordingly are subject to change. For any and all items requiring reporting, it is the intention of the Fund to report the maximum amount permitted under the Internal Revenue Code and the regulations thereunder.
For the fiscal year ended March 31, 2022, the Fund reports distributions paid during the year as follows:
| (A) Long-Term Capital Gain Distributions (Tax Basis) | 76.57 | % |
| (B) Ordinary Income Distributions (Tax Basis) | 23.43 | % |
| Total Distributions (Tax Basis) | 100.00 | % |
____________________
(A) and (B) are based on a percentage of the Fund’s total distributions.
43
Table of Contents
Board of trustees / directors and officers addendum
Delaware Funds by Macquarie®
A mutual fund is governed by a Board of Trustees/Directors (“Trustees”), which has oversight responsibility for the management of a fund’s business affairs. Trustees establish procedures and oversee and review the performance of the investment manager, the distributor, and others who perform services for the fund. The independent fund trustees, in particular, are advocates for shareholder interests. Each trustee has served in that capacity since he or she was elected to or appointed to the Board of Trustees, and will continue to serve until his or her retirement or the election of a new trustee in his or her place. The following is a list of the Trustees and Officers with certain background and related information.
| | | | | | | | Number of | | Other |
| | | | | | Principal | | Portfolios in Fund | | Directorships |
| Name, | | Position(s) | | | | Occupation(s) | | Complex Overseen | | Held by |
| Address, | | Held with | | Length of Time | | During the | | by Trustee | | Trustee |
| and Birth Date | | Fund(s) | | Served | | Past Five Years | | or Officer | | or Officer |
| Interested Trustee | | | | | | | | | | |
| |
| Shawn K. Lytle1 | | President, | | President and | | Global Head of Macquarie Asset | | 146 | | Trustee — UBS Relationship |
| 610 Market Street | | Chief Executive | | Chief Executive | | Management2 | | | | Funds, SMA Relationship Trust, |
| Philadelphia, PA | | Officer, | | Officer | | (January 2019–Present) | | | | and UBS Funds |
| 19106-2354 | | and Trustee | | since August 2015 | | Head of Americas of | | | | (May 2010–April 2015) |
| February 1970 | | | | Trustee since | | Macquarie Group | | | | |
| | | | September 2015 | | (December 2017–Present) | | | | |
| | | | | | Deputy Global Head of Macquarie | | | | |
| | | | | | Asset Management | | | | |
| | | | | | (2017–2019) | | | | |
| | | | | | Head of Macquarie Asset | | | | |
| | | | | | Management Americas | | | | |
| | | | | | (2015–2017) | | | | |
44
Table of Contents
| | | | | | | | Number of | | Other |
| | | | | | Principal | | Portfolios in Fund | | Directorships |
| Name, | | Position(s) | | | | Occupation(s) | | Complex Overseen | | Held by |
| Address, | | Held with | | Length of Time | | During the | | by Trustee | | Trustee |
| and Birth Date | | Fund(s) | | Served | | Past Five Years | | or Officer | | or Officer |
| Independent Trustees |
| |
| Jerome D. Abernathy | | Trustee | | Since January 2019 | | Managing Member, Stonebrook | | 146 | | None |
| 610 Market Street | | | | | | Capital Management, LLC | | | | |
| Philadelphia, PA | | | | | | (financial technology: macro | | | | |
| 19106-2354 | | | | | | factors and databases) | | | | |
| July 1959 | | | | | | (January 1993-Present) | | | | |
| |
| Thomas L. Bennett | | Chair and Trustee | | Trustee since March | | Private Investor | | 146 | | None |
| 610 Market Street | | | | 2005 | | (March 2004–Present) | | | | |
| Philadelphia, PA | | | | Chair since March | | | | | | |
| 19106-2354 | | | | 2015 | | | | | | |
| October 1947 | | | | | | | | | | |
| |
| Ann D. Borowiec | | Trustee | | Since March 2015 | | Chief Executive Officer, Private | | 146 | | Director — Banco Santander |
| 610 Market Street | | | | | | Wealth Management (2011–2013) | | | | International |
| Philadelphia, PA | | | | | | and Market Manager, New Jersey | | | | (October 2016–December 2019) |
| 19106-2354 | | | | | | Private Bank (2005–2011) — J.P. | | | | Director — Santander Bank, N.A. |
| November 1958 | | | | | | Morgan Chase & Co. | | | | (December 2016–December |
| | | | | | | | | | 2019) |
45
Table of Contents
Board of trustees / directors and officers addendum
Delaware Funds by Macquarie®
| | | | | | | | Number of | | Other |
| | | | | | Principal | | Portfolios in Fund | | Directorships |
| Name, | | Position(s) | | | | Occupation(s) | | Complex Overseen | | Held by |
| Address, | | Held with | | Length of Time | | During the | | by Trustee | | Trustee |
| and Birth Date | | Fund(s) | | Served | | Past Five Years | | or Officer | | or Officer |
| |
| Joseph W. Chow | | Trustee | | Since January 2013 | | Private Investor | | 146 | | Director and Audit Committee |
| 610 Market Street | | | | | | (April 2011–Present) | | | | Member — Hercules Technology |
| Philadelphia, PA | | | | | | | | | | Growth Capital, Inc. |
| 19106-2354 | | | | | | | | | | (July 2004–July 2014) |
| January 1953 | | | | | | | | | | |
46
Table of Contents
| | | | | | | | Number of | | Other |
| | | | | | Principal | | Portfolios in Fund | | Directorships |
| Name, | | Position(s) | | | | Occupation(s) | | Complex Overseen | | Held by |
| Address, | | Held with | | Length of Time | | During the | | by Trustee | | Trustee |
| and Birth Date | | Fund(s) | | Served | | Past Five Years | | or Officer | | or Officer |
| |
| H. Jeffrey Dobbs3 | | Trustee | | Since December 2021 | | Global Sector Chairman, | | 146 | | Director, Valparaiso University |
| 610 Market Street | | | | | | Industrial Manufacturing, | | | | (2012–Present) |
| Philadelphia, PA | | | | | | KPMG LLP | | | | Director, TechAccel LLC |
| 19106-2354 | | | | | | (2010-2015) | | | | (2015–Present) (Tech R&D) |
| May 1955 | | | | | | | | | | Board Member, Kansas City |
| | | | | | | | | | Repertory Theatre |
| | | | | | | | | | (2015–Present) |
| | | | | | | | | | Board Member, Patients |
| | | | | | | | | | Voices, Inc. (healthcare) |
| | | | | | | | | | (2018–Present) |
| | | | | | | | | | Kansas City Campus for Animal |
| | | | | | | | | | Care (2018–Present) |
| | | | | | | | | | Director, National Association of |
| | | | | | | | | | Manufacturers (2010–2015) |
| | | | | | | | | | Director, The Children’s Center |
| | | | | | | | | | (2003–2015) |
| | | | | | | | | | Director, Metropolitan Affairs |
| | | | | | | | | | Coalition (2003–2015) |
| | | | | | | | | | Director, Michigan Roundtable for |
| | | | | | | | | | Diversity and Inclusion |
| | | | | | | | | | (2003–2015) |
| | | | | | | | | | Trustee, Ivy Funds Complex |
| | | | | | | | | | (2019–2021) |
47
Table of Contents
Board of trustees / directors and officers addendum
Delaware Funds by Macquarie®
| | | | | | | | Number of | | Other |
| | | | | | Principal | | Portfolios in Fund | | Directorships |
| Name, | | Position(s) | | | | Occupation(s) | | Complex Overseen | | Held by |
| Address, | | Held with | | Length of Time | | During the | | by Trustee | | Trustee |
| and Birth Date | | Fund(s) | | Served | | Past Five Years | | or Officer | | or Officer |
| |
| John A. Fry | | Trustee | | Since January 2001 | | Drexel University | | 146 | | Director; Compensation |
| 610 Market Street | | | | | | (August 2010–Present) | | | | Committee and Governance |
| Philadelphia, PA | | | | | | President — Franklin & Marshall | | | | Committee Member — |
| 19106-2354 | | | | | | College | | | | Community Health Systems |
| May 1960 | | | | | | (July 2002–June 2010) | | | | (May 2004–Present) |
| | | | | | | | | | Director — Drexel Morgan & Co. |
| | | | | | | | | | (2015–2019) |
| | | | | | | | | | Director, Audit and Compensation |
| | | | | | | | | | Committee Member — vTv |
| | | | | | | | | | Therapeutics Inc. (2017–Present) |
| | | | | | | | | | Director and Audit Committee |
| | | | | | | | | | Member — FS Credit Real Estate |
| | | | | | | | | | Income Trust, Inc. (2018–Present) |
| | | | | | | | | | Director — Federal Reserve |
| | | | | | | | | | Bank of Philadelphia |
| | | | | | | | | | (January 2020–Present) |
48
Table of Contents
| | | | | | | | Number of | | Other |
| | | | | | Principal | | Portfolios in Fund | | Directorships |
| Name, | | Position(s) | | | | Occupation(s) | | Complex Overseen | | Held by |
| Address, | | Held with | | Length of Time | | During the | | by Trustee | | Trustee |
| and Birth Date | | Fund(s) | | Served | | Past Five Years | | or Officer | | or Officer |
| |
| Joseph Harroz, Jr.3 | | Trustee | | Since December 2021 | | President (2020–Present), Interim | | 146 | | Director, OU Medicine, Inc. |
| 610 Market Street | | | | | | President (2019–2020), Vice | | | | (2020–Present) |
| Philadelphia, PA | | | | | | President (2010–2019) and Dean | | | | Director and Shareholder, |
| 19106-2354 | | | | | | (2010–2019), College of Law, | | | | Valliance Bank |
| January 1967 | | | | | | University of Oklahoma; | | | | (2007–Present) |
| | | | | | Managing Member, Harroz | | | | Director, Foundation Healthcare |
| | | | | | Investments, LLC, (commercial | | | | (formerly Graymark HealthCare) |
| | | | | | enterprises) (1998–2019); | | | | (2008–2017) |
| | | | | | Managing Member, St. Clair, LLC | | | | Trustee, the Mewbourne Family |
| | | | | | (commercial enterprises) | | | | Support Organization |
| | | | | | (2019–Present) | | | | (2006–Present)(non-profit) |
| | | | | | | | | | Independent Director, LSQ |
| | | | | | | | | | Manager, Inc. (real estate) |
| | | | | | | | | | (2007–2016) |
| | | | | | | | | | Director, Oklahoma Foundation |
| | | | | | | | | | for Excellence (non-profit) |
| | | | | | | | | | (2008–Present) |
| | | | | | | | | | Trustee, Ivy Funds Complex |
| | | | | | | | | | (1998–2021) |
49
Table of Contents
Board of trustees / directors and officers addendum
Delaware Funds by Macquarie®
| | | | | | | | Number of | | Other |
| | | | | | Principal | | Portfolios in Fund | | Directorships |
| Name, | | Position(s) | | | | Occupation(s) | | Complex Overseen | | Held by |
| Address, | | Held with | | Length of Time | | During the | | by Trustee | | Trustee |
| and Birth Date | | Fund(s) | | Served | | Past Five Years | | or Officer | | or Officer |
| |
| Sandra A.J. | | Trustee | | Since December 2021 | | Chief Administrative Officer, | | 146 | | Director, Hall Family Foundation |
| Lawrence3 | | | | | | Children’s Mercy Hospitals and | | | | (1993–Present) |
| 610 Market Street | | | | | | Clinics | | | | Director, Westar Energy (utility) |
| Philadelphia, PA | | | | | | (2016–2019); | | | | (2004–2018) |
| 19106-2354 | | | | | | CFO, Children’s Mercy Hospitals | | | | Trustee, Nelson-Atkins Museum |
| September 1957 | | | | | | and Clinics | | | | of Art (non-profit) (2021–Present) |
| | | | | | (2005–2016) | | | | (2007–2020) |
| | | | | | | | | | Director, Turn the Page KC |
| | | | | | | | | | (non-profit) (2012–2016) |
| | | | | | | | | | Director, Kansas Metropolitan |
| | | | | | | | | | Business and Healthcare |
| | | | | | | | | | Coalition (non-profit) (2017–2019) |
| | | | | | | | | | Director, National Association of |
| | | | | | | | | | Corporate Directors (non-profit) |
| | | | | | | | | | National Board (2022–Present); |
| | | | | | | | | | Regional Board (2017–2021) |
| | | | | | | | | | Director, American Shared |
| | | | | | | | | | Hospital Services (medical |
| | | | | | | | | | device) (2017–2021) |
| | | | | | | | | | Director, Evergy, Inc., Kansas City |
| | | | | | | | | | Power & Light Company, KCP&L |
| | | | | | | | | | Greater Missouri Operations |
| | | | | | | | | | Company, Westar Energy, Inc. |
| | | | | | | | | | and Kansas Gas and Electric |
| | | | | | | | | | Company (related utility |
| | | | | | | | | | companies) (2018–Present) |
50
Table of Contents
| | | | | | | | Number of | | Other |
| | | | | | Principal | | Portfolios in Fund | | Directorships |
| Name, | | Position(s) | | | | Occupation(s) | | Complex Overseen | | Held by |
| Address, | | Held with | | Length of Time | | During the | | by Trustee | | Trustee |
| and Birth Date | | Fund(s) | | Served | | Past Five Years | | or Officer | | or Officer |
| |
| Sandra A.J. | | Trustee | | Since December 2021 | | Chief Administrative Officer, | | 146 | | Director, Stowers (research) |
| Lawrence3 | | | | | | Children’s Mercy Hospitals and | | | | (2018) |
| (continued) | | | | | | Clinics | | | | Co-Chair, Women Corporate |
| 610 Market Street | | | | | | (2016–2019); | | | | Directors (director education) |
| Philadelphia, PA | | | | | | CFO, Children’s Mercy Hospitals | | | | (2018–2020) |
| 19106-2354 | | | | | | and Clinics | | | | Trustee, Ivy Funds Complex |
| September 1957 | | | | | | (2005–2016) | | | | (2019-2021) |
| | | | | | | | | | Director, Brixmor Property |
| | | | | | | | | | Group Inc. |
| | | | | | | | | | (2021–Present) |
| | | | | | | | | | Director, Sera Prognostics Inc. |
| | | | | | | | | | (biotechnology) |
| | | | | | | | | | (2021–Present) |
| | | | | | | | | | Director, Recology (resource |
| | | | | | | | | | recovery) |
| | | | | | | | | | (2021–Present) |
51
Table of Contents
Board of trustees / directors and officers addendum
Delaware Funds by Macquarie®
| | | | | | | | | Number of | | Other |
| | | | | | Principal | | Portfolios in Fund | | Directorships |
| Name, | | Position(s) | | | | Occupation(s) | | Complex Overseen | | Held by |
| Address, | | Held with | | Length of Time | | During the | | by Trustee | | Trustee |
| and Birth Date | | Fund(s) | | Served | | Past Five Years | | or Officer | | or Officer |
| |
| Frances A. | | Trustee | | Since September 2011 | | Private Investor | | 146 | | Trust Manager and Audit |
| Sevilla-Sacasa | | | | | | (January 2017–Present) | | | | Committee Chair — Camden |
| 610 Market Street | | | | | | Chief Executive Officer — Banco | | | | Property Trust |
| Philadelphia, PA | | | | | | Itaú International | | | | (August 2011–Present) |
| 19106-2354 | | | | | | (April 2012–December 2016) | | | | Director; Audit |
| January 1956 | | | | | | Executive Advisor to Dean | | | | and Compensation |
| | | | | | (August 2011–March 2012) and | | | | Committee Member — |
| | | | | | Interim Dean | | | | Callon Petroleum Company |
| | | | | | (January 2011–July 2011) — | | | | (December 2019–Present) |
| | | | | | University of Miami School of | | | | Director — New Senior |
| | | | | | Business Administration | | | | Investment Group Inc. |
| | | | | | President — U.S. Trust, Bank of | | | | (January 2021–September 2021) |
| | | | | | America Private Wealth | | | | Director; Audit Committee |
| | | | | | Management (Private Banking) | | | | Member — Carrizo Oil & Gas, |
| | | | | | (July 2007-December 2008) | | | | Inc. (March 2018–December |
| | | | | | | | | | 2019) |
52
Table of Contents
| | | | | | | | Number of | | Other |
| | | | | | Principal | | Portfolios in Fund | | Directorships |
| Name, | | Position(s) | | | | Occupation(s) | | Complex Overseen | | Held by |
| Address, | | Held with | | Length of Time | | During the | | by Trustee | | Trustee |
| and Birth Date | | Fund(s) | | Served | | Past Five Years | | or Officer | | or Officer |
| |
| Thomas K. Whitford | | Trustee | | Since January 2013 | | Vice Chairman — PNC Financial | | 146 | | Director — HSBC North America |
| 610 Market Street | | | | | | Services Group | | | | Holdings Inc. |
| Philadelphia, PA | | | | | | (2010–April 2013) | | | | (December 2013–Present) |
| 19106-2354 | | | | | | | | | | Director — HSBC USA Inc. |
| March 1956 | | | | | | | | | | (July 2014–Present) |
| | | | | | | | | | Director — HSBC Bank USA, |
| | | | | | | | | | National Association |
| | | | | | | | | | (July 2014–March 2017) |
| | | | | | | | | | Director — HSBC Finance |
| | | | | | | | | | Corporation |
| | | | | | | | | | (December 2013–April 2018) |
53
Table of Contents
Board of trustees / directors and officers addendum
Delaware Funds by Macquarie®
| | | | | | | | Number of | | Other |
| | | | | | Principal | | Portfolios in Fund | | Directorships |
| Name, | | Position(s) | | | | Occupation(s) | | Complex Overseen | | Held by |
| Address, | | Held with | | Length of Time | | During the | | by Trustee | | Trustee |
| and Birth Date | | Fund(s) | | Served | | Past Five Years | | or Officer | | or Officer |
| |
| Christianna Wood | | Trustee | | Since January 2019 | | Chief Executive Officer and | | 146 | | Director; Finance Committee and |
| 610 Market Street | | | | | | President — Gore Creek Capital, | | | | Audit Committee Member — H&R |
| Philadelphia, PA | | | | | | Ltd. (August 2009–Present) | | | | Block Corporation |
| 19106-2354 | | | | | | | | | | (July 2008–Present) |
| August 1959 | | | | | | | | | | Director; Investments Committee, |
| | | | | | | | | | Capital and Finance Committee, |
| | | | | | | | | | and Audit Committee Member — |
| | | | | | | | | | Grange Insurance |
| | | | | | | | | | (2013–Present) |
| | | | | | | | | | Trustee; Chair of Nominating and |
| | | | | | | | | | Governance Committee and Audit |
| | | | | | | | | | Committee Member — |
| | | | | | | | | | The Merger Fund |
| | | | | | | | | | (2013–October 2021), |
| | | | | | | | | | The Merger Fund VL |
| | | | | | | | | | (2013–October 2021); WCM |
| | | | | | | | | | Alternatives: Event-Driven Fund |
| | | | | | | | | | (2013–October 2021), and WCM |
| | | | | | | | | | Alternatives: Credit Event Fund |
| | | | | | | | | | (December 2017–October 2021) |
| | | | | | | | | | Director; Chair of Governance |
| | | | | | | | | | Committee and Audit Committee |
| | | | | | | | | | Member — International |
| | | | | | | | | | Securities Exchange (2010–2016) |
54
Table of Contents
| | | | | | | | Number of | | Other |
| | | | | | Principal | | Portfolios in Fund | | Directorships |
| Name, | | Position(s) | | | | Occupation(s) | | Complex Overseen | | Held by |
| Address, | | Held with | | Length of Time | | During the | | by Trustee | | Trustee |
| and Birth Date | | Fund(s) | | Served | | Past Five Years | | or Officer | | or Officer |
| |
| Janet L. Yeomans | | Trustee | | Since April 1999 | | Vice President and Treasurer | | 146 | | Director; Personnel and |
| 610 Market Street | | | | | | (January 2006–July 2012), Vice | | | | Compensation Committee Chair; |
| Philadelphia, PA | | | | | | President — Mergers & | | | | Member of Nominating, |
| 19106-2354 | | | | | | Acquisitions | | | | Investments, and Audit |
| July 1948 | | | | | | (January 2003–January 2006), | | | | Committees for various periods |
| | | | | | and Vice President and Treasurer | | | | throughout directorship — |
| | | | | | (July 1995–January 2003) — 3M | | | | Okabena Company (2009–2017) |
| | | | | | Company | | | | |
| |
| Officers | | | | | | | | | | |
| |
| David F. Connor | | Senior Vice President, | | Senior Vice President, | | David F. Connor has served in | | 146 | | None4 |
| 610 Market Street | | General Counsel, and | | since May 2013; | | various capacities at different | | | | |
| Philadelphia, PA | | Secretary | | General Counsel | | times at Macquarie Asset | | | | |
| 19106-2354 | | | | since May 2015; | | Management. | | | | |
| December 1963 | | | | Secretary since | | | | | | |
| | | | October 2005 | | | | | | |
| |
| Daniel V. Geatens | | Senior Vice President | | Senior Vice President | | Daniel V. Geatens has served in | | 146 | | None4 |
| 610 Market Street | | and Treasurer | | and Treasurer since | | various capacities at different | | | | |
| Philadelphia, PA | | | | October 2007 | | times at Macquarie Asset | | | | |
| 19106-2354 | | | | | | Management. | | | | |
| October 1972 | | | | | | | | | | |
55
Table of Contents
Board of trustees / directors and officers addendum
Delaware Funds by Macquarie®
| | | | | | | | Number of | | Other |
| | | | | | Principal | | Portfolios in Fund | | Directorships |
| Name, | | Position(s) | | | | Occupation(s) | | Complex Overseen | | Held by |
| Address, | | Held with | | Length of Time | | During the | | by Trustee | | Trustee |
| and Birth Date | | Fund(s) | | Served | | Past Five Years | | or Officer | | or Officer |
| |
| Richard Salus | | Senior Vice President | | Senior Vice President | | Richard Salus has served in | | 146 | | None |
| 610 Market Street | | and Chief Financial | | and Chief Financial | | various capacities at different | | | | |
| Philadelphia, PA | | Officer | | Officer since | | times at Macquarie Asset | | | | |
| 19106-2354 | | | | November 2006 | | Management. | | | | |
| October 1963 | | | | | | | | | | |
| 1 | Shawn K. Lytle is considered to be an “Interested Trustee” because he is an executive officer of the Fund’s(s’) investment advisor. |
| 2 | Macquarie Asset Management is the marketing name for Macquarie Management Holdings, Inc. and its subsidiaries, including the Fund’s(s’) investment advisor, principal underwriter, and its transfer agent. |
| 3 | Messrs. Dobbs and Harroz and Ms. Lawrence were elected as Trustees of the Trust effective December 17, 2021. |
| 4 | David F. Connor serves as Senior Vice President and Secretary, and Daniel V. Geatens serves as Senior Vice President, Treasurer, and Chief Financial Officer, for the six portfolios of the Optimum Fund Trust, which have the same investment advisor, principal underwriter, and transfer agent as the registrant. Mr. Geatens also serves as the Chief Financial Officer and Treasurer for Macquarie Global Infrastructure Total Return Fund Inc. |
The Statement of Additional Information for the Fund(s) includes additional information about the Trustees and Officers and is available, without charge, upon request by calling 800 523-1918.
56
Table of Contents
About the organization
| Board of trustees | | | |
| Shawn K. Lytle | Ann D. Borowiec | John A. Fry | Frances A. |
| President and | Former Chief Executive | President | Sevilla-Sacasa |
| Chief Executive Officer | Officer | Drexel University | Former Chief Executive |
| Delaware Funds | Private Wealth Management | | Officer |
| by Macquarie® | J.P. Morgan Chase & Co. | Joseph Harroz, Jr. | Banco Itaú International |
| | President | |
| Jerome D. Abernathy | Joseph W. Chow | University of Oklahoma | Thomas K. Whitford |
| Managing Member | Private Investor | | Former Vice Chairman |
| Stonebrook Capital | | Sandra A.J. Lawrence | PNC Financial Services |
| Management, LLC | H. Jeffrey Dobbs | Former Chief Administrative | Group |
| Former Global Sector | Officer | |
| Thomas L. Bennett | Chairman | Children's Mercy Hospitals | Christianna Wood |
| Chairman of the Board | Industrial Manufacturing, | and Clinics | Chief Executive Officer |
| Delaware Funds | KPMG, LLP | | and President |
| by Macquarie | | | Gore Creek Capital, Ltd. |
| Private Investor | | | |
| | | Janet L. Yeomans |
| | | Former Vice President and |
| | | Treasurer |
| | | 3M Company |
| | | | |
| Affiliated officers | | | |
| David F. Connor | Daniel V. Geatens | Richard Salus | |
| Senior Vice President, | Senior Vice President and | Senior Vice President and | |
| General Counsel, | Treasurer | Chief Financial Officer | |
| and Secretary | Delaware Funds | Delaware Funds | |
| Delaware Funds | by Macquarie | by Macquarie | |
| by Macquarie | | | |
This annual report is for the information of Delaware Smid Cap Growth Fund shareholders, but it may be used with prospective investors when preceded or accompanied by the Delaware Fund fact sheet for the most recently completed calendar quarter. These documents are available at delawarefunds.com/literature. |
The Fund files its complete schedule of portfolio holdings with the Securities and Exchange Commission (SEC) for the first and third quarters of each fiscal year on Form N-PORT. The Fund’s Forms N-PORT, as well as a description of the policies and procedures that the Fund uses to determine how to vote proxies (if any) relating to portfolio securities, are available without charge (i) upon request, by calling 800 523-1918; and (ii) on the SEC’s website at sec.gov. In addition, a description of the policies and procedures that the Fund uses to determine how to vote proxies (if any) relating to portfolio securities and the Schedule of Investments included in the Fund’s most recent Form N-PORT are available without charge on the Fund’s website at delawarefunds.com/literature. The Fund’s Forms N-PORT may be reviewed and copied at the SEC’s Public Reference Room in Washington, D.C.; information on the operation of the Public Reference Room may be obtained by calling 800 SEC-0330.
Information (if any) regarding how the Fund voted proxies relating to portfolio securities during the most recently disclosed 12-month period ended June 30 is available without charge (i) through the Fund’s website at delawarefunds.com/proxy; and (ii) on the SEC’s website at sec.gov.
57
Item 2. Code of Ethics
The registrant has adopted a code of ethics that applies to the registrant’s principal executive officer, principal financial officer, principal accounting officer or controller, or persons performing similar functions, regardless of whether these individuals are employed by the registrant or a third party. A copy of the registrant’s Code of Business Ethics has been posted on the Delaware Funds by Macquarie® Internet Web site at www.delawarefunds.com. Any amendments to the Code of Business Ethics, and information on any waiver from its provisions granted by the registrant, will also be posted on this Web site within five business days of such amendment or waiver and will remain on the Web site for at least 12 months.
Item 3. Audit Committee Financial Expert
The registrant’s Board of Trustees has determined that certain members of the registrant’s Audit Committee are audit committee financial experts, as defined below. For purposes of this item, an “audit committee financial expert” is a person who has the following attributes:
a. An understanding of generally accepted accounting principles and financial statements;
b. The ability to assess the general application of such principles in connection with the accounting for estimates, accruals, and reserves;
c. Experience preparing, auditing, analyzing, or evaluating financial statements that present a breadth and level of complexity of accounting issues that are generally comparable to the breadth and complexity of issues that can reasonably be expected to be raised by the registrant’s financial statements, or experience actively supervising one or more persons engaged in such activities;
d. An understanding of internal controls and procedures for financial reporting; and
e. An understanding of audit committee functions.
An “audit committee financial expert” shall have acquired such attributes through:
a. Education and experience as a principal financial officer, principal accounting officer, controller, public accountant, or auditor or experience in one or more positions that involve the performance of similar functions;
b. Experience actively supervising a principal financial officer, principal accounting officer, controller, public accountant, auditor, or person performing similar functions;
c. Experience overseeing or assessing the performance of companies or public accountants with respect to the preparation, auditing, or evaluation of financial statements; or
d. Other relevant experience.
The registrant’s Board of Trustees has also determined that each member of the registrant’s Audit Committee is independent. In order to be “independent” for purposes of this item, the Audit Committee member may not: (i) other than in his or her capacity as a member of the Board of Trustees or any committee thereof, accept directly or indirectly any consulting, advisory or other compensatory fee from the issuer; or (ii) be an “interested person” of the registrant as defined in Section 2(a)(19) of the Investment Company Act of 1940.
The names of the audit committee financial experts on the registrant’s Audit Committee are set forth below:
H. Jeffrey Dobbs
John A. Fry
Sandra A.J. Lawrence
Frances Sevilla-Sacasa, Chair
Item 4. Principal Accountant Fees and Services
(a) Audit fees.
The aggregate fees billed for services provided to the registrant by its independent auditors for the audit of the registrant’s annual financial statements and for services normally provided by the independent auditors in connection with statutory and regulatory filings or engagements were $78,993 for the fiscal year ended March 31, 2022.
The aggregate fees billed for services provided to the registrant by its independent auditors for the audit of the registrant’s annual financial statements and for services normally provided by the independent auditors in connection with statutory and regulatory filings or engagements were $87,770 for the fiscal year ended March 31, 2021.
(b) Audit-related fees.
The aggregate fees billed by the registrant’s independent auditors for services relating to the performance of the audit of the registrant’s financial statements and not reported under paragraph (a) of this Item were $0 for the fiscal year ended March 31, 2022.
The aggregate fees billed by the registrant’s independent auditors for services relating to the performance of the audit of the financial statements of the registrant’s investment adviser and other service providers under common control with the adviser and that relate directly to the operations or financial reporting of the registrant were $1,134,001 for the registrant’s fiscal year ended March 31, 2022. The percentage of these fees relating to services approved by the registrant’s Audit Committee pursuant to the de minimis exception from the pre-approval requirement in Rule 2-01(c)(7)(i)(C) of Regulation S-X was 0%. These audit-related services were as follows: year-end audit procedures; group reporting and subsidiary statutory audits.
The aggregate fees billed by the registrant’s independent auditors for services relating to the performance of the audit of the registrant’s financial statements and not reported under paragraph (a) of this Item were $0 for the fiscal year ended March 31, 2021.
The aggregate fees billed by the registrant’s independent auditors for services relating to the performance of the audit of the financial statements of the registrant’s investment adviser and other service providers under common control with the adviser and that relate directly to the operations or financial reporting of the registrant were $903,282 for the registrant’s fiscal year ended March 31, 2021. The percentage of these fees relating to services approved by the registrant’s Audit Committee pursuant to the de minimis exception from the pre-approval requirement in Rule 2-01(c)(7)(i)(C) of Regulation S-X was 0%. These audit-related services were as follows: year-end audit procedures; group reporting and subsidiary statutory audits.
(c) Tax fees.
The aggregate fees billed by the registrant’s independent auditors for tax-related services provided to the registrant were $14,850 for the fiscal year ended March 31, 2022. The percentage of these fees relating to services approved by the registrant’s Audit Committee pursuant to the de minimis exception from the pre-approval requirement in Rule 2-01(c)(7)(i)(C) of Regulation S-X was 0%. These tax-related services were as follows: review of income tax returns and review of annual excise distribution calculations.
The aggregate fees billed by the registrant’s independent auditors for tax-related services provided to the registrant’s investment adviser and other service providers under common control with the adviser and that relate directly to the operations or financial reporting of the registrant were $0 for the registrant’s fiscal year ended March 31, 2022.
The aggregate fees billed by the registrant’s independent auditors for tax-related services provided to the registrant were $16,500 for the fiscal year ended March 31, 2021. The percentage of these fees relating to services approved by the registrant’s Audit Committee pursuant to the de minimis exception from the pre-approval requirement in Rule 2-01(c)(7)(i)(C) of Regulation S-X was 0%. These tax-related services were as follows: review of income tax returns and review of annual excise distribution calculations.
The aggregate fees billed by the registrant’s independent auditors for tax-related services provided to the registrant’s investment adviser and other service providers under common control with the adviser and that relate directly to the operations or financial reporting of the registrant were $0 for the registrant’s fiscal year ended March 31, 2021.
(d) All other fees.
The aggregate fees billed for all services provided by the independent auditors to the registrant other than those set forth in paragraphs (a), (b) and (c) of this Item were $0 for the fiscal year ended March 31, 2022.
The aggregate fees billed for all services other than those set forth in paragraphs (b) and (c) of this Item provided by the registrant’s independent auditors to the registrant’s adviser and other service providers under common control with the adviser and that relate directly to the operations or financial reporting of the registrant were $0 for the registrant’s fiscal year ended March 31, 2022. The percentage of these fees relating to services approved by the registrant’s
Audit Committee pursuant to the de minimis exception from the pre-approval requirement in Rule 2-01(c)(7)(i)(C) of Regulation S-X was 0%.
The aggregate fees billed for all services provided by the independent auditors to the registrant other than those set forth in paragraphs (a), (b) and (c) of this Item were $0 for the fiscal year ended March 31, 2021.
The aggregate fees billed for all services other than those set forth in paragraphs (b) and (c) of this Item provided by the registrant’s independent auditors to the registrant’s adviser and other service providers under common control with the adviser and that relate directly to the operations or financial reporting of the registrant were $0 for the registrant’s fiscal year ended March 31, 2021. The percentage of these fees relating to services approved by the registrant’s Audit Committee pursuant to the de minimis exception from the pre-approval requirement in Rule 2-01(c)(7)(i)(C) of Regulation S-X was 0%.
(e) The registrant’s Audit Committee has established pre-approval policies and procedures as permitted by Rule 2-01(c)(7)(i)(B) of Regulation S-X (the “Pre-Approval Policy”) with respect to services provided by the registrant’s independent auditors. Pursuant to the Pre-Approval Policy, the Audit Committee has pre-approved the services set forth in the table below with respect to the registrant up to the specified fee limits. Certain fee limits are based on aggregate fees to the registrant and other registrants within the Delaware Funds by Macquarie®.
| Service | Range of Fees |
| Audit Services | |
| Statutory audits or financial audits for new Funds | up to $50,000 per Fund |
| Services associated with SEC registration statements (e.g., Form N-1A, Form N-14, etc.), periodic reports and other documents filed with the SEC or other documents issued in connection with securities offerings (e.g., comfort letters for closed-end Fund offerings, consents), and assistance in responding to SEC comment letters | up to $10,000 per Fund |
| Consultations by Fund management as to the accounting or disclosure treatment of transactions or events and/or the actual or potential impact of final or proposed rules, standards or interpretations by the SEC, FASB, or other regulatory or standard-setting bodies (Note: Under SEC rules, some consultations may be considered “audit-related services” rather than “audit services”) | up to $25,000 in the aggregate |
| Audit-Related Services | |
| Consultations by Fund management as to the accounting or disclosure treatment of transactions or events and /or the actual or potential impact of final or proposed rules, standards or interpretations by the SEC, FASB, or other regulatory or standard-setting bodies (Note: Under SEC rules, some consultations may be considered “audit services” rather than “audit-related services”) | up to $25,000 in the aggregate |
| Tax Services | |
| U.S. federal, state and local and international tax planning and advice (e.g., consulting on statutory, regulatory or administrative developments, evaluation of Funds’ tax compliance function, etc.) | up to $25,000 in the aggregate |
| U.S. federal, state and local tax compliance (e.g., excise distribution reviews, etc.) | up to $5,000 per Fund |
| Review of federal, state, local and international income, franchise and other tax returns | up to $5,000 per Fund |
Under the Pre-Approval Policy, the Audit Committee has also pre-approved the services set forth in the table below with respect to the registrant’s investment adviser and other entities controlling, controlled by or under common control with the investment adviser that provide ongoing services to the registrant (the “Control Affiliates”) up to the specified fee limit. This fee limit is based on aggregate fees to the investment adviser and its Control Affiliates.
| Service | Range of Fees |
| Non-Audit Services | |
| Services associated with periodic reports and other documents filed with the SEC and assistance in responding to SEC comment letters | up to $10,000 in the aggregate |
The Pre-Approval Policy requires the registrant’s independent auditors to report to the Audit Committee at each of its regular meetings regarding all services initiated since the last such report was rendered, including those services authorized by the Pre-Approval Policy.
(f) Not applicable.
(g) The aggregate non-audit fees billed by the registrant’s independent auditors for services rendered to the registrant and to its investment adviser and other service providers under common control with the adviser were $9,044,000 and $8,455,000 for the registrant’s fiscal years ended March 31, 2022 and March 31, 2021, respectively.
(h) In connection with its selection of the independent auditors, the registrant’s Audit Committee has considered the independent auditors’ provision of non-audit services to the registrant’s investment adviser and other service providers under common control with the adviser that were not required to be pre-approved pursuant to Rule 2-01(c)(7)(ii) of Regulation S-X. The Audit Committee has determined that the independent auditors’ provision of these services is compatible with maintaining the auditors’ independence.
Item 5. Audit Committee of Listed Registrants
Not applicable.
Item 6. Investments
(a) Included as part of report to shareholders filed under Item 1 of this Form N-CSR.
(b) Divestment of securities in accordance with Section 13(c) of the Investment Company Act of 1940.
Not applicable.
Item 7. Disclosure of Proxy Voting Policies and Procedures for Closed-End Management Investment Companies
Not applicable.
Item 8. Portfolio Managers of Closed-End Management Investment Companies
Not applicable.
Item 9. Purchases of Equity Securities by Closed-End Management Investment Company and Affiliated Purchasers
Not applicable.
Item 10. Submission of Matters to a Vote of Security Holders
Not applicable.
Item 11. Controls and Procedures
The registrant’s principal executive officer and principal financial officers, or persons performing similar functions, have concluded that the registrant’s disclosure controls and procedures (as defined in Rule 30a-3(c) under the Investment Company Act of 1940, as amended (17 CFR 270.30a-3(c))) are effective, as of a date within 90 days of the filing of this report, based on their evaluation of these controls and procedures required by Rule 30a-3(b) under the Investment Company Act of 1940 (17 CFR 270.30a-3(b)) and Rules 13a-15(b) or 15d-15(b) under the Securities Exchange Act of 1934, as amended (17 CFR 240.13a-15(b) or 240.15d-15(b)) and provide reasonable assurance that the information required to be disclosed by the registrant in its reports or statements filed under the Securities Exchange Act of 1934 is recorded, processed, summarized and reported within the time periods specified in the rules and forms of the Securities and Exchange Commission.
There were no significant changes in the registrant’s internal control over financial reporting (as defined in Rule 30a-3(d) under the Investment Company Act of 1940 (17 CFR 270.30a-3(d)) that occurred during the period covered by the report to stockholders included herein that have materially affected, or are reasonably likely to materially affect, the registrant’s internal control over financial reporting.
Item 12. Disclosure of Securities Lending Activities for Closed-End Management Investment Companies
Not applicable.
Item 13. Exhibits
(a) (1) Code of Ethics
Not applicable.
(2) Certifications of Principal Executive Officer and Principal Financial Officer pursuant to Rule 30a-2 under the Investment Company Act of 1940 are attached hereto as Exhibit 99.CERT.
(3) Written solicitations to purchase securities pursuant to Rule 23c-1 under the Securities Exchange Act of 1934.
Not applicable.
(b) Certifications pursuant to Section 906 of the Sarbanes-Oxley Act of 2002 are furnished herewith as Exhibit 99.906CERT.
SIGNATURES
Pursuant to the requirements of the Securities Exchange Act of 1934 and the Investment Company Act of 1940, the registrant has duly caused this report to be signed on its behalf, by the undersigned, thereunto duly authorized.
DELAWARE GROUP® EQUITY FUNDS IV
| /s/SHAWN K. LYTLE |
| By: | Shawn K. Lytle |
| Title: | President and Chief Executive Officer |
| Date: | June 7, 2022 |
Pursuant to the requirements of the Securities Exchange Act of 1934 and the Investment Company Act of 1940, this report has been signed below by the following persons on behalf of the registrant and in the capacities and on the dates indicated.
| /s/SHAWN K. LYTLE |
| By: | Shawn K. Lytle |
| Title: | President and Chief Executive Officer |
| Date: | June 7, 2022 |
| |
| /s/RICHARD SALUS |
| By: | Richard Salus |
| Title: | Chief Financial Officer |
| Date: | June 7, 2022 |