Item 1. Reports to Stockholders
Table of Contents
| | |
 |  |
| | |
| | Annual report |
| | |
| Equity funds | Alternative/specialty funds |
| |
Delaware Equity Income Fund
Delaware Growth and Income Fund
Delaware Growth Equity Fund
Delaware Opportunity Fund
Delaware Global Equity Fund | Delaware Covered Call Strategy Fund
Delaware Hedged U.S. Equity Opportunities Fund
Delaware Premium Income Fund
Multi-asset fund
Delaware Total Return Fund |
September 30, 2021
Carefully consider the Funds’ investment objectives, risk factors, charges, and expenses before investing. This and other information can be found in the Funds’ prospectus and their summary prospectuses, which may be obtained by visiting delawarefunds.com/literature or calling 800 523-1918. Investors should read the prospectus and the summary prospectus carefully before investing.
You can obtain shareholder reports and prospectuses online instead of in the mail.
Visit delawarefunds.com/edelivery.
Table of Contents
Table of contents
Experience Delaware Funds by Macquarie®
Macquarie Investment Management (MIM) is a global asset manager with offices in the United States, Europe, Asia, and Australia. As active managers, we prioritize autonomy and accountability at the investment team level in pursuit of opportunities that matter for clients. Delaware Funds is one of the longest-standing mutual fund families, with more than 80 years in existence.
If you are interested in learning more about creating an investment plan, contact your financial advisor.
You can learn more about Delaware Funds or obtain a prospectus for the Funds at delawarefunds.com/literature.
Manage your account online
| ● | Check your account balance and transactions |
| ● | View statements and tax forms |
| ● | Make purchases and redemptions |
Visit delawarefunds.com/account-access.
Macquarie Asset Management (MAM) offers a diverse range of products including securities investment management, infrastructure and real asset management, and fund and equity-based structured products. MIM is the marketing name for certain companies comprising the asset management division of Macquarie Group. This includes the following investment advisers: Macquarie Investment Management Business Trust (MIMBT), Macquarie Funds Management Hong Kong Limited, Macquarie Investment Management Austria Kapitalanlage AG, Macquarie Investment Management Global Limited, Macquarie Investment Management Europe Limited, and Macquarie Investment Management Europe S.A.
The Funds are distributed by Delaware Distributors, L.P. (DDLP), an affiliate of MIMBT and Macquarie Group Limited.
Other than Macquarie Bank Limited (MBL), none of the entities noted are authorized deposit-taking institutions for the purposes of the Banking Act 1959 (Commonwealth of Australia). The obligations of these entities do not represent deposits or other liabilities of MBL. MBL does not guarantee or otherwise provide assurance in respect of the obligations of these entities, unless noted otherwise.
The Funds are governed by US laws and regulations.
Unless otherwise noted, views expressed herein are current as of September 30, 2021, and subject to change for events occurring after such date.
The Funds are not FDIC insured and are not guaranteed. It is possible to lose the principal amount invested.
Advisory services provided by Delaware Management Company, a series of MIMBT, a US registered investment advisor.
All third-party marks cited are the property of their respective owners.
© 2021 Macquarie Management Holdings, Inc.
Table of Contents
Portfolio management reviews
Delaware Equity Income Fund
October 12, 2021 (Unaudited)
| Performance preview (for the year ended September 30, 2021) | | | | |
| Delaware Equity Income Fund (Institutional Class shares) | | 1-year return | | +30.91% |
| Delaware Equity Income Fund (Class A shares) | | 1-year return | | +30.49% |
| Russell 1000® Value Index (benchmark) | | 1-year return | | +35.01% |
Past performance does not guarantee future results.
For complete, annualized performance for Delaware Equity Income Fund, please see the table on page 19.
Institutional Class shares are not subject to a sales charge and are offered for sale exclusively to certain eligible investors. In addition, Institutional Class shares pay no distribution and service fee.
The performance of Class A shares excludes the applicable sales charge. The performance of both Institutional Class shares and Class A shares reflects the reinvestment of all distributions.
Please see page 21 for a description of the index. Index performance returns do not reflect any management fees, transaction costs, or expenses. Indices are unmanaged and one cannot invest directly in an index.
Investment objective
The Fund seeks total return.
At a meeting on November 18, 2020, Delaware Group® Equity Funds IV Board of Trustees (the “Board”) approved the replacement of the Fund’s current portfolio managers with the Global Systematic Investments team of the Fund’s current sub-advisor, Macquarie Investment Management Global Limited (MIMGL). In connection with this determination, the Board approved certain changes to the Fund’s investment strategies. These portfolio management and strategy changes were effective on or about January 29, 2021. The investment management changes may result in higher portfolio turnover in the near term, as the new portfolio management team purchases and sells securities to accommodate the investment changes. A higher portfolio turnover is likely to cause the Fund to realize capital gains and incur transaction costs. You should consult your financial advisor about the changes that will result from the investment strategy changes. Please see the supplement in the Fund’s prospectus dated November 23, 2020 for more information.
Market review
Overall, equity markets were strong during the fiscal year ended September 30, 2021, recording new highs in each quarter. Investors were buoyed by the Federal Reserve’s commitment to an accommodative monetary policy. Together with the successful introduction of COVID-19 vaccines, which enabled many businesses to reopen and resume near-normal activity, investors had ample reason to be optimistic.
The 12-month period was not without concerns, however, chief among them the threat of inflation, supply-chain disruptions, an acute labor shortage, and uneven vaccination acceptance that threatened renewed lockdowns in some areas of the country.
Throughout the latter half of the fiscal period, investors and economists debated whether the uptick in inflation was transitory. Bond yields increased slightly in response to inflationary concern but remained at relatively low levels.
Both the supply-chain disruptions and the shortage of workers willing to fill many service and hospital jobs were also unresolved at period end, making it difficult for many businesses to resume normal business activity. Although the introduction of COVID-19 vaccines was met with great enthusiasm initially, as the summer months approached, the vaccination rates declined dramatically, though not uniformly across the country. The high degree of vaccination resistance proved to be problematic, especially given the highly transmissible Delta variant.
Within the Fund
For the fiscal year ended September 30, 2021, Delaware Equity Income Fund underperformed its benchmark, the Russell 1000® Value Index. The Fund’s Institutional Class shares gained 30.91%. The Fund’s Class A shares gained 30.49% at net asset value (NAV) and 23.00% at maximum offer price. These figures reflect reinvestment of all distributions. During the same period, the Fund’s benchmark gained 35.01%. For complete, annualized performance of Delaware Equity Income Fund, please see the table on page 19.
Following is a discussion about performance during the period from January 29, 2021 (when the Global Systematic Investments team began managing the Fund) to September 30, 2021.
On a sector basis, industrials, information technology (IT), and energy contributed to Fund performance during the period that the team managed the Fund. The strong performance from industrials was driven mainly by positive stock selection although sector allocation also contributed. In particular, holdings in Caterpillar Inc., Raytheon Technologies Corp., and Northrop Grumman Corp. contributed to the Fund’s performance. Construction and mining equipment manufacturer Caterpillar hit record highs during the
1
Table of Contents
Portfolio management reviews
Delaware Equity Income Fund
period that the team managed the Fund. Caterpillar’s largest global dealer, Finning International Inc., reported solid sequential demand improvement, with demand for mining equipment notably picking up in Canada and Latin America. This is a positive sign for us that restocking of dealer inventory is beginning.
In the IT sector, stock selection was the key driver, although this was partially offset by a negative sector allocation effect. Overweight positions in Motorola Solutions Inc. and Oracle Corp. were the largest contributors to performance.
Stock selection drove outperformance in the energy sector, while sector allocation was neutral. The key driver was an overweight holding in ConocoPhillips. The company announced in March that it is resuming a share-buyback program that was previously suspended. It expects to buy back shares at an annualized rate of $1.5 billion, 50% more than before. ConocoPhillips also intends to return more than 30% of its cash from operations to shareholders every year. In a statement, the CEO said that commodity prices have strengthened such that the dividend alone may not be sufficient to meet the company’s return-of-capital (ROC) commitment.
Healthcare, materials, and communication services were the leading detractors from performance during the period that the team managed the Fund. Healthcare was the main detractor, driven by both negative stock selection and sector allocation. Among the Fund’s holdings, shares of Viatris Inc. fell after the pharmaceutical and healthcare services company provided a downbeat revenue outlook for 2021, adding that it was initiating a dividend. The company, formed in November 2020 through the combination of Mylan and Pfizer Inc.’s Upjohn business, said it expects 2021 revenue of $17.2 billion to $17.8 billion, compared to the consensus estimate of $18.4 billion.
Underperformance in materials was driven by stock selection. The sector allocation effect was flat. An overweight in DuPont de Nemours Inc. detracted from performance, while underweight positions in companies such as Nucor Corp., Freeport-McMoRan Inc.,and Steel Dynamics Inc. also detracted from performance.
In communication services, stock selection detracted from performance, while sector allocation was neutral. Holdings in AT&T Inc. and Verizon Communications Inc. were key detractors.
As of the close of the fiscal year, the Fund held 49 names diversified across sectors. Cash was 0.3% of the total portfolio and no derivative instruments were held. From a sector positioning point of view, the Fund was overweight energy, healthcare, and IT and was underweight financials, real estate, and utilities. The largest active positions were First American Financial Corp. and technology firms Motorola Solutions and Broadcom Inc. From a factor perspective, at the end of the period the Fund had a quality and value tilt. Due to the Fund’s objective, there was also a large exposure to income.
2
Table of Contents
Portfolio management reviews
Delaware Growth and Income Fund
October 12, 2021 (Unaudited)
| Performance preview (for the year ended September 30, 2021) | | | | |
| Delaware Growth and Income Fund (Institutional Class shares) | | 1-year return | | +31.19% |
| Delaware Growth and Income Fund (Class A shares) | | 1-year return | | +30.89% |
| Russell 1000® Value Index (benchmark) | | 1-year return | | +35.01% |
Past performance does not guarantee future results.
For complete, annualized performance for Delaware Growth and Income Fund, please see the table on page 22.
Institutional Class shares are not subject to a sales charge and are offered for sale exclusively to certain eligible investors. In addition, Institutional Class shares pay no distribution and service fee.
The performance of Class A shares excludes the applicable sales charge. The performance of both Institutional Class shares and Class A shares reflects the reinvestment of all distributions.
Please see page 24 for a description of the index. Index performance returns do not reflect any management fees, transaction costs, or expenses. Indices are unmanaged and one cannot invest directly in an index.
Investment objective
The Fund seeks long-term growth of capital and current income.
At a meeting on November 18, 2020, Delaware Group® Equity Funds IV Board of Trustees (the “Board”) approved the replacement of the Fund’s current portfolio managers with the Global Systematic Investments team of the Fund’s current sub-advisor, Macquarie Investment Management Global Limited (MIMGL). In connection with this determination, the Board approved certain changes to the Fund’s investment strategies. These portfolio management and strategy changes were effective on or about January 29, 2021. The investment management changes may result in higher portfolio turnover in the near term, as the new portfolio management team purchases and sells securities to accommodate the investment changes. A higher portfolio turnover is likely to cause the Fund to realize capital gains and incur transaction costs. You should consult your financial advisor about the changes that will result from the investment strategy changes. Please see the supplement in the Fund’s prospectus dated November 23, 2020 for more information.
Market review
Overall, equity markets were strong during the fiscal year ended September 30, 2021, recording new highs in each quarter. Investors were buoyed by the Federal Reserve’s commitment to an accommodative monetary policy. Together with the successful introduction of COVID-19 vaccines, which enabled many businesses to reopen and resume near-normal activity, investors had ample reason to be optimistic.
The 12-month period was not without concerns, however, chief among them the threat of inflation, supply-chain disruptions, an acute labor shortage, and uneven vaccination acceptance that threatened renewed lockdowns in some areas of the country.
Throughout the latter half of the fiscal period, investors and economists debated whether the uptick in inflation was transitory. Bond yields increased slightly in response to inflationary concern but remained at relatively low levels.
Both the supply-chain disruptions and the shortage of workers willing to fill many service and hospital jobs were also unresolved at period end, making it difficult for many businesses to resume normal business activity. Although the introduction of COVID-19 vaccines was met with great enthusiasm initially, as the summer months approached, the vaccination rates declined dramatically, though not uniformly across the country. The high degree of vaccination resistance proved to be problematic, especially given the highly transmissible Delta variant.
Within the Fund
For the fiscal year ended September 30, 2021, Delaware Growth and Income Fund underperformed its benchmark, the Russell 1000® Value Index. The Fund’s Institutional Class shares gained 31.19%. The Fund’s Class A shares gained 30.89% at net asset value (NAV) and 23.35% at maximum offer price. These figures reflect reinvestment of all distributions. During the same period, the Fund’s benchmark gained 35.01%. For complete, annualized performance of Delaware Growth and Income Fund, please see the table on page 22.
Following is a discussion about performance during the period from January 29, 2021 (when the Global Systematic Investments team began managing the Fund) to September 30, 2021.
On a sector basis, industrials, information technology (IT), and energy contributed to Fund performance during the period that the team managed the Fund. The strong performance from industrials was driven mainly by positive stock selection although sector allocation also contributed. In particular, holdings in Caterpillar Inc., Raytheon Technologies Corp.,and Northrop Grumman Corp. contributed to the Fund’s performance. Construction and mining equipment manufacturer Caterpillar hit record highs during the
3
Table of Contents
Portfolio management reviews
Delaware Growth and Income Fund
period that the team managed the Fund. Caterpillar’s largest global dealer, Finning International Inc., reported solid sequential demand improvement, with demand for mining equipment notably picking up in Canada and Latin America. This is a positive sign for us that restocking of dealer inventory is beginning.
In the IT sector, stock selection was the key driver, although this was partially offset by a negative sector allocation effect. Overweight positions in Motorola Solutions Inc. and Oracle Corp. were the largest contributors to performance.
Stock selection drove outperformance in the energy sector, while sector allocation was neutral. The key driver was an overweight holding in ConocoPhillips. The company announced in March that it is resuming a share-buyback program that was previously suspended. It expects to buy back shares at an annualized rate of $1.5 billion, 50% more than before. ConocoPhillips also intends to return more than 30% of its cash from operations to shareholders every year. In a statement the CEO said that commodity prices have strengthened such that the dividend alone may not be sufficient to meet the company’s return-of-capital (ROC) commitment.
Healthcare, materials, and communication services were the leading detractors from performance during the period that the team managed the Fund. Healthcare was the main detractor, driven by both negative stock selection and sector allocation. Among the Fund’s holdings, shares of Viatris Inc. fell after the pharmaceutical and healthcare services company provided a downbeat revenue outlook for 2021, adding that it was initiating a dividend. The company, formed in November 2020 through the combination of Mylan and Pfizer Inc.’s Upjohn business, said it expects 2021 revenue of $17.2 billion to $17.8 billion, compared to the consensus estimate of $18.4 billion.
Underperformance in materials was driven by stock selection. The sector allocation effect was flat. An overweight in DuPont de Nemours Inc. detracted from performance, while underweight positions in companies such as Nucor Corp., Freeport-McMoRan Inc., and Steel Dynamics Inc. also detracted from performance.
In communication services, stock selection detracted from performance, while sector allocation was neutral. Holdings in AT&T Inc. and Verizon Communications Inc. were key detractors.
As of the close of the fiscal year, the Fund held 49 names diversified across sectors. Cash was 0.3% of the total portfolio and no derivative instruments were held. From a sector positioning point of view, the Fund was overweight energy, healthcare, and IT and was underweight financials, real estate, and utilities. The largest active positions were First American Financial Corp. and technology firms Motorola Solutions and Broadcom Inc. From a factor perspective, at the end of the period the Fund had a quality and value tilt. Due to the Fund’s objective, there was also a large exposure to income.
4
Table of Contents
Portfolio management reviews
Delaware Growth Equity Fund
October 12, 2021 (Unaudited)
| Performance preview (for the year ended September 30, 2021) | | | | |
| Delaware Growth Equity Fund (Institutional Class shares) | | 1-year return | | +41.98% |
| Delaware Growth Equity Fund (Class A shares) | | 1-year return | | +41.67% |
| Russell 1000® Growth Index (benchmark) | | 1-year return | | +27.32% |
Past performance does not guarantee future results.
For complete, annualized performance for Delaware Growth Equity Fund, please see the table on page 25.
Institutional Class shares are not subject to a sales charge and are offered for sale exclusively to certain eligible investors. In addition, Institutional Class shares pay no distribution and service fee.
The performance of Class A shares excludes the applicable sales charge. The performance of both Institutional Class shares and Class A shares reflects the reinvestment of all distributions.
Please see page 27 for a description of the index. Index performance returns do not reflect any management fees, transaction costs, or expenses. Indices are unmanaged and one cannot invest directly in an index.
Investment objective
The Fund seeks long-term growth of capital.
Smith Asset Management Group, L.P. (Smith), a US registered investment advisor, is the sub-advisor to the Fund. As sub-advisor, Smith is responsible for day-to-day management of the Fund’s assets. Delaware Management Company (DMC), a series of Macquarie Investment Management Business Trust (MIMBT), has ultimate responsibility for all investment advisory services.
The 12-month period ended September 30, 2021 continued to build on the economic rebound from the COVID-19 pandemic. The Fund’s benchmark, the Russell 1000® Growth Index, started the fiscal period strongly, rising 11.4% for the final quarter of 2020. The benchmark went on to record four positive quarterly moves for the fiscal year, two barely positive and two quarterly gains of more than 11%.
Optimistic projections of very strong global economic growth have trended downward toward more reasonable levels. The combination of the COVID-19 Delta variant and supply chain bottlenecks have acted like a dam holding back the gush of liquidity into the economy. Yet while growth has been inhibited, it has not been derailed. Economic reports earlier in the calendar year were pervasively ahead of expectations and the outlook for the rest of 2021 grew to be quite optimistic. Those hurdles became more difficult to achieve, however, given some of the constraints that businesses experienced and a resurgence of a new, more infectious COVID strain.
The Citigroup® Economic Surprise Index turned negative in August and drifted down to the bottom decile of historic readings before bottoming in mid-September. Manufacturers reported strong demand, but tight inputs made it difficult to meet that demand. As the fiscal year ended, a tight labor market, materials shortages, inflation, and logistics issues continued to cause capacity constraints.
Our investment process is centered on a specific and clearly defined fundamental outcome: Companies that can sustainably grow earnings faster than expected have the potential to outperform over time. During the fiscal year, the Fund’s holdings delivered 31.4% earnings growth versus an expectation of 6.3%, compared with the benchmark, where holdings delivered 21.4% earnings growth versus an expectation of 8.0%.
Within the Fund
For the fiscal year ended September 30, 2021, Delaware Growth Equity Fund outperformed its benchmark, the Russell 1000 Growth Index. The Fund’s Institutional Class shares gained 41.98%. The Fund’s Class A shares gained 41.67% at net asset value and 33.56% at maximum offer price. These figures reflect all distributions reinvested. For the same period, the benchmark gained 27.32%. For complete, annualized performance of Delaware Growth Equity Fund, please see the table on page 25.
The information technology sector – with holdings gaining 48% – was the strongest contributor to the Fund’s returns, even while holdings in the financials and communication services sectors delivered stronger absolute returns at 68% and 55%, respectively. Shares of Fortinet Inc., a provider of both hardware- and software-based cyber-security solutions, gained 150% as the company benefited from businesses reevaluating their technology needs in a post-pandemic environment. Zebra Technologies Corp. is a developer of automated identification and data capture technologies such as bar-code and radio-frequency identification (RFID) equipment that are used in a variety of end markets, including retail and ecommerce, manufacturing, healthcare, logistics, banking, and others. The company saw demand grow at a strong pace, as economic activity rebounded. Shares rose 105% during the fiscal year. Shares of EPAM Systems Inc., a provider of software product
5
Table of Contents
Portfolio management reviews
Delaware Growth Equity Fund
development and digital platform engineering, rose 77% during the 12-month period due to growing demand for business processing outsourcing services.
While cash in the Fund’s portfolio was the largest detractor from performance, causing a 0.4% drag for the fiscal year, the communication services sector also had a negative effect on the Fund’s relative returns. Alphabet Inc., the parent company of Google, was the most significant source of return in the sector with a gain of 83% during the period. With an average weight of 5.3% in the benchmark, the Fund’s exposure of just 3.6% caused a significant negative relative return for the sector. Thus, although the Fund’s holdings in the sector delivered the second-strongest absolute returns at 55% during the fiscal year, the overall effect relative to the benchmark was negative due to the lower weight of the Alphabet position. The Fund’s two other largest individual detractors for the 12-month period were Tesla Inc. and Moderna, Inc. The Fund held neither stock based on valuation concerns. Tesla returned 80% for the 12-month period, while Moderna gained 444% on its successful COVID-vaccine development.
We believe the global economy has the potential to deliver historic growth numbers. While fiscal policy seeks to pour more fuel on the fire, there is an output gap to be filled in important segments of the economy. Central bankers seem loath to reduce stimulus until inflation is clearly on a sustained upward trajectory and employment approaches prior peak levels. Vaccinations continue to ramp up in both developed and developing countries and global economic data outpaces estimates by close to a record margin, per the Citigroup Economic Surprise Index. Although we believe there will likely be some bumps in the road, we think the trend for the global economy and corporate earnings seems to indicate recovery and expansion.
6
Table of Contents
Portfolio management reviews
Delaware Opportunity Fund
October 12, 2021 (Unaudited)
| Performance preview (for the year ended September 30, 2021) | | | | |
| Delaware Opportunity Fund (Institutional Class shares) | | 1-year return | | +47.50% |
| Delaware Opportunity Fund (Class A shares) | | 1-year return | | +47.10% |
| Russell Midcap® Value Index (benchmark) | | 1-year return | | +42.40% |
Past performance does not guarantee future results.
For complete, annualized performance for Delaware Opportunity Fund, please see the table on page 28.
Institutional Class shares are not subject to a sales charge and are offered for sale exclusively to certain eligible investors. In addition, Institutional Class shares pay no distribution and service fee.
The performance of Class A shares excludes the applicable sales charge. The performance of both Institutional Class shares and Class A shares reflects the reinvestment of all distributions.
Please see page 30 for a description of the index. Index performance returns do not reflect any management fees, transaction costs, or expenses. Indices are unmanaged and one cannot invest directly in an index.
Investment objective
The Fund seeks long-term capital growth.
Market review
Mid-cap value stocks experienced a strong run during the Fund’s fiscal year ended September 30, 2021. During the fiscal year, value companies outperformed growth companies across the US market capitalization spectrum as investors showed a preference for higher-quality companies in cyclical and economically sensitive industries that lagged during the first nine months of calendar year 2020. The performance disparity between value companies and growth companies was significant in mid-cap equities over the fiscal year, as the Russell Midcap Value Index returned 42.40%, outpacing the 30.45% return of the Russell Midcap® Growth Index.
The US Food and Drug Administration (FDA) issued an Emergency Use Authorization (EUA) for two COVID-19 vaccines in December 2020, resulting in a surge in the US equity markets. The US economy continued to improve during the fiscal year, aided by strengthening consumer confidence and spending. During the fiscal year, the Fed maintained its extremely accommodative monetary policy, keeping short-term rates near zero as inflation rose well above its 2% target and the unemployment rate declined from 7.8% in September 2020 to 4.8% in September 2021.
Within the Fund
For the fiscal year ended September 30, 2021, Delaware Opportunity Fund outperformed its benchmark, the Russell Midcap Value Index. The Fund’s Institutional Class shares gained 47.50%. The Fund’s Class A shares gained 47.10% at net asset value (NAV) and 38.64% at maximum offer price. These figures reflect reinvestment of all distributions. During the same period, the Fund’s benchmark, the Russell Midcap Value Index, gained 42.40%. For complete annualized performance of Delaware Opportunity Fund, please see the table on page 28.
Stock selection and sector positioning contributed to relative outperformance during the fiscal year. Stock selection and a relative overweight allocation contributed to the financial services sector. The Fund’s holdings in the industrials, REIT, and technology sectors outperformed those in the benchmark during the fiscal year. The Fund’s holdings in the basic industry, consumer discretionary, and transportation sectors advanced during the fiscal year but lagged the stronger returns of those sectors in the benchmark, which detracted from performance.
Shares of regional bank East West Bancorp Inc. outperformed for the fiscal year. East West Bancorp is one of the largest independent banks headquartered in California, operating over 120 locations in the US and in China. East West Bancorp reported multiple quarters of better-than-expected earnings results during the fiscal year. We maintained the Fund’s position in East West Bancorp as its loan growth is accelerating and its profitability is strong.
Quanta Services Inc. is a specialized contracting services company that delivers comprehensive infrastructure solutions for the utility, communications, pipeline, and energy industries. During the Fund’s fiscal year, Quanta outperformed as the company reported multiple quarters of better-than-expected financial results. Quanta has multi-year projects to modernize and harden utility infrastructure and renewable energy sources. We maintained the Fund’s position in Quanta as it has been able to increase its dividend and repurchase its stock and seems to have a healthy backlog of projects.
During the Fund’s fiscal year, shares of Newmont Corp. lagged the broader metals and mining industry. Newmont is the world’s leading gold company and a producer of copper, silver, zinc, and lead. We believed Newmont’s stock price performance would lag during periods of strong market performance, which is what we experienced during the Fund’s fiscal year. During this period, Newmont increased its dividend and repurchased its stock. This is consistent with the company’s framework to return incremental free cash flow to
7
Table of Contents
Portfolio management reviews
Delaware Opportunity Fund
shareholders. We maintained the Fund’s position in Newmont as it generates significant free cash flow and remains disciplined with its use of capital.
Cable One Inc. is a video, broadband communications, and telephone provider serving residential and business customers in 24 states. Shares of Cable One outperformed during the first nine months of calendar year 2020 but traded slightly lower during the Fund’s fiscal year, which detracted. With more Americans staying home during the pandemic, Cable One added more broadband subscribers than expected. However, the pace of subscription growth slowed during the Fund’s fiscal year, while company’s financial results remained strong. We maintained the Fund’s position in Cable One as it is growing its free cash flow, pays a dividend, and has organic growth potential.
The Fund ended the fiscal year overweight the financial services, technology, basic industry, and transportation sectors. The Fund ended the fiscal year underweight the REIT, healthcare, consumer staples, and utilities sectors. Sector weightings were similar to those in the benchmark in the consumer discretionary, industrials, and energy sectors at fiscal year end.
Our team’s disciplined philosophy remains unchanged. We continue to focus on bottom-up stock selection and specifically on identifying companies that, in our view, trade at attractive valuations, generate strong free cash flow, and have the ability to implement shareholder-friendly policies through share buybacks, dividend increases, and debt reduction.
8
Table of Contents
Portfolio management reviews
Delaware Global Equity Fund
October 12, 2021 (Unaudited)
| Performance preview (for the year ended September 30, 2021) | | | | |
| Delaware Global Equity Fund (Institutional Class shares) | | 1-year return | | +12.54% |
| Delaware Global Equity Fund (Class A shares) | | 1-year return | | +12.11% |
| MSCI World Index (benchmark) (net) | | 1-year return | | +28.82% |
| MSCI World Index (benchmark) (gross) | | 1-year return | | +29.39% |
Past performance does not guarantee future results.
For complete, annualized performance for Delaware Global Equity Fund, please see the table on page 31.
Institutional Class shares are not subject to a sales charge and are offered for sale exclusively to certain eligible investors. In addition, Institutional Class shares pay no distribution and service fee.
The performance of Class A shares excludes the applicable sales charge. The performance of both Institutional Class shares and Class A shares reflects the reinvestment of all distributions.
Please see page 33 for a description of the index. Index performance returns do not reflect any management fees, transaction costs, or expenses. Indices are unmanaged and one cannot invest directly in an index.
Investment objective
The Fund seeks long-term capital growth.
Economic developments and market performance
For the past 12 months, investors have watched the unravelling of the external shock of the COVID-19 pandemic, affecting every industry and every sector, both short-term and long-term. With one-third of the world’s population vaccinated against the coronavirus by the end of summer 2021, hope for the return of life as we knew it lifted stock markets and equity prices. As long as a vaccine-resistant virus does not emerge, it seems like humanity, in a collective effort with the excellent help of the global healthcare industry, has defied another pandemic.
Supported by the relief after surviving humanity’s latest brush with death, the Fund’s benchmark MSCI World Index (net) gained +28.82%. Based on the lessons learned and conclusions drawn, one focus of the stock market going forward is the weaker estimates for gross domestic product (GDP) growth in the US, where unemployment is still higher than it was pre-pandemic, despite labor shortages and wage increases in some pandemic-hit sectors. On the positive side, for equity markets, there is a chance that inflation will be short-lived, negating the need for the Federal Reserve to raise interest rates.
Brent crude prices, which, at the beginning of the pandemic, were below $20 US quadrupled to $80 by the end of third quarter 2021. At the same time, a shortage of electricity and record prices for coal hit China’s industrial heartland. This might cut short China’s GDP growth. Heading into the Northern Hemisphere’s winter season does not help energy prices either.
Within the Fund
For the fiscal year ended September 30, 2021, Delaware Global Equity Fund underperformed its benchmark, the MSCI World Index (net). The Fund’s Institutional Class shares gained 12.54%. The Fund’s Class A shares gained 12.11% at net asset value (NAV) and 5.62% at maximum offer price. These figures reflect reinvestment of all distributions. During the same period, the Fund’s benchmark gained 28.82%. For complete, annualized performance of Delaware Global Equity Fund, please see the table on page 31.
The portfolio management team invests with the mindset of long-term business owners. Our research is focused on how well we think a company can deploy its capital and redeploy retained earnings. Therefore, the Fund’s portfolio is built bottom-up (stock-by-stock) by selecting company stocks based on quantitative insights and qualitative assessments.
We use a multivariate risk model to analyze what we view as the various potential contributors to and detractors from the Fund’s performance against its benchmark. For the year ended September 2021, active country and region weights had a minor negative impact on performance. The Fund’s overweight in Switzerland and Germany and the Fund’s underweight in the US relative to the benchmark had a negative effect. The Fund’s overweight in France relative to its benchmark was positive.
The greatest impact on the Fund’s underperformance from the active sector allocation came from the Fund’s overweight in consumer staples. In addition, the Fund has no holdings in financials, real estate, energy, and utilities. The underweights to energy and financials relative to the benchmark had a negative impact on performance, as these were the two strongest-performing sectors for the past 12 months. No holdings in utilities had a positive allocation effect on the Fund’s performance.
9
Table of Contents
Portfolio management reviews
Delaware Global Equity Fund
In terms of individual holdings, three of the largest contributors to active performance were French advertising agency conglomerate Publicis Group, offering a various range of services globally; Danish multinational pharmaceutical company Novo Nordisk A/S, specializing in producing insulin and treating obesity; and US pharma company Pfizer, upgrading its sales forecasts of the COVID-19 vaccine on several occasions, when efficacy studies of its effectiveness against the coronavirus exceeded market expectations.
Conversely, three of the largest detractors from performance during the year were Fresenius Medical Care AG, a German healthcare provider and global leader in treating dialysis patients who unfortunately are vulnerable to the coronavirus; Smith & Nephew, a British-based advanced medical devices and treatment provider with a hesitant customer group who have postponed medical care during the pandemic; and Lamb Weston, an American frozen potato and french fries producer that struggled with global COVID restrictions and rising transportation costs, especially affecting restaurants – maybe the company’s most important customers.
10
Table of Contents
Portfolio management reviews
Delaware Covered Call Strategy Fund
October 12, 2021 (Unaudited)
| Performance preview (for the year ended September 30, 2021) | | | | |
| Delaware Covered Call Strategy Fund (Institutional Class shares) | | 1-year return | | +20.40% |
| Delaware Covered Call Strategy Fund (Class A shares) | | 1-year return | | +20.11% |
| Cboe S&P 500 BuyWrite Index (benchmark) | | 1-year return | | +21.10% |
Past performance does not guarantee future results.
For complete, annualized performance for Delaware Covered Call Strategy Fund, please see the table on page 34.
Institutional Class shares are not subject to a sales charge and are offered for sale exclusively to certain eligible investors. In addition, Institutional Class shares pay no distribution and service fee.
The performance of Class A shares excludes the applicable sales charge. The performance of both Institutional Class shares and Class A shares reflects the reinvestment of all distributions.
Please see page 36 for a description of the index. Index performance returns do not reflect any management fees, transaction costs, or expenses. Indices are unmanaged and one cannot invest directly in an index.
Investment objective
The Fund seeks long-term capital appreciation.
Ziegler Capital Management, LLC (ZCM), an investment advisor registered with the US Securities and Exchange Commission, is the sub-advisor to the Fund. As sub-advisor, ZCM is responsible for day-to-day management of the Fund’s assets. DMC, a series of MIMBT, has ultimate responsibility for all investment advisory services.
Market review
Equity markets rose to record highs for each successive calendar quarter during the fiscal year, with the S&P 500® Index producing a total return of 29.98% for the period. According to Bloomberg, S&P 500 Index trailing earnings also grew nearly 30% during the fiscal year and are expected to grow 9.1% in calendar year 2022. The resulting forward price-to-earnings (P/E) ratio of the market was an above-average 19.6.
Bond returns were disappointing for the fiscal year, with the Bloomberg US Aggregate Index returning -0.90%. Interest rates rose modestly but remained at significantly low levels. For example, the Bloomberg US Aggregate Index ended the period with a yield of 1.56%, which equates to a negative real yield as inflation has been consistently above 2%.
The fiscal year began with numerous uncertainties on the horizon, including a presidential election, COVID-related lockdowns, and highly anticipated initial reporting from COVID-19 vaccine trials. Considering these significant unknowns, implied volatility, as measured by the Cboe Volatility Index® (VIX®), began the fiscal year at 26.4% and rose to 40.3% before the election, well above the long-term average of 19.6%.
COVID-19 and the accompanying restrictions on economic activity have been the main impediments to economic growth since the pandemic began, and they persisted through the first half of the fiscal year. Consumer spending was most depressed in coronavirus-sensitive industries, including retail, food service, hospitality, recreation, and leisure. Large fiscal stimulus alongside economic restrictions essentially resulted in forced savings, as households were limited in their spending on a multitude of items. Fortunately, the vaccine trials were successful, and a rapid rollout of the vaccine ensued during late winter and early spring. As vaccination rates increased, restrictions were lifted, and consumer spending rebounded with gross domestic product (GDP) growing at a near 6% annualized rate over the past six months.
Despite rising inflation metrics in recent quarters, inflation expectations have remained well-anchored near long-term average levels. The US Consumer Price Index (CPI) is expected to return to more typical levels later next year as the economy normalizes, supply chain constraints abate, labor supply increases, and COVID-19 cases decline with higher global vaccination rates.
Source: Bloomberg.
Within the Fund
For the fiscal year ended September 30, 2021, Delaware Covered Call Strategy Fund underperformed its benchmark, the Cboe S&P 500 BuyWrite Index. The Fund’s Institutional Class shares gained 20.40%. The Fund’s Class A shares gained 20.11% at net asset value and 13.20% at maximum offer price. Both figures reflect all distributions reinvested. For the same period, the Fund’s benchmark gained 21.10%. For complete, annualized performance of Delaware Covered Call Strategy Fund, please see the table on page 34.
The Fund captured 72% of the return of the S&P 500 Index, an above-average upside capture ratio during a notably strong period of equity-market outperformance. The Fund’s outperformance versus the benchmark was due entirely to outperformance from call options, while the stocks in the Fund lagged the stocks in the benchmark.
11
Table of Contents
Portfolio management reviews
Delaware Covered Call Strategy Fund
The actively managed, single-stock call options in the Fund outperformed the index call options in the benchmark by 444 basis points during the fiscal year (a basis point equals one hundredth of a percentage point). Since the Fund’s inception in 2016, the call options in the Fund have outperformed the benchmark’s call options by 405 basis points per year. There are three main reasons for the Fund’s consistent call-option outperformance. First, actively managing the call options allows us to analyze the entire option chain and select what we believe are the most attractive call options for each individual stock in the portfolio, while the rules-based benchmark is limited to the same at-the-money index option every month. Second, the Fund’s active option strategy takes advantage of high implied volatility levels. For example, the elevated level of implied volatility, particularly during the first half of the fiscal year, allowed us to write longer-term options to “lock in” high-call premiums, which gradually decayed during subsequent months. In contrast, the Fund’s rules-based benchmark is limited to one-month options every month and, as a result, it cannot sell longer-term options during volatility spikes. Third, the Fund’s single-stock call options tend to provide higher call premiums than the benchmark’s index options – a consistent feature of the Fund versus the benchmark.
The stocks in the Fund performed in line with those in the benchmark during the first half of the fiscal year. During that period, the Fund owned a variety of COVID-19 reopening and recovery stocks that performed strongly. However, during the spring, the Fund purchased energy and financial stocks. Despite continued economic growth and rising oil prices, these energy and financial stocks detracted from returns. As a result, the Fund’s stocks underperformed for the second half of the fiscal year. For instance, large-cap growth stocks returned 14.02% for the second half of the fiscal year, while large-cap value stocks returned only 4.10%. Both software and hardware companies in the portfolio outperformed, particularly the semiconductor companies, as global demand for these products has continued to remain strong amid tight supply. The Fund’s holdings of aerospace and defense companies underperformed the benchmark. An underweight to the healthcare sector, owing to the potential for increased government regulation, contributed to returns, as this sector lagged the market during the fiscal year.
Stock selection detracted from performance in communication services. Stock selection made a large positive contribution in consumer discretionary, as we continue to believe consumers are generally in strong financial health, with a still large amount of pent-up savings and plentiful job opportunities.
Overall, we think implied volatility for the market has remained attractive, and call premiums are generally above average. We will continue to closely monitor implied volatility opportunities, which we think could have the potential to add further excess returns versus the benchmark’s rules-based, index options. We continue to believe the Fund’s portfolio of stocks offers significant risk-reward potential going forward, especially when combined with actively managed, single-stock call premiums.
12
Table of Contents
Portfolio management reviews
Delaware Hedged U.S. Equity Opportunities Fund
October 12, 2021 (Unaudited)
| Performance preview (for the year ended September 30, 2021) | | | | |
| Delaware Hedged U.S. Equity Opportunities Fund (Institutional Class shares) | | 1-year return | | +14.79% |
| Delaware Hedged U.S. Equity Opportunities Fund (Class A shares) | | 1-year return | | +14.35% |
| Russell 3000® Index (primary benchmark) | | 1-year return | | +31.88% |
| 70% Russell 3000 Index / 30% ICE BofA US 3-Month Treasury Bill Index (secondary benchmark) | | 1-year return | | +23.06% |
| ICE BofA US 3-Month Treasury Bill Index (secondary benchmark) | | 1-year return | | +0.07% |
Past performance does not guarantee future results.
For complete, annualized performance for Delaware Hedged U.S. Equity Opportunities Fund, please see the table on page 38.
Institutional Class shares are not subject to a sales charge and are offered for sale exclusively to certain eligible investors. In addition, Institutional Class shares pay no distribution and service fee.
The performance of Class A shares excludes the applicable sales charge. The performance of both Institutional Class shares and Class A shares reflects the reinvestment of all distributions.
Please see page 40 for a description of the indices. Index performance returns do not reflect any management fees, transaction costs, or expenses. Indices are unmanaged and one cannot invest directly in an index.
Investment objective
The Fund seeks total return and, secondarily, capital preservation.
Wellington Management Company LLP (Wellington Management), a US-registered investment advisor, is the sub-advisor to the Fund. As sub-advisor, Wellington Management is responsible for day-to-day management of the Fund’s assets. Delaware Management Company (DMC), a series of Macquarie Investment Management Business Trust (MIMBT), has ultimate responsibility for all investment advisory services.
Market review
US equity markets rose during the 12-month period ended September 30, 2021. Throughout the period, a supportive macroeconomic backdrop underpinned equity-market strength. Joe Biden was elected president after a closely contested election, removing a key element of investors’ uncertainty. In the fourth quarter of 2020 corporate earnings were better than expected, the Federal Reserve continued to provide substantial monetary support, and a long-awaited new stimulus package was approved.
On the pandemic front, optimism became reality as several COVID-19 vaccines were approved in the first half of 2021. The rapid initial uptake of the vaccines enabled economic growth to accelerate as the reopening of many businesses contributed to equity-market strength. However, inflation increased sharply as robust demand for goods and services and significant global supply-chain disruptions drove consumer and producer prices significantly higher.
Amid this changing inflation and growth backdrop, the Fed grew increasingly hawkish in 2021. In the third quarter of 2021, anxiety about rising inflation, political gridlock in Washington, and Fed policy normalization weighed against robust corporate earnings and continued strong demand for goods and services. The tension between anxiety and optimism coincided with rotations between value and growth stocks. Growth stocks outperformed their value counterparts in July and August. At the end of September, however, surging Treasury yields sparked a sharp selloff in shares of large technology companies that triggered a rotation into value stocks.
Within the Fund
For the fiscal year ended September 30, 2021, Delaware Hedged U.S. Equity Opportunities Fund underperformed its primary benchmark, the Russell 3000 Index, and its secondary benchmark, a blend of 70% Russell 3000 Index and 30% ICE BofA US 3-Month Treasury Bill Index. The Fund outperformed its other secondary benchmark, the ICE BofA US 3-Month Treasury Bill Index. The Fund’s Institutional Class shares gained 14.79%. The Fund’s Class A shares gained 14.35% at net asset value and 7.76% at maximum offer price (both figures reflect all distributions reinvested). For the same period, the Russell 3000 Index gained 31.88%. The blend of 70% Russell 3000 Index / 30% ICE BofA US 3-Month Treasury Bill Index gained 23.06%, and the ICE BofA US 3-Month Treasury Bill Index gained 0.07%. For complete, annualized performance of Delaware Hedged U.S. Equity Opportunities Fund, please see the table on page 38.
While the Fund posted positive absolute returns, it underperformed its primary benchmark, the Russell 3000 Index, for the fiscal year. The primary driver of underperformance was weak stock selection within the industrials, information technology, and consumer discretionary sectors. Sector allocation, a residual of the underlying managers’ bottom-up stock selection process – we note that as the lead portfolio managers, we allocate to other portfolio managers at Wellington to manage the active equity portion of the Fund – detracted from performance, driven by our underweight allocations to
13
Table of Contents
Portfolio management reviews
Delaware Hedged U.S. Equity Opportunities Fund
energy and information technology. The Fund’s overweight allocation to financials partially offset this.
Our decision not to hold consumer discretionary company Tesla Inc. was the largest relative detractor from performance. Shares of the electric-vehicle manufacturer rose after the company was added to the S&P 500 Index, triggering forced buying by index-tracking investors and mutual funds. Furthermore, positive investor and consumer sentiment for electric vehicles remained a strong tailwind for the industry.
The Fund’s overweight positioning in healthcare company Novartis AG detracted from results. Shares declined after the company reported 2020 results and 2021 guidance. Reduced patient traffic in 2020, a result of the pandemic, led to a decline in the company’s dermatology and oncology segments. Shares further declined following second-quarter results showing that the oncology segment was still experiencing patient volumes below pre-COVID levels. Key drug Sandoz also faced headwinds and was a drag on earnings. The company also announced it discontinued a study of CFZ533 in kidney transplant patients because of lack of demonstrated efficacy. We continued to hold the name in the Fund as of fiscal year end.
In the financials sector, the Fund’s overweight position in The Charles Schwab Corp. was the largest relative contributor to performance during the fiscal year. The stock price rose after the company posted better-than-expected fourth-quarter 2020 results, with record client engagement across all channels. First- and second-quarter 2021 results were also strong as the company again saw record client engagement. The stock performed well as rates moved higher and investors sought exposure to “reflation trades.” The company continued to focus on making improvements and structural changes in monetization, pricing, and industry structure which, we believe, should help the stock continue to outperform. The Fund continued to hold Charles Schwab as of fiscal year end.
In the consumer discretionary sector, the Fund’s underweight position in Amazon.com Inc. contributed to results. Shares of the ecommerce giant rose early in the 12-month period following strong third-quarter 2020 results that beat analysts’ expectations, and then fell in the early part of 2021, after the company announced that founder Jeff Bezos would step down as CEO to focus on new products and initiatives. The stock price remained under pressure, despite the company’s reporting second-quarter earnings that exceeded expectations. Management stated that sales growth was expected to slow over the next several quarters. We maintained a position in Amazon.com as of the end of the fiscal year.
The Fund’s hedging strategy detracted from results during the fiscal year. The beta hedge, which is designed to reduce the Fund’s equity exposure by selling futures on US indices, detracted from results as US markets rose. The Fund’s tail risk management strategy, designed to mitigate capital losses in periods when equities experience a sharp decline, also detracted from results as markets rallied.
We believe volatility is likely to continue as investors balance long-term opportunities and nearer-term risks. While company earnings have improved relative to 2020, risks continue to evolve, including the potential economic ramifications of the rapidly spreading COVID-19 Delta variant, the approaching government debt ceiling in the US, and the potential impact on company fundamentals as central banks begin rolling back stimulus programs. We remain vigilant in managing risks in the Fund’s portfolio and seek to deliver performance that is driven by security selection.
Looking across markets, we are mindful of the ever-evolving risks of different equity factors and seek to create a portfolio of differentiated investment styles and philosophies. We maintain exposure to cyclical areas of the market through allocations to managers who look to invest in undervalued companies with solid fundamentals, and we complement these exposures with allocations to managers who seek to invest in attractive companies with favorable growth prospects. We balance these exposures with allocations to managers who focus on high-quality stable businesses that we believe may outperform in the event of an unexpected shock to markets. We combine these allocations with our hedging strategy, as we strive to deliver a robust and consistent risk profile.
The Fund used the following derivatives during the fiscal year:
| Instrument | Ending allocation | Performance effect |
| Futures | -17% (notional exposure) | Negative, as markets rose |
| Options | -6% (notional exposure) | Negative, as markets rose |
| Foreign currency exchange forwards | -3% (market value) | Neutral |
14
Table of Contents
Portfolio management reviews
Delaware Premium Income Fund
October 12, 2021 (Unaudited)
| Performance preview (for the year ended September 30, 2021) | | | | |
| Delaware Premium Income Fund (Institutional Class shares) | | 1-year return | | +12.27% |
| Delaware Premium Income Fund (Class A shares) | | 1-year return | | +11.96% |
| Cboe S&P 500 BuyWrite Index (benchmark) | | 1-year return | | +21.10% |
Past performance does not guarantee future results.
For complete, annualized performance for Delaware Premium Income Fund, please see the table on page 42.
Institutional Class shares are not subject to a sales charge and are offered for sale exclusively to certain eligible investors. In addition, Institutional Class shares pay no distribution and service fee.
The performance of Class A shares excludes the applicable sales charge. The performance of both Institutional Class shares and Class A shares reflects the reinvestment of all distributions.
Please see page 44 for a description of the index. Index performance returns do not reflect any management fees, transaction costs, or expenses. Indices are unmanaged and one cannot invest directly in an index.
Investment objective
The Fund seeks to generate income.
Ziegler Capital Management, LLC (ZCM), an investment adviser registered with the US Securities and Exchange Commission, is the sub-adviser to the Fund. As sub-adviser, ZCM is responsible for day-to-day management of the Fund’s assets. DMC, a series of MIMBT, has ultimate responsibility for all investment advisory services.
Market review
Equity markets rose to record highs for each successive calendar quarter during the past fiscal year, with the S&P 500® Index returning 29.98% for the period. According to Bloomberg, S&P 500 Index trailing earnings also grew nearly 30% during the fiscal year and are expected to grow 9.1% in calendar year 2022. The resulting forward price-to-earnings (P/E) ratio of the market is an above-average 19.6.
Bond returns were disappointing for the fiscal year, with the Bloomberg US Aggregate Index returning -0.90% for the period. Interest rates rose modestly but remained at significantly low levels. For example, the Bloomberg US Aggregate Index ended the fiscal year with a yield of 1.56%, which equates to a negative real yield as inflation has been consistently above 2%.
The fiscal year began with numerous uncertainties on the horizon, including a presidential election, COVID-related lockdowns, and highly anticipated initial reporting from nascent COVID-19 vaccine trials. Considering these significant unknowns, implied volatility, as measured by the Cboe Volatility Index® (VIX®), began the fiscal year at 26.4% and rose to 40.3% before the election, well above the long-term average of 19.6%.
COVID-19 and the accompanying restrictions on economic activity have been the main impediments to economic growth since the pandemic began, and they persisted through the first half of the fiscal year. Consumer spending was most depressed in coronavirus-sensitive industries, including retail, food service, hospitality, recreation, and leisure. Large fiscal stimulus, alongside economic restrictions, essentially resulted in forced savings, as households were limited in their spending on a multitude of items. Fortunately, the vaccine trials were successful, and a rapid rollout of the vaccine ensued during late winter and early spring. As vaccination rates increased, restrictions were lifted and consumer spending rebounded with gross domestic product (GDP) growing at a near 6% annualized rate over the past six months.
Despite rising inflation metrics in recent quarters, inflation expectations have remained well-anchored near long-term average levels, and it appears that investors believe many of the factors currently causing higher inflation are transitory. The US Consumer Price Index (CPI) is expected to return to more typical levels later next year as the economy normalizes, supply chain constraints abate, labor supply increases, and COVID-19 cases decline with higher global vaccination rates.
Source: Bloomberg.
Within the Fund
For the fiscal year ended September 30, 2021, Delaware Premium Income Fund underperformed its benchmark, the Cboe S&P 500 BuyWrite Index. The Fund’s Institutional Class shares gained 12.27%. The Fund’s Class A shares gained 11.96% at net asset value and 5.54% at maximum offer price. Both figures reflect all distributions reinvested. For the same period, the benchmark gained 21.10%. For complete, annualized performance of Delaware Premium Income Fund, please see the table on page 42.
The Fund returned 13.47%, gross of fees, for the fiscal year, producing an above-average upside capture ratio of 45% relative to the S&P 500 Index during a strong period of equity-market outperformance. The Fund produced 40% less risk than its benchmark and 61% less risk than the S&P 500 Index for the fiscal
15
Table of Contents
Portfolio management reviews
Delaware Premium Income Fund
year as measured by standard deviation. We feel the risk-adjusted return is a more accurate measure to compare performance relative to standard market indices. For the fiscal year, the Fund’s risk-adjusted return outperformed all three major indices: the S&P 500 Index, the Cboe S&P 500 BuyWrite Index, and the Bloomberg US Aggregate Index. The outperformance was due to both the risk-dampening characteristics of the in-the-money call options, as well as the returns from call option time decay and dividends.
The Fund outperformed the Bloomberg US Aggregate Index by a wide margin during the fiscal year, as the index posted a negative return of -0.90% during the period. The 10-year Treasury bond began the fiscal year with a yield of 0.69% and ended the fiscal year at 1.48%, which is still well below the level of inflation expected over the next ten years. Writer James Grant of Grant’s Interest Rate Observer famously described low-yielding bonds as “return-free risk.” If inflation or interest rates continue to rise, bonds may continue to suffer losses as they have over the past year. Unlike bonds, the Fund’s returns historically have not been negatively affected by higher interest rates. Considering today’s continued low interest rate environment, we believe Delaware Premium Income Fund may be an attractive, non-correlating strategy to complement investors’ fixed income portfolios.
The high levels of implied volatility throughout most of the fiscal year created above-average call premiums within the Fund. This provided a substantial tailwind to returns as the above-average time value in these call options gradually decayed during subsequent months. While the Fund’s absolute return on the call options underperformed the call options in the benchmark, we think this is not an apples-to-apples comparison because the Fund is designed to have less equity-market exposure by writing deep in-the-money call options, and the benchmark writes at-the-money call options. During such a strong period for equity markets, at-the-money call options would naturally outperform in-the-money call options because they offer the potential for more upside-capture. However, on a risk-adjusted basis, the call options in the Fund outperformed the call options in the benchmark.
Value-leaning stocks have been the foundation of the Fund’s investment strategy. This value tilt in the portfolio contributed to performance during the fiscal year, as value stocks outperformed the market. For example, the Fund’s overweight positions in energy and financials were additive, as these sectors were the leading contributors during the first half of the fiscal year, the result of positive vaccine news and the gradual reopening of the economy. An overweight to consumer staples detracted from returns as this relatively stable sector lagged the market during the fiscal year’s strong equity-market rally. Stock selection was positive in consumer discretionary and information technology but was negative in industrials as the main defense stock in the Fund underperformed. The semi-conductor holdings in the Fund continued to outperform, as global demand for these products has continued to remain strong amid tight supply.
Given the current environment of historically low interest rates, attractive call premiums, and compelling valuations of the value-oriented stocks in the Fund, we believe the Fund is well-positioned relative to bonds at the end of the fiscal year and can serve as a low-volatility component for an equity-overweighted position. As we manage the active option writing strategy of the Fund, we will continue to closely monitor for implied volatility opportunities and downside protection amounts that we think could help enhance the risk-adjusted return of the Fund relative to our benchmarks. We continue to believe the stocks in the Fund offer attractive risk-reward potential going forward, especially when combined with deep in-the-money call options that can help stabilize returns by offering opportunities for both downside protection and a return component.
16
Table of Contents
Portfolio management reviews
Delaware Total Return Fund
October 12, 2021 (Unaudited)
| Performance preview (for the year ended September 30, 2021) | | | | |
| Delaware Total Return Fund (Institutional Class shares) | | 1-year return | | +22.06% |
| Delaware Total Return Fund (Class A shares) | | 1-year return | | +21.77% |
| S&P 500 Index® (primary benchmark) | | 1-year return | | +30.00% |
| 60% S&P 500 Index / 40% Bloomberg US Aggregate Index (secondary benchmark) | | 1-year return | | +16.91% |
| Bloomberg US Aggregate Index (secondary benchmark) | | 1-year return | | -0.90% |
Past performance does not guarantee future results.
For complete, annualized performance for Delaware Total Return Fund, please see the table on page 46.
Institutional Class shares are not subject to a sales charge and are offered for sale exclusively to certain eligible investors. In addition, Institutional Class shares pay no distribution and service fee.
The performance of Class A shares excludes the applicable sales charge. The performance of both Institutional Class shares and Class A shares reflects the reinvestment of all distributions.
Please see page 48 for a description of the index. Index performance returns do not reflect any management fees, transaction costs, or expenses. Indices are unmanaged and one cannot invest directly in an index.
Investment objective
The Fund seeks to provide sustainable current income with potential for capital appreciation with moderate investment risk.
Market review
A risk-on environment characterized the Fund’s fiscal year. Higher-risk assets continued to perform strongly on the back of the recovery story after the COVID-19-related crash. Although there were short setbacks – mainly due to further COVID waves – the Federal Reserve’s continued loose monetary policy coupled with extremely expansive fiscal policy led equities to new highs. High yield corporates also recorded very strong performance in the fiscal year, but commodity prices developed even more strongly – with the exception of gold. On the other hand, due to rising yields, government bonds recorded losses, especially in the US and the UK, but also in the European Union.
The change in power to the Democrats in the White House and Congress made further stimulus packages possible in 2021. Rising demand led to supply bottlenecks and sharply rising energy prices. This price pressure manifested itself in the highest inflation rates in years and led to discussions about tapering the central bank’s bond purchases. Accordingly, yields also rose significantly, and in September, the Fed officially spoke of the possibility of starting tapering in 2021.
China also caused a lot of turbulence over the summer, with tough government regulatory measures against its own technology sector, the collapse of the real estate giant Evergrande, and electricity shortages in the country leading to restrictions.
After seven positive months, stock markets recorded their first monthly loss in September in the face of various uncertainties, including the US debt ceiling debate. However, a government shutdown was avoided for the present with a last-minute decision to extend government funding for two months.
Within the Fund
For the fiscal year ended September 30, 2021, Delaware Total Return Fund underperformed its primary benchmark, the S&P 500 Index. With respect to its secondary benchmarks, the Fund outperformed both – a blend of 60% S&P 500 Index and 40% Bloomberg US Aggregate Index and the Bloomberg US Aggregate Index. The Fund’s Institutional Class shares rose 22.06%. The Fund’s Class A shares gained 21.77% at net asset value and 14.74% at maximum offer price. These figures reflect all distributions reinvested. During the same period, the S&P 500 Index rose 30.00%. The blend of 60% S&P 500 Index and 40% Bloomberg US Aggregate Index gained 16.91% while the Bloomberg US Aggregate Index fell 0.90%. For complete annualized performance of Delaware Total Return Fund, please see the table on page 46.
The Fund’s outperformance for the fiscal year mainly stemmed from equity exposure that first was largely allocated to value equities, but over the course of the year shifted more and more toward quality and income stocks after value had performed very strongly. Although US large-cap value outperformed US large-cap core over the 12-month period, the reallocation toward quality and income proved to be very beneficial for the Fund, as the sector outperformed value stocks strongly from March 2021 on. Accordingly, profits were taken from value at the right time. Additionally, the Fund’s allocation to international and real estate equities contributed to performance. While international equities lagged US performance, US REITs strongly outperformed.
Another important performance contributor were convertible bonds, which delivered by far the highest performance of the bond sleeves. To take profits here as well, their weight was reduced in the last third of the Fund’s fiscal year. The same was true for high yield bonds,
17
Table of Contents
Portfolio management reviews
Delaware Total Return Fund
which also showed decent gains, albeit at a much slower pace than equities and convertibles. The freed-up funds were partly shifted to investment grade corporates and partly to the opportunistic sleeve. While the allocation to investment grade produced a neutral result, the increase of the previously strongly performing opportunistic sleeve was detrimental as the sleeve had its best performance before the shift. However, over the course of the full 12 months, it still contributed substantially to the Fund’s performance.
The Fund’s strategic policy weights reflect a commitment to seeking diversification across geographies and asset classes. As part of the oversight process, we periodically analyze the sources of the Fund’s active performance. For the fiscal year, the Fund’s active positioning with respect to the strategic policy weights of different asset classes contributed to performance.
We periodically examine the contribution of derivatives to the Fund’s performance. Based on the available information, we believe the Fund’s combination of futures, options, swaps, and currency positions had only a limited effect on performance during the fiscal year.
At the end of the Fund’s fiscal year, we sought to continue to deliver the potential benefits of diversification while actively managing risk. With these two principles in mind, the Fund seeks to deliver returns that are derived from tactical asset allocation decisions as well as from active management of individual asset classes and investment styles.
We manage the Fund based on the assumption that investors should keep a global perspective when evaluating potential investment opportunities. We therefore continue to include investment possibilities around the globe within the Fund.
We believe a thoughtful, active management approach is needed, given today’s increased political, economic, and market uncertainty. The Multi Asset team’s decisions are taken collectively, and the weightings assigned to individual asset classes reflect our unique asset class ranking methodology, highlighted by our distinctive pairwise approach, which includes assessment of one asset class versus another on a head-to-head basis. Vigilant and continuous assessment of the current market environment may offer opportunities to take advantage of market dislocations and has the potential to achieve what we view as attractive risk-adjusted returns through an active focus on portfolio risk and diversification.
18
Table of Contents
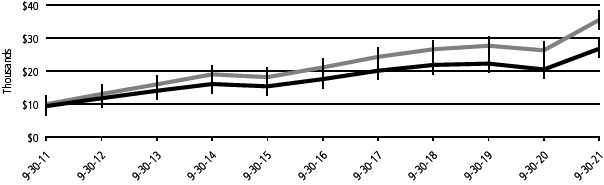
Performance summaries
Delaware Equity Income Fund
September 30, 2021 (Unaudited)
The performance quoted represents past performance and does not guarantee future results. Investment return and principal value of an investment will fluctuate so that shares, when redeemed, may be worth more or less than their original cost. Current performance may be lower or higher than the performance quoted. Performance data current to the most recent month end may be obtained by calling 800 523-1918 or visiting delawarefunds.com/performance.
| Fund and benchmark performance1,2 | | Average annual total returns through September 30, 2021 |
| | 1 year | | 5 year | | 10 year | | Lifetime |
| Class A (Est. February 22, 1993) | | | | | | | | | | |
| Excluding sales charge | | +30.49% | | +8.77% | | +11.02% | | | — | |
| Including sales charge | | +23.00% | | +7.50% | | +10.36% | | | — | |
| Institutional Class (Est. April 1, 2013) | | | | | | | | | | |
| Excluding sales charge | | +30.91% | | +9.07% | | — | | | +9.12% | |
| Including sales charge | | +30.91% | | +9.07% | | — | | | +9.12% | |
| Class R6 (Est. April 1, 2013) | | | | | | | | | | |
| Excluding sales charge | | +30.91% | | +9.18% | | — | | | +9.23% | |
| Including sales charge | | +30.91% | | +9.18% | | — | | | +9.23% | |
| Russell 1000 Value Index | | +35.01% | | +10.94% | | — | | | +10.74% | * |
| * | The benchmark lifetime return is for Institutional Class share comparison only and is calculated using the month end prior to the Fund’s Institutional Class inception date. |
| 1 | Returns reflect the reinvestment of all distributions and are presented both with and without the applicable sales charges described below. Returns do not reflect the deduction of taxes the shareholder would pay on Fund distributions or redemptions of Fund shares. |
Expense limitations were in effect for certain classes during some or all of the periods shown in the “Fund and benchmark performance” table. Expenses for each class are listed on the “Fund expense ratios” table on page 20. Performance would have been lower had expense limitations not been in effect.
Institutional Class shares are not subject to a sales charge and are offered for sale exclusively to certain eligible investors. In addition, Institutional Class shares pay no distribution and service (12b-1) fee.
Class A shares are sold with a maximum front-end sales charge of 5.75%, and have an annual 12b-1 fee of 0.25% of average daily net assets. Performance for Class A shares, excluding sales charges, assumes that no front-end sales charge applied.
Class R6 shares are available only to certain investors. In addition, Class R6 shares do not pay any service fees, sub-accounting fees, and/or sub-transfer agency fees to any brokers, dealers, or other financial intermediaries. Class R6 shares pay no 12b-1 fee.
Risk is increased in a concentrated portfolio since it holds a limited number of securities with each investment having a greater effect on the overall performance.
The disruptions caused by natural disasters, pandemics, or similar events could prevent the Fund from executing advantageous investment decisions in a timely manner and could negatively impact the Fund’s ability to achieve its investment objective and the value of the Fund’s investments.
19
Table of Contents
Performance summaries
Delaware Equity Income Fund
| 2 | The Fund’s expense ratios, as described in the most recent prospectus, are disclosed in the following “Fund expense ratios” table. Delaware Management Company has agreed to reimburse certain expenses and/or waive certain fees in order to prevent total annual fund operating expenses (excluding any 12b-1 fees, acquired fund fees and expenses, taxes, interest, short sale dividend and interest expenses, brokerage fees, certain insurance costs, and nonroutine expenses or costs, including, but not limited to, those relating to reorganizations, litigation, conducting shareholder meetings, and liquidations) from exceeding 1.17%, 0.85%, and 0.81% of the Fund’s average daily net assets for Class A shares, Institutional Class shares, and Class R6 shares, respectively, from October 1, 2020 to September 30, 2021.* Prior to January 27, 2021, the expense waiver was 1.17% of the Fund’s average daily net assets for Class A shares. Please see the most recent prospectus and any applicable supplement(s) for additional information on these fee waivers and/or reimbursements. Please see the “Financial highlights” section in this report for the most recent expense ratios. |
| Fund expense ratios | | Class A | | Institutional Class | | Class R6 |
| Total annual operating expenses (without fee waivers) | | 1.16% | | 0.94% | | 0.88% |
| Net expenses (including fee waivers, if any) | | 1.12% | | 0.85% | | 0.81% |
| Type of waiver | | Contractual | | Contractual | | Contractual |
| * | The aggregate contractual waiver period covering this report for Class R6 shares is from October 4, 2019 through January 31, 2022, and for Class A and Institutional Class shares is from January 28, 2021 through January 31, 2022. |
Performance of a $10,000 investment1
Class A shares
Average annual total returns from September 30, 2011 through September 30, 2021
| For period beginning September 30, 2011 through September 30, 2021 | | Starting value | | Ending value |
 | Russell 1000 Value Index | | | $ | 10,000 | | | | $ | 35,522 | |
 | Delaware Equity Income Fund — Class A shares | | | $ | 9,425 | | | | $ | 26,792 | |
20
Table of Contents
Institutional Class shares
Average annual total returns from April 1, 2013 (Fund’s inception) through September 30, 2021
| For period beginning April 1, 2013 through September 30, 2021 | | Starting value | | Ending value |
| Russell 1000 Value Index | | | $ | 10,000 | | | | $ | 24,735 | |
| Delaware Equity Income Fund — Institutional Class shares | | | $ | 10,000 | | | | $ | 21,000 | |
| 1 | The “Performance of a $10,000 investment” graph for Class A shares assumes $10,000 invested in Class A shares of the Fund on September 30, 2011, and includes the effect of a 5.75% front-end sales charge and the reinvestment of all distributions. The graph also assumes $10,000 invested in Russell 1000 Value Index as of September 30, 2011. |
The “Performance of a $10,000 investment” graph for Institutional Class shares assumes $10,000 invested in Institutional Class shares of the Fund on April 1, 2013, and includes the reinvestment of all distributions. The graph also assumes $10,000 invested in Russell 1000 Value Index as of April 1, 2013.
The graphs do not reflect the deduction of taxes the shareholders would pay on Fund distributions or redemptions of Fund shares. Expense limitations were in effect for some or all of the periods shown. Performance would have been lower had expense limitations not been in effect. Expenses are listed in the “Fund expense ratios” table on page 20. Please note additional details on pages 19 through 21.
| | Nasdaq | | |
| | symbols | | CUSIPs |
| Class A | | FIUTX | | 24611D409 |
| Institutional Class | | FIUUX | | 24611D508 |
| Class R6 | | FIUVX | | 24611D607 |
The Russell 1000 Value Index measures the performance of the large-cap value segment of the US equity universe. It includes those Russell 1000 companies with lower price-to-book ratios and lower forecasted growth values.
Frank Russell Company is the source and owner of the trademarks, service marks and copyrights related to the Russell Indexes. Russell® is a trademark of Frank Russell Company.
Index performance returns do not reflect any management fees, transaction costs, or expenses. Indices are unmanaged and one cannot invest directly in an index. Past performance is not a guarantee of future results.
Performance of other Fund classes will vary due to different charges and expenses.
21
Table of Contents
Performance summaries
Delaware Growth and Income Fund
September 30, 2021 (Unaudited)
The performance quoted represents past performance and does not guarantee future results. Investment return and principal value of an investment will fluctuate so that shares, when redeemed, may be worth more or less than their original cost. Current performance may be lower or higher than the performance quoted. Performance data current to the most recent month end may be obtained by calling 800 523-1918 or visiting delawarefunds.com/performance.
| Fund and benchmark performance1,2 | | Average annual total returns through September 30, 2021 |
| | 1 year | | 5 year | | 10 year | | Lifetime |
| Class A (Est. October 4, 1993) | | | | | | | | | | | | |
| Excluding sales charge | | +30.89 | % | | +9.10 | % | | +11.93 | % | | — | |
| Including sales charge | | +23.35 | % | | +7.82 | % | | +11.27 | % | | — | |
| Institutional Class (Est. April 1, 2013) | | | | | | | | | | | | |
| Excluding sales charge | | +31.19 | % | | +9.43 | % | | — | | | +9.44 | % |
| Including sales charge | | +31.19 | % | | +9.43 | % | | — | | | +9.44 | % |
| Class R6 (Est. April 1, 2013) | | | | | | | | | | | | |
| Excluding sales charge | | +31.25 | % | | +9.50 | % | | — | | | +9.50 | % |
| Including sales charge | | +31.25 | % | | +9.50 | % | | — | | | +9.50 | % |
| Russell 1000 Value Index | | +35.01 | % | | +10.94 | % | | — | | | +10.74 | %* |
| * | The benchmark lifetime return is for Institutional Class share comparison only and is calculated using the month end prior to the Fund’s Institutional Class inception date. |
| 1 | Returns reflect the reinvestment of all distributions and are presented both with and without the applicable sales charges described below. Returns do not reflect the deduction of taxes the shareholder would pay on Fund distributions or redemptions of Fund shares. |
Expense limitations were in effect for certain classes during some or all of the periods shown in the “Fund and benchmark performance” table. Expenses for each class are listed on the “Fund expense ratios” table on page 23. Performance would have been lower had expense limitations not been in effect.
Institutional Class shares are not subject to a sales charge and are offered for sale exclusively to certain eligible investors. In addition, Institutional Class shares pay no distribution and service (12b-1) fee.
Class A shares are sold with a maximum front-end sales charge of 5.75%, and have an annual 12b-1 fee of 0.25% of average daily net assets. Performance for Class A shares, excluding sales charges, assumes that no front-end sales charge applied.
Class R6 shares are available only to certain investors. In addition, Class R6 shares do not pay any service fees, sub-accounting fees, and/or sub-transfer agency fees to any brokers, dealers, or other financial intermediaries. Class R6 shares pay no 12b-1 fee.
Risk is increased in a concentrated portfolio since it holds a limited number of securities with each investment having a greater effect on the overall performance.
The disruptions caused by natural disasters, pandemics, or similar events could prevent the Fund from executing advantageous investment decisions in a timely manner and could negatively impact the Fund’s ability to achieve its investment objective and the value of the Fund’s investments.
22
Table of Contents
| 2 | The Fund’s expense ratios, as described in the most recent prospectus, are disclosed in the following “Fund expense ratios” table. Delaware Management Company has agreed to reimburse certain expenses and/or waive certain fees in order to prevent total annual fund operating expenses (excluding any 12b-1 fees, acquired fund fees and expenses, taxes, interest, short sale dividend and interest expenses, brokerage fees, certain insurance costs, and nonroutine expenses or costs, including, but not limited to, those relating to reorganizations, litigation, conducting shareholder meetings, and liquidations) from exceeding 1.11%, 0.82%, and 0.75% of the Fund’s average daily net assets for Class A shares, Institutional Class shares, and Class R6 shares, respectively, from October 1, 2020 to September 30, 2021.* Prior to January 27, 2021, the expense waiver was 1.11% of the Fund’s average daily net assets for Class A shares. Please see the most recent prospectus and any applicable supplement(s) for additional information on these fee waivers and/or reimbursements. Please see the “Financial highlights” section in this report for the most recent expense ratios. |
| Fund expense ratios | | Class A | | Institutional Class | | Class R6 |
| Total annual operating expenses (without fee waivers) | | 1.10% | | 0.86% | | 0.81% |
| Net expenses (including fee waivers, if any) | | 1.08% | | 0.82% | | 0.75% |
| Type of waiver | | Contractual | | Contractual | | Contractual |
| * | The aggregate contractual waiver period covering covering this report for Class R6 shares is from October 4, 2019 through January 31, 2022, and for Class A and Institutional Class shares is from January 28, 2021 through January 31, 2022. |
Performance of a $10,000 investment1
Class A shares
Average annual total returns from September 30, 2011 through September 30, 2021

| For period beginning September 30, 2011 through September 30, 2021 | | Starting value | | Ending value |
| Russell 1000 Value Index | | | $ | 10,000 | | | | $ | 35,522 | |
| Delaware Growth and Income Fund — Class A shares | | | $ | 9,425 | | | | $ | 29,091 | |
23
Table of Contents
Performance summaries
Delaware Growth and Income Fund
Institutional Class shares
Average annual total returns from April 1, 2013 (Fund’s inception) through September 30, 2021
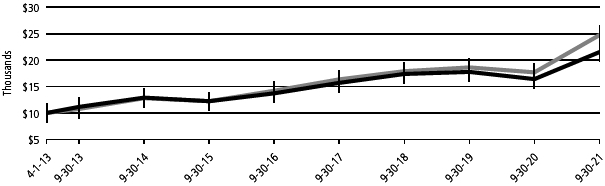
| For period beginning April 1, 2013 through September 30, 2021 | | Starting value | | Ending value |
| Russell 1000 Value Index | | $10,000 | | $24,735 |
| Delaware Growth and Income Fund — Institutional Class shares | | $10,000 | | $21,522 |
| 1 | The “Performance of a $10,000 investment” graph for Class A shares assumes $10,000 invested in Class A shares of the Fund on September 30, 2011, and includes the effect of a 5.75% front-end sales charge and the reinvestment of all distributions. The graph also assumes $10,000 invested in Russell 1000 Value Index as of September 30, 2011. |
The “Performance of a $10,000 investment” graph for Institutional Class shares assumes $10,000 invested in Institutional Class shares of the Fund on April 1, 2013, and includes the reinvestment of all distributions. The graph also assumes $10,000 invested in Russell 1000 Value Index as of April 1, 2013.
The graphs do not reflect the deduction of taxes the shareholders would pay on Fund distributions or redemptions of Fund shares. Expense limitations were in effect for some or all of the periods shown. Performance would have been lower had expense limitations not been in effect. Expenses are listed in the “Fund expense ratios” table on page 23. Please note additional details on pages 22 through 24.
The Russell 1000 Value Index measures the performance of the large-cap value segment of the US equity universe. It includes those Russell 1000 companies with lower price-to-book ratios and lower forecasted growth values.
Frank Russell Company is the source and owner of the trademarks, service marks and copyrights related to the Russell Indexes. Russell® is a trademark of Frank Russell Company.
Index performance returns do not reflect any management fees, transaction costs, or expenses. Indices are unmanaged and one cannot invest directly in an index. Past performance is not a guarantee of future results.
Performance of other Fund classes will vary due to different charges and expenses.
| | Nasdaq | | |
| | symbols | | CUSIPs |
| Class A | | FGINX | | 24611D870 |
| Institutional Class | | FGIPX | | 24611D862 |
| Class R6 | | FGIQX | | 24611D854 |
24
Table of Contents
Performance summaries
Delaware Growth Equity Fund
September 30, 2021 (Unaudited)
The performance quoted represents past performance and does not guarantee future results. Investment return and principal value of an investment will fluctuate so that shares, when redeemed, may be worth more or less than their original cost. Current performance may be lower or higher than the performance quoted. Performance data current to the most recent month end may be obtained by calling 800 523-1918 or visiting delawarefunds.com/performance.
| Fund and benchmark performance1,2 | | Average annual total returns through September 30, 2021 |
| | 1 year | | 5 year | | 10 year | | Lifetime |
| Class A (Est. October 25, 2000) | | | | | | | | | | | | |
| Excluding sales charge | | +41.67 | % | | +20.66 | % | | +17.52 | % | | — | |
| Including sales charge | | +33.56 | % | | +19.23 | % | | +16.84 | % | | — | |
| Institutional Class (Est. April 1, 2013) | | | | | | | | | | | | |
| Excluding sales charge | | +41.98 | % | | +21.03 | % | | — | | | +17.20 | % |
| Including sales charge | | +41.98 | % | | +21.03 | % | | — | | | +17.20 | % |
| Class R6 (Est. April 1, 2013) | | | | | | | | | | | | |
| Excluding sales charge | | +42.12 | % | | +21.11 | % | | — | | | +17.31 | % |
| Including sales charge | | +42.12 | % | | +21.11 | % | | — | | | +17.31 | % |
| Russell 1000 Growth Index | | +27.32 | % | | +22.84 | % | | — | | | +18.77 | %* |
| * | The benchmark lifetime return is for Institutional Class share comparison only and is calculated using the month end prior to the Fund’s Institutional Class inception date. |
| 1 | Returns reflect the reinvestment of all distributions and are presented both with and without the applicable sales charges described below. Returns do not reflect the deduction of taxes the shareholder would pay on Fund distributions or redemptions of Fund shares. |
Expense limitations were in effect for certain classes during some or all of the periods shown in the “Fund and benchmark performance” table. Expenses for each class are listed on the “Fund expense ratios” table on page 26. Performance would have been lower had expense limitations not been in effect.
Institutional Class shares are not subject to a sales charge and are offered for sale exclusively to certain eligible investors. In addition, Institutional Class shares pay no distribution and service (12b-1) fee.
Class A shares are sold with a maximum front-end sales charge of 5.75%, and have an annual 12b-1 fee of 0.25% of average daily net assets. Performance for Class A shares, excluding sales charges, assumes that no front-end sales charge applied.
Class R6 shares are available only to certain investors. In addition, Class R6 shares do not pay any service fees, sub-accounting fees, and/or sub-transfer agency fees to any brokers, dealers, or other financial intermediaries. Class R6 shares pay no 12b-1 fee.
Investments in small and/or medium-sized companies typically exhibit greater risk and higher volatility than larger, more established companies.
Narrowly focused investments may exhibit higher volatility than investments in multiple industry sectors.
Because the Fund expects to hold a concentrated portfolio of limited number of securities, the Fund’s risk is increased because each investment has a greater effect on the Fund’s overall performance.
The disruptions caused by natural disasters, pandemics, or similar events could prevent the Fund from executing advantageous investment decisions in a timely manner and could negatively impact the Fund’s ability to achieve its investment objective and the value of the Fund’s investments.
25
Table of Contents
Performance summaries
Delaware Growth Equity Fund
| 2 | The Fund’s expense ratios, as described in the most recent prospectus, are disclosed in the following “Fund expense ratios” table. Delaware Management Company has agreed to reimburse certain expenses and/or waive certain fees in order to prevent total annual fund operating expenses (excluding any 12b-1 fees, acquired fund fees and expenses, taxes, interest, short sale dividend and interest expenses, brokerage fees, certain insurance costs, and nonroutine expenses or costs, including, but not limited to, those relating to reorganizations, litigation, conducting shareholder meetings, and liquidations) from exceeding 1.17%, 0.86%, and 0.79% of the Fund’s average daily net assets for Class A shares, Institutional Class shares, and Class R6 shares, respectively, from October 1, 2020 to September 30, 2021.* Prior to January 27, 2021, the expense waiver was 1.17% and 0.86% of the Fund’s average daily net assets for Class A shares and Institutional Class shares, respectively. Please see the most recent prospectus and any applicable supplement(s) for additional information on these fee waivers and/or reimbursements. Please see the “Financial highlights” section in this report for the most recent expense ratios. |
| Fund expense ratios | | Class A | | Institutional Class | | Class R6 |
| Total annual operating expenses (without fee waivers) | | 1.14% | | 0.89% | | 0.83% |
| Net expenses (including fee waivers, if any) | | 1.14% | | 0.86% | | 0.79% |
| Type of waiver | | Contractual | | Contractual | | Contractual |
| * | The aggregate contractual waiver period covering this report for Class R6 shares is from October 4, 2019 through January 31, 2022, and for Class A and Institutional Class shares is from January 28, 2021 through January 31, 2022. |
Performance of a $10,000 investment1
Class A shares
Average annual total returns from September 30, 2011 through September 30, 2021
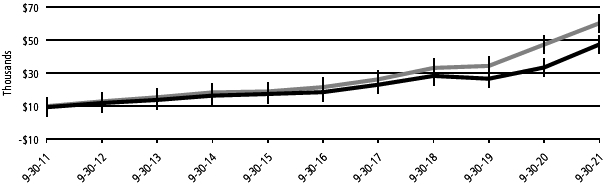
| For period beginning September 30, 2011 through September 30, 2021 | | Starting value | | Ending value |
| Russell 1000 Growth Index | | | $ | 10,000 | | | | $ | 60,261 | |
| Delaware Growth Equity Fund — Class A shares | | | $ | 9,425 | | | | $ | 47,406 | |
26
Table of Contents
Institutional Class shares
Average annual total returns from April 1, 2013 (Fund’s inception) through September 30, 2021

| For period beginning April 1, 2013 through September 30, 2021 | | Starting value | | Ending value |
| Russell 1000 Growth Index | | $10,000 | | $43,441 |
| Delaware Growth Equity Fund — Institutional Class shares | | $10,000 | | $38,533 |
| 1 | The “Performance of a $10,000 investment” graph for Class A shares assumes $10,000 invested in Class A shares of the Fund on September 30, 2011, and includes the effect of a 5.75% front-end sales charge and the reinvestment of all distributions. The graph also assumes $10,000 invested in the Russell 1000 Growth Index as of September 30, 2011. |
The “Performance of a $10,000 investment” graph for Institutional Class shares assumes $10,000 invested in Institutional Class shares of the Fund on April 1, 2013, and includes the reinvestment of all distributions. The graph also assumes $10,000 invested in the Russell 1000 Growth Index as of April 1, 2013.
The graphs do not reflect the deduction of taxes the shareholders would pay on Fund distributions or redemptions of Fund shares. Expense limitations were in effect for some or all of the periods shown. Performance would have been lower had expense limitations not been in effect. Expenses are listed in the “Fund expense ratios” table on page 26. Please note additional details on pages 25 through 27.
The Russell 1000 Growth Index measures the performance of the large-cap growth segment of the US equity universe. It includes those Russell 1000 companies with higher price-to-book ratios and higher forecasted growth values.
The Citigroup® Economic Surprise Index, mentioned on pages 5 and 6, is a 3-month rolling measure of actual economic surprises relative to market expectations. A positive reading means that data have been stronger than expected, while a negative reading means that economic data have been weaker than expected.
Index performance returns do not reflect any management fees, transaction costs, or expenses. Indices are unmanaged and one cannot invest directly in an index. Past performance is not a guarantee of future results.
Performance of other Fund classes will vary due to different charges and expenses.
| | Nasdaq | | |
| | symbols | | CUSIPs |
| Class A | | FICGX | | 24611D714 |
| Institutional Class | | FICHX | | 24611D698 |
| Class R6 | | FICIX | | 24611D680 |
27
Table of Contents
Performance summaries
Delaware Opportunity Fund
September 30, 2021 (Unaudited)
The performance quoted represents past performance and does not guarantee future results. Investment return and principal value of an investment will fluctuate so that shares, when redeemed, may be worth more or less than their original cost. Current performance may be lower or higher than the performance quoted. Performance data current to the most recent month end may be obtained by calling 800 523-1918 or visiting delawarefunds.com/performance.
| Fund and benchmark performance1,2 | | Average annual total returns through September 30, 2021 |
| | 1 year | | 5 year | | 10 year | | Lifetime |
| Class A (Est. August 24, 1992) | | | | | | | | | | | | |
| Excluding sales charge | | +47.10 | % | | +9.88 | % | | +12.73 | % | | — | |
| Including sales charge | | +38.64 | % | | +8.58 | % | | +12.07 | % | | — | |
| Institutional Class (Est. April 1, 2013) | | | | | | | | | | | | |
| Excluding sales charge | | +47.50 | % | | +10.22 | % | | — | | | +10.24 | % |
| Including sales charge | | +47.50 | % | | +10.22 | % | | — | | | +10.24 | % |
| Class R6 (Est. April 1, 2013) | | | | | | | | | | | | |
| Excluding sales charge | | +47.71 | % | | +10.34 | % | | — | | | +10.39 | % |
| Including sales charge | | +47.71 | % | | +10.34 | % | | — | | | +10.39 | % |
| Russell Midcap Value Index | | +42.40 | % | | +10.59 | % | | +13.93 | % | | +10.86 | %* |
| * | The benchmark lifetime return is for Institutional Class share comparison only and is calculated using the month end prior to the Fund’s Institutional Class inception date. |
| 1 | Returns reflect the reinvestment of all distributions and are presented both with and without the applicable sales charges described below. Returns do not reflect the deduction of taxes the shareholder would pay on Fund distributions or redemptions of Fund shares. |
Expense limitations were in effect for certain classes during some or all of the periods shown in the “Fund and benchmark performance” table. Expenses for each class are listed on the “Fund expense ratios” table on page 29. Performance would have been lower had expense limitations not been in effect.
Institutional Class shares are not subject to a sales charge and are offered for sale exclusively to certain eligible investors. In addition, Institutional Class shares pay no distribution and service (12b-1) fee.
Class A shares are sold with a maximum front-end sales charge of 5.75%, and have an annual 12b-1 fee of 0.25% of average daily net assets. Performance for Class A shares, excluding sales charges, assumes that no front-end sales charge applied.
Class R6 shares are available only to certain investors. In addition, Class R6 shares do not pay any service fees, sub-accounting fees, and/or sub-transfer agency fees to any brokers, dealers, or other financial intermediaries. Class R6 shares pay no 12b-1 fee.
Investments in small and/or medium-sized companies typically exhibit greater risk and higher volatility than larger, more established companies.
REIT investments are subject to many of the risks associated with direct real estate ownership, including changes in economic conditions, credit risk, and interest rate fluctuations.
An exchange-traded fund (ETF) is a security that represents all the stocks on a given exchange. ETF shares can be bought, sold, short-sold, traded on margin, and generally function as if they were stocks.
The disruptions caused by natural disasters, pandemics, or similar events could prevent the Fund from executing advantageous investment decisions in a timely manner and could negatively impact the Fund’s ability to achieve its investment objective and the value of the Fund’s investments.
28
Table of Contents
| 2 | The Fund’s expense ratios, as described in the most recent prospectus, are disclosed in the following “Fund expense ratios” table. Delaware Management Company has agreed to reimburse certain expenses and/or waive certain fees in order to prevent total annual fund operating expenses (excluding any 12b-1 fees, acquired fund fees and expenses, taxes, interest, short sale dividend and interest expenses, brokerage fees, certain insurance costs, and nonroutine expenses or costs, including, but not limited to, those relating to reorganizations, litigation, conducting shareholder meetings, and liquidations) from exceeding 1.21%, 0.90%, and 0.78% of the Fund’s average daily net assets for Class A shares, Institutional Class shares, and Class R6 shares, respectively, from October 1, 2020 to September 30, 2021.* Please see the most recent prospectus and any applicable supplement(s) for additional information on these fee waivers and/or reimbursements. Please see the “Financial highlights” section in this report for the most recent expense ratios. |
| Fund expense ratios | | Class A | | Institutional Class | | Class R6 |
| Total annual operating expenses (without fee waivers) | | 1.24% | | 1.04% | | 0.95% |
| Net expenses (including fee waivers, if any) | | 1.21% | | 0.90% | | 0.78% |
| Type of waiver | | Contractual | | Contractual | | Contractual |
| * | The aggregate contractual waiver period covering this report is from January 28, 2021 through January 31, 2022. |
Performance of a $10,000 investment1
Class A shares
Average annual total returns from September 30, 2011 through September 30, 2021

| For period beginning September 30, 2011 through September 30, 2021 | | Starting value | | Ending value |
| Russell Midcap Value Index | | | $ | 10,000 | | | | $ | 36,857 | |
| Delaware Opportunity Fund — Class A shares | | | $ | 9,425 | | | | $ | 31,241 | |
29
Table of Contents
Performance summaries
Delaware Opportunity Fund
Institutional Class shares
Average annual total returns from April 1, 2013 (Fund’s inception) through September 30, 2021
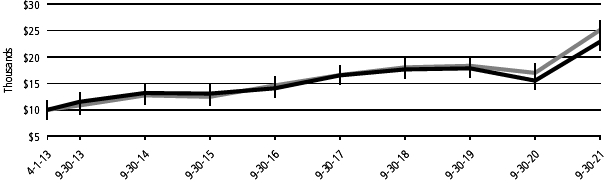
| For period beginning April 1, 2013 through September 30, 2021 | | Starting value | | Ending value |
| Russell Midcap Value Index | | $10,000 | | $25,116 |
| Delaware Opportunity Fund — Institutional Class shares | | $10,000 | | $22,896 |
| 1 | The “Performance of a $10,000 investment” graph for Class A shares assumes $10,000 invested in Class A shares of the Fund on September 30, 2011, and includes the effect of a 5.75% front-end sales charge and the reinvestment of all distributions. The graph also assumes $10,000 invested in Russell Midcap Value Index as of September 30, 2011. |
The “Performance of a $10,000 investment” graph for Institutional Class shares assumes $10,000 invested in Institutional Class shares of the Fund on April 1, 2013, and includes the reinvestment of all distributions. The graph also assumes $10,000 invested in Russell Midcap Value Index as of April 1, 2013.
The graphs do not reflect the deduction of taxes the shareholders would pay on Fund distributions or redemptions of Fund shares. Expense limitations were in effect for some or all of the periods shown. Performance would have been lower had expense limitations not been in effect. Expenses are listed in the “Fund expense ratios” table on page 29. Please note additional details on pages 28 through 30.
The Russell Midcap Value Index measures the performance of the mid-cap value segment of the US equity universe. It includes those Russell Midcap Index companies with lower price-to-book ratios and lower forecasted growth values.
The Russell Midcap Growth Index, mentioned on page 7, measures the performance of the mid-cap growth segment of the US equity universe. It includes those Russell Midcap Index companies with higher price-to-book ratios and higher forecasted growth values.
Index performance returns do not reflect any management fees, transaction costs, or expenses. Indices are unmanaged and one cannot invest directly in an index. Past performance is not a guarantee of future results.
Performance of other Fund classes will vary due to different charges and expenses.
| | Nasdaq | | |
| | symbols | | CUSIPs |
| Class A | | FIUSX | | 24611D771 |
| Institutional Class | | FIVUX | | 24611D763 |
| Class R6 | | FIVVX | | 24611D755 |
30
Table of Contents
Performance summaries
Delaware Global Equity Fund
September 30, 2021 (Unaudited)
The performance quoted represents past performance and does not guarantee future results. Investment return and principal value of an investment will fluctuate so that shares, when redeemed, may be worth more or less than their original cost. Current performance may be lower or higher than the performance quoted. Performance data current to the most recent month end may be obtained by calling 800 523-1918 or visiting delawarefunds.com/performance.
| Fund and benchmark performance1,2 | | Average annual total returns through September 30, 2021 |
| | 1 year | | 5 year | | 10 year | | Lifetime |
| Class A (Est. November 16, 1981) | | | | | | | | | | | | |
| Excluding sales charge | | +12.11 | % | | +8.43 | % | | +9.89 | % | | — | |
| Including sales charge | | +5.62 | % | | +7.14 | % | | +9.24 | % | | — | |
| Institutional Class (Est. April 1, 2013) | | | | | | | | | | | | |
| Excluding sales charge | | +12.54 | % | | +8.80 | % | | — | | | +8.47 | % |
| Including sales charge | | +12.54 | % | | +8.80 | % | | — | | | +8.47 | % |
| Class R6 (Est. April 1, 2013) | | | | | | | | | | | | |
| Excluding sales charge | | +12.61 | % | | +8.86 | % | | — | | | +8.57 | % |
| Including sales charge | | +12.61 | % | | +8.86 | % | | — | | | +8.57 | % |
| MSCI World Index (net) | | +28.82 | % | | +13.74 | % | | — | | | +11.16 | %* |
| MSCI World Index (gross) | | +29.39 | % | | +14.34 | % | | — | | | +11.77 | %* |
| * | The benchmark lifetime return is for Institutional Class share comparison only and is calculated using the month end prior to the Fund’s Institutional Class inception date. |
| 1 | Returns reflect the reinvestment of all distributions and are presented both with and without the applicable sales charges described below. Returns do not reflect the deduction of taxes the shareholder would pay on Fund distributions or redemptions of Fund shares. |
Expense limitations were in effect for certain classes during some or all of the periods shown in the “Fund and benchmark performance” table. Expenses for each class are listed on the “Fund expense ratios” table on page 32. Performance would have been lower had expense limitations not been in effect.
Institutional Class shares are not subject to a sales charge and are offered for sale exclusively to certain eligible investors. In addition, Institutional Class shares pay no distribution and service (12b-1) fee.
Class A shares are sold with a maximum front-end sales charge of 5.75%, and have an annual 12b-1 fee of 0.25% of average daily net assets. Performance for Class A shares, excluding sales charges, assumes that no front-end sales charge applied.
Class R6 shares are available only to certain investors. In addition, Class R6 shares do not pay any service fees, sub-accounting fees, and/or sub-transfer agency fees to any brokers, dealers, or other financial intermediaries. Class R6 shares pay no 12b-1 fee.
International investments entail risks including fluctuation in currency values, differences in accounting principles, or economic or political instability. Investing in emerging markets can be riskier than investing in established foreign markets due to increased volatility, lower trading volume, and higher risk of market closures. In many emerging markets, there is substantially less publicly available information and the available information may be incomplete or misleading. Legal claims are generally more difficult to pursue.
Liquidity risk is the possibility that securities cannot be readily sold within seven days at approximately the price at which a fund has valued them.
The Fund may allocate more of their net assets to investments in single securities than “diversified” funds.
Narrowly focused investments may exhibit higher volatility than investments in multiple industry sectors.
The disruptions caused by natural disasters, pandemics, or similar events could prevent the Fund from executing advantageous investment decisions in a timely manner and could negatively impact the Fund’s ability to achieve its investment objective and the value of the Fund’s investments.
31
Table of Contents
Performance summaries
Delaware Global Equity Fund
| 2 | The Fund’s expense ratios, as described in the most recent prospectus, are disclosed in the following “Fund expense ratios” table. Delaware Management Company has agreed to reimburse certain expenses and/or waive certain fees in order to prevent total annual fund operating expenses (excluding any 12b-1 fees, acquired fund fees and expenses, taxes, interest, short sale dividend and interest expenses, brokerage fees, certain insurance costs, and nonroutine expenses or costs, including, but not limited to, those relating to reorganizations, litigation, conducting shareholder meetings, and liquidations) from exceeding 1.41%, 1.07%, and 1.02% of the Fund’s average daily net assets for Class A shares, Institutional Class shares, and Class R6 shares, respectively, from October 1, 2020 to September 30, 2021.* Prior to January 27, 2021, the expense waiver was 1.41% of the Fund’s average daily net assets for Class A shares. Please see the most recent prospectus and any applicable supplement(s) for additional information on these fee waivers and/or reimbursements. Please see the “Financial highlights” section in this report for the most recent expense ratios. |
| Fund expense ratios | | Class A | | Institutional Class | | Class R6 |
| Total annual operating expenses (without fee waivers) | | 1.42% | | 1.18% | | 1.13% |
| Net expenses (including fee waivers, if any) | | 1.37% | | 1.07% | | 1.02% |
| | | | | | | |
| Type of waiver | | Contractual | | Contractual | | Contractual |
| * | The aggregate contractual waiver period covering this report for Class R6 shares is from October 4, 2019 through January 31, 2022, and for Class A and Institutional Class shares is from January 28, 2021 through January 31, 2022. |
Performance of a $10,000 investment1
Class A shares
Average annual total returns from September 30, 2011 through September 30, 2021
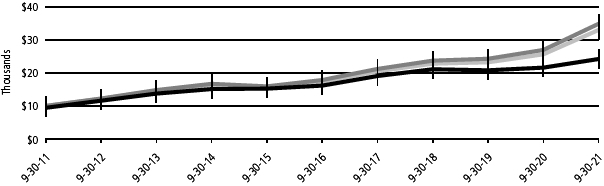
| For period beginning September 30, 2011 through September 30, 2021 | | Starting value | | Ending value |
 | MSCI World Index (gross) | | | $ | 10,000 | | | | $ | 34,860 | |
| MSCI World Index (net) | | | $ | 10,000 | | | | $ | 32,996 | |
| Delaware Global Equity Fund — Class A shares | | | $ | 9,425 | | | | $ | 24,200 | |
32
Table of Contents
Institutional Class shares
Average annual total returns from April 1, 2013 (Fund’s inception) through September 30, 2021

| For period beginning April 1,2013 through September 30, 2021 | | Starting value | | Ending value |
| MSCI World Index (gross) | | | $ | 10,000 | | | | $ | 24,939 | |
| MSCI World Index (net) | | | $ | 10,000 | | | | $ | 23,827 | |
| Delaware Global Equity Fund — Institutional Class shares | | | $ | 10,000 | | | | $ | 19,962 | |
| 1 | The “Performance of a $10,000 investment” graph for Class A shares assumes $10,000 invested in Class A shares of the Fund on September 30, 2011, and includes the effect of a 5.75% front-end sales charge and the reinvestment of all distributions. The graph also assumes $10,000 invested in the MSCI World Index as of September 30, 2011. |
The “Performance of a $10,000 investment” graph for Institutional Class shares assumes $10,000 invested in Institutional Class shares of the Fund on April 1, 2013, and includes the reinvestment of all distributions. The graph also assumes $10,000 invested in the MSCI World Index as of April 1, 2013.
The graphs do not reflect the deduction of taxes the shareholders would pay on Fund distributions or redemptions of Fund shares. Expense limitations were in effect for some or all of the periods shown. Performance would have been lower had expense limitations not been in effect. Expenses are listed in the “Fund expense ratios” table on page 32. Please note additional details on pages 31 through 33.
| | Nasdaq
symbols | | CUSIPs |
| Class A | | FIISX | | 24611D706 |
| Institutional Class | | FIITX | | 24611D805 |
| Class R6 | | FIIUX | | 24611D888 |
The MSCI World Index represents large- and mid-cap stocks across 23 developed market countries worldwide. The index covers approximately 85% of the free float-adjusted market capitalization in each country. Index “net” return approximates the minimum possible dividend reinvestment, after deduction of withholding tax at the highest possible rate. Index “gross” return approximates the maximum possible dividend reinvestment.
Index performance returns do not reflect any management fees, transaction costs, or expenses. Indices are unmanaged and one cannot invest directly in an index. Past performance is not a guarantee of future results.
Performance of other Fund classes will vary due to different charges and expenses.
33
Table of Contents
Performance summaries
Delaware Covered Call Strategy Fund
September 30, 2021 (Unaudited)
The performance quoted represents past performance and does not guarantee future results. Investment return and principal value of an investment will fluctuate so that shares, when redeemed, may be worth more or less than their original cost. Current performance may be lower or higher than the performance quoted. Performance data current to the most recent month end may be obtained by calling 800 523-1918 or visiting delawarefunds.com/performance.
| Fund and benchmark performance1,2 | Average annual total returns through September 30, 2021 |
| 1 year | | 3 year | | 5 year | | Lifetime |
| Class A (Est. April 1, 2016) | | | | | | | |
| Excluding sales charge | +20.11% | | +4.55% | | +5.91% | | +6.10% |
| Including sales charge | +13.20% | | +2.52% | | +4.67% | | +4.96% |
| Institutional Class (Est. April 1, 2016) | | | | | | | |
| Excluding sales charge | +20.40% | | +4.81% | | +6.21% | | +6.40% |
| Including sales charge | +20.40% | | +4.81% | | +6.21% | | +6.40% |
| Class R6 (Est. April 1, 2016) | | | | | | | |
| Excluding sales charge | +20.57% | | +5.01% | | +6.38% | | +6.58% |
| Including sales charge | +20.57% | | +5.01% | | +6.38% | | +6.58% |
| Cboe S&P 500 BuyWrite Index | +21.10% | | +4.15% | | +6.95% | | +7.26%* |
| * | The benchmark lifetime return is for Institutional Class share comparison only and is calculated using the month end prior to the Fund’s Institutional Class inception date. |
| 1 | Returns reflect the reinvestment of all distributions and are presented both with and without the applicable sales charges described below. Returns do not reflect the deduction of taxes the shareholder would pay on Fund distributions or redemptions of Fund shares. |
Expense limitations were in effect for certain classes during some or all of the periods shown in the “Fund and benchmark performance” table. Expenses for each class are listed on the “Fund expense ratios” table on page 34. Performance would have been lower had expense limitations not been in effect.
Institutional Class shares are not subject to a sales charge and are offered for sale exclusively to certain eligible investors. In addition, Institutional Class shares pay no distribution and service (12b-1) fee.
Class A shares are sold with a maximum front-end sales charge of 5.75%, and have an annual 12b-1 fee of 0.25% of average daily net assets. Performance for Class A shares, excluding sales charges, assumes that no front-end sales charge applied.
Class R6 shares are available only to certain investors. In addition, Class R6 shares do not pay any service fees, sub-accounting fees, and/or sub-transfer agency fees to any brokers, dealers, or other financial intermediaries. Class R6 shares pay no 12b-1 fee.
A covered call is a transaction in which the investor selling call options owns the equivalent amount of the underlying security. Call options are financial contracts that give the option buyer the right, but not the obligation, to buy a security at a specified price within a specific time period. The investor’s long position in the asset is the “cover” because it means the seller can deliver the shares if the buyer of the call option chooses to exercise.
An exchange-traded fund (ETF) is a security that represents all the stocks on a given exchange. ETF shares can be bought, sold, short-sold, traded on margin, and generally function as if they were stocks.
Investments in small and/or medium-sized companies typically exhibit greater risk and higher volatility than larger, more established companies.
Investing in ADRs may have some limitations for investors such as the absence of voting rights.
Narrowly focused investments may exhibit higher volatility than investments in multiple industry sectors.
The Fund may experience portfolio turnover in excess of 100%, which could result in higher transaction costs and tax liability.
Writing call options involves risks.
There is no guarantee that dividend-paying stocks will continue to pay dividends.
By writing covered call options, the Fund will give up the opportunity to benefit from potential increases in the value of a Fund asset above the exercise price, but will bear the risk of declines in the value of the
34
Table of Contents
asset. Writing call options may expose the Fund to significant additional costs. Derivatives may be difficult to sell, unwind or value.
Writing call options may significantly reduce or eliminate the amount of Fund dividends that qualify to be taxed to non-corporate shareholders at a lower rate. Covered calls also are subject to federal tax rules that may: (1) limit the allowance of certain losses or deductions by the Fund; (2) convert the Fund’s long-term capital gains into higher taxed short-term capital gains or ordinary income; (3) convert the Fund’s ordinary losses or deductions to capital losses, the deductibility of which is more limited; and/or (4) cause the Fund to recognize income or gains without a corresponding receipt of cash.
The disruptions caused by natural disasters, pandemics, or similar events could prevent the Fund from executing advantageous investment decisions in a timely manner and could negatively impact the Fund’s ability to achieve its investment objective and the value of the Fund’s investments.
| 2 | The Fund’s expense ratios, as described in the most recent prospectus, are disclosed in the following “Fund expense ratios” table. Delaware Management Company has agreed to reimburse certain expenses and/or waive certain fees in order to prevent total annual fund operating expenses (excluding any 12b-1 fees, acquired fund fees and expenses, taxes, interest, short sale dividend and interest expenses, brokerage fees, certain insurance costs, and nonroutine expenses or costs, including, but not limited to, those relating to reorganizations, litigation, conducting shareholder meetings, and liquidations) from exceeding 1.31%, 1.06%, and 0.88% of the Fund’s average daily net assets for Class A shares, Institutional Class shares, and Class R6 shares, respectively, from October 1, 2020 through September 20, 2021.* Prior to January 27, 2021, the expense waiver was 1.09% of the Fund’s average daily net assets for Institutional Class shares. Please see the most recent prospectus and any applicable supplement(s) for additional information on these fee waivers and/or reimbursements. Please see the “Financial highlights” section in this report for the most recent expense ratios. |
| Fund expense ratios | | Class A | | Institutional Class | | Class R6 |
| Total annual operating expenses (without fee waivers) | | 1.37% | | 1.12% | | 1.07% |
| Net expenses (including fee waivers, if any) | | 1.31% | | 1.06% | | 0.88% |
| Type of waiver | | Contractual | | Contractual | | Contractual |
| * | The aggregate contractual waiver period covering this report for Class R6 shares is from October 4, 2019 through January 31, 2022, and for Class A and Institutional Class shares is from January 28, 2021 through January 31, 2022. |
35
Table of Contents
Performance summaries
Delaware Covered Call Strategy Fund
Performance of a $10,000 investment1
Institutional Class and Class A shares
Average annual total returns from April 1, 2016 (Fund’s inception) through September 30, 2021

| For period beginning April 1, 2016 through September 30, 2021 | | Starting value | | Ending value |
| S&P 500 Index | | | $ | 10,000 | | | | $ | 24,203 | |
| Cboe S&P 500 BuyWrite Index | | | $ | 10,000 | | | | $ | 14,641 | |
 | Delaware Covered Call Strategy Fund — Institutional Class shares | | | $ | 10,000 | | | | $ | 14,065 | |
| Delaware Covered Call Strategy Fund — Class A shares | | | $ | 9,425 | | | | $ | 13,053 | |
| 1 | The “Performance of a $10,000 investment” graph assumes $10,000 invested in Institutional Class and Class A shares of the Fund on April 1, 2016, and includes the effect of a 5.75% front-end sales charge (for Class A shares) and the reinvestment of all distributions. The graph does not reflect the deduction of taxes the shareholders would pay on Fund distributions or redemptions of Fund shares. Expense limitations were in effect for some or all of the periods shown. Performance would have been lower had expense limitations not been in effect. Expenses are listed in the “Fund expense ratios” table on page 35. Please note additional details on pages 34 through 37. |
The graph also assumes $10,000 invested in the Cboe S&P 500 BuyWrite Index as of April 1, 2016. The Cboe S&P 500 BuyWrite Index is designed to show the hypothetical performance of a portfolio that engages in a buy-write strategy using S&P 500® Index call options.
The S&P 500 Index, mentioned on page 11, measures the performance of 500 mostly large-cap stocks weighted by market value, and is often used to represent performance of the US stock market.
The Bloomberg US Aggregate Index, mentioned on page 11, is a broad composite that tracks the investment grade US bond market.
The Cboe Volatility Index, mentioned on page 11, is a key measure of market expectations of near-term volatility conveyed by S&P 500 stock index option prices.
The US Consumer Price Index (CPI), mentioned on page 11, is a measure of inflation that is calculated by the US Department of Labor, representing changes in prices of all goods and services purchased for consumption by urban households.
Gross domestic product, mentioned on page 11, is a measure of all goods and services produced by a nation in a year.
The price-to-earnings ratio (P/E ratio), mentioned on page 11, is a valuation ratio of a company’s current share price compared to its earnings per share. Generally, a high P/E ratio means that investors are anticipating higher growth in the future. A forward P/E ratio is calculated using consensus forecasted earnings per share for the next 12 months.
Index performance returns do not reflect any management fees, transaction costs, or expenses. Indices are unmanaged and one cannot invest directly in an index. Past performance is not a guarantee of future results.
Performance of other Fund classes will vary due to different charges and expenses.
36
Table of Contents
| | Nasdaq | | |
| | symbols | | CUSIPs |
| Class A | | FRCCX | | 24611D102 |
| Institutional Class | | FRCDX | | 24611D201 |
| Class R6 | | FRCEX | | 24611D300 |
37
Table of Contents
Performance summaries
Delaware Hedged U.S. Equity Opportunities Fund
September 30, 2021 (Unaudited)
The performance quoted represents past performance and does not guarantee future results. Investment return and principal value of an investment will fluctuate so that shares, when redeemed, may be worth more or less than their original cost. Current performance may be lower or higher than the performance quoted. Performance data current to the most recent month end may be obtained by calling 800 523-1918 or visiting delawarefunds.com/performance.
| Fund and benchmark performance1,2 | | Average annual total returns through September 30, 2021 |
| | | 1 year | | 3 year | | 5 year | | Lifetime |
| Class A (Est. August 1, 2016) | | | | | | | | |
| Excluding sales charge | | +14.35% | | +10.34% | | +10.04% | | +9.51% |
| Including sales charge | | +7.76% | | +8.17% | | +8.75% | | +8.26% |
| Institutional Class (Est. August 1, 2016) | | | | | | | | |
| Excluding sales charge | | +14.79% | | +10.68% | | +10.41% | | +9.87% |
| Including sales charge | | +14.79% | | +10.68% | | +10.41% | | +9.87% |
| Class R6 (Est. August 1, 2016) | | | | | | | | |
| Excluding sales charge | | +14.92% | | +10.85% | | +10.55% | | +10.00% |
| Including sales charge | | +14.92% | | +10.85% | | +10.55% | | +10.00% |
| Russell 3000 Index (primary benchmark) | | +31.88% | | +16.00% | | +16.85% | | +16.36%* |
| 70% Russell 3000 Index / 30% ICE BofA US 3-Month Treasury Bill Index | | | | | | | | |
| (secondary benchmark) | | +23.06% | | +12.45% | | +12.61% | | +12.24%* |
| ICE BofA US 3-Month Treasury Bill Index (secondary benchmark) | | +0.07% | | +1.18% | | +1.16% | | +1.13%* |
| * | The benchmark lifetime return is for Institutional Class share comparison only and is calculated using the month end prior to the Fund’s Institutional Class inception date. |
| 1 | Returns reflect the reinvestment of all distributions and are presented both with and without the applicable sales charges described below. Returns do not reflect the deduction of taxes the shareholder would pay on Fund distributions or redemptions of Fund shares. |
Expense limitations were in effect for certain classes during some or all of the periods shown in the “Fund and benchmark performance” table. Expenses for each class are listed on the “Fund expense ratios” table on page 39. Performance would have been lower had expense limitations not been in effect.
Institutional Class shares are not subject to a sales charge and are offered for sale exclusively to certain eligible investors. In addition, Institutional Class shares pay no distribution and service (12b-1) fee.
Class A shares are sold with a maximum front-end sales charge of 5.75%, and have an annual 12b-1 fee of 0.25% of average daily net assets. Performance for Class A shares, excluding sales charges, assumes that no front-end sales charge applied.
Class R6 shares are available only to certain investors. In addition, Class R6 shares do not pay any service fees, sub-accounting fees, and/or sub-transfer agency fees to any brokers, dealers, or other financial intermediaries. Class R6 shares pay no 12b-1 fee.
Fixed income securities and bond funds can lose value, and investors can lose principal as interest rates rise. They also may be affected by economic conditions that hinder an issuer’s ability to make interest and principal payments on its debt. This includes prepayment risk, the risk that the principal of a bond that is held by a portfolio will be prepaid prior to maturity at the time when interest rates are lower than what the bond was paying. A portfolio may then have to reinvest that money at a lower interest rate.
Investments in small and/or medium-sized companies typically exhibit greater risk and higher volatility than larger, more established companies.
Hedging seeks to limit downside risks, but it also will limit the Fund’s return potential. This will especially be true during periods of rapid or large market gains. Hedging activities involve fees and expenses, which can further reduce the Fund’s returns. If the Fund uses a hedging instrument at the wrong time or judges market conditions incorrectly, or the hedged instrument does not correlate to the risk sought to be hedged, the hedge might be unsuccessful, reduce the Fund’s return, and/or create a loss.
An exchange-traded fund (ETF) is a security that represents all the stocks on a given exchange. ETF shares can be bought, sold, short-sold, traded on margin, and generally function as if they were stocks.
38
Table of Contents
The Fund may experience portfolio turnover in excess of 100%, which could result in higher transaction costs and tax liability.
Futures and options involve risks, such as possible default by a counterparty, potential losses if markets do not move as expected, and the potential for greater losses than if these techniques had not been used. Investments in derivatives can increase the volatility of the Fund’s share price and expose it to significant additional costs. Derivatives may be difficult to sell, unwind, or value.
The disruptions caused by natural disasters, pandemics, or similar events could prevent the Fund from executing advantageous investment decisions in a timely manner and could negatively impact the Fund’s ability to achieve its investment objective and the value of the Fund’s investments
| 2 | The Fund’s expense ratios, as described in the most recent prospectus, are disclosed in the following “Fund expense ratios” table. Delaware Management Company has agreed to reimburse certain expenses and/or waive certain fees in order to prevent total annual fund operating expenses (excluding any 12b-1 fees, acquired fund fees and expenses, taxes, interest, short sale dividend and interest expenses, brokerage fees, certain insurance costs, and nonroutine expenses or costs, including, but not limited to, those relating to reorganizations, litigation, conducting shareholder meetings, and liquidations) from exceeding 1.64%, 1.30%, and 1.20% of the Fund’s average daily net assets for Class A shares, Institutional Class shares, and Class R6 shares, respectively, from October 1, 2020 to September 30, 2021.* Please see the most recent prospectus and any applicable supplement(s) for additional information on these fee waivers and/or reimbursements. Please see the “Financial highlights” section in this report for the most recent expense ratios. |
| Fund expense ratios | | Class A | | Institutional Class | | Class R6 |
| Total annual operating expenses (without fee waivers) | | 1.85% | | 1.62% | | 1.57% |
| Net expenses (including fee waivers, if any) | | 1.64% | | 1.30% | | 1.20% |
| Type of waiver | | Contractual | | Contractual | | Contractual |
| * | The aggregate contractual waiver period covering this report for Class R6 shares is from October 4, 2019 through January 31, 2022, and for Class A and Institutional Class shares is from January 28, 2021 through January 31, 2022. |
39
Table of Contents
Performance summaries
Delaware Hedged U.S. Equity Opportunities Fund
Performance of a $10,000 investment1
Institutional Class and Class A shares
Average annual total returns August 1, 2016 (Fund’s inception) through September 30, 2021
| For period beginning August 1, 2016 through September 30, 2021 | | Starting value | | Ending value |
| Russell 3000 Index (primary benchmark) | | | $ | 10,000 | | | | $ | 28,897 | |
 | 70% Russell 3000 Index / 30% ICE BofA US 3-Month Treasury Bill Index (secondary benchmark) | | | $ | 10,000 | | | | $ | 18,129 | |
 | Delaware Hedged U.S. Equity Opportunities Fund — Institutional Class shares | | | $ | 10,000 | | | | $ | 16,260 | |
| Delaware Hedged U.S. Equity Opportunities Fund — Class A shares | | | $ | 9,425 | | | | $ | 15,067 | |
 | ICE BofA US 3-Month Treasury Bill Index (secondary benchmark) | | | $ | 10,000 | | | | $ | 10,599 | |
| 1 | The “Performance of a $10,000 investment” graph assumes $10,000 invested in Institutional Class and Class A shares of the Fund on August 1, 2016, and includes the effect of a 5.75% front-end sales charge (for Class A shares) and the reinvestment of all distributions. The graph does not reflect the deduction of taxes the shareholders would pay on Fund distributions or redemptions of Fund shares. Expense limitations were in effect for some or all of the periods shown. Performance would have been lower had expense limitations not been in effect. Expenses are listed in the “Fund expense ratios” table on page 39. Please note additional details on pages 38 through 41. |
The graph also assumes $10,000 invested in the Russell 3000 Index, 70% Russell 3000 Index/30% ICE BofA US 3-Month Treasury Bill Index, and the ICE BofA US 3-Month Treasury Bill Index as of August 1, 2016.
The Russell 3000 Index measures the performance of the largest 3,000 US companies, representing approximately 98% of the investable US equity market.
The ICE BofA US 3-Month Treasury Bill Index tracks the performance of US Treasury bills with a maturity of three months. The index comprises a single Treasury issue purchased at the beginning of the month, which is then sold at the end of the month and rolled into a newly selected issue that matures closest to, but not beyond, three months from the transaction date (known as the rebalancing date).
The S&P 500 Index, mentioned on page 14, measures the performance of 500 mostly large-cap stocks weighted by market value, and is often used to represent performance of the US stock market.
Frank Russell Company is the source and owner of the trademarks, service marks, and copyrights related to the Russell Indexes. Russell® is a trademark of Frank Russell Company.
Index performance returns do not reflect any management fees, transaction costs, or expenses. Indices are unmanaged and one cannot invest directly in an index. Past performance is not a guarantee of future results.
Performance of other Fund classes will vary due to different charges and expenses.
40
Table of Contents
| | Nasdaq | | |
| | symbols | | CUSIPs |
| Class A | | FHEJX | | 24611D847 |
| Institutional Class | | FHEKX | | 24611D839 |
| Class R6 | | FHELX | | 24611D821 |
41
Table of Contents
Performance summaries
Delaware Premium Income Fund
September 30, 2021 (Unaudited)
The performance quoted represents past performance and does not guarantee future results. Investment return and principal value of an investment will fluctuate so that shares, when redeemed, may be worth more or less than their original cost. Current performance may be lower or higher than the performance quoted. Performance data current to the most recent month end may be obtained by calling 800 523-1918 or visiting delawarefunds.com/performance.
| Fund and benchmark performance1,2 | | Average annual total returns through September 30, 2021 |
| | | 1 year | | 3 year | | Lifetime |
| Class A (Est. April 2, 2018) | | | | | | | |
| Excluding sales charge | | | +11.96% | | +3.14% | | +3.58% |
| Including sales charge | | | +5.54% | | +1.11% | | +1.84% |
| Institutional Class (Est. April 2, 2018) | | | | | | | |
| Excluding sales charge | | | +12.27% | | +3.42% | | +3.85% |
| Including sales charge | | | +12.27% | | +3.42% | | +3.85% |
| Class R6 (Est. April 2, 2018) | | | | | | | |
| Excluding sales charge | | | +12.54% | | +3.61% | | +4.04% |
| Including sales charge | | | +12.54% | | +3.61% | | +4.04% |
| Cboe S&P 500 BuyWrite Index | | | +21.10% | | +4.15% | | +5.98%* |
| * | The benchmark lifetime return is for Institutional Class share comparison only and is calculated using the month end prior to the Fund’s Institutional Class inception date. |
| 1 | Returns reflect the reinvestment of all distributions and are presented both with and without the applicable sales charges described below. Returns do not reflect the deduction of taxes the shareholder would pay on Fund distributions or redemptions of Fund shares. |
Expense limitations were in effect for certain classes during some or all of the periods shown in the “Fund and benchmark performance” table. Expenses for each class are listed on the “Fund expense ratios” table on page 43. Performance would have been lower had expense limitations not been in effect.
Institutional Class shares are not subject to a sales charge and are offered for sale exclusively to certain eligible investors. In addition, Institutional Class shares pay no distribution and service (12b-1) fee.
Class A shares are sold with a maximum front-end sales charge of 5.75%, and have an annual 12b-1 fee of 0.25% of average daily net assets. Performance for Class A shares, excluding sales charges, assumes that no front-end sales charge applied.
Class R6 shares are available only to certain investors. In addition, Class R6 shares do not pay any service fees, sub-accounting fees, and/or sub-transfer agency fees to any brokers, dealers, or other financial intermediaries. Class R6 shares pay no 12b-1 fee. A covered call is a transaction in which the investor selling call options owns the equivalent amount of the underlying security. Call options are financial contracts that give the option buyer the right, but not the obligation, to buy a security at a specified price within a specific time period. The investor’s long position in the asset is the “cover” because it means the seller can deliver the shares if the buyer of the call option chooses to exercise.
Writing call options involves risks. By writing covered call options, the Fund will lose money if the exercise price of an option is below the market price of the asset on which an option was written and the premium received by the Fund for writing the option is insufficient to make up for that loss. The Fund will also give up the opportunity to benefit from potential increases in the value of a Fund asset above the option’s exercise price. Nevertheless, the Fund will continue to bear the risk of declines in the value of the covered assets. Derivatives may be difficult to sell, unwind or value.
There is no guarantee that dividend-paying stocks will continue to pay dividends. Writing call options may significantly reduce or eliminate the amount of dividends that generally are taxable to non-corporate shareholders at a lower rate.
Covered call options also are subject to federal tax rules that: (1) limit the allowance of certain losses or deductions; (2) convert long-term capital gains into higher taxed short-term capital gains or ordinary income; (3) convert ordinary losses or deductions to capital losses, the deductibility of which are more limited; and/or (4) cause the recognition of income or gains without a corresponding receipt of cash.
Writing call options may significantly reduce or eliminate the amount of Fund dividends that qualify to be taxed to non-corporate shareholders at a lower rate. Covered calls also are subject to federal tax rules that may: (1) limit the allowance of certain losses or
42
Table of Contents
deductions by the Fund; (2) convert the Fund’s long-term capital gains into higher taxed short-term capital gains or ordinary income; (3) convert the Fund’s ordinary losses or deductions to capital losses, the deductibility of which is more limited; and/or (4) cause the Fund to recognize income or gains without a corresponding receipt of cash.
Investments in small and/or medium-sized companies typically exhibit greater risk and higher volatility than larger, more established companies.
IBOR risk is the risk that changes related to the use of the London interbank offered rate (LIBOR) or similar rates (such as EONIA) could have adverse impacts on financial instruments that reference these rates. The abandonment of these rates and transition to alternative rates could affect the value and liquidity of instruments that reference them and could affect investment strategy performance.
The disruptions caused by natural disasters, pandemics, or similar events could prevent the Fund from executing advantageous investment decisions in a timely manner and could negatively impact the Fund’s ability to achieve its investment objective and the value of the Fund’s investments.
| 2 | The Fund’s expense ratios, as described in the most recent prospectus, are disclosed in the following “Fund expense ratios” table. Delaware Management Company has agreed to reimburse certain expenses and/or waive certain fees in order to prevent total annual fund operating expenses (excluding any 12b-1 fees, acquired fund fees and expenses, taxes, interest, short sale dividend and interest expenses, brokerage fees, certain insurance costs, and nonroutine expenses or costs, including, but not limited to, those relating to reorganizations, litigation, conducting shareholder meetings, and liquidations) expenses from exceeding 1.30%, 1.05%, and 0.90% of the Fund’s average daily net assets for Class A shares, Institutional Class shares, and Class R6 shares, respectively, from October 1, 2020 to September 30, 2021.* Please see the most recent prospectus and any applicable supplement(s) for additional information on these fee waivers and/or reimbursements. Please see the “Financial highlights” section in this report for the most recent expense ratios. |
| Fund expense ratios | | Class A | | Institutional Class | | Class R6 |
| Total annual operating expenses (without fee waivers) | | 1.44% | | 1.19% | | 1.13% |
| Net expenses (including fee waivers, if any) | | 1.30% | | 1.05% | | 0.90% |
| Type of waiver | | Contractual | | Contractual | | Contractual |
| * | The aggregate contractual waiver period covering this report for Class R6 shares is from October 4, 2019 through January 31, 2022, and for Class A and Institutional Class shares is from January 28, 2021 through January 31, 2022. |
43
Table of Contents
Performance summaries
Delaware Premium Income Fund
Performance of a $10,000 investment1
Institutional Class and Class A shares
Average annual total returns from April 2, 2018 (Fund’s inception) through September 30, 2021

| For period beginning April 2, 2018 through September 30, 2021 | | Starting value | | Ending value |
| Cboe S&P 500 BuyWrite Index | | | $ | 10,000 | | | | $ | 12,306 | |
 | Delaware Premium Income Fund — Institutional Class shares | | | $ | 10,000 | | | | $ | 11,412 | |
| Delaware Premium Income Fund — Class A shares | | | $ | 9,425 | | | | $ | 10,657 | |
| 1 | The “Performance of a $10,000 investment” graph assumes $10,000 invested in Institutional Class and Class A shares of the Fund on April 2, 2018, and includes the effect of a 5.75% front-end sales charge (for Class A shares) and the reinvestment of all distributions. The graph does not reflect the deduction of taxes the shareholders would pay on Fund distributions or redemptions of Fund shares. Expense limitations were in effect for some or all of the periods shown. Performance would have been lower had expense limitations not been in effect. Expenses are listed in the “Fund expense ratios” table on page 43. Please note additional details on pages 42 through 45. |
The graph also assumes $10,000 invested in the Cboe S&P 500 BuyWrite Index as of April 2, 2018. The Cboe S&P 500 BuyWrite Index is designed to show the hypothetical performance of a portfolio that engages in a buy-write strategy using S&P 500® Index call options.
The S&P 500 Index, mentioned on page 15, measures the performance of 500 mostly large-cap stocks weighted by market value, and is often used to represent performance of the US stock market.
The Bloomberg US Aggregate Index, mentioned on page 15, is a broad composite that tracks the investment grade US bond market.
The Cboe Volatility Index, mentioned on page 15, is a key measure of market expectations of near-term volatility conveyed by S&P 500 stock index option prices.
The US Consumer Price Index (CPI), mentioned on page 15, is a measure of inflation that is calculated by the US Department of Labor, representing changes in prices of all goods and services purchased for consumption by urban households.
Gross domestic product, mentioned on page 15, is a measure of all goods and services produced by a nation in a year.
The price-to-earnings ratio (P/E ratio), mentioned on page 16, is a valuation ratio of a company’s current share price compared to its earnings per share. Generally, a high P/E ratio means that investors are anticipating higher growth in the future. A forward P/E ratio is calculated using consensus forecasted earnings per share for the next 12 months.
Index performance returns do not reflect any management fees, transaction costs, or expenses. Indices are unmanaged and one cannot invest directly in an index. Past performance is not a guarantee of future results.
Performance of other Fund classes will vary due to different charges and expenses.
44
Table of Contents
| | Nasdaq | | |
| | symbols | | CUSIPs |
| Class A | | FPIKX | | 24611D748 |
| Institutional Class | | FPILX | | 24611D730 |
| Class R6 | | FPIMX | | 24611D722 |
45
Table of Contents
Performance summaries
Delaware Total Return Fund
September 30, 2021 (Unaudited)
The performance quoted represents past performance and does not guarantee future results. Investment return and principal value of an investment will fluctuate so that shares, when redeemed, may be worth more or less than their original cost. Current performance may be lower or higher than the performance quoted. Performance data current to the most recent month end may be obtained by calling 800 523-1918 or visiting delawarefunds.com/performance.
| Fund and benchmark performance1,2 | | Average annual total returns through September 30, 2021 |
| | 1 year | | 5 year | | 10 year | | Lifetime |
| Class A (Est. April 24, 1990) | | | | | | | | |
| Excluding sales charge | | +21.77% | | +6.73% | | +8.32% | | — |
| Including sales charge | | +14.74% | | +5.47% | | +7.68% | | — |
| Institutional Class (Est. April 1, 2013) | | | | | | | | |
| Excluding sales charge | | +22.06% | | +7.09% | | — | | +6.78% |
| Including sales charge | | +22.06% | | +7.09% | | — | | +6.78% |
| Class R6 (Est. April 1, 2013) | | | | | | | | |
| Excluding sales charge | | +22.23% | | +7.15% | | — | | +6.88% |
| Including sales charge | | +22.23% | | +7.15% | | — | | +6.88% |
| S&P 500 Index (primary benchmark) | | +30.00% | | +16.90% | | +16.63% | | +14.86%* |
| 60% S&P 500 Index / 40% Bloomberg US Aggregate Index | | | | | | | | |
| (secondary benchmark) | | +16.91% | | +11.63% | | +11.34% | | +10.36%* |
| Bloomberg US Aggregate Index (secondary benchmark) | | -0.90% | | +2.94% | | +3.01% | | +2.93%* |
| * | The benchmark lifetime return is for Institutional Class share comparison only and is calculated using the month end prior to the Fund’s Institutional Class inception date. |
| 1 | Returns reflect the reinvestment of all distributions and are presented both with and without the applicable sales charges described below. Returns do not reflect the deduction of taxes the shareholder would pay on Fund distributions or redemptions of Fund shares. |
Expense limitations were in effect for certain classes during some or all of the periods shown in the “Fund and benchmark performance” table. Expenses for each class are listed on the “Fund expense ratios” table on page 47. Performance would have been lower had expense limitations not been in effect.
Institutional Class shares are not subject to a sales charge and are offered for sale exclusively to certain eligible investors. In addition, Institutional Class shares pay no distribution and service (12b-1) fee.
Class A shares are sold with a maximum front-end sales charge of 5.75%, and have an annual 12b-1 fee of 0.25% of average daily net assets. Performance for Class A shares, excluding sales charges, assumes that no front-end sales charge applied.
Class R6 shares are available only to certain investors. In addition, Class R6 shares do not pay any service fees, sub-accounting fees, and/or sub-transfer agency fees to any brokers, dealers, or other financial intermediaries. Class R6 shares pay no 12b-1 fee.
Fixed income securities and bond funds can lose value, and investors can lose principal as interest rates rise. They also may be affected by economic conditions that hinder an issuer’s ability to make interest and principal payments on its debt. This includes prepayment risk, the risk that the principal of a bond that is held by a portfolio will be prepaid prior to maturity at the time when interest rates are lower than what the bond was paying. A portfolio may then have to reinvest that money at a lower interest rate.
High yielding, non-investment-grade bonds (junk bonds) involve higher risk than investment grade bonds. The high yield secondary market is particularly susceptible to liquidity problems when institutional investors, such as mutual funds and certain other financial institutions, temporarily stop buying bonds for regulatory, financial, or other reasons. In addition, a less liquid secondary market makes it more difficult for to obtain precise valuations of the high yield securities.
International investments entail risks including fluctuation in currency values, differences in accounting principles, or economic or political instability. Investing in emerging markets can be riskier than investing in established foreign markets due to increased volatility, lower trading volume, and higher risk of market closures. In many emerging markets, there is substantially less publicly available information and the available information may be incomplete or misleading. Legal claims are generally more difficult to pursue.
46
Table of Contents
Investments in small and/or medium-sized companies typically exhibit greater risk and higher volatility than larger, more established companies.
REIT investments are subject to many of the risks associated with direct real estate ownership, including changes in economic conditions, credit risk, and interest rate fluctuations.
Risk controls and asset allocation models do not promise any level of performance or guarantee against loss of principal.
An exchange-traded fund (ETF) is a security that represents all the stocks on a given exchange. ETF shares can be bought, sold, short-sold, traded on margin, and generally function as if they were stocks.
Liquidity risk is the possibility that securities cannot be readily sold within seven days at approximately the price at which a fund has valued them.
“Non-diversified” investments may allocate more of their net assets to investments in single securities than “diversified” investments. Resulting adverse effects may subject these investments to greater risks and volatility.
The Fund may invest in derivatives, which may involve additional expenses and are subject to risk, including the risk that an underlying security or securities index moves in the opposite direction from what the portfolio manager anticipated. A derivatives transaction depends upon the counterparties’ ability to fulfill their contractual obligations.
IBOR risk is the risk that changes related to the use of the London interbank offered rate (LIBOR) or similar rates (such as EONIA) could have adverse impacts on financial instruments that reference these rates. The abandonment of these rates and transition to alternative rates could affect the value and liquidity of instruments that reference them and could affect investment strategy performance.
The disruptions caused by natural disasters, pandemics, or similar events could prevent the Fund from executing advantageous investment decisions in a timely manner and could negatively impact the Fund’s ability to achieve its investment objective and the value of the Fund’s investments.
| 2 | The Fund’s expense ratios, as described in the most recent prospectus, are disclosed in the following “Fund expense ratios” table. Delaware Management Company has agreed to reimburse certain expenses and/or waive certain fees in order to prevent total annual fund operating expenses (excluding any 12b-1 fees, acquired fund fees and expenses, taxes, interest, short sale dividend and interest expenses, brokerage fees, certain insurance costs, and nonroutine expenses or costs, including, but not limited to, those relating to reorganizations, litigation, conducting shareholder meetings, and liquidations) from exceeding 1.15%, 0.91%, and 0.79% of the Fund’s average daily net assets for Class A shares, Institutional Class shares, and Class R6 shares, respectively, from October 1, 2020 to September 30, 2021.* Prior to January 27, 2021, the expense waiver was 0.91% of the Fund’s average daily net assets for Institutional Class shares. Please see the most recent prospectus and any applicable supplement(s) for additional information on these fee waivers and/or reimbursements. Please see the “Financial highlights” section in this report for the most recent expense ratios. |
| Fund expense ratios | | Class A | | Institutional Class | | Class R6 |
| Total annual operating expenses (without fee waivers) | | 1.17% | | 0.90% | | 0.89% |
| Net expenses (including fee waivers, if any) | | 1.15% | | 0.90% | | 0.79% |
| | | | | | | |
| Type of waiver | | Contractual | | Contractual | | Contractual |
| * | The aggregate contractual waiver period covering this report for Class R6 shares is from October 4, 2019 through January 31, 2022, and for Class A and Institutional Class shares is from January 28, 2021 through January 31, 2022. |
47
Table of Contents
Performance summaries
Delaware Total Return Fund
Performance of a $10,000 investment1
Class A shares
Average annual total returns from September 30, 2011 through September 30, 2021

| For period beginning September 30, 2011 through September 30, 2021 | | Starting value | | Ending value |
 | S&P 500 Index (primary benchmark) | | | $ | 10,000 | | | | $ | 46,586 | |
 | 60% S&P 500 Index / 40% Bloomberg US Aggregate Index | | | | | | | | | | |
| | (secondary benchmark) | | | $ | 10,000 | | | | $ | 29,275 | |
 | Delaware Total Return Fund — Class A shares | | | $ | 9,425 | | | | $ | 20,960 | |
| Bloomberg US Aggregate Index (secondary benchmark) | | | $ | 10,000 | | | | $ | 13,455 | |
Institutional Class shares
Average annual total returns from April 1, 2013 (Fund’s inception) through September 30, 2021
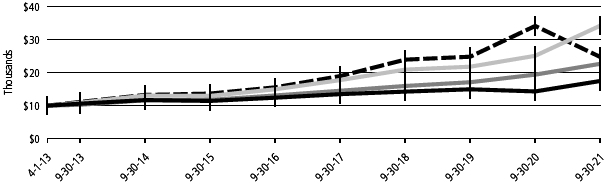
| For period beginning April 1, 2013 through September 30, 2021 | | Starting value | | Ending value |
| S&P 500 Index (primary benchmark) | | | $ | 10,000 | | | | $ | 34,207 | |
| Bloomberg US Aggregate Index (secondary benchmark) | | | $ | 10,000 | | | | $ | 24,735 | |
| 60% S&P 500 Index / 40% Bloomberg US Aggregate Index | | | | | | | | | | |
| | (secondary benchmark) | | | $ | 10,000 | | | | $ | 22,666 | |
| Delaware Total Return Fund — Institutional Class shares | | | $ | 10,000 | | | | $ | 17,460 | |
| 1 | The “Performance of a $10,000 investment” graph for Class A shares assumes $10,000 invested in Class A shares of the Fund on September 30, 2011, and includes the effect of a 5.75% front-end sales charge and the reinvestment of all distributions. The graph also assumes $10,000 invested in the S&P 500 Index (the Fund’s primary benchmark), 60% S&P 500 Index / 40% Bloomberg US Aggregate |
48
Table of Contents
Index (the Fund’s secondary benchmark), and the Bloomberg Aggregate Index (the Fund’s secondary benchmark) as of September 30, 2011.
The “Performance of a $10,000 investment” graph for Institutional Class shares assumes $10,000 invested in Institutional Class shares of the Fund on April 1, 2013, and includes the reinvestment of all distributions. The graph also assumes $10,000 invested in the S&P 500 Index (the Fund’s primary benchmark), 60% S&P 500 Index / 40% Bloomberg US Aggregate Index (the Fund’s secondary benchmark), and the Bloomberg Aggregate Index (the Fund’s secondary benchmark) as of April 1, 2013.
The graphs do not reflect the deduction of taxes the shareholders would pay on Fund distributions or redemptions of Fund shares. Expense limitations were in effect for some or all of the periods shown. Performance would have been lower had expense limitations not been in effect. Expenses are listed in the “Fund expense ratios” table on page 47. Please note additional details on pages 46 through 49.
| | Nasdaq | | |
| | symbols | | CUSIPs |
| Class A | | FITRX | | 24611D649 |
| Institutional Class | | FITUX | | 24611D631 |
| Class R6 | | FITVX | | 24611D623 |
The S&P 500 Index measures the performance of 500 mostly large-cap stocks weighted by market value, and is often used to represent performance of the US stock market.
The Bloomberg US Aggregate Index is a broad composite that tracks the investment grade US bond market.
Index performance returns do not reflect any management fees, transaction costs, or expenses. Indices are unmanaged and one cannot invest directly in an index. Past performance is not a guarantee of future results.
Performance of other Fund classes will vary due to different charges and expenses.
49
Table of Contents
Disclosure of Fund expenses
For the six-month period from April 1, 2021 to September 30, 2021 (Unaudited)
As a shareholder of a Fund, you incur two types of costs: (1) transaction costs, including sales charges (loads) on purchase payments, reinvested dividends, or other distributions; redemption fees; and exchange fees; and (2) ongoing costs, including management fees; distribution and service (12b-1) fees; and other Fund expenses. The following examples are intended to help you understand your ongoing costs (in dollars) of investing in a Fund and to compare these costs with the ongoing costs of investing in other mutual funds.
The examples are based on an investment of $1,000 invested at the beginning of the period and held for the entire six-month period from April 1, 2021 to September 30, 2021.
Actual expenses
The first section of the tables shown, “Actual Fund return,” provides information about actual account values and actual expenses. You may use the information in this section of the table, together with the amount you invested, to estimate the expenses that you paid over the period. Simply divide your account value by $1,000 (for example, an $8,600 account value divided by $1,000 = 8.6), then multiply the result by the number in the first section under the heading entitled “Expenses Paid During Period” to estimate the expenses you paid on your account during this period.
Hypothetical example for comparison purposes
The second section of the tables shown, “Hypothetical 5% return,” provides information about hypothetical account values and hypothetical expenses based on a Fund’s actual expense ratio and an assumed rate of return of 5% per year before expenses, which is not the Fund’s actual return. The hypothetical account values and expenses may not be used to estimate the actual ending account balance or expenses you paid for the period. You may use this information to compare the ongoing costs of investing in each Fund and other funds. To do so, compare this 5% hypothetical example with the 5% hypothetical examples that appear in the shareholder reports of the other funds.
Please note that the expenses shown in the tables are meant to highlight your ongoing costs only and do not reflect any transactional costs, such as sales charges (loads), redemption fees, or exchange fees. Therefore, the second section of each table is useful in comparing ongoing costs only, and will not help you determine the relative total costs of owning different funds. In addition, if these transactional costs were included, your costs would have been higher. The Funds’ expenses shown in the tables reflect fee waivers in effect and assume reinvestment of all dividends and distributions.
Delaware Equity Income Fund
Expense analysis of an investment of $1,000
| | Beginning
Account
Value
4/1/21 | | Ending
Account
Value
9/30/21 | | Annualized
Expense
Ratio | | Expenses
Paid
During
Period
4/1/21 to
9/30/21* |
| Actual Fund return† | | | | | | | | | | | | | | | | | |
| Class A | | | $ | 1,000.00 | | | | $ | 1,042.20 | | | 1.13% | | | $ | 5.79 | |
| Institutional Class | | | | 1,000.00 | | | | | 1,044.80 | | | 0.85% | | | | 4.36 | |
| Class R6 | | | | 1,000.00 | | | | | 1,044.10 | | | 0.81% | | | | 4.15 | |
| Hypothetical 5% return (5% return before expenses) | | | | | | | | |
| Class A | | | $ | 1,000.00 | | | | $ | 1,019.40 | | | 1.13% | | | $ | 5.72 | |
| Institutional Class | | | | 1,000.00 | | | | | 1,020.81 | | | 0.85% | | | | 4.31 | |
| Class R6 | | | | 1,000.00 | | | | | 1,021.01 | | | 0.81% | | | | 4.10 | |
50
Table of Contents
Delaware Growth and Income Fund
Expense analysis of an investment of $1,000
| | Beginning
Account
Value
4/1/21 | | Ending
Account
Value
9/30/21 | | Annualized
Expense
Ratio | | Expenses
Paid
During
Period
4/1/21 to
9/30/21* |
| Actual Fund return† | | | | | | | | | | | | | | | | | |
| Class A | | | $ | 1,000.00 | | | | $ | 1,044.30 | | | 1.07% | | | $ | 5.48 | |
| Institutional Class | | | | 1,000.00 | | | | | 1,045.60 | | | 0.82% | | | | 4.20 | |
| Class R6 | | | | 1,000.00 | | | | | 1,045.70 | | | 0.75% | | | | 3.85 | |
| Hypothetical 5% return (5% return before expenses) | | | | | | | | |
| Class A | | | $ | 1,000.00 | | | | $ | 1,019.70 | | | 1.07% | | | $ | 5.42 | |
| Institutional Class | | | | 1,000.00 | | | | | 1,020.96 | | | 0.82% | | | | 4.15 | |
| Class R6 | | | | 1,000.00 | | | | | 1,021.31 | | | 0.75% | | | | 3.80 | |
Delaware Growth Equity Fund
Expense analysis of an investment of $1,000
| | Beginning
Account
Value
4/1/21 | | Ending
Account
Value
9/30/21 | | Annualized
Expense
Ratio | | Expenses
Paid
During
Period
4/1/21 to
9/30/21* |
| Actual Fund return† | | | | | | | | | | | | | | | | | |
| Class A | | | $ | 1,000.00 | | | | $ | 1,152.30 | | | 1.09% | | | $ | 5.88 | |
| Institutional Class | | | | 1,000.00 | | | | | 1,153.60 | | | 0.84% | | | | 4.53 | |
| Class R6 | | | | 1,000.00 | | | | | 1,154.20 | | | 0.75% | | | | 4.05 | |
| Hypothetical 5% return (5% return before expenses) | | | | | | | | |
| Class A | | | $ | 1,000.00 | | | | $ | 1,019.60 | | | 1.09% | | | $ | 5.52 | |
| Institutional Class | | | | 1,000.00 | | | | | 1,020.86 | | | 0.84% | | | | 4.26 | |
| Class R6 | | | | 1,000.00 | | | | | 1,021.31 | | | 0.75% | | | | 3.80 | |
51
Table of Contents
Disclosure of Fund expenses
Delaware Opportunity Fund
Expense analysis of an investment of $1,000
| | | | | | | | | | Expenses |
| | | | | | | | | | Paid |
| | Beginning | | Ending | | | | During |
| | Account | | Account | | Annualized | | Period |
| | Value | | Value | | Expense | | 4/1/21 to |
| | 4/1/21 | | 9/30/21 | | Ratio | | 9/30/21* |
| Actual Fund return† | | | | | | | | | | | | | |
| Class A | | $ | 1,000.00 | | $ | 1,037.60 | | 1.20% | | | $ | 6.13 | |
| Institutional Class | | | 1,000.00 | | | 1,039.20 | | 0.90% | | | | 4.60 | |
| Class R6 | | | 1,000.00 | | | 1,039.80 | | 0.78% | | | | 3.99 | |
| Hypothetical 5% return (5% return before expenses) | | | | | | | | | | | | | |
| Class A | | $ | 1,000.00 | | $ | 1,019.05 | | 1.20% | | | $ | 6.07 | |
| Institutional Class | | | 1,000.00 | | | 1,020.56 | | 0.90% | | | | 4.56 | |
| Class R6 | | | 1,000.00 | | | 1,021.16 | | 0.78% | | | | 3.95 | |
Delaware Global Equity Fund
Expense analysis of an investment of $1,000
| | | | | | | | | | Expenses |
| | | | | | | | | | Paid |
| | Beginning | | Ending | | | | During |
| | Account | | Account | | Annualized | | Period |
| | Value | | Value | | Expense | | 4/1/21 to |
| | 4/1/21 | | 9/30/21 | | Ratio | | 9/30/21* |
| Actual Fund return† | | | | | | | | | | | | | |
| Class A | | $ | 1,000.00 | | $ | 1,021.50 | | 1.35% | | | $ | 6.84 | |
| Institutional Class | | | 1,000.00 | | | 1,023.30 | | 1.07% | | | | 5.43 | |
| Class R6 | | | 1,000.00 | | | 1,022.90 | | 1.02% | | | | 5.17 | |
| Hypothetical 5% return (5% return before expenses) | | | | | | | | | | | | | |
| Class A | | $ | 1,000.00 | | $ | 1,018.30 | | 1.35% | | | $ | 6.83 | |
| Institutional Class | | | 1,000.00 | | | 1,019.70 | | 1.07% | | | | 5.42 | |
| Class R6 | | | 1,000.00 | | | 1,019.95 | | 1.02% | | | | 5.16 | |
52
Table of Contents
Delaware Covered Call Strategy Fund
Expense analysis of an investment of $1,000
| | | | | | | | | | Expenses |
| | | | | | | | | | Paid |
| | Beginning | | Ending | | | | During |
| | Account | | Account | | Annualized | | Period |
| | Value | | Value | | Expense | | 4/1/21 to |
| | 4/1/21 | | 9/30/21 | | Ratio | | 9/30/21* |
| Actual Fund return† | | | | | | | | | | | | | |
| Class A | | $ | 1,000.00 | | $ | 1,037.80 | | 1.31% | | | $ | 6.69 | |
| Institutional Class | | | 1,000.00 | | | 1,039.50 | | 1.06% | | | | 5.42 | |
| Class R6 | | | 1,000.00 | | | 1,040.40 | | 0.88% | | | | 4.50 | |
| Hypothetical 5% return (5% return before expenses) | | | | | | | | | | | | | |
| Class A | | $ | 1,000.00 | | $ | 1,018.50 | | 1.31% | | | $ | 6.63 | |
| Institutional Class | | | 1,000.00 | | | 1,019.75 | | 1.06% | | | | 5.37 | |
| Class R6 | | | 1,000.00 | | | 1,020.66 | | 0.88% | | | | 4.46 | |
Delaware Hedged U.S. Equity Opportunities Fund
Expense analysis of an investment of $1,000
| | | | | | | | | | Expenses |
| | | | | | | | | | Paid |
| | Beginning | | Ending | | | | During |
| | Account | | Account | | Annualized | | Period |
| | Value | | Value | | Expense | | 4/1/21 to |
| | 4/1/21 | | 9/30/21 | | Ratio | | 9/30/21* |
| Actual Fund return† | | | | | | | | | | | | | |
| Class A | | $ | 1,000.00 | | $ | 1,033.40 | | 1.64% | | | $ | 8.36 | |
| Institutional Class | | | 1,000.00 | | | 1,035.70 | | 1.30% | | | | 6.63 | |
| Class R6 | | | 1,000.00 | | | 1,036.60 | | 1.20% | | | | 6.13 | |
| Hypothetical 5% return (5% return before expenses) | | | | | | | | | | | | | |
| Class A | | $ | 1,000.00 | | $ | 1,016.85 | | 1.64% | | | $ | 8.29 | |
| Institutional Class | | | 1,000.00 | | | 1,018.55 | | 1.30% | | | | 6.58 | |
| Class R6 | | | 1,000.00 | | | 1,019.05 | | 1.20% | | | | 6.07 | |
53
Table of Contents
Disclosure of Fund expenses
Delaware Premium Income Fund
Expense analysis of an investment of $1,000
| | | | | | | | | | Expenses |
| | | | | | | | | | Paid |
| | Beginning | | Ending | | | | During |
| | Account | | Account | | Annualized | | Period |
| | Value | | Value | | Expense | | 4/1/21 to |
| | 4/1/21 | | 9/30/21 | | Ratio | | 9/30/21* |
| Actual Fund return† | | | | | | | | | | | | | |
| Class A | | $ | 1,000.00 | | $ | 1,023.40 | | 1.30% | | | $ | 6.59 | |
| Institutional Class | | | 1,000.00 | | | 1,024.90 | | 1.05% | | | | 5.33 | |
| Class R6 | | | 1,000.00 | | | 1,027.20 | | 0.90% | | | | 4.57 | |
| Hypothetical 5% return (5% return before expenses) | | | | | | | | | | | | | |
| Class A | | $ | 1,000.00 | | $ | 1,018.55 | | 1.30% | | | $ | 6.58 | |
| Institutional Class | | | 1,000.00 | | | 1,019.80 | | 1.05% | | | | 5.32 | |
| Class R6 | | | 1,000.00 | | | 1,020.56 | | 0.90% | | | | 4.56 | |
Delaware Total Return Fund
Expense analysis of an investment of $1,000
| | | | | | | | | | Expenses |
| | | | | | | | | | Paid |
| | Beginning | | Ending | | | | During |
| | Account | | Account | | Annualized | | Period |
| | Value | | Value | | Expense | | 4/1/21 to |
| | 4/1/21 | | 9/30/21 | | Ratio | | 9/30/21* |
| Actual Fund return† | | | | | | | | | | | | | |
| Class A | | $ | 1,000.00 | | $ | 1,047.40 | | 1.14% | | | $ | 5.85 | |
| Institutional Class | | | 1,000.00 | | | 1,048.50 | | 0.89% | | | | 4.57 | |
| Class R6 | | | 1,000.00 | | | 1,048.90 | | 0.79% | | | | 4.06 | |
| Hypothetical 5% return (5% return before expenses) | | | | | | | | | | | | | |
| Class A | | $ | 1,000.00 | | $ | 1,019.35 | | 1.14% | | | $ | 5.77 | |
| Institutional Class | | | 1,000.00 | | | 1,020.61 | | 0.89% | | | | 4.51 | |
| Class R6 | | | 1,000.00 | | | 1,021.11 | | 0.79% | | | | 4.00 | |
| * | “Expenses Paid During Period” are equal to the relevant Fund’s annualized expense ratio, multiplied by the average account value over the period, multiplied by 183/365 (to reflect the one-half year period). |
| † | Because actual returns reflect only the most recent six-month period, the returns shown may differ significantly from fiscal year returns. |
In addition to the Fund’s expenses reflected above, each Fund also indirectly bears its portion of the fees and expenses of the investment companies (Underlying Funds) in which it invests, including exchange-traded funds. The tables above do not reflect the expenses of the Underlying Funds.
54
Table of Contents
Security type / sector allocations and top 10 equity holdings
Delaware Equity Income Fund
As of September 30, 2021 (Unaudited)
Sector designations may be different from the sector designations presented in other Fund materials. The sector designations may represent the investment manager’s internal sector classifications.
| | Percentage |
| Security type / sector | | of net assets |
| Common Stock | | | 99.74 | % | |
| Communication Services | | | 9.66 | % | |
| Consumer Discretionary | | | 3.74 | % | |
| Consumer Staples | | | 7.52 | % | |
| Energy | | | 6.59 | % | |
| Financials | | | 18.96 | % | |
| Healthcare | | | 22.56 | % | |
| Industrials | | | 10.12 | % | |
| Information Technology | | | 16.35 | % | |
| Materials | | | 3.75 | % | |
| Real Estate | | | 0.08 | % | |
| Utilities | | | 0.41 | % | |
| Short-Term Investments | | | 0.22 | % | |
| Total Value of Securities | | | 99.96 | % | |
| Receivables and Other Assets Net of | | | | | |
| Liabilities | | | 0.04 | % | |
| Total Net Assets | | | 100.00 | % | |
Holdings are for informational purposes only and are subject to change at any time. They are not a recommendation to buy, sell, or hold any security.
| | Percentage |
| Top 10 equity holdings | | of net assets |
| Johnson & Johnson | | | 4.46 | % | |
| Cisco Systems | | | 3.97 | % | |
| Raytheon Technologies | | | 3.70 | % | |
| Philip Morris International | | | 3.58 | % | |
| Comcast Class A | | | 3.56 | % | |
| Verizon Communications | | | 3.54 | % | |
| Motorola Solutions | | | 3.53 | % | |
| Exxon Mobil | | | 3.49 | % | |
| First American Financial | | | 3.33 | % | |
| Broadcom | | | 3.22 | % | |
55
Table of Contents
Security type / sector allocations and top 10 equity holdings
Delaware Growth and Income Fund
As of September 30, 2021 (Unaudited)
Sector designations may be different from the sector designations presented in other Fund materials. The sector designations may represent the investment manager’s internal sector classifications.
| | Percentage |
| Security type / sector | | of net assets |
| Common Stock | | | 99.68 | % | |
| Communication Services | | | 9.55 | % | |
| Consumer Discretionary | | | 3.77 | % | |
| Consumer Staples | | | 7.41 | % | |
| Energy | | | 6.70 | % | |
| Financials | | | 18.79 | % | |
| Healthcare | | | 22.80 | % | |
| Industrials | | | 10.21 | % | |
| Information Technology | | | 16.16 | % | |
| Materials | | | 3.82 | % | |
| Real Estate | | | 0.07 | % | |
| Utilities | | | 0.40 | % | |
| Short-Term Investments | | | 0.25 | % | |
| Total Value of Securities | | | 99.93 | % | |
| Receivables and Other Assets Net of | | | | | |
| Liabilities | | | 0.07 | % | |
| Total Net Assets | | | 100.00 | % | |
Holdings are for informational purposes only and are subject to change at any time. They are not a recommendation to buy, sell, or hold any security.
| | Percentage |
| Top 10 equity holdings | | of net assets |
| Johnson & Johnson | | | 4.49 | % | |
| Cisco Systems | | | 3.89 | % | |
| Raytheon Technologies | | | 3.65 | % | |
| Comcast Class A | | | 3.55 | % | |
| Philip Morris International | | | 3.53 | % | |
| Motorola Solutions | | | 3.48 | % | |
| Verizon Communications | | | 3.46 | % | |
| ConocoPhillips | | | 3.43 | % | |
| First American Financial | | | 3.35 | % | |
| Exxon Mobil | | | 3.27 | % | |
56
Table of Contents
Security type / sector allocations and top 10 equity holdings
Delaware Growth Equity Fund
As of September 30, 2021 (Unaudited)
Sector designations may be different from the sector designations presented in other Fund materials. The sector designations may represent the investment manager’s internal sector classifications.
| | | Percentage |
| Security type / sector | | of net assets |
| Common Stock ◆ | | | 98.91% | |
| Communication Services | | | 6.94% | |
| Consumer Discretionary | | | 16.14% | |
| Consumer Staples | | | 2.36% | |
| Financials | | | 9.28% | |
| Healthcare | | | 15.35% | |
| Industrials | | | 11.19% | |
| Information Technology* | | | 36.47% | |
| Materials | | | 1.18% | |
| Short-Term Investments | | | 1.25% | |
| Total Value of Securities | | | 100.16% | |
| Liabilities Net of Receivables and Other | | | | |
| Assets | | | (0.16% | ) |
| Total Net Assets | | | 100.00% | |
| ◆ | Narrow industries are utilized for compliance purposes for diversification whereas broad sectors are used for financial reporting. |
| * | To monitor compliance with the Fund’s concentration guidelines as described in the Fund’s prospectus and Statement of Additional Information, the Information Technology sector (as disclosed herein for financial reporting purposes) is subdivided into a variety of “industries” (in accordance with the requirements of the Investment Company Act of 1940, as amended). The Information Technology sector consisted of commercial services, computers, electronics, office/business equipment, semiconductors, and software. As of September 30, 2021, such amounts, as a percentage of total net assets were 3.30%, 11.34%, 1.91%, 3.20%, 5.81%, and 10.91%, respectively. The percentage in any such single industry will comply with the Fund’s concentration policy even if the percentage in the Information Technology sector for financial reporting purposes may exceed 25%. |
Holdings are for informational purposes only and are subject to change at any time. They are not a recommendation to buy, sell, or hold any security.
| | Percentage |
| Top 10 equity holdings | | of net assets |
| Apple | | | 4.88% | |
| Microsoft | | | 4.86% | |
| Alphabet Class A | | | 3.81% | |
| NVIDIA | | | 3.56% | |
| Fortinet | | | 3.33% | |
| PayPal Holdings | | | 3.29% | |
| Tempur Sealy International | | | 3.22% | |
| Zebra Technologies Class A | | | 3.20% | |
| Facebook Class A | | | 3.14% | |
| EPAM Systems | | | 3.13% | |
57
Table of Contents
Security type / sector allocations and top 10 equity holdings
Delaware Opportunity Fund
As of September 30, 2021 (Unaudited)
Sector designations may be different from the sector designations presented in other Fund materials. The sector designations may represent the investment manager’s internal sector classifications.
| | | Percentage |
| Security type / sector | | of net assets |
| Common Stock | | | 99.45% | |
| Basic Industry | | | 8.72% | |
| Business Services | | | 1.49% | |
| Capital Spending | | | 10.27% | |
| Consumer Cyclical | | | 5.53% | |
| Consumer Services | | | 8.61% | |
| Consumer Staples | | | 2.98% | |
| Energy | | | 5.33% | |
| Financial Services | | | 21.08% | |
| Healthcare | | | 6.01% | |
| Real Estate Investment Trusts | | | 7.71% | |
| Technology | | | 12.81% | |
| Transportation | | | 2.99% | |
| Utilities | | | 5.92% | |
| Short-Term Investments | | | 0.66% | |
| Total Value of Securities | | | 100.11% | |
| Liabilities Net of Receivables and Other | | | | |
| Assets | | | (0.11% | ) |
| Total Net Assets | | | 100.00% | |
Holdings are for informational purposes only and are subject to change at any time. They are not a recommendation to buy, sell, or hold any security.
| | Percentage |
| Top 10 equity holdings | | of net assets |
| East West Bancorp | | | 2.61% | |
| Hess | | | 2.25% | |
| Raymond James Financial | | | 2.19% | |
| Quanta Services | | | 2.11% | |
| Synchrony Financial | | | 1.99% | |
| KBR | | | 1.89% | |
| Synopsys | | | 1.84% | |
| Hartford Financial Services Group | | | 1.78% | |
| Agilent Technologies | | | 1.73% | |
| Teradyne | | | 1.70% | |
58
Table of Contents
Security type / country and sector allocations
Delaware Global Equity Fund
As of September 30, 2021 (Unaudited)
Sector designations may be different from the sector designations presented in other Fund materials. The sector designations may represent the investment manager’s internal sector classifications.
| | Percentage |
| Security type / country | | of net assets |
| Common Stock by Country | | | 98.20% | |
| Denmark | | | 3.01% | |
| France | | | 14.87% | |
| Germany | | | 10.88% | |
| Japan | | | 8.45% | |
| Netherlands | | | 3.83% | |
| Spain | | | 3.20% | |
| Sweden | | | 7.36% | |
| Switzerland | | | 9.98% | |
| United Kingdom | | | 8.71% | |
| United States | | | 27.91% | |
| Exchange-Traded Fund | | | 1.10% | |
| Short-Term Investments | | | 0.17% | |
| Total Value of Securities | | | 99.47% | |
| Receivables and Other Assets Net of | | | | |
| Liabilities | | | 0.53% | |
| Total Net Assets | | | 100.00% | |
| | | | |
| | Percentage |
| Common stock and preferred stock by sector◆ | | of net assets |
| Communication Services | | | 5.21% | |
| Consumer Discretionary | | | 9.72% | |
| Consumer Staples* | | | 42.96% | |
| Healthcare | | | 21.98% | |
| Industrials | | | 8.60% | |
| Information Technology | | | 3.20% | |
| Materials | | | 3.52% | |
| Technology | | | 3.01% | |
| Total | | | 98.20% | |
| ◆ | Narrow industries are utilized for compliance purposes for diversification whereas broad sectors are used for financial reporting. |
| * | To monitor compliance with the Fund’s concentration guidelines as described in the Fund’s prospectus and Statement of Additional Information, the Consumer Staples sector (as disclosed herein for financial reporting purposes) is subdivided into a variety of “industries” (in accordance with the requirements of the Investment Company Act of 1940, as amended). The Consumer Staples sector consisted of beverages, cosmetics/personal care, agricultural products, food retail, packaged foods & meats, household products/ wares, and retail. As of September 30, 2021, such amounts, as a percentage of total net assets were 6.36%, 4.76%, 2.63%, 6.56%, 16.75%, 4.48% and 1.42%, respectively. The percentage in any such single industry will comply with the Fund’s concentration policy even if the percentage in the Consumer Staples sector for financial reporting purposes may exceed 25%. |
(continues) 59
Table of Contents
Security type / sector allocations and top 10 equity holdings
Delaware Covered Call Strategy Fund
As of September 30, 2021 (Unaudited)
Sector designations may be different from the sector designations presented in other Fund materials. The sector designations may represent the investment manager’s internal sector classifications.
| | | Percentage |
| Security type / sector | | of net assets |
| Common Stock ◆ | | | 98.49% | |
| Communication Services | | | 8.17% | |
| Consumer Discretionary | | | 15.93% | |
| Consumer Staples | | | 4.83% | |
| Energy | | | 4.58% | |
| Financials | | | 8.94% | |
| Healthcare | | | 9.24% | |
| Industrials | | | 9.36% | |
| Information Technology* | | | 30.57% | |
| Materials | | | 3.42% | |
| Utilities | | | 3.45% | |
| Short-Term Investments | | | 3.38% | |
| Total Value of Securities Before Options | | | | |
| Written | | | 101.87% | |
| Options Written | | | (1.70% | ) |
| Liabilities Net of Receivables and Other | | | | |
| Assets | | | (0.17% | ) |
| Total Net Assets | | | 100.00% | |
| ◆ | Narrow industries are utilized for compliance purposes for diversification whereas broad sectors are used for financial reporting. |
| * | To monitor compliance with the Fund’s concentration guidelines as described in the Fund’s prospectus and Statement of Additional Information, the Information Technology sector (as disclosed herein for financial reporting purposes) is subdivided into a variety of “industries” (in accordance with the requirements of the Investment Company Act of 1940, as amended). The Information Technology sector consisted of computers, diversified financial services, semiconductors, and software. As of September 30, 2021, such amounts, as a percentage of total net assets were 8.92%, 4.35%, 8.88%, and 8.42%, respectively. The percentage in any such single industry will comply with the Fund’s concentration policy even if the percentage in the Information Technology sector for financial reporting purposes may exceed 25%. |
Holdings are for informational purposes only and are subject to change at any time. They are not a recommendation to buy, sell, or hold any security.
| | Percentage |
| Top 10 equity holdings | | of net assets |
| Apple | | | 8.92% | |
| Microsoft | | | 8.42% | |
| Alphabet Class A | | | 5.95% | |
| Home Depot | | | 4.86% | |
| Costco Wholesale | | | 4.83% | |
| Medtronic | | | 4.75% | |
| Texas Instruments | | | 4.53% | |
| Booking Holdings | | | 4.37% | |
| Broadcom | | | 4.36% | |
| BlackRock | | | 3.93% | |
60
Table of Contents
Security type / sector allocations and top 10 equity holdings
Delaware Hedged U.S. Equity Opportunities Fund
As of September 30, 2021 (Unaudited)
Sector designations may be different from the sector designations presented in other Fund materials. The sector designations may represent the investment manager’s internal sector classifications.
| | | Percentage |
| Security type / sector | | of net assets |
| Common Stock | | | 94.50% | |
| Communication Services | | | 7.68% | |
| Consumer Discretionary | | | 14.65% | |
| Consumer Staples | | | 6.80% | |
| Energy | | | 1.37% | |
| Financials | | | 12.97% | |
| Healthcare | | | 13.82% | |
| Industrials | | | 10.74% | |
| Information Technology | | | 18.18% | |
| Materials | | | 3.10% | |
| Real Estate | | | 3.09% | |
| Utilities | | | 2.10% | |
| Exchange-Traded Fund | | | 0.45% | |
| Options Purchased | | | 1.20% | |
| Short-Term Investments | | | 3.57% | |
| Total Value of Securities Before Options | | | | |
| Written | | | 99.72% | |
| Options Written | | | (0.63% | ) |
| Receivables and Other Assets Net of | | | | |
| Liabilities | | | 0.91% | |
| Total Net Assets | | | 100.00% | |
Holdings are for informational purposes only and are subject to change at any time. They are not a recommendation to buy, sell, or hold any security.
| | Percentage |
| Top 10 equity holdings | | of net assets |
| Alphabet Class A | | | 2.16% | |
| Microsoft | | | 2.12% | |
| Amazon.com | | | 2.05% | |
| Facebook Class A | | | 1.53% | |
| Apple | | | 1.40% | |
| Chubb | | | 1.37% | |
| Medtronic | | | 1.24% | |
| Marsh & McLennan | | | 1.21% | |
| Johnson & Johnson | | | 1.10% | |
| TJX | | | 1.07% | |
(continues) 61
Table of Contents
Security type / sector allocations and top 10 equity holdings
Delaware Premium Income Fund
As of September 30, 2021 (Unaudited)
Sector designations may be different from the sector designations presented in other Fund materials. The sector designations may represent the investment manager’s internal sector classifications.
| | Percentage |
| Security type / sector | | of net assets |
| Common Stock ◆ | | | 117.14 | % | |
| Communication Services | | | 8.58 | % | |
| Consumer Discretionary | | | 13.45 | % | |
| Consumer Staples | | | 6.88 | % | |
| Energy | | | 10.28 | % | |
| Financials | | | 14.17 | % | |
| Healthcare | | | 13.84 | % | |
| Industrials | | | 16.38 | % | |
| Information Technology* | | | 31.40 | % | |
| Materials | | | 2.16 | % | |
| Short-Term Investments | | | 2.82 | % | |
| Total Value of Securities Before Options | | | | | |
| Written | | | 119.96 | % | |
| Options Written | | | (19.95 | %) | |
| Liabilities Net of Receivables and Other | | | | | |
| Assets | | | (0.01 | %) | |
| Total Net Assets | | | 100.00 | % | |
| ◆ | Narrow industries are utilized for compliance purposes for diversification whereas broad sectors are used for financial reporting. |
| * | To monitor compliance with the Fund’s concentration guidelines as described in the Fund’s prospectus and Statement of Additional Information, the Information Technology sector (as disclosed herein for financial reporting purposes) is subdivided into a variety of “industries” (in accordance with the requirements of the Investment Company Act of 1940, as amended). The Information Technology sector consisted of computers, energy-alternate sources, semiconductors, software, and telecommunications. As of September 30, 2021, such amounts, as a percentage of total net assets were 4.34%, 2.02%, 12.04%, 2.92%, and 10.08%, respectively. The percentage in any such single industry will comply with the Fund’s concentration policy even if the percentage in the Information Technology sector for financial reporting purposes may exceed 25%. |
Holdings are for informational purposes only and are subject to change at any time. They are not a recommendation to buy, sell, or hold any security.
| | Percentage |
| Top 10 equity holdings | | of net assets |
| Broadcom | | | 10.45 | % | |
| ConocoPhillips | | | 5.70 | % | |
| Corning | | | 5.37 | % | |
| Home Depot | | | 4.90 | % | |
| Pfizer | | | 4.75 | % | |
| Cisco Systems | | | 4.70 | % | |
| Chevron | | | 4.58 | % | |
| Lockheed Martin | | | 4.58 | % | |
| CSX | | | 4.38 | % | |
| Apple | | | 4.34 | % | |
62
Table of Contents
Security type / sector allocations and top 10 equity holdings
Delaware Total Return Fund
As of September 30, 2021 (Unaudited)
Sector designations may be different from the sector designations presented in other Fund materials. The sector designations may represent the investment manager’s internal sector classifications.
| | Percentage |
| Security type / sector | | of net assets |
| Agency Mortgage-Backed Securities | | | 3.07 | % | |
| Collateralized Debt Obligations | | | 0.27 | % | |
| Convertible Bonds | | | 6.73 | % | |
| Corporate Bonds | | | 12.62 | % | |
| Banking | | | 1.30 | % | |
| Basic Industry | | | 1.04 | % | |
| Brokerage | | | 0.06 | % | |
| Capital Goods | | | 0.34 | % | |
| Communications | | | 1.43 | % | |
| Consumer Cyclical | | | 1.17 | % | |
| Consumer Non-Cyclical | | | 0.79 | % | |
| Energy | | | 2.05 | % | |
| Financials | | | 0.61 | % | |
| Healthcare | | | 0.45 | % | |
| Insurance | | | 0.47 | % | |
| Media | | | 0.63 | % | |
| Real Estate Investment Trusts | | | 0.21 | % | |
| Services | | | 0.19 | % | |
| Technology | | | 0.88 | % | |
| Transportation | | | 0.19 | % | |
| Utilities | | | 0.81 | % | |
| Non-Agency Asset-Backed Securities | | | 0.18 | % | |
| Non-Agency Commercial Mortgage-Backed | | | | | |
| Securities | | | 0.99 | % | |
| Sovereign Bonds | | | 1.84 | % | |
| Armenia | | | 0.04 | % | |
| Colombia | | | 0.12 | % | |
| Dominican Republic | | | 0.19 | % | |
| Egypt | | | 0.13 | % | |
| Gabon | | | 0.04 | % | |
| Honduras | | | 0.04 | % | |
| Indonesia | | | 0.03 | % | |
| Ivory Coast | | | 0.12 | % | |
| Malaysia | | | 0.14 | % | |
| Mongolia | | | 0.06 | % | |
| Morocco | | | 0.12 | % | |
| North Macedonia | | | 0.03 | % | |
| Paraguay | | | 0.17 | % | |
| Peru | | | 0.10 | % | |
| Romania | | | 0.02 | % | |
| Senegal | | | 0.04 | % | |
| Serbia | | | 0.10 | % | |
| Turkey | | | 0.04 | % | |
| Ukraine | | | 0.08 | % | |
| Uruguay | | | 0.11 | % | |
| Uzbekistan | | | 0.12 | % | |
| Supranational Banks | | | 0.15 | % | |
| US Treasury Obligations | | | 2.29 | % | |
| Common Stock | | | 58.81 | % | |
| Communication Services | | | 4.47 | % | |
| Consumer Discretionary | | | 7.90 | % | |
| Consumer Staples | | | 5.34 | % | |
| Energy | | | 2.74 | % | |
| Financials | | | 7.13 | % | |
| Healthcare | | | 8.52 | % | |
| Industrials | | | 3.21 | % | |
| Information Technology | | | 13.24 | % | |
| Materials | | | 1.07 | % | |
| REIT Diversified | | | 0.05 | % | |
| REIT Healthcare | | | 0.51 | % | |
| REIT Hotel | | | 0.31 | % | |
| REIT Industrial | | | 0.40 | % | |
| REIT Information Technology | | | 0.32 | % | |
| REIT Mall | | | 0.10 | % | |
| REIT Manufactured Housing | | | 0.11 | % | |
| REIT Multifamily | | | 1.05 | % | |
| REIT Office | | | 0.26 | % | |
| REIT Self-Storage | | | 0.55 | % | |
| REIT Shopping Center | | | 0.27 | % | |
| REIT Single Tenant | | | 0.21 | % | |
| REIT Specialty | | | 0.08 | % | |
| Utilities | | | 0.97 | % | |
| Convertible Preferred Stock | | | 1.46 | % | |
| Exchange-Traded Funds | | | 4.69 | % | |
| Limited Liability Corporation | | | 1.73 | % | |
| Short-Term Investments | | | 5.16 | % | |
(continues) 63
Table of Contents
Security type / sector allocations and top 10 equity holdings
Delaware Total Return Fund
| | Percentage |
| Security type / sector | | of net assets |
| Total Value of Securities | | | 99.99 | % | |
| Receivables and Other Assets Net of | | | | | |
| Liabilities | | | 0.01 | % | |
| Total Net Assets | | | 100.00 | % | |
Holdings are for informational purposes only and are subject to change at any time. They are not a recommendation to buy, sell, or hold any security.
| | Percentage |
| Top 10 equity holdings | | of net assets |
| Apple | | | 2.02 | % | |
| Microsoft | | | 1.88 | % | |
| Johnson & Johnson | | | 1.23 | % | |
| Broadcom | | | 1.10 | % | |
| Lowe’s | | | 1.08 | % | |
| ConocoPhillips | | | 1.05 | % | |
| Merck & Co. | | | 1.02 | % | |
| Verizon Communications | | | 1.02 | % | |
| MetLife | | | 0.97 | % | |
| Amazon.com | | | 0.92 | % | |
64
Table of Contents
Schedules of investments
Delaware Equity Income Fund
September 30, 2021
| | | Number of | | | |
| | | shares | | Value (US $) |
| Common Stock – 99.74% | | | | | |
| Communication Services – 9.66% | | | | | |
| | AT&T | | 277,723 | | $ | 7,501,298 |
| Comcast Class A | | 185,628 | | | 10,382,174 |
| Verizon Communications | | 191,311 | | | 10,332,707 |
| | | | | | 28,216,179 |
| Consumer Discretionary – 3.74% | | | | | |
| Lowe’s | | 13,334 | | | 2,704,935 |
| TJX | | 124,461 | | | 8,211,937 |
| | | | | | 10,916,872 |
| Consumer Staples – 7.52% | | | | | |
| Altria Group | | 97,007 | | | 4,415,759 |
| Archer-Daniels-Midland | | 13,394 | | | 803,774 |
| Herbalife Nutrition † | | 35,548 | | | 1,506,524 |
| Mondelez International Class A | | 82,134 | | | 4,778,556 |
| Philip Morris International | | 110,300 | | | 10,455,337 |
| | | | | | 21,959,950 |
| Energy – 6.59% | | | | | |
| ConocoPhillips | | 133,681 | | | 9,059,561 |
| Exxon Mobil | | 173,372 | | | 10,197,741 |
| | | | | | 19,257,302 |
| Financials – 18.96% | | | | | |
| Allstate | | 67,046 | | | 8,535,626 |
| American Financial Group | | 5,434 | | | 683,760 |
| American International Group | | 111,419 | | | 6,115,789 |
| Discover Financial Services | | 9,254 | | | 1,136,854 |
| First American Financial | | 145,106 | | | 9,729,357 |
| MetLife | | 119,353 | | | 7,367,661 |
| Old Republic International | | 184,973 | | | 4,278,425 |
| OneMain Holdings | | 57,085 | | | 3,158,513 |
| Synchrony Financial | | 127,937 | | | 6,253,561 |
| Truist Financial | | 138,323 | | | 8,112,644 |
| | | | | | 55,372,190 |
| Healthcare – 22.56% | | | | | |
| AbbVie | | 44,752 | | | 4,827,398 |
| AmerisourceBergen | | 31,499 | | | 3,762,556 |
| Bristol-Myers Squibb | | 144,350 | | | 8,541,189 |
| Cardinal Health | | 42,114 | | | 2,082,958 |
| Cigna | | 30,300 | | | 6,064,848 |
| CVS Health | | 65,468 | | | 5,555,614 |
| Gilead Sciences | | 58,762 | | | 4,104,526 |
| Johnson & Johnson | | 80,588 | | | 13,014,962 |
| Merck & Co. | | 113,861 | | | 8,552,100 |
| Pfizer | | 55,594 | | | 2,391,098 |
| Viatris | | 514,205 | | | 6,967,478 |
| | | | | | 65,864,727 |
| Industrials – 10.12% | | | | | |
| Emerson Electric | | 42,593 | | | 4,012,260 |
| Honeywell International | | 25,685 | | | 5,452,412 |
| | Northrop Grumman | | 25,765 | | | 9,279,265 |
| Raytheon Technologies | | 125,841 | | | 10,817,292 |
| | | | | | 29,561,229 |
| Information Technology – 16.35% | | | | | |
| Broadcom | | 19,389 | | | 9,402,308 |
| Cisco Systems | | 212,768 | | | 11,580,962 |
| Cognizant Technology Solutions | | | | | |
| Class A | | 116,683 | | | 8,659,046 |
| HP | | 100,578 | | | 2,751,814 |
| Motorola Solutions | | 44,437 | | | 10,323,604 |
| Oracle | | 46,764 | | | 4,074,547 |
| Western Union | | 46,563 | | | 941,504 |
| | | | | | 47,733,785 |
| Materials – 3.75% | | | | | |
| DuPont de Nemours | | 119,997 | | | 8,158,596 |
| Newmont | | 51,219 | | | 2,781,192 |
| | | | | | 10,939,788 |
| Real Estate – 0.08% | | | | | |
| Equity Residential | | 2,881 | | | 233,131 |
| | | | | | 233,131 |
| Utilities – 0.41% | | | | | |
| NRG Energy | | 29,047 | | | 1,185,989 |
| | | | | | 1,185,989 |
| Total Common Stock | | | | | |
| (cost $257,730,922) | | | | | 291,241,142 |
| | | | | | |
| Short-Term Investments – 0.22% | | | | | |
| Money Market Mutual Funds – 0.22% | | | | | |
| BlackRock FedFund – | | | | | |
| Institutional Shares (seven- | | | | | |
| day effective yield 0.03%) | | 163,431 | | | 163,431 |
| Fidelity Investments Money | | | | | |
| Market Government Portfolio | | | | | |
| – Class I (seven-day effective | | | | | |
| yield 0.01%) | | 163,431 | | | 163,431 |
| GS Financial Square | | | | | |
| Government Fund – | | | | | |
| Institutional Shares (seven- | | | | | |
| day effective yield 0.03%) | | 163,431 | | | 163,431 |
65
Table of Contents
Schedules of investments
Delaware Equity Income Fund
| | | | | | |
| | | Number of | | | |
| | | shares | | Value (US $) |
| Short-Term Investments (continued) | | | | | |
| Money Market Mutual Funds (continued) | | | | | |
| | Morgan Stanley Government | | | | | |
| Portfolio – Institutional | | | | | |
| Share Class (seven-day | | | | | |
| effective yield 0.03%) | | 163,431 | | $ | 163,431 |
| Total Short-Term Investments | | | | | |
| (cost $653,724) | | | | | 653,724 |
| Total Value of | | | | | |
| Securities–99.96% | | | | | |
| (cost $258,384,646) | | | | $ | 291,894,866 |
| † | Non-income producing security. |
Summary of abbreviations:
GS – Goldman Sachs
See accompanying notes, which are an integral part of the financial statements.
66
Table of Contents
Delaware Growth and Income Fund
September 30, 2021
| | | | Number of | | | |
| | | | shares | | Value (US $) |
| Common Stock – 99.68% | | | | | |
| Communication Services – 9.55% | | | | | |
| AT&T | | 981,296 | | $ | 26,504,805 |
| Comcast Class A | | 660,714 | | | 36,953,734 |
| Verizon Communications | | 667,858 | | | 36,071,011 |
| | | | | | 99,529,550 |
| Consumer Discretionary – 3.77% | | | | | |
| Lowe’s | | 47,605 | | | 9,657,150 |
| TJX | | 448,677 | | | 29,603,709 |
| | | | | | 39,260,859 |
| Consumer Staples – 7.41% | | | | | |
| Altria Group | | 346,842 | | | 15,788,248 |
| Archer-Daniels-Midland | | 52,426 | | | 3,146,084 |
| Herbalife Nutrition † | | 123,440 | | | 5,231,387 |
| Mondelez International | | | | | |
| Class A | | 279,301 | | | 16,249,732 |
| Philip Morris International | | 387,800 | | | 36,759,562 |
| | | | | | 77,175,013 |
| Energy – 6.70% | | | | | |
| ConocoPhillips | | 528,327 | | | 35,804,721 |
| Exxon Mobil | | 578,820 | | | 34,046,192 |
| | | | | | 69,850,913 |
| Financials – 18.79% | | | | | |
| Allstate | | 237,781 | | | 30,271,899 |
| American Financial Group | | 19,309 | | | 2,429,651 |
| American International | | | | | |
| Group | | 402,713 | | | 22,104,917 |
| Discover Financial Services | | 32,650 | | | 4,011,053 |
| First American Financial | | 520,599 | | | 34,906,163 |
| MetLife | | 411,460 | | | 25,399,426 |
| Old Republic International | | 648,640 | | | 15,003,043 |
| OneMain Holdings | | 198,291 | | | 10,971,441 |
| Synchrony Financial | | 453,274 | | | 22,156,033 |
| Truist Financial | | 487,412 | | | 28,586,714 |
| | | | | | 195,840,340 |
| Healthcare – 22.80% | | | | | |
| AbbVie | | 160,286 | | | 17,290,051 |
| AmerisourceBergen | | 114,040 | | | 13,622,078 |
| Bristol-Myers Squibb | | 558,333 | | | 33,036,564 |
| Cardinal Health | | 151,732 | | | 7,504,665 |
| Cigna | | 106,438 | | | 21,304,630 |
| CVS Health | | 232,160 | | | 19,701,097 |
| Gilead Sciences | | 215,359 | | | 15,042,826 |
| Johnson & Johnson | | 289,514 | | | 46,756,511 |
| Merck & Co. | | 398,332 | | | 29,918,716 |
| Pfizer | | 198,963 | | | 8,557,399 |
| Viatris | | 1,830,524 | | | 24,803,600 |
| | | | | | 237,538,137 |
| Industrials – 10.21% | | | | | |
| Emerson Electric | | 153,077 | | | 14,419,853 |
| Honeywell International | | 94,681 | | | 20,098,883 |
| Northrop Grumman | | 94,025 | | | 33,863,104 |
| Raytheon Technologies | | 442,282 | | | 38,018,561 |
| | | | | | 106,400,401 |
| Information Technology – 16.16% | | | | | |
| Broadcom | | 69,501 | | | 33,703,120 |
| Cisco Systems | | 744,932 | | | 40,546,649 |
| Cognizant Technology | | | | | |
| Solutions Class A | | 411,757 | | | 30,556,487 |
| HP | | 349,143 | | | 9,552,552 |
| Motorola Solutions | | 156,314 | | | 36,314,869 |
| Oracle | | 165,908 | | | 14,455,564 |
| Western Union | | 162,628 | | | 3,288,338 |
| | | | | | 168,417,579 |
| Materials – 3.82% | | | | | |
| DuPont de Nemours | | 433,464 | | | 29,471,217 |
| Newmont | | 190,683 | | | 10,354,087 |
| | | | | | 39,825,304 |
| Real Estate – 0.07% | | | | | |
| Equity Residential | | 8,737 | | | 706,998 |
| | | | | | 706,998 |
| Utilities – 0.40% | | | | | |
| NRG Energy | | 102,895 | | | 4,201,203 |
| | | | | | 4,201,203 |
| Total Common Stock | | | | | |
| (cost $902,506,123) | | | | | 1,038,746,297 |
| | | | | | |
| Short-Term Investments – 0.25% | | | | | |
| Money Market Mutual Funds – 0.25% | | | | | |
| BlackRock FedFund – | | | | | |
| Institutional Shares (seven- | | | | | |
| day effective yield 0.03%) | | 644,190 | | | 644,190 |
| Fidelity Investments Money | | | | | |
| Market Government | | | | | |
| Portfolio – Class I (seven- | | | | | |
| day effective yield 0.01%) | | 644,190 | | | 644,190 |
| GS Financial Square | | | | | |
| Government Fund – | | | | | |
| Institutional Shares (seven- | | | | | |
| day effective yield 0.03%) | | 644,190 | | | 644,190 |
67
Table of Contents
Schedules of investments
Delaware Growth and Income Fund
| | | Number of | | | |
| | | | shares | | Value (US $) |
| Short-Term Investments (continued) | | | | | |
| Money Market Mutual Funds (continued) | | | | | |
| Morgan Stanley Government | | | | | |
| Portfolio – Institutional | | | | | |
| Share Class (seven-day | | | | | |
| effective yield 0.03%) | | 644,191 | | $ | 644,191 |
| Total Short-Term Investments | | | | | |
| (cost $2,576,761) | | | | | 2,576,761 |
| Total Value of | | | | | |
| Securities–99.93% | | | | | |
| (cost $905,082,884) | | | | $ | 1,041,323,058 |
| † | Non-income producing security. |
Summary of abbreviations:
GS – Goldman Sachs
See accompanying notes, which are an integral part of the financial statements.
68
Table of Contents
Delaware Growth Equity Fund
September 30, 2021
| | | Number of | | | |
| | | | shares | | Value (US $) |
| Common Stock – 98.91%◆ | | | | | |
| Communication Services – 6.94% | | | | | |
| Alphabet Class A † | | 8,550 | | $ | 22,858,596 |
| Facebook Class A † | | 55,490 | | | 18,832,751 |
| | | | | | 41,691,347 |
| Consumer Discretionary – 16.14% | | | | | |
| Amazon.com † | | 4,760 | | | 15,636,790 |
| AutoZone † | | 8,300 | | | 14,093,317 |
| Deckers Outdoor † | | 48,850 | | | 17,595,770 |
| Lowe’s | | 69,160 | | | 14,029,798 |
| Target | | 71,031 | | | 16,249,762 |
| Tempur Sealy International | | 416,730 | | | 19,340,439 |
| | | | | | 96,945,876 |
| Consumer Staples – 2.36% | | | | | |
| Costco Wholesale | | 31,500 | | | 14,154,525 |
| | | | | | 14,154,525 |
| Financials – 9.28% | | | | | |
| Ameriprise Financial | | 54,370 | | | 14,360,204 |
| Capital One Financial | | 94,520 | | | 15,309,405 |
| JPMorgan Chase & Co. | | 81,180 | | | 13,288,354 |
| US Bancorp | | 214,460 | | | 12,747,502 |
| | | | | | 55,705,465 |
| Healthcare – 15.35% | | | | | |
| Encompass Health | | 182,000 | | | 13,657,280 |
| Envista Holdings † | | 320,660 | | | 13,406,795 |
| HCA Healthcare | | 57,200 | | | 13,883,584 |
| IQVIA Holdings † | | 53,600 | | | 12,839,344 |
| Merck & Co. | | 110,680 | | | 8,313,175 |
| Thermo Fisher Scientific | | 21,970 | | | 12,552,120 |
| West Pharmaceutical Services | | 41,300 | | | 17,533,502 |
| | | | | | 92,185,800 |
| Industrials – 11.19% | | | | | |
| Dover | | 90,570 | | | 14,083,635 |
| EMCOR Group | | 108,470 | | | 12,515,269 |
| Parker-Hannifin | | 53,640 | | | 14,998,817 |
| Rockwell Automation | | 44,300 | | | 13,025,972 |
| United Parcel Service Class B | | 69,110 | | | 12,584,931 |
| | | | | | 67,208,624 |
| Information Technology – 36.47% | | | | | |
| Adobe † | | 32,500 | | | 18,710,900 |
| Apple | | 207,278 | | | 29,329,837 |
| Arrow Electronics † | | 102,220 | | | 11,478,284 |
| Cadence Design Systems † | | 116,160 | | | 17,591,270 |
| EPAM Systems † | | 32,953 | | | 18,799,027 |
| Fortinet † | | 68,440 | | | 19,987,218 |
| KLA | | 40,500 | | | 13,547,655 |
| Microsoft | | 103,540 | | | 29,189,997 |
| NVIDIA | | 103,080 | | | 21,354,053 |
| PayPal Holdings † | | 76,050 | | | 19,788,970 |
| Zebra Technologies Class A † | | 37,307 | | | 19,228,774 |
| | | | | | 219,005,985 |
| Materials – 1.18% | | | | | |
| International Paper | | 127,210 | | | 7,113,583 |
| | | | | | 7,113,583 |
| Total Common Stock | | | | | |
| (cost $344,554,586) | | | | | 594,011,205 |
| | | | | | |
| Short-Term Investments – 1.25% | | | | | |
| Money Market Mutual Funds – 1.25% | | | | | |
| BlackRock FedFund – | | | | | |
| Institutional Shares (seven- | | | | | |
| day effective yield 0.03%) | | 1,870,480 | | | 1,870,480 |
| Fidelity Investments Money | | | | | |
| Market Government Portfolio | | | | | |
| – Class I (seven-day effective | | | | | |
| yield 0.01%) | | 1,870,481 | | | 1,870,481 |
| GS Financial Square | | | | | |
| Government Fund – | | | | | |
| Institutional Shares (seven- | | | | | |
| day effective yield 0.03%) | | 1,870,481 | | | 1,870,481 |
| Morgan Stanley Government | | | | | |
| Portfolio – Institutional | | | | | |
| Share Class (seven-day | | | | | |
| effective yield 0.03%) | | 1,870,481 | | | 1,870,481 |
| Total Short-Term Investments | | | | | |
| (cost $7,481,923) | | | | | 7,481,923 |
| Total Value of | | | | | |
| Securities–100.16% | | | | | |
| (cost $352,036,509) | | | | $ | 601,493,128 |
| ◆ | Narrow industries are utilized for compliance purposes for diversification whereas broad sectors are used for financial reporting. |
| † | Non-income producing security. |
Summary of abbreviations:
GS – Goldman Sachs
See accompanying notes, which are an integral part of the financial statements.
69
Table of Contents
Schedules of investments
Delaware Opportunity Fund
September 30, 2021
| | | Number of | | | |
| | | | shares | | | Value (US $) |
| Common Stock – 99.45% | | | | | |
| Basic Industry – 8.72% | | | | | |
| Alcoa † | | 99,600 | | $ | 4,874,424 |
| Axalta Coating Systems † | | 137,500 | | | 4,013,625 |
| Berry Global Group † | | 135,900 | | | 8,273,592 |
| Celanese | | 47,100 | | | 7,095,144 |
| Crown Holdings | | 65,600 | | | 6,611,168 |
| Graphic Packaging Holding | | 385,900 | | | 7,347,536 |
| Huntsman | | 380,000 | | | 11,244,200 |
| Louisiana-Pacific | | 81,800 | | | 5,020,066 |
| Newmont | | 65,000 | | | 3,529,500 |
| | | | | | 58,009,255 |
| Business Services – 1.49% | | | | | |
| Brink’s | | 85,600 | | | 5,418,480 |
| ManpowerGroup | | 41,500 | | | 4,493,620 |
| | | | | | 9,912,100 |
| Capital Spending – 10.27% | | | | | |
| AECOM † | | 138,200 | | | 8,727,330 |
| AMETEK | | 32,200 | | | 3,993,122 |
| Gates Industrial † | | 298,000 | | | 4,848,460 |
| ITT | | 129,700 | | | 11,133,448 |
| KBR | | 318,600 | | | 12,552,840 |
| Oshkosh | | 65,200 | | | 6,674,524 |
| Quanta Services | | 123,500 | | | 14,056,770 |
| United Rentals † | | 18,100 | | | 6,351,833 |
| | | | | | 68,338,327 |
| Consumer Cyclical – 5.53% | | | | | |
| Aptiv † | | 52,400 | | | 7,806,028 |
| DR Horton | | 130,200 | | | 10,932,894 |
| Johnson Controls International | | 133,200 | | | 9,068,256 |
| Stanley Black & Decker | | 51,100 | | | 8,958,341 |
| | | | | | 36,765,519 |
| Consumer Services – 8.61% | | | | | |
| AutoZone † | | 5,400 | | | 9,169,146 |
| Cable One | | 2,500 | | | 4,532,825 |
| Darden Restaurants | | 36,800 | | | 5,574,096 |
| Dollar Tree † | | 46,100 | | | 4,412,692 |
| Hasbro | | 49,900 | | | 4,452,078 |
| Marriott International Class A † | | 65,100 | | | 9,640,659 |
| Polaris | | 45,600 | | | 5,456,496 |
| PVH † | | 25,700 | | | 2,641,703 |
| Ross Stores | | 37,800 | | | 4,114,530 |
| VF | | 67,300 | | | 4,508,427 |
| ViacomCBS Class B | | 71,100 | | | 2,809,161 |
| | | | | | 57,311,813 |
| Consumer Staples – 2.98% | | | | | |
| Campbell Soup | | 56,600 | | | 2,366,446 |
| Conagra Brands | | 128,200 | | | 4,342,134 |
| Kellogg | | 67,700 | | | 4,327,384 |
| Tyson Foods Class A | | 56,500 | | | 4,460,110 |
| US Foods Holding † | | 124,300 | | | 4,308,238 |
| | | | | | 19,804,312 |
| Energy – 5.33% | | | | | |
| Cabot Oil & Gas | | 304,800 | | | 6,632,448 |
| Hess | | 191,900 | | | 14,989,309 |
| Marathon Oil | | 713,400 | | | 9,752,178 |
| Valero Energy | | 57,700 | | | 4,071,889 |
| | | | | | 35,445,824 |
| Financial Services – 21.08% | | | | | |
| Affiliated Managers Group | | 42,600 | | | 6,436,434 |
| Allstate | | 78,000 | | | 9,930,180 |
| American Financial Group | | 38,000 | | | 4,781,540 |
| Assurant | | 45,900 | | | 7,240,725 |
| East West Bancorp | | 223,600 | | | 17,337,944 |
| Globe Life | | 63,200 | | | 5,626,696 |
| Hancock Whitney | | 162,265 | | | 7,645,927 |
| Hartford Financial Services | | | | | |
| Group | | 168,700 | | | 11,851,175 |
| KeyCorp | | 512,500 | | | 11,080,250 |
| Raymond James Financial | | 157,650 | | | 14,547,942 |
| Reinsurance Group of America | | 54,400 | | | 6,052,544 |
| Signature Bank | | 34,500 | | | 9,393,660 |
| Synchrony Financial | | 271,500 | | | 13,270,920 |
| Synovus Financial | | 163,300 | | | 7,167,237 |
| Western Alliance Bancorp | | 72,300 | | | 7,867,686 |
| | | | | | 140,230,860 |
| Healthcare – 6.01% | | | | | |
| AmerisourceBergen | | 53,300 | | | 6,366,685 |
| Quest Diagnostics | | 57,700 | | | 8,384,387 |
| Service Corp. International | | 93,500 | | | 5,634,310 |
| STERIS | | 31,300 | | | 6,393,964 |
| Syneos Health † | | 59,300 | | | 5,187,564 |
| Zimmer Biomet Holdings | | 54,600 | | | 7,991,256 |
| | | | | | 39,958,166 |
| Real Estate Investment Trusts – 7.71% | | | | | |
| Apartment Income REIT | | 130,729 | | | 6,380,882 |
| Brandywine Realty Trust | | 377,300 | | | 5,063,366 |
| Host Hotels & Resorts † | | 263,300 | | | 4,299,689 |
| Kimco Realty | | 330,900 | | | 6,866,175 |
| Life Storage | | 58,650 | | | 6,729,501 |
| MGM Growth Properties | | | | | |
| Class A | | 198,100 | | | 7,587,230 |
| Outfront Media | | 242,300 | | | 6,105,960 |
| Spirit Realty Capital | | 179,100 | | | 8,245,764 |
| | | | | | 51,278,567 |
| Technology – 12.81% | | | | | |
| Agilent Technologies | | 73,200 | | | 11,531,196 |
70
Table of Contents
| | | Number of | | | |
| | | | shares | | | Value (US $) |
| Common Stock (continued) | | | | | |
| Technology (continued) | | | | | |
| Avnet | | 138,800 | | $ | 5,131,436 |
| Ciena † | | 106,500 | | | 5,468,775 |
| Citrix Systems | | 15,700 | | | 1,685,709 |
| Fiserv † | | 28,400 | | | 3,081,400 |
| Flex † | | 440,000 | | | 7,779,200 |
| Keysight Technologies † | | 56,600 | | | 9,298,814 |
| ON Semiconductor † | | 148,500 | | | 6,796,845 |
| Qorvo † | | 50,500 | | | 8,443,095 |
| Synopsys † | | 40,800 | | | 12,215,928 |
| Teradyne | | 103,700 | | | 11,320,929 |
| Western Digital † | | 44,200 | | | 2,494,648 |
| | | | | | 85,247,975 |
| Transportation — 2.99% | | | | | |
| CSX | | 98,200 | | | 2,920,468 |
| JB Hunt Transport Services | | 29,100 | | | 4,866,102 |
| Kirby † | | 73,500 | | | 3,525,060 |
| Southwest Airlines † | | 166,500 | | | 8,563,095 |
| | | | | | 19,874,725 |
| Utilities — 5.92% | | | | | |
| CMS Energy | | 120,700 | | | 7,209,411 |
| Edison International | | 80,400 | | | 4,459,788 |
| MDU Resources Group | | 152,000 | | | 4,509,840 |
| NRG Energy | | 160,500 | | | 6,553,215 |
| Public Service Enterprise Group | | 140,600 | | | 8,562,540 |
| WEC Energy Group | | 50,000 | | | 4,410,000 |
| Xcel Energy | | 59,300 | | | 3,706,250 |
| | | | | | 39,411,044 |
| Total Common Stock | | | | | |
| (cost $487,648,819) | | | | | 661,588,487 |
| | | | | | |
| Short-Term Investments – 0.66% | | | | | |
| Money Market Mutual Funds – 0.66% | | | | | |
| BlackRock FedFund – | | | | | |
| Institutional Shares (seven- | | | | | |
| day effective yield 0.03%) | | 1,101,139 | | | 1,101,139 |
| Fidelity Investments Money | | | | | |
| Market Government Portfolio | | | | | |
| – Class I (seven-day effective | | | | | |
| yield 0.01%) | | 1,101,139 | | | 1,101,139 |
| GS Financial Square | | | | | |
| Government Fund – | | | | | |
| Institutional Shares (seven- | | | | | |
| day effective yield 0.03%) | | 1,101,139 | | | 1,101,139 |
| Morgan Stanley Government | | | | | |
| Portfolio – Institutional | | | | | |
| Share Class (seven-day | | | | | |
| effective yield 0.03%) | | 1,101,140 | | | 1,101,140 |
| Total Short-Term Investments | | | | | |
| (cost $4,404,557) | | | | | 4,404,557 |
| Total Value of | | | | | |
| Securities–100.11% | | | | | |
| (cost $492,053,376) | | | | $ | 665,993,044 |
| † | Non-income producing security. |
Summary of abbreviations:
GS – Goldman Sachs
REIT – Real Estate Investment Trust
See accompanying notes, which are an integral part of the financial statements.
71
Table of Contents
Schedules of investments
Delaware Global Equity Fund
September 30, 2021
| | | | Number of | | | |
| | | shares | | Value (US $) |
| Common Stock – 98.20%Δ | | | | | |
| Denmark – 3.01% | | | | | |
| Novo Nordisk Class B | | 77,790 | | $ | 7,498,145 |
| | | | | | 7,498,145 |
| France – 14.87% | | | | | |
| Air Liquide | | 54,770 | | | 8,771,972 |
| Danone | | 137,420 | | | 9,369,014 |
| Orange | | 542,020 | | | 5,861,873 |
| Publicis Groupe | | 106,170 | | | 7,132,268 |
| Sodexo † | | 68,110 | | | 5,952,522 |
| | | | | | 37,087,649 |
| Germany – 10.88% | | | | | |
| adidas AG | | 18,510 | | | 5,816,889 |
| Fresenius Medical Care AG & | | | | | |
| Co. | | 137,380 | | | 9,636,426 |
| Knorr-Bremse | | 38,910 | | | 4,163,043 |
| SAP | | 55,550 | | | 7,511,983 |
| | | | | | 27,128,341 |
| Japan – 8.45% | | | | | |
| Asahi Group Holdings | | 97,100 | | | 4,685,598 |
| Kao | | 101,400 | | | 6,034,679 |
| Lawson | | 72,300 | | | 3,551,545 |
| Seven & i Holdings | | 149,400 | | | 6,801,352 |
| | | | | | 21,073,174 |
| Netherlands – 3.83% | | | | | |
| Koninklijke Ahold Delhaize | | 286,710 | | | 9,546,909 |
| | | | | | 9,546,909 |
| Spain – 3.20% | | | | | |
| Amadeus IT Group † | | 121,180 | | | 7,970,231 |
| | | | | | 7,970,231 |
| Sweden – 7.36% | | | | | |
| Essity Class B | | 188,250 | | | 5,838,382 |
| H & M Hennes & Mauritz | | | | | |
| Class B † | | 200,905 | | | 4,066,642 |
| Securitas Class B | | 532,800 | | | 8,432,954 |
| | | | | | 18,337,978 |
| Switzerland – 9.98% | | | | | |
| Nestle | | 85,780 | | | 10,335,638 |
| Roche Holding | | 23,700 | | | 8,649,788 |
| Swatch Group | | 22,620 | | | 5,901,145 |
| | | | | | 24,886,571 |
| United Kingdom – 8.71% | | | | | |
| Diageo | | 230,530 | | | 11,161,112 |
| Next | | 22,640 | | | 2,490,420 |
| Smith & Nephew | | 467,960 | | | 8,061,938 |
| | | | | | 21,713,470 |
| United States – 27.91% | | | | | |
| 3M | | 36,590 | | | 6,418,618 |
| Clorox | | 17,120 | | | 2,835,243 |
| Conagra Brands | | 174,290 | | | 5,903,202 |
| General Mills | | 110,620 | | | 6,617,288 |
| Henry Schein † | | 103,420 | | | 7,876,467 |
| Ingredion | | 73,580 | | | 6,549,356 |
| Kimberly-Clark | | 62,940 | | | 8,335,774 |
| Lamb Weston Holdings | | 155,640 | | | 9,551,627 |
| Merck & Co. | | 107,960 | | | 8,108,876 |
| Parker-Hannifin | | 8,690 | | | 2,429,898 |
| Pfizer | | 115,520 | | | 4,968,515 |
| | | | | | 69,594,864 |
| Total Common Stock | | | | | |
| (cost $228,325,104) | | | | | 244,837,332 |
| | | | | | | |
| Exchange-Traded Fund – 1.10% | | | | | |
| Vanguard S&P 500 ETF | | 6,980 | | | 2,752,912 |
| Total Exchange-Traded Fund | | | | | |
| (cost $2,782,179) | | | | | 2,752,912 |
| | | | | | | |
| Short-Term Investments – 0.17% | | | | | |
| Money Market Mutual Funds – 0.17% | | | | | |
| BlackRock FedFund – | | | | | |
| Institutional Shares (seven- | | | | | |
| day effective yield 0.03%) | | 105,783 | | | 105,783 |
| Fidelity Investments Money | | | | | |
| Market Government Portfolio | | | | | |
| – Class I (seven-day effective | | | | | |
| yield 0.01%) | | 105,783 | | | 105,783 |
| GS Financial Square | | | | | |
| Government Fund – | | | | | |
| Institutional Shares (seven- | | | | | |
| day effective yield 0.03%) | | 105,783 | | | 105,783 |
| Morgan Stanley Government | | | | | |
| Portfolio – Institutional | | | | | |
| Share Class (seven-day | | | | | |
| effective yield 0.03%) | | 105,784 | | | 105,784 |
| Total Short-Term Investments | | | | | |
| (cost $423,133) | | | | | 423,133 |
| Total Value of | | | | | |
| Securities–99.47% | | | | | |
| (cost $231,530,416) | | | | $ | 248,013,377 |
| Δ | Securities have been classified by country of origin. Aggregate classification by business sector has been presented on page 59 in “Security type / country and sector allocations.” |
| † | Non-income producing security. |
72
Table of Contents
The following foreign currency exchange contracts were outstanding at September 30, 2021:1
Foreign Currency Exchange Contracts
| | Currency to | | | | | | | | Settlement | | Unrealized |
| Counterparty | | Receive (Deliver) | | In Exchange For | | Date | | Depreciation |
| BNYM | | DKK | | | (175,365 | ) | | | USD | | | 27,253 | | | 10/4/21 | | $ | (65 | ) |
| BNYM | | EUR | | | (27,853 | ) | | | USD | | | 32,191 | | | 10/4/21 | | | (75 | ) |
| BNYM | | JPY | | | (2,018,590 | ) | | | USD | | | 18,081 | | | 10/4/21 | | | (57 | ) |
| BNYM | | SEK | | | (300,859 | ) | | | USD | | | 34,279 | | | 10/4/21 | | | (88 | ) |
| Total Foreign Currency Exchange Contracts | | | | | | | | | | | | | | | | | $ | (285 | ) |
The use of foreign currency exchange contracts involves elements of market risk and risks in excess of the amounts disclosed in the financial statements. The foreign currency exchange contracts presented above represent the Fund’s total exposure in such contracts, whereas only the net unrealized appreciation (depreciation) is reflected in the Fund’s net assets.
| 1 | See Note 8 in “Notes to financial statements.” |
Summary of abbreviations:
AG – Aktiengesellschaft
BNYM – Bank of New York Mellon
ETF – Exchange-Traded Fund
GS – Goldman Sachs
S&P – Standard & Poor’s Financial Services LLC
Summary of currencies:
DKK – Danish Krone
EUR – European Monetary Unit
JPY – Japanese Yen
SEK – Swedish Krona
USD – US Dollar
See accompanying notes, which are an integral part of the financial statements.
73
Table of Contents
Schedules of investments
Delaware Covered Call Strategy Fund
September 30, 2021
| | | | | Number of | | | | |
| | | | shares | | Value (US $) |
| Common Stock – 98.49%◆ | | | | | | | |
| Communication Services – 8.17% | | | | | | | |
| Alphabet Class A ~, † | | 2,900 | | | $ | 7,753,208 | |
| Facebook Class A ~, † | | 8,500 | | | | 2,884,815 | |
| | | | | | | | 10,638,023 | |
| Consumer Discretionary – 15.93% | | | | | | | |
| Amazon.com ~, † | | 600 | | | | 1,971,024 | |
| Booking Holdings ~, † | | 2,400 | | | | 5,697,288 | |
| Home Depot ~ | | 19,300 | | | | 6,335,418 | |
| Tesla ~, † | | 3,300 | | | | 2,559,084 | |
| Whirlpool ~ | | 20,500 | | | | 4,179,130 | |
| | | | | | | | 20,741,944 | |
| Consumer Staples – 4.83% | | | | | | | |
| Costco Wholesale ~ | | 14,000 | | | | 6,290,900 | |
| | | | | | | | 6,290,900 | |
| Energy – 4.58% | | | | | | | |
| Chevron ~ | | 27,600 | | | | 2,800,020 | |
| Exxon Mobil ~ | | 53,800 | | | | 3,164,516 | |
| | | | | | | | 5,964,536 | |
| Financials – 8.94% | | | | | | | |
| Bank of America ~ | | 95,200 | | | | 4,041,240 | |
| BlackRock ~ | | 6,100 | | | | 5,115,826 | |
| JPMorgan Chase & Co. ~ | | 15,200 | | | | 2,488,088 | |
| | | | | | | | 11,645,154 | |
| Healthcare – 9.24% | | | | | | | |
| Bristol-Myers Squibb ~ | | 37,500 | | | | 2,218,875 | |
| Medtronic ~ | | 49,300 | | | | 6,179,755 | |
| UnitedHealth Group ~ | | 9,300 | | | | 3,633,882 | |
| | | | | | | | 12,032,512 | |
| Industrials – 9.36% | | | | | | | |
| Lockheed Martin ~ | | 12,300 | | | | 4,244,730 | |
| Raytheon Technologies ~ | | 24,900 | | | | 2,140,404 | |
| Southwest Airlines ~, † | | 62,100 | | | | 3,193,803 | |
| Union Pacific ~ | | 13,300 | | | | 2,606,933 | |
| | | | | | | | 12,185,870 | |
| Information Technology – 30.57% | | | | | | | |
| Apple ~ | | 82,100 | | | | 11,617,150 | |
| Broadcom ~ | | 11,700 | | | | 5,673,681 | |
| Mastercard Class A ~ | | 11,800 | | | | 4,102,624 | |
| Microsoft ~ | | 38,900 | | | | 10,966,688 | |
| Texas Instruments ~ | | 30,700 | | | | 5,900,847 | |
| Visa Class A ~ | | 7,000 | | | | 1,559,250 | |
| | | | | | | | 39,820,240 | |
| Materials – 3.42% | | | | | | | |
| PPG Industries ~ | | 31,200 | | | | 4,461,912 | |
| | | | | | | | 4,461,912 | |
| Utilities – 3.45% | | | | | | | |
| NextEra Energy ~ | | 57,200 | | | | 4,491,344 | |
| | | | | | | | 4,491,344 | |
| Total Common Stock | | | | | | | |
| (cost $84,372,562) | | | | | | 128,272,435 | |
| | | | | | | | | |
| Short-Term Investments – 3.38% | | | | | | | |
| Money Market Mutual Funds – 3.38% | | | | | | | |
| BlackRock FedFund – | | | | | | | |
| | Institutional Shares (seven- | | | | | | | |
| | day effective yield 0.03%) | | 1,100,214 | | | | 1,100,214 | |
| Fidelity Investments Money | | | | | | | |
| | Market Government Portfolio | | | | | | | |
| | – Class I (seven-day effective | | | | | | | |
| | yield 0.01%) | | 1,100,214 | | | | 1,100,214 | |
| GS Financial Square | | | | | | | |
| | Government Fund – | | | | | | | |
| | Institutional Shares (seven- | | | | | | | |
| | day effective yield 0.03%) | | 1,100,214 | | | | 1,100,214 | |
| Morgan Stanley Government | | | | | | | |
| | Portfolio – Institutional | | | | | | | |
| | Share Class (seven-day | | | | | | | |
| | effective yield 0.03%) | | 1,100,214 | | | | 1,100,214 | |
| Total Short-Term Investments | | | | | | | |
| (cost $4,400,856) | | | | | | 4,400,856 | |
| Total Value of Securities Before | | | | | | | |
| Options Written–101.87% | | | | | | | |
| (cost $88,773,418) | | | | | | 132,673,291 | |
| | | | | | | | |
| | | | Number of | | | | |
| | | | contracts | | | | |
| Options Written – (1.70%) | | | | | | | |
| Equity Call Options – (1.70%) | | | | | | | |
| Alphabet, strike price $3,000, | | | | | | | |
| | expiration date 11/19/21, | | | | | | | |
| | notional amount | | | | | | | |
| | $(8,700,000) | | (29 | ) | | | (46,110 | ) |
| Amazon.com, strike price | | | | | | | |
| | $3,480, expiration date | | | | | | | |
| | 10/15/21, notional amount | | | | | | | |
| | $(2,088,000) | | (6 | ) | | | (5,670 | ) |
| Apple, strike price $150, | | | | | | | |
| | expiration date 11/19/21, | | | | | | | |
| | notional amount | | | | | | | |
| | $(12,315,000) | | (821 | ) | | | (203,197 | ) |
| Bank of America, strike price | | | | | | | |
| | $42, expiration date | | | | | | | |
| | 11/19/21, notional amount | | | | | | | |
| | $(1,911,000) | | (455 | ) | | | (98,052 | ) |
74
Table of Contents
| | | | | Number of | | | | |
| | | | contracts | | Value (US $) |
| Options Written (continued) | | | | | | | |
| Equity Call Options (continued) | | | | | | | |
| Bank of America, strike price | | | | | | | |
| | $44, expiration date | | | | | | | |
| | 10/15/21, notional amount | | | | | | | |
| | $(2,186,800) | | (497 | ) | | $ | (23,359 | ) |
| BlackRock, strike price $940, | | | | | | | |
| | expiration date 10/15/21, | | | | | | | |
| | notional amount | | | | | | | |
| | $(5,734,000) | | (61 | ) | | | (6,100 | ) |
| Booking Holdings, strike price | | | | | | | |
| | $2,415, expiration date | | | | | | | |
| | 11/19/21, notional amount | | | | | | | |
| | $(5,796,000) | | (24 | ) | | | (232,320 | ) |
| Bristol-Myers Squibb, strike | | | | | | | |
| | price $65, expiration date | | | | | | | |
| | 11/19/21, notional amount | | | | | | | |
| | $(2,437,500) | | (375 | ) | | | (18,562 | ) |
| Broadcom, strike price $520, | | | | | | | |
| | expiration date 11/19/21, | | | | | | | |
| | notional amount | | | | | | | |
| | $(6,084,000) | | (117 | ) | | | (64,935 | ) |
| Chevron, strike price $105, | | | | | | | |
| | expiration date 10/15/21, | | | | | | | |
| | notional amount | | | | | | | |
| | $(2,898,000) | | (276 | ) | | | (26,772 | ) |
| Costco Wholesale, strike price | | | | | | | |
| | $460, expiration date | | | | | | | |
| | 12/17/21, notional amount | | | | | | | |
| | $(6,440,000) | | (140 | ) | | | (172,900 | ) |
| Exxon Mobil, strike price $60, | | | | | | | |
| | expiration date 10/15/21, | | | | | | | |
| | notional amount | | | | | | | |
| | $(3,228,000) | | (538 | ) | | | (49,765 | ) |
| Facebook, strike price $365, | | | | | | | |
| | expiration date 11/19/21, | | | | | | | |
| | notional amount | | | | | | | |
| | $(3,102,500) | | (85 | ) | | | (58,225 | ) |
| Home Depot, strike price $335, | | | | | | | |
| | expiration date 10/15/21, | | | | | | | |
| | notional amount | | | | | | | |
| | $(6,465,500) | | (193 | ) | | | (64,655 | ) |
| JPMorgan Chase & Co., strike | | | | | | | |
| | price $160, expiration date | | | | | | | |
| | 10/15/21, notional amount | | | | | | | |
| | $(2,432,000) | | (152 | ) | | | (85,500 | ) |
| Lockheed Martin, strike price | | | | | | | |
| | $370, expiration date | | | | | | | |
| | 10/15/21, notional amount | | | | | | | |
| | $(4,551,000) | | (123 | ) | | | (4,305 | ) |
| Mastercard, strike price $370, | | | | | | | |
| | expiration date 10/15/21, | | | | | | | |
| | notional amount | | | | | | | |
| | $(4,366,000) | | (118 | ) | | | (11,446 | ) |
| Medtronic, strike price $130, | | | | | | | |
| | expiration date 10/15/21, | | | | | | | |
| | notional amount | | | | | | | |
| | $(6,409,000) | | (493 | ) | | | (35,496 | ) |
| Microsoft, strike price $305, | | | | | | | |
| | expiration date 11/19/21, | | | | | | | |
| | notional amount | | | | | | | |
| | $(11,864,500) | | (389 | ) | | | (124,480 | ) |
| NextEra Energy, strike price | | | | | | | |
| | $85, expiration date | | | | | | | |
| | 11/19/21, notional amount | | | | | | | |
| | $(4,862,000) | | (572 | ) | | | (41,470 | ) |
| PPG Industries, strike price | | | | | | | |
| | $170, expiration date | | | | | | | |
| | 10/15/21, notional amount | | | | | | | |
| | $(5,304,000) | | (312 | ) | | | (7,800 | ) |
| Raytheon Technologies, strike | | | | | | | |
| | price $90, expiration date | | | | | | | |
| | 10/15/21, notional amount | | | | | | | |
| | $(2,241,000) | | (249 | ) | | | (8,840 | ) |
| Southwest Airlines, strike price | | | | | | | |
| | $55, expiration date | | | | | | | |
| | 11/19/21, notional amount | | | | | | | |
| | $(3,415,500) | | (621 | ) | | | (80,419 | ) |
| Tesla, strike price $640, | | | | | | | |
| | expiration date 11/19/21, | | | | | | | |
| | notional amount | | | | | | | |
| | $(2,112,000) | | (33 | ) | | | (519,585 | ) |
| Texas Instruments, strike price | | | | | | | |
| | $200, expiration date | | | | | | | |
| | 11/19/21, notional amount | | | | | | | |
| | $(6,140,000) | | (307 | ) | | | (116,660 | ) |
| Union Pacific, strike price $215, | | | | | | | |
| | expiration date 11/19/21, | | | | | | | |
| | notional amount | | | | | | | |
| | $(2,859,500) | | (133 | ) | | | (18,421 | ) |
75
Table of Contents
Schedules of investments
Delaware Covered Call Strategy Fund
| | | | | Number of | | | | |
| | | | contracts | | Value (US $) |
| Options Written (continued) | | | | | | | |
| Equity Call Options (continued) | | | | | | | |
| UnitedHealth Group, strike price | | | | | | | |
| | $440, expiration date | | | | | | | |
| | 10/15/21, notional amount | | | | | | | |
| | $(4,092,000) | | (93 | ) | | $ | (2,744 | ) |
| Visa, strike price $240, | | | | | | | |
| | expiration date 10/15/21, | | | | | | | |
| | notional amount | | | | | | | |
| | $(1,680,000) | | (70 | ) | | | (2,065 | ) |
| Whirlpool, strike price $220, | | | | | | | |
| | expiration date 11/19/21, | | | | | | | |
| | notional amount | | | | | | | |
| | $(4,510,000) | | (205 | ) | | | (82,000 | ) |
| Total Options Written | | | | | | | |
| (premium received $3,312,478) | | | | | $ | (2,211,853 | ) |
| ◆ | Narrow industries are utilized for compliance purposes for diversification whereas broad sectors are used for financial reporting. |
| ~ | All or portion of the security has been pledged as collateral with outstanding options written. |
| † | Non-income producing security. |
Summary of abbreviations:
GS – Goldman Sachs
See accompanying notes, which are an integral part of the financial statements.
76
Table of Contents
Delaware Hedged U.S. Equity Opportunities Fund
September 30, 2021
| | | Number of | | | |
| | | | shares | | Value (US $) |
| Common Stock – 94.50% | | | | | |
| Communication Services – 7.68% | | | | | |
| Activision Blizzard | | 1,887 | | $ | 146,035 |
| Alphabet Class A † | | 564 | | | 1,507,865 |
| Alphabet Class C † | | 127 | | | 338,494 |
| AT&T | | 3,182 | | | 85,946 |
| Cable One | | 210 | | | 380,757 |
| Charter Communications | | | | | |
| Class A † | | 94 | | | 68,391 |
| Electronic Arts | | 1,351 | | | 192,180 |
| Facebook Class A † | | 3,141 | | | 1,066,024 |
| Match Group † | | 1,198 | | | 188,074 |
| Pinterest Class A † | | 2,133 | | | 108,676 |
| Roku † | | 526 | | | 164,822 |
| Snap Class A † | | 5,093 | | | 376,220 |
| Spotify Technology † | | 1,273 | | | 286,858 |
| T-Mobile US † | | 1,323 | | | 169,027 |
| Twitter † | | 2,351 | | | 141,977 |
| Verizon Communications | | 1,616 | | | 87,280 |
| ZoomInfo Technologies Class A † | | 800 | | | 48,952 |
| | | | | | 5,357,578 |
| Consumer Discretionary – 14.65% | | | | | |
| Airbnb Class A † | | 4,098 | | | 687,440 |
| Alibaba Group Holding ADR † | | 592 | | | 87,646 |
| Amazon.com † | | 436 | | | 1,432,277 |
| Arrival † | | 6,194 | | | 81,451 |
| Booking Holdings † | | 96 | | | 227,892 |
| CarMax † | | 2,658 | | | 340,118 |
| Carter’s | | 2,078 | | | 202,065 |
| Chegg † | | 1,517 | | | 103,186 |
| Chewy Class A † | | 2,394 | | | 163,055 |
| Chipotle Mexican Grill † | | 114 | | | 207,197 |
| Choice Hotels International | | 1,631 | | | 206,109 |
| Compass Group † | | 14,595 | | | 298,485 |
| Denny’s † | | 6,183 | | | 101,030 |
| Dollar General | | 469 | | | 99,494 |
| Dollar Tree † | | 2,577 | | | 246,670 |
| DraftKings Class A † | | 4,895 | | | 235,743 |
| Etsy † | | 1,080 | | | 224,597 |
| Five Below † | | 729 | | | 128,895 |
| Garmin | | 2,046 | | | 318,071 |
| General Motors † | | 2,009 | | | 105,894 |
| Genuine Parts | | 869 | | | 105,349 |
| Las Vegas Sands † | | 4,814 | | | 176,192 |
| Lennar Class A | | 1,452 | | | 136,023 |
| Lululemon Athletica † | | 1,066 | | | 431,410 |
| McDonald’s | | 2,781 | | | 670,527 |
| MercadoLibre † | | 112 | | | 188,093 |
| NIKE Class B | | 3,694 | | | 536,480 |
| NVR † | | 114 | | | 546,525 |
| Penn National Gaming † | | 3,528 | | | 255,639 |
| Polaris | | 940 | | | 112,480 |
| Ross Stores | | 2,290 | | | 249,267 |
| Six Flags Entertainment † | | 2,926 | | | 124,355 |
| Steven Madden | | 4,094 | | | 164,415 |
| Thor Industries | | 1,395 | | | 171,250 |
| TJX | | 11,249 | | | 742,209 |
| Wyndham Hotels & Resorts | | 1,431 | | | 110,459 |
| | | | | | 10,217,988 |
| Consumer Staples – 6.80% | | | | | |
| Clorox | | 470 | | | 77,837 |
| Coca-Cola | | 9,653 | | | 506,493 |
| Colgate-Palmolive | | 9,685 | | | 731,992 |
| Constellation Brands Class A | | 970 | | | 204,369 |
| Costco Wholesale | | 243 | | | 109,192 |
| Diageo | | 12,335 | | | 597,199 |
| General Mills | | 1,198 | | | 71,664 |
| Hormel Foods | | 1,883 | | | 77,203 |
| Kellogg | | 1,398 | | | 89,360 |
| Keurig Dr Pepper | | 6,833 | | | 233,415 |
| PepsiCo | | 4,433 | | | 666,768 |
| Philip Morris International | | 3,236 | | | 306,740 |
| Procter & Gamble | | 4,061 | | | 567,728 |
| Sovos Brands † | | 1,828 | | | 25,501 |
| Sysco | | 801 | | | 62,879 |
| Tyson Foods Class A | | 2,379 | | | 187,798 |
| US Foods Holding † | | 4,079 | | | 141,378 |
| Walmart | | 612 | | | 85,301 |
| | | | | | 4,742,817 |
| Energy – 1.37% | | | | | |
| Baker Hughes | | 3,903 | | | 96,521 |
| Canadian Natural Resources | | 6,475 | | | 236,596 |
| ConocoPhillips | | 1,170 | | | 79,291 |
| Diamondback Energy | | 2,481 | | | 234,876 |
| Halliburton | | 2,946 | | | 63,693 |
| Schlumberger | | 3,630 | | | 107,593 |
| SolarEdge Technologies † | | 525 | | | 139,241 |
| | | | | | 957,811 |
| Financials – 12.97% | | | | | |
| AerCap Holdings † | | 2,792 | | | 161,406 |
| Alleghany † | | 225 | | | 140,492 |
| American Express | | 3,562 | | | 596,742 |
| Arthur J Gallagher & Co. | | 754 | | | 112,082 |
| Assurant | | 996 | | | 157,119 |
| Athene Holding Class A † | | 2,634 | | | 181,404 |
| Bank of America | | 9,317 | | | 395,507 |
| Berkshire Hathaway Class B † | | 1,127 | | | 307,603 |
| Brown & Brown | | 1,956 | | | 108,460 |
| Charles Schwab | | 8,662 | | | 630,940 |
| Chubb | | 5,511 | | | 956,048 |
77
Table of Contents
Schedules of investments
Delaware Hedged U.S. Equity Opportunities Fund
| | | Number of | | | |
| | | | shares | | Value (US $) |
| Common Stock (continued) | | | | | |
| Financials (continued) | | | | | |
| CNO Financial Group | | 9,426 | | $ | 221,888 |
| Coinbase Global Class A † | | 265 | | | 60,282 |
| Credit Acceptance † | | 479 | | | 280,359 |
| Equitable Holdings | | 3,540 | | | 104,926 |
| First Citizens BancShares Class A | | 143 | | | 120,573 |
| First Republic Bank | | 813 | | | 156,811 |
| Hanover Insurance Group | | 870 | | | 112,769 |
| Intercontinental Exchange | | 835 | | | 95,875 |
| Kemper | | 1,315 | | | 87,829 |
| M&T Bank | | 3,084 | | | 460,565 |
| Markel † | | 250 | | | 298,782 |
| MarketAxess Holdings | | 175 | | | 73,621 |
| Marsh & McLennan | | 5,566 | | | 842,859 |
| MetLife | | 4,415 | | | 272,538 |
| Moody’s | | 272 | | | 96,590 |
| Progressive | | 1,865 | | | 168,577 |
| Raymond James Financial | | 2,517 | | | 232,269 |
| S&P Global | | 379 | | | 161,033 |
| Tradeweb Markets Class A | | 1,474 | | | 119,070 |
| Travelers | | 811 | | | 123,280 |
| Voya Financial | | 5,088 | | | 312,352 |
| Western Alliance Bancorp | | 2,327 | | | 253,224 |
| White Mountains Insurance | | | | | |
| Group | | 83 | | | 88,778 |
| Willis Towers Watson | | 409 | | | 95,076 |
| Zions Bancorp | | 7,322 | | | 453,159 |
| | | | | | 9,040,888 |
| Healthcare – 13.82% | | | | | |
| Abbott Laboratories | | 496 | | | 58,592 |
| ABIOMED † | | 507 | | | 165,039 |
| Acadia Healthcare † | | 1,700 | | | 108,426 |
| Agilent Technologies | | 669 | | | 105,388 |
| Align Technology † | | 578 | | | 384,619 |
| Allakos † | | 1,130 | | | 119,633 |
| AstraZeneca ADR | | 3,158 | | | 189,669 |
| Baxter International | | 4,860 | | | 390,890 |
| Becton Dickinson and Co. | | 533 | | | 131,022 |
| Biogen † | | 231 | | | 65,371 |
| Boston Scientific † | | 3,637 | | | 157,809 |
| Bristol-Myers Squibb | | 1,443 | | | 85,382 |
| Centene † | | 3,103 | | | 193,348 |
| Cerner | | 1,221 | | | 86,105 |
| CVS Health | | 2,486 | | | 210,962 |
| Danaher | | 1,560 | | | 474,926 |
| Dexcom † | | 627 | | | 342,881 |
| Elanco Animal Health † | | 3,532 | | | 112,635 |
| Eli Lilly & Co. | | 946 | | | 218,573 |
| Encompass Health | | 2,217 | | | 166,364 |
| Exact Sciences † | | 1,238 | | | 118,167 |
| GoodRx Holdings Class A † | | 3,486 | | | 142,996 |
| Humana | | 399 | | | 155,271 |
| Illumina † | | 534 | | | 216,596 |
| Insulet † | | 1,270 | | | 360,972 |
| Integra LifeSciences | | | | | |
| Holdings † | | 1,939 | | | 132,783 |
| Johnson & Johnson | | 4,736 | | | 764,864 |
| Kodiak Sciences † | | 1,737 | | | 166,717 |
| Laboratory Corp. of America | | | | | |
| Holdings † | | 318 | | | 89,498 |
| Medtronic | | 6,912 | | | 866,419 |
| Merck & Co. | | 1,130 | | | 84,874 |
| Molina Healthcare † | | 600 | | | 162,786 |
| Multiplan † | | 13,782 | | | 77,593 |
| Oak Street Health † | | 2,314 | | | 98,414 |
| Organon & Co. | | 3,473 | | | 113,880 |
| Pfizer | | 2,393 | | | 102,923 |
| PTC Therapeutics † | | 4,041 | | | 150,366 |
| Regeneron Pharmaceuticals † | | 287 | | | 173,687 |
| Seagen † | | 2,323 | | | 394,445 |
| STERIS | | 44 | | | 8,988 |
| Stryker | | 800 | | | 210,976 |
| Teleflex | | 577 | | | 217,269 |
| Thermo Fisher Scientific | | 189 | | | 107,981 |
| UnitedHealth Group | | 1,680 | | | 656,443 |
| Veeva Systems Class A † | | 497 | | | 143,221 |
| Vertex Pharmaceuticals † | | 822 | | | 149,103 |
| | | | | | 9,634,866 |
| Industrials – 10.74% | | | | | |
| Airbus † | | 839 | | | 111,231 |
| AMERCO | | 270 | | | 174,428 |
| Canadian National Railway | | 1,816 | | | 210,447 |
| Carlisle | | 688 | | | 136,767 |
| CH Robinson Worldwide | | 995 | | | 86,565 |
| Cintas | | 755 | | | 287,398 |
| Clean Harbors † | | 1,519 | | | 157,778 |
| Colfax † | | 3,660 | | | 167,994 |
| Copart † | | 4,129 | | | 572,775 |
| CoStar Group † | | 2,330 | | | 200,520 |
| CRH | | 1,564 | | | 73,392 |
| Expeditors International of | | | | | |
| Washington | | 2,575 | | | 306,760 |
| Fastenal | | 3,761 | | | 194,105 |
| Fortive | | 1,802 | | | 127,167 |
| IDEX | | 1,117 | | | 231,163 |
| IHS Markit | | 751 | | | 87,582 |
| II-VI † | | 3,288 | | | 195,176 |
| Ingersoll Rand † | | 2,487 | | | 125,370 |
| JB Hunt Transport Services | | 1,264 | | | 211,366 |
78
Table of Contents
| | | Number of | | | |
| | | | shares | | Value (US $) |
| Common Stock (continued) | | | | | |
| Industrials (continued) | | | | | |
| JELD-WEN Holding † | | 4,464 | | $ | 111,734 |
| Johnson Controls International | | 2,870 | | | 195,390 |
| Kennametal | | 2,855 | | | 97,727 |
| Lennox International | | 742 | | | 218,274 |
| Lockheed Martin | | 1,397 | | | 482,105 |
| Middleby † | | 1,564 | | | 266,678 |
| Northrop Grumman | | 1,893 | | | 681,764 |
| PACCAR | | 2,125 | | | 167,705 |
| Raytheon Technologies | | 3,500 | | | 300,860 |
| Rollins | | 2,347 | | | 82,919 |
| SPX FLOW | | 1,599 | | | 116,887 |
| Union Pacific | | 2,270 | | | 444,943 |
| Waste Connections | | 846 | | | 106,537 |
| Westinghouse Air Brake | | | | | |
| Technologies | | 6,420 | | | 553,468 |
| | | | | | 7,484,975 |
| Information Technology – 18.18% | | | | | |
| Accenture Class A | | 1,442 | | | 461,325 |
| Advanced Micro Devices † | | 3,656 | | | 376,202 |
| Amphenol Class A | | 1,134 | | | 83,043 |
| ANSYS † | | 226 | | | 76,942 |
| Apple | | 6,913 | | | 978,189 |
| Arista Networks † | | 844 | | | 290,032 |
| Automatic Data Processing | | 537 | | | 107,357 |
| Black Knight † | | 1,840 | | | 132,480 |
| Booz Allen Hamilton Holding | | 1,052 | | | 83,476 |
| Broadcom | | 390 | | | 189,123 |
| CDW | | 1,232 | | | 224,249 |
| Cisco Systems | | 4,835 | | | 263,169 |
| Cognizant Technology Solutions | | | | | |
| Class A | | 3,053 | | | 226,563 |
| Constellation Software | | 229 | | | 375,162 |
| EPAM Systems † | | 147 | | | 83,861 |
| F5 Networks † | | 1,802 | | | 358,202 |
| Fair Isaac † | | 500 | | | 198,965 |
| Fidelity National Information | | | | | |
| Services | | 1,214 | | | 147,720 |
| First Solar † | | 2,162 | | | 206,385 |
| Fleetcor Technologies † | | 1,464 | | | 382,499 |
| Flex † | | 13,025 | | | 230,282 |
| Genpact | | 6,922 | | | 328,864 |
| GoDaddy Class A † | | 2,183 | | | 152,155 |
| Guidewire Software † | | 1,658 | | | 197,086 |
| Intel | | 1,532 | | | 81,625 |
| Jack Henry & Associates | | 567 | | | 93,022 |
| KLA | | 269 | | | 89,983 |
| Leidos Holdings | | 4,998 | | | 480,458 |
| Lumentum Holdings † | | 3,995 | | | 333,742 |
| Marvell Technology | | 2,195 | | | 132,380 |
| Mastercard Class A | | 1,200 | | | 417,216 |
| Micron Technology | | 1,975 | | | 140,185 |
| Microsoft | | 5,244 | | | 1,478,388 |
| MKS Instruments | | 1,666 | | | 251,416 |
| MongoDB † | | 384 | | | 181,060 |
| Motorola Solutions | | 336 | | | 78,060 |
| NXP Semiconductors | | 446 | | | 87,358 |
| Oracle | | 1,414 | | | 123,202 |
| Paychex | | 1,004 | | | 112,900 |
| Paycom Software † | | 774 | | | 383,710 |
| Q2 Holdings † | | 366 | | | 29,331 |
| RingCentral Class A † | | 686 | | | 149,205 |
| salesforce.com † | | 1,405 | | | 381,064 |
| Samsung Electronics GDR | | 69 | | | 99,689 |
| Topicus.com † | | 365 | | | 38,324 |
| Tower Semiconductor † | | 2,300 | | | 68,770 |
| Tyler Technologies † | | 203 | | | 93,106 |
| Universal Display | | 585 | | | 100,012 |
| Varonis Systems † | | 1,994 | | | 121,335 |
| Visa Class A | | 1,449 | | | 322,765 |
| VMware Class A † | | 1,117 | | | 166,098 |
| WEX † | | 1,165 | | | 205,203 |
| Workday Class A † | | 1,124 | | | 280,876 |
| | | | | | 12,673,814 |
| Materials – 3.10% | | | | | |
| Ball | | 1,389 | | | 124,968 |
| Celanese | | 1,892 | | | 285,011 |
| Ecolab | | 1,948 | | | 406,392 |
| FMC | | 4,157 | | | 380,615 |
| Linde | | 1,526 | | | 447,698 |
| Reliance Steel & Aluminum | | 1,307 | | | 186,143 |
| Rogers † | | 661 | | | 123,263 |
| Sherwin-Williams | | 733 | | | 205,042 |
| | | | | | 2,159,132 |
| Real Estate – 3.09% | | | | | |
| American Tower | | 2,092 | | | 555,238 |
| Americold Realty Trust | | 4,788 | | | 139,091 |
| Digital Realty Trust | | 518 | | | 74,825 |
| Equinix | | 143 | | | 112,989 |
| Gaming and Leisure Properties | | 3,597 | | | 166,613 |
| Public Storage | | 642 | | | 190,738 |
| Redfin † | | 2,528 | | | 126,653 |
| Ryman Hospitality Properties † | | 2,260 | | | 189,162 |
| STORE Capital | | 6,699 | | | 214,569 |
| VICI Properties | | 8,451 | | | 240,093 |
| Welltower | | 1,740 | | | 143,376 |
| | | | | | 2,153,347 |
| Utilities – 2.10% | | | | | |
| American Electric Power | | 69 | | | 5,602 |
79
Table of Contents
Schedules of investments
Delaware Hedged U.S. Equity Opportunities Fund
| | | | Number of | | | | |
| | | | | shares | | Value (US $) |
| Common Stock (continued) | | | | | | | |
| Utilities (continued) | | | | | | | |
| Atmos Energy | | 897 | | | $ | 79,115 | |
| Avangrid | | 1,556 | | | | 75,622 | |
| Consolidated Edison | | 2,029 | | | | 147,285 | |
| Dominion Energy | | 839 | | | | 61,264 | |
| Duke Energy | | 1,799 | | | | 175,564 | |
| Exelon | | 4,968 | | | | 240,153 | |
| Iberdrola | | 13,617 | | | | 136,993 | |
| Pinnacle West Capital | | 3,924 | | | | 283,941 | |
| UGI | | 3,882 | | | | 165,451 | |
| WEC Energy Group | | 1,092 | | | | 96,314 | |
| | | | | | | | 1,467,304 | |
| Total Common Stock | | | | | | | |
| (cost $55,587,951) | | | | | | 65,890,520 | |
| | | |
| Exchange-Traded Fund – 0.45% | | | | | | | |
| iShares Russell 1000 Growth ETF | | 1,140 | | | | 312,406 | |
| Total Exchange-Traded Fund | | | | | | | |
| (cost $319,346) | | | | | | 312,406 | |
| | | |
| | | | Number of | | | | |
| | | | contracts | | | | |
| Options Purchased – 1.20% | | | | | | | |
| Options on Indices – 1.20% | | | | | | | |
| S&P 500 Index, strike price | | | | | | | |
| | $3,800, expiration date | | | | | | | |
| | 3/18/22, notional amount | | | | | | | |
| | $6,460,000 | | 17 | | | | 184,705 | |
| S&P 500 Index, strike price | | | | | | | |
| | $3,875, expiration date | | | | | | | |
| | 12/17/21, notional amount | | | | | | | |
| | $5,425,000 | | 14 | | | | 78,470 | |
| S&P 500 Index, strike price | | | | | | | |
| | $4,025, expiration date | | | | | | | |
| | 11/19/21, notional amount | | | | | | | |
| | $4,830,000 | | 12 | | | | 64,140 | |
| S&P 500 Index, strike price | | | | | | | |
| | $4,050, expiration date | | | | | | | |
| | 12/17/21, notional amount | | | | | | | |
| | $6,075,000 | | 15 | | | | 126,450 | |
| S&P 500 Index, strike price | | | | | | | |
| | $4,100, expiration date | | | | | | | |
| | 6/17/22, notional amount | | | | | | | |
| | $6,560,000 | | 16 | | | | 380,720 | |
| Total Options Purchased | | | | | | | |
| (cost $978,178) | | | | | | 834,485 | |
| | | | | | | | |
| | | | Number of | | | | |
| | | | shares | | | |
| Short-Term Investments – 3.57% | | | | | |
| Money Market Mutual Funds – 3.57% | | | | | |
| BlackRock FedFund – | | | | | | | |
| | Institutional Shares (seven-day | | | | | |
| | effective yield 0.03%) | | 621,797 | | | $ | 621,797 | |
| Fidelity Investments Money | | | | | | | |
| | Market Government Portfolio | | | | | |
| | – Class I (seven-day effective | | | | | |
| | yield 0.01%) | | 621,798 | | | | 621,798 | |
| GS Financial Square Government | | | | | |
| | Fund – Institutional Shares | | | | | |
| | (seven-day effective yield | | | | | | | |
| | 0.03%) | | 621,798 | | | | 621,798 | |
| Morgan Stanley Government | | | | | |
| | Portfolio – Institutional Share | | | | | |
| | Class (seven-day effective | | | | | |
| | yield 0.03%) | | 621,797 | | | | 621,797 | |
| Total Short-Term Investments | | | | | |
| (cost $2,487,190) | | | | | | 2,487,190 | |
| Total Value of Securities Before | | | | | |
| Options Written–99.72% | | | | | |
| (cost $59,372,665) | | | | | | 69,524,601 | |
| | | |
| | | | Number of | | | | |
| | | | contracts | | | | |
| Options Written – (0.63%) | | | | | | | |
| Options on Indices – (0.63%) | | | | | | | |
| S&P 500 Index, strike price | | | | | | | |
| | $3,475, expiration date | | | | | | | |
| | 3/18/22, notional amount | | | | | |
| | $(5,907,500) | | (17 | ) | | | (110,415 | ) |
| S&P 500 Index, strike price | | | | | | | |
| | $3,500, expiration date | | | | | | | |
| | 12/17/21, notional amount | | | | | |
| | $(4,900,000) | | (14 | ) | | | (33,460 | ) |
| S&P 500 Index, strike price | | | | | | | |
| | $3,625, expiration date | | | | | | | |
| | 12/17/21, notional amount | | | | | |
| | $(5,437,500) | | (15 | ) | | | (47,400 | ) |
| S&P 500 Index, strike price | | | | | | | |
| | $3,750, expiration date | | | | | | | |
| | 6/17/22, notional amount | | | | | |
| | $(6,000,000) | | (16 | ) | | | (244,800 | ) |
| Total Options Written | | | | | | | |
| (premium received $562,551) | | | $ | (436,075 | ) |
| † | Non-income producing security. |
80
Table of Contents
The following foreign currency exchange contracts and futures contracts were outstanding at September 30, 2021:1
Foreign Currency Exchange Contracts
| | Currency to | | | | | | Settlement | | Unrealized |
| Counterparty | | Receive (Deliver) | | In Exchange For | | Date | | Appreciation |
| BNP | | GBP | | (954,000 | ) | | USD | | 1,316,308 | | | 12/15/21 | | | $ | 30,687 |
| BNYM | | CAD | | (6,979 | ) | | USD | | 5,510 | | | 10/1/21 | | | | — |
| BNYM | | GBP | | (195 | ) | | USD | | 262 | | | 10/1/21 | | | | — |
| MS | | CAD | | (1,295,000 | ) | | USD | | 1,024,598 | | | 12/15/21 | | | | 2,169 |
| Total Foreign Currency Exchange Contracts | | | | | | | | | | | | | | | $ | 32,856 |
Futures Contracts
Exchange-Traded
| | | | | | | | | | | | | | | | | | | | | Variation |
| | | | | | | | | | | | | | | | | | | | | Margin |
| | | | | | | | Notional | | | | Value/ | | Value/ | | Due from |
| | | | Notional | | Cost | | Expiration | | Unrealized | | Unrealized | | (Due to) |
| Contracts to Buy (Sell) | | Amount | | (Proceeds) | | Date | | Appreciation | | Depreciation | | Brokers |
| (17) | | E-mini S&P 500 Index | | $ | (3,653,088 | ) | | $ | (3,810,561 | ) | | 12/17/21 | | $ | 157,473 | | $ | — | | | $ | 44,200 |
| (22) | | E-mini S&P MidCap 400 Index | | | (5,793,040 | ) | | | (5,951,833 | ) | | 12/17/21 | | | 158,793 | | | — | | | | 93,500 |
| (13) | | FTSE 100 Index | | | (1,239,008 | ) | | | (1,231,717 | ) | | 12/17/21 | | | — | | | (7,291 | ) | | | 230 |
| (5) | | MSCI EAFE Index | | | (566,750 | ) | | | (594,576 | ) | | 12/17/21 | | | 27,826 | | | — | | | | 2,075 |
| (5) | | S&P/TSX 60 Index | | | (944,339 | ) | | | (971,660 | ) | | 12/16/21 | | | 27,321 | | | — | | | | 4,901 |
| Total Futures Contracts | | | | | | $ | (12,560,347 | ) | | | | $ | 371,413 | | $ | (7,291 | ) | | $ | 144,906 |
The use of foreign currency exchange contracts and futures contracts involve elements of market risk and risks in excess of the amounts disclosed in these financial statements. The foreign currency exchange contracts and notional amounts presented above represent the Fund’s total exposure in such contracts, whereas only the net unrealized appreciation (depreciation) and variation margin are reflected in the Fund’s net assets.
| 1 | See Note 8 in “Notes to financial statements.” |
| Summary of abbreviations: |
| ADR – American Depositary Receipt |
| BNP – BNP Paribas |
| BNYM – Bank of New York Mellon |
| EAFE – Europe, Australasia, and Far East |
| ETF – Exchange-Traded Fund |
| FTSE – Financial Times Stock Exchange |
| GDR – Global Depositary Receipt |
| GS – Goldman Sachs |
| MS – Morgan Stanley |
| MSCI – Morgan Stanley Capital International |
| S&P – Standard & Poor’s Financial Services LLC |
| TSX – Toronto Stock Exchange |
| |
| Summary of currencies: |
| CAD – Canadian Dollar |
| GBP – British Pound Sterling |
| USD – US Dollar |
See accompanying notes, which are an integral part of the financial statements.
81
Table of Contents
Schedules of investments
Delaware Premium Income Fund
September 30, 2021
| | | Number of | | | |
| | | | shares | | Value (US $) |
| Common Stock – 117.14% ◆ | | | | | |
| Communication Services – 8.58% | | | | | |
| Alphabet Class A ~, † | | 400 | | $ | 1,069,408 |
| Comcast Class A ~ | | 28,200 | | | 1,577,226 |
| Facebook Class A ~, † | | 4,400 | | | 1,493,316 |
| | | | | | 4,139,950 |
| Consumer Discretionary – 13.45% | | | | | |
| Booking Holdings ~, † | | 500 | | | 1,186,935 |
| Home Depot ~ | | 7,200 | | | 2,363,472 |
| TJX ~ | | 16,800 | | | 1,108,464 |
| Whirlpool ~ | | 9,000 | | | 1,834,740 |
| | | | | | 6,493,611 |
| Consumer Staples – 6.88% | | | | | |
| Constellation Brands Class A ~ | | 9,400 | | | 1,980,486 |
| Mondelez International | | | | | |
| Class A ~ | | 22,700 | | | 1,320,686 |
| Philip Morris International ~ | | 200 | | | 18,958 |
| | | | | | 3,320,130 |
| Energy – 10.28% | | | | | |
| Chevron ~ | | 21,800 | | | 2,211,610 |
| ConocoPhillips ~ | | 40,600 | | | 2,751,462 |
| | | | | | 4,963,072 |
| Financials – 14.17% | | | | | |
| American Express ~ | | 9,300 | | | 1,558,029 |
| Bank of America ~ | | 44,200 | | | 1,876,290 |
| BlackRock ~ | | 2,400 | | | 2,012,784 |
| JPMorgan Chase & Co. ~ | | 8,500 | | | 1,391,365 |
| | | | | | 6,838,468 |
| Healthcare – 13.84% | | | | | |
| Amgen ~ | | 3,200 | | | 680,480 |
| Bristol-Myers Squibb ~ | | 24,800 | | | 1,467,416 |
| Merck & Co. ~ | | 19,900 | | | 1,494,689 |
| Pfizer ~ | | 53,300 | | | 2,292,433 |
| UnitedHealth Group ~ | | 1,900 | | | 742,406 |
| | | | | | 6,677,424 |
| Industrials – 16.38% | | | | | |
| Boeing ~, † | | 7,500 | | | 1,649,550 |
| CSX ~ | | 71,100 | | | 2,114,514 |
| Lockheed Martin ~ | | 6,400 | | | 2,208,640 |
| Raytheon Technologies ~ | | 9,800 | | | 842,408 |
| United Rentals ~, † | | 3,100 | | | 1,087,883 |
| | | | | | 7,902,995 |
| Information Technology – 31.40% | | | | | |
| Apple ~ | | 14,800 | | | 2,094,200 |
| Broadcom ~ | | 10,400 | | | 5,043,272 |
| Cisco Systems ~ | | 41,700 | | | 2,269,731 |
| Corning ~ | | 71,100 | | | 2,594,439 |
| First Solar ~, † | | 10,200 | | | 973,692 |
| Microsoft ~ | | 5,000 | | | 1,409,600 |
| Texas Instruments ~ | | 4,000 | | | 768,840 |
| | | | | | 15,153,774 |
| Materials – 2.16% | | | | | |
| PPG Industries ~ | | 7,300 | | | 1,043,973 |
| | | | | | 1,043,973 |
| Total Common Stock | | | | | |
| (cost $45,712,189) | | | | | 56,533,397 |
| | | | | | |
| Short-Term Investments – 2.82% | | | | | |
| Money Market Mutual Funds – 2.82% | | | | | |
| BlackRock FedFund – | | | | | |
| Institutional Shares (seven-day | | | | | |
| effective yield 0.03%) | | 340,505 | | | 340,505 |
| Fidelity Investments Money | | | | | |
| Market Government Portfolio | | | | | |
| – Class I (seven-day effective | | | | | |
| yield 0.01%) | | 340,505 | | | 340,505 |
| GS Financial Square Government | | | | | |
| Fund – Institutional Shares | | | | | |
| (seven-day effective yield | | | | | |
| 0.03%) | | 340,505 | | | 340,505 |
| Morgan Stanley Government | | | | | |
| Portfolio – Institutional Share | | | | | |
| Class (seven-day effective | | | | | |
| yield 0.03%) | | 340,506 | | | 340,506 |
| Total Short-Term Investments | | | | | |
| (cost $1,362,021) | | | | | 1,362,021 |
| Total Value of Securities Before | | | | | |
| Options Written–119.96% | | | | | |
| (cost $47,074,210) | | | | | 57,895,418 |
| | | Number of | | | | |
| | | | contracts | | | | |
| Options Written – (19.95%) | | | | | | |
| Equity Call Options – (19.95%) | | | | | | |
| Alphabet, strike price $2,120, | | | | | | |
| expiration date 3/18/22, | | | | | | |
| notional amount $(848,000) | | (4 | ) | | (242,460 | ) |
| American Express, strike price | | | | | | |
| $140, expiration date | | | | | | |
| 6/17/22, notional amount | | | | | | |
| $(1,302,000) | | (93 | ) | | (315,735 | ) |
| Amgen, strike price $220, | | | | | | |
| expiration date 1/21/22, | | | | | | |
| notional amount $(704,000) | | (32 | ) | | (25,200 | ) |
| Apple, strike price $110, | | | | | | |
| expiration date 1/21/22, | | | | | | |
| notional amount $(1,628,000) | | (148 | ) | | (490,990 | ) |
82
Table of Contents
| | | Number of | | | | | |
| | | | contracts | | | Value (US $) |
| Options Written (continued) | | | | | | | |
| Equity Call Options (continued) | | | | | | | |
| Bank of America, strike price | | | | | | | |
| $32, expiration date 1/21/22, | | | | | | | |
| notional amount $(1,414,400) | | (442 | ) | | $ | (481,780 | ) |
| BlackRock, strike price $720, | | | | | | | |
| expiration date 6/17/22, | | | | | | | |
| notional amount $(1,728,000) | | (24 | ) | | | (359,880 | ) |
| Boeing, strike price $190, | | | | | | | |
| expiration date 1/21/22, | | | | | | | |
| notional amount $(1,425,000) | | (75 | ) | | | (273,562 | ) |
| Booking Holdings, strike price | | | | | | | |
| $1,880, expiration date | | | | | | | |
| 3/18/22, notional amount | | | | | | | |
| $(376,000) | | (2 | ) | | | (110,620 | ) |
| Booking Holdings, strike price | | | | | | | |
| $1,930, expiration date | | | | | | | |
| 1/21/22, notional amount | | | | | | | |
| $(579,000) | | (3 | ) | | | (145,965 | ) |
| Bristol-Myers Squibb, strike price | | | | | | | |
| $57.50, expiration date | | | | | | | |
| 6/17/22, notional amount | | | | | | | |
| $(1,426,000) | | (248 | ) | | | (146,940 | ) |
| Broadcom, strike price $380, | | | | | | | |
| expiration date 1/21/22, | | | | | | | |
| notional amount $(2,470,000) | | (65 | ) | | | (720,850 | ) |
| Broadcom, strike price $400, | | | | | | | |
| expiration date 6/17/22, | | | | | | | |
| notional amount $(1,560,000) | | (39 | ) | | | (395,655 | ) |
| Chevron, strike price $95, | | | | | | | |
| expiration date 1/21/22, | | | | | | | |
| notional amount $(2,071,000) | | (218 | ) | | | (207,645 | ) |
| Cisco Systems, strike price $46, | | | | | | | |
| expiration date 1/21/22, | | | | | | | |
| notional amount $(1,918,200) | | (417 | ) | | | (375,300 | ) |
| Comcast, strike price $42.50, | | | | | | | |
| expiration date 10/15/21, | | | | | | | |
| notional amount $(25,500) | | (6 | ) | | | (8,100 | ) |
| Comcast, strike price $47.50, | | | | | | | |
| expiration date 1/21/22, | | | | | | | |
| notional amount $(1,311,000) | | (276 | ) | | | (250,470 | ) |
| ConocoPhillips, strike price $45, | | | | | | | |
| expiration date 1/21/22, | | | | | | | |
| notional amount $(1,264,500) | | (281 | ) | | | (654,730 | ) |
| ConocoPhillips, strike price $48, | | | | | | | |
| expiration date 11/19/21, | | | | | | | |
| notional amount $(600,000) | | (125 | ) | | | (251,562 | ) |
| Constellation Brands, strike price | | | | | | | |
| $180, expiration date | | | | | | | |
| 1/21/22, notional amount | | | | | | | |
| $(1,692,000) | | (94 | ) | | | (312,550 | ) |
| Corning, strike price $37, | | | | | | | |
| expiration date 1/21/22, | | | | | | | |
| notional amount $(595,700) | | (161 | ) | | | (31,637 | ) |
| Corning, strike price $39, | | | | | | | |
| expiration date 11/19/21, | | | | | | | |
| notional amount $(2,145,000) | | (550 | ) | | | (38,500 | ) |
| CSX, strike price $29.17, | | | | | | | |
| expiration date 6/17/22, | | | | | | | |
| notional amount $(2,073,987) | | (711 | ) | | | (218,633 | ) |
| Facebook, strike price $290, | | | | | | | |
| expiration date 1/21/22, | | | | | | | |
| notional amount $(870,000) | | (30 | ) | | | (173,625 | ) |
| Facebook, strike price $300, | | | | | | | |
| expiration date 3/18/22, | | | | | | | |
| notional amount $(420,000) | | (14 | ) | | | (76,580 | ) |
| First Solar, strike price $72.50, | | | | | | | |
| expiration date 1/21/22, | | | | | | | |
| notional amount $(739,500) | | (102 | ) | | | (250,155 | ) |
| Home Depot, strike price $290, | | | | | | | |
| expiration date 6/17/22, | | | | | | | |
| notional amount $(2,088,000) | | (72 | ) | | | (368,280 | ) |
| JPMorgan Chase & Co., strike | | | | | | | |
| price $140, expiration date | | | | | | | |
| 1/21/22, notional amount | | | | | | | |
| $(1,190,000) | | (85 | ) | | | (219,300 | ) |
| Lockheed Martin, strike price | | | | | | | |
| $320, expiration date | | | | | | | |
| 6/17/22, notional amount | | | | | | | |
| $(2,048,000) | | (64 | ) | | | (251,520 | ) |
| Merck & Co., strike price $65, | | | | | | | |
| expiration date 6/17/22, | | | | | | | |
| notional amount $(1,293,500) | | (199 | ) | | | (236,313 | ) |
| Microsoft, strike price $190, | | | | | | | |
| expiration date 1/21/22, | | | | | | | |
| notional amount $(950,000) | | (50 | ) | | | (470,000 | ) |
| Mondelez International, strike | | | | | | | |
| price $50, expiration date | | | | | | | |
| 1/21/22, notional amount | | | | | | | |
| $(1,135,000) | | (227 | ) | | | (200,895 | ) |
| Pfizer, strike price $37, expiration | | | | | | | |
| date 9/16/22, notional | | | | | | | |
| amount $(1,972,100) | | (533 | ) | | | (379,762 | ) |
83
Table of Contents
Schedules of investments
Delaware Premium Income Fund
| | | Number of | | | | | |
| | | | contracts | | | Value (US $) |
| Options Written (continued) | | | | | | | |
| Equity Call Options (continued) | | | | | | | |
| Philip Morris International, strike | | | | | | | |
| price $80, expiration date | | | | | | | |
| 1/21/22, notional amount | | | | | | | |
| $(16,000) | | (2 | ) | | $ | (3,195 | ) |
| PPG Industries, strike price $130, | | | | | | | |
| expiration date 5/20/22, | | | | | | | |
| notional amount $(520,000) | | (40 | ) | | | (81,000 | ) |
| PPG Industries, strike price $140, | | | | | | | |
| expiration date 2/18/22, | | | | | | | |
| notional amount $(462,000) | | (33 | ) | | | (35,475 | ) |
| Raytheon Technologies, strike | | | | | | | |
| price $75, expiration date | | | | | | | |
| 6/17/22, notional amount | | | | | | | |
| $(375,000) | | (50 | ) | | | (70,250 | ) |
| Raytheon Technologies, strike | | | | | | | |
| price $80, expiration date | | | | | | | |
| 6/17/22, notional amount | | | | | | | |
| $(384,000) | | (48 | ) | | | (50,040 | ) |
| Texas Instruments, strike price | | | | | | | |
| $160, expiration date 1/21/ | | | | | | | |
| 22, notional amount | | | | | | | |
| $(640,000) | | (40 | ) | | | (139,900 | ) |
| TJX, strike price $60, expiration | | | | | | | |
| date 1/21/22, notional | | | | | | | |
| amount $(1,008,000) | | (168 | ) | | | (130,200 | ) |
| United Rentals, strike price $300, | | | | | | | |
| expiration date 3/18/22, | | | | | | | |
| notional amount $(930,000) | | (31 | ) | | | (212,660 | ) |
| UnitedHealth Group, strike price | | | | | | | |
| $360, expiration date | | | | | | | |
| 1/21/22, notional amount | | | | | | | |
| $(684,000) | | (19 | ) | | | (83,410 | ) |
| Whirlpool, strike price $200, | | | | | | | |
| expiration date 1/21/22, | | | | | | | |
| notional amount $(1,800,000) | | (90 | ) | | | (135,450 | ) |
| Total Options Written | | | | | | | |
| (premium received $10,379,173) | | | | | $ | (9,626,774 | ) |
| ◆ | Narrow industries are utilized for compliance purposes for diversification whereas broad sectors are used for financial reporting. |
| ~ | All or portion of the security has been pledged as collateral with outstanding options written. |
| † | Non-income producing security. |
Summary of abbreviations:
GS – Goldman Sachs
See accompanying notes, which are an integral part of the financial statements.
84
Table of Contents
Delaware Total Return Fund
September 30, 2021
| | | Principal | | | |
| | | | amount° | | Value (US $) |
| Agency Mortgage-Backed Securities – 3.07% | | | | | |
| Fannie Mae | | | | | |
| 4.50% 2/1/44 | | 80,578 | | $ | 88,785 |
| Fannie Mae S.F. 15 yr | | | | | |
| 2.00% 2/1/36 | | 258,633 | | | 267,216 |
| 2.00% 3/1/36 | | 156,683 | | | 162,343 |
| 2.50% 7/1/36 | | 253,051 | | | 264,423 |
| Fannie Mae S.F. 20 yr | | | | | |
| 2.00% 3/1/41 | | 72,309 | | | 73,316 |
| 2.00% 4/1/41 | | 361,056 | | | 365,039 |
| 2.00% 5/1/41 | | 277,527 | | | 281,907 |
| 2.50% 1/1/41 | | 63,543 | | | 65,665 |
| 3.00% 3/1/33 | | 413,403 | | | 437,986 |
| Fannie Mae S.F. 30 yr | | | | | |
| 2.00% 11/1/50 | | 169,924 | | | 170,509 |
| 2.00% 12/1/50 | | 68,629 | | | 68,865 |
| 2.00% 3/1/51 | | 152,225 | | | 152,771 |
| 2.00% 6/1/51 | | 1,770,338 | | | 1,786,924 |
| 2.50% 10/1/50 | | 187,348 | | | 195,748 |
| 2.50% 2/1/51 | | 138,075 | | | 142,488 |
| 2.50% 5/1/51 | | 563,490 | | | 581,499 |
| 2.50% 7/1/51 | | 436,357 | | | 450,586 |
| 2.50% 8/1/51 | | 349,968 | | | 363,833 |
| 2.50% 9/1/51 | | 235,630 | | | 243,314 |
| 3.00% 11/1/46 | | 346,317 | | | 366,072 |
| 3.00% 3/1/50 | | 203,321 | | | 215,770 |
| 3.00% 6/1/50 | | 41,997 | | | 43,986 |
| 3.00% 7/1/50 | | 212,410 | | | 222,370 |
| 3.00% 8/1/50 | | 102,900 | | | 108,094 |
| 3.00% 9/1/50 | | 209,862 | | | 219,374 |
| 3.00% 5/1/51 | | 16,566 | | | 17,621 |
| 3.50% 12/1/47 | | 533,978 | | | 568,635 |
| 3.50% 1/1/48 | | 350,914 | | | 373,301 |
| 4.00% 3/1/47 | | 298,840 | | | 323,748 |
| 4.50% 9/1/40 | | 174,446 | | | 193,530 |
| 5.00% 7/1/47 | | 116,153 | | | 132,672 |
| 6.00% 5/1/36 | | 32,516 | | | 36,515 |
| 6.00% 6/1/37 | | 11,819 | | | 13,961 |
| 6.00% 7/1/37 | | 14,626 | | | 17,016 |
| 6.00% 8/1/37 | | 15,673 | | | 18,413 |
| 6.00% 10/1/40 | | 136,241 | | | 160,738 |
| 6.50% 11/1/33 | | 81,563 | | | 91,611 |
| 6.50% 6/1/36 | | 36,173 | | | 41,156 |
| 7.00% 3/1/32 | | 109,106 | | | 116,638 |
| 7.00% 8/1/32 | | 84,202 | | | 87,264 |
| Fannie Mae S.F. 30 yr TBA | | | | | |
| 2.50% 10/1/51 | | 479,000 | | | 493,875 |
| Freddie Mac S.F. 15 yr | | | | | |
| 1.50% 3/1/36 | | 113,046 | | | 114,447 |
| 2.00% 12/1/35 | | 116,245 | | | 120,668 |
| 3.00% 3/1/35 | | 388,120 | | | 411,890 |
| Freddie Mac S.F. 20 yr | | | | | |
| 2.00% 3/1/41 | | 83,658 | | | 84,823 |
| 2.50% 6/1/41 | | 436,141 | | | 451,787 |
| 3.00% 9/1/40 | | 602,711 | | | 634,000 |
| 3.50% 9/1/35 | | 398,292 | | | 429,130 |
| Freddie Mac S.F. 30 yr | | | | | |
| 2.00% 12/1/50 | | 455,156 | | | 456,723 |
| 3.00% 8/1/51 | | 1,106,994 | | | 1,179,307 |
| 3.50% 8/1/49 | | 446,067 | | | 478,541 |
| 4.50% 10/1/40 | | 316,943 | | | 355,485 |
| GNMA II S.F. 30 yr | | | | | |
| 3.00% 5/20/51 | | 106,819 | | | 111,736 |
| 3.00% 7/20/51 | | 199,041 | | | 208,204 |
| Total Agency Mortgage-Backed Securities | | | | | |
| (cost $15,086,692) | | | | | 15,062,318 |
| | | | | | |
| Collateralized Debt Obligations – 0.27% | | | | | |
| Octagon Investment | | | | | |
| Partners 34 | | | | | |
| Series 2017-1A | | | | | |
| A1 144A 1.274% | | | | | |
| (LIBOR03M + 1.14%) | | | | | |
| 1/20/30 #, ● | | 1,000,000 | | | 1,002,258 |
| Venture 34 CLO | | | | | |
| Series 2018-34A A | | | | | |
| 144A 1.356% | | | | | |
| (LIBOR03M + 1.23%, | | | | | |
| Floor 1.23%) | | | | | |
| 10/15/31 #, ● | | 300,000 | | | 300,236 |
| Total Collateralized Debt Obligations | | | | | |
| (cost $1,297,725) | | | | | 1,302,494 |
| | | | | | |
| Convertible Bonds – 6.73% | | | | | |
| Basic Industry – 0.12% | | | | | |
| Ivanhoe Mines 144A | | | | | |
| 2.50% exercise price | | | | | |
| $7.43, maturity date | | | | | |
| 4/15/26 # | | 513,000 | | | 602,270 |
| | | | | | 602,270 |
| Capital Goods – 0.49% | | | | | |
| Chart Industries 144A | | | | | |
| 1.00% exercise price | | | | | |
| $58.73, maturity date | | | | | |
| 11/15/24 # | | 482,000 | | | 1,575,839 |
| Kaman 3.25% exercise | | | | | |
| price $65.26, maturity | | | | | |
| date 5/1/24 | | 798,000 | | | 813,360 |
| | | | | | 2,389,199 |
85
Table of Contents
Schedules of investments
Delaware Total Return Fund
| | | Principal | | | |
| | | | amount° | | Value (US $) |
| Convertible Bonds (continued) | | | | | |
| Communications – 1.23% | | | | | |
| Cable One 144A 1.125% | | | | | |
| exercise price | | | | | |
| $2,275.83, maturity | | | | | |
| date 3/15/28 # | | 984,000 | | $ | 1,003,316 |
| DISH Network 3.375% | | | | | |
| exercise price $65.18, | | | | | |
| maturity date 8/15/26 | | 1,007,000 | | | 1,049,294 |
| InterDigital 2.00% | | | | | |
| exercise price $81.29, | | | | | |
| maturity date 6/1/24 | | 1,057,000 | | | 1,146,184 |
| Liberty Broadband 144A | | | | | |
| 1.25% exercise price | | | | | |
| $900.01, maturity | | | | | |
| date 9/30/50 # | | 1,013,000 | | | 1,033,767 |
| Liberty Latin America | | | | | |
| 2.00% exercise price | | | | | |
| $20.65, maturity date | | | | | |
| 7/15/24 | | 541,000 | | | 551,820 |
| Liberty Media 2.25% | | | | | |
| exercise price $32.28, | | | | | |
| maturity date 9/30/46 | | 2,744,000 | | | 1,241,650 |
| | | | | | 6,026,031 |
| Consumer Cyclical – 0.26% | | | | | |
| Cheesecake Factory | | | | | |
| 0.375% exercise price | | | | | |
| $78.40, maturity date | | | | | |
| 6/15/26 | | 583,000 | | | 558,223 |
| Ford Motor 144A 0.00% | | | | | |
| exercise price $17.49, | | | | | |
| maturity date | | | | | |
| 3/15/26 #, ^ | | 682,000 | | | 738,691 |
| | | | | | 1,296,914 |
| Consumer Non-Cyclical – 1.96% | | | | | |
| BioMarin Pharmaceutical | | | | | |
| 0.599% exercise price | | | | | |
| $124.67, maturity | | | | | |
| date 8/1/24 | | 743,000 | | | 762,085 |
| Chefs’ Warehouse | | | | | |
| 1.875% exercise price | | | | | |
| $44.20, maturity date | | | | | |
| 12/1/24 | | 1,110,000 | | | 1,188,558 |
| Coherus Biosciences | | | | | |
| 1.50% exercise price | | | | | |
| $19.26, maturity date | | | | | |
| 4/15/26 | | 738,000 | | | 822,398 |
| Collegium | | | | | |
| Pharmaceutical | | | | | |
| 2.625% exercise price | | | | | |
| $29.19, maturity date | | | | | |
| 2/15/26 | | 811,000 | | | 809,785 |
| FTI Consulting 2.00% | | | | | |
| exercise price | | | | | |
| $101.38, maturity | | | | | |
| date 8/15/23 | | 595,000 | | | 835,380 |
| Insulet 0.375% exercise | | | | | |
| price $226.73, | | | | | |
| maturity date 9/1/26 | | 313,000 | | | 436,831 |
| Integra | | | | | |
| LifeSciences Holdings | | | | | |
| 0.50% exercise price | | | | | |
| $73.67, maturity date | | | | | |
| 8/15/25 | | 1,088,000 | | | 1,200,608 |
| Ionis Pharmaceuticals | | | | | |
| 0.125% exercise price | | | | | |
| $83.28, maturity date | | | | | |
| 12/15/24 | | 808,000 | | | 740,845 |
| Jazz Investments I 2.00% | | | | | |
| exercise price | | | | | |
| $155.81, maturity | | | | | |
| date 6/15/26 | | 468,000 | | | 542,587 |
| Neurocrine Biosciences | | | | | |
| 2.25% exercise price | | | | | |
| $75.92, maturity date | | | | | |
| 5/15/24 | | 284,000 | | | 379,373 |
| Paratek Pharmaceuticals | | | | | |
| 4.75% exercise price | | | | | |
| $15.90, maturity date | | | | | |
| 5/1/24 | | 1,269,000 | | | 1,124,563 |
| Repay Holdings 144A | | | | | |
| 0.316% exercise price | | | | | |
| $33.60, maturity date | | | | | |
| 2/1/26 #, ^ | | 799,000 | | | 775,529 |
| | | | | | 9,618,542 |
| Energy – 0.43% | | | | | |
| Cheniere Energy 4.25% | | | | | |
| exercise price | | | | | |
| $138.38, maturity | | | | | |
| date 3/15/45 | | 1,242,000 | | | 1,077,989 |
| Helix Energy Solutions | | | | | |
| Group 6.75% exercise | | | | | |
| price $6.97, maturity | | | | | |
| date 2/15/26 | | 967,000 | | | 1,010,703 |
| | | | | | 2,088,692 |
| Real Estate Investment Trusts – 0.33% | | | | | |
| Blackstone Mortgage | | | | | |
| Trust 4.75% exercise | | | | | |
| price $36.23, maturity | | | | | |
| date 3/15/23 | | 813,000 | | | 834,808 |
86
Table of Contents
| | | | Principal | | | |
| | | amount° | | Value (US $) |
| Convertible Bonds (continued) | | | | | | | |
| Real Estate Investment Trusts (continued) | | | |
| Summit Hotel Properties | | | | | | | |
| 1.50% exercise price | | | | | | | |
| $11.99, maturity date | | | | | | | |
| 2/15/26 | | | | 739,000 | | $ | 779,852 |
| | | | | | | | 1,614,660 |
| Technology – 1.27% | | | | | | | |
| Knowles 3.25% exercise | | | | | | | |
| price $18.43, maturity | | | | | | | |
| date 11/1/21 | | | | 638,000 | | | 668,341 |
| Microchip Technology | | | | | | | |
| 1.625% exercise price | | | | | | | |
| $93.85, maturity date | | | | | | | |
| 2/15/27 | | | | 440,000 | | | 1,006,928 |
| ON Semiconductor | | | | | | | |
| 1.625% exercise price | | | | | | | |
| $20.72, maturity date | | | | | | | |
| 10/15/23 | | | | 513,000 | | | 1,157,585 |
| Palo Alto Networks | | | | | | | |
| 0.75% exercise price | | | | | | | |
| $266.35, maturity | | | | | | | |
| date 7/1/23 | | | | 489,000 | | | 889,931 |
| Quotient Technology | | | | | | | |
| 1.75% exercise price | | | | | | | |
| $17.36, maturity date | | | | | | | |
| 12/1/22 | | | | 1,017,000 | | | 987,834 |
| Travere Therapeutics | | | | | | | |
| 2.50% exercise price | | | | | | | |
| $38.80, maturity date | | | | | | | |
| 9/15/25 | | | | 905,000 | | | 912,238 |
| Vishay Intertechnology | | | | | | | |
| 2.25% exercise price | | | | | | | |
| $31.32, maturity date | | | | | | | |
| 6/15/25 | | | | 567,000 | | | 585,316 |
| | | | | | | | 6,208,173 |
| Transportation – 0.39% | | | | | | | |
| Seaspan 144A 3.75% | | | | | | | |
| exercise price $13.01, | | | | | | | |
| maturity date | | | | | | | |
| 12/15/25 # | | | | 977,000 | | | 1,256,422 |
| Spirit Airlines 1.00% | | | | | | | |
| exercise price $49.07, | | | | | | | |
| maturity date 5/15/26 | | | | 723,000 | | | 681,005 |
| | | | | | | | 1,937,427 |
| Utilities – 0.25% | | | | | | | |
| NextEra Energy Partners | | | | | | | |
| 144A 0.357% exercise | | | | | | | |
| price $76.10, maturity | | | | | | | |
| date 11/15/25 #, ^ | | | | 377,000 | | | 401,505 |
| NRG Energy 2.75% | | | | | | | |
| exercise price $45.21, | | | | | |
| maturity date 6/1/48 | | | | 703,000 | | | 828,134 |
| | | | | | | | 1,229,639 |
| Total Convertible Bonds | | | | | |
| (cost $29,750,339) | | | | | | | 33,011,547 |
| |
| Corporate Bonds – 12.62% | | | | | |
| Banking – 1.30% | | | | | | | |
| Banco Continental 144A | | | | | |
| 2.75% 12/10/25 # | | | | 200,000 | | | 198,752 |
| Banco Nacional de | | | | | | | |
| Panama 144A 2.50% | | | | | |
| 8/11/30 # | | | | 205,000 | | | 196,851 |
| Bank of America | | | | | | | |
| 1.898% 7/23/31 µ | | | | 85,000 | | | 82,018 |
| 2.482% 9/21/36 µ | | | | 370,000 | | | 362,851 |
| Bank of New York Mellon | | | | | | | |
| 4.70% 9/20/25 µ, ψ | | | | 20,000 | | | 22,000 |
| Barclays 5.20% 5/12/26 | | 200,000 | | | 229,157 |
| BBVA Bancomer 144A | | | | | | | |
| 1.875% 9/18/25 # | | | | 200,000 | | | 201,340 |
| Citigroup | | | | | | | |
| 4.00% 12/10/25 µ, ψ | | 10,000 | | | 10,387 |
| 4.45% 9/29/27 | | | | 375,000 | | | 426,753 |
| Corp. Financiera de | | | | | | | |
| Desarrollo 144A | | | | | | | |
| 2.40% 9/28/27 # | | | | 200,000 | | | 198,783 |
| Credit Agricole 144A | | | | | | | |
| 2.811% 1/11/41 # | | | | 620,000 | | | 592,601 |
| Credit Suisse Group | | | | | | | |
| 144A 2.593% | | | | | | | |
| 9/11/25 #, µ | | | | 250,000 | | | 259,240 |
| Deutsche Bank 2.222% | | | | | |
| 9/18/24 µ | | | | 335,000 | | | 343,461 |
| Development Bank of | | | | | | | |
| Kazakhstan 144A | | | | | | | |
| 10.95% 5/6/26 # | | KZT | | 100,000,000 | | | 236,573 |
| Goldman Sachs Group | | | | | | | |
| 1.542% 9/10/27 µ | | | | 480,000 | | | 478,386 |
| JPMorgan Chase & Co. | | | | | | | |
| 1.47% 9/22/27 µ | | | | 5,000 | | | 4,970 |
| 2.58% 4/22/32 µ | | | | 230,000 | | | 233,361 |
| 3.328% 4/22/52 µ | | | | 10,000 | | | 10,494 |
| 4.023% 12/5/24 µ | | | | 150,000 | | | 160,691 |
| 4.60% 2/1/25 µ, ψ | | | | 30,000 | | | 30,712 |
| Morgan Stanley | | | | | | | |
| 2.484% 9/16/36 µ | | | | 254,000 | | | 248,731 |
| 3.622% 4/1/31 µ | | | | 20,000 | | | 22,055 |
| 5.00% 11/24/25 | | | | 110,000 | | | 125,810 |
87
Table of Contents
Schedules of investments
Delaware Total Return Fund
| | | | Principal | | | |
| | | amount° | | Value (US $) |
| Corporate Bonds (continued) | | | | | |
| Banking (continued) | | | | | |
| NBK SPC 144A 1.625% | | | | | |
| 9/15/27 #, µ | | 205,000 | | $ | 202,745 |
| PNC Financial Services | | | | | |
| Group 2.60% | | | | | |
| 7/23/26 | | 130,000 | | | 138,234 |
| QNB Finance 2.625% | | | | | |
| 5/12/25 | | 200,000 | | | 208,504 |
| SVB Financial Group | | | | | |
| 1.80% 2/2/31 | | 15,000 | | | 14,411 |
| 4.00% 5/15/26 µ, ψ | | 405,000 | | | 415,631 |
| Truist Bank 2.636% | | | | | |
| 9/17/29 µ | | 275,000 | | | 287,569 |
| Truist Financial | | | | | |
| 1.887% 6/7/29 µ | | 20,000 | | | 19,999 |
| 4.95% 9/1/25 µ, ψ | | 30,000 | | | 32,845 |
| US Bancorp | | | | | |
| 1.45% 5/12/25 | | 30,000 | | | 30,492 |
| 3.00% 7/30/29 | | 290,000 | | | 311,676 |
| Wells Fargo & Co. 3.90% | | | | | |
| 3/15/26 µ, ψ | | 40,000 | | | 41,275 |
| | | | | | 6,379,358 |
| Basic Industry – 1.04% | | | | | |
| AngloGold Ashanti | | | | | |
| Holdings 3.75% | | | | | |
| 10/1/30 | | 200,000 | | | 205,373 |
| Artera Services 144A | | | | | |
| 9.033% 12/4/25 # | | 520,000 | | | 564,850 |
| Avient 144A 5.75% | | | | | |
| 5/15/25 # | | 144,000 | | | 151,920 |
| Chemours 144A 5.75% | | | | | |
| 11/15/28 # | | 260,000 | | | 272,597 |
| Corp Nacional del Cobre | | | | | |
| de Chile 144A 3.15% | | | | | |
| 1/14/30 # | | 657,000 | | | 679,103 |
| CSN Inova Ventures 144A | | | | | |
| 6.75% 1/28/28 # | | 200,000 | | | 213,590 |
| First Quantum Minerals | | | | | |
| 144A 7.25% 4/1/23 # | | 360,000 | | | 366,750 |
| 144A 7.50% 4/1/25 # | | 365,000 | | | 374,884 |
| Freeport-McMoRan | | | | | |
| 5.45% 3/15/43 | | 280,000 | | | 345,100 |
| Georgia-Pacific | | | | | |
| 144A 1.75% | | | | | |
| 9/30/25 # | | 20,000 | | | 20,485 |
| 144A 2.10% | | | | | |
| 4/30/27 # | | 145,000 | | | 149,393 |
| 144A 2.30% | | | | | |
| 4/30/30 # | | 35,000 | | | 35,657 |
| INEOS Quattro Finance 2 | | | | | |
| 144A 3.375% | | | | | |
| 1/15/26 # | | 200,000 | | | 202,250 |
| International Flavors & | | | | | |
| Fragrances 144A | | | | | |
| 1.832% 10/15/27 # | | 240,000 | | | 240,504 |
| LyondellBasell Industries | | | | | |
| 4.625% 2/26/55 | | 215,000 | | | 260,006 |
| New Gold 144A 7.50% | | | | | |
| 7/15/27 # | | 220,000 | | | 226,719 |
| Newmont | | | | | |
| 2.25% 10/1/30 | | 140,000 | | | 139,371 |
| 2.80% 10/1/29 | | 100,000 | | | 104,074 |
| NOVA Chemicals 144A | | | | | |
| 4.25% 5/15/29 # | | 225,000 | | | 225,281 |
| OCP 144A 3.75% | | | | | |
| 6/23/31 # | | 200,000 | | | 199,892 |
| Westlake Chemical | | | | | |
| 3.125% 8/15/51 | | 105,000 | | | 99,293 |
| | | | | | 5,077,092 |
| Brokerage – 0.06% | | | | | |
| Charles Schwab | | | | | |
| 4.00% 6/1/26 µ, ψ | | 15,000 | | | 15,675 |
| 5.375% 6/1/25 µ, ψ | | 25,000 | | | 27,844 |
| Jefferies Group 4.15% | | | | | |
| 1/23/30 | | 230,000 | | | 258,851 |
| | | | | | 302,370 |
| Capital Goods – 0.34% | | | | | |
| Intertape Polymer Group | | | | | |
| 144A 4.375% | | | | | |
| 6/15/29 # | | 235,000 | | | 239,197 |
| Madison IAQ 144A | | | | | |
| 5.875% 6/30/29 # | | 180,000 | | | 181,585 |
| Teledyne Technologies | | | | | |
| 0.95% 4/1/24 | | 115,000 | | | 115,210 |
| 2.25% 4/1/28 | | 30,000 | | | 30,573 |
| 2.75% 4/1/31 | | 310,000 | | | 317,356 |
| Terex 144A 5.00% | | | | | |
| 5/15/29 # | | 260,000 | | | 269,750 |
| TK Elevator US Newco | | | | | |
| 144A 5.25% | | | | | |
| 7/15/27 # | | 235,000 | | | 246,568 |
| TransDigm 144A 6.25% | | | | | |
| 3/15/26 # | | 260,000 | | | 271,375 |
| | | | | | 1,671,614 |
| Communications – 1.43% | | | | | |
| Altice Financing 144A | | | | | |
| 5.00% 1/15/28 # | | 200,000 | | | 193,142 |
| Altice France 144A | | | | | |
| 5.50% 10/15/29 # | | 215,000 | | | 213,101 |
| Altice France Holding | | | | | |
| 144A 6.00% | | | | | |
| 2/15/28 # | | 545,000 | | | 524,246 |
88
Table of Contents
| | | | Principal | | | |
| | | amount° | | Value (US $) |
| Corporate Bonds (continued) | | | | | |
| Communications (continued) | | | | | |
| AT&T | | | | | |
| 1.70% 3/25/26 | | 110,000 | | $ | 111,390 |
| 3.10% 2/1/43 | | 131,000 | | | 125,825 |
| 3.50% 6/1/41 | | 84,000 | | | 86,355 |
| 3.50% 9/15/53 | | 140,000 | | | 138,836 |
| Cellnex Finance 144A | | | | | |
| 3.875% 7/7/41 # | | 250,000 | | | 245,989 |
| Charter Communications | | | | | |
| Operating 4.40% | | | | | |
| 12/1/61 | | 290,000 | | | 302,237 |
| Comcast 3.20% 7/15/36 | | 440,000 | | | 469,109 |
| Consolidated | | | | | |
| Communications | | | | | |
| 144A 5.00% | | | | | |
| 10/1/28 # | | 110,000 | | | 113,718 |
| 144A 6.50% | | | | | |
| 10/1/28 # | | 110,000 | | | 119,627 |
| Discovery | | | | | |
| Communications | | | | | |
| 4.00% 9/15/55 | | 235,000 | | | 246,257 |
| Frontier Communications | | | | | |
| Holdings 144A | | | | | |
| 5.875% 10/15/27 # | | 255,000 | | | 271,256 |
| Level 3 Financing 144A | | | | | |
| 4.25% 7/1/28 # | | 230,000 | | | 232,065 |
| Millicom International | | | | | |
| Cellular 144A 4.50% | | | | | |
| 4/27/31 # | | 200,000 | | | 209,461 |
| Ooredoo International | | | | | |
| Finance 144A 5.00% | | | | | |
| 10/19/25 # | | 267,000 | | | 305,710 |
| Sprint 7.125% 6/15/24 | | 495,000 | | | 564,028 |
| Time Warner Cable | | | | | |
| 7.30% 7/1/38 | | 110,000 | | | 158,036 |
| Time Warner | | | | | |
| Entertainment 8.375% | | | | | |
| 3/15/23 | | 55,000 | | | 61,114 |
| T-Mobile USA | | | | | |
| 1.50% 2/15/26 | | 15,000 | | | 15,058 |
| 2.55% 2/15/31 | | 180,000 | | | 180,759 |
| 2.625% 4/15/26 | | 120,000 | | | 122,850 |
| 3.00% 2/15/41 | | 195,000 | | | 188,922 |
| 3.375% 4/15/29 | | 120,000 | | | 125,340 |
| 3.50% 4/15/25 | | 20,000 | | | 21,553 |
| 3.75% 4/15/27 | | 20,000 | | | 22,048 |
| Verizon Communications | | | | | |
| 2.10% 3/22/28 | | 120,000 | | | 121,907 |
| 2.55% 3/21/31 | | 15,000 | | | 15,194 |
| 3.40% 3/22/41 | | 15,000 | | | 15,680 |
| 3.55% 3/22/51 | | 15,000 | | | 15,839 |
| 4.50% 8/10/33 | | 245,000 | | | 291,973 |
| ViacomCBS | | | | | |
| 4.375% 3/15/43 | | 270,000 | | | 309,442 |
| 4.95% 1/15/31 | | 15,000 | | | 17,932 |
| Vodafone Group | | | | | |
| 4.25% 9/17/50 | | 115,000 | | | 132,771 |
| 4.875% 6/19/49 | | 130,000 | | | 162,395 |
| Zayo Group Holdings | | | | | |
| 144A 6.125% | | | | | |
| 3/1/28 # | | 535,000 | | | 543,121 |
| | | | | | 6,994,286 |
| Consumer Cyclical – 1.17% | | | | | |
| Allison Transmission | | | | | |
| 144A 5.875% | | | | | |
| 6/1/29 # | | 400,000 | | | 435,720 |
| Bath & Body Works | | | | | |
| 6.875% 11/1/35 | | 245,000 | | | 307,781 |
| 6.95% 3/1/33 | | 169,000 | | | 199,634 |
| Caesars Entertainment | | | | | |
| 144A 6.25% 7/1/25 # | | 410,000 | | | 432,143 |
| Carnival | | | | | |
| 144A 5.75% 3/1/27 # | | 310,000 | | | 320,850 |
| 144A 7.625% | | | | | |
| 3/1/26 # | | 300,000 | | | 320,625 |
| Ford Motor 9.00% | | | | | |
| 4/22/25 | | 245,000 | | | 294,926 |
| Ford Motor Credit | | | | | |
| 2.90% 2/16/28 | | 350,000 | | | 350,000 |
| 3.375% 11/13/25 | | 270,000 | | | 277,762 |
| 4.542% 8/1/26 | | 285,000 | | | 307,680 |
| General Motors | | | | | |
| 5.40% 10/2/23 | | 15,000 | | | 16,364 |
| 6.125% 10/1/25 | | 15,000 | | | 17,582 |
| General Motors Financial | | | | | |
| 0.81% (SOFR + | | | | | |
| 0.76%) 3/8/24 ● | | 135,000 | | | 136,337 |
| 4.35% 4/9/25 | | 75,000 | | | 82,383 |
| 5.25% 3/1/26 | | 165,000 | | | 188,645 |
| Hutama Karya Persero | | | | | |
| 144A 3.75% | | | | | |
| 5/11/30 # | | 400,000 | | | 433,332 |
| Jaguar Land Rover | | | | | |
| Automotive 144A | | | | | |
| 5.875% 1/15/28 # | | 200,000 | | | 201,104 |
| Legends Hospitality | | | | | |
| Holding 144A 5.00% | | | | | |
| 2/1/26 # | | 150,000 | | | 153,995 |
| Levi Strauss & Co. 144A | | | | | |
| 3.50% 3/1/31 # | | 213,000 | | | 215,396 |
| MGM Resorts | | | | | |
| International 4.75% | | | | | |
| 10/15/28 | | 110,000 | | | 116,050 |
89
Table of Contents
Schedules of investments
Delaware Total Return Fund
| | | | Principal | | | |
| | | amount° | | Value (US $) |
| Corporate Bonds (continued) | | | | | |
| Consumer Cyclical (continued) | | | | | |
| Murphy Oil USA 144A | | | | | |
| 3.75% 2/15/31 # | | 225,000 | | $ | 226,687 |
| Royal Caribbean Cruises | | | | | |
| 144A 5.50% 4/1/28 # | | 320,000 | | | 327,769 |
| Scientific Games | | | | | |
| International 144A | | | | | |
| 8.25% 3/15/26 # | | 207,000 | | | 219,938 |
| Six Flags Entertainment | | | | | |
| 144A 4.875% | | | | | |
| 7/31/24 # | | 150,000 | | | 151,594 |
| | | | | | 5,734,297 |
| Consumer Non-Cyclical – 0.79% | | | | | |
| AbbVie | | | | | |
| 2.60% 11/21/24 | | 30,000 | | | 31,547 |
| 2.95% 11/21/26 | | 25,000 | | | 26,792 |
| 4.05% 11/21/39 | | 10,000 | | | 11,504 |
| 4.25% 11/21/49 | | 30,000 | | | 35,581 |
| Amgen | | | | | |
| 2.00% 1/15/32 | | 10,000 | | | 9,624 |
| 2.80% 8/15/41 | | 10,000 | | | 9,675 |
| Anheuser-Busch InBev | | | | | |
| Worldwide | | | | | |
| 3.65% 2/1/26 | | 145,000 | | | 159,118 |
| 4.50% 6/1/50 | | 130,000 | | | 155,476 |
| 4.70% 2/1/36 | | 25,000 | | | 30,234 |
| Auna 144A 6.50% | | | | | |
| 11/20/25 # | | 200,000 | | | 210,250 |
| BAT Capital 2.259% | | | | | |
| 3/25/28 | | 40,000 | | | 39,728 |
| BAT International Finance | | | | | |
| 1.668% 3/25/26 | | 55,000 | | | 55,057 |
| Biogen 3.15% 5/1/50 | | 365,000 | | | 348,596 |
| Bristol-Myers Squibb | | | | | |
| 2.35% 11/13/40 | | 245,000 | | | 233,400 |
| Bunge Finance 2.75% | | | | | |
| 5/14/31 | | 400,000 | | | 405,599 |
| CVS Health | | | | | |
| 2.70% 8/21/40 | | 140,000 | | | 133,801 |
| 3.25% 8/15/29 | | 280,000 | | | 301,138 |
| 3.75% 4/1/30 | | 15,000 | | | 16,675 |
| 4.30% 3/25/28 | | 6,000 | | | 6,850 |
| Gilead Sciences 4.15% | | | | | |
| 3/1/47 | | 30,000 | | | 35,152 |
| JBS USA LUX 144A | | | | | |
| 6.50% 4/15/29 # | | 287,000 | | | 321,081 |
| Kraft Heinz Foods 5.20% | | | | | |
| 7/15/45 | | 160,000 | | | 200,742 |
| Post Holdings 144A | | | | | |
| 5.50% 12/15/29 # | | 418,000 | | | 443,640 |
| Regeneron | | | | | |
| Pharmaceuticals | | | | | |
| 1.75% 9/15/30 | | 15,000 | | | 14,283 |
| Royalty Pharma | | | | | |
| 1.20% 9/2/25 | | 285,000 | | | 283,323 |
| 1.75% 9/2/27 | | 190,000 | | | 189,344 |
| Thermo Fisher Scientific | | | | | |
| 2.80% 10/15/41 | | 10,000 | | | 9,989 |
| Viatris | | | | | |
| 144A 1.65% | | | | | |
| 6/22/25 # | | 5,000 | | | 5,053 |
| 144A 2.30% | | | | | |
| 6/22/27 # | | 5,000 | | | 5,109 |
| 144A 2.70% | | | | | |
| 6/22/30 # | | 115,000 | | | 116,333 |
| 144A 4.00% | | | | | |
| 6/22/50 # | | 10,000 | | | 10,650 |
| | | | | | 3,855,344 |
| Energy – 2.05% | | | | | |
| Ascent Resources Utica | | | | | |
| Holdings | | | | | |
| 144A 5.875% | | | | | |
| 6/30/29 # | | 195,000 | | | 199,480 |
| 144A 7.00% | | | | | |
| 11/1/26 # | | 95,000 | | | 98,324 |
| BP Capital Markets | | | | | |
| America 3.06% | | | | | |
| 6/17/41 | | 430,000 | | | 434,657 |
| Cenovus Energy | | | | | |
| 2.65% 1/15/32 | | 5,000 | | | 4,910 |
| 3.75% 2/15/52 | | 5,000 | | | 4,866 |
| CNX Midstream Partners | | | | | |
| 144A 4.75% | | | | | |
| 4/15/30 # | | 75,000 | | | 76,254 |
| CNX Resources | | | | | |
| 144A 6.00% | | | | | |
| 1/15/29 # | | 250,000 | | | 264,687 |
| 144A 7.25% | | | | | |
| 3/14/27 # | | 120,000 | | | 127,914 |
| Crestwood Midstream | | | | | |
| Partners | | | | | |
| 144A 5.625% | | | | | |
| 5/1/27 # | | 66,000 | | | 68,010 |
| 144A 6.00% 2/1/29 # | | 171,000 | | | 179,161 |
| DCP Midstream | | | | | |
| Operating 5.125% | | | | | |
| 5/15/29 | | 235,000 | | | 264,889 |
| Diamondback Energy | | | | | |
| 3.125% 3/24/31 | | 300,000 | | | 311,738 |
90
Table of Contents
| | | | Principal | | | |
| | | amount° | | Value (US $) |
| Corporate Bonds (continued) | | | | | |
| Energy (continued) | | | | | |
| Enbridge | | | | | |
| 0.45% (SOFR + | | | | | |
| 0.40%) 2/17/23 ● | | 160,000 | | $ | 160,508 |
| 2.50% 8/1/33 | | 310,000 | | | 311,470 |
| Energy Transfer | | | | | |
| 5.25% 4/15/29 | | 85,000 | | | 99,703 |
| 6.25% 4/15/49 | | 55,000 | | | 72,384 |
| 6.50% 11/15/26 µ, ψ | | 155,000 | | | 161,800 |
| Enterprise Products | | | | | |
| Operating | | | | | |
| 3.20% 2/15/52 | | 360,000 | | | 349,158 |
| 3.30% 2/15/53 | | 5,000 | | | 4,885 |
| EQM Midstream Partners | | | | | |
| 144A 4.75% | | | | | |
| 1/15/31 # | | 145,000 | | | 150,984 |
| 144A 6.50% 7/1/27 # | | 290,000 | | | 326,540 |
| Equinor 1.75% 1/22/26 | | 15,000 | | | 15,375 |
| Genesis Energy | | | | | |
| 7.75% 2/1/28 | | 340,000 | | | 340,136 |
| 8.00% 1/15/27 | | 235,000 | | | 238,247 |
| KazTransGas JSC 144A | | | | | |
| 4.375% 9/26/27 # | | 579,000 | | | 639,314 |
| Kinder Morgan 3.60% | | | | | |
| 2/15/51 | | 20,000 | | | 20,255 |
| Lukoil Securities 144A | | | | | |
| 3.875% 5/6/30 # | | 265,000 | | | 278,926 |
| Marathon Oil 4.40% | | | | | |
| 7/15/27 | | 285,000 | | | 320,340 |
| MPLX | | | | | |
| 1.75% 3/1/26 | | 15,000 | | | 15,102 |
| 4.125% 3/1/27 | | 290,000 | | | 324,003 |
| Murphy Oil 6.375% | | | | | |
| 7/15/28 | | 385,000 | | | 407,619 |
| NuStar Logistics 5.625% | | | | | |
| 4/28/27 | | 205,000 | | | 218,729 |
| Occidental Petroleum | | | | | |
| 3.00% 2/15/27 | | 125,000 | | | 125,131 |
| 3.50% 8/15/29 | | 220,000 | | | 224,041 |
| 6.125% 1/1/31 | | 210,000 | | | 252,362 |
| 6.45% 9/15/36 | | 100,000 | | | 125,938 |
| 6.625% 9/1/30 | | 200,000 | | | 246,750 |
| PDC Energy 5.75% | | | | | |
| 5/15/26 | | 280,000 | | | 291,900 |
| PTTEP Treasury Center | | | | | |
| 144A 2.587% | | | | | |
| 6/10/27 # | | 200,000 | | | 207,308 |
| Qatar Petroleum 144A | | | | | |
| 2.25% 7/12/31 # | | 200,000 | | | 198,354 |
| Sabine Pass Liquefaction | | | | | |
| 5.625% 3/1/25 | | 40,000 | | | 45,414 |
| 5.75% 5/15/24 | | 275,000 | | | 306,358 |
| Southwestern Energy | | | | | |
| 7.75% 10/1/27 | | 234,000 | | | 253,083 |
| Targa Resources Partners | | | | | |
| 5.375% 2/1/27 | | 220,000 | | | 228,239 |
| TechnipFMC 144A | | | | | |
| 6.50% 2/1/26 # | | 440,000 | | | 472,028 |
| Tengizchevroil Finance | | | | | |
| Co International 144A | | | | | |
| 2.625% 8/15/25 # | | 200,000 | | | 204,316 |
| Tennessee Gas Pipeline | | | | | |
| 144A 2.90% 3/1/30 # | | 250,000 | | | 258,706 |
| Western Midstream | | | | | |
| Operating 4.75% | | | | | |
| 8/15/28 | | 110,000 | | | 120,145 |
| | | | | | 10,050,441 |
| Financials – 0.61% | | | | | |
| AerCap Ireland Capital | | | | | |
| DAC 4.45% 4/3/26 | | 195,000 | | | 212,527 |
| Air Lease | | | | | |
| 2.875% 1/15/26 | | 195,000 | | | 203,850 |
| 3.00% 2/1/30 | | 45,000 | | | 45,693 |
| 3.375% 7/1/25 | | 15,000 | | | 15,937 |
| Ally Financial | | | | | |
| 4.70% 5/15/26 µ, ψ | | 320,000 | | | 334,072 |
| 8.00% 11/1/31 | | 35,000 | | | 50,525 |
| Aviation Capital Group | | | | | |
| 144A 1.95% | | | | | |
| 1/30/26 # | | 465,000 | | | 463,542 |
| Avolon Holdings Funding | | | | | |
| 144A 3.25% | | | | | |
| 2/15/27 # | | 10,000 | | | 10,318 |
| 144A 3.95% 7/1/24 # | | 75,000 | | | 79,660 |
| Banco del Estado de | | | | | |
| Chile 144A 2.704% | | | | | |
| 1/9/25 # | | 280,000 | | | 290,570 |
| Bank of Georgia 144A | | | | | |
| 6.00% 7/26/23 # | | 255,000 | | | 272,071 |
| DAE Sukuk DIFC 144A | | | | | |
| 3.75% 2/15/26 # | | 419,000 | | | 442,982 |
| Hightower Holding 144A | | | | | |
| 6.75% 4/15/29 # | | 135,000 | | | 138,544 |
| Midcap Financial Issuer | | | | | |
| Trust | | | | | |
| 144A 5.625% | | | | | |
| 1/15/30 # | | 200,000 | | | 198,353 |
| 144A 6.50% 5/1/28 # | | 200,000 | | | 209,184 |
| | | | | | 2,967,828 |
| Healthcare – 0.45% | | | | | |
| Bausch Health 144A | | | | | |
| 6.25% 2/15/29 # | | 380,000 | | | 376,557 |
91
Table of Contents
Schedules of investments
Delaware Total Return Fund
| | | | Principal | | | |
| | | | amount° | | Value (US $) |
| Corporate Bonds (continued) | | | | | |
| Healthcare (continued) | | | | | |
| CHS | | | | | |
| | | 144A 4.75% | | | | | |
| | 2/15/31 # | | 105,000 | | $ | 105,788 |
| | 144A 6.625% | | | | | |
| | 2/15/25 # | | 220,000 | | | 230,450 |
| DaVita 144A 4.625% | | | | | |
| | 6/1/30 # | | 195,000 | | | 200,823 |
| Hadrian Merger Sub | | | | | |
| | 144A 8.50% 5/1/26 # | | 295,000 | | | 306,064 |
| HCA | | | | | |
| | 5.375% 2/1/25 | | 215,000 | | | 240,531 |
| | 5.875% 2/1/29 | | 250,000 | | | 300,734 |
| Ortho-Clinical | | | | | |
| | Diagnostics 144A | | | | | |
| | 7.25% 2/1/28 # | | 120,000 | | | 128,609 |
| Tenet Healthcare 144A | | | | | |
| | 6.125% 10/1/28 # | | 295,000 | | | 310,269 |
| | | | | | | 2,199,825 |
| Insurance – 0.47% | | | | | |
| Aon 2.90% 8/23/51 | | 30,000 | | | 28,996 |
| Arthur J Gallagher & Co. | | | | | |
| | 3.50% 5/20/51 | | 440,000 | | | 471,940 |
| Athene Global Funding | | | | | |
| | 144A 1.00% | | | | | |
| | 4/16/24 # | | 95,000 | | | 95,368 |
| Athene Holding 3.95% | | | | | |
| | 5/25/51 | | 340,000 | | | 376,466 |
| Brighthouse Financial | | | | | |
| | 5.625% 5/15/30 | | 15,000 | | | 18,127 |
| GA Global Funding Trust | | | | | |
| | 144A 1.00% 4/8/24 # | | 470,000 | | | 472,135 |
| HUB International 144A | | | | | |
| | 7.00% 5/1/26 # | | 260,000 | | | 269,100 |
| USI 144A 6.875% | | | | | |
| | 5/1/25 # | | 585,000 | | | 596,097 |
| | | | | | | 2,328,229 |
| Media – 0.63% | | | | | |
| AMC Networks 4.25% | | | | | |
| | 2/15/29 | | 650,000 | | | 647,562 |
| CCO Holdings | | | | | |
| | 4.50% 5/1/32 | | 65,000 | | | 67,031 |
| | 144A 5.375% | | | | | |
| | 6/1/29 # | | 335,000 | | | 362,219 |
| Clear Channel Outdoor | | | | | |
| | Holdings 144A 7.50% | | | | | |
| | 6/1/29 # | | 135,000 | | | 140,569 |
| CSC Holdings | | | | | |
| | 144A 3.375% | | | | | |
| | 2/15/31 # | | 495,000 | | | 460,969 |
| | 144A 5.00% | | | | | |
| | 11/15/31 # | | 280,000 | | | 268,716 |
| Gray Television | | | | | |
| | 144A 4.75% | | | | | |
| | 10/15/30 # | | 125,000 | | | 122,969 |
| | 144A 7.00% | | | | | |
| | 5/15/27 # | | 215,000 | | | 230,856 |
| Nielsen Finance | | | | | |
| | 144A 4.50% | | | | | |
| | 7/15/29 # | | 55,000 | | | 53,848 |
| | 144A 4.75% | | | | | |
| | 7/15/31 # | | 185,000 | | | 180,199 |
| Sirius XM Radio 144A | | | | | |
| | 4.00% 7/15/28 # | | 325,000 | | | 330,891 |
| Terrier Media Buyer 144A | | | | | |
| | 8.875% 12/15/27 # | | 200,000 | | | 211,738 |
| | | | | | | 3,077,567 |
| Real Estate Investment Trusts – 0.21% | | | | | |
| Crown Castle | | | | | |
| | International 1.05% | | | | | |
| | 7/15/26 | | 485,000 | | | 474,980 |
| Iron Mountain 144A | | | | | |
| | 5.25% 3/15/28 # | | 375,000 | | | 392,344 |
| MGM Growth Properties | | | | | |
| | Operating Partnership | | | | | |
| | 144A 3.875% | | | | | |
| | 2/15/29 # | | 120,000 | | | 127,950 |
| | 5.75% 2/1/27 | | 35,000 | | | 40,294 |
| | | | | | | 1,035,568 |
| Services – 0.19% | | | | | |
| H&E Equipment Services | | | | | |
| | 144A 3.875% | | | | | |
| | 12/15/28 # | | 145,000 | | | 144,616 |
| Prime Security Services | | | | | |
| | Borrower 144A 5.75% | | | | | |
| | 4/15/26 # | | 298,000 | | | 322,737 |
| United Rentals North | | | | | |
| | America 5.25% | | | | | |
| | 1/15/30 | | 220,000 | | | 241,175 |
| Univar Solutions USA | | | | | |
| | 144A 5.125% | | | | | |
| | 12/1/27 # | | 230,000 | | | 241,776 |
| | | | | | | 950,304 |
| Technology – 0.88% | | | | | |
| Broadcom | | | | | |
| | 144A 3.137% | | | | | |
| | 11/15/35 # | | 4,000 | | | 3,987 |
| | 144A 3.419% | | | | | |
| | 4/15/33 # | | 11,000 | | | 11,396 |
| | 144A 3.469% | | | | | |
| | 4/15/34 # | | 435,000 | | | 448,343 |
92
Table of Contents
| | | | Principal | | | |
| | | | amount° | | Value (US $) |
| Corporate Bonds (continued) | | | | | |
| Technology (continued) | | | | | |
| Fidelity National | | | | | |
| | Information Services | | | | | |
| | | 1.65% 3/1/28 | | 470,000 | | $ | 464,342 |
| Fiserv 3.20% 7/1/26 | | 315,000 | | | 340,242 |
| Global Payments 2.65% | | | | | |
| | 2/15/25 | | 147,000 | | | 153,703 |
| Go Daddy Operating | | | | | |
| | 144A 3.50% 3/1/29 # | | 235,000 | | | 233,237 |
| Microchip Technology | | | | | |
| | 144A 0.972% | | | | | |
| | 2/15/24 # | | 345,000 | | | 345,327 |
| | 144A 0.983% | | | | | |
| | 9/1/24 # | | 125,000 | | | 124,886 |
| MSCI 144A 3.625% | | | | | |
| | 11/1/31 # | | 200,000 | | | 208,375 |
| NXP | | | | | |
| | 144A 3.25% | | | | | |
| | 5/11/41 # | | 90,000 | | | 93,070 |
| | 144A 4.875% | | | | | |
| | 3/1/24 # | | 285,000 | | | 310,928 |
| Oracle 2.95% 4/1/30 | | 30,000 | | | 31,448 |
| PayPal Holdings 2.65% | | | | | |
| | 10/1/26 | | 440,000 | | | 470,466 |
| SS&C Technologies 144A | | | | | |
| | 5.50% 9/30/27 # | | 390,000 | | | 412,303 |
| StoneCo 144A 3.95% | | | | | |
| | 6/16/28 # | | 200,000 | | | 193,650 |
| VMware 1.00% 8/15/24 | | 475,000 | | | 476,654 |
| | | | | | | 4,322,357 |
| Transportation – 0.19% | | | | | |
| Delta Air Lines 7.375% | | | | | |
| | 1/15/26 | | 131,000 | | | 154,400 |
| Mileage Plus Holdings | | | | | |
| | 144A 6.50% | | | | | |
| | 6/20/27 # | | 270,000 | | | 293,952 |
| Rutas 2 and 7 Finance | | | | | |
| | 144A 3.241% | | | | | |
| | 9/30/36 #, ^ | | 302,000 | | | 225,076 |
| Southwest Airlines | | | | | |
| | 5.125% 6/15/27 | | 35,000 | | | 40,957 |
| United Airlines | | | | | |
| | 144A 4.375% | | | | | |
| | 4/15/26 # | | 80,000 | | | 82,200 |
| | 144A 4.625% | | | | | |
| | 4/15/29 # | | 95,000 | | | 98,296 |
| VistaJet Malta Finance | | | | | |
| | 144A 10.50% | | | | | |
| | 6/1/24 # | | 55,000 | | | 59,813 |
| | | | | | | 954,694 |
| Utilities – 0.81% | | | | | |
| Calpine | | | | | |
| | 144A 4.50% | | | | | |
| | 2/15/28 # | | 95,000 | | | 97,019 |
| | 144A 5.00% 2/1/31 # | | 220,000 | | | 220,275 |
| | 144A 5.25% 6/1/26 # | | 145,000 | | | 149,347 |
| CenterPoint Energy | | | | | |
| | 1.45% 6/1/26 | | 345,000 | | | 345,304 |
| Duke Energy 4.875% | | | | | |
| | 9/16/24 µ, ψ | | 320,000 | | | 342,800 |
| Entergy Mississippi | | | | | |
| | 2.85% 6/1/28 | | 90,000 | | | 95,384 |
| Entergy Texas 3.55% | | | | | |
| | 9/30/49 | | 185,000 | | | 197,242 |
| Evergy Kansas Central | | | | | |
| | 3.45% 4/15/50 | | 35,000 | | | 37,580 |
| Infraestructura Energetica | | | | | |
| | Nova 144A 3.75% | | | | | |
| | 1/14/28 # | | 275,000 | | | 297,258 |
| Mong Duong Finance | | | | | |
| | Holdings 144A | | | | | |
| | 5.125% 5/7/29 # | | 749,000 | | | 747,656 |
| Oryx Funding 144A | | | | | |
| | 5.80% 2/3/31 # | | 200,000 | | | 212,169 |
| Pacific Gas and Electric | | | | | |
| | 2.10% 8/1/27 | | 330,000 | | | 322,266 |
| | 2.50% 2/1/31 | | 15,000 | | | 14,289 |
| | 3.25% 6/1/31 | | 5,000 | | | 4,988 |
| | 3.30% 8/1/40 | | 5,000 | | | 4,621 |
| PG&E 5.25% 7/1/30 | | 130,000 | | | 133,250 |
| Sempra Energy 4.875% | | | | | |
| | 10/15/25 µ, ψ | | 20,000 | | | 21,750 |
| Southern California | | | | | |
| | Edison | | | | | |
| | 4.00% 4/1/47 | | 35,000 | | | 37,600 |
| | 4.20% 3/1/29 | | 150,000 | | | 168,255 |
| | 4.875% 3/1/49 | | 90,000 | | | 107,703 |
| UEP Penonome II 144A | | | | | |
| | 6.50% 10/1/38 # | | 197,194 | | | 206,466 |
| Vistra Operations 144A | | | | | |
| | 4.375% 5/1/29 # | | 220,000 | | | 221,624 |
| | | | | | | 3,984,846 |
| Total Corporate Bonds | | | | | |
| (cost $59,924,173) | | | | | 61,886,020 |
| | | | | | | |
| Non-Agency Asset-Backed Securities – 0.18% | | | | | |
| Diamond Infrastructure | | | | | |
| | Funding | | | | | |
| | Series 2021-1A A | | | | | |
| | 144A 1.76% | | | | | |
| | 4/15/49 # | | 150,000 | | | 147,898 |
93
Table of Contents
Schedules of investments
Delaware Total Return Fund
| | | | | | Principal | | | |
| | | | | | amount° | | Value (US $) |
| Non-Agency Asset-Backed Securities (continued) | | | | | | | |
| Domino’s Pizza Master | | | | | | | |
| | | Issuer | | | | | | | |
| | Series 2021-1A A2I | | | | | | | |
| | 144A 2.662% | | | | | | | |
| | 4/25/51 # | | | | 149,625 | | $ | 153,877 |
| Taco Bell Funding | | | | | | | |
| | Series 2021-1A A2I | | | | | | | |
| | 144A 1.946% | | | | | | | |
| | 8/25/51 # | | | | 270,000 | | | 269,784 |
| Trafigura Securitisation | | | | | | | |
| | Finance | | | | | | | |
| | Series 2021-1A | | | | | | | |
| | A2 144A 1.08% | | | | | | | |
| | 1/15/25 # | | | | 300,000 | | | 298,643 |
| Total Non-Agency Asset-Backed Securities | | | | | | | |
| (cost $869,589) | | | | | | | 870,202 |
| | | | | | | | | |
| Non-Agency Commercial Mortgage-Backed Securities – | | | | | | | |
| 0.99% | | | | | | | |
| BANK | | | | | | | |
| | Series 2019- | | | | | | | |
| | BN21 A5 2.851% | | | | | | | |
| | 10/17/52 | | | | 100,000 | | | 106,028 |
| | Series 2020- | | | | | | | |
| | BN25 A5 2.649% | | | | | | | |
| | 1/15/63 | | | | 500,000 | | | 522,762 |
| Benchmark Mortgage | | | | | | | |
| | Trust | | | | | | | |
| | Series 2020- | | | | | | | |
| | B17 A5 2.289% | | | | | | | |
| | 3/15/53 | | | | 500,000 | | | 508,262 |
| | Series 2020- | | | | | | | |
| | B20 A5 2.034% | | | | | | | |
| | 10/15/53 | | | | 400,000 | | | 397,636 |
| Cantor Commercial Real | | | | | | | |
| | Estate Lending | | | | | | | |
| | Series 2019- | | | | | | | |
| | CF2 A5 2.874% | | | | | | | |
| | 11/15/52 | | | | 350,000 | | | 368,039 |
| Citigroup Commercial | | | | | | | |
| | Mortgage Trust | | | | | | | |
| | Series 2019- | | | | | | | |
| | C7 A4 3.102% | | | | | | | |
| | 12/15/72 | | | | 500,000 | | | 538,933 |
| GS Mortgage Securities | | | | | | | |
| | Trust | | | | | | | |
| | Series 2017- | | | | | | | |
| | GS5 A4 3.674% | | | | | | | |
| | 3/10/50 | | | | 350,000 | | | 385,801 |
| | Series 2017- | | | | | | | |
| | GS6 A3 3.433% | | | | | | | |
| | 5/10/50 | | | | 350,000 | | | 382,378 |
| GS Mortgage Securities | | | | | | | |
| | Trust | | | | | | | |
| | Series 2019- | | | | | | | |
| | GC42 A4 3.001% | | | | | | | |
| | 9/1/52 | | | | 500,000 | | | 535,735 |
| JPM-DB Commercial | | | | | | | |
| | Mortgage Securities | | | | | | | |
| | Trust | | | | | | | |
| | Series 2017- | | | | | | | |
| | C7 A5 3.409% | | | | | | | |
| | 10/15/50 | | | | 350,000 | | | 384,239 |
| Morgan Stanley Bank of | | | | | | | |
| | America Merrill Lynch | | | | | | | |
| | Trust | | | | | | | |
| | Series 2016- | | | | | | | |
| | C29 A4 3.325% | | | | | | | |
| | 5/15/49 | | | | 350,000 | | | 377,358 |
| Wells Fargo Commercial | | | | | | | |
| | Mortgage Trust | | | | | | | |
| | Series 2016- | | | | | | | |
| | BNK1 A3 2.652% | | | | | | | |
| | 8/15/49 | | | | 350,000 | | | 367,796 |
| Total Non-Agency Commercial Mortgage- | | | | | | | |
| Backed Securities | | | | | | | |
| (cost $4,858,749) | | | | | | | 4,874,967 |
| | | | | | | | | |
| Sovereign Bonds – 1.84%Δ | | | | | | | |
| Armenia – 0.04% | | | | | | | |
| Republic of Armenia | | | | | | | |
| | International Bond | | | | | | | |
| | 144A 3.60% 2/2/31 # | | | | 200,000 | | | 189,460 |
| | | | | | | | | 189,460 |
| Colombia – 0.12% | | | | | | | |
| Colombia Government | | | | | | | |
| | International Bond | | | | | | | |
| | 4.125% 2/22/42 | | | | 217,000 | | | 195,630 |
| Colombian 7.00% | | | | | | | |
| | 6/30/32 | | COP | | 1,635,100,000 | | | 406,979 |
| | | | | | | | | 602,609 |
| Dominican Republic – 0.19% | | | | | | | |
| Dominican Republic | | | | | | | |
| | International Bonds | | | | | | | |
| | 144A 4.50% 1/30/30 # | | | | 913,000 | | | 931,269 |
| | | | | | | | | 931,269 |
| Egypt – 0.13% | | | | | | | |
| Egypt Government | | | | | | | |
| | International Bonds | | | | | | | |
| | 144A 5.75% 5/29/24 # | | | | 425,000 | | | 442,528 |
| | 7.903% 2/21/48 | | | | 200,000 | | | 183,250 |
| | | | | | | | | 625,778 |
94
Table of Contents
| | | | | | Principal | | | |
| | | | | | amount° | | Value (US $) |
| Sovereign BondsΔ (continued) | | | | | | | |
| Gabon – 0.04% | | | | | | | |
| Gabon Government | | | | | | | |
| | International Bond | | | | | | | |
| | | 144A 6.625% 2/6/31 # | | | | 200,000 | | $ | 197,452 |
| | | | | | | | | 197,452 |
| Honduras – 0.04% | | | | | | | |
| Honduras Government | | | | | | | |
| | International Bond | | | | | | | |
| | 144A 5.625% | | | | | | | |
| | 6/24/30 # | | | | 200,000 | | | 209,002 |
| | | | | | | | | 209,002 |
| Indonesia – 0.03% | | | | | | | |
| Indonesia Treasury Bond | | | | | | | |
| | 6.125% 5/15/28 | | IDR | | 1,768,000,000 | | | 126,184 |
| | | | | | | | | 126,184 |
| Ivory Coast – 0.12% | | | | | | | |
| Ivory Coast Government | | | | | | | |
| | International Bond | | | | | | | |
| | 144A 6.125% | | | | | | | |
| | 6/15/33 # | | | | 234,000 | | | 247,806 |
| Ivory Coast Government | | | | | | | |
| | International Bonds | | | | | | | |
| | 144A 4.875% | | | | | | | |
| | 1/30/32 # | | EUR | | 200,000 | | | 226,250 |
| | 144A 6.875% | | | | | | | |
| | 10/17/40 # | | EUR | | 100,000 | | | 124,094 |
| | | | | | | | | 598,150 |
| Malaysia – 0.14% | | | | | | | |
| Malaysia Government | | | | | | | |
| | Bond | | | | | | | |
| | 3.955% 9/15/25 | | MYR | | 2,648,000 | | | 662,278 |
| | | | | | | | | 662,278 |
| Mongolia – 0.06% | | | | | | | |
| Mongolia Government | | | | | | | |
| | International Bond | | | | | | | |
| | 144A 5.625% 5/1/23 # | | | | 269,000 | | | 283,001 |
| | | | | | | | | 283,001 |
| Morocco – 0.12% | | | | | | | |
| Morocco Government | | | | | | | |
| | International Bonds | | | | | | | |
| | 144A 1.375% | | | | | | | |
| | 3/30/26 # | | EUR | | 270,000 | | | 314,301 |
| | 144A 2.375% | | | | | | | |
| | 12/15/27 # | | | | 300,000 | | | 294,366 |
| | | | | | | | | 608,667 |
| North Macedonia – 0.03% | | | | | | | |
| North Macedonia | | | | | | | |
| | | Government | | | | | | | |
| | International Bond | | | | | | | |
| | 144A 3.675% 6/3/26 # EUR | | | | 100,000 | | | 127,264 |
| | | | | | | | | 127,264 |
| Paraguay – 0.17% | | | | | | | |
| Paraguay Government | | | | | | | |
| | International Bonds | | | | | | | |
| | 144A 4.95% 4/28/31 # | | | | 742,000 | | | 839,758 |
| | | | | | | | | 839,758 |
| Peru – 0.10% | | | | | | | |
| Peru Government Bond | | | | | | | |
| | 6.95% 8/12/31 | | PEN | | 743,000 | | | 186,631 |
| Peruvian Government | | | | | | | |
| | International Bonds | | | | | | | |
| | 2.392% 1/23/26 | | | | 300,000 | | | 306,696 |
| | | | | | | | | 493,327 |
| Romania – 0.02% | | | | | | | |
| Romanian Government | | | | | | | |
| | International Bonds | | | | | | | |
| | 144A 2.625% | | | | | | | |
| | 12/2/40 # | | EUR | | 100,000 | | | 108,163 |
| | | | | | | | | 108,163 |
| Senegal – 0.04% | | | | | | | |
| Senegal Government | | | | | | | |
| | International Bond | | | | | | | |
| | 144A 6.25% 5/23/33 # | | | | 200,000 | | | 209,020 |
| | | | | | | | | 209,020 |
| Serbia – 0.10% | | | | | | | |
| Serbia International | | | | | | | |
| | Bonds | | | | | | | |
| | 144A 2.125% | | | | | | | |
| | 12/1/30 # | | | | 200,000 | | | 187,568 |
| | 144A 3.125% | | | | | | | |
| | 5/15/27 # | | EUR | | 250,000 | | | 318,585 |
| | | | | | | | | 506,153 |
| Turkey – 0.04% | | | | | | | |
| Turkiye Ihracat Kredi | | | | | | | |
| | Bankasi | | | | | | | |
| | 144A 5.75% 7/6/26 # | | | | 200,000 | | | 196,292 |
| | | | | | | | | 196,292 |
| Ukraine – 0.08% | | | | | | | |
| Ukraine Government | | | | | | | |
| | International Bonds | | | | | | | |
| | 144A 6.876% | | | | | | | |
| | 5/21/29 # | | | | 400,000 | | | 406,534 |
| | | | | | | | | 406,534 |
95
Table of Contents
Schedules of investments
Delaware Total Return Fund
| | | | | | Principal | | | |
| | | | | | amount° | | Value (US $) |
| Sovereign BondsΔ (continued) | | | | | | | |
| Uruguay – 0.11% | | | | | | | |
| | Uruguay Government | | | | | | | |
| | International Bonds | | | | | | | |
| | 4.50% 8/14/24 | | | | 69,000 | | $ | 74,034 |
| | 9.875% 6/20/22 | | UYU | | 19,415,000 | | | 462,034 |
| | | | | | | | | 536,068 |
| Uzbekistan – 0.12% | | | | | | | |
| Republic of Uzbekistan | | | | | | | |
| | International Bonds | | | | | | | |
| | 144A 3.90% | | | | | | | |
| | 10/19/31 # | | | | 200,000 | | | 195,346 |
| | 144A 4.75% 2/20/24 # | | | | 374,000 | | | 392,324 |
| | | | | | | | | 587,670 |
| Total Sovereign Bonds | | | | | | | |
| (cost $9,114,925) | | | | | | | 9,044,099 |
| | | | | | | | | |
| Supranational Banks – 0.15% | | | | | | | |
| Banque Ouest Africaine | | | | | | | |
| | de Developpement | | | | | | | |
| | 144A 4.70% | | | | | | | |
| | 10/22/31 # | | | | 306,000 | | | 336,939 |
| Central American Bank | | | | | | | |
| | for Economic | | | | | | | |
| | Integration | | | | | | | |
| | 144A 2.00% 5/6/25 # | | | | 400,000 | | | 411,109 |
| Total Supranational Banks | | | | | | | |
| (cost $705,959) | | | | | | | 748,048 |
| | | | | | | | | |
| US Treasury Obligations – 2.29% | | | | | | | |
| US Treasury Bonds | | | | | | | |
| | 1.75% 8/15/41 | | | | 435,000 | | | 415,969 |
| | 2.00% 8/15/51 | | | | 110,000 | | | 108,075 |
| | 2.25% 8/15/46 | | | | 1,185,000 | | | 1,224,207 |
| | 4.375% 2/15/38 | | | | 890,000 | | | 1,218,500 |
| US Treasury Notes | | | | | | | |
| | 0.375% 9/15/24 | | | | 2,215,000 | | | 2,205,656 |
| | 0.875% 6/30/26 | | | | 710,000 | | | 707,559 |
| | 0.875% 9/30/26 | | | | 1,550,000 | | | 1,541,766 |
| | 1.125% 8/31/28 | | | | 295,000 | | | 291,566 |
| | 1.25% 6/30/28 | | | | 2,505,000 | | | 2,500,009 |
| | 1.25% 8/15/31 | | | | 770,000 | | | 751,412 |
| US Treasury Strip | | | | | | | |
| | Principal | | | | | | | |
| | 2.239% 5/15/44 ^ | | | | 380,000 | | | 236,630 |
| Total US Treasury Obligations | | | | | | | |
| (cost $11,224,110) | | | | | | | 11,201,349 |
| | | | | | | | | |
| Common Stock – 58.81% | | | | | | | |
| Communication Services – 4.47% | | | | | | | |
| Alphabet Class A † | | | | 374 | | | 999,897 |
| Alphabet Class C † | | | | 594 | | | 1,583,194 |
| AT&T | | | | 77,624 | | | 2,096,624 |
| Comcast Class A | | | | 52,367 | | | 2,928,886 |
| Facebook Class A † | | | | 4,871 | | | 1,653,169 |
| KDDI | | | | 36,500 | | | 1,201,694 |
| Orange | | | | 91,700 | | | 991,723 |
| Publicis Groupe | | | | 21,980 | | | 1,476,568 |
| Take-Two Interactive | | | | | | | |
| | Software † | | | | 7,434 | | | 1,145,357 |
| Verizon Communications | | | | 92,202 | | | 4,979,830 |
| Walt Disney † | | | | 16,813 | | | 2,844,255 |
| | | | | | | | | 21,901,197 |
| Consumer Discretionary – 7.90% | | | | | | | |
| adidas AG † | | | | 3,900 | | | 1,225,601 |
| Amazon.com † | | | | 1,377 | | | 4,523,500 |
| Bath & Body Works | | | | 15,879 | | | 1,000,853 |
| Best Buy | | | | 7,887 | | | 833,735 |
| Buckle | | | | 40,451 | | | 1,601,455 |
| Dollar General | | | | 13,007 | | | 2,759,305 |
| Dollar Tree † | | | | 30,900 | | | 2,957,748 |
| eBay | | | | 9,975 | | | 694,958 |
| H & M Hennes & Mauritz | | | | | | | |
| | Class B † | | | | 40,440 | | | 818,571 |
| Haverty Furniture | | | | 15,123 | | | 509,796 |
| Home Depot | | | | 8,254 | | | 2,709,458 |
| Lowe’s | | | | 26,203 | | | 5,315,541 |
| Newell Brands | | | | 8,417 | | | 186,352 |
| Next † | | | | 4,160 | | | 457,604 |
| NIKE Class B | | | | 11,297 | | | 1,640,663 |
| PulteGroup | | | | 12,644 | | | 580,612 |
| Ross Stores | | | | 13,819 | | | 1,504,198 |
| Sodexo † | | | | 14,030 | | | 1,226,162 |
| Sturm Ruger & Co. | | | | 20,163 | | | 1,487,626 |
| Swatch Group | | | | 6,530 | | | 1,703,558 |
| Tesla † | | | | 495 | | | 383,863 |
| TJX | | | | 26,529 | | | 1,750,383 |
| Tractor Supply | | | | 9,801 | | | 1,985,781 |
| Ulta Beauty † | | | | 2,416 | | | 871,983 |
| | | | | | | | | 38,729,306 |
| Consumer Staples – 5.34% | | | | | | | |
| Altria Group | | | | 37,650 | | | 1,713,828 |
| Archer-Daniels-Midland | | | | 49,500 | | | 2,970,495 |
| Asahi Group Holdings | | | | 18,000 | | | 868,597 |
| Clorox | | | | 1,835 | | | 303,894 |
| Colgate-Palmolive | | | | 8,878 | | | 670,999 |
| Conagra Brands | | | | 90,200 | | | 3,055,074 |
| Danone | | | | 26,010 | | | 1,773,309 |
| Diageo | | | | 60,200 | | | 2,914,583 |
96
Table of Contents
| | | Number of | | | |
| | | | shares | | Value (US $) |
| Common Stock (continued) | | | | | |
| Consumer Staples (continued) | | | | | |
| Essity Class B | | 38,400 | | $ | 1,190,937 |
| Kao | | 22,700 | | | 1,350,959 |
| Kellogg | | 10,214 | | | 652,879 |
| Kirin Holdings | | 20,300 | | | 376,766 |
| Koninklijke Ahold Delhaize | | 54,060 | | | 1,800,097 |
| Lawson | | 13,900 | | | 682,800 |
| Nestle | | 18,150 | | | 2,186,895 |
| Philip Morris International | | 20,583 | | | 1,951,063 |
| Seven & i Holdings | | 37,400 | | | 1,702,614 |
| | | | | | 26,165,789 |
| Energy – 2.74% | | | | | |
| Chevron | | 5,763 | | | 584,656 |
| ConocoPhillips | | 76,186 | | | 5,163,125 |
| EOG Resources | | 21,057 | | | 1,690,245 |
| Exxon Mobil | | 41,896 | | | 2,464,323 |
| Kinder Morgan | | 90,676 | | | 1,517,010 |
| Marathon Petroleum | | 18,435 | | | 1,139,467 |
| Williams | | 34,250 | | | 888,445 |
| | | | | | 13,447,271 |
| Financials – 7.13% | | | | | |
| AGNC Investment | | 94,174 | | | 1,485,124 |
| American Financial Group | | 12,096 | | | 1,522,040 |
| American International Group | | 54,700 | | | 3,002,483 |
| Ameriprise Financial | | 4,440 | | | 1,172,693 |
| Annaly Capital Management | | 55,113 | | | 464,051 |
| Artisan Partners Asset | | | | | |
| Management Class A | | 24,901 | | | 1,218,157 |
| BlackRock | | 2,507 | | | 2,102,521 |
| Blackstone | | 12,746 | | | 1,482,870 |
| Diamond Hill Investment | | | | | |
| Group | | 2,701 | | | 474,458 |
| Discover Financial Services | | 34,877 | | | 4,284,639 |
| Invesco | | 62,661 | | | 1,510,757 |
| MetLife | | 76,691 | | | 4,734,135 |
| Principal Financial Group | | 26,274 | | | 1,692,045 |
| Prudential Financial | | 13,533 | | | 1,423,672 |
| S&P Global | | 2,291 | | | 973,423 |
| Synchrony Financial | | 24,573 | | | 1,201,128 |
| Truist Financial | | 51,800 | | | 3,038,070 |
| US Bancorp | | 53,000 | | | 3,150,320 |
| | | | | | 34,932,586 |
| Healthcare – 8.52% | | | | | |
| AbbVie | | 18,625 | | | 2,009,079 |
| AmerisourceBergen | | 14,577 | | | 1,741,223 |
| Amgen | | 7,216 | | | 1,534,482 |
| Baxter International | | 10,024 | | | 806,230 |
| Bristol-Myers Squibb | | 24,925 | | | 1,474,812 |
| Cardinal Health | | 37,121 | | | 1,836,005 |
| Cigna | | 13,100 | | | 2,622,096 |
| CVS Health | | 36,200 | | | 3,071,932 |
| Eli Lilly & Co. | | 3,618 | | | 835,939 |
| Fresenius Medical Care AG & | | | | | |
| Co. | | 27,490 | | | 1,928,267 |
| Humana | | 1,591 | | | 619,138 |
| Johnson & Johnson | | 37,188 | | | 6,005,862 |
| Merck & Co. | | 66,509 | | | 4,995,491 |
| Molina Healthcare † | | 3,370 | | | 914,315 |
| Novo Nordisk Class B | | 20,500 | | | 1,975,986 |
| Organon & Co. † | | 2,263 | | | 74,204 |
| Pfizer | | 54,904 | | | 2,361,421 |
| Roche Holding | | 4,760 | | | 1,737,257 |
| Smith & Nephew | | 92,540 | | | 1,594,264 |
| UnitedHealth Group | | 1,661 | | | 649,019 |
| Viatris | | 218,088 | | | 2,955,092 |
| | | | | | 41,742,114 |
| Industrials – 3.21% | | | | | |
| Dover | | 18,053 | | | 2,807,241 |
| Honeywell International | | 13,484 | | | 2,862,383 |
| Knorr-Bremse | | 5,860 | | | 626,971 |
| Lockheed Martin | | 4,105 | | | 1,416,635 |
| Northrop Grumman | | 8,500 | | | 3,061,275 |
| Raytheon Technologies | | 35,832 | | | 3,080,119 |
| Securitas Class B | | 117,130 | | | 1,853,889 |
| United Parcel Service Class B | | 197 | | | 35,874 |
| | | | | | 15,744,387 |
| Information Technology – 13.24% | | | | | |
| Adobe † | | 4,287 | | | 2,468,112 |
| Amadeus IT Group † | | 20,910 | | | 1,375,289 |
| Analog Devices | | 2,012 | | | 336,970 |
| Apple | | 69,974 | | | 9,901,321 |
| Broadcom | | 11,171 | | | 5,417,153 |
| Cisco Systems | | 80,956 | | | 4,406,435 |
| Cognizant Technology | | | | | |
| Solutions Class A | | 39,345 | | | 2,919,792 |
| Dropbox Class A † | | 53,921 | | | 1,575,572 |
| Enphase Energy † | | 3,425 | | | 513,647 |
| Fidelity National Information | | | | | |
| Services | | 21,081 | | | 2,565,136 |
| HP | | 58,257 | | | 1,593,911 |
| International Business | | | | | |
| Machines | | 8,343 | | | 1,159,093 |
| Lam Research | | 3,167 | | | 1,802,498 |
| Microsoft | | 32,633 | | | 9,199,895 |
| Monolithic Power Systems | | 3,789 | | | 1,836,452 |
| Motorola Solutions | | 12,806 | | | 2,975,090 |
| NetApp | | 21,547 | | | 1,934,059 |
| NVIDIA | | 2,654 | | | 549,803 |
97
Table of Contents
Schedules of investments
Delaware Total Return Fund
| | | Number of | | | |
| | | | shares | | Value (US $) |
| Common Stock (continued) | | | | | |
| Information Technology (continued) | | | | | |
| Oracle | | 33,500 | | $ | 2,918,855 |
| Paychex | | 14,596 | | | 1,641,320 |
| Paycom Software † | | 1,341 | | | 664,801 |
| QUALCOMM | | 13,117 | | | 1,691,831 |
| SAP | | 11,660 | | | 1,576,773 |
| TE Connectivity | | 6,366 | | | 873,543 |
| Western Union | | 61,470 | | | 1,242,923 |
| Xilinx | | 11,835 | | | 1,786,967 |
| | | | | | 64,927,241 |
| Materials – 1.07% | | | | | |
| Air Liquide | | 11,560 | | | 1,851,452 |
| Dow | | 10,563 | | | 608,006 |
| DuPont de Nemours | | 41,100 | | | 2,794,389 |
| | | | | | 5,253,847 |
| REIT Diversified – 0.05% | | | | | |
| DigitalBridge Group † | | 2,402 | | | 14,484 |
| Lexington Realty Trust | | 16,740 | | | 213,435 |
| | | | | | 227,919 |
| REIT Healthcare – 0.51% | | | | | |
| CareTrust REIT | | 8,903 | | | 180,909 |
| Healthcare Trust of America | | | | | |
| Class A | | 9,580 | | | 284,143 |
| Healthpeak Properties | | 4,893 | | | 163,818 |
| Medical Properties Trust | | 37,386 | | | 750,337 |
| National Health Investors | | 930 | | | 49,755 |
| Omega Healthcare Investors | | 21,116 | | | 632,635 |
| Ventas | | 1,060 | | | 58,522 |
| Welltower | | 4,872 | | | 401,453 |
| | | | | | 2,521,572 |
| REIT Hotel – 0.31% | | | | | |
| Apple Hospitality REIT | | 12,855 | | | 202,209 |
| Chatham Lodging Trust † | | 4,653 | | | 56,999 |
| Gaming and Leisure | | | | | |
| Properties | | 4,264 | | | 197,509 |
| Host Hotels & Resorts † | | 1,325 | | | 21,637 |
| VICI Properties | | 36,598 | | | 1,039,749 |
| | | | | | 1,518,103 |
| REIT Industrial – 0.40% | | | | | |
| Americold Realty Trust | | 1,286 | | | 37,358 |
| Duke Realty | | 7,527 | | | 360,318 |
| Plymouth Industrial REIT | | 832 | | | 18,928 |
| Prologis | | 11,370 | | | 1,426,139 |
| Terreno Realty | | 2,161 | | | 136,640 |
| | | | | | 1,979,383 |
| REIT Information Technology – 0.32% | | | | | |
| Digital Realty Trust | | 3,616 | | | 522,331 |
| Equinix | | 1,332 | | | 1,052,453 |
| | | | | | 1,574,784 |
| REIT Mall – 0.10% | | | | | |
| Simon Property Group | | 3,606 | | | 468,672 |
| | | | | | 468,672 |
| REIT Manufactured Housing – 0.11% | | | | | |
| Equity LifeStyle Properties | | 1,576 | | | 123,086 |
| Sun Communities | | 2,211 | | | 409,256 |
| | | | | | 532,342 |
| REIT Multifamily – 1.05% | | | | | |
| American Homes 4 Rent | | | | | |
| Class A | | 4,287 | | | 163,420 |
| AvalonBay Communities | | 1,147 | | | 254,221 |
| Camden Property Trust | | 1,444 | | | 212,947 |
| Equity Residential | | 42,188 | | | 3,413,853 |
| Essex Property Trust | | 1,435 | | | 458,827 |
| Invitation Homes | | 11,425 | | | 437,920 |
| Mid-America Apartment | | | | | |
| Communities | | 1,006 | | | 187,871 |
| UDR | | 457 | | | 24,212 |
| | | | | | 5,153,271 |
| REIT Office – 0.26% | | | | | |
| Alexandria Real Estate | | | | | |
| Equities | | 2,466 | | | 471,179 |
| Boston Properties | | 1,635 | | | 177,152 |
| Columbia Property Trust | | 4,170 | | | 79,314 |
| Cousins Properties | | 4,885 | | | 182,162 |
| Douglas Emmett | | 3,389 | | | 107,126 |
| Highwoods Properties | | 2,505 | | | 109,869 |
| Kilroy Realty | | 836 | | | 55,352 |
| Piedmont Office Realty Trust | | | | | |
| Class A | | 4,224 | | | 73,624 |
| SL Green Realty | | 529 | | | 37,474 |
| | | | | | 1,293,252 |
| REIT Self-Storage – 0.55% | | | | | |
| CubeSmart | | 2,709 | | | 131,251 |
| Extra Space Storage | | 2,408 | | | 404,520 |
| Iron Mountain | | 26,002 | | | 1,129,787 |
| Life Storage | | 2,096 | | | 240,495 |
| National Storage Affiliates | | | | | |
| Trust | | 2,695 | | | 142,269 |
| Public Storage | | 2,249 | | | 668,178 |
| | | | | | 2,716,500 |
| REIT Shopping Center – 0.27% | | | | | |
| Brixmor Property Group | | 11,958 | | | 264,391 |
| Kimco Realty | | 7,299 | | | 151,454 |
| Kite Realty Group Trust | | 5,567 | | | 113,344 |
98
Table of Contents
| | | Number of | | | |
| | | | shares | | Value (US $) |
| Common Stock (continued) | | | | | |
| REIT Shopping Center (continued) | | | | | |
| Regency Centers | | 3,459 | | $ | 232,895 |
| Retail Opportunity | | | | | |
| Investments | | 12,015 | | | 209,301 |
| SITE Centers | | 13,148 | | | 203,005 |
| Urban Edge Properties | | 8,147 | | | 149,172 |
| | | | | | 1,323,562 |
| REIT Single Tenant – 0.21% | | | | | |
| Essential Properties Realty | | | | | |
| Trust | | 4,757 | | | 132,815 |
| Four Corners Property Trust | | 5,447 | | | 146,306 |
| National Retail Properties | | 5,232 | | | 225,970 |
| Realty Income | | 3,344 | | | 216,892 |
| Spirit Realty Capital | | 4,375 | | | 201,425 |
| STORE Capital | | 2,954 | | | 94,617 |
| | | | | | 1,018,025 |
| REIT Specialty – 0.08% | | | | | |
| Lamar Advertising Class A | | 1,068 | | | 121,165 |
| Outfront Media † | | 2,652 | | | 66,830 |
| WP Carey | | 2,590 | | | 189,174 |
| | | | | | 377,169 |
| Utilities – 0.97% | | | | | |
| Edison International | | 52,100 | | | 2,889,987 |
| NRG Energy | | 41,226 | | | 1,683,258 |
| PPL | | 6,732 | | | 187,688 |
| | | | | | 4,760,933 |
| Total Common Stock | | | | | |
| (cost $258,156,789) | | | | | 288,309,225 |
| | | | | | |
| Convertible Preferred Stock – 1.46% | | | | | |
| 2020 Mandatory | | | | | |
| Exchangeable Trust | | | | | |
| 144A 6.50% exercise | | | | | |
| price $47.09, maturity | | | | | |
| date 5/16/23 # | | 506 | | | 784,047 |
| Algonquin Power & | | | | | |
| Utilities 7.75% | | | | | |
| exercise price $18.00, | | | | | |
| maturity date 6/15/24 | | 8,276 | | | 400,724 |
| AMG Capital Trust II | | | | | |
| 5.15% exercise price | | | | | |
| $195.47, maturity | | | | | |
| date 10/15/37 | | 10,058 | | | 581,352 |
| Bank of America 7.25% | | | | | |
| exercise price | | | | | |
| $50.00 ** | | 350 | | | 504,847 |
| El Paso Energy Capital | | | | | |
| Trust I 4.75% exercise | | | | | |
| price $34.49, maturity | | | | | |
| date 3/31/28 | | 25,777 | | | 1,277,250 |
| Elanco Animal Health | | | | | |
| 5.00% exercise price | | | | | |
| $38.40, maturity date | | | | | |
| 2/1/23 | | 12,172 | | | 607,018 |
| Essential Utilities 6.00% | | | | | |
| exercise price $42.19, | | | | | |
| maturity date 4/30/22 | | 21,600 | | | 1,239,624 |
| Lyondellbasell Advanced | | | | | |
| Polymers 6.00% | | | | | |
| exercise price | | | | | |
| $52.33 ** | | 818 | | | 829,043 |
| RBC Bearings 5.00% | | | | | |
| exercise price | | | | | |
| $226.60, maturity | | | | | |
| date 10/15/24 | | 1,009 | | | 112,473 |
| UGI 7.25% exercise price | | | | | |
| $52.57, maturity date | | | | | |
| 6/1/24 | | 8,097 | | | 808,567 |
| Total Convertible Preferred Stock | | | | | |
| (cost $6,656,304) | | | | | 7,144,945 |
| | | | | | |
| Exchange-Traded Funds – 4.69% | | | | | |
| iShares Core MSCI Emerging | | | | | |
| Markets ETF | | 158,400 | | | 9,782,784 |
| iShares Global Infrastructure | | | | | |
| ETF | | 267,940 | | | 12,298,446 |
| iShares MSCI EAFE ETF | | 1,060 | | | 82,691 |
| iShares Russell 1000 Growth | | | | | |
| ETF | | 470 | | | 128,799 |
| iShares Trust iShares ESG | | | | | |
| Aware MSCI EAFE ETF | | 7,140 | | | 559,633 |
| Vanguard Mega Cap Growth | | | | | |
| ETF | | 540 | | | 126,792 |
| Total Exchange-Traded Funds | | | | | |
| (cost $24,192,553) | | | | | 22,979,145 |
| | | | | | |
| | | Principal | | | |
| | | amount° | | | |
| Limited Liability Corporation – 1.73% | | | | | |
| Sc Hixson Pp | | | | | |
| 0.000% | | | | | |
| 1/7/20 =, †,π | | 7,200,000 | | | 8,470,080 |
| Total Limited Liability Corporation | | | | | |
| (cost $6,768,000) | | | | | 8,470,080 |
99
Table of Contents
Schedules of investments
Delaware Total Return Fund
| | | Number of | | | |
| | | | shares | | Value (US $) |
| Short-Term Investments – 5.16% | | | | | |
| Money Market Mutual Funds – 5.16% | | | | | |
| BlackRock FedFund – | | | | | |
| Institutional Shares | | | | | |
| (seven-day effective | | | | | |
| yield 0.03%) | | 6,325,927 | | $ | 6,325,927 |
| Fidelity Investments | | | | | |
| Money Market | | | | | |
| Government Portfolio | | | | | |
| – Class I (seven-day | | | | | |
| effective yield 0.01%) | | 6,325,927 | | | 6,325,927 |
| GS Financial Square | | | | | |
| Government Fund – | | | | | |
| Institutional Shares | | | | | |
| (seven-day effective | | | | | |
| yield 0.03%) | | 6,325,927 | | | 6,325,927 |
| Morgan Stanley | | | | | |
| Government Portfolio | | | | | |
| – Institutional Share | | | | | |
| Class (seven-day | | | | | |
| effective yield 0.03%) | | 6,325,927 | | | 6,325,927 |
| Total Short-Term Investments | | | | | |
| (cost $25,303,708) | | | | | 25,303,708 |
| Total Value of | | | | | |
| Securities–99.99% | | | | | |
| (cost $453,909,615) | | | | $ | 490,208,147 |
| ° | Principal amount shown is stated in USD unless noted that the security is denominated in another currency. |
| # | Security exempt from registration under Rule 144A of the Securities Act of 1933, as amended. At September 30, 2021, the aggregate value of Rule 144A securities was $50,110,293, which represents 10.22% of the Fund’s net assets. See Note 11 in “Notes to financial statements.” |
| ● | Variable rate investment. Rates reset periodically. Rate shown reflects the rate in effect at September 30, 2021. For securities based on a published reference rate and spread, the reference rate and spread are indicated in their descriptions. The reference rate descriptions (i.e. LIBOR03M, LIBOR06M, etc.) used in this report are identical for different securities, but the underlying reference rates may differ due to the timing of the reset period. Certain variable rate securities are not based on a published reference rate and spread but are determined by the issuer or agent and are based on current market conditions, or for mortgage-backed securities, are impacted by the individual mortgages which are paying off over time. These securities do not indicate a reference rate and spread in their descriptions. |
| ^ | Zero-coupon security. The rate shown is the effective yield at the time of purchase. |
| µ | Fixed to variable rate investment. The rate shown reflects the fixed rate in effect at September 30, 2021. Rate will reset at a future date. |
| ψ | Perpetual security. Maturity date represents next call date. |
| Δ | Securities have been classified by country of origin. |
| † | Non-income producing security. |
| ** | Perpetual security with no stated maturity date. |
| = | The value of this security was determined using significant unobservable inputs and is reported as a Level 3 security in the disclosure table located in Note 3 in “Notes to financial statements.” |
| π | Restricted security. These investments are in securities not registered under the Securities Act of 1933, as amended, and have certain restrictions on resale which may limit their liquidity. At September 30, 2021, the aggregate value of restricted securities was $8,470,080, which represented 1.73% of the Fund’s net assets. See Note 11 in “Notes to financial statements” and the following table, for additional details on restricted securities. |
Restricted Securities
| Investments | | Date of Acquisition | | Cost | | Value |
| Sc Hixson Pp | | 1/7/2020 | | $6,768,000 | | $8,470,080 |
100
Table of Contents
The following foreign currency exchange contracts, futures contracts and swap contracts were outstanding at September 30, 2021:1
Foreign Currency Exchange Contracts
| | Currency to | | | | | | Settlement | | Unrealized | | Unrealized |
| Counterparty | | Receive (Deliver) | | In Exchange For | | Date | | Appreciation | | Depreciation |
| BNYM | | EUR | (36,389 | ) | | USD | 42,148 | | | 10/1/21 | | $ | – | | $ | (5 | ) |
| BNYM | | EUR | (13,276 | ) | | USD | 15,343 | | | 10/4/21 | | | – | | | (36 | ) |
| BNYM | | SEK | (68,977 | ) | | USD | 7,823 | | | 10/1/21 | | | – | | | (56 | ) |
| CITI | | COP | (1,699,368,000 | ) | | USD | 437,701 | | | 12/3/21 | | | – | | | (6,594 | ) |
| JPMCB | | EUR | (1,124,834 | ) | | USD | 1,319,987 | | | 12/3/21 | | | 15,321 | | | – | |
| JPMCB | | KZT | 434,625,199 | | | USD | (1,008,645 | ) | | 12/3/21 | | | – | | | (2,638 | ) |
| JPMCB | | MXN | 20,507 | | | USD | (1,009 | ) | | 12/3/21 | | | – | | | (25 | ) |
| Total Foreign Currency Exchange Contracts | | | | | | | | | $ | 15,321 | | $ | (9,354 | ) |
Futures Contracts
Exchange-Traded
| | | | | | | | | | | | | | | | | Variation |
| | | | | | | | | | | | | | | | | Margin |
| | | | | | | | Notional | | | | Value/ | | Due from |
| | | | Notional | | Cost | | Expiration | | Unrealized | | (Due to) |
| Contracts to Buy (Sell) | | Amount | | (Proceeds) | | Date | | Appreciation | | Brokers |
| (11) | | US Treasury 10 yr Notes | | $ | (1,447,703 | ) | | $ | (1,463,316 | ) | | 12/21/21 | | $ | 15,613 | | $ | (1,547 | ) |
| (4) | | US Treasury 10 yr Ultra Notes | | | (581,000 | ) | | | (592,428 | ) | | 12/21/21 | | | 11,428 | | | (687 | ) |
| (2) | | US Treasury Ultra Bonds | | | (382,125 | ) | | | (391,901 | ) | | 12/21/21 | | | 9,776 | | | 312 | |
| Total Futures Contracts | | | | | | $ | (2,447,645 | ) | | | | $ | 36,817 | | $ | (1,922 | ) |
Swap Contracts
CDS Contracts2
| Counterparty/ | | | | | | | | | Upfront | | | | | | | |
| Reference Obligation/ | | | | | | | | | Payments | | | | | | Variation Margin |
| Termination Date/ | | Notional | | Annual Protection | | | | | Paid | | Unrealized | | Due from |
| Payment Frequency | | Amount3 | | Payments | | Value | | (Received) | | Depreciation4 | | (Due to) Brokers |
| Over-The-Counter: | | | | | | | | | | | | | | | | | |
| Protection Purchased/ | | | | | | | | | | | | | | | | | |
| Moody’s Ratings: | | | | | | | | | | | | | | | | | |
| JPMCB-Republic of Turkey | | | | | | | | | | | | | | | | | |
| 11.875% 6/20/22 BB | | | | | | | | | | | | | | | | | |
| 6/22/26- | | | | | | | | | | | | | | | | | |
| Quarterly | | 200,000 | | 1.000% | | $ | 26,799 | | $ | 31,520 | | $ | (4,721 | ) | | $ | – |
| Total CDS Contracts | | | | | | $ | 26,799 | | $ | 31,520 | | $ | (4,721 | ) | | $ | – |
| 1 | See Note 8 in “Notes to financial statements.” |
| 2 | A CDS contract is a risk-transfer instrument through which one party (purchaser of protection) transfers to another party (seller of protection) the financial risk of a credit event (as defined in the CDS agreement), as it relates to a particular reference security or basket of securities (such as an index). Periodic payments (receipts) on such contracts are accrued daily and recorded as unrealized losses (gains) on swap contracts. Upon payment (receipt), such amounts are recorded as realized losses (gains) on swap contracts. Upfront payments made or received in connection with CDS contracts are amortized over the expected life of the CDS contracts as unrealized losses (gains) on swap contracts. The change in value of CDS contracts is recorded daily as unrealized appreciation or depreciation. A realized gain or loss is recorded upon a credit event (as defined in the CDS agreement) or the maturity or termination of the CDS agreement. |
| 3 | Notional amount shown is stated in USD unless noted that the swap is denominated in another currency. |
| 4 | Unrealized appreciation (depreciation) does not include periodic interest payments (receipt) on swap contracts accrued daily in the amount of $(61). |
101
Table of Contents
Schedules of investments
Delaware Total Return Fund
The use of foreign currency exchange contracts, futures contracts, and swap contracts involve elements of market risk and risks in excess of the amounts disclosed in these financial statements. The foreign currency exchange contracts and notional amounts presented on the previous page represent the Fund’s total exposure in such contracts, whereas only the net unrealized appreciation (depreciation) and variation margin is reflected in the Fund’s net assets.
| Summary of abbreviations: |
| AG – Aktiengesellschaft |
| BNYM – Bank of New York Mellon |
| CITI – Citigroup |
| CLO – Collateralized Loan Obligation |
| DAC – Designated Activity Company |
| DB – Deutsche Bank |
| DIFC – Dubai International Financial Centre |
| EAFE – Europe, Australasia, and Far East |
| ESG – Environmental, Social, and Governance |
| ETF – Exchange-Traded Fund |
| GNMA – Government National Mortgage Association |
| GS – Goldman Sachs |
| ICE – Intercontinental Exchange, Inc. |
| JPMCB – JPMorgan Chase Bank |
| JSC – Joint Stock Company |
| LIBOR – London interbank offered rate |
| LIBOR03M – ICE LIBOR USD 3 Month |
| LIBOR06M – ICE LIBOR USD 6 Month |
| MSCI – Morgan Stanley Capital International |
| REIT – Real Estate Investment Trust |
| S&P – Standard & Poor’s Financial Services LLC |
| S.F. – Single Family |
| SOFR – Secured Overnight Financing Rate |
| TBA – To be announced |
| yr – Year |
| |
| Summary of currencies: |
| COP – Colombia Peso |
| EUR – European Monetary Unit |
| IDR – Indonesia Rupiah |
| KZT – Kazakhstan Tenge |
| MXN – Mexican Peso |
| MYR – Malaysian Ringgit |
| PEN – Peruvian Sol |
| SEK – Swedish Krona |
| USD – US Dollar |
| UYU – Uruguayan Peso |
See accompanying notes, which are an integral part of the financial statements.
102
Table of Contents
Statements of assets and liabilities
Delaware Group® Equity Funds IV (Trust)
September 30, 2021
| | | Delaware | | Delaware | | Delaware |
| | | Equity Income | | Growth and | | Growth Equity |
| | | | Fund | | Income Fund | | Fund |
| Assets: | | | | | | | | | |
| Investments, at value* | | $ | 291,894,866 | | $ | 1,041,323,058 | | $ | 601,493,128 |
| Dividends and interest receivable | | | 853,615 | | | 2,992,044 | | | 227,473 |
| Receivable for fund shares sold | | | 24,290 | | | 391,315 | | | 209,869 |
| Receivable for securities sold | | | — | | | — | | | 3,889,257 |
| Other assets | | | 19,982 | | | 57,616 | | | 24,395 |
| Total Assets | | | 292,792,753 | | | 1,044,764,033 | | | 605,844,122 |
| Liabilities: | | | | | | | | | |
| Payable for fund shares redeemed | | | 377,960 | | | 1,230,844 | | | 641,230 |
| Investment management fees payable to affiliates | | | 146,072 | | | 544,362 | | | 332,083 |
| Dividend disbursing and transfer agent fees and expenses payable to non-affiliates | | | 113,346 | | | 470,494 | | | 222,276 |
| Distribution fees payable to affiliates | | | 61,481 | | | 219,038 | | | 113,064 |
| Reports and statements to shareholders expenses payable to non-affiliates | | | 38,658 | | | 131,336 | | | 79,113 |
| Accounting and administration fees payable to non-affiliates | | | 29,213 | | | 63,052 | | | 44,045 |
| Custody fees payable | | | 7,456 | | | 19,599 | | | 10,439 |
| Audit and tax fees payable | | | 4,725 | | | 4,725 | | | 4,725 |
| Other accrued expenses | | | 3,078 | | | 5,458 | | | 1,999 |
| Dividend disbursing and transfer agent fees and expenses payable to affiliates | | | 2,108 | | | 7,504 | | | 4,439 |
| Accounting and administration expenses payable to affiliates | | | 1,207 | | | 3,456 | | | 2,179 |
| Legal fees payable to affiliates | | | 634 | | | 2,247 | | | 2,137 |
| Trustees’ fees and expenses payable to affiliates | | | 544 | | | 1,929 | | | 1,128 |
| Reports and statements to shareholders expenses payable to affiliates | | | 485 | | | 1,732 | | | 998 |
| Payable for securities purchased | | | — | | | — | | | 3,822,571 |
| Total Liabilities | | | 786,967 | | | 2,705,776 | | | 5,282,426 |
| Total Net Assets | | $ | 292,005,786 | | $ | 1,042,058,257 | | $ | 600,561,696 |
| | | | | | | | | | |
| Net Assets Consist of: | | | | | | | | | |
| Paid-in capital | | $ | 226,821,245 | | $ | 809,921,055 | | $ | 194,999,596 |
| Total distributable earnings (loss) | | | 65,184,541 | | | 232,137,202 | | | 405,562,100 |
| Total Net Assets | | $ | 292,005,786 | | $ | 1,042,058,257 | | $ | 600,561,696 |
103
Table of Contents
Statements of assets and liabilities
Delaware Group® Equity Funds IV (Trust)
| | Delaware | | Delaware | | Delaware |
| | Equity Income | | Growth and | | Growth Equity |
| | Fund | | Income Fund | | Fund |
| Net Asset Value | | | | | | | | | | | | |
| | | | | | | | | | | | | |
| Class A: | | | | | | | | | | | | |
| Net assets | | $ | 290,190,958 | | | $ | 1,037,062,112 | | | $ | 518,096,264 | |
| Shares of beneficial interest outstanding, unlimited authorization, no par | | | 38,592,512 | | | | 70,957,857 | | | | 29,384,404 | |
| Net asset value per share | | $ | 7.52 | | | $ | 14.62 | | | $ | 17.63 | |
| Sales charge | | | 5.75 | % | | | 5.75 | % | | | 5.75 | % |
| Offering price per share, equal to net asset value per share / (1 - sales charge) | | $ | 7.98 | | | $ | 15.51 | | | $ | 18.71 | |
| | | | | | | | | | | | | |
| Institutional Class: | | | | | | | | | | | | |
| Net assets | | $ | 1,794,115 | | | $ | 4,804,146 | | | $ | 80,647,489 | |
| Shares of beneficial interest outstanding, unlimited authorization, no par | | | 236,673 | | | | 328,221 | | | | 4,435,318 | |
| Net asset value per share | | $ | 7.58 | | | $ | 14.64 | | | $ | 18.18 | |
| | | | | | | | | | | | | |
| Class R6: | | | | | | | | | | | | |
| Net assets | | $ | 20,713 | | | $ | 191,999 | | | $ | 1,817,943 | |
| Shares of beneficial interest outstanding, unlimited authorization, no par | | | 2,758 | | | | 13,041 | | | | 99,124 | |
| Net asset value per share | | $ | 7.51 | | | $ | 14.72 | | | $ | 18.34 | |
| ____________________ |
| *Investments, at cost | | $ | 258,384,646 | | | $ | 905,082,884 | | | $ | 352,036,509 | |
See accompanying notes, which are an integral part of the financial statements.
104
Table of Contents
| | | | | | | | | Delaware |
| | | Delaware | | Delaware | | Covered Call |
| | | Opportunity | | Global Equity | | Strategy |
| | | | Fund | | Fund | | Fund |
| Assets: | | | | | | | | | |
| Investments, at value* | | $ | 665,993,044 | | $ | 248,013,377 | | $ | 132,673,291 |
| Foreign currencies, at valueΔ | | | — | | | 84,831 | | | — |
| Dividends and interest receivable | | | 867,345 | | | 448,375 | | | 49,498 |
| Receivable for fund shares sold | | | 188,260 | | | 36,840 | | | 130,105 |
| Receivable for securities sold | | | — | | | 126,401 | | | — |
| Foreign tax reclaims receivable | | | — | | | 1,262,326 | | | — |
| Other assets | | | 37,070 | | | 19,900 | | | 11,236 |
| Total Assets | | | 667,085,719 | | | 249,992,050 | | | 132,864,130 |
| Liabilities: | | | | | | | | | |
| Options written, at valueΣ | | | — | | | — | | | 2,211,853 |
| Due to custodian | | | 96 | | | — | | | — |
| Payable for fund shares redeemed | | | 805,520 | | | 211,138 | | | 208,613 |
| Investment management fees payable to affiliates | | | 412,483 | | | 179,266 | | | 81,489 |
| Dividend disbursing and transfer agent fees and expenses payable to non-affiliates | | | 290,711 | | | 96,492 | | | 49,470 |
| Distribution fees payable to affiliates | | | 139,603 | | | 49,786 | | | 20,296 |
| Reports and statements to shareholders expenses payable to non-affiliates | | | 73,417 | | | 38,870 | | | 19,797 |
| Accounting and administration fees payable to non-affiliates | | | 45,818 | | | 27,402 | | | 23,278 |
| Custody fees payable | | | 15,065 | | | 42,447 | | | 2,274 |
| Audit and tax fees payable | | | 5,175 | | | 5,175 | | | 6,355 |
| Dividend disbursing and transfer agent fees and expenses payable to affiliates | | | 4,789 | | | 1,809 | | | 942 |
| Other accrued expenses | | | 3,947 | | | 4,048 | | | 1,189 |
| Accounting and administration expenses payable to affiliates | | | 2,325 | | | 1,083 | | | 721 |
| Legal fees payable to affiliates | | | 1,421 | | | 537 | | | 279 |
| Trustees’ fees and expenses payable to affiliates | | | 1,220 | | | 461 | | | 240 |
| Reports and statements to shareholders expenses payable to affiliates | | | 1,106 | | | 414 | | | 216 |
| Unrealized depreciation on foreign currency exchange contracts | | | — | | | 285 | | | — |
| Total Liabilities | | | 1,802,696 | | | 659,213 | | | 2,627,012 |
| Total Net Assets | | $ | 665,283,023 | | $ | 249,332,837 | | $ | 130,237,118 |
| |
| Net Assets Consist of: | | | | | | | | | |
| Paid-in capital | | $ | 461,783,105 | | $ | 211,302,925 | | $ | 91,432,431 |
| Total distributable earnings (loss) | | | 203,499,918 | | | 38,029,912 | | | 38,804,687 |
| Total Net Assets | | $ | 665,283,023 | | $ | 249,332,837 | | $ | 130,237,118 |
105
Table of Contents
Statements of assets and liabilities
Delaware Group® Equity Funds IV (Trust)
| | | | | | | | | | Delaware |
| | Delaware | | Delaware | | Covered Call |
| | Opportunity | | Global Equity | | Strategy |
| | Fund | | Fund | | Fund |
| Net Asset Value | | | | | | | | | | | | |
| |
| Class A: | | | | | | | | | | | | |
| Net assets | | $ | 660,972,628 | | | $ | 233,849,939 | | | $ | 95,582,891 | |
| Shares of beneficial interest outstanding, unlimited authorization, no par | | | 19,476,970 | | | | 32,812,128 | | | | 7,287,636 | |
| Net asset value per share | | $ | 33.94 | | | $ | 7.13 | | | $ | 13.12 | |
| Sales charge | | | 5.75 | % | | | 5.75 | % | | | 5.75 | % |
| Offering price per share, equal to net asset value per share / (1 - sales charge) | | $ | 36.01 | | | $ | 7.56 | | | $ | 13.92 | |
| |
| Institutional Class: | | | | | | | | | | | | |
| Net assets | | $ | 4,082,893 | | | $ | 15,344,780 | | | $ | 34,606,466 | |
| Shares of beneficial interest outstanding, unlimited authorization, no par | | | 114,746 | | | | 2,052,619 | | | | 2,646,123 | |
| Net asset value per share | | $ | 35.58 | | | $ | 7.48 | | | $ | 13.08 | |
| |
| Class R6: | | | | | | | | | | | | |
| Net assets | | $ | 227,502 | | | $ | 138,118 | | | $ | 47,761 | |
| Shares of beneficial interest outstanding, unlimited authorization, no par | | | 6,406 | | | | 18,230 | | | | 3,666 | |
| Net asset value per share | | $ | 35.51 | | | $ | 7.58 | | | $ | 13.03 | |
| ____________________ |
| *Investments, at cost | | $ | 492,053,376 | | | $ | 231,530,416 | | | $ | 88,773,418 | |
| ΔForeign currencies, at cost | | | — | | | | 83,267 | | | | — | |
| ΣOptions written, premium received | | | — | | | | — | | | | (3,312,478 | ) |
See accompanying notes, which are an integral part of the financial statements.
106
Table of Contents
| | | Delaware | | | | | | | |
| | | Hedged | | | | | | | |
| | | U.S. Equity | | Delaware | | Delaware |
| | | Opportunities | | Premium | | Total Return |
| | | | Fund | | Income Fund | | Fund |
| Assets: | | | | | | | | | | |
| Investments, at value* | | $ | 69,524,601 | | $ | 57,895,418 | | | $ | 490,208,147 |
| Cash | | | 147 | | | — | | | | 243,837 |
| Cash collateral due from brokers | | | 738,154 | | | — | | | | 40,920 |
| Foreign currencies, at valueΔ | | | 9,114 | | | — | | | | 6,602 |
| Receivable for securities sold | | | 161,082 | | | — | | | | 5,005,529 |
| Variation margin due from broker on futures contracts | | | 144,906 | | | — | | | | — |
| Dividends and interest receivable | | | 55,243 | | | 34,038 | | | | 1,524,406 |
| Unrealized appreciation on foreign currency exchange contracts | | | 32,856 | | | — | | | | 15,321 |
| Receivable for fund shares sold | | | 24,957 | | | 49,997 | | | | 239,926 |
| Foreign tax reclaims receivable | | | 1,344 | | | — | | | | 150,381 |
| Upfront payments paid on credit default swap contracts | | | — | | | — | | | | 31,520 |
| Other assets | | | 5,108 | | | 2,452 | | | | 29,462 |
| Total Assets | | | 70,697,512 | | | 57,981,905 | | | | 497,496,051 |
| Liabilities: | | | | | | | | | | |
| Options written, at valueΣ | | | 436,075 | | | 9,626,774 | | | | — |
| Payable for securities purchased | | | 293,774 | | | — | | | | 5,719,185 |
| Payable for fund shares redeemed | | | 107,403 | | | 20,855 | | | | 746,140 |
| Investment management fees payable to affiliates | | | 46,877 | | | 17,297 | | | | 269,011 |
| Custody fees payable | | | 21,933 | | | 1,190 | | | | 38,304 |
| Accounting and administration fees payable to non-affiliates | | | 19,013 | | | 17,986 | | | | 38,102 |
| Dividend disbursing and transfer agent fees and expenses payable to non-affiliates | | | 18,129 | | | 12,155 | | | | 188,920 |
| Reports and statements to shareholders expenses payable to non-affiliates | | | 10,696 | | | 10,798 | | | | 64,378 |
| Distribution fees payable to affiliates | | | 9,604 | | | 4,616 | | | | 103,504 |
| Audit and tax fees payable | | | 4,950 | | | 4,950 | | | | 6,129 |
| Other accrued expenses | | | 1,259 | | | 588 | | | | 26,123 |
| Accounting and administration expenses payable to affiliates | | | 540 | | | 472 | | | | 1,804 |
| Dividend disbursing and transfer agent fees and expenses payable to affiliates | | | 507 | | | 345 | | | | 3,541 |
| Legal fees payable to affiliates | | | 150 | | | 102 | | | | 1,050 |
| Trustees’ fees and expenses payable to affiliates | | | 129 | | | 87 | | | | 901 |
| Reports and statements to shareholders expenses payable to affiliates | | | 116 | | | 80 | | | | 815 |
| Unrealized depreciation on foreign currency exchange contracts | | | — | | | — | | | | 9,354 |
| Cash collateral due to brokers | | | — | | | — | | | | 30,000 |
| Unrealized depreciation on credit default swap contracts | | | — | | | — | | | | 4,721 |
| Foreign capital gains tax payable | | | — | | | — | | | | 567 |
| Swap payments payable | | | — | | | — | | | | 61 |
| Variation margin due to broker on futures contracts* | | | — | | | — | | | | 1,922 |
| Total Liabilities | | | 971,155 | | | 9,718,295 | | | | 7,254,532 |
| Total Net Assets | | $ | 69,726,357 | | $ | 48,263,610 | | | $ | 490,241,519 |
| | | | | | | | | | | |
| Net Assets Consist of: | | | | | | | | | | |
| Paid-in capital | | $ | 52,938,439 | | $ | 53,053,233 | | | $ | 392,898,971 |
| Total distributable earnings (loss) | | | 16,787,918 | | | (4,789,623 | ) | | | 97,342,548 |
| Total Net Assets | | $ | 69,726,357 | | $ | 48,263,610 | | | $ | 490,241,519 |
107
Table of Contents
Statements of assets and liabilities
Delaware Group® Equity Funds IV (Trust)
| | Delaware | | | | | | | | |
| | Hedged | | | | | | | | |
| | U.S. Equity | | Delaware | | Delaware |
| | Opportunities | | Premium | | Total Return |
| | Fund | | Income Fund | | Fund |
| Net Asset Value | | | | | | | | | | | | |
| | | | | | | | | | | | | |
| Class A: | | | | | | | | | | | | |
| Net assets | | $ | 45,084,334 | | | $ | 22,015,093 | | | $ | 488,791,930 | |
| Shares of beneficial interest outstanding, unlimited authorization, no par | | | 4,420,275 | | | | 2,132,319 | | | | 28,473,531 | |
| Net asset value per share | | $ | 10.20 | | | $ | 10.32 | | | $ | 17.17 | |
| Sales charge | | | 5.75 | % | | | 5.75 | % | | | 5.75 | % |
| Offering price per share, equal to net asset value per share / (1 - sales charge) | | $ | 10.82 | | | $ | 10.95 | | | $ | 18.22 | |
| | | | | | | | | | | | | |
| Institutional Class: | | | | | | | | | | | | |
| Net assets | | $ | 24,625,446 | | | $ | 26,233,035 | | | $ | 1,387,960 | |
| Shares of beneficial interest outstanding, unlimited authorization, no par | | | 2,356,582 | | | | 2,539,371 | | | | 80,504 | |
| Net asset value per share | | $ | 10.45 | | | $ | 10.33 | | | $ | 17.24 | |
| | | | | | | | | | | | | |
| Class R6: | | | | | | | | | | | | |
| Net assets | | $ | 16,577 | | | $ | 15,482 | | | $ | 61,629 | |
| Shares of beneficial interest outstanding, unlimited authorization, no par | | | 1,584 | | | | 2,962 | | | | 3,565 | |
| Net asset value per share | | $ | 10.47 | | | $ | 5.23 | | | $ | 17.29 | |
____________________ | | | | | | | | | | | | |
| *Investments, at cost | | $ | 59,372,665 | | | $ | 47,074,210 | | | $ | 453,909,615 | |
| Δ Foreign currencies, at cost | | | 9,092 | | | | — | | | | 6,865 | |
| Σ Options written, premium received | | | (562,551 | ) | | | (10,379,173 | ) | | | — | |
See accompanying notes, which are an integral part of the financial statements.
108
Table of Contents
Statements of operations
Delaware Group® Equity Funds IV (Trust)
Year ended September 30, 2021
| | | Delaware | | Delaware | | Delaware |
| | | | Equity Income Fund | | Growth and Income Fund | | Growth Equity Fund |
| Investment Income: | | | | | | | | | | | | | | | | | | |
| Dividends | | | $ | 9,528,197 | | | | | $ | 31,677,933 | | | | | $ | 5,178,162 | | |
| | | | | | | | | | | | | | | | | | | |
| Expenses: | | | | | | | | | | | | | | | | | | |
| Management fees | | | | 2,049,681 | | | | | | 6,778,698 | | | | | | 4,083,658 | | |
| Distribution expenses — Class A | | | | 784,357 | | | | | | 2,726,634 | | | | | | 1,286,117 | | |
| Dividend disbursing and transfer agent fees and expenses | | | | 383,365 | | | | | | 1,445,093 | | | | | | 790,257 | | |
| Reports and statements to shareholders expenses | | | | 89,297 | | | | | | 284,707 | | | | | | 135,600 | | |
| Accounting and administration expenses | | | | 89,290 | | | | | | 213,892 | | | | | | 140,967 | | |
| Registration fees | | | | 52,642 | | | | | | 57,773 | | | | | | 55,773 | | |
| Audit and tax fees | | | | 45,255 | | | | | | 73,342 | | | | | | 56,252 | | |
| Legal fees | | | | 21,639 | | | | | | 61,389 | | | | | | 34,071 | | |
| Custodian fees | | | | 13,989 | | | | | | 38,439 | | | | | | 20,771 | | |
| Trustees’ fees and expenses | | | | 12,880 | | | | | | 44,429 | | | | | | 25,904 | | |
| Other | | | | 15,669 | | | | | | 33,338 | | | | | | 21,098 | | |
| | | | | 3,558,064 | | | | | | 11,757,734 | | | | | | 6,650,468 | | |
| Less expenses waived | | | | (37,417 | ) | | | | | (63 | ) | | | | | — | | |
| Less expenses paid indirectly | | | | (1,545 | ) | | | | | (5,021 | ) | | | | | (2,132 | ) | |
| Total operating expenses | | | | 3,519,102 | | | | | | 11,752,650 | | | | | | 6,648,336 | | |
| Net Investment Income (Loss) | | | | 6,009,095 | | | | | | 19,925,283 | | | | | | (1,470,174 | ) | |
| Net Realized and Unrealized Gain: | | | | | | | | | | | | | | | | | | |
| Net realized gain on: | | | | | | | | | | | | | | | | | | |
| Investments | | | | 40,762,390 | | | | | | 123,986,437 | | | | | | 166,788,168 | | |
| Net realized gain | | | | 40,762,390 | | | | | | 123,986,437 | | | | | | 166,788,168 | | |
| | | | | | | | | | | | | | | | | | | |
| Net change in unrealized appreciation (depreciation) of: | | | | | | | | | | | | | | | | | | |
| Investments | | | | 37,952,856 | | | | | | 150,039,410 | | | | | | 58,692,023 | | |
| Net change in unrealized appreciation (depreciation) | | | | 37,952,856 | | | | | | 150,039,410 | | | | | | 58,692,023 | | |
| Net Realized and Unrealized Gain | | | | 78,715,246 | | | | | | 274,025,847 | | | | | | 225,480,191 | | |
| Net Increase in Net Assets Resulting from Operations | | | $ | 84,724,341 | | | | | $ | 293,951,130 | | | | | $ | 224,010,017 | | |
See accompanying notes, which are an integral part of the financial statements.
109
Table of Contents
Statements of operations
Delaware Group® Equity Funds IV (Trust)
| | | | | | | | | | | | | | | Delaware |
| | | Delaware | | Delaware | | Covered Call Strategy |
| | | | Opportunity Fund | | Global Equity Fund | | Fund |
| Investment Income: | | | | | | | | | | | | | | | | | | |
| Dividends | | | $ | 18,015,804 | | | | | $ | 7,042,515 | | | | | $ | 2,659,039 | | |
| Foreign tax withheld | | | | — | | | | | | (650,094 | ) | | | | | — | | |
| | | | | 18,015,804 | | | | | | 6,392,421 | | | | | | 2,659,039 | | |
| | | | | | | | | | | | | | | | | | | |
| Expenses: | | | | | | | | | | | | | | | | | | |
| Management fees | | | | 5,109,899 | | | | | | 2,360,950 | | | | | | 1,166,920 | | |
| Distribution expenses — Class A | | | | 1,725,215 | | | | | | 652,191 | | | | | | 274,983 | | |
| Dividend disbursing and transfer agent fees and expenses | | | | 960,231 | | | | | | 360,401 | | | | | | 200,047 | | |
| Reports and statements to shareholders expenses | | | | 147,287 | | | | | | 65,791 | | | | | | 38,007 | | |
| Accounting and administration expenses | | | | 149,734 | | | | | | 83,294 | | | | | | 64,248 | | |
| Registration fees | | | | 53,391 | | | | | | 51,950 | | | | | | 48,360 | | |
| Audit and tax fees | | | | 59,262 | | | | | | 46,219 | | | | | | 46,354 | | |
| Legal fees | | | | 36,631 | | | | | | 15,733 | | | | | | 8,612 | | |
| Custodian fees | | | | 28,954 | | | | | | 67,077 | | | | | | 4,837 | | |
| Trustees’ fees and expenses | | | | 27,873 | | | | | | 11,497 | | | | | | 6,148 | | |
| Other | | | | 24,418 | | | | | | 20,509 | | | | | | 14,050 | | |
| | | | | 8,322,895 | | | | | | 3,735,612 | | | | | | 1,872,566 | | |
| Less expenses waived | | | | (2,106 | ) | | | | | (6,840 | ) | | | | | (49,832 | ) | |
| Less expenses paid indirectly | | | | (3,299 | ) | | | | | (1,435 | ) | | | | | (921 | ) | |
| Total operating expenses | | | | 8,317,490 | | | | | | 3,727,337 | | | | | | 1,821,813 | | |
| Net Investment Income | | | | 9,698,314 | | | | | | 2,665,084 | | | | | | 837,226 | | |
| Net Realized and Unrealized Gain (Loss): | | | | | | | | | | | | | | | | | | |
| Net realized gain (loss) on: | | | | | | | | | | | | | | | | | | |
| Investments | | | | 41,816,533 | | | | | | 23,466,804 | | | | | | 28,498,661 | | |
| Foreign currencies | | | | — | | | | | | (25,506 | ) | | | | | — | | |
| Foreign currency exchange contracts | | | | — | | | | | | (150,018 | ) | | | | | — | | |
| Options written | | | | — | | | | | | — | | | | | | (4,903,922 | ) | |
| Net realized gain | | | | 41,816,533 | | | | | | 23,291,280 | | | | | | 23,594,739 | | |
| | | | | | | | | | | | | | | | | | | |
| Net change in unrealized appreciation (depreciation) of: | | | | | | | | | | | | | | | | | | |
| Investments | | | | 209,856,575 | | | | | | 7,690,351 | | | | | | 4,792,954 | | |
| Foreign currencies | | | | — | | | | | | (31,751 | ) | | | | | — | | |
| Foreign currency exchange contracts | | | | — | | | | | | 777 | | | | | | — | | |
| Options written | | | | — | | | | | | — | | | | | | (1,465,684 | ) | |
| Net change in unrealized appreciation (depreciation) | | | | 209,856,575 | | | | | | 7,659,377 | | | | | | 3,327,270 | | |
| Net Realized and Unrealized Gain | | | | 251,673,108 | | | | | | 30,950,657 | | | | | | 26,922,009 | | |
| Net Increase in Net Assets Resulting from Operations | | | $ | 261,371,422 | | | | | $ | 33,615,741 | | | | | $ | 27,759,235 | | |
See accompanying notes, which are an integral part of the financial statements.
110
Table of Contents
| | | Delaware | | | | | | | | | | | |
| | | Hedged U.S. Equity | | Delaware | | Delaware |
| | | | Opportunities Fund | | Premium Income Fund | | Total Return Fund |
| Investment Income: | | | | | | | | | | | | | | | | | |
| Dividends | | | $ | 882,787 | | | | | $ | 1,524,625 | | | | | $ | 8,925,449 | |
| Interest | | | | — | | | | | | — | | | | | | 5,347,113 | |
| Foreign tax withheld | | | | (4,951 | ) | | | | | — | | | | | | (144,776 | ) |
| | | | | 877,836 | | | | | | 1,524,625 | | | | | | 14,127,786 | |
| |
| Expenses: | | | | | | | | | | | | | | | | | |
| Management fees | | | | 872,037 | | | | | | 428,563 | | | | | | 3,476,438 | |
| Distribution expenses — Class A | | | | 127,238 | | | | | | 66,182 | | | | | | 1,341,234 | |
| Dividend disbursing and transfer agent fees and expenses | | | | 88,238 | | | | | | 60,992 | | | | | | 656,364 | |
| Reports and statements to shareholders expenses | | | | 21,695 | | | | | | 18,555 | | | | | | 139,025 | |
| Accounting and administration expenses | | | | 51,070 | | | | | | 47,527 | | | | | | 124,753 | |
| Registration fees | | | | 49,634 | | | | | | 46,570 | | | | | | 53,762 | |
| Audit and tax fees | | | | 43,747 | | | | | | 40,208 | | | | | | 82,188 | |
| Legal fees | | | | 4,115 | | | | | | 3,108 | | | | | | 51,015 | |
| Custodian fees | | | | 30,715 | | | | | | 2,514 | | | | | | 59,712 | |
| Trustees’ fees and expenses | | | | 3,136 | | | | | | 2,301 | | | | | | 22,376 | |
| Other | | | | 14,150 | | | | | | 12,787 | | | | | | 71,456 | |
| | | | | 1,305,775 | | | | | | 729,307 | | | | | | 6,078,323 | |
| Less expenses waived | | | | (147,824 | ) | | | | | (101,080 | ) | | | | | (42 | ) |
| Less expenses paid indirectly | | | | (380 | ) | | | | | (277 | ) | | | | | (2,835 | ) |
| Total operating expenses | | | | 1,157,571 | | | | | | 627,950 | | | | | | 6,075,446 | |
| Net Investment Income (Loss) | | | | (279,735 | ) | | | | | 896,675 | | | | | | 8,052,340 | |
| Net Realized and Unrealized Gain (Loss): | | | | | | | | | | | | | | | | | |
| Net realized gain (loss) on: | | | | | | | | | | | | | | | | | |
| Investments | | | | 16,148,297 | | | | | | 4,524,011 | | | | | | 66,481,789 | |
| Foreign currencies | | | | 2,700 | | | | | | — | | | | | | (9,900 | ) |
| Foreign currency exchange contracts | | | | (110,089 | ) | | | | | — | | | | | | 14,216 | |
| Futures contracts | | | | (4,939,868 | ) | | | | | — | | | | | | 69,358 | |
| Options purchased | | | | (2,273,652 | ) | | | | | (10,532,028 | ) | | | | | — | |
| Options written | | | | 1,134,086 | | | | | | — | | | | | | — | |
| Swap contracts | | | | — | | | | | | — | | | | | | (23,521 | ) |
| Net realized gain (loss) | | | | 9,961,474 | | | | | | (6,008,017 | ) | | | | | 66,531,942 | |
| |
| Net change in unrealized appreciation (depreciation) of: | | | | | | | | | | | | | | | | | |
| Investments1 | | | | 556,687 | | | | | | 11,846,191 | | | | | | 33,695,963 | |
| Foreign currencies | | | | (126 | ) | | | | | — | | | | | | (5,766 | ) |
| Foreign currency exchange contracts | | | | (11,903 | ) | | | | | — | | | | | | 10,904 | |
| Futures contracts | | | | 366,073 | | | | | | — | | | | | | 39,796 | |
| Options purchased | | | | (232,657 | ) | | | | | — | | | | | | — | |
| Options written | | | | 112,272 | | | | | | (311,830 | ) | | | | | — | |
| Swap contracts | | | | — | | | | | | — | | | | | | 2,214 | |
| Net change in unrealized appreciation (depreciation) | | | | 790,346 | | | | | | 11,534,361 | | | | | | 33,743,111 | |
| Net Realized and Unrealized Gain | | | | 10,751,820 | | | | | | 5,526,344 | | | | | | 100,275,053 | |
| Net Increase in Net Assets Resulting from Operations | | | $ | 10,472,085 | | | | | $ | 6,423,019 | | | | | $ | 108,327,393 | |
| 1 | Includes $(567) capital gains tax accrued for Delaware Total Return Fund. |
See accompanying notes, which are an integral part of the financial statements.
111
Table of Contents
Statements of changes in net assets
Delaware Group® Equity Funds IV (Trust)
| | | | | Delaware Equity Income Fund | | Delaware Growth and Income Fund |
| | | | Year ended | | Year ended |
| | | | 9/30/21 | | 9/30/20 | | 9/30/21 | | 9/30/20 |
| Increase (Decrease) in Net Assets from Operations: | | | | | | | | | | | | | | | | |
| Net investment income | | $ | 6,009,095 | | | $ | 5,835,970 | | | $ | 19,925,283 | | | $ | 20,834,476 | |
| Net realized gain | | | 40,762,390 | | | | 106,713,928 | | | | 123,986,437 | | | | 355,058,601 | |
| Net change in unrealized appreciation (depreciation) | | | 37,952,856 | | | | (144,981,746 | ) | | | 150,039,410 | | | | (480,016,900 | ) |
| Net increase (decrease) in net assets resulting from operations | | | 84,724,341 | | | | (32,431,848 | ) | | | 293,951,130 | | | | (104,123,823 | ) |
| | | | | | | | | | | | | | | | | | |
| Dividends and Distributions to Shareholders from: | | | | | | | | | | | | | | | | |
| Distributable earnings: | | | | | | | | | | | | | | | | |
| | Class A | | | (24,457,751 | ) | | | (132,797,526 | ) | | | (71,056,321 | ) | | | (491,601,820 | ) |
| | Institutional Class1 | | | (110,899 | ) | | | (336,217 | ) | | | (340,754 | ) | | | (2,861,172 | ) |
| | Class R62 | | | (6,268 | ) | | | (386,245 | ) | | | (17,294 | ) | | | (1,904,446 | ) |
| | | | | (24,574,918 | ) | | | (133,519,988 | ) | | | (71,414,369 | ) | | | (496,367,438 | ) |
| | | | | | | | | | | | | | | | | | |
| Capital Share Transactions: | | | | | | | | | | | | | | | | |
| Proceeds from shares sold: | | | | | | | | | | | | | | | | |
| | Class A | | | 8,476,289 | | | | 21,226,285 | | | | 31,810,651 | | | | 57,869,184 | |
| | Institutional Class1 | | | 1,040,174 | | | | 903,185 | | | | 2,213,795 | | | | 3,311,866 | |
| | Class R62 | | | — | | | | 179,886 | | | | — | | | | 352,004 | |
| | | | | | | | | | | | | | | | | | |
| Net asset value of shares issued upon reinvestment of dividends | | | | | | | | | | | | | | | | |
| | and distributions: | | | | | | | | | | | | | | | | |
| | Class A | | | 24,369,427 | | | | 131,262,560 | | | | 70,843,149 | | | | 487,454,636 | |
| | Institutional Class1 | | | 110,899 | | | | 311,497 | | | | 340,033 | | | | 2,801,661 | |
| | Class R62 | | | 6,268 | | | | 386,245 | | | | 17,294 | | | | 1,904,446 | |
| | | | | 34,003,057 | | | | 154,269,658 | | | | 105,224,922 | | | | 553,693,797 | |
| Cost of shares redeemed: | | | | | | | | | | | | | | | | |
| | Class A | | | (107,437,014 | ) | | | (151,101,932 | ) | | | (310,857,682 | ) | | | (390,939,730 | ) |
| | Institutional Class1 | | | (533,493 | ) | | | (1,704,420 | ) | | | (2,772,085 | ) | | | (20,418,470 | ) |
| | Class R62 | | | (697,843 | ) | | | (819,926 | ) | | | (2,667,596 | ) | | | (2,837,045 | ) |
| | | | | (108,668,350 | ) | | | (153,626,278 | ) | | | (316,297,363 | ) | | | (414,195,245 | ) |
| Increase (decrease) in net assets derived from capital share | | | | | | | | | | | | | | | | |
| | transactions | | | (74,665,293 | ) | | | 643,380 | | | | (211,072,441 | ) | | | 139,498,552 | |
| Net Increase (Decrease) in Net Assets | | | (14,515,870 | ) | | | (165,308,456 | ) | | | 11,464,320 | | | | (460,992,709 | ) |
| | | | | | | | | | | | | | | | | | |
| Net Assets: | | | | | | | | | | | | | | | | |
| Beginning of year | | | 306,521,656 | | | | 471,830,112 | | | | 1,030,593,937 | | | | 1,491,586,646 | |
| End of year | | $ | 292,005,786 | | | $ | 306,521,656 | | | $ | 1,042,058,257 | | | $ | 1,030,593,937 | |
| 1 | On October 4, 2019, Advisor Class shares were reorganized into Institutional Class shares. See Notes to financial statements. |
| 2 | On October 4, 2019, Institutional Class shares were reorganized into Class R6 shares. See Notes to financial statements. |
See accompanying notes, which are an integral part of the financial statements.
112
Table of Contents
| | | | | Delaware Growth Equity Fund | | Delaware Opportunity Fund |
| | | | Year ended | | Year ended |
| | | | 9/30/21 | | 9/30/20 | | 9/30/21 | | 9/30/20 |
| Increase (Decrease) in Net Assets from Operations: | | | | | | | | | | | | | | | | |
| Net investment income (loss) | | $ | (1,470,174 | ) | | $ | (1,004,744 | ) | | $ | 9,698,314 | | | $ | 4,486,312 | |
| Net realized gain | | | 166,788,168 | | | | 52,514,563 | | | | 41,816,533 | | | | 152,637,370 | |
| Net change in unrealized appreciation (depreciation) | | | 58,692,023 | | | | 86,054,104 | | | | 209,856,575 | | | | (265,065,831 | ) |
| Net increase (decrease) in net assets resulting from operations | | | 224,010,017 | | | | 137,563,923 | | | | 261,371,422 | | | | (107,942,149 | ) |
| | | | | | | | | | | | | | | | | | |
| Dividends and Distributions to Shareholders from: | | | | | | | | | | | | | | | | |
| Distributable earnings: | | | | | | | | | | | | | | | | |
| | Class A | | | (44,227,721 | ) | | | (51,258,363 | ) | | | (5,426,910 | ) | | | (260,597,869 | ) |
| | Institutional Class1 | | | (11,172,975 | ) | | | (14,562,190 | ) | | | (29,402 | ) | | | (1,436,451 | ) |
| | Class R62 | | | (70,467 | ) | | | (406,462 | ) | | | — | | | | (621,869 | ) |
| | | | | (55,471,163 | ) | | | (66,227,015 | ) | | | (5,456,312 | ) | | | (262,656,189 | ) |
| | | | | | | | | | | | | | | | | | |
| Capital Share Transactions: | | | | | | | | | | | | | | | | |
| Proceeds from shares sold: | | | | | | | | | | | | | | | | |
| | Class A | | | 32,140,436 | | | | 41,056,959 | | | | 20,796,944 | | | | 42,545,399 | |
| | Institutional Class1 | | | 31,792,980 | | | | 30,743,036 | | | | 1,949,558 | | | | 1,619,419 | |
| | Class R62 | | | 1,129,570 | | | | 1,185,958 | | | | 26,918 | | | | 306,732 | |
| | | | | | | | | | | | | | | | | | |
| Net asset value of shares issued upon reinvestment of dividends and | | | | | | | | | | | | | | | | |
| | distributions: | | | | | | | | | | | | | | | | |
| | Class A | | | 44,114,355 | | | | 50,800,590 | | | | 5,409,732 | | | | 258,629,421 | |
| | Institutional Class1 | | | 11,166,619 | | | | 14,146,829 | | | | 29,402 | | | | 1,387,018 | |
| | Class R62 | | | 70,467 | | | | 406,461 | | | | — | | | | 621,869 | |
| | | | | 120,414,427 | | | | 138,339,833 | | | | 28,212,554 | | | | 305,109,858 | |
| Cost of shares redeemed: | | | | | | | | | | | | | | | | |
| | Class A | | | (163,229,065 | ) | | | (184,763,540 | ) | | | (219,420,050 | ) | | | (249,059,513 | ) |
| | Institutional Class1 | | | (119,660,332 | ) | | | (79,327,920 | ) | | | (1,476,289 | ) | | | (8,988,193 | ) |
| | Class R62 | | | (3,336,162 | ) | | | (2,450,659 | ) | | | (1,010,135 | ) | | | (1,403,898 | ) |
| | | | | (286,225,559 | ) | | | (266,542,119 | ) | | | (221,906,474 | ) | | | (259,451,604 | ) |
| Increase (decrease) in net assets derived from capital share | | | | | | | | | | | | | | | | |
| | transactions | | | (165,811,132 | ) | | | (128,202,286 | ) | | | (193,693,920 | ) | | | 45,658,254 | |
| | Net Increase (Decrease) in Net Assets | | | 2,727,722 | | | | (56,865,378 | ) | | | 62,221,190 | | | | (324,940,084 | ) |
| | | | | | | | | | | | | | | | | | |
| Net Assets: | | | | | | | | | | | | | | | | |
| Beginning of year | | | 597,833,974 | | | | 654,699,352 | | | | 603,061,833 | | | | 928,001,917 | |
| End of year | | $ | 600,561,696 | | | $ | 597,833,974 | | | $ | 665,283,023 | | | $ | 603,061,833 | |
| 1 | On October 4, 2019, Advisor Class shares were reorganized into Institutional Class shares. See Notes to financial statements. |
| 2 | On October 4, 2019, Institutional Class shares were reorganized into Class R6 shares. See Notes to financial statements. |
See accompanying notes, which are an integral part of the financial statements.
113
Table of Contents
Statements of changes in net assets
Delaware Group® Equity Funds IV (Trust)
| | | | | Delaware Global Equity Fund | | Delaware Covered Call Strategy Fund |
| | | | Year ended | | Year ended |
| | | | 9/30/21 | | 9/30/20 | | 9/30/21 | | 9/30/20 |
| Increase (Decrease) in Net Assets from Operations: | | | | | | | | | | | | | | | | |
| Net investment income | | $ | 2,665,084 | | | $ | 2,848,858 | | | $ | 837,226 | | | $ | 2,532,386 | |
| Net realized gain (loss) | | | 23,291,280 | | | | 63,037,800 | | | | 23,594,739 | | | | (4,963,332 | ) |
| Net change in unrealized appreciation (depreciation) | | | 7,659,377 | | | | (55,098,902 | ) | | | 3,327,270 | | | | (13,267,870 | ) |
| Net increase (decrease) in net assets resulting from operations | | | 33,615,741 | | | | 10,787,756 | | | | 27,759,235 | | | | (15,698,816 | ) |
| | | |
| Dividends and Distributions to Shareholders from: | | | | | | | | | | | | | | | | |
| Distributable earnings: | | | | | | | | | | | | | | | | |
| | Class A | | | (12,688,395 | ) | | | (47,492,756 | ) | | | (677,582 | ) | | | (1,835,673 | ) |
| | Institutional Class1 | | | (805,368 | ) | | | (3,789,098 | ) | | | (320,034 | ) | | | (673,147 | ) |
| | Class R62 | | | (2,751 | ) | | | (280,865 | ) | | | (978 | ) | | | (12,223 | ) |
| | | | | (13,496,514 | ) | | | (51,562,719 | ) | | | (998,594 | ) | | | (2,521,043 | ) |
| | | |
| Capital Share Transactions: | | | | | | | | | | | | | | | | |
| Proceeds from shares sold: | | | | | | | | | | | | | | | | |
| | Class A | | | 6,700,103 | | | | 12,759,103 | | | | 5,000,427 | | | | 18,268,580 | |
| | Institutional Class1 | | | 1,481,082 | | | | 4,378,398 | | | | 2,882,027 | | | | 7,106,153 | |
| | Class R62 | | | 118,387 | | | | 187,613 | | | | 42,113 | | | | 76,426 | |
| | | |
| Net asset value of shares issued upon reinvestment of dividends | | | | | | | | | | | | | | | | |
| | and distributions: | | | | | | | | | | | | | | | | |
| | Class A | | | 12,628,543 | | | | 46,817,307 | | | | 673,593 | | | | 1,811,286 | |
| | Institutional Class1 | | | 805,368 | | | | 3,775,915 | | | | 296,723 | | | | 625,930 | |
| | Class R62 | | | 2,751 | | | | 280,865 | | | | 787 | | | | 11,557 | |
| | | | | 21,736,234 | | | | 68,199,201 | | | | 8,895,670 | | | | 27,899,932 | |
| Cost of shares redeemed: | | | | | | | | | | | | | | | | |
| | Class A | | | (75,417,284 | ) | | | (95,565,732 | ) | | | (52,033,124 | ) | | | (96,821,816 | ) |
| | Institutional Class1 | | | (5,681,192 | ) | | | (62,707,530 | ) | | | (12,821,056 | ) | | | (31,441,208 | ) |
| | Class R62 | | | (1,304,516 | ) | | | (886,084 | ) | | | (253,701 | ) | | | (1,233,538 | ) |
| | | | | (82,402,992 | ) | | | (159,159,346 | ) | | | (65,107,881 | ) | | | (129,496,562 | ) |
| Decrease in net assets derived from capital share transactions | | | (60,666,758 | ) | | | (90,960,145 | ) | | | (56,212,211 | ) | | | (101,596,630 | ) |
| | Net Decrease in Net Assets | | | (40,547,531 | ) | | | (131,735,108 | ) | | | (29,451,570 | ) | | | (119,816,489 | ) |
| | | | | | | | | | | | | | | | | |
| Net Assets: | | | | | | | | | | | | | | | | |
| Beginning of year | | | 289,880,368 | | | | 421,615,476 | | | | 159,688,688 | | | | 279,505,177 | |
| End of year | | $ | 249,332,837 | | | $ | 289,880,368 | | | $ | 130,237,118 | | | $ | 159,688,688 | |
| 1 | On October 4, 2019, Advisor Class shares were reorganized into Institutional Class shares. See Notes to financial statements. |
| 2 | On October 4, 2019, Institutional Class shares were reorganized into Class R6 shares. See Notes to financial statements. |
See accompanying notes, which are an integral part of the financial statements.
114
Table of Contents
| | | | | Delaware Hedged U.S. Equity Opportunities Fund | | Delaware Premium Income Fund |
| | | | Year ended | | Year ended |
| | | | 9/30/21 | | 9/30/20 | | 9/30/21 | | 9/30/20 |
| Increase (Decrease) in Net Assets from | | | | | | | | | | | | | | | | | | | | |
| Operations: | | | | | | | | | | | | | | | | | | | | |
| Net investment income (loss) | | | $ | (279,735 | ) | | | | $ | (39,903 | ) | | | $ | 896,675 | | | $ | 2,189,714 | |
| Net realized gain (loss) | | | | 9,961,474 | | | | | | 20,051,043 | | | | | (6,008,017 | ) | | | (9,955,759 | ) |
| Net change in unrealized appreciation (depreciation) | | | | 790,346 | | | | | | (11,743,058 | ) | | | | 11,534,361 | | | | 1,029,161 | |
| Net increase (decrease) in net assets resulting from | | | | | | | | | | | | | | | | | | | | |
| | operations | | | | 10,472,085 | | | | | | 8,268,082 | | | | | 6,423,019 | | | | (6,736,884 | ) |
| | | | | | | | | | | | | | | | | | | | | | |
| Dividends and Distributions to Shareholders | | | | | | | | | | | | | | | | | | | | |
| from: | | | | | | | | | | | | | | | | | | | | |
| Distributable earnings: | | | | | | | | | | | | | | | | | | | | |
| | Class A | | | | (12,646,227 | ) | | | | | (11,099,496 | ) | | | | (403,701 | ) | | | (1,633,590 | ) |
| | Institutional Class1 | | | | (4,921,276 | ) | | | | | (4,445,817 | ) | | | | (491,110 | ) | | | (1,969,385 | ) |
| | Class R62 | | | | (22,403 | ) | | | | | (49,879 | ) | | | | (1,540 | ) | | | (3,282 | ) |
| | | | | | (17,589,906 | ) | | | | | (15,595,192 | ) | | | | (896,351 | ) | | | (3,606,257 | ) |
| | | | | | | | | | | | | | | | | | | | | | |
| Capital Share Transactions: | | | | | | | | | | | | | | | | | | | | |
| Proceeds from shares sold: | | | | | | | | | | | | | | | | | | | | |
| | Class A | | | | 6,493,969 | | | | | | 7,719,313 | | | | | 947,867 | | | | 7,031,159 | |
| | Institutional Class1 | | | | 16,845,480 | | | | | | 6,202,399 | | | | | 5,013,875 | | | | 13,762,407 | |
| | Class R62 | | | | 38,668 | | | | | | 80,032 | | | | | — | | | | 27,712 | |
| | | | | | | | | | | | | | | | | | | | | | |
| Net asset value of shares issued upon reinvestment of | | | | | | | | | | | | | | | | | | | | |
| | dividends and distributions: | | | | | | | | | | | | | | | | | | | | |
| | Class A | | | | 12,579,722 | | | | | | 10,953,456 | | | | | 399,834 | | | | 1,601,078 | |
| | Institutional Class1 | | | | 4,921,276 | | | | | | 4,430,714 | | | | | 459,186 | | | | 1,869,625 | |
| | Class R62 | | | | 22,403 | | | | | | 49,879 | | | | | 1,412 | | | | 3,073 | |
| | | | | | 40,901,518 | | | | | | 29,435,793 | | | | | 6,822,174 | | | | 24,295,054 | |
| Cost of shares redeemed: | | | | | | | | | | | | | | | | | | | | |
| | Class A | | | | (24,132,677 | ) | | | | | (36,331,747 | ) | | | | (13,596,508 | ) | | | (33,215,498 | ) |
| | Institutional Class1 | | | | (14,722,965 | ) | | | | | (33,680,974 | ) | | | | (14,741,378 | ) | | | (45,142,958 | ) |
| | Class R62 | | | | (125,139 | ) | | | | | (353,825 | ) | | | | (22,568 | ) | | | (20,372 | ) |
| | | | | | (38,980,781 | ) | | | | | (70,366,546 | ) | | | | (28,360,454 | ) | | | (78,378,828 | ) |
| Increase (decrease) in net assets derived from capital | | | | | | | | | | | | | | | | | | | | |
| | share transactions | | | | 1,920,737 | | | | | | (40,930,753 | ) | | | | (21,538,280 | ) | | | (54,083,774 | ) |
| Net Decrease in Net Assets | | | | (5,197,084 | ) | | | | | (48,257,863 | ) | | | | (16,011,612 | ) | | | (64,426,915 | ) |
| | | | | | | | | | | | | | | | | | | | | | |
| Net Assets: | | | | | | | | | | | | | | | | | | | | |
| Beginning of year | | | | 74,923,441 | | | | | | 123,181,304 | | | | | 64,275,222 | | | | 128,702,137 | |
| End of year | | | $ | 69,726,357 | | | | | $ | 74,923,441 | | | | $ | 48,263,610 | | | $ | 64,275,222 | |
| 1 | On October 4, 2019, Advisor Class shares were reorganized into Institutional Class shares. See Notes to financial statements. |
| 2 | On October 4, 2019, Institutional Class shares were reorganized into Class R6 shares. See Notes to financial statements. |
See accompanying notes, which are an integral part of the financial statements.
115
Table of Contents
Statements of changes in net assets
Delaware Group® Equity Funds IV (Trust)
| | | | | Delaware Total Return Fund |
| | | | Year ended |
| | | | 9/30/21 | | 9/30/20 |
| Increase (Decrease) in Net Assets from Operations: | | | | | | | | |
| Net investment income | | $ | 8,052,340 | | | $ | 12,357,635 | |
| Net realized gain | | | 66,531,942 | | | | 102,760,183 | |
| Net change in unrealized appreciation (depreciation) | | | 33,743,111 | | | | (149,042,507 | ) |
| Net increase (decrease) in net assets resulting from operations | | | 108,327,393 | | | | (33,924,689 | ) |
| | | | | | | | | | |
| Dividends and Distributions to Shareholders from: | | | | | | | | |
| Distributable earnings: | | | | | | | | |
| | Class A | | | (10,186,083 | ) | | | (156,963,527 | ) |
| | Institutional Class1 | | | (25,842 | ) | | | (193,281 | ) |
| | Class R62 | | | (3,194 | ) | | | (363,775 | ) |
| | | | | | | | | | |
| Return of capital: | | | | | | | | |
| | Class A | | | — | | | | (250,419 | ) |
| | Institutional Class | | | — | | | | (348 | ) |
| | Class R6 | | | — | | | | (345 | ) |
| | | | | (10,215,119 | ) | | | (157,771,695 | ) |
| | | | | | | | | | |
| Capital Share Transactions: | | | | | | | | |
| Proceeds from shares sold: | | | | | | | | |
| | Class A | | | 19,064,709 | | | | 37,411,499 | |
| | Institutional Class1 | | | 1,197,743 | | | | 1,066,775 | |
| | Class R62 | | | 1,596 | | | | 156,157 | |
| | | | | | | | | | |
| Net asset value of shares issued upon reinvestment of dividends and distributions: | | | | | | | | |
| | Class A | | | 10,098,032 | | | | 155,382,017 | |
| | Institutional Class1 | | | 25,842 | | | | 176,086 | |
| | Class R62 | | | 3,194 | | | | 364,120 | |
| | | | | 30,391,116 | | | | 194,556,654 | |
| Cost of shares redeemed: | | | | | | | | |
| | Class A | | | (188,287,340 | ) | | | (252,634,094 | ) |
| | Institutional Class1 | | | (790,311 | ) | | | (1,432,600 | ) |
| | Class R62 | | | (735,529 | ) | | | (1,293,618 | ) |
| | | | | (189,813,180 | ) | | | (255,360,312 | ) |
| Decrease in net assets derived from capital share transactions | | | (159,422,064 | ) | | | (60,803,658 | ) |
| Net Decrease in Net Assets | | | (61,309,790 | ) | | | (252,500,042 | ) |
| | | | | | | | | | |
| Net Assets: | | | | | | | | |
| Beginning of year | | | 551,551,309 | | | | 804,051,351 | |
| End of year | | $ | 490,241,519 | | | $ | 551,551,309 | |
| 1 | On October 4, 2019, Advisor Class shares were reorganized into Institutional Class shares. See Notes to financial statements. |
| 2 | On October 4, 2019, Institutional Class shares were reorganized into Class R6 shares. See Notes to financial statements. |
See accompanying notes, which are an integral part of the financial statements.
116
Table of Contents
Financial highlights
Delaware Equity Income Fund Class A
Selected data for each share of the Fund outstanding throughout each period were as follows:
| | Year ended |
| | 9/30/21 | | 9/30/201 | | 9/30/19 | | 9/30/18 | | 9/30/17 |
| Net asset value, beginning of period | | $ | 6.24 | | | $ | 9.68 | | | $ | 11.09 | | | $ | 10.71 | | | $ | 9.72 | |
| | | | | | | | | | | | | | | | | | | | | |
| Income (loss) from investment operations: | | | | | | | | | | | | | | | | | | | | |
| Net investment income2 | | | 0.14 | | | | 0.11 | | | | 0.15 | | | | 0.26 | | | | 0.16 | |
| Net realized and unrealized gain (loss) | | | 1.69 | | | | (0.51 | ) | | | (0.16 | ) | | | 0.65 | | | | 1.22 | |
| Total from investment operations | | | 1.83 | | | | (0.40 | ) | | | (0.01 | ) | | | 0.91 | | | | 1.38 | |
| | | | | | | | | | | | | | | | | | | | | |
| Less dividends and distributions from: | | | | | | | | | | | | | | | | | | | | |
| Net investment income | | | (0.10 | ) | | | (0.13 | ) | | | (0.26 | ) | | | (0.17 | ) | | | (0.21 | ) |
| Net realized gain | | | (0.45 | ) | | | (2.91 | ) | | | (1.14 | ) | | | (0.36 | ) | | | (0.18 | ) |
| Total dividends and distributions | | | (0.55 | ) | | | (3.04 | ) | | | (1.40 | ) | | | (0.53 | ) | | | (0.39 | ) |
| | | | | | | | | | | | | | | | | | | | | |
| Net asset value, end of period | | $ | 7.52 | | | $ | 6.24 | | | $ | 9.68 | | | $ | 11.09 | | | $ | 10.71 | |
| | | | | | | | | | | | | | | | | | | | | |
| Total return3 | | | 30.49% | 4 | | | (7.89% | ) | | | 1.83% | | | | 8.68% | | | | 14.46% | |
| | | | | | | | | | | | | | | | | | | | | |
| Ratios and supplemental data: | | | | | | | | | | | | | | | | | | | | |
| Net assets, end of period (000 omitted) | | $ | 290,191 | | | $ | 304,917 | | | $ | 468,634 | | | $ | 545,810 | | | $ | 564,918 | |
| Ratio of expenses to average net assets5 | | | 1.12% | | | | 1.16% | | | | 1.19% | | | | 1.20% | | | | 1.20% | |
| Ratio of expenses to average net assets prior to fees waived5 | | | 1.13% | | | | 1.16% | | | | 1.19% | | | | 1.20% | | | | 1.20% | |
| Ratio of net investment income to average net assets | | | 1.90% | | | | 1.56% | | | | 1.58% | | | | 2.42% | | | | 1.58% | |
| Ratio of net investment income to average net assets prior to | | | | | | | | | | | | | | | | | | | | |
| fees waived | | | 1.89% | | | | 1.56% | | | | 1.58% | | | | 2.42% | | | | 1.58% | |
| Portfolio turnover | | | 57% | | | | 114% | 6 | | | 39% | | | | 35% | | | | 15% | |
| 1 | On October 4, 2019, Class A shares of First Investors Equity Income Fund were reorganized into Class A shares of Delaware Equity Income Fund. See Notes to financial statements. The Class A shares’ financial highlights for the periods prior to October 4, 2019, reflect the performance of First Investors Equity Income Fund Class A shares. |
| 2 | Calculated using average shares outstanding. |
| 3 | Total return is based on the change in net asset value of a share during the period and assumes reinvestment of dividends and distributions at net asset value. |
| 4 | Total return during the period reflects a waiver by the manager. Performance would have been lower had the waiver not been in effect. |
| 5 | Expense ratios do not include expenses of the Underlying Funds in which the Fund invests. |
| 6 | The Fund’s portfolio turnover rate increased substantially during the year ended September 30, 2020 due to a change in the Fund’s portfolio managers and associated repositioning. |
See accompanying notes, which are an integral part of the financial statements.
117
Table of Contents
Financial highlights
Delaware Equity Income Fund Institutional Class
Selected data for each share of the Fund outstanding throughout each period were as follows:
| | Year ended |
| | 9/30/21 | | 9/30/201 | | 9/30/19 | | 9/30/18 | | 9/30/17 |
| Net asset value, beginning of period | | $ | 6.28 | | | $ | 9.73 | | | $ | 11.16 | | | $ | 10.77 | | | $ | 9.74 | |
| | | | | | | | | | | | | | | | | | | | |
| Income (loss) from investment operations: | | | | | | | | | | | | | | | | | | | | |
| Net investment income2 | | | 0.16 | | | | 0.13 | | | | 0.20 | | | | 0.31 | | | | 0.19 | |
| Net realized and unrealized gain (loss) | | | 1.71 | | | | (0.53 | ) | | | (0.20 | ) | | | 0.65 | | | | 1.23 | |
| Total from investment operations | | | 1.87 | | | | (0.40 | ) | | | — | | | | 0.96 | | | | 1.42 | |
| | | | | | | | | | | | | | | | | | | | |
| Less dividends and distributions from: | | | | | | | | | | | | | | | | | | | | |
| Net investment income | | | (0.12 | ) | | | (0.14 | ) | | | (0.29 | ) | | | (0.21 | ) | | | (0.21 | ) |
| Net realized gain | | | (0.45 | ) | | | (2.91 | ) | | | (1.14 | ) | | | (0.36 | ) | | | (0.18 | ) |
| Total dividends and distributions | | | (0.57 | ) | | | (3.05 | ) | | | (1.43 | ) | | | (0.57 | ) | | | (0.39 | ) |
| | | | | | | | | | | | | | | | | | | | |
| Net asset value, end of period | | $ | 7.58 | | | $ | 6.28 | | | $ | 9.73 | | | $ | 11.16 | | | $ | 10.77 | |
| | | | | | | | | | | | | | | | | | | | |
| Total return3 | | | 30.91% | 4 | | | (7.72% | )4 | | | 1.97% | | | | 9.09% | | | | 14.87% | |
| | | | | | | | | | | | | | | | | | | | |
| Ratios and supplemental data: | | | | | | | | | | | | | | | | | | | | |
| Net assets, end of period (000 omitted) | | $ | 1,794 | | | $ | 926 | | | $ | 1,786 | | | $ | 80,387 | | | $ | 71,611 | |
| Ratio of expenses to average net assets5 | | | 0.85% | | | | 0.89% | | | | 0.86% | | | | 0.85% | | | | 0.84% | |
| Ratio of expenses to average net assets prior to fees waived5 | | | 0.88% | | | | 0.94% | | | | 0.86% | | | | 0.85% | | | | 0.84% | |
| Ratio of net investment income to average net assets | | | 2.21% | | | | 1.86% | | | | 2.08% | | | | 2.79% | | | | 1.94% | |
| Ratio of net investment income to average net assets prior to | | | | | | | | | | | | | | | | | | | | |
| fees waived | | | 2.18% | | | | 1.81% | | | | 2.08% | | | | 2.79% | | | | 1.94% | |
| Portfolio turnover | | | 57% | | | | 114% | 6 | | | 39% | | | | 35% | | | | 15% | |
| 1 | On October 4, 2019, Advisor Class shares of First Investors Equity Income Fund were reorganized into Institutional Class shares of Delaware Equity Income Fund. See Notes to financial statements. The Institutional Class shares’ financial highlights for the periods prior to October 4, 2019, reflect the performance of First Investors Equity Income Fund Advisor Class shares. |
| 2 | Calculated using average shares outstanding. |
| 3 | Total return is based on the change in net asset value of a share during the period and assumes reinvestment of dividends and distributions at net asset value. |
| 4 | Total return during the period reflects a waiver by the manager. Performance would have been lower had the waiver not been in effect. |
| 5 | Expense ratios do not include expenses of the Underlying Funds in which the Fund invests. |
| 6 | The Fund’s portfolio turnover rate increased substantially during the year ended September 30, 2020 due to a change in the Fund’s portfolio managers and associated repositioning. |
See accompanying notes, which are an integral part of the financial statements.
118
Table of Contents
Delaware Equity Income Fund Class R6
Selected data for each share of the Fund outstanding throughout each period were as follows:
| | Year ended |
| | 9/30/21 | | 9/30/201 | | 9/30/19 | | 9/30/18 | | 9/30/17 |
| Net asset value, beginning of period | | $ | 6.23 | | | $ | 9.67 | | | $ | 11.12 | | | $ | 10.72 | | | $ | 9.78 | |
| | | | | | | | | | | | | | | | | | | | |
| Income (loss) from investment operations: | | | | | | | | | | | | | | | | | | | | |
| Net investment income2 | | | 0.16 | | | | 0.14 | | | | 0.19 | | | | 0.31 | | | | 0.37 | |
| Net realized and unrealized gain (loss) | | | 1.69 | | | | (0.52 | ) | | | (0.17 | ) | | | 0.66 | | | | 1.06 | |
| Total from investment operations | | | 1.85 | | | | (0.38 | ) | | | 0.02 | | | | 0.97 | | | | 1.43 | |
| | | | | | | | | | | | | | | | | | | | |
| Less dividends and distributions from: | | | | | | | | | | | | | | | | | | | | |
| Net investment income | | | (0.12 | ) | | | (0.15 | ) | | | (0.33 | ) | | | (0.21 | ) | | | (0.31 | ) |
| Net realized gain | | | (0.45 | ) | | | (2.91 | ) | | | (1.14 | ) | | | (0.36 | ) | | | (0.18 | ) |
| Total dividends and distributions | | | (0.57 | ) | | | (3.06 | ) | | | (1.47 | ) | | | (0.57 | ) | | | (0.49 | ) |
| | | | | | | | | | | | | | | | | | | | |
| Net asset value, end of period | | $ | 7.51 | | | $ | 6.23 | | | $ | 9.67 | | | $ | 11.12 | | | $ | 10.72 | |
| | | | | | | | | | | | | | | | | | | | |
| Total return3 | | | 30.91% | 4 | | | (7.54% | )4 | | | 2.18% | | | | 9.21% | | | | 14.84% | |
| | | | | | | | | | | | | | | | | | | | |
| Ratios and supplemental data: | | | | | | | | | | | | | | | | | | | | |
| Net assets, end of period (000 omitted) | | $ | 21 | | | $ | 679 | | | $ | 1,411 | | | $ | 2,499 | | | $ | 2,193 | |
| Ratio of expenses to average net assets5 | | | 0.81% | | | | 0.82% | | | | 0.81% | | | | 0.80% | | | | 0.80% | |
| Ratio of expenses to average net assets prior to fees waived5 | | | 0.82% | | | | 0.88% | | | | 0.81% | | | | 0.80% | | | | 0.80% | |
| Ratio of net investment income to average net assets | | | 2.46% | | | | 1.92% | | | | 1.94% | | | | 2.81% | | | | 2.02% | |
| Ratio of net investment income to average net assets prior to | | | | | | | | | | | | | | | | | | | | |
| fees waived | | | 2.45% | | | | 1.86% | | | | 1.94% | | | | 2.81% | | | | 2.02% | |
| Portfolio turnover | | | 57% | | | | 114% | 6 | | | 39% | | | | 35% | | | | 15% | |
| 1 | On October 4, 2019, Institutional Class shares of First Investors Equity Income Fund were reorganized into Class R6 shares of Delaware Equity Income Fund. See Notes to financial statements. The Class R6 shares’ financial highlights for the periods prior to October 4, 2019, reflect the performance of First Investors Equity Income Fund Institutional Class shares. |
| 2 | Calculated using average shares outstanding. |
| 3 | Total return is based on the change in net asset value of a share during the period and assumes reinvestment of dividends and distributions at net asset value. |
| 4 | Total return during the period reflects a waiver by the manager. Performance would have been lower had the waiver not been in effect. |
| 5 | Expense ratios do not include expenses of the Underlying Funds in which the Fund invests. |
| 6 | The Fund’s portfolio turnover rate increased substantially during the year ended September 30, 2020 due to a change in the Fund’s portfolio managers and associated repositioning. |
See accompanying notes, which are an integral part of the financial statements.
119
Table of Contents
Financial highlights
Delaware Growth and Income Fund Class A
Selected data for each share of the Fund outstanding throughout each period were as follows:
| | Year ended |
| | 9/30/21 | | 9/30/201 | | 9/30/19 | | 9/30/18 | | 9/30/17 |
| Net asset value, beginning of period | | $ | 11.94 | | | $ | 19.85 | | | $ | 24.41 | | | $ | 23.30 | | | $ | 21.51 | |
| | | | | | | | | | | | | | | | | | | | |
| Income (loss) from investment operations: | | | | | | | | | | | | | | | | | | | | |
| Net investment income2 | | | 0.25 | | | | 0.23 | | | | 0.27 | | | | 0.26 | | | | 0.25 | |
| Net realized and unrealized gain (loss) | | | 3.34 | | | | (0.95 | ) | | | (0.54 | ) | | | 2.11 | | | | 2.66 | |
| Total from investment operations | | | 3.59 | | | | (0.72 | ) | | | (0.27 | ) | | | 2.37 | | | | 2.91 | |
| | | | | | | | | | | | | | | | | | | | |
| Less dividends and distributions from: | | | | | | | | | | | | | | | | | | | | |
| Net investment income | | | (0.21 | ) | | | (0.25 | ) | | | (0.27 | ) | | | (0.32 | ) | | | (0.37 | ) |
| Net realized gain | | | (0.70 | ) | | | (6.94 | ) | | | (4.02 | ) | | | (0.94 | ) | | | (0.75 | ) |
| Total dividends and distributions | | | (0.91 | ) | | | (7.19 | ) | | | (4.29 | ) | | | (1.26 | ) | | | (1.12 | ) |
| | | | | | | | | | | | | | | | | | | | |
| Net asset value, end of period | | $ | 14.62 | | | $ | 11.94 | | | $ | 19.85 | | | $ | 24.41 | | | $ | 23.30 | |
| | | | | | | | | | | | | | | | | | | | |
| Total return3 | | | 30.89% | | | | (7.99% | ) | | | 2.02% | | | | 10.35% | | | | 13.99% | |
| | | | | | | | | | | | | | | | | | | | |
| Ratios and supplemental data: | | | | | | | | | | | | | | | | | | | | |
| Net assets, end of period (000 omitted) | | $ | 1,037,062 | | | $ | 1,023,821 | | | $ | 1,464,393 | | | $ | 1,653,563 | | | $ | 1,675,590 | |
| Ratio of expenses to average net assets4 | | | 1.07% | | | | 1.10% | | | | 1.13% | | | | 1.14% | | | | 1.15% | |
| Ratio of net investment income to average net assets | | | 1.82% | | | | 1.71% | | | | 1.37% | | | | 1.08% | | | | 1.13% | |
| Portfolio turnover | | | 51% | | | | 113% | 5 | | | 55% | | | | 34% | | | | 16% | |
| 1 | On October 4, 2019, Class A shares of First Investors Growth & Income Fund were reorganized into Class A shares of Delaware Growth and Income Fund. See Notes to financial statements. The Class A shares’ financial highlights for the periods prior to October 4, 2019, reflect the performance of First Investors Growth & Income Fund Class A shares. |
| 2 | Calculated using average shares outstanding. |
| 3 | Total return is based on the change in net asset value of a share during the period and assumes reinvestment of dividends and distributions at net asset value and does not reflect the impact of a sales charge. |
| 4 | Expense ratios do not include expenses of the Underlying Funds in which the Fund invests. |
| 5 | The Fund’s portfolio turnover rate increased substantially during the year ended September 30, 2020 due to a change in the Fund’s portfolio managers and associated repositioning. |
See accompanying notes, which are an integral part of the financial statements.
120
Table of Contents
Delaware Growth and Income Fund Institutional Class
Selected data for each share of the Fund outstanding throughout each period were as follows:
| | Year ended |
| | 9/30/21 | | 9/30/201 | | 9/30/19 | | 9/30/18 | | 9/30/17 |
| Net asset value, beginning of period | | $ | 11.99 | | | $ | 19.87 | | | $ | 24.58 | | | $ | 23.46 | | | $ | 21.67 | |
| | | | | | | | | | | | | | | | | | | | |
| Income (loss) from investment operations: | | | | | | | | | | | | | | | | | | | | |
| Net investment income2 | | | 0.29 | | | | 0.30 | | | | 0.33 | | | | 0.35 | | | | 0.33 | |
| Net realized and unrealized gain (loss) | | | 3.34 | | | | (0.98 | ) | | | (0.55 | ) | | | 2.11 | | | | 2.69 | |
| Total from investment operations | | | 3.63 | | | | (0.68 | ) | | | (0.22 | ) | | | 2.46 | | | | 3.02 | |
| | | | | | | | | | | | | | | | | | | | |
| Less dividends and distributions from: | | | | | | | | | | | | | | | | | | | | |
| Net investment income | | | (0.28 | ) | | | (0.26 | ) | | | (0.47 | ) | | | (0.40 | ) | | | (0.48 | ) |
| Net realized gain | | | (0.70 | ) | | | (6.94 | ) | | | (4.02 | ) | | | (0.94 | ) | | | (0.75 | ) |
| Total dividends and distributions | | | (0.98 | ) | | | (7.20 | ) | | | (4.49 | ) | | | (1.34 | ) | | | (1.23 | ) |
| | | | | | | | | | | | | | | | | | | | |
| Net asset value, end of period | | $ | 14.64 | | | $ | 11.99 | | | $ | 19.87 | | | $ | 24.58 | | | $ | 23.46 | |
| | | | | | | | | | | | | | | | | | | | |
| Total return3 | | | 31.19% | | | | (7.68% | )4 | | | 2.26% | | | | 10.73% | | | | 14.42% | |
| | | | | | | | | | | | | | | | | | | | |
| Ratios and supplemental data: | | | | | | | | | | | | | | | | | | | | |
| Net assets, end of period (000 omitted) | | $ | 4,804 | | | $ | 4,063 | | | $ | 21,597 | | | $ | 142,220 | | | $ | 166,851 | |
| Ratio of expenses to average net assets5 | | | 0.82% | | | | 0.85% | | | | 0.83% | | | | 0.79% | | | | 0.78% | |
| Ratio of expenses to average net assets prior to fees waived5 | | | 0.82% | | | | 0.86% | | | | 0.83% | | | | 0.79% | | | | 0.78% | |
| Ratio of net investment income to average net assets | | | 2.08% | | | | 1.98% | | | | 1.66% | | | | 1.44% | | | | 1.50% | |
| Ratio of net investment income to average net assets prior to | | | | | | | | | | | | | | | | | | | | |
| fees waived | | | 2.08% | | | | 1.97% | | | | 1.66% | | | | 1.44% | | | | 1.50% | |
| Portfolio turnover | | | 51% | | | | 113% | 6 | | | 55% | | | | 34% | | | | 16% | |
| 1 | On October 4, 2019, Advisor Class shares of First Investors Growth & Income Fund were reorganized into Institutional Class shares of Delaware Growth and Income Fund. See Notes to financial statements. The Institutional Class shares’ financial highlights for the periods prior to October 4, 2019, reflect the performance of First Investors Growth & Income Fund Advisor Class shares. |
| 2 | Calculated using average shares outstanding. |
| 3 | Total return is based on the change in net asset value of a share during the period and assumes reinvestment of dividends and distributions at net asset value. |
| 4 | Total return during the period reflects a waiver by the manager. Performance would have been lower had the waiver not been in effect. |
| 5 | Expense ratios do not include expenses of the Underlying Funds in which the Fund invests. |
| 6 | The Fund’s portfolio turnover rate increased substantially during the year ended September 30, 2020 due to a change in the Fund’s portfolio managers and associated repositioning. |
See accompanying notes, which are an integral part of the financial statements.
121
Table of Contents
Financial highlights
Delaware Growth and Income Fund Class R6
Selected data for each share of the Fund outstanding throughout each period were as follows:
| | Year ended |
| | 9/30/21 | | 9/30/201 | | 9/30/19 | | 9/30/18 | | | 9/30/17 | |
| Net asset value, beginning of period | | $ | 12.01 | | | $ | 19.92 | | | $ | 24.52 | | | $ | 23.39 | | | $ | 21.58 | |
| | | | | | | | | | | | | | | | | | | | | |
| Income (loss) from investment operations: | | | | | | | | | | | | | | | | | | | | |
| Net investment income2 | | | 0.30 | | | | 0.29 | | | | 0.35 | | | | 0.36 | | | | 0.34 | |
| Net realized and unrealized gain (loss) | | | 3.35 | | | | (0.96 | ) | | | (0.56 | ) | | | 2.12 | | | | 2.67 | |
| Total from investment operations | | | 3.65 | | | | (0.67 | ) | | | (0.21 | ) | | | 2.48 | | | | 3.01 | |
| | | | | | | | | | | | | | | | | | | | | |
| Less dividends and distributions from: | | | | | | | | | | | | | | | | | | | | |
| Net investment income | | | (0.24 | ) | | | (0.30 | ) | | | (0.37 | ) | | | (0.41 | ) | | | (0.45 | ) |
| Net realized gain | | | (0.70 | ) | | | (6.94 | ) | | | (4.02 | ) | | | (0.94 | ) | | | (0.75 | ) |
| Total dividends and distributions | | | (0.94 | ) | | | (7.24 | ) | | | (4.39 | ) | | | (1.35 | ) | | | (1.20 | ) |
| | | | | | | | | | | | | | | | | | | | | |
| Net asset value, end of period | | $ | 14.72 | | | $ | 12.01 | | | $ | 19.92 | | | $ | 24.52 | | | $ | 23.39 | |
| | | | | | | | | | | | | | | | | | | | | |
| Total return3 | | | 31.25% | 4 | | | (7.63% | )4 | | | 2.34% | | | | 10.85% | | | | 14.47% | |
| | | | | | | | | | | | | | | | | | | | | |
| Ratios and supplemental data: | | | | | | | | | | | | | | | | | | | | |
| Net assets, end of period (000 omitted) | | $ | 192 | | | $ | 2,710 | | | $ | 5,597 | | | $ | 11,067 | | | $ | 10,839 | |
| Ratio of expenses to average net assets5 | | | 0.75% | | | | 0.76% | | | | 0.75% | | | | 0.74% | | | | 0.74% | |
| Ratio of expenses to average net assets prior to fees waived5 | | | 0.76% | | | | 0.81% | | | | 0.75% | | | | 0.74% | | | | 0.74% | |
| Ratio of net investment income to average net assets | | | 2.29% | | | | 2.07% | | | | 1.75% | | | | 1.49% | | | | 1.54% | |
| Ratio of net investment income to average net assets prior to | | | | | | | | | | | | | | | | | | | | |
| fees waived | | | 2.28% | | | | 2.02% | | | | 1.75% | | | | 1.49% | | | | 1.54% | |
| Portfolio turnover | | | 51% | | | | 113% | 6 | | | 55% | | | | 34% | | | | 16% | |
| 1 | On October 4, 2019, Institutional Class shares of First Investors Growth & Income Fund were reorganized into Class R6 shares of Delaware Growth and Income Fund. See Notes to financial statements. The Class R6 shares’ financial highlights for the periods prior to October 4, 2019, reflect the performance of First Investors Growth & Income Fund Institutional Class shares. |
| 2 | Calculated using average shares outstanding. |
| 3 | Total return is based on the change in net asset value of a share during the period and assumes reinvestment of dividends and distributions at net asset value. |
| 4 | Total return during the period reflects a waiver by the manager. Performance would have been lower had the waiver not been in effect. |
| 5 | Expense ratios do not include expenses of the Underlying Funds in which the Fund invests. |
| 6 | The Fund’s portfolio turnover rate increased substantially during the year ended September 30, 2020 due to a change in the Fund’s portfolio managers and associated repositioning. |
See accompanying notes, which are an integral part of the financial statements.
122
Table of Contents
Delaware Growth Equity Fund Class A
Selected data for each share of the Fund outstanding throughout each period were as follows:
| | Year ended |
| | 9/30/21 | | 9/30/201 | | 9/30/19 | | 9/30/18 | | 9/30/17 |
| Net asset value, beginning of period | | $ | 13.67 | | | $ | 12.09 | | | $ | 13.61 | | | $ | 12.04 | | | $ | 11.24 | |
| | | | | | | | | | | | | | | | | | | | | |
| Income (loss) from investment operations: | | | | | | | | | | | | | | | | | | | | |
| Net investment income (loss)2 | | | (0.04 | ) | | | (0.03 | ) | | | 0.02 | | | | (0.01 | ) | | | — | |
| Net realized and unrealized gain (loss) | | | 5.37 | | | | 2.93 | | | | (0.92 | ) | | | 2.66 | | | | 2.38 | |
| Total from investment operations | | | 5.33 | | | | 2.90 | | | | (0.90 | ) | | | 2.65 | | | | 2.38 | |
| | | | | | | | | | | | | | | | | | | | | |
| Less dividends and distributions from: | | | | | | | | | | | | | | | | | | | | |
| Net investment income | | | — | | | | (0.02 | ) | | | — | | | | (0.01 | ) | | | (0.03 | ) |
| Net realized gain | | | (1.37 | ) | | | (1.30 | ) | | | (0.62 | ) | | | (1.07 | ) | | | (1.55 | ) |
| Total dividends and distributions | | | (1.37 | ) | | | (1.32 | ) | | | (0.62 | ) | | | (1.08 | ) | | | (1.58 | ) |
| | | | | | | | | | | | | | | | | | | | | |
| Net asset value, end of period | | $ | 17.63 | | | $ | 13.67 | | | $ | 12.09 | | | $ | 13.61 | | | $ | 12.04 | |
| | | | | | | | | | | | | | | | | | | | | |
| Total return3 | | | 41.67% | | | | 25.53% | | | | (6.01% | )4 | | | 23.22% | | | | 24.16% | |
| | | | | | | | | | | | | | | | | | | | | |
| Ratios and supplemental data: | | | | | | | | | | | | | | | | | | | | |
| Net assets, end of period (000 omitted) | | $ | 518,096 | | | $ | 472,795 | | | $ | 507,351 | | | $ | 570,309 | | | $ | 444,933 | |
| Ratio of expenses to average net assets5 | | | 1.09% | | | | 1.14% | | | | 1.19% | | | | 1.22% | | | | 1.25% | |
| Ratio of expenses to average net assets prior to fees waived5 | | | 1.09% | | | | 1.14% | | | | 1.20% | | | | 1.22% | | | | 1.25% | |
| Ratio of net investment income (loss) to average net assets | | | (0.28% | ) | | | (0.22% | ) | | | 0.16% | | | | (0.06% | ) | | | 0.00% | |
| Ratio of net investment income (loss) to average net assets prior | | | | | | | | | | | | | | | | | | | | |
| to fees waived | | | (0.28% | ) | | | (0.22% | ) | | | 0.15% | | | | (0.06% | ) | | | 0.00% | |
| Portfolio turnover | | | 31% | | | | 37% | | | | 51% | | | | 37% | | | | 58% | |
| 1 | On October 4, 2019, Class A shares of First Investors Select Growth Fund were reorganized into Class A shares of Delaware Growth Equity Fund. See Notes to financial statements. The Class A shares’ financial highlights for the periods prior to October 4, 2019, reflect the performance of First Investors Select Growth Fund Class A shares. |
| 2 | Calculated using average shares outstanding. |
| 3 | Total return is based on the change in net asset value of a share during the period and assumes reinvestment of dividends and distributions at net asset value and does not reflect the impact of a sales charge. |
| 4 | Total return during the period reflects a waiver by the manager. Performance would have been lower had the waiver not been in effect. |
| 5 | Expense ratios do not include expenses of the Underlying Funds in which the Fund invests. |
See accompanying notes, which are an integral part of the financial statements.
123
Table of Contents
Financial highlights
Delaware Growth Equity Fund Institutional Class
Selected data for each share of the Fund outstanding throughout each period were as follows:
| | Year ended |
| | 9/30/21 | | 9/30/201 | | 9/30/19 | | 9/30/18 | | 9/30/17 |
| Net asset value, beginning of period | | $ | 14.03 | | | $ | 12.38 | | | $ | 13.89 | | | $ | 12.23 | | | $ | 11.37 | |
| | | | | | | | | | | | | | | | | | | | | |
| Income (loss) from investment operations: | | | | | | | | | | | | | | | | | | | | |
| Net investment income (loss)2 | | | (0.01 | ) | | | 0.01 | | | | 0.06 | | | | 0.04 | | | | 0.05 | |
| Net realized and unrealized gain (loss) | | | 5.53 | | | | 3.00 | | | | (0.94 | ) | | | 2.71 | | | | 2.40 | |
| Total from investment operations | | | 5.52 | | | | 3.01 | | | | (0.88 | ) | | | 2.75 | | | | 2.45 | |
| | | | | | | | | | | | | | | | | | | | | |
| Less dividends and distributions from: | | | | | | | | | | | | | | | | | | | | |
| Net investment income | | | — | | | | (0.06 | ) | | | (0.01 | ) | | | (0.02 | ) | | | (0.04 | ) |
| Net realized gain | | | (1.37 | ) | | | (1.30 | ) | | | (0.62 | ) | | | (1.07 | ) | | | (1.55 | ) |
| Total dividends and distributions | | | (1.37 | ) | | | (1.36 | ) | | | (0.63 | ) | | | (1.09 | ) | | | (1.59 | ) |
| | | | | | | | | | | | | | | | | | | | | |
| Net asset value, end of period | | $ | 18.18 | | | $ | 14.03 | | | $ | 12.38 | | | $ | 13.89 | | | $ | 12.23 | |
| | | | | | | | | | | | | | | | | | | | | |
| Total return3 | | | 41.98% | | | | 25.88% | 4 | | | (5.74% | )4 | | | 23.74% | | | | 24.61% | |
| | | | | | | | | | | | | | | | | | | | | |
| Ratios and supplemental data: | | | | | | | | | | | | | | | | | | | | |
| Net assets, end of period (000 omitted) | | $ | 80,648 | | | $ | 121,478 | | | $ | 143,304 | | | $ | 194,554 | | | $ | 81,203 | |
| Ratio of expenses to average net assets5 | | | 0.84% | | | | 0.86% | | | | 0.88% | | | | 0.83% | | | | 0.84% | |
| Ratio of expenses to average net assets prior to fees waived5 | | | 0.84% | | | | 0.89% | | | | 0.89% | | | | 0.83% | | | | 0.84% | |
| Ratio of net investment income (loss) to average net assets | | | (0.05% | ) | | | 0.06% | | | | 0.50% | | | | 0.34% | | | | 0.40% | |
| Ratio of net investment income (loss) to average net assets prior | | | | | | | | | | | | | | | | | | | | |
| to fees waived | | | (0.05% | ) | | | 0.03% | | | | 0.49% | | | | 0.34% | | | | 0.40% | |
| Portfolio turnover | | | 31% | | | | 37% | | | | 51% | | | | 37% | | | | 58% | |
| 1 | On October 4, 2019, Advisor Class shares of First Investors Select Growth Fund were reorganized into Institutional Class shares of Delaware Growth Equity Fund. See Notes to financial statements. The Institutional Class shares’ financial highlights for the periods prior to October 4, 2019, reflect the performance of First Investors Select Growth Fund Advisor Class shares. |
| 2 | Calculated using average shares outstanding. |
| 3 | Total return is based on the change in net asset value of a share during the period and assumes reinvestment of dividends and distributions at net asset value. |
| 4 | Total return during the period reflects a waiver by the manager. Performance would have been lower had the waiver not been in effect. |
| 5 | Expense ratios do not include expenses of the Underlying Funds in which the Fund invests. |
See accompanying notes, which are an integral part of the financial statements.
124
Table of Contents
Delaware Growth Equity Fund Class R6
Selected data for each share of the Fund outstanding throughout each period were as follows:
| | Year ended |
| | 9/30/21 | | 9/30/201 | | 9/30/19 | | 9/30/18 | | 9/30/17 |
| Net asset value, beginning of period | | $ | 14.13 | | | $ | 12.46 | | | $ | 13.97 | | | $ | 12.29 | | | $ | 11.42 | |
| | | | | | | | | | | | | | | | | | | | | |
| Income (loss) from investment operations: | | | | | | | | | | | | | | | | | | | | |
| Net investment income2 | | | 0.01 | | | | 0.02 | | | | 0.07 | | | | 0.05 | | | | 0.05 | |
| Net realized and unrealized gain (loss) | | | 5.57 | | | | 3.02 | | | | (0.95 | ) | | | 2.72 | | | | 2.41 | |
| Total from investment operations | | | 5.58 | | | | 3.04 | | | | (0.88 | ) | | | 2.77 | | | | 2.46 | |
| | | | | | | | | | | | | | | | | | | | | |
| Less dividends and distributions from: | | | | | | | | | | | | | | | | | | | | |
| Net investment income | | | — | | | | (0.07 | ) | | | (0.01 | ) | | | (0.02 | ) | | | (0.04 | ) |
| Net realized gain | | | (1.37 | ) | | | (1.30 | ) | | | (0.62 | ) | | | (1.07 | ) | | | (1.55 | ) |
| Total dividends and distributions | | | (1.37 | ) | | | (1.37 | ) | | | (0.63 | ) | | | (1.09 | ) | | | (1.59 | ) |
| | | | | | | | | | | | | | | | | | | | | |
| Net asset value, end of period | | $ | 18.34 | | | $ | 14.13 | | | $ | 12.46 | | | $ | 13.97 | | | $ | 12.29 | |
| | | | | | | | | | | | | | | | | | | | | |
| Total return3 | | | 42.12% | | | | 25.97% | 4 | | | (5.66% | )4 | | | 23.81% | | | | 24.61% | |
| | | | | | | | | | | | | | | | | | | | | |
| Ratios and supplemental data: | | | | | | | | | | | | | | | | | | | | |
| Net assets, end of period (000 omitted) | | $ | 1,818 | | | $ | 3,561 | | | $ | 4,044 | | | $ | 7,836 | | | $ | 4,950 | |
| Ratio of expenses to average net assets5 | | | 0.76% | | | | 0.79% | | | | 0.79% | | | | 0.80% | | | | 0.82% | |
| Ratio of expenses to average net assets prior to fees waived5 | | | 0.76% | | | | 0.83% | | | | 0.80% | | | | 0.80% | | | | 0.82% | |
| Ratio of net investment income to average net assets | | | 0.08% | | | | 0.12% | | | | 0.57% | | | | 0.35% | | | | 0.43% | |
| Ratio of net investment income to average net assets prior to | | | | | | | | | | | | | | | | | | | | |
| fees waived | | | 0.08% | | | | 0.08% | | | | 0.56% | | | | 0.35% | | | | 0.43% | |
| Portfolio turnover | | | 31% | | | | 37% | | | | 51% | | | | 37% | | | | 58% | |
| 1 | On October 4, 2019, Institutional Class shares of First Investors Select Growth Fund were reorganized into Class R6 shares of Delaware Growth Equity Fund. See Notes to financial statements. The Class R6 shares’ financial highlights for the periods prior to October 4, 2019, reflect the performance of First Investors Select Growth Fund Institutional Class shares. |
| 2 | Calculated using average shares outstanding. |
| 3 | Total return is based on the change in net asset value of a share during the period and assumes reinvestment of dividends and distributions at net asset value. |
| 4 | Total return during the period reflects a waiver by the manager. Performance would have been lower had the waiver not been in effect. |
| 5 | Expense ratios do not include expenses of the Underlying Funds in which the Fund invests. |
See accompanying notes, which are an integral part of the financial statements.
125
Table of Contents
Financial highlights
Delaware Opportunity Fund Class A
Selected data for each share of the Fund outstanding throughout each period were as follows:
| | Year ended |
| | 9/30/21 | | 9/30/201 | | 9/30/19 | | 9/30/18 | | 9/30/17 |
| Net asset value, beginning of period | | $ | 23.26 | | | $ | 37.79 | | | $ | 42.06 | | | $ | 41.86 | | | $ | 37.29 | |
| | | | | | | | | | | | | | | | | | | | | |
| Income (loss) from investment operations: | | | | | | | | | | | | | | | | | | | | |
| Net investment income2 | | | 0.43 | | | | 0.16 | | | | 0.12 | | | | 0.39 | | | | 0.11 | |
| Net realized and unrealized gain (loss) | | | 10.48 | | | | (3.01 | ) | | | (0.60 | ) | | | 2.31 | | | | 6.03 | |
| Total from investment operations | | | 10.91 | | | | (2.85 | ) | | | (0.48 | ) | | | 2.70 | | | | 6.14 | |
| | | | | | | | | | | | | | | | | | | | | |
| Less dividends and distributions from: | | | | | | | | | | | | | | | | | | | | |
| Net investment income | | | (0.23 | ) | | | (0.24 | ) | | | (0.38 | ) | | | (0.12 | ) | | | (0.22 | ) |
| Net realized gain | | | — | | | | (11.44 | ) | | | (3.41 | ) | | | (2.38 | ) | | | (1.35 | ) |
| Total dividends and distributions | | | (0.23 | ) | | | (11.68 | ) | | | (3.79 | ) | | | (2.50 | ) | | | (1.57 | ) |
| | | | | | | | | | | | | | | | | | | | | |
| Net asset value, end of period | | $ | 33.94 | | | $ | 23.26 | | | $ | 37.79 | | | $ | 42.06 | | | $ | 41.86 | |
| | | | | | | | | | | | | | | | | | | | | |
| Total return3 | | | 47.10% | | | | (13.31% | )4 | | | 0.80% | | | | 6.49% | | | | 16.99% | |
| | | | | | | | | | | | | | | | | | | | | |
| Ratios and supplemental data: | | | | | | | | | | | | | | | | | | | | |
| Net assets, end of period (000 omitted) | | $ | 660,973 | | | $ | 599,543 | | | $ | 915,339 | | | $ | 1,010,312 | | | $ | 1,002,618 | |
| Ratio of expenses to average net assets5 | | | 1.20% | | | | 1.21% | | | | 1.20% | | | | 1.20% | | | | 1.20% | |
| Ratio of expenses to average net assets prior to fees waived5 | | | 1.20% | | | | 1.24% | | | | 1.20% | | | | 1.20% | | | | 1.20% | |
| Ratio of net investment income to average net assets | | | 1.40% | | | | 0.62% | | | | 0.32% | | | | 0.93% | | | | 0.27% | |
| Ratio of net investment income to average net assets prior to | | | | | | | | | | | | | | | | | | | | |
| fees waived | | | 1.40% | | | | 0.59% | | | | 0.32% | | | | 0.93% | | | | 0.27% | |
| Portfolio turnover | | | 13% | | | | 120% | 6 | | | 47% | | | | 35% | | | | 32% | |
| 1 | On October 4, 2019, Class A shares of First Investors Opportunity Fund were reorganized into Class A shares of Delaware Opportunity Fund. See Notes to financial statements. The Class A shares’ financial highlights for the periods prior to October 4, 2019, reflect the performance of First Investors Opportunity Fund Class A shares. |
| 2 | Calculated using average shares outstanding. |
| 3 | Total return is based on the change in net asset value of a share during the period and assumes reinvestment of dividends and distributions at net asset value and does not reflect the impact of a sales charge. |
| 4 | Total return during the period reflects a waiver by the manager. Performance would have been lower had the waiver not been in effect. |
| 5 | Expense ratios do not include expenses of the Underlying Funds in which the Fund invests. |
| 6 | The Fund’s portfolio turnover rate increased substantially during the year ended September 30, 2020 due to a change in the Fund’s portfolio managers and associated repositioning. |
See accompanying notes, which are an integral part of the financial statements.
126
Table of Contents
Delaware Opportunity Fund Institutional Class
Selected data for each share of the Fund outstanding throughout each period were as follows:
| | Year ended |
| | 9/30/21 | | 9/30/201 | | 9/30/19 | | 9/30/18 | | 9/30/17 |
| Net asset value, beginning of period | | $ | 24.37 | | | $ | 38.75 | | | $ | 42.91 | | | $ | 42.56 | | | $ | 37.79 | |
| |
| Income (loss) from investment operations: | | | | | | | | | | | | | | | | | | | | |
| Net investment income2 | | | 0.52 | | | | 0.24 | | | | 0.23 | | | | 0.61 | | | | 0.24 | |
| Net realized and unrealized gain (loss) | | | 10.99 | | | | (3.18 | ) | | | (0.58 | ) | | | 2.27 | | | | 6.12 | |
| Total from investment operations | | | 11.51 | | | | (2.94 | ) | | | (0.35 | ) | | | 2.88 | | | | 6.36 | |
| |
| Less dividends and distributions from: | | | | | | | | | | | | | | | | | | | | |
| Net investment income | | | (0.30 | ) | | | — | | | | (0.40 | ) | | | (0.15 | ) | | | (0.24 | ) |
| Net realized gain | | | — | | | | (11.44 | ) | | | (3.41 | ) | | | (2.38 | ) | | | (1.35 | ) |
| Total dividends and distributions | | | (0.30 | ) | | | (11.44 | ) | | | (3.81 | ) | | | (2.53 | ) | | | (1.59 | ) |
| |
| Net asset value, end of period | | $ | 35.58 | | | $ | 24.37 | | | $ | 38.75 | | | $ | 42.91 | | | $ | 42.56 | |
| |
| Total return3 | | | 47.50% | 4 | | | (13.04% | )4 | | | 1.14% | | | | 6.82% | | | | 17.37% | |
| |
| Ratios and supplemental data: | | | | | | | | | | | | | | | | | | | | |
| Net assets, end of period (000 omitted) | | $ | 4,083 | | | $ | 2,490 | | | $ | 10,325 | | | $ | 149,481 | | | $ | 81,773 | |
| Ratio of expenses to average net assets5 | | | 0.90% | | | | 0.95% | | | | 0.92% | | | | 0.89% | | | | 0.88% | |
| Ratio of expenses to average net assets prior to fees waived5 | | | 0.95% | | | | 1.04% | | | | 0.92% | | | | 0.89% | | | | 0.88% | |
| Ratio of net investment income to average net assets | | | 1.59% | | | | 0.83% | | | | 0.62% | | | | 1.42% | | | | 0.59% | |
| Ratio of net investment income to average net assets prior to | | | | | | | | | | | | | | | | | | | | |
| fees waived | | | 1.54% | | | | 0.74% | | | | 0.62% | | | | 1.42% | | | | 0.59% | |
| Portfolio turnover | | | 13% | | | | 120% | 6 | | | 47% | | | | 35% | | | | 32% | |
| 1 | On October 4, 2019, Advisor Class shares of First Investors Opportunity Fund were reorganized into Institutional Class shares of Delaware Opportunity Fund. See Notes to financial statements. The Institutional Class shares’ financial highlights for the periods prior to October 4, 2019, reflect the performance of First Investors Opportunity Fund Advisor Class shares. |
| 2 | Calculated using average shares outstanding. |
| 3 | Total return is based on the change in net asset value of a share during the period and assumes reinvestment of dividends and distributions at net asset value. |
| 4 | Total return during the period reflects a waiver by the manager. Performance would have been lower had the waiver not been in effect. |
| 5 | Expense ratios do not include expenses of the Underlying Funds in which the Fund invests. |
| 6 | The Fund’s portfolio turnover rate increased substantially during the year ended September 30, 2020 due to a change in the Fund’s portfolio managers and associated repositioning. |
See accompanying notes, which are an integral part of the financial statements.
127
Table of Contents
Financial highlights
Delaware Opportunity Fund Class R6
Selected data for each share of the Fund outstanding throughout each period were as follows:
| | Year ended |
| | 9/30/21 | | 9/30/201 | | 9/30/19 | | 9/30/18 | | 9/30/17 |
| Net asset value, beginning of period | | $ | 24.04 | | | $ | 38.71 | | | $ | 42.87 | | | $ | 42.49 | | | $ | 37.71 | |
| |
| Income (loss) from investment operations: | | | | | | | | | | | | | | | | | | | | |
| Net investment income2 | | | 0.54 | | | | 0.28 | | | | 0.27 | | | | 0.59 | | | | 0.27 | |
| Net realized and unrealized gain (loss) | | | 10.93 | | | | (3.11 | ) | | | (0.59 | ) | | | 2.33 | | | | 6.12 | |
| Total from investment operations | | | 11.47 | | | | (2.83 | ) | | | (0.32 | ) | | | 2.92 | | | | 6.39 | |
| |
| Less dividends and distributions from: | | | | | | | | | | | | | | | | | | | | |
| Net investment income | | | — | | | | (0.40 | ) | | | (0.43 | ) | | | (0.16 | ) | | | (0.26 | ) |
| Net realized gain | | | — | | | | (11.44 | ) | | | (3.41 | ) | | | (2.38 | ) | | | (1.35 | ) |
| Total dividends and distributions | | | — | | | | (11.84 | ) | | | (3.84 | ) | | | (2.54 | ) | | | (1.61 | ) |
| |
| Net asset value, end of period | | $ | 35.51 | | | $ | 24.04 | | | $ | 38.71 | | | $ | 42.87 | | | $ | 42.49 | |
| |
| Total return3 | | | 47.71% | 4 | | | (12.93% | )4 | | | 1.23% | | | | 6.95% | | | | 17.49% | |
| |
| Ratios and supplemental data: | | | | | | | | | | | | | | | | | | | | |
| Net assets, end of period (000 omitted) | | $ | 227 | | | $ | 1,029 | | | $ | 2,338 | | | $ | 5,793 | | | $ | 5,678 | |
| Ratio of expenses to average net assets5 | | | 0.78% | | | | 0.79% | | | | 0.78% | | | | 0.77% | | | | 0.78% | |
| Ratio of expenses to average net assets prior to fees waived5 | | | 0.88% | | | | 0.95% | | | | 0.78% | | | | 0.77% | | | | 0.78% | |
| Ratio of net investment income to average net assets | | | 1.75% | | | | 1.00% | | | | 0.73% | | | | 1.38% | | | | 0.70% | |
| Ratio of net investment income to average net assets prior to | | | | | | | | | | | | | | | | | | | | |
| fees waived | | | 1.65% | | | | 0.84% | | | | 0.73% | | | | 1.38% | | | | 0.70% | |
| Portfolio turnover | | | 13% | | | | 120% | 6 | | | 47% | | | | 35% | | | | 32% | |
| 1 | On October 4, 2019, Institutional Class shares of First Investors Opportunity Fund were reorganized into Class R6 shares of Delaware Opportunity Fund. See Notes to financial statements. The Class R6 shares’ financial highlights for the periods prior to October 4, 2019, reflect the performance of First Investors Opportunity Fund Institutional Class shares. |
| 2 | Calculated using average shares outstanding. |
| 3 | Total return is based on the change in net asset value of a share during the period and assumes reinvestment of dividends and distributions at net asset value. |
| 4 | Total return during the period reflects a waiver by the manager. Performance would have been lower had the waiver not been in effect. |
| 5 | Expense ratios do not include expenses of the Underlying Funds in which the Fund invests. |
| 6 | The Fund’s portfolio turnover rate increased substantially during the year ended September 30, 2020 due to a change in the Fund’s portfolio managers and associated repositioning. |
See accompanying notes, which are an integral part of the financial statements.
128
Table of Contents
Delaware Global Equity Fund Class A
Selected data for each share of the Fund outstanding throughout each period were as follows:
| | Year ended |
| | 9/30/21 | | 9/30/201 | | 9/30/19 | | 9/30/18 | | 9/30/17 |
| Net asset value, beginning of period | | $ | 6.67 | | | $ | 7.50 | | | $ | 8.81 | | | $ | 8.60 | | | $ | 7.30 | |
| |
| Income (loss) from investment operations: | | | | | | | | | | | | | | | | | | | | |
| Net investment income (loss)2 | | | 0.07 | | | | 0.06 | | | | 0.04 | | | | (0.01 | ) | | | 0.02 | |
| Net realized and unrealized gain (loss) | | | 0.73 | | | | 0.23 | | | | (0.35 | ) | | | 0.89 | | | | 1.29 | |
| Total from investment operations | | | 0.80 | | | | 0.29 | | | | (0.31 | ) | | | 0.88 | | | | 1.31 | |
| |
| Less dividends and distributions from: | | | | | | | | | | | | | | | | | | | | |
| Net investment income | | | (0.07 | ) | | | (0.08 | ) | | | — | | | | (0.04 | ) | | | (0.01 | ) |
| Net realized gain | | | (0.27 | ) | | | (1.04 | ) | | | (1.00 | ) | | | (0.63 | ) | | | — | |
| Total dividends and distributions | | | (0.34 | ) | | | (1.12 | ) | | | (1.00 | ) | | | (0.67 | ) | | | (0.01 | ) |
| |
| Net asset value, end of period | | $ | 7.13 | | | $ | 6.67 | | | $ | 7.50 | | | $ | 8.81 | | | $ | 8.60 | |
| |
| Total return3 | | | 12.11% | | | | 3.89% | 4 | | | (1.48% | )4 | | | 10.69% | 4 | | | 17.99% | 4 |
| |
| Ratios and supplemental data: | | | | | | | | | | | | | | | | | | | | |
| Net assets, end of period (000 omitted) | | $ | 233,850 | | | $ | 271,088 | | | $ | 344,592 | | | $ | 393,697 | | | $ | 379,176 | |
| Ratio of expenses to average net assets5 | | | 1.36% | | | | 1.41% | | | | 1.44% | | | | 1.43% | | | | 1.44% | |
| Ratio of expenses to average net assets prior to fees waived5 | | | 1.36% | | | | 1.42% | | | | 1.46% | | | | 1.48% | | | | 1.49% | |
| Ratio of net investment income (loss) to average net assets | | | 0.94% | | | | 0.86% | | | | 0.55% | | | | (0.16% | ) | | | 0.30% | |
| Ratio of net investment income (loss) to average net assets prior | | | | | | | | | | | | | | | | | | | | |
| to fees waived | | | 0.94% | | | | 0.85% | | | | 0.53% | | | | (0.21% | ) | | | 0.25% | |
| Portfolio turnover | | | 34% | | | | 128% | | | | 119% | | | | 132% | | | | 117% | |
| 1 | On October 4, 2019, Class A shares of First Investors Global Fund were reorganized into Class A shares of Delaware Global Equity Fund. See Notes to financial statements. The Class A shares’ financial highlights for the periods prior to October 4, 2019, reflect the performance of First Investors Global Fund Class A shares. |
| 2 | Calculated using average shares outstanding. |
| 3 | Total return is based on the change in net asset value of a share during the period and assumes reinvestment of dividends and distributions at net asset value and does not reflect the impact of a sales charge. |
| 4 | Total return during the period reflects a waiver by the manager. Performance would have been lower had the waiver not been in effect. |
| 5 | Expense ratios do not include expenses of the Underlying Funds in which the Fund invests. |
See accompanying notes, which are an integral part of the financial statements.
129
Table of Contents
Financial highlights
Delaware Global Equity Fund Institutional Class
Selected data for each share of the Fund outstanding throughout each period were as follows:
| | Year ended |
| | 9/30/21 | | 9/30/201 | | 9/30/19 | | 9/30/18 | | 9/30/17 |
| Net asset value, beginning of period | | $ | 6.97 | | | $ | 7.74 | | | $ | 9.03 | | | $ | 8.78 | | | $ | 7.43 | |
| |
| Income (loss) from investment operations: | | | | | | | | | | | | | | | | | | | | |
| Net investment income2 | | | 0.09 | | | | 0.07 | | | | 0.07 | | | | 0.02 | | | | 0.06 | |
| Net realized and unrealized gain (loss) | | | 0.77 | | | | 0.25 | | | | (0.36 | ) | | | 0.91 | | | | 1.31 | |
| Total from investment operations | | | 0.86 | | | | 0.32 | | | | (0.29 | ) | | | 0.93 | | | | 1.37 | |
| |
| Less dividends and distributions from: | | | | | | | | | | | | | | | | | | | | |
| Net investment income | | | (0.08 | ) | | | (0.05 | ) | | | — | | | | (0.05 | ) | | | (0.02 | ) |
| Net realized gain | | | (0.27 | ) | | | (1.04 | ) | | | (1.00 | ) | | | (0.63 | ) | | | — | |
| Total dividends and distributions | | | (0.35 | ) | | | (1.09 | ) | | | (1.00 | ) | | | (0.68 | ) | | | (0.02 | ) |
| |
| Net asset value, end of period | | $ | 7.48 | | | $ | 6.97 | | | $ | 7.74 | | | $ | 9.03 | | | $ | 8.78 | |
| |
| Total return3 | | | 12.54% | | | | 4.24% | | | | (1.20% | ) | | | 11.03% | | | | 18.46% | |
| |
| Ratios and supplemental data: | | | | | | | | | | | | | | | | | | | | |
| Net assets, end of period (000 omitted) | | $ | 15,345 | | | $ | 17,475 | | | $ | 75,077 | | | $ | 228,234 | | | $ | 191,839 | |
| Ratio of expenses to average net assets4 | | | 1.07% | | | | 1.09% | | | | 1.09% | | | | 1.05% | | | | 1.04% | |
| Ratio of expenses to average net assets prior to fees waived4 | | | 1.11% | | | | 1.18% | | | | 1.11% | | | | 1.10% | | | | 1.09% | |
| Ratio of net investment income to average net assets | | | 1.24% | | | | 0.93% | | | | 0.95% | | | | 0.25% | | | | 0.70% | |
| Ratio of net investment income to average net assets prior to | | | | | | | | | | | | | | | | | | | | |
| fees waived | | | 1.20% | | | | 0.84% | | | | 0.93% | | | | 0.20% | | | | 0.65% | |
| Portfolio turnover | | | 34% | | | | 128% | | | | 119% | | | | 132% | | | | 117% | |
| 1 | On October 4, 2019, Advisor Class shares of First Investors Global Fund were reorganized into Institutional Class shares of Delaware Global Equity Fund. See Notes to financial statements. The Institutional Class shares’ financial highlights for the periods prior to October 4, 2019, reflect the performance of First Investors Global Fund Advisor Class shares. |
| 2 | Calculated using average shares outstanding. |
| 3 | Total return is based on the change in net asset value of a share during the period and assumes reinvestment of dividends and distributions at net asset value. Total return during all of the periods shown reflects a waiver by the manager. Performance would have been lower had the waiver not been in effect. |
| 4 | Expense ratios do not include expenses of the Underlying Funds in which the Fund invests. |
See accompanying notes, which are an integral part of the financial statements.
130
Table of Contents
Delaware Global Equity Fund Class R6
Selected data for each share of the Fund outstanding throughout each period were as follows:
| | Year ended |
| | 9/30/21 | | 9/30/201 | | 9/30/19 | | 9/30/18 | | 9/30/17 |
| Net asset value, beginning of period | | $ | 6.98 | | | $ | 7.80 | | | $ | 9.08 | | | $ | 8.82 | | | $ | 7.47 | |
| |
| Income (loss) from investment operations: | | | | | | | | | | | | | | | | | | | | |
| Net investment income2 | | | 0.02 | | | | 0.08 | | | | 0.07 | | | | 0.03 | | | | 0.06 | |
| Net realized and unrealized gain (loss) | | | 0.85 | | | | 0.25 | | | | (0.35 | ) | | | 0.91 | | | | 1.31 | |
| Total from investment operations | | | 0.87 | | | | 0.33 | | | | (0.28 | ) | | | 0.94 | | | | 1.37 | |
| |
| Less dividends and distributions from: | | | | | | | | | | | | | | | | | | | | |
| Net investment income | | | — | | | | (0.11 | ) | | | — | | | | (0.05 | ) | | | (0.02 | ) |
| Net realized gain | | | (0.27 | ) | | | (1.04 | ) | | | (1.00 | ) | | | (0.63 | ) | | | — | |
| Total dividends and distributions | | | (0.27 | ) | | | (1.15 | ) | | | (1.00 | ) | | | (0.68 | ) | | | (0.02 | ) |
| |
| Net asset value, end of period | | $ | 7.58 | | | $ | 6.98 | | | $ | 7.80 | | | $ | 9.08 | | | $ | 8.82 | |
| |
| Total return3 | | | 12.61% | | | | 4.32% | | | | (1.08% | ) | | | 11.12% | | | | 18.38% | |
| |
| Ratios and supplemental data: | | | | | | | | | | | | | | | | | | | | |
| Net assets, end of period (000 omitted) | | $ | 138 | | | $ | 1,317 | | | $ | 1,946 | | | $ | 4,419 | | | $ | 3,800 | |
| Ratio of expenses to average net assets4 | | | 1.02% | | | | 1.03% | | | | 1.02% | | | | 1.00% | | | | 1.00% | |
| Ratio of expenses to average net assets prior to fees waived4 | | | 1.05% | | | | 1.13% | | | | 1.04% | | | | 1.05% | | | | 1.05% | |
| Ratio of net investment income to average net assets | | | 0.31% | | | | 1.21% | | | | 0.95% | | | | 0.29% | | | | 0.74% | |
| Ratio of net investment income to average net assets prior to | | | | | | | | | | | | | | | | | | | | |
| fees waived | | | 0.28% | | | | 1.11% | | | | 0.93% | | | | 0.24% | | | | 0.69% | |
| Portfolio turnover | | | 34% | | | | 128% | | | | 119% | | | | 132% | | | | 117% | |
| 1 | On October 4, 2019, Institutional Class shares of First Investors Global Fund were reorganized into Class R6 shares of Delaware Global Equity Fund. See Notes to financial statements. The Class R6 shares’ financial highlights for the periods prior to October 4, 2019, reflect the performance of First Investors Global Fund Institutional Class shares. |
| 2 | Calculated using average shares outstanding. |
| 3 | Total return is based on the change in net asset value of a share during the period and assumes reinvestment of dividends and distributions at net asset value. Total return during all of the periods shown reflects a waiver by the manager. Performance would have been lower had the waiver not been in effect. |
| 4 | Expense ratios do not include expenses of the Underlying Funds in which the Fund invests. |
See accompanying notes, which are an integral part of the financial statements.
131
Table of Contents
Financial highlights
Delaware Covered Call Strategy Fund Class A
Selected data for each share of the Fund outstanding throughout each period were as follows:
| | Year ended |
| | 9/30/21 | | 9/30/201 | | 9/30/19 | | 9/30/18 | | 9/30/17 |
| Net asset value, beginning of period | | $ | 10.99 | | | $ | 11.81 | | | $ | 11.83 | | | $ | 11.18 | | | $ | 10.36 | |
| | | | | | | | | | | | | | | | | | | | | |
| Income (loss) from investment operations: | | | | | | | | | | | | | | | | | | | | |
| Net investment income2 | | | 0.06 | | | | 0.13 | | | | 0.12 | | | | 0.11 | | | | 0.10 | |
| Net realized and unrealized gain (loss) | | | 2.14 | | | | (0.82 | ) | | | (0.02 | ) | | | 0.64 | | | | 0.85 | |
| Total from investment operations | | | 2.20 | | | | (0.69 | ) | | | 0.10 | | | | 0.75 | | | | 0.95 | |
| | | | | | | | | | | | | | | | | | | | | |
| Less dividends and distributions from: | | | | | | | | | | | | | | | | | | | | |
| Net investment income | | | (0.07 | ) | | | (0.13 | ) | | | (0.12 | ) | | | (0.10 | ) | | | (0.11 | ) |
| Net realized gain | | | — | | | | — | | | | — | | | | — | | | | (0.02 | ) |
| Total dividends and distributions | | | (0.07 | ) | | | (0.13 | ) | | | (0.12 | ) | | | (0.10 | ) | | | (0.13 | ) |
| | | | | | | | | | | | | | | | | | | | | |
| Net asset value, end of period | | $ | 13.12 | | | $ | 10.99 | | | $ | 11.81 | | | $ | 11.83 | | | $ | 11.18 | |
| | | | | | | | | | | | | | | | | | | | | |
| Total return3 | | | 20.11% | | | | (5.75% | ) | | | 0.97% | | | | 6.79% | | | | 9.17% | |
| | | | | | | | | | | | | | | | | | | | | |
| Ratios and supplemental data: | | | | | | | | | | | | | | | | | | | | |
| Net assets, end of period (000 omitted) | | $ | 95,583 | | | $121,566 | | | $211,777 | | | $237,103 | | | $167,906 | |
| Ratio of expenses to average net assets4 | | | 1.31% | | | | 1.32% | | | | 1.30% | | | | 1.30% | | | | 1.30% | |
| Ratio of expenses to average net assets prior to fees waived4 | | | 1.35% | | | | 1.37% | | | | 1.28% | | | | 1.28% | | | | 1.36% | |
| Ratio of net investment income to average net assets | | | 0.51% | | | | 1.15% | | | | 1.11% | | | | 0.95% | | | | 1.18% | |
| Ratio of net investment income to average net assets prior to | | | | | | | | | | | | | | | | | | | | |
| fees waived | | | 0.47% | | | | 1.10% | | | | 1.13% | | | | 0.97% | | | | 1.12% | |
| Portfolio turnover | | | 41% | | | | 49% | | | | 34% | | | | 107% | | | | 121% | |
| 1 | On October 4, 2019, Class A shares of First Investors Covered Call Strategy Fund were reorganized into Class A shares of Delaware Covered Call Strategy Fund. See Notes to financial statements. The Class A shares’ financial highlights for the periods prior to October 4, 2019, reflect the performance of First Investors Covered Call Strategy Fund Class A shares. |
| 2 | Calculated using average shares outstanding. |
| 3 | Total return is based on the change in net asset value of a share during the period and assumes reinvestment of dividends and distributions at net asset value and does not reflect the impact of a sales charge. Total return during all of the periods shown reflects a waiver by the manager. Performance would have been lower had the waiver not been in effect. |
| 4 | Expense ratios do not include expenses of the Underlying Funds in which the Fund invests. |
See accompanying notes, which are an integral part of the financial statements.
132
Table of Contents
Delaware Covered Call Strategy Fund Institutional Class
Selected data for each share of the Fund outstanding throughout each period were as follows:
| | Year ended |
| | 9/30/21 | | 9/30/201 | | 9/30/19 | | 9/30/18 | | 9/30/17 |
| Net asset value, beginning of period | | $ | 10.96 | | | $ | 11.78 | | | $ | 11.80 | | | $ | 11.16 | | | $ | 10.34 | |
| | | | | | | | | | | | | | | | | | | | | |
| Income (loss) from investment operations: | | | | | | | | | | | | | | | | | | | | |
| Net investment income2 | | | 0.09 | | | | 0.15 | | | | 0.16 | | | | 0.14 | | | | 0.13 | |
| Net realized and unrealized gain (loss) | | | 2.14 | | | | (0.81) | | | | (0.02) | | | | 0.64 | | | | 0.86 | |
| Total from investment operations | | | 2.23 | | | | (0.66) | | | | 0.14 | | | | 0.78 | | | | 0.99 | |
| | | | | | | | | | | | | | | | | | | | | |
| Less dividends and distributions from: | | | | | | | | | | | | | | | | | | | | |
| Net investment income | | | (0.11 | ) | | | (0.16 | ) | | | (0.16 | ) | | | (0.14 | ) | | | (0.15 | ) |
| Net realized gain | | | — | | | | — | | | | — | | | | — | | | | (0.02 | ) |
| Total dividends and distributions | | | (0.11 | ) | | | (0.16 | ) | | | (0.16 | ) | | | (0.14 | ) | | | (0.17 | ) |
| | | | | | | | | | | | | | | | | | | | | |
| Net asset value, end of period | | $ | 13.08 | | | $ | 10.96 | | | $ | 11.78 | | | $ | 11.80 | | | $ | 11.16 | |
| | | | | | | | | | | | | | | | | | | | | |
| Total return3 | | | 20.40% | | | | (5.54% | ) | | | 1.25% | | | | 7.09% | | | | 9.62% | |
| | | | | | | | | | | | | | | | | | | | | |
| Ratios and supplemental data: | | | | | | | | | | | | | | | | | | | | |
| Net assets, end of period (000 omitted) | | $ | 34,606 | | | $ | 37,887 | | | $ | 66,252 | | | $ | 114,275 | | | $ | 109,360 | |
| Ratio of expenses to average net assets4 | | | 1.07% | | | | 1.10% | | | | 1.00% | | | | 0.97% | | | | 0.97% | |
| Ratio of expenses to average net assets prior to fees waived4 | | | 1.10% | | | | 1.12% | | | | 0.96% | | | | 1.03% | | | | 1.06% | |
| Ratio of net investment income to average net assets | | | 0.75% | | | | 1.38% | | | | 1.41% | | | | 1.25% | | | | 1.53% | |
| Ratio of net investment income to average net assets prior to | | | | | | | | | | | | | | | | | | | | |
| fees waived | | | 0.72% | | | | 1.36% | | | | 1.45% | | | | 1.19% | | | | 1.44% | |
| Portfolio turnover | | | 41% | | | | 49% | | | | 34% | | | | 107% | | | | 121% | |
| 1 | On October 4, 2019, Advisor Class shares of First Investors Covered Call Strategy Fund were reorganized into Institutional Class shares of Delaware Covered Call Strategy Fund. See Notes to financial statements. The Institutional Class shares’ financial highlights for the periods prior to October 4, 2019, reflect the performance of First Investors Covered Call Strategy Fund Advisor Class shares. |
| 2 | Calculated using average shares outstanding. |
| 3 | Total return is based on the change in net asset value of a share during the period and assumes reinvestment of dividends and distributions at net asset value. Total return during all of the periods shown reflects a waiver by the manager. Performance would have been lower had the waiver not been in effect. |
| 4 | Expense ratios do not include expenses of the Underlying Funds in which the Fund invests. |
See accompanying notes, which are an integral part of the financial statements.
133
Table of Contents
Financial highlights
Delaware Covered Call Strategy Fund Class R6
Selected data for each share of the Fund outstanding throughout each period were as follows:
| | Year ended |
| | 9/30/21 | | 9/30/201 | | 9/30/19 | | | 9/30/18 | | | | 9/30/17 | |
| Net asset value, beginning of period | | $ | 10.91 | | | $ | 11.69 | | | | $ 11.72 | | | | $ 11.17 | | | | $ 10.35 | |
| | | | | | | | | | | | | | | | | | | | | |
| Income (loss) from investment operations: | | | | | | | | | | | | | | | | | | | | |
| Net investment income2 | | | 0.12 | | | | 0.18 | | | | 0.17 | | | | 0.16 | | | | 0.16 | |
| Net realized and unrealized gain (loss) | | | 2.12 | | | | (0.81) | | | | (0.02) | | | | 0.63 | | | | 0.85 | |
| Total from investment operations | | | 2.24 | | | | (0.63) | | | | 0.15 | | | | 0.79 | | | | 1.01 | |
| | | | | | | | | | | | | | | | | | | | | |
| Less dividends and distributions from: | | | | | | | | | | | | | | | | | | | | |
| Net investment income | | | (0.12 | ) | | | (0.15 | ) | | | (0.18 | ) | | | (0.24 | ) | | | (0.17 | ) |
| Net realized gain | | | — | | | | — | | | | — | | | | — | | | | (0.02 | ) |
| Total dividends and distributions | | | (0.12 | ) | | | (0.15 | ) | | | (0.18 | ) | | | (0.24 | ) | | | (0.19 | ) |
| | | | | | | | | | | | | | | | | | | | | |
| Net asset value, end of period | | $ | 13.03 | | | $ | 10.91 | | | $ | 11.69 | | | $ | 11.72 | | | $ | 11.17 | |
| | | | | | | | | | | | | | | | | | | | | |
| Total return3 | | | 20.57% | | | | (5.30% | ) | | | 1.42% | | | | 7.19% | | | | 9.77% | |
| | | | | | | | | | | | | | | | | | | | | |
| Ratios and supplemental data: | | | | | | | | | | | | | | | | | | | | |
| Net assets, end of period (000 omitted) | | $ | 48 | | | $ | 236 | | | $ | 1,477 | | | $ | 2,913 | | | $ | 7,334 | |
| Ratio of expenses to average net assets4 | | | 0.88% | | | | 0.89% | | | | 0.87% | | | | 0.84% | | | | 0.84% | |
| Ratio of expenses to average net assets prior to fees waived4 | | | 1.02% | | | | 1.07% | | | | 0.90% | | | | 0.89% | | | | 0.96% | |
| Ratio of net investment income to average net assets | | | 1.02% | | | | 1.64% | | | | 1.54% | | | | 1.38% | | | | 1.65% | |
| Ratio of net investment income to average net assets prior to | | | | | | | | | | | | | | | | | | | | |
| fees waived | | | 0.88% | | | | 1.46% | | | | 1.51% | | | | 1.33% | | | | 1.53% | |
| Portfolio turnover | | | 41% | | | | 49% | | | | 34% | | | | 107% | | | | 121% | |
| 1 | On October 4, 2019, Institutional Class shares of First Investors Covered Call Strategy Fund were reorganized into Class R6 shares of Delaware Covered Call Strategy Fund. See Notes to financial statements. The Class R6 shares’ financial highlights for the periods prior to October 4, 2019, reflect the performance of First Investors Covered Call Strategy Fund Institutional Class shares. |
| 2 | Calculated using average shares outstanding. |
| 3 | Total return is based on the change in net asset value of a share during the period and assumes reinvestment of dividends and distributions at net asset value. Total return during all of the periods shown reflects a waiver by the manager. Performance would have been lower had the waiver not been in effect. |
| 4 | Expense ratios do not include expenses of the Underlying Funds in which the Fund invests. |
See accompanying notes, which are an integral part of the financial statements.
134
Table of Contents
Delaware Hedged U.S. Equity Opportunities Fund Class A
Selected data for each share of the Fund outstanding throughout each period were as follows:
| | Year ended |
| | 9/30/21 | | 9/30/201 | | 9/30/19 | | 9/30/18 | | 9/30/17 |
| Net asset value, beginning of period | | $ | 11.61 | | | $ | 12.36 | | | $ | 11.90 | | | $ | 10.77 | | | $ | 9.91 | |
| | | | | | | | | | | | | | | | | | | | | |
| Income (loss) from investment operations: | | | | | | | | | | | | | | | | | | | | |
| Net investment loss2 | | | (0.05 | ) | | | (0.02 | ) | | | (0.01 | ) | | | (0.03 | ) | | | (0.02 | ) |
| Net realized and unrealized gain | | | 1.55 | | | | 1.23 | | | | 0.68 | | | | 1.16 | | | | 0.88 | |
| Total from investment operations | | | 1.50 | | | | 1.21 | | | | 0.67 | | | | 1.13 | | | | 0.86 | |
| | | | | | | | | | | | | | | | | | | | | |
| Less dividends and distributions from: | | | | | | | | | | | | | | | | | | | | |
| Net investment income | | | — | | | | (0.05 | ) | | | — | | | | — | | | | — | |
| Net realized gain | | | (2.91 | ) | | | (1.91 | ) | | | (0.21 | ) | | | — | | | | — | |
| Total dividends and distributions | | | (2.91 | ) | | | (1.96 | ) | | | (0.21 | ) | | | — | | | | — | |
| | | | | | | | | | | | | | | | | | | | | |
| Net asset value, end of period | | $ | 10.20 | | | $ | 11.61 | | | $ | 12.36 | | | $ | 11.90 | | | $ | 10.77 | |
| | | | | | | | | | | | | | | | | | | | | |
| Total return3 | | | 14.35% | | | | 10.91% | | | | 5.92% | | | | 10.49% | | | | 8.68% | |
| | | | | | | | | | | | | | | | | | | | | |
| Ratios and supplemental data: | | | | | | | | | | | | | | | | | | | | |
| Net assets, end of period (000 omitted) | | $ | 45,084 | | | $ | 55,603 | | | $ | 78,297 | | | $ | 66,746 | | | $ | 44,228 | |
| Ratio of expenses to average net assets4 | | | 1.64% | | | | 1.66% | | | | 1.75% | | | | 1.75% | | | | 1.75% | |
| Ratio of expenses to average net assets prior to fees waived4 | | | 1.80% | | | | 1.85% | | | | 1.68% | | | | 1.76% | | | | 2.09% | |
| Ratio of net investment loss to average net assets | | | (0.48% | ) | | | (0.14% | ) | | | (0.05% | ) | | | (0.22% | ) | | | (0.21% | ) |
| Ratio of net investment income (loss) to average net assets prior | | | | | | | | | | | | | | | | | | | | |
| to fees waived | | | (0.64% | ) | | | (0.33% | ) | | | 0.02% | | | | (0.23% | ) | | | (0.55% | ) |
| Portfolio turnover | | | 60% | | | | 109% | | | | 124% | | | | 56% | | | | 75% | |
| 1 | On October 4, 2019, Class A shares of First Investors Hedged U.S. Equity Opportunities Fund were reorganized into Class A shares of Delaware Hedged U.S. Equity Opportunities Fund. See Notes to financial statements. The Class A shares’ financial highlights for the periods prior to October 4, 2019, reflect the performance of First Investors Hedged U.S. Equity Opportunities Fund Class A shares. |
| 2 | Calculated using average shares outstanding. |
| 3 | Total return is based on the change in net asset value of a share during the period and assumes reinvestment of dividends and distributions at net asset value and does not reflect the impact of a sales charge. Total return during all of the periods shown reflects a waiver by the manager. Performance would have been lower had the waiver not been in effect. |
| 4 | Expense ratios do not include expenses of the Underlying Funds in which the Fund invests. |
See accompanying notes, which are an integral part of the financial statements.
135
Table of Contents
Financial highlights
Delaware Hedged U.S. Equity Opportunities Fund Institutional Class
Selected data for each share of the Fund outstanding throughout each period were as follows:
| | Year ended |
| | 9/30/21 | | 9/30/201 | | 9/30/19 | | 9/30/18 | | 9/30/17 |
| Net asset value, beginning of period | | $ | 11.79 | | | $ | 12.48 | | | $ | 11.99 | | | $ | 10.81 | | | $ | 9.91 | |
| | | | | | | | | | | | | | | | | | | | | |
| Income (loss) from investment operations: | | | | | | | | | | | | | | | | | | | | |
| Net investment income (loss)2 | | | (0.02 | ) | | | 0.02 | | | | 0.03 | | | | 0.02 | | | | 0.01 | |
| Net realized and unrealized gain | | | 1.59 | | | | 1.25 | | | | 0.67 | | | | 1.16 | | | | 0.89 | |
| Total from investment operations | | | 1.57 | | | | 1.27 | | | | 0.70 | | | | 1.18 | | | | 0.90 | |
| | | | | | | | | | | | | | | | | | | | | |
| Less dividends and distributions from: | | | | | | | | | | | | | | | | | | | | |
| Net investment income | | | — | | | | (0.05 | ) | | | — | 3 | | | — | | | | — | 3 |
| Net realized gain | | | (2.91 | ) | | | (1.91 | ) | | | (0.21 | ) | | | — | | | | — | |
| Total dividends and distributions | | | (2.91 | ) | | | (1.96 | ) | | | (0.21 | ) | | | — | | | | — | 3 |
| | | | | | | | | | | | | | | | | | | | | |
| Net asset value, end of period | | $ | 10.45 | | | $ | 11.79 | | | $ | 12.48 | | | $ | 11.99 | | | $ | 10.81 | |
| | | | | | | | | | | | | | | | | | | | | |
| Total return4 | | | 14.79% | | | | 11.28% | | | | 6.14% | | | | 10.92% | | | | 9.11% | |
| | | | | | | | | | | | | | | | | | | | | |
| Ratios and supplemental data: | | | | | | | | | | | | | | | | | | | | |
| Net assets, end of period (000 omitted) | | $ | 24,625 | | | $ | 19,229 | | | $ | 44,543 | | | $ | 94,955 | | | $ | 33,770 | |
| Ratio of expenses to average net assets5 | | | 1.30% | | | | 1.33% | | | | 1.42% | | | | 1.42% | | | | 1.42% | |
| Ratio of expenses to average net assets prior to fees waived5 | | | 1.56% | | | | 1.62% | | | | 1.39% | | | | 1.40% | | | | 1.76% | |
| Ratio of net investment income (loss) to average net assets | | | (0.15% | ) | | | 0.21% | | | | 0.27% | | | | 0.16% | | | | 0.10% | |
| Ratio of net investment income (loss) to average net assets prior | | | | | | | | | | | | | | | | | | | | |
| to fees waived | | | (0.41% | ) | | | (0.08% | ) | | | 0.30% | | | | 0.18% | | | | (0.24% | ) |
| Portfolio turnover | | | 60% | | | | 109% | | | | 124% | | | | 56% | | | | 75% | |
| 1 | On October 4, 2019, Advisor Class shares of First Investors Hedged U.S. Equity Opportunities Fund were reorganized into Institutional Class shares of Delaware Hedged U.S. Equity Opportunities Fund. See Notes to financial statements. The Institutional Class shares’ financial highlights for the periods prior to October 4, 2019, reflect the performance of First Investors Hedged U.S. Equity Opportunities Fund Advisor Class shares. |
| 2 | Calculated using average shares outstanding. |
| 3 | Amount is less than $0.005 per share. |
| 4 | Total return is based on the change in net asset value of a share during the period and assumes reinvestment of dividends and distributions at net asset value. Total return during all of the periods shown reflects a waiver by the manager. Performance would have been lower had the waiver not been in effect. |
| 5 | Expense ratios do not include expenses of the Underlying Funds in which the Fund invests. |
See accompanying notes, which are an integral part of the financial statements.
136
Table of Contents
Delaware Hedged U.S. Equity Opportunities Fund Class R6
Selected data for each share of the Fund outstanding throughout each period were as follows:
| | Year ended |
| | 9/30/21 | | 9/30/201 | | 9/30/19 | | 9/30/18 | | 9/30/17 |
| Net asset value, beginning of period | | $ | 11.80 | | | $ | 12.53 | | | $ | 12.01 | | | $ | 10.82 | | | $ | 9.91 | |
| | | | | | | | | | | | | | | | | | | | | |
| Income from investment operations: | | | | | | | | | | | | | | | | | | | | |
| Net investment income2 | | | — | 3 | | | 0.04 | | | | 0.04 | | | | 0.02 | | | | 0.02 | |
| Net realized and unrealized gain | | | 1.58 | | | | 1.24 | | | | 0.69 | | | | 1.17 | | | | 0.89 | |
| Total from investment operations | | | 1.58 | | | | 1.28 | | | | 0.73 | | | | 1.19 | | | | 0.91 | |
| | | | | | | | | | | | | | | | | | | | | |
| Less dividends and distributions from: | | | | | | | | | | | | | | | | | | | | |
| Net investment income | | | — | | | | (0.10 | ) | | | — | 3 | | | — | | | | — | 3 |
| Net realized gain | | | (2.91 | ) | | | (1.91 | ) | | | (0.21 | ) | | | — | | | | — | |
| Total dividends and distributions | | | (2.91 | ) | | | (2.01 | ) | | | (0.21 | ) | | | — | | | | — | 3 |
| | | | | | | | | | | | | | | | | | | | | |
| Net asset value, end of period | | $ | 10.47 | | | $ | 11.80 | | | $ | 12.53 | | | $ | 12.01 | | | $ | 10.82 | |
| | | | | | | | | | | | | | | | | | | | | |
| Total return4 | | | 14.92% | | | | 11.41% | | | | 6.39% | | | | 11.00% | | | | 9.21% | |
| | | | | | | | | | | | | | | | | | | | | |
| Ratios and supplemental data: | | | | | | | | | | | | | | | | | | | | |
| Net assets, end of period (000 omitted) | | $ | 17 | | | $ | 91 | | | $ | 341 | | | $ | 574 | | | $ | 472 | |
| Ratio of expenses to average net assets5 | | | 1.20% | | | | 1.23% | | | | 1.31% | | | | 1.31% | | | | 1.31% | |
| Ratio of expenses to average net assets prior to fees waived5 | | | 1.49% | | | | 1.57% | | | | 1.30% | | | | 1.39% | | | | 1.74% | |
| Ratio of net investment income (loss) to average net assets | | | (0.05% | ) | | | 0.31% | | | | 0.37% | | | | 0.21% | | | | 0.23% | |
| Ratio of net investment income (loss) to average net assets prior | | | | | | | | | | | | | | | | | | | | |
| to fees waived | | | (0.34% | ) | | | (0.03% | ) | | | 0.38% | | | | 0.13% | | | | (0.20% | ) |
| Portfolio turnover | | | 60% | | | | 109% | | | | 124% | | | | 56% | | | | 75% | |
| 1 | On October 4, 2019, Institutional Class shares of First Investors Hedged U.S. Equity Opportunities Fund were reorganized into Class R6 shares of Delaware Hedged U.S. Equity Opportunities Fund. See Notes to financial statements. The Class R6 shares’ financial highlights for the periods prior to October 4, 2019, reflect the performance of First Investors Hedged U.S. Equity Opportunities Fund Institutional Class shares. |
| 2 | Calculated using average shares outstanding. |
| 3 | Amount is less than $0.005 per share. |
| 4 | Total return is based on the change in net asset value of a share during the period and assumes reinvestment of dividends and distributions at net asset value. Total return during all of the periods shown reflects a waiver by the manager. Performance would have been lower had the waiver not been in effect. |
| 5 | Expense ratios do not include expenses of the Underlying Funds in which the Fund invests. |
See accompanying notes, which are an integral part of the financial statements.
137
Table of Contents
Financial highlights
Delaware Premium Income Fund Class A
Selected data for each share of the Fund outstanding throughout each period were as follows:
| | | | | | | | | | | | | | 4/2/181 |
| | Year ended | | to |
| | 9/30/21 | | 9/30/202 | | 9/30/19 | | 9/30/18 |
| Net asset value, beginning of period | | $ | 9.36 | | | $ | 10.14 | | | $ | 10.26 | | | $ | 10.00 | |
| | | | | | | | | | | | | | | | | |
| Income (loss) from investment operations: | | | | | | | | | | | | | | | | |
| Net investment income3 | | | 0.16 | | | | 0.21 | | | | 0.18 | | | | 0.08 | |
| Net realized and unrealized gain (loss) | | | 0.96 | | | | (0.65 | ) | | | 0.05 | | | | 0.23 | |
| Total from investment operations | | | 1.12 | | | | (0.44 | ) | | | 0.23 | | | | 0.31 | |
| | | | | | | | | | | | | | | | | |
| Less dividends and distributions from: | | | | | | | | | | | | | | | | |
| Net investment income | | | (0.16 | ) | | | (0.21 | ) | | | (0.17 | ) | | | (0.05 | ) |
| Net realized gain | | | — | | | | (0.13 | ) | | | (0.18 | ) | | | — | |
| Total dividends and distributions | | | (0.16 | ) | | | (0.34 | ) | | | (0.35 | ) | | | (0.05 | ) |
| | | | | | | | | | | | | | | | | |
| Net asset value, end of period | | $ | 10.32 | | | $ | 9.36 | | | $ | 10.14 | | | $ | 10.26 | |
| | | | | | | | | | | | | | | | | |
| Total return4 | | | 11.96% | | | | (4.24% | ) | | | 2.33% | | | | 3.06% | |
| | | | | | | | | | | | | | | | | |
| Ratios and supplemental data: | | | | | | | | | | | | | | | | |
| Net assets, end of period (000 omitted) | | $ | 22,015 | | | $ | 31,472 | | | $ | 60,830 | | | $ | 41,688 | |
| Ratio of expenses to average net assets5 | | | 1.30% | | | | 1.30% | | | | 1.30% | | | | 1.30% | |
| Ratio of expenses to average net assets prior to fees waived5 | | | 1.49% | | | | 1.44% | | | | 1.35% | | | | 2.07% | |
| Ratio of net investment income to average net assets | | | 1.55% | | | | 2.19% | | | | 1.74% | | | | 1.57% | |
| Ratio of net investment income to average net assets prior to fees waived | | | 1.36% | | | | 2.05% | | | | 1.69% | | | | 0.80% | |
| Portfolio turnover | | | 16% | | | | 32% | | | | 63% | | | | 77% | |
| 1 | Date of commencement of operations; ratios have been annualized and total return and portfolio turnover have not been annualized. |
| 2 | On October 4, 2019, Class A shares of First Investors Premium Income Fund were reorganized into Class A shares of Delaware Premium Income Fund. See Notes to financial statements. The Class A shares’ financial highlights for the periods prior to October 4, 2019, reflect the performance of First Investors Premium Income Fund Class A shares. |
| 3 | Calculated using average shares outstanding. |
| 4 | Total return is based on the change in net asset value of a share during the period and assumes reinvestment of dividends and distributions at net asset value and does not reflect the impact of a sales charge. Total return during all of the periods shown reflects a waiver by the manager. Performance would have been lower had the waiver not been in effect. |
| 5 | Expense ratios do not include expenses of the Underlying Funds in which the Fund invests. |
See accompanying notes, which are an integral part of the financial statements.
138
Table of Contents
Delaware Premium Income Fund Institutional Class
Selected data for each share of the Fund outstanding throughout each period were as follows:
| | | | | | | | | | | | | | 4/2/181 |
| | Year ended | | to |
| | 9/30/21 | | 9/30/202 | | 9/30/19 | | 9/30/18 |
| Net asset value, beginning of period | | $ | 9.37 | | | $ | 10.16 | | | $ | 10.26 | | | $ | 10.00 | |
| | | | | | | | | | | | | | | | | |
| Income (loss) from investment operations: | | | | | | | | | | | | | | | | |
| Net investment income3 | | | 0.18 | | | | 0.23 | | | | 0.20 | | | | 0.10 | |
| Net realized and unrealized gain (loss) | | | 0.96 | | | | (0.65 | ) | | | 0.07 | | | | 0.22 | |
| Total from investment operations | | | 1.14 | | | | (0.42 | ) | | | 0.27 | | | | 0.32 | |
| | | | | | | | | | | | | | | | | |
| Less dividends and distributions from: | | | | | | | | | | | | | | | | |
| Net investment income | | | (0.18 | ) | | | (0.24 | ) | | | (0.19 | ) | | | (0.06 | ) |
| Net realized gain | | | — | | | | (0.13 | ) | | | (0.18 | ) | | | — | |
| Total dividends and distributions | | | (0.18 | ) | | | (0.37 | ) | | | (0.37 | ) | | | (0.06 | ) |
| | | | | | | | | | | | | | | | | |
| Net asset value, end of period | | $ | 10.33 | | | $ | 9.37 | | | $ | 10.16 | | | $ | 10.26 | |
| | | | | | | | | | | | | | | | | |
| Total return4 | | | 12.27% | | | | (4.05% | ) | | | 2.67% | | | | 3.18% | |
| | | | | | | | | | | | | | | | | |
| Ratios and supplemental data: | | | | | | | | | | | | | | | | |
| Net assets, end of period (000 omitted) | | $ | 26,233 | | | $ | 32,769 | | | $ | 67,844 | | | $ | 34,170 | |
| Ratio of expenses to average net assets5 | | | 1.05% | | | | 1.05% | | | | 1.05% | | | | 1.02% | |
| Ratio of expenses to average net assets prior to fees waived5 | | | 1.24% | | | | 1.19% | | | | 1.10% | | | | 1.52% | |
| Ratio of net investment income to average net assets | | | 1.80% | | | | 2.45% | | | | 1.98% | | | | 1.86% | |
| Ratio of net investment income to average net assets prior to fees waived | | | 1.61% | | | | 2.31% | | | | 1.93% | | | | 1.36% | |
| Portfolio turnover | | | 16% | | | | 32% | | | | 63% | | | | 77% | |
| 1 | Date of commencement of operations; ratios have been annualized and total return and portfolio turnover have not been annualized. |
| 2 | On October 4, 2019, Advisor Class shares of First Investors Premium Income Fund were reorganized into Institutional Class shares of Delaware Premium Income Fund. See Notes to financial statements. The Institutional Class shares’ financial highlights for the periods prior to October 4, 2019, reflect the performance of First Investors Premium Income Fund Advisor Class shares. |
| 3 | Calculated using average shares outstanding. |
| 4 | Total return is based on the change in net asset value of a share during the period and assumes reinvestment of dividends and distributions at net asset value. Total return during all of the periods shown reflects a waiver by the manager. Performance would have been lower had the waiver not been in effect. |
| 5 | Expense ratios do not include expenses of the Underlying Funds in which the Fund invests. |
See accompanying notes, which are an integral part of the financial statements.
139
Table of Contents
Financial highlights
Delaware Premium Income Fund Class R6
Selected data for each share of the Fund outstanding throughout each period were as follows:
| | | | | | | | | | | | | | 4/2/181 |
| | Year ended | | to |
| | 9/30/21 | | 9/30/202 | | 9/30/19 | | 9/30/18 |
| Net asset value, beginning of period | | $ | 4.87 | | | $ | 5.53 | | | $ | 10.16 | | | $ | 10.00 | |
| | | | | | | | | | | | | | | | | |
| Income (loss) from investment operations: | | | | | | | | | | | | | | | | |
| Net investment income3 | | | 0.10 | | | | 0.13 | | | | 0.20 | | | | 0.10 | |
| Net realized and unrealized gain (loss) | | | 0.50 | | | | (0.37 | ) | | | (0.27 | ) | | | 0.23 | |
| Total from investment operations | | | 0.60 | | | | (0.24 | ) | | | (0.07 | ) | | | 0.33 | |
| | | | | | | | | | | | | | | | | |
| Less dividends and distributions from: | | | | | | | | | | | | | | | | |
| Net investment income | | | (0.24 | ) | | | (0.29 | ) | | | (4.38 | ) | | | (0.17 | ) |
| Net realized gain | | | — | | | | (0.13 | ) | | | (0.18 | ) | | | — | |
| Total dividends and distributions | | | (0.24 | ) | | | (0.42 | ) | | | (4.56 | ) | | | (0.17 | ) |
| | | | | | | | | | | | | | | | | |
| Net asset value, end of period | | $ | 5.23 | | | $ | 4.87 | | | $ | 5.53 | | | $ | 10.16 | |
| | | | | | | | | | | | | | | | | |
| Total return4 | | | 12.54% | | | | (3.95% | ) | | | 2.90% | | | | 3.27% | |
| | | | | | | | | | | | | | | | | |
| Ratios and supplemental data: | | | | | | | | | | | | | | | | |
| Net assets, end of period (000 omitted) | | $ | 16 | | | $ | 34 | | | $ | 29 | | | $ | 3,877 | |
| Ratio of expenses to average net assets5 | | | 0.90% | | | | 0.90% | | | | 0.90% | | | | 0.89% | |
| Ratio of expenses to average net assets prior to fees waived5 | | | 1.17% | | | | 1.13% | | | | 1.05% | | | | 1.88% | |
| Ratio of net investment income to average net assets | | | 1.95% | | | | 2.63% | | | | 2.06% | | | | 1.88% | |
| Ratio of net investment income to average net assets prior to fees waived | | | 1.68% | | | | 2.40% | | | | 1.91% | | | | 0.89% | |
| Portfolio turnover | | | 16% | | | | 32% | | | | 63% | | | | 77% | |
| 1 | Date of commencement of operations; ratios have been annualized and total return and portfolio turnover have not been annualized. |
| 2 | On October 4, 2019, Institutional Class shares of First Investors Premium Income Fund were reorganized into Class R6 shares of Delaware Premium Income Fund. See Notes to financial statements. The Class R6 shares’ financial highlights for the periods prior to October 4, 2019, reflect the performance of First Investors Premium Income Fund Institutional Class shares. |
| 3 | Calculated using average shares outstanding. |
| 4 | Total return is based on the change in net asset value of a share during the period and assumes reinvestment of dividends and distributions at net asset value. Total return during all of the periods shown reflects a waiver by the manager. Performance would have been lower had the waiver not been in effect. |
| 5 | Expense ratios do not include expenses of the Underlying Funds in which the Fund invests. |
See accompanying notes, which are an integral part of the financial statements.
140
Table of Contents
Delaware Total Return Fund Class A
Selected data for each share of the Fund outstanding throughout each period were as follows:
| | Year ended |
| | 9/30/21 | | | 9/30/201 | | | 9/30/19 | | 9/30/18 | | 9/30/17 |
| Net asset value, beginning of period | | $ | 14.37 | | | $ | 19.03 | | | $ | 20.22 | | | $ | 19.88 | | | $ | 19.00 | |
| | | | | | | | | | | | | | | | | | | | | |
| Income (loss) from investment operations: | | | | | | | | | | | | | | | | | | | | |
| Net investment income2 | | | 0.24 | | | | 0.29 | | | | 0.28 | | | | 0.31 | | | | 0.23 | |
| Net realized and unrealized gain (loss) | | | 2.87 | | | | (0.88 | ) | | | 0.39 | | | | 0.74 | | | | 1.27 | |
| Total from investment operations | | | 3.11 | | | | (0.59 | ) | | | 0.67 | | | | 1.05 | | | | 1.50 | |
| | | | | | | | | | | | | | | | | | | | | |
| Less dividends and distributions from: | | | | | | | | | | | | | | | | | | | | |
| Net investment income | | | (0.31 | ) | | | (0.33 | ) | | | (0.34 | ) | | | (0.36 | ) | | | (0.32 | ) |
| Net realized gain | | | — | | | | (3.73 | ) | | | (1.52 | ) | | | (0.35 | ) | | | (0.30 | ) |
| Return of capital | | | — | | | | (0.01 | ) | | | — | | | | — | | | | — | |
| Total dividends and distributions | | | (0.31 | ) | | | (4.07 | ) | | | (1.86 | ) | | | (0.71 | ) | | | (0.62 | ) |
| | | | | | | | | | | | | | | | | | | | | |
| Net asset value, end of period | | $ | 17.17 | | | $ | 14.37 | | | $ | 19.03 | | | $ | 20.22 | | | $ | 19.88 | |
| | | | | | | | | | | | | | | | | | | | | |
| Total return3 | | | 21.77% | | | | (4.48% | )4 | | | 4.58% | | | | 5.32% | | | | 8.09% | |
| | | | | | | | | | | | | | | | | | | | | |
| Ratios and supplemental data: | | | | | | | | | | | | | | | | | | | | |
| Net assets, end of period (000 omitted) | | $ | 488,792 | | | $ | 550,020 | | | $ | 800,910 | | | $ | 889,473 | | | $ | 877,311 | |
| Ratio of expenses to average net assets5 | | | 1.13% | | | | 1.16% | | | | 1.17% | | | | 1.18% | | | | 1.19% | |
| Ratio of expenses to average net assets prior to fees waived5 | | | 1.13% | | | | 1.17% | | | | 1.17% | | | | 1.18% | | | | 1.19% | |
| Ratio of net investment income to average net assets | | | 1.50% | | | | 1.89% | | | | 1.50% | | | | 1.55% | | | | 1.22% | |
| Ratio of net investment income to average net assets prior to | | | | | | | | | | | | | | | | | | | | |
| fees waived | | | 1.50% | | | | 1.88% | | | | 1.50% | | | | 1.55% | | | | 1.22% | |
| Portfolio turnover | | | 94% | | | | 151% | 6 | | | 59% | | | | 53% | | | | 39% | |
| 1 | On October 4, 2019, Class A shares of First Investors Total Return Fund were reorganized into Class A shares of Delaware Total Return Fund. See Notes to financial statements. The Class A shares’ financial highlights for the periods prior to October 4, 2019, reflect the performance of First Investors Total Return Fund Class A shares. |
| 2 | Calculated using average shares outstanding. |
| 3 | Total return is based on the change in net asset value of a share during the period and assumes reinvestment of dividends and distributions at net asset value and does not reflect the impact of a sales charge. |
| 4 | Total return during the period reflects a waiver by the manager. Performance would have been lower had the waiver not been in effect. |
| 5 | Expense ratios do not include expenses of the Underlying Funds in which the Fund invests. |
| 6 | The Fund’s portfolio turnover rate increased substantially during the year ended September 30, 2020 due to a change in the Fund’s portfolio managers and associated repositioning. |
See accompanying notes, which are an integral part of the financial statements.
141
Table of Contents
Financial highlights
Delaware Total Return Fund Institutional Class
Selected data for each share of the Fund outstanding throughout each period were as follows:
| | Year ended |
| | 9/30/21 | | 9/30/201 | | 9/30/19 | | 9/30/18 | | 9/30/17 |
| Net asset value, beginning of period | | $ | 14.43 | | | $ | 19.10 | | | $ | 20.32 | | | $ | 19.98 | | | $ | 19.04 | |
| | | | | | | | | | | | | | | | | | | | |
| Income (loss) from investment operations: | | | | | | | | | | | | | | | | | | | | |
| Net investment income2 | | | 0.28 | | | | 0.33 | | | | 0.34 | | | | 0.37 | | | | 0.32 | |
| Net realized and unrealized gain (loss) | | | 2.88 | | | | (0.90 | ) | | | 0.40 | | | | 0.75 | | | | 1.30 | |
| Total from investment operations | | | 3.16 | | | | (0.57 | ) | | | 0.74 | | | | 1.12 | | | | 1.62 | |
| | | | | | | | | | | | | | | | | | | | |
| Less dividends and distributions from: | | | | | | | | | | | | | | | | | | | | |
| Net investment income | | | (0.35 | ) | | | (0.36 | ) | | | (0.44 | ) | | | (0.43 | ) | | | (0.38 | ) |
| Net realized gain | | | — | | | | (3.73 | ) | | | (1.52 | ) | | | (0.35 | ) | | | (0.30 | ) |
| Return of capital | | | — | | | | (0.01 | ) | | | — | | | | — | | | | — | |
| Total dividends and distributions | | | (0.35 | ) | | | (4.10 | ) | | | (1.96 | ) | | | (0.78 | ) | | | (0.68 | ) |
| | | | | | | | | | | | | | | | | | | | |
| Net asset value, end of period | | $ | 17.24 | | | $ | 14.43 | | | $ | 19.10 | | | $ | 20.32 | | | $ | 19.98 | |
| | | | | | | | | | | | | | | | | | | | |
| Total return3 | | | 22.06% | | | | (4.29% | ) | | | 4.93% | | | | 5.69% | | | | 8.69% | |
| | | | | | | | | | | | | | | | | | | | |
| Ratios and supplemental data: | | | | | | | | | | | | | | | | | | | | |
| Net assets, end of period (000 omitted) | | $ | 1,388 | | | $ | 769 | | | $ | 1,166 | | | $ | 1,006 | | | $ | 996 | |
| Ratio of expenses to average net assets4 | | | 0.88% | | | | 0.90% | | | | 0.85% | | | | 0.84% | | | | 0.80% | |
| Ratio of net investment income to average net assets | | | 1.68% | | | | 2.12% | | | | 1.80% | | | | 1.83% | | | | 1.61% | |
| Portfolio turnover | | | 94% | | | | 151% | 5 | | | 59% | | | | 53% | | | | 39% | |
| 1 | On October 4, 2019, Advisor Class shares of First Investors Total Return Fund were reorganized into Institutional Class shares of Delaware Total Return Fund. See Notes to financial statements. The Institutional Class shares’ financial highlights for the periods prior to October 4, 2019, reflect the performance of First Investors Total Return Fund Advisor Class shares. |
| 2 | Calculated using average shares outstanding. |
| 3 | Total return is based on the change in net asset value of a share during the period and assumes reinvestment of dividends and distributions at net asset value. |
| 4 | Expense ratios do not include expenses of the Underlying Funds in which the Fund invests. |
| 5 | The Fund’s portfolio turnover rate increased substantially during the year ended September 30, 2020 due to a change in the Fund’s portfolio managers and associated repositioning. |
See accompanying notes, which are an integral part of the financial statements.
142
Table of Contents
Delaware Total Return Fund Class R6
Selected data for each share of the Fund outstanding throughout each period were as follows:
| | Year ended |
| | 9/30/21 | | 9/30/201 | | 9/30/19 | | 9/30/18 | | 9/30/17 |
| Net asset value, beginning of period | | $ | 14.47 | | | $ | 19.14 | | | $ | 20.38 | | | $ | 20.05 | | | $ | 19.13 | |
| | | | | | | | | | | | | | | | | | | | |
| Income (loss) from investment operations: | | | | | | | | | | | | | | | | | | | | |
| Net investment income2 | | | 0.34 | | | | 0.35 | | | | 0.35 | | | | 0.40 | | | | 0.32 | |
| Net realized and unrealized gain (loss) | | | 2.85 | | | | (0.90 | ) | | | 0.41 | | | | 0.74 | | | | 1.27 | |
| Total from investment operations | | | 3.19 | | | | (0.55 | ) | | | 0.76 | | | | 1.14 | | | | 1.59 | |
| | | | | | | | | | | | | | | | | | | | |
| Less dividends and distributions from: | | | | | | | | | | | | | | | | | | | | |
| Net investment income | | | (0.37 | ) | | | (0.39 | ) | | | (0.48 | ) | | | (0.46 | ) | | | (0.37 | ) |
| Net realized gain | | | — | | | | (3.73 | ) | | | (1.52 | ) | | | (0.35 | ) | | | (0.30 | ) |
| Return of capital | | | — | | | | — | 3 | | | — | | | | — | | | | — | |
| Total dividends and distributions | | | (0.37 | ) | | | (4.12 | ) | | | (2.00 | ) | | | (0.81 | ) | | | (0.67 | ) |
| | | | | | | | | | | | | | | | | | | | |
| Net asset value, end of period | | $ | 17.29 | | | $ | 14.47 | | | $ | 19.14 | | | $ | 20.38 | | | $ | 20.05 | |
| | | | | | | | | | | | | | | | | | | | |
| Total return4 | | | 22.23% | 5 | | | (4.17% | )5 | | | 5.06% | | | | 5.77% | | | | 8.50% | |
| | | | | | | | | | | | | | | | | | | | |
| Ratios and supplemental data: | | | | | | | | | | | | | | | | | | | | |
| Net assets, end of period (000 omitted) | | $ | 62 | | | $ | 762 | | | $ | 1,976 | | | $ | 34,555 | | | $ | 33,545 | |
| Ratio of expenses to average net assets6 | | | 0.79% | | | | 0.81% | | | | 0.79% | | | | 0.77% | | | | 0.77% | |
| Ratio of expenses to average net assets prior to fees waived6 | | | 0.82% | | | | 0.89% | | | | 0.79% | | | | 0.77% | | | | 0.77% | |
| Ratio of net investment income to average net assets | | | 2.16% | | | | 2.23% | | | | 1.86% | | | | 1.96% | | | | 1.65% | |
| Ratio of net investment income to average net assets prior to | | | | | | | | | | | | | | | | | | | | |
| fees waived | | | 2.13% | | | | 2.15% | | | | 1.86% | | | | 1.96% | | | | 1.65% | |
| Portfolio turnover | | | 94% | | | | 151% | 7 | | | 59% | | | | 53% | | | | 39% | |
| 1 | On October 4, 2019, Institutional Class shares of First Investors Total Return Fund were reorganized into Class R6 shares of Delaware Total Return Fund. See Notes to financial statements. The Class R6 shares’ financial highlights for the periods prior to October 4, 2019, reflect the performance of First Investors Total Return Fund Institutional Class shares. |
| 2 | Calculated using average shares outstanding. |
| 3 | Amount is less than $0.005 per share. |
| 4 | Total return is based on the change in net asset value of a share during the period and assumes reinvestment of dividends and distributions at net asset value. |
| 5 | Total return during the period reflects a waiver by the manager. Performance would have been lower had the waiver not been in effect. |
| 6 | Expense ratios do not include expenses of the Underlying Funds in which the Fund invests. |
| 7 | The Fund’s portfolio turnover rate increased substantially during the year ended September 30, 2020 due to a change in the Fund’s portfolio managers and associated repositioning. |
See accompanying notes, which are an integral part of the financial statements.
143
Table of Contents
Notes to financial statements
Delaware Group® Equity Funds IV (Trust)
September 30, 2021
Delaware Group Equity Funds IV (Trust) is organized as a Delaware statutory trust and offers 12 series. These financial statements and the related notes pertain to nine funds listed below (each a Fund, or collectively, the Funds). The Trust is an open-end investment company. The Funds, except for Delaware Global Equity Fund are considered diversified under the Investment Company Act of 1940, as amended (1940 Act). Delaware Global Equity Fund is considered nondiversified. The Funds offer Class A, Institutional Class and Class R6 shares. Class A shares are sold with a maximum front-end sales charge of 5.75%. There is no front- end sales charge when you purchase $1,000,000 or more of Class A shares. However, if Delaware Distributors, L.P. (DDLP) paid your financial intermediary a commission on your purchase of $1,000,000 or more of Class A shares, for shares purchased prior to July 1, 2020, you will have to pay a limited contingent deferred sales charge (Limited CDSC) of 1.00% if you redeem these shares within the first year after your purchase and 0.50% if you redeem these shares within the second year; and for shares purchased on or after July 1, 2020, you will have to pay a Limited CDSC of 1.00% if you redeem these shares within the 18 months after your purchase, unless a specific waiver of the Limited CDSC applies. Institutional Class and Class R6 shares are not subject to a sales charge and are offered for sale exclusively to certain eligible investors. In addition, Class R6 shares do not pay any service fees, sub-accounting fees, and/or sub-transfer agency fees to any brokers, dealers or other financial intermediaries.
Before each Fund commenced operations, on October 4, 2019, all of the assets and liabilities of the corresponding fund identified as its respective Predecessor Fund (the “Predecessor Fund”) were transferred to the Fund in a tax-free reorganization as set forth in an agreement and plan of reorganization (each a Foresters Reorganization) between the Trust, on behalf of the Funds, and Foresters Investment Management Company, Inc., on behalf of the Predecessor Funds. As a result of each Foresters Reorganization, the applicable Fund assumed the performance and accounting history of its corresponding Predecessor Fund. Financial information included for the dates prior to the Foresters Reorganization is that of the Predecessor Funds.
| Fund | | Predecessor Fund |
| Delaware Equity Income Fund | | First Investors Equity Income Fund |
| Delaware Growth and Income Fund | | First Investors Growth & Income Fund |
| Delaware Growth Equity Fund | | First Investors Select Growth Fund |
| Delaware Opportunity Fund | | First Investors Opportunity Fund |
| Delaware Global Equity Fund | | First Investors Global Fund |
| Delaware Covered Call Strategy Fund | | First Investors Covered Call Strategy Fund |
| Delaware Hedged U.S. Equity Opportunities Fund | | First Investors Hedged U.S. Equity Opportunities Fund |
| Delaware Premium Income Fund | | First Investors Premium Income Fund |
| Delaware Total Return Fund | | First Investors Total Return Fund |
1. Significant Accounting Policies
Each Fund follows accounting and reporting guidance under Financial Accounting Standards Board (FASB) Accounting Standards Codification Topic 946, Financial Services — Investment Companies. The following accounting policies are in accordance with US generally accepted accounting principles (US GAAP) and are consistently followed by the Funds.
Security Valuation — Equity securities and exchange-traded funds (ETFs), except those traded on the Nasdaq Stock Market LLC (Nasdaq), are valued at the last quoted sales price as of the time of the regular close of the New York Stock Exchange on the valuation date. Equity securities and ETFs traded on the Nasdaq are valued in accordance with the Nasdaq Official Closing Price, which may not be the last sales price. If, on a particular day, an equity security or ETF does not trade, the mean between the bid and ask prices will be used, which approximates fair value. Equity securities listed on a foreign exchange are normally valued at the last quoted sales price on the valuation date. Debt securities and credit default swap (CDS) contracts are valued based upon valuations provided by an independent pricing service or broker/counterparty and reviewed by management. To the extent current market prices are not available, the pricing service may take into account developments related to the specific security, as well as transactions in comparable securities. US government and agency securities are valued at the mean between the bid and ask prices, which approximates fair value. Valuations for fixed income securities utilize matrix systems, which reflect such factors as security prices, yields, maturities, and ratings, and are supplemented by dealer and exchange quotations. For asset-backed securities, collateralized mortgage obligations (CMOs), commercial mortgage securities, and US government agency mortgage securities, pricing vendors utilize matrix pricing which considers prepayment speed, attributes of the collateral, yield or price of bonds of comparable quality, coupon,
144
Table of Contents
maturity, and type as well as broker/dealer-supplied prices. Swap prices are derived using daily swap curves and models that incorporate a number of market data factors, such as discounted cash flows, trades, and values of the underlying reference instruments. Exchange-traded options are valued at the last reported sale price or, if no sales are reported, at the mean between the last reported bid and ask prices, which approximates fair value. Futures contracts are valued at the daily quoted settlement prices. Foreign currency exchange contracts and foreign cross currency exchange contracts are valued at the mean between the bid and ask prices, which approximates fair value. Interpolated values are derived when the settlement date of the contract is an interim date for which quotations are not available. Open-end investment companies are valued at their published net asset value (NAV). Generally, other securities and assets for which market quotations are not readily available are valued at fair value as determined in good faith under the direction of the Trust’s Board of Trustees (Board). In determining whether market quotations are readily available or fair valuation will be used, various factors will be taken into consideration, such as market closures or suspension of trading in a security. The Funds may use fair value pricing more frequently for securities traded primarily in non-US markets because, among other things, most foreign markets close well before the Funds value their securities, generally as of 4:00pm Eastern Time. The earlier close of these foreign markets gives rise to the possibility that significant events, including broad market moves, government actions or pronouncements, aftermarket trading, or news events may have occurred in the interim. Whenever such a significant event occurs, the Funds may value foreign securities using fair value prices based on third-party vendor modeling tools (international fair value pricing). Restricted securities are valued at fair value using methods approved by the Board.
Federal and Foreign Income Taxes — No provision for federal income taxes has been made as each Fund intends to continue to qualify for federal income tax purposes as a regulated investment company under Subchapter M of the Internal Revenue Code of 1986, as amended, and make the requisite distributions to shareholders. Each Fund evaluates tax positions taken or expected to be taken in the course of preparing each Fund’s tax returns to determine whether the tax positions are “more-likely-than-not” of being sustained by the applicable tax authority. Tax positions not deemed to meet the “more-likely-than-not” threshold are recorded as a tax benefit or expense in the current year. Management has analyzed each Fund’s tax positions taken or expected to be taken on each Fund’s federal income tax returns through the year ended September 30, 2021, and for all open tax years (years ended September 30, 2018–September 30, 2020), and has concluded that no provision for federal income tax is required in each Fund’s financial statements. In regard to foreign taxes only, each Fund has open tax years in certain foreign countries in which it invests in that may date back to the inception of each Fund. If applicable, each Fund recognizes interest accrued on unrecognized tax benefits in interest expense and penalties in “Other” on the “Statements of operations.” During the year ended September 30, 2021, the Funds did not incur any interest or tax penalties.
Class Accounting — Investment income, common expenses, and realized and unrealized gain (loss) on investments are allocated to the various classes of each Fund on the basis of daily net assets of each class. Realized and unrealized gain (loss) on investments are allocated to the various classes of each Fund on the basis of daily net assets of each class. Distribution expenses relating to a specific class are charged directly to that class. Class R6 shares will not be allocated any expenses related to service fees, sub-accounting fees, and/or sub-transfer agency fees paid to brokers, dealers, or other financial intermediaries.
To Be Announced Trades (TBA) — Delaware Total Return Fund may contract to purchase or sell securities for a fixed price at a transaction date beyond the customary settlement period (examples: when issued, delayed delivery, forward commitment, or TBA transactions) consistent with the Fund’s ability to manage its investment portfolio and meet redemption requests. These transactions involve a commitment by the Fund to purchase or sell securities for a predetermined price or yield with payment and delivery taking place more than three days in the future, or after a period longer than the customary settlement period for that type of security. No interest will be earned by the Fund on such purchases until the securities are delivered or the transaction is completed; however, the market value may change prior to delivery.
Foreign Currency Transactions — Transactions denominated in foreign currencies are recorded at the prevailing exchange rates on the valuation date in accordance with the Funds’ prospectus. The value of all assets and liabilities denominated in foreign currencies is translated daily into US dollars at the exchange rate of such currencies against the US dollar. Transaction gains or losses resulting from changes in exchange rates during the reporting period or upon settlement of the foreign currency transaction are reported in operations for the current period. The Funds generally bifurcate that portion of realized gains and losses on investments in debt securities which is due to changes in foreign exchange rates from that which is due to changes in market prices of debt securities. That portion of gains (losses), which is due to changes in foreign exchange rates, is included on the “Statements of operations” under “Net realized gain (loss) on foreign currencies.” For foreign equity securities, the realized gains and losses are included on the “Statements of operations” under “Net realized gain (loss) on investments.” The Funds report certain foreign currency related transactions as components of realized gains (losses) for financial reporting purposes, whereas such components are treated as ordinary income (loss) for federal income tax purposes.
145
Table of Contents
Notes to financial statements
Delaware Group® Equity Funds IV (Trust)
1. Significant Accounting Policies (continued)
Use of Estimates — The preparation of financial statements in conformity with US GAAP requires management to make estimates and assumptions that affect the fair value of investments, the reported amounts of assets and liabilities and disclosure of contingent assets and liabilities at the date of the financial statements, and the reported amounts of revenues and expenses during the reporting period. Actual results could differ from those estimates and the differences could be material.
Other — Expenses directly attributable to a Fund are charged directly to that Fund. Other expenses common to various funds within the Delaware Funds by Macquarie® (Delaware Funds) are generally allocated among such funds on the basis of average net assets. Management fees and certain other expenses are paid monthly. Security transactions are recorded on the date the securities are purchased or sold (trade date) for financial reporting purposes. Costs used in calculating realized gains and losses on the sale of investment securities are those of the specific securities sold. Dividend income is recorded on the ex-dividend date and interest income is recorded on the accrual basis. Discounts and premiums on debt securities are accreted or amortized to interest income, respectively, over the lives of the respective securities using the effective interest method. Premiums on callable debt securities are amortized to interest income to the earliest call date using the effective interest method. Realized gains (losses) on paydowns of asset- and mortgage-backed securities are classified as interest income. Distributions received from investments in real estate investment trusts (REITs) are recorded as dividend income on the ex-dividend date, subject to reclassification upon notice of the character of such distributions by the issuer. Distributions received from investments in master limited partnerships are recorded as return of capital on investments on the ex-dividend date. Foreign dividends are also recorded on the ex-dividend date or as soon after the ex-dividend date that the Funds are aware of such dividends, net of all tax withholdings, a portion of which may be reclaimable. Withholding taxes and reclaims on foreign dividends and interest have been recorded in accordance with the Funds’ understanding of the applicable country’s tax rules and rates. Delaware Total Return Fund declares and pays dividends monthly. Delaware Equity Income Fund, Delaware Growth and Income Fund, Delaware Covered Call Strategy Fund, and Delaware Premium Income Fund declare and pay dividends quarterly. Delaware Growth Equity Fund, Delaware Opportunity Fund, Delaware Global Equity Fund, and Delaware Hedged U.S. Equity Opportunities Fund declare and pay dividends annually. Each Fund declares and pays distributions from net realized gain on investments, if any, annually. Each Fund may distribute more frequently, if necessary for tax purposes. Dividends and distributions, if any, are recorded on the ex-dividend date.
Each Fund receives earnings credits from its custodian when positive cash balances are maintained, which may be used to offset custody fees. The expenses paid under this arrangement are included on the “Statements of operations” under “Custodian fees” with the corresponding expenses offset included under “Less expenses paid indirectly.” For the year ended September 30, 2021, each Fund earned the following amounts under this arrangement:
| Fund | | Custody credits |
| Delaware Equity Income Fund | | | $ | — | |
| Delaware Growth and Income Fund | | | | 210 | |
| Delaware Growth Equity Fund | | | | — | |
| Delaware Opportunity Fund | | | | 2 | |
| Delaware Global Equity Fund | | | | — | |
| Delaware Covered Call Strategy Fund | | | | 9 | |
| Delaware Hedged U.S. Equity Opportunities Fund | | | | — | |
| Delaware Premium Income Fund | | | | — | |
| Delaware Total Return Fund | | | | 181 | |
146
Table of Contents
Each Fund receives earnings credits from its transfer agent when positive cash balances are maintained, which may be used to offset transfer agent fees. If the amount earned is greater than $1, the expenses paid under this arrangement are included on the “Statements of operations” under “Dividend disbursing and transfer agent fees and expenses” with the corresponding expenses offset included under “Less expenses paid indirectly.” For the year ended September 30, 2021, each Fund earned the following amounts under this arrangement:
| Fund | | Earnings Credits |
| Delaware Equity Income Fund | | | $ | 1,545 | |
| Delaware Growth and Income Fund | | | | 4,811 | |
| Delaware Growth Equity Fund | | | | 2,132 | |
| Delaware Opportunity Fund | | | | 3,297 | |
| Delaware Global Equity Fund | | | | 1,435 | |
| Delaware Covered Call Strategy Fund | | | | 912 | |
| Delaware Hedged U.S. Equity Opportunities Fund | | | | 380 | |
| Delaware Premium Income Fund | | | | 277 | |
| Delaware Total Return Fund | | | | 2,654 | |
2. Investment Management, Administration Agreements, and Other Transactions with Affiliates
In accordance with the terms of its respective investment management agreement, each Fund pays Delaware Management Company (DMC), a series of Macquarie Investment Management Business Trust and the investment manager, an annual fee which is calculated daily and paid monthly, based on each Fund’s average daily net assets as follows:
| | On the first | | On the next | | On the next | | In excess of |
| | $500 million | | $500 million | | $1.5 billion | | $2.5 billion |
| Delaware Equity Income Fund | | 0.650% | | 0.600% | | 0.550% | | 0.500% |
| Delaware Growth and Income Fund | | 0.650% | | 0.600% | | 0.550% | | 0.500% |
| Delaware Growth Equity Fund | | 0.650% | | 0.600% | | 0.550% | | 0.500% |
| Delaware Opportunity Fund | | 0.750% | | 0.700% | | 0.650% | | 0.600% |
| Delaware Global Equity Fund | | 0.850% | | 0.800% | | 0.750% | | 0.700% |
| Delaware Total Return Fund | | 0.650% | | 0.600% | | 0.550% | | 0.500% |
| | | On the first | | On the next | | On the next | | On the next | | On the next | | In excess |
| | | $300 million | | $200 million | | $500 million | | $1 billion | | $1 billion | | $3 billion |
| Delaware Covered Call | | | | | | | | | | | | |
| | Strategy Fund | | 0.8000% | | 0.7500% | | 0.7000% | | 0.6500% | | 0.600% | | 0.550% |
| | | | | | | | | | | | | |
| | | On the first | | On the next | | On the next | | On the next | | On the next | | In excess |
| | | $100 million | | $400 million | | $500 million | | $1 billion | | $1 billion | | $3 billion |
| Delaware Hedged | | | | | | | | | | | | |
| U.S. Equity | | | | | | | | | | | | |
| Opportunities Fund | | 1.1500% | | 1.1000% | | 1.0500% | | 1.0000% | | 0.950% | | 0.900% |
Delaware Premium Income Fund pays 0.80% of the Fund’s average daily net assets.
DMC has contractually agreed to waive all or a portion, if any, of its investment advisory fees and/or pay/reimburse expenses (excluding any acquired fund fees and expenses, taxes, interest, short sale dividend and interest expenses, brokerage fees, certain insurance costs, and nonroutine expenses or costs, including, but not limited to, those relating to reorganizations, litigation, conducting shareholder meetings, and liquidations), in order to prevent total annual fund operating expenses from exceeding the following percentages of each Fund’s average daily
147
Table of Contents
Notes to financial statements
Delaware Group® Equity Funds IV (Trust)
2. Investment Management, Administration Agreements, and Other Transactions with Affiliates (continued)
net assets from January 28, 2021 through September 30, 2021.* These waivers and reimbursements may only be terminated by agreement of DMC and each Fund. The waivers and reimbursements are accrued daily and received monthly.
| | Operating expense | | Operating expense | | Operating expense |
| | limitation as a | | limitation as a | | limitation as a |
| | percentage of average | | percentage of average | | percentage of average |
| | daily | | daily | | daily |
| | net assets | | net assets | | net assets |
| Fund | | Class A** | | Institutional Class** | | Class R6 |
| Delaware Equity Income Fund | | 1.12% | | 0.85% | | 0.81% |
| Delaware Growth and Income Fund | | 1.08% | | 0.82% | | 0.75% |
| Delaware Growth Equity Fund | | 1.14% | | 0.86% | | 0.79% |
| Delaware Opportunity Fund | | 1.21% | | 0.90% | | 0.78% |
| Delaware Global Equity Fund | | 1.37% | | 1.07% | | 1.02% |
| Delaware Covered Call Strategy Fund | | 1.31% | | 1.06% | | 0.88% |
| Delaware Hedged U.S. Equity Opportunities Fund | | 1.64% | | 1.30% | | 1.20% |
| Delaware Premium Income Fund | | 1.30% | | 1.05% | | 0.90% |
| Delaware Total Return Fund | | 1.15% | | 0.91% | | 0.79% |
____________________
| * | The aggregate contractual waiver period covering this report for Class R6 is from October 4, 2019 through January 31, 2022 and for Class A and Institutional Class is from January 28, 2021 through January 31, 2022. |
| ** | From October 1, 2020 through January 27, 2021, the operating expense limitations were as follows: |
| | Operating expense | | Operating expense | | Operating expense |
| | limitation as a | | limitation as a | | limitation as a |
| | percentage of average | | percentage of average | | percentage of average |
| | daily net assets | | daily net assets | | daily net assets |
| Fund | | Class A | | Institutional Class | | Class R6 |
| Delaware Equity Income Fund | | 1.17% | | 0.85% | | 0.81% |
| Delaware Growth and Income Fund | | 1.11% | | 0.82% | | 0.75% |
| Delaware Growth Equity Fund | | 1.17% | | 0.86% | | 0.79% |
| Delaware Opportunity Fund | | 1.21% | | 0.90% | | 0.78% |
| Delaware Global Equity Fund | | 1.41% | | 1.07% | | 1.02% |
| Delaware Covered Call Strategy Fund | | 1.31% | | 1.09% | | 0.88% |
| Delaware Hedged U.S. Equity Opportunities Fund | | 1.64% | | 1.30% | | 1.20% |
| Delaware Premium Income Fund | | 1.30% | | 1.05% | | 0.90% |
| Delaware Total Return Fund | | 1.15% | | 0.91% | | 0.79% |
DMC may seek investment advice and recommendations from its affiliates: Macquarie Investment Management Europe Limited, Macquarie Investment Management Austria Kapitalanlage AG, and Macquarie Investment Management Global Limited (together, the “Affiliated Sub-Advisors”). DMC may also permit these Affiliated Sub-Advisors to execute Fund security trades on behalf of the DMC and exercise investment discretion for securities in certain markets where DMC believes it will be beneficial to utilize an Affiliated Sub-Advisor’s specialized market knowledge. Although the Affiliated Sub-Advisors serve as sub-advisors, DMC has ultimate responsibility for all investment advisory services. For these services, DMC, not a Fund, pays each Affiliated Sub-Advisor a portion of its investment management fee.
Although the DMC has principal responsibility for the DMC’s portion of Delaware Equity Income Fund, Delaware Global Equity Fund, Delaware Growth and Income Fund, Delaware Opportunity Fund, and Delaware Total Return Fund, the DMC may permit Macquarie Funds Management Hong Kong Limited to execute Fund security trades on behalf of the DMC.
148
Table of Contents
Delaware Investments Fund Services Company (DIFSC), an affiliate of DMC, provides fund accounting and financial administrative oversight services to the Funds. For these services, DIFSC’s fees are calculated daily and paid monthly, based on the aggregate daily net assets of all funds within the Delaware Funds at the following annual rates: 0.00475% of the first $35 billion, 0.0040% of the next $10 billion; and 0.0025% of aggregate average daily net assets in excess of $45 billion (Total Fee). Each fund in the Delaware Funds pays a minimum of $4,000, which, in aggregate, is subtracted from the Total Fee. Each fund then pays its portion of the remainder of the Total Fee on a relative NAV basis. These amounts are included on the “Statements of operations” under “Accounting and administration expenses.” For the year ended September 30, 2021, each Fund was charged for these services as follows:
| Fund | | Fees |
| Delaware Equity Income Fund | | $ | 14,797 |
| Delaware Growth and Income Fund | | | 41,548 |
| Delaware Growth Equity Fund | | | 25,893 |
| Delaware Opportunity Fund | | | 27,781 |
| Delaware Global Equity Fund | | | 13,507 |
| Delaware Covered Call Strategy Fund | | | 8,989 |
| Delaware Hedged U.S. Equity Opportunities Fund | | | 6,593 |
| Delaware Premium Income Fund | | | 5,830 |
| Delaware Total Return Fund | | | 22,405 |
DIFSC is also the transfer agent and dividend disbursing agent of the Funds. For these services, DIFSC’s fees are calculated daily and paid monthly, based on the aggregate daily net assets of the retail funds within the Delaware Funds at the following annual rates: 0.014% of the first $20 billion; 0.011% of the next $5 billion; 0.007% of the next $5 billion; 0.005% of the next $20 billion; and 0.0025% of average daily net assets in excess of $50 billion. The fees payable to DIFSC under the shareholder services agreement described above are allocated among all retail funds in the Delaware Funds on a relative NAV basis. These amounts are included on the “Statements of operations” under “Dividend disbursing and transfer agent fees and expenses.”
For the year ended September 30, 2021, each Fund was charged for these services as follows:
| Fund | | Fees |
| Delaware Equity Income Fund | | $ | 26,954 |
| Delaware Growth and Income Fund | | | 93,668 |
| Delaware Growth Equity Fund | | | 54,592 |
| Delaware Opportunity Fund | | | 59,290 |
| Delaware Global Equity Fund | | | 23,759 |
| Delaware Covered Call Strategy Fund | | | 12,485 |
| Delaware Hedged U.S. Equity Opportunities Fund | | | 6,481 |
| Delaware Premium Income Fund | | | 4,590 |
| Delaware Total Return Fund | | | 45,992 |
Pursuant to a sub-transfer agency agreement between DIFSC and BNY Mellon Investment Servicing (US) Inc. (BNYMIS), BNYMIS provides certain sub-transfer agency services to each Fund. Sub-transfer agency fees are paid by each Fund and are also included on the “Statements of operations” under “Dividend disbursing and transfer agent fees and expenses.” The fees that are calculated daily and paid as invoices are received on a monthly or quarterly basis.
Pursuant to a distribution agreement and distribution plan, each Fund pays DDLP, the distributor and an affiliate of DMC, an annual 12b-1 fee of 0.25% of the average daily net assets of the Class A shares. The fees are calculated daily and paid monthly. Institutional Class and Class R6 shares do not pay 12b-1 fees.
As provided in the investment management agreement, each Fund bears a portion of the cost of certain resources shared with DMC, including the cost of internal personnel of DMC and/or its affiliates that provide legal, tax, and regulatory reporting services to each Fund. These amounts
149
Table of Contents
Notes to financial statements
Delaware Group® Equity Funds IV (Trust)
2. Investment Management, Administration Agreements, and Other Transactions with Affiliates (continued)
are included on the “Statements of operations” under “Legal fees.” For the year ended September 30, 2021, each Fund was charged for internal legal, tax, and regulatory services provided by DMC and/or its affiliates’ employees as follows:
| Fund | | Fees |
| Delaware Equity Income Fund | | $ | 13,706 |
| Delaware Growth and Income Fund | | | 38,990 |
| Delaware Growth Equity Fund | | | 21,774 |
| Delaware Opportunity Fund | | | 22,479 |
| Delaware Global Equity Fund | | | 8,942 |
| Delaware Covered Call Strategy Fund | | | 4,707 |
| Delaware Hedged U.S. Equity Opportunities Fund | | | 2,462 |
| Delaware Premium Income Fund | | | 1,727 |
| Delaware Total Return Fund | | | 28,308 |
For the year ended September 30, 2021, DDLP earned commissions on sales of Class A shares for each Fund as follows:
| Fund | | Commissions |
| Delaware Equity Income Fund | | | $ | 21,018 | |
| Delaware Growth and Income Fund | | | | 92,412 | |
| Delaware Growth Equity Fund | | | | 63,546 | |
| Delaware Opportunity Fund | | | | 65,724 | |
| Delaware Global Equity Fund | | | | 17,705 | |
| Delaware Covered Call Strategy Fund | | | | 16,665 | |
| Delaware Hedged U.S. Equity Opportunities Fund | | | | 12,950 | |
| Delaware Premium Income Fund | | | | 2,338 | |
| Delaware Total Return Fund | | | | 55,120 | |
For the year ended September 30, 2021, DDLP received gross CDSC commissions on redemptions of each Fund’s Class A shares, and these commissions were entirely used to offset upfront commissions previously paid by DDLP to broker/dealers on sales of those shares. The amounts received were as follows:
| Fund | | Class A |
| Delaware Equity Income Fund | | | $ | 310 | |
| Delaware Growth and Income Fund | | | | 339 | |
| Delaware Growth Equity Fund | | | | 482 | |
| Delaware Opportunity Fund | | | | 241 | |
| Delaware Global Equity Fund | | | | 124 | |
| Delaware Covered Call Strategy Fund | | | | 28 | |
| Delaware Hedged U.S. Equity Opportunities Fund | | | | 278 | |
| Delaware Premium Income Fund | | | | 284 | |
| Delaware Total Return Fund | | | | 847 | |
Trustees’ fees include expenses accrued by each Fund for each Trustee’s retainer and meeting fees. Certain officers of DMC, DIFSC, and DDLP are officers and/or Trustees of the Trust. These officers and Trustees are paid no compensation by the Funds.
In addition to the management fees and other expenses of a Fund, a Fund indirectly bears the investment management fees and other expenses of the investment companies (Underlying Funds) in which it invests. The amount of these fees and expenses incurred indirectly by a Fund will vary based upon the expense and fee levels of the Underlying Funds and the number of shares that are owned of the Underlying Funds at different times.
Cross trades for the year ended September 30, 2021, were executed by the Funds pursuant to procedures adopted by the Board designed to ensure compliance with Rule 17a-7 under the 1940 Act. Cross trading is the buying or selling of portfolio securities between funds of investment companies, or between a fund of an investment company and another entity, that are or could be considered affiliates by virtue of having a common investment advisor (or affiliated investment advisors), common directors/trustees and/or common officers. At its regularly
150
Table of Contents
scheduled meetings, the Board reviews a report related to the Funds’ compliance with the procedures adopted by the Board. Pursuant to these procedures, for the year ended September 30, 2021, the following Funds engaged in Rule 17a-7 securities purchases and securities sales, which resulted in net gains or losses as follows:
| | Purchases | | Sales | | Net realized gain (loss) |
| Delaware Total Return Fund | | $ | 628,781 | | $ | 8,288,329 | | | $ | (93,601 | ) | |
3. Investments
For the year ended September 30, 2021, each Fund made purchases and sales of investment securities other than short-term investments as follows:
| | Purchases | | | | Sales | | |
| | other than | | Purchases of | | other than | | Sales of |
| | US government | | US government | | US government | | US government |
| Fund | | securities | | securities | | securities | | securities |
| Delaware Equity Income Fund | | | $ | 176,277,442 | | | | $ | — | | | | $ | 266,458,765 | | | | $ | — | |
| Delaware Growth and Income Fund | | | | 544,145,733 | | | | | — | | | | | 795,975,462 | | | | | — | |
| Delaware Growth Equity Fund | | | | 195,925,067 | | | | | — | | | | | 418,467,098 | | | | | — | |
| Delaware Opportunity Fund | | | | 87,269,335 | | | | | — | | | | | 271,669,810 | | | | | — | |
| Delaware Global Equity Fund | | | | 91,884,280 | | | | | — | | | | | 164,431,336 | | | | | — | |
| Delaware Covered Call Strategy Fund | | | | 59,215,872 | | | | | — | | | | | 127,182,286 | | | | | — | |
| Delaware Hedged U.S. Equity Opportunities Fund | | | | 42,998,882 | | | | | — | | | | | 65,302,799 | | | | | — | |
| Delaware Premium Income Fund | | | | 10,542,978 | | | | | — | | | | | 45,799,908 | | | | | — | |
| Delaware Total Return Fund | | | | 383,749,964 | | | | | 102,793,265 | | | | | 582,932,152 | | | | | 82,268,473 | |
The tax cost of investments and derivatives includes adjustments to net unrealized appreciation (depreciation) which may not necessarily be the final tax cost basis adjustments, but approximates the tax basis unrealized gains and losses that may be realized and distributed to shareholders. At September 30, 2021, the cost and unrealized appreciation (depreciation) of investments and derivatives for federal income tax purposes were as follows:
| | | | | | | Aggregate | | Aggregate | | |
| | | | | | | unrealized | | unrealized | | Net unrealized |
| | Cost of | | appreciation | | depreciation | | appreciation |
| | investments | | of investments | | of investments | | of investments |
| Fund | | and derivatives | | and derivatives | | and derivatives | | and derivatives |
| Delaware Equity Income Fund | | | $ | 259,894,176 | | | | $ | 39,810,340 | | | $ | (7,809,650 | ) | | | $ | 32,000,690 | |
| Delaware Growth and Income Fund | | | | 905,507,919 | | | | | 158,893,667 | | | | (23,078,528 | ) | | | | 135,815,139 | |
| Delaware Growth Equity Fund | | | | 352,192,354 | | | | | 252,169,838 | | | | (2,869,064 | ) | | | | 249,300,774 | |
| Delaware Opportunity Fund | | | | 493,660,713 | | | | | 182,023,452 | | | | (9,691,121 | ) | | | | 172,332,331 | |
| Delaware Global Equity Fund | | | | 233,112,946 | | | | | 28,288,061 | | | | (13,387,915 | ) | | | | 14,900,146 | |
| Delaware Covered Call Strategy Fund | | | | 87,313,831 | | | | | 43,950,096 | | | | (802,489 | ) | | | | 43,147,607 | |
| Delaware Hedged U.S. Equity Opportunities Fund | | | | 59,978,127 | | | | | 11,536,841 | | | | (2,029,464 | ) | | | | 9,507,377 | |
| Delaware Premium Income Fund | | | | 41,330,714 | | | | | 8,309,073 | | | | (1,371,143 | ) | | | | 6,937,930 | |
| Delaware Total Return Fund | | | | 450,916,622 | | | | | 50,471,920 | | | | (11,142,332 | ) | | | | 39,329,588 | |
US GAAP defines fair value as the price that each Fund would receive to sell an asset or pay to transfer a liability in an orderly transaction between market participants at the measurement date under current market conditions. A three-level hierarchy for fair value measurements has been established based upon the transparency of inputs to the valuation of an asset or liability. Inputs may be observable or unobservable and refer broadly to the assumptions that market participants would use in pricing the asset or liability. Observable inputs reflect the assumptions market participants would use in pricing the asset or liability based on market data obtained from sources independent of the reporting entity. Unobservable inputs reflect the reporting entity’s own assumptions about the assumptions that market participants would use in pricing the
151
Table of Contents
Notes to financial statements
Delaware Group® Equity Funds IV (Trust)
3. Investments (continued)
asset or liability based on the best information available under the circumstances. Each Fund’s investment in its entirety is assigned a level based upon the observability of the inputs which are significant to the overall valuation. The three-level hierarchy of inputs is summarized as follows:
| Level 1 – | Inputs are quoted prices in active markets for identical investments. (Examples: equity securities, open-end investment companies, futures contracts, and exchange-traded options contracts) |
| | |
| Level 2 – | Other observable inputs, including, but not limited to: quoted prices for similar assets or liabilities in markets that are active, quoted prices for identical or similar assets or liabilities in markets that are not active, inputs other than quoted prices that are observable for the assets or liabilities (such as interest rates, yield curves, volatilities, prepayment speeds, loss severities, credit risks, and default rates) or other market-corroborated inputs. (Examples: debt securities, government securities, swap contracts, foreign currency exchange contracts, foreign securities utilizing international fair value pricing, broker-quoted securities, and fair valued securities) |
| | |
| Level 3 – | Significant unobservable inputs, including each Fund’s own assumptions used to determine the fair value of investments. (Examples: broker-quoted securities and fair valued securities) |
Level 3 investments are valued using significant unobservable inputs. Each Fund may also use an income-based valuation approach in which the anticipated future cash flows of the investment are discounted to calculate fair value. Discounts may also be applied due to the nature or duration of any restrictions on the disposition of the investments. Valuations may also be based upon current market prices of securities that are comparable in coupon, rating, maturity, and industry. The derived value of a Level 3 investment may not represent the value which is received upon disposition and this could impact the results of operations.
The following tables summarize the valuation of each Fund’s investments by fair value hierarchy levels as of September 30, 2021:
| | Delaware Equity |
| | Income Fund |
| | Level 1 |
| Securities | | | | | |
| Assets: | | | | | |
| Common Stock | | | $ | 291,241,142 | |
| Short-Term Investments | | | | 653,724 | |
| Total Value of Securities | | | $ | 291,894,866 | |
| | Delaware |
| | Growth and |
| | Income Fund |
| | Level 1 |
| Securities | | | |
| Assets: | | | |
| Common Stock | | $ | 1,038,746,297 |
| Short-Term Investments | | | 2,576,761 |
| Total Value of Securities | | $ | 1,041,323,058 |
152
Table of Contents
| | Delaware |
| | Growth Equity |
| | Fund |
| | Level 1 |
| Securities | | | | | |
| Assets: | | | | | |
| Common Stock | | | $ | 594,011,205 | |
| Short-Term Investments | | | | 7,481,923 | |
| Total Value of Securities | | | $ | 601,493,128 | |
| |
| | Delaware |
| | Opportunity |
| | Fund |
| | Level 1 |
| Securities | | | | | |
| Assets: | | | | | |
| Common Stock | | | $ | 661,588,487 | |
| Short-Term Investments | | | | 4,404,557 | |
| Total Value of Securities | | | $ | 665,993,044 | |
| | Delaware Global Equity Fund |
| | Level 1 | | Level 2 | | Total |
| Securities | | | | | | | | | | | |
| Assets: | | | | | | | | | | | |
| Common Stock | | | | | | | | | | | |
| Communication Services | | $ | — | | $ | 12,994,141 | | | $ | 12,994,141 | |
| Consumer Discretionary | | | — | | | 24,227,618 | | | | 24,227,618 | |
| Consumer Staples | | | 39,792,490 | | | 67,324,229 | | | | 107,116,719 | |
| Healthcare | | | 20,953,858 | | | 33,846,297 | | | | 54,800,155 | |
| Industrials | | | 8,848,516 | | | 12,595,997 | | | | 21,444,513 | |
| Information Technology | | | — | | | 7,970,231 | | | | 7,970,231 | |
| Materials | | | — | | | 8,771,972 | | | | 8,771,972 | |
| Technology | | | — | | | 7,511,983 | | | | 7,511,983 | |
| Exchange-Traded Fund | | | 2,752,912 | | | — | | | | 2,752,912 | |
| Short-Term Investments | | | 423,133 | | | — | | | | 423,133 | |
| Total Value of Securities | | $ | 72,770,909 | | $ | 175,242,468 | | | $ | 248,013,377 | |
| | | | | | | | | | | | |
| Derivatives1 | | | | | | | | | | | |
| Liabilities: | | | | | | | | | | | |
| Foreign Currency Exchange Contracts | | $ | — | | $ | (285 | ) | | $ | (285 | ) |
| 1 | Foreign currency exchange contracts are valued at the unrealized appreciation (depreciation) on the instrument at the year end. |
As a result of utilizing international fair value pricing at September 30, 2021, a portion of Delaware Global Equity Fund’s common stock investments were categorized as Level 2.
153
Table of Contents
Notes to financial statements
Delaware Group® Equity Funds IV (Trust)
3. Investments (continued)
| | Delaware |
| | Covered Call |
| | Strategy Fund |
| | Level 1 |
| Securities | | | | |
| Assets: | | | | |
| Common Stock | | $ | 128,272,435 | |
| Short-Term Investments | | | 4,400,856 | |
| Total Value of Securities Before Options Written | | $ | 132,673,291 | |
| Liabilities: | | | | |
| Options Written | | $ | (2,211,853 | ) |
| | Delaware Hedged U.S. Equity Opportunities Fund |
| | Level 1 | | Level 2 | | Total |
| Securities | | | | | | | | | | | |
| Assets: | | | | | | | | | | | |
| Common Stock | | $ | 64,573,531 | | | $ | 1,316,989 | | $ | 65,890,520 | |
| Exchange-Traded Fund | | | 312,406 | | | | — | | | 312,406 | |
| Options Purchased | | | 834,485 | | | | — | | | 834,485 | |
| Short-Term Investments | | | 2,487,190 | | | | — | | | 2,487,190 | |
| Total Value of Securities Before Options Written | | $ | 68,207,612 | | | $ | 1,316,989 | | $ | 69,524,601 | |
| Liabilities: | | | | | | | | | | | |
| Options Written | | $ | (436,075 | ) | | $ | — | | $ | (436,075 | ) |
| | | | | | | | | | | | |
| Derivatives1 | | | | | | | | | | | |
| Assets: | | | | | | | | | | | |
| Foreign Currency Exchange Contracts | | $ | — | | | $ | 32,856 | | $ | 32,856 | |
| Futures Contracts | | | 371,413 | | | | — | | | 371,413 | |
| Liabilities: | | | | | | | | | | | |
| Futures Contracts | | $ | (7,291 | ) | | $ | — | | $ | (7,291 | ) |
| 1 | Foreign currency exchange contracts and futures contracts are valued at the unrealized appreciation (depreciation) on the instrument at the year end. |
| | Delaware |
| | Premium |
| | Income Fund |
| | Level 1 |
| Securities | | | | |
| Assets: | | | | |
| Common Stock | | $ | 56,533,397 | |
| Short-Term Investments | | | 1,362,021 | |
| Total Value of Securities Before Options Written | | $ | 57,895,418 | |
| Liabilities: | | | | |
| Options Written | | $ | (9,626,774 | ) |
154
Table of Contents
| | Delaware Total Return Fund |
| | Level 1 | | Level 2 | | Level 3 | | Total |
| Securities | | | | | | | | | | | | |
| Assets: | | | | | | | | | | | | |
| Agency Mortgage-Backed | | | | | | | | | | | | |
| Securities | | $ | — | | $ | 15,062,318 | | $ | — | | $ | 15,062,318 |
| Collateralized Debt Obligations | | | — | | | 1,302,494 | | | — | | | 1,302,494 |
| Common Stock1 | | | | | | | | | | | | |
| Communication Services | | | 18,231,212 | | | 3,669,985 | | | — | | | 21,901,197 |
| Consumer Discretionary | | | 33,297,810 | | | 5,431,496 | | | — | | | 38,729,306 |
| Consumer Staples | | | 11,318,232 | | | 14,847,557 | | | — | | | 26,165,789 |
| Energy | | | 13,447,271 | | | — | | | — | | | 13,447,271 |
| Financials | | | 34,932,586 | | | — | | | — | | | 34,932,586 |
| Healthcare | | | 34,506,340 | | | 7,235,774 | | | — | | | 41,742,114 |
| Industrials | | | 13,263,527 | | | 2,480,860 | | | — | | | 15,744,387 |
| Information Technology | | | 61,975,179 | | | 2,952,062 | | | — | | | 64,927,241 |
| Materials | | | 3,402,395 | | | 1,851,452 | | | — | | | 5,253,847 |
| REIT Diversified | | | 227,919 | | | — | | | — | | | 227,919 |
| REIT Healthcare | | | 2,521,572 | | | — | | | — | | | 2,521,572 |
| REIT Hotel | | | 1,518,103 | | | — | | | — | | | 1,518,103 |
| REIT Industrial | | | 1,979,383 | | | — | | | — | | | 1,979,383 |
| REIT Information Technology | | | 1,574,784 | | | — | | | — | | | 1,574,784 |
| REIT Mall | | | 468,672 | | | — | | | — | | | 468,672 |
| REIT Manufactured Housing | | | 532,342 | | | — | | | — | | | 532,342 |
| REIT Multifamily | | | 5,153,271 | | | — | | | — | | | 5,153,271 |
| REIT Office | | | 1,293,252 | | | — | | | — | | | 1,293,252 |
| REIT Self-Storage | | | 2,716,500 | | | — | | | — | | | 2,716,500 |
| REIT Shopping Center | | | 1,323,562 | | | — | | | — | | | 1,323,562 |
| REIT Single Tenant | | | 1,018,025 | | | — | | | — | | | 1,018,025 |
| REIT Specialty | | | 377,169 | | | — | | | — | | | 377,169 |
| Utilities | | | 4,760,933 | | | — | | | — | | | 4,760,933 |
| Convertible Bonds | | | — | | | 33,011,547 | | | — | | | 33,011,547 |
| Convertible Preferred Stock | | | 7,144,945 | | | — | | | — | | | 7,144,945 |
| Corporate Bonds | | | — | | | 61,886,020 | | | — | | | 61,886,020 |
| Exchange-Traded Funds | | | 22,979,145 | | | — | | | — | | | 22,979,145 |
| Limited Liability Corporation | | | — | | | — | | | 8,470,080 | | | 8,470,080 |
| Non-Agency Asset-Backed | | | | | | | | | | | | |
| Securities | | | — | | | 870,202 | | | — | | | 870,202 |
| Non-Agency Commercial | | | | | | | | | | | | |
| Mortgage-Backed Securities | | | — | | | 4,874,967 | | | — | | | 4,874,967 |
| Sovereign Bonds | | | — | | | 9,044,099 | | | — | | | 9,044,099 |
| Supranational Banks | | | — | | | 748,048 | | | — | | | 748,048 |
| US Treasury Obligations | | | — | | | 11,201,349 | | | — | | | 11,201,349 |
| Short-Term Investments | | | 25,303,708 | | | — | | | — | | | 25,303,708 |
| Total Value of Securities | | $ | 305,267,837 | | $ | 176,470,230 | | $ | 8,470,080 | | $ | 490,208,147 |
155
Table of Contents
Notes to financial statements
Delaware Group® Equity Funds IV (Trust)
3. Investments (continued)
| | Delaware Total Return Fund |
| | Level 1 | | Level 2 | | Level 3 | | Total |
| Derivatives2 | | | | | | | | | | | | | | |
| Assets: | | | | | | | | | | | | | | |
| Futures Contracts | | $ | 36,817 | | $ | — | | | $ | — | | $ | 36,817 | |
| Foreign Currency Exchange | | | | | | | | | | | | | | |
| Contracts | | | — | | | 15,321 | | | | — | | | 15,321 | |
| Liabilities: | | | | | | | | | | | | | | |
| Foreign Currency Exchange | | | | | | | | | | | | | | |
| Contracts | | $ | — | | $ | (9,354 | ) | | $ | — | | $ | (9,354 | ) |
| Swap Contracts | | | — | | | (4,721 | ) | | | — | | | (4,721 | ) |
| 1 | Security type is valued across multiple levels. Level 1 investments represent exchange-traded investments, Level 2 investments represent investments with observable inputs or matrix-priced investments, and Level 3 investments represent investments without observable inputs. The amounts attributed to Level 1 investments, Level 2 investments, and Level 3 investments represent the following percentages of the total market value of these security types: |
| | Level 1 | | Level 2 | | Level 3 | | Total |
| Common Stock | | 86.66% | | 13.34% | | — | | 100.00% |
| 2 | Foreign currency exchange contracts, futures contracts, and swap contracts are valued at the unrealized appreciation (depreciation) on the instrument at the year end. |
During the year ended September 30, 2021, there were no transfers into or out of Level 3 investments that had a significant impact to each Fund. Each Fund’s policy is to recognize transfers into or out of Level 3 investments based on fair value at the beginning of the reporting period.
A reconciliation of Level 3 investments is presented when a Fund has a significant amount of Level 3 investments at the beginning, interim, or end of the period in relation to that Fund’s net assets. Management has determined not to provide additional disclosure on Level 3 inputs since the Level 3 investments were not considered significant to each Fund’s net assets at the end of the period except for Delaware Total Return Fund. There were no Level 3 investments during the year ended September 30, 2021 for Delaware Equity Income Fund, Delaware Growth and Income Fund, Delaware Growth Equity Fund, Delaware Opportunity Fund, Delaware Global Equity Fund, Delaware Covered Call Strategy Fund, Delaware Hedged U.S. Equity Opportunities Fund and Delaware Premium Income Fund.
The following is a reconciliation of investments in which significant unobservable inputs (Level 3) were used in determining fair value for Delaware Total Return Fund:
| | Limited Liability Corporation |
| Balance as of 9/30/20 | | | $ | 6,840,000 | | |
| Return of capital | | | | (342,000 | ) | |
| Net change in unrealized appreciation/depreciation | | | | 1,972,080 | | |
| Balance as of 9/30/21 | | | $ | 8,470,080 | | |
| Net change in unrealized appreciation (depreciation) | | | | | | |
| from Level 3 investments still held as of 9/30/21 | | | $ | 1,972,080 | | |
When market quotations are not readily available for one or more portfolio securities, the Fund’s NAV shall be calculated by using the “fair value” of the securities as determined by the Pricing Committee. Such “fair value” is the amount that the Fund might reasonably expect to receive for the security (or asset) upon its current sale. Each such determination should be based on a consideration of all relevant factors, which are likely to vary from one pricing context to another. Examples of such factors may include, but are not limited to: (i) the type of security, (ii) the size of the holding, (iii) the initial cost of the security, (iv) the existence of any contractual restrictions of the security’s disposition, (v) the price and extent of public trading in similar securities of the issuer or of comparable companies, (vi) quotations or evaluated prices from broker/dealers and/or pricing services, (vii) information obtained from the issuer, analysts, and/or appropriate stock exchange (for exchange-traded securities), (viii) an analysis of the company’s financial statements, and (ix) an evaluation of the forces that influence the issuer and the market(s) in which the security is purchased and sold.
156
Table of Contents
The Pricing Committee, or its delegate, employs various methods for calibrating these valuation approaches, including due diligence of the Fund’s pricing vendors and periodic back-testing of the prices that are fair valued under these procedures and reviews of any market related activity. The pricing of all securities fair valued by the Pricing Committee is subsequently reported to and approved by the Board on a quarterly basis.
A significant change to the inputs may result in a significant change to the valuation. Quantitative information about Level 3 fair value measurements for Delaware Total Return Fund is as follows:
| | | | Valuation | | Unobservable |
| Assets | | Value | | Techniques | | Inputs |
| | | | | | Trailing 12 months net operating income, |
| | | | | | adjusted for assets and |
| Limited Liability Corporation | | $8,470,080 | | Market cap rate method | | liabilities; liquidity discount |
4. Dividend and Distribution Information
Income and long-term capital gain distributions are determined in accordance with federal income tax regulations, which may differ from US GAAP. Additionally, distributions from net gains on foreign currency transactions and net short-term gains on sales of investment securities are treated as ordinary income for federal income tax purposes. The tax character of dividends and distributions paid during the years ended September 30, 2021 and 2020 were as follows:
| | | | | Long-term | | | | | | |
| | Ordinary | | capital | | Return of | | | |
| | income | | gains | | capital | | Total |
| Year ended September 30, 2021: | | | | | | | | | | | | |
| Delaware Equity Income Fund | | $ | 4,215,684 | | $ | 20,359,234 | | $ | — | | $ | 24,574,918 |
| Delaware Growth and Income Fund | | | 15,448,086 | | | 55,966,283 | | | — | | | 71,414,369 |
| Delaware Growth Equity Fund | | | 1,381,722 | | | 54,089,441 | | | — | | | 55,471,163 |
| Delaware Opportunity Fund | | | 5,456,312 | | | — | | | — | | | 5,456,312 |
| Delaware Global Equity Fund | | | 9,437,631 | | | 4,058,883 | | | — | | | 13,496,514 |
| Delaware Covered Call Strategy Fund | | | 998,594 | | | — | | | — | | | 998,594 |
| Delaware Hedged U.S. Equity Opportunities Fund | | | 5,100,892 | | | 12,489,014 | | | — | | | 17,589,906 |
| Delaware Premium Income Fund | | | 896,351 | | | — | | | — | | | 896,351 |
| Delaware Total Return Fund | | | 10,215,119 | | | — | | | — | | | 10,215,119 |
| | | | | | | | | | | | | |
| Year ended September 30, 2020: | | | | | | | | | | | | |
| Delaware Equity Income Fund | | | 10,489,987 | | | 123,030,001 | | | — | | | 133,519,988 |
| Delaware Growth and Income Fund | | | 57,572,252 | | | 438,795,186 | | | — | | | 496,367,438 |
| Delaware Growth Equity Fund | | | 1,620,611 | | | 64,606,404 | | | — | | | 66,227,015 |
| Delaware Opportunity Fund | | | 27,128,425 | | | 235,527,764 | | | — | | | 262,656,189 |
| Delaware Global Equity Fund | | | 16,870,014 | | | 34,692,705 | | | — | | | 51,562,719 |
| Delaware Covered Call Strategy Fund | | | 2,521,043 | | | — | | | — | | | 2,521,043 |
| Delaware Hedged U.S. Equity Opportunities Fund | | | 6,319,232 | | | 9,275,960 | | | — | | | 15,595,192 |
| Delaware Premium Income Fund | | | 2,476,042 | | | 1,130,214 | | | — | | | 3,606,256 |
| Delaware Total Return Fund | | | 35,326,624 | | | 122,193,959 | | | 251,112 | | | 157,771,695 |
157
Table of Contents
Notes to financial statements
Delaware Group® Equity Funds IV (Trust)
5. Components of Net Assets on a Tax Basis
As of September 30, 2021, the components of net assets on a tax basis were as follows:
| | Delaware | | Delaware | | Delaware |
| | Equity Income | | Growth and | | Growth Equity |
| | Fund | | Income Fund | | Fund |
| Shares of beneficial interest | | | $ | 226,821,245 | | | $ | 809,921,055 | | | $ | 194,999,596 | |
| Undistributed ordinary income | | | | 6,884,778 | | | | 18,896,640 | | | | 14,379,591 | |
| Undistributed long-term capital gains | | | | 26,299,073 | | | | 77,425,423 | | | | 141,881,735 | |
| Unrealized appreciation (depreciation) of investments, foreign currencies, and derivatives | | | | 32,000,690 | | | | 135,815,139 | | | | 249,300,774 | |
| Net assets | | | $ | 292,005,786 | | | $ | 1,042,058,257 | | | $ | 600,561,696 | |
| | | | | | | | | | | |
| | Delaware | | Delaware | | Delaware |
| | Opportunity | | Global Equity | | Covered Call |
| | Fund | | Fund | | Strategy Fund |
| Shares of beneficial interest | | $ | 461,783,105 | | $ | 211,302,925 | | $ | 91,432,431 | |
| Undistributed ordinary income | | | 6,792,378 | | | 3,707,376 | | | — | |
| Undistributed long-term capital gains | | | 24,375,209 | | | 19,422,390 | | | — | |
| Capital loss carryforwards | | | — | | | — | | | (4,342,920 | ) |
| Unrealized appreciation (depreciation) of investments, foreign currencies, and derivatives | | | 172,332,331 | | | 14,900,146 | | | 43,147,607 | |
| Net assets | | $ | 665,283,023 | | $ | 249,332,837 | | $ | 130,237,118 | |
| | | | | | | | | | | | | |
| | Delaware | | | | | | | |
| | Hedged | | | | | | | |
| | U.S. Equity | | Delaware | | Delaware |
| | Opportunities | | Premium | | Total Return |
| | Fund | | Income Fund | | Fund |
| Shares of beneficial interest | | | $ | 52,938,439 | | | $ | 53,053,233 | | | $ | 392,898,971 |
| Undistributed ordinary income | | | | 3,058,637 | | | | 144,318 | | | | 1,793,529 |
| Undistributed long-term capital gains | | | | 4,221,904 | | | | — | | | | 56,219,431 |
| Capital loss carryforwards | | | | — | | | | (11,871,871 | ) | | | — |
| Unrealized appreciation (depreciation) of investments, foreign currencies, and derivatives | | | | 9,507,377 | | | | 6,937,930 | | | | 39,329,588 |
| Net assets | | | $ | 69,726,357 | | | $ | 48,263,610 | | | $ | 490,241,519 |
The differences between book basis and tax basis components of net assets are primarily attributable to tax deferral of losses on wash sales, tax deferral of losses on straddles, mark-to-market of foreign currency exchange contracts, mark-to-market of futures contracts, tax recognition of unrealized gain on passive foreign investment companies, tax treatment of swap contracts, contingent payment debt instruments, amortization of premium on convertible securities, trust preferred securities, partnership interest and deemed dividend income.
For financial reporting purposes, capital accounts are adjusted to reflect the tax character of permanent book/tax differences. Reclassifications are primarily due to tax treatment of partnership non-deductible expenses, gain (loss) on foreign currency transactions, tax treatment of partnerships, amortization of premium on convertible securities, swap contracts, deemed dividend income, contingent payment on debt instruments, trust preferred securities and paydown gains (losses) of asset- and mortgage-backed securities. Results of operations and net assets were not affected by these reclassifications. For the year ended September 30, 2021, the Funds recorded the following reclassifications:
| | Delaware | | Delaware |
| | Covered Call | | Total Return |
| | Strategy Fund | | Fund |
| Paid-in capital | | | $ | (12,523 | ) | | | | $ | (155 | ) | |
| Total distributable earnings (loss) | | | | 12,523 | | | | | | 155 | | |
158
Table of Contents
For federal income tax purposes, capital loss carryforwards may be carried forward and applied against future capital gains. At September 30, 2021, the Funds utilized the following capital loss carryforwards:
| Delaware Covered Call Strategy Fund | | $ | 25,444,064 |
At September 30, 2021, capital loss carryforwards available to offset future realized capital gains are as follows:
| | | | | | | | | | | | | |
| | Loss carryforward character | | | |
| | Short-term | | Long-term | | Total |
| Delaware Covered Call Strategy Fund | | | $ | 4,342,920 | | | | $ | — | | | $ | 4,342,920 |
| Delaware Premium Income Fund | | | | 9,168,591 | | | | | 2,703,280 | | | | 11,871,871 |
6. Capital Shares
Transactions in capital shares were as follows:
| | Delaware | | Delaware | | Delaware |
| | Equity Income Fund | | Growth and Income Fund | | Growth Equity Fund |
| | Year ended | | Year ended | | Year ended |
| | 9/30/21 | | 9/30/20 | | 9/30/21 | | 9/30/20 | | 9/30/21 | | 9/30/20 |
| Shares sold: | | | | | | | | | | | | | | | | | | |
| Class A | | 1,187,812 | | | 2,992,548 | | | 2,296,732 | | | 4,254,765 | | | 2,066,873 | | | 3,435,618 | |
| Institutional Class1 | | 149,781 | | | 133,502 | | | 164,457 | | | 217,768 | | | 1,861,724 | | | 2,384,153 | |
| Class R62 | | — | | | 20,663 | | | — | | | 24,186 | | | 66,988 | | | 89,882 | |
| | | | | | | | | | | | | | | | | | | |
| Shares issued upon reinvestment of dividends and distributions: | | | | | | | | | | | | | | | | | | |
| Class A | | 3,596,638 | | | 18,307,597 | | | 5,357,405 | | | 35,494,393 | | | 3,182,854 | | | 4,229,857 | |
| Institutional Class1 | | 16,098 | | | 43,326 | | | 25,619 | | | 202,939 | | | 782,524 | | | 1,150,149 | |
| Class R62 | | 937 | | | 54,036 | | | 1,300 | | | 137,914 | | | 4,900 | | | 32,832 | |
| | 4,951,266 | | | 21,551,672 | | | 7,845,513 | | | 40,331,965 | | | 7,965,863 | | | 11,322,491 | |
| | | | | | | | | | | | | | | | | | | |
| Shares redeemed: | | | | | | | | | | | | | | | | | | |
| Class A | | (15,059,596 | ) | | (20,820,065 | ) | | (22,458,779 | ) | | (27,778,176 | ) | | (10,442,589 | ) | | (15,057,768 | ) |
| Institutional Class1 | | (76,607 | ) | | (212,950 | ) | | (200,804 | ) | | (1,168,583 | ) | | (6,867,048 | ) | | (6,455,203 | ) |
| Class R62 | | (107,145 | ) | | (111,573 | ) | | (214,008 | ) | | (217,274 | ) | | (224,736 | ) | | (195,369 | ) |
| | (15,243,348 | ) | | (21,144,588 | ) | | (22,873,591 | ) | | (29,164,033 | ) | | (17,534,373 | ) | | (21,708,340 | ) |
| Net increase (decrease) | | (10,292,082 | ) | | 407,084 | | | (15,028,078 | ) | | 11,167,932 | | | (9,568,510 | ) | | (10,385,849 | ) |
159
Table of Contents
Notes to financial statements
Delaware Group® Equity Funds IV (Trust)
6. Capital Shares (continued)
| | | | | | | | | | | | | | Delaware |
| | Delaware | | Delaware | | Covered Call |
| | Opportunity Fund | | Global Equity Fund | | Strategy Fund |
| | Year ended | | Year ended | | Year ended |
| | 9/30/21 | | 9/30/20 | | 9/30/21 | | 9/30/20 | | 9/30/21 | | 9/30/20 |
| Shares sold: | | | | | | | | | | | | | | | | | | |
| Class A | | 675,704 | | | 1,669,138 | | | 946,910 | | | 1,923,851 | | | 401,971 | | | 1,596,672 | |
| Institutional Class1 | | 58,698 | | | 56,774 | | | 199,494 | | | 625,902 | | | 229,299 | | | 670,475 | |
| Class R62 | | 820 | | | 11,619 | | | 15,026 | | | 25,591 | | | 3,426 | | | 6,854 | |
| | | | | | | | | | | | | | | | | | | |
| Shares issued upon reinvestment of dividends and distributions: | | | | | | | | | | | | | | | | | | |
| Class A | | 192,380 | | | 9,042,987 | | | 1,838,216 | | | 7,061,434 | | | 55,398 | | | 174,427 | |
| Institutional Class1 | | 1,000 | | | 46,419 | | | 112,012 | | | 546,442 | | | 24,119 | | | 60,139 | |
| Class R62 | | — | | | 21,109 | | | 378 | | | 40,587 | | | 65 | | | 1,130 | |
| | 928,602 | | | 10,848,046 | | | 3,112,036 | | | 10,223,807 | | | 714,278 | | | 2,509,697 | |
| | | | | | | | | | | | | | | | | | | |
| Shares redeemed: | | | | | | | | | | | | | | | | | | |
| Class A | | (7,165,676 | ) | | (9,158,482 | ) | | (10,641,883 | ) | | (14,277,425 | ) | | (4,228,881 | ) | | (8,645,575 | ) |
| Institutional Class1 | | (47,140 | ) | | (267,463 | ) | | (765,692 | ) | | (8,362,693 | ) | | (1,062,528 | ) | | (2,899,249 | ) |
| Class R62 | | (37,232 | ) | | (50,306 | ) | | (186,007 | ) | | (126,778 | ) | | (21,461 | ) | | (112,687 | ) |
| | (7,250,048 | ) | | (9,476,251 | ) | | (11,593,582 | ) | | (22,766,896 | ) | | (5,312,870 | ) | | (11,657,511 | ) |
| Net increase (decrease) | | (6,321,446 | ) | | 1,371,795 | ) | | (8,481,546 | ) | | (12,543,089 | ) | | (4,598,592 | ) | | (9,147,814 | ) |
160
Table of Contents
| | Delaware | | | | | | | | | | | | |
| | Hedged U.S. Equity | | Delaware | | Delaware |
| | Opportunities Fund | | Premium Income Fund | | Total Return Fund |
| | Year ended | | Year ended | | Year ended |
| | 9/30/21 | | 9/30/20 | | 9/30/21 | | 9/30/20 | | 9/30/21 | | 9/30/20 |
| Shares sold: | | | | | | | | | | | | | | | | | | |
| Class A | | 622,730 | | | 704,041 | | | 95,024 | | | 712,665 | | | 1,170,029 | | | 2,400,615 | |
| Institutional Class1 | | 1,607,817 | | | 551,142 | | | 492,556 | | | 1,458,295 | | | 74,433 | | | 66,974 | |
| Class R62 | | 3,398 | | | 6,543 | | | — | | | 5,166 | | | 97 | | | 9,344 | |
| | | | | | | | | | | | | | | | | | | |
| Shares issued upon reinvestment of dividends and distributions: | | | | | | | | | | | | | | | | | | |
| Class A | | 1,304,950 | | | 1,008,606 | | | 39,818 | | | 171,054 | | | 623,661 | | | 9,940,920 | |
| Institutional Class1 | | 499,622 | | | 402,426 | | | 45,614 | | | 201,128 | | | 1,569 | | | 11,210 | |
| Class R62 | | 2,274 | | | 4,534 | | | 274 | | | 634 | | | 205 | | | 23,123 | |
| | 4,040,791 | | | 2,677,292 | | | 673,286 | | | 2,548,942 | | | 1,869,994 | | | 12,452,186 | |
| | | | | | | | | | | | | | | | | | | |
| Shares redeemed: | | | | | | | | | | | | | | | | | | |
| Class A | | (2,298,036 | ) | | (3,257,788 | ) | | (1,364,201 | ) | | (3,518,739 | ) | | (11,589,622 | ) | | (16,153,621 | ) |
| Institutional Class1 | | (1,381,471 | ) | | (2,890,833 | ) | | (1,496,072 | ) | | (4,842,640 | | | (48,752 | ) | | (85,982 | ) |
| Class R62 | | (11,818 | ) | | (30,593 | ) | | (4,319 | ) | | (3,956 | ) | | (49,418 | ) | | (83,015 | ) |
| | (3,691,325 | ) | | (6,179,214 | ) | | (2,864,592 | ) | | (8,365,335 | ) | | (11,687,792 | ) | | (16,322,618 | ) |
| Net increase (decrease) | | 349,466 | | | (3,501,922 | ) | | (2,191,306 | ) | | (5,816,393 | ) | | (9,817,798 | ) | | (3,870,432 | ) |
| 1 | On October 4, 2019, Advisor Class shares were reorganized into Institutional Class shares. |
| 2 | On October 4, 2019, Institutional Class shares were reorganized into Class R6 shares. |
Certain shareholders may exchange shares of one class for shares of another class in the same Fund. These exchange transactions are included as subscriptions and redemptions in the tables above and on the “Statements of changes in net assets.” For the years ended September 30, 2021 and 2020, each Fund had the following exchange transactions:
| | Exchange Redemptions | | Exchange Subscriptions | | | |
| | | | | | Institutional | | | | | |
| | Class A | | Class | | Class R6 | | | |
| | Shares | | Shares | | Shares | | Value |
| Delaware Equity Income Fund | | | | | | | | | | | | | | | |
| Year ended | | | | | | | | | | | | | | | |
| 9/30/21 | | | 58,398 | | | | 57,973 | | | | — | | | $ | 405,726 |
| 9/30/20 | | | 12,523 | | | | 12,426 | | | | — | | | | 80,751 |
| | | | | | | | | | | | | | | | |
| Delaware Growth and Income Fund | | | | | | | | | | | | | | | |
| Year ended | | | | | | | | | | | | | | | |
| 9/30/21 | | | 26,269 | | | | 26,225 | | | | — | | | | 354,306 |
| 9/30/20 | | | 504 | | | | 502 | | | | — | | | | 6,167 |
161
Table of Contents
Notes to financial statements
Delaware Group® Equity Funds IV (Trust)
6. Capital Shares (continued)
| | Exchange Redemptions | | Exchange Subscriptions | | | |
| | | | | | Institutional | | | | | | | |
| | Class A | | Class | | Class R6 | | | |
| | Shares | | Shares | | Shares | | Value |
| Delaware Growth Equity Fund | | | | | | | | | | | | | | | |
| Year ended | | | | | | | | | | | | | | | |
| 9/30/21 | | | 38,440 | | | | 36,858 | | | | 489 | | | $ | 552,571 |
| | | | | | | | | | | | | | | | |
| Delaware Opportunity Fund | | | | | | | | | | | | | | | |
| Year ended | | | | | | | | | | | | | | | |
| 9/30/21 | | | 15,046 | | | | 14,200 | | | | 179 | | | | 457,032 |
| 9/30/20 | | | 1,511 | | | | 1,443 | | | | — | | | | 36,216 |
| | | | | | | | | | | | | | | | |
| Delaware Global Equity Fund | | | | | | | | | | | | | | | |
| Year ended | | | | | | | | | | | | | | | |
| 9/30/21 | | | 16,796 | | | | 16,032 | | | | — | | | | 118,179 |
| 9/30/20 | | | 462 | | | | 442 | | | | — | | | | 2,855 |
| | | | | | | | | | | | | | | | |
| Delaware Covered Call Strategy Fund | | | | | | | | | | | | | | | |
| Year ended | | | | | | | | | | | | | | | |
| 9/30/21 | | | 2,664 | | | | 2,671 | | | | — | | | | 29,519 |
| | | | | | | | | | | | | | | | |
| Delaware Hedged U.S. Equity Opportunities Fund | | | | | | | | | | | | | | | |
| Year ended | | | | | | | | | | | | | | | |
| 9/30/21 | | | 2,822 | | | | 2,777 | | | | — | | | | 32,901 |
| | | | | | | | | | | | | | | | |
| Delaware Premium Income Fund | | | | | | | | | | | | | | | |
| Year ended | | | | | | | | | | | | | | | |
| 9/30/21 | | | 8,332 | | | | 8,323 | | | | — | | | | 81,653 |
| | | | | | | | | | | | | | | | |
| Delaware Total Return Fund | | | | | | | | | | | | | | | |
| Year ended | | | | | | | | | | | | | | | |
| 9/30/21 | | | 41,036 | | | | 40,859 | | | | — | | | | 652,541 |
Delaware Growth Equity Fund, Delaware Covered Call Strategy Fund, Delaware Hedged U.S. Equity Opportunities Fund, Delaware Premium Income Fund, and Delaware Total Return Fund did not have any exchange transactions for the year ended September 30, 2020.
7. Line of Credit
Each Fund, along with certain other funds in the Delaware Funds (Participants), was a participant in a $275,000,000 revolving line of credit (Agreement) intended to be used for temporary or emergency purposes as an additional source of liquidity to fund redemptions of investor shares. Under the Agreement, the Participants were charged an annual commitment fee of 0.15%, which was allocated across the Participants based on a weighted average of the respective net assets of each Participant. The Participants were permitted to borrow up to a maximum of one-third of their net assets under the Agreement. Each Participant was individually, and not jointly, liable for its particular advances, if any, under the line of credit. The line of credit available under the Agreement expired on November 2, 2020.
On November 2, 2020, each Fund, along with the other Participants entered into an amendment to the Agreement for an amount of $225,000,000 to be used as described above. It operates in substantially the same manner as the original Agreement with the addition of an upfront fee of 0.05%, which was allocated across the Participants. The line of credit available under the Agreement expires on November 1, 2021.
162
Table of Contents
The Funds had no amounts outstanding as of September 30, 2021, or at any time during the year then ended.
8. Derivatives
US GAAP requires disclosures that enable investors to understand: (1) how and why an entity uses derivatives; (2) how they are accounted for; and (3) how they affect an entity’s results of operations and financial position.
Foreign Currency Exchange Contracts — Each Fund may enter into foreign currency exchange contracts and foreign cross currency exchange contracts as a way of managing foreign exchange rate risk. Each Fund may enter into these contracts to fix the US dollar value of a security that it has agreed to buy or sell for the period between the date the trade was entered into and the date the security is delivered and paid for. Each Fund may also enter into these contracts to hedge the US dollar value of securities it already owns that are denominated in foreign currencies. In addition, each Fund may enter into these contracts to facilitate or expedite the settlement of portfolio transactions. The change in value is recorded as an unrealized gain or loss. When the contract is closed, a realized gain or loss is recorded equal to the difference between the value of the contract at the time it was opened and the value at the time it was closed.
The use of foreign currency exchange contracts and foreign cross currency exchange contracts does not eliminate fluctuations in the underlying prices of the securities, but does establish a rate of exchange that can be achieved in the future. Although foreign currency exchange contracts and foreign cross currency exchange contracts limit the risk of loss due to an unfavorable change in the value of the hedged currency, they also limit any potential gain that might result should the value of the currency change favorably. In addition, each Fund could be exposed to risks if the counterparties to the contracts are unable to meet the terms of their contracts. Each Fund’s maximum risk of loss from counterparty credit risk is the value of its currency exchanged with the counterparty. The risk is generally mitigated by having a netting arrangement between each Fund and the counterparty and by the posting of collateral by the counterparty to the Funds to cover each Fund’s exposure to the counterparty.
During the year ended September 30, 2021, Delaware Global Equity Fund entered into foreign currency exchange contracts and foreign cross currency contracts in order to fix the US dollar value of a security between the trade date and settlement date. Delaware Hedged U.S. Equity Opportunities Bond Fund, and Delaware Total Return Fund entered into foreign currency exchange contracts and foreign cross currency contracts to hedge the U.S. dollar value of securities it already owns that are denominated in foreign currencies. Delaware Total Return Fund also entered into foreign currency contracts and foreign cross currency contracts to facilitate or expedite the settlement of portfolio transactions.
Futures Contracts — A futures contract is an agreement in which the writer (or seller) of the contract agrees to deliver to the buyer an amount of cash or securities equal to a specific dollar amount times the difference between the value of a specific security or index at the close of the last trading day of the contract and the price at which the agreement is made. The Funds may use futures in the normal course of pursuing its investment objective. The Funds may invest in futures contracts to hedge its existing portfolio securities against fluctuations in fair value caused by changes in prevailing market interest rates. Upon entering into a futures contract, the Funds deposit cash or pledge US government securities to a broker, equal to the minimum “initial margin” requirements of the exchange on which the contract is traded. Subsequent payments are received from the broker or paid to the broker each day, based on the daily fluctuation in the market value of the contract. These receipts or payments are known as “variation margin” and are recorded daily by the Funds as unrealized gains or losses until the contracts are closed. When the contracts are closed, the Funds record a realized gain or loss equal to the difference between the value of the contract at the time it was opened and the value at the time it was closed. Risks of entering into futures contracts include potential imperfect correlation between the futures contracts and the underlying securities and the possibility of an illiquid secondary market for these instruments. When investing in futures, there is reduced counterparty credit risk to the Funds because futures are exchange-traded and the exchange’s clearinghouse, as counterparty to all exchange-traded futures, guarantees against default. Delaware Hedged U.S. Equity Opportunities Bond Fund posted $738,154 and Delaware Total Return Fund posted $40,920 cash collateral as margin for open futures contracts.
During the year ended September 30, 2021, Delaware Hedged U.S. Equity Opportunities Bond Fund and Delaware Total Return Fund invested in futures contracts to hedge the Fund’s existing portfolio securities against fluctuations in value caused by changes in interest rates or market conditions.
Options Contracts — During the year ended September 30, 2021, the Funds entered into options contracts in the normal course of pursuing their investment objective. Each Fund may buy or write options contracts for any number of reasons, including without limitation: to manage the Fund’s exposure to changes in securities prices caused by interest rates or market conditions and foreign currencies; as an efficient means of adjusting the Fund’s overall exposure to certain markets; to protect the value of portfolio securities; and as a cash management tool. Each Fund
163
Table of Contents
Notes to financial statements
Delaware Group® Equity Funds IV (Trust)
8. Derivatives (continued)
may buy or write call or put options on securities, futures, swaps, swaptions, financial indices, and foreign currencies. When each Fund buys an option, a premium is paid and an asset is recorded and adjusted on a daily basis to reflect the current market value of the option purchased. When each Fund writes an option, a premium is received and a liability is recorded and adjusted on a daily basis to reflect the current market value of the option written. Premiums received from writing options that expire unexercised are treated by each Fund on the expiration date as realized gains. The difference between the premium received and the amount paid on effecting a closing purchase transaction, including brokerage commissions, is treated as realized gain or loss. If a call option is exercised, the premium is added to the proceeds from the sale of the underlying security in determining whether each Fund has a realized gain or loss. If a put option is exercised, the premium reduces the cost basis of the securities purchased by each Fund. Each Fund, as writer of an option, bears the market risk of an unfavorable change in the price of the security underlying the written option. When writing options, each Fund is subject to minimal counterparty risk because the counterparty is only obligated to pay premiums and does not bear the market risk of an unfavorable market change.
During the year ended September 30, 2021, Delaware Covered Call Strategy Fund, Delaware Hedged U.S. Equity Opportunities Fund, and Delaware Premium Income Fund used options contracts to manage the Funds’ exposure to changes in securities prices caused by interest rates or market conditions. In addition, Delaware Covered Call Strategy Fund and Delaware Premium Income Fund used options contracts to receive premiums for writing options and to protect the value of portfolio securities.
Swap Contracts — Delaware Total Return Fund enters into CDS contracts in the normal course of pursuing its investment objective. The Fund entered into CDS contracts in order to hedge against a credit event and to gain exposure to certain securities or markets. The Fund will not be permitted to enter into any swap transactions unless, at the time of entering into such transactions, the unsecured long-term debt of the actual counterparty, combined with any credit enhancements, is rated at least BBB- by Standard & Poor’s Financial Services LLC (S&P) or Baa3 by Moody’s Investors Service, Inc. (Moody’s) or is determined to be of equivalent credit quality by DMC.
Credit Default Swaps. A CDS contract is a risk-transfer instrument through which one party (purchaser of protection) transfers to another party (seller of protection) the financial risk of a credit event (as defined in the CDS agreement), as it relates to a particular reference security or basket of securities (such as an index). In exchange for the protection offered by the seller of protection, the purchaser of protection agrees to pay the seller of protection a periodic amount at a stated rate that is applied to the notional amount of the CDS contract. In addition, an upfront payment may be made or received by the Fund in connection with an unwinding or assignment of a CDS contract. In addition, an upfront payment may be made or received by Delaware Total Return Fund in connection with an unwinding or assignment of a CDS contract. Upon the occurrence of a credit event, the seller of protection would pay the par (or other agreed-upon) value of the reference security (or basket of securities) to the counterparty. Credit events generally include, among others, bankruptcy, failure to pay, and obligation default.
During the year ended September 30, 2021, Delaware Total Return Fund entered into CDS contracts as a purchaser of protection. Periodic payments (receipts) on such contracts are accrued daily and recorded as unrealized losses (gains) on swap contracts. Upon payment (receipt), such amounts are recorded as realized losses (gains) on swap contracts. Upfront payments made or received in connection with CDS contracts are amortized over the expected life of the CDS contracts as unrealized losses (gains) on swap contracts. The change in value of CDS contracts is recorded daily as unrealized appreciation or depreciation. A realized gain or loss is recorded upon a credit event (as defined in the CDS agreement) or the maturity or termination of the agreement. For the year ended September 30, 2021, the Fund did not enter into any contracts as a seller of protection. Initial margin and variation margin are posted to central counterparties for centrally cleared CDS basket trades, as determined by the applicable central counterparty.
CDS contracts may involve greater risks than if Delaware Total Return Fund had invested in the reference obligation directly. CDS contracts are subject to general market risk, liquidity risk, counterparty risk, and credit risk. The Fund’s maximum risk of loss from counterparty credit risk, either as the seller of protection or the buyer of protection, is the fair value of the contract. This risk is mitigated by (1) for bilateral swap contracts, having a netting arrangement between the Fund and the counterparty and by the posting of collateral by the counterparty to the Fund to cover the Fund’s exposure to the counterparty, and (2) for cleared swaps, trading these instruments through a central counterparty.
During the year ended September 30, 2021, Delaware Total Return Fund used CDS contracts to hedge against credit events and to gain exposure to certain securities or markets.
Swaps Generally. For centrally cleared swaps, payments are received from the broker or paid to the broker each day, based on the daily fluctuation in the market value of the contract. These receipts or payments are known as “variation margin” and are recorded by Delaware Total
164
Table of Contents
Return Fund as unrealized gains or losses until the contracts are closed. When the contracts are closed, Delaware Total Return Fund records a realized gain or loss equal to the difference between the value of the contract at the time it was opened and the value at the time it was closed. The value of open swaps may differ from that which would be realized in the event Delaware Total Return Fund terminated its position in the contract on a given day. Risks of entering into these contracts include the potential inability of the counterparty to meet the terms of the contracts. This type of risk is generally limited to the amount of favorable movement in the value of the underlying security, instrument or basket of instruments, if any, at the day of default. Risks also arise from potential losses from adverse market movements and such losses could exceed the unrealized amounts shown on the “Schedules of investments.”
At September 30, 2021, for bilateral derivative contracts, the Fund received $30,000 in cash collateral, which is included in “Cash collateral due to brokers” on the “Statements of assets and liabilities.”
Fair values of derivative instruments as of September 30, 2021 were as follows:
| | Delaware |
| | Covered Call |
| | Strategy Fund |
| | Liability |
| | Derivatives Fair |
| | Value |
| Statement of Assets and | | Equity |
| Liabilities Location | | Contracts |
| Options written, at value | | | $ | (2,211,853 | ) | |
| | | | | | | |
| | Delaware Hedged U.S. Equity Opportunities Fund |
| | Asset Derivatives Fair Value |
| Statement of Assets and | | Currency | | Equity | | | | |
| Liabilities Location | | Contracts | | Contracts | | Total | |
| Unrealized appreciation on foreign currency exchange contracts | | | $ | 32,856 | | | $ | — | | $ | 32,856 | |
| Variation margin due from broker on futures contracts* | | | | — | | | | 371,413 | | | 371,413 | |
| Options purchased** | | | | — | | | | 834,485 | | | 834,485 | |
| Total | | | $ | 32,856 | | | $ | 1,205,898 | | $ | 1,238,754 | |
| | | | | | | | | | | | | |
| | Liability |
| | Derivatives Fair |
| | Value |
| Statement of Assets and | | Equity |
| Liabilities Location | | Contracts |
| Variation margin due to broker on futures contracts | | | $ | (7,291 | ) | |
| Options written, at value | | | | (436,075 | ) | |
| Total | | | $ | (443,366 | ) | |
| | | | | | | |
| | Delaware |
| | Premium |
| | Income Fund |
| | Liability |
| | Derivatives Fair |
| | Value |
| Statement of Assets and | | Equity |
| Liabilities Location | | Contracts |
| Options written, at value | | | $ | (9,626,774 | ) | |
165
Table of Contents
Notes to financial statements
Delaware Group® Equity Funds IV (Trust)
8. Derivatives (continued)
| | Delaware Total Return Fund |
| | Asset Derivatives Fair Value |
| | | | | | | | Interest | | | | |
| Statement of Assets and | | Currency | | Rate | | | | |
| Liabilities Location | | Contracts | | Contracts | | Total |
| Unrealized appreciation on foreign currency exchange contracts | | | $ | 15,321 | | | | | $ | — | | | | $ | 15,321 | |
| Variation margin due from broker on futures contracts* | | | | — | | | | | | 36,817 | | | | | 36,817 | |
| Total | | | $ | 15,321 | | | | | $ | 36,817 | | | | $ | 52,138 | |
| | | | | | | | | | | | | | | | | |
| | Liability Derivatives Fair Value |
| Statement of Assets and | | Currency | | Credit | | | | |
| Liabilities Location | | Contracts | | Contracts | | Total |
| Unrealized depreciation on foreign currency exchange contracts | | | $ | (9,354 | ) | | | | $ | — | | | | $ | (9,354 | ) |
| Unrealized depreciation on credit default swap contracts | | | | — | | | | | | (4,721 | ) | | | | (4,721 | ) |
| Total | | | $ | (9,354 | ) | | | | $ | (4,721 | ) | | | $ | (14,075 | ) |
* | Includes cumulative appreciation (depreciation) of futures contracts from the date the contracts were opened through September 30, 2021. Only current day variation margin is reported on the Fund’s “Statements of assets and liabilities.” |
** | Included with ”Investments, at value”. |
The effect of derivative instruments on Delaware Hedged U.S. Equity Opportunities Fund’s “Statement of operations” for the year ended September 30, 2021 was as follows:
| | Net Realized Gain (Loss) on: |
| | Foreign | | | | | | | | | | | | | | | |
| | Currency | | | | | | | | | | | | | | | |
| | Exchange | | Futures | | Options | | Options | | | | |
| | Contracts | | Contracts | | Purchased | | Written | | Total |
| Currency contracts | | $ | (110,089 | ) | | $ | — | | | $ | — | | | $ | — | | $ | (110,089 | ) |
| Equity contracts | | | — | | | | (4,939,868 | ) | | | (2,273,652 | ) | | | 1,134,086 | | | (6,079,434 | ) |
| Total | | $ | (110,089 | ) | | $ | (4,939,868 | ) | | $ | (2,273,652 | ) | | $ | 1,134,086 | | $ | (6,189,523 | ) |
| | | | | | | | | | | | | | | | | | | | |
| | Net Change in Unrealized Appreciation (Depreciation) of: |
| | Foreign | | | | | | | | | | | | | | | | | |
| | Currency | | | | | | | | | | | | | | | | | |
| | Exchange | | Futures | | Options | | Options | | | | |
| | Contracts | | Contracts | | Purchased | | Written | | Total |
| Currency contracts | | | $ | (11,903 | ) | | | | $ | — | | | | $ | — | | | $ | — | | $ | (11,903 | ) |
| Equity contracts | | | | — | | | | | | 366,073 | | | | | (232,657 | ) | | | 112,272 | | | 245,688 | |
| Total | | | $ | (11,903 | ) | | | | $ | 366,073 | | | | $ | (232,657 | ) | | $ | 112,272 | | $ | 233,785 | |
166
Table of Contents
The effect of derivative instruments on Delaware Total Return Fund’s “Statement of operations” for the year ended September 30, 2021 was as follows:
| | Net Realized Gain (Loss) on: |
| | | Foreign | | | | | | | | | | | | | | | |
| | | Currency | | | | | | | | | | | | | | | |
| | | Exchange | | Futures | | Swap | | | | | |
| | | Contracts | | Contracts | | Contracts | | Total |
| Currency contracts | | | $ | 14,216 | | | | $ | — | | | | $ | — | | | | $ | 14,216 | |
| Interest rate contracts | | | | — | | | | | 69,358 | | | | | — | | | | | 69,358 | |
| Credit contracts | | | | — | | | | | — | | | | | (23,521 | ) | | | | (23,521 | ) |
| Total | | | $ | 14,216 | | | | $ | 69,358 | | | | $ | (23,521 | ) | | | $ | 60,053 | |
| |
| | | Net Change in Unrealized Appreciation (Depreciation) of: |
| | | Foreign | | | | | | | | | | | | | | | |
| | | Currency | | | | | | | | | | | | | | | |
| | | Exchange | | Futures | | Swap | | | | | |
| | | Contracts | | Contracts | | Contracts | | Total |
| Currency contracts | | | $ | 10,904 | | | | $ | — | | | | $ | — | | | | $ | 10,904 | |
| Interest rate contracts | | | | — | | | | | 39,796 | | | | | — | | | | | 39,796 | |
| Credit contracts | | | | — | | | | | — | | | | | 2,214 | | | | | 2,214 | |
| Total | | | $ | 10,904 | | | | $ | 39,796 | | | | $ | 2,214 | | | | $ | 52,914 | |
During the year ended September 30, 2021, Delaware Global Equity Fund experienced net realized and unrealized gains or losses attributable to foreign currency exchange contracts, which are disclosed on the “Statements of assets and liabilities” and/or “Statements of operations.”
During the year ended September 30, 2021, Delaware Covered Call Strategy Fund and Delaware Premium Income Fund experienced net realized and unrealized gains or losses attributable to options contracts, which are disclosed on the “Statements of assets and liabilities” and/or “Statements of operations.”
167
Table of Contents
Notes to financial statements
Delaware Group® Equity Funds IV (Trust)
8. Derivatives (continued)
The table below summarizes the daily average balance of derivative holdings by each Fund during the year ended September 30, 2021:
| | Long Derivative Volume |
| | | | | | Delaware | | | | |
| | Delaware | | Hedged U.S. Equity | | Delaware |
| | Global Equity Fund | | Opportunities Fund | | Total Return Fund |
| Foreign currency exchange contracts (average notional value) | | $ | 188,214 | | | $ | 128,990 | | | $ | 1,300,670 | |
| Futures contracts (average notional value) | | | — | | | | — | | | | 82,495 | |
| Options contracts (average notional value)* | | | — | | | | 607,298 | | | | — | |
| CDS contracts (average notional value)** | | | — | | | | — | | | | 205,714 | |
| | Short Derivative Volume |
| | | | | | Delaware | | Delaware |
| | | Delaware | | | Covered Call Strategy | | Hedged U.S. Equity |
| | Global Equity Fund | | Fund | | Opportunities Fund |
| Foreign currency exchange contracts (average notional value) | | $ | 425,135 | | | $ | — | | | $ | 2,607,975 | |
| Futures contracts (average notional value) | | | — | | | | — | | | | 14,659,654 | |
| Options contracts (average notional value)* | | | — | | | | 4,759,057 | | | | 336,470 | |
| | | | | | Short Derivative Volume |
| | | | | | Delaware | | Delaware |
| | | | | | Premium Income Fund | | Total Return Fund |
| Foreign currency exchange contracts (average notional value) | | | | | | $ | — | | | $ | 2,030,523 | |
| Futures contracts (average notional value) | | | | | | | — | | | | 3,033,313 | |
| Options contracts (average notional value)* | | | | | | | 12,606,540 | | | | — | |
| * | Long represents purchased options and short represents written options. |
| ** | Long represents buying protection and short represents selling protection. |
9. Offsetting
Each Fund entered into an International Swaps and Derivatives Association, Inc. Master Agreement (ISDA Master Agreement) or a similar agreement with certain of its derivative contract counterparties in order to better define its contractual rights and to secure rights that will help each Fund mitigate its counterparty risk. An ISDA Master Agreement is a bilateral agreement between each Fund and a counterparty that governs over-the-counter (OTC) derivatives and foreign exchange contracts and typically contains, among other things, collateral posting items and netting provisions in the event of a default and/or termination event. Under an ISDA Master Agreement, each Fund may, under certain circumstances, offset with the counterparty certain derivative financial instruments’ payables and/or receivables with collateral held and/or posted and create one single net payment. The provisions of the ISDA Master Agreement typically permit a single net payment in the event of default (close-out), including the bankruptcy or insolvency of the counterparty. However, bankruptcy or insolvency laws of a particular jurisdiction may impose restrictions on or prohibitions against the right of offset in bankruptcy, insolvency, or other events.
For financial reporting purposes, each Fund does not offset derivative assets and derivative liabilities that are subject to netting arrangements on the “Statements of assets and liabilities.”
168
Table of Contents
At September 30, 2021, each Fund had the following assets and liabilities subject to offsetting provisions:
Offsetting of Financial Assets and Liabilities and Derivative Assets and Liabilities
Delaware Global Equity Fund
| | | | | | | Gross Value of | | | | |
| | | Gross Value of | | Derivative | | | | |
| Counterparty | | Derivative Asset | | Liability | | Net Position |
| Bank of New York Mellon | | | $— | | | | $(285 | ) | | | $(285 | ) |
| | | | | | | | Fair Value of | | | | | | Fair Value of | | | | | | | | |
| | | | | | | | Non-Cash | | Cash Collateral | | Non-Cash | | Cash Collateral | | | | |
| Counterparty | | Net Position | | Collateral Received | | Received(a) | | Collateral Pledged | | Pledged | | Net Exposure(b) |
| Bank of New York Mellon | | | $(285 | ) | | | | $— | | | | $— | | | | $— | | | | $— | | | | $(285 | ) |
| Delaware Hedged U.S. Equity Opportunities Fund | | | | | | | | | | | | | | | | | | | | | | | | | |
| �� | | | | | | | Gross Value of | | | | | |
| | | Gross Value of | | Derivative | | | | | |
| Counterparty | | Derivative Asset | | Liability | | Net Position |
| BNP Paribas | | | $ | 30,687 | | | | $ | — | | | | $ | 30,687 | |
| Morgan Stanley | | | | 2,169 | | | | | — | | | | | 2,169 | |
| Total | | | $ | 32,856 | | | | $ | — | | | | $ | 32,856 | |
| | | | | | | | Fair Value of | | | | | | | Fair Value of | | | | | | | | | | |
| | | | | | | | Non-Cash | | Cash Collateral | | Non-Cash | | Cash Collateral | | | | | |
| Counterparty | | Net Position | | Collateral Received | | Received(a) | | Collateral Pledged | | Pledged | | Net Exposure(b) |
| BNP Paribas | | | $ | 30,687 | | | | $ | — | | | | $ | — | | | | $ | — | | | | $ | — | | | | $ | 30,687 | |
| Morgan Stanley | | | | 2,169 | | | | | — | | | | | — | | | | | — | | | | | — | | | | | 2,169 | |
| Total | | | $ | 32,856 | | | | $ | — | | | | $ | — | | | | $ | — | | | | $ | — | | | | $ | 32,856 | |
| Delaware Total Return Fund | | | | | | | | | | | | | | | | | | | | | | | | | | | | | | |
| | | | | | | | Gross Value of | | | | | | |
| | | Gross Value of | | Derivative | | | | | | |
| Counterparty | | Derivative Asset | | Liability | | Net Position |
| Bank of New York Mellon | | | $ | — | | | | $ | (97 | ) | | | | $ | (97 | ) | |
| Citigroup | | | | — | | | | | (6,594 | ) | | | | | (6,594 | ) | |
| JPMorgan Chase Bank | | | | 15,321 | | | | | (7,384 | ) | | | | | 7,937 | | |
| Total | | | $ | 15,321 | | | | $ | (14,075 | ) | | | | $ | 1,246 | | |
| | | | | | | | Fair Value of | | | | | | | | Fair Value of | | | | | | | | | | | |
| | | | | | | | Non-Cash | | Cash Collateral | | Non-Cash | | Cash Collateral | | | | | | |
| Counterparty | | Net Position | | Collateral Received | | Received(a) | | Collateral Pledged | | Pledged | | Net Exposure(b) |
| Bank of New York Mellon | | | $ | (97 | ) | | | | $ | — | | | | $ | — | | | | | $ | — | | | | $ | — | | | | $ | (97 | ) | |
| Citigroup | | | | (6,594 | ) | | | | | — | | | | | — | | | | | | — | | | | | — | | | | | (6,594 | ) | |
| JPMorgan Chase Bank | | | | 7,937 | | | | | | — | | | | | (7,937 | ) | | | | | — | | | | | — | | | | | — | | |
| Total | | | $ | 1,246 | | | | | $ | — | | | | $ | (7,937 | ) | | | | $ | — | | | | $ | — | | | | $ | 6,691 | | |
| (a) | The value of the related collateral exceeded the value of the derivatives as of September 30, 2021, as applicable. |
| (b) | Net exposure represents the receivable (payable) that would be due from (to) the counterparty in the event of default. |
10. Securities Lending
Each Fund, along with other funds in the Delaware Funds, may lend its securities pursuant to a security lending agreement (Lending Agreement) with The Bank of New York Mellon (BNY Mellon). At the time a security is loaned, the borrower must post collateral equal to the required percentage of the market value of the loaned security, including any accrued interest. The required percentage is: (1) 102% with respect to US
169
Table of Contents
Notes to financial statements
Delaware Group® Equity Funds IV (Trust)
10. Securities Lending (continued)
securities and foreign securities that are denominated and payable in US dollars; and (2) 105% with respect to foreign securities. With respect to each loan, if on any business day the aggregate market value of securities collateral plus cash collateral held is less than the aggregate market value of the securities which are the subject of such loan, the borrower will be notified to provide additional collateral by the end of the following business day, which, together with the collateral already held, will be not less than the applicable initial collateral requirements for such security loan. If the aggregate market value of securities collateral and cash collateral held with respect to a security loan exceeds the applicable initial collateral requirement, upon the request of the borrower, BNY Mellon must return enough collateral to the borrower by the end of the following business day to reduce the value of the remaining collateral to the applicable initial collateral requirement for such security loan. As a result of the foregoing, the value of the collateral held with respect to a loaned security on any particular day, may be more or less than the value of the security on loan. The collateral percentage with respect to the market value of the loaned security is determined by the security lending agent.
Cash collateral received by each fund of the Trust is generally invested in a series of individual separate accounts, each corresponding to a fund. The investment guidelines permit each separate account to hold certain securities that would be considered eligible securities for a money market fund. Cash collateral received is generally invested in government securities; certain obligations issued by government sponsored enterprises; repurchase agreements collateralized by US Treasury securities; obligations issued by the central government of any Organization for Economic Cooperation and Development (OECD) country or its agencies, instrumentalities, or establishments; obligations of supranational organizations; commercial paper, notes, bonds, and other debt obligations; certificates of deposit, time deposits, and other bank obligations; and asset-backed securities. Each Fund can also accept US government securities and letters of credit (non-cash collateral) in connection with securities loans.
In the event of default or bankruptcy by the lending agent, realization and/or retention of the collateral may be subject to legal proceedings. In the event the borrower fails to return loaned securities and the collateral received is insufficient to cover the value of the loaned securities and provided such collateral shortfall is not the result of investment losses, the lending agent has agreed to pay the amount of the shortfall to each Fund or, at the discretion of the lending agent, replace the loaned securities. Each Fund continues to record dividends or interest, as applicable, on the securities loaned and is subject to changes in value of the securities loaned that may occur during the term of the loan. Each Fund has the right under the Lending Agreement to recover the securities from the borrower on demand. With respect to security loans collateralized by non-cash collateral, each Fund receives loan premiums paid by the borrower. With respect to security loans collateralized by cash collateral, the earnings from the collateral investments are shared among each Fund, the security lending agent, and the borrower. Each Fund records security lending income net of allocations to the security lending agent and the borrower.
Each Fund may incur investment losses as a result of investing securities lending collateral. This could occur if an investment in the collateral investment account defaulted or became impaired. Under those circumstances, the value of each Fund’s cash collateral account may be less than the amount each Fund would be required to return to the borrowers of the securities and each Fund would be required to make up for this shortfall.
During the year ended September 30, 2021, each Fund had no securities out on loan.
11. Credit and Market Risk
Beginning in January 2020, global financial markets have experienced and may continue to experience significant volatility resulting from the spread of a novel coronavirus known as COVID-19. The outbreak of COVID-19 has resulted in travel and border restrictions, quarantines, supply chain disruptions, lower consumer demand, and general market uncertainty. The effects of COVID-19 have and may continue to adversely affect the global economy, the economies of certain nations, and individual issuers, all of which may negatively impact the Funds’ performance.
Investments in equity securities in general are subject to market risks that may cause their prices to fluctuate over time. Fluctuations in the value of equity securities in which the Funds invest will cause the NAV of the Funds to fluctuate.
Some countries in which the Funds may invest require governmental approval for the repatriation of investment income, capital, or the proceeds of sales of securities by foreign investors. In addition, if there is deterioration in a country’s balance of payments or for other reasons, a country may impose temporary restrictions on foreign capital remittances abroad.
170
Table of Contents
The securities exchanges of certain foreign markets are substantially smaller, less liquid, and more volatile than the major securities markets in the United States. Consequently, acquisition and disposition of securities by the Funds may be inhibited. In addition, a significant portion of the aggregate market value of securities listed on the major securities exchanges in emerging markets is held by a smaller number of investors. This may limit the number of shares available for acquisition or disposition by the Funds.
When interest rates rise, fixed income securities (i.e. debt obligations) generally will decline in value. These declines in value are greater for fixed income securities with longer maturities or durations.
IBOR is the risk that changes related to the use of the London interbank offered rate (LIBOR) and other interbank offered rate (collectively, “IBORs”) could have adverse impacts on financial instruments that reference LIBOR (or the corresponding IBOR). The abandonment of LIBOR could affect the value and liquidity of instruments that reference LIBOR. The use of alternative reference rate products may impact investment strategy performance. These risks may also apply with respect to changes in connection with other IBORs, such as the euro overnight index average (EONIA), which are also the subject of recent reform.
Delaware Total Return Fund invests a portion of its assets in high yield fixed income securities, which are securities rated lower than BBB- by S&P and lower than Baa3 by Moody’s, or similarly rated by another nationally recognized statistical rating organization. Investments in these higher yielding securities are generally accompanied by a greater degree of credit risk than higher-rated securities. Additionally, lower-rated securities may be more susceptible to adverse economic and competitive industry conditions than investment grade securities.
Delaware Total Return Fund invest in fixed income securities whose value is derived from an underlying pool of mortgages or consumer loans. The value of these securities is sensitive to changes in economic conditions, including delinquencies and/or defaults, and may be adversely affected by shifts in the market’s perception of the issuers and changes in interest rates. Investors receive principal and interest payments as the underlying mortgages and consumer loans are paid back. Some of these securities are CMOs. CMOs are debt securities issued by US government agencies or by financial institutions and other mortgage lenders, which are collateralized by a pool of mortgages held under an indenture. Prepayment of mortgages may shorten the stated maturity of the obligations and can result in a loss of premium, if any has been paid. Certain of these securities may be stripped (securities which provide only the principal or interest feature of the underlying security). The yield to maturity on an interest-only CMO is extremely sensitive not only to changes in prevailing interest rates, but also to the rate of principal payments (including prepayments) on the related underlying mortgage assets. A rapid rate of principal payments may have a material adverse effect on a Fund’s yield to maturity. If the underlying mortgage assets experience greater than anticipated prepayments of principal, a Fund may fail to fully recoup its initial investment in these securities even if the securities are rated in the highest rating categories.
Delaware Total Return Fund invests in bank loans and other securities that may subject them to direct indebtedness risk, the risk that the Fund will not receive payment of principal, interest, and other amounts due in connection with these investments and will depend primarily on the financial condition of the borrower. Loans that are fully secured offer the Fund more protection than unsecured loans in the event of nonpayment of scheduled interest or principal, although there is no assurance that the liquidation of collateral from a secured loan would satisfy the corporate borrower’s obligation, or that the collateral can be liquidated. Some loans or claims may be in default at the time of purchase. Certain of the loans and the other direct indebtedness acquired by the Fund may involve revolving credit facilities or other standby financing commitments that obligate the Fund to pay additional cash on a certain date or on demand. These commitments may require each Fund to increase its investment in a company at a time when the Fund might not otherwise decide to do so (including at a time when the company’s financial condition makes it unlikely that such amounts will be repaid). To the extent that each Fund is committed to advance additional funds, it will at all times hold and maintain cash or other high grade debt obligations in an amount sufficient to meet such commitments. When a loan agreement is purchased, the Fund may pay an assignment fee. On an ongoing basis, the Fund may receive a commitment fee based on the undrawn portion of the underlying line of credit portion of a loan agreement. Prepayment penalty fees are received upon the prepayment of a loan agreement by the borrower. Prepayment penalty, facility, commitment, consent, and amendment fees are recorded to income as earned or paid.
As the Fund may be required to rely upon another lending institution to collect and pass on to the Fund amounts payable with respect to the loan and to enforce the Fund’s rights under the loan and other direct indebtedness, an insolvency, bankruptcy, or reorganization of the lending institution may delay or prevent the Fund from receiving such amounts. The highly leveraged nature of many loans may make them especially vulnerable to adverse changes in economic or market conditions. Investments in such loans and other direct indebtedness may involve additional risk to the Fund.
171
Table of Contents
Notes to financial statements
Delaware Group® Equity Funds IV (Trust)
11. Credit and Market Risk (continued)
Delaware Total Return Fund invests in certain obligations that may have liquidity protection designed to ensure that the receipt of payments due on the underlying security is timely. Such protection may be provided through guarantees, insurance policies, or letters of credit obtained by the issuer or sponsor through third parties, through various means of structuring the transaction, or through a combination of such approaches. The Funds will not pay any additional fees for such credit support, although the existence of credit support may increase the price of a security.
Delaware Opportunity Fund, Delaware Hedged U.S. Equity Opportunities Fund, and Delaware Total Return Fund may invest in REITs and are subject to the risks associated with that industry. If a Fund holds real estate directly or receives rental income directly from real estate holdings, its tax status as a regulated investment company may be jeopardized. There were no direct real estate holdings during the year ended September 30, 2021. The Funds’ REIT holdings are also affected by interest rate changes, particularly if the REITs they hold use floating rate debt to finance their ongoing operations. The Funds also invest in real estate acquired as a result of ownership of securities or other instruments, including issuers that invest, deal, or otherwise engage in transactions in real estate or interests therein. These instruments may include interests in private equity limited partnerships or limited liability companies that hold real estate investments (Real Estate Limited Partnerships). The Funds will limit their investments in Real Estate Limited Partnerships to 5% of their total assets at the time of purchase.
Each Fund may invest up to 15% of its net assets in illiquid securities, which may include securities with contractual restrictions on resale, securities exempt from registration under Rule 144A promulgated under the Securities Act of 1933, as amended, and other securities which may not be readily marketable. The relative illiquidity of these securities may impair each Fund from disposing of them in a timely manner and at a fair price when it is necessary or desirable to do so. While maintaining oversight, each Board has delegated to DMC, the day-to-day functions of determining whether individual securities are liquid for purposes of the Funds’ limitation on investments in illiquid securities. Securities eligible for resale pursuant to Rule 144A, which are determined to be liquid, are not subject to the Funds’ 15% limit on investments in illiquid securities. Rule 144A securities have been identified on the “Schedules of investments.”
12. Contractual Obligations
Each Fund enters into contracts in the normal course of business that contain a variety of indemnifications. Each Fund’s maximum exposure under these arrangements is unknown. However, each Fund has not had prior claims or losses pursuant to these contracts. Management has reviewed each Fund’s existing contracts and expects the risk of loss to be remote.
13. Recent Accounting Pronouncements
In March 2020, FASB issued an Accounting Standards Update (ASU), ASU 2020-04, Reference Rate Reform (Topic 848) – Facilitation of the Effects of Reference Rate Reform on Financial Reporting. The amendments in ASU 2020-04 provide optional temporary financial reporting relief from the effect of certain types of contract modifications due to the planned discontinuation of LIBOR and other interbank-offered based reference rates as of the end of 2021. ASU 2020-04 is effective for certain reference rate-related contract modifications that occur during the period March 12, 2020 through December 31, 2022. As of the financial reporting period, Management is evaluating the impact of applying this ASU.
14. Subsequent Events
On November 1, 2021, each Fund, along with the other Participants, entered into an amendment to the agreement for a $355,000,000 revolving line of credit to be used as described in Note 7 and to be operated in substantially the same manner as the agreement described in Note 7. Under the amendment to the agreement, the Participants are charged an annual commitment fee of 0.15% with the addition of an upfront fee of 0.05%, which is allocated across the Participants based on a weighted average of the respective net assets of each Participant. The line of credit available under the agreement expires on October 31, 2022.
Management has determined that no other material events or transactions occurred subsequent to September 30, 2021, that would require recognition or disclosure in the Funds’ financial statements.
172
Table of Contents
Report of independent
registered public accounting firm
To the Board of Trustees of Delaware Group® Equity Funds IV and Shareholders of Delaware Equity Income Fund, Delaware Growth and Income Fund, Delaware Growth Equity Fund, Delaware Opportunity Fund, Delaware Global Equity Fund, Delaware Covered Call Strategy Fund, Delaware Hedged U.S. Equity Opportunities Fund, Delaware Premium Income Fund and Delaware Total Return Fund
Opinions on the Financial Statements
We have audited the accompanying statements of assets and liabilities, including the schedules of investments, of Delaware Equity Income Fund, Delaware Growth and Income Fund, Delaware Growth Equity Fund, Delaware Opportunity Fund, Delaware Global Equity Fund, Delaware Covered Call Strategy Fund, Delaware Hedged U.S. Equity Opportunities Fund, Delaware Premium Income Fund and Delaware Total Return Fund (nine of the funds constituting Delaware Group® Equity Funds IV, hereafter collectively referred to as the “Funds”) as of September 30, 2021, the related statements of operations for the year ended September 30, 2021, the statements of changes in net assets for each of the two years in the period ended September 30, 2021, including the related notes, and the financial highlights for each of the two years in the period ended September 30, 2021 (collectively referred to as the “financial statements”). In our opinion, the financial statements present fairly, in all material respects, the financial position of each of the Funds as of September 30, 2021, the results of each of their operations for the year then ended, the changes in each of their net assets for each of the two years in the period ended September 30, 2021 and each of the financial highlights for each of the two years in the period ended September 30, 2021 in conformity with accounting principles generally accepted in the United States of America.
The financial statements of First Investors Equity Income Fund, First Investors Growth & Income Fund, First Investors Select Growth Fund, First Investors Opportunity Fund, First Investors Global Fund, First Investors Covered Call Strategy Fund, First Investors Hedged U.S. Equity Opportunities Fund, First Investors Premium Income Fund and First Investors Total Return Fund (subsequent to reorganization, known as Delaware Equity Income Fund, Delaware Growth and Income Fund, Delaware Growth Equity Fund, Delaware Opportunity Fund, Delaware Global Equity Fund, Delaware Covered Call Strategy Fund, Delaware Hedged U.S. Equity Opportunities Fund, Delaware Premium Income Fund and Delaware Total Return Fund, respectively) as of and for the year ended September 30, 2019 and the financial highlights for each of the periods ended on or prior to September 30, 2019 (not presented herein, other than the financial highlights) were audited by other auditors whose report dated November 26, 2019 expressed an unqualified opinion on those financial statements and financial highlights.
Basis for Opinions
These financial statements are the responsibility of the Funds’ management. Our responsibility is to express an opinion on the Funds’ financial statements based on our audits. We are a public accounting firm registered with the Public Company Accounting Oversight Board (United States) (PCAOB) and are required to be independent with respect to the Funds in accordance with the U.S. federal securities laws and the applicable rules and regulations of the Securities and Exchange Commission and the PCAOB.
We conducted our audits of these financial statements in accordance with the standards of the PCAOB. Those standards require that we plan and perform the audit to obtain reasonable assurance about whether the financial statements are free of material misstatement, whether due to error or fraud.
Our audits included performing procedures to assess the risks of material misstatement of the financial statements, whether due to error or fraud, and performing procedures that respond to those risks. Such procedures included examining, on a test basis, evidence regarding the amounts and disclosures in the financial statements. Our audits also included evaluating the accounting principles used and significant estimates made by management, as well as evaluating the overall presentation of the financial statements. Our procedures included confirmation of securities owned as of September 30, 2021 by correspondence with the custodian, transfer agents, brokers and portfolio company investees; when replies were not received from brokers, we performed other auditing procedures. We believe that our audits provide a reasonable basis for our opinions.
/s/PricewaterhouseCoopers LLP
Philadelphia, Pennsylvania
November 17, 2021
We have served as the auditor of one or more investment companies in Delaware Funds® by Macquarie since 2010.
173
Table of Contents
Other Fund information (Unaudited)
Liquidity Risk Management Program
The Securities and Exchange Commission (the “SEC”) has adopted Rule 22e-4 under the Investment Company Act of 1940 (the “Liquidity Rule”), which requires all open-end funds (other than money market funds) to adopt and implement a program reasonably designed to assess and manage the fund’s “liquidity risk,” defined as the risk that the fund could not meet requests to redeem shares issued by the fund without significant dilution of remaining investors’ interests in the fund.
The Funds have adopted and implemented a liquidity risk management program in accordance with the Liquidity Rule (the “Program”). The Board has designated the Division Director of the US Operational Risk Group of Macquarie Asset Management as the Program Administrator for each Fund in the Trust.
As required by the Liquidity Rule, the Program includes policies and procedures that provide for: (1) assessment, management, and review (no less frequently than annually) of each Fund’s liquidity risk; (2) classification of each of the Fund’s portfolio holdings into one of four liquidity categories (Highly Liquid, Moderately Liquid, Less Liquid, and Illiquid); (3) funds that do not primarily hold assets that are Highly Liquid, establishing and maintaining a minimum percentage of each Fund’s net assets in Highly Liquid investments (called a “Highly Liquid Investment Minimum” or “HLIM”); and (4) prohibiting each Fund’s acquisition of Illiquid investments if, immediately after the acquisition, each Fund would hold more than 15% of its net assets in Illiquid assets. The Program also requires reporting to the SEC (on a non-public basis) and to the Board if each Fund’s holdings of Illiquid assets exceed 15% of the Fund’s net assets. Funds with HLIMs must have procedures for addressing HLIM shortfalls, including reporting to the Board and, with respect to HLIM shortfalls lasting more than seven consecutive calendar days, reporting to the SEC (on a non-public basis).
In assessing and managing each Fund’s liquidity risk, the Program Administrator considers, as relevant, a variety of factors, including: (1) each Fund’s investment strategy and liquidity of portfolio investments during both normal and reasonably foreseeable stressed conditions; (2) short-term and long-term cash flow projections for the Funds during both normal and reasonably foreseeable stressed conditions; and (3) each Fund’s holdings of cash and cash equivalents and any borrowing arrangements. Classification of each Fund’s portfolio holdings in the four liquidity categories is based on the number of days it is reasonably expected to take to convert the investment to cash (for Highly Liquid and Moderately Liquid holdings) or to sell or dispose of the investment (for Less Liquid and Illiquid investments), in current market conditions without significantly changing the investment’s market value. Each Fund primarily holds assets that are classified as Highly Liquid, and therefore is not required to establish an HLIM.
At a meeting of the Board held on May 25-27, 2021, the Program Administrator provided a written report to the Board addressing the Program’s operation and assessing the adequacy and effectiveness of its implementation for the period from April 1, 2020 through March 31, 2021. The report concluded that the Program is appropriately designed and effectively implemented and that it meets the requirements of Rule 22e-4 and each Fund’s liquidity needs. Each Fund’s HLIM is set at an appropriate level and the Funds complied with their HLIM at all times during the reporting period.
174
Table of Contents
Tax Information
The information set forth below is for each Fund’s fiscal year as required by federal income tax laws. Shareholders, however, must report distributions on a calendar year basis for income tax purposes, which may include distributions for portions of two fiscal years of the Funds. Accordingly, the information needed by shareholders for income tax purposes will be sent to them in January of each year. Please consult your tax advisor for proper treatment of this information.
All disclosures are based on financial information available as of the date of this annual report and, accordingly are subject to change. For any and all items requiring reporting, it is the intention of each Fund to report the maximum amount permitted under the Internal Revenue Code and the regulations thereunder.
For the fiscal year ended September 30, 2021, the Funds report distributions paid during the year as follows:
| | (A) | | | | | | | | | | | | |
| | Long-Term | | (B) | | | | | | | | |
| | Capital Gains | | Ordinary Income | | Total | | (C) |
| | Distributions | | Distributions* | | Distributions | | Qualifying |
| | (Tax Basis) | | (Tax Basis) | | (Tax Basis) | | Dividends1 |
| Delaware Equity Income Fund | | | 82.85 | % | | | 17.15 | % | | | 100.00 | % | | | 100.00 | % |
| Delaware Growth and Income Fund | | | 78.37 | % | | | 21.63 | % | | | 100.00 | % | | | 100.00 | % |
| Delaware Growth Equity Fund | | | 97.51 | % | | | 2.49 | % | | | 100.00 | % | | | 100.00 | % |
| Delaware Opportunity Fund | | | — | | | | 100.00 | % | | | 100.00 | % | | | 100.00 | % |
| Delaware Global Equity Fund | | | 30.07 | % | | | 69.93 | % | | | 100.00 | % | | | 21.15 | % |
| Delaware Covered Call Strategy Fund | | | — | | | | 100.00 | % | | | 100.00 | % | | | 100.00 | % |
| Delaware Hedged U.S. Equity Opportunities Fund | | | 71.00 | % | | | 29.00 | % | | | 100.00 | % | | | 12.84 | % |
| Delaware Premium Income Fund | | | — | | | | 100.00 | % | | | 100.00 | % | | | 100.00 | % |
| Delaware Total Return Fund | | | — | | | | 100.00 | % | | | 100.00 | % | | | 66.73 | % |
____________________
| (A) and (B) are based on a percentage of each Fund’s total distributions. |
| (C) is based on a percentage of each Fund’s ordinary income distributions. |
| 1 | Qualifying dividends represent dividends which qualify for the corporate dividends received deduction. |
* | For the fiscal year ended September 30, 2021, certain dividends paid by the Funds may be subject to a maximum tax rate of 20%. The percentage of dividends paid by the Funds from ordinary income reported as qualified income are as reported in the following table. Complete information will be computed and reported in conjunction with your 2020 Form 1099-DIV. |
| | Maximum |
| | percentage to |
| | be |
| | taxed at a |
| | maximum rate |
| | | of 20 | % |
| Delaware Equity Income Fund | | | 100.00 | % |
| Delaware Growth and Income Fund | | | 100.00 | % |
| Delaware Growth Equity Fund | | | 100.00 | % |
| Delaware Opportunity Fund | | | 100.00 | % |
| Delaware Global Equity Fund | | | 71.91 | % |
| Delaware Covered Call Strategy Fund | | | 100.00 | % |
| Delaware Hedged U.S. Equity Opportunities Fund | | | 15.19 | % |
| Delaware Total Return Fund | | | 77.41 | % |
175
Table of Contents
Other Fund information (Unaudited)
Tax Information (continued)
For the fiscal year ended September 30, 2021, certain distributions paid by the Funds, determined to be Qualified Interest Income or Qualified Short- Term Capital Gains may be subject to relief from US tax withholding for foreign shareholders, as provided by the American Jobs Creation Act of 2004; the Tax Relief Unemployment Insurance Reauthorization, and Job Creations Act of 2010; and as extended by the American Taxpayer Relief Act of 2012. For the fiscal year ended September 30, 2021, the Funds have reported maximum distributions of Qualified Short-Term Capital Gains as follows:
| | Qualified |
| | Short-Term |
| | Capital Gains |
| Delaware Growth and Income Fund | | $ | 14,025,984 | |
| Delaware Global Equity Fund | | | 3,185,045 | |
Delaware Global Equity Fund intends to pass through foreign tax credits in the maximum amount of $304,203. The gross foreign source income earned during the fiscal year 2021 by the Fund was $4,948,264.
176
Table of Contents
Board consideration of Investment Advisory and Sub-Advisory Agreements for Delaware Covered Call Strategy Fund, Delaware Equity Income Fund, Delaware Global Equity Fund, Delaware Growth and Income Fund, Delaware Growth Equity Fund, Delaware Hedged U.S. Equity Opportunities Fund, Delaware Opportunity Fund, Delaware Premium Income Fund, and Delaware Total Return Fund at a meeting held August 10-12, 2021
At a meeting held on August 10-12, 2021 (the “Annual Meeting”), the Board of Trustees (the “Board”), including a majority of disinterested or independent Trustees, approved the renewal of the Investment Advisory and Sub-Advisory Agreements for Delaware Covered Call Strategy Fund, Delaware Equity Income Fund, Delaware Global Equity Fund, Delaware Growth and Income Fund, Delaware Growth Equity Fund, Delaware Hedged U.S. Equity Opportunities Fund, Delaware Opportunity Fund, Delaware Premium Income Fund, and Delaware Total Return Fund (each, a “Fund” and together, the “Funds”). In making its decision, the Board considered information furnished at regular quarterly Board meetings, including reports detailing Fund performance, investment strategies and expenses, as well as information prepared specifically in connection with the renewal of the investment advisory and sub-advisory contracts. Information furnished specifically in connection with the renewal of the Investment Management Agreement with Delaware Management Company (“DMC”), a series of Macquarie Investment Management Business Trust (“MIMBT”) and the Sub-Advisory Agreements with Macquarie Funds Management Hong Kong Limited (“MFMHK”), Macquarie Investment Management Europe Limited (“MIMEL”), Macquarie Investment Management Global Limited (“MIMGL”), Macquarie Investment Management Austria Kapitalanlage AG (“MIMAK”), Smith Asset Management Group, L.P. (“Smith”), Wellington Management Company, LLP (“Wellington”), and Ziegler Capital Management, LLC (“Ziegler”) (each, a “Sub-Adviser” and together, the “Sub-Advisers”), included materials provided by DMC and its affiliates (collectively, “Macquarie Asset Management”) and MFMHK, MIMEL, MIMGL, MIMAK, Smith, Wellington, and Ziegler, as applicable, concerning, among other things, the nature, extent, and quality of services provided to the Funds; the costs of such services to the Funds; economies of scale; and the investment manager’s financial condition and profitability. In addition, in connection with the Annual Meeting, materials were provided to the Trustees in May 2021, including reports provided by Broadridge Financial Solutions (“Broadridge”). The Broadridge reports compared each Fund’s investment performance and expenses with those of other comparable mutual funds. The Independent Trustees reviewed and discussed the Broadridge reports with independent legal counsel to the Independent Trustees. In addition to the information noted above, the Board also requested and received information regarding DMC’s policy with respect to advisory fee levels and its breakpoint philosophy; the structure of portfolio manager compensation; comparative client fee information; and any constraints or limitations on the availability of securities for certain investment styles, which had in the past year inhibited, or which were likely in the future to inhibit, the investment manager’s ability to invest fully in accordance with Fund policies.
In considering information relating to the approval of each Fund’s advisory and sub-advisory agreements, the Independent Trustees received assistance and advice from and met separately with independent legal counsel to the Independent Trustees and also received assistance and advice from an experienced and knowledgeable independent fund consultant, JDL Consultants, LLC (“JDL”). Although the Board gave attention to all information furnished, the following discussion identifies, under separate headings, the primary factors taken into account by the Board during its contract renewal considerations.
Nature, extent, and quality of services. The Board considered the services provided by DMC to the Funds and their shareholders. In reviewing the nature, extent, and quality of services, the Board considered reports furnished to it throughout the year, which covered matters such as the relative performance of the Funds; compliance of portfolio managers with the investment policies, strategies, and restrictions for the Funds; compliance by DMC and Delaware Distributors, L.P. (together, “Management”) personnel with the Code of Ethics adopted throughout the Delaware Funds by Macquarie® (“Delaware Funds”); and adherence to fair value pricing procedures as established by the Board. The Board was pleased with the current staffing of DMC and the emphasis placed on research in the investment process. The Board recognized DMC’s receipt of certain favorable industry distinctions during the past several years. The Board gave favorable consideration to DMC’s efforts to control expenses while maintaining service levels committed to Fund matters. The Board also noted the benefits provided to Fund shareholders through (a) each shareholder’s ability to: (i) exchange an investment in one Delaware Fund for the same class of shares in another Delaware Fund without a sales charge, or (ii) reinvest Fund dividends into additional shares of the Fund or into additional shares of other Delaware Funds, and (b) the privilege to combine holdings in other Delaware Funds to obtain a reduced sales charge. The Board was satisfied with the nature, extent, and quality of the overall services provided by DMC.
Nature, extent, and quality of services. The Board considered the services provided by each Sub-Adviser to the Funds and their shareholders, as applicable. In reviewing the nature, extent, and quality of services, the Board considered reports furnished to it throughout the year at regular Board Meetings covering matters such as relative performance of the Funds, compliance of portfolio managers with the investment policies, strategies, and restrictions for the Funds, the compliance of Sub-Adviser personnel with its Code of Ethics, and adherence to
177
Table of Contents
Other Fund information (Unaudited)
Board consideration of Investment Advisory and Sub-Advisory Agreements for Delaware Covered Call Strategy Fund, Delaware Equity Income Fund, Delaware Global Equity Fund, Delaware Growth and Income Fund, Delaware Growth Equity Fund, Delaware Hedged U.S. Equity Opportunities Fund, Delaware Opportunity Fund, Delaware Premium Income Fund, and Delaware Total Return Fund at a meeting held August 10-12, 2021 (continued)
fair value pricing procedures as established by the Board. The Board was pleased with the current staffing of each Sub-Adviser and the emphasis placed on research in the investment process. The Board was satisfied with the nature, extent, and quality of the overall services provided by each Sub-Adviser.
Investment performance. The Board placed significant emphasis on the investment performance of the Funds in view of the importance of investment performance to shareholders. Although the Board considered performance reports and discussions with portfolio managers at Investment Committee meetings throughout the year, the Board gave particular weight to the Broadridge reports furnished for the Annual Meeting. The Broadridge reports prepared for the Funds showed each Fund’s investment performance in comparison to a group of similar funds (the “Performance Universe”). A fund with the best performance ranked first, and a fund with the poorest performance ranked last. The highest/best performing 25% of funds in the Performance Universe make up the first quartile; the next 25%, the second quartile; the next 25%, the third quartile; and the poorest/worst performing 25% of funds in the Performance Universe make up the fourth quartile. Comparative annualized performance for each Fund was shown for the past 1-, 3-, 5-, and 10-year periods, to the extent applicable, ended December 31, 2020. The Board’s objective is that each Fund’s performance for the 1-, 3-, and 5-year periods be at or above the median of its Performance Universe.
Delaware Covered Call Strategy Fund – The Performance Universe for the Fund consisted of the Fund and all retail and institutional alternative long/short equity funds as selected by Broadridge. The Broadridge report comparison showed that the Fund’s total return for the 1-year, 3-year, and since inception periods was in the third quartile of its Performance Universe. The Board observed that the Fund’s performance results were not in line with the Board’s objective. In evaluating the Fund’s performance, the Board considered the numerous investment and performance reports delivered by Management personnel to the Board’s Investments Committee. The Board was satisfied that Management was taking action to improve Fund performance and to meet the Board’s performance objective.
Delaware Equity Income Fund – The Performance Universe for the Fund consisted of the Fund and all retail and institutional equity income funds as selected by Broadridge. The Broadridge report comparison showed that the Fund’s total return for the 1-year, 3-year, 5-year, and since inception periods was in the fourth quartile of its Performance Universe. The Board observed that the Fund’s performance results were not in line with the Board’s objective. In evaluating the Fund’s performance, the Board considered the performance attribution included in the Meeting materials, as well the numerous investment and performance reports delivered by Management personnel to the Board’s Investments Committee. The Board was satisfied that Management was taking action to improve Fund performance and to meet the Board’s performance objective.
Delaware Global Equity Fund – The Performance Universe for the Fund consisted of the Fund and all retail and institutional global multi-cap value funds as selected by Broadridge. The Broadridge report comparison showed that the Fund’s total return for the 1-, 3- and 5-year periods was in the second quartile of its Performance Universe. The report further showed that the Fund’s total return for the 10-year period was in the first quartile of its Performance Universe. The Board was satisfied with performance.
Delaware Growth and Income Fund – The Performance Universe for the Fund consisted of the Fund and all retail and institutional large-cap value funds as selected by Broadridge. The Broadridge report comparison showed that the Fund’s total return for the 1-year, 3-year, 5-year, and since inception periods was in the fourth quartile of its Performance Universe. The Board observed that the Fund’s performance results were not in line with the Board’s objective. In evaluating the Fund’s performance, the Board considered the performance attribution included in the Meeting materials, as well as the numerous investment and performance reports delivered by Management personnel to the Board’s Investments Committee. The Board was satisfied that Management was taking action to improve Fund performance and to meet the Board’s performance objective.
Delaware Growth Equity Fund – The Performance Universe for the Fund consisted of the Fund and all retail and institutional multi-cap growth funds as selected by Broadridge. The Broadridge report comparison showed that the Fund’s total return for the 1-year, 5-year, and since inception periods was in the third quartile of its Performance Universe. The report further showed that the Fund’s total return for the 3-year period was in the fourth quartile of its Performance Universe. The Board observed that the Fund’s performance results were not in line with the Board’s objective. In evaluating the Fund’s performance, the Board considered the performance attribution included in the Meeting materials, as
178
Table of Contents
well as the numerous investment and performance reports delivered by Management personnel to the Board’s Investments Committee. The Board was satisfied that Management was taking action to improve Fund performance and to meet the Board’s performance objective.
Delaware Hedged U.S. Equity Opportunities Fund – The Performance Universe for the Fund consisted of the Fund and all retail and institutional alternative long/short equity funds as selected by Broadridge. The Broadridge report comparison showed that the Fund’s total return for the 1-year, 3-year, and since inception periods was in the first quartile of its Performance Universe. The Board was satisfied with performance.
Delaware Opportunity Fund – The Performance Universe for the Fund consisted of the Fund and all retail and institutional mid-cap value funds as selected by Broadridge. The Broadridge report comparison showed that the Fund’s total return for the 1-, 3-, and 5-year periods was in the third quartile of its Performance Universe. The report further showed that the Fund’s total return for the since inception period was in the second quartile of its Performance Universe. The Board observed that the Fund’s performance results were not in line with the Board’s objective. In evaluating the Fund’s performance, the Board considered the performance attribution included in the Meeting materials, as well as the numerous investment and performance reports delivered by Management personnel to the Board’s Investments Committee. The Board was satisfied that Management was taking action to improve Fund performance and to meet the Board’s performance objective.
Delaware Premium Income Fund – The Performance Universe for the Fund consisted of the Fund and all retail and institutional alternative long/short equity funds as selected by Broadridge. The Broadridge report comparison showed that the Fund’s total return for the 1-year period was in the fourth quartile of its Performance Universe. The report further showed that the Fund’s total return for the since inception period was in the third quartile of its Performance Universe. The Board observed that the Fund’s performance results were not in line with the Board’s objective. In evaluating the Fund’s performance, the Board considered the performance attribution included in the Meeting materials, as well as the numerous investment and performance reports delivered by Management personnel to the Board’s Investments Committee. The Board was satisfied that Management was taking action to improve Fund performance and to meet the Board’s performance objective.
Delaware Total Return Fund – The Performance Universe for the Fund consisted of the Fund and all retail and institutional mixed-asset target allocation moderate funds as selected by Broadridge. The Broadridge report comparison showed that the Fund’s total return for the 1-, 3-, and 5-year periods was in the fourth quartile of its Performance Universe. The report further showed that the Fund’s total return for the period since inception was in the third quartile of its Performance Universe. The Board observed that the Fund’s performance results were not in line with the Board’s objective. In evaluating the Fund’s performance, the Board considered the performance attribution included in the Meeting materials, as well as the numerous investment and performance reports delivered by Management personnel to the Board’s Investments Committee. The Board was satisfied that Management was taking action to improve Fund performance and to meet the Board’s performance objective.
Comparative expenses. The Board considered expense data for the Delaware Funds. Management provided the Board with information on pricing levels and fee structures for each Fund as of its most recently completed fiscal year. The Board also focused on the comparative analysis of effective management fees and total expense ratios of each Fund versus effective management fees and total expense ratios of a group of similar funds as selected by Broadridge (the “Expense Group”). In reviewing comparative costs, each Fund’s contractual management fee and the actual management fee incurred by the Fund were compared with the contractual management fees (assuming all funds in the Expense Group were similar in size to the Fund) and actual management fees (as reported by each fund) within the Expense Group, taking into account any applicable breakpoints and fee waivers. Each Fund’s total expenses were also compared with those of its Expense Group. The Broadridge total expenses, for comparative consistency, were shown by Broadridge for Class A shares and comparative total expenses including 12b-1 and non-12b-1 service fees. The Board’s objective is for each Fund’s total expense ratio to be competitive with those of the peer funds within its Expense Group.
Delaware Covered Call Strategy Fund – The expense comparisons for the Fund showed that its actual management fee and total expenses were in the quartile with the lowest expenses of its Expense Group. The Board was satisfied with the management fee and total expenses of the Fund.
Delaware Equity Income Fund – The expense comparisons for the Fund showed that its actual management fee was in the quartile with the second highest expenses of its Expense Group and its total expenses were in the quartile with the highest expenses of its Expense Group. The Board noted that the Fund’s total expenses were not in line with the Board’s objective. In evaluating the total expenses, the Board considered fee waivers in place through January 2022 and various initiatives implemented by Management, such as the negotiation of lower fees for fund accounting, fund accounting oversight services, and custody, which had created an opportunity for a further reduction in expenses. The Board was satisfied with Management’s efforts to improve the Fund’s total expense ratio and to bring it in line with the Board’s objective.
179
Table of Contents
Other Fund information (Unaudited)
Board consideration of Investment Advisory and Sub-Advisory Agreements for Delaware Covered Call Strategy Fund, Delaware Equity Income Fund, Delaware Global Equity Fund, Delaware Growth and Income Fund, Delaware Growth Equity Fund, Delaware Hedged U.S. Equity Opportunities Fund, Delaware Opportunity Fund, Delaware Premium Income Fund, and Delaware Total Return Fund at a meeting held August 10-12, 2021 (continued)
Delaware Global Equity Fund – The expense comparisons for the Fund showed that its actual management fee was in the quartile with the second highest expenses of its Expense Group and its total expenses were in the quartile with the highest expenses of its Expense Group. The Board noted that the Fund’s total expenses were not in line with the Board’s objective. In evaluating the total expenses, the Board considered fee waivers in place through January 2022 and various initiatives implemented by Management, such as the negotiation of lower fees for fund accounting, fund accounting oversight services, and custody, which had created an opportunity for a further reduction in expenses. The Board was satisfied with Management’s efforts to improve the Fund’s total expense ratio and to bring it in line with the Board’s objective.
Delaware Growth and Income Fund – The expense comparisons for the Fund showed that its actual management fee was in the quartile with the second highest expenses of its Expense Group and its total expenses were in the quartile with the highest expenses of its Expense Group. The Board gave favorable consideration to the Fund’s management fee but noted that the Fund’s total expenses were not in line with the Board’s objective. In evaluating the total expenses, the Board considered fee waivers in place through January 2022 and various initiatives implemented by Management, such as the negotiation of lower fees for fund accounting, fund accounting oversight services, and custody, which had created an opportunity for a further reduction in expenses. The Board was satisfied with Management’s efforts to improve the Fund’s total expense ratio and to bring it in line with the Board’s objective.
Delaware Growth Equity Fund – The expense comparisons for the Fund showed that its actual management fee was in the quartile with the second lowest expenses of its Expense Group and total expenses were in the quartile with the second highest expenses of its Expense Group. The Board gave favorable consideration to the Fund’s management fee but noted that the Fund’s total expenses were not in line with the Board’s objective. In evaluating total expenses, the Board considered fee waivers in place through January 2022 and various initiatives implemented by Management, such as the negotiation of lower fees for fund accounting, fund accounting oversight and custody services, which had created an opportunity for a further reduction in expenses. The Board was satisfied with Management’s efforts to improve the Fund’s total expense ratio and to bring it in line with the Board’s objective.
Delaware Hedged U.S. Equity Opportunities Fund – The expense comparisons for the Fund showed that its actual management fee and total expenses were in the quartile with the second lowest expenses of its Expense Group. The Board was satisfied with the management fee and total expenses of the Fund in comparison to those of its Expense Group as shown in the Broadridge report.
Delaware Opportunity Fund – The expense comparisons for the Fund showed that its actual management fee was in the quartile with the second lowest expenses of its Expense Group and its total expenses were in the quartile with the highest expenses of its Expense Group. The Board gave favorable consideration to the Fund’s management fee but noted that the Fund’s total expenses were not in line with the Board’s objective. In evaluating the total expenses, the Board considered fee waivers in place through January 2022 and various initiatives implemented by Management, such as the negotiation of lower fees for fund accounting, fund accounting oversight and custody services, which had created an opportunity for a further reduction in expenses. The Board was satisfied with Management’s efforts to improve the Fund’s total expense ratio and to bring it in line with the Board’s objective.
Delaware Premium Income Fund – The expense comparisons for the Fund showed that its actual management fee and total expenses were in the quartile with the lowest expenses of its Expense Group. The Board was satisfied with the management fee and total expenses of the Fund in comparison to those of its Expense Group as shown in the Broadridge report.
Delaware Total Return Fund – The expense comparisons for the Fund showed that its actual management fee was in the quartile with the second lowest expenses of its Expense Group and its total expenses were in the quartile with the highest expenses of its Expense Group. The Board gave favorable consideration to the Fund’s management fee but noted that the Fund’s total expenses were not in line with the Board’s objective. In evaluating the total expenses, the Board considered fee waivers in place through January 2022 and various initiatives implemented by Management, such as the negotiation of lower fees for fund accounting, fund accounting oversight and custody services, which had created an opportunity for a further reduction in expenses. The Board was satisfied with Management’s efforts to improve the Fund’s total expense ratio and to bring it in line with the Board’s objective.
180
Table of Contents
Management profitability. The Board considered the level of profits realized by DMC in connection with the operation of the Funds. In this respect, the Board reviewed the Investment Management Profitability Analysis that addressed the overall profitability of DMC’s business in providing management and other services to each of the individual funds and the Delaware Funds as a whole. Specific attention was given to the methodology used by DMC in allocating costs for the purpose of determining profitability. Management stated that the level of profits of DMC, to a certain extent, reflects recent operational cost savings and efficiencies initiated by DMC. The Board considered DMC’s efforts to improve services provided to Fund shareholders and to meet additional regulatory and compliance requirements resulting from recent industry-wide Securities and Exchange Commission initiatives. The Board also considered the extent to which DMC might derive ancillary benefits from fund operations, including the potential for procuring additional business as a result of the prestige and visibility associated with its role as service provider to the Delaware Funds and the benefits from allocation of fund brokerage to improve trading efficiencies. As part of its work, the Board also reviewed a report prepared by JDL regarding MIMBT profitability as compared to certain peer fund complexes and the Independent Trustees discussed with JDL personnel regarding DMC’s profitability in such context. The Board found that the management fees were reasonable in light of the services rendered and the level of profitability of DMC.
Management profitability. Trustees were also given available information on profits being realized by each Sub-Adviser in relation to the services being provided to the Funds, as applicable, and in relation to each Sub-Adviser’s overall investment advisory business, but believed such information to be of limited relevance because the sub-advisory fees are paid by DMC out of its management fee, and changes in the level of sub-advisory fees have no impact on Fund expenses. The Board was also provided information on potential fall-out benefits derived or to be derived by each Sub-Adviser in connection with its relationship to the Funds, such as reputational enhancement, soft dollar arrangements or commissions paid to affiliated broker-dealers, as applicable.
Economies of scale. The Trustees considered whether economies of scale are realized by DMC as each Fund’s assets increase and the extent to which any economies of scale are reflected in the level of management fees charged. The Trustees reviewed each Fund’s advisory fee pricing and structure, approved by the Board and shareholders, which includes breakpoints, and which applies to most funds in the Delaware Funds complex. Breakpoints in the advisory fee occur when the advisory fee rate is reduced on assets in excess of specified levels. Breakpoints result in a lower advisory fee than would otherwise be the case in the absence of breakpoints, when the asset levels specified in the breakpoints are exceeded. The Board noted that, as of March 31, 2021, the net assets for each of Delaware Opportunity Fund and Delaware Total Return Fund exceeded the first breakpoint level. The Board believed that, given the extent to which economies of scale might be realized by DMC and its affiliates, the schedule of fees under the Investment Management Agreements provides a sharing of benefits with the Funds and their shareholders. Although, as of March 31, 2021, Delaware Covered Call Strategy Fund, Delaware Equity Income Fund, Delaware Global Equity Fund, Delaware Growth and Income Fund, Delaware Growth Equity Fund, Delaware Hedged U.S. Equity Opportunities Fund, and Delaware Premium Income Fund had each not reached a size at which it could take advantage of any breakpoints in the applicable fee schedule, the Board recognized that the fee was structured so that, if the Fund increases sufficiently in size, then economies of scale may be shared.
181
Table of Contents
Board of trustees / directors and officers addendum
Delaware Funds by Macquarie®
A mutual fund is governed by a Board of Trustees/Directors (“Trustees”), which has oversight responsibility for the management of a fund’s business affairs. Trustees establish procedures and oversee and review the performance of the investment manager, the distributor, and others who perform services for the fund. The independent fund trustees, in particular, are advocates for shareholder interests. Each trustee has served in that capacity since he or she was elected to or appointed to the Board of Trustees, and will continue to serve until his or her retirement or the election of a new trustee in his or her place. The following is a list of the Trustees and Officers with certain background and related information.
| | | | | | | | Number of | | Other |
| | | | | | Principal | | Portfolios in Fund | | Directorships |
| Name, | | Position(s) | | | | Occupation(s) | | Complex Overseen | | Held by |
| Address, | | Held with | | Length of Time | | During the | | by Trustee | | Trustee |
| and Birth Date | | Fund(s) | | Served | | Past Five Years | | or Officer | | or Officer |
| Interested Trustee |
| |
| Shawn K. Lytle1 | | President, | | President and | | Global Head of Macquarie Investment | | 150 | | Trustee — UBS |
| 610 Market Street | | Chief Executive Officer, | | Chief Executive Officer | | Management2 | | | | Relationship Funds, SMA |
| Philadelphia, PA | | and Trustee | | since August 2015 | | (January 2019–Present) | | | | Relationship Trust, and |
| 19106-2354 | | | | Trustee since | | Head of Americas of | | | | UBS Funds |
| February 1970 | | | | September 2015 | | Macquarie Group | | | | (May 2010–April 2015) |
| | | | | | (December 2017–Present) | | | | |
| | | | | | Deputy Global Head of Macquarie Investment | | | | |
| | | | | | Management | | | | |
| | | | | | (2017–2019) | | | | |
| | | | | | Head of Macquarie Investment Management | | | | |
| | | | | | Americas | | | | |
| | | | | | (2015–2017) | | | | |
| Independent Trustees |
| |
| Jerome D. Abernathy | | Trustee | | Since January 2019 | | Managing Member, Stonebrook Capital | | 150 | | None |
| 610 Market Street | | | | | | Management, LLC (financial technology: macro | | | | |
| Philadelphia, PA | | | | | | factors and databases) | | | | |
| 19106-2354 | | | | | | (January 1993-Present) | | | | |
| July 1959 | | | | | | | | | | |
| |
| Thomas L. Bennett | | Chair and Trustee | | Trustee since March | | Private Investor | | 150 | | None |
| 610 Market Street | | | | 2005 | | (March 2004–Present) | | | | |
| Philadelphia, PA | | | | Chair since March 2015 | | | | | | |
| 19106-2354 | | | | | | | | | | |
| October 1947 | | | | | | | | | | |
| |
| Ann D. Borowiec | | Trustee | | Since March 2015 | | Chief Executive Officer, Private Wealth | | 150 | | Director — Banco |
| 610 Market Street | | | | | | Management (2011–2013) and Market | | | | Santander International |
| Philadelphia, PA | | | | | | Manager, New Jersey Private Bank (2005– | | | | (October 2016–December |
| 19106-2354 | | | | | | 2011) — J.P. Morgan Chase & Co. | | | | 2019) |
| November 1958 | | | | | | | | | | Director — Santander |
| | | | | | | | | | Bank, N.A. (December |
| | | | | | | | | | 2016–December 2019) |
| |
| Joseph W. Chow | | Trustee | | Since January 2013 | | Private Investor | | 150 | | Director and Audit |
| 610 Market Street | | | | | | (April 2011–Present) | | | | Committee Member — |
| Philadelphia, PA | | | | | | | | | | Hercules Technology |
| 19106-2354 | | | | | | | | | | Growth Capital, Inc. |
| January 1953 | | | | | | | | | | (July 2004–July 2014) |
182
Table of Contents
| | | | | | | | Number of | | Other |
| | | | | | Principal | | Portfolios in Fund | | Directorships |
| Name, | | Position(s) | | | | Occupation(s) | | Complex Overseen | | Held by |
| Address, | | Held with | | Length of Time | | During the | | by Trustee | | Trustee |
| and Birth Date | | Fund(s) | | Served | | Past Five Years | | or Officer | | or Officer |
| |
| John A. Fry | | Trustee | | Since January 2001 | | President — Drexel University (August | | 150 | | Director; Compensation |
| 610 Market Street | | | | | | 2010–Present) | | | | Committee and |
| Philadelphia, PA | | | | | | President — Franklin & Marshall College (July | | | | Governance Committee |
| 19106-2354 | | | | | | 2002–June 2010) | | | | Member — Community |
| May 1960 | | | | | | | | | | Health Systems |
| | | | | | | | | | (May 2004–Present) |
| | | | | | | | | | Director — Drexel Morgan |
| | | | | | | | | | & Co. (2015–2019) |
| | | | | | | | | | Director, Audit and |
| | | | | | | | | | Compensation Committee |
| | | | | | | | | | Member — vTv |
| | | | | | | | | | Therapeutics Inc. |
| | | | | | | | | | (2017–Present) |
| | | | | | | | | | Director and Audit |
| | | | | | | | | | Committee Member — FS |
| | | | | | | | | | Credit Real Estate Income |
| | | | | | | | | | Trust, Inc. (2018–Present) |
| | | | | | | | | | Director — Federal |
| | | | | | | | | | Reserve |
| | | | | | | | | | Bank of Philadelphia |
| | | | | | | | | | (January 2020–Present) |
| |
| Frances A. | | Trustee | | Since September 2011 | | Private Investor | | 150 | | Trust Manager and Audit |
| Sevilla-Sacasa | | | | | | (January 2017–Present) | | | | Committee Chair — |
| 610 Market Street | | | | | | Chief Executive Officer — Banco Itaú | | | | Camden Property Trust |
| Philadelphia, PA | | | | | | International | | | | (August 2011–Present) |
| 19106-2354 | | | | | | (April 2012–December 2016) | | | | Director; Audit |
| January 1956 | | | | | | Executive Advisor to Dean (August 2011– | | | | and Compensation |
| | | | | | March 2012) and Interim Dean | | | | Committee Member — |
| | | | | | (January 2011–July 2011) — University of | | | | Callon Petroleum |
| | | | | | Miami School of Business Administration | | | | Company |
| | | | | | President — U.S. Trust, Bank of America | | | | (December 2019–Present) |
| | | | | | Private Wealth Management (Private Banking) | | | | Director — New Senior |
| | | | | | (July 2007-December 2008) | | | | Investment Group Inc. |
| | | | | | | | | | (January 2021–Present) |
| | | | | | | | | | Director; Audit Committee |
| | | | | | | | | | Member — Carrizo Oil & |
| | | | | | | | | | Gas, Inc. (March 2018– |
| | | | | | | | | | December 2019) |
| |
| Thomas K. Whitford | | Trustee | | Since January 2013 | | Vice Chairman — PNC Financial Services | | 150 | | Director — HSBC North |
| 610 Market Street | | | | | | Group(2010–April 2013) | | | | America Holdings Inc. |
| Philadelphia, PA | | | | | | | | | | (December 2013–Present) |
| 19106-2354 | | | | | | | | | | Director — HSBC USA Inc. |
| March 1956 | | | | | | | | | | (July 2014–Present) |
| | | | | | | | | | Director — HSBC Bank |
| | | | | | | | | | USA, National Association |
| | | | | | | | | | (July 2014–March 2017) |
| | | | | | | | | | Director — HSBC Finance |
| | | | | | | | | | Corporation |
| | | | | | | | | | (December 2013–April |
| | | | | | | | | | 2018) |
183
Table of Contents
Board of trustees / directors and officers addendum
Delaware Funds by Macquarie®
| | | | | | | | Number of | | Other |
| | | | | | Principal | | Portfolios in Fund | | Directorships |
| Name, | | Position(s) | | | | Occupation(s) | | Complex Overseen | | Held by |
| Address, | | Held with | | Length of Time | | During the | | by Trustee | | Trustee |
| and Birth Date | | Fund(s) | | Served | | Past Five Years | | or Officer | | or Officer |
| |
| Christianna Wood | | Trustee | | Since January 2019 | | Chief Executive Officer and President — Gore | | 150 | | Director; Finance |
| 610 Market Street | | | | | | Creek Capital, Ltd. (August 2009–Present) | | | | Committee and Audit |
| Philadelphia, PA | | | | | | | | | | Committee Member — |
| 19106-2354 | | | | | | | | | | H&R Block Corporation |
| August 1959 | | | | | | | | | | (July 2008–Present) |
| | | | | | | | | | Director; Investments |
| | | | | | | | | | Committee, Capital and |
| | | | | | | | | | Finance Committee, and |
| | | | | | | | | | Audit Committee Member |
| | | | | | | | | | — Grange Insurance |
| | | | | | | | | | (2013–Present) |
| | | | | | | | | | Trustee; Chair of |
| | | | | | | | | | Nominating and |
| | | | | | | | | | Governance Committee |
| | | | | | | | | | and Audit Committee |
| | | | | | | | | | Member — |
| | | | | | | | | | The Merger Fund |
| | | | | | | | | | (2013–October 2021), |
| | | | | | | | | | The Merger Fund VL |
| | | | | | | | | | (2013–October 2021); |
| | | | | | | | | | WCM Alternatives: Event- |
| | | | | | | | | | Driven Fund (2013– |
| | | | | | | | | | October 2021), and WCM |
| | | | | | | | | | Alternatives: Credit Event |
| | | | | | | | | | Fund (December 2017– |
| | | | | | | | | | October 2021) |
| | | | | | | | | | Director; Chair of |
| | | | | | | | | | Governance Committee |
| | | | | | | | | | and Audit Committee |
| | | | | | | | | | Member — International |
| | | | | | | | | | Securities Exchange |
| | | | | | | | | | (2010–2016) |
| |
| Janet L. Yeomans | | Trustee | | Since April 1999 | | Vice President and Treasurer (January 2006– | | 150 | | Director; Personnel and |
| 610 Market Street | | | | | | July 2012), Vice President — Mergers & | | | | Compensation Committee |
| Philadelphia, PA | | | | | | Acquisitions | | | | Chair; Member of |
| 19106-2354 | | | | | | (January 2003–January 2006), and Vice | | | | Nominating, Investments, |
| July 1948 | | | | | | President and Treasurer | | | | and Audit Committees for |
| | | | | | (July 1995–January 2003) — 3M Company | | | | various periods |
| | | | | | | | | | throughout directorship |
| | | | | | | | | | — Okabena Company |
| | | | | | | | | | (2009–2017) |
| Officers | | | | | | | | | | |
| |
| David F. Connor | | Senior Vice President, | | Senior Vice President, | | David F. Connor has served in various | | 150 | | None3 |
| 610 Market Street | | General Counsel, and | | since May 2013; General | | capacities at different times at Macquarie | | | | |
| Philadelphia, PA | | Secretary | | Counsel since May 2015; | | Investment Management. | | | | |
| 19106-2354 | | | | Secretary since October | | | | | | |
| December 1963 | | | | 2005 | | | | | | |
| |
| Daniel V. Geatens | | Senior Vice President and | | Senior Vice President and | | Daniel V. Geatens has served in various | | 150 | | None3 |
| 610 Market Street | | Treasurer | | Treasurer since October | | capacities at different times at Macquarie | | | | |
| Philadelphia, PA | | | | 2007 | | Investment Management. | | | | |
| 19106-2354 | | | | | | | | | | |
| October 1972 | | | | | | | | | | |
| |
| Richard Salus | | Senior Vice President and | | Senior Vice President and | | Richard Salus has served in various capacities | | 150 | | None |
| 610 Market Street | | Chief Financial Officer | | Chief Financial Officer | | at different times at Macquarie Investment | | | | |
| Philadelphia, PA | | | | since November 2006 | | Management. | | | | |
| 19106-2354 | | | | | | | | | | |
| October 1963 | | | | | | | | | | |
| 1 | Shawn K. Lytle is considered to be an “Interested Trustee” because he is an executive officer of the Fund’s(s’) investment advisor. |
184
Table of Contents
| 2 | Macquarie Investment Management is the marketing name for Macquarie Management Holdings, Inc. and its subsidiaries, including the Fund’s(s’) investment advisor, principal underwriter, and its transfer agent. |
| 3 | Daniel V. Geatens serves in a similar capacity for the six portfolios of the Optimum Fund Trust, which have the same investment advisor, principal underwriter, and transfer agent as the registrant. David F. Connor also serves as Secretary of the Optimum Fund Trust. Mr. Geatens also serves as the Chief Financial Officer of the Optimum Fund Trust and he is the Chief Financial Officer and Treasurer for Macquarie Global Infrastructure Total Return Fund Inc. |
The Statement of Additional Information for the Fund(s) includes additional information about the Trustees and Officers and is available, without charge, upon request by calling 800 523-1918.
185
Table of Contents
About the organization
This annual report is for the information of Delaware Group® Equity Funds IV Funds shareholders.
Board of directors/trustees Shawn K. Lytle
President and
Chief Executive Officer
Delaware Funds by Macquarie®
Philadelphia, PA Jerome D. Abernathy
Managing Member,
Stonebrook Capital Management, LLC
Jersey City, NJ Thomas L. Bennett
Chairman of the Board
Delaware Funds by Macquarie
Private Investor
Rosemont, PA Ann D. Borowiec
Former Chief Executive Officer
Private Wealth Management
J.P. Morgan Chase & Co.
New York, NY Joseph W. Chow
Former Executive Vice President
State Street Corporation
Boston, MA John A. Fry
President Drexel University
Philadelphia, PA Frances A. Sevilla-Sacasa
Former Chief Executive Officer
Banco Itaú International
Miami, FL Thomas K. Whitford
Former Vice Chairman
PNC Financial Services Group
Pittsburgh, PA | | Christianna Wood
Chief Executive Officer and President
Gore Creek Capital, Ltd.
Golden, CO Janet L. Yeomans
Former Vice President and Treasurer
3M Company
St. Paul, MN Affiliated officers David F. Connor
Senior Vice President,
General Counsel, and Secretary
Delaware Funds by Macquarie
Philadelphia, PA Daniel V. Geatens
Senior Vice President and Treasurer
Delaware Funds by Macquarie
Philadelphia, PA Richard Salus
Senior Vice President and
Chief Financial Officer
Delaware Funds by Macquarie
Philadelphia, PA This annual report is for the information of Delaware Equity Income Fund, Delaware Growth and Income Fund, Delaware Growth Equity Fund, Delaware Opportunity Fund, Delaware Global Equity Fund, Delaware Covered Call Strategy Fund, Delaware Hedged U.S. Equity Opportunities Fund, Delaware Premium Income Fund, and Delaware Total Return Fund shareholders, but it may be used with prospective investors when preceded or accompanied by the Delaware Fund fact sheet for the most recently completed calendar quarter. These documents are available at delawarefunds.com/literature. | | Each Fund files its complete schedule of portfolio holdings with the Securities and Exchange Commission (SEC) for the first and third quarters of each fiscal year on Form N-PORT. Each Fund’s Forms N-PORT, as well as a description of the policies and procedures that the Funds use to determine how to vote proxies (if any) relating to portfolio securities, are available without charge (i) upon request, by calling 800 523-1918; and (ii) on the SEC’s website at sec.gov. In addition, a description of the policies and procedures that the Funds use to determine how to vote proxies (if any) relating to portfolio securities and the Schedules of Investments included in the Funds’ most recent Forms N-PORT are available without charge on the Funds’ website at delawarefunds.com/literature. Each Fund’s Forms N-PORT may be reviewed and copied at the SEC’s Public Reference Room in Washington, D.C.; information on the operation of the Public Reference Room may be obtained by calling 800 SEC-0330. Information (if any) regarding how the Funds voted proxies relating to portfolio securities during the most recently disclosed 12-month period ended June 30 is available without charge (i) through the Funds’ website at delawarefunds.com/proxy; and (ii) on the SEC’s website at sec.gov. |
186
Item 2. Code of Ethics
Item 3. Audit Committee Financial Expert
The registrant’s Board of Trustees has determined that certain members of the registrant’s Audit Committee are audit committee financial experts, as defined below. For purposes of this item, an “audit committee financial expert” is a person who has the following attributes:
a. An understanding of generally accepted accounting principles and financial statements;
b. The ability to assess the general application of such principles in connection with the accounting for estimates, accruals, and reserves;
c. Experience preparing, auditing, analyzing, or evaluating financial statements that present a breadth and level of complexity of accounting issues that are generally comparable to the breadth and complexity of issues that can reasonably be expected to be raised by the registrant’s financial statements, or experience actively supervising one or more persons engaged in such activities;
d. An understanding of internal controls and procedures for financial reporting; and
e. An understanding of audit committee functions.
An “audit committee financial expert” shall have acquired such attributes through:
a. Education and experience as a principal financial officer, principal accounting officer, controller, public accountant, or auditor or experience in one or more positions that involve the performance of similar functions;
b. Experience actively supervising a principal financial officer, principal accounting officer, controller, public accountant, auditor, or person performing similar functions;
c. Experience overseeing or assessing the performance of companies or public accountants with respect to the preparation, auditing, or evaluation of financial statements; or
d. Other relevant experience.
The registrant’s Board of Trustees has also determined that each member of the registrant’s Audit Committee is independent. In order to be “independent” for purposes of this item, the Audit Committee member may not: (i) other than in his or her capacity as a member of the Board of Trustees or any committee thereof, accept directly or indirectly any consulting, advisory or other compensatory fee from the issuer; or (ii) be an “interested person” of the registrant as defined in Section 2(a)(19) of the Investment Company Act of 1940.
The names of the audit committee financial experts on the registrant’s Audit Committee are set forth below:
Jerome D. Abernathy
John A. Fry
Thomas K. Whitford, Chair
Christianna Wood
Item 4. Principal Accountant Fees and Services
The aggregate fees billed for services provided to the registrant by its independent auditors for the audit of the registrant’s annual financial statements and for services normally provided by the independent auditors in connection with statutory and regulatory filings or engagements were $243,387 for the fiscal year ended September 30, 2021.
The aggregate fees billed for services provided to the registrant by its independent auditors for the audit of the registrant’s annual financial statements and for services normally provided by the independent auditors in connection with statutory and regulatory filings or engagements were $567,680 for the fiscal year ended September 30, 2020.
The aggregate fees billed by the registrant’s independent auditors for services relating to the performance of the audit of the registrant’s financial statements and not reported under paragraph (a) of this Item were $0 for the fiscal year ended September 30, 2021.
The aggregate fees billed by the registrant’s independent auditors for services relating to the performance of the audit of the registrant’s financial statements and not reported under paragraph (a) of this Item were $0 for the fiscal year ended September 30, 2021.
The aggregate fees billed by the registrant’s independent auditors for tax-related services provided to the registrant’s investment adviser and other service providers under common control with the adviser and that relate directly to the operations or financial reporting of the registrant were $0 for the registrant’s fiscal year ended September 30, 2021. The percentage of these fees relating to services approved by the registrant’s Audit Committee pursuant to the de minimis exception from the pre-approval requirement in Rule 2-01(c)(7)(i)(C) of Regulation S-X was 0%.
The aggregate fees billed by the registrant’s independent auditors for tax-related services provided to the registrant’s investment adviser and other service providers under common control with the adviser and that relate directly to the operations or financial reporting of the registrant were $0 for the registrant’s fiscal year ended September 30, 2020. The percentage of these fees relating to services approved by the registrant’s Audit Committee pursuant to the de minimis exception from the pre-approval requirement in Rule 2-01(c)(7)(i)(C) of Regulation S-X was 0%.
The aggregate fees billed for all services provided by the independent auditors to the registrant other than those set forth in paragraphs (a), (b) and (c) of this Item were $0 for the fiscal year ended September 30, 2021.
The aggregate fees billed for all services provided by the independent auditors to the registrant other than those set forth in paragraphs (a), (b) and (c) of this Item were $0 for the fiscal year ended September 30, 2020.
Under the Pre-Approval Policy, the Audit Committee has also pre-approved the services set forth in the table below with respect to the registrant’s investment adviser and other entities controlling, controlled by or under common control with the investment adviser that provide ongoing services to the registrant (the “Control Affiliates”) up to the specified fee limit. This fee limit is based on aggregate fees to the investment adviser and its Control Affiliates.
The Pre-Approval Policy requires the registrant’s independent auditors to report to the Audit Committee at each of its regular meetings regarding all services initiated since the last such report was rendered, including those services authorized by the Pre-Approval Policy.
(f) Not applicable.
(g) The aggregate non-audit fees billed by the registrant’s independent auditors for services rendered to the registrant and to its investment adviser and other service providers under common control with the adviser were $9,044,000 and $5,607,000 for the registrant’s fiscal years ended September 30, 2021 and September 30, 2020, respectively.
(h) In connection with its selection of the independent auditors, the registrant’s Audit Committee has considered the independent auditors’ provision of non-audit services to the registrant’s investment adviser and other service providers under common control with the adviser that were not required to be pre-approved pursuant to Rule 2-01(c)(7)(ii) of Regulation S-X. The Audit Committee has determined that the independent auditors’ provision of these services is compatible with maintaining the auditors’ independence.
Item 5. Audit Committee of Listed Registrants
Not applicable.
Item 6. Investments
(a) Included as part of report to shareholders filed under Item 1 of this Form N-CSR.
(b) Divestment of securities in accordance with Section 13(c) of the Investment Company Act of 1940.
Not applicable.
Item 7. Disclosure of Proxy Voting Policies and Procedures for Closed-End Management Investment Companies
Not applicable.
Item 8. Portfolio Managers of Closed-End Management Investment Companies
Not applicable.
Item 9. Purchases of Equity Securities by Closed-End Management Investment Companies and Affiliated Purchasers
Not applicable.
Item 10. Submission of Matters to a Vote of Security Holders
Not applicable.
Item 11. Controls and Procedures
The registrant’s principal executive officer and principal financial officer have evaluated the registrant’s disclosure controls and procedures within 90 days of the filing of this report and have concluded that they are effective in providing reasonable assurance that the information required to be disclosed by the registrant in its reports or statements filed under the Securities Exchange Act of 1934 is recorded, processed, summarized and reported within the time periods specified in the rules and forms of the Securities and Exchange Commission.
There were no significant changes in the registrant’s internal control over financial reporting that occurred during the period covered by the report to stockholders included herein that have materially affected, or are reasonably likely to materially affect, the registrant’s internal control over financial reporting.
Item 12. Disclosure of Securities Lending Activities for Closed-End Management Investment Companies
Not applicable.
Item 13. Exhibits
Not applicable.
(3) Written solicitations to purchase securities pursuant to Rule 23c-1 under the Securities Exchange Act of 1934.
Not applicable.
Pursuant to the requirements of the Securities Exchange Act of 1934 and the Investment Company Act of 1940, the registrant has duly caused this report to be signed on its behalf, by the undersigned, thereunto duly authorized.
Pursuant to the requirements of the Securities Exchange Act of 1934 and the Investment Company Act of 1940, this report has been signed below by the following persons on behalf of the registrant and in the capacities and on the dates indicated.