Exhibit (17)(b)(i)

Privacy. The Eaton Vance organization is committed to ensuring your financial privacy. Each of the financial institutions identified below has in effect the following policy (Privacy Policy) with respect to nonpublic personal information about its customers:
• Only such information received from you, through application forms or otherwise, and information about your Eaton Vance fund transactions will be collected. This may include information such as name, address, social security number, tax status, account balances and transactions.
• None of such information about you (or former customers) will be disclosed to anyone, except as permitted by law (which includes disclosure to employees necessary to service your account). In the normal course of servicing a customer’s account, Eaton Vance may share information with unaffiliated third parties that perform various required services such as transfer agents, custodians and broker/dealers.
• Policies and procedures (including physical, electronic and procedural safeguards) are in place that are designed to protect the confidentiality of such information.
• We reserve the right to change our Privacy Policy at any time upon proper notification to you. Customers may want to review our Privacy Policy periodically for changes by accessing the link on our homepage: www.eatonvance.com.
Our pledge of privacy applies to the following entities within the Eaton Vance organization: the Eaton Vance Family of Funds, Eaton Vance Management, Eaton Vance Investment Counsel, Boston Management and Research, and Eaton Vance Distributors, Inc. Our Privacy Policy applies only to those Eaton Vance customers who are individuals and who have a direct relationship with us. If a customer’s account (i.e., fund shares) is held in the name of a third-party financial adviser/broker-dealer, it is likely that only such adviser’s privacy policies apply to the customer. This notice supersedes all previously issued privacy disclosures. For more information about Eaton Vance’s Privacy Policy, please call 1-800-262-1122.
Delivery of Shareholder Documents. The Securities and Exchange Commission (the “SEC”) permits funds to deliver only one copy of shareholder documents, including prospectuses, proxy statements and shareholder reports, to fund investors with multiple accounts at the same residential or post office box address. This practice is often called “householding” and it helps eliminate duplicate mailings to shareholders.
Eaton Vance, or your financial adviser, may household the mailing of your documents indefinitely unless you instruct Eaton Vance, or your financial adviser, otherwise. If you would prefer that your Eaton Vance documents not be householded, please contact Eaton Vance at 1-800-262-1122, or contact your financial adviser. Your instructions that householding not apply to delivery of your Eaton Vance documents will be effective within 30 days of receipt by Eaton Vance or your financial adviser.
Portfolio Holdings. Each Eaton Vance Fund and its underlying Portfolio(s) (if applicable) will file a schedule of portfolio holdings on Form N-Q with the SEC for the first and third quarters of each fiscal year. The Form N-Q will be available on the Eaton Vance website at www.eatonvance.com, by calling Eaton Vance at 1-800-262-1122 or in the EDGAR database on the SEC’s website at www.sec.gov. Form N-Q may also be reviewed and copied at the SEC’s public reference room in Washington, D.C. (call 1-800-732-0330 for information on the operation of the public reference room).
Proxy Voting. From time to time, funds are required to vote proxies related to the securities held by the funds. The Eaton Vance Funds or their underlying Portfolios (if applicable) vote proxies according to a set of policies and procedures approved by the Funds’ and Portfolios’ Boards. You may obtain a description of these policies and procedures and information on how the Funds or Portfolios voted proxies relating to portfolio securities during the most recent 12 month period ended June 30, without charge, upon request, by calling 1-800-262-1122. This description is also available on the SEC’s website at www.sec.gov.
Eaton Vance Municipal Income Funds a s o f J u l y 3 1 , 2 0 1 0
TABLE OF CONTENTS |
| |
| Management’s Discussion of Fund Performance | 2 |
| |
| Performance Information and Portfolio Composition | |
Arizona | 3 |
Colorado | 5 |
Connecticut | 7 |
Michigan | 9 |
Minnesota | 11 |
New Jersey | 13 |
Pennsylvania | 15 |
| |
| Fund Expenses | 17 |
| |
| Financial Statements | 21 |
| |
| Federal Tax Information | 89 |
| |
| Board of Trustees’ Contract Approval | 90 |
| |
| Management and Organization | 93 |
1
Eaton Vance Municipal Income Funds a s o f J u l y 3 1 , 2 0 1 0
MANAGEMENT’S DISCUSSION OF FUND PERFORMANCE |
Economic and Market Conditions
The U.S. economy remained generally stable, if still weak, during the year ending July 31, 2010, even as concerns about high unemployment and budget deficits provoked ongoing skittishness in the capital markets. The U.S. economy grew at an annualized rate of 3.7% in the first quarter of 2010, but slowed to 1.6% in the second quarter, according to the U.S. Department of Commerce. This followed annualized growth rates of 2.2% and 5.6% in the third and fourth quarters of 2009, respectively.
Municipal bond performance was positive for the period, in spite of ongoing negative media attention on the tax-exempt sector. The Barclays Capital Municipal Bond Index (the Index)1— an unmanaged index of municipal bonds traded in the U.S.—gained 9.15% for the period, reflecting continued demand for munis, supported in part by the limited supply of tax-exempt issues due to the success of the Build America Bond program. Demand began to taper off later in the period, however, likely as a result of low yields and concerns about the fiscal stress on many issuers.
Against this backdrop, munis with longer and intermediate maturities performed best during the year, with the 20-year segment of the Index returning 10.94% and the 7-year segment 7.59%. Shorter-maturity bonds in the 5-year segment of the Index returned 6.49%, trailing the broader municipal bond market.
Management Discussion
During the year ending July 31, 2010, the Funds’ performances at net asset value were generally in line with the Index and their Lipper peer group averages, with notable outperformance seen in Eaton Vance Colorado and New Jersey Municipal Income Funds, and underperformance in Eaton Vance Minnesota Municipal Income Fund. Given the significant price movement at the longer end of the municipal yield curve, management’s bias toward longer maturities was generally beneficial for relative performance during the period. Investing across the credit spectrum and making higher allocations to revenue bonds was helpful.
The Funds were modestly hedged using Treasury futures—an ongoing strategy that management has employed for many years and is designed to mitigate interest-rate risk. During the second half of the period, the volatile economic situation in Europe and increasing uncertainty about the global economic outlook bolstered the U.S. Treasury market, sending Treasury yields lower and causing the municipal/Treasury ratio to climb from 89% at the beginning of 2010 to 99.8% as of July 31, 2010. As a result, the Funds’ hedged Treasury positions detracted from their relative returns during the second half of the year. However, this strategy contributed positively during the first half.
Management employed leverage in some of the Funds, through which additional exposure to the municipal market was achieved. Leverage has the impact of magnifying a Fund’s exposure to its underlying investments in both up and down markets. During the period, the Funds’ leverage contributed positively to their relative performance.2
As we move ahead, we continue to focus on state and local government budget deficits, which likely peaked in 2010 or are expected to peak in early 2011. The decline in tax revenues appears to be reaching a bottom, with some municipalities realizing growth in tax receipts due to a combination of slim economic growth and an increase in actual tax rates. However, spending continues to grow faster than tax receipts despite deep spending cuts enacted by some government officials. We will continue to analyze any new developments and solutions that government leaders formulate to address their fiscal problems.
The Board of Trustees of the Eaton Vance Colorado Municipal Income Fund approved a proposal to reorganize the Fund into Eaton Vance National Municipal Income Fund, a series of Eaton Vance Municipals Trust, with substantially the same investment objective and policies as the Fund. Proxy materials describing the proposed reorganization commenced mailing on August 31, 2010, to the Fund’s record date shareholders. If approved by shareholders of the Fund, the reorganization is expected to be completed in the fourth quarter of 2010.
1 It is not possible to invest directly in an Index or a Lipper classification. The Index’s total return does not reflect expenses that would have been incurred if an investor individually purchased or sold the securities represented in the Index. The Lipper total returns are the average total returns, at net asset value, of the funds that are in the same Lipper Classification as the Funds.
2 Certain Funds employ residual interest bond (RIB) financing. The leverage created by RIB investments provides an opportunity for increased income but, at the same time, creates special risks (including the likelihood of greater volatility of net asset value). See Note 1I to the financial statements for more information on RIB investments.
Fund shares are not insured by the FDIC and are not deposits or other obligations of, or guaranteed by, any depository institution. Shares are subject to investment risks, including possible loss of principal invested.
The views expressed throughout this report are those of the portfolio managers and are current only through the end of the period of the report as stated on the cover. These views are subject to change at any time based upon market or other conditions, and the investment adviser disclaims any responsibility to update such views. These views may not be relied on as investment advice and, because investment decisions for a fund are based on many factors, may not be relied on as an indication of trading intent on behalf of any Eaton Vance fund. Portfolio information provided in the report may not be representative of the Funds’ current or future investments and may change due to active management.
2
Eaton Vance Arizona Municipal Income Fund as of J u l y 3 1 , 2 0 1 0
PERFORMANCE INFORMATION |
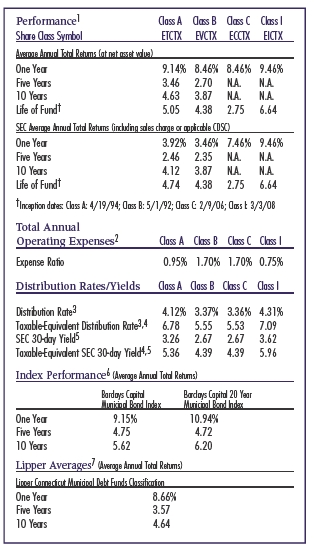
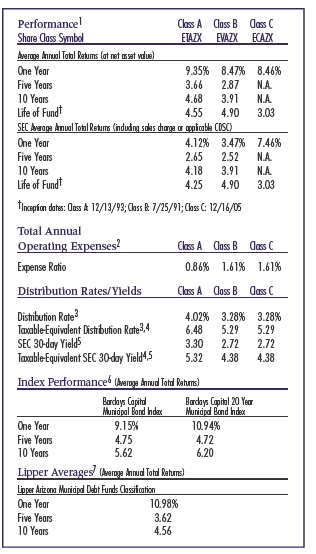
The line graph and table set forth below provide information about the Fund’s performance. The line graph compares the performance of Class B of the Fund with that of the Barclays Capital Municipal Bond Index, an unmanaged index of municipal bonds traded in the U.S., and the Barclays Capital 20 Year Municipal Bond Index, an unmanaged index of municipal bonds traded in the U.S. with maturities ranging from 17-22 years. The lines on the graph represent the total returns of a hypothetical investment of $10,000 in each of Class B, the Barclays Capital Municipal Bond Index and the Barclays Capital 20 Year Municipal Bond Index. The table includes the total returns of each Class of the Fund at net asset value and maximum public offering price. The performance presented below does not reflect the deduction of taxes, if any, that a shareholder would pay on distributions or redemptions of Fund shares.
Portfolio Manager: Craig R. Brandon, CFA
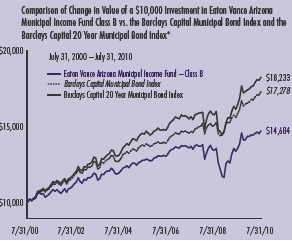
* Source: Lipper, Inc. Class B of the Fund commenced investment operations on 7/25/91.
A $10,000 hypothetical investment at net asset value in Class A on 7/31/00 and Class C on 12/16/05 (commencement of operations) would have been valued at $15,809 ($15,058 at the maximum offering price) and $11,482, respectively, on 7/31/10. It is not possible to invest directly in an Index. The Indices’ total returns do not reflect expenses that would have been incurred if an investor individually purchased or sold the securities represented in the Indices.
Past performance is no guarantee of future results. Returns are historical and are calculated by determining the percentage change in net asset value or offering price (as applicable) with all distributions reinvested. Investment return and principal value will fluctuate so that shares, when redeemed, may be worth more or less than their original cost. Performance is for the stated time period only; due to market volatility, the Fund’s current performance may be lower or higher than the quoted return. Fund performance during certain periods reflects the strong bond market performance and/or the strong performance of bonds held during those periods. This performance is not typical and may not be repeated. For performance as of the most recent month end, please refer to www.eatonvance.com.
1 Average Annual Total Returns do not include the 4.75% maximum sales charge for Class A shares or the applicable contingent deferred sales charges (CDSC) for Class B and Class C shares. If sales charges were deducted, the returns would be lower. SEC Average Annual Total Returns for Class A reflect the maximum 4.75% sales charge. SEC Average Annual Total Returns for Class B reflect the applicable CDSC based on the following schedule: 5% - 1st and 2nd years; 4% - 3rd year; 3% - 4th year; 2% - 5th year; 1% - 6th year. SEC Average Annual Total Returns for Class C reflect a 1% CDSC for the first year. 2 Source: Prospectus dated 12/1/09, as supplemented. Includes interest expense of 0.06% relating to the Fund’s liability with respect to floating rate notes held by third parties in conjunction with residual interest bond transactions by the Fund. The Fund also records offsetting interest income in an amount equal to this expense relating to the municipal obligations underlying such transactions, and as a result net asset value and performance have not been affected by this expense. 3 The Fund’s distribution rate represents actual distributions paid to shareholders and is calculated by dividing the last regular distribution per share in the period (annualized) by the net asset value at the end of the period. 4 Taxable-equivalent figures assume a maximum 37.95% combined federal and state income tax rate. A lower tax rate would result in lower tax-equivalent figures. 5 The Fund's SEC yield is calculated by dividing the net investment income per share for the 30-day period by the offering price at the end of the period and annualizing the result. 6 It is not possible to invest directly in an Index. The Indices’ total returns do not reflect the expenses that would have been incurred if an investor individually purchased or sold the securities represented in the Indices. Index performance is available as of month end only. 7 The Lipper Averages are the average annual total returns, at net asset value, of the funds that are in the same Lipper Classification as the Fund. It is not possible to invest in a Lipper Classification. Lipper Classifications may include insured and uninsured funds, as well as leveraged and unleveraged funds. The Lipper Arizona Municipal Debt Funds Classification contained 30, 23 and 23 funds for the 1-year, 5-year and 10-year time periods, respectively. Lipper Averages are available as of month end only.
3
Eaton Vance Arizona Municipal Income Fund as of J u l y 3 1 , 2 0 1 0
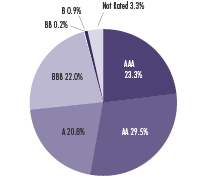
PORTFOLIO COMPOSITION |
Rating Distribution*1
By total investments |
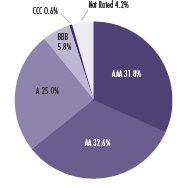
*The rating distribution presented above includes the ratings of securities held by special purpose vehicles in which the Fund holds a residual interest. See Note 1I to the Fund's financial statements. Absent such securities, the Fund's rating distribution as of 7/31/10 is as follows:
| | | |
| AAA | 31.4% | BBB | 5.9% |
| AA | 32.4% | CCC | 0.6% |
| A | 25.4% | Not Rated | 4.3% |
| Fund Statistics2 | |
|
| * Number of Issues: | 73 |
| * Average Maturity: | 17.4 years |
| * Average Effective Maturity: | 11.3 years |
| * Average Call Protection: | 8.1 years |
| * Average Dollar Price: | $100.25 |
| * RIB Leverage3 : | 1.8% |
1Rating Distribution is determined by dividing the total market value of the issues by the total investments of the Fund. Ratings are based on Moody’s, S&P or Fitch, as applicable. Credit ratings are based largely on the rating agency’s investment analysis at the time of rating and the rating assigned to any particular security is not necessarily a reflection of the issuer’s current financial condition. The rating assigned to a security by a rating agency does not necessarily reflect its assessment of the volatility of a security’s market value or of the liquidity of an investment in the security. If securities are rated differently by the rating agencies, the higher rating is applied.
2Fund holdings information excludes securities held by special purpose vehicles in which the Fund holds a residual interest. See Note 1I to the Fund’s financial statements.
3See Note 1l to the Fund’s financial statements. RIB leverage represents the amount of Floating Rate Notes outstanding as of 7/31/10 as a percentage of the Fund’s net assets plus Floating Rate Notes.
4
Eaton Vance Colorado Municipal Income Fund as of J u l y 3 1 , 2 0 1 0
PERFORMANCE INFORMATION |
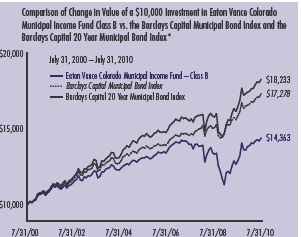
The line graph and table set forth below provide information about the Fund’s performance. The line graph compares the performance of Class B of the Fund with that of the Barclays Capital Municipal Bond Index, an unmanaged index of municipal bonds traded in the U.S., and the Barclays Capital 20 Year Municipal Bond Index, an unmanaged index of municipal bonds traded in the U.S. with maturities ranging from 17-22 years. The lines on the graph represent the total returns of a hypothetical investment of $10,000 in each of Class B, the Barclays Capital Municipal Bond Index and the Barclays Capital 20 Year Municipal Bond Index. The table includes the total returns of each Class of the Fund at net asset value and maximum public offering price. The performance presented below does not reflect the deduction of taxes, if any, that a shareholder would pay on distributions or redemptions of Fund shares.

Portfolio Manager: William H. Ahern, Jr., CFA
* Source: Lipper, Inc. Class B of the Fund commenced investment operations on 8/25/92.
A $10,000 hypothetical investment at net asset value in Class A on 7/31/00 and Class C on 10/8/07 (commencement of operations) would have been valued at $15,441 ($14,708 at the maximum offering price) and $10,295, respectively, on 7/31/10. It is not possible to invest directly in an Index. The Indices’ total returns do not reflect expenses that would have been incurred if an investor individually purchased or sold the securities represented in the Indices.
Past performance is no guarantee of future results. Returns are historical and are calculated by determining the percentage change in net asset value or offering price (as applicable) with all distributions reinvested. Investment return and principal value will fluctuate so that shares, when redeemed, may be worth more or less than their original cost. Performance is for the stated time period only; due to market volatility, the Fund’s current performance may be lower or higher than the quoted return. Fund performance during certain periods reflects the strong bond market performance and/or the strong performance of bonds held during those periods. This performance is not typical and may not be repeated. For performance as of the most recent month end, please refer to www.eatonvance.com.
1 Average Annual Total Returns do not include the 4.75% maximum sales charge for Class A shares or the applicable contingent deferred sales charges (CDSC) for Class B and Class C shares. If sales charges were deducted, the returns would be lower. SEC Average Annual Total Returns for Class A reflect the maximum 4.75% sales charge. SEC Average Annual Total Returns for Class B reflect the applicable CDSC based on the following schedule: 5% - 1st and 2nd years; 4% - 3rd year; 3% - 4th year; 2% - 5th year; 1% - 6th year. SEC Average Annual Total Returns for Class C reflect a 1% CDSC for the first year. 2 Source: Prospectus dated 12/1/09, as supplemented. 3 The Fund’s distribution rate represents actual distributions paid to shareholders and is calculated by dividing the last regular distribution per share in the period (annualized) by the net asset value at the end of the period. 4 Taxable-equivalent figures assume a maximum 38.01% combined federal and state income tax rate. A lower tax rate would result in lower tax-equivalent figures. 5 The Fund's SEC yield is calculated by dividing the net investment income per share for the 30-day period by the offering price at the end of the period and annualizing the result. 6 It is not possible to invest directly in an Index. The Indices’ total returns do not reflect the expenses that would have been incurred if an investor individually purchased or sold the securities represented in the Indices. Index performance is available as of month end only. 7 The Lipper Averages are the average annual total returns, at net asset value, of the funds that are in the same Lipper Classification as the Fund. It is not possible to invest in a Lipper Classification. Lipper Classifications may include insured and uninsured funds, as well as leveraged and unleveraged funds. The Lipper Colorado Municipal Debt Funds Classification contained 21, 18 and 18 funds for the 1-year, 5-year and 10-year time periods, respectively. Lipper Averages are available as of month end only.
5
Eaton Vance Colorado Municipal Income Fund as of J u l y 3 1 , 2 0 1 0
PORTFOLIO COMPOSITION |
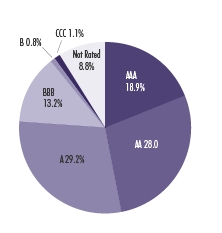
Rating Distribution1
By total investments |
| |
| * Number of Issues: | 58 |
| * Average Maturity: | 19.9 years |
| * Average Effective Maturity: | 11.6 years |
| * Average Call Protection: | 8.1 years |
| * Average Dollar Price: | $96.44 |
1 Rating Distribution is determined by dividing the total market value of the issues by the total investments of the Fund. Ratings are based on Moody’s, S&P or Fitch, as applicable. Credit ratings are based largely on the rating agency’s investment analysis at the time of rating and the rating assigned to any particular security is not necessarily a reflection of the issuer’s current financial condition. The rating assigned to a security by a rating agency does not necessarily reflect its assessment of the volatility of a security’s market value or of the liquidity of an investment in the security. If securities are rated differently by the rating agencies, the higher rating is applied.
6
Eaton Vance Connecticut Municipal Income Fund as of J u l y 3 1 , 2 0 1 0
PERFORMANCE INFORMATION |
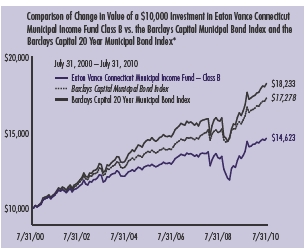
The line graph and table set forth below provide information about the Fund’s performance. The line graph compares the performance of Class B of the Fund with that of the Barclays Capital Municipal Bond Index, an unmanaged index of municipal bonds traded in the U.S., and the Barclays Capital 20 Year Municipal Bond Index, an unmanaged index of municipal bonds traded in the U.S. with maturities ranging from 17-22 years. The lines on the graph represent the total returns of a hypothetical investment of $10,000 in each of Class B, the Barclays Capital Municipal Bond Index and the Barclays Capital 20 Year Municipal Bond Index. The table includes the total returns of each Class of the Fund at net asset value and maximum public offering price. The performance presented below does not reflect the deduction of taxes, if any, that a shareholder would pay on distributions or redemptions of Fund shares.
Portfolio Manager: William H. Ahern, Jr., CFA
* Source: Lipper, Inc. Class B of the Fund commenced investment operations on 5/1/92.
A $10,000 hypothetical investment at net asset value in Class A on 7/31/00, Class C on 2/9/06 (commencement of operations) and Class I on 3/3/08 (commencement of operations) would have been valued at $15,729 ($14,982 at the maximum offering price), $11,291 and $11,677, respectively, on 7/31/10. It is not possible to invest directly in an Index. The Indices’ total returns do not reflect expenses that would have been incurred if an investor individually purchased or sold the securities represented in the Indices.
Past performance is no guarantee of future results. Returns are historical and are calculated by determining the percentage change in net asset value or offering price (as applicable) with all distributions reinvested. Investment return and principal value will fluctuate so that shares, when redeemed, may be worth more or less than their original cost. Performance is for the stated time period only; due to market volatility, the Fund’s current performance may be lower or higher than the quoted return. Fund performance during certain periods reflects the strong bond market performance and/or the strong performance of bonds held during those periods. This performance is not typical and may not be repeated. For performance as of the most recent month end, please refer to www.eatonvance.com.
1 Average Annual Total Returns do not include the 4.75% maximum sales charge for Class A shares or the applicable contingent deferred sales charges (CDSC) for Class B and Class C shares. If sales charges were deducted, the returns would be lower. SEC Average Annual Total Returns for Class A reflect the maximum 4.75% sales charge. SEC Average Annual Total Returns for Class B reflect the applicable CDSC based on the following schedule: 5% - 1st and 2nd years; 4% - 3rd year; 3% - 4th year; 2% - 5th year; 1% - 6th year. SEC Average Annual Total Returns for Class C reflect a 1% CDSC for the first year. Class I shares are not subject to a sales charge. 2 Source: Prospectus dated 12/1/09, as supplemented. Includes interest expense of 0.15% relating to the Fund’s liability with respect to floating rate notes held by third parties in conjunction with residual interest bond transactions by the Fund. The Fund also records offsetting interest income in an amount equal to this expense relating to the municipal obligations underlying such transactions, and as a result net asset value and performance have not been affected by this expense. 3 The Fund’s distribution rate represents actual distributions paid to shareholders and is calculated by dividing the last regular distribution per share in the period (annualized) by the net asset value at the end of the period. 4 Taxable-equivalent figures assume a maximum 39.23% combined federal and state income tax rate. A lower tax rate would result in lower tax-equivalent figures. 5 The Fund's SEC yield is calculated by dividing the net investment income per share for the 30-day period by the offering price at the end of the period and annualizing the result. 6 It is not possible to invest directly in an Index. The Indices’ total returns do not reflect the expenses that would have been incurred if an investor individually purchased or sold the securities represented in the Indices. Index performance is available as of month end only. 7 The Lipper Averages are the average annual total returns, at net asset value, of the funds that are in the same Lipper Classification as the Fund. It is not possible to invest in a Lipper Classification. Lipper Classifications may include insured and uninsured funds, as well as leveraged and unleveraged funds. The Lipper Connecticut Municipal Debt Funds Classification contained 22, 16 and 16 funds for the 1-year, 5-year and 10-year time periods, respectively. Lipper Averages are available as of month end only.
7
Eaton Vance Connecticut Municipal Income Fund as of J u l y 3 1 , 2 0 1 0
PORTFOLIO COMPOSITION |
Rating Distribution*1
By total investments |
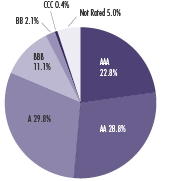
*The rating distribution presented above includes the ratings of securities held by special purpose vehicles in which the Fund holds a residual interest. See Note 1I to the Fund's financial statements. Absent such securities, the Fund's rating distribution as of 7/31/10 is as follows:
| | | |
| AAA | 20.7% | BBB | 11.3% |
| AA | 29.1% | BB | 2.1% |
| A | 30.4% | CCC | 0.4% |
| | | Not Rated | 6.0% |
| |
| * Number of Issues: | 82 |
| * Average Maturity: | 16.5 years |
| * Average Effective Maturity: | 8.8 years |
| * Average Call Protection: | 7.2 years |
| * Average Dollar Price: | $106.80 |
| * RIB Leverage3 : | 5.2% |
1Rating Distribution is determined by dividing the total market value of the issues by the total investments of the Fund. Ratings are based on Moody’s, S&P or Fitch, as applicable. Credit ratings are based largely on the rating agency’s investment analysis at the time of rating and the rating assigned to any particular security is not necessarily a reflection of the issuer’s current financial condition. The rating assigned to a security by a rating agency does not necessarily reflect its assessment of the volatility of a security’s market value or of the liquidity of an investment in the security. If securities are rated differently by the rating agencies, the higher rating is applied.
2Fund holdings information excludes securities held by special purpose vehicles in which the Fund holds a residual interest. See Note 1I to the Fund’s financial statements.
3See Note 1l to the Fund’s financial statements. RIB leverage represents the amount of Floating Rate Notes outstanding as of 7/31/10 as a percentage of the Fund’s net assets plus Floating Rate Notes.
8
Eaton Vance Michigan Municipal Income Fund as of J u l y 3 1 , 2 0 1 0
PERFORMANCE INFORMATION |
The line graph and table set forth below provide information about the Fund’s performance. The line graph compares the performance of Class A of the Fund with that of the Barclays Capital Municipal Bond Index, an unmanaged index of municipal bonds traded in the U.S., and the Barclays Capital 20 Year Municipal Bond Index, an unmanaged index of municipal bonds traded in the U.S. with maturities ranging from 17-22 years. The lines on the graph represent the total returns of a hypothetical investment of $10,000 in each of Class A, the Barclays Capital Municipal Bond Index and the Barclays Capital 20 Year Municipal Bond Index. Class A total returns are presented at net asset value and maximum public offering price. The table includes the total returns of each Class of the Fund at net asset value and maximum public offering price. The performance presented below does not reflect the deduction of taxes, if any, that a shareholder would pay on distributions or redemptions of Fund shares.
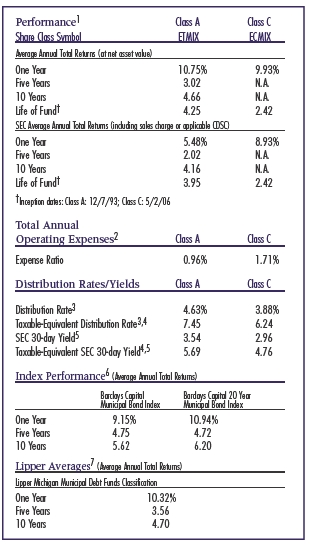
Portfolio Manager: William H. Ahern, Jr., CFA
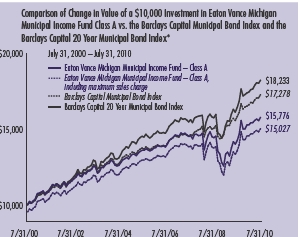
* Source: Lipper, Inc. Class A of the Fund commenced investment operations on 12/7/93.
A $10,000 hypothetical investment at net asset value in Class C on 5/2/06 (commencement of operations) would have been valued at $11,069 on 7/31/10. It is not possible to invest directly in an Index. The Indices’ total returns do not reflect expenses that would have been incurred if an investor individually purchased or sold the securities represented in the Indices.
Past performance is no guarantee of future results. Returns are historical and are calculated by determining the percentage change in net asset value or offering price (as applicable) with all distributions reinvested. Investment return and principal value will fluctuate so that shares, when redeemed, may be worth more or less than their original cost. Performance is for the stated time period only; due to market volatility, the Fund’s current performance may be lower or higher than the quoted return. Fund performance during certain periods reflects the strong bond market performance and/or the strong performance of bonds held during those periods. This performance is not typical and may not be repeated. For performance as of the most recent month end, please refer to www.eatonvance.com.
1 Average Annual Total Returns do not include the 4.75% maximum sales charge for Class A shares or the applicable contingent deferred sales charge (CDSC) for Class C shares. If sales charges were deducted, the returns would be lower. SEC Average Annual Total Returns for Class A reflect the maximum 4.75% sales charge. SEC Average Annual Total Returns for Class C reflect a 1% CDSC for the first year. 2 Source: Prospectus dated 12/1/09, as supplemented. Includes interest expense of 0.16% relating to the Fund’s liability with respect to floating rate notes held by third parties in conjunction with residual interest bond transactions by the Fund. The Fund also records offsetting interest income in an amount equal to this expense relating to the municipal obligations underlying such transactions, and as a result net asset value and performance have not been affected by this expense. 3 The Fund’s distribution rate represents actual distributions paid to shareholders and is calculated by dividing the last regular distribution per share in the period (annualized) by the net asset value at the end of the period. 4 Taxable-equivalent figures assume a maximum 37.83% combined federal and state income tax rate. A lower tax rate would result in lower tax-equivalent figures. 5 The Fund's SEC yield is calculated by dividing the net investment income per share for the 30-day period by the offering price at the end of the period and annualizing the result. 6 It is not possible to invest directly in an Index. The Indices’ total returns do not reflect the expenses that would have been incurred if an investor individually purchased or sold the securities represented in the Indices. Index performance is available as of month end only. 7 The Lipper Averages are the average annual total returns, at net asset value, of the funds that are in the same Lipper Classification as the Fund. It is not possible to invest in a Lipper Classification. Lipper Classifications may include insured and uninsured funds, as well as leveraged and unleveraged funds. The Lipper Michigan Municipal Debt Funds Classification contained 22, 15 and 15 funds for the 1-year, 5-year and 10-year time periods, respectively. Lipper Averages are available as of month end only.
9
Eaton Vance Michigan Municipal Income Fund as of J u l y 3 1 , 2 0 1 0
Rating Distribution*1
By total investments |
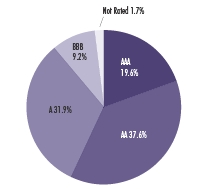
*The rating distribution presented above includes the ratings of securities held by special purpose vehicles in which the Fund holds a residual interest. See Note 1I to the Fund's financial statements. Absent such securities, the Fund's rating distribution as of 7/31/10 is as follows:
| | | |
| AAA | 18.9% | BBB | 9.4% |
| AA | 37.4% | Not Rated | 1.8% |
| A | 32.5% | | |
| |
| * Number of Issues: | 56 |
| * Average Maturity: | 19.8 years |
| * Average Effective Maturity: | 13.0 years |
| * Average Call Protection: | 7.5 years |
| * Average Dollar Price: | $96.90 |
| * RIB Leverage3 : | 1.9% |
1Rating Distribution is determined by dividing the total market value of the issues by the total investments of the Fund. Ratings are based on Moody’s, S&P or Fitch, as applicable. Credit ratings are based largely on the rating agency’s investment analysis at the time of rating and the rating assigned to any particular security is not necessarily a reflection of the issuer’s current financial condition. The rating assigned to a security by a rating agency does not necessarily reflect its assessment of the volatility of a security’s market value or of the liquidity of an investment in the security. If securities are rated differently by the rating agencies, the higher rating is applied.
2Fund holdings information excludes securities held by special purpose vehicles in which the Fund holds a residual interest. See Note 1I to the Fund’s financial statements.
3See Note 1l to the Fund’s financial statements. RIB leverage represents the amount of Floating Rate Notes outstanding as of 7/31/10 as a percentage of the Fund’s net assets plus Floating Rate Notes.
10
Eaton Vance Minnesota Municipal Income Fund as of J u l y 3 1 , 2 0 1 0
PERFORMANCE INFORMATION |
The line graph and table set forth below provide information about the Fund’s performance. The line graph compares the performance of Class B of the Fund with that of the Barclays Capital Municipal Bond Index, an unmanaged index of municipal bonds traded in the U.S., and the Barclays Capital 20 Year Municipal Bond Index, an unmanaged index of municipal bonds traded in the U.S. with maturities ranging from 17-22 years. The lines on the graph represent the total returns of a hypothetical investment of $10,000 in each of Class B, the Barclays Capital Municipal Bond Index and the Barclays Capital 20 Year Municipal Bond Index. The table includes the total returns of each Class of the Fund at net asset value and maximum public offering price. The performance presented below does not reflect the deduction of taxes, if any, that a shareholder would pay on distributions or redemptions of Fund shares.
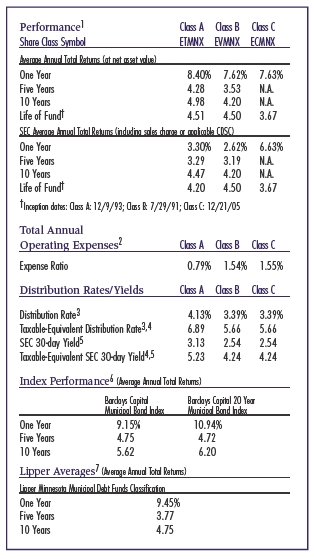
Portfolio Manager: Craig R. Brandon, CFA
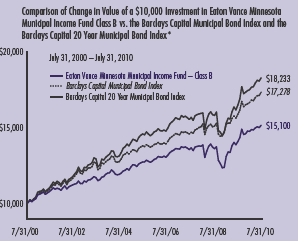
* Source: Lipper, Inc. Class B of the Fund commenced investment operations on 7/29/91.
A $10,000 hypothetical investment at net asset value in Class A on 7/31/00 and Class C on 12/21/05 (commencement of operations) would have been valued at $16,259 ($15,486 at the maximum offering price) and $11,809, respectively, on 7/31/10. It is not possible to invest directly in an Index. The Indices’ total returns do not reflect expenses that would have been incurred if an investor individually purchased or sold the securities represented in the Indices.
Past performance is no guarantee of future results. Returns are historical and are calculated by determining the percentage change in net asset value or offering price (as applicable) with all distributions reinvested. Investment return and principal value will fluctuate so that shares, when redeemed, may be worth more or less than their original cost. Performance is for the stated time period only; due to market volatility, the Fund’s current performance may be lower or higher than the quoted return. Fund performance during certain periods reflects the strong bond market performance and/or the strong performance of bonds held during those periods. This performance is not typical and may not be repeated. For performance as of the most recent month end, please refer to www.eatonvance.com.
1 Average Annual Total Returns do not include the 4.75% maximum sales charge for Class A shares or the applicable contingent deferred sales charges (CDSC) for Class B and Class C shares. If sales charges were deducted, the returns would be lower. SEC Average Annual Total Returns for Class A reflect the maximum 4.75% sales charge. SEC Average Annual Total Returns for Class B reflect the applicable CDSC based on the following schedule: 5% - 1st and 2nd years; 4% - 3rd year; 3% - 4th year; 2% - 5th year; 1% - 6th year. SEC Average Annual Total Returns for Class C reflect a 1% CDSC for the first year. 2 Source: Prospectus dated 12/1/09, as supplemented. 3 The Fund’s distribution rate represents actual distributions paid to shareholders and is calculated by dividing the last regular distribution per share in the period (annualized) by the net asset value at the end of the period. 4 Taxable-equivalent figures assume a maximum 40.10% combined federal and state income tax rate. A lower tax rate would result in lower tax-equivalent figures. 5 The Fund's SEC yield is calculated by dividing the net investment income per share for the 30-day period by the offering price at the end of the period and annualizing the result. 6 It is not possible to invest directly in an Index. The Indices’ total returns do not reflect the expenses that would have been incurred if an investor individually purchased or sold the securities represented in the Indices. Index performance is available as of month end only. 7 The Lipper Averages are the average annual total returns, at net asset value, of the funds that are in the same Lipper Classification as the Fund. It is not possible to invest in a Lipper Classification. Lipper Classifications may include insured and uninsured funds, as well as leveraged and unleveraged funds. The Lipper Minnesota Municipal Debt Funds Classification contained 40, 33 and 32 funds for the 1-year, 5-year and 10-year time periods, respectively. Lipper Averages are available as of month end only.
11
Eaton Vance Minnesota Municipal Income Fund as of J u l y 3 1 , 2 0 1 0
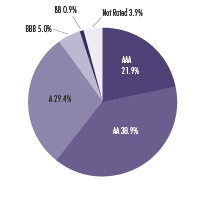
PORTFOLIO COMPOSITION |
Rating Distribution1
By total investments |
| |
| * Number of Issues: | 93 |
| * Average Maturity: | 19.9 years |
| * Average Effective Maturity: | 8.8 years |
| * Average Call Protection: | 6.7 years |
| * Average Dollar Price: | $100.46 |
1 Rating Distribution is determined by dividing the total market value of the issues by the total investments of the Fund. Ratings are based on Moody’s, S&P or Fitch, as applicable. Credit ratings are based largely on the rating agency’s investment analysis at the time of rating and the rating assigned to any particular security is not necessarily a reflection of the issuer’s current financial condition. The rating assigned to a security by a rating agency does not necessarily reflect its assessment of the volatility of a security’s market value or of the liquidity of an investment in the security. If securities are rated differently by the rating agencies, the higher rating is applied.
12
Eaton Vance New Jersey Municipal Income Fund as of J u l y 3 1 , 2 0 1 0
PERFORMANCE INFORMATION
The line graph and table set forth below provide information about the Fund’s performance. The line graph compares the performance of Class A of the Fund with that of the Barclays Capital Municipal Bond Index, an unmanaged index of municipal bonds traded in the U.S., and the Barclays Capital 20 Year Municipal Bond Index, an unmanaged index of municipal bonds traded in the U.S. with maturities ranging from 17-22 years. The lines on the graph represent the total returns of a hypothetical investment of $10,000 in each of Class A, the Barclays Capital Municipal Bond Index and the Barclays Capital 20 Year Municipal Bond Index. Class A total returns are presented at net asset value and maximum public offering price. The table includes the total returns of each Class of the Fund at net asset value and maximum public offering price. The performance presented below does not reflect the deduction of taxes, if any, that a shareholder would pay on distributions or redemptions of Fund shares.
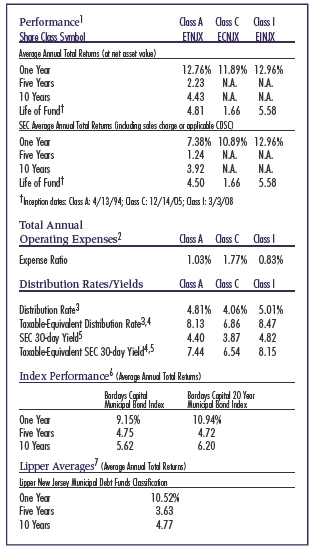
Portfolio Manager: Adam A. Weigold, CFA
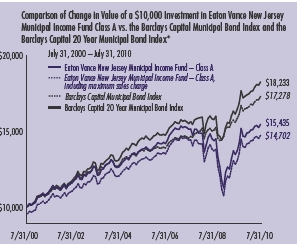
* Source: Lipper, Inc. Class A of the Fund commenced investment operations on 4/13/94.
A $10,000 hypothetical investment at net asset value in Class C on 12/14/05 (commencement of operations) and Class I on 3/3/08 (commencement of operations) would have been valued at $10,791 and $11,399, respectively, on 7/31/10. It is not possible to invest directly in an Index. The Indices’ total returns do not reflect expenses that would have been incurred if an investor individually purchased or sold the securities represented in the Indices.
Past performance is no guarantee of future results. Returns are historical and are calculated by determining the percentage change in net asset value or offering price (as applicable) with all distributions reinvested. Investment return and principal value will fluctuate so that shares, when redeemed, may be worth more or less than their original cost. Performance is for the stated time period only; due to market volatility, the Fund’s current performance may be lower or higher than the quoted return. Fund performance during certain periods reflects the strong bond market performance and/or the strong performance of bonds held during those periods. This performance is not typical and may not be repeated. For performance as of the most recent month end, please refer to www.eatonvance.com.
1 Average Annual Total Returns do not include the 4.75% maximum sales charge for Class A shares or the applicable contingent deferred sales charge (CDSC) for Class C shares. If sales charges were deducted, the returns would be lower. SEC Average Annual Total Returns for Class A reflect the maximum 4.75% sales charge. SEC Average Annual Total Returns for Class C reflect a 1% CDSC for the first year. Class I shares are not subject to a sales charge. 2 Source: Prospectus dated 12/1/09, as supplemented. Includes interest expense of 0.18% relating to the Fund’s liability with respect to floating rate notes held by third parties in conjunction with residual interest bond transactions by the Fund. The Fund also records offsetting interest income in an amount equal to this expense relating to the municipal obligations underlying such transactions, and as a result net asset value and performance have not been affected by this expense. 3 The Fund’s distribution rate represents actual distributions paid to shareholders and is calculated by dividing the last regular distribution per share in the period (annualized) by the net asset value at the end of the period. 4 Taxable-equivalent figures assume a maximum 40.83% combined federal and state income tax rate. A lower tax rate would result in lower tax-equivalent figures. 5 The Fund's SEC yield is calculated by dividing the net investment income per share for the 30-day period by the offering price at the end of the period and annualizing the result. 6 It is not possible to invest directly in an Index. The Indices’ total returns do not reflect the expenses that would have been incurred if an investor individually purchased or sold the securities represented in the Indices. Index performance is available as of month end only. 7 The Lipper Averages are the average annual total returns, at net asset value, of the funds that are in the same Lipper Classification as the Fund. It is not possible to invest in a Lipper Classification. Lipper Classifications may include insured and uninsured funds, as well as leveraged and unleveraged funds. The Lipper New Jersey Municipal Debt Funds Classification contained 47, 34 and 31 funds for the 1-year, 5-year and 10-year time periods, respectively. Lipper Averages are available as of month end only.
13
Eaton Vance New Jersey Municipal Income Fund as of J u l y 3 1 , 2 0 1 0
PORTFOLIO COMPOSITION |
Rating Distribution*1
By total investments |
*The rating distribution presented above includes the ratings of securities held by special purpose vehicles in which the Fund holds a residual interest. See Note 1I to the Fund's financial statements. Absent such securities, the Fund's rating distribution as of 7/31/10 is as follows.
| | | |
| AAA | 12.7% | BBB | 25.4% |
| AA | 31.7% | BB | 0.3% |
| A | 24.0% | B | 1.0% |
| | | Not Rated | 4.9% |
| |
| * Number of Issues: | 91 |
| * Average Maturity: | 26.4 years |
| * Average Effective Maturity: | 13.1 years |
| * Average Call Protection: | 8.8 years |
| * Average Dollar Price: | $92.18 |
| * RIB Leverage3 : | 13.2% |
1Rating Distribution is determined by dividing the total market value of the issues by the total investments of the Fund. Ratings are based on Moody’s, S&P or Fitch, as applicable. Credit ratings are based largely on the rating agency’s investment analysis at the time of rating and the rating assigned to any particular security is not necessarily a reflection of the issuer’s current financial condition. The rating assigned to a security by a rating agency does not necessarily reflect its assessment of the volatility of a security’s market value or of the liquidity of an investment in the security. If securities are rated differently by the rating agencies, the higher rating is applied.
2Fund holdings information excludes securities held by special purpose vehicles in which the Fund holds a residual interest. See Note 1I to the Fund’s financial statements.
3See Note 1l to the Fund’s financial statements. RIB leverage represents the amount of Floating Rate Notes outstanding as of 7/31/10 as a percentage of the Fund’s net assets plus Floating Rate Notes.
14
Eaton Vance Pennsylvania Municipal Income Fund as of J u l y 3 1 , 2 0 1 0
PERFORMANCE INFORMATION |
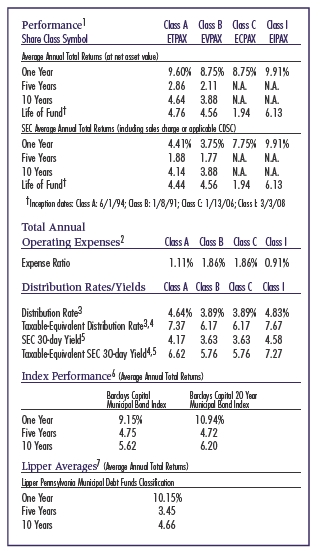
The line graph and table set forth below provide information about the Fund’s performance. The line graph compares the performance of Class B of the Fund with that of the Barclays Capital Municipal Bond Index, an unmanaged index of municipal bonds traded in the U.S., and the Barclays Capital 20 Year Municipal Bond Index, an unmanaged index of municipal bonds traded in the U.S. with maturities ranging from 17-22 years. The lines on the graph represent the total returns of a hypothetical investment of $10,000 in each of Class B, the Barclays Capital Municipal Bond Index and the Barclays Capital 20 Year Municipal Bond Index. The table includes the total returns of each Class of the Fund at net asset value and maximum public offering price. The performance presented below does not reflect the deduction of taxes, if any, that a shareholder would pay on distributions or redemptions of Fund shares.
Portfolio Manager: Adam A. Weigold, CFA
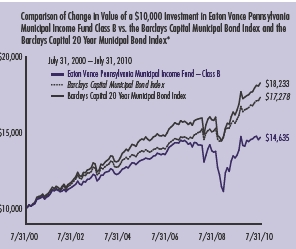
* Source: Lipper, Inc. Class B of the Fund commenced investment operations on 1/8/91.
A $10,000 hypothetical investment at net asset value in Class A on 7/31/00, Class C on 1/13/06 (commencement of operations) and Class I on 3/3/08 (commencement of operations) would have been valued at $15,742 ($14,995 at the maximum offering price), $10,913 and $11,542, respectively, on 7/31/10. It is not possible to invest directly in an Index. The Indices’ total returns do not reflect expenses that would have been incurred if an investor individually purchased or sold the securities represented in the Indices.
Past performance is no guarantee of future results. Returns are historical and are calculated by determining the percentage change in net asset value or offering price (as applicable) with all distributions reinvested. Investment return and principal value will fluctuate so that shares, when redeemed, may be worth more or less than their original cost. Performance is for the stated time period only; due to market volatility, the Fund’s current performance may be lower or higher than the quoted return. Fund performance during certain periods reflects the strong bond market performance and/or the strong performance of bonds held during those periods. This performance is not typical and may not be repeated. For performance as of the most recent month end, please refer to www.eatonvance.com.
1 Average Annual Total Returns do not include the 4.75% maximum sales charge for Class A shares or the applicable contingent deferred sales charges (CDSC) for Class B and Class C shares. If sales charges were deducted, the returns would be lower. SEC Average Annual Total Returns for Class A reflect the maximum 4.75% sales charge. SEC Average Annual Total Returns for Class B reflect the applicable CDSC based on the following schedule: 5% - 1st and 2nd years; 4% - 3rd year; 3% - 4th year; 2% - 5th year; 1% - 6th year. SEC Average Annual Total Returns for Class C reflect a 1% CDSC for the first year. Class I shares are not subject to a sales charge. 2 Source: Prospectus dated 12/1/09, as supplemented. Includes interest expense of 0.29% relating to the Fund’s liability with respect to floating rate notes held by third parties in conjunction with residual interest bond transactions by the Fund. The Fund also records offsetting interest income in an amount equal to this expense relating to the municipal obligations underlying such transactions, and as a result net asset value and performance have not been affected by this expense. 3 The Fund’s distribution rate represents actual distributions paid to shareholders and is calculated by dividing the last regular distribution per share in the period (annualized) by the net asset value at the end of the period. 4 Taxable-equivalent figures assume a maximum 37.00% combined federal and state income tax rate. A lower tax rate would result in lower tax-equivalent figures. 5 The Fund's SEC yield is calculated by dividing the net investment income per share for the 30-day period by the offering price at the end of the period and annualizing the result. 6 It is not possible to invest directly in an Index. The Indices’ total returns do not reflect the expenses that would have been incurred if an investor individually purchased or sold the securities represented in the Indices. Index performance is available as of month end only. 7 The Lipper Averages are the average annual total returns, at net asset value, of the funds that are in the same Lipper Classification as the Fund. It is not possible to invest in a Lipper Classification. Lipper Classifications may include insured and uninsured funds, as well as leveraged and unleveraged funds. The Lipper Pennsylvania Municipal Debt Funds Classification contained 60, 48 and 47 funds for the 1-year, 5-year and 10-year time periods, respectively. Lipper Averages are available as of month end only.
15
Eaton Vance Pennsylvania Municipal Income Fund as of J u l y 31, 2010
PORTFOLIO COMPOSITION |
Rating Distribution*1
By total investments |
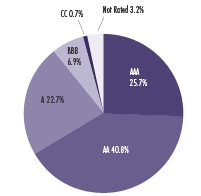
*The rating distribution presented above includes the ratings of securities held by special purpose vehicles in which the Fund holds a residual interest. See Note 1I to the Fund's financial statements. Absent such securities, the Fund's rating distribution as of 7/31/10 is as follows.
| | | |
| AAA | 19.3% | BBB | 7.8% |
| AA | 43.3% | CC | 0.8 |
| A | 25.2% | Not Rated | 3.6% |
Fund Statistics2 | |
| * Number of Issues: | 134 |
| * Average Maturity: | 21.2 years |
| * Average Effective Maturity: | 12.4 years |
| * Average Call Protection: | 8.3 years |
| * Average Dollar Price: | $97.79 |
| * RIB Leverage3 : | 10.6% |
1Rating Distribution is determined by dividing the total market value of the issues by the total investments of the Fund. Ratings are based on Moody’s, S&P or Fitch, as applicable. Credit ratings are based largely on the rating agency’s investment analysis at the time of rating and the rating assigned to any particular security is not necessarily a reflection of the issuer’s current financial condition. The rating assigned to a security by a rating agency does not necessarily reflect its assessment of the volatility of a security’s market value or of the liquidity of an investment in the security. If securities are rated differently by the rating agencies, the higher rating is applied.
2Fund holdings information excludes securities held by special purpose vehicles in which the Fund holds a residual interest. See Note 1I to the Fund’s financial statements.
3See Note 1l to the Fund’s financial statements. RIB leverage represents the amount of Floating Rate Notes outstanding as of 7/31/10 as a percentage of the Fund’s net assets plus Floating Rate Notes.
16
Eaton Vance Municipal Income Funds as of July 31, 2010
FUN D EXP ENSES |
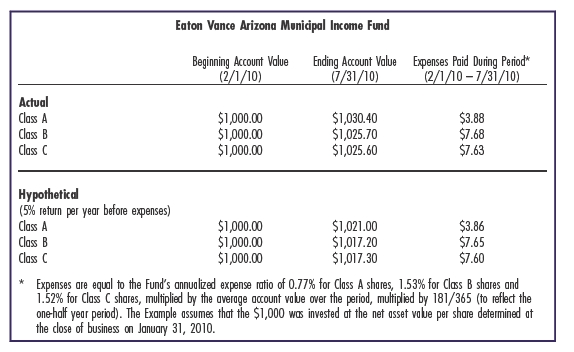
Example: As a shareholder of a Fund, you incur two types of costs: (1) transaction costs, including sales charges (loads) on purchases and redemption fees (if applicable); and (2) ongoing costs, including management fees; distribution or service fees; and other Fund expenses. This Example is intended to help you understand your ongoing costs (in dollars) of investing in a Fund and to compare these costs with the ongoing costs of investing in other mutual funds. The Example is based on an investment of $1,000 invested at the beginning of the period and held for the entire period (February 1, 2010 – July 31, 2010).
Actual Expenses: The first section of each table below provides information about actual account values and actual expenses. You may use the information in this section, together with the amount you invested, to estimate the expenses that you paid over the period. Simply divide your account value by $1,000 (for example, an $8,600 account value divided by $1,000 = 8.6), then multiply the result by the number in the first section under the heading entitled “Expenses Paid During Period” to estimate the expenses you paid on your account during this period.
Hypothetical Example for Comparison Purposes: The second section of each table below provides information about hypothetical account values and hypothetical expenses based on the actual Fund expense ratio and an assumed rate of return of 5% per year (before expenses), which is not the actual return of the Fund. The hypothetical account values and expenses may not be used to estimate the actual ending account balance or expenses you paid for the period. You may use this information to compare the ongoing costs of investing in your Fund and other funds. To do so, compare this 5% hypothetical example with the 5% hypothetical examples that appear in the shareholder reports of the other funds.
Please note that the expenses shown in each table are meant to highlight your ongoing costs only and do not reflect any transactional costs, such as sales charges (loads) or redemption fees (if applicable). Therefore, the second section of each table is useful in comparing ongoing costs only, and will not help you determine the relative total costs of owning different funds. In addition, if these transactional costs were included, your costs would be higher.
17
Eaton Vance Municipal Income Funds as of July 31, 2010
FUN D EXP ENSES CONT’D |
| | | |
| | Eaton Vance Colorado Municipal Income Fund | |
| |
| | Beginning Account Value | Ending Account Value | Expenses Paid During Period* |
| | (2/1/10) | (7/31/10) | (2/1/10 – 7/31/10) |
| |
| Actual | | | |
| Class A | $1,000.00 | $1,040.80 | $3.74 |
| Class B | $1,000.00 | $1,036.50 | $7.57 |
| Class C | $1,000.00 | $1,036.50 | $7.47 |
| |
| |
| Hypothetical | | | |
| (5% return per year before expenses) | | | |
| Class A | $1,000.00 | $1,021.10 | $3.71 |
| Class B | $1,000.00 | $1,017.40 | $7.50 |
| Class C | $1,000.00 | $1,017.50 | $7.40 |
| |
| * Expenses are equal to the Fund’s annualized expense ratio of 0.74% for Class A shares, 1.50% for Class B shares and |
| 1.48% for Class C shares, multiplied by the average account value over the period, multiplied by 181/365 (to reflect the |
| one-half year period). The Example assumes that the $1,000 was invested at the net asset value per share determined at |
| the close of business on January | 31, 2010. | | |
| | | |
| Eaton Vance Connecticut Municipal Income Fund |
| |
| | Beginning Account Value | Ending Account Value | Expenses Paid During Period* |
| | (2/1/10) | (7/31/10) | (2/1/10 – 7/31/10) |
| |
| Actual | | | |
| Class A | $1,000.00 | $1,030.90 | $4.08 |
| Class B | $1,000.00 | $1,027.20 | $7.84 |
| Class C | $1,000.00 | $1,027.20 | $7.84 |
| Class I | $1,000.00 | $1,031.90 | $3.07 |
| |
| |
| Hypothetical | | | |
| (5% return per year before expenses) | | |
| Class A | $1,000.00 | $1,020.80 | $4.06 |
| Class B | $1,000.00 | $1,017.10 | $7.80 |
| Class C | $1,000.00 | $1,017.10 | $7.80 |
| Class I | $1,000.00 | $1,021.80 | $3.06 |
| |
| * Expenses are equal to the Fund’s annualized expense ratio of 0.81% for Class A shares, 1.56% for Class B shares, 1.56% |
| for Class C shares and 0.61% for Class I shares, multiplied by the average account value over the period, multiplied by |
| 181/365 (to reflect the one-half year period). The Example assumes that the $1,000 was invested at the net asset value |
| per share determined at the close of business on January 31, 2010. | |
18
Eaton Vance Municipal Income Funds as of July 31, 2010
FUN D EXP ENSES CONT’D |
| | | |
| | Eaton Vance Michigan Municipal Income Fund | |
| |
| | Beginning Account Value | Ending Account Value | Expenses Paid During Period* |
| | (2/1/10) | (7/31/10) | (2/1/10 – 7/31/10) |
| |
| Actual | | | |
| Class A | $1,000.00 | $1,032.50 | $3.88 |
| Class C | $1,000.00 | $1,028.70 | $7.65 |
| |
| |
| Hypothetical | | | |
| (5% return per year before expenses) | | | |
| Class A | $1,000.00 | $1,021.00 | $3.86 |
| Class C | $1,000.00 | $1,017.30 | $7.60 |
| |
| * Expenses are equal to the Fund’s annualized expense ratio of 0.77% for Class A shares and 1.52% for Class C shares, |
| multiplied by the average account value over the period, multiplied by 181/365 (to reflect the one-half year period). The |
| Example assumes that the $1,000 was invested at the net asset value per share determined at the close of business on |
| January 31, 2010. | | | |
| | | |
| | Eaton Vance Minnesota Municipal Income Fund | |
| |
| | Beginning Account Value | Ending Account Value | Expenses Paid During Period* |
| | (2/1/10) | (7/31/10) | (2/1/10 – 7/31/10) |
| |
| Actual | | | |
| Class A | $1,000.00 | $1,031.00 | $3.73 |
| Class B | $1,000.00 | $1,027.50 | $7.54 |
| Class C | $1,000.00 | $1,026.50 | $7.49 |
| |
| |
| Hypothetical | | | |
| (5% return per year before expenses) | | |
| Class A | $1,000.00 | $1,021.10 | $3.71 |
| Class B | $1,000.00 | $1,017.40 | $7.50 |
| Class C | $1,000.00 | $1,017.40 | $7.45 |
| |
| * Expenses are equal to the Fund’s annualized expense ratio of 0.74% for Class A shares, 1.50% for Class B shares and |
| 1.49% for Class C shares, multiplied by the average account value over the period, multiplied by 181/365 (to reflect the |
| one-half year period). The Example assumes that the $1,000 was invested at the net asset value per share determined at |
| the close of business on January 31, 2010. | | |
19
Eaton Vance Municipal Income Funds as of July 31, 2010
FUN D EXP ENSES CONT’D |
| | | |
| Eaton Vance New Jersey Municipal Income Fund |
| |
| Beginning Account Value | Ending Account Value | Expenses Paid During Period* |
| | (2/1/10) | (7/31/10) | (2/1/10 – 7/31/10) |
| |
| Actual | | | |
| Class A | $1,000.00 | $1,036.50 | $4.65 |
| Class C | $1,000.00 | $1,033.40 | $8.42 |
| Class I | $1,000.00 | $1,037.50 | $3.59 |
| |
| |
| Hypothetical | | | |
| (5% return per year before expenses) | | | |
| Class A | $1,000.00 | $1,020.20 | $4.61 |
| Class C | $1,000.00 | $1,016.50 | $8.35 |
| Class I | $1,000.00 | $1,021.30 | $3.56 |
| |
| * Expenses are equal to the Fund’s annualized expense ratio of 0.92% for Class A shares, 1.67% for Class C shares and |
| 0.71% for Class I shares, multiplied by the average account value over the period, multiplied by 181/365 (to reflect the |
| one-half year period). The Example assumes that the $1,000 was invested at the net asset value per share determined at |
| the close of business on January 31, 2010. | | | |
| | | |
| Eaton Vance Pennsylvania Municipal Income Fund |
| |
| | Beginning Account Value | Ending Account Value | Expenses Paid During Period* |
| | (2/1/10) | (7/31/10) | (2/1/10 – 7/31/10) |
| |
| Actual | | | |
| Class A | $1,000.00 | $1,023.00 | $4.41 |
| Class B | $1,000.00 | $1,019.30 | $8.16 |
| Class C | $1,000.00 | $1,019.30 | $8.16 |
| Class I | $1,000.00 | $1,025.20 | $3.41 |
| |
| |
| Hypothetical | | | |
| (5% return per year before expenses) | | |
| Class A | $1,000.00 | $1,020.40 | $4.41 |
| Class B | $1,000.00 | $1,016.70 | $8.15 |
| Class C | $1,000.00 | $1,016.70 | $8.15 |
| Class I | $1,000.00 | $1,021.40 | $3.41 |
| |
| * Expenses are equal to the Fund’s annualized expense ratio of 0.88% for Class A shares, 1.63% for Class B shares, 1.63% |
| for Class C shares and 0.68% for Class I shares, multiplied by the average account value over the period, multiplied by |
| 181/365 (to reflect the one-half year period). The Example assumes that the $1,000 was invested at the net asset value |
| per share determined at the close of business on January 31, 2010. | |
20
Eaton Vance Arizona Municipal Income Fund as of July 31, 2010
PORTFOLIO OF INVESTMENTS |
| | |
| Tax-Exe m pt Inve stm e nts — 100. 4% | |
| |
| Principal Amount | | |
| (000’s omitted) | Security | Value |
| |
| Education — 3.3% | |
| $ 1,500 | Arizona Board of Regents, (University of Arizona), | |
| | 5.00%, 6/1/33 | $ 1,570,155 |
| 1,500 | Glendale Industrial Development Authority, | |
| | (Midwestern University), 5.00%, 5/15/25 | 1,534,815 |
| | | $ 3,104,970 |
| |
| Electric Utilities — 5.0% | |
| $ 500 | Maricopa County Pollution Control Corp., (Arizona Public | |
| | Service Co.), 6.00% to 5/1/14 (Put Date), 5/1/29 | $ 538,535 |
| 2,000 | Salt River Agricultural Improvements and Power District, | |
| | 5.00%, 1/1/33 | 2,126,280 |
| 2,000 | Salt River Agricultural Improvements and Power District, | |
| | 5.00%, 1/1/39 | 2,108,780 |
| | | $ 4,773,595 |
| |
| Escrowed / Prerefunded — 13.4% | |
| $ 7,500 | Maricopa County, SFMR, Escrowed to Maturity, | |
| | 0.00%, 2/1/16 | $ 6,683,025 |
| 6,500 | Phoenix Industrial Development Authority, SFMR, Escrowed | |
| | to Maturity, 0.00%, 12/1/14(1) | 6,092,190 |
| | | $12,775,215 |
| |
| General Obligations — 5.6% | |
| $ 1,200 | Maricopa County Community College District, | |
| | 3.00%, 7/1/23 | $ 1,187,916 |
| 1,125 | Puerto Rico, 0.00%, 7/1/18 | 773,302 |
| 1,385 | Tempe, 3.75%, 7/1/24 | 1,398,310 |
| 1,600 | Tempe, 5.375%, 7/1/21 | 1,935,792 |
| | | $ 5,295,320 |
| |
| Health Care-Miscellaneous — 1.0% | |
| $ 475 | Yavapai County Industrial Development Authority, | |
| | (West Yavapai Guidance Clinic), 6.25%, 12/1/36 | $ 434,216 |
| 500 | Yavapai County Industrial Development Authority, (West | |
| | Yavapai Guidance Clinic), 6.625%, 8/15/24 | 484,470 |
| | | $ 918,686 |
| |
| Hospital — 11.4% | |
| $ 2,000 | Arizona Health Facilities Authority, (Banner Health | |
| | System), 5.00%, 1/1/35 | $ 1,983,200 |
| 1,275 | Glendale Industrial Development Authority, (John C. Lincoln | |
| | Health Network), 5.00%, 12/1/28 | 1,223,171 |
| | |
| Principal Amount | | |
| (000’s omitted) | Security | Value |
| |
| Hospital (continued) | |
| $ 750 | Glendale Industrial Development Authority, (John C. Lincoln | |
| | Health Network), 5.00%, 12/1/32 | $ 700,230 |
| 200 | Glendale Industrial Development Authority, (John C. Lincoln | |
| | Health Network), 5.00%, 12/1/37 | 183,552 |
| 1,750 | Maricopa County Industrial Development Authority, | |
| | (Catholic Healthcare), 5.25%, 7/1/32 | 1,777,300 |
| 1,350 | Maricopa County Industrial Development Authority, | |
| | (Catholic Healthcare), 5.50%, 7/1/26 | 1,387,949 |
| 1,450 | Maricopa County Industrial Development Authority, (Mayo | |
| | Clinic), 5.00%, 11/15/36 | 1,474,679 |
| 1,500 | Scottsdale Industrial Development Authority, (Scottsdale | |
| | Healthcare), 5.25%, 9/1/30 | 1,494,390 |
| 630 | Winslow Industrial Development Authority, (Winslow | |
| | Memorial Hospital), 5.50%, 6/1/22 | 565,022 |
| | | $10,789,493 |
| |
| Industrial Development Revenue — 0.6% | |
| $ 650 | Phoenix Industrial Development Authority, (America West | |
| | Airlines, Inc.), (AMT), 6.25%, 6/1/19 | $ 544,102 |
| | | $ 544,102 |
| |
| Insured-Education — 1.1% | |
| $ 1,000 | North Campus Facilities LLC, (Northern Arizona University), | |
| | (AMBAC), 5.00%, 6/1/25 | $ 1,053,930 |
| | | $ 1,053,930 |
| |
| Insured-Electric Utilities — 4.2% | |
| $ 750 | Maricopa County Pollution Control Corp., | |
| | (El Paso Electric Co.), (FGIC), 4.80%, 8/1/40 | $ 676,327 |
| 1,000 | Mesa Utility System, (FGIC), (NPFG), 5.00%, 7/1/23 | 1,139,710 |
| 750 | Puerto Rico Electric Power Authority, (NPFG), | |
| | 5.25%, 7/1/29 | 785,415 |
| 1,200 | Puerto Rico Electric Power Authority, (NPFG), | |
| | 5.50%, 7/1/16 | 1,364,712 |
| | | $ 3,966,164 |
| |
| Insured-Escrowed / Prerefunded — 2.4% | |
| $ 1,000 | Maricopa County Industrial Development Authority, | |
| | (Samaritan Health Services), (NPFG), Escrowed to | |
| | Maturity, 7.00%, 12/1/16 | $ 1,220,680 |
| 1,000 | Pima County Industrial Development Authority, (Carondolet | |
| | Health Care Corp.), (NPFG), Escrowed to Maturity, | |
| | 5.25%, 7/1/11 | 1,046,130 |
| | | $ 2,266,810 |
S e e notes to financ ial statem ents
21
Eaton Vance Arizona Municipal Income Fund as of July 31, 2010
PORTFOLIO OF INVESTMENTS CONT’D |
| | |
| Principal Amount | | |
| (000’s omitted) | Security | Value |
| |
| Insured-General Obligations — 7.6% | |
| $ 400 | Flagstaff, (AMBAC), 3.25%, 7/1/23 | $ 401,172 |
| 810 | Goodyear, (AGM), 4.25%, 7/1/37 | 785,943 |
| 1,300 | Goodyear, (NPFG), 3.00%, 7/1/26 | 1,180,244 |
| 2,920 | Maricopa County Elementary School District No. 3, | |
| | (AGM), 5.00%, 7/1/25 | 3,493,430 |
| 1,200 | Pinal County Unified School District No. 43, Apache | |
| | Junction, (AGM), 5.00%, 7/1/24 | 1,386,912 |
| | | $ 7,247,701 |
| |
| Insured-Hospital — 3.5% | |
| $ 1,195 | Arizona Health Facilities Authority, (Arizona Healthcare | |
| | Systems), (FGIC), (NPFG), 5.50%, 6/1/15 | $ 1,318,372 |
| 2,000 | Maricopa County Industrial Development Authority, (Mayo | |
| | Clinic), (AMBAC), 5.25%, 11/15/37 | 2,000,900 |
| | | $ 3,319,272 |
| |
| Insured-Lease Revenue / Certificates of | |
| Participation — 2.6% | |
| $ 1,000 | Arizona State University, (Research Infrastructure Projects), | |
| | (AMBAC), 5.00%, 9/1/30 | $ 1,004,170 |
| 1,500 | Phoenix Civic Improvement Corp., (Civic Plaza), (FGIC), | |
| | (NPFG), 5.50%, (0.00% until 7/1/13), 7/1/41 | 1,351,860 |
| 130 | Prescott Municipal Property Corp., (NPFG), | |
| | 5.00%, 7/1/34 | 133,011 |
| | | $ 2,489,041 |
| |
| Insured-Special Tax Revenue — 10.4% | |
| $ 915 | Arizona Tourism and Sports Authority, (Multipurpose | |
| | Stadium Facility), (NPFG), 4.50%, 7/1/24 | $ 926,639 |
| 1,000 | Arizona Tourism and Sports Authority, (Multipurpose | |
| | Stadium Facility), (NPFG), 5.00%, 7/1/25 | 1,011,590 |
| 500 | Arizona Tourism and Sports Authority, (Multipurpose | |
| | Stadium Facility), (NPFG), 5.00%, 7/1/28 | 501,595 |
| 3,915 | Downtown Phoenix Hotel Corp., (FGIC), (NPFG), | |
| | 5.00%, 7/1/36 | 3,763,646 |
| 750 | Glendale Transportation, Excise Tax Revenue, (NPFG), | |
| | 4.50%, 7/1/32 | 753,075 |
| 3,370 | Puerto Rico Sales Tax Financing Corp., (AMBAC), | |
| | 0.00%, 8/1/54 | 210,456 |
| 680 | Puerto Rico Sales Tax Financing Corp., (NPFG), | |
| | 0.00%, 8/1/44 | 82,899 |
| 1,345 | Puerto Rico Sales Tax Financing Corp., (NPFG), | |
| | 0.00%, 8/1/45 | 152,819 |
| 1,080 | Puerto Rico Sales Tax Financing Corp., (NPFG), | |
| | 0.00%, 8/1/46 | 115,117 |
| 2,000 | Queen Creek, Excise Tax & State Shared Revenue, | |
| | (NPFG), 5.00%, 8/1/27 | 2,062,520 |
| | |
| Principal Amount | | |
| (000’s omitted) | Security | Value |
| |
| Insured-Special Tax Revenue (continued) | |
| $ 320 | Scottsdale, (Municipal Property Corp.), (AMBAC), | |
| | 4.50%, 7/1/35 | $ 321,891 |
| | | $ 9,902,247 |
| |
| Insured-Transportation — 6.8% | |
| $ 2,750 | Phoenix Civic Improvement Corp., Airport Revenue, (FGIC), | |
| | (NPFG), (AMT), 5.25%, 7/1/27 | $ 2,772,330 |
| 1,725 | Pima County, Street and Highway Revenue, (AMBAC), | |
| | 3.25%, 7/1/22 | 1,696,451 |
| 1,900 | Puerto Rico Highway and Transportation Authority, (AGC), | |
| | (CIFG), 5.25%, 7/1/41(2) | 1,981,966 |
| | | $ 6,450,747 |
| |
| Insured-Water and Sewer — 1.7% | |
| $ 500 | Cottonwood Property Corp., Water Revenue, (XLCA), | |
| | 5.00%, 7/1/29 | $ 473,055 |
| 1,135 | Phoenix Civic Improvement Corp., Wastewater System | |
| | Revenue, (AGM), (NPFG), 5.00%, 7/1/37 | 1,182,080 |
| | | $ 1,655,135 |
| |
| Lease Revenue / Certificates of Participation — 0.9% |
| $ 750 | Mohave County Industrial Development Authority, (Mohave | |
| | Prison LLC), 8.00%, 5/1/25 | $ 862,463 |
| | | $ 862,463 |
| |
| Other Revenue — 3.6% | |
| $ 1,750 | Arizona Health Facilities Authority, (Blood Systems, Inc.), | |
| | 4.75%, 4/1/25 | $ 1,759,537 |
| 16,505 | Children’s Trust Fund, PR, Tobacco Settlement, | |
| | 0.00%, 5/15/50 | 565,626 |
| 10,765 | Children’s Trust Fund, PR, Tobacco Settlement, | |
| | 0.00%, 5/15/55 | 194,847 |
| 1,000 | Salt Verde Financial Corp., Senior Gas Revenue, | |
| | 5.00%, 12/1/37 | 891,520 |
| | | $ 3,411,530 |
| |
| Senior Living / Life Care — 1.3% | |
| $ 1,800 | Arizona Health Facilities Authority, (Care Institute, Inc. - | |
| | Mesa), 7.625%, 1/1/26(3) | $ 1,204,074 |
| | | $ 1,204,074 |
S e e notes to financ ial statem ents
22
Eaton Vance Arizona Municipal Income Fund as of July 31, 2010
PORTFOLIO OF INVESTMENTS CONT’D |
| | |
| Principal Amount | | |
| (000’s omitted) | Security | Value |
| |
| Special Tax Revenue — 9.5% | |
| $ 1,000 | Gilbert Public Facilities Municipal Property Corp., | |
| | 5.50%, 7/1/27 | $ 1,093,120 |
| 1,000 | Glendale Western Loop, (101 Public Facilities Corp.), | |
| | Series A, 6.25%, 7/1/38 | 1,051,290 |
| 250 | Glendale Western Loop, (101 Public Facilities Corp.), | |
| | Series B, 6.25%, 7/1/38 | 262,823 |
| 270 | Guam, Limited Obligation Bonds, 5.625%, 12/1/29 | 278,281 |
| 295 | Guam, Limited Obligation Bonds, 5.75%, 12/1/34 | 303,885 |
| 1,000 | Puerto Rico Sales Tax Financing Corp., 5.25%, 8/1/57(2) | 1,009,560 |
| 2,500 | Scottsdale, (Municipal Property Corp.), 5.00%, 7/1/30 | 2,849,500 |
| 1,000 | Scottsdale, (Municipal Property Corp.), 5.00%, 7/1/34 | 1,120,450 |
| 1,000 | Tempe Transportation, Excise Tax Revenue, | |
| | 5.00%, 7/1/33 | 1,058,570 |
| | | $ 9,027,479 |
| |
| Transportation — 3.4% | |
| $ 3,000 | Arizona Transportation Board, Highway Revenue, | |
| | 5.00%, 7/1/32 | $ 3,190,290 |
| | | $ 3,190,290 |
| |
| Water and Sewer — 1.1% | |
| $ 1,000 | Arizona Water Infrastructure Finance Authority, | |
| | 5.00%, 10/1/30 | $ 1,092,000 |
| | | $ 1,092,000 |
| |
| Total Tax-Exempt Investments — 100.4% | |
| (identified cost $90,853,914) | $95,340,264 |
| |
| Other Assets, Less Liabilities — (0.4)% | $ (368,900) |
| |
| Net Assets — 100.0% | $94,971,364 |
The percentage shown for each investment category in the Portfolio of Investments is based on net assets.
AGC - Assured Guaranty Corp.
AGM - Assured Guaranty Municipal Corp.
AMBAC - AMBAC Financial Group, Inc.
AMT - Interest earned from these securities may be considered a tax preference item for purposes of the Federal Alternative Minimum Tax.
CIFG - CIFG Assurance North America, Inc.
FGIC - Financial Guaranty Insurance Company
NPFG - National Public Finance Guaranty Corp.
SFMR - Single Family Mortgage Revenue
XLCA - XL Capital Assurance, Inc.
The Fund invests primarily in debt securities issued by Arizona municipalities. The ability of the issuers of the debt securities to meet their obligations may be affected by economic developments in a specific industry or municipality. In order to reduce the risk associated with such economic developments, at July 31, 2010, 40.2% of total investments are backed by bond insurance of various financial institutions and financial guaranty assurance agencies. The aggregate percentage insured by an individual financial institution ranged from 0.5% to 24.0% of total investments.
(1) Security (or a portion thereof) has been pledged to cover margin requirements on open financial futures contracts.
(2) Security represents the underlying municipal bond of an inverse floater (see Note 1I).
(3) Security is in default with respect to scheduled principal payments.
S e e notes to financ ial statem ents
23
Eaton Vance Colorado Municipal Income Fund as of July 31, 2010
PORTFOLIO OF INVESTMENTS |
| | |
| Tax-Exe m pt Inve stm e nts — 97.3% | |
| |
| Principal Amount | | |
| (000’s omitted) | Security | Value |
| |
| Education — 7.9% | |
| $1,000 | Colorado Educational and Cultural Facilities Authority, | |
| | (Alexander Dawson School), 5.30%, 2/15/29 | $ 1,005,170 |
| 425 | Colorado Educational and Cultural Facilities Authority, (Kent | |
| | Denver School), 5.125%, 10/1/39 | 427,597 |
| 500 | Mesa State College, (Auxiliary Facilities System Enterprise | |
| | Revenue), 5.00%, 5/15/33 | 522,760 |
| 750 | University of Colorado, (Enterprise Revenue), | |
| | 5.125%, 6/1/29 | 814,980 |
| | | $ 2,770,507 |
| |
| Electric Utilities — 3.2% | |
| $1,000 | Platte River Power Authority, 5.00%, 6/1/27 | $ 1,106,310 |
| | | $ 1,106,310 |
| |
| Escrowed / Prerefunded — 9.2% | |
| $ 500 | Colorado Health Facilities Authority, (Portercare Adventist | |
| | Health), Prerefunded to 11/15/11, 6.50%, 11/15/31 | $ 544,090 |
| 3,000 | Dawson Ridge Metropolitan District No. 1, Escrowed to | |
| | Maturity, 0.00%, 10/1/22(1) | 1,916,820 |
| 715 | University of Colorado Hospital Authority, Prerefunded to | |
| | 11/15/11, 5.60%, 11/15/25 | 761,689 |
| | | $ 3,222,599 |
| |
| General Obligations — 4.5% | |
| $1,000 | Boulder Valley School District No. RE-2, | |
| | 5.00%, 12/1/34 | $ 1,070,310 |
| 500 | Eagle-Vail Metropolitan District, 5.00%, 12/1/35 | 506,670 |
| | | $ 1,576,980 |
| |
| Hospital — 12.8% | |
| $ 500 | Aspen Valley Hospital District, (Colorado Hospital), | |
| | 5.00%, 10/15/26 | $ 443,460 |
| 500 | Aurora, (Children’s Hospital Association), | |
| | 5.00%, 12/1/40 | 501,120 |
| 1,150 | Colorado Health Facilities Authority, | |
| | (Adventist Health/Sunbelt), 5.25%, 11/15/35 | 1,164,651 |
| 485 | Colorado Health Facilities Authority, | |
| | (Catholic Health Initiatives), 4.50%, 9/1/38 | 464,111 |
| 320 | Colorado Health Facilities Authority, | |
| | (Parkview Medical Center), 5.00%, 9/1/25 | 320,941 |
| 350 | Colorado Health Facilities Authority, | |
| | (Parkview Medical Center), 5.00%, 9/1/37 | 327,821 |
| | |
| Principal Amount | | |
| (000’s omitted) | Security | Value |
| |
| Hospital (continued) | |
| $ 750 | Colorado Health Facilities Authority, (Sisters of Charity of | |
| | Leavenworth Health System), 5.00%, 1/1/40 | $ 752,767 |
| 500 | Colorado Health Facilities Authority, (Vail Valley Medical | |
| | Center), 5.80%, 1/15/27 | 502,895 |
| | | $ 4,477,766 |
| |
| Housing — 2.8% | |
| $ 670 | Denver City and County, Multi-Family Housing, | |
| | (Bank Lofts), (FHA), (AMT), 6.15%, 12/1/16 | $ 671,253 |
| 305 | Lake Creek, (Affordable Housing Corp.), | |
| | 6.25%, 12/1/23 | 315,471 |
| | | $ 986,724 |
| |
| Industrial Development Revenue — 7.0% | |
| $ 500 | Colorado Housing and Finance Authority, | |
| | (Waste Management, Inc.), (AMT), 5.70%, 7/1/18 | $ 530,520 |
| 320 | Denver City and County Special Facilities, | |
| | (United Airlines), (AMT), 5.75%, 10/1/32 | 280,618 |
| 530 | Fort Collins, Pollution Control Revenue, | |
| | (Anheuser-Busch Cos., Inc.), 4.70%, 9/1/40 | 490,955 |
| 340 | Park Meadows Business Improvement District, | |
| | 5.35%, 12/1/31 | 295,885 |
| 440 | Puerto Rico Port Authority, (American Airlines, Inc.), | |
| | (AMT), 6.25%, 6/1/26 | 362,419 |
| 525 | Virgin Islands Public Finance Authority, (HOVENSA LLC), | |
| | (AMT), 4.70%, 7/1/22 | 486,617 |
| | | $ 2,447,014 |
| |
| Insured-Education — 6.3% | |
| $1,800 | Colorado Educational and Cultural Facilities Authority, | |
| | (University of Denver), (FGIC), (NPFG), 5.00%, 3/1/35 | $ 1,821,618 |
| 610 | Colorado School of Mines, (NPFG), 0.00%, 12/1/21 | 370,874 |
| | | $ 2,192,492 |
| |
| Insured-Electric Utilities — 5.0% | |
| $ 750 | Arkansas River Power Authority, (XLCA), | |
| | 5.875%, 10/1/26 | $ 805,695 |
| 750 | Colorado Water Resources and Power Development | |
| | Authority, (Fountaine Electric), (AGC), 5.25%, 12/1/38 | 789,225 |
| 150 | Puerto Rico Electric Power Authority, (FGIC), (NPFG), | |
| | 5.25%, 7/1/34 | 153,396 |
| | | $ 1,748,316 |
S e e notes to financ ial statem ents
24
Eaton Vance Colorado Municipal Income Fund as of July 31, 2010
PORTFOLIO OF INVESTMENTS CONT’D |
| | |
| Principal Amount | | |
| (000’s omitted) | Security | Value |
| |
| Insured-General Obligations — 3.9% | |
| $ 60 | Castle Pines North Metropolitan District, (AGM), | |
| | 5.00%, 12/1/27 | $ 62,503 |
| 1,000 | Castlewood Ranch Metropolitan District, (XLCA), | |
| | 4.25%, 12/1/34 | 762,760 |
| 500 | Moffat County School District No. RE001, (AGM), | |
| | 5.25%, 12/1/27 | 547,685 |
| | | $ 1,372,948 |
| |
| Insured-Hospital — 4.3% | |
| $ 750 | Colorado Health Facilities Authority, (Catholic Health), | |
| | (AGM), 5.10%, 10/1/41 | $ 761,445 |
| 750 | Colorado Health Facilities Authority, (Poudre Valley Health | |
| | Care, Inc.), (AGM), 5.25%, 3/1/40 | 759,750 |
| | | $ 1,521,195 |
| |
| Insured-Housing — 2.2% | |
| $ 750 | Denver City and County Housing Authority, Capital | |
| Fund Program Revenue, (Three Towers Rehabilitation | |
| | Project), (AGM), (AMT), 5.20%, 11/1/27 | $ 758,520 |
| | | $ 758,520 |
| |
| Insured-Special Tax Revenue — 6.0% | |
| $ 750 | Denver City and County, Excise Tax Revenue, (AGC), | |
| | 6.00%, 9/1/23 | $ 873,367 |
| 500 | Denver Convention Center, (XLCA), 4.75%, 12/1/35 | 416,255 |
| 355 | Denver Convention Center, (XLCA), 5.125%, 12/1/26 | 335,624 |
| 665 | McKay Landing Metropolitan District No. 2, (AMBAC), | |
| | 4.25%, 12/1/36 | 493,889 |
| | | $ 2,119,135 |
| |
| Insured-Transportation — 8.6% | |
| $1,750 | E-470 Public Highway Authority, (NPFG), | |
| | 0.00%, 9/1/16 | $ 1,321,827 |
| 500 | Northwest Parkway Public Highway Authority, (AGM), | |
| | Prerefunded to 6/15/11, 5.25%, 6/15/41 | 531,470 |
| 1,700 | Puerto Rico Highway and Transportation Authority, | |
| | (AMBAC), 0.00%, 7/1/18 | 1,168,546 |
| | | $ 3,021,843 |
| |
| Insured-Water and Sewer — 0.4% | |
| $ 150 | Colorado Water Resources and Power Development | |
| Authority, (Colorado UTE Electric Association), (AGM), | |
| | 4.375%, 8/1/35 | $ 150,167 |
| | | $ 150,167 |
| | |
| Principal Amount | | |
| (000’s omitted) | Security | Value |
| |
| Lease Revenue / Certificates of Participation — 1.6% |
| $ 365 | Colorado Higher Education Capital Construction, Lease | |
| | Purchase Program, 5.50%, 11/1/27 | $ 393,948 |
| 135 | Colorado Higher Education Capital Construction, Lease | |
| | Purchase Program, Prerefunded to 11/1/18, | |
| | 5.50%, 11/1/27 | 166,420 |
| | | $ 560,368 |
| |
| Senior Living / Life Care — 3.9% | |
| $ 400 | Colorado Health Facilities Authority, (Covenant Retirement | |
| | Communities, Inc.), 5.00%, 12/1/35 | $ 343,116 |
| 750 | Colorado Health Facilities Authority, (Evangelical Lutheran | |
| | Project), 5.25%, 6/1/36 | 721,245 |
| 425 | Logan County Industrial Development, (TLC Care Choices, | |
| | Inc.), 6.875%, 12/1/23(2) | 321,377 |
| | | $ 1,385,738 |
| |
| Special Tax Revenue — 0.9% | |
| $ 95 | Guam, Limited Obligation Bonds, 5.625%, 12/1/29 | $ 97,914 |
| 105 | Guam, Limited Obligation Bonds, 5.75%, 12/1/34 | 108,162 |
| 100 | Virgin Islands Public Finance Authority, 6.75%, 10/1/37 | 111,785 |
| | | $ 317,861 |
| |
| Transportation — 1.8% | |
| $ 300 | Eagle County, (Eagle County Airport Terminal), (AMT), | |
| | 5.25%, 5/1/20 | $ 284,664 |
| 360 | Walker Field Public Airport Authority, 4.75%, 12/1/27 | 340,434 |
| | | $ 625,098 |
| |
| Water and Sewer — 5.0% | |
| $ 500 | Colorado Springs Utilities, 5.25%, 11/15/36 | $ 539,130 |
| 500 | Colorado Springs Utilities, 5.50%, 11/15/48 | 532,575 |
| 540 | Colorado Water Resources and Power Development | |
| | Authority, 5.50%, 9/1/22 | 677,867 |
| | | $ 1,749,572 |
| |
| Total Tax-Exempt Investments — 97.3% | |
| (identified cost $33,870,830) | $34,111,153 |
| |
| Other Assets, Less Liabilities — 2.7% | $ 937,540 |
| |
| Net Assets — 100.0% | $35,048,693 |
S e e notes to financ ial statem ents
25
Eaton Vance Colorado Municipal Income Fund as of July 31, 2010
PORTFOLIO OF INVESTMENTS CONT’D |
The percentage shown for each investment category in the Portfolio of Investments is based on net assets.
AGC - Assured Guaranty Corp.
AGM - Assured Guaranty Municipal Corp.
AMBAC - AMBAC Financial Group, Inc.
AMT - Interest earned from these securities may be considered a tax preference item for purposes of the Federal Alternative Minimum Tax.
FGIC - Financial Guaranty Insurance Company
FHA - Federal Housing Administration
NPFG - National Public Finance Guaranty Corp.
XLCA - XL Capital Assurance, Inc.
The Fund invests primarily in debt securities issued by Colorado municipalities. The ability of the issuers of the debt securities to meet their obligations may be affected by economic developments in a specific industry or municipality. In order to reduce the risk associated with such economic developments, at July 31, 2010, 37.8% of total investments are backed by bond insurance of various financial institutions and financial guaranty assurance agencies. The aggregate percentage insured by an individual financial institution ranged from 4.9% to 10.8% of total investments.
(1) Security (or a portion thereof) has been pledged to cover margin requirements on open financial futures contracts.
(2) Security is in default and making only partial interest payments.
S e e notes to financ ial statem ent
26
Eaton Vance Connecticut Municipal Income Fund as of July 31, 2010
PORTFOLIO OF INVESTMENTS |
| | |
| Tax-Exe m pt Inve stm e nts — 102. 7% | |
| |
| Principal Amount | | |
| (000’s omitted) | Security | Value |
| |
| Education — 13.9% | |
| $ 1,000 | Connecticut Health and Educational Facilities Authority, | |
| | (Fairfield University), 5.00%, 7/1/34 | $ 1,029,940 |
| 1,500 | Connecticut Health and Educational Facilities Authority, | |
| | (Fairfield University), 5.00%, 7/1/40 | 1,535,895 |
| 2,000 | Connecticut Health and Educational Facilities Authority, | |
| | (Wesleyan University), 5.00%, 7/1/39 | 2,137,860 |
| 5,000 | Connecticut Health and Educational Facilities Authority, | |
| | (Yale University), 4.85%, 7/1/37(1) | 5,224,700 |
| 4,220 | Connecticut Health and Educational Facilities Authority, | |
| | (Yale University), 5.00%, 7/1/42 | 4,328,623 |
| 1,315 | University of Connecticut, 5.00%, 2/15/21 | 1,530,266 |
| 1,350 | University of Connecticut, 5.00%, 5/15/23 | 1,413,774 |
| 875 | University of Connecticut, 5.00%, 2/15/28 | 961,336 |
| | | $ 18,162,394 |
| |
| Electric Utilities — 3.1% | |
| $ 2,000 | Connecticut Development Authority, (Connecticut Light | |
| | and Power), 5.85%, 9/1/28 | $ 2,018,220 |
| 1,500 | Connecticut Development Authority, Solid Waste Disposal, | |
| | (PSEG Power LLC), (AMT), 5.75%, 11/1/37 | 1,503,930 |
| 500 | Puerto Rico Electric Power Authority, 5.00%, 7/1/37 | 491,625 |
| | | $ 4,013,775 |
| |
| Escrowed / Prerefunded — 4.7% | |
| $ 1,050 | Connecticut Clean Water Fund, Escrowed to Maturity, | |
| | 6.00%, 10/1/12 | $ 1,111,477 |
| 3,010 | Connecticut Clean Water Fund, Prerefunded to | |
| | 10/1/11, 5.50%, 10/1/19 | 3,197,523 |
| 1,500 | Connecticut Health and Educational Facilities Authority, | |
| | (Loomis Chaffee School), Prerefunded to 7/1/11, | |
| | 5.25%, 7/1/31 | 1,582,860 |
| 170 | Puerto Rico Public Finance Corp., Escrowed to Maturity, | |
| | 6.00%, 8/1/26 | 220,638 |
| | | $ 6,112,498 |
| |
| General Obligations — 10.6% | |
| $ 1,475 | Connecticut, 4.875%, 11/1/20 | $ 1,706,722 |
| 1,000 | Connecticut, 5.00%, 2/15/29 | 1,094,060 |
| 350 | East Lyme, 4.00%, 7/15/22 | 382,267 |
| 525 | East Lyme, 4.00%, 7/15/23 | 567,740 |
| 250 | East Lyme, 4.25%, 7/15/24 | 272,743 |
| 250 | East Lyme, 4.25%, 7/15/25 | 269,905 |
| 1,000 | Fairfield, 5.00%, 1/1/23 | 1,214,760 |
| 2,020 | Hartford County Metropolitan District, 5.00%, 7/15/34 | 2,160,592 |
| | |
| Principal Amount | | |
| (000’s omitted) | Security | Value |
| |
| General Obligations (continued) | |
| $ 1,475 | North Haven, 5.00%, 7/15/23 | $ 1,774,808 |
| 1,490 | North Haven, 5.00%, 7/15/25 | 1,791,040 |
| 400 | Redding, 5.50%, 10/15/18 | 499,028 |
| 650 | Redding, 5.625%, 10/15/19 | 823,225 |
| 535 | Wilton, 5.25%, 7/15/18(2) | 655,498 |
| 535 | Wilton, 5.25%, 7/15/19 | 659,232 |
| | | $ 13,871,620 |
| |
| Hospital — 2.0% | |
| $ 2,500 | Connecticut Health and Educational Facilities Authority, | |
| | (Ascension Health), 5.00%, 11/15/40 | $ 2,580,475 |
| | | $ 2,580,475 |
| |
| Housing — 1.5% | |
| $ 2,000 | Connecticut Housing Finance Authority, (AMT), | |
| | 5.15%, 5/15/38 | $ 2,037,560 |
| | | $ 2,037,560 |
| |
| Industrial Development Revenue — 7.5% | |
| $ 2,325 | Connecticut Development Authority, (Signature Flight | |
| | Support Corp.), (AMT), 6.625%, 12/1/14 | $ 2,268,502 |
| 4,500 | Eastern Connecticut Resource Recovery Authority, | |
| | (Wheelabrator Lisbon), (AMT), 5.50%, 1/1/20 | 4,458,735 |
| 620 | Puerto Rico Port Authority, (American Airlines, Inc.), | |
| | (AMT), 6.25%, 6/1/26 | 510,682 |
| 1,350 | Sprague, (International Paper Co.), (AMT), | |
| | 5.70%, 10/1/21 | 1,350,202 |
| 1,320 | Virgin Islands Public Finance Authority, (HOVENSA LLC), | |
| | (AMT), 4.70%, 7/1/22 | 1,223,495 |
| | | $ 9,811,616 |
| |
| Insured-Education — 14.7% | |
| $ 1,950 | Connecticut Health and Educational Facilities Authority, | |
| | (Loomis Chaffee School), (AMBAC), 5.25%, 7/1/30 | $ 2,285,400 |
| 2,050 | Connecticut Health and Educational Facilities Authority, | |
| | (Loomis Chaffee School), (AMBAC), 5.25%, 7/1/31 | 2,388,435 |
| 1,920 | Connecticut Health and Educational Facilities Authority, | |
| | (Quinnipiac University), (BHAC), (NPFG), | |
| | 5.00%, 7/1/37 | 2,005,402 |
| 2,500 | Connecticut Health and Educational Facilities Authority, | |
| | (Quinnipiac University), (NPFG), 5.75%, 7/1/33 | 2,740,150 |
| 5,305 | Connecticut Health and Educational Facilities Authority, | |
| | (Trinity College), (NPFG), 5.50%, 7/1/21 | 6,318,785 |
S e e notes to financ ial statem ent
27
Eaton Vance Connecticut Municipal Income Fund as of July 31, 2010
PORTFOLIO OF INVESTMENTS CONT’D |
| | |
| Principal Amount | | |
| (000’s omitted) | Security | Value |
| |
| Insured-Education (continued) | |
| $ 2,500 | Connecticut Health and Educational Facilities Authority, | |
| | (University of Hartford), (RADIAN), 5.25%, 7/1/32 | $ 2,411,600 |
| 1,000 | University of Connecticut, (FGIC), (NPFG), | |
| | 5.00%, 2/15/24 | 1,090,890 |
| | | $ 19,240,662 |
| |
| Insured-Electric Utilities — 3.8% | |
| $ 1,755 | Puerto Rico Electric Power Authority, (FGIC), (NPFG), | |
| | 5.25%, 7/1/35 | $ 1,788,082 |
| 2,840 | Puerto Rico Electric Power Authority, (NPFG), | |
| | 5.50%, 7/1/16 | 3,229,818 |
| | | $ 5,017,900 |
| |
| Insured-Escrowed / Prerefunded — 2.5% | |
| $ 1,500 | Connecticut, (AGM), Prerefunded to 10/15/12, | |
| | 5.00%, 10/15/19 | $ 1,653,090 |
| 1,000 | Connecticut Health and Educational Facilities Authority, | |
| (Greenwich Academy), (AGM), Prerefunded to 3/1/11, | |
| | 5.00%, 3/1/32 | 1,037,230 |
| 515 | Puerto Rico, (FGIC), Prerefunded to 7/1/12, | |
| | 5.00%, 7/1/32 | 561,134 |
| | | $ 3,251,454 |
| |
| Insured-General Obligations — 4.8% | |
| $ 3,370 | Bridgeport, (FGIC), (NPFG), 4.75%, 8/15/21 | $ 3,414,922 |
| 1,000 | Connecticut, (AMBAC), 5.25%, 6/1/20 | 1,218,950 |
| 1,000 | Hartford, (AGC), 5.00%, 8/15/28 | 1,085,500 |
| 500 | New Britain, (NPFG), 6.00%, 3/1/12 | 528,255 |
| | | $ 6,247,627 |
| |
| Insured-Hospital — 2.3% | |
| $ 2,000 | Connecticut Health and Educational Facilities Authority, | |
| | (Children’s Medical Center), (NPFG), 5.00%, 7/1/21 | $ 2,022,600 |
| 1,000 | Connecticut Health and Educational Facilities Authority, | |
| | (William W. Backus Hospital), (AGM), | |
| | 5.125%, 7/1/35 | 1,031,800 |
| | | $ 3,054,400 |
| |
| Insured-Housing — 0.5% | |
| $ 610 | Connecticut Housing Finance Authority, (AMBAC), | |
| | 5.10%, 11/15/38 | $ 612,166 |
| | | $ 612,166 |
| | |
| Principal Amount | | |
| (000’s omitted) | Security | Value |
| |
| Insured-Lease Revenue / Certificates of | |
| Participation — 2.2% | |
| $ 2,740 | Puerto Rico Public Buildings Authority, (AMBAC), | |
| | 5.50%, 7/1/21 | $ 2,896,646 |
| | | $ 2,896,646 |
| |
| Insured-Pooled Loans — 0.7% | |
| $ 925 | Connecticut Higher Education Supplemental Loan | |
| | Authority, (NPFG), (AMT), 5.25%, 11/15/21 | $ 934,019 |
| | | $ 934,019 |
| |
| Insured-Special Tax Revenue — 0.8% | |
| $ 1,000 | Connecticut, Special Tax Obligation, (Transportation | |
| | Infrastructure), (AMBAC), 5.00%, 7/1/24 | $ 1,070,250 |
| | | $ 1,070,250 |
| |
| Insured-Transportation — 8.7% | |
| $ 5,500 | Connecticut Airport, (Bradley International Airport), | |
| | (FGIC), (NPFG), (AMT), 5.125%, 10/1/26 | $ 5,517,490 |
| 500 | Guam International Airport Authority, (NPFG), | |
| | 5.25%, 10/1/23 | 511,700 |
| 3,900 | Puerto Rico Highway and Transportation Authority, (AGC), | |
| | (CIFG), 5.25%, 7/1/41(1) | 4,068,246 |
| 1,750 | Puerto Rico Highway and Transportation Authority, | |
| | (AMBAC), 0.00%, 7/1/16 | 1,356,460 |
| | | $ 11,453,896 |
| |
| Insured-Water and Sewer — 5.2% | |
| $ 1,000 | Connecticut Development Authority, (Aquarion Water Co. | |
| | of Connecticut), (XLCA), 4.70%, 7/1/36 | $ 858,880 |
| 1,000 | Connecticut Development Authority, (Aquarion Water Co. | |
| | of Connecticut), (XLCA), 5.10%, 9/1/37 | 911,250 |
| 3,420 | South Central Connecticut Regional Water Authority, | |
| | (NPFG), 5.25%, 8/1/24 | 3,956,666 |
| 1,000 | South Central Connecticut Regional Water Authority, | |
| | (NPFG), 5.25%, 8/1/32 | 1,061,780 |
| | | $ 6,788,576 |
| |
| Lease Revenue / Certificates of Participation — 1.8% |
| $ 1,830 | Puerto Rico Public Finance Corp., (Commonwealth | |
| | Appropriation), Escrowed to Maturity, 6.00%, 8/1/26 | $ 2,375,102 |
| | | $ 2,375,102 |
S e e notes to financ ial statem ents
28
Eaton Vance Connecticut Municipal Income Fund as of July 31, 2010
PORTFOLIO OF INVESTMENTS CONT’D |
| | |
| Principal Amount | | |
| (000’s omitted) | Security | Value |
| |
| Other Revenue — 0.7% | |
| $ 8,700 | Children’s Trust Fund, PR, Tobacco Settlement, | |
| | 0.00%, 5/15/50 | $ 298,149 |
| 16,465 | Children’s Trust Fund, PR, Tobacco Settlement, | |
| | 0.00%, 5/15/55 | 298,017 |
| 400 | Connecticut Development Authority, (Mystic Marinelife | |
| | Aquarium), 4.75%, 5/1/42 | 372,136 |
| | | $ 968,302 |
| |
| Senior Living / Life Care — 0.7% | |
| $ 1,000 | Connecticut Development Authority, (Alzheimers Resource | |
| | Center), 5.50%, 8/15/27 | $ 875,440 |
| | | $ 875,440 |
| |
| Solid Waste — 2.1% | |
| $ 2,750 | Connecticut Resource Recovery Authority, (American REF- | |
| | FUEL Co.), (AMT), 6.45%, 11/15/22 | $ 2,751,402 |
| | | $ 2,751,402 |
| |
| Special Tax Revenue — 5.7% | |
| $ 2,185 | Connecticut, Special Tax Obligation, (Transportation | |
| | Infrastructure), 6.125%, 9/1/12 | $ 2,301,111 |
| 2,000 | Connecticut, Special Tax Obligation, (Transportation | |
| | Infrastructure), 6.50%, 10/1/12 | 2,250,920 |
| 135 | Guam, Limited Obligation Bonds, 5.625%, 12/1/29 | 139,140 |
| 150 | Guam, Limited Obligation Bonds, 5.75%, 12/1/34 | 154,518 |
| 500 | Puerto Rico Sales Tax Financing Corp., 5.25%, 8/1/41 | 502,510 |
| 1,700 | Puerto Rico Sales Tax Financing Corp., | |
| | 5.25%, 8/1/57(1) | 1,716,252 |
| 10 | Puerto Rico Sales Tax Financing Corp., 5.25%, 8/1/57 | 10,096 |
| 365 | Virgin Islands Public Finance Authority, | |
| | 6.75%, 10/1/37 | 408,015 |
| | | $ 7,482,562 |
| |
| Water and Sewer — 2.2% | |
| $ 1,000 | Connecticut, (Revolving Fund), 5.00%, 6/1/24 | $ 1,143,920 |
| 1,500 | Connecticut, (Revolving Fund), 5.00%, 6/1/25 | 1,703,235 |
| | | $ 2,847,155 |
| |
| Total Tax-Exempt Investments — 102.7% | |
| (identified cost $129,209,107) | $134,457,497 |
| |
| Other Assets, Less Liabilities — (2.7)% | $ (3,516,069) |
| |
| Net Assets — 100.0% | $130,941,428 |
The percentage shown for each investment category in the Portfolio of Investments is based on net assets.
AGC - Assured Guaranty Corp.
AGM - Assured Guaranty Municipal Corp.
AMBAC - AMBAC Financial Group, Inc.
AMT - Interest earned from these securities may be considered a tax preference item for purposes of the Federal Alternative Minimum Tax.
BHAC - Berkshire Hathaway Assurance Corp.
CIFG - CIFG Assurance North America, Inc.
FGIC - Financial Guaranty Insurance Company
NPFG - National Public Finance Guaranty Corp.
RADIAN - Radian Group, Inc.
XLCA - XL Capital Assurance, Inc.
The Fund invests primarily in debt securities issued by Connecticut municipalities. In addition, 15.5% of the Fund’s net assets at July 31, 2010 were invested in municipal obligations issued by Puerto Rico. The ability of the issuers of the debt securities to meet their obligations may be affected by economic developments in a specific industry or municipality. In order to reduce the risk associated with such economic developments, at July 31, 2010, 45.0% of total investments are backed by bond insurance of various financial institutions and financial guaranty assurance agencies. The aggregate percentage insured by an individual financial institution ranged from 1.3% to 26.1% of total investments.
| (1) | Security represents the underlying municipal bond of an inverse floater (see Note 1I). |
| (2) | Security (or a portion thereof) has been pledged to cover margin requirements on open financial futures contracts. |
S e e notes to financ ial statem ents
29
Eaton Vance Michigan Municipal Income Fund as of July 31, 2010
PORTFOLIO OF INVESTMENTS |
| | |
| Tax-Exe m pt Inve stm e nts — 101. 0% | |
| |
| Principal Amount | | |
| (000’s omitted) | Security | Value |
| |
| Education — 2.0% | |
| $ 475 | Grand Valley State University, 5.625%, 12/1/29 | $ 503,876 |
| 475 | Grand Valley State University, 5.75%, 12/1/34 | 498,840 |
| | | $ 1,002,716 |
| |
| Electric Utilities — 0.7% | |
| $ 375 | Puerto Rico Electric Power Authority, 5.00%, 7/1/37 | $ 368,719 |
| | | $ 368,719 |
| |
| Escrowed / Prerefunded — 6.9% | |
| $ 530 | Macomb County Hospital Finance Authority, (Mount | |
| Clemens General Hospital), Prerefunded to 11/15/13, | |
| | 5.875%, 11/15/34 | $ 618,902 |
| 1,250 | Michigan Higher Education Facilities Authority, (Creative | |
| | Studies), Prerefunded to 6/1/12, 5.85%, 12/1/22 | 1,371,150 |
| 250 | Michigan Hospital Finance Authority, (Sparrow Obligation | |
| | Group), Prerefunded to 11/15/11, 5.625%, 11/15/36 | 269,230 |
| 1,000 | Puerto Rico Highway and Transportation Authority, | |
| | Prerefunded to 7/1/16, 5.00%, 7/1/36 | 1,197,220 |
| | | $ 3,456,502 |
| |
| General Obligations — 2.8% | |
| $ 500 | Kent County Building Authority, 5.50%, 6/1/26(1) | $ 621,450 |
| 230 | Michigan, 5.50%, 11/1/25 | 256,059 |
| 500 | Wayne Charter County, 6.75%, 11/1/39 | 531,970 |
| | | $ 1,409,479 |
| |
| Hospital — 19.9% | |
| $ 500 | Allegan Hospital Finance Authority, (Allegan General | |
| | Hospital), 7.00%, 11/15/21 | $ 501,205 |
| 410 | Gaylord Hospital Finance Authority, (Otsego Memorial | |
| | Hospital Association), 6.20%, 1/1/25 | 376,655 |
| 690 | Kent Hospital Finance Authority, (Spectrum Health), | |
| | 5.50% to 1/15/15 (Put Date), 1/15/47 | 772,600 |
| 1,500 | Michigan Hospital Finance Authority, (Central Michigan | |
| | Community Hospital), 6.25%, 10/1/27 | 1,500,195 |
| 1,500 | Michigan Hospital Finance Authority, (Henry Ford Health | |
| | System), 5.25%, 11/15/46 | 1,389,525 |
| 805 | Michigan Hospital Finance Authority, (McLaren Healthcare), | |
| | 5.00%, 8/1/35 | 797,062 |
| 500 | Michigan Hospital Finance Authority, (Mid Michigan | |
| | Obligation Group), 5.00%, 4/15/36 | 483,805 |
| 500 | Michigan Hospital Finance Authority, (Mid Michigan | |
| | Obligation Group), 6.125%, 6/1/39 | 535,315 |
| | |
| Principal Amount | | |
| (000’s omitted) | Security | Value |
| |
| Hospital (continued) | |
| $1,180 | Michigan Hospital Finance Authority, (Oakwood Obligation | |
| | Group), 5.00%, 7/15/37 | $ 1,086,674 |
| 1,300 | Michigan Hospital Finance Authority, (Sparrow Obligation | |
| | Group), 5.00%, 11/15/36 | 1,230,814 |
| 800 | Michigan Hospital Finance Authority, (Trinity Health), | |
| | 5.00%, 8/15/34 | 788,968 |
| 575 | Monroe County Hospital Finance Authority, (Mercy | |
| | Memorial Hospital Corp.), 5.375%, 6/1/26 | 524,285 |
| | | $ 9,987,103 |
| |
| Insured-Education — 4.1% | |
| $ 495 | Ferris State University, (AGC), 5.125%, 10/1/33 | $ 520,760 |
| 1,500 | Wayne University, (NPFG), 5.00%, 11/15/37 | 1,550,790 |
| | | $ 2,071,550 |
| |
| Insured-Electric Utilities — 3.9% | |
| $ 300 | Michigan Strategic Fund, (Detroit Edison Co.), (FGIC), | |
| | (NPFG), 6.95%, 5/1/11 | $ 312,240 |
| 1,000 | Michigan Strategic Fund, (Detroit Edison Co.), (NPFG), | |
| | (AMT), 5.55%, 9/1/29 | 1,001,720 |
| 625 | Puerto Rico Electric Power Authority, (FGIC), (NPFG), | |
| | 5.25%, 7/1/35 | 636,781 |
| | | $ 1,950,741 |
| |
| Insured-Escrowed / Prerefunded — 4.5% | |
| $2,000 | Detroit School District, (FGIC), Prerefunded to 5/1/13, | |
| | 5.25%, 5/1/28 | $ 2,250,460 |
| | | $ 2,250,460 |
| |
| Insured-General Obligations — 23.7% | |
| $1,005 | Brighton School District, (AMBAC), 0.00%, 5/1/18 | $ 760,393 |
| 1,000 | Detroit City School District, (AGM), 6.00%, 5/1/29 | 1,121,990 |
| 1,200 | Grosse Pointe Public Schools, (FGIC), (NPFG), | |
| | 3.00%, 5/1/27 | 990,996 |
| 1,000 | HealthSource Saginaw, Inc., Saginaw County, (NPFG), | |
| | 5.00%, 5/1/29 | 1,031,690 |
| 1,900 | Holland School District, (AMBAC), 0.00%, 5/1/17 | 1,507,137 |
| 2,000 | Okemos Public School District, (NPFG), 0.00%, 5/1/16 | 1,671,260 |
| 1,790 | Parchment School District, (NPFG), 5.00%, 5/1/25 | 1,927,132 |
| 1,400 | Redford Union School District No. 1, (AMBAC), | |
| | 5.00%, 5/1/22 | 1,578,234 |
| 1,250 | Van Dyke Public Schools, (AGM), 5.00%, 5/1/38 | 1,285,487 |
| | | $11,874,319 |
S e e notes to financ ial statem ents
30
Eaton Vance Michigan Municipal Income Fund as of July 31, 2010
PORTFOLIO OF INVESTMENTS CONT’D |
| | |
| Principal Amount | | |
| (000’s omitted) | Security | Value |
| Insured-Housing — 0.1% | |
| $ 25 | Michigan Housing Development Authority, Rental Housing, | |
| | (NPFG), (AMT), 5.30%, 10/1/37 | $ 25,042 |
| | | $ 25,042 |
| |
| Insured-Lease Revenue / Certificates of | |
| Participation — 2.1% | |
| $3,000 | Michigan Building Authority, (AGM), (FGIC), | |
| | 0.00%, 10/15/29 | $ 1,074,000 |
| | | $ 1,074,000 |
| |
| Insured-Transportation — 5.3% | |
| $1,000 | Puerto Rico Highway and Transportation Authority, (AGC), | |
| | (CIFG), 5.25%, 7/1/41(2) | $ 1,043,140 |
| 1,700 | Wayne Charter County Airport, (NPFG), (AMT), | |
| | 5.00%, 12/1/28 | 1,613,759 |
| | | $ 2,656,899 |
| |
| Insured-Water and Sewer — 6.7% | |
| $2,500 | Detroit Sewer Disposal System, (NPFG), 4.50%, 7/1/35 | $ 2,273,250 |
| 1,000 | Grand Rapids Water Supply System, (AGC), | |
| | 5.00%, 1/1/29 | 1,059,850 |
| | | $ 3,333,100 |
| |
| Lease Revenue / Certificates of Participation — 2.2% |
| $1,000 | Michigan Building Authority, 6.00%, 10/15/38 | $ 1,092,950 |
| | | $ 1,092,950 |
| |
| Other Revenue — 1.6% | |
| $1,090 | Michigan Tobacco Settlement Finance Authority, | |
| | 6.00%, 6/1/48 | $ 790,403 |
| | | $ 790,403 |
| |
| Special Tax Revenue — 9.8% | |
| $2,900 | Detroit, Downtown Tax Increment, 0.00%, 7/1/16 | $ 2,228,418 |
| 2,000 | Detroit, Downtown Tax Increment, 0.00%, 7/1/20 | 1,180,640 |
| 145 | Guam, Limited Obligation Bonds, 5.625%, 12/1/29 | 149,447 |
| 155 | Guam, Limited Obligation Bonds, 5.75%, 12/1/34 | 159,669 |
| 6,630 | Puerto Rico Sales Tax Financing Corp., 0.00%, 8/1/56 | 366,175 |
| 5 | Puerto Rico Sales Tax Financing Corp., 5.25%, 8/1/57 | 5,048 |
| 660 | Puerto Rico Sales Tax Financing Corp., 5.25%, 8/1/57(2) | 666,309 |
| 135 | Virgin Islands Public Finance Authority, 6.75%, 10/1/37 | 150,910 |
| | | $ 4,906,616 |
| | |
| Principal Amount | | |
| (000’s omitted) | Security | Value |
| |
| Water and Sewer — 4.7% | |
| $ 910 | Grand Rapids, (Sanitary Sewer System), 5.00%, 1/1/28 | $ 1,011,219 |
| 1,000 | Michigan Municipal Bond Authority, (Clean Water | |
| | Revenue), 5.00%, 10/1/29 | 1,095,780 |
| 250 | Michigan Municipal Bond Authority, (Clean Water | |
| | Revenue), 5.25%, 10/1/11 | 264,480 |
| | | $ 2,371,479 |
| |
| Total Tax-Exempt Investments — 101.0% | |
| (identified cost $48,353,460) | $50,622,078 |
| |
| Other Assets, Less Liabilities — (1.0)% | $ (488,690) |
| |
| Net Assets — 100.0% | $50,133,388 |
The percentage shown for each investment category in the Portfolio of Investments is based on net assets.
AGC - Assured Guaranty Corp.
AGM - Assured Guaranty Municipal Corp. AMBAC - AMBAC Financial Group, Inc.
AMT - Interest earned from these securities may be considered a tax preference item for purposes of the Federal Alternative Minimum Tax.
CIFG - CIFG Assurance North America, Inc.
FGIC - Financial Guaranty Insurance Company
NPFG - National Public Finance Guaranty Corp.
The Fund invests primarily in debt securities issued by Michigan municipalities. The ability of the issuers of the debt securities to meet their obligations may be affected by economic developments in a specific industry or municipality. In order to reduce the risk associated with such economic developments, at July 31, 2010, 49.9% of total investments are backed by bond insurance of various financial institutions and financial guaranty assurance agencies. The aggregate percentage insured by an individual financial institution ranged from 2.1% to 25.7% of total investments.
(1) Security (or a portion thereof) has been pledged to cover margin requirements on open financial futures contracts.
(2) Security represents the underlying municipal bond of an inverse floater (see Note 1I).
S e e notes to financ ial statem ents
31
Eaton Vance Minnesota Municipal Income Fund as of July 31, 2010
PORTFOLIO OF INVESTMENTS |
| | |
| Tax-Exe m pt Inve stm e nts — 98.1% | |
| |
| Principal Amount | | |
| (000’s omitted) | Security | Value |
| |
| Education — 12.0% | |
| $ 1,000 | Minnesota Higher Education Facilities Authority, (Carleton | |
| | College), 5.00%, 1/1/28 | $ 1,084,660 |
| 1,000 | Minnesota Higher Education Facilities Authority, (Carleton | |
| | College), 5.00%, 3/1/40 | 1,059,720 |
| 1,000 | Minnesota Higher Education Facilities Authority, (Gustavus | |
| | Adolphus College), 5.00%, 10/1/31(1) | 1,034,890 |
| 1,030 | Minnesota Higher Education Facilities Authority, | |
| | (Macalester College), 4.25%, 3/1/27 | 1,045,347 |
| 1,500 | Minnesota Higher Education Facilities Authority, | |
| | (Macalester College), 4.25%, 3/1/32 | 1,483,230 |
| 575 | Minnesota Higher Education Facilities Authority, | |
| | (Minneapolis College of Art), 5.375%, 5/1/21 | 576,190 |
| 1,000 | Minnesota Higher Education Facilities Authority, | |
| | (University of St. Thomas), 5.00%, 10/1/39 | 1,030,340 |
| 1,475 | Minnesota Higher Education Facilities Authority, | |
| | (University of St. Thomas), 5.25%, 4/1/39 | 1,530,283 |
| 1,380 | St. Cloud Housing and Redevelopment Authority, | |
| | (University Foundation), 5.00%, 5/1/23 | 1,444,336 |
| 500 | University of Minnesota, 5.00%, 12/1/21 | 580,760 |
| 1,000 | University of Minnesota, 5.125%, 4/1/34 | 1,076,890 |
| 1,000 | University of Minnesota, (State Supported Stadium | |
| | Debt), 5.00%, 8/1/29 | 1,054,530 |
| | | $ 13,001,176 |
| |
| Electric Utilities — 4.2% | |
| $ 500 | Minnesota Municipal Power Agency, 4.75%, 10/1/32 | $ 507,710 |
| 750 | Minnesota Municipal Power Agency, 5.00%, 10/1/34 | 763,065 |
| 2,000 | Minnesota Municipal Power Agency, 5.00%, 10/1/35 | 2,038,620 |
| 185 | Puerto Rico Electric Power Authority, 5.00%, 7/1/37 | 181,901 |
| 1,000 | Rochester Electric, Utility Revenue, 5.00%, 12/1/30 | 1,058,010 |
| | | $ 4,549,306 |
| |
| Escrowed / Prerefunded — 8.3% | |
| $ 1,980 | Chaska Electric, Prerefunded to 10/1/10, | |
| | 6.10%, 10/1/30 | $ 1,999,800 |
| 495 | Columbia Heights, MFMR, (Housing Crest), (GNMA), | |
| | Prerefunded to 10/20/12, 6.625%, 4/20/43 | 585,402 |
| 750 | Dakota County Community Development Agency, (Senior | |
| | Housing Facilities), Prerefunded to 1/1/12, | |
| | 5.00%, 1/1/21 | 799,170 |
| 2,000 | Minnesota Public Facilities Authority, Clean Water | |
| | Revenue, Prerefunded to 3/1/17, 5.00%, 3/1/26 | 2,385,780 |
| 1,980 | Rochester Electric, Prerefunded to 12/1/10, | |
| | 5.25%, 12/1/30 | 2,012,987 |
| | |
| Principal Amount | | |
| (000’s omitted) | Security | Value |
| |
| Escrowed / Prerefunded (continued) |
| $ 1,000 | St. Louis Park, Health Care Facilities Revenue, (Nicollet |
| | Health Services), Prerefunded to 7/1/14, |
| | 5.25%, 7/1/30 | $ 1,156,890 |
| | | $ 8,940,029 |
| |
| General Obligations — 14.3% | |
| $ 1,000 | Burnsville Independent School District No. 191, |
| | 4.75%, 2/1/29 | $ 1,053,170 |
| 500 | Dakota County Community Development Agency, (Senior |
| | Housing Facilities), 5.125%, 1/1/35 | 515,090 |
| 2,000 | Duluth, 5.00%, 2/1/34 | 2,099,440 |
| 2,000 | Fairmont Independent School District No. 2752, |
| | (Alternative Facilities), 5.00%, 2/1/34 | 2,128,860 |
| 2,000 | Hennepin County Regional Railroad Authority, |
| | 4.00%, 12/1/29 | 2,038,200 |
| 825 | Minneapolis and St. Paul Metropolitan Airports |
| | Commission, (AMT), 4.50%, 1/1/15(2) | 830,478 |
| 1,155 | Minnesota, 5.00%, 6/1/21 | 1,343,484 |
| 1,000 | Minnesota, 5.00%, 8/1/22 | 1,173,390 |
| 1,000 | Minnesota, 5.00%, 11/1/26 | 1,097,360 |
| 1,000 | St. Michael Independent School District No. 885, |
| | 4.50%, 2/1/28 | 1,039,030 |
| 1,500 | Washington County, 3.50%, 2/1/28 | 1,423,485 |
| 750 | Zumbrota-Mazeppa Independent School District |
| | No. 2805, 4.50%, 2/1/28 | 779,273 |
| | | $ 15,521,260 |
| |
| Hospital — 12.9% | |
| $ 1,000 | Douglas County, (Douglas County Hospital Project), |
| | 6.25%, 7/1/38 | $ 1,029,470 |
| 700 | Martin County, (Fairmont Community Hospital |
| | Association), 6.625%, 9/1/22 | 704,886 |
| 1,000 | Minneapolis and St. Paul Housing and Redevelopment |
| Authority, Health Care Systems, (Children’s Health Care), | |
| | 5.25%, 8/15/35 | 1,020,320 |
| 500 | Northfield, 5.375%, 11/1/31 | 484,265 |
| 1,500 | Rochester Health Care Facilities, (Mayo Clinic), |
| | 5.00%, 11/15/36 | 1,544,700 |
| 1,000 | Rochester Health Care Facilities, (Mayo Clinic), |
| | 5.00%, 11/15/38 | 1,044,010 |
| 1,500 | Rochester Health Care Facilities, (Olmsted Medical |
| | Center), 5.875%, 7/1/30 | 1,509,435 |
| 500 | Shakopee Health Care Facilities, (St. Francis Regional |
| | Medical Center), 5.25%, 9/1/34 | 475,720 |
| 1,000 | St. Cloud Health Care Revenue, (Centracare Health |
| | System), 5.125%, 5/1/30 | 1,031,290 |
| 1,000 | St. Louis Park, Health Care Facilities Revenue, (Nicollet |
| | Health Services), 5.75%, 7/1/30 | 1,023,550 |
S e e notes to financ ial statem ents
32
Eaton Vance Minnesota Municipal Income Fund as of July 31, 2010
PORTFOLIO OF INVESTMENTS CONT’D |
| | |
| Principal Amount | | |
| (000’s omitted) | Security | Value |
| |
| Hospital (continued) | |
| $ 1,000 | St. Louis Park, Health Care Facilities Revenue, (Nicollet | |
| | Health Services), 5.75%, 7/1/39 | $ 1,006,880 |
| 1,000 | St. Paul Housing and Redevelopment Authority, (Allina | |
| | Health System), 5.25%, 11/15/29 | 1,027,300 |
| 750 | St. Paul Housing and Redevelopment Authority, (Health | |
| | East Project), 6.00%, 11/15/35 | 711,667 |
| 1,500 | St. Paul Housing and Redevelopment Authority, | |
| | (HealthPartners, Inc.), 5.25%, 5/15/36 | 1,416,960 |
| | | $ 14,030,453 |
| |
| Housing — 6.0% | |
| $ 500 | Minneapolis, MFMR, (Bottineau Commons), (AMT), | |
| | 5.45%, 4/20/43 | $ 503,790 |
| 1,000 | Minnesota Housing Finance Agency, (AMT), | |
| | 4.80%, 7/1/38 | 964,200 |
| 1,000 | Minnesota Housing Finance Agency, (AMT), | |
| | 4.85%, 7/1/38 | 971,650 |
| 970 | Minnesota Housing Finance Agency, (AMT), | |
| | 4.90%, 7/1/37 | 957,109 |
| 500 | Minnesota Housing Finance Agency, (AMT), | |
| | 5.00%, 8/1/40 | 496,155 |
| 100 | Minnesota Housing Finance Agency, (AMT), | |
| | 5.15%, 7/1/38 | 100,700 |
| 965 | Minnesota Housing Finance Agency, (AMT), | |
| | 5.25%, 7/1/33 | 980,054 |
| 1,650 | Minnetonka, MFMR, (Archer Heights Apartments), | |
| | (AMT), 6.00%, 1/20/27 | 1,499,107 |
| | | $ 6,472,765 |
| |
| Industrial Development Revenue — 0.9% | |
| $ 1,000 | Cloquet, (Potlach Corp.), 5.90%, 10/1/26 | $ 959,200 |
| | | $ 959,200 |
| |
| Insured-Education — 0.5% | |
| $ 500 | Minnesota State Colleges and University, (St. Cloud | |
| | State University), (AGM), 5.00%, 10/1/19 | $ 539,795 |
| | | $ 539,795 |
| |
| Insured-Electric Utilities — 10.9% | |
| $ 1,000 | Northern Municipal Power Agency, (AGC), | |
| | 5.00%, 1/1/21 | $ 1,103,770 |
| 1,150 | Puerto Rico Electric Power Authority, (FGIC), (NPFG), | |
| | 5.25%, 7/1/34 | 1,176,036 |
| 315 | Puerto Rico Electric Power Authority, (FGIC), (NPFG), | |
| | 5.25%, 7/1/35 | 320,938 |
| 2,000 | Rochester Electric, (NPFG), 4.50%, 12/1/26 | 2,119,100 |
| | |
| Principal Amount | | |
| (000’s omitted) | Security | Value |
| |
| Insured-Electric Utilities (continued) | |
| $ 950 | Southern Minnesota Municipal Power Agency, (NPFG), | |
| | 0.00%, 1/1/21 | $ 641,772 |
| 10,000 | Southern Minnesota Municipal Power Agency, (NPFG), | |
| | 0.00%, 1/1/25 | 5,391,800 |
| 1,000 | Western Minnesota Municipal Power Agency, (AGM), | |
| | 5.00%, 1/1/36 | 1,031,510 |
| | | $ 11,784,926 |
| |
| Insured-Escrowed / Prerefunded — 2.7% | |
| $ 1,270 | Hopkins Housing and Redevelopment Authority, (Public | |
| | Works and Fire Station), (NPFG), Prerefunded to | |
| | 2/1/13, 5.00%, 2/1/20 | $ 1,411,567 |
| 1,500 | Minneapolis and St. Paul Metropolitan Airports | |
| | Commission, (FGIC), Prerefunded to 1/1/11, | |
| | 5.25%, 1/1/32(3) | 1,531,770 |
| | | $ 2,943,337 |
| |
| Insured-General Obligations — 6.1% | |
| $ 1,200 | Alexandria Independent School District No. 206, (AGM), | |
| | 5.00%, 2/1/27 | $ 1,312,488 |
| 2,245 | Cambridge Independent School District No. 911, (NPFG), | |
| | 0.00%, 2/1/29 | 890,928 |
| 400 | Chaska Independent School District No. 112, (NPFG), | |
| | 4.50%, 2/1/28 | 413,784 |
| 705 | Fergus Falls Independent School District No. 544, | |
| | (AGM), 4.625%, 1/1/28 | 733,715 |
| 1,000 | Rosemount Independent School District No. 196, (AGM), | |
| | 5.00%, 2/1/23 | 1,074,370 |
| 1,000 | Spring Lake Park Independent School District No. 16, | |
| | (AGM), 5.00%, 2/1/22 | 1,100,380 |
| 1,000 | St. Francis Independent School District No. 15, (NPFG), | |
| | 5.00%, 2/1/27 | 1,082,630 |
| | | $ 6,608,295 |
| |
| Insured-Hospital — 4.8% | |
| $ 750 | Minneapolis and St. Paul Housing and Redevelopment | |
| Authority, Health Care Systems, (Children’s Health Care), | |
| | (AGM), 5.00%, 8/15/34 | $ 766,020 |
| 1,950 | Minneapolis, (Fairview Health Services), (AMBAC), | |
| | 5.00%, 11/15/34 | 1,958,853 |
| 2,000 | Minnesota Agricultural and Economic Development Board, | |
| | (Essentia Health), (AGC), 5.00%, 2/15/37(3) | 2,050,460 |
| 450 | Plymouth, (Westhealth), (AGM), 6.25%, 6/1/16 | 451,323 |
| | | $ 5,226,656 |
S e e notes to financ ial statem ent
33
Eaton Vance Minnesota Municipal Income Fund as of July 31, 2010
PORTFOLIO OF INVESTMENTS CONT’D |
| | |
| Principal Amount | | |
| (000’s omitted) | Security | Value |
| |
| Insured-Special Tax Revenue — 2.8% | |
| $ 2,000 | St. Paul, Sales Tax Revenue, (XLCA), 5.00%, 11/1/30 | $ 2,048,720 |
| 1,000 | Washington County Housing and Redevelopment | |
| | Authority, (Annual Appropriation), (NPFG), | |
| | 5.50%, 2/1/32 | 1,015,390 |
| | | $ 3,064,110 |
| |
| Insured-Transportation — 2.3% | |
| $ 1,000 | Minneapolis and St. Paul Metropolitan Airports | |
| | Commission, (AMBAC), (AMT), 5.00%, 1/1/22 | $ 1,021,410 |
| 1,475 | Minneapolis and St. Paul Metropolitan Airports | |
| | Commission, (AMBAC), (BHAC), 4.50%, 1/1/32 | 1,500,046 |
| | | $ 2,521,456 |
| |
| Lease Revenue / Certificates of Participation — 0.9% |
| $ 560 | Minnetonka Independent School District No. 276, | |
| | 5.00%, 3/1/29 | $ 593,650 |
| 350 | Plymouth Intermediate School District No. 287, | |
| | 5.00%, 2/1/25 | 379,981 |
| | | $ 973,631 |
| |
| Miscellaneous — 1.9% | |
| $ 2,000 | Minneapolis Art Center Facilities, (Walker Art Center), | |
| | 5.125%, 7/1/21 | $ 2,068,200 |
| | | $ 2,068,200 |
| |
| Senior Living / Life Care — 0.7% | |
| $ 975 | St. Paul Housing and Redevelopment Authority, (Care | |
| | Institute, Inc. - Highland), 8.75%, 11/1/24(4) | $ 759,028 |
| | | $ 759,028 |
| |
| Special Tax Revenue — 4.9% | |
| $ 270 | Guam, Limited Obligation Bonds, 5.625%, 12/1/29 | $ 278,281 |
| 295 | Guam, Limited Obligation Bonds, 5.75%, 12/1/34 | 303,885 |
| 2,000 | Hennepin County, Sales Tax Revenue, | |
| | 4.75%, 12/15/33 | 2,073,540 |
| 2,000 | Hennepin County, Sales Tax Revenue, | |
| | 4.75%, 12/15/37 | 2,060,740 |
| 500 | Virgin Islands Public Finance Authority, | |
| | 6.75%, 10/1/37 | 558,925 |
| | | $ 5,275,371 |
| |
| Principal Amount | |
| (000’s omitted) Security | Value |
| Transportation — 1.0% | |
| $ 1,000 Minneapolis and St. Paul Metropolitan Airports | |
| Commission, 5.00%, 1/1/35(1) | $ 1,041,520 |
| | $ 1,041,520 |
| Total Tax-Exempt Investments — 98.1% | |
| (identified cost $100,717,402) | $106,280,514 |
| Other Assets, Less Liabilities — 1.9% | $ 2,084,526 |
| Net Assets — 100.0% | $108,365,040 |
The percentage shown for each investment category in the Portfolio of Investments is based on net assets.
AGC - Assured Guaranty Corp.
AGM - Assured Guaranty Municipal Corp.
AMBAC - AMBAC Financial Group, Inc.
AMT - Interest earned from these securities may be considered a tax preference item for purposes of the Federal Alternative Minimum Tax.
BHAC - Berkshire Hathaway Assurance Corp.
FGIC - Financial Guaranty Insurance Company
GNMA - Government National Mortgage Association
MFMR - Multi-Family Mortgage Revenue
NPFG - National Public Finance Guaranty Corp.
XLCA - XL Capital Assurance, Inc.
The Fund invests primarily in debt securities issued by Minnesota municipalities. The ability of the issuers of the debt securities to meet their obligations may be affected by economic developments in a specific industry or municipality. In order to reduce the risk associated with such economic developments, at July 31, 2010, 30.8% of total investments are backed by bond insurance of various financial institutions and financial guaranty assurance agencies. The aggregate percentage insured by an individual financial institution ranged from 1.4% to 13.6% of total investments.
| (1) | When-issued security. |
| (2) | Security (or a portion thereof) has been pledged to cover margin requirements on open financial futures contracts. |
| (3) | Security (or a portion thereof) has been segregated to cover payable for when-issued securities. |
| (4) | Security is in default with respect to scheduled principal payments. |
S e e notes to financ ial statem ents
34
Eaton Vance New Jersey Municipal Income Fund as of July 31, 2010
PORTFOLIO OF INVESTMENTS |
| | |
| Tax-Exe m pt Inve stm e nts — 114. 8% | |
| |
| Principal Amount | | |
| (000’s omitted) | Security | Value |
| |
| Education — 13.7% | |
| $ 750 | New Jersey Educational Facilities Authority, (Georgian | |
| | Court University), 5.00%, 7/1/27 | $ 754,762 |
| 750 | New Jersey Educational Facilities Authority, (Georgian | |
| | Court University), 5.00%, 7/1/33 | 725,145 |
| 660 | New Jersey Educational Facilities Authority, (Georgian | |
| | Court University), 5.25%, 7/1/37 | 653,400 |
| 1,475 | New Jersey Educational Facilities Authority, (Princeton | |
| | University), 4.25%, 7/1/40 | 1,477,670 |
| 4,035 | New Jersey Educational Facilities Authority, (Princeton | |
| | University), 4.50%, 7/1/37(1) | 4,137,368 |
| 10,125 | New Jersey Educational Facilities Authority, (Princeton | |
| | University), 4.50%, 7/1/38(1) | 10,399,691 |
| 3,575 | New Jersey Educational Facilities Authority, (Stevens | |
| | Institute of Technology), 5.00%, 7/1/27 | 3,643,926 |
| 880 | New Jersey Educational Facilities Authority, (Stevens | |
| | Institute of Technology), 5.00%, 7/1/34 | 870,276 |
| 2,565 | New Jersey Educational Facilities Authority, (University of | |
| | Medicine and Dentistry), 7.50%, 12/1/32 | 2,952,931 |
| 8,580 | Rutgers State University, 5.00%, 5/1/39(1) | 9,142,591 |
| | | $ 34,757,760 |
| |
| Electric Utilities — 1.0% | |
| $ 2,500 | Salem County Pollution Control Financing Authority, | |
| | (Public Service Enterprise Group, Inc.), (AMT), | |
| | 5.75%, 4/1/31 | $ 2,513,700 |
| | | $ 2,513,700 |
| |
| General Obligations — 1.0% | |
| $ 2,365 | Morris County, 4.00%, 4/15/22(2) | $ 2,526,790 |
| | | $ 2,526,790 |
| |
| Health Care-Miscellaneous — 0.3% | |
| $ 900 | New Jersey Economic Development Authority, (Hudson | |
| | County Occupational Center), 6.50%, 7/1/18 | $ 815,427 |
| | | $ 815,427 |
| |
| Hospital — 13.4% | |
| $ 1,700 | Camden County Improvement Authority, (Cooper Health | |
| | System), 5.00%, 2/15/35 | $ 1,545,827 |
| 2,220 | Camden County Improvement Authority, (Cooper Health | |
| | System), 5.75%, 2/15/34 | 2,227,859 |
| 7,125 | New Jersey Health Care Facilities Financing Authority, | |
| | (AHS Hospital Corp.), 5.00%, 7/1/27 | 7,255,245 |
| | |
| Principal Amount | | |
| (000’s omitted) | Security | Value |
| |
| Hospital (continued) | |
| $ 6,620 | New Jersey Health Care Facilities Financing Authority, | |
| | (Atlanticare Regional Medical Center), 5.00%, 7/1/37 | $ 6,673,622 |
| 1,135 | New Jersey Health Care Facilities Financing Authority, | |
| | (Chilton Memorial Hospital), 5.50%, 7/1/29 | 1,120,495 |
| 1,110 | New Jersey Health Care Facilities Financing Authority, | |
| | (Chilton Memorial Hospital), 5.75%, 7/1/39 | 1,113,008 |
| 4,140 | New Jersey Health Care Facilities Financing Authority, | |
| | (Kennedy Health System), 5.625%, 7/1/31 | 4,163,142 |
| 6,915 | New Jersey Health Care Facilities Financing Authority, | |
| | (South Jersey Hospital), 5.00%, 7/1/46 | 6,754,572 |
| 3,000 | New Jersey Health Care Facilities Financing Authority, | |
| | (Virtua Health), 5.75%, 7/1/33 | 3,182,340 |
| | | $ 34,036,110 |
| |
| Housing — 3.5% | |
| $ 5,435 | New Jersey Housing & Mortgage Finance Agency, | |
| | (Single Family Housing), (AMT), 4.70%, 10/1/37 | $ 5,218,741 |
| 3,000 | New Jersey Housing & Mortgage Finance Agency, | |
| | (Single Family Housing), (AMT), 4.95%, 10/1/32 | 3,004,860 |
| 700 | New Jersey Housing & Mortgage Finance Agency, | |
| | (Single Family Housing), (AMT), 5.00%, 10/1/37 | 703,101 |
| | | $ 8,926,702 |
| |
| Industrial Development Revenue — 8.6% | |
| $ 2,460 | Middlesex County Pollution Control Authority, (Amerada | |
| | Hess), 6.05%, 9/15/34 | $ 2,516,777 |
| 6,780 | New Jersey Economic Development Authority, (Anheuser- | |
| | Busch Cos., Inc.), (AMT), 4.95%, 3/1/47 | 6,347,232 |
| 540 | New Jersey Economic Development Authority, | |
| | (Continental Airlines), (AMT), 6.25%, 9/15/29 | 517,606 |
| 1,875 | New Jersey Economic Development Authority, | |
| | (Continental Airlines), (AMT), 9.00%, 6/1/33 | 1,980,881 |
| 4,370 | New Jersey Economic Development Authority, (New | |
| | Jersey American Water Co., Inc.), (AMT), | |
| | 5.70%, 10/1/39 | 4,500,401 |
| 6,465 | Virgin Islands Public Finance Authority, (HOVENSA LLC), | |
| | (AMT), 4.70%, 7/1/22 | 5,992,344 |
| | | $ 21,855,241 |
| |
| Insured-Education — 4.7% | |
| $ 9,690 | New Jersey Educational Facilities Authority, (College of | |
| | New Jersey), (AGM), 5.00%, 7/1/35(1) | $ 10,140,875 |
| 2,210 | New Jersey Educational Facilities Authority, (Rowan | |
| | University), (AGM), (FGIC), 3.00%, 7/1/28 | 1,826,720 |
| | | $ 11,967,595 |
S e e notes to financ ial statem ents
35
Eaton Vance New Jersey Municipal Income Fund as of July 31, 2010
PORTFOLIO OF INVESTMENTS CONT’D |
| | |
| Principal Amount | | |
| (000’s omitted) | Security | Value |
| |
| Insured-Gas Utilities — 3.9% | |
| $ 9,610 | New Jersey Economic Development Authority, (New | |
| | Jersey Natural Gas Co.), (FGIC), (NPFG), (AMT), | |
| | 4.90%, 10/1/40 | $ 9,891,189 |
| | | $ 9,891,189 |
| |
| Insured-General Obligations — 6.6% | |
| $ 3,050 | Hudson County Improvement Authority, (NPFG), | |
| | 0.00%, 12/15/35 | $ 707,844 |
| 3,100 | Hudson County Improvement Authority, (NPFG), | |
| | 0.00%, 12/15/36 | 674,002 |
| 5,150 | Irvington Township, (AGM), 0.00%, 7/15/22 | 3,191,764 |
| 5,350 | Irvington Township, (AGM), 0.00%, 7/15/23 | 3,129,590 |
| 10,850 | Jackson Township School District, (NPFG), | |
| | 2.50%, 6/15/27 | 9,008,429 |
| | | $ 16,711,629 |
| |
| Insured-Hospital — 3.8% | |
| $ 4,100 | New Jersey Economic Development Authority, (Hillcrest | |
| | Health Services), (AMBAC), 0.00%, 1/1/19 | $ 2,600,794 |
| 10,470 | New Jersey Economic Development Authority, (St. | |
| | Barnabas Medical Center), (NPFG), 0.00%, 7/1/26 | 3,328,413 |
| 3,480 | New Jersey Health Care Facilities Financing Authority, | |
| | (St. Barnabas Health Care System), (NPFG), | |
| | 0.00%, 7/1/23 | 1,425,304 |
| 2,170 | New Jersey Health Care Facilities Financing Authority, | |
| | (Virtua Health), (AGC), 5.50%, 7/1/38 | 2,321,314 |
| | | $ 9,675,825 |
| |
| Insured-Lease Revenue / Certificates of | |
| Participation — 1.3% | |
| $ 2,000 | New Jersey Economic Development Authority, (School | |
| | Facilities Construction), (AGC), 5.50%, 12/15/34 | $ 2,204,580 |
| 1,000 | South Jersey Port Corp., (Marine Terminal), (AGC), | |
| | 5.75%, 1/1/34 | 1,084,210 |
| | | $ 3,288,790 |
| |
| Insured-Other Revenue — 1.2% | |
| $ 2,785 | Hudson County Improvement Authority, (Harrison | |
| | Parking), (AGC), 5.25%, 1/1/39 | $ 2,980,284 |
| | | $ 2,980,284 |
| |
| Insured-Special Tax Revenue — 6.3% | |
| $ 7,870 | Garden Preservation Trust and Open Space and | |
| | Farmland, (AGM), 0.00%, 11/1/24 | $ 4,353,212 |
| 2,000 | New Jersey Economic Development Authority, (Motor | |
| | Vehicle Surcharges), (NPFG), 5.25%, 7/1/26 | 2,160,820 |
| | |
| Principal Amount | | |
| (000’s omitted) | Security | Value |
| |
| Insured-Special Tax Revenue (continued) | |
| $12,590 | New Jersey Economic Development Authority, (Motor | |
| | Vehicle Surcharges), (XLCA), 0.00%, 7/1/26 | $ 5,647,371 |
| 5,890 | New Jersey Economic Development Authority, (Motor | |
| | Vehicle Surcharges), (XLCA), 0.00%, 7/1/27 | 2,475,214 |
| 4,145 | Puerto Rico Sales Tax Financing Corp., (AMBAC), | |
| | 0.00%, 8/1/54 | 258,855 |
| 2,255 | Puerto Rico Sales Tax Financing Corp., (NPFG), | |
| | 0.00%, 8/1/44 | 274,907 |
| 4,470 | Puerto Rico Sales Tax Financing Corp., (NPFG), | |
| | 0.00%, 8/1/45 | 507,881 |
| 3,580 | Puerto Rico Sales Tax Financing Corp., (NPFG), | |
| | 0.00%, 8/1/46 | 381,592 |
| | | $ 16,059,852 |
| |
| Insured-Student Loan — 2.3% | |
| $ 5,445 | New Jersey Higher Education Assistance Authority, (AGC), | |
| | (AMT), 6.125%, 6/1/30 | $ 5,786,946 |
| | | $ 5,786,946 |
| |
| Insured-Transportation — 1.6% | |
| $10,000 | New Jersey Transportation Trust Fund Authority, | |
| | (Transportation System), (BHAC), (FGIC), | |
| | 0.00%, 12/15/31 | $ 3,235,100 |
| 850 | South Jersey Transportation Authority, (AGC), | |
| | 5.50%, 11/1/33 | 930,869 |
| | | $ 4,165,969 |
| |
| Insured-Water and Sewer — 6.2% | |
| $ 285 | Middlesex County Utilities Authority, (NPFG), | |
| | 6.25%, 8/15/10 | $ 285,576 |
| 8,845 | New Jersey Economic Development Authority, (United | |
| | Water New Jersey, Inc.), (AMBAC), (AMT), | |
| | 4.875%, 11/1/25 | 8,745,936 |
| 13,840 | North Hudson Sewer Authority, (NPFG), | |
| | 0.00%, 8/1/25 | 6,645,691 |
| | | $ 15,677,203 |
| |
| Lease Revenue / Certificates of Participation — 6.9% |
| $ 720 | Atlantic City, Public Facilities Lease Agreement, | |
| | 8.875%, 1/15/14 | $ 860,573 |
| 785 | Atlantic City, Public Facilities Lease Agreement, | |
| | 8.875%, 1/15/15 | 965,409 |
| 5,000 | New Jersey Economic Development Authority, (Economic | |
| | Recovery Fund), 0.00%, 3/15/13 | 4,757,600 |
| 1,000 | New Jersey Economic Development Authority, (School | |
| | Facilities Construction), 5.00%, 9/1/34 | 1,047,940 |
S e e notes to financ ial statem ents
36
Eaton Vance New Jersey Municipal Income Fund as of July 31, 2010
PORTFOLIO OF INVESTMENTS CONT’D |
| | |
| Principal Amount | | |
| (000’s omitted) | Security | Value |
| |
| Lease Revenue / Certificates of Participation (continued) |
| $ 3,000 | New Jersey Economic Development Authority, (School | |
| | Facilities Construction), 5.25%, 12/15/33 | $ 3,220,860 |
| 6,540 | New Jersey Health Care Facilities Financing Authority, | |
| | (Hospital Asset Transformation Program), | |
| | 5.25%, 10/1/38 | 6,648,106 |
| | | $ 17,500,488 |
| |
| Other Revenue — 5.2% | |
| $16,000 | Children’s Trust Fund, PR, Tobacco Settlement, | |
| | 0.00%, 5/15/50 | $ 548,320 |
| 34,960 | Children’s Trust Fund, PR, Tobacco Settlement, | |
| | 0.00%, 5/15/55 | 632,776 |
| 1,680 | New Jersey Economic Development Authority, (Duke | |
| | Farms Foundation), 5.00%, 7/1/48(1) | 1,782,144 |
| 7,500 | New Jersey Economic Development Authority, (Duke | |
| | Farms Foundation), 5.00%, 7/1/48(1) | 7,956,000 |
| 20 | New Jersey Economic Development Authority, (Duke | |
| | Farms Foundation), 5.00%, 7/1/48 | 21,216 |
| 12,800 | Tobacco Settlement Financing Corp., 0.00%, 6/1/41 | 638,976 |
| 2,440 | Tobacco Settlement Financing Corp., 5.00%, 6/1/41 | 1,608,179 |
| | | $ 13,187,611 |
| |
| Senior Living / Life Care — 2.9% | |
| $ 1,345 | New Jersey Economic Development Authority, (Cranes | |
| | Mill, Inc.), 5.875%, 7/1/28 | $ 1,300,844 |
| 2,230 | New Jersey Economic Development Authority, (Cranes | |
| | Mill, Inc.), 6.00%, 7/1/38 | 2,125,614 |
| 3,390 | New Jersey Economic Development Authority, (Forsgate), | |
| | (AMT), 8.625%, 6/1/25(3) | 2,303,979 |
| 1,935 | New Jersey Economic Development Authority, (Seabrook | |
| | Village), 5.25%, 11/15/36 | 1,606,611 |
| | | $ 7,337,048 |
| |
| Special Tax Revenue — 2.4% | |
| $ 300 | New Jersey Economic Development Authority, (Newark | |
| | Downtown District Management Corp.), | |
| | 5.125%, 6/15/27 | $ 289,632 |
| 525 | New Jersey Economic Development Authority, (Newark | |
| | Downtown District Management Corp.), | |
| | 5.125%, 6/15/37 | 483,021 |
| 15,000 | Puerto Rico Sales Tax Financing Corp., 0.00%, 8/1/37 | 2,652,600 |
| 1,245 | Puerto Rico Sales Tax Financing Corp., 5.25%, 8/1/57 | 1,256,902 |
| 1,295 | Virgin Islands Public Finance Authority, | |
| | 6.75%, 10/1/37 | 1,447,616 |
| | | $ 6,129,771 |
| | |
| Principal Amount | | |
| (000’s omitted) | Security | Value |
| |
| Student Loan — 3.8% | |
| $ 635 | New Jersey Higher Education Assistance Authority, | |
| | 5.625%, 6/1/30 | $ 672,789 |
| 9,000 | New Jersey Higher Education Assistance Authority, | |
| | (AMT), Variable Rate, 1.337%, 6/1/36(1)(4) | 8,974,530 |
| | | $ 9,647,319 |
| |
| Transportation — 11.3% | |
| $ 1,550 | Delaware River Port Authority, 5.00%, 1/1/35 | $ 1,580,860 |
| 1,250 | Delaware River Port Authority, 5.00%, 1/1/40 | 1,271,088 |
| 2,500 | New Jersey Transportation Trust Fund Authority, | |
| | (Transportation System), 5.875%, 12/15/38 | 2,769,700 |
| 6,000 | New Jersey Turnpike Authority, 5.25%, 1/1/40 | 6,361,860 |
| 13,900 | Port Authority of New York and New Jersey, | |
| | 6.125%, 6/1/94 | 16,799,540 |
| | | $ 28,783,048 |
| |
| Water and Sewer — 2.9% | |
| $ 2,615 | Cumberland County Improvement Authority, (Solid Waste | |
| | System), 5.00%, 1/1/30 | $ 2,635,449 |
| 4,870 | New Jersey Economic Development Authority, (Atlantic | |
| | City Sewer), (AMT), 5.45%, 4/1/28 | 4,870,633 |
| | | $ 7,506,082 |
| |
| Total Tax-Exempt Investments — 114.8% | |
| (identified cost $286,378,679) | $291,728,379 |
| |
| Other Assets, Less Liabilities — (14.8)% | $ (37,631,178) |
| |
| Net Assets — 100.0% | $254,097,201 |
The percentage shown for each investment category in the Portfolio of Investments is based on net assets.
AGC - Assured Guaranty Corp.
AGM - Assured Guaranty Municipal Corp.
AMBAC - AMBAC Financial Group, Inc.
AMT - Interest earned from these securities may be considered a tax preference item for purposes of the Federal Alternative Minimum Tax.
BHAC - Berkshire Hathaway Assurance Corp.
FGIC - Financial Guaranty Insurance Company
NPFG - National Public Finance Guaranty Corp.
XLCA - XL Capital Assurance, Inc.
The Fund invests primarily in debt securities issued by New Jersey municipalities. The ability of the issuers of the debt securities to meet their obligations may be affected by economic developments in a specific industry or municipality. In order to reduce the risk associated with such economic developments, at July 31, 2010, 33.0% of total investments are backed by bond insurance of
S e e notes to financ ial statem ents
37
Eaton Vance New Jersey Municipal Income Fund as of July 31, 201
PORTFOLIO OF INVESTMENTS CONT’D |
various financial institutions and financial guaranty assurance agencies. The aggregate percentage insured by an individual financial institution ranged from 1.1% to 12.1% of total investments.
| (1) | Security represents the underlying municipal bond of an inverse floater (see Note 1I). |
| (2) | Security (or a portion thereof) has been pledged to cover margin requirements on open financial futures contracts. |
| (3) | Security is in default and making only partial interest payments. |
| (4) | Security (or a portion thereof) has been pledged as collateral for inverse floating-rate security transactions. The aggregate value of such collateral is $1,774,530. |
S e e notes to financ ial statem ent
38
Eaton Vance Pennsylvania Municipal Income Fund as of July 31, 2010
PORTFOLIO OF INVESTMENTS |
| | |
| Tax-Exe m pt Inve stm e nts — 111. 8% | |
| |
| Principal Amount | | |
| (000’s omitted) | Security | Value |
| |
| Bond Bank — 1.8% | |
| $ 5,000 | Delaware Valley Regional Finance Authority, | |
| | 5.75%, 7/1/32 | $ 5,502,750 |
| | | $ 5,502,750 |
| |
| Cogeneration — 0.8% | |
| $ 3,200 | Pennsylvania Economic Development Financing Authority, | |
| | (Northampton Generating), (AMT), 6.50%, 1/1/13 | $ 2,008,736 |
| 1,000 | Pennsylvania Economic Development Financing Authority, | |
| | (Northampton Generating), (AMT), 6.60%, 1/1/19 | 564,210 |
| | | $ 2,572,946 |
| |
| Education — 7.6% | |
| $ 1,150 | Allegheny County Higher Education Building Authority, | |
| | (Duquesne University), 5.00%, 3/1/33 | $ 1,169,400 |
| 1,000 | Bucks County Industrial Development Authority, (George | |
| | School), 5.00%, 9/15/34 | 1,039,310 |
| 1,500 | Bucks County Industrial Development Authority, (George | |
| | School), 5.00%, 9/15/39 | 1,546,485 |
| 2,000 | Lancaster Higher Education Authority, (Franklin & | |
| | Marshall College), 5.00%, 4/15/37 | 2,045,420 |
| 3,000 | Northampton County General Purpose Authority, | |
| | (Lafayette College), 5.00%, 11/1/34 | 3,159,330 |
| 4,000 | Northampton County General Purpose Authority, (Lehigh | |
| | University), 5.00%, 11/15/39 | 4,182,080 |
| 1,000 | Pennsylvania Higher Educational Facilities Authority, (La | |
| | Salle University), 5.00%, 5/1/37 | 955,900 |
| 3,800 | Pennsylvania Higher Educational Facilities Authority, | |
| | (University of Pennsylvania), 4.75%, 7/15/35 | 3,857,760 |
| 3,400 | Pennsylvania State University, 4.50%, 8/15/36 | 3,418,700 |
| 2,000 | Washington County Industrial Development Authority, | |
| | (Washington and Jefferson College), 5.25%, 11/1/30 | 2,095,480 |
| | | $ 23,469,865 |
| |
| Electric Utilities — 0.8% | |
| $ 2,250 | York County Industrial Development Authority, Pollution | |
| Control Revenue, (Public Service Enterprise Group, Inc.), | |
| | 5.50%, 9/1/20 | $ 2,302,515 |
| | | $ 2,302,515 |
| |
| Escrowed / Prerefunded — 0.7% | |
| $ 675 | Allegheny County Industrial Development Authority, | |
| (Residential Resources, Inc.), Prerefunded to 9/1/11, | |
| | 6.60%, 9/1/31 | $ 718,943 |
| | |
| Principal Amount | | |
| (000’s omitted) | Security | Value |
| |
| Escrowed / Prerefunded (continued) | |
| $ 1,210 | Bucks County Industrial Development Authority, | |
| | (Pennswood Village), Prerefunded to 10/1/12, | |
| | 6.00%, 10/1/27 | $ 1,362,133 |
| | | $ 2,081,076 |
| |
| General Obligations — 2.2% | |
| $ 2,000 | Centennial School District, Bucks County, | |
| | 5.00%, 12/15/37 | $ 2,116,080 |
| 1,000 | Chester County, 5.00%, 7/15/27(1) | 1,116,520 |
| 410 | Chester County, 5.00%, 7/15/28(1) | 454,776 |
| 2,000 | Montgomery County, 4.375%, 12/1/31(1) | 2,060,520 |
| 1,000 | Radnor Township, 5.125%, 7/15/34 | 1,037,340 |
| | | $ 6,785,236 |
| |
| Hospital — 15.7% | |
| $ 3,000 | Allegheny County Hospital Development Authority, | |
| | (University of Pittsburgh Medical Center), | |
| | 5.50%, 8/15/34 | $ 3,085,980 |
| 4,220 | Dauphin County General Authority, (Pinnacle Health | |
| | System), 6.00%, 6/1/29 | 4,505,694 |
| 1,000 | Franklin County Industrial Development Authority, (The | |
| | Chambersburg Hospital), 5.375%, 7/1/42 | 1,002,620 |
| 2,735 | Hazelton Health Services Authority, (Hazelton General | |
| | Hospital), 5.50%, 7/1/27 | 2,446,321 |
| 1,000 | Lancaster County Hospital Authority, (Lancaster General | |
| | Hospital), 5.00%, 3/15/22 | 1,055,860 |
| 1,050 | Lebanon County Health Facilities Authority, (Good | |
| | Samaritan Hospital), 6.00%, 11/15/35 | 953,799 |
| 4,855 | Lehigh County General Purpose Authority, (Lehigh Valley | |
| | Health Network), 5.25%, 7/1/32 | 4,886,121 |
| 3,250 | Lycoming County Authority, (Susquehanna Health | |
| | System), 5.75%, 7/1/39 | 3,322,605 |
| 2,000 | Monroe County Hospital Authority, (Pocono Medical | |
| | Center), 5.125%, 1/1/37 | 1,975,660 |
| 1,000 | Monroe County Hospital Authority, (Pocono Medical | |
| | Center), 5.25%, 1/1/43 | 992,250 |
| 9,000 | Pennsylvania Higher Educational Facilities Authority, | |
| | (University of Pennsylvania Health System), | |
| | 6.00%, 8/15/26(2) | 10,131,660 |
| 3,150 | Pennsylvania Higher Educational Facilities Authority, | |
| | (UPMC Health System), 5.00%, 5/15/31 | 3,193,627 |
| 4,100 | Pennsylvania Higher Educational Facilities Authority, | |
| | (UPMC Health System), 6.00%, 1/15/31 | 4,249,240 |
| 3,300 | Philadelphia Hospitals and Higher Education Facilities | |
| | Authority, (Children’s Hospital), 4.50%, 7/1/37 | 3,259,278 |
| 1,500 | South Fork Municipal Authority, (Conemaugh Health | |
| | System), 5.50%, 7/1/29 | 1,484,280 |
S e e notes to financ ial statem ents
39
Eaton Vance Pennsylvania Municipal Income Fund as of July 31, 2010
PORTFOLIO OF INVESTMENTS CONT’D |
| | |
| Principal Amount | | |
| (000’s omitted) | Security | Value |
| |
| Hospital (continued) | |
| $ 1,885 | Washington County Hospital Authority, (Monongahela | |
| | Hospital), 5.50%, 6/1/17 | $ 1,952,332 |
| | | $ 48,497,327 |
| |
| Housing — 6.4% | |
| $ 1,865 | Allegheny County Residential Finance Authority, SFMR, | |
| | (AMT), 4.95%, 11/1/37 | $ 1,842,863 |
| 6,460 | Pennsylvania Housing Finance Agency, SFMR, (AMT), | |
| | 4.70%, 10/1/37 | 6,138,292 |
| 3,165 | Pennsylvania Housing Finance Agency, SFMR, (AMT), | |
| | 4.875%, 4/1/26 | 3,185,129 |
| 5,960 | Pennsylvania Housing Finance Agency, SFMR, (AMT), | |
| | 4.90%, 10/1/37 | 5,933,001 |
| 2,745 | Pennsylvania Housing Finance Agency, SFMR, (AMT), | |
| | 5.25%, 4/1/32 | 2,757,407 |
| | | $ 19,856,692 |
| |
| Industrial Development Revenue — 1.9% | |
| $ 500 | Erie Industrial Development Authority, (International | |
| | Paper), (AMT), 5.85%, 12/1/20 | $ 500,240 |
| 1,200 | Luzerne County Industrial Development Authority, | |
| | (Pennsylvania-American Water Co.), 5.50%, 12/1/39 | 1,242,876 |
| 1,500 | New Morgan Industrial Development Authority, | |
| | (Browning-Ferris Industries, Inc.), (AMT), | |
| | 6.50%, 4/1/19 | 1,501,110 |
| 1,000 | Pennsylvania Economic Development Financing Authority, | |
| | (Pennsylvania-American Water Co.), 6.20%, 4/1/39 | 1,087,900 |
| 1,500 | Pennsylvania Economic Development Financing Authority, | |
| | (Waste Management, Inc.), (AMT), 5.10%, 10/1/27 | 1,501,230 |
| | | $ 5,833,356 |
| |
| Insured-Education — 7.7% | |
| $ 3,000 | Lycoming County Authority, (Pennsylvania College of | |
| | Technology), (AGC), 5.50%, 10/1/37 | $ 3,158,760 |
| 1,350 | Lycoming County Authority, (Pennsylvania College of | |
| | Technology), (AMBAC), 5.25%, 5/1/32 | 1,305,707 |
| 2,500 | Pennsylvania Higher Educational Facilities Authority, | |
| | (Drexel University), (NPFG), 5.00%, 5/1/37 | 2,572,550 |
| 2,500 | Pennsylvania Higher Educational Facilities Authority, | |
| | (State System of Higher Education), (NPFG), | |
| | 5.00%, 6/15/23 | 2,712,825 |
| 2,875 | Pennsylvania Higher Educational Facilities Authority, | |
| | (Temple University), (NPFG), 4.50%, 4/1/36 | 2,787,542 |
| 4,850 | Pennsylvania Higher Educational Facilities Authority, | |
| | (Temple University), (NPFG), 5.00%, 4/1/25 | 5,104,916 |
| 1,400 | Pennsylvania Higher Educational Facilities Authority, | |
| | (University of Pennsylvania), (NPFG), 4.50%, 6/15/36 | 1,395,688 |
| | |
| Principal Amount | | |
| (000’s omitted) | Security | Value |
| |
| Insured-Education (continued) | |
| $ 3,535 | Pennsylvania Higher Educational Facilities Authority, | |
| | (University of the Sciences in Philadelphia), (AGC), | |
| | 5.00%, 11/1/32 | $ 3,690,186 |
| 965 | Pennsylvania Higher Educational Facilities Authority, | |
| (University of the Sciences in Philadelphia), (XLCA), | |
| | 4.75%, 11/1/33 | 970,433 |
| | | $ 23,698,607 |
| |
| Insured-Electric Utilities — 1.3% | |
| $ 2,055 | Lehigh County Industrial Development Authority, (PPL | |
| | Electric Utilities Corp.), (FGIC), (NPFG), | |
| | 4.75%, 2/15/27 | $ 2,066,631 |
| 1,830 | Puerto Rico Electric Power Authority, (FGIC), (NPFG), | |
| | 5.25%, 7/1/35 | 1,864,496 |
| | | $ 3,931,127 |
| |
| Insured-Escrowed / Prerefunded — 6.2% | |
| $ 2,500 | Erie School District, (NPFG), Escrowed to Maturity, | |
| | 0.00%, 5/1/19 | $ 1,909,375 |
| 2,625 | Erie School District, (NPFG), Escrowed to Maturity, | |
| | 0.00%, 5/1/20 | 1,898,505 |
| 2,625 | Erie School District, (NPFG), Escrowed to Maturity, | |
| | 0.00%, 5/1/21 | 1,798,624 |
| 3,625 | Erie School District, (NPFG), Escrowed to Maturity, | |
| | 0.00%, 5/1/22 | 2,359,549 |
| 2,320 | McKeesport Area School District, (AMBAC), Escrowed to | |
| | Maturity, 0.00%, 10/1/25 | 1,274,121 |
| 2,610 | Westmoreland Municipal Authority, (FGIC), Escrowed to | |
| | Maturity, 0.00%, 8/15/19 | 1,970,654 |
| 5,780 | Westmoreland Municipal Authority, Series A, (FGIC), | |
| | Escrowed to Maturity, 0.00%, 8/15/20 | 4,133,451 |
| 5,400 | Westmoreland Municipal Authority, Series C, (FGIC), | |
| | Escrowed to Maturity, 0.00%, 8/15/20 | 3,888,486 |
| | | $ 19,232,765 |
| |
| Insured-General Obligations — 15.3% | |
| $ 2,150 | Beaver County, (AGM), 5.55%, 11/15/31 | $ 2,328,859 |
| 1,885 | Bethlehem Area School District, (AGM), | |
| | 5.25%, 1/15/25 | 2,050,428 |
| 940 | Bethlehem Area School District, (AGM), | |
| | 5.25%, 1/15/26 | 1,014,843 |
| 3,000 | Centennial School District, (AGM), 5.25%, 12/15/37 | 3,189,840 |
| 2,170 | Elizabeth Forward School District, (NPFG), | |
| | 0.00%, 9/1/20 | 1,478,161 |
| 2,170 | Elizabeth Forward School District, (NPFG), | |
| | 0.00%, 9/1/21 | 1,399,932 |
| 2,170 | Elizabeth Forward School District, (NPFG), | |
| | 0.00%, 9/1/22 | 1,323,526 |
S e e notes to financ ial statem ents
40
Eaton Vance Pennsylvania Municipal Income Fund as of July 31, 2010
PORTFOLIO OF INVESTMENTS CONT’D |
| | |
| Principal Amount | | |
| (000’s omitted) | Security | Value |
| |
| Insured-General Obligations (continued) | |
| $ 2,170 | Elizabeth Forward School District, (NPFG), | |
| | 0.00%, 9/1/23 | $ 1,249,486 |
| 2,180 | Harrisburg, (AMBAC), 0.00%, 3/15/17 | 1,166,126 |
| 2,000 | Harrisburg School District, (AGC), 5.00%, 11/15/33 | 2,091,040 |
| 5,175 | Hazelton School District, (FGIC), (NPFG), | |
| | 0.00%, 3/1/21 | 3,256,731 |
| 1,000 | Hopewell School District, (AGM), 0.00%, 9/1/22 | 621,590 |
| 2,000 | Hopewell School District, (AGM), 0.00%, 9/1/26 | 988,380 |
| 1,315 | Lake Lehman School District, (NPFG), 0.00%, 4/1/26 | 627,281 |
| 2,325 | Lancaster County, (AGM), 5.00%, 3/1/31 | 2,460,152 |
| 1,430 | Mars Area School District, (NPFG), Escrowed to Maturity, | |
| | 0.00%, 3/1/14 | 1,365,264 |
| 1,100 | McKeesport Area School District, (AMBAC), | |
| | 0.00%, 10/1/25 | 546,909 |
| 2,340 | McKeesport Area School District, (AMBAC), | |
| | 0.00%, 10/1/27 | 1,022,603 |
| 5,000 | Norwin School District, (AGM), 3.25%, 4/1/33 | 4,009,150 |
| 1,500 | Philadelphia, (AGC), 7.00%, 7/15/28 | 1,725,720 |
| 1,290 | Philadelphia School District, (FGIC), (NPFG), | |
| | 4.375%, 6/1/34 | 1,248,178 |
| 8,500 | Scranton School District, (AGM), 5.00%, 7/15/38 | 8,766,560 |
| 2,000 | State Public School Building Authority, (Harrisburg School | |
| | District), (AGC), 4.75%, 11/15/33 | 2,035,840 |
| 1,200 | West Mifflin Area School District, (AGM), | |
| | 5.125%, 4/1/31 | 1,271,760 |
| | | $ 47,238,359 |
| |
| Insured-Hospital — 5.6% | |
| $ 3,750 | Allegheny County Hospital Development Authority, | |
| | (Magee-Women’s Hospital), (FGIC), (NPFG), | |
| | 0.00%, 10/1/15 | $ 3,204,375 |
| 2,000 | Allegheny County Hospital Development Authority, (UPMC | |
| | Health System), (NPFG), 6.00%, 7/1/24 | 2,350,960 |
| 3,000 | Centre County Hospital Authority, (Mount Nittany Medical | |
| | Center), (AGC), 6.25%, 11/15/44 | 3,133,560 |
| 6,930 | Lehigh County General Purpose Authority, (Lehigh Valley | |
| | Health Network), (AGM), 5.00%, 7/1/35(2) | 7,014,269 |
| 1,310 | Washington County Hospital Authority, (Washington | |
| | Hospital), (AMBAC), 5.50%, 7/1/17 | 1,405,604 |
| | | $ 17,108,768 |
| |
| Insured-Industrial Development Revenue — 1.2% |
| $ 4,000 | York County Industrial Development Authority, (York | |
| | Water Co.), (FGIC), (AMT), 4.75%, 10/1/36 | $ 3,601,440 |
| | | $ 3,601,440 |
| | |
| Principal Amount | | |
| (000’s omitted) | Security | Value |
| |
| Insured-Lease Revenue / Certificates of | |
| Participation — 3.8% | |
| $ 1,000 | Commonwealth Financing Authority, (AGC), | |
| | 5.00%, 6/1/31 | $ 1,045,340 |
| 9,500 | State Public School Building Authority, (AGM), | |
| | 5.50%, 6/1/28(2) | 10,800,645 |
| | | $ 11,845,985 |
| |
| Insured-Special Tax Revenue — 1.3% | |
| $ 2,000 | Puerto Rico Infrastructure Financing Authority, (BHAC), | |
| | (FGIC), 5.50%, 7/1/20 | $ 2,353,840 |
| 11,000 | Puerto Rico Sales Tax Financing Corp., (AMBAC), | |
| | 0.00%, 8/1/54 | 686,950 |
| 2,035 | Puerto Rico Sales Tax Financing Corp., (NPFG), | |
| | 0.00%, 8/1/44 | 248,087 |
| 4,035 | Puerto Rico Sales Tax Financing Corp., (NPFG), | |
| | 0.00%, 8/1/45 | 458,456 |
| 3,225 | Puerto Rico Sales Tax Financing Corp., (NPFG), | |
| | 0.00%, 8/1/46 | 343,753 |
| | | $ 4,091,086 |
| |
| Insured-Transportation — 12.7% | |
| $ 8,800 | Pennsylvania Turnpike Commission, (AGM), | |
| | 5.25%, 7/15/30(2) | $ 9,912,320 |
| 6,000 | Philadelphia, Airport Revenue, (AGM), (AMT), | |
| | 5.00%, 6/15/27 | 5,992,860 |
| 5,970 | Philadelphia, Airport Revenue, (NPFG), (AMT), | |
| | 4.75%, 6/15/35 | 5,677,052 |
| 11,000 | Puerto Rico Highway and Transportation Authority, (AGC), | |
| | (AGM), 5.25%, 7/1/36(2) | 11,486,750 |
| 6,000 | Puerto Rico Highway and Transportation Authority, (AGC), | |
| | (CIFG), 5.25%, 7/1/41(2) | 6,258,840 |
| | | $ 39,327,822 |
| |
| Insured-Utilities — 2.6% | |
| $ 8,245 | Philadelphia Gas Works, (AMBAC), 5.00%, 10/1/37(3) | $ 8,088,263 |
| | | $ 8,088,263 |
| |
| Insured-Water and Sewer — 7.8% | |
| $ 5,125 | Allegheny County Sanitation Authority, (FGIC), (NPFG), | |
| | 5.00%, 12/1/37 | $ 5,198,697 |
| 460 | Allegheny County Sanitation Authority, (NPFG), | |
| | 5.50%, 12/1/30 | 465,916 |
| 3,905 | Chester County Industrial Development Authority, (Aqua | |
| | Pennsylvania, Inc.), (FGIC), (NPFG), (AMT), | |
| | 5.00%, 2/1/40 | 3,914,645 |
S e e notes to financ ial statem ents
41
Eaton Vance Pennsylvania Municipal Income Fund as of July 31, 2010
PORTFOLIO OF INVESTMENTS CONT’D |
| | |
| Principal Amount | | |
| (000’s omitted) | Security | Value |
| |
| Insured-Water and Sewer (continued) | |
| $ 5,670 | Delaware County Industrial Development Authority, (Aqua | |
| | Pennsylvania, Inc.), (FGIC), (NPFG), (AMT), | |
| | 5.00%, 2/1/35 | $ 5,700,618 |
| 4,125 | Delaware County Industrial Development Authority, (Aqua | |
| | Pennsylvania, Inc.), (FGIC), (NPFG), (AMT), | |
| | 5.00%, 11/1/36 | 4,144,553 |
| 3,000 | Philadelphia, Water and Wastewater Revenue, (AGM), | |
| | 5.00%, 8/1/35(4) | 3,074,790 |
| 2,235 | Westmoreland Municipal Authority, (FGIC), | |
| | 0.00%, 8/15/19 | 1,443,743 |
| | | $ 23,942,962 |
| |
| Nursing Home — 1.7% | |
| $ 2,000 | Allegheny County Housing Development Authority, (Villa | |
| | St. Joseph), 6.00%, 8/15/28 | $ 1,781,780 |
| 2,595 | Montgomery County Industrial Development Authority, | |
| | (Advancement of Geriatric Health Care Institute), | |
| | 8.375%, 7/1/23 | 2,597,829 |
| 1,080 | Westmoreland County Industrial Development Authority, | |
| | (Highland Health Systems, Inc.), 9.25%, 6/1/22 | 906,746 |
| | | $ 5,286,355 |
| |
| Senior Living / Life Care — 1.6% | |
| $ 2,500 | Cliff House Trust, (AMT), 6.625%, 6/1/27 | $ 1,311,200 |
| 1,835 | Lancaster County Hospital Authority, (Willow Valley | |
| | Retirement Communities), 5.875%, 6/1/31 | 1,857,020 |
| 600 | Montgomery County Industrial Development Authority, | |
| | (Foulkeways at Gwynedd), 5.00%, 12/1/24 | 596,922 |
| 1,300 | Montgomery County Industrial Development Authority, | |
| | (Foulkeways at Gwynedd), 5.00%, 12/1/30 | 1,247,038 |
| | | $ 5,012,180 |
| |
| Special Tax Revenue — 1.3% | |
| $12,500 | Puerto Rico Sales Tax Financing Corp., 0.00%, 8/1/38 | $ 2,062,000 |
| 1,080 | Puerto Rico Sales Tax Financing Corp., | |
| | 5.25%, 8/1/57(2) | 1,090,325 |
| 10 | Puerto Rico Sales Tax Financing Corp., 5.25%, 8/1/57 | 10,096 |
| 810 | Virgin Islands Public Finance Authority, | |
| | 6.75%, 10/1/37 | 905,458 |
| | | $ 4,067,879 |
| |
| Transportation — 2.8% | |
| $ 1,550 | Delaware River Port Authority, 5.00%, 1/1/35 | $ 1,580,860 |
| 950 | Delaware River Port Authority, 5.00%, 1/1/40 | 966,027 |
| 750 | Pennsylvania Economic Development Financing Authority, | |
| | (Amtrak), (AMT), 6.25%, 11/1/31 | 761,453 |
| | |
| Principal Amount | | |
| (000’s omitted) | Security | Value |
| Transportation (continued) | |
| $ 1,000 | Pennsylvania Turnpike Commission, 0.00%, 12/1/38 | $ 721,570 |
| 4,500 | Pennsylvania Turnpike Commission, 5.25%, 6/1/36 | 4,646,970 |
| | | $ 8,676,880 |
| |
| Water and Sewer — 1.0% | |
| $ 1,750 | Harrisburg Water Authority, 5.25%, 7/15/31 | $ 1,749,947 |
| 1,235 | Philadelphia, Water and Wastewater Revenue, | |
| | 5.25%, 1/1/32 | 1,298,825 |
| | | $ 3,048,772 |
| |
| Total Tax-Exempt Investments — 111.8% | |
| (identified cost $334,365,398) | $345,101,013 |
| |
| Other Assets, Less Liabilities — (11.8)% | $ (36,301,672) |
| |
| Net Assets — 100.0% | $308,799,341 |
The percentage shown for each investment category in the Portfolio of Investments is based on net assets.
AGC - Assured Guaranty Corp.
AGM - Assured Guaranty Municipal Corp.
AMBAC - AMBAC Financial Group, Inc.
AMT - Interest earned from these securities may be considered a tax preference item for purposes of the Federal Alternative Minimum Tax.
BHAC - Berkshire Hathaway Assurance Corp.
CIFG - CIFG Assurance North America, Inc.
FGIC - Financial Guaranty Insurance Company
NPFG - National Public Finance Guaranty Corp.
SFMR - Single Family Mortgage Revenue
XLCA - XL Capital Assurance, Inc.
The Fund invests primarily in debt securities issued by Pennsylvania municipalities. The ability of the issuers of the debt securities to meet their obligations may be affected by economic developments in a specific industry or municipality. In order to reduce the risk associated with such economic developments, at July 31, 2010, 58.6% of total investments are backed by bond insurance of various financial institutions and financial guaranty assurance agencies. The aggregate percentage insured by an individual financial institution ranged from 0.3% to 21.7% of total investments.
(1) Security (or a portion thereof) has been pledged to cover margin requirements on open financial futures contracts.
(2) Security represents the underlying municipal bond of an inverse floater (see Note 1I).
(3) Security (or a portion thereof) has been segregated to cover payable for when-issued securities.
(4) When-issued security.
S e e notes to financ ial statem ents
42
Eaton Vance Municipal Income Funds as of July 31, 2010
FINANCIAL STATEMENTS
State m ents of Asse ts and Liabilities
As of July 31, 2010 |
| | | | |
| | Arizona Fund | Colorado Fund | Connecticut Fund | Michigan Fund |
| |
| Assets | | | | |
| |
| Investments — | | | | |
Identified cost | $90,853,914 | $33,870,830 | $129,209,107 | $48,353,460 |
Unrealized appreciation | 4,486,350 | 240,323 | 5,248,390 | 2,268,618 |
| |
| Investments, at value | $ 95,340,264 | $ 34,111,153 | $ 134,457,497 | $ 50,622,078 |
| Cash | $ 1,432,178 | $ 773,036 | $ 1,977,486 | $ 379,656 |
| Interest receivable | 546,524 | 379,173 | 1,361,973 | 447,850 |
| Receivable for investments sold | 24,028 | — | 995,000 | — |
| Receivable for Fund shares sold | 26,864 | 7,007 | 66,662 | 8,523 |
| |
| Total assets | $ 97,369,858 | $ 35,270,369 | $ 138,858,618 | $ 51,458,107 |
| |
| Liabilities | | | | |
| |
| Payable for floating rate notes issued | $ 1,700,000 | $ — | $ 7,225,000 | $ 995,000 |
| Payable for variation margin on open financial futures contracts | 108,781 | 30,031 | 42,125 | 46,844 |
| Payable for open swap contracts | 102,045 | 33,187 | 156,172 | 70,277 |
| Payable for Fund shares redeemed | 229,096 | 38,420 | 188,771 | 54,963 |
| Distributions payable | 134,428 | 57,168 | 142,413 | 73,279 |
| Payable to affiliates: | | | | |
Investment adviser fee | 27,973 | 6,235 | 41,837 | 11,419 |
Distribution and service fees | 23,701 | 6,979 | 29,730 | 10,784 |
| Interest expense and fees payable | 793 | — | 4,084 | 423 |
| Accrued expenses | 71,677 | 49,656 | 87,058 | 61,730 |
| |
| Total liabilities | $ 2,398,494 | $ 221,676 | $ 7,917,190 | $ 1,324,719 |
| |
| Net Assets | $ 94,971,364 | $ 35,048,693 | $ 130,941,428 | $ 50,133,388 |
| |
| Sources of Net Assets | | | | |
| |
| Paid-in capital | $97,543,397 | $37,750,767 | $129,988,505 | $51,381,729 |
| Accumulated net realized loss | (6,672,437) | (2,808,580) | (3,865,624) | (3,371,017) |
| Accumulated undistributed (distributions in excess of) net investment income | (66,344) | (6,560) | (142,413) | 74,141 |
| Net unrealized appreciation | 4,166,748 | 113,066 | 4,960,960 | 2,048,535 |
| |
| Net Assets | $ 94,971,364 | $ 35,048,693 | $ 130,941,428 | $ 50,133,388 |
| |
| Class A Shares | | | | |
| |
| Net Assets | $83,120,246 | $33,583,484 | $110,954,692 | $46,491,985 |
| Shares Outstanding | 8,844,822 | 3,777,404 | 10,872,718 | 5,218,048 |
| Net Asset Value and Redemption Price Per Share | | | | |
| (net assets shares of beneficial interest outstanding) | $ 9.40 | $ 8.89 | $ 10.20 | $ 8.91 |
| Maximum Offering Price Per Share | | | | |
| (100 95.25 of net asset value per share) | $ 9.87 | $ 9.33 | $ 10.71 | $ 9.35 |
| |
| Class B Shares | | | | |
| |
| Net Assets | $ 3,086,409 | $ 1,095,092 | $ 5,618,884 | $ — |
| Shares Outstanding | 295,502 | 113,147 | 553,194 | — |
| Net Asset Value and Offering Price Per Share* | | | | |
| (net assets shares of beneficial interest outstanding) | $ 10.44 | $ 9.68 | $ 10.16 | $ — |
| |
| Class C Shares | | | | |
| |
| Net Assets | $ 8,764,709 | $ 370,117 | $ 7,683,808 | $ 3,641,403 |
| Shares Outstanding | 838,609 | 38,189 | 755,664 | 408,426 |
| Net Asset Value and Offering Price Per Share** | | | | |
| (net assets shares of beneficial interest outstanding) | $ 10.45 | $ 9.69 | $ 10.17 | $ 8.92 |
| |
| Class I Shares | | | | |
| |
| Net Assets | $ — | $ — | $ 6,684,044 | $ — |
| Shares Outstanding | — | — | 654,817 | — |
| Net Asset Value, Offering Price and Redemption Price Per Share | | | | |
| (net assets shares of beneficial interest outstanding) | $ — | $ — | $ 10.21 | $ — |
| |
| On sales of $50,000 or more, the offering price of Class A shares is reduced. | | | | |
| * Redemption price per share is equal to the net asset value less any applicable contingent deferred sales charge. | | | |
S e e notes to financ ial statem ents
43 |
Eaton Vance Municipal Income Funds as of July 31, 2010
FINANCIAL STATEMENTS CON T ’ D
State m ents of Asse ts and Liabilities
As of July 31, 2010 |
| | | | |
| | Minnesota Fund | New Jersey Fund | Pennsylvania Fund |
| |
| Assets | | | | |
| |
| Investments — | | | | |
Identified cost | $100,717,402 | $286,378,679 | $334,365,398 |
Unrealized appreciation | | 5,563,112 | 5,349,700 | 10,735,615 |
| |
| Investments, at value | $ 106,280,514 | $ 291,728,379 | $ 345,101,013 |
| Cash | $ 1,645,090 | $ 1,142,182 | $ 3,323,573 |
| Interest receivable | | 1,265,070 | 2,039,058 | 3,174,546 |
| Receivable for investments sold | | 1,702,638 | 2,501,716 | 220,376 |
| Receivable for Fund shares sold | | 110,321 | 161,783 | 224,484 |
| |
| Total assets | $ 111,003,633 | $ 297,573,118 | $ 352,043,992 |
| |
| Liabilities | | | | |
| |
| Payable for floating rate notes issued | $ — | $ 38,745,000 | $ 36,475,000 |
| Payable for investments purchased | | — | 2,938,074 | — |
| Payable for when-issued securities | | 2,060,640 | — | 3,066,270 |
| Payable for variation margin on open financial futures contracts | | 129,062 | 440,625 | 1,198,438 |
| Payable for open swap contracts | | 43,734 | 385,585 | 564,224 |
| Payable for Fund shares redeemed | | 176,150 | 257,063 | 1,066,655 |
| Distributions payable | | 97,813 | 373,853 | 476,576 |
| Payable to affiliates: | | | | |
Investment adviser fee | | 32,559 | 92,043 | 112,356 |
Distribution and service fees | | 30,912 | 61,720 | 86,897 |
| Interest expense and fees payable | | — | 40,603 | 44,206 |
| Accrued expenses | | 67,723 | 141,351 | 154,029 |
| |
| Total liabilities | $ 2,638,593 | $ 43,475,917 | $ 43,244,651 |
| |
| Net Assets | $ 108,365,040 | $ 254,097,201 | $ 308,799,341 |
| |
| Sources of Net Assets | | | | |
| |
| Paid-in capital | $106,730,028 | $281,097,466 | $333,407,472 |
| Accumulated net realized loss | | (3,671,077) | (31,921,383) | (31,802,147) |
| Accumulated undistributed net investment income | | 44,829 | 1,238,079 | 67,803 |
| Net unrealized appreciation | | 5,261,260 | 3,683,039 | 7,126,213 |
| |
| Net Assets | $ 108,365,040 | $ 254,097,201 | $ 308,799,341 |
| |
| Class A Shares | | | | |
| |
| Net Assets | $ 89,036,443 | $214,220,056 | $210,024,403 |
| Shares Outstanding | | 9,591,552 | 23,241,743 | 23,182,044 |
| Net Asset Value and Redemption Price Per Share | | | | |
| (net assets shares of beneficial interest outstanding) | $ 9.28 | $ 9.22 | $ 9.06 |
| Maximum Offering Price Per Share | | | | |
| (100 95.25 of net asset value per share) | $ 9.74 | $ 9.68 | $ 9.51 |
| |
| Class B Shares | | | | |
| |
| Net Assets | $ 4,037,910 | $ — | $ 17,328,061 |
| Shares Outstanding | | 404,263 | — | 1,847,934 |
| Net Asset Value and Offering Price Per Share* | | | | |
| (net assets shares of beneficial interest outstanding) | $ 9.99 | $ — | $ 9.38 |
| |
| Class C Shares | | | | |
| |
| Net Assets | $ 15,290,687 | $ 31,491,415 | $ 46,080,247 |
| Shares Outstanding | | 1,531,830 | 3,274,068 | 4,911,527 |
| Net Asset Value and Offering Price Per Share* | | | | |
| (net assets shares of beneficial interest outstanding) | $ 9.98 | $ 9.62 | $ 9.38 |
| |
| Class I Shares | | | | |
| |
| Net Assets | $ — | $ 8,385,730 | $ 35,366,630 |
| Shares Outstanding | | — | 909,592 | 3,888,529 |
| Net Asset Value, Offering Price and Redemption Price Per Share | | | | |
| (net assets shares of beneficial interest outstanding) | $ — | $ 9.22 | $ 9.10 |
| |
| On sales of $50,000 or more, the offering price of Class A shares is reduced. | | | | |
| * Redemption price per share is equal to the net asset value less any applicable contingent deferred sales charge. | | | |
S e e notes to financ ial statem ents
44 |
| | Eaton Vance Municipal Income Funds as of July 31, 2010
FINANCIAL STATEMENTS CON T ’ D
Statements of Operations
For the Year Ended July 31, 2010 |
| | | | |
| | Arizona Fund | Colorado Fund | Connecticut Fund | Michigan Fund |
| |
| Investment Income | | | | |
| Interest | $ 4,925,299 | $1,851,149 | $ 6,492,864 | $2,720,419 |
| Total investment income | $ 4,925,299 | $1,851,149 | $ 6,492,864 | $2,720,419 |
| |
| |
| Expenses | | | | |
| Investment adviser fee | $ 338,415 | $ 77,659 | $ 490,328 | $ 140,571 |
| Distribution and service fees | | | | |
Class A | 168,896 | 68,679 | 221,607 | 95,904 |
Class B | 38,436 | 16,194 | 68,247 | — |
Class C | 85,451 | 3,528 | 65,940 | 36,969 |
| Trustees’ fees and expenses | 3,829 | 1,745 | 4,969 | 2,265 |
| Custodian fee | 70,088 | 34,339 | 85,372 | 44,301 |
| Transfer and dividend disbursing agent fees | 31,143 | 16,720 | 52,511 | 30,376 |
| Legal and accounting services | 41,147 | 30,503 | 54,074 | 36,189 |
| Printing and postage | 14,000 | 6,400 | 11,907 | 8,574 |
| Registration fees | 12,588 | 5,764 | 9,783 | 4,088 |
| Interest expense and fees | 13,212 | — | 60,224 | 6,959 |
| Miscellaneous | 19,874 | 15,394 | 22,104 | 15,725 |
| Total expenses | $ 837,079 | $ 276,925 | $ 1,147,066 | $ 421,921 |
| Deduct — | | | | |
Reduction of custodian fee | $ 907 | $ 177 | $ 861 | $ 172 |
| Total expense reductions | $ 907 | $ 177 | $ 861 | $ 172 |
| |
| Net expenses | $ 836,172 | $ 276,748 | $ 1,146,205 | $ 421,749 |
| |
| Net investment income | $ 4,089,127 | $1,574,401 | $ 5,346,659 | $2,298,670 |
| |
| |
| Realized and Unrealized Gain (Loss) | | | | |
| Net realized gain (loss) — | | | | |
Investment transactions | $ (290,857) | $ (232,272) | $ 207,057 | $ 12,735 |
Financial futures contracts | (1,005,975) | (423,478) | (598,247) | (681,380) |
Swap contracts | (304,951) | (43,744) | (205,853) | (92,634) |
| Net realized loss | $ (1,601,783) | $ (699,494) | $ (597,043) | $ (761,279) |
| Change in unrealized appreciation (depreciation) — | | | | |
Investments | $ 6,020,149 | $3,416,428 | $ 6,561,850 | $3,794,895 |
Financial futures contracts | (29,846) | (24,807) | (33,155) | (44,256) |
Swap contracts | 66,041 | (12,425) | (58,472) | (26,312) |
| Net change in unrealized appreciation (depreciation) | $ 6,056,344 | $3,379,196 | $ 6,470,223 | $3,724,327 |
| |
| Net realized and unrealized gain | $ 4,454,561 | $2,679,702 | $ 5,873,180 | $2,963,048 |
| |
| Net increase in net assets from operations | $ 8,543,688 | $4,254,103 | $11,219,839 | $5,261,718 |
S e e notes to financ ial statem ents
45 |
| | Eaton Vance Municipal Income Funds as of July 31, 2010
FINANCIAL STATEMENTS CON T ’ D
Statements of Operations
For the Year Ended July 31, 2010 |
| | | |
| | Minnesota Fund | New Jersey Fund | Pennsylvania Fund |
| |
| Investment Income | | | |
| Interest | $4,889,074 | $15,126,968 | $17,686,810 |
| Total investment income | $4,889,074 | $ 15,126,968 | $ 17,686,810 |
| |
| |
| Expenses | | | |
| Investment adviser fee | $ 355,384 | $ 1,087,012 | $ 1,363,250 |
| Distribution and service fees | | | |
Class A | 165,571 | 443,037 | 438,287 |
Class B | 45,128 | — | 192,303 |
Class C | 133,899 | 288,240 | 423,708 |
| Trustees’ fees and expenses | 4,087 | 9,306 | 11,280 |
| Custodian fee | 69,060 | 155,596 | 173,533 |
| Transfer and dividend disbursing agent fees | 42,491 | 122,281 | 165,566 |
| Legal and accounting services | 36,534 | 74,652 | 83,742 |
| Printing and postage | 11,185 | 26,908 | 30,380 |
| Registration fees | 5,134 | 9,943 | 10,075 |
| Interest expense and fees | — | 277,212 | 278,752 |
| Miscellaneous | 20,048 | 31,162 | 36,858 |
| Total expenses | $ 888,521 | $ 2,525,349 | $ 3,207,734 |
| Deduct — | | | |
Reduction of custodian fee | $ 1,053 | $ 263 | $ 1,724 |
| Total expense reductions | $ 1,053 | $ 263 | $ 1,724 |
| |
| Net expenses | $ 887,468 | $ 2,525,086 | $ 3,206,010 |
| |
| Net investment income | $4,001,606 | $ 12,601,882 | $ 14,480,800 |
| |
| |
| Realized and Unrealized Gain (Loss) | | | |
| Net realized gain (loss) — | | | |
Investment transactions | $ 114,105 | $ 618,362 | $ (398,020) |
Financial futures contracts | (802,576) | (3,075,828) | (7,816,653) |
Swap contracts | (130,693) | (1,152,279) | (1,099,210) |
| Net realized loss | $ (819,164) | $ (3,609,745) | $ (9,313,883) |
| Change in unrealized appreciation (depreciation) — | | | |
Investments | $4,812,105 | $22,336,409 | $23,481,553 |
Financial futures contracts | (137,570) | (1,127,063) | (821,222) |
Swap contracts | 28,303 | 249,541 | 6,182 |
| Net change in unrealized appreciation (depreciation) | $4,702,838 | $ 21,458,887 | $ 22,666,513 |
| |
| Net realized and unrealized gain | $3,883,674 | $ 17,849,142 | $ 13,352,630 |
| |
| Net increase in net assets from operations | $7,885,280 | $ 30,451,024 | $ 27,833,430 |
S e e notes to financ ial statem ents
46 |
| | Eaton Vance Municipal Income Funds as of July 31, 2010
FINANCIAL STATEMENTS CON T ’ D
State ments of Change s in Ne t A ssets
For the Year Ended July 31, 2010 |
| | | | |
| Increase (Decrease) in Net Assets | Arizona Fund | Colorado Fund | Connecticut Fund | Michigan Fund |
| From operations — | | | | |
Net investment income | $ 4,089,127 | $ 1,574,401 | $ 5,346,659 | $ 2,298,670 |
Net realized loss from investment transactions, financial futures contracts | | | | |
and swap contracts | (1,601,783) | (699,494) | (597,043) | (761,279) |
Net change in unrealized appreciation (depreciation) from investments, | | | | |
financial futures contracts and swap contracts | 6,056,344 | 3,379,196 | 6,470,223 | 3,724,327 |
| Net increase in net assets from operations | $ 8,543,688 | $ 4,254,103 | $ 11,219,839 | $ 5,261,718 |
| Distributions to shareholders — | | | | |
| From net investment income | | | | |
Class A | $ (3,508,419) | $ (1,444,732) | $ (4,704,175) | $ (2,135,144) |
Class B | (139,229) | (59,388) | (252,090) | — |
Class C | (308,214) | (12,914) | (241,457) | (144,322) |
Class I | — | — | (204,736) | — |
| Total distributions to shareholders | $ (3,955,862) | $ (1,517,034) | $ (5,402,458) | $ (2,279,466) |
| Transactions in shares of beneficial interest — | | | | |
| Proceeds from sale of shares | | | | |
Class A | $ 7,225,203 | $ 4,073,114 | $ 10,645,628 | $ 2,338,264 |
Class B | 234,789 | 18,575 | 359,728 | — |
Class C | 1,166,745 | 12,513 | 3,063,972 | 1,048,798 |
Class I | — | — | 4,498,053 | — |
| Net asset value of shares issued to shareholders in payment of | | | | |
| distributions declared | | | | |
Class A | 1,940,703 | 756,427 | 3,272,704 | 1,297,719 |
Class B | 79,025 | 40,264 | 162,673 | — |
Class C | 220,788 | 6,102 | 140,957 | 94,403 |
Class I | — | — | 89,413 | — |
| Cost of shares redeemed | | | | |
Class A | (13,733,801) | (7,839,151) | (18,603,191) | (7,800,913) |
Class B | (844,098) | (359,969) | (741,077) | — |
Class C | (1,590,164) | (32,004) | (1,462,259) | (1,225,673) |
Class I | — | — | (164,257) | — |
| Net asset value of shares exchanged | | | | |
Class A | 1,359,067 | 918,318 | 2,918,293 | — |
Class B | (1,359,067) | (918,318) | (2,918,293) | — |
| Net increase (decrease) in net assets from Fund share transactions | $ (5,300,810) | $ (3,324,129) | $ 1,262,344 | $ (4,247,402) |
| |
| Net increase (decrease) in net assets | $ (712,984) | $ (587,060) | $ 7,079,725 | $ (1,265,150) |
| |
| |
| Net Assets | | | | |
| At beginning of year | $ 95,684,348 | $35,635,753 | $123,861,703 | $51,398,538 |
| At end of year | $ 94,971,364 | $ 35,048,693 | $ 130,941,428 | $ 50,133,388 |
| |
| |
| Accumulated undistributed | | | | |
| (distributions in excess of) net | | | | |
| investment income included in net assets | | | | |
| |
| At end of year | $ (66,344) | $ (6,560) | $ (142,413) | $ 74,141 |
S e e notes to financ ial statem ents
47 |
| | Eaton Vance Municipal Income Funds as of July 31, 2010
FINANCIAL STATEMENTS CON T ’ D
State ments of Change s in Ne t A ssets
For the Year Ended July 31, 2010 |
| | | |
| Increase (Decrease) in Net Assets | Minnesota Fund | New Jersey Fund | Pennsylvania Fund |
| From operations — | | | |
| Net investment income | $ 4,001,606 | $ 12,601,882 | $ 14,480,800 |
| Net realized loss from investment transactions, financial futures contracts and swap contracts | (819,164) | (3,609,745) | (9,313,883) |
| Net change in unrealized appreciation (depreciation) from investments, financial futures contracts and | | | |
| swap contracts | 4,702,838 | 21,458,887 | 22,666,513 |
| Net increase in net assets from operations | $ 7,885,280 | $ 30,451,024 | $ 27,833,430 |
| Distributions to shareholders — | | | |
| From net investment income | | | |
Class A | $ (3,230,898) | $ (10,700,115) | $ (9,946,020) |
Class B | (149,931) | — | (772,031) |
Class C | (446,690) | (1,254,265) | (1,700,397) |
Class I | — | (289,809) | (1,446,463) |
| Total distributions to shareholders | $ (3,827,519) | $ (12,244,189) | $ (13,864,911) |
| Transactions in shares of beneficial interest — | | | |
| Proceeds from sale of shares | | | |
Class A | $ 18,812,426 | $ 14,961,289 | $ 22,063,023 |
Class B | 311,703 | — | 1,561,936 |
Class C | 5,001,195 | 7,982,121 | 11,527,067 |
Class I | — | 7,346,089 | 14,161,132 |
| Net asset value of shares issued to shareholders in payment of distributions declared | | | |
Class A | 2,337,725 | 6,920,242 | 6,529,474 |
Class B | 97,085 | — | 449,264 |
Class C | 246,168 | 787,649 | 1,212,114 |
Class I | — | 29,439 | 48,497 |
| Cost of shares redeemed | | | |
Class A | (10,965,572) | (39,055,562) | (45,886,152) |
Class B | (617,116) | — | (2,982,206) |
Class C | (2,576,603) | (5,478,539) | (6,874,145) |
Class I | — | (980,625) | (2,505,064) |
| Net asset value of shares exchanged | | | |
Class A | 1,193,028 | — | 4,866,346 |
Class B | (1,193,028) | — | (4,866,346) |
| Net increase (decrease) in net assets from Fund share transactions | $ 12,647,011 | $ (7,487,897) | $ (695,060) |
| |
| Net increase in net assets | $ 16,704,772 | $ 10,718,938 | $ 13,273,459 |
| |
| |
| |
| Net Assets | | | |
| At beginning of year | $ 91,660,268 | $243,378,263 | $295,525,882 |
| At end of year | $108,365,040 | $ 254,097,201 | $ 308,799,341 |
| |
| |
| |
| Accumulated undistributed net investment income | | | |
| included in net assets | | | |
| |
| At end of year | $ 44,829 | $ 1,238,078 | $ 67,803 |
S e e notes to financ ial statem ents
48 |
| | Eaton Vance Municipal Income Funds as of July 31, 2010
FINANCIAL STATEMENTS CON T ’ D
State ments of Change s in Ne t A ssets
For the Year Ended July 31, 2009 |
| | | | |
| Increase (Decrease) in Net Assets | Arizona Fund | Colorado Fund | Connecticut Fund | Michigan Fund |
| From operations — | | | | |
Net investment income | $ 4,427,099 | $ 1,645,229 | $ 5,416,659 | $ 2,624,814 |
Net realized loss from investment transactions, financial futures contracts | | | | |
and swap contracts | (3,318,121) | (1,308,031) | (2,701,461) | (2,228,329) |
Net change in unrealized appreciation (depreciation) from investments, | | | | |
financial futures contracts and swap contracts | (577,636) | (1,384,904) | (327,015) | (1,943,233) |
| Net increase (decrease) in net assets from operations | $ 531,342 | $ (1,047,706) | $ 2,388,183 | $ (1,546,748) |
| Distributions to shareholders — | | | | |
| From net investment income | | | | |
Class A | $ (3,862,883) | $ (1,543,581) | $ (4,770,369) | $ (2,493,538) |
Class B | (216,302) | (109,508) | (415,377) | — |
Class C | (291,316) | (12,252) | (175,973) | (147,501) |
Class I | — | — | (40,986) | — |
| Total distributions to shareholders | $ (4,370,501) | $ (1,665,341) | $ (5,402,705) | $ (2,641,039) |
| Transactions in shares of beneficial interest — | | | | |
| Proceeds from sale of shares | | | | |
Class A | $ 12,466,620 | $ 5,497,187 | $ 21,775,497 | $ 2,153,007 |
Class B | 242,080 | 102,125 | 464,269 | — |
Class C | 2,985,620 | 341,602 | 2,833,670 | 1,298,061 |
Class I | — | — | 2,041,247 | — |
| Net asset value of shares issued to shareholders in payment of | | | | |
| distributions declared | | | | |
Class A | 2,352,473 | 803,254 | 2,928,594 | 1,382,254 |
Class B | 110,589 | 61,845 | 252,195 | — |
Class C | 212,327 | 8,616 | 95,995 | 89,838 |
Class I | — | — | 37,895 | — |
| Cost of shares redeemed | | | | |
Class A | (22,914,347) | (6,205,574) | (20,582,453) | (10,363,111) |
Class B | (1,269,611) | (431,444) | (2,210,135) | — |
Class C | (2,825,235) | (223,231) | (1,019,864) | (1,642,470) |
Class I | — | — | (105,120) | — |
| Net asset value of shares exchanged | | | | |
Class A | 1,402,151 | 794,871 | 2,299,850 | — |
Class B | (1,402,151) | (794,871) | (2,299,850) | — |
| Net increase (decrease) in net assets from Fund share transactions | $ (8,639,484) | $ (45,620) | $ 6,511,790 | $ (7,082,421) |
| |
| Net increase (decrease) in net assets | $ (12,478,643) | $ (2,758,667) | $ 3,497,268 | $ (11,270,208) |
| |
| |
| Net Assets | | | | |
| At beginning of year | $108,162,991 | $38,394,420 | $120,364,435 | $ 62,668,746 |
| At end of year | $ 95,684,348 | $ 35,635,753 | $ 123,861,703 | $ 51,398,538 |
| |
| |
| Accumulated undistributed | | | | |
| (distributions in excess of) net | | | | |
| investment income included in net assets | | | | |
| |
| At end of year | $ (80,434) | $ (54,779) | $ (91,820) | $ 69,691 |
S e e notes to financ ial statem ents
49 |
| | Eaton Vance Municipal Income Funds as of July 31, 2010
FINANCIAL STATEMENTS CON T ’ D
State ments of Change s in Ne t A ssets
For the Year Ended July 31, 2009 |
| | | |
| Increase (Decrease) in Net Assets | Minnesota Fund | New Jersey Fund | Pennsylvania Fund |
| From operations — | | | |
Net investment income | $ 3,602,456 | $ 13,066,071 | $ 13,461,843 |
Net realized loss from investment transactions, financial futures contracts and swap contracts | (1,543,893) | (20,789,811) | (9,012,304) |
Net change in unrealized appreciation (depreciation) from investments, financial futures contracts and | | | |
swap contracts | 1,404,760 | (8,741,731) | (6,769,062) |
| Net increase (decrease) in net assets from operations | $ 3,463,323 | $ (16,465,471) | $ (2,319,523) |
| Distributions to shareholders — | | | |
| From net investment income | | | |
Class A | $ (3,048,312) | $ (11,652,913) | $ (10,437,242) |
Class B | (213,253) | — | (1,022,590) |
Class C | (357,003) | (1,110,580) | (1,360,344) |
Class I | — | (61,385) | (636,909) |
| Total distributions to shareholders | $ (3,618,568) | $ (12,824,878) | $ (13,457,085) |
| Transactions in shares of beneficial interest — | | | |
| Proceeds from sale of shares | | | |
Class A | $ 20,271,982 | $ 14,507,369 | $ 27,890,896 |
Class B | 352,606 | — | 1,580,020 |
Class C | 5,963,015 | 7,354,362 | 14,225,844 |
Class I | — | 1,790,156 | 23,034,562 |
| Net asset value of shares issued to shareholders in payment of distributions declared | | | |
Class A | 2,074,003 | 7,410,537 | 6,509,874 |
Class B | 122,495 | — | 556,510 |
Class C | 191,162 | 712,678 | 913,839 |
Class I | — | 18,668 | 132 |
| Cost of shares redeemed | | | |
Class A | (17,828,750) | (41,838,872) | (40,840,906) |
Class B | (1,240,003) | — | (3,819,633) |
Class C | (2,855,168) | (7,087,566) | (8,176,435) |
Class I | — | (205,664) | (2,585,172) |
| Net asset value of shares exchanged | | | |
Class A | 867,366 | — | 2,801,670 |
Class B | (867,366) | — | (2,801,670) |
| Net increase (decrease) in net assets from Fund share transactions | $ 7,051,342 | $ (17,338,332) | $ 19,289,531 |
| |
| Net increase (decrease) in net assets | $ 6,896,097 | $ (46,628,681) | $ 3,512,923 |
| |
| |
| |
| Net Assets | | | |
| At beginning of year | $ 84,764,171 | $290,006,944 | $292,012,959 |
| At end of year | $ 91,660,268 | $ 243,378,263 | $ 295,525,882 |
| |
| |
| |
| Accumulated undistributed | | | |
| (distributions in excess of) net | | | |
| investment income included in net assets | | | |
| |
| At end of year | $ (98,541) | $ 956,831 | $ (380,114) |
S e e notes to financ ial statem ents
50 |
| | Eaton Vance Municipal Income Funds as of July 31, 2010
FINANCIAL STATEMENTS CON T ’ D
State ment of Cash Flows
For the Year Ended July 31, 2010 |
| |
| Cash Flows From Operating Activities | New Jersey Fund |
| Net increase in net assets from operations | $ 30,451,024 |
| Adjustments to reconcile net increase in net assets from operations to net cash provided by operating activities: | |
Investments purchased | (36,094,930) |
Investments sold | 43,042,973 |
Net accretion/amortization of premium (discount) | (2,775,514) |
Decrease in interest receivable | 344,659 |
Decrease in receivable for investments sold | 432,942 |
Increase in payable for investments purchased | 2,938,074 |
Decrease in payable for variation margin on open financial futures contracts | (58,203) |
Decrease in payable for open swap contracts | (249,541) |
Decrease in payable to affiliate for investment adviser fee | (29,572) |
Increase in payable to affiliate for distribution and service fees | 4,606 |
Increase in interest expense and fees payable | 12,754 |
Increase in accrued expenses | 2,824 |
Net change in unrealized (appreciation) depreciation from investments | (22,336,409) |
Net realized gain from investments | (618,362) |
Net cash provided by operating activities | $ 15,067,325 |
| |
| |
| |
| Cash Flows From Financing Activities | |
| Proceeds from Fund shares sold | $ 30,610,652 |
| Fund shares redeemed | (45,611,172) |
| Distributions paid, net of reinvestments | (4,521,000) |
| Proceeds from secured borrowings | 8,320,000 |
| Decrease in demand note payable | (2,800,000) |
| Net cash used in financing activities | $ (14,001,520) |
| |
| Net increase in cash | $ 1,065,805 |
| |
| Cash at beginning of year | $ 76,377 |
| |
| Cash at end of year | $ 1,142,182 |
| |
| |
| |
| Supplemental disclosure of cash flow information: | |
| Noncash financing activities not included herein consist of: | |
| Reinvestment of dividends and distributions | $ 7,737,330 |
| Cash paid for interest and fees | $ 264,458 |
S e e notes to financ ial statem ent
51
| | Eaton Vance Municipal Income Funds as of July 31, 2010
FINANCIAL STATEMENTS CON T ’ D
Financ ial Highlig hts |
| | | | | |
| | | | Arizona Fund — Class A | | |
| | | | Year Ended July 31, | | |
| | 2010 | 2009 | 2008 | 2007 | 2006 |
| Net asset value — Beginning of year | $ 8.960 | $ 9.220 | $ 9.750 | $ 9.730 | $ 9.780 |
| |
| Income (Loss) From Operations | | | | | |
| Net investment income(1) | $ 0.400 | $ 0.409 | $ 0.417 | $ 0.433 | $ 0.438 |
| Net realized and unrealized gain (loss) | 0.427 | (0.266) | (0.535) | 0.013 | (0.055) |
| Total income (loss) from operations | $ 0.827 | $ 0.143 | $ (0.118) | $ 0.446 | $ 0.383 |
| |
| |
| Less Distributions | | | | | |
| From net investment income | $ (0.387) | $ (0.403) | $ (0.412) | $ (0.426) | $ (0.433) |
| Total distributions | $ (0.387) | $ (0.403) | $ (0.412) | $ (0.426) | $ (0.433) |
| Net asset value — End of year | $ 9.400 | $ 8.960 | $ 9.220 | $ 9.750 | $ 9.730 |
| |
| Total Return(2) | 9.35% | 1.85% | (1.23)% | 4.62% | 4.00% |
| |
| Ratios/Supplemental Data | | | | | |
| Net assets, end of year (000’s omitted) | $83,120 | $82,365 | $92,266 | $91,301 | $72,090 |
| Ratios (as a percentage of average daily net assets): | | | | | |
Expenses excluding interest and fees | 0.75% | 0.80% | 0.76% | 0.76%(3) | 0.77% |
Interest and fee expense(4) | 0.01% | 0.06% | 0.14% | 0.22% | 0.27% |
Total expenses before custodian fee reduction | 0.76% | 0.86% | 0.90% | 0.98%(3) | 1.04% |
Expenses after custodian fee reduction excluding interest and fees | 0.75% | 0.79% | 0.73% | 0.71%(3) | 0.74% |
Net investment income | 4.30% | 4.75% | 4.37% | 4.40% | 4.50% |
| Portfolio Turnover | 5% | 18% | 21% | 17% | 17% |
| (1) | Computed using average shares outstanding. |
| (2) | Returns are historical and are calculated by determining the percentage change in net asset value with all distributions reinvested and do not reflect the effect of sales charges. |
| (3) | The investment adviser was allocated a portion of the Fund’s operating expenses (equal to less than 0.005% of average daily net assets for the year ended July 31, 2007). Absent this allocation, total return would be lower. |
| (4) | Interest and fee expense relates to the liability for floating rate notes issued in conjunction with inverse floater securities transactions (see Note 1I). |
S e e notes to financ ial statem ents
52
| | Eaton Vance Municipal Income Funds as of July 31, 2010
FINANCIAL STATEMENTS CON T ’ D
Financ ial Highlig hts |
| | | | | |
| | | | Arizona Fund — Class B | | |
| | | | Year Ended July 31, | | |
| | 2010 | 2009 | 2008 | 2007 | 2006 |
| Net asset value — Beginning of year | $ 9.960 | $10.250 | $10.840 | $10.810 | $10.870 |
| |
| Income (Loss) From Operations | | | | | |
| Net investment income(1) | $ 0.367 | $ 0.383 | $ 0.385 | $ 0.404 | $ 0.409 |
| Net realized and unrealized gain (loss) | 0.468 | (0.299) | (0.597) | 0.017 | (0.070) |
| Total income (loss) from operations | $ 0.835 | $ 0.084 | $ (0.212) | $ 0.421 | $ 0.339 |
| |
| |
| Less Distributions | | | | | |
| From net investment income | $(0.355) | $ (0.374) | $ (0.378) | $ (0.391) | $ (0.399) |
| Total distributions | $ (0.355) | $ (0.374) | $ (0.378) | $ (0.391) | $ (0.399) |
| Net asset value — End of year | $10.440 | $ 9.960 | $10.250 | $10.840 | $10.810 |
| |
| Total Return(2) | 8.47% | 1.06% | (1.99)% | 3.92% | 3.18% |
| |
| Ratios/Supplemental Data | | | | | |
| Net assets, end of year (000’s omitted) | $ 3,086 | $ 4,759 | $ 7,416 | $ 8,834 | $12,958 |
| Ratios (as a percentage of average daily net assets): | | | | | |
Expenses excluding interest and fees | 1.50% | 1.55% | 1.51% | 1.51%(3) | 1.52% |
Interest and fee expense(4) | 0.01% | 0.06% | 0.14% | 0.22% | 0.27% |
Total expenses before custodian fee reduction | 1.51% | 1.61% | 1.65% | 1.73%(3) | 1.79% |
Expenses after custodian fee reduction excluding interest and fees | 1.50% | 1.54% | 1.48% | 1.46%(3) | 1.49% |
Net investment income | 3.55% | 4.01% | 3.63% | 3.69% | 3.78% |
| Portfolio Turnover | 5% | 18% | 21% | 17% | 17% |
| (1) | Computed using average shares outstanding. |
| (2) | Returns are historical and are calculated by determining the percentage change in net asset value with all distributions reinvested and do not reflect the effect of sales charges. |
| (3) | The investment adviser was allocated a portion of the Fund’s operating expenses (equal to less than 0.005% of average daily net assets for the year ended July 31, 2007). Absent this allocation, total return would be lower. |
| (4) | Interest and fee expense relates to the liability for floating rate notes issued in conjunction with inverse floater securities transactions (see Note 1I). |
S e e notes to financ ial statem ents
53
| | Eaton Vance Municipal Income Funds as of July 31, 2010
FINANCIAL STATEMENTS CON T ’ D
Financ ial Highlig hts |
| | | | | |
| | | | Arizona Fund — Class C | |
| | | Year Ended July 31, | | Period Ended |
| | 2010 | 2009 | 2008 | 2007 | July 31, 2006(1) |
| Net asset value — Beginning of period | $ 9.970 | $10.260 | $10.840 | $10.820 | $10.760 |
| |
| Income (Loss) From Operations | | | | | |
| Net investment income(2) | $ 0.367 | $ 0.382 | $ 0.382 | $ 0.388 | $ 0.241 |
| Net realized and unrealized gain (loss) | 0.468 | (0.298) | (0.584) | 0.023 | 0.063(3) |
| Total income (loss) from operations | $ 0.835 | $ 0.084 | $ (0.202) | $ 0.411 | $ 0.304 |
| |
| Less Distributions | | | | | |
| From net investment income | $(0.355) | $ (0.374) | $ (0.378) | $ (0.391) | $ (0.244) |
| Total distributions | $ (0.355) | $ (0.374) | $ (0.378) | $ (0.391) | $ (0.244) |
| Net asset value — End of period | $10.450 | $ 9.970 | $10.260 | $10.840 | $10.820 |
| Total Return(4) | 8.46% | 1.06% | (1.89)% | 3.82% | 2.84%(5) |
| |
| Ratios/Supplemental Data | | | | | |
| Net assets, end of period (000’s omitted) | $ 8,765 | $ 8,561 | $ 8,481 | $ 6,835 | $ 994 |
| Ratios (as a percentage of average daily net assets): | | | | | |
Expenses excluding interest and fees | 1.50% | 1.55% | 1.51% | 1.51%(6) | 1.52%(7) |
Interest and fee expense(8) | 0.01% | 0.06% | 0.14% | 0.22% | 0.27%(7) |
Total expenses before custodian fee reduction | 1.51% | 1.61% | 1.65% | 1.73%(6) | 1.79%(7) |
Expenses after custodian fee reduction excluding interest and fees | 1.50% | 1.54% | 1.48% | 1.46%(6) | 1.49%(7) |
Net investment income | 3.54% | 3.98% | 3.61% | 3.55% | 3.55%(7) |
| Portfolio Turnover | 5% | 18% | 21% | 17% | 17%(9) |
| (1) | For the period from the start of business, December 16, 2005, to July 31, 2006. |
| (2) | Computed using average shares outstanding. |
| (3) | The per share amount is not in accord with the net realized and unrealized gain (loss) on investments for the period because of the timing of sales of Fund shares and the amount of the per share realized and unrealized gains and losses at such time. |
| (4) | Returns are historical and are calculated by determining the percentage change in net asset value with all distributions reinvested and do not reflect the effect of sales charges. |
| (5) | Not annualized. |
| (6) | The investment adviser was allocated a portion of the Fund’s operating expenses (equal to less than 0.005% of average daily net assets for the year ended July 31, 2007). Absent this allocation, total return would be lower. |
| (7) | Annualized. |
| (8) | Interest and fee expense relates to the liability for floating rate notes issued in conjunction with inverse floater securities transactions (see Note 1I). |
| (9) | For the year ended July 31, 2006. |
S e e notes to financ ial statem ents
54
| | Eaton Vance Municipal Income Funds as of July 31, 2010
FINANCIAL STATEMENTS CON T ’ D
Financ ial Highlig hts |
| | | | | |
| | | | Colorado Fund — Class A | | |
| | | | Year Ended July 31, | | |
| | 2010 | 2009 | 2008 | 2007 | 2006 |
| Net asset value — Beginning of year | $ 8.250 | $ 8.880 | $ 9.670 | $ 9.730 | $ 9.690 |
| |
| Income (Loss) From Operations | | | | | |
| Net investment income(1) | $ 0.381 | $ 0.390 | $ 0.398 | $ 0.409 | $ 0.411 |
| Net realized and unrealized gain (loss) | 0.626 | (0.625) | (0.778) | (0.060) | 0.043 |
| Total income (loss) from operations | $ 1.007 | $ (0.235) | $ (0.380) | $ 0.349 | $ 0.454 |
| |
| |
| Less Distributions | | | | | |
| From net investment income | $ (0.367) | $ (0.395) | $ (0.410) | $ (0.409) | $ (0.414) |
| Total distributions | $ (0.367) | $ (0.395) | $ (0.410) | $ (0.409) | $ (0.414) |
| Net asset value — End of year | $ 8.890 | $ 8.250 | $ 8.880 | $ 9.670 | $ 9.730 |
| |
| Total Return(2) | 12.37% | (2.42)% | (4.00)% | 3.58% | 4.79% |
| |
| Ratios/Supplemental Data | | | | | |
| Net assets, end of year (000’s omitted) | $33,583 | $33,112 | $34,679 | $39,032 | $27,021 |
| Ratios (as a percentage of average daily net assets): | | | | | |
Expenses excluding interest and fees | 0.72% | 0.79% | 0.75% | 0.70%(3) | 0.73% |
Interest and fee expense(4) | — | — | 0.04% | 0.08% | 0.09% |
Total expenses before custodian fee reduction | 0.72% | 0.79% | 0.79% | 0.78%(3) | 0.82% |
Expenses after custodian fee reduction excluding interest and fees | 0.72% | 0.78% | 0.73% | 0.65%(3) | 0.69% |
Net investment income | 4.37% | 4.83% | 4.28% | 4.15% | 4.25% |
| Portfolio Turnover | 13% | 16% | 17% | 12% | 25% |
| (1) | Computed using average shares outstanding. |
| (2) | Returns are historical and are calculated by determining the percentage change in net asset value with all distributions reinvested and do not reflect the effect of sales charges. |
| (3) | The investment adviser was allocated a portion of the Fund’s operating expenses (equal to less than 0.005% of average daily net assets for the year ended July 31, 2007). Absent this allocation, total return would be lower. |
| (4) | Interest and fee expense relates to the liability for floating rate notes issued in conjunction with inverse floater securities transactions (see Note 1I). |
S e e notes to financ ial statem ents
55
| | Eaton Vance Municipal Income Funds as of July 31, 2010
FINANCIAL STATEMENTS CON T ’ D
Financ ial Highlig hts |
| | | | | |
| | | | Colorado Fund — Class B | | |
| | | | Year Ended July 31, | | |
| | 2010 | 2009 | 2008 | 2007 | 2006 |
| Net asset value — Beginning of year | $ 8.980 | $ 9.660 | $10.520 | $10.590 | $10.550 |
| |
| Income (Loss) From Operations | | | | | |
| Net investment income(1) | $ 0.345 | $ 0.359 | $ 0.358 | $ 0.367 | $ 0.370 |
| Net realized and unrealized gain (loss) | 0.686 | (0.678) | (0.851) | (0.072) | 0.041 |
| Total income (loss) from operations | $ 1.031 | $(0.319) | $ (0.493) | $ 0.295 | $ 0.411 |
| |
| |
| Less Distributions | | | | | |
| From net investment income | $(0.331) | $(0.361) | $ (0.367) | $ (0.365) | $ (0.371) |
| Total distributions | $(0.331) | $(0.361) | $ (0.367) | $ (0.365) | $ (0.371) |
| Net asset value — End of year | $ 9.680 | $ 8.980 | $ 9.660 | $10.520 | $10.590 |
| |
| Total Return(2) | 11.60% | (3.13)% | (4.76)% | 2.77% | 3.98% |
| |
| Ratios/Supplemental Data | | | | | |
| Net assets, end of year (000’s omitted) | $ 1,095 | $ 2,168 | $ 3,497 | $ 5,502 | $ 6,567 |
| Ratios (as a percentage of average daily net assets): | | | | | |
Expenses excluding interest and fees | 1.47% | 1.54% | 1.50% | 1.45%(3) | 1.48% |
Interest and fee expense(4) | — | — | 0.04% | 0.08% | 0.09% |
Total expenses before custodian fee reduction | 1.47% | 1.54% | 1.54% | 1.53%(3) | 1.57% |
Expenses after custodian fee reduction excluding interest and fees | 1.47% | 1.54% | 1.48% | 1.40%(3) | 1.44% |
Net investment income | 3.63% | 4.07% | 3.53% | 3.42% | 3.52% |
| Portfolio Turnover | 13% | 16% | 17% | 12% | 25% |
| (1) | Computed using average shares outstanding. |
| (2) | Returns are historical and are calculated by determining the percentage change in net asset value with all distributions reinvested and do not reflect the effect of sales charges. |
| (3) | The investment adviser was allocated a portion of the Fund’s operating expenses (equal to less than 0.005% of average daily net assets for the year ended July 31, 2007). Absent this allocation, total return would be lower. |
| (4) | Interest and fee expense relates to the liability for floating rate notes issued in conjunction with inverse floater securities transactions (see Note 1I). |
S e e notes to financ ial statem ents
56
| | Eaton Vance Municipal Income Funds as of July 31, 2010
FINANCIAL STATEMENTS CON T ’ D
Financ ial Highlig hts |
| | | |
| | Colorado Fund — Class C |
| | Year Ended July 31, Period Ended |
| | 2010 | 2009 | July 31, 2008(1) |
| Net asset value — Beginning of period | $ 9.000 | $ 9.680 | $10.460 |
| |
| Income (Loss) From Operations | | | |
| Net investment income(2) | $ 0.344 | $ 0.357 | $ 0.289 |
| Net realized and unrealized gain (loss) | 0.677 | (0.676) | (0.772) |
| Total income (loss) from operations | $ 1.021 | $(0.319) | $ (0.483) |
| |
| Less Distributions | | | |
| From net investment income | $(0.331) | $(0.361) | $ (0.297) |
| Total distributions | $(0.331) | $(0.361) | $ (0.297) |
| Net asset value — End of period | $ 9.690 | $ 9.000 | $ 9.680 |
| Total Return(3) | 11.46% | (3.12)% | (4.66)%(4) |
| |
| Ratios/Supplemental Data | | | |
| Net assets, end of period (000’s omitted) | $ 370 | $ 356 | $ 219 |
| Ratios (as a percentage of average daily net assets): | | | |
Expenses excluding interest and fees | 1.47% | 1.54% | 1.48%(5) |
Interest and fee expense(6) | — | — | 0.04%(5) |
Total expenses before custodian fee reduction | 1.47% | 1.54% | 1.52%(5) |
Expenses after custodian fee reduction excluding interest and fees | 1.47% | 1.54% | 1.46%(5) |
Net investment income | 3.61% | 4.07% | 3.60%(5) |
| Portfolio Turnover | 13% | 16% | 17%(7) |
| (1) | For the period from the start of business, October 8, 2007, to July 31, 2008. |
| (2) | Computed using average shares outstanding. |
| (3) | Returns are historical and are calculated by determining the percentage change in net asset value with all distributions reinvested and do not reflect the effect of sales charges. |
| (4) | Not annualized. |
| (5) | Annualized. |
| (6) | Interest and fee expense relates to the liability for floating rate notes issued in conjunction with inverse floater securities transactions (see Note 1I). |
| (7) | For the year ended July 31, 2008. |
S e e notes to financ ial statem ents
57
| | Eaton Vance Municipal Income Funds as of July 31, 2010
FINANCIAL STATEMENTS CON T ’ D
Financ ial Highlig hts |
| | | | | |
| | | | Connecticut Fund — Class A | | |
| | | | Year Ended July 31, | | |
| | 2010 | 2009 | 2008 | 2007 | 2006 |
| Net asset value — Beginning of year | $ 9.750 | $ 9.990 | $ 10.530 | $ 10.530 | $ 10.660 |
| |
| Income (Loss) From Operations | | | | | |
| Net investment income(1) | $ 0.425 | $ 0.446 | $ 0.446 | $ 0.437 | $ 0.442 |
| Net realized and unrealized gain (loss) | 0.455 | (0.241) | (0.548) | 0.000(2) | (0.134) |
| Total income (loss) from operations | $ 0.880 | $ 0.205 | $ (0.102) | $ 0.437 | $ 0.308 |
| |
| |
| Less Distributions | | | | | |
| From net investment income | $ (0.430) | $ (0.445) | $ (0.438) | $ (0.437) | $ (0.438) |
| Total distributions | $ (0.430) | $ (0.445) | $ (0.438) | $ (0.437) | $ (0.438) |
| Net asset value — End of year | $ 10.200 | $ 9.750 | $ 9.990 | $ 10.530 | $ 10.530 |
| |
| Total Return(3) | 9.14% | 2.31% | (1.01)% | 4.17% | 2.95% |
| |
| Ratios/Supplemental Data | | | | | |
| Net assets, end of year (000’s omitted) | $110,955 | $107,689 | $103,906 | $115,076 | $104,089 |
| Ratios (as a percentage of average daily net assets): | | | | | |
Expenses excluding interest and fees | 0.76% | 0.80% | 0.77% | 0.78%(4) | 0.77% |
Interest and fee expense(5) | 0.05% | 0.15% | 0.35% | 0.27% | 0.17% |
Total expenses before custodian fee reduction | 0.81% | 0.95% | 1.12% | 1.05%(4) | 0.94% |
Expenses after custodian fee reduction excluding interest and fees | 0.76% | 0.79% | 0.76% | 0.76%(4) | 0.76% |
Net investment income | 4.20% | 4.72% | 4.31% | 4.10% | 4.19% |
| Portfolio Turnover | 10% | 20% | 23% | 16% | 26% |
| (1) | Computed using average shares outstanding. |
| (2) | Amount is less than $0.0005. |
| (3) | Returns are historical and are calculated by determining the percentage change in net asset value with all distributions reinvested and do not reflect the effect of sales charges. |
| (4) | The investment adviser was allocated a portion of the Fund’s operating expenses (equal to less than 0.005% of average daily net assets for the year ended July 31, 2007). Absent this allocation, total return would be lower. |
| (5) | Interest and fee expense relates to the liability for floating rate notes issued in conjunction with inverse floater securities transactions (see Note 1I). |
S e e notes to financ ial statem ents
58
| | Eaton Vance Municipal Income Funds as of July 31, 2010
FINANCIAL STATEMENTS CON T ’ D
Financ ial Highlig hts |
| | | | | |
| | | | Connecticut Fund — Class B | | |
| | | | Year Ended July 31, | | |
| | 2010 | 2009 | 2008 | 2007 | 2006 |
| Net asset value — Beginning of year | $ 9.700 | $ 9.940 | $10.480 | $10.480 | $10.610 |
| |
| Income (Loss) From Operations | | | | | |
| Net investment income(1) | $ 0.348 | $ 0.375 | $ 0.367 | $ 0.356 | $ 0.362 |
| Net realized and unrealized gain (loss) | 0.465 | (0.244) | (0.552) | (0.001) | (0.136) |
| Total income (loss) from operations | $ 0.813 | $ 0.131 | $ (0.185) | $ 0.355 | $ 0.226 |
| |
| |
| Less Distributions | | | | | |
| From net investment income | $(0.353) | $(0.371) | $ (0.355) | $ (0.355) | $ (0.356) |
| Total distributions | $ (0.353) | $(0.371) | $ (0.355) | $ (0.355) | $ (0.356) |
| Net asset value — End of year | $10.160 | $ 9.700 | $ 9.940 | $10.480 | $10.480 |
| |
| Total Return(2) | 8.46% | 1.53% | (1.80)% | 3.39% | 2.17% |
| |
| Ratios/Supplemental Data | | | | | |
| Net assets, end of year (000’s omitted) | $ 5,619 | $ 8,387 | $12,622 | $18,238 | $24,179 |
| Ratios (as a percentage of average daily net assets): | | | | | |
Expenses excluding interest and fees | 1.51% | 1.55% | 1.52% | 1.53%(3) | 1.52% |
Interest and fee expense(4) | 0.05% | 0.15% | 0.35% | 0.27% | 0.17% |
Total expenses before custodian fee reduction | 1.56% | 1.70% | 1.87% | 1.80%(3) | 1.69% |
Expenses after custodian fee reduction excluding interest and fees | 1.51% | 1.54% | 1.51% | 1.51%(3) | 1.51% |
Net investment income | 3.46% | 3.99% | 3.56% | 3.35% | 3.44% |
| Portfolio Turnover | 10% | 20% | 23% | 16% | 26% |
| (1) | Computed using average shares outstanding. |
| (2) | Returns are historical and are calculated by determining the percentage change in net asset value with all distributions reinvested and do not reflect the effect of sales charges. |
| (3) | The investment adviser was allocated a portion of the Fund’s operating expenses (equal to less than 0.005% of average daily net assets for the year ended July 31, 2007). Absent this allocation, total return would be lower. |
| (4) | Interest and fee expense relates to the liability for floating rate notes issued in conjunction with inverse floater securities transactions (see Note 1I). |
S e e notes to financ ial statem ents
59
| | Eaton Vance Municipal Income Funds as of July 31, 2010
FINANCIAL STATEMENTS CON T ’ D
Financ ial Highlig hts |
| | | | | |
| | | | Connecticut Fund — Class C | |
| | | Year Ended July 31, | | Period Ended |
| | 2010 | 2009 | 2008 | 2007 | July 31, 2006(1) |
| Net asset value — Beginning of period | $ 9.710 | $ 9.950 | $10.480 | $10.480 | $10.550 |
| |
| Income (Loss) From Operations | | | | | |
| Net investment income(2) | $ 0.347 | $ 0.372 | $ 0.366 | $ 0.355 | $ 0.152 |
| Net realized and unrealized gain (loss) | 0.466 | (0.240) | (0.541) | 0.000(3) | (0.054) |
| Total income (loss) from operations | $ 0.813 | $ 0.132 | $ (0.175) | $ 0.355 | $ 0.098 |
| |
| Less Distributions | | | | | |
| From net investment income | $(0.353) | $(0.372) | $ (0.355) | $ (0.355) | $ (0.168) |
| Total distributions | $ (0.353) | $(0.372) | $ (0.355) | $ (0.355) | $ (0.168) |
| Net asset value — End of period | $10.170 | $ 9.710 | $ 9.950 | $10.480 | $10.480 |
| Total Return(4) | 8.46% | 1.53% | (1.71)% | 3.39% | 0.90%(5) |
| |
| Ratios/Supplemental Data | | | | | |
| Net assets, end of period (000’s omitted) | $ 7,684 | $ 5,664 | $ 3,827 | $ 3,433 | $ 207 |
| Ratios (as a percentage of average daily net assets): | | | | | |
Expenses excluding interest and fees | 1.51% | 1.55% | 1.52% | 1.53%(6) | 1.53%(7) |
Interest and fee expense(8) | 0.05% | 0.15% | 0.35% | 0.27% | 0.17%(7) |
Total expenses before custodian fee reduction | 1.56% | 1.70% | 1.87% | 1.80%(6) | 1.70%(7) |
Expenses after custodian fee reduction excluding interest and fees | 1.51% | 1.54% | 1.51% | 1.51%(6) | 1.51%(7) |
Net investment income | 3.44% | 3.96% | 3.55% | 3.35% | 3.07%(7) |
| Portfolio Turnover | 10% | 20% | 23% | 16% | 26%(9) |
| (1) | For the period from the start of business, February 9, 2006, to July 31, 2006. |
| (2) | Computed using average shares outstanding. |
| (3) | Amount is less than $0.0005. |
| (4) | Returns are historical and are calculated by determining the percentage change in net asset value with all distributions reinvested and do not reflect the effect of sales charges. |
| (5) | Not annualized. |
| (6) | The investment adviser was allocated a portion of the Fund’s operating expenses (equal to less than 0.005% of average daily net assets for the year ended July 31, 2007). Absent this allocation, total return would be lower. |
| (7) | Annualized. |
| (8) | Interest and fee expense relates to the liability for floating rate notes issued in conjunction with inverse floater securities transactions (see Note 1I). |
| (9) | For the year ended July 31, 2006. |
S e e notes to financ ial statem ents
60
| | Eaton Vance Municipal Income Funds as of July 31, 2010
FINANCIAL STATEMENTS CON T ’ D
Financ ial Highlig hts |
| | | |
| | Connecticut Fund — Class I |
| | Year Ended July 31, Period Ended |
| | 2010 | 2009 | July 31, 2008(1) |
| Net asset value — Beginning of period | $ 9.750 | $ 9.990 | $ 9.780 |
| |
| Income (Loss) From Operations | | | |
| Net investment income(2) | $ 0.446 | $ 0.461 | $ 0.196 |
| Net realized and unrealized gain (loss) | 0.464 | (0.237) | 0.203 |
| Total income from operations | $ 0.910 | $ 0.224 | $ 0.399 |
| |
| Less Distributions | | | |
| From net investment income | $(0.450) | $(0.464) | $(0.189) |
| Total distributions | $ (0.450) | $(0.464) | $(0.189) |
| Net asset value — End of period | $10.210 | $ 9.750 | $ 9.990 |
| Total Return(3) | 9.46% | 2.52% | 4.06%(4) |
| |
| Ratios/Supplemental Data | | | |
| Net assets, end of period (000’s omitted) | $ 6,684 | $ 2,122 | $ 10 |
| Ratios (as a percentage of average daily net assets): | | | |
Expenses excluding interest and fees | 0.56% | 0.60% | 0.58%(5) |
Interest and fee expense(6) | 0.05% | 0.15% | 0.35%(5) |
Total expenses before custodian fee reduction | 0.61% | 0.75% | 0.93%(5) |
Expenses after custodian fee reduction excluding interest and fees | 0.56% | 0.59% | 0.56%(5) |
Net investment income | 4.40% | 4.87% | 4.66%(5) |
| Portfolio Turnover | 10% | 20% | 23%(7) |
| (1) | For the period from the start of business, March 3, 2008, to July 31, 2008. |
| (2) | Computed using average shares outstanding. |
| (3) | Returns are historical and are calculated by determining the percentage change in net asset value with all distributions reinvested. |
| (4) | Not annualized. |
| (5) | Annualized. |
| (6) | Interest and fee expense relates to the liability for floating rate notes issued in conjunction with inverse floater securities transactions (see Note 1I). |
| (7) | For the year ended July 31, 2008. |
S e e notes to financ ial statem ents
61
| | Eaton Vance Municipal Income Funds as of July 31, 2010
FINANCIAL STATEMENTS CON T ’ D
Financ ial Highlig hts |
| | | | | |
| | | | Michigan Fund — Class A | | |
| | | | Year Ended July 31, | | |
| | 2010 | 2009 | 2008 | 2007 | 2006 |
| Net asset value — Beginning of year | $ 8.410 | $ 8.950 | $ 9.480 | $ 9.510 | $ 9.630 |
| |
| Income (Loss) From Operations | | | | | |
| Net investment income(1) | $ 0.397 | $ 0.402 | $ 0.407 | $ 0.401 | $ 0.419 |
| Net realized and unrealized gain (loss) | 0.496 | (0.538) | (0.489) | (0.028) | (0.131) |
| Total income (loss) from operations | $ 0.893 | $ (0.136) | $ (0.082) | $ 0.373 | $ 0.288 |
| |
| |
| Less Distributions | | | | | |
| From net investment income | $ (0.393) | $ (0.404) | $ (0.403) | $ (0.403) | $ (0.408) |
| From net realized gains | — | — | (0.045) | — | — |
| Total distributions | $ (0.393) | $ (0.404) | $ (0.448) | $ (0.403) | $ (0.408) |
| |
| Net asset value — End of year | $ 8.910 | $ 8.410 | $ 8.950 | $ 9.480 | $ 9.510 |
| Total Return(2) | 10.75% | (1.29)% | (0.88)% | 3.92% | 3.06% |
| |
| |
| Ratios/Supplemental Data | | | | | |
| Net assets, end of year (000’s omitted) | $46,492 | $47,885 | $58,620 | $64,786 | $53,595 |
| Ratios (as a percentage of average daily net assets): | | | | | |
Expenses excluding interest and fees | 0.75% | 0.80% | 0.77% | 0.78%(3) | 0.79% |
Interest and fee expense(4) | 0.01% | 0.16% | 0.14% | 0.24% | 0.24% |
Total expenses before custodian fee reduction | 0.76% | 0.96% | 0.91% | 1.02%(3) | 1.03% |
Expenses after custodian fee reduction excluding interest and fees | 0.75% | 0.80% | 0.75% | 0.75%(3) | 0.78% |
Net investment income | 4.49% | 4.89% | 4.40% | 4.16% | 4.39% |
| Portfolio Turnover | 6% | 15% | 24% | 15% | 32% |
| (1) | Computed using average shares outstanding. |
| (2) | Returns are historical and are calculated by determining the percentage change in net asset value with all distributions reinvested and do not reflect the effect of sales charges. |
| (3) | The investment adviser was allocated a portion of the Fund’s operating expenses (equal to less than 0.005% of average daily net assets for the year ended July 31, 2007). Absent this allocation, total return would be lower. |
| (4) | Interest and fee expense relates to the liability for floating rate notes issued in conjunction with inverse floater securities transactions (see Note 1I). |
S e e notes to financ ial statem ents
62
| | Eaton Vance Municipal Income Funds as of July 31, 2010
FINANCIAL STATEMENTS CON T ’ D
Financ ial Highlig hts |
| | | | | |
| | | | Michigan Fund — Class C | |
| | | Year Ended July 31, | | Period Ended |
| | 2010 | 2009 | 2008 | 2007 | July 31, 2006(1) |
| Net asset value — Beginning of period | $ 8.420 | $ 8.960 | $ 9.480 | $ 9.510 | $ 9.480 |
| |
| |
| Income (Loss) From Operations | | | | | |
| Net investment income(2) | $ 0.330 | $ 0.341 | $ 0.337 | $ 0.326 | $ 0.080 |
| Net realized and unrealized gain (loss) | 0.498 | (0.540) | (0.481) | (0.025) | 0.033 |
| Total income (loss) from operations | $ 0.828 | $(0.199) | $(0.144) | $ 0.301 | $ 0.113 |
| |
| |
| Less Distributions | | | | | |
| From net investment income | $(0.328) | $(0.341) | $(0.331) | $(0.331) | $(0.083) |
| From net realized gain | — | — | (0.045) | — | — |
| Total distributions | $(0.328) | $(0.341) | $(0.376) | $(0.331) | $(0.083) |
| |
| Net asset value — End of period | $ 8.920 | $ 8.420 | $ 8.960 | $ 9.480 | $ 9.510 |
| |
| Total Return(3) | 9.93% | (2.04)% | (1.54)% | 3.16% | 1.20%(4) |
| |
| |
| Ratios/Supplemental Data | | | | | |
| Net assets, end of period (000’s omitted) | $ 3,641 | $ 3,513 | $ 4,049 | $ 3,028 | $ 141 |
| Ratios (as a percentage of average daily net assets): | | | | | |
Expenses excluding interest and fees | 1.50% | 1.55% | 1.52% | 1.53%(5) | 1.54%(6) |
Interest and fee expense(7) | 0.01% | 0.16% | 0.14% | 0.24% | 0.24%(6) |
Total expenses before custodian fee reduction | 1.51% | 1.71% | 1.66% | 1.77%(5) | 1.78%(6) |
Expenses after custodian fee reduction excluding interest and fees | 1.50% | 1.55% | 1.50% | 1.50%(5) | 1.53%(6) |
Net investment income | 3.74% | 4.14% | 3.65% | 3.39% | 3.39%(6) |
| Portfolio Turnover | 6% | 15% | 24% | 15% | 32%(8) |
| (1) | For the period from the start of business, May 2, 2006, to July 31, 2006. |
| (2) | Computed using average shares outstanding. |
| (3) | Returns are historical and are calculated by determining the percentage change in net asset value with all distributions reinvested and do not reflect the effect of sales charges. |
| (4) | Not annualized. |
| (5) | The investment adviser was allocated a portion of the Fund’s operating expenses (equal to less than 0.005% of average daily net assets for the year ended July 31, 2007). Absent this allocation, total return would be lower. |
| (6) | Annualized. |
| (7) | Interest and fee expense relates to the liability for floating rate notes issued in conjunction with inverse floater securities transactions (see Note 1I). |
| (8) | For the year ended July 31, 2006. |
S e e notes to financ ial statem ents
63
| | Eaton Vance Municipal Income Funds as of July 31, 2010
FINANCIAL STATEMENTS CON T ’ D
Financ ial Highlig hts |
| | | | | |
| | | | Minnesota Fund — Class A | | |
| | | | Year Ended July 31, | | |
| | 2010 | 2009 | 2008 | 2007 | 2006 |
| Net asset value — Beginning of year | $ 8.900 | $ 8.930 | $ 9.280 | $ 9.280 | $ 9.320 |
| |
| Income (Loss) From Operations | | | | | |
| Net investment income(1) | $ 0.375 | $ 0.374 | $ 0.382 | $ 0.403 | $ 0.424 |
| Net realized and unrealized gain (loss) | 0.364 | (0.028) | (0.336) | 0.007 | (0.052) |
| Total income from operations | $ 0.739 | $ 0.346 | $ 0.046 | $ 0.410 | $ 0.372 |
| |
| |
| Less Distributions | | | | | |
| From net investment income | $ (0.359) | $ (0.376) | $ (0.396) | $ (0.410) | $ (0.412) |
| Total distributions | $ (0.359) | $ (0.376) | $ (0.396) | $ (0.410) | $ (0.412) |
| Net asset value — End of year | $ 9.280 | $ 8.900 | $ 8.930 | $ 9.280 | $ 9.280 |
| |
| Total Return(2) | 8.40% | 4.15% | 0.51% | 4.45% | 4.08% |
| |
| Ratios/Supplemental Data | | | | | |
| Net assets, end of year (000’s omitted) | $89,036 | $74,358 | $69,234 | $57,574 | $34,677 |
| Ratios (as a percentage of average daily net assets): | | | | | |
Expenses excluding interest and fees | 0.73% | 0.79% | 0.75% | 0.78%(3) | 0.77% |
Interest and fee expense(4) | — | — | 0.10% | 0.20% | 0.22% |
Total expenses before custodian fee reduction | 0.73% | 0.79% | 0.85% | 0.98%(3) | 0.99% |
Expenses after custodian fee reduction excluding interest and fees | 0.73% | 0.79% | 0.70% | 0.72%(3) | 0.74% |
Net investment income | 4.08% | 4.38% | 4.17% | 4.30% | 4.57% |
| Portfolio Turnover | 3% | 23% | 18% | 4% | 14% |
| (1) | Computed using average shares outstanding. |
| (2) | Returns are historical and are calculated by determining the percentage change in net asset value with all distributions reinvested and do not reflect the effect of sales charges. |
| (3) | The investment adviser was allocated a portion of the Fund’s operating expenses (equal to less than 0.005% of average daily net assets for the year ended July 31, 2007). Absent this allocation, total return would be lower. |
| (4) | Interest and fee expense relates to the liability for floating rate notes issued in conjunction with inverse floater securities transactions (see Note 1I). |
S e e notes to financ ial statem ents
64
| | Eaton Vance Municipal Income Funds as of July 31, 2010
FINANCIAL STATEMENTS CON T ’ D
Financ ial Highlig hts |
| | | | | |
| | | | Minnesota Fund — Class B | | |
| | | | Year Ended July 31, | | |
| | 2010 | 2009 | 2008 | 2007 | 2006 |
| Net asset value — Beginning of year | $ 9.580 | $ 9.600 | $ 9.990 | $ 9.990 | $10.020 |
| |
| Income (Loss) From Operations | | | | | |
| Net investment income(1) | $ 0.330 | $ 0.334 | $ 0.338 | $ 0.363 | $ 0.383 |
| Net realized and unrealized gain (loss) | 0.393 | (0.020) | (0.376) | 0.003 | (0.045) |
| Total income (loss) from operations | $ 0.723 | $ 0.314 | $(0.038) | $ 0.366 | $ 0.338 |
| |
| |
| Less Distributions | | | | | |
| From net investment income | $(0.313) | $(0.334) | $(0.352) | $(0.366) | $ (0.368) |
| Total distributions | $(0.313) | $(0.334) | $(0.352) | $(0.366) | $ (0.368) |
| Net asset value — End of year | $ 9.990 | $ 9.580 | $ 9.600 | $ 9.990 | $ 9.990 |
| |
| Total Return(2) | 7.62% | 3.49% | (0.39)% | 3.68% | 3.44% |
| |
| Ratios/Supplemental Data | | | | | |
| Net assets, end of year (000’s omitted) | $ 4,038 | $ 5,225 | $ 6,962 | $ 7,827 | $ 9,941 |
| Ratios (as a percentage of average daily net assets): | | | | | |
Expenses excluding interest and fees | 1.49% | 1.54% | 1.50% | 1.53%(3) | 1.52% |
Interest and fee expense(4) | — | — | 0.10% | 0.20% | 0.22% |
Total expenses before custodian fee reduction | 1.49% | 1.54% | 1.60% | 1.73%(3) | 1.74% |
Expenses after custodian fee reduction excluding interest and fees | 1.49% | 1.54% | 1.45% | 1.47%(3) | 1.49% |
Net investment income | 3.33% | 3.64% | 3.43% | 3.60% | 3.84% |
| Portfolio Turnover | 3% | 23% | 18% | 4% | 14% |
| (1) | Computed using average shares outstanding. |
| (2) | Returns are historical and are calculated by determining the percentage change in net asset value with all distributions reinvested and do not reflect the effect of sales charges. |
| (3) | The investment adviser was allocated a portion of the Fund’s operating expenses (equal to less than 0.005% of average daily net assets for the year ended July 31, 2007). Absent this allocation, total return would be lower. |
| (4) | Interest and fee expense relates to the liability for floating rate notes issued in conjunction with inverse floater securities transactions (see Note 1I). |
S e e notes to financ ial statem ents
65
| | Eaton Vance Municipal Income Funds as of July 31, 2010
FINANCIAL STATEMENTS CON T ’ D
Financ ial Highlig hts |
| | | | | |
| | | | Minnesota Fund — Class C | |
| | | Year Ended July 31, | | Period Ended |
| | 2010 | 2009 | 2008 | 2007 | July 31, 2006(1) |
| Net asset value — Beginning of period | $ 9.570 | $ 9.620 | $ 9.990 | $ 9.990 | $ 9.940 |
| |
| Income (Loss) From Operations | | | | | |
| Net investment income(2) | $ 0.329 | $ 0.333 | $ 0.335 | $ 0.357 | $ 0.231 |
| Net realized and unrealized gain (loss) | 0.394 | (0.049) | (0.353) | 0.009 | 0.041(3) |
| Total income (loss) from operations | $ 0.723 | $ 0.284 | $(0.018) | $ 0.366 | $ 0.272 |
| |
| Less Distributions | | | | | |
| From net investment income | $ (0.313) | $ (0.334) | $(0.352) | $(0.366) | $(0.222) |
| Total distributions | $ (0.313) | $ (0.334) | $(0.352) | $(0.366) | $(0.222) |
| Net asset value — End of period | $ 9.980 | $ 9.570 | $ 9.620 | $ 9.990 | $ 9.990 |
| Total Return(4) | 7.63% | 3.17% | (0.19)% | 3.68% | 2.77%(5) |
| |
| Ratios/Supplemental Data | | | | | |
| Net assets, end of period (000’s omitted) | $15,291 | $12,078 | $ 8,569 | $ 4,115 | $ 986 |
| Ratios (as a percentage of average daily net assets): | | | | | |
Expenses excluding interest and fees | 1.48% | 1.55% | 1.50% | 1.53%(6) | 1.52%(7) |
Interest and fee expense(8) | — | — | 0.10% | 0.20% | 0.22%(7) |
Total expenses before custodian fee reduction | 1.48% | 1.55% | 1.60% | 1.73%(6) | 1.74%(7) |
Expenses after custodian fee reduction excluding interest and fees | 1.48% | 1.54% | 1.45% | 1.47%(6) | 1.49%(7) |
Net investment income | 3.32% | 3.61% | 3.41% | 3.54% | 3.78%(7) |
| Portfolio Turnover | 3% | 23% | 18% | 4% | 14%(9) |
| (1) | For the period from the start of business, December 21, 2005, to July 31, 2006. |
| (2) | Computed using average shares outstanding. |
| (3) | The per share amount is not in accord with the net realized and unrealized gain (loss) on investments for the period because of the timing of sales of Fund shares and the amount of the per share realized and unrealized gains and losses at such time. |
| (4) | Returns are historical and are calculated by determining the percentage change in net asset value with all distributions reinvested and do not reflect the effect of sales charges. |
| (5) | Not annualized. |
| (6) | The investment adviser was allocated a portion of the Fund’s operating expenses (equal to less than 0.005% of average daily net assets for the year ended July 31, 2007). Absent this allocation, total return would be lower. |
| (7) | Annualized. |
| (8) | Interest and fee expense relates to the liability for floating rate notes issued in conjunction with inverse floater securities transactions (see Note 1I). |
| (9) | For the year ended July 31, 2006. |
S e e notes to financ ial statem ents
66
| | Eaton Vance Municipal Income Funds as of July 31, 2010
FINANCIAL STATEMENTS CON T ’ D
Financ ial Highlig hts |
| | | | | |
| | | | New Jersey Fund — Class A | | |
| | | | Year Ended July 31, | | |
| | 2010 | 2009 | 2008 | 2007 | 2006 |
| Net asset value — Beginning of year | $ 8.580 | $ 9.500 | $ 10.500 | $ 10.420 | $ 10.470 |
| |
| Income (Loss) From Operations | | | | | |
| Net investment income(1) | $ 0.454 | $ 0.457 | $ 0.456 | $ 0.481 | $ 0.462 |
| Net realized and unrealized gain (loss) | 0.627 | (0.929) | (0.977) | 0.058 | (0.055) |
| Total income (loss) from operations | $ 1.081 | $ (0.472) | $ (0.521) | $ 0.539 | $ 0.407 |
| |
| |
| Less Distributions | | | | | |
| From net investment income | $ (0.441) | $ (0.448) | $ (0.462) | $ (0.459) | $ (0.457) |
| From net realized gain | — | — | (0.017) | — | — |
| Total distributions | $ (0.441) | $ (0.448) | $ (0.479) | $ (0.459) | $ (0.457) |
| |
| Net asset value — End of year | $ 9.220 | $ 8.580 | $ 9.500 | $ 10.500 | $ 10.420 |
| Total Return(2) | 12.76% | (4.66)% | (5.04)% | 5.18% | 4.00% |
| |
| |
| Ratios/Supplemental Data | | | | | |
| Net assets, end of year (000’s omitted) | $214,220 | $215,406 | $261,792 | $264,281 | $189,294 |
| Ratios (as a percentage of average daily net assets): | | | | | |
Expenses excluding interest and fees | 0.79% | 0.85% | 0.81% | 0.79%(3) | 0.80% |
Interest and fee expense(4) | 0.11% | 0.18% | 0.26% | 0.42% | 0.39% |
Total expenses before custodian fee reduction | 0.90% | 1.03% | 1.07% | 1.21%(3) | 1.19% |
Expenses after custodian fee reduction excluding interest and fees | 0.79% | 0.85% | 0.80% | 0.76%(3) | 0.78% |
Net investment income | 4.98% | 5.48% | 4.57% | 4.51% | 4.45% |
| Portfolio Turnover | 13% | 35% | 47% | 37% | 27% |
| (1) | Computed using average shares outstanding. |
| (2) | Returns are historical and are calculated by determining the percentage change in net asset value with all distributions reinvested and do not reflect the effect of sales charges. |
| (3) | The investment adviser was allocated a portion of the Fund’s operating expenses (equal to less than 0.005% of average daily net assets for the year ended July 31, 2007). Absent this allocation, total return would be lower. |
| (4) | Interest and fee expense relates to the liability for floating rate notes issued in conjunction with inverse floater securities transactions (see Note 1I). |
S e e notes to financ ial statem ents
67
| | Eaton Vance Municipal Income Funds as of July 31, 2010
FINANCIAL STATEMENTS CON T ’ D
Financ ial Highlig hts |
| | | | | |
| | | New Jersey Fund — Class C | |
| | | Year Ended July 31, | | Period Ended |
| | 2010 | 2009 | 2008 | 2007 | July 31, 2006(1) |
| Net asset value — Beginning of period | $ 8.960 | $ 9.920 | $10.950 | $10.870 | $10.740 |
| |
| |
| Income (Loss) From Operations | | | | | |
| Net investment income(2) | $ 0.402 | $ 0.411 | $ 0.394 | $ 0.402 | $ 0.233 |
| Net realized and unrealized gain (loss) | 0.652 | (0.972) | (1.008) | 0.075 | 0.148(3) |
| Total income (loss) from operations | $ 1.054 | $ (0.561) | $ (0.614) | $ 0.477 | $ 0.381 |
| |
| |
| Less Distributions | | | | | |
| From net investment income | $ (0.394) | $ (0.399) | $ (0.399) | $ (0.397) | $ (0.251) |
| From net realized gain | — | — | (0.017) | — | — |
| Total distributions | $ (0.394) | $ (0.399) | $ (0.416) | $ (0.397) | $ (0.251) |
| |
| Net asset value — End of period | $ 9.620 | $ 8.960 | $ 9.920 | $10.950 | $10.870 |
| |
| Total Return(4) | 11.89% | (5.40)% | (5.68)% | 4.38% | 3.56%(5) |
| |
| |
| Ratios/Supplemental Data | | | | | |
| Net assets, end of period (000’s omitted) | $31,491 | $26,165 | $28,204 | $22,479 | $ 3,659 |
| Ratios (as a percentage of average daily net assets): | | | | | |
Expenses excluding interest and fees | 1.53% | 1.59% | 1.56% | 1.54%(6) | 1.55%(7) |
Interest and fee expense(8) | 0.11% | 0.18% | 0.26% | 0.42% | 0.39%(7) |
Total expenses before custodian fee reduction | 1.64% | 1.77% | 1.82% | 1.96%(6) | 1.94%(7) |
Expenses after custodian fee reduction excluding interest and fees | 1.53% | 1.59% | 1.55% | 1.51%(6) | 1.53%(7) |
Net investment income | 4.21% | 4.73% | 3.79% | 3.61% | 3.45%(7) |
| Portfolio Turnover | 13% | 35% | 47% | 37% | 27%(9) |
| (1) | For the period from the start of business, December 14, 2005, to July 31, 2006. |
| (2) | Computed using average shares outstanding. |
| (3) | The per share amount is not in accord with the net realized and unrealized gain (loss) on investments for the period because of the timing of sales of Fund shares and the amount of the per share realized and unrealized gains and losses at such time. |
| (4) | Returns are historical and are calculated by determining the percentage change in net asset value with all distributions reinvested and do not reflect the effect of sales charges. |
| (5) | Not annualized. |
| (6) | The investment adviser was allocated a portion of the Fund’s operating expenses (equal to less than 0.005% of average daily net assets for the year ended July 31, 2007). Absent this allocation, total return would be lower. |
| (7) | Annualized. |
| (8) | Interest and fee expense relates to the liability for floating rate notes issued in conjunction with inverse floater securities transactions (see Note 1I). |
| (9) | For the year ended July 31, 2006. |
S e e notes to financ ial statem ents
68
Eaton Vance Municipal Income Funds as of July 31, 2010
FINANCIAL STATEMENTS CON T ’ D
Financ ial Highlig hts |
| | | |
| | New Jersey Fund — Class I |
| | Year Ended July 31, Period Ended |
| | 2010 | 2009 | July 31, 2008(1) |
| Net asset value — Beginning of period | $ 8.580 | $ 9.510 | $ 9.180 |
| |
| Income (Loss) From Operations | | | |
| Net investment income(2) | $ 0.473 | $ 0.468 | $ 0.190 |
| Net realized and unrealized gain (loss) | 0.625 | (0.933) | 0.337 |
| Total income (loss) from operations | $ 1.098 | $(0.465) | $ 0.527 |
| |
| Less Distributions | | | |
| From net investment income | $(0.458) | $(0.465) | $(0.197) |
| Total distributions | $(0.458) | $(0.465) | $(0.197) |
| Net asset value — End of period | $ 9.220 | $ 8.580 | $ 9.510 |
| Total Return(3) | 12.96% | (4.56)% | 5.73%(4) |
| |
| Ratios/Supplemental Data | | | |
| Net assets, end of period (000’s omitted) | $ 8,386 | $ 1,808 | $ 10 |
| Ratios (as a percentage of average daily net assets): | | | |
Expenses excluding interest and fees | 0.58% | 0.65% | 0.61%(5) |
Interest and fee expense(6) | 0.11% | 0.18% | 0.26%(5) |
Total expenses before custodian fee reduction | 0.69% | 0.83% | 0.87%(5) |
Expenses after custodian fee reduction excluding interest and fees | 0.58% | 0.65% | 0.60%(5) |
Net investment income | 5.16% | 5.74% | 4.76%(5) |
| Portfolio Turnover | 13% | 35% | 47%(7) |
| (1) | For the period from the start of business, March 3, 2008, to July 31, 2008. |
| (2) | Computed using average shares outstanding. |
| (3) | Returns are historical and are calculated by determining the percentage change in net asset value with all distributions reinvested. |
| (4) | Not annualized. |
| (5) | Annualized. |
| (6) | Interest and fee expense relates to the liability for floating rate notes issued in conjunction with inverse floater securities transactions (see Note 1I). |
| (7) | For the year ended July 31, 2008. |
S e e notes to financ ial statem ent
69
| | Eaton Vance Municipal Income Funds as of July 31, 2010
FINANCIAL STATEMENTS CON T ’ D
Financ ial Highlig hts |
| | | | | |
| | | | Pennsylvania Fund — Class A | |
| | | | Year Ended July 31, | | |
| | 2010 | 2009 | 2008 | 2007 | 2006 |
| Net asset value — Beginning of year | $ 8.650 | $ 9.190 | $ 9.970 | $ 9.930 | $ 9.920 |
| |
| Income (Loss) From Operations | | | | | |
| Net investment income(1) | $ 0.431 | $ 0.427 | $ 0.440 | $ 0.434 | $ 0.458 |
| Net realized and unrealized gain (loss) | 0.391 | (0.539) | (0.785) | 0.042 | 0.010 |
| Total income (loss) from operations | $ 0.822 | $ (0.112) | $ (0.345) | $ 0.476 | $ 0.468 |
| |
| |
| Less Distributions | | | | | |
| From net investment income | $ (0.412) | $ (0.428) | $ (0.435) | $ (0.436) | $ (0.458) |
| Total distributions | $ (0.412) | $ (0.428) | $ (0.435) | $ (0.436) | $ (0.458) |
| Net asset value — End of year | $ 9.060 | $ 8.650 | $ 9.190 | $ 9.970 | $ 9.930 |
| |
| Total Return(2) | 9.60% | (0.87)% | (3.52)% | 4.81% | 4.84% |
| |
| Ratios/Supplemental Data | | | | | |
| Net assets, end of year (000’s omitted) | $210,024 | $212,358 | $229,953 | $238,254 | $187,902 |
| Ratios (as a percentage of average daily net assets): | | | | | |
Expenses excluding interest and fees | 0.79% | 0.82% | 0.81% | 0.80%(3) | 0.82% |
Interest and fee expense(4) | 0.09% | 0.29% | 0.42% | 0.54% | 0.38% |
Total expenses before custodian fee reduction | 0.88% | 1.11% | 1.23% | 1.34%(3) | 1.20% |
Expenses after custodian fee reduction excluding interest and fees | 0.79% | 0.82% | 0.79% | 0.77%(3) | 0.80% |
Net investment income | 4.74% | 5.15% | 4.58% | 4.29% | 4.63% |
| Portfolio Turnover | 10% | 27% | 24% | 27% | 31% |
| (1) | Computed using average shares outstanding. |
| (2) | Returns are historical and are calculated by determining the percentage change in net asset value with all distributions reinvested and do not reflect the effect of sales charges. |
| (3) | The investment adviser was allocated a portion of the Fund’s operating expenses (equal to less than 0.005% of average daily net assets for the year ended July 31, 2007). Absent this allocation, total return would be lower. |
| (4) | Interest and fee expense relates to the liability for floating rate notes issued in conjunction with inverse floater securities transactions (see Note 1I). |
S e e notes to financ ial statem ents
70
| | Eaton Vance Municipal Income Funds as of July 31, 2010
FINANCIAL STATEMENTS CON T ’ D
Financ ial Highlig hts |
| | | | | |
| | | Pennsylvania Fund — Class B | |
| | | | Year Ended July 31, | | |
| | 2010 | 2009 | 2008 | 2007 | 2006 |
| Net asset value — Beginning of year | $ 8.960 | $ 9.500 | $10.310 | $10.270 | $10.260 |
| |
| Income (Loss) From Operations | | | | | |
| Net investment income(1) | $ 0.375 | $ 0.379 | $ 0.381 | $ 0.372 | $ 0.398 |
| Net realized and unrealized gain (loss) | 0.404 | (0.544) | (0.818) | 0.040 | 0.009 |
| Total income (loss) from operations | $ 0.779 | $ (0.165) | $ (0.437) | $ 0.412 | $ 0.407 |
| |
| |
| Less Distributions | | | | | |
| From net investment income | $ (0.359) | $ (0.375) | $ (0.373) | $ (0.372) | $ (0.397) |
| Total distributions | $ (0.359) | $ (0.375) | $ (0.373) | $ (0.372) | $ (0.397) |
| Net asset value — End of year | $ 9.380 | $ 8.960 | $ 9.500 | $10.310 | $10.270 |
| |
| Total Return(2) | 8.75% | (1.45)% | (4.30)% | 4.02% | 4.05% |
| |
| Ratios/Supplemental Data | | | | | |
| Net assets, end of year (000’s omitted) | $17,328 | $22,120 | $28,571 | $36,425 | $42,291 |
| Ratios (as a percentage of average daily net assets): | | | | | |
Expenses excluding interest and fees | 1.55% | 1.57% | 1.56% | 1.55%(3) | 1.57% |
Interest and fee expense(4) | 0.09% | 0.29% | 0.42% | 0.54% | 0.38% |
Total expenses before custodian fee reduction | 1.64% | 1.86% | 1.98% | 2.09%(3) | 1.95% |
Expenses after custodian fee reduction excluding interest and fees | 1.55% | 1.57% | 1.54% | 1.52%(3) | 1.55% |
Net investment income | 3.99% | 4.41% | 3.83% | 3.56% | 3.89% |
| Portfolio Turnover | 10% | 27% | 24% | 27% | 31% |
| (1) | Computed using average shares outstanding. |
| (2) | Returns are historical and are calculated by determining the percentage change in net asset value with all distributions reinvested and do not reflect the effect of sales charges. |
| (3) | The investment adviser was allocated a portion of the Fund’s operating expenses (equal to less than 0.005% of average daily net assets for the year ended July 31, 2007). Absent this allocation, total return would be lower. |
| (4) | Interest and fee expense relates to the liability for floating rate notes issued in conjunction with inverse floater securities transactions (see Note 1I). |
S e e notes to financ ial statem ents
71
| | Eaton Vance Municipal Income Funds as of July 31, 2010
FINANCIAL STATEMENTS CON T ’ D
Financ ial Highlig hts |
| | | | | |
| | | Pennsylvania Fund — Class C | |
| | | Year Ended July 31, | | Period Ended |
| | 2010 | 2009 | 2008 | 2007 | July 31, 2006(1) |
| Net asset value — Beginning of period | $ 8.960 | $ 9.510 | $10.320 | $10.280 | $10.250 |
| |
| Income (Loss) From Operations | | | | | |
| Net investment income(2) | $ 0.375 | $ 0.377 | $ 0.380 | $ 0.368 | $ 0.203 |
| Net realized and unrealized gain (loss) | 0.404 | (0.551) | (0.816) | 0.045 | 0.044 |
| Total income (loss) from operations | $ 0.779 | $ (0.174) | $ (0.436) | $ 0.413 | $ 0.247 |
| |
| Less Distributions | | | | | |
| From net investment income | $ (0.359) | $ (0.376) | $ (0.374) | $ (0.373) | $ (0.217) |
| Total distributions | $ (0.359) | $ (0.376) | $ (0.374) | $ (0.373) | $ (0.217) |
| Net asset value — End of period | $ 9.380 | $ 8.960 | $ 9.510 | $10.320 | $10.280 |
| Total Return(3) | 8.75% | (1.55)% | (4.29)% | 4.02% | 2.38%(4) |
| |
| Ratios/Supplemental Data | | | | | |
| Net assets, end of period (000’s omitted) | $46,080 | $38,427 | $33,457 | $20,528 | $ 3,026 |
| Ratios (as a percentage of average daily net assets): | | | | | |
Expenses excluding interest and fees | 1.54% | 1.57% | 1.56% | 1.55%(5) | 1.57%(6) |
Interest and fee expense(7) | 0.09% | 0.29% | 0.42% | 0.54% | 0.38%(6) |
Total expenses before custodian fee reduction | 1.63% | 1.86% | 1.98% | 2.09%(5) | 1.95%(6) |
Expenses after custodian fee reduction excluding interest and fees | 1.54% | 1.57% | 1.54% | 1.52%(5) | 1.55%(6) |
Net investment income | 3.98% | 4.38% | 3.83% | 3.52% | 3.60%(6) |
| Portfolio Turnover | 10% | 27% | 24% | 27% | 31%(8) |
| (1) | For the period from the start of business, January 12, 2006, to July 31, 2006. |
| (2) | Computed using average shares outstanding. |
| (3) | Returns are historical and are calculated by determining the percentage change in net asset value with all distributions reinvested and do not reflect the effect of sales charges. |
| (4) | Not annualized. |
| (5) | The investment adviser was allocated a portion of the Fund’s operating expenses (equal to less than 0.005% of average daily net assets for the year ended July 31, 2007). Absent this allocation, total return would be lower. |
| (6) | Annualized. |
| (7) | Interest and fee expense relates to the liability for floating rate notes issued in conjunction with inverse floater securities transactions (see Note 1I). |
| (8) | For the year ended July 31, 2006. |
S e e notes to financ ial statem ents
72
Eaton Vance Municipal Income Funds as of July 31, 2010
FINANCIAL STATEMENTS CON T ’ D
Financ ial Highlig hts |
| | | |
| | Pennsylvania Fund — Class I |
| | Year Ended July 31, Period Ended |
| | 2010 | 2009 | July 31, 2008(1) |
| Net asset value — Beginning of period | $ 8.680 | $ 9.200 | $ 8.900 |
| |
| Income (Loss) From Operations | | | |
| Net investment income(2) | $ 0.450 | $ 0.442 | $ 0.192 |
| Net realized and unrealized gain (loss) | 0.401 | (0.517) | 0.297 |
| Total income (loss) from operations | $ 0.851 | $ (0.075) | $ 0.489 |
| |
| Less Distributions | | | |
| From net investment income | $ (0.431) | $ (0.445) | $(0.189) |
| Total distributions | $ (0.431) | $ (0.445) | $(0.189) |
| Net asset value — End of period | $ 9.100 | $ 8.680 | $ 9.200 |
| Total Return(3) | 9.91% | (0.45)% | 5.49%(4) |
| |
| Ratios/Supplemental Data | | | |
| Net assets, end of period (000’s omitted) | $35,367 | $22,621 | $ 32 |
| Ratios (as a percentage of average daily net assets): | | | |
| Expenses excluding interest and fees | 0.60% | 0.62% | 0.60%(5) |
| Interest and fee expense(6) | 0.09% | 0.29% | 0.42%(5) |
| Total expenses before custodian fee reduction | 0.69% | 0.91% | 1.02%(5) |
| Expenses after custodian fee reduction excluding interest and fees | 0.60% | 0.62% | 0.58%(5) |
| Net investment income | 4.93% | 5.37% | 4.98%(5) |
| Portfolio Turnover | 10% | 27% | 24%(7) |
| (1) | For the period from the start of business, March 3, 2008, to July 31, 2008. |
| (2) | Computed using average shares outstanding. |
| (3) | Returns are historical and are calculated by determining the percentage change in net asset value with all distributions reinvested. |
| (4) | Not annualized. |
| (5) | Annualized. |
| (6) | Interest and fee expense relates to the liability for floating rate notes issued in conjunction with inverse floater securities transactions (see Note 1I). |
| (7) | For the year ended July 31, 2008. |
S e e notes to financ ial statem ents
73
Eaton Vance Municipal Income Funds as of July 31, 2010
NOTES TO FINANCIAL STATEMENTS |
1 Significant Accounting Policies
Eaton Vance Municipals Trust (the Trust) is a Massachusetts business trust registered under the Investment Company Act of 1940, as amended (the 1940 Act), as an open-end management investment company. The Trust presently consists of twenty-five funds, seven of which, each non-diversified, are included in these financial statements. They include Eaton Vance Arizona Municipal Income Fund (formerly, Eaton Vance Arizona Municipals Fund) (Arizona Fund), Eaton Vance Colorado Municipal Income Fund (formerly, Eaton Vance Colorado Municipals Fund) (Colorado Fund), Eaton Vance Connecticut Municipal Income Fund (formerly, Eaton Vance Connecticut Municipals Fund) (Connecticut Fund), Eaton Vance Michigan Municipal Income Fund (formerly, Eaton Vance Michigan Municipals Fund) (Michigan Fund), Eaton Vance Minnesota Municipal Income Fund (formerly, Eaton Vance Minnesota Municipals Fund) (Minnesota Fund), Eaton Vance New Jersey Municipal Income Fund (formerly, Eaton Vance New Jersey Municipals Fund) (New Jersey Fund) and Eaton Vance Pennsylvania Municipal Income Fund (formerly, Eaton Vance Pennsylvania Municipals Fund) (Pennsylvania Fund), (each individually referred to as the Fund, and collectively, the Funds). The Funds seek to provide current income exempt from regular federal income tax and from particular state or local income or other taxes. As of July 31, 2010, the Michigan Fund offered two classes of shares, the Arizona Fund, Colorado Fund, Minnesota Fund and New Jersey Fund offered three classes of shares and the Connecticut Fund and Pennsylvania Fund offered four classes of shares. Effective August 1, 2010, the Arizona Fund, Michigan Fund and Minnesota Fund began offering Class I shares, which are sold at net asset value and are not subject to a sales charge. Class A shares are generally sold subject to a sales charge imposed at time of purchase. Class B and Class C shares are sold at net asset value and are generally subject to a contingent deferred sales charge (see Note 5). Class I shares are sold at net asset value and are not subject to a sales charge. Class B shares of each Fund automatically convert to Class A shares eight years after their purchase as described in each Fund’s prospectus. Each class represents a pro-rata interest in the Fund, but votes separately on class-specific matters and (as noted below) is subject to different expenses. Realized and unrealized gains and losses are allocated daily to each class of shares based on the relative net assets of each class to the total net assets of the Fund. Net investment income, other than class-specific expenses, is allocated daily to each class of shares based upon the ratio of the value of each class’s paid shares to the total value of all paid shares. Each class of shares differs in its distribution plan and certain other class-specific expenses.
The following is a summary of significant accounting policies of the Funds. The policies are in conformity with accounting principles generally accepted in the United States of America.
A Investment Valuation — Debt obligations (including short-term obligations with a remaining maturity of more than sixty days) are generally valued on the basis of valuations provided by third party pricing services, as derived from such services’ pricing models. Inputs to the models may include, but are not limited to, reported trades, executable bid and asked prices, broker/ dealer quotations, prices or yields of securities with similar characteristics, benchmark curves or information pertaining to the issuer, as well as industry and economic events. The pricing services may use a matrix approach, which considers information regarding securities with similar characteristics to determine the valuation for a security. Short-term obligations purchased with a remaining maturity of sixty days or less are generally valued at amortized cost, which approximates market value. Financial futures contracts are valued at the closing settlement price established by the board of trade or exchange on which they are traded. Interest rate swaps are normally valued using valuations provided by a third party pricing service. Such pricing service valuations are based on the present value of fixed and projected floating rate cash flows over the term of the swap contract. Future cash flows are discounted to their present value using swap curves provided by electronic data services or by broker/dealers. Investments for which valuations or market quotations are not readily available or are deemed unreliable are valued at fair value using methods determined in good faith by or at the direction of the Trustees of a Fund in a manner that most fairly reflects the security’s value, or the amount that the Fund might reasonably expect to receive for the security upon its current sale in the ordinary course. Each such determination is based on a consideration of all relevant factors, which are likely to vary from one pricing context to another. These factors may include, but are not limited to, the type of security, the existence of any contractual restrictions on the security’s disposition, the price and extent of public trading in similar securities of the issuer or of comparable entities, quotations or relevant information obtained from broker-dealers or other market participants, information obtained from the issuer, analysts, and/or the appropriate stock exchange (for exchange-traded securities), an analysis of the entity’s financial condition, and an evaluation of the forces that influence the issuer and the market(s) in which the security is purchased and sold.
B Investment Transactions and Related Income— Investment transactions for financial statement purposes are accounted for on a trade date basis. Realized gains and losses on investments sold are
74
Eaton Vance Municipal Income Funds as of July 31, 2010
NOTES TO FINANCIAL STATEMENTS CON T’D |
determined on the basis of identified cost. Interest income is recorded on the basis of interest accrued, adjusted for amortization of premium or accretion of discount.
C Federal Taxes — Each Fund's policy is to comply with the provisions of the Internal Revenue Code applicable to regulated investment companies and to distribute to shareholders each year substantially all of its taxable, if any, and tax-exempt net investment income, and all or substantially all of its net realized capital gains. Accordingly, no provision for federal income or excise tax is necessary. Each Fund intends to satisfy conditions which will enable it to designate distributions from the interest income generated by its investments in municipal obligations, which are exempt from regular federal income tax when received by each Fund, as exempt-interest dividends. The portion of such interest, if any, earned on private activity bonds issued after August 7, 1986, may be considered a tax preference item to shareholders.
At July 31, 2010, the following Funds, for federal income tax purposes, had capital loss carryforwards which will reduce the respective Fund’s taxable income arising from future net realized gains on investment transactions, if any, to the extent permitted by the Internal Revenue Code, and thus will reduce the amount of distributions to shareholders, which would otherwise be necessary to relieve the Funds of any liability for federal income or excise tax. The amounts and expiration dates of the capital loss carryforwards are as follows:
| | |
| Fund | Amount | Expiration Date |
| Arizona | $ 353,624 | July 31, 2012 |
| | 691,155 | July 31, 2013 |
| | 736,704 | July 31, 2014 |
| | 160,306 | July 31, 2016 |
| | 997,387 | July 31, 2017 |
| | 3,471,707 | July 31, 2018 |
| |
| Colorado | $ 284,426 | July 31, 2013 |
| | 327,021 | July 31, 2016 |
| | 94,190 | July 31, 2017 |
| | 1,811,052 | July 31, 2018 |
| |
| Connecticut | $ 374,997 | July 31, 2013 |
| | 329,657 | July 31, 2016 |
| | 662,277 | July 31, 2017 |
| | 2,387,746 | July 31, 2018 |
| |
| Michigan | $ 337,787 | July 31, 2016 |
| | 391,429 | July 31, 2017 |
| | 2,239,220 | July 31, 2018 |
| |
| Minnesota | $ 382,839 | July 31, 2012 |
| | 504,289 | July 31, 2013 |
| | 410,833 | July 31, 2016 |
| | 566,758 | July 31, 2017 |
| | 1,523,293 | July 31, 2018 |
| | |
| Fund | Amount | Expiration Date |
| New Jersey | $ 3,716,712 | July 31, 2016 |
| | 6,120,511 | July 31, 2017 |
| | 20,873,952 | July 31, 2018 |
| |
| Pennsylvania | $ 5,831,137 | July 31, 2011 |
| | 1,108,751 | July 31, 2012 |
| | 3,349,896 | July 31, 2013 |
| | 1,414,955 | July 31, 2016 |
| | 5,414,612 | July 31, 2017 |
| | 10,375,222 | July 31, 2018 |
Additionally, at July 31, 2010, the Arizona Fund, Colorado Fund, Connecticut Fund, Michigan Fund, Minnesota Fund, New Jersey Fund and Pennsylvania Fund had net capital losses of $1,050,093, $411,761, $497,726, $660,302, $685,360, $2,293,729 and $7,819,381, respectively, attributable to security transactions incurred after October 31, 2009. These net capital losses are treated as arising on the first day of the Funds’ taxable year ending July 31, 2011.
As of July 31, 2010, the Funds had no uncertain tax positions that would require financial statement recognition, de-recognition, or disclosure. Each of the Funds’ federal tax returns filed in the 3-year period ended July 31, 2010 remains subject to examination by the Internal Revenue Service.
D Expenses —The majority of expenses of the Trust are directly identifiable to an individual fund. Expenses which are not readily identifiable to a specific fund are allocated taking into consideration, among other things, the nature and type of expense and the relative size of the funds.
E Expense Reduction —State Street Bank and Trust Company (SSBT) serves as custodian of the Funds. Pursuant to the respective custodian agreements, SSBT receives a fee reduced by credits, which are determined based on the average daily cash balance each Fund maintains with SSBT. All credit balances, if any, used to reduce each Fund’s custodian fees are reported as a reduction of expenses in the Statements of Operations.
F Legal Fees —Legal fees and other related expenses incurred as part of negotiations of the terms and requirement of capital infusions, or that are expected to result in the restructuring of, or a plan of reorganization for, an investment are recorded as realized losses. Ongoing expenditures to protect or enhance an investment are treated as operating expenses.
G Use of Estimates —The preparaton of the financial statements in conformity with accounting principles generally accepted in the United States of
75
Eaton Vance Municipal Income Funds as of July 31, 2010
NOTES TO FINANCIAL STATEMENTS CON T’D |
America requires management to make estimates and assumptions that affect the reported amounts of assets and liabilities at the date of the financial statements and the reported amounts of income and expense during the reporting period. Actual results could differ from those estimates.
H Indemnifications —Under the Trust's organizational documents, its officers and Trustees may be indemnified against certain liabilities and expenses arising out of the performance of their duties to the Funds. Under Massachusetts law, if certain conditions prevail, shareholders of a Massachusetts business trust (such as the Trust) could be deemed to have personal liability for the obligations of the Trust. However, the Trust’s Declaration of Trust contains an express disclaimer of liability on the part of Fund shareholders and the By-laws provide that the Trust shall assume the defense on behalf of any Fund shareholders. Moreover, the By-laws also provide for indemnification out of Fund property of any shareholder held personally liable solely by reason of being or having been a shareholder for all loss or expense arising from such liability. Additionally, in the normal course of business, each Fund enters into agreements with service providers that may contain indemnification clauses. Each Fund’s maximum exposure under these arrangements is unknown as this would involve future claims that may be made against each Fund that have not yet occurred.
I Floating Rate Notes Issued in Conjunction with Securities Held— The Funds may invest in inverse floating rate securities, also referred to as residual interest bonds, whereby a Fund may sell a fixed rate bond to a broker for cash. At the same time, the Fund buys a residual interest in the assets and cash flows of a Special-Purpose Vehicle (the SPV), (which is generally organized as a trust), set up by the broker, often referred to as an inverse floating rate obligation (Inverse Floater). The broker deposits a fixed rate bond into the SPV with the same CUSIP number as the fixed rate bond sold to the broker by the Fund, and which may have been, but is not required to be, the fixed rate bond purchased from the Fund (the Fixed Rate Bond). The SPV also issues floating rate notes (Floating Rate Notes) which are sold to third-parties. The Inverse Floater held by a Fund gives the Fund the right (1) to cause the holders of the Floating Rate Notes to tender their notes at par, and (2) to have the broker transfer the Fixed Rate Bond held by the SPV to the Fund, thereby terminating the SPV. Should the Fund exercise such right, it would pay the broker the par amount due on the Floating Rate Notes and exchange the Inverse Floater for the underlying Fixed Rate Bond. Pursuant to generally accepted accounting principles for transfers and servicing of financial assets and extinguishment of liabilities, the Funds account for the transaction described above as a secured borrowing by including the Fixed Rate Bond in their Portfolio of Investments and the Floating Rate Notes as a liability under the caption “Payable for floating rate notes issued” in their Statement of Assets and Liabilities. The Floating Rate Notes have interest rates that generally reset weekly and their holders have the option to tender their notes to the broker for redemption at par at each reset date. Interest expense related to the Funds’ liability with respect to Floating Rate Notes is recorded as incurred. The SPV may be terminated by the Fund, as noted above, or by the broker upon the occurrence of certain termination events as defined in the trust agreement, such as a downgrade in the credit quality of the underlying bond, bankruptcy of or payment failure by the issuer of the underlying bond, the inability to remarket Floating Rate Notes that have been tendered due to insufficient buyers in the market, or the failure by the SPV to obtain renewal of the liquidity agreement under which liquidity support is provided for the Floating Rate Notes up to one year. At July 31, 2010, the amounts of the Funds’ Floating Rate Notes and related interest rates and collateral were as follows:
| | | |
| | | | Collateral |
| | Floating | Interest Rate | for Floating |
| | Rate | or Range of | Rate |
| | Notes | Interest | Notes |
| Fund | Outstanding | Rates (%) | Outstanding |
| Arizona | $ 1,700,000 | 0.26 – 0.33 | $ 2,991,526 |
| Connecticut | 7,225,000 | 0.26 – 0.33 | 11,009,198 |
| Michigan | 995,000 | 0.26 – 0.33 | 1,709,449 |
| New Jersey | 38,745,000 | 0.27 – 0.34 | 52,533,199 |
| Pennsylvania | 36,475,000 | 0.26 – 0.38 | 56,694,809 |
For the year ended July 31, 2010, the Funds’ average Floating Rate Notes outstanding and the average interest rate including fees were as follows:
| | |
| | Average Floating | |
| | Rate Notes | Average |
| Fund | Outstanding | Interest Rate |
| Arizona | $ 968,493 | 1.36% |
| Connecticut | 5,981,438 | 1.01 |
| Michigan | 512,205 | 1.36 |
| New Jersey | 32,767,137 | 0.85 |
| Pennsylvania | 29,394,589 | 0.95 |
The Funds may enter into shortfall and forbearance agreements with the broker by which a Fund agrees to reimburse the broker, in certain circumstances, for the difference between the liquidation value of the Fixed Rate Bond held by the SPV and the liquidation value of the Floating Rate Notes, as well as any shortfalls in interest cash flows. The Funds had no shortfalls as of July 31, 2010.
The Funds may also purchase Inverse Floaters from brokers in a secondary market transaction without first owning the underlying fixed rate bond. Such transactions
76
Eaton Vance Municipal Income Funds as of July 31, 2010
NOTES TO FINANCIAL STATEMENTS CON T’D |
are not required to be treated as secured borrowings. Shortfall agreements, if any, related to Inverse Floaters purchased in a secondary market transaction are disclosed in the Portfolio of Investments. The Funds’ investment policies and restrictions expressly permit investments in Inverse Floaters. Inverse floating rate securities typically offer the potential for yields exceeding the yields available on fixed rate bonds with comparable credit quality and maturity. These securities tend to underperform the market for fixed rate bonds in a rising long-term interest rate environment, but tend to outperform the market for fixed rate bonds when long-term interest rates decline.
The value and income of inverse floating rate securities are generally more volatile than that of a fixed rate bond. The Funds’ investment policies do not allow the Funds to borrow money except as permitted by the 1940 Act. Management believes that the Funds’ restrictions on borrowing money and issuing senior securities (other than as specifically permitted) do not apply to Floating Rate Notes issued by the SPV and included as a liability in the Funds’ Statement of Assets and Liabilities. As secured indebtedness issued by an SPV, Floating Rate Notes are distinct from the borrowings and senior securities to which the Funds’ restrictions apply. Inverse Floaters held by the Funds are securities exempt from registration under Rule 144A of the Securities Act of 1933.
J Financial Futures Contracts — The Funds may enter into financial futures contracts. The Funds’ investment in financial futures contracts is designed for hedging against changes in interest rates or as a substitute for the purchase of securities. Upon entering into a financial futures contract, a Fund is required to deposit with the broker, either in cash or securities, an amount equal to a certain percentage of the purchase price (initial margin). Subsequent payments, known as variation margin, are made or received by the Fund each business day, depending on the daily fluctuations in the value of the underlying security, and are recorded as unrealized gains or losses by the Fund. Gains (losses) are realized upon the expiration or closing of the financial futures contracts. Should market conditions change unexpectedly, the Fund may not achieve the anticipated benefits of the financial futures contracts and may realize a loss. Futures contracts have minimal counterparty risk as they are exchange traded and the clearinghouse for the exchange is substituted as the counterparty, guaranteeing counterparty performance.
K Interest Rate Swaps — The Funds may enter into interest rate swap agreements to enhance return, to hedge against fluctuations in securities prices or interest rates, or as substitution for the purchase or sale of securities. Pursuant to these agreements, a Fund makes periodic payments at a fixed interest rate and, in exchange, receives payments based on the interest rate of a benchmark industry index. During the term of the outstanding swap agreement, changes in the underlying value of the swap are recorded as unrealized gains or losses. The value of the swap is determined by changes in the relationship between two rates of interest. A Fund is exposed to credit loss in the event of non-performance by the swap counterparty. Risk may also arise from movements in interest rates.
L When-Issued Securities and Delayed Delivery Transactions — The Funds may purchase or sell securities on a delayed delivery or when-issued basis. Payment and delivery may take place after the customary settlement period for that security. At the time the transaction is negotiated, the price of the security that will be delivered is fixed. The Funds maintain security positions for these commitments such that sufficient liquid assets will be available to make payments upon settlement. Securities purchased on a delayed delivery or when-issued basis are marked-to-market daily and begin earning interest on settlement date. Losses may arise due to changes in the market value of the underlying securities or if the counterparty does not perform under the contract.
M Statement of Cash Flows —The cash amount shown in the Statement of Cash Flows of a Fund is the amount included in the Fund’s Statement of Assets and Liabilities and represents the cash on hand at its custodian and does not include any short-term investments.
2 Distributions to Shareholders
The net investment income of each Fund is determined daily and substantially all of the net investment income so determined is declared as a dividend to shareholders of record at the time of declaration. Distributions are declared separately for each class of shares. Distributions are paid monthly. Distributions of realized capital gains (reduced by available capital loss carryforwards, if any), are made at least annually. Shareholders may reinvest income and capital gain distributions in additional shares of the same class of a Fund at the net asset value as of the reinvestment date or, at the election of the shareholder, receive distributions in cash. The Funds distinguish between distributions on a tax basis and a financial reporting basis. Accounting principles generally accepted in the United States of America require that only distributions in excess of tax basis earnings and profits be reported in the financial statements as a return of capital. Permanent differences between book and tax accounting relating to distributions are reclassified to paid-in capital.
77
Eaton Vance Municipal Income Funds as of July 31, 2010
NOTES TO FINANCIAL STATEMENTS CON T’D |
The tax character of distributions declared for the years ended July 31, 2010 and July 31, 2009 was as follows:
| | | | | | | |
| | Arizona | Colorado | Connecticut | Michigan | Minnesota | New Jersey | Pennsylvania |
| Year Ended July 31, 2010 | Fund | Fund | Fund | Fund | Fund | Fund | Fund |
| Distributions declared from: | | | | | | | |
| Tax-exempt income | $ 3,955,862 | $ 1,516,126 | $ 5,356,505 | $ 2,277,974 | $ 3,826,600 | $ 12,238,534 | $ 13,863,112 |
| Ordinary income | $ — | $ 908 | $ 45,953 | $ 1,492 | $ 919 | $ 5,655 | $ 1,799 |
| |
| | Arizona | Colorado | Connecticut | Michigan | Minnesota | New Jersey | Pennsylvania |
| Year Ended July 31, 2009 | Fund | Fund | Fund | Fund | Fund | Fund | Fund |
| Distributions declared from: | | | | | | | |
| Tax-exempt income | $ 4,359,086 | $ 1,665,287 | $ 5,400,164 | $ 2,625,811 | $ 3,578,428 | $ 12,677,836 | $ 13,448,914 |
| Ordinary income | $ 11,415 | $ 54 | $ 2,541 | $ 15,228 | $ 40,140 | $ 147,042 | $ 8,171 |
During the year ended July 31, 2010, the following amounts were reclassified due to expired capital loss carryforwards, the tax treatment of distributions in excess of net tax-exempt income and differences between book and tax accounting, primarily for accretion of market discount.
| | | | | | | |
| | Arizona | Colorado | Connecticut | Michigan | Minnesota | New Jersey | Pennsylvania |
| | Fund | Fund | Fund | Fund | Fund | Fund | Fund |
| Increase (decrease): | | | | | | | |
| Paid-in capital | $ (536,449) | $ — | $ (38,487) | $ — | $ (56,582) | $ — | $ — |
| Accumulated net realized | | | | | | | |
| gain | $ 655,624 | $ 9,148 | $ 33,281 | $ 14,754 | $ 87,299 | $ 76,445 | $ 167,972 |
| Accumulated undistributed | | | | | | | |
| (distributions in excess | | | | | | | |
| of) net investment | | | | | | | |
| income | $ (119,175) | $ (9,148) | $ 5,206 | $ (14,754) | $ (30,717) | $ (76,445) | $ (167,972) |
These reclassifications had no effect on the net assets or net asset value per share of the Funds.
As of July 31, 2010, the components of distributable earnings (accumulated losses) and unrealized appreciation (depreciation) on a tax basis were as follows:
| | | | | | | |
| | Arizona | Colorado | Connecticut | Michigan | Minnesota | New Jersey | Pennsylvania |
| | Fund | Fund | Fund | Fund | Fund | Fund | Fund |
| Undistributed tax-exempt | | | | | | | |
| income | $ 68,084 | $ 50,608 | $ — | $ 147,420 | $ 142,642 | $ 1,611,932 | $ 544,379 |
| Capital loss carryforward and | | | | | | | |
| post October losses | $(7,460,976) | $(2,928,450) | $(4,252,403) | $(3,628,738) | $(4,073,372) | $(33,004,904) | $(35,313,954) |
| Net unrealized appreciation | $ 4,955,287 | $ 232,936 | $ 5,347,739 | $ 2,306,256 | $ 5,663,555 | $ 4,766,560 | $ 10,638,020 |
| Other temporary differences | $ (134,428) | $ (57,168) | $ (142,413) | $ (73,279) | $ (97,813) | $ (373,853) | $ (476,576) |
The differences between components of distributable earnings (accumulated losses) on a tax basis and the amounts reflected in the Statements of Assets and Liabilities are primarily due to futures contracts, accretion of market discount, inverse floaters, wash sales and the timing of recognizing distributions to shareholders.
3 Investment Adviser Fee and Other Transactions with Affiliates
The investment adviser fee is earned by Boston Management and Research (BMR), a subsidiary of Eaton Vance Management (EVM), as compensation for management and investment advisory services rendered to each Fund. The fee is based upon a percentage of average daily net assets plus a percentage of gross income (i.e., income other than gains from the sale of securities) as presented in the following table and is payable monthly.
| | |
| Annual | Daily |
| Daily Net Assets | Asset Rate | Income Rate |
| Up to $20 million | 0.10% | 1.00% |
| $20 million up to $40 million | 0.20 | 2.00 |
| $40 million up to $500 million | 0.30 | 3.00 |
78
Eaton Vance Municipal Income Funds as of July 31, 2010
NOTES TO FINANCIAL STATEMENTS CON T’D |
On average daily net assets of $500 million or more, the rates are reduced. For the year ended July 31, 2010, investment adviser fees incurred by the Funds and the effective annual rates, as a percentage of average daily net assets, were as follows:
| | |
| | Investment | Effective |
| Fund | Adviser Fee | Annual Rate |
| Arizona | $ 338,415 | 0.35% |
| Colorado | 77,659 | 0.21 |
| Connecticut | 490,328 | 0.38 |
| Michigan | 140,571 | 0.27 |
| Minnesota | 355,384 | 0.35 |
| New Jersey | 1,087,012 | 0.42 |
| Pennsylvania | 1,363,250 | 0.43 |
During the year ended July 31, 2010, EVM reimbursed the Michigan Fund $2,212 for a trading error. The effect of the loss incurred and the reimbursement by EVM of such amount had no impact on total return.
EVM serves as administrator of each Fund, but receives no compensation. EVM serves as the sub-transfer agent of each Fund and receives from the transfer agent an aggregate fee based upon the actual expenses incurred by EVM in the performance of these services. Eaton Vance Distributors, Inc. (EVD), an affiliate of EVM and the Funds’ principal underwriter, received a portion of the sales charge on sales of Class A shares of the Funds. EVD also received distribution and service fees from Class A, Class B and Class C shares (see Note 4) and contingent deferred sales charges (see Note 5). Sub-transfer agent fees earned by EVM and Class A sales charges that the Funds were informed were received by EVD for the year ended July 31, 2010 were as follows:
| | |
| | EVM’s | EVD’s |
| | Sub-Transfer | Class A |
| Fund | Agent Fees | Sales Charges |
| Arizona | $1,391 | $12,571 |
| Colorado | 794 | 5,526 |
| Connecticut | 2,538 | 15,906 |
| Michigan | 1,507 | 15,565 |
| Minnesota | 1,842 | 24,357 |
| New Jersey | 5,481 | 55,815 |
| Pennsylvania | 6,934 | 75,574 |
Except for Trustees of the Funds who are not members of EVM’s or BMR’s organizations, officers and Trustees receive remuneration for their services to the Funds out of the investment adviser fee. Trustees of the Funds who are not affiliated with the investment adviser may elect to defer receipt of all or a percentage of their annual fees in accordance with the terms of the Trustees Deferred Compensation Plan. For the year ended July 31, 2010, no significant amounts have been deferred. Certain officers and Trustees of the Funds are officers of the above organizations.
4 Distribution Plans
Each Fund has in effect a distribution plan for Class A shares (Class A Plan) pursuant to Rule 12b-1 under the 1940 Act. The Class A Plan provides that each Fund will pay EVD a distribution and service fee not exceeding 0.25% per annum of its average daily net assets attributable to Class A shares for distribution services and facilities provided to each Fund by EVD, as well as for personal services and/or the maintenance of shareholder accounts. The Trustees approved distribution and service fee payments equal to 0.20% per annum of each Fund’s average daily net assets attributable to Class A shares. Distribution and service fees paid or accrued to EVD for the year ended July 31, 2010 for Class A shares amounted to the following:
| |
| | Class A |
| | Distribution and |
| Fund | Service Fees |
| Arizona | $168,896 |
| Colorado | 68,679 |
| Connecticut | 221,607 |
| Michigan | 95,904 |
| Minnesota | 165,571 |
| New Jersey | 443,037 |
| Pennsylvania | 438,287 |
Each Fund also has in effect distribution plans for Class B shares (Class B Plan) and Class C shares (Class C Plan) pursuant to Rule 12b-1 under the 1940 Act. The Class B and Class C Plans require each Fund to pay EVD amounts equal to 0.75% per annum of its average daily net assets attributable to Class B and Class C shares for providing ongoing distribution services and facilities to the respective Funds. Each Fund will automatically discontinue payments to EVD during any period in which there are no outstanding Uncovered Distribution Charges, which are equivalent to the sum of (i) 5% and 6.25% of the aggregate amount received by each Fund for Class B and Class C shares sold, respectively, plus (ii) interest calculated by applying the rate of 1% over the prevailing prime rate to the outstanding balance of Uncovered Distribution Charges of EVD of each respective class, reduced by the aggregate amount of contingent deferred sales charges (see Note 5) and amounts theretofore paid or payable to EVD by each respective class. For the year ended July 31, 2010, the Funds paid or accrued to EVD the following distribution fees, representing 0.75% of the average daily net assets of each Fund’s Class B and Class C shares:
79
Eaton Vance Municipal Income Funds as of July 31, 2010
NOTES TO FINANCIAL STATEMENTS CON T’D |
| | |
| | Class B | Class C |
| | Distribution | Distribution |
| Fund | Fees | Fees |
| Arizona | $ 30,344 | $ 67,462 |
| Colorado | 12,785 | 2,785 |
| Connecticut | 53,879 | 52,058 |
| Michigan | — | 29,186 |
| Minnesota | 35,627 | 105,710 |
| New Jersey | — | 227,558 |
| Pennsylvania | 151,818 | 334,506 |
At July 31, 2010, the amounts of Uncovered Distribution Charges of EVD calculated under the Class B and Class C Plans were approximately as follows:
| | |
| Fund | Class B | Class C |
| Arizona | $ 924,000 | $ 803,000 |
| Colorado | 1,002,000 | 18,000 |
| Connecticut | 1,047,000 | 536,000 |
| Michigan | — | 366,000 |
| Minnesota | 690,000 | 691,000 |
| New Jersey | — | 2,868,000 |
| Pennsylvania | 1,210,000 | 3,243,000 |
The Class B and Class C Plans also authorize the Funds to make payments of service fees to EVD, financial intermediaries and other persons in amounts not exceeding 0.25% per annum of the average daily net assets attributable to that class. The Trustees approved service fee payments equal to 0.20% per annum of each Fund’s average daily net assets attributable to Class B and Class C shares. Service fees paid or accrued are for personal services and/or the maintenance of shareholder accounts. They are separate and distinct from the Class B and Class C sales commissions and distribution fees and, as such, are not subject to automatic discontinuance when there are no outstanding Uncovered Distribution Charges of EVD. Service fees paid or accrued for the year ended July 31, 2010 amounted to the following:
| | |
| | Class B | Class C |
| Fund | Service Fees | Service Fees |
| Arizona | $ 8,092 | $17,989 |
| Colorado | 3,409 | 743 |
| Connecticut | 14,368 | 13,882 |
| Michigan | — | 7,783 |
| Minnesota | 9,501 | 28,189 |
| New Jersey | — | 60,682 |
| Pennsylvania | 40,485 | 89,202 |
5 Contingent Deferred Sales Charges
A contingent deferred sales charge (CDSC) generally is imposed on redemptions of Class B shares made within six years of purchase and on redemptions of Class C shares made within one year of purchase. Class A shares may be subject to a 1% CDSC if redeemed within eighteen months of purchase (depending on the circumstances of purchase). Generally, the CDSC is based upon the lower of the net asset value at date of redemption or date of purchase. No charge is levied on shares acquired by reinvestment of dividends or capital gain distributions. The CDSC for Class B shares is imposed at declining rates that begin at 5% in the case of redemptions in the first and second year after purchase, declining one percentage point each subsequent year. Class C shares are subject to a 1% CDSC if redeemed within one year of purchase. No CDSC is levied on shares which have been sold to EVM or its affiliates or to their respective employees or clients and may be waived under certain other limited conditions. CDSCs received on Class B and Class C redemptions are paid to EVD to reduce the amount of Uncovered Distribution Charges calculated under each Fund’s Class B and Class C Plans. CDSCs received on Class B and Class C redemptions when no Uncovered Distribution Charges exist are credited to each Fund. For the year ended July 31, 2010, the Funds were informed that EVD received approximately the following amounts of CDSCs paid by Class A, Class B and Class C shareholders:
| | | |
| Fund | Class A | Class B | Class C |
| Arizona | $10,000 | $ 2,000 | $3,000 |
| Colorado | — | 1,000 | 100 |
| Connecticut | 1,000 | 3,000 | 2,000 |
| Michigan | 1,000 | — | 4,000 |
| Minnesota | — | 5,000 | 1,000 |
| New Jersey | 2,000 | — | — |
| Pennsylvania | 3,000 | 22,000 | 9,000 |
6 Purchases and Sales of Investments
Purchases and sales of investments, other than short-term obligations, for the year ended July 31, 2010 were as follows:
| | |
| Fund | Purchases | Sales |
| Arizona | $ 4,530,515 | $11,507,251 |
| Colorado | 4,564,448 | 8,737,485 |
| Connecticut | 13,031,755 | 12,848,838 |
| Michigan | 3,067,935 | 9,195,735 |
| Minnesota | 15,349,541 | 3,340,859 |
| New Jersey | 36,094,930 | 43,042,973 |
| Pennsylvania | 34,756,116 | 34,393,358 |
80
Eaton Vance Municipal Income Funds as of July 31, 2010
NOTES TO FINANCIAL STATEMENTS CON T’D |
7 Shares of Beneficial Interest
Each Fund’s Declaration of Trust permits the Trustees to issue an unlimited number of full and fractional shares of beneficial interest (without par value). Such shares may be issued in a number of different series (such as the Funds) and classes. Transactions in Fund shares were as follows:
| | |
| Arizona Fund | | |
| | Year Ended July 31, |
| Class A | 2010 | 2009 |
| Sales | 776,872 | 1,451,559 |
| Issued to shareholders electing to receive payments of | | |
| distributions in Fund shares | 208,037 | 275,485 |
| Redemptions | (1,474,125) | (2,704,860) |
| Exchange from Class B shares | 145,555 | 162,583 |
| Net decrease | (343,661) | (815,233) |
| |
| | Year Ended July 31, |
| Class B | 2010 | 2009 |
| Sales | 22,790 | 25,577 |
| Issued to shareholders electing to receive payments of | | |
| distributions in Fund shares | 7,624 | 11,620 |
| Redemptions | (81,480) | (136,644) |
| Exchange to Class A shares | (130,959) | (146,186) |
| Net decrease | (182,025) | (245,633) |
| |
| | Year Ended July 31, |
| Class C | 2010 | 2009 |
| Sales | 112,745 | 311,516 |
| Issued to shareholders electing to receive payments of | | |
| distributions in Fund shares | 21,283 | 22,222 |
| Redemptions | (153,947) | (301,970) |
| Net increase (decrease) | (19,919) | 31,768 |
| |
| |
| Colorado Fund | | |
| | Year Ended July 31, |
| Class A | 2010 | 2009 |
| Sales | 468,403 | 696,293 |
| Issued to shareholders electing to receive payments of | | |
| distributions in Fund shares | 86,465 | 99,856 |
| Redemptions | (895,659) | (788,512) |
| Exchange from Class B shares | 105,050 | 98,923 |
| Net increase (decrease) | (235,741) | 106,560 |
| | |
| Colorado Fund (continued) | | |
| | Year Ended July 31, |
| Class B | 2010 | 2009 |
| Sales | 1,957 | 11,572 |
| Issued to shareholders electing to receive payments of | | |
| distributions in Fund shares | 4,234 | 7,054 |
| Redemptions | (37,923) | (48,338) |
| Exchange to Class A shares | (96,474) | (90,844) |
| Net decrease | (128,206) | (120,556) |
| |
| | Year Ended July 31, |
| Class C | 2010 | 2009 |
| Sales | 1,302 | 41,777 |
| Issued to shareholders electing to receive payments of | | |
| distributions in Fund shares | 640 | 987 |
| Redemptions | (3,335) | (25,778) |
| Net increase (decrease) | (1,393) | 16,986 |
| |
| |
| Connecticut Fund | | |
| | Year Ended July 31, |
| Class A | 2010 | 2009 |
| Sales | 1,053,629 | 2,328,614 |
| Issued to shareholders electing to receive payments of | | |
| distributions in Fund shares | 322,900 | 311,065 |
| Redemptions | (1,838,941) | (2,236,225) |
| Exchange from Class B shares | 288,294 | 242,135 |
| Net increase (decrease) | (174,118) | 645,589 |
| |
| | Year Ended July 31, |
| Class B | 2010 | 2009 |
| Sales | 35,844 | 50,180 |
| Issued to shareholders electing to receive payments of | | |
| distributions in Fund shares | 16,130 | 26,970 |
| Redemptions | (73,682) | (239,145) |
| Exchange to Class A shares | (289,445) | (243,071) |
| Net decrease | (311,153) | (405,066) |
| |
| | Year Ended July 31, |
| Class C | 2010 | 2009 |
| Sales | 303,458 | 299,999 |
| Issued to shareholders electing to receive payments of | | |
| distributions in Fund shares | 13,949 | 10,224 |
| Redemptions | (144,857) | (111,630) |
| Net increase | 172,550 | 198,593 |
81
Eaton Vance Municipal Income Funds as of July 31, 2010
NOTES TO FINANCIAL STATEMENTS CON T’D |
| | |
| Connecticut Fund (continued) | | |
| | Year Ended July 31, |
| Class I | 2010 | 2009 |
| Sales | 444,509 | 223,450 |
| Issued to shareholders electing to receive payments of | | |
| distributions in Fund shares | 8,806 | 3,996 |
| Redemptions | (16,155) | (10,811) |
| Net increase | 437,160 | 216,635 |
| |
| |
| Michigan Fund | | |
| | Year Ended July 31, |
| Class A | 2010 | 2009 |
| Sales | 264,399 | 259,476 |
| Issued to shareholders electing to receive payments of | | |
| distributions in Fund shares | 146,769 | 168,836 |
| Redemptions | (885,289) | (1,283,083) |
| Net decrease | (474,121) | (854,771) |
| |
| | Year Ended July 31, |
| Class C | 2010 | 2009 |
| Sales | 118,762 | 160,898 |
| Issued to shareholders electing to receive payments of | | |
| distributions in Fund shares | 10,669 | 10,967 |
| Redemptions | (138,327) | (206,466) |
| Net decrease | (8,896) | (34,601) |
| |
| |
| Minnesota Fund | | |
| | Year Ended July 31, |
| Class A | 2010 | 2009 |
| Sales | 2,041,993 | 2,393,161 |
| Issued to shareholders electing to receive payments of | | |
| distributions in Fund shares | 253,681 | 243,435 |
| Redemptions | (1,188,662) | (2,139,472) |
| Exchange from Class B shares | 129,430 | 101,450 |
| Net increase | 1,236,442 | 598,574 |
| |
| | Year Ended July 31, |
| Class B | 2010 | 2009 |
| Sales | 31,436 | 37,773 |
| Issued to shareholders electing to receive payments of | | |
| distributions in Fund shares | 9,797 | 13,380 |
| Redemptions | (62,310) | (136,289) |
| Exchange to Class A shares | (120,211) | (94,227) |
| Net decrease | (141,288) | (179,363) |
| | |
| Minnesota Fund (continued) | | |
| | Year Ended July 31, |
| Class C | 2010 | 2009 |
| Sales | 505,491 | 673,492 |
| Issued to shareholders electing to receive payments of | | |
| distributions in Fund shares | 24,832 | 20,799 |
| Redemptions | (260,240) | (323,696) |
| Net increase | 270,083 | 370,595 |
| |
| |
| New Jersey Fund | | |
| | Year Ended July 31, |
| Class A | 2010 | 2009 |
| Sales | 1,640,241 | 1,760,909 |
| Issued to shareholders electing to receive payments of | | |
| distributions in Fund shares | 756,696 | 898,458 |
| Redemptions | (4,270,367) | (5,087,924) |
| Net decrease | (1,873,430) | (2,428,557) |
| |
| | Year Ended July 31, |
| Class C | 2010 | 2009 |
| Sales | 844,613 | 846,701 |
| Issued to shareholders electing to receive payments of | | |
| distributions in Fund shares | 82,499 | 82,811 |
| Redemptions | (574,771) | (851,032) |
| Net increase | 352,341 | 78,480 |
| |
| | Year Ended July 31, |
| Class I | 2010 | 2009 |
| Sales | 802,366 | 232,405 |
| Issued to shareholders electing to receive payments of | | |
| distributions in Fund shares | 3,203 | 2,257 |
| Redemptions | (106,758) | (24,970) |
| Net increase | 698,811 | 209,692 |
| |
| |
| Pennsylvania Fund | | |
| | Year Ended July 31, |
| Class A | 2010 | 2009 |
| Sales | 2,424,069 | 3,428,534 |
| Issued to shareholders electing to receive payments of | | |
| distributions in Fund shares | 719,122 | 789,904 |
| Redemptions | (5,040,854) | (5,048,365) |
| Exchange from Class B shares | 536,056 | 344,052 |
| Net decrease | (1,361,607) | (485,875) |
82
Eaton Vance Municipal Income Funds as of July 31, 2010
NOTES TO FINANCIAL STATEMENTS CON T’D |
| | |
| Pennsylvania Fund (continued) | | |
| | Year Ended July 31, |
| Class B | 2010 | 2009 |
| Sales | 166,125 | 182,348 |
| Issued to shareholders electing to receive payments of | | |
distributions in Fund shares | 47,811 | 65,316 |
| Redemptions | (317,762) | (452,727) |
| Exchange to Class A shares | (517,650) | (331,809) |
| Net decrease | (621,476) | (536,872) |
| |
| | Year Ended July 31, |
| Class C | 2010 | 2009 |
| Sales | 1,225,972 | 1,651,896 |
| Issued to shareholders electing to receive payments of | | |
| distributions in Fund shares | 128,884 | 106,708 |
| Redemptions | (730,907) | (988,213) |
| Net increase | 623,949 | 770,391 |
| |
| | Year Ended July 31, |
| Class I | 2010 | 2009 |
| Sales | 1,551,957 | 2,934,186 |
| Issued to shareholders electing to receive payments of | | |
| distributions in Fund shares | 5,314 | 15 |
| Redemptions | (273,703) | (332,747) |
| Net increase | 1,283,568 | 2,601,454 |
8 Federal Income Tax Basis of Investments The cost and unrealized appreciation (depreciation) of investments of each Fund at July 31, 2010, as determined on a federal income tax basis, were as follows:
| |
| Arizona Fund | |
| Aggregate cost | $ 88,582,932 |
| Gross unrealized appreciation | $ 8,091,615 |
| Gross unrealized depreciation | (3,034,283) |
| Net unrealized appreciation | $ 5,057,332 |
| |
| Colorado Fund | |
| Aggregate cost | $ 33,845,030 |
| Gross unrealized appreciation | $ 1,544,037 |
| Gross unrealized depreciation | (1,277,914) |
| Net unrealized appreciation | $ 266,123 |
| |
| Connecticut Fund | |
| Aggregate cost | $121,728,586 |
| Gross unrealized appreciation | $ 7,563,135 |
| Gross unrealized depreciation | (2,059,224) |
| Net unrealized appreciation | $ 5,503,911 |
| |
| Michigan Fund | |
| Aggregate cost | $ 47,250,545 |
| Gross unrealized appreciation | $ 3,537,813 |
| Gross unrealized depreciation | (1,161,280) |
| Net unrealized appreciation | $ 2,376,533 |
| |
| Minnesota Fund | |
| Aggregate cost | $100,573,225 |
| Gross unrealized appreciation | $ 6,427,673 |
| Gross unrealized depreciation | (720,384) |
| Net unrealized appreciation | $ 5,707,289 |
| |
| New Jersey Fund | |
| Aggregate cost | $247,831,234 |
| Gross unrealized appreciation | $ 13,956,903 |
| Gross unrealized depreciation | (8,804,758) |
| Net unrealized appreciation | $ 5,152,145 |
| |
| Pennsylvania Fund | |
| Aggregate cost | $297,423,769 |
| Gross unrealized appreciation | $ 20,254,010 |
| Gross unrealized depreciation | (9,051,766) |
| Net unrealized appreciation | $ 11,202,244 |
9 Line of Credit
The Funds participate with other portfolios and funds managed by EVM and its affiliates in a $450 million unsecured line of credit agreement with a group of banks. Borrowings are made by the Funds solely to facilitate the handling of unusual and/or unanticipated short-term cash requirements. Interest is charged to each Fund based on its borrowings at an amount above either the Eurodollar rate or Federal Funds rate. In addition, a fee computed at an annual rate of 0.10% on the daily unused portion of the line of credit is allocated among the participating portfolios and funds at the end of each quarter. Because the line of
83
Eaton Vance Municipal Income Funds as of July 31, 2010
NOTES TO FINANCIAL STATEMENTS CON T’D |
credit is not available exclusively to the Funds, a Fund may be unable to borrow some or all of its requested amounts at any particular time. The Funds did not have any significant borrowings or allocated fees during the year ended July 31, 2010.
10 Financial Instruments
The Funds may trade in financial instruments with off-balance sheet risk in the normal course of their investing activities. These financial instruments may include financial futures contracts and interest rate swaps and may involve, to a varying degree, elements of risk in excess of the amounts recognized for financial statement purposes. The notional or contractual amounts of these instruments represent the investment a Fund has in particular classes of financial instruments and do not necessarily represent the amounts potentially subject to risk. The measurement of the risks associated with these instruments is meaningful only when all related and offsetting transactions are considered.
A summary of obligations under these financial instruments at July 31, 2010 is as follows:
| | | | | | | |
| Futures Contracts | | | | | |
| | | | | | Net |
| | Expiration | | Aggregate | | Unrealized |
| Fund | Date | Contracts Position Cost | Value | Depreciation |
| Arizona | 9/10 | 59 | | | | |
| | | U.S. 30-Year Treasury Bond Short | $ (7,376,849)$ | (7,594,406)$ | (217,557) |
| Colorado | 9/10 | 11 | | | | | |
| | | U.S. 10-Year Treasury Note Short | $ (1,324,087)$ | (1,361,938)$ | (37,851) |
| | 9/10 | 12 | | | | | |
| | | U.S. 30-Year Treasury Bond Short | $ (1,488,406) | | (1,544,625) | (56,219) |
| Connecticut | 9/10 | 15 | | | | | |
| | | U.S. 10-Year Treasury Note Short | $ (1,805,573)$ | (1,857,188)$ | (51,615) |
| | 9/10 | 17 | | | | | |
| | | U.S. 30-Year Treasury Bond Short | $(2,108,576) | | (2,188,219) | (79,643) |
| Michigan | 9/10 | 19 | | | | | |
| | | U.S. 10-Year Treasury Note Short | $ (2,286,960)$ | (2,352,438)$ | (65,478) |
| | 9/10 | 18 | | | | | |
| | | U.S. 30-Year Treasury Bond Short | $ (2,232,610) | | (2,316,938) | (84,328) |
| Minnesota | 9/10 | 70 | | | | | |
| | | U.S. 30-Year Treasury Bond Short | $ (8,752,194)$ | (9,010,312)$ | (258,118) |
| New Jersey | 9/10 | 100 | | | | | |
| | | U.S. 10-Year Treasury Note Short | $(12,037,150) | | (12,381,250) | | (344,100) |
| | 9/10 | 200 | | | | | |
| | | U.S. 30-Year Treasury Bond Short | $(24,806,774) | | (25,743,750) | (936,976) |
| Pennsylvania 9/10 | 650 | | | | | |
| | | U.S. 30-Year Treasury Bond Short | $(80,622,010) | | (83,667,188) | | (3,045,178) |
| | | | | |
| Interest Rate Swaps | | | | |
| |
| Arizona Fund | | | | |
| | | Annual | Floating | Effective Date/ | |
| | Notional | Fixed Rate | Rate | Termination | Net Unrealized |
| Counterparty | Amount | Paid By Fund | Paid To Fund | Date | Depreciation |
| JPMorgan | | | 3-month | September 17, 2010/ | |
| Chase Co. | $1,750,000 | 4.046% | USD-LIBOR-BBA | September 17, 2040 | $(102,045) |
| |
| |
| Colorado Fund | | | | |
| | | Annual | Floating | Effective Date/ | |
| | Notional | Fixed Rate | Rate | Termination | Net Unrealized |
| Counterparty | Amount | Paid By Fund | Paid To Fund | Date | Depreciation |
| Merrill Lynch | | | | | |
| Capital | | | 3-month | August 24, 2010/ | |
| Services, Inc. | $ 425,000 | 4.140% | USD-LIBOR-BBA | August 24, 2040 | $ (33,187) |
| |
| |
| Connecticut Fund | | | | |
| | | Annual | Floating | Effective Date/ | |
| | Notional | Fixed Rate | Rate | Termination | Net Unrealized |
| Counterparty | Amount | Paid By Fund | Paid To Fund | Date | Depreciation |
| Merrill Lynch | | | | | |
| Capital | | | 3-month | August 24, 2010/ | |
| Services, Inc. | $2,000,000 | 4.140% | USD-LIBOR-BBA | August 24, 2040 | $(156,172) |
| |
| |
| Michigan Fund | | | | |
| | | Annual | Floating | Effective Date/ | |
| | Notional | Fixed Rate | Rate | Termination | Net Unrealized |
| Counterparty | Amount | Paid By Fund | Paid To Fund | Date | Depreciation |
| Merrill Lynch | | | | | |
| Capital | | | 3-month | August 24, 2010/ | |
| Services, Inc. | $ 900,000 | 4.140% | USD-LIBOR-BBA | August 24, 2040 | $ (70,277) |
| |
| |
| Minnesota Fund | | | | |
| | | Annual | Floating | Effective Date/ | |
| | Notional | Fixed Rate | Rate | Termination | Net Unrealized |
| Counterparty | Amount | Paid By Fund | Paid To Fund | Date | Depreciation |
| JPMorgan | | | 3-month | September 17, 2010/ | |
| Chase Co. | $ 750,000 | 4.046% | USD-LIBOR-BBA | September 17, 2040 | $ (43,734) |
| |
| |
| New Jersey Fund | | | | |
| | | Annual | Floating | Effective Date/ | |
| | Notional | Fixed Rate | Rate | Termination | Net Unrealized |
| Counterparty | Amount | Paid By Fund | Paid To Fund | Date | Depreciation |
| JPMorgan | | | 3-month | September 17, 2010/ | |
| Chase Co. | $6,612,500 | 4.046% | USD-LIBOR-BBA | September 17, 2040 | $(385,585) |
84
Eaton Vance Municipal Income Funds as of July 31, 2010
NOTES TO FINANCIAL STATEMENTS CON T’D |
| | | | | |
| Pennsylvania Fund | | | | |
| | | Annual | Floating | Effective Date/ | |
| | Notional | Fixed Rate | Rate | Termination | Net Unrealized |
| Counterparty | Amount | Paid By Fund | Paid To Fund | Date | Depreciation |
| JPMorgan | | | 3-month | September 17, 2010/ | |
| Chase Co. | $3,650,000 | 4.046% | USD-LIBOR-BBA | September 17, 2040 | $(212,837) |
| Merrill Lynch | | | | | |
| Capital | | | 3-month | August 24, 2010/ | |
| Services, Inc. | 4,500,000 | 4.140 | USD-LIBOR-BBA | August 24, 2040 | (351,387) |
| | | | | | $(564,224) |
The effective date represents the date on which a Fund and the counterparty to the interest rate swap contract begin interest payment accruals.
At July 31, 2010, the Funds had sufficient cash and/or securities to cover commitments under these contracts.
Each Fund is subject to interest rate risk in the normal course of pursuing its investment objectives. Because the Funds hold fixed rate bonds, the value of these bonds may decrease if interest rates rise. To hedge against this risk, each Fund may enter into interest rate swap contracts. The Funds may also purchase and sell U.S. Treasury futures contracts to hedge against changes in interest rates.
The Funds enter into interest rate swap contracts that may contain provisions whereby the counterparty may terminate the contract under certain conditions, including but not limited to a decline in a Fund’s net assets below a certain level over a certain period of time, which would trigger a payment by the Fund for those swaps in a liability position. At July 31, 2010, the fair value of interest rate swaps with credit-related contingent features in a net liability position was equal to the fair value of the liability derivative related to interest rate swaps included in the table below for each respective Fund. The value of securities pledged as collateral, if any, for open interest rate swap contracts at July 31, 2010 is disclosed in a note to each Fund’s Portfolio of Investments.
The non-exchange traded derivatives in which a Fund invests, including swap contracts, are subject to the risk that the counterparty to the contract fails to perform its obligations under the contract. At July 31, 2010, the maximum amount of loss the Funds would incur due to counterparty risk was equal to the fair value of the asset derivative related to interest rate swaps included in the table below for each respective Fund. Counterparties may be required to pledge collateral in the form of cash, U.S. Government securities or highly-rated bonds for the benefit of a Fund if the net amount due from the counterparty with respect to a derivative contract exceeds a certain threshold. The amount of collateral posted by the counterparties with respect to such contracts would also reduce the amount of any loss incurred.
The fair value of derivative instruments (not considered to be hedging instruments for accounting disclosure purposes) and whose primary underlying risk exposure is interest rate risk at July 31, 2010 was as follows:
| | |
| | Fair Value |
| | Asset Derivative | Liability Derivative |
| Arizona Fund | | |
| Futures Contracts | $ — | $ (217,557)(1) |
| Interest Rate Swaps | — | (102,045)(2) |
| Total | $ — | $ (319,602) |
| Colorado Fund | | |
| Futures Contracts | $ — | $ (94,070)(1) |
| Interest Rate Swaps | — | (33,187)(2) |
| Total | $ — | $ (127,257) |
| Connecticut Fund | | |
| Futures Contracts | $ — | $ (131,258)(1) |
| Interest Rate Swaps | — | (156,172)(2) |
| Total | $ — | $ (287,430) |
| Michigan Fund | | |
| Futures Contracts | $ — | $ (149,806)(1) |
| Interest Rate Swaps | — | (70,277)(2) |
| Total | $ — | $ (220,083) |
| Minnesota Fund | | |
| Futures Contracts | $ — | $ (258,118)(1) |
| Interest Rate Swaps | — | (43,734)(2) |
| Total | $ — | $ (301,852) |
| New Jersey Fund | | |
| Futures Contracts | $ — | $(1,281,076)(1) |
| Interest Rate Swaps | — | (385,585)(2) |
| Total | $ — | $ (1,666,661) |
| Pennsylvania Fund | | |
| Futures Contracts | $ — | $(3,045,178)(1) |
| Interest Rate Swaps | — | (564,224)(2) |
| Total | $ — | $ (3,609,402) |
(1) Amount represents cumulative unrealized depreciation on futures contracts in the Futures Contracts table above. Only the current day’s variation margin on open futures contracts is reported within the Statement of Assets and Liabilities as Receivable or Payable for variation margin, as applicable.
(2) Statement of Assets and Liabilities location: Payable for open swap contracts; Net unrealized appreciation.
85
Eaton Vance Municipal Income Funds as of July 31, 2010
NOTES TO FINANCIAL STATEMENTS CON T’D |
The effect of derivative instruments (not considered to be hedging instruments for accounting disclosure purposes) on the Statement of Operations and whose primary underlying risk exposure is interest rate risk for the year ended July 31, 2010 was as follows:
| | |
| | | Change in |
| | | Unrealized |
| | Realized Gain | Appreciation |
| | (Loss) on | (Depreciation) on |
| | Derivatives | Derivatives |
| | Recognized in | Recognized in |
| Fund | Income(1) | Income(2) |
| Arizona | $(1,310,926) | $ 36,195 |
| Colorado | (467,222) | (37,232) |
| Connecticut | (804,100) | (91,627) |
| Michigan | (774,014) | (70,568) |
| Minnesota | (933,269) | (109,267) |
| New Jersey | (4,228,107) | (877,522) |
| Pennsylvania | (8,915,863) | (815,040) |
| (1) | Statement of Operations location: Net realized gain (loss) – Financial futures contracts and swap contracts. |
| (2) | Statement of Operations location: Change in unrealized appreciation (depreciation) – Financial futures contracts and swap contracts. |
The average notional amounts of futures contracts and interest rate swaps outstanding during the year ended July 31, 2010, which are indicative of the volume of these derivative types, were approximately as follows:
| | |
| | Average Notional Amount |
| Fund | Futures Contracts | Interest Rate Swaps |
| Arizona | $ 9,746,000 | $1,750,000 |
| Colorado | 4,131,000 | 425,000 |
| Connecticut | 5,846,000 | 2,000,000 |
| Michigan | 6,700,000 | 900,000 |
| Minnesota | 7,000,000 | 750,000 |
| New Jersey | 29,038,000 | 6,612,500 |
| Pennsylvania | 64,615,000 | 8,150,000 |
11 Fair Value Measurements
Under generally accepted accounting principles for fair value measurements, a three-tier hierarchy to prioritize the assumptions, referred to as inputs, is used in valuation techniques to measure fair value. The three-tier hierarchy of inputs is summarized in the three broad levels listed below.
- Level 1 – quoted prices in active markets for identical investments
- Level 2 – other significant observable inputs (including quoted prices for similar investments, interest rates, prepayment speeds, credit risk, etc.)
- Level 3 – significant unobservable inputs (including a fund’s own assumptions in determining the fair value of investments)
The inputs or methodology used for valuing securities are not necessarily an indication of the risk associated with investing in those securities.
At July 31, 2010, the inputs used in valuing the Funds’ investments, which are carried at value, were as follows:
| | | | | | | |
| Arizona Fund | | | | | | | |
| | Quoted | | | | | | |
| | Prices in | | | | | | |
| | Active | | Significant | | | |
| | Markets for | Other | Significant | |
| | Identical | | Observable | Unobservable | |
| | Assets | | Inputs | Inputs | |
| Asset Description | (Level 1) | (Level 2) | (Level 3) | Total |
| Tax-Exempt Investments | $ — | $95,340,264 | $ — | $95,340,264 |
| |
| Total Investments | $ — | $ 95,340,264 | $ — | $ 95,340,264 |
| |
| Liability Description | | | | | | | |
| Futures Contracts | $(217,557) $ | — | $ — | $ (217,557) |
| Interest Rate Swaps | | — | | (102,045) | — | (102,045) |
| |
| Total | $ (217,557) $ | (102,045) | $ — | $ (319,602) |
| |
| Colorado Fund | | | | | | | |
| | Quoted | | | | | | |
| | Prices in | | | | | | |
| | Active | | Significant | | | |
| | Markets for | Other | Significant | |
| | Identical | | Observable | Unobservable | |
| | Assets | | Inputs | Inputs | |
| Asset Description | (Level 1) | (Level 2) | (Level 3) | Total |
| Tax-Exempt Investments | $ — | $34,111,153 | $ — | $34,111,153 |
| |
| Total Investments | $ — | $ 34,111,153 | $ — | $ 34,111,153 |
| |
| Liability Description | | | | | | | |
| Futures Contracts | $(94,070) $ | — | $ — | $ (94,070) |
| Interest Rate Swaps | | — | | (33,187) | | — | (33,187) |
| |
| Total | $ (94,070) $ | (33,187) | $ — | $ (127,257) |
86
Eaton Vance Municipal Income Funds as of July 31, 2010
NOTES TO FINANCIAL STATEMENTS CON T’D |
| | | | | | | | | |
| Connecticut Fund | | | | | | | | | |
| | Quoted | | | | | | | | |
| | Prices in | | | | | | | | |
| | Active | | Significant | | | | |
| | Markets for | Other | | Significant | | |
| | Identical | | Observable | Unobservable | | |
| | Assets | | Inputs | Inputs | | |
| Asset Description | (Level 1) | (Level 2) | (Level 3) | Total | |
| Tax-Exempt Investments | $ — | $134,457,497 | $ — | $134,457,497 |
| |
| Total Investments | $ — | $ 134,457,497 | $ — | $ 134,457,497 |
| |
| Liability Description | | | | | | | | | |
| Futures Contracts | $(131,258) $ | | — | $ — | $ (131,258) |
| Interest Rate Swaps | | — | | (156,172) | | — | | (156,172) |
| |
| Total | $ (131,258) $ | (156,172) | $ — | $ (287,430) |
| |
| Michigan Fund | | | | | | | | | |
| | Quoted | | | | | | | |
| | Prices in | | | | | | | |
| | Active | | | Significant | | | | |
| | Markets for | Other | Significant | | |
| | Identical | | Observable | Unobservable | | |
| | Assets | | | Inputs | Inputs | | |
| Asset Description | (Level 1) | | (Level 2) | (Level 3) | Total |
| Tax-Exempt Investments | $ — | $50,622,078 | $ — | $50,622,078 |
| |
| Total Investments | $ — | $ 50,622,078 | $ — | $ 50,622,078 |
| |
| Liability Description | | | | | | | | | |
| Futures Contracts | $(149,806) $ | — | $ — | $ (149,806) |
| Interest Rate Swaps | | — | | (70,277) | — | | (70,277) |
| |
| Total | $ (149,806) $ | (70,277) $ | — | $ (220,083) |
| |
| Minnesota Fund | | | | | | | | | |
| | Quoted | | | | | | | | |
| | Prices in | | | | | | | | |
| | Active | | Significant | | | | |
| | Markets for | Other | | Significant | | |
| | Identical | | Observable | Unobservable | | |
| | Assets | | Inputs | Inputs | | | |
| Asset Description | (Level 1) | (Level 2) | (Level 3) | | Total |
| Tax-Exempt Investments | $ — | $106,280,514 | $ — | $106,280,514 |
| |
| Total Investments | $ — | $ 106,280,514 | $ — | $ 106,280,514 |
| |
| Liability Description | | | | | | | | | |
| Futures Contracts | $(258,118) $ | | — | $ — | $ (258,118) |
| Interest Rate Swaps | | — | | | (43,734) | | — | | (43,734) |
| |
| Total | $ (258,118) $ | | (43,734) | $ — | $ (301,852) |
| | | | | | | |
| New Jersey Fund | | | | | | | |
| | Quoted | | | | | | |
| | Prices in | | | | | | |
| | Active | | Significant | | | |
| | Markets for | Other | Significant | |
| | Identical | | Observable | Unobservable | |
| | Assets | | Inputs | Inputs | |
| Asset Description | (Level 1) | | (Level 2) | (Level 3) | Total |
| Tax-Exempt Investments $ | — | $291,728,379 | $ — | $291,728,379 |
| |
| Total Investments | $ — | $ 291,728,379 | $ — | $ 291,728,379 |
| |
| Liability Description | | | | | | | |
| Futures Contracts | $(1,281,076) $ | — | $ — | $ (1,281,076) |
| Interest Rate Swaps | | — | | (385,585) | | — | (385,585) |
| |
| Total | $ (1,281,076) $ | (385,585) | $ — | $ (1,666,661) |
| |
| Pennsylvania Fund | | | | | | | |
| | Quoted | | | | | | |
| | Prices in | | | | | | |
| | Active | | Significant | | | |
| | Markets for | Other | Significant | |
| | Identical | | Observable | Unobservable | |
| | Assets | | Inputs | Inputs | |
| Asset Description | (Level 1) | (Level 2) | (Level 3) | Total |
| Tax-Exempt Investments | $ — $345,101,013 | $ — | $345,101,013 |
| |
| Total Investments | $ — $ 345,101,013 | $ — | $ 345,101,013 |
| |
| Liability Description | | | | | | | |
| Futures Contracts | $(3,045,178)$ | — | $ — | $ (3,045,178) |
| Interest Rate Swaps | | — | | (564,224) | | — | (564,224) |
| |
| Total | $ (3,045,178)$ | (564,224) | $ — | $ (3,609,402) |
The Funds held no investments or other financial instruments as of July 31, 2009 whose fair value was determined using Level 3 inputs.
12 Plan of Reorganization
On June 7, 2010, the Board of Trustees of the Colorado Fund approved a proposal to reorganize the Colorado Fund into Eaton Vance National Municipal Income Fund, a series of Eaton Vance Municipals Trust with substantially the same investment objective as the Colorado Fund. The proposed reorganization is subject to approval by the shareholders of the Colorado Fund. After the close of business on June 18, 2010, the Colorado Fund was closed to new investors.
87
Eaton Vance Municipal Income Funds as of July 31, 2010
REPORT OF INDEPENDENT REGISTERED PUBLIC ACCOUNTING FIRM |
To the Trustees of Eaton Vance Municipals Trust and Shareholders of Eaton Vance Arizona Municipal Income Fund (formerly Eaton Vance Arizona Municipals Fund), Eaton Vance Colorado Municipal Income Fund (formerly Eaton Vance Colorado Municipals Fund), Eaton Vance Connecticut Municipal Income Fund (formerly Eaton Vance Connecticut Municipals Fund), Eaton Vance Michigan Municipal Income Fund (formerly Eaton Vance Michigan Municipals Fund), Eaton Vance Minnesota Municipal Income Fund (formerly Eaton Vance Minnesota Municipals Fund), Eaton Vance New Jersey Municipal Income Fund (formerly Eaton Vance New Jersey Municipals Fund) and Eaton Vance Pennsylvania Municipal Income Fund (formerly Eaton Vance Pennsylvania Municipals Fund):
We have audited the accompanying statements of assets and liabilities of Eaton Vance Arizona Municipal Income Fund (formerly Eaton Vance Arizona Municipals Fund), Eaton Vance Colorado Municipal Income Fund (formerly Eaton Vance Colorado Municipals Fund), Eaton Vance Connecticut Municipal Income Fund (formerly Eaton Vance Connecticut Municipals Fund), Eaton Vance Michigan Municipal Income Fund (formerly Eaton Vance Michigan Municipals Fund), Eaton Vance Minnesota Municipal Income Fund (formerly Eaton Vance Minnesota Municipals Fund), Eaton Vance New Jersey Municipal Income Fund (formerly Eaton Vance New Jersey Municipals Fund) and Eaton Vance Pennsylvania Municipal Income Fund (formerly Eaton Vance Pennsylvania Municipals Fund) (collectively, the “Funds”) (certain of the funds constituting Eaton Vance Municipals Trust) including the portfolios of investments, as of July 31, 2010, and the related statements of operations for the year then ended, the statements of changes in net assets for each of the two years in the period then ended, the financial highlights for each of the five years in the period then ended and the statement of cash flows of Eaton Vance New Jersey Municipal Income Fund for the year ended July 31, 2010. These financial statements and financial highlights are the responsibility of the Funds’ management. Our responsibility is to express an opinion on these financial statements and financial highlights based on our audits.
We conducted our audits in accordance with the standards of the Public Company Accounting Oversight Board (United States). Those standards require that we plan and perform the audits to obtain reasonable assurance about whether the financial statements and financial highlights are free of material misstatement. The Funds are not required to have, nor were we engaged to perform, an audit of their internal control over financial reporting. Our audits included consideration of internal control over financial reporting as a basis for designing audit procedures that are appropriate in the circumstances, but not for the purpose of expressing an opinion on the effectiveness of the Funds’ internal control over financial reporting. Accordingly, we express no such opinion. An audit also includes examining, on a test basis, evidence supporting the amounts and disclosures in the financial statements, assessing the accounting principles used and significant estimates made by management, as well as evaluating the overall financial statement presentation. Our procedures included confirmation of securities owned as of July 31, 2010, by correspondence with the custodian and brokers; where replies were not received from brokers, we performed other auditing procedures. We believe that our audits provide a reasonable basis for our opinion.
In our opinion, the financial statements and financial highlights referred to above present fairly, in all material respects, the financial positions of Eaton Vance Arizona Municipal Income Fund, Eaton Vance Colorado Municipal Income Fund, Eaton Vance Connecticut Municipal Income Fund, Eaton Vance Michigan Municipal Income Fund, Eaton Vance Minnesota Municipal Income Fund, Eaton Vance New Jersey Municipal Income Fund and Eaton Vance Pennsylvania Municipal Income Fund as of July 31, 2010, and the results of their operations for the year then ended, the changes in their net assets for each of the two years in the period then ended, their financial highlights for each of the five years in the period then ended, and the statement of cash flows of Eaton Vance New Jersey Municipal Income Fund for the year ended July 31, 2010, in conformity with accounting principles generally accepted in the United States of America.
DELOITTE & TOUCHE LLP
Boston, Massachusetts
September 14, 2010 |
88
Eaton Vance Municipal Income Funds as of July 31, 2010
FEDERAL TAX INFORMATION (Unaud i ted) |
The Form 1099-DIV you receive in January 2011 will show the tax status of all distributions paid to your account in calendar year 2010. Shareholders are advised to consult their own tax adviser with respect to the tax consequences of their investment in a Fund. As required by the Internal Revenue Code regulations, shareholders must be notified within 60 days of a Fund’s fiscal year end regarding exempt-interest dividends.
Exempt-Interest Dividends. The Funds designate the following amounts of dividends from net investment income as an exempt interest dividend.
| |
| Arizona Municipal Income Fund | 100.00% |
| Colorado Municipal Income Fund | 99.94% |
| Connecticut Municipal Income Fund | 99.15% |
| Michigan Municipal Income Fund | 99.93% |
| Minnesota Municipal Income Fund | 99.98% |
| New Jersey Municipal Income Fund | 99.95% |
| Pennsylvania Municipal Income Fund | 99.99% |
89
Eaton Vance Municipal Income Funds
BOA RD OF TRUSTEES’ CONTRACT APPRO VAL |
Overview of the Contract Review Process
The Investment Company Act of 1940, as amended (the “1940 Act”), provides, in substance, that each investment advisory agreement between a fund and its investment adviser will continue in effect from year to year only if its continuance is approved at least annually by the fund’s board of trustees, including by a vote of a majority of the trustees who are not “interested persons” of the fund (“Independent Trustees”), cast in person at a meeting called for the purpose of considering such approval.
At a meeting of the Boards of Trustees (each a “Board”) of the Eaton Vance group of mutual funds (the “Eaton Vance Funds”) held on April 26, 2010, the Board, including a majority of the Independent Trustees, voted to approve continuation of existing advisory and sub-advisory agreements for the Eaton Vance Funds for an additional one-year period. In voting its approval, the Board relied upon the affirmative recommendation of the Contract Review Committee of the Board, which is a committee comprised exclusively of Independent Trustees. Prior to making its recommendation, the Contract Review Committee reviewed information furnished for a series of meetings of the Contract Review Committee held between February and April 2010. Such information included, among other things, the following:
Information about Fees, Performance and Expenses
- An independent report comparing the advisory and related fees paid by each fund with fees paid by comparable funds;
- An independent report comparing each fund’s total expense ratio and its components to comparable funds;
- An independent report comparing the investment performance of each fund (including yield where relevant) to the investment performance of comparable funds over various time periods;
- Data regarding investment performance in comparison to relevant peer groups of similarly managed funds and appropriate indices;
- For each fund, comparative information concerning the fees charged and the services provided by each adviser in managing other mutual funds and institutional accounts using investment strategies and techniques similar to those used in managing such fund;
- Profitability analyses for each adviser with respect to each fund;
| Information about Portfolio Management |
- Descriptions of the investment management services provided to each fund, including the investment strategies and processes employed, and any changes in portfolio management processes and personnel;
- Information concerning the allocation of brokerage and the benefits received by each adviser as a result of brokerage allocation, including information concerning the acquisition of research through “soft dollar” benefits received in connection with the funds’ brokerage, and the implementation of a soft dollar reimbursement program established with respect to the funds;
- Data relating to portfolio turnover rates of each fund;
- The procedures and processes used to determine the fair value of fund assets and actions taken to monitor and test the effectiveness of such procedures and processes;
| Information about each Adviser |
- Reports detailing the financial results and condition of each adviser;
- Descriptions of the qualifications, education and experience of the individual investment professionals whose responsibilities include portfolio management and investment research for the funds, and information relating to their compensation and responsibilities with respect to managing other mutual funds and investment accounts;
- Copies of the Codes of Ethics of each adviser and its affiliates, together with information relating to compliance with and the administration of such codes;
- Copies of or descriptions of each adviser’s policies and procedures relating to proxy voting, the handling of corporate actions and class actions;
- Information concerning the resources devoted to compliance efforts undertaken by each adviser and its affiliates on behalf of the funds (including descriptions of various compliance programs) and their record of compliance with investment policies and restrictions, including policies with respect to market-timing, late trading and selective portfolio disclosure, and with policies on personal securities transactions;
- Descriptions of the business continuity and disaster recovery plans of each adviser and its affiliates;
- A description of Eaton Vance Management’s procedures for overseeing third party advisers and sub-advisers;
| Other Relevant Information |
- Information concerning the nature, cost and character of the administrative and other non-investment management services provided by Eaton Vance Management and its affiliates;
- Information concerning management of the relationship with the custodian, subcustodians and fund accountants by each adviser or the funds’ administrator; and
- The terms of each advisory agreement.
90
Eaton Vance Municipal Income Funds
BOA RD OF TRUSTEES’ CONTRACT APPRO VAL CONT’ D |
In addition to the information identified above, the Contract Review Committee considered information provided from time to time by each adviser throughout the year at meetings of the Board and its committees. Over the course of the twelve-month period ended April 30, 2010, with respect to one or more Funds, the Board met ten times and the Contract Review Committee, the Audit Committee, the Governance Committee, the Portfolio Management Committee and the Compliance Reports and Regulatory Matters Committee, each of which is a Committee comprised solely of Independent Trustees, met nine, thirteen, three, eight and fifteen times, respectively. At such meetings, the Trustees received, among other things, presentations by the portfolio managers and other investment professionals of each adviser relating to the investment performance of each fund and the investment strategies used in pursuing the fund’s investment objective including, where relevant, the use of derivative instruments, as well as trading policies and procedures and risk management techniques.
For funds that invest through one or more underlying portfolios, the Board considered similar information about the portfolio(s) when considering the approval of advisory agreements. In addition, in cases where the fund’s investment adviser has engaged a sub-adviser, the Board considered similar information about the sub-adviser when considering the approval of any sub-advisory agreement.
The Contract Review Committee was assisted throughout the contract review process by Goodwin Procter LLP, legal counsel for the Independent Trustees. The members of the Contract Review Committee relied upon the advice of such counsel and their own business judgment in determining the material factors to be considered in evaluating each advisory and sub-advisory agreement and the weight to be given to each such factor. The conclusions reached with respect to each advisory and sub-advisory agreement were based on a comprehensive evaluation of all the information provided and not any single factor. Moreover, each member of the Contract Review Committee may have placed varying emphasis on particular factors in reaching conclusions with respect to each advisory and sub-advisory agreement.
Results of the Process
Based on its consideration of the foregoing, and such other information as it deemed relevant, including the factors and conclusions described below, the Contract Review Committee concluded that the continuance of the investment advisory agreements of the following funds:
- Eaton Vance Arizona Municipal Income Fund (formerly Eaton Vance Arizona Municipals Fund)
- Eaton Vance Colorado Municipal Income Fund (formerly Eaton Vance Colorado Municipals Fund)
- Eaton Vance Connecticut Municipal Income Fund (formerly Eaton Vance Connecticut Municipals Fund)
- Eaton Vance Michigan Municipal Income Fund (formerly Eaton Vance Michigan Municipals Fund)
- Eaton Vance Minnesota Municipal Income Fund (formerly Eaton Vance Minnesota Municipals Fund)
- Eaton Vance New Jersey Municipal Income Fund (formerly Eaton Vance New Jersey Municipals Fund)
- Eaton Vance Pennsylvania Municipal Income Fund (formerly Eaton Vance Pennsylvania Municipals Fund)
(the “Funds”), each with Boston Management and Research (the “Adviser”), including their fee structures, is in the interests of shareholders and, therefore, the Contract Review Committee recommended to the Board approval of each agreement. The Board accepted the recommendation of the Contract Review Committee as well as the factors considered and conclusions reached by the Contract Review Committee with respect to each agreement. Accordingly, the Board, including a majority of the Independent Trustees, voted to approve continuation of the investment advisory agreement for each Fund.
Nature, Extent and Quality of Services
In considering whether to approve the investment advisory agreements of the Funds, the Board evaluated the nature, extent and quality of services provided to the Funds by the Adviser.
The Board considered the Adviser’s management capabilities and investment process with respect to the types of investments held by each Fund, including the education, experience and number of its investment professionals and other personnel who provide portfolio management, investment research, and similar services to the Funds, including recent changes to such personnel (where applicable). In particular, the Board evaluated, where relevant, the abilities and experience of such investment personnel in analyzing factors such as credit risk, tax efficiency, and special considerations relevant to investing in municipal bonds. The Board considered the Adviser’s large municipal bond team, which includes portfolio managers and credit specialists who provide services to the Funds. The Board also took into account the resources dedicated to portfolio management and other services, including the compensation methods of the Adviser to recruit and retain investment personnel, and the time and attention devoted to each Fund by senior management.
The Board also reviewed the compliance programs of the Adviser and relevant affiliates thereof. Among other matters, the Board considered compliance and reporting matters relating to personal trading by investment personnel, selective disclosure of portfolio
91
Eaton Vance Municipal Income Funds
BOA RD OF TRUSTEES’ CONTRACT APPRO VAL CONT’ D |
holdings, late trading, frequent trading, portfolio valuation, business continuity and the allocation of investment opportunities. The Board also evaluated the responses of the Adviser and its affiliates to requests in recent years from regulatory authorities such as the Securities and Exchange Commission and the Financial Industry Regulatory Authority.
The Board considered shareholder and other administrative services provided or managed by Eaton Vance Management and its affiliates, including transfer agency and accounting services. The Board evaluated the benefits to shareholders of investing in a fund that is a part of a large family of funds, including the ability, in many cases, to exchange an investment among different funds without incurring additional sales charges.
After consideration of the foregoing factors, among others, the Board concluded that the nature, extent and quality of services provided by the Adviser, taken as a whole, are appropriate and consistent with the terms of the respective investment advisory agreements.
Fund Performance
The Board compared each Fund’s investment performance to a relevant universe of similarly managed funds identified by an independent data provider and appropriate benchmark indices. The Board reviewed comparative performance data for the one-, three-, five- and ten-year periods ended September 30, 2009 for each Fund. The Board considered the impact of extraordinary market conditions during 2008 and 2009 on each Fund’s performance relative to its peer universe in light of, among other things, the Adviser’s longstanding strategy of generating current income through investments in higher quality (including insured) municipal bonds with longer maturities. The Board noted that the Adviser had restructured management of the municipal bond team and had implemented additional processes and tools designed to manage credit and interest rate risk. The Board concluded that appropriate actions are being taken by the Adviser to improve Fund performance and that additional time is required to evaluate the effectiveness of such actions.
Management Fees and Expenses
The Board reviewed contractual investment advisory fee rates payable by each Fund (referred to as “management fees”). As part of its review, the Board considered each Fund’s management fees and total expense ratio for the year ended September 30, 2009, as compared to a group of similarly managed funds selected by an independent data provider. The Board also considered factors that had an impact on the Funds’ expense ratios, as identified by management in response to inquiries from the Contract Review Committee, as well as actions being taken to reduce expenses at the Eaton Vance fund complex level.
After reviewing the foregoing information, and in light of the nature, extent and quality of the services provided by the Adviser, the Board concluded with respect to each Fund that the management fees charged for advisory and related services are reasonable.
Profitability
The Board reviewed the level of profits realized by the Adviser and relevant affiliates thereof in providing investment advisory and administrative services to each Fund and to all Eaton Vance Funds as a group. The Board considered the level of profits realized without regard to revenue sharing or other payments by the Adviser and its affiliates to third parties in respect of distribution services. The Board also considered other direct or indirect benefits received by the Adviser and its affiliates in connection with their relationship with the Funds, including the benefits of research services that may be available to the Adviser as a result of securities transactions effected for a Fund and other investment advisory clients.
The Board concluded that, in light of the foregoing factors and the nature, extent and quality of the services rendered, the profits realized by the Adviser and its affiliates are reasonable.
Economies of Scale
In reviewing management fees and profitability, the Board also considered the extent to which the Adviser and its affiliates, on the one hand, and each Fund, on the other hand, can expect to realize benefits from economies of scale as the assets of the Fund increase. The Board acknowledged the difficulty in accurately measuring the benefits resulting from the economies of scale with respect to the management of any specific fund or group of funds. The Board reviewed data summarizing the increases and decreases in the assets of each Fund and of all Eaton Vance Funds as a group over various time periods, and evaluated the extent to which the total expense ratio of each Fund and the profitability of the Adviser and its affiliates may have been affected by such increases or decreases. Based upon the foregoing, the Board concluded that the benefits from economies of scale are currently being shared equitably by the Adviser and its affiliates and each Fund. The Board also concluded that, assuming reasonably foreseeable increases in the assets of each Fund, the structure of each advisory fee, which includes breakpoints at several asset levels, can be expected to cause the Adviser and its affiliates and the Fund to continue to share such benefits equitably.
92
| | Eaton Vance Municipal Income Funds
MANAGEMENT AND ORGANIZATION |
Fund Management. The Trustees of Eaton Vance Municipals Trust (the Trust) are responsible for the overall management and supervision of the Trust’s affairs. The Trustees and officers of the Trust are listed below. Except as indicated, each individual has held the office shown or other offices in the same company for the last five years. Trustees and officers of the Trust hold indefinite terms of office. The “Noninterested Trustees” consist of those Trustees who are not “interested persons” of the Trust, as that term is defined under the 1940 Act. The business address of each Trustee and officer is Two International Place, Boston, Massachusetts 02110. As used below, “EVC” refers to Eaton Vance Corp., “EV” refers to Eaton Vance, Inc., “EVM” refers to Eaton Vance Management, “BMR” refers to Boston Management and Research and “EVD” refers to Eaton Vance Distributors, Inc. EVC and EV are the corporate parent and trustee, respectively, of EVM and BMR. EVD is the Funds’ principal underwriter and a direct, wholly-owned subsidiary of EVC. Each officer affiliated with Eaton Vance may hold a position with other Eaton Vance affiliates that is comparable to his or her position with EVM listed below.
| | | | | |
| | | Term of | | Number of Portfolios | |
| | | Office and | Principal Occupation(s) | in Fund Complex | Other Directorships Held |
| Name and | Trust | Length of | During Past Five Years | Overseen By | During the Last |
| Date of Birth | Position(s) | Service | and Other Relevant Experience | Trustee(1) | Five Years(2) |
| |
| Interested Trustee | | | | |
| |
| Thomas E. Faust Jr. | Trustee | Since 2007 | Chairman, Chief Executive Officer and President of EVC, Director | 183 | Director of EVC. |
| 5/31/58 | | | and President of EV, Chief Executive Officer and President of | | |
| | | | EVM and BMR, and Director of EVD. Trustee and/or officer of | | |
| | | | 183 registered investment companies and 2 private companies | | |
| | | | managed by EVM or BMR. Mr. Faust is an interested person | | |
| | | | because of his positions with EVM, BMR, EVD, EVC and EV, | | |
| | | | which are affiliates of the Trust. | | |
| |
| Noninterested Trustees | | | | |
| |
| Benjamin C. Esty | Trustee | Since 2005 | Roy and Elizabeth Simmons Professor of Business Administration | 183 | None |
| 1/2/63 | | | and Finance Unit Head, Harvard University Graduate School of | | |
| | | | Business Administration. | | |
| |
| Allen R. Freedman | Trustee | Since 2007 | Private Investor and Consultant. Former Chairman (2002-2004) | 183 | Director of Assurant, Inc. (insurance provider) |
| 4/3/40 | | | and a Director (1983-2004) of Systems & Computer | | and Stonemor Partners, L.P. (owner and |
| | | | Technology Corp. (provider of software to higher education). | | operator of cemeteries). |
| | | | Formerly, a Director of Loring Ward International (fund | | |
| | | | distributor) (2005-2007). Formerly, Chairman and a Director of | | |
| | | | Indus International, Inc. (provider of enterprise management | | |
| | | | software to the power generating industry) (2005-2007). | | |
| |
| William H. Park | Trustee | Since 2003 | Vice Chairman, Commercial Industrial Finance Corp. (specialty | 183 | None |
| 9/19/47 | | | finance company) (since 2006). Formerly, President and Chief | | |
| | | | Executive Officer, Prizm Capital Management, LLC (investment | | |
| | | | management firm) (2002-2005). Formerly, Executive Vice | | |
| | | | President and Chief Financial Officer, United Asset Management | | |
| | | | Corporation (an institutional investment management firm) | | |
| | | | (1982-2001). Formerly, Senior Manager, Price Waterhouse | | |
| | | | (now PricewaterhouseCoopers) (an independent registered public | | |
| | | | accounting firm) (1972-1981). | | |
| |
| Ronald A. Pearlman | Trustee | Since 2003 | Professor of Law, Georgetown University Law Center. Formerly, | 183 | None |
| 7/10/40 | | | Deputy Assistant Secretary (Tax Policy) and Assistant Secretary | | |
| | | | (Tax Policy), U.S. Department of the Treasury (1983-1985). | | |
| | | | Formerly, Chief of Staff, Joint Committee on Taxation, U.S. | | |
| | | | Congress (1988-1990). | | |
93
Eaton Vance Municipal Income Funds
MANAGEMENT AND ORGANIZATION CON T’D |
| | | | | | |
| | | Term of | | | Number of Portfolios | |
| | | Office and | Principal Occupation(s) | | in Fund Complex | Other Directorships Held |
| Name and | Trust | Length of | During Past Five Years | | Overseen By | During the Last |
| Date of Birth | Position(s) | Service | and Other Relevant Experience | | Trustee(1) | Five Years(2) |
| |
| Noninterested Trustees (continued) | | | | |
| |
| |
| Helen Frame Peters | Trustee | Since 2008 | Professor of Finance, Carroll School of Management, Boston | 183 | Director of BJ’s Wholesale Club, Inc. |
| 3/22/48 | | | College. Formerly, Dean, Carroll School of Management, Boston | | (wholesale club retailer). Formerly, Trustee of |
| | | | College (2000-2002). Formerly, Chief Investment Officer, Fixed | | SPDR Index Shares Funds and SPDR Series |
| | | | Income, Scudder Kemper Investments (investment management | | Trust (exchange traded funds) (2000-2009). |
| | | | firm) (1998-1999). Formerly, Chief Investment Officer, Equity | | Formerly, Director of Federal Home Loan Bank |
| | | | and Fixed Income, Colonial Management Associates (investment | | of Boston (a bank for banks) (2007-2009). |
| | | | management firm) (1991-1998). | | | |
| |
| Heidi L. Steiger | Trustee | Since 2007 | Managing Partner, Topridge Associates LLC (global wealth | | 183 | Director of Nuclear Electric Insurance Ltd. |
| 7/8/53 | | | management firm) (since 2008); Senior Adviser (since 2008), | | (nuclear insurance provider), Aviva USA |
| | | | President (2005-2008), Lowenhaupt Global Advisors, LLC | | | (insurance provider) and CIFG (family of |
| | | | (global wealth management firm). Formerly, President and | | financial guaranty companies), and Advisory |
| | | | Contributing Editor, Worth Magazine (2004-2005). Formerly, | | Director, Berkshire Capital Securities LLC |
| | | | Executive Vice President and Global Head of Private Asset | | | (private investment banking firm). |
| | | | Management (and various other positions), Neuberger Berman | | |
| | | | (investment firm) (1986-2004). | | | |
| |
| Lynn A. Stout | Trustee | Since 1998 | Paul Hastings Professor of Corporate and Securities Law (since | 183 | None |
| 9/14/57 | | | 2006) and Professor of Law (2001-2006), University of | | | |
| | | | California at Los Angeles School of Law. Professor Stout teaches | | |
| | | | classes in corporate law and securities regulation and is the | | |
| | | | author of numerous academic and professional papers on these | | |
| | | | areas. | | | |
| |
| Ralph F. Verni | Chairman of | Chairman of the Board | Consultant and private investor. Formerly, Chief Investment | 183 | None |
| 1/26/43 | the Board | since 2007 and Trustee | Officer (1982-1992), Chief Financial Officer (1988-1990) and | | |
| | and Trustee | since 2005 | Director (1982-1992), New England Life. Formerly, Chairperson, | | |
| | | | New England Mutual Funds (1982-1992). Formerly, President | | |
| | | | and Chief Executive Officer, State Street Management & | | | |
| | | | Research (1992-2000). Formerly, Chairperson, State Street | | |
| | | | Research Mutual Funds (1992-2000). Formerly, Director, W.P. | | |
| | | | Carey, LLC (1998-2004) and First Pioneer Farm Credit Corp. | | |
| | | | (2002-2006). | | | |
| |
| Principal Officers who are not Trustees | | | |
| |
| | | | Term of | | | |
| | | | Office and | | | |
| Name and | | Trust | Length of | | Principal Occupation(s) |
| Date of Birth | | Position(s) | Service | | During Past Five Years |
| |
| Thomas M. Metzold | | President | Since 2010 | Vice President of EVM and BMR. Officer of 56 registered investment companies |
| 8/3/58 | | | | managed by EVM or BMR. | |
| |
| William H. Ahern, Jr. | | Vice President | Since 2004 | Vice President of EVM and BMR. Officer of 78 registered investment companies |
| 7/28/59 | | | | managed by EVM or BMR. | |
| |
| Craig R. Brandon | | Vice President | Since 2004 | Vice President of EVM and BMR. Officer of 49 registered investment companies |
| 12/21/66 | | | | managed by EVM or BMR. | |
| |
| Cynthia J. Clemson | | Vice President | Since 2004 | Vice President of EVM and BMR. Officer of 94 registered investment companies |
| 3/2/63 | | | | managed by EVM or BMR. | |
| |
| Adam A. Weigold | | Vice President | Since 2007 | Vice President of EVM and BMR. Officer of 71 registered investment companies |
| 3/22/75 | | | | managed by EVM or BMR. | |
| |
| Barbara E. Campbell | | Treasurer | Since 2005 | Vice President of EVM and BMR. Officer of 183 registered investment companies |
| 6/19/57 | | | | managed by EVM or BMR. | |
94
Eaton Vance Municipal Income Funds
MANAGEMENT AND ORGANIZATION CON T’D |
| | | |
| | | Term of | |
| | | Office and | |
| Name and | Trust | Length of | Principal Occupation(s) |
| Date of Birth | Position(s) | Service | During Past Five Years |
| |
| Principal Officers who are not Trustees (continued) | |
| |
| |
| Maureen A. Gemma | Chief Legal Officer | Secretary since 2007 and | Vice President of EVM and BMR. Officer of 183 registered investment companies |
| 5/24/60 | and Secretary | Chief Legal Officer | managed by EVM or BMR. |
| | | since 2008 | |
| |
| Paul M. O’Neil | Chief Compliance Officer | Since 2004 | Vice President of EVM and BMR. Officer of 183 registered investment companies |
| 7/11/53 | | | managed by EVM or BMR. |
| (1) | Includes both master and feeder funds in a master-feeder structure. |
| (2) | During their respective tenures, the Trustees also served as trustees of one or more of the following Eaton Vance funds (which operated in the years noted): Eaton Vance Credit Opportunities Fund (launched in 2005 and terminated in 2010); Eaton Vance Insured Florida Plus Municipal Bond Fund (launched in 2002 and terminated in 2009); and Eaton Vance National Municipal Income Fund (launched in 1998 and terminated in 2009). |
The SAI for the Funds includes additional information about the Trustees and officers of the Funds and can be obtained without charge on Eaton Vance’s website at www.eatonvance.com or by calling 1-800-262-1122.
95
This Page Intentionally Left Blank
Investment Adviser
Boston Management and Research
Two International Place
Boston, MA 02110 |
Administrator
Eaton Vance Management
Two International Place
Boston, MA 02110 |
Principal Underwriter*
Eaton Vance Distributors, Inc
Two International Place
Boston, MA 02110
(617) 482-8260 |
Custodian
State Street Bank and Trust Company
200 Clarendon Street
Boston, MA 02116 |
Transfer Agent
BNY Mellon Asset Servicing
Attn: Eaton Vance Funds
P.O. Box 9653
Providence, RI 02940-9653
(800) 262-1122 |
Independent Registered Public Accounting Firm
Deloitte & Touche LLP
200 Berkeley Street
Boston, MA 02116-5022 |
Eaton Vance Municipals Trust
Two International Place
Boston, MA 02110 |
* FINRA BrokerCheck. Investors may check the background of their Investment Professional by contacting the Financial Industry Regulatory Authority (FINRA). FINRA BrokerCheck is a free tool to help investors check the professional background of current and former FINRA-registered securities firms and brokers. FINRA BrokerCheck is available by calling 1-800-289-9999 and at www.FINRA.org. The FINRA BrokerCheck brochure describing the program is available to investors at www.FINRA.org.
This report must be preceded or accompanied by a current prospectus or summary prospectus, if available. Before investing, investors should consider carefully a Fund’s investment objective(s), risks, and charges and expenses. The Funds’ current prospectus or summary prospectus, if available, contains this and other information about the Funds and is available through your financial advisor. Please read the prospectus carefully before you invest or send money. For further information please call 1-800-262-1122.