UNITED STATES
SECURITIES AND EXCHANGE COMMISSION
Washington, D.C. 20549
FORM N-CSR
CERTIFIED SHAREHOLDER REPORT OF REGISTERED
MANAGEMENT INVESTMENT COMPANIES
Investment Company Act file number | 811-04409 |
|
Eaton Vance Municipals Trust |
(Exact name of registrant as specified in charter) |
|
The Eaton Vance Building, 255 State Street, Boston, Massachusetts | | 02109 |
(Address of principal executive offices) | | (Zip code) |
|
Alan R. Dynner
The Eaton Vance Building, 255 State Street, Boston, Massachusetts 02109 |
(Name and address of agent for service) |
|
Registrant’s telephone number, including area code: | (617) 482-8260 | |
|
Date of fiscal year end: | September 30 | |
|
Date of reporting period: | March 31, 2007 | |
| | | | | | | | |
Item 1. Reports to Stockholders

Semiannual Report March 31, 2007


EATON VANCE
NATIONAL
MUNICIPALS
FUND

IMPORTANT NOTICES REGARDING PRIVACY,
DELIVERY OF SHAREHOLDER DOCUMENTS,
PORTFOLIO HOLDINGS AND PROXY VOTING
Privacy. The Eaton Vance organization is committed to ensuring your financial privacy. Each of the financial institutions identified below has in effect the following policy ("Privacy Policy") with respect to nonpublic personal information about its customers:
• Only such information received from you, through application forms or otherwise, and information about your Eaton Vance fund transactions will be collected. This may include information such as name, address, social security number, tax status, account balances and transactions.
• None of such information about you (or former customers) will be disclosed to anyone, except as permitted by law (which includes disclosure to employees necessary to service your account). In the normal course of servicing a customer's account, Eaton Vance may share information with unaffiliated third parties that perform various required services such as transfer agents, custodians and broker/dealers.
• Policies and procedures (including physical, electronic and procedural safeguards) are in place that are designed to protect the confidentiality of such information.
• We reserve the right to change our Privacy Policy at any time upon proper notification to you. Customers may want to review our Policy periodically for changes by accessing the link on our homepage: www.eatonvance.com.
Our pledge of privacy applies to the following entities within the Eaton Vance organization: the Eaton Vance Family of Funds, Eaton Vance Management, Eaton Vance Investment Counsel, Boston Management and Research, and Eaton Vance Distributors, Inc.
In addition, our Privacy Policy only applies to those Eaton Vance customers who are individuals and who have a direct relationship with us. If a customer's account (i.e. fund shares) is held in the name of a third-party financial adviser/ broker-dealer, it is likely that only such adviser's privacy policies apply to the customer. This notice supersedes all previously issued privacy disclosures.
For more information about Eaton Vance's Privacy Policy, please call 1-800-262-1122.
Delivery of Shareholder Documents. The Securities and Exchange Commission (the "SEC") permits funds to deliver only one copy of shareholder documents, including prospectuses, proxy statements and shareholder reports, to fund investors with multiple accounts at the same residential or post office box address. This practice is often called "householding" and it helps eliminate duplicate mailings to shareholders.
Eaton Vance, or your financial adviser, may household the mailing of your documents indefinitely unless you instruct Eaton Vance, or your financial adviser, otherwise.
If you would prefer that your Eaton Vance documents not be householded, please contact Eaton Vance at 1-800-262-1122, or contact your financial adviser.
Your instructions that householding not apply to delivery of your Eaton Vance documents will be effective within 30 days of receipt by Eaton Vance or your financial adviser.
Portfolio Holdings. Each Eaton Vance Fund and it's underlying Portfolio (if applicable) will file a schedule of its portfolio holdings on Form N-Q with the SEC for the first and third quarters of each fiscal year. The Form N-Q will be available on the Eaton Vance website www.eatonvance.com, by calling Eaton Vance at 1-800-262-1122 or in the EDGAR database on the SEC's website at www.sec.gov. Form N-Q may also be reviewed and copied at the SEC's public reference room in Washington, D.C. (call 1-800-732-0330 for information on the operation of the public reference room).
Proxy Voting. From time to time, funds are required to vote proxies related to the securities held by the funds. The Eaton Vance Funds or their underlying Portfolios (if applicable) vote proxies according to a set of policies and procedures approved by the Funds' and Portfolios' Boards. You may obtain a description of these policies and procedures and information on how the Funds or Portfolios voted proxies relating to Portfolio securities during the most recent 12 month period ended June 30, without charge, upon request, by calling 1-800-262-1122. This description is also available on the SEC's website at www.sec.gov.
Eaton Vance National Municipals Fund as of March 31, 2007
INVESTMENT UPDATE
Eaton Vance National Municipals Fund (the “Fund”) is designed to provide current income exempt from regular federal income tax. The Fund invests primarily in investment-grade municipal obligations but also invests in lower-rated municipal obligations.
Economic and Market Conditions
First quarter economic growth rose 1.3% following the 2.2% growth rate achieved in the fourth quarter of 2006. The housing sector continued to struggle, with the sub-prime sector experiencing continuing pressure, and short-term variable rate mortgages resetting higher. Building permits and housing starts have both fallen significantly from their highs in early 2006, while sales of new and existing homes both peaked in 2005. Away from housing and autos, the economy appears to be slowing but in a somewhat controlled manner.
Inflation measures have remained somewhat elevated on an absolute level, while core inflation measures (less food and energy) are fairly well contained. With this backdrop, the Fed is in a pausing mode, awaiting further economic inputs to determine the future direction of interest rate moves. At March 31, 2007, the Federal Funds rate stood at 5.25%.
Municipal market supply rose in the first quarter, resulting in underperformance of the municipal sector. On March 31, 2007, long-term AAA-rated municipal bonds yielded 93% of U.S. Treasury bonds with similar maturities.*
For the six months ended March 31, 2007, the Lehman Brothers Municipal Bond Index† (the “Index”), an unmanaged index of municipal bonds, posted a gain of 1.92%. For more information about the Fund’s performance and that of funds in the same Lipper Classification,† see the Performance Information and Portfolio Composition page that follows.
Management Discussion
The Fund invests primarily in bonds with stated maturities of 10 years or longer at the time of investment, as longer-maturity bonds historically have provided greater tax-exempt income for investors than shorter-maturity bonds. Given the flattening of the yield curve for other fixed-income securities over the past two years — with shorter-maturity yields rising more than longer-maturity yields — management felt that the long end of the municipal curve was a relatively attractive place to be positioned.
Because of the mixed economic backdrop of contained inflation expectations, a weakened housing market and continued growth in the labor market, Fund management continued to maintain a somewhat cautious outlook on interest rates. In this environment, Fund management continued to focus on finding relative value within the marketplace – in issuer names, coupons, maturities and sectors. Relative value trading, which seeks to capitalize on undervalued securities, has enhanced the Fund’s returns during the period.
For the year ended March 31, 2007, Eaton Vance National Municipals Fund, Class A, was ranked #2 out of 240 funds; for three years, #2 out of 232 funds; for five years, #2 out of 216 funds; and for ten years, #1 out of 137 funds. Past performance is no guarantee of future results. Rankings are based on percentage change in net asset value with all distributions reinvested and do not take sales charges into consideration. Source: Lipper, Inc.
* Source: Bloomberg L.P. Yields are a compilation of a representative variety of general obligations and are not necessarily representative of the Fund’s yield.
† It is not possible to invest directly in an Index or Lipper Classification. The Index’s total return does not reflect expenses that would have been incurred if an investor individually purchased or sold the securities represented in the Index. The Lipper Average is the average annual total return, at net asset value, of the funds that are in the same Lipper Classification as the Fund. Past performance is no guarantee of future results.
Fund shares are not insured by the FDIC and are not deposits or other obligations of, or guaranteed by, any depository institution. Shares are subject to investment risks, including possible loss of principal invested.
The views expressed throughout this report are those of the portfolio manager and are current only through the end of the period of the report as stated on the cover. These views are subject to change at any time based upon market or other conditions, and the investment adviser disclaims any responsibility to update such views. These views may not be relied on as investment advice and, because investment decisions for a fund are based on many factors, may not be relied on as an indication of trading intent on behalf of any Eaton Vance fund.
Eaton Vance National Municipals Fund as of March 31, 2007
PERFORMANCE INFORMATION AND PORTFOLIO COMPOSITION
Portfolio Manager: Thomas M. Metzold, CFA
Performance(1) | | Class A | | Class B | | Class C | | Class I | |
| | | | | | | | | |
Average Annual Total Returns (at net asset value) | | | | | | | | | |
Six Months | | 3.15 | % | 2.78 | % | 2.78 | % | 3.28 | % |
One Year | | 8.17 | | 7.37 | | 7.37 | | 8.43 | |
Five Years | | 8.97 | | 8.39 | | 8.19 | | 9.24 | |
Ten Years | | 7.11 | | 6.49 | | 6.29 | | N.A. | |
Life of Fund† | | 7.43 | | 6.83 | | 5.66 | | 7.34 | |
| | | | | | | | | |
SEC Average Annual Total Returns (including sales charge or applicable CDSC) | | | | | | | | | |
Six Months | | -1.77 | % | -2.22 | % | 1.78 | % | 3.28 | % |
One Year | | 3.05 | | 2.37 | | 6.37 | | 8.43 | |
Five Years | | 7.91 | | 8.10 | | 8.19 | | 9.24 | |
Ten Years | | 6.59 | | 6.49 | | 6.29 | | N.A. | |
Life of Fund† | | 7.02 | | 6.83 | | 5.66 | | 7.34 | |
†Inception Dates – Class A: 4/5/94; Class B: 12/19/85; Class C: 12/3/93; Class I: 7/1/99
Total Annual | | | | | | | | | |
Operating Expenses(2)* | | Class A | | Class B | | Class C | | Class I | |
| | | | | | | | | |
Expense Ratio | | 1.33 | % | 2.08 | % | 2.08 | % | 1.08 | % |
*From the Fund’s prospectus dated 2/1/07.
Distribution Rates/Yields | | Class A | | Class B | | Class C | | Class I | |
| | | | | | | | | |
Distribution Rate(3) | | 4.38 | % | 3.65 | % | 3.65 | % | 4.63 | % |
Taxable-Equivalent Dist. Rate(3),(4) | | 6.74 | | 5.62 | | 5.62 | | 7.12 | |
SEC 30-day Yield(5) | | 3.89 | | 3.33 | | 3.32 | | 4.34 | |
Taxable-Equivalent SEC 30-day Yield(4),(5) | | 5.98 | | 5.12 | | 5.11 | | 6.68 | |
Index Performance(6)
Lehman Brothers Municipal Bond Index Average Annual Total Returns | | | |
Six Months | | 1.92 | % |
One Year | | 5.43 | |
Five Years | | 5.50 | |
Ten Years | | 5.87 | |
Lipper Averages(7)
Lipper General Municipal Debt Funds Classification Average Annual Total Returns | | | |
Six Months | | 1.63 | % |
One Year | | 4.86 | |
Five Years | | 4.85 | |
Ten Years | | 5.01 | |
1
Rating Distribution**(8)
By total Investments
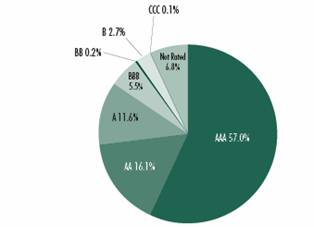
** The rating distribution presented above includes the ratings of securities held by special purpose vehicles in which the Fund holds a residual interest. See Note 1B to the Fund’s financial statements. Absent such securities, the Fund’s rating distribution at March 31, 2007, is as follows, and the average rating is AA:
AAA | | 55.1 | % | BB | | 0.3 | % |
AA | | 12.0 | % | B | | 3.1 | % |
A | | 13.5 | % | CCC | | 0.2 | % |
BBB | | 6.0 | % | Not Rated | | 9.8 | % |
Fund Statistics(9)
· Number of Issues: | | 289 | |
· Average Maturity: | | 26.8 years | |
· Average Effective Maturity: | | 17.2 years | |
· Average Call Protection: | | 10.1 years | |
· Average Dollar Price: | | $ | 100.73 | |
| | | | |
Past performance is no guarantee of future results. Returns are historical and are calculated by determining the percentage change in net asset value or offering price (as applicable) with all distributions reinvested. Investment return and principal value will fluctuate so that shares, when redeemed, may be worth more or less than their original cost. Performance is for the stated time period only; due to market volatility, the Fund’s current performance may be lower or higher than the quoted return. For performance as of the most recent month end, please refer to www.eatonvance.com.
(1) Average annual total returns do not include the 4.75% maximum sales charge for Class A shares or the applicable contingent deferred sales charges (CDSC) for Class B and Class C shares. If sales charges were deducted, returns would be lower. SEC Average Annual Total Returns for Class A reflect the maximum 4.75% sales charge. SEC Average Annual Total Returns for Class B reflect the applicable CDSC based on the following schedule: 5% - 1st and 2nd years; 4% - 3rd year; 3% - 4th year; 2% - 5th year; 1% - 6th year. SEC Average Annual Total Returns for Class C reflect a 1% CDSC for the first year. Class I shares are not subject to a sales charge.
(2) Includes interest expense of 0.61% relating to the Fund’s liability with respect to floating rate notes held by third parties in conjunction with inverse floater securities transactions by the Fund. The Fund also records offsetting interest income relating to the municipal obligation underlying such transactions.
(3) The Fund’s distribution rate represents actual distributions paid to shareholders and is calculated by dividing the last distribution per share (annualized) by the net asset value.
(4) Taxable-equivalent figure assumes a maximum 35.00% federal income tax rate. A lower tax rate would result in lower tax-equivalent figures.
(5) The Fund’s SEC yield is calculated by dividing the net investment income per share for the 30-day period by the offering price at the end of the period and annualizing the result.
(6) It is not possible to invest directly in an Index. The Index’s total return does not reflect the expenses that would have been incurred if an investor individually purchased or sold the securities represented in the Index. Index performance is available as of month end only.
(7) The Lipper Average is the average annual total return, at net asset value, of the funds that are in the same Lipper Classification as the Fund. It is not possible to invest in a Lipper Classification. Lipper Classifications may include insured and uninsured funds, as well as leveraged and unleveraged funds. The Lipper General Municipal Debt Funds Classification contained 247, 240, 216 and 137 funds for the 6-month, 1-year, 5-year and 10-year periods, respectively. Lipper Averages are available as of month end only.
(8) As of 3/31/07. Rating Distribution is determined by dividing the total market value of the issues by the total investments of the Fund.
(9) As of 3/31/07. Portfolio holdings information excludes securities held by special purpose vehicles in which the Fund holds a residual interest. See Note 1B to the fund’s financial statements. Portfolio information mat not be representative of the Fund’s current or future investments and may change due to active management.
2
Eaton Vance National Municipals Fund as of March 31, 2007
FUND EXPENSES
Example: As a shareholder of the Fund, you incur two types of costs: (1) transaction costs, including sales charges (loads) on purchases and redemption fees (if applicable); and (2) ongoing costs, including management fees; distribution or service fees; and other Fund expenses. This Example is intended to help you understand your ongoing costs (in dollars) of investing in the Fund and to compare these costs with the ongoing costs of investing in other mutual funds. The Example is based on an investment of $1,000 invested at the beginning of the period and held for the entire period (October 1, 2006 –March 31, 2007).
Actual Expenses: The first section of the table below provides information about actual account values and actual expenses. You may use the information in this section, together with the amount you invested, to estimate the expenses that you paid over the period. Simply divide your account value by $1,000 (for example, an $8,600 account value divided by $1,000 = 8.6), then multiply the result by the number in the first section under the heading entitled "Expenses Paid During Period" to estimate the expenses you paid on your account during this period.
Hypothetical Example for Comparison Purposes: The second section of the table below provides information about hypothetical account values and hypothetical expenses based on the Fund's actual expense ratio and an assumed rate of return of 5% per year (before expenses), which is not the actual return of the Fund. The hypothetical account values and expenses may not be used to estimate the actual ending account balance or expenses you paid for the period. You may use this information to compare the ongoing costs of investing in your Fund and other funds. To do so, compare this 5% hypothetical example with the 5% hypothetical examples that appear in the shareholder reports of the other funds.
Please note that the expenses shown in the table are meant to highlight your ongoing costs only and do not reflect any transactional costs, such as sales charges (loads) or redemption fees (if applicable). Therefore, the second section of the table is useful in comparing ongoing costs only, and will not help you determine the relative total costs of owning different funds. In addition, if these transactional costs were included, your costs would have been higher.
Eaton Vance National Municipals Fund
| | | Beginning Account Value
(10/1/06) | | Ending Account Value
(3/31/07) | | Expenses Paid During Period*
(10/1/06 – 3/31/07) | |
| Actual | | | | | |
| Class A | | $ | 1,000.00 | | | $ | 1,031.50 | | | $ | 6.69 | | |
| Class B | | $ | 1,000.00 | | | $ | 1,027.80 | | | $ | 10.47 | | |
| Class C | | $ | 1,000.00 | | | $ | 1,027.80 | | | $ | 10.47 | | |
| Class I | | $ | 1,000.00 | | | $ | 1,032.80 | | | $ | 5.42 | | |
| Hypothetical | |
| (5% return per year before expenses) | |
| Class A | | $ | 1,000.00 | | | $ | 1,018.30 | | | $ | 6.64 | | |
| Class B | | $ | 1,000.00 | | | $ | 1,014.60 | | | $ | 10.40 | | |
| Class C | | $ | 1,000.00 | | | $ | 1,014.60 | | | $ | 10.40 | | |
| Class I | | $ | 1,000.00 | | | $ | 1,019.60 | | | $ | 5.39 | | |
* Expenses are equal to the Fund's annualized expense ratio of 1.32% for Class A shares, 2.07% for Class B shares, 2.07% for Class C shares, and 1.07% for Class I shares, multiplied by the average account value over the period, multiplied by 182/365 (to reflect the one-half year period). The Example assumes that the $1,000 was invested at the net asset value per share determined at the close of business on September 30, 2006.
3
Eaton Vance National Municipals Fund as of March 31, 2007
PORTFOLIO OF INVESTMENTS (Unaudited)
| Tax-Exempt Investments — 117.5% | | | |
Principal Amount
(000's omitted) | |
Security | |
Value | |
| Bond Bank — 0.5% | | | |
| $ | 25,530 | | | Rickenbacker, OH, Port Authority, 5.375%, 1/1/32(1) | | $ | 28,172,780 | | |
| | | | | | | $ | 28,172,780 | | |
| Cogeneration — 1.0% | | | |
| $ | 22,150 | | | Maryland Energy Cogeneration, (AES Warrior Run),
(AMT), 7.40%, 9/1/19 | | $ | 22,147,120 | | |
| | 6,100 | | | Pennsylvania Economic Development Financing Authority,
(Northampton Generating), (AMT), 6.50%, 1/1/13 | | | 6,197,539 | | |
| | 21,950 | | | Pennsylvania Economic Development Financing Authority,
(Northampton Generating), (AMT), 6.60%, 1/1/19 | | | 22,178,719 | | |
| | 4,200 | | | Pennsylvania Economic Development Financing Authority,
(Northampton Generating), Junior Liens, (AMT),
6.875%, 1/1/11 | | | 4,200,126 | | |
| | 5,000 | | | Pennsylvania Economic Development Financing Authority,
(Northampton Generating), Junior Liens, (AMT),
6.95%, 1/1/21 | | | 5,000,200 | | |
| | | | | | | $ | 59,723,704 | | |
| Education — 2.1% | | | |
| $ | 12,390 | | | California Educational Facilities Authority, (Stanford
University), 5.35%, 6/1/27(1) | | $ | 12,627,929 | | |
| | 7,230 | | | Maryland Health and Higher Educational Facilities
Authority, (Loyola College), 5.125%, 10/1/45 | | | 7,582,752 | | |
| | 22,035 | | | Massachusetts Development Finance Agency,
(Smith College), 5.00%, 7/1/35(1) | | | 23,103,477 | | |
| | 27,750 | | | Massachusetts Health and Educational Facilities
Authority, (Massachusetts Institute of Technology),
5.50%, 7/1/32 | | | 33,502,020 | | |
| | 5,725 | | | New York Dormitory Authority, (Vassar College),
4.25%, 7/1/32(2) | | | 5,522,564 | | |
| | 15,265 | | | New York Dormitory Authority, (Vassar College),
4.25%, 7/1/39(2) | | | 14,505,872 | | |
| | 21,500 | | | Vermont Educational and Health Buildings Finance
Agency, (Middlebury College), 5.00%, 10/31/46 | | | 22,518,025 | | |
| | | | | | | $ | 119,362,639 | | |
| Electric Utilities — 2.7% | | | |
| $ | 13,000 | | | Brazos River Authority, TX, (Reliant Energy, Inc.),
7.75%, 12/1/18 | | $ | 13,673,920 | | |
| | 9,260 | | | Brazos River Authority, TX, PCR (Texas Energy Co.),
(AMT), 5.40%, 5/1/29 | | | 9,505,853 | | |
Principal Amount
(000's omitted) | |
Security | |
Value | |
| Electric Utilities (continued) | | | |
| $ | 28,000 | | | Long Island, NY, Power Authority, (Electric
Systems Revenue), 5.00%, 9/1/35 | | $ | 29,470,840 | | |
| | 2,000 | | | Matagorda County, TX, Navigation District No.1,
(Reliant Energy), 8.00%, 5/1/29 | | | 2,102,840 | | |
| | 5,000 | | | Matagorda County, TX, Navigation District No.1,
(Reliant Energy), (AMT), 5.95%, 5/1/30 | | | 5,141,350 | | |
| | 8,000 | | | North Carolina Municipal Power Agency, (Catawba),
6.50%, 1/1/20 | | | 8,603,840 | | |
| | 42,000 | | | Salt River, AZ, Agricultural Improvements and
Power District, 5.00%, 1/1/31(1) | | | 44,048,760 | | |
| | 42,000 | | | Salt River, AZ, Agricultural Improvements and
Power District, 5.00%, 1/1/31(1) | | | 44,048,760 | | |
| | | | | | | $ | 156,596,163 | | |
| Escrowed / Prerefunded — 6.5% | | | |
| $ | 2,400 | | | Bexar County, TX, Health Facilities, (St. Luke's Lutheran),
Escrowed to Maturity, 7.00%, 5/1/21 | | $ | 3,116,424 | | |
| | 24,130 | | | California Statewide Communities Development
Authority, (Corporate Fund for Housing), (AMT),
Prerefunded to 12/1/09, 6.50%, 6/1/29(1)(11) | | | 25,955,562 | | |
| | 1,500 | | | Capital Trust Agency, FL, (Seminole Tribe Convention),
Prerefunded to 10/1/12, 8.95%, 10/1/33(3) | | | 1,833,630 | | |
| | 11,195 | | | Colorado Health Facilities Authority, (Liberty Heights),
Escrowed to Maturity, 0.00%, 7/15/22 | | | 5,797,443 | | |
| | 215,825 | | | Dawson Ridge, CO, Metropolitan District #1, Escrowed
to Maturity, 0.00%, 10/1/22(4) | | | 110,754,915 | | |
| | 11,175 | | | Dawson Ridge, CO, Metropolitan District #1, Escrowed
to Maturity, 0.00%, 10/1/22 | | | 5,734,675 | | |
| | 101,555 | | | Illinois Development Finance Authority, (Regency Park),
Escrowed to Maturity, 0.00%, 7/15/23 | | | 50,214,885 | | |
| | 6,625 | | | Louisiana Public Facilities Authority, (Southern Baptist
Hospitals, Inc.), Escrowed to Maturity, 8.00%, 5/15/12 | | | 7,313,072 | | |
| | 5,675 | | | Maricopa County, AZ, Industrial Development Authority,
(Place Five and The Greenery), Escrowed to Maturity,
6.625%, 1/1/27 | | | 6,096,425 | | |
| | 100,000 | | | Mississippi Housing Finance Corp., Single Family,
Escrowed to Maturity, 0.00%, 6/1/15 | | | 72,450,000 | | |
| | 1,190 | | | New York, NY, Prerefunded to 6/1/13, 5.25%, 6/1/28(1) | | | 1,295,063 | | |
| | 11,435 | | | North Miami, FL, Health Care Facilities Authority,
(Imperial Club), Prerefunded to 1/1/09,
6.75%, 1/1/33 | | | 12,252,259 | | |
| | 52,285 | | | Tobacco Settlement Financing Corp., NY, Prerefunded to
6/1/13, 6.75%, 6/1/39 | | | 60,927,710 | | |
| | 6,000 | | | Tri-County, OR, Metropolitan Transportation District,
Prerefunded to 8/1/09, 5.00%, 8/1/19(1) | | | 6,186,960 | | |
| | 3,725 | | | Wisconsin Health and Educational Facilities Authority,
(Wisconsin Illinois Senior Housing), Prerefunded to
8/1/09, 7.00%, 8/1/29 | | | 4,006,945 | | |
| | | | | | | $ | 373,935,968 | | |
See notes to financial statements
4
Eaton Vance National Municipals Fund as of March 31, 2007
PORTFOLIO OF INVESTMENTS (Unaudited) CONT'D
Principal Amount
(000's omitted) | |
Security | |
Value | |
| General Obligations — 6.5% | | | |
| $ | 122,600 | | | California, 4.50%, 8/1/30(2) | | $ | 121,109,184 | | |
| | 35,000 | | | California, 4.75%, 6/1/35 | | | 35,626,500 | | |
| | 57,700 | | | California, 4.75%, 9/1/35 | | | 58,811,879 | | |
| | 16,000 | | | California, 5.25%, 11/1/29 | | | 17,094,880 | | |
| | 20,000 | | | California, 5.25%, 2/1/30 | | | 21,269,200 | | |
| | 9,875 | | | California, 5.50%, 11/1/33 | | | 10,760,590 | | |
| | 34,500 | | | Georgia, 1.00%, 3/1/26 | | | 19,813,005 | | |
| | 13,015 | | | New York, NY, 5.25%, 6/1/28(1) | | | 13,811,481 | | |
| | 20,280 | | | New York, NY, 4.25%, 1/1/29 | | | 19,593,725 | | |
| | 29,910 | | | New York, NY , 4.25%, 1/1/27 | | | 28,841,615 | | |
| | 15,000 | | | North Carolina, 3.00%, 3/1/28 | | | 12,156,150 | | |
| | 10,750 | | | South Carolina, 3.00%, 8/1/21 | | | 9,344,330 | | |
| | 10,000 | | | South Carolina, 3.00%, 8/1/22 | | | 8,596,600 | | |
| | | | | | | $ | 376,829,139 | | |
| Health Care-Miscellaneous — 0.1% | | | |
| $ | 2,198 | | | Tax Revenue Exempt Securities Trust, Community
Health Provider, (Pooled Loan Program Various States
Trust Certificates), 5.50%, 12/1/36 | | $ | 2,251,450 | | |
| | 2,354 | | | Tax Revenue Exempt Securities Trust, Community
Health Provider, (Pooled Loan Program Various States
Trust Certificates), 5.875%, 12/1/36 | | | 2,421,504 | | |
| | | | | | | $ | 4,672,954 | | |
| Hospital — 11.8% | | | |
| $ | 34,260 | | | Alabama Special Care Facilities Financing Authority,
(Ascension Health), 5.00%, 11/15/39(1) | | $ | 35,424,840 | | |
| | 14,000 | | | Brevard County, FL, Health Facilities Authority,
(Health First, Inc.), 5.00%, 4/1/36 | | | 14,445,480 | | |
| | 30,500 | | | California Health Facilities Financing Authority,
(Cedars-Sinai Medical Center), 5.00%, 11/15/34 | | | 31,633,685 | | |
| | 12,500 | | | California Health Facilities Financing Authority,
(Kaiser Permanente), 5.25%, 4/1/39 | | | 13,183,000 | | |
| | 13,000 | | | California Statewide Communities Development Authority,
(Huntington Memorial Hospital), 5.00%, 7/1/35 | | | 13,524,940 | | |
| | 17,295 | | | California Statewide Communities Development Authority,
(John Muir Health), 5.00%, 8/15/36 | | | 18,057,191 | | |
| | 45,500 | | | California Statewide Communities Development Authority,
(Kaiser Permanente), 5.00%, 3/1/41 | | | 46,733,960 | | |
| | 77,500 | | | California Statewide Communities Development Authority,
(Kaiser Permanente), 5.25%, 3/1/45 | | | 81,467,225 | | |
| | 7,100 | | | Camden County, NJ, Improvement Authority, (Cooper
Health System), 5.00%, 2/15/25 | | | 7,332,880 | | |
| | 14,905 | | | Camden County, NJ, Improvement Authority, (Cooper
Health System), 5.00%, 2/15/35 | | | 15,264,658 | | |
| | 14,320 | | | Camden County, NJ, Improvement Authority, (Cooper
Health System), 5.25%, 2/15/27 | | | 15,053,900 | | |
Principal Amount
(000's omitted) | |
Security | |
Value | |
| Hospital (continued) | | | |
| $ | 33,235 | | | Colorado Health Facilities Authority, (Catholic Health
Initiatives), 4.50%, 9/1/38 | | $ | 32,334,331 | | |
| | 4,000 | | | Erie County, OH, Hospital Facilities, (Firelands Regional
Medical Center), 5.00%, 8/15/36 | | | 4,156,040 | | |
| | 9,500 | | | Erie County, OH, Hospital Facilities, (Firelands Regional
Medical Center), 5.25%, 8/15/46 | | | 10,012,050 | | |
| | 27,775 | | | Highlands County, FL, Health Facilities Authority,
(Adventist Health System), 5.00%, 11/15/35 | | | 28,547,145 | | |
| | 12,975 | | | Indiana Health and Educational Facilities Authority,
(Clarian Health Partners), 4.75%, 2/15/34 | | | 13,007,827 | | |
| | 25,520 | | | Indiana Health and Educational Facilities Authority,
(Clarian Health Partners), 5.00%, 2/15/39 | | | 26,190,155 | | |
| | 82,080 | | | Indiana Health and Educational Facilities Authority,
(Ascension Health), 5.00%, 11/15/36(1) | | | 85,253,213 | | |
| | 39,025 | | | Maryland Health and Higher Educational Facilities
Authority, (Medstar Health), 4.75%, 5/15/42 | | | 38,647,238 | | |
| | 17,435 | | | Maryland Health and Higher Educational Facilities
Authority, (Peninsula Regional Medical Center),
5.00%, 7/1/36 | | | 18,154,717 | | |
| | 26,730 | | | Michigan Hospital Finance Authority, (McLaren
Healthcare), 5.00%, 8/1/35 | | | 27,508,378 | | |
| | 24,000 | | | Michigan Hospital Finance Authority, (Trinity Health),
5.00%, 12/1/31 | | | 25,113,120 | | |
| | 3,500 | | | New Jersey Health Care Facilities Financing Authority,
(Trinitas Hospital), 7.50%, 7/1/30 | | | 3,860,570 | | |
| | 44,055 | | | New York Dormitory Authority, (Memorial Sloan-Kettering
Cancer Center), 4.75%, 7/1/28(1) | | | 45,467,697 | | |
| | 4,000 | | | Oneida County, NY, Industrial Development Agency,
(Elizabeth Medical Center), 6.00%, 12/1/29 | | | 4,107,400 | | |
| | 3,075 | | | Prince George's County, MD, (Greater Southeast
Healthcare System), 6.375%, 1/1/23(6) | | | 90,097 | | |
| | 25,000 | | | Rochester, MN, Health Care Facilities, (Mayo Clinic),
5.50%, 11/15/27(1) | | | 25,685,375 | | |
| | 6,950 | | | University of Kansas Hospital Authority, 4.50%, 9/1/32 | | | 6,861,596 | | |
| | | | | | | $ | 687,118,708 | | |
| Housing — 1.6% | | | |
| $ | 3,000 | | | ABAG Finance Authority, CA, (Civic Center Drive
Apartments), (AMT), 6.375%, 9/1/32 | | $ | 3,070,680 | | |
| | 7,050 | | | Arkansas Development Finance Authority, MFMR,
(Park Apartments), (AMT), 5.95%, 12/1/28 | | | 5,990,667 | | |
| | 7,610 | | | California Department of Veterans Affairs, Home
Purchase Revenue, 5.20%, 12/1/28 | | | 7,615,023 | | |
| | 8,910 | | | California Housing Finance Agency, (AMT),
4.95%, 8/1/36 | | | 9,024,226 | | |
| | 16,000 | | | Charter Mac Equity Trust, TN, (AMT), 6.625%,
6/30/09(3) | | | 16,756,160 | | |
See notes to financial statements
5
Eaton Vance National Municipals Fund as of March 31, 2007
PORTFOLIO OF INVESTMENTS (Unaudited) CONT'D
Principal Amount
(000's omitted) | |
Security | |
Value | |
| Housing (continued) | | | |
| $ | 9,100 | | | Lake Creek, CO, (Affordable Housing Corp.),
Multifamily Housing, 6.25%, 12/1/23 | | $ | 9,664,746 | | |
| | 14,710 | | | Nebraska Investment Finance Authority, (Single
Family Housing), (AMT), 4.70%, 9/1/21 | | | 14,889,021 | | |
| | 14,915 | | | New Hampshire Housing Finance Authority, Multifamily
Housing, (AMT), 6.20%, 7/1/36 | | | 15,362,003 | | |
| | 10,640 | | | Texas Student Housing Corp., (University of Northern
Texas), 6.85%, 7/1/31 | | | 10,557,646 | | |
| | | | | | | $ | 92,930,172 | | |
| Housing-Multifamily — 0.2% | | | |
| $ | 10,770 | | | Florida Capital Projects Finance Authority, Student
Housing Revenue, (Florida University), Prerefunded to
8/15/10, 7.85%, 8/15/31 | | $ | 12,353,728 | | |
| | | | | | | $ | 12,353,728 | | |
| Industrial Development Revenue — 11.4% | | | |
| $ | 6,960 | | | Austin, TX, (Cargoport Development LLC), (AMT),
8.30%, 10/1/21 | | $ | 7,753,788 | | |
| | 10,260 | | | Bedford County, VA, Industrial Development Authority,
(Nekoosa Packaging), (AMT), 6.55%, 12/1/25 | | | 10,740,784 | | |
| | 2,250 | | | Calhoun County, AR, Solid Waste Disposal Revenue,
(Georgia-Pacific Corp.), (AMT), 6.375%, 11/1/26 | | | 2,360,182 | | |
| | 6,050 | | | Carbon County, UT, (Laidlaw Environmental), (AMT),
7.50%, 2/1/10 | | | 6,093,983 | | |
| | 4,000 | | | Courtland, AL, Solid Waste Disposal, (Champion
International Corp.), (AMT), 6.70%, 11/1/29 | | | 4,244,520 | | |
| | 5,000 | | | Dallas-Fort Worth, TX, International Airport Facility
Improvements Corp., (American Airlines),
7.25%, 11/1/30 | | | 4,999,250 | | |
| | 62,785 | | | Denver, CO, City and County Special Facilities,
(United Airlines), (AMT), 6.875%, 10/1/32 | | | 64,197,662 | | |
| | 13,290 | | | Effingham County, GA, (Solid Waste Disposal),
(Fort James), (AMT), 5.625%, 7/1/18 | | | 13,480,844 | | |
| | 3,500 | | | Effingham County, GA, Industrial Development Authority,
PCR, (Georgia Pacific Corp.), 6.50%, 6/1/31 | | | 3,715,425 | | |
| | 6,290 | | | Hardeman County, TN, (Correctional Facilities Corp.),
7.75%, 8/1/17 | | | 6,448,193 | | |
| | 30,000 | | | Houston, TX, Airport System, (Continental Airlines),
(AMT), 6.75%, 7/1/29 | | | 32,145,900 | | |
| | 98,100 | | | Liberty, NY, Development Corp., (Goldman Sachs
Group, Inc.), 5.25%, 10/1/35(1) | | | 112,005,675 | | |
| | 161,730 | | | Liberty, NY, Development Corp., (Goldman Sachs
Group, Inc.), 5.25%, 10/1/35 | | | 184,655,227 | | |
| | 42,000 | | | Liberty, NY, Development Corp., (Goldman Sachs
Group, Inc.), 5.25%, 10/1/35(1) | | | 47,953,500 | | |
| | 5,000 | | | McMinn County, TN, (Calhoun Newsprint - Bowater, Inc.),
(AMT), 7.40%, 12/1/22 | | | 5,068,300 | | |
Principal Amount
(000's omitted) | |
Security | |
Value | |
| Industrial Development Revenue (continued) | | | |
| $ | 10,000 | | | Michigan Strategic Fund, (S.D. Warren), (AMT),
7.375%, 1/15/22 | | $ | 10,171,900 | | |
| | 15,000 | | | Michigan Strategic Fund, (S.D. Warren), (AMT),
7.375%, 1/15/22 | | | 15,257,550 | | |
| | 3,500 | | | Michigan Strategic Fund, (S.D. Warren), (AMT),
7.375%, 1/15/22 | | | 3,560,095 | | |
| | 5,025 | | | New Jersey Economic Development Authority,
(American Airlines), (AMT), 7.10%, 11/1/31 | | | 5,033,191 | | |
| | 18,820 | | | New Jersey Economic Development Authority,
(Continental Airlines), (AMT), 6.25%, 9/15/29 | | | 19,470,607 | | |
| | 4,950 | | | New Jersey Economic Development Authority,
(Continental Airlines), (AMT), 9.00%, 6/1/33 | | | 6,055,484 | | |
| | 10,000 | | | New York City, NY, Industrial Development Agency,
(American Airlines, Inc.-JFK International Airport),
(AMT), 8.00%, 8/1/12 | | | 11,461,400 | | |
| | 7,000 | | | New York City, NY, Industrial Development Agency,
(American Airlines, Inc.), (AMT), 7.50%, 8/1/16 | | | 8,136,520 | | |
| | 15,000 | | | New York City, NY, Industrial Development Agency,
(American Airlines, Inc.), (AMT), 7.75%, 8/1/31 | | | 18,210,750 | | |
| | 29,000 | | | New York City, NY, Industrial Development Agency,
(American Airlines, Inc.-JFK International Airport), (AMT),
7.625%, 8/1/25 | | | 35,026,490 | | |
| | 12,500 | | | New York City, NY, Industrial Development Agency,
(JFK International Airport), (AMT), 8.50%, 8/1/28 | | | 14,776,250 | | |
| | 2,567 | | | Savannah, GA, Economic Development Authority,
(Intercat-Savannah), (AMT), 9.00%, 1/1/15 | | | 2,591,242 | | |
| | 1,159 | | | Savannah, GA, Economic Development Authority,
(Intercat-Savannah), (AMT), 9.75%, 7/1/10 | | | 1,166,130 | | |
| | 5,000 | | | Skowhegan, ME, (S.D. Warren), (AMT),
6.65%, 10/15/15 | | | 5,137,900 | | |
| | | | | | | $ | 661,918,742 | | |
| Insured-Education — 2.6% | | | |
| $ | 15,045 | | | Broward County, FL, Educational Facilities Authority,
(Nova Southeastern University), (AGC),
4.50%, 4/1/36 | | $ | 14,817,219 | | |
| | 23,120 | | | New Jersey Educational Facility Authority, (Montclair
State University), (MBIA), 4.25%, 7/1/30 | | | 22,567,663 | | |
| | 20,525 | | | New Jersey Educational Facility Authority, (Montclair
State University), (MBIA), 4.25%, 7/1/34 | | | 19,910,892 | | |
| | 28,695 | | | Pennsylvania Higher Educational Facilities Authority,
(Temple University), (MBIA), 4.50%, 4/1/36 | | | 28,579,646 | | |
| | 16,335 | | | Puerto Rico Industrial, Tourist, Educational, Medical and
Environmental Authority, (University of Puerto Rico),
(MBIA), 5.00%, 7/1/33(1)(11) | | | 16,848,092 | | |
| | 10,000 | | | University of Alabama, (XLCA), 4.50%, 7/1/36 | | | 9,879,100 | | |
| | 22,675 | | | University of California, (MBIA), 4.75%, 5/15/33 | | | 23,259,335 | | |
| | 12,720 | | | University of California, (MBIA), 4.75%, 5/15/37 | | | 13,032,149 | | |
| | | | | | | $ | 148,894,096 | | |
See notes to financial statements
6
Eaton Vance National Municipals Fund as of March 31, 2007
PORTFOLIO OF INVESTMENTS (Unaudited) CONT'D
Principal Amount
(000's omitted) | |
Security | |
Value | |
| Insured-Electric Utilities — 4.5% | | | |
| $ | 7,500 | | | Burlington, KS, PCR, (Kansas Gas & Electric Co.),
(MBIA), 5.30%, 6/1/31 | | $ | 8,027,325 | | |
| | 57,200 | | | Hawaii Department of Budget and Finance, (Hawaii
Electric Co.), (FGIC), (AMT), 4.60%, 5/1/26 | | | 56,771,000 | | |
| | 30 | | | Hawaii Department of Budget and Finance, (Hawaii
Electric Co.), (FGIC), (AMT), 4.65%, 3/1/37 | | | 29,603 | | |
| | 27,900 | | | Hawaii Department of Budget and Finance, (Hawaii
Electric Co.), (FGIC), 4.65%, 3/1/37 | | | 27,481,500 | | |
| | 14,645 | | | Intermountain Power Agency, UT, ( MBIA),
5.75%, 7/1/19(1) | | | 15,011,577 | | |
| | 33,915 | | | Lincoln, NE, Electric System, (FSA), 4.75%, 9/1/35 | | | 34,873,777 | | |
| | 20,000 | | | Los Angeles, CA, Department of Water and Power,
(FSA), 4.625%, 7/1/37 | | | 20,217,600 | | |
| | 23,000 | | | Oklahoma State Municipal Power Authority, (FGIC),
4.50%, 1/1/47 | | | 22,580,480 | | |
| | 18,000 | | | Sacramento, CA, Municipal Electric Utility District, (FSA),
5.00%, 8/15/28(1) | | | 18,707,580 | | |
| | 59,275 | | | Springfield, MO, Public Utility, (FGIC), 4.50%, 8/1/36 | | | 58,746,860 | | |
| | | | | | | $ | 262,447,302 | | |
| Insured-Escrowed / Prerefunded — 3.4% | | | |
| $ | 78,360 | | | California Infrastructure and Economic Development,
(Bay Area Toll Bridges), (AMBAC), Prerefunded to
1/1/28, 5.00%, 7/1/36(1) | | $ | 88,088,393 | | |
| | 18,450 | | | California Infrastructure and Economic Development,
(Bay Area Toll Bridges), Prerefunded to 1/1/28,
(AMBAC), 5.00%, 7/1/33(1) | | | 20,740,568 | | |
| | 7,355 | | | Intermountain Power Agency, UT, (MBIA),
Prerefunded to 7/1/07, 5.75%, 7/1/19(1) | | | 7,538,808 | | |
| | 19,000 | | | Massachusetts Turnpike Authority, (FGIC), Escrowed to
Maturity, 5.00%, 1/1/20(1) | | | 20,660,410 | | |
| | 41,010 | | | Massachusetts Turnpike Authority, (FGIC), Escrowed to
Maturity, 5.125%, 1/1/23(1) | | | 46,100,366 | | |
| | 3,000 | | | Puerto Rico Highway and Transportation Authority,
Prerefunded to 7/1/15, (AGC), 5.00%, 7/1/45 | | | 3,262,770 | | |
| | 10,000 | | | Umatilla County, OR, School District No. 008R, (MBIA),
Prerefunded to 6/15/09, 5.20%, 6/15/19(1) | | | 10,337,250 | | |
| | | | | | | $ | 196,728,565 | | |
| Insured-General Obligations — 10.1% | | | |
| $ | 17,770 | | | Beaverton, OR, School District, (FSA),
4.125%, 6/1/25 | | $ | 17,259,646 | | |
| | 10,100 | | | Beaverton, OR, School District, (FSA),
4.125%, 6/1/26 | | | 9,774,073 | | |
| | 695 | | | California, (AMBAC), 4.375%, 3/1/31 | | | 677,854 | | |
| | 34,995 | | | California, (AMBAC), 5.00%, 2/1/28(1) | | | 39,141,208 | | |
| | 9,900 | | | California, (AMBAC), Variable Rate,
7.975%, 5/1/26(3)(7) | | | 11,992,068 | | |
Principal Amount
(000's omitted) | |
Security | |
Value | |
| Insured-General Obligations (continued) | | | |
| $ | 49,000 | | | California, (FSA), 4.50%, 9/1/36 | | $ | 48,485,500 | | |
| | 12,000 | | | California, (MBIA), 4.75%, 3/1/31 | | | 12,305,040 | | |
| | 16,980 | | | Chicago, IL, Board of Education, (FGIC),
0.00%, 12/1/25 | | | 7,589,720 | | |
| | 50,985 | | | Detroit, MI, School District, (FSA), 5.25%, 5/1/32 | | | 58,932,032 | | |
| | 4,450 | | | Geary County, KS, Unified School District #475,
(MBIA), 3.00%, 9/1/26 | | | 3,629,376 | | |
| | 20,000 | | | Georgia, (MBIA), 2.00%, 9/1/24 | | | 14,390,400 | | |
| | 159,400 | | | Los Angeles, CA, Unified School District, (MBIA),
4.50%, 1/1/28 | | | 160,890,390 | | |
| | 10,000 | | | Montgomery County, TX, (Municipal Utility District
No. 46 Waterworks and Sewer), (AMBAC),
4.00%, 3/1/30 | | | 9,242,100 | | |
| | 20,000 | | | North Las Vegas, NV, Wastewater Reclamation System,
(MBIA), 4.50%, 10/1/36 | | | 19,854,600 | | |
| | 32,340 | | | Puerto Rico, (AGC), 5.50%, 7/1/29(1) | | | 38,248,195 | | |
| | 24,470 | | | Spring Branch, TX, Independent School District, (FSA),
4.50%, 2/1/26 | | | 24,512,822 | | |
| | 34,115 | | | Texas, (Transportation Commission-Mobility Fund),
(FGIC), 4.50%, 4/1/30 | | | 33,993,892 | | |
| | 77,110 | | | Texas, (Transportation Commission-Mobility Fund),
(FGIC), 4.50%, 4/1/35 | | | 76,321,936 | | |
| | | | | | | $ | 587,240,852 | | |
| Insured-Hospital — 1.2% | | | |
| $ | 15,210 | | | Maryland Health and Higher Educational Facilities
Authority, (Medlantic), (AMBAC), 5.25%, 8/15/38(1) | | $ | 17,670,572 | | |
| | 7,835 | | | Tyler, TX, Health Facility Development Corp., (East Texas
Medical Center), (FSA), 5.375%, 11/1/27 | | | 8,173,080 | | |
| | 15,300 | | | University of California Regents Medical Center, (MBIA),
4.50%, 5/15/37 | | | 15,211,719 | | |
| | 9,395 | | | Washington Health Care Facilities Authority, (Providence
Health Care), (FGIC), 4.50%, 10/1/35 | | | 9,224,669 | | |
| | 13,500 | | | Washington Health Care Facilities Authority, (Providence
Health Care), (FGIC), 4.625%, 10/1/34 | | | 13,500,000 | | |
| | 5,000 | | | Wisconsin Health and Educational Facilities Authority,
(Ministry Health Care), (MBIA), 5.125%, 2/15/22 | | | 5,231,700 | | |
| | | | | | | $ | 69,011,740 | | |
| Insured-Housing — 0.7% | | | |
| $ | 40,496 | | | Virginia Housing Development Authority, (MBIA),
5.375%, 7/1/36(1) | | $ | 42,481,722 | | |
| | | | | | | $ | 42,481,722 | | |
See notes to financial statements
7
Eaton Vance National Municipals Fund as of March 31, 2007
PORTFOLIO OF INVESTMENTS (Unaudited) CONT'D
Principal Amount
(000's omitted) | |
Security | |
Value | |
Insured-Lease Revenue / Certificates of
Participation — 2.6% | | | |
| $ | 112,475 | | | Hudson, NY, Infrastructure Corp., (MBIA),
4.50%, 2/15/47(4) | | $ | 111,214,155 | | |
| | 20,040 | | | Jackson County, MO, (Harry S. Truman Sports Complex),
(AMBAC), 4.50%, 12/1/31 | | | 20,023,968 | | |
| | 1,635 | | | Western Regional Jail Authority, VA, (MBIA),
4.25%, 6/1/29 | | | 1,590,250 | | |
| | 7,570 | | | Western Regional Jail Authority, VA, (MBIA),
4.25%, 6/1/34 | | | 7,280,296 | | |
| | 10,270 | | | Western Regional Jail Authority, VA, (MBIA),
4.25%, 6/1/39 | | | 9,826,850 | | |
| | | | | | | $ | 149,935,519 | | |
| Insured-Other Revenue — 5.4% | | | |
| $ | 40,295 | | | Golden State Tobacco Securitization Corp., CA, (FGIC),
5.00%, 6/1/38 | | $ | 42,346,016 | | |
| | 25,000 | | | Harris County-Houston, TX, Sports Authority, (MBIA),
0.00%, 11/15/41 | | | 4,260,250 | | |
| | 25,470 | | | New York City, NY, Industrial Development Agency,
(Queens Baseball Stadium), (AMBAC), 4.75%, 1/1/42 | | | 26,118,212 | | |
| | 60,045 | | | New York City, NY, Industrial Development Agency,
(Yankee Stadium), (FGIC), 4.50%, 3/1/39 | | | 59,570,044 | | |
| | 114,980 | | | New York City, NY, Industrial Development Agency,
(Yankee Stadium), (FGIC), 5.00%, 3/1/46 | | | 121,247,560 | | |
| | 55,475 | | | New York City, NY, Industrial Development Agency,
(Yankee Stadium), (MBIA), 4.75%, 3/1/46 | | | 56,828,035 | | |
| | | | | | | $ | 310,370,117 | | |
| Insured-Pooled Loans — 1.1% | | | |
| $ | 12,580 | | | Massachusetts Educational Financing Authority,
(AMBAC), 4.70%, 1/1/27(2) | | $ | 12,580,000 | | |
| | 52,030 | | | Massachusetts Educational Financing Authority,
(AMBAC), 4.70%, 1/1/33(2) | | | 51,795,345 | | |
| | | | | | | $ | 64,375,345 | | |
| Insured-Ports — 0.6% | | | |
| $ | 37,115 | | | Alabama State Dock Authority, (MBIA), (AMT),
4.50%, 10/1/36 | | $ | 36,109,926 | | |
| | | | | | | $ | 36,109,926 | | |
| Insured-Special Tax Revenue — 3.9% | | | |
| $ | 13,305 | | | Illinois Sports Facility Authority, (AMBAC),
0.00%, 6/15/23 | | $ | 6,623,628 | | |
| | 31,010 | | | Illinois Sports Facility Authority, (AMBAC),
0.00%, 6/15/24 | | | 14,737,503 | | |
Principal Amount
(000's omitted) | |
Security | |
Value | |
| Insured-Special Tax Revenue (continued) | | | |
| $ | 10,000 | | | Illinois Sports Facility Authority, (AMBAC),
0.00%, 6/15/25 | | $ | 4,543,400 | | |
| | 48,605 | | | Louisiana Gas and Fuels Tax, (FSA), 4.75%, 5/1/39(4) | | | 49,665,075 | | |
| | 6,645 | | | Massachusetts Bay Transportation Authority, Assessment
Bonds, Sales Tax Revenue, (MBIA), 4.50%, 7/1/35 | | | 6,639,285 | | |
| | 32,330 | | | Metropolitan Transportation Authority, NY, Dedicated
Tax Revenue, (MBIA), 4.50%, 11/15/36 | | | 32,302,196 | | |
| | 11,495 | | | Miami-Dade County, FL, Transit Sales Surtax Revenue,
(XLCA), 4.75%, 7/1/36 | | | 11,757,891 | | |
| | 59,820 | | | New York City, NY, Transitional Finance Authority, (FGIC),
4.25%, 1/15/34 | | | 57,718,523 | | |
| | 29,200 | | | New York Convention Center Development Corp.,
Hotel Occupancy Tax, (AMBAC), 4.75%, 11/15/45 | | | 29,822,544 | | |
| | 9,185 | | | Regional Transportation Authority, LA, (FGIC),
0.00%, 12/1/15 | | | 6,128,048 | | |
| | 9,500 | | | Regional Transportation Authority, LA, (FGIC),
0.00%, 12/1/21 | | | 4,590,400 | | |
| | | | | | | $ | 224,528,493 | | |
| Insured-Transportation — 12.1% | | | |
| $ | 29,800 | | | Central, TX, Regional Mobility Authority, (FGIC),
5.00%, 1/1/45(4) | | $ | 30,813,498 | | |
| | 10,000 | | | Chicago, IL, O'Hare International Airport, (AMBAC),
(AMT), 5.375%, 1/1/32 | | | 10,456,600 | | |
| | 45,355 | | | Clark County, NV, Airport Authority, (FGIC),
5.00%, 7/1/36(8) | | | 47,269,435 | | |
| | 5,000 | | | Dallas Fort Worth, TX, International Airport Facility
Improvements Corp., (FGIC), (AMT), 5.625%, 11/1/21 | | | 5,321,000 | | |
| | 10,000 | | | Dallas Fort Worth, TX, International Airport Facility
Improvements Corp., (FSA), (AMT), 5.50%, 11/1/17(1) | | | 10,845,989 | | |
| | 12,000 | | | Dallas Fort Worth, TX, International Airport Facility
Improvements Corp., (MBIA), (AMT), 5.50%, 11/1/19(1) | | | 13,007,480 | | |
| | 2,500 | | | Dallas-Fort Worth, TX, International Airport Facility
Improvements Corp., (FGIC), (AMT), 5.50%, 11/1/20 | | | 2,645,425 | | |
| | 10,000 | | | E-470 Public Highway Authority, CO, (MBIA),
0.00%, 9/1/37 | | | 2,312,400 | | |
| | 25,720 | | �� | E-470 Public Highway Authority, CO, (MBIA),
0.00%, 9/1/38 | | | 5,639,882 | | |
| | 5,450 | | | Florida Department of Transportation, (Turnpike Revenue),
(FSA), 4.50%, 7/1/34 | | | 5,432,669 | | |
| | 75,300 | | | Indianapolis, IN, Local Public Improvement Bond Bank,
(AMBAC), (AMT), 5.00%, 1/1/36(1) | | | 78,698,666 | | |
| | 12,000 | | | Massachusetts Turnpike Authority, Metropolitan
Highway System, (AMBAC), 5.00%, 1/1/39 | | | 12,280,800 | | |
| | 107,125 | | | Metropolitan Transportation Authority, NY, (FSA),
4.50%, 11/15/32 | | | 107,327,466 | | |
| | 19,240 | | | Miami-Dade County, FL, Aviation, (Miami International
Airport), (XLCA), (AMT), 5.00%, 10/1/37 | | | 20,079,249 | | |
See notes to financial statements
8
Eaton Vance National Municipals Fund as of March 31, 2007
PORTFOLIO OF INVESTMENTS (Unaudited) CONT'D
Principal Amount
(000's omitted) | |
Security | |
Value | |
| Insured-Transportation (continued) | | | |
| $ | 7,410 | | | North Texas Tollway Authority, (FSA), 4.50%, 1/1/38 | | $ | 7,270,247 | | |
| | 64,670 | | | Port Authority of New York and New Jersey, (CIFG),
(AMT), 4.50%, 9/1/35 | | | 63,648,214 | | |
| | 7,485 | | | Port Authority of New York and New Jersey, (FGIC),
(AMT), 4.50%, 4/1/25 | | | 7,475,793 | | |
| | 38,020 | | | Port Authority of New York and New Jersey, (FGIC),
(AMT), 4.50%, 9/1/29 | | | 38,071,707 | | |
| | 21,195 | | | Port Authority of New York and New Jersey, (FSA),
(AMT), 4.25%, 12/1/32 | | | 20,058,524 | | |
| | 27,500 | | | Puerto Rico Highway and Transportation Authority,
(AMBAC), 5.50%, 7/1/29 | | | 32,656,800 | | |
| | 15,770 | | | Puerto Rico Highway and Transportation Authority,
(FSA), 5.00%, 7/1/32 | | | 16,460,095 | | |
| | 24,200 | | | Regional Transportation Authority, IL, (MBIA),
4.50%, 7/1/35 | | | 23,950,256 | | |
| | 28,230 | | | South Carolina Transportation Infrastracture Bank,
(AMBAC), 4.50%, 10/1/31 | | | 28,262,465 | | |
| | 49,900 | | | South Carolina Transportation Infrastracture Bank,
(XLCA), 4.50%, 10/1/37 | | | 49,694,412 | | |
| | 12,280 | | | South Jersey, NJ, Transportation Authority, (FGIC),
4.50%, 11/1/35 | | | 12,318,682 | | |
| | 15,270 | | | Tampa-Hillsborough County, FL, Expressway Authority,
(AMBAC), 4.00%, 7/1/34 | | | 14,076,955 | | |
| | 50,000 | | | Texas Turnpike Authority, (AMBAC), 0.00%, 8/15/22 | | | 25,800,000 | | |
| | 9,775 | | | Tri-County, OR, Metropolitan Transportation District,
(MBIA), 4.25%, 9/1/31 | | | 9,492,405 | | |
| | | | | | | $ | 701,367,114 | | |
| Insured-Water and Sewer — 8.7% | | | |
| $ | 11,915 | | | Atlanta, GA, Water and Wastewater, (FGIC),
5.00%, 11/1/38 | | $ | 12,092,414 | | |
| | 75,230 | | | Birmingham, AL, Waterworks and Sewer Board,
(AMBAC), 4.50%, 1/1/39 | | | 73,914,227 | | |
| | 29,865 | | | Birmingham, AL, Waterworks and Sewer Board,
(AMBAC), 4.50%, 1/1/43 | | | 29,111,207 | | |
| | 10,445 | | | Castaic Lake, CA, Water Agency Certificates of
Participation, (Water System Improvements), (AMBAC),
0.00%, 8/1/21 | | | 5,667,770 | | |
| | 80,000 | | | Detroit, MI, Water Supply System, (FSA),
5.00%, 7/1/33 | | | 84,451,200 | | |
| | 25,335 | | | East Baton Rouge, LA, Sewer Commission, (FSA),
4.50%, 2/1/31 | | | 25,132,320 | | |
| | 21,750 | | | East Baton Rouge, LA, Sewer Commission, (FSA),
4.50%, 2/1/36 | | | 21,420,488 | | |
| | 8,490 | | | Fort Lauderdale, FL, Water and Sewer, (MBIA),
4.25%, 9/1/33 | | | 8,157,277 | | |
| | 8,375 | | | Houston, TX, Water and Sewer System, (FSA),
0.00%, 12/1/28 | | | 3,213,320 | | |
Principal Amount
(000's omitted) | |
Security | |
Value | |
| Insured-Water and Sewer (continued) | | | |
| $ | 6,465 | | | King County, WA, Sewer Revenue, (MBIA),
4.50%, 1/1/32 | | $ | 6,440,692 | | |
| | 24,330 | | | Los Angeles County, CA, Sanitation Districts Financing
Authority, (District No. 20 Subordinate Bonds),
(AMBAC), 4.50%, 10/1/42 | | | 24,032,201 | | |
| | 12,915 | | | Los Angeles, CA, Wastewater System, (MBIA),
4.50%, 6/1/29 | | | 12,988,874 | | |
| | 20 | | | Los Angeles, CA, Wastewater System, (MBIA),
4.75%, 6/1/35 | | | 20,551 | | |
| | 57,175 | | | Los Angeles, CA, Wastewater System, (MBIA),
4.75%, 6/1/35(1) | | | 58,749,943 | | |
| | 40,600 | | | New York City, NY, Municipal Finance Authority, (FSA),
4.25%, 6/15/39 | | | 38,720,626 | | |
| | 31,360 | | | San Francisco, CA, City and County Public Utilities
Commission Water Revenue, (FSA), 4.25%, 11/1/33 | | | 30,268,358 | | |
| | 17,800 | | | San Francisco, CA, City and County Public Utilities
Commission, (FSA), 4.50%, 11/1/31 | | | 17,845,568 | | |
| | 32,885 | | | Seattle, WA, Water Systems Revenue, (FSA),
4.50%, 2/1/37 | | | 32,589,693 | | |
| | 20,805 | | | Spartanburg, SC, Sanitation Sewer District, (MBIA),
4.00%, 3/1/40 | | | 18,812,089 | | |
| | | | | | | $ | 503,628,818 | | |
| Nursing Home — 1.0% | | | |
| $ | 4,455 | | | Delaware County, PA, Industrial Development Authority,
(Care Institute, Inc.), 9.00%, 8/1/31 | | $ | 3,623,341 | | |
| | 9,490 | | | Hillsborough County, FL, Industrial Development Authority,
(Tampa Bay Retirement Center), 7.50%, 6/1/25 | | | 9,874,914 | | |
| | 2,370 | | | Lackawanna County, PA, Industrial Development
Authority, (Edella Street Associates), 8.875%, 9/1/14 | | | 2,375,475 | | |
| | 12,965 | | | Massachusetts Industrial Finance Agency, (Age Institute
of Massachusetts), 8.05%, 11/1/25 | | | 13,368,860 | | |
| | 11,420 | | | Mississippi Business Finance Corp., (Magnolia
Healthcare), 7.99%, 7/1/25 | | | 9,766,498 | | |
| | 10,675 | | | Montgomery, PA, Industrial Development Authority,
(Advancement of Geriatric Health Care Institute),
8.375%, 7/1/23 | | | 10,692,294 | | |
| | 3,500 | | | Orange County, FL, Health Facilities Authority,
(Westminster Community Care), 6.75%, 4/1/34 | | | 3,639,790 | | |
| | 2,125 | | | Westmoreland, PA, (Highland Health Systems, Inc.),
9.25%, 6/1/22 | | | 2,130,376 | | |
| | | | | | | $ | 55,471,548 | | |
See notes to financial statements
9
Eaton Vance National Municipals Fund as of March 31, 2007
PORTFOLIO OF INVESTMENTS (Unaudited) CONT'D
Principal Amount
(000's omitted) | |
Security | |
Value | |
| Other Revenue — 8.8% | | | |
| $ | 20,935 | | | California Statewide Communities Development Authority,
(East Valley Tourist Development Authority),
8.25%, 10/1/14(3) | | $ | 22,524,385 | | |
| | 10,000 | | | California Statewide Communities Development Authority,
(East Valley Tourist Development Authority),
9.25%, 10/1/20(3) | | | 11,002,100 | | |
| | 71,985 | | | Golden State Tobacco Securitization Corp., CA,
5.00%, 6/1/45 | | | 74,393,618 | | |
| | 21,900 | | | Golden State Tobacco Securitization Corp., CA,
5.50%, 6/1/43(1) | | | 24,038,973 | | |
| | 25,000 | | | Golden State Tobacco Securitization Corp., CA,
5.75%, 6/1/47 | | | 26,591,250 | | |
| | 71,875 | | | Golden State Tobacco Securitization Corp., CA ,
5.125%, 6/1/47 | | | 71,372,594 | | |
| | 20,000 | | | Golden State Tobacco Securitization Corp., CA,
5.50%, 6/1/33(1) | | | 21,953,400 | | |
| | 22,600 | | | Golden State Tobacco Securitization Corp., CA,
5.625%, 6/1/38(1) | | | 24,961,926 | | |
| | 12,000 | | | Non-Profit Preferred Funding Trust, Various States,
Series B, 4.47%, 9/15/37 | | | 11,977,680 | | |
| | 19,000 | | | Non-Profit Preferred Funding Trust, Various States,
Series C, 4.72%, 9/15/37 | | | 18,949,840 | | |
| | 21,350 | | | Northern Tobacco Securitization Corp., AK,
0.00%, 6/1/46 | | | 2,056,219 | | |
| | 56,530 | | | Northern Tobacco Securitization Corp., AK,
5.00%, 6/1/46 | | | 55,104,313 | | |
| | 23,300 | | | Silicon Valley Tobacco Securitization Authority, CA,
0.00%, 6/1/36 | | | 4,589,634 | | |
| | 15,000 | | | Silicon Valley Tobacco Securitization Authority, CA,
0.00%, 6/1/41 | | | 2,215,350 | | |
| | 14,000 | | | Silicon Valley Tobacco Securitization Authority, CA,
0.00%, 6/1/47 | | | 1,330,280 | | |
| | 27,555 | | | Silicon Valley Tobacco Securitization Authority, CA,
0.00%, 6/1/47 | | | 2,832,103 | | |
| | 20,000 | | | Tennessee Energy Acquisition Corp., 5.25%, 9/1/26(1) | | | 22,189,700 | | |
| | 10,000 | | | Texas Municipal Gas Acquisition and Supply Corp.,
I, Variable Rate, 4.956%, 12/15/17(3)(7) | | | 10,062,500 | | |
| | 13,000 | | | Texas Municipal Gas Acquisition and Supply Corp.,
I, Variable Rate, 4.98%, 12/15/17(3)(7) | | | 13,081,250 | | |
| | 115,180 | | | Tobacco Settlement Financing Corp., NJ, 0.00%, 6/1/41 | | | 17,198,678 | | |
| | 31,685 | | | Tobacco Settlement Financing Corp., NJ, 4.75%, 6/1/34 | | | 29,906,521 | | |
| | 36,000 | | | Tobacco Settlement Financing Corp., VA, 5.625%, 6/1/37(1) | | | 38,524,920 | | |
| | 2,275 | | | Willacy County, TX, Local Government Corp.,
6.00%, 3/1/09 | | | 2,305,849 | | |
| | | | | | | $ | 509,163,083 | | |
Principal Amount
(000's omitted) | |
Security | |
Value | |
| Senior Living / Life Care — 1.1% | | | |
| $ | 3,940 | | | Albuquerque, NM, Retirement Facilities, (La Vida Liena
Retirement Center), 5.75%, 12/15/28 | | $ | 4,073,054 | | |
| | 9,380 | | | Albuquerque, NM, Retirement Facilities, (La Vida Liena
Retirement Center), 6.60%, 12/15/28 | | | 9,768,707 | | |
| | 6,035 | | | Arizona Health Facilities Authority, (Care Institute,
Inc.-Mesa), 7.625%, 1/1/26(5) | | | 5,506,274 | | |
| | 6,680 | | | Glen Cove, NY, Industrial Development Agency,
(The Regency at Glen Cove), 9.50%, 7/1/12(5) | | | 6,107,324 | | |
| | 1,000 | | | Kansas City, MO, Industrial Development Authority,
(Kingswood United Methodist Manor),
5.375%, 11/15/09 | | | 1,000,780 | | |
| | 9,345 | | | New Jersey Economic Development Authority, (Forsgate),
(AMT), 8.625%, 6/1/25(5) | | | 6,450,012 | | |
| | 800 | | | North Miami, FL, Health Care Facilities Authority,
(Imperial Club), 9.00%, 1/1/12(6) | | | 140,296 | | |
| | 12,590 | | | North Miami, FL, Health Care Facilities Revenue,
(Imperial Club), 6.125%, 1/1/42 | | | 12,621,727 | | |
| | 7,915 | | | Roseville, MN, Elder Care Facility, (Care Institute,
Inc.-Roseville), 7.75%, 11/1/23(9) | | | 7,656,734 | | |
| | 12,140 | | | St. Paul, MN, Housing and Redevelopment Authority,
(Care Institute, Inc.-Highland), 8.75%, 11/1/24(10) | | | 10,483,740 | | |
| | | | | | | $ | 63,808,648 | | |
| Special Tax Revenue — 0.4% | | | |
| $ | 6,000 | | | New Jersey Economic Development Authority,
(Cigarette Tax), 5.50%, 6/15/24 | | $ | 6,316,620 | | |
| | 10,000 | | | New Jersey Economic Development Authority,
(Cigarette Tax), 5.75%, 6/15/29 | | | 10,817,700 | | |
| | 1,815 | | | New Jersey Economic Development Authority,
(Cigarette Tax), 5.75%, 6/15/34 | | | 1,952,976 | | |
| | 4,230 | | | University Square, FL, Community Development
District, 6.75%, 5/1/20 | | | 4,474,790 | | |
| | | | | | | $ | 23,562,086 | | |
| Transportation — 0.5% | | | |
| $ | 30,845 | | | Port Authority of New York and New Jersey, (AMT),
4.75%, 12/1/34 | | $ | 31,321,555 | | |
| | | | | | | $ | 31,321,555 | | |
| Water and Sewer — 4.4% | | | |
| $ | 27,660 | | | Massachusetts Water Resources Authority,
4.00%, 8/1/46 | | $ | 24,444,248 | | |
| | 121,150 | | | New York City, NY, Municipal Water Finance Authority,
(Water and Sewer System), 4.75%, 6/15/33(1) | | | 124,462,726 | | |
| | 16,000 | | | New York City, NY, Municipal Water Finance Authority,
4.25%, 6/15/33 | | | 15,327,680 | | |
See notes to financial statements
10
Eaton Vance National Municipals Fund as of March 31, 2007
PORTFOLIO OF INVESTMENTS (Unaudited) CONT'D
Principal Amount
(000's omitted) | |
Security | |
Value | |
| Water and Sewer (continued) | | | |
| $ | 55,485 | | | New York City, NY, Municipal Water Finance Authority,
(Water and Sewer System), 4.50%, 6/15/37 | | $ | 55,073,301 | | |
| | 23,625 | | | New York City, NY, Municipal Water Finance Authority,
(Water and Sewer System), 4.75%, 6/15/38 | | | 24,199,088 | | |
| | 10,250 | | | New York State Environmental Facilities Corp.,
4.75%, 6/15/35 | | | 10,554,835 | | |
| | | | | | | $ | 254,061,878 | | |
Total Tax-Exempt Investments — 117.5%
(identified cost $6,530,802,400) | | $ | 6,808,123,104 | | |
| Other Assets, Less Liabilities — (17.5%) | | $ | (1,016,270,935 | ) | |
| Net Assets — 100.0% | | $ | 5,791,852,169 | | |
AGC - Assured Guaranty Corp.
AMBAC - AMBAC Financial Group, Inc.
AMT - Interest earned from these securities may be considered a tax preference item for purposes of the Federal Alternative Minimum Tax.
CIFG - CDC IXIS Financial Guaranty North America, Inc.
FGIC - Financial Guaranty Insurance Company
FSA - Financial Security Assurance, Inc.
MBIA - Municipal Bond Insurance Association
XLCA - XL Capital Assurance, Inc.
At March 31, 2007, the concentration of the Fund's investments in the various states, determined as a percentage of net assets, is as follows:
| California | | | 25.9 | % | |
| New York | | | 27.1 | % | |
| Others, representing less than 10% individually | | | 64.5 | % | |
The Fund invests primarily in debt securities issued by municipalities. The ability of the issuers of the debt securities to meet their obligations may be affected by economic developments in a specific industry or municipality. In order to reduce the risk associated with such economic developments, at March 31, 2007, 48.1% of total investments are backed by bond insurance of various financial institutions and financial guaranty assurance agencies. The aggregate percentage insured by an individual financial institution ranged from 0.8% to 12.7% of total investments.
(1) Security represents the underlying municipal obligation of an inverse floating rate obligation held by the Fund.
(2) When-issued security.
(3) Security exempt from registration under Rule 144A of the Securities Act of 1933. These securities may be sold in transactions exempt from registration, normally to qualified institutional buyers. At March 31, 2007, the aggregate value of the securities is $87,252,093 or 1.5% of the Fund's net assets.
(4) Security (or a portion thereof) has been segregated to cover when-issued securities.
(5) Security is in default and making only partial interest payments.
(6) Defaulted bond.
(7) Security has been issued as a leveraged inverse floater bond. The stated interest rate represents the rate in effect at March 31, 2007.
(8) Security (or a portion thereof) has been segregated to cover margin requirements on open financial futures contracts.
(9) Security is in default with respect to interest payments.
(10) Security in default with respect to principal payments.
(11) Security valued at fair value using methods determined in good faith by or at the direction of the Trustees.
See notes to financial statements
11
Eaton Vance National Municipals Fund as of March 31, 2007
FINANCIAL STATEMENTS (Unaudited)
Statement of Assets and Liabilities
As of March 31, 2007
| Assets | |
| Investments, at value (identified cost, $6,530,802,400) | | $ | 6,808,123,104 | | |
| Receivable for investments sold | | | 42,999,955 | | |
| Receivable for Fund shares sold | | | 38,202,976 | | |
| Interest receivable | | | 81,371,588 | | |
| Receivable for daily variation margin on open financial futures contracts | | | 6,250,000 | | |
| Receivable for open interest rate swap contracts | | | 1,540,554 | | |
| Miscellaneous receivable | | | 19,678 | | |
| Total assets | | $ | 6,978,507,855 | | |
| Liabilities | |
| Demand note payable | | $ | 84,000,000 | | |
| Payable for when-issued securities | | | 205,954,194 | | |
| Dividends payable | | | 7,848,070 | | |
| Payable for Fund shares redeemed | | | 7,337,612 | | |
| Payable to affiliate for distribution and service fees | | | 3,657,025 | | |
| Payable to affiliate for investment advisory fees | | | 1,528,788 | | |
| Payable for floating rate notes issued | | | 863,780,950 | | |
| Due to custodian | | | 16,789 | | |
| Interest expense and fees payable | | | 11,941,069 | | |
| Accrued expenses | | | 591,189 | | |
| Total liabilities | | $ | 1,186,655,686 | | |
| Net assets | | $ | 5,791,852,169 | | |
| Sources of Net Assets | |
| Paid-in capital | | $ | 5,444,738,634 | | |
Accumulated undistributed net realized gain (computed on
the basis of identified cost) | | | 26,120,114 | | |
| Accumulated undistributed net investment income | | | 9,342,788 | | |
| Net unrealized appreciation (computed on the basis of identified cost) | | | 311,650,633 | | |
| Total | | $ | 5,791,852,169 | | |
| Class A Shares | |
| Net Assets | | $ | 4,271,967,480 | | |
| Shares Outstanding | | | 359,293,710 | | |
Net Asset Value and Redemption Price Per Share
(net assets ÷ shares of beneficial interest outstanding) | | $ | 11.89 | | |
Maximum Offering Price Per Share
(100 ÷ 95.25 of $11.89) | | $ | 12.48 | | |
| Class B Shares | |
| Net Assets | | $ | 169,075,811 | | |
| Shares Outstanding | | | 14,222,713 | | |
Net Asset Value, Offering Price and Redemption Price Per Share
(net assets ÷ shares of beneficial interest outstanding) | | $ | 11.89 | | |
| Class C Shares | |
| Net Assets | | $ | 1,196,259,775 | | |
| Shares Outstanding | | | 100,627,294 | | |
Net Asset Value, Offering Price and Redemption Price Per Share
(net assets ÷ shares of beneficial interest outstanding) | | $ | 11.89 | | |
| Class I Shares | |
| Net Assets | | $ | 154,549,103 | | |
| Shares Outstanding | | | 12,994,779 | | |
Net Asset Value, Offering Price and Redemption Price Per Share
(net assets ÷ shares of beneficial interest outstanding) | | $ | 11.89 | | |
| On sales of $25,000 or more, the offering price of Class A shares is reduced. | |
Statement of Operations
For the Six Months Ended
March 31, 2007
| Investment Income | |
| Interest | | $ | 142,710,559 | | |
| Total investment income | | $ | 142,710,559 | | |
| Expenses | |
| Investment adviser fee | | $ | 8,097,488 | | |
| Trustees' fees and expenses | | | 15,198 | | |
Distribution and service fees
Class A | | | 4,690,268 | | |
| Class B | | | 774,323 | | |
| Class C | | | 4,873,580 | | |
| Custodian fee | | | 375,712 | | |
| Transfer and dividend disbursing agent fees | | | 771,261 | | |
| Registration fees | | | 195,160 | | |
| Printing and postage | | | 98,420 | | |
| Legal and accounting services | | | 35,841 | | |
| Interest expense and fees | | | 16,667,319 | | |
| Miscellaneous | | | 508,192 | | |
| Total expenses | | $ | 37,102,762 | | |
Deduct —
Reduction of custodian fee | | $ | 152,109 | | |
| Total expense reductions | | $ | 152,109 | | |
| Net expenses | | $ | 36,950,653 | | |
| Net investment income | | $ | 105,759,906 | | |
| Realized and Unrealized Gain (Loss) | |
Net realized gain (loss) —
Investment transactions (identified cost basis) | | $ | 27,144,621 | | |
| Financial futures contracts | | | (22,269,230 | ) | |
| Net realized gain | | $ | 4,875,391 | | |
Change in unrealized appreciation (depreciation) —
Investments (identified cost basis) | | $ | (23,778,059 | ) | |
| Financial futures contracts | | | 52,157,125 | | |
| Interest rate swap contracts | | | 1,540,554 | | |
| Net change in unrealized appreciation (depreciation) | | $ | 29,919,620 | | |
| Net realized and unrealized gain | | $ | 34,795,011 | | |
| Net increase in net assets from operations | | $ | 140,554,917 | | |
See notes to financial statements
12
Eaton Vance National Municipals Fund as of March 31, 2007
FINANCIAL STATEMENTS CONT'D
Statements of Changes in Net Assets
Increase (Decrease)
in Net Assets | | Six Months Ended
March 31, 2007
(Unaudited) | | Year Ended
September 30, 2006 | |
From operations —
Net investment income | | $ | 105,759,906 | | | $ | 155,263,037 | | |
Net realized gain from investment
transactions, financial futures contracts
and interest rate swap contracts | | | 4,875,391 | | | | 70,533,392 | | |
Net change in unrealized appreciation
(depreciation) from investments,
financial futures contracts and
interest rate swap contracts | | | 29,919,620 | | | | 73,862,460 | | |
| Net increase in net assets from operations | | $ | 140,554,917 | | | $ | 299,658,889 | | |
Distributions to shareholders —
From net investment income
Class A | | $ | (81,381,900 | ) | | $ | (118,051,895 | ) | |
| Class B | | | (2,814,536 | ) | | | (4,320,365 | ) | |
| Class C | | | (17,642,076 | ) | | | (20,894,988 | ) | |
| Class I | | | (2,615,691 | ) | | | (2,101,962 | ) | |
| Total distributions to shareholders | | $ | (104,454,203 | ) | | $ | (145,369,210 | ) | |
Transactions in shares of beneficial interest —
Proceeds from sale of shares
Class A | | $ | 1,160,201,033 | | | $ | 1,268,188,085 | | |
| Class B | | | 33,754,073 | | | | 61,402,718 | | |
| Class C | | | 443,187,927 | | | | 420,877,219 | | |
| Class I | | | 80,375,031 | | | | 71,850,088 | | |
Net asset value of shares issued to
shareholders in payment of
distributions declared
Class A | | | 48,801,473 | | | | 64,304,849 | | |
| Class B | | | 1,592,903 | | | | 2,334,782 | | |
| Class C | | | 9,666,835 | | | | 10,889,973 | | |
| Class I | | | 2,152,411 | | | | 1,617,446 | | |
Cost of shares redeemed
Class A | | | (225,651,235 | ) | | | (342,257,371 | ) | |
| Class B | | | (6,983,924 | ) | | | (10,711,188 | ) | |
| Class C | | | (45,913,047 | ) | | | (63,309,338 | ) | |
| Class I | | | (11,254,521 | ) | | | (8,201,000 | ) | |
Net asset value of shares exchanged
Class A | | | 1,119,484 | | | | 1,388,451 | | |
| Class B | | | (1,119,484 | ) | | | (1,388,451 | ) | |
Net increase in net assets from
Fund share transactions | | $ | 1,489,928,959 | | | $ | 1,476,986,263 | | |
| Net increase in net assets | | $ | 1,526,029,673 | | | $ | 1,631,275,942 | | |
| Net Assets | | Six Months Ended
March 31, 2007
(Unaudited) | | Year Ended
September 30, 2006 | |
| At beginning of period | | $ | 4,265,822,496 | | | $ | 2,634,546,554 | | |
| At end of period | | $ | 5,791,852,169 | | | $ | 4,265,822,496 | | |
Accumulated undistributed
net investment income
included in net assets | |
| At end of period | | $ | 9,342,788 | | | $ | 8,037,085 | | |
See notes to financial statements
13
Eaton Vance National Municipals Fund as of March 31, 2007
FINANCIAL STATEMENTS (Unaudited) CONT'D
Statement of Cash Flows
| | | For the Six Months
Ended March 31, 2007
(Unaudited) | |
Cash flows from operating activities
Net increase in net assets from operations | | $ | 140,554,917 | | |
Adjustments to reconcile net increase in net assets resulting
from operations to net cash provided/(used) in operating activities: | | | | | |
| Investments purchased | | | (3,297,266,397 | ) | |
| Investments sold | | | 1,442,153,680 | | |
| Net amortization of premium/(discount) | | | (7,288,248 | ) | |
| Interest receivable | | | (4,409,192 | ) | |
| Receivable for daily variation margin on open financial futures contracts | | | (6,250,000 | ) | |
| Receivable for open interest rate swap contracts | | | (1,540,554 | ) | |
| Payable for closed interest rate swap contracts | | | (2,782,000 | ) | |
| Payable for when-issued securities | | | 153,016,914 | | |
| Payable to affiliate for investment advisory fees | | | 186,050 | | |
| Payable to affiliate for distribution and service fees | | | 1,001,825 | | |
| Interest expense and fees payable | | | 5,080,364 | | |
| Accrued expenses | | | (130,540 | ) | |
| Net change in realized and unrealized (gain)/loss on investments | | | (3,366,562 | ) | |
| Net cash provided/(used) in operating activities | | $ | (1,581,039,743 | ) | |
| Cash flows from financing activities | |
| Due to custodian | | $ | 16,789 | | |
| Proceeds from shares sold | | | 1,716,948,728 | | |
| Shares redeemed | | | (298,267,416 | ) | |
| Cash distributions paid net of reinvestments | | | (40,484,005 | ) | |
| Demand note payable | | | 35,900,000 | | |
| Proceeds from secured borrowings | | | 220,220,000 | | |
| Repayment of secured borrowings | | | (53,355,000 | ) | |
| Net cash provided/(used) by financing activities | | $ | 1,580,979,096 | | |
| Net increase (decrease) in cash | | $ | (60,647 | ) | |
| Cash at beginning of period | | $ | 60,647 | | |
| Cash at end of period | | $ | — | | |
Supplemental disclosure of
cash flow information: | |
Noncash financing activities not included herein consists of
reinvestment of dividends and distributions of: | | $ | 62,213,622 | | |
See notes to financial statements
14
Eaton Vance National Municipals Fund as of March 31, 2007
FINANCIAL STATEMENTS
Financial Highlights
| | | Class A | |
| | | Six Months Ended
March 31, 2007 | | Year Ended September 30, | |
| | | (Unaudited)(1) | | 2006(1) | | 2005(1) | | 2004(1) | | 2003(1) | | 2002(1)(2) | |
| Net asset value — Beginning of period | | $ | 11.780 | | | $ | 11.270 | | | $ | 10.920 | | | $ | 10.840 | | | $ | 10.920 | | | $ | 10.550 | | |
| Income (loss) from operations | |
| Net investment income | | $ | 0.262 | | | $ | 0.565 | | | $ | 0.574 | | | $ | 0.654 | | | $ | 0.666 | | | $ | 0.656 | | |
| Net realized and unrealized gain (loss) | | | 0.108 | | | | 0.478 | | | | 0.355 | | | | 0.079 | | | | (0.105 | ) | | | 0.334 | | |
| Total income from operations | | $ | 0.370 | | | $ | 1.043 | | | $ | 0.929 | | | $ | 0.733 | | | $ | 0.561 | | | $ | 0.990 | | |
| Less distributions | |
| From net investment income | | $ | (0.260 | ) | | $ | (0.533 | ) | | $ | (0.579 | ) | | $ | (0.653 | ) | | $ | (0.641 | ) | | $ | (0.620 | ) | |
| Total distributions | | $ | (0.260 | ) | | $ | (0.533 | ) | | $ | (0.579 | ) | | $ | (0.653 | ) | | $ | (0.641 | ) | | $ | (0.620 | ) | |
| Net asset value — End of period | | $ | 11.890 | | | $ | 11.780 | | | $ | 11.270 | | | $ | 10.920 | | | $ | 10.840 | | | $ | 10.920 | | |
| Total Return(3) | | | 3.15 | % | | | 9.50 | % | | | 8.69 | % | | | 6.94 | % | | | 5.46 | % | | | 9.84 | % | |
| Ratios/Supplemental Data | |
| Net assets, end of period (000's omitted) | | $ | 4,271,967 | | | $ | 3,259,363 | | | $ | 2,147,435 | | | $ | 1,769,191 | | | $ | 236,885 | | | $ | 213,456 | | |
| Ratios (As a percentage of average daily net assets): | |
| Expenses excluding interst and fees | | | 0.66 | %(4) | | | 0.72 | % | | | 0.77 | %(5) | | | 0.79 | %(5) | | | 0.78 | %(5) | | | 0.83 | %(5) | |
| Interest and fee expense(6) | | | 0.67 | %(4) | | | 0.61 | % | | | 0.44 | %(5) | | | 0.33 | %(5) | | | 0.27 | %(5) | | | 0.31 | %(5) | |
| Total expenses | | | 1.33 | %(4) | | | 1.33 | % | | | 1.21 | %(5) | | | 1.12 | %(5) | | | 1.05 | %(5) | | | 1.14 | %(5) | |
| Expenses after custodian fee reduction excluding interest and fees | | | 0.65 | %(4) | | | 0.71 | % | | | 0.76 | %(5) | | | 0.79 | %(5) | | | 0.78 | %(5) | | | 0.82 | %(5) | |
| Net investment income | | | 4.41 | %(4) | | | 4.93 | % | | | 5.14 | % | | | 6.05 | % | | | 6.29 | % | | | 6.31 | % | |
| Portfolio Turnover of the Portfolio(7) | | | — | | | | — | | | | — | | | | 9 | % | | | 22 | % | | | 32 | % | |
| Portfolio Turnover of the Fund | | | 26 | % | | | 58 | % | | | 54 | % | | | — | | | | — | | | | — | | |
(1) Net investment income per share was computed using average shares outstanding.
(2) The Fund, through its investment in the Portfolio, has adopted the provisions of the revised AICPA Audit and Accounting Guide for Investment Companies and began using the interest method to amortize premiums on fixed-income securities. The effect of this change for the year ended September 30, 2002 was to increase net investment income per share by $0.003, decrease net realized and unrealized gains per share by $0.003 and increase the ratio of net investment income to average net assets from 6.28% to 6.31%.
(3) Returns are historical and are calculated by determining the percentage change in net asset value with all distributions reinvested. Total return is not computed on an annualized basis.
(4) Annualized.
(5) Includes the Fund's share of the Portfolio's allocated expenses while the Fund was making investments directly into the Portfolio.
(6) Interest and fee expense relates to the liability for floating rate notes issued in conjunction with inverse floater securities transactions (See Note 1B).
(7) Portfolio turnover represents the rate of portfolio activity for the period while Fund was making investments directly into the Portfolio.
See notes to financial statements
15
Eaton Vance National Municipals Fund as of March 31, 2007
FINANCIAL STATEMENTS CONT'D
Financial Highlights
| | | Class B | |
| | | Six Months Ended
March 31, 2007 | | Year Ended September 30, | |
| | | (Unaudited)(1) | | 2006(1) | | 2005(1)(2) | | 2004(1)(2) | | 2003(1)(2) | | 2002(1)(2)(3) | |
| Net asset value — Beginning of period | | $ | 11.780 | | | $ | 11.270 | (2) | | $ | 10.920 | | | $ | 10.850 | | | $ | 10.920 | | | $ | 10.550 | | |
| Income (loss) from operations | |
| Net investment income | | $ | 0.218 | | | $ | 0.478 | | | $ | 0.482 | | | $ | 0.598 | | | $ | 0.622 | | | $ | 0.613 | | |
| Net realized and unrealized gain (loss) | | | 0.108 | | | | 0.480 | | | | 0.364 | | | | 0.063 | | | | (0.097 | ) | | | 0.330 | | |
| Total income from operations | | $ | 0.326 | | | $ | 0.958 | | | $ | 0.846 | | | $ | 0.661 | | | $ | 0.525 | | | $ | 0.943 | | |
| Less distributions | |
| From net investment income | | $ | (0.216 | ) | | $ | (0.448 | )(2) | | $ | (0.496 | ) | | $ | (0.595 | ) | | $ | (0.601 | ) | | $ | (0.578 | ) | |
| Total distributions | | $ | (0.216 | ) | | $ | (0.448 | ) | | $ | (0.496 | ) | | $ | (0.595 | ) | | $ | (0.601 | ) | | $ | (0.578 | ) | |
| Contingent deferred sales charges | | $ | — | | | $ | — | | | $ | — | | | $ | 0.004 | | | $ | 0.006 | | | $ | 0.005 | | |
| Net asset value — End of period | | $ | 11.890 | | | $ | 11.780 | | | $ | 11.270 | | | $ | 10.920 | | | $ | 10.850 | | | $ | 10.920 | | |
| Total Return(4) | | | 2.78 | % | | | 8.69 | % | | | 8.15 | %(5) | | | 6.25 | % | | | 5.17 | % | | | 9.30 | % | |
| Ratios/Supplemental Data | |
| Net assets, end of period (000's omitted) | | $ | 169,076 | | | $ | 140,593 | | | $ | 83,629 | | | $ | 29,577 | | | $ | 1,553,297 | | | $ | 1,582,772 | | |
| Ratios (As a percentage of average daily net assets): | |
| Expenses excluding interst and fees | | | 1.41 | %(6) | | | 1.47 | % | | | 1.52 | %(7) | | | 1.17 | %(7) | | | 1.20 | %(7) | | | 1.25 | %(7) | |
| Interest and fee expense(8) | | | 0.67 | %(6) | | | 0.61 | % | | | 0.44 | %(7) | | | 0.33 | %(7) | | | 0.27 | %(7) | | | 0.31 | %(7) | |
| Total expenses | | | 2.08 | %(6) | | | 2.08 | % | | | 1.96 | %(7) | | | 1.50 | %(7) | | | 1.47 | %(7) | | | 1.56 | %(7) | |
| Expenses after custodian fee reduction excluding interest and fees | | | 1.40 | %(6) | | | 1.46 | % | | | 1.51 | %(7) | | | 1.17 | %(7) | | | 1.20 | %(7) | | | 1.24 | %(7) | |
| Net investment income | | | 3.67 | %(6) | | | 4.17 | % | | | 4.30 | % | | | 5.44 | % | | | 5.88 | % | | | 5.89 | % | |
| Portfolio Turnover of the Portfolio(9) | | | — | | | | — | | | | — | | | | 9 | % | | | 22 | % | | | 32 | % | |
| Portfolio Turnover of the Fund | | | 26 | % | | | 58 | % | | | 54 | % | | | — | | | | — | | | | — | | |
(1) Net investment income per share was computed using average shares outstanding.
(2) Per share data have been restated or adjusted to reflect the effects of a 0.9334516-for-1 reverse stock split effective on November 11, 2005.
(3) The Fund, through its investment in the Portfolio, has adopted the provisions of the revised AICPA Audit and Accounting Guide for Investment Companies and began using the interest method to amortize premiums on fixed-income securities. The effect of this change for the year ended September 30, 2002 was to increase net investment income per share by $0.003, decrease net realized and unrealized gains per share by $0.003 and increase the ratio of net investment income to average net assets from 5.86% to 5.89%.
(4) Returns are historical and are calculated by determining the percentage change in net asset value with all distributions reinvested. Total return is not computed on an annualized basis.
(5) Total return reflects an increase of 0.19% due to a change in the timing of the payment and reinvestment of distributions.
(6) Annualized.
(7) Includes the Fund's share of the Portfolio's allocated expenses while the Fund was making investments directly into the Portfolio.
(8) Interest and fee expense relates to the liability for floating rate notes issued in conjunction with inverse floater securities transactions (See Note 1B).
(9) Portfolio turnover represents the rate of portfolio activity for the period while the Fund was making investments directly into the Portfolio.
See notes to financial statements
16
Eaton Vance National Municipals Fund as of March 31, 2007
FINANCIAL STATEMENTS CONT'D
Financial Highlights
| | | Class C | |
| | | Six Months Ended
March 31, 2007 | | Year Ended September 30, | |
| | | (Unaudited)(1) | | 2006(1) | | 2005(1)(2) | | 2004(1)(2) | | 2003(1)(2) | | 2002(1)(2)(3) | |
| Net asset value — Beginning of period | | $ | 11.780 | | | $ | 11.270 | (2) | | $ | 10.920 | | | $ | 10.840 | | | $ | 10.920 | | | $ | 10.550 | | |
| Income (loss) from operations | |
| Net investment income | | $ | 0.216 | | | $ | 0.480 | | | $ | 0.486 | | | $ | 0.565 | | | $ | 0.587 | | | $ | 0.579 | | |
| Net realized and unrealized gain (loss) | | | 0.110 | | | | 0.478 | | | | 0.360 | | | | 0.087 | | | | (0.101 | ) | | | 0.333 | | |
| Total income from operations | | $ | 0.326 | | | $ | 0.958 | | | $ | 0.846 | | | $ | 0.652 | | | $ | 0.486 | | | $ | 0.912 | | |
| Less distributions | |
| From net investment income | | $ | (0.216 | ) | | $ | (0.448 | )(2) | | $ | (0.496 | ) | | $ | (0.572 | ) | | $ | (0.566 | ) | | $ | (0.542 | ) | |
| Total distributions | | $ | (0.216 | ) | | $ | (0.448 | ) | | $ | (0.496 | ) | | $ | (0.572 | ) | | $ | (0.566 | ) | | $ | (0.542 | ) | |
| Net asset value — End of period | | $ | 11.890 | | | $ | 11.780 | | | $ | 11.270 | | | $ | 10.920 | | | $ | 10.840 | | | $ | 10.920 | | |
| Total Return(4) | | | 2.78 | % | | | 8.69 | % | | | 7.99 | %(5) | | | 6.15 | % | | | 4.71 | % | | | 9.02 | % | |
| Ratios/Supplemental Data | |
| Net assets, end of period (000's omitted) | | $ | 1,196,260 | | | $ | 783,143 | | | $ | 388,276 | | | $ | 224,955 | | | $ | 200,310 | | | $ | 185,439 | | |
| Ratios (As a percentage of average daily net assets): | |
| Expenses excluding interst and fees | | | 1.41 | %(6) | | | 1.47 | % | | | 1.52 | %(7) | | | 1.53 | %(7) | | | 1.53 | %(7) | | | 1.57 | %(7) | |
| Interest and fee expense(8) | | | 0.67 | %(6) | | | 0.61 | % | | | 0.44 | %(7) | | | 0.33 | %(7) | | | 0.27 | %(7) | | | 0.31 | %(7) | |
| Total expenses | | | 2.08 | %(6) | | | 2.08 | % | | | 1.96 | %(7) | | | 1.86 | %(7) | | | 1.80 | %(7) | | | 1.88 | %(7) | |
| Expenses after custodian fee reduction excluding interest and fees | | | 1.40 | %(6) | | | 1.46 | % | | | 1.51 | %(7) | | | 1.53 | %(7) | | | 1.53 | %(7) | | | 1.56 | %(7) | |
| Net investment income | | | 3.64 | %(6) | | | 4.18 | % | | | 4.35 | % | | | 5.19 | % | | | 5.54 | % | | | 5.56 | % | |
| Portfolio Turnover of the Portfolio(9) | | | — | | | | — | | | | — | | | | 9 | % | | | 22 | % | | | 32 | % | |
| Portfolio Turnover of the Fund | | | 26 | % | | | 58 | % | | | 54 | % | | | — | | | | — | | | | — | | |
(1) Net investment income per share was computed using average shares outstanding.
(2) Per share data have been restated or adjusted to reflect the effects of a 0.8890861-for-1 reverse stock split effective on November 11, 2005.
(3) The Fund, through its investment in the Portfolio, has adopted the provisions of the revised AICPA Audit and Accounting Guide for Investment Companies and began using the interest method to amortize premiums on fixed-income securities. The effect of this change for the year ended September 30, 2002 was to increase net investment income per share by $0.003, decrease net realized and unrealized gains per share by $0.003 and increase the ratio of net investment income to average net assets from 5.53% to 5.56%.
(4) Returns are historical and are calculated by determining the percentage change in net asset value with all distributions reinvested. Total return is not computed on an annualized basis.
(5) Total return reflects an increase of 0.10% due to a change in the timing of the payment and reinvestment of distributions.
(6) Annualized.
(7) Includes the Fund's share of the Portfolio's allocated expenses while the Fund was making investments directly into the Portfolio.
(8) Interest and fee expense relates to the liability for floating rate notes issued in conjunction with inverse floater securities transactions (See Note 1B).
(9) Portfolio turnover represents the rate of portfolio activity for the period while the Fund was making investments directly into the Portfolio.
See notes to financial statements
17
Eaton Vance National Municipals Fund as of March 31, 2007
FINANCIAL STATEMENTS CONT'D
Financial Highlights
| | | Class I | |
| | | Six Months Ended
March 31, 2007 | | Year Ended September 30, | |
| | | (Unaudited)(1) | | 2006(1) | | 2005(1)(2) | | 2004(1)(2) | | 2003(1)(2) | | 2002(1)(2)(3) | |
| Net asset value — Beginning of period | | $ | 11.780 | | | $ | 11.270 | (2) | | $ | 10.920 | | | $ | 10.850 | | | $ | 10.910 | | | $ | 10.550 | | |
| Income (loss) from operations | |
| Net investment income | | $ | 0.276 | | | $ | 0.601 | | | $ | 0.590 | | | $ | 0.673 | | | $ | 0.693 | | | $ | 0.688 | | |
| Net realized and unrealized gain (loss) | | | 0.108 | | | | 0.471 | | | | 0.368 | | | | 0.078 | | | | (0.088 | ) | | | 0.314 | | |
| Total income from operations | | $ | 0.384 | | | $ | 1.072 | | | $ | 0.958 | | | $ | 0.751 | | | $ | 0.605 | | | $ | 1.002 | | |
| Less distributions | |
| From net investment income | | $ | (0.274 | ) | | $ | (0.562 | )(2) | | $ | (0.608 | ) | | $ | (0.681 | ) | | $ | (0.665 | ) | | $ | (0.642 | ) | |
| Total distributions | | $ | (0.274 | ) | | $ | (0.562 | ) | | $ | (0.608 | ) | | $ | (0.681 | ) | | $ | (0.665 | ) | | $ | (0.642 | ) | |
| Net asset value — End of period | | $ | 11.890 | | | $ | 11.780 | | | $ | 11.270 | | | $ | 10.920 | | | $ | 10.850 | | | $ | 10.910 | | |
| Total Return(4) | | | 3.28 | % | | | 9.77 | % | | | 8.92 | % | | | 7.17 | % | | | 5.84 | % | | | 10.05 | % | |
| Ratios/Supplemental Data | |
| Net assets, end of period (000's omitted) | | $ | 154,549 | | | $ | 82,723 | | | $ | 15,208 | | | $ | 5,400 | | | $ | 2,414 | | | $ | 2,193 | | |
| Ratios (As a percentage of average daily net assets): | |
| Expenses excluding interst and fees | | | 0.41 | %(5) | | | 0.47 | % | | | 0.52 | %(6) | | | 0.53 | %(6) | | | 0.53 | %(6) | | | 0.57 | %(6) | |
| Interest and fee expense(7) | | | 0.67 | %(5) | | | 0.61 | % | | | 0.44 | %(6) | | | 0.33 | %(6) | | | 0.27 | %(6) | | | 0.31 | %(6) | |
| Total expenses | | | 1.08 | %(5) | | | 1.08 | % | | | 0.96 | %(6) | | | 0.86 | %(6) | | | 0.80 | %(6) | | | 0.88 | %(6) | |
| Expenses after custodian fee reduction excluding interest and fees | | | 0.40 | %(5) | | | 0.46 | % | | | 0.51 | %(6) | | | 0.53 | %(6) | | | 0.53 | %(6) | | | 0.56 | %(6) | |
| Net investment income | | | 4.64 | %(5) | | | 5.22 | % | | | 5.27 | % | | | 6.18 | % | | | 6.54 | % | | | 6.60 | % | |
| Portfolio Turnover of the Portfolio(8) | | | — | | | | — | | | | — | | | | 9 | % | | | 22 | % | | | 32 | % | |
| Portfolio Turnover of the Fund | | | 26 | % | | | 58 | % | | | 54 | % | | | — | | | | — | | | | — | | |
(1) Net investment income per share was computed using average shares outstanding.
(2) Per share data have been restated or adjusted to reflect the effects of a 0.9263531-for-1 reverse stock split effective on November 11, 2005.
(3) The Fund, through its investment in the Portfolio, has adopted the provisions of the revised AICPA Audit and Accounting Guide for Investment Companies and began using the interest method to amortize premiums on fixed-income securities. The effect of this change for the year ended September 30, 2002 was to increase net investment income per share by $0.003, decrease net realized and unrealized gains per share by $0.003 and increase the ratio of net investment income to average net assets from 6.57% to 6.60%.
(4) Returns are historical and are calculated by determining the percentage change in net asset value with all distributions reinvested. Total return is not computed on an annualized basis.
(5) Annualized.
(6) Includes the Fund's share of the Portfolio's allocated expenses while the Fund was making investments directly into the Portfolio.
(7) Interest and fee expense relates to the liability for floating rate notes issued in conjunction with inverse floater securities transactions (See Note 1B).
(8) Portfolio turnover represents the rate of portfolio activity for the period while the Fund was making investments directly into the Portfolio.
See notes to financial statements
18
Eaton Vance National Municipals Fund as of March 31, 2007
NOTES TO FINANCIAL STATEMENTS (Unaudited)
1 Significant Accounting Policies
Eaton Vance National Municipals Fund (the Fund) is a diversified series of Eaton Vance Municipals Trust (the Trust). The Trust is an entity of the type commonly known as a Massachusetts business trust and is registered under the Investment Company Act of 1940, as amended, as an open-end management investment company. The Fund seeks to achieve current income exempt from regular federal income tax by investing primarily in investment grade municipal obligations. The Fund offers four classes of shares. Class A shares are generally sold subject to a sales charge imposed at time of purchase. Class B and Class C shares are sold at net asset value and are subject to a contingent deferred sales charge (see Note 6). The Trustees have adopted a conversion feature pursuant to which Class B shares of the Fund automatically convert to Class A shares eight years after their purchase as described in the Fund's prospectus. Class I shares are so ld at net asset value. Each class represents a pro rata interest in the Fund, but votes separately on class-specific matters and (as noted below) is subject to different expenses. Realized and unrealized gains and losses are allocated daily to each class of shares based on the relative net assets of each class to the total net assets of the Fund. Net investment income, other than class-specific expenses, is allocated daily to each class of shares based upon the ratio of the value of each class' paid shares to the total value of all paid shares. Each class of shares differs in its distribution plan and certain other class-specific expenses.
The following is a summary of significant accounting policies consistently followed by the Fund in the preparation of its financial statements. The policies are in conformity with accounting principles generally accepted in the United States of America.
A Investment Valuation — Municipal bonds and taxable obligations, if any, are normally valued on the basis of valuations furnished by a pricing service. Financial futures contracts and options on financial futures contracts listed on commodity exchanges are valued at closing settlement prices. Over-the-counter options on financial futures contracts are normally valued at the mean between the latest bid and asked prices. Interest rate swaps are normally valued on the basis of valuations furnished by a pricing service. Short-term obligations, maturing in sixty days or less, are valued at amortized cost, which approximates value. Investments for which valuations or market quotations are unavailable, and investments for which the price of the security is not believed to repre sent its fair market value, are valued at fair value using methods determined in good faith by or at the direction of the Trustees.
B Floating Rate Notes Issued in Conjunction with Securities Held — The Fund sells a fixed-rate bond to a broker for cash. At the same time the Fund buys a residual interest in a trust's (the "Trust") assets and cash flows set up by the broker, often referred to as an inverse floating rate obligation ("Inverse Floater"). The broker deposits a fixed-rate bond into the trust with the same CUSIP number as the fixed-rate bond sold to the broker by the Fund, and which may have been, but is not required to be, the fixed-rate bond purchased from the Fund, (the "Fixed-Rate Bond"). The Trust also issues floating-rate notes ("Floating Rate Notes") which are sold to third-parties. The Fund may enter into shortfall and forbearance agreements with the broker by which the Fund agrees to reimburse the broker, in certain circumstances, for the difference between the liquidation value of the Fixed-Rate Bond held by the Trust and the liquidation value of the Floating-Rate Notes, as well as any shortfalls in interest cash flows. The Inverse Floater held by a Fund gives the Fund the right (1) to cause the holders of the Floating-Rate Notes to tender their notes at par, and (2) to have the broker transfer the Fixed-Rate Bond held by the Trust to the Fund, thereby collapsing the Trust. Pursuant to Financial Accounting Standards Board Statement No. 140, ("FAS 140"), the Fund accounts for the transaction described above as a secured borrowing by including the Fixed-Rate Bond in their Portfolio of Investments, and accounts for the Floating-Rate Notes as a liability under the caption "payable for floating rate notes issued" in the Fund's "Statement of Assets and Liabilities". The Floating-Rate Notes have interest rates that generally reset weekly and their holders have the option to tender their notes to the broker for redemption at par at each reset date. At March 31, 2007, the Floating-Rate Notes outstanding and the collateral for Floating-Rate Notes outstanding were $863,780,950 and $1,350,049,536, respectively. The range of interest rates on the Floating-Rate Notes outstanding at March 31, 2007 was 3.64% to 3.79%.
The Fund's investment policies and restrictions expressly permit investments in inverse floating rate securities. Inverse floating rate securities typically offer the potential for yields exceeding the yields available on fixed rate bonds with comparable credit quality and maturity. The Fund's investment policies do not allow the Fund to borrow money for purposes of making investments. Fund Management believes that the Funds' restrictions on borrowings do not apply to the secured borrowings deemed to have occurred for accounting
19
Eaton Vance National Municipals Fund as of March 31, 2007
NOTES TO FINANCIAL STATEMENTS (Unaudited) CONT'D
purposes pursuant to FAS 140, which is distinct from legal borrowing of the Fund to which the restrictions apply. Inverse Floaters held by the Fund are Securities exempt from registration under Rules 144A of the Securities Act of 1933.
C Income — Interest income is determined on the basis of interest accrued, adjusted for amortization of premium and discount.
D Interest Expense — Interest expense relates to the Fund's liability with respect to floating rate notes held by third parties in conjunction with inverse floater securities transactions by the Funds. Interest expense is recorded as incurred.
E Federal Taxes — The Fund's policy is to comply with the provisions of the Internal Revenue Code applicable to regulated investment companies and to distribute to shareholders each year all of its taxable, if any, and tax-exempt income, including any net realized gain on investments. Accordingly, no provision for federal income or excise tax is necessary. At September 30, 2006, the Fund, for federal income tax purposes, had a capital loss carryover of $7,688,726 which will reduce taxable income arising from future net realized gains on investments, if any, to the extent permitted by the Internal Revenue Code, and thus will reduce the amount of the distributions to shareholders which would otherwise be necessary to relieve the Fund of any liability for federal income or e xcise tax. Such capital loss carryover will expire on September 30, 2013 ($7,688,726). Dividends paid by the Fund from net tax-exempt interest on municipal bonds are not includable by shareholders as gross income for federal income tax purposes because the Fund intends to meet certain requirements of the Internal Revenue Code applicable to regulated investment companies which will enable the Fund to pay exempt-interest dividends. The portion of such interest, if any, earned on private activity bonds issued after August 7, 1986, may be considered a tax preference item to shareholders.
Additionally, at September 30, 2006, the Fund had net capital losses of $2,315,826, attributable to security transactions incurred after October 31, 2005. These are treated as arising on the first day of the Fund's taxable year ending September 30, 2007.
F Financial Futures Contracts — Upon the entering of a financial futures contract, the Fund is required to deposit (initial margin) either in cash or securities an amount equal to a certain percentage of the purchase price indicated in the financial futures contract. Subsequent payments are made or received by the Fund (margin maintenance) each day, dependent on the daily fluctuations in the value of the underlying security, and are recorded for book purposes as unrealized gains or losses by the Fund. The Fund's investment in financial futures contracts is designed for both hedging against anticipated future changes in interest rates and investment purposes. Should interest rates move unexpectedly, th e Fund may not achieve the anticipated benefits of the financial futures contracts and may realize a loss.
G Options on Financial Futures Contracts — Upon the purchase of a put option on a financial futures contract by the Fund, the premium paid is recorded as an investment, the value of which is marked-to-market daily. When a purchased option expires, the Fund will realize a loss in the amount of the cost of the option. When the Fund enters into a closing sale transaction, the Fund will realize a gain or loss depending on whether the sales proceeds from the closing sale transaction are greater or less than the cost of the option. When the Fund exercises a put option, settlement is made in cash. The risk associated with purchasing put options is limited to the premium originally paid.
H When-issued and Delayed Delivery Transactions — The Fund may engage in when-issued and delayed delivery transactions. The Fund records when-issued securities on trade date and maintains security positions such that sufficient liquid assets will be available to make payments for the securities purchased. Securities purchased on a when-issued or delayed delivery basis are marked-to-market daily and begin earning interest on settlement date.
I Interest Rate Swaps — The Fund may enter into interest rate swap agreements to enhance return, to hedge against fluctuations in securities prices or interest rates or as substitution for the purchase or sale of securities. Pursuant to these agreements, the Fund makes bi-annual payments at a fixed interest rate. In exchange, the Fund receives payments based on the interest rate of a benchmark industry index. During the term of the outstanding swap agreement, changes in the underlying value of the swap are recorded as unrealized gains and losses. The value of the swap is determined by changes in the relationship between two rates of interest. The Fund is exposed to credit loss in the event of non-performance by the swap counterparty. However, the Fund does not anticipate non-performance by the counterparty. Risk may also arise from the unanticipated movements in value of interest rates.
20
Eaton Vance National Municipals Fund as of March 31, 2007
NOTES TO FINANCIAL STATEMENTS (Unaudited) CONT'D
J Legal Fees — Legal fees and other related expenses incurred as part of negotiations of the terms and requirements of capital infusions, or that are expected to result in the restructuring of or a plan of reorganization for an investment are recorded as realized losses. Ongoing expenditures to protect or enhance an investment are treated as operating expenses.
K Expenses — The majority of expenses of the Trust are directly identifiable to an individual fund. Expenses which are not readily identifiable to a specific fund are allocated taking into consideration, among other things, the nature and type of expense and the relative size of the funds.
L Expense Reduction — Investors Bank & Trust Company (IBT) serves as custodian of the Fund. Pursuant to the custodian agreement, IBT receives a fee reduced by credits which are determined based on the average daily cash balance the Fund maintains with IBT. All credit balances used to reduce the Fund's custodian fees are reported as a reduction of total expenses on the Statement of Operations.
M Use of Estimates — The preparation of the financial statements in conformity with accounting principles generally accepted in the United States of America requires management to make estimates and assumptions that affect the reported amounts of assets and liabilities at the date of the financial statements and the reported amounts of income and expense during the reporting period. Actual results could differ from those estimates.
N Indemnifications — Under the Trust's organizational documents, its officers and Trustees may be indemnified against certain liabilities and expenses arising out of the performance of their duties to the Fund, and shareholders are indemnified against personal liability for obligations of the Trust. Additionally, in the normal course of business, the Fund enters into agreements with service providers that may contain indemnification clauses. The Fund's maximum exposure under these agreements is unknown as this would involve future claims that may be made against the Fund that have not yet occurred.
O Other — Investment transactions are accounted for on a trade-date basis. Realized gains and losses are computed on the specific identification of the securities sold.
P Interim Financial Statements — The interim financial statements relating to March 31, 2007 and for the six months then ended have not been audited by an independent registered public accounting firm, but in the opinion of the Fund's management reflect all adjustments, consisting only of normal recurring adjustments, necessary for the fair presentation of the financial statements.
2 Distributions to Shareholders
The net income of the Fund is determined daily and substantially all of the net income so determined is declared as a dividend to shareholders of record at the time of declaration. Distributions are declared separately for each class of shares. Distributions are paid monthly. Distributions of realized capital gains, if any, are made at least annually. Shareholders may reinvest income and capital gain distributions in additional shares of the same class of the Fund at the net asset value as of the reinvestment date. Distributions are paid in the form of additional shares of the same class or, at the election of the shareholder, in cash. The Fund distinguishes between distributions on a tax basis and a financial reporting basis. Accounting principles generally accepted in the United States of America require that only distributions in excess of tax basis earnings and profits be reported in the financial statements as a return of c apital. Permanent differences between book and tax accounting relating to distributions are reclassified to paid-in capital.
3 Shares of Beneficial Interest
The Fund's Declaration of Trust permits the Trustees to issue an unlimited number of full and fractional shares of beneficial interest (without par value). Such shares may be issued in a number of different series (such as the Fund) and classes. Transactions in Fund shares were as follows:
| Class A | | Six Months Ended
March 31, 2007
(Unaudited) | | Year Ended
September 30, 2006 | |
| Sales | | | 97,348,981 | | | | 110,289,109 | | |
Issued to shareholders electing to
receive payments of distributions
in Fund shares | | | 4,089,483 | | | | 5,604,798 | | |
| Redemptions | | | (18,931,645 | ) | | | (29,882,391 | ) | |
| Exchange from Class B shares | | | 93,846 | | | | 120,481 | | |
| Net increase | | | 82,600,665 | | | | 86,131,997 | | |
21
Eaton Vance National Municipals Fund as of March 31, 2007
NOTES TO FINANCIAL STATEMENTS (Unaudited) CONT'D
| Class B | | Six Months Ended
March 31, 2007
(Unaudited) | | Year Ended
September 30, 2006(1) | |
| Sales | | | 2,832,836 | | | | 5,366,218 | | |
Issued to shareholders electing to
receive payments of distributions
in Fund shares | | | 133,483 | | | | 203,492 | | |
| Redemptions | | | (586,108 | ) | | | (933,733 | ) | |
| Exchange to Class A shares | | | (93,823 | ) | | | (121,217 | ) | |
| Net increase | | | 2,286,388 | | | | 4,514,760 | | |
| Class C | | Six Months Ended
March 31, 2007
(Unaudited) | | Year Ended
September 30, 2006(1) | |
| Sales | | | 37,184,378 | | | | 36,607,877 | | |
Issued to shareholders electing to
receive payments of distributions
in Fund shares | | | 810,056 | | | | 948,550 | | |
| Redemptions | | | (3,852,196 | ) | | | (5,524,603 | ) | |
| Net increase | | | 34,142,238 | | | | 32,031,824 | | |
| Class I | | Six Months Ended
March 31, 2007
(Unaudited) | | Year Ended
September 30, 2006(1) | |
| Sales | | | 6,738,176 | | | | 6,247,874 | | |
Issued to shareholders electing to
receive payments of distributions
in Fund shares | | | 180,286 | | | | 140,108 | | |
| Redemptions | | | (944,615 | ) | | | (716,111 | ) | |
| Net increase | | | 5,973,847 | | | | 5,671,871 | | |
(1) Transactions have been restated or adjusted to reflect the effects of a 0.9334516-for-1 reverse stock split on Class B shares, a 0.8890861-for-1 reverse stock split on Class C shares and a 0.9263531-for-1 reverse stock split on Class I shares effective on November 11, 2005.
4 Investment Adviser Fee and Other Transactions with Affiliates
The investment adviser fee is earned by Boston Management and Research (BMR), a wholly-owned subsidiary of Eaton Vance Management (EVM), as compensation for management and investment advisory services rendered to the Fund. The fee is based upon a percentage of average daily net assets plus a percentage of gross income (i.e., income other than gains from the sale of securities). For the six months ended March 31, 2007, the fee was equivalent to 0.32% of the Fund's average daily net assets for such period and amounted to $8,097,488. Except as to Trustees of the Fund who are not members of EVM's or BMR's organization, officers and Trustees receive remuneration for their services to the Fund out of such investment adviser fee. EVM serves as the Administrator of the Fund, but receives no compensation. EVM serves as the sub-transfer agent of the Fund and receives from the transfer agent an aggregate fee based upon the actual expenses incurred by EVM in the performance of those services. For the six months ended March 31, 2007, EVM earned $51,378 in sub-transfer agent fees. The Fund was informed that Eaton Vance Distributors, Inc. (EVD), a subsidiary of EVM and the Fund's principal underwriter, received $643,713, as its portion of the sales charge on sales of Class A shares for the six months ended March 31, 2007.
Trustees of the Fund that are not affiliated with the investment adviser may elect to defer receipt of all or a percentage of their annual fees in accordance with the terms of the Trustees Deferred Compensation Plan. For the six months ended March 31, 2007, no significant amounts have been deferred.
Certain officers and Trustees of the Fund are officers of the above organizations.
5 Distribution Plans
Class A has in effect a distribution plan pursuant to Rule 12b-1 (Class A Plan) under the Investment Company Act of 1940. The Class A Plan provides that the Fund will pay EVD a distribution and service fee of 0.25% (annualized) of the Fund's average daily net assets attributable to Class A shares for each fiscal year for distribution services and facilities provided to the Fund by EVD, as well as for personal services and/or the maintenance of shareholder accounts. Distribution and service fees paid or accrued for the six months ended March 31, 2007 amounted to $4,690,268 for Class A shares. The Fund also has in effect distribution plans for Class B shares (Class B Plan) and Class C shares (Class C Plan) pursuant to Rule 12b-1 under the Investment Company Act of 1940 (collectively, the Plans). The Class B and Class C Plans require the Fund to pay EVD amounts equal to 1/365 of 0.75% (annualized) of the Fund's average daily net as sets attributable to Class B and Class C shares for providing ongoing distribution services and facilities to the Fund. The Fund will automatically discontinue payments to EVD during any period in which there are no outstanding Uncovered Distribution Charges, which are equivalent to the sum of (i) 5% and 6.25% of the aggregate amount received by the Fund for the Class B and Class C shares sold, respectively, plus (ii) interest calculated by applying the rate of 1% over the prevailing
22
Eaton Vance National Municipals Fund as of March 31, 2007
NOTES TO FINANCIAL STATEMENTS (Unaudited) CONT'D
prime rate to the outstanding balance of Uncovered Distribution Charges of EVD of each respective class, reduced by the aggregate amount of contingent deferred sales charges (see Note 6) and daily amounts theretofore paid to EVD by each respective class. The Fund paid or accrued $580,742 and $3,655,185 for Class B and Class C shares, respectively, to or payable to EVD for the six months ended March 31, 2007, representing 0.75% (annualized) of the average daily net assets for Class B and Class C shares. At March 31, 2007, the amount of Uncovered Distribution Charges of EVD calculated under the Plans was approximately $5,863,000 and $89,832,000 for Class B and Class C shares, respectively. The Class B and Class C Plans also authorize the Fund to make payments of service fees to EVD, investment dealers and other persons in amounts not exceeding 0.25% annually of the average daily net assets attributable to that Class. Service fees are paid for personal services and/or the maintenance of shareholder accounts. They are separate and distinct from the Class B and Class C sales commissions and distribution fees and, as such, are not subject to automatic discontinuance when there are no outstanding Uncovered Distribution Charges to EVD. Service fees paid or accrued for the six months ended March 31, 2007 amounted to $193,581 and $1,218,395 for Class B and Class C shares, respectively.
6 Contingent Deferred Sales Charge
A contingent deferred sales charge (CDSC) generally is imposed on redemptions of Class B shares made within six years of purchase and on redemptions of Class C shares made within one year of purchase. Class A shares may be subject to a 1% CDSC if redeemed within eighteen months of purchase (depending upon the circumstances of purchase) or a 1% or 0.50% CDSC if redeemed within one year or two years, respectively, on purchases through the Eaton Vance Supplemental Retirement Account. Generally, the CDSC is based upon the lower of the net asset value at date of redemption or date of purchase. No charge is levied on shares acquired by reinvestment of dividends or capital gains distributions. The Class B CDSC is imposed at declining rates that begin at 5% in the case of redemptions in the first and second year after purchase, declining one percentage point each subsequent year. Class C shares will be subject to a 1% CDSC if redeemed w ithin one year of purchase. No CDSC is levied on shares which have been sold to EVM or its affiliates or to their respective employees or clients and may be waived under certain other limited conditions. CDSC charges are paid to EVD to reduce the amount of Uncovered Distribution Charges calculated under the Fund's Distribution Plan (see Note 5). CDSC charges received when no Uncovered Distribution Charges exist will be credited to the Fund. EVD received approximately $17,000, $167,000 and $101,000 of CDSC paid by shareholders for Class A, Class B and Class C shares, respectively, for the six months ended March 31, 2007.
7 Investments
Purchases and sales of investments, other than U.S. Government securities and short-term obligations, aggregated $3,244,845,766 and $1,484,858,635, respectively, for the six months ended March 31, 2007.
8 Federal Income Tax Basis of Unrealized Appreciation (Depreciation)
The cost and unrealized appreciation/depreciation in the value of the investments owned at March 31, 2007, as determined on a federal income tax basis, were as follows:
| Aggregate cost | | $ | 5,589,222,292 | | |
| Gross unrealized appreciation | | $ | 307,070,504 | | |
| Gross unrealized depreciation | | | (20,030,642 | ) | |
| Net unrealized appreciation | | $ | 287,039,862 | | |
9 Line of Credit
The Fund participates with other portfolios and funds managed by EVM and its affiliates in a $150 million unsecured line of credit with a group of banks. Borrowings will be made by the Fund solely to facilitate the handling of unusual and/or unanticipated short-term cash requirements. Interest is charged to each participating portfolio or fund based on its borrowings at an amount above either the Eurodollar rate or federal funds rate. In addition, a fee computed at an annual rate of 0.10% on the daily unused portion of the line of credit is allocated among the participating portfolios and funds at the end of each quarter. At March 31,2007, the Fund had a balance outstanding pursuant to this line of credit of $84,000,000. The Fund did not have any significant borrowings or allocated fees during the six month ended March 31, 2007.
10 Financial Instruments
The Fund regularly trades in financial instruments with off-balance sheet risk in the normal course of its investing activities to assist in managing exposure to various market risks. These financial instruments include futures contracts and interest rate swap contracts and may involve, to a varying degree, elements of risk in
23
Eaton Vance National Municipals Fund as of March 31, 2007
NOTES TO FINANCIAL STATEMENTS (Unaudited) CONT'D
excess of the amounts recognized for financial statement purposes. The notional or contractual amounts of these instruments represent the investment a Fund has in particular classes of financial instruments and does not necessarily represent the amounts potentially subject to risk. The measurement of the risks associated with these instruments is meaningful only when all related and offsetting transactions are considered. A summary of obligations under these financial instruments at March 31, 2007 is as follows:
| Futures Contracts | |
Expiration
Date | |
Contracts | |
Position | |
Aggregate
Cost | |
Value | | Net
Unrealized
Appreciation | |
| | 06/07 | | | 20,000
U.S. Treasury Bond | | Short | | $ | (2,257,789,375 | ) | | $ | (2,225,000,000 | ) | | $ | 32,789,375 | | |
At March 31, 2007, the Fund had sufficient cash and/or securities to cover commitments under these contracts.
At March 31, 2007, the Fund had entered into an interest rate swap agreement with Morgan Stanley, Inc. whereby the Fund makes bi-annual payments at a fixed rate equal to 3.948% on the notional amount of $55,000,000. In exchange, the Fund receives bi-annual payments at a rate equal to the USD-BMA Municipal Swap Index on the same notional amount. The effective date of the interest rate swap is January 23, 2008. The value of the contract, which terminates on January 23, 2038, is recorded as a receivable for open interest rate swap contracts of $596,443 on March 31, 2007.
At March 31, 2007, the Fund had entered into an interest rate swap agreement with Lehman Brothers, Inc. whereby the Funds makes bi-annual payments at a fixed rate equal to 3.896% on the notional amount of $55,000,000. In exchange, the Fund receives bi-annual payments at a rate equal to the USD-BMA Municipal Swap Index on the same notional amount. The effective date of the interest rate swap is October 23, 2007. The value of the contract, which terminates on October 23, 2037, is recorded as a receivable for open interest rate swap contracts of $944,111 on March 31, 2007.
11 Overdraft Advances
Pursuant to the custodian agreement between the Fund and IBT, IBT may in its discretion advance funds to the Fund to make properly authorized payments. When such payments result in an overdraft by the Fund, the Fund is obligated to repay IBT at the current rate of interest charged by IBT for secured loans (currently, a rate above the Federal Funds rate). This obligation is payable on demand to IBT. IBT has a lien on a Fund's assets to the extent of any overdraft. At March 31, 2007, the Fund had payment due to IBT pursuant to the foregoing arrangement of $16,789.
12 Recently Issued Accounting Pronouncements
In June 2006, the Financial Accounting Standards Board ("FASB") issued FASB Interpretation No. 48, ("FIN 48") "Accounting for Uncertainty in Income Taxes – an interpretation of FASB Statement No. 109". FIN 48 clarifies the accounting for uncertainty in income taxes recognized in accordance with FASB Statement No. 109, "Accounting for Income Taxes." This interpretation prescribes a recognition threshold and measurement attribute for the financial statement recognition and measurement of a tax position taken or expected to be taken in a tax return. It also provides guidance on de-recognition, classification, interest and penalties, accounting in interim periods, disclosure and transition. FIN 48 is effective during the first required financial reporting period for fiscal years beginning after December 15, 2006. Management is currently evaluating the impact of applying the various provisions of FIN 48.
In September 2006, the FASB issued Statement of Financial Accounting Standards No. 157, ("FAS 157") "Fair Value Measurements". FAS 157 defines fair value, establishes a framework for measuring fair value in accordance with generally accepted accounting principles and expands disclosure about fair value measurements. FAS 157 is effective for fiscal years beginning after November 15, 2007. Management is currently evaluating the impact the adoption of FAS 157 will have on the Fund's financial statement disclosures.
24
Eaton Vance National Municipals Fund
BOARD OF TRUSTEES' ANNUAL APPROVAL OF THE INVESTMENT ADVISORY AGREEMENT
Overview of the Contract Review Process
The Investment Company Act of 1940, as amended (the "1940 Act"), provides, in substance, that each investment advisory agreement between a fund and its investment adviser will continue in effect from year to year only if its continuance is approved at least annually by the fund's board of trustees, including by a vote of a majority of the trustees who are not "interested persons" of the fund ("Independent Trustees") cast in person at a meeting called for the purpose of considering such approval.
At a meeting of the Boards of Trustees (each a "Board") of the Eaton Vance group of mutual funds (the "Eaton Vance Funds") held on March 27, 2006, the Board, including a majority of the Independent Trustees, voted to approve continuation of existing advisory and sub-advisory agreements for the Eaton Vance Funds for an additional one-year period. In voting its approval, the Board relied upon the affirmative recommendation of the Special Committee of the Board, which is a committee comprised exclusively of Independent Trustees. Prior to making its recommendation, the Special Committee reviewed information furnished for a series of meetings of the Special Committee held in February and March 2006. Such information included, among other things, the following:
Information about Fees, Performance and Expenses
• An independent report comparing the advisory and related fees paid by each fund with fees paid by comparable funds;
• An independent report comparing each fund's total expense ratio and its components to comparable funds;
• An independent report comparing the investment performance of each fund to the investment performance of comparable funds over various time periods;
• Data regarding investment performance in comparison to relevant peer groups of funds and appropriate indices;
• Comparative information concerning fees charged by each adviser for managing other mutual funds and institutional accounts using investment strategies and techniques similar to those used in managing the fund;
• Profitability analyses for each adviser with respect to each fund managed by it;
Information about Portfolio Management
• Descriptions of the investment management services provided to each fund, including the investment strategies and processes employed;
• Information concerning the allocation of brokerage and the benefits received by each adviser as a result of brokerage allocation, including information concerning the acquisition of research through "soft dollar" benefits received in connection with the funds' brokerage, and the implementation of a soft dollar reimbursement program established with respect to the funds;
• Data relating to portfolio turnover rates of each fund;
• The procedures and processes used to determine the fair value of fund assets and actions taken to monitor and test the effectiveness of such procedures and processes;
Information about the Adviser
• Reports detailing the financial results and condition of each adviser;
• Descriptions of the qualifications, education and experience of the individual investment professionals whose responsibilities include portfolio management and investment research for the funds, and information relating to their compensation and responsibilities with respect to managing other mutual funds and investment accounts;
• Copies of the Codes of Ethics of each adviser and its affiliates, together with information relating to compliance with and the administration of such codes;
• Information concerning the resources devoted to compliance efforts undertaken by each adviser and its affiliates on behalf of the funds (including descriptions of various compliance programs) and their record of compliance with investment policies and restrictions, including policies with respect to market-timing, late trading and selective portfolio disclosure, and with policies on personal securities transactions;
• Descriptions of the business continuity and disaster recovery plans of each adviser and its affiliates;
Other Relevant Information
• Information concerning the nature, cost and character of the administrative and other non-investment management services provided by Eaton Vance Management and its affiliates;
• Information concerning management of the relationship with the custodian, subcustodians and fund accountants by each adviser or the funds' administrator; and
• The terms of each advisory agreement.
25
Eaton Vance National Municipals Fund
BOARD OF TRUSTEES' ANNUAL APPROVAL OF THE INVESTMENT ADVISORY AGREEMENT CONT'D
In addition to the information identified above, the Special Committee considered information provided from time to time by each adviser throughout the year at meetings of the Board and its committees. Over the course of the twelve month period ended March 31, 2006, the Board met nine times and the Special Committee, the Audit Committee and the Governance Committee, each of which is a Committee comprised solely of Independent Trustees, met eight, twelve and five times, respectively. At such meetings, the Trustees received, among other things, presentations by the portfolio managers and other investment professionals of each adviser relating to the investment performance of each fund and the investment strategies used in pursuing the fund's investment objective.
For funds that invest through one or more underlying portfolios, the Board considered similar information about the portfolio(s) when considering the approval of advisory agreements. In addition, in cases where the fund's investment adviser has engaged a sub-adviser, the Board considered similar information about the sub-adviser when considering the approval of any such sub-advisory agreement.
The Special Committee was assisted throughout the contract review process by Goodwin Procter LLP, legal counsel for the Independent Trustees. The members of the Special Committee relied upon the advice of such counsel and their own business judgment in determining the material factors to be considered in evaluating each advisory and sub-advisory agreement and the weight to be given to each such factor. The conclusions reached with respect to each advisory and sub-advisory agreement were based on a comprehensive evaluation of all the information provided and not any single factor. Moreover, each member of the Special Committee may have placed varying emphasis on particular factors in reaching conclusions with respect to each advisory and sub-advisory agreement.
Results of the Process
Based on its consideration of the foregoing, and such other information as it deemed relevant, including the factors and conclusions described below, the Special Committee concluded that the continuance of the investment advisory agreement of the National Municipals Fund (the "Fund") with Boston Management and Research (the "Adviser"), including its fee structure, is in the interests of shareholders and, therefore, the Special Committee recommended to the Board approval of the agreement. The Board accepted the recommendation of the Special Committee as well as the factors considered and conclusions reached by the Special Committee with respect to the agreement. Accordingly, the Board, including a majority of the Independent Trustees, voted to approve continuation of the advisory agreement for the Fund.
Nature, Extent and Quality of Services
In considering whether to approve the investment advisory agreement of the Fund, the Board evaluated the nature, extent and quality of services provided to the Fund by the Adviser.
The Board considered the Adviser's management capabilities and investment process with respect to the types of investments held by the Fund, including the education, experience and number of its investment professionals and other personnel who provide portfolio management, investment research, and similar services to the Fund, including recent changes to such personnel. In particular, the Board evaluated, where relevant, the abilities and experience of such investment personnel in analyzing factors such as credit risk, tax efficiency, and special considerations relevant to investing in municipal bonds. Specifically, the Board considered the Adviser's 30-person municipal bond team, which includes six portfolio managers and nine credit specialists who provide services to the Funds. The Board also took into account the resources dedicated to portfolio management and other services, including the compensation paid to recruit and ret ain investment personnel, and the time and attention devoted to each Fund in the complex by senior management.
The Board reviewed the compliance programs of the Adviser and relevant affiliates thereof. Among other matters, the Board considered compliance and reporting matters relating to personal trading by investment personnel, selective disclosure of portfolio holdings, late trading, frequent trading, portfolio valuation, business continuity and the allocation of investment opportunities. The Board also evaluated the responses of the Adviser and its affiliates to requests from regulatory authorities such as the Securities and Exchange Commission and the National Association of Securities Dealers.
The Board considered shareholder and other administrative services provided or managed by Eaton Vance Management and its affiliates, including transfer agency and accounting services. The Board evaluated the benefits to shareholders of investing in a fund that is a part of a large family of funds, including the ability, in many cases, to exchange an investment among different funds without incurring additional sales charges.
After consideration of the foregoing factors, among others, the Board concluded that the nature, extent and quality of services provided by the Adviser, taken as a whole, are appropriate and consistent with the terms of the investment advisory agreement.
26
Eaton Vance National Municipals Fund
BOARD OF TRUSTEES' ANNUAL APPROVAL OF THE INVESTMENT ADVISORY AGREEMENT CONT'D
Fund Performance
The Board compared the Fund's investment performance to a relevant universe of similarly managed funds identified by an independent data provider and appropriate benchmark indices. The Board reviewed comparative performance data for the one-, three-, five- and ten-year periods ended September 30, 2005 for the Fund. On the basis of the foregoing and other relevant information, the Board concluded that the performance of the Fund is satisfactory.
Management Fees and Expenses
The Board reviewed contractual investment advisory fee rates payable by the Fund (referred to as "management fees").
As part of its review, the Board considered the Fund's management fee and total expense ratio for the one-year period ended September 30, 2005, as compared to a group of similarly managed funds selected by an independent data provider.
After reviewing the foregoing information, and in light of the nature, extent and quality of the services provided by the Adviser, the Board concluded with respect to the Fund that the management fee charged to the Fund for advisory and related services and the total expense ratio of the Fund are reasonable.
Profitability
The Board reviewed the level of profits realized by the Adviser and, if applicable, its affiliates in providing investment advisory and administrative services to the Fund and to all Eaton Vance Funds as a group. The Board considered the level of profits realized without regard to revenue sharing or other payments by the Adviser and its affiliates to third parties in respect of distribution services. The Board also considered other direct or indirect benefits received by the Adviser in connection with its relationship with the Fund.
The Board concluded that, in light of the foregoing factors and the nature, extent and quality of the services rendered, the profits realized by the Adviser and its affiliates are reasonable.
Economies of Scale
In reviewing management fees and profitability, the Board also considered the extent to which the Adviser and its affiliates, on the one hand, and the Fund, on the other hand, can expect to realize benefits from economies of scale as the assets of the Fund increase. The Board acknowledged the difficulty in accurately measuring the benefits resulting from the economies of scale with respect to the management of any specific fund or group of funds. The Board reviewed data summarizing the increases and decreases in the assets of the Fund and of all Eaton Vance Funds as a group over various time periods, and evaluated the extent to which the total expense ratio of the Fund and the Adviser's profitability may have been affected by such increases or decreases. Based upon the foregoing, the Board concluded that the benefits from economies of scale are currently being shared equitably by the Adviser and the Fund. The Board also conclude d that, the structure of the advisory fee, which includes breakpoints at several asset levels, can be expected to cause the Adviser and its affiliates and the Fund to continue to share such benefits equitably.
27
Eaton Vance National Municipals Fund
INVESTMENT MANAGEMENT
Officers
Robert B. MacIntosh
President
William H. Ahern, Jr.
Vice President
Craig R. Brandon
Vice President
Cynthia J. Clemson
Vice President
James B. Hawkes
Vice President and Trustee
Thomas M. Metzold
Vice President and Portfolio Manager
Barbara E. Campbell
Treasurer
Alan R. Dynner
Secretary
Paul M. O'Neil
Chief Compliance Officer | | Trustees
Samuel L. Hayes, III
Chairman
Benjamin C. Esty
Thomas E. Faust Jr.
Allen R. Freedman
William H. Park
Ronald A. Pearlman
Norton H. Reamer
Heidi L. Steiger
Lynn A. Stout
Ralph F. Verni | |
|
28
Investment Adviser of Eaton Vance National Municipals Fund
Boston Management and Research
The Eaton Vance Building
255 State Street
Boston, MA 02109
Administrator of Eaton Vance National Municipals Fund
Eaton Vance Management
The Eaton Vance Building
255 State Street
Boston, MA 02109
Principal Underwriter
Eaton Vance Distributors, Inc.
The Eaton Vance Building
255 State Street
Boston, MA 02109
(617) 482-8260
Custodian
Investors Bank & Trust Company
200 Clarendon Street
Boston, MA 02116
Transfer Agent
PFPC Inc.
Attn: Eaton Vance Funds
P.O. Box 9653
Providence, RI 02940-9653
(800) 262-1122
Eaton Vance Municipals Trust
The Eaton Vance Building
255 State Street
Boston, MA 02109
This report must be preceded or accompanied by a current prospectus. Before investing, investors should consider carefully the Fund's investment objective(s), risks, and charges and expenses. The Fund's current prospectus contains this and other information about the Fund and is available through your financial advisor. Please read the prospectus carefully before you invest or send money. For further information please call 1-800-225-6265.
448-5/07 HMSRC

Semiannual Report March 31, 2007


EATON VANCE
MUNICIPALS
TRUST
California
Florida
Massachusetts
Mississippi
New York
Ohio
Rhode Island
West Virginia
IMPORTANT NOTICES REGARDING PRIVACY,
DELIVERY OF SHAREHOLDER DOCUMENTS,
PORTFOLIO HOLDINGS AND PROXY VOTING
Privacy. The Eaton Vance organization is committed to ensuring your financial privacy. Each of the financial institutions identified below has in effect the following policy ("Privacy Policy") with respect to nonpublic personal information about its customers:
• Only such information received from you, through application forms or otherwise, and information about your Eaton Vance fund transactions will be collected. This may include information such as name, address, social security number, tax status, account balances and transactions.
• None of such information about you (or former customers) will be disclosed to anyone, except as permitted by law (which includes disclosure to employees necessary to service your account). In the normal course of servicing a customer's account, Eaton Vance may share information with unaffiliated third parties that perform various required services such as transfer agents, custodians and broker/dealers.
• Policies and procedures (including physical, electronic and procedural safeguards) are in place that are designed to protect the confidentiality of such information.
• We reserve the right to change our Privacy Policy at any time upon proper notification to you. Customers may want to review our Policy periodically for changes by accessing the link on our homepage: www.eatonvance.com.
Our pledge of privacy applies to the following entities within the Eaton Vance organization: the Eaton Vance Family of Funds, Eaton Vance Management, Eaton Vance Investment Counsel, Boston Management and Research, and Eaton Vance Distributors, Inc.
In addition, our Privacy Policy only applies to those Eaton Vance customers who are individuals and who have a direct relationship with us. If a customer's account (i.e., fund shares) is held in the name of a third-party financial adviser/ broker-dealer, it is likely that only such adviser's privacy policies apply to the customer. This notice supersedes all previously issued privacy disclosures.
For more information about Eaton Vance's Privacy Policy, please call 1-800-262-1122.
Delivery of Shareholder Documents. The Securities and Exchange Commission (the "SEC") permits funds to deliver only one copy of shareholder documents, including prospectuses, proxy statements and shareholder reports, to fund investors with multiple accounts at the same residential or post office box address. This practice is often called "householding" and it helps eliminate duplicate mailings to shareholders.
Eaton Vance, or your financial adviser, may household the mailing of your documents indefinitely unless you instruct Eaton Vance, or your financial adviser, otherwise.
If you would prefer that your Eaton Vance documents not be householded, please contact Eaton Vance at 1-800-262-1122, or contact your financial adviser.
Your instructions that householding not apply to delivery of your Eaton Vance documents will be effective within 30 days of receipt by Eaton Vance or your financial adviser.
Portfolio Holdings. Each Eaton Vance Fund and its underlying Portfolio (if applicable) will file a schedule of its portfolio holdings on Form N-Q with the SEC for the first and third quarters of each fiscal year. The Form N-Q will be available on the Eaton Vance website www.eatonvance.com, by calling Eaton Vance at 1-800-262-1122 or in the EDGAR database on the SEC's website at www.sec.gov. Form N-Q may also be reviewed and copied at the SEC's public reference room in Washington, D.C. (call 1-800-732-0330 for information on the operation of the public reference room).
Proxy Voting. From time to time, funds are required to vote proxies related to the securities held by the funds. The Eaton Vance Funds or their underlying Portfolios (if applicable) vote proxies according to a set of policies and procedures approved by the Funds' and Portfolios' Boards. You may obtain a description of these policies and procedures and information on how the Funds or Portfolios voted proxies relating to portfolio securities during the 12 month period ended June 30, without charge, upon request, by calling 1-800-262-1122. This description is also available on the SEC's website at www.sec.gov.
Eaton Vance Municipals Funds as of March 31, 2007
Table of ConTenTs
Investment Update | 2 |
| |
Lipper Rankings | 3 |
| |
Performance Information and Portfolio Composition | |
California | 4 |
Florida | 5 |
Massachusetts | 6 |
Mississippi | 7 |
New York | 8 |
Ohio | 9 |
Rhode Island | 10 |
West Virginia | 11 |
| |
Fund Expenses | 12 |
| |
Financial Statements | 17 |
| |
Board of Trustees Annual Approvalof the Investment Advisory Agreements | |
| 85 |
Investment Management | 88 |
1
Eaton Vance Municipals Funds as of March 31, 2007
invesTmenT updaTe
The investment objective of each Eaton Vance Municipals Fund (the “Fund” or “Funds”) is to provide current income exempt from regular federal income tax and particular state or local income or other taxes, as applicable. The Funds primarily invest in investment- grade municipal obligations but may also invest in lower-rated obligations.
Economic and Market Conditions
First quarter economic growth rose 1.3% following the 2.2% growth rate achieved in the fourth quarter of 2006. The housing sector continued to struggle, with the sub-prime sector experiencing continuing pressure, and short-term variable rate mortgages resetting higher. Building permits and housing starts have both fallen significantly from their highs in early 2006, while sales of new and existing homes both peaked in 2005. Away from housing and autos, the economy appears to be slowing but in a somewhat controlled manner.
Inflation measures have remained somewhat elevated on an absolute level, while core inflation measures (less food and energy) are fairly well contained. With this backdrop, the Fed is in a pausing mode, awaiting further economic inputs to determine the future direction of interest rate moves. At March 31, 2007, the Federal Funds rate stood at 5.25%.
Municipal market supply rose in the first quarter, resulting in underperformance of the municipal sector. On March 31, 2007, long-term AAA-rated municipal bonds yielded 93% of U.S. Treasury bonds with similar maturities.*
For the six months ended March 31, 2007, the Lehman Brothers Municipal Bond Index† (the “Index”), an unmanaged index of municipal bonds, posted a gain of 1.92%. For more information about each Fund’s performance and that of funds in the same Lipper Classification,† see the Performance Information and Portfolio Composition pages that follow.
Management Discussion
The Funds invest primarily in bonds with stated maturities of 10 years or longer at the time of investment, as longer-maturity bonds historically have provided greater tax-exempt income for investors than shorter-maturity bonds. Given the flattening of the yield curve for other fixed-income securities over the past two years – with shorter-maturity yields rising more than longer-maturity yields — management felt that the long end of the municipal curve was a relatively attractive place to be positioned.
Because of the mixed economic backdrop of contained inflation expectations, a weakened housing market and sustained growth in the labor market, Fund management continued to maintain a somewhat cautious outlook on interest rates. In this environment, Fund management continued to focus on finding relative value within the marketplace – in issuer names, coupons, maturities, sectors and jurisdictions. Relative value trading, which seeks to capitalize on undervalued securities, has enhanced the Funds’ returns during the period.
* Source: Bloomberg L.P. Yields are a compilation of a representative variety of general obligations and are not necessarily representative of a Fund’s yield.
† It is not possible to invest directly in an Index or Lipper Classification. The Index’s total return does not reflect expenses that would have been incurred if an investor individually purchased or sold the securities represented in the Index. The Lipper Average is the average annual total return, at net asset value, of the funds that are in the same Lipper Classification as the Funds. Past performance is no guarantee of future results.
Fund shares are not insured by the FDIC and are not deposits or other obligations of, or guaranteed by, any depository institution. Shares are subject to investment risks, including possible loss of principal invested.
The views expressed throughout this report are those of the portfolio managers and are current only through the end of the period of the report as stated on the cover. These views are subject to change at any time based upon market or other conditions, and the investment adviser disclaims any responsibility to update such views. These views may not be relied on as investment advice and, because investment decisions for a fund are based on many factors, may not be relied on as an indication of trading intent on behalf of any Eaton Vance fund.
2
Eaton Vance Municipals Funds as of March 31, 2007
lipper rankings
LIPPER QUINTILE RANKINGS BY TOTAL RETURN at 3/31/07
FUND | | 1-YEAR | | 3-YEAR | | 5-YEAR | | 10-YEAR |
| | | | | | | | |
CALIFORNIA MuNICIpALs CLAss A | | 1ST | | 1ST | | 1ST | | 1ST |
CALIFORNIA MUNICIPAL DEBT FUNDS CLASSIFICATION | | 19 of 116 | | 10 of 107 | | 10 of 94 | | 10 of 69 |
| | | | | | | | |
FLORIDA MuNICIpALs CLAss A | | 1ST | | 1ST | | 1ST | | 1ST |
FLORIDA MUNICIPAL DEBT FUNDS CLASSIFICATION | | 1 of 36 | | 1 of 35 | | 1 of 34 | | 3 of 30 |
| | | | | | | | |
MAssACHusEtts MuNICIpALs CLAss A | | 1ST | | 1ST | | 1ST | | 1ST |
MASSACHUSETTS MUNICIPAL DEBT FUNDS CLASSIFICATION | | 1 of 51 | | 1 of 50 | | 1of 49 | | 1 of 41 |
| | | | | | | | |
MIssIssIppI MuNICIpALs CLAss A | | 1ST | | 1ST | | 2ND | | 2ND |
OTHER STATES MUNICIPAL DEBT FUNDS CLASSIFICATION | | 11 of 76 | | 7 of 74 | | 21 of 71 | | 18 of 53 |
| | | | | | | | |
NEW YORK MuNICIpALs CLAss A | | 1ST | | 1ST | | 1ST | | 1ST |
NEW YORK MUNICIPAL DEBT FUNDS CLASSIFICATION | | 8 of 95 | | 8 of 95 | | 9 of 85 | | 2 of 65 |
| | | | | | | | |
OHIO MuNICIpALs CLAss A | | 1ST | | 1ST | | 1ST | | 1ST |
OHIO MUNICIPAL DEBT FUNDS CLASSIFICATION | | 1 of 43 | | 1 of 42 | | 1 of 39 | | 2 of 35 |
| | | | | | | | |
RHODE IsLAND MuNICIpALs CLAss A | | 2ND | | 1ST | | 1ST | | 1ST |
OTHER STATES MUNICIPAL DEBT FUNDS CLASSIFICATION | | 20 of 76 | | 4 of 74 | | 5 of 71 | | 3 of 53 |
| | | | | | | | |
WEst vIRgINIA MuNICIpALs CLAss A | | 1ST | | 1ST | | 1ST | | 1ST |
OTHER STATES MUNICIPAL DEBT FUNDS CLASSIFICATION | | 5 of 76 | | 9 of 74 | | 11 of 71 | | 8 of 53 |
Source: Lipper Inc. Rankings are based on percentage change in net asset value with all distributions reinvested and do not take sales charges into consideration. Past performance is no guarantee of future results. It is not possible to invest in a Lipper Classification.
3
Eaton Vance California Municipals Fund as of March 31, 2007
performanCe informaTion and porTfolio ComposiTion
performance(1) | | Class A | | Class B | | Class C | |
| | | | | | | |
Average Annual Total Returns (at net asset value) | | | | | | | |
Six Months | | 2.20 | % | 1.72 | % | 1.82 | % |
One Year | | 5.61 | | 4.81 | | 4.81 | |
Five Years | | 6.06 | | 5.56 | | N.A. | |
Ten Years | | 5.80 | | 5.32 | | N.A. | |
Life of Fund† | | 6.15 | | 5.82 | | 4.87 | |
| | | | | | | |
SEC Average Annual Total Returns (including sales charge or applicable CDSC) | | | | | | | |
Six Months | | -2.64 | % | -3.19 | % | 0.84 | % |
One Year | | 0.56 | | -0.16 | | 3.82 | |
Five Years | | 5.04 | | 5.23 | | N.A. | |
Ten Years | | 5.28 | | 5.32 | | N.A. | |
Life of Fund† | | 5.75 | | 5.82 | | 4.87 | |
†Inception date: Class A: 5/27/94; Class B: 12/19/85; Class C: 8/31/04
Total Annual
Operating Expenses(2)* | | Class A | | Class B | | Class C | |
| | | | | | | |
Expense Ratio | | 1.23 | % | 1.98 | % | 1.98 | % |
*From the Fund’s prospectus dated 2/1/07.
Distribution Rates/Yields | | Class A | | Class B | | Class C | |
| | | | | | | |
Distribution Rate(3) | | 4.22 | % | 3.45 | % | 3.45 | % |
Taxable-Equivalent Distribution Rate(3),(4) | | 7.16 | | 5.85 | | 5.85 | |
SEC 30-day Yield(5) | | 3.48 | | 2.91 | | 2.91 | |
Taxable-Equivalent SEC 30-day Yield(4),(5) | | 5.90 | | 4.94 | | 4.94 | |
Index Performance(6)
Lehman Brothers Municipal Bond Index Average Annual Total Returns | | | |
Six Months | | 1.92 | % |
One Year | | 5.43 | |
Five Years | | 5.50 | |
Ten Years | | 5.87 | |
Lipper Averages(7)
Lipper California Municipal Debt Funds Classification Average Annual Total Returns | | | |
Six Months | | 1.77 | % |
One Year | | 5.05 | |
Five Years | | 5.14 | |
Ten Years | | 5.26 | |
Portfolio Manager: Cynthia J. Clemson
Rating Distribution**(8)
By total investments

** The rating distribution presented above includes the ratings of securities held by special purpose vehicles in which the Fund holds a residual interest. See Note 1B to the Fund’s financial statements. Absent such securities, the Fund’s rating distribution at March 31, 2007, is as follows, and the average rating is AA+:
AAA | | 49.4% | | BBB | | 5.8% | |
AA | | 9.4% | | BB | | 1.0% | |
A | | 23.5% | | Not Rated | | 10.9% | |
Fund Statistics(9)
· | Number of Issues: | | 92 |
· | Average Maturity: | | 20.7 years |
· | Average Effective Maturity: | | 10.8 years |
· | Average Call Protection: | | 9.0 years |
· | Average Dollar Price: | | $100.73 |
Past performance is no guarantee of future results. Returns are historical and are calculated by determining the percentage change in net asset value or offering price (as applicable) with all distributions reinvested. Investment return and principal value will fluctuate so that shares, when redeemed, may be worth more or less than their original cost. Performance is for the stated time period only; due to market volatility, the Fund’s current performance may be lower or higher than the quoted return. For performance as of the most recent month end, please refer to www.eatonvance.com.
(1) Average annual total returns do not include the 4.75% maximum sales charge for Class A shares or the applicable contingent deferred sales charges (CDSC) for Class B and Class C shares. If sales charges were deducted, returns would be lower. SEC Average Annual Total Returns for Class A reflect the maximum 4.75% sales charge. SEC Average Annual Total Returns for Class B reflect the applicable CDSC based on the following schedule: 5% - 1st and 2nd years; 4% - 3rd year; 3% - - 4th year; 2% - 5th year; 1% - 6th year. SEC Average Annual Total Returns for Class C reflect a 1% CDSC for the first year.
(2) Includes interest expense of 0.37% relating to the Fund’s liability with respect to floating rate notes held by third parties in conjunction with inverse floater securities transactions by the Fund. The Fund also records offsetting interest income relating to the municipal obligation underlying such transactions.
(3) The Fund’s distribution rate represents actual distributions paid to shareholders and is calculated by dividing the last distribution per share (annualized) by the net asset value.
(4) Taxable-equivalent figures assume a maximum 41.05% combined federal and state income tax rate. A lower tax rate would result in lower taxable-equivalent figures.
(5) The Fund’s SEC yield is calculated by dividing the net investment income per share for the 30-day period by the offering price at the end of the period and annualizing the result.
(6) It is not possible to invest directly in an Index. The Index’s total return does not reflect the expenses that would have been incurred if an investor individually purchased or sold the securities represented in the Index. Index performance is available as of month end only.
(7) The Lipper Averages are the average annual total returns, at net asset value, of the funds that are in the same Lipper Classification as the Fund. It is not possible to invest in a Lipper Classification. Lipper Classifications may include insured and uninsured funds, as well as leveraged and unleveraged funds. The Lipper California Municipal Debt Funds Classification contained 116, 116, 94 and 69 funds for the 6-month, 1-year, 5-year and 10-year periods, respectively. Lipper Averages are available as of month end only.
(8) As of 3/31/07. Rating Distribution is determined by dividing the total market value of the issues by the total investments of the Fund.
(9) As of 3/31/07. Portfolio holdings information excludes securities held by special purpose vehicles in which the Fund holds a residual interest. See Note 1B to the Fund’s financial statements. Portfolio information may not be representative of the Fund’s current or future investments and may change due to active management
4
Eaton Vance Florida Municipals Fund as of March 31, 2007
performanCe informaTion and porTfolio ComposiTion
Performance(1) | | Class A | | Class B | | Class C | |
| | | | | | | |
Average Annual Total Returns (at net asset value) | | | | | | | |
Six Months | | 2.41 | % | 2.02 | % | 2.12 | % |
One Year | | 5.91 | | 5.18 | | 5.18 | |
Five Years | | 5.91 | | 5.15 | | N.A. | |
Ten Years | | 5.72 | | 4.94 | | N.A. | |
Life of Fund† | | 6.06 | | 5.80 | | 5.00 | |
| | | | | | | |
SEC Average Annual Total Returns (including sales charge or applicable CDSC) | | | | | | | |
Six Months | | -2.46 | % | -2.98 | % | 1.12 | % |
One Year | | 0.91 | | 0.18 | | 4.18 | |
Five Years | | 4.87 | | 4.82 | | N.A. | |
Ten Years | | 5.21 | | 4.94 | | N.A. | |
Life of Fund† | | 5.66 | | 5.80 | | 5.00 | |
†Inception date: Class A: 4/5/94; Class B: 8/28/90; Class C: 3/13/06
Total Annual
Operating Expenses(2)* | | Class A | | Class B | | Class C | |
| | | | | | | |
Expense Ratio | | 1.29 | % | 2.04 | % | 2.04 | % |
*From the Fund’s prospectus dated 2/1/07.
Distribution Rates/Yields | | Class A | | Class B | | Class C | |
| | | | | | | |
Distribution Rate(3) | | 4.42 | % | 3.67 | % | 3.67 | % |
Taxable-Equivalent Distribution Rate(3),(4) | | 6.80 | | 5.65 | | 5.65 | |
SEC 30-day Yield5 | | 3.72 | | 3.15 | | 3.16 | |
Taxable-Equivalent SEC 30-day Yield(4),(5) | | 5.72 | | 4.85 | | 4.86 | |
Index Performance(6)
Lehman Brothers Municipal Bond Index Average Annual Total Returns | | | | | | | |
Six Months | | | | | | 1.92 | % |
One Year | | | | | | 5.43 | |
Five Years | | | | | | 5.50 | |
Ten Years | | | | | | 5.87 | |
Lipper Averages(7)
Lipper Florida Municipal Debt Funds Classification Average Annual Total Returns | | | | | | | |
Six Months | | | | | | 1.58 | % |
One Year | | | | | | 4.65 | |
Five Years | | | | | | 4.77 | |
Ten Years | | | | | | 4.94 | |
Portfolio Manager: Cynthia J. Clemson
Rating Distribution**(8)
By total investments
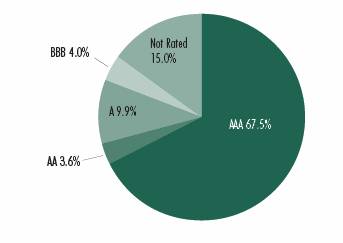
** The rating distribution presented above includes the ratings of securities held by special purpose vehicles in which the Fund holds a residual interest. See Note 1B to the Fund’s financial statements. Absent such securities, the Fund’s rating distribution at March 31, 2007, is as follows, and the average rating is AA-:
AAA | | 60.0% | | BBB | | 4.7% | |
AA | | 4.1% | | Not Rated | | 19.8% | |
A | | 11.4% | | | | | |
Fund Statistics(9)
· | Number of Issues: | | 100 |
· | Average Maturity: | | 21.8 years |
· | Average Effective Maturity: | | 8.9 years |
· | Average Call Protection: | | 7.1 years |
· | Average Dollar Price: | | $100.65 |
Past performance is no guarantee of future results. Returns are historical and are calculated by determining the percentage change in net asset value or offering price (as applicable) with all distributions reinvested. Investment return and principal value will fluctuate so that shares, when redeemed, may be worth more or less than their original cost. Performance is for the stated time period only; due to market volatility, the Fund’s current performance may be lower or higher than the quoted return. For performance as of the most recent month end, please refer to www.eatonvance.com.
(1) Average annual total returns do not include the 4.75% maximum sales charge for Class A shares or the applicable contingent deferred sales charges (CDSC) for Class B and Class C shares. If sales charges were deducted, returns would be lower. SEC Average Annual Total Returns for Class A reflect the maximum 4.75% sales charge. SEC Average Annual Total Returns for Class B reflect the applicable CDSC based on the following schedule: 5% - 1st and 2nd years; 4% - 3rd year; 3% - - 4th year; 2% - 5th year; 1% - 6th year. SEC Average Annual Total Returns for Class C reflect a 1% CDSC for the first year.
(2) Includes interest expense of 0.50% relating to the Fund’s liability with respect to floating rate notes held by third parties in conjunction with inverse floater securities transactions by the Fund. The Fund also records offsetting interest income relating to the municipal obligation underlying such transactions.
(3) The Fund’s distribution rate represents actual distributions paid to shareholders and is calculated by dividing the last distribution per share (annualized) by the net asset value.
(4) Taxable-equivalent figures assume a maximum 35.00% federal tax rate. A lower tax rate would result in lower taxable-equivalent figures.
(5) The Fund’s SEC yield is calculated by dividing the net investment income per share for the 30-day period by the offering price at the end of the period and annualizing the result.
(6) It is not possible to invest directly in an Index. The Index’s total return does not reflect the expenses that would have been incurred if an investor individually purchased or sold the securities represented in the Index. Index performance is available as of month end only.
(7) The Lipper Averages are the average annual total returns, at net asset value, of the funds that are in the same Lipper Classification as the Fund. It is not possible to invest in a Lipper Classification. Lipper Classifications may include insured and uninsured funds, as well as leveraged and unleveraged funds. The Lipper Florida Municipal Debt Funds Classification contained 36, 36, 34 and 30 funds for the 6-month, 1-year, 5-year and 10-year periods, respectively. Lipper Averages are available as of month end only.
(8) As of 3/31/07. Rating Distribution is determined by dividing the total market value of the issues by the total investments of the Fund.
(9) As of 3/31/07. Portfolio holdings information excludes securities held by special purpose vehicles in which the Fund holds a residual interest. See Note 1B to the Fund’s financial statements. Portfolio information may not be representative of the Fund’s current or future investments and may change due to active management.
5
Eaton Vance Massachusetts Municipals Fund as of March 31, 2007
performanCe informaTion and porTfolio ComposiTion
Performance(1) | | Class A | | Class B | | Class C | | Class I | |
| | | | | | | | | |
Average Annual Total Returns (at net asset value) | | | | | | | | | |
Six Months | | 2.16 | % | 1.79 | % | 1.79 | % | 2.26 | % |
One Year | | 6.41 | | 5.64 | | N.A. | | 6.62 | |
Five Years | | 6.11 | | 5.36 | | N.A. | | 6.38 | |
Ten Years | | 5.88 | | 5.08 | | N.A. | | 6.07 | |
Life of Fund† | | 5.17 | | 5.55 | | 5.96 | * | 5.58 | |
| | | | | | | | | |
SEC Average Annual Total Returns (including sales charge or applicable CDSC) |
Six Months | | -2.68 | % | -3.21 | % | 0.79 | % | 2.26 | % |
One Year | | 1.38 | | 0.64 | | N.A. | | 6.62 | |
Five Years | | 5.09 | | 5.03 | | N.A. | | 6.38 | |
Ten Years | | 5.37 | | 5.08 | | N.A. | | 6.07 | |
Life of Fund† | | 4.78 | | 5.55 | | 4.96 | * | 5.58 | |
†Inception date: Class A: 12/7/93; Class B: 4/18/91; Class C: 5/2/06; Class I: 6/17/93
*Returns are cumulative since inception of share class.
Total Annual
Operating Expenses(2)** | | Class A | | Class B | | Class C | | Class I | |
| | | | | | | | | |
Expense Ratio | | 1.21 | % | 1.96 | % | 1.96 | % | 1.01 | % |
**From the Fund’s prospectus dated 2/1/07.
Distribution Rates/Yields | | Class A | | Class B | | Class C | | Class I | |
| | | | | | | | | |
Distribution Rate(3) | | 4.23 | % | 3.47 | % | 3.47 | % | 4.44 | % |
Taxable-Equivalent Distribution Rate(3),(4) | | 6.87 | | 5.64 | | 5.64 | | 7.21 | |
SEC 30-day Yield(5) | | 3.30 | | 2.71 | | 2.72 | | 3.67 | |
Taxable-Equivalent SEC 30-day Yield((5),(6) | | 5.36 | | 4.40 | | 4.42 | | 5.96 | |
Index Performance(6)
Lehman Brothers Municipal Bond Index Average Annual Total Returns | | | | | | | | | |
Six Months | | | | | | | | 1.92 | % |
One Year | | | | | | | | 5.43 | |
Five Years | | | | | | | | 5.50 | |
Ten Years | | | | | | | | 5.87 | |
Lipper Averages(8)
Lipper Massachusetts Municipal Debt Funds Classification Average Annual Total Returns | | | | | | | | | |
Six Months | | | | | | | | 1.56 | % |
One Year | | | | | | | | 4.52 | |
Five Years | | | | | | | | 4.72 | |
Ten Years | | | | | | | | 4.89 | |
Portfolio Manager: Robert B. MacIntosh, CFA
Rating Distribution***(8)
By total investments
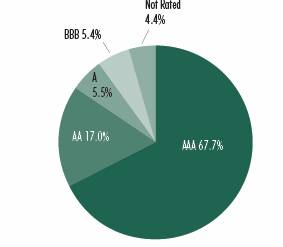
*** The rating distribution presented above includes the ratings of securities held by special purpose vehicles in which the Fund holds a residual interest. See Note 1B to the Fund’s financial statements. Absent such securities, the Fund’s rating distribution at March 31, 2007, is as follows, and the average rating is AA+:
AAA | | 63.50% | | BBB | | 5.9% | |
AA | | 18.6% | | Not Rated | | 5.9% | |
A | | 6.1% | | | | | |
Fund Statistics(9)
· | Number of Issues: | | 81 |
· | Average Maturity: | | 23.0 years |
· | Average Effective Maturity: | | 14.9 years |
· | Average Call Protection: | | 12.5 years |
· | Average Dollar Price: | | $104.17 |
Past performance is no guarantee of future results. Returns are historical and are calculated by determining the percentage change in net asset value or offering price (as applicable) with all distributions reinvested. Investment return and principal value will fluctuate so that shares, when redeemed, may be worth more or less than their original cost. Performance is for the stated time period only; due to market volatility, the Fund’s current performance may be lower or higher than the quoted return. For performance as of the most recent month end, please refer to www.eatonvance.com.
(1) Average annual total returns do not include the 4.75% maximum sales charge for Class A shares or the applicable contingent deferred sales charges (CDSC) for Class B and Class C shares. If sales charges were deducted, returns would be lower. SEC Average Annual Total Returns for Class A reflect the maximum 4.75% sales charge. SEC Average Annual Total Returns for Class B reflect the applicable CDSC based on the following schedule: 5% - 1st and 2nd years; 4% - 3rd year; 3% - - 4th year; 2% - 5th year; 1% - 6th year. SEC Average Annual Total Returns for Class C reflect a 1% CDSC for the first year. Class I shares are not subject to a sales charge.
(2) Includes interest expense of 0.42% relating to the Fund’s liability with respect to floating rate notes held by third parties in conjunction with inverse floater securities transactions by the Fund. The Fund also records offsetting interest income relating to the municipal obligation underlying such transactions.
(3) The Fund’s distribution rate represents actual distributions paid to shareholders and is calculated by dividing the last distribution per share (annualized) by the net asset value.
(4) Taxable-equivalent figures assume a maximum 38.45% combined federal and state income tax rate. A lower tax rate would result in lower taxable-equivalent figures.
(5) The Fund’s SEC yield is calculated by dividing the net investment income per share for the 30-day period by the offering price at the end of the period and annualizing the result.
(6) It is not possible to invest directly in an Index. The Index’s total return does not reflect the expenses that would have been incurred if an investor individually purchased or sold the securities represented in the Index. Index performance is available as of month end only.
(7) The Lipper Averages are the average annual total returns, at net asset value, of the funds that are in the same Lipper Classification as the Fund. It is not possible to invest in a Lipper Classification. Lipper Classifications may include insured and uninsured funds, as well as leveraged and unleveraged funds. The Lipper Massachusetts Municipal Debt Funds Classification contained 55, 51, 49 and 41 funds for the 6-month, 1-year, 5-year and 10-year periods, respectively. Lipper Averages are available as of month end only.
(8) As of 3/31/07. Rating Distribution is determined by dividing the total market value of the issues by the total investments of the Fund.
(9) As of 3/31/07. Portfolio holdings information excludes securities held by special purpose vehicles in which the Fund holds a residual interest. See Note 1B to the Fund’s financial statements. Portfolio information may not be representative of the Fund’s current or future investments and may change due to active management.
6
Eaton Vance Mississippi Municipals Fund as of March 31, 2007
performanCe informaTion and porTfolio ComposiTion
Performance(1) | | Class A | | Class B | |
| | | | | |
Average Annual Total Returns (at net asset value) | | | | | |
Six Months | | 2.11 | % | 1.73 | % |
One Year | | 5.30 | | 4.49 | |
Five Years | | 5.01 | | 4.26 | |
Ten Years | | 5.17 | | 4.43 | |
Life of Fund† | | 4.71 | | 4.29 | |
| | | | | |
SEC Average Annual Total Returns (including sales charge or applicable CDSC) | | | | | |
Six Months | | -2.71 | % | -3.27 | % |
One Year | | 0.28 | | -0.51 | |
Five Years | | 3.98 | | 3.92 | |
Ten Years | | 4.66 | | 4.43 | |
Life of Fund† | | 4.32 | | 4.29 | |
†Inception date: Class A: 12/7/93; Class B: 6/11/93
Total Annual
Operating Expenses(2)* | | Class A | | Class B | |
| | | | | |
Expense Ratio | | 1.00 | % | 1.75 | % |
*From the Fund’s prospectus dated 2/1/07.
Distribution Rates/Yields | | Class A | | Class B | |
| | | | | |
Distribution Rate(3) | | 4.18 | % | 3.43 | % |
Taxable-Equivalent Distribution Rate(3),(4) | | 6.77 | | 5.55 | |
SEC 30-day Yield(5) | | 3.36 | | 2.79 | |
Taxable-Equivalent SEC 30-day Yield(4),(5) | | 5.44 | | 4.52 | |
Index Performance(6)
Lehman Brothers Municipal Bond Index Average Annual Total Returns | | | | | |
Six Months | | | | 1.92 | % |
One Year | | | | 5.43 | |
Five Years | | | | 5.50 | |
Ten Years | | | | 5.87 | |
Lipper Averages(7)
Lipper Other States Municipal Debt Funds Classification Average Annual Total Returns | | | | | |
Six Months | | | | 1.54 | % |
One Year | | | | 4.65 | |
Five Years | | | | 4.40 | |
Ten Years | | | | 4.73 | |
Portfolio Manager: Craig R. Brandon, CFA
Rating Distribution**(8)
By total investments
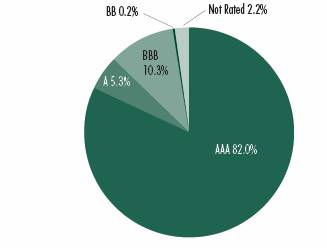
** The rating distribution presented above includes the ratings of securities held by special purpose vehicles in which the Fund holds a residual interest. See Note 1B to the Fund’s financial statements. Absent such securities, the Fund’s rating distribution at March 31, 2007, is as follows, and the average rating is AA+:
AAA | | 80.9% | | BBB | | 0.2% | |
AA | | 5.6% | | Not Rated | | 2.4% | |
A | | 10.9% | | | | | |
&# 160;
Fund Statistics(9)
· | Number of Issues: | | 49 |
· | Average Maturity: | | 18.6 years |
· | Average Effective Maturity: | | 8.8 years |
· | Average Call Protection: | | 7.6 years |
· | Average Dollar Price: | | $101.75 |
Past performance is no guarantee of future results. Returns are historical and are calculated by determining the percentage change in net asset value or offering price (as applicable) with all distributions reinvested. Investment return and principal value will fluctuate so that shares, when redeemed, may be worth more or less than their original cost. Performance is for the stated time period only; due to market volatility, the Fund’s current performance may be lower or higher than the quoted return. For performance as of the most recent month end, please refer to www.eatonvance.com.
(1) Average annual total returns do not include the 4.75% maximum sales charge for Class A shares or the applicable contingent deferred sales charges (CDSC) for Class B shares. If sales charges were deducted, returns would be lower. SEC Average Annual Total Returns for Class A reflect the maximum 4.75% sales charge. SEC Average Annual Total Returns for Class B reflect the applicable CDSC based on the following schedule: 5% - 1st and 2nd years; 4% - 3rd year; 3% - 4th year; 2% - 5th year; 1% - 6th year.
(2) Includes interest expense of 0.19% relating to the Fund’s liability with respect to floating rate notes held by third parties in conjunction with inverse floater securities transactions by the Fund. The Fund also records offsetting interest income relating to the municipal obligation underlying such transactions.
(3) The Fund’s distribution rate represents actual distributions paid to shareholders and is calculated by dividing the last distribution per share (annualized) by the net asset value.
(4) Taxable-equivalent figures assume a maximum 38.25% combined federal and state income tax rate. A lower tax rate would result in lower taxable-equivalent figures.
(5) The Fund’s SEC yield is calculated by dividing the net investment income per share for the 30-day period by the offering price at the end of the period and annualizing the result.
(6) It is not possible to invest directly in an Index. The Index’s total return does not reflect the expenses that would have been incurred if an investor individually purchased or sold the securities represented in the Index. Index performance is available as of month end only.
(7) The Lipper Averages are the average annual total returns, at net asset value, of the funds that are in the same Lipper Classification as the Fund. It is not possible to invest in a Lipper Classification. Lipper Classifications may include insured and uninsured funds, as well as leveraged and unleveraged funds. The Lipper Other States Municipal Debt Funds Classification contained 77, 76, 71 and 53 funds for the 6-month, 1-year, 5-year and 10-year periods, respectively. Lipper Averages are available as of month end only.
(8) As of 3/31/07. Rating Distribution is determined by dividing the total market value of the issues by the total investments of the Fund.
(9) As of 3/31/07. Portfolio holdings information excludes securities held by special purpose vehicles in which the Fund holds a residual interest. See Note 1B to the Fund’s financial statements. Portfolio information may not be representative of the Fund’s current or future investments and may change due to active management.
7
Eaton Vance New York Municipals Fund as of March 31, 2007
performanCe informaTion and porTfolio ComposiTion
Performance(1) | | Class A | | Class B | | Class C | |
| | | | | | | |
Average Annual Total Returns (at net asset value) | | | | | | | |
Six Months | | 2.18 | % | 1.90 | % | 1.90 | % |
One Year | | 6.35 | | 5.55 | | 5.66 | |
Five Years | | 5.88 | | 5.31 | | N.A. | |
Ten Years | | 6.08 | | 5.38 | | N.A. | |
Life of Fund† | | 6.21 | | 6.23 | | 3.75 | |
SEC Average Annual Total Returns (including sales charge or applicable CDSC) | | | | | | | |
Six Months | | -2.70 | % | -3.08 | % | 0.90 | % |
One Year | | 1.27 | | 0.55 | | 4.66 | |
Five Years | | 4.85 | | 4.98 | | N.A. | |
Ten Years | | 5.56 | | 5.38 | | N.A. | |
Life of Fund† | | 5.81 | | 6.23 | | 3.75 | |
†Inception date: Class A: 4/15/94; Class B: 8/30/90; Class C: 9/30/03
Total Annual
Operating Expenses(2)* | | Class A | | Class B | | Class C | |
| | | | | | | |
Expense Ratio | | 1.28 | % | 2.03 | % | 2.03 | % |
*From the Fund’s prospectus dated 2/1/07.
Distribution Rates/Yields | | Class A | | Class B | | Class C | |
| | | | | | | |
Distribution Rate(3) | | 4.24 | % | 3.47 | % | 3.47 | % |
Taxable-Equivalent Distribution Rate(3),(4) | | 7.00 | | 5.73 | | 5.73 | |
SEC 30-day Yield5 | | 3.64 | | 3.07 | | 3.06 | |
Taxable-Equivalent SEC 30-day Yield(4),(5) | | 6.01 | | 5.07 | | 5.05 | |
Index Performance(6)
Lehman Brothers Municipal Bond Index Average Annual Total Returns | | | | | | | |
Six Months | | | | | | 1.92 | % |
One Year | | | | | | 5.43 | |
Five Years | | | | | | 5.50 | |
Ten Years | | | | | | 5.87 | |
Lipper Averages(7)
Lipper New York Municipal Debt Funds Classification Average Annual Total Returns | | | | | | | |
Six Months | | | | | | 1.60 | % |
One Year | | | | | | 4.88 | |
Five Years | | | | | | 4.88 | |
Ten Years | | | | | | 5.10 | |
Portfolio Manager: Craig R. Brandon, CFA
Rating Distribution**(8)
By total investments

** The rating distribution presented above includes the ratings of securities held by special purpose vehicles in which the Fund holds a residual interest. See Note 1B to the Fund’s financial statements. Absent such securities, the Fund’s rating distribution at March 31, 2007, is as follows, and the average rating is AA-:
AAA | | 34.7 % | | BB | | 0.5% | |
AA | | 40.1% | | B | | 1.3% | |
A | | 15.6% | | Not Rated | | 5.0% | |
BBB | | 2.8% | | | | | |
Fund Statistics(9)
· | Number of Issues: | | 100 |
· | Average Maturity: | | 22.8 years |
· | Average Effective Maturity: | | 13.9 years |
· | Average Call Protection: | | 10.4 years |
· | Average Dollar Price: | | $104.90 |
Past performance is no guarantee of future results. Returns are historical and are calculated by determining the percentage change in net asset value or offering price (as applicable) with all distributions reinvested. Investment return and principal value will fluctuate so that shares, when redeemed, may be worth more or less than their original cost. Performance is for the stated time period only; due to market volatility, the Fund’s current performance may be lower or higher than the quoted return. For performance as of the most recent month end, please refer to www.eatonvance.com.
(1) Average annual total returns do not include the 4.75% maximum sales charge for Class A shares or the applicable contingent deferred sales charges (CDSC) for Class B and Class C shares. If sales charges were deducted, returns would be lower. SEC Average Annual Total Returns for Class A reflect the maximum 4.75% sales charge. SEC Average Annual Total Returns for Class B reflect the applicable CDSC based on the following schedule: 5% - 1st and 2nd years; 4% - 3rd year; 3% - - 4th year; 2% - 5th year; 1% - 6th year. SEC Average Annual Total Returns for Class C reflect a 1% CDSC for the first year.
(2) Includes interest expense of 0.49% relating to the Fund’s liability with respect to floating rate notes held by third parties in conjunction with inverse floater securities transactions by the Fund. The Fund also records offsetting interest income relating to the municipal obligation underlying such transactions.
(3) The Fund’s distribution rate represents actual distributions paid to shareholders and is calculated by dividing the last distribution per share (annualized) by the net asset value.
(4) Taxable-equivalent figures assume a maximum 39.45% combined federal and state income tax rate. A lower tax rate would result in lower taxable-equivalent figures.
(5) The Fund’s SEC yield is calculated by dividing the net investment income per share for the 30-day period by the offering price at the end of the period and annualizing the result.
(6) It is not possible to invest directly in an Index. The Index’s total return does not reflect the expenses that would have been incurred if an investor individually purchased or sold the securities represented in the Index. Index performance is available as of month end only.
(7) The Lipper Averages are the average annual total returns, at net asset value, of the funds that are in the same Lipper Classification as the Fund. It is not possible to invest in a Lipper Classification. Lipper Classifications may include insured and uninsured funds, as well as leveraged and unleveraged funds. The Lipper New York Municipal Debt Funds Classification contained 95, 95, 85 and 65 funds for the 6-month, 1-year, 5-year and 10-year periods, respectively. Lipper Averages are available as of month end only.
(8) As of 3/31/07. Rating Distribution is determined by dividing the total market value of the issues by the total investments of the Fund.
(9) As of 3/31/07. Portfolio holdings information excludes securities held by special purpose vehicles in which the Fund holds a residual interest. See Note 1B to the Fund’s financial statements. Portfolio information may not be representative of the Fund’s current or future investments and may change due to active management.
8
Eaton Vance Ohio Municipals Fund as of March 31, 2007
performanCe informaTion and porTfolio ComposiTion
Performance(1) | | Class A | | Class B | | Class C | |
| | | | | | | |
Average Annual Total Returns (at net asset value) | | | | | | | |
Six Months | | 2.16 | % | 1.90 | % | 1.79 | % |
One Year | | 6.19 | | 5.50 | | 5.40 | |
Five Years | | 6.33 | | 5.55 | | N.A. | |
Ten Years | | 5.61 | | 4.81 | | N.A. | |
Life of Fund† | | 5.01 | | 5.49 | | 5.08 | |
| | | | | | | |
SEC Average Annual Total Returns (including sales charge or applicable CDSC) | | | | | | | |
Six Months | | -2.68 | % | -3.10 | % | 0.79 | % |
One Year | | 1.18 | | 0.50 | | 4.40 | |
Five Years | | 5.29 | | 5.23 | | N.A. | |
Ten Years | | 5.10 | | 4.81 | | N.A. | |
Life of Fund† | | 4.63 | | 5.49 | | 5.08 | |
†Inception date: Class A: 12/7/93; Class B: 4/18/91; Class C: 2/3/06
Total Annual
Operating Expenses(2)* | | Class A | | Class B | | Class C | |
| | | | | | | |
Expense Ratio | | 1.25 | % | 2.00 | % | 2.00 | % |
*From the Fund’s prospectus dated 2/1/07.
Distribution Rates/Yields | | Class A | | Class B | | Class C | |
| | | | | | | |
Distribution Rate(3) | | 4.18 | % | 3.42 | % | 3.42 | % |
Taxable-Equivalent Distribution Rate(3),(4) | | 6.95 | | 5.69 | | 5.69 | |
SEC 30-day Yield(5) | | 3.44 | | 2.86 | | 2.87 | |
Taxable-Equivalent SEC 30-day Yield(4),(5) | | 5.72 | | 4.76 | | 4.77 | |
Index Performance(6)
Lehman Brothers Municipal Bond Index Average Annual Total Returns
Six Months | | | | | | 1.92 | % |
One Year | | | | | | 5.43 | |
Five Years | | | | | | 5.50 | |
Ten Years | | | | | | 5.87 | |
Lipper Averages(7)
Lipper Ohio Municipal Debt Funds Classification Average Annual Total Returns | | | | | | | |
Six Months | | | | | | 1.62 | % |
One Year | | | | | | 4.42 | |
Five Years | | | | | | 4.44 | |
Ten Years | | | | | | 4.78 | |
Portfolio Manager: William H. Ahern, CFA
Rating Distribution**(8)
By total investments
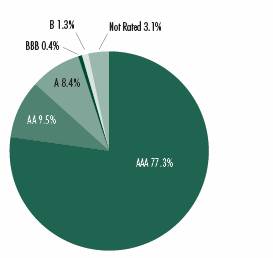
** The rating distribution presented above includes the ratings of securities held by special purpose vehicles in which the Fund holds a residual interest. See Note 1B to the Fund’s financial statements. Absent such securities, the Fund’s rating distribution at March 31, 2007, is as follows, and the average rating is AA+:
AAA | | 73.4 % | | BB | | 0.4% | |
AA | | 8.5% | | B | | 1.4% | |
A | | 9.0% | | Not Rated | | 7.3% | |
Fund Statistics(9)
· | Number of Issues: | | 120 |
· | Average Maturity: | | 22.2 years |
· | Average Effective Maturity: | | 10.6years |
· | Average Call Protection: | | 8.8 years |
· | Average Dollar Price: | | $104.21 |
Past performance is no guarantee of future results. Returns are historical and are calculated by determining the percentage change in net asset value or offering price (as applicable) with all distributions reinvested. Investment return and principal value will fluctuate so that shares, when redeemed, may be worth more or less than their original cost. Performance is for the stated time period only; due to market volatility, the Fund’s current performance may be lower or higher than the quoted return. For performance as of the most recent month end, please refer to www.eatonvance.com.
(1) Average annual total returns do not include the 4.75% maximum sales charge for Class A shares or the applicable contingent deferred sales charges (CDSC) for Class B and Class C shares. If sales charges were deducted, returns would be lower. SEC Average Annual Total Returns for Class A reflect the maximum 4.75% sales charge. SEC Average Annual Total Returns for Class B reflect the applicable CDSC based on the following schedule: 5% - 1st and 2nd years; 4% - 3rd year; 3% - - 4th year; 2% - 5th year; 1% - 6th year. SEC Average Annual Total Returns for Class C reflect a 1% CDSC for the first year.
(2) Includes interest expense of 0.47% relating to the Fund’s liability with respect to floating rate notes held by third parties in conjunction with inverse floater securities transactions by the Fund. The Fund also records offsetting interest income relating to the municipal obligation underlying such transactions.
(3) The Fund’s distribution rate represents actual distributions paid to shareholders and is calculated by dividing the last distribution per share (annualized) by the net asset value.
(4) Taxable-equivalent figures assume a maximum 39.88% combined federal and state income tax rate. A lower tax rate would result in lower taxable-equivalent figures.
(5) The Fund’s SEC yield is calculated by dividing the net investment income per share for the 30-day period by the offering price at the end of the period and annualizing the result.
(6) It is not possible to invest directly in an Index. The Index’s total return does not reflect the expenses that would have been incurred if an investor individually purchased or sold the securities represented in the Index. Index performance is available as of month end only.
(7) The Lipper Averages are the average annual total returns, at net asset value, of the funds that are in the same Lipper Classification as the Fund. It is not possible to invest in a Lipper Classification. Lipper Classifications may include insured and uninsured funds, as well as leveraged and unleveraged funds. The Lipper Ohio Municipal Debt Funds Classification contained 46, 43, 39 and 35 funds for the 6-month, 1-year, 5-year and 10-year periods, respectively. Lipper Averages are available as of month end only.
(8) As of 3/31/07. Rating Distribution is determined by dividing the total market value of the issues by the total investments of the Fund.
(9) As of 3/31/07. Portfolio holdings information excludes securities held by special purpose vehicles in which the Fund holds a residual interest. See Note 1B to the Fund’s financial statements. Portfolio information may not be representative of the Fund’s current or future investments and may change due to active management.
9
Eaton Vance Rhode Island Municipals Fund as of March 31, 2007
performanCe informaTion and porTfolio ComposiTion
Performance(1) | | Class A | | Class B | | Class C | |
| | | | | | | |
Average Annual Total Returns (at net asset value) | | | | | | | |
Six Months | | 1.80 | % | 1.54 | % | 1.44 | % |
One Year | | 4.99 | | 4.30 | | 4.30 | |
Five Years | | 5.61 | | 4.85 | | N.A. | |
Ten Years | | 5.55 | | 4.82 | | N.A. | |
Life of Fund† | | 4.82 | | 4.47 | | 3.73 | |
| | | | | | | |
SEC Average Annual Total Returns (including sales charge or applicable CDSC) | | | | | | | |
Six Months | | -3.02 | % | -3.45 | % | 0.44 | % |
One Year | | -0.03 | | -0.70 | | 3.30 | |
Five Years | | 4.59 | | 4.52 | | N.A. | |
Ten Years | | 5.04 | | 4.82 | | N.A. | |
Life of Fund† | | 4.44 | | 4.47 | | 3.73 | |
†Inception date: Class A: 12/7/93; Class B: 6/11/93; Class C: 3/20/06
Total Annual
Operating Expenses(2)* | | Class A | | Class B | | Class C | |
| | | | | | | |
Expense Ratio | | 1.10 | % | 1.85 | % | 1.85 | % |
*From the Fund’s prospectus dated 2/1/07.
Distribution Rates/Yields | | Class A | | Class B | | Class C | |
| | | | | | | |
Distribution Rate(3) | | 4.14 | % | 3.39 | % | 3.39 | % |
Taxable-Equivalent Distribution Rate(3),(4) | | 6.98 | | 5.72 | | 5.72 | |
SEC 30-day Yield(5) | | 3.47 | | 2.89 | | 2.89 | |
Taxable-Equivalent SEC 30-day Yield(4),(5) | | 5.85 | | 4.87 | | 4.87 | |
Index Performance(6)
Lehman Brothers Municipal Bond Index Average Annual Total Returns | | | | | | | |
Six Months | | | | | | 1.92 | % |
One Year | | | | | | 5.43 | |
Five Years | | | | | | 5.50 | |
Ten Years | | | | | | 5.87 | |
Lipper Averages(7)
Lipper Other States Municipal Debt Funds Classification Average Annual Total Returns | | | | | | | |
Six Months | | | | | | 1.54 | % |
One Year | | | | | | 4.65 | |
Five Years | | | | | | 4.40 | |
Ten Years | | | | | | 4.73 | |
Portfolio Manager: Robert B. MacIntosh, CFA
Rating Distribution**(8)
By total investments
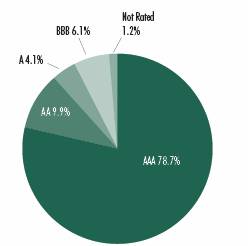
** The rating distribution presented above includes the ratings of securities held by special purpose vehicles in which the Fund holds a residual interest. See Note 1B to the Fund’s financial statements. Absent such securities, the Fund’s rating distribution at March 31, 2007, is as follows, and the average rating is AA+:
AAA | | 77.7 % | | BB | | 6.6% | |
AA | | 11.6% | | B | | 1.4% | |
A | | 2.7% | | | | | |
Fund Statistics(9)
· | Number of Issues: | | 66 |
· | Average Maturity: | | 20.2 years |
· | Average Effective Maturity: | | 7.1years |
· | Average Call Protection: | | 7.6 years |
· | Average Dollar Price: | | $103.64 |
Past performance is no guarantee of future results. Returns are historical and are calculated by determining the percentage change in net asset value or offering price (as applicable) with all distributions reinvested. Investment return and principal value will fluctuate so that shares, when redeemed, may be worth more or less than their original cost. Performance is for the stated time period only; due to market volatility, the Fund’s current performance may be lower or higher than the quoted return. For performance as of the most recent month end, please refer to www.eatonvance.com.
(1) Average annual total returns do not include the 4.75% maximum sales charge for Class A shares or the applicable contingent deferred sales charges (CDSC) for Class B and Class C shares. If sales charges were deducted, returns would be lower. SEC Average Annual Total Returns for Class A reflect the maximum 4.75% sales charge. SEC Average Annual Total Returns for Class B reflect the applicable CDSC based on the following schedule: 5% - 1st and 2nd years; 4% - 3rd year; 3% - - 4th year; 2% - 5th year; 1% - 6th year. SEC Average Annual Total Returns for Class C reflect a 1% CDSC for the first year.
(2) Includes interest expense of 0.35% relating to the Fund’s liability with respect to floating rate notes held by third parties in conjunction with inverse floater securities transactions by the Fund. The Fund also records offsetting interest income relating to the municipal obligation underlying such transactions.
(3) The Fund’s distribution rate represents actual distributions paid to shareholders and is calculated by dividing the last distribution per share (annualized) by the net asset value.
(4) Taxable-equivalent figures assume a maximum 40.69% combined federal and state income tax rate. A lower tax rate would result in lower taxable-equivalent figures.
(5) The Fund’s SEC yield is calculated by dividing the net investment income per share for the 30-day period by the offering price at the end of the period and annualizing the result.
(6) It is not possible to invest directly in an Index. The Index’s total return does not reflect the expenses that would have been incurred if an investor individually purchased or sold the securities represented in the Index. Index performance is available as of month end only.
(7) The Lipper Averages are the average annual total returns, at net asset value, of the funds that are in the same Lipper Classification as the Fund. It is not possible to invest in a Lipper Classification. Lipper Classifications may include insured and uninsured funds, as well as leveraged and unleveraged funds. The Lipper Other States Municipal Debt Funds Classification contained 77, 76, 71 and 53 funds for the 6-month, 1-year, 5-year and 10-year periods, respectively. Lipper Averages are available as of month end only.
(8) As of 3/31/07. Rating Distribution is determined by dividing the total market value of the issues by the total investments of the Fund.
(9) As of 3/31/07. Portfolio holdings information excludes securities held by special purpose vehicles in which the Fund holds a residual interest. See Note 1B to the Fund’s financial statements. Portfolio information may not be representative of the Fund’s current or future investments and may change due to active management.
10
Eaton Vance West Virginia Municipals Fund as of March 31, 2007
performanCe informaTion and porTfolio ComposiTion
Performance(1) | | Class A | | Class B | |
| | | | | |
Average Annual Total Returns (at net asset value) | | | | | |
Six Months | | 2.35 | % | 1.87 | % |
One Year | | 5.89 | | 4.97 | |
Five Years | | 5.41 | | 4.63 | |
Ten Years | | 5.39 | | 4.59 | |
Life of Fund† | | 4.86 | | 4.36 | |
| | | | | |
SEC Average Annual Total Returns (including sales charge or applicable CDSC) | | | | | |
Six Months | | -2.49 | % | -3.13 | % |
One Year | | 0.82 | | -0.03 | |
Five Years | | 4.39 | | 4.29 | |
Ten Years | | 4.88 | | 4.59 | |
Life of Fund† | | 4.47 | | 4.36 | |
†Inception date: Class A: 12/13/93; Class B: 6/11/93
Total Annual
Operating Expenses(2)* | | Class A | | Class B | |
| | | | | |
Expense Ratio | | 0.93 | % | 1.68 | % |
*From the Fund’s prospectus dated 2/1/07.
Distribution Rates/Yields | | Class A | | Class B | |
| | | | | |
Distribution Rate(3) | | 4.04 | % | 3.29 | % |
| | | | | |
Taxable-Equivalent Distribution Rate 3, 4 | | 6.65 | | 5.41 | |
SEC 30-day Yield 5 | | 3.15 | | 2.56 | |
Taxable-Equivalent SEC 30-day Yield 5, 6 | | 5.18 | | 4.21 | |
Index Performance(6)
Lehman Brothers Municipal Bond Index Average Annual Total Returns | | | | | |
Six Months | | | | 1.92 | % |
One Year | | | | 5.43 | |
Five Years | | | | 5.50 | |
Ten Years | | | | 5.87 | |
Lipper Averages(7)
Lipper Other States Municipal Debt Funds Classification Average Annual Total Returns | | | | | |
Six Months | | | | 1.54 | % |
One Year | | | | 4.65 | |
Five Years | | | | 4.40 | |
Ten Years | | | | 4.73 | |
Portfolio Manager: Robert B. MacIntosh, CFA
Rating Distribution**(8)
By total investments
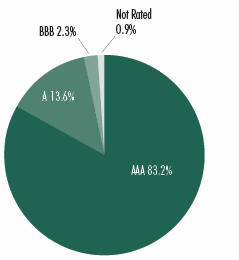
** The rating distribution presented above includes the ratings of securities held by special purpose vehicles in which the Fund holds a residual interest. See Note 1B to the Fund’s financial statements. Absent such securities, the Fund’s rating distribution at March 31, 2007, is as follows, and the average rating is AA+:
AAA | | 80.0 % | | BBB | | 2.4% | |
A | | 14.5% | | Not Rated | | 3.1% | |
Fund Statistics(9)
· | Number of Issues: | | 45 |
· | Average Maturity: | | 22.7 years |
· | Average Effective Maturity: | | 9.7 years |
· | Average Call Protection: | | 8.4 years |
· | Average Dollar Price: | | $99.83 |
Past performance is no guarantee of future results. Returns are historical and are calculated by determining the percentage change in net asset value or offering price (as applicable) with all distributions reinvested. Investment return and principal value will fluctuate so that shares, when redeemed, may be worth more or less than their original cost. Performance is for the stated time period only; due to market volatility, the Fund’s current performance may be lower or higher than the quoted return. For performance as of the most recent month end, please refer to www.eatonvance.com.
(1) Average annual total returns do not include the 4.75% maximum sales charge for Class A shares or the applicable contingent deferred sales charges (CDSC) for Class B shares. If sales charges were deducted, returns would be lower. SEC Average Annual Total Returns for Class A reflect the maximum 4.75% sales charge. SEC Average Annual Total Returns for Class B reflect the applicable CDSC based on the following schedule: 5% - 1st and 2nd years; 4% - 3rd year; 3% - 4th year; 2% - 5th year; 1% - 6th year.
(2) Includes interest expense of 0.18% relating to the Fund’s liability with respect to floating rate notes held by third parties in conjunction with inverse floater securities transactions by the Fund. The Fund also records offsetting interest income relating to the municipal obligation underlying such transactions.
(3) The Fund’s distribution rate represents actual distributions paid to shareholders and is calculated by dividing the last distribution per share (annualized) by the net asset value.
(4) Taxable-equivalent figures assume a maximum 39.23% combined federal and state income tax rate. A lower tax rate would result in lower taxable-equivalent figures.
(5) The Fund’s SEC yield is calculated by dividing the net investment income per share for the 30-day period by the offering price at the end of the period and annualizing the result.
(6) It is not possible to invest directly in an Index. The Index’s total return does not reflect the expenses that would have been incurred if an investor individually purchased or sold the securities represented in the Index. Index performance is available as of month end only.
(7) The Lipper Averages are the average annual total returns, at net asset value, of the funds that are in the same Lipper Classification as the Fund. It is not possible to invest in a Lipper Classification. Lipper Classifications may include insured and uninsured funds, as well as leveraged and unleveraged funds. The Lipper Other States Municipal Debt Funds Classification contained 77, 76, 71 and 53 funds for the 6-month, 1-year, 5-year and 10-year periods, respectively. Lipper Averages are available as of month end only.
(8) As of 3/31/07. Rating Distribution is determined by dividing the total market value of the issues by the total investments of the Fund.
(9) As of 3/31/07. Portfolio holdings information excludes securities held by special purpose vehicles in which the Fund holds a residual interest. See Note 1B to the Fund’s financial statements. Portfolio information may not be representative of the Fund’s current or future investments and may change due to active management.
11
Eaton Vance Municipals Funds as of March 31, 2007
FUND EXPENSES
Example: As a shareholder of a Fund, you incur two types of costs: (1) transaction costs, including sales charges (loads) on purchases and redemption fees (if applicable); and (2) ongoing costs, including management fees; distribution or service fees; and other Fund expenses. This Example is intended to help you understand your ongoing costs (in dollars) of investing in a Fund and to compare these costs with the ongoing costs of investing in other mutual funds. The Example is based on an investment of $1,000 invested at the beginning of the period and held for the entire period (October 1, 2006 – March 31, 2007).
Actual Expenses: The first section of each table below provides information about actual account values and actual expenses. You may use the information in this line, together with the amount you invested, to estimate the expenses that you paid over the period. Simply divide your account value by $1,000 (for example, an $8,600 account value divided by $1,000 = 8.6), then multiply the result by the number in the first line under the heading entitled "Expenses Paid During Period" to estimate the expenses you paid on your account during this period.
Hypothetical Example for Comparison Purposes: The second section of each table below provides information about hypothetical account values and hypothetical expenses based on a Fund's actual expense ratio and an assumed rate of return of 5% per year (before expenses), which is not the actual return of the Fund. The hypothetical account values and expenses may not be used to estimate the actual ending account balance or expenses you paid for the period. You may use this information to compare the ongoing costs of investing in the Funds and other funds. To do so, compare this 5% hypothetical example with the 5% hypothetical examples that appear in the shareholder reports of the other funds.
Please note that the expenses shown in each table are meant to highlight your ongoing costs only and do not reflect any transactional costs, such as sales charges (loads) or redemption fees (if applicable). Therefore, the second section of each table is useful in comparing ongoing costs only, and will not help you determine the relative total costs of owning different funds. In addition, if these transactional costs were included, your costs would have been higher.
Eaton Vance California Municipals Fund
| | | Beginning Account Value
(10/1/06) | | Ending Account Value
(3/31/07) | | Expenses Paid During Period*
(10/1/06 – 3/31/07) | |
| Actual | |
| Class A | | $ | 1,000.00 | | | $ | 1,022.00 | | | $ | 6.00 | | |
| Class B | | $ | 1,000.00 | | | $ | 1,017.20 | | | $ | 9.76 | | |
| Class C | | $ | 1,000.00 | | | $ | 1,018.20 | | | $ | 9.76 | | |
| Hypothetical | |
| (5% return per year before expenses) | |
| Class A | | $ | 1,000.00 | | | $ | 1,019.00 | | | $ | 5.99 | | |
| Class B | | $ | 1,000.00 | | | $ | 1,015.30 | | | $ | 9.75 | | |
| Class C | | $ | 1,000.00 | | | $ | 1,015.30 | | | $ | 9.75 | | |
* Expenses are equal to the Fund's annualized expense ratio of 1.19% for Class A shares, 1.94% for Class B shares and 1.94% for Class C shares multiplied by the average account value over the period, multiplied by 182/365 (to reflect the one-half year period). The Example assumes that the $1,000 was invested at the net asset value per share determined at the close of business on September 30, 2006.
12
Eaton Vance Municipals Funds as of March 31, 2007
FUND EXPENSES CONT'D
Eaton Vance Florida Municipals Fund
| | | Beginning Account Value
(10/1/06) | | Ending Account Value
(3/31/07) | | Expenses Paid During Period*
(10/1/06 – 3/31/07) | |
| Actual | |
| Class A | | $ | 1,000.00 | | | $ | 1,024.10 | | | $ | 6.51 | | |
| Class B | | $ | 1,000.00 | | | $ | 1,020.20 | | | $ | 10.27 | | |
| Class C | | $ | 1,000.00 | | | $ | 1,021.20 | | | $ | 10.23 | | |
| Hypothetical | |
| (5% return per year before expenses) | |
| Class A | | $ | 1,000.00 | | | $ | 1,018.10 | | | $ | 6.49 | | |
| Class B | | $ | 1,000.00 | | | $ | 1,014.80 | | | $ | 10.25 | | |
| Class C | | $ | 1,000.00 | | | $ | 1,014.80 | | | $ | 10.20 | | |
* Expenses are equal to the Fund's annualized expense ratio of 1.29% for Class A shares, 2.04% for Class B shares and 2.03% for Class C shares, multiplied by the average account value over the period, multiplied by 182/365 (to reflect the one-half year period). The Example assumes that the $1,000 was invested at the net asset value per share determined at the close of business on September 30, 2006.
Eaton Vance Massachusetts Municipals Fund
| | | Beginning Account Value
(10/1/06) | | Ending Account Value
(3/31/07) | | Expenses Paid During Period*
(10/1/06 – 3/31/07) | |
| Actual | |
| Class A | | $ | 1,000.00 | | | $ | 1,021.60 | | | $ | 6.00 | | |
| Class B | | $ | 1,000.00 | | | $ | 1,017.90 | | | $ | 9.76 | | |
| Class C | | $ | 1,000.00 | | | $ | 1,017.90 | | | $ | 9.76 | | |
| Class I | | $ | 1,000.00 | | | $ | 1,022.60 | | | $ | 4.99 | | |
| Hypothetical | |
| (5% return per year before expenses) | |
| Class A | | $ | 1,000.00 | | | $ | 1,019.00 | | | $ | 5.99 | | |
| Class B | | $ | 1,000.00 | | | $ | 1,015.30 | | | $ | 9.75 | | |
| Class C | | $ | 1,000.00 | | | $ | 1,015.30 | | | $ | 9.75 | | |
| Class I | | $ | 1,000.00 | | | $ | 1,020.00 | | | $ | 4.99 | | |
* Expenses are equal to the Fund's annualized expense ratio of 1.19% for class A shares, 1.94% for Class B shares, 1.94% for Class C shares and 0.99% for Class I shares, multiplied by the average account value over the period, multiplied by 182/365 (to reflect the one-half year period). The Example assumes that the $1,000 was invested at the next asset value per share determined at the close of business on September 30, 2006.
13
Eaton Vance Municipals Funds as of March 31, 2007
FUND EXPENSES CONT'D
Eaton Vance Mississippi Municipals Fund
| | | Beginning Account Value
(10/1/06) | | Ending Account Value
(3/31/07) | | Expenses Paid During Period*
(10/1/06 – 3/31/07) | |
| Actual | |
| Class A | | $ | 1,000.00 | | | $ | 1,021.10 | | | $ | 5.19 | | |
| Class B | | $ | 1,000.00 | | | $ | 1,017.30 | | | $ | 8.95 | | |
| Hypothetical | |
| (5% return per year before expenses) | |
| Class A | | $ | 1,000.00 | | | $ | 1,019.80 | | | $ | 5.19 | | |
| Class B | | $ | 1,000.00 | | | $ | 1,016.10 | | | $ | 8.95 | | |
* Expenses are equal to the Fund's annualized expense ratio of 1.03% for Class A shares and 1.78% for Class B shares, multiplied by the average account value over the period, multiplied by 182/365 (to reflect the one-half year period). The Example assumes that the $1,000 was invested at the net asset value per share determined at the close of business on September 30, 2006.
Eaton Vance New York Municipals Fund
| | | Beginning Account Value
(10/1/06) | | Ending Account Value
(3/31/07) | | Expenses Paid During Period*
(10/1/06 – 3/31/07) | |
| Actual | |
| Class A | | $ | 1,000.00 | | | $ | 1,021.80 | | | $ | 4.89 | | |
| Class B | | $ | 1,000.00 | | | $ | 1,019.00 | | | $ | 8.66 | | |
| Class C | | $ | 1,000.00 | | | $ | 1,019.00 | | | $ | 8.66 | | |
| Hypothetical | |
| (5% return per year before expenses) | |
| Class A | | $ | 1,000.00 | | | $ | 1,020.10 | | | $ | 4.89 | | |
| Class B | | $ | 1,000.00 | | | $ | 1,016.40 | | | $ | 8.65 | | |
| Class C | | $ | 1,000.00 | | | $ | 1,016.40 | | | $ | 8.65 | | |
* Expenses are equal to the Fund's annualized expense ratio of 0.97% for Class A shares, 1.72% for Class B shares and 1.72% for Class C shares multiplied by the average account value over the period, multiplied by 182/365 (to reflect the one-half year period). The Example assumes that the $1,000 was invested at the net asset per share determined at the close of business on September 30, 2006.
14
Eaton Vance Municipals Funds as of March 31, 2007
FUND EXPENSES CONT'D
Eaton Vance Ohio Municipals Fund
| | | Beginning Account Value
(10/1/06) | | Ending Account Value
(3/31/07) | | Expenses Paid During Period*
(10/1/06 – 3/31/07) | |
| Actual | |
| Class A | | $ | 1,000.00 | | | $ | 1,021.60 | | | $ | 5.34 | | |
| Class B | | $ | 1,000.00 | | | $ | 1,019.00 | | | $ | 9.11 | | |
| Class C | | $ | 1,000.00 | | | $ | 1,017.90 | | | $ | 9.11 | | |
| Hypothetical | |
| (5% return per year before expenses) | |
| Class A | | $ | 1,000.00 | | | $ | 1,019.60 | | | $ | 5.34 | | |
| Class B | | $ | 1,000.00 | | | $ | 1,015.90 | | | $ | 9.10 | | |
| Class C | | $ | 1,000.00 | | | $ | 1,015.90 | | | $ | 9.10 | | |
* Expenses are equal to the Fund's annualized expense ratio of 1.06% for Class A shares, 1.81% for Class B shares and 1.81% for Class C shares multiplied by the average account value over the period, multiplied by 182/365 (to reflect the one-half year period). The Example assumes that the $1,000 was invested at the net asset per share determined at the close of business on September 30, 2006.
Eaton Vance Rhode Island Municipals Fund
| | | Beginning Account Value
(10/1/06) | | Ending Account Value
(3/31/07) | | Expenses Paid During Period*
(10/1/06 – 3/31/07) | |
| Actual | |
| Class A | | $ | 1,000.00 | | | $ | 1,018.00 | | | $ | 5.28 | | |
| Class B | | $ | 1,000.00 | | | $ | 1,015.40 | | | $ | 9.04 | | |
| Class C | | $ | 1,000.00 | | | $ | 1,014.40 | | | $ | 8.99 | | |
| Hypothetical | |
| (5% return per year before expenses) | |
| Class A | | $ | 1,000.00 | | | $ | 1,019.70 | | | $ | 5.29 | | |
| Class B | | $ | 1,000.00 | | | $ | 1,016.00 | | | $ | 9.05 | | |
| Class C | | $ | 1,000.00 | | | $ | 1,016.00 | | | $ | 9.00 | | |
* Expenses are equal to the Fund's annualized expense ratio of 1.05% for Class A shares, 1.80% for Class B shares and 1.79% for Class C shares multiplied by the average account value over the period, multiplied by 182/365 (to reflect the one-half year period). The Example assumes that the $1,000 was invested at the net asset value per share determined at the close of business September 30, 2006.
15
Eaton Vance Municipals Funds as of March 31, 2007
FUND EXPENSES CONT'D
Eaton Vance West Virginia Municipals Fund
| | | Beginning Account Value
(10/1/06) | | Ending Account Value
(3/31/07) | | Expenses Paid During Period*
(10/1/06 – 3/31/07) | |
| Actual | |
| Class A | | $ | 1,000.00 | | | $ | 1,023.50 | | | $ | 4.74 | | |
| Class B | | $ | 1,000.00 | | | $ | 1,018.70 | | | $ | 8.51 | | |
| Hypothetical | |
| (5% return per year before expenses) | |
| Class A | | $ | 1,000.00 | | | $ | 1,020.20 | | | $ | 4.73 | | |
| Class B | | $ | 1,000.00 | | | $ | 1,016.50 | | | $ | 8.50 | | |
* Expenses are equal to the Fund's annualized expense ratio of 0.94% for Class A shares and 1.69% for Class B shares, multiplied by the average account value over the period, multiplied by 182/365 (to reflect the one-half year period). The Example assumes that the $1,000 was invested at the net asset value per share determined at the close of business on September 30, 2006.
16
Eaton Vance California Municipals Fund as of March 31, 2007
PORTFOLIO OF INVESTMENTS (Unaudited)
| Tax-Exempt Investments — 104.7% | | | |
Principal Amount
(000's omitted) | | Security | | Value | |
| Education — 3.9% | | | |
| $ | 3,500 | | | California Educational Facilities Authority, (Lutheran
University), 5.00%, 10/1/29 | | $ | 3,648,855 | | |
| | 2,500 | | | California Educational Facilities Authority, (Santa Clara
University), 5.25%, 9/1/26 | | | 2,829,975 | | |
| | 4,000 | | | California Educational Facilities Authority, (Stanford
University), 5.25%, 12/1/32 | | | 4,221,760 | | |
| | | | | | | $ | 10,700,590 | | |
| Electric Utilities — 1.2% | | | |
| $ | 3,000 | | | Chula Vista, (San Diego Gas), (AMT),
5.00%, 12/1/27 | | $ | 3,130,980 | | |
| | | | | | | $ | 3,130,980 | | |
| Escrowed / Prerefunded — 7.1% | | | |
| $ | 1,000 | | | Sacramento County, Single Family, (GNMA), (AMT),
Escrowed to Maturity, 8.25%, 1/1/21 | | $ | 1,402,550 | | |
| | 11,285 | | | Sacramento County, Single Family, (GNMA), (AMT),
Escrowed to Maturity, 8.50%, 11/1/16 | | | 15,209,020 | | |
| | 5,765 | | | San Joaquin Hills Transportation Corridor Agency, Toll Road
Bonds, Escrowed to Maturity, 0.00%, 1/1/26 | | | 2,562,888 | | |
| | | | | | | $ | 19,174,458 | | |
| General Obligations — 4.1% | | | |
| $ | 2,250 | | | California, 4.75%, 6/1/35 | | $ | 2,290,275 | | |
| | 1,000 | | | California, 5.25%, 4/1/30 | | | 1,065,500 | | |
| | 2,250 | | | California, 5.25%, 4/1/34 | | | 2,406,555 | | |
| | 5,000 | | | California, 5.50%, 11/1/33 | | | 5,448,400 | | |
| | | | | | | $ | 11,210,730 | | |
| Hospital — 15.7% | | | |
| $ | 1,000 | | | California Health Facilities Financing Authority, (Catholic
Healthcare West), 5.25%, 7/1/23 | | $ | 1,056,350 | | |
| | 8,850 | | | California Health Facilities Financing Authority,
(Cedars-Sinai Medical Center), 5.00%, 11/15/34 | | | 9,178,954 | | |
| | 4,000 | | | California Health Facilities Financing Authority,
(Marshall Medical Center), 5.00%, 11/1/33 | | | 4,131,080 | | |
| | 2,250 | | | California Infrastructure and Economic Development,
(Kaiser Hospital), 5.50%, 8/1/31 | | | 2,373,322 | | |
| | 6,500 | | | California Statewide Communities Development Authority,
(Huntington Memorial Hospital), 5.00%, 7/1/35 | | | 6,762,470 | | |
| | 2,500 | | | California Statewide Communities Development Authority,
(John Muir Health), 5.00%, 8/15/36 | | | 2,610,175 | | |
| | 1,700 | | | California Statewide Communities Development Authority,
(Kaiser Permanente), 5.00%, 3/1/41 | | | 1,746,104 | | |
Principal Amount
(000's omitted) | | Security | | Value | |
| Hospital (continued) | | | |
| $ | 2,900 | | | California Statewide Communities Development Authority,
(Kaiser Permanente), 5.25%, 3/1/45 | | $ | 3,048,451 | | |
| | 1,850 | | | California Statewide Communities Development Authority,
(Kaiser Permanente), 5.50%, 11/1/32 | | | 1,940,687 | | |
| | 1,500 | | | California Statewide Communities Development Authority,
(Sonoma County Indian Health), 6.40%, 9/1/29 | | | 1,576,965 | | |
| �� | 215 | | | Eastern Plumas Health Care District,
7.50%, 8/1/07 | | | 216,299 | | |
| | 2,700 | | | San Benito Health Care District,
5.40%, 10/1/20 | | | 2,725,083 | | |
| | 1,000 | | | Torrance Hospital, (Torrance Memorial Medical Center),
5.50%, 6/1/31 | | | 1,056,220 | | |
| | 2,640 | | | Turlock, (Emanuel Medical Center, Inc.),
5.375%, 10/15/34 | | | 2,769,941 | | |
| | 1,250 | | | Washington Township Hospital Health Care District,
5.25%, 7/1/29 | | | 1,281,500 | | |
| | | | | | | $ | 42,473,601 | | |
| Housing — 0.7% | | | |
| $ | 1,407 | | | Commerce (Hermitage III Senior Apartments),
6.50%, 12/1/29 | | $ | 1,500,046 | | |
| | 424 | | | Commerce (Hermitage III Senior Apartments),
6.85%, 12/1/29 | | | 447,579 | | |
| | | | | | | $ | 1,947,625 | | |
| Industrial Development Revenue — 3.2% | | | |
| $ | 2,750 | | | California Pollution Control Financing Authority, (Browning
Ferris Industries), (AMT), 5.80%, 12/1/16 | | $ | 2,751,210 | | |
| | 1,700 | | | California Pollution Control Financing Authority, (Solid
Waste Disposal), (AMT), 5.40%, 4/1/25 | | | 1,791,001 | | |
| | 4,000 | | | California Statewide Communities Development Authority,
(Anheuser Busch Project), 4.80%, 9/1/46 | | | 4,016,720 | | |
| | | | | | | $ | 8,558,931 | | |
| Insured-Education — 1.5% | | | |
| $ | 3,990 | | | Puerto Rico Industrial, Tourist, Educational, Medical and
Environmental Authority, (University of Puerto Rico),
(MBIA), 5.00%, 7/1/33(1) | | $ | 4,119,555 | | |
| | | | | | | $ | 4,119,555 | | |
| Insured-Electric Utilities — 7.8% | | | |
| $ | 5,000 | | | California Pollution Control Financing Authority, PCR,
(Pacific Gas and Electric), (MBIA), (AMT),
5.35%, 12/1/16 | | $ | 5,345,200 | | |
| | 9,000 | | | Northern California Power Agency, (Hydroelectric), (MBIA),
5.125%, 7/1/23(1) | | | 9,219,840 | | |
| | 1,500 | | | Puerto Rico Electric Power Authority, (FSA),
5.25%, 7/1/29(1) | | | 1,578,675 | | |
See notes to financial statements
17
Eaton Vance California Municipals Fund as of March 31, 2007
PORTFOLIO OF INVESTMENTS (Unaudited) CONT'D
Principal Amount
(000's omitted) | | Security | | Value | |
| Insured-Electric Utilities (continued) | | | |
| $ | 7,070 | | | Southern California Public Power Authority, (MBIA),
0.00%, 7/1/15 | | $ | 5,100,864 | | |
| | | | | | | $ | 21,244,579 | | |
| Insured-Escrowed / Prerefunded — 5.8% | | | |
| $ | 2,500 | | | California Infrastructure and Economic Development,
(Bay Area Toll Bridges), Prerefunded to 1/1/28,
(AMBAC), 5.00%, 7/1/33(2) | | $ | 2,810,375 | | |
| | 5,000 | | | California Infrastructure and Economic Development,
(Bay Area Toll Bridges), Prerefunded to 1/1/28, (FGIC),
5.00%, 7/1/29 | | | 5,620,750 | | |
| | 15,000 | | | Foothill/Eastern Corridor Agency, Toll Road Bonds,
Escrowed to Maturity, (FSA), 0.00%, 1/1/28 | | | 6,054,300 | | |
| | 1,135 | | | Puerto Rico Highway and Transportation Authority,
Prerefunded to 7/1/15, (AGC), 5.00%, 7/1/45 | | | 1,234,415 | | |
| | | | | | | $ | 15,719,840 | | |
| Insured-General Obligations — 7.1% | | | |
| $ | 3,000 | | | Allan Hancock, (Joint Community College), (FSA),
4.375%, 8/1/31 | | $ | 2,946,900 | | |
| | 5,000 | | | California, (FSA), 5.25%, 8/1/32(3) | | | 5,809,350 | | |
| | 2,285 | | | Merced Unified School District, (FGIC), 0.00%, 8/1/19 | | | 1,363,414 | | |
| | 3,300 | | | Puerto Rico, (FSA), Variable Rate, 5.84%, 7/1/27(4)(5) | | | 3,901,623 | | |
| | 4,500 | | | San Diego Unified School District, (MBIA),
5.50%, 7/1/24(1) | | | 5,245,920 | | |
| | | | | | | $ | 19,267,207 | | |
| Insured-Hospital — 5.7% | | | |
| $ | 2,550 | | | California Statewide Communities Development Authority,
(Children's Hospital Los Angeles), (MBIA),
5.25%, 8/15/29 | | $ | 2,648,736 | | |
| | 7,500 | | | California Statewide Communities Development Authority,
(Rady Children's Hospital), (MBIA), 4.50%, 8/15/28 | | | 7,525,275 | | |
| | 4,920 | | | California Statewide Communities Development Authority,
(Sutter Health), (FSA), 5.75%, 8/15/27(1) | | | 5,177,218 | | |
| | | | | | | $ | 15,351,229 | | |
Insured-Lease Revenue / Certificates of
Participation — 5.1% | | | |
| $ | 6,500 | | | Anaheim Public Financing Authority, (Public
Improvements), (FSA), 0.00%, 9/1/22 | | $ | 3,330,470 | | |
| | 11,280 | | | Anaheim Public Financing Authority, (Public
Improvements), (FSA), 0.00%, 9/1/30 | | | 3,914,950 | | |
| | 5,000 | | | Los Angeles County, (Disney Parking), (AMBAC),
0.00%, 9/1/17 | | | 3,268,100 | | |
| | 5,370 | | | Los Angeles County, (Disney Parking), (AMBAC),
0.00%, 3/1/18 | | | 3,418,864 | | |
| | | | | | | $ | 13,932,384 | | |
Principal Amount
(000's omitted) | | Security | | Value | |
| Insured-Special Tax Revenue — 2.8% | | | |
| $ | 2,565 | | | Ceres Redevelopment Agency, (Ceres Redevelopment
Project Area No. 1), (AMBAC), 4.00%, 11/1/31 | | $ | 2,362,801 | | |
| | 1,000 | | | Puerto Rico Convention Center Authority, (CIFG),
4.50%, 7/1/36 | | | 1,004,830 | | |
| | 4,540 | | | San Francisco Bay Area Rapid Transportation District, Sales
Tax Revenue, (FSA), 4.25%, 7/1/36 | | | 4,366,844 | | |
| | | | | | | $ | 7,734,475 | | |
| Insured-Transportation — 3.1% | | | |
| $ | 4,320 | | | Los Angeles County Metropolitan Transportation Authority,
(AMBAC), 5.00%, 7/1/23(1) | | $ | 4,463,726 | | |
| | 2,500 | | | Puerto Rico Highway and Transportation Authority,
(AMBAC), 5.50%, 7/1/29 | | | 2,968,800 | | |
| | 1,800 | | | San Joaquin Hills Transportation Corridor Agency, Toll Road
Bonds, (MBIA), 0.00%, 1/15/24 | | | 869,580 | | |
| | | | | | | $ | 8,302,106 | | |
| Insured-Water and Sewer — 7.8% | | | |
| $ | 2,000 | | | Calleguas Las Virgines Public Financing Authority Revenue,
(Municipal Water District), (MBIA), 4.25%, 7/1/32 | | $ | 1,916,140 | | |
| | 3,500 | | | Los Angeles, Water and Power, (AMBAC), 5.00%, 7/1/36 | | | 3,719,520 | | |
| | 6,675 | | | Los Angeles, Water and Power, (FSA), 4.75%, 7/1/36 | | | 6,860,365 | | |
| | 1,680 | | | Los Angeles, Water and Power, (MBIA),
3.00%, 7/1/30 | | | 1,328,208 | | |
| | 3,000 | | | San Diego County Water Authority, (FGIC), Variable Rate,
9.09%, 4/22/09(6) | | | 3,251,310 | | |
| | 4,135 | | | San Francisco City and County Public Utilities Commission,
(FSA), 4.25%, 11/1/33 | | | 3,991,061 | | |
| | | | | | | $ | 21,066,604 | | |
| Lease Revenue / Certificates of Participation — 11.6% | | | |
| $ | 6,500 | | | California Public Works, (University of California),
5.00%, 6/1/23(7) | | $ | 6,503,900 | | |
| | 5,000 | | | California Public Works, (University of California),
5.25%, 6/1/20 | | | 5,550,700 | | |
| | 5,115 | | | Los Angeles County, (Disney Parking), 0.00%, 3/1/16 | | | 3,408,789 | | |
| | 1,925 | | | Los Angeles County, (Disney Parking), 0.00%, 3/1/17 | | | 1,220,354 | | |
| | 3,100 | | | Los Angeles County, (Disney Parking), 0.00%, 3/1/20 | | | 1,682,618 | | |
| | 6,520 | | | Pasadena Parking Facility, 6.25%, 1/1/18 | | | 7,369,556 | | |
| | 5,000 | | | Sacramento City Financing Authority, 5.40%, 11/1/20 | | | 5,608,450 | | |
| | | | | | | $ | 31,344,367 | | |
See notes to financial statements
18
Eaton Vance California Municipals Fund as of March 31, 2007
PORTFOLIO OF INVESTMENTS (Unaudited) CONT'D
Principal Amount
(000's omitted) | | Security | | Value | |
| Other Revenue — 3.1% | | | |
| $ | 2,380 | | | California Statewide Communities Development Authority,
(East Valley Tourist Development Authority),
8.25%, 10/1/14(4) | | $ | 2,560,690 | | |
| | 5,100 | | | Golden State Tobacco Securitization Corp., (Tobacco
Settlement Revenue), 5.125%, 6/1/47 | | | 5,064,351 | | |
| | 700 | | | Puerto Rico Infrastructure Financing Authority, Variable Rate,
6.477%, 10/1/34(4)(5) | | | 846,951 | | |
| | | | | | | $ | 8,471,992 | | |
| Senior Living / Life Care — 0.5% | | | |
| $ | 250 | | | California Statewide Communities Development Authority,
(Senior Living - Presbyterian Homes), 4.75%, 11/15/26 | | $ | 252,490 | | |
| | 1,000 | | | California Statewide Communities Development Authority,
(Senior Living - Presbyterian Homes), 4.875%, 11/15/36 | | | 1,012,210 | | |
| | | | | | | $ | 1,264,700 | | |
| Special Tax Revenue — 6.3% | | | |
| $ | 2,500 | | | Bonita Canyon Public Financing Authority,
5.375%, 9/1/28 | | $ | 2,523,550 | | |
| | 415 | | | Brentwood Infrastructure Financing Authority,
5.00%, 9/2/26 | | | 423,271 | | |
| | 665 | | | Brentwood Infrastructure Financing Authority,
5.00%, 9/2/34 | | | 673,273 | | |
| | 1,810 | | | Corona Public Financing Authority, 5.80%, 9/1/20 | | | 1,816,643 | | |
| | 1,060 | | | Fairfield Improvement Bond Act of 1915, (North Cordelia
District), 7.375%, 9/2/18 | | | 1,102,983 | | |
| | 600 | | | Jurupa Community Services District, (Community
Facilities District No. 16), 5.30%, 9/1/34 | | | 614,220 | | |
| | 2,115 | | | Lincoln Public Financing Authority, Improvement
Bond Act of 1915, (Twelve Bridges), 6.20%, 9/2/25 | | | 2,222,992 | | |
| | 1,430 | | | Moreno Valley Unified School District, 5.95%, 9/1/34 | | | 1,464,391 | | |
| | 2,300 | | | Santa Margarita Water District, 6.20%, 9/1/20 | | | 2,448,419 | | |
| | 1,000 | | | Santaluz Community Facilities District No. 2,
6.20%, 9/1/30 | | | 1,006,610 | | |
| | 350 | | | Temecula Unified School District, 5.00%, 9/1/27 | | | 358,039 | | |
| | 535 | | | Temecula Unified School District, 5.00%, 9/1/37 | | | 544,025 | | |
| | 1,000 | | | Torrance Redevelopment Agency, 5.625%, 9/1/28 | | | 1,021,110 | | |
| | 900 | | | Whittier Public Financing Authority, (Greenleaf Avenue
Redevelopment), 5.50%, 11/1/23 | | | 937,890 | | |
| | | | | | | $ | 17,157,416 | | |
| Water and Sewer — 0.6% | | | |
| $ | 1,740 | | | Metropolitan Water District of Southern California,
(Waterworks Revenue Authorization),
4.75%, 7/1/36(1) | | $ | 1,793,114 | | |
| | | | | | | $ | 1,793,114 | | |
Principal Amount
(000's omitted) | | Security | | Value | |
Total Tax-Exempt Investments — 104.7%
(identified cost $262,135,937) | | $ | 283,966,483 | | |
| Short-Term Investments — 1.1% | |
Principal Amount
(000's omitted) | | Security | | Value | |
| $ | 3,000 | | | California Department of Water Resource Power Supply,
Variable Rate, 3.70%, 5/1/22 | | $ | 3,000,000 | | |
Total Short-Term Investments
(at amortized cost, $3,000,000) | | $ | 3,000,000 | | |
Total Investments — 105.8%
(identified cost $265,135,937) | | $ | 286,966,483 | | |
| Other Assets, Less Liabilities — (5.8)% | | $ | (15,628,630 | ) | |
| Net Assets — 100.0% | | $ | 271,337,853 | | |
AGC - Assured Guaranty Corp.
AMBAC - AMBAC Financial Group, Inc.
AMT - Interest earned from these securities may be considered a tax preference item for purposes of the Federal Alternative Minimum Tax.
CIFG - CDC IXIS Financial Guaranty North America, Inc.
FGIC - Financial Guaranty Insurance Company
FSA - Financial Security Assurance, Inc.
GNMA - Government National Mortgage Association (Ginnie Mae)
MBIA - Municipal Bond Insurance Association
The Fund invests primarily in debt securities issued by California municipalities. The ability of the issuers of the debt securities to meet their obligations may be affected by economic developments in a specific industry or municipality. In order to reduce the risk associated with such economic developments, at March 31, 2007, 44.2% of total investments are backed by bond insurance of various financial institutions and financial guaranty assurance agencies. The aggregate percentage insured by an individual financial institution ranged from 0.4% to 16.7% of total investments.
(1) Security represents the underlying municipal obligation of an inverse floating rate obligation held by the Fund.
(2) Security (or a portion thereof) has been segregated to cover margin requirements on open financial futures contracts.
(3) When-issued security.
(4) Security exempt from registration under Rule 144A of the Securities Act of 1933. These securities may be sold in transactions exempt from registration, normally to qualified institutional buyers. At March 31, 2007, the aggregate value of the securities is $7,309,264 or 2.7% of the Fund's net assets.
(5) Security has been issued as a leveraged inverse floater bond. The stated interest rate represents the rate in effect at March 31, 2007.
(6) Security has been issued as an inverse floater bond. The stated interest rate represents the rate in effect at March 31, 2007.
(7) Security (or a portion thereof) has been segregated to cover when-issued securities.
See notes to financial statements
19
Eaton Vance Florida Municipals Fund as of March 31, 2007
PORTFOLIO OF INVESTMENTS (Unaudited)
| Tax-Exempt Investments — 110.9% | | | |
Principal Amount
(000's omitted) | |
Security | |
Value | |
| Escrowed / Prerefunded — 7.7% | | | |
| $ | 1,000 | | | Capital Trust Agency, (Seminole Tribe Convention),
Prerefunded to 10/1/12, 8.95%, 10/1/33(1) | | $ | 1,222,420 | | |
| | 615 | | | Florida Mid-Bay Bridge Authority, Escrowed to Maturity,
6.10%, 10/1/22 | | | 745,423 | | |
| | 1,675 | | | Florida Mid-Bay Bridge Authority, Escrowed to Maturity,
6.875%, 10/1/22 | | | 2,180,850 | | |
| | 1,000 | | | Halifax Medical Center, Prerefunded to 10/1/10,
7.25%, 10/1/24 | | | 1,128,800 | | |
| | 1,100 | | | Highlands County Health Facilities Authority, (Adventist
Health System), Prerefunded to 11/15/13,
5.375%, 11/15/35 | | | 1,200,914 | | |
| | 1,250 | | | Lakeland Hospital System, (Lakeland Regional
Health System), Prerefunded to 11/15/12,
5.50%, 11/15/32 | | | 1,370,425 | | |
| | 500 | | | Lee County Industrial Development Authority,
(Shell Point Village), Prerefunded to 11/15/09,
5.50%, 11/15/21 | | | 526,130 | | |
| | 2,775 | | | Lee County Industrial Development Authority,
(Shell Point Village), Prerefunded to 11/15/09,
5.50%, 11/15/29 | | | 2,920,021 | | |
| | 3,690 | | | North Miami Health Care Facilities Authority, (Imperial Club),
Prerefunded to 1/1/09, 6.75%, 1/1/33 | | | 3,953,724 | | |
| | 4,000 | | | Orange County Health Facilities Authority, (Adventist
Health System), Prerefunded to 11/15/12,
5.625%, 11/15/32 | | | 4,410,520 | | |
| | | | | | | $ | 19,659,227 | | |
| Health Care-Miscellaneous — 0.4% | | | |
| $ | 1,056 | | | Osceola County Industrial Development Authority,
Community Provider Pooled Loan, 7.75%, 7/1/17 | | $ | 1,057,140 | | |
| | | | | | | $ | 1,057,140 | | |
| Hospital — 6.8% | | | |
| $ | 4,500 | | | Brevard County Health Facilities Authority, (Health
First, Inc.), 5.00%, 4/1/36 | | $ | 4,643,190 | | |
| | 2,795 | | | Cape Canaveral Hospital District, (Cape Canaveral
Hospital, Inc.), 5.25%, 1/1/28 | | | 2,840,698 | | |
| | 1,750 | | | Highlands County Health Facilities Authority, (Adventist
Glenoaks Hospital/Adventist Healthcare),
5.00%, 11/15/31 | | | 1,802,430 | | |
| | 250 | | | Highlands County Health Facilities Authority, (Adventist
Health System), 5.00%, 11/15/35 | | | 256,950 | | |
| | 2,750 | | | Jacksonville Economic Development Authority, (Mayo Clinic),
5.50%, 11/15/36 | | | 2,936,120 | | |
| | 2,200 | | | Orange County Health Facilities Authority, (Orlando Regional
Healthcare), 5.125%, 11/15/39 | | | 2,290,816 | | |
Principal Amount
(000's omitted) | |
Security | |
Value | |
| Hospital (continued) | | | |
| $ | 2,500 | | | West Orange Health Care District, 5.80%, 2/1/31 | | $ | 2,637,325 | | |
| | | | | | | $ | 17,407,529 | | |
| Housing — 0.5% | | | |
| $ | 75 | | | Florida Housing Finance Authority, 6.35%, 6/1/14 | | $ | 75,118 | | |
| | 510 | | | Florida Housing Finance Authority, (AMT), 6.35%, 7/1/28 | | | 515,136 | | |
| | 565 | | | Orange County Housing Finance Authority, (AMT),
6.60%, 4/1/28 | | | 568,622 | | |
| | | | | | | $ | 1,158,876 | | |
| Housing-Multifamily — 1.4% | | | |
| $ | 1,515 | | | Capital Trust Agency, (Atlantic Housing Foundation),
5.30%, 7/1/35 | | $ | 1,546,951 | | |
| | 1,800 | | | Florida Capital Projects Finance Authority, Student Housing
Revenue, (Florida University), Prerefunded to 8/15/10,
7.75%, 8/15/20 | | | 2,025,486 | | |
| | | | | | | $ | 3,572,437 | | |
| Industrial Development Revenue — 2.0% | | | |
| $ | 2,459 | | | Broward County Industrial Development Revenue,
(Lynxs Cargoport), (AMT), 6.75%, 6/1/19 | | $ | 2,538,459 | | |
| | 2,460 | | | Capital Trust Agency, (Fort Lauderdale Project), (AMT),
5.75%, 1/1/32 | | | 2,581,032 | | |
| | | | | | | $ | 5,119,491 | | |
| Insured-Electric Utilities — 2.1% | | | |
| $ | 5,125 | | | Lakeland Energy System, (XLCA), 4.75%, 10/1/36 | | $ | 5,245,079 | | |
| | | | | | | $ | 5,245,079 | | |
| Insured-Escrowed / Prerefunded — 8.2% | | | |
| $ | 9,225 | | | Dade County, (Baptist Hospital of Miami), Escrowed to
Maturity, (MBIA), 5.75%, 5/1/21 | | $ | 10,364,564 | | |
| | 3,835 | | | Dade County, Professional Sports Franchise Facility,
Escrowed to Maturity, (MBIA), 0.00%, 10/1/23 | | | 1,934,489 | | |
| | 1,800 | | | Miami-Dade County Health Facilities Authority, (Miami
Children's Hospital),Prerefunded to 8/15/11, (AMBAC),
5.125%, 8/15/26 | | | 1,917,612 | | |
| | 5,600 | | | St. Lucie Utility System, Escrowed to Maturity, (FGIC),
6.00%, 10/1/20 | | | 6,693,568 | | |
| | | | | | | $ | 20,910,233 | | |
| Insured-General Obligations — 1.2% | | | |
| $ | 2,700 | | | Puerto Rico, (MBIA), 5.50%, 7/1/20(2) | | $ | 3,111,795 | | |
| | | | | | | $ | 3,111,795 | | |
See notes to financial statements
20
Eaton Vance Florida Municipals Fund as of March 31, 2007
PORTFOLIO OF INVESTMENTS (Unaudited) CONT'D
Principal Amount
(000's omitted) | |
Security | |
Value | |
| Insured-Health Care Miscellaneous — 0.0% | | | |
| $ | 107 | | | Osceola County Industrial Development Authority,
Community Provider Pooled Loan-93 Program, (FSA),
7.75%, 7/1/10 | | $ | 108,179 | | |
| | | | | | | $ | 108,179 | | |
| Insured-Hospital — 7.0% | | | |
| $ | 4,000 | | | Coral Gables Health Facilities Authority, (Baptist Health
System of South Florida), (FSA), 5.00%, 8/15/29 | | $ | 4,194,480 | | |
| | 9,560 | | | Sarasota County Public Hospital Board, (Sarasota Memorial
Hospital), (MBIA), 5.50%, 7/1/28 | | | 11,110,441 | | |
| | 2,250 | | | South Miami Health Facility Authority, Hospital Revenue,
(Baptist Health), (AMBAC), 5.25%, 11/15/33 | | | 2,368,057 | | |
| | | | | | | $ | 17,672,978 | | |
| Insured-Housing — 1.2% | | | |
| $ | 3,000 | | | Florida Housing Finance Authority, (Brittany of Rosemont),
(AMBAC), (AMT), 6.875%, 8/1/26 | | $ | 3,004,380 | | |
| | | | | | | $ | 3,004,380 | | |
Insured-Lease Revenue / Certificates of
Participation — 1.5% | | | |
| $ | 3,300 | | | Puerto Rico Public Finance Corp., (AMBAC),
5.125%, 6/1/24(2) | | $ | 3,681,337 | | |
| | | | | | | $ | 3,681,337 | | |
| Insured-Special Tax Revenue — 18.4% | | | |
| $ | 5,525 | | | Cape Coral, Special Obligation, (MBIA), 4.50%, 10/1/36 | | $ | 5,467,098 | | |
| | 6,345 | | | Dade County, Special Obligation, (AMBAC),
5.00%, 10/1/35(2) | | | 6,418,835 | | |
| | 1,500 | | | Jacksonville, Excise Tax, (FGIC), (AMT), 0.00%, 10/1/12 | | | 1,208,220 | | |
| | 1,575 | | | Miami-Dade County, Special Obligation, (MBIA),
0.00%, 10/1/36 | | | 359,714 | | |
| | 6,630 | | | Miami-Dade County, Special Obligation, (MBIA),
0.00%, 10/1/37 | | | 1,433,737 | | |
| | 5,000 | | | Miami-Dade County, Special Obligation, (MBIA),
0.00%, 10/1/38 | | | 1,024,450 | | |
| | 10,000 | | | Miami-Dade County, Special Obligation, (MBIA),
0.00%, 10/1/39 | | | 1,939,700 | | |
| | 10,055 | | | Miami-Dade County, Special Obligation, (MBIA),
0.00%, 10/1/40 | | | 1,855,851 | | |
| | 985 | | | Opa-Locka, Sales Tax, (FGIC), 7.00%, 1/1/14 | | | 987,591 | | |
| | 7,830 | | | Orange County Tourist Development Tax, (AMBAC),
5.125%, 10/1/30(2) | | | 8,240,344 | | |
| | 4,000 | | | Sunrise Public Facilities, (MBIA), 0.00%, 10/1/15 | | | 2,857,040 | | |
| | 4,140 | | | Sunrise Public Facilities, (MBIA), 0.00%, 10/1/16 | | | 2,828,821 | | |
| | 2,525 | | | Sunrise Public Facilities, (MBIA), 0.00%, 10/1/17 | | | 1,649,204 | | |
Principal Amount
(000's omitted) | |
Security | |
Value | |
| Insured-Special Tax Revenue (continued) | | | |
| $ | 2,000 | | | Tampa Utility Tax, (AMBAC), 0.00%, 10/1/18 | | $ | 1,247,180 | | |
| | 6,800 | | | Tampa Utility Tax, (AMBAC), 0.00%, 4/1/19 | | | 4,128,960 | | |
| | 5,000 | | | Tampa Utility Tax, (AMBAC), 0.00%, 10/1/19 | | | 2,973,550 | | |
| | 4,000 | | | Tampa Utility Tax, (AMBAC), 0.00%, 10/1/20 | | | 2,269,960 | | |
| | | | | | | $ | 46,890,255 | | |
| Insured-Transportation — 18.6% | | | |
| $ | 1,225 | | | Florida Turnpike Authority, (FSA), 4.50%, 7/1/28 | | $ | 1,225,110 | | |
| | 8,750 | | | Florida Turnpike Authority, Water & Sewer Revenue,
(Department of Transportation), (FGIC), 4.50%, 7/1/27(3) | | | 8,755,950 | | |
| | 8,700 | | | Greater Orlando Aviation Authority, (FGIC), (AMT),
5.25%, 10/1/18(2) | | | 9,032,224 | | |
| | 7,680 | | | Miami-Dade County, Aviation Revenue, (Miami International
Airport), (CIFG), (AMT), 5.00%, 10/1/38(2) | | | 8,003,942 | | |
| | 2,000 | | | Orlando and Orange County Expressway Authority,
(FGIC), 8.25%, 7/1/14 | | | 2,567,440 | | |
| | 7,500 | | | Palm Beach County Airport System, (MBIA), (AMT),
5.00%, 10/1/34 | | | 7,819,550 | | |
| | 1,100 | | | Port Palm Beach District, (Public Improvements),
(XLCA), 0.00%, 9/1/22 | | | 569,954 | | |
| | 1,100 | | | Port Palm Beach District, (Public Improvements),
(XLCA), 0.00%, 9/1/23 | | | 544,401 | | |
| | 5,000 | | | Puerto Rico Highway and Transportation Authority,
(FSA), 4.75%, 7/1/38 | | | 5,232,850 | | |
| | 3,940 | | | Tampa-Hillsborough County Expressway Authority,
(AMBAC), 4.00%, 7/1/34 | | | 3,632,168 | | |
| | | | | | | $ | 47,383,589 | | |
| Insured-Water and Sewer — 14.3% | | | |
| $ | 3,020 | | | Fort Lauderdale, Water and Sewer,
(MBIA), 4.50%, 9/1/35 | | $ | 3,004,538 | | |
| | 10,000 | | | Fort Myers Utility, (FGIC), 5.50%, 10/1/29(2) | | | 10,481,000 | | |
| | 2,500 | | | Martin County Utilities System, (AMBAC), 5.00%, 10/1/28 | | | 2,638,975 | | |
| | 2,000 | | | Miami Beach, Storm Water, (FGIC), 5.375%, 9/1/30 | | | 2,109,720 | | |
| | 10,525 | | | Sunrise Utility System, (AMBAC), 5.00%, 10/1/28 | | | 11,311,744 | | |
| | 2,600 | | | Tampa Bay Water Utility System,
(FGIC), 4.75%, 10/1/27(2) | | | 2,634,943 | | |
| | 4,150 | | | Tampa Bay Water Utility System, (FGIC), Prerefunded to
10/1/08, 4.75%, 10/1/27(2) | | | 4,254,917 | | |
| | | | | | | $ | 36,435,837 | | |
| Nursing Home — 3.1% | | | |
| $ | 4,210 | | | Dade County Industrial Development Authority, (Gramercy
Park Nursing Care), (FHA), 6.60%, 8/1/23 | | $ | 4,218,546 | | |
| | 3,500 | | | Orange County Health Facilities Authority, (Westminster
Community Care), 6.60%, 4/1/24 | | | 3,633,770 | | |
| | | | | | | $ | 7,852,316 | | |
See notes to financial statements
21
Eaton Vance Florida Municipals Fund as of March 31, 2007
PORTFOLIO OF INVESTMENTS (Unaudited) CONT'D
Principal Amount
(000's omitted) | |
Security | |
Value | |
| Senior Living / Life Care — 2.3% | | | |
| $ | 4,100 | | | North Miami Health Care Facilities Authority,
(Imperial Club), 6.125%, 1/1/42 | | $ | 4,110,332 | | |
| | 1,750 | | | Plantation Health Facilities Authority, (Covenant
Village of Florida), 5.125%, 12/1/22 | | | 1,768,113 | | |
| | | | | | | $ | 5,878,445 | | |
| Special Tax Revenue — 10.6% | | | |
| $ | 1,115 | | | Concorde Estates Community Development District,
5.85%, 5/1/35 | | $ | 1,174,697 | | |
| | 255 | | | Covington Park Community Development District, (Capital
Improvements), 5.00%, 5/1/21 | | | 260,258 | | |
| | 1,185 | | | Covington Park Community Development District, (Capital
Improvements), 5.00%, 5/1/31 | | | 1,216,663 | | |
| | 710 | | | Dupree Lakes Community Development District,
5.00%, 11/1/10 | | | 710,107 | | |
| | 1,015 | | | Dupree Lakes Community Development District,
5.375%, 5/1/37 | | | 1,022,227 | | |
| | 970 | | | Fishhawk Community Development District,
6.125%, 5/1/34 | | | 1,029,859 | | |
| | 235 | | | Gateway Services Community Development District,
Special Assessment, 6.50%, 5/1/33 | | | 254,066 | | |
| | 660 | | | Heritage Harbor South Community Development District,
(Capital Improvements), 6.20%, 5/1/35 | | | 708,325 | | |
| | 480 | | | Heritage Harbor South Community Development District,
(Capital Improvements), 6.50%, 5/1/34 | | | 518,942 | | |
| | 10 | | | Heritage Harbor South, Community Development District,
(Capital Improvements), 5.40%, 11/1/08 | | | 10,022 | | |
| | 1,390 | | | Heritage Springs Community Development District,
5.25%, 5/1/26 | | | 1,415,131 | | |
| | 1,100 | | | Lexington Oaks Community Development District,
7.20%, 5/1/30 | | | 1,123,694 | | |
| | 185 | | | Longleaf Community Development District,
6.20%, 5/1/09 | | | 186,228 | | |
| | 880 | | | New River Community Development District,
5.00%, 5/1/13 | | | 874,729 | | |
| | 360 | | | New River Community Development District,
5.35%, 5/1/38 | | | 359,712 | | |
| | 1,230 | | | North Springs Improvement District, (Heron Bay),
5.20%, 5/1/27 | | | 1,249,975 | | |
| | 2,270 | | | River Hall Community Development District, (Capital
Improvements), 5.45%, 5/1/36 | | | 2,299,805 | | |
| | 970 | | | Southern Hills Plantation I Community Development District,
5.80%, 5/1/35 | | | 1,003,300 | | |
| | 1,670 | | | Sterling Hill Community Development District,
6.20%, 5/1/35 | | | 1,779,535 | | |
| | 2,500 | | | Tisons Landing Community Development District,
5.625%, 5/1/37 | | | 2,558,525 | | |
| | 2,895 | | | University Square Community Development District,
6.75%, 5/1/20 | | | 3,062,534 | | |
| | 610 | | | Vista Lakes Community Development District,
7.20%, 5/1/32 | | | 652,688 | | |
Principal Amount
(000's omitted) | |
Security | |
Value | |
| Special Tax Revenue (continued) | | | |
| $ | 400 | | | West Palm Beach Community Redevelopment Agency,
(Northwood Pleasant Community), 5.00%, 3/1/29 | | $ | 417,232 | | |
| | 2,870 | | | West Palm Beach Community Redevelopment Agency,
(Northwood Pleasant Community), 5.00%, 3/1/35 | | | 2,978,630 | | |
| | | | | | | $ | 26,866,884 | | |
| Transportation — 1.0% | | | |
| $ | 2,385 | | | Florida Mid-Bay Bridge Authority, 6.10%, 10/1/22 | | $ | 2,487,865 | | |
| | | | | | | $ | 2,487,865 | | |
| Water and Sewer — 2.6% | | | |
| $ | 6,275 | | | Jacksonville Electric Authority, Water and Sewer Revenue,
5.25%, 10/1/39 | | $ | 6,502,030 | | |
| | | | | | | $ | 6,502,030 | | |
Total Tax-Exempt Investments — 110.9%
(identified cost $258,676,157) | | $ | 282,005,902 | | |
| Other Assets, Less Liabilities — (10.9)% | | $ | (27,763,536 | ) | |
| Net Assets — 100.0% | | $ | 254,242,366 | | |
AMBAC - AMBAC Financial Group, Inc.
AMT - Interest earned from these securities may be considered a tax preference item for purposes of the Federal Alternative Minimum Tax.
CIFG - CDC IXIS Financial Guaranty North America, Inc.
FGIC - Financial Guaranty Insurance Company
FHA - Federal Housing Administration
FSA - Financial Security Assurance, Inc.
MBIA - Municipal Bond Insurance Association
XLCA - XL Capital Assurance, Inc.
The Fund invests primarily in debt securities issued by Florida municipalities. The ability of the issuers of the debt securities to meet their obligations may be affected by economic developments in a specific industry or municipality. In order to reduce the risk associated with such economic developments, at March 31, 2007, 65.4% of total investments are backed by bond insurance of various financial institutions and financial guaranty assurance agencies. The aggregate percentage insured by an individual financial institution ranged from 2.3% to 20.1% of total investments.
(1) Security exempt from registration under Rule 144A of the Securities Act of 1933. These securities may be sold in transactions exempt from registration, normally to qualified institutional buyers. At March 31, 2007, the aggregate value of the securities is $1,222,420 or 0.5% of the Fund's net assets.
(2) Security represents the underlying municipal obligation of an inverse floating rate obligation held by the Fund.
(3) Security (or a portion thereof) has been segregated to cover margin requirements on open financial futures contracts.
See notes to financial statements
22
Eaton Vance Massachusetts Municipals Fund as of March 31, 2007
PORTFOLIO OF INVESTMENTS (Unaudited)
| Tax-Exempt Investments — 111.6% | | | |
Principal Amount
(000's omitted) | |
Security | |
Value | |
| Education — 16.3% | | | |
| $ | 5,500 | | | Massachusetts Development Finance Agency,
(Boston University), 5.45%, 5/15/59 | | $ | 6,177,655 | | |
| | 1,000 | | | Massachusetts Development Finance Agency,
(Middlesex School), 5.00%, 9/1/33 | | | 1,033,490 | | |
| | 1,000 | | | Massachusetts Development Finance Agency,
(Wheeler School), 6.50%, 12/1/29 | | | 1,053,800 | | |
| | 2,630 | | | Massachusetts Health and Educational Facilities Authority,
(Harvard University), 5.00%, 7/15/35 | | | 2,784,381 | | |
| | 1,700 | | | Massachusetts Health and Educational Facilities Authority,
(Harvard University), 5.125%, 7/15/37 | | | 1,795,268 | | |
| | 4,000 | | | Massachusetts Health and Educational Facilities Authority,
(Massachusetts Institute of Technology), 5.25%, 7/1/33 | | | 4,681,560 | | |
| | 6,000 | | | Massachusetts Health and Educational Facilities Authority,
(Massachusetts Institute of Technology), 5.50%, 7/1/32 | | | 7,243,680 | | |
| | 4,555 | | | Massachusetts Health and Educational Facilities Authority,
(Williams College), 4.50%, 7/1/33 | | | 4,556,412 | | |
| | 6,745 | | | Massachusetts Health and Educational Facilities Authority,
(Williams College), 5.00%, 7/1/31 | | | 7,168,046 | | |
| | 10,000 | | | Massachusetts Health and Educational Facilities Authority,
(Williams College), 5.00%, 7/1/36 | | | 10,595,700 | | |
| | 2,000 | | | Massachusetts Industrial Finance Agency,
(St. Johns High School, Inc.), 5.35%, 6/1/28 | | | 2,045,120 | | |
| | | | | | | $ | 49,135,112 | | |
| Electric Utilities — 5.5% | | | |
| $ | 5,815 | | | Massachusetts Development Finance Agency,
(Dominion Energy Brayton Point), (AMT),
5.00%, 2/1/36 | | $ | 5,971,772 | | |
| | 3,000 | | | Puerto Rico Electric Power Authority, 0.00%, 7/1/17 | | | 1,944,330 | | |
| | 13,230 | | | Puerto Rico Electric Power Authority, 0.00%, 7/1/17 | | | 8,531,630 | | |
| | | | | | | $ | 16,447,732 | | |
| Escrowed / Prerefunded — 9.6% | | | |
| $ | 2,190 | | | Massachusetts Development Finance Agency,
(Belmont Hill School), Prerefunded to 9/1/11,
5.00%, 9/1/31 | | $ | 2,324,116 | | |
| | 2,000 | | | Massachusetts Industrial Finance Agency,
(Belmont Hill School),
Prerefunded to 9/1/08, 5.25%, 9/1/28 | | | 2,056,660 | | |
| | 20,000 | | | Massachusetts Turnpike Authority, Escrowed to Maturity,
5.00%, 1/1/20 | | | 21,747,600 | | |
| | 2,435 | | | Massachusetts Water Pollution Abatement Trust,
Prerefunded to 8/1/13, 5.25%, 8/1/33 | | | 2,647,040 | | |
| | | | | | | $ | 28,775,416 | | |
Principal Amount
(000's omitted) | |
Security | |
Value | |
| Hospital — 6.1% | | | |
| $ | 1,000 | | | Massachusetts Health and Educational Facilities Authority,
(Berkshire Health System), 6.25%, 10/1/31 | | $ | 1,074,780 | | |
| | 1,500 | | | Massachusetts Health and Educational Facilities Authority,
(Central New England Health Systems), 6.125%, 8/1/13 | | | 1,504,095 | | |
| | 2,600 | | | Massachusetts Health and Educational Facilities Authority,
(Healthcare System-Covenant Health), 6.00%, 7/1/22 | | | 2,805,712 | | |
| | 1,000 | | | Massachusetts Health and Educational Facilities Authority,
(Partners Healthcare System), 5.75%, 7/1/32 | | | 1,077,210 | | |
| | 4,000 | | | Massachusetts Industrial Finance Agency,
(Biomedical Research Corp.), 0.00%, 8/1/08 | | | 3,804,160 | | |
| | 9,000 | | | Massachusetts Industrial Finance Agency,
(Biomedical Research Corp.), 0.00%, 8/1/09 | | | 8,240,490 | | |
| | | | | | | $ | 18,506,447 | | |
| Housing — 5.8% | | | |
| $ | 2,000 | | | Massachusetts Housing Finance Agency,
(AMT), 4.65%, 12/1/36 | | $ | 1,960,440 | | |
| | 10,000 | | | Massachusetts Housing Finance Agency,
(AMT), 4.85%, 6/1/40(1) | | | 10,010,400 | | |
| | 1,350 | | | Massachusetts Housing Finance Agency,
(AMT), 5.00%, 12/1/28 | | | 1,377,580 | | |
| | 4,000 | | | Massachusetts Housing Finance Agency,
(AMT), 5.10%, 12/1/37 | | | 4,100,440 | | |
| | | | | | | $ | 17,448,860 | | |
| Industrial Development Revenue — 1.4% | | | |
| $ | 2,155 | | | Massachusetts Industrial Finance Agency, (American
Hingham Water Co.), (AMT), 6.60%, 12/1/15 | | $ | 2,181,205 | | |
| | 2,005 | | | Virgin Islands Public Financing Authority, (Hovensa LLC),
(AMT), 4.70%, 7/1/22 | | | 2,013,782 | | |
| | | | | | | $ | 4,194,987 | | |
| Insured-Education — 10.3% | | | |
| $ | 2,500 | | | Massachusetts College Building Authority,
(XLCA), 5.50%, 5/1/28 | | $ | 2,945,775 | | |
| | 5,000 | | | Massachusetts College Building Authority,
(XLCA), 5.50%, 5/1/33 | | | 5,948,400 | | |
| | 6,000 | | | Massachusetts Development Finance Agency,
(Boston University), (XLCA), 5.375%, 5/15/39 | | | 7,008,480 | | |
| | 5,460 | | | Massachusetts Development Finance Agency,
(College of the Holy Cross), (AMBAC), 5.25%, 9/1/32(2) | | | 6,364,431 | | |
| | 2,800 | | | Massachusetts Development Finance Agency,
(Franklin W. Olin College), (XLCA), 5.25%, 7/1/33 | | | 2,960,804 | | |
| | 1,000 | | | Massachusetts Development Finance Agency,
(Merrimack College), (MBIA), 5.20%, 7/1/32 | | | 1,059,980 | | |
| | 3,120 | | | Massachusetts Development Finance Agency,
(Simmons College), (XLCA), 5.25%, 10/1/33 | | | 3,555,958 | | |
See notes to financial statements
23
Eaton Vance Massachusetts Municipals Fund as of March 31, 2007
PORTFOLIO OF INVESTMENTS (Unaudited) CONT'D
Principal Amount
(000's omitted) | |
Security | |
Value | |
| Insured-Education (continued) | | | |
| $ | 1,000 | | | Massachusetts Development Finance Agency,
(Western New England College), (AGC), 5.00%, 9/1/33 | | $ | 1,047,890 | | |
| | | | | | | $ | 30,891,718 | | |
| Insured-Electric Utilities — 2.1% | | | |
| $ | 6,000 | | | Puerto Rico Electric Power Authority,
(FSA), 5.25%, 7/1/29(2) | | $ | 6,314,700 | | |
| | | | | | | $ | 6,314,700 | | |
| Insured-Escrowed / Prerefunded — 2.4% | | | |
| $ | 2,000 | | | Massachusetts Health and Educational Facilities Authority,
(UMass-Worcester Campus), (FGIC), Prerefunded to
10/1/11, 5.25%, 10/1/31 | | $ | 2,127,920 | | |
| | 200 | | | Massachusetts Turnpike Authority, (MBIA), Escrowed to
Maturity, 5.00%, 1/1/20 | | | 217,476 | | |
| | 2,540 | | | Massachusetts Water Resource Authority, (MBIA),
Escrowed to Maturity, 5.25%, 12/1/15 | | | 2,755,595 | | |
| | 1,995 | | | Puerto Rico Highway and Transportation Authority,
(MBIA), Prerefunded to 7/1/16, 5.00%, 7/1/36(2) | | | 2,187,518 | | |
| | | | | | | $ | 7,288,509 | | |
| Insured-General Obligations — 2.0% | | | |
| $ | 560 | | | Ashland, (AMBAC), 4.75%, 5/15/29 | | $ | 580,798 | | |
| | 500 | | | Plymouth, (MBIA), 5.25%, 10/15/20 | | | 529,975 | | |
| | 1,200 | | | Puerto Rico, (MBIA), 5.50%, 7/1/20(2) | | | 1,383,020 | | |
| | 3,665 | | | Tewksbury, (MBIA), 4.25%, 1/15/27 | | | 3,609,329 | | |
| | | | | | | $ | 6,103,122 | | |
| Insured-Hospital — 0.9% | | | |
| $ | 2,550 | | | Massachusetts Health and Educational Facilities Authority,
(The Medical Center of Central Massachusetts),
(AMBAC), Variable Rate, 9.27%, 6/23/22(3) | | $ | 2,683,543 | | |
| | | | | | | $ | 2,683,543 | | |
Insured-Lease Revenue / Certificates of
Participation — 3.3% | | | |
| $ | 7,500 | | | Massachusetts Development Finance Agency,
(MBIA), 5.125%, 2/1/34 | | $ | 7,874,025 | | |
| | 1,800 | | | Puerto Rico Public Finance Corp.,
(AMBAC), 5.125%, 6/1/24(2) | | | 2,008,002 | | |
| | | | | | | $ | 9,882,027 | | |
Principal Amount
(000's omitted) | |
Security | |
Value | |
| Insured-Other Revenue — 5.2% | | | |
| $ | 8,680 | | | Massachusetts Development Finance Agency,
(WGBH Educational Foundation),
(AMBAC), 5.75%, 1/1/42(2) | | $ | 10,801,254 | | |
| | 4,000 | | | Massachusetts Development Finance Agency,
(WGBH Educational Foundation),
(AMBAC), 5.75%, 1/1/42(4) | | | 4,977,440 | | |
| | 55 | | | Massachusetts Health and Educational Facilities
Authority, (Capital Assets), (MBIA), 7.20%, 7/1/09 | | | 55,148 | | |
| | | | | | | $ | 15,833,842 | | |
| Insured-Pooled Loans — 2.4% | | | |
| $ | 1,425 | | | Massachusetts Educational Financing Authority,
(AMBAC), 4.70%, 1/1/27(1) | | $ | 1,425,000 | | |
| | 5,860 | | | Massachusetts Educational Financing Authority,
(AMBAC), 4.70%, 1/1/33(1) | | | 5,833,571 | | |
| | | | | | | $ | 7,258,571 | | |
| Insured-Special Tax Revenue — 12.0% | | | |
| $ | 3,425 | | | Martha's Vineyard Land Bank, (AMBAC), 4.25%, 5/1/36 | | $ | 3,316,462 | | |
| | 1,000 | | | Martha's Vineyard Land Bank, (AMBAC), 5.00%, 5/1/29 | | | 1,053,260 | | |
| | 4,620 | | | Martha's Vineyard Land Bank, (AMBAC), 5.00%, 5/1/32 | | | 4,862,134 | | |
| | 2,630 | | | Massachusetts Bay Transportation Authority, Assessment
Bonds, Sales Tax Revenue, (MBIA), 4.50%, 7/1/35 | | | 2,627,738 | | |
| | 15,600 | | | Massachusetts School Building Authority, (AMBAC),
4.50%, 8/15/35 | | | 15,512,640 | | |
| | 7,500 | | | Massachusetts Special Obligation, Dedicated Tax Revenue,
(FGIC), 5.50%, 1/1/30 | | | 8,888,625 | | |
| | | | | | | $ | 36,260,859 | | |
| Insured-Transportation — 6.8% | | | |
| $ | 19,000 | | | Massachusetts Turnpike Authority,
(MBIA), 0.00%, 1/1/28 | | $ | 7,637,620 | | |
| | 10,750 | | | Massachusetts Turnpike Authority, Metropolitan
Highway System, (MBIA), 0.00%, 1/1/22 | | | 5,714,055 | | |
| | 4,320 | | | Puerto Rico Highway and Transportation Authority,
(CIFG), 5.25%, 7/1/41(2) | | | 5,030,294 | | |
| | 1,000 | | | Puerto Rico Highway and Transportation Authority,
(FSA), 4.75%, 7/1/38 | | | 1,046,570 | | |
| | 1,000 | | | Puerto Rico Highway and Transportation Authority,
(MBIA), 4.75%, 7/1/38 | | | 1,046,570 | | |
| | | | | | | $ | 20,475,109 | | |
| Insured-Water and Sewer — 0.6% | | | |
| $ | 1,625 | | | Massachusetts Water Resource Authority,
(MBIA), 5.25%, 12/1/15 | | $ | 1,760,834 | | |
| | | | | | | $ | 1,760,834 | | |
See notes to financial statements
24
Eaton Vance Massachusetts Municipals Fund as of March 31, 2007
PORTFOLIO OF INVESTMENTS (Unaudited) CONT'D
Principal Amount
(000's omitted) | |
Security | |
Value | |
| Nursing Home — 1.9% | | | |
| $ | 2,400 | | | Massachusetts Health and Educational Facilities Authority,
(Christopher House), 6.875%, 1/1/29 | | $ | 2,481,888 | | |
| | 3,155 | | | Massachusetts Industrial Finance Agency, (Age Institute of
Massachusetts), 8.05%, 11/1/25 | | | 3,253,278 | | |
| | | | | | | $ | 5,735,166 | | |
| Other Revenue — 1.6% | | | |
| $ | 4,455 | | | Puerto Rico Infrastructure Financing Authority,
5.50%, 10/1/34(2) | | $ | 4,766,746 | | |
| | | | | | | $ | 4,766,746 | | |
| Pooled Loans — 0.7% | | | |
| $ | 2,000 | | | New England Educational Loan Marketing Corp.,
(AMT), 6.90%, 11/1/09 | | $ | 2,104,820 | | |
| | | | | | | $ | 2,104,820 | | |
| Senior Living / Life Care — 1.0% | | | |
| $ | 1,250 | | | Massachusetts Development Finance Agency,
(Berkshire Retirement Community, Inc./Edgecombe),
5.10%, 7/1/29 | | $ | 1,261,600 | | |
| | 1,760 | | | Massachusetts Industrial Finance Agency, (Forge Hill),
(AMT), Prerefunded to 4/1/08, 6.75%, 4/1/30 | | | 1,812,254 | | |
| | | | | | | $ | 3,073,854 | | |
| Solid Waste — 1.1% | | | |
| $ | 3,250 | | | Massachusetts Industrial Finance Agency, Resource Recovery,
(Ogden Haverhill), (AMT), 5.60%, 12/1/19 | | $ | 3,370,900 | | |
| | | | | | | $ | 3,370,900 | | |
| Special Tax Revenue — 4.0% | | | |
| $ | 10,050 | | | Massachusetts Bay Transportation Authority,
5.00%, 7/1/34(2) | | $ | 10,759,832 | | |
| | 1,310 | | | Massachusetts Bay Transportation Authority, Special
Assessment Revenue, 5.25%, 7/1/35 | | | 1,513,509 | | |
| | | | | | | $ | 12,273,341 | | |
| Water and Sewer — 8.6% | | | |
| $ | 8,900 | | | Boston Industrial Development Authority, (Harbor Electric
Energy Co.), (AMT), 7.375%, 5/15/15(5) | | $ | 8,972,624 | | |
| | 3,220 | | | Massachusetts Water Pollution Abatement Trust,
5.25%, 8/1/25 | | | 3,691,601 | | |
| | 3,205 | | | Massachusetts Water Pollution Abatement Trust,
5.25%, 8/1/32 | | | 3,701,807 | | |
| | 565 | | | Massachusetts Water Pollution Abatement Trust,
5.25%, 8/1/33 | | | 606,443 | | |
Principal Amount
(000's omitted) | |
Security | |
Value | |
| Water and Sewer (continued) | |
| $ | 10,000 | | | Massachusetts Water Resources Authority,
4.00%, 8/1/46 | | $ | 8,837,400 | | |
| | | | | $ | 25,809,875 | | |
Total Tax-Exempt Investments
(identified cost $317,456,182) | | $ | 336,396,090 | | |
| Short-Term Investments — 0.5% | |
Principal Amount
(000's omitted) | |
Security | |
Value | |
| $ | 1,600 | | | Massachusetts, Variable Rate, 3.63%, 1/1/21 | | $ | 1,600,000 | | |
Total Short-Term Investments
(at amortized cost, $1,600,000) | | $ | 1,600,000 | | |
Total Investments — 112.1%
(identified cost $319,056,182) | | $ | 337,996,090 | | |
| Other Assets, Less Liabilities — (12.1)% | | $ | (36,547,518 | ) | |
| Net Assets — 100.0% | | | | $ | 301,448,572 | | |
AGC - Assured Guaranty Corp.
AMBAC - AMBAC Financial Group, Inc.
AMT - Interest earned from these securities may be considered a tax preference item for purposes of the Federal Alternative Minimum Tax.
CIFG - CDC IXIS Financial Guaranty North America, Inc.
FGIC - Financial Guaranty Insurance Company
FSA - Financial Security Assurance, Inc.
MBIA - Municipal Bond Insurance Association
XLCA - XL Capital Assurance, Inc.
The Fund invests primarily in debt securities issued by Massachusetts municipalities. The ability of the issuers of the debt securities to meet their obligations may be affected by economic developments in a specific industry or municipality. In order to reduce the risk associated with such economic developments, at March 31, 2007, 42.8% of total investments are backed by bond insurance of various financial institutions and financial guaranty assurance agencies. The aggregate percentage insured by an individual financial institution ranged from 0.3% to 17.6% of total investments.
(1) When-issued security.
(2) Security represents the underlying municipal obligation of an inverse floating rate obligation held by the Fund.
(3) Security has been issued as an inverse floater bond. The stated interest rate represents the rate in effect at March 31, 2007.
(4) Security (or a portion thereof) has been segregated to cover margin requirements on open financial futures contracts.
(5) Security (or a portion thereof) has been segregated to cover when-issued securities.
See notes to financial statements
25
Eaton Vance Mississippi Municipals Fund as of March 31, 2007
PORTFOLIO OF INVESTMENTS (Unaudited)
| Tax-Exempt Investments — 103.6% | | | |
Principal Amount
(000's omitted) | |
Security | |
Value | |
| Electric Utilities — 1.3% | | | |
| $ | 250 | | | Mississippi Business Finance Corp., (System Energy
Resources, Inc.), 5.90%, 5/1/22 | | $ | 252,675 | | |
| | | | | | | $ | 252,675 | | |
| Escrowed / Prerefunded — 9.5% | | | |
| $ | 2,500 | | | Mississippi Housing Finance Corp., Single Family,
Escrowed to Maturity, 0.00%, 6/1/15 | | $ | 1,811,250 | | |
| | | | | | | $ | 1,811,250 | | |
| Hospital — 6.0% | | | |
| $ | 500 | | | Mississippi Hospital Equipment and Facilities Authority,
(Baptist Health System), 5.00%, 8/15/29 | | $ | 517,790 | | |
| | 600 | | | Mississippi Hospital Equipment and Facilities Authority,
(South Central Regional Medical Center),
5.25%, 12/1/31 | | | 623,712 | | |
| | | | | | | $ | 1,141,502 | | |
| Housing — 0.7% | | | |
| $ | 75 | | | Mississippi Home Corp., Single Family, (GNMA),
(AMT), 6.625%, 4/1/27 | | $ | 75,090 | | |
| | 55 | | | Mississippi Home Corp., Single Family, (GNMA),
(AMT), 7.55%, 12/1/27 | | | 57,604 | | |
| | | | | | | $ | 132,694 | | |
| Industrial Development Revenue — 6.6% | | | |
| $ | 200 | | | Lowndes County, (Weyerhaeuser), 6.80%, 4/1/22 | | $ | 244,534 | | |
| | 175 | | | Mississippi Business Finance Corp., (Air Cargo),
(AMT), 7.25%, 7/1/34 | | | 192,582 | | |
| | 500 | | | Mississippi Business Finance Corp., (Northrop Grumman
Ship System), 4.55%, 12/1/28 | | | 499,015 | | |
| | 300 | | | Warren County, (International Paper), (AMT),
6.70%, 8/1/18 | | | 321,276 | | |
| | | | | | | $ | 1,257,407 | | |
| Insured-Bond Bank — 5.1% | | | |
| $ | 435 | | | Mississippi Development Bank, (Capital Projects),
(AMBAC), 5.00%, 7/1/24 | | $ | 440,603 | | |
| | 500 | | | Mississippi Development Bank, (Hinds County Public
Improvement), (FSA), 5.25%, 10/1/30 | | | 539,995 | | |
| | | | | | | $ | 980,598 | | |
Principal Amount
(000's omitted) | |
Security | |
Value | |
| Insured-Education — 7.6% | | | |
| $ | 750 | | | Jackson State University Educational Building Corp.,
(FGIC), 5.00%, 3/1/29 | | $ | 786,337 | | |
| | 500 | | | Mississippi State University Educational Building Corp.,
Facilities Renovation, (MBIA), 5.25%, 8/1/17 | | | 553,935 | | |
| | 100 | | | Puerto Rico Industrial, Tourist, Educational, Medical and
Environmental Control Facilities Financing Authority,
(Inter American University), (MBIA), 4.50%, 10/1/29 | | | 100,601 | | |
| | | | | | | $ | 1,440,873 | | |
| Insured-Electric Utilities — 7.3% | | | |
| $ | 750 | | | Mississippi Development Bank, (Municipal Energy),
(XLCA), 5.00%, 3/1/41 | | $ | 782,032 | | |
| | 250 | | | Puerto Rico Electric Power Authority,
(FSA), 5.25%, 7/1/29(1) | | | 263,375 | | |
| | 300 | | | Puerto Rico Electric Power Authority,
(MBIA), 5.50%, 7/1/16(1) | | | 339,829 | | |
| | | | | | | $ | 1,385,236 | | |
| Insured-Escrowed / Prerefunded — 9.5% | | | |
| $ | 600 | | | Harrison County, Wastewater Management and Solid Waste,
(FGIC), Prerefunded to 2/1/08, 4.75%, 2/1/27 | | $ | 611,406 | | |
| | 250 | | | Mississippi Development Bank, (Waste Water Treatment),
(FSA), Prerefunded to 2/1/13, 5.00%, 2/1/28 | | | 266,840 | | |
| | 150 | | | Puerto Rico, (FSA), Prerefunded to 7/1/11,
5.125%, 7/1/30 | | | 158,907 | | |
| | 240 | | | Puerto Rico Highway and Transportation Authority,
(AMBAC), Prerefunded to 7/1/08, 5.00%, 7/1/28 | | | 246,586 | | |
| | 500 | | | Southern Mississippi University Educational Building Corp.,
(AMBAC), Prerefunded to 3/1/11, 5.00%, 3/1/21 | | | 528,485 | | |
| | | | | | | $ | 1,812,224 | | |
| Insured-General Obligations — 11.4% | | | |
| $ | 500 | | | Hinds County, (MBIA), 6.25%, 3/1/11 | | $ | 546,580 | | |
| | 500 | | | Mississippi Development Bank, (Gulf Coast College District),
(XLCA), 4.25%, 1/1/24 | | | 493,775 | | |
| | 500 | | | Mississippi Development Bank, (FSA), 4.50%, 10/1/36 | | | 489,205 | | |
| | 250 | | | Mississippi, (FSA), 5.25%, 11/1/21(1) | | | 283,899 | | |
| | 100 | | | Puerto Rico, (FSA), 5.125%, 7/1/30 | | | 104,812 | | |
| | 220 | | | Puerto Rico, (FSA), Variable Rate, 5.84%, 7/1/27(2)(3) | | | 260,108 | | |
| | | | | | | $ | 2,178,379 | | |
| Insured-Hospital — 11.6% | | | |
| $ | 750 | | | Gulfport, (Gulfport Memorial Hospital), (MBIA),
6.20%, 7/1/18 | | $ | 751,312 | | |
| | 530 | | | Hinds County, (Mississippi Methodist Hospital),
(AMBAC), 5.60%, 5/1/12(4) | | | 550,458 | | |
See notes to financial statements
26
Eaton Vance Mississippi Municipals Fund as of March 31, 2007
PORTFOLIO OF INVESTMENTS (Unaudited) CONT'D
Principal Amount
(000's omitted) | |
Security | |
Value | |
| Insured-Hospital (continued) | | | |
| $ | 610 | | | Mississippi Development Bank, (Covington County Hospital),
(AMBAC), 5.00%, 7/1/31 | | $ | 647,295 | | |
| | 250 | | | Mississippi Hospital Equipment and Facilities Authority,
(Forrest County General Hospital), (FSA), 5.50%, 1/1/27 | | | 263,430 | | |
| | | | | | | $ | 2,212,495 | | |
Insured-Lease Revenue / Certificates of
Participation — 3.5% | | | |
| $ | 600 | | | Puerto Rico Public Finance Corp., (AMBAC),
5.125%, 6/1/24(1) | | $ | 669,334 | | |
| | | | | | | $ | 669,334 | | |
| Insured-Special Tax Revenue — 1.6% | | | |
| $ | 300 | | | Puerto Rico Convention Center Authority,
(CIFG), 4.50%, 7/1/36(1) | | $ | 301,449 | | |
| | | | | | | $ | 301,449 | | |
| Insured-Transportation — 9.1% | | | |
| $ | 1,000 | | | Jackson Municipal Airport Authority, (AMBAC),
5.00%, 10/1/31 | | $ | 1,049,780 | | |
| | 250 | | | Mississippi Development Bank, (Mississippi Highway
Construction), (FGIC), 5.00%, 1/1/25 | | | 263,525 | | |
| | 10 | | | Puerto Rico Highway and Transportation Authority,
(AMBAC), 5.00%, 7/1/28 | | | 10,223 | | |
| | 175 | | | Puerto Rico Highway and Transportation Authority,
(MBIA), 4.75%, 7/1/38 | | | 183,150 | | |
| | 200 | | | Puerto Rico Highway and Transportation Authority,
(MBIA), Prerefunded to 7/1/16, 5.00%, 7/1/36 | | | 219,300 | | |
| | | | | | | $ | 1,725,978 | | |
| Insured-Water and Sewer — 8.1% | | | |
| $ | 300 | | | Gautier Utility District, (FGIC), 5.125%, 3/1/19 | | $ | 317,466 | | |
| | 500 | | | Jackson Water and Sewer System, (FSA), 4.75%, 9/1/24 | | | 516,630 | | |
| | 435 | | | Mississippi Development Bank, (Combined Water & Sewer
System), (AMBAC), 5.00%, 7/1/23 | | | 448,655 | | |
| | 250 | | | Mississippi Development Bank, (Combined Water & Sewer
System), (FSA), 5.00%, 9/1/29 | | | 262,222 | | |
| | | | | | | $ | 1,544,973 | | |
| Nursing Home — 1.3% | | | |
| $ | 290 | | | Mississippi Business Finance Corp., (Magnolia
Healthcare), 7.99%, 7/1/25 | | $ | 248,011 | | |
| | | | | | | $ | 248,011 | | |
Principal Amount
(000's omitted) | |
Security | |
Value | |
| Other Revenue — 0.6% | | | |
| $ | 1,200 | | | Children's Trust Fund, Tobacco Settlement,
0.00%, 5/15/50 | | $ | 82,044 | | |
| | 1,000 | | | Children's Trust Fund, Tobacco Settlement,
0.00%, 5/15/55 | | | 36,660 | | |
| | | | | | | $ | 118,704 | | |
| Water and Sewer — 2.8% | | | |
| $ | 250 | | | Mississippi Development Bank, (Desoto County
Regional Utility Authority), 5.25%, 7/1/28 | | $ | 266,873 | | |
| | 250 | | | Mississippi Development Bank, (Desoto County
Regional Utility Authority), 5.25%, 7/1/31 | | | 266,480 | | |
| | | | | | | $ | 533,353 | | |
Total Tax-Exempt Investments — 103.6%
(identified cost $18,700,122) | | $ | 19,747,135 | | |
| Other Assets, Less Liabilities — (3.6)% | | $ | (684,145 | ) | |
| Net Assets — 100.0% | | $ | 19,062,990 | | |
AMBAC - AMBAC Financial Group, Inc.
AMT - Interest earned from these securities may be considered a tax preference item for purposes of the Federal Alternative Minimum Tax.
CIFG - CDC IXIS Financial Guaranty North America, Inc.
FGIC - Financial Guaranty Insurance Company
FSA - Financial Security Assurance, Inc.
GNMA - Government National Mortgage Association (Ginnie Mae)
MBIA - Municipal Bond Insurance Association
XLCA - XL Capital Assurance, Inc.
The Fund invests primarily in debt securities issued by Mississippi municipalities. The ability of the issuers of the debt securities to meet their obligations may be affected by economic developments in a specific industry or municipality. In order to reduce the risk associated with such economic developments, at March 31, 2007, 72.2% of total investments are backed by bond insurance of various financial institutions and financial guaranty assurance agencies. The aggregate percentage insured by an individual financial institution ranged from 1.5% to 23.3% of total investments.
(1) Security represents the underlying municipal obligation of an inverse floating rate obligation held by the Fund.
(2) Security exempt from registration under Rule 144A of the Securities Act of 1933. These securities may be sold in transactions exempt from registration, normally to qualified institutional buyers. At March 31, 2007, the aggregate value of the securities is $260,108 or 1.4% of the Fund's net assets.
(3) Security has been issued as a leveraged inverse floater bond. The stated interest rate represents the rate in effect at March 31, 2007.
(4) Security (or a portion thereof) has been segregated to cover margin requirements on open financial futures contracts.
See notes to financial statements
27
Eaton Vance New York Municipals Fund as of March 31, 2007
PORTFOLIO OF INVESTMENTS (Unaudited)
Tax-Exempt Investments — 110.5% | | | |
Principal Amount
(000's omitted) | | Security | | Value | |
| Cogeneration — 0.9% | | | |
| $ | 4,250 | | | Suffolk County Industrial Development Agency,
(Nissequogue Cogeneration Partners Facility),
(AMT), 5.50%, 1/1/23(1) | | $ | 4,232,787 | | |
| | | | | | | $ | 4,232,787 | | |
| Education — 16.2% | | | |
| $ | 3,200 | | | Hempstead Industrial Development Agency,
(Adelphi University), 4.50%, 10/1/24 | | $ | 3,205,600 | | |
| | 900 | | | Hempstead Industrial Development Agency,
(Adelphi University), 5.00%, 10/1/35 | | | 940,887 | | |
| | 2,110 | | | New York City Industrial Development Agency,
(St. Francis College), 5.00%, 10/1/34 | | | 2,191,256 | | |
| | 8,500 | | | New York Dormitory Authority, (City University),
6.00%, 7/1/20 | | | 10,004,245 | | |
| | 3,090 | | | New York Dormitory Authority, (City University),
7.50%, 7/1/10 | | | 3,276,389 | | |
| | 9,850 | | | New York Dormitory Authority, (State University
Educational Facilities), 5.25%, 5/15/15 | | | 10,610,814 | | |
| | 18,775 | | | New York Dormitory Authority, (State University
Educational Facilities), 5.25%, 5/15/19(2) | | | 20,505,116 | | |
| | 14,680 | | | New York Dormitory Authority, (State University
Educational Facilities), 5.25%, 5/15/21 | | | 16,244,448 | | |
| | 2,000 | | | New York Dormitory Authority, (State University
Educational Facilities), 5.50%, 5/15/19 | | | 2,247,400 | | |
| | 1,085 | | | New York Dormitory Authority, (Vassar College),
4.25%, 7/1/32(3) | | | 1,046,634 | | |
| | 2,900 | | | New York Dormitory Authority, (Vassar College),
4.25%, 7/1/39(3) | | | 2,755,783 | | |
| | | | | | | $ | 73,028,572 | | |
| Electric Utilities — 4.4% | | | |
| $ | 1,500 | | | Long Island Power Authority, Electric System Revenue,
5.00%, 9/1/24 | | $ | 1,567,290 | | |
| | 3,100 | | | Long Island Power Authority, Electric System Revenue,
5.00%, 12/1/35 | | | 3,259,216 | | |
| | 2,500 | | | New York Energy Research and Development Authority,
(Brooklyn Union Gas), (AMT), Variable Rate,
9.612%, 7/1/26(4) | | | 2,645,750 | | |
| | 5,000 | | | Puerto Rico Electric Power Authority, 5.125%, 7/1/29 | | | 5,227,900 | | |
| | 2,000 | | | Puerto Rico Electric Power Authority, 5.25%, 7/1/31 | | | 2,108,120 | | |
| | 4,900 | | | Suffolk County Industrial Development Agency,
(Keyspan-Port Jefferson), (AMT),
5.25%, 6/1/27 | | | 5,138,777 | | |
| | | | | | | $ | 19,947,053 | | |
Principal Amount
(000's omitted) | |
Security | |
Value | |
| Escrowed / Prerefunded — 4.1% | | | |
| $ | 3,500 | | | Metropolitan Transportation Authority, Prerefunded to
11/15/13, 5.25%, 11/15/32 | | $ | 3,827,845 | | |
| | 2,415 | | | New York City, Prerefunded to 12/1/11,
5.375%, 12/1/26 | | | 2,592,768 | | |
| | 2,185 | | | New York Dormitory Authority, (City University),
Escrowed to Maturity, 7.00%, 7/1/09 | | | 2,267,790 | | |
| | 8,905 | | | Triborough Bridge and Tunnel Authority, Escrowed to Maturity,
5.50%, 1/1/17 | | | 9,893,811 | | |
| | | | | | | $ | 18,582,214 | | |
| General Obligations — 2.6% | | | |
| $ | 3,410 | | | New York City, 4.25%, 1/1/28 | | $ | 3,306,779 | | |
| | 2,250 | | | New York City, 5.25%, 8/15/26 | | | 2,405,025 | | |
| | 5,755 | | | New York City, 5.25%, 9/15/33 | | | 6,115,321 | | |
| | | | | | | $ | 11,827,125 | | |
| Health Care-Miscellaneous — 0.2% | | | |
| $ | 360 | | | New York City Industrial Development Agency,
(A Very Special Place, Inc.), 5.75%, 1/1/29 | | $ | 364,424 | | |
| | 110 | | | Suffolk County Industrial Development Agency,
(Alliance of Long Island Agencies), 7.50%, 9/1/15 | | | 118,260 | | |
| | 80 | | | Suffolk County Industrial Development Agency,
(Alliance of Long Island Agencies), 7.50%, 9/1/15 | | | 86,007 | | |
| | 165 | | | Suffolk County Industrial Development Agency,
(Alliance of Long Island Agencies), 7.50%, 9/1/15 | | | 177,390 | | |
| | 145 | | | Suffolk County Industrial Development Agency,
(Alliance of Long Island Agencies), 7.50%, 9/1/15 | | | 155,888 | | |
| | | | | | | $ | 901,969 | | |
| Hospital — 9.0% | | | |
| $ | 1,040 | | | Chautauqua County Industrial Development Agency,
(Women's Christian Association), 6.35%, 11/15/17 | | $ | 1,090,762 | | |
| | 3,170 | | | Chautauqua County Industrial Development Agency,
(Women's Christian Association), 6.40%, 11/15/29 | | | 3,320,829 | | |
| | 3,000 | | | Fulton County Industrial Development Agency,
(Nathan Littauer Hospital), 6.00%, 11/1/18 | | | 3,045,360 | | |
| | 4,250 | | | Monroe County Industrial Development Agency,
(Highland Hospital), 5.00%, 8/1/22 | | | 4,364,877 | | |
| | 685 | | | Nassau County Industrial Development Agency,
(North Shore Health System), 5.875%, 11/1/11 | | | 717,168 | | |
| | 4,500 | | | New York Dormitory Authority, (Lenox Hill Hospital),
5.50%, 7/1/30 | | | 4,699,530 | | |
| | 11,490 | | | New York Dormitory Authority, (Memorial Sloan-Kettering
Cancer Center), 4.75%, 7/1/28(5) | | | 11,858,446 | | |
| | 2,000 | | | New York Dormitory Authority, (Methodist Hospital),
5.25%, 7/1/33 | | | 2,105,080 | | |
See notes to financial statements
28
Eaton Vance New York Municipals Fund as of March 31, 2007
PORTFOLIO OF INVESTMENTS (Unaudited) CONT'D
Principal Amount
(000's omitted) | |
Security | |
Value | |
| Hospital (continued) | | | |
| $ | 2,750 | | | Oneida County Industrial Development Agency, (Elizabeth
Medical Center), 5.875%, 12/1/29 | | $ | 2,815,037 | | |
| | 1,000 | | | Oneida County Industrial Development Agency, (Elizabeth
Medical Center), 6.00%, 12/1/29 | | | 1,026,850 | | |
| | 5,000 | | | Suffolk County Industrial Development Agency, (Huntington
Hospital), 5.875%, 11/1/32 | | | 5,314,450 | | |
| | | | | | | $ | 40,358,389 | | |
| Housing — 4.5% | | | |
| $ | 10,350 | | | New York City Housing Development Corp., (Multi-Family
Housing), 4.95%, 11/1/33 | | $ | 10,764,207 | | |
| | 3,500 | | | New York City Housing Development Corp., (Multi-Family
Housing), (AMT), 4.70%, 11/1/40 | | | 3,515,155 | | |
| | 5,730 | | | New York City Housing Development Corp., (Multi-Family
Housing), (AMT), 5.00%, 11/1/24 | | | 5,902,874 | | |
| | | | | | | $ | 20,182,236 | | |
| Industrial Development Revenue — 6.9% | | | |
| $ | 3,000 | | | Liberty Development Corp., (Goldman Sachs Group, Inc.),
5.25%, 10/1/35 | | $ | 3,425,250 | | |
| | 7,995 | | | Liberty Development Corp., (Goldman Sachs Group, Inc.),
5.25%, 10/1/35(5) | | | 9,128,291 | | |
| | 3,500 | | | New York City Industrial Development Agency,
(American, Inc. - JFK International Airport), (AMT),
8.00%, 8/1/12 | | | 4,011,490 | | |
| | 10,500 | | | Onondaga County Industrial Development Agency,
(Anheuser-Busch), 4.875%, 7/1/41 | | | 10,668,420 | | |
| | 1,965 | | | Onondaga County Industrial Development Agency,
(Senior Air Cargo), (AMT), 6.125%, 1/1/32 | | | 2,084,826 | | |
| | 1,600 | | | Port Authority of New York and New Jersey, (Continental
Airlines), (AMT), 9.125%, 12/1/15 | | | 1,669,360 | | |
| | | | | | | $ | 30,987,637 | | |
| Insured-Education — 8.1% | | | |
| $ | 5,000 | | | New York Dormitory Authority, (City University), (AMBAC),
5.25%, 7/1/30 | | $ | 5,721,600 | | |
| | 12,500 | | | New York Dormitory Authority, (New York University), (MBIA),
5.75%, 7/1/27(5) | | | 15,114,625 | | |
| | 5,000 | | | New York Dormitory Authority, (University of Rochester),
(AMBAC), 4.25%, 7/1/39 | | | 4,767,600 | | |
| | 9,205 | | | New York Dormitory Authority, (Yeshiva University), (AMBAC),
5.50%, 7/1/35(6) | | | 10,975,490 | | |
| | | | | | | $ | 36,579,315 | | |
Principal Amount
(000's omitted) | |
Security | |
Value | |
| Insured-Electric Utilities — 3.5% | | | |
| $ | 6,525 | | | Long Island Power Authority, Electric System Revenue,
(MBIA), 4.25%, 5/1/33 | | $ | 6,300,148 | | |
| | 1,500 | | | Puerto Rico Electric Power Authority,
(FSA), 5.25%, 7/1/29 | | | 1,578,675 | | |
| | 1,500 | | | Puerto Rico Electric Power Authority, (FSA), Variable Rate,
7.90%, 7/1/29(7)(8) | | | 1,736,025 | | |
| | 6,000 | | | Puerto Rico Electric Power Authority, (MBIA),
4.75%, 7/1/33(5) | | | 6,171,120 | | |
| | | | | | | $ | 15,785,968 | | |
| Insured-Escrowed / Prerefunded — 6.1% | | | |
| $ | 15,135 | | | New York City Cultural Resource Trust, (Museum of History),
(AMBAC), Prerefunded to 7/1/19, 5.75%, 7/1/29(5) | | $ | 15,976,910 | | |
| | 16,945 | | | New York Dormitory Authority, (Memorial Sloan-Kettering
Cancer Center), (MBIA), Escrowed to Maturity,
0.00%, 7/1/30 | | | 6,201,362 | | |
| | 4,650 | | | Puerto Rico Highway and Transportation Authority,
Prerefunded to 7/1/15, (AGC), 5.00%, 7/1/45 | | | 5,057,294 | | |
| | | | | | | $ | 27,235,566 | | |
| Insured-General Obligations — 0.7% | | | |
| $ | 700 | | | Jamestown, (AMBAC), 7.10%, 3/15/11 | | $ | 787,724 | | |
| | 675 | | | Jamestown, (AMBAC), 7.10%, 3/15/12 | | | 781,657 | | |
| | 675 | | | Jamestown, (AMBAC), 7.10%, 3/15/13 | | | 795,197 | | |
| | 515 | | | Jamestown, (AMBAC), 7.10%, 3/15/14 | | | 619,514 | | |
| | | | | | | $ | 2,984,092 | | |
Insured-Lease Revenue / Certificates of
Participation — 3.9% | | | |
| $ | 13,500 | | | Hudson Yards Infrastructure Corp., (MBIA),
4.50%, 2/15/47 | | $ | 13,348,665 | | |
| | 1,086 | | | Puerto Rico Public Buildings Authority, (CIFG),
5.25%, 7/1/36(5) | | | 1,159,080 | | |
| | 3,013 | | | Puerto Rico Public Buildings Authority, (CIFG),
Prerefunded to 7/1/12, 5.25%, 7/1/36(5) | | | 3,239,274 | | |
| | | | | | | $ | 17,747,019 | | |
| Insured-Other Revenue — 5.3% | | | |
| $ | 4,000 | | | New York City Cultural Resource Trust, (American Museum
of Natural History), (MBIA), 5.00%, 7/1/44 | | $ | 4,180,720 | | |
| | 12,000 | | | New York City Industrial Development Agency, (Queens
Baseball Stadium), (AMBAC), 4.75%, 1/1/42 | | | 12,305,400 | | |
| | 6,060 | | | New York City Industrial Development Agency, (Yankee
Stadium), (FGIC), 4.50%, 3/1/39 | | | 6,012,065 | | |
| | 1,500 | | | New York City Industrial Development Agency, (Yankee
Stadium), (MBIA), 4.75%, 3/1/46 | | | 1,536,585 | | |
| | | | | | | $ | 24,034,770 | | |
See notes to financial statements
29
Eaton Vance New York Municipals Fund as of March 31, 2007
PORTFOLIO OF INVESTMENTS (Unaudited) CONT'D
Principal Amount
(000's omitted) | |
Security | |
Value | |
| Insured-Solid Waste — 1.0% | | | |
| $ | 4,495 | | | Islip Resource Recovery Agency, (AMBAC),
6.50%, 7/1/09(6) | | $ | 4,555,188 | | |
| | | | | | | $ | 4,555,188 | | |
| Insured-Special Tax Revenue — 3.8% | | | |
| $ | 3,850 | | | New York Convention Center Development Corp.,
Hotel Occupancy Tax, (AMBAC), 4.75%, 11/15/45 | | $ | 3,932,082 | | |
| | 7,750 | | | Puerto Rico Infrastructure Financing Authority,
(AMBAC), 0.00%, 7/1/28 | | | 3,063,575 | | |
| | 16,200 | | | Puerto Rico Infrastructure Financing Authority,
(AMBAC), 0.00%, 7/1/34 | | | 4,856,112 | | |
| | 15,000 | | | Puerto Rico Infrastructure Financing Authority,
(AMBAC), 0.00%, 7/1/35 | | | 4,292,400 | | |
| | 4,140 | | | Puerto Rico Infrastructure Financing Authority,
(AMBAC), 0.00%, 7/1/37 | | | 1,077,890 | | |
| | | | | | | $ | 17,222,059 | | |
| Insured-Transportation — 3.1% | | | |
| $ | 3,165 | | | Monroe County Airport Authority, (MBIA), (AMT),
7.69%, 1/1/19(4)(7) | | $ | 4,061,075 | | |
| | 3,500 | | | Niagara Frontier Airport Authority, (Buffalo Niagara
International Airport), (MBIA), (AMT), 5.625%, 4/1/29(5) | | | 3,646,737 | | |
| | 6,065 | | | Port Authority of New York and New Jersey, (CIFG),
(AMT), 4.50%, 9/1/35 | | | 5,969,173 | | |
| | | | | | | $ | 13,676,985 | | |
| Insured-Water and Sewer — 0.6% | | | |
| $ | 2,535 | | | Nassau County Industrial Development Agency, (Water
Services Corp.), (AMBAC), (AMT), 5.00%, 12/1/35 | | $ | 2,652,801 | | |
| | | | | | | $ | 2,652,801 | | |
| Lease Revenue / Certificates of Participation — 7.1% | | | |
| $ | 27,940 | | | New York Urban Development Corp., 5.70%, 4/1/20 | | $ | 32,079,032 | | |
| | | | | | | $ | 32,079,032 | | |
| Other Revenue — 5.2% | | | |
| $ | 2,000 | | | Albany Industrial Development Agency Civic Facility,
(Charitable Leadership), 5.75%, 7/1/26 | | $ | 2,111,780 | | |
| | 5,520 | | | New York City Industrial Development Agency,
(YMCA of Greater New York), 5.00%, 8/1/26 | | | 5,786,119 | | |
| | 4,020 | | | New York City Industrial Development Agency,
(YMCA of Greater New York), 5.00%, 8/1/36 | | | 4,207,493 | | |
Principal Amount
(000's omitted) | |
Security | |
Value | |
| Other Revenue (continued) | | | |
| $ | 10,500 | | | Puerto Rico Infrastructure Financing Authority,
5.50%, 10/1/32(5) | | $ | 11,234,755 | | |
| | | | | | | $ | 23,340,147 | | |
| Senior Living / Life Care — 0.9% | | | |
| $ | 2,670 | | | Glen Cove Industrial Development Agency,
(The Regency at Glen Cove), 9.50%, 7/1/12(9) | | $ | 2,441,101 | | |
| | 800 | | | Mount Vernon Industrial Development Agency,
(Wartburg Senior Housing, Inc.), 6.20%, 6/1/29 | | | 828,664 | | |
| | 550 | | | Suffolk County Industrial Development Agency,
(Jefferson's Ferry Project), 5.00%, 11/1/28 | | | 562,381 | | |
| | | | | | | $ | 3,832,146 | | |
| Transportation — 6.3% | | | |
| $ | 9,000 | | | Metropolitan Transportation Authority, 5.00%, 11/15/35 | | $ | 9,439,650 | | |
| | 7,600 | | | Port Authority of New York and New Jersey, (AMT),
4.75%, 6/15/33(5) | | | 7,681,890 | | |
| | 2,500 | | | Port Authority of New York and New Jersey,
6.125%, 6/1/94 | | | 3,010,625 | | |
| | 8,050 | | | Port Authority of New York and New Jersey,
(AMT), 4.75%, 12/1/34 | | | 8,174,373 | | |
| | | | | | | $ | 28,306,538 | | |
| Water and Sewer — 6.1% | | | |
| $ | 3,000 | | | New York City Municipal Water Finance Authority,
4.25%, 6/15/33 | | $ | 2,873,940 | | |
| | 8,120 | | | New York City Municipal Water Finance Authority,
4.50%, 6/15/37 | | | 8,059,750 | | |
| | 6,760 | | | New York City Municipal Water Finance Authority,
4.75%, 6/15/38 | | | 6,924,268 | | |
| | 3,250 | | | New York State Environmental Facilities Corp., Clean Water,
(Municipal Water Finance), 4.50%, 6/15/36 | | | 3,253,445 | | |
| | 4,300 | | | New York State Environmental Facilities Corp., Clean Water,
(Municipal Water Finance), 4.50%, 6/15/36 | | | 4,275,490 | | |
| | 2,000 | | | New York State Environmental Facilities Corp., Clean Water,
(Municipal Water Finance), 4.50%, 6/15/36 | | | 1,998,260 | | |
| | | | | | | $ | 27,385,153 | | |
Total Tax-Exempt Investments
(identified cost $466,079,882) | | $ | 497,464,761 | | |
See notes to financial statements
30
Eaton Vance New York Municipals Fund as of March 31, 2007
PORTFOLIO OF INVESTMENTS (Unaudited) CONT'D
| Short-Term Investments — 0.2% | |
Principal Amount
(000's omitted) | |
Security | |
Value | |
| $ | 1,000 | | | Metropolitan Transportation Authority, (FSA) Variable Rate,
2.98%, 11/1/29 | | $ | 1,000,000 | | |
Total Short-Term Investments
(at amortized cost, $1,000,000) | | $ | 1,000,000 | | |
Total Investments — 110.7%
(identified cost $467,079,882) | | $ | 498,464,761 | | |
| Other Assets, Less Liabilities — (10.7)% | | $ | (48,257,191 | ) | |
| Net Assets — 100.0% | | $ | 450,207,570 | | |
AGC - Assured Guaranty Corp.
AMBAC- AMBAC Financial Group, Inc.
AMT - Interest earned from these securities may be considered a tax preference item for purposes of the Federal Alternative Minimum Tax.
CIFG - CDC IXIS Financial Guaranty North America, Inc.
FGIC - Financial Guaranty Insurance Company
FSA - Financial Security Assurance, Inc.
MBIA - Municipal Bond Insurance Association
The Fund invests primarily in debt securities issued by New York municipalities. The ability of the issuers of the debt securities to meet their obligations may be affected by economic developments in a specific industry or municipality. In order to reduce the risk associated with such economic developments, at March 31, 2007, 32.8% of total investments are backed by bond insurance of various financial institutions and financial guaranty assurance agencies. The aggregate percentage insured by an individual financial institution ranged from 0.9% to 15.5% of total investments.
(1) Security is in bankruptcy but continues to make full interest payments.
(2) Security (or a portion thereof) has been segregated to cover margin requirements on open financial futures contracts.
(3) When-issued security.
(4) Security has been issued as an inverse floater bond. The stated interest rate represents the rate in effect at March 31, 2007.
(5) Security represents the underlying municipal obligation of an inverse floating rate obligation held by the Fund.
(6) Security (or a portion thereof) has been segregated to cover when-issued securities.
(7) Security exempt from registration under Rule 144A of the Securities Act of 1933. These securities may be sold in transactions exempt from registration, normally to qualified institutional buyers. At March 31, 2007, the aggregate value of the securities is $5,797,100 or 1.3% of the Fund's net assets.
(8) Security has been issued as a leveraged inverse floater bond. The stated interest rate represents the rate in effect at March 31, 2007.
(9) Security is in default and making only partial interest payments.
See notes to financial statements
31
Eaton Vance Ohio Municipals Fund as of March 31, 2007
PORTFOLIO OF INVESTMENTS (Unaudited)
Tax-Exempt Investments — 104.4% | | | |
Principal Amount
(000's omitted) | | Security | | Value | |
| Cogeneration — 0.7% | | | |
| $ | 2,005 | | | Ohio Water Development Authority, Solid Waste Disposal,
(Bay Shore Power), (AMT), 5.875%, 9/1/20 | | $ | 2,037,842 | | |
| | | | | | | $ | 2,037,842 | | |
| Education — 2.5% | | | |
| $ | 550 | | | Ohio Higher Educational Facilities Authority, (Case Western
Reserve University), 6.50%, 10/1/20 | | $ | 670,241 | | |
| | 471 | | | Ohio Higher Educational Facilities Authority,
(Oberlin College), 5.00%, 10/1/29(1) | | | 482,466 | | |
| | 3,250 | | | Ohio Higher Educational Facilities Authority, (Oberlin
College), Variable Rate, 6.03%, 10/1/29(2)(3) | | | 3,514,713 | | |
| | 2,500 | | | Ohio Higher Educational Facilities, (Case Western Reserve
University), 5.50%, 10/1/21 | | | 2,722,200 | | |
| | | | | | | $ | 7,389,620 | | |
| Electric Utilities — 0.7% | | | |
| $ | 1,825 | | | Clyde, Electric System Revenue, (AMT),
6.00%, 11/15/14 | | $ | 1,900,245 | | |
| | | | | | | $ | 1,900,245 | | |
| Escrowed / Prerefunded — 5.3% | | | |
| $ | 1,815 | | | Little Miami School District, (FSA),
Prerefunded to 12/1/16, 5.00%, 12/1/34 | | $ | 1,987,461 | | |
| | 4,779 | | | Ohio Higher Educational Facilities Authority, (Oberlin College),
Prerefunded to 10/1/09, 5.00%, 10/1/29(1) | | | 4,981,340 | | |
| | 2,000 | | | Ohio Water Development Authority, (Fresh Water
Improvement), Prerefunded to 6/1/14, 5.00%, 12/1/28 | | | 2,157,740 | | |
| | 4,250 | | | Parma, (Parma Community General Hospital Association),
Prerefunded to 11/1/08, 5.375%, 11/1/29 | | | 4,400,960 | | |
| | 1,670 | | | Richland County Hospital Facilities, (Medcentral Health
Systems), Prerefunded to 11/15/10, 6.375%, 11/15/30 | | | 1,836,282 | | |
| | | | | | | $ | 15,363,783 | | |
| General Obligations — 0.9% | | | |
| $ | 2,000 | | | Ohio, (Common Schools), 4.50%, 9/15/23 | | $ | 2,031,400 | | |
| | 580 | | | Tuscarawas County Public Library Improvement,
6.90%, 12/1/11 | | | 581,311 | | |
| | | | | | | $ | 2,612,711 | | |
| Hospital — 6.6% | | | |
| $ | 1,350 | | | Cuyahoga County, (Cleveland Clinic Health System),
5.50%, 1/1/29 | | $ | 1,442,097 | | |
| | 500 | | | Erie County Hospital Facilities, (Firelands Regional Medical
Center), 5.00%, 8/15/36 | | | 519,505 | | |
Principal Amount
(000's omitted) | |
Security | |
Value | |
| Hospital (continued) | | | |
| $ | 2,350 | | | Erie County Hospital Facilities, (Firelands Regional Medical
Center), 5.25%, 8/15/46 | | $ | 2,476,665 | | |
| | 3,000 | | | Erie County Hospital Facilities, (Firelands Regional Medical
Center), 5.625%, 8/15/32 | | | 3,200,010 | | |
| | 2,000 | | | Highland County, (Joint Township Hospital District),
6.75%, 12/1/29 | | | 2,113,640 | | |
| | 1,250 | | | Miami, (Upper Valley Medical Center), 5.25%, 5/15/26 | | | 1,320,412 | | |
| | 2,500 | | | Ohio Higher Educational Facilities Authority, (University
Hospital Health Systems, Inc.), 4.75%, 1/15/46 | | | 2,491,025 | | |
| | 2,000 | | | Ohio Higher Educational Facilities, (University Hospital
Health Systems, Inc.), 4.75%, 1/15/36 | | | 2,007,640 | | |
| | 2,500 | | | Richland County Hospital Facilities, (Medcentral Health
Systems), 5.25%, 11/15/36 | | | 2,638,025 | | |
| | 830 | | | Richland County Hospital Facilities, (Medcentral Health
Systems), 6.375%, 11/15/30 | | | 895,030 | | |
| | | | | | | $ | 19,104,049 | | |
| Housing — 1.4% | | | |
| $ | 4,000 | | | Franklin County, (Tuttle Park), (FHA), (AMT),
6.60%, 3/1/36(4) | | $ | 4,203,400 | | |
| | | | | | | $ | 4,203,400 | | |
| Industrial Development Revenue — 4.3% | | | |
| $ | 3,970 | | | Cleveland Airport, (Continental Airlines), (AMT),
5.375%, 9/15/27 | | $ | 3,985,404 | | |
| | 2,890 | | | Dayton, Special Facilities Revenue, (Emery Air Freight),
5.625%, 2/1/18 | | | 2,984,358 | | |
| | 1,000 | | | Ohio Pollution Control, (Standard Oil), 6.75%, 12/1/15 | | | 1,196,240 | | |
| | 4,000 | | | Ohio Sewer and Solid Waste Disposal Facilities, (Anheuser
Busch), (AMT), 6.00%, 7/1/35 | | | 4,232,080 | | |
| | | | | | | $ | 12,398,082 | | |
| Insured-Education — 3.5% | | | |
| $ | 1,000 | | | Miami University, (AMBAC), 3.25%, 9/1/26 | | $ | 849,110 | | |
| | 1,500 | | | Ohio Higher Educational Facilities Authority, (University of
Dayton), (AMBAC), 5.00%, 12/1/30 | | | 1,597,545 | | |
| | 2,100 | | | Puerto Rico Industrial, Tourist, Educational, Medical and
Environmental Authority, (University Plaza), (MBIA),
5.00%, 7/1/33(1) | | | 2,168,187 | | |
| | 1,340 | | | University of Akron, (FGIC), 4.75%, 1/1/26 | | | 1,377,708 | | |
| | 4,000 | | | University of Cincinnati, (FGIC), 5.00%, 6/1/31 | | | 4,148,040 | | |
| | | | | | | $ | 10,140,590 | | |
| Insured-Electric Utilities — 11.0% | | | |
| $ | 2,000 | | | Cuyahoga County Utility Systems, (Medical Center Co.),
(MBIA), (AMT), 6.10%, 8/15/15 | | $ | 2,015,660 | | |
See notes to financial statements
32
Eaton Vance Ohio Municipals Fund as of March 31, 2007
PORTFOLIO OF INVESTMENTS (Unaudited) CONT'D
Principal Amount
(000's omitted) | |
Security | |
Value | |
| Insured-Electric Utilities (continued) | | | |
| $ | 2,000 | | | Hamilton, Electric System Revenue, (FSA),
4.70%, 10/15/25 | | $ | 2,060,520 | | |
| | 7,430 | | | Ohio Air Quality Development Authority, (Dayton Power &
Light Co.), (FGIC), 4.80%, 1/1/34 | | | 7,606,983 | | |
| | 5,330 | | | Ohio Air Quality Development Authority, (Ohio Power),
(AMBAC), 5.15%, 5/1/26 | | | 5,502,319 | | |
| | 3,000 | | | Ohio Municipal Electric Generation Agency, (MBIA),
0.00%, 2/15/26 | | | 1,316,880 | | |
| | 2,500 | | | Ohio Municipal Electric Generation Agency, (MBIA),
0.00%, 2/15/27 | | | 1,048,525 | | |
| | 4,750 | | | Ohio Municipal Electric Generation Agency, (MBIA),
0.00%, 2/15/28 | | | 1,903,087 | | |
| | 3,000 | | | Ohio Water Development Authority, (Fresh Water
Improvement), (FGIC), 4.80%, 1/1/34 | | | 3,071,460 | | |
| | 4,640 | | | Puerto Rico Electric Power Authority, (FGIC),
5.00%, 7/1/35 | | | 4,911,254 | | |
| | 2,700 | | | Puerto Rico Electric Power Authority, (MBIA),
4.75%, 7/1/33(1) | | | 2,777,004 | | |
| | | | | | | $ | 32,213,692 | | |
| Insured-Escrowed / Prerefunded — 5.8% | | | |
| $ | 1,250 | | | Athens City School District, (FSA), Prerefunded to
12/1/10, 6.00%, 12/1/24 | | $ | 1,362,925 | | |
| | 1,000 | | | Cincinnati City School District, (Classroom Facilities
Construction & Improvement), (FSA),
Prerefunded to 12/1/13, 5.00%, 12/1/31 | | | 1,075,860 | | |
| | 495 | | | Cuyahoga County Hospital, (Cleveland Clinic), (MBIA),
Escrowed to Maturity, 5.125%, 1/1/29 | | | 508,924 | | |
| | 2,390 | | | Hamilton County, Sales Tax Revenue, (AMBAC),
Prerefunded to 12/1/10, 5.25%, 12/1/32 | | | 2,523,888 | | |
| | 1,475 | | | Lima City School District, (AMBAC), Prerefunded to
12/1/10, 6.00%, 12/1/22 | | | 1,624,417 | | |
| | 3,000 | | | Marysville Exempt Village School District, (School Facilities),
(MBIA), Prerefunded to 6/1/15, 5.25%, 12/1/30 | | | 3,302,220 | | |
| | 1,300 | | | Minerva Local School District, (Classroom Facility), (MBIA),
Prerefunded to 12/1/12, 5.30%, 12/1/29 | | | 1,407,991 | | |
| | 800 | | | Norwalk City School District, (AMBAC), Prerefunded to
12/1/09, 4.75%, 12/1/26 | | | 823,080 | | |
| | 4,000 | | | University of Akron, (FGIC), Prerefunded to
1/1/10, 5.75%, 1/1/29(1) | | | 4,256,780 | | |
| | | | | | | $ | 16,886,085 | | |
| Insured-General Obligations — 34.0% | | | |
| $ | 2,000 | | | Adams County Local School District, (FSA),
4.25%, 12/1/33 | | $ | 1,930,220 | | |
| | 1,500 | | | Amherst School District, (FGIC), 5.00%, 12/1/26 | | | 1,588,455 | | |
| | 2,500 | | | Canal Winchester Local School District, (MBIA),
0.00%, 12/1/32 | | | 803,725 | | |
| | 1,000 | | | Cincinnati City School District, (Classroom Facilities
Construction & Improvement), (FSA), 5.00%, 12/1/21 | | | 1,106,000 | | |
| | 2,155 | | | Cleveland, (AMBAC), 5.50%, 10/1/23 | | | 2,521,307 | | |
Principal Amount
(000's omitted) | |
Security | |
Value | |
| Insured-General Obligations (continued) | | | |
| $ | 5,000 | | | Columbus School District, (Classroom Facilities
Construction & Improvement), (FSA), 4.25%, 12/1/32 | | $ | 4,836,450 | | |
| | 4,000 | | | Fairview Park, (MBIA), 5.00%, 12/1/25 | | | 4,258,720 | | |
| | 1,000 | | | Gallia County Local School District, (FSA),
4.75%, 12/1/25 | | | 1,040,290 | | |
| | 3,000 | | | Gallia County Local School District, (FSA),
5.00%, 12/1/30 | | | 3,189,150 | | |
| | 2,890 | | | Hilliard School District, (MBIA),
5.00%, 12/1/27 | | | 3,085,046 | | |
| | 6,580 | | | Indian Lake Local School District, (School Facilities
Construction), (MBIA), 5.00%, 12/1/34 | | | 7,005,660 | | |
| | 1,975 | | | Ironton City School District, (MBIA), 4.25%, 12/1/28 | | | 1,921,675 | | |
| | 1,180 | | | Lake County, (MBIA), 5.00%, 12/1/25 | | | 1,252,605 | | |
| | 2,000 | | | Lakota School District, (FGIC), 5.25%, 12/1/26 | | | 2,303,940 | | |
| | 3,505 | | | Mahoning County, (FSA), 5.00%, 12/1/27 | | | 3,757,956 | | |
| | 1,065 | | | Marysville Exempt Village School District, (FSA),
4.375%, 12/1/29 | | | 1,055,862 | | |
| | 5,500 | | | Marysville Exempt Village School District, (FSA),
5.00%, 12/1/29 | | | 5,835,115 | | |
| | 1,670 | | | Miami East Ohio School District, (FSA),
4.50%, 12/1/29(5) | | | 1,670,000 | | |
| | 3,780 | | | New Albany Plain Local School District, (MBIA),
4.25%, 12/1/28 | | | 3,677,940 | | |
| | 7,400 | | | Olentangy School District, (FSA), 4.50%, 12/1/32 | | | 7,408,214 | | |
| | 3,695 | | | Olentangy School District, (FSA), 5.00%, 12/1/21 | | | 3,968,763 | | |
| | 1,000 | | | Painesville City School District, (MBIA), 4.75%, 12/1/32 | | | 1,026,760 | | |
| | 1,620 | | | Painesville City School District, (MBIA), 5.00%, 12/1/24 | | | 1,719,922 | | |
| | 2,115 | | | Pickerington Local School District, (MBIA),
4.00%, 12/1/26 | | | 1,994,995 | | |
| | 2,500 | | | Pickerington Local School District, (MBIA),
4.25%, 12/1/34 | | | 2,407,275 | | |
| | 1,500 | | | Pickerington Local School District, (School Facility
Contract), (FGIC), 0.00%, 12/1/16 | | | 1,014,165 | | |
| | 1,500 | | | South-Western City School District, (FSA), 4.25%, 12/1/26 | | | 1,467,615 | | |
| | 5,000 | | | Springboard Community City School District, (FSA),
5.25%, 12/1/30 | | | 5,778,250 | | |
| | 1,000 | | | Springfield City School District, (Clark County), (FGIC),
5.20%, 12/1/23 | | | 1,074,320 | | |
| | 2,500 | | | Sugarcreek Local School District, (FSA), 4.25%, 12/1/31 | | | 2,419,975 | | |
| | 5,000 | | | Trotwood-Madison, City School District, (School
Improvements), (FSA), 4.50%, 12/1/30 | | | 5,013,350 | | |
| | 4,000 | | | Wauseon, Exempt Village School District, (Classroom
Facilities and School Improvements), (FSA),
4.25%, 12/1/34 | | | 3,845,480 | | |
| | 6,705 | | | Westerville City School District, (XLCA), 5.00%, 12/1/27 | | | 7,425,117 | | |
| | | | | | | $ | 99,404,317 | | |
See notes to financial statements
33
Eaton Vance Ohio Municipals Fund as of March 31, 2007
PORTFOLIO OF INVESTMENTS (Unaudited) CONT'D
Principal Amount
(000's omitted) | |
Security | |
Value | |
| Insured-Hospital — 2.0% | | | |
| $ | 1,000 | | | Akron, Bath, Copley, Joint Township Hospital District,
(Children's Hospital Medical Center), (FSA),
5.25%, 11/15/25 | | $ | 1,063,400 | | |
| | 500 | | | Cuyahoga County, (Cleveland Clinic), (MBIA),
5.125%, 1/1/29 | | | 514,065 | | |
| | 1,300 | | | Franklin County, (Ohio Health Corp.), (MBIA),
5.00%, 5/15/33 | | | 1,348,841 | | |
| | 2,845 | | | Hamilton County, (Cincinnati Children's Hospital), (FGIC),
5.00%, 5/15/32 | | | 2,966,851 | | |
| | | | | | | $ | 5,893,157 | | |
Insured-Lease Revenue / Certificates of
Participation — 0.9% | | | |
| $ | 1,195 | | | Ohio Higher Educational Facilities Authority,
(Xavier University), (CIFG), 5.00%, 5/1/22 | | $ | 1,268,875 | | |
| | 1,245 | | | Ohio Higher Educational Facilities Authority,
(Xavier University), (CIFG), 5.25%, 5/1/21 | | | 1,354,124 | | |
| | | | | | | $ | 2,622,999 | | |
| Insured-Special Tax Revenue — 3.9% | | | |
| $ | 5,000 | | | Hamilton County, Sales Tax Revenue, (AMBAC),
4.25%, 12/1/32 | | $ | 4,836,450 | | |
| | 610 | | | Hamilton County, Sales Tax Revenue, (AMBAC),
5.60%, 12/1/32 | | | 637,871 | | |
| | 2,490 | | | Hamilton County, Sales Tax Revenue, (MBIA),
5.00%, 12/1/27 | | | 2,553,196 | | |
| | 4,760 | | | Puerto Rico Infrastructure Financing Authority, (AMBAC),
0.00%, 7/1/29 | | | 1,793,044 | | |
| | 5,000 | | | Puerto Rico Infrastructure Financing Authority, (AMBAC),
0.00%, 7/1/34 | | | 1,498,800 | | |
| | 590 | | | Puerto Rico Infrastructure Financing Authority, (AMBAC),
0.00%, 7/1/37 | | | 153,612 | | |
| | | | | | | $ | 11,472,973 | | |
| Insured-Transportation — 6.1% | | | |
| $ | 1,000 | | | Butler County Transportation Improvement District, (XLCA),
4.50%, 12/1/34 | | $ | 991,340 | | |
| | 7,000 | | | Ohio Turnpike Commission, (FGIC), 5.50%, 2/15/24(6) | | | 8,208,270 | | |
| | 5,000 | | | Puerto Rico Highway and Transportation Authority, (CIFG),
5.25%, 7/1/41 | | | 5,787,200 | | |
| | 2,500 | | | Puerto Rico Highway and Transportation Authority, (FSA),
5.25%, 7/1/22 | | | 2,837,200 | | |
| | | | | | | $ | 17,824,010 | | |
Principal Amount
(000's omitted) | |
Security | |
Value | |
| Insured-Water and Sewer — 0.9% | | | |
| $ | 1,500 | | | Marysville Wastewater Treatment System, (XLCA),
4.75%, 12/1/46 | | $ | 1,523,175 | | |
| | 1,060 | | | Toledo, Waterworks, (MBIA), 5.00%, 11/15/25 | | | 1,128,275 | | |
| | | | | | | $ | 2,651,450 | | |
| Nursing Home — 3.6% | | | |
| $ | 1,250 | | | Cuyahoga County Health Care Facilities, (Maple Care Center)
(GNMA), (AMT), 8.00%, 8/20/16 | | $ | 1,346,662 | | |
| | 1,205 | | | North Canton Health Care Facilities, (St. Luke Lutheran),
(GNMA), 6.10%, 9/20/16 | | | 1,304,232 | | |
| | 6,455 | | | North Canton Health Care Facilities, (St. Luke Lutheran),
(GNMA), 9.55%, 3/20/32 | | | 7,761,879 | | |
| | | | | | | $ | 10,412,773 | | |
| Other Revenue — 3.3% | | | |
| $ | 9,000 | | | Puerto Rico Infrastructure Financing Authority,
5.50%, 10/1/32(1) | | $ | 9,629,790 | | |
| | | | | | | $ | 9,629,790 | | |
| Pooled Loans — 4.3% | | | |
| $ | 750 | | | Cleveland-Cuyahoga County Port Authority,
5.125%, 5/15/25 | | $ | 766,208 | | |
| | 800 | | | Cleveland-Cuyahoga County Port Authority, (Columbia
National), (AMT), 5.00%, 5/15/20 | | | 809,512 | | |
| | 250 | | | Ohio Economic Development Commission, (Burrows
Paper), (AMT), 7.625%, 6/1/11 | | | 250,703 | | |
| | 1,440 | | | Ohio Economic Development Commission, (Ohio Enterprise
Bond Fund), (AMT), 4.85%, 6/1/25 | | | 1,495,296 | | |
| | 675 | | | Ohio Economic Development Commission, (Progress Plastic
Products), (AMT), 7.80%, 12/1/09 | | | 677,012 | | |
| | 7,455 | | | Rickenbacker Port Authority, Oasbo Expanded Asset Pool Loan,
5.375%, 1/1/27 | | | 8,226,717 | | |
| | 425 | | | Toledo Lucas County, Port Authority Development,
5.125%, 11/15/25 | | | 431,486 | | |
| | | | | | | $ | 12,656,934 | | |
| Senior Living / Life Care — 0.4% | | | |
| $ | 1,000 | | | Allen County Lima, (Convalescent Home Foundation),
(GNMA), 6.40%, 1/1/21 | | $ | 1,002,000 | | |
| | 40 | | | Hamilton County Hospital Facilities, (Episcopal Retirement
Home), 6.80%, 1/1/08 | | | 40,091 | | |
| | | | | | | $ | 1,042,091 | | |
See notes to financial statements
34
Eaton Vance Ohio Municipals Fund as of March 31, 2007
PORTFOLIO OF INVESTMENTS (Unaudited) CONT'D
Principal Amount
(000's omitted) | |
Security | |
Value | |
| Special Tax Revenue — 1.3% | | | |
| $ | 2,000 | | | Cleveland-Cuyahoga County Port Authority,
7.00%, 12/1/18 | | $ | 2,192,380 | | |
| | 1,405 | | | Cuyahoga County, Economic Development, (Shaker
Square), 6.75%, 12/1/30 | | | 1,566,238 | | |
| | | | | | | $ | 3,758,618 | | |
| Water and Sewer — 1.0% | | | |
| $ | 3,000 | | | Cincinnati Water System Authority,
4.50%, 12/1/23 | | $ | 3,052,830 | | |
| | | | | | | $ | 3,052,830 | | |
Total Tax-Exempt Investments
(identified cost $290,585,615) | | $ | 304,672,041 | | |
| Short-Term Investments — 1.8% | | | |
Principal Amount
(000's omitted) | |
Description | |
Value | |
| $ | 1,500 | | | Franklin County, (Trinity Health Credit), (FSA),
Variable Rate, 3.68%, 12/1/30 | | $ | 1,500,000 | | |
| | 2,900 | | | Ohio Higher Educational Facilities, (Capital University),
Variable Rate, 3.67%, 12/1/31 | | | 2,900,000 | | |
| | 1,000 | | | Ohio Higher Educational Facilities, (Case Western
Reserve University), Variable Rate, 3.65%, 10/1/22 | | | 1,000,000 | | |
Total Short-Term Investments
(at amortized cost, $5,400,000) | | $ | 5,400,000 | | |
Total Investments — 106.2%
(identified cost $295,985,615) | | $ | 310,072,041 | | |
| Other Assets, Less Liabilities — (6.2)% | | $ | (18,123,397 | ) | |
| Net Assets — 100.0% | | $ | 291,948,644 | | |
AMBAC - AMBAC Financial Group, Inc.
AMT - Interest earned from these securities may be considered a tax preference item for purposes of the Federal Alternative Minimum Tax.
CIFG - CDC IXIS Financial Guaranty North America, Inc.
FGIC - Financial Guaranty Insurance Company
FSA - Financial Security Assurance, Inc.
MBIA - Municipal Bond Insurance Association
XLCA - XL Capital Assurance, Inc.
The Fund invests primarily in debt securities issued by Ohio municipalities. The ability of the issuers of the debt securities to
meet their obligations may be affected by economic developments in a specific industry or municipality. In order to reduce the risk associated with such economic developments, at March 31, 2007, 65.3% of total investments are backed by bond insurance of various financial institutions and financial guaranty assurance agencies. The aggregate percentage insured by an individual financial institution ranged from 2.7% to 21.4% of total investments.
(1) Security represents the underlying municipal obligation of an inverse floating rate obligation held by the Fund.
(2) Security exempt from registration under Rule 144A of the Securities Act of 1933. These securities may be sold in transactions exempt from registration, normally to qualified institutional buyers. At March 31, 2007, the aggregate value of the securities is $3,514,713 or 1.2% of the Fund's net assets.
(3) Security has been issued as an inverse floater bond. The stated interest rate represents the rate in effect at March 31, 2007.
(4) Security (or a portion thereof) has been segregated to cover when-issued securities.
(5) When-issued security.
(6) Security (or a portion thereof) has been segregated to cover margin requirements on open financial futures contracts.
See notes to financial statements
35
Eaton Vance Rhode Island Municipals Fund as of March 31, 2007
PORTFOLIO OF INVESTMENTS (Unaudited)
Tax-Exempt Investments — 103.2% | | | |
Principal Amount
(000's omitted) | | Security | | Value | |
| Education — 5.7% | | | |
| $ | 500 | | | Rhode Island Health and Educational Building Corp.,
(Brown University), 4.75%, 9/1/33 | | $ | 511,220 | | |
| | 2,105 | | | Rhode Island Health and Educational Building Corp.,
(Brown University), 4.75%, 9/1/37 | | | 2,149,879 | | |
| | 400 | | | Rhode Island Health and Educational Building Corp.,
(Higher Education Facility-Brown University),
5.00%, 9/1/23 | | | 417,528 | | |
| | 500 | | | Rhode Island Health and Educational Building Corp.,
(Higher Education Facility-Salve Regina University),
5.125%, 3/15/32 | | | 518,540 | | |
| | | | | | | $ | 3,597,167 | | |
| Electric Utilities — 2.3% | | | |
| $ | 1,000 | | | Puerto Rico Electric Power Authority, 5.125%, 7/1/29(1) | | $ | 1,045,589 | | |
| | 400 | | | Puerto Rico Electric Power Authority, Variable Rate,
5.659%, 7/1/29(3)(5) | | | 436,464 | | |
| | | | | | | $ | 1,482,053 | | |
| Escrowed / Prerefunded — 1.8% | | | |
| $ | 1,000 | | | Rhode Island Health and Educational Building Corp.,
(Hospital Financing-Lifespan Obligation Group),
Prerefunded to 8/15/12, 6.50%, 8/15/32 | | $ | 1,132,950 | | |
| | | | | | | $ | 1,132,950 | | |
| General Obligations — 0.2% | | | |
| $ | 225 | | | Puerto Rico, 0.00%, 7/1/16 | | $ | 153,511 | | |
| | | | | | | $ | 153,511 | | |
| Hospital — 0.8% | | | |
| $ | 500 | | | Rhode Island Health and Educational Building Corp.,
(Newport Hospital), 5.30%, 7/1/29 | | $ | 514,145 | | |
| | | | | | | $ | 514,145 | | |
| Housing — 3.0% | | | |
| $ | 900 | | | Rhode Island Housing and Mortgage Finance Corp., (AMT),
4.90%, 4/1/22 | | $ | 909,738 | | |
| | 1,000 | | | Rhode Island Housing and Mortgage Finance Corp., (AMT),
4.90%, 10/1/28 | | | 1,016,620 | | |
| | | | | | | $ | 1,926,358 | | |
Principal Amount
(000's omitted) | |
Security | |
Value | |
| Industrial Development Revenue — 2.4% | | | |
| $ | 1,000 | | | Rhode Island Industrial Facilities Corp., (Waste
Management, Inc.), (AMT), 4.625%, 4/1/16 | | $ | 999,270 | | |
| | 520 | | | Virgin Islands Public Financing Authority, (Hovensa LLC),
(AMT), 4.70%, 7/1/22 | | | 522,278 | | |
| | | | | | | $ | 1,521,548 | | |
| Insured-Education — 15.4% | | | |
| $ | 2,145 | | | Rhode Island Health and Educational Building Corp.,
(Bryant College), (AMBAC), 5.00%, 12/1/31 | | $ | 2,217,415 | | |
| | 900 | | | Rhode Island Health and Educational Building Corp.,
(Higher Education Facilities-Rhode Island School of Design),
(XLCA), 5.00%, 8/15/23 | | | 948,429 | | |
| | 1,000 | | | Rhode Island Health and Educational Building Corp.,
(Higher Education Facilities-University of Rhode Island),
(AMBAC), 5.00%, 9/15/30 | | | 1,057,540 | | |
| | 1,575 | | | Rhode Island Health and Educational Building Corp.,
(Johnson and Wales University), (MBIA), 5.00%, 4/1/29 | | | 1,614,517 | | |
| | 710 | | | Rhode Island Health and Educational Building Corp.,
(New England Institution of Technology), (AMBAC),
4.50%, 3/1/26 | | | 712,513 | | |
| | 1,000 | | | Rhode Island Health and Educational Building Corp.,
(Providence College), (XLCA), 5.00%, 11/1/24 | | | 1,042,950 | | |
| | 1,600 | | | Rhode Island Health and Educational Building Corp.,
(Rhode Island School of Design), (MBIA), 5.00%, 6/1/31 | | | 1,669,280 | | |
| | 500 | | | Rhode Island Health and Educational Building Corp.,
(Roger Williams College), (AMBAC), 5.00%, 11/15/24 | | | 517,870 | | |
| | | | | | | $ | 9,780,514 | | |
| Insured-Electric Utilities — 4.2% | | | |
| $ | 1,000 | | | Puerto Rico Electric Power Authority, (FSA),
5.25%, 7/1/29(1) | | $ | 1,052,712 | | |
| | 975 | | | Puerto Rico Electric Power Authority, (MBIA),
0.00%, 7/1/17 | | | 631,907 | | |
| | 900 | | | Puerto Rico Electric Power Authority, (MBIA),
5.50%, 7/1/16(1) | | | 1,019,487 | | |
| | | | | | | $ | 2,704,106 | | |
| Insured-Escrowed / Prerefunded — 9.7% | | | |
| $ | 1,000 | | | North Kingstown, Prerefunded to 10/1/09, (FGIC),
5.875%, 10/1/25(2) | | $ | 1,062,760 | | |
| | 1,000 | | | Providence, Prerefunded to 1/15/11, (FGIC),
5.00%, 1/15/26 | | | 1,055,520 | | |
| | 230 | | | Rhode Island Depositors Economic Protection Corp.,
Escrowed to Maturity, (FSA), 5.75%, 8/1/21 | | | 273,162 | | |
| | 500 | | | Rhode Island Depositors Economic Protection Corp.,
Escrowed to Maturity, (MBIA), 5.80%, 8/1/09 | | | 524,235 | | |
| | 1,000 | | | Rhode Island Depositors Economic Protection Corp.,
Escrowed to Maturity, (MBIA), 5.80%, 8/1/12 | | | 1,102,060 | | |
See notes to financial statements
36
Eaton Vance Rhode Island Municipals Fund as of March 31, 2007
PORTFOLIO OF INVESTMENTS (Unaudited) CONT'D
Principal Amount
(000's omitted) | |
Security | |
Value | |
| Insured-Escrowed / Prerefunded (continued) | | | |
| $ | 500 | | | Rhode Island Health and Educational Building Corp.,
(Rhode Island College), Prerefunded to 9/15/10,
(AMBAC), 5.625%, 9/15/30 | | $ | 536,465 | | |
| | 500 | | | Rhode Island Health and Educational Building Corp.,
(University of Rhode Island), Prerefunded to 9/15/09,
(MBIA), 5.50%, 9/15/19 | | | 526,550 | | |
| | 1,000 | | | Rhode Island Health and Educational Building Corp.,
(University of Rhode Island), Prerefunded to 9/15/10,
(AMBAC), 5.70%, 9/15/30 | | | 1,075,350 | | |
| | | | | | | $ | 6,156,102 | | |
| Insured-General Obligations — 4.4% | | | |
| $ | 600 | | | North Kingstown, (FGIC), 5.00%, 10/1/25 | | $ | 638,658 | | |
| | 500 | | | Puerto Rico, (FSA), Variable Rate, 5.84%, 7/1/27(3)(4) | | | 591,155 | | |
| | 600 | | | Rhode Island and Providence Plantations, (FSA),
4.75%, 8/1/26 | | | 624,060 | | |
| | 575 | | | Warwick, (AMBAC), 5.00%, 7/15/21 | | | 605,509 | | |
| | 350 | | | Woonsocket, (AMBAC), 5.00%, 3/1/35 | | | 367,843 | | |
| | | | | | | $ | 2,827,225 | | |
| Insured-Hospital — 6.8% | | | |
| $ | 1,900 | | | Rhode Island Health and Educational Building Corp.,
(Lifespan), (MBIA), 5.25%, 5/15/26 | | $ | 1,940,584 | | |
| | 2,250 | | | Rhode Island Health and Educational Building Corp.,
(Rhode Island Hospital), (FSA), 5.00%, 5/15/32 | | | 2,359,935 | | |
| | | | | | | $ | 4,300,519 | | |
| Insured-Housing — 2.3% | | | |
| $ | 400 | | | Rhode Island Housing and Mortgage Finance Corp., (Rental
Housing Program), (FSA), (AMT), 5.25%, 10/1/31 | | $ | 407,388 | | |
| | 1,000 | | | Rhode Island Housing and Mortgage Finance Corp., (Rental
Housing Program), (FSA), (AMT), 5.55%, 10/1/32 | | | 1,029,990 | | |
| | | | | | | $ | 1,437,378 | | |
Insured-Lease Revenue / Certificates of
Participation — 4.1% | | | |
| $ | 680 | | | Providence Redevelopment Agency, (Public Safety Building),
(AMBAC), 5.00%, 4/1/25 | | $ | 715,945 | | |
| | 1,000 | | | Providence Redevelopment Agency, (Public Safety Building),
(AMBAC), 5.00%, 4/1/28 | | | 1,050,780 | | |
| | 800 | | | Rhode Island Health and Educational Building Corp.,
(Higher Education Facilities), (MBIA), 5.00%, 9/15/23 | | | 837,936 | | |
| | | | | | | $ | 2,604,661 | | |
Principal Amount
(000's omitted) | |
Security | |
Value | |
| Insured-Pooled Loans — 0.8% | | | |
| $ | 500 | | | Rhode Island Student Loan Authority, (AMBAC),
(AMT), 4.90%, 12/1/26 | | $ | 517,095 | | |
| | | | | | | $ | 517,095 | | |
| Insured-Solid Waste — 1.2% | | | |
| $ | 750 | | | Rhode Island Resource Recovery Corp., (MBIA), (AMT),
5.00%, 3/1/22 | | $ | 773,032 | | |
| | | | | | | $ | 773,032 | | |
| Insured-Special Tax Revenue — 11.5% | | | |
| $ | 2,300 | | | Convention Center Authority of Rhode Island, (MBIA),
5.25%, 5/15/15 | | $ | 2,466,313 | | |
| | 2,010 | | | Puerto Rico Convention Center Authority, (CIFG),
4.50%, 7/1/36(1) | | | 2,019,708 | | |
| | 265 | | | Puerto Rico Infrastructure Financing Authority, (AMBAC),
0.00%, 7/1/28 | | | 104,754 | | |
| | 1,425 | | | Puerto Rico Infrastructure Financing Authority, (AMBAC),
0.00%, 7/1/29 | | | 536,783 | | |
| | 1,625 | | | Puerto Rico Infrastructure Financing Authority, (AMBAC),
0.00%, 7/1/37 | | | 423,085 | | |
| | 2,000 | | | Puerto Rico Infrastructure Financing Authority, (FGIC),
0.00%, 7/1/30 | | | 719,400 | | |
| | 1,000 | | | Rhode Island Economic Development Corp., (Rhode Island
Department of Transportation), Motor Fuel Tax Revenue,
(AMBAC), 5.00%, 6/15/26 | | | 1,057,770 | | |
| | | | | | | $ | 7,327,813 | | |
| Insured-Transportation — 10.4% | | | |
| $ | 1,500 | | | Puerto Rico Highway and Transportation Authority, (CIFG),
5.25%, 7/1/41(1) | | $ | 1,746,630 | | |
| | 1,000 | | | Puerto Rico Highway and Transportation Authority, (FSA),
4.75%, 7/1/38 | | | 1,046,570 | | |
| | 1,500 | | | Puerto Rico Highway and Transportation Authority, (FSA),
5.25%, 7/1/33 | | | 1,743,630 | | |
| | 1,000 | | | Rhode Island Economic Development Corp.
(T.F. Green Airport),(FSA), (AMT), 5.00%, 7/1/20 | | | 1,041,260 | | |
| | 1,000 | | | Rhode Island Economic Development Corp., (Rhode Island
Airport Corp.), (CIFG), 5.00%, 7/1/31 | | | 1,052,520 | | |
| | | | | | | $ | 6,630,610 | | |
| Insured-Water and Sewer — 7.8% | | | |
| $ | 3,350 | | | Narragansett Bay Commission, (MBIA), 5.00%, 8/1/27 | | $ | 3,537,868 | | |
| | 1,000 | | | Narragansett Bay Commission, (MBIA), 5.00%, 8/1/28 | | | 1,056,080 | | |
| | 350 | | | Rhode Island Clean Water, Water Pollution Control, (MBIA),
5.40%, 10/1/15 | | | 379,355 | | |
| | | | | | | $ | 4,973,303 | | |
See notes to financial statements
37
Eaton Vance Rhode Island Municipals Fund as of March 31, 2007
PORTFOLIO OF INVESTMENTS (Unaudited) CONT'D
Principal Amount
(000's omitted) | |
Security | |
Value | |
| Nursing Home — 4.5% | | | |
| $ | 500 | | | Rhode Island Health and Educational Building Corp.,
(Roger Williams Realty), 6.50%, 8/1/29 | | $ | 535,080 | | |
| | 1,275 | | | Rhode Island Health and Educational Building Corp.,
(Steere House), 5.80%, 7/1/20 | | | 1,293,819 | | |
| | 1,000 | | | Rhode Island Health and Educational Building Corp.,
(Tockwotton Home), 6.25%, 8/15/22 | | | 1,011,830 | | |
| | | | | | | $ | 2,840,729 | | |
| Other Revenue — 3.0% | | | |
| $ | 250 | | | Central Falls Detention Facility Revenue, 7.25%, 7/15/35 | | $ | 281,423 | | |
| | 1,545 | | | Puerto Rico Infrastructure Financing Authority,
5.50%, 10/1/32(1) | | | 1,653,114 | | |
| | | | | | | $ | 1,934,537 | | |
| Special Tax Revenue — 0.9% | | | |
| $ | 500 | | | Tiverton, Obligation Tax Increment, (Mount Hope
Bay Village), 6.875%, 5/1/22 | | $ | 542,740 | | |
| | | | | | | $ | 542,740 | | |
Total Tax-Exempt Investments — 103.2%
(identified cost $62,503,439) | | $ | 65,678,096 | | |
| Other Assets, Less Liabilities — (3.2)% | | $ | (2,053,189 | ) | |
| Net Assets — 100.0% | | $ | 63,624,907 | | |
AMBAC - AMBAC Financial Group, Inc.
AMT - Interest earned from these securities may be considered a tax preference item for purposes of the Federal Alternative Minimum Tax.
CIFG - CDC IXIS Financial Guaranty North America, Inc.
FGIC - Financial Guaranty Insurance Company
FSA - Financial Security Assurance, Inc.
MBIA - Municipal Bond Insurance Association
XLCA - XL Capital Assurance, Inc.
The Fund invests primarily in debt securities issued by Rhode Island municipalities. The ability of the issuers of the debt securities to meet their obligations may be affected by economic developments in a specific industry or municipality. In order to reduce the risk associated with such economic developments, at March 31, 2007, 76.2% of total investments are backed by bond insurance of various financial institutions and financial guaranty assurance agencies. The aggregate percentage insured by an individual financial institution ranged from 3.0% to 27.5% of total investments.
(1) Security represents the underlying municipal obligation of an inverse floating rate obligation held by the Fund.
(2) Security (or a portion thereof) has been segregated to cover margin requirements on open financial futures contracts.
(3) Security exempt from registration under Rule 144A of the Securities Act of 1933. These securities may be sold in transactions exempt from registration, normally to qualified institutional buyers. At March 31, 2007, the aggregate value of the securities is $1,027,619 or 1.6% of the Fund's net assets.
(4) Security has been issued as a leveraged inverse floater bond. The stated interest rate represents the rate in effect at March 31, 2007.
(5) Security has been issued as an inverse floater bond. The stated interest rate represents the rate in effect at March 31, 2007.
See notes to financial statements
38
Eaton Vance West Virginia Municipals Fund as of March 31, 2007
PORTFOLIO OF INVESTMENTS (Unaudited)
Tax-Exempt Investments — 105.2% | | | |
Principal Amount
(000's omitted) | | Security | | Value | |
| Education — 2.5% | | | |
| $ | 750 | | | Sheperd College Board of Governors, 5.125%, 12/1/33 | | $ | 782,362 | | |
| | | | | | | $ | 782,362 | | |
| Electric Utilities — 1.6% | | | |
| $ | 500 | | | Mason County PCR, (Appalachian Power Co.),
5.50%, 10/1/22 | | $ | 516,780 | | |
| | | | | | | $ | 516,780 | | |
| Escrowed / Prerefunded — 15.9% | | | |
| $ | 2,500 | | | Kanawha-Putnam, Single Family, Escrowed to Maturity,
0.00%, 12/1/16 | | $ | 1,685,475 | | |
| | 1,000 | | | Puerto Rico Highway and Transportation Authority,
Prerefunded to 7/1/16, 5.00%, 7/1/36 | | | 1,096,500 | | |
| | 1,820 | | | West Virginia Health Facilities Authority, (Charleston Area
Medical Center), Escrowed to Maturity, 6.50%, 9/1/23 | | | 2,251,558 | | |
| | | | | | | $ | 5,033,533 | | |
| Housing — 2.5% | | | |
| $ | 800 | | | West Virginia Housing Development Fund, (AMT),
4.625%, 11/1/32 | | $ | 787,000 | | |
| | | | | | | $ | 787,000 | | |
| Industrial Development Revenue — 0.7% | | | |
| $ | 235 | | | Virgin Islands Public Financing Authority,
(Hovensa LLC), (AMT), 4.70%, 7/1/22 | | $ | 236,029 | | |
| | | | | | | $ | 236,029 | | |
| Insured-Education — 10.5% | | | |
| $ | 750 | | | Fairmont College Student Activity Revenue, (FGIC),
5.00%, 6/1/32 | | $ | 789,765 | | |
| | 455 | | | West Virginia Higher Education Interim Governing Board,
(Marshall University), (FGIC), 5.00%, 5/1/31 | | | 467,745 | | |
| | 500 | | | West Virginia Higher Education Policy Commission, (FGIC),
5.00%, 4/1/29 | | | 523,280 | | |
| | 1,000 | | | West Virginia Higher Education Policy Commission, (FGIC),
5.00%, 4/1/34(1) | | | 1,043,480 | | |
| | 500 | | | West Virginia University, (FGIC), 4.75%, 10/1/35 | | | 510,920 | | |
| | | | | | | $ | 3,335,190 | | |
| Insured-Electric Utilities — 11.5% | | | |
| $ | 250 | | | Pleasants County PCR, (Potomac Edison), (AMBAC), (AMT),
5.50%, 4/1/29 | | $ | 258,480 | | |
| | 1,000 | | | Pleasants County PCR, (West Pennsylvania), (AMBAC), (AMT),
5.50%, 4/1/29 | | | 1,036,600 | | |
Principal Amount
(000's omitted) | |
Security | |
Value | |
| Insured-Electric Utilities (continued) | | | |
| $ | 1,800 | | | Puerto Rico Electric Power Authority, (MBIA),
4.75%, 7/1/33(2) | | $ | 1,851,336 | | |
| | 450 | | | Puerto Rico Electric Power Authority, (MBIA),
5.50%, 7/1/16(2) | | | 509,743 | | |
| | | | | | | $ | 3,656,159 | | |
| Insured-Escrowed / Prerefunded — 3.3% | | | |
| $ | 500 | | | Harrison County Building Commission, (Maplewood
Retirement), (AMBAC), Prerefunded to 4/1/08,
5.25%, 4/1/28 | | $ | 517,525 | | |
| | 500 | | | West Virginia School Building Authority, Prerefunded to
7/1/07, (AMBAC), 5.60%, 7/1/17 | | | 512,295 | | |
| | | | | | | $ | 1,029,820 | | |
| Insured-General Obligations — 9.0% | | | |
| $ | 1,000 | | | Monongalia County Board of Education, (MBIA),
5.00%, 5/1/33 | | $ | 1,051,880 | | |
| | 250 | | | Ohio County Board of Education, (MBIA),
5.125%, 6/1/18 | | | 258,745 | | |
| | 190 | | | Puerto Rico, (FSA), 5.125%, 7/1/30 | | | 199,143 | | |
| | 300 | | | Puerto Rico, (FSA), Variable Rate, 5.84%, 7/1/27(3)(4) | | | 354,693 | | |
| | 1,700 | | | West Virginia, (FGIC), 0.00%, 11/1/19 | | | 1,002,558 | | |
| | | | | | | $ | 2,867,019 | | |
| Insured-Hospital — 8.3% | | | |
| $ | 500 | | | Randolph County Commission Health System, (Davis Health
System, Inc.), (FSA), 5.20%, 11/1/21 | | $ | 529,820 | | |
| | 1,200 | | | West Virginia Health Facilities Authority, (West Virginia
University Medical Corp.), (MBIA), 6.10%, 1/1/18 | | | 1,204,452 | | |
| | 900 | | | West Virginia Hospital Finance Authority, (United Hospital
Center, Inc.), (AMBAC), 4.50%, 6/1/34 | | | 896,454 | | |
| | | | | | | $ | 2,630,726 | | |
Insured-Lease Revenue / Certificates of
Participation — 3.3% | | | |
| $ | 500 | | | West Virginia Economic Development Authority, (Correctional
Juvenile and Public), (MBIA), 5.00%, 6/1/26 | | $ | 526,510 | | |
| | 500 | | | West Virginia Economic Development Authority, (West
Virginia University), (AMBAC), 5.00%, 7/15/31 | | | 523,360 | | |
| | | | | | | $ | 1,049,870 | | |
| Insured-Special Tax Revenue — 4.5% | | | |
| $ | 3,780 | | | Puerto Rico Infrastructure Financing Authority, (AMBAC),
0.00%, 7/1/29 | | $ | 1,423,888 | | |
| | | | | | | $ | 1,423,888 | | |
See notes to financial statements
39
Eaton Vance West Virginia Municipals Fund as of March 31, 2007
PORTFOLIO OF INVESTMENTS (Unaudited) CONT'D
Principal Amount
(000's omitted) | |
Security | |
Value | |
| Insured-Transportation — 3.6% | | | |
| $ | 750 | | | Puerto Rico Highway and Transportation Authority, (CIFG),
5.25%, 7/1/41(2) | | $ | 873,315 | | |
| | 250 | | | West Virginia Parkways, Economic Development and
Tourism Authority, (FGIC), 5.25%, 5/15/19 | | | 280,165 | | |
| | | | | | | $ | 1,153,480 | | |
| Insured-Water and Sewer — 25.7% | | | |
| $ | 500 | | | Crab Orchard-MacArthur, Public Service District Sewer
System, (AMBAC), 5.50%, 10/1/25 | | $ | 510,700 | | |
| | 500 | | | Martinsburg Water and Sewer, (MBIA), 5.00%, 9/1/31 | | | 520,430 | | |
| | 750 | | | West Virginia Water Development Authority, (AMBAC),
5.00%, 10/1/28 | | | 790,988 | | |
| | 1,000 | | | West Virginia Water Development Authority,
(Loan Program II), (FGIC), 5.00%, 11/1/36 | | | 1,049,410 | | |
| | 1,000 | | | West Virginia Water Development Authority, (West Virginia
Infrastructure Jobs Program), (FSA), 4.75%, 10/1/45 | | | 1,015,680 | | |
| | 500 | | | West Virginia Water Development, (Loan Program II),
(AMBAC), 5.00%, 11/1/33 | | | 529,570 | | |
| | 375 | | | West Virginia Water Development, (Loan Program II),
(FGIC), 4.50%, 11/1/31 | | | 371,955 | | |
| | 500 | | | West Virginia Water Development, (Loan Program II),
(FGIC), 5.00%, 11/1/33 | | | 526,540 | | |
| | 500 | | | West Virginia Water Development, (Loan Program III),
(AMBAC), (AMT), 5.65%, 7/1/40 | | | 527,800 | | |
| | 500 | | | West Virginia Water Development, (Loan Program IV),
(AMBAC), 4.75%, 11/1/35 | | | 510,410 | | |
| | 750 | | | West Virginia Water Development, (Loan Program IV),
(FSA), 5.00%, 11/1/44 | | | 783,773 | | |
| | 1,000 | | | Wheeling Waterworks and Sewer System, (FSA),
4.75%, 6/1/36 | | | 1,025,740 | | |
| | | | | | | $ | 8,162,996 | | |
| Lease Revenue / Certificates of Participation — 1.3% | | | |
| $ | 400 | | | West Virginia Economic Development Authority,
(State Office Building), 5.00%, 10/1/26 | | $ | 413,096 | | |
| | | | | | | $ | 413,096 | | |
| Senior Living / Life Care — 1.0% | | | |
| $ | 300 | | | West Virginia Economic Development Authority,
(Edgewood Summit, Inc.), 5.50%, 11/1/29 | | $ | 306,984 | | |
| | | | | | | $ | 306,984 | | |
Total Tax-Exempt Investments — 105.2%
(identified cost $31,699,037) | | $ | 33,384,932 | | |
| Other Assets, Less Liabilities — (5.2)% | | $ | (1,650,883 | ) | |
| Net Assets — 100.0% | | $ | 31,734,049 | | |
AMBAC - AMBAC Financial Group, Inc.
AMT - Interest earned from these securities may be considered a tax preference item for purposes of the Federal Alternative Minimum Tax.
CIFG - CDC IXIS Financial Guaranty North America, Inc.
FGIC - Financial Guaranty Insurance Company
FSA - Financial Security Assurance, Inc.
MBIA - Municipal Bond Insurance Association
The Fund invests primarily in debt securities issued by West Virginia municipalities. The ability of the issuers of the debt securities to meet their obligations may be affected by economic developments in a specific industry or municipality. In order to reduce the risk associated with such economic developments, at March 31, 2007, 75.8% of total investments are backed by bond insurance of various financial institutions and financial guaranty assurance agencies. The aggregate percentage insured by an individual financial institution ranged from 2.6% to 24.1% of total investments.
(1) Security (or a portion thereof) has been segregated to cover margin requirements on open financial futures contracts.
(2) Security represents the underlying municipal obligation of an inverse floating rate obligation held by the Fund.
(3) Security exempt from registration under Rule 144A of the Securities Act of 1933. These securities may be sold in transactions exempt from registration, normally to qualified institutional buyers. At March 31, 2007, the aggregate value of the securities is $354,693 or 1.1% of the Fund's net assets.
(4) Security has been issued as a leveraged inverse floater bond. The stated interest rate represents the rate in effect at March 31, 2007.
See notes to financial statements
40
Eaton Vance Municipals Funds as of March 31, 2007
FINANCIAL STATEMENTS (Unaudited)
Statements of Assets and Liabilities
As of March 31, 2007
| | | California Fund | | Florida Fund | | Massachusetts Fund | | Mississippi Fund | |
| Assets | |
| Investments — | |
| Identified cost | | $ | 265,135,937 | | | $ | 258,676,157 | | | $ | 319,056,182 | | | $ | 18,700,122 | | |
| Unrealized appreciation | | | 21,830,546 | | | | 23,329,745 | | | | 18,939,908 | | | | 1,047,013 | | |
| Investments, at value | | $ | 286,966,483 | | | $ | 282,005,902 | | | $ | 337,996,090 | | | $ | 19,747,135 | | |
| Cash | | $ | 7,488,004 | | | $ | 1,125,215 | | | $ | 3,839,544 | | | $ | 283,133 | | |
| Receivable for investments sold | | | — | | | | 310,000 | | | | 2,917,809 | | | | 5,000 | | |
| Receivable for Fund shares sold | | | 448,425 | | | | 207,271 | | | | 1,100,245 | | | | 6,824 | | |
| Interest receivable | | | 3,410,307 | | | | 5,258,776 | | | | 3,638,334 | | | | 218,874 | | |
| Receivable for daily variation margin on open financial futures contracts | | | 134,063 | | | | 144,063 | | | | 161,250 | | | | 5,313 | | |
| Receivable for open interest rate swap contracts | | | 8,115 | | | | 8,439 | | | | 8,764 | | | | 8,227 | | |
| Receivable for closed interest rate swap contracts | | | — | | | | — | | | | — | | | | 2,815 | | |
| Total assets | | $ | 298,455,397 | | | $ | 289,059,666 | | | $ | 349,662,036 | | | $ | 20,277,321 | | |
| Liabilities | |
| Payable for floating rate notes issued | | $ | 20,125,000 | | | $ | 32,745,000 | | | $ | 29,306,500 | | | $ | 1,130,000 | | |
| Interest expense and fees payable | | | 181,320 | | | | 792,415 | | | | 240,237 | | | | 12,300 | | |
| Payable for Fund shares redeemed | | | 263,499 | | | | 549,053 | | | | 577,510 | | | | 1,343 | | |
| Dividends payable | | | 381,005 | | | | 408,087 | | | | 445,692 | | | | 32,525 | | |
| Payable for when-issued securities | | | 5,828,942 | | | | — | | | | 17,291,076 | | | | — | | |
| Payable to affiliate for investment advisory fees | | | 102,713 | | | | 91,933 | | | | 106,296 | | | | 2,448 | | |
| Payable to affiliate for distribution and service fees | | | 164,101 | | | | 147,772 | | | | 167,375 | | | | 11,871 | | |
| Accrued expenses | | | 70,964 | | | | 83,040 | | | | 78,778 | | | | 23,844 | | |
| Total liabilities | | $ | 27,117,544 | | | $ | 34,817,300 | | | $ | 48,213,464 | | | $ | 1,214,331 | | |
| Net Assets | | $ | 271,337,853 | | | $ | 254,242,366 | | | $ | 301,448,572 | | | $ | 19,062,990 | | |
| Sources of Net Assets | |
| Paid-in capital | | $ | 247,658,779 | | | $ | 235,135,147 | | | $ | 284,227,586 | | | $ | 18,132,753 | | |
Accumulated net realized gain (loss) (computed on the basis
of identified cost) | | | 1,222,801 | | | | (6,203,035 | ) | | | (2,279,797 | ) | | | (122,642 | ) | |
Accumulated undistributed (distributions in excess of) net
investment income | | | (98,121 | ) | | | 1,202,949 | | | | (292,646 | ) | | | (29,000 | ) | |
| Net unrealized appreciation (computed on the basis of identified cost) | | | 22,554,394 | | | | 24,107,305 | | | | 19,793,429 | | | | 1,081,879 | | |
| Total | | $ | 271,337,853 | | | $ | 254,242,366 | | | $ | 301,448,572 | | | $ | 19,062,990 | | |
| Class A Shares | |
| Net Assets | | $ | 259,113,906 | | | $ | 222,053,242 | | | $ | 229,577,330 | | | $ | 15,252,098 | | |
| Shares Outstanding | | | 23,759,450 | | | | 20,485,511 | | | | 23,308,404 | | | | 1,574,479 | | |
Net Asset Value and Redemption Price Per Share
(net assets ÷ shares of beneficial interest outstanding) | | $ | 10.91 | | | $ | 10.84 | | | $ | 9.85 | | | $ | 9.69 | | |
Maximum Offering Price Per Share
(100 ÷ 95.25 of net asset value per share) | | $ | 11.45 | | | $ | 11.38 | | | $ | 10.34 | | | $ | 10.17 | | |
| Class B Shares | |
| Net Assets | | $ | 4,126,866 | | | $ | 30,466,010 | | | $ | 45,122,677 | | | $ | 3,810,892 | | |
| Shares Outstanding | | | 409,357 | | | | 2,742,736 | | | | 4,581,489 | | | | 384,670 | | |
Net Asset Value, Offering Price and Redemption Price Per Share
(net assets ÷ shares of beneficial interest outstanding) | | $ | 10.08 | | | $ | 11.11 | | | $ | 9.85 | | | $ | 9.91 | | |
| Class C Shares | |
| Net Assets | | $ | 8,097,081 | | | $ | 1,723,114 | | | $ | 11,716,310 | | | $ | — | | |
| Shares Outstanding | | | 803,224 | | | | 155,114 | | | | 1,189,634 | | | | — | | |
Net Asset Value, Offering Price and Redemption Price Per Share
(net assets ÷ shares of beneficial interest outstanding) | | $ | 10.08 | | | $ | 11.11 | | | $ | 9.85 | | | $ | — | | |
| Class I Shares | |
| Net Assets | | $ | — | | | $ | — | | | $ | 15,032,255 | | | $ | — | | |
| Shares Outstanding | | | — | | | | — | | | | 1,526,374 | | | | — | | |
Net Asset Value, Offering Price and Redemption Price Per Share
(net assets ÷ shares of beneficial interest outstanding) | | $ | — | | | $ | — | | | $ | 9.85 | | | $ | — | | |
On sales of $25,000 or more, the offering price of Class A shares is reduced.
See notes to financial statements
41
Eaton Vance Municipals Funds as of March 31, 2007
FINANCIAL STATEMENTS (Unaudited) CONT'D
Statements of Assets and Liabilities
As of March 31, 2007
| | | New York Fund | | Ohio Fund | | Rhode Island Fund | | West Virginia Fund | |
| Assets | |
| Investments — | |
| Identified cost | | $ | 467,079,882 | | | $ | 295,985,615 | | | $ | 62,503,439 | | | $ | 31,699,037 | | |
| Unrealized appreciation | | | 31,384,879 | | | | 14,086,426 | | | | 3,174,657 | | | | 1,685,895 | | |
| Investments, at value | | $ | 498,464,761 | | | $ | 310,072,041 | | | $ | 65,678,096 | | | $ | 33,384,932 | | |
| Cash | | $ | 414,758 | | | $ | 1,256,948 | | | $ | 2,219,752 | | | $ | — | | |
| Receivable for investments sold | | | 265,665 | | | | — | | | | 55,000 | | | | — | | |
| Receivable for Fund shares sold | | | 2,488,257 | | | | 979,626 | | | | 2,081,677 | | | | 84,561 | | |
| Interest receivable | | | 6,841,376 | | | | 4,026,127 | | | | 821,313 | | | | 469,628 | | |
| Receivable for daily variation margin on open financial futures contracts | | | 251,250 | | | | 37,500 | | | | 28,438 | | | | 17,188 | | |
| Receivable for open interest rate swap contracts | | | 166,892 | | | | — | | | | 1,883 | | | | 974 | | |
| Receivable for closed interest rate swap contracts | | | 56,296 | | | | — | | | | — | | | | — | | |
| Total assets | | $ | 508,949,255 | | | $ | 316,372,242 | | | $ | 70,886,159 | | | $ | 33,957,283 | | |
| Liabilities | |
| Payable for floating rate notes issued | | $ | 52,363,000 | | | $ | 13,825,000 | | | $ | 5,135,000 | | | $ | 2,000,000 | | |
| Interest expense and fees payable | | | 312,378 | | | | 209,209 | | | | 38,367 | | | | 19,338 | | |
| Payable for investments purchased | | | — | | | | 7,753,539 | | | | 1,850,349 | | | | — | | |
| Payable for Fund shares redeemed | | | 1,144,498 | | | | 241,716 | | | | 66,605 | | | | 68,319 | | |
| Dividends payable | | | 591,813 | | | | 391,303 | | | | 83,276 | | | | 39,832 | | |
| Payable for open interest rate swap contracts | | | — | | | | 1,004 | | | | — | | | | — | | |
| Payable for when-issued securities | | | 3,834,167 | | | | 1,670,000 | | | | — | | | | — | | |
| Due to custodian | | | — | | | | — | | | | — | | | | 44,906 | | |
| Payable to affiliate for investment advisory fees | | | 165,004 | | | | 104,286 | | | | 15,461 | | | | 5,386 | | |
| Payable to affiliate for distribution and service fees | | | 232,567 | | | | 162,252 | | | | 40,660 | | | | 19,454 | | |
| Accrued expenses | | | 98,258 | | | | 65,289 | | | | 31,534 | | | | 25,999 | | |
| Total liabilities | | $ | 58,741,685 | | | $ | 24,423,598 | | | $ | 7,261,252 | | | $ | 2,223,234 | | |
| Net Assets | | $ | 450,207,570 | | | $ | 291,948,644 | | | $ | 63,624,907 | | | $ | 31,734,049 | | |
| Sources of Net Assets | |
| Paid-in capital | | $ | 416,299,389 | | | $ | 284,751,581 | | | $ | 61,055,772 | | | $ | 30,648,140 | | |
Accumulated net realized gain (loss) (computed on the basis
of identified cost) | | | 1,477,084 | | | | (6,777,258 | ) | | | (661,234 | ) | | | (662,570 | ) | |
| Accumulated distributions in excess of net investment income | | | (380,564 | ) | | | (299,118 | ) | | | (95,149 | ) | | | (28,432 | ) | |
| Net unrealized appreciation (computed on the basis of identified cost) | | | 32,811,661 | | | | 14,273,439 | | | | 3,325,518 | | | | 1,776,911 | | |
| Total | | $ | 450,207,570 | | | $ | 291,948,644 | | | $ | 63,624,907 | | | $ | 31,734,049 | | |
| Class A Shares | |
| Net Assets | | $ | 415,089,917 | | | $ | 238,921,412 | | | $ | 45,552,984 | | | $ | 25,311,148 | | |
| Shares Outstanding | | | 38,784,545 | | | | 25,281,325 | | | | 4,632,571 | | | | 2,557,852 | | |
Net Asset Value and Redemption Price Per Share
(net assets ÷ shares of beneficial interest outstanding) | | $ | 10.70 | | | $ | 9.45 | | | $ | 9.83 | | | $ | 9.90 | | |
Maximum Offering Price Per Share
(100 ÷ 95.25 of net asset value per share) | | $ | 11.23 | | | $ | 9.92 | | | $ | 10.32 | | | $ | 10.39 | | |
| Class B Shares | |
| Net Assets | | $ | 11,156,744 | | | $ | 31,656,951 | | | $ | 16,051,548 | | | $ | 6,422,901 | | |
| Shares Outstanding | | | 1,040,754 | | | | 3,351,533 | | | | 1,595,732 | | | | 636,887 | | |
Net Asset Value, Offering Price and Redemption Price Per Share
(net assets ÷ shares of beneficial interest outstanding) | | $ | 10.72 | | | $ | 9.45 | | | $ | 10.06 | | | $ | 10.08 | | |
| Class C Shares | |
| Net Assets | | $ | 23,960,909 | | | $ | 21,370,281 | | | $ | 2,020,375 | | | $ | — | | |
| Shares Outstanding | | | 2,238,215 | | | | 2,262,978 | | | | 200,778 | | | | — | | |
Net Asset Value, Offering Price and Redemption Price Per Share
(net assets ÷ shares of beneficial interest outstanding) | | $ | 10.71 | | | $ | 9.44 | | | $ | 10.06 | | | $ | — | | |
On sales of $25,000 or more, the offering price of Class A shares is reduced.
See notes to financial statements
42
Eaton Vance Municipals Funds as of March 31, 2007
FINANCIAL STATEMENTS (Unaudited) CONT'D
Statements of Operations
For the Six Months Ended March 31, 2007
| | | California Fund | | Florida Fund | | Massachusetts Fund | | Mississippi Fund | |
| Investment Income | |
| Interest | | $ | 6,864,249 | | | $ | 7,434,406 | | | $ | 7,515,630 | | | $ | 503,991 | | |
| Total investment income | | $ | 6,864,249 | | | $ | 7,434,406 | | | $ | 7,515,630 | | | $ | 503,991 | | |
| Expenses | |
| Investment adviser fee | | $ | 574,932 | | | $ | 546,251 | | | $ | 579,665 | | | $ | 14,392 | | |
| Trustees' fees and expenses | | | 6,742 | | | | 7,757 | | | | 7,757 | | | | 85 | | |
| Distribution and service fees — | |
| Class A | | | 303,967 | | | | 223,956 | | | | 208,448 | | | | 15,008 | | |
| Class B | | | 20,388 | | | | 158,450 | | | | 222,359 | | | | 19,266 | | |
| Class C | | | 33,224 | | | | 5,539 | | | | 32,212 | | | | — | | |
| Legal and accounting services | | | 31,882 | | | | 30,393 | | | | 28,624 | | | | 16,384 | | |
| Printing and postage | | | 7,255 | | | | 7,776 | | | | 9,509 | | | | 818 | | |
| Custodian fee | | | 88,741 | | | | 81,178 | | | | 79,625 | | | | 13,988 | | |
| Interest expense and fees | | | 457,684 | | | | 660,946 | | | | 608,374 | | | | 21,826 | | |
| Transfer and dividend disbursing agent fees | | | 41,632 | | | | 50,495 | | | | 50,487 | | | | 4,818 | | |
| Registration fees | | | 728 | | | | 4,550 | | | | 8,252 | | | | 182 | | |
| Miscellaneous | | | 14,935 | | | | 22,839 | | | | 18,486 | | | | 8,052 | | |
| Total expenses | | $ | 1,582,110 | | | $ | 1,800,130 | | | $ | 1,853,798 | | | $ | 114,819 | | |
| Deduct — | |
| Reduction of custodian fee | | $ | 33,400 | | | $ | 4,785 | | | $ | 17,133 | | | $ | 1,670 | | |
| Total expense reductions | | $ | 33,400 | | | $ | 4,785 | | | $ | 17,133 | | | $ | 1,670 | | |
| Net expenses | | $ | 1,548,710 | | | $ | 1,795,345 | | | $ | 1,836,665 | | | $ | 113,149 | | |
| Net investment income | | $ | 5,315,539 | | | $ | 5,639,061 | | | $ | 5,678,965 | | | $ | 390,842 | | |
| Realized and Unrealized Gain (Loss) | |
| Net realized gain (loss) — | |
| Investment transactions (identified cost basis) | | $ | 1,276,024 | | | $ | 437,050 | | | $ | 2,615,786 | | | $ | 50,786 | | |
| Financial futures contracts | | | (1,261,655 | ) | | | (1,348,937 | ) | | | (1,958,798 | ) | | | (60,563 | ) | |
| Interest rate swap contracts | | | — | | | | — | | | | — | | | | (28,000 | ) | |
| Net realized gain (loss) | | $ | 14,369 | | | $ | (911,887 | ) | | $ | 656,988 | | | $ | (37,777 | ) | |
| Change in unrealized appreciation (depreciation) — | |
| Investments (identified cost basis) | | $ | (1,762,794 | ) | | $ | (471,207 | ) | | $ | (3,141,680 | ) | | $ | (71,817 | ) | |
| Financial futures contracts | | | 1,718,373 | | | | 1,839,945 | | | | 2,421,752 | | | | 77,424 | | |
| Interest rate swap contracts | | | 8,115 | | | | 8,439 | | | | 8,764 | | | | 18,674 | | |
| Net change in unrealized appreciation (depreciation) | | $ | (36,306 | ) | | $ | 1,377,177 | | | $ | (711,164 | ) | | $ | 24,281 | | |
| Net realized and unrealized gain (loss) | | $ | (21,937 | ) | | $ | 465,290 | | | $ | (54,176 | ) | | $ | (13,496 | ) | |
| Net increase in net assets from operations | | $ | 5,293,602 | | | $ | 6,104,755 | | | $ | 5,624,789 | | | $ | 377,346 | | |
See notes to financial statements
43
Eaton Vance Municipals Funds as of March 31, 2007
FINANCIAL STATEMENTS (Unaudited) CONT'D
Statements of Operations
For the Six Months Ended March 31, 2007
| | | New York Fund | | Ohio Fund | | Rhode Island Fund | | West Virginia Fund | |
| Investment Income | |
| Interest | | $ | 11,406,125 | | | $ | 6,640,361 | | | $ | 1,541,321 | | | $ | 761,975 | | |
| Total investment income | | $ | 11,406,125 | | | $ | 6,640,361 | | | $ | 1,541,321 | | | $ | 761,975 | | |
| Expenses | |
| Investment adviser fee | | $ | 933,986 | | | $ | 529,897 | | | $ | 87,580 | | | $ | 30,602 | | |
| Trustees' fees and expenses | | | 9,787 | | | | 6,742 | | | | 3,359 | | | | 845 | | |
| Distribution and service fees — | |
| Class A | | | 403,201 | | | | 207,580 | | | | 40,627 | | | | 23,911 | | |
| Class B | | | 49,611 | | | | 153,695 | | | | 83,126 | | | | 32,251 | | |
| Class C | | | 87,213 | | | | 69,450 | | | | 4,722 | | | | — | | |
| Legal and accounting services | | | 34,071 | | | | 21,417 | | | | 19,702 | | | | 16,321 | | |
| Printing and postage | | | 13,792 | | | | 9,795 | | | | 2,056 | | | | 1,452 | | |
| Custodian fee | | | 106,051 | | | | 76,992 | | | | 24,788 | | | | 17,561 | | |
| Interest expense and fees | | | 483,846 | | | | 414,904 | | | | 110,437 | | | | 38,304 | | |
| Transfer and dividend disbursing agent fees | | | 85,542 | | | | 56,466 | | | | 12,240 | | | | 7,815 | | |
| Registration fees | | | 2,351 | | | | — | | | | 499 | | | | 182 | | |
| Miscellaneous | | | 31,103 | | | | 11,905 | | | | 8,259 | | | | 6,808 | | |
| Total expenses | | $ | 2,240,554 | | | $ | 1,558,843 | | | $ | 397,395 | | | $ | 176,052 | | |
| Deduct — | |
| Reduction of custodian fee | | $ | 28,013 | | | $ | 38,220 | | | $ | 16,070 | | | $ | 6,598 | | |
| Total expense reductions | | $ | 28,013 | | | $ | 38,220 | | | $ | 16,070 | | | $ | 6,598 | | |
| Net expenses | | $ | 2,212,541 | | | $ | 1,520,623 | | | $ | 381,325 | | | $ | 169,454 | | |
| Net investment income | | $ | 9,193,584 | | | $ | 5,119,738 | | | $ | 1,159,996 | | | $ | 592,521 | | |
| Realized and Unrealized Gain (Loss) | |
| Net realized gain (loss) — | |
| Investment transactions (identified cost basis) | | $ | 1,824,677 | | | $ | 1,758,898 | | | $ | 129,780 | | | $ | 247,722 | | |
| Financial futures contracts | | | (2,586,416 | ) | | | 263,122 | | | | (326,831 | ) | | | (191,554 | ) | |
| Interest rate swap contracts | | | (560,000 | ) | | | — | | | | — | | | | — | | |
| Net realized gain (loss) | | $ | (1,321,739 | ) | | $ | 2,022,020 | | | $ | (197,051 | ) | | $ | 56,168 | | |
| Change in unrealized appreciation (depreciation) — | |
| Investments (identified cost basis) | | $ | (2,326,198 | ) | | $ | (2,494,899 | ) | | $ | (376,037 | ) | | $ | (228,445 | ) | |
| Financial futures contracts | | | 3,426,696 | | | | 321,929 | | | | 423,238 | | | | 250,027 | | |
| Interest rate swap contracts | | | 375,823 | | | | (1,004 | ) | | | 1,883 | | | | 974 | | |
| Net change in unrealized appreciation (depreciation) | | $ | 1,476,321 | | | $ | (2,173,974 | ) | | $ | 49,084 | | | $ | 22,556 | | |
| Net realized and unrealized gain (loss) | | $ | 154,582 | | | $ | (151,954 | ) | | $ | (147,967 | ) | | $ | 78,724 | | |
| Net increase in net assets from operations | | $ | 9,348,166 | | | $ | 4,967,784 | | | $ | 1,012,029 | | | $ | 671,245 | | |
See notes to financial statements
44
Eaton Vance Municipals Funds as of March 31, 2007
FINANCIAL STATEMENTS (Unaudited) CONT'D
Statements of Changes in Net Assets
For the Six Months Ended March 31, 2007
| Increase (Decrease) in Net Assets | | California Fund | | Florida Fund | | Massachusetts Fund | | Mississippi Fund | |
| From operations — | |
| Net investment income | | $ | 5,315,539 | | | $ | 5,639,061 | | | $ | 5,678,965 | | | $ | 390,842 | | |
Net realized gain (loss) from investment transactions, financial
futures contracts and interest rate swaps contracts | | | 14,369 | | | | (911,887 | ) | | | 656,988 | | | | (37,777 | ) | |
Net change in unrealized appreciation (depreciation) from investments,
financial futures contracts and interest rate swap contracts | | | (36,306 | ) | | | 1,377,177 | | | | (711,164 | ) | | | 24,281 | | |
| Net increase in net assets from operations | | $ | 5,293,602 | | | $ | 6,104,351 | | | $ | 5,624,789 | | | $ | 377,346 | | |
| Distributions to shareholders — | |
| From net investment income | |
| Class A | | $ | (5,176,349 | ) | | $ | (4,940,455 | ) | | $ | (4,464,185 | ) | | $ | (315,305 | ) | |
| Class B | | | (71,939 | ) | | | (611,786 | ) | | | (833,926 | ) | | | (70,060 | ) | |
| Class C | | | (116,308 | ) | | | (21,050 | ) | | | (116,751 | ) | | | — | | |
| Class I | | | — | | | | — | | | | (325,526 | ) | | | — | | |
| From net realized gain | |
| Class A | | | (3,830,123 | ) | | | — | | | | — | | | | — | | |
| Class B | | | (70,687 | ) | | | — | | | | — | | | | — | | |
| Class C | | | (112,357 | ) | | | — | | | | — | | | | — | | |
| Total distributions to shareholders | | $ | (9,377,763 | ) | | $ | (5,573,291 | ) | | $ | (5,740,388 | ) | | $ | (385,365 | ) | |
| Transactions in shares of beneficial interest — | |
| Proceeds from sale of shares | |
| Class A | | $ | 37,497,695 | | | $ | 12,461,042 | | | $ | 54,323,288 | | | $ | 677,868 | | |
| Class B | | | 362,980 | | | | 520,591 | | | | 1,175,476 | | | | 99,037 | | |
| Class C | | | 3,599,329 | | | | 1,144,089 | | | | 8,859,366 | | | | — | | |
| Class I | | | — | | | | — | | | | 2,816,156 | | | | — | | |
Net asset value of shares issued to shareholders in payment of
distributions declared | | | |
| Class A | | | 5,542,986 | | | | 2,861,602 | | | | 2,450,999 | | | | 148,155 | | |
| Class B | | | 80,013 | | | | 276,644 | | | | 453,710 | | | | 33,992 | | |
| Class C | | | 160,401 | | | | 11,607 | | | | 96,378 | | | | — | | |
| Class I | | | — | | | | — | | | | 89,292 | | | | — | | |
| Cost of shares redeemed | |
| Class A | | | (13,652,795 | ) | | | (18,355,367 | ) | | | (26,659,772 | ) | | | (785,017 | ) | |
| Class B | | | (335,282 | ) | | | (3,754,575 | ) | | | (3,584,495 | ) | | | (334,043 | ) | |
| Class C | | | (474,398 | ) | | | (75,075 | ) | | | (4,714 | ) | | | — | | |
| Class I | | | — | | | | — | | | | (1,075,079 | ) | | | — | | |
Net asset value of shares exchanged
Class A | | | — | | | | 2,625,832 | | | | 1,911,236 | | | | 64,821 | | |
| Class B | | | — | | | | (2,625,832 | ) | | | (1,911,236 | ) | | | (64,821 | ) | |
| Net increase (decrease) in net assets from Fund share transactions | | $ | 32,780,929 | | | $ | (4,909,442 | ) | | $ | 38,940,605 | | | $ | (160,008 | ) | |
| Net increase (decrease) in net assets | | $ | 28,696,768 | | | $ | (4,378,382 | ) | | $ | 38,825,006 | | | $ | (168,027 | ) | |
| Net Assets | |
| At beginning of year | | $ | 242,641,085 | | | $ | 258,620,748 | | | $ | 262,623,566 | | | $ | 19,231,017 | | |
| At end of year | | $ | 271,337,853 | | | $ | 254,242,366 | | | $ | 301,448,572 | | | $ | 19,062,990 | | |
Accumulated undistributed
(distributions in excess of) net
investment income included in net assets | |
| At end of year | | $ | (98,121 | ) | | $ | 1,202,949 | | | $ | (292,646 | ) | | $ | (29,000 | ) | |
See notes to financial statements
45
Eaton Vance Municipals Funds as of March 31, 2007
FINANCIAL STATEMENTS (Unaudited) CONT'D
Statements of Changes in Net Assets
For the Six Months Ended March 31, 2007
| Increase (Decrease) in Net Assets | | New York Fund | | Ohio Fund | | Rhode Island Fund | | West Virginia Fund | |
| From operations — | |
| Net investment income | | $ | 9,193,584 | | | $ | 5,119,738 | | | $ | 1,159,996 | | | $ | 592,521 | | |
Net realized gain (loss) from investment transactions,
financial futures contracts and interest rate swaps contracts | | | (1,321,739 | ) | | | 2,022,020 | | | | (197,051 | ) | | | 56,168 | | |
Net change in unrealized appreciation (depreciation) from investments,
financial futures contracts and interest rate swap contracts | | | 1,476,321 | | | | (2,173,974 | ) | | | 49,084 | | | | 22,556 | | |
| Net increase in net assets from operations | | $ | 9,348,166 | | | $ | 4,967,784 | | | $ | 1,012,029 | | | $ | 671,245 | | |
| Distributions to shareholders — | |
| From net investment income | |
| Class A | | $ | (8,638,352 | ) | | $ | (4,447,604 | ) | | $ | (854,268 | ) | | $ | (484,697 | ) | |
| Class B | | | (184,212 | ) | | | (575,736 | ) | | | (303,531 | ) | | | (112,744 | ) | |
| Class C | | | (321,138 | ) | | | (254,512 | ) | | | (16,719 | ) | | | — | | |
| From net realized gain | |
| Class A | | | (1,984,237 | ) | | | — | | | | — | | | | — | | |
| Class B | | | (52,351 | ) | | | — | | | | — | | | | — | | |
| Class C | | | (90,494 | ) | | | — | | | | — | | | | — | | |
| Total distributions to shareholders | | $ | (11,270,784 | ) | | $ | (5,277,852 | ) | | $ | (1,174,518 | ) | | $ | (597,441 | ) | |
| Transactions in shares of beneficial interest — | |
| Proceeds from sale of shares | |
| Class A | | $ | 36,178,835 | | | $ | 61,688,585 | | | $ | 6,038,986 | | | $ | 2,545,752 | | |
| Class B | | | 2,286,690 | | | | 2,107,425 | | | | 506,639 | | | | 100,424 | | |
| Class C | | | 12,137,164 | | | | 13,416,405 | | | | 1,618,715 | | | | — | | |
Net asset value of shares issued to shareholders in payment of
distributions declared | | | |
| Class A | | | 6,803,622 | | | | 2,646,207 | | | | 481,341 | | | | 291,128 | | |
| Class B | | | 147,939 | | | | 316,338 | | | | 185,363 | | | | 69,183 | | |
| Class C | | | 263,586 | | | | 158,620 | | | | 6,289 | | | | — | | |
| Cost of shares redeemed | |
| Class A | | | (19,978,301 | ) | | | (9,485,434 | ) | | | (1,834,722 | ) | | | (650,025 | ) | |
| Class B | | | (367,002 | ) | | | (1,674,682 | ) | | | (1,473,827 | ) | | | (509,774 | ) | |
| Class C | | | (2,197,749 | ) | | | (439,774 | ) | | | (24,657 | ) | | | — | | |
Net asset value of shares exchanged
Class A | | | 346,764 | | | | 1,603,935 | | | | 1,691,314 | | | | 259,833 | | |
| Class B | | | (346,764 | ) | | | (1,603,935 | ) | | | (1,691,314 | ) | | | (259,833 | ) | |
| Net increase in net assets from Fund share transactions | | $ | 35,274,784 | | | $ | 68,733,690 | | | $ | 5,504,127 | | | $ | 1,846,688 | | |
| Net increase in net assets | | $ | 33,352,166 | | | $ | 68,423,622 | | | $ | 5,341,638 | | | $ | 1,920,492 | | |
| Net Assets | |
| At beginning of year | | $ | 416,855,404 | | | $ | 223,525,022 | | | $ | 58,283,269 | | | $ | 29,813,557 | | |
| At end of year | | $ | 450,207,570 | | | $ | 291,948,644 | | | $ | 63,624,907 | | | $ | 31,734,049 | | |
Accumulated distributions
in excess of net investment
income included in net assets | |
| At end of year | | $ | (380,564 | ) | | $ | (299,118 | ) | | $ | (95,149 | ) | | $ | (28,432 | ) | |
See notes to financial statements
46
Eaton Vance Municipals Funds as of March 31, 2007
FINANCIAL STATEMENTS CONT'D
Statements of Changes in Net Assets
For the Year Ended September 30, 2006
| Increase (Decrease) in Net Assets | | California Fund | | Florida Fund | | Massachusetts Fund | | Mississippi Fund | |
| From operations — | |
| Net investment income | | $ | 10,182,311 | | | $ | 11,103,022 | | | $ | 10,315,447 | | | $ | 781,245 | | |
Net realized gain from investment transactions,
financial futures contracts and interest rate swaps contracts | | | 9,128,146 | | | | 5,765,096 | | | | 3,171,135 | | | | 268,636 | | |
Net change in unrealized appreciation (depreciation) from investments,
financial futures contracts and interest rate swap contracts | | | (5,240,660 | ) | | | (1,585,810 | ) | | | 1,497,408 | | | | (119,212 | ) | |
| Net increase in net assets from operations | | $ | 14,069,797 | | | $ | 15,282,308 | | | $ | 14,983,990 | | | $ | 930,669 | | |
| Distributions to shareholders — | |
| From net investment income | |
| Class A | | $ | (9,972,724 | ) | | $ | (9,441,249 | ) | | $ | (7,721,439 | ) | | $ | (603,656 | ) | |
| Class B | | | (139,318 | ) | | | (1,502,836 | ) | | | (1,948,881 | ) | | | (168,393 | ) | |
| Class C | | | (103,771 | ) | | | (5,141 | ) | | | (14,478 | ) | | | — | | |
| Class I | | | — | | | | — | | | | (606,426 | ) | | | — | | |
| Total distributions to shareholders | | $ | (10,215,813 | ) | | $ | (10,949,226 | ) | | $ | (10,291,224 | ) | | $ | (772,049 | ) | |
| Transactions in shares of beneficial interest — | |
| Proceeds from sale of shares | |
| Class A | | $ | 32,034,321 | | | $ | 49,480,953 | | | $ | 57,658,956 | | | $ | 3,408,757 | | |
| Class B | | | 1,316,847 | | | | 2,264,945 | | | | 2,492,023 | | | | 84,085 | | |
| Class C | | | 3,582,123 | | | | 668,884 | | | | 2,868,575 | | | | — | | |
| Class I | | | — | | | | — | | | | 2,067,997 | | | | — | | |
Net asset value of shares issued to shareholders in payment of
distributions declared | | | |
| Class A | | | 5,475,667 | | | | 5,159,159 | | | | 3,939,179 | | | | 266,225 | | |
| Class B | | | 69,404 | | | | 687,930 | | | | 1,062,806 | | | | 83,618 | | |
| Class C | | | 78,530 | | | | 1,510 | | | | 8,412 | | | | — | | |
| Class I | | | — | | | | — | | | | 165,578 | | | | — | | |
| Cost of shares redeemed | |
| Class A | | | (31,262,512 | ) | | | (36,823,235 | ) | | | (27,591,007 | ) | | | (1,943,071 | ) | |
| Class B | | | (894,048 | ) | | | (5,492,148 | ) | | | (6,467,954 | ) | | | (1,019,558 | ) | |
| Class C | | | (520,843 | ) | | | (35,224 | ) | | | (102,038 | ) | | | — | | |
| Class I | | | — | | | | — | | | | (962,093 | ) | | | — | | |
| Net asset value of shares exchanged | |
| Class A | | | 120,123 | | | | 4,169,418 | | | | 3,703,637 | | | | 394,330 | | |
| Class B | | | (120,123 | ) | | | (4,169,418 | ) | | | (3,703,637 | ) | | | (394,330 | ) | |
| Net increase in net assets from Fund share transactions | | $ | 9,879,489 | | | $ | 15,912,774 | | | $ | 35,140,434 | | | $ | 880,056 | | |
| Net increase in net assets | | $ | 13,733,473 | | | $ | 20,245,856 | | | $ | 39,833,200 | | | $ | 1,038,676 | | |
| Net Assets | |
| At beginning of year | | $ | 228,907,612 | | | $ | 238,374,892 | | | $ | 222,790,366 | | | $ | 18,192,341 | | |
| At end of year | | $ | 242,641,085 | | | $ | 258,620,748 | | | $ | 262,623,566 | | | $ | 19,231,017 | | |
Accumulated undistributed
(distributions in excess of) net
investment income included in net assets | |
| At end of year | | $ | (49,064 | ) | | $ | 1,137,179 | | | $ | (231,223 | ) | | $ | (34,477 | ) | |
See notes to financial statements
47
Eaton Vance Municipals Funds as of March 31, 2007
FINANCIAL STATEMENTS CONT'D
Statements of Changes in Net Assets
For the Year Ended September 30, 2006
| Increase (Decrease) in Net Assets | | New York Fund | | Ohio Fund | | Rhode Island Fund | | West Virginia Fund | |
| From operations — | |
| Net investment income | | $ | 16,996,252 | | | $ | 8,384,944 | | | $ | 2,134,162 | | | $ | 1,194,306 | | |
Net realized gain from investment transactions, financial futures
contracts and interest rate swaps contracts | | | 6,445,728 | | | | 821,216 | | | | 1,005,639 | | | | 452,871 | | |
Net change in unrealized appreciation (depreciation) from investments,
financial futures contracts and interest rate swap contracts | | | (102,096 | ) | | | 2,381,174 | | | | (436,979 | ) | | | (119,598 | ) | |
| Net increase in net assets from operations | | $ | 23,339,884 | | | $ | 11,587,334 | | | $ | 2,702,822 | | | $ | 1,527,579 | | |
| Distributions to shareholders — | |
| From net investment income | |
| Class A | | $ | (16,267,428 | ) | | $ | (7,143,933 | ) | | $ | (1,408,995 | ) | | $ | (905,143 | ) | |
| Class B | | | (292,649 | ) | | | (1,268,140 | ) | | | (748,975 | ) | | | (257,946 | ) | |
| Class C | | | (327,193 | ) | | | (77,302 | ) | | | (2,882 | ) | | | — | | |
| From net realized gain | |
| Class A | | | (4,001,915 | ) | | | — | | | | — | | | | — | | |
| Class B | | | (80,541 | ) | | | — | | | | — | | | | — | | |
| Class C | | | (70,625 | ) | | | — | | | | — | | | | — | | |
| Total distributions to shareholders | | $ | (21,040,351 | ) | | $ | (8,489,375 | ) | | $ | (2,160,852 | ) | | $ | (1,163,089 | ) | |
| Transactions in shares of beneficial interest — | |
| Proceeds from sale of shares | |
| Class A | | $ | 67,952,820 | | | $ | 49,124,730 | | | $ | 10,055,904 | | | $ | 2,552,239 | | |
| Class B | | | 4,152,878 | | | | 3,508,789 | | | | 866,449 | | | | 143,069 | | |
| Class C | | | 10,165,692 | | | | 8,494,045 | | | | 422,979 | | | | — | | |
Net asset value of shares issued to shareholders in payment of
distributions declared | | | |
| Class A | | | 13,458,930 | | | | 4,082,432 | | | | 692,472 | | | | 535,565 | | |
| Class B | | | 229,042 | | | | 653,183 | | | | 458,469 | | | | 152,214 | | |
| Class C | | | 245,516 | | | | 50,258 | | | | 1,800 | | | | — | | |
| Cost of shares redeemed | |
| Class A | | | (47,717,026 | ) | | | (15,301,626 | ) | | | (3,654,953 | ) | | | (2,451,138 | ) | |
| Class B | | | (1,078,139 | ) | | | (4,416,758 | ) | | | (3,640,347 | ) | | | (1,018,300 | ) | |
| Class C | | | (1,396,835 | ) | | | (379,377 | ) | | | — | | | | — | | |
| Net asset value of shares exchanged | |
| Class A | | | 88,818 | | | | 1,913,051 | | | | 2,091,173 | | | | 641,204 | | |
| Class B | | | (88,818 | ) | | | (1,913,051 | ) | | | (2,091,173 | ) | | | (641,204 | ) | |
Net increase (decrease) in net assets from Fund
share transactions | | $ | 46,012,878 | | | $ | 45,815,676 | | | $ | 5,202,773 | | | $ | (86,351 | ) | |
| Net increase in net assets | | $ | 48,312,411 | | | $ | 48,913,635 | | | $ | 5,744,743 | | | $ | 278,139 | | |
| Net Assets | |
| At beginning of year | | $ | 368,542,993 | | | $ | 174,611,387 | | | $ | 52,538,526 | | | $ | 29,535,418 | | |
| At end of year | | $ | 416,855,404 | | | $ | 223,525,022 | | | $ | 58,283,269 | | | $ | 29,813,557 | | |
Accumulated distributions
in excess of net investment
income included in net assets | |
| At end of year | | $ | (430,446 | ) | | $ | (141,004 | ) | | $ | (80,627 | ) | | $ | (23,512 | ) | |
See notes to financial statements
48
Eaton Vance Municipals Funds as of March 31, 2007
FINANCIAL STATEMENTS (Unaudited) CONT'D
Statements of Cash Flows
For the Six Months Ended March 31, 2007
| | | Florida Fund | | Massachusetts Fund | | New York Fund | |
| Cash flows from operating activities — | |
| Net increase in net assets from operations | | $ | 6,104,755 | | | $ | 5,624,789 | | | $ | 9,348,166 | | |
Adjustments to reconcile net increase in net assets resulting from
operations to net cash provided/(used) in operating activities: | |
| Investments purchased | | | (13,196,037 | ) | | | (149,585,071 | ) | | | (117,598,485 | ) | |
| Investments sold | | | 22,234,397 | | | | 101,357,405 | | | | 87,247,083 | | |
| Sale of short-term investments, net | | | — | | | | (1,600,000 | ) | | | — | | |
| Net amortization of premium/(discount) | | | (729,079 | ) | | | (897,482 | ) | | | (516,831 | ) | |
| Interest receivable | | | (365,438 | ) | | | (247,878 | ) | | | (353,525 | ) | |
| Receivable for daily variation margin on open financial futures contracts | | | (144,063 | ) | | | (161,250 | ) | | | (251,250 | ) | |
| Receivable for open interest rate swap contracts | | | (8,439 | ) | | | (8,764 | ) | | | (166,892 | ) | |
| Payable for open interest rate swap contracts | | | — | | | | — | | | | (208,931 | ) | |
| Receivable for closed interest rate swap contracts | | | — | | | | — | | | | (56,296 | ) | |
| Payable for when-issued securities | | | (1,504,440 | ) | | | 17,291,076 | | | | (2,665,833 | ) | |
| Payable to affiliate for investment advisory fees | | | 1,987 | | | | 16,919 | | | | 18,736 | | |
| Payable to affiliate for distribution and service fees | | | (4,714 | ) | | | 14,655 | | | | 19,623 | | |
| Interest expense and fees payable | | | 309,488 | | | | (45,728 | ) | | | (277,986 | ) | |
| Accrued expenses | | | (34,461 | ) | | | (33,682 | ) | | | (49,119 | ) | |
| Net change in realized and unrealized (gain)/loss on investments | | | 34,157 | | | | 525,894 | | | | 501,521 | | |
| Net cash provided/(used) in operating activities | | | 12,698,113 | | | | (27,749,117 | ) | | | (25,010,019 | ) | |
| Cash flows from financing activities — | |
| Proceeds from shares sold | | $ | 14,328,025 | | | $ | 66,894,195 | | | $ | 50,995,794 | | |
| Shares redeemed | | | (22,032,777 | ) | | | (31,040,803 | ) | | | (21,918,586 | ) | |
| Cash distributions paid net of reinvestments | | | (2,416,005 | ) | | | (2,655,222 | ) | | | (4,017,054 | ) | |
| Demand note payable | | | (300,000 | ) | | | — | | | | — | | |
| Proceeds from secured borrowings | | | — | | | | 6,700,000 | | | | 2,400,000 | | |
| Repayment of secured borrowings | | | (1,250,000 | ) | | | (8,650,000 | ) | | | (3,025,000 | ) | |
| Net cash flow provided/(used) by financing activities | | $ | (11,670,757 | ) | | $ | 31,248,170 | | | $ | 24,435,154 | | |
| Net increase (decrease) in cash | | $ | 1,027,356 | | | $ | 3,499,053 | | | $ | (574,865 | ) | |
| Cash at beginning of period | | $ | 97,859 | | | $ | 340,491 | | | $ | 989,623 | | |
| Cash at end of period | | $ | 1,125,215 | | | $ | 3,839,544 | | | $ | 414,758 | | |
| Supplemental disclosure of cash flow information: | |
Noncash financing activities not included herein consists of
reinvestment of dividends and distributions of : | | $ | 3,149,853 | | | $ | 3,090,379 | | | $ | 7,215,147 | | |
See notes to financial statements
49
Eaton Vance Municipals Funds as of March 31, 2007
FINANCIAL STATEMENTS CONT'D
Financial Highlights
| | | California Fund — Class A | |
| | | Six Months Ended
March 31, 2007 | | Year Ended September 30, | |
| | | (Unaudited)(1) | | 2006(1) | | 2005(1) | | 2004(1) | | 2003(1) | | 2002(1)(2) | |
| Net asset value — Beginning of period | | $ | 11.080 | | | $ | 10.900 | | | $ | 10.860 | | | $ | 10.920 | | | $ | 11.250 | | | $ | 10.880 | | |
| Income (loss) from operations | |
| Net investment income | | $ | 0.232 | | | $ | 0.486 | | | $ | 0.515 | | | $ | 0.548 | | | $ | 0.542 | | | $ | 0.548 | | |
| Net realized and unrealized gain (loss) | | | 0.009 | (8) | | | 0.181 | | | | 0.037 | | | | (0.078 | ) | | | (0.342 | ) | | | 0.352 | | |
| Total income from operations | | $ | 0.241 | | | $ | 0.667 | | | $ | 0.552 | | | $ | 0.470 | | | $ | 0.200 | | | $ | 0.900 | | |
| Less distributions | |
| From net investment income | | $ | (0.235 | ) | | $ | (0.487 | ) | | $ | (0.512 | ) | | $ | (0.530 | ) | | $ | (0.530 | ) | | $ | (0.530 | ) | |
| From net realized gain | | | (0.176 | ) | | | — | | | | — | | | | — | | | | — | | | | — | | |
| Total distributions | | $ | (0.411 | ) | | $ | (0.487 | ) | | $ | (0.512 | ) | | $ | (0.530 | ) | | $ | (0.530 | ) | | $ | (0.530 | ) | |
| Net asset value — End of period | | $ | 10.910 | | | $ | 11.080 | | | $ | 10.900 | | | $ | 10.860 | | | $ | 10.920 | | | $ | 11.250 | | |
| Total Return(3) | | | 2.20 | % | | | 6.28 | % | | | 5.18 | % | | | 4.42 | % | | | 1.89 | % | | | 8.61 | % | |
| Ratios/Supplemental Data | |
| Net assets, end of period (000's omitted) | | $ | 259,114 | | | $ | 233,618 | | | $ | 223,528 | | | $ | 227,878 | | | $ | 34,753 | | | $ | 24,863 | | |
| Ratios (As a percentage of average daily net assets): | |
| Expenses excluding interest and fees | | | 0.86 | %(5) | | | 0.86 | % | | | 0.88 | %(6) | | | 0.90 | %(6) | | | 0.88 | %(6) | | | 0.91 | %(6) | |
| Interest and fee expense(4) | | | 0.36 | %(5) | | | 0.37 | % | | | 0.23 | %(6) | | | 0.15 | %(6) | | | 0.12 | %(6) | | | 0.14 | %(6) | |
| Total expenses | | | 1.22 | %(5) | | | 1.23 | % | | | 1.11 | %(6) | | | 1.05 | %(6) | | | 1.00 | %(6) | | | 1.05 | %(6) | |
Expenses after custodian fee reduction
excluding interest and fees | | | 0.83 | %(5) | | | 0.85 | % | | | 0.87 | %(6) | | | 0.90 | %(6) | | | 0.87 | %(6) | | | 0.91 | %(6) | |
| Net investment income | | | 4.22 | %(5) | | | 4.45 | % | | | 4.71 | % | | | 5.09 | % | | | 4.97 | % | | | 5.09 | % | |
| Portfolio Turnover of the Portfolio(7) | | | — | | | | — | | | | — | | | | 18 | % | | | 21 | % | | | 3 | % | |
| Portfolio Turnover of the Fund | | | 10 | % | | | 30 | % | | | 23 | % | | | — | | | | — | | | | — | | |
(1) Net investment income per share was computed using average shares outstanding.
(2) The Fund, through its investment in the Portfolio, has adopted the provisions of the revised AICPA Audit and Accounting Guide for Investment Companies and began using the interest method to amortize premiums on fixed-income securities. The effect of this change for the year ended September 30, 2002 was to increase net investment income per share by $0.004, decrease net realized and unrealized gains per share by $0.004 and increase the ratio of net investment income to average net assets from 5.05% to 5.09%.
(3) Returns are historical and are calculated by determining the percentage change in net asset value with all distributions reinvested. Total return is not computed on an annualized basis.
(4) Interest and fee expense relates to the liability for floating rate notes issued in conjunction with inverse floater securities transactions (see Note 1B).
(5) Annualized.
(6) Includes the Fund's share of its corresponding Portfolio's allocated expenses while the Fund was making investments directly into the Portfolio.
(7) Portfolio turnover represents the rate of portfolio activity for the period while the Fund was making investments directly into the Portfolio.
(8) The per share amount does not reflect the actual net realized gain and unrealized gain (loss) for the period because of the timing of sales of Fund shares and the amount of the per share realized and unrealized gains and losses at such time.
See notes to financial statements
50
Eaton Vance Municipals Funds as of March 31, 2007
FINANCIAL STATEMENTS CONT'D
Financial Highlights
| | | California Fund — Class B | |
| | | Six Months Ended
March 31, 2007 | | Year Ended September 30, | |
| | | (Unaudited)(1) | | 2006(1) | | 2005(1) | | 2004(1) | | 2003(1) | | 2002(1)(2) | |
| Net asset value — Beginning of period | | $ | 10.260 | | | $ | 10.090 | | | $ | 10.060 | | | $ | 10.110 | | | $ | 10.400 | | | $ | 10.050 | | |
| Income (loss) from operations | |
| Net investment income | | $ | 0.177 | | | $ | 0.374 | | | $ | 0.399 | | | $ | 0.483 | | | $ | 0.481 | | | $ | 0.474 | | |
| Net realized and unrealized gain (loss) | | | (0.002 | ) | | | 0.171 | | | | 0.030 | | | | (0.083 | ) | | | (0.317 | ) | | | 0.327 | | |
| Total income from operations | | $ | 0.175 | | | $ | 0.545 | | | $ | 0.429 | | | $ | 0.400 | | | $ | 0.164 | | | $ | 0.801 | | |
| Less distributions | |
| From net investment income | | $ | (0.179 | ) | | $ | (0.375 | ) | | $ | (0.399 | ) | | $ | (0.455 | ) | | $ | (0.459 | ) | | $ | (0.455 | ) | |
| From net realized gain | | | (0.176 | ) | | | — | | | | — | | | | — | | | | — | | | | — | | |
| Total distributions | | $ | (0.355 | ) | | $ | (0.375 | ) | | $ | (0.399 | ) | | $ | (0.455 | ) | | $ | (0.459 | ) | | $ | (0.455 | ) | |
| Contingent deferred sales charges | | $ | — | | | $ | — | | | $ | — | | | $ | 0.005 | | | $ | 0.005 | | | $ | 0.004 | | |
| Net asset value — End of period | | $ | 10.080 | | | $ | 10.260 | | | $ | 10.090 | | | $ | 10.060 | | | $ | 10.110 | | | $ | 10.400 | | |
| Total Return(3) | | | 1.72 | % | | | 5.52 | % | | | 4.50 | %(4) | | | 4.14 | % | | | 1.73 | % | | | 8.30 | % | |
| Ratios/Supplemental Data | |
| Net assets, end of period (000's omitted) | | $ | 4,127 | | | $ | 4,090 | | | $ | 3,655 | | | $ | 1,983 | | | $ | 212,145 | | | $ | 233,973 | | |
| Ratios (As a percentage of average daily net assets): | |
| Expenses excluding interest and fees | | | 1.61 | %(6) | | | 1.61 | % | | | 1.63 | %(7) | | | 1.10 | %(7) | | | 1.09 | %(7) | | | 1.24 | %(7) | |
| Interest and fee expense(5) | | | 0.36 | %(6) | | | 0.37 | % | | | 0.23 | %(7) | | | 0.15 | %(7) | | | 0.12 | %(7) | | | 0.14 | %(7) | |
| Total expenses | | | 1.97 | %(6) | | | 1.98 | % | | | 1.86 | %(7) | | | 1.25 | %(7) | | | 1.21 | %(7) | | | 1.38 | %(7) | |
Expenses after custodian fee reduction
excluding interest and fees | | | 1.58 | %(6) | | | 1.60 | % | | | 1.62 | %(7) | | | 1.10 | %(7) | | | 1.08 | %(7) | | | 1.24 | %(7) | |
| Net investment income | | | 3.48 | %(6) | | | 3.70 | % | | | 3.94 | % | | | 4.75 | % | | | 4.79 | % | | | 4.77 | % | |
| Portfolio Turnover of the Portfolio(8) | | | — | | | | — | | | | — | | | | 18 | % | | | 21 | % | | | 3 | % | |
| Portfolio Turnover of the Fund | | | 10 | % | | | 30 | % | | | 23 | % | | | — | | | | — | | | | — | | |
(1) Net investment income per share was computed using average shares outstanding.
(2) The Fund, through its investment in the Portfolio, has adopted the provisions of the revised AICPA Audit and Accounting Guide for Investment Companies and began using the interest method to amortize premiums on fixed-income securities. The effect of this change for the year ended September 30, 2002 was to increase net investment income per share by $0.004, decrease net realized and unrealized gains per share by $0.004 and increase the ratio of net investment income to average net assets from 4.73% to 4.77%.
(3) Returns are historical and are calculated by determining the percentage change in net asset value with all distributions reinvested. Total return is not computed on an annualized basis.
(4) Total return reflects an increase of 0.17% due to a change in the timing of the payment and reinvestment of distributions.
(5) Interest and fee expense relates to the liability for floating rate notes issued in conjunction with inverse floater securities transactions (see Note 1B).
(6) Annualized.
(7) Includes the Fund's share of its corresponding Portfolio's allocated expenses while the Fund was making investments directly into the Portfolio.
(8) Portfolio turnover represents the rate of portfolio activity for the period while the Fund was making investments directly into the Portfolio.
See notes to financial statements
51
Eaton Vance Municipals Funds as of March 31, 2007
FINANCIAL STATEMENTS CONT'D
Financial Highlights
| | | California Fund — Class C | |
| | | Six Months Ended
March 31, 2007 | | Year Ended September 30, | | Period Ended
September 30, | |
| | | (Unaudited)(1) | | 2006(1) | | 2005(1) | | 2004(1)(2) | |
| Net asset value — Beginning of period | | $ | 10.250 | | | $ | 10.090 | | | $ | 10.060 | | | $ | 10.000 | | |
| Income (loss) from operations | |
| Net investment income | | $ | 0.176 | | | $ | 0.366 | | | $ | 0.384 | | | $ | 0.033 | | |
| Net realized and unrealized gain | | | 0.009 | (9) | | | 0.169 | | | | 0.045 | | | | 0.062 | | |
| Total income from operations | | $ | 0.185 | | | $ | 0.535 | | | $ | 0.429 | | | $ | 0.095 | | |
| Less distributions | |
| From net investment income | | $ | (0.179 | ) | | $ | (0.375 | ) | | $ | (0.399 | ) | | $ | (0.035 | ) | |
| From net realized gain | | | (0.176 | ) | | | — | | | | — | | | | — | | |
| Total distributions | | $ | (0.355 | ) | | $ | (0.375 | ) | | $ | (0.399 | ) | | $ | (0.035 | ) | |
| Net asset value — End of period | | $ | 10.080 | | | $ | 10.250 | | | $ | 10.090 | | | $ | 10.060 | | |
| Total Return(3) | | | 1.82 | % | | | 5.42 | % | | | 4.42 | %(4) | | | 0.86 | % | |
| Ratios/Supplemental Data | |
| Net assets, end of period (000's omitted) | | $ | 8,097 | | | $ | 4,933 | | | $ | 1,725 | | | $ | 96 | | |
| Ratios (As a percentage of average daily net assets): | |
| Expenses excluding interest and fees | | | 1.61 | %(6) | | | 1.61 | % | | | 1.63 | %(7) | | | 1.65 | %(6)(7) | |
| Interest and fee expense(5) | | | 0.36 | %(6) | | | 0.37 | % | | | 0.23 | %(7) | | | 0.15 | %(6)(7) | |
| Total expenses | | | 1.97 | %(6) | | | 1.98 | % | | | 1.86 | %(7) | | | 1.80 | %(6)(7) | |
| Expenses after custodian fee reduction excluding interest and fees | | | 1.58 | %(6) | | | 1.60 | % | | | 1.62 | %(7) | | | 1.65 | %(6)(7) | |
| Net investment income | | | 3.48 | %(6) | | | 3.62 | % | | | 3.78 | % | | | 4.24 | %(6) | |
| Portfolio Turnover of the Portfolio(8) | | | — | | | | — | | | | — | | | | 18 | % | |
| Portfolio Turnover of the Fund | | | 10 | % | | | 30 | % | | | 23 | % | | | — | | |
(1) Net investment income per share was computed using average shares outstanding.
(2) For the period from the start of business, August 31, 2004 to September 30, 2004.
(3) Returns are historical and are calculated by determining the percentage change in net asset value with all distributions reinvested. Total return is not computed on an annualized basis.
(4) Total return reflects an increase of 0.09% due to a change in the timing of the payment and reinvestment of distributions.
(5) Interest and fee expense relates to the liability for floating rate notes issued in conjunction with inverse floater securities transactions (see Note 1B).
(6) Annualized.
(7) Includes the Fund's share of its corresponding Portfolio's allocated expenses while the Fund was making investments directly into the Portfolio.
(8) Portfolio turnover represents the rate of portfolio activity for the period while the Fund was making investments directly into the Portfolio.
(9) The per share amount does not reflect the actual net realized gain and unrealized gain (loss) for the period because of the timing of sales of Fund shares and the amount of the per share realized and unrealized gains and losses at such time.
See notes to financial statements
52
Eaton Vance Municipals Funds as of March 31, 2007
FINANCIAL STATEMENTS CONT'D
Financial Highlights
| | | Florida Fund — Class A | |
| | | Six Months Ended
March 31, 2007 | | Year Ended September 30, | |
| | | (Unaudited)(1) | | 2006(1) | | 2005(1) | | 2004(1) | | 2003(1) | | 2002(1)(2) | |
| Net asset value — Beginning of period | | $ | 10.820 | | | $ | 10.640 | | | $ | 10.580 | | | $ | 10.680 | | | $ | 10.940 | | | $ | 10.630 | | |
| Income (loss) from operations | |
| Net investment income | | $ | 0.242 | | | $ | 0.490 | | | $ | 0.506 | | | $ | 0.536 | | | $ | 0.548 | | | $ | 0.572 | | |
| Net realized and unrealized gain (loss) | | | 0.017 | | | | 0.174 | | | | 0.065 | | | | (0.098 | ) | | | (0.259 | ) | | | 0.287 | | |
| Total income from operations | | $ | 0.259 | | | $ | 0.664 | | | $ | 0.571 | | | $ | 0.438 | | | $ | 0.289 | | | $ | 0.859 | | |
| Less distributions | |
| From net investment income | | $ | (0.239 | ) | | $ | (0.484 | ) | | $ | (0.511 | ) | | $ | (0.538 | ) | | $ | (0.549 | ) | | $ | (0.549 | ) | |
| Total distributions | | $ | (0.239 | ) | | $ | (0.484 | ) | | $ | (0.511 | ) | | $ | (0.538 | ) | | $ | (0.549 | ) | | $ | (0.549 | ) | |
| Net asset value — End of period | | $ | 10.840 | | | $ | 10.820 | | | $ | 10.640 | | | $ | 10.580 | | | $ | 10.680 | | | $ | 10.940 | | |
| Total Return(3) | | | 2.41 | % | | | 6.40 | % | | | 5.50 | % | | | 4.18 | % | | | 2.76 | % | | | 8.38 | % | |
| Ratios/Supplemental Data | |
| Net assets, end of period (000's omitted) | | $ | 222,053 | | | $ | 222,008 | | | $ | 196,300 | | | $ | 193,379 | | | $ | 25,996 | | | $ | 21,866 | | |
| Ratios (As a percentage of average daily net assets): | |
| Expenses excluding interest and fees | | | 0.78 | %(5) | | | 0.79 | % | | | 0.82 | %(6) | | | 0.82 | %(6) | | | 0.79 | %(6) | | | 0.86 | %(6) | |
| Interest and fee expense(4) | | | 0.51 | %(5) | | | 0.44 | % | | | 0.26 | %(6) | | | 0.13 | %(6) | | | 0.20 | %(6) | | | 0.11 | %(6) | |
| Total expenses | | | 1.29 | %(5) | | | 1.23 | % | | | 1.08 | %(6) | | | 0.95 | %(6) | | | 0.99 | %(6) | | | 0.97 | %(6) | |
| Expenses after custodian fee reduction | |
| excluding interest and fees | | | 0.78 | %(5) | | | 0.78 | % | | | 0.81 | %(6) | | | 0.82 | %(6) | | | 0.78 | %(6) | | | 0.82 | %(6) | |
| Net investment income | | | 4.46 | %(5) | | | 4.59 | % | | | 4.75 | % | | | 5.09 | % | | | 5.12 | % | | | 5.40 | % | |
| Portfolio Turnover of the Portfolio(7) | | | — | | | | — | | | | — | | | | 9 | % | | | 23 | % | | | 19 | % | |
| Portfolio Turnover of the Fund | | | 5 | % | | | 42 | % | | | 16 | % | | | — | | | | — | | | | — | | |
(1) Net investment income per share was computed using average shares outstanding.
(2) The Fund, through its investment in the Portfolio, has adopted the provisions of the revised AICPA Audit and Accounting Guide for Investment Companies and began using the interest method to amortize premiums on fixed-income securities. The effect of this change for the year ended September 30, 2002 was to increase net investment income per share by $0.001, decrease net realized and unrealized gains per share by $0.001 and increase the ratio of net investment income to average net assets from 5.39% to 5.40%.
(3) Returns are historical and are calculated by determining the percentage change in net asset value with all distributions reinvested. Total return is not computed on an annualized basis.
(4) Interest and fee expense relates to the liability for floating rate notes issued in conjunction with inverse floater securities transactions (see Note 1B).
(5) Annualized.
(6) Includes the Fund's share of its corresponding Portfolio's allocated expenses while the Fund was making investments directly into the Portfolio.
(7) Portfolio turnover represents the rate of portfolio activity for the period while the Fund was making investments directly into the Portfolio.
See notes to financial statements
53
Eaton Vance Municipals Funds as of March 31, 2007
FINANCIAL STATEMENTS CONT'D
Financial Highlights
| | | Florida Fund — Class B | |
| | | Six Months Ended
March 31, 2007 | | Year Ended September 30, | |
| | | (Unaudited)(1) | | 2006(1) | | 2005(1) | | 2004(1) | | 2003(1) | | 2002(1)(2) | |
| Net asset value — Beginning of period | | $ | 11.090 | | | $ | 10.910 | | | $ | 10.840 | | | $ | 10.950 | | | $ | 11.220 | | | $ | 10.900 | | |
| Income (loss) from operations | |
| Net investment income | | $ | 0.206 | | | $ | 0.421 | | | $ | 0.437 | | | $ | 0.469 | | | $ | 0.482 | | | $ | 0.507 | | |
| Net realized and unrealized gain (loss) | | | 0.017 | | | | 0.172 | | | | 0.075 | | | | (0.110 | ) | | | (0.272 | ) | | | 0.293 | | |
| Total income from operations | | $ | 0.223 | | | $ | 0.593 | | | $ | 0.512 | | | $ | 0.359 | | | $ | 0.210 | | | $ | 0.800 | | |
| Less distributions | |
| From net investment income | | $ | (0.203 | ) | | $ | (0.413 | ) | | $ | (0.442 | ) | | $ | (0.469 | ) | | $ | (0.480 | ) | | $ | (0.480 | ) | |
| Total distributions | | $ | (0.203 | ) | | $ | (0.413 | ) | | $ | (0.442 | ) | | $ | (0.469 | ) | | $ | (0.480 | ) | | $ | (0.480 | ) | |
| Net asset value — End of period | | $ | 11.110 | | | $ | 11.090 | | | $ | 10.910 | | | $ | 10.840 | | | $ | 10.950 | | | $ | 11.220 | | |
| Total Return(3) | | | 2.02 | % | | | 5.55 | % | | | 4.98 | %(4) | | | 3.34 | % | | | 1.93 | % | | | 7.56 | % | |
| Ratios/Supplemental Data | |
| Net assets, end of period (000's omitted) | | $ | 30,466 | | | $ | 35,969 | | | $ | 42,074 | | | $ | 51,162 | | | $ | 236,914 | | | $ | 254,603 | | |
| Ratios (As a percentage of average daily net assets): | |
| Expenses excluding interest and fees | | | 1.53 | %(6) | | | 1.54 | % | | | 1.57 | %(7) | | | 1.57 | %(7) | | | 1.54 | %(7) | | | 1.61 | %(7) | |
| Interest and fee expense(5) | | | 0.51 | %(6) | | | 0.44 | % | | | 0.26 | %(7) | | | 0.13 | %(7) | | | 0.20 | %(7) | | | 0.11 | %(7) | |
| Total expenses | | | 2.04 | %(6) | | | 1.98 | % | | | 1.83 | %(7) | | | 1.70 | %(7) | | | 1.74 | %(7) | | | 1.72 | %(7) | |
| Expenses after custodian fee reduction excluding interest and fees | | | 1.53 | %(6) | | | 1.53 | % | | | 1.56 | %(7) | | | 1.57 | %(7) | | | 1.53 | %(7) | | | 1.57 | %(7) | |
| Net investment income | | | 3.72 | %(6) | | | 3.85 | % | | | 4.01 | % | | | 4.26 | % | | | 4.39 | % | | | 4.67 | % | |
| Portfolio Turnover of the Portfolio(8) | | | — | | | | — | | | | — | | | | 9 | % | | | 23 | % | | | 19 | % | |
| Portfolio Turnover of the Fund | | | 5 | % | | | 42 | % | | | 16 | % | | | — | | | | — | | | | — | | |
(1) Net investment income per share was computed using average shares outstanding.
(2) The Fund, through its investment in the Portfolio, has adopted the provisions of the revised AICPA Audit and Accounting Guide for Investment Companies and began using the interest method to amortize premiums on fixed-income securities. The effect of this change for the year ended September 30, 2002 was to increase net investment income per share by $0.001, decrease net realized and unrealized gains per share by $0.001 and increase the ratio of net investment income to average net assets from 4.66% to 4.67%.
(3) Returns are historical and are calculated by determining the percentage change in net asset value with all distributions reinvested. Total return is not computed on an annualized basis.
(4) Total return reflects an increase of 0.17% due to a change in the timing of the payment and reinvestment of distributions.
(5) Interest and fee expense relates to the liability for floating rate notes issued in conjunction with inverse floater securities transactions (see Note 1B).
(6) Annualized.
(7) Includes the Fund's share of its corresponding Portfolio's allocated expenses while the Fund was making investments directly into the Portfolio.
(8) Portfolio turnover represents the rate of portfolio activity for the period while the Fund was making investments directly into the Portfolio.
See notes to financial statements
54
Eaton Vance Municipals Funds as of March 31, 2007
FINANCIAL STATEMENTS CONT'D
Financial Highlights
| | | Florida Fund — Class C | |
| | | Six Months Ended
March 31, 2007
(Unaudited)(1) | | Period Ended
September 30,
2006(1)(2) | |
| Net asset value — Beginning of period | | $ | 11.080 | | | $ | 10.970 | | |
| Income (loss) from operations | |
| Net investment income | | $ | 0.207 | | | $ | 0.215 | | |
| Net realized and unrealized gain | | | 0.026 | | | | 0.118 | | |
| Total income from operations | | $ | 0.233 | | | $ | 0.333 | | |
| Less distributions | |
| From net investment income | | $ | (0.203 | ) | | $ | (0.223 | ) | |
| Total distributions | | $ | (0.203 | ) | | $ | (0.223 | ) | |
| Net asset value — End of period | | $ | 11.110 | | | $ | 11.080 | | |
| Total Return(3) | | | 2.12 | % | | | 3.08 | % | |
| Ratios/Supplemental Data | |
| Net assets, end of period (000's omitted) | | $ | 1,723 | | | $ | 643 | | |
| Ratios (As a percentage of average daily net assets): | |
| Expenses excluding interest and fees | | | 1.52 | %(5) | | | 1.54 | %(5) | |
| Interest and fee expense(4) | | | 0.51 | %(5) | | | 0.44 | %(5) | |
| Total expense | | | 2.03 | %(5) | | | 1.98 | %(5) | |
| Expenses after custodian fee reduction excluding interest and fees | | | 1.52 | %(5) | | | 1.53 | %(5) | |
| Net investment income | | | 3.72 | %(5) | | | 3.53 | %(5) | |
| Portfolio Turnover of the Fund | | | 5 | % | | | 42 | %(6) | |
(1) Net investment income per share was computed using average shares outstanding.
(2) For the period from the start of business, March 13, 2006 to September 30, 2006.
(3) Returns are historical and are calculated by determining the percentage change in net asset value with all distributions reinvested. Total return is not computed on an annualized basis.
(4) Interest and fee expense relates to the liability for floating rate notes issued in conjunction with inverse floater securities transactions (see Note 1B).
(5) Annualized.
(6) For the year ended September 30, 2006.
See notes to financial statements
55
Eaton Vance Municipals Funds as of March 31, 2007
FINANCIAL STATEMENTS CONT'D
Financial Highlights
| | | Massachusetts Fund — Class A | |
| | | Six Months Ended
March 31, 2007 | | Year Ended September 30, | |
| | | (Unaudited)(1) | | 2006(1) | | 2005(1) | | 2004(1) | | 2003(1) | | 2002(1)(2) | |
| Net asset value — Beginning of period | | $ | 9.850 | | | $ | 9.670 | | | $ | 9.660 | | | $ | 9.680 | | | $ | 9.850 | | | $ | 9.550 | | |
| Income (loss) from operations | |
| Net investment income | | $ | 0.209 | | | $ | 0.432 | | | $ | 0.449 | | | $ | 0.484 | | | $ | 0.492 | | | $ | 0.496 | | |
| Net realized and unrealized gain (loss) | | | 0.003 | (8) | | | 0.180 | | | | 0.017 | | | | (0.020 | ) | | | (0.180 | ) | | | 0.285 | | |
| Total income from operations | | $ | 0.212 | | | $ | 0.612 | | | $ | 0.466 | | | $ | 0.464 | | | $ | 0.312 | | | $ | 0.781 | | |
| Less distributions | |
| From net investment income | | $ | (0.212 | ) | | $ | (0.432 | ) | | $ | (0.456 | ) | | $ | (0.484 | ) | | $ | (0.482 | ) | | $ | (0.481 | ) | |
| Total distributions | | $ | (0.212 | ) | | $ | (0.432 | ) | | $ | (0.456 | ) | | $ | (0.484 | ) | | $ | (0.482 | ) | | $ | (0.481 | ) | |
| Net asset value — End of period | | $ | 9.850 | | | $ | 9.850 | | | $ | 9.670 | | | $ | 9.660 | | | $ | 9.680 | | | $ | 9.850 | | |
| Total Return(3) | | | 2.16 | % | | | 6.51 | % | | | 4.90 | % | | | 4.92 | % | | | 3.29 | % | | | 8.48 | % | |
| Ratios/Supplemental Data | |
| Net assets, end of period (000's omitted) | | $ | 229,577 | | | $ | 197,580 | | | $ | 156,382 | | | $ | 143,086 | | | $ | 41,413 | | | $ | 38,857 | | |
| Ratios (As a percentage of average daily net assets): | |
| Expenses excluding interest and fees | | | 0.76 | %(5) | | | 0.79 | % | | | 0.79 | %(6)† | | | 0.81 | %(6) | | | 0.81 | %(6) | | | 0.82 | %(6) | |
| Interest and fee expense(4) | | | 0.44 | %(5) | | | 0.42 | % | | | 0.28 | %(6)† | | | 0.11 | %(6) | | | 0.10 | %(6) | | | 0.10 | %(6) | |
| Total expenses | | | 1.20 | %(5) | | | 1.21 | % | | | 1.07 | %(6)† | | | 0.92 | %(6) | | | 0.91 | %(6) | | | 0.92 | %(6) | |
Expenses after custodian fee reduction
excluding interest and fees | | | 0.75 | %(5) | | | 0.77 | % | | | 0.78 | %(6)† | | | 0.81 | %(6) | | | 0.80 | %(6) | | | 0.80 | %(6) | |
| Net investment income | | | 4.24 | %(5) | | | 4.48 | % | | | 4.62 | %† | | | 5.05 | % | | | 5.09 | % | | | 5.21 | % | |
| Portfolio Turnover of the Portfolio(7) | | | — | | | | — | | | | — | | | | 27 | % | | | 16 | % | | | 10 | % | |
| Portfolio Turnover of the Fund | | | 33 | % | | | 28 | % | | | 15 | % | | | — | | | | — | | | | — | | |
† The operating expenses of the Fund reflect a reduction of the investment adviser fee. Had such action not been taken, the ratios would have changed by less than 0.005%.
(1) Net investment income per share was computed using average shares outstanding.
(2) The Fund, through its investment in the Portfolio, has adopted the provisions of the revised AICPA Audit and Accounting Guide for Investment Companies and began using the interest method to amortize premiums on fixed-income securities. The effect of this change for the year ended September 30, 2002 was to increase net investment income per share by $0.004, decrease net realized and unrealized gains per share by $0.004 and increase the ratio of net investment income to average net assets from 5.17% to 5.21%.
(3) Returns are historical and are calculated by determining the percentage change in net asset value with all distributions reinvested. Total return is not computed on an annualized basis.
(4) Interest and fee expense relates to the liability for floating rate notes issued in conjunction with inverse floater securities transactions (see Note 1B).
(5) Annualized.
(6) Includes the Fund's share of its corresponding Portfolio's allocated expenses while the Fund was making investments directly into the Portfolio.
(7) Portfolio turnover represents the rate of portfolio activity for the period while the Fund was making investments directly into the Portfolio.
(8) The per share amount does not reflect the actual net realized gain and unrealized gain (loss) for the period because of the timing of sales of Fund shares and the amount of the per share realized and unrealized gains and losses at such time.
See notes to financial statements
56
Eaton Vance Municipals Funds as of March 31, 2007
FINANCIAL STATEMENTS CONT'D
Financial Highlights
| | | Massachusetts Fund — Class B | |
| | | Six Months Ended
March 31, 2007 | | Year Ended September 30, | |
| | | (Unaudited)(1) | | 2006(1) | | 2005(1)(2) | | 2004(1)(2) | | 2003(1)(2) | | 2002(1)(2)(3) | |
| Net asset value — Beginning of period | | $ | 9.850 | | | $ | 9.670 | (2) | | $ | 9.650 | | | $ | 9.680 | | | $ | 9.860 | | | $ | 9.560 | | |
| Income (loss) from operations | |
| Net investment income | | $ | 0.173 | | | $ | 0.362 | | | $ | 0.378 | | | $ | 0.414 | | | $ | 0.421 | | | $ | 0.427 | | |
| Net realized and unrealized gain (loss) | | | 0.003 | (10) | | | 0.179 | | | | 0.026 | | | | (0.031 | ) | | | (0.188 | ) | | | 0.283 | | |
| Total income from operations | | $ | 0.176 | | | $ | 0.541 | | | $ | 0.404 | | | $ | 0.383 | | | $ | 0.233 | | | $ | 0.710 | | |
| Less distributions | |
| From net investment income | | $ | (0.176 | ) | | $ | (0.361 | )(2) | | $ | (0.384 | ) | | $ | (0.413 | ) | | $ | (0.413 | ) | | $ | (0.410 | ) | |
| Total distributions | | $ | (0.176 | ) | | $ | (0.361 | ) | | $ | (0.384 | ) | | $ | (0.413 | ) | | $ | (0.413 | ) | | $ | (0.410 | ) | |
| Net asset value — End of period | | $ | 9.850 | | | $ | 9.850 | | | $ | 9.670 | | | $ | 9.650 | | | $ | 9.680 | | | $ | 9.860 | | |
| Total Return(4) | | | 1.79 | % | | | 5.73 | % | | | 4.39 | %(5) | | | 4.07 | % | | | 2.43 | % | | | 7.61 | % | |
| Ratios/Supplemental Data | |
| Net assets, end of period (000's omitted) | | $ | 45,123 | | | $ | 48,991 | | | $ | 54,708 | | | $ | 59,036 | | | $ | 160,416 | | | $ | 169,602 | | |
| Ratios (As a percentage of average daily net assets): | |
| Expenses excluding interest and fees | | | 1.51 | %(7) | | | 1.54 | % | | | 1.54 | %(8)† | | | 1.56 | %(8) | | | 1.56 | %(8) | | | 1.57 | %(8) | |
| Interest and fee expense(6) | | | 0.44 | %(7) | | | 0.42 | % | | | 0.28 | %(8)† | | | 0.11 | %(8) | | | 0.10 | %(8) | | | 0.10 | %(8) | |
| Total expenses | | | 1.95 | %(7) | | | 1.96 | % | | | 1.82 | %(8)† | | | 1.67 | %(8) | | | 1.66 | %(8) | | | 1.67 | %(8) | |
Expenses after custodian fee reduction
excluding interest and fees | | | 1.50 | %(7) | | | 1.52 | % | | | 1.53 | %(8)† | | | 1.56 | %(8) | | | 1.55 | %(8) | | | 1.55 | %(8) | |
| Net investment income | | | 3.50 | %(7) | | | 3.75 | % | | | 3.88 | %† | | | 4.26 | % | | | 4.35 | % | | | 4.49 | % | |
| Portfolio Turnover of the Portfolio(9) | | | — | | | | — | | | | — | | | | 27 | % | | | 16 | % | | | 10 | % | |
| Portfolio Turnover of the Fund | | | 33 | % | | | 28 | % | | | 15 | % | | | — | | | | — | | | | — | | |
† The operating expenses of the Fund reflect a reduction of the investment adviser fee. Had such action not been taken, the ratios would have changed by less than 0.005%.
(1) Net investment income per share was computed using average shares outstanding.
(2) Per share data have been restated or adjusted to reflect the effects of a 1.1146694-for-1 stock split effective on November 11, 2005.
(3) The Fund, through its investment in the Portfolio, has adopted the provisions of the revised AICPA Audit and Accounting Guide for Investment Companies and began using the interest method to amortize premiums on fixed-income securities. The effect of this change for the year ended September 30, 2002 was to increase net investment income per share by $0.004, decrease net realized and unrealized gains per share by $0.004 and increase the ratio of net investment income to average net assets from 4.45% to 4.49%.
(4) Returns are historical and are calculated by determining the percentage change in net asset value with all distributions reinvested. Total return is not computed on an annualized basis.
(5) Total return reflects an increase of 0.16% due to a change in the timing of the payment and reinvestment of distributions.
(6) Interest and fee expense relates to the liability for floating rate notes issued in conjunction with inverse floater securities transactions (see Note 1B).
(7) Annualized
(8) Includes the Fund's share of its corresponding Portfolio's allocated expenses while the Fund was making investments directly into the Portfolio.
(9) Portfolio turnover represents the rate of portfolio activity for the period while the Fund was making investments directly into the Portfolio.
(10) The per share amount does not reflect the actual net realized gain and unrealized gain (loss) for the period because of the timing of sales of Fund shares and the amount of the per share realized and unrealized gains and losses at such time.
See notes to financial statements
57
Eaton Vance Municipals Funds as of March 31, 2007
FINANCIAL STATEMENTS CONT'D
Financial Highlights
| | | Massachusetts Fund — Class C | |
| | | Six Months Ended
March 31, 2007
(Unaudited)(1) | | Period Ended
September 30,
2006(1)(2) | |
| Net asset value — Beginning of period | | $ | 9.850 | | | $ | 9.610 | | |
| Income (loss) from operations | |
| Net investment income | | $ | 0.173 | | | $ | 0.136 | | |
| Net realized and unrealized gain | | | 0.003 | (7) | | | 0.254 | | |
| Total income from operations | | $ | 0.176 | | | $ | 0.390 | | |
| Less distributions | |
| From net investment income | | $ | (0.176 | ) | | $ | (0.150 | ) | |
| Total distributions | | $ | (0.176 | ) | | $ | (0.150 | ) | |
| Net asset value — End of period | | $ | 9.850 | | | $ | 9.850 | | |
| Total Return(3) | | | 1.79 | % | | | 4.10 | % | |
| Ratios/Supplemental Data | |
| Net assets, end of period (000's omitted) | | $ | 11,716 | | | $ | 2,825 | | |
| Ratios (As a percentage of average daily net assets): | |
| Expenses excluding interest and fees | | | 1.51 | %(5) | | | 1.54 | %(5) | |
| Interest and fee expense(4) | | | 0.44 | %(5) | | | 0.42 | %(5) | |
| Total expenses | | | 1.95 | %(5) | | | 1.96 | %(5) | |
| Expenses after custodian fee reduction excluding interest and fees | | | 1.50 | %(5) | | | 1.52 | %(5) | |
| Net investment income | | | 3.50 | %(5) | | | 3.40 | %(5) | |
| Portfolio Turnover of the Fund | | | 33 | % | | | 28 | %(6) | |
(1) Net investment income per share was computed using average share outstanding.
(2) For the period from the start of business, May 2, 2006 to September 30, 2006.
(3) Returns are historical and are calculated by determining the percentage change in net asset value with all distributions reinvested. Total return is not computed on an annualized basis.
(4) Interest and fee expense relates to the liability for floating rate notes issued in conjunction with inverse floater securities transactions (see Note 1B).
(5) Annualized.
(6) For the year ended September 30, 2006.
(7) The per share amount does not reflect the actual net realized gain and unrealized gain (loss) for the period because of the timing of sales of Fund shares and the amount of the per share realized and unrealized gains and losses at such time.
See notes to financial statements
58
Eaton Vance Municipals Funds as of March 31, 2007
FINANCIAL STATEMENTS CONT'D
Financial Highlights
| | | Massachusetts Fund — Class I | |
| | | Six Months Ended
March 31, 2007 | | Year Ended September 30, | |
| | | (Unaudited)(1) | | 2006(1) | | 2005(1)(2) | | 2004(1)(2) | | 2003(1)(2) | | 2002(1)(2)(3) | |
| Net asset value — Beginning of period | | $ | 9.850 | (2) | | $ | 9.670 | (2) | | $ | 9.650 | | | $ | 9.680 | | | $ | 9.840 | | | $ | 9.550 | | |
| Income (loss) from operations | |
| Net investment income | | $ | 0.219 | | | $ | 0.453 | | | $ | 0.468 | | | $ | 0.504 | | | $ | 0.512 | | | $ | 0.517 | | |
| Net realized and unrealized gain (loss) | | | 0.003 | (10) | | | 0.178 | | | | 0.027 | | | | (0.031 | ) | | | (0.172 | ) | | | 0.272 | | |
| Total income from operations | | $ | 0.222 | | | $ | 0.631 | | | $ | 0.495 | | | $ | 0.473 | | | $ | 0.340 | | | $ | 0.789 | | |
| Less distributions | |
| From net investment income | | $ | (0.222 | ) | | $ | (0.451 | )(2) | | $ | (0.475 | ) | | $ | (0.503 | ) | | $ | (0.500 | ) | | $ | (0.499 | ) | |
| Total distributions | | $ | (0.222 | ) | | $ | (0.451 | ) | | $ | (0.475 | ) | | $ | (0.503 | ) | | $ | (0.500 | ) | | $ | (0.499 | ) | |
| Net asset value — End of period | | $ | 9.850 | | | $ | 9.850 | | | $ | 9.670 | | | $ | 9.650 | | | $ | 9.680 | | | $ | 9.840 | | |
| Total Return(4) | | | 2.26 | % | | | 6.72 | % | | | 5.43 | %(5) | | | 5.04 | % | | | 3.51 | % | | | 8.55 | % | |
| Ratios/Supplemental Data | |
| Net assets, end of period (000's omitted) | | $ | 15,032 | | | $ | 13,227 | | | $ | 11,701 | | | $ | 8,321 | | | $ | 7,608 | | | $ | 8,880 | | |
| Ratios (As a percentage of average daily net assets): | |
| Expenses excluding interest and fees | | | 0.56 | %(7) | | | 0.59 | % | | | 0.59 | %†(8) | | | 0.61 | %(8) | | | 0.61 | %(8) | | | 0.62 | %(8) | |
| Interest and fee expense(6) | | | 0.44 | %(7) | | | 0.42 | % | | | 0.28 | %†(8) | | | 0.11 | %(8) | | | 0.10 | %(8) | | | 0.10 | %(8) | |
| Total expenses | | | 1.00 | %(7) | | | 1.01 | % | | | 0.87 | %†(8) | | | 0.72 | %(8) | | | 0.71 | %(8) | | | 0.72 | %(8) | |
Expenses after custodian fee reduction
excluding interest and fees | | | 0.55 | %(7) | | | 0.57 | % | | | 0.58 | %†(8) | | | 0.61 | %(8) | | | 0.60 | %(8) | | | 0.60 | %(8) | |
| Net investment income | | | 4.43 | %(7) | | | 4.69 | % | | | 4.81 | %† | | | 5.23 | % | | | 5.29 | % | | | 5.44 | % | |
| Portfolio Turnover of the Portfolio(9) | | | — | | | | — | | | | — | | | | 27 | % | | | 16 | % | | | 10 | % | |
| Portfolio Turnover of the Fund | | | 33 | % | | | 28 | % | | | 15 | % | | | — | | | | — | | | | — | | |
† The operating expenses of the Fund reflect a reduction of the investment adviser fee. Had such action not been taken, the ratios would have changed by less than 0.005%.
(1) Net investment income per share was computed using average shares outstanding.
(2) Per share data have been restated or adjusted to reflect the effects of a 1.0330579-for-1 stock split effective on November 11, 2005.
(3) The Fund, through its investment in the Portfolio, has adopted the provisions of the revised AICPA Audit and Accounting Guide for Investment Companies and began using the interest method to amortize premiums on fixed-income securities. The effect of this change for the year ended September 30, 2002 was to increase net investment income per share by $0.004, decrease net realized and unrealized gains per share by $0.004 and increase the ratio of net investment income to average net assets from 5.40% to 5.44%.
(4) Returns are historical and are calculated by determining the percentage change in net asset value with all distributions reinvested. Total return is not computed on an annualized basis.
(5) Total return reflects an increase of 0.20% due to a change in the timing of the payment and reinvestment of distributions.
(6) Interest and fee expense relates to the liability for floating rate notes issued in conjunction with inverse floater securities transactions (see Note 1B).
(7) Annualized.
(8) Includes the Fund's share of its corresponding Portfolio's allocated expenses while the Fund was making investments directly into the Portfolio.
(9) Portfolio turnover represents the rate of portfolio activity for the period while the Fund was making investments directly into the Portfolio.
(10) The per share amount does not reflect the actual net realized gain and unrealized gain (loss) for the period because of the timing of sales of Fund shares and the amount of the per share realized and unrealized gains and losses at such time.
See notes to financial statements
59
Eaton Vance Municipals Funds as of March 31, 2007
FINANCIAL STATEMENTS CONT'D
Financial Highlights
| | | Mississippi Fund — Class A | |
| | | Six Months Ended
March 31, 2007 | | Year Ended September 30, | |
| | | (Unaudited)(1) | | 2006(1) | | 2005(1) | | 2004(1) | | 2003(1) | | 2002(1)(2) | |
| Net asset value — Beginning of period | | $ | 9.690 | | | $ | 9.610 | | | $ | 9.720 | | | $ | 9.840 | | | $ | 10.000 | | | $ | 9.750 | | |
| Income (loss) from operations | |
| Net investment income | | $ | 0.206 | | | $ | 0.417 | | | $ | 0.428 | | | $ | 0.455 | | | $ | 0.473 | | | $ | 0.471 | | |
| Net realized and unrealized gain (loss) | | | (0.003 | ) | | | 0.075 | | | | (0.099 | ) | | | (0.116 | ) | | | (0.163 | ) | | | 0.249 | | |
| Total income from operations | | $ | 0.203 | | | $ | 0.492 | | | $ | 0.329 | | | $ | 0.339 | | | $ | 0.310 | | | $ | 0.720 | | |
| Less distributions | |
| From net investment income | | $ | (0.203 | ) | | $ | (0.412 | ) | | $ | (0.439 | ) | | $ | (0.459 | ) | | $ | (0.470 | ) | | $ | (0.470 | ) | |
| Total distributions | | $ | (0.203 | ) | | $ | (0.412 | ) | | $ | (0.439 | ) | | $ | (0.459 | ) | | $ | (0.470 | ) | | $ | (0.470 | ) | |
| Net asset value — End of period | | $ | 9.690 | | | $ | 9.690 | | | $ | 9.610 | | | $ | 9.720 | | | $ | 9.840 | | | $ | 10.000 | | |
| Total Return(3) | | | 2.11 | % | | | 5.26 | % | | | 3.44 | % | | | 3.54 | % | | | 3.21 | % | | | 7.64 | % | |
| Ratios/Supplemental Data | |
| Net assets, end of period (000's omitted) | | $ | 15,252 | | | $ | 15,154 | | | $ | 12,901 | | | $ | 11,379 | | | $ | 2,727 | | | $ | 1,945 | | |
| Ratios (As a percentage of average daily net assets): | |
| Expenses excluding interest and fees | | | 0.82 | %(5) | | | 0.81 | % | | | 0.86 | %(6) | | | 0.84 | %(6) | | | 0.81 | %(6) | | | 0.90 | %(6) | |
| Interest and fee expense(4) | | | 0.23 | %(5) | | | 0.19 | % | | | 0.12 | %(6) | | | 0.06 | %(6) | | | 0.03 | %(6) | | | 0.02 | %(6) | |
| Total expenses | | | 1.05 | %(5) | | | 1.00 | % | | | 0.98 | %(6) | | | 0.90 | %(6) | | | 0.84 | %(6) | | | 0.92 | %(6) | |
Expenses before custodian fee reduction
excluding interest and fees | | | 0.80 | %(5) | | | 0.78 | % | | | 0.84 | %(6) | | | 0.83 | %(6) | | | 0.79 | %(6) | | | 0.88 | %(6) | |
| Net investment income | | | 4.26 | % | | | 4.34 | % | | | 4.41 | % | | | 4.70 | % | | | 4.81 | % | | | 4.85 | % | |
| Portfolio Turnover of the Portfolio(7) | | | — | | | | — | | | | — | | | | 15 | % | | | 11 | % | | | 10 | % | |
| Portfolio turnover of the Fund | | | 11 | % | | | 22 | % | | | 21 | % | | | — | | | | — | | | | — | | |
(1) Net investment income per share was computed using average shares outstanding.
(2) The Fund, through its investment in the Portfolio, has adopted the provisions of the revised AICPA Audit and Accounting Guide for Investment Companies and began using the interest method to amortize premiums on fixed-income securities. The effect of this change for the year ended September 30, 2002 was to increase net investment income per share by $0.010, decrease net realized and unrealized gains per share by $0.010 and increase the ratio of net investment income to average net assets from 4.75% to 4.85%.
(3) Returns are historical and are calculated by determining the percentage change in net asset value with all distributions reinvested. Total return is not computed on an annualized basis.
(4) Interest and fee expense relates to the liability for floating rates notes issued in conjunction with inverse floater securities transactions (see Note 1B).
(5) Annualized.
(6) Includes the Fund's share of its corresponding Portfolio's allocated expenses while the Fund was making investments directly into the Portfolio.
(7) Portfolio turnover represents the rate of portfolio activity for the period while the Fund was making investments directly into the Portfolio.
See notes to financial statements
60
Eaton Vance Municipals Funds as of March 31, 2007
FINANCIAL STATEMENTS CONT'D
Financial Highlights
| | | Mississippi Fund — Class B | |
| | | Six Months Ended
March 31, 2007 | | Year Ended September 30, | |
| | | (Unaudited)(1) | | 2006(1) | | 2005(1) | | 2004(1) | | 2003(1) | | 2002(1)(2) | |
| Net asset value — Beginning of period | | $ | 9.910 | | | $ | 9.830 | | | $ | 9.940 | | | $ | 10.060 | | | $ | 10.220 | | | $ | 9.970 | | |
| Income (loss) from operations | |
| Net investment income | | $ | 0.174 | | | $ | 0.354 | | | $ | 0.365 | | | $ | 0.393 | | | $ | 0.409 | | | $ | 0.409 | | |
| Net realized and unrealized gain (loss) | | | (0.003 | ) | | | 0.073 | | | | (0.100 | ) | | | (0.119 | ) | | | (0.163 | ) | | | 0.247 | | |
| Total income from operations | | $ | 0.171 | | | $ | 0.427 | | | $ | 0.265 | | | $ | 0.274 | | | $ | 0.246 | | | $ | 0.656 | | |
| Less distributions | |
| From net investment income | | $ | (0.171 | ) | | $ | (0.347 | ) | | $ | (0.375 | ) | | $ | (0.394 | ) | | $ | (0.406 | ) | | $ | (0.406 | ) | |
| Total distributions | | $ | (0.171 | ) | | $ | (0.347 | ) | | $ | (0.375 | ) | | $ | (0.394 | ) | | $ | (0.406 | ) | | $ | (0.406 | ) | |
| Net asset value — End of period | | $ | 9.910 | | | $ | 9.910 | | | $ | 9.830 | | | $ | 9.940 | | | $ | 10.060 | | | $ | 10.220 | | |
| Total Return(3) | | | 1.73 | % | | | 4.44 | % | | | 2.86 | %(4) | | | 2.79 | % | | | 2.47 | % | | | 6.75 | % | |
| Ratios/Supplemental Data | |
| Net assets, end of period (000's omitted) | | $ | 3,811 | | | $ | 4,077 | | | $ | 5,291 | | | $ | 6,013 | | | $ | 15,018 | | | $ | 15,202 | | |
| Ratios (As a percentage of average daily net assets): | |
| Expenses excluding interest and fees | | | 1.57 | %(6) | | | 1.56 | % | | | 1.61 | %(7) | | | 1.59 | %(7) | | | 1.56 | %(7) | | | 1.65 | %(7) | |
| Interest and fee expense(5) | | | 0.23 | %(6) | | | 0.19 | % | | | 0.12 | %(7) | | | 0.06 | %(7) | | | 0.03 | %(7) | | | 0.02 | %(7) | |
| Total expenses | | | 1.80 | %(6) | | | 1.75 | % | | | 1.73 | %(7) | | | 1.65 | %(7) | | | 1.59 | %(7) | | | 1.67 | %(7) | |
Expenses before custodian fee reduction
excluding interest and fees | | | 1.55 | %(6) | | | 1.53 | % | | | 1.59 | %(7) | | | 1.58 | %(7) | | | 1.54 | %(7) | | | 1.63 | %(7) | |
| Net investment income | | | 3.51 | % | | | 3.61 | % | | | 3.68 | % | | | 3.93 | % | | | 4.07 | % | | | 4.11 | % | |
| Portfolio Turnover of the Portfolio(8) | | | — | | | | — | | | | — | | | | 15 | % | | | 11 | % | | | 10 | % | |
| Portfolio Turnover of the Fund | | | 11 | % | | | 22 | % | | | 21 | % | | | — | | | | — | | | | — | | |
(1) Net investment income per share was computed using average shares outstanding.
(2) The Fund, through its investment in the Portfolio, has adopted the provisions of the revised AICPA Audit and Accounting Guide for Investment Companies and began using the interest method to amortize premiums on fixed-income securities. The effect of this change for the year ended September 30, 2002 was to increase net investment income per share by $0.010, decrease net realized and unrealized gains per share by $0.010 and increase the ratio of net investment income to average net assets from 4.01% to 4.11%.
(3) Returns are historical and are calculated by determining the percentage change in net asset value with all distributions reinvested. Total return is not computed on an annualized basis.
(4) Total return reflects an increase of 0.16% due to a change in the timing of payment and reinvestment of distributions.
(5) Interest and fee expense relates to the liability for floating rates notes issued in conjunction with inverse floater securities transactions (see Note 1B).
(6) Annualized.
(7) Includes the Fund's share of its corresponding Portfolio's allocated expenses while the Fund was making investments directly into the Portfolio.
(8) Portfolio turnover represents the rate of portfolio activity for the period while the Fund was making investments directly into the Portfolio.
See notes to financial statements
61
Eaton Vance Municipals Funds as of March 31, 2007
FINANCIAL STATEMENTS CONT'D
Financial Highlights
| | | New York Fund — Class A | |
| | | Six Months Ended
March 31, 2007 | | Year Ended September 30, | |
| | | (Unaudited)(1) | | 2006(1) | | 2005(1) | | 2004(1) | | 2003(1) | | 2002(1)(2) | |
| Net asset value — Beginning of period | | $ | 10.750 | | | $ | 10.700 | | | $ | 10.800 | | | $ | 10.920 | | | $ | 11.070 | | | $ | 10.610 | | |
| Income (loss) from operations | |
| Net investment income | | $ | 0.231 | | | $ | 0.476 | | | $ | 0.502 | | | $ | 0.542 | | | $ | 0.539 | | | $ | 0.543 | | |
| Net realized and unrealized gain (loss) | | | 0.002 | | | | 0.170 | | | | (0.090 | ) | | | (0.049 | ) | | | (0.165 | ) | | | 0.430 | | |
| Total income from operations | | $ | 0.233 | | | $ | 0.646 | | | $ | 0.412 | | | $ | 0.493 | | | $ | 0.374 | | | $ | 0.973 | | |
| Less distributions | |
| From net investment income | | $ | (0.230 | ) | | $ | (0.473 | ) | | $ | (0.512 | ) | | $ | (0.587 | ) | | $ | (0.518 | ) | | $ | (0.513 | ) | |
| From net realized gain | | | (0.053 | ) | | | (0.123 | ) | | | — | | | | (0.026 | ) | | | (0.006 | ) | | | — | | |
| Total distributions | | $ | (0.283 | ) | | $ | (0.596 | ) | | $ | (0.512 | ) | | $ | (0.613 | ) | | $ | (0.524 | ) | | $ | (0.513 | ) | |
| Net asset value — End of period | | $ | 10.700 | | | $ | 10.750 | | | $ | 10.700 | | | $ | 10.800 | | | $ | 10.920 | | | $ | 11.070 | | |
| Total Return(3) | | | 2.18 | % | | | 6.29 | % | | | 3.88 | % | | | 4.66 | % | | | 3.54 | % | | | 9.49 | % | |
| Ratios/Supplemental Data | |
| Net assets, end of period (000's omitted) | | $ | 415,090 | | | $ | 393,479 | | | $ | 357,652 | | | $ | 335,153 | | | $ | 42,481 | | | $ | 29,817 | | |
| Ratios (As a percentage of average daily net assets): | |
| Expenses excluding interest and fees | | | 0.76 | %(7) | | | 0.79 | % | | | 0.80 | %(5) | | | 0.82 | %(5) | | | 0.80 | %(5) | | | 0.82 | %(5) | |
| Interest and fee expense(4) | | | 0.22 | %(7) | | | 0.48 | % | | | 0.35 | %(5) | | | 0.19 | %(5) | | | 0.09 | %(5) | | | 0.10 | %(5) | |
| Total expenses | | | 0.98 | %(7) | | | 1.27 | % | | | 1.15 | %(5) | | | 1.01 | %(5) | | | 0.89 | %(5) | | | 0.92 | %(5) | |
Expenses after custodian fee reduction
excluding interest and fees | | | 0.75 | %(7) | | | 0.78 | % | | | 0.79 | %(5) | | | 0.82 | %(5) | | | 0.80 | %(5) | | | 0.82 | %(5) | |
| Net investment income | | | 4.31 | %(7) | | | 4.50 | % | | | 4.65 | % | | | 5.07 | % | | | 4.99 | % | | | 5.11 | % | |
| Portfolio Turnover of the Portfolio(6) | | | — | | | | — | | | | — | | | | 26 | % | | | 19 | % | | | 7 | % | |
| Portfolio Turnover of the Fund | | | 18 | % | | | 34 | % | | | 45 | % | | | — | | | | — | | | | — | | |
(1) Net investment income per share was computed using average shares outstanding.
(2) The Fund, through its investment in the Portfolio, has adopted the provisions of the revised AICPA Audit and Accounting Guide for Investment Companies and began using the interest method to amortize premiums on fixed-income securities. The effect of this change for the year ended September 30, 2002 was to increase net investment income per share by $0.002, decrease net realized and unrealized gains per share by $0.002 and increase the ratio of net investment income to average net assets from 5.09% to 5.11%.
(3) Returns are historical and are calculated by determining the percentage change in net asset value with all distributions reinvested. Total return is not computed on an annualized basis.
(4) Interest and fee expense relates to the liability for floating rate notes issued in conjunction with inverse floater securities transactions (see Note 1B).
(5) Includes the Fund's share of its corresponding Portfolio's allocated expenses while the Fund was making investments directly into the Portfolio.
(6) Portfolio turnover represents the rate of portfolio activity for the period while the Fund was making investments directly into the Portfolio.
(7) Annualized.
See notes to financial statements
62
Eaton Vance Municipals Funds as of March 31, 2007
FINANCIAL STATEMENTS CONT'D
Financial Highlights
| | | New York Fund — Class B | |
| | | Six Months Ended
March 31, 2007 | | Year Ended September 30, | |
| | | (Unaudited)(1) | | 2006(1) | | 2005(1)(2) | | 2004(1)(2) | | 2003(1)(2) | | 2002(1)(2)(3) | |
| Net asset value — Beginning of period | | $ | 10.760 | | | $ | 10.700 | (2) | | $ | 10.800 | | | $ | 10.910 | | | $ | 11.050 | | | $ | 10.590 | | |
| Income (loss) from operations | |
| Net investment income | | $ | 0.191 | | | $ | 0.396 | | | $ | 0.415 | | | $ | 0.533 | | | $ | 0.494 | | | $ | 0.464 | | |
| Net realized and unrealized gain (loss) | | | 0.012 | | | | 0.181 | | | | (0.083 | ) | | | (0.084 | ) | | | (0.169 | ) | | | 0.431 | | |
| Total income from operations | | $ | 0.203 | | | $ | 0.577 | | | $ | 0.332 | | | $ | 0.449 | | | $ | 0.325 | | | $ | 0.895 | | |
| Less distributions | |
| From net investment income | | $ | (0.190 | ) | | $ | (0.394 | )(2) | | $ | (0.432 | ) | | $ | (0.540 | ) | | $ | (0.463 | ) | | $ | (0.435 | ) | |
| From net realized gain | | | (0.053 | ) | | | (0.123 | ) | | | — | | | | (0.024 | ) | | | (0.006 | ) | | | — | | |
| Total distributions | | $ | (0.243 | ) | | $ | (0.517 | ) | | $ | (0.432 | ) | | $ | (0.564 | ) | | $ | (0.469 | ) | | $ | (0.435 | ) | |
| Contingent deferred sales charges | | $ | — | | | $ | — | | | $ | — | | | $ | 0.005 | | | $ | 0.004 | | | $ | — | | |
| Net asset value — End of period | | $ | 10.720 | | | $ | 10.760 | | | $ | 10.700 | | | $ | 10.800 | | | $ | 10.910 | | | $ | 11.050 | | |
| Total Return(4) | | | 1.90 | % | | | 5.59 | % | | | 3.27 | %(5) | | | 4.28 | % | | | 3.08 | % | | | 8.70 | % | |
| Ratios/Supplemental Data | |
| Net assets, end of period (000's omitted) | | $ | 11,157 | | | $ | 9,488 | | | $ | 6,189 | | | $ | 2,984 | | | $ | 307,299 | | | $ | 320,497 | | |
| Ratios (As a percentage of average daily net assets): | |
| Expenses excluding interest and fees | | | 1.51 | %(9) | | | 1.54 | % | | | 1.55 | %(7) | | | 0.93 | %(7) | | | 1.23 | %(7) | | | 1.57 | %(7) | |
| Interest and fee expense(6) | | | 0.22 | %(9) | | | 0.48 | % | | | 0.35 | %(7) | | | 0.19 | %(7) | | | 0.09 | %(7) | | | 0.10 | %(7) | |
| Total expenses | | | 1.73 | %(9) | | | 2.02 | % | | | 1.90 | %(7) | | | 1.12 | %(7) | | | 1.32 | %(7) | | | 1.67 | %(7) | |
Expenses after custodian fee reduction
excluding interest and fees | | | 1.50 | %(9) | | | 1.53 | % | | | 1.54 | %(7) | | | 0.93 | %(7) | | | 1.23 | %(7) | | | 1.57 | %(7) | |
| Net investment income | | | 3.55 | %(9) | | | 3.74 | % | | | 3.84 | % | | | 4.86 | % | | | 4.58 | % | | | 4.37 | % | |
| Portfolio Turnover of the Portfolio(8) | | | — | | | | — | | | | — | | | | 26 | % | | | 19 | % | | | 7 | % | |
| Portfolio Turnover of the Fund | | | 18 | % | | | 34 | % | | | 45 | % | | | — | | | | — | | | | — | | |
(1) Net investment income per share was computed using average shares outstanding.
(2) Per share data have been restated or adjusted to reflect the effects of a 1.0812325-for-1 stock split effective on November 11, 2005.
(3) The Fund, through its investment in the Portfolio, has adopted the provisions of the revised AICPA Audit and Accounting Guide for Investment Companies and began using the interest method to amortize premiums on fixed-income securities. The effect of this change for the year ended September 30, 2002 was to increase net investment income per share by $0.002, decrease net realized and unrealized gains per share by $0.002 and increase the ratio of net investment income to average net assets from 4.35% to 4.37%.
(4) Returns are historical and are calculated by determining the percentage change in net asset value with all distributions reinvested. Total return is not computed on an annualized basis.
(5) Total return reflects an increase of 0.16% due to a change in the timing of the payment and reinvestment of distributions.
(6) Interest and fee expense relates to the liability for floating rate notes issued in conjunction with inverse floater securities transactions (see Note 1B).
(7) Includes the Fund's share of its corresponding Portfolio's allocated expenses while the Fund was making investments directly into the Portfolio.
(8) Portfolio turnover represents the rate of portfolio activity for the period while the Fund was making investments directly into the Portfolio.
(9) Annualized.
See notes to financial statements
63
Eaton Vance Municipals Funds as of March 31, 2007
FINANCIAL STATEMENTS CONT'D
Financial Highlights
| | | New York Fund — Class C | |
| | | Six Months Ended
March 31, 2007 | | Year Ended September 30, | |
| | | (Unaudited)(1) | | 2006(1) | | 2005(1)(2) | | 2004(1)(2) | | 2003(1)(2)(3) | |
| Net asset value — Beginning of period | | $ | 10.750 | | | $ | 10.700 | (2) | | $ | 10.800 | | | $ | 11.070 | | | $ | 11.020 | | |
| Income (loss) from operations | |
| Net investment income | | $ | 0.189 | | | $ | 0.391 | | | $ | 0.408 | | | $ | 0.448 | | | $ | 0.002 | | |
| Net realized and unrealized gain (loss) | | | 0.014 | | | | 0.176 | | | | (0.077 | ) | | | (0.222 | ) | | | 0.049 | | |
| Total income from operations | | $ | 0.203 | | | $ | 0.567 | | | $ | 0.331 | | | $ | 0.226 | | | $ | 0.051 | | |
| Less distributions | |
| From net investment income | | $ | (0.190 | ) | | $ | (0.394 | )(2) | | $ | (0.431 | ) | | $ | (0.467 | ) | | $ | (0.001 | ) | |
| From net realized gain | | | (0.053 | ) | | | (0.123 | ) | | | — | | | | (0.029 | ) | | | — | | |
| Total distributions | | $ | (0.243 | ) | | $ | (0.517 | ) | | $ | (0.431 | ) | | $ | (0.496 | ) | | $ | (0.001 | ) | |
| Net asset value — End of period | | $ | 10.710 | | | $ | 10.750 | | | $ | 10.700 | | | $ | 10.800 | | | $ | 11.070 | | |
| Total Return(4) | | | 1.90 | % | | | 5.50 | % | | | 3.20 | %(5) | | | 1.99 | % | | | 0.50 | % | |
| Ratios/Supplemental Data | |
| Net assets, end of period (000's omitted) | | $ | 23,961 | | | $ | 13,889 | | | $ | 4,702 | | | $ | 940 | | | $ | 11 | | |
| Ratios (As a percentage of average daily net assets): | |
| Expenses excluding interest and fees | | | 1.51 | %(8) | | | 1.54 | % | | | 1.54 | %(7) | | | 1.56 | %(7) | | | 1.89 | %(7)(8) | |
| Interest and fee expense(6) | | | 0.22 | %(8) | | | 0.48 | % | | | 0.35 | %(7) | | | 0.19 | %(7) | | | 0.09 | %(7)(8) | |
| Total expenses | | | 1.73 | %(8) | | | 2.02 | % | | | 1.89 | %(7) | | | 1.75 | %(7) | | | 1.98 | %(7)(8) | |
Expenses after custodian fee reduction
excluding interest and fees | | | 1.50 | %(8) | | | 1.53 | % | | | 1.53 | %(7) | | | 1.56 | %(7) | | | 1.89 | %(7)(8) | |
| Net investment income | | | 3.51 | %(8) | | | 3.70 | % | | | 3.78 | % | | | 4.17 | % | | | 6.41 | %(8) | |
| Portfolio Turnover of the Portfolio(9) | | | — | | | | — | | | | — | | | | 26 | % | | | 19 | % | |
| Portfolio Turnover of the Fund | | | 18 | % | | | 34 | % | | | 45 | % | | | — | | | | — | | |
(1) Net investment income per share was computed using average shares outstanding.
(2) Per share data have been restated or adjusted to reflect the effects of a 0.9075630-for-1 reverse stock split effective on November 11, 2005.
(3) Class C shares commenced operations on September 30, 2003.
(4) Returns are historical and are calculated by determining the percentage change in net asset value with all distributions reinvested. Total return is not computed on an annualized basis.
(5) Total return reflects an increase of 0.09% due to a change in the timing of the payment and reinvestment of distributions.
(6) Interest and fee expense relates to the liability for floating rate notes issued in conjunction with inverse floater securities transactions (see Note 1B).
(7) Includes the Fund's share of its corresponding Portfolio's allocated expenses while the Fund was making investments directly into the Portfolio.
(8) Annualized.
(9) Portfolio turnover represents the rate of portfolio activity for the period while the Fund was making investments directly into the Portfolio.
See notes to financial statements
64
Eaton Vance Municipals Funds as of March 31, 2007
FINANCIAL STATEMENTS CONT'D
Financial Highlights
| | | Ohio Fund — Class A | |
| | | Six Months Ended
March 31, 2007 | | Year Ended September 30, | |
| | | (Unaudited)(1) | | 2006(1) | | 2005(1) | | 2004(1) | | 2003 | | 2002(1)(2) | |
| Net asset value — Beginning of period | | $ | 9.450 | | | $ | 9.320 | | | $ | 9.180 | | | $ | 9.230 | | | $ | 9.290 | | | $ | 9.130 | | |
| Income (loss) from operations | |
| Net investment income | | $ | 0.196 | | | $ | 0.420 | | | $ | 0.464 | | | $ | 0.491 | | | $ | 0.499 | | | $ | 0.490 | | |
| Net realized and unrealized gain (loss) | | | 0.008 | (8) | | | 0.137 | | | | 0.142 | | | | (0.034 | ) | | | (0.077 | ) | | | 0.148 | | |
| Total income from operations | | $ | 0.204 | | | $ | 0.557 | | | $ | 0.606 | | | $ | 0.457 | | | $ | 0.422 | | | $ | 0.638 | | |
| Less distributions | |
| From net investment income | | $ | (0.204 | ) | | $ | (0.427 | ) | | $ | (0.466 | ) | | $ | (0.507 | ) | | $ | (0.482 | ) | | $ | (0.478 | ) | |
| Total distributions | | $ | (0.204 | ) | | $ | (0.427 | ) | | $ | (0.466 | ) | | $ | (0.507 | ) | | $ | (0.482 | ) | | $ | (0.478 | ) | |
| Net asset value — End of period | | $ | 9.450 | | | $ | 9.450 | | | $ | 9.320 | | | $ | 9.180 | | | $ | 9.230 | | | $ | 9.290 | | |
| Total Return(3) | | | 2.16 | % | | | 6.15 | % | | | 6.71 | % | | | 5.07 | % | | | 4.73 | % | | | 7.23 | % | |
| Ratios/Supplemental Data | |
| Net assets, end of period (000's omitted) | | $ | 238,921 | | | $ | 182,719 | | | $ | 140,355 | | | $ | 126,212 | | | $ | 15,612 | | | $ | 14,526 | | |
| Ratios (As a percentage of average daily net assets): | |
| Expenses excluding interest and fees | | | 0.76 | %(5) | | | 0.78 | % | | | 0.82 | %(6) | | | 0.85 | %(6) | | | 0.81 | %(6) | | | 0.84 | %(6) | |
| Interest and fee expense(4) | | | 0.33 | %(5) | | | 0.47 | % | | | 0.35 | %(6) | | | 0.25 | %(6) | | | 0.25 | %(6) | | | 0.27 | %(6) | |
| Total expenses | | | 1.09 | %(5) | | | 1.25 | % | | | 1.17 | %(6) | | | 1.10 | %(6) | | | 1.06 | %(6) | | | 1.11 | %(6) | |
Expenses after custodian fee reduction
excluding interest and fees | | | 0.73 | %(5) | | | 0.75 | % | | | 0.81 | %(6) | | | 0.85 | %(6) | | | 0.80 | %(6) | | | 0.83 | %(6) | |
| Net investment income | | | 4.15 | %(5) | | | 4.53 | % | | | 4.97 | % | | | 5.38 | % | | | 5.46 | % | | | 5.40 | % | |
| Portfolio Turnover of the Portfolio(7) | | | — | | | | — | | | | — | | | | 9 | % | | | 15 | % | | | 15 | % | |
| Portfolio Turnover of the Fund | | | 12 | % | | | 24 | % | | | 28 | % | | | — | | | | — | | | | — | | |
(1) Net investment income per share was computed using average shares outstanding.
(2) The Fund, through its investment in the Portfolio, has adopted the provisions of the revised AICPA Audit and Accounting Guide for Investment Companies and began using the interest method to amortize premiums on fixed-income securities. The effect of this change for the year ended September 30, 2002 was to increase net investment income per share by less than $0.001, decrease net realized and unrealized gains per share by less than $0.001 and increase the ratio of net investment income to average net assets by less than 0.01%.
(3) Returns are historical and are calculated by determining the percentage change in net asset value with all distributions reinvested. Total return is not computed on an annualized basis.
(4) Interest and fee expense relates to the liability for floating rates notes issued in conjunction with inverse floater securities transactions (see Note 1B).
(5) Annualized.
(6) Includes the Fund's share of its corresponding Portfolio's allocated expenses while the Fund was making investments directly into the Portfolio.
(7) Portfolio turnover represents the rate of portfolio activity for the period while the Fund was making investments directly into the Portfolio.
(8) The per share amount does not reflect the actual net realized gain and unrealized gain (loss) for the period because of the timing of sales of Fund shares and the amount of the per share realized and unrealized gains and losses at such time.
See notes to financial statements
65
Eaton Vance Municipals Funds as of March 31, 2007
FINANCIAL STATEMENTS CONT'D
Financial Highlights
| | | Ohio Fund — Class B | |
| | | Six Months Ended
March 31, 2007 | | Year Ended September 30, | |
| | | (Unaudited)(1) | | 2006(1) | | 2005(1)(2) | | 2004(1)(2) | | 2003(1)(2) | | 2002(1)(2)(3) | |
| Net asset value — Beginning of period | | $ | 9.440 | | | $ | 9.320 | (2) | | $ | 9.180 | | | $ | 9.240 | | | $ | 9.290 | | | $ | 9.140 | | |
| Income (loss) from operations | |
| Net investment income | | $ | 0.162 | | | $ | 0.353 | | | $ | 0.394 | | | $ | 0.423 | | | $ | 0.433 | | | $ | 0.424 | | |
| Net realized and unrealized gain (loss) | | | 0.016 | (10) | | | 0.124 | | | | 0.143 | | | | (0.046 | ) | | | (0.068 | ) | | | 0.136 | | |
| Total income from operations | | $ | 0.178 | | | $ | 0.477 | | | $ | 0.537 | | | $ | 0.377 | | | $ | 0.365 | | | $ | 0.560 | | |
| Less distributions | |
| From net investment income | | $ | (0.168 | ) | | $ | (0.357 | )(2) | | $ | (0.397 | ) | | $ | (0.437 | ) | | $ | (0.415 | ) | | $ | (0.410 | ) | |
| Total distributions | | $ | (0.168 | ) | | $ | (0.357 | ) | | $ | (0.397 | ) | | $ | (0.437 | ) | | $ | (0.415 | ) | | $ | (0.410 | ) | |
| Net asset value — End of period | | $ | 9.450 | | | $ | 9.440 | | | $ | 9.320 | | | $ | 9.180 | | | $ | 9.240 | | | $ | 9.290 | | |
| Total Return(4) | | | 1.90 | % | | | 5.25 | % | | | 6.14 | %(5) | | | 4.14 | % | | | 4.01 | % | | | 6.30 | % | |
| Ratios/Supplemental Data | |
| Net assets, end of period (000's omitted) | | $ | 31,657 | | | $ | 32,512 | | | $ | 34,257 | | | $ | 36,545 | | | $ | 157,077 | | | $ | 167,015 | | |
| Ratios (As a percentage of average daily net assets): | |
| Expenses excluding interest and fees | | | 1.51 | %(7) | | | 1.53 | % | | | 1.57 | %(8) | | | 1.60 | %(8) | | | 1.56 | %(8) | | | 1.59 | %(8) | |
| Interest and fee expense(6) | | | 0.33 | %(7) | | | 0.47 | % | | | 0.35 | %(8) | | | 0.25 | %(8) | | | 0.25 | %(8) | | | 0.27 | %(8) | |
| Total expenses | | | 1.84 | %(7) | | | 2.00 | % | | | 1.92 | %(8) | | | 1.85 | %(8) | | | 1.81 | %(8) | | | 1.86 | %(8) | |
Expenses after custodian fee reduction
excluding interest and fees | | | 1.48 | %(7) | | | 1.50 | % | | | 1.56 | %(8) | | | 1.60 | %(8) | | | 1.55 | %(8) | | | 1.58 | %(8) | |
| Net investment income | | | 3.42 | %(7) | | | 3.80 | % | | | 4.23 | % | | | 4.56 | % | | | 4.73 | % | | | 4.67 | % | |
| Portfolio Turnover of Portfolio(9) | | | — | | | | — | | | | — | | | | 9 | % | | | 15 | % | | | 15 | % | |
| Portfolio Turnover of the Fund | | | 12 | % | | | 24 | % | | | 28 | % | | | — | | | | — | | | | — | | |
(1) Net investment income per share was computed using average shares outstanding.
(2) Per share data have been restated or adjusted to reflect the effects of a 1.1287554-for-1 stock split effective on November 11, 2005.
(3) The Fund, through its investment in the Portfolio, has adopted the provisions of the revised AICPA Audit and Accounting Guide for Investment Companies and began using the interest method to amortize premiums on fixed-income securities. The effect of this change for the year ended September 30, 2002 was to increase net investment income per share by less than $0.001, decrease net realized and unrealized gains per share by less than $0.001 and increase the ratio of net investment income to average net assets by less than 0.01%.
(4) Returns are historical and are calculated by determining the percentage change in net asset value with all distributions reinvested. Total return is not computed on an annualized basis.
(5) Total return reflects an increase of 0.18% due to a change in the timing of the payment and reinvestment of distributions.
(6) Interest and fee expense relates to the liability for floating rates notes issued in conjunction with inverse floater securities transactions (see Note 1B).
(7) Annualized.
(8) Includes the Fund's share of its corresponding Portfolio's allocated expenses while the Fund was making investments directly into the Portfolio.
(9) Portfolio turnover represents the rate of portfolio activity for the period while the Fund was making investments directly into the Portfolio.
(10) The per share amount does not reflect the actual net realized gain and unrealized gain (loss) for the period because of the timing of sales of Fund shares and the amount of the per share realized and unrealized gains and losses at such time.
See notes to financial statements
66
Eaton Vance Municipals Funds as of March 31, 2007
FINANCIAL STATEMENTS CONT'D
Financial Highlights
| | | Ohio Fund — Class C | |
| | | Six Months Ended
March 31, 2007
(Unaudited)(1) | | Period Ended
September 30,
2006(1)(2) | |
| Net asset value — Beginning of period | | $ | 9.440 | | | $ | 9.300 | | |
| Income (loss) from operations | |
| Net investment income | | $ | 0.162 | | | $ | 0.211 | | |
| Net realized and unrealized gain | | | 0.006 | (7) | | | 0.160 | | |
| Total income from operations | | $ | 0.168 | | | $ | 0.371 | | |
| Less distributions | |
| From net investment income | | $ | (0.168 | ) | | $ | (0.231 | ) | |
| Total distributions | | $ | (0.168 | ) | | $ | (0.231 | ) | |
| Net asset value — End of period | | $ | 9.440 | | | $ | 9.440 | | |
| Total Return(3) | | | 1.79 | % | | | 4.06 | % | |
| Ratios/Supplemental Data | |
| Net assets, end of period (000's omitted) | | $ | 21,370 | | | $ | 8,294 | | |
| Ratios (As a percentage of average daily net assets): | |
| Expenses excluding interest and fees | | | 1.51 | %(5) | | | 1.53 | %(5) | |
| Interest and fee expense(4) | | | 0.33 | %(5) | | | 0.47 | %(5) | |
| Total expenses | | | 1.84 | %(5) | | | 2.00 | %(5) | |
Expenses after custodian fee reduction
excluding interest and fees | | | 1.48 | %(5) | | | 1.50 | %(5) | |
| Net investment income | | | 3.42 | %(5) | | | 3.45 | %(5) | |
| Portfolio Turnover | | | 12 | % | | | 24 | %(6) | |
(1) Net investment income per share was computed using average shares outstanding.
(2) For the period from the start of business, February 3, 2006 to September 30, 2006.
(3) Returns are historical and are calculated by determining the percentage change in net asset value with all distributions reinvested. Total return is not computed on an annualized basis.
(4) Interest and fee expense relates to the liability for floating rate notes issued in conjunction with inverse floater securities transactions (see Note 1B)
(5) Annualized.
(6) For the year ended September 30, 2006.
(7) The per share amount does not reflect the actual net realized gain and unrealized gain (loss) for the period because of the timing of sales of Fund shares and the amount of the per share realized and unrealized gains and losses at such time.
See notes to financial statements
67
Eaton Vance Municipals Funds as of March 31, 2007
FINANCIAL STATEMENTS CONT'D
Financial Highlights
| | | Rhode Island Fund — Class A | |
| | | Six Months Ended
March 31, 2007 | | Year Ended September 30, | |
| | | (Unaudited)(1) | | 2006(1) | | 2005(1) | | 2004(1) | | 2003(1) | | 2002(1)(2) | |
| Net asset value — Beginning of period | | $ | 9.860 | | | $ | 9.760 | | | $ | 9.780 | | | $ | 9.760 | | | $ | 10.010 | | | $ | 9.710 | | |
| Income (loss) from operations | |
| Net investment income | | $ | 0.205 | | | $ | 0.423 | | | $ | 0.441 | | | $ | 0.462 | | | $ | 0.472 | | | $ | 0.472 | | |
| Net realized and unrealized gain (loss) | | | (0.028 | ) | | | 0.106 | | | | (0.014 | ) | | | 0.028 | | | | (0.253 | ) | | | 0.297 | | |
| Total income from operations | | $ | 0.177 | | | $ | 0.529 | | | $ | 0.427 | | | $ | 0.490 | | | $ | 0.219 | | | $ | 0.769 | | |
| Less distributions | |
| From net investment income | | $ | (0.207 | ) | | $ | (0.429 | ) | | $ | (0.447 | ) | | $ | (0.470 | ) | | $ | (0.469 | ) | | $ | (0.469 | ) | |
| Total distributions | | $ | (0.207 | ) | | $ | (0.429 | ) | | $ | (0.447 | ) | | $ | (0.470 | ) | | $ | (0.469 | ) | | $ | (0.469 | ) | |
| Net asset value — End of period | | $ | 9.830 | | | $ | 9.860 | | | $ | 9.760 | | | $ | 9.780 | | | $ | 9.760 | | | $ | 10.010 | | |
| Total Return(3) | | | 1.80 | % | | | 5.56 | % | | | 4.44 | % | | | 5.13 | % | | | 2.29 | % | | | 8.21 | % | |
| Ratios/Supplemental Data | |
| Net assets, end of period (000's omitted) | | $ | 45,553 | | | $ | 39,291 | | | $ | 29,745 | | | $ | 26,558 | | | $ | 11,701 | | | $ | 10,169 | | |
| Ratios (As a percentage of average daily net assets): | |
| Expenses excluding interest and fees | | | 0.74 | %(5) | | | 0.75 | % | | | 0.77 | %(6) | | | 0.77 | %(6) | | | 0.74 | %(6) | | | 0.75 | %(6) | |
| Interest and fee expense(4) | | | 0.37 | %(5) | | | 0.35 | % | | | 0.18 | %(6) | | | 0.10 | %(6) | | | 0.09 | %(6) | | | 0.11 | %(6) | |
| Total expenses | | | 1.11 | %(5) | | | 1.10 | % | | | 0.95 | %(6) | | | 0.87 | %(6) | | | 0.83 | %(6) | | | 0.86 | %(6) | |
Expenses after custodian fee reduction
excluding interest and fees | | | 0.68 | %(5) | | | 0.72 | % | | | 0.75 | %(6) | | | 0.77 | %(6) | | | 0.73 | %(6) | | | 0.72 | %(6) | |
| Net investment income | | | 4.16 | %(5) | | | 4.34 | % | | | 4.49 | % | | | 4.74 | % | | | 4.82 | % | | | 4.89 | % | |
| Portfolio Turnover of the Portfolio(7) | | | — | | | | — | | | | — | | | | 16 | % | | | 19 | % | | | 13 | % | |
| Portfolio Turnover of the Fund | | | 3 | % | | | 19 | % | | | 15 | % | | | — | | | | — | | | | — | | |
(1) Net investment income per share was computed using average shares outstanding.
(2) The Fund, through its investment in the Portfolio, has adopted the provisions of the revised AICPA Audit and Accounting Guide for Investment Companies and began using the interest method to amortize premiums on fixed-income securities. The effect of this change for the year ended September 30, 2002 was to increase net investment income per share by $0.002, decrease net realized and unrealized gains per share by $0.002 and increase the ratio of net investment income to average net assets from 4.87% to 4.89%.
(3) Returns are historical and are calculated by determining the percentage change in net asset value with all distributions reinvested. Total return is not computed on an annualized basis.
(4) Interest and fee expense relates to the liability for floating rate notes issued in conjunction with inverse floater securities transactions (see Note 1B).
(5) Annualized.
(6) Includes the Fund's share of its corresponding Portfolio's allocated expenses while the Fund was making investments directly into the Portfolio.
(7) Portfolio turnover represents the rate of portfolio activity for the period while the Fund was making investments directly into the Portfolio.
See notes to financial statements
68
Eaton Vance Municipals Funds as of March 31, 2007
FINANCIAL STATEMENTS CONT'D
Financial Highlights
| | | Rhode Island Fund — Class B | |
| | | Six Months Ended
March 31, 2007 | | Year Ended September 30, | |
| | | (Unaudited)(1) | | 2006(1) | | 2005(1) | | 2004(1) | | 2003(1) | | 2002(1)(2) | |
| Net asset value — Beginning of period | | $ | 10.080 | | | $ | 9.980 | | | $ | 10.000 | | | $ | 9.990 | | | $ | 10.250 | | | $ | 9.940 | | |
| Income (loss) from operations | |
| Net investment income | | $ | 0.172 | | | $ | 0.361 | | | $ | 0.377 | | | $ | 0.401 | | | $ | 0.409 | | | $ | 0.410 | | |
| Net realized and unrealized gain (loss) | | | (0.017 | ) | | | 0.103 | | | | (0.015 | ) | | | 0.016 | | | | (0.262 | ) | | | 0.307 | | |
| Total income from operations | | $ | 0.155 | | | $ | 0.464 | | | $ | 0.362 | | | $ | 0.417 | | | $ | 0.147 | | | $ | 0.717 | | |
| Less distributions | |
| From net investment income | | $ | (0.175 | ) | | $ | (0.364 | ) | | $ | (0.382 | ) | | $ | (0.407 | ) | | $ | (0.407 | ) | | $ | (0.407 | ) | |
| Total distributions | | $ | (0.175 | ) | | $ | (0.364 | ) | | $ | (0.382 | ) | | $ | (0.407 | ) | | $ | (0.407 | ) | | $ | (0.407 | ) | |
| Net asset value — End of period | | $ | 10.060 | | | $ | 10.080 | | | $ | 9.980 | | | $ | 10.000 | | | $ | 9.990 | | | $ | 10.250 | | |
| Total Return(3) | | | 1.54 | % | | | 4.76 | % | | | 3.83 | %(4) | | | 4.25 | % | | | 1.48 | % | | | 7.42 | % | |
| Ratios/Supplemental Data | |
| Net assets, end of period (000's omitted) | | $ | 16,052 | | | $ | 18,564 | | | $ | 22,793 | | | $ | 25,084 | | | $ | 42,930 | | | $ | 44,513 | | |
| Ratios (As a percentage of average daily net assets): | |
| Expenses excluding interest and fees | | | 1.49 | %(6) | | | 1.50 | % | | | 1.52 | %(7) | | | 1.52 | %(7) | | | 1.49 | %(7) | | | 1.50 | %(7) | |
| Interest and fee expense(5) | | | 0.37 | %(6) | | | 0.35 | % | | | 0.18 | %(7) | | | 0.10 | %(7) | | | 0.09 | %(7) | | | 0.11 | %(7) | |
| Total expenses | | | 1.86 | %(6) | | | 1.85 | % | | | 1.70 | %(7) | | | 1.62 | %(7) | | | 1.58 | %(7) | | | 1.61 | %(7) | |
Expenses after custodian fee reduction
excluding interest and fees | | | 1.43 | %(6) | | | 1.47 | % | | | 1.50 | %(7) | | | 1.52 | %(7) | | | 1.48 | %(7) | | | 1.47 | %(7) | |
| Net investment income | | | 3.41 | %(6) | | | 3.62 | % | | | 3.76 | % | | | 4.00 | % | | | 4.08 | % | | | 4.14 | % | |
| Portfolio Turnover of the Portfolio(8) | | | — | | | | — | | | | — | | | | 16 | % | | | 19 | % | | | 13 | % | |
| Portfolio Turnover of the Fund | | | 3 | % | | | 19 | % | | | 15 | % | | | — | | | | — | | | | — | | |
(1) Net investment income per share was computed using average shares outstanding.
(2) The Fund, through its investment in the Portfolio, has adopted the provisions of the revised AICPA Audit and Accounting Guide for Investment Companies and began using the interest method to amortize premiums on fixed-income securities. The effect of this change for the year ended September 30, 2002 was to increase net investment income per share by $0.002, decrease net realized and unrealized gains per share by $0.002 and increase the ratio of net investment income to average net assets from 4.12% to 4.14%.
(3) Returns are historical and are calculated by determining the percentage change in net asset value with all distributions reinvested. Total return is not computed on an annualized basis.
(4) Total return reflects an increase of 0.15% due to a change in the timing of the payment and reinvestment of distributions.
(5) Interest and fee expense relates to the liability for floating rate notes issued in conjunction with inverse floater securities transactions (see Note 1B).
(6) Annualized.
(7) Includes the Fund's share of its corresponding Portfolio's allocated expenses while the Fund was making investments directly into the Portfolio.
(8) Portfolio turnover represents the rate of portfolio activity for the period while the Fund was making investments directly into the Portfolio.
See notes to financial statements
69
Eaton Vance Municipals Funds as of March 31, 2007
FINANCIAL STATEMENTS CONT'D
Financial Highlights
| | | Rhode Island Fund — Class C | |
| | | Six Months Ended
March 31, 2007
(Unaudited)(1) | | Period Ended
September 30,
2006(1)(2) | |
| Net asset value ��� Beginning of period | | $ | 10.090 | | | $ | 10.040 | | |
| Income (loss) from operations | |
| Net investment income | | $ | 0.166 | | | $ | 0.173 | | |
| Net realized and unrealized gain (loss) | | | (0.021 | ) | | | 0.065 | | |
| Total income from operations | | $ | 0.145 | | | $ | 0.238 | | |
| Less distributions | |
| From net investment income | | $ | (0.175 | ) | | $ | (0.188 | ) | |
| Total distributions | | $ | (0.175 | ) | | $ | (0.188 | ) | |
| Net asset value — End of period | | $ | 10.060 | | | $ | 10.090 | | |
| Total Return(3) | | | 1.44 | % | | | 2.40 | % | |
| Ratios/Supplemental Data | |
| Net assets, end of period (000's omitted) | | $ | 2,020 | | | $ | 428 | | |
| Ratios (As a percentage of average daily net assets): | |
| Expenses excluding interest and fees | | | 1.48 | %(5) | | | 1.50 | %(5) | |
| Interest expense and fee expense | | | 0.37 | %(5) | | | 0.35 | %(5) | |
| Total expenses(4) | | | 1.85 | %(5) | | | 1.85 | %(5) | |
| Expenses after custodian fee reduction excluding interest and fees | | | 1.42 | %(5) | | | 1.47 | %(5) | |
| Net investment income | | | 3.29 | %(5) | | | 3.23 | %(5) | |
| Portfolio Turnover | | | 3 | % | | | 19 | %(6) | |
(1) Net investment income per share was computed using average shares outstanding.
(2) For the period from the start of business, March 20, 2006 to September 30, 2006.
(3) Returns are historical and are calculated by determining the percentage change in net asset value with all distributions reinvested. Total return is not calculated on an annualized basis.
(4) Interest and fee expense relates to the liability for floating rate notes issued in conjunction with inverse floater securities transactions (see Note 1B).
(5) Annualized.
(6) For the year ended September 30, 2006.
See notes to financial statements
70
Eaton Vance Municipals Funds as of March 31, 2007
FINANCIAL STATEMENTS CONT'D
Financial Highlights
| | | West Virginia Fund — Class A | |
| | | Six Months Ended
March 31, 2007 | | Year Ended September 30, | |
| | | (Unaudited)(1) | | 2006(1) | | 2005(1) | | 2004(1) | | 2003 | | 2002(1)(2) | |
| Net asset value — Beginning of period | | $ | 9.870 | | | $ | 9.750 | | | $ | 9.810 | | | $ | 9.880 | | | $ | 10.130 | | | $ | 9.750 | | |
| Income (loss) from operations | |
| Net investment income | | $ | 0.199 | | | $ | 0.415 | | | $ | 0.434 | | | $ | 0.462 | | | $ | 0.468 | | | $ | 0.465 | | |
| Net realized and unrealized gain (loss) | | | 0.032 | | | | 0.110 | | | | (0.053 | ) | | | (0.081 | ) | | | (0.253 | ) | | | 0.380 | | |
| Total income from operations | | $ | 0.231 | | | $ | 0.525 | | | $ | 0.381 | | | $ | 0.381 | | | $ | 0.215 | | | $ | 0.845 | | |
| Less distributions | |
| From net investment income | | $ | (0.201 | ) | | $ | (0.405 | ) | | $ | (0.441 | ) | | $ | (0.451 | ) | | $ | (0.465 | ) | | $ | (0.465 | ) | |
| Total distributions | | $ | (0.201 | ) | | $ | (0.405 | ) | | $ | (0.441 | ) | | $ | (0.451 | ) | | $ | (0.465 | ) | | $ | (0.465 | ) | |
| Net asset value — End of period | | $ | 9.900 | | | $ | 9.870 | | | $ | 9.750 | | | $ | 9.810 | | | $ | 9.880 | | | $ | 10.130 | | |
| Total Return(3) | | | 2.35 | % | | | 5.53 | % | | | 3.95 | % | | | 3.94 | % | | | 2.23 | % | | | 8.97 | % | |
| Ratios/Supplemental Data | |
| Net assets, end of period (000's omitted) | | $ | 25,311 | | | $ | 22,812 | | | $ | 21,249 | | | $ | 18,670 | | | $ | 3,522 | | | $ | 3,517 | | |
| Ratios (As a percentage of average daily net assets): | |
| Expenses before custodian fee reduction | | | 0.73 | %(5) | | | 0.75 | % | | | 0.79 | %(6) | | | 0.79 | %(6) | | | 0.73 | %(6) | | | 0.78 | %(6) | |
| Interest and fee expense(4) | | | 0.25 | %(5) | | | 0.18 | % | | | 0.06 | %(6) | | | 0.03 | %(6) | | | 0.04 | %(6) | | | 0.03 | %(6) | |
| Total expenses | | | 0.98 | %(5) | | | 0.93 | % | | | 0.85 | %(6) | | | 0.82 | %(6) | | | 0.77 | %(6) | | | 0.81 | %(6) | |
Expenses after custodian fee reduction
excluding interest and fees | | | 0.69 | %(5) | | | 0.72 | % | | | 0.78 | %(6) | | | 0.78 | %(6) | | | 0.71 | %(6) | | | 0.77 | %(6) | |
| Net investment income | | | 4.02 | %(5) | | | 4.26 | % | | | 4.42 | % | | | 4.73 | % | | | 4.74 | % | | | 4.78 | % | |
| Portfolio Turnover of the Portfolio(7) | | | — | | | | — | | | | — | | | | 12 | % | | | 21 | % | | | 19 | % | |
| Portfolio Turnover of the Fund | | | 16 | % | | | 20 | % | | | 21 | % | | | — | | | | — | | | | — | | |
(1) Net investment income per share was computed using average shares outstanding.
(2) The Fund, through its investment in the Portfolio, has adopted the provisions of the revised AICPA Audit and Accounting Guide for Investment Companies and began using the interest method to amortize premiums on fixed-income securities. The effect of this change for the year ended September 30, 2002 was to increase net investment income per share by $0.003, decrease net realized and unrealized gains per share by $0.003 and increase the ratio of net investment income to average net assets from 4.75% to 4.78%.
(3) Returns are historical and are calculated by determining the percentage change in net asset value with all distributions reinvested. Total return is not computed on an annualized basis.
(4) Interest and fee expense relates to the liability for floating rate notes issued in conjunction with inverse floater securities transactions (see Note 1B).
(5) Annualized.
(6) Includes the Fund's share of its corresponding Portfolio's allocated expenses while the Fund was making investments directly into the Portfolio.
(7) Portfolio turnover represents the rate of portfolio activity for the period while the Fund was making investments directly into the Portfolio.
See notes to financial statements
71
Eaton Vance Municipals Funds as of March 31, 2007
FINANCIAL STATEMENTS CONT'D
Financial Highlights
| | | West Virginia Fund — Class B | |
| | | Six Months Ended
March 31, 2007 | | Year Ended September 30, | |
| | | (Unaudited)(1) | | 2006(1) | | 2005(1) | | 2004(1) | | 2003 | | 2002(1)(2) | |
| Net asset value — Beginning of period | | $ | 10.060 | | | $ | 9.930 | | | $ | 10.000 | | | $ | 10.080 | | | $ | 10.340 | | | $ | 9.950 | | |
| Income (loss) from operations | |
| Net investment income | | $ | 0.166 | | | $ | 0.350 | | | $ | 0.378 | | | $ | 0.395 | | | $ | 0.402 | | | $ | 0.403 | | |
| Net realized and unrealized gain (loss) | | | 0.021 | | | | 0.118 | | | | (0.073 | ) | | | (0.087 | ) | | | (0.261 | ) | | | 0.388 | | |
| Total income from operations | | $ | 0.187 | | | $ | 0.468 | | | $ | 0.305 | | | $ | 0.308 | | | $ | 0.141 | | | $ | 0.791 | | |
| Less distributions | |
| From net investment income | | $ | (0.167 | ) | | $ | (0.338 | ) | | $ | (0.375 | ) | | $ | (0.388 | ) | | $ | (0.401 | ) | | $ | (0.401 | ) | |
| Total distributions | | $ | (0.167 | ) | | $ | (0.338 | ) | | $ | (0.375 | ) | | $ | (0.388 | ) | | $ | (0.401 | ) | | $ | (0.401 | ) | |
| Net asset value — End of period | | $ | 10.080 | | | $ | 10.060 | | | $ | 9.930 | | | $ | 10.000 | | | $ | 10.080 | | | $ | 10.340 | | |
| Total Return(3) | | | 1.87 | % | | | 4.82 | % | | | 3.26 | %(4) | | | 3.09 | % | | | 1.41 | % | | | 8.17 | % | |
| Ratios/Supplemental Data | |
| Net assets, end of period (000's omitted) | | $ | 6,423 | | | $ | 7,002 | | | $ | 8,287 | | | $ | 8,550 | | | $ | 23,634 | | | $ | 23,701 | | |
| Ratios (As a percentage of average daily net assets): | |
| Expenses before custodian fee reduction | | | 1.48 | %(6) | | | 1.50 | % | | | 1.54 | %(7) | | | 1.55 | %(7) | | | 1.48 | %(7) | | | 1.53 | %(7) | |
| Interest and fee expense(5) | | | 0.25 | %(6) | | | 0.18 | % | | | 0.06 | %(7) | | | 0.03 | %(7) | | | 0.04 | %(7) | | | 0.03 | %(7) | |
| Total expenses | | | 1.73 | %(6) | | | 1.68 | % | | | 1.60 | %(7) | | | 1.58 | %(7) | | | 1.52 | %(7) | | | 1.56 | %(7) | |
Expenses after custodian fee reduction
excluding interest and fees | | | 1.44 | %(6) | | | 1.47 | % | | | 1.53 | %(7) | | | 1.54 | %(7) | | | 1.46 | %(7) | | | 1.52 | %(7) | |
| Net investment income | | | 3.29 | %(6) | | | 3.53 | % | | | 3.78 | % | | | 3.91 | % | | | 3.99 | % | | | 4.05 | % | |
| Portfolio Turnover of the Portfolio(8) | | | — | | | | — | | | | — | | | | 12 | % | | | 21 | % | | | 19 | % | |
| Portfolio Turnover of the Fund | | | 16 | % | | | 20 | % | | | 21 | % | | | — | | | | — | | | | — | | |
(1) Net investment income per share was computed using average shares outstanding.
(2) The Fund, through its investment in the Portfolio, has adopted the provisions of the revised AICPA Audit and Accounting Guide for Investment Companies and began using the interest method to amortize premiums on fixed-income securities. The effect of this change for the year ended September 30, 2002 was to increase net investment income per share by $0.003, decrease net realized and unrealized gains per share by $0.003 and increase the ratio of net investment income to average net assets from 4.02% to 4.05%.
(3) Returns are historical and are calculated by determining the percentage change in net asset value with all distributions reinvested. Total return is not computed on an annualized basis.
(4) Total return reflects an increase of 0.16% due to a change in the timing of payment and reinvestment of distributions.
(5) Interest and fee expense relates to the liability for floating rate notes issued in conjunction with inverse floater securities transactions (see Note 1B).
(6) Annualized.
(7) Includes the Fund's share of its corresponding Portfolio's allocated expenses while the Fund was making investments directly into the Portfolio.
(8) Portfolio turnover represents the rate of portfolio activity for the period while the Fund was making investments directly into the Portfolio.
See notes to financial statements
72
Eaton Vance Municipals Funds as of March 31, 2007
NOTES TO FINANCIAL STATEMENTS (Unaudited)
1 Significant Accounting Policies
Eaton Vance Municipals Trust (the Trust) is an entity of the type commonly known as a Massachusetts business trust and is registered under the Investment Company Act of 1940, as amended, as an open-end management investment company. The Trust presently consists of twenty-eight Funds, eight of which, each non-diversified, are included in these financial statements. They include Eaton Vance California Municipals Fund (California Fund), Eaton Vance Florida Municipals Fund (Florida Fund), Eaton Vance Massachusetts Municipals Fund (Massachusetts Fund), Eaton Vance Mississippi Municipals Fund (Mississippi Fund), Eaton Vance New York Municipals Fund (New York Fund), Eaton Vance Ohio Municipals Fund (Ohio Fund), Eaton Vance Rhode Island Municipals Fund (Rhode Island Fund) and Eaton Vance West Virginia Municipals Fund (West Virginia Fund), (indi vidually, the Fund, collectively, the Funds). The Funds seek to provide current income exempt from regular federal income tax and particular state or local income or other taxes. Each Fund primarily invests in investment grade municipal obligations, but may also invest in lower rated obligations. The Mississippi Fund and the West Virginia Fund offer two classes of shares. The California Fund, Florida Fund, New York Fund, Ohio Fund and the Rhode Island Fund offer three classes of shares. The Massachusetts Fund offers four classes of shares. Class A shares are generally sold subject to a sales charge imposed at time of purchase. Class B shares, and Class C shares of California Fund, Florida Fund, Massachusetts Fund, New York Fund, Ohio Fund and Rhode Island Fund, are sold at net asset value and are subject to a contingent deferred sales charge (see Note 6). The Trustees have adopted a conversion feature pursuant to wh ich Class B shares of the Funds automatically convert to Class A shares eight years after their purchase as described in each Fund's prospectus. Class I shares of the Massachusetts Fund are sold at net asset value. Each class represents a pro rata interest in the Fund, but votes separately on class-specific matters and (as noted below) is subject to different expenses. Realized and unrealized gains and losses are allocated daily to each class of shares based on the relative net assets of each class to the total net assets of the Fund. Net investment income, other than class specific expenses, is allocated daily to each class of shares based upon the ratio of the value of each class' paid shares to the total value of all paid shares. Each class of shares differs in its distribution plan and certain other class specific expenses.
The following is a summary of significant accounting policies consistently followed by the Trust in the preparation of its financial statements. The policies are in conformity with accounting principles generally accepted in the United States of America.
A Investment Valuation — Municipal bonds and taxable obligations, if any, are normally valued on the basis of valuations furnished by a pricing service. Financial futures contracts and options on financial futures contracts listed on commodity exchanges are valued at closing settlement prices. Over-the-counter options on financial futures contracts are normally valued at the mean between the latest bid and asked prices. Interest rate swaps are normally valued on the basis of valuations furnished by a pricing service. Short-term obligations, maturing in sixty days or less, are valued at amortized cost, which approximates value. Investments for which valuations or market quotations are unavailable, and investments for which the price of the security is not believed to represent its fair market value, are valued at fair value using methods determined in good faith by or at the direction of the Trustees.
B Floating Rate Notes Issued in Conjunction with Securities Held — The Funds sell a fixed-rate bond to a broker for cash. At the same time the Funds buy a residual interest in a Special Purpose Vehicle's (which is generally organized as a trust) ("SPV") assets and cash flows set up by the broker, often referred to as an inverse floating rate obligation ("Inverse Floater"). The broker deposits a fixed-rate bond into the trust with the same CUSIP number as the fixed-rate bond sold to the broker by the Fund, and which may have been, but is not required to be, the fixed-rate bond purchased from the Fund, (the "Fixed-Rate Bond"). The SPV also issues floating rate notes ("Floating Rate Notes") which are sold to third-parties. The Funds may enter into shortfall and forbearance a greements with the broker by which a Fund agrees to reimburse the broker, in certain circumstances, for the difference between the liquidation value of the Fixed-Rate Bond held by the SPV and the liquidation value of the Floating Rate Notes, as well as any shortfalls in interest cash flows. The Inverse Floater held by a Fund gives the Fund the right (1) to cause the holders of the Floating Rate Notes to tender their notes at par, and (2) to have the broker transfer the Fixed-Rate Bond held by the SPV to the Fund, thereby collapsing the SPV. Pursuant to Financial Accounting Standards Board ("FASB") Statement No. 140, "Accounting for Transfers and Servicing of Financial Assets and Extinguishment of Liabilities" ("FAS 140"), the Funds
73
Eaton Vance Municipals Funds as of March 31, 2007
NOTES TO FINANCIAL STATEMENTS (Unaudited) CONT'D
account for the transaction described above as a secured borrowing by including the Fixed-Rate Bond in their Portfolio of Investments, and account for the Floating Rate Notes as a liability under the caption "payable for floating rate notes issued" in the Fund's "Statement of Assets and Liabilities". The Floating Rate Notes have interest rates that generally reset weekly and their holders have the option to tender their notes to the broker for redemption at par at each reset date. At March 31, 2007, the Funds' investments were as follows:
| Fund | | Floating Rate
Notes
Outstanding | | Interest Rate
or Range of
Interest Rates | | Collateral for
Floating Rate
Notes
Outstanding | |
| California | | $ | 20,125,000 | | | 3.64% – 3.67% | | $ | 31,598,048 | | |
| Florida | | | 32,745,000 | | | 3.64% – 3.69% | | | 55,859,337 | | |
| Massachusetts | | | 29,306,500 | | | 3.64% – 3.68% | | | 49,615,797 | | |
| Mississippi | | | 1,130,000 | | | 3.64% – 3.69% | | | 1,857,886 | | |
| New York | | | 52,363,000 | | | 3.64% – 3.72% | | | 85,211,128 | | |
| Ohio | | | 13,825,000 | | | 3.64% – 3.69% | | | 24,295,567 | | |
| Rhode Island | | | 5,135,000 | | | 3.64% – 3.66% | | | 8,537,240 | | |
| West Virginia | | | 2,000,000 | | | 3.64% – 3.66% | | | 3,234,394 | | |
The Funds' investment policies and restrictions expressly permit investments in inverse floating rate securities. Inverse floating rate securities typically offer the potential for yields exceeding the yields available on fixed rate bonds with comparable credit quality and maturity. The Funds' investment policies do not allow the Funds to borrow money for purposes of making investments. Management believes that the Funds' restrictions on borrowings do not apply to the secured borrowings deemed to have occurred for accounting purposes pursuant to FAS 140, which is distinct from legal borrowing of the Funds to which the restrictions apply. Inverse Floaters held by the Funds are Securities exempt from registration under Rules 144A of the Securities Act of 1933.
C Income — Interest income is determined on the basis of interest accrued, adjusted for amortization of premium or accretion of discount.
D Interest Expense — Interest expense relates to the Fund's liability with respect to floating rate notes held by third parties in conjunction with inverse floater securities transactions by the Funds. Interest expense is recorded as incurred.
E Federal Taxes — Each Fund's policy is to comply with the provisions of the Internal Revenue Code applicable to regulated investment companies and to distribute to shareholders each year all of its taxable, if any, and tax-exempt income, including any net realized gain on investments. Accordingly, no provision for federal income or excise tax is necessary. At September 30, 2006, the following Funds, for federal income tax purposes, had capital loss carryovers which will reduce each Fund's taxable income arising from future net realized gain on investments, if any, to the extent permitted by the Internal Revenue Code, and thus will reduce the amount of the distributions to shareholders which would otherwise be necessary to relieve the Funds of any liability for federal in come or excise tax. The amounts and expiration dates of the capital loss carryovers are as follows:
| Fund | | Amount | | Expires | |
| Florida | | $ | 1,523,246 | | | September 30, 2010 | |
|
| | | | 5,188,570 | | | September 30, 2013 | |
|
| Massachusetts | | | 856,779 | | | September 30, 2010 | |
|
| | | | 1,430,573 | | | September 30, 2011 | |
|
| | | | 355,911 | | | September 30, 2012 | |
|
| | | | 1,751,809 | | | September 30, 2013 | |
|
| Mississippi | | | 3,745 | | | September 30, 2012 | |
|
| | | | 306,988 | | | September 30, 2013 | |
|
| Ohio | | | 1,257,471 | | | September 30, 2010 | |
|
| | | | 6,140,842 | | | September 30, 2011 | |
|
| | | | 1,709,089 | | | September 30, 2013 | |
|
| Rhode Island | | | 221,880 | | | September 30, 2009 | |
|
| | | | 21,737 | | | September 30, 2010 | |
|
| | | | 90,400 | | | September 30, 2011 | |
|
| | | | 439,807 | | | September 30, 2013 | |
|
| West Virginia | | | 102,630 | | | September 29, 2009 | |
|
| | | | 211,865 | | | September 30, 2010 | |
|
| | | | 596,125 | | | September 29, 2013 | |
|
Dividends paid by each Fund from net tax-exempt interest on municipal bonds are not includable by shareholders as gross income for federal income tax purposes because each Fund intends to meet certain requirements of the Internal Revenue Code applicable to regulated investment companies which will enable the Funds to pay exempt-interest dividends. The portion of such interest, if any, earned on private activity bonds issued after August 7, 1986 may be considered a tax preference item to shareholders.
74
Eaton Vance Municipals Funds as of March 31, 2007
NOTES TO FINANCIAL STATEMENTS (Unaudited) CONT'D
Additionally, at September 30, 2006, Massachusetts Fund, Ohio Fund and West Virginia Fund had net capital losses of $825,101, $54,533 and $5,385, respectively, attributable to security transactions incurred after October 31, 2005. These capital losses are treated as arising on the first day of each Fund's taxable year ending September 30, 2007.
F Financial Futures Contracts — Upon the entering of a financial futures contract, a Fund is required to deposit (initial margin) either in cash or securities an amount equal to a certain percentage of the purchase price indicated in the financial futures contract. Subsequent payments are made or received by a Fund (margin maintenance) each day, dependent on the daily fluctuations in the value of the underlying security, and are recorded for book purposes as unrealized gains or losses by a Fund. A Fund's investment in financial futures contracts is designed for both hedging against anticipated future changes in interest rates and investment purposes. Should interest rates move unexpectedly, a Fund may not achieve the anticipated benefits of the financial futures contracts and may realize a loss.
G Options on Financial Futures Contracts — Upon the purchase of a put option on a financial futures contract by a Fund, the premium paid is recorded as an investment, the value of which is marked-to-market daily. When a purchased option expires, a Fund will realize a loss in the amount of the cost of the option. When a Fund enters into a closing sale transaction, a Fund will realize a gain or loss depending on whether the sales proceeds from the closing sale transaction are greater or less than the cost of the option. When a Fund exercises a put option, settlement is made in cash. The risk associated with purchasing put options is limited to the premium originally paid.
H When-Issued and Delayed Delivery Transactions — The Funds may engage in when-issued and delayed delivery transactions. The Funds record when-issued securities on trade date and maintain security positions such that sufficient liquid assets will be available to make payments for the securities purchased. Securities purchased on a when-issued or delayed delivery basis are marked-to-market daily and begin earning interest on settlement date.
I Interest Rate Swaps — A Fund may enter into interest rate swap agreements to enhance return, to hedge against fluctuations in securities prices or interest rates or as substitution for the purchase or sale of securities. Pursuant to these agreements, the Fund makes bi-annual payments at a fixed interest rate. In exchange, a Fund receives payments based on the interest rate of a benchmark industry index. During the term of the outstanding swap agreement, changes in the underlying value of the swap are recorded as unrealized gains and losses. The value of the swap is determined by changes in the relationship between two rates of interest. The Fund is exposed to credit loss in the event of non-performa nce by the swap counterparty. However, the Fund does not anticipate non-performance by the counterparty. Risk may also arise from the unanticipated movements in value of interest rates.
J Legal Fees — Legal fees and other related expenses incurred as part of negotiations of the terms and requirements of capital infusions, or that are expected to result in the restructuring of or a plan of reorganization for an investment are recorded as realized losses. Ongoing expenditures to protect or enhance an investment are treated as operating expenses.
K Expenses — The majority of expenses of the Trust are directly identifiable to an individual fund. Expenses which are not readily identifiable to a specific fund are allocated taking into consideration, among other things, the nature and type of expense and the relative size of the funds.
L Expense Reduction — Investors Bank & Trust Company (IBT) serves as custodian of the Funds. Pursuant to the respective custodian agreements, IBT receives a fee reduced by credits which are determined based on the average daily cash balance each Fund maintains with IBT. All credit balances used to reduce the Funds' custodian fees are reported as a reduction of total expenses on the Statements of Operations.
M Use of Estimates — The preparation of the financial statements in conformity with accounting principles generally accepted in the United States of America requires management to make estimates and assumptions that affect the reported amounts of assets and liabilities at the date of the financial statements and the reported amounts of income and expense during the reporting period. Actual results could differ from those estimates.
N Indemnifications — Under the Trust's organizational documents, its officers and Trustees may be indemnified against certain liabilities and expenses
75
Eaton Vance Municipals Funds as of March 31, 2007
NOTES TO FINANCIAL STATEMENTS (Unaudited) CONT'D
arising out of the performance of their duties to the Funds and shareholders are indemnified against personal liability for obligations of the Trust. Additionally, in the normal course of business, the Funds enter into agreements with service providers that may contain indemnification clauses. The Funds' maximum exposure under these arrangements is unknown as this would involve future claims that may be made against the Funds that have not yet occurred.
O Other — Investment transactions are accounted for on a trade date basis. Realized gains and losses are computed on the specific identification of the securities sold.
P Interim Financial Statements — The interim financial statements relating to March 31, 2007 and for the six months then ended have not been audited by an independent registered public accounting firm, but in the opinion of the Funds' management reflect all adjustments, consisting only of normal recurring adjustments, necessary for the fair presentation of the financial statements.
2 Distributions to Shareholders
The net income of each Fund is determined daily and substantially all of the net income so determined is declared as a dividend to shareholders of record at the time of declaration. Distributions are declared separately for each class of shares. Distributions are paid monthly. Distributions of realized capital gains, if any, are made at least annually. Shareholders may reinvest income and capital gain distributions in additional shares of the same class of the Fund at the net asset value as of the reinvestment date. Distributions are paid in the form of additional shares of the same class or, at the election of the shareholder, in cash. The Funds distinguish between distributions on a tax basis and a financial reporting basis. Accounting principles generally accepted in the United States of America require that only distributions in excess of tax basis earnings and profits be reported in the financial statements as a return of c apital. Permanent differences between book and tax accounting relating to distributions are reclassified to paid-in capital.
3 Shares of Beneficial Interest
The Funds' Declaration of Trust permits the Trustees to issue an unlimited number of full and fractional shares of beneficial interest (without par value). Such shares may be issued in a number of different series (such as the Funds) and classes. Transactions in Fund shares were as follows:
| | | California Fund | |
| Class A | | Six Months Ended
March 31, 2007
(Unaudited) | | Year Ended
September 30, 2006 | |
| Sales | | | 3,411,472 | | | | 2,923,207 | | |
Issued to shareholders electing to
receive payments of distributions
in Fund shares | | | 504,771 | | | | 501,288 | | |
| Redemptions | | | (1,241,836 | ) | | | (2,858,517 | ) | |
| Exchange from Class B shares | | | — | | | | 10,952 | | |
| Net increase | | | 2,674,407 | | | | 576,930 | | |
| | | California Fund | |
| Class B | | Six Months Ended
March 31, 2007
(Unaudited) | | Year Ended
September 30, 2006 | |
| Sales | | | 35,687 | | | | 130,196 | | |
Issued to shareholders electing to
receive payments of distributions
in Fund shares | | | 7,884 | | | | 6,864 | | |
| Redemptions | | | (33,010 | ) | | | (88,682 | ) | |
| Exchange to Class A shares | | | — | | | | (11,829 | ) | |
| Net increase | | | 10,561 | | | | 36,549 | | |
| | | California Fund | |
| Class C | | Six Months Ended
March 31, 2007
(Unaudited) | | Year Ended
September 30, 2006 | |
| Sales | | | 353,194 | | | | 353,834 | | |
Issued to shareholders electing to
receive payments of distributions
in Fund shares | | | 15,806 | | | | 7,759 | | |
| Redemptions | | | (46,897 | ) | | | (51,450 | ) | |
| Net increase | | | 322,103 | | | | 310,143 | | |
76
Eaton Vance Municipals Funds as of March 31, 2007
NOTES TO FINANCIAL STATEMENTS (Unaudited) CONT'D
| | | Florida Fund | |
| Class A | | Six Months Ended
March 31, 2007
(Unaudited) | | Year Ended
September 30, 2006 | |
| Sales | | | 1,147,397 | | | | 4,655,592 | | |
Issued to shareholders electing to
receive payments of distributions
in Fund shares | | | 263,316 | | | | 483,287 | | |
| Redemptions | | | (1,688,679 | ) | | | (3,449,888 | ) | |
| Exchange from Class B shares | | | 241,782 | | | | 390,471 | | |
| Net increase (decrease) | | | (36,184 | ) | | | 2,079,462 | | |
| | | Florida Fund | |
| Class B | | Six Months Ended
March 31, 2007
(Unaudited) | | Year Ended
September 30, 2006 | |
| Sales | | | 46,764 | | | | 207,293 | | |
Issued to shareholders electing to
receive payments of distributions
in Fund shares | | | 24,838 | | | | 62,917 | | |
| Redemptions | | | (337,506 | ) | | | (502,195 | ) | |
| Exchange to Class A shares | | | (235,835 | ) | | | (380,876 | ) | |
| Net decrease | | | (501,739 | ) | | | (612,861 | ) | |
| | | Florida Fund | |
| Class C | | Six Months Ended
March 31, 2007
(Unaudited) | | Year Ended
September 30, 2006(1) | |
| Sales | | | 102,792 | | | | 61,121 | | |
Issued to shareholders electing to
receive payments of distributions
in Fund shares | | | 1,042 | | | | 136 | | |
| Redemptions | | | (6,763 | ) | | | (3,214 | ) | |
| Net increase | | | 97,071 | | | | 58,043 | | |
| | | Massachusetts Fund | |
| Class A | | Six Months Ended
March 31, 2007
(Unaudited) | | Year Ended
September 30, 2006 | |
| Sales | | | 5,488,742 | | | | 5,947,826 | | |
Issued to shareholders electing to
receive payments of distributions
in Fund shares | | | 247,032 | | | | 407,730 | | |
| Redemptions | | | (2,675,144 | ) | | | (2,855,747 | ) | |
| Exchange from Class B shares | | | 192,767 | | | | 383,209 | | |
| Net increase | | | 3,253,397 | | | | 3,883,018 | | |
| | | Massachusetts Fund | |
| Class B | | Six Months Ended
March 31, 2007
(Unaudited) | | Year Ended
September 30, 2006 | |
| Sales | | | 118,827 | | | | 258,255 | | |
Issued to shareholders electing to
receive payments of distributions
in Fund shares | | | 45,726 | | | | 110,071 | | |
| Redemptions | | | (363,103 | ) | | | (671,372 | ) | |
| Exchange to Class A shares | | | (192,804 | ) | | | (381,152 | ) | |
| Net decrease | | | (391,354 | ) | | | (684,198 | ) | |
| | | Massachusetts Fund | |
| Class C | | Six Months Ended
March 31, 2007
(Unaudited) | | Year Ended
September 30, 2006(2) | |
| Sales | | | 893,434 | | | | 296,719 | | |
Issued to shareholders electing to
receive payments of distributions
in Fund shares | | | 9,725 | | | | 858 | | |
| Redemptions | | | (475 | ) | | | (10,627 | ) | |
| Net increase | | | 902,684 | | | | 286,950 | | |
| | | Massachusetts Fund | |
| Class I | | Six Months Ended
March 31, 2007
(Unaudited) | | Year Ended
September 30, 2006 | |
| Sales | | | 283,041 | | | | 214,943 | | |
Issued to shareholders electing to
receive payments of distributions
in Fund shares | | | 9,002 | | | | 17,153 | | |
| Redemptions | | | (108,404 | ) | | | (99,575 | ) | |
| Net increase | | | 183,639 | | | | 132,521 | | |
| | | Mississippi Fund | |
| Class A | | Six Months Ended
March 31, 2007
(Unaudited) | | Year Ended
September 30, 2006 | |
| Sales | | | 69,770 | | | | 355,323 | | |
Issued to shareholders electing to
receive payments of distributions
in Fund shares | | | 15,259 | | | | 27,750 | | |
| Redemptions | | | (80,831 | ) | | | (202,461 | ) | |
| Exchange from Class B shares | | | 6,676 | | | | 40,983 | | |
| Net increase | | | 10,874 | | | | 221,595 | | |
77
Eaton Vance Municipals Funds as of March 31, 2007
NOTES TO FINANCIAL STATEMENTS (Unaudited) CONT'D
| | | Mississippi Fund | |
| Class B | | Six Months Ended
March 31, 2007
(Unaudited) | | Year Ended
September 30, 2006 | |
| Sales | | | 9,955 | | | | 8,576 | | |
Issued to shareholders electing to
receive payments of distributions
in Fund shares | | | 3,423 | | | | 8,526 | | |
| Redemptions | | | (33,570 | ) | | | (103,928 | ) | |
| Exchange to Class A shares | | | (6,521 | ) | | | (40,062 | ) | |
| Net decrease | | | (26,713 | ) | | | (126,888 | ) | |
| | | New York Fund | |
| Class A | | Six Months Ended
March 31, 2007
(Unaudited) | | Year Ended
September 30, 2006 | |
| Sales | | | 3,360,323 | | | | 6,415,756 | | |
Issued to shareholders electing to
receive payments of distributions
in Fund shares | | | 631,490 | | | | 1,276,111 | | |
| Redemptions | | | (1,854,320 | ) | | | (4,514,572 | ) | |
| Exchange from Class B shares | | | 32,189 | | | | 8,667 | | |
| Net increase | | | 2,169,682 | | | | 3,185,962 | | |
| | | New York Fund | |
| Class B | | Six Months Ended
March 31, 2007
(Unaudited) | | Year Ended
September 30, 2006 | |
| Sales | | | 211,760 | | | | 392,545 | | |
Issued to shareholders electing to
receive payments of distributions
in Fund shares | | | 13,709 | | | | 21,695 | | |
| Redemptions | | | (34,061 | ) | | | (102,685 | ) | |
| Exchange to Class A shares | | | (32,118 | ) | | | (8,265 | ) | |
| Net increase | | | 159,290 | | | | 303,290 | | |
| | | New York Fund | |
| Class C | | Six Months Ended
March 31, 2007
(Unaudited) | | Year Ended
September 30, 2006 | |
| Sales | | | 1,125,793 | | | | 961,161 | | |
Issued to shareholders electing to
receive payments of distributions
in Fund shares | | | 24,466 | | | | 23,257 | | |
| Redemptions | | | (204,046 | ) | | | (132,016 | ) | |
| Net increase | | | 946,213 | | | | 852,402 | | |
| | | Ohio Fund | |
| Class A | | Six Months Ended
March 31, 2007
(Unaudited) | | Year Ended
September 30, 2006 | |
| Sales | | | 6,496,478 | | | | 5,285,759 | | |
Issued to shareholders electing to
receive payments of distributions
in Fund shares | | | 278,581 | | | | 439,242 | | |
| Redemptions | | | (998,136 | ) | | | (1,649,373 | ) | |
| Exchange from Class B shares | | | 169,010 | | | | 206,014 | | |
| Net increase | | | 5,945,933 | | | | 4,281,642 | | |
| | | Ohio Fund | |
| Class B | | Six Months Ended
March 31, 2007
(Unaudited) | | Year Ended
September 30, 2006 | |
| Sales | | | 221,863 | | | | 378,311 | | |
Issued to shareholders electing to
receive payments of distributions
in Fund shares | | | 33,321 | | | | 70,353 | | |
| Redemptions | | | (176,912 | ) | | | (477,282 | ) | |
| Exchange to Class A | | | (169,028 | ) | | | (205,711 | ) | |
| Net decrease | | | (90,756 | ) | | | (234,329 | ) | |
| | | Ohio Fund | |
| Class C | | Six Months Ended
March 31, 2007
(Unaudited) | | Year Ended
September 30, 2006(3) | |
| Sales | | | 1,413,747 | | | | 914,054 | | |
Issued to shareholders electing to
receive payments of distributions
in Fund shares | | | 16,723 | | | | 5,388 | | |
| Redemptions | | | (46,163 | ) | | | (40,771 | ) | |
| Net increase | | | 1,384,307 | | | | 878,671 | | |
| | | Rhode Island Fund | |
| Class A | | Six Months Ended
March 31, 2007
(Unaudited) | | Year Ended
September 30, 2006 | |
| Sales | | | 612,507 | | | | 1,027,155 | | |
Issued to shareholders electing to
receive payments of distributions
in Fund shares | | | 48,749 | | | | 70,976 | | |
| Redemptions | | | (185,789 | ) | | | (375,107 | ) | |
| Exchange from Class B shares | | | 171,428 | | | | 214,473 | | |
| Net increase | | | 646,895 | | | | 937,497 | | |
78
Eaton Vance Municipals Funds as of March 31, 2007
NOTES TO FINANCIAL STATEMENTS (Unaudited) CONT'D
| | | Rhode Island Fund | |
| Class B | | Six Months Ended
March 31, 2007
(Unaudited) | | Year Ended
September 30, 2006 | |
| Sales | | | 50,058 | | | | 86,760 | | |
Issued to shareholders electing to
receive payments of distributions
in Fund shares | | | 18,346 | | | | 45,979 | | |
| Redemptions | | | (145,827 | ) | | | (365,523 | ) | |
| Exchange to Class A shares | | | (167,628 | ) | | | (209,611 | ) | |
| Net decrease | | | (245,051 | ) | | | (442,395 | ) | |
| | | Rhode Island Fund | |
| Class C | | Six Months Ended
March 31, 2007
(Unaudited) | | Year Ended
September 30, 2006(4) | |
| Sales | | | 160,168 | | | | 42,251 | | |
Issued to shareholders electing to
receive payments of distributions
in Fund shares | | | 623 | | | | 180 | | |
| Redemptions | | | (2,444 | ) | | | — | | |
| Net increase | | | 158,347 | | | | 42,431 | | |
| | | West Virginia Fund | |
| Class A | | Six Months Ended
March 31, 2007
(Unaudited) | | Year Ended
September 30, 2006 | |
| Sales | | | 256,589 | | | | 262,500 | | |
Issued to shareholders electing to
receive payments of distributions
in Fund shares | | | 29,313 | | | | 55,037 | | |
| Redemptions | | | (65,529 | ) | | | (252,069 | ) | |
| Exchange from Class B shares | | | 26,140 | | | | 66,082 | | |
| Net increase | | | 246,513 | | | | 131,550 | | |
| | | West Virginia Fund | |
| Class B | | Six Months Ended
March 31, 2007
(Unaudited) | | Year Ended
September 30, 2006 | |
| Sales | | | 9,928 | | | | 14,412 | | |
Issued to shareholders electing to
receive payments of distributions
in Fund shares | | | 6,835 | | | | 15,352 | | |
| Redemptions | | | (50,346 | ) | | | (102,973 | ) | |
| Exchange to Class A shares | | | (25,647 | ) | | | (64,802 | ) | |
| Net decrease | | | (59,230 | ) | | | (138,011 | ) | |
(1) Class C shares of the Florida Fund commenced operations on March 13, 2006.
(2) Class C shares of the Massachusetts Fund commenced operations on May 2, 2006.
(3) Class C shares of the Ohio Fund commenced operations on February 3, 2006.
(4) Class C shares of the Rhode Island Fund commenced operations on March 20, 2006.
4 Investment Adviser Fee and Other Transactions with Affiliates
The investment adviser fee is earned by Boston Management and Research (BMR), a wholly-owned subsidiary of Eaton Vance Management (EVM), as compensation for management and investment advisory services rendered to each Fund. The fee is based upon a percentage of average daily net assets plus a percentage of gross income (i.e., income other than gains from the sale of securities). For the six months ended March 31, 2007, each Fund paid or accrued advisory fees as follows:
| Fund | | Amount | | Effective Rate* | |
| California | | $ | 574,932 | | | | 0.45 | % | |
| Florida | | | 546,251 | | | | 0.42 | % | |
| Massachusetts | | | 579,665 | | | | 0.42 | % | |
| Mississippi | | | 14,392 | | | | 0.15 | % | |
| New York | | | 933,986 | | | | 0.43 | % | |
| Ohio | | | 529,897 | | | | 0.47 | % | |
| Rhode Island | | | 87,580 | | | | 0.30 | % | |
| West Virginia | | | 30,602 | | | | 0.20 | % | |
* Advisory fees paid as a percentage of average daily net assets.
Except as to Trustees of the Funds who are not members of EVM's or BMR's organization, officers and Trustees receive remuneration for their services to the Funds out of such investment adviser fee. Trustees of the Funds that are not affiliated with the Investment Adviser may elect to defer receipt of all or a percentage of their annual fees in accordance with the terms of the Trustees Deferred Compensation Plan. For the six months ended March 31, 2007, no significant amounts have been deferred. EVM serves as the Administrator of each Fund, but receives no compensation. EVM serves as the sub-transfer agent of the Funds and receives from the transfer agent an aggregate fee based upon the actual expenses incurred by EVM in the performance of those services. For the six months ended March 31, 2007, EVM received $2,899, $3,258, $3,864, $328, $5,647, $3,989, $919, and $615 in sub-transfer agent fees from the California Fund, Florida F und, Massachusetts Fund, Mississippi Fund, New York Fund, Ohio Fund, Rhode
79
Eaton Vance Municipals Funds as of March 31, 2007
NOTES TO FINANCIAL STATEMENTS (Unaudited) CONT'D
Island Fund, and West Virginia Fund, respectively. The Funds were informed that Eaton Vance Distributors, Inc. (EVD), a subsidiary of EVM and the Funds' principal underwriter, received $10,420, $7,671, $38,890, $1,122, $27,109, $56,963, $4,348, and $4,369 from the California Fund, Florida Fund, Massachusetts Fund, Mississippi Fund, New York Fund, Ohio Fund, Rhode Island Fund, and West Virginia Fund, respectively, as its portion of the sales charge of Class A shares for the six months ended March 31, 2007.
Certain officers and Trustees of the Funds are officers of the above organizations.
5 Distribution Plans
Class A of each Fund has in effect a distribution plan pursuant to Rule 12b-1 (Class A Plan) under the Investment Company Act of 1940 (the 1940 Act). The Class A Plan provides that each Fund will pay EVD a distribution and service fee not exceeding 0.25% (annualized) of each Fund's average daily net assets attributable to Class A shares for each fiscal year for distribution services and facilities provided to each Fund by EVD, as well as for personal services and/or the maintenance of shareholder accounts. The Trustees approved distribution and service fee payments equal to 0.20%, (0.25% for the California Fund) annually of each Fund's average daily net assets attributable to Class A each fiscal year. Distribution and service fees paid or accrued for the six months ended March 31, 2007, amounted to $303,967, $223,956, $208,448, $15,008, $403,201, $207,580, $40,627 and $23,911 for Class A shares of California Fund, Florida Fund, Massachusetts Fund, Mississippi Fund, New York Fund, Ohio Fund, Rhode Island Fund and West Virginia Fund, respectively. Each Fund also has in effect a distribution plan for Class B shares (Class B Plan) pursuant to Rule 12b-1. In addition, the California Fund, Florida Fund, Massachusetts Fund, New York Fund, Ohio Fund and Rhode Island Fund each has in effect a distribution plan for Class C shares (Class C Plan) pursuant to Rule 12b-1 under the 1940 Act. The Class B and Class C Plans require each Fund to pay EVD amounts equal to 1/365 of 0.75% (annualized) of each Fund's average daily net assets attributable to Class B and Class C shares for providing ongoing distribution services and facilities to each Fund. Each Fund will automatically discontinue payments to EVD during any period in which there are no outstanding Uncovered Distribution Charges, which are equivalent to the sum of (i) 5% and 6.25% of the aggregate a mount received by a Fund for Class B and Class C shares sold, respectively, plus (ii) interest calculated by applying the rate of 1% over the prevailing prime rate to the outstanding balance of Uncovered Distribution Charges of EVD of each respective class, reduced by the aggregate amount of contingent deferred sales charges (see Note 6) and daily amounts theretofore paid or payable to EVD by each respective class. The California Fund, Florida Fund, Massachusetts Fund, Mississippi Fund, New York Fund, Ohio Fund, Rhode Island Fund and West Virginia Fund paid or accrued $15,291, $125,092, $175,547, $15,210, $39,167, $121,338, $65,626 and $25,461, respectively, for Class B shares, to or payable to EVD for the six months ended March 31, 2007, representing 0.75% (annualized) of the average daily net assets for Class B shares. The California Fund, Flo rida Fund, Massachusetts Fund, New York Fund, Ohio Fund and Rhode Island Fund paid or accrued $24,918, $4,373, $25,436, $68,852, $54,829, and $3,733, respectively, for Class C shares, to or payable to EVD for the six months ended March 31, 2007, representing 0.75% (annualized) of the average daily net assets for Class C shares. At March 31, 2007, the amount of Uncovered Distribution Charges of EVD calculated under the Plans for the California Fund, Florida Fund, Massachusetts Fund, Mississippi Fund, New York Fund, Ohio Fund, Rhode Island Fund and West Virginia Fund were approximately $87,000, $757,000, $609,000, $487,000, $327,000, $148,000, $1,034,000 and $546,000, respectively, for Class B shares, and the amount of Uncovered Distribution Charges of EVD calculated under the Plans for the California Fund, Florida Fund, Massachusetts Fund, New York Fund, Ohio Fund and Rhode Island Fund were approximately $456,000, $9 8,000, $714,000, $1,422,000, $1,312,000 and $127,000, respectively, for Class C shares. The Class B and Class C Plans also authorize the Funds to make payments of service fees to EVD, investment dealers and other persons in amounts not exceeding 0.25% annually of the average daily net assets attributable to that Class. The Trustees approved service fee payments equal to 0.20% (0.25% for the California Fund) annually of each Fund's average daily net assets attributable to Class B and Class C, if applicable, for each fiscal year. Service fees are paid for personal services and/or the maintenance of shareholder accounts. They are separate and distinct from the Class B and Class C sales commissions and distribution fees and, as such, are not subject to automatic discontinuance when there are no outstanding Uncovered Distribution Charges to EVD. Service fees paid or accrued for the six months ended March 31, 2007, amounted to $5,097, $33,358, $46,812, $4,056, $10,444, $32,357, $17,500 and $6,790 for the Californi a Fund, Florida Fund, Massachusetts Fund, Mississippi Fund, New York Fund, Ohio Fund, Rhode Island Fund and West Virginia Fund,
80
Eaton Vance Municipals Funds as of March 31, 2007
NOTES TO FINANCIAL STATEMENTS (Unaudited) CONT'D
respectively, for Class B shares. Service fees paid or accrued for the six months ended March 31, 2007, amounted to $8,306 $1,166, $6,776, $18,361, $14,621 and $989, for the California Fund, Florida Fund, Massachusetts Fund, New York Fund, Ohio Fund and Rhode Island Fund, respectively, for Class C shares.
6 Contingent Deferred Sales Charge
A contingent deferred sales charge (CDSC) generally is imposed on redemptions of Class B shares made within six years of purchase and on redemptions of Class C shares made within one year of purchase. Class A shares may be subject to a 1% CDSC if redeemed within eighteen months of purchase (depending upon the circumstances of purchase) or a 1% or 0.50% CDSC if redeemed within one or two years, respectively, on purchases through the Eaton Vance Supplemental Retirement Account. Generally, the CDSC is based upon the lower of the net asset value at date of redemption or date of purchase. No charge is levied on shares acquired by reinvestment of dividends or capital gains distributions. The Class B CDSC is imposed at declining rates that begin at 5% in the case of redemptions in the first and second year after purchase, declining one percentage point each subsequent year. Class C shares are subject to a 1% CDSC if redeemed within one year of purchase. No CDSC is levied on shares which have been sold to EVD or its affiliates or to their respective employees or clients and may be waived under certain other limited conditions. CDSC received on Class B and Class C redemptions are paid to EVD to reduce the amount of Uncovered Distribution Charges calculated under each Fund's Class B and, if applicable, Class C Plan (see Note 5). CDSC received on Class B and Class C redemptions when no Uncovered Distribution Charges exist will be credited to each Fund. EVD received approximately $9,000 $1,000 and $10,000 of CDSC paid by Class A shareholders of California Fund, Massachusetts Fund and Ohio Fund, respectively, and $13,000, $42,000, $35,000, $1,000, $7,000, $44,000, $32,000 and $4,000 of CDSC paid by Class B shareholders of California Fund, Florida Fund, Massachusetts Fund, Mississippi Fund, New York Fund, Ohio Fund, Rhode Island Fund and West Virginia Fund, respectively, for the six months ended March 31, 2007. EVD received approximately $800, $ 11, $1,000, and $3,000 of CDSC paid by Class C shareholders of the California Fund, Florida Fund, New York Fund, and Ohio Fund, respectively, for the six months ended March 31, 2007.
7 Investments
Purchases and sales of investments, other than U.S. Government securities and short-term obligations, for the six months ended March 31, 2007 were as follows:
| California Fund | |
| Purchases | | $ | 49,859,451 | | |
| Sales | | | 27,735,506 | | |
| Florida Fund | |
| Purchases | | $ | 13,185,612 | | |
| Sales | | | 22,514,397 | | |
| Massachusetts Fund | |
| Purchases | | $ | 149,569,704 | | |
| Sales | | | 104,275,215 | | |
| Mississippi Fund | |
| Purchases | | $ | 2,248,083 | | |
| Sales | | | 2,926,705 | | |
| New York Fund | |
| Purchases | | $ | 117,573,056 | | |
| Sales | | | 87,512,748 | | |
| Ohio Fund | |
| Purchases | | $ | 91,474,770 | | |
| Sales | | | 32,533,898 | | |
| Rhode Island Fund | |
| Purchases | | $ | 4,843,917 | | |
| Sales | | | 2,127,715 | | |
| West Virginia Fund | |
| Purchases | | $ | 6,985,720 | | |
| Sales | | | 5,332,595 | | |
81
Eaton Vance Municipals Funds as of March 31, 2007
NOTES TO FINANCIAL STATEMENTS (Unaudited) CONT'D
8 Federal Income Tax Basis of Unrealized Appreciation (Depreciation)
The cost and unrealized appreciation (depreciation) in the value of the investments owned by each Fund at March 31, 2007, as determined on a federal income tax basis, were as follows:
| California Fund | |
| Aggregate Cost | | $ | 244,796,854 | | |
| Gross unrealized appreciation | | $ | 22,219,227 | | |
| Gross unrealized depreciation | | | (174,598 | ) | |
| Net unrealized appreciation | | $ | 22,044,629 | | |
| Florida Fund | |
| Aggregate Cost | | $ | 220,820,994 | | |
| Gross unrealized appreciation | | $ | 23,459,249 | | |
| Gross unrealized depreciation | | | (19,341 | ) | |
| Net unrealized appreciation | | $ | 23,439,908 | | |
| Massachusetts Fund | |
| Aggregate Cost | | $ | 289,351,145 | | |
| Gross unrealized appreciation | | $ | 20,010,959 | | |
| Gross unrealized depreciation | | | (672,514 | ) | |
| Net unrealized appreciation | | $ | 19,338,445 | | |
| Mississippi Fund | |
| Aggregate Cost | | $ | 17,391,773 | | |
| Gross unrealized appreciation | | $ | 1,259,078 | | |
| Gross unrealized depreciation | | | (33,716 | ) | |
| Net unrealized appreciation | | $ | 1,225,362 | | |
| New York Fund | |
| Aggregate Cost | | $ | 414,004,966 | | |
| Gross unrealized appreciation | | $ | 32,713,975 | | |
| Gross unrealized depreciation | | | (617,180 | ) | |
| Net unrealized appreciation | | $ | 32,096,795 | | |
| Ohio Fund | |
| Aggregate Cost | | $ | 274,074,946 | | |
| Gross unrealized appreciation | | $ | 13,922,505 | | |
| Gross unrealized depreciation | | | (470,410 | ) | |
| Net unrealized appreciation | | $ | 13,452,095 | | |
| Rhode Island Fund | |
| Aggregate Cost | | $ | 57,325,224 | | |
| Gross unrealized appreciation | | $ | 3,240,104 | | |
| Gross unrealized depreciation | | | (22,232 | ) | |
| Net unrealized appreciation | | $ | 3,217,872 | | |
| West Virginia Fund | |
| Aggregate Cost | | $ | 29,650,598 | | |
| Gross unrealized appreciation | | $ | 1,748,111 | | |
| Gross unrealized depreciation | | | (13,777 | ) | |
| Net unrealized appreciation | | $ | 1,734,334 | | |
9 Overdraft Advances
Pursuant to the custodian agreement between the Funds and IBT, IBT may in its discretion advance funds to the Funds to make properly authorized payments. When such payments result in an overdraft by the Funds, the Funds are obligated to repay IBT at the current rate of interest charged by IBT for secured loans (currently, a rate above the Federal Funds rate). This obligation is payable on demand to IBT. IBT has a lien on a Funds' assets to the extent of any overdraft. At March 31, 2007, the West Virginia Fund had a payment due to IBT pursuant to the foregoing arrangement of $44,906.
10 Line of Credit
The Funds participate with other portfolios and funds managed by BMR and EVM and their affiliates in a $150 million unsecured line of credit agreement with a group of banks. Borrowings will be made by the portfolios or funds solely to facilitate the handling of unusual and/or unanticipated short-term cash requirements. Interest is charged to each portfolio or fund based on its borrowings at an amount above either the Eurodollar rate or federal funds rate. In addition, a fee computed at an annual rate of 0.10% on the daily unused portion of the line of credit is allocated among the participating portfolios and funds at the end of each quarter. The
82
Eaton Vance Municipals Funds as of March 31, 2007
NOTES TO FINANCIAL STATEMENTS (Unaudited) CONT'D
Funds did not have any significant borrowings or allocated fees during the six months ended March 31, 2007.
11 Financial Instruments
The Funds regularly trade in financial instruments with off-balance sheet risk in the normal course of their investing activities to assist in managing exposure to various market risks. These financial instruments include futures contracts and interest rate swap contracts and may involve, to a varying degree, elements of risk in excess of the amounts recognized for financial statement purposes. The notional or contractual amounts of these instruments represent the investment a Fund has in particular classes of financial instruments and does not necessarily represent the amounts potentially subject to risk. The measurement of the risks associated with these instruments is meaningful only when all related and offsetting transactions are considered.
A summary of obligations under these financial instruments at March 31, 2007 is as follows:
Futures Contracts
Fund | |
Expiration
Date | |
Contracts | |
Position | |
Aggregate
Cost | |
Value | | Net
Unrealized
Appreciation | |
| California | | 06/07 | | 429
U.S. Treasury Bond | | Short | | $ | (48,441,983 | ) | | $ | (47,726,250 | ) | | $ | 715,733 | | |
| Florida | | 06/07 | | 461
U.S. Treasury Bond | | Short | | $ | (52,055,371 | ) | | $ | (51,286,250 | ) | | $ | 769,121 | | |
| Massachusetts | | 06/07 | | 516
U.S. Treasury Bond | | Short | | $ | (58,249,757 | ) | | $ | (57,405,000 | ) | | $ | 844,757 | | |
| Mississippi | | 06/07 | | 17
U.S. Treasury Bond | | Short | | $ | (1,917,889 | ) | | $ | (1,891,250 | ) | | $ | 26,639 | | |
| New York | | 06/07 | | 804
U.S. Treasury Bond | | Short | | $ | (90,704,889 | ) | | $ | (89,445,000 | ) | | $ | 1,259,889 | | |
| Ohio | | 06/07 | | 120
U.S. Treasury Bond | | Short | | $ | (13,538,017 | ) | | $ | (13,350,000 | ) | | $ | 188,017 | | |
| Rhode Island | | 06/07 | | 91
U.S. Treasury Bond | | Short | | $ | (10,272,728 | ) | | $ | (10,123,750 | ) | | $ | 148,978 | | |
| West Virginia | | 06/07 | | 55
U.S. Treasury Bond | | Short | | $ | (6,208,792 | ) | | $ | (6,118,750 | ) | | $ | 90,042 | | |
At March 31, 2007, certain Funds had entered into an interest rate swap agreement with Morgan Stanley Capital Services, Inc., whereby the Funds make bi-annual payments at a fixed rate equal to 3.93% on the notional amount. In exchange, the Funds receive bi-annual payments at a rate equal to the USD-BMA Municipal Swap Index on the same notional amounts. The summary of these agreements are as follows:
| Fund | | Effective
Date | | Termination
Date | | Notional
Amount | | Net Unrealized
Appreciation | |
| New York | | | 12/20/07 | | | | 12/20/37 | | | $ | 16,000,000 | | | $ | 151,294 | | |
| Mississippi | | | 12/20/07 | | | | 12/20/37 | | | $ | 800,000 | | | $ | 7,565 | | |
At March 31, 2007, certain Funds had entered into an interest rate swap agreement with Merrill Lynch Capital Services, Inc. whereby the Funds make bi-annual payments at a fixed rate equal to 4.006% on the notional amount. In exchange, the Funds receive bi-annual payments at a rate equal to the USD-BMA Municipal Swap Index on the same notional amounts. The summary of these agreements are as follows:
| Fund | | Effective
Date | | Termination
Date | | Notional
Amount | | Net Unrealized
(Depreciation) | |
| California | | 8/7/07 | | 8/7/37 | | $ | 6,250,000 | | | $ | (1,082 | ) | |
| Florida | | 8/7/07 | | 8/7/37 | | $ | 6,500,000 | | | $ | (1,126 | ) | |
| Massachusetts | | 8/7/07 | | 8/7/37 | | $ | 6,750,000 | | | $ | (1,169 | ) | |
| Ohio | | 8/7/07 | | 8/7/37 | | $ | 5,800,000 | | | $ | (1,004 | ) | |
| Rhode Island | | 8/7/07 | | 8/7/37 | | $ | 1,450,000 | | | $ | (251 | ) | |
| West Virginia | | 8/7/07 | | 8/7/37 | | $ | 750,000 | | | $ | (130 | ) | |
At March 31, 2007, certain Funds had entered into an interest rate swap agreement with Citibank, N.A. whereby the Funds make bi-annual payments at a fixed rate equal to 3.925% on the notional amount. In exchange, the Funds receive bi-annual payments at a rate equal to the USD-BMA Municipal Swap Index on the same notional amounts. The summary of these agreements are as follows:
| Fund | | Effective
Date | | Termination
Date | | Notional
Amount | | Net Unrealized
Appreciation | |
| California | | 8/16/07 | | 8/16/27 | | $ | 6,250,000 | | | $ | 9,197 | | |
| Florida | | 8/16/07 | | 8/16/27 | | $ | 6,500,000 | | | $ | 9,565 | | |
| Massachusetts | | 8/16/07 | | 8/16/27 | | $ | 6,750,000 | | | $ | 9,933 | | |
| Mississippi | | 8/16/07 | | 8/16/27 | | $ | 450,000 | | | $ | 662 | | |
| New York | | 8/16/07 | | 8/16/27 | | $ | 10,600,000 | | | $ | 15,598 | | |
| Rhode Island | | 8/16/07 | | 8/16/27 | | $ | 1,450,000 | | | $ | 2,134 | | |
| West Virginia | | 8/16/07 | | 8/16/27 | | $ | 750,000 | | | $ | 1,104 | | |
At March 31, 2007, the Funds had sufficient cash and/or securities to cover margin commitments under these contracts.
83
Eaton Vance Municipals Funds as of March 31, 2007
NOTES TO FINANCIAL STATEMENTS (Unaudited) CONT'D
12 Recently Issued Accounting Pronouncements
In June 2006, the FASB issued FASB Interpretation No. 48, ("FIN 48") "Accounting for Uncertainty in Income Taxes – an interpretation of FASB Statement No. 109". FIN 48 clarifies the accounting for uncertainty in income taxes recognized in accordance with FASB Statement No. 109, "Accounting for Income Taxes." This interpretation prescribes a recognition threshold and measurement attribute for the financial statement recognition and measurement of a tax position taken or expected to be taken in a tax return. It also provides guidance on de-recognition, classification, interest and penalties, accounting in interim periods, disclosure and transition. FIN 48 is effective during the first required financial reporting period for fiscal years beginning after December 15, 2006. Management is currently evaluating the impact of applying the various provisions of FIN 48.
In September 2006, the FASB issued Statement of Financial Accounting Standards No. 157, ("FAS 157") "Fair Value Measurements". FAS 157 defines fair value, establishes a framework for measuring fair value in accordance with generally accepted accounting principles and expands disclosure about fair value measurements. FAS 157 is effective for fiscal years beginning after November 15, 2007. Management is currently evaluating the impact the adoption of FAS 157 will have on the Funds' financial statement disclosures.
84
Eaton Vance Municipals Funds
BOARD OF TRUSTEES' ANNUAL APPROVAL OF THE INVESTMENT ADVISORY AGREEMENT
Overview of the Contract Review Process
The Investment Company Act of 1940, as amended (the "1940 Act"), provides, in substance, that each investment advisory agreement between a fund and its investment adviser will continue in effect from year to year only if its continuance is approved at least annually by the fund's board of trustees, including by a vote of a majority of the trustees who are not "interested persons" of the fund ("Independent Trustees") cast in person at a meeting called for the purpose of considering such approval.
At a meeting of the Boards of Trustees (each a "Board") of the Eaton Vance group of mutual funds (the "Eaton Vance Funds") held on March 27, 2006, the Board, including a majority of the Independent Trustees, voted to approve continuation of existing advisory and sub-advisory agreements for the Eaton Vance Funds for an additional one-year period. In voting its approval, the Board relied upon the affirmative recommendation of the Special Committee of the Board, which is a committee comprised exclusively of Independent Trustees. Prior to making its recommendation, the Special Committee reviewed information furnished for a series of meetings of the Special Committee held in February and March 2006. Such information included, among other things, the following:
Information about Fees, Performance and Expenses
• An independent report comparing the advisory and related fees paid by each fund with fees paid by comparable funds;
• An independent report comparing each fund's total expense ratio and its components to comparable funds;
• An independent report comparing the investment performance of each fund to the investment performance of comparable funds over various time periods;
• Data regarding investment performance in comparison to relevant peer groups of funds and appropriate indices;
• Comparative information concerning fees charged by each adviser for managing other mutual funds and institutional accounts using investment strategies and techniques similar to those used in managing the fund;
• Profitability analyses for each adviser with respect to each fund managed by it;
Information about Portfolio Management
• Descriptions of the investment management services provided to each fund, including the investment strategies and processes employed;
• Information concerning the allocation of brokerage and the benefits received by each adviser as a result of brokerage allocation, including information concerning the acquisition of research through "soft dollar" benefits received in connection with the funds' brokerage, and the implementation of a soft dollar reimbursement program established with respect to the funds;
• Data relating to portfolio turnover rates of each fund;
• The procedures and processes used to determine the fair value of fund assets and actions taken to monitor and test the effectiveness of such procedures and processes;
Information about the Adviser
• Reports detailing the financial results and condition of each adviser;
• Descriptions of the qualifications, education and experience of the individual investment professionals whose responsibilities include portfolio management and investment research for the funds, and information relating to their compensation and responsibilities with respect to managing other mutual funds and investment accounts;
• Copies of the Codes of Ethics of each adviser and its affiliates, together with information relating to compliance with and the administration of such codes;
• Information concerning the resources devoted to compliance efforts undertaken by each adviser and its affiliates on behalf of the funds (including descriptions of various compliance programs) and their record of compliance with investment policies and restrictions, including policies with respect to market-timing, late trading and selective portfolio disclosure, and with policies on personal securities transactions;
• Descriptions of the business continuity and disaster recovery plans of each adviser and its affiliates;
Other Relevant Information
• Information concerning the nature, cost and character of the administrative and other non-investment management services provided by Eaton Vance Management and its affiliates;
• Information concerning management of the relationship with the custodian, subcustodians and fund accountants by each adviser or the funds' administrator; and
• The terms of each advisory agreement.
In addition to the information identified above, the Special Committee considered information provided from time to time by each adviser throughout the year at meetings of the Board and its committees. Over the course of the twelve month period ended March 31, 2006, the Board met nine times and the Special Committee, the Audit Committee and the Governance Committee, each of which is a
85
Eaton Vance Municipals Funds
BOARD OF TRUSTEES' ANNUAL APPROVAL OF THE INVESTMENT ADVISORY AGREEMENT CONT'D
Committee comprised solely of Independent Trustees, met eight, twelve and five times, respectively. At such meetings, the Trustees received, among other things, presentations by the portfolio managers and other investment professionals of each adviser relating to the investment performance of each fund and the investment strategies used in pursuing the fund's investment objective.
For funds that invest through one or more underlying portfolios, the Board considered similar information about the portfolio(s) when considering the approval of advisory agreements. In addition, in cases where the fund's investment adviser has engaged a sub-adviser, the Board considered similar information about the sub-adviser when considering the approval of any such sub-advisory agreement.
The Special Committee was assisted throughout the contract review process by Goodwin Procter LLP, legal counsel for the Independent Trustees. The members of the Special Committee relied upon the advice of such counsel and their own business judgment in determining the material factors to be considered in evaluating each advisory and sub-advisory agreement and the weight to be given to each such factor. The conclusions reached with respect to each advisory and sub-advisory agreement were based on a comprehensive evaluation of all the information provided and not any single factor. Moreover, each member of the Special Committee may have placed varying emphasis on particular factors in reaching conclusions with respect to each advisory and sub-advisory agreement.
Results of the Process
Based on its consideration of the foregoing, and such other information as it deemed relevant, including the factors and conclusions described below, the Special Committee concluded that the continuance of the investment advisory agreements of the following funds:
• Eaton Vance California Municipals Fund
• Eaton Vance Florida Municipals Fund
• Eaton Vance Massachusetts Municipals Fund
• Eaton Vance Mississippi Municipals Fund
• Eaton Vance New York Municipals Fund
• Eaton Vance Ohio Municipals Fund
• Eaton Vance Rhode Island Municipals Fund
• Eaton Vance West Virginia Municipals Fund
(the "Funds"), each with Boston Management and Research (the "Adviser"), including their fee structures, is in the interests of shareholders and, therefore, the Special Committee recommended to the Board approval of each agreement. The Board accepted the recommendation of the Special Committee as well as the factors considered and conclusions reached by the Special Committee with respect to each agreement. Accordingly, the Board, including a majority of the Independent Trustees, voted to approve continuation of the advisory agreements for each Fund.
Nature, Extent and Quality of Services
In considering whether to approve the investment advisory agreements of the Funds, the Board evaluated the nature, extent and quality of services provided to the Funds by the Adviser.
The Board considered the Adviser's management capabilities and investment process with respect to the types of investments held by each Fund, including the education, experience and number of its investment professionals and other personnel who provide portfolio management, investment research, and similar services to the Funds, and recent changes in the identity of such personnel. In particular, the Board evaluated, where relevant, the abilities and experience of such investment personnel in analyzing factors such as credit risk, tax efficiency, and special considerations relevant to investing in municipal bonds. Specifically, the Board considered the Adviser's 30-person municipal bond team, which includes six portfolio managers and nine credit specialists who provide services to the Funds. The Board also took into account the resources dedicated to portfolio management and other services, including the compensation paid to rec ruit and retain investment personnel, and the time and attention devoted to each Fund in the complex by senior management.
The Board reviewed the compliance programs of the Adviser and relevant affiliates thereof. Among other matters, the Board considered compliance and reporting matters relating to personal trading by investment personnel, selective disclosure of portfolio holdings, late trading, frequent trading, portfolio valuation, business continuity and the allocation of investment opportunities. The Board also evaluated the responses of the Adviser and its affiliates to requests from regulatory authorities such as the Securities and Exchange Commission and the National Association of Securities Dealers.
The Board also considered shareholder and other administrative services provided or managed by Eaton Vance Management and its affiliates, including transfer agency and accounting services. The Board evaluated the benefits to shareholders of investing in a fund that is a part of a large family of funds, including the ability, in many cases, to exchange an investment among different funds without incurring additional sales charges.
86
Eaton Vance Municipals Funds
BOARD OF TRUSTEES' ANNUAL APPROVAL OF THE INVESTMENT ADVISORY AGREEMENT CONT'D
After consideration of the foregoing factors, among others, the Board concluded that the nature, extent and quality of services provided by the Adviser, taken as a whole, are appropriate and consistent with the terms of the respective investment advisory agreements.
Fund Performance
The Board compared each Fund's investment performance to a relevant universe of similarly managed funds identified by an independent data provider and appropriate benchmark indices. The Board reviewed comparative performance data for the one-, three-, five- and ten-year periods ended September 30, 2005 for each Fund in operation over such periods. On the basis of the foregoing and other relevant information, the Board concluded that the performance of each Fund is satisfactory.
Management Fees and Expenses
The Board reviewed contractual investment advisory fee rates payable by each Fund (referred to as "management fees").
As part of its review, the Board considered each Fund's management fee and total expense ratio for the one year period ended September 30, 2005, as compared to a group of similarly managed funds selected by an independent data provider.
After reviewing the foregoing information, and in light of the nature, extent and quality of the services provided by the Adviser, the Board concluded with respect to each Fund that the management fee charged to the Fund for advisory and related services and the total expense ratio of the Fund are reasonable.
Profitability
The Board reviewed the level of profits realized by the Adviser and, if applicable, its affiliates in providing investment advisory and administrative services to each Fund and to all Eaton Vance Funds as a group. The Board considered the level of profits realized without regard to revenue sharing or other payments by the Adviser and its affiliates to third parties in respect of distribution services. The Board also considered other direct or indirect benefits received by the Adviser and its affiliates in connection with their relationship with the Funds.
The Board concluded that, in light of the foregoing factors and the nature, extent and quality of the services rendered, the profits realized by the Adviser and its affiliates are reasonable.
Economies of Scale
In reviewing management fees and profitability, the Board also considered the extent to which the Adviser and its affiliates, on the one hand, and each Fund, on the other hand, can expect to realize benefits from economies of scale as the assets of the Fund increase. The Board acknowledged the difficulty in accurately measuring the benefits resulting from the economies of scale with respect to the management of any specific fund or group of funds. The Board reviewed data summarizing the increases and decreases in the assets of each Fund and of all Eaton Vance Funds as a group over various time periods, and evaluated the extent to which the total expense ratio of each Fund and the profitability of the Adviser and its affiliates may have been affected by such increases or decreases. Based upon the foregoing, the Board concluded that the benefits from economies of scale are currently being shared equitably by the Adviser and its af filiates and each Fund. The Board also concluded that, assuming reasonably foreseeable increases in the assets of each Fund, the structure of each advisory fee, which includes breakpoints at several asset levels, can be expected to cause the Adviser and its affiliates and the Fund to continue to share such benefits equitably.
87
Eaton Vance Municipals Funds
INVESTMENT MANAGEMENT
Eaton Vance Municipals Funds
Officers
Robert B. MacIntosh
President and Portfolio Manager
of Massachusetts, Rhode Island
and West Virginia Municipals
Funds
William H. Ahern, Jr.
Vice President and Portfolio
Manager of Ohio Municipals
Fund
Craig R. Brandon
Vice President and Portfolio
Manager of Mississippi and
New York Municipals Funds
Cynthia J. Clemson
Vice President and Portfolio
Manager of California and
Florida Municipals Funds
James B. Hawkes
Vice President and Trustee
Thomas M. Metzold
Vice President
Barbara E. Campbell
Treasurer
Alan R. Dynner
Secretary
Paul M. O'Neil
Chief Compliance Officer | | Trustees
Samuel L. Hayes, III
Chairman
Benjamin C. Esty
Thomas E. Faust Jr.
Allen R. Freedman
William H. Park
Ronald A. Pearlman
Norton H. Reamer
Heidi L. Steiger
Lynn A. Stout
Ralph F. Verni | |
|
88
Investment Adviser
Boston Management and Research
The Eaton Vance Building
255 State Street
Boston, MA 02109
Fund Administrator
Eaton Vance Management
The Eaton Vance Building
255 State Street
Boston, MA 02109
Principal Underwriter
Eaton Vance Distributors, Inc.
The Eaton Vance Building
255 State Street
Boston, MA 02109
(617) 482-8260
Custodian
Investors Bank & Trust Company
200 Clarendon Street
Boston, MA 02116
Transfer Agent
PFPC Inc.
Attn: Eaton Vance Funds
P.O. Box 9653
Providence, RI 02940-9653
(800) 262-1122
Eaton Vance Municipals Trust
The Eaton Vance Building
255 State Street
Boston, MA 02109
This report must be preceded or accompanied by a current prospectus. Before investing, investors should consider carefully a Fund's investment objective(s), risks, and charges and expenses. The Funds' current prospectus contains this and other information about the Funds and is available through your financial advisor. Please read the prospectus carefully before you invest or send money. For further information please call 1-800-225-6265.
438-5/07 MUNISRC
Item 2. Code of Ethics
The registrant has adopted a code of ethics applicable to its Principal Executive Officer, Principal Financial Officer and Principal Accounting Officer. The registrant undertakes to provide a copy of such code of ethics to any person upon request, without charge, by calling 1-800-262-1122.
Item 3. Audit Committee Financial Expert
The registrant’s Board has designated William H. Park, Samuel L. Hayes, III and Norton H. Reamer, each an independent trustee, as its audit committee financial experts. Mr. Park is a certified public accountant who is the Vice Chairman of Commercial Industrial Finance Corp (specialty finance company). Previously, he served as President and Chief Executive Officer of Prizm Capital Management, LLC (investment management firm) and as Executive Vice President and Chief Financial Officer of United Asset Management Corporation (“UAM”) (a holding company owning institutional investment management firms). Mr. Hayes is the Jacob H. Schiff Professor of Investment Banking Emeritus of the Harvard University Graduate School of Business Administration. Mr. Reamer is the President, Chief Executive Officer and a Director of Asset Management Finance Corp. (a specialty finance company serving the investment management industry) and is President of Unicorn Corporation (an investment and financial advisory services company). Formerly, Mr. Reamer was Chairman and Chief Operating Officer of Hellman, Jordan Management Co., Inc. (an investment management company) and Advisory Director of Berkshire Capital Corporation (an investment banking firm), Chairman of the Board of UAM and Chairman, President and Director of the UAM Funds (mutual funds).
Item 4. Principal Accountant Fees and Services
Not required in this filing.
Item 5. Audit Committee of Listed registrants
Not required in this filing.
Item 6. Schedule of Investments
Please see schedule of investments contained in the Report to Stockholders included under Item 1 of this Form N-CSR.
Item 7. Disclosure of Proxy Voting Policies and Procedures for Closed-End Management Investment Companies
Not required in this filing.
Item 8. Portfolio Managers of Closed-End Management Investment Companies
Not required in this filing.
Item 9. Purchases of Equity Securities by Closed-End Management Investment Company and Affiliated Purchasers.
Not required in this filing.
Item 10. Submission of Matters to a Vote of Security Holders.
No Material Changes.
Item 11. Controls and Procedures
(a) It is the conclusion of the registrant’s principal executive officer and principal financial officer that the effectiveness of the registrant’s current disclosure controls and procedures (such disclosure controls and procedures having been evaluated within 90 days of the date of this filing) provide reasonable assurance that the information required to be disclosed by the registrant has been recorded, processed, summarized and reported within the time period specified in the Commission’s rules and forms and that the information required to be disclosed by the registrant has been accumulated and communicated to the registrant’s principal executive officer and principal financial officer in order to allow timely decisions regarding required disclosure.
(b) During the second fiscal quarter of the period covered by this report, the registrant’s internal control over financial reporting was modified to enhance the review and analysis of the relevant terms and conditions of transfers of securities in connection with inverse floating rate obligations in light of Statement of Financial Accounting Standards No. 140.
Item 12. Exhibits
(a)(1) | Registrant’s Code of Ethics – Not applicable (please see Item 2). |
(a)(2)(i) | Treasurer’s Section 302 certification. |
(a)(2)(ii) | President’s Section 302 certification. |
(b) | Combined Section 906 certification. |
Signatures
Pursuant to the requirements of the Securities Exchange Act of 1934 and the Investment Company Act of 1940, the registrant has duly caused this report to be signed on its behalf by the undersigned, thereunto duly authorized.
Eaton Vance Municipals Trust
By: | /s/Robert B. MacIntosh | |
| Robert B. MacIntosh |
| President |
| |
| |
Date: | May 10, 2007 |
Pursuant to the requirements of the Securities Exchange Act of 1934 and the Investment Company Act of 1940, this report has been signed below by the following persons on behalf of the registrant and in the capacities and on the dates indicated.
By: | /s/Barbara E. Campbell | |
| Barbara E. Campbell |
| Treasurer |
| |
| |
Date: | May 10, 2007 |
By: | /s/Robert B. MacIntosh | |
| Robert B. MacIntosh |
| President |
| |
| |
Date: | May 10, 2007 |