UNITED STATES
SECURITIES AND EXCHANGE COMMISSION
Washington, D.C. 20549
FORM N-CSR
CERTIFIED SHAREHOLDER REPORT OF REGISTERED
MANAGEMENT INVESTMENT COMPANIES
Investment Company Act file number | 811-04409 |
|
Eaton Vance Municipals Trust |
(Exact name of registrant as specified in charter) |
|
The Eaton Vance Building, 255 State Street, Boston, Massachusetts | | 02109 |
(Address of principal executive offices) | | (Zip code) |
|
Maureen A. Gemma The Eaton Vance Building, 255 State Street, Boston, Massachusetts 02109 |
(Name and address of agent for service) |
|
Registrant’s telephone number, including area code: | (617) 482-8260 | |
|
Date of fiscal year end: | July 31 | |
|
Date of reporting period: | January 31, 2008 | |
| | | | | | | |
Item 1. Reports to Stockholders

Semiannual Report January 31, 2008


EATON VANCE
MUNICIPALS
TRUST
Arizona
Colorado
Connecticut
Michigan
Minnesota
New Jersey
Pennsylvania
IMPORTANT NOTICES REGARDING PRIVACY,
DELIVERY OF SHAREHOLDER DOCUMENTS,
PORTFOLIO HOLDINGS, AND PROXY VOTING
Privacy. The Eaton Vance organization is committed to ensuring your financial privacy. Each of the financial institutions identified below has in effect the following policy ("Privacy Policy") with respect to nonpublic personal information about its customers:
• Only such information received from you, through application forms or otherwise, and information about your Eaton Vance fund transactions will be collected. This may include information such as name, address, social security number, tax status, account balances and transactions.
• None of such information about you (or former customers) will be disclosed to anyone, except as permitted by law (which includes disclosure to employees necessary to service your account). In the normal course of servicing a customer's account, Eaton Vance may share information with unaffiliated third parties that perform various required services such as transfer agents, custodians and broker/dealers.
• Policies and procedures (including physical, electronic and procedural safeguards) are in place that are designed to protect the confidentiality of such information.
• We reserve the right to change our Privacy Policy at any time upon proper notification to you. Customers may want to review our Policy periodically for changes by accessing the link on our homepage: www.eatonvance.com.
Our pledge of privacy applies to the following entities within the Eaton Vance organization: the Eaton Vance Family of Funds, Eaton Vance Management, Eaton Vance Investment Counsel, Boston Management and Research, and Eaton Vance Distributors, Inc.
In addition, our Privacy Policy only applies to those Eaton Vance customers who are individuals and who have a direct relationship with us. If a customer's account (i.e., fund shares) is held in the name of a third-party financial adviser/broker-dealer, it is likely that only such adviser's privacy policies apply to the customer. This notice supersedes all previously issued privacy disclosures.
For more information about Eaton Vance's Privacy Policy, please call 1-800-262-1122.
Delivery of Shareholder Documents. The Securities and Exchange Commission (the "SEC") permits funds to deliver only one copy of shareholder documents, including prospectuses, proxy statements and shareholder reports, to fund investors with multiple accounts at the same residential or post office box address. This practice is often called "householding" and it helps eliminate duplicate mailings to shareholders.
Eaton Vance, or your financial adviser, may household the mailing of your documents indefinitely unless you instruct Eaton Vance, or your financial adviser, otherwise.
If you would prefer that your Eaton Vance documents not be householded, please contact Eaton Vance at 1-800-262-1122, or contact your financial adviser.
Your instructions that householding not apply to delivery of your Eaton Vance documents will be effective within 30 days of receipt by Eaton Vance or your financial adviser.
Portfolio Holdings. Each Eaton Vance Fund and its underlying Portfolio (if applicable) will file a schedule of its portfolio holdings on Form N-Q with the SEC for the first and third quarters of each fiscal year. The Form N-Q will be available on the Eaton Vance website www.eatonvance.com, by calling Eaton Vance at 1-800-262-1122 or in the EDGAR database on the SEC's website at www.sec.gov. Form N-Q may also be reviewed and copied at the SEC's public reference room in Washington, D.C. (call 1-800-732-0330 for information on the operation of the public reference room).
Proxy Voting. From time to time, funds are required to vote proxies related to the securities held by the funds. The Eaton Vance Funds or their underlying Portfolios (if applicable) vote proxies according to a set of policies and procedures approved by the Funds' and Portfolios' Boards. You may obtain a description of these policies and procedures and information on how the Funds or Portfolios voted proxies relating to portfolio securities during the most recent 12 month period ended June 30, without charge, upon request, by calling 1-800-262-1122. This description is also available on the SEC's website at www.sec.gov.
Eaton Vance Municipals Funds as of January 31, 2008
FUND EXPENSES
Example: As a shareholder of a Fund, you incur two types of costs: (1) transaction costs, including sales charges (loads) on purchases and redemption fees (if applicable); and (2) ongoing costs, including management fees; distribution or service fees; and other Fund expenses. This Example is intended to help you understand your ongoing costs (in dollars) of investing in a Fund and to compare these costs with the ongoing costs of investing in other mutual funds. The Example is based on an investment of $1,000 invested at the beginning of the period and held for the entire period (August 1, 2007 – January 31, 2008).
Actual Expenses: The first section of each table below provides information about actual account values and actual expenses. You may use the information in this section, together with the amount you invested, to estimate the expenses that you paid over the period. Simply divide your account value by $1,000 (for example, an $8,600 account value divided by $1,000 = 8.6), then multiply the result by the number in the first section under the heading entitled "Expenses Paid During Period" to estimate the expenses you paid on your account during this period.
Hypothetical Example for Comparison Purposes: The second section of each table below provides information about hypothetical account values and hypothetical expenses based on the actual Fund expense ratio and an assumed rate of return of 5% per year (before expenses), which is not the actual return of the Fund. The hypothetical account values and expenses may not be used to estimate the actual ending account balance or expenses you paid for the period. You may use this information to compare the ongoing costs of investing in your Fund and other funds. To do so, compare this 5% hypothetical example with the 5% hypothetical examples that appear in the shareholder reports of the other funds.
Please note that the expenses shown in each table are meant to highlight your ongoing costs only and do not reflect any transactional costs, such as sales charges (loads) or redemption fees (if applicable). Therefore, the second section of each table is useful in comparing ongoing costs only, and will not help you determine the relative total costs of owning different funds. In addition, if these transactional costs were included, your costs would have been higher.
Eaton Vance Arizona Municipals Fund
| | | Beginning Account Value
(8/1/07) | | Ending Account Value
(1/31/08) | | Expenses Paid During Period*
(8/1/07 – 1/31/08) | |
| Actual | |
| Class A | | $ | 1,000.00 | | | $ | 1,011.30 | | | $ | 4.55 | | |
| Class B | | $ | 1,000.00 | | | $ | 1,007.70 | | | $ | 8.33 | | |
| Class C | | $ | 1,000.00 | | | $ | 1,007.70 | | | $ | 8.33 | | |
| Hypothetical | |
| (5% return per year before expenses) | |
| Class A | | $ | 1,000.00 | | | $ | 1,020.60 | | | $ | 4.57 | | |
| Class B | | $ | 1,000.00 | | | $ | 1,016.80 | | | $ | 8.36 | | |
| Class C | | $ | 1,000.00 | | | $ | 1,016.80 | | | $ | 8.36 | | |
* Expenses are equal to the Fund's annualized expense ratio of 0.90% for Class A shares, 1.65% for Class B shares and 1.65% for Class C shares, multiplied by the average account value over the period, multiplied by 184/366 (to reflect the one-half year period). The Example assumes that the $1,000 was invested at the net asset value per share determined at the close of business on July 31, 2007.
11
Eaton Vance Municipals Funds as of January 31, 2008
FUND EXPENSES CONT'D
Eaton Vance Colorado Municipals Fund
| | | Beginning Account Value
(8/1/07) | | Ending Account Value
(1/31/08) | | Expenses Paid During Period
(8/1/07 – 1/31/08) | |
| Actual* | |
| Class A | | $ | 1,000.00 | | | $ | 997.70 | | | $ | 3.72 | | |
| Class B | | $ | 1,000.00 | | | $ | 994.70 | | | $ | 7.47 | | |
| Class C | | $ | 1,000.00 | | | $ | 990.90 | | | $ | 4.48 | | |
* Class C had not commenced operations on August, 1 2007. Actual expenses are equal to the Fund's annualized expense ratio of 0.74% for Class A shares, 1.49% for Class B shares and 1.49% for Class C Shares, multiplied by the average account value over the period, multiplied by 184/366 (to reflect the one-half year period) and by 116/366 for Class C (to reflect the period from commencement of operations on October 8, 2007 to January 31, 2008). The Example assumes that the $1,000 was invested at the net asset value per share determined at the close of business on July 31, 2007 (October 5, 2007 for Class C).
Hypothetical**
| (5% return per year before expenses) | |
| Class A | | $ | 1,000.00 | | | $ | 1,021.40 | | | $ | 3.76 | | |
| Class B | | $ | 1,000.00 | | | $ | 1,017.60 | | | $ | 7.56 | | |
| Class C | | $ | 1,000.00 | | | $ | 1,018.00 | | | $ | 7.20 | | |
** Hypothetical expenses are equal to the Fund's annualized expense ratio of 0.74% for Class A shares, 1.49% for Class B shares and 1.49% for Class C shares, multiplied by the average account value over the period, multiplied by 184/366 (to reflect the one-half-year period). The Example assumes that the $1,000 was invested at the net asset value per share determined at the close of business on July 31, 2007.
Eaton Vance Connecticut Municipals Fund
| | | Beginning Account Value
(8/1/07) | | Ending Account Value
(1/31/08) | | Expenses Paid During Period*
(8/1/07 – 1/31/08) | |
| Actual | |
| Class A | | $ | 1,000.00 | | | $ | 1,019.20 | | | $ | 5.43 | | |
| Class B | | $ | 1,000.00 | | | $ | 1,015.30 | | | $ | 9.22 | | |
| Class C | | $ | 1,000.00 | | | $ | 1,016.30 | | | $ | 9.22 | | |
| Hypothetical | |
| (5% return per year before expenses) | |
| Class A | | $ | 1,000.00 | | | $ | 1,019.80 | | | $ | 5.43 | | |
| Class B | | $ | 1,000.00 | | | $ | 1,016.00 | | | $ | 9.22 | | |
| Class C | | $ | 1,000.00 | | | $ | 1,016.00 | | | $ | 9.22 | | |
* Expenses are equal to the Fund's annualized expense ratio of 1.07% for Class A shares, 1.82% for Class B shares and 1.82% for Class C shares, multiplied by the average account value over the period, multiplied by 184/366 (to reflect the one-half year period). The Example assumes that the $1,000 was invested at the net asset value per share determined at the close of business on July 31, 2007.
12
Eaton Vance Municipals Funds as of January 31, 2008
FUND EXPENSES CONT'D
Eaton Vance Michigan Municipals Fund
| | | Beginning Account Value
(8/1/07) | | Ending Account Value
(1/31/08) | | Expenses Paid During Period*
(8/1/07 – 1/31/08) | |
| Actual | |
| Class A | | $ | 1,000.00 | | | $ | 1,011.50 | | | $ | 4.40 | | |
| Class C | | $ | 1,000.00 | | | $ | 1,008.60 | | | $ | 8.18 | | |
| Hypothetical | |
| (5% return per year before expenses) | |
| Class A | | $ | 1,000.00 | | | $ | 1,020.80 | | | $ | 4.42 | | |
| Class C | | $ | 1,000.00 | | | $ | 1,017.00 | | | $ | 8.21 | | |
* Expenses are equal to the Fund's annualized expense ratio of 0.87% for Class A shares and 1.62% for Class C shares, multiplied by the average account value over the period, multiplied by 184/366 (to reflect the one-half year period). The Example assumes that the $1,000 was invested at the net asset value per share determined at the close of business on July 31, 2007.
Eaton Vance Minnesota Municipals Fund
| | | Beginning Account Value
(8/1/07) | | Ending Account Value
(1/31/08) | | Expenses Paid During Period*
(8/1/07 – 1/31/08) | |
| Actual | |
| Class A | | $ | 1,000.00 | | | $ | 1,018.70 | | | $ | 4.31 | | |
| Class B | | $ | 1,000.00 | | | $ | 1,014.10 | | | $ | 8.10 | | |
| Class C | | $ | 1,000.00 | | | $ | 1,015.10 | | | $ | 8.10 | | |
| Hypothetical | |
| (5% return per year before expenses) | |
| Class A | | $ | 1,000.00 | | | $ | 1,020.90 | | | $ | 4.32 | | |
| Class B | | $ | 1,000.00 | | | $ | 1,017.10 | | | $ | 8.11 | | |
| Class C | | $ | 1,000.00 | | | $ | 1,017.10 | | | $ | 8.11 | | |
* Expenses are equal to the Fund's annualized expense ratio of 0.85% for Class A shares, 1.60% for Class B shares and 1.60% for Class C shares, multiplied by the average account value over the period, multiplied by 184/366 (to reflect the one-half period). The Example assumes that the $1,000 was invested at the net asset value per share determined at the close of business on July 31, 2007.
13
Eaton Vance Municipals Funds as of January 31, 2008
FUND EXPENSES CONT'D
Eaton Vance New Jersey Municipals Fund
| | | Beginning Account Value
(8/1/07) | | Ending Account Value
(1/31/08) | | Expenses Paid During Period*
(8/1/07 – 1/31/08) | |
| Actual | |
| Class A | | $ | 1,000.00 | | | $ | 980.90 | | | $ | 5.28 | | |
| Class B | | $ | 1,000.00 | | | $ | 979.50 | | | $ | 7.86 | | |
| Class C | | $ | 1,000.00 | | | $ | 977.80 | | | $ | 9.00 | | |
| Hypothetical | |
| (5% return per year before expenses) | |
| Class A | | $ | 1,000.00 | | | $ | 1,019.80 | | | $ | 5.38 | | |
| Class B | | $ | 1,000.00 | | | $ | 1,017.20 | | | $ | 8.01 | | |
| Class C | | $ | 1,000.00 | | | $ | 1,016.00 | | | $ | 9.17 | | |
* Expenses are equal to the Fund's annualized expense ratio of 1.06% for Class A shares, 1.58% for Class B shares and 1.81% for Class C shares, multiplied by the average account value over the period, multiplied by 184/366 (to reflect the one-half year period). The Example assumes that the $1,000 was invested at the net asset value per share determined at the close of business on July 31, 2007.
Eaton Vance Pennsylvania Municipals Fund
| | | Beginning Account Value
(8/1/07) | | Ending Account Value
(1/31/08) | | Expenses Paid During Period*
(8/1/07 – 1/31/08) | |
| Actual | |
| Class A | | $ | 1,000.00 | | | $ | 992.50 | | | $ | 6.51 | | |
| Class B | | $ | 1,000.00 | | | $ | 988.70 | | | $ | 10.25 | | |
| Class C | | $ | 1,000.00 | | | $ | 988.80 | | | $ | 10.25 | | |
| Hypothetical | |
| (5% return per year before expenses) | |
| Class A | | $ | 1,000.00 | | | $ | 1,018.60 | | | $ | 6.60 | | |
| Class B | | $ | 1,000.00 | | | $ | 1,014.80 | | | $ | 10.38 | | |
| Class C | | $ | 1,000.00 | | | $ | 1,014.80 | | | $ | 10.38 | | |
* Expenses are equal to the Fund's annualized expense ratio of 1.30% for Class A shares, 2.05% for Class B shares and 2.05% for Class C shares, multiplied by the average account value over the period, multiplied by 184/366 (to reflect the one-half year period). The Example assumes that the $1,000 was invested at the net asset value per share determined at the close of business on July 31, 2007.
14
Eaton Vance Municipals Funds as of January 31, 2008
TABLE OF CONTENTS
Investment Update | | 2 |
| | |
Morningstar RatingsTM | | 3 |
| | |
Fund Investment Updates | | |
Arizona | | 4 |
Colorado | | 5 |
Connecticut | | 6 |
Michigan | | 7 |
Minnesota | | 8 |
New Jersey | | 9 |
Pennsylvania | | 10 |
| | |
Fund Expenses | | 11 |
| | |
Financial Statements | | 15 |
| | |
Board of Trustees’ Annual Approval of the Investment Advisory Agreements | | 79 |
| | |
Investment Management | | 82 |
1
Eaton Vance Municipals Funds as of January 31, 2008
INVESTMENT UPDATE
The investment objective of each Eaton Vance Municipals Fund (the “Funds”) is to provide current income exempt from regular federal income tax and from particular state or local income or other taxes. The Funds primarily invest in investment-grade municipal obligations but may also invest in lower-rated obligations.
Economic and Market Conditions
Economic growth in the fourth quarter of 2007 measured 0.6%, following the 4.9% growth rate achieved in the third quarter, according to preliminary Commerce Department data reported in January 2008. At January 31, 2008, the housing sector continued to struggle due to market concerns related to subprime mortgages. While the weaker dollar was having a beneficial effect on export-related industries, tourism, and U.S.-based multinational companies, there were signs that consumers were starting to curtail spending by January 31, 2008.
The Federal Reserve (the Fed) lowered its target for the Federal Funds Rate by 0.75% to 3.50% in an unscheduled meeting on January 22, 2008. In its statement, the Fed pointed to a weakening economic outlook, continued deterioration in broader financial market conditions and tighter credit for some businesses and households. They further lowered the Federal Funds Rate to 3.00% in a scheduled meeting on January 31, 2008 noting considerable financial market stress and continued credit tightening. The Fed has now lowered its benchmark Federal Funds Rate by 2.25% (from 5.25%) since September 18, 2007. It has also cut the Discount Rate – the rate charged to banks borrowing directly from the Fed – by 2.75% from 6.25% to 3.50% since August 17, 2007. Management believes these moves were aimed at providing liquidity during this period of increased uncertainty and tighter credit conditions that first surfaced in August 2007.
Management Discussion
The Funds invest primarily in bonds with stated maturities of 10 years or longer, as longer-maturity bonds historically have provided greater tax-exempt income for investors than shorter-maturity bonds.
The Funds underperformed their benchmark, the Lehman Brothers Municipal Bond Index, during the six months ended January 31, 2008.(1) Management believes that much of the underperformance can be attributed to the broader-based credit scare that has shaken the fixed-income markets since August 2007, and led to a flight-to-quality bid in the Treasury market, particularly in shorter-maturity bonds. This move was originally driven by uncertainty surrounding financial companies’ exposure to mortgage-backed collateralized debt obligations (CDOs). More recently, the municipal bond market has been impacted by the downgrade of major municipal bond insurers due to their exposure to mortgage-related CDO debt. As a result of an active management style that focuses on income and longer call protection, the Funds generally hold longer-duration bonds. Accordingly, management believes that investor flight to shorter-maturity uninsured bonds from longer-maturity insured bonds resulted in the Funds’ relative underperformance for the period.
The ratio of yields on current coupon AAA-rated insured bonds to the yield on 30-year Treasury bonds was 105% as of January 31, 2008, with many individual bonds trading higher than 105%.(2) Management believes that this was the result of dislocation in the fixed-income marketplace caused by the subprime contagion fears, insurance companies’ mark-to-market risks and the decentralized nature of the municipal marketplace. Historically, this is a rare occurrence in the municipal bond market and is generally considered a signal that municipal bonds are significantly undervalued compared to Treasuries.
With this backdrop, Eaton Vance continues to manage all of its municipal funds with the same relative value approach that it has traditionally employed – maintaining a long-term perspective when markets exhibit extreme short-term volatility. We believe this approach has provided excellent long-term benefits to our investors over time.
(1) It is not possible to invest directly in an Index or a Lipper Classification. The Index’s total return does not reflect expenses that would have been incurred if an investor individually purchased or sold the securities represented in the Index.
(2) Source: Bloomberg L.P. Yields are a compilation of a representative variety of general obligations and are not necessarily representative of a Fund’s yield.
Past performance is no guarantee of future results.
Fund shares are not insured by the FDIC and are not deposits or other obligations of, or guaranteed by, any depository institution. Shares are subject to investment risks, including possible loss of principal invested.
The views expressed in this report are those of the portfolio managers and are current only through the end of the period of the report as stated on the cover. These views are subject to change at any time based upon market or other conditions, and the investment adviser disclaims any responsibility to update such views. These views may not be relied on as investment advice and, because investment decisions for a fund are based on many factors, may not be relied on as an indication of trading intent on behalf of any Eaton Vance fund. In addition, portfolio information provided in the report may not be representative of a Fund’s current or future investments and may change due to active management.
2
Eaton Vance Municipals Funds as of January 31, 2008
MORNINGSTAR RATINGSTM
As of January 31, 2008
FUND | | OVERALL | | 3-YEAR | | 5-YEAR | | 10-YEAR |
| | | | | | | | |
ARIZONA MUNICIPALS FUND – CLASS A | | *** | | *** | | *** | | *** |
Load waived | | ***** | | ***** | | ***** | | **** |
MUNI SINGLE STATE LONG CATEGORY | | 339 FUNDS | | 339 FUNDS | | 339 FUNDS | | 297 FUNDS |
| | | | | | | | |
COLORADO MUNICIPALS FUND – CLASS A | | ** | | ** | | ** | | ** |
Load waived | | **** | | **** | | **** | | *** |
MUNI SINGLE STATE LONG CATEGORY | | 339 FUNDS | | 339 FUNDS | | 339 FUNDS | | 297 FUNDS |
| | | | | | | | |
CONNECTICUT MUNICIPALS FUND – CLASS A | | *** | | ** | | ** | | *** |
Load waived | | **** | | **** | | **** | | **** |
MUNI SINGLE STATE LONG CATEGORY | | 339 FUNDS | | 339 FUNDS | | 339 FUNDS | | 297 FUNDS |
| | | | | | | | |
MICHIGAN MUNICIPALS FUND – CLASS A | | *** | | ** | | *** | | *** |
Load waived | | **** | | **** | | **** | | **** |
MUNI SINGLE STATE LONG CATEGORY | | 339 FUNDS | | 339 FUNDS | | 339 FUNDS | | 297 FUNDS |
| | | | | | | | |
MINNESOTA MUNICIPALS FUND – CLASS A | | *** | | *** | | *** | | *** |
Load waived | | ***** | | ***** | | ***** | | **** |
MUNI MINNESOTA CATEGORY | | 60 FUNDS | | 60 FUNDS | | 60 FUNDS | | 52 FUNDS |
| | | | | | | | |
NEW JERSEY MUNICIPALS FUND – CLASS A | | *** | | ** | | *** | | *** |
Load waived | | **** | | *** | | **** | | **** |
MUNI NEW JERSEY CATEGORY | | 66 FUNDS | | 66 FUNDS | | 66 FUNDS | | 53 FUNDS |
| | | | | | | | |
PENNSYLVANIA MUNICIPALS FUND – CLASS A | | *** | | *** | | **** | | *** |
Load waived | | ***** | | ***** | | ***** | | **** |
MUNI PENNSYLVANIA CATEGORY | | 85 FUNDS | | 85 FUNDS | | 85 FUNDS | | 78 FUNDS |
Based on risk-adjusted returns. Eaton Vance offers other mutual funds that are not listed here and that do not have similar performance records.
The Overall Morningstar Rating™ for a fund is derived from a weighted average of the performance figures associated with its 3-, 5- and 10-year (if applicable) Morningstar Rating™ metrics.
©2008 Morningstar, Inc. All Rights Reserved. The information contained herein: (1) is proprietary to Morningstar and/or its content providers; (2) may not be copied or distributed; and (3) is not warranted to be accurate, complete or timely. Neither Morningstar nor its content providers is responsible for any damages or losses arising from any use of this information. Past performance is no guarantee of future results. For each fund with at least a three-year history, Morningstar calculates a Morningstar Rating™ based on how a fund ranks on a Morningstar Risk-Adjusted Return measure against other funds in the same category. This measure takes into account variations in a fund’s monthly performance after adjusting for sales loads (except for load-waived A shares), redemption fees, and the risk-free rate, placing more emphasis on downward variations and rewarding consistent performance. The top 10% of funds in each category receive 5 stars; the next 22.5% receive 4 stars; the next 35% receive 3 stars; the next 22.5% receive 2 stars, and the bottom 10% receive 1 star.
Load-waived A share star ratings do not include any front-end sales load and are intended for those investors who have access to such purchase terms (e.g., plan participants of a defined contribution plan). Not all A share mutual funds for which Morningstar calculates a load-waived A share star rating may actually waive their front-end load. Therefore, Morningstar strongly encourages investors to contact their investment professional to determine whether they are eligible to purchase the A share without paying the front-end load. The Morningstar Rating may differ among share classes of a mutual fund as a result of different sales loads and/or expense structure.
As interest rates rise, the value of fixed-income securities is likely to decrease. Fluctuations in the value of securities may not affect interest income on existing securities, but will be reflected in the Funds’ net asset values. For state municipal funds, a portion of income may be subject to federal, state and local tax; a portion may be subject to federal alternative minimum tax. Please see the Funds’ prospectus for more information. Consult your tax/legal advisor before making any tax-related investment decisions.
For information regarding each Fund’s performance, please refer to pages titled “Performance Information and Portfolio Composition” contained in this report.
3
Eaton Vance Arizona Municipals Fund as of January 31, 2008
PERFORMANCE INFORMATION AND PORTFOLIO COMPOSITION
Performance(1) | | Class A | | Class B | | Class C | |
Share Class Symbol | | ETAZX | | EVAZX | | ECAZX | |
| | | | | | | |
Average Annual Total Returns (at net asset value) | | | | | | | |
Six Months | | 1.13 | % | 0.77 | % | 0.77 | % |
One Year | | 2.36 | | 1.61 | | 1.61 | |
Five Years | | 4.54 | | 3.80 | | N.A. | |
Ten Years | | 4.27 | | 3.51 | | N.A. | |
Life of Fund† | | 4.76 | | 5.25 | | 3.50 | |
| | | | | | | |
SEC Average Annual Total Returns (including sales charge or applicable CDSC) | | | | | |
Six Months | | -3.71 | % | -4.18 | % | -0.22 | % |
One Year | | -2.50 | | -3.29 | | 0.63 | |
Five Years | | 3.52 | | 3.46 | | N.A. | |
Ten Years | | 3.77 | | 3.51 | | N.A. | |
Life of Fund† | | 4.39 | | 5.25 | | 3.50 | |
† Inception date: Class A: 12/13/93; Class B: 7/25/91; Class C: 12/16/05
Total Annual | | | | | | | |
Operating Expenses(2)* | | Class A | | Class B | | Class C | |
| | | | | | | |
Expense Ratio | | 0.98 | % | 1.73 | % | 1.73 | % |
*From the Fund’s prospectus dated 10/5/07.
Distribution Rates/Yields | | Class A | | Class B | | Class C | |
| | | | | | | |
Distribution Rate(3) | | 4.27 | % | 3.53 | % | 3.53 | % |
Taxable-Equivalent Distribution Rate(3),(4) | | 6.88 | | 5.69 | | 5.69 | |
SEC 30-day Yield(5) | | 3.48 | | 2.90 | | 2.89 | |
Taxable-Equivalent SEC 30-day Yield(4),(5) | | 5.61 | | 4.67 | | 4.66 | |
Index Performance(6)
Lehman Brothers Municipal Bond Index (Average Annual Total Returns) | | | |
Six Months | | 3.71 | % |
One Year | | 4.93 | |
Five Years | | 4.61 | |
Ten Years | | 5.20 | |
Lipper Averages(7)
Lipper Arizona Municipal Debt Funds Classification (Average Annual Total Returns) | | | |
Six Months | | 1.49 | % |
One Year | | 2.39 | |
Five Years | | 3.83 | |
Ten Years | | 4.09 | |
Portfolio Manager: Craig R. Brandon, CFA
Rating Distribution**(8)
By total investments
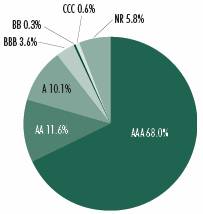
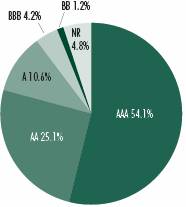
** | The rating distribution presented above includes the ratings of securities held by special purpose vehicles in which the Fund holds a residual interest. See Note 1I to the Fund’s financial statements. Absent such securities, the Fund’s rating distribution at January 31, 2008, is as follows, and the average rating is AA+: |
AAA | | 66.4% |
AA | | 12.2% |
A | | 10.6% |
BBB | | 3.8% |
BB | | 0.4% |
CCC | | 0.6% |
Not Rated | | 6.0% |
Fund Statistics(9)
· Number of Issues: | | 85 | |
· Average Maturity: | | 19.8 years | |
· Average Effective Maturity: | | 12.5 years | |
· Average Call Protection: | | 8.3 years | |
· Average Dollar Price: | | $ | 99.35 | |
| | | | |
Past performance is no guarantee of future results. Returns are historical and are calculated by determining the percentage change in net asset value or offering price (as applicable) with all distributions reinvested. Investment return and principal value will fluctuate so that shares, when redeemed, may be worth more or less than their original cost. Performance is for the stated time period only; due to market volatility, the Fund’s current performance may be lower or higher than the quoted return. For performance as of the most recent month end, please refer to www.eatonvance.com.
(1) Average Annual Total Returns do not include the 4.75% maximum sales charge for Class A shares or the applicable contingent deferred sales charges (CDSC) for Class B and Class C shares. If sales charges were deducted, returns would be lower. SEC Average Annual Total Returns for Class A reflect the maximum 4.75% sales charge. SEC Average Annual Total Returns for Class B reflect the applicable CDSC based on the following schedule: 5% - 1st and 2nd years; 4% - 3rd year; 3% - 4th year; 2% - 5th year; 1% - 6th year. SEC Average Annual Total Returns for Class C reflect a 1% CDSC for the first year.
(2) Includes interest expense of 0.22% relating to the Fund’s liability with respect to floating rate notes held by third parties in conjunction with inverse floater securities transactions by the Fund. The Fund also records offsetting interest income relating to the municipal obligation underlying such transactions, and as a result net asset value and performance have not been affected by this expense.
(3) The Fund’s distribution rate represents actual distributions paid to shareholders and is calculated by dividing the last distribution per share (annualized) by the net asset value.
(4) Taxable-equivalent figures assume a maximum 37.95% combined federal and state income tax rate. A lower tax rate would result in lower tax-equivalent figures.
(5) The Fund’s SEC yield is calculated by dividing the net investment income per share for the 30-day period by the offering price at the end of the period and annualizing the result.
(6) It is not possible to invest directly in an Index. The Index’s total return does not reflect the expenses that would have been incurred if an investor individually purchased or sold the securities represented in the Index. Index performance is available as of month end only.
(7) The Lipper Averages are the average annual total returns, at net asset value, of the funds that are in the same Lipper Classification as the Fund. It is not possible to invest in a Lipper Classification. Lipper Classifications may include insured and uninsured funds, as well as leveraged and unleveraged funds. The Lipper Arizona Municipal Debt Funds Classification contained 33, 33, 28 and 23 funds for the 6-month, 1-year, 5-year and 10-year time periods, respectively. Lipper Averages are available as of month end only.
(8) Rating Distribution is determined by dividing the total market value of the issues by the total investments of the Fund.
(9) Portfolio holdings information excludes securities held by special purpose vehicles in which the Fund holds a residual interest. See Note 1I to the Fund’s financial statements.
4
Eaton Vance Colorado Municipals Fund as of January 31, 2008
PERFORMANCE INFORMATION AND PORTFOLIO COMPOSITION
Performance(1) | | Class A | | Class B | | Class C | |
Share Class Symbol | | ETCOX | | EVCLX | | ECCOX | |
| | | | | | | |
Average Annual Total Returns (at net asset value) | | | | | | | |
Six Months | | -0.23 | % | -0.53 | % | N.A. | |
One Year | | -0.43 | | -1.10 | | N.A. | |
Five Years | | 4.16 | | 3.41 | | N.A. | |
Ten Years | | 4.28 | | 3.53 | | N.A. | |
Life of Fund† | | 4.64 | | 4.72 | | -0.91 | % |
| | | | | | | |
SEC Average Annual Total Returns (including sales charge or applicable CDSC) | | | | | |
Six Months | | -4.95 | % | -5.41 | % | N.A. | |
One Year | | -5.13 | | -5.87 | | N.A. | |
Five Years | | 3.15 | | 3.07 | | N.A. | |
Ten Years | | 3.77 | | 3.53 | | N.A. | |
Life of Fund† | | 4.28 | | 4.72 | | -1.89 | % |
† Inception date: Class A: 12/10/93; Class B: 8/25/92; Class C: 10/8/07
Total Annual | | | | | | | |
Operating Expenses(2)* | | Class A | | Class B | | Class C | |
| | | | | | | |
Expense Ratio | | 0.78 | % | 1.53 | % | 1.53 | % |
* From the Fund’s prospectus dated 10/5/07.
Distribution Rates/Yields | | Class A | | Class B | | Class C | |
| | | | | | | |
Distribution Rate(3) | | 4.31 | % | 3.55 | % | 3.61 | % |
Taxable-Equivalent Distribution Rate(3),(4) | | 6.95 | | 5.73 | | 5.82 | |
SEC 30-day Yield(5) | | 3.87 | | 3.31 | | 3.34 | |
Taxable-Equivalent SEC 30-day Yield(4),(5) | | 6.24 | | 5.34 | | 5.39 | |
Index Performance(6)
Lehman Brothers Municipal Bond Index (Average Annual Total Returns) | | | |
Six Months | | 3.71 | % |
One Year | | 4.93 | |
Five Years | | 4.61 | |
Ten Years | | 5.20 | |
Lipper Averages(7)
Lipper Colorado Municipal Debt Funds Classification (Average Annual Total Returns) | | | |
Six Months | | 2.21 | % |
One Year | | 2.89 | |
Five Years | | 3.93 | |
Ten Years | | 4.19 | |
Portfolio Manager: William H. Ahern, CFA
Rating Distribution**(8)
By total investments
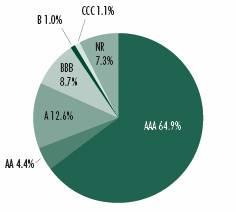
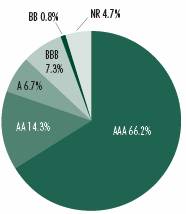
** | The rating distribution presented above includes the ratings of securities held by special purpose vehicles in which the Fund holds a residual interest. See Note 1I to the Fund’s financial statements. Absent such securities, the Fund’s rating distribution at January 31, 2008, is as follows, and the average rating is AA: |
AAA | | 64.7% |
AA | | 4.4% |
A | | 12.7% |
BBB | | 8.8% |
BB | | 1.0% |
CCC | | 1.2% |
Not Rated | | 7.2% |
Fund Statistics(9)
· Number of Issues: | | 58 | |
· Average Maturity: | | 20.2 years | |
· Average Effective Maturity: | | 13.6 years | |
· Average Call Protection: | | 9.0 years | |
· Average Dollar Price: | | $ | 96.69 | |
| | | | |
Past performance is no guarantee of future results. Returns are historical and are calculated by determining the percentage change in net asset value or offering price (as applicable) with all distributions reinvested. Investment return and principal value will fluctuate so that shares, when redeemed, may be worth more or less than their original cost. Performance is for the stated time period only; due to market volatility, the Fund’s current performance may be lower or higher than the quoted return. For performance as of the most recent month end, please refer to www.eatonvance.com.
(1) Average Annual Total Returns do not include the 4.75% maximum sales charge for Class A shares or the applicable contingent deferred sales charges (CDSC) for Class B and Class C shares. If sales charges were deducted, returns would be lower. SEC Average Annual Total Returns for Class A reflect the maximum 4.75% sales charge. SEC Average Annual Total Returns for Class B reflect the applicable CDSC based on the following schedule: 5% - 1st and 2nd years; 4% - 3rd year; 3% - 4th year; 2% - 5th year; 1% - 6th year. SEC Average Annual Total Returns for Class C reflect a 1% CDSC for the first year.
(2) Includes interest expense of 0.08% relating to the Fund’s liability with respect to floating rate notes held by third parties in conjunction with inverse floater securities transactions by the Fund. The Fund also records offsetting interest income relating to the municipal obligation underlying such transactions, and as a result net asset value and performance have not been affected by this expense.
(3) The Fund’s distribution rate represents actual distributions paid to shareholders and is calculated by dividing the last distribution per share (annualized) by the net asset value.
(4) Taxable-equivalent figures assume a maximum 38.01% combined federal and state income tax rate. A lower tax rate would result in lower tax-equivalent figures.
(5) The Fund’s SEC yield is calculated by dividing the net investment income per share for the 30-day period by the offering price at the end of the period and annualizing the result.
(6) It is not possible to invest directly in an Index. The Index’s total return does not reflect the expenses that would have been incurred if an investor individually purchased or sold the securities represented in the Index. Index performance is available as of month end only.
(7) The Lipper Averages are the average annual total returns, at net asset value, of the funds that are in the same Lipper Classification as the Fund. It is not possible to invest in a Lipper Classification. Lipper Classifications may include insured and uninsured funds, as well as leveraged and unleveraged funds. The Lipper Colorado Municipal Debt Funds Classification contained 23, 23, 23 and 19 funds for the 6-month, 1-year, 5-year and 10-year time periods, respectively. Lipper Averages are available as of month end only.
(8) Rating Distribution is determined by dividing the total market value of the issues by the total investments of the Fund.
(9) Portfolio holdings information excludes securities held by special purpose vehicles in which the Fund holds a residual interest. See Note 1I to the Fund’s financial statements.
5
Eaton Vance Connecticut Municipals Fund as of January 31, 2008
PERFORMANCE INFORMATION AND PORTFOLIO COMPOSITION
Performance(1) | | Class A | | Class B | | Class C | |
Share Class Symbol | | ETCTX | | EVCTX | | ECCTX | |
| | | | | | | |
Average Annual Total Returns (at net asset value) | | | | | | | |
Six Months | | 1.92 | % | 1.53 | % | 1.63 | % |
One Year | | 2.65 | | 1.87 | | 1.97 | |
Five Years | | 3.95 | | 3.20 | | N.A. | |
Ten Years | | 4.46 | | 3.69 | | N.A. | |
Life of Fund† | | 5.37 | | 4.67 | | 3.00 | |
| | | | | | | |
SEC Average Annual Total Returns (including sales charge or applicable CDSC) | | | | | |
Six Months | | -2.96 | % | -3.46 | % | 0.63 | % |
One Year | | -2.20 | | -3.05 | | 0.98 | |
Five Years | | 2.93 | | 2.85 | | N.A. | |
Ten Years | | 3.96 | | 3.69 | | N.A. | |
Life of Fund† | | 5.00 | | 4.67 | | 3.00 | |
† Inception date: Class A: 4/19/94; Class B: 5/1/92; Class C: 2/9/06
Total Annual | | | | | | | |
Operating Expenses(2)* | | Class A | | Class B | | Class C | |
| | | | | | | |
Expense Ratio | | 1.05 | % | 1.80 | % | 1.80 | % |
* From the Fund’s prospectus dated 10/5/07.
Distribution Rates/Yields | | Class A | | Class B | | Class C | |
| | | | | | | |
Distribution Rate(3) | | 4.16 | % | 3.39 | % | 3.39 | % |
Taxable-Equivalent Distribution Rate(3),(4) | | 5.85 | | 6.74 | | 5.49 | |
SEC 30-day Yield(5) | | 3.59 | | 3.01 | | 2.98 | |
Taxable-Equivalent SEC 30-day Yield(4),(5) | | 5.81 | | 4.87 | | 4.83 | |
Index Performance(6)
Lehman Brothers Municipal Bond Index (Average Annual Total Returns) | | | |
Six Months | | 3.71 | % |
One Year | | 4.93 | |
Five Years | | 4.61 | |
Ten Years | | 5.20 | |
Lipper Averages(7)
Lipper Connecticut Municipal Debt Funds Classification (Average Annual Total Returns) | | | |
Six Months | | 2.64 | % |
One Year | | 3.30 | |
Five Years | | 3.55 | |
Ten Years | | 4.16 | |
Portfolio Manager: William H. Ahern, CFA
Rating Distribution**(8)
By total investments
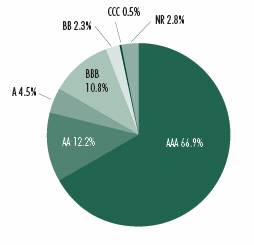
** | The rating distribution presented above includes the ratings of securities held by special purpose vehicles in which the Fund holds a residual interest. See Note 1I to the Fund’s financial statements. Absent such securities, the Fund’s rating distribution at January 31, 2008, is as follows, and the average rating is AA+: |
AAA | | 64.1% |
AA | | 13.2% |
A | | 4.8% |
BBB | | 11.7% |
BB | | 2.5% |
CCC | | 0.5% |
Not Rated | | 3.2% |
Fund Statistics(9)
· Number of Issues: | | 77 | |
· Average Maturity: | | 18.2 years | |
· Average Effective Maturity: | | 10.2 years | |
· Average Call Protection: | | 8.3 years | |
· Average Dollar Price: | | $ | 106.09 | |
| | | | |
Past performance is no guarantee of future results. Returns are historical and are calculated by determining the percentage change in net asset value or offering price (as applicable) with all distributions reinvested. Investment return and principal value will fluctuate so that shares, when redeemed, may be worth more or less than their original cost. Performance is for the stated time period only; due to market volatility, the Fund’s current performance may be lower or higher than the quoted return. For performance as of the most recent month end, please refer to www.eatonvance.com.
(1) Average Annual Total Returns do not include the 4.75% maximum sales charge for Class A shares or the applicable contingent deferred sales charges (CDSC) for Class B and Class C shares. If sales charges were deducted, returns would be lower. SEC Average Annual Total Returns for Class A reflect the maximum 4.75% sales charge. SEC Average Annual Total Returns for Class B reflect the applicable CDSC based on the following schedule: 5% - 1st and 2nd years; 4% - 3rd year; 3% - 4th year; 2% - 5th year; 1% - 6th year. SEC Average Annual Total Returns for Class C reflect a 1% CDSC for the first year.
(2) Includes interest expense of 0.27% relating to the Fund’s liability with respect to floating rate notes held by third parties in conjunction with inverse floater securities transactions by the Fund. The Fund also records offsetting interest income relating to the municipal obligation underlying such transactions, and as a result net asset value and performance have not been affected by this expense.
(3) The Fund’s distribution rate represents actual distributions paid to shareholders and is calculated by dividing the last distribution per share (annualized) by the net asset value.
(4) Taxable-equivalent figures assume a maximum 38.25% combined federal and state income tax rate. A lower tax rate would result in lower tax-equivalent figures.
(5) The Fund’s SEC yield is calculated by dividing the net investment income per share for the 30-day period by the offering price at the end of the period and annualizing the result.
(6) It is not possible to invest directly in an Index. The Index’s total return does not reflect the expenses that would have been incurred if an investor individually purchased or sold the securities represented in the Index. Index performance is available as of month end only.
(7) The Lipper Averages are the average annual total returns, at net asset value, of the funds that are in the same Lipper Classification as the Fund. It is not possible to invest in a Lipper Classification. Lipper Classifications may include insured and uninsured funds, as well as leveraged and unleveraged funds. The Lipper Connecticut Municipal Debt Funds Classification contained 24, 23, 22 and 21 funds for the 6-month, 1-year, 5-year and 10-year time periods, respectively. Lipper Averages are available as of month end only.
(8) Rating Distribution is determined by dividing the total market value of the issues by the total investments of the Fund.
(9) Portfolio holdings information excludes securities held by special purpose vehicles in which the Fund holds a residual interest. See Note 1I to the Fund’s financial statements.
6
Eaton Vance Michigan Municipals Fund as of January 31, 2008
PERFORMANCE INFORMATION AND PORTFOLIO COMPOSITION
Performance(1) | | Class A | | Class C | |
Share Class Symbol | | ETMIX | | ECMIX | |
| | | | | |
Average Annual Total Returns (at net asset value) | | | | | |
Six Months | | 1.15 | % | 0.86 | % |
One Year | | 1.33 | | 0.57 | |
Five Years | | 4.11 | | N.A. | |
Ten Years | | 4.37 | | N.A. | |
Life of Fund† | | 4.51 | | 2.99 | |
| | | | | |
SEC Average Annual Total Returns (including sales charge or applicable CDSC) | | | | | |
Six Months | | -3.63 | % | -0.12 | % |
One Year | | -3.46 | | -0.40 | |
Five Years | | 3.10 | | N.A. | |
Ten Years | | 3.87 | | N.A. | |
Life of Fund† | | 4.15 | | 2.99 | |
†Inception date: Class A: 12/7/93; Class C: 5/2/06
Total Annual | | | | | |
Operating Expenses(2)* | | Class A | | Class C | |
| | | | | |
Expense Ratio | | 1.02 | % | 1.77 | % |
*From the Fund’s prospectus dated 10/5/07.
Distribution Rates/Yields | | Class A | | Class C | |
| | | | | |
Distribution Rate(3) | | 4.30 | % | 3.53 | % |
Taxable-Equivalent Distribution rate(3),(4) | | 6.92 | | 5.68 | |
SEC 30-day Yield(5) | | 3.70 | | 3.13 | |
Taxable-Equivalent SEC 30-day Yield(4),(5) | | 5.95 | | 5.03 | |
Index Performance(6)
Lehman Brothers Municipal Bond Index (Average Annual Total Returns) | | | |
Six Months | | 3.71 | % |
One Year | | 4.93 | |
Five Years | | 4.61 | |
Ten Years | | 5.20 | |
Lipper Averages(7)
Lipper Michigan Municipal Debt Funds Classification (Average Annual Total Returns) | | | |
One Year | | 2.14 | % |
One Year | | 2.94 | |
Five Years | | 3.68 | |
Ten Years | | 4.17 | |
Portfolio Manager: William H. Ahern, CFA
Rating Distribution**(8)
By total investments
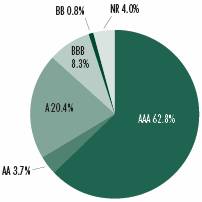
** | The rating distribution presented above includes the ratings of securities held by special purpose vehicles in which the Fund holds a residual interest. See Note 1I to the Fund’s financial statements. Absent such securities, the Fund’s rating distribution at January 31, 2008, is as follows, and the average rating is AA: |
AAA | | 61.1% |
AA | | 3.9% |
A | | 21.3% |
BBB | | 8.7% |
BB | | 0.8% |
Not Rated | | 4.2% |
Fund Statistics(9)
· Number of Issues: | | 54 | |
· Average Maturity: | | 21.9 years | |
· Average Effective Maturity: | | 13.3 years | |
· Average Call Protection: | | 8.7 years | |
· Average Dollar Price: | | $ | 99.73 | |
| | | | |
Past performance is no guarantee of future results. Returns are historical and are calculated by determining the percentage change in net asset value or offering price (as applicable) with all distributions reinvested. Investment return and principal value will fluctuate so that shares, when redeemed, may be worth more or less than their original cost. Performance is for the stated time period only; due to market volatility, the Fund’s current performance may be lower or higher than the quoted return. For performance as of the most recent month end, please refer to www.eatonvance.com.
(1) Average Annual Total Returns do not include the 4.75% maximum sales charge for Class A shares or the applicable contingent deferred sales charges (CDSC) for Class C shares. If sales charges were deducted, returns would be lower. SEC Average Annual Total Returns for Class A reflect the maximum 4.75% sales charge. SEC Average Annual Total Returns for Class C reflect a 1% CDSC for the first year.
(2) Includes interest expense of 0.24% relating to the Fund’s liability with respect to floating rate notes held by third parties in conjunction with inverse floater securities transactions by the Fund. The Fund also records offsetting interest income relating to the municipal obligation underlying such transactions, and as a result net asset value and performance have not been affected by this expense.
(3) The Fund’s distribution rate represents actual distributions paid to shareholders and is calculated by dividing the last distribution per share (annualized) by the net asset value.
(4) Taxable-equivalent figures assume a maximum 37.83% combined federal and state income tax rate. A lower tax rate would result in lower tax-equivalent figures.
(5) The Fund’s SEC yield is calculated by dividing the net investment income per share for the 30-day period by the offering price at the end of the period and annualizing the result.
(6) It is not possible to invest directly in an Index. The Index’s total return does not reflect the expenses that would have been incurred if an investor individually purchased or sold the securities represented in the Index. Index performance is available as of month end only.
(7) The Lipper Averages are the average annual total returns, at net asset value, of the funds that are in the same Lipper Classification as the Fund. It is not possible to invest in a Lipper Classification. Lipper Classifications may include insured and uninsured funds, as well as leveraged and unleveraged funds. The Lipper Michigan Municipal Debt Funds Classification contained 31, 31, 26 and 23 funds for the 6-month, 1-year, 5-year and 10-year time periods, respectively. Lipper Averages are available as of month end only.
(8) Rating Distribution is determined by dividing the total market value of the issues by the total investments of the Fund.
(9) Portfolio holdings information excludes securities held by special purpose vehicles in which the Fund holds a residual interest.
See Note 1I to the Fund’s financial statements.
7
Eaton Vance Minnesota Municipals Fund as of January 31, 2008
PERFORMANCE INFORMATION AND PORTFOLIO COMPOSITION
Performance(1) | | Class A | | Class B | | Class C | |
Share Class Symbol | | ETMNX | | EVMNX | | ECMNX | |
| | | | | | | |
Average Annual Total Returns (at net asset value) | | | | | | | |
Six Months | | 1.87 | % | 1.41 | % | 1.51 | % |
One Year | | 2.77 | | 2.02 | | 2.02 | |
Five Years | | 4.71 | | 3.96 | | N.A. | |
Ten Years | | 4.31 | | 3.54 | | N.A. | |
Life of Fund† | | 4.52 | | 4.63 | | 3.78 | |
| | | | | | | |
SEC Average Annual Total Returns (including sales charge or applicable CDSC) | | | | | |
Six Months | | -2.94 | % | -3.57 | % | 0.51 | % |
One Year | | -2.12 | | -2.90 | | 1.04 | |
Five Years | | 3.69 | | 3.62 | | N.A. | |
Ten Years | | 3.81 | | 3.54 | | N.A. | |
Life of Fund† | | 4.16 | | 4.63 | | 3.78 | |
†Inception date: Class A: 12/9/93; Class B: 7/29/91; Class C: 12/21/05
Total Annual | | | | | | | |
Operating Expenses(2)* | | Class A | | Class B | | Class C | |
| | | | | | | |
Expense Ratio | | 0.98 | % | 1.73 | % | 1.73 | % |
*From the Fund’s prospectus dated 10/5/07.
Distribution Rates/Yields | | Class A | | Class B | | Class C | |
| | | | | | | |
Distribution Rate(3) | | 4.27 | % | 3.52 | % | 3.51 | % |
Taxable-Equivalent Distribution Rate(3),(4) | | 7.13 | | 5.88 | | 5.86 | |
SEC 30-day Yield(5) | | 3.48 | | 2.91 | | 2.90 | |
Taxable-Equivalent SEC 30-day Yield(4),(5) | | 5.81 | | 4.86 | | 4.84 | |
Index Performance(6)
Lehman Brothers Municipal Bond Index (Average Annual Total Returns) | | | |
Six Months | | 3.71 | % |
One Year | | 4.93 | |
Five Years | | 4.61 | |
Ten Years | | 5.20 | |
Lipper Averages(7)
Lipper Minnesota Municipal Debt Funds Classification (Average Annual Total Returns) | | | |
Six Months | | 1.96 | % |
One Year | | 2.58 | |
Five Years | | 3.80 | |
Ten Years | | 4.17 | |
Portfolio Manager: Craig R. Brandon, CFA
Rating Distribution**(8)
By total Investments
** | The rating distribution presented above includes the ratings of securities held by special purpose vehicles in which the Fund holds a residual interest. See Note 1I to the Fund’s financial statements. Absent such securities, the Fund’s rating distribution at January 31, 2008, is as follows, and the average rating is AA+: |
AAA | | 57.4% |
AA | | 21.2% |
A | | 10.9% |
BBB | | 4.4% |
BB | | 1.2% |
Not Rated | | 4.9% |
Fund Statistics(9)
· Number of Issues: | | 72 | |
· Average Maturity: | | 21.1 years | |
· Average Effective Maturity: | | 11.0 years | |
· Average Call Protection: | | 7.3 years | |
· Average Dollar Price: | | $ | 98.55 | |
| | | | |
Past performance is no guarantee of future results. Returns are historical and are calculated by determining the percentage change in net asset value or offering price (as applicable) with all distributions reinvested. Investment return and principal value will fluctuate so that shares, when redeemed, may be worth more or less than their original cost. Performance is for the stated time period only; due to market volatility, the Fund’s current performance may be lower or higher than the quoted return. For performance as of the most recent month end, please refer to www.eatonvance.com.
(1) Average Annual Total Returns do not include the 4.75% maximum sales charge for Class A shares or the applicable contingent deferred sales charges (CDSC) for Class B and Class C shares. If sales charges were deducted, returns would be lower. SEC Average Annual Total Returns for Class A reflect the maximum 4.75% sales charge. SEC Average Annual Total Returns for Class B reflect the applicable CDSC based on the following schedule: 5% - 1st and 2nd years; 4% - 3rd year; 3% - 4th year; 2% - 5th year; 1% - 6th year. SEC Average Annual Total Returns for Class C reflect a 1% CDSC for the first year.
(2) Includes interest expense of 0.20% relating to the Fund’s liability with respect to floating rate notes held by third parties in conjunction with inverse floater securities transactions by the Fund. The Fund also records offsetting interest income relating to the municipal obligation underlying such transactions, and as a result net asset value and performance have not been affected by this expense.
(3) The Fund’s distribution rate represents actual distributions paid to shareholders and is calculated by dividing the last distribution per share (annualized) by the net asset value.
(4) Taxable-equivalent figures assume a maximum 40.10% combined federal and state income tax rate. A lower tax rate would result in lower tax-equivalent figures.
(5) The Fund’s SEC yield is calculated by dividing the net investment income per share for the 30-day period by the offering price at the end of the period and annualizing the result.
(6) It is not possible to invest directly in an Index. The Index’s total return does not reflect the expenses that would have been incurred if an investor individually purchased or sold the securities represented in the Index. Index performance is available as of month end only.
(7) The Lipper Averages are the average annual total returns, at net asset value, of the funds that are in the same Lipper Classification as the Fund. It is not possible to invest in a Lipper Classification. Lipper Classifications may include insured and uninsured funds, as well as leveraged and unleveraged funds. The Lipper Minnesota Municipal Debt Funds Classification contained 47, 47, 40 and 33 funds for the 6-month, 1-year, 5-year and 10-year time periods, respectively. Lipper Averages are available as of month end only.
(8) Rating Distribution is determined by dividing the total market value of the issues by the total investments of the Fund.
(9) Portfolio holdings information excludes securities held by special purpose vehicles in which the Fund holds a residual interest.
See Note 1I to the Fund’s financial statements.
8
Eaton Vance New Jersey Municipals Fund as of January 31, 2008
PERFORMANCE INFORMATION AND PORTFOLIO COMPOSITION
Performance(1) | | Class A | | Class B | | Class C | |
Share Class Symbol | | ETNJX | | EVNJX | | ECNJX | |
| | | | | | | |
Average Annual Total Returns (at net asset value) | | | | | | | |
Six Months | | -1.91 | % | -2.05 | % | -2.22 | % |
One Year | | -1.76 | | -2.28 | | -2.45 | |
Five Years | | 4.31 | | 3.58 | | N.A. | |
Ten Years | | 4.49 | | 3.75 | | N.A. | |
Life of Fund† | | 5.40 | | 5.19 | | 2.63 | |
| | | | | | | |
SEC Average Annual Total Returns (including sales charge or applicable CDSC) | | | | | |
Six Months | | -6.54 | % | -6.84 | % | -3.18 | % |
One Year | | -6.39 | | -6.98 | | -3.39 | |
Five Years | | 3.30 | | 3.24 | | N.A. | |
Ten Years | | 3.99 | | 3.75 | | N.A. | |
Life of Fund† | | 5.03 | | 5.19 | | 2.63 | |
†Inception date: Class A: 4/13/94; Class B: 1/8/91; Class C: 12/14/05
Total Annual | | | | | | | |
Operating Expenses(2)* | | Class A | | Class B | | Class C | |
| | | | | | | |
Expense Ratio | | 1.21 | % | 1.96 | % | 1.96 | % |
*From the Fund’s prospectus dated 10/5/07.
Distribution Rates/Yields | | Class A | | Class B | | Class C | |
| | | | | | | |
Distribution Rate(3) | | 4.59 | % | 4.42 | % | 3.80 | % |
Taxable-Equivalent Distribution Rate(3),(4) | | 7.76 | | 7.47 | | 6.42 | |
SEC 30-day Yield(5) | | 4.13 | | 4.15 | | 3.53 | |
Taxable-Equivalent SEC 30-day Yield(4),(5) | | 6.98 | | 7.01 | | 5.97 | |
Index Performance(6)
Lehman Brothers Municipal Bond Index (Average Annual Total Returns) | | | |
Six Months | | 3.71 | % |
One Year | | 4.93 | |
Five Years | | 4.61 | |
Ten Years | | 5.20 | |
Lipper Averages(7)
Lipper New Jersey Municipal Debt Funds Classification (Average Annual Total Returns) | | | |
Six Months | | 1.94 | % |
One Year | | 2.62 | |
Five Years | | 3.99 | |
Ten Years | | 4.16 | |
Portfolio Manager: Robert B. MacIntosh, CFA
Rating Distribution**(8)
By total investments

** | The rating distribution presented above includes the ratings of securities held by special purpose vehicles in which the Fund holds a residual interest. See Note 1I to the Fund’s financial statements. Absent such securities, the Fund’s rating distribution at January 31, 2008, is as follows, and the average rating is AA-: |
AAA | | 43.1% |
AA | | 15.8% |
A | | 17.9% |
BBB | | 13.8% |
BB | | 0.4% |
B | | 1.3% |
Not Rated | | 7.7% |
Fund Statistics(9)
· Number of Issues: | | 107 | |
· Average Maturity: | | 27.3 years | |
· Average Effective Maturity: | | 16.1 years | |
· Average Call Protection: | | 9.8 years | |
· Average Dollar Price: | | $ | 93.06 | |
| | | | |
Past performance is no guarantee of future results. Returns are historical and are calculated by determining the percentage change in net asset value or offering price (as applicable) with all distributions reinvested. Investment return and principal value will fluctuate so that shares, when redeemed, may be worth more or less than their original cost. Performance is for the stated time period only; due to market volatility, the Fund’s current performance may be lower or higher than the quoted return. For performance as of the most recent month end, please refer to www.eatonvance.com.
(1) Average Annual Total Returns do not include the 4.75% maximum sales charge for Class A shares or the applicable contingent deferred sales charges (CDSC) for Class B and Class C shares. If sales charges were deducted, returns would be lower. SEC Average Annual Total Returns for Class A reflect the maximum 4.75% sales charge. SEC Average Annual Total Returns for Class B reflect the applicable CDSC based on the following schedule: 5% - 1st and 2nd years; 4% - 3rd year; 3% - 4th year; 2% - 5th year; 1% - 6th year. SEC Average Annual Total Returns for Class C reflect a 1% CDSC for the first year.
(2) Includes interest expense of 0.42% relating to the Fund’s liability with respect to floating rate notes held by third parties in conjunction with inverse floater securities transactions by the Fund. The Fund also records offsetting interest income relating to the municipal obligation underlying such transactions, and as a result net asset value and performance have not been affected by this expense.
(3) The Fund’s distribution rate represents actual distributions paid to shareholders and is calculated by dividing the last distribution per share (annualized) by the net asset value.
(4) Taxable-equivalent figures assume a maximum 40.83% combined federal and state income tax rate. A lower tax rate would result in lower tax-equivalent figures.
(5) The Fund’s SEC yield is calculated by dividing the net investment income per share for the 30-day period by the offering price at the end of the period and annualizing the result.
(6) It is not possible to invest directly in an Index. The Index’s total return does not reflect the expenses that would have been incurred if an investor individually purchased or sold the securities represented in the Index. Index performance is available as of month end only.
(7) The Lipper Averages are the average annual total returns, at net assest value, of the funds that are in the same Lipper Classification as the Fund. It is not possible to invest in a Lipper Classification. Lipper Classifications may include insured and uninsured funds, as well as leveraged and unleveraged funds. The Lipper New Jersey Municipal Debt Funds Classification contained 51, 50, 44 and 37 funds for the 6-month, 1-year, 5-year and 10-year time periods, respectively. Lipper Averages are available as of month end only.
(8) Rating Distribution is determined by dividing the total market value of the issues by the total investments of the Fund.
(9) Portfolio holdings information excludes securities held by special purpose vehicles in which the Fund holds a residual interest.
See Note 1I to the Fund’s financial statements.
9
Eaton Vance Pennsylvania Municipals Fund as of January 31, 2008
PERFORMANCE INFORMATION AND PORTFOLIO COMPOSITION
Performance(1) | | Class A | | Class B | | Class C | |
Share Class Symbol | | EXPNX | | ELPNX | | EZPNX | |
| | | | | | | |
Average Annual Total Returns (at net asset value) | | | | | | | |
Six Months | | -0.75 | % | -1.13 | % | -1.12 | % |
One Year | | -0.28 | | -1.07 | | -1.07 | |
Five Years | | 4.59 | | 3.84 | | N.A. | |
Ten Years | | 4.29 | | 3.51 | | N.A. | |
Life of Fund† | | 5.23 | | 5.02 | | 2.55 | |
| | | | | | | |
SEC Average Annual Total Returns (including sales charge or applicable CDSC) | | | | | |
Six Months | | -5.49 | % | -5.98 | % | -2.09 | % |
One Year | | -5.06 | | -5.85 | | -2.02 | |
Five Years | | 3.58 | | 3.50 | | N.A. | |
Ten Years | | 3.78 | | 3.51 | | N.A. | |
Life of Fund† | | 4.86 | | 5.02 | | 2.55 | |
†Inception date: Class A: 6/1/94; Class B: 1/8/91; Class C: 1/13/06
Total Annual | | | | | | | |
Operating Expenses(2)* | | Class A | | Class B | | Class C | |
| | | | | | | |
Expense Ratio | | 1.34 | % | 2.09 | % | 2.09 | % |
*From the Fund’s prospectus dated 10/5/07.
Distribution Rates/Yields | | Class A | | Class B | | Class C | |
| | | | | | | |
Distribution Rate(3) | | 4.51 | % | 3.75 | % | 3.75 | % |
Taxable-Equivalent Distribution Rate(3),(4) | | 7.16 | | 5.95 | | 5.95 | |
SEC 30-day Yield(5) | | 3.80 | | 3.24 | | 3.24 | |
Taxable-Equivalent SEC 30-day Yield(4),(5) | | 6.03 | | 5.14 | | 5.14 | |
Index Performance(6)
Lehman Brothers Municipal Bond Index (Average Annual Total Returns) | | | |
Six Months | | 3.71 | % |
One Year | | 4.93 | |
Five Years | | 4.61 | |
Ten Years | | 5.20 | |
Lipper Averages(7)
Lipper Pennsylvania Municipal Debt Funds Classification (Average Annual Total Returns) | | | |
Six Months | | 1.84 | % |
One Year | | 2.54 | |
Five Years | | 3.87 | |
Ten Years | | 4.10 | |
Portfolio Manager: Adam A. Weigold, CFA
Rating Distribution**(8)
By total Investments
** | The rating distribution presented above includes the ratings of securities held by special purpose vehicles in which the Fund holds a residual interest. See Note 1I to the Fund’s financial statements. Absent such securities, the Fund’s rating distribution at January 31, 2008, is as follows, and the average rating is AA: |
AAA | | 60.7% |
AA | | 16.1% |
A | | 7.6% |
BBB | | 8.3% |
BB | | 0.8% |
Not Rated | | 6.5% |
Fund Statistics(9)
· Number of Issues: | | 120 | |
· Average Maturity: | | 22.8 years | |
· Average Effective Maturity: | | 14.4 years | |
· Average Call Protection: | | 8.8 years | |
· Average Dollar Price: | | $ | 98.10 | |
| | | | |
Past performance is no guarantee of future results. Returns are historical and are calculated by determining the percentage change in net asset value or offering price (as applicable) with all distributions reinvested. Investment return and principal value will fluctuate so that shares, when redeemed, may be worth more or less than their original cost. Performance is for the stated time period only; due to market volatility, the Fund’s current performance may be lower or higher than the quoted return. For performance as of the most recent month end, please refer to www.eatonvance.com.
(1) Average Annual Total Returns do not include the 4.75% maximum sales charge for Class A shares or the applicable contingent deferred sales charges (CDSC) for Class B and Class C shares. If sales charges were deducted, returns would be lower. SEC Average Annual Total Returns for Class A reflect the maximum 4.75% sales charge. SEC Average Annual Total Returns for Class B reflect the applicable CDSC based on the following schedule: 5% - 1st and 2nd years; 4% - 3rd year; 3% - 4th year; 2% - 5th year; 1% - 6th year. SEC Average Annual Total Returns for Class C reflect a 1% CDSC for the first year.
(2) Includes interest expense of 0.54% relating to the Fund’s liability with respect to floating rate notes held by third parties in conjunction with inverse floater securities transactions by the Fund. The Fund also records offsetting interest income relating to the municipal obligation underlying such transactions, and as a result net asset value and performance have not been affected by this expense.
(3) The Fund’s distribution rate represents actual distributions paid to shareholders and is calculated by dividing the last distribution per share (annualized) by the net asset value.
(4) Taxable-equivalent figures assume a maximum 37.00% combined federal and state income tax rate. A lower tax rate would result in lower tax-equivalent figures.
(5) The Fund’s SEC yield is calculated by dividing the net investment income per share for the 30-day period by the offering price at the end of the period and annualizing the result.
(6) It is not possible to invest directly in an Index. The Index’s total return does not reflect the expenses that would have been incurred if an investor individually purchased or sold the securities represented in the Index. Index performance is available as of month end only.
(7) The Lipper Averages are the average annual total returns, at net asset value, of the funds that are in the same Lipper Classification as the Fund. It is not possible to invest in a Lipper Classification. Lipper Classifications may include insured and uninsured funds, as well as leveraged and unleveraged funds. The Lipper Pennsylvania Municipal Debt Funds Classification contained 57, 57, 51 and 48 funds for the 6-month, 1-year, 5-year and 10-year time periods, respectively. Lipper Averages are available as of month end only.
(8) Rating Distribution is determined by dividing the total market value of the issues by the total investments of the Fund.
(9) Portfolio holdings information excludes securities held by special purpose vehicles in which the Fund holds a residual interest.
See Note 1I to the Fund’s financial statements.
10
Eaton Vance Arizona Municipals Fund as of January 31, 2008
PORTFOLIO OF INVESTMENTS (Unaudited)
Tax-Exempt Investments — 102.2%
Principal Amount
(000's omitted) | |
Security | |
Value | |
| Education — 2.8% | | | |
| $ | 1,500 | | | Arizona Board of Regents, University System Revenue,
5.00%, 6/1/33 | | $ | 1,561,980 | | |
| | 1,500 | | | Glendale Industrial Development Authority,
(Midwestern University), 5.00%, 5/15/25 | | | 1,570,245 | | |
| | | $ | 3,132,225 | | |
| Electric Utilities — 6.4% | | | |
| $ | 250 | | | Puerto Rico Electric Power Authority, DRIVERS,
Variable Rate, 10.08%, 7/1/25(1)(2) | | $ | 257,545 | | |
| | 750 | | | Puerto Rico Electric Power Authority, DRIVERS,
Variable Rate, 10.08%, 7/1/37(1)(2) | | | 737,895 | | |
| | 4,000 | | | Salt River Agriculture Improvements and Power District,
4.75%, 1/1/35 | | | 4,061,840 | | |
| | 1,000 | | | Salt River Agriculture Improvements and Power District,
5.00%, 1/1/31 | | | 1,034,140 | | |
| | 1,000 | | | Salt River Agriculture Improvements and Power District,
5.00%, 1/1/37 | | | 1,040,050 | | |
| | | $ | 7,131,470 | | |
| Escrowed / Prerefunded — 13.2% | | | |
| $ | 650 | | | Arizona Health Facilities Authority, (John C. Lincoln
Health Network), Prerefunded to 12/1/12,
5.75%, 12/1/32 | | $ | 741,994 | | |
| | 500 | | | Glendale Industrial Development Authority,
(Midwestern University), Prerefunded to 5/15/11,
5.75%, 5/15/21 | | | 555,335 | | |
| | 1,250 | | | Maricopa County Industrial Development Authority,
(Place Five and The Greenery), Escrowed to Maturity,
8.625%, 1/1/27 | | | 1,251,450 | | |
| | 7,500 | | | Maricopa County, Single Family, Escrowed to Maturity,
0.00%, 2/1/16 | | | 5,654,925 | | |
| | 6,500 | | | Phoenix Industrial Development Authority, Single Family,
Escrowed to Maturity, 0.00%, 12/1/14 | | | 5,225,350 | | |
| | 1,000 | | | Scottsdale Industrial Development Authority,
(Scottsdale Healthcare), Prerefunded to 12/01/11,
5.70%, 12/1/21 | | | 1,122,400 | | |
| | | $ | 14,551,454 | | |
| General Obligations — 3.6% | | | |
| $ | 1,125 | | | Puerto Rico, 0.00%, 7/1/18 | | $ | 731,149 | | |
| | 1,485 | | | Tempe, 3.75%, 7/1/24 | | | 1,419,021 | | |
| | 1,600 | | | Tucson, 5.375%, 7/1/21 | | | 1,847,392 | | |
| | | $ | 3,997,562 | | |
Principal Amount
(000's omitted) | |
Security | |
Value | |
| Health Care-Miscellaneous — 0.8% | | | |
| $ | 500 | | | Yavapai County Industrial Development Authority,
Health Care Institution Revenue Bonds, (West Yavapai
Guidance Clinic Project), 6.25%, 12/1/36 | | $ | 453,735 | | |
| | 500 | | | Yavapai County Industrial Development Authority,
Health Care Institution Revenue Bonds, (West Yavapai
Guidance Clinic Project), 6.625%, 8/15/24 | | | 484,865 | | |
| | | $ | 938,600 | | |
| Hospital — 8.2% | | | |
| $ | 1,275 | | | Glendale Industrial Development Authority,
(John C. Lincoln Health Network), 5.00%, 12/1/28 | | $ | 1,229,342 | | |
| | 750 | | | Glendale Industrial Development Authority,
(John C. Lincoln Health Network), 5.00%, 12/1/32 | | | 706,740 | | |
| | 500 | | | Glendale Industrial Development Authority,
(John C. Lincoln Health Network), 5.00%, 12/1/37 | | | 465,935 | | |
| | 1,750 | | | Maricopa County Industrial Development Authority,
(Catholic Healthcare), 5.25%, 7/1/32 | | | 1,777,212 | | |
| | 1,350 | | | Maricopa County Industrial Development Authority,
(Catholic Healthcare), 5.50%, 7/1/26 | | | 1,405,377 | | |
| | 2,500 | | | Maricopa County Industrial Development Authority,
(Mayo Clinic), 5.00%, 11/15/36 | | | 2,514,150 | | |
| | 1,000 | | | Winslow Industrial Development Authority,
(Winslow Memorial Hospital), 5.50%, 6/1/22 | | | 923,340 | | |
| | | $ | 9,022,096 | | |
| Industrial Development Revenue — 0.6% | | | |
| $ | 650 | | | Phoenix Industrial Development Authority,
(America West Airlines, Inc.), (AMT), 6.25%, 6/1/19 | | $ | 624,715 | | |
| | | $ | 624,715 | | |
| Insured-Education — 2.6% | | | |
| $ | 1,000 | | | North Campus Facilities LLC, (Northern Arizona University),
(AMBAC), 5.00%, 6/1/25 | | $ | 1,050,320 | | |
| | 1,800 | | | Northern Arizona University, (Research Projects), (AMBAC),
5.00%, 9/1/30 | | | 1,834,794 | | |
| | | $ | 2,885,114 | | |
| Insured-Electric Utilities — 4.2% | | | |
| $ | 750 | | | Maricopa County Pollution Control Corp.,
(El Paso Electric Co.), (FGIC), 4.80%, 8/1/40 | | $ | 720,675 | | |
| | 1,000 | | | Mesa Utility System, (FGIC), 5.00%, 7/1/23 | | | 1,091,870 | | |
| | 1,120 | | | Mesa Utility System, (FSA), 4.25%, 7/1/29 | | | 1,092,112 | | |
| | 380 | | | Pima County Industrial Development Authority,
(Tucson Electric Power Co.), (FSA), 7.25%, 7/15/10 | | | 392,354 | | |
See notes to financial statements
15
Eaton Vance Arizona Municipals Fund as of January 31, 2008
PORTFOLIO OF INVESTMENTS (Unaudited) CONT'D
Principal Amount
(000's omitted) | |
Security | |
Value | |
| Insured-Electric Utilities (continued) | | | |
| $ | 1,200 | | | Puerto Rico Electric Power Authority, (MBIA),
5.50%, 7/1/16(3) | | $ | 1,349,876 | | |
| | | $ | 4,646,887 | | |
| Insured-Escrowed / Prerefunded — 7.0% | | | |
| $ | 1,000 | | | Maricopa County Industrial Development Authority,
(Samaritan Health Services), (MBIA), Escrowed to Maturity,
7.00%, 12/1/16 | | $ | 1,240,780 | | |
| | 1,000 | | | Mesa Industrial Development Authority, (Discovery Health
System), (MBIA), Prerefunded to 1/1/10,
5.625%, 1/1/29 | | | 1,068,130 | | |
| | 1,000 | | | Pima County Industrial Development Authority, (Carondolet
Health Care Corp.), (MBIA), Escrowed to Maturity,
5.25%, 7/1/11 | | | 1,090,010 | | |
| | 2,000 | | | Puerto Rico Electric Power Authority, (FSA),
Prerefunded to 7/1/10, 5.25%, 7/1/29(3) | | | 2,157,845 | | |
| | 500 | | | Puerto Rico Electric Power Authority, (MBIA),
Prerefunded to 7/1/13, 5.00%, 7/1/32 | | | 559,315 | | |
| | 500 | | | Tucson Street and Highway Revenue, (FGIC),
Prerefunded to 7/1/10, 5.00%, 7/1/18 | | | 531,365 | | |
| | 1,000 | | | Yuma Industrial Development Authority, (Yuma Regional
Medical Center), (FSA), Prerefunded to 8/1/11,
5.00%, 8/1/31 | | | 1,093,440 | | |
| | | $ | 7,740,885 | | |
| Insured-General Obligations — 9.6% | | | |
| $ | 400 | | | Flagstaff, (AMBAC), 3.25%, 7/1/23 | | $ | 350,736 | | |
| | 1,300 | | | Goodyear, (MBIA), 3.00%, 7/1/26 | | | 1,055,444 | | |
| | 2,920 | | | Maricopa County Elementry School District No. 3,
(FSA), 5.00%, 7/1/25 | | | 3,250,544 | | |
| | 1,425 | | | Maricopa County Unified High School District No. 2, (MBIA),
5.00%, 7/1/20 | | | 1,532,673 | | |
| | 1,200 | | | Maricopa County Unified School District No. 11, (MBIA),
5.00%, 7/1/25 | | | 1,266,996 | | |
| | 2,350 | | | Pinal County Unified School District No. 43, Apache Junction,
(FSA), 5.00%, 7/1/24 | | | 2,605,280 | | |
| | 500 | | | Puerto Rico, (FSA), Variable Rate, 8.682%, 7/1/27(1)(2) | | | 612,130 | | |
| | | $ | 10,673,803 | | |
| Insured-Hospital — 3.9% | | | |
| $ | 1,195 | | | Arizona Health Facilities Authority, (Arizona Healthcare
Systems), (FGIC), 5.50%, 6/1/15 | | $ | 1,341,937 | | |
| | 1,000 | | | Arizona Health Facilities Authority, (Northern Arizona
Healthcare System), (AMBAC), 4.75%, 10/1/30 | | | 961,670 | | |
| | 2,000 | | | Maricopa County Industrial Development Authority, (Mayo
Clinic Hospital), (AMBAC), 5.25%, 11/15/37(4) | | | 2,028,420 | | |
| | | $ | 4,332,027 | | |
Principal Amount
(000's omitted) | |
Security | |
Value | |
| Insured-Housing — 0.9% | | | |
| $ | 1,000 | | | Phoenix Industrial Development Authority,
Student Housing Revenue, (Downtown Phoenix Student,
LLC), (AMBAC), 4.50%, 7/1/42 | | $ | 961,890 | | |
| | | $ | 961,890 | | |
Insured-Lease Revenue / Certificates of
Participation — 3.2% | | | |
| $ | 1,000 | | | Arizona State University, (Research Infrastructure Projects),
(AMBAC), 5.00%, 9/1/30 | | $ | 1,019,330 | | |
| | 550 | | | Marana Municipal Facilities, (Municipal Property Corp.),
(AMBAC), 5.00%, 7/1/28 | | | 564,267 | | |
| | 500 | | | Nogales Municipal Development Authority, Inc., (MBIA),
4.50%, 6/1/31 | | | 471,350 | | |
| | 480 | | | Prescott Municipal Property Corp., (MBIA), 5.00%, 7/1/34 | | | 490,680 | | |
| | 570 | | | Puerto Rico Public Finance Corp., (Commonwealth
Appropriation), (AMBAC), 5.125%, 6/1/24 | | | 633,264 | | |
| | 300 | | | Puerto Rico Public Finance Corp., (Commonwealth
Appropriation), (AMBAC), 5.125%, 6/1/24(3) | | | 333,305 | | |
| | | $ | 3,512,196 | | |
| Insured-Special Tax Revenue — 13.6% | | | |
| $ | 1,000 | | | Arizona Sports and Tourism Authority, (Multipurpose
Stadium Facility), (MBIA), 4.50%, 7/1/24 | | $ | 1,004,160 | | |
| | 1,000 | | | Arizona Tourism and Sports Authority, (Multipurpose
Stadium Facility), (MBIA), 5.00%, 7/1/25 | | | 1,030,060 | | |
| | 750 | | | Arizona Tourism and Sports Authority, (Multipurpose
Stadium Facility), (MBIA), 5.00%, 7/1/28 | | | 765,112 | | |
| | 5,000 | | | Downtown Phoenix Hotel Corp., (FGIC), 5.00%, 7/1/36 | | | 4,921,500 | | |
| | 2,000 | | | Glendale Transportation Excise Tax Revenue, (MBIA),
4.50%, 7/1/32 | | | 1,949,280 | | |
| | 2,040 | | | Puerto Rico Infrastructure Financing Authority, (AMBAC),
5.50%, 7/1/27(3) | | | 2,190,787 | | |
| | 3,670 | | | Puerto Rico Sales Tax Financing, (AMBAC), 0.00%, 8/1/54 | | | 297,086 | | |
| | 680 | | | Puerto Rico Sales Tax Financing, (MBIA), 0.00%, 8/1/44 | | | 97,247 | | |
| | 1,345 | | | Puerto Rico Sales Tax Financing, (MBIA), 0.00%, 8/1/45 | | | 182,167 | | |
| | 1,080 | | | Puerto Rico Sales Tax Financing, (MBIA), 0.00%, 8/1/46 | | | 138,370 | | |
| | 2,000 | | | Queen Creek, Excise Tax & State Shared Revenue, (MBIA),
5.00%, 8/1/27 | | | 2,096,320 | | |
| | 350 | | | Scottsdale, (Municipal Property Corp.), (AMBAC),
4.50%, 7/1/35 | | | 343,228 | | |
| | | $ | 15,015,317 | | |
| Insured-Transportation — 7.9% | | | |
| $ | 3,000 | | | Phoenix Civic Improvement Corp., Airport Revenue, (FGIC),
(AMT), 5.25%, 7/1/27 | | $ | 3,033,390 | | |
| | 1,725 | | | Pima County, (AMBAC), 3.25%, 7/1/22 | | | 1,527,574 | | |
See notes to financial statements
16
Eaton Vance Arizona Municipals Fund as of January 31, 2008
PORTFOLIO OF INVESTMENTS (Unaudited) CONT'D
Principal Amount
(000's omitted) | |
Security | |
Value | |
| Insured-Transportation (continued) | | | |
| $ | 1,900 | | | Puerto Rico Highway and Transportation Authority, (AGC),
(CIFG), 5.25%, 7/1/41(3) | | $ | 2,084,766 | | |
| | 2,000 | | | Puerto Rico Highway and Transportation Authority, (FGIC),
5.25%, 7/1/39 | | | 2,048,220 | | |
| | | $ | 8,693,950 | | |
| Insured-Water and Sewer — 2.8% | | | |
| $ | 1,000 | | | Cottonwood Property Corp., Water Revenue, (XLCA),
5.00%, 7/1/29 | | $ | 1,003,500 | | |
| | 1,000 | | | Phoenix Civic Improvement Corp., Wastewater System,
(MBIA), 5.00%, 7/1/29 | | | 1,027,280 | | |
| | 1,000 | | | Phoenix Civic Improvement Corp., Water System Revenue,
(FGIC), 5.00%, 7/1/22 | | | 1,046,270 | | |
| | | $ | 3,077,050 | | |
| Lease Revenue / Certificates of Participation — 0.7% | | | |
| $ | 750 | | | Arizona Game and Fish Department & Commission,
(AGF Adminstration Building), 5.00%, 7/1/32 | | $ | 749,445 | | |
| | | $ | 749,445 | | |
| Other Revenue — 2.1% | | | |
| $ | 1,750 | | | Arizona Health Facilities Authority, (Blood Systems, Inc.),
4.75%, 4/1/25 | | $ | 1,724,643 | | |
| | 4,400 | | | Children's Trust Fund, PR, Tobacco Settlement,
0.00%, 5/15/50 | | | 254,452 | | |
| | 10,765 | | | Children's Trust Fund, PR, Tobacco Settlement,
0.00%, 5/15/55 | | | 377,098 | | |
| | | $ | 2,356,193 | | |
| Senior Living / Life Care — 1.5% | | | |
| $ | 1,800 | | | Arizona Health Facilities Authority,
(Care Institute, Inc. - Mesa), 7.625%, 1/1/26(5) | | $ | 1,662,876 | | |
| | | $ | 1,662,876 | | |
| Special Tax Revenue — 3.8% | | | |
| $ | 2,425 | | | Puerto Rico Sales Tax Financing, 5.25%, 8/1/57 | | $ | 2,476,847 | | |
| | 1,750 | | | Scottsdale, (Municipal Property Corp.), 4.25%, 7/1/31 | | | 1,688,978 | | |
| | | $ | 4,165,825 | | |
| Student Loan — 1.8% | | | |
| $ | 2,000 | | | Arizona Educational Loan Marketing Corp., (AMT),
6.30%, 12/1/08 | | $ | 2,012,340 | | |
| | | $ | 2,012,340 | | |
Principal Amount
(000's omitted) | |
Security | |
Value | |
| Water and Sewer — 1.0% | |
| $ | 1,000 | | | Central Arizona Water Conservation District,
5.50%, 11/1/09 | | $ | 1,058,530 | | |
| | | $ | 1,058,530 | | |
Total Tax-Exempt Investments — 102.2%
(identified cost $108,671,289) | | $ | 112,942,450 | | |
| Other Assets, Less Liabilities — (2.2)% | | | | $ | (2,384,337 | ) | |
| Net Assets — 100.0% | | | | $ | 110,558,113 | | |
AGC - Assured Guaranty Corp.
AMBAC - AMBAC Financial Group, Inc.
AMT - Interest earned from these securities may be considered a tax preference item for purposes of the Federal Alternative Minimum Tax.
CIFG - CIFG Assurance North America, Inc.
DRIVERS - Derivative Inverse Tax-Exempt Receipts
FGIC - Financial Guaranty Insurance Company
FSA - Financial Security Assurance, Inc.
MBIA - Municipal Bond Insurance Association
XLCA - XL Capital Assurance, Inc.
The Fund invests primarily in debt securities issued by Arizona municipalities. The ability of the issuers of the debt securities to meet their obligations may be affected by economic developments in a specific industry or municipality. In order to reduce the risk associated with such economic developments, at January 31, 2008, 56.3% of total investments are backed by bond insurance of various financial institutions and financial guaranty assurance agencies. The aggregate percentage insured by an individual financial institution ranged from 0.9% to 16.3% of total investments.
(1) Security exempt from registration under Rule 144A of the Securities Act of 1933. These securities may be sold in transactions exempt from registration, normally to qualified institutional buyers. At January 31, 2008, the aggregate value of the securities is $1,607,570 or 1.5% of the Fund's net assets.
(2) Security has been issued as a leveraged inverse floater bond. The stated interest rate represents the rate in effect at January 31, 2008.
(3) Security represents the underlying municipal obligation of an inverse floating rate obligation held by the Fund.
(4) Security (or a portion thereof) has been segregated to cover margin requirements on open financial futures contracts.
(5) Security is in default with respect to scheduled principal payments.
See notes to financial statements
17
Eaton Vance Colorado Municipals Fund as of January 31, 2008
PORTFOLIO OF INVESTMENTS (Unaudited)
| Tax-Exempt Investments — 99.1% | | | |
Principal Amount
(000's omitted) | |
Security | |
Value | |
| Education — 2.5% | | | |
| $ | 1,000 | | | Colorado Educational and Cultural Facilities Authority,
(Alexander Dawson School), 5.30%, 2/15/29 | | $ | 1,015,740 | | |
| | | $ | 1,015,740 | | |
| Electric Utilities — 2.5% | | | |
| $ | 500 | | | Colorado Springs Utilities, 4.75%, 11/15/34 | | $ | 504,735 | | |
| | 125 | | | Puerto Rico Electric Power Authority, DRIVERS, Variable Rate,
10.08%, 7/1/25(1)(2) | | | 128,772 | | |
| | 375 | | | Puerto Rico Electric Power Authority, DRIVERS, Variable Rate,
10.08%, 7/1/37(1)(2) | | | 368,947 | | |
| | | $ | 1,002,454 | | |
| Escrowed / Prerefunded — 11.0% | | | |
| $ | 350 | | | Aspen Valley Hospital District, Prerefunded to 4/15/10,
6.80%, 10/15/24 | | $ | 382,263 | | |
| | 500 | | | Colorado Health Facilities Authority, (Portercare Adventist
Health), Prerefunded to 11/15/11, 6.50%, 11/15/31 | | | 575,515 | | |
| | 975 | | | Colorado Water Resources and Power Development Authority,
Prerefunded to 9/1/11, 5.00%, 9/1/21 | | | 1,059,493 | | |
| | 3,000 | | | Dawson Ridge Metropolitan District #1, Escrowed to Maturity,
0.00%, 10/1/22 | | | 1,600,500 | | |
| | 715 | | | University of Colorado Hospital Authority,
Prerefunded to 11/15/11, 5.60%, 11/15/25 | | | 790,668 | | |
| | | $ | 4,408,439 | | |
| Hospital — 9.6% | | | |
| $ | 500 | | | Aspen Valley Hospital District, 5.00%, 10/15/26 | | $ | 497,860 | | |
| | 950 | | | Colorado Health Facilities Authority, (Adventist Health/Sunbelt),
Variable Rate, 5.25%, 11/15/35 | | | 964,963 | | |
| | 750 | | | Colorado Health Facilities Authority, (Catholic Health Initiatives),
4.50%, 9/1/38 | | | 711,210 | | |
| | 500 | | | Colorado Health Facilities Authority, (Parkview Medical Center),
5.00%, 9/1/25 | | | 503,730 | | |
| | 320 | | | Colorado Health Facilities Authority, (Parkview Medical Center),
5.00%, 9/1/25 | | | 323,104 | | |
| | 350 | | | Colorado Health Facilities Authority, (Parkview Medical Center),
5.00%, 9/1/37 | | | 339,213 | | |
| | 500 | | | Colorado Health Facilities Authority, (Vail Valley Medical Center),
5.80%, 1/15/27 | | | 509,105 | | |
| | | $ | 3,849,185 | | |
Principal Amount
(000's omitted) | |
Security | |
Value | |
| Housing — 5.5% | | | |
| $ | 990 | | | Colorado Housing and Finance Authority, (Birchwood Manor
Project), (GNMA), (AMT), 5.50%, 9/20/36 | | $ | 999,682 | | |
| | 865 | | | Denver, Multifamily, (Bank Lofts), (FHA), (AMT),
6.15%, 12/1/16 | | | 866,609 | | |
| | 325 | | | Lake Creek, (Affordable Housing Corp.), 6.25%, 12/1/23 | | | 336,547 | | |
| | | $ | 2,202,838 | | |
| Industrial Development Revenue — 6.8% | | | |
| $ | 500 | | | Colorado Health Facilities Authority, (Waste Management, Inc.),
(AMT), 5.70%, 7/1/18 | | $ | 536,740 | | |
| | 230 | | | Denver City and County Special Facilities, (United Airlines),
(AMT), 5.25%, 10/1/32 | | | 196,077 | | |
| | 220 | | | Denver City and County Special Facilities, (United Airlines),
(AMT), 5.75%, 10/1/32 | | | 200,963 | | |
| | 580 | | | Fort Collins Pollution Control Revenue, (Anheuser-Busch
Co., Inc.), 4.70%, 9/1/40 | | | 541,732 | | |
| | 340 | | | Park Meadows Business Improvement District,
5.35%, 12/1/31 | | | 331,262 | | |
| | 500 | | | Puerto Rico Port Authority, (American Airlines), (AMT),
6.25%, 6/1/26 | | | 457,455 | | |
| | 525 | | | Virgin Islands Public Financing Authority, (HOVENSA LLC),
(AMT), 4.70%, 7/1/22 | | | 471,970 | | |
| | | $ | 2,736,199 | | |
| Insured-Education — 6.7% | | | |
| $ | 1,900 | | | Colorado Educational and Cultural Facilities Authority,
(University of Denver), (FGIC), 5.00%, 3/1/35 | | $ | 2,027,661 | | |
| | 610 | | | Colorado School of Mines, (MBIA), 0.00%, 12/1/21 | | | 328,705 | | |
| | 320 | | | University of Northern Colorado, (FSA), 5.00%, 6/1/35 | | | 331,194 | | |
| | | $ | 2,687,560 | | |
| Insured-Electric Utilities — 2.2% | | | |
| $ | 750 | | | Arkansas River Power Authority, (XLCA), 5.875%, 10/1/26 | | $ | 887,775 | | |
| | | $ | 887,775 | | |
| Insured-General Obligations — 10.7% | | | |
| $ | 270 | | | Castle Pines North Metropolitan District, (FSA),
5.00%, 12/1/27 | | $ | 282,533 | | |
| | 1,000 | | | Castlewood Ranch Metropolitan District, (XLCA),
4.25%, 12/1/34 | | | 897,970 | | |
| | 715 | | | McKay Landing Metropolitan District No. 2, (AMBAC),
4.25%, 12/1/36 | | | 666,037 | | |
| | 500 | | | Moffat County School District No. RE001, (FSA),
5.25%, 12/1/27 | | | 540,860 | | |
| | 1,000 | | | Pueblo County School District #70, (FGIC),
5.00%, 12/1/19 | | | 1,110,140 | | |
See notes to financial statements
18
Eaton Vance Colorado Municipals Fund as of January 31, 2008
PORTFOLIO OF INVESTMENTS (Unaudited) CONT'D
Principal Amount
(000's omitted) | |
Security | |
Value | |
| Insured-General Obligations (continued) | | | |
| $ | 200 | | | Puerto Rico, (FSA), Variable Rate,
8.682%, 7/1/27(1)(2) | | $ | 244,852 | | |
| | 500 | | | West Metropolitan Fire Protection District, (MBIA),
5.25%, 12/1/21 | | | 551,025 | | |
| | | $ | 4,293,417 | | |
| Insured-Housing — 1.9% | | | |
| $ | 750 | | | Denver City and County Housing Authority, Capital Fund
Program Revenue, (Three Towers Rehabilitation Project),
(FSA), (AMT), 5.20%, 11/1/27 | | $ | 750,105 | | |
| | | $ | 750,105 | | |
Insured-Lease Revenue / Certificates of
Participation — 3.3% | | | |
| $ | 795 | | | Puerto Rico Public Finance Corp., (Commonwealth
Appropriation), (AMBAC), 5.125%, 6/1/24 | | $ | 883,237 | | |
| | 405 | | | Puerto Rico Public Finance Corp., (Commonwealth
Appropriation), (AMBAC), 5.125%, 6/1/24(3) | | | 449,962 | | |
| | | $ | 1,333,199 | | |
| Insured-Special Tax Revenue — 9.4% | | | |
| $ | 500 | | | Denver Convention Center, (XLCA), 4.75%, 12/1/35 | | $ | 470,210 | | |
| | 1,500 | | | Denver Convention Center, (XLCA), 5.125%, 12/1/26 | | | 1,502,295 | | |
| | 830 | | | Regional Transportation District, (Fastracks Project), (AMBAC),
4.375%, 11/1/36 | | | 787,770 | | |
| | 1,000 | | | Sand Creek Metropolitan District, (XLCA), 5.375%, 12/1/27 | | | 1,024,030 | | |
| | | $ | 3,784,305 | | |
| Insured-Transportation — 16.9% | | | |
| $ | 1,000 | | | Denver, City and County Airport Revenue, (MBIA), (AMT),
5.00%, 11/15/30 | | $ | 985,210 | | |
| | 2,750 | | | E-470 Colorado Public Highway Authority, (MBIA),
0.00%, 9/1/16 | | | 1,890,048 | | |
| | 1,750 | | | Northwest Parkway Public Highway Authority, (FSA),
Prerefunded to 6/15/11, 5.25%, 6/15/41(4) | | | 1,926,575 | | |
| | 3,095 | | | Puerto Rico Highway and Transportation Authority, (AMBAC),
0.00%, 7/1/18 | | | 2,011,471 | | |
| | | $ | 6,813,304 | | |
| Insured-Water and Sewer — 0.4% | | | |
| $ | 150 | | | Colorado Water Resources and Power Development Authority,
(Colorado UTE Electric Association), (FSA),
4.375%, 8/1/35 | | $ | 145,859 | | |
| | | $ | 145,859 | | |
Principal Amount
(000's omitted) | |
Security | |
Value | |
| Senior Living / Life Care — 3.5% | | | |
| $ | 400 | | | Colorado Health Facilities Authority, (Covenant Retirement
Communities, Inc.), 5.00%, 12/1/35 | | $ | 354,276 | | |
| | 750 | | | Colorado Health Facilities Authority, (Evangelical Lutheran
Project), 5.25%, 6/1/36 | | | 742,845 | | |
| | 425 | | | Logan County Industrial Development, (TLC Care Choices, Inc.),
6.875%, 12/1/23(5) | | | 328,631 | | |
| | | $ | 1,425,752 | | |
| Special Tax Revenue — 2.8% | | | |
| $ | 400 | | | Bachelor Gulch Metropolitan District, 6.70%, 11/15/19 | | $ | 411,548 | | |
| | 360 | | | Bell Mountain Ranch Metropolitan District, 6.625%, 11/15/25 | | | 365,303 | | |
| | 350 | | | Black Hawk Device Tax, 5.00%, 12/1/18 | | | 349,541 | | |
| | | $ | 1,126,392 | | |
| Transportation — 1.8% | | | |
| $ | 300 | | | Eagle County, (Eagle County Airport Terminal), (AMT),
5.25%, 5/1/20 | | $ | 285,873 | | |
| | 500 | | | Walker Field Public Airport Authority, 4.75%, 12/1/27 | | | 454,745 | | |
| | | $ | 740,618 | | |
| Water and Sewer — 1.6% | | | |
| $ | 540 | | | Colorado Water Resources and Power Development Authority,
5.50%, 9/1/22 | | $ | 628,501 | | |
| | | $ | 628,501 | | |
Total Tax-Exempt Investments — 99.1%
(identified cost $39,068,875) | | $ | 39,831,642 | | |
| Other Assets, Less Liabilities — 0.9% | | $ | 356,158 | | |
| Net Assets — 100.0% | | $ | 40,187,800 | | |
AMBAC - AMBAC Financial Group, Inc.
AMT - Interest earned from these securities may be considered a tax preference item for purposes of the Federal Alternative Minimum Tax.
DRIVERS - Derivative Inverse Tax-Exempt Receipts
FGIC - Financial Guaranty Insurance Company
FHA - Federal Housing Administration
FSA - Financial Security Assurance, Inc.
GNMA - Government National Mortgage Association (Ginnie Mae)
MBIA - Municipal Bond Insurance Association
XLCA - XL Capital Assurance, Inc.
See notes to financial statements
19
Eaton Vance Colorado Municipals Fund as of January 31, 2008
PORTFOLIO OF INVESTMENTS (Unaudited) CONT'D
The Fund invests primarily in debt securities issued by Colorado municipalities. The ability of the issuers of the debt securities to meet their obligations may be affected by economic developments in a specific industry or municipality. In order to reduce the risk associated with such economic developments, at January 31, 2008, 52.0% of total investments are backed by bond insurance of various financial institutions and financial guaranty assurance agencies. The aggregate percentage insured by an individual financial institution ranged from 7.9% to 12.1% of total investments.
(1) Security exempt from registration under Rule 144A of the Securities Act of 1933. These securities may be sold in transactions exempt from registration, normally to qualified institutional buyers. At January 31, 2008, the aggregate value of the securities is $742,571 or 1.8% of the Fund's net assets.
(2) Security has been issued as a leveraged inverse floater bond. The stated interest rate represents the rate in effect at January 31, 2008.
(3) Security represents the underlying municipal obligation of an inverse floating rate obligation held by the Fund.
(4) Security (or a portion thereof) has been segregated to cover margin requirements on open financial futures contracts.
(5) Security is in default and making only partial interest payments.
See notes to financial statements
20
Eaton Vance Connecticut Municipals Fund as of January 31, 2008
PORTFOLIO OF INVESTMENTS (Unaudited)
| Tax-Exempt Investments — 107.1% | | | |
Principal Amount
(000's omitted) | |
Security | |
Value | |
| Education — 6.2% | | | |
| $ | 2,500 | | | Connecticut Health and Educational Facilities Authority,
(University of Hartford), (RADIAN), 5.25%, 7/1/32 | | $ | 2,537,950 | | |
| | 4,220 | | | Connecticut Health and Educational Facilities Authority,
(Yale University), 5.00%, 7/1/42 | | | 4,354,027 | | |
| | 1,350 | | | University of Connecticut, 5.00%, 5/15/23 | | | 1,421,671 | | |
| | | $ | 8,313,648 | | |
| Electric Utilities — 3.5% | | | |
| $ | 3,135 | | | Connecticut Development Authority, (Connecticut Light and
Power), 5.85%, 9/1/28 | | $ | 3,211,902 | | |
| | 1,500 | | | Connecticut Development Authority, Solid Waste Disposal,
(PSEG Power LLC), (AMT), 5.75%, 11/1/37 | | | 1,515,660 | | |
| | | $ | 4,727,562 | | |
| Escrowed / Prerefunded — 4.6% | | | |
| $ | 3,010 | | | Connecticut Clean Water Fund, Prerefunded to 10/1/11,
5.50%, 10/1/19 | | $ | 3,329,391 | | |
| | 1,500 | | | Connecticut Health and Educational Facilities Authority, (Loomis
Chaffee School), Prerefunded to 7/1/11, 5.25%, 7/1/31 | | | 1,650,360 | | |
| | 795 | | | Puerto Rico Electric Power Authority, Prerefunded to 7/1/13,
5.125%, 7/1/29 | | | 894,295 | | |
| | 170 | | | Puerto Rico Public Finance Corp., Escrowed to Maturity,
6.00%, 8/1/26 | | | 208,466 | | |
| | | $ | 6,082,512 | | |
| General Obligations — 6.2% | | | |
| $ | 1,750 | | | Connecticut, 0.00%, 11/1/09 | | $ | 1,683,972 | | |
| | 1,475 | | | North Haven, 5.00%, 7/15/23 | | | 1,655,584 | | |
| | 1,490 | | | North Haven, 5.00%, 7/15/25 | | | 1,664,896 | | |
| | 1,065 | | | Puerto Rico, 0.00%, 7/1/15 | | | 807,621 | | |
| | 400 | | | Redding, 5.50%, 10/15/18 | | | 471,720 | | |
| | 650 | | | Redding, 5.625%, 10/15/19 | | | 774,722 | | |
| | 535 | | | Wilton, 5.25%, 7/15/18 | | | 624,495 | | |
| | 535 | | | Wilton, 5.25%, 7/15/19 | | | 625,153 | | |
| | | $ | 8,308,163 | | |
| Housing — 2.1% | | | |
| $ | 780 | | | Connecticut Housing Finance Authority, 4.70%, 5/15/28 | | $ | 783,284 | | |
| | 2,000 | | | Connecticut Housing Finance Authority, (AMT),
5.15%, 5/15/38 | | | 1,983,160 | | |
| | | $ | 2,766,444 | | |
Principal Amount
(000's omitted) | |
Security | |
Value | |
| Industrial Development Revenue — 9.1% | | | |
| $ | 1,500 | | | Connecticut Development Authority,
(Mystic Marinelife Aquarium), 4.75%, 5/1/42 | | $ | 1,421,085 | | |
| | 3,065 | | | Connecticut Development Authority, Airport Facility,
(Signature Flight), (AMT), 6.625%, 12/1/14 | | | 3,066,042 | | |
| | 4,500 | | | Eastern Connecticut Resource Recovery Authority,
(Wheelabrator Lisbon), (AMT), 5.50%, 1/1/20 | | | 4,493,925 | | |
| | 700 | | | Puerto Rico Port Authority, (American Airlines), (AMT),
6.25%, 6/1/26 | | | 640,437 | | |
| | 1,350 | | | Sprague Environmental Improvement,
(International Paper Co.), (AMT), 5.70%, 10/1/21 | | | 1,355,508 | | |
| | 1,320 | | | Virgin Islands Public Financing Authority, (HOVENSA LLC),
(AMT), 4.70%, 7/1/22 | | | 1,186,667 | | |
| | | $ | 12,163,664 | | |
| Insured-Education — 10.7% | | | |
| $ | 1,550 | | | Connecticut Health and Educational Facilities Authority,
(Connecticut College), (MBIA), 5.00%, 7/1/32 | | $ | 1,579,373 | | |
| | 1,950 | | | Connecticut Health and Educational Facilities Authority,
(Loomis Chaffee School), (AMBAC), 5.25%, 7/1/30 | | | 2,168,302 | | |
| | 2,050 | | | Connecticut Health and Educational Facilities Authority,
(Loomis Chaffee School), (AMBAC), 5.25%, 7/1/31 | | | 2,285,381 | | |
| | 5,305 | | | Connecticut Health and Educational Facilities Authority,
(Trinity College), (MBIA), 5.50%, 7/1/21 | | | 6,203,190 | | |
| | 1,000 | | | Connecticut Health and Educational Facilities Authority,
(Westminster School), (MBIA), 5.00%, 7/1/29 | | | 1,009,430 | | |
| | 1,000 | | | University of Connecticut, (FGIC), 5.00%, 2/15/24 | | | 1,069,920 | | |
| | | $ | 14,315,596 | | |
| Insured-Electric Utilities — 6.2% | | | |
| $ | 4,000 | | | Puerto Rico Electric Power Authority, (FGIC),
5.25%, 7/1/35 | | $ | 4,139,040 | | |
| | 750 | | | Puerto Rico Electric Power Authority, (MBIA),
4.75%, 7/1/33(1) | | | 728,945 | | |
| | 3,000 | | | Puerto Rico Electric Power Authority, (MBIA),
5.50%, 7/1/16(1) | | | 3,374,690 | | |
| | | $ | 8,242,675 | | |
| Insured-Escrowed / Prerefunded — 6.5% | | | |
| $ | 1,500 | | | Connecticut, (FSA), Prerefunded to 10/15/12,
5.00%, 10/15/19 | | $ | 1,656,255 | | |
| | 1,000 | | | Connecticut Health and Educational Facilities Authority,
(Greenwich Academy), (FSA), Prerefunded to 3/1/11,
5.00%, 3/1/32 | | | 1,085,230 | | |
| | 1,000 | | | Connecticut Special Tax Transportation Infrastructure, (FSA),
Prerefunded to 10/1/11, 5.00%, 10/1/21 | | | 1,087,950 | | |
See notes to financial statements
21
Eaton Vance Connecticut Municipals Fund as of January 31, 2008
PORTFOLIO OF INVESTMENTS (Unaudited) CONT'D
Principal Amount
(000's omitted) | |
Security | |
Value | |
| Insured-Escrowed / Prerefunded (continued) | | | |
| $ | 515 | | | Puerto Rico, (FGIC), Prerefunded to 7/1/12,
5.00%, 7/1/32 | | $ | 567,489 | | |
| | 2,500 | | | Puerto Rico Electric Power Authority, (FSA),
Prerefunded to 7/1/10, 5.25%, 7/1/29(1) | | | 2,695,539 | | |
| | 1,500 | | | Suffield, (MBIA), Prerefunded to 6/15/11,
4.75%, 6/15/21 | | | 1,610,925 | | |
| | | $ | 8,703,388 | | |
| Insured-General Obligations — 11.8% | | | |
| $ | 3,870 | | | Bridgeport, (FGIC), 4.75%, 8/15/21 | | $ | 3,921,859 | | |
| | 2,305 | | | Bridgeport, (FGIC), 5.375%, 8/15/19 | | | 2,464,229 | | |
| | 3,600 | | | Connecticut, (AMBAC), 5.25%, 6/1/19(1) | | | 4,115,076 | | |
| | 1,000 | | | Connecticut, (AMBAC), 5.25%, 6/1/20 | | | 1,140,710 | | |
| | 1,000 | | | Connecticut, (FGIC), 5.00%, 4/1/24 | | | 1,055,520 | | |
| | 1,500 | | | Hartford, (AMBAC), 5.00%, 8/15/26 | | | 1,591,680 | | |
| | 1,000 | | | New Britain, (MBIA), 6.00%, 3/1/12 | | | 1,075,520 | | |
| | 350 | | | Puerto Rico, (FSA), Variable Rate, 8.682%, 7/1/27(2)(3) | | | 428,491 | | |
| | | $ | 15,793,085 | | |
| Insured-Hospital — 3.9% | | | |
| $ | 2,000 | | | Connecticut Health and Educational Facilities Authority,
(Children's Medical Center), (MBIA), 5.00%, 7/1/21 | | $ | 2,106,240 | | |
| | 1,000 | | | Connecticut Health and Educational Facilities Authority,
(William W. Backus Hospital), (FSA), 5.00%, 7/1/26 | | | 1,039,190 | | |
| | 2,000 | | | Connecticut Health and Educational Facilities Authority,
(Yale-New Haven Hospital), (AMBAC), 5.00%, 7/1/31 | | | 2,057,340 | | |
| | | $ | 5,202,770 | | |
| Insured-Housing — 0.7% | | | |
| $ | 1,000 | | | Connecticut Housing Authority, Housing Mortgage, (AMBAC),
5.10%, 11/15/38 | | $ | 971,940 | | |
| | | $ | 971,940 | | |
Insured-Lease Revenue / Certificates of
Participation — 4.6% | | | |
| $ | 3,250 | | | Puerto Rico Public Buildings Authority, (AMBAC),
5.50%, 7/1/21 | | $ | 3,543,703 | | |
| | 1,575 | | | Puerto Rico Public Finance Corp., (Commonwealth
Appropriation), (AMBAC), 5.125%, 6/1/24 | | | 1,749,809 | | |
| | 825 | | | Puerto Rico Public Finance Corp., (Commonwealth
Appropriation), (AMBAC), 5.125%, 6/1/24(1) | | | 916,589 | | |
| | | $ | 6,210,101 | | |
Principal Amount
(000's omitted) | |
Security | |
Value | |
| Insured-Other Revenue — 1.3% | | | |
| $ | 550 | | | Connecticut Health and Educational Facilities Authority,
(Child Care Facility Program), (AMBAC), 5.00%, 7/1/31 | | $ | 558,899 | | |
| | 1,150 | | | Connecticut Health and Educational Facilities Authority,
(Village Families & Children), (AMBAC), 5.00%, 7/1/32 | | | 1,171,793 | | |
| | | $ | 1,730,692 | | |
| Insured-Pooled Loans — 0.8% | | | |
| $ | 1,040 | | | Connecticut Higher Education Supplemental Loan Authority,
(MBIA), (AMT), 5.25%, 11/15/21 | | $ | 1,070,108 | | |
| | | $ | 1,070,108 | | |
| Insured-Special Tax Revenue — 2.4% | | | |
| $ | 2,000 | | | Connecticut Special Tax Transportation Infrastructure,
(AMBAC), 5.00%, 7/1/24 | | $ | 2,104,240 | | |
| | 1,000 | | | Puerto Rico Infrastructure Financing Authority, (AMBAC),
5.50%, 7/1/27(1) | | | 1,073,915 | | |
| | | $ | 3,178,155 | | |
| Insured-Transportation — 8.7% | | | |
| $ | 5,500 | | | Connecticut Airport, (Bradley International Airport), (FGIC),
(AMT), 5.125%, 10/1/26 | | $ | 5,535,475 | | |
| | 500 | | | Guam International Airport Authority, (MBIA),
5.25%, 10/1/23 | | | 532,950 | | |
| | 3,900 | | | Puerto Rico Highway and Transportation Authority, (AGC),
(CIFG), 5.25%, 7/1/41(1) | | | 4,279,256 | | |
| | 1,750 | | | Puerto Rico Highway and Transportation Authority, (AMBAC),
0.00%, 7/1/16 | | | 1,265,880 | | |
| | | $ | 11,613,561 | | |
| Insured-Water and Sewer — 4.3% | | | |
| $ | 1,000 | | | Connecticut Development Authority, (Aquarion Water Co. of
Connecticut), (XLCA), 4.70%, 7/1/36 | | $ | 913,990 | | |
| | 1,000 | | | Connecticut Development Authority, (Aquarion Water Co. of
Connecticut), (XLCA), 5.10%, 9/1/37 | | | 979,020 | | |
| | 3,420 | | | South Central Connecticut Regional Water Authority, (MBIA),
5.25%, 8/1/24 | | | 3,881,597 | | |
| | | $ | 5,774,607 | | |
| Lease Revenue / Certificates of Participation — 1.7% | | | |
| $ | 1,830 | | | Puerto Rico Public Finance Corp., (Commonwealth
Appropriation), Escrowed to Maturity, 6.00%, 8/1/26 | | $ | 2,244,074 | | |
| | | $ | 2,244,074 | | |
See notes to financial statements
22
Eaton Vance Connecticut Municipals Fund as of January 31, 2008
PORTFOLIO OF INVESTMENTS (Unaudited) CONT'D
Principal Amount
(000's omitted) | |
Security | |
Value | |
| Other Revenue — 0.8% | | | |
| $ | 8,700 | | | Children's Trust Fund, PR, Tobacco Settlement,
0.00%, 5/15/50 | | $ | 503,121 | | |
| | 16,465 | | | Children's Trust Fund, PR, Tobacco Settlement,
0.00%, 5/15/55 | | | 576,769 | | |
| | | $ | 1,079,890 | | |
| Senior Living / Life Care — 0.7% | | | |
| $ | 1,000 | | | Connecticut Development Authority, (Alzheimers Resource
Center), 5.50%, 8/15/27 | | $ | 911,820 | | |
| | | $ | 911,820 | | |
| Solid Waste — 2.1% | | | |
| $ | 2,750 | | | Connecticut Resources Recovery Authority,
(American REF-FUEL Co.), (AMT), 6.45%, 11/15/22 | | $ | 2,750,688 | | |
| | | $ | 2,750,688 | | |
| Special Tax Revenue — 6.8% | | | |
| $ | 3,180 | | | Connecticut Special Tax Transportation Infrastructure,
6.125%, 9/1/12(4) | | $ | 3,523,440 | | |
| | 2,000 | | | Connecticut Special Tax Transportation Infrastructure,
6.50%, 10/1/12 | | | 2,324,380 | | |
| | 3,235 | | | Puerto Rico Sales Tax Financing, 5.25%, 8/1/57 | | | 3,304,164 | | |
| | | $ | 9,151,984 | | |
| Transportation — 0.4% | | | |
| $ | 500 | | | Puerto Rico Highway and Transportation Authority,
5.50%, 7/1/15 | | $ | 549,960 | | |
| | | $ | 549,960 | | |
| Water and Sewer — 1.0% | | | |
| $ | 1,250 | | | Connecticut Clean Water Fund, 6.00%, 10/1/12 | | $ | 1,378,200 | | |
| | | $ | 1,378,200 | | |
Total Tax-Exempt Investments — 107.1%
(identified cost $137,374,029) | | $ | 143,235,287 | | |
| Other Assets, Less Liabilities — (7.1)% | | $ | (9,528,898 | ) | |
| Net Assets — 100.0% | | $ | 133,706,389 | | |
AGC - Assured Guaranty Corp.
AMBAC - AMBAC Financial Group, Inc.
AMT - Interest earned from these securities may be considered a tax preference item for purposes of the Federal Alternative Minimum Tax.
CIFG - CIFG Assurance North America, Inc.
FGIC - Financial Guaranty Insurance Company
FSA - Financial Security Assurance, Inc.
MBIA - Municipal Bond Insurance Association
RADIAN - Radian Group, Inc.
XLCA - XL Capital Assurance, Inc.
The Fund invests primarily in debt securities issued by Connecticut municipalities. The ability of the issuers of the debt securities to meet their obligations may be affected by economic developments in a specific industry or municipality. In order to reduce the risk associated with such economic developments, at January 31, 2008, 59.6% of total investments are backed by bond insurance of various financial institutions and financial guaranty assurance agencies. The aggregate percentage insured by an individual financial institution ranged from 1.3% to 18.7% of total investments.
(1) Security represents the underlying municipal obligation of an inverse floating rate obligation held by the Fund.
(2) Security exempt from registration under Rule 144A of the Securities Act of 1933. These securities may be sold in transactions exempt from registration, normally to qualified institutional buyers. At January 31, 2008, the aggregate value of the securities is $428,491 or 0.3% of the Fund's net assets.
(3) Security has been issued as a leveraged inverse floater bond. The stated interest rate represents the rate in effect at January 31, 2008.
(4) Security (or a portion thereof) has been segregated to cover margin requirements on open financial futures contracts.
See notes to financial statements
23
Eaton Vance Michigan Municipals Fund as of January 31, 2008
PORTFOLIO OF INVESTMENTS (Unaudited)
| Tax-Exempt Investments — 102.5% | | | |
Principal Amount
(000's omitted) | |
Security | |
Value | |
| Education — 3.1% | | | |
| $ | 1,250 | | | Michigan Higher Education Facilities Authority, (Creative
Studies), 5.85%, 12/1/22 | | $ | 1,305,675 | | |
| | 750 | | | Michigan Higher Education Facilities Authority, (Hillsdale
College), 5.00%, 3/1/35 | | | 753,090 | | |
| | | $ | 2,058,765 | | |
| Electric Utilities — 2.3% | | | |
| $ | 375 | | | Puerto Rico Electric Power Authority, DRIVERS, Variable Rate,
10.08%, 7/1/25(1)(2) | | $ | 386,317 | | |
| | 1,125 | | | Puerto Rico Electric Power Authority, DRIVERS, Variable Rate,
10.08%, 7/1/37(1)(2) | | | 1,106,842 | | |
| | | $ | 1,493,159 | | |
| Escrowed / Prerefunded — 4.3% | | | |
| $ | 750 | | | Michigan Hospital Finance Authority, (Sparrow Obligation Group),
Prerefunded to 11/15/11, 5.625%, 11/15/36 | | $ | 836,828 | | |
| | 790 | | | Puerto Rico Electric Power Authority,
Prerefunded to 7/1/13, 5.125%, 7/1/29 | | | 888,671 | | |
| | 1,000 | | | Puerto Rico Highway and Transportation Authority,
Prerefunded to 7/1/16, 5.00%, 7/1/36 | | | 1,142,570 | | |
| | | $ | 2,868,069 | | |
| General Obligations — 2.8% | | | |
| $ | 500 | | | Kent County Building Authority, 5.50%, 6/1/26 | | $ | 593,510 | | |
| | 1,250 | | | Puerto Rico Public Buildings Authority, (Commonwealth
Guaranteed), 5.25%, 7/1/29 | | | 1,250,950 | | |
| | | $ | 1,844,460 | | |
| Hospital — 18.9% | | | |
| $ | 500 | | | Allegan Hospital Finance Authority, (Allegan General Hospital),
7.00%, 11/15/21 | | $ | 518,115 | | |
| | 410 | | | Gaylord Hospital Finance Authority, (Otsego Memorial Hospital
Association), 6.20%, 1/1/25 | | | 409,549 | | |
| | 530 | | | Macomb County Hospital Finance Authority, (Mount Clemens
General Hospital), 5.875%, 11/15/34 | | | 522,697 | | |
| | 325 | | | Mecosta County, (Michigan General Hospital),
5.75%, 5/15/09 | | | 327,090 | | |
| | 2,000 | | | Michigan Hospital Finance Authority, (Central Michigan
Community Hospital), 6.25%, 10/1/27 | | | 2,010,860 | | |
| | 1,500 | | | Michigan Hospital Finance Authority, (Henry Ford Health
System), 5.25%, 11/15/46 | | | 1,488,315 | | |
| | 1,555 | | | Michigan Hospital Finance Authority, (McLaren Healthcare),
5.00%, 8/1/35 | | | 1,536,682 | | |
Principal Amount
(000's omitted) | |
Security | |
Value | |
| Hospital (continued) | | | |
| $ | 500 | | | Michigan Hospital Finance Authority, (Mid Michigan Obligation
Group), 5.00%, 4/15/36 | | $ | 494,740 | | |
| | 1,500 | | | Michigan Hospital Finance Authority, (Oakwood Hospital
System), 5.75%, 4/1/32 | | | 1,535,820 | | |
| | 1,500 | | | Michigan Hospital Finance Authority, (Oakwood Obligation
Group), 5.00%, 7/15/37 | | | 1,436,475 | | |
| | 1,300 | | | Michigan Hospital Finance Authority, (Sparrow Obligation
Group), 5.00%, 11/15/36 | | | 1,286,194 | | |
| | 1,000 | | | Michigan Hospital Finance Authority, (Trinity Health),
5.00%, 8/15/34 | | | 1,002,160 | | |
| | | $ | 12,568,697 | | |
| Insured-Education — 7.1% | | | |
| $ | 795 | | | Ferris State University, (AMBAC), 5.00%, 10/1/23(3) | | $ | 796,765 | | |
| | 3,800 | | | Wayne University, (MBIA), 5.00%, 11/15/37 | | | 3,944,286 | | |
| | | $ | 4,741,051 | | |
| Insured-Electric Utilities — 3.6% | | | |
| $ | 300 | | | Michigan Strategic Fund, (Detroit Edison Co.), (FGIC),
6.95%, 5/1/11 | | $ | 338,502 | | |
| | 2,000 | | | Michigan Strategic Fund, (Detroit Edison Co.), (MBIA),
(AMT), 5.55%, 9/1/29 | | | 2,045,000 | | |
| | | $ | 2,383,502 | | |
| Insured-Escrowed / Prerefunded — 12.8% | | | |
| $ | 2,000 | | | Detroit School District, (FGIC), Prerefunded to 5/1/13,
5.25%, 5/1/28 | | $ | 2,246,440 | | |
| | 205 | | | Ferris State University, (AMBAC), Prerefunded to 4/1/08,
5.00%, 10/1/23 | | | 205,998 | | |
| | 1,000 | | | Novi Building Authority, (FSA), Prerefunded to 10/1/10,
5.50%, 10/1/25 | | | 1,090,730 | | |
| | 2,165 | | | Warren, Water and Sewer, (FSA), Prerefunded to 11/1/11,
5.25%, 11/1/26 | | | 2,377,993 | | |
| | 1,500 | | | Wyoming Public Schools, (FGIC), Prerefunded to 5/1/08,
5.125%, 5/1/23 | | | 1,511,430 | | |
| | 1,000 | | | Zeeland Public Schools, (FGIC), Prerefunded to 5/1/09,
5.25%, 5/1/22 | | | 1,039,030 | | |
| | | $ | 8,471,621 | | |
| Insured-General Obligations — 28.8% | | | |
| $ | 850 | | | Allen Park Public School District, (FSA), 4.25%, 5/1/29 | | $ | 829,711 | | |
| | 1,005 | | | Brighton School District, (AMBAC), 0.00%, 5/1/18 | | | 657,672 | | |
| | 1,000 | | | Detroit City School District, (FSA), 6.00%, 5/1/29 | | | 1,230,080 | | |
| | 2,500 | | | Detroit City School District, (FSA), 5.25%, 5/1/32 | | | 2,853,250 | | |
| | 1,000 | | | Grand Blanc Community Schools, (FSA), 5.00%, 5/1/28 | | | 1,037,110 | | |
See notes to financial statements
24
Eaton Vance Michigan Municipals Fund as of January 31, 2008
PORTFOLIO OF INVESTMENTS (Unaudited) CONT'D
Principal Amount
(000's omitted) | |
Security | |
Value | |
| Insured-General Obligations (continued) | | | |
| $ | 1,000 | | | Healthsource Saginaw, Inc., (MBIA), 5.00%, 5/1/29 | | $ | 1,012,360 | | |
| | 1,900 | | | Holland School District, (AMBAC), 0.00%, 5/1/17 | | | 1,314,458 | | |
| | 1,000 | | | Hudsonville Public Schools, (FSA), 5.00%, 5/1/29 | | | 1,036,560 | | |
| | 2,410 | | | Okemos Public School District, (MBIA), 0.00%, 5/1/16 | | | 1,770,482 | | |
| | 500 | | | Otsego Public School District, (FSA), 4.25%, 5/1/34 | | | 478,230 | | |
| | 2,790 | | | Parchment School District, (MBIA), 5.00%, 5/1/25 | | | 3,067,214 | | |
| | 350 | | | Puerto Rico, (FSA), Variable Rate, 8.682%, 7/1/27(1)(2) | | | 428,491 | | |
| | 1,400 | | | Redford Union School District No. 1, (AMBAC),
5.00%, 5/1/22 | | | 1,545,250 | | |
| | 1,965 | | | Woodhaven Brownstown School District, (FSA),
4.00%, 5/1/27 | | | 1,867,222 | | |
| | | $ | 19,128,090 | | |
| Insured-Housing — 0.3% | | | |
| $ | 190 | | | Michigan Housing Development Authority, Rental Housing,
(MBIA), (AMT), 5.30%, 10/1/37 | | $ | 189,844 | | |
| | | $ | 189,844 | | |
| Insured-Transportation — 4.6% | | | |
| $ | 1,000 | | | Puerto Rico Highway and Transportation Authority, (AGC),
(CIFG), 5.25%, 7/1/41(4) | | $ | 1,097,245 | | |
| | 2,000 | | | Wayne Charter County Airport, (MBIA), (AMT),
5.00%, 12/1/28 | | | 1,951,820 | | |
| | | $ | 3,049,065 | | |
| Other Revenue — 1.6% | | | |
| $ | 1,090 | | | Michigan Tobacco Settlement Finance Authority,
6.00%, 6/1/48 | | $ | 1,072,800 | | |
| | | $ | 1,072,800 | | |
| Special Tax Revenue — 7.7% | | | |
| $ | 3,050 | | | Detroit, Downtown Tax Increment, 0.00%, 7/1/16 | | $ | 2,162,969 | | |
| | 2,000 | | | Detroit, Downtown Tax Increment, 0.00%, 7/1/20 | | | 1,132,380 | | |
| | 1,090 | | | Puerto Rico Sales Tax Financing, 5.25%, 8/1/57 | | | 1,113,304 | | |
| | 10,000 | | | Puerto Rico Sales Tax Financing, 0.00%, 8/1/56 | | | 723,100 | | |
| | | $ | 5,131,753 | | |
Principal Amount
(000's omitted) | |
Security | |
Value | |
| Transportation — 4.6% | |
| $ | 3,000 | | | Kent County Airport Facility, 5.00%, 1/1/25(4) | | $ | 3,026,865 | | |
| | | $ | 3,026,865 | | |
Total Tax-Exempt Investments — 102.5%
(identified cost $64,280,251) | | $ | 68,027,741 | | |
| Other Assets, Less Liabilities — (2.5)% | | $ | (1,674,819 | ) | |
| Net Assets — 100.0% | | $ | 66,352,922 | | |
AGC - Assured Guaranty Corp.
AMBAC - AMBAC Financial Group, Inc.
AMT - Interest earned from these securities may be considered a tax preference item for purposes of the Federal Alternative Minimum Tax.
CIFG - CIFG Assurance North America, Inc.
DRIVERS - Derivative Inverse Tax-Exempt Receipts
FGIC - Financial Guaranty Insurance Company
FSA - Financial Security Assurance, Inc.
MBIA - Municipal Bond Insurance Association
The Fund invests primarily in debt securities issued by Michigan municipalities. The ability of the issuers of the debt securities to meet their obligations may be affected by economic developments in a specific industry or municipality. In order to reduce the risk associated with such economic developments, at January 31, 2008, 55.8% of total investments are backed by bond insurance of various financial institutions and financial guaranty assurance agencies. The aggregate percentage insured by an individual financial institution ranged from 1.6% to 20.6% of total investments.
(1) Security exempt from registration under Rule 144A of the Securities Act of 1933. These securities may be sold in transactions exempt from registration, normally to qualified institutional buyers. At January 31, 2008, the aggregate value of the securities is $1,921,650 or 2.9% of the Fund's net assets.
(2) Security has been issued as a leveraged inverse floater bond. The stated interest rate represents the rate in effect at January 31, 2008.
(3) Security (or a portion thereof) has been segregated to cover margin requirements on open financial futures contracts.
(4) Security represents the underlying municipal obligation of an inverse floating rate obligation held by the Fund.
See notes to financial statements
25
Eaton Vance Minnesota Municipals Fund as of January 31, 2008
PORTFOLIO OF INVESTMENTS (Unaudited)
| Tax-Exempt Investments — 98.0% | | | |
Principal Amount
(000's omitted) | |
Security | |
Value | |
| Education — 10.6% | | | |
| $ | 350 | | | Hopkins, (Blake School), 4.625%, 9/1/24 | | $ | 355,953 | | |
| | 750 | | | Minnesota Higher Education Facilities Authority,
(Augsburg College), 5.00%, 5/1/36 | | | 721,417 | | |
| | 1,250 | | | Minnesota Higher Education Facilities Authority,
(Hamline University), 6.00%, 10/1/29 | | | 1,267,050 | | |
| | 1,030 | | | Minnesota Higher Education Facilities Authority,
(Macalester College), 4.25%, 3/1/27 | | | 1,010,543 | | |
| | 1,500 | | | Minnesota Higher Education Facilities Authority,
(Macalester College), 4.25%, 3/1/32 | | | 1,439,190 | | |
| | 575 | | | Minnesota Higher Education Facilities Authority,
(Minneapolis College of Art), 5.375%, 5/1/21 | | | 586,270 | | |
| | 1,000 | | | Minnesota Higher Education Facilities Authority,
(St. Olaf College), 4.50%, 10/1/32 | | | 935,570 | | |
| | 1,380 | | | St. Cloud Housing and Redevelopment Authority,
(University Foundation), 5.00%, 5/1/23 | | | 1,431,446 | | |
| | 1,000 | | | University of Minnesota, (State Supported Stadium Debt),
5.00%, 8/1/29 | | | 1,043,970 | | |
| | | $ | 8,791,409 | | |
| Electric Utilities — 4.0% | | | |
| $ | 500 | | | Minnesota Municipal Power Agency,
4.75%, 10/1/32 | | $ | 495,665 | | |
| | 750 | | | Minnesota Municipal Power Agency,
5.00%, 10/1/34 | | | 757,995 | | |
| | 2,000 | | | Minnesota Municipal Power Agency,
5.00%, 10/1/35 | | | 2,024,000 | | |
| | | $ | 3,277,660 | | |
| Escrowed / Prerefunded — 6.5% | | | |
| $ | 1,980 | | | Chaska Electric, Prerefunded to 10/1/10,
6.10%, 10/1/30 | | $ | 2,162,972 | | |
| | 1,980 | | | Rochester, Electric, Prerefunded to 12/1/10,
5.25%, 12/1/30 | | | 2,136,895 | | |
| | 1,000 | | | St. Louis Park, Health Care Facilities Revenue,
(Nicollet Health Services), Prerefunded to 7/1/14,
5.25%, 7/1/30 | | | 1,133,850 | | |
| | | $ | 5,433,717 | | |
| General Obligations — 8.2% | | | |
| $ | 750 | | | Dakota County Community Development Agency,
(Senior Housing Facilities), 5.00%, 1/1/21 | | $ | 780,368 | | |
| | 500 | | | Dakota County Community Development Agency,
(Senior Housing Facilities), 5.125%, 1/1/35 | | | 510,845 | | |
Principal Amount
(000's omitted) | |
Security | |
Value | |
| General Obligations (continued) | | | |
| $ | 635 | | | Golden Valley, 4.75%, 2/1/24 | | $ | 663,131 | | |
| | 825 | | | Minneapolis and St. Paul General Obligation,
Metropolitan Airport Commission, (AMT),
4.50%, 1/1/15 | | | 840,576 | | |
| | 2,000 | | | Minnesota, 5.00%, 8/1/16 | | | 2,272,760 | | |
| | 1,000 | | | St. Michael Independent School District No. 885,
4.50%, 2/1/28(1) | | | 996,740 | | |
| | 750 | | | Zumbrota-Mazeppa Independent School District No. 2805,
4.50%, 2/1/28 | | | 753,300 | | |
| | | $ | 6,817,720 | | |
| Hospital — 8.7% | | | |
| $ | 1,000 | | | Maple Grove Health Care,
(North Memorial Health Care), 5.00%, 9/1/35 | | $ | 988,160 | | |
| | 700 | | | Martin County, (Fairmont Community Hospital
Association), 6.625%, 9/1/22 | | | 722,890 | | |
| | 500 | | | Northfield, Hospital Revenue, 5.375%, 11/1/31 | | | 488,805 | | |
| | 1,500 | | | Rochester Health Care Facilities, (Mayo Clinic),
5.00%, 11/15/36 | | | 1,515,615 | | |
| | 3,000 | | | Rochester Health Care Facilities, (Mayo Clinic),
5.50%, 11/15/27(2) | | | 3,046,335 | | |
| | 500 | | | Shakopee Health Care Facilities,
(St. Francis Regional Medical Center), 5.25%, 9/1/34 | | | 492,580 | | |
| | | $ | 7,254,385 | | |
| Housing — 6.7% | | | |
| $ | 500 | | | Minneapolis, Multifamily, (Bottineau Commons),
(AMT), 5.45%, 4/20/43 | | $ | 509,220 | | |
| | 1,000 | | | Minnesota Housing Finance Agency, (AMT),
4.85%, 7/1/38 | | | 960,790 | | |
| | 500 | | | Minnesota Housing Finance Agency, (AMT),
5.00%, 8/1/40 | | | 480,235 | | |
| | 1,000 | | | Minnesota Housing Finance Agency, (AMT),
5.25%, 7/1/33 | | | 1,001,060 | | |
| | 1,000 | | | Minnesota Housing Finance Agency, (AMT),
Variable Rate, 4.80%, 7/1/38 | | | 944,270 | | |
| | 1,650 | | | Minnetonka, Multifamily, (Archer Heights Apartments),
(AMT), 6.00%, 1/20/27 | | | 1,674,404 | | |
| | | $ | 5,569,979 | | |
| Industrial Development Revenue — 1.2% | | | |
| $ | 1,000 | | | Cloquet, (Potlach Corp.), 5.90%, 10/1/26 | | $ | 1,002,500 | | |
| | | $ | 1,002,500 | | |
See notes to financial statements
26
Eaton Vance Minnesota Municipals Fund as of January 31, 2008
PORTFOLIO OF INVESTMENTS (Unaudited) CONT'D
Principal Amount
(000's omitted) | |
Security | |
Value | |
| Insured-Education — 1.9% | | | |
| $ | 1,000 | | | Minnesota State Colleges and University,
(MBIA), 5.00%, 10/1/32 | | $ | 1,035,010 | | |
| | 500 | | | Minnesota State Colleges and University,
(St. Cloud St. University), (FSA), 5.00%, 10/1/19 | | | 536,800 | | |
| | | $ | 1,571,810 | | |
| Insured-Electric Utilities — 11.1% | | | |
| $ | 1,150 | | | Puerto Rico Electric Power Authority,
(FGIC), 5.25%, 7/1/34 | | $ | 1,192,711 | | |
| | 2,000 | | | Rochester Electric, (MBIA), 4.50%, 12/1/26 | | | 2,007,860 | | |
| | 950 | | | Southern Minnesota Municipal Power Agency,
(MBIA), 0.00%, 1/1/21(3) | | | 536,703 | | |
| | 10,000 | | | Southern Minnesota Municipal Power Agency,
(MBIA), 0.00%, 1/1/25 | | | 4,475,100 | | |
| | 1,000 | | | Western Minnesota Municipal Power Agency,
(FSA), 5.00%, 1/1/36 | | | 1,041,200 | | |
| | | $ | 9,253,574 | | |
| Insured-Escrowed / Prerefunded — 6.3% | | | |
| $ | 500 | | | Columbia Heights, Multifamily, (Housing Crest), (GNMA),
Prerefunded to 10/20/12, 6.625%, 4/20/43 | | $ | 608,645 | | |
| | 1,270 | | | Hopkins Housing and Redevelopment Authority, (Public
Works and Fire Station), (MBIA), Prerefunded to 2/1/13,
5.00%, 2/1/20(4) | | | 1,405,763 | | |
| | 1,500 | | | Minneapolis and St. Paul Metropolitan Airport
Commission, (FGIC), Prerefunded to 1/1/11,
5.25%, 1/1/32 | | | 1,618,605 | | |
| | 1,500 | | | Puerto Rico Electric Power Authority, (FSA),
Prerefunded to 7/1/10, 5.25%, 7/1/29(2) | | | 1,617,795 | | |
| | | $ | 5,250,808 | | |
| Insured-General Obligations — 15.3% | | | |
| $ | 1,525 | | | Alexandria Independent School District No. 206,
(FSA), 5.00%, 2/1/27 | | $ | 1,616,759 | | |
| | 2,245 | | | Cambridge Independent School District No. 911,
(MBIA), 0.00%, 2/1/29 | | | 760,763 | | |
| | 2,000 | | | Chaska Independent School District No. 112,
(MBIA), 4.50%, 2/1/28 | | | 1,996,080 | | |
| | 685 | | | Chatfield Independent School District No. 227,
(FSA), 4.625%, 2/1/32 | | | 691,562 | | |
| | 1,000 | | | Dayton, (XLCA), 4.375%, 2/1/34 | | | 916,960 | | |
| | 1,000 | | | Farmington Independent School District No. 192,
(FSA), 4.50%, 2/1/22 | | | 1,030,140 | | |
| | 1,005 | | | Fergus Falls Independent School District No. 544,
(FSA), 4.625%, 1/1/28 | | | 1,016,929 | | |
Principal Amount
(000's omitted) | |
Security | |
Value | |
| Insured-General Obligations (continued) | | | |
| $ | 1,040 | | | Kingsland Independent School District No. 2137,
(FSA), 4.375%, 2/1/27 | | $ | 1,037,733 | | |
| | 450 | | | Prior Lake Independant School District No. 719,
(FSA), 4.25%, 2/1/26 | | | 441,392 | | |
| | 1,000 | | | Rosemount Independent School District No. 196,
(FSA), 5.00%, 2/1/23 | | | 1,063,910 | | |
| | 1,000 | | | Spring Lake Park Independent School District No. 16,
(FSA), 5.00%, 2/1/22 | | | 1,072,490 | | |
| | 1,000 | | | St. Francis Independent School District No. 15, (MBIA),
5.00%, 2/1/27 | | | 1,052,170 | | |
| | | $ | 12,696,888 | | |
| Insured-Hospital — 3.0% | | | |
| $ | 1,000 | | | Minneapolis Health Care System, (Fairview Health
Services), (AMBAC), 5.00%, 11/15/30 | | $ | 1,005,370 | | |
| | 1,000 | | | Minneapolis Health Care System, (Fairview Health
Services), (AMBAC), 5.00%, 11/15/34 | | | 1,000,240 | | |
| | 450 | | | Plymouth, (Westhealth), (FSA), 6.25%, 6/1/16 | | | 452,021 | | |
| | | $ | 2,457,631 | | |
| Insured-Other Revenue — 1.0% | | | |
| $ | 800 | | | St. Paul Housing and Redevelopment Authority,
(Block 19), (FSA), 5.35%, 8/1/29 | | $ | 842,736 | | |
| | | $ | 842,736 | | |
| Insured-Special Tax Revenue — 3.6% | | | |
| $ | 2,000 | | | St. Paul, Sales Tax Reveue, (XLCA), 5.00%, 11/1/30 | | $ | 1,985,080 | | |
| | 1,000 | | | Washington County Housing and Redevelopment
Authority, (Annual Appropriation), (MBIA),
5.50%, 2/1/32 | | | 1,034,200 | | |
| | | $ | 3,019,280 | | |
| Insured-Transportation — 1.8% | | | |
| $ | 1,500 | | | Minneapolis and St. Paul Metropolitan Airport
Commission, (AMBAC), 4.50%, 1/1/32 | | $ | 1,458,810 | | |
| | | $ | 1,458,810 | | |
| Miscellaneous — 2.5% | | | |
| $ | 2,000 | | | Minneapolis Art Center Facilities, (Walker Art Center),
5.125%, 7/1/21 | | $ | 2,079,680 | | |
| | | $ | 2,079,680 | | |
See notes to financial statements
27
Eaton Vance Minnesota Municipals Fund as of January 31, 2008
PORTFOLIO OF INVESTMENTS (Unaudited) CONT'D
Principal Amount
(000's omitted) | |
Security | |
Value | |
| Senior Living / Life Care — 1.9% | | | |
| $ | 670 | | | Minneapolis, (Walker Methodist Senior Services),
6.00%, 11/15/28 | | $ | 669,136 | | |
| | 975 | | | St. Paul Housing and Redevelopment,
(Care Institute, Inc. - Highland), 8.75%, 11/1/24(5) | | | 926,357 | | |
| | | $ | 1,595,493 | | |
| Special Tax Revenue — 3.7% | | | |
| $ | 2,000 | | | Hennepin County, Sales Tax Revenue,
4.75%, 12/15/33 | | $ | 2,043,400 | | |
| | 1,000 | | | Hennepin County, Sales Tax Revenue, 4.75%, 12/15/37 | | | 1,018,500 | | |
| | | $ | 3,061,900 | | |
Total Tax-Exempt Investments
(identified cost $79,245,197) | | $ | 81,435,980 | | |
| Short-Term Investments — 2.8% | | | |
Principal Amount
(000's omitted) | |
Security | |
Value | |
| $ | 800 | | | University of Minnesota, Variable Rate,
(SPA: JP Morgan Chase Bank), 2.00%, 12/1/36(6) | | $ | 800,000 | | |
| | 1,500 | | | University of Minnesota, Variable Rate,
(SPA: LandesBank Hessen), 2.00%, 1/1/34(6) | | | 1,500,000 | | |
Total Short-Term Investments
(identified cost $2,300,000) | | $ | 2,300,000 | | |
Total Investments — 100.8%
(identified cost $81,545,197) | | $ | 83,735,980 | | |
| Other Assets, Less Liabilities — (0.8)% | | $ | (654,247 | ) | |
| Net Assets — 100.0% | | $ | 83,081,733 | | |
AMBAC - AMBAC Financial Group, Inc.
AMT - Interest earned from these securities may be considered a tax preference item for purposes of the Federal Alternative Minimum Tax.
FGIC - Financial Guaranty Insurance Company
FSA - Financial Security Assurance, Inc.
GNMA - Government National Mortgage Association (Ginnie Mae)
MBIA - Municipal Bond Insurance Association
SPA - Standby Bond Purchase Agreement
XLCA - XL Capital Assurance, Inc.
The Fund invests primarily in debt securities issued by Minnesota municipalities. The ability of the issuers of the debt securities to meet their obligations may be affected by economic developments in a specific industry or municipality. In order to reduce the risk associated with such economic developments, at January 31, 2008, 42.9% of total investments are backed by bond insurance of various financial institutions and financial guaranty assurance agencies. The aggregate percentage insured by an individual financial institution ranged from 3.4% to 17.1% of total investments.
(1) When-issued security.
(2) Security represents the underlying municipal obligation of an inverse floating rate obligation held by the Fund.
(3) Security (or a portion thereof) has been segregated to cover margin requirements on open financial futures contracts.
(4) Security (or a portion thereof) has been segregated to cover when-issued securities.
(5) Security is in default with respect to scheduled principal payments.
(6) Variable rate demand obligation. The stated interest rate represents the rate in effect at January 31, 2008.
See notes to financial statements
28
Eaton Vance New Jersey Municipals Fund as of January 31, 2008
PORTFOLIO OF INVESTMENTS (Unaudited)
| Tax-Exempt Investments — 106.8% | | | |
Principal Amount
(000's omitted) | |
Security | |
Value | |
| Education — 5.2% | | | |
| $ | 750 | | | New Jersey Educational Facilities Authority, (Georgian
Court University), 5.00%, 7/1/27 | | $ | 742,162 | | |
| | 750 | | | New Jersey Educational Facilities Authority, (Georgian
Court University), 5.00%, 7/1/33 | | | 714,727 | | |
| | 660 | | | New Jersey Educational Facilities Authority, (Georgian
Court University), 5.25%, 7/1/37 | | | 648,325 | | |
| | 7,980 | | | New Jersey Educational Facilities Authority, (Princeton
University), 4.50%, 7/1/30 | | | 8,007,132 | | |
| | 4,035 | | | New Jersey Educational Facilities Authority, (Princeton
University), 4.50%, 7/1/37 | | | 4,031,570 | | |
| | 1,025 | | | New Jersey Educational Facilities Authority, (Stevens
Institute of Technology), 5.00%, 7/1/27 | | | 1,004,992 | | |
| | 880 | | | New Jersey Educational Facilities Authority, (Stevens
Institute of Technology), 5.00%, 7/1/34 | | | 826,610 | | |
| | | | | | | $ | 15,975,518 | | |
| Electric Utilities — 3.3% | | | |
| $ | 9,000 | | | Puerto Rico Electric Power Authority, Series N,
0.00%, 7/1/17 | | $ | 6,218,370 | | |
| | 2,000 | | | Puerto Rico Electric Power Authority, Series O,
0.00%, 7/1/17 | | | 1,381,860 | | |
| | 2,500 | | | Salem County Pollution Control Financing, (Public
Service Enterprise Group, Inc.), (AMT), 5.75%, 4/1/31 | | | 2,505,550 | | |
| | | | | | | $ | 10,105,780 | | |
| Escrowed / Prerefunded — 2.7% | | | |
| $ | 885 | | | New Jersey Health Care Facilities Financing Authority,
(Atlantic City Medical Center), Prerefunded to
7/1/12, 5.75%, 7/1/25 | | $ | 994,492 | | |
| | 3,175 | | | Tobacco Settlement Financing Corp., Prerefunded to
6/1/13, 6.75%, 6/1/39 | | | 3,807,841 | | |
| | 3,000 | | | Tobacco Settlement Financing Corp., Prerefunded to
6/1/13, 6.75%, 6/1/39(1) | | | 3,597,945 | | |
| | | | | | | $ | 8,400,278 | | |
| General Obligations — 0.9% | | | |
| $ | 3,000 | | | Mercer County Improvement Authority,
0.00%, 4/1/10 | | $ | 2,844,000 | | |
| | | | | | | $ | 2,844,000 | | |
| Health Care-Miscellaneous — 0.4% | | | |
| $ | 1,095 | | | New Jersey Economic Development Authority, (Hudson
County Occupational Center), 6.50%, 7/1/18 | | $ | 1,102,807 | | |
| | | | | | | $ | 1,102,807 | | |
Principal Amount
(000's omitted) | |
Security | |
Value | |
| Hospital — 14.8% | | | |
| $ | 600 | | | Camden County Improvement Authority, (Cooper
Health System), 5.00%, 2/15/25 | | $ | 572,502 | | |
| | 1,700 | | | Camden County Improvement Authority, (Cooper
Health System), 5.00%, 2/15/35 | | | 1,512,269 | | |
| | 1,200 | | | Camden County Improvement Authority, (Cooper
Health System), 5.25%, 2/15/27 | | | 1,157,292 | | |
| | 2,250 | | | Camden County Improvement Authority, (Cooper
Health System), 5.75%, 2/15/34 | | | 2,239,402 | | |
| | 1,115 | | | New Jersey Health Care Facilities Financing Authority,
(Atlantic City Medical Center), 5.75%, 7/1/25 | | | 1,162,956 | | |
| | 13,360 | | | New Jersey Health Care Facilities Financing Authority,
(Atlanticare Regional Medical Center), 5.00%, 7/1/37 | | | 13,157,062 | | |
| | 1,250 | | | New Jersey Health Care Facilities Financing Authority,
(Capital Health System), 5.00%, 7/1/26 | | | 1,225,625 | | |
| | 3,000 | | | New Jersey Health Care Facilities Financing Authority,
(Capital Health System), 5.25%, 7/1/17 | | | 3,054,960 | | |
| | 2,625 | | | New Jersey Health Care Facilities Financing Authority,
(Capital Health System), 5.375%, 7/1/33 | | | 2,610,458 | | |
| | 2,700 | | | New Jersey Health Care Facilities Financing Authority,
(Hackensack University Medical Center),
6.00%, 1/1/25 | | | 2,792,718 | | |
| | 1,505 | | | New Jersey Health Care Facilities Financing Authority,
(Hackensack University Medical Center), 6.00%, 1/1/34 | | | 1,545,304 | | |
| | 1,020 | | | New Jersey Health Care Facilities Financing Authority,
(Hunterdon Medical Center), 5.125%, 7/1/35 | | | 1,023,070 | | |
| | 2,000 | | | New Jersey Health Care Facilities Financing Authority,
(Robert Wood Johnson University Hospital),
5.75%, 7/1/31 | | | 2,070,220 | | |
| | 4,300 | | | New Jersey Health Care Facilities Financing Authority,
(South Jersey Hospital), 5.00%, 7/1/36 | | | 4,200,971 | | |
| | 7,265 | | | New Jersey Health Care Facilities Financing Authority,
(South Jersey Hospital), 5.00%, 7/1/46 | | | 6,982,174 | | |
| | | | | | | $ | 45,306,983 | | |
| Housing — 4.5% | | | |
| $ | 2,500 | | | New Jersey Housing & Mortgage Finance Agency, (AMT),
5.00%, 10/1/36 | | $ | 2,453,150 | | |
| | 2,185 | | | New Jersey Housing & Mortgage Finance Agency, (Single
Family Housing), (AMT), 4.70%, 10/1/37 | | | 2,038,998 | | |
| | 3,000 | | | New Jersey Housing & Mortgage Finance Agency, (Single
Family Housing), (AMT), 4.95%, 10/1/32 | | | 2,939,100 | | |
| | 6,365 | | | New Jersey Housing & Mortgage Finance Agency, (Single
Family Housing), (AMT), 5.00%, 10/1/37 | | | 6,253,422 | | |
| | | | | | | $ | 13,684,670 | | |
See notes to financial statements
29
Eaton Vance New Jersey Municipals Fund as of January 31, 2008
PORTFOLIO OF INVESTMENTS (Unaudited) CONT'D
Principal Amount
(000's omitted) | |
Security | |
Value | |
| Industrial Development Revenue — 6.0% | | | |
| $ | 2,500 | | | Middlesex County Pollution Control Authority, (Amerada
Hess Corp.), 5.75%, 9/15/32 | | $ | 2,521,475 | | |
| | 6,780 | | | New Jersey Economic Development Authority, (Anheuser
Busch Cos., Inc.), (AMT), 4.95%, 3/1/47 | | | 6,230,684 | | |
| | 1,875 | | | New Jersey Economic Development Authority, (Continental
Airlines), (AMT), 6.25%, 9/15/29 | | | 1,761,900 | | |
| | 1,875 | | | New Jersey Economic Development Authority, (Continental
Airlines), (AMT), 9.00%, 6/1/33 | | | 2,083,706 | | |
| | 6,465 | | | Virgin Islands Public Financing Authority, (HOVENSA LLC),
(AMT), 4.70%, 7/1/22 | | | 5,811,970 | | |
| | | | | | | $ | 18,409,735 | | |
| Insured-Electric Utilities — 2.3% | | | |
| $ | 2,500 | | | Puerto Rico Electric Power Authority, (FGIC),
5.25%, 7/1/35 | | $ | 2,586,900 | | |
| | 3,900 | | | Puerto Rico Electric Power Authority, (MBIA),
5.50%, 7/1/16(1) | | | 4,387,097 | | |
| | | | | | | $ | 6,973,997 | | |
| Insured-Escrowed / Prerefunded — 2.3% | | | |
| $ | 2,520 | | | New Jersey Health Care Facilities Financing Authority,
(Saint Barnabas Corp.), (MBIA), Escrowed to Maturity,
0.00%, 7/1/23 | | $ | 1,284,368 | | |
| | 110 | | | New Jersey Turnpike Authority, (MBIA), Escrowed to
Maturity, 6.50%, 1/1/16 | | | 130,220 | | |
| | 1,565 | | | New Jersey Turnpike Authority, (MBIA), Escrowed to
Maturity, 6.50%, 1/1/16 | | | 1,852,678 | | |
| | 3,550 | | | Puerto Rico Electric Power Authority, (FSA),
Prerefunded to 7/1/10, 5.25%, 7/1/29(1) | | | 3,827,996 | | |
| | | | | | | $ | 7,095,262 | | |
| Insured-Gas Utilities — 3.3% | | | |
| $ | 10,000 | | | New Jersey Economic Development Authority, (New
Jersey Natural Gas Co.), (FGIC), (AMT),
4.90%, 10/1/40(1) | | $ | 10,064,800 | | |
| | | | | | | $ | 10,064,800 | | |
| Insured-General Obligations — 10.4% | | | |
| $ | 1,325 | | | Colts Neck Township Board of Education, (FSA),
5.00%, 2/1/23 | | $ | 1,458,719 | | |
| | 1,650 | | | Colts Neck Township Board of Education, (FSA),
5.00%, 2/1/27 | | | 1,778,156 | | |
| | 1,000 | | | High Bridge Board of Education, (FSA),
5.00%, 2/15/26 | | | 1,124,170 | | |
| | 3,050 | | | Hudson County Improvements Authority, (MBIA),
0.00%, 12/15/35 | | | 731,268 | | |
Principal Amount
(000's omitted) | |
Security | |
Value | |
| Insured-General Obligations (continued) | | | |
| $ | 3,100 | | | Hudson County Improvements Authority, (MBIA),
0.00%, 12/15/36 | | $ | 704,134 | | |
| | 5,350 | | | Irvington Township, (FSA), 0.00%, 7/15/22 | | | 2,831,702 | | |
| | 5,350 | | | Irvington Township, (FSA), 0.00%, 7/15/23 | | | 2,661,090 | | |
| | 11,735 | | | Jackson Township School District, (MBIA),
2.50%, 6/15/27 | | | 8,848,073 | | |
| | 1,395 | | | Monroe Township Board of Education Middlesex County,
(MBIA), 4.625%, 4/1/34 | | | 1,392,391 | | |
| | 825 | | | Monroe Township Board of Education Middlesex County,
(MBIA), 4.75%, 4/1/36 | | | 837,507 | | |
| | 1,360 | | | Nutley School District, (MBIA), 4.50%, 7/15/29 | | | 1,367,779 | | |
| | 1,695 | | | Nutley School District, (MBIA), 4.75%, 7/15/30 | | | 1,747,731 | | |
| | 2,230 | | | Nutley School District, (MBIA), 4.75%, 7/15/31 | | | 2,295,897 | | |
| | 2,330 | | | Nutley School District, (MBIA), 4.75%, 7/15/32 | | | 2,396,848 | | |
| | 1,600 | | | Sparta Township School District, (FSA),
4.30%, 2/15/32 | | | 1,564,992 | | |
| | | | | | | $ | 31,740,457 | | |
| Insured-Hospital — 2.9% | | | |
| $ | 4,250 | | | New Jersey Economic Development Authority, (Hillcrest
Health Services), (AMBAC), 0.00%, 1/1/19 | | $ | 2,668,193 | | |
| | 3,480 | | | New Jersey Health Care Facilities Financing Authority,
(St. Barnabas Corp.), (MBIA), 0.00%, 7/1/23 | | | 1,664,867 | | |
| | 10,970 | | | New Jersey Economic Development Authority,
(St. Barnabas Medical Center), (MBIA), 0.00%, 7/1/26 | | | 4,417,838 | | |
| | | | | | | $ | 8,750,898 | | |
Insured-Lease Revenue / Certificates of
Participation — 0.8% | | | |
| $ | 1,585 | | | Gloucester County Improvements Authority, (MBIA),
4.75%, 9/1/30 | | $ | 1,611,691 | | |
| | 965 | | | Hudson County Improvements Authority, (FSA),
4.50%, 4/1/35 | | | 955,234 | | |
| | | | | | | $ | 2,566,925 | | |
| Insured-Special Tax Revenue — 6.9% | | | |
| $ | 10,620 | | | Garden Preservation Trust and Open Space and Farmland,
(FSA), 0.00%, 11/1/24 | | $ | 4,925,450 | | |
| | 2,000 | | | New Jersey Economic Development Authority, (Motor
Vehicle Surcharges), (MBIA), 5.25%, 7/1/26 | | | 2,230,440 | | |
| | 12,590 | | | New Jersey Economic Development Authority, (Motor
Vehicle Surcharges), (XLCA), 0.00%, 7/1/26 | | | 4,962,097 | | |
| | 5,890 | | | New Jersey Economic Development Authority, (Motor
Vehicle Surcharges), (XLCA), 0.00%, 7/1/27 | | | 2,186,191 | | |
| | 10 | | | Puerto Rico Infrastructure Financing Authority, (AMBAC),
5.50%, 7/1/27 | | | 10,739 | | |
See notes to financial statements
30
Eaton Vance New Jersey Municipals Fund as of January 31, 2008
PORTFOLIO OF INVESTMENTS (Unaudited) CONT'D
Principal Amount
(000's omitted) | |
Security | |
Value | |
| Insured-Special Tax Revenue (continued) | | | |
| $ | 4,200 | | | Puerto Rico Infrastructure Financing Authority, (AMBAC),
5.50%, 7/1/27(1) | | $ | 4,510,443 | | |
| | 12,215 | | | Puerto Rico Sales Tax Financing, (AMBAC),
0.00%, 8/1/54 | | | 988,804 | | |
| | 2,260 | | | Puerto Rico Sales Tax Financing, (MBIA),
0.00%, 8/1/44 | | | 323,203 | | |
| | 4,480 | | | Puerto Rico Sales Tax Financing, (MBIA),
0.00%, 8/1/45 | | | 606,771 | | |
| | 3,580 | | | Puerto Rico Sales Tax Financing, (MBIA),
0.00%, 8/1/46 | | | 458,670 | | |
| | | | | | | $ | 21,202,808 | | |
| Insured-Transportation — 8.9% | | | |
| $ | 1,010 | | | Delaware River Joint Toll Bridge Commission,
(MBIA), 4.50%, 7/1/37 | | $ | 986,598 | | |
| | 1,675 | | | Delaware River Port Authority, (FSA), 5.20%, 1/1/25 | | | 1,764,780 | | |
| | 3,250 | | | Delaware River Port Authority, (FSA), 5.20%, 1/1/27 | | | 3,421,763 | | |
| | 5,500 | | | Delaware River Port Authority, (FSA), 5.75%, 1/1/26 | | | 5,729,350 | | |
| | 1,680 | | | Morristown Parking Authority, (MBIA), 4.50%, 8/1/37 | | | 1,641,091 | | |
| | 4,000 | | | New Jersey Transportation Trust Fund Authority,
(AMBAC), Variable Rate, 6.505%, 12/15/37(2)(3) | | | 3,835,360 | | |
| | 2,400 | | | New Jersey Turnpike Authority, (FSA), 5.25%, 1/1/30 | | | 2,712,240 | | |
| | 325 | | | New Jersey Turnpike Authority, (MBIA), 6.50%, 1/1/16 | | | 380,185 | | |
| | 5,000 | | | New Jersey Turnpike Authority, RITES, (MBIA),
Variable Rate, 9.171%, 1/1/16(4) | | | 6,697,900 | | |
| | | | | | | $ | 27,169,267 | | |
| Insured-Water and Sewer — 5.6% | | | |
| $ | 1,345 | | | Middlesex County Utilities Authority, (MBIA),
6.25%, 8/15/10 | | $ | 1,405,175 | | |
| | 9,805 | | | New Jersey Economic Development Authority,
(United Water New Jersey, Inc.), (AMBAC), (AMT),
4.875%, 11/1/25 | | | 9,886,676 | | |
| | 13,840 | | | North Hudson Sewer Authority, (MBIA), 0.00%, 8/1/25 | | | 5,871,758 | | |
| | | | | | | $ | 17,163,609 | | |
| Lease Revenue / Certificates of Participation — 3.5% | | | |
| $ | 720 | | | Atlantic City Public Facilities Lease Agreement,
8.875%, 1/15/14 | | $ | 910,462 | | |
| | 785 | | | Atlantic City Public Facilities Lease Agreement,
8.875%, 1/15/15 | | | 1,015,892 | | |
| | 2,591 | | | New Jersey Building Authority, (Garden State
Savings Bonds), 0.00%, 6/15/10 | | | 2,439,401 | | |
| | 1,650 | | | New Jersey Economic Development Authority, (Economic
Recovery), Contract Lease, 0.00%, 9/15/09 | | | 1,589,280 | | |
Principal Amount
(000's omitted) | |
Security | |
Value | |
Lease Revenue / Certificates of
Participation (continued) | | | |
| $ | 5,500 | | | New Jersey Economic Development Authority, (Economic
Recovery), Contract Lease, 0.00%, 3/15/13 | | $ | 4,661,855 | | |
| | | | | | | $ | 10,616,890 | | |
| Other Revenue — 5.4% | | | |
| $ | 16,000 | | | Children's Trust Fund, PR, Tobacco Settlement,
0.00%, 5/15/50 | | $ | 925,280 | | |
| | 34,960 | | | Children's Trust Fund, PR, Tobacco Settlement,
0.00%, 5/15/55 | | | 1,224,649 | | |
| | 6,000 | | | Puerto Rico Infrastructure Financing Authority,
5.50%, 10/1/34(1) | | | 6,369,220 | | |
| | 12,800 | | | Tobacco Settlement Financing Corp., 0.00%, 6/1/41 | | | 1,366,656 | | |
| | 7,875 | | | Tobacco Settlement Financing Corp., 4.75%, 6/1/34 | | | 6,648,311 | | |
| | | | | | | $ | 16,534,116 | | |
| Senior Living / Life Care — 3.4% | | | |
| $ | 2,650 | | | New Jersey Economic Development Authority,
(Fellowship Village), 5.50%, 1/1/18 | | $ | 2,688,081 | | |
| | 2,115 | | | New Jersey Economic Development Authority,
(Fellowship Village), 5.50%, 1/1/25 | | | 2,124,983 | | |
| | 3,390 | | | New Jersey Economic Development Authority, (Forsgate),
(AMT), 8.625%, 6/1/25(5) | | | 3,022,931 | | |
| | 3,075 | | | New Jersey Economic Development Authority,
(Seabrook Village), 5.25%, 11/15/36 | | | 2,697,790 | | |
| | | | | | | $ | 10,533,785 | | |
| Special Tax Revenue — 4.2% | | | |
| $ | 300 | | | New Jersey Economic Development Authority, (Newark
Downtown District Management Corp.),
5.125%, 6/15/27 | | $ | 298,887 | | |
| | 525 | | | New Jersey Economic Development Authority, (Newark
Downtown District Management Corp.),
5.125%, 6/15/37 | | | 490,298 | | |
| | 11,645 | | | Puerto Rico Sales Tax Financing, 5.25%, 8/1/57 | | | 11,893,970 | | |
| | | | | | | $ | 12,683,155 | | |
| Transportation — 7.3% | | | |
| $ | 19,000 | | | Port Authority of New York and New Jersey,
6.125%, 6/1/94(6) | | $ | 22,360,910 | | |
| | | | | | | $ | 22,360,910 | | |
See notes to financial statements
31
Eaton Vance New Jersey Municipals Fund as of January 31, 2008
PORTFOLIO OF INVESTMENTS (Unaudited) CONT'D
Principal Amount
(000's omitted) | |
Security | |
Value | |
| Water and Sewer — 1.8% | |
| $ | 5,310 | | | New Jersey Economic Development Authority, (Atlantic
City Sewer), (AMT), 5.45%, 4/1/28 | | $ | 5,381,260 | | |
| | | | | $ | 5,381,260 | | |
Total Tax-Exempt Investments — 106.8%
(identified cost $316,522,547) | | $ | 326,667,910 | | |
| Other Assets, Less Liabilities — (6.8)% | | $ | (20,752,769 | ) | |
| Net Assets — 100.0% | | $ | 305,915,141 | | |
AMBAC - AMBAC Financial Group, Inc.
AMT - Interest earned from these securities may be considered a tax preference item for purposes of the Federal Alternative Minimum Tax.
FGIC - Financial Guaranty Insurance Company
FSA - Financial Security Assurance, Inc.
MBIA - Municipal Bond Insurance Association
RITES - Residual Interest Tax-Exempt Securities
XLCA - XL Capital Assurance, Inc.
The Fund invests primarily in debt securities issued by New Jersey municipalities. The ability of the issuers of the debt securities to meet their obligations may be affected by economic developments in a specific industry or municipality. In order to reduce the risk associated with such economic developments, at January 31, 2008, 40.6% of total investments are backed by bond insurance of various financial institutions and financial guaranty assurance agencies. The aggregate percentage insured by an individual financial institution ranged from 2.2% to 17.2% of total investments.
(1) Security represents the underlying municipal obligation of an inverse floating rate obligation held by the Fund.
(2) Security exempt from registration under Rule 144A of the Securities Act of 1933. These securities may be sold in transactions exempt from registration, normally to qualified institutional buyers. At January 31, 2008, the aggregate value of the securities is $3,835,360 or 1.3% of the Fund's net assets.
(3) Security has been issued as a leveraged inverse floater bond. The stated interest rate represents the rate in effect at January 31, 2008.
(4) Security has been issued as an inverse floater bond. The stated interest rate represents the rate in effect at January 31, 2008.
(5) Security is in default with respect to scheduled principal payments.
(6) Security (or a portion thereof) has been segregated to cover margin requirements on open financial futures contracts.
See notes to financial statements
32
Eaton Vance Pennsylvania Municipals Fund as of January 31, 2008
PORTFOLIO OF INVESTMENTS (Unaudited)
| Tax-Exempt Investments — 111.7% | | | |
Principal Amount
(000's omitted) | |
Security | |
Value | |
| Cogeneration — 2.6% | | | |
| $ | 1,465 | | | Carbon County Industrial Development Authority,
(Panther Creek Partners), (AMT), 6.65%, 5/1/10 | | $ | 1,507,968 | | |
| | 5,000 | | | Pennsylvania Economic Development Financing Authority,
(Northampton Generating), (AMT), 6.50%, 1/1/13 | | | 5,064,400 | | |
| | 1,000 | | | Pennsylvania Economic Development Financing Authority,
(Northampton Generating), (AMT), 6.60%, 1/1/19 | | | 1,000,450 | | |
| | | | | | | $ | 7,572,818 | | |
| Education — 3.6% | | | |
| $ | 1,000 | | | Pennsylvania Higher Educational Facilities Authority,
(La Salle University), 5.00%, 5/1/37 | | $ | 942,830 | | |
| | 6,050 | | | Pennsylvania Higher Educational Facilities Authority,
(University of Pennsylvania), 4.75%, 7/15/35 | | | 6,093,318 | | |
| | 3,500 | | | Pennsylvania University, 4.50%, 8/15/36 | | | 3,452,855 | | |
| | | | | | | $ | 10,489,003 | | |
| Electric Utilities — 0.8% | | | |
| $ | 2,250 | | | York County Industrial Development Authority, Pollution
Control, (Public Service Enterprise Group, Inc.),
5.50%, 9/1/20 | | $ | 2,225,362 | | |
| | | | | | | $ | 2,225,362 | | |
| Escrowed / Prerefunded — 5.3% | | | |
| $ | 2,000 | | | Allegheny County Industrial Development Authority,
(Residential Resources, Inc.), Prerefunded to
9/1/11, 6.50%, 9/1/21 | | $ | 2,271,200 | | |
| | 675 | | | Allegheny County Industrial Development Authority,
(Residential Resources, Inc.), Prerefunded to
9/1/11, 6.60%, 9/1/31 | | | 768,825 | | |
| | 1,210 | | | Bucks County Industrial Development Authority,
(Pennswood), Prerefunded to
10/1/12, 6.00%, 10/1/27 | | | 1,392,299 | | |
| | 3,500 | | | Chester County Health and Educational Facility Authority,
(Devereux Foundation), Prerefunded to
11/1/09, 6.00%, 11/1/29 | | | 3,762,220 | | |
| | 1,800 | | | Grove City Area Hospital Authority, (Grove Manor),
Prerefunded to 8/15/08, 6.625%, 8/15/29 | | | 1,864,530 | | |
| | 2,250 | | | Lancaster County Hospital Authority, Prerefunded to
9/15/13, 5.50%, 3/15/26 | | | 2,565,292 | | |
| | 2,000 | | | Monroe County Hospital Authority, (Pocono Medical
Center), Prerefunded to 1/1/14, 6.00%, 1/1/43 | | | 2,327,120 | | |
| | 500 | | | Montgomery County Higher Education and Health
Authority, (Faulkeways at Gwynedd), Prerefunded to
11/15/09, 6.75%, 11/15/24 | | | 545,035 | | |
| | | | | | | $ | 15,496,521 | | |
Principal Amount
(000's omitted) | |
Security | |
Value | |
| General Obligations — 0.3% | | | |
| $ | 1,000 | | | Radnor Township, 5.125%, 7/15/34 | | $ | 1,038,000 | | |
| | | | | | | $ | 1,038,000 | | |
| Hospital — 9.3% | | | |
| $ | 3,060 | | | Hazelton Health Services Authority, (Hazelton General
Hospital), 5.50%, 7/1/27 | | $ | 2,907,581 | | |
| | 2,895 | | | Lancaster County Hospital Authority, (Lancaster General
Hospital), 4.50%, 3/15/36 | | | 2,716,986 | | |
| | 2,150 | | | Lebanon County Health Facility Authority, (Good
Samaritan Hospital), 6.00%, 11/15/35 | | | 2,207,298 | | |
| | 5,000 | | | Lehigh County General Purpose Authority, (Lehigh Valley
Health Network), 5.25%, 7/1/32 | | | 5,087,300 | | |
| | 1,000 | | | Monroe County Hospital Authority, (Pocono Medical
Center), 5.25%, 1/1/43 | | | 941,010 | | |
| | 4,100 | | | Pennsylvania Higher Educational Facilities Authority,
(UPMC Health System), 6.00%, 1/15/31 | | | 4,397,250 | | |
| | 7,375 | | | Philadelphia Hospitals and Higher Education Facilities
Authority, (Children's Hospital), 4.50%, 7/1/37 | | | 7,000,129 | | |
| | 1,885 | | | Washington County Hospital Authority, (Monongahela
Hospital), 5.50%, 6/1/17 | | | 1,991,804 | | |
| | | | | | | $ | 27,249,358 | | |
| Housing — 6.1% | | | |
| $ | 1,475 | | | Allegheny County Residential Finance Authority, (Single
Family Mortgages), (AMT), 4.95%, 11/1/37 | | $ | 1,418,286 | | |
| | 4,000 | | | Pennsylvania Housing Finance Agency, (AMT),
4.70%, 10/1/37 | | | 3,709,800 | | |
| | 3,995 | | | Pennsylvania Housing Finance Agency, (AMT),
4.875%, 4/1/26 | | | 3,928,563 | | |
| | 5,960 | | | Pennsylvania Housing Finance Agency, (AMT),
4.90%, 10/1/37 | | | 5,686,376 | | |
| | 3,000 | | | Pennsylvania Housing Finance Agency, (AMT),
Variable Rate, 5.25%, 10/1/33 | | | 2,995,500 | | |
| | | | | | | $ | 17,738,525 | | |
| Industrial Development Revenue — 1.2% | | | |
| $ | 500 | | | Erie Industrial Development Authority, (International
Paper), (AMT), 5.85%, 12/1/20 | | $ | 504,140 | | |
| | 1,500 | | | New Morgan Industrial Development Authority,
(Browning-Ferris Industries, Inc.), (AMT),
6.50%, 4/1/19 | | | 1,499,820 | | |
| | 1,500 | | | Pennsylvania Economic Development Financing Authority,
Solid Waste Disposal, (Waste Management, Inc.),
(AMT), 5.10%, 10/1/27 | | | 1,428,840 | | |
| | | | | | | $ | 3,432,800 | | |
See notes to financial statements
33
Eaton Vance Pennsylvania Municipals Fund as of January 31, 2008
PORTFOLIO OF INVESTMENTS (Unaudited) CONT'D
Principal Amount
(000's omitted) | |
Security | |
Value | |
| Insured-Education — 3.9% | | | |
| $ | 1,000 | | | Chester County Industrial Development Authority,
Educational Facility, (Westtown School), (AMBAC),
5.00%, 1/1/31 | | $ | 1,014,510 | | |
| | 1,350 | | | Lycoming County Authority, (Pennsylvania College of
Technology), (AMBAC), 5.25%, 5/1/32(1) | | | 1,396,116 | | |
| | 2,500 | | | Pennsylvania Higher Educational Facilities Authority,
(MBIA), 5.00%, 6/15/23 | | | 2,660,700 | | |
| | 3,515 | | | Pennsylvania Higher Educational Facilities Authority,
(Temple University), (MBIA), 4.50%, 4/1/36 | | | 3,298,687 | | |
| | 2,190 | | | Pennsylvania Higher Educational Facilities Authority,
(University of Pennsylvania), (MBIA), 4.50%, 6/15/36 | | | 2,146,879 | | |
| | 965 | | | Pennsylvania Higher Educational Facilities Authority,
(University of the Sciences in Philadelphia), (XLCA),
4.75%, 11/1/33 | | | 912,186 | | |
| | | | | | | $ | 11,429,078 | | |
| Insured-Electric Utilities — 3.8% | | | |
| $ | 8,490 | | | Lehigh County Industrial Development Authority, (PPL
Electric Utilities Corp.), (FGIC), 4.75%, 2/15/27(2) | | $ | 8,410,053 | | |
| | 2,500 | | | Puerto Rico Electric Power Authority, (FGIC),
5.25%, 7/1/35 | | | 2,586,900 | | |
| | | | | | | $ | 10,996,953 | | |
| Insured-Escrowed / Prerefunded — 13.6% | | | |
| $ | 2,540 | | | Allegheny County Sanitation Authority, (MBIA),
Prerefunded to 12/1/10, 5.50%, 12/1/30 | | $ | 2,780,868 | | |
| | 2,500 | | | Erie School District, (MBIA), Escrowed to Maturity,
0.00%, 5/1/19 | | | 1,610,025 | | |
| | 2,625 | | | Erie School District, (MBIA), Escrowed to Maturity,
0.00%, 5/1/20 | | | 1,602,405 | | |
| | 2,625 | | | Erie School District, (MBIA), Escrowed to Maturity,
0.00%, 5/1/21 | | | 1,515,334 | | |
| | 3,625 | | | Erie School District, (MBIA), Escrowed to Maturity,
0.00%, 5/1/22 | | | 1,971,529 | | |
| | 1,750 | | | Lower Moreland Township Authority, Sewer Revenue,
(FSA), Prerefunded to 8/1/09, 5.00%, 8/1/29 | | | 1,825,023 | | |
| | 2,320 | | | McKeesport Area School District, (AMBAC), Escrowed to
Maturity, 0.00%, 10/1/25 | | | 1,035,254 | | |
| | 1,365 | | | Pennsylvania Turnpike Commission, (AMBAC),
Escrowed to Maturity, 4.75%, 12/1/27 | | | 1,370,364 | | |
| | 2,530 | | | Philadelphia, (FSA), Prerefunded to
3/15/09, 5.00%, 3/15/28 | | | 2,636,665 | | |
| | 3,355 | | | Philadelphia, (FSA), Prerefunded to
3/15/11, 5.25%, 9/15/25 | | | 3,641,819 | | |
| | 1,000 | | | Philadelphia School District, (FSA), Prerefunded to
2/1/12, 5.50%, 2/1/31 | | | 1,110,780 | | |
Principal Amount
(000's omitted) | |
Security | |
Value | |
| Insured-Escrowed / Prerefunded (continued) | | | |
| $ | 4,700 | | | Philadelphia Water and Wastewater, (FGIC),
Prerefunded to 11/1/12, 5.00%, 11/1/31(2) | | $ | 5,202,578 | | |
| | 5,000 | | | Puerto Rico Electric Power Authority, (FSA),
Prerefunded to 7/1/10, 5.25%, 7/1/29(2) | | | 5,392,257 | | |
| | 2,610 | | | Westmoreland Municipal Authority, (FGIC), Escrowed to
Maturity, 0.00%, 8/15/19 | | | 1,506,309 | | |
| | 5,780 | | | Westmoreland Municipal Authority, (FGIC), Series A,
Escrowed to Maturity, 0.00%, 8/15/20 | | | 3,130,390 | | |
| | 5,400 | | | Westmoreland Municipal Authority, (FGIC), Series C,
Escrowed to Maturity, 0.00%, 8/15/20 | | | 3,258,252 | | |
| | | | | | | $ | 39,589,852 | | |
| Insured-General Obligations — 14.1% | | | |
| $ | 2,170 | | | Elizabeth Forward School District, (MBIA),
0.00%, 9/1/20 | | $ | 1,262,658 | | |
| | 2,170 | | | Elizabeth Forward School District, (MBIA),
0.00%, 9/1/21 | | | 1,185,601 | | |
| | 2,170 | | | Elizabeth Forward School District, (MBIA),
0.00%, 9/1/22 | | | 1,114,772 | | |
| | 2,170 | | | Elizabeth Forward School District, (MBIA),
0.00%, 9/1/23 | | | 1,048,891 | | |
| | 2,365 | | | Harrisburg, (AMBAC), 0.00%, 3/15/17 | | | 1,644,645 | | |
| | 5,175 | | | Hazelton School District, (FGIC), 0.00%, 3/1/21 | | | 2,814,424 | | |
| | 4,000 | | | Hollidaysburg School District, (FSA), 4.75%, 3/15/30 | | | 4,069,440 | | |
| | 1,000 | | | Hopewell School District, (FSA), 0.00%, 9/1/22 | | | 524,820 | | |
| | 2,000 | | | Hopewell School District, (FSA), 0.00%, 9/1/26 | | | 834,380 | | |
| | 1,315 | | | Lake Lehman School District, (MBIA), 0.00%, 4/1/26 | | | 547,684 | | |
| | 1,430 | | | Mars Area School District, (MBIA), Escrowed to Maturity,
0.00%, 3/1/14 | | | 1,178,649 | | |
| | 1,100 | | | McKeesport Area School District, (AMBAC),
0.00%, 10/1/25 | | | 464,486 | | |
| | 2,340 | | | McKeesport Area School District, (AMBAC),
0.00%, 10/1/27 | | | 880,870 | | |
| | 5,000 | | | Montour School District, (FSA), 5.00%, 4/1/32 | | | 5,225,900 | | |
| | 5,400 | | | Northampton County, (FSA), 5.25%, 10/1/30 | | | 5,755,428 | | |
| | 1,000 | | | Northeastern York School District, (FGIC),
5.00%, 4/1/30 | | | 1,033,740 | | |
| | 3,040 | | | Philadelphia School District, (FGIC),
4.375%, 6/1/34 | | | 2,773,696 | | |
| | 3,300 | | | Puerto Rico, (FSA), Variable Rate,
8.682%, 7/1/27(3)(4) | | | 4,040,058 | | |
| | 1,500 | | | Puerto Rico, (MBIA), 5.50%, 7/1/20(2) | | | 1,651,965 | | |
| | 655 | | | Rochester Area School District, (AMBAC),
0.00%, 5/1/10 | | | 617,907 | | |
| | 2,500 | | | Scranton School District, (FSA), 5.00%, 7/15/38 | | | 2,596,325 | | |
| | | | | | | $ | 41,266,339 | | |
See notes to financial statements
34
Eaton Vance Pennsylvania Municipals Fund as of January 31, 2008
PORTFOLIO OF INVESTMENTS (Unaudited) CONT'D
Principal Amount
(000's omitted) | |
Security | |
Value | |
| Insured-Hospital — 3.3% | | | |
| $ | 3,750 | | | Allegheny County Hospital Authority, (Magee-Women's
Hospital), (FGIC), 0.00%, 10/1/15 | | $ | 2,811,825 | | |
| | 4,000 | | | Pennsylvania Higher Educational Facilities Authority,
(UPMC Health System), (FSA), 5.00%, 8/1/29 | | | 4,102,320 | | |
| | 1,250 | | | Sharon Health System Authority, (Sharon Regional
Health), (MBIA), 5.00%, 12/1/28 | | | 1,265,713 | | |
| | 1,310 | | | Washington County Hospital Authority, (Washington
Hospital), (AMBAC), 5.50%, 7/1/17 | | | 1,498,247 | | |
| | | | | | | $ | 9,678,105 | | |
| Insured-Industrial Development Revenue — 1.3% | | | |
| $ | 4,000 | | | York County Industrial Development Authority,
(York Water Co.), (FGIC), (AMT), 4.75%, 10/1/36 | | $ | 3,772,800 | | |
| | | | | | | $ | 3,772,800 | | |
Insured-Lease Revenue / Certificates of
Participation — 4.3% | | | |
| $ | 990 | | | Puerto Rico Public Finance Corp., (Commonwealth
Appropriation), (AMBAC), 5.125%, 6/1/24 | | $ | 1,099,880 | | |
| | 510 | | | Puerto Rico Public Finance Corp., (Commonwealth
Appropriation), (AMBAC), 5.125%, 6/1/24(2) | | | 566,619 | | |
| | 9,500 | | | State Public School Building Authority, (FSA),
5.50%, 6/1/28(2) | | | 10,901,117 | | |
| | | | | | | $ | 12,567,616 | | |
| Insured-Special Tax Revenue — 0.9% | | | |
| $ | 635 | | | Pennsylvania Turnpike Commission, Franchise Tax
Revenue, (AMBAC), 4.75%, 12/1/27 | | $ | 636,016 | | |
| | 11,000 | | | Puerto Rico Sales Tax Financing, (AMBAC),
0.00%, 8/1/54 | | | 890,450 | | |
| | 2,035 | | | Puerto Rico Sales Tax Financing, (MBIA),
0.00%, 8/1/44 | | | 291,025 | | |
| | 4,035 | | | Puerto Rico Sales Tax Financing, (MBIA),
0.00%, 8/1/45 | | | 546,500 | | |
| | 3,225 | | | Puerto Rico Sales Tax Financing, (MBIA),
0.00%, 8/1/46 | | | 413,187 | | |
| | | | | | | $ | 2,777,178 | | |
| Insured-Transportation — 12.8% | | | |
| $ | 1,600 | | | Allegheny County Port Authority, (FGIC),
5.00%, 3/1/29 | | $ | 1,627,088 | | |
| | 6,000 | | | Philadelphia Airport Commission, (FSA), (AMT),
5.00%, 6/15/27 | | | 6,048,780 | | |
| | 7,950 | | | Philadelphia, Airport Revenue, (MBIA), (AMT),
4.75%, 6/15/35 | | | 7,375,692 | | |
| | 3,300 | | | Puerto Rico Highway and Transportation Authority, (AGC),
5.25%, 7/1/36 | | | 3,629,736 | | |
Principal Amount
(000's omitted) | |
Security | |
Value | |
| Insured-Transportation (continued) | | | |
| $ | 6,000 | | | Puerto Rico Highway and Transportation Authority, (AGC),
(CIFG), 5.25%, 7/1/41(2) | | $ | 6,583,470 | | |
| | 11,000 | | | Puerto Rico Highway and Transportation Authority, (FSA),
5.25%, 7/1/36 | | | 12,099,120 | | |
| | | | | | | $ | 37,363,886 | | |
| Insured-Utilities — 7.1% | | | |
| $ | 11,550 | | | Philadelphia Gas Works Revenue, (AMBAC),
5.00%, 10/1/37(2) | | $ | 11,505,032 | | |
| | 8,100 | | | Philadelphia Gas Works Revenue, (FSA),
5.375%, 7/1/17(2) | | | 9,274,230 | | |
| | | | | | | $ | 20,779,262 | | �� |
| Insured-Water and Sewer — 9.2% | | | |
| $ | 5,125 | | | Allegheny County Sanitation Authority, (FGIC),
5.00%, 12/1/37 | | $ | 5,269,013 | | |
| | 460 | | | Allegheny County Sanitation Authority, (MBIA),
5.50%, 12/1/30 | | | 485,433 | | |
| | 4,000 | | | Chester County Industrial Development Authority,
(Aqua Pennsylvania, Inc.), (FGIC), (AMT),
5.00%, 2/1/40 | | | 3,962,160 | | |
| | 5,670 | | | Delaware County Industrial Development Authority,
(Aqua Pennsylvania, Inc.), (FGIC), (AMT),
5.00%, 2/1/35 | | | 5,636,717 | | |
| | 4,125 | | | Delaware County Industrial Development Authority,
(Aqua Pennsylvania, Inc.), (FGIC), (AMT),
5.00%, 11/1/36 | | | 4,093,568 | | |
| | 1,000 | | | Harrisburg Authority, Water Revenue, (FSA),
5.00%, 7/15/29 | | | 1,039,680 | | |
| | 2,470 | | | Philadelphia Water and Wastewater, (AMBAC),
4.25%, 11/1/31 | | | 2,225,124 | | |
| | 2,800 | | | Philadelphia Water and Wastewater, (FGIC),
5.00%, 11/1/31(2) | | | 2,848,297 | | |
| | 2,235 | | | Westmoreland Municipal Authority, (FGIC),
0.00%, 8/15/19 | | | 1,289,886 | | |
| | | | | | | $ | 26,849,878 | | |
| Nursing Home — 2.1% | | | |
| $ | 2,000 | | | Allegheny County Housing Development Authority,
(Villa St. Joseph), 6.00%, 8/15/28 | | $ | 1,897,200 | | |
| | 2,900 | | | Montgomery Industrial Development Authority,
(Advancement of Geriatric Health Care Institute),
8.375%, 7/1/23 | | | 2,903,567 | | |
| | 1,215 | | | Westmoreland County Industrial Development Authority,
(Highland Health Systems, Inc.), 9.25%, 6/1/22 | | | 1,217,248 | | |
| | | | | | | $ | 6,018,015 | | |
See notes to financial statements
35
Eaton Vance Pennsylvania Municipals Fund as of January 31, 2008
PORTFOLIO OF INVESTMENTS (Unaudited) CONT'D
Principal Amount
(000's omitted) | |
Security | |
Value | |
| Senior Living / Life Care — 2.7% | | | |
| $ | 2,500 | | | Cliff House Trust, (AMT), 6.625%, 6/1/27(5) | | $ | 1,674,625 | | |
| | 1,700 | | | Crawford County Hospital Authority, (Wesbury United
Methodist Community), 6.25%, 8/15/29 | | | 1,691,976 | | |
| | 1,835 | | | Lancaster County Hospital Authority, (Willow Valley
Retirement Communities), 5.875%, 6/1/31 | | | 1,880,600 | | |
| | 600 | | | Montgomery County Industrial Development Authority,
(Foulkeways at Gwynedd), 5.00%, 12/1/24 | | | 588,252 | | |
| | 900 | | | Montgomery County Industrial Development Authority,
(Foulkeways at Gwynedd), 5.00%, 12/1/30 | | | 831,366 | | |
| | 1,100 | | | Philadelphia Higher Educational Facilities Authority,
(The Philadelphia Protestant Home), 6.50%, 7/1/27 | | | 1,100,198 | | |
| | | | | | | $ | 7,767,017 | | |
| Special Tax Revenue — 2.5% | | | |
| $ | 7,285 | | | Puerto Rico Sales Tax Financing, 5.25%, 8/1/57 | | $ | 7,440,753 | | |
| | | | | | | $ | 7,440,753 | | |
| Transportation — 0.9% | | | |
| $ | 1,000 | | | Delaware River Joint Toll Bridge Commission,
5.00%, 7/1/28 | | $ | 1,013,440 | | |
| | 995 | | | Erie Municipal Airport Authority, (AMT),
5.875%, 7/1/16 | | | 998,552 | | |
| | 750 | | | Pennsylvania Economic Development Financing Authority,
(Amtrak), (AMT), 6.25%, 11/1/31 | | | 775,140 | | |
| | | | | | | $ | 2,787,132 | | |
Total Tax-Exempt Investments
(identified cost $315,716,282) | | $ | 326,326,251 | | |
| Short-Term Investments — 1.0% | | | |
Principal Amount
(000's omitted) | |
Description | |
Value | |
| $ | 3,000 | | | Pennsylvania Housing Finance Agency, (AMT),
Variable Rate, 5.624%, 10/1/34(6) | | $ | 3,000,000 | | |
Total Short-Term Investments
(identified cost $3,000,000) | | $ | 3,000,000 | | |
Total Investments — 112.7%
(identified cost $318,716,282) | | $ | 329,326,251 | | |
| Other Assets, Less Liabilities — (12.7)% | | $ | (37,189,125 | ) | |
| Net Assets — 100.0% | | $ | 292,137,126 | | |
AGC - Assured Guaranty Corp.
AMBAC - AMBAC Financial Group, Inc.
AMT - Interest earned from these securities may be considered a tax preference item for purposes of the Federal Alternative Minimum Tax.
CIFG - CIFG Assurance North America, Inc.
FGIC - Financial Guaranty Insurance Company
FSA - Financial Security Assurance, Inc.
MBIA - Municipal Bond Insurance Association
XLCA - XL Capital Assurance, Inc.
The Fund invests primarily in debt securities issued by Pennsylvania municipalities. The ability of the issuers of the debt securities to meet their obligations may be affected by economic developments in a specific industry or municipality. In order to reduce the risk associated with such economic developments, at January 31, 2008, 65.9% of total investments are backed by bond insurance of various financial institutions and financial guaranty assurance agencies. The aggregate percentage insured by an individual financial institution ranged from 0.3% to 24.6% of total investments.
(1) Security (or a portion thereof) has been segregated to cover margin requirements on open financial futures contracts.
(2) Security represents the underlying municipal obligation of an inverse floating rate obligation held by the Fund.
(3) Security exempt from registration under Rule 144A of the Securities Act of 1933. These securities may be sold in transactions exempt from registration, normally to qualified institutional buyers. At January 31, 2008, the aggregate value of the securities is $4,040,058 or 1.4% of the Fund's net assets.
(4) Security has been issued as a leveraged inverse floater bond. The stated interest rate represents the rate in effect at January 31, 2008.
(5) Security is in default with respect to scheduled principal payments.
(6) Variable rate demand obligation. The stated interest rate represents the rate in effect at January 31, 2008.
See notes to financial statements
36
Eaton Vance Municipals Funds as of January 31, 2008
FINANCIAL STATEMENTS (Unaudited)
Statements of Assets and Liabilities
As of January 31, 2008
| | | Arizona Fund | | Colorado Fund | | Connecticut Fund | | Michigan Fund | |
| Assets | |
| Investments — | |
| Identified cost | | $ | 108,671,289 | | | $ | 39,068,875 | | | $ | 137,374,029 | | | $ | 64,280,251 | | |
| Unrealized appreciation | | | 4,271,161 | | | | 762,767 | | | | 5,861,258 | | | | 3,747,490 | | |
| Investments, at value | | $ | 112,942,450 | | | $ | 39,831,642 | | | $ | 143,235,287 | | | $ | 68,027,741 | | |
| Cash | | $ | 2,398,310 | | | $ | 309,326 | | | $ | 361,437 | | | $ | 136,274 | | |
| Receivable for investments sold | | | — | | | | — | | | | — | | | | 698,639 | | |
| Receivable for Fund shares sold | | | 410,859 | | | | 124,825 | | | | 149,738 | | | | 116,835 | | |
| Interest receivable | | | 786,959 | | | | 405,819 | | | | 1,515,672 | | | | 733,702 | | |
| Receivable for daily variation margin on open financial futures contracts | | | 138 | | | | — | | | | — | | | | — | | |
| Total assets | | $ | 116,538,716 | | | $ | 40,671,612 | | | $ | 145,262,134 | | | $ | 69,713,191 | | |
| Liabilities | |
| Payable for floating rate notes issued | | $ | 5,285,000 | | | $ | 270,000 | | | $ | 10,795,000 | | | $ | 3,000,000 | | |
| Interest expense and fees payable | | | 30,123 | | | | 1,582 | | | | 40,084 | | | | 8,586 | | |
| Payable for Fund shares redeemed | | | 167,742 | | | | 5,350 | | | | 292,432 | | | | 34,740 | | |
| Payable for daily variation margin on open financial futures contracts | | | — | | | | 100,000 | | | | 77,000 | | | | 139,000 | | |
| Dividends payable | | | 148,882 | | | | 54,243 | | | | 190,397 | | | | 107,242 | | |
| Payable for open interest rate swap contracts | | | 248,360 | | | | 6,355 | | | | 23,302 | | | | 10,827 | | |
| Payable to affiliate for Trustees' fees | | | — | | | | 22 | | | | 2,260 | | | | 180 | | |
| Payable to affiliate for investment advisory fee | | | 33,789 | | | | 7,524 | | | | 42,939 | | | | 17,516 | | |
| Payable to affiliate for distribution and service fees | | | 28,812 | | | | 9,898 | | | | 35,499 | | | | 13,830 | | |
| Accrued expenses | | | 37,895 | | | | 28,838 | | | | 56,832 | | | | 28,348 | | |
| Total liabilities | | $ | 5,980,603 | | | $ | 483,812 | | | $ | 11,555,745 | | | $ | 3,360,269 | | |
| Net Assets | | $ | 110,558,113 | | | $ | 40,187,800 | | | $ | 133,706,389 | | | $ | 66,352,922 | | |
| Sources of Net Assets | |
| Paid-in capital | | $ | 109,877,837 | | | $ | 40,513,997 | | | $ | 129,233,064 | | | $ | 63,690,209 | | |
| Accumulated net realized loss (computed on the basis of identified cost) | | | (3,321,271 | ) | | | (946,837 | ) | | | (1,219,399 | ) | | | (947,078 | ) | |
| Accumulated undistributed (distributions in excess of) net investment income | | | (8,353 | ) | | | 9,875 | | | | (181,025 | ) | | | 64,083 | | |
| Net unrealized appreciation (computed on the basis of identified cost) | | | 4,009,900 | | | | 610,765 | | | | 5,873,749 | | | | 3,545,708 | | |
| Net Assets | | $ | 110,558,113 | | | $ | 40,187,800 | | | $ | 133,706,389 | | | $ | 66,352,922 | | |
| Class A Shares | |
| Net Assets | | $ | 94,594,231 | | | $ | 35,380,102 | | | $ | 114,356,022 | | | $ | 62,381,849 | | |
| Shares Outstanding | | | 9,800,628 | | | | 3,747,301 | | | | 10,882,738 | | | | 6,678,079 | | |
Net Asset Value and Redemption Price Per Share
(net assets ÷ shares of beneficial interest outstanding) | | $ | 9.65 | | | $ | 9.44 | | | $ | 10.51 | | | $ | 9.34 | | |
Maximum Offering Price Per Share
(100 ÷ 95.25 of net asset value per share) | | $ | 10.13 | | | $ | 9.91 | | | $ | 11.03 | | | $ | 9.81 | | |
See notes to financial statements
37
Eaton Vance Municipals Funds as of January 31, 2008
FINANCIAL STATEMENTS (Unaudited) CONT'D
Statements of Assets and Liabilities
As of January 31, 2008
| | | Arizona Fund | | Colorado Fund | | Connecticut Fund | | Michigan Fund | |
| Class B Shares | |
| Net Assets | | $ | 8,083,581 | | | $ | 4,806,705 | | | $ | 15,830,010 | | | $ | — | | |
| Shares Outstanding | | | 753,394 | | | | 467,714 | | | | 1,513,882 | | | | — | | |
Net Asset Value and Offering Price Per Share*
(net assets ÷ shares of beneficial interest outstanding) | | $ | 10.73 | | | $ | 10.28 | | | $ | 10.46 | | | $ | — | | |
| Class C Shares | |
| Net Assets | | $ | 7,880,301 | | | $ | 993 | | | $ | 3,520,357 | | | $ | 3,971,073 | | |
| Shares Outstanding | | | 734,193 | | | | 97 | | | | 336,346 | | | | 424,846 | | |
Net Asset Value and Offering Price Per Share*
(net assets ÷ shares of beneficial interest outstanding) | | $ | 10.73 | | | $ | 10.28 | | | $ | 10.47 | | | $ | 9.35 | | |
On sales of $25,000 or more, the offering price of Class A shares is reduced.
* Redemption price per share is equal to net asset value less any applicable contingent deferred sales charge.
See notes to financial statements
38
Eaton Vance Municipals Funds as of January 31, 2008
FINANCIAL STATEMENTS (Unaudited) CONT'D
Statements of Assets and Liabilities
As of January 31, 2008
| | | Minnesota Fund | | New Jersey Fund | | Pennsylvania Fund | |
| Assets | |
| Investments — | |
| Identified cost | | $ | 81,545,197 | | | $ | 316,522,547 | | | $ | 318,716,282 | | |
| Unrealized appreciation | | | 2,190,783 | | | | 10,145,363 | | | | 10,609,969 | | |
| Investments, at value | | $ | 83,735,980 | | | $ | 326,667,910 | | | $ | 329,326,251 | | |
| Cash | | $ | 1,793,172 | | | $ | 3,889,201 | | | $ | 1,789,282 | | |
| Receivable for investments sold | | | — | | | | 1,339,344 | | | | 676,187 | | |
| Receivable for Fund shares sold | | | 1,808,337 | | | | 1,029,737 | | | | 547,754 | | |
| Interest receivable | | | 1,078,586 | | | | 2,855,191 | | | | 3,460,328 | | |
| Receivable for daily variation margin on open financial futures contracts | | | 7,110 | | | | — | | | | — | | |
| Total assets | | $ | 88,423,185 | | | $ | 335,781,383 | | | $ | 335,799,802 | | |
| Liabilities | |
| Payable for floating rate notes issued | | $ | 2,500,000 | | | $ | 21,120,000 | | | $ | 40,535,000 | | |
| Payable for when-issued securities | | | 996,740 | | | | — | | | | — | | |
| Interest expense and fees payable | | | 14,338 | | | | 104,519 | | | | 187,293 | | |
| Payable for investments purchased | | | 1,541,352 | | | | 6,059,360 | | | | — | | |
| Payable for Fund shares redeemed | | | 21,794 | | | | 400,389 | | | | 617,589 | | |
| Payable for daily variation margin on open financial futures contracts | | | — | | | | 517,401 | | | | 740,000 | | |
| Dividends payable | | | 90,348 | | | | 404,210 | | | | 405,546 | | |
| Payable for open interest rate swap contracts | | | 94,505 | | | | 1,008,004 | | | | 913,897 | | |
| Payable to affiliate for Trustees' fees | | | — | | | | — | | | | 681 | | |
| Payable to affiliate for investment advisory fee | | | 22,418 | | | | 108,963 | | | | 104,512 | | |
| Payable to affiliate for distribution and service fees | | | 22,379 | | | | 81,652 | | | | 86,784 | | |
| Accrued expenses | | | 37,578 | | | | 61,744 | | | | 71,374 | | |
| Total liabilities | | $ | 5,341,452 | | | $ | 29,866,242 | | | $ | 43,662,676 | | |
| Net Assets | | $ | 83,081,733 | | | $ | 305,915,141 | | | $ | 292,137,126 | | |
| Sources of Net Assets | |
| Paid-in capital | | $ | 82,451,378 | | | $ | 304,980,218 | | | $ | 299,685,279 | | |
| Accumulated net realized gain (loss) (computed on the basis of identified cost) | | | (1,371,817 | ) | | | (7,795,735 | ) | | | (15,710,407 | ) | |
| Accumulated undistributed (distributions in excess of) net investment income | | | (95,350 | ) | | | 804,528 | | | | (314,666 | ) | |
| Net unrealized appreciation (computed on the basis of identified cost) | | | 2,097,522 | | | | 7,926,130 | | | | 8,476,920 | | |
| Net Assets | | $ | 83,081,733 | | | $ | 305,915,141 | | | $ | 292,137,126 | | |
| Class A Shares | |
| Net Assets | | $ | 68,390,596 | | | $ | 238,718,445 | | | $ | 234,729,921 | | |
| Shares Outstanding | | | 7,393,264 | | | | 23,745,100 | | | | 24,246,746 | | |
Net Asset Value and Redemption Price Per Share
(net assets ÷ shares of beneficial interest outstanding) | | $ | 9.25 | | | $ | 10.05 | | | $ | 9.68 | | |
Maximum Offering Price Per Share
(100 ÷ 95.25 of net asset value per share) | | $ | 9.71 | | | $ | 10.55 | | | $ | 10.16 | | |
See notes to financial statements
39
Eaton Vance Municipals Funds as of January 31, 2008
FINANCIAL STATEMENTS (Unaudited) CONT'D
Statements of Assets and Liabilities
As of January 31, 2008
| | | Minnesota Fund | | New Jersey Fund | | Pennsylvania Fund | |
| Class B Shares | |
| Net Assets | | $ | 7,429,547 | | | $ | 41,549,398 | | | $ | 32,231,711 | | |
| Shares Outstanding | | | 746,451 | | | | 3,956,941 | | | | 3,218,972 | | |
Net Asset Value and Offering Price Per Share*
(net assets ÷ shares of beneficial interest outstanding) | | $ | 9.95 | | | $ | 10.50 | | | $ | 10.01 | | |
| Class C Shares | |
| Net Assets | | $ | 7,261,590 | | | $ | 25,647,298 | | | $ | 25,175,494 | | |
| Shares Outstanding | | | 728,812 | | | | 2,444,658 | | | | 2,512,064 | | |
Net Asset Value and Offering Price Per Share*
(net assets ÷ shares of beneficial interest outstanding) | | $ | 9.96 | | | $ | 10.49 | | | $ | 10.02 | | |
On sales of $25,000 or more, the offering price of Class A shares is reduced.
* Redemption price per share is equal to net asset value less any applicable contingent deferred sales charge.
See notes to financial statements
40
Eaton Vance Municipals Funds as of January 31, 2008
FINANCIAL STATEMENTS (Unaudited) CONT'D
Statements of Operations
For the Six Months Ended January 31, 2008
| | | Arizona Fund | | Colorado Fund | | Connecticut Fund | | Michigan Fund | |
| Investment Income | |
| Interest | | $ | 2,780,809 | | | $ | 1,033,043 | | | $ | 3,563,363 | | | $ | 1,747,452 | | |
| Total investment income | | $ | 2,780,809 | | | $ | 1,033,043 | | | $ | 3,563,363 | | | $ | 1,747,452 | | |
| Expenses | |
| Investment adviser fee | | $ | 192,263 | | | $ | 48,302 | | | $ | 260,761 | | | $ | 106,236 | | |
| Trustees' fees and expenses | | | 4,485 | | | | 910 | | | | 6,776 | | | | 3,616 | | |
| Distribution and service fees | |
| Class A | | | 91,564 | | | | 36,638 | | | | 115,922 | | | | 63,927 | | |
| Class B | | | 40,597 | | | | 24,153 | | | | 81,400 | | | | — | | |
| Class C | | | 33,140 | | | | 3 | | | | 17,780 | | | | 17,433 | | |
| Legal and accounting services | | | 17,146 | | | | 17,208 | | | | 21,156 | | | | 18,296 | | |
| Printing and postage | | | 4,190 | | | | 2,405 | | | | 7,144 | | | | 4,309 | | |
| Custodian fee | | | 23,772 | | | | 13,029 | | | | 36,046 | | | | 16,246 | | |
| Interest expense and fees | | | 105,314 | | | | 15,196 | | | | 223,643 | | | | 57,640 | | |
| Transfer and dividend disbursing agent fees | | | 18,018 | | | | 11,733 | | | | 27,726 | | | | 15,067 | | |
| Registration fees | | | 4,133 | | | | 228 | | | | 3,019 | | | | 3,820 | | |
| Miscellaneous | | | 7,335 | | | | 4,994 | | | | 6,922 | | | | 2,384 | | |
| Total expenses | | $ | 541,957 | | | $ | 174,799 | | | $ | 808,295 | | | $ | 308,974 | | |
| Deduct — | |
| Reduction of custodian fee | | | 18,524 | | | | 4,637 | | | | 12,782 | | | | 9,943 | | |
| Total expense reductions | | $ | 18,524 | | | $ | 4,637 | | | $ | 12,782 | | | $ | 9,943 | | |
| Net expenses | | $ | 523,433 | | | $ | 170,162 | | | $ | 795,513 | | | $ | 299,031 | | |
| Net investment income | | $ | 2,257,376 | | | $ | 862,881 | | | $ | 2,767,850 | | | $ | 1,448,421 | | |
| Realized and Unrealized Gain (Loss) | |
| Net realized gain (loss) — | |
| Investment transactions (identified cost basis) | | $ | (105,078 | ) | | $ | (52,299 | ) | | $ | (195,853 | ) | | $ | (126,649 | ) | |
| Financial futures contracts | | | (174,805 | ) | | | (789,546 | ) | | | (504,494 | ) | | | (882,451 | ) | |
| Interest rate swap contracts | | | (521,014 | ) | | | (95,360 | ) | | | (349,654 | ) | | | (162,466 | ) | |
| Net realized loss | | $ | (800,897 | ) | | $ | (937,205 | ) | | $ | (1,050,001 | ) | | $ | (1,171,566 | ) | |
| Change in unrealized appreciation (depreciation) — | |
| Investments (identified cost basis) | | $ | 84,066 | | | $ | (139,579 | ) | | $ | 648,121 | | | $ | 501,824 | | |
| Financial futures contracts | | | 6,344 | | | | 76,015 | | | | 179,791 | | | | (9,368 | ) | |
| Interest rate swap contracts | | | (350,547 | ) | | | 4,177 | | | | 15,315 | | | | 7,116 | | |
| Net change in unrealized appreciation (depreciation) | | $ | (260,137 | ) | | $ | (59,387 | ) | | $ | 843,227 | | | $ | 499,572 | | |
| Net realized and unrealized loss | | $ | (1,061,034 | ) | | $ | (996,592 | ) | | $ | (206,774 | ) | | $ | (671,994 | ) | |
| Net increase (decrease) in net assets from operations | | $ | 1,196,342 | | | $ | (133,711 | ) | | $ | 2,561,076 | | | $ | 776,427 | | |
See notes to financial statements
41
Eaton Vance Municipals Funds as of January 31, 2008
FINANCIAL STATEMENTS (Unaudited) CONT'D
Statements of Operations
For the Six Months Ended January 31, 2008
| | | Minnesota Fund | | New Jersey Fund | | Pennsylvania Fund | |
| Investment Income | |
| Interest | | $ | 1,852,862 | | | $ | 8,952,658 | | | $ | 8,391,223 | | |
| Total investment income | | $ | 1,852,862 | | | $ | 8,952,658 | | | $ | 8,391,223 | | |
| Expenses | |
| Investment adviser fee | | $ | 120,592 | | | $ | 687,659 | | | $ | 623,917 | | |
| Trustees' fees and expenses | | | 2,301 | | | | — | | | | 8,836 | | |
| Distribution and service fees | |
| Class A | | | 61,695 | | | | 253,622 | | | | 238,263 | | |
| Class B | | | 36,149 | | | | 161,778 | | | | 162,389 | | |
| Class C | | | 25,079 | | | | 112,816 | | | | 110,271 | | |
| Legal and accounting services | | | 17,881 | | | | 30,430 | | | | 29,830 | | |
| Printing and postage | | | 3,198 | | | | 14,922 | | | | 15,753 | | |
| Custodian fee | | | 25,353 | | | | 56,549 | | | | 73,296 | | |
| Interest expense and fees | | | 52,932 | | | | 505,416 | | | | 781,494 | | |
| Transfer and dividend disbursing agent fees | | | 17,591 | | | | 68,254 | | | | 62,105 | | |
| Registration fees | | | — | | | | 4,460 | | | | 4,080 | | |
| Miscellaneous | | | 3,850 | | | | 26,797 | | | | 16,399 | | |
| Total expenses | | $ | 366,621 | | | $ | 1,922,703 | | | $ | 2,126,633 | | |
| Deduct — | |
| Reduction of custodian fee | | | 18,519 | | | | 17,492 | | | | 39,016 | | |
| Total expense reductions | | $ | 18,519 | | | $ | 17,492 | | | $ | 39,016 | | |
| Net expenses | | $ | 348,102 | | | $ | 1,905,211 | | | $ | 2,087,617 | | |
| Net investment income | | $ | 1,504,760 | | | $ | 7,047,447 | | | $ | 6,303,606 | | |
| Realized and Unrealized Gain (Loss) | |
| Net realized gain (loss) — | |
| Investment transactions (identified cost basis) | | $ | 66,892 | | | $ | (196,909 | ) | | $ | 441,300 | | |
| Financial futures contracts | | | (78,662 | ) | | | (5,188,138 | ) | | | (3,848,543 | ) | |
| Interest rate swap contracts | | | (229,789 | ) | | | (3,616,980 | ) | | | (1,623,915 | ) | |
| Net realized loss | | $ | (241,559 | ) | | $ | (9,002,027 | ) | | $ | (5,031,158 | ) | |
| Change in unrealized appreciation (depreciation) — | |
| Investments (identified cost basis) | | $ | 228,390 | | | $ | (3,830,226 | ) | | $ | (1,244,791 | ) | |
| Financial futures contracts | | | 9,904 | | | | (98,416 | ) | | | (1,219,152 | ) | |
| Interest rate swap contracts | | | (145,167 | ) | | | (553,075 | ) | | | (1,300,015 | ) | |
| Net change in unrealized appreciation (depreciation) | | $ | 93,127 | | | $ | (4,481,717 | ) | | $ | (3,763,958 | ) | |
| Net realized and unrealized loss | | $ | (148,432 | ) | | $ | (13,483,744 | ) | | $ | (8,795,116 | ) | |
| Net increase (decrease) in net assets from operations | | $ | 1,356,328 | | | $ | (6,436,297 | ) | | $ | (2,491,510 | ) | |
See notes to financial statements
42
Eaton Vance Municipals Funds as of January 31, 2008
FINANCIAL STATEMENTS (Unaudited) CONT'D
Statements of Changes in Net Assets
For the Six Months Ended January 31, 2008
| Increase (Decrease) in Net Assets | | Arizona Fund | | Colorado Fund | | Connecticut Fund | | Michigan Fund | |
| From operations — | |
| Net investment income | | $ | 2,257,376 | | | $ | 862,881 | | | $ | 2,767,850 | | | $ | 1,448,421 | | |
Net realized loss from investment transactions, financial futures
contracts and interest rate swap contracts | | | (800,897 | ) | | | (937,205 | ) | | | (1,050,001 | ) | | | (1,171,566 | ) | |
Net change in unrealized appreciation (depreciation) from investments,
financial futures contracts and interest rate swap contracts | | | (260,137 | ) | | | (59,387 | ) | | | 843,227 | | | | 499,572 | | |
| Net increase (decrease) in net assets from operations | | $ | 1,196,342 | | | $ | (133,711 | ) | | $ | 2,561,076 | | | $ | 776,427 | | |
| Distributions to shareholders — | |
| From net investment income | |
| Class A | | $ | (1,960,577 | ) | | $ | (791,241 | ) | | $ | (2,422,675 | ) | | $ | (1,366,284 | ) | |
| Class B | | | (151,410 | ) | | | (89,952 | ) | | | (292,231 | ) | | | — | | |
| Class C | | | (123,333 | ) | | | (11 | ) | | | (63,651 | ) | | | (63,806 | ) | |
| From net realized gain | |
| Class A | | | — | | | | — | | | | — | | | | (301,851 | ) | |
| Class C | | | — | | | | — | | | | — | | | | (19,553 | ) | |
| Total distributions to shareholders | | $ | (2,235,320 | ) | | $ | (881,204 | ) | | $ | (2,778,557 | ) | | $ | (1,751,494 | ) | |
| Transactions in shares of beneficial interest — | |
| Proceeds from sale of shares | |
| Class A | | $ | 12,064,581 | | | $ | 3,766,071 | | | $ | 9,007,509 | | | $ | 5,300,583 | | |
| Class B | | | 177,779 | | | | 27,708 | | | | 432,825 | | �� | | — | | |
| Class C | | | 2,044,098 | | | | 1,000 | | | | 785,922 | | | | 1,446,076 | | |
Net asset value of shares issued to shareholders in payment of
distributions declared | | | |
| Class A | | | 1,206,314 | | | | 500,631 | | | | 1,388,534 | | | | 935,170 | | |
| Class B | | | 68,678 | | | | 52,955 | | | | 171,645 | | | | — | | |
| Class C | | | 95,069 | | | | 11 | | | | 32,542 | | | | 52,021 | | |
| Cost of shares redeemed | |
| Class A | | | (9,439,883 | ) | | | (7,549,024 | ) | | | (12,160,221 | ) | | | (7,710,458 | ) | |
| Class B | | | (558,386 | ) | | | (130,746 | ) | | | (1,755,747 | ) | | | — | | |
| Class C | | | (1,031,863 | ) | | | — | | | | (725,727 | ) | | | (509,283 | ) | |
| Net asset value of shares exchanged | |
| Class A | | | 350,279 | | | | 519,455 | | | | 1,219,571 | | | | — | | |
| Class B | | | (350,279 | ) | | | (519,455 | ) | | | (1,219,571 | ) | | | — | | |
| Net increase (decrease) in net assets from Fund share transactions | | $ | 4,626,387 | | | $ | (3,331,394 | ) | | $ | (2,822,718 | ) | | $ | (485,891 | ) | |
| Net increase (decrease) in net assets | | $ | 3,587,409 | | | $ | (4,346,309 | ) | | $ | (3,040,199 | ) | | $ | (1,460,958 | ) | |
| Net Assets | |
| At beginning of period | | $ | 106,970,704 | | | $ | 44,534,109 | | | $ | 136,746,588 | | | $ | 67,813,880 | | |
| At end of period | | $ | 110,558,113 | | | $ | 40,187,800 | | | $ | 133,706,389 | | | $ | 66,352,922 | | |
Accumulated undistributed
(distributions in excess of) net
investment income included in net assets | |
| At end of period | | $ | (8,353 | ) | | $ | 9,875 | | | $ | (181,025 | ) | | $ | 64,083 | | |
See notes to financial statements
43
Eaton Vance Municipals Funds as of January 31, 2008
FINANCIAL STATEMENTS (Unaudited) CONT'D
Statements of Changes in Net Assets
For the Six Months Ended January 31, 2008
| Increase (Decrease) in Net Assets | | Minnesota Fund | | New Jersey Fund | | Pennsylvania Fund | |
| From operations — | |
| Net investment income | | $ | 1,504,760 | | | $ | 7,047,447 | | | $ | 6,303,606 | | |
Net realized loss from investment transactions, financial futures
contracts and interest rate swap contracts | | | (241,559 | ) | | | (9,002,027 | ) | | | (5,031,158 | ) | |
Net change in unrealized appreciation (depreciation) from investments,
financial futures contracts and interest rate swap contracts | | | 93,127 | | | | (4,481,717 | ) | | | (3,763,958 | ) | |
| Net increase (decrease) in net assets from operations | | $ | 1,356,328 | | | $ | (6,436,297 | ) | | $ | (2,491,510 | ) | |
| Distributions to shareholders — | |
| From net investment income | |
| Class A | | $ | (1,336,300 | ) | | $ | (5,748,547 | ) | | $ | (5,196,746 | ) | |
| Class B | | | (136,359 | ) | | | (875,568 | ) | | | (618,389 | ) | |
| Class C | | | (94,170 | ) | | | (442,705 | ) | | | (419,104 | ) | |
| From net realized gain | |
| Class A | | | — | | | | (404,631 | ) | | | — | | |
| Class B | | | — | | | | (68,537 | ) | | | — | | |
| Class C | | | — | | | | (38,108 | ) | | | — | | |
| Total distributions to shareholders | | $ | (1,566,829 | ) | | $ | (7,578,096 | ) | | $ | (6,234,239 | ) | |
| Transactions in shares of beneficial interest — | |
| Proceeds from sale of shares | |
| Class A | | $ | 16,345,771 | | | $ | 22,850,609 | | | $ | 27,175,917 | | |
| Class B | | | 109,959 | | | | 921,000 | | | | 1,147,938 | | |
| Class C | | | 3,399,750 | | | | 8,685,910 | | | | 9,241,830 | | |
| Net asset value of shares issued to shareholders in payment of distributions declared | |
| Class A | | | 921,457 | | | | 3,970,209 | | | | 3,204,628 | | |
| Class B | | | 76,934 | | | | 569,692 | | | | 345,250 | | |
| Class C | | | 63,187 | | | | 288,502 | | | | 259,778 | | |
| Cost of shares redeemed | |
| Class A | | | (6,616,295 | ) | | | (43,284,792 | ) | | | (28,186,007 | ) | |
| Class B | | | (206,225 | ) | | | (3,950,302 | ) | | | (3,377,499 | ) | |
| Class C | | | (317,514 | ) | | | (4,795,715 | ) | | | (4,156,005 | ) | |
| Net asset value of shares exchanged | |
| Class A | | | 348,543 | | | | 1,993,645 | | | | 1,300,257 | | |
| Class B | | | (348,543 | ) | | | (1,993,645 | ) | | | (1,300,257 | ) | |
| Contingent deferred sales charges | |
| Class B | | | — | | | | 20,499 | | | | — | | |
| Net increase (decrease) in net assets from Fund share transactions | | $ | 13,777,024 | | | $ | (14,724,388 | ) | | $ | 5,655,830 | | |
| Net increase (decrease) in net assets | | $ | 13,566,523 | | | $ | (28,738,781 | ) | | $ | (3,069,919 | ) | |
| Net Assets | |
| At beginning of period | | $ | 69,515,210 | | | $ | 334,653,922 | | | $ | 295,207,045 | | |
| At end of period | | $ | 83,081,733 | | | $ | 305,915,141 | | | $ | 292,137,126 | | |
Accumulated undistributed
(distributions in excess of) net
investment income included in net assets | |
| At end of period | | $ | (95,350 | ) | | $ | 804,528 | | | $ | (314,666 | ) | |
See notes to financial statements
44
Eaton Vance Municipals Funds as of January 31, 2008
FINANCIAL STATEMENTS CONT'D
Statements of Changes in Net Assets
For the Year Ended July 31, 2007
| Increase (Decrease) in Net Assets | | Arizona Fund | | Colorado Fund | | Connecticut Fund | | Michigan Fund | |
| From operations — | |
| Net investment income | | $ | 4,051,858 | | | $ | 1,606,969 | | | $ | 5,354,539 | | | $ | 2,681,381 | | |
Net realized gain from investment transactions, financial futures
contracts and interest rate swap contracts | | | 5,891 | | | | 231,868 | | | | 337,760 | | | | 495,684 | | |
Net change in unrealized appreciation (depreciation) from investments,
financial futures contracts and interest rate swap contracts | | | (101,437 | ) | | | (739,754 | ) | | | (526,652 | ) | | | (853,513 | ) | |
| Net increase in net assets from operations | | $ | 3,956,312 | | | $ | 1,099,083 | | | $ | 5,165,647 | | | $ | 2,323,552 | | |
| Distributions to shareholders — | |
| From net investment income | |
| Class A | | $ | (3,462,603 | ) | | $ | (1,390,685 | ) | | $ | (4,565,497 | ) | | $ | (2,417,810 | ) | |
| Class B | | | (394,962 | ) | | | (207,989 | ) | | | (717,532 | ) | | | (195,575 | ) | |
| Class C | | | (116,174 | ) | | | — | | | | (64,115 | ) | | | (54,808 | ) | |
| Total distributions to shareholders | | $ | (3,973,739 | ) | | $ | (1,598,674 | ) | | $ | (5,347,144 | ) | | $ | (2,668,193 | ) | |
| Transactions in shares of beneficial interest — | |
| Proceeds from sale of shares | |
| Class A | | $ | 28,770,756 | | | $ | 16,198,616 | | | $ | 16,824,239 | | | $ | 12,253,232 | | |
| Class B | | | 433,680 | | | | 199,694 | | | | 884,642 | | | | 216,085 | | |
| Class C | | | 6,388,019 | | | | — | | | | 3,292,843 | | | | 3,127,309 | | |
Net asset value of shares issued to shareholders in payment of
distributions declared | | | |
| Class A | | | 2,011,864 | | | | 900,315 | | | | 2,565,588 | | | | 1,359,235 | | |
| Class B | | | 176,148 | | | | 124,300 | | | | 389,588 | | | | 90,490 | | |
| Class C | | | 86,119 | | | | — | | | | 22,027 | | | | 40,725 | | |
| Cost of shares redeemed | |
| Class A | | | (13,463,277 | ) | | | (5,423,898 | ) | | | (12,179,024 | ) | | | (7,597,969 | ) | |
| Class B | | | (2,859,972 | ) | | | (553,007 | ) | | | (3,299,504 | ) | | | (1,498,236 | ) | |
| Class C | | | (597,469 | ) | | | — | | | | (47,051 | ) | | | (221,818 | ) | |
| Net asset value of shares exchanged | |
| Class A | | | 1,939,448 | | | | 817,489 | | | | 3,987,273 | | | | 930,959 | | |
| Class B | | | (1,939,448 | ) | | | (817,489 | ) | | | (3,987,273 | ) | | | (930,959 | ) | |
| Net asset value of shares merged* | |
| Class A | | | — | | | | — | | | | — | | | | 4,558,776 | | |
| Class B | | | — | | | | — | | | | — | | | | (4,558,776 | ) | |
| Contingent deferred sales charges | |
| Class B | | | — | | | | — | | | | — | | | | 12,600 | | |
| Net increase in net assets from Fund share transactions | | $ | 20,945,868 | | | $ | 11,446,020 | | | $ | 8,453,348 | | | $ | 7,781,653 | | |
| Net increase in net assets | | $ | 20,928,441 | | | $ | 10,946,429 | | | $ | 8,271,851 | | | $ | 7,437,012 | | |
| Net Assets | |
| At beginning of year | | $ | 86,042,263 | | | $ | 33,587,680 | | | $ | 128,474,737 | | | $ | 60,376,868 | | |
| At end of year | | $ | 106,970,704 | | | $ | 44,534,109 | | | $ | 136,746,588 | | | $ | 67,813,880 | | |
Undistributed (distributions in excess of)
net investment income included in net assets | |
| At end of year | | $ | (30,409 | ) | | $ | 28,198 | | | $ | (170,318 | ) | | $ | 45,752 | | |
* At the close of business on July 13, 2007, Class B shares were merged into Class A shares.
See notes to financial statements
45
Eaton Vance Municipals Funds as of January 31, 2008
FINANCIAL STATEMENTS CONT'D
Statements of Changes in Net Assets
For the Year Ended July 31, 2007
| Increase (Decrease) in Net Assets | | Minnesota Fund | | New Jersey Fund | | Pennsylvania Fund | |
| From operations — | |
| Net investment income | | $ | 2,380,839 | | | $ | 13,163,812 | | | $ | 11,226,978 | | |
Net realized gain (loss) from investment transactions, financial futures
contracts and interest rate swap contracts | | | (198,402 | ) | | | 2,506,728 | | | | (335,087 | ) | |
Net change in unrealized appreciation (depreciation) from investments,
financial futures contracts and interest rate swap contracts | | | (107,435 | ) | | | (3,103,259 | ) | | | 114,493 | | |
| Net increase in net assets from operations | | $ | 2,075,002 | | | $ | 12,567,281 | | | $ | 11,006,384 | | |
| Distributions to shareholders — | |
| From net investment income | |
| Class A | | $ | (1,997,778 | ) | | $ | (10,062,143 | ) | | $ | (9,401,070 | ) | |
| Class B | | | (328,850 | ) | | | (1,959,269 | ) | | | (1,418,954 | ) | |
| Class C | | | (82,384 | ) | | | (463,119 | ) | | | (402,301 | ) | |
| Total distributions to shareholders | | $ | (2,409,012 | ) | | $ | (12,484,531 | ) | | $ | (11,222,325 | ) | |
| Transactions in shares of beneficial interest — | |
| Proceeds from sale of shares | |
| Class A | | $ | 29,327,918 | | | $ | 87,687,717 | | | $ | 70,772,562 | | |
| Class B | | | 306,127 | | | | 3,586,311 | | | | 3,156,752 | | |
| Class C | | | 3,241,742 | | | | 20,966,275 | | | | 19,062,146 | | |
Net asset value of shares issued to shareholders in payment of
distributions declared | | | |
| Class A | | | 1,311,274 | | | | 6,250,503 | | | | 5,685,827 | | |
| Class B | | | 189,666 | | | | 1,129,294 | | | | 775,144 | | |
| Class C | | | 59,053 | | | | 242,275 | | | | 251,615 | | |
| Cost of shares redeemed | |
| Class A | | | (8,651,297 | ) | | | (28,485,170 | ) | | | (30,633,549 | ) | |
| Class B | | | (1,395,122 | ) | | | (7,749,665 | ) | | | (5,294,275 | ) | |
| Class C | | | (138,280 | ) | | | (2,020,259 | ) | | | (1,572,598 | ) | |
| Net asset value of shares exchanged | |
| Class A | | | 1,233,931 | | | | 9,735,311 | | | | 4,731,678 | | |
| Class B | | | (1,233,931 | ) | | | (9,735,311 | ) | | | (4,731,678 | ) | |
| Net increase in net assets from Fund share transactions | | $ | 24,251,081 | | | $ | 81,607,281 | | | $ | 62,203,624 | | |
| Net increase in net assets | | $ | 23,917,071 | | | $ | 81,690,031 | | | $ | 61,987,683 | | |
| Net Assets | |
| At beginning of year | | $ | 45,598,139 | | | $ | 252,963,891 | | | $ | 233,219,362 | | |
| At end of year | | $ | 69,515,210 | | | $ | 334,653,922 | | | $ | 295,207,045 | | |
Undistributed (distributions in excess of)
net investment income included in net assets | |
| At end of year | | $ | (33,281 | ) | | $ | 823,901 | | | $ | (384,033 | ) | |
See notes to financial statements
46
Eaton Vance Municipals Funds as of January 31, 2008
FINANCIAL STATEMENTS (Unaudited) CONT'D
Statement of Cash Flows
For the Six Months Ended January 31, 2008
| Cash flows from operating activities | | Pennsylvania Fund | |
| Net decrease in net assets from operations | | $ | (2,491,510 | ) | |
| Adjustments to reconcile net decrease in net assets from operations to net cash provided by operating activities: | |
| Investments purchased | | | (36,606,735 | ) | |
| Investments sold | | | 45,457,218 | | |
| Increase in short-term investments | | | (3,000,000 | ) | |
| Net amortization of premium (discount) | | | (1,007,433 | ) | |
| Increase in interest receivable | | | (220,528 | ) | |
| Increase in receivable for investments sold | | | (453,788 | ) | |
| Decrease in receivable for open interest rate swap contracts | | | 716,022 | | |
| Increase in payable for daily variation margin on open financial futures contracts | | | 740,000 | | |
| Increase in payable for open swaps contracts | | | 583,993 | | |
| Increase in payable to affiliate for investment advisory fee | | | 698 | | |
| Increase in payable to affiliate for distribution and service fees | | | 741 | | |
| Increase in payable to affiliate for Trustees' fees | | | 681 | | |
| Decrease in payable for when-issued securities | | | (1,028,781 | ) | |
| Decrease in accrued expenses | | | (44,316 | ) | |
| Decrease in interest expense and fees payable | | | (161,911 | ) | |
| Net change in unrealized (appreciation) depreciation from investments | | | 1,244,791 | | |
| Net realized (gain) loss on investments | | | (441,300 | ) | |
| Net cash provided by operating activities | | $ | 3,287,842 | | |
| Cash flows from financing activities | |
| Proceeds from shares sold | | $ | 37,368,087 | | |
| Shares redeemed | | | (35,934,973 | ) | |
| Cash distributions paid to shareholders net of reinvestments | | | (2,403,070 | ) | |
| Decrease in demand note payable | | | (300,000 | ) | |
| Decrease in due to custodian | | | (68,604 | ) | |
| Proceeds from secured borrowings | | | 4,500,000 | | |
| Repayment of secured borrowings | | | (4,660,000 | ) | |
| Net cash used in financing activities | | $ | (1,498,560 | ) | |
| Net increase in cash | | $ | 1,789,282 | | |
| Cash at beginning of period | | $ | — | | |
| Cash at end of period | | $ | 1,789,282 | | |
| Supplemental disclosure of cash flow information: | |
| Noncash financing activities not included herein consist of reinvestment of dividends and distributions of: | | $ | 3,809,656 | | |
See notes to financial statements
47
Eaton Vance Municipals Funds as of January 31, 2008
FINANCIAL STATEMENTS CONT'D
Financial Highlights
| | | Arizona Fund — Class A | |
| | | Six Months Ended
January 31, 2008 | | Year Ended July 31, | |
| | | (Unaudited)(1) | | 2007(1) | | 2006(1) | | 2005(1) | | 2004(1) | | 2003(1) | |
| Net asset value — Beginning of period | | $ | 9.750 | | | $ | 9.730 | | | $ | 9.780 | | | $ | 9.650 | | | $ | 9.550 | | | $ | 9.730 | | |
| Income (loss) from operations | |
| Net investment income | | $ | 0.210 | | | $ | 0.433 | | | $ | 0.438 | | | $ | 0.467 | | | $ | 0.493 | | | $ | 0.482 | | |
| Net realized and unrealized gain (loss) | | | (0.102 | ) | | | 0.013 | | | | (0.055 | ) | | | 0.131 | | | | 0.088 | | | | (0.182 | ) | |
| Total income from operations | | $ | 0.108 | | | $ | 0.446 | | | $ | 0.383 | | | $ | 0.598 | | | $ | 0.581 | | | $ | 0.300 | | |
| Less distributions | |
| From net investment income | | $ | (0.208 | ) | | $ | (0.426 | ) | | $ | (0.433 | ) | | $ | (0.468 | ) | | $ | (0.481 | ) | | $ | (0.480 | ) | |
| Total distributions | | $ | (0.208 | ) | | $ | (0.426 | ) | | $ | (0.433 | ) | | $ | (0.468 | ) | | $ | (0.481 | ) | | $ | (0.480 | ) | |
| Net asset value — End of period | | $ | 9.650 | | | $ | 9.750 | | | $ | 9.730 | | | $ | 9.780 | | | $ | 9.650 | | | $ | 9.550 | | |
| Total Return(2) | | | 1.13 | %(8) | | | 4.62 | % | | | 4.00 | % | | | 6.31 | % | | | 6.15 | % | | | 3.06 | % | |
| Ratios/Supplemental Data | |
| Net assets, end of period (000's omitted) | | $ | 94,594 | | | $ | 91,301 | | | $ | 72,090 | | | $ | 58,597 | | | $ | 47,945 | | | $ | 9,174 | | |
| Ratios (As a percentage of average daily net assets): | |
| Expenses excluding interest and fees | | | 0.70 | %(3) | | | 0.76 | %(4) | | | 0.77 | % | | | 0.78 | %(5) | | | 0.78 | %(5) | | | 0.76 | %(5) | |
| Interest and fee expense(6) | | | 0.20 | %(3) | | | 0.22 | % | | | 0.27 | % | | | 0.21 | %(5) | | | 0.14 | %(5) | | | 0.16 | %(5) | |
| Total expenses before custodian fee reduction | | | 0.90 | %(3) | | | 0.98 | %(4) | | | 1.04 | % | | | 0.99 | %(5) | | | 0.92 | %(5) | | | 0.92 | %(5) | |
| Expenses after custodian fee reduction excluding interest and fees | | | 0.67 | %(3) | | | 0.71 | %(4) | | | 0.74 | % | | | 0.76 | %(5) | | | 0.77 | %(5) | | | 0.75 | %(5) | |
| Net investment income | | | 4.32 | %(3) | | | 4.40 | % | | | 4.50 | % | | | 4.79 | % | | | 5.10 | % | | | 4.90 | % | |
| Portfolio Turnover of the Portfolio | | | — | | | | — | | | | — | | | | 0 | %(7) | | | 9 | %(7) | | | 5 | %(7) | |
| Portfolio Turnover of the Fund | | | 5 | % | | | 17 | % | | | 17 | % | | | 15 | % | | | — | | | | — | | |
(1) Net investment income per share was computed using average shares outstanding.
(2) Returns are historical and are calculated by determining the percentage change in net asset value with all distributions reinvested.
(3) Annualized.
(4) The investment adviser was allocated a portion of the Fund's operating expenses (equal to less than 0.005% of average daily net assets for the year ended July 31, 2007). Absent this allocation, total return would be lower.
(5) Includes the Fund's share of its corresponding Portfolio's allocated expenses while the Fund was making investments directly into the Portfolio.
(6) Interest and fee expense relates to the liability for floating rate notes issued in conjunction with inverse floater securities transactions (See Note 1I).
(7) Portfolio turnover represents the rate of portfolio activity for the period while the Fund was making investments directly into the Portfolio.
(8) Not annualized.
See notes to financial statements
48
Eaton Vance Municipals Funds as of January 31, 2008
FINANCIAL STATEMENTS CONT'D
Financial Highlights
| | | Arizona Fund — Class B | |
| | | Six Months Ended
January 31, 2008 | | Year Ended July 31, | |
| | | (Unaudited)(1) | | 2007(1) | | 2006(1) | | 2005(1) | | 2004(1) | | 2003(1) | |
| Net asset value — Beginning of period | | $ | 10.840 | | | $ | 10.810 | | | $ | 10.870 | | | $ | 10.730 | | | $ | 10.620 | | | $ | 10.830 | | |
| Income (loss) from operations | |
| Net investment income | | $ | 0.194 | | | $ | 0.404 | | | $ | 0.409 | | | $ | 0.441 | | | $ | 0.470 | | | $ | 0.456 | | |
| Net realized and unrealized gain (loss) | | | (0.113 | ) | | | 0.017 | | | | (0.070 | ) | | | 0.139 | | | | 0.096 | | | | (0.211 | ) | |
| Total income from operations | | $ | 0.081 | | | $ | 0.421 | | | $ | 0.339 | | | $ | 0.580 | | | $ | 0.566 | | | $ | 0.245 | | |
| Less distributions | |
| From net investment income | | $ | (0.191 | ) | | $ | (0.391 | ) | | $ | (0.399 | ) | | $ | (0.440 | ) | | $ | (0.456 | ) | | $ | (0.455 | ) | |
| Total distributions | | $ | (0.191 | ) | | $ | (0.391 | ) | | $ | (0.399 | ) | | $ | (0.440 | ) | | $ | (0.456 | ) | | $ | (0.455 | ) | |
| Net asset value — End of period | | $ | 10.730 | | | $ | 10.840 | | | $ | 10.810 | | | $ | 10.870 | | | $ | 10.730 | | | $ | 10.620 | | |
| Total Return(2) | | | 0.77 | %(9) | | | 3.92 | % | | | 3.18 | % | | | 5.68 | %(3) | | | 5.38 | % | | | 2.22 | % | |
| Ratios/Supplemental Data | |
| Net assets, end of period (000's omitted) | | $ | 8,084 | | | $ | 8,834 | | | $ | 12,958 | | | $ | 16,935 | | | $ | 19,471 | | | $ | 59,399 | | |
| Ratios (As a percentage of average daily net assets): | |
| Expenses excluding interest and fees | | | 1.45 | %(4) | | | 1.51 | %(5) | | | 1.52 | % | | | 1.53 | %(6) | | | 1.53 | %(6) | | | 1.51 | %(6) | |
| Interest and fee expense(7) | | | 0.20 | %(4) | | | 0.22 | % | | | 0.27 | % | | | 0.21 | %(6) | | | 0.14 | %(6) | | | 0.16 | %(6) | |
| Total expenses before custodian fee reduction | | | 1.65 | %(4) | | | 1.73 | %(5) | | | 1.79 | % | | | 1.74 | %(6) | | | 1.67 | %(6) | | | 1.67 | %(6) | |
| Expenses after custodian fee reduction excluding interest and fees | | | 1.42 | %(4) | | | 1.46 | %(5) | | | 1.49 | % | | | 1.51 | %(6) | | | 1.52 | %(6) | | | 1.50 | %(6) | |
| Net investment income | | | 3.59 | %(4) | | | 3.69 | % | | | 3.78 | % | | | 4.07 | % | | | 4.33 | % | | | 4.17 | % | |
| Portfolio Turnover of the Portfolio | | | — | | | | — | | | | — | | | | 0 | %(8) | | | 9 | %(8) | | | 5 | %(8) | |
| Portfolio Turnover of the Fund | | | 5 | % | | | 17 | % | | | 17 | % | | | 15 | % | | | — | | | | — | | |
(1) Net investment income per share was computed using average shares outstanding.
(2) Returns are historical and are calculated by determining the percentage change in net asset value with all distributions reinvested.
(3) Total return reflects an increase of 0.18% due to a change in the timing of the payment and reinvestment of distributions.
(4) Annualized.
(5) The investment adviser was allocated a portion of the Fund's operating expenses (equal to less than 0.005% of average daily net assets for the year ended July 31, 2007). Absent this allocation, total return would be lower.
(6) Includes the Fund's share of its corresponding Portfolio's allocated expenses while the Fund was making investments directly into the Portfolio.
(7) Interest and fee expense relates to the liability for floating rate notes issued in conjunction with inverse floater securities transactions (See Note 1I).
(8) Portfolio turnover represents the rate of portfolio activity for the period while the Fund was making investments directly into the Portfolio.
(9) Not annualized.
See notes to financial statements
49
Eaton Vance Municipals Funds as of January 31, 2008
FINANCIAL STATEMENTS CONT'D
Financial Highlights
| | | Arizona Fund — Class C | |
| | | Six Months Ended
January 31, 2008
(Unaudited)(1) | | Year Ended
July 31, 2007(1) | | Period Ended
July 31, 2006(1)(2) | |
| Net asset value — Beginning of period | | $ | 10.840 | | | $ | 10.820 | | | $ | 10.760 | | |
| Income (loss) from operations | |
| Net investment income | | $ | 0.193 | | | $ | 0.388 | | | $ | 0.241 | | |
| Net realized and unrealized gain (loss) | | | (0.111 | ) | | | 0.023 | | | | 0.063 | (9) | |
| Total income from operations | | $ | 0.082 | | | $ | 0.411 | | | $ | 0.304 | | |
| Less distributions | |
| From net investment income | | $ | (0.192 | ) | | $ | (0.391 | ) | | $ | (0.244 | ) | |
| Total distributions | | $ | (0.192 | ) | | $ | (0.391 | ) | | $ | (0.244 | ) | |
| Net asset value — End of period | | $ | 10.730 | | | $ | 10.840 | | | $ | 10.820 | | |
| Total Return(3) | | | 0.77 | %(8) | | | 3.82 | % | | | 2.84 | %(8) | |
| Ratios/Supplemental Data | |
| Net assets, end of period (000's omitted) | | $ | 7,880 | | | $ | 6,835 | | | $ | 994 | | |
| Ratios (As a percentage of average daily net assets): | |
| Expenses excluding interest and fees | | | 1.45 | %(4) | | | 1.51 | %(5) | | | 1.52 | %(4) | |
| Interest and fee expense(6) | | | 0.20 | %(4) | | | 0.22 | % | | | 0.27 | %(4) | |
| Total expenses before custodian fee reduction | | | 1.65 | %(4) | | | 1.73 | %(5) | | | 1.79 | %(4) | |
| Expenses after custodian fee reduction excluding interest and fees | | | 1.42 | %(4) | | | 1.46 | %(5) | | | 1.49 | %(4) | |
| Net investment income | | | 3.56 | %(4) | | | 3.55 | % | | | 3.55 | %(4) | |
| Portfolio Turnover | | | 5 | % | | | 17 | % | | | 17 | %(7) | |
(1) Net investment income per share was computed using average shares outstanding.
(2) For the period from the start of business, December 16, 2005, to July 31, 2006.
(3) Returns are historical and are calculated by determining the percentage change in net asset value with all distributions reinvested.
(4) Annualized.
(5) The investment adviser was allocated a portion of the Fund's operating expenses (equal to less than 0.005% of average daily net assets for the year ended July 31, 2007). Absent this allocation, total return would be lower.
(6) Interest and fee expense relates to the liability for floating rate notes issued in conjunction with inverse floater securities transactions (See Note 1I).
(7) For the Fund's fiscal year, August 1, 2005 to July 31, 2006.
(8) Not annualized.
(9) The per share amount is not in accord with the net realized and unrealized gain (loss) for the period because of the timing of sales of Fund shares and the amount of the per share realized and unrealized gains and losses at such time.
See notes to financial statements
50
Eaton Vance Municipals Funds as of January 31, 2008
FINANCIAL STATEMENTS CONT'D
Financial Highlights
| | | Colorado Fund — Class A | |
| | | Six Months Ended
January 31, 2008 | | Year Ended July 31, | |
| | | (Unaudited)(1) | | 2007(1) | | 2006(1) | | 2005(1) | | 2004(1) | | 2003(1) | |
| Net asset value — Beginning of period | | $ | 9.670 | | | $ | 9.730 | | | $ | 9.690 | | | $ | 9.570 | | | $ | 9.440 | | | $ | 9.680 | | |
| Income (loss) from operations | |
| Net investment income | | $ | 0.202 | | | $ | 0.409 | | | $ | 0.411 | | | $ | 0.435 | | | $ | 0.460 | | | $ | 0.464 | | |
| Net realized and unrealized gain (loss) | | | (0.225 | ) | | | (0.060 | ) | | | 0.043 | | | | 0.131 | | | | 0.132 | | | | (0.228 | ) | |
| Total income (loss) from operations | | $ | (0.023 | ) | | $ | 0.349 | | | $ | 0.454 | | | $ | 0.566 | | | $ | 0.592 | | | $ | 0.236 | | |
| Less distributions | |
| From net investment income | | $ | (0.207 | ) | | $ | (0.409 | ) | | $ | (0.414 | ) | | $ | (0.446 | ) | | $ | (0.462 | ) | | $ | (0.476 | ) | |
| Total distributions | | $ | (0.207 | ) | | $ | (0.409 | ) | | $ | (0.414 | ) | | $ | (0.446 | ) | | $ | (0.462 | ) | | $ | (0.476 | ) | |
| Net asset value — End of period | | $ | 9.440 | | | $ | 9.670 | | | $ | 9.730 | | | $ | 9.690 | | | $ | 9.570 | | | $ | 9.440 | | |
| Total Return(2) | | | (0.23 | )%(8) | | | 3.58 | % | | | 4.79 | % | | | 6.02 | % | | | 6.33 | % | | | 2.42 | % | |
| Ratios/Supplemental Data | |
| Net assets, end of period (000's omitted) | | $ | 35,380 | | | $ | 39,032 | | | $ | 27,021 | | | $ | 22,044 | | | $ | 19,700 | | | $ | 8,709 | | |
| Ratios (As a percentage of average daily net assets): | |
| Expenses excluding interest and fees | | | 0.67 | %(3) | | | 0.70 | %(4) | | | 0.73 | % | | | 0.75 | %(5) | | | 0.75 | %(5) | | | 0.73 | %(5) | |
| Interest and fee expense(6) | | | 0.07 | %(3) | | | 0.08 | % | | | 0.09 | % | | | — | | | | — | | | | — | | |
| Total expenses before custodian fee reduction | | | 0.74 | %(3) | | | 0.78 | %(4) | | | 0.82 | % | | | 0.75 | %(5) | | | 0.75 | %(5) | | | 0.73 | %(5) | |
| Expenses after custodian fee reduction excluding interest and fees | | | 0.65 | %(3) | | | 0.65 | %(4) | | | 0.69 | % | | | 0.74 | %(5) | | | 0.75 | %(5) | | | 0.71 | %(5) | |
| Net investment income | | | 4.23 | %(3) | | | 4.15 | % | | | 4.25 | % | | | 4.50 | % | | | 4.78 | % | | | 4.78 | % | |
| Portfolio Turnover of the Portfolio | | | — | | | | — | | | | — | | | | 3 | %(7) | | | 6 | %(7) | | | 21 | %(7) | |
| Portfolio Turnover of the Fund | | | 7 | % | | | 12 | % | | | 25 | % | | | 16 | % | | | — | | | | — | | |
(1) Net investment income per share was computed using average shares outstanding.
(2) Returns are historical and are calculated by determining the percentage change in net asset value with all distributions reinvested.
(3) Annualized.
(4) The investment adviser was allocated a portion of the Fund's operating expenses (equal to less than 0.005% of average daily net assets for the year ended July 31, 2007). Absent this allocation, total return would be lower.
(5) Includes the Fund's share of its corresponding Portfolio's allocated expenses while the Fund was making investments directly into the Portfolio.
(6) Interest and fee expense relates to the liability for floating rate notes issued in conjunction with inverse floater securities transactions (See Note 1I).
(7) Portfolio turnover represents the rate of portfolio activity for the period while the Fund was making investments directly into the Portfolio.
(8) Not annualized.
See notes to financial statements
51
Eaton Vance Municipals Funds as of January 31, 2008
FINANCIAL STATEMENTS CONT'D
Financial Highlights
| | | Colorado Fund — Class B | |
| | | Six Months Ended
January 31, 2008 | | Year Ended July 31, | |
| | | (Unaudited)(1) | | 2007(1) | | 2006(1) | | 2005(1) | | 2004(1) | | 2003(1) | |
| Net asset value — Beginning of period | | $ | 10.520 | | | $ | 10.590 | | | $ | 10.550 | | | $ | 10.420 | | | $ | 10.280 | | | $ | 10.540 | | |
| Income (loss) from operations | |
| Net investment income | | $ | 0.181 | | | $ | 0.367 | | | $ | 0.370 | | | $ | 0.398 | | | $ | 0.421 | | | $ | 0.427 | | |
| Net realized and unrealized gain (loss) | | | (0.237 | ) | | | (0.072 | ) | | | 0.041 | | | | 0.138 | | | | 0.143 | | | | (0.244 | ) | |
| Total income (loss) from operations | | $ | (0.056 | ) | | $ | 0.295 | | | $ | 0.411 | | | $ | 0.536 | | | $ | 0.564 | | | $ | 0.183 | | |
| Less distributions | |
| From net investment income | | $ | (0.184 | ) | | $ | (0.365 | ) | | $ | (0.371 | ) | | $ | (0.406 | ) | | $ | (0.424 | ) | | $ | (0.443 | ) | |
| Total distributions | | $ | (0.184 | ) | | $ | (0.365 | ) | | $ | (0.371 | ) | | $ | (0.406 | ) | | $ | (0.424 | ) | | $ | (0.443 | ) | |
| Net asset value — End of period | | $ | 10.280 | | | $ | 10.520 | | | $ | 10.590 | | | $ | 10.550 | | | $ | 10.420 | | | $ | 10.280 | | |
| Total Return(2) | | | (0.53 | )%(9) | | | 2.77 | % | | | 3.98 | % | | | 5.41 | %(3) | | | 5.53 | % | | | 1.70 | % | |
| Ratios/Supplemental Data | |
| Net assets, end of period (000's omitted) | | $ | 4,807 | | | $ | 5,502 | | | $ | 6,567 | | | $ | 8,334 | | | $ | 10,579 | | | $ | 28,242 | | |
| Ratios (As a percentage of average daily net assets): | |
| Expenses excluding interest and fees | | | 1.42 | %(4) | | | 1.45 | %(5) | | | 1.48 | % | | | 1.50 | %(6) | | | 1.50 | %(6) | | | 1.48 | %(6) | |
| Interest and fee expense(7) | | | 0.07 | %(4) | | | 0.08 | % | | | 0.09 | % | | | — | | | | — | | | | — | | |
| Total expenses before custodian fee reduction | | | 1.49 | %(4) | | | 1.53 | %(5) | | | 1.57 | % | | | 1.50 | %(6) | | | 1.50 | %(6) | | | 1.48 | %(6) | |
| Expenses after custodian fee reduction excluding interest and fees | | | 1.40 | %(4) | | | 1.40 | %(5) | | | 1.44 | % | | | 1.49 | %(6) | | | 1.50 | %(6) | | | 1.46 | %(6) | |
| Net investment income | | | 3.48 | %(4) | | | 3.42 | % | | | 3.52 | % | | | 3.78 | % | | | 4.00 | % | | | 4.04 | % | |
| Portfolio Turnover of the Portfolio | | | — | | | | — | | | | — | | | | 3 | %(8) | | | 6 | %(8) | | | 21 | %(8) | |
| Portfolio Turnover of the Fund | | | 7 | % | | | 12 | % | | | 25 | % | | | 16 | % | | | — | | | | — | | |
(1) Net investment income per share was computed using average shares outstanding.
(2) Returns are historical and are calculated by determining the percentage change in net asset value with all distributions reinvested.
(3) Total return reflects an increase of 0.16% due to a change in the timing of the payment and reinvestment of distributions.
(4) Annualized.
(5) The investment adviser was allocated a portion of the Fund's operating expenses (equal to less than 0.005% of average daily net assets for the year ended July 31, 2007). Absent this allocation, total return would be lower.
(6) Includes the Fund's share of its corresponding Portfolio's allocated expenses while the Fund was making investments directly into the Portfolio.
(7) Interest and fee expense relates to the liability for floating rate notes issued in conjunction with inverse floater securities transactions (See Note 1I).
(8) Portfolio turnover represents the rate of portfolio activity for the period while the Fund was making investments directly into the Portfolio.
(9) Not annualized.
See notes to financial statements
52
Eaton Vance Municipals Funds as of January 31, 2008
FINANCIAL STATEMENTS CONT'D
Financial Highlights
| | | Colorado Fund — Class C | |
| | | Period Ended
January 31, 2008
(Unaudited)(1)(2) | |
| Net asset value — Beginning of period | | $ | 10.460 | | |
| Income (loss) from operations | |
| Net investment income | | $ | 0.115 | | |
| Net realized and unrealized loss | | | (0.181 | ) | |
| Total loss from operations | | $ | (0.066 | ) | |
| Less distributions | |
| From net investment income | | $ | (0.114 | ) | |
| Total distributions | | $ | (0.114 | ) | |
| Net asset value — End of period | | $ | 10.280 | | |
| Total Return(3) | | | (0.91 | )%(7) | |
| Ratios/Supplemental Data | |
| Net assets, end of period (000's omitted) | | $ | 1 | | |
| Ratios (As a percentage of average daily net assets): | |
| Expenses excluding interest and fees | | | 1.42 | %(4) | |
| Interest and fee expense(5) | | | 0.07 | %(4) | |
| Total expenses before custodian fee reduction | | | 1.49 | %(4) | |
| Expenses after custodian fee reduction excluding interest and fees | | | 1.40 | %(4) | |
| Net investment income | | | 3.50 | %(4) | |
| Portfolio Turnover | | | 7 | %(6) | |
(1) Net investment income per share was computed using average shares outstanding.
(2) For the period from the start of business, October 8, 2007, to January 31, 2008.
(3) Returns are historical and are calculated by determining the percentage change in net asset value with all distributions reinvested.
(4) Annualized.
(5) Interest and fee expense relates to the liability for floating rate notes issued in conjunction with inverse floater securities transactions (See Note 1I).
(6) For the Fund's fiscal period, August 1, 2007 to January 31, 2008.
(7) Not annualized.
See notes to financial statements
53
Eaton Vance Municipals Funds as of January 31, 2008
FINANCIAL STATEMENTS CONT'D
Financial Highlights
| | | Connecticut Fund — Class A | |
| | | Six Months Ended
January 31, 2008 | | Year Ended July 31, | |
| | | (Unaudited)(1) | | 2007(1) | | 2006(1) | | 2005(1) | | 2004(1) | | 2003(1) | |
| Net asset value — Beginning of period | | $ | 10.530 | | | $ | 10.530 | | | $ | 10.660 | | | $ | 10.610 | | | $ | 10.540 | | | $ | 10.750 | | |
| Income (loss) from operations | |
| Net investment income | | $ | 0.220 | | | $ | 0.437 | | | $ | 0.442 | | | $ | 0.461 | | | $ | 0.488 | | | $ | 0.494 | | |
| Net realized and unrealized gain (loss) | | | (0.020 | ) | | | 0.000 | (2) | | | (0.134 | ) | | | 0.057 | | | | 0.070 | | | | (0.195 | ) | |
| Total income from operations | | $ | 0.200 | | | $ | 0.437 | | | $ | 0.308 | | | $ | 0.518 | | | $ | 0.558 | | | $ | 0.299 | | |
| Less distributions | |
| From net investment income | | $ | (0.220 | ) | | $ | (0.437 | ) | | $ | (0.438 | ) | | $ | (0.468 | ) | | $ | (0.488 | ) | | $ | (0.509 | ) | |
| Total distributions | | $ | (0.220 | ) | | $ | (0.437 | ) | | $ | (0.438 | ) | | $ | (0.468 | ) | | $ | (0.488 | ) | | $ | (0.509 | ) | |
| Net asset value — End of period | | $ | 10.510 | | | $ | 10.530 | | | $ | 10.530 | | | $ | 10.660 | | | $ | 10.610 | | | $ | 10.540 | | |
| Total Return(3) | | | 1.92 | %(9) | | | 4.17 | % | | | 2.95 | % | | | 4.96 | % | | | 5.34 | % | | | 2.76 | % | |
| Ratios/Supplemental Data | |
| Net assets, end of period (000's omitted) | | $ | 114,356 | | | $ | 115,076 | | | $ | 104,089 | | | $ | 102,378 | | | $ | 96,559 | | | $ | 25,210 | | |
| Ratios (As a percentage of average daily net assets): | |
| Expenses excluding interest and fees | | | 0.74 | %(4) | | | 0.78 | %(5) | | | 0.77 | % | | | 0.78 | %(6) | | | 0.79 | %(6) | | | 0.77 | %(6) | |
| Interest and fee expense(7) | | | 0.33 | %(4) | | | 0.27 | % | | | 0.17 | % | | | 0.10 | %(6) | | | — | | | | — | | |
| Total expenses before custodian fee reduction | | | 1.07 | %(4) | | | 1.05 | %(5) | | | 0.94 | % | | | 0.88 | %(6) | | | 0.79 | %(6) | | | 0.77 | %(6) | |
| Expenses after custodian fee reduction excluding interest and fees | | | 0.72 | %(4) | | | 0.76 | %(5) | | | 0.76 | % | | | 0.77 | %(6) | | | 0.79 | %(6) | | | 0.77 | %(6) | |
| Net investment income | | | 4.16 | %(4) | | | 4.10 | % | | | 4.19 | % | | | 4.31 | % | | | 4.58 | % | | | 4.55 | % | |
| Portfolio Turnover of the Portfolio | | | — | | | | — | | | | — | | | | 2 | %(8) | | | 15 | %(8) | | | 19 | %(8) | |
| Portfolio Turnover of the Fund | | | 15 | % | | | 16 | % | | | 26 | % | | | 13 | % | | | — | | | | — | | |
(1) Net investment income per share was computed using average shares outstanding.
(2) Less than $0.0005 per share.
(3) Returns are historical and are calculated by determining the percentage change in net asset value with all distributions reinvested.
(4) Annualized.
(5) The investment adviser was allocated a portion of the Fund's operating expenses (equal to less than 0.005% of average daily net assets for the year ended July 31, 2007). Absent this allocation, total return would be lower.
(6) Includes the Fund's share of its corresponding Portfolio's allocated expenses while the Fund was making investments directly into the Portfolio.
(7) Interest and fee expense relates to the liability for floating rate notes issued in conjunction with inverse floater securities transactions (See Note 1I).
(8) Portfolio turnover represents the rate of portfolio activity for the period while the Fund was making investments directly into the Portfolio.
(9) Not annualized.
See notes to financial statements
54
Eaton Vance Municipals Funds as of January 31, 2008
FINANCIAL STATEMENTS CONT'D
Financial Highlights
| | | Connecticut Fund — Class B | |
| | | Six Months Ended
January 31, 2008 | | Year Ended July 31, | |
| | | (Unaudited)(1) | | 2007(1) | | 2006(1) | | 2005(1) | | 2004(1) | | 2003(1) | |
| Net asset value — Beginning of period | | $ | 10.480 | | | $ | 10.480 | | | $ | 10.610 | | | $ | 10.560 | | | $ | 10.490 | | | $ | 10.700 | | |
| Income (loss) from operations | |
| Net investment income | | $ | 0.179 | | | $ | 0.356 | | | $ | 0.362 | | | $ | 0.380 | | | $ | 0.404 | | | $ | 0.411 | | |
| Net realized and unrealized gain (loss) | | | (0.020 | ) | | | (0.001 | ) | | | (0.136 | ) | | | 0.056 | | | | 0.071 | | | | (0.194 | ) | |
| Total income from operations | | $ | 0.159 | | | $ | 0.355 | | | $ | 0.226 | | | $ | 0.436 | | | $ | 0.475 | | | $ | 0.217 | | |
| Less distributions | |
| From net investment income | | $ | (0.179 | ) | | $ | (0.355 | ) | | $ | (0.356 | ) | | $ | (0.386 | ) | | $ | (0.405 | ) | | $ | (0.427 | ) | |
| Total distributions | | $ | (0.179 | ) | | $ | (0.355 | ) | | $ | (0.356 | ) | | $ | (0.386 | ) | | $ | (0.405 | ) | | $ | (0.427 | ) | |
| Net asset value — End of period | | $ | 10.460 | | | $ | 10.480 | | | $ | 10.480 | | | $ | 10.610 | | | $ | 10.560 | | | $ | 10.490 | | |
| Total Return(2) | | | 1.53 | %(9) | | | 3.39 | % | | | 2.17 | % | | | 4.36 | %(3) | | | 4.55 | % | | | 1.99 | % | |
| Ratios/Supplemental Data | |
| Net assets, end of period (000's omitted) | | $ | 15,830 | | | $ | 18,238 | | | $ | 24,179 | | | $ | 30,791 | | | $ | 36,518 | | | $ | 122,822 | | |
| Ratios (As a percentage of average daily net assets): | |
| Expenses excluding interest and fees | | | 1.49 | %(4) | | | 1.53 | %(5) | | | 1.52 | % | | | 1.53 | %(6) | | | 1.54 | %(6) | | | 1.52 | %(6) | |
| Interest and fee expense(7) | | | 0.33 | %(4) | | | 0.27 | % | | | 0.17 | % | | | 0.10 | %(6) | | | — | | | | — | | |
| Total expenses before custodian fee reduction | | | 1.82 | %(4) | | | 1.80 | %(5) | | | 1.69 | % | | | 1.63 | %(6) | | | 1.54 | %(6) | | | 1.52 | %(6) | |
| Expenses after custodian fee reduction excluding interest and fees | | | 1.47 | %(4) | | | 1.51 | %(5) | | | 1.51 | % | | | 1.52 | %(6) | | | 1.54 | %(6) | | | 1.52 | %(6) | |
| Net investment income | | | 3.42 | %(4) | | | 3.35 | % | | | 3.44 | % | | | 3.57 | % | | | 3.77 | % | | | 3.82 | % | |
| Portfolio Turnover of the Portfolio | | | — | | | | — | | | | — | | | | 2 | %(8) | | | 15 | %(8) | | | 19 | %(8) | |
| Portfolio Turnover of the Fund | | | 15 | % | | | 16 | % | | | 26 | % | | | 13 | % | | | — | | | | — | | |
(1) Net investment income per share was computed using average shares outstanding.
(2) Returns are historical and are calculated by determining the percentage change in net asset value with all distributions reinvested.
(3) Total return reflects an increase of 0.16% due to a change in the timing of the payment and reinvestment of distributions.
(4) Annualized.
(5) The investment adviser was allocated a portion of the Fund's operating expenses (equal to less than 0.005% of average daily net assets for the year ended July 31, 2007). Absent this allocation, total return would be lower.
(6) Includes the Fund's share of its corresponding Portfolio's allocated expenses while the Fund was making investments directly into the Portfolio.
(7) Interest and fee expense relates to the liability for floating rate notes issued in conjunction with inverse floater securities transactions (See Note 1I).
(8) Portfolio turnover represents the rate of portfolio activity for the period while the Fund was making investments directly into the Portfolio.
(9) Not annualized.
See notes to financial statements
55
Eaton Vance Municipals Funds as of January 31, 2008
FINANCIAL STATEMENTS CONT'D
Financial Highlights
| | | Connecticut Fund — Class C | |
| | | Six Months Ended
January 31, 2008
(Unaudited)(1) | | Year Ended
July 31, 2007(1) | | Period Ended
July 31, 2006(1)(2) | |
| Net asset value — Beginning of period | | $ | 10.480 | | | $ | 10.480 | | | $ | 10.550 | | |
| Income (loss) from operations | |
| Net investment income | | $ | 0.178 | | | $ | 0.355 | | | $ | 0.152 | | |
| Net realized and unrealized gain (loss) | | | (0.009 | ) | | | 0.000 | (3) | | | (0.054 | ) | |
| Total income from operations | | $ | 0.169 | | | $ | 0.355 | | | $ | 0.098 | | |
| Less distributions | |
| From net investment income | | $ | (0.179 | ) | | $ | (0.355 | ) | | $ | (0.168 | ) | |
| Total distributions | | $ | (0.179 | ) | | $ | (0.355 | ) | | $ | (0.168 | ) | |
| Net asset value — End of period | | $ | 10.470 | | | $ | 10.480 | | | $ | 10.480 | | |
| Total Return(4) | | | 1.63 | %(9) | | | 3.39 | % | | | 0.90 | %(9) | |
| Ratios/Supplemental Data | |
| Net assets, end of period (000's omitted) | | $ | 3,520 | | | $ | 3,433 | | | $ | 207 | | |
| Ratios (As a percentage of average daily net assets): | |
| Expenses excluding interest and fees | | | 1.49 | %(5) | | | 1.53 | %(6) | | | 1.53 | %(5) | |
| Interest and fee expense(7) | | | 0.33 | %(5) | | | 0.27 | % | | | 0.17 | %(5) | |
| Total expenses before custodian fee reduction | | | 1.82 | %(5) | | | 1.80 | %(6) | | | 1.70 | %(5) | |
| Expenses after custodian fee reduction excluding interest and fees | | | 1.47 | %(5) | | | 1.51 | %(6) | | | 1.51 | %(5) | |
| Net investment income | | | 3.40 | %(5) | | | 3.35 | % | | | 3.07 | %(5) | |
| Portfolio Turnover | | | 15 | % | | | 16 | % | | | 26 | %(8) | |
(1) Net investment income per share was computed using average shares outstanding.
(2) For the period from the start of business, February 9, 2006, to July 31, 2006.
(3) Less than $0.0005 per share.
(4) Returns are historical and are calculated by determining the percentage change in net asset value with all distributions reinvested.
(5) Annualized.
(6) The investment adviser was allocated a portion of the Fund's operating expenses (equal to less than 0.005% of average daily net assets for the year ended July 31, 2007). Absent this allocation, total return would be lower.
(7) Interest and fee expense relates to the liability for floating rate notes issued in conjunction with inverse floater securities transactions (See Note 1I).
(8) For the Fund's fiscal year, August 1, 2005 to July 31, 2006.
(9) Not annualized.
See notes to financial statements
56
Eaton Vance Municipals Funds as of January 31, 2008
FINANCIAL STATEMENTS CONT'D
Financial Highlights
| | | Michigan Fund — Class A | |
| | | Six Months Ended
January 31, 2008 | | Year Ended July 31, | |
| | | (Unaudited)(1) | | 2007(1) | | 2006(1) | | 2005(1) | | 2004(1) | | 2003(1) | |
| Net asset value — Beginning of period | | $ | 9.480 | | | $ | 9.510 | | | $ | 9.630 | | | $ | 9.480 | | | $ | 9.400 | | | $ | 9.590 | | |
| Income (loss) from operations | |
| Net investment income | | $ | 0.204 | | | $ | 0.401 | | | $ | 0.419 | | | $ | 0.435 | | | $ | 0.456 | | | $ | 0.476 | | |
| Net realized and unrealized gain (loss) | | | (0.098 | ) | | | (0.028 | ) | | | (0.131 | ) | | | 0.156 | | | | 0.086 | | | | (0.190 | ) | |
| Total income from operations | | $ | 0.106 | | | $ | 0.373 | | | $ | 0.288 | | | $ | 0.591 | | | $ | 0.542 | | | $ | 0.286 | | |
| Less distributions | |
| From net investment income | | $ | (0.201 | ) | | $ | (0.403 | ) | | $ | (0.408 | ) | | $ | (0.441 | ) | | $ | (0.462 | ) | | $ | (0.476 | ) | |
| From net realized gain | | | (0.045 | ) | | | — | | | | — | | | | — | | | | — | | | | — | | |
| Total distributions | | $ | (0.246 | ) | | $ | (0.403 | ) | | $ | (0.408 | ) | | $ | (0.441 | ) | | $ | (0.462 | ) | | $ | (0.476 | ) | |
| Net asset value — End of period | | $ | 9.340 | | | $ | 9.480 | | | $ | 9.510 | | | $ | 9.630 | | | $ | 9.480 | | | $ | 9.400 | | |
| Total Return(2) | | | 1.15 | %(8) | | | 3.92 | % | | | 3.06 | % | | | 6.34 | % | | | 5.83 | % | | | 2.96 | % | |
| Ratios/Supplemental Data | |
| Net assets, end of period (000's omitted) | | $ | 62,382 | | | $ | 64,786 | | | $ | 53,595 | | | $ | 53,522 | | | $ | 54,332 | | | $ | 4,079 | | |
| Ratios (As a percentage of average daily net assets): | |
| Expenses excluding interest and fees | | | 0.70 | %(3) | | | 0.78 | %(4) | | | 0.79 | % | | | 0.80 | %(5) | | | 0.81 | %(5) | | | 0.79 | %(5) | |
| Interest and fee expense(6) | | | 0.17 | %(3) | | | 0.24 | % | | | 0.24 | % | | | 0.16 | %(5) | | | 0.09 | %(5) | | | 0.09 | %(5) | |
| Total expenses before custodian fee reduction | | | 0.87 | %(3) | | | 1.02 | %(4) | | | 1.03 | % | | | 0.96 | %(5) | | | 0.90 | %(5) | | | 0.88 | %(5) | |
| Expenses after custodian fee reduction excluding interest and fees | | | 0.67 | %(3) | | | 0.75 | %(4) | | | 0.78 | % | | | 0.79 | %(5) | | | 0.80 | %(5) | | | 0.78 | %(5) | |
| Net investment income | | | 4.33 | %(3) | | | 4.16 | % | | | 4.39 | % | | | 4.53 | % | | | 4.81 | % | | | 4.92 | % | |
| Portfolio Turnover of the Portfolio | | | — | | | | — | | | | — | | | | 2 | %(7) | | | 15 | %(7) | | | 11 | %(7) | |
| Portfolio Turnover of the Fund | | | 9 | % | | | 15 | % | | | 32 | % | | | 19 | % | | | — | | | | — | | |
(1) Net investment income per share was computed using average shares outstanding.
(2) Returns are historical and are calculated by determining the percentage change in net asset value with all distributions reinvested.
(3) Annualized.
(4) The investment adviser was allocated a portion of the Fund's operating expenses (equal to less than 0.005% of average daily net assets for the year ended July 31, 2007). Absent this allocation, total return would be lower.
(5) Includes the Fund's share of its corresponding Portfolio's allocated expenses while the Fund was making investments directly into the Portfolio.
(6) Interest and fee expense relates to the liability for floating rate notes issued in conjunction with inverse floater securities transactions (See Note 1I).
(7) Portfolio turnover represents the rate of portfolio activity for the period while the Fund was making investments directly into the Portfolio.
(8) Not annualized.
See notes to financial statements
57
Eaton Vance Municipals Funds as of January 31, 2008
FINANCIAL STATEMENTS CONT'D
Financial Highlights
| | | Michigan Fund — Class C | |
| | | Six Months Ended
January 31, 2008
(Unaudited)(1) | | Year Ended
July 31, 2007(1) | | Period Ended
July 31, 2006(1)(2) | |
| Net asset value — Beginning of period | | $ | 9.480 | | | $ | 9.510 | | | $ | 9.480 | | |
| Income (loss) from operations | |
| Net investment income | | $ | 0.168 | | | $ | 0.326 | | | $ | 0.080 | | |
| Net realized and unrealized gain (loss) | | | (0.088 | ) | | | (0.025 | ) | | | 0.033 | | |
| Total income from operations | | $ | 0.080 | | | $ | 0.301 | | | $ | 0.113 | | |
| Less distributions | |
| From net investment income | | $ | (0.165 | ) | | $ | (0.331 | ) | | $ | (0.083 | ) | |
| From net realized gain | | | (0.045 | ) | | | — | | | | — | | |
| Total distributions | | $ | (0.210 | ) | | $ | (0.331 | ) | | $ | (0.083 | ) | |
| Net asset value — End of period | | $ | 9.350 | | | $ | 9.480 | | | $ | 9.510 | | |
| Total Return(3) | | | 0.86 | %(8) | | | 3.16 | % | | | 1.20 | %(8) | |
| Ratios/Supplemental Data | |
| Net assets, end of period (000's omitted) | | $ | 3,971 | | | $ | 3,028 | | | $ | 141 | | |
| Ratios (As a percentage of average daily net assets): | |
| Expenses excluding interest and fees | | | 1.45 | %(4) | | | 1.53 | %(5) | | | 1.54 | %(4) | |
| Interest and fee expense(6) | | | 0.17 | %(4) | | | 0.24 | % | | | 0.24 | %(4) | |
| Total expenses before custodian fee reduction | | | 1.62 | %(4) | | | 1.77 | %(5) | | | 1.78 | %(4) | |
| Expenses after custodian fee reduction excluding interest and fees | | | 1.42 | %(4) | | | 1.50 | %(5) | | | 1.53 | %(4) | |
| Net investment income | | | 3.55 | %(4) | | | 3.39 | % | | | 3.39 | %(4) | |
| Portfolio Turnover | | | 9 | % | | | 15 | % | | | 32 | %(7) | |
(1) Net investment income per share was computed using average shares outstanding.
(2) For the period from the start of business, May 2, 2006, to July 31, 2006.
(3) Returns are historical and are calculated by determining the percentage change in net asset value with all distributions reinvested.
(4) Annualized.
(5) The investment adviser was allocated a portion of the Fund's operating expenses (equal to less than 0.005% of average daily net assets for the year ended July 31, 2007). Absent this allocation, total return would be lower.
(6) Interest and fee expense relates to the liability for floating rate notes issued in conjunction with inverse floater securities transactions (See Note 1I).
(7) For the Fund's fiscal year, August 1, 2005 to July 31, 2006.
(8) Not annualized.
See notes to financial statements
58
Eaton Vance Municipals Funds as of January 31, 2008
FINANCIAL STATEMENTS CONT'D
Financial Highlights
| | | Minnesota Fund — Class A | |
| | | Six Months Ended
January 31, 2008 | | Year Ended July 31, | |
| | | (Unaudited)(1) | | 2007(1) | | 2006(1) | | 2005(1) | | 2004(1) | | 2003(1) | |
| Net asset value — Beginning of period | | $ | 9.280 | | | $ | 9.280 | | | $ | 9.320 | | | $ | 9.110 | | | $ | 9.090 | | | $ | 9.310 | | |
| Income (loss) from operations | |
| Net investment income | | $ | 0.193 | | | $ | 0.403 | | | $ | 0.424 | | | $ | 0.422 | | | $ | 0.432 | | | $ | 0.449 | | |
| Net realized and unrealized gain (loss) | | | (0.021 | ) | | | 0.007 | | | | (0.052 | ) | | | 0.206 | | | | 0.029 | | | | (0.185 | ) | |
| Total income from operations | | $ | 0.172 | | | $ | 0.410 | | | $ | 0.372 | | | $ | 0.628 | | | $ | 0.461 | | | $ | 0.264 | | |
| Less distributions | |
| From net investment income | | $ | (0.202 | ) | | $ | (0.410 | ) | | $ | (0.412 | ) | | $ | (0.418 | ) | | $ | (0.441 | ) | | $ | (0.484 | ) | |
| Total distributions | | $ | (0.202 | ) | | $ | (0.410 | ) | | $ | (0.412 | ) | | $ | (0.418 | ) | | $ | (0.441 | ) | | $ | (0.484 | ) | |
| Net asset value — End of period | | $ | 9.250 | | | $ | 9.280 | | | $ | 9.280 | | | $ | 9.320 | | | $ | 9.110 | | | $ | 9.090 | | |
| Total Return(2) | | | 1.87 | %(8) | | | 4.45 | % | | | 4.08 | % | | | 7.02 | % | | | 5.12 | % | | | 2.86 | % | |
| Ratios/Supplemental Data | |
| Net assets, end of period (000's omitted) | | $ | 68,391 | | | $ | 57,574 | | | $ | 34,677 | | | $ | 31,245 | | | $ | 29,369 | | | $ | 8,956 | | |
| Ratios (As a percentage of average daily net assets): | |
| Expenses excluding interest and fees | | | 0.71 | %(3) | | | 0.78 | %(4) | | | 0.77 | % | | | 0.78 | %(5) | | | 0.79 | %(5) | | | 0.78 | %(5) | |
| Interest and fee expense(6) | | | 0.14 | %(3) | | | 0.20 | % | | | 0.22 | % | | | 0.15 | %(5) | | | — | | | | — | | |
| Total expenses before custodian fee reduction | | | 0.85 | %(3) | | | 0.98 | %(4) | | | 0.99 | % | | | 0.93 | %(5) | | | 0.79 | %(5) | | | 0.78 | %(5) | |
| Expenses after custodian fee reduction excluding interest and fees | | | 0.66 | %(3) | | | 0.72 | %(4) | | | 0.74 | % | | | 0.77 | %(5) | | | 0.79 | %(5) | | | 0.76 | %(5) | |
| Net investment income | | | 4.16 | %(3) | | | 4.30 | % | | | 4.57 | % | | | 4.55 | % | | | 4.71 | % | | | 4.83 | % | |
| Portfolio Turnover of the Portfolio | | | — | | | | — | | | | — | | | | 6 | %(7) | | | 12 | %(7) | | | 15 | %(7) | |
| Portfolio Turnover of the Fund | | | 6 | % | | | 4 | % | | | 14 | % | | | 9 | % | | | — | | | | — | | |
(1) Net investment income per share was computed using average shares outstanding.
(2) Returns are historical and are calculated by determining the percentage change in net asset value with all distributions reinvested.
(3) Annualized.
(4) The investment adviser was allocated a portion of the Fund's operating expenses (equal to less than 0.005% of average daily net assets for the year ended July 31, 2007). Absent this allocation, total return would be lower.
(5) Includes the Fund's shares of its corresponding Portfolio's allocated expenses while the Fund was making investments directly into the Portfolio.
(6) Interest and fee expense relates to the liability for floating rate notes issued in conjunction with inverse floater securities transactions (See Note 1I).
(7) Portfolio turnover represents the rate of portfolio activity for the period while the Fund was making investments directly into the Portfolio.
(8) Not annualized.
See notes to financial statements
59
Eaton Vance Municipals Funds as of January 31, 2008
FINANCIAL STATEMENTS CONT'D
Financial Highlights
| | | Minnesota Fund — Class B | |
| | | Six Months Ended
January 31, 2008 | | Year Ended July 31, | |
| | | (Unaudited)(1) | | 2007(1) | | 2006(1) | | 2005(1) | | 2004(1) | | 2003(1) | |
| Net asset value — Beginning of period | | $ | 9.990 | | | $ | 9.990 | | | $ | 10.020 | | | $ | 9.810 | | | $ | 9.790 | | | $ | 10.030 | | |
| Income (loss) from operations | |
| Net investment income | | $ | 0.171 | | | $ | 0.363 | | | $ | 0.383 | | | $ | 0.380 | | | $ | 0.390 | | | $ | 0.411 | | |
| Net realized and unrealized gain (loss) | | | (0.032 | ) | | | 0.003 | | | | (0.045 | ) | | | 0.205 | | | | 0.029 | | | | (0.204 | ) | |
| Total income from operations | | $ | 0.139 | | | $ | 0.366 | | | $ | 0.338 | | | $ | 0.585 | | | $ | 0.419 | | | $ | 0.207 | | |
| Less distributions | |
| From net investment income | | $ | (0.179 | ) | | $ | (0.366 | ) | | $ | (0.368 | ) | | $ | (0.375 | ) | | $ | (0.399 | ) | | $ | (0.447 | ) | |
| Total distributions | | $ | (0.179 | ) | | $ | (0.366 | ) | | $ | (0.368 | ) | | $ | (0.375 | ) | | $ | (0.399 | ) | | $ | (0.447 | ) | |
| Net asset value — End of period | | $ | 9.950 | | | $ | 9.990 | | | $ | 9.990 | | | $ | 10.020 | | | $ | 9.810 | | | $ | 9.790 | | |
| Total Return(2) | | | 1.41 | %(9) | | | 3.68 | % | | | 3.44 | % | | | 6.23 | %(3) | | | 4.33 | % | | | 2.07 | % | |
| Ratios/Supplemental Data | |
| Net assets, end of period (000's omitted) | | $ | 7,430 | | | $ | 7,827 | | | $ | 9,941 | | | $ | 13,571 | | | $ | 15,212 | | | $ | 41,279 | | |
| Ratios (As a percentage of average daily net assets): | |
| Expenses excluding interest and fees | | | 1.46 | %(4) | | | 1.53 | %(5) | | | 1.52 | % | | | 1.53 | %(6) | | | 1.54 | %(6) | | | 1.53 | %(6) | |
| Interest and fee expense(7) | | | 0.14 | %(4) | | | 0.20 | % | | | 0.22 | % | | | 0.15 | %(6) | | | — | | | | — | | |
| Total expenses before custodian fee reduction | | | 1.60 | %(4) | | | 1.73 | %(5) | | | 1.74 | % | | | 1.68 | %(6) | | | 1.54 | %(6) | | | 1.53 | %(6) | |
| Expenses after custodian fee reduction excluding interest and fees | | | 1.41 | %(4) | | | 1.47 | %(5) | | | 1.49 | % | | | 1.52 | %(6) | | | 1.54 | %(6) | | | 1.51 | %(6) | |
| Net investment income | | | 3.43 | %(4) | | | 3.60 | % | | | 3.84 | % | | | 3.81 | % | | | 3.92 | % | | | 4.11 | % | |
| Portfolio Turnover of the Portfolio | | | — | | | | — | | | | — | | | | 6 | %(8) | | | 12 | %(8) | | | 15 | %(8) | |
| Portfolio Turnover of the Fund | | | 6 | % | | | 4 | % | | | 14 | % | | | 9 | % | | | — | | | | — | | |
(1) Net investment income per share was computed using average shares outstanding.
(2) Returns are historical and are calculated by determining the percentage change in net asset value with all distributions reinvested.
(3) Total return reflects an increase of 0.18% due to a change in the timing of the payment and reinvestment of distributions.
(4) Annualized.
(5) The investment adviser was allocated a portion of the Fund's operating expenses (equal to less than 0.005% of average daily net assets for the year ended July 31, 2007). Absent this allocation, total return would be lower.
(6) Includes the Fund's shares of its corresponding Portfolio's allocated expenses while the Fund was making investments directly into the Portfolio.
(7) Interest and fee expense relates to the liability for floating rate notes issued in conjunction with inverse floater securities transactions (See Note 1I).
(8) Portfolio turnover represents the rate of portfolio activity for the period while the Fund was making investments directly into the Portfolio.
(9) Not annualized.
See notes to financial statements
60
Eaton Vance Municipals Funds as of January 31, 2008
FINANCIAL STATEMENTS CONT'D
Financial Highlights
| | | Minnesota Fund — Class C | |
| | | Six Months Ended
January 31, 2008
(Unaudited)(1) | | Year Ended
July 31, 2007(1) | | Period Ended
July 31, 2006(1)(2) | |
| Net asset value — Beginning of period | | $ | 9.990 | | | $ | 9.990 | | | $ | 9.940 | | |
| Income (loss) from operations | |
| Net investment income | | $ | 0.170 | | | $ | 0.357 | | | $ | 0.231 | | |
| Net realized and unrealized gain (loss) | | | (0.021 | ) | | | 0.009 | | | | 0.041 | (3) | |
| Total income from operations | | $ | 0.149 | | | $ | 0.366 | | | $ | 0.272 | | |
| Less distributions | |
| From net investment income | | $ | (0.179 | ) | | $ | (0.366 | ) | | $ | (0.222 | ) | |
| Total distributions | | $ | (0.179 | ) | | $ | (0.366 | ) | | $ | (0.222 | ) | |
| Net asset value — End of period | | $ | 9.960 | | | $ | 9.990 | | | $ | 9.990 | | |
| Total Return(4) | | | 1.51 | %(9) | | | 3.68 | % | | | 2.77 | %(9) | |
| Ratios/Supplemental Data | |
| Net assets, end of period (000's omitted) | | $ | 7,262 | | | $ | 4,115 | | | $ | 986 | | |
| Ratios (As a percentage of average daily net assets): | |
| Expenses excluding interest and fees | | | 1.46 | %(5) | | | 1.53 | %(6) | | | 1.52 | %(5) | |
| Interest and fee expense(7) | | | 0.14 | %(5) | | | 0.20 | % | | | 0.22 | %(5) | |
| Total expenses before custodian fee reduction | | | 1.60 | %(5) | | | 1.73 | %(6) | | | 1.74 | %(5) | |
| Expenses after custodian fee reduction excluding interest and fees | | | 1.41 | %(5) | | | 1.47 | %(6) | | | 1.49 | %(5) | |
| Net investment income | | | 3.39 | %(5) | | | 3.54 | % | | | 3.78 | %(5) | |
| Portfolio Turnover | | | 6 | % | | | 4 | % | | | 14 | %(8) | |
(1) Net investment income per share was computed using average shares outstanding.
(2) For the period from the start of business, December 21, 2005, to July 31, 2006.
(3) The per share amount is not in accord with the net realized and unrealized gain (loss) on investments for the period because of the timing of sales of Fund shares and the amount of the per share realized and unrealized gains and losses at such time.
(4) Returns are historical and are calculated by determining the percentage change in net asset value with all distributions reinvested.
(5) Annualized.
(6) The investment adviser was allocated a portion of the Fund's operating expenses (equal to less than 0.005% of average daily net assets for the year ended July 31, 2007). Absent this allocation, total return would be lower.
(7) Interest and fee expense relates to the liability for floating rate notes issued in conjunction with inverse floater securities transactions (See Note 1I).
(8) For the Fund's fiscal year, August 1, 2005 to July 31, 2006.
(9) Not annualized.
See notes to financial statements
61
Eaton Vance Municipals Funds as of January 31, 2008
FINANCIAL STATEMENTS CONT'D
Financial Highlights
| | | New Jersey Fund — Class A | |
| | | Six Months Ended
January 31, 2008 | | Year Ended July 31, | |
| | | (Unaudited)(1) | | 2007(1) | | 2006(1) | | 2005(1) | | 2004(1) | | 2003(1) | |
| Net asset value — Beginning of period | | $ | 10.500 | | | $ | 10.420 | | | $ | 10.470 | | | $ | 10.130 | | | $ | 10.070 | | | $ | 10.320 | | |
| Income (loss) from operations | |
| Net investment income | | $ | 0.232 | | | $ | 0.481 | | | $ | 0.462 | | | $ | 0.478 | | | $ | 0.508 | | | $ | 0.527 | | |
| Net realized and unrealized gain (loss) | | | (0.431 | ) | | | 0.058 | | | | (0.055 | ) | | | 0.342 | | | | 0.082 | | | | (0.248 | ) | |
| Total income (loss) from operations | | $ | (0.199 | ) | | $ | 0.539 | | | $ | 0.407 | | | $ | 0.820 | | | $ | 0.590 | | | $ | 0.279 | | |
| Less distributions | |
| From net investment income | | $ | (0.234 | ) | | $ | (0.459 | ) | | $ | (0.457 | ) | | $ | (0.480 | ) | | $ | (0.530 | ) | | $ | (0.529 | ) | |
| From net realized gain | | | (0.017 | ) | | | — | | | | — | | | | — | | | | — | | | | — | | |
| Total distributions | | $ | (0.251 | ) | | $ | (0.459 | ) | | $ | (0.457 | ) | | $ | (0.480 | ) | | $ | (0.530 | ) | | $ | (0.529 | ) | |
| Net asset value — End of period | | $ | 10.050 | | | $ | 10.500 | | | $ | 10.420 | | | $ | 10.470 | | | $ | 10.130 | | | $ | 10.070 | | |
| Total Return(2) | | | (1.91 | )%(8) | | | 5.18 | % | | | 4.00 | % | | | 8.24 | % | | | 5.89 | % | | | 2.67 | % | |
| Ratios/Supplemental Data | |
| Net assets, end of period (000's omitted) | | $ | 238,718 | | | $ | 264,281 | | | $ | 189,294 | | | $ | 175,624 | | | $ | 161,964 | | | $ | 31,548 | | |
| Ratios (As a percentage of average daily net assets): | |
| Expenses excluding interest and fees | | | 0.75 | %(3) | | | 0.79 | %(4) | | | 0.80 | % | | | 0.81 | %(5) | | | 0.84 | %(5) | | | 0.82 | %(5) | |
| Interest and fee expense(6) | | | 0.31 | %(3) | | | 0.42 | % | | | 0.39 | % | | | 0.25 | %(5) | | | 0.13 | %(5) | | | 0.11 | %(5) | |
| Total expenses before custodian fee reduction | | | 1.06 | %(3) | | | 1.21 | %(4) | | | 1.19 | % | | | 1.06 | %(5) | | | 0.97 | %(5) | | | 0.93 | %(5) | |
| Expenses after custodian fee reduction excluding interest and fees | | | 0.74 | %(3) | | | 0.76 | %(4) | | | 0.78 | % | | | 0.80 | %(5) | | | 0.83 | %(5) | | | 0.82 | %(5) | |
| Net investment income | | | 4.51 | %(3) | | | 4.51 | % | | | 4.45 | % | | | 4.61 | % | | | 4.99 | % | | | 5.07 | % | |
| Portfolio Turnover of the Portfolio | | | — | | | | — | | | | — | | | | 0 | %(7) | | | 12 | %(7) | | | 13 | %(7) | |
| Portfolio Turnover of the Fund | | | 15 | % | | | 37 | % | | | 27 | % | | | 26 | % | | | — | | | | — | | |
(1) Net investment income per share was computed using average shares outstanding.
(2) Returns are historical and are calculated by determining the percentage change in net asset value with all distributions reinvested.
(3) Annualized.
(4) The investment adviser was allocated a portion of the Fund's operating expenses (equal to less than 0.005% of average daily net assets for the year ended July 31, 2007).
(5) Includes the Fund's share of its corresponding Portfolio's allocated expenses while the Fund was making investments directly into the Portfolio.
(6) Interest and fee expense relates to the liability for floating rate notes issued in conjunction with inverse floater securities transactions (See Note 1I).
(7) Portfolio turnover represents the rate of portfolio activity for the period while the Fund was making investments directly into the Portfolio.
(8) Not annualized.
See notes to financial statements
62
Eaton Vance Municipals Funds as of January 31, 2008
FINANCIAL STATEMENTS CONT'D
Financial Highlights
| | | New Jersey Fund — Class B | |
| | | Six Months Ended
January 31, 2008 | | Year Ended July 31, | |
| | | (Unaudited)(1) | | 2007(1) | | 2006(1) | | 2005(1) | | 2004(1) | | 2003(1) | |
| Net asset value — Beginning of period | | $ | 10.950 | | | $ | 10.880 | | | $ | 10.930 | | | $ | 10.570 | | | $ | 10.510 | | | $ | 10.780 | | |
| Income (loss) from operations | |
| Net investment income | | $ | 0.215 | | | $ | 0.428 | | | $ | 0.402 | | | $ | 0.419 | | | $ | 0.445 | | | $ | 0.470 | | |
| Net realized and unrealized gain (loss) | | | (0.443 | ) | | | 0.039 | | | | (0.056 | ) | | | 0.361 | | | | 0.086 | | | | (0.271 | ) | |
| Total income (loss) from operations | | $ | (0.228 | ) | | $ | 0.467 | | | $ | 0.346 | | | $ | 0.780 | | | $ | 0.531 | | | $ | 0.199 | | |
| Less distributions | |
| From net investment income | | $ | (0.210 | ) | | $ | (0.397 | ) | | $ | (0.396 | ) | | $ | (0.420 | ) | | $ | (0.471 | ) | | $ | (0.469 | ) | |
| From net realized gain | | | (0.017 | ) | | | — | | | | — | | | | — | | | | — | | | | — | | |
| Total distributions | | $ | (0.227 | ) | | $ | (0.397 | ) | | $ | (0.396 | ) | | $ | (0.420 | ) | | $ | (0.471 | ) | | $ | (0.469 | ) | |
| Contingent deferred sales charges | | $ | 0.005 | | | | — | | | | — | | | | — | | | | — | | | | — | | |
| Net asset value — End of period | | $ | 10.500 | | | $ | 10.950 | | | $ | 10.880 | | | $ | 10.930 | | | $ | 10.570 | | | $ | 10.510 | | |
| Total Return(2) | | | (2.05 | )%(9) | | | 4.28 | % | | | 3.25 | % | | | 7.68 | %(3) | | | 5.07 | % | | | 1.80 | % | |
| Ratios/Supplemental Data | |
| Net assets, end of period (000's omitted) | | $ | 41,549 | | | $ | 47,894 | | | $ | 60,011 | | | $ | 72,228 | | | $ | 78,427 | | | $ | 228,575 | | |
| Ratios (As a percentage of average daily net assets): | |
| Expenses excluding interest and fees | | | 1.27 | %(4) | | | 1.54 | %(5) | | | 1.55 | % | | | 1.56 | %(6) | | | 1.59 | %(6) | | | 1.57 | %(6) | |
| Interest and fee expense(7) | | | 0.31 | %(4) | | | 0.42 | % | | | 0.39 | % | | | 0.25 | %(6) | | | 0.13 | %(6) | | | 0.11 | %(6) | |
| Total expenses before custodian fee reduction | | | 1.58 | %(4) | | | 1.96 | %(5) | | | 1.94 | % | | | 1.81 | %(6) | | | 1.72 | %(6) | | | 1.68 | %(6) | |
| Expenses after custodian fee reduction excluding interest and fees | | | 1.26 | %(4) | | | 1.51 | %(5) | | | 1.53 | % | | | 1.55 | %(6) | | | 1.58 | %(6) | | | 1.57 | %(6) | |
| Net investment income | | | 3.99 | %(4) | | | 3.84 | % | | | 3.71 | % | | | 3.87 | % | | | 4.12 | % | | | 4.33 | % | |
| Portfolio Turnover of the Portfolio | | | — | | | | — | | | | — | | | | 0 | %(8) | | | 12 | %(8) | | | 13 | %(8) | |
| Portfolio Turnover of the Fund | | | 15 | % | | | 37 | % | | | 27 | % | | | 26 | % | | | — | | | | — | | |
(1) Net investment income per share was computed using average shares outstanding.
(2) Returns are historical and are calculated by determining the percentage change in net asset value with all distributions reinvested.
(3) Total return reflects an increase of 0.17% due to a change in the timing of the payment and reinvestment of distributions.
(4) Annualized.
(5) The investment adviser was allocated a portion of the Fund's operating expenses (equal to less than 0.005% of average daily net assets for the year ended July 31, 2007).
(6) Includes the Fund's share of its corresponding Portfolio's allocated expenses while the Fund was making investments directly into the Portfolio.
(7) Interest and fee expense relates to the liability for floating rate notes issued in conjunction with inverse floater securities transactions (See Note 1I).
(8) Portfolio turnover represents the rate of portfolio activity for the period while the Fund was making investments directly into the Portfolio.
(9) Not annualized.
See notes to financial statements
63
Eaton Vance Municipals Funds as of January 31, 2008
FINANCIAL STATEMENTS CONT'D
Financial Highlights
| | | New Jersey Fund — Class C | |
| | | Six Months Ended
January 31, 2008
(Unaudited)(1) | | Year Ended
July 31, 2007(1) | | Period Ended
July 31, 2006(1)(2) | |
| Net asset value — Beginning of period | | $ | 10.950 | | | $ | 10.870 | | | $ | 10.740 | | |
| Income (loss) from operations | |
| Net investment income | | $ | 0.199 | | | $ | 0.402 | | | $ | 0.233 | | |
| Net realized and unrealized gain (loss) | | | (0.441 | ) | | | 0.075 | | | | 0.148 | (3) | |
| Total income from operations | | $ | (0.242 | ) | | $ | 0.477 | | | $ | 0.381 | | |
| Less distributions | |
| From net investment income | | $ | (0.201 | ) | | $ | (0.397 | ) | | $ | (0.251 | ) | |
| From net realized gain | | | (0.017 | ) | | | — | | | | — | | |
| Total distributions | | $ | (0.218 | ) | | $ | (0.397 | ) | | $ | (0.251 | ) | |
| Net asset value — End of period | | $ | 10.490 | | | $ | 10.950 | | | $ | 10.870 | | |
| Total Return(4) | | | (2.22 | )%(9) | | | 4.38 | % | | | 3.56 | %(9) | |
| Ratios/Supplemental Data | |
| Net assets, end of period (000's omitted) | | $ | 25,647 | | | $ | 22,479 | | | $ | 3,659 | | |
| Ratios (As a percentage of average daily net assets): | |
| Expenses excluding interest and fees | | | 1.50 | %(5) | | | 1.54 | %(6) | | | 1.55 | %(5) | |
| Interest and fee expense(7) | | | 0.31 | %(5) | | | 0.42 | % | | | 0.39 | %(5) | |
| Total expenses before custodian fee reduction | | | 1.81 | %(5) | | | 1.96 | %(6) | | | 1.94 | %(5) | |
| Expenses after custodian fee reduction excluding interest and fees | | | 1.49 | %(5) | | | 1.51 | %(6) | | | 1.53 | %(5) | |
| Net investment income | | | 3.69 | %(5) | | | 3.61 | % | | | 3.45 | %(5) | |
| Portfolio Turnover | | | 15 | % | | | 37 | % | | | 27 | %(8) | |
(1) Net investment income per share was computed using average shares outstanding.
(2) For the period from the start of business, December 14, 2005, to July 31, 2006.
(3) The per share amount is not in accord with the net realized and unrealized gain (loss) for the period because of the timing of sales of Fund shares and the amount of the per share realized and unrealized gains and losses at such time.
(4) Returns are historical and are calculated by determining the percentage change in net asset value with all distributions reinvested.
(5) Annualized.
(6) The investment adviser was allocated a portion of the Fund's operating expenses (equal to less than 0.005% of average daily net assets for the year ended July 31, 2007). Absent this allocation, total return would be lower.
(7) Interest and fee expense relates to the liability for floating rate notes issued in conjunction with inverse floater securities transactions (See Note 1I).
(8) For the Fund's fiscal year, August 1, 2005 to July 31, 2006.
(9) Not annualized.
See notes to financial statements
64
Eaton Vance Municipals Funds as of January 31, 2008
FINANCIAL STATEMENTS CONT'D
Financial Highlights
| | | Pennsylvania Fund — Class A | |
| | | Six Months Ended
January 31, 2008 | | Year Ended July 31, | |
| | | (Unaudited)(1) | | 2007(1) | | 2006(1) | | 2005(1) | | 2004(1) | | 2003(1) | |
| Net asset value — Beginning of period | | $ | 9.970 | | | $ | 9.930 | | | $ | 9.920 | | | $ | 9.730 | | | $ | 9.680 | | | $ | 9.870 | | |
| Income (loss) from operations | |
| Net investment income | | $ | 0.218 | | | $ | 0.434 | | | $ | 0.458 | | | $ | 0.490 | | | $ | 0.513 | | | $ | 0.525 | | |
| Net realized and unrealized gain (loss) | | | (0.293 | ) | | �� | 0.042 | | | | 0.010 | | | | 0.191 | | | | 0.053 | | | | (0.171 | ) | |
| Total income (loss) from operations | | $ | (0.075 | ) | | $ | 0.476 | | | $ | 0.468 | | | $ | 0.681 | | | $ | 0.566 | | | $ | 0.354 | | |
| Less distributions | |
| From net investment income | | $ | (0.215 | ) | | $ | (0.436 | ) | | $ | (0.458 | ) | | $ | (0.491 | ) | | $ | (0.516 | ) | | $ | (0.544 | ) | |
| Total distributions | | $ | (0.215 | ) | | $ | (0.436 | ) | | $ | (0.458 | ) | | $ | (0.491 | ) | | $ | (0.516 | ) | | $ | (0.544 | ) | |
| Net asset value — End of period | | $ | 9.680 | | | $ | 9.970 | | | $ | 9.930 | | | $ | 9.920 | | | $ | 9.730 | | | $ | 9.680 | | |
| Total Return(2) | | | (0.75 | )%(8) | | | 4.81 | % | | | 4.84 | % | | | 7.14 | % | | | 5.91 | % | | | 3.60 | % | |
| Ratios/Supplemental Data | |
| Net assets, end of period (000's omitted) | | $ | 234,730 | | | $ | 238,254 | | | $ | 187,902 | | | $ | 166,734 | | | $ | 156,465 | | | $ | 17,109 | | |
| Ratios (As a percentage of average daily net assets): | |
| Expenses excluding interest and fees | | | 0.77 | %(3) | | | 0.80 | %(4) | | | 0.82 | % | | | 0.85 | %(5) | | | 0.85 | %(5) | | | 0.83 | %(5) | |
| Interest and fee expense(6) | | | 0.53 | %(3) | | | 0.54 | % | | | 0.38 | % | | | 0.17 | %(5) | | | 0.12 | %(5) | | | — | | |
| Total expenses before custodian fee reduction | | | 1.30 | %(3) | | | 1.34 | %(4) | | | 1.20 | % | | | 1.02 | %(5) | | | 0.97 | %(5) | | | 0.83 | %(5) | |
| Expenses after custodian fee reduction excluding interest and fees | | | 0.74 | %(3) | | | 0.77 | %(4) | | | 0.80 | % | | | 0.84 | %(5) | | | 0.84 | %(5) | | | 0.83 | %(5) | |
| Net investment income | | | 4.41 | %(3) | | | 4.29 | % | | | 4.63 | % | | | 4.97 | % | | | 5.27 | % | | | 5.29 | % | |
| Portfolio Turnover of the Portfolio | | | — | | | | — | | | | — | | | | 1 | %(7) | | | 12 | %(7) | | | 23 | %(7) | |
| Portfolio Turnover of the Fund | | | 11 | % | | | 27 | % | | | 31 | % | | | 15 | % | | | — | | | | — | | |
(1) Net investment income per share was computed using average shares outstanding.
(2) Returns are historical and are calculated by determining the percentage change in net asset value with all distributions reinvested.
(3) Annualized.
(4) The investment adviser was allocated a portion of the Fund's operating expenses (equal to less than 0.005% of average daily net assets for the year ended July 31, 2007). Absent this allocation, total return would be lower.
(5) Includes the Fund's share of its corresponding Portfolio's allocated expenses while the Fund was making investments directly into the Portfolio.
(6) Interest and fee expense relates to the liability for floating rate notes issued in conjunction with inverse floater securities transactions (See Note 1I).
(7) Portfolio turnover represents the rate of portfolio activity for the period while the Fund was making investments directly into the Portfolio.
(8) Not annualized.
See notes to financial statements
65
Eaton Vance Municipals Funds as of January 31, 2008
FINANCIAL STATEMENTS CONT'D
Financial Highlights
| | | Pennsylvania Fund — Class B | |
| | | Six Months Ended
January 31, 2008 | | Year Ended July 31, | |
| | | (Unaudited)(1) | | 2007(1) | | 2006(1) | | 2005(1) | | 2004(1) | | 2003(1) | |
| Net asset value — Beginning of period | | $ | 10.310 | | | $ | 10.270 | | | $ | 10.260 | | | $ | 10.060 | | | $ | 10.010 | | | $ | 10.210 | | |
| Income (loss) from operations | |
| Net investment income | | $ | 0.187 | | | $ | 0.372 | | | $ | 0.398 | | | $ | 0.431 | | | $ | 0.458 | | | $ | 0.469 | | |
| Net realized and unrealized gain (loss) | | | (0.302 | ) | | | 0.040 | | | | 0.009 | | | | 0.200 | | | | 0.049 | | | | (0.182 | ) | |
| Total income (loss) from operations | | $ | (0.115 | ) | | $ | 0.412 | | | $ | 0.407 | | | $ | 0.631 | | | $ | 0.507 | | | $ | 0.287 | | |
| Less distributions | |
| From net investment income | | $ | (0.185 | ) | | $ | (0.372 | ) | | $ | (0.397 | ) | | $ | (0.431 | ) | | $ | (0.457 | ) | | $ | (0.487 | ) | |
| Total distributions | | $ | (0.185 | ) | | $ | (0.372 | ) | | $ | (0.397 | ) | | $ | (0.431 | ) | | $ | (0.457 | ) | | $ | (0.487 | ) | |
| Net asset value — End of period | | $ | 10.010 | | | $ | 10.310 | | | $ | 10.270 | | | $ | 10.260 | | | $ | 10.060 | | | $ | 10.010 | | |
| Total Return(2) | | | (1.13 | )%(9) | | | 4.02 | % | | | 4.05 | % | | | 6.58 | %(3) | | | 5.10 | % | | | 2.81 | % | |
| Ratios/Supplemental Data | |
| Net assets, end of period (000's omitted) | | $ | 32,232 | | | $ | 36,425 | | | $ | 42,291 | | | $ | 47,747 | | | $ | 51,972 | | | $ | 204,087 | | |
| Ratios (As a percentage of average daily net assets): | |
| Expenses excluding interest and fees | | | 1.52 | %(4) | | | 1.55 | %(5) | | | 1.57 | % | | | 1.60 | %(6) | | | 1.60 | %(6) | | | 1.58 | %(6) | |
| Interest and fee expense(7) | | | 0.53 | %(4) | | | 0.54 | % | | | 0.38 | % | | | 0.17 | %(6) | | | 0.12 | %(6) | | | — | | |
| Total expenses before custodian fee reduction | | | 2.05 | %(4) | | | 2.09 | %(5) | | | 1.95 | % | | | 1.77 | %(6) | | | 1.72 | %(6) | | | 1.58 | %(6) | |
| Expenses after custodian fee reduction excluding interest and fees | | | 1.49 | %(4) | | | 1.52 | %(5) | | | 1.55 | % | | | 1.59 | %(6) | | | 1.59 | %(6) | | | 1.58 | %(6) | |
| Net investment income | | | 3.67 | %(4) | | | 3.56 | % | | | 3.89 | % | | | 4.22 | % | | | 4.48 | % | | | 4.57 | % | |
| Portfolio Turnover of the Portfolio | | | — | | | | — | | | | — | | | | 1 | %(8) | | | 12 | %(8) | | | 23 | %(8) | |
| Portfolio Turnover of the Fund | | | 11 | % | | | 27 | % | | | 31 | % | | | 15 | % | | | — | | | | — | | |
(1) Net investment income per share was computed using average shares outstanding.
(2) Returns are historical and are calculated by determining the percentage change in net asset value with all distributions reinvested.
(3) Total return reflects an increase of 0.18% due to a change in the timing of the payment and reinvestment of distributions.
(4) Annualized.
(5) The investment adviser was allocated a portion of the Fund's operating expenses (equal to less than 0.005% of average daily net assets for the year ended July 31, 2007). Absent this allocation, total return would be lower.
(6) Includes the Fund's share of its corresponding Portfolio's allocated expenses while the Fund was making investments directly into the Portfolio.
(7) Interest and fee expense relates to the liability for floating rate notes issued in conjunction with inverse floater securities transactions (See Note 1I).
(8) Portfolio turnover represents the rate of portfolio activity for the period while the Fund was making investments directly into the Portfolio.
(9) Not annualized.
See notes to financial statements
66
Eaton Vance Municipals Funds as of January 31, 2008
FINANCIAL STATEMENTS CONT'D
Financial Highlights
| | | Pennsylvania Fund — Class C | |
| | | Six Months Ended
January 31, 2008
(Unaudited)(1) | | Year Ended
July 31, 2007(1) | | Period Ended
July 31, 2006(1)(2) | |
| Net asset value — Beginning of period | | $ | 10.320 | | | $ | 10.280 | | | $ | 10.250 | | |
| Income (loss) from operations | |
| Net investment income | | $ | 0.186 | | | $ | 0.368 | | | $ | 0.203 | | |
| Net realized and unrealized gain (loss) | | | (0.301 | ) | | | 0.045 | | | | 0.044 | | |
| Total income (loss) from operations | | $ | (0.115 | ) | | $ | 0.413 | | | $ | 0.247 | | |
| Less distributions | |
| From net investment income | | $ | (0.185 | ) | | $ | (0.373 | ) | | $ | (0.217 | ) | |
| Total distributions | | $ | (0.185 | ) | | $ | (0.373 | ) | | $ | (0.217 | ) | |
| Net asset value — End of period | | $ | 10.020 | | | $ | 10.320 | | | $ | 10.280 | | |
| Total Return(3) | | | (1.12 | )%(8) | | | 4.02 | % | | | 2.38 | %(8) | |
| Ratios/Supplemental Data | |
| Net assets, end of period (000's omitted) | | $ | 25,175 | | | $ | 20,528 | | | $ | 3,026 | | |
| Ratios (As a percentage of average daily net assets): | |
| Expenses excluding interest and fees | | | 1.52 | %(4) | | | 1.55 | %(5) | | | 1.57 | %(4) | |
| Interest and fee expense(6) | | | 0.53 | %(4) | | | 0.54 | % | | | 0.38 | %(4) | |
| Total expenses before custodian fee reduction | | | 2.05 | %(4) | | | 2.09 | %(5) | | | 1.95 | %(4) | |
| Expenses after custodian fee reduction excluding interest and fees | | | 1.49 | %(4) | | | 1.52 | %(5) | | | 1.55 | %(4) | |
| Net investment income | | | 3.64 | %(4) | | | 3.52 | %(5) | | | 3.60 | %(4) | |
| Portfolio Turnover | | | 11 | % | | | 27 | % | | | 31 | %(7) | |
(1) Net investment income per share was computed using average shares outstanding.
(2) For the period from the start of business, January 12, 2006, to July 31, 2006.
(3) Returns are historical and are calculated by determining the percentage change in net asset value with all distributions reinvested.
(4) Annualized.
(5) The investment adviser was allocated a portion of the Fund's operating expenses (equal to less than 0.005% of average daily net assets for the year ended July 31, 2007). Absent this allocation, total return would be lower.
(6) Interest and fee expense relates to the liability for floating rate notes issued in conjunction with inverse floater securities transactions (See Note 1I).
(7) For the Fund's fiscal year, August 1, 2005 to July 31, 2006.
(8) Not annualized.
See notes to financial statements
67
Eaton Vance Municipals Funds as of January 31, 2008
NOTES TO FINANCIAL STATEMENTS (Unaudited)
1 Significant Accounting Policies
Eaton Vance Municipals Trust (the Trust) is a Massachusetts business trust registered under the Investment Company Act of 1940, as amended (the 1940 Act), as an open-end management investment company. The Trust presently consists of twenty-eight funds, seven of which, each non-diversified, are included in these financial statements. They include Eaton Vance Arizona Municipals Fund (Arizona Fund), Eaton Vance Colorado Municipals Fund (Colorado Fund), Eaton Vance Connecticut Municipals Fund (Connecticut Fund), Eaton Vance Michigan Municipals Fund (Michigan Fund), Eaton Vance Minnesota Municipals Fund (Minnesota Fund), Eaton Vance New Jersey Municip als Fund (New Jersey Fund) and Eaton Vance Pennsylvania Municipals Fund (Pennsylvania Fund), each individually referred to as, the Fund, and collectively, the Funds. The Funds seek to provide current income exempt from regular federal income tax and from particular state or local income or other taxes. The Michigan Fund offers two classes of shares. Each of the other funds offers three classes of shares. Class A shares are generally sold subject to a sales charge imposed at time of purchase. Class B and Class C shares are sold at net asset value and are generally subject to a contingent deferred sales charge (see Note 5). Class B shares of each Fund automatically convert to Class A shares eight years after their purchase as described in each Fund's prospectus. Each class represents a pro-rata interest in the Fund, but votes separately on class-specific matters and (as noted below) is subject to different expenses. Realized and unrealized gains and losses are allocated daily to each class of shares based on t he relative net assets of each class to the total net assets of the Fund. Net investment income, other than class-specific expenses, is allocated daily to each class of shares based upon the ratio of the value of each class's paid shares to the total value of all paid shares. Each class of shares differs in its distribution plan and certain other class-specific expenses.
The following is a summary of significant accounting policies of the Funds. The policies are in conformity with accounting principles generally accepted in the United States of America.
A Investment Valuation — Municipal bonds and taxable obligations, if any, are generally valued on the basis of valuations furnished by a pricing service. Financial futures contracts and options on financial futures contracts listed on commodity exchanges are valued at closing settlement prices. Interest rate swaps are generally valued on the basis of valuations furnished by a pricing service. Short-term obligations, maturing in sixty days or less, are valued at amortized cost, which approximates market value. Investments for which valuations or market quotations are not readily available, and investments for which the price of a security is not believed to represent its fair market value, are valued at fair value using methods determined in good faith by or at the directi on of the Trustees.
B Investment Transactions and Related Income — Investment transactions for financial statement purposes are accounted for on a trade date basis. Realized gains and losses on investments sold are determined on the basis of identified cost. Interest income is recorded on the basis of interest accrued, adjusted for amortization of premium or accretion of discount.
C Federal Taxes — Each Fund's policy is to comply with the provisions of the Internal Revenue Code applicable to regulated investment companies and to distribute to shareholders each year substantially all of its taxable, if any, and tax-exempt net investment income, and all or substantially all of its net realized capital gains. Accordingly, no provision for federal income or excise tax is necessary. Each Fund intends to satisfy conditions which will enable it to designate distributions from the interest income generated by its investments in municipal obligations, which are exempt from regular federal income tax when received by each Fund, as exempt-interest dividends. The portion of such interest, if any, earned on private activity bonds issued after August 7, 1986, ma y be considered a tax preference item to shareholders.
At July 31, 2007, the following Funds, for federal income tax purposes, had a capital loss carryforward which will reduce each Fund's taxable income arising from future net realized gains on investment transactions, if any, to the extent permitted by the Internal Revenue Code, and thus will reduce the amount of distributions to shareholders which would otherwise be necessary to relieve the Funds of any liability for federal income or excise tax. The amounts and expiration dates of the capital loss carryforwards are as follows:
| Fund | | Amount | | Expiration Date | |
| Arizona | | $ | 522,797 | | | July 31, 2009 | |
|
| | | | 536,449 | | | July 31, 2010 | |
|
| | | | 353,624 | | | July 31, 2012 | |
|
| | | | 691,155 | | | July 31, 2013 | |
|
| | | | 736,704 | | | July 31, 2014 | |
|
| Colorado | | | 284,426 | | | July 31, 2013 | |
|
| Connecticut | | | 374,997 | | | July 31, 2013 | |
|
| Minnesota | | | 56,582 | | | July 31, 2010 | |
|
| | | | 382,839 | | | July 31, 2012 | |
|
| | | | 504,289 | | | July 31, 2013 | |
|
| Pennsylvania | | | 5,831,137 | | | July 31, 2011 | |
|
| | | | 1,108,751 | | | July 31, 2012 | |
|
| | | | 3,349,896 | | | July 31, 2013 | |
|
The Minnesota Fund had net losses of $298,217 attributable to investment transactions incurred after October 31, 2006. These capital losses are treated as arising on the first day of the Fund's taxable year ending July 31, 2008.
68
Eaton Vance Municipals Funds as of January 31, 2008
NOTES TO FINANCIAL STATEMENTS (Unaudited) CONT'D
In June 2006, the Financial Accounting Standards Board (FASB) issued FASB Interpretation No. 48 (FIN 48), "Accounting for Uncertainty in Income Taxes – an interpretation of FASB Statement No. 109". FIN 48 clarifies the accounting for uncertainty in income taxes recognized in accordance with FASB Statement No. 109, "Accounting for Income Taxes". This interpretation prescribes a recognition threshold and measurement attribute for the financial statement recognition and measurement of a tax position taken or expected to be taken in a tax return. It also provides guidance on de-recognition, classification, interest and penalties, accounting in interim periods, disclosure and transition. FIN 48 is effective on the last business day of the first required financial reporting period for fiscal years beginning after December 15, 2006. Management has concluded that as of January 31, 2008, there are no uncertain tax positions that wou ld require financial statement recognition, de-recognition, or disclosure. Each of the Funds' federal tax returns filed in the 3-year period ended January 31, 2008 remains subject to examination by the Internal Revenue Service.
D Expenses — The majority of expenses of the Trust are directly identifiable to an individual fund. Expenses which are not readily identifiable to a specific fund are allocated taking into consideration, among other things, the nature and type of expense and the relative size of the funds.
E Expense Reduction — State Street Bank and Trust Company (SSBT) serves as custodian of the Funds. Pursuant to the respective custodian agreements, SSBT receives a fee reduced by credits, which are determined based on the average daily cash balance each Fund maintains with SSBT. All credit balances, if any, used to reduce each Fund's custodian fees are reported as a reduction of expenses in the Statements of Operations.
F Legal Fees — Legal fees and other related expenses incurred as part of negotiations of the terms and requirement of capital infusions, or that are expected to result in the restructuring of, or a plan of reorganization for, an investment are recorded as realized losses. Ongoing expenditures to protect or enhance an investment are treated as operating expenses.
G Use of Estimates — The preparation of the financial statements in conformity with accounting principles generally accepted in the United States of America requires management to make estimates and assumptions that affect the reported amounts of assets and liabilities at the date of the financial statements and the reported amounts of income and expense during the reporting period. Actual results could differ from those estimates.
H Indemnifications — Under the Trust's organizational documents, its officers and Trustees may be indemnified against certain liabilities and expenses arising out of the performance of their duties to the Funds, and shareholders are indemnified against personal liability for the obligations of the Trust. Additionally, in the normal course of business, each Fund enters into agreements with service providers that may contain indemnification clauses. Each Fund's maximum exposure under these arrangements is unknown as this would involve future claims that may be made against each Fund that have not yet occurred.
I Floating Rate Notes Issued in Conjunction with Securities Held — The Funds may invest in inverse floating rate securities, whereby a Fund may sell a fixed rate bond to a broker for cash. At the same time, the Fund buys a residual interest in the assets and cash flows of a Special-Purpose Vehicle (the SPV), (which is generally organized as a trust), set up by the broker, often referred to as an inverse floating rate obligation (Inverse Floater). The broker deposits a fixed rate bond into the SPV with the same CUSIP number as the fixed rate bond sold to the broker by the Fund, and which may have been, but is not required to be, the fixed rate bond purchased from the Fund (the Fixed Rate Bond). The SPV also issues floating rate notes (Floating Rate Notes) which are sold to third-parties. The Funds may enter into shortfall and forbearance agreements with the broker by which a Fund agrees to reimburse the broker, in certain circumstances, for the difference between the liquidation value of the Fixed Rate Bond held by the SPV and the liquidation value of the Floating Rate Notes, as well as any shortfalls in interest cash flows. The Inverse Floater held by a Fund gives the Fund the right (1) to cause the holders of the Floating Rate Notes to tender their notes at par, and (2) to have the broker transfer the Fixed Rate Bond held by the SPV to the Fund, thereby collapsing the SPV. Pursuant to Financial Accounting Standards Board (FASB) Statement No. 140, "Accounting for Transfers and Servicing of Financial Assets and Extinguishment of Liabilities" (FAS 140), the Funds account for the transaction described above as a secured borrowing by including the Fixed Rate Bond in their Portfolio of Investments and the Floating Rate Notes as a liability under the caption "Payable for floating rate notes issued" in their Statement of Assets and Liabilities. The Floating Rate Notes have interest rates that generally reset weekly and their holders have the option to tender their notes to the broker for redemption at par at each reset date. Interest expense related to the Funds' liability with respect to Floating Rate Notes is recorded as incurred. At January 31, 2008, the amounts of the
69
Eaton Vance Municipals Funds as of January 31, 2008
NOTES TO FINANCIAL STATEMENTS (Unaudited) CONT'D
Funds' Floating Rate Notes and related interest rates and collateral were as follows:
| Fund | | Floating Rate
Notes Outstanding | | Interest Rate
or Range of
Interest Rates | | Collateral for
Floating Rate
Notes Outstanding | |
| Arizona | | $ | 5,285,000 | | | | 2.23 – 3.90 | % | | $ | 8,116,579 | | |
| Colorado | | | 270,000 | | | | 2.23 – 2.30 | | | | 449,962 | | |
| Connecticut | | | 10,795,000 | | | | 2.23 – 3.90 | | | | 17,184,010 | | |
| Michigan | | | 3,000,000 | | | | 2.20 – 2.38 | | | | 4,124,110 | | |
| Minnesota | | | 2,500,000 | | | | 2.20 – 2.38 | | | | 4,664,130 | | |
| New Jersey | | | 21,120,000 | | | | 2.23 – 5.51 | | | | 32,757,501 | | |
| Pennsylvania | | | 40,535,000 | | | | 2.20 – 5.50 | | | | 62,335,617 | | |
The Funds' investment policies and restrictions expressly permit investments in Inverse Floaters. Inverse floating rate securities typically offer the potential for yields exceeding the yields available on fixed rate bonds with comparable credit quality and maturity. The Funds' investment policies do not allow the Funds to borrow money for purposes of making investments. Management believes that the Funds' restrictions on borrowings do not apply to the secured borrowings deemed to have occurred for accounting purposes pursuant to FAS 140, which is distinct from a legal borrowing of the Funds to which the policies apply. Inverse Floaters held by the Funds are securities exempt from registration under Rule 144A of the Securities Act of 1933.
J Financial Futures Contracts — The Funds may enter into financial futures contracts. The Funds' investment in financial futures contracts is designed for hedging against changes in interest rates or as a substitute for the purchase of securities. Upon entering into a financial futures contract, a Fund is required to deposit with the broker, either in cash or securities an amount equal to a certain percentage of the purchase price (initial margin). Subsequent payments, known as variation margin, are made or received by the Fund each business day, depending on the daily fluctuations in the value of the underlying security, and are recorded as unrealized gains or losses by the Fund. Gains (losses) are realized upon the expiration or closing of the financial futures contract s. Should market conditions change unexpectedly, the Fund may not achieve the anticipated benefits of the financial futures contracts and may realize a loss. In entering such contracts, the Fund bears the risk if the counterparties do not perform under the contracts' terms.
K Interest Rate Swaps — A Fund may enter into interest rate swap agreements to enhance return, to hedge against fluctuations in securities prices or interest rates, or as substitution for the purchase or sale of securities. Pursuant to these agreements, a Fund makes periodic payments at a fixed interest rate and, in exchange, receives payments based on the interest rate of a benchmark industry index. During the term of the outstanding swap agreement, changes in the underlying value of the swap are recorded as unrealized gains or losses. The value of the swap is determined by changes in the relationship between two rates of interest. A Fund is exposed to credit loss in the event of non-performance by t he swap counterparty. Risk may also arise from movements in interest rates.
L When-Issued Securities and Delayed Delivery Transactions — The Funds may purchase or sell securities on a delayed delivery or when-issued basis. Payment and delivery may take place after the customary settlement period for that security. At the time the transaction is negotiated, the price of the security that will be delivered is fixed. The Funds maintain security positions for these commitments such that sufficient liquid assets will be available to make payments upon settlement. Securities purchased on a delayed delivery or when-issued basis are marked-to-market daily and begin earning interest on settlement date. Losses may arise due to changes in the market value of the underlying securities or if the counterparty does not perform under the contract.
M Statement of Cash Flows — The cash amount shown in the Statement of Cash Flows of a Fund is the amount included in the Fund's Statement of Assets and Liabilities and represents cash on hand at its custodian and does not include any short-term investments.
N Interim Financial Statements — The interim financial statements relating to January 31, 2008 and for the six months then ended have not been audited by an independent registered public accounting firm, but in the opinion of the Funds' management, reflect all adjustments, consisting of normal recurring adjustments, necessary for the fair presentation of the financial statements.
2 Distributions to Shareholders
The net investment income of each Fund is determined daily and substantially all of the net investment income so determined is declared as a dividend to shareholders of record at the time of declaration. Distributions are declared separately for each class of shares. Distributions are paid monthly. Distributions of realized capital gains (reduced by available capital loss carryforwards, if any), are made at least annually. Shareholders may reinvest income and capital gain distributions in additional shares of the same class of a Fund at the net asset value as of the reinvestment date or, at the election of the shareholder, receive distributions in cash. The Funds distinguish between distributions on a tax basis and a financial reporting basis. Accounting principles generally accepted in the United States of America require that only
70
Eaton Vance Municipals Funds as of January 31, 2008
NOTES TO FINANCIAL STATEMENTS (Unaudited) CONT'D
distributions in excess of tax basis earnings and profits be reported in the financial statements as a return of capital. Permanent differences between book and tax accounting relating to distributions are reclassified to paid-in capital.
3 Investment Adviser Fee and Other Transactions with Affiliates
The investment adviser fee is earned by Boston Management and Research (BMR), a subsidiary of Eaton Vance Management (EVM), as compensation for management and investment advisory services rendered to each Fund. The fee is based upon a percentage of average daily net assets plus a percentage of gross income (i.e., income other than gains from the sale of securities) and is payable monthly. For the six months ended January 31, 2008, advisory fees incurred by the Funds and the effective annual rates, as a percentage of average daily net assets, were as follows:
| Fund | | Investment
Adviser Fee | | Effective
Annual Rate | |
| Arizona | | $ | 192,263 | | | | 0.36 | % | |
| Colorado | | | 48,302 | | | | 0.23 | % | |
| Connecticut | | | 260,761 | | | | 0.38 | % | |
| Michigan | | | 106,236 | | | | 0.31 | % | |
| Minnesota | | | 120,592 | | | | 0.32 | % | |
| New Jersey | | | 687,659 | | | | 0.43 | % | |
| Pennsylvania | | | 623,917 | | | | 0.42 | % | |
EVM serves as administrator of each Fund, but receives no compensation. EVM serves as the sub-transfer agent of each Fund and receives from the transfer agent an aggregate fee based upon the actual expenses incurred by EVM in the performance of these services. Eaton Vance Distributors, Inc. (EVD), the Funds' principal underwriter and a subsidiary of EVM, receives a portion of the sales charges on sales of Class A shares of the Funds. EVD also receives distribution and service fees from Class A, Class B and Class C shares (see Note 4) and contingent deferred sales charges (see Note 5). Sub-transfer agent fees earned by EVM and Class A sales charges that the Funds were informed were received by EVD for the six months ended January 31, 2008 were as follows:
| Fund | | EVM's
Sub-Transfer
Agent Fees | | EVD's Class A
Sales Charges | |
| Arizona | | $ | 897 | | | $ | 9,133 | | |
| Colorado | | | 473 | | | | 3,327 | | |
| Connecticut | | | 1,688 | | | | 3,910 | | |
| Michigan | | | 980 | | | | 1,841 | | |
| Minnesota | | | 900 | | | | 5,480 | | |
| New Jersey | | | 3,714 | | | | 13,072 | | |
| Pennsylvania | | | 3,953 | | | | 20,606 | | |
Except for Trustees of the Funds who are not members of EVM's or BMR's organizations, officers and Trustees receive remuneration for their services to the Funds out of the investment advisory fee. Trustees of the Funds who are not affiliated with the investment adviser may elect to defer receipt of all or a percentage of their annual fees in accordance with the terms of the Trustees Deferred Compensation Plan. For the six months ended January 31, 2008, no significant amounts have been deferred. Certain officers and Trustees of the Funds are officers of the above organizations.
4 Distribution Plans
Each Fund has in effect a distribution plan for Class A shares (Class A Plan) pursuant to Rule 12b-1 under the 1940 Act. The Class A Plan provides that each Fund will pay EVD a distribution and service fee not exceeding 0.25% per annum of its average daily net assets attributable to Class A shares for distribution services and facilities provided to each Fund by EVD, as well as for personal services and/or the maintenance of shareholder accounts. The Trustees approved distribution and service fee payments equal to 0.20% per annum of each Fund's average daily net assets attributable to Class A shares. Distribution and service fees paid or accrued to EVD for the six months ended January 31, 2008 for Class A shares amounted to the following:
| Fund | | Class A
Distribution and
Service Fees | |
| Arizona | | $ | 91,564 | | |
| Colorado | | | 36,638 | | |
| Connecticut | | | 115,922 | | |
| Michigan | | | 63,927 | | |
| Minnesota | | | 61,695 | | |
| New Jersey | | | 253,622 | | |
| Pennsylvania | | | 238,263 | | |
Each Fund also has in effect distribution plans for Class B shares (Class B Plan) and Class C shares (Class C Plan) pursuant to Rule 12b-1 under the 1940 Act. The Class B and Class C Plans require each Fund to pay EVD amounts equal to 0.75% per annum of its average daily net assets attributable to Class B and Class C shares for providing ongoing distribution services and facilities to the respective Funds. Each Fund will automatically discontinue payments to EVD during any period in which there are no outstanding Uncovered Distribution Charges, which are equivalent to the sum of (i) 5% and 6.25% of the aggregate amount received by each Fund for C lass B
71
Eaton Vance Municipals Funds as of January 31, 2008
NOTES TO FINANCIAL STATEMENTS (Unaudited) CONT'D
and Class C shares sold, respectively, plus (ii) interest calculated by applying the rate of 1% over the prevailing prime rate to the outstanding balance of Uncovered Distribution Charges of EVD of each respective class, reduced by the aggregate amount of contingent deferred sales charges (see Note 5) and amounts theretofore paid or payable to EVD by each respective class. Such payments were discontinued during portions of the six months ended January 31, 2008 with respect to Class B of the New Jersey Fund. For the six months ended January 31, 2008, the Funds paid or accrued to EVD the following distribution fees, each representing 0.75% per annum (0.52% for Class B of the New Jersey Fund) of the average daily net assets of each Fund's Class B and Class C shares:
| Fund | | Class B
Distribution
Fees | | Class C
Distribution
Fees | |
| Arizona | | $ | 32,050 | | | $ | 26,163 | | |
| Colorado | | | 19,068 | | | | 2 | | |
| Connecticut | | | 64,263 | | | | 14,037 | | |
| Michigan | | | — | | | | 13,763 | | |
| Minnesota | | | 28,539 | | | | 19,799 | | |
| New Jersey | | | 116,812 | | | | 89,065 | | |
| Pennsylvania | | | 128,202 | | | | 87,056 | | |
At January 31, 2008, the amounts of Uncovered Distribution Charges of EVD calculated under the Class B and Class C Plans were approximately as follows:
| Fund | | Class B | | Class C | |
| Arizona | | $ | 898,000 | | | $ | 530,000 | | |
| Colorado | | | 935,000 | | | | — | | |
| Connecticut | | | 1,086,000 | | | | 245,000 | | |
| Michigan | | | — | | | | 255,000 | | |
| Minnesota | | | 692,000 | | | | 379,000 | | |
| New Jersey | | | 2,000 | | | | 1,843,000 | | |
| Pennsylvania | | | 1,406,000 | | | | 1,560,000 | | |
The Class B and Class C Plans also authorize the Funds to make payments of service fees to EVD, investment dealers and other persons in amounts not exceeding 0.25% per annum of the average daily net assets attributable to that Class. The Trustees approved service fee payments equal to 0.20% per annum of each Fund's average daily net assets attributable to Class B and Class C shares. Service fees paid or accrued are for personal services and/or the maintenance of shareholder accounts. They are separate and distinct from the Class B and Class C sales commissions and distribution fees and, as such, are not subject to automatic discontinuance when there are no outstanding Uncovered Distribution Charges of EVD. Service fees paid or accrued for the six months ended January 31, 2008 amounted to the following:
| Fund | | Class B
Service Fees | | Class C
Service Fees | |
| Arizona | | $ | 8,547 | | | $ | 6,977 | | |
| Colorado | | | 5,085 | | | | 1 | | |
| Connecticut | | | 17,137 | | | | 3,743 | | |
| Michigan | | | — | | | | 3,670 | | |
| Minnesota | | | 7,610 | | | | 5,280 | | |
| New Jersey | | | 44,966 | | | | 23,751 | | |
| Pennsylvania | | | 34,187 | | | | 23,215 | | |
5 Contingent Deferred Sales Charges
A contingent deferred sales charge (CDSC) generally is imposed on redemptions of Class B shares made within six years of purchase and on redemptions of Class C shares made within one year of purchase. Class A shares may be subject to a 1% CDSC if redeemed within eighteen months of purchase (depending on the circumstances of purchase) or a 1% or 0.50% CDSC if redeemed within one year or two years, respectively, on purchases through the Eaton Vance Supplemental Retirement Account. Generally, the CDSC is based upon the lower of the net asset value at date of redemption or date of purchase. No charge is levied on shares acquired by reinvestment of dividends or capital gains distributions. The CDSC for Class B shares is imposed at declining rates that begin at 5% in the case of redemptions in the first and second year after purchase, declining one percentage point each subsequent year. Class C shares are subject to a 1% CDSC if redee med within one year of purchase. No CDSC is levied on shares which have been sold to EVM or its affiliates or to their respective employees or clients and may be waived under certain other limited conditions. CDSCs received on Class B and Class C redemptions are paid to EVD to reduce the amount of Uncovered Distribution Charges calculated under each Fund's Class B and Class C Plans. CDSCs received on Class B and Class C redemptions when no Uncovered Distribution Charges exist are credited to each Fund. For the six months ended January 31, 2008, the Funds were informed that EVD
72
Eaton Vance Municipals Funds as of January 31, 2008
NOTES TO FINANCIAL STATEMENTS (Unaudited) CONT'D
received approximately the following amounts of CDSC paid by Class A, Class B and Class C shareholders:
| Fund | | Class A | | Class B | | Class C | |
| Arizona | | $ | — | | | $ | 3,200 | | | $ | 4,600 | | |
| Colorado | | | 2,400 | | | | 400 | | | | — | | |
| Connecticut | | | 5,800 | | | | 9,100 | | | | 100 | | |
| Michigan | | | 13,000 | | | | — | | | | 1,100 | | |
| Minnesota | | | 300 | | | | 400 | | | | 200 | | |
| New Jersey | | | 12,300 | | | | 34,500 | (1) | | | 5,500 | | |
| Pennsylvania | | | — | | | | 38,900 | | | | 8,700 | | |
(1) $20,499 was paid directly to the New Jersey Fund for days when no uncovered distributions charges existed.
6 Purchase and Sales of Investments
Purchases and sales of investments, other than short-term obligations, for the six months ended January 31, 2008 were as follows:
| Fund | | Purchases | | Sales | |
| Arizona | | $ | 10,454,594 | | | $ | 5,492,007 | | |
| Colorado | | | 2,855,316 | | | | 8,015,650 | | |
| Connecticut | | | 22,103,158 | | | | 25,026,983 | | |
| Michigan | | | 5,962,829 | | | | 7,975,975 | | |
| Minnesota | | | 14,051,195 | | | | 4,477,648 | | |
| New Jersey | | | 54,094,204 | | | | 96,726,400 | | |
| Pennsylvania | | | 36,606,735 | | | | 45,457,218 | | |
7 Shares of Beneficial Interest
Each Fund's Declaration of Trust permits the Trustees to issue an unlimited number of full and fractional shares of beneficial interest (without par value). Such shares may be issued in a number of different series (such as the Funds) and classes. Transactions in Fund shares were as follows:
Arizona Fund
| Class A | | Six Months Ended
January 31, 2008
(Unaudited) | | Year Ended
July 31, 2007 | |
| Sales | | | 1,250,756 | | | | 2,923,010 | | |
Issued to shareholders electing to
receive payments of distributions
in Fund shares | | | 124,939 | | | | 204,285 | | |
| Redemptions | | | (978,647 | ) | | | (1,367,999 | ) | |
| Exchange from Class B shares | | | 36,357 | | | | 196,704 | | |
| Net increase | | | 433,405 | | | | 1,956,000 | | |
| Class B | | Six Months Ended
January 31, 2008
(Unaudited) | | Year Ended
July 31, 2007 | |
| Sales | | | 16,452 | | | | 39,527 | | |
Issued to shareholders electing to
receive payments of distributions
in Fund shares | | | 6,398 | | | | 16,073 | | |
| Redemptions | | | (52,071 | ) | | | (261,737 | ) | |
| Exchange to Class A shares | | | (32,694 | ) | | | (176,855 | ) | |
| Net decrease | | | (61,915 | ) | | | (382,992 | ) | |
| Class C | | Six Months Ended
January 31, 2008
(Unaudited) | | Year Ended
July 31, 2007 | |
| Sales | | | 190,256 | | | | 585,617 | | |
Issued to shareholders electing to
receive payments of distributions
in Fund shares | | | 8,856 | | | | 7,880 | | |
| Redemptions | | | (95,544 | ) | | | (54,790 | ) | |
| Net increase | | | 103,568 | | | | 538,707 | | |
Colorado Fund
| Class A | | Six Months Ended
January 31, 2008
(Unaudited) | | Year Ended
July 31, 2007 | |
| Sales | | | 396,653 | | | | 1,636,497 | | |
Issued to shareholders electing to
receive payments of distributions
in Fund shares | | | 52,756 | | | | 91,228 | | |
| Redemptions | | | (793,508 | ) | | | (550,374 | ) | |
| Exchange from Class B shares | | | 54,626 | | | | 82,756 | | |
| Net increase (decrease) | | | (289,473 | ) | | | 1,260,107 | | |
| Class B | | Six Months Ended
January 31, 2008
(Unaudited) | | Year Ended
July 31, 2007 | |
| Sales | | | 2,646 | | | | 18,651 | | |
Issued to shareholders electing to
receive payments of distributions
in Fund shares | | | 5,127 | | | | 11,564 | | |
| Redemptions | | | (12,724 | ) | | | (51,444 | ) | |
| Exchange to Class A shares | | | (50,175 | ) | | | (75,999 | ) | |
| Net decrease | | | (55,126 | ) | | | (97,228 | ) | |
| Class C | | Period Ended
January 31, 2008
(Unaudited)(1) | |
| Sales | | | 96 | | |
Issued to shareholders electing to
receive payments of distributions
in Fund shares | | | 1 | | |
| Net increase | | | 97 | | |
73
Eaton Vance Municipals Funds as of January 31, 2008
NOTES TO FINANCIAL STATEMENTS (Unaudited) CONT'D
Connecticut Fund
| Class A | | Six Months Ended
January 31, 2008
(Unaudited) | | Year Ended
July 31, 2007 | |
| Sales | | | 858,603 | | | | 1,576,334 | | |
Issued to shareholders electing to
receive payments of distributions
in Fund shares | | | 132,416 | | | | 240,453 | | |
| Redemptions | | | (1,155,171 | ) | | | (1,141,980 | ) | |
| Exchange from Class B shares | | | 116,178 | | | | 373,068 | | |
| Net increase (decrease) | | | (47,974 | ) | | | 1,047,875 | | |
| Class B | | Six Months Ended
January 31, 2008
(Unaudited) | | Year Ended
July 31, 2007 | |
| Sales | | | 41,305 | | | | 83,472 | | |
Issued to shareholders electing to
receive payments of distributions
in Fund shares | | | 16,453 | | | | 36,668 | | |
| Redemptions | | | (168,201 | ) | | | (311,520 | ) | |
| Exchange to Class A shares | | | (116,708 | ) | | | (374,746 | ) | |
| Net decrease | | | (227,151 | ) | | | (566,126 | ) | |
| Class C | | Six Months Ended
January 31, 2008
(Unaudited) | | Year Ended
July 31, 2007 | |
| Sales | | | 75,084 | | | | 310,098 | | |
Issued to shareholders electing to
receive payments of distributions
in Fund shares | | | 3,116 | | | | 2,080 | | |
| Redemptions | | | (69,311 | ) | | | (4,489 | ) | |
| Net increase | | | 8,889 | | | | 307,689 | | |
Michigan Fund
| Class A | | Six Months Ended
January 31, 2008
(Unaudited) | | Year Ended
July 31, 2007 | |
| Sales | | | 564,247 | | | | 1,268,726 | | |
Issued to shareholders electing to
receive payments of distributions
in Fund shares | | | 100,043 | | | | 140,815 | | |
| Redemptions | | | (823,733 | ) | | | (786,352 | ) | |
| Exchange from Class B shares | | | — | | | | 96,280 | | |
| Merger from Class B shares | | | — | | | | 482,160 | | |
| Net increase (decrease) | | | (159,443 | ) | | | 1,201,629 | | |
| Class C | | Six Months Ended
January 31, 2008
(Unaudited) | | Year Ended
July 31, 2007 | |
| Sales | | | 154,650 | | | | 323,436 | | |
Issued to shareholders electing to
receive payments of distributions
in Fund shares | | | 5,564 | | | | 4,232 | | |
| Redemptions | | | (54,733 | ) | | | (23,153 | ) | |
| Net increase | | | 105,481 | | | | 304,515 | | |
Minnesota Fund
| Class A | | Six Months Ended
January 31, 2008
(Unaudited) | | Year Ended
July 31, 2007 | |
| Sales | | | 1,767,757 | | | | 3,124,829 | | |
Issued to shareholders electing to
receive payments of distributions
in Fund shares | | | 99,827 | | | | 139,773 | | |
| Redemptions | | | (715,552 | ) | | | (927,291 | ) | |
| Exchange from Class B shares | | | 37,865 | | | | 131,232 | | |
| Net increase | | | 1,189,897 | | | | 2,468,543 | | |
| Class B | | Six Months Ended
January 31, 2008
(Unaudited) | | Year Ended
July 31, 2007 | |
| Sales | | | 11,087 | | | | 30,312 | | |
Issued to shareholders electing to
receive payments of distributions
in Fund shares | | | 7,746 | | | | 18,764 | | |
| Redemptions | | | (20,988 | ) | | | (138,629 | ) | |
| Exchange to Class A shares | | | (35,173 | ) | | | (121,889 | ) | |
| Net decrease | | | (37,328 | ) | | | (211,442 | ) | |
| Class C | | Six Months Ended
January 31, 2008
(Unaudited) | | Year Ended
July 31, 2007 | |
| Sales | | | 342,337 | | | | 320,833 | | |
Issued to shareholders electing to
receive payments of distributions
in Fund shares | | | 6,354 | | | | 5,857 | | |
| Redemptions | | | (31,584 | ) | | | (13,686 | ) | |
| Net increase | | | 317,107 | | | | 313,004 | | |
74
Eaton Vance Municipals Funds as of January 31, 2008
NOTES TO FINANCIAL STATEMENTS (Unaudited) CONT'D
New Jersey Fund
| Class A | | Six Months Ended
January 31, 2008
(Unaudited) | | Year Ended
July 31, 2007 | |
| Sales | | | 2,228,225 | | | | 8,194,573 | | |
Issued to shareholders electing to
receive payments of distributions
in Fund shares | | | 388,990 | | | | 584,684 | | |
| Redemptions | | | (4,245,605 | ) | | | (2,673,411 | ) | |
| Exchange from Class B shares | | | 195,413 | | | | 909,614 | | |
| Net increase (decrease) | | | (1,432,977 | ) | | | 7,015,460 | | |
| Class B | | Six Months Ended
January 31, 2008
(Unaudited) | | Year Ended
July 31, 2007 | |
| Sales | | | 87,208 | | | | 321,212 | | |
Issued to shareholders electing to
receive payments of distributions
in Fund shares | | | 53,512 | | | | 101,149 | | |
| Redemptions | | | (368,811 | ) | | | (696,185 | ) | |
| Exchange to Class A shares | | | (187,075 | ) | | | (871,020 | ) | |
| Net decrease | | | (415,166 | ) | | | (1,144,844 | ) | |
| Class C | | Six Months Ended
January 31, 2008
(Unaudited) | | Year Ended
July 31, 2007 | |
| Sales | | | 814,931 | | | | 1,876,221 | | |
Issued to shareholders electing to
receive payments of distributions
in Fund shares | | | 27,107 | | | | 21,780 | | |
| Redemptions | | | (449,862 | ) | | | (182,171 | ) | |
| Net increase | | | 392,176 | | | | 1,715,830 | | |
Pennsylvania Fund
| Class A | | Six Months Ended
January 31, 2008
(Unaudited) | | Year Ended
July 31, 2007 | |
| Sales | | | 2,765,308 | | | | 6,997,514 | | |
Issued to shareholders electing to
receive payments of distributions
in Fund shares | | | 327,438 | | | | 562,008 | | |
| Redemptions | | | (2,882,358 | ) | | | (3,039,727 | ) | |
| Exchange from Class B shares | | | 132,726 | | | | 468,264 | | |
| Net increase | | | 343,114 | | | | 4,988,059 | | |
| Class B | | Six Months Ended
January 31, 2008
(Unaudited) | | Year Ended
July 31, 2007 | |
| Sales | | | 112,788 | | | | 301,496 | | |
Issued to shareholders electing to
receive payments of distributions
in Fund shares | | | 34,100 | | | | 74,042 | | |
| Redemptions | | | (332,943 | ) | | | (505,964 | ) | |
| Exchange to Class A shares | | | (128,255 | ) | | | (452,751 | ) | |
| Net decrease | | | (314,310 | ) | | | (583,177 | ) | |
| Class C | | Six Months Ended
January 31, 2008
(Unaudited) | | Year Ended
July 31, 2007 | |
| Sales | | | 907,265 | | | | 1,822,557 | | |
Issued to shareholders electing to
receive payments of distributions
in Fund shares | | | 25,652 | | | | 24,071 | | |
| Redemptions | | | (410,151 | ) | | | (151,781 | ) | |
| Net increase | | | 522,766 | | | | 1,694,847 | | |
(1) Class C of the Colorado Fund commenced operations on October 8, 2007.
8 Federal Income Tax Basis of Unrealized Appreciation (Depreciation)
The cost and unrealized appreciation (depreciation) of investments of each Fund at January 31, 2008, as determined on a federal income tax basis, were as follows:
| Arizona Fund | |
| Aggregate Cost | | $ | 103,066,632 | | |
| Gross unrealized appreciation | | $ | 5,898,905 | | |
| Gross unrealized depreciation | | | (1,308,087 | ) | |
| Net unrealized appreciation | | $ | 4,590,818 | | |
| Colorado Fund | |
| Aggregate Cost | | $ | 38,782,974 | | |
| Gross unrealized appreciation | | $ | 1,717,085 | | |
| Gross unrealized depreciation | | | (938,417 | ) | |
| Net unrealized appreciation | | $ | 778,668 | | |
75
Eaton Vance Municipals Funds as of January 31, 2008
NOTES TO FINANCIAL STATEMENTS (Unaudited) CONT'D
| Connecticut Fund | |
| Aggregate Cost | | $ | 126,558,981 | | |
| Gross unrealized appreciation | | $ | 6,772,609 | | |
| Gross unrealized depreciation | | | (891,303 | ) | |
| Net unrealized appreciation | | $ | 5,881,306 | | |
| Michigan Fund | |
| Aggregate Cost | | $ | 61,203,700 | | |
| Gross unrealized appreciation | | $ | 4,498,587 | | |
| Gross unrealized depreciation | | | (674,546 | ) | |
| Net unrealized appreciation | | $ | 3,824,041 | | |
| Minnesota Fund | |
| Aggregate Cost | | $ | 78,937,625 | | |
| Gross unrealized appreciation | | $ | 3,031,411 | | |
| Gross unrealized depreciation | | | (733,056 | ) | |
| Net unrealized appreciation | | $ | 2,298,355 | | |
| New Jersey Fund | |
| Aggregate Cost | | $ | 292,014,158 | | |
| Gross unrealized appreciation | | $ | 16,711,111 | | |
| Gross unrealized depreciation | | | (6,405,359 | ) | |
| Net unrealized appreciation | | $ | 10,305,752 | | |
| Pennsylvania Fund | |
| Aggregate Cost | | $ | 278,791,754 | | |
| Gross unrealized appreciation | | $ | 14,702,249 | | |
| Gross unrealized depreciation | | | (4,702,752 | ) | |
| Net unrealized appreciation | | $ | 9,999,497 | | |
9 Line of Credit
The Funds participate with other portfolios and funds managed by EVM and its affiliates in a $200 million unsecured line of credit agreement with a group of banks. Borrowings are made by the Funds solely to facilitate the handling of unusual and/or unanticipated short-term cash requirements. Interest is charged to each Fund based on its borrowings at an amount above either the Eurodollar rate or Federal Funds rate. In addition, a fee computed at an annual rate of 0.07% on the daily unused portion of the line of credit is allocated among the participating portfolios and funds at the end of each quarter. The Funds did not have any significant borrowings or allocated fees during the six months ended January 31, 2008.
10 Financial Instruments
The Funds may trade in financial instruments with off-balance sheet risk in the normal course of their investing activities to assist in managing exposure to various market risks. These financial instruments may include financial futures contracts and interest rate swaps and may involve, to a varying degree, elements of risk in excess of the amounts recognized for financial statement purposes. The notional or contractual amounts of these instruments represent the investment a Fund has in particular classes of financial instruments and does not necessarily represent the amounts potentially subject to risk. The measurement of the risks associated with these instruments is meaningful only when all related and offsetting transactions are considered.
A summary of obligations under these financial instruments at January 31, 2008 is as follows:
Futures Contracts
Fund | |
Expiration
Date | |
Contracts | |
Position | |
Aggregate
Cost | |
Value | | Net
Unrealized
Appreciation
(Depreciation) | |
| Arizona | | 3/08 | | 70
U.S. Treasury Bond | | Short | | | $(8,338,974) | | | | $(8,351,875) | | | | $(12,901) | | |
| Colorado | | 3/08 | | 100
U.S. Treasury Bond | | Short | | $ | (11,785,604 | ) | | $ | (11,931,251 | ) | | $ | (145,647 | ) | |
| Connecticut | | 3/08 | | 77
U.S. Treasury Bond | | Short | | | $(9,222,856) | | | | $(9,187,063) | | | | $35,793 | | |
| Michigan | | 3/08 | | 139
U.S. Treasury Bond | | Short | | $ | (16,393,484 | ) | | $ | (16,584,439 | ) | | $ | (190,955 | ) | |
| Minnesota | | 3/08 | | 49
U.S. Treasury Bond | | Short | | $ | (5,847,556 | ) | | $ | (5,846,312 | ) | | $ | 1,244 | | |
| New Jersey | | 3/08 | | 600
U.S. Treasury Bond | | Short | | $ | (70,376,271 | ) | | $ | (71,587,500 | ) | | $ | (1,211,229 | ) | |
| Pennsylvania | | 3/08 | | 740
U.S. Treasury Bond | | Short | | $ | (87,072,098 | ) | | $ | (88,291,250 | ) | | $ | (1,219,152 | ) | |
76
Eaton Vance Municipals Funds as of January 31, 2008
NOTES TO FINANCIAL STATEMENTS (Unaudited) CONT'D
Interest Rate Swaps
Arizona Fund
Counterparty | |
Notional
Amount | | Annual
Fixed Rate
Paid By Fund | | Floating
Rate
Paid To Fund | | Effective Date/
Termination
Date | | Net Unrealized
Depreciation | |
| Lehman | | | | | | | | | | 3-month | | September 28, 2008/ | | |
| | |
| Brothers, Inc. | | $ | 3,500,000 | | | | 4.985 | % | | USD-LIBOR-BBA | | September 28, 2038 | | $ | (59,460 | ) | |
| Morgan Stanley | | | | | | | | | | SIFMA | | | | |
| | |
| Capital | | | | | | | | | | Municipal | | September 15, 2008/ | | |
| | |
| Services, Inc. | | $ | 3,500,000 | | | | 3.952 | % | | Swap Index | | September 15, 2038 | | $ | (70,687 | ) | |
| Morgan Stanley | | | | | | | | | | | | | | |
| | |
| Capital | | | | | | | | | | 3-month | | September 10, 2008/ | | |
| | |
| Services, Inc. | | $ | 1,350,000 | | | | 5.428 | % | | USD-LIBOR-BBA | | September 10, 2038 | | $ | (118,213 | ) | |
| | | | | | | | | | | | | | | $ | (248,360 | ) | |
Colorado Fund
Counterparty | |
Notional
Amount | | Annual
Fixed Rate
Paid By Fund | | Floating
Rate
Paid To Fund | | Effective Date/
Termination
Date | | Net Unrealized
Depreciation | |
| Merrill Lynch | | | | | | | | | |
| |
| Capital | | | | | | 3-month | | July 9, 2008/ | |
| |
| Services, Inc. | | $ | 675,000 | | | | 4.903 | % | | USD-LIBOR-BBA | | July 9, 2038 | | $ | (6,355 | ) | |
| | | | | | | | | | | $ | (6,355 | ) | |
Connecticut Fund
Counterparty | |
Notional
Amount | | Annual
Fixed Rate
Paid By Fund | | Floating
Rate
Paid To Fund | | Effective Date/
Termination
Date | | Net Unrealized
Depreciation | |
| Merrill Lynch | | | | | | | | | |
| |
| Capital | | | | | | 3-month | | July 9, 2008/ | |
| |
| Services, Inc. | | $ | 2,475,000 | | | | 4.903 | % | | USD-LIBOR-BBA | | July 9, 2038 | | $ | (23,302 | ) | |
| | | | | | | | | | | $ | (23,302 | ) | |
Michigan Fund
Counterparty | |
Notional
Amount | | Annual
Fixed Rate
Paid By Fund | | Floating
Rate
Paid To Fund | | Effective Date/
Termination
Date | | Net Unrealized
Depreciation | |
| Merrill Lynch | | | | | | | | | |
| |
| Capital | | | | | | 3-month | | July 9, 2008/ | |
| |
| Services, Inc. | | $ | 1,150,000 | | | | 4.903 | % | | USD-LIBOR-BBA | | July 9, 2038 | | $ | (10,827 | ) | |
| | | | | | | | | | | $ | (10,827 | ) | |
Minnesota Fund
Counterparty | |
Notional
Amount | | Annual
Fixed Rate
Paid By Fund | | Floating
Rate
Paid To Fund | | Effective Date/
Termination
Date | | Net Unrealized
Depreciation | |
| Lehman | | | | | | | | | | 3-month | | September 28, 2008/ | | |
| | |
| Brothers, Inc. | | $ | 1,500,000 | | | | 4.985 | % | | USD-LIBOR-BBA | | September 28, 2038 | | $ | (25,484 | ) | |
| Morgan Stanley | | | | | | | | | | SIFMA | | | | |
| | |
| Capital | | | | | | | | | | Municipal | | September 15, 2008/ | | |
| | |
| Services, Inc. | | $ | 1,900,000 | | | | 3.952 | % | | Swap Index | | September 15, 2038 | | $ | (38,373 | ) | |
| Morgan Stanley | | | | | | | | | | | | | | |
| | |
| Capital | | | | | | | | | | 3-month | | September 10, 2008/ | | |
| | |
| Services, Inc. | | $ | 350,000 | | | | 5.428 | % | | USD-LIBOR-BBA | | September 10, 2038 | | $ | (30,648 | ) | |
| | | | | | | | | | | | | | | $ | (94,505 | ) | |
New Jersey Fund
Counterparty | |
Notional
Amount | | Annual
Fixed Rate
Paid By Fund | | Floating
Rate
Paid To Fund | | Effective Date/
Termination
Date | | Net Unrealized
(Depreciation) | |
| | | | | | | | | | SIFMA | | | | |
| | |
| Lehman | | | | | | | | | | Municipal | | July 24, 2008/ | | |
| | |
| Brothers, Inc. | | $ | 10,000,000 | | | | 4.003 | % | | Swap Index | | July 24, 2038 | | $ | (309,687 | ) | |
| Lehman | | | | | | | | | | 3-month | | September 28, 2008/ | | |
| | |
| Brothers, Inc. | | $ | 13,225,000 | | | | 4.985 | % | | USD-LIBOR-BBA | | September 28, 2038 | | $ | (224,673 | ) | |
| Merrill Lynch | | | | | | | | | | | | | | |
| | |
| Capital | | | | | | | | | | 3-month | | July 9, 2008/ | | |
| | |
| Services, Inc. | | $ | 12,175,000 | | | | 4.903 | % | | USD-LIBOR-BBA | | July 9, 2038 | | $ | (114,626 | ) | |
| Morgan Stanley | | | | | | | | | | | | | | |
| | |
| Capital | | | | | | | | | | 3-month | | September 10, 2008/ | | |
| | |
| Services, Inc. | | $ | 4,100,000 | | | | 5.428 | % | | USD-LIBOR-BBA | | September 10, 2038 | | $ | (359,018 | ) | |
| | | | | | | | | | | | | | | | | $ | (1,008,004 | ) | |
Pennsylvania Fund
Counterparty | |
Notional
Amount | | Annual
Fixed Rate
Paid By Fund | | Floating
Rate
Paid To Fund | | Effective Date/
Termination
Date | | Net Unrealized
Depreciation | |
| | | | | | | | | | SIFMA | | | | |
| | |
| Lehman | | | | | | | | | | Municipal | | July 24, 2008/ | | |
| | |
| Brothers, Inc. | | $ | 10,000,000 | | | | 4.003 | % | | Swap Index | | July 24, 2038 | | $ | (309,687 | ) | |
| Lehman | | | | | | | | | | 3-month | | September 28, 2008/ | | |
| | |
| Brothers, Inc. | | $ | 7,300,000 | | | | 4.985 | % | | USD-LIBOR-BBA | | September 28, 2038 | | $ | (124,016 | ) | |
Merrill Lynch
| |
| Capital | | | | | | | | | | 3-month | | July 9, 2008/ | | |
| | |
| Services, Inc. | | $ | 4,500,000 | | | | 4.903 | % | | USD-LIBOR-BBA | | July 9, 2038 | | $ | (42,368 | ) | |
Morgan Stanley
| |
| Capital | | | | | | | | | | 3-month | | September 10, 2008/ | | |
| | |
| Services, Inc. | | $ | 5,000,000 | | | | 5.428 | % | | USD-LIBOR-BBA | | September 10, 2038 | | $ | (437,826 | ) | |
| | | | | | | | | | | | | | | | | $ | (913,897 | ) | |
The effective date represents the date on which the Fund and the counterparty to the interest rate swap contract begin interest payment accruals.
77
Eaton Vance Municipals Funds as of January 31, 2008
NOTES TO FINANCIAL STATEMENTS (Unaudited) CONT'D
At January 31, 2008, the Funds had sufficient cash and/or securities to cover commitments under these contracts.
11 Recently Issued Accounting Pronouncement
In September 2006, the FASB issued Statement of Financial Accounting Standards No. 157 (FAS 157), "Fair Value Measurements". FAS 157 defines fair value, establishes a framework for measuring fair value in accordance with accounting principles generally accepted in the United States of America and expands disclosure about fair value measurements. FAS 157 is effective for fiscal years beginning after November 15, 2007. As of January 31, 2008, management does not believe the adoption of FAS 157 will impact the amounts reported in the financial statements; however, additional disclosures may be required about the inputs used to develop the measurements of fair value and the effect of certain of the measurements on changes in net assets for the period.
78
Eaton Vance Municipals Funds
BOARD OF TRUSTEES' ANNUAL APPROVAL OF THE INVESTMENT ADVISORY AGREEMENTS
Overview of the Contract Review Process
The Investment Company Act of 1940, as amended (the "1940 Act"), provides, in substance, that each investment advisory agreement between a fund and its investment adviser will continue in effect from year to year only if its continuance is approved at least annually by the fund's board of trustees, including by a vote of a majority of the trustees who are not "interested persons" of the fund ("Independent Trustees"), cast in person at a meeting called for the purpose of considering such approval.
At a meeting of the Boards of Trustees (each a "Board") of the Eaton Vance group of mutual funds (the "Eaton Vance Funds") held on April 23, 2007, the Board, including a majority of the Independent Trustees, voted to approve continuation of existing advisory and sub-advisory agreements for the Eaton Vance Funds for an additional one-year period. In voting its approval, the Board relied upon the affirmative recommendation of the Special Committee of the Board, which is a committee comprised exclusively of Independent Trustees. Prior to making its recommendation, the Special Committee reviewed information furnished for a series of meetings of the Special Committee held in February, March and April 2007. Such information included, among other things, the following:
Information about Fees, Performance and Expenses
• An independent report comparing the advisory and related fees paid by each fund with fees paid by comparable funds;
• An independent report comparing each fund's total expense ratio and its components to comparable funds;
• An independent report comparing the investment performance of each fund to the investment performance of comparable funds over various time periods;
• Data regarding investment performance in comparison to relevant peer groups of funds and appropriate indices;
• Comparative information concerning fees charged by each adviser for managing other mutual funds and institutional accounts using investment strategies and techniques similar to those used in managing the fund;
• Profitability analyses for each adviser with respect to each fund;
Information about Portfolio Management
• Descriptions of the investment management services provided to each fund, including the investment strategies and processes employed;
• Information concerning the allocation of brokerage and the benefits received by each adviser as a result of brokerage allocation, including information concerning the acquisition of research through "soft dollar" benefits received in connection with the funds' brokerage, and the implementation of a soft dollar reimbursement program established with respect to the funds;
• Data relating to portfolio turnover rates of each fund;
• The procedures and processes used to determine the fair value of fund assets and actions taken to monitor and test the effectiveness of such procedures and processes;
Information about each Adviser
• Reports detailing the financial results and condition of each adviser;
• Descriptions of the qualifications, education and experience of the individual investment professionals whose responsibilities include portfolio management and investment research for the funds, and information relating to their compensation and responsibilities with respect to managing other mutual funds and investment accounts;
• Copies of the Codes of Ethics of each adviser and its affiliates, together with information relating to compliance with and the administration of such codes;
• Copies of or descriptions of each adviser's proxy voting policies and procedures;
• Information concerning the resources devoted to compliance efforts undertaken by each adviser and its affiliates on behalf of the funds (including descriptions of various compliance programs) and their record of compliance with investment policies and restrictions, including policies with respect to market-timing, late trading and selective portfolio disclosure, and with policies on personal securities transactions;
• Descriptions of the business continuity and disaster recovery plans of each adviser and its affiliates;
Other Relevant Information
• Information concerning the nature, cost and character of the administrative and other non-investment management services provided by Eaton Vance Management and its affiliates;
• Information concerning management of the relationship with the custodian, subcustodians and fund accountants by each adviser or the funds' administrator; and
• The terms of each advisory agreement.
79
Eaton Vance Municipals Funds
BOARD OF TRUSTEES' ANNUAL APPROVAL OF THE INVESTMENT ADVISORY AGREEMENTS CONT'D
In addition to the information identified above, the Special Committee considered information provided from time to time by each adviser throughout the year at meetings of the Board and its committees. Over the course of the twelve-month period ended April 30, 2007, the Board met eleven times and the Special Committee, the Audit Committee and the Governance Committee, each of which is a Committee comprised solely of Independent Trustees, met thirteen , fourteen and nine times, respectively. At such meetings, the Trustees received, among other things, presentations by the portfolio managers and other investment professionals of each adviser relating to the investment performance of each fund and the investment strategies used in pursuing the fund's investment objective.
For funds that invest through one or more underlying portfolios, the Board considered similar information about the portfolio(s) when considering the approval of advisory agreements. In addition, in cases where the fund's investment adviser has engaged a sub-adviser, the Board considered similar information about the sub-adviser when considering the approval of any sub-advisory agreement.
The Special Committee was assisted throughout the contract review process by Goodwin Procter LLP, legal counsel for the Independent Trustees. The members of the Special Committee relied upon the advice of such counsel and their own business judgment in determining the material factors to be considered in evaluating each advisory and sub-advisory agreement and the weight to be given to each such factor. The conclusions reached with respect to each advisory and sub-advisory agreement were based on a comprehensive evaluation of all the information provided and not any single factor. Moreover, each member of the Special Committee may have placed varying emphasis on particular factors in reaching conclusions with respect to each advisory and sub-advisory agreement.
Results of the Process
Based on its consideration of the foregoing, and such other information as it deemed relevant, including the factors and conclusions described below, the Special Committee concluded that the continuance of the investment advisory agreements of the following funds:
• Eaton Vance Arizona Municipals Fund
• Eaton Vance Colorado Municipals Fund
• Eaton Vance Connecticut Municipals Fund
• Eaton Vance Michigan Municipals Fund
• Eaton Vance Minnesota Municipals Fund
• Eaton Vance New Jersey Municipals Fund
• Eaton Vance Pennsylvania Municipals Fund
(the "Funds"), each with Boston Management and Research (the "Adviser"), including their fee structures, is in the interests of shareholders and, therefore, the Special Committee recommended to the Board approval of each agreement. The Board accepted the recommendation of the Special Committee as well as the factors considered and conclusions reached by the Special Committee with respect to each agreement. Accordingly, the Board, including a majority of the Independent Trustees, voted to approve continuation of the advisory agreement for each Fund.
Nature, Extent and Quality of Services
In considering whether to approve the investment advisory agreements of the Funds, the Board evaluated the nature, extent and quality of services provided to the Funds by the Adviser.
The Board considered the Adviser's management capabilities and investment process with respect to the types of investments held by each Fund, including the education, experience and number of its investment professionals and other personnel who provide portfolio management, investment research, and similar services to the Funds, and recent changes in the identity of such personnel. In particular, the Board evaluated, where relevant, the abilities and experience of such investment personnel in analyzing factors such as credit risk, tax efficiency, and special considerations relevant to investing in municipal bonds. Specifically, the Board considered the Adviser's 30-person municipal bond team, which includes six portfolio managers and nine credit specialists who provide services to the Funds. The Board also took into account the resources dedicated to portfolio management and other services, including the compensation paid to rec ruit and retain investment personnel, and the time and attention devoted to each Fund in the complex by senior management.
The Board reviewed the compliance programs of the Adviser and relevant affiliates thereof. Among other matters, the Board considered compliance and reporting matters relating to personal trading by investment personnel, selective disclosure of portfolio holdings, late trading, frequent trading, portfolio valuation, business continuity and the allocation of investment opportunities. The Board also evaluated the responses of the Adviser and its affiliates to requests from regulatory authorities such as the Securities and Exchange Commission and the National Association of Securities Dealers.
The Board also considered shareholder and other administrative services provided or managed by Eaton Vance Management and its affiliates, including transfer agency and accounting services. The Board evaluated the benefits to shareholders of investing in a fund that
80
Eaton Vance Municipals Funds
BOARD OF TRUSTEES' ANNUAL APPROVAL OF THE INVESTMENT ADVISORY AGREEMENTS CONT'D
is a part of a large family of funds, including the ability, in many cases, to exchange an investment among different funds without incurring additional sales charges.
After consideration of the foregoing factors, among others, the Board concluded that the nature, extent and quality of services provided by the Adviser, taken as a whole, are appropriate and consistent with the terms of the respective investment advisory agreements.
Fund Performance
The Board compared each Fund's investment performance to a relevant universe of similarly managed funds identified by an independent data provider and appropriate benchmark indices. The Board reviewed comparative performance data for the one-, three-, five- and ten-year periods ended September 30, 2006 for each Fund in operation over such periods. On the basis of the foregoing and other relevant information, the Board concluded that the performance of each Fund is satisfactory.
Management Fees and Expenses
The Board reviewed contractual investment advisory fee rates, including any administrative fee rates, payable by each Fund (referred to as "management fees"). As part of its review, the Board considered each Fund's management fees and total expense ratio for the year ended September 30, 2006, as compared to a group of similarly managed funds selected by an independent data provider.
After reviewing the foregoing information, and in light of the nature, extent and quality of the services provided by the Adviser, the Board concluded with respect to each Fund that the management fees charged for advisory and related services and the Fund's total expense ratio are reasonable.
Profitability
The Board reviewed the level of profits realized by the Adviser and relevant affiliates thereof in providing investment advisory and administrative services to each Fund and to all Eaton Vance Funds as a group. The Board considered the level of profits realized without regard to revenue sharing or other payments by the Adviser and its affiliates to third parties in respect of distribution services. The Board also considered other direct or indirect benefits received by the Adviser and its affiliates in connection with their relationship with the Funds.
The Board concluded that, in light of the foregoing factors and the nature, extent and quality of the services rendered, the profits realized by the Adviser and its affiliates are reasonable.
Economies of Scale
In reviewing management fees and profitability of each Fund, the Board also considered the extent to which the Adviser and its affiliates, on the one hand, and each Fund, on the other hand, can expect to realize benefits from economies of scale as the assets of the Fund increase. The Board acknowledged the difficulty in accurately measuring the benefits resulting from the economies of scale with respect to the management of any specific fund or group of funds. The Board reviewed data summarizing the increases and decreases in the assets of each Fund and of all Eaton Vance Funds as a group over various time periods, and evaluated the extent to which the total expense ratio of each Fund and the profitability of the Adviser and its affiliates may have been affected by such increases or decreases. Based upon the foregoing, the Board concluded that the benefits from economies of scale are currently being shared equitably by the Advis er and its affiliates and each Fund. The Board also concluded that, assuming reasonably foreseeable increases in the assets of each Fund, the structure of each advisory fee, which includes breakpoints at several asset levels, can be expected to cause the Adviser and its affiliates and the Fund to continue to share such benefits equitably.
81
Eaton Vance Municipals Funds
INVESTMENT MANAGEMENT
Eaton Vance Municipals Funds
Officers
Robert B. MacIntosh
President and Portfolio Manager of New Jersey Fund
William H. Ahern, Jr.
Vice President and Portfolio
Manager of Colorado,
Connecticut and Michigan
Funds
Craig R. Brandon
Vice President and Portfolio
Manager of Arizona and
Minnesota Funds
Cynthia J. Clemson
Vice President
Thomas M. Metzold
Vice President
Adam A. Weigold
Vice President and Portfolio
Manager of Pennsylvania
Fund
Barbara E. Campbell
Treasurer
Maureen A. Gemma
Secretary
Paul M. O'Neil
Chief Compliance Officer
John A. Pelletier
Chief Legal Officer | | Trustees
Ralph F. Verni
Chairman
Benjamin C. Esty
Thomas E. Faust Jr.
Allen R. Freedman
William H. Park
Ronald A. Pearlman
Norton H. Reamer
Heidi L. Steiger
Lynn A. Stout | |
|
82
This Page Intentionally Left Blank
This Page Intentionally Left Blank
Investment Adviser
Boston Management and Research
The Eaton Vance Building
255 State Street
Boston, MA 02109
Administrator
Eaton Vance Management
The Eaton Vance Building
255 State Street
Boston, MA 02109
Principal Underwriter
Eaton Vance Distributors, Inc.
The Eaton Vance Building
255 State Street
Boston, MA 02109
Custodian
State Street Bank and Trust Company
200 Clarendon Street
Boston, MA 02116
Transfer Agent
PFPC Inc.
Attn: Eaton Vance Funds
P.O. Box 9653
Providence, RI 02940-9653
(800) 262-1122
Eaton Vance Municipals Trust
The Eaton Vance Building
255 State Street
Boston, MA 02109
This report must be preceded or accompanied by a current prospectus. Before investing, investors should consider carefully a Fund's investment objective(s), risks, and charges and expenses. The Funds' current prospectus contains this and other information about the Funds and is available through your financial advisor. Please read the prospectus carefully before you invest or send money. For further information please call 800-225-6265.
313-3/08 7CSRC
Item 2. Code of Ethics
The registrant has adopted a code of ethics applicable to its Principal Executive Officer, Principal Financial Officer and Principal Accounting Officer. The registrant undertakes to provide a copy of such code of ethics to any person upon request, without charge, by calling 1-800-262-1122.
Item 3. Audit Committee Financial Expert
The registrant’s Board has designated William H. Park and Norton H. Reamer, each an independent trustee, as its audit committee financial experts. Mr. Park is a certified public accountant who is the Vice Chairman of Commercial Industrial Finance Corp (specialty finance company). Previously, he served as President and Chief Executive Officer of Prizm Capital Management, LLC (investment management firm) and as Executive Vice President and Chief Financial Officer of United Asset Management Corporation (“UAM”) (a holding company owning institutional investment management firms). Mr. Reamer is the President, Chief Executive Officer and a Director of Asset Management Finance Corp. (a specialty finance company serving the investment management industry) and is President of Unicorn Corporation (an investment and financial advisory services company). Formerly, Mr. Reamer was Chairman and Chief Operating Officer of Hellman, Jordan Management Co., Inc. (an investment management company) and Advisory Director of Berkshire Capital Corporation (an investment banking firm), Chairman of the Board of UAM and Chairman, President and Director of the UAM Funds (mutual funds).
Item 4. Principal Accountant Fees and Services
Not required in this filing
Item 5. Audit Committee of Listed registrants
Not required in this filing.
Item 6. Schedule of Investments
Please see schedule of investments contained in the Report to Stockholders included under Item 1 of this Form N-CSR.
Item 7. Disclosure of Proxy Voting Policies and Procedures for Closed-End Management Investment Companies
Not required in this filing.
Item 8. Portfolio Managers of Closed-End Management Investment Companies\
Not required in this filing.
Item 9. Purchases of Equity Securities by Closed-End Management Investment Company and Affiliated Purchasers.
Not required in this filing.
Item 10. Submission of Matters to a Vote of Security Holders.
No Material Changes.
Item 11. Controls and Procedures
(a) It is the conclusion of the registrant’s principal executive officer and principal financial officer that the effectiveness of the registrant’s current disclosure controls and procedures (such disclosure controls
and procedures having been evaluated within 90 days of the date of this filing) provide reasonable assurance that the information required to be disclosed by the registrant has been recorded, processed, summarized and reported within the time period specified in the Commission’s rules and forms and that the information required to be disclosed by the registrant has been accumulated and communicated to the registrant’s principal executive officer and principal financial officer in order to allow timely decisions regarding required disclosure.
(b) There have been no changes in the registrant’s internal controls over financial reporting during the second fiscal quarter of the period covered by this report that has materially affected, or is reasonably likely to materially affect, the registrant’s internal control over financial reporting.
Item 12. Exhibits
(a)(1) | Registrant’s Code of Ethics – Not applicable (please see Item 2). |
(a)(2)(i) | Treasurer’s Section 302 certification. |
(a)(2)(ii) | President’s Section 302 certification. |
(b) | Combined Section 906 certification. |
Signatures
Pursuant to the requirements of the Securities Exchange Act of 1934 and the Investment Company Act of 1940, the registrant has duly caused this report to be signed on its behalf by the undersigned, thereunto duly authorized.
Eaton Vance Municipals Trust
By: | /s/ Robert B. MacIntosh | |
| Robert B. MacIntosh |
| President |
| |
| |
Date: | March 13, 2008 | |
Pursuant to the requirements of the Securities Exchange Act of 1934 and the Investment Company Act of 1940, this report has been signed below by the following persons on behalf of the registrant and in the capacities and on the dates indicated.
By: | /s/ Barbara E. Campbell | |
| Barbara E. Campbell |
| Treasurer |
| |
| |
Date: | March 13, 2008 | |
By: | /s/ Robert B. MacIntosh | |
| Robert B. MacIntosh |
| President |
| |
| |
Date: | March 13, 2008 | |