UNITED STATES
SECURITIES AND EXCHANGE COMMISSION
Washington, D.C. 20549
FORM N-CSR
CERTIFIED SHAREHOLDER REPORT OF REGISTERED
MANAGEMENT INVESTMENT COMPANIES
Investment Company Act file number | 811-04409 |
|
Eaton Vance Municipals Trust |
(Exact name of registrant as specified in charter) |
|
The Eaton Vance Building, 255 State Street, Boston, Massachusetts | | 02109 |
(Address of principal executive offices) | | (Zip code) |
|
Maureen A. Gemma
The Eaton Vance Building, 255 State Street, Boston, Massachusetts 02109 |
(Name and address of agent for service) |
|
Registrant’s telephone number, including area code: | (617) 482-8260 | |
|
Date of fiscal year end: | August 31, 2008 | |
|
Date of reporting period: | February 29, 2008 | |
| | | | | | | |
Item 1. Reports to Stockholders

Semiannual Report February 29, 2008


EATON VANCE
MUNICIPALS
TRUST
Alabama
Arkansas
Georgia
Kentucky
Louisiana
Maryland
Missouri
North Carolina
Oregon
South Carolina
Tennessee
Virginia
IMPORTANT NOTICES REGARDING PRIVACY,
DELIVERY OF SHAREHOLDER DOCUMENTS,
PORTFOLIO HOLDINGS AND PROXY VOTING
Privacy. The Eaton Vance organization is committed to ensuring your financial privacy. Each of the financial institutions identified below has in effect the following policy ("Privacy Policy") with respect to nonpublic personal information about its customers:
• Only such information received from you, through application forms or otherwise, and information about your Eaton Vance fund transactions will be collected. This may include information such as name, address, social security number, tax status, account balances and transactions.
• None of such information about you (or former customers) will be disclosed to anyone, except as permitted by law (which includes disclosure to employees necessary to service your account). In the normal course of servicing a customer's account, Eaton Vance may share information with unaffiliated third parties that perform various required services such as transfer agents, custodians and broker/dealers.
• Policies and procedures (including physical, electronic and procedural safeguards) are in place that are designed to protect the confidentiality of such information.
• We reserve the right to change our Privacy Policy at any time upon proper notification to you. Customers may want to review our Policy periodically for changes by accessing the link on our homepage: www.eatonvance.com.
Our pledge of privacy applies to the following entities within the Eaton Vance organization: the Eaton Vance Family of Funds, Eaton Vance Management, Eaton Vance Investment Counsel, Boston Management and Research, and Eaton Vance Distributors, Inc.
In addition, our Privacy Policy only applies to those Eaton Vance customers who are individuals and who have a direct relationship with us. If a customer's account (i.e., fund shares) is held in the name of a third-party financial adviser/ broker-dealer, it is likely that only such adviser's privacy policies apply to the customer. This notice supersedes all previously issued privacy disclosures.
For more information about Eaton Vance's Privacy Policy, please call 1-800-262-1122.
Delivery of Shareholder Documents. The Securities and Exchange Commission (the "SEC") permits funds to deliver only one copy of shareholder documents, including prospectuses, proxy statements and shareholder reports, to fund investors with multiple accounts at the same residential or post office box address. This practice is often called "householding" and it helps eliminate duplicate mailings to shareholders.
Eaton Vance, or your financial adviser, may household the mailing of your documents indefinitely unless you instruct Eaton Vance, or your financial adviser, otherwise.
If you would prefer that your Eaton Vance documents not be householded, please contact Eaton Vance at 1-800-262-1122, or contact your financial adviser.
Your instructions that householding not apply to delivery of your Eaton Vance documents will be effective within 30 days of receipt by Eaton Vance or your financial adviser.
Portfolio Holdings. Each Eaton Vance Fund and its underlying Portfolio (if applicable) will file a schedule of its portfolio holdings on Form N-Q with the SEC for the first and third quarters of each fiscal year. The Form N-Q will be available on the Eaton Vance website www.eatonvance.com, by calling Eaton Vance at 1-800-262-1122 or in the EDGAR database on the SEC's website at www.sec.gov. Form N-Q may also be reviewed and copied at the SEC's public reference room in Washington, D.C. (call 1-800-732-0330 for information on the operation of the public reference room).
Proxy Voting. From time to time, funds are required to vote proxies related to the securities held by the funds. The Eaton Vance Funds or their underlying Portfolios (if applicable) vote proxies according to a set of policies and procedures approved by the Funds' and Portfolios' Boards. You may obtain a description of these policies and procedures and information on how the Funds or Portfolios voted proxies relating to portfolio securities during the most recent 12 month period ended June 30, without charge, upon request, by calling 1-800-262-1122. This description is also available on the SEC's website at www.sec.gov.
Eaton Vance Municipals Funds as of February 29, 2008
TABLE OF CONTENTS
Investment Update | | 2 |
| | |
Morningstar RatingsTM | | 3 |
| | |
Fund Investment Updates | | |
Alabama | | 4 |
Arkansas | | 5 |
Georgia | | 6 |
Kentucky | | 7 |
Louisiana | | 8 |
Maryland | | 9 |
Missouri | | 10 |
North Carolina | | 11 |
Oregon | | 12 |
South Carolina | | 13 |
Tennessee | | 14 |
Virginia | | 15 |
| | |
Fund Expenses | | 16 |
| | |
Financial Statements | | 23 |
| | |
Board of Trustees’ Annual Approval of the Investment Advisory Agreements | | 123 |
| | |
Investment Management | | 126 |
1
Eaton Vance Municipals Funds as of February 29, 2008
INVESTMENT UPDATE
The investment objective of each Eaton Vance Municipals Fund (the “Funds”) is to provide current income exempt from regular federal income tax and from particular state or local income or other taxes. The Funds primarily invest in investment-grade municipal obligations but may also invest in lower rated obligations.
Economic and Market Conditions
Economic growth in the fourth quarter of 2007 measured 0.6%, following the 4.9% growth rate achieved in the third quarter, according to preliminary Commerce Department data reported in January 2008. The housing sector continued to struggle due to market concerns related to subprime mortgages. While the weaker dollar was having a beneficial effect on export-related industries, tourism, and U.S.-based multinational companies, there were signs that consumers were starting to curtail spending by February 29, 2008.
The Federal Reserve (the Fed) lowered its target for the Federal Funds Rate by 0.75% to 3.50% in an unscheduled meeting on January 22, 2008. In its statement, the Fed pointed to a weakening economic outlook, continued deterioration in broader financial market conditions and tighter credit for some businesses and households. The Fed further lowered the Federal Funds Rate to 3.00% in a scheduled meeting on January 30, 2008 noting considerable financial market stress and continued credit tightening. After the period, on March 18, 2008, the Fed again lowered the Federal Funds Rate to 2.25%, down from 5.25% since September 18, 2007, and it also lowered the Discount Rate – the rate charged to banks borrowing directly from the Fed to 2.50%, down from 6.25% since August 17, 2007. Management believes these moves were aimed at providing liquidity during this period of increased uncertainty and tighter credit conditions that first surfaced in August 2007.
Management Discussion
The Funds invest primarily in bonds with stated maturities of 10 years or longer, as longer-maturity bonds historically have provided greater tax-exempt income for investors than shorter-maturity bonds.
The Funds underperformed their benchmark, the Lehman Brothers Municipal Bond Index – a broad-based, unmanaged index of municipal bonds – during the six months ended February 29, 2008.(1) Management believes that much of the underperformance can be attributed to the broader-based credit scare that has shaken the fixed-income markets since August 2007, and led to a flight-to-quality bid in the Treasury market, particularly in shorter-maturity bonds. This move was originally driven by uncertainty surrounding financial companies’ exposure to mortgage-backed collateralized debt obligations (CDOs). More recently, the municipal bond market has been impacted by the downgrade of major municipal bond insurers due to their exposure to mortgage-related CDO debt. As a result of an active management style that focuses on income and longer call protection, the Funds generally hold longer-duration bonds. Accordingly, management believes that investor flight to shorter-maturity uninsured bonds from longer-maturity insured bonds resulted in the Funds’ relative underperformance for the period.
The ratio of yields on current coupon AAA-rated insured bonds to the yield on 30-year Treasury bonds was 119% as of February 29, 2008, with many individual bonds trading higher than 119%.(2) Management believes that this was the result of dislocation in the fixed-income marketplace caused by the subprime contagion fears, insurance companies’ mark-to-market risks and the decentralized nature of the municipal marketplace Historically, this is a rare occurrence in the municipal bond market and is generally considered a signal that municipal bonds are significantly undervalued compared to Treasuries.
With this backdrop, Eaton Vance continues to manage all of its municipal funds with the same relative value approach that it has traditionally employed – maintaining a long-term perspective when markets exhibit extreme short-term volatility. We believe this approach has provided excellent long-term benefits to our investors over time.
(1) It is not possible to invest directly in an Index. The Index’s total return does not reflect expenses that would have been incurred if an investor individually purchased or sold the securities represented in the Index.
(2) Source: Bloomberg L.P. Yields are a compilation of a representative variety of general obligations and are not necessarily representative of a Fund’s yield.
Past performance is no guarantee of future results.
Fund shares are not insured by the FDIC and are not deposits or other obligations of, or guaranteed by, any depository institution. Shares are subject to investment risks, including possible loss of principal invested.
The views expressed throughout this report are those of the portfolio managers and are current only through the end of the period of the report as stated on the cover. These views are subject to change at any time based upon market or other conditions, and the investment adviser disclaims any responsibility to update such views. These views may not be relied on as investment advice and, because investment decisions for a fund are based on many factors, may not be relied on as an indication of trading intent on behalf of any Eaton Vance fund. Portfolio information provided in the report may not be representative of the Fund’s current or future investments and may change due to active management.
2
Eaton Vance Municipals Funds as of February 29, 2008
MORNING STAR RATINGSTM
As of February 29, 2008
FUND | | OVERALL | | 3-YEAR | | 5-YEAR | | 10-YEAR | |
| | | | | | | | | |
ALABAMA MUNICIPALS FUND – CLASS A | | *** | | ** | | *** | | *** | |
Load waived | | **** | | **** | | **** | | *** | |
MUNI SINGLE STATE LONG CATEGORY | | 339 FUNDS | | 339 FUNDS | | 339 FUNDS | | 297 FUNDS | |
| | | | | | | | | |
ARKANSAS MUNICIPALS FUND – CLASS A | | ** | | * | | *** | | *** | |
Load waived | | **** | | *** | | ***** | | **** | |
MUNI SINGLE ESTATE INTERMEDIATE CATEGORY | | 284 FUNDS | | 284 FUNDS | | 281 FUNDS | | 221 FUNDS | |
| | | | | | | | | |
GEORGIA MUNICIPALS FUND – CLASS A | | ** | | * | | ** | | *** | |
Load waived | | *** | | *** | | **** | | *** | |
MUNI SINGLE STATE LONG CATEGORY | | 339 FUNDS | | 339 FUNDS | | 339 FUNDS | | 297 FUNDS | |
| | | | | | | | | |
KENTUCKY MUNICIPALS FUND – CLASS A | | ** | | ** | | ** | | ** | |
Load waived | | *** | | *** | | *** | | **** | |
MUNI SINGLE STATE LONG CATEGORY | | 339 FUNDS | | 339 FUNDS | | 339 FUNDS | | 297 FUNDS | |
| | | | | | | | | |
LOUISIANA MUNICIPALS FUND – CLASS A | | *** | | ** | | *** | | *** | |
Load waived | | **** | | *** | | **** | | **** | |
MUNI SINGLE STATE LONG CATEGORY | | 339 FUNDS | | 339 FUNDS | | 339 FUNDS | | 297 FUNDS | |
| | | | | | | | | |
MARYLAND MUNICIPALS FUND – CLASS A | | ** | | ** | | ** | | ** | |
Load waived | | *** | | *** | | *** | | **** | |
MUNI SINGLE STATE LONG CATEGORY | | 339 FUNDS | | 339 FUNDS | | 339 FUNDS | | 297 FUNDS | |
| | | | | | | | | |
MISSOURI MUNICIPALS FUND – CLASS A | | *** | | * | | *** | | *** | |
Load waived | | **** | | *** | | **** | | **** | |
MUNI SINGLE STATE LONG CATEGORY | | 339 FUNDS | | 339 FUNDS | | 339 FUNDS | | 297 FUNDS | |
| | | | | | | | | |
NORTH CAROLINA MUNICIPALS FUND – CLASS A | | *** | | ** | | *** | | *** | |
Load waived | | **** | | **** | | **** | | **** | |
MUNI SINGLE STATE LONG CATEGORY | | 339 FUNDS | | 339 FUNDS | | 339 FUNDS | | 297 FUNDS | |
| | | | | | | | | |
OREGON MUNICIPALS FUND – CLASS A | | *** | | ** | | *** | | *** | |
Load waived | | **** | | *** | | **** | | **** | |
MUNI SINGLE STATE LONG CATEGORY | | 339 FUNDS | | 339 FUNDS | | 339 FUNDS | | 297 FUNDS | |
| | | | | | | | | |
SOUTH CAROLINA MUNICIPALS FUND – CLASS A | | *** | | * | | *** | | *** | |
Load waived | | *** | | ** | | **** | | *** | |
MUNI SINGLE STATE LONG CATEGORY | | 339 FUNDS | | 339 FUNDS | | 339 FUNDS | | 297 FUNDS | |
| | | | | | | | | |
TENNESSEE MUNICIPALS FUND – CLASS A | | ** | | * | | ** | | *** | |
Load waived | | **** | | *** | | *** | | *** | |
MUNI SINGLE STATE LONG CATEGORY | | 339 FUNDS | | 339 FUNDS | | 339 FUNDS | | 297 FUNDS | |
| | | | | | | | | |
VIRGINIA MUNICIPALS FUND – CLASS A | | ** | | * | | * | | ** | |
Load waived | | *** | | ** | | *** | | *** | |
MUNI SINGLE STATE LONG CATEGORY | | 339 FUNDS | | 339 FUNDS | | 339 FUNDS | | 297 FUNDS | |
Based on risk-adjusted returns. Eaton Vance offers other mutual funds that are not listed here and that do not have similar performance records.
The Overall Morningstar Rating™ for a fund is derived from a weighted average of the performance figures associated with its 3-, 5- and 10-year (if applicable) Morningstar Rating™ metrics.
©2008 Morningstar, Inc. All Rights Reserved. The information contained herein: (1) is proprietary to Morningstar and/or its content providers; (2) may not be copied or distributed; and (3) is not warranted to be accurate, complete or timely. Neither Morningstar nor its content providers is responsible for any damages or losses arising from any use of this information. Past performance is no guarantee of future results. For each fund with at least a three-year history, Morningstar calculates a Morningstar Rating™ based on how a fund ranks on a Morningstar Risk-Adjusted Return measure against other funds in the same category. This measure takes into account variations in a fund’s monthly performance after adjusting for sales loads (except for load-waived A shares), redemption fees, and the risk-free rate, placing more emphasis on downward variations and rewarding consistent performance. The top 10% of funds in each category receive 5 stars; the next 22.5% receive 4 stars; the next 35% receive 3 stars; the next 22.5% receive 2 stars, and the bottom 10% receive 1 star.
Load-waived A share star ratings do not include any front-end sales load and are intended for those investors who have access to such purchase terms (e.g., plan participants of a defined contribution plan). Not all A share mutual funds for which Morningstar calculates a load-waived A share star rating may actually waive their front-end sales load. Therefore, Morningstar strongly encourages investors to contact their investment professional to determine whether they are eligible to purchase the A share without paying the front-end sales load. The Morningstar Rating may differ among share classes of a mutual fund as a result of different sales loads and/or expense structure.
As interest rates rise, the value of fixed-income securities is likely to decrease. Fluctuations in the value of securities may not affect interest income on existing securities, but will be reflected in the Funds’ net asset values. For state municipal funds, a portion of income may be subject to federal, state and local tax; a portion may be subject to federal alternative minimum tax. Please see the Funds’ prospectus for more information. Consult your tax/legal advisor before making any tax-related investment decisions.
For information regarding each Fund’s performance, please refer to pages titled “Performance Information and Portfolio Composition” contained in this report.
3
Eaton Vance Alabama Municipals Fund as of February 29, 2008
PERFORMANCE INFORMATION AND PORTFOLIO COMPOSITION
Fund Performance(1) | | Class A | | Class B | | Class C | |
Share Class Symbol | | ETALX | | EVALX | | ECALX | |
| | | | | | | |
Average Annual Total Returns (at net asset value) | | | | | | | |
Six Months | | -3.48 | % | -3.83 | % | -3.73 | % |
One Year | | -5.28 | | -6.01 | | -5.91 | |
Five Years | | 2.76 | | 2.02 | | N.A. | |
Ten Years | | 3.73 | | 2.97 | | N.A. | |
Life of Fund† | | 4.16 | | 4.38 | | -0.61 | |
| | | | | | | |
SEC Average Annual Total Returns (including sales charge or applicable CDSC) | | | | | | | |
Six Months | | -8.07 | % | -8.54 | % | -4.68 | % |
One Year | | -9.80 | | -10.54 | | -6.82 | |
Five Years | | 1.77 | | 1.68 | | N.A. | |
Ten Years | | 3.23 | | 2.97 | | N.A. | |
Life of Fund† | | 3.80 | | 4.38 | | -0.61 | |
†Inception date: Class A: 12/7/93; Class B: 5/01/92; Class C: 3/21/06
Total Annual | | | | | | | |
Operating Expenses (2),* | | Class A | | Class B | | Class C | |
Expense Ratio | | 0.91 | % | 1.66 | % | 1.66 | % |
*Source: Prospectus dated 12/1/07.
Distribution Rates/Yields | | Class A | | Class B | | Class C | |
| | | | | | | |
Distribution Rate(3) | | 4.38 | % | 3.57 | % | 3.57 | % |
Taxable-Equivalent Distribution Rate(3),(4) | | 7.09 | | 5.78 | | 5.78 | |
SEC 30-day Yield(5) | | 3.75 | | 3.13 | | 3.16 | |
Taxable-Equivalent SEC 30-day Yield(4),(5) | | 6.07 | | 5.07 | | 5.12 | |
Index Performance(6)
Lehman Brothers Municipal Bond Index (Average Annual Total Returns) | | | |
Six Months | | -0.60 | % |
One Year | | -1.17 | |
Five Years | | 3.35 | |
Ten Years | | 4.71 | |
Lipper Averages(7)
Lipper Alabama Municipal Debt Funds Classification (Average Annual Total Returns) | | | |
Six Months | | -2.11 | % |
One Year | | -3.54 | |
Five Years | | 2.50 | |
Ten Years | | 3.60 | |
Portfolio Manager: William H. Ahern, CFA
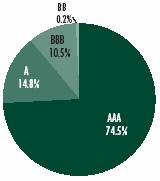
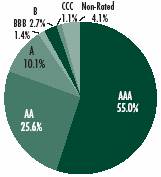
Rating Distribution**,(8)
By total investments
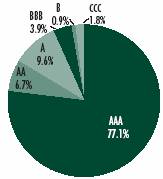
** The rating distribution presented above includes the ratings of securities held by special purpose vehicles in which the Fund holds a residual interest. See Note 1I to the Fund’s financial statements. Absent such securities, the Fund’s rating distribution at 2/29/08, is as follows, and the average rating is AA+.
AAA | | 78.3 | % |
AA | | 4.9 | % |
A | | 9.9 | % |
BBB | | 4.0 | % |
B | | 0.9 | % |
CCC | | 1.8 | % |
Not Rated | | 0.2 | % |
Fund Statistics(9)
· Number of Issues: | | 54 | |
· Average Maturity: | | 20.8 years | |
· Average Effective Maturity: | | 16.4 years | |
· Average Call Protection: | | 7.2 years | |
· Average Dollar Price: | | $ | 93.31 | |
| | | | |
Past performance is no guarantee of future results. Returns are historical and are calculated by determining the percentage change in net asset value or offering price (as applicable) with all distributions reinvested. Investment return and principal value will fluctuate so that shares, when redeemed, may be worth more or less than their original cost. Performance is for the stated time period only; due to market volatility, the Fund’s current performance may be lower or higher than the quoted return. For performance as of the most recent month end, please refer to www.eatonvance.com.
(1) Average Annual Total Returns do not include the 4.75% maximum sales charge for Class A shares or the applicable contingent deferred sales charges (CDSC) for Class B and Class C shares. If sales charges were deducted, the returns would be lower. SEC Average Annual Total Returns for Class A reflect the maximum 4.75% sales charge. SEC Average Annual Total Returns for Class B reflect the applicable CDSC based on the following schedule: 5% - 1st and 2nd years; 4% - 3rd year; 3% - - 4th year; 2% - 5th year; 1% - 6th year. SEC Average Annual Total Returns for Class C reflect a 1% CDSC for the first year.
(2) Includes interest expense of 0.16% relating to the Fund’s liability with respect to floating rate notes held by third parties in conjunction with inverse floater securities transactions by the Fund. The Fund also records offsetting interest income relating to the municipal obligation underlying such transactions, and as a result net asset value and performance have not been affected by this expense.
(3) The Fund’s distribution rate represents actual distributions paid to shareholders and is calculated by dividing the last distribution per share (annualized) by the net asset value.
(4) Taxable-equivalent figure assumes a maximum 38.25% combined federal and state income tax rate. A lower tax rate would result in lower tax-equivalent figures.
(5) The Fund’s SEC yield is calculated by dividing the net investment income per share for the 30-day period by the offering price at the end of the period and annualizing the result.
(6) It is not possible to invest directly in an Index. The Index’s total return does not reflect the expenses that would have been incurred if an investor individually purchased or sold the securities represented in the Index. Index performance is available as of month end only.
(7) The Lipper Averages are the average annual total returns, at net asset value, of the funds that are in the same Lipper Classification as the Fund. It is not possible to invest in a Lipper Classification. Lipper Classifications may include insured and uninsured funds, as well as leveraged and unleveraged funds. The Lipper Alabama Municipal Debt Funds Classification contained 13, 13, 9 and 7 funds for the 6-month, 1-year, 5-year and 10-year time periods, respectively. Lipper Averages are available as of month end only.
(8) Rating Distribution is determined by dividing the total market value of the issues by the total investments of the Fund
(9) Excludes securities held by special purpose vehicles in which the Fund holds a residual interest. See Note 1I to the Fund’s financial statements.
4
Eaton Vance Arkansas Municipals Fund as of February y 29, 2008
PERFORMANCE INFORMATION AND PORTFOLIO COMPOSITION
Fund Performance(1) | | Class A | | Class B | | Class C | |
Share Class Symbol | | ETARX | | EVARX | | ECARX | |
| | | | | | | |
Average Annual Total Returns (at net asset value) | | | | | | | |
Six Months | | -6.23 | % | -6.59 | % | -6.60 | % |
One Year | | -8.28 | | -8.97 | | -8.98 | |
Five Years | | 2.53 | | 1.76 | | N.A. | |
Ten Years | | 3.72 | | 2.94 | | N.A. | |
Life of Fund† | | 4.12 | | 4.11 | | -1.80 | |
| | | | | | | |
SEC Average Annual Total Returns (including sales charge or applicable CDSC) | | | | | | | |
Six Months | | -10.64 | % | -11.18 | % | -7.52 | % |
One Year | | -12.67 | | -13.36 | | -9.86 | |
Five Years | | 1.54 | | 1.43 | | N.A. | |
Ten Years | | 3.21 | | 2.94 | | N.A. | |
Life of Fund† | | 3.76 | | 4.11 | | -1.80 | |
†Inception date: Class A: 2/9/94; Class B: 10/2/92; Class C: 4/28/06
Total Annual | | | | | | | |
Operating Expenses(2),* | | Class A | | Class B | | Class C | |
| | | | | | | |
Expense Ratio | | 0.95 | % | 1.70 | % | 1.70 | % |
*Source: Prospectus dated 12/1/07.
Distribution Rates/Yields | | Class A | | Class B | | Class C | |
| | | | | | | |
Distribution Rate(3) | | 4.84 | % | 4.02 | % | 4.02 | % |
Taxable-Equivalent Distribution Rate(3),(4) | | 8.01 | | 6.65 | | 6.65 | |
SEC 30-day Yield(5) | | 4.20 | | 3.61 | | 3.62 | |
Taxable-Equivalent SEC 30-day Yield(4),(5) | | 6.95 | | 5.97 | | 5.99 | |
Index Performance(6)
Lehman Brothers Municipal Bond Index (Average Annual Total Returns) | | | |
Six Months | | -0.60 | % |
One Year | | -1.17 | |
Five Years | | 3.35 | |
Ten Years | | 4.71 | |
Lipper Averages(7)
Lipper Other States Municipal Debt Funds Classification (Average Annual Total Returns) | | | |
Six Months | | -2.06 | % |
One Year | | -3.06 | |
Five Years | | 2.31 | |
Ten Years | | 3.46 | |
Portfolio Manager: Adam Weigold, CFA
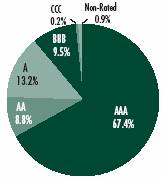
Rating Distribution**,(8)
By total investments
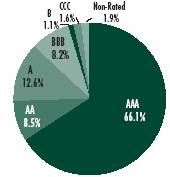
**The rating distribution presented above includes the ratings of securities held by special purpose vehicles in which the Fund holds a residual interest. See Note 1I to the Fund’s financial statements. Absent such securities, the Fund’s rating distribution at 2/29/08, is as follows, and the average rating is AA.
AAA | | 64.8 | % |
AA | | 8.9 | % |
A | | 13.0 | % |
BBB | | 8.5 | % |
B | | 1.2 | % |
CCC | | 1.7 | % |
Not Rated | | 1.9 | % |
Fund Statistics(9)
· Number of Issues: | | 77 | |
· Average Maturity: | | 20.8 years | |
· Average Effective Maturity: | | 18.8 years | |
· Average Call Protection: | | 8.7 years | |
· Average Dollar Price: | | $ | 91.93 | |
| | | | |
Past performance is no guarantee of future results. Returns are historical and are calculated by determining the percentage change in net asset value or offering price (as applicable) with all distributions reinvested. Investment return and principal value will fluctuate so that shares, when redeemed, may be worth more or less than their original cost. Performance is for the stated time period only; due to market volatility, the Fund’s current performance may be lower or higher than the quoted return. For performance as of the most recent month end, please refer to www.eatonvance.com.
(1) Average Annual Total Returns do not include the 4.75% maximum sales charge for Class A shares or the applicable contingent deferred sales charges (CDSC) for Class B and Class C shares. If sales charges were deducted, the returns would be lower. SEC Average Annual Total Returns for Class A reflect the maximum 4.75% sales charge. SEC Average Annual Total Returns for Class B reflect the applicable CDSC based on the following schedule: 5% - 1st and 2nd years; 4% - 3rd year; 3% - - 4th year; 2% - 5th year; 1% - 6th year. SEC Average Annual Total Returns for Class C reflect a 1% CDSC for the first year.
(2) Includes interest expense of 0.20% relating to the Fund’s liability with respect to floating rate notes held by third parties in conjunction with inverse floater securities transactions by the Fund. The Fund also records offsetting interest income relating to the municipal obligation underlying such transactions, and as a result net asset value and performance have not been affected by this expense.
(3) The Fund’s distribution rate represents actual distributions paid to shareholders and is calculated by dividing the last distribution per share (annualized) by the net asset value.
(4) Taxable-equivalent figure assumes a maximum 39.55% combined federal and state income tax rate. A lower tax rate would result in lower tax-equivalent figures.
(5) The Fund’s SEC yield is calculated by dividing the net investment income per share for the 30-day period by the offering price at the end of the period and annualizing the result.
(6) It is not possible to invest directly in an Index. The Index’s total return does not reflect the expenses that would have been incurred if an investor individually purchased or sold the securities represented in the Index. Index performance is available as of month end only.
(7) The Lipper Averages are the average annual total returns, at net asset value, of the funds that are in the same Lipper Classification as the Fund. It is not possible to invest in a Lipper Classification. Lipper Classifications may include insured and uninsured funds, as well as leveraged and unleveraged funds. The Lipper Other States Municipal Debt Funds Classification contained 74, 74, 71 and 52 funds for the 6-month, 1-year, 5-year and 10-year time periods, respectively. Lipper Averages are available as of month end only.
(8) Rating Distribution is determined by dividing the total market value of the issues by the total investments of the Fund.
(9) Excludes securities held by special purpose vehicles in which the Fund holds a residual interest. See Note 11 to the Fund’s financial statements.
5
Eaton Vance Georgia Municipals Fund as of February 29, 2008
PERFORMANCE INFORMATION AND PORTFOLIO COMPOSITION
Fund Performance(1) | | Class A | | Class B | | Class C | |
Share Class Symbol | | ETGAX | | EVGAX | | ECGAX | |
| | | | | | | |
Average Annual Total Returns (at net asset value) | | | | | | | |
Six Months | | -6.00 | % | -6.36 | % | -6.46 | % |
One Year | | -8.23 | | -8.95 | | -9.04 | |
Five Years | | 2.38 | | 1.62 | | N.A. | |
Ten Years | | 3.49 | | 2.72 | | N.A. | |
Life of Fund† | | 3.76 | | 3.92 | | -2.20 | |
| | | | | | | |
SEC Average Annual Total Returns (including sales charge or applicable CDSC) | | | | | | | |
Six Months | | -10.51 | % | -10.96 | % | -7.38 | % |
One Year | | -12.62 | | -13.35 | | -9.92 | |
Five Years | | 1.39 | | 1.28 | | N.A. | |
Ten Years | | 2.99 | | 2.72 | | N.A. | |
Life of Fund† | | 3.40 | | 3.92 | | -2.20 | |
†Inception date: Class A: 12/7/93; Class B: 12/23/91; Class C: 4/25/06
Total Annual | | | | | | | |
Operating Expenses(2),* | | Class A | | Class B | | Class C | |
| | | | | | | |
Expense Ratio | | 1.05 | % | 1.80 | % | 1.80 | % |
*Source: Prospectus dated 12/1/07.
Distribution Rates/Yields | | Class A | | Class B | | Class C | |
| | | | | | | |
Distribution Rate(3) | | 4.71 | % | 3.88 | % | 3.88 | % |
Taxable-Equivalent Distribution Rate(3),(4) | | 7.71 | | 6.35 | | 6.35 | |
SEC 30-day Yield(5) | | 3.94 | | 3.33 | | 3.51 | |
Taxable-Equivalent SEC 30-day Yield(4),(5) | | 6.45 | | 5.45 | | 5.74 | |
Index Performance(6)
Lehman Brothers Municipal Bond Index (Average Annual Total Returns) | | | | | | | |
Six Months | | | | | | -0.60 | % |
One Year | | | | | | -1.17 | |
Five Years | | | | | | 3.35 | |
Ten Years | | | | | | 4.71 | |
Lipper Averages(7)
Lipper Georgia Municipal Debt Funds Classification (Average Annual Total Returns) | | | | | | | |
Six Months | | | | | | -2.19 | % |
One Year | | | | | | -3.52 | |
Five Years | | | | | | 2.13 | |
Ten Years | | | | | | 3.55 | |
Portfolio Manager: Adam Weigold, CFA
Rating Distribution**,(8)
By total investments
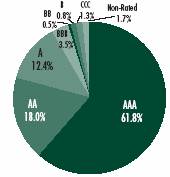
**The rating distribution presented above includes the ratings of securities held by special purpose vehicles in which the Fund holds a residual interest. See Note 1I to the Fund’s financial statements. Absent such securities, the Fund’s rating distribution at 2/29/08, is as follows, and the average rating is AA+.
AAA | | 60.7 | % |
AA | | 18.5 | % |
A | | 12.8 | % |
BBB | | 3.6 | % |
BB | | 0.6 | % |
B | | 0.8 | % |
CCC | | 1.3 | % |
Not Rated | | 1.7 | % |
Fund Statistics(9)
· Number of Issues: | | 81 | |
· Average Maturity: | | 22.0 years | |
· Average Effective Maturity: | | 20.6 years | |
· Average Call Protection: | | 10.0 years | |
· Average Dollar Price: | | $ | 94.68 | |
| | | | |
Past performance is no guarantee of future results. Returns are historical and are calculated by determining the percentage change in net asset value or offering price (as applicable) with all distributions reinvested. Investment return and principal value will fluctuate so that shares, when redeemed, may be worth more or less than their original cost. Performance is for the stated time period only; due to market volatility, the Fund’s current performance may be lower or higher than the quoted return. For performance as of the most recent month end, please refer to www.eatonvance.com.
(1) Average Annual Total Returns do not include the 4.75% maximum sales charge for Class A shares or the applicable contingent deferred sales charges (CDSC) for Class B and Class C shares. If sales charges were deducted, the returns would be lower. SEC Average Annual Total Returns for Class A reflect the maximum 4.75% sales charge. SEC Average Annual Total Returns for Class B reflect the applicable CDSC based on the following schedule: 5% - 1st and 2nd years; 4% - 3rd year; 3% - - 4th year; 2% - 5th year; 1% - 6th year. SEC Average Annual Total Returns for Class C reflect a 1% CDSC for the first year.
(2) Includes interest expense of 0.29% relating to the Fund’s liability with respect to floating rate notes held by third parties in conjunction with inverse floater securities transactions by the Fund. The Fund also records offsetting interest income relating to the municipal obligation underlying such transactions, and as a result net asset value and performance have not been affected by this expense.
(3) The Fund’s distribution rate represents actual distributions paid to shareholders and is calculated by dividing the last distribution per share (annualized) by the net asset value.
(4) Taxable-equivalent figure assumes a maximum 38.90% combined federal and state income tax rate. A lower tax rate would result in lower tax-equivalent figures.
(5) The Fund’s SEC yield is calculated by dividing the net investment income per share for the 30-day period by the offering price at the end of the period and annualizing the result.
(6) It is not possible to invest directly in an Index. The Index’s total return does not reflect the expenses that would have been incurred if an investor individually purchased or sold the securities represented in the Index. Index performance is available as of month end only.
(7) The Lipper Averages are the average annual total returns, at net asset value, of the funds that are in the same Lipper Classification as the Fund. It is not possible to invest in a Lipper Classification. Lipper Classifications may include insured and uninsured funds, as well as leveraged and unleveraged funds. The Lipper Georgia Municipal Debt Funds Classification contained 27, 27, 26 and 22 funds for the 6-month, 1-year, 5-year and 10-year time periods, respectively. Lipper Averages are available as of month end only.
(8) Rating Distribution is determined by dividing the total market value of the issues by the total investments of the Fund.
(9) Excludes securities held by special purpose vehicles in which the Fund holds a residual interest. See Note 1I to the Fund’s financial statements.
6
Eaton Vance Kentucky Municipals Fund as of February 29, 2008
PERFORMANCE INFORMATION AND PORTFOLIO COMPOSITION
Fund Performance(1) | | Class A | | Class B | | Class C | |
Share Class Symbol | | ETKYX | | EVKYX | | ECKYX | |
| | | | | | | |
Average Annual Total Returns (at net asset value) | | | | | | | |
Six Months | | -4.09 | % | -4.43 | % | -4.43 | % |
One Year | | -5.29 | | -5.94 | | -5.94 | |
Five Years | | 2.11 | | 1.39 | | N.A. | |
Ten Years | | 3.27 | | 2.53 | | N.A. | |
Life of Fund† | | 3.74 | | 3.93 | | -1.08 | |
| | | | | | | |
SEC Average Annual Total Returns (including sales charge or applicable CDSC) | | | | | | | |
Six Months | | -8.67 | % | -9.12 | % | -5.37 | % |
One Year | | -9.77 | | -10.48 | | -6.85 | |
Five Years | | 1.13 | | 1.06 | | N.A. | |
Ten Years | | 2.77 | | 2.53 | | N.A. | |
Life of Fund† | | 3.39 | | 3.93 | | -1.08 | |
†Inception date: Class A: 12/7/93; Class B: 12/23/91; Class C: 3/23/06
Total Annual | | | | | | | |
Operating Expenses(2),* | | Class A | | Class B | | Class C | |
| | | | | | | |
Expense Ratio | | 0.84 | % | 1.59 | % | 1.59 | % |
*Source: Prospectus dated 12/1/07.
Distribution Rates/Yields | | Class A | | Class B | | Class C | |
| | | | | | | |
Distribution Rate(3) | | 4.60 | % | 3.76 | % | 3.76 | % |
Taxable-Equivalent Distribution Rate(3),(4) | | 7.53 | | 6.15 | | 6.15 | |
SEC 30-day Yield(5) | | 3.98 | | 3.38 | | 3.39 | |
Taxable-Equivalent SEC 30-day Yield(4),(5) | | 6.51 | | 5.53 | | 5.55 | |
Index Performance(6)
Lehman Brothers Municipal Bond Index (Average Annual Total Returns) | | | |
Six Months | | -0.60 | % |
One Year | | -1.17 | |
Five Years | | 3.35 | |
Ten Years | | 4.71 | |
Lipper Averages(7)
Lipper Kentucky Municipal Debt Funds Classification (Average Annual Total Returns) | | | |
Six Months | | -2.17 | % |
One Year | | -3.44 | |
Five Years | | 2.24 | |
Ten Years | | 3.48 | |
Portfolio Manager: Adam Weigold, CFA
Rating Distribution**,(8)
By total investments
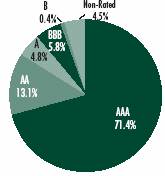
**The rating distribution presented above includes the ratings of securities held by special purpose vehicles in which the Fund holds a residual interest. See Note 1I to the Fund’s financial statements. Absent such securities, the Fund’s rating distribution at 2/29/08, is as follows, and the average rating is AA+.
AAA | | 69.4 | % |
AA | | 14.0 | % |
A | | 5.2 | % |
BBB | | 6.2 | % |
BB | | 0.4 | % |
Not Rated | | 4.8 | % |
Fund Statistics(9)
· Number of Issues: | | 47 | |
· Average Maturity: | | 18.5 years | |
· Average Effective Maturity: | | 15.0 years | |
· Average Call Protection: | | 6.8 years | |
· Average Dollar Price: | | $ | 87.49 | |
| | | | |
Past performance is no guarantee of future results. Returns are historical and are calculated by determining the percentage change in net asset value or offering price (as applicable) with all distributions reinvested. Investment return and principal value will fluctuate so that shares, when redeemed, may be worth more or less than their original cost. Performance is for the stated time period only; due to market volatility, the Fund’s current performance may be lower or higher than the quoted return. For performance as of the most recent month end, please refer to www.eatonvance.com.
(1) Average Annual Total Returns do not include the 4.75% maximum sales charge for Class A shares or the applicable contingent deferred sales charges (CDSC) for Class B and Class C shares. If sales charges were deducted, the returns would be lower. SEC Average Annual Total Returns for Class A reflect the maximum 4.75% sales charge. SEC Average Annual Total Returns for Class B reflect the applicable CDSC based on the following schedule: 5% - 1st and 2nd years; 4% - 3rd year; 3% - 4th year; 2% - 5th year; 1% - 6th year. SEC Average Annual Total Returns for Class C reflect a 1% CDSC for the first year.
(2) Includes interest expense of 0.06% relating to the Fund’s liability with respect to floating rate notes held by third parties in conjunction with inverse floater securities transactions by the Fund. The Fund also records offsetting interest income relating to the municipal obligation underlying such transactions, and as a result net asset value and performance have not been affected by this expense.
(3) The Fund’s distribution rate represents actual distributions paid to shareholders and is calculated by dividing the last distribution per share (annualized) by the net asset value.
(4) Taxable-equivalent figure assumes a maximum 38.90% combined federal and state income tax rate. A lower tax rate would result in lower tax-equivalent figures.
(5) The Fund’s SEC yield is calculated by dividing the net investment income per share for the 30-day period by the offering price at the end of the period and annualizing the result.
(6) It is not possible to invest directly in an Index. The Index’s total return does not reflect the expenses that would have been incurred if an investor individually purchased or sold the securities represented in the Index. Index performance is available as of month end only.
(7) The Lipper Averages are the average annual total returns, at net asset value, of the funds that are in the same Lipper Classification as the Fund. It is not possible to invest in a Lipper Classification. Lipper Classifications may include insured and uninsured funds, as well as leveraged and unleveraged funds. The Lipper Kentucky Municipal Debt Funds Classification contained 18, 18, 17 and 11 funds for the 6-month, 1-year, 5-year and 10-year time periods, respectively. Lipper Averages are available as of month end only.
(8) Rating Distribution is determined by dividing the total market value of the issues by the total investments of the Fund.
(9) Excludes securities held by special purpose vehicles in which the Fund holds a residual interest. See Note 1I to the Fund’s financial statements.
7
Eaton Vance Louisiana Municipals Fund as of February 29, 2008
PERFORMANCE INFORMATION AND PORTFOLIO COMPOSITION
Fund Performance(1) | | Class A | | Class B | | Class C | |
Share Class Symbol | | ETLAX | | EVLAX | | ELACX | |
| | | | | | | |
Average Annual Total Returns (at net asset value) | | | | | | | |
Six Months | | -5.58 | % | -5.93 | % | N.A. | |
One Year | | -7.50 | | -8.16 | | N.A. | |
Five Years | | 2.70 | | 1.95 | | N.A. | |
Ten Years | | 3.80 | | 3.03 | | N.A. | |
Life of Fund† | | 4.21 | | 4.18 | | -6.98 | % |
| | | | | | | |
SEC Average Annual Total Returns (including sales charge or applicable CDSC) | | | | | | | |
Six Months | | -10.05 | % | -10.55 | % | N.A. | |
One Year | | -11.87 | | -12.58 | | N.A. | |
Five Years | | 1.70 | | 1.61 | | N.A. | |
Ten Years | | 3.29 | | 3.03 | | N.A. | |
Life of Fund† | | 3.85 | | 4.18 | | -7.90 | % |
†Inception date: Class A: 2/14/94; Class B: 10/2/92; Class C: 12/4/07
Total Annual | | | | | | | |
Operating Expenses(2),* | | Class A | | Class B | | Class C | |
| | | | | | | |
Expense Ratio | | 0.98 | % | 1.73 | % | 1.73 | % |
*Source: Prospectus dated 12/1/07.
Distribution Rates/Yields | | Class A | | Class B | | Class C | |
| | | | | | | |
Distribution Rate(3) | | 4.81 | % | 3.97 | % | 3.97 | % |
Taxable-Equivalent Distribution Rate(3),(4) | | 7.87 | | 6.50 | | 6.50 | |
SEC 30-day Yield(5) | | 4.35 | | 3.76 | | 3.75 | |
Taxable-Equivalent SEC 30-day Yield(4),(5) | | 7.12 | | 6.15 | | 6.14 | |
Index Performance(6)
Lehman Brothers Municipal Bond Index (Average Annual Total Returns) | | | |
Six Months | | -0.60 | % |
One Year | | -1.17 | |
Five Years | | 3.35 | |
Ten Years | | 4.71 | |
Lipper Averages(7)
Lipper Louisiana Municipal Debt Funds Classification (Average Annual Total Returns) | | | |
Six Months | | -2.60 | % |
One Year | | -3.07 | |
Five Years | | 2.32 | |
Ten Years | | 3.61 | |
Portfolio Manager: Robert B. MacIntosh, CFA
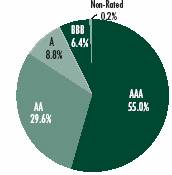
Rating Distribution**,(8)
By total investments
**The rating distribution presented above includes the ratings of securities held by special purpose vehicles in which the Fund holds a residual interest. See Note 1I to the Fund’s financial statements. Absent such securities, the Fund’s rating distribution at 2/29/08, is as follows, and the average rating is AA+.
AAA | | 71.5 | % |
A | | 15.6 | % |
BBB | | 11.0 | % |
BB | | 0.2 | % |
Non-Rated | | 1.7 | % |
Fund Statistics(9)
· Number of Issues: | | 54 | |
· Average Maturity: | | 23.1 years | |
· Average Effective Maturity: | | 20.5 years | |
· Average Call Protection: | | 7.4 years | |
· Average Dollar Price: | | $ | 89.17 | |
| | | | |
Past performance is no guarantee of future results. Returns are historical and are calculated by determining the percentage change in net asset value or offering price (as applicable) with all distributions reinvested. Investment return and principal value will fluctuate so that shares, when redeemed, may be worth more or less than their original cost. Performance is for the stated time period only; due to market volatility, the Fund’s current performance may be lower or higher than the quoted return. For performance as of the most recent month end, please refer to www.eatonvance.com.
(1) Average Annual Total Returns do not include the 4.75% maximum sales charge for Class A shares or the applicable contingent deferred sales charges (CDSC) for Class B and Class C shares. If sales charges were deducted, the returns would be lower. SEC Average Annual Total Returns for Class A reflect the maximum 4.75% sales charge. SEC Average Annual Total Returns for Class B reflect the applicable CDSC based on the following schedule: 5% - 1st and 2nd years; 4% - 3rd year; 3% - 4th year; 2% - 5th year; 1% - 6th year. SEC Average Annual Total Returns for Class C reflect a 1% CDSC for the first year.
(2) Includes interest expense of 0.26% relating to the Fund’s liability with respect to floating rate notes held by third parties in conjunction with inverse floater securities transactions by the Fund. The Fund also records offsetting interest income relating to the municipal obligation underlying such transactions, and as a result net asset value and performance have not been affected by this expense.
(3) The Fund’s distribution rate represents actual distributions paid to shareholders and is calculated by dividing the last distribution per share (annualized) by the net asset value.
(4) Taxable-equivalent figure assumes a maximum 38.90% combined federal and state income tax rate. A lower tax rate would result in lower tax-equivalent figures.
(5) The Fund’s SEC yield is calculated by dividing the net investment income per share for the 30-day period by the offering price at the end of the period and annualizing the result.
(6) It is not possible to invest directly in an Index. The Index’s total return does not reflect the expenses that would have been incurred if an investor individually purchased or sold the securities represented in the Index. Index performance is available as of month end only.
(7) The Lipper Averages are the average annual total returns, at net asset value, of the funds that are in the same Lipper Classification as the Fund. It is not possible to invest in a Lipper Classification. Lipper Classifications may include insured and uninsured funds, as well as leveraged and unleveraged funds. The Lipper Louisiana Municipal Debt Funds Classification contained 13, 13, 13 and 11 funds for the 6-month, 1-year, 5-year and 10-year time periods, respectively. Lipper Averages are available as of month end only.
(8) Rating Distribution is determined by dividing the total market value of the issues by the total investments of the Fund.
(9) Excludes securities held by special purpose vehicles in which the Fund holds a residual interest. See Note 1I to the Fund’s financial statements.
8
Eaton Vance Maryland Municipals Fund as of February 29, 2008
PERFORMANCE INFORMATION AND PORTFOLIO COMPOSITION
Fund Performance(1) | | Class A | | Class B | | Class C | |
Share Class Symbol | | ETMDX | | EVMYX | | ECMDX | |
| | | | | | | |
Average Annual Total Returns (at net asset value) | | | | | | | |
Six Months | | -5.03 | % | -5.30 | % | -5.30 | % |
One Year | | -7.88 | | -8.54 | | -8.45 | |
Five Years | | 2.08 | | 1.35 | | N.A. | |
Ten Years | | 3.24 | | 2.47 | | N.A. | |
Life of Fund† | | 3.80 | | 4.02 | | -1.61 | |
| | | | | | | |
SEC Average Annual Total Returns (including sales charge or applicable CDSC) | | | | | | | |
Six Months | | -9.53 | % | -9.95 | % | -6.23 | % |
One Year | | -12.29 | | -12.94 | | -9.33 | |
Five Years | | 1.09 | | 1.01 | | N.A. | |
Ten Years | | 2.74 | | 2.47 | | N.A. | |
Life of Fund† | | 3.45 | | 4.02 | | -1.61 | |
†Inception date: Class A: 12/10/93; Class B: 2/3/92; Class C: 5/2/06
Total Annual | | | | | | | |
Operating Expenses(2),* | | Class A | | Class B | | Class C | |
| | | | | | | |
Expense Ratio | | 1.19 | % | 1.94 | % | 1.94 | % |
*Source: Prospectus dated 12/1/07.
Distribution Rates/Yields | | Class A | | Class B | | Class C | |
| | | | | | | |
Distribution Rate(3) | | 4.86 | % | 4.03 | % | 4.03 | % |
Taxable-Equivalent Distribution Rate(3),(4) | | 7.91 | | 6.56 | | 6.56 | |
SEC 30-day Yield(5) | | 4.10 | | 3.52 | | 3.50 | |
Taxable-Equivalent SEC 30-day Yield(4),(5) | | 6.68 | | 5.73 | | 5.70 | |
Index Performance(6)
Lehman Brothers Municipal Bond Index (Average Annual Total Returns) | | | |
Six Months | | -0.60 | % |
One Year | | -1.17 | |
Five Years | | 3.35 | |
Ten Years | | 4.71 | |
Lipper Averages(7)
Lipper Maryland Municipal Debt Funds Classification (Average Annual Total Returns) | | | |
Six Months | | -1.97 | % |
One Year | | -3.61 | |
Five Years | | 2.21 | |
Ten Years | | 3.55 | |
Portfolio Manager: Craig R. Brandon, CFA
Rating Distribution**,(8)
By total investments
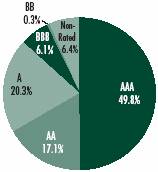
**The rating distribution presented above includes the ratings of securities held by special purpose vehicles in which the Fund holds a residual interest. See Note 1I to the Fund’s financial statements. Absent such securities, the Fund’s rating distribution at 2/29/08, is as follows, and the average rating is AA.
AAA | | 47.1 | % |
AA | | 18.0 | % |
A | | 21.4 | % |
BBB | | 6.4 | % |
BB | | 0.3 | % |
Non-Rated | | 6.8 | % |
Fund Statistics(9)
· Number of Issues: | | 73 | |
· Average Maturity: | | 24.3 years | |
· Average Effective Maturity: | | 19.6 years | |
· Average Call Protection: | | 9.1 years | |
· Average Dollar Price: | | $ | 95.33 | |
| | | | |
Past performance is no guarantee of future results. Returns are historical and are calculated by determining the percentage change in net asset value or offering price (as applicable) with all distributions reinvested. Investment return and principal value will fluctuate so that shares, when redeemed, may be worth more or less than their original cost. Performance is for the stated time period only; due to market volatility, the Fund’s current performance may be lower or higher than the quoted return. For performance as of the most recent month end, please refer to www.eatonvance.com.
(1) Average Annual Total Returns do not include the 4.75% maximum sales charge for Class A shares or the applicable contingent deferred sales charges (CDSC) for Class B and Class C shares. If sales charges were deducted, the returns would be lower. SEC Average Annual Total Returns for Class A reflect the maximum 4.75% sales charge. SEC Average Annual Total Returns for Class B reflect the applicable CDSC based on the following schedule: 5% - 1st and 2nd years; 4% - 3rd year; 3% - 4th year; 2% - 5th year; 1% - 6th year. SEC Average Annual Total Returns for Class C reflect a 1% CDSC for the first year.
(2) Includes interest expense of 0.41% relating to the Fund’s liability with respect to floating rate notes held by third parties in conjunction with inverse floater securities transactions by the Fund. The Fund also records offsetting interest income relating to the municipal obligation underlying such transactions, and as a result net asset value and performance have not been affected by this expense.
(3) The Fund’s distribution rate represents actual distributions paid to shareholders and is calculated by dividing the last distribution per share (annualized) by the net asset value.
(4) Taxable-equivalent figure assumes a maximum 38.58% combined federal and state income tax rate. A lower tax rate would result in lower tax-equivalent figures.
(5) The Fund’s SEC yield is calculated by dividing the net investment income per share for the 30-day period by the offering price at the end of the period and annualizing the result.
(6) It is not possible to invest directly in an Index. The Index’s total return does not reflect the expenses that would have been incurred if an investor individually purchased or sold the securities represented in the Index. Index performance is available as of month end only.
(7) The Lipper Averages are the average annual total returns, at net asset value, of the funds that are in the same Lipper Classification as the Fund. It is not possible to invest in a Lipper Classification. Lipper Classifications may include insured and uninsured funds, as well as leveraged and unleveraged funds. The Lipper Maryland Municipal Debt Funds Classification contained 40, 40, 35 and 26 funds for the 6-month, 1-year, 5-year and 10-year time periods, respectively. Lipper Averages are available as of month end only.
(8) Rating Distribution is determined by dividing the total market value of the issues by the total investments of the Fund.
(9) Excludes securities held by special purpose vehicles in which the Fund holds a residual interest. See Note 1I to the Fund’s financial statements.
9
Eaton Vance Missouri Municipals Fund as of February 29, 2008
PERFORMANCE INFORMATION AND PORTFOLIO COMPOSITION
Fund Performance(1) | | Class A | | Class B | | Class C | |
Share Class Symbol | | ETMOX | | EVMOX | | ECMOX | |
| | | | | | | |
Average Annual Total Returns (at net asset value) | | | | | | | |
Six Months | | -5.46 | % | -5.77 | % | -5.86 | % |
One Year | | -7.97 | | -8.63 | | -8.64 | |
Five Years | | 2.40 | | 1.66 | | N.A. | |
Ten Years | | 3.72 | | 2.93 | | N.A. | |
Life of Fund† | | 4.26 | | 4.53 | | -2.00 | |
| | | | | | | |
SEC Average Annual Total Returns (including sales charge or applicable CDSC) | | | | | | | |
Six Months | | -9.99 | % | -10.40 | % | -6.79 | % |
One Year | | -12.35 | | -13.05 | | -9.52 | |
Five Years | | 1.42 | | 1.33 | | N.A. | |
Ten Years | | 3.21 | | 2.93 | | N.A. | |
Life of Fund† | | 3.91 | | 4.53 | | -2.00 | |
†Inception date: Class A: 12/7/93; Class B: 5/1/92; Class C: 2/16/06
Total Annual | | | | | | | |
Operating Expenses(2),* | | Class A | | Class B | | Class C | |
| | | | | | | |
Expense Ratio | | 0.92 | % | 1.67 | % | 1.67 | % |
*Source: Prospectus dated 12/1/07.
Distribution Rates/Yields | | Class A | | Class B | | Class C | |
| | | | | | | |
Distribution Rate(3) | | 4.61 | % | 3.79 | % | 3.79 | % |
Taxable-Equivalent Distribution Rate(3),(4) | | 7.55 | | 6.20 | | 6.20 | |
SEC 30-day Yield(5) | | 4.16 | | 3.56 | | 3.56 | |
Taxable-Equivalent SEC 30-day Yield(4),(5) | | 6.81 | | 5.83 | | 5.83 | |
Index Performance(6)
Lehman Brothers Municipal Bond Index (Average Annual Total Returns) | | | |
Six Months | | -0.60 | % |
One Year | | -1.17 | |
Five Years | | 3.35 | |
Ten Years | | 4.71 | |
Lipper Averages(7)
Lipper Missouri Municipal Debt Funds Classification (Average Annual Total Returns) | | | |
Six Months | | -2.48 | % |
One Year | | -4.07 | |
Five Years | | 2.34 | |
Ten Years | | 3.71 | |
Portfolio Manager: Cynthia J. Clemson
Rating Distribution**,(8)
By total investments
**The rating distribution presented above includes the ratings of securities held by special purpose vehicles in which the Fund holds a residual interest. See Note 1I to the Fund’s financial statements. Absent such securities, the Fund’s rating distribution at 2/29/08, is as follows, and the average rating is AA+.
AAA | | 71.1 | % |
AA | | 9.1 | % |
A | | 10.1 | % |
BBB | | 4.9 | % |
B | | 1.1 | % |
Not Rated | | 3.7 | % |
Fund Statistics(9)
· Number of Issues: | | 93 | |
· Average Maturity: | | 20.3 years | |
· Average Effective Maturity: | | 18.2 years | |
· Average Call Protection: | | 9.1 years | |
· Average Dollar Price: | | $ | 91.20 | |
| | | | |
Past performance is no guarantee of future results. Returns are historical and are calculated by determining the percentage change in net asset value or offering price (as applicable) with all distributions reinvested. Investment return and principal value will fluctuate so that shares, when redeemed, may be worth more or less than their original cost. Performance is for the stated time period only; due to market volatility, the Fund’s current performance may be lower or higher than the quoted return. For performance as of the most recent month end, please refer to www.eatonvance.com.
(1) Average Annual Total Returns do not include the 4.75% maximum sales charge for Class A shares or the applicable contingent deferred sales charges (CDSC) for Class B and Class C shares. If sales charges were deducted, the returns would be lower. SEC Average Annual Total Returns for Class A reflect the maximum 4.75% sales charge. SEC Average Annual Total Returns for Class B reflect the applicable CDSC based on the following schedule: 5% - 1st and 2nd years; 4% - 3rd year; 3% - 4th year; 2% - 5th year; 1% - 6th year. SEC Average Annual Total Returns for Class C reflect a 1% CDSC for the first year.
(2) Includes interest expense of 0.17% relating to the Fund’s liability with respect to floating rate notes held by third parties in conjunction with inverse floater securities transactions by the Fund. The Fund also records offsetting interest income relating to the municipal obligation underlying such transactions, and as a result net asset value and performance have not been affected by this expense.
(3) The Fund’s distribution rate represents actual distributions paid to shareholders and is calculated by dividing the last distribution per share (annualized) by the net asset value.
(4) Taxable-equivalent figure assumes a maximum 38.90% combined federal and state income tax rate. A lower tax rate would result in lower tax-equivalent figures.
(5) The Fund’s SEC yield is calculated by dividing the net investment income per share for the 30-day period by the offering price at the end of the period and annualizing the result.
(6) It is not possible to invest directly in an Index. The Index’s total return does not reflect the expenses that would have been incurred if an investor individually purchased or sold the securities represented in the Index. Index performance is available as of month end only.
(7) The Lipper Averages are the average annual total returns, at net asset value, of the funds that are in the same Lipper Classification as the Fund. It is not possible to invest in a Lipper Classification. Lipper Classifications may include insured and uninsured funds, as well as leveraged and unleveraged funds. The Lipper Missouri Municipal Debt Funds Classification contained 18, 18, 17 and 15 funds for the 6-month, 1-year, 5-year and 10-year time periods, respectively. Lipper Averages are available as of month end only.
(8) Rating Distribution is determined by dividing the total market value of the issues by the total investments of the Fund.
(9) Excludes securities held by special purpose vehicles in which the Fund holds a residual interest. See Note 1I to the Fund’s financial statements.
10
Eaton Vance North Carolina Municipals Fund as of February 29, 2008
PERFORMANCE INFORMATION AND PORTFOLIO COMPOSITION
Fund Performance(1) | | Class A | | Class B | | Class C | |
Share Class Symbol | | ETNCX | | EVNCX | | ECNCX | |
| | | | | | | |
Average Annual Total Returns (at net asset value) | | | | | | | |
Six Months | | -4.62 | % | -5.03 | % | -5.03 | % |
One Year | | -5.83 | | -6.64 | | -6.55 | |
Five Years | | 2.31 | | 1.57 | | N.A. | |
Ten Years | | 3.40 | | 2.64 | | N.A. | |
Life of Fund† | | 3.80 | | 3.99 | | -0.56 | |
| | | | | | | |
SEC Average Annual Total Returns (including sales charge or applicable CDSC) | | | | | | | |
Six Months | | -9.18 | % | -9.70 | % | -5.96 | % |
One Year | | -10.28 | | -11.15 | | -7.45 | |
Five Years | | 1.31 | | 1.23 | | N.A. | |
Ten Years | | 2.90 | | 2.64 | | N.A. | |
Life of Fund† | | 3.44 | | 3.99 | | -0.56 | |
†Inception date: Class A: 12/7/93; Class B: 10/23/91; Class C: 5/2/06
Total Annual | | | | | | | |
Operating Expenses(2),* | | Class A | | Class B | | Class C | |
| | | | | | | |
Expense Ratio | | 1.35 | % | 2.10 | % | 2.09 | % |
*Source: Prospectus dated 12/1/07.
Distribution Rates/Yields | | Class A | | Class B | | Class C | |
| | | | | | | |
Distribution Rate(3) | | 4.62 | % | 3.80 | % | 3.80 | % |
Taxable-Equivalent Distribution Rate(3),(4) | | 7.73 | | 6.35 | | 6.35 | |
SEC 30-day Yield(5) | | 3.84 | | 3.25 | | 3.26 | |
Taxable-Equivalent SEC 30-day Yield(4),(5) | | 6.42 | | 5.43 | | 5.45 | |
Index Performance(6)
Lehman Brothers Municipal Bond Index (Average Annual Total Returns) | | | |
Six Months | | -0.60 | % |
One Year | | -1.17 | |
Five Years | | 3.35 | |
Ten Years | | 4.71 | |
Lipper Averages(7)
Lipper North Carolina Municipal Debt Funds Classification (Average Annual Total Returns) | | | |
Six Months | | -2.50 | % |
One Year | | -4.09 | |
Five Years | | 2.19 | |
Ten Years | | 3.53 | |
Portfolio Manager: Thomas M. Metzold, CFA
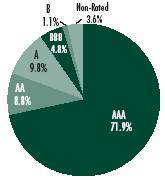
Rating Distribution**,(8)
By total investments
**The rating distribution presented above includes the ratings of securities held by special purpose vehicles in which the Fund holds a residual interest. See Note 1I to the Fund’s financial statements. Absent such securities, the Fund’s rating distribution at 2/29/08, is as follows, and the average rating is AA+.
AAA | | 54.4 | % |
AA | | 28.6 | % |
A | | 9.5 | % |
BBB | | 6.9 | % |
Not Rated | | 0.6 | % |
Fund Statistics(9)
· Number of Issues: | | 72 | |
· Average Maturity: | | 19.5 years | |
· Average Effective Maturity: | | 15.5 years | |
· Average Call Protection: | | 7.2 years | |
· Average Dollar Price: | | $ | 94.03 | |
| | | | |
Past performance is no guarantee of future results. Returns are historical and are calculated by determining the percentage change in net asset value or offering price (as applicable) with all distributions reinvested. Investment return and principal value will fluctuate so that shares, when redeemed, may be worth more or less than their original cost. Performance is for the stated time period only; due to market volatility, the Fund’s current performance may be lower or higher than the quoted return. For performance as of the most recent month end, please refer to www.eatonvance.com.
(1) Average Annual Total Returns do not include the 4.75% maximum sales charge for Class A shares or the applicable contingent deferred sales charges (CDSC) for Class B and Class C shares. If sales charges were deducted, the returns would be lower. SEC Average Annual Total Returns for Class A reflect the maximum 4.75% sales charge. SEC Average Annual Total Returns for Class B reflect the applicable CDSC based on the following schedule: 5% - 1st and 2nd years; 4% - 3rd year; 3% - 4th year; 2% - 5th year; 1% - 6th year. SEC Average Annual Total Returns for Class C reflect a 1% CDSC for the first year.
(2) Includes interest expense of 0.58% relating to the Fund’s liability with respect to floating rate notes held by third parties in conjunction with inverse floater securities transactions by the Fund. The Fund also records offsetting interest income relating to the municipal obligation underlying such transactions, and as a result net asset value and performance have not been affected by this expense.
(3) The Fund’s distribution rate represents actual distributions paid to shareholders and is calculated by dividing the last distribution per share (annualized) by the net asset value.
(4) Taxable-equivalent figure assumes a maximum 40.20% combined federal and state income tax rate. A lower tax rate would result in lower tax-equivalent figures.
(5) The Fund’s SEC yield is calculated by dividing the net investment income per share for the 30-day period by the offering price at the end of the period and annualizing the result.
(6) It is not possible to invest directly in an Index. The Index’s total return does not reflect the expenses that would have been incurred if an investor individually purchased or sold the securities represented in the Index. Index performance is available as of month end only.
(7) The Lipper Averages are the average annual total returns, at net asset value, of the funds that are in the same Lipper Classification as the Fund. It is not possible to invest in a Lipper Classification. Lipper Classifications may include insured and uninsured funds, as well as leveraged and unleveraged funds. The Lipper North Carolina Municipal Debt Funds Classification contained 31, 31, 25 and 23 funds for the 6-month, 1-year, 5-year and 10-year time periods, respectively. Lipper Averages are available as of month end only.
(8) Rating Distribution is determined by dividing the total market value of the issues by the total investments of the Fund.
(9) Excludes securities held by special purpose vehicles in which the Fund holds a residual interest. See Note 1I to the Fund’s financial statements.
11
Eaton Vance Oregon Municipals Fund as of February 29, 2008
PERFORMANCE INFORMATION AND PORTFOLIO COMPOSITION
Fund Performance(1) | | Class A | | Class B | | Class C | |
Share Class Symbol | | ETORX | | EVORX | | ECORX | |
| | | | | | | |
Average Annual Total Returns (at net asset value) | | | | | | | |
Six Months | | -7.01 | % | -7.38 | % | -7.37 | % |
One Year | | -9.33 | | -10.11 | | -10.10 | |
Five Years | | 2.37 | | 1.61 | | N.A. | |
Ten Years | | 3.52 | | 2.73 | | N.A. | |
Life of Fund† | | 3.81 | | 4.08 | | -2.35 | |
| | | | | | | |
SEC Average Annual Total Returns (including sales charge or applicable CDSC) | | | | | | | |
Six Months | | -11.41 | % | -11.93 | % | -8.28 | % |
One Year | | -13.60 | | -14.44 | | -10.97 | |
Five Years | | 1.37 | | 1.28 | | N.A. | |
Ten Years | | 3.02 | | 2.73 | | N.A. | |
Life of Fund† | | 3.45 | | 4.08 | | -2.35 | |
†Inception date: Class A: 12/28/93; Class B: 12/24/91; Class C: 3/2/06
Total Annual | | | | | | | |
Operating Expenses(2),* | | Class A | | Class B | | Class C | |
| | | | | | | |
Expense Ratio | | 1.25 | % | 2.00 | % | 2.00 | % |
*Source: Prospectus dated 12/1/07.
Distribution Rates/Yields | | Class A | | Class B | | Class C | |
| | | | | | | |
Distribution Rate(3) | | 4.99 | % | 4.14 | % | 4.14 | % |
Taxable-Equivalent Distribution Rate(3),(4) | | 8.44 | | 7.00 | | 7.00 | |
SEC 30-day Yield(5) | | 4.35 | | 3.76 | | 3.75 | |
Taxable-Equivalent SEC 30-day Yield(4),(5) | | 7.35 | | 6.36 | | 6.34 | |
Index Performance(6)
Lehman Brothers Municipal Bond Index (Average Annual Total Returns) | | | |
Six Months | | -0.60 | % |
One Year | | -1.17 | |
Five Years | | 3.35 | |
Ten Years | | 4.71 | |
Lipper Averages(7)
Lipper Oregon Municipal Debt Funds Classification (Average Annual Total Returns) | | | |
Six Months | | -2.11 | % |
One Year | | -3.11 | |
Five Years | | 2.56 | |
Ten Years | | 3.69 | |
Portfolio Manager: Thomas M. Metzold, CFA
Rating Distribution**,(8)
By total investments
**The rating distribution presented above includes the ratings of securities held by special purpose vehicles in which the Fund holds a residual interest. See Note 1I to the Fund’s financial statements. Absent such securities, the Fund’s rating distribution at 2/29/08, is as follows, and the average rating is AA.
AAA | | 54.0 | % |
AA | | 27.5 | % |
A | | 8.6 | % |
BBB | | 1.5 | % |
B | | 2.9 | % |
CCC | | 1.1 | % |
Not Rated | | 4.4 | % |
Fund Statistics(9)
· Number of Issues: | | 98 | |
· Average Maturity: | | 21.8 years | |
· Average Effective Maturity: | | 17.4 years | |
· Average Call Protection: | | 8.9 years | |
· Average Dollar Price: | | $ | 88.57 | |
| | | | |
Past performance is no guarantee of future results. Returns are historical and are calculated by determining the percentage change in net asset value or offering price (as applicable) with all distributions reinvested. Investment return and principal value will fluctuate so that shares, when redeemed, may be worth more or less than their original cost. Performance is for the stated time period only; due to market volatility, the Fund’s current performance may be lower or higher than the quoted return. For performance as of the most recent month end, please refer to www.eatonvance.com.
(1) Average Annual Total Returns do not include the 4.75% maximum sales charge for Class A shares or the applicable contingent deferred sales charges (CDSC) for Class B and Class C shares. If sales charges were deducted, the returns would be lower. SEC Average Annual Total Returns for Class A reflect the maximum 4.75% sales charge. SEC Average Annual Total Returns for Class B reflect the applicable CDSC based on the following schedule: 5% - 1st and 2nd years; 4% - 3rd year; 3% - 4th year; 2% - 5th year; 1% - 6th year. SEC Average Annual Total Returns for Class C reflect a 1% CDSC for the first year.
(2) Includes interest expense of 0.47% relating to the Fund’s liability with respect to floating rate notes held by third parties in conjunction with inverse floater securities transactions by the Fund. The Fund also records offsetting interest income relating to the municipal obligation underlying such transactions, and as a result net asset value and performance have not been affected by this expense.
(3) The Fund’s distribution rate represents actual distributions paid to shareholders and is calculated by dividing the last distribution per share (annualized) by the net asset value.
(4) Taxable-equivalent figure assumes a maximum 40.85% combined federal and state income tax rate. A lower tax rate would result in lower tax-equivalent figures.
(5) The Fund’s SEC yield is calculated by dividing the net investment income per share for the 30-day period by the offering price at the end of the period and annualizing the result.
(6) It is not possible to invest directly in an Index. The Index’s total return does not reflect the expenses that would have been incurred if an investor individually purchased or sold the securities represented in the Index. Index performance is available as of month end only.
(7) The Lipper Averages are the average annual total returns, at net asset value, of the funds that are in the same Lipper Classification as the Fund. It is not possible to invest in a Lipper Classification. Lipper Classifications may include insured and uninsured funds, as well as leveraged and unleveraged funds. The Lipper Oregon Municipal Debt Funds Classification contained 16, 16, 15 and 14 funds for the 6-month, 1-year, 5-year and 10-year time periods, respectively. Lipper Averages are available as of month end only.
(8) Rating Distribution is determined by dividing the total market value of the issues by the total investments of the Fund.
(9) Excludes securities held by special purpose vehicles in which the Fund holds a residual interest. See Note 1I to the Fund’s financial statements.
12
Eaton Vance South Carolina Municipals Fund as of February 29, 2008
PERFORMANCE INFORMATION AND PORTFOLIO COMPOSITION
Fund Performance(1) | | Class A | | Class B | | Class C | |
Share Class Symbol | | EASCX | | EVSCX | | ECSCX | |
| | | | | | | |
Average Annual Total Returns (at net asset value) | | | | | | | |
Six Months | | -9.18 | % | -9.49 | % | -9.39 | % |
One Year | | -12.43 | | -13.02 | | -12.93 | |
Five Years | | 2.47 | | 1.74 | | N.A. | |
Ten Years | | 3.49 | | 2.71 | | N.A. | |
Life of Fund† | | 3.91 | | 3.89 | | -2.86 | |
| | | | | | | |
SEC Average Annual Total Returns (including sales charge or applicable CDSC) | | | | | | | |
Six Months | | -13.46 | % | -13.93 | % | -10.28 | % |
One Year | | -16.57 | | -17.22 | | -13.77 | |
Five Years | | 1.48 | | 1.40 | | N.A. | |
Ten Years | | 2.98 | | 2.71 | | N.A. | |
Life of Fund† | | 3.55 | | 3.89 | | -2.86 | |
†Inception date: Class A: 2/14/94; Class B: 10/2/92; Class C: 1/12/06
Total Annual | | | | | | | |
Operating Expenses(2),* | | Class A | | Class B | | Class C | |
| | | | | | | |
Expense Ratio | | 1.21 | % | 1.96 | % | 1.96 | % |
*Source: Prospectus dated 12/1/07.
Distribution Rates/Yields | | Class A | | Class B | | Class C | |
| | | | | | | |
Distribution Rate(3) | | 4.95 | % | 4.11 | % | 4.11 | % |
Taxable-Equivalent Distribution Rate(3),(4) | | 8.19 | | 6.80 | | 6.80 | |
SEC 30-day Yield(5) | | 5.03 | | 4.43 | | 4.43 | |
Taxable-Equivalent SEC 30-day Yield(4),(5) | | 8.32 | | 7.33 | | 7.33 | |
Index Performance(6)
Lehman Brothers Municipal Bond Index (Average Annual Total Returns) | | | |
Six Months | | -0.60 | % |
One Year | | -1.17 | |
Five Years | | 3.35 | |
Ten Years | | 4.71 | |
Lipper Averages(7)
Lipper Other States Municipal Debt Funds Classification (Average Annual Total Returns) | | | |
Six Months | | -2.06 | % |
One Year | | -3.06 | |
Five Years | | 2.31 | |
Ten Years | | 3.46 | |
Portfolio Manager: Thomas M. Metzold, CFA
Rating Distribution**,(8)
By total investments
** The rating distribution presented above includes the ratings of securities held by special purpose vehicles in which the Fund holds a residual interest. See Note 1I to the Fund’s financial statements. Absent such securities, the Fund’s rating distribution at 2/29/08, is as follows, and the average rating is AA+.
AAA | | 65.6 | % |
AA | | 8.0 | % |
A | | 14.3 | % |
BBB | | 10.3 | % |
CCC | | 0.3 | % |
Not Rated | | 1.5 | % |
Fund Statistics(9)
· Number of Issues: | | 89 | |
· Average Maturity: | | 23.2 years | |
· Average Effective Maturity: | | 20.2 years | |
· Average Call Protection: | | 8.7 years | |
· Average Dollar Price: | | $ | 91.13 | |
| | | | |
Past performance is no guarantee of future results. Returns are historical and are calculated by determining the percentage change in net asset value or offering price (as applicable) with all distributions reinvested. Investment return and principal value will fluctuate so that shares, when redeemed, may be worth more or less than their original cost. Performance is for the stated time period only; due to market volatility, the Fund’s current performance may be lower or higher than the quoted return. For performance as of the most recent month end, please refer to www.eatonvance.com.
(1) Average Annual Total Returns do not include the 4.75% maximum sales charge for Class A shares or the applicable contingent deferred sales charges (CDSC) for Class B and Class C shares. If sales charges were deducted, the returns would be lower. SEC Average Annual Total Returns for Class A reflect the maximum 4.75% sales charge. SEC Average Annual Total Returns for Class B reflect the applicable CDSC based on the following schedule: 5% - 1st and 2nd years; 4% - 3rd year; 3% - 4th year; 2% - 5th year; 1% - 6th year. SEC Average Annual Total Returns for Class C reflect a 1% CDSC for the first year.
(2) Includes interest expense of 0.45% relating to the Fund’s liability with respect to floating rate notes held by third parties in conjunction with inverse floater securities transactions by the Fund. The Fund also records offsetting interest income relating to the municipal obligation underlying such transactions, and as a result net asset value and performance have not been affected by this expense.
(3) The Fund’s distribution rate represents actual distributions paid to shareholders and is calculated by dividing the last distribution per share (annualized) by the net asset value.
(4) Taxable-equivalent figure assumes a maximum 39.55% combined federal and state income tax rate. A lower tax rate would result in lower tax-equivalent figures.
(5) The Fund’s SEC yield is calculated by dividing the net investment income per share for the 30-day period by the offering price at the end of the period and annualizing the result.
(6) It is not possible to invest directly in an Index. The Index’s total return does not reflect the expenses that would have been incurred if an investor individually purchased or sold the securities represented in the Index. Index performance is available as of month end only.
(7) The Lipper Averages are the average annual total returns, at net asset value, of the funds that are in the same Lipper Classification as the Fund. It is not possible to invest in a Lipper Classification. Lipper Classifications may include insured and uninsured funds, as well as leveraged and unleveraged funds. The Lipper Other States Municipal Debt Funds Classification contained 74, 74, 71 and 52 funds for the 6-month, 1-year, 5-year and 10-year time periods, respectively. Lipper Averages are available as of month end only.
(8) Rating Distribution is determined by dividing the total market value of the issues by the total investments of the Fund.
(9) Excludes securities held by special purpose vehicles in which the Fund holds a residual interest. See Note 1I to the Fund’s financial statements.
13
Eaton Vance Tennessee Municipals Fund as of February 29, 2008
PERFORMANCE INFORMATION AND PORTFOLIO COMPOSITION
Fund Performance(1) | | Class A | | Class B | | Class C | |
Share Class Symbol | | ETTNX | | EVTNX | | ECTNX | |
| | | | | | | |
Average Annual Total Returns (at net asset value) | | | | | | | |
Six Months | | -5.37 | % | -5.80 | % | -5.81 | % |
One Year | | -7.48 | | -8.18 | | -8.19 | |
Five Years | | 2.05 | | 1.30 | | N.A. | |
Ten Years | | 3.63 | | 2.85 | | N.A. | |
Life of Fund† | | 4.04 | | 4.17 | | -1.83 | |
| | | | | | | |
SEC Average Annual Total Returns (including sales charge or applicable CDSC) | | | | | | | |
Six Months | | -9.91 | % | -10.43 | % | -6.74 | % |
One Year | | -11.90 | | -12.62 | | -9.08 | |
Five Years | | 1.06 | | 0.96 | | N.A. | |
Ten Years | | 3.12 | | 2.85 | | N.A. | |
Life of Fund† | | 3.68 | | 4.17 | | -1.83 | |
†Inception date: Class A: 12/9/93; Class B: 8/25/92; Class C: 5/2/06
Total Annual | | | | | | | |
Operating Expenses(2),* | | Class A | | Class B | | Class C | |
| | | | | | | |
Expense Ratio | | 0.96 | % | 1.71 | % | 1.70 | % |
*Source: Prospectus dated 12/1/07.
Distribution Rates/Yields | | Class A | | Class B | | Class C | |
| | | | | | | |
Distribution Rate(3) | | 4.64 | % | 3.83 | % | 3.83 | % |
Taxable-Equivalent Distribution Rate(3),(4) | | 7.59 | | 6.27 | | 6.27 | |
SEC 30-day Yield(5) | | 3.82 | | 3.21 | | 3.21 | |
Taxable-Equivalent SEC 30-day Yield(4),(5) | | 6.25 | | 5.25 | | 5.25 | |
Index Performance(6)
Lehman Brothers Municipal Bond Index (Average Annual Total Returns) | | | |
Six Months | | -0.60% | |
One Year | | -1.17 | |
Five Years | | 3.35 | |
Ten Years | | 4.71 | |
Lipper Averages(7)
Lipper Tennessee Municipal Debt Funds Classification (Average Annual Total Returns) | | | |
Six Months | | -2.29% | |
One Year | | -3.44 | |
Five Years | | 2.57 | |
Ten Years | | 3.72 | |
Portfolio Manager: Adam Weigold, CFA
Rating Distribution**,(8)
By total investments
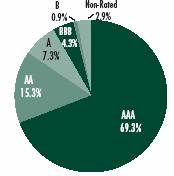
** The rating distribution presented above includes the ratings of securities held by special purpose vehicles in which the Fund holds a residual interest. See Note 1I to the Fund’s financial statements. Absent such securities, the Fund’s rating distribution at 2/29/08, is as follows, and the average rating is AA+.
AAA | | 68.7 | % |
AA | | 15.6 | % |
A | | 7.5 | % |
BBB | | 4.4 | % |
B | | 0.9 | % |
Not Rated | | 2.9 | % |
Fund Statistics(9)
· Number of Issues: | | 69 | |
· Average Maturity: | | 19.7 years | |
· Average Effective Maturity: | | 16.7 years | |
· Average Call Protection: | | 8.2 years | |
· Average Dollar Price: | | $ | 92.37 | |
| | | | |
Past performance is no guarantee of future results. Returns are historical and are calculated by determining the percentage change in net asset value or offering price (as applicable) with all distributions reinvested. Investment return and principal value will fluctuate so that shares, when redeemed, may be worth more or less than their original cost. Performance is for the stated time period only; due to market volatility, the Fund’s current performance may be lower or higher than the quoted return. For performance as of the most recent month end, please refer to www.eatonvance.com.
(1) Average Annual Total Returns do not include the 4.75% maximum sales charge for Class A shares or the applicable contingent deferred sales charges (CDSC) for Class B and Class C shares. If sales charges were deducted, the returns would be lower. SEC Average Annual Total Returns for Class A reflect the maximum 4.75% sales charge. SEC Average Annual Total Returns for Class B reflect the applicable CDSC based on the following schedule: 5% - 1st and 2nd years; 4% - 3rd year; 3% - 4th year; 2% - 5th year; 1% - 6th year. SEC Average Annual Total Returns for Class C reflect a 1% CDSC for the first year.
(2) Includes interest expense of 0.21% relating to the Fund’s liability with respect to floating rate notes held by third parties in conjunction with inverse floater securities transactions by the Fund. The Fund also records offsetting interest income relating to the municipal obligation underlying such transactions, and as a result net asset value and performance have not been affected by this expense.
(3) The Fund’s distribution rate represents actual distributions paid to shareholders and is calculated by dividing the last distribution per share (annualized) by the net asset value.
(4) Taxable-equivalent figure assumes a maximum 38.90% combined federal and state income tax rate. A lower tax rate would result in lower tax-equivalent figures.
(5) The Fund’s SEC yield is calculated by dividing the net investment income per share for the 30-day period by the offering price at the end of the period and annualizing the result.
(6) It is not possible to invest directly in an Index. The Index’s total return does not reflect the expenses that would have been incurred if an investor individually purchased or sold the securities represented in the Index. Index performance is available as of month end only.
(7) The Lipper Averages are the average annual total returns, at net asset value, of the funds that are in the same Lipper Classification as the Fund. It is not possible to invest in a Lipper Classification. Lipper Classifications may include insured and uninsured funds, as well as leveraged and unleveraged funds. The Lipper Tennessee Municipal Debt Funds Classification contained 11, 11, 10 and 10 funds for the 6-month, 1-year, 5-year and 10-year time periods, respectively. Lipper Averages are available as of month end only.
(8) Rating Distribution is determined by dividing the total market value of the issues by the total investments of the Fund.
(9) Excludes securities held by special purpose vehicles in which the Fund holds a residual interest. See Note 1I to the Fund’s financial statements.
14
Eaton Vance Virginia Municipals Fund as of February 29, 2008
PERFORMANCE INFORMATION AND PORTFOLIO COMPOSITION
Fund Performance(1) | | Class A | | Class B | | Class C | |
Share Class Symbol | | ETVAX | | EVVAX | | ECVAX | |
| | | | | | | |
Average Annual Total Returns (at net asset value) | | | | | | | |
Six Months | | -7.03 | % | -7.40 | % | -7.49 | % |
One Year | | -10.90 | | -11.55 | | -11.64 | |
Five Years | | 1.90 | | 1.15 | | N.A. | |
Ten Years | | 3.29 | | 2.52 | | N.A. | |
Life of Fund† | | 3.75 | | 4.13 | | -2.90 | |
| | | | | | | |
SEC Average Annual Total Returns (including sales charge or applicable CDSC) | | | | | | | |
Six Months | | -11.42 | % | -11.95 | % | -8.40 | % |
One Year | | -15.11 | | -15.82 | | -12.49 | |
Five Years | | 0.91 | | 0.82 | | N.A. | |
Ten Years | | 2.79 | | 2.52 | | N.A. | |
Life of Fund† | | 3.39 | | 4.13 | | -2.90 | |
†Inception date: Class A: 12/17/93; Class B: 7/26/91; Class C: 2/8/06
Total Annual | | | | | | | |
Operating Expenses(2),* | | Class A | | Class B | | Class C | |
| | | | | | | |
Expense Ratio | | 1.35 | % | 2.10 | % | 2.10 | % |
*Source: Prospectus dated 12/1/07.
Distribution Rates/Yields | | Class A | | Class B | | Class C | |
| | | | | | | |
Distribution Rate(3) | | 4.86 | % | 4.04 | % | 4.04 | % |
Taxable-Equivalent Distribution Rate(3),(4) | | 7.93 | | 6.59 | | 6.59 | |
SEC 30-day Yield(5) | | 4.47 | | 3.71 | | 3.71 | |
Taxable-Equivalent SEC 30-day Yield(4),(5) | | 7.30 | | 6.06 | | 6.06 | |
Index Performance(6)
Lehman Brothers Municipal Bond Index (Average Annual Total Returns) | | | |
Six Months | | -0.60 | % |
One Year | | -1.17 | |
Five Years | | 3.35 | |
Ten Years | | 4.71 | |
Lipper Averages(7)
Lipper Virginia Municipal Debt Funds Classification (Average Annual Total Returns) | | | |
Six Months | | -2.47 | % |
One Year | | -4.36 | |
Five Years | | 2.38 | |
Ten Years | | 3.61 | |
Portfolio Manager: Adam Weigold, CFA
Rating Distribution**,(8)
By total investments
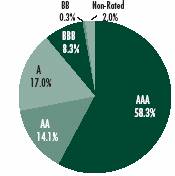
** The rating distribution presented above includes the ratings of securities held by special purpose vehicles in which the Fund holds a residual interest. See Note 1I to the Fund's financial statements. Absent such securities, the Fund’s rating distribution at 2/29/08, is as follows, and the average rating is AA.
AAA | | 54.4 | % |
AA | | 13.0 | % |
A | | 18.9 | % |
BBB | | 9.2 | % |
BB | | 0.3 | % |
Not Rated | | 4.2 | % |
Fund Statistics(9)
· Number of Issues: | | 75 | |
· Average Maturity: | | 23.4 years | |
· Average Effective Maturity: | | 20.6 years | |
· Average Call Protection: | | 9.5 years | |
· Average Dollar Price: | | $ | 95.73 | |
| | | | |
Past performance is no guarantee of future results. Returns are historical and are calculated by determining the percentage change in net asset value or offering price (as applicable) with all distributions reinvested. Investment return and principal value will fluctuate so that shares, when redeemed, may be worth more or less than their original cost. Performance is for the stated time period only; due to market volatility, the Fund’s current performance may be lower or higher than the quoted return. For performance as of the most recent month end, please refer to www.eatonvance.com.
(1) Average Annual Total Returns do not include the 4.75% maximum sales charge for Class A shares or the applicable contingent deferred sales charges (CDSC) for Class B and Class C shares. If sales charges were deducted, the returns would be lower. SEC Average Annual Total Returns for Class A reflect the maximum 4.75% sales charge. SEC Average Annual Total Returns for Class B reflect the applicable CDSC based on the following schedule: 5% - 1st and 2nd years; 4% - 3rd year; 3% - 4th year; 2% - 5th year; 1% - 6th year. SEC Average Annual Total Returns for Class C reflect a 1% CDSC for the first year.
(2) Includes interest expense of 0.57% relating to the Fund’s liability with respect to floating rate notes held by third parties in conjunction with inverse floater securities transactions by the Fund. The Fund also records offsetting interest income relating to the municipal obligation underlying such transactions, and as a result net asset value and performance have not been affected by this expense.
(3) The Fund’s distribution rate represents actual distributions paid to shareholders and is calculated by dividing the last distribution per share (annualized) by the net asset value.
(4) Taxable-equivalent figure assumes a maximum 38.74% combined federal and state income tax rate. A lower tax rate would result in lower tax-equivalent figures.
(5) The Fund’s SEC yield is calculated by dividing the net investment income per share for the 30-day period by the offering price at the end of the period and annualizing the result.
(6) It is not possible to invest directly in an Index. The Index’s total return does not reflect the expenses that would have been incurred if an investor individually purchased or sold the securities represented in the Index. Index performance is available as of month end only.
(7) The Lipper Averages are the average annual total returns, at net asset value, of the funds that are in the same Lipper Classification as the Fund. It is not possible to invest in a Lipper Classification. Lipper Classifications may include insured and uninsured funds, as well as leveraged and unleveraged funds. The Lipper Virginia Municipal Debt Funds Classification contained 37, 37, 33 and 28 funds for the 6-month, 1-year, 5-year and 10-year time periods, respectively. Lipper Averages are available as of month end only.
(8) Rating Distribution is determined by dividing the total market value of the issues by the total investments of the Fund.
(9) Excludes securities held by special purpose vehicles in which the Fund holds a residual interest. See Note 1I to the Fund’s financial statements.
15
Eaton Vance Municipals Funds as of February 29, 2008
FUND EXPENSES
Example: As a shareholder of a Fund, you incur two types of costs: (1) transaction costs, including sales charges (loads) on purchases and redemption fees (if applicable); and (2) ongoing costs, including management fees; distribution or service fees; and other Fund expenses. This Example is intended to help you understand your ongoing costs (in dollars) of investing in a Fund and to compare these costs with the ongoing costs of investing in other mutual funds. The Example is based on an investment of $1,000 invested at the beginning of the period and held for the entire period (September 1, 2007 – February 29, 2008).
Actual Expenses: The first section of each table below provides information about actual account values and actual expenses. You may use the information in this section, together with the amount you invested, to estimate the expenses that you paid over the period. Simply divide your account value by $1,000 (for example, an $8,600 account value divided by $1,000 = 8.6), then multiply the result by the number in the first section under the heading entitled "Expenses Paid During Period" to estimate the expenses you paid on your account during this period.
Hypothetical Example for Comparison Purposes: The second section of each table below provides information about hypothetical account values and hypothetical expenses based on the actual Fund expense ratio and an assumed rate of return of 5% per year (before expenses), which is not the actual return of the Fund. The hypothetical account values and expenses may not be used to estimate the actual ending account balance or expenses you paid for the period. You may use this information to compare the ongoing costs of investing in your Fund and other funds. To do so, compare this 5% hypothetical example with the 5% hypothetical examples that appear in the shareholder reports of the other funds.
Please note that the expenses shown in each table are meant to highlight your ongoing costs only and do not reflect any transactional costs, such as sales charges (loads) or redemption fees (if applicable). Therefore, the second section of each table is useful in comparing ongoing costs only, and will not help you determine the relative total costs of owning different funds. In addition, if these transactional costs were included, your costs would have been higher.
Eaton Vance Alabama Municipals Fund
| | | Beginning Account Value
(9/1/07) | | Ending Account Value
(2/29/08) | | Expenses Paid During Period*
(9/1/07 – 2/29/08) | |
| Actual | |
| Class A | | $ | 1,000.00 | | | $ | 965.20 | | | $ | 4.35 | | |
| Class B | | $ | 1,000.00 | | | $ | 961.70 | | | $ | 8.00 | | |
| Class C | | $ | 1,000.00 | | | $ | 962.70 | | | $ | 8.05 | | |
| Hypothetical | |
| (5% return per year before expenses) | |
| Class A | | $ | 1,000.00 | | | $ | 1,020.40 | | | $ | 4.47 | | |
| Class B | | $ | 1,000.00 | | | $ | 1,016.70 | | | $ | 8.22 | | |
| Class C | | $ | 1,000.00 | | | $ | 1,016.70 | | | $ | 8.27 | | |
* Expenses are equal to the Fund's annualized expense ratio of 0.89% for Class A shares, 1.64% for Class B shares and 1.65% for Class C shares, multiplied by the average account value over the period, multiplied by 182/366 (to reflect the one-half year period). The Example assumes that the $1,000 was invested at the net asset value per share determined at the close of business on August 31, 2007.
16
Eaton Vance Municipals Funds as of February 29, 2008
FUND EXPENSES CONT'D
Eaton Vance Arkansas Municipals Fund
| | | Beginning Account Value
(9/1/07) | | Ending Account Value
(2/29/08) | | Expenses Paid During Period*
(9/1/07 – 2/29/08) | |
| Actual | |
| Class A | | $ | 1,000.00 | | | $ | 937.70 | | | $ | 4.34 | | |
| Class B | | $ | 1,000.00 | | | $ | 934.10 | | | $ | 7.93 | | |
| Class C | | $ | 1,000.00 | | | $ | 934.00 | | | $ | 7.93 | | |
| Hypothetical | |
| (5% return per year before expenses) | |
| Class A | | $ | 1,000.00 | | | $ | 1,020.40 | | | $ | 4.52 | | |
| Class B | | $ | 1,000.00 | | | $ | 1,016.70 | | | $ | 8.27 | | |
| Class C | | $ | 1,000.00 | | | $ | 1,016.70 | | | $ | 8.27 | | |
* Expenses are equal to the Fund's annualized expense ratio of 0.90% for Class A shares, 1.65% for Class B shares and 1.65% for Class C shares, multiplied by the average account value over the period, multiplied by 182/366 (to reflect the one-half year period). The Example assumes that the $1,000 was invested at the asset value per share determined at the close of business on August 31, 2007.
Eaton Vance Georgia Municipals Fund
| | | Beginning Account Value
(9/1/07) | | Ending Account Value
(2/29/08) | | Expenses Paid During Period*
(9/1/07 – 2/29/08) | |
| Actual | |
| Class A | | $ | 1,000.00 | | | $ | 940.00 | | | $ | 4.68 | | |
| Class B | | $ | 1,000.00 | | | $ | 936.40 | | | $ | 8.28 | | |
| Class C | | $ | 1,000.00 | | | $ | 935.40 | | | $ | 8.28 | | |
| Hypothetical | |
| (5% return per year before expenses) | |
| Class A | | $ | 1,000.00 | | | $ | 1,020.00 | | | $ | 4.87 | | |
| Class B | | $ | 1,000.00 | | | $ | 1,016.30 | | | $ | 8.62 | | |
| Class C | | $ | 1,000.00 | | | $ | 1,016.30 | | | $ | 8.62 | | |
* Expenses are equal to the Fund's annualized expense ratio of 0.97% for Class A shares, 1.72% for Class B shares and 1.72% for Class C shares, multiplied by the average account value over the period, multiplied by 182/366 (to reflect the one-half year period). The Example assumes that the $1,000 was invested at the net asset value per share determined at the close of business on August 31, 2007.
17
Eaton Vance Municipals Funds as of February 29, 2008
FUND EXPENSES CONT'D
Eaton Vance Kentucky Municipals Fund
| | | Beginning Account Value
(9/1/07) | | Ending Account Value
(2/29/08) | | Expenses Paid During Period*
(9/1/07 – 2/29/08) | |
| Actual | |
| Class A | | $ | 1,000.00 | | | $ | 959.10 | | | $ | 3.85 | | |
| Class B | | $ | 1,000.00 | | | $ | 955.70 | | | $ | 7.49 | | |
| Class C | | $ | 1,000.00 | | | $ | 955.70 | | | $ | 7.49 | | |
| Hypothetical | |
| (5% return per year before expenses) | |
| Class A | | $ | 1,000.00 | | | $ | 1,020.90 | | | $ | 3.97 | | |
| Class B | | $ | 1,000.00 | | | $ | 1,017.20 | | | $ | 7.72 | | |
| Class C | | $ | 1,000.00 | | | $ | 1,017.20 | | | $ | 7.72 | | |
* Expenses are equal to the Fund's annualized expense ratio of 0.79% for Class A shares, 1.54% for Class B shares and 1.54% for Class C shares, multiplied by the average account value over the period, multiplied by 182/366 (to reflect the one-half year period). The Example assumes that the $1,000 was invested at the net asset value per share determined at the close of business on August 31, 2007.
Eaton Vance Louisiana Municipals Fund
| | | Beginning Account Value
(9/1/07) | | Ending Account Value
(2/29/08) | | Expenses Paid During Period
(9/1/07 – 2/29/08) | |
| Actual* | |
| Class A | | $ | 1,000.00 | | | $ | 944.20 | | | $ | 4.11 | | |
| Class B | | $ | 1,000.00 | | | $ | 940.70 | | | $ | 7.72 | | |
| Class C | | $ | 1,000.00 | | | $ | 930.20 | | | $ | 3.90 | | |
* Class C shares had not commenced operations as of September 1, 2007. Actual expenses are equal to the Fund's annualized expense ratio of 0.85% for Class A shares, 1.60% for Class B shares and 1.68% for Class C shares, multiplied by the average account value over the period, multiplied by 182/366 for Class A and B (to reflect the one-half year period) and by 88/366 for Class C (to reflect the period from commencement of operations on December 4, 2007 to February 29, 2008). The Example assumes that the $1,000 was invested at the net asset value per share determined at the close of business on August 31, 2007 for Class A and B shares and at the opening of business on December 4, 2007 for Class C shares.
| Hypothetical** | |
| (5% return per year before expenses) | |
| Class A | | $ | 1,000.00 | | | $ | 1,020.60 | | | $ | 4.27 | | |
| Class B | | $ | 1,000.00 | | | $ | 1,016.90 | | | $ | 8.02 | | |
| Class C | | $ | 1,000.00 | | | $ | 1,016.50 | | | $ | 8.42 | | |
** Hypothetical expenses are equal to the Fund's annualized expense ratio of 0.85% for Class A shares, 1.60% for Class B shares and 1.68% for Class C shares, multiplied by the average account value over the period, multiplied by 182/366 (to reflect the one-half year period). The Example assumes that the $1,000 was invested at the net asset value per share determined at the close of business on August 31, 2007.
18
Eaton Vance Municipals Funds as of February 29, 2008
FUND EXPENSES CONT'D
Eaton Vance Maryland Municipals Fund
| | | Beginning Account Value
(9/1/07) | | Ending Account Value
(2/29/08) | | Expenses Paid During Period*
(9/1/07 – 2/29/08) | |
| Actual | |
| Class A | | $ | 1,000.00 | | | $ | 949.70 | | | $ | 5.43 | | |
| Class B | | $ | 1,000.00 | | | $ | 947.00 | | | $ | 9.05 | | |
| Class C | | $ | 1,000.00 | | | $ | 947.00 | | | $ | 9.10 | | |
| Hypothetical | |
| (5% return per year before expenses) | |
| Class A | | $ | 1,000.00 | | | $ | 1,019.30 | | | $ | 5.62 | | |
| Class B | | $ | 1,000.00 | | | $ | 1,015.60 | | | $ | 9.37 | | |
| Class C | | $ | 1,000.00 | | | $ | 1,015.50 | | | $ | 9.42 | | |
* Expenses are equal to the Fund's annualized expense ratio of 1.12% for Class A shares, 1.87% for Class B shares and 1.88% for Class C shares, multiplied by the average account value over the period, multiplied by 182/366 (to reflect the one-half year period). The Example assumes that the $1,000 was invested at the net asset value per share determined at the close of business on August 31, 2007.
Eaton Vance Missouri Municipals Fund
| | | Beginning Account Value
(9/1/07) | | Ending Account Value
(2/29/08) | | Expenses Paid During Period*
(9/1/07 – 2/29/08) | |
| Actual | |
| Class A | | $ | 1,000.00 | | | $ | 945.40 | | | $ | 4.21 | | |
| Class B | | $ | 1,000.00 | | | $ | 942.30 | | | $ | 7.82 | | |
| Class C | | $ | 1,000.00 | | | $ | 941.40 | | | $ | 7.87 | | |
| Hypothetical | |
| (5% return per year before expenses) | |
| Class A | | $ | 1,000.00 | | | $ | 1,020.50 | | | $ | 4.37 | | |
| Class B | | $ | 1,000.00 | | | $ | 1,016.80 | | | $ | 8.12 | | |
| Class C | | $ | 1,000.00 | | | $ | 1,016.80 | | | $ | 8.17 | | |
* Expenses are equal to the Fund's annualized expense ratio of 0.87% for Class A shares, 1.62% for Class B shares and 1.63% for Class C shares, multiplied by the average account value over the period, multiplied by 182/366 (to reflect the one-half year period). The Example assumes that the $1,000 was invested at the net asset value per share determined at the close of business on August 31, 2007.
19
Eaton Vance Municipals Funds as of February 29, 2008
FUND EXPENSES CONT'D
Eaton Vance North Carolina Municipals Fund
| | | Beginning Account Value
(9/1/07) | | Ending Account Value
(2/29/08) | | Expenses Paid During Period*
(9/1/07 – 2/29/08) | |
| Actual | |
| Class A | | $ | 1,000.00 | | | $ | 953.80 | | | $ | 5.78 | | |
| Class B | | $ | 1,000.00 | | | $ | 949.70 | | | $ | 9.40 | | |
| Class C | | $ | 1,000.00 | | | $ | 949.70 | | | $ | 9.36 | | |
| Hypothetical | |
| (5% return per year before expenses) | |
| Class A | | $ | 1,000.00 | | | $ | 1,018.90 | | | $ | 5.97 | | |
| Class B | | $ | 1,000.00 | | | $ | 1,015.20 | | | $ | 9.72 | | |
| Class C | | $ | 1,000.00 | | | $ | 1,015.30 | | | $ | 9.67 | | |
* Expenses are equal to the Fund's annualized expense ratio of 1.19% for Class A shares, 1.94% for Class B shares and 1.93% for Class C shares, multiplied by the average account value over the period, multiplied by 182/366 (to reflect the one-half year period). The Example assumes that the $1,000 was invested at the net asset value per share determined at the close of business on August 31, 2007.
Eaton Vance Oregon Municipals Fund
| | | Beginning Account Value
(9/1/07) | | Ending Account Value
(2/29/08) | | Expenses Paid During Period*
(9/1/07 – 2/29/08) | |
| Actual | |
| Class A | | $ | 1,000.00 | | | $ | 929.90 | | | $ | 4.85 | | |
| Class B | | $ | 1,000.00 | | | $ | 926.20 | | | $ | 8.43 | | |
| Class C | | $ | 1,000.00 | | | $ | 926.30 | | | $ | 8.43 | | |
| Hypothetical | |
| (5% return per year before expenses) | |
| Class A | | $ | 1,000.00 | | | $ | 1,019.80 | | | $ | 5.07 | | |
| Class B | | $ | 1,000.00 | | | $ | 1,016.10 | | | $ | 8.82 | | |
| Class C | | $ | 1,000.00 | | | $ | 1,016.10 | | | $ | 8.82 | | |
* Expenses are equal to the Fund's annualized expense ratio of 1.01% for Class A shares, 1.76% for Class B shares and 1.76% for Class C shares, multiplied by the average account value over the period, multiplied by 182/366 (to reflect the one-half year period). The Example assumes that the $1,000 was invested at the net asset value per share determined at the close of business on August 31, 2007.
20
Eaton Vance Municipals Funds as of February 29, 2008
FUND EXPENSES CONT'D
Eaton Vance South Carolina Municipals Fund
| | | Beginning Account Value
(9/1/07) | | Ending Account Value
(2/29/08) | | Expenses Paid During Period*
(9/1/07 – 2/29/08) | |
| Actual | |
| Class A | | $ | 1,000.00 | | | $ | 908.20 | | | $ | 5.03 | | |
| Class B | | $ | 1,000.00 | | | $ | 905.10 | | | $ | 8.57 | | |
| Class C | | $ | 1,000.00 | | | $ | 906.10 | | | $ | 8.58 | | |
| Hypothetical | |
| (5% return per year before expenses) | |
| Class A | | $ | 1,000.00 | | | $ | 1,019.60 | | | $ | 5.32 | | |
| Class B | | $ | 1,000.00 | | | $ | 1,015.90 | | | $ | 9.07 | | |
| Class C | | $ | 1,000.00 | | | $ | 1,015.90 | | | $ | 9.07 | | |
* Expenses are equal to the Fund's annualized expense ratio of 1.06% for Class A shares, 1.81% for Class B shares and 1.81% for Class C shares, multiplied by the average account value over the period, multiplied by 182/366 (to reflect the one-half year period). The Example assumes that the $1,000 was invested at the net asset value per share determined at the close of business on August 31, 2007.
Eaton Vance Tennessee Municipals Fund
| | | Beginning Account Value
(9/1/07) | | Ending Account Value
(2/29/08) | | Expenses Paid During Period*
(9/1/07 – 2/29/08) | |
| Actual | |
| Class A | | $ | 1,000.00 | | | $ | 946.30 | | | $ | 4.26 | | |
| Class B | | $ | 1,000.00 | | | $ | 942.00 | | | $ | 7.92 | | |
| Class C | | $ | 1,000.00 | | | $ | 941.90 | | | $ | 7.92 | | |
| Hypothetical | |
| (5% return per year before expenses) | |
| Class A | | $ | 1,000.00 | | | $ | 1,020.50 | | | $ | 4.42 | | |
| Class B | | $ | 1,000.00 | | | $ | 1,016.70 | | | $ | 8.22 | | |
| Class C | | $ | 1,000.00 | | | $ | 1,016.70 | | | $ | 8.22 | | |
* Expenses are equal to the Fund's annualized expense ratio of 0.88% for Class A shares, 1.64% for Class B shares and 1.64% for Class C shares, multiplied by the average account value over the period, multiplied by 182/366 (to reflect the one-half year period). The Example assumes that the $1,000 was invested at the net asset value per share determined at the close of business on August 31, 2007.
21
Eaton Vance Municipals Funds as of February 29, 2008
FUND EXPENSES CONT'D
Eaton Vance Virginia Municipals Fund
| | | Beginning Account Value
(9/1/07) | | Ending Account Value
(2/29/08) | | Expenses Paid During Period*
(9/1/07 – 2/29/08) | |
| Actual | |
| Class A | | $ | 1,000.00 | | | $ | 929.70 | | | $ | 5.90 | | |
| Class B | | $ | 1,000.00 | | | $ | 926.00 | | | $ | 9.48 | | |
| Class C | | $ | 1,000.00 | | | $ | 925.10 | | | $ | 9.48 | | |
| Hypothetical | |
| (5% return per year before expenses) | |
| Class A | | $ | 1,000.00 | | | $ | 1,018.70 | | | $ | 6.17 | | |
| Class B | | $ | 1,000.00 | | | $ | 1,015.00 | | | $ | 9.92 | | |
| Class C | | $ | 1,000.00 | | | $ | 1,015.00 | | | $ | 9.92 | | |
* Expenses are equal to the Fund's annualized expense ratio of 1.23% for Class A shares, 1.98% for Class B shares and 1.98% for Class C shares, multiplied by the average account value over the period, multiplied by 182/366 (to reflect the one-half year period). The Example assumes that the $1,000 was invested at the net asset value per share determined at the close of business on August 31, 2007.
22
Eaton Vance Alabama Municipals Fund as of February 29, 2008
PORTFOLIO OF INVESTMENTS (Unaudited)
| Tax-Exempt Investments — 100.4% | | | |
Principal Amount
(000's omitted) | | Security | | Value | |
| Escrowed / Prerefunded — 5.8% | | | |
| $ | 1,250 | | | Huntsville, Health Care Authority, Prerefunded to
6/1/11, 5.75%, 6/1/31 | | $ | 1,354,637 | | |
| | 1,000 | | | Puerto Rico Electric Power Authority, Prerefunded to
7/1/12, 5.25%, 7/1/31 | | | 1,084,960 | | |
| | 790 | | | Puerto Rico Electric Power Authority, Prerefunded to
7/1/13, 5.125%, 7/1/29 | | | 855,388 | | |
| | | | | | | $ | 3,294,985 | | |
| General Obligations — 2.0% | | | |
| $ | 1,125 | | | Huntsville, 5.25%, 5/1/31 | | $ | 1,118,947 | | |
| | | | | | | $ | 1,118,947 | | |
| Hospital — 6.5% | | | |
| $ | 1,740 | | | Alabama Special Care Facilities Financing Authority,
(Ascension Health), 5.00%, 11/15/39(1) | | $ | 1,584,844 | | |
| | 750 | | | Health Care Authority, (Baptist Health), 5.00%, 11/15/18 | | | 731,730 | | |
| | 400 | | | Health Care Authority, (Baptist Health), 5.00%, 11/15/21 | | | 377,208 | | |
| | 1,000 | | | Marshall County, Health Care Authority, 5.75%, 1/1/32 | | | 985,880 | | |
| | | | | | | $ | 3,679,662 | | |
| Industrial Development Revenue — 5.7% | | | |
| $ | 600 | | | Butler, Industrial Development Board,
(Georgia-Pacific Corp.), (AMT), 5.75%, 9/1/28 | | $ | 497,184 | | |
| | 1,000 | | | Courtland, Solid Waste Disposal,
(Champion International Corp.), (AMT), 6.70%, 11/1/29 | | | 1,013,960 | | |
| | 750 | | | Phoenix County, Industrial Development Board
Environmental Improvements, 6.10%, 5/15/30 | | | 719,580 | | |
| | 1,180 | | | Puerto Rico Port Authority, (American Airlines), (AMT),
6.25%, 6/1/26 | | | 1,017,479 | | |
| | | | | | | $ | 3,248,203 | | |
| Insured-Education — 14.9% | | | |
| $ | 3,000 | | | Alabama Public School and College Authority, (FSA),
2.50%, 12/1/27 | | $ | 1,928,070 | | |
| | 2,000 | | | Alabama State University, (XLCA), 4.625%, 8/1/36 | | | 1,768,080 | | |
| | 750 | | | Auburn University, (MBIA), 5.00%, 6/1/26 | | | 734,647 | | |
| | 1,110 | | | Montgomery, Public Educational Building Authority
(Alabama State University), (XLCA), 5.25%, 10/1/25 | | | 1,080,496 | | |
| | 4,500 | | | University of South Alabama, (AMBAC), 0.00%, 11/15/16 | | | 2,949,435 | | |
| | | | | | | $ | 8,460,728 | | |
Principal Amount
(000's omitted) | | Security | | Value | |
| Insured-Electric Utilities — 2.5% | | | |
| $ | 1,000 | | | Puerto Rico Electric Power Authority, (FGIC),
5.25%, 7/1/34 | | $ | 952,010 | | |
| | 525 | | | Puerto Rico Electric Power Authority, (MBIA),
4.75%, 7/1/33(1) | | | 457,894 | | |
| | | | | | | $ | 1,409,904 | | |
| Insured-Escrowed / Prerefunded — 14.9% | | | |
| $ | 2,500 | | | Birmingham, Waterworks and Sewer Board, (MBIA),
Prerefunded to 1/1/13, 5.25%, 1/1/33(2) | | $ | 2,706,375 | | |
| | 445 | | | Helena, Utilities Board Water and Sewer, (MBIA),
Prerefunded to 4/1/12, 5.25%, 4/1/27 | | | 481,196 | | |
| | 555 | | | Helena, Utilities Board Water and Sewer, (MBIA),
Prerefunded to 4/1/12, 5.25%, 4/1/27 | | | 600,144 | | |
| | 450 | | | Helena, Utilities Board Water and Sewer, (MBIA),
Prerefunded to 4/1/12, 5.25%, 4/1/33 | | | 486,603 | | |
| | 1,000 | | | Huntsville, Health Care Authority, (MBIA),
Prerefunded to 5/14/12, 5.40%, 6/1/22 | | | 1,091,390 | | |
| | 2,065 | | | Montgomery, BMC Special Care Facilities Financing
Authority, (Baptist Health Montgomery), (MBIA),
Prerefunded to 11/15/14, 5.15%, 11/15/27 | | | 2,241,764 | | |
| | 495 | | | Puerto Rico Electric Power Authority, (FSA),
Prerefunded to 7/1/10, 5.25%, 7/1/29(1) | | | 525,441 | | |
| | 330 | | | Puerto Rico Public Finance Corp., (AMBAC),
Escrowed to Maturity, 5.50%, 8/1/27 | | | 340,567 | | |
| | | | | | | $ | 8,473,480 | | |
| Insured-General Obligations — 12.4% | | | |
| $ | 1,500 | | | Etowah County, Board of Education, (FSA),
5.00%, 9/1/28 | | $ | 1,456,920 | | |
| | 2,000 | | | Gadsden, (AMBAC), 5.125%, 8/1/28 | | | 1,959,000 | | |
| | 1,000 | | | Homewood, (FSA), 4.25%, 9/1/31 | | | 845,540 | | |
| | 500 | | | Mobile, General Obligation Unlimited Warrants, (AMBAC),
5.00%, 2/15/30 | | | 474,445 | | |
| | 1,000 | | | Pell City, (XLCA), 5.00%, 2/1/24 | | | 952,460 | | |
| | 700 | | | Puerto Rico, (FSA), Variable Rate,
11.337%, 7/1/27(3)(4) | | | 782,061 | | |
| | 675 | | | Tuscaloosa, (AMBAC), 4.375%, 7/1/37 | | | 565,852 | | |
| | | | | | | $ | 7,036,278 | | |
| Insured-Hospital — 7.4% | | | |
| $ | 3,000 | | | Birmingham, Care Facility Financing Authority,
(Children's Hospital), (AMBAC), 5.00%, 6/1/32 | | $ | 2,819,250 | | |
| | 1,500 | | | East Alabama, Health Care Authority, (MBIA),
5.00%, 9/1/27 | | | 1,395,000 | | |
| | | | | | | $ | 4,214,250 | | |
See notes to financial statements
23
Eaton Vance Alabama Municipals Fund as of February 29, 2008
PORTFOLIO OF INVESTMENTS (Unaudited) CONT'D
Principal Amount
(000's omitted) | | Security | | Value | |
Insured-Lease Revenue / Certificates of
Participation — 6.3% | | | |
| $ | 1,250 | | | Mobile, Public Educational Building Authority, (AMBAC),
4.50%, 3/1/31 | | $ | 1,096,838 | | |
| | 500 | | | Montgomery County, Public Building Authority, (MBIA),
5.00%, 3/1/31 | | | 476,360 | | |
| | 1,200 | | | Puerto Rico Public Finance Corp.,
(AMBAC), 5.125%, 6/1/24 | | | 1,219,272 | | |
| | 770 | | | Puerto Rico Public Finance Corp., (AMBAC),
5.50%, 8/1/27 | | | 794,655 | | |
| | | | | | | $ | 3,587,125 | | |
| Insured-Special Tax Revenue — 1.9% | | | |
| $ | 1,825 | | | Birmingham Jefferson, Civic Center Authority, (MBIA),
0.00%, 9/1/18 | | $ | 1,075,199 | | |
| | | | | | | $ | 1,075,199 | | |
| Insured-Transportation — 4.4% | | | |
| $ | 750 | | | Alabama State Dock Authority, (MBIA), 4.50%, 10/1/36 | | $ | 658,140 | | |
| | 1,000 | | | Puerto Rico Highway and Transportation Authority, (AMBAC),
0.00%, 7/1/16 | | | 669,760 | | |
| | 1,185 | | | Puerto Rico Highway and Transportation Authority, (AMBAC),
5.50%, 7/1/29 | | | 1,164,464 | | |
| | | | | | | $ | 2,492,364 | | |
| Insured-Utilities — 1.6% | | | |
| $ | 1,000 | | | Foley, Utilities Board, (FSA), 4.75%, 11/1/31 | | $ | 927,510 | | |
| | | | | | | $ | 927,510 | | |
| Insured-Water and Sewer — 12.0% | | | |
| $ | 2,410 | | | Alabama Drinking Water Finance Authority, (AMBAC),
4.00%, 8/15/28 | | $ | 1,997,770 | | |
| | 800 | | | Birmingham, Waterworks and Sewer Board, (FSA),
4.50%, 1/1/35 | | | 702,008 | | |
| | 550 | | | Helena, Utilities Board Water and Sewer, (MBIA),
5.25%, 4/1/33 | | | 594,737 | | |
| | 270 | | | Limestone County, Water and Sewer Authority, (XLCA),
4.25%, 12/1/29 | | | 220,906 | | |
| | 1,340 | | | Madison, Water and Wastewater Board, (XLCA),
4.25%, 12/1/28 | | | 1,120,977 | | |
| | 1,000 | | | Opelika, Water Works Board Utility Revenue, (FSA),
5.125%, 6/1/31 | | | 980,610 | | |
| | 1,195 | | | Warrior River, Water Authority, (FSA), 5.25%, 8/1/23 | | | 1,204,919 | | |
| | | | | | | $ | 6,821,927 | | |
Principal Amount
(000's omitted) | | Security | | Value | |
| Lease Revenue / Certificates of Participation — 0.8% | |
| $ | 500 | | | Puerto Rico, (Guaynabo Municipal Government Center Lease),
5.625%, 7/1/22 | | $ | 485,365 | | |
| | | | | $ | 485,365 | | |
| Special Tax Revenue — 1.3% | |
| $ | 810 | | | Puerto Rico Sales Tax Financing, 5.25%, 8/1/57 | | $ | 730,499 | | |
| | | | | $ | 730,499 | | |
Total Tax-Exempt Investments — 100.4%
(identified cost $58,597,931) | | $ | 57,056,426 | | |
| Other Assets, Less Liabilities — (0.4)% | | $ | (215,770 | ) | |
| Net Assets — 100.0% | | $ | 56,840,656 | | |
AMBAC - AMBAC Financial Group, Inc.
AMT - Interest earned from these securities may be considered a tax preference item for purposes of the Federal Alternative Minimum Tax.
FGIC - Financial Guaranty Insurance Company
FSA - Financial Security Assurance, Inc.
MBIA - Municipal Bond Insurance Association
XLCA - XL Capital Assurance, Inc.
The Fund invests primarily in debt securities issued by Alabama municipalities. The ability of the issuers of the debt securities to meet their obligations may be affected by economic developments in a specific industry or municipality. In order to reduce the risk associated with such economic developments, at February 29, 2008, 78.0% of total investments are backed by bond insurance of various financial institutions and financial guaranty assurance agencies. The aggregate percentage insured by an individual financial institution ranged from 1.7% to 28.1% of total investments.
(1) Security represents the underlying municipal obligation of an inverse floating rate obligation held by the Fund.
(2) Security (or a portion thereof) has been segregated to cover margin requirements on open financial futures contracts.
(3) Security exempt from registration under Rule 144A of the Securities Act of 1933. These securities may be sold in transactions exempt from registration, normally to qualified institutional buyers. At February 29, 2008, the aggregate value of the securities is $782,061 or 1.4% of the Fund's net assets.
(4) Security has been issued as a leveraged inverse floater bond. The stated interest rate represents the rate in effect at February 29, 2008.
See notes to financial statements
24
Eaton Vance Arkansas Municipals Fund as of February 29, 2008
PORTFOLIO OF INVESTMENTS (Unaudited)
| Tax-Exempt Investments — 101.5% | | | |
Principal Amount
(000's omitted) | | Security | | Value | |
| Education — 1.5% | | | |
| $ | 1,000 | | | Conway, Public Facilities Board, (Hendrix College),
5.00%, 10/1/35 | | $ | 908,340 | | |
| | | | | | | $ | 908,340 | | |
| Electric Utilities — 1.2% | | | |
| $ | 250 | | | Puerto Rico Electric Power Authority, DRIVERS, Variable Rate,
7.74%, 7/1/25(1)(2) | | $ | 197,680 | | |
| | 750 | | | Puerto Rico Electric Power Authority, DRIVERS, Variable Rate,
7.74%, 7/1/37(1)(2) | | | 535,545 | | |
| | | | | | | $ | 733,225 | | |
| Escrowed / Prerefunded — 2.2% | | | |
| $ | 500 | | | Arkansas Development Finance Authority,
(Washington Regional Medical Center),
Prerefunded to 2/1/10, 7.375%, 2/1/29 | | $ | 539,845 | | |
| | 750 | | | Baxter County, Community Hospital District,
Prerefunded to 9/1/09, 5.625%, 9/1/28 | | | 781,080 | | |
| | | | | | | $ | 1,320,925 | | |
| General Obligations — 5.4% | | | |
| $ | 750 | | | Arkansas, 4.75%, 6/1/29 | | $ | 703,170 | | |
| | 2,750 | | | Arkansas State College Savings, 0.00%, 6/1/14 | | | 2,182,647 | | |
| | 350 | | | Puerto Rico Public Buildings Authority, Government Facilities,
5.00%, 7/1/36 | | | 313,477 | | |
| | | | | | | $ | 3,199,294 | | |
| Hospital — 4.8% | | | |
| $ | 800 | | | Arkansas Development Finance Authority,
(White River Medical Center), 5.60%, 6/1/24 | | $ | 773,264 | | |
| | 1,000 | | | Conway, Health Facilities Board Hospital
Improvements Revenue, (Conway Regional Medical Center),
6.40%, 8/1/29 | | | 1,021,240 | | |
| | 250 | | | North Little Rock, Health Facilities Board, (Baptist Health),
5.70%, 7/1/22 | | | 251,947 | | |
| | 785 | | | Pulaski County, (Children's Hospital), 5.25%, 3/1/16 | | | 791,751 | | |
| | | | | | | $ | 2,838,202 | | |
| Housing — 5.5% | | | |
| $ | 435 | | | Arkansas Development Finance Authority,
Single Family Mortgage, (GNMA), (AMT),
5.125%, 7/1/24 | | $ | 417,530 | | |
| | 245 | | | Arkansas Development Finance Authority,
Single Family Mortgage, (GNMA/FNMA),
5.05%, 7/1/31 | | | 222,514 | | |
Principal Amount
(000's omitted) | | Security | | Value | |
| Housing (continued) | | | |
| $ | 1,475 | | | Arkansas Development Finance Authority,
Single Family Mortgage, (GNMA/FNMA), (AMT),
4.75%, 7/1/32 | | $ | 1,275,993 | | |
| | 950 | | | Arkansas Development Finance Authority,
Single Family Mortgage, (GNMA/FNMA), (AMT),
4.80%, 7/1/26 | | | 864,519 | | |
| | 115 | | | Arkansas Development Finance Authority,
Single Family Mortgage, (GNMA/FNMA),
(AMT), 5.00%, 1/1/29 | | | 116,899 | | |
| | 420 | | | North Little Rock, Residential Housing Facilities,
(Parkstone Place), 6.50%, 8/1/21 | | | 409,895 | | |
| | | | | | | $ | 3,307,350 | | |
| Industrial Development Revenue — 8.2% | | | |
| $ | 400 | | | Arkansas Development Finance Authority,
Industrial Facility Revenue, (Potlatch Corp.), (AMT),
7.75%, 8/1/25 | | $ | 416,956 | | |
| | 2,000 | | | Baxter, (Aeroquip Corp.), 5.80%, 10/1/13 | | | 2,153,200 | | |
| | 750 | | | Calhoun County, Solid Waste Disposal Revenue,
(Georgia-Pacific Corp.), (AMT), 6.375%, 11/1/26 | | | 673,815 | | |
| | 250 | | | Pine Bluff, Environmental Improvements Revenue,
(International Paper Co.), (AMT), 6.70%, 8/1/20 | | | 255,380 | | |
| | 1,150 | | | Puerto Rico Port Authority, (American Airlines), (AMT),
6.25%, 6/1/26 | | | 991,610 | | |
| | 475 | | | Virgin Islands Public Financing Authority, (HOVENSA LLC),
(AMT), 4.70%, 7/1/22 | | | 392,150 | | |
| | | | | | | $ | 4,883,111 | | |
| Insured-Education — 17.0% | | | |
| $ | 1,000 | | | Arkansas State University, (AMBAC),
5.00%, 9/1/35 | | $ | 945,760 | | |
| | 1,000 | | | Arkansas State University, (Consolidated Building System),
(AMBAC), 5.00%, 4/1/24 | | | 981,540 | | |
| | 1,250 | | | Arkansas State University, (Student Fee), (AMBAC),
5.00%, 3/1/32 | | | 1,189,625 | | |
| | 2,155 | | | Pulaski Technical College, (AMBAC), 5.00%, 11/1/36 | | | 2,038,845 | | |
| | 500 | | | University of Arkansas, (AMBAC), 5.00%, 12/1/30 | | | 474,565 | | |
| | 1,000 | | | University of Arkansas, (Fayetteville Campus), (AMBAC),
5.00%, 11/1/36 | | | 946,100 | | |
| | 750 | | | University of Arkansas, (Fayetteville Campus), (FGIC),
5.00%, 12/1/32 | | | 712,177 | | |
| | 500 | | | University of Arkansas, (Fayetteville Campus), (MBIA),
4.75%, 11/1/24 | | | 483,195 | | |
| | 1,000 | | | University of Arkansas, (Pine Bluffs Campus), (AMBAC),
5.00%, 12/1/35 | | | 948,230 | | |
| | 1,500 | | | University of Arkansas, (UAMS Campus), (MBIA),
5.00%, 11/1/34 | | | 1,436,025 | | |
| | | | | | | $ | 10,156,062 | | |
See notes to financial statements
25
Eaton Vance Arkansas Municipals Fund as of February 29, 2008
PORTFOLIO OF INVESTMENTS (Unaudited) CONT'D
Principal Amount
(000's omitted) | | Security | | Value | |
| Insured-Electric Utilities — 2.1% | | | |
| $ | 160 | | | North Little Rock, Electric System, (MBIA),
6.50%, 7/1/10 | | $ | 166,250 | | |
| | 1,000 | | | North Little Rock, Electric System, (MBIA),
6.50%, 7/1/15 | | | 1,113,180 | | |
| | | | | | | $ | 1,279,430 | | |
| Insured-Escrowed / Prerefunded — 4.3% | | | |
| $ | 500 | | | Harrison, Residential Housing Facility Board,
Single Family Mortgage, (FGIC), Escrowed to Maturity,
7.40%, 9/1/11 | | $ | 565,250 | | |
| | 1,500 | | | Puerto Rico, (FGIC), Prerefunded to 7/1/12,
5.00%, 7/1/32(3) | | | 1,599,430 | | |
| | 400 | | | Puerto Rico Electric Power Authority, (FSA), Prerefunded to
7/1/10, 5.25%, 7/1/29(3) | | | 424,906 | | |
| | | | | | | $ | 2,589,586 | | |
| Insured-General Obligations — 2.2% | | | |
| $ | 500 | | | Arkansas State College Savings, (FGIC),
0.00%, 6/1/17 | | $ | 314,455 | | |
| | 500 | | | Little Rock, School District, (FSA), 5.25%, 2/1/33 | | | 497,910 | | |
| | 480 | | | Puerto Rico, (MBIA), 5.50%, 7/1/20 | | | 493,618 | | |
| | | | | | | $ | 1,305,983 | | |
| Insured-Health-Miscellaneous — 1.5% | | | |
| $ | 370 | | | Arkansas Development Finance Authority,
(Public Health Laboratory), (AMBAC), 3.90%, 12/1/24 | | $ | 370,437 | | |
| | 500 | | | Arkansas Development Finance Authority,
(Public Health Laboratory), (AMBAC), 5.00%, 12/1/18 | | | 509,520 | | |
| | | | | | | $ | 879,957 | | |
| Insured-Hospital — 8.0% | | | |
| $ | 1,140 | | | Heber Springs, Hospital and Health Care
Facilities Board,(Baptist Healthcare System),
(CIFG), 5.00%, 5/1/26 | | $ | 1,049,963 | | |
| | 1,500 | | | Pulaski County, (Children's Hospital), (AMBAC),
5.00%, 3/1/30 | | | 1,410,420 | | |
| | 2,065 | | | Pulaski County, (Children's Hospital), (AMBAC),
5.00%, 3/1/35 | | | 1,939,944 | | |
| | 370 | | | Saline County, Retirement Housing and Healthcare
Facilities Board, (Evan Lutheran Good Samaritan),
(AMBAC), 5.80%, 6/1/11 | | | 370,792 | | |
| | | | | | | $ | 4,771,119 | | |
Principal Amount
(000's omitted) | | Security | | Value | |
Insured-Lease Revenue / Certificates of
Participation — 2.9% | | | |
| $ | 1,000 | | | Arkansas Development Finance Authority,
Single Family Mortgage, (Donaghey Plaza), (FSA),
5.00%, 6/1/29 | | $ | 970,620 | | |
| | 720 | | | Puerto Rico Public Finance Corp.,
(Commonwealth Appropriation), (AMBAC),
5.125%, 6/1/24 | | | 731,563 | | |
| | | | | | | $ | 1,702,183 | | |
| Insured-Other Revenue — 3.8% | | | |
| $ | 1,000 | | | Arkansas Development Finance Authority,
Tobacco Settlement Revenue, (AMBAC), 0.00%, 7/1/24 | | $ | 387,340 | | |
| | 3,500 | | | Arkansas Development Finance Authority,
Tobacco Settlement Revenue, (AMBAC), 0.00%, 7/1/36 | | | 651,770 | | |
| | 7,690 | | | Arkansas Development Finance Authority,
Tobacco Settlement Revenue, (AMBAC), 0.00%, 7/1/46 | | | 771,845 | | |
| | 500 | | | University of Arkansas, Parking Revenue, (MBIA),
5.00%, 7/1/29 | | | 474,200 | | |
| | | | | | | $ | 2,285,155 | | |
| Insured-Special Tax Revenue — 6.5% | | | |
| $ | 675 | | | Bentonville Sales and Use Tax Revenue, (AMBAC),
4.375%, 11/1/27 | | $ | 601,519 | | |
| | 1,000 | | | Puerto Rico Infrastructure Financing Authority, (AMBAC),
5.50%, 7/1/27 | | | 982,410 | | |
| | 1,000 | | | Puerto Rico Infrastructure Financing Authority, (FGIC),
0.00%, 7/1/42 | | | 115,720 | | |
| | 5,790 | | | Puerto Rico Sales Tax Financing, (AMBAC), 0.00%, 8/1/54 | | | 331,709 | | |
| | 1,070 | | | Puerto Rico Sales Tax Financing, (MBIA), 0.00%, 8/1/44 | | | 118,246 | | |
| | 7,500 | | | Puerto Rico Sales Tax Financing, (MBIA), 0.00%, 8/1/45 | | | 780,450 | | |
| | 1,695 | | | Puerto Rico Sales Tax Financing, (MBIA), 0.00%, 8/1/46 | | | 166,161 | | |
| | 785 | | | Springdale Sales and Use Tax Revenue, (FSA),
4.00%, 7/1/27 | | | 786,499 | | |
| | | | | | | $ | 3,882,714 | | |
| Insured-Transportation — 2.9% | | | |
| $ | 1,200 | | | Puerto Rico Highway and Transportation Authority,
(AGC), (CIFG), 5.25%, 7/1/41(3) | | $ | 1,178,244 | | |
| | 600 | | | Puerto Rico Highway and Transportation Authority,
(FGIC), 5.25%, 7/1/39 | | | 560,724 | | |
| | | | | | | $ | 1,738,968 | | |
| Insured-Utilities — 4.6% | | | |
| $ | 2,935 | | | Benton, Utilities Revenue, (AMBAC), 5.00%, 3/1/36 | | $ | 2,777,420 | | |
| | | | | | | $ | 2,777,420 | | |
See notes to financial statements
26
Eaton Vance Arkansas Municipals Fund as of February 29, 2008
PORTFOLIO OF INVESTMENTS (Unaudited) CONT'D
Principal Amount
(000's omitted) | | Security | | Value | |
| Insured-Water and Sewer — 8.9% | | | |
| $ | 665 | | | Arkansas Community Water System, Public Water Authority,
(MBIA), 5.00%, 10/1/33 | | $ | 630,959 | | |
| | 500 | | | Arkansas Community Water System, Public Water Authority,
(MBIA), 5.00%, 10/1/42 | | | 471,785 | | |
| | 500 | | | Conway, Water Revenue, (FGIC), 5.125%, 12/1/23 | | | 498,090 | | |
| | 1,145 | | | Fort Smith, Water and Sewer, (FSA), 5.00%, 10/1/23 | | | 1,147,737 | | |
| | 500 | | | Little Rock, Sewer Revenue, (FSA), 4.75%, 6/1/37 | | | 459,305 | | |
| | 750 | | | Little Rock, Sewer Revenue, (FSA), 5.00%, 10/1/37 | | | 716,543 | | |
| | 1,500 | | | Rogers, Water Revenue, (AMBAC), 5.00%, 2/1/37 | | | 1,418,910 | | |
| | | | | | | $ | 5,343,329 | | |
| Special Tax Revenue — 5.1% | | | |
| $ | 2,000 | | | Little Rock, Hotel and Restaurant Gross Receipts Tax,
7.375%, 8/1/15 | | $ | 2,291,280 | | |
| | 815 | | | Puerto Rico Sales Tax Financing, 5.25%, 8/1/57 | | | 735,008 | | |
| | | | | | | $ | 3,026,288 | | |
| Transportation — 0.8% | | | |
| $ | 500 | | | Northwest Arkansas Regional Airport Authority,
(AMT), 5.00%, 2/1/18 | | $ | 457,565 | | |
| | | | | | | $ | 457,565 | | |
| Water and Sewer — 2.1% | | | |
| $ | 1,000 | | | Arkansas Development Finance Authority,
(Waste Water System), 5.00%, 6/1/22(4) | | $ | 1,001,130 | | |
| | 250 | | | Arkansas Development Finance Authority,
(Waste Water System), 5.50%, 12/1/19 | | | 270,048 | | |
| | | | | | | $ | 1,271,178 | | |
Total Tax-Exempt Investments — 101.5%
(identified cost $64,849,904) | | $ | 60,657,384 | | |
| Other Assets, Less Liabilities — (1.5)% | | $ | (895,312 | ) | |
| Net Assets — 100.0% | | $ | 59,762,072 | | |
AGC - Assured Guaranty Corp.
AMBAC - AMBAC Financial Group, Inc.
AMT - Interest earned from these securities may be considered a tax preference item for purposes of the Federal Alternative Minimum Tax.
CIFG - CIFG Assurance North America, Inc.
DRIVERS - Derivative Inverse Tax-Exempt Receipts
FGIC - Financial Guaranty Insurance Company
FNMA - Federal National Mortgage Association (Fannie Mae)
FSA - Financial Security Assurance, Inc.
GNMA - Government National Mortgage Association (Ginnie Mae)
MBIA - Municipal Bond Insurance Association
The Fund invests primarily in debt securities issued by Arkansas municipalities. The ability of the issuers of the debt securities to meet their obligations may be affected by economic developments in a specific industry or municipality. In order to reduce the risk associated with such economic developments, at February 29, 2008, 63.8% of total investments are backed by bond insurance of various financial institutions and financial guaranty assurance agencies. The aggregate percentage insured by an individual financial institution ranged from 1.9% to 34.3% of total investments.
(1) Security exempt from registration under Rule 144A of the Securities Act of 1933. These securities may be sold in transactions exempt from registration, normally to qualified institutional buyers. At February 29, 2008, the aggregate value of the securities is $733,225 or 1.2% of the Fund's net assets.
(2) Security has been issued as a leveraged inverse floater bond. The stated interest rate represents the rate in effect at February 29, 2008.
(3) Security represents the underlying municipal obligation of an inverse floating rate obligation held by the Fund.
(4) Security (or a portion thereof) has been segregated to cover margin requirements on open financial futures contracts.
See notes to financial statements
27
Eaton Vance Georgia Municipals Fund as of February 29, 2008
PORTFOLIO OF INVESTMENTS (Unaudited)
| Tax-Exempt Investments — 103.2% | | | |
Principal Amount
(000's omitted) | | Security | | Value | |
| Education — 5.1% | | | |
| $ | 2,000 | | | Athens-Clarke County Unified Government
Development Authority, Educational Facilities,
4.50%, 6/15/38 | | $ | 1,722,780 | | |
| | 1,000 | | | Atlanta Development Authority, Educational Facilities,
5.00%, 7/1/39 | | | 898,220 | | |
| | 1,500 | | | Fulton County, Development Authority,
(Georgia Technology Foundation), 5.00%, 11/1/31 | | | 1,449,405 | | |
| | | | | | | $ | 4,070,405 | | |
| Electric Utilities — 1.1% | | | |
| $ | 665 | | | Puerto Rico Electric Power Authority, 0.00%, 7/1/17 | | $ | 418,724 | | |
| | 150 | | | Puerto Rico Electric Power Authority, DRIVERS,
Variable Rate, 7.74%, 7/1/25(1)(2) | | | 118,608 | | |
| | 450 | | | Puerto Rico Electric Power Authority, DRIVERS,
Variable Rate, 7.74%, 7/1/37(1)(2) | | | 321,327 | | |
| | | | | | | $ | 858,659 | | |
| Escrowed / Prerefunded — 3.9% | | | |
| $ | 800 | | | Forsyth County, Hospital Authority,
(Georgia Baptist Health Care System),
Escrowed to Maturity, 6.375%, 10/1/28 | | $ | 902,072 | | |
| | 1,000 | | | Gainesville and Hall County, Hospital Authority,
(Northeast Georgia Health System, Inc.),
Prerefunded to 5/15/11, 5.50%, 5/15/31 | | | 1,066,300 | | |
| | 45 | | | Georgia Municipal Electric Power Authority,
Prerefunded to Various Dates, 0.00%, 1/1/12 | | | 36,363 | | |
| | 500 | | | Gwinnett County, Water and Sewer Authority,
Prerefunded to 8/1/12, 5.25%, 8/1/24 | | | 538,795 | | |
| | 500 | | | Milledgeville & Baldwin County, Development Authority,
(Georgia College and State University Funding),
Prerefunded to 9/1/14, 5.625%, 9/1/30 | | | 560,830 | | |
| | | | | | | $ | 3,104,360 | | |
| General Obligations — 7.0% | | | |
| $ | 230 | | | Alpharetta, 6.50%, 5/1/10 | | $ | 239,366 | | |
| | 2,000 | | | Georgia, 1.00%, 3/1/26 | | | 998,060 | | |
| | 500 | | | Georgia, 2.00%, 12/1/23 | | | 330,580 | | |
| | 3,095 | | | Paulding County, 5.00%, 2/1/33 | | | 2,967,238 | | |
| | 1,000 | | | Puerto Rico Aqueduct and Sewer Authority, 6.25%, 7/1/12 | | | 1,082,530 | | |
| | | | | | | $ | 5,617,774 | | |
Principal Amount
(000's omitted) | | Security | | Value | |
| Hospital — 0.5% | | | |
| $ | 500 | | | Baldwin County, Hospital Authority,
(Oconee Regional Medical Center), 5.375%, 12/1/28 | | $ | 442,575 | | |
| | | | | | | $ | 442,575 | | |
| Housing — 3.0% | | | |
| $ | 1,000 | | | Georgia Housing and Finance Authority, (AMT),
4.85%, 12/1/37 | | $ | 861,470 | | |
| | 1,000 | | | Georgia Housing and Finance Authority, (AMT),
5.25%, 12/1/37 | | | 910,560 | | |
| | 600 | | | Georgia Private Colleges and Universities Authority,
Student Housing Revenue, (Mercer Housing Corp.),
6.00%, 6/1/31 | | | 600,156 | | |
| | | | | | | $ | 2,372,186 | | |
| Industrial Development Revenue — 10.4% | | | |
| $ | 2,000 | | | Albany Dougherty, Payroll Development Authority,
Solid Waste Disposal, (Procter and Gamble), (AMT),
5.20%, 5/15/28(3) | | $ | 1,948,580 | | |
| | 700 | | | Cartersville, Development Authority, (Anheuser-Busch),
(AMT), 5.95%, 2/1/32 | | | 687,267 | | |
| | 1,000 | | | Cartersville, Development Authority, (Anheuser-Busch),
(AMT), 7.375%, 5/1/09 | | | 1,043,890 | | |
| | 1,000 | | | Cobb County, Development Authority, Solid Waste Disposal,
(Georgia Waste Management Project), 5.00%, 4/1/33 | | | 818,190 | | |
| | 750 | | | Effingham County, (Solid Waste Disposal), (Fort James Project),
(AMT), 5.625%, 7/1/18 | | | 651,705 | | |
| | 1,250 | | | Puerto Rico Port Authority, (American Airlines), (AMT),
6.25%, 6/1/26 | | | 1,077,837 | | |
| | 1,000 | | | Savannah Economic Development Authority,
(Intercat-Savannah), (AMT), 7.00%, 1/1/38 | | | 939,480 | | |
| | 920 | | | Vienna Water and Sewer, (Cargill), (AMT), 6.00%, 9/1/14 | | | 921,380 | | |
| | 225 | | | Virgin Islands Public Financing Authority, (HOVENSA LLC),
(AMT), 4.70%, 7/1/22 | | | 185,755 | | |
| | | | | | | $ | 8,274,084 | | |
| Insured-Education — 8.0% | | | |
| $ | 1,000 | | | Carrollton, Payroll Development Authority, (University
of West Georgia), (MBIA), 4.75%, 8/1/30 | | $ | 925,830 | | |
| | 1,000 | | | Fulton County, Development Authority, (Morehouse
College), (AMBAC), 4.50%, 6/1/37 | | | 878,970 | | |
| | 1,500 | | | Fulton County, Development Authority, (Tuff Morehouse),
(AMBAC), 5.00%, 2/1/34 | | | 1,422,750 | | |
| | 1,500 | | | Georgia Private Colleges and Universities Authority,
(Agnes Scott College), (MBIA), 4.75%, 6/1/28 | | | 1,412,385 | | |
| | 2,000 | | | South Regional Joint Development Authority,
(Valdosta State University), (XLCA), 5.00%, 8/1/38 | | | 1,790,800 | | |
| | | | | | | $ | 6,430,735 | | |
See notes to financial statements
28
Eaton Vance Georgia Municipals Fund as of February 29, 2008
PORTFOLIO OF INVESTMENTS (Unaudited) CONT'D
Principal Amount
(000's omitted) | | Security | | Value | |
| Insured-Electric Utilities — 6.8% | | | |
| $ | 685 | | | Georgia Municipal Electric Power Authority, (MBIA),
0.00%, 1/1/12 | | $ | 536,608 | | |
| | 3,005 | | | Georgia Municipal Electric Power Authority, (MBIA),
5.50%, 1/1/20 | | | 3,242,155 | | |
| | 750 | | | Puerto Rico Electric Power Authority, (FGIC),
5.25%, 7/1/35 | | | 713,422 | | |
| | 1,000 | | | Puerto Rico Electric Power Authority, (MBIA),
5.25%, 7/1/29 | | | 961,470 | | |
| | | | | | | $ | 5,453,655 | | |
| Insured-Escrowed / Prerefunded — 2.0% | | | |
| $ | 1,500 | | | Puerto Rico Highway and Transportation Authority, (MBIA),
Prerefunded to 7/1/16, 5.00%, 7/1/36(4) | | $ | 1,618,080 | | |
| | | | | | | $ | 1,618,080 | | |
| Insured-General Obligations — 4.1% | | | |
| $ | 660 | | | Fayette County, School District, (FSA),
0.00%, 3/1/25 | | $ | 548,130 | | |
| | 1,325 | | | Gilmer County, (XLCA), 5.00%, 4/1/32 | | | 1,257,398 | | |
| | 900 | | | Puerto Rico, (FSA), Variable Rate, 11.337%, 7/1/27(1)(2) | | | 1,005,507 | | |
| | 480 | | | Puerto Rico, (MBIA), 5.50%, 7/1/20 | | | 493,618 | | |
| | | | | | | $ | 3,304,653 | | |
| Insured-Hospital — 3.2% | | | |
| $ | 1,190 | | | Clarke County Hospital Authority, (Athens Regional
Medical Center), (MBIA), 5.00%, 1/1/32 | | $ | 1,084,923 | | |
| | 1,000 | | | Henry County, Hospital Authority Revenue, (Henry
Medical Center, Inc.), (AMBAC), 6.00%, 7/1/29 | | | 1,032,830 | | |
| | 400 | | | Medical Center Hospital Authority, (Columbus Regional
Healthcare System), (MBIA), Variable Rate,
9.288%, 8/1/10(1)(5) | | | 410,652 | | |
| | | | | | | $ | 2,528,405 | | |
| Insured-Housing — 0.4% | | | |
| $ | 380 | | | Peach County Development Authority, (Fort Valley State
University Foundation), (AMBAC), 4.50%, 6/1/37 | | $ | 327,868 | | |
| | | | | | | $ | 327,868 | | |
| Insured-Industrial Development Revenue — 0.9% | | | |
| $ | 765 | | | Monroe County Development Authority,
(Georgia Power Co.), (AMBAC),
4.90%, 7/1/36 | | $ | 702,706 | | |
| | | | | | | $ | 702,706 | | |
Principal Amount
(000's omitted) | | Security | | Value | |
Insured-Lease Revenue / Certificates of
Participation — 4.7% | | | |
| $ | 1,000 | | | Atlanta, Downtown Development Authority, (MBIA),
4.50%, 12/1/26 | | $ | 904,030 | | |
| | 750 | | | Atlanta, Public Safety and Judicial Facilities Authority,
(Public Safety Facility), (FSA), 5.00%, 12/1/26 | | | 732,105 | | |
| | 991 | | | Georgia Local Government Certificate of Participation,
(MBIA), 4.75%, 6/1/28 | | | 913,316 | | |
| | 1,200 | | | Puerto Rico Public Finance Corp., (Commonwealth
Appropriation), (AMBAC), 5.125%, 6/1/24 | | | 1,219,272 | | |
| | | | | | | $ | 3,768,723 | | |
| Insured-Other Revenue — 1.7% | | | |
| $ | 1,500 | | | Downtown Savannah Authority, (Savannah Ellis
Square Parking), (MBIA), 4.75%, 8/1/32 | | $ | 1,378,050 | | |
| | | | | | | $ | 1,378,050 | | |
| Insured-Special Tax Revenue — 3.7% | | | |
| $ | 1,000 | | | George L. Smith, (Georgia World Congress Center-
Domed Stadium), (MBIA), (AMT), 5.50%, 7/1/20 | | $ | 1,002,640 | | |
| | 4,000 | | | Puerto Rico Infrastructure Financing Authority, (AMBAC),
0.00%, 7/1/34 | | | 780,200 | | |
| | 1,200 | | | Puerto Rico Infrastructure Financing Authority, (AMBAC),
5.50%, 7/1/27 | | | 1,178,892 | | |
| | | | | | | $ | 2,961,732 | | |
| Insured-Transportation — 11.6% | | | |
| $ | 785 | | | Atlanta, Airport Passenger Facility Charge, (FSA),
4.75%, 1/1/28 | | $ | 728,700 | | |
| | 2,000 | | | Atlanta, Airport Passenger Facility Charge, (FSA),
5.00%, 1/1/34 | | | 1,878,500 | | |
| | 500 | | | Atlanta, Airport Revenue, (FGIC), 5.625%, 1/1/25 | | | 479,740 | | |
| | 1,000 | | | Metropolitan Atlanta Rapid Transit Authority, (AMBAC),
6.25%, 7/1/20 | | | 1,116,240 | | |
| | 2,000 | | | Metropolitan Atlanta Rapid Transit Authority, (FGIC),
5.25%, 7/1/32 | | | 2,010,820 | | |
| | 1,780 | | | Puerto Rico Highway and Transportation Authority, (AGC),
(CIFG), 5.25%, 7/1/41(4) | | | 1,747,729 | | |
| | 750 | | | Puerto Rico Highway and Transportation Authority, (AMBAC),
0.00%, 7/1/18 | | | 435,825 | | |
| | 900 | | | Puerto Rico Highway and Transportation Authority, (FGIC),
5.25%, 7/1/39 | | | 841,086 | | |
| | | | | | | $ | 9,238,640 | | |
See notes to financial statements
29
Eaton Vance Georgia Municipals Fund as of February 29, 2008
PORTFOLIO OF INVESTMENTS (Unaudited) CONT'D
Principal Amount
(000's omitted) | | Security | | Value | |
| Insured-Water and Sewer — 16.0% | | | |
| $ | 1,180 | | | Atlanta, Water and Wastewater, (FGIC),
5.00%, 11/1/38 | | $ | 1,116,304 | | |
| | 2,000 | | | Atlanta, Water and Wastewater, (FSA),
5.00%, 11/1/34 | | | 1,898,300 | | |
| | 500 | | | Atlanta, Water and Wastewater, (MBIA),
5.00%, 11/1/39 | | | 471,435 | | |
| | 1,250 | | | Augusta, Water and Sewer (FSA),
5.00%, 10/1/30 | | | 1,207,275 | | |
| | 2,000 | | | Augusta, Water and Sewer, (FSA),
5.00%, 10/1/32 | | | 1,931,300 | | |
| | 1,135 | | | Coweta County, Water and Sewer Authority, (FSA),
5.00%, 6/1/26 | | | 1,129,529 | | |
| | 1,000 | | | De Kalb County, Water and Sewer, (FSA),
5.25%, 10/1/32 | | | 1,021,460 | | |
| | 1,000 | | | Henry County, Water and Sewer Authority, (MBIA),
5.25%, 2/1/25 | | | 1,022,530 | | |
| | 1,000 | | | Henry County, Water and Sewer Authority, (MBIA),
5.25%, 2/1/30 | | | 1,014,320 | | |
| | 1,040 | | | Newnan, Water, Sewer and Light Commission, (AMBAC),
5.25%, 1/1/24 | | | 1,048,850 | | |
| | 1,000 | | | Walton County, Water and Sewer Authority, (FSA),
5.00%, 2/1/38 | | | 950,870 | | |
| | | | | | | $ | 12,812,173 | | |
| Lease Revenue / Certificates of Participation — 1.2% | | | |
| $ | 1,000 | | | Fulton County, Building Authority, Judicial Center,
0.00%, 1/1/10 | | $ | 949,980 | | |
| | | | | | | $ | 949,980 | | |
| Other Revenue — 1.1% | | | |
| $ | 1,000 | | | Main Street National Gas Inc., 5.00%, 3/15/22 | | $ | 866,500 | | |
| | | | | | | $ | 866,500 | | |
| Special Tax Revenue — 2.3% | | | |
| $ | 2,020 | | | Puerto Rico Sales Tax Financing, 5.25%, 8/1/57 | | $ | 1,821,737 | | |
| | | | | | | $ | 1,821,737 | | |
| Transportation — 0.3% | | | |
| $ | 250 | | | Augusta, Airport Revenue, 5.15%, 1/1/35 | | $ | 211,983 | | |
| | | | | | | $ | 211,983 | | |
Principal Amount
(000's omitted) | | Security | | Value | |
| Water and Sewer — 4.2% | |
| $ | 1,500 | | | Coweta County, Water and Sewer Authority,
5.00%, 6/1/32 | | $ | 1,429,020 | | |
| | 2,000 | | | Coweta County, Water and Sewer Authority,
5.00%, 6/1/37 | | | 1,891,280 | | |
| | | | | $ | 3,320,300 | | |
Total Tax-Exempt Investments — 103.2%
(identified cost $87,263,003) | | $ | 82,435,963 | | |
| Other Assets, Less Liabilities — (3.2)% | | $ | (2,532,501 | ) | |
| Net Assets — 100.0% | | $ | 79,903,462 | | |
AGC - Assured Guaranty Corp.
AMBAC - AMBAC Financial Group, Inc.
AMT - Interest earned from these securities may be considered a tax preference item for purposes of the Federal Alternative Minimum Tax.
CIFG - CIFG Assurance North America, Inc.
DRIVERS - Derivative Inverse Tax-Exempt Receipts
FGIC - Financial Guaranty Insurance Company
FSA - Financial Security Assurance, Inc.
MBIA - Municipal Bond Insurance Association
XLCA - XL Capital Assurance, Inc.
The Fund invests primarily in debt securities issued by Georgia municipalities. The ability of the issuers of the debt securities to meet their obligations may be affected by economic developments in a specific industry or municipality. In order to reduce the risk associated with such economic developments, at February 29, 2008, 61.3% of total investments are backed by bond insurance of various financial institutions and financial guaranty assurance agencies. The aggregate percentage insured by an individual financial institution ranged from 2.1% to 21.1% of total investments.
(1) Security exempt from registration under Rule 144A of the Securities Act of 1933. These securities may be sold in transactions exempt from registration, normally to qualified institutional buyers. At February 29, 2008, the aggregate value of the securities is $1,856,094 or 2.3% of the Fund's net assets.
(2) Security has been issued as a leveraged inverse floater bond. The stated interest rate represents the rate in effect at February 29, 2008.
(3) Security (or a portion thereof) has been segregated to cover margin requirements on open financial futures contracts.
(4) Security represents the underlying municipal obligation of an inverse floating rate obligation held by the Fund.
(5) Security has been issued as an inverse floater bond. The stated interest rate represents the rate in effect at February 29, 2008.
See notes to financial statements
30
Eaton Vance Kentucky Municipals Fund as of February 29, 2008
PORTFOLIO OF INVESTMENTS (Unaudited)
| Tax-Exempt Investments — 103.7% | | | |
Principal Amount
(000's omitted) | |
Security | | Value | |
| Education — 2.1% | | | |
| $ | 1,280 | | | Campbellsville, (Campbellsville University),
5.70%, 3/1/34 | | $ | 1,193,651 | | |
| | | | | | | $ | 1,193,651 | | |
| Electric Utilities — 3.9% | | | |
| $ | 3,500 | | | Puerto Rico Electric Power Authority,
0.00%, 7/1/17 | | $ | 2,203,810 | | |
| | | | | | | $ | 2,203,810 | | |
| Escrowed / Prerefunded — 1.5% | | | |
| $ | 790 | | | Puerto Rico Electric Power Authority, Prerefunded to
7/1/13, 5.125%, 7/1/29 | | $ | 855,388 | | |
| | | | | | | $ | 855,388 | | |
| General Obligations — 2.7% | | | |
| $ | 1,465 | | | Bowling Green, 5.30%, 6/1/19 | | $ | 1,528,391 | | |
| | | | | | | $ | 1,528,391 | | |
| Hospital — 1.5% | | | |
| $ | 1,000 | | | Murray Hospital Facilities, (Murray Calloway
County Hospital), 5.125%, 8/1/37 | | $ | 876,000 | | |
| | | | | | | $ | 876,000 | | |
| Housing — 5.8% | | | |
| $ | 500 | | | Kentucky Housing Corp., (AMT), 5.00%, 7/1/37 | | $ | 444,525 | | |
| | 2,000 | | | Kentucky Housing Corp., (AMT), 5.30%, 1/1/38(1) | | | 1,848,100 | | |
| | 1,000 | | | Kentucky Housing Corp., (Urban Florence I,
L.P.), (AMT), 5.00% to 6/1/23, 6/1/35 | | | 963,200 | | |
| | | | | | | $ | 3,255,825 | | |
| Industrial Development Revenue — 6.9% | | | |
| $ | 1,500 | | | Hancock County, (Southwire Co.), (AMT),
7.75%, 7/1/25 | | $ | 1,501,785 | | |
| | 695 | | | Virgin Islands Public Financing Authority,
(HOVENSA LLC), (AMT), 4.70%, 7/1/22 | | | 573,778 | | |
| | 1,820 | | | Wickliffe, Solid Waste Disposal, (Westvaco Corp.),
(AMT), 6.375%, 4/1/26 | | | 1,806,368 | | |
| | | | | | | $ | 3,881,931 | | |
Principal Amount
(000's omitted) | |
Security | | Value | |
| Insured-Education — 6.8% | | | |
| $ | 2,000 | | | Boyle County, (Centre College), (CIFG),
5.00%, 6/1/32 | | $ | 1,829,300 | | |
| | 2,000 | | | Lexington-Fayette Urban County, (University of Kentucky,
Alumni Association, Inc.), (MBIA), 5.00%, 11/1/18 | | | 2,037,600 | | |
| | | | | | | $ | 3,866,900 | | |
| Insured-Electric Utilities — 8.7% | | | |
| $ | 1,000 | | | Kentucky Municipal Power Agency, (MBIA),
5.25%, 9/1/27 | | $ | 961,070 | | |
| | 2,000 | | | Kentucky Municipal Power Agency, (Prairie Street
Project), (MBIA), 5.00%, 9/1/37 | | | 1,871,420 | | |
| | 1,000 | | | Louisville and Jefferson County, Metropolitan
Government Environmental Facilities, (Louisville
Gas and Electric Co.), (AMBAC), Variable Rate,
8.50%, 6/1/33 | | | 1,000,000 | | |
| | 2,000 | | | Owensboro, (AMBAC), 0.00%, 1/1/20 | | | 1,066,280 | | |
| | | | | | | $ | 4,898,770 | | |
| Insured-Escrowed / Prerefunded — 10.7% | | | |
| $ | 2,700 | | | Kenton County, Airport, (MBIA), (AMT),
Prerefunded to 3/1/08, 6.30%, 3/1/15 | | $ | 2,727,459 | | |
| | 1,195 | | | Kenton County, Airport, (MBIA), (AMT),
Prerefunded to 3/1/08, 6.45%, 3/1/15 | | | 1,219,151 | | |
| | 1,000 | | | Kentucky Property and Buildings Commission,
(FSA), Prerefunded to 8/1/11, 5.00%, 8/1/21 | | | 1,059,150 | | |
| | 1,000 | | | Puerto Rico Highway and Transportation Authority,
(AMBAC), Prerefunded to 7/1/08, 5.00%, 7/1/28 | | | 1,018,510 | | |
| | | | | | | $ | 6,024,270 | | |
| Insured-General Obligations — 3.5% | | | |
| $ | 350 | | | Puerto Rico, (FSA), Variable Rate,
11.337%, 7/1/27(2)(3) | | $ | 391,030 | | |
| | 600 | | | Puerto Rico, (MBIA), 5.50%, 7/1/20 | | | 617,022 | | |
| | 1,000 | | | Warren County, (Judicial Office Building and Parks),
(AMBAC), 5.20%, 9/1/29 | | | 1,001,980 | | |
| | | | | | | $ | 2,010,032 | | |
| Insured-Hospital — 5.1% | | | |
| $ | 850 | | | Jefferson County, Health Facilities Authority,
(University Medical Center), (MBIA), 5.25%, 7/1/22 | | $ | 851,785 | | |
| | 6,775 | | | Kentucky Economic Development Finance Authority,
(Norton Healthcare, Inc.), (MBIA), 0.00%, 10/1/27 | | | 2,033,110 | | |
| | | | | | | $ | 2,884,895 | | |
See notes to financial statements
31
Eaton Vance Kentucky Municipals Fund as of February 29, 2008
PORTFOLIO OF INVESTMENTS (Unaudited) CONT'D
Principal Amount
(000's omitted) | |
Security | | Value | |
| Insured-Industrial Development Revenue — 0.8% | | | |
| $ | 500 | | | Boone County, (Dayton Power & Light Co.,
(The)), (FGIC), 4.70%, 1/1/28 | | $ | 437,670 | | |
| | | | | | | $ | 437,670 | | |
Insured-Lease Revenue / Certificates of
Participation — 16.3% | | | |
| $ | 1,000 | | | Gallatin County, School District Finance Corp.
School Building, (XLCA), 4.50%, 5/1/26 | | $ | 863,890 | | |
| | 1,350 | | | Hardin County, School District Finance Corp.
School Building, (FSA), 4.75%, 7/1/21 | | | 1,340,037 | | |
| | 1,000 | | | Jefferson County, School District Finance Corp.
School Building, (FSA), 4.50%, 7/1/23 | | | 935,410 | | |
| | 1,150 | | | Kentucky Area Development Districts, (XLCA),
4.70%, 6/1/35 | | | 999,178 | | |
| | 1,000 | | | Letcher County, School District Finance Corp.,
School Building, (FSA), 5.00%, 6/1/26 | | | 984,630 | | |
| | 1,000 | | | Louisville, Parking Authority, (MBIA), 5.00%, 6/1/32 | | | 955,290 | | |
| | 1,000 | | | Puerto Rico Public Buildings Authority, (AMBAC),
5.50%, 7/1/21 | | | 1,015,530 | | |
| | 1,000 | | | Puerto Rico Public Buildings Authority, (XLCA),
5.50%, 7/1/21 | | | 995,250 | | |
| | 900 | | | Puerto Rico Public Finance Corp., (Commonwealth
Appropriation), (AMBAC), 5.125%, 6/1/24 | | | 914,454 | | |
| | 255 | | | Wayne County, School District Finance Corp., (MBIA),
4.00%, 7/1/25 | | | 217,535 | | |
| | | | | | | $ | 9,221,204 | | |
| Insured-Transportation — 6.8% | | | |
| $ | 1,000 | | | Kentucky Economic Development Authority, (State
Turnpike Revitalization), (FGIC), 0.00%, 1/1/10 | | $ | 946,030 | | |
| | 5,000 | | | Puerto Rico Highway and Transportation Authority,
(AMBAC), 0.00%, 7/1/18(4) | | | 2,905,500 | | |
| | | | | | | $ | 3,851,530 | | |
| Insured-Water and Sewer — 12.0% | | | |
| $ | 1,500 | | | Boone-Florence Water Commission, Water Supply
System, (FGIC), 5.00%, 12/1/27 | | $ | 1,443,405 | | |
| | 1,000 | | | Campbell and Kenton County, District No. 1, (FSA),
5.00%, 8/1/31 | | | 963,870 | | |
| | 1,500 | | | Campbell and Kenton County, Sanitation District No. 1,
(MBIA), 4.375%, 8/1/35 | | | 1,262,415 | | |
| | 1,060 | | | Kentucky Rural Water Finance Corp., (MBIA),
4.70%, 8/1/35 | | | 960,031 | | |
| | 2,250 | | | Louisville and Jefferson County, Metropolitan Sewer District
and Drainage System, (FGIC), 5.00%, 5/15/38(5) | | | 2,142,180 | | |
| | | | | | | $ | 6,771,901 | | |
Principal Amount
(000's omitted) | |
Security | | Value | |
| Lease Revenue / Certificates of Participation — 7.9% | | | |
| $ | 1,000 | | | Jefferson County, (Capital Projects Corp.),
0.00%, 8/15/12 | | $ | 850,870 | | |
| | 4,990 | | | Jefferson County, (Capital Projects Corp.),
0.00%, 8/15/15 | | | 3,618,000 | | |
| | | | | | | $ | 4,468,870 | | |
| Other Revenue — 0.7% | | | |
| $ | 4,200 | | | Children's Trust Fund, Tobacco Settlement,
0.00%, 5/15/50 | | $ | 197,106 | | |
| | 7,595 | | | Children's Trust Fund, Tobacco Settlement,
0.00%, 5/15/55 | | | 223,673 | | |
| | | | | | | $ | 420,779 | | |
Total Tax-Exempt Investments
(identified cost $59,586,786) | | $ | 58,651,817 | | |
| Auction-Rate Securities — 1.8% | | | |
Principal Amount
(000's omitted) | |
Security | | Value | |
| $ | 1,000 | | | Kentucky Economic Development Finance Authority,
(St. Elizabeth Medical Center), Variable Rate,
8.50%, 5/1/33(6) | | $ | 1,000,000 | | |
Total Auction-Rate Securities
(identified cost $1,000,000) | | $ | 1,000,000 | | |
Total Investments — 105.5%
(identified cost $60,586,786) | | $ | 59,651,817 | | |
| Other Assets, Less Liabilities — (5.5)% | | $ | (3,122,875 | ) | |
| Net Assets — 100.0% | | $ | 56,528,942 | | |
AMBAC - AMBAC Financial Group, Inc.
AMT - Interest earned from these securities may be considered a tax preference item for purposes of the Federal Alternative Minimum Tax.
CIFG - CIFG Assurance North America, Inc.
FGIC - Financial Guaranty Insurance Company
FSA - Financial Security Assurance, Inc.
MBIA - Municipal Bond Insurance Association
XLCA - XL Capital Assurance, Inc.
See notes to financial statements
32
Eaton Vance Kentucky Municipals Fund as of February 29, 2008
PORTFOLIO OF INVESTMENTS (Unaudited) CONT'D
The Fund invests primarily in debt securities issued by Kentucky municipalities. The ability of the issuers of the debt securities to meet their obligations may be affected by economic developments in a specific industry or municipality. In order to reduce the risk associated with such economic developments, at February 29, 2008, 67.0% of total investments are backed by bond insurance of various financial institutions and financial guaranty assurance agencies. The aggregate percentage insured by an individual financial institution ranged from 3.1% to 26.3% of total investments.
(1) When-issued security.
(2) Security exempt from registration under Rule 144A of the Securities Act of 1933. These securities may be sold in transactions exempt from registration, normally to qualified institutional buyers. At February 29, 2008, the aggregate value of the securities is $391,030 or 0.7% of the Fund's net assets.
(3) Security has been issued as a leveraged inverse floater bond. The stated interest rate represents the rate in effect at February 29, 2008.
(4) Security (or a portion thereof) has been segregated to cover payable for when-issued securities.
(5) Security (or a portion thereof) has been segregated to cover margin requirements on open financial futures contracts.
(6) Security subject to redemption at each auction date. The stated interest rate represents the rate in effect at February 29, 2008.
See notes to financial statements
33
Eaton Vance Louisiana Municipals Fund as of February 29, 2008
PORTFOLIO OF INVESTMENTS (Unaudited)
| Tax-Exempt Investments — 102.2% | | | |
Principal Amount
(000's omitted) | | Security | | Value | |
| Hospital — 10.8% | | | |
| $ | 1,000 | | | Louisiana Public Facilities Authority, (Franciscan
Missionaries), 5.00%, 8/15/33 | | $ | 891,170 | | |
| | 1,000 | | | Louisiana Public Facilities Authority, (Ochsner Clinic
Foundation), 5.50%, 5/15/47 | | | 908,530 | | |
| | 1,120 | | | Louisiana Public Facilities Authority, (Ochsner Clinic
Foundation), Prerefunded to 5/15/26,
5.50%, 5/15/32 | | | 1,191,187 | | |
| | 500 | | | Louisiana Public Facilities Authority, (Tuoro Infirmary),
5.625%, 8/15/29 | | | 444,450 | | |
| | 1,010 | | | Tangipahoa Parish, Hospital Service District No.1,
(North Oaks Medical Center), 5.00%, 2/1/30 | | | 912,161 | | |
| | | | | | | $ | 4,347,498 | | |
| Housing — 6.3% | | | |
| $ | 15 | | | Louisiana Health Facilities Authority, Single
Family, (GNMA), (AMT), 8.00%, 3/1/25 | | $ | 15,328 | | |
| | 1,725 | | | Louisiana Housing Finance Agency,
(GNMA/FNMA/FHLMC), 4.80%, 12/1/38 | | | 1,469,959 | | |
| | 1,000 | | | Louisiana Housing Finance Agency, (AMT),
(GNMA/FNMA/FHLMC), 5.20%, 6/1/39 | | | 908,450 | | |
| | 345 | | | Louisiana Housing Finance Authority, Single Family,
(GNMA/FNMA), 0.00%, 6/1/27 | | | 123,106 | | |
| | | | | | | $ | 2,516,843 | | |
| Industrial Development Revenue — 7.2% | | | |
| $ | 325 | | | Louisiana Environmental Facilities and Community
Development Authority, (Senior-Air Cargo),
(AMT), 6.65%, 1/1/25 | | $ | 325,094 | | |
| | 2,000 | | | St. John Baptist Parish, (Marathon Oil Corp.),
5.125%, 6/1/37 | | | 1,750,940 | | |
| | 1,000 | | | Virgin Islands Public Financing Authority,
(HOVENSA LLC), (AMT), 4.70%, 7/1/22 | | | 825,580 | | |
| | | | | | | $ | 2,901,614 | | |
| Insured-Education — 14.3% | | | |
| $ | 500 | | | Lafayette, Public Trust Financing Authority, (Ragin
Cajun Facility, Inc.), (MBIA), 5.00%, 10/1/32 | | $ | 474,885 | | |
| | 1,500 | | | Louisiana Environmental Facilities and Community
Development Authority, (AMBAC), 4.50%, 10/1/37 | | | 1,285,860 | | |
| | 500 | | | Louisiana Environmental Facilities and Community
Development Authority, (Louisiana State University
Student Housing), (MBIA), 4.75%, 8/1/28 | | | 448,990 | | |
| | 550 | | | Louisiana Public Facilities Authority,
(Black & Gold Facilities), (CIFG), 4.50%, 7/1/38 | | | 449,784 | | |
Principal Amount
(000's omitted) | | Security | | Value | |
| Insured-Education (continued) | | | |
| $ | 1,000 | | | Louisiana Public Facilities Authority, (Dillard
University), (AMBAC), 5.30%, 8/1/26 | | $ | 1,000,340 | | |
| | 1,000 | | | Louisiana Public Facilities Authority, (University
of New Orleans), (MBIA), 4.75%, 3/1/32 | | | 901,940 | | |
| | 1,200 | | | New Orleans, Finance Authority, (Xavier University),
(MBIA), 5.30%, 6/1/32 | | | 1,174,248 | | |
| | | | | | | $ | 5,736,047 | | |
| Insured-Electric Utilities — 9.0% | | | |
| $ | 1,250 | | | Puerto Rico Electric Power Authority, (MBIA),
0.00%, 7/1/17 | | $ | 780,650 | | |
| | 1,350 | | | Puerto Rico Electric Power Authority, (MBIA),
4.75%, 7/1/33(1) | | | 1,177,443 | | |
| | 2,000 | | | Rapides Finance Authority, (Cleco Power LLC),
(AMBAC), 4.70%, 11/1/36 | | | 1,651,260 | | |
| | | | | | | $ | 3,609,353 | | |
| Insured-Escrowed / Prerefunded — 6.1% | | | |
| $ | 750 | | | Jefferson, District Sales Tax and Sales Tax Revenue,
(AMBAC), Prerefunded to 12/1/12, 5.25%, 12/1/22 | | $ | 812,025 | | |
| | 2,475 | | | Jefferson Parish, Home Mortgage Authority,
Single Family, (FGIC), Escrowed to Maturity,
0.00%, 5/1/17(2) | | | 1,643,623 | | |
| | | | | | | $ | 2,455,648 | | |
| Insured-General Obligations — 10.1% | | | |
| $ | 750 | | | Louisiana, (State Bond Commission), (CIFG),
5.00%, 7/15/25 | | $ | 722,543 | | |
| | 500 | | | Louisiana, (State Bond Commission), (FGIC),
5.00%, 11/15/20 | | | 501,535 | | |
| | 2,250 | | | New Orleans, (AMBAC), 0.00%, 9/1/15 | | | 1,605,555 | | |
| | 800 | | | New Orleans, (AMBAC), 0.00%, 9/1/16 | | | 535,432 | | |
| | 300 | | | Puerto Rico, (FSA), Variable Rate, 11.337%, 7/1/27(3)(4) | | | 335,169 | | |
| | 360 | | | Puerto Rico, (MBIA), 5.50%, 7/1/20 | | | 370,213 | | |
| | | | | | | $ | 4,070,447 | | |
| Insured-Hospital — 1.9% | | | |
| $ | 750 | | | Terrebonne Parish, Hospital Service District No. 1,
(Terrebonne General Medical Center), (AMBAC),
5.50%, 4/1/33 | | $ | 750,728 | | |
| | | | | | | $ | 750,728 | | |
See notes to financial statements
34
Eaton Vance Louisiana Municipals Fund as of February 29, 2008
PORTFOLIO OF INVESTMENTS (Unaudited) CONT'D
Principal Amount
(000's omitted) | | Security | | Value | |
| Insured-Industrial Development Revenue — 2.9% | | | |
| $ | 1,250 | | | Louisiana Environmental Facilities and Community
Development Authority, (BRCC Facility Corp.), (MBIA),
5.00%, 12/1/32 | | $ | 1,154,800 | | |
| | | | | | | $ | 1,154,800 | | |
Insured-Lease Revenue / Certificates of
Participation — 3.8% | | | |
| $ | 500 | | | Calcasieu Parish Public Trust Authority Student Lease,
(McNeese Student Housing), (MBIA), 5.25%, 5/1/33 | | $ | 495,820 | | |
| | 500 | | | Louisiana Environmental Facilities and Community
Development Authority, (Jefferson Parking Garage),
(AMBAC), 5.00%, 9/1/31 | | | 462,895 | | |
| | 540 | | | Puerto Rico Public Finance Corp., (Commonwealth
Appropriation), (AMBAC), 5.125%, 6/1/24 | | | 548,672 | | |
| | | | | | | $ | 1,507,387 | | |
| Insured-Other Revenue — 3.0% | | | |
| $ | 500 | | | Louisiana Environmental Facilities and Community
Development Authority, (Capital and Equipment
Acquisition), (AMBAC), 4.50%, 12/1/18 | | $ | 490,440 | | |
| | 700 | | | Louisiana Environmental Facilities and Community
Development Authority, (Parking Facility Corp. Garage),
(AMBAC), 5.375%, 10/1/31 | | | 696,717 | | |
| | | | | | | $ | 1,187,157 | | |
| Insured-Special Tax Revenue — 5.3% | | | |
| $ | 1,000 | | | Louisiana Gas and Fuels Tax, (AMBAC),
5.00%, 6/1/32 | | $ | 942,320 | | |
| | 1,525 | | | Puerto Rico Sales Tax Financing, (AMBAC),
0.00%, 8/1/54 | | | 87,367 | | |
| | 280 | | | Puerto Rico Sales Tax Financing, (MBIA),
0.00%, 8/1/44 | | | 30,943 | | |
| | 560 | | | Puerto Rico Sales Tax Financing, (MBIA),
0.00%, 8/1/45 | | | 58,274 | | |
| | 445 | | | Puerto Rico Sales Tax Financing, (MBIA),
0.00%, 8/1/46 | | | 43,623 | | |
| | 1,000 | | | Saint Tammany Parish, Sales Tax District No. 3,
(CIFG), 5.00%, 6/1/30 | | | 944,760 | | |
| | | | | | | $ | 2,107,287 | | |
| Insured-Transportation — 4.9% | | | |
| $ | 1,500 | | | New Orleans Aviation Board, (FSA), (AMT),
5.00%, 1/1/38 | | $ | 1,370,100 | | |
| | 620 | | | Puerto Rico Highway and Transportation Authority,
(AGC), (CIFG), 5.25%, 7/1/41(1) | | | 608,759 | | |
| | | | | | | $ | 1,978,859 | | |
Principal Amount
(000's omitted) | | Security | | Value | |
| Insured-Water and Sewer — 2.9% | | | |
| $ | 1,350 | | | East Baton Rouge, Sewer Commission, (FSA),
4.50%, 2/1/36 | | $ | 1,179,981 | | |
| | | | | | | $ | 1,179,981 | | |
| Other Revenue — 5.5% | | | |
| $ | 2,000 | | | Children's Trust Fund, Tobacco Settlement,
0.00%, 5/15/50 | | $ | 93,860 | | |
| | 3,015 | | | Children's Trust Fund, Tobacco Settlement,
0.00%, 5/15/55 | | | 88,792 | | |
| | 1,050 | | | Puerto Rico Infrastructure Financing Authority,
5.50%, 10/1/32(1) | | | 1,089,396 | | |
| | 1,000 | | | Tobacco Settlement Financing Corp.,
5.875%, 5/15/39 | | | 926,810 | | |
| | | | | | | $ | 2,198,858 | | |
| Senior Living / Life Care — 3.4% | | | |
| $ | 500 | | | Louisiana Housing Finance Authority, (Saint Dominic
Assisted Care Facility), (GNMA), 6.85%, 9/1/25 | | $ | 505,380 | | |
| | 850 | | | Louisiana Public Facilities Authority, (Glen Retirement
System), 6.70%, 12/1/25 | | | 850,332 | | |
| | | | | | | $ | 1,355,712 | | |
| Special Tax Revenue — 2.3% | | | |
| $ | 1,010 | | | Puerto Rico Sales Tax Financing, 5.25%, 8/1/57 | | $ | 910,869 | | |
| | | | | | | $ | 910,869 | | |
| Transportation — 2.5% | | | |
| $ | 1,000 | | | Louisiana Offshore Terminal Authority,
Deepwater Port Revenue, (Loop LLC),
5.20%, 10/1/18 | | $ | 1,001,390 | | |
| | | | | | | $ | 1,001,390 | | |
Total Tax-Exempt Investments — 102.2%
(identified cost $43,276,017) | | $ | 40,970,478 | | |
| Other Assets, Less Liabilities — (2.2)% | | $ | (869,869 | ) | |
| Net Assets — 100.0% | | $ | 40,100,609 | | |
See notes to financial statements
35
Eaton Vance Louisiana Municipals Fund as of February 29, 2008
PORTFOLIO OF INVESTMENTS (Unaudited) CONT'D
AGC - Assured Guaranty Corp.
AMBAC - AMBAC Financial Group, Inc.
AMT - Interest earned from these securities may be considered a tax preference item for purposes of the Federal Alternative Minimum Tax.
CIFG - CIFG Assurance North America, Inc.
FGIC - Financial Guaranty Insurance Company
FHLMC - Federal Home Loan Mortgage Corporation (Freddie Mac)
FNMA - Federal National Mortgage Association (Fannie Mae)
FSA - Financial Security Assurance, Inc.
GNMA - Government National Mortgage Association (Ginnie Mae)
MBIA - Municipal Bond Insurance Association
The Fund invests primarily in debt securities issued by Louisiana municipalities. The ability of the issuers of the debt securities to meet their obligations may be affected by economic developments in a specific industry or municipality. In order to reduce the risk associated with such economic developments, at February 29, 2008, 62.8% of total investments are backed by bond insurance of various financial institutions and financial guaranty assurance agencies. The aggregate percentage insured by an individual financial institution ranged from 1.5% to 26.5% of total investments.
(1) Security represents the underlying municipal obligation of an inverse floating rate obligation held by the Fund.
(2) Security (or a portion thereof) has been segregated to cover margin requirements on open financial futures contracts.
(3) Security exempt from registration under Rule 144A of the Securities Act of 1933. These securities may be sold in transactions exempt from registration, normally to qualified institutional buyers. At February 29, 2008, the aggregate value of the securities is $335,169 or 0.8% of the Fund's net assets.
(4) Security has been issued as a leveraged inverse floater bond. The stated interest rate represents the rate in effect at February 29, 2008.
See notes to financial statements
36
Eaton Vance Maryland Municipals Fund as of February 29, 2008
PORTFOLIO OF INVESTMENTS (Unaudited)
| Tax-Exempt Investments — 104.1% | | | |
Principal Amount
(000's omitted) | | Security | | Value | |
| Cogeneration — 1.3% | | | |
| $ | 1,250 | | | Maryland Energy Cogeneration, (AES Warrior Run),
(AMT), 7.40%, 9/1/19 | | $ | 1,182,975 | | |
| | | | | | | $ | 1,182,975 | | |
| Education — 10.6% | | | |
| $ | 4,000 | | | Maryland Health and Higher Educational Facilities
Authority, (Johns Hopkins University),
5.00%, 7/1/32 | | $ | 3,863,200 | | |
| | 2,250 | | | Maryland Health and Higher Educational Facilities
Authority, (Loyola College), 4.75%, 10/1/33 | | | 2,013,952 | | |
| | 1,500 | | | Maryland Health and Higher Educational Facilities
Authority, (Loyola College), 5.125%, 10/1/45 | | | 1,382,070 | | |
| | 1,500 | | | Maryland Health and Higher Educational Facilities
Authority, (Maryland Institute College of Art),
5.00%, 6/1/36 | | | 1,280,670 | | |
| | 400 | | | Maryland Health and Higher Educational Facilities
Authority, (Washington Christian Academy),
5.50%, 7/1/38 | | | 315,544 | | |
| | 1,000 | | | Maryland Industrial Development Financing Authority,
(Our Lady of Good Counsel High School), 6.00%, 5/1/35 | | | 903,070 | | |
| | | | | | | $ | 9,758,506 | | |
| Escrowed / Prerefunded — 12.6% | | | |
| $ | 1,225 | | | Baltimore County, Economic Development Revenue,
(Revisions, Inc.), Prerefunded to 8/15/11,
8.50%, 8/15/25 | | $ | 1,468,567 | | |
| | 1,125 | | | Baltimore, SFMR, (Inner Harbor), Escrowed to Maturity,
8.00%, 12/1/10 | | | 1,271,989 | | |
| | 3,250 | | | Maryland Health and Higher Educational Facilities
Authority, (Johns Hopkins University), Prerefunded to
7/1/09, 6.00%, 7/1/39(1) | | | 3,418,902 | | |
| | 2,000 | | | Maryland Health and Higher Educational Facilities
Authority, (Johns Hopkins Hospital), Prerefunded to
11/15/13, 5.125%, 11/15/34 | | | 2,170,900 | | |
| | 500 | | | Maryland Health and Higher Educational Facilities
Authority, (Maryland Institute College of Art),
Prerefunded to 6/1/11, 5.50%, 6/1/21 | | | 535,450 | | |
| | 1,300 | | | Maryland Health and Higher Educational Facilities
Authority, (Maryland Institute College of Art),
Prerefunded to 6/1/11, 5.50%, 6/1/32 | | | 1,392,170 | | |
| | 800 | | | Maryland Health and Higher Educational Facilities
Authority, (University of Maryland Medical System),
Prerefunded to 7/1/10, 6.75%, 7/1/30 | | | 875,936 | | |
| | 425 | | | Westminster, Educational Facilities, (McDaniel
College), Prerefunded to 10/1/12, 5.50%, 4/1/27 | | | 463,556 | | |
| | | | | | | $ | 11,597,470 | | |
Principal Amount
(000's omitted) | | Security | | Value | |
| General Obligations — 9.0% | | | |
| $ | 905 | | | Baltimore County, (Metropolitan District),
4.25%, 9/1/36 | | $ | 770,426 | | |
| | 2,000 | | | Baltimore County, (Metropolitan District),
5.00%, 2/1/31 | | | 1,978,400 | | |
| | 1,500 | | | Montgomery County, 5.00%, 5/1/25 | | | 1,507,575 | | |
| | 1,000 | | | Montgomery County, 5.25%, 10/1/19 | | | 1,052,270 | | |
| | 2,235 | | | Prince George's County, Housing Authority,
5.00%, 7/15/23 | | | 2,249,840 | | |
| | 1,100 | | | Puerto Rico, 0.00%, 7/1/16 | | | 733,150 | | |
| | | | | | | $ | 8,291,661 | | |
| Hospital — 11.0% | | | |
| $ | 2,500 | | | Baltimore County, (Catholic Health Initiatives),
4.50%, 9/1/33 | | $ | 2,150,475 | | |
| | 1,000 | | | Maryland Health and Higher Educational Facilities
Authority, (Calvert Health System), 5.50%, 7/1/36 | | | 969,910 | | |
| | 1,500 | | | Maryland Health and Higher Educational Facilities
Authority, (Medstar Health), 4.75%, 5/15/42 | | | 1,177,965 | | |
| | 2,330 | | | Maryland Health and Higher Educational Facilities
Authority, (Peninsula Regional Medical Center),
5.00%, 7/1/36 | | | 2,066,128 | | |
| | 1,000 | | | Maryland Health and Higher Educational Facilities
Authority, (Union Hospital of Cecil County),
5.00%, 7/1/40 | | | 881,720 | | |
| | 2,500 | | | Maryland Health and Higher Educational Facilities
Authority, (University of Maryland Medical System),
5.00%, 7/1/41 | | | 2,257,075 | | |
| | 750 | | | Maryland Health and Higher Educational Facilities
Authority, (Washington County Hospital), 5.75%, 1/1/38 | | | 675,315 | | |
| | | | | | | $ | 10,178,588 | | |
| Housing — 4.3% | | | |
| $ | 1,000 | | | Maryland Community Development Administration,
(AMT), 5.10%, 9/1/37 | | $ | 901,640 | | |
| | 2,000 | | | Maryland Community Development Authority,
Multifamily Housing, (AMT), 4.85%, 9/1/47 | | | 1,654,780 | | |
| | 500 | | | Maryland Economic Development Corp.,
(Towson University), 5.00%, 7/1/39 | | | 398,720 | | |
| | 1,000 | | | Prince George's County, Housing Authority, (Langely
Gardens), (AMT), 5.875%, 2/20/39 | | | 1,002,030 | | |
| | | | | | | $ | 3,957,170 | | |
See notes to financial statements
37
Eaton Vance Maryland Municipals Fund as of February 29, 2008
PORTFOLIO OF INVESTMENTS (Unaudited) CONT'D
Principal Amount
(000's omitted) | | Security | | Value | |
| Industrial Development Revenue — 1.2% | | | |
| $ | 1,000 | | | Maryland Economic Development Authority,
(AFCO Cargo), (AMT), 6.50%, 7/1/24 | | $ | 925,140 | | |
| | 215 | | | Maryland Economic Development Authority,
(AFCO Cargo), (AMT), 7.34%, 7/1/24 | | | 214,970 | | |
| | | | | | | $ | 1,140,110 | | |
| Insured-Education — 1.4% | | | |
| $ | 1,200 | | | Morgan State University, Academic and Facilities, (MBIA),
6.10%, 7/1/20 | | $ | 1,324,332 | | |
| | | | | | | $ | 1,324,332 | | |
| Insured-Escrowed / Prerefunded — 10.5% | | | |
| $ | 3,145 | | | Maryland Health and Higher Educational
Facilities Authority, (Helix Health Issue), (AMBAC),
Escrowed to Maturity, 5.00%, 7/1/27 | | $ | 3,152,925 | | |
| | 4,650 | | | Puerto Rico Electric Power Authority, (FSA),
Prerefunded to 7/1/10, 5.25%, 7/1/29(2) | | | 4,935,960 | | |
| | 1,500 | | | Puerto Rico Electric Power Authority, (FSA),
Prerefunded to 7/1/12, 5.125%, 7/1/26 | | | 1,619,925 | | |
| | | | | | | $ | 9,708,810 | | |
| Insured-General Obligations — 1.5% | | | |
| $ | 350 | | | Puerto Rico, (FSA), Variable Rate,
11.337%, 7/1/27(3)(4) | | $ | 391,031 | | |
| | 1,000 | | | Puerto Rico, (MBIA), 5.50%, 7/1/29 | | | 982,670 | | |
| | | | | | | $ | 1,373,701 | | |
| Insured-Hospital — 11.3% | | | |
| $ | 380 | | | Maryland Health and Higher Educational Facilities
Authority, (Lifebridge Health), (AGC), 4.75%, 7/1/38 | | $ | 344,892 | | |
| | 50 | | | Maryland Health and Higher Educational Facilities
Authority, (Lifebridge Health), (AGC), 4.75%, 7/1/42 | | | 44,872 | | |
| | 2,500 | | | Maryland Health and Higher Educational Facilities
Authority, (Lifebridge Health), (AGC), 4.75%, 7/1/42(2) | | | 2,243,650 | | |
| | 4,860 | | | Maryland Health and Higher Educational Facilities
Authority, (Medlantic/Helix Issue), (AMBAC),
5.25%, 8/15/38 | | | 4,619,381 | | |
| | 3,150 | | | Puerto Rico, Industrial Tourist Educational Medical &
Environment Control Facilities Authority, (Auxilio Mutuo
Obligated Group), (MBIA), 6.25%, 7/1/24 | | | 3,174,003 | | |
| | | | | | | $ | 10,426,798 | | |
Principal Amount
(000's omitted) | | Security | | Value | |
| Insured-Housing — 1.5% | | | |
| $ | 1,580 | | | Maryland Economic Development Corp.,
(University of Maryland), (CIFG), 4.50%, 6/1/35 | | $ | 1,344,264 | | |
| | | | | | | $ | 1,344,264 | | |
Insured-Lease Revenue / Certificates of
Participation — 1.7% | | | |
| $ | 1,500 | | | Puerto Rico Public Finance Corp., (Commonwealth
Appropriation), (AMBAC), 5.125%, 6/1/24 | | $ | 1,524,090 | | |
| | | | | | | $ | 1,524,090 | | |
| Insured-Special Tax Revenue — 3.5% | | | |
| $ | 2,000 | | | Baltimore, (Baltimore Hotel Corp.), (XLCA),
5.25%, 9/1/39 | | $ | 1,824,740 | | |
| | 550 | | | Puerto Rico Infrastructure Financing Authority,
(AMBAC), 0.00%, 7/1/28 | | | 155,364 | | |
| | 1,325 | | | Puerto Rico Infrastructure Financing Authority,
(AMBAC), 0.00%, 7/1/29 | | | 350,781 | | |
| | 2,000 | | | Puerto Rico Infrastructure Financing Authority,
(AMBAC), 0.00%, 7/1/34 | | | 390,100 | | |
| | 300 | | | Puerto Rico Infrastructure Financing Authority,
(AMBAC), 0.00%, 7/1/37 | | | 48,642 | | |
| | 2,000 | | | Puerto Rico Infrastructure Financing Authority,
(FGIC), 0.00%, 7/1/30 | | | 490,460 | | |
| | | | | | | $ | 3,260,087 | | |
| Insured-Transportation — 8.2% | | | |
| $ | 1,000 | | | Maryland Transportation Authority,
(FSA), 4.50%, 7/1/41 | | $ | 868,390 | | |
| | 1,000 | | | Maryland Transportation Authority,
(FSA), 5.00%, 7/1/28 | | | 984,880 | | |
| | 1,500 | | | Maryland Transportation Authority, Baltimore-Washington
International Airport, (AMBAC), 5.00%, 3/1/27 | | | 1,439,565 | | |
| | 1,500 | | | Maryland Transportation Authority, Baltimore-Washington
International Airport, (AMBAC), (AMT), 5.25%, 3/1/27 | | | 1,395,945 | | |
| | 3,000 | | | Puerto Rico Highway and Transportation Authority,
(MBIA), 5.25%, 7/1/32 | | | 2,842,110 | | |
| | | | | | | $ | 7,530,890 | | |
| Insured-Water and Sewer — 6.0% | | | |
| $ | 500 | | | Baltimore, (Water Projects), (FGIC), 5.125%, 7/1/42 | | $ | 476,340 | | |
| | 2,000 | | | Baltimore, Wastewater, (AMBAC), 5.00%, 7/1/32 | | | 1,915,700 | | |
| | 1,000 | | | Baltimore, Wastewater, (FGIC), 5.00%, 7/1/22 | | | 997,800 | | |
| | 2,000 | | | Baltimore, Wastewater, (MBIA), 5.65%, 7/1/20 | | | 2,182,900 | | |
| | | | | | | $ | 5,572,740 | | |
See notes to financial statements
38
Eaton Vance Maryland Municipals Fund as of February 29, 2008
PORTFOLIO OF INVESTMENTS (Unaudited) CONT'D
Principal Amount
(000's omitted) | | Security | | Value | |
| Other Revenue — 2.6% | | | |
| $ | 4,300 | | | Children's Trust Fund, Tobacco Settlement,
0.00%, 5/15/50 | | $ | 201,799 | | |
| | 10,110 | | | Children's Trust Fund, Tobacco Settlement,
0.00%, 5/15/55 | | | 297,740 | | |
| | 895 | | | Maryland Health and Higher Educational Facilities
Authority, (Board of Child Care), 5.375%, 7/1/32 | | | 875,319 | | |
| | 1,000 | | | Maryland Health and Higher Educational Facilities
Authority, (Board of Child Care), 5.625%, 7/1/22 | | | 1,019,740 | | |
| | | | | | | $ | 2,394,598 | | |
| Senior Living / Life Care — 1.4% | | | |
| $ | 375 | | | Maryland Health and Higher Educational Facilities
Authority, (Edenwald), 5.40%, 1/1/37 | | $ | 328,511 | | |
| | 325 | | | Maryland Health and Higher Educational Facilities
Authority, (King Farm Presbyterian Community),
5.00%, 1/1/17 | | | 304,944 | | |
| | 750 | | | Maryland Health and Higher Educational Facilities
Authority, (Mercy Ridge), 4.75%, 7/1/34 | | | 609,660 | | |
| | | | | | | $ | 1,243,115 | | |
| Special Tax Revenue — 4.5% | | | |
| $ | 750 | | | Baltimore, (Clipper Mill), 6.25%, 9/1/33 | | $ | 692,288 | | |
| | 500 | | | Baltimore, (Strathdale Manor), 7.00%, 7/1/33 | | | 507,710 | | |
| | 800 | | | Frederick County, Urbana Community Development
Authority, 6.625%, 7/1/25 | | | 790,984 | | |
| | 2,425 | | | Puerto Rico Sales Tax Financing, 5.25%, 8/1/57 | | | 2,186,986 | | |
| | | | | | | $ | 4,177,968 | | |
Total Tax-Exempt Investments — 104.1%
(identified cost $101,250,284) | | $ | 95,987,873 | | |
| Other Assets, Less Liabilities — (4.1)% | | $ | (3,763,351 | ) | |
| Net Assets — 100.0% | | $ | 92,224,522 | | |
AGC - Assured Guaranty Corp.
AMBAC - AMBAC Financial Group, Inc.
AMT - Interest earned from these securities may be considered a tax preference item for purposes of the Federal Alternative Minimum Tax.
CIFG - CIFG Assurance North America, Inc.
FGIC - Financial Guaranty Insurance Company
FSA - Financial Security Assurance, Inc.
MBIA - Municipal Bond Insurance Association
SFMR - Single Family Mortgage Revenue
XLCA - XL Capital Assurance, Inc.
The Fund invests primarily in debt securities issued by Maryland municipalities. The ability of the issuers of the debt securities to meet their obligations may be affected by economic developments in a specific industry or municipality. In order to reduce the risk associated with such economic developments, at February 29, 2008, 43.8% of total investments are backed by bond insurance of various financial institutions and financial guaranty assurance agencies. The aggregate percentage insured by an individual financial institution ranged from 1.4% to 15.6% of total investments.
(1) Security (or a portion thereof) has been segregated to cover margin requirements on open financial futures contracts.
(2) Security represents the underlying municipal obligation of an inverse floating rate obligation held by the Fund.
(3) Security exempt from registration under Rule 144A of the Securities Act of 1933. These securities may be sold in transactions exempt from registration, normally to qualified institutional buyers. At February 29, 2008, the aggregate value of the securities is $391,031 or 0.4% of the Fund's net assets.
(4) Security has been issued as a leveraged inverse floater bond. The stated interest rate represents the rate in effect at February 29, 2008.
See notes to financial statements
39
Eaton Vance Missouri Municipals Fund as of February 29, 2008
PORTFOLIO OF INVESTMENTS (Unaudited)
Tax-Exempt Investments — 100.9% | | | |
Principal Amount
(000's omitted) | |
Security | |
Value | |
| Education — 3.2% | | | |
| $ | 2,000 | | | Curators University System Facilities Revenue, (University of
Missouri), 5.00%, 11/1/35 | | $ | 1,947,240 | | |
| | 1,500 | | | Missouri State Health and Educational Facilities Authority,
(Washington University), 4.50%, 1/15/41 | | | 1,301,535 | | |
| | | | | | | $ | 3,248,775 | | |
| Electric Utilities — 0.4% | | | |
| $ | 150 | | | Puerto Rico Electric Power Authority, DRIVERS, Variable Rate,
7.74%, 7/1/25(1)(2) | | $ | 118,608 | | |
| | 450 | | | Puerto Rico Electric Power Authority, DRIVERS, Variable Rate,
7.74%, 7/1/37(1)(2) | | | 321,327 | | |
| | | | | | | $ | 439,935 | | |
| Escrowed / Prerefunded — 3.1% | | | |
| $ | 500 | | | Lees Summit Industrial Development Authority, Health Facility,
(John Knox Village), Prerefunded to 8/15/12,
5.70%, 8/15/22 | | $ | 544,865 | | |
| | 1,500 | | | Missouri State Health and Educational Facilities Authority,
(Children's Mercy Hospital), Prerefunded to 5/15/08,
5.30%, 5/15/28 | | | 1,523,745 | | |
| | 1,000 | | | Saint Louis County, Mortgage Revenue, (GNMA), (AMT),
Escrowed to Maturity, 5.40%, 1/1/16 | | | 1,061,890 | | |
| | | | | | | $ | 3,130,500 | | |
| Hospital — 6.9% | | | |
| $ | 1,000 | | | Cape Girardeaua County, Industrial Development Authority,
(Southeast Missouri Hospital Association), 5.00%, 6/1/36 | | $ | 802,640 | | |
| | 1,000 | | | Johnson County, (Western Missouri Medical Center),
5.00%, 6/1/25 | | | 929,900 | | |
| | 400 | | | Joplin Industrial Development Authority, (Freeman Health
Systems), 5.375%, 2/15/35 | | | 361,856 | | |
| | 1,950 | | | Missouri State Health and Educational Facilities Authority,
(Barnes Jewish Christian Hospital), 5.25%, 5/15/14 | | | 2,082,425 | | |
| | 1,000 | | | Missouri State Health and Educational Facilities Authority,
(Freeman Health Systems), 5.25%, 2/15/18 | | | 992,330 | | |
| | 495 | | | Missouri State Health and Educational Facilities Authority,
(Lake of the Ozarks General Hospital), 6.50%, 2/15/21 | | | 495,317 | | |
| | 250 | | | Missouri State Health and Educational Facilities Authority,
(Lake Regional Health System), 5.70%, 2/15/34 | | | 237,668 | | |
| | 1,250 | | | West Plains Industrial Development Authority, (Ozarks
Medical Center), 5.65%, 11/15/22 | | | 1,131,625 | | |
| | | | | | | $ | 7,033,761 | | |
Principal Amount
(000's omitted) | |
Security | |
Value | |
| Housing — 1.9% | | | |
| $ | 905 | | | Jefferson County Industrial Development Authority,
Multifamily, (Riverview Bend Apartments), (AMT),
6.75%, 11/1/29 | | $ | 913,199 | | |
| | 95 | | | Missouri Housing Development Authority, SFMR, (GNMA),
(AMT), 6.45%, 9/1/27 | | | 96,227 | | |
| | 5 | | | Missouri Housing Development Authority, SFMR, (GNMA),
(AMT), 7.25%, 9/1/26 | | | 5,085 | | |
| | 505 | | | Missouri Housing Development Commission, (AMT),
5.05%, 1/1/24 | | | 481,139 | | |
| | 500 | | | Missouri Housing Development Commission, SFMR,
(GNMA), (AMT), 5.00%, 9/1/37 | | | 444,440 | | |
| | | | | | | $ | 1,940,090 | | |
| Industrial Development Revenue — 4.2% | | | |
| $ | 105 | | | Jefferson County, (Kmart Corp.), 6.40%, 8/1/08 | | $ | 104,903 | | |
| | 1,080 | | | Missouri Development Finance Authority, Solid Waste
Disposal, (Procter and Gamble Paper Products), (AMT),
5.20%, 3/15/29 | | | 1,058,324 | | |
| | 1,200 | | | Missouri Environmental Improvement and Energy Resources
Authority, (American Cyanamid), 5.80%, 9/1/09 | | | 1,239,780 | | |
| | 2,000 | | | Saint Louis, Industrial Development Authority, (Anheuser
Busch Sewer and Solid Waste Disposal Facilities),
4.875%, 3/1/32 | | | 1,675,640 | | |
| | 300 | | | Virgin Islands Public Financing Authority, (HOVENSA LLC),
(AMT), 4.70%, 7/1/22 | | | 247,674 | | |
| | | | | | | $ | 4,326,321 | | |
| Insured-Education — 3.3% | | | |
| $ | 1,000 | | | Lincoln University Auxiliary System Revenue, (AGC),
5.125%, 6/1/37 | | $ | 954,050 | | |
| | 1,000 | | | Missouri State Health and Educational Facilities Authority,
(St. Louis University), (AMBAC), 4.75%, 10/1/24 | | | 954,630 | | |
| | 1,500 | | | Missouri State University Auxiliary Enterprise System,
(XLCA), 5.00%, 4/1/25 | | | 1,418,790 | | |
| | | | | | | $ | 3,327,470 | | |
| Insured-Electric Utilities — 11.0% | | | |
| $ | 1,240 | | | Columbia Electric Utility Improvement Revenue, (AMBAC),
5.00%, 10/1/28 | | $ | 1,187,672 | | |
| | 2,250 | | | Missouri Environmental Improvement and Energy Resources
Authority, (Union Electric), (AMBAC), (AMT),
5.45%, 10/1/28 | | | 2,206,238 | | |
| | 1,240 | | | Missouri Joint Municipal Electric Utility Commission,
(AMBAC), 4.50%, 1/1/36 | | | 1,073,741 | | |
| | 3,000 | | | Missouri Joint Municipal Electric Utility Commission,
(AMBAC), 4.50%, 1/1/37 | | | 2,639,130 | | |
| | 1,000 | | | Missouri Joint Municipal Electric Utility Commission, (MBIA),
5.00%, 1/1/26 | | | 922,180 | | |
See notes to financial statements
40
Eaton Vance Missouri Municipals Fund as of February 29, 2008
PORTFOLIO OF INVESTMENTS (Unaudited) CONT'D
Principal Amount
(000's omitted) | |
Security | |
Value | |
| Insured-Electric Utilities (continued) | | | |
| $ | 1,000 | | | Missouri Joint Municipal Electric Utility Commission, Series A,
(AMBAC), 5.00%, 1/1/42 | | $ | 935,120 | | |
| | 1,000 | | | Puerto Rico Electric Power Authority, (MBIA),
5.25%, 7/1/29 | | | 961,470 | | |
| | 1,200 | | | Puerto Rico Electric Power Authority, (MBIA),
5.50%, 7/1/16(3) | | | 1,289,504 | | |
| | | | | | | $ | 11,215,055 | | |
| Insured-Escrowed / Prerefunded — 6.0% | | | |
| $ | 1,500 | | | Bi-State Development Agency, Illinois Metropolitan District,
(Saint Clair County Metrolink Extension), (MBIA),
Prerefunded to 7/1/08, 5.00%, 7/1/28 | | $ | 1,542,540 | | |
| | 575 | | | Missouri State Health and Educational Facilities Authority,
(Saint Louis Children's Hospital), (MBIA), Escrowed to
Maturity, 0.00%, 5/15/08 | | | 572,027 | | |
| | 2,000 | | | Puerto Rico, (FGIC), Prerefunded to 7/1/12,
5.00%, 7/1/32 | | | 2,132,560 | | |
| | 1,000 | | | Puerto Rico Electric Power Authority, (MBIA),
Prerefunded to 7/1/13, 5.00%, 7/1/32(4) | | | 1,073,680 | | |
| | 750 | | | Saint Louis Airport, (Capital Improvement Program),
(MBIA), Prerefunded to 7/1/12, 5.00%, 7/1/32 | | | 797,220 | | |
| | | | | | | $ | 6,118,027 | | |
| Insured-General Obligations — 11.1% | | | |
| $ | 2,800 | | | Jackson County, Consolidated School District No. 002
(Missouri Direct Deposit), (MBIA), 5.00%, 3/1/27 | | $ | 2,742,824 | | |
| | 1,000 | | | Kansas City, (MBIA), 5.00%, 2/1/27 | | | 981,960 | | |
| | 1,300 | | | Marion County School District No. 060, (FSA),
5.00%, 3/1/25 | | | 1,294,098 | | |
| | 1,000 | | | Platte County Reorganized School District No. R-3, (FSA),
5.00%, 3/1/25 | | | 988,720 | | |
| | 900 | | | Puerto Rico, (FSA), Variable Rate, 11.337%, 7/1/27(1)(2) | | | 1,005,507 | | |
| | 1,900 | | | Saint Charles County, Francis Howell School District, (FGIC),
0.00%, 3/1/16 | | | 1,297,453 | | |
| | 1,000 | | | Saint Charles County, Francis Howell School District, (FGIC),
5.25%, 3/1/21 | | | 1,033,170 | | |
| | 1,000 | | | Saint Louis, Board of Education, (MBIA), 5.00%, 4/1/25 | | | 986,400 | | |
| | 1,000 | | | Springfield, School District No. R-12, (FSA),
5.25%, 3/1/25 | | | 1,011,060 | | |
| | | | | | | $ | 11,341,192 | | |
| Insured-Hospital — 6.5% | | | |
| $ | 9,500 | | | Missouri Health and Educational Facilities Authority,
(Lester Cox Medical Center), (MBIA), 0.00%, 9/1/20 | | $ | 4,896,870 | | |
| | 540 | | | Missouri Health and Educational Facilities Authority,
(Lester Cox Medical Center), (MBIA), 0.00%, 9/1/21 | | | 259,853 | | |
Principal Amount
(000's omitted) | |
Security | |
Value | |
| Insured-Hospital (continued) | | | |
| $ | 1,500 | | | North Kansas City, (North Kansas City Memorial Hospital),
(FSA), 5.125%, 11/15/33 | | $ | 1,450,995 | | |
| | | | | | | $ | 6,607,718 | | |
| Insured-Industrial Development Revenue — 1.7% | | | |
| $ | 2,000 | | | Kansas City, Industrial Development Authority, (AMBAC),
4.50%, 12/1/32 | | $ | 1,723,860 | | |
| | | | | | | $ | 1,723,860 | | |
Insured-Lease Revenue / Certificates of
Participation — 11.5% | | | |
| $ | 1,000 | | | Cape Girardeua County, Building Corp., (Jackson R-II School
District), (MBIA), 5.25%, 3/1/25 | | $ | 979,960 | | |
| | 1,000 | | | Cape Girardeua County, Building Corp., (Jackson R-II School
District), (MBIA), 5.25%, 3/1/26 | | | 973,660 | | |
| | 1,000 | | | Jackson County, Leasehold Revenue, (Truman Sports),
(AMBAC), 0.00%, 12/1/20 | | | 501,150 | | |
| | 1,970 | | | Jackson County, Leasehold Revenue, (Truman Sports),
(AMBAC), 4.50%, 12/1/31 | | | 1,758,225 | | |
| | 2,000 | | | Jackson County, Leasehold Revenue, (Truman Sports),
(MBIA), 5.00%, 12/1/27 | | | 1,917,460 | | |
| | 2,270 | | | Kansas City, Leasehold Revenue, (Municipal Assistance),
(AMBAC), 0.00%, 4/15/26 | | | 786,691 | | |
| | 2,105 | | | Kansas City, Leasehold Revenue, (Municipal Assistance),
(AMBAC), 0.00%, 4/15/30 | | | 572,097 | | |
| | 239 | | | Puerto Rico Public Buildings Authority, (CIFG),
5.25%, 7/1/36(3) | | | 230,303 | | |
| | 662 | | | Puerto Rico Public Buildings Authority, (CIFG),
Prerefunded to 7/1/12, 5.25%, 7/1/36(3) | | | 707,833 | | |
| | 1,200 | | | Puerto Rico Public Finance Corp., (Commonwealth
Appropriation), (AMBAC), 5.125%, 6/1/24 | | | 1,219,272 | | |
| | 2,000 | | | Saint Louis, Industrial Development Authority,
(Convention Center Hotel), (AMBAC), 0.00%, 7/15/19 | | | 1,077,580 | | |
| | 1,000 | | | Springfield County, Leasehold Revenue, (Capital
Improvement Program), (AMBAC), 5.00%, 3/1/24 | | | 975,270 | | |
| | | | | | | $ | 11,699,501 | | |
| Insured-Other Revenue — 0.7% | | | |
| $ | 750 | | | Missouri Development Finance Authority, Cultural Facility,
(Nelson Gallery Foundation), (MBIA), 5.25%, 12/1/22 | | $ | 756,795 | | |
| | | | | | | $ | 756,795 | | |
| Insured-Special Tax Revenue — 7.3% | | | |
| $ | 1,000 | | | Bi-State Development Agency, Missouri and Illinois
Metropolitan District, (Metrolink Cross County), (FSA),
5.00%, 10/1/32 | | $ | 965,650 | | |
See notes to financial statements
41
Eaton Vance Missouri Municipals Fund as of February 29, 2008
PORTFOLIO OF INVESTMENTS (Unaudited) CONT'D
Principal Amount
(000's omitted) | |
Security | |
Value | |
| Insured-Special Tax Revenue (continued) | | | |
| $ | 2,350 | | | Bi-State Development Agency, Missouri and Illinois
Metropolitan District, (Saint Clair County Metrolink), (FSA),
5.25%, 7/1/28 | | $ | 2,332,422 | | |
| | 1,955 | | | Howard Bend, Levee District, (XLCA), 5.25%, 3/1/28 | | | 1,851,229 | | |
| | 600 | | | Kansas City, (Blue Parkway Town Center), (MBIA),
5.00%, 7/1/27 | | | 578,346 | | |
| | 1,000 | | | Kansas City, Special Obligations, (AGC), 5.00%, 3/1/28 | | | 974,090 | | |
| | 4,000 | | | Puerto Rico Infrastructure Financing Authority, (AMBAC),
0.00%, 7/1/34 | | | 780,200 | | |
| | | | | | | $ | 7,481,937 | | |
| Insured-Transportation — 6.4% | | | |
| $ | 615 | | | Puerto Rico Highway and Transportation Authority, (AGC),
5.25%, 7/1/36 | | $ | 609,576 | | |
| | 2,060 | | | Puerto Rico Highway and Transportation Authority, (AGC),
(CIFG), 5.25%, 7/1/41(3) | | | 2,022,652 | | |
| | 1,000 | | | Puerto Rico Highway and Transportation Authority, (AMBAC),
5.50%, 7/1/29 | | | 982,670 | | |
| | 1,000 | | | Puerto Rico Highway and Transportation Authority, (FGIC),
5.25%, 7/1/39 | | | 934,540 | | |
| | 910 | | | Saint Louis Airport, (Lambert International Airport), (FGIC),
(AMT), 6.00%, 7/1/14 | | | 991,818 | | |
| | 1,000 | | | Saint Louis Airport, (Lambert International Airport), (MBIA),
5.50%, 7/1/31 | | | 1,005,160 | | |
| | | | | | | $ | 6,546,416 | | |
| Insured-Utilities — 2.0% | | | |
| $ | 2,370 | | | Springfield, Public Utility Revenue, (FGIC),
4.50%, 8/1/36 | | $ | 2,088,563 | | |
| | | | | | | $ | 2,088,563 | | |
| Insured-Water and Sewer — 0.8% | | | |
| $ | 1,000 | | | Missouri Environmental Improvement and Energy Resources
Authority, (Missouri - American Water Co.), (AMBAC),
4.60%, 12/1/36 | | $ | 835,430 | | |
| | | | | | | $ | 835,430 | | |
| Lease Revenue / Certificates of Participation — 0.5% | | | |
| $ | 500 | | | St. Joseph, Industrial Development Authority, (Sewage
Systems Improvements Project), 5.00%, 4/1/27 | | $ | 476,905 | | |
| | | | | | | $ | 476,905 | | |
| Other Revenue — 2.3% | | | |
| $ | 2,500 | | | Missouri Development Finance Board Cultural Facilities
Revenue, (Kauffman Center), 4.75%, 6/1/37 | | $ | 2,303,500 | | |
| | | | | | | $ | 2,303,500 | | |
Principal Amount
(000's omitted) | |
Security | |
Value | |
| Senior Living / Life Care — 4.5% | | | |
| $ | 1,000 | | | Kansas City, Industrial Development Revenue, (Kingswood
Manor), 5.80%, 11/15/17 | | $ | 928,640 | | |
| | 1,000 | | | Lees Summit Industrial Development Authority, Health
Facility, (John Knox Village), 5.125%, 8/15/32 | | | 876,890 | | |
| | 2,000 | | | Missouri State Health and Educational Facilities Authority,
(Lutheran Senior Services), 5.125%, 2/1/27 | | | 1,828,880 | | |
| | 1,000 | | | St. Louis County, Industrial Development Authority,
(Friendship Village West County), Series A,
5.50%, 9/1/28 | | | 892,260 | | |
| | | | | | | $ | 4,526,670 | | |
| Special Tax Revenue — 2.7% | | | |
| $ | 600 | | | Kansas City, Tax Increment Revenue, (Maincor Projects),
Series A, 5.25%, 3/1/18 | | $ | 562,434 | | |
| | 2,425 | | | Puerto Rico Sales Tax Financing, 5.25%, 8/1/57 | | | 2,186,986 | | |
| | | | | | | $ | 2,749,420 | | |
| Transportation — 1.6% | | | |
| $ | 270 | | | Branson, Regional Airport Transportation Development
District, (Branson Airport LLC), (AMT), 6.00%, 7/1/25 | | $ | 240,000 | | |
| | 525 | | | Branson, Regional Airport Transportation Development
District, (Branson Airport LLC), (AMT), 6.00%, 7/1/37 | | | 444,234 | | |
| | 1,000 | | | Missouri Highway and Transportation Commission,
5.00%, 5/1/26 | | | 991,680 | | |
| | | | | | | $ | 1,675,914 | | |
| Water and Sewer — 1.3% | | | |
| $ | 520 | | | Missouri Environmental Improvement and Energy Resources
Authority, (Revolving Fund Program), 7.20%, 7/1/16 | | $ | 523,260 | | |
| | 1,000 | | | Missouri Environmental Improvement and Energy Resources
Authority, (Revolving Fund Program), Water Pollution
Control, 0.00%, 1/1/14 | | | 789,010 | | |
| | | | | | | $ | 1,312,270 | | |
Total Tax-Exempt Investments — 100.9%
(identified cost $108,141,844) | | $ | 102,906,025 | | |
| Other Assets, Less Liabilities — (0.9)% | | $ | (882,075 | ) | |
| Net Assets — 100.0% | | $ | 102,023,950 | | |
See notes to financial statements
42
Eaton Vance Missouri Municipals Fund as of February 29, 2008
PORTFOLIO OF INVESTMENTS (Unaudited) CONT'D
AGC - Assured Guaranty Corp.
AMBAC - AMBAC Financial Group, Inc.
AMT - Interest earned from these securities may be considered a tax preference item for purposes of the Federal Alternative Minimum Tax.
CIFG - CIFG Assurance North America, Inc.
DRIVERS - Derivative Inverse Tax-Exempt Receipts
FGIC - Financial Guaranty Insurance Company
FSA - Financial Security Assurance, Inc.
GNMA - Government National Mortgage Association (Ginnie Mae)
MBIA - Municipal Bond Insurance Association
SFMR - Single Family Mortgage Revenue
XLCA - XL Capital Assurance, Inc.
The Fund invests primarily in debt securities issued by Missouri municipalities. The ability of the issuers of the debt securities to meet their obligations may be affected by economic developments in a specific industry or municipality. In order to reduce the risk associated with such economic developments, at February 29, 2008, 67.8% of total investments are backed by bond insurance of various financial institutions and financial guaranty assurance agencies. The aggregate percentage insured by an individual financial institution ranged from 2.9% to 22.6% of total investments.
(1) Security exempt from registration under Rule 144A of the Securities Act of 1933. These securities may be sold in transactions exempt from registration, normally to qualified institutional buyers. At February 29, 2008, the aggregate value of the securities is $1,445,442 or 1.4% of the Fund's net assets.
(2) Security has been issued as a leveraged inverse floater bond. The stated interest rate represents the rate in effect at February 29, 2008.
(3) Security represents the underlying municipal obligation of an inverse floating rate obligation held by the Fund.
(4) Security (or a portion thereof) has been segregated to cover margin requirements on open financial futures contracts.
See notes to financial statements
43
Eaton Vance North Carolina Municipals Fund as of February 29, 2008
PORTFOLIO OF INVESTMENTS (Unaudited)
Tax-Exempt Investments — 103.5% | | | |
Principal Amount
(000's omitted) | |
Security | |
Value | |
| Education — 9.6% | | | |
| $ | 2,000 | | | North Carolina Capital Facilities Finance Agency,
(Duke University), 4.50%, 10/1/40 | | $ | 1,735,160 | | |
| | 510 | | | North Carolina Capital Facilities Finance Agency,
(Duke University), 5.125%, 10/1/41 | | | 491,936 | | |
| | 1,000 | | | North Carolina Educational Facilities Finance Agency,
(Duke University), 5.00%, 10/1/41 | | | 953,120 | | |
| | 7,410 | | | University of North Carolina at Chapel Hill, 0.00%, 8/1/17 | | | 4,811,461 | | |
| | 1,980 | | | University of North Carolina at Chapel Hill, 0.00%, 8/1/21 | | | 986,297 | | |
| | | | | | | $ | 8,977,974 | | |
| Electric Utilities — 14.5% | | | |
| $ | 5,000 | | | North Carolina Eastern Municipal Power Agency,
6.125%, 1/1/09 | | $ | 5,111,450 | | |
| | 1,250 | | | North Carolina Eastern Municipal Power Agency,
6.75%, 1/1/26 | | | 1,310,075 | | |
| | 3,500 | | | North Carolina Municipal Power Agency, (Catawba),
6.50%, 1/1/20 | | | 3,671,920 | | |
| | 1,950 | | | Puerto Rico Electric Power Authority, Series N,
0.00%, 7/1/17 | | | 1,227,837 | | |
| | 2,000 | | | Puerto Rico Electric Power Authority, Series O,
0.00%, 7/1/17 | | | 1,259,320 | | |
| | 1,000 | | | Wake County, Industrial Facilities and Pollution Control
Financing Authority, (Carolina Power and Light Co.),
5.375%, 2/1/17 | | | 1,027,870 | | |
| | | | | | | $ | 13,608,472 | | |
| Escrowed / Prerefunded — 9.2% | | | |
| $ | 1,000 | | | Charlotte, Prerefunded to 6/1/10, 5.60%, 6/1/20 | | $ | 1,077,350 | | |
| | 1,000 | | | Charlotte, Water and Sewer, Prerefunded to 6/1/10,
5.25%, 6/1/25 | | | 1,060,390 | | |
| | 1,000 | | | New Hanover County, Public Improvements,
Prerefunded to 11/1/10, 5.75%, 11/1/17 | | | 1,090,490 | | |
| | 1,000 | | | North Carolina Eastern Municipal Power Agency,
Escrowed to Maturity, 4.00%, 1/1/18 | | | 987,780 | | |
| | 2,210 | | | North Carolina Eastern Municipal Power Agency,
Escrowed to Maturity, 5.00%, 1/1/17(1) | | | 2,343,661 | | |
| | 440 | | | North Carolina Eastern Municipal Power Agency,
Escrowed to Maturity, 5.00%, 1/1/21 | | | 452,333 | | |
| | 1,500 | | | North Carolina Medical Care Commission, (Annie Penn
Memorial Hospital), Prerefunded to 1/1/15,
5.375%, 1/1/22 | | | 1,590,465 | | |
| | | | | | | $ | 8,602,469 | | |
Principal Amount
(000's omitted) | |
Security | |
Value | |
| General Obligations — 1.1% | | | |
| $ | 1,000 | | | Charlotte, 5.00%, 7/1/29 | | $ | 993,450 | | |
| | | | | | | $ | 993,450 | | |
| Hospital — 10.4% | | | |
| $ | 4,800 | | | Charlotte-Mecklenburg Hospital Authority, (Carolinas
Healthcare System), 5.00%, 1/15/45(2) | | $ | 5,107,872 | | |
| | 2,000 | | | North Carolina Medical Care Commission, (Mission
Health System), 5.00%, 10/1/25 | | | 1,877,380 | | |
| | 1,500 | | | North Carolina Medical Care Commission, (Mission
Health System), 5.00%, 10/1/36 | | | 1,370,355 | | |
| | 1,000 | | | North Carolina Medical Care Commission, (Southeastern
Regional Medical Center), 5.375%, 6/1/32 | | | 938,760 | | |
| | 500 | | | North Carolina Medical Care Commission, (Union Regional
Medical Center), 5.375%, 1/1/32 | | | 469,630 | | |
| | | | | | | $ | 9,763,997 | | |
| Housing — 7.8% | | | |
| $ | 1,430 | | | Charlotte Housing Authority, (South Oaks Crossing
Apartments), (AMT), 4.60%, 8/20/26 | | $ | 1,277,576 | | |
| | 2,430 | | | North Carolina Housing Finance Agency, (AMT),
4.80%, 1/1/37 | | | 2,070,967 | | |
| | 2,000 | | | North Carolina Housing Finance Agency, (AMT),
4.80%, 1/1/39 | | | 1,704,040 | | |
| | 1,000 | | | North Carolina Housing Finance Agency, (AMT),
4.85%, 7/1/38 | | | 859,970 | | |
| | 1,000 | | | North Carolina Housing Finance Agency, (AMT),
4.90%, 7/1/37 | | | 873,370 | | |
| | 500 | | | North Carolina Housing Finance Agency, MFMR, (AMT),
6.45%, 9/1/27 | | | 505,605 | | |
| | | | | | | $ | 7,291,528 | | |
| Insured-Education — 3.2% | | | |
| $ | 1,320 | | | North Carolina Educational Facilities Finance Agency,
(Johnson & Wales University), (XLCA), 5.00%, 4/1/33 | | $ | 1,192,514 | | |
| | 2,000 | | | University of North Carolina at Charlotte, (AMBAC),
4.75%, 10/1/35 | | | 1,849,560 | | |
| | | | | | | $ | 3,042,074 | | |
| Insured-Electric Utilities — 2.8% | | | |
| $ | 1,250 | | | Puerto Rico Electric Power Authority, (FGIC),
5.25%, 7/1/35 | | $ | 1,189,037 | | |
| | 1,650 | | | Puerto Rico Electric Power Authority, (MBIA),
4.75%, 7/1/33(2) | | | 1,439,097 | | |
| | | | | | | $ | 2,628,134 | | |
See notes to financial statements
44
Eaton Vance North Carolina Municipals Fund as of February 29, 2008
PORTFOLIO OF INVESTMENTS (Unaudited) CONT'D
Principal Amount
(000's omitted) | |
Security | |
Value | |
| Insured-Escrowed / Prerefunded — 7.0% | | | |
| $ | 1,745 | | | Broad River, Water Authority Water System, (MBIA),
Prerefunded to 6/1/10, 5.375%, 6/1/26 | | $ | 1,855,109 | | |
| | 1,375 | | | East Carolina University, (Housing Dining Facility
Systems Revenue), (AMBAC), Prerefunded to 5/1/11,
5.25%, 11/1/21 | | | 1,475,127 | | |
| | 3,000 | | | Puerto Rico Highway and Transportation Authority, (MBIA),
Prerefunded to 7/1/16, 5.00%, 7/1/36(2) | | | 3,236,160 | | |
| | | | | | | $ | 6,566,396 | | |
| Insured-General Obligations — 1.9% | | | |
| $ | 840 | | | Puerto Rico, (MBIA), 5.50%, 7/1/20 | | $ | 863,831 | | |
| | 995 | | | Smithville Township, Brunswick County, (MBIA),
5.00%, 6/1/24 | | | 969,001 | | |
| | | | | | | $ | 1,832,832 | | |
| Insured-Hospital — 6.7% | | | |
| $ | 1,045 | | | North Carolina Medical Care Commission, (Betsy Johnson),
(FSA), 5.375%, 10/1/24 | | $ | 1,056,746 | | |
| | 2,000 | | | North Carolina Medical Care Commission, (Cleveland
County Healthcare), (AMBAC), 5.00%, 7/1/35 | | | 1,878,080 | | |
| | 1,500 | | | North Carolina Medical Care Commission, (Wilson
Memorial Hospital), (AMBAC), 0.00%, 11/1/15 | | | 1,063,095 | | |
| | 1,210 | | | Onslow County, Hospital Authority, (Onslow
Memorial Hospital), (MBIA), 5.00%, 4/1/25 | | | 1,126,970 | | |
| | 1,275 | | | Onslow County, Hospital Authority, (Onslow
Memorial Hospital), (MBIA), 5.00%, 4/1/26 | | | 1,177,717 | | |
| | | | | | | $ | 6,302,608 | | |
| Insured-Lease Revenue / Certificates of Participation — 1.4% | | | |
| $ | 1,260 | | | Puerto Rico Public Finance Corp., (Commonwealth
Appropriation), (AMBAC), 5.125%, 6/1/24 | | $ | 1,280,236 | | |
| | | | | | | $ | 1,280,236 | | |
| Insured-Other Revenue — 2.0% | | | |
| $ | 2,000 | | | Monroe, Combined Enterprise System Revenue, (AGC),
5.00%, 3/1/33 | | $ | 1,909,400 | | |
| | | | | | | $ | 1,909,400 | | |
Principal Amount
(000's omitted) | |
Security | |
Value | |
| Insured-Special Tax Revenue — 0.4% | | | |
| $ | 2,440 | | | Puerto Rico Sales Tax Financing, (AMBAC), 0.00%, 8/1/54 | | $ | 139,788 | | |
| | 450 | | | Puerto Rico Sales Tax Financing, (MBIA), 0.00%, 8/1/44 | | | 49,730 | | |
| | 895 | | | Puerto Rico Sales Tax Financing, (MBIA), 0.00%, 8/1/45 | | | 93,134 | | |
| | 720 | | | Puerto Rico Sales Tax Financing, (MBIA), 0.00%, 8/1/46 | | | 70,582 | | |
| | | | | | | $ | 353,234 | | |
| Insured-Transportation — 7.0% | | | |
| $ | 2,000 | | | Charlotte, Airport, (AMBAC), 4.50%, 7/1/37 | | $ | 1,710,240 | | |
| | 500 | | | Charlotte, Airport, (MBIA), (AMT), 5.25%, 7/1/21 | | | 488,255 | | |
| | 1,800 | | | Puerto Rico Highway and Transportation Authority, (AGC),
(CIFG), 5.25%, 7/1/41(2) | | | 1,767,366 | | |
| | 1,800 | | | Puerto Rico Highway and Transportation Authority, (MBIA),
5.25%, 7/1/32 | | | 1,705,266 | | |
| | 1,000 | | | Raleigh Durham, Airport Authority, (FGIC), 5.00%, 11/1/31 | | | 927,940 | | |
| | | | | | | $ | 6,599,067 | | |
| Insured-Water and Sewer — 6.3% | | | |
| $ | 1,000 | | | Asheville, Water System Revenue, (MBIA), 5.00%, 8/1/32 | | $ | 952,560 | | |
| | 1,685 | | | Broad River, Water Authority Water System, (XLCA),
5.00%, 6/1/21 | | | 1,611,180 | | |
| | 500 | | | Brunswick County, Enterprise System Water and
Sewer Revenue, (FSA), 5.25%, 4/1/26 | | | 501,785 | | |
| | 1,500 | | | Franklin County, Certificates of Participation, (MBIA),
5.00%, 9/1/27 | | | 1,436,910 | | |
| | 1,500 | | | Kannapolis, Water and Sewer, (FSA), (AMT),
5.25%, 2/1/26 | | | 1,455,870 | | |
| | | | | | | $ | 5,958,305 | | |
| Lease Revenue / Certificates of Participation — 4.6% | | | |
| $ | 1,000 | | | Charlotte, (Government Facilities), 5.00%, 6/1/28 | | $ | 951,020 | | |
| | 1,500 | | | Charlotte, (Government Facilities), 5.00%, 6/1/33 | | | 1,413,750 | | |
| | 2,000 | | | Raleigh, (Downtown Improvement Projects),
5.00%, 2/1/27 | | | 1,926,460 | | |
| | | | | | | $ | 4,291,230 | | |
| Senior Living / Life Care — 0.2% | | | |
| $ | 250 | | | North Carolina Medical Care Commission (United Methodist),
5.25%, 10/1/24 | | $ | 222,030 | | |
| | | | | | | $ | 222,030 | | |
| Special Tax Revenue — 1.6% | | | |
| $ | 1,620 | | | Puerto Rico Sales Tax Financing, 5.25%, 8/1/57 | | $ | 1,460,997 | | |
| | | | | | | $ | 1,460,997 | | |
See notes to financial statements
45
Eaton Vance North Carolina Municipals Fund as of February 29, 2008
PORTFOLIO OF INVESTMENTS (Unaudited) CONT'D
Principal Amount
(000's omitted) | |
Security | |
Value | |
| Water and Sewer — 5.8% | | | |
| $ | 1,700 | | | Charlotte, Storm Water, 5.00%, 6/1/25 | | $ | 1,684,360 | | |
| | 1,000 | | | Charlotte, Water and Sewer, 4.625%, 7/1/36 | | | 902,850 | | |
| | 1,975 | | | Charlotte, Water and Sewer, 5.125%, 6/1/26 | | | 1,987,285 | | |
| | 1,000 | | | Raleigh Enterprise System, 4.50%, 3/1/36 | | | 885,000 | | |
| | | | | | | $ | 5,459,495 | | |
Total Tax-Exempt Investments
(identified cost $99,687,448) | | $ | 97,143,928 | | |
| Auction-Rate Securities — 3.2% | | | |
Principal Amount
(000's omitted) | |
Description | |
Value | |
| $ | 1,000 | | | North Carolina Medical Care Commission, (Baptist Hospital),
(MBIA), Variable Rate, 7.00%, 6/1/34(3) | | $ | 1,000,000 | | |
| | 1,000 | | | North Carolina Medical Care Commission, (Baptist Hospital),
(MBIA), Variable Rate, 7.67%, 6/1/34(3) | | | 1,000,000 | | |
| | 1,000 | | | North Carolina Medical Care Commission,
(Caremont Hospital), Variable Rate, 8.00%, 8/15/34(3) | | | 1,000,000 | | |
Total Auction-Rate Securities
(identified cost $3,000,000) | | $ | 3,000,000 | | |
Total Investments — 106.7%
(identified cost $102,687,448) | | $ | 100,143,928 | | |
| Other Assets, Less Liabilities — (6.7)% | | $ | (6,289,062 | ) | |
| Net Assets — 100.0% | | $ | 93,854,866 | | |
AGC - Assured Guaranty Corp.
AMBAC - AMBAC Financial Group, Inc.
AMT - Interest earned from these securities may be considered a tax preference item for purposes of the Federal Alternative Minimum Tax.
CIFG - CIFG Assurance North America, Inc.
FGIC - Financial Guaranty Insurance Company
FSA - Financial Security Assurance, Inc.
MBIA - Municipal Bond Insurance Association
MFMR - Multi Family Mortgage Revenue
XLCA - XL Capital Assurance, Inc.
The Fund invests primarily in debt securities issued by North Carolina municipalities. The ability of the issuers of the debt securities to meet their obligations may be affected by economic developments in a specific industry or municipality. In order to reduce the risk associated with such economic developments, at February 29, 2008, 38.4% of total investments are backed by bond insurance of various financial institutions and financial guaranty assurance agencies. The aggregate percentage insured by an individual financial institution ranged from 1.8% to 17.4% of total investments.
(1) Security (or a portion thereof) has been segregated to cover margin requirements on open financial futures contracts.
(2) Security represents the underlying municipal obligation of an inverse floating rate obligation held by the Fund.
(3) Security subject to redemption at each auction date. The stated interest rate represents the rate in effect at February 29, 2008.
See notes to financial statements
46
Eaton Vance Oregon Municipals Fund as of February 29, 2008
PORTFOLIO OF INVESTMENTS (Unaudited)
Tax-Exempt Investments — 100.9% | | | |
Principal Amount
(000's omitted) | |
Security | |
Value | |
| Cogeneration — 0.9% | | | |
| $ | 1,235 | | | Western Generation Agency, (Wauna Cogeneration), (AMT),
5.00%, 1/1/12 | | $ | 1,242,410 | | |
| | | | | | | $ | 1,242,410 | | |
| Education — 0.7% | | | |
| $ | 1,000 | | | Oregon State Facilities Authority, (Linfield College),
5.00%, 10/1/25 | | $ | 927,030 | | |
| | | | | | | $ | 927,030 | | |
| Electric Utilities — 2.6% | | | |
| $ | 1,000 | | | Northern Wasco County, (Bonneville Power Administration),
5.20%, 12/1/24 | | $ | 1,000,060 | | |
| | 1,000 | | | Port of Morrow, Pollution Control, (Portland General Electric),
Variable Rate, 5.20%, 5/1/33 | | | 1,012,920 | | |
| | 505 | | | Puerto Rico Electric Power Authority, DRIVERS, Variable Rate,
7.74%, 7/1/25(1)(2) | | | 399,314 | | |
| | 1,495 | | | Puerto Rico Electric Power Authority, DRIVERS, Variable Rate,
7.74%, 7/1/37(1)(2) | | | 1,067,520 | | |
| | | | | | | $ | 3,479,814 | | |
| Escrowed / Prerefunded — 6.4% | | | |
| $ | 2,000 | | | Oregon Department of Transportation, (Highway User Tax),
Prerefunded to 11/15/12, 5.125%, 11/15/26 | | $ | 2,154,160 | | |
| | 1,250 | | | Portland, Community College District, Prerefunded to 6/1/11,
5.00%, 6/1/21 | | | 1,321,437 | | |
| | 3,710 | | | Portland Housing Authority, Multifamily Revenue Housing
(Berry Ridge), (AMT), Prerefunded to 5/1/08,
6.30%, 5/1/29 | | | 3,730,553 | | |
| | 1,500 | | | Umatilla County, Hospital Facilities Authority, (Catholic
Health Initiatives), Escrowed to Maturity, 5.50%, 3/1/32 | | | 1,509,090 | | |
| | | | | | | $ | 8,715,240 | | |
| General Obligations — 11.0% | | | |
| $ | 5,000 | | | Oregon, 4.50%, 8/1/37 | | $ | 4,373,450 | | |
| | 1,565 | | | Oregon Board of Higher Education, 0.00%, 8/1/20 | | | 826,117 | | |
| | 4,425 | | | Oregon Elderly and Disabled Housing, (AMT),
5.65%, 8/1/26 | | | 4,424,867 | | |
| | 660 | | | Oregon Veterans Welfare, Series 81, 5.25%, 10/1/42 | | | 628,010 | | |
| | 1,270 | | | Oregon Veterans Welfare, Series 82, 5.50%, 12/1/42 | | | 1,235,380 | | |
| | 3,440 | | | Portland, (Headwater Apartments), 5.00%, 4/1/25 | | | 3,464,321 | | |
| | | | | | | $ | 14,952,145 | | |
Principal Amount
(000's omitted) | |
Security | |
Value | |
| Hospital — 1.6% | | | |
| $ | 2,105 | | | Hood River County, Health Facility Authority Elderly Housing,
(Down Manor), 6.50%, 1/1/17 | | $ | 2,112,157 | | |
| | | | | | | $ | 2,112,157 | | |
| Housing — 15.3% | | | |
| $ | 870 | | | Oregon Health Authority, (Trillium Affordable Housing),
(AMT), 6.75%, 2/15/29 | | $ | 874,437 | | |
| | 1,000 | | | Oregon Housing and Community Services Department,
(AMT), 4.85%, 7/1/37 | | | 862,220 | | |
| | 2,000 | | | Oregon Housing and Community Services Department,
(Single Family Mortgage), (AMT), 4.75%, 7/1/36 | | | 1,706,960 | | |
| | 2,170 | | | Oregon Housing and Community Services Department,
(Single Family Mortgage), (AMT), 5.00%, 1/1/25 | | | 2,038,086 | | |
| | 750 | | | Oregon Housing and Community Services Department,
MFMR, (AMT), 5.70%, 7/1/29 | | | 745,357 | | |
| | 2,500 | | | Oregon Housing and Community Services Department,
MFMR, (FHA), (AMT), 5.00%, 7/1/47 | | | 2,145,400 | | |
| | 820 | | | Oregon Housing and Community Services Department,
SFMR, (AMT), 6.20%, 7/1/27 | | | 821,181 | | |
| | 440 | | | Oregon Housing and Community Services Department,
SFMR, (AMT), 6.40%, 7/1/26 | | | 440,246 | | |
| | 495 | | | Oregon Housing and Community Services Department,
SFMR, (AMT), 6.45%, 7/1/26 | | | 495,297 | | |
| | 1,655 | | | Portland Housing Authority, (Pearl Court LP), (AMT),
4.50%, 1/1/22 | | | 1,512,521 | | |
| | 2,080 | | | Portland Housing Authority, (Pearl Court LP), (AMT),
4.625%, 1/1/27 | | | 1,821,456 | | |
| | 465 | | | Portland Housing Authority, (Yards Union Station Project),
(AMT), 4.75%, 5/1/22 | | | 432,985 | | |
| | 2,740 | | | Portland Housing Authority, (Yards Union Station Project),
(AMT), 4.85%, 5/1/29 | | | 2,436,983 | | |
| | 2,875 | | | Portland Housing Authority, MFMR, (Cherry Blossom),
(AMT), 6.20%, 12/20/36 | | | 2,893,687 | | |
| | 1,500 | | | Washington County, Housing Authority, (Bethany Meadows),
(AMT), 5.85%, 9/1/27 | | | 1,530,255 | | |
| | | | | | | $ | 20,757,071 | | |
| Industrial Development Revenue — 4.1% | | | |
| $ | 590 | | | Oregon Economic Development Authority, (Georgia-Pacific),
(AMT), 5.70%, 12/1/25 | | $ | 492,449 | | |
| | 3,500 | | | Port of Astoria, PCR, (James River Corp.), 6.55%, 2/1/15 | | | 3,380,160 | | |
| | 165 | | | Port of Portland, (North Portland Crown Zellerbach Corp.),
6.125%, 5/15/08 | | | 164,503 | | |
| | 830 | | | Puerto Rico Port Authority, (American Airlines), (AMT),
6.25%, 6/1/26 | | | 715,684 | | |
| | 915 | | | Puerto Rico Port Authority, (American Airlines), (AMT),
6.30%, 6/1/23 | | | 804,386 | | |
| | | | | | | $ | 5,557,182 | | |
See notes to financial statements
47
Eaton Vance Oregon Municipals Fund as of February 29, 2008
PORTFOLIO OF INVESTMENTS (Unaudited) CONT'D
Principal Amount
(000's omitted) | |
Security | |
Value | |
| Insured-Education — 2.7% | | | |
| $ | 4,850 | | | Oregon Health Science University, (MBIA), 0.00%, 7/1/21 | | $ | 2,282,798 | | |
| | 1,500 | | | Oregon Health Science University, (MBIA), 5.00%, 7/1/32 | | | 1,386,690 | | |
| | | | | | | $ | 3,669,488 | | |
| Insured-Electric Utilities — 2.0% | | | |
| $ | 750 | | | Emerald People's Utility District, (FSA), 5.25%, 11/1/22 | | $ | 764,295 | | |
| | 1,000 | | | Eugene, Electric Utility, (FSA), 5.25%, 8/1/22 | | | 1,015,080 | | |
| | 1,000 | | | Puerto Rico Electric Power Authority, (FGIC), 5.25%, 7/1/35 | | | 951,230 | | |
| | | | | | | $ | 2,730,605 | | |
| Insured-Escrowed / Prerefunded — 4.4% | | | |
| $ | 1,750 | | | Clackamas County, School District No. 007J, (Lake Oswego),
(MBIA), Prerefunded to 6/1/11, 5.00%, 6/1/26(3) | | $ | 1,850,012 | | |
| | 3,896 | | | Puerto Rico, (FGIC), Prerefunded to 7/1/12,
5.00%, 7/1/32(4) | | | 4,154,518 | | |
| | | | | | | $ | 6,004,530 | | |
| Insured-General Obligations — 19.8% | | | |
| $ | 1,200 | | | Clackamas County, School District No. 108, (FSA),
5.50%, 6/15/24 | | $ | 1,266,240 | | |
| | 5,000 | | | Clackamas County, School District No. 115, (MBIA),
0.00%, 6/15/27 | | | 1,583,150 | | |
| | 1,050 | | | Clackamas County, School District No. 12, (North Clackamas),
(FSA), 4.50%, 6/15/32 | | | 935,907 | | |
| | 1,000 | | | Columbia, School District No. 502, (FGIC), 0.00%, 6/1/17 | | | 631,750 | | |
| | 1,000 | | | Deschutes and Jefferson County, School District No. 2J,
(FGIC), 0.00%, 6/15/18 | | | 588,320 | | |
| | 2,950 | | | Deschutes and Jefferson County, School District No. 2J,
(FGIC), 0.00%, 6/15/23 | | | 1,228,586 | | |
| | 1,230 | | | Jackson County, School District No. 549C, (FSA),
4.25%, 12/15/28 | | | 1,077,935 | | |
| | 1,460 | | | Jackson County, School District No. 549C, (FSA),
4.50%, 12/15/31 | | | 1,305,167 | | |
| | 1,545 | | | Jackson County, School District No. 549C, (FSA),
5.00%, 12/15/21 | | | 1,579,716 | | |
| | 200 | | | Jefferson County, School District No. 509J, (FGIC),
5.00%, 6/15/22 | | | 200,906 | | |
| | 500 | | | Jefferson County, School District No. 509J, (FGIC),
5.25%, 6/15/19 | | | 519,010 | | |
| | 3,750 | | | Lane County, School District No. 019, (Springfield), (FSA),
0.00%, 6/15/28 | | | 1,108,575 | | |
| | 575 | | | Lane County, School District No. 019, (Springfield), (FSA),
0.00%, 6/15/29 | | | 159,286 | | |
| | 1,475 | | | Lane County, School District No. 40, (Creswell), (FSA),
4.25%, 6/15/27 | | | 1,301,569 | | |
| | 800 | | | Lebanon, (AMBAC), 4.25%, 6/1/26 | | | 706,728 | | |
| | 2,000 | | | Linn County, Community School District No. 9, (Lebanon),
(FGIC), 5.50%, 6/15/27 | | | 2,069,880 | | |
Principal Amount
(000's omitted) | |
Security | |
Value | |
| Insured-General Obligations (continued) | | | |
| $ | 4,000 | | | Linn County, Community School District No. 9, (Lebanon),
(FGIC), 5.50%, 6/15/30(4) | | $ | 4,157,000 | | |
| | 195 | | | Marion and Clackamas Counties, School District No. 4J,
(Silver Falls), (MBIA), 4.25%, 6/15/27 | | | 171,855 | | |
| | 1,470 | | | Marion County, (AMBAC), 5.50%, 6/1/23 | | | 1,544,456 | | |
| | 1,065 | | | Polk Marion and Benton Counties Oresch District No. 13J,
(FSA), 4.125%, 6/15/27 | | | 910,958 | | |
| | 855 | | | Portland, Oregon Revenue, (MBIA), 4.50%, 6/1/28 | | | 770,612 | | |
| | 600 | | | Puerto Rico, (MBIA), 5.50%, 7/1/20 | | | 617,022 | | |
| | 100 | | | Tualatin Valley Fire and Rescue, (Rural Fire Protection District),
(MBIA), 4.25%, 4/1/26 | | | 88,750 | | |
| | 1,000 | | | Tualatin Valley Fire and Rescue, (Rural Fire Protection District),
(MBIA), 4.25%, 4/1/27 | | | 880,000 | | |
| | 875 | | | Washington Clackamas and Yamhill Counties,
School District No. 88J, (MBIA), 4.25%, 6/15/28 | | | 760,174 | | |
| | 3,425 | | | Washington Clackamas and Yamhill Counties,
School District No. 88J, Series A, (MBIA), 0.00%, 6/15/31 | | | 808,780 | | |
| | | | | | | $ | 26,972,332 | | |
| Insured-Hospital — 1.7% | | | |
| $ | 500 | | | Oregon Health, Housing, Educational and Cultural Facilities
Authority, (Peace Health), (AMBAC), 5.00%, 11/15/32 | | $ | 452,640 | | |
| | 2,000 | | | Salem, Hospital Facility Authority, (Salem Hospital Project),
(AMBAC), 5.00%, 8/15/36 | | | 1,829,100 | | |
| | | | | | | $ | 2,281,740 | | |
Insured-Lease Revenue / Certificates of
Participation — 3.2% | | | |
| $ | 2,000 | | | Oregon Department of Administration Services, (FGIC),
5.00%, 11/1/22 | | $ | 1,975,300 | | |
| | 1,500 | | | Oregon Department of Administration Services, (MBIA),
5.25%, 11/1/20 | | | 1,526,565 | | |
| | 900 | | | Puerto Rico Public Finance Corp., (Commonwealth
Appropriation), (AMBAC), 5.125%, 6/1/24 | | | 914,454 | | |
| | | | | | | $ | 4,416,319 | | |
| Insured-Other Revenue — 1.0% | | | |
| $ | 1,520 | | | Oregon Bond Bank, (AMBAC), 4.375%, 1/1/32 | | $ | 1,301,485 | | |
| | | | | | | $ | 1,301,485 | | |
| Insured-Special Tax Revenue — 3.9% | | | |
| $ | 560 | | | Puerto Rico Infrastructure Financing Authority, (AMBAC),
0.00%, 7/1/28 | | $ | 158,189 | | |
| | 450 | | | Puerto Rico Infrastructure Financing Authority, (AMBAC),
0.00%, 7/1/37 | | | 72,963 | | |
| | 12,100 | | | Puerto Rico Infrastructure Financing Authority, (AMBAC),
0.00%, 7/1/44 | | | 1,261,304 | | |
See notes to financial statements
48
Eaton Vance Oregon Municipals Fund as of February 29, 2008
PORTFOLIO OF INVESTMENTS (Unaudited) CONT'D
Principal Amount
(000's omitted) | |
Security | |
Value | |
| Insured-Special Tax Revenue (continued) | | | |
| $ | 20,000 | | | Puerto Rico Infrastructure Financing Authority, (FGIC),
0.00%, 7/1/42 | | $ | 2,314,400 | | |
| | 17,500 | | | Puerto Rico Sales Tax Financing, (AMBAC), 0.00%, 8/1/54 | | | 1,002,575 | | |
| | 905 | | | Puerto Rico Sales Tax Financing, (MBIA), 0.00%, 8/1/44 | | | 100,012 | | |
| | 1,795 | | | Puerto Rico Sales Tax Financing, (MBIA), 0.00%, 8/1/45 | | | 186,788 | | |
| | 1,435 | | | Puerto Rico Sales Tax Financing, (MBIA), 0.00%, 8/1/46 | | | 140,673 | | |
| | | | | | | $ | 5,236,904 | | |
| Insured-Transportation — 6.7% | | | |
| $ | 1,400 | | | Jackson County, Airport, (XLCA), 5.25%, 12/1/37 | | $ | 1,311,996 | | |
| | 2,265 | | | Jackson County, Airport, (XLCA), (AMT), 5.25%, 12/1/23 | | | 2,146,201 | | |
| | 3,955 | | | Puerto Rico Highway and Transportation Authority, (AGC),
5.25%, 7/1/36 | | | 3,920,117 | | |
| | 1,800 | | | Puerto Rico Highway and Transportation Authority, (AGC),
(CIFG), 5.25%, 7/1/41(4) | | | 1,767,366 | | |
| | | | | | | $ | 9,145,680 | | |
| Insured-Water and Sewer — 3.0% | | | |
| $ | 1,575 | | | Albany, Water Revenue, (FGIC), 5.125%, 8/1/26 | | $ | 1,544,587 | | |
| | 1,000 | | | Portland, Sewer System, (FSA), 5.00%, 6/1/23 | | | 1,002,670 | | |
| | 900 | | | Portland, Water System, (MBIA), 4.50%, 10/1/31 | | | 798,570 | | |
| | 750 | | | Washington County, Clean Water Services, (Senior Lien),
(FGIC), 5.00%, 10/1/21 | | | 754,733 | | |
| | | | | | | $ | 4,100,560 | | |
| Other Revenue — 1.1% | | | |
| $ | 1,500 | | | Puerto Rico Infrastructure Financing Authority,
5.50%, 10/1/32(4) | | $ | 1,556,280 | | |
| | | | | | | $ | 1,556,280 | | |
| Senior Living / Life Care — 1.2% | | | |
| $ | 1,750 | | | Clackamas County, Hospital Facility Authority,
(Homewoods), 5.15%, 10/20/37 | | $ | 1,658,370 | | |
| | | | | | | $ | 1,658,370 | | |
| Special Tax Revenue — 7.6% | | | |
| $ | 5,000 | | | Oregon Department of Transportation, (Highway User Tax),
4.50%, 11/15/32 | | $ | 4,459,700 | | |
| | 2,475 | | | Portland Limited Tax General Obligation, 0.00%, 6/1/22 | | | 1,156,345 | | |
| | 5,235 | | | Puerto Rico Sales Tax Financing, 5.25%, 8/1/57 | | | 4,721,185 | | |
| | | | | | | $ | 10,337,230 | | |
Total Tax-Exempt Investments
(identified cost $148,071,800) | | $ | 137,154,572 | | |
Auction-Rate Securities — 4.4% | |
Principal Amount
(000's omitted) | |
Description | |
Value | |
| $ | 1,000 | | | Medford Hospital Facilities Authority, (Asante Health System),
(MBIA), Variable Rate, 11.00%, 8/15/29(5) | | $ | 1,000,000 | | |
| | 5,000 | | | Salem, Hospital Facility Authority, (Salem Hospital Project),
(CIFG), Variable Rate, 11.50%, 8/15/21(5) | | | 5,000,000 | | |
Total Auction-Rate Securities
(identified cost $6,000,000) | | $ | 6,000,000 | | |
Total Investments — 105.3%
(identified cost $154,071,800) | | $ | 143,154,572 | | |
| Other Assets, Less Liabilities — (5.3)% | | $ | (7,262,260 | ) | |
| Net Assets — 100.0% | | $ | 135,892,312 | | |
AGC - Assured Guaranty Corp.
AMBAC - AMBAC Financial Group, Inc.
AMT - Interest earned from these securities may be considered a tax preference item for purposes of the Federal Alternative Minimum Tax.
CIFG - CIFG Assurance North America, Inc.
DRIVERS - Derivative Inverse Tax-Exempt Receipts
FGIC - Financial Guaranty Insurance Company
FHA - Federal Housing Administration
FSA - Financial Security Assurance, Inc.
MBIA - Municipal Bond Insurance Association
MFMR - Multi-Family Mortgage Revenue
SFMR - Single-Family Mortgage Revenue
XLCA - XL Capital Assurance, Inc.
The Fund invests primarily in debt securities issued by Oregon municipalities. The ability of the issuers of the debt securities to meet their obligations may be affected by economic developments in a specific industry or municipality. In order to reduce the risk associated with such economic developments, at February 29, 2008, 50.2% of total investments are backed by bond insurance of various financial institutions and financial guaranty assurance agencies. The aggregate percentage insured by an individual financial institution ranged from 2.4% to 14.7% of total investments.
(1) Security exempt from registration under Rule 144A of the Securities Act of 1933. These securities may be sold in transactions exempt from registration, normally to qualified institutional buyers. At February 29, 2008, the aggregate value of the securities is $1,466,834 or 1.1% of the Fund's net assets.
(2) Security has been issued as a leveraged inverse floater bond. The stated interest rate represents the rate in effect at February 29, 2008.
(3) Security (or a portion thereof) has been segregated to cover margin requirements on open financial futures contracts.
(4) Security represents the underlying municipal obligation of an inverse floating rate obligation held by the Fund.
(5) Security subject to redemption at each auction date. The stated interest rate represents the rate in effect at February 29, 2008.
See notes to financial statements
49
Eaton Vance South Carolina Municipals Fund as of February 29, 2008
PORTFOLIO OF INVESTMENTS (Unaudited)
Tax-Exempt Investment — 105.3% | | | |
Principal Amount
(000's omitted) | |
Security | |
Value | |
| Education — 2.2% | | | |
| $ | 1,175 | | | South Carolina Educational Facilities Authority,
(Furman University), 4.625%, 10/1/35 | | $ | 1,017,902 | | |
| | 1,100 | | | South Carolina Educational Facilities Authority,
(Furman University), 5.00%, 10/1/38 | | | 1,009,855 | | |
| | 750 | | | South Carolina Educational Facilities Authority,
(Wofford College), 4.50%, 4/1/30 | | | 646,140 | | |
| | 145 | | | South Carolina Educational Facilities Authority,
(Wofford College), 5.00%, 4/1/36 | | | 132,942 | | |
| | | | | | | $ | 2,806,839 | | |
| Electric Utilities — 1.0% | | | |
| $ | 440 | | | Puerto Rico Electric Power Authority, DRIVERS,
Variable Rate, 7.74%, 7/1/25(1)(2) | | $ | 347,917 | | |
| | 1,310 | | | Puerto Rico Electric Power Authority, DRIVERS,
Variable Rate, 7.74%, 7/1/37(1)(2) | | | 935,419 | | |
| | | | | | | $ | 1,283,336 | | |
| Escrowed / Prerefunded — 3.6% | | | |
| $ | 695 | | | Kershaw County, School District, Prerefunded to
2/1/10, 5.00%, 2/1/18 | | $ | 722,320 | | |
| | 1,000 | | | Lexington County, (Health Services District, Inc.),
Prerefunded to 11/1/13, 5.50%, 11/1/32 | | | 1,098,690 | | |
| | 1,000 | | | Medical University Hospital Authority, Prerefunded to
8/15/12, 6.50%, 8/15/32 | | | 1,127,430 | | |
| | 50 | | | South Carolina Jobs Economic Development Authority,
(Bon Secours Health System, Inc.), Prerefunded to
11/15/12, 5.625%, 11/15/30 | | | 54,798 | | |
| | 1,335 | | | South Carolina Jobs Economic Development Authority,
(Palmetto Health Facility), Prerefunded to
8/1/13, 6.375%, 8/1/34 | | | 1,522,527 | | |
| | 165 | | | South Carolina Jobs Economic Development Authority,
(Palmetto Health Facility), Prerefunded to
8/1/13, 6.375%, 8/1/34 | | | 187,740 | | |
| | | | | | | $ | 4,713,505 | | |
| General Obligations — 4.1% | | | |
| $ | 1,500 | | | Charleston County, School District, 5.00%, 2/1/25 | | $ | 1,486,425 | | |
| | 1,085 | | | Richland County, Sewer System, (Broad River),
5.125%, 3/1/29 | | | 1,084,306 | | |
| | 2,360 | | | South Carolina, 3.25%, 8/1/30 | | | 1,722,116 | | |
| | 1,240 | | | South Carolina, (Clemson University),
2.50%, 6/1/21 | | | 945,773 | | |
| | | | | | | $ | 5,238,620 | | |
Principal Amount
(000's omitted) | |
Security | |
Value | |
| Hospital — 2.7% | | | |
| $ | 3,500 | | | Lexington County, (Health Services District, Inc.),
5.00%, 11/1/27 | | $ | 3,249,295 | | |
| | 200 | | | South Carolina Jobs Economic Development Authority,
(Bon Secours Health System, Inc.), 5.625%, 11/15/30 | | | 196,584 | | |
| | | | | | | $ | 3,445,879 | | |
| Housing — 0.2% | | | |
| $ | 270 | | | South Carolina Housing Finance Authority, SFMR, (FHA),
6.45%, 7/1/17 | | $ | 270,259 | | |
| | | | | | | $ | 270,259 | | |
| Industrial Development Revenue — 3.4% | | | |
| $ | 1,400 | | | Darlington County, (Sonoco Products), (AMT),
6.00%, 4/1/26 | | $ | 1,329,636 | | |
| | 400 | | | Puerto Rico Port Authority, (American Airlines), (AMT),
6.25%, 6/1/26 | | | 344,908 | | |
| | 1,500 | | | Richland County, Environmental Improvement,
(International Paper Co.), (AMT), 5.95%, 9/1/31 | | | 1,362,000 | | |
| | 1,400 | | | Richland County, Environmental Improvement,
(International Paper Co.), (AMT), 6.10%, 4/1/23 | | | 1,374,352 | | |
| | | | | | | $ | 4,410,896 | | |
| Insured-Education — 4.0% | | | |
| $ | 1,000 | | | College of Charleston, Academic and Administrative
Facilities, (XLCA), 5.125%, 4/1/30 | | $ | 930,000 | | |
| | 1,250 | | | College of Charleston, Academic and Administrative
Facilities, (XLCA), 5.375%, 4/1/25 | | | 1,210,975 | | |
| | 2,000 | | | College of Charleston, Higher Education Facility, (XLCA),
4.50%, 4/1/37 | | | 1,739,960 | | |
| | 1,345 | | | University of South Carolina, (AMBAC), 4.75%, 5/1/27 | | | 1,264,233 | | |
| | | | | | | $ | 5,145,168 | | |
| Insured-Electric Utilities — 10.2% | | | |
| $ | 7,500 | | | Piedmont Municipal Power Agency, (AMBAC),
0.00%, 1/1/29 | | $ | 2,196,825 | | |
| | 2,940 | | | Piedmont Municipal Power Agency, (AMBAC),
0.00%, 1/1/32 | | | 724,975 | | |
| | 2,090 | | | Piedmont Municipal Power Agency, (FGIC),
0.00%, 1/1/23 | | | 873,056 | | |
| | 1,350 | | | Puerto Rico Electric Power Authority, (FGIC),
5.25%, 7/1/34 | | | 1,285,213 | | |
| | 7,500 | | | South Carolina Public Service Authority, (AMBAC),
5.00%, 1/1/37 | | | 7,084,275 | | |
| | 1,000 | | | South Carolina Public Service Authority, (FSA),
5.125%, 1/1/21 | | | 1,018,380 | | |
| | | | | | | $ | 13,182,724 | | |
See notes to financial statements
50
Eaton Vance South Carolina Municipals Fund as of February 29, 2008
PORTFOLIO OF INVESTMENTS (Unaudited) CONT'D
Principal Amount
(000's omitted) | |
Security | |
Value | |
| Insured-Escrowed / Prerefunded — 0.8% | | | |
| $ | 990 | | | Puerto Rico, (FGIC), Prerefunded to 7/1/12,
5.00%, 7/1/32(3) | | $ | 1,055,624 | | |
| | | | | | | $ | 1,055,624 | | |
| Insured-General Obligations — 5.0% | | | |
| $ | 2,065 | | | Beaufort County, School District, (FSA), 5.00%, 3/1/28 | | $ | 2,031,650 | | |
| | 1,300 | | | Berkeley County, (FSA), 2.00%, 9/1/25 | | | 811,213 | | |
| | 1,000 | | | Lancaster County School District, (FSA), 4.75%, 3/1/18 | | | 1,012,140 | | |
| | 1,980 | | | Puerto Rico, (AGC), 5.50%, 7/1/29(3) | | | 2,032,668 | | |
| | 600 | | | Puerto Rico, (MBIA), 5.50%, 7/1/20 | | | 617,022 | | |
| | | | | | | $ | 6,504,693 | | |
| Insured-Hospital — 0.7% | | | |
| $ | 1,000 | | | Florence County, (McLeod Regional Medical Center), (FSA),
5.25%, 11/1/34 | | $ | 966,510 | | |
| | | | | | | $ | 966,510 | | |
Insured-Lease Revenue / Certificates of
Participation — 14.4% | | | |
| $ | 250 | | | Berkeley County, School District, (CIFG), 4.75%, 12/1/31 | | $ | 224,367 | | |
| | 500 | | | Greenville County, School District, (Building Equity Sooner),
(AGC), 5.00%, 12/1/28 | | | 469,245 | | |
| | 3,975 | | | Greenwood Fifty School Facilities, Inc., Installment Purchase
Revenue, (AGC), 4.50%, 12/1/32 | | | 3,444,457 | | |
| | 1,390 | | | Greenwood Fifty Schools Facilities, Inc., Installment Purchase
Revenue, (AGC), 4.625%, 12/1/29 | | | 1,245,774 | | |
| | 2,810 | | | Kershaw County, Public Schools Foundation, (CIFG),
5.00%, 12/1/31 | | | 2,692,963 | | |
| | 1,245 | | | Puerto Rico Public Finance Corp., (Commonwealth
Appropriation), (AMBAC), 5.125%, 6/1/24 | | | 1,264,995 | | |
| | 3,665 | | | Scago Educational Facilities Corp., Cherokee School
District No. 1, (FSA), 5.00%, 12/1/30 | | | 3,469,362 | | |
| | 2,000 | | | Scago Educational Facilities Corp., Pickens School District,
(FSA), 5.00%, 12/1/31 | | | 1,863,100 | | |
| | 2,500 | | | Scago Educational Facilities Corp., Pickens School District,
(FSA), Variable Rate, 6.71%, 12/1/28(1)(2) | | | 1,628,950 | | |
| | 2,635 | | | Sumter Two School Facilities, Inc., Installment Purchase
Revenue, (AGC), 4.50%, 12/1/32 | | | 2,305,888 | | |
| | | | | | | $ | 18,609,101 | | |
| Insured-Other Revenue — 2.7% | | | |
| $ | 1,710 | | | Columbia, Parking Facility, (CIFG), 5.00%, 2/1/25 | | $ | 1,612,752 | | |
| | 2,000 | | | Columbia, Parking Facility, (CIFG), 5.00%, 2/1/37 | | | 1,855,940 | | |
| | | | | | | $ | 3,468,692 | | |
Principal Amount
(000's omitted) | |
Security | |
Value | |
| Insured-Pooled Loans — 3.7% | | | |
| $ | 4,980 | | | Puerto Rico Municipal Finance Agency, (FSA),
5.00%, 8/1/27(3) | | $ | 4,800,006 | | |
| | | | | | | $ | 4,800,006 | | |
| Insured-Special Tax Revenue — 1.3% | | | |
| $ | 1,000 | | | Myrtle Beach, (Hospitality Fee), (FGIC), 5.375%, 6/1/24 | | $ | 1,007,040 | | |
| | 4,890 | | | Puerto Rico Sales Tax Financing, (AMBAC), 0.00%, 8/1/54 | | | 280,148 | | |
| | 905 | | | Puerto Rico Sales Tax Financing, (MBIA), 0.00%, 8/1/44 | | | 100,012 | | |
| | 1,795 | | | Puerto Rico Sales Tax Financing, (MBIA), 0.00%, 8/1/45 | | | 186,788 | | |
| | 1,435 | | | Puerto Rico Sales Tax Financing, (MBIA), 0.00%, 8/1/46 | | | 140,673 | | |
| | | | | | | $ | 1,714,661 | | |
| Insured-Transportation — 2.9% | | | |
| $ | 2,700 | | | Puerto Rico Highway and Transportation Authority, (AGC),
(CIFG), 5.25%, 7/1/41(3) | | $ | 2,651,049 | | |
| | 1,095 | | | Richland Lexington, Airport, (AMT), (CIFG), 5.00%, 1/1/21 | | | 1,038,213 | | |
| | | | | | | $ | 3,689,262 | | |
| Insured-Utilities — 3.9% | | | |
| $ | 1,000 | | | Greer, Combined Utility System, (AMBAC), 5.50%, 9/1/27 | | $ | 1,009,560 | | |
| | 2,000 | | | Greer, Combined Utility System, (AMBAC), 5.50%, 9/1/32(4) | | | 2,032,460 | | |
| | 2,000 | | | South Carolina Jobs Economic Development Authority, (South
Carolina Electric and Gas Co.), (AMBAC), 5.20%, 11/1/27 | | | 1,951,740 | | |
| | | | | | | $ | 4,993,760 | | |
| Insured-Water and Sewer — 18.7% | | | |
| $ | 3,150 | | | Beaufort-Jasper, Water and Sewer Authority, (FSA),
4.50%, 3/1/31 | | $ | 2,782,868 | | |
| | 1,530 | | | Cayce, Waterworks and Sewer Revenue, (XLCA),
4.625%, 7/1/27 | | | 1,365,862 | | |
| | 1,000 | | | Dorchester County, Water and Sewer System, (MBIA),
5.00%, 10/1/28 | | | 942,080 | | |
| | 1,000 | | | Easley, SC Utility Revenue, (FSA), 5.00%, 12/1/27 | | | 1,071,790 | | |
| | 2,800 | | | Easley, SC Utility Revenue, (FSA), 5.00%, 12/1/34 | | | 3,034,864 | | |
| | 1,500 | | | Grand Strand, Water and Sewer Authority, (FSA),
5.00%, 6/1/26 | | | 1,476,945 | | |
| | 1,875 | | | Greenwood, Metropolitan District Subway System, Variable
Rate, (FSA), 10.158%, 10/1/30(1)(2) | | | 1,561,387 | | |
| | 3,830 | | | Lugoff-Elgin, Water Authority, (MBIA), 4.625%, 7/1/37 | | | 3,415,824 | | |
| | 1,895 | | | Richland County, Sewer System, (Broad River), (XLCA),
4.50%, 3/1/34 | | | 1,658,125 | | |
| | 500 | | | Spartanburg, Sanitary Sewer District, (MBIA),
5.00%, 3/1/26 | | | 479,930 | | |
| | 1,000 | | | Spartanburg, Sewer System, (MBIA), 5.25%, 3/1/30 | | | 983,350 | | |
| | 6,250 | | | Sumter, Waterworks and Sewer System, (XLCA),
4.50%, 12/1/32 | | | 5,379,563 | | |
| | | | | | | $ | 24,152,588 | | |
See notes to financial statements
51
Eaton Vance South Carolina Municipals Fund as of February 29, 2008
PORTFOLIO OF INVESTMENTS (Unaudited) CONT'D
Principal Amount
(000's omitted) | |
Security | |
Value | |
| Lease Revenue / Certificates of Participation — 13.0% | | | |
| $ | 2,000 | | | Charleston Educational Excellence Financing Corp.,
5.00%, 12/1/31 | | $ | 1,830,980 | | |
| | 1,000 | | | Dorchester County, School District No. 2, 5.00%, 12/1/30 | | | 917,250 | | |
| | 3,000 | | | Greenville County, School District, 5.00%, 12/1/24(3) | | | 2,874,950 | | |
| | 3,500 | | | Laurens County, School District, 5.25%, 12/1/30 | | | 3,134,250 | | |
| | 1,420 | | | Lexington, One School Facility Corp., 5.00%, 12/1/23 | | | 1,351,442 | | |
| | 2,000 | | | Lexington, One School Facility Corp., 5.00%, 12/1/26 | | | 1,859,400 | | |
| | 1,470 | | | Lexington, One School Facility Corp., 5.25%, 12/1/27 | | | 1,382,094 | | |
| | 2,420 | | | Newberry, (Newberry County School District),
5.00%, 12/1/30 | | | 2,056,371 | | |
| | 1,520 | | | Newberry, (Newberry County School District),
5.25%, 12/1/25 | | | 1,400,254 | | |
| | | | | | | $ | 16,806,991 | | |
| Other Revenue — 3.7% | | | |
| $ | 1,650 | | | Puerto Rico Infrastructure Financing Authority,
5.50%, 10/1/32(3) | | $ | 1,711,908 | | |
| | 1,000 | | | Tobacco Settlement Management Authority,
6.00%, 5/15/22 | | | 1,000,260 | | |
| | 2,000 | | | Tobacco Settlement Management Authority,
6.375%, 5/15/28 | | | 2,003,760 | | |
| | | | | | | $ | 4,715,928 | | |
| Pooled Loans — 0.8% | | | |
| $ | 1,000 | | | South Carolina Education Authority, Student Loan, (AMT),
6.30%, 9/1/08 | | $ | 1,000,190 | | |
| | | | | | | $ | 1,000,190 | | |
| Special Tax Revenue — 2.3% | | | |
| $ | 3,235 | | | Puerto Rico Sales Tax Financing, 5.25%, 8/1/57 | | $ | 2,917,485 | | |
| | | | | | | $ | 2,917,485 | | |
Total Tax-Exempt Investments
(identified cost $147,125,418) | | $ | 135,892,717 | | |
Auction-Rate Securities — 3.9% | |
Principal Amount
(000's omitted) | |
Description | |
Value | |
| $ | 5,000 | | | South Carolina Jobs Economic Development, (FSA),
Variable Rate, 10.00%, 8/1/35(5) | | $ | 5,000,000 | | |
Total Auction-Rate Securities
(identified cost $5,000,000) | | $ | 5,000,000 | | |
Total Investments — 109.2%
(identified cost $152,125,418) | | $ | 140,892,717 | | |
| Other Assets, Less Liabilities — (9.2)% | | $ | (11,919,389 | ) | |
| Net Assets — 100.0% | | $ | 128,973,328 | | |
AGC - Assured Guaranty Corp.
AMBAC - AMBAC Financial Group, Inc.
AMT - Interest earned from these securities may be considered a tax preference item for purposes of the Federal Alternative Minimum Tax.
CIFG - CIFG Assurance North America, Inc.
DRIVERS - Derivative Inverse Tax-Exempt Receipts
FGIC - Financial Guaranty Insurance Company
FHA - Federal Housing Administration
FSA - Financial Security Assurance, Inc.
MBIA - Municipal Bond Insurance Association
SFMR - Single Family Mortgage Revenue
XLCA - XL Capital Assurance, Inc.
The Fund invests primarily in debt securities issued by South Carolina municipalities. The ability of the issuers of the debt securities to meet their obligations may be affected by economic developments in a specific industry or municipality. In order to reduce the risk associated with such economic developments, at February 29, 2008, 62.7% of total investments are backed by bond insurance of various financial institutions and financial guaranty assurance agencies. The aggregate percentage insured by an individual financial institution ranged from 3.0% to 19.5% of total investments.
(1) Security exempt from registration under Rule 144A of the Securities Act of 1933. These securities may be sold in transactions exempt from registration, normally to qualified institutional buyers. At February 29, 2008, the aggregate value of the securities is $4,473,673 or 3.5% of the Fund's net assets.
(2) Security has been issued as a leveraged inverse floater bond. The stated interest rate represents the rate in effect at February 29, 2008.
(3) Security represents the underlying municipal obligation of an inverse floating rate obligation held by the Fund.
(4) Security (or a portion thereof) has been segregated to cover margin requirements on open financial futures contracts.
(5) Security subject to redemption at each auction date. The stated interest rate represents the rate in effect at February 29, 2008.
See notes to financial statements
52
Eaton Vance Tennessee Municipals Fund as of February 29, 2008
PORTFOLIO OF INVESTMENTS (Unaudited)
Tax-Exempt Investments — 99.3% | | | |
Principal Amount
(000's omitted) | |
Security | |
Value | |
| Education — 2.7% | | | |
| $ | 1,500 | | | Metropolitan Government of Nashville and Davidson County,
(Vanderbilt University), 5.00%, 10/1/28 | | $ | 1,462,290 | | |
| | | | | | | $ | 1,462,290 | | |
| Electric Utilities — 2.3% | | | |
| $ | 1,000 | | | Metropolitan Government of Nashville and Davidson County,
5.125%, 5/15/26 | | $ | 991,280 | | |
| | 100 | | | Puerto Rico Electric Power Authority, DRIVERS, Variable Rate,
7.74%, 7/1/25(1)(2) | | | 79,072 | | |
| | 300 | | | Puerto Rico Electric Power Authority, DRIVERS, Variable Rate,
7.74%, 7/1/37(1)(2) | | | 214,218 | | |
| | | | | | | $ | 1,284,570 | | |
| Escrowed / Prerefunded — 2.3% | | | |
| $ | 395 | | | Puerto Rico Electric Power Authority, Prerefunded to 7/1/13,
5.125%, 7/1/29 | | $ | 427,694 | | |
| | 470 | | | Sullivan County, Health, Educational and Housing Facilities
Board, (Wellmont Health System), Prerefunded to 9/1/12,
6.25%, 9/1/22 | | | 526,461 | | |
| | 280 | | | Sullivan County, Health, Educational and Housing Facilities
Board, (Wellmont Health System), Prerefunded to 9/1/12,
6.25%, 9/1/22 | | | 313,636 | | |
| | | | | | | $ | 1,267,791 | | |
| Hospital — 7.6% | | | |
| $ | 1,000 | | | Johnson City, Health and Educational Facilities Board,
5.50%, 7/1/36 | | $ | 885,240 | | |
| | 5,000 | | | Knox County, Educational and Housing Facilities Board,
(Covenant Health), 0.00%, 1/1/39 | | | 675,000 | | |
| | 3,200 | | | Knox County, Educational and Housing Facilities Board,
(Covenant Health), 0.00%, 1/1/42 | | | 357,856 | | |
| | 500 | | | Knox County, Educational and Housing Facilities Board,
(East Tennessee Hospital), 5.75%, 7/1/33 | | | 483,145 | | |
| | 1,000 | | | Shelby County, Health, Educational and Housing Facilities
Board, (St. Jude Children's Research Hospital),
5.00%, 7/1/31 | | | 938,390 | | |
| | 1,000 | | | Sullivan County, Educational and Housing Facilities Board,
(Wellmont Health System), 5.25%, 9/1/36 | | | 861,770 | | |
| | | | | | | $ | 4,201,401 | | |
Principal Amount
(000's omitted) | |
Security | |
Value | |
| Housing — 1.5% | | | |
| $ | 500 | | | Tennessee Housing Development Agency, (AMT),
4.85%, 7/1/38 | | $ | 429,985 | | |
| | 365 | | | Tennessee Housing Development Agency, (AMT),
5.375%, 7/1/23 | | | 373,300 | | |
| | | | | | | $ | 803,285 | | |
| Industrial Development Revenue — 1.9% | | | |
| $ | 445 | | | Hardeman County, (Correctional Facilities Corp.),
7.75%, 8/1/17 | | $ | 447,261 | | |
| | 500 | | | McMinn County, (Calhoun Newsprint - Bowater, Inc.), (AMT),
7.40%, 12/1/22 | | | 471,110 | | |
| | 150 | | | Virgin Islands Public Financing Authority, (HOVENSA LLC),
(AMT), 4.70%, 7/1/22 | | | 123,837 | | |
| | | | | | | $ | 1,042,208 | | |
| Insured-Cogeneration — 1.7% | | | |
| $ | 1,000 | | | Metropolitan Government of Nashville and Davidson County,
(AMBAC), 5.00%, 10/1/33 | | $ | 952,810 | | |
| | | | | | | $ | 952,810 | | |
| Insured-Education — 4.2% | | | |
| $ | 1,000 | | | Metropolitan Government of Nashville and Davidson County,
(Meharry Medical College), (AMBAC), 5.00%, 12/1/24 | | $ | 973,370 | | |
| | 1,230 | | | Metropolitan Government of Nashville and Davidson County,
(Meharry Medical College), (AMBAC), 6.00%, 12/1/19 | | | 1,368,584 | | |
| | | | | | | $ | 2,341,954 | | |
| Insured-Electric Utilities — 13.1% | | | |
| $ | 1,000 | | | Lawrenceburg, Electric, (MBIA), 6.625%, 7/1/18 | | $ | 1,170,000 | | |
| | 500 | | | Lawrenceburg, Public Building Authority, (Electric System-Public
Works), (AMBAC), 5.00%, 7/1/26 | | | 473,245 | | |
| | 1,000 | | | Lawrenceburg, Public Building Authority, (Electric System-Public
Works), (FSA), Prerefunded to 7/1/11, 5.00%, 7/1/26 | | | 1,057,990 | | |
| | 1,000 | | | Metropolitan Government of Nashville and Davidson County,
(AMBAC), 5.00%, 5/15/29 | | | 961,980 | | |
| | 2,000 | | | Metropolitan Government of Nashville and Davidson County,
(MBIA), 0.00%, 5/15/17 | | | 1,293,920 | | |
| | 1,000 | | | Pleasant View, Utility District, (MBIA), 5.00%, 9/1/32 | | | 1,001,570 | | |
| | 500 | | | Puerto Rico Electric Power Authority, (FGIC), 5.25%, 7/1/35 | | | 475,615 | | |
| | 750 | | | Puerto Rico Electric Power Authority,
(MBIA), 5.50%, 7/1/16(3) | | | 805,940 | | |
| | | | | | | $ | 7,240,260 | | |
See notes to financial statements
53
Eaton Vance Tennessee Municipals Fund as of February 29, 2008
PORTFOLIO OF INVESTMENTS (Unaudited) CONT'D
Principal Amount
(000's omitted) | |
Security | |
Value | |
| Insured-Escrowed / Prerefunded — 14.0% | | | |
| $ | 500 | | | Bristol, (Bristol Memorial Hospital), (FGIC), Escrowed to
Maturity, 6.75%, 9/1/10 | | $ | 527,780 | | |
| | 250 | | | Chattanooga, (Memorial Hospital), (MBIA), Escrowed to
Maturity, 6.625%, 9/1/09 | | | 264,135 | | |
| | 1,500 | | | Johnson City, Health and Educational Facilities Board, (Johnson
City Medical Center), (MBIA), Prerefunded to
7/1/23, 5.125%, 7/1/25 | | | 1,510,725 | | |
| | 825 | | | Knox County, Health, Educational and Housing Facilities
Board, (Covenant Health), (FSA), Prerefunded to
1/1/13, 5.00%, 1/1/26 | | | 883,212 | | |
| | 500 | | | Puerto Rico Electric Power Authority, (FSA), Prerefunded to
7/1/12, 5.125%, 7/1/26 | | | 539,975 | | |
| | 250 | | | Puerto Rico Electric Power Authority, (MBIA), Prerefunded to
7/1/13, 5.00%, 7/1/32 | | | 268,420 | | |
| | 1,500 | | | Shelby County, (Lebonheur Children's Hospital), (MBIA),
Escrowed to Maturity, 5.50%, 8/15/12 | | | 1,579,485 | | |
| | 2,000 | | | West Wilson Utility District Waterworks, (MBIA), Prerefunded to
6/1/14, 5.00%, 6/1/34(4) | | | 2,154,080 | | |
| | | | | | | $ | 7,727,812 | | |
| Insured-General Obligations — 8.3% | | | |
| $ | 1,425 | | | Franklin, Special School District, (FSA), 0.00%, 6/1/19 | | $ | 812,877 | | |
| | 2,500 | | | Franklin, Special School District, (FSA), 0.00%, 6/1/20 | | | 1,335,800 | | |
| | 500 | | | Lincoln County, (FGIC), 5.25%, 4/1/21 | | | 516,150 | | |
| | 700 | | | Puerto Rico, (FSA), Variable Rate, 11.337%, 7/1/27(1)(2) | | | 782,061 | | |
| | 250 | | | Putnam County, (FGIC), 5.25%, 4/1/20 | | | 260,637 | | |
| | 1,000 | | | Rutherford County, (MBIA), 4.50%, 4/1/30 | | | 897,030 | | |
| | | | | | | $ | 4,604,555 | | |
| Insured-Hospital — 1.2% | | | |
| $ | 675 | | | Knox County, Health, Educational and Housing Facilities
Board, (Covenant Health), (FSA), 5.00%, 1/1/26 | | $ | 642,796 | | |
| | | | | | | $ | 642,796 | | |
Insured-Lease Revenue / Certificates of
Participation — 2.6% | | | |
| $ | 500 | | | Blount County, Tennessee Public Building Authority, (XLCA),
4.50%, 6/1/37 | | $ | 415,645 | | |
| | 1,020 | | | Puerto Rico Public Finance Corp., (Commonwealth
Appropriation), (AMBAC), 5.125%, 6/1/24 | | | 1,036,381 | | |
| | | | | | | $ | 1,452,026 | | |
| Insured-Pooled Loans — 1.7% | | | |
| $ | 1,000 | | | Puerto Rico Municipal Finance Agency, (FSA), 5.00%, 8/1/27 | | $ | 963,850 | | |
| | | | | | | $ | 963,850 | | |
Principal Amount
(000's omitted) | |
Security | |
Value | |
| Insured-Special Tax Revenue — 2.5% | | | |
| $ | 3,000 | | | Puerto Rico Infrastructure Financing Authority, (AMBAC),
0.00%, 7/1/34 | | $ | 585,150 | | |
| | 4,450 | | | Puerto Rico Infrastructure Financing Authority, (AMBAC),
0.00%, 7/1/44 | | | 463,868 | | |
| | 1,750 | | | Puerto Rico Infrastructure Financing Authority, (FGIC),
0.00%, 7/1/33 | | | 355,250 | | |
| | | | | | | $ | 1,404,268 | | |
| Insured-Transportation — 6.4% | | | |
| $ | 1,500 | | | Memphis-Shelby County, Airport Authority, (AMBAC), (AMT),
6.00%, 3/1/24 | | $ | 1,507,620 | | |
| | 515 | | | Memphis-Shelby County, Airport Authority, (MBIA), (AMT),
6.50%, 2/15/09 | | | 529,863 | | |
| | 560 | | | Puerto Rico Highway and Transportation Authority, (AGC),
(CIFG), 5.25%, 7/1/41(3) | | | 549,847 | | |
| | 1,000 | | | Puerto Rico Highway and Transportation Authority, (MBIA),
5.25%, 7/1/32 | | | 947,370 | | |
| | | | | | | $ | 3,534,700 | | |
| Insured-Water and Sewer — 19.7% | | | |
| $ | 1,000 | | | Clarksville, Water, Sewer and Gas, (FSA), 5.25%, 2/1/18 | | $ | 1,074,120 | | |
| | 1,000 | | | Hallsdale-Powell, Utility District, (FGIC), 5.00%, 4/1/31 | | | 953,860 | | |
| | 1,000 | | | Harpeth Valley Utilities District, Davidson & Williamson
Counties, (FGIC), 5.00%, 9/1/35 | | | 934,890 | | |
| | 500 | | | Harpeth Valley Utilities District, Davidson and Williamson
Counties, (MBIA), 5.00%, 9/1/34 | | | 477,400 | | |
| | 875 | | | Knox County, First Utility District, (MBIA), 5.00%, 12/1/25 | | | 864,789 | | |
| | 500 | | | Knoxville, Waste Water System, (FSA), 4.50%, 4/1/37 | | | 433,675 | | |
| | 1,000 | | | Knoxville, Waste Water System, (MBIA), 4.00%, 4/1/40 | | | 778,780 | | |
| | 775 | | | Knoxville, Waste Water System, (MBIA), 4.75%, 4/1/32 | | | 717,348 | | |
| | 1,000 | | | Memphis, Sanitary Sewer System, (FSA), 4.75%, 7/1/24 | | | 960,380 | | |
| | 1,000 | | | Metropolitan Government of Nashville and Davidson County,
Water System, (FGIC), 5.20%, 1/1/13 | | | 1,056,450 | | |
| | 1,500 | | | Rutherford County, Consolidated Utility District, (FSA),
5.00%, 2/1/31 | | | 1,442,550 | | |
| | 705 | | | West Wilson Utility District Waterworks, (MBIA),
4.00%, 6/1/32 | | | 566,503 | | |
| | 750 | | | West Wilson Utility District Waterworks, (MBIA),
4.25%, 6/1/36 | | | 617,962 | | |
| | | | | | | $ | 10,878,707 | | |
| Other Revenue — 3.3% | | | |
| $ | 2,000 | | | Tennessee Energy Acquisition Corp., Gas Revenue,
5.25%, 9/1/24 | | $ | 1,834,400 | | |
| | | | | | | $ | 1,834,400 | | |
See notes to financial statements
54
Eaton Vance Tennessee Municipals Fund as of February 29, 2008
PORTFOLIO OF INVESTMENTS (Unaudited) CONT'D
Principal Amount
(000's omitted) | |
Security | |
Value | |
| Special Tax Revenue — 2.3% | |
| $ | 1,410 | | | Puerto Rico Sales Tax Financing, 5.25%, 8/1/57 | | $ | 1,271,609 | | |
| | | | | $ | 1,271,609 | | |
Total Tax-Exempt Investments — 99.3%
(identified cost $57,237,820) | | $ | 54,911,292 | | |
| Other Assets, Less Liabilities — 0.7% | | $ | 395,634 | | |
| Net Assets — 100.0% | | $ | 55,306,926 | | |
AGC - Assured Guaranty Corp.
AMBAC - AMBAC Financial Group, Inc.
AMT - Interest earned from these securities may be considered a tax preference item for purposes of the Federal Alternative Minimum Tax.
CIFG - CIFG Assurance North America, Inc.
DRIVERS - Derivative Inverse Tax-Exempt Receipts
FGIC - Financial Guaranty Insurance Company
FSA - Financial Security Assurance, Inc.
MBIA - Municipal Bond Insurance Association
XLCA - XL Capital Assurance, Inc.
The Fund invests primarily in debt securities issued by Tennessee municipalities. The ability of the issuers of the debt securities to meet their obligations may be affected by economic developments in a specific industry or municipality. In order to reduce the risk associated with such economic developments, at February 29, 2008, 76.0% of total investments are backed by bond insurance of various financial institutions and financial guaranty assurance agencies. The aggregate percentage insured by an individual financial institution ranged from 0.8% to 30.0% of total investments.
(1) Security exempt from registration under Rule 144A of the Securities Act of 1933. These securities may be sold in transactions exempt from registration, normally to qualified institutional buyers. At February 29, 2008, the aggregate value of the securities is $1,075,351 or 1.9% of the Fund's net assets.
(2) Security has been issued as a leveraged inverse floater bond. The stated interest rate represents the rate in effect at February 29, 2008.
(3) Security represents the underlying municipal obligation of an inverse floating rate obligation held by the Fund.
(4) Security (or a portion thereof) has been segregated to cover margin requirements on open financial futures contracts.
See notes to financial statements
55
Eaton Vance Virginia Municipals Fund as of February 29, 2008
PORTFOLIO OF INVESTMENTS (Unaudited)
Tax-Exempt Investments — 108.9% | | | |
Principal Amount
(000's omitted) | |
Security | |
Value | |
| Education — 2.7% | | | |
| $ | 800 | | | Alexandria Industrial Development Authority,
4.50%, 1/1/35 | | $ | 682,528 | | |
| | 2,920 | | | Virginia College Building Authority, 4.75%, 9/1/35 | | | 2,708,738 | | |
| | | | | | | $ | 3,391,266 | | |
| Electric Utilities — 1.1% | | | |
| $ | 1,500 | | | Chesterfield County Economic Development Authority, (Virginia
Electric Power Co. Project), (AMT), 5.60%, 11/1/31 | | $ | 1,370,880 | | |
| | | | | | | $ | 1,370,880 | | |
| Escrowed / Prerefunded — 0.1% | | | |
| $ | 75 | | | Henrico County Economic Development,
(Bon Secours Health System, Inc.), Prerefunded to
11/15/12, 5.60%, 11/15/30 | | $ | 82,184 | | |
| | | | | | | $ | 82,184 | | |
| General Obligations — 3.3% | | | |
| $ | 1,000 | | | Austin Trust Various States, Variable Rate,
13.729%, 10/1/35(1)(2) | | $ | 676,530 | | |
| | 1,390 | | | Peninsula Airport Commission, (City Guaranteed), (AMT),
5.50%, 7/15/21 | | | 1,403,094 | | |
| | 2,000 | | | Virginia Public School Authority, 5.00%, 8/1/21 | | | 2,025,960 | | |
| | | | | | | $ | 4,105,584 | | |
| Hospital — 16.5% | | | |
| $ | 2,250 | | | Albemarle County Industrial Development Authority,
(Martha Jefferson Hospital), 5.25%, 10/1/35 | | $ | 2,071,890 | | |
| | 1,500 | | | Fairfax County Industrial Development Authority,
(Inova Health System Hospitals), 5.00%, 8/15/14 | | | 1,572,705 | | |
| | 2,000 | | | Fairfax County Industrial Development Authority,
(Inova Health System Hospitals), 5.00%, 8/15/15 | | | 2,082,420 | | |
| | 5,000 | | | Fairfax County Industrial Development Authority,
(Inova Health System Hospitals), 5.00%, 8/15/23(3) | | | 4,873,598 | | |
| | 1,000 | | | Fauquier County Industrial Development Authority,
(Fauquier Hospital), 5.25%, 10/1/37 | | | 887,880 | | |
| | 1,775 | | | Henrico County Economic Development, (Bon Secours
Health System, Inc.), 5.60%, 11/15/30 | | | 1,774,840 | | |
| | 500 | | | Prince William County Industrial Development Authority,
5.20%, 10/1/30 | | | 461,875 | | |
| | 1,000 | | | Prince William County Industrial Development Authority,
(Potomac Hospital Corp.), 5.35%, 10/1/36 | | | 924,150 | | |
| | 3,000 | | | Stafford County Economic Development Authority,
(Medicorp Health System), 5.25%, 6/15/37 | | | 2,778,450 | | |
Principal Amount
(000's omitted) | |
Security | |
Value | |
| Hospital (continued) | | | |
| $ | 1,500 | | | Virginia Small Business Financing Authority, (Wellmort
Health), 5.25%, 9/1/37 | | $ | 1,341,480 | | |
| | 2,000 | | | Winchester Industrial Development Authority, (Valley
Health System), 5.25%, 1/1/37 | | | 1,878,540 | | |
| | | | | | | $ | 20,647,828 | | |
| Housing — 4.8% | | | |
| $ | 5,000 | | | Fairfax County Redevelopment and Housing Authority,
(Cedar Ridge), (AMT), 4.85%, 10/1/48 | | $ | 4,168,150 | | |
| | 1,850 | | | Multifamily Housing Bond Pass Through Certificates of
Beneficial Owners, (Prince William County), (AMT),
6.00%, 11/1/33 | | | 1,871,146 | | |
| | | | | | | $ | 6,039,296 | | |
| Industrial Development Revenue — 4.2% | | | |
| $ | 1,250 | | | James City County Industrial Development Authority,
(Anheuser Busch Cos., Inc.), (AMT), 6.00%, 4/1/32 | | $ | 1,251,725 | | |
| | 2,260 | | | Norfolk, Airport Authority, (AMT), 6.25%, 1/1/30 | | | 2,160,876 | | |
| | 2,230 | | | Virgin Islands Public Financing Authority, (HOVENSA LLC),
(AMT), 4.70%, 7/1/22 | | | 1,841,043 | | |
| | | | | | | $ | 5,253,644 | | |
| Insured-Education — 5.4% | | | |
| $ | 6,655 | | | Virginia College Building Authority, (Washington and
Lee University), (MBIA), 5.25%, 1/1/31 | | $ | 6,815,519 | | |
| | | | | | | $ | 6,815,519 | | |
| Insured-Electric Utilities — 2.6% | | | |
| $ | 2,100 | | | Puerto Rico Electric Power Authority, (MBIA),
5.50%, 7/1/16(3) | | $ | 2,256,632 | | |
| | 1,000 | | | Puerto Rico Electric Power Authority, (XLCA),
5.375%, 7/1/18 | | | 1,055,550 | | |
| | | | | | | $ | 3,312,182 | | |
| Insured-Escrowed / Prerefunded — 6.6% | | | |
| $ | 3,495 | | | Puerto Rico Electric Power Authority, (FSA), Prerefunded to
7/1/10, 5.25%, 7/1/29(3) | | $ | 3,709,931 | | |
| | 750 | | | Puerto Rico Highway and Transportation Authority, (MBIA),
Prerefunded to 7/1/16, 5.00%, 7/1/36(3) | | | 809,040 | | |
| | 1,000 | | | Richmond, Public Utilities, (FSA), Prerefunded to
1/15/12, 5.00%, 1/15/27 | | | 1,060,360 | | |
| | 2,500 | | | Virginia Resource Authority Infrastructure Revenue, (MBIA),
Prerefunded to 5/1/11, 5.50%, 5/1/26 | | | 2,700,775 | | |
| | | | | | | $ | 8,280,106 | | |
See notes to financial statements
56
Eaton Vance Virginia Municipals Fund as of February 29, 2008
PORTFOLIO OF INVESTMENTS (Unaudited) CONT'D
Principal Amount
(000's omitted) | |
Security | |
Value | |
| Insured-General Obligations — 3.1% | | | |
| $ | 710 | | | Fairfax, (MBIA), 4.50%, 1/15/36 | | $ | 628,662 | | |
| | 1,040 | | | Harrisonburg, (FSA), 4.25%, 2/1/33 | | | 892,434 | | |
| | 1,000 | | | Puerto Rico, (FSA), Variable Rate, 11.337%, 7/1/27(1)(2) | | | 1,117,230 | | |
| | 1,200 | | | Puerto Rico, (MBIA), 5.50%, 7/1/20 | | | 1,234,044 | | |
| | | | | | | $ | 3,872,370 | | |
| Insured-Hospital — 5.5% | | | |
| $ | 1,500 | | | Henrico County, (Bon Secours Health System, Inc.), (MBIA),
6.25%, 8/15/20 | | $ | 1,652,505 | | |
| | 5,000 | | | Virginia Beach, (Virginia Beach Memorial Hospital),
(AMBAC), 5.125%, 2/15/18 | | | 5,218,350 | | |
| | | | | | | $ | 6,870,855 | | |
| Insured-Housing — 2.8% | | | |
| $ | 3,600 | | | Virginia Housing Development Authority, (MBIA),
5.375%, 7/1/36 | | $ | 3,480,336 | | |
| | | | | | | $ | 3,480,336 | | |
Insured-Lease Revenue / Certificates of
Participation — 4.7% | | | |
| $ | 1,000 | | | Orange County Economic Development Authority,
(Virginia Projects), (AGC), 4.625%, 2/1/27 | | $ | 915,460 | | |
| | 900 | | | Powhatan County Economic Development Authority,
Lease Revenue, (AMBAC), 5.25%, 7/15/33 | | | 878,976 | | |
| | 1,800 | | | Puerto Rico Public Finance Corp., (Commonwealth
Appropriation), (AMBAC), 5.125%, 6/1/24 | | | 1,828,908 | | |
| | 2,550 | | | Rappahannock, Regional Jail Authority, (MBIA),
4.50%, 12/1/36 | | | 2,236,835 | | |
| | | | | | | $ | 5,860,179 | | |
| Insured-Pooled Loans — 1.4% | | | |
| $ | 250 | | | Stafford County & Staunton Industrial Development Authority,
(CIFG), 4.75%, 8/1/29 | | $ | 226,270 | | |
| | 1,640 | | | Stafford County & Staunton Industrial Development Authority,
(CIFG), 5.00%, 8/1/36 | | | 1,531,645 | | |
| | | | | | | $ | 1,757,915 | | |
| Insured-Special Tax Revenue — 0.2% | | | |
| $ | 1,020 | | | Puerto Rico Infrastructure Financing Authority, (AMBAC),
0.00%, 7/1/28 | | $ | 288,130 | | |
| | | | | | | $ | 288,130 | | |
Principal Amount
(000's omitted) | |
Security | |
Value | |
| Insured-Transportation — 15.7% | | | |
| $ | 5,000 | | | Chesapeake Bay Bridge and Tunnel Commission,
(General Resolution), (MBIA), 5.50%, 7/1/25 | | $ | 5,263,450 | | |
| | 1,000 | | | Metropolitan Washington, DC, Airport Authority System,
(FGIC), (AMT), 5.00%, 10/1/33 | | | 902,560 | | |
| | 1,000 | | | Metropolitan Washington, DC, Airport Authority System,
(FGIC), (AMT), 5.25%, 10/1/32 | | | 938,310 | | |
| | 3,255 | | | Metropolitan Washington, DC, Airport Authority System,
(MBIA), (AMT), 5.50%, 10/1/27 | | | 3,112,040 | | |
| | 1,000 | | | Norfolk, Airport Authority, (FGIC), 5.125%, 7/1/31 | | | 940,950 | | |
| | 3,040 | | | Puerto Rico Highway and Transportation Authority, (AGC),
(CIFG), 5.25%, 7/1/41(3) | | | 2,984,885 | | |
| | 1,600 | | | Puerto Rico Highway and Transportation Authority, (AMBAC),
5.50%, 7/1/29 | | | 1,572,272 | | |
| | 3,900 | | | Richmond, Metropolitan Authority Expressway, (FGIC),
5.25%, 7/15/22 | | | 3,994,887 | | |
| | | | | | | $ | 19,709,354 | | |
| Insured-Water and Sewer — 5.1% | | | |
| $ | 1,000 | | | Henry County, Water and Sewer Authority, (FSA),
5.50%, 11/15/19 | | $ | 1,094,290 | | |
| | 4,000 | | | Spotsylvania County, Water and Sewer, (FSA),
4.50%, 6/1/32 | | | 3,545,760 | | |
| | 750 | | | Spotsylvania County, Water and Sewer, (FSA),
4.75%, 6/1/32 | | | 701,760 | | |
| | 1,000 | | | Upper Occoquan, Sewer Authority, (MBIA), 5.15%, 7/1/20 | | | 1,042,180 | | |
| | | | | | | $ | 6,383,990 | | |
| Other Revenue — 9.1% | | | |
| $ | 7,000 | | | Children's Trust Fund, Tobacco Settlement, 0.00%, 5/15/50 | | $ | 328,510 | | |
| | 14,980 | | | Children's Trust Fund, Tobacco Settlement, 0.00%, 5/15/55 | | | 441,161 | | |
| | 1,250 | | | Prince William County Industrial Development Authority,
(Catholic Diocese Arlington), 5.50%, 10/1/33 | | | 1,216,475 | | |
| | 3,000 | | | Puerto Rico Infrastructure Financing Authority,
5.50%, 10/1/34(3) | | | 3,112,560 | | |
| | 30,000 | | | Tobacco Settlement Financing Corp., 0.00%, 6/1/47 | | | 1,797,900 | | |
| | 1,500 | | | Tobacco Settlement Financing Corp., 5.00%, 6/1/47 | | | 1,187,040 | | |
| | 3,000 | | | Tobacco Settlement Financing Corp., Prerefunded to 6/1/15,
5.625%, 6/1/37(3) | | | 3,303,580 | | |
| | | | | | | $ | 11,387,226 | | |
| Senior Living / Life Care — 2.3% | | | |
| $ | 1,500 | | | Fairfax County Economic Development Authority,
(Goodwin House, Inc.), 5.125%, 10/1/37 | | $ | 1,277,175 | | |
| | 880 | | | Fairfax County Economic Development Authority,
(Goodwin House, Inc.), 5.125%, 10/1/42 | | | 736,094 | | |
See notes to financial statements
57
Eaton Vance Virginia Municipals Fund as of February 29, 2008
PORTFOLIO OF INVESTMENTS (Unaudited) CONT'D
Principal Amount
(000's omitted) | |
Security | |
Value | |
| Senior Living / Life Care (continued) | | | |
| $ | 1,000 | | | Virginia Beach, Development Authority, (Westminster-
Canterbury), 5.375%, 11/1/32 | | $ | 868,590 | | |
| | | | | | | $ | 2,881,859 | | |
| Special Tax Revenue — 4.2% | | | |
| $ | 100 | | | Heritage Hunt, Community Development Authority,
6.85%, 3/1/19 | | $ | 100,895 | | |
| | 5,685 | | | Puerto Rico Sales Tax Financing, 5.25%, 8/1/57 | | | 5,127,017 | | |
| | | | | | | $ | 5,227,912 | | |
| Water and Sewer — 7.5% | | | |
| $ | 4,250 | | | Fairfax County, Water Authority, 5.00%, 4/1/21(4) | | $ | 4,397,815 | | |
| | 2,795 | | | Fairfax County, Water Authority, 5.25%, 4/1/27 | | | 2,876,698 | | |
| | 2,500 | | | Upper Occoquan Sewer Authority, 4.50%, 7/1/38 | | | 2,206,250 | | |
| | | | | | | $ | 9,480,763 | | |
Total Tax-Exempt Investments
(identified cost $141,898,775) | | $ | 136,499,378 | | |
| Auction-Rate Securities — 2.4% | | | |
Principal Amount
(000's omitted) | |
Description | |
Value | |
| $ | 1,000 | | | Fairfax County Industrial Development Authority,
(Inova Health System Hospitals), (AMBAC), Variable Rate,
6.23%, 4/15/35(5) | | $ | 1,000,000 | | |
| | 1,000 | | | Harrisonburg Industrial Development Authority
(Rockingham Memorial Hospital), (AMBAC), Variable Rate,
9.00%, 8/15/46(5) | | | 1,000,000 | | |
| | 1,000 | | | Lynchburg Industrial Development Authority,
(Central Health), (MBIA), Variable Rate,
8.96%, 1/1/35(5) | | | 1,000,000 | | |
Total Auction-Rate Securities
(identified cost $3,000,000) | | $ | 3,000,000 | | |
Total Investments — 111.3%
(identified cost $144,898,775) | | $ | 139,499,378 | | |
| Other Assets, Less Liabilities — (11.3)% | | $ | (14,109,816 | ) | |
| Net Assets — 100.0% | | $ | 125,389,562 | | |
AGC - Assured Guaranty Corp.
AMBAC - AMBAC Financial Group, Inc.
AMT - Interest earned from these securities may be considered a tax preference item for purposes of the Federal Alternative Minimum Tax.
CIFG - CIFG Assurance North America, Inc.
FGIC - Financial Guaranty Insurance Company
FSA - Financial Security Assurance, Inc.
MBIA - Municipal Bond Insurance Association
XLCA - XL Capital Assurance, Inc.
The Fund invests primarily in debt securities issued by Virginia municipalities. The ability of the issuers of the debt securities to meet their obligations may be affected by economic developments in a specific industry or municipality. In order to reduce the risk associated with such economic developments, at February 29, 2008, 49.9% of total investments are backed by bond insurance of various financial institutions and financial guaranty assurance agencies. The aggregate percentage insured by an individual financial institution ranged from 0.8% to 23.1% of total investments.
(1) Security exempt from registration under Rule 144A of the Securities Act of 1933. These securities may be sold in transactions exempt from registration, normally to qualified institutional buyers. At February 29, 2008, the aggregate value of the securities is $1,793,760 or 1.4% of the Fund's net assets.
(2) Security has been issued as a leveraged inverse floater bond. The stated interest rate represents the rate in effect at February 29, 2008.
(3) Security represents the underlying municipal obligation of an inverse floating rate obligation held by the Fund.
(4) Security (or a portion thereof) has been segregated to cover margin requirements on open financial futures contracts.
(5) Security subject to redemption at each auction date. The stated interest rate represents the rate in effect at February 29, 2008.
See notes to financial statements
58
Eaton Vance Municipals Funds as of February 29, 2008
FINANCIAL STATEMENTS (Unaudited)
Statements of Assets and Liabilities
As of February 29, 2008
| | | Alabama Fund | | Arkansas Fund | | Georgia Fund | | Kentucky Fund | |
| Assets | |
| Investments — | |
| Identified cost | | $ | 58,597,931 | | | $ | 64,849,904 | | | $ | 87,263,003 | | | $ | 60,586,786 | | |
| Unrealized depreciation | | | (1,541,505 | ) | | | (4,192,520 | ) | | | (4,827,040 | ) | | | (934,969 | ) | |
| Investments, at value | | $ | 57,056,426 | | | $ | 60,657,384 | | | $ | 82,435,963 | | | $ | 59,651,817 | | |
| Cash | | $ | 1,383,424 | | | $ | 32,461 | | | $ | 155,947 | | | $ | 4,263 | | |
| Receivable for investments sold | | | — | | | | — | | | | 9,861 | | | | 300,000 | | |
| Receivable for Fund shares sold | | | 24,330 | | | | 970,871 | | | | 328,855 | | | | 212 | | |
| Interest receivable | | | 680,682 | | | | 858,701 | | | | 920,113 | | | | 649,042 | | |
| Receivable for open interest rate swap contracts | | | 1,764 | | | | 1,230 | | | | 5,045 | | | | 1,887 | | |
| Total assets | | $ | 59,146,626 | | | $ | 62,520,647 | | | $ | 83,855,784 | | | $ | 60,607,221 | | |
| Liabilities | |
| Payable for floating rate notes issued | | $ | 1,840,000 | | | $ | 2,165,000 | | | $ | 2,335,000 | | | $ | — | | |
| Interest expense and fees payable | | | 14,618 | | | | 10,663 | | | | 11,651 | | | | — | | |
| Payable for Fund shares redeemed | | | 146,803 | | | | 41,905 | | | | 1,020,157 | | | | 404,524 | | |
| Payable for daily variation margin on open financial futures contracts | | | 144,000 | | | | 200,000 | | | | 270,000 | | | | 141,828 | | |
| Demand note payable | | | — | | | | 100,000 | | | | — | | | | 1,400,000 | | |
| Dividends payable | | | 92,496 | | | | 90,008 | | | | 128,503 | | | | 67,811 | | |
| Payable for open interest rate swap contracts | | | — | | | | 87,526 | | | | 93,352 | | | | — | | |
| Payable for when-issued securities | | | — | | | | — | | | | — | | | | 1,994,960 | | |
| Payable to affiliate for investment adviser fee | | | 14,921 | | | | 16,132 | | | | 25,171 | | | | 14,688 | | |
| Payable to affiliate for distribution and service fees | | | 16,267 | | | | 14,477 | | | | 23,915 | | | | 15,141 | | |
| Accrued expenses | | | 36,865 | | | | 32,864 | | | | 44,573 | | | | 39,327 | | |
| Total liabilities | | $ | 2,305,970 | | | $ | 2,758,575 | | | $ | 3,952,322 | | | $ | 4,078,279 | | |
| Net Assets | | $ | 56,840,656 | | | $ | 59,762,072 | | | $ | 79,903,462 | | | $ | 56,528,942 | | |
| Sources of Net Assets | |
| Paid-in capital | | $ | 59,047,514 | | | $ | 65,525,006 | | | $ | 87,493,512 | | | $ | 60,924,051 | | |
| Accumulated net realized loss (computed on the basis of identified cost) | | | (350,369 | ) | | | (1,023,532 | ) | | | (2,058,144 | ) | | | (3,182,812 | ) | |
| Accumulated distributions in excess of net investment income | | | (40,496 | ) | | | (84,455 | ) | | | (108,782 | ) | | | (36,832 | ) | |
| Net unrealized depreciation (computed on the basis of identified cost) | | | (1,815,993 | ) | | | (4,654,947 | ) | | | (5,423,124 | ) | | | (1,175,465 | ) | |
| Net Assets | | $ | 56,840,656 | | | $ | 59,762,072 | | | $ | 79,903,462 | | | $ | 56,528,942 | | |
| Class A Shares | |
| Net Assets | | $ | 46,617,487 | | | $ | 52,795,304 | | | $ | 64,695,583 | | | $ | 47,635,150 | | |
| Shares Outstanding | | | 5,155,615 | | | | 5,928,507 | | | | 7,705,964 | | | | 5,655,174 | | |
Net Asset Value and Redemption Price Per Share
(net assets ÷ shares of beneficial interest outstanding) | | $ | 9.04 | | | $ | 8.91 | | | $ | 8.40 | | | $ | 8.42 | | |
Maximum Offering Price Per Share
(100 ÷ 95.25 of net asset value per share) | | $ | 9.49 | | | $ | 9.35 | | | $ | 8.82 | | | $ | 8.84 | | |
| Class B Shares | |
| Net Assets | | $ | 9,208,261 | | | $ | 4,652,822 | | | $ | 9,075,273 | | | $ | 6,682,705 | | |
| Shares Outstanding | | | 925,581 | | | | 486,344 | | | | 1,011,913 | | | | 735,035 | | |
Net Asset Value and Offering Price Per Share*
(net assets ÷ shares of beneficial interest outstanding) | | $ | 9.95 | | | $ | 9.57 | | | $ | 8.97 | | | $ | 9.09 | | |
| Class C Shares | |
| Net Assets | | $ | 1,014,908 | | | $ | 2,313,946 | | | $ | 6,132,606 | | | $ | 2,211,087 | | |
| Shares Outstanding | | | 101,933 | | | | 241,919 | | | | 683,404 | | | | 243,153 | | |
Net Asset Value and Offering Price Per Share*
(net assets ÷ shares of beneficial interest outstanding) | | $ | 9.96 | | | $ | 9.56 | | | $ | 8.97 | | | $ | 9.09 | | |
On sales of $25,000 or more, the offering price of Class A shares is reduced.
* Redemption price per share is equal to net asset value less any applicable contingent deferred sales charge.
See notes to financial statements
59
Eaton Vance Municipals Funds as of February 29, 2008
FINANCIAL STATEMENTS (Unaudited) CONT'D
Statements of Assets and Liabilities
As of February 29, 2008
| | | Louisiana Fund | | Maryland Fund | | Missouri Fund | | North Carolina Fund | |
| Assets | |
| Investments — | |
| Identified cost | | $ | 43,276,017 | | | $ | 101,250,284 | | | $ | 108,141,844 | | | $ | 102,687,448 | | |
| Unrealized depreciation | | | (2,305,539 | ) | | | (5,262,411 | ) | | | (5,235,819 | ) | | | (2,543,520 | ) | |
| Investments, at value | | $ | 40,970,478 | | | $ | 95,987,873 | | | $ | 102,906,025 | | | $ | 100,143,928 | | |
| Cash | | $ | 882,747 | | | $ | — | | | $ | 2,343,474 | | | $ | 875,127 | | |
| Receivable for investments sold | | | 10,000 | | | | 993,611 | | | | 15,000 | | | | 1,280,428 | | |
| Receivable for Fund shares sold | | | 12,234 | | | | 259,780 | | | | 121,785 | | | | 656,802 | | |
| Interest receivable | | | 526,326 | | | | 1,169,915 | | | | 1,323,771 | | | | 1,070,572 | | |
| Receivable for open interest rate swap contracts | | | 2,542 | | | | 19,549 | | | | 5,988 | | | | 2,460 | | |
| Total assets | | $ | 42,404,327 | | | $ | 98,430,728 | | | $ | 106,716,043 | | | $ | 104,029,317 | | |
| Liabilities | |
| Payable for floating rate notes issued | | $ | 2,065,000 | | | $ | 4,975,000 | | | $ | 2,945,000 | | | $ | 7,650,000 | | |
| Interest expense and fees payable | | | 18,162 | | | | 20,522 | | | | 15,125 | | | | 34,301 | | |
| Payable for investments purchased | | | — | | | | — | | | | 993,730 | | | | 1,472,757 | | |
| Payable for Fund shares redeemed | | | 3,671 | | | | 47,483 | | | | 191,264 | | | | 244,472 | | |
| Payable for daily variation margin on open financial futures contracts | | | 46,000 | | | | 146,000 | | | | 206,000 | | | | 400,000 | | |
| Demand note payable | | | — | | | | 700,000 | | | | — | | | | — | | |
| Dividends payable | | | 77,109 | | | | 109,636 | | | | 127,099 | | | | 136,840 | | |
| Payable for open interest rate swap contracts | | | 52,854 | | | | 103,376 | | | | 111,097 | | | | 126,783 | | |
| Due to custodian | | | — | | | | 178 | | | | — | | | | — | | |
| Payable to affiliate for investment adviser fee | | | 8,493 | | | | 28,568 | | | | 32,375 | | | | 29,404 | | |
| Payable to affiliate for distribution and service fees | | | 9,410 | | | | 27,346 | | | | 25,343 | | | | 23,863 | | |
| Accrued expenses | | | 23,019 | | | | 48,097 | | | | 45,060 | | | | 56,031 | | |
| Total liabilities | | $ | 2,303,718 | | | $ | 6,206,206 | | | $ | 4,692,093 | | | $ | 10,174,451 | | |
| Net Assets | | $ | 40,100,609 | | | $ | 92,224,522 | | | $ | 102,023,950 | | | $ | 93,854,866 | | |
| Sources of Net Assets | |
| Paid-in capital | | $ | 43,617,649 | | | $ | 102,587,000 | | | $ | 109,928,527 | | | $ | 98,295,552 | | |
| Accumulated net realized loss (computed on the basis of identified cost) | | | (1,019,199 | ) | | | (4,853,033 | ) | | | (2,102,504 | ) | | | (843,641 | ) | |
| Accumulated undistributed (distributions in excess of) net investment income | | | (48,292 | ) | | | 134,181 | | | | (73,730 | ) | | | (114,439 | ) | |
| Net unrealized depreciation (computed on the basis of identified cost) | | | (2,449,549 | ) | | | (5,643,626 | ) | | | (5,728,343 | ) | | | (3,482,606 | ) | |
| Net Assets | | $ | 40,100,609 | | | $ | 92,224,522 | | | $ | 102,023,950 | | | $ | 93,854,866 | | |
| Class A Shares | |
| Net Assets | | $ | 36,016,447 | | | $ | 73,214,021 | | | $ | 89,289,680 | | | $ | 80,654,318 | | |
| Shares Outstanding | | | 4,036,465 | | | | 8,508,993 | | | | 9,885,385 | | | | 9,435,247 | | |
Net Asset Value and Redemption Price Per Share
(net assets ÷ shares of beneficial interest outstanding) | | $ | 8.92 | | | $ | 8.60 | | | $ | 9.03 | | | $ | 8.55 | | |
Maximum Offering Price Per Share
(100 ÷ 95.25 of net asset value per share) | | $ | 9.36 | | | $ | 9.03 | | | $ | 9.48 | | | $ | 8.98 | | |
| Class B Shares | |
| Net Assets | | $ | 4,083,232 | | | $ | 10,537,038 | | | $ | 8,279,745 | | | $ | 6,668,058 | | |
| Shares Outstanding | | | 433,011 | | | | 1,123,000 | | | | 829,541 | | | | 725,199 | | |
Net Asset Value and Offering Price Per Share*
(net assets ÷ shares of beneficial interest outstanding) | | $ | 9.43 | | | $ | 9.38 | | | $ | 9.98 | | | $ | 9.19 | | |
| Class C Shares | |
| Net Assets | | $ | 930 | | | $ | 8,473,463 | | | $ | 4,454,525 | | | $ | 6,532,490 | | |
| Shares Outstanding | | | 99 | | | | 902,996 | | | | 446,751 | | | | 710,589 | | |
Net Asset Value and Offering Price Per Share*
(net assets ÷ shares of beneficial interest outstanding) | | $ | 9.43 | | | $ | 9.38 | | | $ | 9.97 | | | $ | 9.19 | | |
On sales of $25,000 or more, the offering price of Class A shares is reduced.
* Redemption price per share is equal to net asset value less any applicable contingent deferred sales charge.
See notes to financial statements
60
Eaton Vance Municipals Funds as of February 29, 2008
FINANCIAL STATEMENTS (Unaudited) CONT'D
Statements of Assets and Liabilities
As of February 29, 2008
| | | Oregon Fund | | South Carolina Fund | | Tennessee Fund | | Virginia Fund | |
| Assets | |
| Investments — | |
| Identified cost | | $ | 154,071,800 | | | $ | 152,125,418 | | | $ | 57,237,820 | | | $ | 144,898,775 | | |
| Unrealized depreciation | | | (10,917,228 | ) | | | (11,232,701 | ) | | | (2,326,528 | ) | | | (5,399,397 | ) | |
| Investments, at value | | $ | 143,154,572 | | | $ | 140,892,717 | | | $ | 54,911,292 | | | $ | 139,499,378 | | |
| Cash | | $ | — | | | $ | 23,137 | | | $ | 663,210 | | | $ | — | | |
| Receivable for investments sold | | | — | | | | — | | | | 980,417 | | | | 100,000 | | |
| Receivable for Fund shares sold | | | 633,880 | | | | 232,205 | | | | 167,142 | | | | 2,220,083 | | |
| Interest receivable | | | 1,499,232 | | | | 1,912,825 | | | | 743,376 | | | | 1,647,617 | | |
| Receivable for open interest rate swap contracts | | | 4,102 | | | | 4,921 | | | | 3,773 | | | | 8,162 | | |
| Total assets | | $ | 145,291,786 | | | $ | 143,065,805 | | | $ | 57,469,210 | | | $ | 143,475,240 | | |
| Liabilities | |
| Payable for floating rate notes issued | | $ | 8,146,000 | | | $ | 10,425,000 | | | $ | 920,000 | | | $ | 13,840,000 | | |
| Interest expense and fees payable | | | 56,897 | | | | 62,366 | | | | 21,773 | | | | 86,023 | | |
| Payable for Fund shares redeemed | | | 57,519 | | | | 513,937 | | | | 809,984 | | | | 1,741,295 | | |
| Payable for daily variation margin on open financial futures contracts | | | 650,000 | | | | 1,100,000 | | | | 180,000 | | | | 760,000 | | |
| Demand note payable | | | — | | | | 1,500,000 | | | | — | | | | 1,100,000 | | |
| Dividends payable | | | 188,117 | | | | 173,864 | | | | 81,386 | | | | 169,862 | | |
| Payable for open interest rate swap contracts | | | 154,176 | | | | 177,208 | | | | 75,066 | | | | 158,394 | | |
| Due to custodian | | | 1,004 | | | | — | | | | — | | | | 85,544 | | |
| Payable to affiliate for investment adviser fee | | | 46,796 | | | | 44,741 | | | | 14,654 | | | | 42,678 | | |
| Payable to affiliate for distribution and service fees | | | 38,940 | | | | 40,627 | | | | 15,094 | | | | 36,209 | | |
| Accrued expenses | | | 60,025 | | | | 54,734 | | | | 44,327 | | | | 65,673 | | |
| Total liabilities | | $ | 9,399,474 | | | $ | 14,092,477 | | | $ | 2,162,284 | | | $ | 18,085,678 | | |
| Net Assets | | $ | 135,892,312 | | | $ | 128,973,328 | | | $ | 55,306,926 | | | $ | 125,389,562 | | |
| Sources of Net Assets | |
| Paid-in capital | | $ | 151,990,820 | | | $ | 146,143,558 | | | $ | 59,010,282 | | | $ | 136,709,953 | | |
| Accumulated net realized loss (computed on the basis of identified cost) | | | (3,489,864 | ) | | | (3,380,739 | ) | | | (905,600 | ) | | | (4,315,949 | ) | |
| Accumulated distributions in excess of net investment income | | | (217,353 | ) | | | (143,906 | ) | | | (61,417 | ) | | | (25,514 | ) | |
| Net unrealized depreciation (computed on the basis of identified cost) | | | (12,391,291 | ) | | | (13,645,585 | ) | | | (2,736,339 | ) | | | (6,978,928 | ) | |
| Net Assets | | $ | 135,892,312 | | | $ | 128,973,328 | | | $ | 55,306,926 | | | $ | 125,389,562 | | |
| Class A Shares | |
| Net Assets | | $ | 110,601,645 | | | $ | 100,235,816 | | | $ | 46,540,242 | | | $ | 101,908,819 | | |
| Shares Outstanding | | | 13,140,778 | | | | 11,621,566 | | | | 5,272,943 | | | | 12,080,318 | | |
Net Asset Value and Redemption Price Per Share
(net assets ÷ shares of beneficial interest outstanding) | | $ | 8.42 | | | $ | 8.62 | | | $ | 8.83 | | | $ | 8.44 | | |
Maximum Offering Price Per Share
(100 ÷ 95.25 of net asset value per share) | | $ | 8.84 | | | $ | 9.05 | | | $ | 9.27 | | | $ | 8.86 | | |
| Class B Shares | |
| Net Assets | | $ | 14,494,178 | | | $ | 12,085,766 | | | $ | 5,603,288 | | | $ | 15,569,581 | | |
| Shares Outstanding | | | 1,574,720 | | | | 1,321,713 | | | | 583,083 | | | | 1,667,171 | | |
Net Asset Value and Offering Price Per Share*
(net assets ÷ shares of beneficial interest outstanding) | | $ | 9.20 | | | $ | 9.14 | | | $ | 9.61 | | | $ | 9.34 | | |
| Class C Shares | |
| Net Assets | | $ | 10,796,489 | | | $ | 16,651,746 | | | $ | 3,163,396 | | | $ | 7,911,162 | | |
| Shares Outstanding | | | 1,172,680 | | | | 1,820,658 | | | | 329,482 | | | | 846,965 | | |
Net Asset Value and Offering Price Per Share*
(net assets ÷ shares of beneficial interest outstanding) | | $ | 9.21 | | | $ | 9.15 | | | $ | 9.60 | | | $ | 9.34 | | |
On sales of $25,000 or more, the offering price of Class A shares is reduced.
* Redemption price per share is equal to net asset value less any applicable contingent deferred sales charge.
See notes to financial statements
61
Eaton Vance Municipals Funds as of February 29, 2008
FINANCIAL STATEMENTS (Unaudited) CONT'D
Statements of Operations
For the Six Months Ended February 29, 2008
| | | Alabama Fund | | Arkansas Fund | | Georgia Fund | | Kentucky Fund | |
| Investment Income | |
| Interest | | $ | 1,459,595 | | | $ | 1,710,677 | | | $ | 2,312,394 | | | $ | 1,542,104 | | |
| Total investment income | | $ | 1,459,595 | | | $ | 1,710,677 | | | $ | 2,312,394 | | | $ | 1,542,104 | | |
| Expenses | |
| Investment adviser fee | | $ | 85,325 | | | $ | 102,492 | | | $ | 153,142 | | | $ | 91,878 | | |
| Trustees' fees and expenses | | | 3,441 | | | | 3,431 | | | | 3,429 | | | | 3,482 | | |
| Distribution and service fees | |
| Class A | | | 46,390 | | | | 57,651 | | | | 71,551 | | | | 50,856 | | |
| Class B | | | 48,578 | | | | 24,686 | | | | 50,379 | | | | 36,418 | | |
| Class C | | | 7,439 | | | | 12,311 | | | | 29,292 | | | | 10,452 | | |
| Legal and accounting services | | | 17,917 | | | | 16,072 | | | | 20,581 | | | | 18,327 | | |
| Printing and postage | | | 4,573 | | | | 4,784 | | | | 7,141 | | | | 5,510 | | |
| Custodian fee | | | 23,408 | | | | 17,897 | | | | 29,287 | | | | 23,420 | | |
| Interest expense and fees | | | 45,767 | | | | 65,188 | | | | 98,985 | | | | 17,318 | | |
| Transfer and dividend disbursing agent fees | | | 11,795 | | | | 11,602 | | | | 16,257 | | | | 12,689 | | |
| Registration fees | | | 454 | | | | — | | | | 1,821 | | | | 1,028 | | |
| Miscellaneous | | | 8,437 | | | | 8,113 | | | | 7,716 | | | | 5,740 | | |
| Total expenses | | $ | 303,524 | | | $ | 324,227 | | | $ | 489,581 | | | $ | 277,118 | | |
Deduct —
Reduction of custodian fee | | | 5,690 | | | | 7,618 | | | | 15,594 | | | | 3,655 | | |
| Total expense reductions | | $ | 5,690 | | | $ | 7,618 | | | $ | 15,594 | | | $ | 3,655 | | |
| Net expenses | | $ | 297,834 | | | $ | 316,609 | | | $ | 473,987 | | | $ | 273,463 | | |
| Net investment income | | $ | 1,161,761 | | | $ | 1,394,068 | | | $ | 1,838,407 | | | $ | 1,268,641 | | |
| Realized and Unrealized Gain (Loss) | |
| Net realized gain (loss) — | |
| Investment transactions (identified cost basis) | | $ | 76,142 | | | $ | (89,071 | ) | | $ | 320,397 | | | $ | 80,912 | | |
| Financial futures contracts | | | (65,740 | ) | | | (42,266 | ) | | | 80,397 | | | | (18,508 | ) | |
| Interest rate swap contracts | | | (151,870 | ) | | | (268,343 | ) | | | (736,256 | ) | | | (162,466 | ) | |
| Net realized loss | | $ | (141,468 | ) | | $ | (399,680 | ) | | $ | (335,462 | ) | | $ | (100,062 | ) | |
| Change in unrealized appreciation (depreciation) — | |
| Investments (identified cost basis) | | $ | (3,001,431 | ) | | $ | (4,479,697 | ) | | $ | (6,332,714 | ) | | $ | (3,406,723 | ) | |
| Financial futures contracts | | | (271,417 | ) | | | (358,719 | ) | | | (520,905 | ) | | | (236,404 | ) | |
| Interest rate swap contracts | | | 60,882 | | | | (95,761 | ) | | | 139,294 | | | | 65,129 | | |
| Net change in unrealized appreciation (depreciation) | | $ | (3,211,966 | ) | | $ | (4,934,177 | ) | | $ | (6,714,325 | ) | | $ | (3,577,998 | ) | |
| Net realized and unrealized loss | | $ | (3,353,434 | ) | | $ | (5,333,857 | ) | | $ | (7,049,787 | ) | | $ | (3,678,060 | ) | |
| Net decrease in net assets from operations | | $ | (2,191,673 | ) | | $ | (3,939,789 | ) | | $ | (5,211,380 | ) | | $ | (2,409,419 | ) | |
See notes to financial statements
62
Eaton Vance Municipals Funds as of February 29, 2008
FINANCIAL STATEMENTS (Unaudited) CONT'D
Statements of Operations
For the Six Months Ended February 29, 2008
| | | Louisiana Fund | | Maryland Fund | | Missouri Fund | | North Carolina Fund | |
| Investment Income | |
| Interest | | $ | 1,179,640 | | | $ | 2,653,943 | | | $ | 2,691,742 | | | $ | 2,637,006 | | |
| Total investment income | | $ | 1,179,640 | | | $ | 2,653,943 | | | $ | 2,691,742 | | | $ | 2,637,006 | | |
| Expenses | |
| Investment adviser fee | | $ | 55,477 | | | $ | 175,120 | | | $ | 197,110 | | | $ | 173,044 | | |
| Trustees' fees and expenses | | | 899 | | | | 3,430 | | | | 2,170 | | | | 3,429 | | |
| Distribution and service fees | |
| Class A | | | 39,983 | | | | 77,170 | | | | 93,582 | | | | 82,966 | | |
| Class B | | | 21,237 | | | | 57,827 | | | | 44,057 | | | | 37,040 | | |
| Class C | | | 3 | | | | 37,650 | | | | 22,078 | | | | 28,760 | | |
| Legal and accounting services | | | 16,033 | | | | 26,489 | | | | 16,902 | | | | 18,314 | | |
| Printing and postage | | | 2,524 | | | | 7,166 | | | | 7,806 | | | | 8,508 | | |
| Custodian fee | | | 10,029 | | | | 30,107 | | | | 38,140 | | | | 37,012 | | |
| Interest expense and fees | | | 48,019 | | | | 173,424 | | | | 64,505 | | | | 202,167 | | |
| Transfer and dividend disbursing agent fees | | | 5,752 | | | | 20,399 | | | | 19,724 | | | | 21,530 | | |
| Registration fees | | | 923 | | | | 3,189 | | | | 1,833 | | | | 863 | | |
| Miscellaneous | | | 5,181 | | | | 8,090 | | | | 11,371 | | | | 12,196 | | |
| Total expenses | | $ | 206,060 | | | $ | 620,061 | | | $ | 519,278 | | | $ | 625,829 | | |
Deduct —
Reduction of custodian fee | | | 5,237 | | | | 19,866 | | | | 12,415 | | | | 19,410 | | |
| Total expense reductions | | $ | 5,237 | | | $ | 19,866 | | | $ | 12,415 | | | $ | 19,410 | | |
| Net expenses | | $ | 200,823 | | | $ | 600,195 | | | $ | 506,863 | | | $ | 606,419 | | |
| Net investment income | | $ | 978,817 | | | $ | 2,053,748 | | | $ | 2,184,879 | | | $ | 2,030,587 | | |
| Realized and Unrealized Gain (Loss) | |
| Net realized gain (loss) — | |
| Investment transactions (identified cost basis) | | $ | (47,804 | ) | | $ | 185,246 | | | $ | (235,070 | ) | | $ | 260,293 | | |
| Financial futures contracts | | | (71,914 | ) | | | (286,886 | ) | | | (62,189 | ) | | | (315,560 | ) | |
| Interest rate swap contracts | | | (374,861 | ) | | | (351,676 | ) | | | (891,022 | ) | | | (464,156 | ) | |
| Net realized loss | | $ | (494,579 | ) | | $ | (453,316 | ) | | $ | (1,188,281 | ) | | $ | (519,423 | ) | |
| Change in unrealized appreciation (depreciation) — | |
| Investments (identified cost basis) | | $ | (2,795,874 | ) | | $ | (6,069,860 | ) | | $ | (6,792,066 | ) | | $ | (5,331,206 | ) | |
| Financial futures contracts | | | (101,199 | ) | | | (309,543 | ) | | | (401,259 | ) | | | (771,232 | ) | |
| Interest rate swap contracts | | | 64,532 | | | | (110,307 | ) | | | 165,835 | | | | (129,964 | ) | |
| Net change in unrealized appreciation (depreciation) | | $ | (2,832,541 | ) | | $ | (6,489,710 | ) | | $ | (7,027,490 | ) | | $ | (6,232,402 | ) | |
| Net realized and unrealized loss | | $ | (3,327,120 | ) | | $ | (6,943,026 | ) | | $ | (8,215,771 | ) | | $ | (6,751,825 | ) | |
| Net decrease in net assets from operations | | $ | (2,348,303 | ) | | $ | (4,889,278 | ) | | $ | (6,030,892 | ) | | $ | (4,721,238 | ) | |
See notes to financial statements
63
Eaton Vance Municipals Funds as of February 29, 2008
FINANCIAL STATEMENTS (Unaudited) CONT'D
Statements of Operations
For the Six Months Ended February 29, 2008
| | | Oregon Fund | | South Carolina Fund | | Tennessee Fund | | Virginia Fund | |
| Investment Income | |
| Interest | | $ | 3,763,873 | | | $ | 3,657,434 | | | $ | 1,529,056 | | | $ | 3,765,708 | | |
| Total investment income | | $ | 3,763,873 | | | $ | 3,657,434 | | | $ | 1,529,056 | | | $ | 3,765,708 | | |
| Expenses | |
| Investment adviser fee | | $ | 272,922 | | | $ | 262,290 | | | $ | 89,512 | | | $ | 260,678 | | |
| Trustees' fees and expenses | | | 4,485 | | | | 4,489 | | | | 3,467 | | | | 4,485 | | |
| Distribution and service fees | |
| Class A | | | 114,797 | | | | 106,759 | | | | 50,507 | | | | 110,697 | | |
| Class B | | | 77,911 | | | | 67,246 | | | | 29,288 | | | | 84,176 | | |
| Class C | | | 44,914 | | | | 75,002 | | | | 14,706 | | | | 32,328 | | |
| Legal and accounting services | | | 19,914 | | | | 21,100 | | | | 16,264 | | | | 19,121 | | |
| Printing and postage | | | 7,857 | | | | 8,390 | | | | 5,237 | | | | 9,530 | | |
| Custodian fee | | | 48,730 | | | | 30,527 | | | | 23,278 | | | | 42,187 | | |
| Interest expense and fees | | | 182,646 | | | | 223,501 | | | | 43,396 | | | | 314,277 | | |
| Transfer and dividend disbursing agent fees | | | 22,965 | | | | 21,874 | | | | 13,478 | | | | 34,348 | | |
| Registration fees | | | 755 | | | | 496 | | | | 1,530 | | | | 3,026 | | |
| Miscellaneous | | | 9,501 | | | | 14,523 | | | | 8,287 | | | | 9,396 | | |
| Total expenses | | $ | 807,397 | | | $ | 836,197 | | | $ | 298,950 | | | $ | 924,249 | | |
Deduct —
Reduction of custodian fee | | | 24,266 | | | | 16,326 | | | | 7,664 | | | | 13,879 | | |
| Total expense reductions | | $ | 24,266 | | | $ | 16,326 | | | $ | 7,664 | | | $ | 13,879 | | |
| Net expenses | | $ | 783,131 | | | $ | 819,871 | | | $ | 291,286 | | | $ | 910,370 | | |
| Net investment income | | $ | 2,980,742 | | | $ | 2,837,563 | | | $ | 1,237,770 | | | $ | 2,855,338 | | |
| Realized and Unrealized Gain (Loss) | |
| Net realized gain (loss) — | |
| Investment transactions (identified cost basis) | | $ | (142,798 | ) | | $ | (419,659 | ) | | $ | (35,142 | ) | | $ | (95,354 | ) | |
| Financial futures contracts | | | (462,342 | ) | | | (1,970,733 | ) | | | 28,782 | | | | (1,583,447 | ) | |
| Interest rate swap contracts | | | (665,433 | ) | | | (662,753 | ) | | | (545,288 | ) | | | (1,184,719 | ) | |
| Net realized loss | | $ | (1,270,573 | ) | | $ | (3,053,145 | ) | | $ | (551,648 | ) | | $ | (2,863,520 | ) | |
| Change in unrealized appreciation (depreciation) — | |
| Investments (identified cost basis) | | $ | (10,867,205 | ) | | $ | (10,931,512 | ) | | $ | (3,699,403 | ) | | $ | (8,366,850 | ) | |
| Financial futures contracts | | | (1,254,341 | ) | | | (2,066,478 | ) | | | (348,066 | ) | | | (1,521,247 | ) | |
| Interest rate swap contracts | | | (125,046 | ) | | | (29,982 | ) | | | 101,397 | | | | 221,486 | | |
| Net change in unrealized appreciation (depreciation) | | $ | (12,246,592 | ) | | $ | (13,027,972 | ) | | $ | (3,946,072 | ) | | $ | (9,666,611 | ) | |
| Net realized and unrealized loss | | $ | (13,517,165 | ) | | $ | (16,081,117 | ) | | $ | (4,497,720 | ) | | $ | (12,530,131 | ) | |
| Net decrease in net assets from operations | | $ | (10,536,423 | ) | | $ | (13,243,554 | ) | | $ | (3,259,950 | ) | | $ | (9,674,793 | ) | |
See notes to financial statements
64
Eaton Vance Municipals Funds as of February 29, 2008
FINANCIAL STATEMENTS (Unaudited) CONT'D
Statements of Changes in Net Assets
For the Six Months Ended February 29, 2008
| Increase (Decrease) in Net Assets | | Alabama Fund | | Arkansas Fund | | Georgia Fund | | Kentucky Fund | |
| From operations — | |
| Net investment income | | $ | 1,161,761 | | | $ | 1,394,068 | | | $ | 1,838,407 | | | $ | 1,268,641 | | |
Net realized loss from investment transactions, financial futures
contracts and interest rate swap contracts | | | (141,468 | ) | | | (399,680 | ) | | | (335,462 | ) | | | (100,062 | ) | |
Net change in unrealized appreciation (depreciation) from investments,
financial futures contracts and interest rate swap contracts | | | (3,211,966 | ) | | | (4,934,177 | ) | | | (6,714,325 | ) | | | (3,577,998 | ) | |
| Net decrease in net assets from operations | | $ | (2,191,673 | ) | | $ | (3,939,789 | ) | | $ | (5,211,380 | ) | | $ | (2,409,419 | ) | |
| Distributions to shareholders — | |
| From net investment income | |
| Class A | | $ | (924,687 | ) | | $ | (1,240,628 | ) | | $ | (1,525,025 | ) | | $ | (1,089,219 | ) | |
| Class B | | | (164,609 | ) | | | (92,166 | ) | | | (185,516 | ) | | | (134,555 | ) | |
| Class C | | | (25,364 | ) | | | (45,870 | ) | | | (107,683 | ) | | | (38,550 | ) | |
| From net realized gain | |
| Class A | | | (213,483 | ) | | | — | | | | — | | | | — | | |
| Class B | | | (42,294 | ) | | | — | | | | — | | | | — | | |
| Class C | | | (9,634 | ) | | | — | | | | — | | | | — | | |
| Total distributions to shareholders | | $ | (1,380,071 | ) | | $ | (1,378,664 | ) | | $ | (1,818,224 | ) | | $ | (1,262,324 | ) | |
| Transactions in shares of beneficial interest — | |
| Proceeds from sale of shares | |
| Class A | | $ | 6,866,477 | | | $ | 5,125,457 | | | $ | 9,130,649 | | | $ | 2,044,816 | | |
| Class B | | | 235,952 | | | | 171,159 | | | | 168,198 | | | | 44,718 | | |
| Class C | | | 1,132,680 | | | | 447,817 | | | | 2,628,463 | | | | 437,314 | | |
Net asset value of shares issued to shareholders in payment of
distributions declared | | | |
| Class A | | | 620,370 | | | | 710,633 | | | | 855,829 | | | | 707,913 | | |
| Class B | | | 123,853 | | | | 48,811 | | | | 104,046 | | | | 84,661 | | |
| Class C | | | 22,286 | | | | 13,786 | | | | 69,331 | | | | 33,447 | | |
| Cost of shares redeemed | |
| Class A | | | (3,728,468 | ) | | | (5,909,011 | ) | | | (9,049,102 | ) | | | (3,173,061 | ) | |
| Class B | | | (413,734 | ) | | | (311,902 | ) | | | (1,567,575 | ) | | | (649,232 | ) | |
| Class C | | | (1,368,568 | ) | | | (703,955 | ) | | | (2,356,483 | ) | | | (109,612 | ) | |
| Net asset value of shares exchanged | |
| Class A | | | 879,516 | | | | 250,865 | | | | 215,691 | | | | 423,398 | | |
| Class B | | | (879,516 | ) | | | (250,865 | ) | | | (215,691 | ) | | | (423,398 | ) | |
| Net increase (decrease) in net assets from Fund share transactions | | $ | 3,490,848 | | | $ | (407,205 | ) | | $ | (16,644 | ) | | $ | (579,036 | ) | |
| Net decrease in net assets | | $ | (80,896 | ) | | $ | (5,725,658 | ) | | $ | (7,046,248 | ) | | $ | (4,250,779 | ) | |
| Net Assets | |
| At beginning of period | | $ | 56,921,552 | | | $ | 65,487,730 | | | $ | 86,949,710 | | | $ | 60,779,721 | | |
| At end of period | | $ | 56,840,656 | | | $ | 59,762,072 | | | $ | 79,903,462 | | | $ | 56,528,942 | | |
Accumulated distributions in excess of net
investment income included in net assets | |
| At end of period | | $ | (40,496 | ) | | $ | (84,455 | ) | | $ | (108,782 | ) | | $ | (36,832 | ) | |
See notes to financial statements
65
Eaton Vance Municipals Funds as of February 29, 2008
FINANCIAL STATEMENTS (Unaudited) CONT'D
Statements of Changes in Net Assets
For the Six Months Ended February 29, 2008
| Increase (Decrease) in Net Assets | | Louisiana Fund | | Maryland Fund | | Missouri Fund | | North Carolina Fund | |
| From operations — | |
| Net investment income | | $ | 978,817 | | | $ | 2,053,748 | | | $ | 2,184,879 | | | $ | 2,030,587 | | |
Net realized loss from investment transactions, financial futures
contracts and interest rate swap contracts | | | (494,579 | ) | | | (453,316 | ) | | | (1,188,281 | ) | | | (519,423 | ) | |
Net change in unrealized appreciation (depreciation) from investments,
financial futures contracts and interest rate swap contracts | | | (2,832,541 | ) | | | (6,489,710 | ) | | | (7,027,490 | ) | | | (6,232,402 | ) | |
| Net decrease in net assets from operations | | $ | (2,348,303 | ) | | $ | (4,889,278 | ) | | $ | (6,030,892 | ) | | $ | (4,721,238 | ) | |
| Distributions to shareholders — | |
| From net investment income | |
| Class A | | $ | (884,190 | ) | | $ | (1,710,419 | ) | | $ | (1,910,957 | ) | | $ | (1,781,180 | ) | |
| Class B | | | (81,515 | ) | | | (222,887 | ) | | | (153,869 | ) | | | (137,855 | ) | |
| Class C | | | (9 | ) | | | (144,534 | ) | | | (77,272 | ) | | | (106,523 | ) | |
| Total distributions to shareholders | | $ | (965,714 | ) | | $ | (2,077,840 | ) | | $ | (2,142,098 | ) | | $ | (2,025,558 | ) | |
| Transactions in shares of beneficial interest — | |
| Proceeds from sale of shares | |
| Class A | | $ | 4,003,940 | | | $ | 13,812,838 | | | $ | 11,645,770 | | | $ | 12,223,622 | | |
| Class B | | | 159,333 | | | | 163,365 | | | | 410,162 | | | | 207,565 | | |
| Class C | | | 1,000 | | | | 2,829,664 | | | | 579,208 | | | | 3,659,918 | | |
Net asset value of shares issued to shareholders in payment of
distributions declared | | | |
| Class A | | | 435,783 | | | | 1,174,711 | | | | 1,239,635 | | | | 1,033,812 | | |
| Class B | | | 28,204 | | | | 137,284 | | | | 83,866 | | | | 67,670 | | |
| Class C | | | 9 | | | | 96,105 | | | | 55,043 | | | | 73,451 | | |
| Cost of shares redeemed | |
| Class A | | | (5,815,038 | ) | | | (12,151,426 | ) | | | (7,058,210 | ) | | | (7,164,840 | ) | |
| Class B | | | (208,975 | ) | | | (1,102,231 | ) | | | (621,873 | ) | | | (1,371,736 | ) | |
| Class C | | | — | | | | (666,488 | ) | | | (312,859 | ) | | | (1,600,044 | ) | |
| Net asset value of shares exchanged | |
| Class A | | | 46,599 | | | | 869,903 | | | | 567,960 | | | | 456,488 | | |
| Class B | | | (46,599 | ) | | | (869,903 | ) | | | (567,960 | ) | | | (456,488 | ) | |
| Net increase (decrease) in net assets from Fund share transactions | | $ | (1,395,744 | ) | | $ | 4,293,822 | | | $ | 6,020,742 | | | $ | 7,129,418 | | |
| Net increase (decrease) in net assets | | $ | (4,709,761 | ) | | $ | (2,673,296 | ) | | $ | (2,152,248 | ) | | $ | 382,622 | | |
| Net Assets | |
| At beginning of period | | $ | 44,810,370 | | | $ | 94,897,818 | | | $ | 104,176,198 | | | $ | 93,472,244 | | |
| At end of period | | $ | 40,100,609 | | | $ | 92,224,522 | | | $ | 102,023,950 | | | $ | 93,854,866 | | |
Accumulated undistributed (distributions in excess of)
net investment income included in net assets | |
| At end of period | | $ | (48,292 | ) | | $ | 134,181 | | | $ | (73,730 | ) | | $ | (114,439 | ) | |
See notes to financial statements
66
Eaton Vance Municipals Funds as of February 29, 2008
FINANCIAL STATEMENTS (Unaudited) CONT'D
Statements of Changes in Net Assets
For the Six Months Ended February 29, 2008
| Increase (Decrease) in Net Assets | | Oregon Fund | | South Carolina Fund | | Tennessee Fund | | Virginia Fund | |
| From operations — | |
| Net investment income | | $ | 2,980,742 | | | $ | 2,837,563 | | | $ | 1,237,770 | | | $ | 2,855,338 | | |
Net realized loss from investment transactions, financial futures
contracts and interest rate swap contracts | | | (1,270,573 | ) | | | (3,053,145 | ) | | | (551,648 | ) | | | (2,863,520 | ) | |
Net change in unrealized appreciation (depreciation) from investments,
financial futures contracts and interest rate swap contracts | | | (12,246,592 | ) | | | (13,027,972 | ) | | | (3,946,072 | ) | | | (9,666,611 | ) | |
| Net decrease in net assets from operations | | $ | (10,536,423 | ) | | $ | (13,243,554 | ) | | $ | (3,259,950 | ) | | $ | (9,674,793 | ) | |
| Distributions to shareholders — | |
| From net investment income | |
| Class A | | $ | (2,552,948 | ) | | $ | (2,290,402 | ) | | $ | (1,058,747 | ) | | $ | (2,405,870 | ) | |
| Class B | | | (302,263 | ) | | | (249,518 | ) | | | (106,008 | ) | | | (316,499 | ) | |
| Class C | | | (174,032 | ) | | | (277,279 | ) | | | (53,248 | ) | | | (121,487 | ) | |
| Total distributions to shareholders | | $ | (3,029,243 | ) | | $ | (2,817,199 | ) | | $ | (1,218,003 | ) | | $ | (2,843,856 | ) | |
| Transactions in shares of beneficial interest — | |
| Proceeds from sale of shares | |
| Class A | | $ | 18,343,048 | | | $ | 20,020,666 | | | $ | 3,574,726 | | | $ | 18,524,251 | | |
| Class B | | | 548,028 | | | | 521,297 | | | | 86,670 | | | | 1,144,002 | | |
| Class C | | | 4,292,571 | | | | 7,208,878 | | | | 908,706 | | | | 3,863,268 | | |
Net asset value of shares issued to shareholders in payment of
distributions declared | | | |
| Class A | | | 1,640,441 | | | | 1,460,088 | | | | 623,253 | | | | 1,499,602 | | |
| Class B | | | 176,047 | | | | 144,843 | | | | 69,271 | | | | 205,593 | | |
| Class C | | | 117,186 | | | | 174,772 | | | | 27,654 | | | | 99,188 | | |
| Cost of shares redeemed | |
| Class A | | | (9,419,693 | ) | | | (12,969,688 | ) | | | (3,471,022 | ) | | | (16,133,563 | ) | |
| Class B | | | (827,998 | ) | | | (1,400,628 | ) | | | (170,026 | ) | | | (2,714,842 | ) | |
| Class C | | | (910,554 | ) | | | (2,282,705 | ) | | | (205,487 | ) | | | (502,147 | ) | |
| Net asset value of shares exchanged | |
| Class A | | | 1,044,911 | | | | 229,056 | | | | 150,992 | | | | 588,677 | | |
| Class B | | | (1,044,911 | ) | | | (229,056 | ) | | | (150,992 | ) | | | (588,677 | ) | |
| Net increase in net assets from Fund share transactions | | $ | 13,959,076 | | | $ | 12,877,523 | | | $ | 1,443,745 | | | $ | 5,985,352 | | |
| Net increase (decrease) in net assets | | $ | 393,410 | | | $ | (3,183,230 | ) | | $ | (3,034,208 | ) | | $ | (6,533,297 | ) | |
| Net Assets | |
| At beginning of period | | $ | 135,498,902 | | | $ | 132,156,558 | | | $ | 58,341,134 | | | $ | 131,922,859 | | |
| At end of period | | $ | 135,892,312 | | | $ | 128,973,328 | | | $ | 55,306,926 | | | $ | 125,389,562 | | |
Accumulated distributions in excess of net
investment income included in net assets | |
| At end of period | | $ | (217,353 | ) | | $ | (143,906 | ) | | $ | (61,417 | ) | | $ | (25,514 | ) | |
See notes to financial statements
67
Eaton Vance Municipals Funds as of February 29, 2008
FINANCIAL STATEMENTS CONT'D
Statements of Changes in Net Assets
For the Year Ended August 31, 2007
| Increase (Decrease) in Net Assets | | Alabama Fund | | Arkansas Fund | | Georgia Fund | | Kentucky Fund | |
| From operations — | |
| Net investment income | | $ | 2,225,203 | | | $ | 2,603,387 | | | $ | 3,083,216 | | | $ | 2,617,144 | | |
Net realized gain from investment transactions, financial futures
contracts and interest rate swap contracts | | | 615,212 | | | | 231,720 | | | | 4,687 | | | | 431,811 | | |
Net change in unrealized appreciation (depreciation) from investments,
financial futures contracts and interest rate swap contracts | | | (2,205,422 | ) | | | (2,095,675 | ) | | | (2,945,685 | ) | | | (2,293,606 | ) | |
| Net increase in net assets from operations | | $ | 634,993 | | | $ | 739,432 | | | $ | 142,218 | | | $ | 755,349 | | |
| Distributions to shareholders — | |
| From net investment income | |
| Class A | | $ | (1,772,526 | ) | | $ | (2,327,548 | ) | | $ | (2,573,677 | ) | | $ | (2,210,293 | ) | |
| Class B | | | (404,410 | ) | | | (243,294 | ) | | | (448,314 | ) | | | (318,995 | ) | |
| Class C | | | (48,201 | ) | | | (66,947 | ) | | | (111,142 | ) | | | (40,962 | ) | |
| From net realized gain | |
| Class A | | | (211,681 | ) | | | — | | | | — | | | | — | | |
| Class B | | | (58,312 | ) | | | — | | | | — | | | | — | | |
| Class C | | | (5,606 | ) | | | — | | | | — | | | | — | | |
| Total distributions to shareholders | | $ | (2,500,736 | ) | | $ | (2,637,789 | ) | | $ | (3,133,133 | ) | | $ | (2,570,250 | ) | |
| Transactions in shares of beneficial interest — | |
| Proceeds from sale of shares | |
| Class A | | $ | 6,446,215 | | | $ | 16,743,171 | | | $ | 25,703,429 | | | $ | 3,351,438 | | |
| Class B | | | 448,589 | | | | 103,319 | | | | 531,370 | | | | 243,056 | | |
| Class C | | | 1,909,569 | | | | 2,298,827 | | | | 5,796,983 | | | | 1,869,880 | | |
Net asset value of shares issued to shareholders in payment of
distributions declared | | | |
| Class A | | | 1,019,772 | | | | 1,270,627 | | | | 1,466,729 | | | | 1,391,816 | | |
| Class B | | | 263,218 | | | | 132,547 | | | | 234,079 | | | | 195,185 | | |
| Class C | | | 40,077 | | | | 17,201 | | | | 67,029 | | | | 33,607 | | |
| Cost of shares redeemed | |
| Class A | | | (6,199,215 | ) | | | (7,008,569 | ) | | | (6,274,937 | ) | | | (5,681,002 | ) | |
| Class B | | | (1,550,324 | ) | | | (1,649,572 | ) | | | (1,023,706 | ) | | | (1,262,474 | ) | |
| Class C | | | (1,204,567 | ) | | | (104,956 | ) | | | (559,338 | ) | | | (154,692 | ) | |
| Net asset value of shares exchanged | |
| Class A | | | 1,967,082 | | | | 1,198,566 | | | | 1,340,582 | | | | 1,003,064 | | |
| Class B | | | (1,967,082 | ) | | | (1,198,566 | ) | | | (1,340,582 | ) | | | (1,003,064 | ) | |
| Net increase (decrease) in net assets from Fund share transactions | | $ | 1,173,334 | | | $ | 11,802,595 | | | $ | 25,941,638 | | | $ | (13,186 | ) | |
| Net increase (decrease) in net assets | | $ | (692,409 | ) | | $ | 9,904,238 | | | $ | 22,950,723 | | | $ | (1,828,087 | ) | |
| Net Assets | |
| At beginning of year | | $ | 57,613,961 | | | $ | 55,583,492 | | | $ | 63,998,987 | | | $ | 62,607,808 | | |
| At end of year | | $ | 56,921,552 | | | $ | 65,487,730 | | | $ | 86,949,710 | | | $ | 60,779,721 | | |
Accumulated distributions in excess of net
investment income included in net assets | |
| At end of year | | $ | (87,597 | ) | | $ | (99,859 | ) | | $ | (128,965 | ) | | $ | (43,149 | ) | |
See notes to financial statements
68
Eaton Vance Municipals Funds as of February 29, 2008
FINANCIAL STATEMENTS CONT'D
Statements of Changes in Net Assets
For the Year Ended August 31, 2007
| Increase (Decrease) in Net Assets | | Louisiana Fund | | Maryland Fund | | Missouri Fund | | North Carolina Fund | |
| From operations — | |
| Net investment income | | $ | 1,608,093 | | | $ | 3,486,821 | | | $ | 3,596,847 | | | $ | 3,644,559 | | |
Net realized gain (loss) from investment transactions, financial futures
contracts and interest rate swap contracts | | | 76,096 | | | | (3,921,566 | ) | | | 102,533 | | | | 3,377 | | |
Net change in unrealized appreciation (depreciation) from investments,
financial futures contracts and interest rate swap contracts | | | (1,390,914 | ) | | | 295,871 | | | | (3,913,294 | ) | | | (2,168,870 | ) | |
| Net increase (decrease) in net assets from operations | | $ | 293,275 | | | $ | (138,874 | ) | | $ | (213,914 | ) | | $ | 1,479,066 | | |
| Distributions to shareholders — | |
| From net investment income | |
| Class A | | $ | (1,455,776 | ) | | $ | (2,925,794 | ) | | $ | (3,132,310 | ) | | $ | (3,153,338 | ) | |
| Class B | | | (197,987 | ) | | | (558,649 | ) | | | (364,699 | ) | | | (370,816 | ) | |
| Class C | | | — | | | | (93,277 | ) | | | (92,277 | ) | | | (93,284 | ) | |
| Total distributions to shareholders | | $ | (1,653,763 | ) | | $ | (3,577,720 | ) | | $ | (3,589,286 | ) | | $ | (3,617,438 | ) | |
| Transactions in shares of beneficial interest — | |
| Proceeds from sale of shares | |
| Class A | | $ | 14,757,123 | | | $ | 29,034,235 | | | $ | 35,480,110 | | | $ | 18,246,422 | | |
| Class B | | | 423,045 | | | | 676,110 | | | | 1,033,043 | | | | 629,903 | | |
| Class C | | | — | | | | 7,129,231 | | | | 3,587,748 | | | | 4,435,577 | | |
Net asset value of shares issued to shareholders in payment of
distributions declared | | | |
| Class A | | | 786,001 | | | | 2,067,382 | | | | 1,955,119 | | | | 1,714,223 | | |
| Class B | | | 57,256 | | | | 347,552 | | | | 204,099 | | | | 179,586 | | |
| Class C | | | — | | | | 64,286 | | | | 62,700 | | | | 78,213 | | |
| Cost of shares redeemed | |
| Class A | | | (2,105,149 | ) | | | (11,114,758 | ) | | | (10,392,319 | ) | | | (7,710,041 | ) | |
| Class B | | | (843,446 | ) | | | (2,081,531 | ) | | | (1,071,894 | ) | | | (2,062,941 | ) | |
| Class C | | | — | | | | (407,843 | ) | | | (112,111 | ) | | | (51,745 | ) | |
| Net asset value of shares exchanged | |
| Class A | | | 1,126,295 | | | | 2,618,315 | | | | 1,342,904 | | | | 2,001,579 | | |
| Class B | | | (1,126,295 | ) | | | (2,618,315 | ) | | | (1,342,904 | ) | | | (2,001,579 | ) | |
| Net increase in net assets from Fund share transactions | | $ | 13,074,830 | | | $ | 25,714,664 | | | $ | 30,746,495 | | | $ | 15,459,197 | | |
| Net increase in net assets | | $ | 11,714,342 | | | $ | 21,998,070 | | | $ | 26,943,295 | | | $ | 13,320,825 | | |
| Net Assets | |
| At beginning of year | | $ | 33,096,028 | | | $ | 72,899,748 | | | $ | 77,232,903 | | | $ | 80,151,419 | | |
| At end of year | | $ | 44,810,370 | | | $ | 94,897,818 | | | $ | 104,176,198 | | | $ | 93,472,244 | | |
Undistributed (distributions in excess of) net
investment income included in net assets | |
| At end of year | | $ | (61,395 | ) | | $ | 158,273 | | | $ | (116,511 | ) | | $ | (119,468 | ) | |
See notes to financial statements
69
Eaton Vance Municipals Funds as of February 29, 2008
FINANCIAL STATEMENTS CONT'D
Statements of Changes in Net Assets
For the Year Ended August 31, 2007
| Increase (Decrease) in Net Assets | | Oregon Fund | | South Carolina Fund | | Tennessee Fund | | Virginia Fund | |
| From operations — | |
| Net investment income | | $ | 4,844,098 | | | $ | 4,502,930 | | | $ | 2,287,006 | | | $ | 4,962,578 | | |
Net realized gain (loss) from investment transactions, financial futures
contracts and interest rate swap contracts | | | (943,608 | ) | | | 49,294 | | | | 161,281 | | | | (447,828 | ) | |
Net change in unrealized appreciation (depreciation) from investments,
financial futures contracts and interest rate swap contracts | | | (3,334,372 | ) | | | (5,075,827 | ) | | | (2,114,462 | ) | | | (6,292,837 | ) | |
| Net increase (decrease) in net assets from operations | | $ | 566,118 | | | $ | (523,603 | ) | | $ | 333,825 | | | $ | (1,778,087 | ) | |
| Distributions to shareholders — | |
| From net investment income | |
| Class A | | $ | (4,069,309 | ) | | $ | (3,729,243 | ) | | $ | (1,986,003 | ) | | $ | (4,151,015 | ) | |
| Class B | | | (715,314 | ) | | | (549,655 | ) | | | (256,077 | ) | | | (763,737 | ) | |
| Class C | | | (162,293 | ) | | | (248,471 | ) | | | (49,254 | ) | | | (97,596 | ) | |
| Total distributions to shareholders | | $ | (4,946,916 | ) | | $ | (4,527,369 | ) | | $ | (2,291,334 | ) | | $ | (5,012,348 | ) | |
| Transactions in shares of beneficial interest — | |
| Proceeds from sale of shares | |
| Class A | | $ | 46,492,755 | | | $ | 46,182,078 | | | $ | 8,094,153 | | | $ | 30,952,330 | | |
| Class B | | | 1,570,878 | | | | 1,333,974 | | | | 288,795 | | | | 1,696,581 | | |
| Class C | | | 8,050,962 | | | | 12,066,000 | | | | 2,251,426 | | | | 5,224,355 | | |
Net asset value of shares issued to shareholders in payment of
distributions declared | | | |
| Class A | | | 2,521,018 | | | | 2,292,378 | | | | 1,125,232 | | | | 2,581,965 | | |
| Class B | | | 405,462 | | | | 313,566 | | | | 170,383 | | | | 448,608 | | |
| Class C | | | 113,316 | | | | 162,129 | | | | 25,648 | | | | 84,007 | | |
| Cost of shares redeemed | |
| Class A | | | (12,044,050 | ) | | | (13,610,642 | ) | | | (4,841,231 | ) | | | (13,080,884 | ) | |
| Class B | | | (2,477,242 | ) | | | (2,524,086 | ) | | | (1,962,053 | ) | | | (2,887,917 | ) | |
| Class C | | | (197,783 | ) | | | (358,965 | ) | | | (73,461 | ) | | | (362,770 | ) | |
| Net asset value of shares exchanged | |
| Class A | | | 2,896,866 | | | | 1,691,059 | | | | 693,351 | | | | 3,592,085 | | |
| Class B | | | (2,896,866 | ) | | | (1,691,059 | ) | | | (693,351 | ) | | | (3,592,085 | ) | |
| Net increase in net assets from Fund share transactions | | $ | 44,435,316 | | | $ | 45,856,432 | | | $ | 5,078,892 | | | $ | 24,656,275 | | |
| Net increase in net assets | | $ | 40,054,518 | | | $ | 40,805,460 | | | $ | 3,121,383 | | | $ | 17,865,840 | | |
| Net Assets | |
| At beginning of year | | $ | 95,444,384 | | | $ | 91,351,098 | | | $ | 55,219,751 | | | $ | 114,057,019 | | |
| At end of year | | $ | 135,498,902 | | | $ | 132,156,558 | | | $ | 58,341,134 | | | $ | 131,922,859 | | |
Accumulated distributions in excess of net
investment income included in net assets | |
| At end of year | | $ | (168,852 | ) | | $ | (164,270 | ) | | $ | (81,184 | ) | | $ | (36,996 | ) | |
See notes to financial statements
70
Eaton Vance Municipals Funds as of February 29, 2008
FINANCIAL STATEMENTS (Unaudited) CONT'D
Statement of Cash Flows
For the Six Months Ended February 29, 2008
| | | Virginia Fund | |
| Cash Flows From Operating Activities | |
| Net decrease in net assets from operations | | $ | (9,674,793 | ) | |
Adjustments to reconcile net decrease in net assets from
operations to net cash provided by operating activities: | |
| Investments purchased | | | (21,215,568 | ) | |
| Investments sold | | | 26,013,864 | | |
| Increase in short-term investments | | | (3,000,000 | ) | |
| Net amortization of premium (discount) | | | (169,314 | ) | |
| Increase in interest receivable | | | (32,540 | ) | |
| Decrease in payable for investments purchased | | | (132,557 | ) | |
| Decrease in receivable for daily variation margin on open financial futures contracts | | | 142,500 | | |
| Increase in receivable for open interest rate swap contracts | | | (8,162 | ) | |
| Increase in payable for daily variation margin on open financial futures contracts | | | 760,000 | | |
| Decrease in payable for open interest rate swap contracts | | | (213,324 | ) | |
| Increase in payable to affiliate for investment adviser fee | | | 1,073 | | |
| Decrease in payable to affiliate for distribution and service fees | | | (23,133 | ) | |
| Decrease in accrued expenses | | | (11,127 | ) | |
| Decrease in interest expense and fees payable | | | (68,756 | ) | |
| Net change in unrealized (appreciation) depreciation on investments | | | 8,366,850 | | |
| Net realized (gain) loss on investments | | | 95,354 | | |
| Net cash provided by operating activities | | $ | 830,367 | | |
| Cash Flows From Financing Activities | |
| Proceeds from shares sold | | $ | 22,034,663 | | |
| Shares redeemed | | | (18,057,409 | ) | |
| Cash distributions paid net of reinvestments | | | (1,041,928 | ) | |
| Increase in demand note payable | | | 1,100,000 | | |
| Increase in due to custodian | | | 85,544 | | |
| Proceeds from secured borrowings | | | 2,280,000 | | |
| Repayment of secured borrowings | | | (7,690,000 | ) | |
| Net cash used in financing activities | | $ | (1,289,130 | ) | |
| Net decrease in cash | | $ | (458,763 | ) | |
| Cash at beginning of period | | $ | 458,763 | | |
| Cash at end of period | | $ | — | | |
| Supplemental disclosure of cash flow information: | |
Noncash financing activities not included herein consist of reinvestment of
dividends and distributions of: | | $ | 1,804,383 | | |
See notes to financial statements
71
Eaton Vance Municipals Funds as of February 29, 2008
FINANCIAL STATEMENTS CONT'D
Financial Highlights
| | | Alabama Fund — Class A | |
| | | Six Months Ended
February 29, 2008 | | Year Ended August 31, | |
| | | (Unaudited)(1) | | 2007(1) | | 2006(1) | | 2005(1) | | 2004(1) | | 2003 | |
| Net asset value — Beginning of period | | $ | 9.600 | | | $ | 9.910 | | | $ | 9.890 | | | $ | 9.800 | | | $ | 9.720 | | | $ | 9.920 | | |
| Income (loss) from operations | |
| Net investment income | | $ | 0.200 | | | $ | 0.394 | | | $ | 0.401 | | | $ | 0.422 | | | $ | 0.454 | | | $ | 0.475 | | |
| Net realized and unrealized gain (loss) | | | (0.522 | ) | | | (0.261 | ) | | | 0.026 | | | | 0.099 | | | | 0.085 | | | | (0.206 | ) | |
| Total income (loss) from operations | | $ | (0.322 | ) | | $ | 0.133 | | | $ | 0.427 | | | $ | 0.521 | | | $ | 0.539 | | | $ | 0.269 | | |
| Less distributions | |
| From net investment income | | $ | (0.193 | ) | | $ | (0.395 | ) | | $ | (0.407 | ) | | $ | (0.431 | ) | | $ | (0.459 | ) | | $ | (0.469 | ) | |
| From net realized gain | | | (0.045 | ) | | | (0.048 | ) | | | — | | | | — | | | | — | | | | — | | |
| Total distributions | | $ | (0.238 | ) | | $ | (0.443 | ) | | $ | (0.407 | ) | | $ | (0.431 | ) | | $ | (0.459 | ) | | $ | (0.469 | ) | |
| Net asset value — End of period | | $ | 9.040 | | | $ | 9.600 | | | $ | 9.910 | | | $ | 9.890 | | | $ | 9.800 | | | $ | 9.720 | | |
| Total Return(2) | | | (3.48 | )%(8) | | | 1.30 | % | | | 4.46 | % | | | 5.43 | % | | | 5.61 | % | | | 2.74 | % | |
| Ratios/Supplemental Data | |
| Net assets, end of period (000's omitted) | | $ | 46,617 | | | $ | 44,947 | | | $ | 43,163 | | | $ | 42,390 | | | $ | 40,225 | | | $ | 9,226 | | |
| Ratios (As a percentage of average daily net assets): | |
| Expenses excluding interest and fees | | | 0.73 | %(3) | | | 0.75 | %(4) | | | 0.75 | % | | | 0.76 | %(5) | | | 0.76 | %(5) | | | 0.76 | %(5) | |
| Interest and fee expense(6) | | | 0.16 | %(3) | | | 0.16 | % | | | 0.09 | % | | | 0.05 | %(5) | | | 0.03 | %(5) | | | 0.02 | %(5) | |
| Total expenses before custodian fee reduction | | | 0.89 | %(3) | | | 0.91 | %(4) | | | 0.84 | % | | | 0.81 | %(5) | | | 0.79 | %(5) | | | 0.78 | %(5) | |
| Expenses after custodian fee reduction excluding interest and fees | | | 0.71 | %(3) | | | 0.74 | %(4) | | | 0.73 | % | | | 0.75 | %(5) | | | 0.76 | %(5) | | | 0.74 | %(5) | |
| Net investment income | | | 4.14 | %(3) | | | 3.99 | % | | | 4.11 | % | | | 4.29 | % | | | 4.63 | % | | | 4.78 | % | |
| Portfolio Turnover of the Portfolio(7) | | | — | | | | — | | | | — | | | | — | | | | 23 | % | | | 10 | % | |
| Portfolio Turnover of the Fund | | | 7 | % | | | 29 | % | | | 31 | % | | | 16 | % | | | — | | | | — | | |
(1) Net investment income per share was computed using average shares outstanding.
(2) Returns are historical and are calculated by determining the percentage change in net asset value with all distributions reinvested.
(3) Annualized.
(4) The investment adviser was allocated a portion of the Fund's operating expenses (equal to less than 0.01% of average daily net assets for the year ended August 31, 2007). Absent this allocation, total return would be lower.
(5) Includes the Fund's share of its corresponding Portfolio's allocated expenses while the Fund was making investments directly into the Portfolio.
(6) Interest and fee expense relates to the liability for floating rate notes issued in conjunction with inverse floater securities transactions (See Note 1I).
(7) Portfolio turnover represents the rate of portfolio activity for the period while the Fund was making investments directly into the Portfolio.
(8) Not annualized.
See notes to financial statements
72
Eaton Vance Municipals Funds as of February 29, 2008
FINANCIAL STATEMENTS CONT'D
Financial Highlights
| | | Alabama Fund — Class B | |
| | | Six Months Ended
February 29, 2008 | | Year Ended August 31, | |
| | | (Unaudited)(1) | | 2007(1) | | 2006(1) | | 2005(1) | | 2004(1) | | 2003 | |
| Net asset value — Beginning of period | | $ | 10.560 | | | $ | 10.900 | | | $ | 10.870 | | | $ | 10.770 | | | $ | 10.690 | | | $ | 10.910 | | |
| Income (loss) from operations | |
| Net investment income | | $ | 0.180 | | | $ | 0.353 | | | $ | 0.362 | | | $ | 0.384 | | | $ | 0.423 | | | $ | 0.439 | | |
| Net realized and unrealized gain (loss) | | | (0.574 | ) | | | (0.293 | ) | | | 0.034 | | | | 0.108 | | | | 0.080 | | | | (0.219 | ) | |
| Total income (loss) from operations | | $ | (0.394 | ) | | $ | 0.060 | | | $ | 0.396 | | | $ | 0.492 | | | $ | 0.503 | | | $ | 0.220 | | |
| Less distributions | |
| From net investment income | | $ | (0.171 | ) | | $ | (0.352 | ) | | $ | (0.366 | ) | | $ | (0.392 | ) | | $ | (0.423 | ) | | $ | (0.440 | ) | |
| From net realized gain | | | (0.045 | ) | | | (0.048 | ) | | | — | | | | — | | | | — | | | | — | | |
| Total distributions | | $ | (0.216 | ) | | $ | (0.400 | ) | | $ | (0.366 | ) | | $ | (0.392 | ) | | $ | (0.423 | ) | | $ | (0.440 | ) | |
| Net asset value — End of period | | $ | 9.950 | | | $ | 10.560 | | | $ | 10.900 | | | $ | 10.870 | | | $ | 10.770 | | | $ | 10.690 | | |
| Total Return(2) | | | (3.83 | )%(9) | | | 0.51 | % | | | 3.75 | % | | | 4.81 | %(3) | | | 4.77 | % | | | 2.02 | % | |
| Ratios/Supplemental Data | |
| Net assets, end of period (000's omitted) | | $ | 9,208 | | | $ | 10,690 | | | $ | 13,854 | | | $ | 17,556 | | | $ | 19,947 | | | $ | 55,263 | | |
| Ratios (As a percentage of average daily net assets): | |
| Expenses excluding interest and fees | | | 1.48 | %(4) | | | 1.50 | %(5) | | | 1.50 | % | | | 1.51 | %(6) | | | 1.52 | %(6) | | | 1.51 | %(6) | |
| Interest and fee expense(7) | | | 0.16 | %(4) | | | 0.16 | % | | | 0.09 | % | | | 0.05 | %(6) | | | 0.03 | %(6) | | | 0.02 | %(6) | |
| Total expenses before custodian fee reduction | | | 1.64 | %(4) | | | 1.66 | %(5) | | | 1.59 | % | | | 1.56 | %(6) | | | 1.55 | %(6) | | | 1.53 | %(6) | |
| Expenses after custodian fee reduction excluding interest and fees | | | 1.46 | %(4) | | | 1.49 | %(5) | | | 1.48 | % | | | 1.50 | %(6) | | | 1.52 | %(6) | | | 1.49 | %(6) | |
| Net investment income | | | 3.39 | %(4) | | | 3.25 | % | | | 3.37 | % | | | 3.55 | % | | | 3.88 | % | | | 4.04 | % | |
| Portfolio Turnover of the Portfolio(8) | | | — | | | | — | | | | — | | | | — | | | | 23 | % | | | 10 | % | |
| Portfolio Turnover of the Fund | | | 7 | % | | | 29 | % | | | 31 | % | | | 16 | % | | | — | | | | — | | |
(1) Net investment income per share was computed using average shares outstanding.
(2) Returns are historical and are calculated by determining the percentage change in net asset value with all distributions reinvested.
(3) Total return reflects an increase of 0.15% due to a change in the timing of payment and reinvestment of distributions.
(4) Annualized.
(5) The investment adviser was allocated a portion of the Fund's operating expenses (equal to less than 0.01% of average daily net assets for the year ended August 31, 2007). Absent this allocation, total return would be lower.
(6) Includes the Fund's share of its corresponding Portfolio's allocated expenses while the Fund was making investments directly into the Portfolio.
(7) Interest and fee expense relates to the liability for floating rate notes issued in conjunction with inverse floater securities transactions (See Note 1I).
(8) Portfolio turnover represents the rate of portfolio activity for the period while the Fund was making investments directly into the Portfolio.
(9) Not annualized.
See notes to financial statements
73
Eaton Vance Municipals Funds as of February 29, 2008
FINANCIAL STATEMENTS CONT'D
Financial Highlights
| | | Alabama Fund — Class C | |
| | | Six Months Ended
February 29, 2008
(Unaudited)(1) | | Year Ended
August 31, 2007(1) | | Period Ended
August 31, 2006(1)(2) | |
| Net asset value — Beginning of period | | $ | 10.560 | | | $ | 10.900 | | | $ | 10.830 | | |
| Income (loss) from operations | |
| Net investment income | | $ | 0.184 | | | $ | 0.351 | | | $ | 0.138 | | |
| Net realized and unrealized gain (loss) | | | (0.568 | ) | | | (0.291 | ) | | | 0.089 | | |
| Total income (loss) from operations | | $ | (0.384 | ) | | $ | 0.060 | | | $ | 0.227 | | |
| Less distributions | |
| From net investment income | | $ | (0.171 | ) | | $ | (0.352 | ) | | $ | (0.157 | ) | |
| From net realized gain | | | (0.045 | ) | | | (0.048 | ) | | | — | | |
| Total distributions | | $ | (0.216 | ) | | $ | (0.400 | ) | | $ | (0.157 | ) | |
| Net asset value — End of period | | $ | 9.960 | | | $ | 10.560 | | | $ | 10.900 | | |
| Total Return(3) | | | (3.73 | )%(8) | | | 0.51 | % | | | 2.13 | %(8) | |
| Ratios/Supplemental Data | |
| Net assets, end of period (000's omitted) | | $ | 1,015 | | | $ | 1,285 | | | $ | 598 | | |
| Ratios (As a percentage of average daily net assets): | |
| Expenses excluding interest and fees | | | 1.49 | %(4) | | | 1.50 | %(5) | | | 1.50 | %(4) | |
| Interest and fee expense(6) | | | 0.16 | %(4) | | | 0.16 | % | | | 0.09 | %(4) | |
| Total expenses before custodian fee reduction | | | 1.65 | %(4) | | | 1.66 | %(5) | | | 1.59 | %(4) | |
| Expenses after custodian fee reduction excluding interest and fees | | | 1.47 | %(4) | | | 1.49 | %(5) | | | 1.48 | %(4) | |
| Net investment income | | | 3.45 | %(4) | | | 3.23 | % | | | 2.85 | %(4) | |
| Portfolio Turnover | | | 7 | % | | | 29 | % | | | 31 | %(7) | |
(1) Net investment income per share was computed using average shares outstanding.
(2) For the period from the start of business, March 21, 2006, to August 31, 2006.
(3) Returns are historical and are calculated by determining the percentage change in net asset value with all distributions reinvested.
(4) Annualized.
(5) The investment adviser was allocated a portion of the Fund's operating expenses (equal to less than 0.01% of average daily net assets for the year ended August 31, 2007). Absent this allocation, total return would be lower.
(6) Interest and fee expense relates to the liability for floating rate notes issued in conjunction with inverse floater securities transactions (See Note 1I).
(7) For the Fund's fiscal year, September 1, 2005 to August 31, 2006.
(8) Not annualized.
See notes to financial statements
74
Eaton Vance Municipals Funds as of February 29, 2008
FINANCIAL STATEMENTS CONT'D
Financial Highlights
| | | Arkansas Fund — Class A | |
| | | Six Months Ended
February 29, 2008 | | Year Ended August 31, | |
| | | (Unaudited)(1) | | 2007(1) | | 2006(1) | | 2005(1) | | 2004(1) | | 2003 | |
| Net asset value — Beginning of period | | $ | 9.710 | | | $ | 9.970 | | | $ | 9.870 | | | $ | 9.880 | | | $ | 9.730 | | | $ | 9.980 | | |
| Income (loss) from operations | |
| Net investment income | | $ | 0.211 | | | $ | 0.419 | | | $ | 0.438 | | | $ | 0.460 | | | $ | 0.483 | | | $ | 0.490 | | |
| Net realized and unrealized gain (loss) | | | (0.802 | ) | | | (0.254 | ) | | | 0.100 | | | | (0.002 | ) | | | 0.150 | | | | (0.251 | ) | |
| Total income (loss) from operations | | $ | (0.591 | ) | | $ | 0.165 | | | $ | 0.538 | | | $ | 0.458 | | | $ | 0.633 | | | $ | 0.239 | | |
| Less distributions | |
| From net investment income | | $ | (0.209 | ) | | $ | (0.425 | ) | | $ | (0.438 | ) | | $ | (0.468 | ) | | $ | (0.483 | ) | | $ | (0.489 | ) | |
| Total distributions | | $ | (0.209 | ) | | $ | (0.425 | ) | | $ | (0.438 | ) | | $ | (0.468 | ) | | $ | (0.483 | ) | | $ | (0.489 | ) | |
| Net asset value — End of period | | $ | 8.910 | | | $ | 9.710 | | | $ | 9.970 | | | $ | 9.870 | | | $ | 9.880 | | | $ | 9.730 | | |
| Total Return(2) | | | (6.23 | )%(8) | | | 1.61 | % | | | 5.61 | % | | | 4.74 | % | | | 6.58 | % | | | 2.42 | % | |
| Ratios/Supplemental Data | |
| Net assets, end of period (000's omitted) | | $ | 52,795 | | | $ | 57,319 | | | $ | 46,779 | | | $ | 36,014 | | | $ | 33,215 | | | $ | 9,480 | | |
| Ratios (As a percentage of average daily net assets): | |
| Expenses excluding interest and fees | | | 0.70 | %(3) | | | 0.75 | %(4) | | | 0.74 | % | | | 0.74 | %(5) | | | 0.72 | %(5) | | | 0.73 | %(5) | |
| Interest and fee expense(6) | | | 0.20 | %(3) | | | 0.20 | % | | | 0.21 | % | | | 0.13 | %(5) | | | 0.07 | %(5) | | | 0.04 | %(5) | |
| Total expenses before custodian fee reduction | | | 0.90 | %(3) | | | 0.95 | %(4) | | | 0.95 | % | | | 0.87 | %(5) | | | 0.79 | %(5) | | | 0.77 | %(5) | |
| Expenses after custodian fee reduction excluding interest and fees | | | 0.68 | %(3) | | | 0.72 | %(4) | | | 0.71 | % | | | 0.73 | %(5) | | | 0.72 | %(5) | | | 0.71 | %(5) | |
| Net investment income | | | 4.35 | %(3) | | | 4.19 | % | | | 4.46 | % | | | 4.65 | % | | | 4.86 | % | | | 4.90 | % | |
| Portfolio Turnover of the Portfolio(7) | | | — | | | | — | | | | — | | | | — | | | | 15 | % | | | 25 | % | |
| Portfolio Turnover of the Fund | | | 2 | % | | | 26 | % | | | 18 | % | | | 14 | % | | | — | | | | — | | |
(1) Net investment income per share was computed using average shares outstanding.
(2) Returns are historical and are calculated by determining the percentage change in net asset value with all distributions reinvested.
(3) Annualized.
(4) The investment adviser was allocated a portion of the Fund's operating expenses (equal to less than 0.01% of average daily net assets for the year ended August 31, 2007). Absent this allocation, total return would be lower.
(5) Includes the Fund's share of its corresponding Portfolio's allocated expenses while the Fund was making investments directly into the Portfolio.
(6) Interest and fee expense relates to the liability for floating rate notes issued in conjunction with inverse floater securities transactions (See Note 1I).
(7) Portfolio turnover represents the rate of portfolio activity for the period while the Fund was making investments directly into the Portfolio.
(8) Not annualized.
See notes to financial statements
75
Eaton Vance Municipals Funds as of February 29, 2008
FINANCIAL STATEMENTS CONT'D
Financial Highlights
| | | Arkansas Fund — Class B | |
| | | Six Months Ended
February 29, 2008 | | Year Ended August 31, | |
| | | (Unaudited)(1) | | 2007(1) | | 2006(1) | | 2005(1) | | 2004(1) | | 2003 | |
| Net asset value — Beginning of period | | $ | 10.430 | | | $ | 10.710 | | | $ | 10.610 | | | $ | 10.610 | | | $ | 10.460 | | | $ | 10.720 | | |
| Income (loss) from operations | |
| Net investment income | | $ | 0.187 | | | $ | 0.372 | | | $ | 0.393 | | | $ | 0.416 | | | $ | 0.443 | | | $ | 0.444 | | |
| Net realized and unrealized gain (loss) | | | (0.862 | ) | | | (0.275 | ) | | | 0.098 | | | | 0.007 | | | | 0.145 | | | | (0.259 | ) | |
| Total income (loss) from operations | | $ | (0.675 | ) | | $ | 0.097 | | | $ | 0.491 | | | $ | 0.423 | | | $ | 0.588 | | | $ | 0.185 | | |
| Less distributions | |
| From net investment income | | $ | (0.185 | ) | | $ | (0.377 | ) | | $ | (0.391 | ) | | $ | (0.423 | ) | | $ | (0.438 | ) | | $ | (0.445 | ) | |
| Total distributions | | $ | (0.185 | ) | | $ | (0.377 | ) | | $ | (0.391 | ) | | $ | (0.423 | ) | | $ | (0.438 | ) | | $ | (0.445 | ) | |
| Net asset value — End of period | | $ | 9.570 | | | $ | 10.430 | | | $ | 10.710 | | | $ | 10.610 | | | $ | 10.610 | | | $ | 10.460 | | |
| Total Return(2) | | | (6.59 | )%(9) | | | 0.85 | % | | | 4.75 | % | | | 4.23 | %(3) | | | 5.68 | % | | | 1.72 | % | |
| Ratios/Supplemental Data | |
| Net assets, end of period (000's omitted) | | $ | 4,653 | | | $ | 5,413 | | | $ | 8,166 | | | $ | 8,924 | | | $ | 10,354 | | | $ | 33,975 | | |
| Ratios (As a percentage of average daily net assets): | |
| Expenses excluding interest and fees | | | 1.45 | %(4) | | | 1.50 | %(5) | | | 1.50 | % | | | 1.49 | %(6) | | | 1.47 | %(6) | | | 1.48 | %(6) | |
| Interest and fee expense(7) | | | 0.20 | %(4) | | | 0.20 | % | | | 0.21 | % | | | 0.13 | %(6) | | | 0.07 | %(6) | | | 0.04 | %(6) | |
| Total expenses before custodian fee reduction | | | 1.65 | %(4) | | | 1.70 | %(5) | | | 1.71 | % | | | 1.62 | %(6) | | | 1.54 | %(6) | | | 1.52 | %(6) | |
| Expenses after custodian fee reduction excluding interest and fees | | | 1.43 | %(4) | | | 1.47 | %(5) | | | 1.46 | % | | | 1.48 | %(6) | | | 1.47 | %(6) | | | 1.46 | %(6) | |
| Net investment income | | | 3.60 | %(4) | | | 3.47 | % | | | 3.72 | % | | | 3.92 | % | | | 4.13 | % | | | 4.17 | % | |
| Portfolio Turnover of the Portfolio(8) | | | — | | | | — | | | | — | | | | — | | | | 15 | % | | | 25 | % | |
| Portfolio Turnover of the Fund | | | 2 | % | | | 26 | % | | | 18 | % | | | 14 | % | | | — | | | | — | | |
(1) Net investment income per share was computed using average shares outstanding.
(2) Returns are historical and are calculated by determining the percentage change in net asset value with all distributions reinvested.
(3) Total return reflects an increase of 0.17% due to a change in the timing of the payment and reinvestment of distributions.
(4) Annualized.
(5) The investment adviser was allocated a portion of the Fund's operating expenses (equal to less than 0.01% of average daily net assets for the year ended August 31, 2007). Absent this allocation, total return would be lower.
(6) Includes the Fund's share of its corresponding Portfolio's allocated expenses while the Fund was making investments directly into the Portfolio.
(7) Interest and fee expense relates to the liability for floating rate notes issued in conjunction with inverse floater securities transactions (See Note 1I).
(8) Portfolio turnover represents the rate of portfolio activity for the period while the Fund was making investments directly into the Portfolio.
(9) Not annualized.
See notes to financial statements
76
Eaton Vance Municipals Funds as of February 29, 2008
FINANCIAL STATEMENTS CONT'D
Financial Highlights
| | | Arkansas Fund — Class C | |
| | | Six Months Ended
February 29, 2008
(Unaudited)(1) | | Year Ended
August 31, 2007(1) | | Period Ended
August 31, 2006(1)(2) | |
| Net asset value — Beginning of period | | $ | 10.420 | | | $ | 10.710 | | | $ | 10.550 | | |
| Income (loss) from operations | |
| Net investment income | | $ | 0.188 | | | $ | 0.364 | | | $ | 0.112 | | |
| Net realized and unrealized gain (loss) | | | (0.864 | ) | | | (0.277 | ) | | | 0.177 | | |
| Total income (loss) from operations | | $ | (0.676 | ) | | $ | 0.087 | | | $ | 0.289 | | |
| Less distributions | |
| From net investment income | | $ | (0.184 | ) | | $ | (0.377 | ) | | $ | (0.129 | ) | |
| Total distributions | | $ | (0.184 | ) | | $ | (0.377 | ) | | $ | (0.129 | ) | |
| Net asset value — End of period | | $ | 9.560 | | | $ | 10.420 | | | $ | 10.710 | | |
| Total Return(3) | | | (6.60 | )%(8) | | | 0.76 | % | | | 2.76 | %(8) | |
| Ratios/Supplemental Data | |
| Net assets, end of period (000's omitted) | | $ | 2,314 | | | $ | 2,756 | | | $ | 638 | | |
| Ratios (As a percentage of average daily net assets): | |
| Expenses excluding interest and fees | | | 1.45 | %(4) | | | 1.50 | %(5) | | | 1.49 | %(4) | |
| Interest and fee expense(6) | | | 0.20 | %(4) | | | 0.20 | % | | | 0.21 | %(4) | |
| Total expenses before custodian fee reduction | | | 1.65 | %(4) | | | 1.70 | %(5) | | | 1.70 | %(4) | |
| Expenses after custodian fee reduction excluding interest and fees | | | 1.43 | %(4) | | | 1.47 | %(5) | | | 1.46 | %(4) | |
| Net investment income | | | 3.61 | %(4) | | | 3.41 | % | | | 3.07 | %(4) | |
| Portfolio Turnover | | | 2 | % | | | 26 | % | | | 18 | %(7) | |
(1) Net investment income per share was computed using average shares outstanding.
(2) For the period from the start of business, April 28, 2006, to August 31, 2006.
(3) Returns are historical and are calculated by determining the percentage change in net asset value with all distributions reinvested.
(4) Annualized.
(5) The investment adviser was allocated a portion of the Fund's operating expenses (equal to less than 0.01% of average daily net assets for the year ended August 31, 2007). Absent this allocation, total return would be lower.
(6) Interest and fee expense relates to the liability for floating rate notes issued in conjunction with inverse floater securities transactions (See Note 1I).
(7) For the Fund's fiscal year, September 1, 2005 to August 31, 2006.
(8) Not annualized.
See notes to financial statements
77
Eaton Vance Municipals Funds as of February 29, 2008
FINANCIAL STATEMENTS CONT'D
Financial Highlights
| | | Georgia Fund — Class A | |
| | | Six Months Ended
February 29, 2008 | | Year Ended August 31, | |
| | | (Unaudited)(1) | | 2007(1) | | 2006(1) | | 2005(1) | | 2004(1) | | 2003(1) | |
| Net asset value — Beginning of period | | $ | 9.130 | | | $ | 9.460 | | | $ | 9.510 | | | $ | 9.480 | | | $ | 9.260 | | | $ | 9.410 | | |
| Income (loss) from operations | |
| Net investment income | | $ | 0.197 | | | $ | 0.393 | | | $ | 0.420 | | | $ | 0.448 | | | $ | 0.473 | | | $ | 0.478 | | |
| Net realized and unrealized gain (loss) | | | (0.732 | ) | | | (0.321 | ) | | | (0.044 | ) | | | 0.039 | | | | 0.213 | | | | (0.162 | ) | |
| Total income (loss) from operations | | $ | (0.535 | ) | | $ | 0.072 | | | $ | 0.376 | | | $ | 0.487 | | | $ | 0.686 | | | $ | 0.316 | | |
| Less distributions | |
| From net investment income | | $ | (0.195 | ) | | $ | (0.402 | ) | | $ | (0.426 | ) | | $ | (0.457 | ) | | $ | (0.466 | ) | | $ | (0.466 | ) | |
| Total distributions | | $ | (0.195 | ) | | $ | (0.402 | ) | | $ | (0.426 | ) | | $ | (0.457 | ) | | $ | (0.466 | ) | | $ | (0.466 | ) | |
| Net asset value — End of period | | $ | 8.400 | | | $ | 9.130 | | | $ | 9.460 | | | $ | 9.510 | | | $ | 9.480 | | | $ | 9.260 | | |
| Total Return(2) | | | (6.00 | )%(8) | | | 0.71 | % | | | 4.10 | % | | | 5.25 | % | | | 7.52 | % | | | 3.39 | % | |
| Ratios/Supplemental Data | |
| Net assets, end of period (000's omitted) | | $ | 64,696 | | | $ | 69,269 | | | $ | 49,431 | | | $ | 42,511 | | | $ | 38,229 | | | $ | 4,234 | | |
| Ratios (As a percentage of average daily net assets): | |
| Expenses excluding interest and fees | | | 0.75 | %(3) | | | 0.76 | %(4) | | | 0.75 | % | | | 0.77 | %(5) | | | 0.78 | %(5) | | | 0.77 | %(5) | |
| Interest and fee expense(6) | | | 0.22 | %(3) | | | 0.29 | % | | | 0.45 | % | | | 0.34 | %(5) | | | 0.24 | %(5) | | | 0.23 | %(5) | |
| Total expenses before custodian fee reduction | | | 0.97 | %(3) | | | 1.05 | %(4) | | | 1.20 | % | | | 1.11 | %(5) | | | 1.02 | %(5) | | | 1.00 | %(5) | |
| Expenses after custodian fee reduction excluding interest and fees | | | 0.71 | %(3) | | | 0.71 | %(4) | | | 0.73 | % | | | 0.75 | %(5) | | | 0.78 | %(5) | | | 0.75 | %(5) | |
| Net investment income | | | 4.31 | %(3) | | | 4.18 | % | | | 4.49 | % | | | 4.71 | % | | | 5.02 | % | | | 5.07 | % | |
| Portfolio Turnover of the Portfolio(7) | | | — | | | | — | | | | — | | | | 2 | % | | | 3 | % | | | 16 | % | |
| Portfolio Turnover of the Fund | | | 20 | % | | | 12 | % | | | 20 | % | | | 11 | % | | | — | | | | — | | |
(1) Net investment income per share was computed using average shares outstanding.
(2) Returns are historical and are calculated by determining the percentage change in net asset value with all distributions reinvested.
(3) Annualized.
(4) The investment adviser was allocated a portion of the Fund's operating expenses (equal to less than 0.01% of average daily net assets for the year ended August 31, 2007). Absent this allocation, total return would be lower.
(5) Includes the Fund's share of its corresponding Portfolio's allocated expenses while the Fund was making investments directly into the Portfolio.
(6) Interest and fee expense relates to the liability for floating rate notes issued in conjunction with inverse floater securities transactions (See Note 1I).
(7) Portfolio turnover represents the rate of portfolio activity for the period while the Fund was making investments directly into the Portfolio.
(8) Not annualized.
See notes to financial statements
78
Eaton Vance Municipals Funds as of February 29, 2008
FINANCIAL STATEMENTS CONT'D
Financial Highlights
| | | Georgia Fund — Class B | |
| | | Six Months Ended
February 29, 2008 | | Year Ended August 31, | |
| | | (Unaudited)(1) | | 2007(1) | | 2006(1) | | 2005(1) | | 2004(1) | | 2003(1) | |
| Net asset value — Beginning of period | | $ | 9.750 | | | $ | 10.100 | | | $ | 10.150 | | | $ | 10.130 | | | $ | 9.900 | | | $ | 10.050 | | |
| Income (loss) from operations | |
| Net investment income | | $ | 0.174 | | | $ | 0.347 | | | $ | 0.375 | | | $ | 0.404 | | | $ | 0.435 | | | $ | 0.437 | | |
| Net realized and unrealized gain (loss) | | | (0.783 | ) | | | (0.343 | ) | | | (0.046 | ) | | | 0.028 | | | | 0.218 | | | | (0.164 | ) | |
| Total income (loss) from operations | | $ | (0.609 | ) | | $ | 0.004 | | | $ | 0.329 | | | $ | 0.432 | | | $ | 0.653 | | | $ | 0.273 | | |
| Less distributions | |
| From net investment income | | $ | (0.171 | ) | | $ | (0.354 | ) | | $ | (0.379 | ) | | $ | (0.412 | ) | | $ | (0.423 | ) | | $ | (0.423 | ) | |
| Total distributions | | $ | (0.171 | ) | | $ | (0.354 | ) | | $ | (0.379 | ) | | $ | (0.412 | ) | | $ | (0.423 | ) | | $ | (0.423 | ) | |
| Net asset value — End of period | | $ | 8.970 | | | $ | 9.750 | | | $ | 10.100 | | | $ | 10.150 | | | $ | 10.130 | | | $ | 9.900 | | |
| Total Return(2) | | | (6.36 | )%(9) | | | (0.02 | )% | | | 3.35 | % | | | 4.52 | %(3) | | | 6.69 | % | | | 2.72 | % | |
| Ratios/Supplemental Data | |
| Net assets, end of period (000's omitted) | | $ | 9,075 | | | $ | 11,363 | | | $ | 13,382 | | | $ | 15,075 | | | $ | 15,860 | | | $ | 49,773 | | |
| Ratios (As a percentage of average daily net assets): | |
| Expenses excluding interest and fees | | | 1.50 | %(4) | | | 1.51 | %(5) | | | 1.50 | % | | | 1.52 | %(6) | | | 1.53 | %(6) | | | 1.52 | %(6) | |
| Interest and fee expense(7) | | | 0.22 | %(4) | | | 0.29 | % | | | 0.45 | % | | | 0.34 | %(6) | | | 0.24 | %(6) | | | 0.23 | %(6) | |
| Total expenses before custodian fee reduction | | | 1.72 | %(4) | | | 1.80 | %(5) | | | 1.95 | % | | | 1.86 | %(6) | | | 1.77 | %(6) | | | 1.75 | %(6) | |
| Expenses after custodian fee reduction excluding interest and fees | | | 1.46 | %(4) | | | 1.46 | %(5) | | | 1.48 | % | | | 1.50 | %(6) | | | 1.53 | %(6) | | | 1.50 | %(6) | |
| Net investment income | | | 3.57 | %(4) | | | 3.44 | % | | | 3.75 | % | | | 3.98 | % | | | 4.27 | % | | | 4.34 | % | |
| Portfolio Turnover of the Portfolio(8) | | | — | | | | — | | | | — | | | | 2 | % | | | 3 | % | | | 16 | % | |
| Portfolio Turnover of the Fund | | | 20 | % | | | 12 | % | | | 20 | % | | | 11 | % | | | — | | | | — | | |
(1) Net investment income per share was computed using average shares outstanding.
(2) Returns are historical and are calculated by determining the percentage change in net asset value with all distributions reinvested.
(3) Total return reflects an increase of 0.18% due to a change in the timing of the payment and reinvestment of distributions.
(4) Annualized.
(5) The investment adviser was allocated a portion of the Fund's operating expenses (equal to less than 0.01% of average daily net assets for the year ended August 31, 2007). Absent this allocation, total return would be lower.
(6) Includes the Fund's share of its corresponding Portfolio's allocated expenses while the Fund was making investments directly into the Portfolio.
(7) Interest and fee expense relates to the liability for floating rate notes issued in conjunction with inverse floater securities transactions (See Note 1I).
(8) Portfolio turnover represents the rate of portfolio activity for the period while the Fund was making investments directly into the Portfolio.
(9) Not annualized.
See notes to financial statements
79
Eaton Vance Municipals Funds as of February 29, 2008
FINANCIAL STATEMENTS CONT'D
Financial Highlights
| | | Georgia Fund — Class C | |
| | | Six Months Ended
February 29, 2008
(Unaudited)(1) | | Year Ended
August 31, 2007(1) | | Period Ended
August 31, 2006(1)(2) | |
| Net asset value — Beginning of period | | $ | 9.760 | | | $ | 10.100 | | | $ | 9.980 | | |
| Income (loss) from operations | |
| Net investment income | | $ | 0.171 | | | $ | 0.342 | | | $ | 0.116 | | |
| Net realized and unrealized gain (loss) | | | (0.790 | ) | | | (0.328 | ) | | | 0.133 | (3) | |
| Total income (loss) from operations | | $ | (0.619 | ) | | $ | 0.014 | | | $ | 0.249 | | |
| Less distributions | |
| From net investment income | | $ | (0.171 | ) | | $ | (0.354 | ) | | $ | (0.129 | ) | |
| Total distributions | | $ | (0.171 | ) | | $ | (0.354 | ) | | $ | (0.129 | ) | |
| Net asset value — End of period | | $ | 8.970 | | | $ | 9.760 | | | $ | 10.100 | | |
| Total Return(4) | | | (6.46 | )%(9) | | | 0.08 | % | | | 2.52 | %(9) | |
| Ratios/Supplemental Data | |
| Net assets, end of period (000's omitted) | | $ | 6,133 | | | $ | 6,318 | | | $ | 1,185 | | |
| Ratios (As a percentage of average daily net assets): | |
| Expenses excluding interest and fees | | | 1.50 | %(5) | | | 1.51 | %(6) | | | 1.50 | %(5) | |
| Interest and fee expense(7) | | | 0.22 | %(5) | | | 0.29 | % | | | 0.45 | %(5) | |
| Total expenses before custodian fee reduction | | | 1.72 | %(5) | | | 1.80 | %(6) | | | 1.95 | %(5) | |
| Expenses after custodian fee reduction excluding interest and fees | | | 1.46 | %(5) | | | 1.46 | %(6) | | | 1.48 | %(5) | |
| Net investment income | | | 3.51 | %(5) | | | 3.41 | % | | | 3.28 | %(5) | |
| Portfolio Turnover | | | 20 | % | | | 12 | % | | | 20 | %(8) | |
(1) Net investment income per share was computed using average shares outstanding.
(2) For the period from the start of business, April 25, 2006, to August 31, 2006.
(3) The per share amount is not in accord with the net realized and unrealized gain (loss) for the period due to the timing of sales of Fund shares and the amount of the per share realized and unrealized gains and losses at such time.
(4) Returns are historical and are calculated by determining the percentage change in net asset value with all distributions reinvested.
(5) Annualized.
(6) The investment adviser was allocated a portion of the Fund's operating expenses (equal to less than 0.01% of average daily net assets for the year ended August 31, 2007). Absent this allocation, total return would be lower.
(7) Interest and fee expense relates to the liability for floating rate notes issued in conjunction with inverse floater securities transactions (See Note 1I).
(8) For the Fund's fiscal year, September 1, 2005 to August 31, 2006.
(9) Not annualized.
See notes to financial statements
80
Eaton Vance Municipals Funds as of February 29, 2008
FINANCIAL STATEMENTS CONT'D
Financial Highlights
| | | Kentucky Fund — Class A | |
| | | Six Months Ended
February 29, 2008 | | Year Ended August 31, | |
| | | (Unaudited)(1) | | 2007(1) | | 2006(1) | | 2005(1) | | 2004(1) | | 2003(1) | |
| Net asset value — Beginning of period | | $ | 8.970 | | | $ | 9.240 | | | $ | 9.320 | | | $ | 9.320 | | | $ | 9.240 | | | $ | 9.420 | | |
| Income (loss) from operations | |
| Net investment income | | $ | 0.194 | | | $ | 0.399 | | | $ | 0.400 | | | $ | 0.424 | | | $ | 0.442 | | | $ | 0.446 | | |
| Net realized and unrealized gain (loss) | | | (0.551 | ) | | | (0.277 | ) | | | (0.074 | ) | | | 0.005 | (2) | | | 0.077 | | | | (0.174 | ) | |
| Total income (loss) from operations | | $ | (0.357 | ) | | $ | 0.122 | | | $ | 0.326 | | | $ | 0.429 | | | $ | 0.519 | | | $ | 0.272 | | |
| Less distributions | |
| From net investment income | | $ | (0.193 | ) | | $ | (0.392 | ) | | $ | (0.406 | ) | | $ | (0.429 | ) | | $ | (0.439 | ) | | $ | (0.452 | ) | |
| Total distributions | | $ | (0.193 | ) | | $ | (0.392 | ) | | $ | (0.406 | ) | | $ | (0.429 | ) | | $ | (0.439 | ) | | $ | (0.452 | ) | |
| Net asset value — End of period | | $ | 8.420 | | | $ | 8.970 | | | $ | 9.240 | | | $ | 9.320 | | | $ | 9.320 | | | $ | 9.240 | | |
| Total Return(3) | | | (4.09 | )%(9) | | | 1.31 | % | | | 3.63 | % | | | 4.71 | % | | | 5.70 | % | | | 2.90 | % | |
| Ratios/Supplemental Data | |
| Net assets, end of period (000's omitted) | | $ | 47,635 | | | $ | 50,736 | | | $ | 52,188 | | | $ | 50,371 | | | $ | 47,288 | | | $ | 4,248 | | |
| Ratios (As a percentage of average daily net assets): | |
| Expenses excluding interest and fees | | | 0.73 | %(4) | | | 0.78 | %(5) | | | 0.79 | % | | | 0.77 | %(6) | | | 0.78 | %(6) | | | 0.77 | %(6) | |
| Interest and fee expense(7) | | | 0.06 | %(4) | | | 0.06 | % | | | 0.06 | % | | | 0.05 | %(6) | | | 0.02 | %(6) | | | 0.01 | %(6) | |
| Total expenses before custodian fee reduction | | | 0.79 | %(4) | | | 0.84 | %(5) | | | 0.85 | % | | | 0.82 | %(6) | | | 0.80 | %(6) | | | 0.78 | %(6) | |
| Expenses after custodian fee reduction excluding interest and fees | | | 0.72 | %(4) | | | 0.76 | %(5) | | | 0.76 | % | | | 0.75 | %(6) | | | 0.77 | %(6) | | | 0.75 | %(6) | |
| Net investment income | | | 4.30 | %(4) | | | 4.35 | % | | | 4.37 | % | | | 4.56 | % | | | 4.77 | % | | | 4.73 | % | |
| Portfolio Turnover of the Portfolio(8) | | | — | | | | — | | | | — | | | | — | | | | 3 | % | | | 10 | % | |
| Portfolio Turnover of the Fund | | | 8 | % | | | 14 | % | | | 11 | % | | | 22 | % | | | — | | | | — | | |
(1) Net investment income per share was computed using average shares outstanding.
(2) The per share amount is not in accord with the net realized and unrealized gain (loss) on investments for the period because of the timing of sales of Fund shares and the amount of the per share realized and unrealized gains and losses at such time.
(3) Returns are historical and are calculated by determining the percentage change in net asset value with all distributions reinvested.
(4) Annualized.
(5) The investment adviser was allocated a portion of the Fund's operating expenses (equal to less than 0.01% of average daily net assets for the year ended August 31, 2007). Absent this allocation, total return would be lower.
(6) Includes the Fund's share of its corresponding Portfolio's allocated expenses while the Fund was making investments directly into the Portfolio.
(7) Interest and fee expense relates to the liability for floating rate notes issued in conjunction with inverse floater securities transactions (See Note 1I).
(8) Portfolio turnover represents the rate of portfolio activity for the period while the Fund was making investments directly into the Portfolio.
(9) Not annualized.
See notes to financial statements
81
Eaton Vance Municipals Funds as of February 29, 2008
FINANCIAL STATEMENTS CONT'D
Financial Highlights
| | | Kentucky Fund — Class B | |
| | | Six Months Ended
February 29, 2008 | | Year Ended August 31, | |
| | | (Unaudited)(1) | | 2007(1) | | 2006(1) | | 2005(1) | | 2004(1) | | 2003(1) | |
| Net asset value — Beginning of period | | $ | 9.680 | | | $ | 9.970 | | | $ | 10.050 | | | $ | 10.060 | | | $ | 9.970 | | | $ | 10.160 | | |
| Income (loss) from operations | |
| Net investment income | | $ | 0.173 | | | $ | 0.356 | | | $ | 0.359 | | | $ | 0.384 | | | $ | 0.406 | | | $ | 0.408 | | |
| Net realized and unrealized gain (loss) | | | (0.593 | ) | | | (0.298 | ) | | | (0.076 | ) | | | (0.007 | ) | | | 0.081 | | | | (0.188 | ) | |
| Total income (loss) from operations | | $ | (0.420 | ) | | $ | 0.058 | | | $ | 0.283 | | | $ | 0.377 | | | $ | 0.487 | | | $ | 0.220 | | |
| Less distributions | |
| From net investment income | | $ | (0.170 | ) | | $ | (0.348 | ) | | $ | (0.363 | ) | | $ | (0.387 | ) | | $ | (0.397 | ) | | $ | (0.410 | ) | |
| Total distributions | | $ | (0.170 | ) | | $ | (0.348 | ) | | $ | (0.363 | ) | | $ | (0.387 | ) | | $ | (0.397 | ) | | $ | (0.410 | ) | |
| Net asset value — End of period | | $ | 9.090 | | | $ | 9.680 | | | $ | 9.970 | | | $ | 10.050 | | | $ | 10.060 | | | $ | 9.970 | | |
| Total Return(2) | | | (4.43 | )%(9) | | | 0.56 | % | | | 2.92 | % | | | 3.99 | %(3) | | | 4.96 | % | | | 2.15 | % | |
| Ratios/Supplemental Data | |
| Net assets, end of period (000's omitted) | | $ | 6,683 | | | $ | 8,050 | | | $ | 10,122 | | | $ | 13,305 | | | $ | 16,433 | | | $ | 63,232 | | |
| Ratios (As a percentage of average daily net assets): | |
| Expenses excluding interest and fees | | | 1.48 | %(4) | | | 1.53 | %(5) | | | 1.54 | % | | | 1.52 | %(6) | | | 1.53 | %(6) | | | 1.52 | %(6) | |
| Interest and fee expense(7) | | | 0.06 | %(4) | | | 0.06 | % | | | 0.06 | % | | | 0.05 | %(6) | | | 0.02 | %(6) | | | 0.01 | %(6) | |
| Total expenses before custodian fee reduction | | | 1.54 | %(4) | | | 1.59 | %(5) | | | 1.60 | % | | | 1.57 | %(6) | | | 1.55 | %(6) | | | 1.53 | %(6) | |
| Expenses after custodian fee reduction excluding interest and fees | | | 1.47 | %(4) | | | 1.51 | %(5) | | | 1.51 | % | | | 1.50 | %(6) | | | 1.52 | %(6) | | | 1.50 | %(6) | |
| Net investment income | | | 3.56 | %(4) | | | 3.60 | % | | | 3.63 | % | | | 3.82 | % | | | 4.00 | % | | | 4.01 | % | |
| Portfolio Turnover of the Portfolio(8) | | | — | | | | — | | | | — | | | | — | | | | 3 | % | | | 10 | % | |
| Portfolio Turnover of the Fund | | | 8 | % | | | 14 | % | | | 11 | % | | | 22 | % | | | — | | | | — | | |
(1) Net investment income per share was computed using average shares outstanding.
(2) Returns are historical and are calculated by determining the percentage change in net asset value with all distributions reinvested.
(3) Total return reflects an increase of 0.17% due to a change in the timing of the payment and reinvestment of distributions.
(4) Annualized.
(5) The investment adviser was allocated a portion of the Fund's operating expenses (equal to less than 0.01% of average daily net assets for the year ended August 31, 2007). Absent this allocation, total return would be lower.
(6) Includes the Fund's share of its corresponding Portfolio's allocated expenses while the Fund was making investments directly into the Portfolio.
(7) Interest and fee expense relates to the liability for floating rate notes issued in conjunction with inverse floater securities transactions (See Note 1I).
(8) Portfolio turnover represents the rate of portfolio activity for the period while the Fund was making investments directly into the Portfolio.
(9) Not annualized.
See notes to financial statements
82
Eaton Vance Municipals Funds as of February 29, 2008
FINANCIAL STATEMENTS CONT'D
Financial Highlights
| | | Kentucky Fund — Class C | |
| | | Six Months Ended
February 29, 2008
(Unaudited)(1) | | Year Ended
August 31, 2007(1) | | Period Ended
August 31, 2006(1)(2) | |
| Net asset value — Beginning of period | | $ | 9.680 | | | $ | 9.970 | | | $ | 9.940 | | |
| Income (loss) from operations | |
| Net investment income | | $ | 0.173 | | | $ | 0.354 | | | $ | 0.147 | | |
| Net realized and unrealized gain (loss) | | | (0.593 | ) | | | (0.296 | ) | | | 0.037 | (3) | |
| Total income (loss) from operations | | $ | (0.420 | ) | | $ | 0.058 | | | $ | 0.184 | | |
| Less distributions | |
| From net investment income | | $ | (0.170 | ) | | $ | (0.348 | ) | | $ | (0.154 | ) | |
| Total distributions | | $ | (0.170 | ) | | $ | (0.348 | ) | | $ | (0.154 | ) | |
| Net asset value — End of period | | $ | 9.090 | | | $ | 9.680 | | | $ | 9.970 | | |
| Total Return(4) | | | (4.43 | )%(9) | | | 0.56 | % | | | 1.89 | %(9) | |
| Ratios/Supplemental Data | |
| Net assets, end of period (000's omitted) | | $ | 2,211 | | | $ | 1,994 | | | $ | 297 | | |
| Ratios (As a percentage of average daily net assets): | |
| Expenses excluding interest and fees | | | 1.48 | %(5) | | | 1.53 | %(6) | | | 1.54 | %(5) | |
| Interest and fee expense(7) | | | 0.06 | %(5) | | | 0.06 | % | | | 0.06 | %(5) | |
| Total expenses before custodian fee reduction | | | 1.54 | %(5) | | | 1.59 | %(6) | | | 1.60 | %(5) | |
| Expenses after custodian fee reduction excluding interest and fees | | | 1.47 | %(5) | | | 1.51 | %(6) | | | 1.51 | %(5) | |
| Net investment income | | | 3.55 | %(5) | | | 3.59 | % | | | 3.37 | %(5) | |
| Portfolio Turnover | | | 8 | % | | | 14 | % | | | 11 | %(8) | |
(1) Net investment income per share was computed using average shares outstanding.
(2) For the period from the start of business, March 23, 2006, to August 31, 2006.
(3) The per share amount is not in accord with the net realized and unrealized gain (loss) on investments for the period because of the timing of sales of Fund shares and the amount of the per share realized and unrealized gains and losses at such time.
(4) Returns are historical and are calculated by determining the percentage change in net asset value with all distributions reinvested.
(5) Annualized.
(6) The investment adviser was allocated a portion of the Fund's operating expenses (equal to less than 0.01% of average daily net assets for the year ended August 31, 2007). Absent this allocation, total return would be lower.
(7) Interest and fee expense relates to the liability for floating rate notes issued in conjunction with inverse floater securities transactions (See Note 1I).
(8) For the Fund's fiscal year, September 1, 2005 to August 31, 2006.
(9) Not annualized.
See notes to financial statements
83
Eaton Vance Municipals Funds as of February 29, 2008
FINANCIAL STATEMENTS CONT'D
Financial Highlights
| | | Louisiana Fund — Class A | |
| | | Six Months Ended
February 29, 2008 | | Year Ended August 31, | |
| | | (Unaudited)(1) | | 2007(1) | | 2006(1) | | 2005(1) | | 2004(1) | | 2003 | |
| Net asset value — Beginning of period | | $ | 9.660 | | | $ | 9.960 | | | $ | 9.960 | | | $ | 9.840 | | | $ | 9.610 | | | $ | 9.790 | | |
| Income (loss) from operations | |
| Net investment income | | $ | 0.217 | | | $ | 0.425 | | | $ | 0.449 | | | $ | 0.460 | | | $ | 0.485 | | | $ | 0.490 | | |
| Net realized and unrealized gain (loss) | | | (0.743 | ) | | | (0.285 | ) | | | — | | | | 0.123 | | | | 0.217 | | | | (0.208 | ) | |
| Total income (loss) from operations | | $ | (0.526 | ) | | $ | 0.140 | | | $ | 0.449 | | | $ | 0.583 | | | $ | 0.702 | | | $ | 0.282 | | |
| Less distributions | |
| From net investment income | | $ | (0.214 | ) | | $ | (0.440 | ) | | $ | (0.449 | ) | | $ | (0.463 | ) | | $ | (0.472 | ) | | $ | (0.462 | ) | |
| Total distributions | | $ | (0.214 | ) | | $ | (0.440 | ) | | $ | (0.449 | ) | | $ | (0.463 | ) | | $ | (0.472 | ) | | $ | (0.462 | ) | |
| Net asset value — End of period | | $ | 8.920 | | | $ | 9.660 | | | $ | 9.960 | | | $ | 9.960 | | | $ | 9.840 | | | $ | 9.610 | | |
| Total Return(2) | | | (5.58 | )%(8) | | | 1.36 | % | | | 4.66 | % | | | 6.04 | % | | | 7.44 | % | | | 2.89 | % | |
| Ratios/Supplemental Data | |
| Net assets, end of period (000's omitted) | | $ | 36,016 | | | $ | 40,323 | | | $ | 26,972 | | | $ | 22,317 | | | $ | 17,793 | | | $ | 6,027 | | |
| Ratios (As a percentage of average daily net assets): | |
| Expenses excluding interest and fees | | | 0.63 | %(3) | | | 0.72 | %(4) | | | 0.71 | % | | | 0.76 | %(5) | | | 0.76 | %(5) | | | 0.74 | %(5) | |
| Interest and fee expense(6) | | | 0.22 | %(3) | | | 0.26 | % | | | 0.26 | % | | | 0.14 | %(5) | | | 0.08 | %(5) | | | 0.06 | %(5) | |
| Total expenses before custodian fee reduction | | | 0.85 | %(3) | | | 0.98 | %(4) | | | 0.97 | % | | | 0.90 | %(5) | | | 0.84 | %(5) | | | 0.80 | %(5) | |
| Expenses after custodian fee reduction excluding interest and fees | | | 0.61 | %(3) | | | 0.67 | %(4) | | | 0.68 | % | | | 0.75 | %(5) | | | 0.75 | %(5) | | | 0.72 | %(5) | |
| Net investment income | | | 4.48 | %(3) | | | 4.28 | % | | | 4.57 | % | | | 4.63 | % | | | 4.98 | % | | | 5.00 | % | |
| Portfolio Turnover of the Portfolio(7) | | | — | | | | — | | | | — | | | | — | | | | 9 | % | | | 21 | % | |
| Portfolio Turnover of the Fund | | | 12 | % | | | 19 | % | | | 30 | % | | | 12 | % | | | — | | | | — | | |
(1) Net investment income per share was computed using average shares outstanding.
(2) Returns are historical and are calculated by determining the percentage change in net asset value with all distributions reinvested.
(3) Annualized.
(4) The investment adviser was allocated a portion of the Fund's operating expenses (equal to 0.01% of average daily net assets for the year ended August 31, 2007). Absent this allocation, total return would be lower.
(5) Includes the Fund's share of its corresponding Portfolio's allocated expenses while the Fund was making investments directly into the Portfolio.
(6) Interest and fee expense relates to the liability for floating rate notes issued in conjunction with inverse floater securities transactions (See Note 1I).
(7) Portfolio turnover represents the rate of portfolio activity for the period while the Fund was making investments directly into the Portfolio.
(8) Not annualized.
See notes to financial statements
84
Eaton Vance Municipals Funds as of February 29, 2008
FINANCIAL STATEMENTS CONT'D
Financial Highlights
| | | Louisiana Fund — Class B | |
| | | Six Months Ended
February 29, 2008 | | Year Ended August 31, | |
| | | (Unaudited)(1) | | 2007(1) | | 2006(1) | | 2005(1) | | 2004(1) | | 2003 | |
| Net asset value — Beginning of period | | $ | 10.210 | | | $ | 10.530 | | | $ | 10.520 | | | $ | 10.400 | | | $ | 10.150 | | | $ | 10.350 | | |
| Income (loss) from operations | |
| Net investment income | | $ | 0.190 | | | $ | 0.374 | | | $ | 0.399 | | | $ | 0.411 | | | $ | 0.438 | | | $ | 0.441 | | |
| Net realized and unrealized gain (loss) | | | (0.784 | ) | | | (0.309 | ) | | | 0.006 | | | | 0.120 | | | | 0.233 | | | | (0.227 | ) | |
| Total income (loss) from operations | | $ | (0.594 | ) | | $ | 0.065 | | | $ | 0.405 | | | $ | 0.531 | | | $ | 0.671 | | | $ | 0.214 | | |
| Less distributions | |
| From net investment income | | $ | (0.186 | ) | | $ | (0.385 | ) | | $ | (0.395 | ) | | $ | (0.411 | ) | | $ | (0.421 | ) | | $ | (0.414 | ) | |
| Total distributions | | $ | (0.186 | ) | | $ | (0.385 | ) | | $ | (0.395 | ) | | $ | (0.411 | ) | | $ | (0.421 | ) | | $ | (0.414 | ) | |
| Net asset value — End of period | | $ | 9.430 | | | $ | 10.210 | | | $ | 10.530 | | | $ | 10.520 | | | $ | 10.400 | | | $ | 10.150 | | |
| Total Return(2) | | | (5.93 | )%(9) | | | 0.57 | % | | | 3.97 | % | | | 5.36 | %(3) | | | 6.72 | % | | | 2.05 | % | |
| Ratios/Supplemental Data | |
| Net assets, end of period (000's omitted) | | $ | 4,083 | | | $ | 4,487 | | | $ | 6,124 | | | $ | 8,285 | | | $ | 9,444 | | | $ | 22,312 | | |
| Ratios (As a percentage of average daily net assets): | |
| Expenses excluding interest and fees | | | 1.38 | %(4) | | | 1.47 | %(5) | | | 1.47 | % | | | 1.51 | %(6) | | | 1.51 | %(6) | | | 1.49 | %(6) | |
| Interest and fee expense(7) | | | 0.22 | %(4) | | | 0.26 | % | | | 0.26 | % | | | 0.14 | %(6) | | | 0.08 | %(6) | | | 0.06 | %(6) | |
| Total expenses before custodian fee reduction | | | 1.60 | %(4) | | | 1.73 | %(5) | | | 1.73 | % | | | 1.65 | %(6) | | | 1.59 | %(6) | | | 1.55 | %(6) | |
| Expenses after custodian fee reduction excluding interest and fees | | | 1.36 | %(4) | | | 1.42 | %(5) | | | 1.44 | % | | | 1.50 | %(6) | | | 1.50 | %(6) | | | 1.47 | %(6) | |
| Net investment income | | | 3.73 | %(4) | | | 3.56 | % | | | 3.84 | % | | | 3.91 | % | | | 4.23 | % | | | 4.25 | % | |
| Portfolio Turnover of the Portfolio(8) | | | — | | | | — | | | | — | | | | — | | | | 9 | % | | | 21 | % | |
| Portfolio Turnover of the Fund | | | 12 | % | | | 19 | % | | | 30 | % | | | 12 | % | | | — | | | | — | | |
(1) Net investment income per share was computed using average shares outstanding.
(2) Returns are historical and are calculated by determining the percentage change in net asset value with all distributions reinvested.
(3) Total return reflects an increase of 0.17% due to a change in the timing of the payment and reinvestment of distributions.
(4) Annualized.
(5) The investment adviser was allocated a portion of the Fund's operating expenses (equal to 0.01% of average daily net assets for the year ended August 31, 2007). Absent this allocation, total return would be lower.
(6) Includes the Fund's share of its corresponding Portfolio's allocated expenses while the Fund was making investments directly into the Portfolio.
(7) Interest and fee expense relates to the liability for floating rate notes issued in conjunction with inverse floater securities transactions (See Note 1I).
(8) Portfolio turnover represents the rate of portfolio activity for the period while the Fund was making investments directly into the Portfolio.
(9) Not annualized.
See notes to financial statements
85
Eaton Vance Municipals Funds as of February 29, 2008
FINANCIAL STATEMENTS CONT'D
Financial Highlights
| | | Louisiana Fund — Class C | |
| | | Period Ended
February 29, 2008
(Unaudited)(1)(2) | |
| Net asset value — Beginning of period | | $ | 10.250 | | |
| Income (loss) from operations | |
| Net investment income | | $ | 0.090 | | |
| Net realized and unrealized loss | | | (0.820 | ) | |
| Total loss from operations | | $ | (0.730 | ) | |
| Less distributions | |
| From net investment income | | $ | (0.090 | ) | |
| Total distributions | | $ | (0.090 | ) | |
| Net asset value — End of period | | $ | 9.430 | | |
| Total Return(3) | | | (6.98 | )%(7) | |
| Ratios/Supplemental Data | |
| Net assets, end of period (000's omitted) | | $ | 1 | | |
| Ratios (As a percentage of average daily net assets): | |
| Expenses excluding interest and fees | | | 1.46 | %(4) | |
| Interest and fee expense(5) | | | 0.22 | %(4) | |
| Total expenses before custodian fee reduction | | | 1.68 | %(4) | |
| Expenses after custodian fee reduction excluding interest and fees | | | 1.44 | %(4) | |
| Net investment income | | | 3.66 | %(4) | |
| Portfolio Turnover | | | 12 | %(6) | |
(1) Net investment income per share was computed using average shares outstanding.
(2) For the period from the start of business, December 4, 2007, to February 29, 2008.
(3) Returns are historical and are calculated by determining the percentage change in net asset value with all distributions reinvested.
(4) Annualized.
(5) Interest and fee expense relates to the liability for floating rate notes issued in conjunction with inverse floater securities transactions (See Note 1I).
(6) For the Fund's fiscal period, September 1, 2007 to February 29, 2008.
(7) Not annualized.
See notes to financial statements
86
Eaton Vance Municipals Funds as of February 29, 2008
FINANCIAL STATEMENTS CONT'D
Financial Highlights
| | | Maryland Fund — Class A | |
| | | Six Months Ended
February 29, 2008 | | Year Ended August 31, | |
| | | (Unaudited)(1) | | 2007(1) | | 2006(1) | | 2005(1) | | 2004(1) | | 2003(1) | |
| Net asset value — Beginning of period | | $ | 9.260 | | | $ | 9.620 | | | $ | 9.590 | | | $ | 9.490 | | | $ | 9.500 | | | $ | 9.700 | | |
| Income (loss) from operations | |
| Net investment income | | $ | 0.203 | | | $ | 0.411 | | | $ | 0.454 | | | $ | 0.442 | | | $ | 0.459 | | | $ | 0.454 | | |
| Net realized and unrealized gain (loss) | | | (0.657 | ) | | | (0.347 | ) | | | 0.005 | | | | 0.094 | | | | 0.022 | | | | (0.203 | ) | |
| Total income (loss) from operations | | $ | (0.454 | ) | | $ | 0.064 | | | $ | 0.459 | | | $ | 0.536 | | | $ | 0.481 | | | $ | 0.251 | | |
| Less distributions | |
| From net investment income | | $ | (0.206 | ) | | $ | (0.424 | ) | | $ | (0.429 | ) | | $ | (0.436 | ) | | $ | (0.449 | ) | | $ | (0.449 | ) | |
| From net realized gain | | | — | | | | — | | | | — | | | | — | | | | (0.042 | ) | | | (0.002 | ) | |
| Total distributions | | $ | (0.206 | ) | | $ | (0.424 | ) | | $ | (0.429 | ) | | $ | (0.436 | ) | | $ | (0.491 | ) | | $ | (0.451 | ) | |
| Net asset value — End of period | | $ | 8.600 | | | $ | 9.260 | | | $ | 9.620 | | | $ | 9.590 | | | $ | 9.490 | | | $ | 9.500 | | |
| Total Return(2) | | | (5.03 | )%(8) | | | 0.59 | % | | | 4.94 | % | | | 5.77 | % | | | 5.14 | % | | | 2.58 | % | |
| Ratios/Supplemental Data | |
| Net assets, end of period (000's omitted) | | $ | 73,214 | | | $ | 75,025 | | | $ | 55,380 | | | $ | 45,791 | | | $ | 45,913 | | | $ | 8,085 | | |
| Ratios (As a percentage of average daily net assets): | |
| Expenses excluding interest and fees | | | 0.76 | %(3) | | | 0.78 | %(4) | | | 0.79 | % | | | 0.80 | %(5) | | | 0.79 | %(5) | | | 0.78 | %(5) | |
| Interest and fee expense(6) | | | 0.36 | %(3) | | | 0.41 | % | | | 0.76 | % | | | 0.28 | %(5) | | | 0.03 | %(5) | | | 0.09 | %(5) | |
| Total expenses before custodian fee reduction | | | 1.12 | %(3) | | | 1.19 | %(4) | | | 1.55 | % | | | 1.08 | %(5) | | | 0.82 | %(5) | | | 0.87 | %(5) | |
| Expenses after custodian fee reduction excluding interest and fees | | | 0.72 | %(3) | | | 0.73 | %(4) | | | 0.76 | % | | | 0.79 | %(5) | | | 0.79 | %(5) | | | 0.76 | %(5) | |
| Net investment income | | | 4.38 | %(3) | | | 4.29 | % | | | 4.78 | % | | | 4.64 | % | | | 4.84 | % | | | 4.67 | % | |
| Portfolio Turnover of the Portfolio(7) | | | — | | | | — | | | | — | | | | — | | | | 12 | % | | | 28 | % | |
| Portfolio Turnover of the Fund | | | 10 | % | | | 6 | % | | | 15 | % | | | 10 | % | | | — | | | | — | | |
(1) Net investment income per share was computed using average shares outstanding.
(2) Returns are historical and are calculated by determining the percentage change in net asset value with all distributions reinvested.
(3) Annualized.
(4) The investment adviser was allocated a portion of the Fund's operating expenses (equal to less than 0.005% of average daily net assets for the year ended August 31, 2007). Absent this allocation, total return would be lower.
(5) Includes the Fund's share of its corresponding Portfolio's allocated expenses while the Fund was making investments directly into the Portfolio.
(6) Interest and fee expense relates to the liability for floating rate notes issued in conjunction with inverse floater securities transactions (See Note 1I).
(7) Portfolio turnover represents the rate of portfolio activity for the period while the Fund was making investments directly into the Portfolio.
(8) Not annualized.
See notes to financial statements
87
Eaton Vance Municipals Funds as of February 29, 2008
FINANCIAL STATEMENTS CONT'D
Financial Highlights
| | | Maryland Fund — Class B | |
| | | Six Months Ended
February 29, 2008 | | Year Ended August 31, | |
| | | (Unaudited)(1) | | 2007(1) | | 2006(1) | | 2005(1) | | 2004(1) | | 2003(1) | |
| Net asset value — Beginning of period | | $ | 10.090 | | | $ | 10.490 | | | $ | 10.460 | | | $ | 10.350 | | | $ | 10.360 | | | $ | 10.580 | | |
| Income (loss) from operations | |
| Net investment income | | $ | 0.184 | | | $ | 0.373 | | | $ | 0.419 | | | $ | 0.405 | | | $ | 0.426 | | | $ | 0.416 | | |
| Net realized and unrealized gain (loss) | | | (0.708 | ) | | | (0.388 | ) | | | 0.002 | | | | 0.103 | | | | 0.018 | | | | (0.222 | ) | |
| Total income (loss) from operations | | $ | (0.524 | ) | | $ | (0.015 | ) | | $ | 0.421 | | | $ | 0.508 | | | $ | 0.444 | | | $ | 0.194 | | |
| Less distributions | |
| From net investment income | | $ | (0.186 | ) | | $ | (0.385 | ) | | $ | (0.391 | ) | | $ | (0.398 | ) | | $ | (0.412 | ) | | $ | (0.412 | ) | |
| From net realized gain | | | — | | | | — | | | | — | | | | — | | | | (0.042 | ) | | | (0.002 | ) | |
| Total distributions | | $ | (0.186 | ) | | $ | (0.385 | ) | | $ | (0.391 | ) | | $ | (0.398 | ) | | $ | (0.454 | ) | | $ | (0.414 | ) | |
| Net asset value — End of period | | $ | 9.380 | | | $ | 10.090 | | | $ | 10.490 | | | $ | 10.460 | | | $ | 10.350 | | | $ | 10.360 | | |
| Total Return(2) | | | (5.30 | )%(9) | | | (0.22 | )% | | | 4.14 | % | | | 5.17 | %(3) | | | 4.34 | % | | | 1.80 | % | |
| Ratios/Supplemental Data | |
| Net assets, end of period (000's omitted) | | $ | 10,537 | | | $ | 12,995 | | | $ | 17,178 | | | $ | 19,783 | | | $ | 25,455 | | | $ | 70,431 | | |
| Ratios (As a percentage of average daily net assets): | |
| Expenses excluding interest and fees | | | 1.51 | %(4) | | | 1.53 | %(5) | | | 1.54 | % | | | 1.55 | %(6) | | | 1.54 | %(6) | | | 1.53 | %(6) | |
| Interest and fee expense(7) | | | 0.36 | %(4) | | | 0.41 | % | | | 0.76 | % | | | 0.28 | %(6) | | | 0.03 | %(6) | | | 0.09 | %(6) | |
| Total expenses before custodian fee reduction | | | 1.87 | %(4) | | | 1.94 | %(5) | | | 2.30 | % | | | 1.83 | %(6) | | | 1.57 | %(6) | | | 1.62 | %(6) | |
| Expenses after custodian fee reduction excluding interest and fees | | | 1.47 | %(4) | | | 1.48 | %(5) | | | 1.51 | % | | | 1.54 | %(6) | | | 1.54 | %(6) | | | 1.51 | %(6) | |
| Net investment income | | | 3.64 | %(4) | | | 3.56 | % | | | 4.05 | % | | | 3.90 | % | | | 4.05 | % | | | 3.92 | % | |
| Portfolio Turnover of the Portfolio(8) | | | — | | | | — | | | | — | | | | — | | | | 12 | % | | | 28 | % | |
| Portfolio Turnover of the Fund | | | 10 | % | | | 6 | % | | | 15 | % | | | 10 | % | | | — | | | | — | | |
(1) Net investment income per share was computed using average shares outstanding.
(2) Returns are historical and are calculated by determining the percentage change in net asset value with all distributions reinvested.
(3) Total return reflects an increase of 0.17% due to a change in the timing of the payment and reinvestment of distributions.
(4) Annualized.
(5) The investment adviser was allocated a portion of the Fund's operating expenses (equal to less than 0.005% of average daily net assets for the year ended August 31, 2007). Absent this allocation, total return would be lower.
(6) Includes the Fund's share of its corresponding Portfolio's allocated expenses while the Fund was making investments directly into the Portfolio.
(7) Interest and fee expense relates to the liability for floating rate notes issued in conjunction with inverse floater securities transactions (See Note 1I).
(8) Portfolio turnover represents the rate of portfolio activity for the period while the Fund was making investments directly into the Portfolio.
(9) Not annualized.
See notes to financial statements
88
Eaton Vance Municipals Funds as of February 29, 2008
FINANCIAL STATEMENTS CONT'D
Financial Highlights
| | | Maryland Fund — Class C | |
| | | Six Months Ended
February 29, 2008
(Unaudited)(1) | | Year Ended
August 31, 2007(1) | | Period Ended
August 31, 2006(1)(2) | |
| Net asset value — Beginning of period | | $ | 10.090 | | | $ | 10.470 | | | $ | 10.340 | | |
| Income (loss) from operations | |
| Net investment income | | $ | 0.183 | | | $ | 0.366 | | | $ | 0.115 | | |
| Net realized and unrealized gain (loss) | | | (0.707 | ) | | | (0.361 | ) | | | 0.146 | | |
| Total income (loss) from operations | | $ | (0.524 | ) | | $ | 0.005 | | | $ | 0.261 | | |
| Less distributions | |
| From net investment income | | $ | (0.186 | ) | | $ | (0.385 | ) | | $ | (0.131 | ) | |
| Total distributions | | $ | (0.186 | ) | | $ | (0.385 | ) | | $ | (0.131 | ) | |
| Net asset value — End of period | | $ | 9.380 | | | $ | 10.090 | | | $ | 10.470 | | |
| Total Return(3) | | | (5.30 | )%(8) | | | (0.03 | )% | | | 2.54 | %(8) | |
| Ratios/Supplemental Data | |
| Net assets, end of period (000's omitted) | | $ | 8,473 | | | $ | 6,878 | | | $ | 342 | | |
| Ratios (As a percentage of average daily net assets): | |
| Expenses excluding interest and fees | | | 1.52 | %(4) | | | 1.53 | %(5) | | | 1.54 | %(4) | |
| Interest and fee expense(6) | | | 0.36 | %(4) | | | 0.41 | % | | | 0.76 | %(4) | |
| Total expenses before custodian fee reduction | | | 1.88 | %(4) | | | 1.94 | %(5) | | | 2.30 | %(4) | |
| Expenses after custodian fee reduction excluding interest and fees | | | 1.48 | %(4) | | | 1.48 | %(5) | | | 1.51 | %(4) | |
| Net investment income | | | 3.61 | %(4) | | | 3.53 | % | | | 3.31 | %(4) | |
| Portfolio Turnover | | | 10 | % | | | 6 | % | | | 15 | %(7) | |
(1) Net investment income per share was computed using average shares outstanding.
(2) For the period from the start of business, May 2, 2006, to August 31, 2006.
(3) Returns are historical and are calculated by determining the percentage change in net asset value with all distributions reinvested.
(4) Annualized.
(5) The investment adviser was allocated a portion of the Fund's operating expenses (equal to less than 0.005% of average daily net assets for the year ended August 31, 2007). Absent this allocation, total return would be lower.
(6) Interest and fee expense relates to the liability for floating rate notes issued in conjunction with inverse floater securities transactions (See Note 1I).
(7) For the Fund's fiscal year, September 1, 2005 to August 31, 2006.
(8) Not annualized.
See notes to financial statements
89
Eaton Vance Municipals Funds as of February 29, 2008
FINANCIAL STATEMENTS CONT'D
Financial Highlights
| | | Missouri Fund — Class A | |
| | | Six Months Ended
February 29, 2008 | | Year Ended August 31, | |
| | | (Unaudited)(1) | | 2007(1) | | 2006(1) | | 2005(1) | | 2004(1) | | 2003(1) | |
| Net asset value — Beginning of period | | $ | 9.750 | | | $ | 10.120 | | | $ | 10.180 | | | $ | 10.080 | | | $ | 9.890 | | | $ | 10.090 | | |
| Income (loss) from operations | |
| Net investment income | | $ | 0.204 | | | $ | 0.415 | | | $ | 0.441 | | | $ | 0.462 | | | $ | 0.497 | | | $ | 0.510 | | |
| Net realized and unrealized gain (loss) | | | (0.724 | ) | | | (0.368 | ) | | | (0.058 | ) | | | 0.116 | | | | 0.232 | | | | (0.192 | ) | |
| Total income (loss) from operations | | $ | (0.520 | ) | | $ | 0.047 | | | $ | 0.383 | | | $ | 0.578 | | | $ | 0.729 | | | $ | 0.318 | | |
| Less distributions | |
| From net investment income | | $ | (0.200 | ) | | $ | (0.417 | ) | | $ | (0.443 | ) | | $ | (0.478 | ) | | $ | (0.539 | ) | | $ | (0.518 | ) | |
| Total distributions | | $ | (0.200 | ) | | $ | (0.417 | ) | | $ | (0.443 | ) | | $ | (0.478 | ) | | $ | (0.539 | ) | | $ | (0.518 | ) | |
| Net asset value — End of period | | $ | 9.030 | | | $ | 9.750 | | | $ | 10.120 | | | $ | 10.180 | | | $ | 10.080 | | | $ | 9.890 | | |
| Total Return(2) | | | (5.46 | )%(8) | | | 0.41 | % | | | 3.91 | % | | | 5.87 | % | | | 7.53 | % | | | 3.18 | % | |
| Ratios/Supplemental Data | |
| Net assets, end of period (000's omitted) | | $ | 89,290 | | | $ | 90,059 | | | $ | 64,947 | | | $ | 55,806 | | | $ | 44,385 | | | $ | 7,311 | | |
| Ratios (As a percentage of average daily net assets): | |
| Expenses excluding interest and fees | | | 0.75 | %(3) | | | 0.75 | %(4) | | | 0.75 | % | | | 0.79 | %(5) | | | 0.81 | %(5) | | | 0.79 | %(5) | |
| Interest and fee expense(6) | | | 0.12 | %(3) | | | 0.17 | % | | | 0.27 | % | | | 0.21 | %(5) | | | 0.13 | %(5) | | | 0.13 | %(5) | |
| Total expenses before custodian fee reduction | | | 0.87 | %(3) | | | 0.92 | %(4) | | | 1.02 | % | | | 1.00 | %(5) | | | 0.94 | %(5) | | | 0.92 | %(5) | |
| Expenses after custodian fee reduction excluding interest and fees | | | 0.73 | %(3) | | | 0.71 | %(4) | | | 0.71 | % | | | 0.76 | %(5) | | | 0.80 | %(5) | | | 0.77 | %(5) | |
| Net investment income | | | 4.16 | %(3) | | | 4.12 | % | | | 4.41 | % | | | 4.58 | % | | | 4.99 | % | | | 5.06 | % | |
| Portfolio Turnover of the Portfolio(7) | | | — | | | | — | | | | — | | | | — | | | | 10 | % | | | 20 | % | |
| Portfolio Turnover of the Fund | | | 7 | % | | | 20 | % | | | 27 | % | | | 6 | % | | | — | | | | — | | |
(1) Net investment income per share was computed using average shares outstanding.
(2) Returns are historical and are calculated by determining the percentage change in net asset value with all distributions reinvested.
(3) Annualized.
(4) The investment adviser was allocated a portion of the Fund's operating expenses (equal to less than 0.01% of average daily net assets for the year ended August 31, 2007). Absent this allocation, total return would be lower.
(5) Includes the Fund's share of its corresponding Portfolio's allocated expenses while the Fund was making investments directly into the Portfolio.
(6) Interest and fee expense relates to the liability for floating rate notes issued in conjunction with inverse floater securities transactions (See Note 1I).
(7) Portfolio turnover represents the rate of portfolio activity for the period while the Fund was making investments directly into the Portfolio.
(8) Not annualized.
See notes to financial statements
90
Eaton Vance Municipals Funds as of February 29, 2008
FINANCIAL STATEMENTS CONT'D
Financial Highlights
| | | Missouri Fund — Class B | |
| | | Six Months Ended
February 29, 2008 | | Year Ended August 31, | |
| | | (Unaudited)(1) | | 2007(1) | | 2006(1) | | 2005(1) | | 2004(1) | | 2003(1) | |
| Net asset value — Beginning of period | | $ | 10.770 | | | $ | 11.180 | | | $ | 11.250 | | | $ | 11.140 | | | $ | 10.930 | | | $ | 11.140 | | |
| Income (loss) from operations | |
| Net investment income | | $ | 0.185 | | | $ | 0.377 | | | $ | 0.407 | | | $ | 0.429 | | | $ | 0.474 | | | $ | 0.482 | | |
| Net realized and unrealized gain (loss) | | | (0.795 | ) | | | (0.409 | ) | | | (0.071 | ) | | | 0.125 | | | | 0.244 | | | | (0.201 | ) | |
| Total income (loss) from operations | | $ | (0.610 | ) | | $ | (0.032 | ) | | $ | 0.336 | | | $ | 0.554 | | | $ | 0.718 | | | $ | 0.281 | | |
| Less distributions | |
| From net investment income | | $ | (0.180 | ) | | $ | (0.378 | ) | | $ | (0.406 | ) | | $ | (0.444 | ) | | $ | (0.508 | ) | | $ | (0.491 | ) | |
| Total distributions | | $ | (0.180 | ) | | $ | (0.378 | ) | | $ | (0.406 | ) | | $ | (0.444 | ) | | $ | (0.508 | ) | | $ | (0.491 | ) | |
| Net asset value — End of period | | $ | 9.980 | | | $ | 10.770 | | | $ | 11.180 | | | $ | 11.250 | | | $ | 11.140 | | | $ | 10.930 | | |
| Total Return(2) | | | (5.77 | )%(9) | | | (0.35 | )% | | | 3.10 | % | | | 5.26 | %(3) | | | 6.71 | % | | | 2.52 | % | |
| Ratios/Supplemental Data | |
| Net assets, end of period (000's omitted) | | $ | 8,280 | | | $ | 9,626 | | | $ | 11,169 | | | $ | 13,142 | | | $ | 12,903 | | | $ | 49,870 | | |
| Ratios (As a percentage of average daily net assets): | |
| Expenses excluding interest and fees | | | 1.50 | %(4) | | | 1.50 | %(5) | | | 1.50 | % | | | 1.54 | %(6) | | | 1.56 | %(6) | | | 1.54 | %(6) | |
| Interest and fee expense(7) | | | 0.12 | %(4) | | | 0.17 | % | | | 0.27 | % | | | 0.21 | %(6) | | | 0.13 | %(6) | | | 0.13 | %(6) | |
| Total expenses before custodian fee reduction | | | 1.62 | %(4) | | | 1.67 | %(5) | | | 1.77 | % | | | 1.75 | %(6) | | | 1.69 | %(6) | | | 1.67 | %(6) | |
| Expenses after custodian fee reduction excluding interest and fees | | | 1.48 | %(4) | | | 1.46 | %(5) | | | 1.46 | % | | | 1.51 | %(6) | | | 1.55 | %(6) | | | 1.52 | %(6) | |
| Net investment income | | | 3.42 | %(4) | | | 3.38 | % | | | 3.68 | % | | | 3.85 | % | | | 4.26 | % | | | 4.32 | % | |
| Portfolio Turnover of the Portfolio(8) | | | — | | | | — | | | | — | | | | — | | | | 10 | % | | | 20 | % | |
| Portfolio Turnover of the Fund | | | 7 | % | | | 20 | % | | | 27 | % | | | 6 | % | | | — | | | | — | | |
(1) Net investment income per share was computed using average shares outstanding.
(2) Returns are historical and are calculated by determining the percentage change in net asset value with all distributions reinvested.
(3) Total return reflects an increase of 0.16% due to a change in the timing of the payment and reinvestment of distributions.
(4) Annualized.
(5) The investment adviser was allocated a portion of the Fund's operating expenses (equal to less than 0.01% of average daily net assets for the year ended August 31, 2007). Absent this allocation, total return would be lower.
(6) Includes the Fund's share of its corresponding Portfolio's allocated expenses while the Fund was making investments directly into the Portfolio.
(7) Interest and fee expense relates to the liability for floating rate notes issued in conjunction with inverse floater securities transactions (See Note 1I).
(8) Portfolio turnover represents the rate of portfolio activity for the period while the Fund was making investments directly into the Portfolio.
(9) Not annualized.
See notes to financial statements
91
Eaton Vance Municipals Funds as of February 29, 2008
FINANCIAL STATEMENTS CONT'D
Financial Highlights
| | | Missouri Fund — Class C | |
| | | Six Months Ended
February 29, 2008
(Unaudited)(1) | | Year Ended
August 31, 2007(1) | | Period Ended
August 31, 2006(1)(2) | |
| Net asset value — Beginning of period | | $ | 10.770 | | | $ | 11.170 | | | $ | 11.140 | | |
| Income (loss) from operations | |
| Net investment income | | $ | 0.182 | | | $ | 0.371 | | | $ | 0.189 | | |
| Net realized and unrealized gain (loss) | | | (0.802 | ) | | | (0.393 | ) | | | 0.052 | (3) | |
| Total income (loss) from operations | | $ | (0.620 | ) | | $ | (0.022 | ) | | $ | 0.241 | | |
| Less distributions | |
| From net investment income | | $ | (0.180 | ) | | $ | (0.378 | ) | | $ | (0.211 | ) | |
| Total distributions | | $ | (0.180 | ) | | $ | (0.378 | ) | | $ | (0.211 | ) | |
| Net asset value — End of period | | $ | 9.970 | | | $ | 10.770 | | | $ | 11.170 | | |
| Total Return(4) | | | (5.86 | )%(9) | | | (0.26 | )% | | | 2.20 | %(9) | |
| Ratios/Supplemental Data | |
| Net assets, end of period (000's omitted) | | $ | 4,455 | | | $ | 4,491 | | | $ | 1,117 | | |
| Ratios (As a percentage of average daily net assets): | |
| Expenses excluding interest and fees | | | 1.51 | %(5) | | | 1.50 | %(6) | | | 1.50 | %(5) | |
| Interest and fee expense(7) | | | 0.12 | %(5) | | | 0.17 | % | | | 0.27 | %(5) | |
| Total expenses before custodian fee reduction | | | 1.63 | %(5) | | | 1.67 | %(6) | | | 1.77 | %(5) | |
| Expenses after custodian fee reduction excluding interest and fees | | | 1.49 | %(5) | | | 1.46 | %(6) | | | 1.46 | %(5) | |
| Net investment income | | | 3.36 | %(5) | | | 3.35 | % | | | 3.17 | %(5) | |
| Portfolio Turnover | | | 7 | % | | | 20 | % | | | 27 | %(8) | |
(1) Net investment income per share was computed using average shares outstanding.
(2) For the period from the start of business, February 16, 2006, to August 31, 2006.
(3) The per share data is not in accord with the net realized and unrealized gain (loss) on investments for the period because of the timing of sales of Fund shares and the amount of the per share realized and unrealized gains and losses at such time.
(4) Returns are historical and are calculated by determining the percentage change in net asset value with all distributions reinvested.
(5) Annualized.
(6) The investment adviser was allocated a portion of the Fund's operating expenses (equal to less than 0.01% of average daily net assets for the year ended August 31, 2007). Absent this allocation, total return would be lower.
(7) Interest and fee expense relates to the liability for floating rate notes issued in conjunction with inverse floater securities transactions (See Note 1I).
(8) For the Fund's fiscal year, September 1, 2005 to August 31, 2006.
(9) Not annualized.
See notes to financial statements
92
Eaton Vance Municipals Funds as of February 29, 2008
FINANCIAL STATEMENTS CONT'D
Financial Highlights
| | | North Carolina Fund — Class A | |
| | | Six Months Ended
February 29, 2008 | | Year Ended August 31, | |
| | | (Unaudited)(1) | | 2007(1) | | 2006(1) | | 2005(1) | | 2004(1) | | 2003(1) | |
| Net asset value — Beginning of period | | $ | 9.160 | | | $ | 9.370 | | | $ | 9.340 | | | $ | 9.390 | | | $ | 9.320 | | | $ | 9.600 | | |
| Income (loss) from operations | |
| Net investment income | | $ | 0.197 | | | $ | 0.404 | | | $ | 0.410 | | | $ | 0.419 | | | $ | 0.436 | | | $ | 0.447 | | |
| Net realized and unrealized gain (loss) | | | (0.610 | ) | | | (0.212 | ) | | | 0.025 | | | | (0.052 | ) | | | 0.071 | | | | (0.275 | ) | |
| Total income (loss) from operations | | $ | (0.413 | ) | | $ | 0.192 | | | $ | 0.435 | | | $ | 0.367 | | | $ | 0.507 | | | $ | 0.172 | | |
| Less distributions | |
| From net investment income | | $ | (0.197 | ) | | $ | (0.402 | ) | | $ | (0.405 | ) | | $ | (0.417 | ) | | $ | (0.437 | ) | | $ | (0.452 | ) | |
| Total distributions | | $ | (0.197 | ) | | $ | (0.402 | ) | | $ | (0.405 | ) | | $ | (0.417 | ) | | $ | (0.437 | ) | | $ | (0.452 | ) | |
| Net asset value — End of period | | $ | 8.550 | | | $ | 9.160 | | | $ | 9.370 | | | $ | 9.340 | | | $ | 9.390 | | | $ | 9.320 | | |
| Total Return(2) | | | (4.62 | )%(8) | | | 2.04 | % | | | 4.80 | % | | | 4.00 | % | | | 5.52 | % | | | 1.80 | % | |
| Ratios/Supplemental Data | |
| Net assets, end of period (000's omitted) | | $ | 80,654 | | | $ | 79,909 | | | $ | 67,480 | | | $ | 57,823 | | | $ | 61,704 | | | $ | 9,351 | | |
| Ratios (As a percentage of average daily net assets): | |
| Expenses excluding interest and fees | | | 0.77 | %(3) | | | 0.77 | %(4) | | | 0.77 | % | | | 0.79 | %(5) | | | 0.79 | %(5) | | | 0.79 | %(5) | |
| Interest and fee expense(6) | | | 0.42 | %(3) | | | 0.58 | % | | | 0.38 | % | | | 0.16 | %(5) | | | 0.19 | %(5) | | | 0.03 | %(5) | |
| Total expenses before custodian fee reduction | | | 1.19 | %(3) | | | 1.35 | %(4) | | | 1.15 | % | | | 0.95 | %(5) | | | 0.98 | %(5) | | | 0.82 | %(5) | |
| Expenses after custodian fee reduction excluding interest and fees | | | 0.73 | %(3) | | | 0.74 | %(4) | | | 0.75 | % | | | 0.79 | %(5) | | | 0.79 | %(5) | | | 0.77 | %(5) | |
| Net investment income | | | 4.30 | %(3) | | | 4.32 | % | | | 4.43 | % | | | 4.48 | % | | | 4.65 | % | | | 4.69 | % | |
| Portfolio Turnover of the Portfolio(7) | | | — | | | | — | | | | — | | | | — | | | | 19 | % | | | 21 | % | |
| Portfolio Turnover of the Fund | | | 9 | % | | | 9 | % | | | 18 | % | | | 8 | % | | | — | | | | — | | |
(1) Net investment income per share was computed using average shares outstanding.
(2) Returns are historical and are calculated by determining the percentage change in net asset value with all distributions reinvested.
(3) Annualized.
(4) The investment adviser was allocated a portion of the Fund's operating expenses (equal to less than 0.01% of average daily net assets for the year ended August 31, 2007). Absent this allocation, total return would be lower.
(5) Includes the Fund's share of its corresponding Portfolio's allocated expenses while the Fund was making investments directly into the Portfolio.
(6) Interest and fee expense relates to the liability for floating rate notes issued in conjunction with inverse floater securities transactions (See Note 1I).
(7) Portfolio turnover represents the rate of portfolio activity for the period while the Fund was making investments directly into the Portfolio.
(8) Not annualized.
See notes to financial statements
93
Eaton Vance Municipals Funds as of February 29, 2008
FINANCIAL STATEMENTS CONT'D
Financial Highlights
| | | North Carolina Fund — Class B | |
| | | Six Months Ended
February 29, 2008 | | Year Ended August 31, | |
| | | (Unaudited)(1) | | 2007(1) | | 2006(1) | | 2005(1) | | 2004(1) | | 2003(1) | |
| Net asset value — Beginning of period | | $ | 9.850 | | | $ | 10.080 | | | $ | 10.040 | | | $ | 10.100 | | | $ | 10.030 | | | $ | 10.310 | | |
| Income (loss) from operations | |
| Net investment income | | $ | 0.176 | | | $ | 0.360 | | | $ | 0.368 | | | $ | 0.375 | | | $ | 0.402 | | | $ | 0.405 | | |
| Net realized and unrealized gain (loss) | | | (0.662 | ) | | | (0.233 | ) | | | 0.032 | | | | (0.061 | ) | | | 0.062 | | | | (0.277 | ) | |
| Total income (loss) from operations | | $ | (0.486 | ) | | $ | 0.127 | | | $ | 0.400 | | | $ | 0.314 | | | $ | 0.464 | | | $ | 0.128 | | |
| Less distributions | |
| From net investment income | | $ | (0.174 | ) | | $ | (0.357 | ) | | $ | (0.360 | ) | | $ | (0.374 | ) | | $ | (0.394 | ) | | $ | (0.408 | ) | |
| Total distributions | | $ | (0.174 | ) | | $ | (0.357 | ) | | $ | (0.360 | ) | | $ | (0.374 | ) | | $ | (0.394 | ) | | $ | (0.408 | ) | |
| Net asset value — End of period | | $ | 9.190 | | | $ | 9.850 | | | $ | 10.080 | | | $ | 10.040 | | | $ | 10.100 | | | $ | 10.030 | | |
| Total Return(2) | | | (5.03 | )%(9) | | | 1.23 | % | | | 4.09 | % | | | 3.32 | %(3) | | | 4.69 | % | | | 1.23 | % | |
| Ratios/Supplemental Data | |
| Net assets, end of period (000's omitted) | | $ | 6,668 | | | $ | 8,683 | | | $ | 12,145 | | | $ | 15,344 | | | $ | 18,098 | | | $ | 79,932 | | |
| Ratios (As a percentage of average daily net assets): | |
| Expenses excluding interest and fees | | | 1.52 | %(4) | | | 1.52 | %(5) | | | 1.52 | % | | | 1.54 | %(6) | | | 1.54 | %(6) | | | 1.54 | %(6) | |
| Interest and fee expense(7) | | | 0.42 | %(4) | | | 0.58 | % | | | 0.38 | % | | | 0.16 | %(6) | | | 0.19 | %(6) | | | 0.03 | %(6) | |
| Total expenses before custodian fee reduction | | | 1.94 | %(4) | | | 2.10 | %(5) | | | 1.90 | % | | | 1.70 | %(6) | | | 1.73 | %(6) | | | 1.57 | %(6) | |
| Expenses after custodian fee reduction excluding interest and fees | | | 1.48 | %(4) | | | 1.49 | %(5) | | | 1.50 | % | | | 1.54 | %(6) | | | 1.54 | %(6) | | | 1.52 | %(6) | |
| Net investment income | | | 3.57 | %(4) | | | 3.57 | % | | | 3.69 | % | | | 3.73 | % | | | 3.93 | % | | | 3.96 | % | |
| Portfolio Turnover of the Portfolio(8) | | | — | | | | — | | | | — | | | | — | | | | 19 | % | | | 21 | % | |
| Portfolio Turnover of the Fund | | | 9 | % | | | 9 | % | | | 18 | % | | | 8 | % | | | — | | | | — | | |
(1) Net investment income per share was computed using average shares outstanding.
(2) Returns are historical and are calculated by determining the percentage change in net asset value with all distributions reinvested.
(3) Total return reflects an increase of 0.16% due to a change in the timing of the payment and reinvestment of distributions.
(4) Annualized.
(5) The investment adviser was allocated a portion of the Fund's operating expenses (equal to less than 0.01% of average daily net assets for the year ended August 31, 2007). Absent this allocation, total return would be lower.
(6) Includes the Fund's share of its corresponding Portfolio's allocated expenses while the Fund was making investments directly into the Portfolio.
(7) Interest and fee expense relates to the liability for floating rate notes issued in conjunction with inverse floater securities transactions (See Note 1I).
(8) Portfolio turnover represents the rate of portfolio activity for the period while the Fund was making investments directly into the Portfolio.
(9) Not annualized.
See notes to financial statements
94
Eaton Vance Municipals Funds as of February 29, 2008
FINANCIAL STATEMENTS CONT'D
Financial Highlights
| | | North Carolina Fund — Class C | |
| | | Six Months Ended
February 29, 2008
(Unaudited)(1) | | Year Ended
August 31, 2007(1) | | Period Ended
August 31, 2006(1)(2) | |
| Net asset value — Beginning of period | | $ | 9.850 | | | $ | 10.070 | | | $ | 9.910 | | |
| Income (loss) from operations | |
| Net investment income | | $ | 0.174 | | | $ | 0.357 | | | $ | 0.097 | | |
| Net realized and unrealized gain (loss) | | | (0.660 | ) | | | (0.220 | ) | | | 0.183 | (3) | |
| Total income (loss) from operations | | $ | (0.486 | ) | | $ | 0.137 | | | $ | 0.280 | | |
| Less distributions | |
| From net investment income | | $ | (0.174 | ) | | $ | (0.357 | ) | | $ | (0.120 | ) | |
| Total distributions | | $ | (0.174 | ) | | $ | (0.357 | ) | | $ | (0.120 | ) | |
| Net asset value — End of period | | $ | 9.190 | | | $ | 9.850 | | | $ | 10.070 | | |
| Total Return(4) | | | (5.03 | )%(9) | | | 1.34 | % | | | 2.85 | %(9) | |
| Ratios/Supplemental Data | |
| Net assets, end of period (000's omitted) | | $ | 6,532 | | | $ | 4,880 | | | $ | 527 | | |
| Ratios (As a percentage of average daily net assets): | |
| Expenses excluding interest and fees | | | 1.51 | %(5) | | | 1.51 | %(6) | | | 1.52 | %(5) | |
| Interest and fee expense(7) | | | 0.42 | %(5) | | | 0.58 | % | | | 0.38 | %(5) | |
| Total expenses before custodian fee reduction | | | 1.93 | %(5) | | | 2.09 | %(6) | | | 1.90 | %(5) | |
| Expenses after custodian fee reduction excluding interest and fees | | | 1.47 | %(5) | | | 1.48 | %(6) | | | 1.50 | %(5) | |
| Net investment income | | | 3.53 | %(5) | | | 3.56 | % | | | 2.91 | %(5) | |
| Portfolio Turnover | | | 9 | % | | | 9 | % | | | 18 | %(8) | |
(1) Net investment income per share was computed using average shares outstanding.
(2) For the period from the start of business, May 2, 2006, to August 31, 2006.
(3) The per share amount is not in accord with the net realized and unrealized gain (loss) on investments for the period because of the timing of sales of Fund shares and the amount of the per share realized and unrealized gains and losses at such time.
(4) Returns are historical and are calculated by determining the percentage change in net asset value with all distributions reinvested.
(5) Annualized.
(6) The investment adviser was allocated a portion of the Fund's operating expenses (equal to less than 0.01% of average daily net assets for the year ended August 31, 2007). Absent this allocation, total return would be lower.
(7) Interest and fee expense relates to the liability for floating rate notes issued in conjunction with inverse floater securities transactions (See Note 1I).
(8) For the Fund's fiscal year, September 1, 2005 to August 31, 2006.
(9) Not annualized.
See notes to financial statements
95
Eaton Vance Municipals Funds as of February 29, 2008
FINANCIAL STATEMENTS CONT'D
Financial Highlights
| | | Oregon Fund — Class A | |
| | | Six Months Ended
February 29, 2008 | | Year Ended August 31, | |
| | | (Unaudited)(1) | | 2007(1) | | 2006(1) | | 2005(1) | | 2004(1) | | 2003(1) | |
| Net asset value — Beginning of period | | $ | 9.260 | | | $ | 9.550 | | | $ | 9.460 | | | $ | 9.480 | | | $ | 9.420 | | | $ | 9.690 | | |
| Income (loss) from operations | |
| Net investment income | | $ | 0.202 | | | $ | 0.411 | | | $ | 0.443 | | | $ | 0.470 | | | $ | 0.497 | | | $ | 0.496 | | |
| Net realized and unrealized gain (loss) | | | (0.836 | ) | | | (0.278 | ) | | | 0.089 | | | | (0.015 | ) | | | 0.062 | | | | (0.278 | ) | |
| Total income (loss) from operations | | $ | (0.634 | ) | | $ | 0.133 | | | $ | 0.532 | | | $ | 0.455 | | | $ | 0.559 | | | $ | 0.218 | | |
| Less distributions | |
| From net investment income | | $ | (0.206 | ) | | $ | (0.423 | ) | | $ | (0.442 | ) | | $ | (0.475 | ) | | $ | (0.499 | ) | | $ | (0.488 | ) | |
| Total distributions | | $ | (0.206 | ) | | $ | (0.423 | ) | | $ | (0.442 | ) | | $ | (0.475 | ) | | $ | (0.499 | ) | | $ | (0.488 | ) | |
| Net asset value — End of period | | $ | 8.420 | | | $ | 9.260 | | | $ | 9.550 | | | $ | 9.460 | | | $ | 9.480 | | | $ | 9.420 | | |
| Total Return(2) | | | (7.01 | )%(8) | | | 1.34 | % | | | 5.78 | % | | | 4.91 | % | | | 5.98 | % | | | 2.30 | % | |
| Ratios/Supplemental Data | |
| Net assets, end of period (000's omitted) | | $ | 110,602 | | | $ | 110,060 | | | $ | 73,764 | | | $ | 66,240 | | | $ | 55,604 | | | $ | 9,778 | | |
| Ratios (As a percentage of average daily net assets): | |
| Expenses excluding interest and fees | | | 0.75 | %(3) | | | 0.78 | %(4) | | | 0.77 | % | | | 0.80 | %(5) | | | 0.81 | %(5) | | | 0.80 | %(5) | |
| Interest and fee expense(6) | | | 0.26 | %(3) | | | 0.47 | % | | | 0.46 | % | | | 0.26 | %(5) | | | 0.13 | %(5) | | | 0.10 | %(5) | |
| Total expenses before custodian fee reduction | | | 1.01 | %(3) | | | 1.25 | %(4) | | | 1.23 | % | | | 1.06 | %(5) | | | 0.94 | %(5) | | | 0.90 | %(5) | |
| Expenses after custodian fee reduction excluding interest and fees | | | 0.72 | %(3) | | | 0.75 | %(4) | | | 0.75 | % | | | 0.79 | %(5) | | | 0.80 | %(5) | | | 0.78 | %(5) | |
| Net investment income | | | 4.38 | %(3) | | | 4.31 | % | | | 4.69 | % | | | 4.96 | % | | | 5.19 | % | | | 5.19 | % | |
| Portfolio Turnover of the Portfolio(7) | | | — | | | | — | | | | — | | | | — | | | | 6 | % | | | 16 | % | |
| Portfolio Turnover of the Fund | | | 10 | % | | | 42 | % | | | 15 | % | | | 27 | % | | | — | | | | — | | |
(1) Net investment income per share was computed using average shares outstanding.
(2) Returns are historical and are calculated by determining the percentage change in net asset value with all distributions reinvested.
(3) Annualized.
(4) The investment adviser was allocated a portion of the Fund's operating expenses (equal to less than 0.01% of average daily net assets for the year ended August 31, 2007). Absent this allocation, total return would be lower.
(5) Includes the Fund's share of its corresponding Portfolio's allocated expenses while the Fund was making investments directly into the Portfolio.
(6) Interest and fee expense relates to the liability for floating rate notes issued in conjunction with inverse floater securities transactions (See Note 1I).
(7) Portfolio turnover represents the rate of portfolio activity for the period while the Fund was making investments directly into the Portfolio.
(8) Not annualized.
See notes to financial statements
96
Eaton Vance Municipals Funds as of February 29, 2008
FINANCIAL STATEMENTS CONT'D
Financial Highlights
| | | Oregon Fund — Class B | |
| | | Six Months Ended
February 29, 2008 | | Year Ended August 31, | |
| | | (Unaudited)(1) | | 2007(1) | | 2006(1) | | 2005(1) | | 2004(1) | | 2003(1) | |
| Net asset value — Beginning of period | | $ | 10.120 | | | $ | 10.440 | | | $ | 10.340 | | | $ | 10.370 | | | $ | 10.300 | | | $ | 10.600 | | |
| Income (loss) from operations | |
| Net investment income | | $ | 0.184 | | | $ | 0.376 | | | $ | 0.408 | | | $ | 0.438 | | | $ | 0.470 | | | $ | 0.466 | | |
| Net realized and unrealized gain (loss) | | | (0.918 | ) | | | (0.312 | ) | | | 0.097 | | | | (0.026 | ) | | | 0.068 | | | | (0.309 | ) | |
| Total income (loss) from operations | | $ | (0.734 | ) | | $ | 0.064 | | | $ | 0.505 | | | $ | 0.412 | | | $ | 0.538 | | | $ | 0.157 | | |
| Less distributions | |
| From net investment income | | $ | (0.186 | ) | | $ | (0.384 | ) | | $ | (0.405 | ) | | $ | (0.442 | ) | | $ | (0.468 | ) | | $ | (0.457 | ) | |
| Total distributions | | $ | (0.186 | ) | | $ | (0.384 | ) | | $ | (0.405 | ) | | $ | (0.442 | ) | | $ | (0.468 | ) | | $ | (0.457 | ) | |
| Net asset value — End of period | | $ | 9.200 | | | $ | 10.120 | | | $ | 10.440 | | | $ | 10.340 | | | $ | 10.370 | | | $ | 10.300 | | |
| Total Return(2) | | | (7.38 | )%(9) | | | 0.56 | % | | | 5.00 | % | | | 4.24 | %(3) | | | 5.26 | % | | | 1.49 | % | |
| Ratios/Supplemental Data | |
| Net assets, end of period (000's omitted) | | $ | 14,494 | | | $ | 17,077 | | | $ | 21,015 | | | $ | 22,363 | | | $ | 24,787 | | | $ | 72,634 | | |
| Ratios (As a percentage of average daily net assets): | |
| Expenses excluding interest and fees | | | 1.50 | %(4) | | | 1.53 | %(5) | | | 1.52 | % | | | 1.55 | %(6) | | | 1.56 | %(6) | | | 1.55 | %(6) | |
| Interest and fee expense(7) | | | 0.26 | %(4) | | | 0.47 | % | | | 0.46 | % | | | 0.26 | %(6) | | | 0.13 | %(6) | | | 0.10 | %(6) | |
| Total expenses before custodian fee reduction | | | 1.76 | %(4) | | | 2.00 | %(5) | | | 1.98 | % | | | 1.81 | %(6) | | | 1.69 | %(6) | | | 1.65 | %(6) | |
| Expenses after custodian fee reduction excluding interest and fees | | | 1.47 | %(4) | | | 1.50 | %(5) | | | 1.50 | % | | | 1.54 | %(6) | | | 1.55 | %(6) | | | 1.53 | %(6) | |
| Net investment income | | | 3.63 | %(4) | | | 3.60 | % | | | 3.96 | % | | | 4.24 | % | | | 4.45 | % | | | 4.45 | % | |
| Portfolio Turnover of the Portfolio(8) | | | — | | | | — | | | | — | | | | — | | | | 6 | % | | | 16 | % | |
| Portfolio Turnover of the Fund | | | 10 | % | | | 42 | % | | | 15 | % | | | 27 | % | | | — | | | | — | | |
(1) Net investment income per share was computed using average shares outstanding.
(2) Returns are historical and are calculated by determining the percentage change in net asset value with all distributions reinvested.
(3) Total return reflects an increase of 0.18% due to a change in the timing of the payment and reinvestment of distributions.
(4) Annualized.
(5) The investment adviser was allocated a portion of the Fund's operating expenses (equal to less than 0.01% of average daily net assets for the year ended August 31, 2007). Absent this allocation, total return would be lower.
(6) Includes the Fund's share of its corresponding Portfolio's allocated expenses while the Fund was making investments directly into the Portfolio.
(7) Interest and fee expense relates to the liability for floating rate notes issued in conjunction with inverse floater securities transactions (See Note 1I).
(8) Portfolio turnover represents the rate of portfolio activity for the period while the Fund was making investments directly into the Portfolio.
(9) Not annualized.
See notes to financial statements
97
Eaton Vance Municipals Funds as of February 29, 2008
FINANCIAL STATEMENTS CONT'D
Financial Highlights
| | | Oregon Fund — Class C | |
| | | Six Months Ended
February 29, 2008
(Unaudited)(1) | | Year Ended
August 31, 2007(1) | | Period Ended
August 31, 2006(1)(2) | |
| Net asset value — Beginning of period | | $ | 10.130 | | | $ | 10.440 | | | $ | 10.400 | | |
| Income (loss) from operations | |
| Net investment income | | $ | 0.182 | | | $ | 0.368 | | | $ | 0.172 | | |
| Net realized and unrealized gain (loss) | | | (0.916 | ) | | | (0.294 | ) | | | 0.061 | (3) | |
| Total income (loss) from operations | | $ | (0.734 | ) | | $ | 0.074 | | | $ | 0.233 | | |
| Less distributions | |
| From net investment income | | $ | (0.186 | ) | | $ | (0.384 | ) | | $ | (0.193 | ) | |
| Total distributions | | $ | (0.186 | ) | | $ | (0.384 | ) | | $ | (0.193 | ) | |
| Net asset value — End of period | | $ | 9.210 | | | $ | 10.130 | | | $ | 10.440 | | |
| Total Return(4) | | | (7.37 | )%(9) | | | 0.66 | % | | | 2.27 | %(9) | |
| Ratios/Supplemental Data | |
| Net assets, end of period (000's omitted) | | $ | 10,796 | | | $ | 8,362 | | | $ | 666 | | |
| Ratios (As a percentage of average daily net assets): | |
| Expenses excluding interest and fees | | | 1.50 | %(5) | | | 1.53 | %(6) | | | 1.52 | %(5) | |
| Interest and fee expense(7) | | | 0.26 | %(5) | | | 0.47 | % | | | 0.46 | %(5) | |
| Total expenses before custodian fee reduction | | | 1.76 | %(5) | | | 2.00 | %(6) | | | 1.98 | %(5) | |
| Expenses after custodian fee reduction excluding interest and fees | | | 1.47 | %(5) | | | 1.50 | %(6) | | | 1.50 | %(5) | |
| Net investment income | | | 3.62 | %(5) | | | 3.54 | % | | | 3.32 | %(5) | |
| Portfolio Turnover | | | 10 | % | | | 42 | % | | | 15 | %(8) | |
(1) Net investment income per share was computed using average shares outstanding.
(2) For the period from the start of business, March 2, 2006, to August 31, 2006.
(3) The per share amount is not in accord with the net realized and unrealized gain (loss) on investments for the period because of the timing of sales of Fund shares and the amount of the per share realized and unrealized gains and losses at such time.
(4) Returns are historical and are calculated by determining the percentage change in net asset value with all distributions reinvested.
(5) Annualized.
(6) The investment adviser was allocated a portion of the Fund's operating expenses (equal to less than 0.01% of average daily net assets for the year ended August 31, 2007). Absent this allocation, total return would be lower.
(7) Interest and fee expense relates to the liability for floating rate notes issued in conjunction with inverse floater securities transactions (See Note 1I).
(8) For the Fund's fiscal year, September 1, 2005 to August 31, 2006.
(9) Not annualized.
See notes to financial statements
98
Eaton Vance Municipals Funds as of February 29, 2008
FINANCIAL STATEMENTS CONT'D
Financial Highlights
| | | South Carolina Fund — Class A | |
| | | Six Months Ended
February 29, 2008 | | Year Ended August 31, | |
| | | (Unaudited)(1) | | 2007(1) | | 2006(1) | | 2005(1) | | 2004 | | 2003 | |
| Net asset value — Beginning of period | | $ | 9.700 | | | $ | 10.050 | | | $ | 10.060 | | | $ | 9.710 | | | $ | 9.450 | | | $ | 9.660 | | |
| Income (loss) from operations | |
| Net investment income | | $ | 0.209 | | | $ | 0.409 | | | $ | 0.423 | | | $ | 0.463 | | | $ | 0.508 | | | $ | 0.488 | | |
| Net realized and unrealized gain (loss) | | | (1.081 | ) | | | (0.346 | ) | | | (0.002 | ) | | | 0.370 | | | | 0.265 | | | | (0.213 | ) | |
| Total income (loss) from operations | | $ | (0.872 | ) | | $ | 0.063 | | | $ | 0.421 | | | $ | 0.833 | | | $ | 0.773 | | | $ | 0.275 | | |
| Less distributions | |
| From net investment income | | $ | (0.208 | ) | | $ | (0.413 | ) | | $ | (0.431 | ) | | $ | (0.483 | ) | | $ | (0.513 | ) | | $ | (0.485 | ) | |
| Total distributions | | $ | (0.208 | ) | | $ | (0.413 | ) | | $ | (0.431 | ) | | $ | (0.483 | ) | | $ | (0.513 | ) | | $ | (0.485 | ) | |
| Net asset value — End of period | | $ | 8.620 | | | $ | 9.700 | | | $ | 10.050 | | | $ | 10.060 | | | $ | 9.710 | | | $ | 9.450 | | |
| Total Return(2) | | | (9.18 | )%(8) | | | 0.55 | % | | | 4.35 | % | | | 8.78 | % | | | 8.32 | % | | | 2.88 | % | |
| Ratios/Supplemental Data | |
| Net assets, end of period (000's omitted) | | $ | 100,236 | | | $ | 103,975 | | | $ | 71,412 | | | $ | 50,953 | | | $ | 34,601 | | | $ | 10,727 | | |
| Ratios (As a percentage of average daily net assets): | |
| Expenses excluding interest and fees | | | 0.73 | %(4) | | | 0.76 | %(5) | | | 0.75 | % | | | 0.75 | %(6) | | | 0.75 | %(6) | | | 0.73 | %(6) | |
| Interest and fee expense(3) | | | 0.33 | %(4) | | | 0.45 | % | | | 0.37 | % | | | 0.37 | %(6) | | | 0.23 | %(6) | | | 0.03 | %(6) | |
| Total expenses before custodian fee reduction | | | 1.06 | %(4) | | | 1.21 | %(5) | | | 1.12 | % | | | 1.12 | %(6) | | | 0.98 | %(6) | | | 0.76 | %(6) | |
| Expenses after custodian fee reduction excluding interest and fees | | | 0.71 | %(4) | | | 0.73 | %(5) | | | 0.73 | % | | | 0.72 | %(6) | | | 0.75 | %(6) | | | 0.71 | %(6) | |
| Net investment income | | | 4.32 | % | | | 4.06 | % | | | 4.28 | % | | | 4.69 | % | | | 5.22 | % | | | 5.06 | % | |
| Portfolio Turnover of the Portfolio(7) | | | — | | | | — | | | | — | | | | — | | | | 40 | % | | | 25 | % | |
| Portfolio Turnover of the Fund | | | 19 | % | | | 33 | % | | | 42 | % | | | 29 | % | | | — | | | | — | | |
(1) Net investment income per share was computed using average shares outstanding.
(2) Returns are historical and are calculated by determining the percentage change in net asset value with all distributions reinvested.
(3) Interest and fee expense relates to the liability for floating rate notes issued in conjunction with inverse floater securities transactions (See Note 1I.)
(4) Annualized.
(5) The investment adviser was allocated a portion of the Fund's operating expenses (equal to less than 0.01% of average daily net assets for the year ended August 31, 2007). Absent this allocation, total return would be lower.
(6) Includes the Fund's share of its corresponding Portfolio's allocated expenses while the Fund was making investments directly into the Portfolio.
(7) Portfolio turnover represents the rate of portfolio activity for the period while the Fund was making investments directly into the Portfolio.
(8) Not annualized.
See notes to financial statements
99
Eaton Vance Municipals Funds as of February 29, 2008
FINANCIAL STATEMENTS CONT'D
Financial Highlights
| | | South Carolina Fund — Class B | |
| | | Six Months Ended
February 29, 2008 | | Year Ended August 31, | |
| | | (Unaudited)(1) | | 2007(1) | | 2006(1) | | 2005(1) | | 2004 | | 2003 | |
| Net asset value — Beginning of period | | $ | 10.280 | | | $ | 10.660 | | | $ | 10.670 | | | $ | 10.300 | | | $ | 10.020 | | | $ | 10.250 | | |
| Income (loss) from operations | |
| Net investment income | | $ | 0.183 | | | $ | 0.356 | | | $ | 0.372 | | | $ | 0.417 | | | $ | 0.465 | | | $ | 0.441 | | |
| Net realized and unrealized gain (loss) | | | (1.142 | ) | | | (0.378 | ) | | | (0.005 | ) | | | 0.387 | | | | 0.283 | | | | (0.231 | ) | |
| Total income (loss) from operations | | $ | (0.959 | ) | | $ | (0.022 | ) | | $ | 0.367 | | | $ | 0.804 | | | $ | 0.748 | | | $ | 0.210 | | |
| Less distributions | |
| From net investment income | | $ | (0.181 | ) | | $ | (0.358 | ) | | $ | (0.377 | ) | | $ | (0.434 | ) | | $ | (0.468 | ) | | $ | (0.440 | ) | |
| Total distributions | | $ | (0.181 | ) | | $ | (0.358 | ) | | $ | (0.377 | ) | | $ | (0.434 | ) | | $ | (0.468 | ) | | $ | (0.440 | ) | |
| Net asset value — End of period | | $ | 9.140 | | | $ | 10.280 | | | $ | 10.660 | | | $ | 10.670 | | | $ | 10.300 | | | $ | 10.020 | | |
| Total Return(2) | | | (9.49 | )%(9) | | | (0.29 | )% | | | 3.57 | % | | | 8.16 | %(3) | | | 7.58 | % | | | 2.06 | % | |
| Ratios/Supplemental Data | |
| Net assets, end of period (000's omitted) | | $ | 12,086 | | | $ | 14,559 | | | $ | 17,667 | | | $ | 18,039 | | | $ | 18,529 | | | $ | 40,459 | | |
| Ratios (As a percentage of average daily net assets): | |
| Expenses excluding interest and fees | | | 1.48 | %(5) | | | 1.51 | %(6) | | | 1.50 | % | | | 1.50 | %(7) | | | 1.50 | %(7) | | | 1.48 | %(7) | |
| Interest and fee expense(4) | | | 0.33 | %(5) | | | 0.45 | % | | | 0.37 | % | | | 0.37 | %(7) | | | 0.23 | %(7) | | | 0.03 | %(7) | |
| Total expenses before custodian fee reduction | | | 1.81 | %(5) | | | 1.96 | %(6) | | | 1.87 | % | | | 1.87 | %(7) | | | 1.73 | %(7) | | | 1.51 | %(7) | |
| Expenses after custodian fee reduction excluding interest and fees | | | 1.46 | %(5) | | | 1.48 | %(6) | | | 1.48 | % | | | 1.47 | %(7) | | | 1.50 | %(7) | | | 1.46 | %(7) | |
| Net investment income | | | 3.57 | % | | | 3.33 | % | | | 3.55 | % | | | 3.98 | % | | | 4.50 | % | | | 4.33 | % | |
| Portfolio Turnover of the Portfolio(8) | | | — | | | | — | | | | — | | | | — | | | | 40 | % | | | 25 | % | |
| Portfolio Turnover of the Fund | | | 19 | % | | | 33 | % | | | 42 | % | | | 29 | % | | | — | | | | — | | |
(1) Net investment income per share was computed using average shares outstanding.
(2) Returns are historical and are calculated by determining the percentage change in net asset value with all distributions reinvested.
(3) Total return reflects an increase of 0.18% due to a change in the timing of the payment and reinvestment of distributions.
(4) Interest and fee expense relates to the liability for floating rate notes issued in conjunction with inverse floater securities transactions (See Note 1I.)
(5) Annualized.
(6) The investment adviser was allocated a portion of the Fund's operating expenses (equal to less than 0.01% of average daily net assets for the year ended August 31, 2007). Absent this allocation, total return would be lower.
(7) Includes the Fund's share of its corresponding Portfolio's allocated expenses while the Fund was making investments directly into the Portfolio.
(8) Portfolio turnover represents the rate of portfolio activity for the period while the Fund was making investments directly into the Portfolio.
(9) Not annualized.
See notes to financial statements
100
Eaton Vance Municipals Funds as of February 29, 2008
FINANCIAL STATEMENTS CONT'D
Financial Highlights
| | | South Carolina Fund — Class C | |
| | | Six Months Ended
February 29, 2008
(Unaudited)(1) | | Year Ended
August 31, 2007(1) | | Period Ended
August 31, 2006(1)(2) | |
| Net asset value — Beginning of period | | $ | 10.280 | | | $ | 10.660 | | | $ | 10.470 | | |
| Income (loss) from operations | |
| Net investment income | | $ | 0.182 | | | $ | 0.349 | | | $ | 0.218 | | |
| Net realized and unrealized gain (loss) | | | (1.131 | ) | | | (0.371 | ) | | | 0.199 | (3) | |
| Total income (loss) from operations | | $ | (0.949 | ) | | $ | (0.022 | ) | | $ | 0.417 | | |
| Less distributions | |
| From net investment income | | $ | (0.181 | ) | | $ | (0.358 | ) | | $ | (0.227 | ) | |
| Total distributions | | $ | (0.181 | ) | | $ | (0.358 | ) | | $ | (0.227 | ) | |
| Net asset value — End of period | | $ | 9.150 | | | $ | 10.280 | | | $ | 10.660 | | |
| Total Return(4) | | | (9.39 | )%(9) | | | (0.29 | )% | | | 4.04 | %(9) | |
| Ratios/Supplemental Data | |
| Net assets, end of period (000's omitted) | | $ | 16,652 | | | $ | 13,623 | | | $ | 2,272 | | |
| Ratios (As a percentage of average daily net assets): | |
| Expenses excluding interest and fees | | | 1.48 | %(6) | | | 1.51 | %(7) | | | 1.50 | %(6) | |
| Interest and fee expense(5) | | | 0.33 | %(6) | | | 0.45 | % | | | 0.37 | %(6) | |
| Total expenses before custodian fee reduction | | | 1.81 | %(6) | | | 1.96 | %(7) | | | 1.87 | %(6) | |
| Expenses after custodian fee reduction excluding interest and fees | | | 1.46 | %(6) | | | 1.48 | %(7) | | | 1.48 | %(6) | |
| Net investment income | | | 3.55 | % | | | 3.29 | % | | | 3.27 | % | |
| Portfolio Turnover | | | 19 | % | | | 33 | % | | | 42 | %(8) | |
(1) Net investment income per share was computed using average shares outstanding.
(2) For the period from the start of business, January 12, 2006, to August 31, 2006.
(3) The per share amount is not in accord with the net realized and unrealized gain (loss) on investments for the period because of the timing of sales of Fund shares and the amount of the per share realized and unrealized gains and losses at such time.
(4) Returns are historical and are calculated by determining the percentage change in net asset value with all distributions reinvested.
(5) Interest and fee expense relates to the liability for floating rate notes issued in conjunction with inverse floater securities transactions (See Note 1I).
(6) Annualized.
(7) The investment adviser was allocated a portion of the Fund's operating expenses (equal to less than 0.01% of average daily net assets for the year ended August 31, 2007). Absent this allocation, total return would be lower.
(8) For the Fund's fiscal year, September 1, 2005 to August 31, 2006.
(9) Not annualized.
See notes to financial statements
101
Eaton Vance Municipals Funds as of February 29, 2008
FINANCIAL STATEMENTS CONT'D
Financial Highlights
| | | Tennessee Fund — Class A | |
| | | Six Months Ended
February 29, 2008 | | Year Ended August 31, | |
| | | (Unaudited)(1) | | 2007(1) | | 2006(1) | | 2005(1) | | 2004(1) | | 2003(1) | |
| Net asset value — Beginning of period | | $ | 9.530 | | | $ | 9.850 | | | $ | 9.880 | | | $ | 9.990 | | | $ | 9.790 | | | $ | 9.910 | | |
| Income (loss) from operations | |
| Net investment income | | $ | 0.203 | | | $ | 0.407 | | | $ | 0.419 | | | $ | 0.431 | | | $ | 0.462 | | | $ | 0.469 | | |
| Net realized and unrealized gain (loss) | | | (0.703 | ) | | | (0.318 | ) | | | (0.028 | ) | | | (0.001 | ) | | | 0.133 | | | | (0.111 | ) | |
| Total income (loss) from operations | | $ | (0.500 | ) | | $ | 0.089 | | | $ | 0.391 | | | $ | 0.430 | | | $ | 0.595 | | | $ | 0.358 | | |
| Less distributions | |
| From net investment income | | $ | (0.200 | ) | | $ | (0.409 | ) | | $ | (0.421 | ) | | $ | (0.450 | ) | | $ | (0.485 | ) | | $ | (0.478 | ) | |
| Total distributions | | $ | (0.200 | ) | | $ | (0.409 | ) | | $ | (0.421 | ) | | $ | (0.450 | ) | | $ | (0.485 | ) | | $ | (0.478 | ) | |
| Net asset value — End of period | | $ | 8.830 | | | $ | 9.530 | | | $ | 9.850 | | | $ | 9.880 | | | $ | 9.900 | | | $ | 9.790 | | |
| Total Return(2) | | | (5.37 | )%(8) | | | 0.85 | % | | | 4.09 | % | | | 4.44 | % | | | 6.17 | % | | | 3.65 | % | |
| Ratios/Supplemental Data | |
| Net assets, end of period (000's omitted) | | $ | 46,540 | | | $ | 49,444 | | | $ | 46,023 | | | $ | 42,088 | | | $ | 39,285 | | | $ | 9,051 | | |
| Ratios (As a percentage of average daily net assets): | |
| Expenses excluding interest and fees | | | 0.74 | %(3) | | | 0.75 | %(4) | | | 0.73 | % | | | 0.76 | %(5) | | | 0.74 | %(5) | | | 0.74 | %(5) | |
| Interest and fee expense(6) | | | 0.14 | %(3) | | | 0.21 | % | | | 0.19 | % | | | 0.16 | %(5) | | | 0.08 | %(5) | | | 0.05 | %(5) | |
| Total expenses before custodian fee reduction | | | 0.88 | %(3) | | | 0.96 | %(4) | | | 0.92 | % | | | 0.92 | %(5) | | | 0.82 | %(5) | | | 0.79 | %(5) | |
| Expenses after custodian fee reduction excluding interest and fees | | | 0.71 | %(3) | | | 0.72 | %(4) | | | 0.70 | % | | | 0.75 | %(5) | | | 0.73 | %(5) | | | 0.71 | %(5) | |
| Net investment income | | | 4.26 | %(3) | | | 4.15 | % | | | 4.30 | % | | | 4.36 | % | | | 4.69 | % | | | 4.72 | % | |
| Portfolio Turnover of the Portfolio(7) | | | — | | | | — | | | | — | | | | — | | | | 20 | % | | | 17 | % | |
| Portfolio Turnover of the Fund | | | 13 | % | | | 20 | % | | | 16 | % | | | 13 | % | | | — | | | | — | | |
(1) Net investment income per share was computed using average shares outstanding.
(2) Returns are historical and are calculated by determining the percentage change in net asset value with all distributions reinvested.
(3) Annualized.
(4) The investment adviser was allocated a portion of the Fund's operating expenses (equal to less than 0.01% of average daily net assets for the year ended August 31, 2007). Absent this allocation, total return would be lower.
(5) Includes the Fund's share of its corresponding Portfolio's allocated expenses while the Fund was making investments directly into the Portfolio.
(6) Interest and fee expense relates to the liability for floating rate notes issued in conjunction with inverse floater securities transactions (See note 1I).
(7) Portfolio turnover represents the rate of portfolio activity for the period while the Fund was making investments directly into the Portfolio.
(8) Not annualized.
See notes to financial statements
102
Eaton Vance Municipals Funds as of February 29, 2008
FINANCIAL STATEMENTS CONT'D
Financial Highlights
| | | Tennessee Fund — Class B | |
| | | Six Months Ended
February 29, 2008 | | Year Ended August 31, | |
| | | (Unaudited)(1) | | 2007(1) | | 2006(1) | | 2005(1) | | 2004(1) | | 2003(1) | |
| Net asset value — Beginning of period | | $ | 10.380 | | | $ | 10.730 | | | $ | 10.750 | | | $ | 10.780 | | | $ | 10.660 | | | $ | 10.800 | | |
| Income (loss) from operations | |
| Net investment income | | $ | 0.182 | | | $ | 0.365 | | | $ | 0.378 | | | $ | 0.390 | | | $ | 0.429 | | | $ | 0.433 | | |
| Net realized and unrealized gain (loss) | | | (0.773 | ) | | | (0.350 | ) | | | (0.020 | ) | | | (0.010 | ) | | | 0.137 | | | | (0.133 | ) | |
| Total income (loss) from operations | | $ | (0.591 | ) | | $ | 0.015 | | | $ | 0.358 | | | $ | 0.380 | | | $ | 0.566 | | | $ | 0.300 | | |
| Less distributions | |
| From net investment income | | $ | (0.179 | ) | | $ | (0.365 | ) | | $ | (0.378 | ) | | $ | (0.410 | ) | | $ | (0.446 | ) | | $ | (0.440 | ) | |
| Total distributions | | $ | (0.179 | ) | | $ | (0.365 | ) | | $ | (0.378 | ) | | $ | (0.410 | ) | | $ | (0.446 | ) | | $ | (0.440 | ) | |
| Net asset value — End of period | | $ | 9.610 | | | $ | 10.380 | | | $ | 10.730 | | | $ | 10.750 | | | $ | 10.780 | | | $ | 10.660 | | |
| Total Return(2) | | | (5.80 | )%(9) | | | 0.09 | % | | | 3.43 | % | | | 3.75 | %(3) | | | 5.39 | % | | | 2.79 | % | |
| Ratios/Supplemental Data | |
| Net assets, end of period (000's omitted) | | $ | 5,603 | | | $ | 6,215 | | | $ | 8,638 | | | $ | 10,346 | | | $ | 11,924 | | | $ | 39,182 | | |
| Ratios (As a percentage of average daily net assets): | |
| Expenses excluding interest and fees | | | 1.50 | %(4) | | | 1.50 | %(5) | | | 1.48 | % | | | 1.51 | %(6) | | | 1.49 | %(6) | | | 1.49 | %(6) | |
| Interest and fee expense(7) | | | 0.14 | %(4) | | | 0.21 | % | | | 0.19 | % | | | 0.16 | %(6) | | | 0.08 | %(6) | | | 0.05 | %(6) | |
| Total expenses before custodian fee reduction | | | 1.64 | %(4) | | | 1.71 | %(5) | | | 1.67 | % | | | 1.67 | %(6) | | | 1.57 | %(6) | | | 1.54 | %(6) | |
| Expenses after custodian fee reduction excluding interest and fees | | | 1.47 | %(4) | | | 1.47 | %(5) | | | 1.45 | % | | | 1.50 | %(6) | | | 1.48 | %(6) | | | 1.46 | %(6) | |
| Net investment income | | | 3.51 | %(4) | | | 3.41 | % | | | 3.56 | % | | | 3.63 | % | | | 3.95 | % | | | 3.99 | % | |
| Portfolio Turnover of the Portfolio(8) | | | — | | | | — | | | | — | | | | — | | | | 20 | % | | | 17 | % | �� |
| Portfolio Turnover of the Fund | | | 13 | % | | | 20 | % | | | 16 | % | | | 13 | % | | | — | | | | — | | |
(1) Net investment income per share was computed using average shares outstanding.
(2) Returns are historical and are calculated by determining the percentage change in net asset value with all distributions reinvested.
(3) Total return reflects an increase of 0.16% due to a change in the timing of the payment and reinvestment of distributions.
(4) Annualized.
(5) The investment adviser was allocated a portion of the Fund's operating expenses (equal to less than 0.01% of average daily net assets for the year ended August 31, 2007). Absent this allocation, total return would be lower.
(6) Includes the Fund's share of its corresponding Portfolio's allocated expenses while the Fund was making investments directly into the Portfolio.
(7) Interest and fee expense relates to the liability for floating rate notes issued in conjunction with inverse floater securities transactions (See note 1I).
(8) Portfolio turnover represents the rate of portfolio activity for the period while the Fund was making investments directly into the Portfolio.
(9) Not annualized.
See notes to financial statements
103
Eaton Vance Municipals Funds as of February 29, 2008
FINANCIAL STATEMENTS CONT'D
Financial Highlights
| | | Tennessee Fund — Class C | |
| | | Six Months Ended
February 29, 2008
(Unaudited)(1) | | Year Ended
August 31, 2007(1) | | Period Ended
August 31, 2006(1)(2) | |
| Net asset value — Beginning of period | | $ | 10.370 | | | $ | 10.720 | | | $ | 10.580 | | |
| Income (loss) from operations | |
| Net investment income | | $ | 0.182 | | | $ | 0.362 | | | $ | 0.110 | | |
| Net realized and unrealized gain (loss) | | | (0.774 | ) | | | (0.347 | ) | | | 0.156 | (3) | |
| Total income (loss) from operations | | $ | (0.592 | ) | | $ | 0.015 | | | $ | 0.266 | | |
| Less distributions | |
| From net investment income | | $ | (0.178 | ) | | $ | (0.365 | ) | | $ | (0.126 | ) | |
| Total distributions | | $ | (0.178 | ) | | $ | (0.365 | ) | | $ | (0.126 | ) | |
| Net asset value — End of period | | $ | 9.600 | | | $ | 10.370 | | | $ | 10.720 | | |
| Total Return(4) | | | (5.81 | )%(9) | | | 0.09 | % | | | 2.54 | %(9) | |
| Ratios/Supplemental Data | |
| Net assets, end of period (000's omitted) | | $ | 3,163 | | | $ | 2,683 | | | $ | 559 | | |
| Ratios (As a percentage of average daily net assets): | |
| Expenses excluding interest and fees | | | 1.50 | %(5) | | | 1.49 | %(6) | | | 1.48 | %(5) | |
| Interest and fee expense(7) | | | 0.14 | %(5) | | | 0.21 | % | | | 0.19 | %(5) | |
| Total expenses before custodian fee reduction | | | 1.64 | %(5) | | | 1.70 | %(6) | | | 1.67 | %(5) | |
| Expenses after custodian fee reduction excluding interest and fees | | | 1.47 | %(5) | | | 1.46 | %(6) | | | 1.45 | %(5) | |
| Net investment income | | | 3.50 | %(5) | | | 3.40 | % | | | 3.10 | %(5) | |
| Portfolio Turnover | | | 13 | % | | | 20 | % | | | 16 | %(8) | |
(1) Net investment income per share was computed using average shares outstanding.
(2) For the period from start of business, May 2, 2006, to August 31, 2006.
(3) The per share amount is not in accord with the net realized and unrealized gain (loss) on investments for the period due to the timing of sales of Fund shares and the amount of the per share realized and unrealized gains and losses at such time.
(4) Returns are historical and are calculated by determining the percentage change in net asset value with all distributions reinvested.
(5) Annualized.
(6) The investment adviser was allocated a portion of the Fund's operating expenses (equal to less than 0.01% of average daily net assets for the year ended August 31, 2007). Absent this allocation, total return would be lower.
(7) Interest and fee expense relates to the liability for floating rate notes issued in conjunction with inverse floater securities transactions (See Note 1I).
(8) For the Fund's fiscal year, September 1, 2005 to August 31, 2006.
(9) Not annualized.
See notes to financial statements
104
Eaton Vance Municipals Funds as of February 29, 2008
FINANCIAL STATEMENTS CONT'D
Financial Highlights
| | | Virginia Fund — Class A | |
| | | Six Months Ended
February 29, 2008 | | Year Ended August 31, | |
| | | (Unaudited)(1) | | 2007(1) | | 2006(1) | | 2005(1) | | 2004(1) | | 2003(1) | |
| Net asset value — Beginning of period | | $ | 9.280 | | | $ | 9.770 | | | $ | 9.790 | | | $ | 9.590 | | | $ | 9.390 | | | $ | 9.600 | | |
| Income (loss) from operations | |
| Net investment income | | $ | 0.202 | | | $ | 0.403 | | | $ | 0.418 | | | $ | 0.426 | | | $ | 0.451 | | | $ | 0.463 | | |
| Net realized and unrealized gain (loss) | | | (0.840 | ) | | | (0.485 | ) | | | (0.025 | ) | | | 0.202 | | | | 0.202 | | | | (0.217 | ) | |
| Total income (loss) from operations | | $ | (0.638 | ) | | $ | (0.082 | ) | | $ | 0.393 | | | $ | 0.628 | | | $ | 0.653 | | | $ | 0.246 | | |
| Less distributions | |
| From net investment income | | $ | (0.202 | ) | | $ | (0.408 | ) | | $ | (0.413 | ) | | $ | (0.428 | ) | | $ | (0.453 | ) | | $ | (0.456 | ) | |
| Total distributions | | $ | (0.202 | ) | | $ | (0.408 | ) | | $ | (0.413 | ) | | $ | (0.428 | ) | | $ | (0.453 | ) | | $ | (0.456 | ) | |
| Net asset value — End of period | | $ | 8.440 | | | $ | 9.280 | | | $ | 9.770 | | | $ | 9.790 | | | $ | 9.590 | | | $ | 9.390 | | |
| Total Return(2) | | | (7.03 | )%(8) | | | (0.95 | )% | | | 4.16 | % | | | 6.70 | % | | | 7.06 | % | | | 2.58 | % | |
| Ratios/Supplemental Data | |
| Net assets, end of period (000's omitted) | | $ | 101,909 | | | $ | 107,632 | | | $ | 89,098 | | | $ | 78,848 | | | $ | 73,924 | | | $ | 9,477 | | |
| Ratios (As a percentage of average daily net assets): | |
| Expenses excluding interest and fees | | | 0.77 | %(3) | | | 0.78 | %(4) | | | 0.77 | % | | | 0.80 | %(5) | | | 0.79 | %(5) | | | 0.81 | %(5) | |
| Interest and fee expense(6) | | | 0.46 | %(3) | | | 0.57 | % | | | 0.54 | % | | | 0.23 | %(5) | | | 0.12 | %(5) | | | 0.08 | %(5) | |
| Total expenses before custodian fee reduction | | | 1.23 | %(3) | | | 1.35 | %(4) | | | 1.31 | % | | | 1.03 | %(5) | | | 0.91 | %(5) | | | 0.89 | %(5) | |
| Expenses after custodian fee reduction excluding interest and fees | | | 0.75 | %(3) | | | 0.76 | %(4) | | | 0.76 | % | | | 0.79 | %(5) | | | 0.79 | %(5) | | | 0.80 | %(5) | |
| Net investment income | | | 4.36 | %(3) | | | 4.14 | % | | | 4.34 | % | | | 4.41 | % | | | 4.75 | % | | | 4.83 | % | |
| Portfolio Turnover of the Portfolio(7) | | | — | | | | — | | | | — | | | | — | | | | 14 | % | | | 20 | % | |
| Portfolio Turnover of the Fund | | | 14 | % | | | 28 | % | | | 30 | % | | | 47 | % | | | — | | | | — | | |
(1) Net investment income per share was computed using average shares outstanding.
(2) Returns are historical and are calculated by determining the percentage change in net asset value with all distributions reinvested.
(3) Annualized.
(4) The investment adviser was allocated a portion of the Fund's operating expenses (equal to less than 0.01% of average daily net assets for the year ended August 31, 2007). Absent this allocation, total return would be lower.
(5) Includes the Fund's share of its corresponding Portfolio's allocated expenses while the Fund was making investments directly into the Portfolio.
(6) Interest and fee expense relates to the liability for floating rate notes issued in conjunction with inverse floater securities transactions (See Note 1I).
(7) Portfolio turnover represents the rate of portfolio activity for the period while the Fund was making investments directly into the Portfolio.
(8) Not annualized.
See notes to financial statements
105
Eaton Vance Municipals Funds as of February 29, 2008
FINANCIAL STATEMENTS CONT'D
Financial Highlights
| | | Virginia Fund — Class B | |
| | | Six Months Ended
February 29, 2008 | | Year Ended August 31, | |
| | | (Unaudited)(1) | | 2007(1) | | 2006(1) | | 2005(1) | | 2004(1) | | 2003(1) | |
| Net asset value — Beginning of period | | $ | 10.270 | | | $ | 10.820 | | | $ | 10.830 | | | $ | 10.610 | | | $ | 10.400 | | | $ | 10.630 | | |
| Income (loss) from operations | |
| Net investment income | | $ | 0.185 | | | $ | 0.367 | | | $ | 0.384 | | | $ | 0.392 | | | $ | 0.426 | | | $ | 0.434 | | |
| Net realized and unrealized gain (loss) | | | (0.932 | ) | | | (0.547 | ) | | | (0.018 | ) | | | 0.222 | | | | 0.204 | | | | (0.240 | ) | |
| Total income (loss) from operations | | $ | (0.747 | ) | | $ | (0.180 | ) | | $ | 0.366 | | | $ | 0.614 | | | $ | 0.630 | | | $ | 0.194 | | |
| Less distributions | |
| From net investment income | | $ | (0.183 | ) | | $ | (0.370 | ) | | $ | (0.376 | ) | | $ | (0.394 | ) | | $ | (0.420 | ) | | $ | (0.424 | ) | |
| Total distributions | | $ | (0.183 | ) | | $ | (0.370 | ) | | $ | (0.376 | ) | | $ | (0.394 | ) | | $ | (0.420 | ) | | $ | (0.424 | ) | |
| Net asset value — End of period | | $ | 9.340 | | | $ | 10.270 | | | $ | 10.820 | | | $ | 10.830 | | | $ | 10.610 | | | $ | 10.400 | | |
| Total Return(2) | | | (7.40 | )%(9) | | | (1.77 | )% | | | 3.49 | % | | | 6.06 | %(3) | | | 6.15 | % | | | 1.81 | % | |
| Ratios/Supplemental Data | |
| Net assets, end of period (000's omitted) | | $ | 15,570 | | | $ | 19,055 | | | $ | 24,411 | | | $ | 29,456 | | | $ | 32,477 | | | $ | 103,739 | | |
| Ratios (As a percentage of average daily net assets): | |
| Expenses excluding interest and fees | | | 1.52 | %(4) | | | 1.53 | %(5) | | | 1.52 | % | | | 1.55 | %(6) | | | 1.54 | %(6) | | | 1.56 | %(6) | |
| Interest and fee expense(7) | | | 0.46 | %(4) | | | 0.57 | % | | | 0.54 | % | | | 0.23 | %(6) | | | 0.12 | %(6) | | | 0.08 | %(6) | |
| Total expenses before custodian fee reduction | | | 1.98 | %(4) | | | 2.10 | %(5) | | | 2.06 | % | | | 1.78 | %(6) | | | 1.66 | %(6) | | | 1.64 | %(6) | |
| Expenses after custodian fee reduction excluding interest and fees | | | 1.50 | %(4) | | | 1.51 | %(5) | | | 1.51 | % | | | 1.54 | %(6) | | | 1.54 | %(6) | | | 1.55 | %(6) | |
| Net investment income | | | 3.61 | %(4) | | | 3.40 | % | | | 3.61 | % | | | 3.67 | % | | | 4.00 | % | | | 4.09 | % | |
| Portfolio Turnover of the Portfolio(8) | | | — | | | | — | | | | — | | | | — | | | | 14 | % | | | 20 | % | |
| Portfolio Turnover of the Fund | | | 14 | % | | | 28 | % | | | 30 | % | | | 47 | % | | | — | | | | — | | |
(1) Net investment income per share was computed using average shares outstanding.
(2) Returns are historical and are calculated by determining the percentage change in net asset value with all distributions reinvested.
(3) Total return reflects an increase of 0.16% due to a change in the timing of the payment and reinvestment of distributions.
(4) Annualized.
(5) The investment adviser was allocated a portion of the Fund's operating expenses (equal to less than 0.01% of average daily net assets for the year ended August 31, 2007). Absent this allocation, total return would be lower.
(6) Includes the Fund's share of its corresponding Portfolio's allocated expenses while the Fund was making investments directly into the Portfolio.
(7) Interest and fee expense relates to the liability for floating rate notes issued in conjunction with inverse floater securities transactions (See Note 1I).
(8) Portfolio turnover represents the rate of portfolio activity for the period while the Fund was making investments directly into the Portfolio.
(9) Not annualized.
See notes to financial statements
106
Eaton Vance Municipals Funds as of February 29, 2008
FINANCIAL STATEMENTS CONT'D
Financial Highlights
| | | Virginia Fund — Class C | |
| | | Six Months Ended
February 29, 2008
(Unaudited)(1) | | Year Ended
August 31, 2007(1) | | Period Ended
August 31, 2006(1)(2) | |
| Net asset value — Beginning of period | | $ | 10.280 | | | $ | 10.810 | | | $ | 10.660 | | |
| Income (loss) from operations | |
| Net investment income | | $ | 0.185 | | | $ | 0.365 | | | $ | 0.198 | | |
| Net realized and unrealized gain (loss) | | | (0.942 | ) | | | (0.525 | ) | | | 0.158 | (3) | |
| Total income (loss) from operations | | $ | (0.757 | ) | | $ | (0.160 | ) | | $ | 0.356 | | |
| Less distributions | |
| From net investment income | | $ | (0.183 | ) | | $ | (0.370 | ) | | $ | (0.206 | ) | |
| Total distributions | | $ | (0.183 | ) | | $ | (0.370 | ) | | $ | (0.206 | ) | |
| Net asset value — End of period | | $ | 9.340 | | | $ | 10.280 | | | $ | 10.810 | | |
| Total Return(4) | | | (7.49 | )%(9) | | | (1.58 | )% | | | 3.38 | %(9) | |
| Ratios/Supplemental Data | |
| Net assets, end of period (000's omitted) | | $ | 7,911 | | | $ | 5,236 | | | $ | 548 | | |
| Ratios (As a percentage of average daily net assets): | |
| Expenses excluding interest and fees | | | 1.52 | %(5) | | | 1.53 | %(6) | | | 1.52 | %(5) | |
| Interest and fee expense(7) | | | 0.46 | %(5) | | | 0.57 | % | | | 0.54 | %(5) | |
| Total expenses before custodian fee reduction | | | 1.98 | %(5) | | | 2.10 | %(6) | | | 2.06 | %(5) | |
| Expenses after custodian fee reduction excluding interest and fees | | | 1.50 | %(5) | | | 1.51 | %(6) | | | 1.51 | %(5) | |
| Net investment income | | | 3.61 | %(5) | | | 3.40 | % | | | 3.31 | %(5) | |
| Portfolio Turnover | | | 14 | % | | | 28 | % | | | 30 | %(8) | |
(1) Net investment income per share was computed using average shares outstanding.
(2) For the period from the start of business, February 8, 2006, to August 31, 2006.
(3) The per share amount is not in accord with the net realized and unrealized gain (loss) on investments for the period because of the timing of sales of Fund shares and the amount of the per share realized and unrealized gains and losses at such time.
(4) Returns are historical and are calculated by determining the percentage change in net asset value with all distributions reinvested.
(5) Annualized.
(6) The investment adviser was allocated a portion of the Fund's operating expenses (equal to less than 0.01% of average daily net assets for the year ended August 31, 2007). Absent this allocation, total return would be lower.
(7) Interest and fee expense relates to the liability for floating rate notes issued in conjunction with inverse floater securities transactions (See Note 1I).
(8) For the Fund's fiscal year, September 1, 2005 to August 31, 2006.
(9) Not annualized.
See notes to financial statements
107
Eaton Vance Municipals Funds as of February 29, 2008
NOTES TO FINANCIAL STATEMENTS (Unaudited)
1 Significant Accounting Policies
Eaton Vance Municipals Trust (the Trust) is a Massachusetts business trust registered under the Investment Company Act of 1940, as amended (the 1940 Act), as an open-end management investment company. The Trust presently consists of twenty-eight funds, twelve of which, each non-diversified, are included in these financial statements. They include Eaton Vance Alabama Municipals Fund (Alabama Fund), Eaton Vance Arkansas Municipals Fund (Arkansas Fund), Eaton Vance Georgia Municipals Fund (Georgia Fund), Eaton Vance Kentucky Municipals Fund (Kentucky Fund), Eaton Vance Louisiana Municipals Fund (Louisiana Fund), Eaton Vance Maryland Municipals Fund (Maryland Fund), Eaton Vance Missouri Municipals Fund (Missouri Fund), Eaton Vance North Carolina Municipals Fund (North Carolina Fund), Eaton Vance Oregon Municipals Fund (Oregon Fund), Eaton Vance South Carolina Municipals Fund (South Carolina Fund), Eaton Vance Tennessee Municipals Fu nd (Tennessee Fund) and Eaton Vance Virginia Municipals Fund (Virginia Fund), (each individually referred to as the Fund, and collectively, the Funds). The Funds seek to provide current income exempt from regular federal income tax and from particular state or local income or other taxes. As of February 29, 2008 the Funds offered three classes of shares. Effective March 3, 2008, the Alabama Fund, Georgia Fund, Maryland Fund, North Carolina Fund, South Carolina Fund and Virginia Fund began offering Class I shares, which are sold at net asset value and are not subject to a sales charge. Class A shares are generally sold subject to a sales charge imposed at time of purchase. Class B and Class C shares are sold at net asset value and are generally subject to a contingent deferred sales charge (see Note 5). Class B shares of each Fund automatically convert to Class A shares eight years after their purchase as described in each Fund's prospectus. Each class represents a pro-rata interest in the Fund, but votes sep arately on class-specific matters and (as noted below) is subject to different expenses. Realized and unrealized gains and losses are allocated daily to each class of shares based on the relative net assets of each class to the total net assets of the Fund. Net investment income, other than class-specific expenses, is allocated daily to each class of shares based upon the ratio of the value of each class's paid shares to the total value of all paid shares. Each class of shares differs in its distribution plan and certain other class-specific expenses.
The following is a summary of significant accounting policies of the Funds. The policies are in conformity with accounting principles generally accepted in the United States of America.
A Investment Valuation — Municipal bonds and taxable obligations, if any, are generally valued on the basis of valuations furnished by a pricing service. Financial futures contracts and options on financial futures contracts listed on commodity exchanges are valued at closing settlement prices. Interest rate swaps are generally valued on the basis of valuations furnished by a pricing service. Short-term obligations, maturing in sixty days or less, are valued at amortized cost, which approximates market value. Investments for which valuations or market quotations are not readily available, and investments for which the price of a s ecurity is not believed to represent its fair market value, are valued at fair value using methods determined in good faith by or at the direction of the Trustees.
B Investment Transactions and Related Income — Investment transactions for financial statement purposes are accounted for on a trade date basis. Realized gains and losses on investments sold are determined on the basis of identified cost. Interest income is recorded on the basis of interest accrued, adjusted for amortization of premium or accretion of discount.
C Federal Taxes — Each Fund's policy is to comply with the provisions of the Internal Revenue Code applicable to regulated investment companies and to distribute to shareholders each year substantially all of its taxable, if any, and tax-exempt net investment income, and all or substantially all of its net realized capital gains. Accordingly, no provision for federal income or excise tax is necessary. Each Fund intends to satisfy conditions which will enable it to designate distributions from the interest income generated by its investments in municipal obligations, which are exempt from regular federal income tax when received by each Fund, as exempt-interest dividends. The portion of such interest, if any, earned on private activity bonds issued after August 7, 1986, may be considered a tax preference item to shareholders.
At August 31, 2007, the following Funds, for federal income tax purposes, had capital loss carryforwards which will reduce each Fund's taxable income arising from future net realized gains on investment transactions, if any, to the extent permitted by the Internal Revenue Code, and thus will reduce the amount of distributions to shareholders which would otherwise be necessary to relieve the Funds of any liability for federal income or excise tax. The amounts and expiration dates of the capital loss carryforwards are as follows:
| Fund | | Amount | | Expiration Date | |
| Arkansas | | $ | 661,011 | | | August 31, 2013 | |
| Georgia | | | 129,324 | | | August 31, 2011 | |
| | | | 117,457 | | | August 31, 2012 | |
| | | | 931,893 | | | August 31, 2013 | |
| | | | 536,265 | | | August 31, 2015 | |
108
Eaton Vance Municipals Funds as of February 29, 2008
NOTES TO FINANCIAL STATEMENTS (Unaudited) CONT'D
| Fund | | Amount | | Expiration Date | |
| Kentucky | | $ | 2,260,947 | | | August 31, 2012 | |
| | | | 944,485 | | | August 31, 2013 | |
| Louisiana | | | 129,330 | | | August 31, 2008 | |
| | | | 159,254 | | | August 31, 2009 | |
| | | | 183,393 | | | August 31, 2010 | |
| | | | 142,162 | | | August 31, 2012 | |
| | | | 197,480 | | | August 31, 2013 | |
| Maryland | | | 818,358 | | | August 31, 2013 | |
| | | | 204,999 | | | August 31, 2015 | |
| Missouri | | | 69,474 | | | August 31, 2010 | |
| | | | 135,451 | | | August 31, 2012 | |
| | | | 831,764 | | | August 31, 2013 | |
| North Carolina | | | 106,713 | | | August 31, 2013 | |
| | | | 439,915 | | | August 31, 2015 | |
| Oregon | | | 1,258,470 | | | August 31, 2013 | |
| South Carolina | | | 290,746 | | | August 31, 2013 | |
| Tennessee | | | 398,146 | | | August 31, 2013 | |
| Virginia | | | 174,008 | | | August 31, 2012 | |
| | | | 1,185,970 | | | August 31, 2013 | |
Additionally, at August 31, 2007, the Maryland Fund and Oregon Fund had net capital losses of $3,263,672 and $1,110,958, respectively, attributable to security transactions incurred after October 31, 2006. These net capital losses are treated as arising on the first day of the Funds' taxable year ending August 31, 2008.
In June 2006, the Financial Accounting Standards Board (FASB) issued FASB Interpretation No. 48 (FIN 48), "Accounting for Uncertainty in Income Taxes – an interpretation of FASB Statement No. 109". FIN 48 clarifies the accounting for uncertainty in income taxes recognized in accordance with FASB Statement No. 109, "Accounting for Income Taxes". This interpretation prescribes a recognition threshold and measurement attribute for the financial statement recognition and measurement of a tax position taken or expected to be taken in a tax return. It also provides guidance on de-recognition, classification, interest and penalties, accounting in interim periods, disclosure and transition. FIN 48 is effective on the last business day of the first required financial reporting period for fiscal years beginning after December 15, 2006. Management has concluded that as of February 29, 2008, there are no uncertain tax positions that wo uld require financial statement recognition, de-recognition, or disclosure. Each of the Funds' federal tax returns filed in the 3-year period ended August 31, 2007 remains subject to examination by the Internal Revenue Service.
D Expenses — The majority of expenses of the Trust are directly identifiable to an individual fund. Expenses which are not readily identifiable to a specific fund are allocated taking into consideration, among other things, the nature and type of expense and the relative size of the funds.
E Expense Reduction — State Street Bank and Trust Company (SSBT) serves as custodian of the Funds. Pursuant to the respective custodian agreements, SSBT receives a fee reduced by credits, which are determined based on the average daily cash balance each Fund maintains with SSBT. All credit balances, if any, used to reduce each Fund's custodian fees are reported as a reduction of expenses in the Statements of Operations.
F Legal Fees — Legal fees and other related expenses incurred as part of negotiations of the terms and requirement of capital infusions, or that are expected to result in the restructuring of, or a plan of reorganization for, an investment are recorded as realized losses. Ongoing expenditures to protect or enhance an investment are treated as operating expenses.
G Use of Estimates — The preparation of the financial statements in conformity with accounting principles generally accepted in the United States of America requires management to make estimates and assumptions that affect the reported amounts of assets and liabilities at the date of the financial statements and the reported amounts of income and expense during the reporting period. Actual results could differ from those estimates.
H Indemnifications — Under the Trust's organizational documents, its officers and Trustees may be indemnified against certain liabilities and expenses arising out of the performance of their duties to the Funds, and shareholders are indemnified against personal liability for the obligations of the Trust. Additionally, in the normal course of business, each Fund enters into agreements with service providers that may contain indemnification clauses. Each Fund's maximum exposure under these arrangements is unknown as this would involve future claims that may be made against each Fund that have not yet occurred.
I Floating Rate Notes Issued in Conjunction with Securities Held — The Funds may invest in inverse floating rate securities, whereby a Fund may sell a fixed rate bond to a broker for cash. At the same time, the Fund buys a residual interest in the assets and cash flows of a Special-Purpose Vehicle (the SPV), (which is generally organized as a trust), set up by the broker, often referred to as an inverse floating rate obligation (Inverse Floater). The broker deposits a fixed rate bond into the SPV with the same CUSIP number as the fixed rate bond sold to the broker by the Fund, and which
109
Eaton Vance Municipals Funds as of February 29, 2008
NOTES TO FINANCIAL STATEMENTS (Unaudited) CONT'D
may have been, but is not required to be, the fixed rate bond purchased from the Fund (the Fixed Rate Bond). The SPV also issues floating rate notes (Floating Rate Notes) which are sold to third-parties. The Funds may enter into shortfall and forbearance agreements with the broker by which a Fund agrees to reimburse the broker, in certain circumstances, for the difference between the liquidation value of the Fixed Rate Bond held by the SPV and the liquidation value of the Floating Rate Notes, as well as any shortfalls in interest cash flows. The Inverse Floater held by a Fund gives the Fund the right (1) to cause the holders of the Floating Rate Notes to tender their notes at par, and (2) to have the broker transfer the Fixed Rate Bond held by the SPV to the Fund, thereby collapsing the SPV. Pursuant to Financial Accounting Standards Board (FASB) Statement No. 140, "Accounting for Transfers and Servicing of Financial Assets and Extinguishment of Liabilities" (FAS 140), the Funds account for the transaction described above as a secured borrowing by including the Fixed Rate Bond in their Portfolio of Investments and the Floating Rate Notes as a liability under the caption "Payable for floating rate notes issued" in their Statement of Assets and Liabilities. The Floating Rate Notes have interest rates that generally reset weekly and their holders have the option to tender their notes to the broker for redemption at par at each reset date. Interest expense related to the Funds' liability with respect to Floating Rate Notes is recorded as incurred. At February 29, 2008, the amounts of the Funds' Floating Rate Notes and related interest rates and collateral were as follows:
| Fund | | Floating
Rate
Notes
Outstanding | | Interest Rate
or Range of
Interest
Rates (%) | | Collateral
for Floating
Rate
Notes
Outstanding | |
| Alabama | | $ | 1,840,000 | | | 3.19 – 3.56 | | $ | 2,568,179 | | |
| Arkansas | | | 2,165,000 | | | 3.17 – 3.56 | | | 3,202,580 | | |
| Georgia | | | 2,335,000 | | | 3.17 | | | 3,365,809 | | |
| Louisiana | | | 2,065,000 | | | 3.17 – 5.50 | | | 2,875,598 | | |
| Maryland | | | 4,975,000 | | | 3.41 – 3.56 | | | 7,179,610 | | |
| Missouri | | | 2,945,000 | | | 3.17 – 4.62 | | | 4,250,292 | | |
| North Carolina | | | 7,650,000 | | | 3.17 – 5.50 | | | 11,550,495 | | |
| Oregon | | | 8,146,000 | | | 3.17 – 3.36 | | | 11,635,164 | | |
| South Carolina | | | 10,425,000 | | | 3.17 – 3.23 | | | 15,126,205 | | |
| Tennessee | | | 920,000 | | | 3.17 – 4.62 | | | 1,355,787 | | |
| Virginia | | | 13,840,000 | | | 3.16 – 4.62 | | | 21,050,226 | | |
The Funds' investment policies and restrictions expressly permit investments in Inverse Floaters. Inverse floating rate securities typically offer the potential for yields exceeding the yields available on fixed rate bonds with comparable credit quality and maturity. The Funds' investment policies do not allow the Funds to borrow money for purposes of making investments. Management believes that the Funds' restrictions on borrowings do not apply to the secured borrowings deemed to have occurred for accounting purposes pursuant to FAS 140, which is distinct from a legal borrowing of the Funds to which the policies apply. Inverse Floaters held by the Funds are securities exempt from registration under Rule 144A of the Securities Act of 1933.
J Financial Futures Contracts — The Funds may enter into financial futures contracts. The Funds' investment in financial futures contracts is designed for hedging against changes in interest rates or as a substitute for the purchase of securities. Upon entering into a financial futures contract, a Fund is required to deposit with the broker, either in cash or securities an amount equal to a certain percentage of the purchase price (initial margin). Subsequent payments, known as variation margin, are made or received by the Fund each business day, depending on the daily fluctuations in the value of the underlying security, and are recorded as unrealized gains or losses by the Fund. Gains (losses) are r ealized upon the expiration or closing of the financial futures contracts. Should market conditions change unexpectedly, the Fund may not achieve the anticipated benefits of the financial futures contracts and may realize a loss. In entering such contracts, the Fund bears the risk if the counterparties do not perform under the contracts' terms.
K Interest Rate Swaps — A Fund may enter into interest rate swap agreements to enhance return, to hedge against fluctuations in securities prices or interest rates, or as substitution for the purchase or sale of securities. Pursuant to these agreements, a Fund makes periodic payments at a fixed interest rate and, in exchange, receives payments based on the interest rate of a benchmark industry index. During the term of the outstanding swap agreement, changes in the underlying value of the swap are recorded as unrealized gains or losses. The value of the swap is determined by changes in the relationship between two rates of interest. A Fund is exposed to credit loss in the event of non-performance by t he swap counterparty. Risk may also arise from movements in interest rates.
L When Issued Securities and Delayed Delivery Transactions — The Funds may purchase or sell securities on a delayed delivery or when-issued basis. Payment and delivery may take place after the customary settlement period for that security. At the time the transaction is negotiated, the price of the security that will be delivered is fixed. The Funds maintain security positions for these commitments such that sufficient liquid assets will be available to make payments upon settlement. Securities purchased on a delayed delivery or when-issued basis are marked-to-market daily and begin earning interest on settlement date. Losses may arise due to changes in the market value of the underlying securities or if the counterparty does not perform under the contract.
110
Eaton Vance Municipals Funds as of February 29, 2008
NOTES TO FINANCIAL STATEMENTS (Unaudited) CONT'D
M Statement of Cash Flows — The cash amount shown in the Statement of Cash Flows of a Fund is the amount included in the Fund's Statement of Assets and Liabilities and represents the cash on hand at its custodian and does not include any short-term investments.
N Interim Financial Statements — The interim financial statements relating to February 29, 2008 and for the six months then ended have not been audited by an independent registered public accounting firm, but in the opinion of the Funds' management, reflect all adjustments, consisting of normal recurring adjustments, necessary for the fair presentation of the financial statements.
2 Distributions to Shareholders
The net investment income of each Fund is determined daily and substantially all of the net investment income so determined is declared as a dividend to shareholders of record at the time of declaration. Distributions are declared separately for each class of shares. Distributions are paid monthly. Distributions of realized capital gains (reduced by available capital loss carryforwards, if any), are made at least annually. Shareholders may reinvest income and capital gain distributions in additional shares of the same class of a Fund at the net asset value as of the reinvestment date or, at the election of the shareholder, receive distributions in cash. The Funds distinguish between distributions on a tax basis and a financial reporting basis. Accounting principles generally accepted in the United States of America require that only distributions in excess of tax basis earnings and profits be reported in the financial statements as a return of capital. Permanent differences between book and tax accounting relating to distributions are reclassified to paid-in capital.
3 Investment Adviser Fee and Other Transactions with Affiliates
The investment adviser fee is earned by Boston Management and Research (BMR), a subsidiary of Eaton Vance Management (EVM), as compensation for management and investment advisory services rendered to each Fund. The fee is based upon a percentage of average daily net assets plus a percentage of gross income (i.e., income other than gains from the sale of securities) and is payable monthly. For the six months ended February 29, 2008, advisory fees incurred by the Funds and the effective annual rates, as a percentage of average daily net assets, were as follows:
| Fund | | Amount | | Effective
Annual Rate | |
| Alabama | | $ | 85,325 | | | | 0.29 | % | |
| Arkansas | | | 102,492 | | | | 0.31 | % | |
| Georgia | | | 153,142 | | | | 0.35 | % | |
| Fund | | Amount | | Effective
Annual Rate | |
| Kentucky | | $ | 91,878 | | | | 0.30 | % | |
| Louisiana | | | 55,477 | | | | 0.25 | % | |
| Maryland | | | 175,120 | | | | 0.36 | % | |
| Missouri | | | 197,110 | | | | 0.37 | % | |
| North Carolina | | | 173,044 | | | | 0.36 | % | |
| Oregon | | | 272,922 | | | | 0.39 | % | |
| South Carolina | | | 262,290 | | | | 0.38 | % | |
| Tennessee | | | 89,512 | | | | 0.30 | % | |
| Virginia | | | 260,678 | | | | 0.39 | % | |
EVM serves as administrator of each Fund, but receives no compensation. EVM serves as the sub-transfer agent of each Fund and receives from the transfer agent an aggregate fee based upon the actual expenses incurred by EVM in the performance of these services. Eaton Vance Distributors, Inc. (EVD), the Funds' principal underwriter and a subsidiary of EVM, receives a portion of the sales charge on sales of Class A shares of the Funds. EVD also receives distribution and service fees from Class A, Class B and Class C shares (see Note 4) and contingent deferred sales charges (see Note 5). Sub-transfer agent fees earned by EVM and Class A sales charges that the Funds were informed were received by EVD for the six months ended February 29, 2008 were as follows:
| Fund | | EVM's
Sub-transfer
Agent Fees | | EVD's
Class A
Sales Charges | |
| Alabama | | $ | 676 | | | $ | 2,536 | | |
| Arkansas | | | 812 | | | | 5,636 | | |
| Georgia | | | 939 | | | | 5,561 | | |
| Kentucky | | | 796 | | | | 1,951 | | |
| Louisiana | | | 293 | | | | 2,117 | | |
| Maryland | | | 1,082 | | | | 7,700 | | |
| Missouri | | | 1,345 | | | | 6,094 | | |
| North Carolina | | | 1,289 | | | | 5,693 | | |
| Oregon | | | 1,546 | | | | 15,104 | | |
| South Carolina | | | 1,234 | | | | 10,321 | | |
| Tennessee | | | 708 | | | | 4,706 | | |
| Virginia | | | 1,722 | | | | 4,118 | | |
Except for Trustees of the Funds who are not members of EVM's or BMR's organizations, officers and Trustees receive remuneration for their services to the Funds out of the investment adviser fee. Trustees of the Funds who are not affiliated with the investment adviser may elect to defer receipt of all or a percentage of their annual fees
111
Eaton Vance Municipals Funds as of February 29, 2008
NOTES TO FINANCIAL STATEMENTS (Unaudited) CONT'D
in accordance with the terms of the Trustees Deferred Compensation Plan. For the six months ended February 29, 2008, no significant amounts have been deferred. Certain officers and Trustees of the Funds are officers of the above organizations.
4 Distribution Plans
Each Fund has in effect a distribution plan for Class A shares (Class A Plan) pursuant to Rule 12b-1 under the 1940 Act. The Class A Plan provides that each Fund will pay EVD a distribution and service fee not exceeding 0.25% per annum of its average daily net assets attributable to Class A shares for distribution services and facilities provided to each Fund by EVD, as well as for personal services and/or the maintenance of shareholder accounts. The Trustees approved distribution and service fee payments equal to 0.20% per annum of each Fund's average daily net assets attributable to Class A shares. Distribution and service fees paid or accrued to EVD for the six months ended February 29, 2008 for Class A shares amounted to the following:
| Fund | | Class A
Distribution and
Service Fees | |
| Alabama | | $ | 46,390 | | |
| Arkansas | | | 57,651 | | |
| Georgia | | | 71,551 | | |
| Kentucky | | | 50,856 | | |
| Louisiana | | | 39,983 | | |
| Maryland | | | 77,170 | | |
| Missouri | | | 93,582 | | |
| North Carolina | | | 82,966 | | |
| Oregon | | | 114,797 | | |
| South Carolina | | | 106,759 | | |
| Tennessee | | | 50,507 | | |
| Virginia | | | 110,697 | | |
Each Fund also has in effect distribution plans for Class B shares (Class B Plan) and Class C shares (Class C Plan) pursuant to Rule 12b-1 under the 1940 Act. The Class B and Class C Plans require each Fund to pay EVD amounts equal to 0.75% per annum of its average daily net assets attributable to Class B and Class C shares for providing ongoing distribution services and facilities to the respective Funds. Each Fund will automatically discontinue payments to EVD during any period in which there are no outstanding Uncovered Distribution Charges, which are equivalent to the sum of (i) 5% and 6.25% of the aggregate amount received by each Fund for Class B and Class C shares sold, respectively, plus (ii) interest calculated by applying the rate of 1% over the prevailing prime rate to the outstanding balance of Uncovered Distribution Charges of EVD of each respec tive class, reduced by the aggregate amount of contingent deferred sales charges (see Note 5) and amounts theretofore paid or payable to EVD by each respective class. For the six months ended February 29, 2008, the Funds paid or accrued to EVD the following distribution fees, representing 0.75% (annualized) of the average daily net assets of each Fund's Class B and Class C shares:
| Fund | | Class B
Distribution Fees | | Class C
Distribution Fees | |
| Alabama | | $ | 38,351 | | | $ | 5,873 | | |
| Arkansas | | | 19,489 | | | | 9,719 | | |
| Georgia | | | 39,773 | | | | 23,125 | | |
| Kentucky | | | 28,751 | | | | 8,252 | | |
| Louisiana | | | 16,766 | | | | 2 | | |
| Maryland | | | 45,679 | | | | 29,750 | | |
| Missouri | | | 34,782 | | | | 17,430 | | |
| North Carolina | | | 29,242 | | | | 22,705 | | |
| Oregon | | | 61,509 | | | | 35,458 | | |
| South Carolina | | | 53,089 | | | | 59,212 | | |
| Tennessee | | | 23,122 | | | | 11,610 | | |
| Virginia | | | 66,455 | | | | 25,522 | | |
At February 29, 2008, the amounts of Uncovered Distribution Charges of EVD calculated under the Class B and Class C Plans were approximately as follows:
| Fund | | Class B | | Class C | |
| Alabama | | $ | 1,155,000 | | | $ | 168,000 | | |
| Arkansas | | | 1,068,000 | | | | 196,000 | | |
| Georgia | | | 1,627,000 | | | | 408,000 | | |
| Kentucky | | | 1,149,000 | | | | 136,000 | | |
| Louisiana | | | 701,000 | | | | 60 | | |
| Maryland | | | 3,422,000 | | | | 582,000 | | |
| Missouri | | | 441,000 | | | | 282,000 | | |
| North Carolina | | | 1,617,000 | | | | 416,000 | | |
| Oregon | | | 1,557,000 | | | | 723,000 | | |
| South Carolina | | | 1,221,000 | | | | 1,220,000 | | |
| Tennessee | | | 670,000 | | | | 185,000 | | |
| Virginia | | | 1,028,000 | | | | 475,000 | | |
The Class B and Class C Plans also authorize the Funds to make payments of service fees to EVD, investment dealers and other persons in amounts not exceeding 0.25% per annum of the average daily net assets attributable to that class. The Trustees approved service fee payments equal to 0.20% per annum of each Fund's average daily net assets attributable to Class B and
112
Eaton Vance Municipals Funds as of February 29, 2008
NOTES TO FINANCIAL STATEMENTS (Unaudited) CONT'D
Class C shares. Service fees paid or accrued are for personal services and/or the maintenance of shareholder accounts. They are separate and distinct from the Class B and Class C sales commissions and distribution fees and, as such, are not subject to automatic discontinuance when there are no outstanding Uncovered Distribution Charges of EVD. Service fees paid or accrued for the six months ended February 29, 2008 amounted to the following:
| Fund | | Class B
Service Fees | | Class C
Service Fees | |
| Alabama | | $ | 10,227 | | | $ | 1,566 | | |
| Arkansas | | | 5,197 | | | | 2,592 | | |
| Georgia | | | 10,606 | | | | 6,167 | | |
| Kentucky | | | 7,667 | | | | 2,200 | | |
| Louisiana | | | 4,471 | | | | 1 | | |
| Maryland | | | 12,148 | | | | 7,900 | | |
| Missouri | | | 9,275 | | | | 4,648 | | |
| North Carolina | | | 7,798 | | | | 6,055 | | |
| Oregon | | | 16,402 | | | | 9,456 | | |
| South Carolina | | | 14,157 | | | | 15,790 | | |
| Tennessee | | | 6,166 | | | | 3,096 | | |
| Virginia | | | 17,721 | | | | 6,806 | | |
5 Contingent Deferred Sales Charges
A contingent deferred sales charge (CDSC) generally is imposed on redemptions of Class B shares made within six years of purchase and on redemptions of Class C shares made within one year of purchase. Class A shares may be subject to a 1% CDSC if redeemed within eighteen months of purchase (depending on the circumstances of purchase) or a 1% or 0.50% CDSC if redeemed within one year or two years, respectively, on purchases through the Eaton Vance Supplemental Retirement Account. Generally, the CDSC is based upon the lower of the net asset value at date of redemption or date of purchase. No charge is levied on shares acquired by reinvestment of dividends or capital gains distributions. The CDSC for Class B shares is imposed at declining rates that begin at 5% in the case of redemptions in the first and second year after purchase, declining one percentage point each subsequent year. Class C shares are subject to a 1% CDSC if redee med within one year of purchase. No CDSC is levied on shares which have been sold to EVM or its affiliates or to their respective employees or clients and may be waived under certain other limited conditions. CDSCs received on Class B and Class C redemptions are paid to EVD to reduce the amount of Uncovered Distribution Charges calculated under each Fund's Class B and Class C Plans. CDSCs received on Class B and Class C redemptions when no Uncovered Distribution Charges exist are credited to each Fund. For the six months ended February 29, 2008, the Funds were informed that EVD received approximately the following amounts of CDSCs paid by Class A, Class B and Class C shareholders:
| Fund | | Class A | | Class B | | Class C | |
| Alabama | | $ | — | | | $ | 900 | | | $ | 6,000 | | |
| Arkansas | | | 5,000 | | | | 6,000 | | | | 1,000 | | |
| Georgia | | | — | | | | 11,000 | | | | 100 | | |
| Kentucky | | | — | | | | 9,000 | | | | — | | |
| Louisiana | | | 900 | | | | 3,000 | | | | — | | |
| Maryland | | | 9,000 | | | | 10,000 | | | | 600 | | |
| Missouri | | | — | | | | 3,000 | | | | 900 | | |
| North Carolina | | | — | | | | 15,000 | | | | 2,000 | | |
| Oregon | | | — | | | | 4,000 | | | | 3,000 | | |
| South Carolina | | | 3,000 | | | | 19,000 | | | | 2,000 | | |
| Tennessee | | | — | | | | 2,000 | | | | — | | |
| Virginia | | | 9,000 | | | | 6,000 | | | | — | | |
6 Purchases and Sales of Investments
Purchases and sales of investments, other than short-term obligations, for the six months ended February 29, 2008, were as follows:
| Fund | | Purchases | | Sales | |
| Alabama | | $ | 4,530,137 | | | $ | 4,115,280 | | |
| Arkansas | | | 1,509,150 | | | | 5,184,482 | | |
| Georgia | | | 18,232,140 | | | | 19,850,211 | | |
| Kentucky | | | 5,146,974 | | | | 8,976,353 | | |
| Louisiana | | | 5,251,710 | | | | 8,624,670 | | |
| Maryland | | | 9,681,920 | | | | 9,787,941 | | |
| Missouri | | | 9,898,327 | | | | 7,242,186 | | |
| North Carolina | | | 8,961,347 | | | | 14,067,905 | | |
| Oregon | | | 19,086,627 | | | | 13,484,336 | | |
| South Carolina | | | 27,597,268 | | | | 26,220,710 | | |
| Tennessee | | | 7,700,253 | | | | 8,324,678 | | |
| Virginia | | | 21,215,568 | | | | 26,013,864 | | |
113
Eaton Vance Municipals Funds as of February 29, 2008
NOTES TO FINANCIAL STATEMENTS (Unaudited) CONT'D
7 Shares of Beneficial Interest
Each Fund's Declaration of Trust permits the Trustees to issue an unlimited number of full and fractional shares of beneficial interest (without par value). Such shares may be issued in a number of different series (such as the Funds) and classes. Transactions in Fund shares were as follows:
Alabama Fund
| Class A | | Six Months Ended
February 29, 2008
(Unaudited) | | Year Ended
August 31, 2007 | |
| Sales | | | 704,079 | | | | 653,226 | | |
Issued to shareholders electing to
receive payments of distributions
in Fund shares | | | 64,491 | | | | 103,256 | | |
| Redemptions | | | (384,605 | ) | | | (628,416 | ) | |
| Exchange from Class B shares | | | 90,224 | | | | 200,036 | | |
| Net increase | | | 474,189 | | | | 328,102 | | |
| Class B | | Six Months Ended
February 29, 2008
(Unaudited) | | Year Ended
August 31, 2007 | |
| Sales | | | 22,170 | | | | 41,240 | | |
Issued to shareholders electing to
receive payments of distributions
in Fund shares | | | 11,703 | | | | 24,152 | | |
| Redemptions | | | (38,631 | ) | | | (142,559 | ) | |
| Exchange to Class A shares | | | (82,025 | ) | | | (181,791 | ) | |
| Net decrease | | | (86,783 | ) | | | (258,958 | ) | |
| Class C | | Six Months Ended
February 29, 2008
(Unaudited) | | Year Ended
August 31, 2007 | |
| Sales | | | 105,627 | | | | 175,192 | | |
Issued to shareholders electing to
receive payments of distributions
in Fund shares | | | 2,098 | | | | 3,689 | | |
| Redemptions | | | (127,477 | ) | | | (112,007 | ) | |
| Net increase (decrease) | | | (19,752 | ) | | | 66,874 | | |
Arkansas Fund
| Class A | | Six Months Ended
February 29, 2008
(Unaudited) | | Year Ended
August 31, 2007 | |
| Sales | | | 533,998 | | | | 1,671,467 | | |
Issued to shareholders electing to
receive payments of distributions
in Fund shares | | | 74,073 | | | | 127,119 | | |
| Redemptions | | | (610,525 | ) | | | (703,729 | ) | |
| Exchange from Class B shares | | | 25,703 | | | | 119,956 | | |
| Net increase | | | 23,249 | | | | 1,214,813 | | |
| Class B | | Six Months Ended
February 29, 2008
(Unaudited) | | Year Ended
August 31, 2007 | |
| Sales | | | 16,199 | | | | 9,547 | | |
Issued to shareholders electing to
receive payments of distributions
in Fund shares | | | 4,732 | | | | 12,320 | | |
| Redemptions | | | (29,777 | ) | | | (153,332 | ) | |
| Exchange to Class A shares | | | (23,911 | ) | | | (111,630 | ) | |
| Net decrease | | | (32,757 | ) | | | (243,095 | ) | |
| Class C | | Six Months Ended
February 29, 2008
(Unaudited) | | Year Ended
August 31, 2007 | |
| Sales | | | 43,240 | | | | 213,411 | | |
Issued to shareholders electing to
receive payments of distributions
in Fund shares | | | 1,338 | | | | 1,609 | | |
| Redemptions | | | (67,082 | ) | | | (10,177 | ) | |
| Net increase (decrease) | | | (22,504 | ) | | | 204,843 | | |
Georgia Fund
| Class A | | Six Months Ended
February 29, 2008
(Unaudited) | | Year Ended
August 31, 2007 | |
| Sales | | | 995,729 | | | | 2,732,538 | | |
Issued to shareholders electing to
receive payments of distributions
in Fund shares | | | 94,556 | | | | 155,755 | | |
| Redemptions | | | (997,098 | ) | | | (670,074 | ) | |
| Exchange from Class B shares | | | 23,642 | | | | 142,897 | | |
| Net increase | | | 116,829 | | | | 2,361,116 | | |
114
Eaton Vance Municipals Funds as of February 29, 2008
NOTES TO FINANCIAL STATEMENTS (Unaudited) CONT'D
Georgia Fund (continued)
| Class B | | Six Months Ended
February 29, 2008
(Unaudited) | | Year Ended
August 31, 2007 | |
| Sales | | | 17,180 | | | | 52,686 | | |
Issued to shareholders electing to
receive payments of distributions
in Fund shares | | | 10,755 | | | | 23,240 | | |
| Redemptions | | | (159,388 | ) | | | (101,749 | ) | |
| Exchange to Class A shares | | | (22,123 | ) | | | (133,751 | ) | |
| Net decrease | | | (153,576 | ) | | | (159,574 | ) | |
| Class C | | Six Months Ended
February 29, 2008
(Unaudited) | | Year Ended
August 31, 2007 | |
| Sales | | | 268,244 | | | | 579,454 | | |
Issued to shareholders electing to
receive payments of distributions
in Fund shares | | | 7,173 | | | | 6,684 | | |
| Redemptions | | | (239,543 | ) | | | (55,920 | ) | |
| Net increase | | | 35,874 | | | | 530,218 | | |
Kentucky Fund
| Class A | | Six Months Ended
February 29, 2008
(Unaudited) | | Year Ended
August 31, 2007 | |
| Sales | | | 226,006 | | | | 365,207 | | |
Issued to shareholders electing to
receive payments of distributions
in Fund shares | | | 79,098 | | | | 151,535 | | |
| Redemptions | | | (352,837 | ) | | | (619,652 | ) | |
| Exchange from Class B shares | | | 46,810 | | | | 109,267 | | |
| Net increase (decrease) | | | (923 | ) | | | 6,357 | | |
| Class B | | Six Months Ended
February 29, 2008
(Unaudited) | | Year Ended
August 31, 2007 | |
| Sales | | | 4,570 | | | | 24,913 | | |
Issued to shareholders electing to
receive payments of distributions
in Fund shares | | | 8,756 | | | | 19,689 | | |
| Redemptions | | | (66,511 | ) | | | (127,315 | ) | |
| Exchange to Class A shares | | | (43,362 | ) | | | (101,219 | ) | |
| Net decrease | | | (96,547 | ) | | | (183,932 | ) | |
| Class C | | Six Months Ended
February 29, 2008
(Unaudited) | | Year Ended
August 31, 2007 | |
| Sales | | | 44,819 | | | | 188,584 | | |
Issued to shareholders electing to
receive payments of distributions
in Fund shares | | | 3,462 | | | | 3,409 | | |
| Redemptions | | | (11,111 | ) | | | (15,835 | ) | |
| Net increase | | | 37,170 | | | | 176,158 | | |
Louisiana Fund
| Class A | | Six Months Ended
February 29, 2008
(Unaudited) | | Year Ended
August 31, 2007 | |
| Sales | | | 411,113 | | | | 1,487,178 | | |
Issued to shareholders electing to
receive payments of distributions
in Fund shares | | | 45,429 | | | | 79,036 | | |
| Redemptions | | | (598,955 | ) | | | (212,736 | ) | |
| Exchange from Class B shares | | | 4,793 | | | | 113,211 | | |
| Net increase (decrease) | | | (137,620 | ) | | | 1,466,689 | | |
| Class B | | Six Months Ended
February 29, 2008
(Unaudited) | | Year Ended
August 31, 2007 | |
| Sales | | | 15,404 | | | | 40,203 | | |
Issued to shareholders electing to
receive payments of distributions
in Fund shares | | | 2,783 | | | | 5,440 | | |
| Redemptions | | | (20,168 | ) | | | (80,778 | ) | |
| Exchange to Class A shares | | | (4,536 | ) | | | (107,106 | ) | |
| Net decrease | | | (6,517 | ) | | | (142,241 | ) | |
| Class C | | Period Ended
February 29, 2008
(Unaudited)(1) | | | |
| Sales | | | 98 | | | | | | |
Issued to shareholders electing to
receive payments of distributions
in Fund shares | | | 1 | | | | | | |
| Net increase | | | 99 | | | | | | |
115
Eaton Vance Municipals Funds as of February 29, 2008
NOTES TO FINANCIAL STATEMENTS (Unaudited) CONT'D
Maryland Fund
| Class A | | Six Months Ended
February 29, 2008
(Unaudited) | | Year Ended
August 31, 2007 | |
| Sales | | | 1,491,070 | | | | 3,026,941 | | |
Issued to shareholders electing to
receive payments of distributions
in Fund shares | | | 127,350 | | | | 215,292 | | |
| Redemptions | | | (1,307,842 | ) | | | (1,168,252 | ) | |
| Exchange from Class B shares | | | 93,073 | | | | 272,184 | | |
| Net increase | | | 403,651 | | | | 2,346,165 | | |
| Class B | | Six Months Ended
February 29, 2008
(Unaudited) | | Year Ended
August 31, 2007 | |
| Sales | | | 15,999 | | | | 64,745 | | |
Issued to shareholders electing to
receive payments of distributions
in Fund shares | | | 13,657 | | | | 33,122 | | |
| Redemptions | | | (108,949 | ) | | | (198,943 | ) | |
| Exchange to Class A shares | | | (85,325 | ) | | | (249,499 | ) | |
| Net decrease | | | (164,618 | ) | | | (350,575 | ) | |
| Class C | | Six Months Ended
February 29, 2008
(Unaudited) | | Year Ended
August 31, 2007 | |
| Sales | | | 277,943 | | | | 681,893 | | |
Issued to shareholders electing to
receive payments of distributions
in Fund shares | | | 9,582 | | | | 6,199 | | |
| Redemptions | | | (65,944 | ) | | | (39,286 | ) | |
| Net increase | | | 221,581 | | | | 648,806 | | |
Missouri Fund
| Class A | | Six Months Ended
February 29, 2008
(Unaudited) | | Year Ended
August 31, 2007 | |
| Sales | | | 1,183,786 | | | | 3,517,868 | | |
Issued to shareholders electing to
receive payments of distributions
in Fund shares | | | 127,881 | | | | 194,125 | | |
| Redemptions | | | (719,154 | ) | | | (1,030,428 | ) | |
| Exchange from Class B shares | | | 57,614 | | | | 133,431 | | |
| Net increase | | | 650,127 | | | | 2,814,996 | | |
| Class B | | Six Months Ended
February 29, 2008
(Unaudited) | | Year Ended
August 31, 2007 | |
| Sales | | | 37,602 | | | | 92,578 | | |
Issued to shareholders electing to
receive payments of distributions
in Fund shares | | | 7,822 | | | | 18,299 | | |
| Redemptions | | | (57,166 | ) | | | (96,025 | ) | |
| Exchange to Class A shares | | | (52,123 | ) | | | (120,651 | ) | |
| Net decrease | | | (63,865 | ) | | | (105,799 | ) | |
| Class C | | Six Months Ended
February 29, 2008
(Unaudited) | | Year Ended
August 31, 2007 | |
| Sales | | | 53,133 | | | | 321,817 | | |
Issued to shareholders electing to
receive payments of distributions
in Fund shares | | | 5,146 | | | | 5,654 | | |
| Redemptions | | | (28,680 | ) | | | (10,313 | ) | |
| Net increase | | | 29,599 | | | | 317,158 | | |
North Carolina Fund
| Class A | | Six Months Ended
February 29, 2008
(Unaudited) | | Year Ended
August 31, 2007 | |
| Sales | | | 1,329,204 | | | | 1,951,516 | | |
Issued to shareholders electing to
receive payments of distributions
in Fund shares | | | 113,702 | | | | 183,108 | | |
| Redemptions | | | (778,884 | ) | | | (827,166 | ) | |
| Exchange from Class B shares | | | 49,501 | | | | 213,406 | | |
| Net increase | | | 713,523 | | | | 1,520,864 | | |
| Class B | | Six Months Ended
February 29, 2008
(Unaudited) | | Year Ended
August 31, 2007 | |
| Sales | | | 20,926 | | | | 62,711 | | |
Issued to shareholders electing to
receive payments of distributions
in Fund shares | | | 6,904 | | | | 17,809 | | |
| Redemptions | | | (137,811 | ) | | | (205,928 | ) | |
| Exchange to Class A shares | | | (46,000 | ) | | | (198,333 | ) | |
| Net decrease | | | (155,981 | ) | | | (323,741 | ) | |
116
Eaton Vance Municipals Funds as of February 29, 2008
NOTES TO FINANCIAL STATEMENTS (Unaudited) CONT'D
North Carolina Fund (continued)
| Class C | | Six Months Ended
February 29, 2008
(Unaudited) | | Year Ended
August 31, 2007 | |
| Sales | | | 370,127 | | | | 440,492 | | |
Issued to shareholders electing to
receive payments of distributions
in Fund shares | | | 7,502 | | | | 7,794 | | |
| Redemptions | | | (162,400 | ) | | | (5,226 | ) | |
| Net increase | | | 215,229 | | | | 443,060 | | |
Oregon Fund
| Class A | | Six Months Ended
February 29, 2008
(Unaudited) | | Year Ended
August 31, 2007 | |
| Sales | | | 1,976,632 | | | | 4,856,458 | | |
Issued to shareholders electing to
receive payments of distributions
in Fund shares | | | 179,443 | | | | 264,173 | | |
| Redemptions | | | (1,014,192 | ) | | | (1,261,229 | ) | |
| Exchange from Class B shares | | | 111,953 | | | | 303,103 | | |
| Net increase | | | 1,253,836 | | | | 4,162,505 | | |
| Class B | | Six Months Ended
February 29, 2008
(Unaudited) | | Year Ended
August 31, 2007 | |
| Sales | | | 54,004 | | | | 150,002 | | |
Issued to shareholders electing to
receive payments of distributions
in Fund shares | | | 17,595 | | | | 38,773 | | |
| Redemptions | | | (81,276 | ) | | | (237,486 | ) | |
| Exchange to Class A shares | | | (102,339 | ) | | | (277,108 | ) | |
| Net decrease | | | (112,016 | ) | | | (325,819 | ) | |
| Class C | | Six Months Ended
February 29, 2008
(Unaudited) | | Year Ended
August 31, 2007 | |
| Sales | | | 425,050 | | | | 769,942 | | |
Issued to shareholders electing to
receive payments of distributions
in Fund shares | | | 11,752 | | | | 10,887 | | |
| Redemptions | | | (89,468 | ) | | | (19,272 | ) | |
| Net increase | | | 347,334 | | | | 761,557 | | |
South Carolina Fund
| Class A | | Six Months Ended
February 29, 2008
(Unaudited) | | Year Ended
August 31, 2007 | |
| Sales | | | 2,058,165 | | | | 4,583,212 | | |
Issued to shareholders electing to
receive payments of distributions
in Fund shares | | | 153,510 | | | | 227,700 | | |
| Redemptions | | | (1,336,797 | ) | | | (1,359,186 | ) | |
| Exchange from Class B shares | | | 23,652 | | | | 168,366 | | |
| Net increase | | | 898,530 | | | | 3,620,092 | | |
| Class B | | Six Months Ended
February 29, 2008
(Unaudited) | | Year Ended
August 31, 2007 | |
| Sales | | | 50,179 | | | | 124,928 | | |
Issued to shareholders electing to
receive payments of distributions
in Fund shares | | | 14,346 | | | | 29,317 | | |
| Redemptions | | | (136,855 | ) | | | (236,701 | ) | |
| Exchange to Class A shares | | | (22,306 | ) | | | (158,781 | ) | |
| Net decrease | | | (94,636 | ) | | | (241,237 | ) | |
| Class C | | Six Months Ended
February 29, 2008
(Unaudited) | | Year Ended
August 31, 2007 | |
| Sales | | | 702,788 | | | | 1,130,734 | | |
Issued to shareholders electing to
receive payments of distributions
in Fund shares | | | 17,351 | | | | 15,256 | | |
| Redemptions | | | (224,352 | ) | | | (34,320 | ) | |
| Net increase | | | 495,787 | | | | 1,111,670 | | |
Tennessee Fund
| Class A | | Six Months Ended
February 29, 2008
(Unaudited) | | Year Ended
August 31, 2007 | |
| Sales | | | 372,193 | | | | 828,170 | | |
Issued to shareholders electing to
receive payments of distributions
in Fund shares | | | 65,903 | | | | 114,566 | | |
| Redemptions | | | (369,872 | ) | | | (495,023 | ) | |
| Exchange from Class B shares | | | 15,887 | | | | 70,366 | | |
| Net increase | | | 84,111 | | | | 518,079 | | |
117
Eaton Vance Municipals Funds as of February 29, 2008
NOTES TO FINANCIAL STATEMENTS (Unaudited) CONT'D
Tennessee Fund (continued)
| Class B | | Six Months Ended
February 29, 2008
(Unaudited) | | Year Ended
August 31, 2007 | |
| Sales | | | 8,244 | | | | 26,826 | | |
Issued to shareholders electing to
receive payments of distributions
in Fund shares | | | 6,725 | | | | 15,911 | | |
| Redemptions | | | (16,254 | ) | | | (184,203 | ) | |
| Exchange to Class A shares | | | (14,582 | ) | | | (64,613 | ) | |
| Net decrease | | | (15,867 | ) | | | (206,079 | ) | |
| Class C | | Six Months Ended
February 29, 2008
(Unaudited) | | Year Ended
August 31, 2007 | |
| Sales | | | 87,826 | | | | 211,047 | | |
Issued to shareholders electing to
receive payments of distributions
in Fund shares | | | 2,686 | | | | 2,410 | | |
| Redemptions | | | (19,715 | ) | | | (6,931 | ) | |
| Net increase | | | 70,797 | | | | 206,526 | | |
Virginia Fund
| Class A | | Six Months Ended
February 29, 2008
(Unaudited) | | Year Ended
August 31, 2007 | |
| Sales | | | 2,011,768 | | | | 3,194,126 | | |
Issued to shareholders electing to
receive payments of distributions
in Fund shares | | | 163,434 | | | | 265,326 | | |
| Redemptions | | | (1,757,060 | ) | | | (1,344,714 | ) | |
| Exchange from Class B shares | | | 62,911 | | | | 367,370 | | |
| Net increase | | | 481,053 | | | | 2,482,108 | | |
| Class B | | Six Months Ended
February 29, 2008
(Unaudited) | | Year Ended
August 31, 2007 | |
| Sales | | | 111,044 | | | | 157,819 | | |
Issued to shareholders electing to
receive payments of distributions
in Fund shares | | | 20,238 | | | | 41,599 | | |
| Redemptions | | | (262,738 | ) | | | (269,219 | ) | |
| Exchange to Class A shares | | | (56,824 | ) | | | (331,831 | ) | |
| Net decrease | | | (188,280 | ) | | | (401,632 | ) | |
| Class C | | Six Months Ended
February 29, 2008
(Unaudited) | | Year Ended
August 31, 2007 | |
| Sales | | | 376,684 | | | | 484,478 | | |
Issued to shareholders electing to
receive payments of distributions
in Fund shares | | | 9,798 | | | | 7,844 | | |
| Redemptions | | | (49,057 | ) | | | (33,492 | ) | |
| Net increase | | | 337,425 | | | | 458,830 | | |
(1) Class C of the Louisiana Fund commenced operations on December 4, 2007.
8 Federal Income Tax Basis of Investments
The cost and unrealized appreciation (depreciation) of investments of each Fund at February 29, 2008, as determined on a federal income tax basis, were as follows:
| Alabama Fund | |
| Aggregate cost | | $ | 56,758,733 | | |
| Gross unrealized appreciation | | $ | 1,526,614 | | |
| Gross unrealized depreciation | | | (3,068,921 | ) | |
| Net unrealized depreciation | | $ | (1,542,307 | ) | |
| Arkansas Fund | |
| Aggregate cost | | $ | 62,666,953 | | |
| Gross unrealized appreciation | | $ | 1,053,661 | | |
| Gross unrealized depreciation | | | (5,228,230 | ) | |
| Net unrealized depreciation | | $ | (4,174,569 | ) | |
| Georgia Fund | |
| Aggregate cost | | $ | 84,900,225 | | |
| Gross unrealized appreciation | | $ | 1,620,025 | | |
| Gross unrealized depreciation | | | (6,419,287 | ) | |
| Net unrealized depreciation | | $ | (4,799,262 | ) | |
| Kentucky Fund | |
| Aggregate cost | | $ | 60,477,481 | | |
| Gross unrealized appreciation | | $ | 1,757,348 | | |
| Gross unrealized depreciation | | | (2,583,012 | ) | |
| Net unrealized depreciation | | $ | (825,664 | ) | |
118
Eaton Vance Municipals Funds as of February 29, 2008
NOTES TO FINANCIAL STATEMENTS (Unaudited) CONT'D
| Louisiana Fund | |
| Aggregate cost | | $ | 40,952,951 | | |
| Gross unrealized appreciation | | $ | 840,547 | | |
| Gross unrealized depreciation | | | (2,888,020 | ) | |
| Net unrealized depreciation | | $ | (2,047,473 | ) | |
| Maryland Fund | |
| Aggregate cost | | $ | 95,742,747 | | |
| Gross unrealized appreciation | | $ | 1,957,128 | | |
| Gross unrealized depreciation | | | (6,687,002 | ) | |
| Net unrealized depreciation | | $ | (4,729,874 | ) | |
| Missouri Fund | |
| Aggregate cost | | $ | 105,155,930 | | |
| Gross unrealized appreciation | | $ | 2,295,023 | | |
| Gross unrealized depreciation | | | (7,489,928 | ) | |
| Net unrealized depreciation | | $ | (5,194,905 | ) | |
| North Carolina Fund | |
| Aggregate cost | | $ | 94,816,283 | | |
| Gross unrealized appreciation | | $ | 2,615,756 | | |
| Gross unrealized depreciation | | | (4,938,111 | ) | |
| Net unrealized depreciation | | $ | (2,322,355 | ) | |
| Oregon Fund | |
| Aggregate cost | | $ | 145,896,243 | | |
| Gross unrealized appreciation | | $ | 1,342,601 | | |
| Gross unrealized depreciation | | | (12,230,272 | ) | |
| Net unrealized depreciation | | $ | (10,887,671 | ) | |
| South Carolina Fund | |
| Aggregate cost | | $ | 141,661,362 | | |
| Gross unrealized appreciation | | $ | 1,215,980 | | |
| Gross unrealized depreciation | | | (12,409,625 | ) | |
| Net unrealized depreciation | | $ | (11,193,645 | ) | |
| Tennessee Fund | |
| Aggregate cost | | $ | 56,270,613 | | |
| Gross unrealized appreciation | | $ | 1,494,710 | | |
| Gross unrealized depreciation | | | (3,774,031 | ) | |
| Net unrealized depreciation | | $ | (2,279,321 | ) | |
| Virginia Fund | |
| Aggregate cost | | $ | 130,991,432 | | |
| Gross unrealized appreciation | | $ | 3,715,981 | | |
| Gross unrealized depreciation | | | (9,048,035 | ) | |
| Net unrealized depreciation | | $ | (5,332,054 | ) | |
9 Line of Credit
The Funds participate with other portfolios and funds managed by EVM and its affiliates in a $200 million unsecured line of credit agreement with a group of banks. Borrowings are made by the Funds solely to facilitate the handling of unusual and/or unanticipated short-term cash requirements. Interest is charged to each Fund based on its borrowings at an amount above either the Eurodollar rate or Federal Funds rate. In addition, a fee computed at an annual rate of 0.07% on the daily unused portion of the line of credit is allocated among the participating portfolios and funds at the end of each quarter.
At February 29, 2008, the Arkansas Fund, Kentucky Fund, Maryland Fund, South Carolina Fund and Virginia Fund had a balance outstanding pursuant to this line of credit of $100,000, $1,400,000, $700,000, $1,500,000 and $1,100,000, respectively. The Funds did not have any significant borrowings or allocated fees during the six months ended February 29, 2008.
10 Overdraft Advances
Pursuant to the respective custodian agreements, SSBT may, in its discretion, advance funds to the Funds to make properly authorized payments. When such payments result in an overdraft, the Funds are obligated to repay SSBT at the current rate of interest charged by SSBT for secured loans (currently, a rate above the Federal Funds rate). This obligation is payable on demand to SSBT. SSBT has a lien on a Fund's assets to the extent of any overdraft.
At February 29, 2008, the Maryland Fund, Oregon Fund and Virginia Fund had payments due to SSBT pursuant to the foregoing arrangement of $178, $1,004 and $85,544, respectively.
119
Eaton Vance Municipals Funds as of February 29, 2008
NOTES TO FINANCIAL STATEMENTS (Unaudited) CONT'D
11 Financial Instruments
The Funds may trade in financial instruments with off-balance sheet risk in the normal course of their investing activities to assist in managing exposure to various market risks. These financial instruments may include financial futures contracts and interest rate swaps and may involve, to a varying degree, elements of risk in excess of the amounts recognized for financial statement purposes. The notional or contractual amounts of these instruments represent the investment a Fund has in particular classes of financial instruments and does not necessarily represent the amounts potentially subject to risk. The measurement of the risks associated with these instruments is meaningful only when all related and offsetting transactions are considered.
A summary of obligations held under these financial instruments at February 29, 2008 is as follows:
Futures Contracts
Fund | | Expiration
Date | |
Contracts | |
Position | | Aggregate
Cost | |
Value | | Net
Unrealized
Depreciation | |
| Alabama | | 06/08 | | 72
U.S. Treasury Bond | | Short | | $ | (8,264,748 | ) | | $ | (8,541,000 | ) | | $ | (276,252 | ) | |
| Arkansas | | 06/08 | | 100
U.S. Treasury Bond | | Short | | $ | (11,486,369 | ) | | $ | (11,862,500 | ) | | $ | (376,131 | ) | |
| Georgia | | 06/08 | | 135
U.S. Treasury Bond | | Short | | $ | (15,506,598 | ) | | $ | (16,014,375 | ) | | $ | (507,777 | ) | |
| Kentucky | | 06/08 | | 55
U.S. Treasury Bond | | Short | | $ | (6,317,503 | ) | | $ | (6,524,375 | ) | | $ | (206,872 | ) | |
| | 06/08 | | 21
U.S. Treasury Note | | Short | | | (2,427,395 | ) | | | (2,462,906 | ) | | | (35,511 | ) | |
| Louisiana | | 06/08 | | 23
U.S. Treasury Bond | | Short | | $ | (2,634,677 | ) | | $ | (2,728,375 | ) | | $ | (93,698 | ) | |
| Maryland | | 06/08 | | 73
U.S. Treasury Bond | | Short | | $ | (8,362,237 | ) | | $ | (8,659,625 | ) | | $ | (297,388 | ) | |
| Missouri | | 06/08 | | 103
U.S. Treasury Bond | | Short | | $ | (11,830,960 | ) | | $ | (12,218,375 | ) | | $ | (387,415 | ) | |
North
Carolina | | 06/08
| | 200
U.S. Treasury Bond | |
Short | | $ | (22,910,237 | ) | | $ | (23,725,000 | ) | | $ | (814,763 | ) | |
| Oregon | | 06/08 | | 325
U.S. Treasury Bond | | Short | | $ | (37,229,136 | ) | | $ | (38,553,125 | ) | | $ | (1,323,989 | ) | |
South
Carolina | | 06/08
| | 550
U.S. Treasury Bond | |
Short | | $ | (63,003,153 | ) | | $ | (65,243,750 | ) | | $ | (2,240,597 | ) | |
| Tennessee | | 06/08 | | 90
U.S. Treasury Bond | | Short | | $ | (10,337,732 | ) | | $ | (10,676,250 | ) | | $ | (338,518 | ) | |
| Virginia | | 06/08 | | 380
U.S. Treasury Bond | | Short | | $ | (43,648,201 | ) | | $ | (45,077,500 | ) | | $ | (1,429,299 | ) | |
Interest Rate Swaps
Alabama Fund
| Counterparty | | Notional
Amount | | Annual
Fixed Rate
Paid By Fund | | Floating
Rate
Paid To Fund | | Effective Date/
Termination
Date | | Net
Unrealized
Appreciation | |
Merrill Lynch
Capital Services, Inc. | | $ | 1,075,000 | | | | 4.903 | % | | 3-month
USD-LIBOR-BBA | | July 9, 2008/
July 9, 2038 | | $ | 1,764 | | |
| | | | | $ | 1,764 | | |
Arkansas Fund
| Counterparty | | Notional
Amount | | Annual
Fixed Rate
Paid By Fund | | Floating
Rate
Paid To Fund | | Effective Date/
Termination
Date | | Net Unrealized
Appreciation
(Depreciation) | |
| Lehman Brothers, Inc. | | $ | 2,500,000 | | | | 4.003 | %
| | SIFMA
Municipal
Swap Index | | July 24, 2008/
July 24, 2038 | | $ | (11,232 | ) | |
Lehman Brothers, Inc.
| | $ | 1,825,000 |
| | | 4.985 | %
| | 3-month
USD-LIBOR-BBA | | September 28, 2008/
September 28, 2038 | | $ | (9,865 | ) | |
Merrill Lynch
Capital Services, Inc. | | $ | 750,000 | | | | 4.903 | % | | 3-month
USD-LIBOR-BBA | | July 9, 2008/
July 9, 2038 | | $ | 1,230 | | |
Morgan Stanley
Capital Services, Inc. | | $ | 875,000 | | | | 5.428 | % | | 3-month
USD-LIBOR-BBA | | September 10, 2008/
September 10, 2038 | | $ | (66,429 | ) | |
| | | | | $ | (86,296 | ) | |
Georgia Fund
| Counterparty | | Notional
Amount | | Annual
Fixed Rate
Paid By Fund | | Floating
Rate
Paid To Fund | | Effective Date/
Termination
Date | | Net Unrealized
Appreciation
(Depreciation) | |
| Lehman Brothers, Inc. | | $ | 3,225,000 | | | | 4.985 | % | | 3-month
USD-LIBOR-BBA | | September 28, 2008/
September 28, 2038 | | $ | (17,433 | ) | |
Merrill Lynch
Capital Services, Inc. | | $ | 3,075,000 | | | | 4.903 | % | | 3-month
USD-LIBOR-BBA | | July 9, 2008/
July 9, 2038 | | $ | 5,045 | | |
Morgan Stanley
Capital Services, Inc. | | $ | 1,000,000 | | | | 5.428 | % | | 3-month
USD-LIBOR-BBA | | September 10, 2008/
September 10, 2038 | | $ | (75,919 | ) | |
| | | | | $ | (88,307 | ) | |
Kentucky Fund
| Counterparty | | Notional
Amount | | Annual
Fixed Rate
Paid By Fund | | Floating
Rate
Paid To Fund | | Effective Date/
Termination
Date | | Net Unrealized
Appreciation | |
Merrill Lynch
Capital Services, Inc. | | $ | 1,150,000 | | | | 4.903 | % | | 3-month
USD-LIBOR-BBA | | July 9, 2008/
July 9, 2038 | | $ | 1,887 | | |
| | | | | $ | 1,887 | | |
120
Eaton Vance Municipals Funds as of February 29, 2008
NOTES TO FINANCIAL STATEMENTS (Unaudited) CONT'D
Louisiana Fund
| Counterparty | | Notional
Amount | | Annual
Fixed Rate
Paid By Fund | | Floating
Rate
Paid To Fund | | Effective Date/
Termination
Date | | Net Unrealized
Appreciation
(Depreciation) | |
| Lehman Brothers, Inc. | | $ | 1,300,000 | | | | 4.003 | % | | SIFMA
Municipal
Swap Index | | July 24, 2008/
July 24, 2038 | | $ | (5,841 | ) | |
| Lehman Brothers, Inc. | | $ | 1,675,000 | | | | 4.985 | % | | 3-month
USD-LIBOR-BBA | | September 28, 2008/
September 28, 2038 | | $ | (9,054 | ) | |
Merrill Lynch
Capital Services, Inc. | | $ | 1,550,000 | | | | 4.903 | % | | 3-month
USD-LIBOR-BBA | | July 9, 2008/
July 9, 2038 | | $ | 2,542 | | |
Morgan Stanley
Capital Services, Inc. | | $ | 500,000 | | | | 5.428 | % | | 3-month
USD-LIBOR-BBA | | September 10, 2008/
September 10, 2038 | | $ | (37,959 | ) | |
| | | | | $ | (50,312 | ) | |
Maryland Fund
| Counterparty | | Notional
Amount | | Annual
Fixed Rate
Paid By Fund | | Floating
Rate
Paid To Fund | | Effective Date/
Termination
Date | | Net Unrealized
Appreciation
(Depreciation) | |
| Lehman Brothers, Inc. | | $ | 3,675,000 | | | | 4.985 | % | | 3-month
USD-LIBOR-BBA | | September 28, 2008/
September 28, 2038 | | $ | (19,866 | ) | |
Morgan Stanley
Capital Services, Inc. | | $ | 1,100,000 | | | | 5.428 | % | | 3-month
USD-LIBOR-BBA | | September 10, 2008/
September 10, 2038 | | $ | (83,510 | ) | |
Morgan Stanley
Capital Services, Inc. | | $ | 3,000,000 | | | | 3.9515 | % | | SIFMA
Municipal
Swap Index | | September 15, 2008/
September 15, 2038 | | $ | 19,549 | | |
| | | $ | (83,827 | ) | |
Missouri Fund
| Counterparty | | Notional
Amount | | Annual
Fixed Rate
Paid By Fund | | Floating
Rate
Paid To Fund | | Effective Date/
Termination
Date | | Net Unrealized
Appreciation
(Depreciation) | |
| Lehman Brothers, Inc. | | $ | 4,050,000 | | | | 4.985 | % | | 3-month
USD-LIBOR-BBA | | September 28, 2008/
September 28, 2038 | | $ | (21,893 | ) | |
Merrill Lynch
Capital Services, Inc. | | $ | 3,650,000 | | | | 4.903 | % | | 3-month
USD-LIBOR-BBA | | July 9, 2008/
July 9, 2038 | | $ | 5,988 | | |
Morgan Stanley
Capital Services, Inc. | | $ | 1,175,000 | | | | 5.428 | % | | 3-month
USD-LIBOR-BBA | | September 10, 2008/
September 10, 2038 | | $ | (89,204 | ) | |
| | | $ | (105,109 | ) | |
North Carolina Fund
| Counterparty | | Notional
Amount | | Annual
Fixed Rate
Paid By Fund | | Floating
Rate
Paid To Fund | | Effective Date/
Termination
Date | | Net Unrealized
Appreciation
(Depreciation) | |
| Lehman Brothers, Inc. | | $ | 4,000,000 | | | | 4.003 | % | | SIFMA
Municipal
Swap Index | | July 24, 2008/
July 24,2038 | | $ | (17,972 | ) | |
| Lehman Brothers, Inc. | | $ | 2,925,000 | | | | 4.985 | % | | 3-month
USD-LIBOR-BBA | | September 28, 2008/
September 28, 2038 | | $ | (15,811 | ) | |
Merrill Lynch
Capital Services, Inc. | | $ | 1,500,000 | | | | 4.903 | % | | 3-month
USD-LIBOR-BBA | | July 9, 2008/
July 9, 2038 | | $ | 2,460 | | |
Morgan Stanley
Capital Services, Inc. | | $ | 1,225,000 | | | | 5.428 | % | | 3-month
USD-LIBOR-BBA | | September 10, 2008/
September 10, 2038 | | $ | (93,000 | ) | |
| | | $ | (124,323 | ) | |
Oregon Fund
| Counterparty | | Notional
Amount | | Annual
Fixed Rate
Paid By Fund | | Floating
Rate
Paid To Fund | | Effective Date/
Termination
Date | | Net Unrealized
Appreciation
(Depreciation) | |
| Lehman Brothers, Inc. | | $ | 5,000,000 | | | | 4.003 | % | | SIFMA
Municipal
Swap Index | | July 24, 2008/
July 24, 2038 | | $ | (22,465 | ) | |
| Lehman Brothers, Inc. | | $ | 3,650,000 | | | | 4.985 | % | | 3-month
USD-LIBOR-BBA | | September 28, 2008/
September 28, 2038 | | $ | (19,731 | ) | |
Merrill Lynch
Capital Services, Inc. | | $ | 2,500,000 | | | | 4.903 | % | | 3-month
USD-LIBOR-BBA | | July 9, 2008/
July 9, 2038 | | $ | 4,102 | | |
Morgan Stanley
Capital Services, Inc. | | $ | 1,475,000 | | | | 5.428 | % | | 3-month
USD-LIBOR-BBA | | September 10, 2008/
September 10, 2038 | | $ | (111,980 | ) | |
| | | $ | (150,074 | ) | |
South Carolina Fund
| Counterparty | | Notional
Amount | | Annual
Fixed Rate
Paid By Fund | | Floating
Rate
Paid To Fund | | Effective Date/
Termination
Date | | Net Unrealized
Appreciation
(Depreciation) | |
| Lehman Brothers, Inc. | | $ | 3,000,000 | | | | 4.003 | % | | SIFMA
Municipal
Swap Index | | July 24, 2008/
July 24, 2038 | | $ | (13,479 | ) | |
| Lehman Brothers, Inc. | | $ | 2,200,000 | | | | 4.985 | % | | 3-month
USD-LIBOR-BBA | | September 28, 2008/
September 28, 2038 | | $ | (11,892 | ) | |
Merrill Lynch
Capital Services, Inc. | | $ | 3,000,000 | | | | 4.903 | % | | 3-month
USD-LIBOR-BBA | | July 9, 2008/
July 9, 2038 | | $ | 4,921 | | |
Morgan Stanley
Capital Services, Inc. | | $ | 2,000,000 | | | | 5.428 | % | | 3-month
USD-LIBOR-BBA | | September 10, 2008/
September 10, 2038 | | $ | (151,837 | ) | |
| | | $ | (172,287 | ) | |
121
Eaton Vance Municipals Funds as of February 29, 2008
NOTES TO FINANCIAL STATEMENTS (Unaudited) CONT'D
Tennessee Fund
| Counterparty | | Notional
Amount | | Annual
Fixed Rate
Paid By Fund | | Floating
Rate
Paid To Fund | | Effective Date/
Termination
Date | | Net Unrealized
Appreciation
(Depreciation) | |
| Lehman Brothers, Inc. | | $ | 2,300,000 | | | | 4.985 | % | | 3-month
USD-LIBOR-BBA | | September 28, 2008/
September 28, 2038 | | $ | (12,433 | ) | |
Merrill Lynch
Capital Services, Inc. | | $ | 2,300,000 | | | | 4.903 | % | | 3-month
USD-LIBOR-BBA | | July 9, 2008/
July 9, 2038 | | $ | 3,773 | | |
Morgan Stanley
Capital Services, Inc. | | $ | 825,000 | | | | 5.428 | % | | 3-month
USD-LIBOR-BBA | | September 10, 2008/
September 10, 2038 | | $ | (62,633 | ) | |
| | | $ | (71,293 | ) | |
Virginia Fund
| Counterparty | | Notional
Amount | | Annual
Fixed Rate
Paid By Fund | | Floating
Rate
Paid To Fund | | Effective Date/
Termination
Date | | Net Unrealized
Appreciation
(Depreciation) | |
| Lehman Brothers, Inc. | | $ | 5,075,000 | | | | 4.985 | % | | 3-month
USD-LIBOR-BBA | | September 28, 2008/
September 28, 2038 | | $ | (27,434 | ) | |
Merrill Lynch
Capital Services, Inc. | | $ | 4,975,000 | | | | 4.903 | % | | 3-month
USD-LIBOR-BBA | | July 9, 2008/
July 9, 2038 | | $ | 8,162 | | |
Morgan Stanley
Capital Services, Inc. | | $ | 1,725,000 | | | | 5.428 | % | | 3-month
USD-LIBOR-BBA | | September 10, 2008/
September 10, 2038 | | $ | (130,960 | ) | |
| | | $ | (150,232 | ) | |
The effective date represents the date on which a Fund and the counterparty to the interest rate swap contract begin interest payment accruals.
At February 29, 2008, the Funds had sufficient cash and/or securities to cover commitments under these contracts.
12 Recently Issued Accounting Pronouncement
In September 2006, the FASB issued Statement of Financial Accounting Standards No. 157 (FAS 157), "Fair Value Measurements". FAS 157 defines fair value, establishes a framework for measuring fair value in accordance with generally accepted accounting principles and expands disclosure about fair value measurements. FAS 157 is effective for fiscal years beginning after November 15, 2007. As of February 29, 2008, management does not believe the adoption of FAS 157 will impact the amounts reported in the financial statements; however, additional disclosures may be required about the inputs used to develop the measurements of fair value and the effect of certain of the measurements on changes in net assets for the period.
122
Eaton Vance Municipals Funds
BOARD OF TRUSTEES' ANNUAL APPROVAL OF THE INVESTMENT ADVISORY AGREEMENTS
Overview of the Contract Review Process
The Investment Company Act of 1940, as amended (the "1940 Act"), provides, in substance, that each investment advisory agreement between a fund and its investment adviser will continue in effect from year to year only if its continuance is approved at least annually by the fund's board of trustees, including by a vote of a majority of the trustees who are not "interested persons" of the fund ("Independent Trustees"), cast in person at a meeting called for the purpose of considering such approval.
At a meeting of the Boards of Trustees (each a "Board") of the Eaton Vance group of mutual funds (the "Eaton Vance Funds") held on April 23, 2007, the Board, including a majority of the Independent Trustees, voted to approve continuation of existing advisory and sub-advisory agreements for the Eaton Vance Funds for an additional one-year period. In voting its approval, the Board relied upon the affirmative recommendation of the Special Committee of the Board, which is a committee comprised exclusively of Independent Trustees. Prior to making its recommendation, the Special Committee reviewed information furnished for a series of meetings of the Special Committee held in February, March and April 2007. Such information included, among other things, the following:
Information about Fees, Performance and Expenses
• An independent report comparing the advisory and related fees paid by each fund with fees paid by comparable funds;
• An independent report comparing each fund's total expense ratio and its components to comparable funds;
• An independent report comparing the investment performance of each fund to the investment performance of comparable funds over various time periods;
• Data regarding investment performance in comparison to relevant peer groups of funds and appropriate indices;
• Comparative information concerning fees charged by each adviser for managing other mutual funds and institutional accounts using investment strategies and techniques similar to those used in managing the fund;
• Profitability analyses for each adviser with respect to each fund;
Information about Portfolio Management
• Descriptions of the investment management services provided to each fund, including the investment strategies and processes employed;
• Information concerning the allocation of brokerage and the benefits received by each adviser as a result of brokerage allocation, including information concerning the acquisition of research through "soft dollar" benefits received in connection with the funds' brokerage, and the implementation of a soft dollar reimbursement program established with respect to the funds;
• Data relating to portfolio turnover rates of each fund;
• The procedures and processes used to determine the fair value of fund assets and actions taken to monitor and test the effectiveness of such procedures and processes;
Information about each Adviser
• Reports detailing the financial results and condition of each adviser;
• Descriptions of the qualifications, education and experience of the individual investment professionals whose responsibilities include portfolio management and investment research for the funds, and information relating to their compensation and responsibilities with respect to managing other mutual funds and investment accounts;
• Copies of the Codes of Ethics of each adviser and its affiliates, together with information relating to compliance with and the administration of such codes;
• Copies of or descriptions of each adviser's proxy voting policies and procedures;
• Information concerning the resources devoted to compliance efforts undertaken by each adviser and its affiliates on behalf of the funds (including descriptions of various compliance programs) and their record of compliance with investment policies and restrictions, including policies with respect to market-timing, late trading and selective portfolio disclosure, and with policies on personal securities transactions;
• Descriptions of the business continuity and disaster recovery plans of each adviser and its affiliates;
Other Relevant Information
• Information concerning the nature, cost and character of the administrative and other non-investment management services provided by Eaton Vance Management and its affiliates;
• Information concerning management of the relationship with the custodian, subcustodians and fund accountants by each adviser or the funds' administrator; and
• The terms of each advisory agreement.
123
Eaton Vance Municipals Funds
BOARD OF TRUSTEES' ANNUAL APPROVAL OF THE INVESTMENT ADVISORY AGREEMENTS CONT'D
In addition to the information identified above, the Special Committee considered information provided from time to time by each adviser throughout the year at meetings of the Board and its committees. Over the course of the twelve-month period ended April 30, 2007, the Board met ten times and the Special Committee, the Audit Committee and the Governance Committee, each of which is a Committee comprised solely of Independent Trustees, met twelve, fourteen and eight times, respectively. At such meetings, the Trustees received, among other things, presentations by the portfolio managers and other investment professionals of each adviser relating to the investment performance of each fund and the investment strategies used in pursuing the fund's investment objective.
For funds that invest through one or more underlying portfolios, the Board considered similar information about the portfolio(s) when considering the approval of advisory agreements. In addition, in cases where the fund's investment adviser has engaged a sub-adviser, the Board considered similar information about the sub-adviser when considering the approval of any sub-advisory agreement.
The Special Committee was assisted throughout the contract review process by Goodwin Procter LLP, legal counsel for the Independent Trustees. The members of the Special Committee relied upon the advice of such counsel and their own business judgment in determining the material factors to be considered in evaluating each advisory and sub-advisory agreement and the weight to be given to each such factor. The conclusions reached with respect to each advisory and sub-advisory agreement were based on a comprehensive evaluation of all the information provided and not any single factor. Moreover, each member of the Special Committee may have placed varying emphasis on particular factors in reaching conclusions with respect to each advisory and sub-advisory agreement.
Results of the Process
Based on its consideration of the foregoing, and such other information as it deemed relevant, including the factors and conclusions described below, the Special Committee concluded that the continuance of the investment advisory agreements of the following funds:
• Eaton Vance Alabama Municipals Fund
• Eaton Vance Arkansas Municipals Fund
• Eaton Vance Georgia Municipals Fund
• Eaton Vance Kentucky Municipals Fund
• Eaton Vance Louisiana Municipals Fund
• Eaton Vance Maryland Municipals Fund
• Eaton Vance Missouri Municipals Fund
• Eaton Vance North Carolina Municipals Fund
• Eaton Vance Oregon Municipals Fund
• Eaton Vance South Carolina Municipals Fund
• Eaton Vance Tennessee Municipals Fund
• Eaton Vance Virginia Municipals Fund
(the "Funds"), each with Boston Management and Research (the "Adviser"), including their fee structures, is in the interests of shareholders and, therefore, the Special Committee recommended to the Board approval of each agreement. The Board accepted the recommendation of the Special Committee as well as the factors considered and conclusions reached by the Special Committee with respect to each agreement. Accordingly, the Board, including a majority of the Independent Trustees, voted to approve continuation of the advisory agreement for each Fund.
Nature, Extent and Quality of Services
In considering whether to approve the investment advisory agreements of the Funds, the Board evaluated the nature, extent and quality of services provided to the Funds by the Adviser.
The Board considered the Adviser's management capabilities and investment process with respect to the types of investments held by each Fund, including the education, experience and number of its investment professionals and other personnel who provide portfolio management, investment research, and similar services to the Funds, and recent changes in the identity of such personnel. In particular, the Board evaluated, where relevant, the abilities and experience of such investment personnel in analyzing factors such as credit risk, tax efficiency, and special considerations relevant to investing in municipal bonds. Specifically, the Board considered the Adviser's 30-person municipal bond team, which includes six portfolio managers and nine credit specialists who provide services to the Funds. The Board also took into account the resources dedicated to portfolio management and other services, including the compensation paid to rec ruit and retain investment personnel, and the time and attention devoted to each Fund in the complex by senior management.
The Board reviewed the compliance programs of the Adviser and relevant affiliates thereof. Among other matters, the Board considered compliance and reporting matters relating to personal trading by investment personnel, selective disclosure of portfolio holdings, late
124
Eaton Vance Municipals Funds
BOARD OF TRUSTEES' ANNUAL APPROVAL OF THE INVESTMENT ADVISORY AGREEMENTS CONT'D
trading, frequent trading, portfolio valuation, business continuity and the allocation of investment opportunities. The Board also evaluated the responses of the Adviser and its affiliates to requests from regulatory authorities such as the Securities and Exchange Commission and the National Association of Securities Dealers.
The Board also considered shareholder and other administrative services provided or managed by Eaton Vance Management and its affiliates, including transfer agency and accounting services. The Board evaluated the benefits to shareholders of investing in a fund that is a part of a large family of funds, including the ability, in many cases, to exchange an investment among different funds without incurring additional sales charges.
After consideration of the foregoing factors, among others, the Board concluded that the nature, extent and quality of services provided by the Adviser, taken as a whole, are appropriate and consistent with the terms of the respective investment advisory agreements.
Fund Performance
The Board compared each Fund's investment performance to a relevant universe of similarly managed funds identified by an independent data provider and appropriate benchmark indices. The Board reviewed comparative performance data for the one-, three-, five- and ten-year periods ended September 30, 2006 for each Fund in operation over such periods. On the basis of the foregoing and other relevant information, the Board concluded that the performance of each Fund is satisfactory.
Management Fees and Expenses
The Board reviewed contractual investment advisory fee rates, including any administrative fee rates, payable by each Fund (referred to as "management fees"). As part of its review, the Board considered each Fund's management fees and total expense ratio for the year ended September 30, 2006, as compared to a group of similarly managed funds selected by an independent data provider.
After reviewing the foregoing information, and in light of the nature, extent and quality of the services provided by the Adviser, the Board concluded with respect to each Fund that the management fees charged for advisory and related services and each Fund's total expense ratio are reasonable.
Profitability
The Board reviewed the level of profits realized by the Adviser and relevant affiliates thereof in providing investment advisory and administrative services to each Fund and to all Eaton Vance Funds as a group. The Board considered the level of profits realized without regard to revenue sharing or other payments by the Adviser and its affiliates to third parties in respect of distribution services. The Board also considered other direct or indirect benefits received by the Adviser and its affiliates in connection with their relationship with the Funds.
The Board concluded that, in light of the foregoing factors and the nature, extent and quality of the services rendered, the profits realized by the Adviser and its affiliates are reasonable.
Economies of Scale
In reviewing management fees and profitability of each Fund, the Board also considered the extent to which the Adviser and its affiliates, on the one hand, and each Fund, on the other hand, can expect to realize benefits from economies of scale as the assets of the Fund increase. The Board acknowledged the difficulty in accurately measuring the benefits resulting from the economies of scale with respect to the management of any specific fund or group of funds. The Board reviewed data summarizing the increases and decreases in the assets of each Fund and of all Eaton Vance Funds as a group over various time periods, and evaluated the extent to which the total expense ratio of each Fund and the profitability of the Adviser and its affiliates may have been affected by such increases or decreases. Based upon the foregoing, the Board concluded that the benefits from economies of scale are currently being shared equitably by the Advis er and its affiliates and each Fund. The Board also concluded that, assuming reasonably foreseeable increases in the assets of each Fund, the structure of each advisory fee, which includes breakpoints at several asset levels, can be expected to cause the Adviser and its affiliates and each Fund to continue to share such benefits equitably.
125
Eaton Vance Municipals Funds
INVESTMENT MANAGEMENT
Eaton Vance Municipals Funds
Officers
Robert B. MacIntosh
President
William H. Ahern Jr.
Vice President
Craig R. Brandon
Vice President
Cynthia J. Clemson
Vice President
Thomas M. Metzold
Vice President
Adam A. Weigold
Vice President
Barbara E. Campbell
Treasurer
Maureen A. Gemma
Secretary
Paul M. O'Neil
Chief Compliance Officer
John E. Pelletier
Chief Legal Officer | | Trustees
Ralph F. Verni
Chairman
Benjamin C. Esty
Thomas E. Faust Jr.
Allen R. Freedman
William H. Park
Ronald A. Pearlman
Norton H. Reamer
Heidi L. Steiger
Lynn A. Stout | |
|
126
This Page Intentionally Left Blank
This Page Intentionally Left Blank
Investment Adviser
Boston Management and Research
The Eaton Vance Building
255 State Street
Boston, MA 02109
Fund Administrator
Eaton Vance Management
The Eaton Vance Building
255 State Street
Boston, MA 02109
Principal Underwriter
Eaton Vance Distributors, Inc.
The Eaton Vance Building
255 State Street
Boston, MA 02109
(617) 482-8260
Custodian
State Street Bank and Trust Company
200 Clarendon Street
Boston, MA 02116
Transfer Agent
PFPC Inc.
P.O. Box 9653
Providence, RI 02940-9653
1-800-262-1122
Eaton Vance Municipals Trust
The Eaton Vance Building
255 State Street
Boston, MA 02109
This report must be preceded or accompanied by a current prospectus. Before investing, investors should consider carefully a Fund's investment objective(s), risks, and charges and expenses. The Funds' current prospectus contains this and other information about the Funds and is available through your financial advisor. Please read the prospectus carefully before you invest or send money. For further information please call 800-225-6265.
445-4/08 12MUNISRC
Item 2. Code of Ethics
The registrant has adopted a code of ethics applicable to its Principal Executive Officer, Principal Financial Officer and Principal Accounting Officer. The registrant undertakes to provide a copy of such code of ethics to any person upon request, without charge, by calling 1-800-262-1122.
Item 3. Audit Committee Financial Expert
The registrant’s Board has designated William H. Park and Norton H. Reamer, each an independent trustee, as its audit committee financial experts. Mr. Park is a certified public accountant who is the Vice Chairman of Commercial Industrial Finance Corp (specialty finance company). Previously, he served as President and Chief Executive Officer of Prizm Capital Management, LLC (investment management firm) and as Executive Vice President and Chief Financial Officer of United Asset Management Corporation (“UAM”) (a holding company owning institutional investment management firms). Mr. Reamer is the President, Chief Executive Officer and a Director of Asset Management Finance Corp. (a specialty finance company serving the investment management industry) and is President of Unicorn Corporation (an investment and financial advisory services company). Formerly, Mr. Reamer was Chairman and Chief Operating Officer of Hellman, Jordan Management Co., Inc. (an investment management company) and Advisory Director of Berkshire Capital Corporation (an investment banking firm), Chairman of the Board of UAM and Chairman, President and Director of the UAM Funds (mutual funds).
Item 4. Principal Accountant Fees and Services
Not required in this filing
Item 5. Audit Committee of Listed registrants
Not required in this filing.
Item 6. Schedule of Investments
Please see schedule of investments contained in the Report to Stockholders included under Item 1 of this Form N-CSR.
Item 7. Disclosure of Proxy Voting Policies and Procedures for Closed-End Management Investment Companies
Not required in this filing.
Item 8. Portfolio Managers of Closed-End Management Investment Companies
Not required in this filing.
Item 9. Purchases of Equity Securities by Closed-End Management Investment Company and Affiliated Purchasers.
Not required in this filing.
Item 10. Submission of Matters to a Vote of Security Holders.
No Material Changes.
Item 11. Controls and Procedures
(a) It is the conclusion of the registrant’s principal executive officer and principal financial officer that the effectiveness of the registrant’s current disclosure controls and procedures (such disclosure controls and procedures having been evaluated within 90 days of the date of this filing) provide reasonable assurance that the information required to be disclosed by the registrant has been recorded, processed, summarized and reported within the time period specified in the Commission’s rules and forms and that the information required to be disclosed by the registrant has been accumulated and communicated to the registrant’s principal executive officer and principal financial officer in order to allow timely decisions regarding required disclosure.
(b) There have been no changes in the registrant’s internal controls over financial reporting during the second fiscal quarter of the period covered by this report that has materially affected, or is reasonably likely to materially affect, the registrant’s internal control over financial reporting.
Item 12. Exhibits
(a)(1) | Registrant’s Code of Ethics – Not applicable (please see Item 2). |
(a)(2)(i) | Treasurer’s Section 302 certification. |
(a)(2)(ii) | President’s Section 302 certification. |
(b) | Combined Section 906 certification. |
Signatures
Pursuant to the requirements of the Securities Exchange Act of 1934 and the Investment Company Act of 1940, the registrant has duly caused this report to be signed on its behalf by the undersigned, thereunto duly authorized.
Eaton Vance Municipals Trust |
|
By: | /s/Robert B. MacIntosh | |
| Robert B. MacIntosh | |
| President | |
| | |
| | |
Date: | April 11, 2008 | |
Pursuant to the requirements of the Securities Exchange Act of 1934 and the Investment Company Act of 1940, this report has been signed below by the following persons on behalf of the registrant and in the capacities and on the dates indicated.
By: | /s/Barbara E. Campbell | |
| Barbara E. Campbell | |
| Treasurer | |
| | |
| | |
Date: | April 11, 2008 | |
| | |
| | |
By: | /s/Robert B. MacIntosh | |
| Robert B. MacIntosh | |
| President | |
| | |
| | |
Date: | April 11, 2008 | |