UNITED STATES
SECURITIES AND EXCHANGE COMMISSION
Washington, D.C. 20549
Form N-CSR
CERTIFIED SHAREHOLDER REPORT OF REGISTERED
MANAGEMENT INVESTMENT COMPANIES
Investment Company Act File Number: 811-04409
Eaton Vance Municipals Trust
(Exact Name of Registrant as Specified in Charter)
Two International Place, Boston, Massachusetts 02110
(Address of Principal Executive Offices)
Maureen A. Gemma
Two International Place, Boston, Massachusetts 02110
(Name and Address of Agent for Services)
(617) 482-8260
(Registrant’s Telephone Number)
September 30
Date of Fiscal Year End
March 31, 2018
Date of Reporting Period
Item 1. Reports to Stockholders

Eaton Vance
Municipal Income Funds
Semiannual Report
March 31, 2018
AMT-Free • National

Commodity Futures Trading Commission Registration. Effective December 31, 2012, the Commodity Futures Trading Commission (“CFTC”) adopted certain regulatory changes that subject registered investment companies and advisers to regulation by the CFTC if a fund invests more than a prescribed level of its assets in certain CFTC-regulated instruments (including futures, certain options and swap agreements) or markets itself as providing investment exposure to such instruments. Each Fund has claimed an exclusion from the definition of the term “commodity pool operator” under the Commodity Exchange Act. Accordingly, neither the Funds nor the adviser with respect to the operation of the Funds is subject to CFTC regulation. Because of its management of other strategies, each Fund’s adviser is registered with the CFTC as a commodity pool operator and a commodity trading advisor.
Fund shares are not insured by the FDIC and are not deposits or other obligations of, or guaranteed by, any depository institution. Shares are subject to investment risks, including possible loss of principal invested.
This report must be preceded or accompanied by a current summary prospectus or prospectus. Before investing, investors should consider carefully the investment objective, risks, and charges and expenses of a mutual fund. This and other important information is contained in the summary prospectus and prospectus, which can be obtained from a financial advisor. Prospective investors should read the prospectus carefully before investing. For further information, please call 1-800-262-1122.
Semiannual Report March 31, 2018
Eaton Vance
Municipal Income Funds
Table of Contents
| | | | |
Performance and Fund Profile | | | | |
| |
| | | | |
AMT-Free Municipal Income Fund | | | 2 | |
National Municipal Income Fund | | | 3 | |
| |
| | | | |
| |
Endnotes and Additional Disclosures | | | 4 | |
| |
Fund Expenses | | | 5 | |
| |
Financial Statements | | | 7 | |
| |
Officers and Trustees | | | 41 | |
| |
Important Notices | | | 42 | |
Eaton Vance
AMT-Free Municipal Income Fund
March 31, 2018
Performance1,2
Portfolio Manager Cynthia J. Clemson
| | | | | | | | | | | | | | | | | | | | | | | | |
| % Average Annual Total Returns | | Class
Inception Date | | | Performance
Inception Date | | | Six Months | | | One Year | | | Five Years | | | Ten Years | |
Class A at NAV | | | 01/06/1998 | | | | 03/16/1978 | | | | –0.24 | % | | | 3.03 | % | | | 2.76 | % | | | 4.43 | % |
Class A with 4.75% Maximum Sales Charge | | | — | | | | — | | | | –5.02 | | | | –1.87 | | | | 1.76 | | | | 3.92 | |
Class C at NAV | | | 05/02/2006 | | | | 03/16/1978 | | | | –0.62 | | | | 2.26 | | | | 1.99 | | | | 3.65 | |
Class C with 1% Maximum Sales Charge | | | — | | | | — | | | | –1.60 | | | | 1.26 | | | | 1.99 | | | | 3.65 | |
Class I at NAV | | | 03/16/1978 | | | | 03/16/1978 | | | | –0.14 | | | | 3.25 | | | | 3.00 | | | | 4.68 | |
Bloomberg Barclays Municipal Bond Index | | | — | | | | — | | | | –0.37 | % | | | 2.66 | % | | | 2.73 | % | | | 4.40 | % |
Bloomberg Barclays Long (22+) Year Municipal Bond Index | | | — | | | | — | | | | 0.63 | | | | 4.68 | | | | 3.96 | | | | 5.63 | |
| | | | | | |
| | | | | | | | | | | | | | | | | | | | | | | | |
| % Total Annual Operating Expense Ratios3 | | | | | | | | | | | Class A | | | Class C | | | Class I | |
Gross | | | | | | | | | | | | | | | 0.98 | % | | | 1.73 | % | | | 0.73 | % |
Net | | | | | | | | | | | | | | | 0.82 | | | | 1.57 | | | | 0.57 | |
| | | | | | |
| | | | | | | | | | | | | | | | | | | | | | | | |
| % Distribution Rates/Yields4 | | | | | | | | | | | Class A | | | Class C | | | Class I | |
Distribution Rate | | | | | | | | | | | | | | | 3.73 | % | | | 2.97 | % | | | 3.99 | % |
Taxable-Equivalent Distribution Rate | | | | | | | | | | | | | | | 6.30 | | | | 5.02 | | | | 6.74 | |
SEC 30-day Yield | | | | | | | | | | | | | | | 2.31 | | | | 1.68 | | | | 2.68 | |
Taxable-Equivalent SEC 30-day Yield | | | | | | | | | | | | | | | 3.90 | | | | 2.84 | | | | 4.52 | |
| | | | | | |
| | | | | | | | | | | | | | | | | | | | | | | | |
| % Total Leverage5 | | | | | | | | | | | | | | | | | | |
Residual Interest Bond (RIB) Financing | | | | | | | | | | | | | | | | | | | | | | | 11.60 | % |
Fund Profile
Credit Quality (% of total investments)6,7
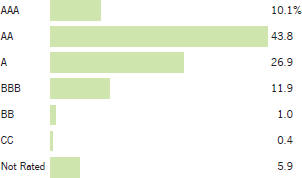
See Endnotes and Additional Disclosures in this report.
Past performance is no guarantee of future results. Returns are historical and are calculated by determining the percentage change in net asset value (NAV) or offering price (as applicable) with all distributions reinvested. Investment return and principal value will fluctuate so that shares, when redeemed, may be worth more or less than their original cost. Performance less than or equal to one year is cumulative. Performance is for the stated time period only; due to market volatility, the Fund’s current performance may be lower or higher than quoted. Returns are before taxes unless otherwise noted. For performance as of the most recent month-end, please refer to eatonvance.com.
Eaton Vance
National Municipal Income Fund
March 31, 2018
Performance1,2
Portfolio Manager Craig R. Brandon, CFA
| | | | | | | | | | | | | | | | | | | | | | | | |
| % Average Annual Total Returns | | Class
Inception Date | | | Performance
Inception Date | | | Six Months | | | One Year | | | Five Years | | | Ten Years | |
Class A at NAV | | | 04/05/1994 | | | | 12/19/1985 | | | | –0.57 | % | | | 2.92 | % | | | 3.04 | % | | | 4.40 | % |
Class A with 4.75% Maximum Sales Charge | | | — | | | | — | | | | –5.33 | | | | –1.99 | | | | 2.05 | | | | 3.89 | |
Class B at NAV | | | 12/19/1985 | | | | 12/19/1985 | | | | –0.94 | | | | 2.15 | | | | 2.28 | | | | 3.63 | |
Class B with 5% Maximum Sales Charge | | | — | | | | — | | | | –5.82 | | | | –2.81 | | | | 1.93 | | | | 3.63 | |
Class C at NAV | | | 12/03/1993 | | | | 12/19/1985 | | | | –0.94 | | | | 2.15 | | | | 2.28 | | | | 3.63 | |
Class C with 1% Maximum Sales Charge | | | — | | | | — | | | | –1.92 | | | | 1.16 | | | | 2.28 | | | | 3.63 | |
Class I at NAV | | | 07/01/1999 | | | | 12/19/1985 | | | | –0.44 | | | | 3.18 | | | | 3.28 | | | | 4.66 | |
Bloomberg Barclays Municipal Bond Index | | | — | | | | — | | | | –0.37 | % | | | 2.66 | % | | | 2.73 | % | | | 4.40 | % |
Bloomberg Barclays Long (22+) Year Municipal Bond Index | | | — | | | | — | | | | 0.63 | | | | 4.68 | | | | 3.96 | | | | 5.63 | |
| | | | | | |
| | | | | | | | | | | | | | | | | | | | | | | | |
| % Total Annual Operating Expense Ratios3 | | | | | | | | Class A | | | Class B | | | Class C | | | Class I | |
Gross | | | | | | | | | | | 0.84 | % | | | 1.59 | % | | | 1.59 | % | | | 0.59 | % |
Net | | | | | | | | | | | 0.68 | | | | 1.43 | | | | 1.43 | | | | 0.43 | |
| | | | | | |
| | | | | | | | | | | | | | | | | | | | | | | | |
| % Distribution Rates/Yields4 | | | | | | | | Class A | | | Class B | | | Class C | | | Class I | |
Distribution Rate | | | | | | | | | | | 3.59 | % | | | 2.82 | % | | | 2.82 | % | | | 3.84 | % |
Taxable-Equivalent Distribution Rate | | | | | | | | | | | 6.06 | | | | 4.76 | | | | 4.76 | | | | 6.49 | |
SEC 30-day Yield | | | | | | | | | | | 2.78 | | | | 2.17 | | | | 2.17 | | | | 3.17 | |
Taxable-Equivalent SEC 30-day Yield | | | | | | | | | | | 4.70 | | | | 3.67 | | | | 3.67 | | | | 5.35 | |
| | | | | | |
| | | | | | | | | | | | | | | | | | | | | | | | |
| % Total Leverage5 | | | | | | | | | | | | | | | | | | |
RIB Financing | | | | | | | | | | | | | | | | | | | | | | | 9.12 | % |
Fund Profile
Credit Quality (% of total investments)6,7
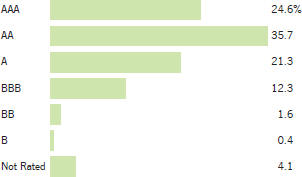
See Endnotes and Additional Disclosures in this report.
Past performance is no guarantee of future results. Returns are historical and are calculated by determining the percentage change in net asset value (NAV) or offering price (as applicable) with all distributions reinvested. Investment return and principal value will fluctuate so that shares, when redeemed, may be worth more or less than their original cost. Performance less than or equal to one year is cumulative. Performance is for the stated time period only; due to market volatility, the Fund’s current performance may be lower or higher than quoted. Returns are before taxes unless otherwise noted. For performance as of the most recent month-end, please refer to eatonvance.com.
Eaton Vance
Municipal Income Funds
March 31, 2018
Endnotes and Additional Disclosures
| 1 | Bloomberg Barclays Municipal Bond Index is an unmanaged index of municipal bonds traded in the U.S. Bloomberg Barclays Long (22+) Year Municipal Bond Index is an unmanaged index of municipal bonds traded in the U.S. with maturities of 22 years or more. Unless otherwise stated, index returns do not reflect the effect of any applicable sales charges, commissions, expenses, taxes or leverage, as applicable. It is not possible to invest directly in an index. |
| 2 | Total Returns at NAV do not include applicable sales charges. If sales charges were deducted, the returns would be lower. Total Returns shown with maximum sales charge reflect the stated maximum sales charge. Unless otherwise stated, performance does not reflect the deduction of taxes on Fund distributions or redemptions of Fund shares. Performance since inception for an index, if presented, is the performance since the Fund’s or oldest share class’ inception, as applicable. |
| 3 | Total annual operating expense ratios are as stated in the Fund’s most recent prospectus. Net expense ratio is not a result of a fee waiver or expense reimbursement. Net expense ratio excludes interest expense relating to the Fund’s liability with respect to floating rate notes held by third parties in conjunction with residual interest bond transactions by the Fund. The Fund also records offsetting interest income in an amount equal to this expense relating to the municipal obligations underlying such transactions and, as a result, net asset value and performance have not been affected by this expense. The expense ratios for the current reporting period can be found in the Financial Highlights section of this report. |
| 4 | The Distribution Rate is based on the Fund’s last regular distribution per share in the period (annualized) divided by the Fund’s NAV at the end of the period. The Fund’s distributions may be comprised of amounts characterized for federal income tax purposes as tax-exempt income, qualified and non-qualified ordinary dividends, capital gains and nondividend distributions, also known as return of capital. The Fund will determine the federal income tax character of distributions paid to a shareholder after the end of the calendar year. This is reported on the IRS form 1099-DIV and provided to the shareholder shortly after each year-end. The Fund’s distributions are determined by the investment adviser based on its current assessment of the Fund’s long-term return potential. As portfolio and market conditions change, the rate of distributions paid by the Fund could change. Taxable-equivalent performance is based on the highest combined federal and state income tax rates, where applicable. Lower tax rates would result in lower tax-equivalent performance. Actual tax rates will vary depending on your income, exemptions and deductions. Rates do not include local taxes. The SEC Yield is a standardized measure based on the estimated yield to maturity of a fund’s investments over a 30-day period and is based on the maximum offer price at the date specified. The SEC Yield is not based on the distributions made by the Fund, which may differ. |
| 5 | Fund employs RIB financing. The leverage created by RIB investments provides an opportunity for increased income but, at the same time, creates special risks (including the likelihood of greater volatility of NAV). The cost of leverage rises and falls with changes in short-term interest rates. See “Floating Rate Notes Issued in Conjunction with Securities Held” in the notes to the financial statements for more information about RIB financing. RIB leverage represents the amount of Floating Rate Notes outstanding at period end as a percentage of Fund net assets plus Floating Rate Notes. |
| 6 | Ratings are based on Moody’s, S&P or Fitch, as applicable. If securities are rated differently by the ratings agencies, the highest rating is applied. Ratings, which are subject to change, apply to the creditworthiness of the issuers of the underlying securities and not to the Fund or its shares. Credit ratings measure the quality of a bond based on the issuer’s creditworthiness, with ratings ranging from AAA, being the highest, to D, being the lowest based on S&P’s measures. Ratings of BBB or higher by S&P or Fitch (Baa or higher by Moody’s) are considered to be investment-grade quality. Credit ratings are based largely on the ratings agency’s analysis at the time of rating. The rating assigned to any particular security is not necessarily a reflection of the issuer’s current financial condition and does not necessarily reflect its assessment of the volatility of a security’s market value or of the liquidity of an investment in the security. Holdings designated as “Not Rated” (if any) are not rated by the national ratings agencies stated above. |
| 7 | The chart includes the municipal bonds held by a trust that issues residual interest bonds, consistent with the Portfolio of Investments. |
| | Fund profiles subject to change due to active management. |
Eaton Vance
Municipal Income Funds
March 31, 2018
Fund Expenses
Example: As a Fund shareholder, you incur two types of costs: (1) transaction costs, including sales charges (loads) on purchases and redemption fees (if applicable); and (2) ongoing costs, including management fees; distribution and/or service fees; and other Fund expenses. This Example is intended to help you understand your ongoing costs (in dollars) of Fund investing and to compare these costs with the ongoing costs of investing in other mutual funds. The Example is based on an investment of $1,000 invested at the beginning of the period and held for the entire period (October 1, 2017 – March 31, 2018).
Actual Expenses: The first section of each table below provides information about actual account values and actual expenses. You may use the information in this section, together with the amount you invested, to estimate the expenses that you paid over the period. Simply divide your account value by $1,000 (for example, an $8,600 account value divided by $1,000 = 8.6), then multiply the result by the number in the first section under the heading entitled “Expenses Paid During Period” to estimate the expenses you paid on your account during this period.
Hypothetical Example for Comparison Purposes: The second section of each table below provides information about hypothetical account values and hypothetical expenses based on the actual Fund expense ratio and an assumed rate of return of 5% per year (before expenses), which is not the actual Fund return. The hypothetical account values and expenses may not be used to estimate the actual ending account balance or expenses you paid for the period. You may use this information to compare the ongoing costs of investing in your Fund and other funds. To do so, compare this 5% hypothetical example with the 5% hypothetical examples that appear in the shareholder reports of the other funds.
Please note that the expenses shown in each table are meant to highlight your ongoing costs only and do not reflect any transactional costs, such as sales charges (loads) or redemption fees (if applicable). Therefore, the second section of each table is useful in comparing ongoing costs only, and will not help you determine the relative total costs of owning different funds. In addition, if these transactional costs were included, your costs would be higher.
Eaton Vance AMT-Free Municipal Income Fund
| | | | | | | | | | | | | | | | |
| | | Beginning
Account Value
(10/1/17) | | | Ending
Account Value
(3/31/18) | | | Expenses Paid
During Period*
(10/1/17 – 3/31/18) | | | Annualized
Expense
Ratio | |
| | | | |
Actual | | | | | | | | | | | | | | | | |
Class A | | $ | 1,000.00 | | | $ | 997.60 | | | $ | 5.23 | | | | 1.05 | % |
Class C | | $ | 1,000.00 | | | $ | 993.80 | | | $ | 8.95 | | | | 1.80 | % |
Class I | | $ | 1,000.00 | | | $ | 998.60 | | | $ | 3.99 | | | | 0.80 | % |
| | | | | |
Hypothetical | | | | | | | | | | | | | | | | |
(5% return per year before expenses) | | | | | | | | | | | | | | | | |
Class A | | $ | 1,000.00 | | | $ | 1,019.70 | | | $ | 5.29 | | | | 1.05 | % |
Class C | | $ | 1,000.00 | | | $ | 1,016.00 | | | $ | 9.05 | | | | 1.80 | % |
Class I | | $ | 1,000.00 | | | $ | 1,020.90 | | | $ | 4.03 | | | | 0.80 | % |
| * | Expenses are equal to the Fund’s annualized expense ratio for the indicated Class, multiplied by the average account value over the period, multiplied by 182/365 (to reflect the one-half year period). The Example assumes that the $1,000 was invested at the net asset value per share determined at the close of business on September 30, 2017. |
Eaton Vance
Municipal Income Funds
March 31, 2018
Fund Expenses — continued
Eaton Vance National Municipal Income Fund
| | | | | | | | | | | | | | | | |
| | | Beginning
Account Value
(10/1/17) | | | Ending
Account Value
(3/31/18) | | | Expenses Paid
During Period*
(10/1/17 – 3/31/18) | | | Annualized
Expense
Ratio | |
| | | | |
Actual | | | | | | | | | | | | | | | | |
Class A | | $ | 1,000.00 | | | $ | 994.30 | | | $ | 4.33 | | | | 0.87 | % |
Class B | | $ | 1,000.00 | | | $ | 990.60 | | | $ | 8.09 | | | | 1.63 | % |
Class C | | $ | 1,000.00 | | | $ | 990.60 | | | $ | 8.04 | | | | 1.62 | % |
Class I | | $ | 1,000.00 | | | $ | 995.60 | | | $ | 3.08 | | | | 0.62 | % |
| | | | | |
Hypothetical | | | | | | | | | | | | | | | | |
(5% return per year before expenses) | | | | | | | | | | | | | | | | |
Class A | | $ | 1,000.00 | | | $ | 1,020.60 | | | $ | 4.38 | | | | 0.87 | % |
Class B | | $ | 1,000.00 | | | $ | 1,016.80 | | | $ | 8.20 | | | | 1.63 | % |
Class C | | $ | 1,000.00 | | | $ | 1,016.90 | | | $ | 8.15 | | | | 1.62 | % |
Class I | | $ | 1,000.00 | | | $ | 1,021.80 | | | $ | 3.13 | | | | 0.62 | % |
| * | Expenses are equal to the Fund’s annualized expense ratio for the indicated Class, multiplied by the average account value over the period, multiplied by 182/365 (to reflect the one-half year period). The Example assumes that the $1,000 was invested at the net asset value per share determined at the close of business on September 30, 2017. |
Eaton Vance
AMT-Free Municipal Income Fund
March 31, 2018
Portfolio of Investments (Unaudited)
| | | | | | | | |
| Tax-Exempt Municipal Securities — 112.4% | |
| Security | | Principal
Amount
(000’s omitted) | | | Value | |
|
| Bond Bank — 3.4% | |
New York State Environmental Facilities Corp., 5.00%, 10/15/35(1) | | $ | 9,900 | | | $ | 10,503,108 | |
| | | | | | | $ | 10,503,108 | |
|
| Education — 9.7% | |
Arizona State University, 5.00%, 7/1/35 | | $ | 500 | | | $ | 567,810 | |
Arizona State University, 5.00%, 7/1/36 | | | 750 | | | | 850,327 | |
Arizona State University, 5.00%, 7/1/37 | | | 750 | | | | 848,947 | |
Arizona State University, 5.00%, 7/1/38 | | | 1,000 | | | | 1,130,090 | |
Connecticut Health and Educational Facilities Authority, (Fairfield University), 5.00%, 7/1/46 | | | 5,000 | | | | 5,570,700 | |
Connecticut Health and Educational Facilities Authority, (Sacred Heart University), 5.00%, 7/1/42 | | | 2,125 | | | | 2,374,794 | |
Monroe County Industrial Development Corp., NY, (University of Rochester), 4.00%, 7/1/43 | | | 2,005 | | | | 2,078,684 | |
Oregon Facilities Authority, (Lewis & Clark College), 5.625%, 10/1/36 | | | 1,050 | | | | 1,166,581 | |
Pennsylvania Higher Educational Facilities Authority, (Drexel University), 5.00%, 5/1/37 | | | 1,750 | | | | 1,981,805 | |
Shelby County Health, Educational and Housing Facility Board, TN, (Rhodes College), 5.00%, 8/1/30 | | | 625 | | | | 734,763 | |
Shelby County Health, Educational and Housing Facility Board, TN, (Rhodes College), 5.00%, 8/1/31 | | | 325 | | | | 380,562 | |
Shelby County Health, Educational and Housing Facility Board, TN, (Rhodes College), 5.00%, 8/1/32 | | | 500 | | | | 583,160 | |
University of California, 5.25%, 5/15/35 | | | 3,555 | | | | 4,108,407 | |
University of Nebraska, 5.00%, 5/15/35 | | | 1,000 | | | | 1,135,510 | |
University of Nebraska, 5.00%, 7/1/35 | | | 3,000 | | | | 3,415,170 | |
West Virginia University, 5.00%, 10/1/31 | | | 3,000 | | | | 3,299,520 | |
| | | | | | | $ | 30,226,830 | |
|
| Electric Utilities — 4.6% | |
Apache County Industrial Development Authority, AZ, (Tucson Electric Power Co.), 4.50%, 3/1/30 | | $ | 1,605 | | | $ | 1,726,964 | |
Chula Vista, CA, (San Diego Gas and Electric), 5.875%, 2/15/34 | | | 3,520 | | | | 3,681,498 | |
Northern Municipal Power Agency, MN, 5.00%, 1/1/31 | | | 200 | | | | 230,058 | |
Northern Municipal Power Agency, MN, 5.00%, 1/1/32 | | | 210 | | | | 240,519 | |
Northern Municipal Power Agency, MN, 5.00%, 1/1/33 | | | 235 | | | | 267,994 | |
Northern Municipal Power Agency, MN, 5.00%, 1/1/34 | | | 210 | | | | 238,795 | |
Northern Municipal Power Agency, MN, 5.00%, 1/1/35 | | | 170 | | | | 193,171 | |
Northern Municipal Power Agency, MN, 5.00%, 1/1/36 | | | 160 | | | | 181,418 | |
Pima County Industrial Development Authority, AZ, (Tucson Electric Power Co.), 5.25%, 10/1/40 | | | 1,410 | | | | 1,513,832 | |
| | | | | | | | |
| Security | | Principal
Amount
(000’s omitted) | | | Value | |
|
| Electric Utilities (continued) | |
Utility Debt Securitization Authority, NY, 5.00%, 12/15/33 | | $ | 2,895 | | | $ | 3,277,169 | |
Vernon, CA, Electric System Revenue, 5.125%, 8/1/21 | | | 2,700 | | | | 2,809,917 | |
| | | | | | | $ | 14,361,335 | |
|
| Escrowed / Prerefunded — 9.3% | |
Brooklyn Arena Local Development Corp., NY, (Barclays Center), Prerefunded to 1/15/20, 6.00%, 7/15/30 | | $ | 880 | | | $ | 946,484 | |
Brooklyn Arena Local Development Corp., NY, (Barclays Center), Prerefunded to 1/15/20, 6.25%, 7/15/40 | | | 1,320 | | | | 1,425,508 | |
Kansas Development Finance Authority, (Adventist Health System), Prerefunded to 11/15/19, 5.75%, 11/15/38 | | | 115 | | | | 122,032 | |
Massachusetts Development Finance Agency, (Tufts Medical Center), Prerefunded to 1/1/21, 6.75%, 1/1/36 | | | 470 | | | | 529,178 | |
Metropolitan Transportation Authority, NY, Prerefunded to 11/15/18, 6.50%, 11/15/28 | | | 310 | | | | 319,393 | |
Metropolitan Transportation Authority, NY, Prerefunded to 11/15/18, 6.50%, 11/15/28 | | | 2,730 | | | | 2,812,719 | |
New Jersey Turnpike Authority, Prerefunded to 7/1/22, 5.00%, 1/1/30 | | | 3,060 | | | | 3,438,338 | |
Oklahoma Development Finance Authority, (St. John Health System), Prerefunded to 2/15/22, 5.00%, 2/15/34 | | | 2,035 | | | | 2,259,420 | |
Savannah Economic Development Authority, GA, Escrowed to Maturity, 0.00%, 12/1/21 | | | 6,000 | | | | 5,584,440 | |
Triborough Bridge and Tunnel Authority, NY, Prerefunded to 11/15/18, 5.25%, 11/15/34(1) | | | 3,745 | | | | 3,831,060 | |
Vernon, CA, Electric System Revenue, Prerefunded to 8/1/19, 5.125%, 8/1/21 | | | 1,155 | | | | 1,197,042 | |
Washington, Prerefunded to 2/1/21, 5.25%, 2/1/36(1) | | | 6,000 | | | | 6,571,560 | |
| | | | | | | $ | 29,037,174 | |
|
| General Obligations — 13.5% | |
Beaverton School District No. 48J, Washington and Multnomah Counties, OR, 5.00%, (0.00% until 6/15/18), 6/15/36 | | $ | 1,000 | | | $ | 1,142,880 | |
California, 5.00%, 10/1/26 | | | 1,300 | | | | 1,508,078 | |
California, 5.00%, 10/1/27 | | | 630 | | | | 727,959 | |
California, 5.25%, 10/1/29 | | | 560 | | | | 624,949 | |
California, 5.25%, 10/1/32 | | | 3,480 | | | | 3,868,612 | |
Chicago Board of Education, IL, 5.00%, 12/1/21 | | | 230 | | | | 242,478 | |
District of Columbia, 5.00%, 6/1/37(1) | | | 7,000 | | | | 8,138,270 | |
Erie County, PA, 5.00%, 9/1/25 | | | 500 | | | | 582,605 | |
Fennville Public Schools, MI, 4.00%, 5/1/34 | | | 1,000 | | | | 1,093,070 | |
Foothill-De Anza Community College District, CA, 5.00%, 8/1/34 | | | 1,150 | | | | 1,317,980 | |
Foothill-De Anza Community College District, CA, 5.00%, 8/1/36 | | | 1,150 | | | | 1,312,196 | |
Illinois, 5.00%, 11/1/28 | | | 3,600 | | | | 3,731,976 | |
| | | | |
| | 7 | | See Notes to Financial Statements. |
Eaton Vance
AMT-Free Municipal Income Fund
March 31, 2018
Portfolio of Investments (Unaudited) — continued
| | | | | | | | |
| Security | | Principal
Amount
(000’s omitted) | | | Value | |
|
| General Obligations (continued) | |
Illinois, 5.00%, 11/1/29 | | $ | 1,400 | | | $ | 1,446,284 | |
Kane, Cook and DuPage Counties School District No. 46, IL, 5.00%, 1/1/31 | | | 4,470 | | | | 5,000,857 | |
Salem-Keizer School District No. 24J, OR, 0.00%, 6/15/24 | | | 1,220 | | | | 1,047,114 | |
Santa Clara County, CA, (Election of 2008), Prerefunded to 8/1/19, 5.00%, 8/1/39(1) | | | 7,700 | | | | 8,046,577 | |
Springfield School District No. 19, OR, 5.00%, 6/15/30 | | | 1,085 | | | | 1,250,321 | |
University of Connecticut, 5.00%, 2/15/32 | | | 650 | | | | 723,131 | |
Wentzville R-IV School District, MO, 0.00%, 3/1/29 | | | 500 | | | | 353,855 | |
| | | | | | | $ | 42,159,192 | |
|
| Hospital — 18.2% | |
California Health Facilities Financing Authority, (Catholic Healthcare West), 5.25%, 3/1/28 | | $ | 535 | | | $ | 581,550 | |
California Health Facilities Financing Authority, (Kaiser Permanente), Green Bonds, 5.00%, 11/1/27 | | | 1,090 | | | | 1,334,323 | |
California Health Facilities Financing Authority, (Providence Health System), 5.50%, 10/1/39 | | | 5,175 | | | | 5,446,636 | |
California Health Facilities Financing Authority, (St. Joseph Health System), 5.00%, 7/1/33 | | | 1,720 | | | | 1,938,165 | |
California Health Facilities Financing Authority, (St. Joseph Health System), 5.00%, 7/1/37 | | | 2,300 | | | | 2,570,089 | |
California Health Facilities Financing Authority, (Sutter Health), 5.00%, 11/15/26(2) | | | 1,400 | | | | 1,684,116 | |
California Health Facilities Financing Authority, (Sutter Health), 5.25%, 8/15/31 | | | 1,325 | | | | 1,473,652 | |
California Statewide Communities Development Authority, (John Muir Health), Prerefunded to 7/1/19, 5.00%, 7/1/29 | | | 1,330 | | | | 1,385,461 | |
California Statewide Communities Development Authority, (Loma Linda University Medical Center), 5.25%, 12/1/34 | | | 3,000 | | | | 3,279,570 | |
Colorado Health Facilities Authority, (Vail Valley Medical Center), 4.00%, 1/15/45 | | | 2,155 | | | | 2,182,261 | |
Colorado Health Facilities Authority, (Vail Valley Medical Center), 5.00%, 1/15/35 | | | 2,000 | | | | 2,266,820 | |
Henrico County Economic Development Authority, VA, (Bon Secours Health System, Inc.), 5.00%, 11/1/30 | | | 1,185 | | | | 1,308,584 | |
Illinois Finance Authority, (Presence Health Network), 4.00%, 2/15/36 | | | 5,345 | | | | 5,416,570 | |
Kansas Development Finance Authority, (Adventist Health System), 5.75%, 11/15/38 | | | 5,115 | | | | 5,439,598 | |
Massachusetts Development Finance Agency, (Children’s Hospital), 5.00%, 10/1/31 | | | 2,110 | | | | 2,425,761 | |
Massachusetts Development Finance Agency, (Tufts Medical Center), 6.75%, 1/1/36 | | | 315 | | | | 353,673 | |
Missouri Health and Educational Facilities Authority, (Mercy Health), 5.00%, 11/15/47 | | | 3,000 | | | | 3,367,260 | |
| | | | | | | | |
| Security | | Principal
Amount
(000’s omitted) | | | Value | |
|
| Hospital (continued) | |
New Jersey Health Care Facilities Financing Authority, (Princeton HealthCare System), 5.00%, 7/1/29 | | $ | 1,450 | | | $ | 1,659,220 | |
New York Dormitory Authority, (Orange Regional Medical Center), Prerefunded to 12/1/18, 6.25%, 12/1/37 | | | 3,380 | | | | 3,482,853 | |
Ohio, (University Hospitals Health Systems, Inc.), 5.00%, 1/15/36 | | | 2,500 | | | | 2,767,800 | |
Orange County Health Facilities Authority, FL, (Orlando Health, Inc.), 5.375%, 10/1/23 | | | 1,000 | | | | 1,053,090 | |
Tarrant County Cultural Education Facilities Finance Corp., TX, (Cook Children’s Medical Center), 5.25%, 12/1/39(1) | | | 5,000 | | | | 5,565,000 | |
| | | | | | | $ | 56,982,052 | |
|
| Housing — 0.1% | |
Texas Student Housing Corp., (University of North Texas), 9.375%, 7/1/06(3) | | $ | 285 | | | $ | 236,550 | |
| | | | | | | $ | 236,550 | |
|
| Industrial Development Revenue — 0.9% | |
Selma Industrial Development Board, AL, (International Paper Co.), 5.80%, 5/1/34 | | $ | 2,670 | | | $ | 2,885,656 | |
| | | | | | | $ | 2,885,656 | |
|
| Insured – Education — 0.7% | |
Virginia College Building Authority, (Washington and Lee University), (NPFG), 5.25%, 1/1/31 | | $ | 1,750 | | | $ | 2,106,808 | |
| | | | | | | $ | 2,106,808 | |
|
| Insured – Electric Utilities — 2.4% | |
Long Island Power Authority, NY, Electric System Revenue, (BHAC), Prerefunded to 4/1/19, 5.75%, 4/1/33 | | $ | 5,415 | | | $ | 5,635,824 | |
Ohio Municipal Electric Generation Agency, (NPFG), 0.00%, 2/15/29 | | | 2,865 | | | | 1,990,430 | |
| | | | | | | $ | 7,626,254 | |
|
| Insured – Escrowed / Prerefunded — 0.8% | |
New Orleans Aviation Board, LA, (AGC), Prerefunded to 1/1/19, 6.00%, 1/1/23 | | $ | 1,040 | | | $ | 1,074,247 | |
Texas Transportation Commission, (Central Texas Turnpike System), (AMBAC), Escrowed to Maturity, 0.00%, 8/15/21 | | | 1,560 | | | | 1,457,929 | |
| | | | | | | $ | 2,532,176 | |
|
| Insured – General Obligations — 0.1% | |
Atlantic City, NJ, (AGM), 4.00%, 3/1/42 | | $ | 145 | | | $ | 147,830 | |
| | | | | | | $ | 147,830 | |
| | | | |
| | 8 | | See Notes to Financial Statements. |
Eaton Vance
AMT-Free Municipal Income Fund
March 31, 2018
Portfolio of Investments (Unaudited) — continued
| | | | | | | | |
| Security | | Principal
Amount
(000’s omitted) | | | Value | |
|
| Insured – Lease Revenue / Certificates of Participation — 1.7% | |
Anaheim Public Financing Authority, CA, (Anaheim Public Improvements), (AGM), 0.00%, 9/1/31 | | $ | 8,680 | | | $ | 5,294,713 | |
| | | | | | | $ | 5,294,713 | |
|
| Insured – Other Revenue — 1.7% | |
Harris County-Houston Sports Authority, TX, (AGM), (NPFG), 0.00%, 11/15/34 | | $ | 10,600 | | | $ | 5,322,154 | |
| | | | | | | $ | 5,322,154 | |
|
| Insured – Special Tax Revenue — 6.6% | |
Alabama Public School and College Authority, (AGM), 2.50%, 12/1/27 | | $ | 5,265 | | | $ | 5,175,863 | |
Massachusetts, Special Obligation, Dedicated Tax Revenue, (NPFG), 5.50%, 1/1/27 | | | 6,000 | | | | 7,316,160 | |
Massachusetts, Special Obligation, Dedicated Tax Revenue, (NPFG), 5.50%, 1/1/30 | | | 2,565 | | | | 3,207,225 | |
Puerto Rico Sales Tax Financing Corp., (NPFG), 0.00%, 8/1/45 | | | 6,245 | | | | 1,240,757 | |
Puerto Rico Sales Tax Financing Corp., (NPFG), 0.00%, 8/1/46 | | | 12,295 | | | | 2,317,730 | |
Successor Agency to San Francisco City and County Redevelopment Agency, CA, (NPFG), 5.00%, 8/1/43 | | | 1,100 | | | | 1,241,130 | |
| | | | | | | $ | 20,498,865 | |
|
| Insured – Transportation — 3.4% | |
Chicago, IL, (O’Hare International Airport), (AGM), 5.00%, 1/1/28 | | $ | 1,000 | | | $ | 1,103,610 | |
Chicago, IL, (O’Hare International Airport), (AGM), 5.125%, 1/1/31 | | | 1,000 | | | | 1,100,710 | |
Chicago, IL, (O’Hare International Airport), (AGM), 5.25%, 1/1/32 | | | 785 | | | | 872,810 | |
E-470 Public Highway Authority, CO, (NPFG), 0.00%, 9/1/39 | | | 7,120 | | | | 2,724,753 | |
Texas Transportation Commission, (Central Texas Turnpike System), (AMBAC), 0.00%, 8/15/21 | | | 5,285 | | | | 4,895,020 | |
| | | | | | | $ | 10,696,903 | |
|
| Insured – Water and Sewer — 2.4% | |
Detroit, MI, Sewage Disposal System, (AGM), 5.00%, 7/1/39 | | $ | 4,825 | | | $ | 5,123,571 | |
Michigan Finance Authority, (Detroit Water and Sewerage Department), (AGM), 5.00%, 7/1/32 | | | 655 | | | | 730,639 | |
Michigan Finance Authority, (Detroit Water and Sewerage Department), (AGM), 5.00%, 7/1/33 | | | 565 | | | | 628,545 | |
Michigan Finance Authority, (Detroit Water and Sewerage Department), (AGM), 5.00%, 7/1/35 | | | 280 | | | | 311,156 | |
Michigan Finance Authority, (Detroit Water and Sewerage Department), (AGM), 5.00%, 7/1/37 | | | 565 | | | | 626,851 | |
| | | | | | | $ | 7,420,762 | |
| | | | | | | | |
| Security | | Principal
Amount
(000’s omitted) | | | Value | |
|
| Other Revenue — 3.1% | |
Austin Convention Enterprises, Inc., TX, (Convention Center Hotel), 5.00%, 1/1/22 | | $ | 400 | | | $ | 441,092 | |
Central Falls Detention Facility Corp., RI, 7.25%, 7/15/35(4) | | | 1,200 | | | | 216,000 | |
New York City Transitional Finance Authority, NY, (Building Aid), 6.00%, 7/15/38 | | | 7,250 | | | | 7,341,205 | |
White Earth Band of Chippewa Indians, MN, 6.375%, 12/1/26(5) | | | 1,685 | | | | 1,690,763 | |
| | | | | | | $ | 9,689,060 | |
|
| Senior Living / Life Care — 3.8% | |
North Miami, FL, (Imperial Club), 6.125%, 1/1/42 | | $ | 1,480 | | | $ | 1,185,954 | |
Palm Beach County Health Facilities Authority, FL, (Sinai Residences of Boca Raton), 7.25%, 6/1/39 | | | 570 | | | | 659,285 | |
Palm Beach County Health Facilities Authority, FL, (Sinai Residences of Boca Raton), 7.50%, 6/1/49 | | | 2,690 | | | | 3,131,429 | |
Saint Louis County Industrial Development Authority, MO, (St. Andrew’s Resources for Seniors Obligated Group), 5.00%, 12/1/35 | | | 1,700 | | | | 1,793,908 | |
Tempe Industrial Development Authority, AZ, (Friendship Village of Tempe), 6.00%, 12/1/32 | | | 160 | | | | 169,947 | |
Tempe Industrial Development Authority, AZ, (Friendship Village of Tempe), 6.25%, 12/1/42 | | | 660 | | | | 701,283 | |
Washington Housing Finance Commission, (Horizon House), 5.00%, 1/1/32(5) | | | 1,575 | | | | 1,748,943 | |
Washington Housing Finance Commission, (Horizon House), 5.00%, 1/1/38(5) | | | 2,325 | | | | 2,551,873 | |
| | | | | | | $ | 11,942,622 | |
|
| Special Tax Revenue — 2.8% | |
Bridgeville, DE, (Heritage Shores Special Development District), 5.45%, 7/1/35 | | $ | 997 | | | $ | 996,940 | |
Jurupa Public Financing Authority, CA, 5.00%, 9/1/31 | | | 1,200 | | | | 1,350,168 | |
Metropolitan Transportation Authority, NY, Dedicated Tax Revenue, Green Bonds, 5.00%, 11/15/33 | | | 2,500 | | | | 2,940,050 | |
New York Convention Center Development Corp., Hotel Unit Fee, 0.00%, 11/15/27 | | | 1,375 | | | | 1,026,768 | |
Puerto Rico Sales Tax Financing Corp., 5.00%, 8/1/40(4) | | | 2,340 | | | | 1,374,750 | |
River Hall Community Development District, FL, (Capital Improvements), 5.45%, 5/1/36 | | | 1,000 | | | | 999,970 | |
| | | | | | | $ | 8,688,646 | |
|
| Transportation — 18.5% | |
Central Texas Regional Mobility Authority, Prerefunded to 1/1/21, 5.75%, 1/1/31 | | $ | 415 | | | $ | 457,396 | |
Chicago, IL, (Midway International Airport), 5.00%, 1/1/41 | | | 4,225 | | | | 4,764,448 | |
| | | | |
| | 9 | | See Notes to Financial Statements. |
Eaton Vance
AMT-Free Municipal Income Fund
March 31, 2018
Portfolio of Investments (Unaudited) — continued
| | | | | | | | |
| Security | | Principal
Amount
(000’s omitted) | | | Value | |
|
| Transportation (continued) | |
Dallas and Fort Worth, TX, (Dallas/Fort Worth International Airport), 5.25%, 11/1/30 | | $ | 1,100 | | | $ | 1,252,262 | |
Dallas and Fort Worth, TX, (Dallas/Fort Worth International Airport), 5.25%, 11/1/31 | | | 1,455 | | | | 1,653,971 | |
Delaware River Port Authority of Pennsylvania and New Jersey, 5.00%, 1/1/31 | | | 700 | | | | 780,773 | |
Denver City and County, CO, Airport System Revenue, 2.025%, (70% of 1 mo. USD LIBOR + 0.86%), 11/15/19 (Put Date), 11/15/31(6) | | | 1,000 | | | | 1,004,480 | |
Grand Parkway Transportation Corp., TX, 5.125%, 10/1/43 | | | 1,100 | | | | 1,217,007 | |
Metropolitan Transportation Authority, NY, 5.00%, 11/15/35 | | | 2,375 | | | | 2,700,399 | |
Metropolitan Transportation Authority, NY, 6.25%, 11/15/23 | | | 430 | | | | 442,483 | |
Metropolitan Transportation Authority, NY, 6.50%, 11/15/28 | | | 960 | | | | 989,338 | |
Miami-Dade County, FL, Aviation Revenue, 5.00%, 10/1/33 | | | 6,450 | | | | 7,230,321 | |
New Orleans Aviation Board, LA, 5.00%, 1/1/43 | | | 1,555 | | | | 1,754,304 | |
Pennsylvania Turnpike Commission, 6.375%, 12/1/38 | | | 11,500 | | | | 14,211,125 | |
San Joaquin Hills Transportation Corridor Agency, CA, 5.00%, 1/15/34 | | | 5,235 | | | | 5,778,393 | |
Texas Private Activity Bond Surface Transportation Corp., (LBJ Express Managed Lanes Project), 7.00%, 6/30/34 | | | 3,500 | | | | 3,870,195 | |
Texas Private Activity Bond Surface Transportation Corp., (North Tarrant Express Managed Lanes Project), 6.875%, 12/31/39 | | | 2,980 | | | | 3,220,754 | |
Triborough Bridge and Tunnel Authority, NY, 5.25%, 11/15/34(1) | | | 6,255 | | | | 6,398,365 | |
| | | | | | | $ | 57,726,014 | |
|
| Water and Sewer — 4.7% | |
Atlanta, GA, Water and Wastewater Revenue, 5.00%, 11/1/35(1) | | $ | 6,990 | | | $ | 8,228,908 | |
El Paso, TX, Water and Sewer Revenue, 5.00%, 3/1/31 | | | 1,080 | | | | 1,264,345 | |
New York City Municipal Water Finance Authority, NY, (Water and Sewer System), 5.75%, 6/15/40(1) | | | 5,280 | | | | 5,322,293 | |
| | | | | | | $ | 14,815,546 | |
| |
Total Tax-Exempt Municipal Securities — 112.4%
(identified cost $331,928,594) | | | $ | 350,900,250 | |
| | | | | | | | |
| Taxable Municipal Securities — 0.0%(7) | |
| Security | | Principal
Amount
(000’s omitted) | | | Value | |
|
| Other Revenue — 0.0%(7) | |
Otero County, NM, Jail Project Revenue, 8.75%, 4/1/18 | | $ | 120 | | | $ | 119,995 | |
| |
Total Taxable Municipal Securities — 0.0%(7)
(identified cost $120,000) | | | $ | 119,995 | |
| |
Total Investments — 112.4%
(identified cost $332,048,594) | | | $ | 351,020,245 | |
| |
Other Assets, Less Liabilities — (12.4)% | | | $ | (38,710,278 | ) |
| |
Net Assets — 100.0% | | | $ | 312,309,967 | |
The percentage shown for each investment category in the Portfolio of Investments is based on net assets.
At March 31, 2018, the concentration of the Fund’s investments in the various states and territories, determined as a percentage of net assets, is as follows:
| | | | |
| California | | | 20.0% | |
| New York | | | 19.7% | |
| Others, representing less than 10% individually | | | 72.7% | |
The Fund invests primarily in debt securities issued by municipalities. The ability of the issuers of the debt securities to meet their obligations may be affected by economic developments in a specific industry or municipality. In order to reduce the risk associated with such economic developments, at March 31, 2018, 17.6% of total investments are backed by bond insurance of various financial institutions and financial guaranty assurance agencies. The aggregate percentage insured by an individual financial institution or financial guaranty assurance agency ranged from 0.3% to 7.8% of total investments.
| (1) | Security represents the municipal bond held by a trust that issues residual interest bonds (see Note 1H). |
| (2) | When-issued security. |
| (3) | The issuer is in default on the payment of principal but continues to pay interest. |
| (4) | Defaulted security. Issuer has defaulted on the payment of interest and/or principal or has filed for bankruptcy. |
| (5) | Security exempt from registration pursuant to Rule 144A under the Securities Act of 1933, as amended. These securities may be sold in certain transactions in reliance on an exemption from registration (normally to qualified institutional buyers). At March 31, 2018, the aggregate value of these securities is $5,991,579 or 1.9% of the Fund’s net assets. |
| (6) | Floating rate security. The stated interest rate represents the rate in effect at March 31, 2018. |
| (7) | Amount is less than 0.05%. |
| | | | |
| | 10 | | See Notes to Financial Statements. |
Eaton Vance
AMT-Free Municipal Income Fund
March 31, 2018
Portfolio of Investments (Unaudited) — continued
| | | | | | | | | | | | | | | | | | | | |
| Futures Contracts | | | | | | | | | | | | | | | |
| | | | | |
| Description | | Number of
Contracts | | | Position | | | Expiration
Month/Year | | | Notional
Amount | | | Value/Net
Unrealized
Depreciation | |
| | | | | |
Interest Rate Futures | | | | | | | | | | | | | | | | | | | | |
| U.S. 10-Year Treasury Note | | | 145 | | | | Short | | | | Jun-18 | | | $ | (17,565,391 | ) | | $ | (109,024 | ) |
| U.S. Long Treasury Bond | | | 121 | | | | Short | | | | Jun-18 | | | | (17,741,625 | ) | | | (367,924 | ) |
| | | | | |
| | | | | | | | | | | | | | | | | | | $ | (476,948 | ) |
Abbreviations:
| | | | |
| AGC | | – | | Assured Guaranty Corp. |
| AGM | | – | | Assured Guaranty Municipal Corp. |
| AMBAC | | – | | AMBAC Financial Group, Inc. |
| BHAC | | – | | Berkshire Hathaway Assurance Corp. |
| LIBOR | | – | | London Interbank Offered Rate |
| NPFG | | – | | National Public Finance Guaranty Corp. |
Currency Abbreviations:
| | | | |
| USD | | – | | United States Dollar |
| | | | |
| | 11 | | See Notes to Financial Statements. |
Eaton Vance
National Municipal Income Fund
March 31, 2018
Portfolio of Investments (Unaudited)
| | | | | | | | |
| Tax-Exempt Municipal Securities — 108.3% | |
| Security | | Principal
Amount
(000’s omitted) | | | Value | |
|
| Bond Bank — 1.7% | |
Connecticut, (State Revolving Fund), Green Bonds, 5.00%, 3/1/28 | | $ | 10,000 | | | $ | 11,584,400 | |
New York State Environmental Facilities Corp., (New York City Municipal Water Finance Authority), 5.00%, 6/15/42 | | | 8,500 | | | | 9,879,805 | |
Rickenbacker Port Authority, OH, (OASBO Expanded Asset Pooled Financing Program), 5.375%, 1/1/32 | | | 19,750 | | | | 22,065,490 | |
| | | | | | | $ | 43,529,695 | |
|
| Cogeneration — 0.2% | |
Northampton County Industrial Development Authority, PA, (Northampton Generating), (AMT), 5.00%, 12/31/23(1) | | $ | 14,652 | | | $ | 4,395,694 | |
| | | | | | | $ | 4,395,694 | |
|
| Education — 8.0% | |
Massachusetts Development Finance Agency, (Harvard University), 5.00%, 7/15/33 | | $ | 21,215 | | | $ | 25,090,556 | |
Massachusetts Development Finance Agency, (Harvard University), 5.00%, 7/15/34 | | | 5,000 | | | | 5,897,050 | |
Monroe County Industrial Development Corp., NY, (University of Rochester), 4.00%, 7/1/43 | | | 8,000 | | | | 8,294,000 | |
New Jersey Educational Facilities Authority, (Princeton University), 5.00%, 7/1/29 | | | 3,000 | | | | 3,632,040 | |
New Jersey Educational Facilities Authority, (Princeton University), 5.00%, 7/1/30 | | | 3,000 | | | | 3,618,270 | |
New Jersey Educational Facilities Authority, (Princeton University), 5.00%, 7/1/33 | | | 6,470 | | | | 7,726,733 | |
Oregon Facilities Authority, (Lewis & Clark College), 5.625%, 10/1/36 | | | 9,930 | | | | 11,032,528 | |
Rutgers University, NJ, 5.00%, 5/1/43(2) | | | 37,000 | | | | 40,680,020 | |
University of California, 5.25%, 5/15/36 | | | 7,080 | | | | 8,169,116 | |
University of California, 5.25%, 5/15/37 | | | 13,000 | | | | 14,975,870 | |
University of California, 5.25%, 5/15/38 | | | 7,700 | | | | 8,860,929 | |
University of Texas, 3.00%, 8/15/35 | | | 1,750 | | | | 1,683,220 | |
University of Virginia, 5.00%, 4/1/38 | | | 27,060 | | | | 31,647,211 | |
University of Virginia, 5.00%, 4/1/39 | | | 32,640 | | | | 38,116,992 | |
| | | | | | | $ | 209,424,535 | |
|
| Electric Utilities — 7.5% | |
Hawaii Department of Budget and Finance, (Hawaiian Electric Co.), 6.50%, 7/1/39 | | $ | 8,600 | | | $ | 9,063,110 | |
Omaha Public Power District, NE, 5.00%, 2/1/39 | | | 14,190 | | | | 15,754,022 | |
Owensboro, KY, Electric Light and Power System Revenue, 4.00%, 1/1/26 | | | 1,750 | | | | 1,895,232 | |
| | | | | | | | |
| Security | | Principal
Amount
(000’s omitted) | | | Value | |
|
| Electric Utilities (continued) | |
Public Power Generation Agency, NE, (Whelan Energy Center Unit 2), 5.00%, 1/1/28 | | $ | 6,025 | | | $ | 6,814,456 | |
Public Power Generation Agency, NE, (Whelan Energy Center Unit 2), 5.00%, 1/1/31 | | | 5,625 | | | | 6,285,206 | |
San Antonio, TX, (Electric and Gas Systems), Prerefunded to 2/1/19, 5.00%, 2/1/34(2) | | | 41,100 | | | | 42,247,101 | |
Unified Government of Wyandotte County/Kansas City, KS, Utility System Revenue, 5.00%, 9/1/32 | | | 10,000 | | | | 11,029,000 | |
Utility Debt Securitization Authority, NY, 5.00%, 12/15/30(2) | | | 22,500 | | | | 25,636,950 | |
Utility Debt Securitization Authority, NY, 5.00%, 12/15/31(2) | | | 27,500 | | | | 31,239,725 | |
Utility Debt Securitization Authority, NY, 5.00%, 12/15/38 | | | 4,690 | | | | 5,500,057 | |
Utility Debt Securitization Authority, NY, 5.00%, 12/15/39 | | | 13,260 | | | | 15,537,935 | |
Vernon, CA, Electric System Revenue, 5.125%, 8/1/21 | | | 25,180 | | | | 26,205,078 | |
| | | | | | | $ | 197,207,872 | |
|
| Escrowed / Prerefunded — 6.9% | |
Bexar County Health Facilities Development Corp., TX, (St. Luke’s Lutheran Hospital), Escrowed to Maturity, 7.00%, 5/1/21 | | $ | 2,400 | | | $ | 2,627,064 | |
Brooklyn Arena Local Development Corp., NY, (Barclays Center), Prerefunded to 1/15/20, 6.00%, 7/15/30 | | | 9,530 | | | | 10,249,991 | |
Brooklyn Arena Local Development Corp., NY, (Barclays Center), Prerefunded to 1/15/20, 6.25%, 7/15/40 | | | 14,295 | | | | 15,437,599 | |
Guam, Limited Obligation Bonds, Prerefunded to 12/1/19, 5.625%, 12/1/29 | | | 350 | | | | 372,873 | |
Guam, Limited Obligation Bonds, Prerefunded to 12/1/19, 5.75%, 12/1/34 | | | 375 | | | | 400,271 | |
Massachusetts Development Finance Agency, (Tufts Medical Center), Prerefunded to 1/1/21, 6.75%, 1/1/36 | | | 4,505 | | | | 5,072,225 | |
North Carolina, Capital Improvement Limited Obligation Bonds, Prerefunded to 5/1/20, 5.25%, 5/1/31 | | | 22,875 | | | | 24,540,300 | |
Pennsylvania Turnpike Commission, Prerefunded to 6/1/19, 5.25%, 6/1/39 | | | 4,800 | | | | 4,998,384 | |
Pennsylvania Turnpike Commission, Prerefunded to 6/1/19, 5.25%, 6/1/39 | | | 3,900 | | | | 4,061,187 | |
Pennsylvania Turnpike Commission, Prerefunded to 6/1/19, 5.25%, 6/1/39 | | | 605 | | | | 630,005 | |
Pennsylvania Turnpike Commission, Prerefunded to 12/1/20, 5.35%, 12/1/30 | | | 3,490 | | | | 3,813,279 | |
Pennsylvania Turnpike Commission, Prerefunded to 12/1/20, 5.35%, 12/1/30 | | | 4,515 | | | | 4,920,898 | |
Pennsylvania Turnpike Commission, Prerefunded to 12/1/20, 5.45%, 12/1/35 | | | 12,125 | | | | 13,279,542 | |
Pennsylvania Turnpike Commission, Prerefunded to 12/1/20, 6.00%, 12/1/34 | | | 17,620 | | | | 19,548,509 | |
| | | | |
| | 12 | | See Notes to Financial Statements. |
Eaton Vance
National Municipal Income Fund
March 31, 2018
Portfolio of Investments (Unaudited) — continued
| | | | | | | | |
| Security | | Principal
Amount
(000’s omitted) | | | Value | |
|
| Escrowed / Prerefunded (continued) | |
Pennsylvania Turnpike Commission, Prerefunded to 12/1/20, 6.00%, 12/1/34 | | $ | 3,795 | | | $ | 4,199,927 | |
Pennsylvania Turnpike Commission, Prerefunded to 12/1/20, 6.00%, 12/1/34 | | | 3,585 | | | | 3,967,520 | |
Pennsylvania Turnpike Commission, Prerefunded to 12/1/20, 6.50%, 12/1/36 | | | 10,000 | | | | 11,210,000 | |
Southwestern Illinois Development Authority, (Memorial Group, Inc.), Prerefunded to 11/1/23, 7.25%, 11/1/33 | | | 9,170 | | | | 11,560,619 | |
Tarrant County Cultural Education Facilities Finance Corp., TX, (Scott & White Healthcare), Prerefunded to 8/15/20, 5.25%, 8/15/40 | | | 1,000 | | | | 1,079,800 | |
Tarrant County Cultural Education Facilities Finance Corp., TX, (Scott & White Healthcare), Prerefunded to 8/15/20, 5.25%, 8/15/40 | | | 12,500 | | | | 13,527,875 | |
Triborough Bridge and Tunnel Authority, NY, Prerefunded to 11/15/18,
5.25%, 11/15/34(2) | | | 14,590 | | | | 14,925,278 | |
Vernon, CA, Electric System Revenue, Prerefunded to 8/1/19, 5.125%, 8/1/21 | | | 10,795 | | | | 11,187,938 | |
| | | | | | | $ | 181,611,084 | |
|
| General Obligations — 23.1% | |
Beaverton School District No. 48J, Washington and Multnomah Counties, OR, 5.00%, (0.00% until 6/15/18), 6/15/35 | | $ | 5,000 | | | $ | 5,727,400 | |
California, 5.00%, 8/1/26 | | | 8,440 | | | | 10,108,335 | |
California, 5.00%, 10/1/39 | | | 7,325 | | | | 8,404,339 | |
California, 5.00%, 8/1/46 | | | 10,000 | | | | 11,447,900 | |
Chicago Board of Education, IL, 5.00%, 12/1/21 | | | 1,980 | | | | 2,087,415 | |
Clackamas Community College District, OR, 5.00%, (0.00% until 6/15/20), 6/15/38 | | | 760 | | | | 783,066 | |
Clackamas Community College District, OR, 5.00%, (0.00% until 6/15/20), 6/15/39 | | | 1,000 | | | | 1,028,680 | |
Clackamas Community College District, OR, 5.00%, (0.00% until 6/15/20), 6/15/40 | | | 1,250 | | | | 1,283,763 | |
Dallas, TX, 5.00%, 2/15/24 | | | 10,530 | | | | 11,964,081 | |
Delaware, 5.00%, 1/1/27 | | | 9,255 | | | | 11,191,239 | |
East Hampton Union Free School District, NY, 4.00%, 6/1/26 | | | 3,765 | | | | 4,214,315 | |
Fremont Union High School District, CA, 5.00%, 8/1/44 | | | 22,730 | | | | 26,605,692 | |
Gallatin County High School District No. 7, (Bozeman), MT, 4.00%, 6/1/36 | | | 1,230 | | | | 1,314,624 | |
Glendale Community College District, CA, (Election of 2016), 5.25%, 8/1/41 | | | 10,000 | | | | 11,989,500 | |
Hawaii, 5.00%, 1/1/34 | | | 14,200 | | | | 16,794,340 | |
Illinois, 5.00%, 2/1/24 | | | 10,705 | | | | 11,182,443 | |
Illinois, 5.00%, 11/1/24 | | | 11,295 | | | | 11,815,925 | |
Illinois, 5.00%, 2/1/27 | | | 18,500 | | | | 19,064,065 | |
| | | | | | | | |
| Security | | Principal
Amount
(000’s omitted) | | | Value | |
|
| General Obligations (continued) | |
Illinois, 5.00%, 11/1/29 | | $ | 15,000 | | | $ | 15,542,400 | |
Illinois, 5.25%, 7/1/30 | | | 6,150 | | | | 6,336,837 | |
Kane, Cook and DuPage Counties School District No. 46, IL, 5.00%, 1/1/29 | | | 1,920 | | | | 2,157,792 | |
Kane, Cook and DuPage Counties School District No. 46, IL, 5.00%, 1/1/30 | | | 4,105 | | | | 4,604,127 | |
Klein Independent School District, TX, (PSF Guaranteed), 5.00%, 2/1/36 | | | 14,180 | | | | 15,258,247 | |
Los Angeles Unified School District, CA, (Election of 2005), 5.25%, 7/1/42 | | | 15,000 | | | | 17,958,900 | |
Maryland, 4.00%, 6/1/27 | | | 8,700 | | | | 9,503,010 | |
Maryland, 5.00%, 8/1/23 | | | 17,150 | | | | 19,644,124 | |
Maryland, 5.00%, 3/15/27 | | | 6,500 | | | | 7,853,755 | |
Massachusetts, 5.00%, 7/1/35 | | | 10,000 | | | | 11,503,800 | |
Massachusetts, 5.00%, 7/1/36 | | | 21,160 | | | | 24,296,970 | |
Massachusetts, 5.00%, 3/1/37 | | | 10,900 | | | | 12,248,330 | |
Massachusetts, 5.00%, 3/1/41 | | | 9,425 | | | | 10,552,607 | |
New York, NY, 4.00%, 3/1/36 | | | 9,000 | | | | 9,497,520 | |
New York, NY, 4.00%, 10/1/41 | | | 5,000 | | | | 5,196,350 | |
New York, NY, 5.00%, 8/1/33 | | | 10,000 | | | | 11,543,400 | |
Port of Houston Authority of Harris County, TX, (AMT), 5.625%, 10/1/38 | | | 10,000 | | | | 10,201,400 | |
Port of Houston Authority of Harris County, TX, (AMT), 5.625%, 10/1/38(2) | | | 41,620 | | | | 42,458,227 | |
Portland Community College District, OR, 5.00%, 6/15/32(3) | | | 2,700 | | | | 3,155,976 | |
Portland Community College District, OR, 5.00%, 6/15/33(3) | | | 1,875 | | | | 2,184,150 | |
Santa Clara County, CA, (Election of 2008), Prerefunded to 8/1/19, 5.00%, 8/1/39(2) | | | 57,400 | | | | 59,983,574 | |
Santa Monica Community College District, CA, (Election of 2008), 5.00%, 8/1/35 | | | 7,000 | | | | 8,243,690 | |
Wake County, NC, 5.00%, 3/1/28 | | | 8,885 | | | | 10,894,076 | |
Washington, 5.00%, 8/1/22 | | | 6,875 | | | | 7,713,681 | |
Washington, 5.00%, 2/1/33 | | | 17,100 | | | | 19,275,804 | |
Washington, 5.00%, 2/1/34 | | | 15,000 | | | | 17,704,500 | |
Washington, 5.00%, 2/1/35 | | | 15,000 | | | | 17,648,250 | |
Will County Community Unit School District No. 365-U, IL, (Valley View), 5.75%, 11/1/31 | | | 12,995 | | | | 14,678,892 | |
Wisconsin, 2017 Series 1, 5.00%, 11/1/28 | | | 5,000 | | | | 6,000,450 | |
Wisconsin, 2017 Series 2, 5.00%, 11/1/28 | | | 1,000 | | | | 1,200,090 | |
Wisconsin, 5.00%, 5/1/32 | | | 7,000 | | | | 8,074,640 | |
Wisconsin, 5.00%, 5/1/38 | | | 25,000 | | | | 28,405,500 | |
| | | | | | | $ | 608,528,191 | |
| | | | |
| | 13 | | See Notes to Financial Statements. |
Eaton Vance
National Municipal Income Fund
March 31, 2018
Portfolio of Investments (Unaudited) — continued
| | | | | | | | |
| Security | | Principal
Amount
(000’s omitted) | | | Value | |
|
| Hospital — 10.7% | |
California Health Facilities Financing Authority, (Catholic Healthcare West), 5.25%, 3/1/28 | | $ | 5,700 | | | $ | 6,195,957 | |
California Health Facilities Financing Authority, (Providence Health System), 5.50%, 10/1/39(2) | | | 36,700 | | | | 38,626,383 | |
California Health Facilities Financing Authority, (St. Joseph Health System), 5.00%, 7/1/33 | | | 17,530 | | | | 19,753,505 | |
California Health Facilities Financing Authority, (St. Joseph Health System), 5.00%, 7/1/37 | | | 25,465 | | | | 28,455,355 | |
California Health Facilities Financing Authority, (Sutter Health), 5.00%, 11/15/24(3) | | | 2,500 | | | | 2,935,350 | |
California Health Facilities Financing Authority, (Sutter Health), 5.00%, 11/15/25(3) | | | 2,250 | | | | 2,677,230 | |
California Health Facilities Financing Authority, (Sutter Health), 5.00%, 11/15/35(3) | | | 2,000 | | | | 2,315,560 | |
California Health Facilities Financing Authority, (Sutter Health), 5.00%, 11/15/36(3) | | | 4,000 | | | | 4,620,320 | |
California Health Facilities Financing Authority, (Sutter Health), 5.00%, 11/15/37(3) | | | 2,000 | | | | 2,304,780 | |
California Health Facilities Financing Authority, (Sutter Health), 5.00%, 11/15/38(3) | | | 2,000 | | | | 2,301,200 | |
California Health Facilities Financing Authority, (Sutter Health), 5.00%, 11/15/46 | | | 22,000 | | | | 24,872,320 | |
California Health Facilities Financing Authority, (Sutter Health), 5.25%, 8/15/31 | | | 13,675 | | | | 15,209,198 | |
Idaho Health Facilities Authority, (Trinity Health Credit Group), 5.00%, 12/1/45 | | | 2,200 | | | | 2,463,912 | |
Illinois Finance Authority, (Presence Health Network), 4.00%, 2/15/33 | | | 10,000 | | | | 10,239,900 | |
Illinois Finance Authority, (Presence Health Network), 5.00%, 2/15/26 | | | 7,500 | | | | 8,566,500 | |
Illinois Finance Authority, (Presence Health Network), 5.00%, 2/15/33 | | | 2,500 | | | | 2,816,125 | |
Maple Grove, MN, (Maple Grove Hospital Corp.), 4.00%, 5/1/22 | | | 475 | | | | 506,635 | |
Maryland Health and Higher Educational Facilities Authority, (LifeBridge Health), 5.00%, 7/1/22 | | | 320 | | | | 357,485 | |
Massachusetts Development Finance Agency, (Tufts Medical Center), 6.75%, 1/1/36 | | | 3,005 | | | | 3,373,924 | |
Michigan Finance Authority, (Trinity Health Credit Group), 5.00%, 12/1/42 | | | 2,500 | | | | 2,831,325 | |
Missouri Health and Educational Facilities Authority, (SSM Health Care), 5.00%, 6/1/30 | | | 7,505 | | | | 8,356,742 | |
New Hanover County, NC, (New Hanover Regional Medical Center), 5.00%, 10/1/35 | | | 1,500 | | | | 1,714,290 | |
New Jersey Health Care Facilities Financing Authority, (Inspira Health Obligated Group), 5.00%, 7/1/37 | | | 1,300 | | | | 1,467,050 | |
Ohio, (Cleveland Clinic Health System), 5.00%, 1/1/27 | | | 4,250 | | | | 5,079,770 | |
| | | | | | | | |
| Security | | Principal
Amount
(000’s omitted) | | | Value | |
|
| Hospital (continued) | |
Oklahoma Development Finance Authority, (OU Medicine), 5.00%, 8/15/38(3) | | $ | 1,750 | | | $ | 1,918,998 | |
Oklahoma Development Finance Authority, (OU Medicine), 5.25%, 8/15/43(3) | | | 5,200 | | | | 5,779,436 | |
Oregon Facilities Authority, (Samaritan Health Services), 5.00%, 10/1/35 | | | 2,260 | | | | 2,519,538 | |
University of Kansas Hospital Authority, 5.00%, 9/1/45 | | | 25,500 | | | | 28,506,450 | |
Washington Health Care Facilities Authority, (Overlake Hospital Medical Center), 5.00%, 7/1/42 | | | 2,250 | | | | 2,506,837 | |
Washington Township Health Care District, CA, 6.25%, 7/1/39 | | | 16,675 | | | | 17,352,005 | |
West Virginia Hospital Finance Authority, (West Virginia United Health System Obligated Group), 5.375%, 6/1/38 | | | 21,895 | | | | 24,252,873 | |
| | | | | | | $ | 280,876,953 | |
|
| Housing — 0.4% | |
Nebraska Investment Finance Authority, Single Family Housing Revenue, (AMT), (FHLMC), (FNMA), (GNMA), 1.60%, 3/1/21 | | $ | 1,145 | | | $ | 1,119,146 | |
Texas Student Housing Corp., (University of Northern Texas), 6.85%, 7/1/31 | | | 10,640 | | | | 10,457,205 | |
| | | | | | | $ | 11,576,351 | |
|
| Industrial Development Revenue — 1.7% | |
Amelia County Industrial Development Authority, VA, (Waste Management, Inc.), (AMT), 2.125% to 4/1/20 (Put Date), 4/1/27 | | $ | 8,155 | | | $ | 8,206,703 | |
Metropolitan Nashville Airport Authority, TN, (Aero Nashville), 5.20%, 7/1/26 | | | 365 | | | | 376,111 | |
New Jersey Economic Development Authority, (New Jersey-American Water Co., Inc.), (AMT), 5.70%, 10/1/39 | | | 28,150 | | | | 29,518,371 | |
Public Finance Authority, WI, (Waste Management, Inc.), (AMT), 2.00% to 6/1/21 (Put Date), 7/1/29 | | | 5,000 | | | | 4,902,000 | |
Vermont Economic Development Authority, (Casella Waste Systems, Inc.), (AMT), 4.625% to 4/3/28 (Put Date), 4/1/36(3)(4) | | | 475 | | | | 475,000 | |
| | | | | | | $ | 43,478,185 | |
|
| Insured – Education — 0.0%(5) | |
Metropolitan Government of Nashville and Davidson County Health and Educational Facilities Board, TN, (Meharry Medical College), (AMBAC), 6.00%, 12/1/19 | | $ | 845 | | | $ | 872,986 | |
| | | | | | | $ | 872,986 | |
| | | | |
| | 14 | | See Notes to Financial Statements. |
Eaton Vance
National Municipal Income Fund
March 31, 2018
Portfolio of Investments (Unaudited) — continued
| | | | | | | | |
| Security | | Principal
Amount
(000’s omitted) | | | Value | |
|
| Insured – Escrowed / Prerefunded — 0.7% | |
Miami-Dade County, FL, (Miami International Airport), (AGM), (AMT), Prerefunded to 10/1/18, 5.25%, 10/1/41 | | $ | 18,775 | | | $ | 19,102,624 | |
| | | | | | | $ | 19,102,624 | |
|
| Insured – General Obligations — 0.1% | |
Atlantic City, NJ, (AGM), 5.00%, 3/1/25 | | $ | 750 | | | $ | 844,972 | |
Atlantic City, NJ, (AGM), 5.00%, 3/1/26 | | | 500 | | | | 568,440 | |
Atlantic City, NJ, (AGM), 5.00%, 3/1/27 | | | 650 | | | | 744,959 | |
| | | | | | | $ | 2,158,371 | |
|
| Insured – Hospital — 0.5% | |
Medford Hospital Facilities Authority, OR, (Asante Health System), (AGM), 5.50%, 8/15/28 | | $ | 12,000 | | | $ | 12,890,760 | |
| | | | | | | $ | 12,890,760 | |
|
| Insured – Other Revenue — 1.1% | |
Harris County-Houston Sports Authority, TX, (AGM), (NPFG), 0.00%, 11/15/34 | | $ | 58,155 | | | $ | 29,199,044 | |
| | | | | | | $ | 29,199,044 | |
|
| Insured – Special Tax Revenue — 4.2% | |
Massachusetts, Special Obligation, Dedicated Tax Revenue, (NPFG), 5.50%, 1/1/29 | | $ | 11,000 | | | $ | 13,589,180 | |
Massachusetts, Special Obligation, Dedicated Tax Revenue, (NPFG), 5.50%, 1/1/30 | | | 3,080 | | | | 3,851,170 | |
Puerto Rico Sales Tax Financing Corp., (NPFG), 0.00%, 8/1/44 | | | 83,550 | | | | 17,500,383 | |
Puerto Rico Sales Tax Financing Corp., (NPFG), 0.00%, 8/1/45 | | | 253,860 | | | | 50,436,905 | |
Puerto Rico Sales Tax Financing Corp., (NPFG), 0.00%, 8/1/46 | | | 128,640 | | | | 24,249,927 | |
| | | | | | | $ | 109,627,565 | |
|
| Insured – Student Loan — 0.7% | |
Massachusetts Educational Financing Authority, (AGC), (AMT), 6.35%, 1/1/30 | | $ | 18,590 | | | $ | 18,728,124 | |
| | | | | | | $ | 18,728,124 | |
|
| Insured – Transportation — 2.0% | |
E-470 Public Highway Authority, CO, (NPFG), 0.00%, 9/1/37 | | $ | 13,335 | | | $ | 5,671,242 | |
New York Transportation Development Corp., (LaGuardia Airport Terminal B Redevelopment), (AGM), (AMT), 4.00%, 7/1/41 | | | 2,940 | | | | 3,021,703 | |
| | | | | | | | |
| Security | | Principal
Amount
(000’s omitted) | | | Value | |
|
| Insured – Transportation (continued) | |
North Texas Tollway Authority, (AGC), 6.20%, 1/1/42 | | $ | 37,070 | | | $ | 44,538,122 | |
| | | | | | | $ | 53,231,067 | |
|
| Lease Revenue / Certificates of Participation — 0.6% | |
Commonwealth Financing Authority, PA, Tobacco Master Settlement Payment Revenue, 5.00%, 6/1/35 | | $ | 3,000 | | | $ | 3,333,030 | |
Virginia College Building Authority, (21st Century College and Equipment Programs), 5.00%, 2/1/26 | | | 10,000 | | | | 11,852,900 | |
| | | | | | | $ | 15,185,930 | |
|
| Nursing Home — 0.3% | |
Mississippi Business Finance Corp., (Magnolia Healthcare), 7.99%, 7/1/25 | | $ | 7,110 | | | $ | 7,178,327 | |
| | | | | | | $ | 7,178,327 | |
|
| Other Revenue — 2.9% | |
Central Falls Detention Facility Corp., RI, 7.25%, 7/15/35(6) | | $ | 250 | | | $ | 45,000 | |
New York City Transitional Finance Authority, NY, (Building Aid), 5.00%, 7/15/33 | | | 10,000 | | | | 11,317,200 | |
Oregon, Lottery Revenue, 5.00%, 4/1/35 | | | 1,500 | | | | 1,750,395 | |
Texas Municipal Gas Acquisition and Supply Corp. I, Gas Supply Revenue, 6.25%, 12/15/26 | | | 21,135 | | | | 24,770,643 | |
Texas Municipal Gas Acquisition and Supply Corp. III, Gas Supply Revenue, 5.00%, 12/15/30 | | | 4,845 | | | | 5,306,680 | |
Texas Municipal Gas Acquisition and Supply Corp. III, Gas Supply Revenue, 5.00%, 12/15/32 | | | 29,755 | | | | 32,494,543 | |
Washington Health Care Facilities Authority, (Fred Hutchinson Cancer Research Center), 2.342%, (67% of 1 mo. USD LIBOR + 1.10%), 7/1/22 (Put Date), 1/1/42(7) | | | 1,000 | | | | 1,006,540 | |
| | | | | | | $ | 76,691,001 | |
|
| Senior Living / Life Care — 0.8% | |
Logan County, CO, (TLC Care Choices, Inc.), 6.875%, 12/1/23(8) | | $ | 409 | | | $ | 110,475 | |
New Hope Cultural Education Facilities Finance Corp., TX, (Longhorn Village), 5.00%, 1/1/47 | | | 5,500 | | | | 5,823,015 | |
North Miami, FL, (Imperial Club), 6.125%, 1/1/42 | | | 16,435 | | | | 13,169,694 | |
Rockville, MD, (Ingleside at King Farm), 5.00%, 11/1/31 | | | 1,010 | | | | 1,130,695 | |
Rockville, MD, (Ingleside at King Farm), 5.00%, 11/1/32 | | | 525 | | | | 585,748 | |
Wisconsin Health and Educational Facilities Authority, (Saint John’s Communities, Inc.), 5.00%, 9/15/40(3) | | | 750 | | | | 786,990 | |
| | | | | | | $ | 21,606,617 | |
| | | | |
| | 15 | | See Notes to Financial Statements. |
Eaton Vance
National Municipal Income Fund
March 31, 2018
Portfolio of Investments (Unaudited) — continued
| | | | | | | | |
| Security | | Principal
Amount
(000’s omitted) | | | Value | |
|
| Special Tax Revenue — 7.3% | |
Lafayette Parish School Board, LA, Sales Tax Revenue, 4.00%, 4/1/35 | | $ | 500 | | | $ | 526,650 | |
Lafayette Parish School Board, LA, Sales Tax Revenue, 5.00%, 4/1/48 | | | 3,000 | | | | 3,419,160 | |
Metropolitan Transportation Authority, NY, Dedicated Tax Revenue, Green Bonds, 5.25%, 11/15/33 | | | 10,000 | | | | 12,071,400 | |
New River Community Development District, FL, (Capital Improvements),
5.00%, 5/1/13(6) | | | 230 | | | | 0 | |
New River Community Development District, FL, (Capital Improvements),
5.35%, 5/1/38(6) | | | 80 | | | | 0 | |
New River Community Development District, FL, (Capital Improvements), Series 2010A-2, 5.75%, 5/1/38 | | | 390 | | | | 390,011 | |
New York City Transitional Finance Authority, NY, Future Tax Revenue, 4.00%, 8/1/41 | | | 7,500 | | | | 7,768,575 | |
New York City Transitional Finance Authority, NY, Future Tax Revenue, 5.00%, 2/1/34 | | | 7,355 | | | | 8,537,611 | |
New York City Transitional Finance Authority, NY, Future Tax Revenue, 5.00%, 2/1/36 | | | 5,000 | | | | 5,770,300 | |
New York City Transitional Finance Authority, NY, Future Tax Revenue, 5.00%, 8/1/38 | | | 8,550 | | | | 9,665,262 | |
New York City Transitional Finance Authority, NY, Future Tax Revenue, 5.00%, 11/1/38 | | | 8,125 | | | | 9,126,731 | |
New York City Transitional Finance Authority, NY, Future Tax Revenue, 5.00%, 5/1/39 | | | 4,740 | | | | 5,459,864 | |
New York City Transitional Finance Authority, NY, Future Tax Revenue, 5.00%, 8/1/39 | | | 10,000 | | | | 11,554,700 | |
New York City Transitional Finance Authority, NY, Future Tax Revenue, (SPA: Barclays Bank PLC), 1.73%, 11/1/42(9) | | | 16,200 | | | | 16,200,000 | |
New York Dormitory Authority, Personal Income Tax Revenue, 5.00%, 2/15/41 | | | 7,520 | | | | 8,666,950 | |
New York Dormitory Authority, Personal Income Tax Revenue, 5.00%, 2/15/43 | | | 22,400 | | | | 24,605,280 | |
New York Dormitory Authority, Sales Tax Revenue, 5.00%, 3/15/36 | | | 8,000 | | | | 9,250,960 | |
New York Dormitory Authority, Sales Tax Revenue, 5.00%, 3/15/41 | | | 10,000 | | | | 11,517,100 | |
New York Dormitory Authority, Sales Tax Revenue, 5.00%, 3/15/43 | | | 10,000 | | | | 11,024,800 | |
New York State Urban Development Corp., Personal Income Tax Revenue, 5.00%, 3/15/34 | | | 470 | | | | 544,895 | |
New York State Urban Development Corp., Personal Income Tax Revenue, 5.00%, 3/15/35 | | | 10,000 | | | | 11,426,600 | |
Sales Tax Asset Receivables Corp., NY, 5.00%, 10/15/31 | | | 10,000 | | | | 11,465,800 | |
Southern Hills Plantation I Community Development District, FL, Series A1, 5.80%, 5/1/35 | | | 470 | | | | 469,995 | |
Southern Hills Plantation I Community Development District, FL, Series A2, 5.80%, 5/1/35 | | | 345 | | | | 318,283 | |
| | | | | | | | |
| Security | | Principal
Amount
(000’s omitted) | | | Value | |
|
| Special Tax Revenue (continued) | |
Sterling Hill Community Development District, FL, 6.20%, 5/1/35 | | $ | 1,532 | | | $ | 980,254 | |
Texas Transportation Commission, 5.00%, 4/1/33(2) | | | 10,000 | | | | 11,383,700 | |
| | | | | | | $ | 192,144,881 | |
|
| Student Loan — 0.4% | |
Iowa Student Loan Liquidity Corp., 5.25%, 12/1/22 | | $ | 4,060 | | | $ | 4,198,081 | |
New Jersey Higher Education Student Assistance Authority, (AMT), 4.00%, 12/1/28 | | | 5,340 | | | | 5,500,413 | |
| | | | | | | $ | 9,698,494 | |
|
| Transportation — 17.6% | |
Central Texas Regional Mobility Authority, Series 2015A, 5.00%, 1/1/40 | | $ | 2,105 | | | $ | 2,319,542 | |
Charleston County Airport District, SC, (AMT), 5.50%, 7/1/38 | | | 10,000 | | | | 11,147,800 | |
Chicago, IL, (Midway International Airport), 5.00%, 1/1/33 | | | 6,025 | | | | 6,672,989 | |
Chicago, IL, (Midway International Airport), (AMT), 5.00%, 1/1/34 | | | 5,250 | | | | 5,747,805 | |
Chicago, IL, (O’Hare International Airport), Series 2016C, 5.00%, 1/1/36 | | | 6,000 | | | | 6,709,140 | |
Chicago, IL, (O’Hare International Airport), Series 2017B, 5.00%, 1/1/36 | | | 8,000 | | | | 9,051,280 | |
Chicago, IL, (O’Hare International Airport), (AMT), 5.00%, 1/1/23 | | | 1,125 | | | | 1,252,181 | |
Chicago, IL, (O’Hare International Airport), (AMT), 5.00%, 1/1/25 | | | 16,100 | | | | 17,753,148 | |
Chicago, IL, (O’Hare International Airport), (AMT), 5.00%, 1/1/33 | | | 7,300 | | | | 8,086,429 | |
Chicago, IL, (O’Hare International Airport), (AMT), 5.00%, 7/1/48(3) | | | 2,000 | | | | 2,189,200 | |
Colorado Bridge Enterprise, (Central 70 Project), (AMT), 4.00%, 6/30/28 | | | 1,000 | | | | 1,051,070 | |
Dallas and Fort Worth, TX, (Dallas/Fort Worth International Airport), 5.25%, 11/1/31 | | | 10,395 | | | | 11,816,516 | |
Dallas and Fort Worth, TX, (Dallas/Fort Worth International Airport), (AMT), 5.25%, 11/1/30 | | | 11,445 | | | | 12,858,343 | |
Delaware River Port Authority of Pennsylvania and New Jersey, 5.00%, 1/1/31 | | | 5,630 | | | | 6,279,646 | |
Hawaii, Airports System Revenue, (AMT), 5.00%, 7/1/41 | | | 2,935 | | | | 3,248,047 | |
Houston, TX, (United Airlines, Inc.), (AMT), 5.00%, 7/1/29 | | | 7,670 | | | | 8,362,908 | |
Illinois Toll Highway Authority, 5.00%, 1/1/33 | | | 3,265 | | | | 3,647,233 | |
Kansas Department of Transportation, 5.00%, 9/1/30 | | | 20,000 | | | | 22,957,200 | |
Los Angeles Department of Airports, CA, (Los Angeles International Airport), 5.00%, 5/15/35(2) | | | 7,200 | | | | 7,671,600 | |
Los Angeles Department of Airports, CA, (Los Angeles International Airport), (AMT), 5.00%, 5/15/34(3) | | | 6,000 | | | | 6,998,220 | |
| | | | |
| | 16 | | See Notes to Financial Statements. |
Eaton Vance
National Municipal Income Fund
March 31, 2018
Portfolio of Investments (Unaudited) — continued
| | | | | | | | |
| Security | | Principal
Amount
(000’s omitted) | | | Value | |
|
| Transportation (continued) | |
Los Angeles Department of Airports, CA, (Los Angeles International Airport), (AMT), 5.00%, 5/15/40 | | $ | 5,000 | | | $ | 5,561,850 | |
Los Angeles Department of Airports, CA, (Los Angeles International Airport), (AMT), 5.00%, 5/15/44 | | | 15,500 | | | | 17,778,965 | |
Louisiana Offshore Terminal Authority, (LOOP LLC), 2.00% to 10/1/22 (Put Date), 10/1/40 | | | 2,000 | | | | 1,986,360 | |
Maryland Economic Development Corp., (Transportation Facilities), 5.00%, 6/1/35 | | | 1,050 | | | | 1,182,699 | |
Metropolitan Transportation Authority, NY, 5.00%, 11/15/30 | | | 8,000 | | | | 9,409,840 | |
Metropolitan Transportation Authority, NY, 5.25%, 11/15/33 | | | 5,550 | | | | 6,346,258 | |
Metropolitan Transportation Authority, NY, 6.25%, 11/15/23 | | | 3,735 | | | | 3,843,427 | |
Metropolitan Transportation Authority, NY, Green Bonds, 0.00%, 11/15/32 | | | 16,710 | | | | 10,120,746 | |
Metropolitan Transportation Authority, NY, Green Bonds, 4.00%, 11/15/35 | | | 10,000 | | | | 10,466,000 | |
Metropolitan Washington Airports Authority, D.C., (AMT), 5.00%, 10/1/42 | | | 2,000 | | | | 2,264,740 | |
Miami-Dade County, FL, Aviation Revenue, (AMT), 5.00%, 10/1/33 | | | 23,600 | | | | 26,116,940 | |
Miami-Dade County, FL, Aviation Revenue, (AMT), 5.00%, 10/1/36 | | | 10,000 | | | | 10,998,700 | |
New Jersey Turnpike Authority, 4.00%, 1/1/43 | | | 5,000 | | | | 5,162,950 | |
New Jersey Turnpike Authority, 5.00%, 1/1/32 | | | 5,000 | | | | 5,848,500 | |
New Jersey Turnpike Authority, Series 2014A, 5.00%, 1/1/31 | | | 10,000 | | | | 11,331,600 | |
New Jersey Turnpike Authority, Series 2015E, 5.00%, 1/1/31 | | | 7,425 | | | | 8,383,345 | |
New Jersey Turnpike Authority, Series 2017B, 5.00%, 1/1/31 | | | 5,760 | | | | 6,769,440 | |
New York Transportation Development Corp., (LaGuardia Airport Terminal B Redevelopment), (AMT), 5.00%, 7/1/41 | | | 7,465 | | | | 8,122,741 | |
North Texas Tollway Authority, 5.00%, 1/1/30 | | | 10,650 | | | | 12,286,692 | |
North Texas Tollway Authority, 5.00%, 1/1/31 | | | 2,000 | | | | 2,298,340 | |
Orlando-Orange County Expressway Authority, FL, Prerefunded to 7/1/20, 5.00%, 7/1/35 | | | 11,855 | | | | 12,704,529 | |
Orlando-Orange County Expressway Authority, FL, Prerefunded to 7/1/20, 5.00%, 7/1/35 | | | 3,145 | | | | 3,370,371 | |
Pennsylvania Turnpike Commission, 5.00%, 12/1/28 | | | 1,500 | | | | 1,756,800 | |
Pennsylvania Turnpike Commission, 5.00%, 12/1/35 | | | 1,250 | | | | 1,425,625 | |
Pennsylvania Turnpike Commission, Prerefunded to 12/1/20, 5.35%, 12/1/30 | | | 5,005 | | | | 5,454,949 | |
Philadelphia, PA, Airport Revenue, (AMT), 5.00%, 7/1/34 | | | 2,000 | | | | 2,260,380 | |
Port Authority of New York and New Jersey, (AMT), 5.00%, 9/15/23 | | | 10,000 | | | | 11,277,100 | |
| | | | | | | | |
| Security | | Principal
Amount
(000’s omitted) | | | Value | |
|
| Transportation (continued) | |
Port Authority of New York and New Jersey, (AMT), 5.00%, 11/15/30 | | $ | 250 | | | $ | 291,265 | |
Port Authority of New York and New Jersey, (AMT), 5.00%, 9/15/32 | | | 5,000 | | | | 5,807,950 | |
Public Finance Authority, WI, (Denver International Airport Great Hall), (AMT), 5.00%, 9/30/37 | | | 1,855 | | | | 2,055,934 | |
San Francisco City and County Airport Commission, CA, (San Francisco International Airport), 5.00%, 5/1/47 | | | 10,535 | | | | 12,027,388 | |
Texas Private Activity Bond Surface Transportation Corp., (LBJ Express Managed Lanes Project), 7.00%, 6/30/34 | | | 29,200 | | | | 32,288,484 | |
Texas Private Activity Bond Surface Transportation Corp., (North Tarrant Express Managed Lanes Project), 6.875%, 12/31/39 | | | 24,110 | | | | 26,057,847 | |
Triborough Bridge and Tunnel Authority, NY, 5.25%, 11/15/34(2) | | | 24,390 | | | | 24,949,019 | |
| | | | | | | $ | 463,828,071 | |
|
| Water and Sewer — 8.9% | |
Baltimore, MD, (Water Projects), (Liq: JPMorgan Chase Bank, N.A.), 1.61%, 7/1/21(4)(10) | | $ | 11,250 | | | $ | 11,250,000 | |
Detroit, MI, Sewage Disposal System, 5.25%, 7/1/39 | | | 22,500 | | | | 24,250,950 | |
Detroit, MI, Water Supply System, 5.00%, 7/1/41 | | | 2,185 | | | | 2,313,478 | |
Detroit, MI, Water Supply System, 5.25%, 7/1/41 | | | 56,420 | | | | 61,077,471 | |
East Bay Municipal Utility District, CA, 5.00%, 6/1/34 | | | 5,355 | | | | 6,178,278 | |
East Bay Municipal Utility District, CA, 5.00%, 6/1/36 | | | 10,000 | | | | 11,523,300 | |
East Bay Municipal Utility District, CA, 5.00%, 6/1/37 | | | 13,430 | | | | 15,381,513 | |
Michigan Finance Authority, (Detroit Water and Sewerage Department), 5.00%, 7/1/33 | | | 8,095 | | | | 8,942,385 | |
Michigan Finance Authority, (Detroit Water and Sewerage Department), 5.00%, 7/1/44 | | | 8,095 | | | | 8,816,264 | |
New York City Municipal Water Finance Authority, NY, (Water and Sewer System), 5.75%, 6/15/40(2) | | | 32,355 | | | | 32,614,163 | |
Northeast Ohio Regional Sewer District, 5.00%, 11/15/44 | | | 10,000 | | | | 11,262,200 | |
Pearland, TX, Water and Sewer System Revenue, 5.00%, 9/1/22 | | | 185 | | | | 207,736 | |
San Francisco City and County Public Utilities Commission, CA, Water Revenue, Green Bonds, 5.00%, 11/1/35 | | | 4,455 | | | | 5,074,423 | |
San Francisco City and County Public Utilities Commission, CA, Water Revenue, Green Bonds, 5.00%, 11/1/36 | | | 4,685 | | | | 5,330,359 | |
San Francisco City and County Public Utilities Commission, CA, Water Revenue, Green Bonds, 5.00%, 11/1/42 | | | 4,325 | | | | 4,887,380 | |
San Francisco City and County Public Utilities Commission, CA, Water Revenue, Green Bonds, 5.00%, 11/1/47 | | | 10,425 | | | | 11,733,859 | |
| | | | | | | | |
| | | | |
| | 17 | | See Notes to Financial Statements. |
Eaton Vance
National Municipal Income Fund
March 31, 2018
Portfolio of Investments (Unaudited) — continued
| | | | | | | | |
| Security | | Principal
Amount
(000’s omitted) | | | Value | |
|
| Water and Sewer (continued) | |
Santa Clara Valley Water District, CA, 5.00%, 6/1/41 | | $ | 10,000 | | | $ | 11,484,800 | |
Tucson, AZ, Water System Revenue, 5.00%, 7/1/25 | | | 1,100 | | | | 1,290,696 | |
| | | | | | | $ | 233,619,255 | |
| |
Total Tax-Exempt Municipal Securities — 108.3%
(identified cost $2,746,808,158) | | | $ | 2,846,391,677 | |
|
| Taxable Municipal Securities — 4.2% | |
| Security | | Principal
Amount
(000’s omitted) | | | Value | |
| | |
| Cogeneration — 0.0%(5) | | | | | | |
Northampton County Industrial Development Authority, PA, (Northampton Generating), 5.00%, 12/31/23(1) | | $ | 2,244 | | | $ | 673,143 | |
| | | | | | | $ | 673,143 | |
|
| General Obligations — 1.4% | |
Chicago, IL, 7.517%, 1/1/40(11) | | $ | 21,895 | | | $ | 24,954,607 | |
Chicago, IL, 7.75%, 1/1/42 | | | 11,005 | | | | 11,995,450 | |
| | | | | | | $ | 36,950,057 | |
|
| Hospital — 1.4% | |
California Statewide Communities Development Authority, (Loma Linda University Medical Center), 6.00%, 12/1/24 | | $ | 34,250 | | | $ | 36,588,590 | |
| | | | | | | $ | 36,588,590 | |
|
| Insured – Transportation — 1.4% | |
Alameda Corridor Transportation Authority, CA, (AMBAC), 0.00%, 10/1/26 | | $ | 22,500 | | | $ | 15,394,500 | |
Alameda Corridor Transportation Authority, CA, (AMBAC), 0.00%, 10/1/27 | | | 34,390 | | | | 22,267,869 | |
| | | | | | | $ | 37,662,369 | |
| |
Total Taxable Municipal Securities — 4.2%
(identified cost $101,709,068) | | | $ | 111,874,159 | |
| |
Total Investments — 112.5%
(identified cost $2,848,517,226) | | | $ | 2,958,265,836 | |
| |
Other Assets, Less Liabilities — (12.5)% | | | $ | (328,955,757 | ) |
| |
Net Assets — 100.0% | | | $ | 2,629,310,079 | |
The percentage shown for each investment category in the Portfolio of Investments is based on net assets.
At March 31, 2018, the concentration of the Fund’s investments in the various states and territories, determined as a percentage of net assets, is as follows:
| | | | |
| California | | | 22.3% | |
| New York | | | 18.2% | |
| Texas | | | 15.7% | |
| Others, representing less than 10% individually | | | 56.3% | |
The Fund invests primarily in debt securities issued by municipalities. The ability of the issuers of the debt securities to meet their obligations may be affected by economic developments in a specific industry or municipality. In order to reduce the risk associated with such economic developments, at March 31, 2018, 9.6% of total investments are backed by bond insurance of various financial institutions and financial guaranty assurance agencies. The aggregate percentage insured by an individual financial institution or financial guaranty assurance agency ranged from 1.3% to 4.9% of total investments.
| | (1) | Represents a payment-in-kind security which may pay interest in additional principal at the issuer’s discretion. |
| | (2) | Security represents the municipal bond held by a trust that issues residual interest bonds (see Note 1H). |
| | (3) | When-issued security. |
| | (4) | Security exempt from registration pursuant to Rule 144A under the Securities Act of 1933, as amended. These securities may be sold in certain transactions in reliance on an exemption from registration (normally to qualified institutional buyers). At March 31, 2018, the aggregate value of these securities is $11,725,000 or 0.4% of the Fund’s net assets. |
| | (5) | Amount is less than 0.05%. |
| | (6) | Defaulted security. Issuer has defaulted on the payment of interest and/or principal or has filed for bankruptcy. |
| | (7) | Floating rate security. The stated interest rate represents the rate in effect at March 31, 2018. |
| | (8) | Security is in default and making only partial interest payments. |
| | (9) | Variable rate demand obligation that may be tendered at par on any day for payment the same or next business day. The stated interest rate, which generally resets daily, is determined by the remarketing agent and represents the rate in effect at March 31, 2018. |
| (10) | Floating rate certificate issued by a tender option bond trust that owns the underlying municipal bond. The floating rate certificate may be tendered at par on any day for payment the lesser of 5 business days or 7 calendar days. The stated interest rate, which generally resets weekly, represents the rate in effect at March 31, 2018. |
| (11) | Build America Bond. Represents taxable municipal obligation issued pursuant to the American Recovery and Reinvestment Act of 2009 or other legislation providing for the issuance of taxable municipal debt on which the issuer receives federal support. |
| | | | |
| | 18 | | See Notes to Financial Statements. |
Eaton Vance
National Municipal Income Fund
March 31, 2018
Portfolio of Investments (Unaudited) — continued
| | | | | | | | | | | | | | | | | | | | |
| Futures Contracts | |
| | | | | |
| Description | | Number of
Contracts | | | Position | | | Expiration
Month/Year | | | Notional
Amount | | | Value/Net
Unrealized
Depreciation | |
| | | | | |
Interest Rate Futures | | | | | | | | | | | | | | | | | | | | |
| U.S. Long Treasury Bond | | | 1,500 | | | | Short | | | | Jun-18 | | | $ | (219,937,500 | ) | | $ | (4,561,035 | ) |
| | | | | |
| | | | | | | | | | | | | | | | | | | $ | (4,561,035 | ) |
Abbreviations:
| | | | |
| AGC | | – | | Assured Guaranty Corp. |
| AGM | | – | | Assured Guaranty Municipal Corp. |
| AMBAC | | – | | AMBAC Financial Group, Inc. |
| AMT | | – | | Interest earned from these securities may be considered a tax preference item for purposes of the Federal Alternative Minimum Tax. |
| FHLMC | | – | | Federal Home Loan Mortgage Corp. |
| FNMA | | – | | Federal National Mortgage Association |
| GNMA | | – | | Government National Mortgage Association |
| Liq | | – | | Liquidity Provider |
| LIBOR | | – | | London Interbank Offered Rate |
| NPFG | | – | | National Public Finance Guaranty Corp. |
| PSF | | – | | Permanent School Fund |
| SPA | | – | | Standby Bond Purchase Agreement |
Currency Abbreviations:
| | | | |
| USD | | – | | United States Dollar |
| | | | |
| | 19 | | See Notes to Financial Statements. |
Eaton Vance
Municipal Income Funds
March 31, 2018
Statements of Assets and Liabilities (Unaudited)
| | | | | | | | |
| | | March 31, 2018 | |
| Assets | | AMT-Free Fund | | | National Fund | |
Investments — | | | | | | | | |
Identified cost | | $ | 332,048,594 | | | $ | 2,848,517,226 | |
Unrealized appreciation | | | 18,971,651 | | | | 109,748,610 | |
Investments, at value | | $ | 351,020,245 | | | $ | 2,958,265,836 | |
Cash | | $ | 158,922 | | | $ | 4,386,022 | |
Deposits for derivatives collateral — financial futures contracts | | | 440,270 | | | | 3,750,000 | |
Interest receivable | | | 4,933,462 | | | | 35,433,525 | |
Receivable for investments sold | | | 33,041 | | | | 24,872,933 | |
Receivable for Fund shares sold | | | 273,217 | | | | 4,044,764 | |
Total assets | | $ | 356,859,157 | | | $ | 3,030,753,080 | |
| | |
| Liabilities | | | | | | | | |
Payable for floating rate notes issued | | $ | 41,001,623 | | | $ | 264,259,619 | |
Payable for investments purchased | | | — | | | | 54,020,430 | |
Payable for when-issued securities | | | 1,666,098 | | | | 40,274,902 | |
Payable for variation margin on open financial futures contracts | | | 124,741 | | | | 1,125,033 | |
Payable for Fund shares redeemed | | | 1,048,085 | | | | 36,881,369 | |
Distributions payable | | | 179,329 | | | | 1,244,670 | |
Payable to affiliates: | | | | | | | | |
Investment adviser fee | | | 116,213 | | | | 795,065 | |
Distribution and service fees | | | 61,020 | | | | 671,830 | |
Interest expense and fees payable | | | 236,688 | | | | 1,556,672 | |
Accrued expenses | | | 115,393 | | | | 613,411 | |
Total liabilities | | $ | 44,549,190 | | | $ | 401,443,001 | |
Net Assets | | $ | 312,309,967 | | | $ | 2,629,310,079 | |
| | |
| Sources of Net Assets | | | | | | | | |
Paid-in capital | | $ | 329,654,779 | | | $ | 3,593,426,209 | |
Accumulated undistributed net investment income | | | 1,550,095 | | | | 10,728,351 | |
Accumulated net realized loss | | | (37,389,610 | ) | | | (1,080,032,056 | ) |
Net unrealized appreciation | | | 18,494,703 | | | | 105,187,575 | |
Net Assets | | $ | 312,309,967 | | | $ | 2,629,310,079 | |
| | |
| Class A Shares | | | | | | | | |
Net Assets | | $ | 145,572,832 | | | $ | 1,481,817,834 | |
Shares Outstanding | | | 16,288,842 | | | | 152,692,369 | |
Net Asset Value and Redemption Price Per Share | | | | | | | | |
(net assets ÷ shares of beneficial interest outstanding) | | $ | 8.94 | | | $ | 9.70 | |
Maximum Offering Price Per Share | | | | | | | | |
(100 ÷ 95.25 of net asset value per share) | | $ | 9.39 | | | $ | 10.18 | |
| | |
| Class B Shares | | | | | | | | |
Net Assets | | $ | — | | | $ | 3,822,621 | |
Shares Outstanding | | | — | | | | 393,886 | |
Net Asset Value and Offering Price Per Share* | | | | | | | | |
(net assets ÷ shares of beneficial interest outstanding) | | $ | — | | | $ | 9.70 | |
| | |
| Class C Shares | | | | | | | | |
Net Assets | | $ | 35,326,776 | | | $ | 412,226,850 | |
Shares Outstanding | | | 3,974,973 | | | | 42,479,593 | |
Net Asset Value and Offering Price Per Share* | | | | | | | | |
(net assets ÷ shares of beneficial interest outstanding) | | $ | 8.89 | | | $ | 9.70 | |
| | |
| Class I Shares | | | | | | | | |
Net Assets | | $ | 131,410,359 | | | $ | 731,442,774 | |
Shares Outstanding | | | 13,461,300 | | | | 75,371,666 | |
Net Asset Value, Offering Price and Redemption Price Per Share | | | | | | | | |
(net assets ÷ shares of beneficial interest outstanding) | | $ | 9.76 | | | $ | 9.70 | |
On sales of $50,000 or more, the offering price of Class A shares is reduced.
| * | Redemption price per share is equal to the net asset value less any applicable contingent deferred sales charge. |
| | | | |
| | 20 | | See Notes to Financial Statements. |
Eaton Vance
Municipal Income Funds
March 31, 2018
Statements of Operations (Unaudited)
| | | | | | | | |
| | | Six Months Ended March 31, 2018 | |
| Investment Income | | AMT-Free Fund | | | National Fund | |
Interest | | $ | 7,860,183 | | | $ | 61,274,561 | |
Total investment income | | $ | 7,860,183 | | | $ | 61,274,561 | |
| | |
| Expenses | | | | | | | | |
Investment adviser fee | | $ | 715,574 | | | $ | 4,805,105 | |
Distribution and service fees | | | | | | | | |
Class A | | | 186,739 | | | | 1,924,005 | |
Class B | | | — | | | | 26,155 | |
Class C | | | 184,959 | | | | 2,186,764 | |
Trustees’ fees and expenses | | | 6,996 | | | | 50,750 | |
Custodian fee | | | 45,291 | | | | 248,621 | |
Transfer and dividend disbursing agent fees | | | 52,240 | | | | 529,821 | |
Legal and accounting services | | | 34,762 | | | | 59,167 | |
Printing and postage | | | 10,803 | | | | 66,947 | |
Registration fees | | | 44,182 | | | | 68,080 | |
Interest expense and fees | | | 358,851 | | | | 2,551,908 | |
Miscellaneous | | | 41,494 | | | | 172,704 | |
Total expenses | | $ | 1,681,891 | | | $ | 12,690,027 | |
| | |
Net investment income | | $ | 6,178,292 | | | $ | 48,584,534 | |
| | |
| Realized and Unrealized Gain (Loss) | | | | | | | | |
Net realized gain (loss) — | | | | | | | | |
Investment transactions | | $ | 913,866 | | | $ | 5,837,003 | |
Financial futures contracts | | | 1,951,170 | | | | 14,425,812 | |
Net realized gain | | $ | 2,865,036 | | | $ | 20,262,815 | |
Change in unrealized appreciation (depreciation) — | | | | | | | | |
Investments | | $ | (8,728,779 | ) | | $ | (74,845,669 | ) |
Financial futures contracts | | | (974,737 | ) | | | (8,319,933 | ) |
Net change in unrealized appreciation (depreciation) | | $ | (9,703,516 | ) | | $ | (83,165,602 | ) |
| | |
Net realized and unrealized loss | | $ | (6,838,480 | ) | | $ | (62,902,787 | ) |
| | |
Net decrease in net assets from operations | | $ | (660,188 | ) | | $ | (14,318,253 | ) |
| | | | |
| | 21 | | See Notes to Financial Statements. |
Eaton Vance
Municipal Income Funds
March 31, 2018
Statements of Changes in Net Assets
| | | | | | | | |
| | | Six Months Ended March 31, 2018 (Unaudited) | |
| Increase (Decrease) in Net Assets | | AMT-Free Fund | | | National Fund | |
From operations — | | | | | | | | |
Net investment income | | $ | 6,178,292 | | | $ | 48,584,534 | |
Net realized gain | | | 2,865,036 | | | | 20,262,815 | |
Net change in unrealized appreciation (depreciation) | | | (9,703,516 | ) | | | (83,165,602 | ) |
Net decrease in net assets from operations | | $ | (660,188 | ) | | $ | (14,318,253 | ) |
Distributions to shareholders — | | | | | | | | |
From net investment income | | | | | | | | |
Class A | | $ | (2,793,004 | ) | | $ | (27,306,587 | ) |
Class B | | | — | | | | (72,655 | ) |
Class C | | | (552,774 | ) | | | (6,115,774 | ) |
Class I | | | (2,810,142 | ) | | | (14,580,642 | ) |
Total distributions to shareholders | | $ | (6,155,920 | ) | | $ | (48,075,658 | ) |
Transactions in shares of beneficial interest — | | | | | | | | |
Proceeds from sale of shares | | | | | | | | |
Class A | | $ | 5,795,701 | | | $ | 39,475,102 | |
Class B | | | — | | | | 8,618 | |
Class C | | | 1,338,570 | | | | 8,060,677 | |
Class I | | | 11,516,803 | | | | 107,693,419 | |
Net asset value of shares issued to shareholders in payment of distributions declared | | | | | | | | |
Class A | | | 2,532,772 | | | | 22,945,544 | |
Class B | | | — | | | | 63,353 | |
Class C | | | 468,363 | | | | 5,155,643 | |
Class I | | | 2,159,617 | | | | 12,201,970 | |
Cost of shares redeemed | | | | | | | | |
Class A | | | (15,206,009 | ) | | | (148,016,807 | ) |
Class B | | | — | | | | (651,810 | ) |
Class C | | | (4,802,634 | ) | | | (53,327,109 | ) |
Class I | | | (33,542,053 | ) | | | (148,080,609 | ) |
Net asset value of shares exchanged | | | | | | | | |
Class A | | | — | | | | 2,196,315 | |
Class B | | | — | | | | (2,196,315 | ) |
Net decrease in net assets from Fund share transactions | | $ | (29,738,870 | ) | | $ | (154,472,009 | ) |
| | |
Net decrease in net assets | | $ | (36,554,978 | ) | | $ | (216,865,920 | ) |
| | |
| Net Assets | | | | | | | | |
At beginning of period | | $ | 348,864,945 | | | $ | 2,846,175,999 | |
At end of period | | $ | 312,309,967 | | | $ | 2,629,310,079 | |
| | |
Accumulated undistributed net investment income
included in net assets | | | | | | | | |
At end of period | | $ | 1,550,095 | | | $ | 10,728,351 | |
| | | | |
| | 22 | | See Notes to Financial Statements. |
Eaton Vance
Municipal Income Funds
March 31, 2018
Statements of Changes in Net Assets — continued
| | | | | | | | |
| | | Year Ended September 30, 2017 | |
| Increase (Decrease) in Net Assets | | AMT-Free Fund | | | National Fund | |
From operations — | | | | | | | | |
Net investment income | | $ | 13,682,275 | | | $ | 105,975,740 | |
Net realized gain | | | 4,559,831 | | | | 31,025,039 | |
Net change in unrealized appreciation (depreciation) | | | (17,779,322 | ) | | | (109,786,377 | ) |
Net increase in net assets from operations | | $ | 462,784 | | | $ | 27,214,402 | |
Distributions to shareholders — | | | | | | | | |
From net investment income | | | | | | | | |
Class A | | $ | (6,820,357 | ) | | $ | (61,522,253 | ) |
Class B | | | (9,554 | ) | | | (340,756 | ) |
Class C | | | (1,288,630 | ) | | | (15,020,929 | ) |
Class I | | | (5,640,830 | ) | | | (28,735,950 | ) |
Total distributions to shareholders | | $ | (13,759,371 | ) | | $ | (105,619,888 | ) |
Transactions in shares of beneficial interest — | | | | | | | | |
Proceeds from sale of shares | | | | | | | | |
Class A | | $ | 19,621,044 | | | $ | 126,339,026 | |
Class B | | | 2,952 | | | | 97,636 | |
Class C | | | 2,335,395 | | | | 23,900,574 | |
Class I | | | 65,424,212 | | | | 374,243,229 | |
Net asset value of shares issued to shareholders in payment of distributions declared | | | | | | | | |
Class A | | | 6,287,424 | | | | 52,070,599 | |
Class B | | | 5,012 | | | | 289,706 | |
Class C | | | 1,036,787 | | | | 11,985,618 | |
Class I | | | 4,250,282 | | | | 23,093,780 | |
Cost of shares redeemed | | | | | | | | |
Class A | | | (62,858,604 | ) | | | (395,385,791 | ) |
Class B | | | (76,797 | ) | | | (2,352,032 | ) |
Class C | | | (8,361,832 | ) | | | (135,670,059 | ) |
Class I | | | (64,803,824 | ) | | | (305,867,231 | ) |
Net asset value of shares exchanged | | | | | | | | |
Class A | | | 181,803 | | | | 7,478,483 | |
Class B | | | (181,803 | ) | | | (7,478,483 | ) |
Net asset value of shares merged* | | | | | | | | |
Class A | | | 205,964 | | | | — | |
Class B | | | (205,964 | ) | | | — | |
Net decrease in net assets from Fund share transactions | | $ | (37,137,949 | ) | | $ | (227,254,945 | ) |
| | |
Net decrease in net assets | | $ | (50,434,536 | ) | | $ | (305,660,431 | ) |
| | |
| Net Assets | | | | | | | | |
At beginning of year | | $ | 399,299,481 | | | $ | 3,151,836,430 | |
At end of year | | $ | 348,864,945 | | | $ | 2,846,175,999 | |
| | |
Accumulated undistributed net investment income
included in net assets | | | | | | | | |
At end of year | | $ | 1,527,723 | | | $ | 10,219,475 | |
| * | At the close of business on September 20, 2017, Class B shares of AMT-Free Fund were merged into Class A shares. |
| | | | |
| | 23 | | See Notes to Financial Statements. |
Eaton Vance
Municipal Income Funds
March 31, 2018
Statements of Cash Flows (Unaudited)
| | | | | | | | |
| | | Six Months Ended March 31, 2018 | |
| Cash Flows From Operating Activities | | AMT-Free Fund | | | National Fund | |
Net decrease in net assets from operations | | $ | (660,188 | ) | | $ | (14,318,253 | ) |
Adjustments to reconcile net decrease in net assets from operations to net cash provided by operating activities: | | | | | | | | |
Investments purchased | | | (39,039,727 | ) | | | (1,117,018,783 | ) |
Investments sold | | | 56,489,685 | | | | 1,255,587,628 | |
Net amortization/accretion of premium (discount) | | | (270,994 | ) | | | 4,704,164 | |
Decrease in deposits for derivatives collateral — financial futures contracts | | | 89,500 | | | | 750,000 | |
Decrease (increase) in interest receivable | | | (274,161 | ) | | | 1,645,280 | |
Decrease in receivable for variation margin on open financial futures contracts | | | 30,204 | | | | — | |
Increase in payable for variation margin on open financial futures contracts | | | 124,741 | | | | 1,078,158 | |
Decrease in payable to affiliate for investment adviser fee | | | (8,320 | ) | | | (25,277 | ) |
Decrease in payable to affiliate for distribution and service fees | | | (3,540 | ) | | | (47,597 | ) |
Increase in interest expense and fees payable | | | 36,393 | | | | 169,240 | |
Decrease in accrued expenses | | | (30,192 | ) | | | (83,682 | ) |
Net change in unrealized (appreciation) depreciation from investments | | | 8,728,779 | | | | 74,845,669 | |
Net realized gain from investments | | | (913,866 | ) | | | (5,837,003 | ) |
Net cash provided by operating activities | | $ | 24,298,314 | | | $ | 201,449,544 | |
| | |
| Cash Flows From Financing Activities | | | | | | | | |
Proceeds from Fund shares sold | | $ | 18,515,889 | | | $ | 153,132,658 | |
Fund shares redeemed | | | (53,004,753 | ) | | | (319,088,710 | ) |
Distributions paid, net of reinvestments | | | (972,540 | ) | | | (7,894,855 | ) |
Repayment of secured borrowings | | | — | | | | (32,895,000 | ) |
Net cash used in financing activities | | $ | (35,461,404 | ) | | $ | (206,745,907 | ) |
| | |
Net decrease in cash | | $ | (11,163,090 | ) | | $ | (5,296,363 | ) |
| | |
Cash at beginning of period | | $ | 11,322,012 | | | $ | 9,682,385 | |
| | |
Cash at end of period | | $ | 158,922 | | | $ | 4,386,022 | |
| | |
| Supplemental disclosure of cash flow information: | | | | | | | | |
Noncash financing activities not included herein consist of: | | | | | | | | |
Reinvestment of dividends and distributions | | $ | 5,160,752 | | | $ | 40,366,510 | |
Cash paid for interest and fees | | $ | 322,458 | | | $ | 2,382,668 | |
| | | | |
| | 24 | | See Notes to Financial Statements. |
Eaton Vance
Municipal Income Funds
March 31, 2018
Financial Highlights
| | | | | | | | | | | | | | | | | | | | | | | | |
| | | AMT-Free Fund — Class A | |
| | | Six Months Ended
March 31, 2018
(Unaudited) | | | Year Ended September 30, | |
| | | | 2017 | | | 2016 | | | 2015 | | | 2014 | | | 2013 | |
Net asset value — Beginning of period | | $ | 9.130 | | | $ | 9.430 | | | $ | 9.210 | | | $ | 9.350 | | | $ | 8.670 | | | $ | 9.600 | |
| | | | | | |
| Income (Loss) From Operations | | | | | | | | | | | | | | | | | | | | | | | | |
Net investment income(1) | | $ | 0.169 | | | $ | 0.351 | | | $ | 0.358 | | | $ | 0.374 | | | $ | 0.395 | | | $ | 0.400 | |
Net realized and unrealized gain (loss) | | | (0.190 | ) | | | (0.298 | ) | | | 0.218 | | | | (0.142 | ) | | | 0.677 | | | | (0.934 | ) |
| | | | | | |
Total income (loss) from operations | | $ | (0.021 | ) | | $ | 0.053 | | | $ | 0.576 | | | $ | 0.232 | | | $ | 1.072 | | | $ | (0.534 | ) |
| | | | | | |
| Less Distributions | | | | | | | | | | | | | | | | | | | | | | | | |
From net investment income | | $ | (0.169 | ) | | $ | (0.353 | ) | | $ | (0.356 | ) | | $ | (0.372 | ) | | $ | (0.392 | ) | | $ | (0.396 | ) |
| | | | | | |
Total distributions | | $ | (0.169 | ) | | $ | (0.353 | ) | | $ | (0.356 | ) | | $ | (0.372 | ) | | $ | (0.392 | ) | | $ | (0.396 | ) |
| | | | | | |
Net asset value — End of period | | $ | 8.940 | | | $ | 9.130 | | | $ | 9.430 | | | $ | 9.210 | | | $ | 9.350 | | | $ | 8.670 | |
| | | | | | |
Total Return(2) | | | (0.24 | )%(3) | | | 0.64 | % | | | 6.33 | % | | | 2.52 | % | | | 12.63 | % | | | (5.75 | )% |
| | | | | | |
| Ratios/Supplemental Data | | | | | | | | | | | | | | | | | | | | | | | | |
Net assets, end of period (000’s omitted) | | $ | 145,573 | | | $ | 155,589 | | | $ | 198,762 | | | $ | 194,227 | | | $ | 200,408 | | | $ | 224,506 | |
Ratios (as a percentage of average daily net assets): | | | | | | | | | | | | | | | | | | | | | | | | |
Expenses excluding interest and fees(4) | | | 0.83 | %(5) | | | 0.82 | % | | | 0.81 | % | | | 0.82 | % | | | 0.83 | % | | | 0.83 | % |
Interest and fee expense(6) | | | 0.22 | %(5) | | | 0.16 | % | | | 0.10 | % | | | 0.08 | % | | | 0.09 | % | | | 0.11 | % |
Total expenses(4) | | | 1.05 | %(5) | | | 0.98 | % | | | 0.91 | % | | | 0.90 | % | | | 0.92 | % | | | 0.94 | % |
Net investment income | | | 3.76 | %(5) | | | 3.86 | % | | | 3.81 | % | | | 4.02 | % | | | 4.40 | % | | | 4.26 | % |
Portfolio Turnover | | | 8 | %(3) | | | 33 | % | | | 21 | % | | | 17 | % | | | 24 | % | | | 31 | % |
| (1) | Computed using average shares outstanding. |
| (2) | Returns are historical and are calculated by determining the percentage change in net asset value with all distributions reinvested and do not reflect the effect of sales charges. |
| (4) | Excludes the effect of custody fee credits, if any, of less than 0.005%. Effective September 1, 2015, custody fee credits, which were earned on cash deposit balances, were discontinued by the custodian. |
| (6) | Interest and fee expense relates to the liability for floating rate notes issued in conjunction with residual interest bond transactions (see Note 1H). |
| | | | |
| | 25 | | See Notes to Financial Statements. |
Eaton Vance
Municipal Income Funds
March 31, 2018
Financial Highlights — continued
| | | | | | | | | | | | | | | | | | | | | | | | |
| | | AMT-Free Fund — Class C | |
| | | Six Months Ended
March 31, 2018
(Unaudited) | | | Year Ended September 30, | |
| | | | 2017 | | | 2016 | | | 2015 | | | 2014 | | | 2013 | |
Net asset value — Beginning of period | | $ | 9.080 | | | $ | 9.380 | | | $ | 9.160 | | | $ | 9.300 | | | $ | 8.620 | | | $ | 9.550 | |
| | | | | | |
| Income (Loss) From Operations | | | | | | | | | | | | | | | | | | | | | | | | |
Net investment income(1) | | $ | 0.135 | | | $ | 0.281 | | | $ | 0.286 | | | $ | 0.302 | | | $ | 0.326 | | | $ | 0.327 | |
Net realized and unrealized gain (loss) | | | (0.191 | ) | | | (0.298 | ) | | | 0.218 | | | | (0.142 | ) | | | 0.677 | | | | (0.933 | ) |
| | | | | | |
Total income (loss) from operations | | $ | (0.056 | ) | | $ | (0.017 | ) | | $ | 0.504 | | | $ | 0.160 | | | $ | 1.003 | | | $ | (0.606 | ) |
| | | | | | |
| Less Distributions | | | | | | | | | | | | | | | | | | | | | | | | |
From net investment income | | $ | (0.134 | ) | | $ | (0.283 | ) | | $ | (0.284 | ) | | $ | (0.300 | ) | | $ | (0.323 | ) | | $ | (0.324 | ) |
| | | | | | |
Total distributions | | $ | (0.134 | ) | | $ | (0.283 | ) | | $ | (0.284 | ) | | $ | (0.300 | ) | | $ | (0.323 | ) | | $ | (0.324 | ) |
| | | | | | |
Net asset value — End of period | | $ | 8.890 | | | $ | 9.080 | | | $ | 9.380 | | | $ | 9.160 | | | $ | 9.300 | | | $ | 8.620 | |
| | | | | | |
Total Return(2) | | | (0.62 | )%(3) | | | (0.12 | )% | | | 5.56 | % | | | 1.75 | % | | | 11.84 | % | | | (6.51 | )% |
| | | | | | |
| Ratios/Supplemental Data | | | | | | | | | | | | | | | | | | | | | | | | |
Net assets, end of period (000’s omitted) | | $ | 35,327 | | | $ | 39,099 | | | $ | 45,606 | | | $ | 41,903 | | | $ | 37,193 | | | $ | 40,823 | |
Ratios (as a percentage of average daily net assets): | | | | | | | | | | | | | | | | | | | | | | | | |
Expenses excluding interest and fees(4) | | | 1.58 | %(5) | | | 1.57 | % | | | 1.56 | % | | | 1.57 | % | | | 1.58 | % | | | 1.58 | % |
Interest and fee expense(6) | | | 0.22 | %(5) | | | 0.16 | % | | | 0.10 | % | | | 0.08 | % | | | 0.09 | % | | | 0.11 | % |
Total expenses(4) | | | 1.80 | %(5) | | | 1.73 | % | | | 1.66 | % | | | 1.65 | % | | | 1.67 | % | | | 1.69 | % |
Net investment income | | | 3.00 | %(5) | | | 3.11 | % | | | 3.06 | % | | | 3.27 | % | | | 3.65 | % | | | 3.52 | % |
Portfolio Turnover | | | 8 | %(3) | | | 33 | % | | | 21 | % | | | 17 | % | | | 24 | % | | | 31 | % |
| (1) | Computed using average shares outstanding. |
| (2) | Returns are historical and are calculated by determining the percentage change in net asset value with all distributions reinvested and do not reflect the effect of sales charges. |
| (4) | Excludes the effect of custody fee credits, if any, of less than 0.005%. Effective September 1, 2015, custody fee credits, which were earned on cash deposit balances, were discontinued by the custodian. |
| (6) | Interest and fee expense relates to the liability for floating rate notes issued in conjunction with residual interest bond transactions (see Note 1H). |
| | | | |
| | 26 | | See Notes to Financial Statements. |
Eaton Vance
Municipal Income Funds
March 31, 2018
Financial Highlights — continued
| | | | | | | | | | | | | | | | | | | | | | | | |
| | | AMT-Free Fund — Class I | |
| | | Six Months Ended
March 31, 2018
(Unaudited) | | | Year Ended September 30, | |
| | | | 2017 | | | 2016 | | | 2015 | | | 2014 | | | 2013 | |
Net asset value — Beginning of period | | $ | 9.970 | | | $ | 10.300 | | | $ | 10.060 | | | $ | 10.210 | | | $ | 9.470 | | | $ | 10.480 | |
| | | | | | |
| Income (Loss) From Operations | | | | | | | | | | | | | | | | | | | | | | | | |
Net investment income(1) | | $ | 0.197 | | | $ | 0.407 | | | $ | 0.415 | | | $ | 0.434 | | | $ | 0.455 | | | $ | 0.463 | |
Net realized and unrealized gain (loss) | | | (0.210 | ) | | | (0.327 | ) | | | 0.240 | | | | (0.152 | ) | | | 0.737 | | | | (1.015 | ) |
| | | | | | |
Total income (loss) from operations | | $ | (0.013 | ) | | $ | 0.080 | | | $ | 0.655 | | | $ | 0.282 | | | $ | 1.192 | | | $ | (0.552 | ) |
| | | | | | |
| Less Distributions | | | | | | | | | | | | | | | | | | | | | | | | |
From net investment income | | $ | (0.197 | ) | | $ | (0.410 | ) | | $ | (0.415 | ) | | $ | (0.432 | ) | | $ | (0.452 | ) | | $ | (0.458 | ) |
| | | | | | |
Total distributions | | $ | (0.197 | ) | | $ | (0.410 | ) | | $ | (0.415 | ) | | $ | (0.432 | ) | | $ | (0.452 | ) | | $ | (0.458 | ) |
| | | | | | |
Net asset value — End of period | | $ | 9.760 | | | $ | 9.970 | | | $ | 10.300 | | | $ | 10.060 | | | $ | 10.210 | | | $ | 9.470 | |
| | | | | | |
Total Return(2) | | | (0.14 | )%(3) | | | 0.87 | % | | | 6.60 | % | | | 2.70 | % | | | 12.99 | % | | | (5.46 | )% |
| | | | | | |
| Ratios/Supplemental Data | | | | | | | | | | | | | | | | | | | | | | | | |
Net assets, end of period (000’s omitted) | | $ | 131,410 | | | $ | 154,177 | | | $ | 154,458 | | | $ | 109,937 | | | $ | 102,404 | | | $ | 99,553 | |
Ratios (as a percentage of average daily net assets): | | | | | | | | | | | | | | | | | | | | | | | | |
Expenses excluding interest and fees(4) | | | 0.58 | %(5) | | | 0.57 | % | | | 0.56 | % | | | 0.57 | % | | | 0.58 | % | | | 0.58 | % |
Interest and fee expense(6) | | | 0.22 | %(5) | | | 0.16 | % | | | 0.10 | % | | | 0.08 | % | | | 0.09 | % | | | 0.11 | % |
Total expenses(4) | | | 0.80 | %(5) | | | 0.73 | % | | | 0.66 | % | | | 0.65 | % | | | 0.67 | % | | | 0.69 | % |
Net investment income | | | 4.00 | %(5) | | | 4.09 | % | | | 4.04 | % | | | 4.27 | % | | | 4.64 | % | | | 4.52 | % |
Portfolio Turnover | | | 8 | %(3) | | | 33 | % | | | 21 | % | | | 17 | % | | | 24 | % | | | 31 | % |
| (1) | Computed using average shares outstanding. |
| (2) | Returns are historical and are calculated by determining the percentage change in net asset value with all distributions reinvested. |
| (4) | Excludes the effect of custody fee credits, if any, of less than 0.005%. Effective September 1, 2015, custody fee credits, which were earned on cash deposit balances, were discontinued by the custodian. |
| (6) | Interest and fee expense relates to the liability for floating rate notes issued in conjunction with residual interest bond transactions (see Note 1H). |
| | | | |
| | 27 | | See Notes to Financial Statements. |
Eaton Vance
Municipal Income Funds
March 31, 2018
Financial Highlights — continued
| | | | | | | | | | | | | | | | | | | | | | | | |
| | | National Fund — Class A | |
| | | Six Months Ended
March 31, 2018
(Unaudited) | | | Year Ended September 30, | |
| | | | 2017 | | | 2016 | | | 2015 | | | 2014 | | | 2013 | |
Net asset value — Beginning of period | | $ | 9.930 | | | $ | 10.170 | | | $ | 9.810 | | | $ | 9.870 | | | $ | 9.170 | | | $ | 10.200 | |
| | | | | | |
| Income (Loss) From Operations | | | | | | | | | | | | | | | | | | | | | | | | |
Net investment income(1) | | $ | 0.176 | | | $ | 0.366 | | | $ | 0.385 | | | $ | 0.389 | | | $ | 0.446 | | | $ | 0.468 | |
Net realized and unrealized gain (loss) | | | (0.232 | ) | | | (0.242 | ) | | | 0.357 | | | | (0.064 | ) | | | 0.707 | | | | (1.032 | ) |
| | | | | | |
Total income (loss) from operations | | $ | (0.056 | ) | | $ | 0.124 | | | $ | 0.742 | | | $ | 0.325 | | | $ | 1.153 | | | $ | (0.564 | ) |
| | | | | | |
| Less Distributions | | | | | | | | | | | | | | | | | | | | | | | | |
From net investment income | | $ | (0.174 | ) | | $ | (0.364 | ) | | $ | (0.382 | ) | | $ | (0.385 | ) | | $ | (0.453 | ) | | $ | (0.466 | ) |
| | | | | | |
Total distributions | | $ | (0.174 | ) | | $ | (0.364 | ) | | $ | (0.382 | ) | | $ | (0.385 | ) | | $ | (0.453 | ) | | $ | (0.466 | ) |
| | | | | | |
Net asset value — End of period | | $ | 9.700 | | | $ | 9.930 | | | $ | 10.170 | | | $ | 9.810 | | | $ | 9.870 | | | $ | 9.170 | |
| | | | | | |
Total Return(2) | | | (0.57 | )%(3) | | | 1.31 | % | | | 7.68 | % | | | 3.35 | % | | | 12.89 | % | | | (5.77 | )% |
| | | | | | |
| Ratios/Supplemental Data | | | | | | | | | | | | | | | | | | | | | | | | |
Net assets, end of period (000’s omitted) | | $ | 1,481,818 | | | $ | 1,600,127 | | | $ | 1,857,375 | | | $ | 1,899,324 | | | $ | 2,126,465 | | | $ | 2,134,502 | |
Ratios (as a percentage of average daily net assets): | | | | | | | | | | | | | | | | | | | | | | | | |
Expenses excluding interest and fees(4) | | | 0.68 | %(5) | | | 0.68 | % | | | 0.67 | % | | | 0.67 | % | | | 0.71 | % | | | 0.66 | % |
Interest and fee expense(6) | | | 0.19 | %(5) | | | 0.16 | % | | | 0.12 | % | | | 0.09 | % | | | 0.09 | % | | | 0.11 | % |
Total expenses(4) | | | 0.87 | %(5) | | | 0.84 | % | | | 0.79 | % | | | 0.76 | % | | | 0.80 | % | | | 0.77 | % |
Net investment income | | | 3.59 | %(5) | | | 3.71 | % | | | 3.83 | % | | | 3.94 | % | | | 4.71 | % | | | 4.67 | % |
Portfolio Turnover | | | 38 | %(3) | | | 70 | % | | | 71 | % | | | 57 | % | | | 47 | % | | | 74 | % |
| (1) | Computed using average shares outstanding. |
| (2) | Returns are historical and are calculated by determining the percentage change in net asset value with all distributions reinvested and do not reflect the effect of sales charges. |
| (4) | Excludes the effect of custody fee credits, if any, of less than 0.005%. Effective September 1, 2015, custody fee credits, which were earned on cash deposit balances, were discontinued by the custodian. |
| (6) | Interest and fee expense relates to the liability for floating rate notes issued in conjunction with residual interest bond transactions (see Note 1H). |
| | | | |
| | 28 | | See Notes to Financial Statements. |
Eaton Vance
Municipal Income Funds
March 31, 2018
Financial Highlights — continued
| | | | | | | | | | | | | | | | | | | | | | | | |
| | | National Fund — Class B | |
| | | Six Months Ended
March 31, 2018
(Unaudited) | | | Year Ended September 30, | |
| | | | 2017 | | | 2016 | | | 2015 | | | 2014 | | | 2013 | |
Net asset value — Beginning of period | | $ | 9.930 | | | $ | 10.170 | | | $ | 9.810 | | | $ | 9.870 | | | $ | 9.170 | | | $ | 10.200 | |
| | | | | | |
| Income (Loss) From Operations | | | | | | | | | | | | | | | | | | | | | | | | |
Net investment income(1) | | $ | 0.138 | | | $ | 0.292 | | | $ | 0.311 | | | $ | 0.315 | | | $ | 0.379 | | | $ | 0.392 | |
Net realized and unrealized gain (loss) | | | (0.231 | ) | | | (0.242 | ) | | | 0.356 | | | | (0.064 | ) | | | 0.704 | | | | (1.031 | ) |
| | | | | | |
Total income (loss) from operations | | $ | (0.093 | ) | | $ | 0.050 | | | $ | 0.667 | | | $ | 0.251 | | | $ | 1.083 | | | $ | (0.639 | ) |
| | | | | | |
| Less Distributions | | | | | | | | | | | | | | | | | | | | | | | | |
From net investment income | | $ | (0.137 | ) | | $ | (0.290 | ) | | $ | (0.307 | ) | | $ | (0.311 | ) | | $ | (0.383 | ) | | $ | (0.391 | ) |
| | | | | | |
Total distributions | | $ | (0.137 | ) | | $ | (0.290 | ) | | $ | (0.307 | ) | | $ | (0.311 | ) | | $ | (0.383 | ) | | $ | (0.391 | ) |
| | | | | | |
Net asset value — End of period | | $ | 9.700 | | | $ | 9.930 | | | $ | 10.170 | | | $ | 9.810 | | | $ | 9.870 | | | $ | 9.170 | |
| | | | | | |
Total Return(2) | | | (0.94 | )%(3) | | | 0.55 | % | | | 6.88 | % | | | 2.58 | % | | | 12.06 | % | | | (6.47 | )% |
| | | | | | |
| Ratios/Supplemental Data | | | | | | | | | | | | | | | | | | | | | | | | |
Net assets, end of period (000’s omitted) | | $ | 3,823 | | | $ | 6,718 | | | $ | 16,644 | | | $ | 25,732 | | | $ | 42,655 | | | $ | 59,244 | |
Ratios (as a percentage of average daily net assets): | | | | | | | | | | | | | | | | | | | | | | | | |
Expenses excluding interest and fees(4) | | | 1.44 | %(5) | | | 1.43 | % | | | 1.42 | % | | | 1.42 | % | | | 1.46 | % | | | 1.41 | % |
Interest and fee expense(6) | | | 0.19 | %(5) | | | 0.16 | % | | | 0.12 | % | | | 0.09 | % | | | 0.09 | % | | | 0.11 | % |
Total expenses(4) | | | 1.63 | %(5) | | | 1.59 | % | | | 1.54 | % | | | 1.51 | % | | | 1.55 | % | | | 1.52 | % |
Net investment income | | | 2.82 | %(5) | | | 2.96 | % | | | 3.10 | % | | | 3.20 | % | | | 4.01 | % | | | 3.90 | % |
Portfolio Turnover | | | 38 | %(3) | | | 70 | % | | | 71 | % | | | 57 | % | | | 47 | % | | | 74 | % |
| (1) | Computed using average shares outstanding. |
| (2) | Returns are historical and are calculated by determining the percentage change in net asset value with all distributions reinvested and do not reflect the effect of sales charges. |
| (4) | Excludes the effect of custody fee credits, if any, of less than 0.005%. Effective September 1, 2015, custody fee credits, which were earned on cash deposit balances, were discontinued by the custodian. |
| (6) | Interest and fee expense relates to the liability for floating rate notes issued in conjunction with residual interest bond transactions (see Note 1H). |
| | | | |
| | 29 | | See Notes to Financial Statements. |
Eaton Vance
Municipal Income Funds
March 31, 2018
Financial Highlights — continued
| | | | | | | | | | | | | | | | | | | | | | | | |
| | | National Fund — Class C | |
| | | Six Months Ended
March 31, 2018
(Unaudited) | | | Year Ended September 30, | |
| | | | 2017 | | | 2016 | | | 2015 | | | 2014 | | | 2013 | |
Net asset value — Beginning of period | | $ | 9.930 | | | $ | 10.170 | | | $ | 9.810 | | | $ | 9.870 | | | $ | 9.170 | | | $ | 10.200 | |
| | | | | | |
| Income (Loss) From Operations | | | | | | | | | | | | | | | | | | | | | | | | |
Net investment income(1) | | $ | 0.139 | | | $ | 0.292 | | | $ | 0.310 | | | $ | 0.315 | | | $ | 0.376 | | | $ | 0.392 | |
Net realized and unrealized gain (loss) | | | (0.232 | ) | | | (0.242 | ) | | | 0.357 | | | | (0.064 | ) | | | 0.707 | | | | (1.031 | ) |
| | | | | | |
Total income (loss) from operations | | $ | (0.093 | ) | | $ | 0.050 | | | $ | 0.667 | | | $ | 0.251 | | | $ | 1.083 | | | $ | (0.639 | ) |
| | | | | | |
| Less Distributions | | | | | | | | | | | | | | | | | | | | | | | | |
From net investment income | | $ | (0.137 | ) | | $ | (0.290 | ) | | $ | (0.307 | ) | | $ | (0.311 | ) | | $ | (0.383 | ) | | $ | (0.391 | ) |
| | | | | | |
Total distributions | | $ | (0.137 | ) | | $ | (0.290 | ) | | $ | (0.307 | ) | | $ | (0.311 | ) | | $ | (0.383 | ) | | $ | (0.391 | ) |
| | | | | | |
Net asset value — End of period | | $ | 9.700 | | | $ | 9.930 | | | $ | 10.170 | | | $ | 9.810 | | | $ | 9.870 | | | $ | 9.170 | |
| | | | | | |
Total Return(2) | | | (0.94 | )%(3) | | | 0.56 | % | | | 6.88 | % | | | 2.58 | % | | | 12.06 | % | | | (6.47 | )% |
| | | | | | |
| Ratios/Supplemental Data | | | | | | | | | | | | | | | | | | | | | | | | |
Net assets, end of period (000’s omitted) | | $ | 412,227 | | | $ | 462,269 | | | $ | 576,664 | | | $ | 585,346 | | | $ | 645,801 | | | $ | 681,072 | |
Ratios (as a percentage of average daily net assets): | | | | | | | | | | | | | | | | | | | | | | | | |
Expenses excluding interest and fees(4) | | | 1.43 | %(5) | | | 1.43 | % | | | 1.42 | % | | | 1.42 | % | | | 1.46 | % | | | 1.41 | % |
Interest and fee expense(6) | | | 0.19 | %(5) | | | 0.16 | % | | | 0.12 | % | | | 0.09 | % | | | 0.09 | % | | | 0.11 | % |
Total expenses(4) | | | 1.62 | %(5) | | | 1.59 | % | | | 1.54 | % | | | 1.51 | % | | | 1.55 | % | | | 1.52 | % |
Net investment income | | | 2.84 | %(5) | | | 2.96 | % | | | 3.08 | % | | | 3.19 | % | | | 3.98 | % | | | 3.92 | % |
Portfolio Turnover | | | 38 | %(3) | | | 70 | % | | | 71 | % | | | 57 | % | | | 47 | % | | | 74 | % |
| (1) | Computed using average shares outstanding. |
| (2) | Returns are historical and are calculated by determining the percentage change in net asset value with all distributions reinvested and do not reflect the effect of sales charges. |
| (4) | Excludes the effect of custody fee credits, if any, of less than 0.005%. Effective September 1, 2015, custody fee credits, which were earned on cash deposit balances, were discontinued by the custodian. |
| (6) | Interest and fee expense relates to the liability for floating rate notes issued in conjunction with residual interest bond transactions (see Note 1H). |
| | | | |
| | 30 | | See Notes to Financial Statements. |
Eaton Vance
Municipal Income Funds
March 31, 2018
Financial Highlights — continued
| | | | | | | | | | | | | | | | | | | | | | | | |
| | | National Fund — Class I | |
| | | Six Months Ended
March 31, 2018
(Unaudited) | | | Year Ended September 30, | |
| | | | 2017 | | | 2016 | | | 2015 | | | 2014 | | | 2013 | |
Net asset value — Beginning of period | | $ | 9.930 | | | $ | 10.170 | | | $ | 9.810 | | | $ | 9.870 | | | $ | 9.180 | | | $ | 10.200 | |
| | | | | | |
| Income (Loss) From Operations | | | | | | | | | | | | | | | | | | | | | | | | |
Net investment income(1) | | $ | 0.188 | | | $ | 0.390 | | | $ | 0.410 | | | $ | 0.413 | | | $ | 0.478 | | | $ | 0.492 | |
Net realized and unrealized gain (loss) | | | (0.232 | ) | | | (0.241 | ) | | | 0.357 | | | | (0.063 | ) | | | 0.690 | | | | (1.021 | ) |
| | | | | | |
Total income (loss) from operations | | $ | (0.044 | ) | | $ | 0.149 | | | $ | 0.767 | | | $ | 0.350 | | | $ | 1.168 | | | $ | (0.529 | ) |
| | | | | | |
| Less Distributions | | | | | | | | | | | | | | | | | | | | | | | | |
From net investment income | | $ | (0.186 | ) | | $ | (0.389 | ) | | $ | (0.407 | ) | | $ | (0.410 | ) | | $ | (0.478 | ) | | $ | (0.491 | ) |
| | | | | | |
Total distributions | | $ | (0.186 | ) | | $ | (0.389 | ) | | $ | (0.407 | ) | | $ | (0.410 | ) | | $ | (0.478 | ) | | $ | (0.491 | ) |
| | | | | | |
Net asset value — End of period | | $ | 9.700 | | | $ | 9.930 | | | $ | 10.170 | | | $ | 9.810 | | | $ | 9.870 | | | $ | 9.180 | |
| | | | | | |
Total Return(2) | | | (0.44 | )%(3) | | | 1.56 | % | | | 7.94 | % | | | 3.50 | % | | | 13.17 | % | | | (5.43 | )% |
| | | | | | |
| Ratios/Supplemental Data | | | | | | | | | | | | | | | | | | | | | | | | |
Net assets, end of period (000’s omitted) | | $ | 731,443 | | | $ | 777,063 | | | $ | 701,153 | | | $ | 674,696 | | | $ | 686,514 | | | $ | 981,936 | |
Ratios (as a percentage of average daily net assets): | | | | | | | | | | | | | | | | | | | | | | | | |
Expenses excluding interest and fees(4) | | | 0.43 | %(5) | | | 0.43 | % | | | 0.42 | % | | | 0.42 | % | | | 0.46 | % | | | 0.41 | % |
Interest and fee expense(6) | | | 0.19 | %(5) | | | 0.16 | % | | | 0.12 | % | | | 0.09 | % | | | 0.09 | % | | | 0.11 | % |
Total expenses(4) | | | 0.62 | %(5) | | | 0.59 | % | | | 0.54 | % | | | 0.51 | % | | | 0.55 | % | | | 0.52 | % |
Net investment income | | | 3.84 | %(5) | | | 3.95 | % | | | 4.09 | % | | | 4.19 | % | | | 5.07 | % | | | 4.93 | % |
Portfolio Turnover | | | 38 | %(3) | | | 70 | % | | | 71 | % | | | 57 | % | | | 47 | % | | | 74 | % |
| (1) | Computed using average shares outstanding. |
| (2) | Returns are historical and are calculated by determining the percentage change in net asset value with all distributions reinvested. |
| (4) | Excludes the effect of custody fee credits, if any, of less than 0.005%. Effective September 1, 2015, custody fee credits, which were earned on cash deposit balances, were discontinued by the custodian. |
| (6) | Interest and fee expense relates to the liability for floating rate notes issued in conjunction with residual interest bond transactions (see Note 1H). |
| | | | |
| | 31 | | See Notes to Financial Statements. |
Eaton Vance
Municipal Income Funds
March 31, 2018
Notes to Financial Statements (Unaudited)
1 Significant Accounting Policies
Eaton Vance AMT-Free Municipal Income Fund (AMT-Free Fund) and Eaton Vance National Municipal Income Fund (National Fund) (each individually referred to as the Fund, and collectively, the Funds) are a diversified series of Eaton Vance Mutual Funds Trust and Eaton Vance Municipals Trust, respectively (collectively, the Trusts). The Trusts are Massachusetts business trusts registered under the Investment Company Act of 1940, as amended (the 1940 Act), as open-end management investment companies. The Funds’ investment objective is to provide current income exempt from regular federal income tax. The AMT-Free Fund offers three classes of shares. The National Fund offers four classes of shares. Class A shares are generally sold subject to a sales charge imposed at time of purchase. Class B and Class C shares are sold at net asset value and are generally subject to a contingent deferred sales charge (see Note 5). Class I shares are sold at net asset value and are not subject to a sales charge. Class B shares of National Fund automatically convert to Class A shares eight years after their purchase as described in National Fund’s prospectus. Beginning January 1, 2012, Class B shares are only available for purchase upon exchange from another Eaton Vance fund or through reinvestment of distributions. Each class represents a pro-rata interest in the Fund, but votes separately on class-specific matters and (as noted below) is subject to different expenses. Realized and unrealized gains and losses are allocated daily to each class of shares based on the relative net assets of each class to the total net assets of the Fund. Net investment income, other than class-specific expenses, is allocated daily to each class of shares based upon the ratio of the value of each class’s paid shares to the total value of all paid shares. Each class of shares differs in its distribution plan and certain other class-specific expenses.
The following is a summary of significant accounting policies of the Funds. The policies are in conformity with accounting principles generally accepted in the United States of America (U.S. GAAP). Each Fund is an investment company and follows accounting and reporting guidance in the Financial Accounting Standards Board (FASB) Accounting Standards Codification Topic 946.
A Investment Valuation — The following methodologies are used to determine the market value or fair value of investments.
Debt Obligations. Debt obligations are generally valued on the basis of valuations provided by third party pricing services, as derived from such services’ pricing models. Inputs to the models may include, but are not limited to, reported trades, executable bid and asked prices, broker/dealer quotations, prices or yields of securities with similar characteristics, interest rates, anticipated prepayments, benchmark curves or information pertaining to the issuer, as well as industry and economic events. The pricing services may use a matrix approach, which considers information regarding securities with similar characteristics to determine the valuation for a security. Short-term obligations purchased with a remaining maturity of sixty days or less for which a valuation from a third party pricing service is not readily available may be valued at amortized cost, which approximates fair value.
Derivatives. Financial futures contracts are valued at the closing settlement price established by the board of trade or exchange on which they are traded.
Fair Valuation. Investments for which valuations or market quotations are not readily available or are deemed unreliable are valued at fair value using methods determined in good faith by or at the direction of the Trustees of a Fund in a manner that fairly reflects the security’s value, or the amount that a Fund might reasonably expect to receive for the security upon its current sale in the ordinary course. Each such determination is based on a consideration of relevant factors, which are likely to vary from one pricing context to another. These factors may include, but are not limited to, the type of security, the existence of any contractual restrictions on the security’s disposition, the price and extent of public trading in similar securities of the issuer or of comparable entities, quotations or relevant information obtained from broker/dealers or other market participants, information obtained from the issuer, analysts, and/or the appropriate stock exchange (for exchange-traded securities), an analysis of the entity’s financial condition, and an evaluation of the forces that influence the issuer and the market(s) in which the security is purchased and sold.
B Investment Transactions and Related Income — Investment transactions for financial statement purposes are accounted for on a trade date basis. Realized gains and losses on investments sold are determined on the basis of identified cost. Interest income is recorded on the basis of interest accrued, adjusted for amortization of premium or accretion of discount.
C Federal Taxes — Each Fund’s policy is to comply with the provisions of the Internal Revenue Code applicable to regulated investment companies and to distribute to shareholders each year substantially all of its taxable, if any, and tax-exempt net investment income, and all or substantially all of its net realized capital gains. Accordingly, no provision for federal income or excise tax is necessary. Each Fund intends to satisfy conditions which will enable it to designate distributions from the interest income generated by its investments in non-taxable municipal securities, which are exempt from regular federal income tax when received by each Fund, as exempt-interest dividends. For National Fund, the portion of such interest, if any, earned on private activity bonds issued after August 7, 1986, may be considered a tax preference item to shareholders.
As of March 31, 2018, the Funds had no uncertain tax positions that would require financial statement recognition, de-recognition, or disclosure. Each Fund files a U.S. federal income tax return annually after its fiscal year-end, which is subject to examination by the Internal Revenue Service for a period of three years from the date of filing.
D Expenses — The majority of expenses of the Trusts are directly identifiable to an individual fund. Expenses which are not readily identifiable to a specific fund are allocated taking into consideration, among other things, the nature and type of expense and the relative size of the funds.
E Legal Fees — Legal fees and other related expenses incurred as part of negotiations of the terms and requirement of capital infusions, or that are expected to result in the restructuring of, or a plan of reorganization for, an investment are recorded as realized losses. Ongoing expenditures to protect or enhance an investment are treated as operating expenses.
Eaton Vance
Municipal Income Funds
March 31, 2018
Notes to Financial Statements (Unaudited) — continued
F Use of Estimates — The preparation of the financial statements in conformity with U.S. GAAP requires management to make estimates and assumptions that affect the reported amounts of assets and liabilities at the date of the financial statements and the reported amounts of income and expense during the reporting period. Actual results could differ from those estimates.
G Indemnifications — Under each Trust’s organizational documents, its officers and Trustees may be indemnified against certain liabilities and expenses arising out of the performance of their duties to the Funds. Under Massachusetts law, if certain conditions prevail, shareholders of a Massachusetts business trust (such as a Trust) could be deemed to have personal liability for the obligations of the Trust. However, each Trust’s Declaration of Trust contains an express disclaimer of liability on the part of Fund shareholders and the By-laws provide that the Trust shall assume the defense on behalf of any Fund shareholders. Moreover, the By-laws also provide for indemnification out of Fund property of any shareholder held personally liable solely by reason of being or having been a shareholder for all loss or expense arising from such liability. Additionally, in the normal course of business, each Fund enters into agreements with service providers that may contain indemnification clauses. Each Fund’s maximum exposure under these arrangements is unknown as this would involve future claims that may be made against each Fund that have not yet occurred.
H Floating Rate Notes Issued in Conjunction with Securities Held — The Funds may invest in residual interest bonds, also referred to as inverse floating rate securities, whereby a Fund may sell a variable or fixed rate bond for cash to a Special-Purpose Vehicle (the SPV), (which is generally organized as a trust), while at the same time, buying a residual interest in the assets and cash flows of the SPV. The bond is deposited into the SPV with the same CUSIP number as the bond sold to the SPV by the Fund, and which may have been, but is not required to be, the bond purchased from the Fund (the Bond). The SPV also issues floating rate notes (Floating Rate Notes) which are sold to third-parties. The residual interest bond held by a Fund gives the Fund the right (1) to cause the holders of the Floating Rate Notes to generally tender their notes at par, and (2) to have the Bond held by the SPV transferred to the Fund, thereby terminating the SPV. Should the Fund exercise such right, it would generally pay the SPV the par amount due on the Floating Rate Notes and exchange the residual interest bond for the underlying Bond. Pursuant to generally accepted accounting principles for transfers and servicing of financial assets and extinguishment of liabilities, the Funds account for the transaction described above as a secured borrowing by including the Bond in their Portfolio of Investments and the Floating Rate Notes as a liability under the caption “Payable for floating rate notes issued” in their Statement of Assets and Liabilities. The Floating Rate Notes have interest rates that generally reset weekly and their holders have the option to tender their notes to the SPV for redemption at par at each reset date. Accordingly, the fair value of the payable for floating rate notes issued approximates its carrying value. If measured at fair value, the payable for floating rate notes would have been considered as Level 2 in the fair value hierarchy (see Note 10) at March 31, 2018. Interest expense related to a Fund’s liability with respect to Floating Rate Notes is recorded as incurred. The SPV may be terminated by the Fund, as noted above, or by the occurrence of certain termination events as defined in the trust agreement, such as a downgrade in the credit quality of the underlying Bond, bankruptcy of or payment failure by the issuer of the underlying Bond, the inability to remarket Floating Rate Notes that have been tendered due to insufficient buyers in the market, or the failure by the SPV to obtain renewal of the liquidity agreement under which liquidity support is provided for the Floating Rate Notes up to one year. At March 31, 2018, the amounts of the Funds’ Floating Rate Notes and related interest rates and collateral were as follows:
| | | | | | | | |
| | | AMT-Free
Fund | | | National Fund | |
| | |
Floating Rate Notes Outstanding | | $ | 41,001,623 | | | $ | 264,259,619 | |
Interest Rate or Range of Interest Rates (%) | | | 1.60 - 1.63 | | | | 1.60 - 1.66 | |
Collateral for Floating Rate Notes Outstanding | | $ | 62,605,141 | | | $ | 372,415,740 | |
For the six months ended March 31, 2018, the Funds’ average Floating Rate Notes outstanding and the average interest rate (annualized) including fees were as follows:
| | | | | | | | |
| | | AMT-Free
Fund | | | National Fund | |
| | |
Average Floating Rate Notes Outstanding | | $ | 40,970,000 | | | $ | 290,265,275 | |
Average Interest Rate | | | 1.76 | % | | | 1.76 | % |
In certain circumstances, the Funds may enter into shortfall and forbearance agreements with brokers by which a Fund agrees to reimburse the broker for the difference between the liquidation value of the Bond held by the SPV and the liquidation value of the Floating Rate Notes, as well as any shortfalls in interest cash flows. The Funds had no shortfalls as of March 31, 2018.
The Funds may also purchase residual interest bonds in a secondary market transaction without first owning the underlying bond. Such transactions are not required to be treated as secured borrowings. Shortfall agreements, if any, related to residual interest bonds purchased in a secondary market transaction are disclosed in the Portfolio of Investments.
Eaton Vance
Municipal Income Funds
March 31, 2018
Notes to Financial Statements (Unaudited) — continued
The Funds’ investment policies and restrictions expressly permit investments in residual interest bonds. Such bonds typically offer the potential for yields exceeding the yields available on fixed rate bonds with comparable credit quality and maturity. These securities tend to underperform the market for fixed rate bonds in a rising long-term interest rate environment, but tend to outperform the market for fixed rate bonds when long-term interest rates decline. The value and income of residual interest bonds are generally more volatile than that of a fixed rate bond. The Funds’ investment policies do not allow the Funds to borrow money except as permitted by the 1940 Act. Management believes that the Funds’ restrictions on borrowing money and issuing senior securities (other than as specifically permitted) do not apply to Floating Rate Notes issued by the SPV and included as a liability in the Funds’ Statement of Assets and Liabilities. As secured indebtedness issued by an SPV, Floating Rate Notes are distinct from the borrowings and senior securities to which the Funds’ restrictions apply. Residual interest bonds held by the Funds are securities exempt from registration under Rule 144A of the Securities Act of 1933.
I Financial Futures Contracts — Upon entering into a financial futures contract, a Fund is required to deposit with the broker, either in cash or securities, an amount equal to a certain percentage of the contract amount (initial margin). Subsequent payments, known as variation margin, are made or received by the Fund each business day, depending on the daily fluctuations in the value of the underlying security, and are recorded as unrealized gains or losses by the Fund. Gains (losses) are realized upon the expiration or closing of the financial futures contracts. Should market conditions change unexpectedly, the Fund may not achieve the anticipated benefits of the financial futures contracts and may realize a loss. Futures contracts have minimal counterparty risk as they are exchange traded and the clearinghouse for the exchange is substituted as the counterparty, guaranteeing counterparty performance.
J When-Issued Securities and Delayed Delivery Transactions — The Funds may purchase or sell securities on a delayed delivery or when-issued basis. Payment and delivery may take place after the customary settlement period for that security. At the time the transaction is negotiated, the price of the security that will be delivered is fixed. The Funds maintain cash and/or security positions for these commitments such that sufficient liquid assets will be available to make payments upon settlement. Securities purchased on a delayed delivery or when-issued basis are marked-to-market daily and begin earning interest on settlement date. Losses may arise due to changes in the market value of the underlying securities or if the counterparty does not perform under the contract.
K Statement of Cash Flows — The cash amount shown in the Statement of Cash Flows of a Fund is the amount included in the Fund’s Statement of Assets and Liabilities and represents the unrestricted cash on hand at its custodian and does not include any short-term investments.
L Interim Financial Statements — The interim financial statements relating to March 31, 2018 and for the six months then ended have not been audited by an independent registered public accounting firm, but in the opinion of the Funds’ management, reflect all adjustments, consisting only of normal recurring adjustments, necessary for the fair presentation of the financial statements.
2 Distributions to Shareholders and Income Tax Information
The net investment income of each Fund is determined daily and substantially all of the net investment income so determined is declared as a dividend to shareholders of record at the time of declaration. Distributions are declared separately for each class of shares. Distributions are paid monthly. Distributions of realized capital gains (reduced by available capital loss carryforwards from prior years) are made at least annually. Shareholders may reinvest income and capital gain distributions in additional shares of the same class of a Fund at the net asset value as of the reinvestment date or, at the election of the shareholder, receive distributions in cash. Distributions to shareholders are determined in accordance with income tax regulations, which may differ from U.S. GAAP. As required by U.S. GAAP, only distributions in excess of tax basis earnings and profits are reported in the financial statements as a return of capital. Permanent differences between book and tax accounting relating to distributions are reclassified to paid-in capital. For tax purposes, distributions from short-term capital gains are considered to be from ordinary income.
At September 30, 2017, the following Funds, for federal income tax purposes, had capital loss carryforwards and deferred capital losses which would reduce the respective Fund’s taxable income arising from future net realized gains on investment transactions, if any, to the extent permitted by the Internal Revenue Code, and thus would reduce the amount of distributions to shareholders, which would otherwise be necessary to relieve the Funds of any liability for federal income or excise tax. Under tax regulations, capital losses incurred in taxable years beginning after December 2010 are considered deferred capital losses and are treated as arising on the first day of a Fund’s next taxable year, retaining the same short-term or long-term character as when originally deferred. Deferred capital losses are required to be used prior to capital loss carryforwards, which carry an expiration date. As a result of this ordering rule, capital loss carryforwards may be more likely to expire unused. The amounts and expiration dates of the capital loss carryforwards, whose character is short-term, and the amounts of the deferred capital losses are as follows:
| | | | | | | | |
| Expiration Date | | AMT-Free Fund | | | National Fund | |
| | |
September 30, 2018 | | $ | 10,549,691 | | | $ | 797,269,779 | |
September 30, 2019 | | | — | | | | 56,374,590 | |
| | |
Total capital loss carryforwards | | $ | 10,549,691 | | | $ | 853,644,369 | |
Eaton Vance
Municipal Income Funds
March 31, 2018
Notes to Financial Statements (Unaudited) — continued
| | | | | | | | |
| | | AMT-Free Fund | | | National Fund | |
| | |
Deferred capital losses: | | | | | | | | |
Short-term | | $ | 15,098,515 | | | $ | 152,211,165 | |
Long-term | | $ | 14,650,623 | | | $ | 124,918,523 | |
Included in the amounts above for National Fund are capital loss carryforwards of $7,766,545 as a result of reorganizations which occurred in prior years. Utilization of these capital loss carryforwards may be limited in accordance with certain income tax regulations.
The cost and unrealized appreciation (depreciation) of investments, including open derivative contracts, of each Fund at March 31, 2018, as determined on a federal income tax basis, were as follows:
| | | | | | | | |
| | | AMT-Free
Fund | | | National Fund | |
| | |
Aggregate cost | | $ | 290,514,250 | | | $ | 2,547,445,204 | |
| | |
Gross unrealized appreciation | | $ | 22,760,651 | | | $ | 178,582,094 | |
Gross unrealized depreciation | | | (3,733,227 | ) | | | (36,582,116 | ) |
| | |
Net unrealized appreciation | | $ | 19,027,424 | | | $ | 141,999,978 | |
3 Investment Adviser Fee and Other Transactions with Affiliates
The investment adviser fee is earned by Eaton Vance Management (EVM) for AMT-Free Fund and Boston Management and Research (BMR), a subsidiary of EVM, for National Fund as compensation for management and investment advisory services rendered to each Fund. The fee is based upon a percentage of average daily net assets plus a percentage of gross income (i.e., income other than gains from the sale of securities) as presented in the following table and is payable monthly.
| | | | | | | | |
| Daily Net Assets | | Annual Asset
Rate | | | Daily Income
Rate | |
| | |
Up to $500 million | | | 0.300 | % | | | 3.00 | % |
$500 million up to $1 billion | | | 0.275 | | | | 2.75 | |
$1 billion up to $1.5 billion | | | 0.250 | | | | 2.50 | |
$1.5 billion up to $2 billion | | | 0.225 | | | | 2.25 | |
$2 billion up to $3 billion | | | 0.200 | | | | 2.00 | |
$3 billion and over | | | 0.175 | | | | 1.75 | |
For the six months ended March 31, 2018, investment adviser fees incurred by the Funds and the effective annual rates, as a percentage of average daily net assets, were as follows:
| | | | | | | | |
| | | AMT-Free
Fund | | | National
Fund | |
| | |
Investment Adviser Fee | | $ | 715,574 | | | $ | 4,805,105 | |
Effective Annual Rate | | | 0.44 | % | | | 0.35 | % |
EVM serves as the administrator of each Fund, but receives no compensation. EVM provides sub-transfer agency and related services to the Funds pursuant to a Sub-Transfer Agency Support Services Agreement. Eaton Vance Distributors, Inc. (EVD), an affiliate of EVM and the Funds’ principal underwriter, received a portion of the sales charge on sales of Class A shares of the Funds. EVD also received distribution and service fees from Class A, Class B and Class C shares (see Note 4) and contingent deferred sales charges (see Note 5). Sub-transfer agent fees earned by EVM, which are included in
Eaton Vance
Municipal Income Funds
March 31, 2018
Notes to Financial Statements (Unaudited) — continued
transfer and dividend disbursing agent fees on the Statements of Operations, and Class A sales charges that the Funds were informed were received by EVD for the six months ended March 31, 2018 were as follows:
| | | | | | | | |
| | | AMT-Free
Fund | | | National
Fund | |
| | |
EVM’s Sub-Transfer Agent Fees | | $ | 5,785 | | | $ | 59,964 | |
EVD’s Class A Sales Charges | | $ | 5,655 | | | $ | 46,677 | |
Trustees and officers of the Funds who are members of EVM’s or BMR’s organizations receive remuneration for their services to the Funds out of the investment adviser fee. Trustees of the Funds who are not affiliated with the investment advisers may elect to defer receipt of all or a percentage of their annual fees in accordance with the terms of the Trustees Deferred Compensation Plan. For the six months ended March 31, 2018, no significant amounts have been deferred. Certain officers and Trustees of the Funds are officers of the above organizations.
4 Distribution Plans
Each Fund has in effect a distribution plan for Class A shares (Class A Plan) pursuant to Rule 12b-1 under the 1940 Act. Pursuant to the Class A Plan, each Fund pays EVD a distribution and service fee of 0.25% per annum of its average daily net assets attributable to Class A shares for distribution services and facilities provided to each Fund by EVD, as well as for personal services and/or the maintenance of shareholder accounts. Distribution and service fees paid or accrued to EVD for the six months ended March 31, 2018 for Class A shares amounted to the following:
| | | | | | | | |
| | | AMT-Free
Fund | | | National Fund | |
Class A Distribution and Service Fees | | $ | 186,739 | | | $ | 1,924,005 | |
Each Fund also has in effect distribution plans for Class B shares (Class B Plan) and/or Class C shares (Class C Plan) pursuant to Rule 12b-1 under the 1940 Act. Pursuant to the Class B and Class C Plans, each Fund pays EVD amounts equal to 0.75% per annum of its average daily net assets attributable to Class B and Class C shares for providing ongoing distribution services and facilities to the respective Funds. For the six months ended March 31, 2018, the Funds paid or accrued to EVD the following distribution fees:
| | | | | | | | |
| | | AMT-Free
Fund | | | National Fund | |
| | |
Class B Distribution Fees | | $ | — | | | $ | 19,616 | |
Class C Distribution Fees | | $ | 138,719 | | | $ | 1,640,073 | |
Pursuant to the Class B and Class C Plans, each Fund also makes payments of service fees to EVD, financial intermediaries and other persons in amounts equal to 0.25% per annum of the average daily net assets attributable to that class. Service fees paid or accrued are for personal services and/or the maintenance of shareholder accounts. They are separate and distinct from the Class B and Class C sales commissions and distribution fees payable to EVD. Service fees paid or accrued for the six months ended March 31, 2018 amounted to the following:
| | | | | | | | |
| | | AMT-Free
Fund | | | National
Fund | |
| | |
Class B Service Fees | | $ | — | | | $ | 6,539 | |
Class C Service Fees | | $ | 46,240 | | | $ | 546,691 | |
Distribution and service fees are subject to the limitations contained in the Financial Industry Regulatory Authority Rule 2341(d) and for Class B, are further limited to a 5% maximum sales charge as determined in accordance with such rule.
5 Contingent Deferred Sales Charges
A contingent deferred sales charge (CDSC) generally is imposed on redemptions of Class B shares made within six years of purchase and on redemptions of Class C shares made within one year of purchase. Class A shares may be subject to a 1% CDSC if redeemed within eighteen months of purchase
Eaton Vance
Municipal Income Funds
March 31, 2018
Notes to Financial Statements (Unaudited) — continued
(depending on the circumstances of purchase). Generally, the CDSC is based upon the lower of the net asset value at date of redemption or date of purchase. No charge is levied on shares acquired by reinvestment of dividends or capital gain distributions. The CDSC for Class B shares is imposed at declining rates that begin at 5% in the case of redemptions in the first and second year after purchase, declining one percentage point each subsequent year. Class C shares are subject to a 1% CDSC if redeemed within one year of purchase. For the six months ended March 31, 2018, the Funds were informed that EVD received approximately the following amounts of CDSCs paid by Class A, Class B and Class C shareholders:
| | | | | | | | |
| | | AMT-Free
Fund | | | National
Fund | |
| | |
Class A | | $ | 4,000 | | | $ | 100 | |
Class B | | $ | — | | | $ | 2,000 | |
Class C | | $ | 1,000 | | | $ | 2,000 | |
6 Purchases and Sales of Investments
Purchases and sales of investments, other than short-term obligations, for the six months ended March 31, 2018 were as follows:
| | | | | | | | |
| | | AMT-Free
Fund | | | National Fund | |
| | |
Purchases | | $ | 30,270,604 | | | $ | 1,148,258,436 | |
Sales | | $ | 54,258,931 | | | $ | 1,247,882,051 | |
7 Shares of Beneficial Interest
Each Fund’s Declaration of Trust permits the Trustees to issue an unlimited number of full and fractional shares of beneficial interest (without par value). Such shares may be issued in a number of different series (such as the Funds) and classes. Transactions in Fund shares were as follows:
| | | | | | | | | | | | | | | | |
AMT-Free Fund | | | | | | | | | | | | |
| | | Six Months Ended March 31, 2018 (Unaudited) | |
| | | Class A | | | Class B | | | Class C | | | Class I | |
| | | | |
Sales | | | 641,644 | | | | — | | | | 148,606 | | | | 1,163,577 | |
Issued to shareholders electing to receive payments of distributions in Fund shares | | | 281,039 | | | | — | | | | 52,262 | | | | 219,295 | |
Redemptions | | | (1,680,379 | ) | | | — | | | | (533,557 | ) | | | (3,385,812 | ) |
| | | | |
Net decrease | | | (757,696 | ) | | | — | | | | (332,689 | ) | | | (2,002,940 | ) |
| |
| | | Year Ended September 30, 2017 | |
| | | Class A | | | Class B(1) | | | Class C | | | Class I | |
| | | | |
Sales | | | 2,163,432 | | | | 327 | | | | 257,467 | | | | 6,592,820 | |
Issued to shareholders electing to receive payments of distributions in Fund shares | | | 692,435 | | | | 556 | | | | 114,812 | | | | 428,335 | |
Redemptions | | | (6,933,019 | ) | | | (8,583 | ) | | | (928,788 | ) | | | (6,554,849 | ) |
Exchange from Class B shares | | | 20,078 | | | | — | | | | — | | | | — | |
Exchange to Class A shares | | | — | | | | (20,212 | ) | | | — | | | | — | |
Merger from Class B shares | | | 22,496 | | | | — | | | | — | | | | — | |
Merger to Class A shares | | | — | | | | (22,636 | ) | | | — | | | | — | |
| | | | |
Net increase (decrease) | | | (4,034,578 | ) | | | (50,548 | ) | | | (556,509 | ) | | | 466,306 | |
| (1) | At the close of business on September 20, 2017, Class B shares of AMT- Free Fund were merged into Class A shares. |
Eaton Vance
Municipal Income Funds
March 31, 2018
Notes to Financial Statements (Unaudited) — continued
| | | | | | | | | | | | | | | | |
National Fund | | | | | | | | | | | | |
| | | Six Months Ended March 31, 2018 (Unaudited) | |
| | | Class A | | | Class B | | | Class C | | | Class I | |
| | | | |
Sales | | | 4,018,773 | | | | 877 | | | | 821,138 | | | | 10,980,061 | |
Issued to shareholders electing to receive payments of distributions in Fund shares | | | 2,346,544 | | | | 6,474 | | | | 527,266 | | | | 1,248,036 | |
Redemptions | | | (15,095,961 | ) | | | (66,379 | ) | | | (5,440,850 | ) | | | (15,141,146 | ) |
Exchange from Class B shares | | | 223,900 | | | | — | | | | — | | | | — | |
Exchange to Class A shares | | | — | | | | (223,896 | ) | | | — | | | | — | |
| | | | |
Net decrease | | | (8,506,744 | ) | | | (282,924 | ) | | | (4,092,446 | ) | | | (2,913,049 | ) |
| |
| | | Year Ended September 30, 2017 | |
| | | Class A | | | Class B | | | Class C | | | Class I | |
| | | | |
Sales | | | 12,835,603 | | | | 10,004 | | | | 2,428,369 | | | | 38,187,835 | |
Issued to shareholders electing to receive payments of distributions in Fund shares | | | 5,288,742 | | | | 29,457 | | | | 1,217,398 | | | | 2,344,480 | |
Redemptions | | | (40,305,026 | ) | | | (238,801 | ) | | | (13,773,358 | ) | | | (31,184,190 | ) |
Exchange from Class B shares | | | 760,362 | | | | — | | | | — | | | | — | |
Exchange to Class A shares | | | — | | | | (760,484 | ) | | | — | | | | — | |
| | | | |
Net increase (decrease) | | | (21,420,319 | ) | | | (959,824 | ) | | | (10,127,591 | ) | | | 9,348,125 | |
8 Line of Credit
The Funds participate with other portfolios and funds managed by EVM and its affiliates in a $625 million unsecured line of credit agreement with a group of banks, which is in effect through October 30, 2018. Borrowings are made by the Funds solely to facilitate the handling of unusual and/or unanticipated short-term cash requirements. Interest is charged to each Fund based on its borrowings at an amount above either the Eurodollar rate or Federal Funds rate. In addition, a fee computed at an annual rate of 0.15% on the daily unused portion of the line of credit is allocated among the participating portfolios and funds at the end of each quarter. Because the line of credit is not available exclusively to the Funds, a Fund may be unable to borrow some or all of its requested amounts at any particular time. The Funds did not have any significant borrowings or allocated fees during the six months ended March 31, 2018.
9 Financial Instruments
The Funds may trade in financial instruments with off-balance sheet risk in the normal course of their investing activities. These financial instruments may include financial futures contracts and may involve, to a varying degree, elements of risk in excess of the amounts recognized for financial statement purposes. The notional or contractual amounts of these instruments represent the investment a Fund has in particular classes of financial instruments and do not necessarily represent the amounts potentially subject to risk. The measurement of the risks associated with these instruments is meaningful only when all related and offsetting transactions are considered. A summary of obligations under these financial instruments at March 31, 2018 is included in the Portfolio of Investments. At March 31, 2018, the Funds had sufficient cash and/or securities to cover commitments under these contracts.
Each Fund is subject to interest rate risk in the normal course of pursuing its investment objective. Because the Funds hold fixed-rate bonds, the value of these bonds may decrease if interest rates rise. The Funds enter into U.S. Treasury futures contracts to hedge against changes in interest rates.
Eaton Vance
Municipal Income Funds
March 31, 2018
Notes to Financial Statements (Unaudited) — continued
The fair values of open derivative instruments (not considered to be hedging instruments for accounting disclosure purposes) and whose primary underlying risk exposure is interest rate risk at March 31, 2018 were as follows:
| | | | | | | | |
| | | AMT-Free
Fund | | | National
Fund | |
| | |
Liability Derivative: | | | | | | | | |
Futures Contracts | | $ | (476,948 | )(1) | | $ | (4,561,035 | )(1) |
| | |
Total | | $ | (476,948 | ) | | $ | (4,561,035 | ) |
| (1) | Amount represents cumulative unrealized depreciation on futures contracts. Only the current day’s variation margin on open futures contracts is reported within the Statement of Assets and Liabilities as Payable for variation margin on open financial futures contracts. |
The effect of derivative instruments (not considered to be hedging instruments for accounting disclosure purposes) on the Statement of Operations and whose primary underlying risk exposure is interest rate risk for the six months ended March 31, 2018 was as follows:
| | | | | | | | |
| | | AMT-Free
Fund | | | National
Fund | |
| | |
Realized Gain (Loss) on Derivatives Recognized in Income | | $ | 1,951,170 | (1) | | $ | 14,425,812 | (1) |
Change in Unrealized Appreciation (Depreciation) on Derivatives Recognized in Income | | $ | (974,737 | )(2) | | $ | (8,319,933 | )(2) |
| (1) | Statement of Operations location: Net realized gain (loss) – Financial futures contracts. |
| (2) | Statement of Operations location: Change in unrealized appreciation (depreciation) – Financial futures contracts. |
The average notional cost of futures contracts outstanding during the six months ended March 31, 2018, which is indicative of the volume of this derivative type, was approximately as follows:
| | | | | | | | |
| | | AMT-Free
Fund | | | National Fund | |
| | |
Average Notional Cost: | | | | | | | | |
Futures Contracts — Short | | $ | 36,250,000 | | | $ | 226,658,000 | |
10 Fair Value Measurements
Under generally accepted accounting principles for fair value measurements, a three-tier hierarchy to prioritize the assumptions, referred to as inputs, is used in valuation techniques to measure fair value. The three-tier hierarchy of inputs is summarized in the three broad levels listed below.
| • | | Level 1 – quoted prices in active markets for identical investments |
| • | | Level 2 – other significant observable inputs (including quoted prices for similar investments, interest rates, prepayment speeds, credit risk, etc.) |
| • | | Level 3 – significant unobservable inputs (including a fund’s own assumptions in determining the fair value of investments) |
In cases where the inputs used to measure fair value fall in different levels of the fair value hierarchy, the level disclosed is determined based on the lowest level input that is significant to the fair value measurement in its entirety. The inputs or methodology used for valuing securities are not necessarily an indication of the risk associated with investing in those securities.
Eaton Vance
Municipal Income Funds
March 31, 2018
Notes to Financial Statements (Unaudited) — continued
At March 31, 2018, the hierarchy of inputs used in valuing the Funds’ investments and open derivative instruments, which are carried at value, were as follows:
| | | | | | | | | | | | | | | | |
AMT-Free Fund | | | | | | | | | | | | |
| Asset Description | | Level 1 | | | Level 2 | | | Level 3 | | | Total | |
| | | | |
Tax-Exempt Municipal Securities | | $ | — | | | $ | 350,900,250 | | | $ | — | | | $ | 350,900,250 | |
Taxable Municipal Securities | | | — | | | | 119,995 | | | | — | | | | 119,995 | |
| | | | |
Total Investments | | $ | — | | | $ | 351,020,245 | | | $ | — | | | $ | 351,020,245 | |
| | | |
Liability Description | | | | | | | | | | | | |
| | | | |
Futures Contracts | | $ | (476,948 | ) | | $ | — | | | $ | — | | | $ | (476,948 | ) |
| | | | |
Total | | $ | (476,948 | ) | | $ | — | | | $ | — | | | $ | (476,948 | ) |
|
National Fund | |
| Asset Description | | Level 1 | | | Level 2 | | | Level 3 | | | Total | |
| | | | |
Tax-Exempt Municipal Securities | | $ | — | | | $ | 2,846,391,677 | | | $ | — | | | $ | 2,846,391,677 | |
Taxable Municipal Securities | | | — | | | | 111,874,159 | | | | — | | | | 111,874,159 | |
| | | | |
Total Investments | | $ | — | | | $ | 2,958,265,836 | | | $ | — | | | $ | 2,958,265,836 | |
| | | |
Liability Description | | | | | | | | | | | | |
| | | | |
Futures Contracts | | $ | (4,561,035 | ) | | $ | — | | | $ | — | | | $ | (4,561,035 | ) |
| | | | |
Total | | $ | (4,561,035 | ) | | $ | — | | | $ | — | | | $ | (4,561,035 | ) |
At March 31, 2018, there were no investments transferred between Level 1 and Level 2 during the six months then ended.
Eaton Vance
Municipal Income Funds
March 31, 2018
Officers and Trustees
Officers of Eaton Vance Municipals Trust and Eaton Vance Mutual Funds Trust
Payson F. Swaffield
President
Maureen A. Gemma
Vice President, Secretary and
Chief Legal Officer
James F. Kirchner
Treasurer
Richard F. Froio
Chief Compliance Officer
Trustees of Eaton Vance Municipals Trust and Eaton Vance Mutual Funds Trust
William H. Park
Chairperson
Thomas E. Faust Jr.*
Mark R. Fetting
Cynthia E. Frost
George J. Gorman
Valerie A. Mosley
Helen Frame Peters
Susan J. Sutherland
Harriett Tee Taggart
Scott E. Wennerholm
Eaton Vance Funds
IMPORTANT NOTICES
Privacy. The Eaton Vance organization is committed to ensuring your financial privacy. Each of the financial institutions identified below has in effect the following policy (“Privacy Policy”) with respect to nonpublic personal information about its customers:
| • | | Only such information received from you, through application forms or otherwise, and information about your Eaton Vance fund transactions will be collected. This may include information such as name, address, social security number, tax status, account balances and transactions. |
| • | | None of such information about you (or former customers) will be disclosed to anyone, except as permitted by law (which includes disclosure to employees necessary to service your account). In the normal course of servicing a customer’s account, Eaton Vance may share information with unaffiliated third parties that perform various required services such as transfer agents, custodians and broker-dealers. |
| • | | Policies and procedures (including physical, electronic and procedural safeguards) are in place that are designed to protect the confidentiality of such information. |
| • | | We reserve the right to change our Privacy Policy at any time upon proper notification to you. Customers may want to review our Privacy Policy periodically for changes by accessing the link on our homepage: www.eatonvance.com. |
Our pledge of privacy applies to the following entities within the Eaton Vance organization: the Eaton Vance Family of Funds, Eaton Vance Management, Eaton Vance Investment Counsel, Eaton Vance Distributors, Inc., Eaton Vance Trust Company, Eaton Vance Management (International) Limited, Eaton Vance Advisers International Ltd., Eaton Vance Management’s Real Estate Investment Group and Boston Management and Research. In addition, our Privacy Policy applies only to those Eaton Vance customers who are individuals and who have a direct relationship with us. If a customer’s account (i.e., fund shares) is held in the name of a third-party financial advisor/broker-dealer, it is likely that only such advisor’s privacy policies apply to the customer. This notice supersedes all previously issued privacy disclosures. For more information about Eaton Vance’s Privacy Policy, please call 1-800-262-1122.
Delivery of Shareholder Documents. The Securities and Exchange Commission (SEC) permits funds to deliver only one copy of shareholder documents, including prospectuses, proxy statements and shareholder reports, to fund investors with multiple accounts at the same residential or post office box address. This practice is often called “householding” and it helps eliminate duplicate mailings to shareholders. Eaton Vance, or your financial advisor, may household the mailing of your documents indefinitely unless you instruct Eaton Vance, or your financial advisor, otherwise. If you would prefer that your Eaton Vance documents not be householded, please contact Eaton Vance at 1-800-262-1122, or contact your financial advisor. Your instructions that householding not apply to delivery of your Eaton Vance documents will typically be effective within 30 days of receipt by Eaton Vance or your financial advisor.
Portfolio Holdings. Each Eaton Vance Fund and its underlying Portfolio(s) (if applicable) will file a schedule of portfolio holdings on Form N-Q with the SEC for the first and third quarters of each fiscal year. The Form N-Q will be available on the Eaton Vance website at www.eatonvance.com, by calling Eaton Vance at 1-800-262-1122 or in the EDGAR database on the SEC’s website at www.sec.gov. Form N-Q may also be reviewed and copied at the SEC’s public reference room in Washington, D.C. (call 1-800-732-0330 for information on the operation of the public reference room).
Proxy Voting. From time to time, funds are required to vote proxies related to the securities held by the funds. The Eaton Vance Funds or their underlying Portfolios (if applicable) vote proxies according to a set of policies and procedures approved by the Funds’ and Portfolios’ Boards. You may obtain a description of these policies and procedures and information on how the Funds or Portfolios voted proxies relating to portfolio securities during the most recent 12-month period ended June 30, without charge, upon request, by calling 1-800-262-1122 and by accessing the SEC’s website at www.sec.gov.
This Page Intentionally Left Blank
This Page Intentionally Left Blank
Investment Advisers
AMT-Free Municipal Income Fund
Eaton Vance Management
Two International Place
Boston, MA 02110
National Municipal Income Fund
Boston Management and Research
Two International Place
Boston, MA 02110
Administrator
Eaton Vance Management
Two International Place
Boston, MA 02110
Principal Underwriter*
Eaton Vance Distributors, Inc.
Two International Place
Boston, MA 02110
(617) 482-8260
Custodian
State Street Bank and Trust Company
State Street Financial Center, One Lincoln Street
Boston, MA 02111
Transfer Agent
BNY Mellon Investment Servicing (US) Inc.
Attn: Eaton Vance Funds
P.O. Box 9653
Providence, RI 02940-9653
(800) 262-1122
Fund Offices
Two International Place
Boston, MA 02110
| * | FINRA BrokerCheck. Investors may check the background of their Investment Professional by contacting the Financial Industry Regulatory Authority (FINRA). FINRA BrokerCheck is a free tool to help investors check the professional background of current and former FINRA-registered securities firms and brokers. FINRA BrokerCheck is available by calling 1-800-289-9999 and at www.FINRA.org. The FINRA BrokerCheck brochure describing this program is available to investors at www.FINRA.org. |
7714 3.31.18

Eaton Vance
Municipals Trust
Semiannual Report
March 31, 2018
California Opportunities • Massachusetts • New York • Ohio

Commodity Futures Trading Commission Registration. Effective December 31, 2012, the Commodity Futures Trading Commission (“CFTC”) adopted certain regulatory changes that subject registered investment companies and advisers to regulation by the CFTC if a fund invests more than a prescribed level of its assets in certain CFTC-regulated instruments (including futures, certain options and swap agreements) or markets itself as providing investment exposure to such instruments. Each Fund has claimed an exclusion from the definition of the term “commodity pool operator” under the Commodity Exchange Act. Accordingly, neither the Funds nor the adviser with respect to the operation of the Funds is subject to CFTC regulation. Because of its management of other strategies, each Fund’s adviser is registered with the CFTC as a commodity pool operator and a commodity trading advisor.
Fund shares are not insured by the FDIC and are not deposits or other obligations of, or guaranteed by, any depository institution. Shares are subject to investment risks, including possible loss of principal invested.
This report must be preceded or accompanied by a current summary prospectus or prospectus. Before investing, investors should consider carefully the investment objective, risks, and charges and expenses of a mutual fund. This and other important information is contained in the summary prospectus and prospectus, which can be obtained from a financial advisor. Prospective investors should read the prospectus carefully before investing. For further information, please call 1-800-262-1122.
Semiannual Report March 31, 2018
Eaton Vance
Municipal Income Funds
Table of Contents
| | | | |
Performance and Fund Profile | | | | |
| |
| | | | |
California Municipal Opportunities Fund | | | 2 | |
Massachusetts Municipal Income Fund | | | 3 | |
New York Municipal Income Fund | | | 4 | |
Ohio Municipal Income Fund | | | 5 | |
| |
| | | | |
| |
Endnotes and Additional Disclosures | | | 6 | |
| |
Fund Expenses | | | 7 | |
| |
Financial Statements | | | 10 | |
| |
Officers and Trustees | | | 52 | |
| |
Important Notices | | | 53 | |
Eaton Vance
California Municipal Opportunities Fund
March 31, 2018
Performance1,2
Portfolio Managers Craig R. Brandon, CFA and Adam A. Weigold, CFA
| | | | | | | | | | | | | | | | | | | | | | | | |
| % Average Annual Total Returns | | Class
Inception Date | | | Performance
Inception Date | | | Six Months | | | One Year | | | Five Years | | | Ten Years | |
Class A at NAV | | | 05/27/1994 | | | | 12/19/1985 | | | | –0.58 | % | | | 2.14 | % | | | 3.06 | % | | | 4.26 | % |
Class A with 4.75% Maximum Sales Charge | | | — | | | | — | | | | –5.31 | | | | –2.69 | | | | 2.05 | | | | 3.76 | |
Class C at NAV | | | 08/31/2004 | | | | 12/19/1985 | | | | –0.89 | | | | 1.35 | | | | 2.27 | | | | 3.49 | |
Class C with 1% Maximum Sales Charge | | | — | | | | — | | | | –1.88 | | | | 0.35 | | | | 2.27 | | | | 3.49 | |
Class I at NAV | | | 03/03/2008 | | | | 12/19/1985 | | | | –0.46 | | | | 2.50 | | | | 3.32 | | | | 4.52 | |
Bloomberg Barclays Municipal Bond Index | | | — | | | | — | | | | –0.37 | % | | | 2.66 | % | | | 2.73 | % | | | 4.40 | % |
| | | | | | |
| | | | | | | | | | | | | | | | | | | | | | | | |
| % Total Annual Operating Expense Ratios3 | | | | | | Class A | | | Class C | | | Class I | |
Gross | | | | | | | | | | | | | | | 0.83 | % | | | 1.58 | % | | | 0.58 | % |
Net | | | | | | | | | | | | | | | 0.78 | | | | 1.53 | | | | 0.53 | |
| | | | | | |
| | | | | | | | | | | | | | | | | | | | | | | | |
| % Distribution Rates/Yields4 | | | | | | | | | | | Class A | | | Class C | | | Class I | |
Distribution Rate | | | | | | | | | | | | | | | 2.57 | % | | | 1.81 | % | | | 2.82 | % |
Taxable-Equivalent Distribution Rate | | | | | | | | | | | | | | | 5.01 | | | | 3.53 | | | | 5.49 | |
SEC 30-day Yield | | | | | | | | | | | | | | | 1.97 | | | | 1.33 | | | | 2.32 | |
Taxable-Equivalent SEC 30-day Yield | | | | | | | | | | | | | | | 3.85 | | | | 2.60 | | | | 4.52 | |
| | | | | | |
| | | | | | | | | | | | | | | | | | | | | | | | |
| % Total Leverage5 | | | | | | | | | | | | | | | | | | |
Residual Interest Bond (RIB) Financing | | | | | | | | | | | | | | | | | | | | | | | 3.89 | % |
Fund Profile
Credit Quality (% of total investments)6,7
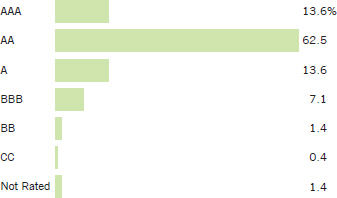
See Endnotes and Additional Disclosures in this report.
Past performance is no guarantee of future results. Returns are historical and are calculated by determining the percentage change in net asset value (NAV) or offering price (as applicable) with all distributions reinvested. Investment return and principal value will fluctuate so that shares, when redeemed, may be worth more or less than their original cost. Performance less than or equal to one year is cumulative. Performance is for the stated time period only; due to market volatility, the Fund’s current performance may be lower or higher than quoted. Returns are before taxes unless otherwise noted. For performance as of the most recent month-end, please refer to eatonvance.com.
Eaton Vance
Massachusetts Municipal Income Fund
March 31, 2018
Performance1,2
Portfolio Manager Craig R. Brandon, CFA
| | | | | | | | | | | | | | | | | | | | | | | | |
| % Average Annual Total Returns | | Class
Inception Date | | | Performance
Inception Date | | | Six Months | | | One Year | | | Five Years | | | Ten Years | |
Class A at NAV | | | 12/07/1993 | | | | 04/18/1991 | | | | –0.50 | % | | | 2.07 | % | | | 2.23 | % | | | 4.16 | % |
Class A with 4.75% Maximum Sales Charge | | | — | | | | — | | | | –5.20 | | | | –2.79 | | | | 1.25 | | | | 3.66 | |
Class C at NAV | | | 05/02/2006 | | | | 04/18/1991 | | | | –0.75 | | | | 1.31 | | | | 1.49 | | | | 3.38 | |
Class C with 1% Maximum Sales Charge | | | — | | | | — | | | | –1.73 | | | | 0.32 | | | | 1.49 | | | | 3.38 | |
Class I at NAV | | | 06/17/1993 | | | | 04/18/1991 | | | | –0.28 | | | | 2.28 | | | | 2.46 | | | | 4.37 | |
Bloomberg Barclays Municipal Bond Index | | | — | | | | — | | | | –0.37 | % | | | 2.66 | % | | | 2.73 | % | | | 4.40 | % |
Bloomberg Barclays 20 Year Municipal Bond Index | | | — | | | | — | | | | 0.24 | | | | 4.28 | | | | 3.62 | | | | 5.49 | |
| | | | | | |
| | | | | | | | | | | | | | | | | | | | | | | | |
| % Total Annual Operating Expense Ratios3 | | | | | | Class A | | | Class C | | | Class I | |
Gross | | | | | | | | | | | | | | | 0.76 | % | | | 1.52 | % | | | 0.56 | % |
Net | | | | | | | | | | | | | | | 0.70 | | | | 1.46 | | | | 0.50 | |
| | | | | | |
| | | | | | | | | | | | | | | | | | | | | | | | |
| % Distribution Rates/Yields4 | | | | | | | | | | | Class A | | | Class C | | | Class I | |
Distribution Rate | | | | | | | | | | | | | | | 3.21 | % | | | 2.46 | % | | | 3.43 | % |
Taxable-Equivalent Distribution Rate | | | | | | | | | | | | | | | 5.71 | | | | 4.38 | | | | 6.11 | |
SEC 30-day Yield | | | | | | | | | | | | | | | 1.91 | | | | 1.26 | | | | 2.20 | |
Taxable-Equivalent SEC 30-day Yield | | | | | | | | | | | | | | | 3.40 | | | | 2.25 | | | | 3.92 | |
| | | | | | |
| | | | | | | | | | | | | | | | | | | | | | | | |
| % Total Leverage5 | | | | | | | | | | | | | | | | | | |
RIB Financing | | | | | | | | | | | | | | | | | | | | | | | 2.38 | % |
Fund Profile
Credit Quality (% of total investments)6,7
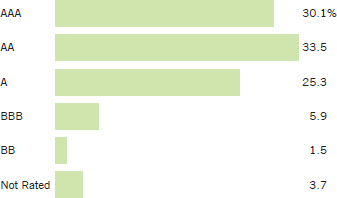
See Endnotes and Additional Disclosures in this report.
Past performance is no guarantee of future results. Returns are historical and are calculated by determining the percentage change in net asset value (NAV) or offering price (as applicable) with all distributions reinvested. Investment return and principal value will fluctuate so that shares, when redeemed, may be worth more or less than their original cost. Performance less than or equal to one year is cumulative. Performance is for the stated time period only; due to market volatility, the Fund’s current performance may be lower or higher than quoted. Returns are before taxes unless otherwise noted. For performance as of the most recent month-end, please refer to eatonvance.com.
Eaton Vance
New York Municipal Income Fund
March 31, 2018
Performance1,2
Portfolio Manager Craig R. Brandon, CFA
| | | | | | | | | | | | | | | | | | | | | | | | |
| % Average Annual Total Returns | | Class
Inception Date | | | Performance
Inception Date | | | Six Months | | | One Year | | | Five Years | | | Ten Years | |
Class A at NAV | | | 04/15/1994 | | | | 08/30/1990 | | | | –0.57 | % | | | 2.54 | % | | | 2.79 | % | | | 4.45 | % |
Class A with 4.75% Maximum Sales Charge | | | — | | | | — | | | | –5.25 | | | | –2.36 | | | | 1.80 | | | | 3.94 | |
Class C at NAV | | | 09/30/2003 | | | | 08/30/1990 | | | | –1.04 | | | | 1.67 | | | | 2.03 | | | | 3.67 | |
Class C with 1% Maximum Sales Charge | | | — | | | | — | | | | –2.02 | | | | 0.68 | | | | 2.03 | | | | 3.67 | |
Class I at NAV | | | 03/03/2008 | | | | 08/30/1990 | | | | –0.47 | | | | 2.75 | | | | 3.00 | | | | 4.66 | |
Bloomberg Barclays Municipal Bond Index | | | — | | | | — | | | | –0.37 | % | | | 2.66 | % | | | 2.73 | % | | | 4.40 | % |
Bloomberg Barclays 20 Year Municipal Bond Index | | | — | | | | — | | | | 0.24 | | | | 4.28 | | | | 3.62 | | | | 5.49 | |
| | | | | | |
| | | | | | | | | | | | | | | | | | | | | | | | |
| % Total Annual Operating Expense Ratios3 | | | | | | Class A | | | Class C | | | Class I | |
Gross | | | | | | | | | | | | | | | 0.77 | % | | | 1.52 | % | | | 0.57 | % |
Net | | | | | | | | | | | | | | | 0.70 | | | | 1.45 | | | | 0.50 | |
| | | | | | |
| | | | | | | | | | | | | | | | | | | | | | | | |
| % Distribution Rates/Yields4 | | | | | | | | | | | Class A | | | Class C | | | Class I | |
Distribution Rate | | | | | | | | | | | | | | | 2.83 | % | | | 2.07 | % | | | 3.04 | % |
Taxable-Equivalent Distribution Rate | | | | | | | | | | | | | | | 5.24 | | | | 3.83 | | | | 5.63 | |
SEC 30-day Yield | | | | | | | | | | | | | | | 2.22 | | | | 1.58 | | | | 2.53 | |
Taxable-Equivalent SEC 30-day Yield | | | | | | | | | | | | | | | 4.11 | | | | 2.93 | | | | 4.68 | |
| | | | | | |
| | | | | | | | | | | | | | | | | | | | | | | | |
| % Total Leverage5 | | | | | | | | | | | | | | | | | | |
RIB Financing | | | | | | | | | | | | | | | | | | | | | | | 4.94 | % |
Fund Profile
Credit Quality (% of total investments)6,7
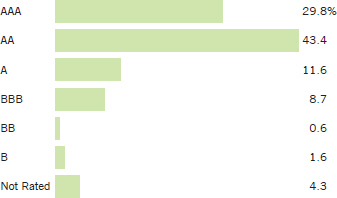
See Endnotes and Additional Disclosures in this report.
Past performance is no guarantee of future results. Returns are historical and are calculated by determining the percentage change in net asset value (NAV) or offering price (as applicable) with all distributions reinvested. Investment return and principal value will fluctuate so that shares, when redeemed, may be worth more or less than their original cost. Performance less than or equal to one year is cumulative. Performance is for the stated time period only; due to market volatility, the Fund’s current performance may be lower or higher than quoted. Returns are before taxes unless otherwise noted. For performance as of the most recent month-end, please refer to eatonvance.com.
Eaton Vance
Ohio Municipal Income Fund
March 31, 2018
Performance1,2
Portfolio Manager Cynthia J. Clemson
| | | | | | | | | | | | | | | | | | | | | | | | |
| % Average Annual Total Returns | | Class
Inception Date | | | Performance
Inception Date | | | Six Months | | | One Year | | | Five Years | | | Ten Years | |
Class A at NAV | | | 12/07/1993 | | | | 04/18/1991 | | | | –1.07 | % | | | 2.01 | % | | | 2.57 | % | | | 4.10 | % |
Class A with 4.75% Maximum Sales Charge | | | — | | | | — | | | | –5.77 | | | | –2.80 | | | | 1.58 | | | | 3.59 | |
Class C at NAV | | | 02/03/2006 | | | | 04/18/1991 | | | | –1.33 | | | | 1.25 | | | | 1.80 | | | | 3.32 | |
Class C with 1% Maximum Sales Charge | | | — | | | | — | | | | –2.31 | | | | 0.26 | | | | 1.80 | | | | 3.32 | |
Class I at NAV | | | 08/03/2010 | | | | 04/18/1991 | | | | –0.86 | | | | 2.21 | | | | 2.77 | | | | 4.26 | |
Bloomberg Barclays Municipal Bond Index | | | — | | | | — | | | | –0.37 | % | | | 2.66 | % | | | 2.73 | % | | | 4.40 | % |
Bloomberg Barclays 20 Year Municipal Bond Index | | | — | | | | — | | | | 0.24 | | | | 4.28 | | | | 3.62 | | | | 5.49 | |
| | | | | | |
| | | | | | | | | | | | | | | | | | | | | | | | |
| % Total Annual Operating Expense Ratios3 | | | | | | Class A | | | Class C | | | Class I | |
Gross | | | | | | | | | | | | | | | 0.83 | % | | | 1.58 | % | | | 0.63 | % |
Net | | | | | | | | | | | | | | | 0.72 | | | | 1.47 | | | | 0.52 | |
| | | | | | |
| | | | | | | | | | | | | | | | | | | | | | | | |
| % Distribution Rates/Yields4 | | | | | | | | | | | Class A | | | Class C | | | Class I | |
Distribution Rate | | | | | | | | | | | | | | | 3.13 | % | | | 2.37 | % | | | 3.34 | % |
Taxable-Equivalent Distribution Rate | | | | | | | | | | | | | | | 5.57 | | | | 4.21 | | | | 5.94 | |
SEC 30-day Yield | | | | | | | | | | | | | | | 2.52 | | | | 1.90 | | | | 2.85 | |
Taxable-Equivalent SEC 30-day Yield | | | | | | | | | | | | | | | 4.49 | | | | 3.39 | | | | 5.07 | |
| | | | | | |
| | | | | | | | | | | | | | | | | | | | | | | | |
| % Total Leverage5 | | | | | | | | | | | | | | | | | | |
RIB Financing | | | | | | | | | | | | | | | | | | | | | | | 7.58 | % |
Fund Profile
Credit Quality (% of total investments)6,7
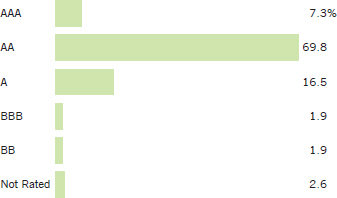
See Endnotes and Additional Disclosures in this report.
Past performance is no guarantee of future results. Returns are historical and are calculated by determining the percentage change in net asset value (NAV) or offering price (as applicable) with all distributions reinvested. Investment return and principal value will fluctuate so that shares, when redeemed, may be worth more or less than their original cost. Performance less than or equal to one year is cumulative. Performance is for the stated time period only; due to market volatility, the Fund’s current performance may be lower or higher than quoted. Returns are before taxes unless otherwise noted. For performance as of the most recent month-end, please refer to eatonvance.com.
Eaton Vance
Municipal Income Funds
March 31, 2018
Endnotes and Additional Disclosures
| 1 | Bloomberg Barclays Municipal Bond Index is an unmanaged index of municipal bonds traded in the U.S. Bloomberg Barclays 20 Year Municipal Bond Index is an unmanaged index of municipal bonds traded in the U.S. with maturities ranging from 17–22 years. Unless otherwise stated, index returns do not reflect the effect of any applicable sales charges, commissions, expenses, taxes or leverage, as applicable. It is not possible to invest directly in an index. |
| 2 | Total Returns at NAV do not include applicable sales charges. If sales charges were deducted, the returns would be lower. Total |
Returns shown with maximum sales charge reflect the stated maximum sales charge. Unless otherwise stated, performance does not reflect the deduction of taxes on Fund distributions or redemptions of Fund shares.
| | Performance prior to the inception date of a class may be linked to the performance of an older class of the Fund. This linked performance is adjusted for any applicable sales charge, but is not adjusted for class expense differences. If adjusted for such differences, the performance would be different. For Ohio Municipal Income Fund, the performance of Class I is linked to Class A. Performance since inception for an index, if presented, is the performance since the Fund’s or oldest share class’ inception, as applicable. Performance presented in the Financial Highlights included in the financial statements is not linked. |
| 3 | Total annual operating expense ratios are as stated in the Fund’s most recent prospectus. Net expense ratio is not a result of a fee waiver or expense reimbursement. Net expense ratio excludes interest expense relating to the Fund’s liability with respect to floating rate notes held by third parties in conjunction with residual interest bond transactions by the Fund. The Fund also records offsetting interest income in an amount equal to this expense relating to the municipal obligations underlying such transactions and, as a result, net asset value and performance have not been affected by this expense. The expense ratios for the current reporting period can be found in the Financial Highlights section of this report. |
| 4 | The Distribution Rate is based on the Fund’s last regular distribution per share in the period (annualized) divided by the Fund’s NAV at the end of the period. The Fund’s distributions may be comprised of amounts characterized for federal income tax purposes as tax-exempt income, qualified and non-qualified ordinary dividends, capital gains and nondividend distributions, also known as return of capital. The Fund will determine the federal income tax character of distributions paid to a shareholder after the end of the calendar year. This is reported on the IRS form 1099-DIV and provided to the shareholder shortly after each year-end. The Fund’s distributions are determined by the investment adviser based on its current assessment of the Fund’s long-term return potential. As portfolio and market conditions change, the rate of distributions paid by the Fund could change. Taxable-equivalent performance is based on the highest combined federal and state income tax rates, where applicable. Lower tax rates would result in lower tax-equivalent performance. Actual tax rates will vary depending on your income, exemptions and deductions. Rates do not include local taxes. The SEC Yield is a standardized measure based on the estimated yield to maturity of a fund’s investments over a 30-day period and is based on the maximum offer price at the date specified. The SEC Yield is not based on the distributions made by the Fund, which may differ. |
| 5 | Fund employs RIB financing. The leverage created by RIB investments provides an opportunity for increased income but, at the same time, creates special risks (including the likelihood of greater volatility of NAV). The cost of leverage rises and falls with changes in short-term interest rates. See “Floating Rate Notes Issued in Conjunction with Securities Held” in the notes to the financial statements for more information about RIB financing. RIB leverage represents the amount of Floating Rate Notes outstanding at period end as a percentage of Fund net assets plus Floating Rate Notes. |
| 6 | Ratings are based on Moody’s, S&P or Fitch, as applicable. If securities are rated differently by the ratings agencies, the highest rating is applied. Ratings, which are subject to change, apply to the creditworthiness of the issuers of the underlying securities and not to the Fund or its shares. Credit ratings measure the quality of a bond based on the issuer’s creditworthiness, with ratings ranging from AAA, being the highest, to D, being the lowest based on S&P’s measures. Ratings of BBB or higher by S&P or Fitch (Baa or higher by Moody’s) are considered to be investment-grade quality. Credit ratings are based largely on the ratings agency’s analysis at the time of rating. The rating assigned to any particular security is not necessarily a reflection of the issuer’s current financial condition and does not necessarily reflect its assessment of the volatility of a security’s market value or of the liquidity of an investment in the security. Holdings designated as “Not Rated” (if any) are not rated by the national ratings agencies stated above. |
| 7 | The chart includes the municipal bonds held by a trust that issues residual interest bonds, consistent with the Portfolio of Investments. |
| | Fund profiles subject to change due to active management. |
Eaton Vance
Municipal Income Funds
March 31, 2018
Fund Expenses
Example: As a Fund shareholder, you incur two types of costs: (1) transaction costs, including sales charges (loads) on purchases and redemption fees (if applicable); and (2) ongoing costs, including management fees; distribution and/or service fees; and other Fund expenses. This Example is intended to help you understand your ongoing costs (in dollars) of Fund investing and to compare these costs with the ongoing costs of investing in other mutual funds. The Example is based on an investment of $1,000 invested at the beginning of the period and held for the entire period (October 1, 2017 – March 31, 2018).
Actual Expenses: The first section of each table below provides information about actual account values and actual expenses. You may use the information in this section, together with the amount you invested, to estimate the expenses that you paid over the period. Simply divide your account value by $1,000 (for example, an $8,600 account value divided by $1,000 = 8.6), then multiply the result by the number in the first section under the heading entitled “Expenses Paid During Period” to estimate the expenses you paid on your account during this period.
Hypothetical Example for Comparison Purposes: The second section of each table below provides information about hypothetical account values and hypothetical expenses based on the actual Fund expense ratio and an assumed rate of return of 5% per year (before expenses), which is not the actual Fund return. The hypothetical account values and expenses may not be used to estimate the actual ending account balance or expenses you paid for the period. You may use this information to compare the ongoing costs of investing in your Fund and other funds. To do so, compare this 5% hypothetical example with the 5% hypothetical examples that appear in the shareholder reports of the other funds.
Please note that the expenses shown in each table are meant to highlight your ongoing costs only and do not reflect any transactional costs, such as sales charges (loads) or redemption fees (if applicable). Therefore, the second section of each table is useful in comparing ongoing costs only, and will not help you determine the relative total costs of owning different funds. In addition, if these transactional costs were included, your costs would be higher.
Eaton Vance California Municipal Opportunities Fund
| | | | | | | | | | | | | | | | |
| | | Beginning
Account Value
(10/1/17) | | | Ending
Account Value
(3/31/18) | | | Expenses Paid
During Period*
(10/1/17 – 3/31/18) | | | Annualized
Expense
Ratio | |
| | | | |
Actual | | | | | | | | | | | | | | | | |
Class A | | $ | 1,000.00 | | | $ | 994.20 | | | $ | 4.13 | | | | 0.83 | % |
Class C | | $ | 1,000.00 | | | $ | 991.10 | | | $ | 7.84 | | | | 1.58 | % |
Class I | | $ | 1,000.00 | | | $ | 995.40 | | | $ | 2.89 | | | | 0.58 | % |
| | | | | |
Hypothetical | | | | | | | | | | | | | | | | |
(5% return per year before expenses) | | | | | | | | | | | | | | | | |
Class A | | $ | 1,000.00 | | | $ | 1,020.80 | | | $ | 4.18 | | | | 0.83 | % |
Class C | | $ | 1,000.00 | | | $ | 1,017.10 | | | $ | 7.95 | | | | 1.58 | % |
Class I | | $ | 1,000.00 | | | $ | 1,022.00 | | | $ | 2.92 | | | | 0.58 | % |
| * | Expenses are equal to the Fund’s annualized expense ratio for the indicated Class, multiplied by the average account value over the period, multiplied by 182/365 (to reflect the one-half year period). The Example assumes that the $1,000 was invested at the net asset value per share determined at the close of business on September 30, 2017. |
Eaton Vance
Municipal Income Funds
March 31, 2018
Fund Expenses — continued
Eaton Vance Massachusetts Municipal Income Fund
| | | | | | | | | | | | | | | | |
| | | Beginning
Account Value
(10/1/17) | | | Ending
Account Value
(3/31/18) | | | Expenses Paid
During Period*
(10/1/17 – 3/31/18) | | | Annualized
Expense
Ratio | |
| | | | |
Actual | | | | | | | | | | | | | | | | |
Class A | | $ | 1,000.00 | | | $ | 995.00 | | | $ | 3.78 | | | | 0.76 | % |
Class C | | $ | 1,000.00 | | | $ | 992.50 | | | $ | 7.55 | | | | 1.52 | % |
Class I | | $ | 1,000.00 | | | $ | 997.20 | | | $ | 2.79 | | | | 0.56 | % |
| | | | | |
Hypothetical | | | | | | | | | | | | | | | | |
(5% return per year before expenses) | | | | | | | | | | | | | | | | |
Class A | | $ | 1,000.00 | | | $ | 1,021.10 | | | $ | 3.83 | | | | 0.76 | % |
Class C | | $ | 1,000.00 | | | $ | 1,017.40 | | | $ | 7.65 | | | | 1.52 | % |
Class I | | $ | 1,000.00 | | | $ | 1,022.10 | | | $ | 2.82 | | | | 0.56 | % |
| * | Expenses are equal to the Fund’s annualized expense ratio for the indicated Class, multiplied by the average account value over the period, multiplied by 182/365 (to reflect the one-half year period). The Example assumes that the $1,000 was invested at the net asset value per share determined at the close of business on September 30, 2017. |
Eaton Vance New York Municipal Income Fund
| | | | | | | | | | | | | | | | |
| | | Beginning
Account Value
(10/1/17) | | | Ending
Account Value
(3/31/18) | | | Expenses Paid
During Period*
(10/1/17 – 3/31/18) | | | Annualized
Expense
Ratio | |
| | | | |
Actual | | | | | | | | | | | | | | | | |
Class A | | $ | 1,000.00 | | | $ | 994.30 | | | $ | 3.88 | | | | 0.78 | % |
Class C | | $ | 1,000.00 | | | $ | 989.60 | | | $ | 7.59 | | | | 1.53 | % |
Class I | | $ | 1,000.00 | | | $ | 995.30 | | | $ | 2.89 | | | | 0.58 | % |
| | | | | |
Hypothetical | | | | | | | | | | | | | | | | |
(5% return per year before expenses) | | | | | | | | | | | | | | | | |
Class A | | $ | 1,000.00 | | | $ | 1,021.00 | | | $ | 3.93 | | | | 0.78 | % |
Class C | | $ | 1,000.00 | | | $ | 1,017.30 | | | $ | 7.70 | | | | 1.53 | % |
Class I | | $ | 1,000.00 | | | $ | 1,022.00 | | | $ | 2.92 | | | | 0.58 | % |
| * | Expenses are equal to the Fund’s annualized expense ratio for the indicated Class, multiplied by the average account value over the period, multiplied by 182/365 (to reflect the one-half year period). The Example assumes that the $1,000 was invested at the net asset value per share determined at the close of business on September 30, 2017. |
Eaton Vance
Municipal Income Funds
March 31, 2018
Fund Expenses — continued
Eaton Vance Ohio Municipal Income Fund
| | | | | | | | | | | | | | | | |
| | | Beginning
Account Value
(10/1/17) | | | Ending
Account Value
(3/31/18) | | | Expenses Paid
During Period*
(10/1/17 – 3/31/18) | | | Annualized
Expense
Ratio | |
| | | | |
Actual | | | | | | | | | | | | | | | | |
Class A | | $ | 1,000.00 | | | $ | 989.30 | | | $ | 4.27 | | | | 0.86 | % |
Class C | | $ | 1,000.00 | | | $ | 986.70 | | | $ | 7.97 | | | | 1.61 | % |
Class I | | $ | 1,000.00 | | | $ | 991.40 | | | $ | 3.28 | | | | 0.66 | % |
| | | | | |
Hypothetical | | | | | | | | | | | | | | | | |
(5% return per year before expenses) | | | | | | | | | | | | | | | | |
Class A | | $ | 1,000.00 | | | $ | 1,020.60 | | | $ | 4.33 | | | | 0.86 | % |
Class C | | $ | 1,000.00 | | | $ | 1,016.90 | | | $ | 8.10 | | | | 1.61 | % |
Class I | | $ | 1,000.00 | | | $ | 1,021.60 | | | $ | 3.33 | | | | 0.66 | % |
| * | Expenses are equal to the Fund’s annualized expense ratio for the indicated Class, multiplied by the average account value over the period, multiplied by 182/365 (to reflect the one-half year period). The Example assumes that the $1,000 was invested at the net asset value per share determined at the close of business on September 30, 2017. |
Eaton Vance
California Municipal Opportunities Fund
March 31, 2018
Portfolio of Investments (Unaudited)
| | | | | | | | |
| Tax-Exempt Municipal Securities — 104.0% | |
| Security | | Principal
Amount
(000’s omitted) | | | Value | |
|
| Education — 3.5% | |
California Educational Facilities Authority, (Claremont McKenna College), 5.25%, 1/1/30 | | $ | 1,000 | | | $ | 1,089,140 | |
California Educational Facilities Authority, (Loyola Marymount University), 5.00%, 10/1/30 | | | 2,895 | | | | 3,031,442 | |
California Educational Facilities Authority, (Santa Clara University), 5.00%, 4/1/33 | | | 1,000 | | | | 1,157,430 | |
California Municipal Finance Authority, (University of San Diego), 5.25%, 10/1/27 | | | 915 | | | | 1,013,902 | |
California Municipal Finance Authority, (University of San Diego), 5.25%, 10/1/28 | | | 960 | | | | 1,062,403 | |
California State University, 5.25%, 11/1/31 | | | 1,465 | | | | 1,632,347 | |
| | | | | | | $ | 8,986,664 | |
|
| Electric Utilities — 7.3% | |
Chula Vista, (San Diego Gas and Electric), 5.875%, 2/15/34 | | $ | 895 | | | $ | 936,063 | |
Los Angeles Department of Water and Power, Power System Revenue, 5.00%, 7/1/39 | | | 1,750 | | | | 1,971,235 | |
Los Angeles Department of Water and Power, Power System Revenue, 5.00%, 7/1/42 | | | 2,000 | | | | 2,284,900 | |
Los Angeles Department of Water and Power, Power System Revenue, (SPA: Bank of America, N.A.), 1.46%, 7/1/35(1) | | | 2,400 | | | | 2,400,000 | |
Los Angeles Department of Water and Power, Power System Revenue, (SPA: TD Bank, N.A.), 1.47%, 7/1/34(1) | | | 5,000 | | | | 5,000,000 | |
Sacramento Municipal Utility District, 5.00%, 8/15/27 | | | 1,080 | | | | 1,191,640 | |
Sacramento Municipal Utility District, 5.00%, 8/15/28 | | | 1,455 | | | | 1,604,399 | |
Southern California Public Power Authority, (Tieton Hydropower), 5.00%, 7/1/35 | | | 2,160 | | | | 2,306,383 | |
Vernon, Electric System Revenue, 5.125%, 8/1/21 | | | 1,065 | | | | 1,108,356 | |
| | | | | | | $ | 18,802,976 | |
|
| Escrowed / Prerefunded — 3.2% | |
California Health Facilities Financing Authority, (Catholic Healthcare West), Prerefunded to 7/1/19, 6.00%, 7/1/29 | | $ | 1,855 | | | $ | 1,955,114 | |
California Health Facilities Financing Authority, (Cedars-Sinai Medical Center), Prerefunded to 8/15/19, 5.00%, 8/15/34 | | | 2,500 | | | | 2,617,525 | |
California Health Facilities Financing Authority, (Sutter Health), Prerefunded to 8/15/20, 5.875%, 8/15/31 | | | 3,000 | | | | 3,289,260 | |
Vernon, Electric System Revenue, Prerefunded to 8/1/19, 5.125%, 8/1/21 | | | 455 | | | | 471,562 | |
| | | | | | | $ | 8,333,461 | |
|
| General Obligations — 32.2% | |
Alta Loma School District, (Election of 2016), 5.00%, 8/1/42 | | $ | 2,090 | | | $ | 2,420,450 | |
Berryessa Union School District, (Election of 2014), 5.00%, 8/1/36 | | | 400 | | | | 462,968 | |
| | | | | | | | |
| Security | | Principal
Amount
(000’s omitted) | | | Value | |
|
| General Obligations (continued) | |
Burbank Unified School District, (Election of 2013), 5.00%, 8/1/28 | | $ | 2,170 | | | $ | 2,600,767 | |
California, 1.822%, (70% of 1 mo. USD LIBOR + 0.70%), 12/1/20 (Put Date), 12/1/28(2) | | | 2,850 | | | | 2,872,116 | |
California, 2.58%, (SIFMA + 1.00%), 5/1/19(2) | | | 3,000 | | | | 3,012,840 | |
California, 5.00%, 8/1/26 | | | 4,220 | | | | 5,054,167 | |
California, 5.00%, 8/1/38 | | | 2,925 | | | | 3,371,764 | |
California, 5.00%, 10/1/39 | | | 1,830 | | | | 2,099,650 | |
California, 5.50%, 11/1/35 | | | 2,500 | | | | 2,733,925 | |
California, 6.00%, 4/1/38 | | | 1,000 | | | | 1,042,830 | |
Glendale Community College District, (Election of 2016), 5.00%, 8/1/32 | | | 500 | | | | 598,810 | |
Glendale Community College District, (Election of 2016), 5.00%, 8/1/33 | | | 750 | | | | 894,105 | |
Glendale Community College District, (Election of 2016), 5.00%, 8/1/34 | | | 1,530 | | | | 1,814,243 | |
Glendale Community College District, (Election of 2016), 5.00%, 8/1/35 | | | 1,000 | | | | 1,179,460 | |
Glendale Community College District, (Election of 2016), 5.00%, 8/1/36 | | | 1,000 | | | | 1,172,290 | |
Glendale Unified School District, (Election of 2011), 3.00%, 9/1/19 | | | 50 | | | | 51,050 | |
Grossmont Union High School District, (Election of 2004), 4.00%, 8/1/33 | | | 1,450 | | | | 1,537,841 | |
Los Alamitos Unified School District, 5.00%, 8/1/27 | | | 550 | | | | 645,546 | |
Los Alamitos Unified School District, 5.00%, 8/1/30 | | | 1,100 | | | | 1,271,897 | |
Los Angeles Unified School District, (Election of 2005), 5.25%, 7/1/42 | | | 5,000 | | | | 5,986,300 | |
Marin Community College District, (Election of 2016), 5.00%, 8/1/27 | | | 565 | | | | 681,424 | |
Marin Healthcare District, (Election of 2013), 4.00%, 8/1/47 | | | 5,000 | | | | 5,221,600 | |
Morgan Hill Unified School District, (Election of 2012), 5.00%, 8/1/41 | | | 1,250 | | | | 1,465,363 | |
Mt. San Antonio Community College District, (Election of 2008), 5.00%, 6/1/33 | | | 750 | | | | 860,033 | |
Ohlone Community College District, (Election of 2010), 4.00%, 8/1/41 | | | 2,000 | | | | 2,074,560 | |
Palo Alto, (Election of 2008), 5.00%, 8/1/40(3) | | | 5,200 | | | | 5,560,308 | |
San Diego Unified School District, (Election of 2012), Series F, 4.00%, 7/1/35 | | | 2,000 | | | | 2,122,580 | |
San Diego Unified School District, (Election of 2012), Series G, 4.00%, 7/1/35 | | | 1,000 | | | | 1,061,290 | |
San Luis Coastal Unified School District, (Election of 2014), 5.00%, 8/1/30 | | | 655 | | | | 783,242 | |
Santa Barbara Unified School District, (Election of 2016), 5.00%, 8/1/31 | | | 500 | | | | 601,105 | |
Santa Barbara Unified School District, (Election of 2016), 5.00%, 8/1/35 | | | 500 | | | | 589,730 | |
| | | | |
| | 10 | | See Notes to Financial Statements. |
Eaton Vance
California Municipal Opportunities Fund
March 31, 2018
Portfolio of Investments (Unaudited) — continued
| | | | | | | | |
| Security | | Principal
Amount
(000’s omitted) | | | Value | |
|
| General Obligations (continued) | |
Santa Barbara Unified School District, (Election of 2016), 5.00%, 8/1/41 | | $ | 2,500 | | | $ | 2,919,600 | |
Santa Clara County, (Election of 2008), Prerefunded to 8/1/19, 5.00%, 8/1/39(3) | | | 5,400 | | | | 5,643,054 | |
Santa Monica Community College District, (Election of 2008), 5.00%, 8/1/30 | | | 440 | | | | 528,568 | |
Santa Monica Community College District, (Election of 2008), 5.00%, 8/1/31 | | | 600 | | | | 716,922 | |
Santa Monica Community College District, (Election of 2008), 5.00%, 8/1/32 | | | 700 | | | | 833,861 | |
Santa Monica Community College District, (Election of 2008), 5.00%, 8/1/34 | | | 500 | | | | 590,180 | |
Santa Monica-Malibu Unified School District, (Election of 2012), 5.00%, 7/1/32 | | | 500 | | | | 598,480 | |
Sonoma County Junior College District, 5.00%, 8/1/28 | | | 1,825 | | | | 2,173,593 | |
Southwestern Community College District, (Election of 2016), 4.00%, 8/1/32 | | | 500 | | | | 540,405 | |
Tahoe-Truckee Unified School District, (Election of 2014), 5.00%, 8/1/31 | | | 1,000 | | | | 1,183,570 | |
Tahoe-Truckee Unified School District, (Election of 2014), 5.00%, 8/1/33 | | | 1,000 | | | | 1,171,280 | |
Tahoe-Truckee Unified School District, (Election of 2014), 5.00%, 8/1/36 | | | 1,000 | | | | 1,156,740 | |
Vista Unified School District, 5.00%, 8/1/27 | | | 1,280 | | | | 1,500,493 | |
Vista Unified School District, 5.00%, 8/1/28 | | | 900 | | | | 1,048,464 | |
Yosemite Community College District, 5.00%, 8/1/28 | | | 1,000 | | | | 1,176,660 | |
| | | | | | | $ | 83,626,124 | |
|
| Hospital — 11.5% | |
California Health Facilities Financing Authority, (City of Hope), 5.00%, 11/15/32 | | $ | 735 | | | $ | 820,069 | |
California Health Facilities Financing Authority, (City of Hope), 5.00%, 11/15/35 | | | 1,050 | | | | 1,167,631 | |
California Health Facilities Financing Authority, (St. Joseph Health System), 5.00%, 7/1/33 | | | 1,500 | | | | 1,690,260 | |
California Health Facilities Financing Authority, (St. Joseph Health System), 5.50%, 7/1/29 | | | 1,500 | | | | 1,573,095 | |
California Health Facilities Financing Authority, (Sutter Health), 5.00%, 11/15/27(4) | | | 500 | | | | 605,270 | |
California Health Facilities Financing Authority, (Sutter Health), 5.00%, 11/15/28(4) | | | 800 | | | | 957,856 | |
California Health Facilities Financing Authority, (Sutter Health), 5.00%, 11/15/41 | | | 3,225 | | | | 3,637,768 | |
California Health Facilities Financing Authority, (Sutter Health), 5.00%, 8/15/43 | | | 550 | | | | 617,562 | |
California Municipal Finance Authority, (NorthBay Healthcare Group), 5.00%, 11/1/23 | | | 100 | | | | 111,122 | |
| | | | | | | | |
| Security | | Principal
Amount
(000’s omitted) | | | Value | |
|
| Hospital (continued) | |
California Municipal Finance Authority, (NorthBay Healthcare Group), 5.00%, 11/1/24 | | $ | 800 | | | $ | 896,368 | |
California Municipal Finance Authority, (NorthBay Healthcare Group), Series 2015, 5.00%, 11/1/25 | | | 200 | | | | 223,332 | |
California Municipal Finance Authority, (NorthBay Healthcare Group), Series 2017A, 5.00%, 11/1/25 | | | 800 | | | | 904,240 | |
California Municipal Finance Authority, (NorthBay Healthcare Group), 5.00%, 11/1/26 | | | 500 | | | | 568,240 | |
California Municipal Finance Authority, (NorthBay Healthcare Group), 5.00%, 11/1/27 | | | 165 | | | | 183,417 | |
California Municipal Finance Authority, (NorthBay Healthcare Group), 5.00%, 11/1/29 | | | 105 | | | | 116,786 | |
California Municipal Finance Authority, (NorthBay Healthcare Group), 5.00%, 11/1/30 | | | 150 | | | | 166,367 | |
California Public Finance Authority, (Henry Mayo Newhall Hospital), 5.00%, 10/15/33 | | | 425 | | | | 473,000 | |
California Public Finance Authority, (Sharp HealthCare), 5.00%, 8/1/47 | | | 5,000 | | | | 5,717,300 | |
California Statewide Communities Development Authority, (Cottage Health System), 5.25%, 11/1/30 | | | 500 | | | | 536,315 | |
California Statewide Communities Development Authority, (Kaiser Permanente), 1.58%, 4/1/32(5) | | | 7,500 | | | | 7,500,000 | |
Washington Township Health Care District, 5.25%, 7/1/30 | | | 1,240 | | | | 1,313,929 | |
| | | | | | | $ | 29,779,927 | |
|
| Housing — 0.4% | |
California Municipal Finance Authority, (Caritas Corp.), Mobile Home Park Revenue, 5.00%, 8/15/23 | | $ | 475 | | | $ | 531,240 | |
California Municipal Finance Authority, (Caritas Corp.), Mobile Home Park Revenue, 5.00%, 8/15/25 | | | 525 | | | | 598,385 | |
| | | | | | | $ | 1,129,625 | |
|
| Insured – Electric Utilities — 1.7% | |
Puerto Rico Electric Power Authority, (NPFG), Series QQ, 5.00%, 7/1/22 | | $ | 180 | | | $ | 179,991 | |
Puerto Rico Electric Power Authority, (NPFG), Series RR, 5.00%, 7/1/22 | | | 140 | | | | 139,993 | |
Puerto Rico Electric Power Authority, (NPFG), 5.00%, 7/1/23 | | | 125 | | | | 124,849 | |
Puerto Rico Electric Power Authority, (NPFG), Series RR, 5.00%, 7/1/24 | | | 300 | | | | 298,674 | |
Puerto Rico Electric Power Authority, (NPFG), Series SS, 5.00%, 7/1/24 | | | 130 | | | | 129,425 | |
Puerto Rico Electric Power Authority, (NPFG), 5.25%, 7/1/22 | | | 1,500 | | | | 1,516,110 | |
Puerto Rico Electric Power Authority, (NPFG), 5.25%, 7/1/32 | | | 2,000 | | | | 1,939,220 | |
| | | | | | | $ | 4,328,262 | |
| | | | |
| | 11 | | See Notes to Financial Statements. |
Eaton Vance
California Municipal Opportunities Fund
March 31, 2018
Portfolio of Investments (Unaudited) — continued
| | | | | | | | |
| Security | | Principal
Amount
(000’s omitted) | | | Value | |
|
| Insured – Special Tax Revenue — 1.1% | |
Puerto Rico Sales Tax Financing Corp., (NPFG), 0.00%, 8/1/45 | | $ | 6,995 | | | $ | 1,389,766 | |
Puerto Rico Sales Tax Financing Corp., (NPFG), 0.00%, 8/1/46 | | | 3,925 | | | | 739,902 | |
Successor Agency to Rosemead Community Development Commission, (BAM), 5.00%, 10/1/26 | | | 585 | | | | 697,291 | |
| | | | | | | $ | 2,826,959 | |
|
| Insured – Transportation — 0.6% | |
San Joaquin Hills Transportation Corridor Agency, (NPFG), 0.00%, 1/15/24 | | $ | 1,800 | | | $ | 1,526,508 | |
| | | | | | | $ | 1,526,508 | |
|
| Other Revenue — 3.1% | |
California Infrastructure and Economic Development Bank, (Academy of Motion Picture Arts and Sciences Obligated Group), 4.00%, 11/1/31 | | $ | 1,330 | | | $ | 1,398,522 | |
California Infrastructure and Economic Development Bank, (Academy of Motion Picture Arts and Sciences Obligated Group), 5.00%, 11/1/33 | | | 1,740 | | | | 1,964,164 | |
California Infrastructure and Economic Development Bank, (Academy of Motion Picture Arts and Sciences Obligated Group), 5.00%, 11/1/34 | | | 2,580 | | | | 2,905,235 | |
California Infrastructure and Economic Development Bank, (Segerstrom Center for the Arts), 5.00%, 7/1/23 | | | 1,655 | | | | 1,875,396 | |
| | | | | | | $ | 8,143,317 | |
|
| Senior Living / Life Care — 2.7% | |
ABAG Finance Authority for Nonprofit Corporations, (Episcopal Senior Communities), 6.00%, 7/1/31 | | $ | 615 | | | $ | 681,857 | |
California Municipal Finance Authority, (Channing House), 5.00%, 5/15/37 | | | 250 | | | | 290,950 | |
California Municipal Finance Authority, (Channing House), 5.00%, 5/15/47 | | | 2,450 | | | | 2,791,285 | |
California Statewide Communities Development Authority, (American Baptist Homes of the West), 5.00%, 10/1/26 | | | 500 | | | | 576,820 | |
California Statewide Communities Development Authority, (American Baptist Homes of the West), 5.00%, 10/1/27 | | | 780 | | | | 889,621 | |
California Statewide Communities Development Authority, (Southern California Presbyterian Homes), 7.25%, 11/15/41(6) | | | 1,000 | | | | 1,078,240 | |
California Statewide Communities Development Authority, (The Redwoods, a Community of Seniors), 5.125%, 11/15/35 | | | 715 | | | | 807,163 | |
| | | | | | | $ | 7,115,936 | |
|
| Special Tax Revenue — 8.3% | |
Chula Vista Municipal Financing Authority, 5.50%, 9/1/30 | | $ | 1,525 | | | $ | 1,730,372 | |
Irvine Community Facilities District No. 2013-3, (Great Park), 5.00%, 9/1/30 | | | 580 | | | | 636,892 | |
| | | | | | | | |
| Security | | Principal
Amount
(000’s omitted) | | | Value | |
|
| Special Tax Revenue (continued) | |
Irvine Community Facilities District No. 2013-3, (Great Park), 5.00%, 9/1/31 | | $ | 465 | | | $ | 508,924 | |
Irvine Community Facilities District No. 2013-3, (Great Park), 5.00%, 9/1/32 | | | 450 | | | | 490,878 | |
Irvine Community Facilities District No. 2013-3, (Great Park), 5.00%, 9/1/33 | | | 545 | | | | 592,546 | |
Irvine Community Facilities District No. 2013-3, (Great Park), 5.00%, 9/1/34 | | | 360 | | | | 390,546 | |
Los Angeles County Community Facilities District No. 3, (Valencia/Newhall Area), 5.00%, 9/1/23 | | | 520 | | | | 572,265 | |
Puerto Rico Sales Tax Financing Corp., 5.00%, 8/1/40(7) | | | 1,400 | | | | 822,500 | |
Puerto Rico Sales Tax Financing Corp., 5.25%, 8/1/40(7) | | | 550 | | | | 323,125 | |
Riverside County Transportation Commission, Sales Tax Revenue, Prerefunded to 6/1/23, 5.25%, 6/1/33 | | | 4,000 | | | | 4,640,760 | |
San Diego County Regional Transportation Commission, Sales Tax Revenue, 5.00%, 4/1/35 | | | 550 | | | | 646,030 | |
San Francisco Bay Area Rapid Transit District, Sales Tax Revenue, 5.00%, 7/1/33 | | | 1,725 | | | | 1,995,463 | |
South Orange County Public Financing Authority, Special Tax Revenue, (Ladera Ranch), 5.00%, 8/15/27 | | | 515 | | | | 570,388 | |
South Orange County Public Financing Authority, Special Tax Revenue, (Ladera Ranch), 5.00%, 8/15/28 | | | 775 | | | | 852,213 | |
Successor Agency to San Diego Redevelopment Agency, 5.00%, 9/1/31 | | | 3,605 | | | | 4,239,913 | |
Successor Agency to San Francisco City and County Redevelopment Agency, 5.00%, 8/1/37 | | | 1,630 | | | | 1,856,994 | |
Torrance Redevelopment Agency, 5.625%, 9/1/28 | | | 710 | | | | 710,745 | |
| | | | | | | $ | 21,580,554 | |
|
| Transportation — 16.7% | |
Burbank-Glendale-Pasadena Airport Authority, (AMT), 5.00%, 7/1/22 | | $ | 1,970 | | | $ | 2,186,385 | |
Los Angeles Department of Airports, (Los Angeles International Airport), 5.00%, 5/15/35(3) | | | 3,080 | | | | 3,281,740 | |
Los Angeles Department of Airports, (Los Angeles International Airport), (AMT), 5.00%, 5/15/32(4) | | | 2,500 | | | | 2,932,525 | |
Los Angeles Department of Airports, (Los Angeles International Airport), (AMT), 5.00%, 5/15/33(4) | | | 6,000 | | | | 7,015,260 | |
Los Angeles Department of Airports, (Los Angeles International Airport), (AMT), 5.00%, 5/15/35 | | | 1,000 | | | | 1,152,620 | |
Los Angeles Department of Airports, (Los Angeles International Airport), (AMT), 5.00%, 5/15/36 | | | 1,385 | | | | 1,592,501 | |
Los Angeles Department of Airports, (Los Angeles International Airport), (AMT), 5.00%, 5/15/41 | | | 310 | | | | 344,419 | |
Los Angeles Department of Airports, (Los Angeles International Airport), (AMT), 5.375%, 5/15/30 | | | 2,750 | | | | 2,762,127 | |
San Francisco City and County Airport Commission, (San Francisco International Airport), 5.00%, 5/1/47 | | | 2,800 | | | | 3,196,648 | |
| | | | |
| | 12 | | See Notes to Financial Statements. |
Eaton Vance
California Municipal Opportunities Fund
March 31, 2018
Portfolio of Investments (Unaudited) — continued
| | | | | | | | |
| Security | | Principal
Amount
(000’s omitted) | | | Value | |
|
| Transportation (continued) | |
San Francisco City and County Airport Commission, (San Francisco International Airport), (AMT), 5.00%, 5/1/24 | | $ | 3,600 | | | $ | 3,920,760 | |
San Francisco City and County Airport Commission, (San Francisco International Airport), (AMT), 5.00%, 5/1/46 | | | 5,000 | | | | 5,587,000 | |
San Jose, Airport Revenue, (AMT), 5.00%, 3/1/23 | | | 1,000 | | | | 1,119,260 | |
San Jose, Airport Revenue, (AMT), 5.00%, 3/1/24 | | | 1,000 | | | | 1,131,870 | |
San Jose, Airport Revenue, (AMT), 5.00%, 3/1/25 | | | 1,000 | | | | 1,142,740 | |
San Jose, Airport Revenue, (AMT), 5.00%, 3/1/35 | | | 2,350 | | | | 2,663,960 | |
San Jose, Airport Revenue, (AMT), 5.00%, 3/1/47 | | | 2,985 | | | | 3,337,260 | |
| | | | | | | $ | 43,367,075 | |
|
| Water and Sewer — 11.7% | |
Dublin San Ramon Services District, Water Revenue, 5.00%, 8/1/32 | | $ | 1,000 | | | $ | 1,189,410 | |
East Bay Municipal Utility District, 5.00%, 6/1/32 | | | 2,450 | | | | 2,861,477 | |
Los Angeles Department of Water and Power, Water System Revenue, 5.00%, 7/1/38 | | | 2,000 | | | | 2,293,860 | |
Metropolitan Water District of Southern California, (SPA: Citibank, N.A.), 1.49%, 7/1/35(1) | | | 4,000 | | | | 4,000,000 | |
Metropolitan Water District of Southern California, 5.00%, 7/1/36 | | | 300 | | | | 347,916 | |
Orange County Water District, 5.00%, 8/15/28 | | | 500 | | | | 603,700 | |
Orange County Water District, 5.00%, 8/15/34 | | | 1,000 | | | | 1,180,250 | |
Riverside, Water System Revenue, 2.21%, (SIFMA + 0.63%), 1/15/20 (Put Date), 10/1/35(2) | | | 1,935 | | | | 1,935,000 | |
Ross Valley Public Financing Authority, (Sanitary District No. 1 of Marin County), 5.00%, 1/1/32 | | | 150 | | | | 172,533 | |
Ross Valley Public Financing Authority, (Sanitary District No. 1 of Marin County), 5.00%, 1/1/33 | | | 150 | | | | 172,034 | |
Ross Valley Public Financing Authority, (Sanitary District No. 1 of Marin County), 5.00%, 1/1/36 | | | 495 | | | | 563,117 | |
Ross Valley Public Financing Authority, (Sanitary District No. 1 of Marin County), 5.00%, 1/1/37 | | | 425 | | | | 482,082 | |
Ross Valley Public Financing Authority, (Sanitary District No. 1 of Marin County), 5.00%, 1/1/39 | | | 500 | | | | 563,880 | |
Ross Valley Public Financing Authority, (Sanitary District No. 1 of Marin County), 5.00%, 1/1/43 | | | 1,190 | | | | 1,331,205 | |
San Diego Public Facilities Financing Authority, Wastewater System Revenue, 5.00%, 5/15/27 | | | 1,500 | | | | 1,768,755 | |
San Diego Public Facilities Financing Authority, Wastewater System Revenue, 5.00%, 5/15/34 | | | 1,750 | | | | 2,055,498 | |
San Francisco City and County Public Utilities Commission, Green Bonds, 5.00%, 11/1/38 | | | 5,180 | | | | 5,880,181 | |
Silicon Valley Clean Water, Wastewater Revenue, 4.00%, 8/1/44 | | | 2,855 | | | | 2,999,434 | |
| | | | | | | $ | 30,400,332 | |
| |
Total Tax-Exempt Municipal Securities — 104.0%
(identified cost $264,008,779) | | | $ | 269,947,720 | |
| | | | | | | | |
| Taxable Municipal Securities — 3.3% | | | | | | | | |
| Security | | Principal
Amount
(000’s omitted) | | | Value | |
| | |
| Hospital — 1.5% | | | | | | |
California Statewide Communities Development Authority, (Loma Linda University Medical Center), 6.00%, 12/1/24 | | $ | 3,750 | | | $ | 4,006,050 | |
| | | | | | | $ | 4,006,050 | |
|
| Insured – Special Tax Revenue — 1.2% | |
Industry, Sales Tax Revenue, (AGM), 2.50%, 1/1/20 | | $ | 235 | | | $ | 233,541 | |
Successor Agency to Banning Redevelopment Agency, (AGM), 2.525%, 9/1/23 | | | 770 | | | | 741,133 | |
Successor Agency to Pittsburg Redevelopment Agency, (AGM), 2.698%, 8/1/19 | | | 880 | | | | 881,302 | |
Successor Agency to Pittsburg Redevelopment Agency, (AGM), 3.388%, 8/1/22 | | | 955 | | | | 962,926 | |
Successor Agency to Stanton Redevelopment Agency, (BAM), 2.75%, 12/1/22 | | | 130 | | | | 126,610 | |
Successor Agency to Stanton Redevelopment Agency, (BAM), 3.00%, 12/1/23 | | | 150 | | | | 146,596 | |
| | | | | | | $ | 3,092,108 | |
|
| Special Tax Revenue — 0.6% | |
Successor Agency to San Diego Redevelopment Agency, 2.875%, 9/1/21 | | $ | 300 | | | $ | 300,039 | |
Successor Agency to San Diego Redevelopment Agency, 3.25%, 9/1/22 | | | 250 | | | | 252,273 | |
Successor Agency to San Diego Redevelopment Agency, 3.375%, 9/1/23 | | | 250 | | | | 253,188 | |
Successor Agency to San Diego Redevelopment Agency, 3.50%, 9/1/24 | | | 250 | | | | 254,022 | |
Successor Agency to San Diego Redevelopment Agency, 3.625%, 9/1/25 | | | 250 | | | | 255,090 | |
Successor Agency to San Diego Redevelopment Agency, 3.75%, 9/1/26 | | | 250 | | | | 255,740 | |
| | | | | | | $ | 1,570,352 | |
| |
Total Taxable Municipal Securities — 3.3%
(identified cost $8,559,264) | | | $ | 8,668,510 | |
| |
Total Investments — 107.3%
(identified cost $272,568,043) | | | $ | 278,616,230 | |
| |
Other Assets, Less Liabilities — (7.3)% | | | $ | (19,003,560 | ) |
| |
Net Assets — 100.0% | | | $ | 259,612,670 | |
The percentage shown for each investment category in the Portfolio of Investments is based on net assets.
| | | | |
| | 13 | | See Notes to Financial Statements. |
Eaton Vance
California Municipal Opportunities Fund
March 31, 2018
Portfolio of Investments (Unaudited) — continued
The Fund invests primarily in debt securities issued by California municipalities. The ability of the issuers of the debt securities to meet their obligations may be affected by economic developments in a specific industry or municipality. In order to reduce the risk associated with such economic developments, at March 31, 2018, 4.2% of total investments are backed by bond insurance of various financial institutions and financial guaranty assurance agencies. The aggregate percentage insured by an individual financial institution or financial guaranty assurance agency ranged from 0.3% to 2.9% of total investments.
| (1) | Variable rate demand obligation that may be tendered at par on any day for payment the same or next business day. The stated interest rate, which generally resets daily, is determined by the remarketing agent and represents the rate in effect at March 31, 2018. |
| (2) | Floating rate security. The stated interest rate represents the rate in effect at March 31, 2018. |
| (3) | Security represents the municipal bond held by a trust that issues residual interest bonds (see Note 1H). |
| (4) | When-issued security. |
| (5) | Variable rate demand obligation that may be tendered at par on any day for payment the lesser of 5 business days or 7 calendar days. The stated interest rate, which generally resets weekly, is determined by the remarketing agent and represents the rate in effect at March 31, 2018. |
| (6) | Security exempt from registration pursuant to Rule 144A under the Securities Act of 1933, as amended. These securities may be sold in certain transactions in reliance on an exemption from registration (normally to qualified institutional buyers). At March 31, 2018, the aggregate value of these securities is $1,078,240 or 0.4% of the Fund’s net assets. |
| (7) | Defaulted security. Issuer has defaulted on the payment of interest and/or principal or has filed for bankruptcy. |
Abbreviations:
| | | | |
| AGM | | – | | Assured Guaranty Municipal Corp. |
| AMT | | – | | Interest earned from these securities may be considered a tax preference item for purposes of the Federal Alternative Minimum Tax. |
| BAM | | – | | Build America Mutual Assurance Co. |
| LIBOR | | – | | London Interbank Offered Rate |
| NPFG | | – | | National Public Finance Guaranty Corp. |
| SIFMA | | – | | Securities Industry and Financial Markets Association Municipal Swap Index |
| SPA | | – | | Standby Bond Purchase Agreement |
Currency Abbreviations:
| | | | |
| USD | | – | | United States Dollar |
| | | | |
| | 14 | | See Notes to Financial Statements. |
Eaton Vance
Massachusetts Municipal Income Fund
March 31, 2018
Portfolio of Investments (Unaudited)
| | | | | | | | |
| Tax-Exempt Investments — 99.0% | | | | | | | | |
| Security | | Principal Amount
(000’s omitted) | | | Value | |
| | |
| Bond Bank — 7.6% | | | | | | |
Massachusetts Water Pollution Abatement Trust, 5.00%, 8/1/32 | | $ | 4,000 | | | $ | 4,160,640 | |
Massachusetts Water Pollution Abatement Trust, 5.25%, 8/1/33 | | | 2,465 | | | | 3,163,458 | |
Massachusetts Water Pollution Abatement Trust, 5.25%, 8/1/34 | | | 3,105 | | | | 4,006,195 | |
| | | | $ | 11,330,293 | |
| | |
| Education — 21.6% | | | | | | |
Massachusetts Development Finance Agency, (Babson College), 5.00%, 10/1/42 | | $ | 2,000 | | | $ | 2,280,440 | |
Massachusetts Development Finance Agency, (Berklee College of Music), 5.00%, 10/1/37 | | | 2,000 | | | | 2,280,280 | |
Massachusetts Development Finance Agency, (Boston University), 5.00%, 10/1/46 | | | 2,000 | | | | 2,277,080 | |
Massachusetts Development Finance Agency, (College of the Holy Cross), (LOC: JPMorgan Chase Bank, N.A.), 1.58%, 9/1/37(1) | | | 1,550 | | | | 1,550,000 | |
Massachusetts Development Finance Agency, (Dexter Southfield), 5.00%, 5/1/33 | | | 1,550 | | | | 1,716,098 | |
Massachusetts Development Finance Agency, (Dexter Southfield), 5.00%, 5/1/35 | | | 1,660 | | | | 1,829,088 | |
Massachusetts Development Finance Agency, (Harvard University), 5.00%, 7/15/34 | | | 2,570 | | | | 3,031,084 | |
Massachusetts Development Finance Agency, (Milton Academy), 5.00%, 9/1/35 | | | 1,100 | | | | 1,176,747 | |
Massachusetts Development Finance Agency, (Northeastern University), 5.00%, 3/1/33 | | | 1,950 | | | | 2,170,935 | |
Massachusetts Development Finance Agency, (Olin College), 5.00%, 11/1/38 | | | 1,750 | | | | 1,938,912 | |
Massachusetts Development Finance Agency, (Wentworth Institute of Technology), 5.00%, 10/1/36 | | | 1,575 | | | | 1,741,210 | |
Massachusetts Health and Educational Facilities Authority, (Boston College), 5.50%, 6/1/27 | | | 2,925 | | | | 3,647,533 | |
Massachusetts Health and Educational Facilities Authority, (Massachusetts Institute of Technology), 5.50%, 7/1/32 | | | 5,000 | | | | 6,618,250 | |
| | | | $ | 32,257,657 | |
| | |
| Escrowed / Prerefunded — 5.0% | | | | | | |
Massachusetts Development Finance Agency, (Tufts Medical Center), Prerefunded to 1/1/21, 7.25%, 1/1/32 | | $ | 1,140 | | | $ | 1,298,676 | |
Massachusetts Development Finance Agency, (UMass Memorial), Prerefunded to 7/1/21, 5.50%, 7/1/31 | | | 1,040 | | | | 1,157,229 | |
Massachusetts Health and Educational Facilities Authority, (Isabella Stewart Gardner Museum), Prerefunded to 5/1/19, 5.00%, 5/1/22 | | | 1,590 | | | | 1,647,001 | |
| | | | | | | | |
| Security | | Principal Amount
(000’s omitted) | | | Value | |
| | |
| Escrowed / Prerefunded (continued) | | | | | | |
Massachusetts Health and Educational Facilities Authority, (Isabella Stewart Gardner Museum), Prerefunded to 5/1/19, 5.00%, 5/1/23 | | $ | 1,195 | | | $ | 1,237,841 | |
Massachusetts Health and Educational Facilities Authority, (Isabella Stewart Gardner Museum), Prerefunded to 5/1/19, 5.00%, 5/1/25 | | | 1,580 | | | | 1,636,643 | |
Massachusetts Turnpike Authority, Escrowed to Maturity, 5.00%, 1/1/20 | | | 480 | | | | 497,242 | |
| | | | $ | 7,474,632 | |
| | |
| General Obligations — 18.8% | | | | | | |
Brookline, 5.00%, 3/15/25 | | $ | 1,740 | | | $ | 2,056,071 | |
Cambridge, 5.00%, 2/15/27 | | | 2,000 | | | | 2,429,060 | |
Cambridge, 5.00%, 2/15/28 | | | 2,000 | | | | 2,460,300 | |
Danvers, 5.25%, 7/1/36 | | | 2,800 | | | | 3,083,472 | |
Lexington, 4.00%, 2/1/23 | | | 970 | | | | 1,056,505 | |
Massachusetts, 5.00%, 3/1/31 | | | 4,000 | | | | 4,550,960 | |
Massachusetts, (SPA: Barclays Bank PLC), 1.61%, 3/1/26(1) | | | 1,190 | | | | 1,190,000 | |
Plymouth, 5.00%, 5/1/26 | | | 710 | | | | 774,376 | |
Plymouth, 5.00%, 5/1/28 | | | 1,160 | | | | 1,264,446 | |
Plymouth, 5.00%, 5/1/31 | | | 1,090 | | | | 1,185,418 | |
Plymouth, 5.00%, 5/1/32 | | | 1,000 | | | | 1,086,910 | |
Swampscott, 5.00%, 1/15/25 | | | 310 | | | | 361,857 | |
Swampscott, 5.00%, 1/15/26 | | | 355 | | | | 420,160 | |
Wayland, 5.00%, 2/1/33 | | | 1,790 | | | | 1,930,211 | |
Wayland, 5.00%, 2/1/36 | | | 2,680 | | | | 2,889,147 | |
Wellesley, 4.00%, 6/1/24 | | | 465 | | | | 513,816 | |
Winchester, 5.00%, 4/15/36 | | | 775 | | | | 839,759 | |
| | | | $ | 28,092,468 | |
| | |
| Hospital — 12.9% | | | | | | |
Massachusetts Development Finance Agency, (Berkshire Health Systems), 5.00%, 10/1/27 | | $ | 1,100 | | | $ | 1,197,625 | |
Massachusetts Development Finance Agency, (Children’s Hospital), 5.00%, 10/1/31 | | | 1,840 | | | | 2,115,356 | |
Massachusetts Development Finance Agency, (Dana-Farber Cancer Institute), 5.00%, 12/1/41 | | | 2,750 | | | | 3,115,062 | |
Massachusetts Development Finance Agency, (Lahey Health System Obligated Group), 5.00%, 8/15/40 | | | 2,000 | | | | 2,224,800 | |
Massachusetts Development Finance Agency, (Partners HealthCare System), 5.00%, 7/1/37 | | | 1,600 | | | | 1,827,872 | |
Massachusetts Development Finance Agency, (South Shore Hospital), 5.00%, 7/1/41 | | | 2,795 | | | | 3,067,652 | |
Massachusetts Development Finance Agency, (Tufts Medical Center), 7.25%, 1/1/32 | | | 760 | | | | 862,722 | |
| | | | |
| | 15 | | See Notes to Financial Statements. |
Eaton Vance
Massachusetts Municipal Income Fund
March 31, 2018
Portfolio of Investments (Unaudited) — continued
| | | | | | | | |
| Security | | Principal Amount
(000’s omitted) | | | Value | |
| | |
| Hospital (continued) | | | | | | |
Massachusetts Development Finance Agency, (UMass Memorial), 5.50%, 7/1/31 | | $ | 55 | | | $ | 59,751 | |
Massachusetts Health and Educational Facilities Authority, (Baystate Medical Center, Inc.), Prerefunded to 7/1/19, 5.75%, 7/1/36 | | | 2,120 | | | | 2,223,880 | |
Massachusetts Health and Educational Facilities Authority, (Lowell General Hospital), 5.125%, 7/1/35 | | | 1,645 | | | | 1,734,916 | |
Massachusetts Health and Educational Facilities Authority, (Southcoast Health System), 5.00%, 7/1/29 | | | 750 | | | | 777,683 | |
| | | | $ | 19,207,319 | |
| | |
| Industrial Development Revenue — 1.5% | | | | | | |
Massachusetts Development Finance Agency, (Covanta Energy), (AMT),
4.875%, 11/1/27(2) | | $ | 2,200 | | | $ | 2,201,650 | |
| | | | $ | 2,201,650 | |
| | |
| Insured – Education — 4.6% | | | | | | |
Massachusetts Development Finance Agency, (College of the Holy Cross), (AMBAC), 5.25%, 9/1/32(3) | | $ | 5,460 | | | $ | 6,925,409 | |
| | | | $ | 6,925,409 | |
| | |
| Insured – Escrowed / Prerefunded — 1.0% | | | | | | |
Massachusetts Health and Educational Facilities Authority, (Cape Cod Healthcare), (AGC), Prerefunded to 11/15/19, 5.00%, 11/15/25 | | $ | 1,395 | | | $ | 1,468,307 | |
Massachusetts Turnpike Authority, (NPFG), Escrowed to Maturity, 5.00%, 1/1/20 | | | 65 | | | | 67,699 | |
| | | | $ | 1,536,006 | |
| | |
| Insured – Special Tax Revenue — 5.5% | | | | | | |
Martha’s Vineyard Land Bank, (BAM), 5.00%, 5/1/26 | | $ | 1,760 | | | $ | 2,036,883 | |
Massachusetts, Special Obligation, Dedicated Tax Revenue, (NPFG), 5.50%, 1/1/30 | | | 4,955 | | | | 6,195,633 | |
| | | | $ | 8,232,516 | |
| | |
| Insured – Student Loan — 0.5% | | | | | | |
Massachusetts Educational Financing Authority, (AGC), (AMT), 6.35%, 1/1/30 | | $ | 715 | | | $ | 720,313 | |
| | | | $ | 720,313 | |
| | |
| Insured – Transportation — 6.8% | | | | | | |
Massachusetts Port Authority, (Bosfuel Project), (NPFG), (AMT), 5.00%, 7/1/32 | | $ | 2,790 | | | $ | 2,795,496 | |
Massachusetts Turnpike Authority, Metropolitan Highway System, (NPFG), 0.00%, 1/1/22 | | | 8,000 | | | | 7,359,760 | |
| | | | $ | 10,155,256 | |
| | | | | | | | |
| Security | | Principal Amount
(000’s omitted) | | | Value | |
| | |
| Other Revenue — 0.6% | | | | | | |
Massachusetts Development Finance Agency, (WGBH Educational Foundation), 5.00%, 1/1/23 | | $ | 775 | | | $ | 865,931 | |
| | | | $ | 865,931 | |
| | |
| Senior Living / Life Care — 2.4% | | | | | | |
Massachusetts Development Finance Agency, (Carleton-Willard Village), 5.625%, 12/1/30 | | $ | 525 | | | $ | 552,389 | |
Massachusetts Development Finance Agency, (VOA Concord Assisted Living, Inc.), 5.125%, 11/1/27(2) | | | 615 | | | | 615,240 | |
Massachusetts Development Finance Agency, (VOA Concord Assisted Living, Inc.), 5.20%, 11/1/41(2) | | | 2,465 | | | | 2,465,148 | |
| | | | $ | 3,632,777 | |
| | |
| Special Tax Revenue — 4.4% | | | | | | |
Massachusetts, (Rail Enhancement and Accelerated Bridge Programs), 5.00%, 6/1/40 | | $ | 4,250 | | | $ | 4,950,400 | |
Massachusetts Bay Transportation Authority, Sales Tax Revenue, 5.25%, 7/1/31 | | | 1,240 | | | | 1,564,768 | |
| | | | $ | 6,515,168 | |
| | |
| Transportation — 5.8% | | | | | | |
Massachusetts, (Accelerated Bridge Program), 5.00%, 6/15/27 | | $ | 2,000 | | | $ | 2,310,300 | |
Massachusetts Port Authority, 5.00%, 7/1/28 | | | 3,750 | | | | 4,011,863 | |
Massachusetts Port Authority, (AMT), 5.00%, 7/1/34 | | | 2,110 | | | | 2,420,866 | |
| | | | $ | 8,743,029 | |
| |
Total Tax-Exempt Investments — 99.0%
(identified cost $138,310,415) | | | $ | 147,890,424 | |
| | |
Other Assets, Less Liabilities — 1.0% | | | | | | $ | 1,508,216 | |
| | |
Net Assets — 100.0% | | | | | | $ | 149,398,640 | |
The percentage shown for each investment category in the Portfolio of Investments is based on net assets.
The Fund invests primarily in debt securities issued by Massachusetts municipalities. The ability of the issuers of the debt securities to meet their obligations may be affected by economic developments in a specific industry or municipality. In order to reduce the risk associated with such economic developments, at March 31, 2018, 18.6% of total investments are backed by bond insurance of various financial institutions and financial guaranty assurance agencies. The aggregate percentage insured by an individual financial institution or financial guaranty assurance agency ranged from 1.4% to 11.1% of total investments.
| | | | |
| | 16 | | See Notes to Financial Statements. |
Eaton Vance
Massachusetts Municipal Income Fund
March 31, 2018
Portfolio of Investments (Unaudited) — continued
| (1) | Variable rate demand obligation that may be tendered at par on any day for payment the same or next business day. The stated interest rate, which generally resets daily, is determined by the remarketing agent and represents the rate in effect at March 31, 2018. |
| (2) | Security exempt from registration pursuant to Rule 144A under the Securities Act of 1933, as amended. These securities may be sold in certain transactions in reliance on an exemption from registration (normally to qualified institutional buyers). At March 31, 2018, the aggregate value of these securities is $5,282,038 or 3.5% of the Fund’s net assets. |
| (3) | Security represents the municipal bond held by a trust that issues residual interest bonds (see Note 1H). |
| | | | | | | | | | | | | | | | | | | | |
| Futures Contracts | |
| | | | | |
| Description | | Number of
Contracts | | | Position | | | Expiration
Month/Year | | | Notional
Amount | | | Value/Net
Unrealized
Depreciation | |
| | | | | |
Interest Rate Futures | | | | | | | | | | | | | | | | | | | | |
| U.S. Long Treasury Bond | | | 50 | | | | Short | | | | Jun-18 | | | $ | (7,331,250 | ) | | $ | (152,035 | ) |
| |
| | | | $ | (152,035 | ) |
Abbreviations:
| | | | |
| AGC | | – | | Assured Guaranty Corp. |
| AMBAC | | – | | AMBAC Financial Group, Inc. |
| AMT | | – | | Interest earned from these securities may be considered a tax preference item for purposes of the Federal Alternative Minimum Tax. |
| BAM | | – | | Build America Mutual Assurance Co. |
| LOC | | – | | Letter of Credit |
| NPFG | | – | | National Public Finance Guaranty Corp. |
| SPA | | – | | Standby Bond Purchase Agreement |
| | | | |
| | 17 | | See Notes to Financial Statements. |
Eaton Vance
New York Municipal Income Fund
March 31, 2018
Portfolio of Investments (Unaudited)
| | | | | | | | |
| Tax-Exempt Investments — 101.3% | |
| Security | | Principal
Amount
(000’s omitted) | | | Value | |
|
| Bond Bank — 4.2% | |
New York State Environmental Facilities Corp., 5.00%, 10/15/39 | | $ | 5,910 | | | $ | 6,262,708 | |
New York State Environmental Facilities Corp., Green Bonds, 4.00%, 8/15/34 | | | 1,500 | | | | 1,610,220 | |
New York State Environmental Facilities Corp., Green Bonds, 5.00%, 8/15/38 | | | 1,000 | | | | 1,170,240 | |
New York State Environmental Facilities Corp., (New York City Municipal Water Finance Authority), 5.00%, 6/15/37(1) | | | 8,400 | | | | 8,451,744 | |
| | | | | | | $ | 17,494,912 | |
|
| Cogeneration — 1.3% | |
New York City Industrial Development Agency, (Brooklyn Navy Yard Cogeneration Partners, L.P.), (AMT), 5.65%, 10/1/28 | | $ | 2,850 | | | $ | 2,849,801 | |
Suffolk County Industrial Development Agency, (Nissequogue Cogeneration Partners Facility), (AMT), 5.50%, 1/1/23 | | | 2,580 | | | | 2,581,006 | |
| | | | | | | $ | 5,430,807 | |
|
| Education — 12.5% | |
Albany Capital Resource Corp., (Albany College of Pharmacy and Health Sciences), 5.00%, 12/1/30 | | $ | 250 | | | $ | 276,477 | |
Build NYC Resource Corp., (Ethical Culture Fieldston School), 5.00%, 6/1/32 | | | 525 | | | | 586,808 | |
Build NYC Resource Corp., (Ethical Culture Fieldston School), 5.00%, 6/1/33 | | | 495 | | | | 551,262 | |
Dutchess County Local Development Corp., (Culinary Institute of America), 5.00%, 7/1/18 | | | 690 | | | | 695,299 | |
Dutchess County Local Development Corp., (Culinary Institute of America), 5.00%, 7/1/29 | | | 150 | | | | 170,471 | |
Dutchess County Local Development Corp., (Culinary Institute of America), 5.00%, 7/1/30 | | | 185 | | | | 209,527 | |
Dutchess County Local Development Corp., (Culinary Institute of America), 5.00%, 7/1/31 | | | 180 | | | | 203,029 | |
Dutchess County Local Development Corp., (Culinary Institute of America), 5.00%, 7/1/32 | | | 200 | | | | 224,818 | |
Geneva Development Corp., (Hobart and William Smith Colleges), Series 2012, 5.00%, 9/1/32 | | | 1,450 | | | | 1,599,205 | |
Monroe County Industrial Development Corp., (Nazareth College of Rochester), 5.00%, 10/1/31 | | | 235 | | | | 265,292 | |
Monroe County Industrial Development Corp., (Nazareth College of Rochester), 5.00%, 10/1/32 | | | 260 | | | | 292,391 | |
Monroe County Industrial Development Corp., (University of Rochester), Series 2017C, 4.00%, 7/1/43 | | | 2,945 | | | | 3,053,229 | |
Monroe County Industrial Development Corp., (University of Rochester), Series 2017D, 4.00%, 7/1/43 | | | 1,650 | | | | 1,710,637 | |
New York City Cultural Resources Trust, (The Juilliard School), 5.00%, 1/1/34 | | | 5,725 | | | | 5,855,816 | |
| | | | | | | | |
| Security | | Principal
Amount
(000’s omitted) | | | Value | |
|
| Education (continued) | |
New York Dormitory Authority, (Brooklyn Law School), 5.75%, 7/1/33 | | $ | 1,650 | | | $ | 1,714,399 | |
New York Dormitory Authority, (City University), 6.00%, 7/1/20 | | | 5,000 | | | | 5,354,500 | |
New York Dormitory Authority, (Cornell University), 5.00%, 7/1/34(1) | | | 10,000 | | | | 10,399,300 | |
New York Dormitory Authority, (Cornell University), 5.00%, 7/1/39 | | | 2,500 | | | | 2,596,675 | |
New York Dormitory Authority, (Culinary Institute of America), 5.50%, 7/1/33 | | | 350 | | | | 396,508 | |
New York Dormitory Authority, (Fordham University), 5.00%, 7/1/32 | | | 500 | | | | 575,395 | |
New York Dormitory Authority, (Fordham University), 5.00%, 7/1/33 | | | 650 | | | | 742,768 | |
New York Dormitory Authority, (Skidmore College), 5.25%, 7/1/31 | | | 250 | | | | 274,648 | |
New York Dormitory Authority, (State University), 5.50%, 5/15/19 | | | 2,000 | | | | 2,032,460 | |
New York Dormitory Authority, (The New School), Prerefunded to 7/1/20, 5.50%, 7/1/40 | | | 5,500 | | | | 5,956,940 | |
Onondaga Civic Development Corp., (Le Moyne College), 5.20%, 7/1/29 | | | 970 | | | | 1,028,307 | |
Onondaga Civic Development Corp., (Le Moyne College), 5.375%, 7/1/40 | | | 2,515 | | | | 2,653,124 | |
Onondaga County Cultural Resources Trust, (Syracuse University), 5.00%, 12/1/33 | | | 1,775 | | | | 2,009,832 | |
Tompkins County Development Corp., (Ithaca College), 5.00%, 7/1/32 | | | 300 | | | | 351,741 | |
Tompkins County Development Corp., (Ithaca College), 5.00%, 7/1/34 | | | 70 | | | | 81,429 | |
| | | | | | | $ | 51,862,287 | |
|
| Electric Utilities — 2.1% | |
New York Power Authority, 5.00%, 11/15/31 | | $ | 1,000 | | | $ | 1,104,150 | |
Utility Debt Securitization Authority, 5.00%, 12/15/33 | | | 2,895 | | | | 3,277,169 | |
Utility Debt Securitization Authority, 5.00%, 12/15/34 | | | 1,465 | | | | 1,655,904 | |
Utility Debt Securitization Authority, 5.00%, 12/15/38 | | | 615 | | | | 721,223 | |
Utility Debt Securitization Authority, 5.00%, 12/15/39 | | | 1,740 | | | | 2,038,914 | |
| | | | | | | $ | 8,797,360 | |
|
| Escrowed / Prerefunded — 2.9% | |
Brooklyn Arena Local Development Corp., (Barclays Center), Prerefunded to 1/15/20, 6.25%, 7/15/40 | | $ | 1,260 | | | $ | 1,360,712 | |
Metropolitan Transportation Authority, Prerefunded to 11/15/21, 5.00%, 11/15/27 | | | 940 | | | | 1,044,848 | |
New York City, Prerefunded to 4/1/19, 5.30%, 4/1/27 | | | 85 | | | | 88,047 | |
New York City, Prerefunded to 4/1/19, 5.375%, 4/1/36 | | | 4,810 | | | | 4,985,998 | |
| | | | |
| | 18 | | See Notes to Financial Statements. |
Eaton Vance
New York Municipal Income Fund
March 31, 2018
Portfolio of Investments (Unaudited) — continued
| | | | | | | | |
| Security | | Principal
Amount
(000’s omitted) | | | Value | |
|
| Escrowed / Prerefunded (continued) | |
Saratoga County, Prerefunded to 7/15/18, 4.75%, 7/15/37 | | $ | 1,000 | | | $ | 1,009,270 | |
Triborough Bridge and Tunnel Authority, Prerefunded to 11/15/18,
5.25%, 11/15/34(1) | | | 3,370 | | | | 3,447,442 | |
| | | | | | | $ | 11,936,317 | |
|
| General Obligations — 9.8% | |
Bronxville Union Free School District, 5.00%, 9/1/26 | | $ | 515 | | | $ | 624,288 | |
Bronxville Union Free School District, 5.00%, 9/1/27 | | | 530 | | | | 650,464 | |
Islip, 4.00%, 10/15/24 | | | 1,000 | | | | 1,117,370 | |
Nassau County, 5.00%, 10/1/30 | | | 2,000 | | | | 2,335,560 | |
Nassau County, 5.00%, 10/1/37 | | | 990 | | | | 1,128,818 | |
New York City, 4.00%, 8/1/32 | | | 1,840 | | | | 1,956,490 | |
New York City, 4.00%, 8/1/34 | | | 5,670 | | | | 6,020,179 | |
New York City, 4.00%, 10/1/40 | | | 1,900 | | | | 1,976,171 | |
New York City, 5.00%, 8/1/28 | | | 4,400 | | | | 5,136,648 | |
New York City, 5.00%, 8/1/32 | | | 905 | | | | 1,028,677 | |
New York City, 5.00%, 8/1/37 | | | 550 | | | | 628,760 | |
New York City, 5.25%, 3/1/35 | | | 4,000 | | | | 4,793,120 | |
New York City, 5.30%, 4/1/27 | | | 10 | | | | 10,359 | |
New York City, 5.375%, 4/1/36 | | | 190 | | | | 196,779 | |
New York City, 6.25%, 10/15/28 | | | 170 | | | | 174,310 | |
Rochester, 4.00%, 2/15/28 | | | 510 | | | | 566,238 | |
Southampton Union Free School District, 4.00%, 6/1/24 | | | 1,480 | | | | 1,648,024 | |
Southampton Union Free School District, 4.00%, 6/1/25 | | | 1,540 | | | | 1,731,391 | |
Southampton Union Free School District, 4.00%, 6/1/26 | | | 1,605 | | | | 1,819,701 | |
Westchester County, 4.00%, 7/1/29 | | | 3,445 | | | | 3,887,269 | |
Westchester County, 4.00%, 7/1/33 | | | 1,545 | | | | 1,705,634 | |
Westchester County, 4.00%, 7/1/34 | | | 1,440 | | | | 1,584,763 | |
| | | | | | | $ | 40,721,013 | |
|
| Hospital — 5.1% | |
Dutchess County Local Development Corp., (Health Quest Systems, Inc.), 5.00%, 7/1/35 | | $ | 1,250 | | | $ | 1,413,787 | |
Dutchess County Local Development Corp., (Health Quest Systems, Inc.), 5.75%, 7/1/30 | | | 370 | | | | 404,484 | |
Dutchess County Local Development Corp., (Health Quest Systems, Inc.), 5.75%, 7/1/40 | | | 2,435 | | | | 2,650,059 | |
Jefferson County Civic Facility Development Corp., (Samaritan Medical Center), 5.00%, 11/1/37 | | | 1,140 | | | | 1,255,676 | |
New York Dormitory Authority, (Mount Sinai Hospital), 5.00%, 7/1/26 | | | 2,500 | | | | 2,667,725 | |
New York Dormitory Authority, (North Shore-Long Island Jewish Obligated Group), 5.00%, 5/1/33 | | | 1,500 | | | | 1,695,090 | |
New York Dormitory Authority, (NYU Hospitals Center), 5.00%, 7/1/30 | | | 3,480 | | | | 3,958,396 | |
| | | | | | | | |
| Security | | Principal
Amount
(000’s omitted) | | | Value | |
|
| Hospital (continued) | |
New York Dormitory Authority, (Orange Regional Medical Center), 5.00%, 12/1/30(2) | | $ | 4,500 | | | $ | 4,969,215 | |
Suffolk County Economic Development Corp., (Catholic Health Services of Long Island Obligated Group), 5.00%, 7/1/28 | | | 2,190 | | | | 2,375,186 | |
| | | | | | | $ | 21,389,618 | |
|
| Housing — 2.3% | |
Albany Capital Resource Corp., (Empire Commons Student Housing, Inc.), 5.00%, 5/1/27 | | $ | 550 | | | $ | 634,772 | |
Albany Capital Resource Corp., (Empire Commons Student Housing, Inc.), 5.00%, 5/1/28 | | | 300 | | | | 345,306 | |
Albany Capital Resource Corp., (Empire Commons Student Housing, Inc.), 5.00%, 5/1/29 | | | 785 | | | | 900,505 | |
Albany Capital Resource Corp., (Empire Commons Student Housing, Inc.), 5.00%, 5/1/30 | | | 635 | | | | 724,999 | |
Albany Capital Resource Corp., (Empire Commons Student Housing, Inc.), 5.00%, 5/1/31 | | | 450 | | | | 511,704 | |
Albany Capital Resource Corp., (Empire Commons Student Housing, Inc.), 5.00%, 5/1/32 | | | 1,095 | | | | 1,240,131 | |
New York Housing Finance Agency, 5.25%, 11/1/41 | | | 2,000 | | | | 2,061,120 | |
New York Mortgage Agency, 3.65%, 4/1/32 | | | 1,000 | | | | 1,033,240 | |
Westchester County Local Development Corp., (Purchase Housing Corp. II), 5.00%, 6/1/27 | | | 235 | | | | 272,802 | |
Westchester County Local Development Corp., (Purchase Housing Corp. II), 5.00%, 6/1/28 | | | 200 | | | | 231,478 | |
Westchester County Local Development Corp., (Purchase Housing Corp. II), 5.00%, 6/1/29 | | | 200 | | | | 230,958 | |
Westchester County Local Development Corp., (Purchase Housing Corp. II), 5.00%, 6/1/42 | | | 1,250 | | | | 1,403,112 | |
| | | | | | | $ | 9,590,127 | |
|
| Industrial Development Revenue — 3.0% | |
New York Energy Research and Development Authority, (New York Electric and Gas Corp.), 2.00% to 5/1/20 (Put Date), 6/1/29 | | $ | 6,000 | | | $ | 5,990,220 | |
New York State Environmental Facilities Corp., (Casella Waste Systems, Inc.), (AMT), 3.75% to 12/2/19 (Put Date), 12/1/44(2) | | | 4,020 | | | | 4,012,764 | |
Niagara Area Development Corp., (Covanta Energy), 4.00%, 11/1/24(2) | | | 2,580 | | | | 2,581,342 | |
| | | | | | | $ | 12,584,326 | |
|
| Insured – Education — 2.0% | |
New York Dormitory Authority, (City University), (AMBAC), 5.50%, 7/1/35 | | $ | 6,600 | | | $ | 8,247,030 | |
| | | | | | | $ | 8,247,030 | |
| | | | |
| | 19 | | See Notes to Financial Statements. |
Eaton Vance
New York Municipal Income Fund
March 31, 2018
Portfolio of Investments (Unaudited) — continued
| | | | | | | | |
| Security | | Principal
Amount
(000’s omitted) | | | Value | |
|
| Insured – Escrowed / Prerefunded — 3.8% | |
Brentwood Union Free School District, (AGC), Prerefunded to 11/15/19, 4.75%, 11/15/21 | | $ | 1,875 | | | $ | 1,967,925 | |
Brentwood Union Free School District, (AGC), Prerefunded to 11/15/19, 4.75%, 11/15/22 | | | 2,700 | | | | 2,833,812 | |
New York Dormitory Authority, (Memorial Sloan Kettering Cancer Center), (NPFG), Escrowed to Maturity, 0.00%, 7/1/30 | | | 14,980 | | | | 11,024,082 | |
| | | | | | | $ | 15,825,819 | |
|
| Insured – General Obligations — 1.5% | |
Monroe County, (AGM), 5.00%, 6/1/23 | | $ | 945 | | | $ | 1,067,000 | |
Oyster Bay, (AGM), 4.00%, 8/1/28 | | | 3,295 | | | | 3,471,513 | |
Suffolk County, (AGM), 5.00%, 10/15/26 | | | 1,600 | | | | 1,874,800 | |
| | | | | | | $ | 6,413,313 | |
|
| Insured – Other Revenue — 0.3% | |
New York City Industrial Development Agency, (Yankee Stadium), (AGC), 0.00%, 3/1/31 | | $ | 1,690 | | | $ | 1,096,337 | |
| | | | | | | $ | 1,096,337 | |
|
| Insured – Transportation — 0.2% | |
New York Transportation Development Corp., (LaGuardia Airport Terminal B Redevelopment), (AGM), (AMT), 4.00%, 7/1/41 | | $ | 920 | | | $ | 945,567 | |
| | | | | | | $ | 945,567 | |
|
| Lease Revenue / Certificates of Participation — 2.3% | |
Hudson Yards Infrastructure Corp., 5.00%, 2/15/35 | | $ | 1,225 | | | $ | 1,412,400 | |
Hudson Yards Infrastructure Corp., 5.00%, 2/15/38 | | | 3,000 | | | | 3,433,830 | |
New York State Urban Development Corp., 5.70%, 4/1/20 | | | 4,745 | | | | 4,930,577 | |
| | | | | | | $ | 9,776,807 | |
|
| Other Revenue — 7.1% | |
Brooklyn Arena Local Development Corp., (Barclays Center), 0.00%, 7/15/31 | | $ | 6,000 | | | $ | 3,667,620 | |
Brooklyn Arena Local Development Corp., (Barclays Center), 5.00%, 7/15/28 | | | 1,500 | | | | 1,730,070 | |
New York City Transitional Finance Authority, (Building Aid), 4.00%, 7/15/36 | | | 4,355 | | | | 4,586,207 | |
New York City Transitional Finance Authority, (Building Aid), 4.00%, 7/15/37 | | | 1,000 | | | | 1,049,890 | |
New York City Transitional Finance Authority, (Building Aid), 4.00%, 7/15/39 | | | 200 | | | | 208,918 | |
New York City Transitional Finance Authority, (Building Aid), 5.00%, 7/15/30 | | | 1,125 | | | | 1,283,614 | |
| | | | | | | | |
| Security | | Principal
Amount
(000’s omitted) | | | Value | |
|
| Other Revenue (continued) | |
New York City Transitional Finance Authority, (Building Aid), 5.00%, 7/15/37 | | $ | 1,025 | | | $ | 1,198,266 | |
New York City Transitional Finance Authority, (Building Aid), 5.00%, 7/15/43 | | | 3,500 | | | | 3,948,840 | |
New York City Transitional Finance Authority, (Building Aid), 5.25%, 1/15/39 | | | 1,000 | | | | 1,027,480 | |
New York City Transitional Finance Authority, (Building Aid), 6.00%, 7/15/33 | | | 1,960 | | | | 1,984,715 | |
New York City Trust for Cultural Resources, (Alvin Ailey Dance Foundation), 4.00%, 7/1/24 | | | 445 | | | | 481,481 | |
New York City Trust for Cultural Resources, (Alvin Ailey Dance Foundation), 4.00%, 7/1/25 | | | 455 | | | | 493,980 | |
New York City Trust for Cultural Resources, (Alvin Ailey Dance Foundation), 4.00%, 7/1/26 | | | 590 | | | | 642,687 | |
New York City Trust for Cultural Resources, (Alvin Ailey Dance Foundation), 4.00%, 7/1/34 | | | 750 | | | | 780,990 | |
New York City Trust for Cultural Resources, (Alvin Ailey Dance Foundation), 5.00%, 7/1/30 | | | 715 | | | | 821,542 | |
New York Liberty Development Corp., (7 World Trade Center), 5.00%, 9/15/32 | | | 5,000 | | | | 5,530,800 | |
| | | | | | | $ | 29,437,100 | |
|
| Senior Living / Life Care — 2.7% | |
Brookhaven Local Development Corp., (Jefferson’s Ferry), 5.25%, 11/1/30 | | $ | 650 | | | $ | 752,947 | |
Brookhaven Local Development Corp., (Jefferson’s Ferry), 5.25%, 11/1/31 | | | 650 | | | | 749,248 | |
Buffalo and Erie County Industrial Land Development Corp., (Orchard Park CCRC, Inc.), 5.00%, 11/15/37 | | | 4,500 | | | | 4,888,125 | |
New York Dormitory Authority, (Miriam Osborn Memorial Home Association), 5.00%, 7/1/29 | | | 720 | | | | 743,782 | |
New York Dormitory Authority, (Miriam Osborn Memorial Home Association), 5.00%, 7/1/42 | | | 305 | | | | 314,122 | |
Suffolk County Economic Development Corp., (Peconic Landing at Southold, Inc.), 6.00%, 12/1/40 | | | 2,395 | | | | 2,588,181 | |
Tompkins County Development Corp., (Kendal at Ithaca), 5.00%, 7/1/34 | | | 100 | | | | 108,285 | |
Westchester County Local Development Corp., (Kendal on Hudson), 5.00%, 1/1/34 | | | 1,000 | | | | 1,078,150 | |
| | | | | | | $ | 11,222,840 | |
|
| Special Tax Revenue — 21.9% | |
Metropolitan Transportation Authority, Dedicated Tax Revenue, Green Bonds, 5.00%, 11/15/33 | | $ | 2,500 | | | $ | 2,940,050 | |
Metropolitan Transportation Authority, Dedicated Tax Revenue, Green Bonds, 5.00%, 11/15/35 | | | 5,250 | | | | 6,095,565 | |
Metropolitan Transportation Authority, Dedicated Tax Revenue, Green Bonds, 5.25%, 11/15/33 | | | 2,500 | | | | 3,017,850 | |
| | | | |
| | 20 | | See Notes to Financial Statements. |
Eaton Vance
New York Municipal Income Fund
March 31, 2018
Portfolio of Investments (Unaudited) — continued
| | | | | | | | |
| Security | | Principal
Amount
(000’s omitted) | | | Value | |
|
| Special Tax Revenue (continued) | |
New York City Transitional Finance Authority, Future Tax Revenue, 4.00%, 8/1/37 | | $ | 4,455 | | | $ | 4,647,278 | |
New York City Transitional Finance Authority, Future Tax Revenue, 4.00%, 8/1/41 | | | 1,500 | | | | 1,553,715 | |
New York City Transitional Finance Authority, Future Tax Revenue, 5.00%, 5/1/36 | | | 1,605 | | | | 1,659,907 | |
New York City Transitional Finance Authority, Future Tax Revenue, 5.00%, 5/1/39 | | | 2,160 | | | | 2,488,039 | |
New York City Transitional Finance Authority, Future Tax Revenue, 5.00%, 8/1/39 | | | 1,500 | | | | 1,694,730 | |
New York City Transitional Finance Authority, Future Tax Revenue, 5.00%, 11/1/39 | | | 5,000 | | | | 5,348,900 | |
New York City Transitional Finance Authority, Future Tax Revenue, 5.00%, 2/1/41 | | | 1,750 | | | | 1,957,690 | |
New York Convention Center Development Corp., Hotel Unit Fee, 0.00%, 11/15/28 | | | 1,565 | | | | 1,116,048 | |
New York Dormitory Authority, Personal Income Tax Revenue, 5.00%, 2/15/28 | | | 2,500 | | | | 2,954,650 | |
New York Dormitory Authority, Personal Income Tax Revenue, 5.00%, 2/15/29 | | | 210 | | | | 238,600 | |
New York Dormitory Authority, Personal Income Tax Revenue, 5.00%, 2/15/41 | | | 3,505 | | | | 4,039,583 | |
New York Dormitory Authority, Personal Income Tax Revenue, 5.00%, 2/15/43 | | | 4,980 | | | | 5,470,281 | |
New York Dormitory Authority, Personal Income Tax Revenue, Prerefunded to 3/15/19, 5.25%, 3/15/38 | | | 5,500 | | | | 5,691,675 | |
New York Dormitory Authority, Personal Income Tax Revenue, Series 2011A, 5.00%, 3/15/33 | | | 725 | | | | 785,480 | |
New York Dormitory Authority, Personal Income Tax Revenue, Series 2015A, 5.00%, 3/15/33 | | | 3,335 | | | | 3,788,660 | |
New York Dormitory Authority, Personal Income Tax Revenue, Series 2016A, 5.00%, 2/15/43 | | | 5,000 | | | | 5,695,200 | |
New York Dormitory Authority, Sales Tax Revenue, 5.00%, 3/15/29 | | | 5,000 | | | | 5,695,950 | |
New York Dormitory Authority, Sales Tax Revenue, 5.00%, 3/15/34 | | | 4,600 | | | | 5,194,090 | |
New York Dormitory Authority, Sales Tax Revenue, 5.00%, 3/15/35 | | | 4,600 | | | | 5,279,512 | |
New York Dormitory Authority, Sales Tax Revenue, 5.00%, 3/15/36 | | | 2,000 | | | | 2,312,740 | |
Sales Tax Asset Receivables Corp., 5.00%, 10/15/27 | | | 5,000 | | | | 5,804,700 | |
Sales Tax Asset Receivables Corp., 5.00%, 10/15/28 | | | 5,000 | | | | 5,788,250 | |
| | | | | | | $ | 91,259,143 | |
|
| Transportation — 12.5% | |
Buffalo and Fort Erie Public Bridge Authority, 5.00%, 1/1/37 | | $ | 875 | | | $ | 996,415 | |
Metropolitan Transportation Authority, 5.00%, 11/15/27 | | | 1,990 | | | | 2,195,786 | |
Metropolitan Transportation Authority, 5.00%, 11/15/35 | | | 4,035 | | | | 4,587,835 | |
| | | | | | | | |
| Security | | Principal
Amount
(000’s omitted) | | | Value | |
|
| Transportation (continued) | |
Metropolitan Transportation Authority, Green Bonds, 0.00%, 11/15/32 | | $ | 595 | | | $ | 360,374 | |
Metropolitan Transportation Authority, Green Bonds, 0.00%, 11/15/33 | | | 5,000 | | | | 2,899,450 | |
Metropolitan Transportation Authority, Green Bonds, 4.00%, 11/15/32 | | | 2,750 | | | | 2,926,522 | |
Metropolitan Transportation Authority, Green Bonds, 4.00%, 11/15/35 | | | 2,520 | | | | 2,637,432 | |
Metropolitan Transportation Authority, Green Bonds, 5.00%, 11/15/26 | | | 2,000 | | | | 2,354,840 | |
Nassau County Bridge Authority, 5.00%, 10/1/40 | | | 1,915 | | | | 2,034,860 | |
New York Thruway Authority, 5.00%, 1/1/33 | | | 1,500 | | | | 1,753,170 | |
New York Thruway Authority, 5.00%, 1/1/42 | | | 1,000 | | | | 1,084,320 | |
New York Transportation Development Corp., (LaGuardia Airport Terminal B Redevelopment), (AMT), 5.00%, 7/1/41 | | | 3,100 | | | | 3,373,141 | |
Niagara Frontier Transportation Authority, (Buffalo Niagara International Airport), (AMT), 5.00%, 4/1/26 | | | 1,210 | | | | 1,358,806 | |
Port Authority of New York and New Jersey, 6.125%, 6/1/94 | | | 2,500 | | | | 3,004,900 | |
Triborough Bridge and Tunnel Authority, 5.00%, 11/15/31 | | | 2,145 | | | | 2,527,990 | |
Triborough Bridge and Tunnel Authority, 5.00%, 11/15/34 | | | 3,505 | | | | 4,093,910 | |
Triborough Bridge and Tunnel Authority, 5.00%, 11/15/36 | | | 2,175 | | | | 2,527,176 | |
Triborough Bridge and Tunnel Authority, 5.00%, 11/15/37 | | | 1,920 | | | | 2,225,914 | |
Triborough Bridge and Tunnel Authority, 5.00%, 11/15/38 | | | 1,160 | | | | 1,342,816 | |
Triborough Bridge and Tunnel Authority, 5.00%, 11/15/42 | | | 1,600 | | | | 1,843,888 | |
Triborough Bridge and Tunnel Authority, 5.25%, 11/15/34(1) | | | 5,630 | | | | 5,759,039 | |
| | | | | | | $ | 51,888,584 | |
|
| Water and Sewer — 3.8% | |
New York City Municipal Water Finance Authority, (Water and Sewer System), 4.00%, 6/15/37 | | $ | 3,600 | | | $ | 3,783,816 | |
New York City Municipal Water Finance Authority, (Water and Sewer System), 5.00%, 6/15/38 | | | 4,835 | | | | 5,602,991 | |
New York City Municipal Water Finance Authority, (Water and Sewer System), 5.25%, 6/15/40 | | | 1,000 | | | | 1,037,340 | |
New York City Municipal Water Finance Authority, (Water and Sewer System), 5.75%, 6/15/40(1) | | | 2,655 | | | | 2,676,267 | |
New York City Municipal Water Finance Authority, (Water and Sewer System), (SPA: TD Bank, N.A.),
1.70%, 6/15/49(3) | | | 2,500 | | | | 2,500,000 | |
| | | | | | | $ | 15,600,414 | |
| |
Total Tax-Exempt Investments — 101.3%
(identified cost $409,501,600) | | | $ | 421,519,721 | |
| | | | |
| | 21 | | See Notes to Financial Statements. |
Eaton Vance
New York Municipal Income Fund
March 31, 2018
Portfolio of Investments (Unaudited) — continued
| | | | | | | | |
| Miscellaneous — 0.3% | | | | | | | | |
| Security | | Units | | | Value | |
| | |
| Real Estate — 0.3% | | | | | | |
CMS Liquidating Trust(2)(4)(5) | | | 400 | | | $ | 1,146,071 | |
| |
Total Miscellaneous — 0.3%
(identified cost $1,280,000) | | | $ | 1,146,071 | |
| |
Total Investments — 101.6%
(identified cost $410,781,600) | | | $ | 422,665,792 | |
| |
Other Assets, Less Liabilities — (1.6)% | | | $ | (6,763,576 | ) |
| | |
Net Assets — 100.0% | | | | | | $ | 415,902,216 | |
The percentage shown for each investment category in the Portfolio of Investments is based on net assets.
The Fund invests primarily in debt securities issued by New York municipalities. The ability of the issuers of the debt securities to meet their
obligations may be affected by economic developments in a specific industry or municipality. In order to reduce the risk associated with such economic developments, at March 31, 2018, 7.7% of total investments are backed by bond insurance of various financial institutions and financial guaranty assurance agencies. The aggregate percentage insured by an individual financial institution or financial guaranty assurance agency ranged from 1.4% to 2.6% of total investments.
| (1) | Security represents the municipal bond held by a trust that issues residual interest bonds (see Note 1H). |
| (2) | Security exempt from registration pursuant to Rule 144A under the Securities Act of 1933, as amended. These securities may be sold in certain transactions in reliance on an exemption from registration (normally to qualified institutional buyers). At March 31, 2018, the aggregate value of these securities is $12,709,392 or 3.1% of the Fund’s net assets. |
| (3) | Variable rate demand obligation that may be tendered at par on any day for payment the same or next business day. The stated interest rate, which generally resets daily, is determined by the remarketing agent and represents the rate in effect at March 31, 2018. |
| (4) | Non-income producing. |
| (5) | For fair value measurement disclosure purposes, security is categorized as Level 3 (see Note 10). |
| | | | | | | | | | | | | | | | | | | | |
| Futures Contracts | |
| | | | | |
| Description | | Number of
Contracts | | | Position | | | Expiration
Month/Year | | | Notional
Amount | | | Value/Net
Unrealized
Depreciation | |
| | | | | |
Interest Rate Futures | | | | | | | | | | | | | | | | | | | | |
| U.S. Long Treasury Bond | | | 128 | | | | Short | | | | Jun-18 | | | $ | (18,768,000 | ) | | $ | (389,208 | ) |
| |
| | | | $ | (389,208 | ) |
Abbreviations:
| | | | |
| AGC | | – | | Assured Guaranty Corp. |
| AGM | | – | | Assured Guaranty Municipal Corp. |
| AMBAC | | – | | AMBAC Financial Group, Inc. |
| AMT | | – | | Interest earned from these securities may be considered a tax preference item for purposes of the Federal Alternative Minimum Tax. |
| NPFG | | – | | National Public Finance Guaranty Corp. |
| SPA | | – | | Standby Bond Purchase Agreement |
| | | | |
| | 22 | | See Notes to Financial Statements. |
Eaton Vance
Ohio Municipal Income Fund
March 31, 2018
Portfolio of Investments (Unaudited)
| | | | | | | | |
| Tax-Exempt Investments — 104.8% | |
| Security | | Principal Amount
(000’s omitted) | | | Value | |
|
| Bond Bank — 6.4% | |
Ohio Water Development Authority, 4.00%, 6/1/36 | | $ | 1,500 | | | $ | 1,580,025 | |
Ohio Water Development Authority, 5.00%, 12/1/35 | | | 2,000 | | | | 2,322,120 | |
Ohio Water Development Authority, Water Pollution Control Loan Fund, 1.58%, (SIFMA + 0.22%), 12/1/20(1) | | | 1,700 | | | | 1,699,966 | |
Ohio Water Development Authority, Water Pollution Control Loan Fund, (Water Quality), 5.25%, 6/1/20 | | | 1,000 | | | | 1,075,880 | |
Rickenbacker Port Authority, (OASBO Expanded Asset Pooled Financing Program), 5.375%, 1/1/32 | | | 3,105 | | | | 3,469,030 | |
| | | | | | | $ | 10,147,021 | |
|
| Education — 8.8% | |
Kent State University, 5.00%, 5/1/30 | | $ | 1,185 | | | $ | 1,374,138 | |
Ohio Higher Educational Facility Commission, (Case Western Reserve University), 5.00%, 12/1/26 | | | 350 | | | | 412,675 | |
Ohio Higher Educational Facility Commission, (Case Western Reserve University), 5.00%, 12/1/27 | | | 300 | | | | 349,434 | |
Ohio Higher Educational Facility Commission, (Case Western Reserve University), 5.00%, 12/1/40 | | | 1,000 | | | | 1,126,320 | |
Ohio Higher Educational Facility Commission, (Case Western Reserve University), 6.50%, 10/1/20 | | | 300 | | | | 318,552 | |
Ohio Higher Educational Facility Commission, (Denison University), 5.25%, 11/1/46 | | | 1,355 | | | | 1,579,266 | |
Ohio Higher Educational Facility Commission, (Oberlin College), 5.00%, 10/1/33 | | | 2,000 | | | | 2,220,480 | |
Ohio Higher Educational Facility Commission, (Oberlin College), 5.00%, 10/1/38 | | | 910 | | | | 1,005,932 | |
Ohio Higher Educational Facility Commission, (University of Dayton), 5.00%, 12/1/32 | | | 550 | | | | 616,253 | |
Ohio State University, 5.00%, 12/1/29 | | | 1,060 | | | | 1,298,892 | |
Ohio University, 5.00%, 12/1/35 | | | 500 | | | | 575,240 | |
University of Cincinnati, 5.00%, 6/1/34 | | | 585 | | | | 674,148 | |
University of Cincinnati, 5.00%, 6/1/45 | | | 2,000 | | | | 2,282,120 | |
| | | | | | | $ | 13,833,450 | |
|
| Electric Utilities — 2.4% | |
American Municipal Power, Inc., (Greenup Hydroelectric Facility), 5.00%, 2/15/41 | | $ | 1,000 | | | $ | 1,115,430 | |
American Municipal Power, Inc., (Meldahl Hydroelectric), 4.00%, 2/15/34 | | | 2,005 | | | | 2,062,223 | |
American Municipal Power, Inc., (Meldahl Hydroelectric), 5.00%, 2/15/33 | | | 595 | | | | 669,381 | |
| | | | | | | $ | 3,847,034 | |
| | | | | | | | |
| Security | | Principal Amount
(000’s omitted) | | | Value | |
|
| Escrowed / Prerefunded — 2.7% | |
Cleveland, Income Tax Revenue, (Bridges and Roadways Improvements), Prerefunded to 10/1/22, 5.00%, 10/1/32 | | $ | 1,000 | | | $ | 1,126,960 | |
Lakewood City School District, Prerefunded to 11/1/22, 5.00%, 11/1/36 | | | 1,330 | | | | 1,504,310 | |
Ohio Higher Educational Facility Commission, (Summa Health System), Prerefunded to 5/15/20, 5.75%, 11/15/40 | | | 1,495 | | | | 1,616,424 | |
Ohio State University, Escrowed to Maturity, 5.00%, 12/1/29 | | | 45 | | | | 56,110 | |
| | | | | | | $ | 4,303,804 | |
|
| General Obligations — 3.0% | |
Butler County, Special Tax Assessment, 5.50%, 12/1/28 | | $ | 1,000 | | | $ | 1,025,450 | |
Cuyahoga Community College District, 3.50%, 12/1/39 | | | 1,400 | | | | 1,391,530 | |
Northwest Local School District, 5.00%, 12/1/40 | | | 500 | | | | 559,700 | |
Ohio, 5.00%, 5/1/33 | | | 1,500 | | | | 1,758,945 | |
| | | | | | | $ | 4,735,625 | |
|
| Hospital — 16.9% | |
Akron, Bath and Copley Joint Township Hospital District, (Children’s Hospital Medical Center of Akron), 5.00%, 11/15/32 | | $ | 2,450 | | | $ | 2,642,300 | |
Akron, Bath and Copley Joint Township Hospital District, (Children’s Hospital Medical Center of Akron), 5.00%, 11/15/38 | | | 1,155 | | | | 1,275,894 | |
Allen County, (Mercy Health), 4.00%, 8/1/47(2) | | | 5,150 | | | | 5,216,692 | |
Bluffton, (Blanchard Valley Health System), 5.00%, 12/1/31 | | | 750 | | | | 854,708 | |
Butler County, (Kettering Health Network Obligated Group), 5.25%, 4/1/31 | | | 2,500 | | | | 2,682,200 | |
Butler County, (UC Health), 4.00%, 11/15/37 | | | 920 | | | | 936,910 | |
Butler County, (UC Health), 5.00%, 11/15/28 | | | 590 | | | | 683,645 | |
Franklin County, (Nationwide Children’s Hospital), 5.00%, 11/1/34 | | | 750 | | | | 866,475 | |
Franklin County, (Nationwide Children’s Hospital), Prerefunded to 11/1/19, 5.00%, 11/1/34 | | | 950 | | | | 999,504 | |
Franklin County, (OhioHealth Corp.), 5.00%, 5/15/40 | | | 1,200 | | | | 1,345,380 | |
Franklin County, (Trinity Health Credit Group), 5.00%, 12/1/47 | | | 1,470 | | | | 1,651,927 | |
Lucas County, (ProMedica Healthcare Obligated Group), 4.00%, 11/15/45 | | | 775 | | | | 786,168 | |
Montgomery County, (Catholic Health Initiatives), 5.50%, 5/1/34 | | | 650 | | | | 670,527 | |
Muskingum County, (Genesis HealthCare System Obligated Group), 5.00%, 2/15/33 | | | 460 | | | | 487,232 | |
Ohio, (Cleveland Clinic Health System), 4.00%, 1/1/43 | | | 2,210 | | | | 2,278,333 | |
Ohio Higher Educational Facility Commission, (Summa Health System), 5.75%, 11/15/40 | | | 870 | | | | 924,392 | |
Ohio Higher Educational Facility Commission, (University Hospitals Health System, Inc.), 5.00%, 1/15/27 | | | 1,500 | | | | 1,663,020 | |
| | | | |
| | 23 | | See Notes to Financial Statements. |
Eaton Vance
Ohio Municipal Income Fund
March 31, 2018
Portfolio of Investments (Unaudited) — continued
| | | | | | | | |
| Security | | Principal Amount
(000’s omitted) | | | Value | |
|
| Hospital (continued) | |
Ohio Higher Educational Facility Commission, (University Hospitals Health System, Inc.), 5.00%, 1/15/29 | | $ | 450 | | | $ | 498,267 | |
Southeastern Ohio Port Authority, (Memorial Health System Obligated Group), 5.00%, 12/1/24 | | | 215 | | | | 230,833 | |
| | | | | | | $ | 26,694,407 | |
|
| Industrial Development Revenue — 2.6% | |
Cleveland, (Continental Airlines), (AMT), 5.375%, 9/15/27 | | $ | 2,380 | | | $ | 2,386,926 | |
Ohio Air Quality Development Authority, (Pratt Paper, LLC), (AMT), 4.25%, 1/15/38(3) | | | 1,700 | | | | 1,708,024 | |
| | | | | | | $ | 4,094,950 | |
|
| Insured – Education — 0.1% | |
Kent State University, (AGC), 5.00%, 5/1/29 | | $ | 175 | | | $ | 180,910 | |
| | | | | | | $ | 180,910 | |
|
| Insured – Electric Utilities — 7.7% | |
Cleveland, Public Power System Revenue, (AGM), 5.00%, 11/15/24 | | $ | 1,500 | | | $ | 1,720,440 | |
Cleveland, Public Power System Revenue, (NPFG), 0.00%, 11/15/27 | | | 2,540 | | | | 1,841,881 | |
Ohio Municipal Electric Generation Agency, (NPFG), 0.00%, 2/15/26 | | | 3,000 | | | | 2,347,890 | |
Ohio Municipal Electric Generation Agency, (NPFG), 0.00%, 2/15/27 | | | 2,500 | | | | 1,881,725 | |
Ohio Municipal Electric Generation Agency, (NPFG), 0.00%, 2/15/28 | | | 4,750 | | | | 3,435,723 | |
Puerto Rico Electric Power Authority, (NPFG), 5.25%, 7/1/34 | | | 1,005 | | | | 964,237 | |
| | | | | | | $ | 12,191,896 | |
|
| Insured – Escrowed / Prerefunded — 6.5% | |
Lorain County, (Catholic Healthcare Partners), (AGM), Prerefunded to 5/8/18, 5.00%, 2/1/29 | | $ | 5,160 | | | $ | 5,177,183 | |
Lorain County, (Catholic Healthcare Partners), (AGM), Prerefunded to 5/8/18, 5.00%, 2/1/29(2) | | | 5,140 | | | | 5,157,116 | |
| | | | | | | $ | 10,334,299 | |
|
| Insured – General Obligations — 24.2% | |
Cincinnati City School District, (AGM), (FGIC), 5.25%, 12/1/29(2) | | $ | 7,500 | | | $ | 9,317,025 | |
Cleveland, (AMBAC), 5.50%, 10/1/23 | | | 2,105 | | | | 2,453,167 | |
Kettering City School District, (AGM), 5.25%, 12/1/31 | | | 6,705 | | | | 8,107,954 | |
Mason City School District, (AGM), 5.25%, 12/1/31 | | | 3,525 | | | | 4,376,464 | |
Springboro Community City School District, (AGM), 5.25%, 12/1/30 | | | 5,000 | | | | 6,072,100 | |
| | | | | | | | |
| Security | | Principal Amount
(000’s omitted) | | | Value | |
|
| Insured – General Obligations (continued) | |
Westerville City School District, (XLCA), 5.00%, 12/1/27 | | $ | 6,705 | | | $ | 8,010,799 | |
| | | | | | | $ | 38,337,509 | |
|
| Insured – Transportation — 8.9% | |
Cleveland, Airport System Revenue, (AGM), 5.00%, 1/1/30 | | $ | 1,170 | | | $ | 1,271,275 | |
Ohio, (Portsmouth Gateway Group, LLC), (AGM), (AMT), 5.00%, 12/31/35 | | | 1,500 | | | | 1,664,010 | |
Ohio Turnpike Commission, (NPFG), 5.50%, 2/15/24 | | | 5,000 | | | | 5,725,250 | |
Puerto Rico Highway and Transportation Authority, (AGC), 5.25%, 7/1/41 | | | 5,000 | | | | 5,354,650 | |
| | | | | | | $ | 14,015,185 | |
|
| Other Revenue — 2.6% | |
Riversouth Authority, (Lazarus Building Redevelopment), 5.75%, 12/1/27 | | $ | 2,535 | | | $ | 2,540,197 | |
Summit County Port Authority, 5.00%, 12/1/31 | | | 1,410 | | | | 1,571,374 | |
| | | | | | | $ | 4,111,571 | |
|
| Senior Living / Life Care — 1.1% | |
Lorain County Port Authority, (Kendal at Oberlin), 5.00%, 11/15/30 | | $ | 580 | | | $ | 637,327 | |
Warren County, (Otterbein Homes Obligated Group), 5.75%, 7/1/33 | | | 905 | | | | 1,038,144 | |
| | | | | | | $ | 1,675,471 | |
|
| Special Tax Revenue — 5.9% | |
Cleveland, Income Tax Revenue, (Parks and Recreation Facilities Improvements), 5.00%, 10/1/35 | | $ | 1,000 | | | $ | 1,097,620 | |
Cuyahoga County, (Quicken Loans Arena), Sales Tax Revenue, 4.00%, 1/1/27 | | | 250 | | | | 272,605 | |
Cuyahoga County, Sales Tax Revenue, 5.00%, 12/1/35 | | | 1,000 | | | | 1,143,910 | |
Delaware County, Sales Tax Revenue, 5.00%, 12/1/28 | | | 2,000 | | | | 2,313,140 | |
Franklin County Convention Facilities Authority, 5.00%, 12/1/26 | | | 1,000 | | | | 1,149,180 | |
Greater Cleveland Regional Transit Authority, Sales Tax Revenue, 5.00%, 12/1/31 | | | 435 | | | | 507,406 | |
Green, Income Tax Revenue, (Community Learning Centers), 5.00%, 12/1/26 | | | 570 | | | | 644,641 | |
Green, Income Tax Revenue, (Community Learning Centers), 5.00%, 12/1/28 | | | 940 | | | | 1,060,414 | |
Hamilton County, Sales Tax Revenue, 5.00%, 12/1/30 | | | 1,000 | | | | 1,161,450 | |
| | | | | | | $ | 9,350,366 | |
|
| Water and Sewer — 5.0% | |
Cleveland, Water Pollution Control Revenue, 5.00%, 11/15/41 | | $ | 945 | | | $ | 1,061,859 | |
| | | | |
| | 24 | | See Notes to Financial Statements. |
Eaton Vance
Ohio Municipal Income Fund
March 31, 2018
Portfolio of Investments (Unaudited) — continued
| | | | | | | | |
| Security | | Principal Amount
(000’s omitted) | | | Value | |
|
| Water and Sewer (continued) | |
Columbus, Sewerage System Revenue, 5.00%, 6/1/32 | | $ | 1,500 | | | $ | 1,743,975 | |
Lancaster, Wastewater System Revenue, 4.00%, 12/1/33 | | | 1,265 | | | | 1,339,407 | |
Northeast Ohio Regional Sewer District, 5.00%, 11/15/44 | | | 1,255 | | | | 1,413,406 | |
Toledo, Water System Revenue, 5.00%, 11/15/41 | | | 2,000 | | | | 2,275,620 | |
| | | | | | | $ | 7,834,267 | |
| |
Total Tax-Exempt Investments — 104.8%
(identified cost $155,806,630) | | | $ | 165,687,765 | |
| |
Other Assets, Less Liabilities — (4.8)% | | | $ | (7,550,330 | ) |
| | |
Net Assets — 100.0% | | | | | | $ | 158,137,435 | |
The percentage shown for each investment category in the Portfolio of Investments is based on net assets.
The Fund invests primarily in debt securities issued by Ohio municipalities. The ability of the issuers of the debt securities to meet their obligations may be affected by economic developments in a specific industry or municipality. In order to reduce the risk associated with such economic developments, at March 31, 2018, 45.3% of total investments are backed by bond insurance of various financial institutions and financial guaranty assurance agencies. The aggregate percentage insured by an individual financial institution or financial guaranty assurance agency ranged from 1.5% to 25.9% of total investments.
| (1) | Floating rate security. The stated interest rate represents the rate in effect at March 31, 2018. |
| (2) | Security represents the municipal bond held by a trust that issues residual interest bonds (see Note 1H). |
| (3) | Security exempt from registration pursuant to Rule 144A under the Securities Act of 1933, as amended. These securities may be sold in certain transactions in reliance on an exemption from registration (normally to qualified institutional buyers). At March 31, 2018, the aggregate value of these securities is $1,708,024 or 1.1% of the Fund’s net assets. |
| | | | | | | | | | | | | | | | | | | | |
| Futures Contracts | |
| | | | | |
| Description | | Number of
Contracts | | | Position | | | Expiration
Month/Year | | | Notional
Amount | | | Value/Net
Unrealized
Depreciation | |
| | | | | |
Interest Rate Futures | | | | | | | | | | | | | | | | | | | | |
| U.S. Long Treasury Bond | | | 55 | | | | Short | | | | Jun-18 | | | $ | (8,064,375 | ) | | $ | (167,238 | ) |
| |
| | | | $ | (167,238 | ) |
Abbreviations:
| | | | |
| AGC | | – | | Assured Guaranty Corp. |
| AGM | | – | | Assured Guaranty Municipal Corp. |
| AMBAC | | – | | AMBAC Financial Group, Inc. |
| AMT | | – | | Interest earned from these securities may be considered a tax preference item for purposes of the Federal Alternative Minimum Tax. |
| FGIC | | – | | Financial Guaranty Insurance Company |
| NPFG | | – | | National Public Finance Guaranty Corp. |
| SIFMA | | – | | Securities Industry and Financial Markets Association Municipal Swap Index |
| XLCA | | – | | XL Capital Assurance, Inc. |
| | | | |
| | 25 | | See Notes to Financial Statements. |
Eaton Vance
Municipal Income Funds
March 31, 2018
Statements of Assets and Liabilities (Unaudited)
| | | | | | | | | | | | | | | | |
| | | March 31, 2018 | |
| Assets | | California Opportunities
Fund | | | Massachusetts
Fund | | | New York Fund | | | Ohio Fund | |
Investments — | | | | | | | | | | | | | | | | |
Identified cost | | $ | 272,568,043 | | | $ | 138,310,415 | | | $ | 410,781,600 | | | $ | 155,806,630 | |
Unrealized appreciation | | | 6,048,187 | | | | 9,580,009 | | | | 11,884,192 | | | | 9,881,135 | |
Investments, at value | | $ | 278,616,230 | | | $ | 147,890,424 | | | $ | 422,665,792 | | | $ | 165,687,765 | |
Cash | | $ | 878,438 | | | $ | 3,758,220 | | | $ | 4,121,594 | | | $ | 3,550,340 | |
Deposits for derivatives collateral — financial futures contracts | | | — | | | | 125,000 | | | | 320,000 | | | | 137,500 | |
Interest receivable | | | 2,717,801 | | | | 1,663,112 | | | | 4,999,987 | | | | 2,128,499 | |
Receivable for investments sold | | | 1,357,563 | | | | — | | | | 8,812,050 | | | | — | |
Receivable for Fund shares sold | | | 569,478 | | | | 50,273 | | | | 198,046 | | | | 158,363 | |
Total assets | | $ | 284,139,510 | | | $ | 153,487,029 | | | $ | 441,117,469 | | | $ | 171,662,467 | |
|
| Liabilities | |
Payable for floating rate notes issued | | $ | 10,535,014 | | | $ | 3,663,132 | | | $ | 21,620,513 | | | $ | 13,008,026 | |
Payable for investments purchased | | | 467,420 | | | | — | | | | 2,243,075 | | | | — | |
Payable for when-issued securities | | | 11,421,164 | | | | — | | | | — | | | | — | |
Payable for variation margin on open financial futures contracts | | | — | | | | 37,502 | | | | 96,003 | | | | 41,251 | |
Payable for Fund shares redeemed | | | 1,751,825 | | | | 170,679 | | | | 625,906 | | | | 207,531 | |
Distributions payable | | | 85,443 | | | | 71,192 | | | | 160,962 | | | | 67,695 | |
Payable to affiliates: | | | | | | | | | | | | | | | | |
Investment adviser fee | | | 88,573 | | | | 45,008 | | | | 137,062 | | | | 48,363 | |
Distribution and service fees | | | 48,749 | | | | 29,168 | | | | 89,017 | | | | 34,436 | |
Interest expense and fees payable | | | 37,189 | | | | 5,275 | | | | 118,889 | | | | 52,806 | |
Accrued expenses | | | 91,463 | | | | 66,433 | | | | 123,826 | | | | 64,924 | |
Total liabilities | | $ | 24,526,840 | | | $ | 4,088,389 | | | $ | 25,215,253 | | | $ | 13,525,032 | |
Net Assets | | $ | 259,612,670 | | | $ | 149,398,640 | | | $ | 415,902,216 | | | $ | 158,137,435 | |
|
| Sources of Net Assets | |
Paid-in capital | | $ | 270,448,603 | | | $ | 163,979,411 | | | $ | 428,840,064 | | | $ | 170,718,064 | |
Accumulated undistributed (distributions in excess of) net investment income | | | 387,354 | | | | 489,903 | | | | 481,497 | | | | (51,347 | ) |
Accumulated net realized loss | | | (17,271,474 | ) | | | (24,498,648 | ) | | | (24,914,329 | ) | | | (22,243,179 | ) |
Net unrealized appreciation | | | 6,048,187 | | | | 9,427,974 | | | | 11,494,984 | | | | 9,713,897 | |
Net Assets | | $ | 259,612,670 | | | $ | 149,398,640 | | | $ | 415,902,216 | | | $ | 158,137,435 | |
|
| Class A Shares | |
Net Assets | | $ | 118,872,996 | | | $ | 93,415,581 | | | $ | 232,460,090 | | | $ | 103,437,317 | |
Shares Outstanding | | | 11,628,335 | | | | 10,733,335 | | | | 23,466,216 | | | | 11,775,451 | |
Net Asset Value and Redemption Price Per Share | | | | | | | | | | | | | | | | |
(net assets ÷ shares of beneficial interest outstanding) | | $ | 10.22 | | | $ | 8.70 | | | $ | 9.91 | | | $ | 8.78 | |
Maximum Offering Price Per Share | | | | | | | | | | | | | | | | |
(100 ÷ 95.25 of net asset value per share) | | $ | 10.73 | | | $ | 9.13 | | | $ | 10.40 | | | $ | 9.22 | |
|
| Class C Shares | |
Net Assets | | $ | 26,799,119 | | | $ | 16,455,233 | | | $ | 60,963,341 | | | $ | 20,964,523 | |
Shares Outstanding | | | 2,834,957 | | | | 1,889,777 | | | | 6,151,327 | | | | 2,388,196 | |
Net Asset Value and Offering Price Per Share* | | | | | | | | | | | | | | | | |
(net assets ÷ shares of beneficial interest outstanding) | | $ | 9.45 | | | $ | 8.71 | | | $ | 9.91 | | | $ | 8.78 | |
|
| Class I Shares | |
Net Assets | | $ | 113,940,555 | | | $ | 39,527,826 | | | $ | 122,478,785 | | | $ | 33,735,595 | |
Shares Outstanding | | | 11,138,406 | | | | 4,542,455 | | | | 12,365,420 | | | | 3,838,026 | |
Net Asset Value, Offering Price and Redemption Price Per Share | | | | | | | | | | | | | | | | |
(net assets ÷ shares of beneficial interest outstanding) | | $ | 10.23 | | | $ | 8.70 | | | $ | 9.90 | | | $ | 8.79 | |
On sales of $50,000 or more, the offering price of Class A shares is reduced.
| * | Redemption price per share is equal to the net asset value less any applicable contingent deferred sales charge. |
| | | | |
| | 26 | | See Notes to Financial Statements. |
Eaton Vance
Municipal Income Funds
March 31, 2018
Statements of Operations (Unaudited)
| | | | | | | | | | | | | | | | |
| | | Six Months Ended March 31, 2018 | |
| Investment Income | | California
Opportunities
Fund | | | Massachusetts
Fund | | | New York Fund | | | Ohio Fund | |
Interest | | $ | 4,495,466 | | | $ | 2,995,959 | | | $ | 7,875,063 | | | $ | 3,339,706 | |
Total investment income | | $ | 4,495,466 | | | $ | 2,995,959 | | | $ | 7,875,063 | | | $ | 3,339,706 | |
|
| Expenses | |
Investment adviser fee | | $ | 532,881 | | | $ | 287,585 | | | $ | 838,541 | | | $ | 296,575 | |
Distribution and service fees | | | | | | | | | | | | | | | | |
Class A | | | 152,771 | | | | 96,308 | | | | 239,997 | | | | 107,273 | |
Class C | | | 142,228 | | | | 84,079 | | | | 306,210 | | | | 102,669 | |
Trustees’ fees and expenses | | | 5,935 | | | | 3,545 | | | | 9,455 | | | | 3,650 | |
Custodian fee | | | 37,330 | | | | 24,871 | | | | 56,181 | | | | 25,014 | |
Transfer and dividend disbursing agent fees | | | 42,163 | | | | 32,767 | | | | 81,559 | | | | 35,578 | |
Legal and accounting services | | | 34,361 | | | | 30,948 | | | | 41,517 | | | | 27,654 | |
Printing and postage | | | 9,659 | | | | 9,767 | | | | 15,317 | | | | 8,420 | |
Registration fees | | | 765 | | | | 5,904 | | | | 4,773 | | | | 4,186 | |
Interest expense and fees | | | 91,021 | | | | 32,228 | | | | 188,628 | | | | 117,751 | |
Miscellaneous | | | 23,284 | | | | 13,121 | | | | 22,878 | | | | 12,334 | |
Total expenses | | $ | 1,072,398 | | | $ | 621,123 | | | $ | 1,805,056 | | | $ | 741,104 | |
| | | | |
Net investment income | | $ | 3,423,068 | | | $ | 2,374,836 | | | $ | 6,070,007 | | | $ | 2,598,602 | |
|
| Realized and Unrealized Gain (Loss) | |
Net realized gain (loss) — | | | | | | | | | | | | | | | | |
Investment transactions | | $ | (347,582 | ) | | $ | 1,966,331 | | | $ | 5,458,148 | | | $ | 498,636 | |
Financial futures contracts | | | — | | | | 480,860 | | | | 1,231,003 | | | | 528,946 | |
Net realized gain (loss) | | $ | (347,582 | ) | | $ | 2,447,191 | | | $ | 6,689,151 | | | $ | 1,027,582 | |
Change in unrealized appreciation (depreciation) — | | | | | | | | | | | | | | | | |
Investments | | $ | (4,500,886 | ) | | $ | (5,184,277 | ) | | $ | (14,794,267 | ) | | $ | (4,953,866 | ) |
Financial futures contracts | | | — | | | | (277,332 | ) | | | (709,967 | ) | | | (305,064 | ) |
Net change in unrealized appreciation (depreciation) | | $ | (4,500,886 | ) | | $ | (5,461,609 | ) | | $ | (15,504,234 | ) | | $ | (5,258,930 | ) |
| | | | |
Net realized and unrealized loss | | $ | (4,848,468 | ) | | $ | (3,014,418 | ) | | $ | (8,815,083 | ) | | $ | (4,231,348 | ) |
| | | | |
Net decrease in net assets from operations | | $ | (1,425,400 | ) | | $ | (639,582 | ) | | $ | (2,745,076 | ) | | $ | (1,632,746 | ) |
| | | | |
| | 27 | | See Notes to Financial Statements. |
Eaton Vance
Municipal Income Funds
March 31, 2018
Statements of Changes in Net Assets
| | | | | | | | | | | | | | | | |
| | | Six Months Ended March 31, 2018 (Unaudited) | |
| Increase (Decrease) in Net Assets | | California
Opportunities
Fund | | | Massachusetts
Fund | | | New York Fund | | | Ohio Fund | |
From operations — | | | | | | | | | | | | | | | | |
Net investment income | | $ | 3,423,068 | | | $ | 2,374,836 | | | $ | 6,070,007 | | | $ | 2,598,602 | |
Net realized gain (loss) | | | (347,582 | ) | | | 2,447,191 | | | | 6,689,151 | | | | 1,027,582 | |
Net change in unrealized appreciation (depreciation) | | | (4,500,886 | ) | | | (5,461,609 | ) | | | (15,504,234 | ) | | | (5,258,930 | ) |
Net decrease in net assets from operations | | $ | (1,425,400 | ) | | $ | (639,582 | ) | | $ | (2,745,076 | ) | | $ | (1,632,746 | ) |
Distributions to shareholders — | | | | | | | | | | | | | | | | |
From net investment income | | | | | | | | | | | | | | | | |
Class A | | $ | (1,539,053 | ) | | $ | (1,596,533 | ) | | $ | (3,425,168 | ) | | $ | (1,738,408 | ) |
Class C | | | (251,040 | ) | | | (228,056 | ) | | | (678,223 | ) | | | (269,075 | ) |
Class I | | | (1,614,630 | ) | | | (748,097 | ) | | | (1,952,163 | ) | | | (560,334 | ) |
Total distributions to shareholders | | $ | (3,404,723 | ) | | $ | (2,572,686 | ) | | $ | (6,055,554 | ) | | $ | (2,567,817 | ) |
Transactions in shares of beneficial interest — | | | | | | | | | | | | | | | | |
Proceeds from sale of shares | | | | | | | | | | | | | | | | |
Class A | | $ | 6,413,114 | | | $ | 1,548,988 | | | $ | 8,699,150 | | | $ | 4,192,935 | |
Class C | | | 1,435,110 | | | | 461,188 | | | | 2,554,101 | | | | 1,805,467 | |
Class I | | | 20,597,526 | | | | 5,163,319 | | | | 20,962,633 | | | | 5,937,248 | |
Net asset value of shares issued to shareholders in payment of distributions declared | | | | | | | | | | | | | | | | |
Class A | | | 1,279,550 | | | | 1,330,077 | | | | 2,932,794 | | | | 1,470,260 | |
Class C | | | 218,811 | | | | 185,572 | | | | 545,691 | | | | 228,117 | |
Class I | | | 1,385,286 | | | | 587,920 | | | | 1,544,282 | | | | 435,028 | |
Cost of shares redeemed | | | | | | | | | | | | | | | | |
Class A | | | (11,444,923 | ) | | | (7,412,443 | ) | | | (21,460,157 | ) | | | (13,745,515 | ) |
Class C | | | (4,363,844 | ) | | | (3,043,038 | ) | | | (7,563,406 | ) | | | (2,716,061 | ) |
Class I | | | (24,655,486 | ) | | | (10,915,166 | ) | | | (23,923,229 | ) | | | (3,847,623 | ) |
Net decrease in net assets from Fund share transactions | | $ | (9,134,856 | ) | | $ | (12,093,583 | ) | | $ | (15,708,141 | ) | | $ | (6,240,144 | ) |
| | | | |
Net decrease in net assets | | $ | (13,964,979 | ) | | $ | (15,305,851 | ) | | $ | (24,508,771 | ) | | $ | (10,440,707 | ) |
|
| Net Assets | |
At beginning of period | | $ | 273,577,649 | | | $ | 164,704,491 | | | $ | 440,410,987 | | | $ | 168,578,142 | |
At end of period | | $ | 259,612,670 | | | $ | 149,398,640 | | | $ | 415,902,216 | | | $ | 158,137,435 | |
|
Accumulated undistributed (distributions in excess of) net investment income
included in net assets | |
At end of period | | $ | 387,354 | | | $ | 489,903 | | | $ | 481,497 | | | $ | (51,347 | ) |
| | | | |
| | 28 | | See Notes to Financial Statements. |
Eaton Vance
Municipal Income Funds
March 31, 2018
Statements of Changes in Net Assets — continued
| | | | | | | | | | | | | | | | |
| | | Year Ended September 30, 2017 | |
| Increase (Decrease) in Net Assets | | California
Opportunities
Fund | | | Massachusetts
Fund | | | New York Fund | | | Ohio Fund | |
From operations — | | | | | | | | | | | | | | | | |
Net investment income | | $ | 6,915,526 | | | $ | 5,383,136 | | | $ | 12,981,494 | | | $ | 5,829,363 | |
Net realized gain (loss) | | | (4,611,452 | ) | | | 673,583 | | | | 7,523,875 | | | | 1,125,266 | |
Net change in unrealized appreciation (depreciation) | | | (4,806,038 | ) | | | (6,838,532 | ) | | | (20,556,784 | ) | | | (6,929,232 | ) |
Net increase (decrease) in net assets from operations | | $ | (2,501,964 | ) | | $ | (781,813 | ) | | $ | (51,415 | ) | | $ | 25,397 | |
Distributions to shareholders — | | | | | | | | | | | | | | | | |
From net investment income | | | | | | | | | | | | | | | | |
Class A | | $ | (3,297,967 | ) | | $ | (3,358,988 | ) | | $ | (7,918,075 | ) | | $ | (4,196,284 | ) |
Class B | | | — | | | | — | | | | (3,299 | ) | | | — | |
Class C | | | (553,952 | ) | | | (516,153 | ) | | | (1,691,615 | ) | | | (623,724 | ) |
Class I | | | (3,025,069 | ) | | | (1,478,479 | ) | | | (3,578,576 | ) | | | (947,992 | ) |
Total distributions to shareholders | | $ | (6,876,988 | ) | | $ | (5,353,620 | ) | | $ | (13,191,565 | ) | | $ | (5,768,000 | ) |
Transactions in shares of beneficial interest — | | | | | | | | | | | | | | | | |
Proceeds from sale of shares | | | | | | | | | | | | | | | | |
Class A | | $ | 14,941,125 | | | $ | 5,793,864 | | | $ | 19,482,318 | | | $ | 7,552,899 | |
Class C | | | 5,671,177 | | | | 1,568,652 | | | | 7,793,000 | | | | 2,315,945 | |
Class I | | | 80,833,225 | | | | 19,172,312 | | | | 57,878,971 | | | | 18,155,119 | |
Net asset value of shares issued to shareholders in payment of distributions declared | | | | | | | | | | | | | | | | |
Class A | | | 2,796,101 | | | | 2,822,818 | | | | 6,815,052 | | | | 3,510,338 | |
Class C | | | 463,871 | | | | 412,558 | | | | 1,313,186 | | | | 518,768 | |
Class I | | | 2,551,780 | | | | 1,127,255 | | | | 2,707,572 | | | | 699,270 | |
Cost of shares redeemed | | | | | | | | | | | | | | | | |
Class A | | | (36,693,851 | ) | | | (21,641,833 | ) | | | (63,628,165 | ) | | | (28,612,421 | ) |
Class B | | | — | | | | — | | | | (18,716 | ) | | | — | |
Class C | | | (9,971,647 | ) | | | (6,108,126 | ) | | | (20,481,180 | ) | | | (4,666,011 | ) |
Class I | | | (70,485,012 | ) | | | (18,350,759 | ) | | | (36,178,830 | ) | | | (7,204,192 | ) |
Net asset value of shares exchanged | | | | | | | | | | | | | | | | |
Class A | | | — | | | | — | | | | 8,915 | | | | — | |
Class B | | | — | | | | — | | | | (8,915 | ) | | | — | |
Net asset value of shares merged* | | | | | | | | | | | | | | | | |
Class A | | | — | | | | — | | | | 1,830,276 | | | | — | |
Class B | | | — | | | | — | | | | (1,830,276 | ) | | | — | |
Net decrease in net assets from Fund share transactions | | $ | (9,893,231 | ) | | $ | (15,203,259 | ) | | $ | (24,316,792 | ) | | $ | (7,730,285 | ) |
| | | | |
Net decrease in net assets | | $ | (19,272,183 | ) | | $ | (21,338,692 | ) | | $ | (37,559,772 | ) | | $ | (13,472,888 | ) |
|
| Net Assets | |
At beginning of year | | $ | 292,849,832 | | | $ | 186,043,183 | | | $ | 477,970,759 | | | $ | 182,051,030 | |
At end of year | | $ | 273,577,649 | | | $ | 164,704,491 | | | $ | 440,410,987 | | | $ | 168,578,142 | |
|
Accumulated undistributed (distributions in excess of) net investment income
included in net assets | |
At end of year | | $ | 369,009 | | | $ | 687,753 | | | $ | 467,044 | | | $ | (82,132 | ) |
| * | At the close of business on October 21, 2016, Class B shares of New York Fund were merged into Class A shares. |
| | | | |
| | 29 | | See Notes to Financial Statements. |
Eaton Vance
Municipal Income Funds
March 31, 2018
Financial Highlights
| | | | | | | | | | | | | | | | | | | | | | | | |
| | | California Opportunities Fund — Class A | |
| | | Six Months Ended
March 31, 2018
(Unaudited) | | | Year Ended September 30, | |
| | | | 2017 | | | 2016 | | | 2015 | | | 2014 | | | 2013 | |
Net asset value — Beginning of period | | $ | 10.410 | | | $ | 10.740 | | | $ | 10.250 | | | $ | 10.230 | | | $ | 9.580 | | | $ | 10.410 | |
|
| Income (Loss) From Operations | |
Net investment income(1) | | $ | 0.130 | | | $ | 0.262 | | | $ | 0.302 | | | $ | 0.377 | | | $ | 0.394 | | | $ | 0.377 | |
Net realized and unrealized gain (loss) | | | (0.190 | ) | | | (0.332 | ) | | | 0.491 | | | | 0.018 | | | | 0.647 | | | | (0.833 | ) |
| | | | | | |
Total income (loss) from operations | | $ | (0.060 | ) | | $ | (0.070 | ) | | $ | 0.793 | | | $ | 0.395 | | | $ | 1.041 | | | $ | (0.456 | ) |
|
| Less Distributions | |
From net investment income | | $ | (0.130 | ) | | $ | (0.260 | ) | | $ | (0.303 | ) | | $ | (0.375 | ) | | $ | (0.391 | ) | | $ | (0.374 | ) |
| | | | | | |
Total distributions | | $ | (0.130 | ) | | $ | (0.260 | ) | | $ | (0.303 | ) | | $ | (0.375 | ) | | $ | (0.391 | ) | | $ | (0.374 | ) |
| | | | | | |
Net asset value — End of period | | $ | 10.220 | | | $ | 10.410 | | | $ | 10.740 | | | $ | 10.250 | | | $ | 10.230 | | | $ | 9.580 | |
| | | | | | |
Total Return(2) | | | (0.58 | )%(3) | | | (0.60 | )% | | | 7.83 | % | | | 3.92 | % | | | 11.07 | % | | | (4.51 | )% |
|
| Ratios/Supplemental Data | |
Net assets, end of period (000’s omitted) | | $ | 118,873 | | | $ | 124,821 | | | $ | 148,675 | | | $ | 122,727 | | | $ | 120,695 | | | $ | 133,046 | |
Ratios (as a percentage of average daily net assets): | | | | | | | | | | | | | | | | | | | | | | | | |
Expenses excluding interest and fees(4) | | | 0.76 | %(5) | | | 0.77 | % | | | 0.78 | % | | | 0.84 | % | | | 0.85 | % | | | 0.84 | % |
Interest and fee expense(6) | | | 0.07 | %(5) | | | 0.05 | % | | | 0.04 | % | | | 0.04 | % | | | 0.04 | % | | | 0.04 | % |
Total expenses(4) | | | 0.83 | %(5) | | | 0.82 | % | | | 0.82 | % | | | 0.88 | % | | | 0.89 | % | | | 0.88 | % |
Net investment income | | | 2.53 | %(5) | | | 2.53 | % | | | 2.86 | % | | | 3.68 | % | | | 3.99 | % | | | 3.71 | % |
Portfolio Turnover | | | 84 | %(3) | | | 146 | % | | | 219 | % | | | 66 | % | | | 12 | % | | | 33 | % |
| (1) | Computed using average shares outstanding. |
| (2) | Returns are historical and are calculated by determining the percentage change in net asset value with all distributions reinvested and do not reflect the effect of sales charges. |
| (4) | Excludes the effect of custody fee credits, if any, of less than 0.005%. Effective September 1, 2015, custody fee credits, which were earned on cash deposit balances, were discontinued by the custodian. |
| (6) | Interest and fee expense relates to the liability for floating rate notes issued in conjunction with residual interest bond transactions (see Note 1H). |
| | | | |
| | 30 | | See Notes to Financial Statements. |
Eaton Vance
Municipal Income Funds
March 31, 2018
Financial Highlights — continued
| | | | | | | | | | | | | | | | | | | | | | | | |
| | | California Opportunities Fund — Class C | |
| | | Six Months Ended
March 31, 2018
(Unaudited) | | | Year Ended September 30, | |
| | | | 2017 | | | 2016 | | | 2015 | | | 2014 | | | 2013 | |
Net asset value — Beginning of period | | $ | 9.620 | | | $ | 9.930 | | | $ | 9.480 | | | $ | 9.460 | | | $ | 8.860 | | | $ | 9.630 | |
|
| Income (Loss) From Operations | |
Net investment income(1) | | $ | 0.085 | | | $ | 0.170 | | | $ | 0.198 | | | $ | 0.277 | | | $ | 0.296 | | | $ | 0.278 | |
Net realized and unrealized gain (loss) | | | (0.171 | ) | | | (0.311 | ) | | | 0.459 | | | | 0.019 | | | | 0.597 | | | | (0.773 | ) |
| | | | | | |
Total income (loss) from operations | | $ | (0.086 | ) | | $ | (0.141 | ) | | $ | 0.657 | | | $ | 0.296 | | | $ | 0.893 | | | $ | (0.495 | ) |
|
| Less Distributions | |
From net investment income | | $ | (0.084 | ) | | $ | (0.169 | ) | | $ | (0.207 | ) | | $ | (0.276 | ) | | $ | (0.293 | ) | | $ | (0.275 | ) |
| | | | | | |
Total distributions | | $ | (0.084 | ) | | $ | (0.169 | ) | | $ | (0.207 | ) | | $ | (0.276 | ) | | $ | (0.293 | ) | | $ | (0.275 | ) |
| | | | | | |
Net asset value — End of period | | $ | 9.450 | | | $ | 9.620 | | | $ | 9.930 | | | $ | 9.480 | | | $ | 9.460 | | | $ | 8.860 | |
| | | | | | |
Total Return(2) | | | (0.89 | )%(3) | | | (1.40 | )% | | | 6.98 | % | | | 3.17 | % | | | 10.23 | % | | | (5.25 | )% |
|
| Ratios/Supplemental Data | |
Net assets, end of period (000’s omitted) | | $ | 26,799 | | | $ | 30,020 | | | $ | 35,006 | | | $ | 15,343 | | | $ | 10,297 | | | $ | 10,237 | |
Ratios (as a percentage of average daily net assets): | | | | | | | | | | | | | | | | | | | | | | | | |
Expenses excluding interest and fees(4) | | | 1.51 | %(5) | | | 1.52 | % | | | 1.53 | % | | | 1.59 | % | | | 1.60 | % | | | 1.59 | % |
Interest and fee expense(6) | | | 0.07 | %(5) | | | 0.05 | % | | | 0.04 | % | | | 0.04 | % | | | 0.04 | % | | | 0.04 | % |
Total expenses(4) | | | 1.58 | %(5) | | | 1.57 | % | | | 1.57 | % | | | 1.63 | % | | | 1.64 | % | | | 1.63 | % |
Net investment income | | | 1.78 | %(5) | | | 1.78 | % | | | 2.02 | % | | | 2.92 | % | | | 3.24 | % | | | 2.95 | % |
Portfolio Turnover | | | 84 | %(3) | | | 146 | % | | | 219 | % | | | 66 | % | | | 12 | % | | | 33 | % |
| (1) | Computed using average shares outstanding. |
| (2) | Returns are historical and are calculated by determining the percentage change in net asset value with all distributions reinvested and do not reflect the effect of sales charges. |
| (4) | Excludes the effect of custody fee credits, if any, of less than 0.005%. Effective September 1, 2015, custody fee credits, which were earned on cash deposit balances, were discontinued by the custodian. |
| (6) | Interest and fee expense relates to the liability for floating rate notes issued in conjunction with residual interest bond transactions (see Note 1H). |
| | | | |
| | 31 | | See Notes to Financial Statements. |
Eaton Vance
Municipal Income Funds
March 31, 2018
Financial Highlights — continued
| | | | | | | | | | | | | | | | | | | | | | | | |
| | | California Opportunities Fund — Class I | |
| | | Six Months Ended
March 31, 2018
(Unaudited) | | | Year Ended September 30, | |
| | | | 2017 | | | 2016 | | | 2015 | | | 2014 | | | 2013 | |
Net asset value — Beginning of period | | $ | 10.420 | | | $ | 10.750 | | | $ | 10.260 | | | $ | 10.240 | | | $ | 9.590 | | | $ | 10.420 | |
|
| Income (Loss) From Operations | |
Net investment income(1) | | $ | 0.143 | | | $ | 0.287 | | | $ | 0.312 | | | $ | 0.403 | | | $ | 0.419 | | | $ | 0.402 | |
Net realized and unrealized gain (loss) | | | (0.191 | ) | | | (0.331 | ) | | | 0.507 | | | | 0.018 | | | | 0.647 | | | | (0.833 | ) |
| | | | | | |
Total income (loss) from operations | | $ | (0.048 | ) | | $ | (0.044 | ) | | $ | 0.819 | | | $ | 0.421 | | | $ | 1.066 | | | $ | (0.431 | ) |
|
| Less Distributions | |
From net investment income | | $ | (0.142 | ) | | $ | (0.286 | ) | | $ | (0.329 | ) | | $ | (0.401 | ) | | $ | (0.416 | ) | | $ | (0.399 | ) |
| | | | | | |
Total distributions | | $ | (0.142 | ) | | $ | (0.286 | ) | | $ | (0.329 | ) | | $ | (0.401 | ) | | $ | (0.416 | ) | | $ | (0.399 | ) |
| | | | | | |
Net asset value — End of period | | $ | 10.230 | | | $ | 10.420 | | | $ | 10.750 | | | $ | 10.260 | | | $ | 10.240 | | | $ | 9.590 | |
| | | | | | |
Total Return(2) | | | (0.46 | )%(3) | | | (0.35 | )% | | | 8.09 | % | | | 4.18 | % | | | 11.33 | % | | | (4.27 | )% |
|
| Ratios/Supplemental Data | |
Net assets, end of period (000’s omitted) | | $ | 113,941 | | | $ | 118,737 | | | $ | 109,169 | | | $ | 21,945 | | | $ | 23,320 | | | $ | 26,025 | |
Ratios (as a percentage of average daily net assets): | | | | | | | | | | | | | | | | | | | | | | | | |
Expenses excluding interest and fees(4) | | | 0.51 | %(5) | | | 0.52 | % | | | 0.52 | % | | | 0.59 | % | | | 0.60 | % | | | 0.59 | % |
Interest and fee expense(6) | | | 0.07 | %(5) | | | 0.05 | % | | | 0.04 | % | | | 0.04 | % | | | 0.04 | % | | | 0.04 | % |
Total expenses(4) | | | 0.58 | %(5) | | | 0.57 | % | | | 0.56 | % | | | 0.63 | % | | | 0.64 | % | | | 0.63 | % |
Net investment income | | | 2.78 | %(5) | | | 2.77 | % | | | 2.93 | % | | | 3.92 | % | | | 4.25 | % | | | 3.97 | % |
Portfolio Turnover | | | 84 | %(3) | | | 146 | % | | | 219 | % | | | 66 | % | | | 12 | % | | | 33 | % |
| (1) | Computed using average shares outstanding. |
| (2) | Returns are historical and are calculated by determining the percentage change in net asset value with all distributions reinvested. |
| (4) | Excludes the effect of custody fee credits, if any, of less than 0.005%. Effective September 1, 2015, custody fee credits, which were earned on cash deposit balances, were discontinued by the custodian. |
| (6) | Interest and fee expense relates to the liability for floating rate notes issued in conjunction with residual interest bond transactions (see Note 1H). |
| | | | |
| | 32 | | See Notes to Financial Statements. |
Eaton Vance
Municipal Income Funds
March 31, 2018
Financial Highlights — continued
| | | | | | | | | | | | | | | | | | | | | | | | |
| | | Massachusetts Fund — Class A | |
| | | Six Months Ended
March 31, 2018
(Unaudited) | | | Year Ended September 30, | |
| | | | 2017 | | | 2016 | | | 2015 | | | 2014 | | | 2013 | |
Net asset value — Beginning of period | | $ | 8.890 | | | $ | 9.180 | | | $ | 9.030 | | | $ | 9.120 | | | $ | 8.560 | | | $ | 9.380 | |
|
| Income (Loss) From Operations | |
Net investment income(1) | | $ | 0.135 | | | $ | 0.285 | | | $ | 0.304 | | | $ | 0.322 | | | $ | 0.347 | | | $ | 0.342 | |
Net realized and unrealized gain (loss) | | | (0.179 | ) | | | (0.292 | ) | | | 0.160 | | | | (0.088 | ) | | | 0.566 | | | | (0.822 | ) |
| | | | | | |
Total income (loss) from operations | | $ | (0.044 | ) | | $ | (0.007 | ) | | $ | 0.464 | | | $ | 0.234 | | | $ | 0.913 | | | $ | (0.480 | ) |
|
| Less Distributions | |
From net investment income | | $ | (0.146 | ) | | $ | (0.283 | ) | | $ | (0.314 | ) | | $ | (0.324 | ) | | $ | (0.353 | ) | | $ | (0.340 | ) |
| | | | | | |
Total distributions | | $ | (0.146 | ) | | $ | (0.283 | ) | | $ | (0.314 | ) | | $ | (0.324 | ) | | $ | (0.353 | ) | | $ | (0.340 | ) |
| | | | | | |
Net asset value — End of period | | $ | 8.700 | | | $ | 8.890 | | | $ | 9.180 | | | $ | 9.030 | | | $ | 9.120 | | | $ | 8.560 | |
| | | | | | |
Total Return(2) | | | (0.50 | )%(3) | | | (0.02 | )% | | | 5.20 | % | | | 2.60 | % | | | 10.86 | % | | | (5.27 | )% |
|
| Ratios/Supplemental Data | |
Net assets, end of period (000’s omitted) | | $ | 93,416 | | | $ | 99,934 | | | $ | 116,883 | | | $ | 109,990 | | | $ | 115,002 | | | $ | 119,390 | |
Ratios (as a percentage of average daily net assets): | | | | | | | | | | | | | | | | | | | | | | | | |
Expenses excluding interest and fees(4) | | | 0.72 | %(5) | | | 0.70 | % | | | 0.72 | % | | | 0.72 | % | | | 0.73 | % | | | 0.74 | % |
Interest and fee expense(6) | | | 0.04 | %(5) | | | 0.06 | % | | | 0.06 | % | | | 0.05 | % | | | 0.05 | % | | | 0.07 | % |
Total expenses(4) | | | 0.76 | %(5) | | | 0.76 | % | | | 0.78 | % | | | 0.77 | % | | | 0.78 | % | | | 0.81 | % |
Net investment income | | | 3.06 | %(5) | | | 3.21 | % | | | 3.31 | % | | | 3.54 | % | | | 3.93 | % | | | 3.74 | % |
Portfolio Turnover | | | 27 | %(3) | | | 28 | % | | | 17 | % | | | 10 | % | | | 6 | % | | | 4 | % |
| (1) | Computed using average shares outstanding. |
| (2) | Returns are historical and are calculated by determining the percentage change in net asset value with all distributions reinvested and do not reflect the effect of sales charges. |
| (4) | Excludes the effect of custody fee credits, if any, of less than 0.005%. Effective September 1, 2015, custody fee credits, which were earned on cash deposit balances, were discontinued by the custodian. |
| (6) | Interest and fee expense relates to the liability for floating rate notes issued in conjunction with residual interest bond transactions (see Note 1H). |
| | | | |
| | 33 | | See Notes to Financial Statements. |
Eaton Vance
Municipal Income Funds
March 31, 2018
Financial Highlights — continued
| | | | | | | | | | | | | | | | | | | | | | | | |
| | | Massachusetts Fund — Class C | |
| | | Six Months Ended
March 31, 2018
(Unaudited) | | | Year Ended September 30, | |
| | | | 2017 | | | 2016 | | | 2015 | | | 2014 | | | 2013 | |
Net asset value — Beginning of period | | $ | 8.890 | | | $ | 9.190 | | | $ | 9.040 | | | $ | 9.120 | | | $ | 8.560 | | | $ | 9.390 | |
|
| Income (Loss) From Operations | |
Net investment income(1) | | $ | 0.102 | | | $ | 0.219 | | | $ | 0.234 | | | $ | 0.252 | | | $ | 0.281 | | | $ | 0.274 | |
Net realized and unrealized gain (loss) | | | (0.169 | ) | | | (0.302 | ) | | | 0.162 | | | | (0.076 | ) | | | 0.566 | | | | (0.833 | ) |
| | | | | | |
Total income (loss) from operations | | $ | (0.067 | ) | | $ | (0.083 | ) | | $ | 0.396 | | | $ | 0.176 | | | $ | 0.847 | | | $ | (0.559 | ) |
|
| Less Distributions | |
From net investment income | | $ | (0.113 | ) | | $ | (0.217 | ) | | $ | (0.246 | ) | | $ | (0.256 | ) | | $ | (0.287 | ) | | $ | (0.271 | ) |
| | | | | | |
Total distributions | | $ | (0.113 | ) | | $ | (0.217 | ) | | $ | (0.246 | ) | | $ | (0.256 | ) | | $ | (0.287 | ) | | $ | (0.271 | ) |
| | | | | | |
Net asset value — End of period | | $ | 8.710 | | | $ | 8.890 | | | $ | 9.190 | | | $ | 9.040 | | | $ | 9.120 | | | $ | 8.560 | |
| | | | | | |
Total Return(2) | | | (0.75 | )%(3) | | | (0.87 | )% | | | 4.41 | % | | | 1.95 | % | | | 10.04 | % | | | (6.08 | )% |
|
| Ratios/Supplemental Data | |
Net assets, end of period (000’s omitted) | | $ | 16,455 | | | $ | 19,219 | | | $ | 24,165 | | | $ | 21,074 | | | $ | 18,787 | | | $ | 19,148 | |
Ratios (as a percentage of average daily net assets): | | | | | | | | | | | | | | | | | | | | | | | | |
Expenses excluding interest and fees(4) | | | 1.48 | %(5) | | | 1.46 | % | | | 1.47 | % | | | 1.47 | % | | | 1.48 | % | | | 1.49 | % |
Interest and fee expense(6) | | | 0.04 | %(5) | | | 0.06 | % | | | 0.06 | % | | | 0.05 | % | | | 0.05 | % | | | 0.07 | % |
Total expenses(4) | | | 1.52 | %(5) | | | 1.52 | % | | | 1.53 | % | | | 1.52 | % | | | 1.53 | % | | | 1.56 | % |
Net investment income | | | 2.33 | %(5) | | | 2.47 | % | | | 2.55 | % | | | 2.78 | % | | | 3.18 | % | | | 2.99 | % |
Portfolio Turnover | | | 27 | %(3) | | | 28 | % | | | 17 | % | | | 10 | % | | | 6 | % | | | 4 | % |
| (1) | Computed using average shares outstanding. |
| (2) | Returns are historical and are calculated by determining the percentage change in net asset value with all distributions reinvested and do not reflect the effect of sales charges. |
| (4) | Excludes the effect of custody fee credits, if any, of less than 0.005%. Effective September 1, 2015, custody fee credits, which were earned on cash deposit balances, were discontinued by the custodian. |
| (6) | Interest and fee expense relates to the liability for floating rate notes issued in conjunction with residual interest bond transactions (see Note 1H). |
| | | | |
| | 34 | | See Notes to Financial Statements. |
Eaton Vance
Municipal Income Funds
March 31, 2018
Financial Highlights — continued
| | | | | | | | | | | | | | | | | | | | | | | | |
| | | Massachusetts Fund — Class I | |
| | | Six Months Ended
March 31, 2018
(Unaudited) | | | Year Ended September 30, | |
| | | | 2017 | | | 2016 | | | 2015 | | | 2014 | | | 2013 | |
Net asset value — Beginning of period | | $ | 8.880 | | | $ | 9.180 | | | $ | 9.030 | | | $ | 9.120 | | | $ | 8.560 | | | $ | 9.380 | |
|
| Income (Loss) From Operations | |
Net investment income(1) | | $ | 0.144 | | | $ | 0.302 | | | $ | 0.320 | | | $ | 0.338 | | | $ | 0.361 | | | $ | 0.360 | |
Net realized and unrealized gain (loss) | | | (0.169 | ) | | | (0.301 | ) | | | 0.162 | | | | (0.086 | ) | | | 0.570 | | | | (0.822 | ) |
| | | | | | |
Total income (loss) from operations | | $ | (0.025 | ) | | $ | 0.001 | | | $ | 0.482 | | | $ | 0.252 | | | $ | 0.931 | | | $ | (0.462 | ) |
|
| Less Distributions | |
From net investment income | | $ | (0.155 | ) | | $ | (0.301 | ) | | $ | (0.332 | ) | | $ | (0.342 | ) | | $ | (0.371 | ) | | $ | (0.358 | ) |
| | | | | | |
Total distributions | | $ | (0.155 | ) | | $ | (0.301 | ) | | $ | (0.332 | ) | | $ | (0.342 | ) | | $ | (0.371 | ) | | $ | (0.358 | ) |
| | | | | | |
Net asset value — End of period | | $ | 8.700 | | | $ | 8.880 | | | $ | 9.180 | | | $ | 9.030 | | | $ | 9.120 | | | $ | 8.560 | |
| | | | | | |
Total Return(2) | | | (0.28 | )%(3) | | | 0.07 | % | | | 5.40 | % | | | 2.80 | % | | | 11.09 | % | | | (5.08 | )% |
|
| Ratios/Supplemental Data | |
Net assets, end of period (000’s omitted) | | $ | 39,528 | | | $ | 45,551 | | | $ | 44,995 | | | $ | 32,876 | | | $ | 26,026 | | | $ | 16,229 | |
Ratios (as a percentage of average daily net assets): | | | | | | | | | | | | | | | | | | | | | | | | |
Expenses excluding interest and fees(4) | | | 0.52 | %(5) | | | 0.50 | % | | | 0.52 | % | | | 0.52 | % | | | 0.53 | % | | | 0.54 | % |
Interest and fee expense(6) | | | 0.04 | %(5) | | | 0.06 | % | | | 0.06 | % | | | 0.05 | % | | | 0.05 | % | | | 0.07 | % |
Total expenses(4) | | | 0.56 | %(5) | | | 0.56 | % | | | 0.58 | % | | | 0.57 | % | | | 0.58 | % | | | 0.61 | % |
Net investment income | | | 3.28 | %(5) | | | 3.41 | % | | | 3.49 | % | | | 3.72 | % | | | 4.07 | % | | | 3.95 | % |
Portfolio Turnover | | | 27 | %(3) | | | 28 | % | | | 17 | % | | | 10 | % | | | 6 | % | | | 4 | % |
| (1) | Computed using average shares outstanding. |
| (2) | Returns are historical and are calculated by determining the percentage change in net asset value with all distributions reinvested. |
| (4) | Excludes the effect of custody fee credits, if any, of less than 0.005%. Effective September 1, 2015, custody fee credits, which were earned on cash deposit balances, were discontinued by the custodian. |
| (6) | Interest and fee expense relates to the liability for floating rate notes issued in conjunction with residual interest bond transactions (see Note 1H). |
| | | | |
| | 35 | | See Notes to Financial Statements. |
Eaton Vance
Municipal Income Funds
March 31, 2018
Financial Highlights — continued
| | | | | | | | | | | | | | | | | | | | | | | | |
| | | New York Fund — Class A | |
| | | Six Months Ended
March 31, 2018
(Unaudited) | | | Year Ended September 30, | |
| | | | 2017 | | | 2016 | | | 2015 | | | 2014 | | | 2013 | |
Net asset value — Beginning of period | | $ | 10.110 | | | $ | 10.390 | | | $ | 10.070 | | | $ | 10.140 | | | $ | 9.510 | | | $ | 10.320 | |
|
| Income (Loss) From Operations | |
Net investment income(1) | | $ | 0.143 | | | $ | 0.304 | | | $ | 0.326 | | | $ | 0.365 | | | $ | 0.400 | | | $ | 0.399 | |
Net realized and unrealized gain (loss) | | | (0.200 | ) | | | (0.276 | ) | | | 0.320 | | | | (0.072 | ) | | | 0.629 | | | | (0.808 | ) |
| | | | | | |
Total income (loss) from operations | | $ | (0.057 | ) | | $ | 0.028 | | | $ | 0.646 | | | $ | 0.293 | | | $ | 1.029 | | | $ | (0.409 | ) |
|
| Less Distributions | |
From net investment income | | $ | (0.143 | ) | | $ | (0.308 | ) | | $ | (0.326 | ) | | $ | (0.363 | ) | | $ | (0.399 | ) | | $ | (0.401 | ) |
| | | | | | |
Total distributions | | $ | (0.143 | ) | | $ | (0.308 | ) | | $ | (0.326 | ) | | $ | (0.363 | ) | | $ | (0.399 | ) | | $ | (0.401 | ) |
| | | | | | |
Net asset value — End of period | | $ | 9.910 | | | $ | 10.110 | | | $ | 10.390 | | | $ | 10.070 | | | $ | 10.140 | | | $ | 9.510 | |
| | | | | | |
Total Return(2) | | | (0.57 | )%(3) | | | 0.33 | % | | | 6.49 | % | | | 2.93 | % | | | 11.02 | % | | | (4.10 | )% |
|
| Ratios/Supplemental Data | |
Net assets, end of period (000’s omitted) | | $ | 232,460 | | | $ | 247,160 | | | $ | 291,077 | | | $ | 265,348 | | | $ | 246,418 | | | $ | 224,465 | |
Ratios (as a percentage of average daily net assets): | | | | | | | | | | | | | | | | | | | | | | | | |
Expenses excluding interest and fees(4) | | | 0.69 | %(5) | | | 0.70 | % | | | 0.70 | % | | | 0.71 | % | | | 0.73 | % | | | 0.75 | % |
Interest and fee expense(6) | | | 0.09 | %(5) | | | 0.07 | % | | | 0.05 | % | | | 0.05 | % | | | 0.06 | % | | | 0.07 | % |
Total expenses(4) | | | 0.78 | %(5) | | | 0.77 | % | | | 0.75 | % | | | 0.76 | % | | | 0.79 | % | | | 0.82 | % |
Net investment income | | | 2.86 | %(5) | | | 3.02 | % | | | 3.16 | % | | | 3.61 | % | | | 4.08 | % | | | 3.95 | % |
Portfolio Turnover | | | 43 | %(3) | | | 56 | % | | | 38 | % | | | 8 | % | | | 4 | % | | | 5 | % |
| (1) | Computed using average shares outstanding. |
| (2) | Returns are historical and are calculated by determining the percentage change in net asset value with all distributions reinvested and do not reflect the effect of sales charges. |
| (4) | Excludes the effect of custody fee credits, if any, of less than 0.005%. Effective September 1, 2015, custody fee credits, which were earned on cash deposit balances, were discontinued by the custodian. |
| (6) | Interest and fee expense relates to the liability for floating rate notes issued in conjunction with residual interest bond transactions (see Note 1H). |
| | | | |
| | 36 | | See Notes to Financial Statements. |
Eaton Vance
Municipal Income Funds
March 31, 2018
Financial Highlights — continued
| | | | | | | | | | | | | | | | | | | | | | | | |
| | | New York Fund — Class C | |
| | | Six Months Ended
March 31, 2018
(Unaudited) | | | Year Ended September 30, | |
| | | | 2017 | | | 2016 | | | 2015 | | | 2014 | | | 2013 | |
Net asset value — Beginning of period | | $ | 10.120 | | | $ | 10.390 | | | $ | 10.070 | | | $ | 10.140 | | | $ | 9.520 | | | $ | 10.320 | |
|
| Income (Loss) From Operations | |
Net investment income(1) | | $ | 0.106 | | | $ | 0.229 | | | $ | 0.248 | | | $ | 0.288 | | | $ | 0.327 | | | $ | 0.323 | |
Net realized and unrealized gain (loss) | | | (0.211 | ) | | | (0.266 | ) | | | 0.320 | | | | (0.071 | ) | | | 0.618 | | | | (0.797 | ) |
| | | | | | |
Total income (loss) from operations | | $ | (0.105 | ) | | $ | (0.037 | ) | | $ | 0.568 | | | $ | 0.217 | | | $ | 0.945 | | | $ | (0.474 | ) |
|
| Less Distributions | |
From net investment income | | $ | (0.105 | ) | | $ | (0.233 | ) | | $ | (0.248 | ) | | $ | (0.287 | ) | | $ | (0.325 | ) | | $ | (0.326 | ) |
| | | | | | |
Total distributions | | $ | (0.105 | ) | | $ | (0.233 | ) | | $ | (0.248 | ) | | $ | (0.287 | ) | | $ | (0.325 | ) | | $ | (0.326 | ) |
| | | | | | |
Net asset value — End of period | | $ | 9.910 | | | $ | 10.120 | | | $ | 10.390 | | | $ | 10.070 | | | $ | 10.140 | | | $ | 9.520 | |
| | | | | | |
Total Return(2) | | | (1.04 | )%(3) | | | (0.32 | )% | | | 5.69 | % | | | 2.17 | % | | | 10.08 | % | | | (4.71 | )% |
|
| Ratios/Supplemental Data | |
Net assets, end of period (000’s omitted) | | $ | 60,963 | | | $ | 66,727 | | | $ | 80,371 | | | $ | 62,713 | | | $ | 48,653 | | | $ | 40,695 | |
Ratios (as a percentage of average daily net assets): | | | | | | | | | | | | | | | | | | | | | | | | |
Expenses excluding interest and fees(4) | | | 1.44 | %(5) | | | 1.45 | % | | | 1.44 | % | | | 1.46 | % | | | 1.48 | % | | | 1.50 | % |
Interest and fee expense(6) | | | 0.09 | %(5) | | | 0.07 | % | | | 0.05 | % | | | 0.05 | % | | | 0.06 | % | | | 0.07 | % |
Total expenses(4) | | | 1.53 | %(5) | | | 1.52 | % | | | 1.49 | % | | | 1.51 | % | | | 1.54 | % | | | 1.57 | % |
Net investment income | | | 2.11 | %(5) | | | 2.27 | % | | | 2.40 | % | | | 2.85 | % | | | 3.32 | % | | | 3.20 | % |
Portfolio Turnover | | | 43 | %(3) | | | 56 | % | | | 38 | % | | | 8 | % | | | 4 | % | | | 5 | % |
| (1) | Computed using average shares outstanding. |
| (2) | Returns are historical and are calculated by determining the percentage change in net asset value with all distributions reinvested and do not reflect the effect of sales charges. |
| (4) | Excludes the effect of custody fee credits, if any, of less than 0.005%. Effective September 1, 2015, custody fee credits, which were earned on cash deposit balances, were discontinued by the custodian. |
| (6) | Interest and fee expense relates to the liability for floating rate notes issued in conjunction with residual interest bond transactions (see Note 1H). |
| | | | |
| | 37 | | See Notes to Financial Statements. |
Eaton Vance
Municipal Income Funds
March 31, 2018
Financial Highlights — continued
| | | | | | | | | | | | | | | | | | | | | | | | |
| | | New York Fund — Class I | |
| | | Six Months Ended
March 31, 2018
(Unaudited) | | | Year Ended September 30, | |
| | | | 2017 | | | 2016 | | | 2015 | | | 2014 | | | 2013 | |
Net asset value — Beginning of period | | $ | 10.110 | | | $ | 10.390 | | | $ | 10.070 | | | $ | 10.140 | | | $ | 9.510 | | | $ | 10.320 | |
|
| Income (Loss) From Operations | |
Net investment income(1) | | $ | 0.153 | | | $ | 0.322 | | | $ | 0.342 | | | $ | 0.384 | | | $ | 0.418 | | | $ | 0.419 | |
Net realized and unrealized gain (loss) | | | (0.210 | ) | | | (0.274 | ) | | | 0.324 | | | | (0.071 | ) | | | 0.630 | | | | (0.808 | ) |
| | | | | | |
Total income (loss) from operations | | $ | (0.057 | ) | | $ | 0.048 | | | $ | 0.666 | | | $ | 0.313 | | | $ | 1.048 | | | $ | (0.389 | ) |
|
| Less Distributions | |
From net investment income | | $ | (0.153 | ) | | $ | (0.328 | ) | | $ | (0.346 | ) | | $ | (0.383 | ) | | $ | (0.418 | ) | | $ | (0.421 | ) |
| | | | | | |
Total distributions | | $ | (0.153 | ) | | $ | (0.328 | ) | | $ | (0.346 | ) | | $ | (0.383 | ) | | $ | (0.418 | ) | | $ | (0.421 | ) |
| | | | | | |
Net asset value — End of period | | $ | 9.900 | | | $ | 10.110 | | | $ | 10.390 | | | $ | 10.070 | | | $ | 10.140 | | | $ | 9.510 | |
| | | | | | |
Total Return(2) | | | (0.47 | )%(3) | | | 0.53 | % | | | 6.70 | % | | | 3.14 | % | | | 11.24 | % | | | (3.91 | )% |
|
| Ratios/Supplemental Data | |
Net assets, end of period (000’s omitted) | | $ | 122,479 | | | $ | 126,524 | | | $ | 104,643 | | | $ | 52,507 | | | $ | 34,125 | | | $ | 20,814 | |
Ratios (as a percentage of average daily net assets): | | | | | | | | | | | | | | | | | | | | | | | | |
Expenses excluding interest and fees(4) | | | 0.49 | %(5) | | | 0.50 | % | | | 0.49 | % | | | 0.51 | % | | | 0.53 | % | | | 0.55 | % |
Interest and fee expense(6) | | | 0.09 | %(5) | | | 0.07 | % | | | 0.05 | % | | | 0.05 | % | | | 0.06 | % | | | 0.07 | % |
Total expenses(4) | | | 0.58 | %(5) | | | 0.57 | % | | | 0.54 | % | | | 0.56 | % | | | 0.59 | % | | | 0.62 | % |
Net investment income | | | 3.06 | %(5) | | | 3.20 | % | | | 3.31 | % | | | 3.80 | % | | | 4.25 | % | | | 4.15 | % |
Portfolio Turnover | | | 43 | %(3) | | | 56 | % | | | 38 | % | | | 8 | % | | | 4 | % | | | 5 | % |
| (1) | Computed using average shares outstanding. |
| (2) | Returns are historical and are calculated by determining the percentage change in net asset value with all distributions reinvested. |
| (4) | Excludes the effect of custody fee credits, if any, of less than 0.005%. Effective September 1, 2015, custody fee credits, which were earned on cash deposit balances, were discontinued by the custodian. |
| (6) | Interest and fee expense relates to the liability for floating rate notes issued in conjunction with residual interest bond transactions (see Note 1H). |
| | | | |
| | 38 | | See Notes to Financial Statements. |
Eaton Vance
Municipal Income Funds
March 31, 2018
Financial Highlights — continued
| | | | | | | | | | | | | | | | | | | | | | | | |
| | | Ohio Fund — Class A | |
| | | Six Months Ended
March 31, 2018
(Unaudited) | | | Year Ended September 30, | |
| | | | 2017 | | | 2016 | | | 2015 | | | 2014 | | | 2013 | |
Net asset value — Beginning of period | | $ | 9.020 | | | $ | 9.300 | | | $ | 9.060 | | | $ | 9.180 | | | $ | 8.600 | | | $ | 9.490 | |
|
| Income (Loss) From Operations | |
Net investment income(1) | | $ | 0.146 | | | $ | 0.313 | | | $ | 0.329 | | | $ | 0.348 | | | $ | 0.366 | | | $ | 0.353 | |
Net realized and unrealized gain (loss) | | | (0.242 | ) | | | (0.283 | ) | | | 0.237 | | | | (0.123 | ) | | | 0.579 | | | | (0.892 | ) |
| | | | | | |
Total income (loss) from operations | | $ | (0.096 | ) | | $ | 0.030 | | | $ | 0.566 | | | $ | 0.225 | | | $ | 0.945 | | | $ | (0.539 | ) |
|
| Less Distributions | |
From net investment income | | $ | (0.144 | ) | | $ | (0.310 | ) | | $ | (0.326 | ) | | $ | (0.345 | ) | | $ | (0.365 | ) | | $ | (0.351 | ) |
| | | | | | |
Total distributions | | $ | (0.144 | ) | | $ | (0.310 | ) | | $ | (0.326 | ) | | $ | (0.345 | ) | | $ | (0.365 | ) | | $ | (0.351 | ) |
| | | | | | |
Net asset value — End of period | | $ | 8.780 | | | $ | 9.020 | | | $ | 9.300 | | | $ | 9.060 | | | $ | 9.180 | | | $ | 8.600 | |
| | | | | | |
Total Return(2) | | | (1.07 | )%(3) | | | 0.39 | % | | | 6.33 | % | | | 2.48 | % | | | 11.19 | % | | | (5.83 | )% |
|
| Ratios/Supplemental Data | |
Net assets, end of period (000’s omitted) | | $ | 103,437 | | | $ | 114,303 | | | $ | 136,271 | | | $ | 130,016 | | | $ | 132,578 | | | $ | 142,380 | |
Ratios (as a percentage of average daily net assets): | | | | | | | | | | | | | | | | | | | | | | | | |
Expenses excluding interest and fees(4) | | | 0.71 | %(5) | | | 0.72 | % | | | 0.71 | % | | | 0.72 | % | | | 0.69 | % | | | 0.74 | % |
Interest and fee expense(6) | | | 0.15 | %(5) | | | 0.11 | % | | | 0.05 | % | | | 0.02 | % | | | 0.04 | % | | | 0.03 | % |
Total expenses(4) | | | 0.86 | %(5) | | | 0.83 | % | | | 0.76 | % | | | 0.74 | % | | | 0.73 | % | | | 0.77 | % |
Net investment income | | | 3.28 | %(5) | | | 3.48 | % | | | 3.56 | % | | | 3.81 | % | | | 4.11 | % | | | 3.84 | % |
Portfolio Turnover | | | 8 | %(3) | | | 10 | % | | | 9 | % | | | 4 | % | | | 5 | % | | | 9 | % |
| (1) | Computed using average shares outstanding. |
| (2) | Returns are historical and are calculated by determining the percentage change in net asset value with all distributions reinvested and do not reflect the effect of sales charges. |
| (4) | Excludes the effect of custody fee credits, if any, of less than 0.005%. Effective September 1, 2015, custody fee credits, which were earned on cash deposit balances, were discontinued by the custodian. |
| (6) | Interest and fee expense relates to the liability for floating rate notes issued in conjunction with residual interest bond transactions (see Note 1H). |
| | | | |
| | 39 | | See Notes to Financial Statements. |
Eaton Vance
Municipal Income Funds
March 31, 2018
Financial Highlights — continued
| | | | | | | | | | | | | | | | | | | | | | | | |
| | | Ohio Fund — Class C | |
| | | Six Months Ended
March 31, 2018
(Unaudited) | | | Year Ended September 30, | |
| | | | 2017 | | | 2016 | | | 2015 | | | 2014 | | | 2013 | |
Net asset value — Beginning of period | | $ | 9.010 | | | $ | 9.300 | | | $ | 9.060 | | | $ | 9.170 | | | $ | 8.600 | | | $ | 9.480 | |
|
| Income (Loss) From Operations | |
Net investment income(1) | | $ | 0.112 | | | $ | 0.245 | | | $ | 0.259 | | | $ | 0.279 | | | $ | 0.298 | | | $ | 0.284 | |
Net realized and unrealized gain (loss) | | | (0.232 | ) | | | (0.293 | ) | | | 0.237 | | | | (0.113 | ) | | | 0.570 | | | | (0.882 | ) |
| | | | | | |
Total income (loss) from operations | | $ | (0.120 | ) | | $ | (0.048 | ) | | $ | 0.496 | | | $ | 0.166 | | | $ | 0.868 | | | $ | (0.598 | ) |
|
| Less Distributions | |
From net investment income | | $ | (0.110 | ) | | $ | (0.242 | ) | | $ | (0.256 | ) | | $ | (0.276 | ) | | $ | (0.298 | ) | | $ | (0.282 | ) |
| | | | | | |
Total distributions | | $ | (0.110 | ) | | $ | (0.242 | ) | | $ | (0.256 | ) | | $ | (0.276 | ) | | $ | (0.298 | ) | | $ | (0.282 | ) |
| | | | | | |
Net asset value — End of period | | $ | 8.780 | | | $ | 9.010 | | | $ | 9.300 | | | $ | 9.060 | | | $ | 9.170 | | | $ | 8.600 | |
| | | | | | |
Total Return(2) | | | (1.33 | )%(3) | | | (0.47 | )% | | | 5.53 | % | | | 1.83 | % | | | 10.24 | % | | | (6.44 | )% |
|
| Ratios/Supplemental Data | |
Net assets, end of period (000’s omitted) | | $ | 20,965 | | | $ | 22,210 | | | $ | 24,822 | | | $ | 21,899 | | | $ | 20,094 | | | $ | 21,739 | |
Ratios (as a percentage of average daily net assets): | | | | | | | | | | | | | | | | | | | | | | | | |
Expenses excluding interest and fees(4) | | | 1.46 | %(5) | | | 1.47 | % | | | 1.46 | % | | | 1.47 | % | | | 1.44 | % | | | 1.49 | % |
Interest and fee expense(6) | | | 0.15 | %(5) | | | 0.11 | % | | | 0.05 | % | | | 0.02 | % | | | 0.04 | % | | | 0.03 | % |
Total expenses(4) | | | 1.61 | %(5) | | | 1.58 | % | | | 1.51 | % | | | 1.49 | % | | | 1.48 | % | | | 1.52 | % |
Net investment income | | | 2.53 | %(5) | | | 2.73 | % | | | 2.80 | % | | | 3.06 | % | | | 3.35 | % | | | 3.09 | % |
Portfolio Turnover | | | 8 | %(3) | | | 10 | % | | | 9 | % | | | 4 | % | | | 5 | % | | | 9 | % |
| (1) | Computed using average shares outstanding. |
| (2) | Returns are historical and are calculated by determining the percentage change in net asset value with all distributions reinvested and do not reflect the effect of sales charges. |
| (4) | Excludes the effect of custody fee credits, if any, of less than 0.005%. Effective September 1, 2015, custody fee credits, which were earned on cash deposit balances, were discontinued by the custodian. |
| (6) | Interest and fee expense relates to the liability for floating rate notes issued in conjunction with residual interest bond transactions (see Note 1H). |
| | | | |
| | 40 | | See Notes to Financial Statements. |
Eaton Vance
Municipal Income Funds
March 31, 2018
Financial Highlights — continued
| | | | | | | | | | | | | | | | | | | | | | | | |
| | | Ohio Fund — Class I | |
| | | Six Months Ended
March 31, 2018
(Unaudited) | | | Year Ended September 30, | |
| | | | 2017 | | | 2016 | | | 2015 | | | 2014 | | | 2013 | |
Net asset value — Beginning of period | | $ | 9.020 | | | $ | 9.310 | | | $ | 9.070 | | | $ | 9.180 | | | $ | 8.610 | | | $ | 9.490 | |
|
| Income (Loss) From Operations | |
Net investment income(1) | | $ | 0.154 | | | $ | 0.331 | | | $ | 0.346 | | | $ | 0.366 | | | $ | 0.382 | | | $ | 0.372 | |
Net realized and unrealized gain (loss) | | | (0.231 | ) | | | (0.293 | ) | | | 0.239 | | | | (0.113 | ) | | | 0.571 | | | | (0.883 | ) |
| | | | | | |
Total income (loss) from operations | | $ | (0.077 | ) | | $ | 0.038 | | | $ | 0.585 | | | $ | 0.253 | | | $ | 0.953 | | | $ | (0.511 | ) |
|
| Less Distributions | |
From net investment income | | $ | (0.153 | ) | | $ | (0.328 | ) | | $ | (0.345 | ) | | $ | (0.363 | ) | | $ | (0.383 | ) | | $ | (0.369 | ) |
| | | | | | |
Total distributions | | $ | (0.153 | ) | | $ | (0.328 | ) | | $ | (0.345 | ) | | $ | (0.363 | ) | | $ | (0.383 | ) | | $ | (0.369 | ) |
| | | | | | |
Net asset value — End of period | | $ | 8.790 | | | $ | 9.020 | | | $ | 9.310 | | | $ | 9.070 | | | $ | 9.180 | | | $ | 8.610 | |
| | | | | | |
Total Return(2) | | | (0.86 | )%(3) | | | 0.48 | % | | | 6.54 | % | | | 2.80 | % | | | 11.28 | % | | | (5.53 | )% |
|
| Ratios/Supplemental Data | |
Net assets, end of period (000’s omitted) | | $ | 33,736 | | | $ | 32,065 | | | $ | 20,957 | | | $ | 12,552 | | | $ | 8,882 | | | $ | 6,596 | |
Ratios (as a percentage of average daily net assets): | | | | | | | | | | | | | | | | | | | | | | | | |
Expenses excluding interest and fees(4) | | | 0.51 | %(5) | | | 0.52 | % | | | 0.51 | % | | | 0.52 | % | | | 0.50 | % | | | 0.54 | % |
Interest and fee expense(6) | | | 0.15 | %(5) | | | 0.11 | % | | | 0.05 | % | | | 0.02 | % | | | 0.04 | % | | | 0.03 | % |
Total expenses(4) | | | 0.66 | %(5) | | | 0.63 | % | | | 0.56 | % | | | 0.54 | % | | | 0.54 | % | | | 0.57 | % |
Net investment income | | | 3.47 | %(5) | | | 3.68 | % | | | 3.73 | % | | | 4.00 | % | | | 4.28 | % | | | 4.06 | % |
Portfolio Turnover | | | 8 | %(3) | | | 10 | % | | | 9 | % | | | 4 | % | | | 5 | % | | | 9 | % |
| (1) | Computed using average shares outstanding. |
| (2) | Returns are historical and are calculated by determining the percentage change in net asset value with all distributions reinvested. |
| (4) | Excludes the effect of custody fee credits, if any, of less than 0.005%. Effective September 1, 2015, custody fee credits, which were earned on cash deposit balances, were discontinued by the custodian. |
| (6) | Interest and fee expense relates to the liability for floating rate notes issued in conjunction with residual interest bond transactions (see Note 1H). |
| | | | |
| | 41 | | See Notes to Financial Statements. |
Eaton Vance
Municipal Income Funds
March 31, 2018
Notes to Financial Statements (Unaudited)
1 Significant Accounting Policies
Eaton Vance Municipals Trust (the Trust) is a Massachusetts business trust registered under the Investment Company Act of 1940, as amended (the 1940 Act), as an open-end management investment company. The Trust presently consists of eighteen funds, four of which, each non-diversified, are included in these financial statements. They include Eaton Vance California Municipal Opportunities Fund (California Opportunities Fund), Eaton Vance Massachusetts Municipal Income Fund (Massachusetts Fund), Eaton Vance New York Municipal Income Fund (New York Fund) and Eaton Vance Ohio Municipal Income Fund (Ohio Fund), (each individually referred to as the Fund, and collectively, the Funds). The investment objective of the Massachusetts Fund, New York Fund and Ohio Fund is to provide current income exempt from regular federal income tax and from particular state or local income or other taxes. The investment objective of the California Opportunities Fund is to seek to maximize after-tax total return. The Funds offer three classes of shares. Class A shares are generally sold subject to a sales charge imposed at time of purchase. Class C shares are sold at net asset value and are generally subject to a contingent deferred sales charge (see Note 5). Class I shares are sold at net asset value and are not subject to a sales charge. Each class represents a pro-rata interest in the Fund, but votes separately on class-specific matters and (as noted below) is subject to different expenses. Realized and unrealized gains and losses are allocated daily to each class of shares based on the relative net assets of each class to the total net assets of the Fund. Net investment income, other than class-specific expenses, is allocated daily to each class of shares based upon the ratio of the value of each class’s paid shares to the total value of all paid shares. Each class of shares differs in its distribution plan and certain other class-specific expenses.
The following is a summary of significant accounting policies of the Funds. The policies are in conformity with accounting principles generally accepted in the United States of America (U.S. GAAP). Each Fund is an investment company and follows accounting and reporting guidance in the Financial Accounting Standards Board (FASB) Accounting Standards Codification Topic 946.
A Investment Valuation — The following methodologies are used to determine the market value or fair value of investments.
Debt Obligations. Debt obligations are generally valued on the basis of valuations provided by third party pricing services, as derived from such services’ pricing models. Inputs to the models may include, but are not limited to, reported trades, executable bid and asked prices, broker/dealer quotations, prices or yields of securities with similar characteristics, interest rates, anticipated prepayments, benchmark curves or information pertaining to the issuer, as well as industry and economic events. The pricing services may use a matrix approach, which considers information regarding securities with similar characteristics to determine the valuation for a security. Short-term obligations purchased with a remaining maturity of sixty days or less for which a valuation from a third party pricing service is not readily available may be valued at amortized cost, which approximates fair value.
Derivatives. Financial futures contracts are valued at the closing settlement price established by the board of trade or exchange on which they are traded.
Fair Valuation. Investments for which valuations or market quotations are not readily available or are deemed unreliable are valued at fair value using methods determined in good faith by or at the direction of the Trustees of a Fund in a manner that fairly reflects the security’s value, or the amount that a Fund might reasonably expect to receive for the security upon its current sale in the ordinary course. Each such determination is based on a consideration of relevant factors, which are likely to vary from one pricing context to another. These factors may include, but are not limited to, the type of security, the existence of any contractual restrictions on the security’s disposition, the price and extent of public trading in similar securities of the issuer or of comparable entities, quotations or relevant information obtained from broker/dealers or other market participants, information obtained from the issuer, analysts, and/or the appropriate stock exchange (for exchange-traded securities), an analysis of the entity’s financial condition, and an evaluation of the forces that influence the issuer and the market(s) in which the security is purchased and sold.
B Investment Transactions and Related Income — Investment transactions for financial statement purposes are accounted for on a trade date basis. Realized gains and losses on investments sold are determined on the basis of identified cost. Interest income is recorded on the basis of interest accrued, adjusted for amortization of premium or accretion of discount.
C Federal Taxes — Each Fund’s policy is to comply with the provisions of the Internal Revenue Code applicable to regulated investment companies and to distribute to shareholders each year substantially all of its taxable, if any, and tax-exempt net investment income, and all or substantially all of its net realized capital gains. Accordingly, no provision for federal income or excise tax is necessary. Each Fund intends to satisfy conditions which will enable it to designate distributions from the interest income generated by its investments in non-taxable municipal securities, which are exempt from regular federal income tax when received by each Fund, as exempt-interest dividends. The portion of such interest, if any, earned on private activity bonds issued after August 7, 1986, may be considered a tax preference item to shareholders.
As of March 31, 2018, the Funds had no uncertain tax positions that would require financial statement recognition, de-recognition, or disclosure. Each Fund files a U.S. federal income tax return annually after its fiscal year-end, which is subject to examination by the Internal Revenue Service for a period of three years from the date of filing.
D Expenses — The majority of expenses of the Trust are directly identifiable to an individual fund. Expenses which are not readily identifiable to a specific fund are allocated taking into consideration, among other things, the nature and type of expense and the relative size of the funds.
E Legal Fees — Legal fees and other related expenses incurred as part of negotiations of the terms and requirement of capital infusions, or that are expected to result in the restructuring of, or a plan of reorganization for, an investment are recorded as realized losses. Ongoing expenditures to protect or enhance an investment are treated as operating expenses.
Eaton Vance
Municipal Income Funds
March 31, 2018
Notes to Financial Statements (Unaudited) — continued
F Use of Estimates — The preparation of the financial statements in conformity with U.S. GAAP requires management to make estimates and assumptions that affect the reported amounts of assets and liabilities at the date of the financial statements and the reported amounts of income and expense during the reporting period. Actual results could differ from those estimates.
G Indemnifications — Under the Trust’s organizational documents, its officers and Trustees may be indemnified against certain liabilities and expenses arising out of the performance of their duties to the Funds. Under Massachusetts law, if certain conditions prevail, shareholders of a Massachusetts business trust (such as the Trust) could be deemed to have personal liability for the obligations of the Trust. However, the Trust’s Declaration of Trust contains an express disclaimer of liability on the part of Fund shareholders and the By-laws provide that the Trust shall assume the defense on behalf of any Fund shareholders. Moreover, the By-laws also provide for indemnification out of Fund property of any shareholder held personally liable solely by reason of being or having been a shareholder for all loss or expense arising from such liability. Additionally, in the normal course of business, each Fund enters into agreements with service providers that may contain indemnification clauses. Each Fund’s maximum exposure under these arrangements is unknown as this would involve future claims that may be made against each Fund that have not yet occurred.
H Floating Rate Notes Issued in Conjunction with Securities Held — The Funds may invest in residual interest bonds, also referred to as inverse floating rate securities, whereby a Fund may sell a variable or fixed rate bond for cash to a Special-Purpose Vehicle (the SPV), (which is generally organized as a trust), while at the same time, buying a residual interest in the assets and cash flows of the SPV. The bond is deposited into the SPV with the same CUSIP number as the bond sold to the SPV by the Fund, and which may have been, but is not required to be, the bond purchased from the Fund (the Bond). The SPV also issues floating rate notes (Floating Rate Notes) which are sold to third-parties. The residual interest bond held by a Fund gives the Fund the right (1) to cause the holders of the Floating Rate Notes to generally tender their notes at par, and (2) to have the Bond held by the SPV transferred to the Fund, thereby terminating the SPV. Should the Fund exercise such right, it would generally pay the SPV the par amount due on the Floating Rate Notes and exchange the residual interest bond for the underlying Bond. Pursuant to generally accepted accounting principles for transfers and servicing of financial assets and extinguishment of liabilities, the Funds account for the transaction described above as a secured borrowing by including the Bond in their Portfolio of Investments and the Floating Rate Notes as a liability under the caption “Payable for floating rate notes issued” in their Statement of Assets and Liabilities. The Floating Rate Notes have interest rates that generally reset weekly and their holders have the option to tender their notes to the SPV for redemption at par at each reset date. Accordingly, the fair value of the payable for floating rate notes issued approximates its carrying value. If measured at fair value, the payable for floating rate notes would have been considered as Level 2 in the fair value hierarchy (see Note 10) at March 31, 2018. Interest expense related to a Fund’s liability with respect to Floating Rate Notes is recorded as incurred. The SPV may be terminated by the Fund, as noted above, or by the occurrence of certain termination events as defined in the trust agreement, such as a downgrade in the credit quality of the underlying Bond, bankruptcy of or payment failure by the issuer of the underlying Bond, the inability to remarket Floating Rate Notes that have been tendered due to insufficient buyers in the market, or the failure by the SPV to obtain renewal of the liquidity agreement under which liquidity support is provided for the Floating Rate Notes up to one year. At March 31, 2018, the amounts of the Funds’ Floating Rate Notes and related interest rates and collateral were as follows:
| | | | | | | | | | | | | | | | |
| | | California
Opportunities
Fund | | | Massachusetts
Fund | | | New York
Fund | | | Ohio Fund | |
| | | | |
Floating Rate Notes Outstanding | | $ | 10,535,014 | | | $ | 3,663,132 | | | $ | 21,620,513 | | | $ | 13,008,026 | |
Interest Rate or Range of Interest Rates (%) | | | 1.59 - 1.60 | | | | 1.71 | | | | 1.60 - 1.61 | | | | 1.61 - 1.75 | |
Collateral for Floating Rate Notes Outstanding | | $ | 14,485,102 | | | $ | 6,925,409 | | | $ | 30,733,792 | | | $ | 19,690,833 | |
For the six months ended March 31, 2018, the Funds’ average Floating Rate Notes outstanding and the average interest rate (annualized) including fees were as follows:
| | | | | | | | | | | | | | | | |
| | | California
Opportunities
Fund | | | Massachusetts
Fund | | | New York
Fund | | | Ohio Fund | |
| | | | |
Average Floating Rate Notes Outstanding | | $ | 10,520,000 | | | $ | 3,640,000 | | | $ | 21,620,000 | | | $ | 12,875,934 | |
Average Interest Rate | | | 1.74 | % | | | 1.78 | % | | | 1.75 | % | | | 1.83 | % |
In certain circumstances, the Funds may enter into shortfall and forbearance agreements with brokers by which a Fund agrees to reimburse the broker for the difference between the liquidation value of the Bond held by the SPV and the liquidation value of the Floating Rate Notes, as well as any shortfalls in interest cash flows. The Funds had no shortfalls as of March 31, 2018.
The Funds may also purchase residual interest bonds in a secondary market transaction without first owning the underlying bond. Such transactions are not required to be treated as secured borrowings. Shortfall agreements, if any, related to residual interest bonds purchased in a secondary market transaction are disclosed in the Portfolio of Investments.
Eaton Vance
Municipal Income Funds
March 31, 2018
Notes to Financial Statements (Unaudited) — continued
The Funds’ investment policies and restrictions expressly permit investments in residual interest bonds. Such bonds typically offer the potential for yields exceeding the yields available on fixed rate bonds with comparable credit quality and maturity. These securities tend to underperform the market for fixed rate bonds in a rising long-term interest rate environment, but tend to outperform the market for fixed rate bonds when long-term interest rates decline. The value and income of residual interest bonds are generally more volatile than that of a fixed rate bond. The Funds’ investment policies do not allow the Funds to borrow money except as permitted by the 1940 Act. Management believes that the Funds’ restrictions on borrowing money and issuing senior securities (other than as specifically permitted) do not apply to Floating Rate Notes issued by the SPV and included as a liability in the Funds’ Statement of Assets and Liabilities. As secured indebtedness issued by an SPV, Floating Rate Notes are distinct from the borrowings and senior securities to which the Funds’ restrictions apply. Residual interest bonds held by the Funds are securities exempt from registration under Rule 144A of the Securities Act of 1933.
I Financial Futures Contracts — Upon entering into a financial futures contract, a Fund is required to deposit with the broker, either in cash or securities, an amount equal to a certain percentage of the contract amount (initial margin). Subsequent payments, known as variation margin, are made or received by the Fund each business day, depending on the daily fluctuations in the value of the underlying security, and are recorded as unrealized gains or losses by the Fund. Gains (losses) are realized upon the expiration or closing of the financial futures contracts. Should market conditions change unexpectedly, the Fund may not achieve the anticipated benefits of the financial futures contracts and may realize a loss. Futures contracts have minimal counterparty risk as they are exchange traded and the clearinghouse for the exchange is substituted as the counterparty, guaranteeing counterparty performance.
J When-Issued Securities and Delayed Delivery Transactions — The Funds may purchase or sell securities on a delayed delivery or when-issued basis. Payment and delivery may take place after the customary settlement period for that security. At the time the transaction is negotiated, the price of the security that will be delivered is fixed. The Funds maintain cash and/or security positions for these commitments such that sufficient liquid assets will be available to make payments upon settlement. Securities purchased on a delayed delivery or when-issued basis are marked-to-market daily and begin earning interest on settlement date. Losses may arise due to changes in the market value of the underlying securities or if the counterparty does not perform under the contract.
K Interim Financial Statements — The interim financial statements relating to March 31, 2018 and for the six months then ended have not been audited by an independent registered public accounting firm, but in the opinion of the Funds’ management, reflect all adjustments, consisting only of normal recurring adjustments, necessary for the fair presentation of the financial statements.
2 Distributions to Shareholders and Income Tax Information
The net investment income of each Fund is determined daily and substantially all of the net investment income so determined is declared as a dividend to shareholders of record at the time of declaration. Distributions are declared separately for each class of shares. Distributions are paid monthly. Distributions of realized capital gains (reduced by available capital loss carryforwards from prior years) are made at least annually. Shareholders may reinvest income and capital gain distributions in additional shares of the same class of a Fund at the net asset value as of the reinvestment date or, at the election of the shareholder, receive distributions in cash. Distributions to shareholders are determined in accordance with income tax regulations, which may differ from U.S. GAAP. As required by U.S. GAAP, only distributions in excess of tax basis earnings and profits are reported in the financial statements as a return of capital. Permanent differences between book and tax accounting relating to distributions are reclassified to paid-in capital. For tax purposes, distributions from short-term capital gains are considered to be from ordinary income.
At September 30, 2017, the following Funds, for federal income tax purposes, had capital loss carryforwards and deferred capital losses which would reduce the respective Fund’s taxable income arising from future net realized gains on investment transactions, if any, to the extent permitted by the Internal Revenue Code, and thus would reduce the amount of distributions to shareholders, which would otherwise be necessary to relieve the Funds of any liability for federal income or excise tax. Under tax regulations, capital losses incurred in taxable years beginning after December 2010 are considered deferred capital losses and are treated as arising on the first day of a Fund’s next taxable year, retaining the same short-term or long-term character as when originally deferred. Deferred capital losses are required to be used prior to capital loss carryforwards, which carry an expiration date. As a result of this ordering rule, capital loss carryforwards may be more likely to expire unused. The amounts and expiration dates of the capital loss carryforwards, whose character is short-term, and the amounts of the deferred capital losses are as follows:
| | | | | | | | | | | | | | | | |
| Expiration Date | | California
Opportunities
Fund | | | Massachusetts
Fund | | | New York
Fund | | | Ohio
Fund | |
| | | | |
September 30, 2018 | | $ | 12,351,723 | | | $ | 20,239,992 | | | $ | 22,999,420 | | | $ | 10,217,857 | |
September 30, 2019 | | | — | | | | 4,877,692 | | | | 7,036,080 | | | | 3,163,804 | |
| | | | |
Total capital loss carryforwards | | $ | 12,351,723 | | | $ | 25,117,684 | | | $ | 30,035,500 | | | $ | 13,381,661 | |
| | | | |
Deferred capital losses: | | | | | | | | | | | | | | | | |
Short-term | | $ | 4,630,939 | | | $ | 2,028,641 | | | $ | — | | | $ | 4,514,599 | |
Long-term | | $ | — | | | $ | — | | | $ | — | | | $ | 5,477,505 | |
Eaton Vance
Municipal Income Funds
March 31, 2018
Notes to Financial Statements (Unaudited) — continued
At September 30, 2017, the New York Fund had a net capital loss of $2,035,440 attributable to security transactions incurred after October 31, 2016 that it has elected to defer. This net capital loss is treated as arising on the first day of the Fund’s taxable year ending September 30, 2018.
The cost and unrealized appreciation (depreciation) of investments, including open derivative contracts, of each Fund at March 31, 2018, as determined on a federal income tax basis, were as follows:
| | | | | | | | | | | | | | | | |
| | | California
Opportunities
Fund | | | Massachusetts
Fund | | | New York
Fund | | | Ohio
Fund | |
| | | | |
Aggregate cost | | $ | 261,976,805 | | | $ | 134,395,628 | | | $ | 388,454,730 | | | $ | 142,686,761 | |
| | | | |
Gross unrealized appreciation | | $ | 7,320,500 | | | $ | 10,229,688 | | | $ | 15,736,617 | | | $ | 10,949,088 | |
Gross unrealized depreciation | | | (1,216,089 | ) | | | (550,059 | ) | | | (3,535,276 | ) | | | (1,123,348 | ) |
| | | | |
Net unrealized appreciation | | $ | 6,104,411 | | | $ | 9,679,629 | | | $ | 12,201,341 | | | $ | 9,825,740 | |
3 Investment Adviser Fee and Other Transactions with Affiliates
The investment adviser fee is earned by Boston Management and Research (BMR), a subsidiary of Eaton Vance Management (EVM), as compensation for management and investment advisory services rendered to each Fund. The fee is based upon a percentage of average daily net assets plus a percentage of gross income (i.e., income other than gains from the sale of securities) as presented in the following table (except for California Opportunities Fund) and is payable monthly.
| | | | | | | | |
| Daily Net Assets | | Annual Asset
Rate | | | Daily Income
Rate | |
| | |
Up to $20 million | | | 0.10 | % | | | 1.00 | % |
$20 million up to $40 million | | | 0.20 | | | | 2.00 | |
$40 million up to $500 million | | | 0.30 | | | | 3.00 | |
On average daily net assets of $500 million or more, the rates are reduced. For California Opportunities Fund, the annual asset rate and daily income rate are 0.30% and 3.00%, respectively, on average daily net assets of up to $500 million and at reduced rates on daily net assets of $500 million or more.
For the six months ended March 31, 2018, investment adviser fees incurred by the Funds and the effective annual rates, as a percentage of average daily net assets, were as follows:
| | | | | | | | | | | | | | | | |
| | | California
Opportunities
Fund | | | Massachusetts
Fund | | | New York
Fund | | | Ohio
Fund | |
| | | | |
Investment Adviser Fee | | $ | 532,881 | | | $ | 287,585 | | | $ | 838,541 | | | $ | 296,575 | |
Effective Annual Rate | | | 0.40 | % | | | 0.37 | % | | | 0.39 | % | | | 0.37 | % |
EVM serves as the administrator of each Fund, but receives no compensation. EVM provides sub-transfer agency and related services to the Funds pursuant to a Sub-Transfer Agency Support Services Agreement. Eaton Vance Distributors, Inc. (EVD), an affiliate of EVM and the Funds’ principal underwriter, received a portion of the sales charge on sales of Class A shares of the Funds. EVD also received distribution and service fees from Class A
Eaton Vance
Municipal Income Funds
March 31, 2018
Notes to Financial Statements (Unaudited) — continued
and Class C shares (see Note 4) and contingent deferred sales charges (see Note 5). Sub-transfer agent fees earned by EVM, which are included in transfer and dividend disbursing agent fees on the Statements of Operations, and Class A sales charges that the Funds were informed were received by EVD for the six months ended March 31, 2018 were as follows:
| | | | | | | | | | | | | | | | |
| | | California
Opportunities
Fund | | | Massachusetts
Fund | | | New York
Fund | | | Ohio
Fund | |
| | | | |
EVM’s Sub-Transfer Agent Fees | | $ | 5,558 | | | $ | 6,261 | | | $ | 15,664 | | | $ | 5,076 | |
EVD’s Class A Sales Charges | | $ | 8,294 | | | $ | 1,724 | | | $ | 13,111 | | | $ | 11,042 | |
Trustees and officers of the Funds who are members of EVM’s or BMR’s organizations receive remuneration for their services to the Funds out of the investment adviser fee. Trustees of the Funds who are not affiliated with the investment adviser may elect to defer receipt of all or a percentage of their annual fees in accordance with the terms of the Trustees Deferred Compensation Plan. For the six months ended March 31, 2018, no significant amounts have been deferred. Certain officers and Trustees of the Funds are officers of the above organizations.
4 Distribution Plans
Each Fund has in effect a distribution plan for Class A shares (Class A Plan) pursuant to Rule 12b-1 under the 1940 Act. The Class A Plan provides that each Fund will pay EVD a distribution and service fee not exceeding 0.25% per annum of its average daily net assets attributable to Class A shares for distribution services and facilities provided to each Fund by EVD, as well as for personal services and/or the maintenance of shareholder accounts. The Trustees approved distribution and service fee payments equal to 0.20% (0.25% for California Opportunities Fund) per annum of each Fund’s average daily net assets attributable to Class A shares. Distribution and service fees paid or accrued to EVD for the six months ended March 31, 2018 for Class A shares amounted to the following:
| | | | | | | | | | | | | | | | |
| | | California
Opportunities
Fund | | | Massachusetts
Fund | | | New York
Fund | | | Ohio Fund | |
Class A Distribution and Service Fees | | $ | 152,771 | | | $ | 96,308 | | | $ | 239,997 | | | $ | 107,273 | |
Each Fund also has in effect a distribution plan for Class C shares (Class C Plan) pursuant to Rule 12b-1 under the 1940 Act. Pursuant to the Class C Plan, each Fund pays EVD amounts equal to 0.75% per annum of its average daily net assets attributable to Class C shares for providing ongoing distribution services and facilities to the respective Funds. For the six months ended March 31, 2018, the Funds paid or accrued to EVD the following distribution fees:
| | | | | | | | | | | | | | | | |
| | | California
Opportunities
Fund | | | Massachusetts
Fund | | | New York
Fund | | | Ohio
Fund | |
Class C Distribution Fees | | $ | 106,671 | | | $ | 66,378 | | | $ | 241,745 | | | $ | 81,054 | |
The Class C Plan also authorizes each Fund to make payments of service fees to EVD, financial intermediaries and other persons in amounts not exceeding 0.25% per annum of the average daily net assets attributable to Class C shares. The Trustees approved service fee payments equal to 0.20% (0.25% for California Opportunities Fund) per annum of each Fund’s average daily net assets attributable to Class C shares. Service fees paid or accrued are for personal services and/or the maintenance of shareholder accounts. They are separate and distinct from the Class C sales commissions and distribution fees payable to EVD. Service fees paid or accrued for the six months ended March 31, 2018 amounted to the following:
| | | | | | | | | | | | | | | | |
| | | California
Opportunities
Fund | | | Massachusetts
Fund | | | New York
Fund | | | Ohio
Fund | |
Class C Service Fees | | $ | 35,557 | | | $ | 17,701 | | | $ | 64,465 | | | $ | 21,615 | |
Distribution and service fees are subject to the limitations contained in the Financial Industry Regulatory Authority Rule 2341(d).
Eaton Vance
Municipal Income Funds
March 31, 2018
Notes to Financial Statements (Unaudited) — continued
5 Contingent Deferred Sales Charges
A contingent deferred sales charge (CDSC) of 1% generally is imposed on redemptions of Class C shares made within one year of purchase. Class A shares may be subject to a 1% CDSC if redeemed within eighteen months of purchase (depending on the circumstances of purchase). Generally, the CDSC is based upon the lower of the net asset value at date of redemption or date of purchase. No charge is levied on shares acquired by reinvestment of dividends or capital gain distributions. For the six months ended March 31, 2018, the Funds were informed that EVD received approximately the following amounts of CDSCs paid by Class A and Class C shareholders:
| | | | | | | | | | | | | | | | |
| | | California
Opportunities
Fund | | | Massachusetts
Fund | | | New York
Fund | | | Ohio
Fund | |
| | | | |
Class A | | $ | — | | | $ | 400 | | | $ | — | | | $ | 1,000 | |
Class C | | $ | 3,000 | | | $ | 300 | | | $ | 1,000 | | | $ | 300 | |
6 Purchases and Sales of Investments
Purchases and sales of investments, other than short-term obligations, for the six months ended March 31, 2018 were as follows:
| | | | | | | | | | | | | | | | |
| | | California
Opportunities
Fund | | | Massachusetts
Fund | | | New York
Fund | | | Ohio
Fund | |
| | | | |
Purchases | | $ | 243,180,831 | | | $ | 42,170,936 | | | $ | 191,807,044 | | | $ | 14,551,893 | |
Sales | | $ | 237,892,575 | | | $ | 55,002,611 | | | $ | 206,683,811 | | | $ | 24,184,543 | |
7 Shares of Beneficial Interest
Each Fund’s Declaration of Trust permits the Trustees to issue an unlimited number of full and fractional shares of beneficial interest (without par value). Such shares may be issued in a number of different series (such as the Funds) and classes. Transactions in Fund shares were as follows:
| | | | | | | | | | | | |
California Opportunities Fund | | | | | | | | | |
| | | Six Months Ended March 31, 2018
(Unaudited) | |
| | | Class A | | | Class C | | | Class I | |
| | | |
Sales | | | 623,286 | | | | 150,458 | | | | 1,994,609 | |
Issued to shareholders electing to receive payments of distributions in Fund shares | | | 124,416 | | | | 23,007 | | | | 134,560 | |
Redemptions | | | (1,112,340 | ) | | | (457,711 | ) | | | (2,391,273 | ) |
| | | |
Net decrease | | | (364,638 | ) | | | (284,246 | ) | | | (262,104 | ) |
| |
| | | Year Ended September 30, 2017 | |
| | | Class A | | | Class C | | | Class I | |
| | | |
Sales | | | 1,447,360 | | | | 592,126 | | | | 7,843,944 | |
Issued to shareholders electing to receive payments of distributions in Fund shares | | | 270,620 | | | | 48,553 | | | | 246,587 | |
Redemptions | | | (3,567,739 | ) | | | (1,046,168 | ) | | | (6,847,120 | ) |
| | | |
Net increase (decrease) | | | (1,849,759 | ) | | | (405,489 | ) | | | 1,243,411 | |
Eaton Vance
Municipal Income Funds
March 31, 2018
Notes to Financial Statements (Unaudited) — continued
| | | | | | | | | | | | |
Massachusetts Fund | |
| | | Six Months Ended March 31, 2018
(Unaudited) | |
| | | Class A | | | Class C | | | Class I | |
| | | |
Sales | | | 176,158 | | | | 52,012 | | | | 586,882 | |
Issued to shareholders electing to receive payments of distributions in Fund shares | | | 151,506 | | | | 21,118 | | | | 66,969 | |
Redemptions | | | (840,978 | ) | | | (345,161 | ) | | | (1,238,613 | ) |
| | | |
Net decrease | | | (513,314 | ) | | | (272,031 | ) | | | (584,762 | ) |
| |
| | | Year Ended September 30, 2017 | |
| | | Class A | | | Class C | | | Class I | |
| | | |
Sales | | | 652,940 | | | | 176,580 | | | | 2,177,079 | |
Issued to shareholders electing to receive payments of distributions in Fund shares | | | 318,881 | | | | 46,592 | | | | 127,306 | |
Redemptions | | | (2,453,009 | ) | | | (691,421 | ) | | | (2,077,643 | ) |
| | | |
Net increase (decrease) | | | (1,481,188 | ) | | | (468,249 | ) | | | 226,742 | |
| | | |
New York Fund | | | | | | | | | |
| | | Six Months Ended March 31, 2018
(Unaudited) | |
| | | Class A | | | Class C | | | Class I | |
| | | |
Sales | | | 865,759 | | | | 253,526 | | | | 2,085,788 | |
Issued to shareholders electing to receive payments of distributions in Fund shares | | | 293,195 | | | | 54,552 | | | | 154,417 | |
Redemptions | | | (2,138,421 | ) | | | (753,538 | ) | | | (2,390,560 | ) |
| | | |
Net decrease | | | (979,467 | ) | | | (445,460 | ) | | | (150,355 | ) |
| | | | | | | | | | | | | | | | |
| |
| | | Year Ended September 30, 2017 | |
| | | Class A | | | Class B(1) | | | Class C | | | Class I | |
| | | | |
Sales | | | 1,941,465 | | | | — | | | | 776,508 | | | | 5,796,836 | |
Issued to shareholders electing to receive payments of distributions in Fund shares | | | 679,823 | | | | — | | | | 130,953 | | | | 269,822 | |
Redemptions | | | (6,372,077 | ) | | | (1,818 | ) | | | (2,043,159 | ) | | | (3,623,976 | ) |
Exchange from Class B shares | | | 868 | | | | — | | | | — | | | | — | |
Exchange to Class A shares | | | — | | | | (867 | ) | | | — | | | | — | |
Merger from Class B shares | | | 178,237 | | | | — | | | | — | | | | — | |
Merger to Class A shares | | | — | | | | (178,001 | ) | | | — | | | | — | |
| | | | |
Net increase (decrease) | | | (3,571,684 | ) | | | (180,686 | ) | | | (1,135,698 | ) | | | 2,442,682 | |
| (1) | At the close of business on October 21, 2016, Class B shares of New York Fund were merged into Class A shares. |
Eaton Vance
Municipal Income Funds
March 31, 2018
Notes to Financial Statements (Unaudited) — continued
| | | | | | | | | | | | |
Ohio Fund | | | |
| | | Six Months Ended March 31, 2018
(Unaudited) | |
| | | Class A | | | Class C | | | Class I | |
| | | |
Sales | | | 469,369 | | | | 202,140 | | | | 665,725 | |
Issued to shareholders electing to receive payments of distributions in Fund shares | | | 165,635 | | | | 25,715 | | | | 48,995 | |
Redemptions | | | (1,537,278 | ) | | | (304,677 | ) | | | (430,983 | ) |
| | | |
Net increase (decrease) | | | (902,274 | ) | | | (76,822 | ) | | | 283,737 | |
| |
| | | Year Ended September 30, 2017 | |
| | | Class A | | | Class C | | | Class I | |
| | | |
Sales | | | 842,160 | | | | 257,271 | | | | 2,028,886 | |
Issued to shareholders electing to receive payments of distributions in Fund shares | | | 391,218 | | | | 57,851 | | | | 77,809 | |
Redemptions | | | (3,201,723 | ) | | | (519,637 | ) | | | (803,429 | ) |
| | | |
Net increase (decrease) | | | (1,968,345 | ) | | | (204,515 | ) | | | 1,303,266 | |
8 Line of Credit
The Funds participate with other portfolios and funds managed by EVM and its affiliates in a $625 million unsecured line of credit agreement with a group of banks, which is in effect through October 30, 2018. Borrowings are made by the Funds solely to facilitate the handling of unusual and/or unanticipated short-term cash requirements. Interest is charged to each Fund based on its borrowings at an amount above either the Eurodollar rate or Federal Funds rate. In addition, a fee computed at an annual rate of 0.15% on the daily unused portion of the line of credit is allocated among the participating portfolios and funds at the end of each quarter. Because the line of credit is not available exclusively to the Funds, a Fund may be unable to borrow some or all of its requested amounts at any particular time. The Funds did not have any significant borrowings or allocated fees during the six months ended March 31, 2018.
9 Financial Instruments
The Funds may trade in financial instruments with off-balance sheet risk in the normal course of their investing activities. These financial instruments may include financial futures contracts and may involve, to a varying degree, elements of risk in excess of the amounts recognized for financial statement purposes. The notional or contractual amounts of these instruments represent the investment a Fund has in particular classes of financial instruments and do not necessarily represent the amounts potentially subject to risk. The measurement of the risks associated with these instruments is meaningful only when all related and offsetting transactions are considered. A summary of obligations under these financial instruments at March 31, 2018 is included in the Portfolio of Investments. At March 31, 2018, the Funds had sufficient cash and/or securities to cover commitments under these contracts.
Each Fund is subject to interest rate risk in the normal course of pursuing its investment objective. Because the Funds hold fixed-rate bonds, the value of these bonds may decrease if interest rates rise. The Funds enter into U.S. Treasury futures contracts to hedge against changes in interest rates.
The fair values of open derivative instruments (not considered to be hedging instruments for accounting disclosure purposes) and whose primary underlying risk exposure is interest rate risk at March 31, 2018 were as follows:
| | | | | | | | | | | | |
| | | Massachusetts
Fund | | | New York
Fund | | | Ohio
Fund | |
| | |
Liability Derivative: | | | | | | | | |
| | | |
Futures Contracts | | $ | (152,035 | )(1) | | $ | (389,208 | )(1) | | $ | (167,238 | )(1) |
| | | |
Total | | $ | (152,035 | ) | | $ | (389,208 | ) | | $ | (167,238 | ) |
| (1) | Amount represents cumulative unrealized depreciation on futures contracts. Only the current day’s variation margin on open futures contracts is reported within the Statement of Assets and Liabilities as Payable for variation margin on open financial futures contracts. |
Eaton Vance
Municipal Income Funds
March 31, 2018
Notes to Financial Statements (Unaudited) — continued
The effect of derivative instruments (not considered to be hedging instruments for accounting disclosure purposes) on the Statement of Operations and whose primary underlying risk exposure is interest rate risk for the six months ended March 31, 2018 was as follows:
| | | | | | | | | | | | |
| | | Massachusetts
Fund | | | New York
Fund | | | Ohio
Fund | |
| | | |
Realized Gain (Loss) on Derivatives Recognized in Income | | $ | 480,860 | (1) | | $ | 1,231,003 | (1) | | $ | 528,946 | (1) |
Change in Unrealized Appreciation (Depreciation) on Derivatives Recognized in Income | | $ | (277,332 | )(2) | | $ | (709,967 | )(2) | | $ | (305,064 | )(2) |
| (1) | Statement of Operations location: Net realized gain (loss) – Financial futures contracts. |
| (2) | Statement of Operations location: Change in unrealized appreciation (depreciation) – Financial futures contracts. |
The average notional cost of futures contracts outstanding during the six months ended March 31, 2018, which is indicative of the volume of this derivative type, was approximately as follows:
| | | | | | | | | | | | |
| | | Massachusetts
Fund | | | New York
Fund | | | Ohio
Fund | |
| | |
Average Notional Cost: | | | | | | | | |
| | | |
Futures Contracts — Short | | $ | 7,555,000 | | | $ | 19,341,000 | | | $ | 8,311,000 | |
10 Fair Value Measurements
Under generally accepted accounting principles for fair value measurements, a three-tier hierarchy to prioritize the assumptions, referred to as inputs, is used in valuation techniques to measure fair value. The three-tier hierarchy of inputs is summarized in the three broad levels listed below.
| • | | Level 1 – quoted prices in active markets for identical investments |
| • | | Level 2 – other significant observable inputs (including quoted prices for similar investments, interest rates, prepayment speeds, credit risk, etc.) |
| • | | Level 3 – significant unobservable inputs (including a fund’s own assumptions in determining the fair value of investments) |
In cases where the inputs used to measure fair value fall in different levels of the fair value hierarchy, the level disclosed is determined based on the lowest level input that is significant to the fair value measurement in its entirety. The inputs or methodology used for valuing securities are not necessarily an indication of the risk associated with investing in those securities.
At March 31, 2018, the hierarchy of inputs used in valuing the Funds’ investments and open derivative instruments, which are carried at value, were as follows:
| | | | | | | | | | | | | | | | |
California Opportunities Fund | |
| Asset Description | | Level 1 | | | Level 2 | | | Level 3 | | | Total | |
| | | | |
Tax-Exempt Municipal Securities | | $ | — | | | $ | 269,947,720 | | | $ | — | | | $ | 269,947,720 | |
| | | | |
Taxable Municipal Securities | | | — | | | | 8,668,510 | | | | — | | | | 8,668,510 | |
| | | | |
Total Investments | | $ | — | | | $ | 278,616,230 | | | $ | — | | | $ | 278,616,230 | |
|
Massachusetts Fund | |
| Asset Description | | Level 1 | | | Level 2 | | | Level 3 | | | Total | |
| | | | |
Tax-Exempt Investments | | $ | — | | | $ | 147,890,424 | | | $ | — | | | $ | 147,890,424 | |
| | | | |
Total Investments | | $ | — | | | $ | 147,890,424 | | | $ | — | | | $ | 147,890,424 | |
| | | | |
Liability Description | | | | | | | | | | | | | | | | |
| | | | |
Futures Contracts | | $ | (152,035 | ) | | $ | — | | | $ | — | | | $ | (152,035 | ) |
| | | | |
Total | | $ | (152,035 | ) | | $ | — | | | $ | — | | | $ | (152,035 | ) |
Eaton Vance
Municipal Income Funds
March 31, 2018
Notes to Financial Statements (Unaudited) — continued
| | | | | | | | | | | | | | | | |
New York Fund | |
| Asset Description | | Level 1 | | | Level 2 | | | Level 3* | | | Total | |
| | | | |
Tax-Exempt Investments | | $ | — | | | $ | 421,519,721 | | | $ | — | | | $ | 421,519,721 | |
Miscellaneous | | | — | | | | — | | | | 1,146,071 | | | | 1,146,071 | |
| | | | |
Total Investments | | $ | — | | | $ | 421,519,721 | | | $ | 1,146,071 | | | $ | 422,665,792 | |
| | | | |
Liability Description | | | | | | | | | | | | | | | | |
| | | | |
Futures Contracts | | $ | (389,208 | ) | | $ | — | | | $ | — | | | $ | (389,208 | ) |
| | | | |
Total | | $ | (389,208 | ) | | $ | — | | | $ | — | | | $ | (389,208 | ) |
|
Ohio Fund | |
| Asset Description | | Level 1 | | | Level 2 | | | Level 3 | | | Total | |
| | | | |
Tax-Exempt Investments | | $ | — | | | $ | 165,687,765 | | | $ | — | | | $ | 165,687,765 | |
| | | | |
Total Investments | | $ | — | | | $ | 165,687,765 | | | $ | — | | | $ | 165,687,765 | |
| | | | |
Liability Description | | | | | | | | | | | | | | | | |
| | | | |
Futures Contracts | | $ | (167,238 | ) | | $ | — | | | $ | — | | | $ | (167,238 | ) |
| | | | |
Total | | $ | (167,238 | ) | | $ | — | | | $ | — | | | $ | (167,238 | ) |
| * | None of the unobservable inputs for Level 3 assets, individually or collectively, had a material impact on the New York Fund. |
The California Opportunities Fund, Massachusetts Fund and Ohio Fund held no investments or other financial instruments as of September 30, 2017 whose fair value was determined using Level 3 inputs.
Level 3 investments held by New York Fund at the beginning and/or end of period in relation to net assets were not significant and accordingly, a reconciliation of Level 3 assets for the six months ended March 31, 2018 is not presented.
At March 31, 2018, there were no investments transferred between Level 1 and Level 2 during the six months then ended.
Eaton Vance
Municipal Income Funds
March 31, 2018
Officers and Trustees
Officers of Eaton Vance Municipals Trust
Payson F. Swaffield
President
Maureen A. Gemma
Vice President, Secretary and Chief
Legal Officer
James F. Kirchner
Treasurer
Richard F. Froio
Chief Compliance Officer
Trustees of Eaton Vance Municipals Trust
William H. Park
Chairperson
Thomas E. Faust Jr.*
Mark R. Fetting
Cynthia E. Frost
George J. Gorman
Valerie A. Mosley
Helen Frame Peters
Susan J. Sutherland
Harriett Tee Taggart
Scott E. Wennerholm
Eaton Vance Funds
IMPORTANT NOTICES
Privacy. The Eaton Vance organization is committed to ensuring your financial privacy. Each of the financial institutions identified below has in effect the following policy (“Privacy Policy”) with respect to nonpublic personal information about its customers:
| • | | Only such information received from you, through application forms or otherwise, and information about your Eaton Vance fund transactions will be collected. This may include information such as name, address, social security number, tax status, account balances and transactions. |
| • | | None of such information about you (or former customers) will be disclosed to anyone, except as permitted by law (which includes disclosure to employees necessary to service your account). In the normal course of servicing a customer’s account, Eaton Vance may share information with unaffiliated third parties that perform various required services such as transfer agents, custodians and broker-dealers. |
| • | | Policies and procedures (including physical, electronic and procedural safeguards) are in place that are designed to protect the confidentiality of such information. |
| • | | We reserve the right to change our Privacy Policy at any time upon proper notification to you. Customers may want to review our Privacy Policy periodically for changes by accessing the link on our homepage: www.eatonvance.com. |
Our pledge of privacy applies to the following entities within the Eaton Vance organization: the Eaton Vance Family of Funds, Eaton Vance Management, Eaton Vance Investment Counsel, Eaton Vance Distributors, Inc., Eaton Vance Trust Company, Eaton Vance Management (International) Limited, Eaton Vance Advisers International Ltd., Eaton Vance Management’s Real Estate Investment Group and Boston Management and Research. In addition, our Privacy Policy applies only to those Eaton Vance customers who are individuals and who have a direct relationship with us. If a customer’s account (i.e., fund shares) is held in the name of a third-party financial advisor/broker-dealer, it is likely that only such advisor’s privacy policies apply to the customer. This notice supersedes all previously issued privacy disclosures. For more information about Eaton Vance’s Privacy Policy, please call 1-800-262-1122.
Delivery of Shareholder Documents. The Securities and Exchange Commission (SEC) permits funds to deliver only one copy of shareholder documents, including prospectuses, proxy statements and shareholder reports, to fund investors with multiple accounts at the same residential or post office box address. This practice is often called “householding” and it helps eliminate duplicate mailings to shareholders. Eaton Vance, or your financial advisor, may household the mailing of your documents indefinitely unless you instruct Eaton Vance, or your financial advisor, otherwise. If you would prefer that your Eaton Vance documents not be householded, please contact Eaton Vance at 1-800-262-1122, or contact your financial advisor. Your instructions that householding not apply to delivery of your Eaton Vance documents will typically be effective within 30 days of receipt by Eaton Vance or your financial advisor.
Portfolio Holdings. Each Eaton Vance Fund and its underlying Portfolio(s) (if applicable) will file a schedule of portfolio holdings on Form N-Q with the SEC for the first and third quarters of each fiscal year. The Form N-Q will be available on the Eaton Vance website at www.eatonvance.com, by calling Eaton Vance at 1-800-262-1122 or in the EDGAR database on the SEC’s website at www.sec.gov. Form N-Q may also be reviewed and copied at the SEC’s public reference room in Washington, D.C. (call 1-800-732-0330 for information on the operation of the public reference room).
Proxy Voting. From time to time, funds are required to vote proxies related to the securities held by the funds. The Eaton Vance Funds or their underlying Portfolios (if applicable) vote proxies according to a set of policies and procedures approved by the Funds’ and Portfolios’ Boards. You may obtain a description of these policies and procedures and information on how the Funds or Portfolios voted proxies relating to portfolio securities during the most recent 12-month period ended June 30, without charge, upon request, by calling 1-800-262-1122 and by accessing the SEC’s website at www.sec.gov.
This Page Intentionally Left Blank
This Page Intentionally Left Blank
This Page Intentionally Left Blank
Investment Adviser
Boston Management and Research
Two International Place
Boston, MA 02110
Administrator
Eaton Vance Management
Two International Place
Boston, MA 02110
Principal Underwriter*
Eaton Vance Distributors, Inc.
Two International Place
Boston, MA 02110
(617) 482-8260
Custodian
State Street Bank and Trust Company
State Street Financial Center, One Lincoln Street
Boston, MA 02111
Transfer Agent
BNY Mellon Investment Servicing (US) Inc.
Attn: Eaton Vance Funds
P.O. Box 9653
Providence, RI 02940-9653
(800) 262-1122
Fund Offices
Two International Place
Boston, MA 02110
| * | FINRA BrokerCheck. Investors may check the background of their Investment Professional by contacting the Financial Industry Regulatory Authority (FINRA). FINRA BrokerCheck is a free tool to help investors check the professional background of current and former FINRA-registered securities firms and brokers. FINRA BrokerCheck is available by calling 1-800-289-9999 and at www.FINRA.org. The FINRA BrokerCheck brochure describing this program is available to investors at www.FINRA.org. |
7708 3.31.18
Item 2. Code of Ethics
Not required in this filing.
Item 3. Audit Committee Financial Expert
Not required in this filing.
Item 4. Principal Accountant Fees and Services
Rule 2-01(c)(1)(ii)(A) of Regulation S-X (the “Loan Rule”) prohibits an accounting firm, such as the Trust’s principal accountant, Deloitte & Touche LLP (“D&T”), from having certain financial relationships with their audit clients and affiliated entities. Specifically, the Loan Rule provides, in relevant part, that an accounting firm generally would not be independent if it or a “covered person” of the accounting firm (within the meaning of applicable SEC rules relating to auditor independence) receives a loan from a lender that is a “record or beneficial owner of more than ten percent of the audit client’s equity securities.” Based on information provided to the Audit Committee of the Board of Trustees (the “Audit Committee”) of the Eaton Vance family of funds
by D&T, certain relationships between D&T and its affiliates (“Deloitte Entities”) and one or more lenders who are record owners of shares of one or more funds within the Eaton Vance family of funds (the “Funds”) implicate the Loan Rule, calling into question D&T’s independence with respect to the Funds. The Funds are providing this disclosure to explain the facts and circumstances as well as D&T’s conclusions concerning D&T’s objectivity and impartiality with respect to the audits of the Funds notwithstanding the existence of one or more breaches of the Loan Rule.
On June 20, 2016, the U.S. Securities and Exchange Commission (the “SEC”) issued no-action relief to another mutual fund complex (see Fidelity Management & Research Company et al., No-Action Letter (June 20, 2016) (the “No-Action Letter”)) related to an auditor independence issue arising under the Loan Rule. In the No-Action Letter, the SEC indicated that it would not recommend enforcement action against the fund group if the auditor is not in compliance with the Loan Rule provided that: (1) the auditor has complied with PCAOB Rule 3526(b)(1) and 3526(b)(2); (2) the auditor’s non-compliance under the Loan Rule is with respect to certain lending relationships; and (3) notwithstanding such non-compliance, the auditor has concluded that it is objective and impartial with respect to the issues encompassed within its engagement as auditor of the funds. Although the relief contained in the No-Action Letter was scheduled to expire eighteen months from issuance, it was extended via a subsequent no-action letter issued on September 22, 2017 (see Fidelity Management & Research Company et al., No-Action Letter (Sept. 22, 2017)).
Based on information provided by D&T to the Audit Committee, the requirements of the No-Action Letter appear to be met with respect to D&T’s lending relationships described above. Among other things, D&T has advised the Audit Committee of its conclusion that the consequences of the breach of the Loan Rule have been satisfactorily addressed, that D&T’s objectivity and impartiality in the planning and conduct of the audits of the Fund’s financial statements has not been compromised and that, notwithstanding the breach, D&T is in a position to continue as the auditor for the Funds and D&T does not believe any actions need to be taken with respect to previously issued reports by D&T. D&T has advised the Audit Committee that these conclusions were based in part on its consideration of the No-Action Letter and other relevant information communicated to the Audit Committee.
Item 5. Audit Committee of Listed Registrants
Not applicable.
Item 6. Schedule of Investments
Please see schedule of investments contained in the Report to Stockholders included under Item 1 of this Form N-CSR.
Item 7. Disclosure of Proxy Voting Policies and Procedures for Closed-End Management Investment Companies
Not applicable.
Item 8. Portfolio Managers of Closed-End Management Investment Companies
Not applicable.
Item 9. Purchases of Equity Securities by Closed-End Management Investment Company and Affiliated Purchasers
Not applicable.
Item 10. Submission of Matters to a Vote of Security Holders
No material changes.
Item 11. Controls and Procedures
(a) It is the conclusion of the registrant’s principal executive officer and principal financial officer that the effectiveness of the registrant’s current disclosure controls and procedures (such disclosure controls and procedures having been evaluated within 90 days of the date of this filing) provide reasonable assurance that the information required to be disclosed by the registrant has been recorded, processed, summarized and reported within the time period specified in the Commission’s rules and forms and that the information required to be disclosed by the registrant has been accumulated and communicated to the registrant’s principal executive officer and principal financial officer in order to allow timely decisions regarding required disclosure.
(b) There have been no changes in the registrant’s internal controls over financial reporting during the second fiscal quarter of the period covered by this report that has materially affected, or is reasonably likely to materially affect, the registrant’s internal control over financial reporting.
Item 12. Disclosure of Securities Lending Activities for Closed-End Management Investment Companies
Not applicable.
Item 13. Exhibits
| | |
| (a)(1) | | Registrant’s Code of Ethics – Not applicable (please see Item 2). |
| |
| (a)(2)(i) | | Treasurer’s Section 302 certification. |
| |
| (a)(2)(ii) | | President’s Section 302 certification. |
| |
| (b) | | Combined Section 906 certification. |
Signatures
Pursuant to the requirements of the Securities Exchange Act of 1934 and the Investment Company Act of 1940, the registrant has duly caused this report to be signed on its behalf by the undersigned, thereunto duly authorized.
Eaton Vance Municipals Trust
| | |
| By: | | /s/ Payson F. Swaffield |
| | Payson F. Swaffield |
| | President |
Date: May 24, 2018
Pursuant to the requirements of the Securities Exchange Act of 1934 and the Investment Company Act of 1940, this report has been signed below by the following persons on behalf of the registrant and in the capacities and on the dates indicated.
| | |
| By: | | /s/ James F. Kirchner |
| | James F. Kirchner |
| | Treasurer |
Date: May 24, 2018
| | |
| By: | | /s/ Payson F. Swaffield |
| | Payson F. Swaffield |
| | President |
Date: May 24, 2018