UNITED STATES
SECURITIES AND EXCHANGE COMMISSION
Washington, D.C. 20549
FormN-CSR
CERTIFIED SHAREHOLDER REPORT OF REGISTERED
MANAGEMENT INVESTMENT COMPANIES
Investment Company Act File Number: 811-04409
Eaton Vance Municipals Trust
(Exact Name of Registrant as Specified in Charter)
Two International Place, Boston, Massachusetts 02110
(Address of Principal Executive Offices)
Maureen A. Gemma
Two International Place, Boston, Massachusetts 02110
(Name and Address of Agent for Services)
(617)482-8260
(Registrant’s Telephone Number)
July 31
Date of Fiscal Year End
January 31, 2019
Date of Reporting Period
Item 1. Reports to Stockholders

Eaton Vance
Municipals Trust
Semiannual Report
January 31, 2019
Arizona • Connecticut • Minnesota • New Jersey • Pennsylvania
Important Note. Beginning on January 1, 2021, as permitted by regulations adopted by the Securities and Exchange Commission, paper copies of each Fund’s annual and semi-annual shareholder reports will no longer be sent by mail unless you specifically request paper copies of the reports. Instead, the reports will be made available on the Funds’ website (eatonvance.com/funddocuments), and you will be notified by mail each time a report is posted and provided with a website address to access the report.
If you already elected to receive shareholder reports electronically, you will not be affected by this change and you need not take any action. If you are a direct investor, you may elect to receive shareholder reports and other communications from the Fund electronically by signing up for e-Delivery at eatonvance.com/edelivery. If you own your shares through a financial intermediary (such as a broker-dealer or bank), you must contact your financial intermediary to sign up.
You may elect to receive all future Fund shareholder reports in paper free of charge. If you are a direct investor, you can inform the Fund that you wish to continue receiving paper copies of your shareholder reports by calling 1-800-262-1122. If you own these shares through a financial intermediary, you must contact your financial intermediary or follow instructions included with this disclosure, if applicable, to elect to continue to receive paper copies of your shareholder reports. Your election to receive reports in paper will apply to all Eaton Vance funds held directly or to all funds held through your financial intermediary, as applicable.

Commodity Futures Trading Commission Registration. Effective December 31, 2012, the Commodity Futures Trading Commission (“CFTC”) adopted certain regulatory changes that subject registered investment companies and advisers to regulation by the CFTC if a fund invests more than a prescribed level of its assets in certain CFTC-regulated instruments (including futures, certain options and swap agreements) or markets itself as providing investment exposure to such instruments. Each Fund has claimed an exclusion from the definition of the term “commodity pool operator” under the Commodity Exchange Act. Accordingly, neither the Funds nor the adviser with respect to the operation of the Funds is subject to CFTC regulation. Because of its management of other strategies, each Fund’s adviser is registered with the CFTC as a commodity pool operator and a commodity trading advisor.
Fund shares are not insured by the FDIC and are not deposits or other obligations of, or guaranteed by, any depository institution. Shares are subject to investment risks, including possible loss of principal invested.
This report must be preceded or accompanied by a current summary prospectus or prospectus. Before investing, investors should consider carefully the investment objective, risks, and charges and expenses of a mutual fund. This and other important information is contained in the summary prospectus and prospectus, which can be obtained from a financial advisor. Prospective investors should read the prospectus carefully before investing. For further information, please call 1-800-262-1122.
Semiannual ReportJanuary 31, 2019
Eaton Vance
Municipal Income Funds
Table of Contents
| | | | |
Performance and Fund Profile | | | | |
| |
| | | | |
Arizona Municipal Income Fund | | | 2 | |
Connecticut Municipal Income Fund | | | 3 | |
Minnesota Municipal Income Fund | | | 4 | |
New Jersey Municipal Income Fund | | | 5 | |
Pennsylvania Municipal Income Fund | | | 6 | |
| |
| | | | |
| |
Endnotes and Additional Disclosures | | | 7 | |
| |
Fund Expenses | | | 8 | |
| |
Financial Statements | | | 11 | |
| |
Special Meeting of Shareholders | | | 59 | |
| |
Officers and Trustees | | | 60 | |
| |
Important Notices | | | 61 | |
Eaton Vance
Arizona Municipal Income Fund
January 31, 2019
Performance1,2
Portfolio ManagerCraig R. Brandon, CFA
| | | | | | | | | | | | | | | | | | | | | | | | |
| % Average Annual Total Returns | | Class
Inception Date | | | Performance
Inception Date | | | Six Months | | | One Year | | | Five Years | | | Ten Years | |
Class A at NAV | | | 12/13/1993 | | | | 07/25/1991 | | | | 1.51 | % | | | 2.88 | % | | | 3.39 | % | | | 4.93 | % |
Class A with 4.75% Maximum Sales Charge | | | — | | | | — | | | | –3.30 | | | | –1.99 | | | | 2.39 | | | | 4.42 | |
Class C at NAV | | | 12/16/2005 | | | | 07/25/1991 | | | | 1.02 | | | | 2.02 | | | | 2.59 | | | | 4.14 | |
Class C with 1% Maximum Sales Charge | | | — | | | | — | | | | 0.02 | | | | 1.02 | | | | 2.59 | | | | 4.14 | |
Class I at NAV | | | 08/03/2010 | | | | 07/25/1991 | | | | 1.61 | | | | 3.08 | | | | 3.59 | | | | 5.11 | |
Bloomberg Barclays Municipal Bond Index | | | — | | | | — | | | | 2.05 | % | | | 3.26 | % | | | 3.57 | % | | | 4.55 | % |
Bloomberg Barclays 20 Year Municipal Bond Index | | | — | | | | — | | | | 2.09 | | | | 3.55 | | | | 4.67 | | | | 5.97 | |
| | | | | | |
| | | | | | | | | | | | | | | | | | | | | | | | |
| % Total Annual Operating Expense Ratios3 | | | | | | | | | | | Class A | | | Class C | | | Class I | |
| | | | | | | | | | | | | | | 0.71 | % | | | 1.46 | % | | | 0.51 | % |
| | | | | | |
| | | | | | | | | | | | | | | | | | | | | | | | |
| % Distribution Rates/Yields4 | | | | | | | | | | | Class A | | | Class C | | | Class I | |
Distribution Rate | | | | | | | | | | | | | | | 2.66 | % | | | 1.90 | % | | | 2.86 | % |
Taxable-Equivalent Distribution Rate | | | | | | | | | | | | | | | 4.71 | | | | 3.36 | | | | 5.06 | |
SEC30-day Yield | | | | | | | | | | | | | | | 1.81 | | | | 1.16 | | | | 2.10 | |
Taxable-Equivalent SEC30-day Yield | | | | | | | | | | | | | | | 3.20 | | | | 2.05 | | | | 3.72 | |
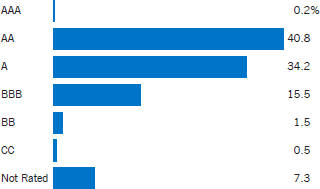
Fund Profile
Credit Quality (% of total investments)6
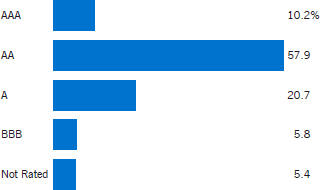
See Endnotes and Additional Disclosures in this report.
Past performance is no guarantee of future results. Returns are historical and are calculated by determining the percentage change in net asset value (NAV) or offering price (as applicable) with all distributions reinvested. Investment return and principal value will fluctuate so that shares, when redeemed, may be worth more or less than their original cost. Performance less than or equal to one year is cumulative. Performance is for the stated time period only; due to market volatility, the Fund’s current performance may be lower or higher than quoted. Returns are before taxes unless otherwise noted. For performance as of the most recentmonth-end, please refer to eatonvance.com.
Eaton Vance
Connecticut Municipal Income Fund
January 31, 2019
Performance1,2
Portfolio ManagerCynthia J. Clemson
| | | | | | | | | | | | | | | | | | | | | | | | |
| % Average Annual Total Returns | | Class
Inception Date | | | Performance
Inception Date | | | Six Months | | | One Year | | | Five Years | | | Ten Years | |
Class A at NAV | | | 04/19/1994 | | | | 05/01/1992 | | | | 1.61 | % | | | 2.66 | % | | | 3.30 | % | | | 4.47 | % |
Class A with 4.75% Maximum Sales Charge | | | — | | | | — | | | | –3.24 | | | | –2.22 | | | | 2.30 | | | | 3.97 | |
Class C at NAV | | | 02/09/2006 | | | | 05/01/1992 | | | | 1.23 | | | | 1.89 | | | | 2.53 | | | | 3.70 | |
Class C with 1% Maximum Sales Charge | | | — | | | | — | | | | 0.23 | | | | 0.90 | | | | 2.53 | | | | 3.70 | |
Class I at NAV | | | 03/03/2008 | | | | 05/01/1992 | | | | 1.72 | | | | 2.86 | | | | 3.51 | | | | 4.68 | |
Bloomberg Barclays Municipal Bond Index | | | — | | | | — | | | | 2.05 | % | | | 3.26 | % | | | 3.57 | % | | | 4.55 | % |
Bloomberg Barclays 20 Year Municipal Bond Index | | | — | | | | — | | | | 2.09 | | | | 3.55 | | | | 4.67 | | | | 5.97 | |
| | | | | | |
| | | | | | | | | | | | | | | | | | | | | | | | |
| % Total Annual Operating Expense Ratios3 | | | | | | | | | | | Class A | | | Class C | | | Class I | |
| | | | | | | | | | | | | | | 0.73 | % | | | 1.48 | % | | | 0.53 | % |
| | | | | | |
| | | | | | | | | | | | | | | | | | | | | | | | |
| % Distribution Rates/Yields4 | | | | | | | | | | | Class A | | | Class C | | | Class I | |
Distribution Rate | | | | | | | | | | | | | | | 2.91 | % | | | 2.15 | % | | | 3.11 | % |
Taxable-Equivalent Distribution Rate | | | | | | | | | | | | | | | 5.28 | | | | 3.90 | | | | 5.65 | |
SEC30-day Yield | | | | | | | | | | | | | | | 1.70 | | | | 1.05 | | | | 1.98 | |
Taxable-Equivalent SEC30-day Yield | | | | | | | | | | | | | | | 3.08 | | | | 1.91 | | | | 3.59 | |
Fund Profile
Credit Quality (% of total investments)6
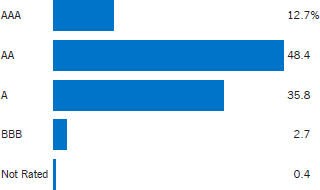
See Endnotes and Additional Disclosures in this report.
Past performance is no guarantee of future results. Returns are historical and are calculated by determining the percentage change in net asset value (NAV) or offering price (as applicable) with all distributions reinvested. Investment return and principal value will fluctuate so that shares, when redeemed, may be worth more or less than their original cost. Performance less than or equal to one year is cumulative. Performance is for the stated time period only; due to market volatility, the Fund’s current performance may be lower or higher than quoted. Returns are before taxes unless otherwise noted. For performance as of the most recentmonth-end, please refer to eatonvance.com.
Eaton Vance
Minnesota Municipal Income Fund
January 31, 2019
Performance1,2
Portfolio ManagerCraig R. Brandon, CFA
| | | | | | | | | | | | | | | | | | | | | | | | |
| % Average Annual Total Returns | | Class Inception Date | | | Performance Inception Date | | | Six Months | | | One Year | | | Five Years | | | Ten Years | |
Class A at NAV | | | 12/09/1993 | | | | 07/29/1991 | | | | 1.83 | % | | | 2.61 | % | | | 2.75 | % | | | 4.40 | % |
Class A with 4.75% Maximum Sales Charge | | | — | | | | — | | | | –2.99 | | | | –2.23 | | | | 1.75 | | | | 3.89 | |
Class C at NAV | | | 12/21/2005 | | | | 07/29/1991 | | | | 1.51 | | | | 1.94 | | | | 1.99 | | | | 3.62 | |
Class C with 1% Maximum Sales Charge | | | — | | | | — | | | | 0.51 | | | | 0.94 | | | | 1.99 | | | | 3.62 | |
Class I at NAV | | | 08/03/2010 | | | | 07/29/1991 | | | | 2.04 | | | | 2.92 | | | | 2.97 | | | | 4.58 | |
Bloomberg Barclays Municipal Bond Index | | | — | | | | — | | | | 2.05 | % | | | 3.26 | % | | | 3.57 | % | | | 4.55 | % |
Bloomberg Barclays 20 Year Municipal Bond Index | | | — | | | | — | | | | 2.09 | | | | 3.55 | | | | 4.67 | | | | 5.97 | |
| | | | | | |
| | | | | | | | | | | | | | | | | | | | | | | | |
| % Total Annual Operating Expense Ratios3 | | | | | | | | | | | Class A | | | Class C | | | Class I | |
| | | | | | | | | | | | | | | 0.69 | % | | | 1.44 | % | | | 0.49 | % |
| | | | | | |
| | | | | | | | | | | | | | | | | | | | | | | | |
| % Distribution Rates/Yields4 | | | | | | | | | | | Class A | | | Class C | | | Class I | |
Distribution Rate | | | | | | | | | | | | | | | 2.46 | % | | | 1.69 | % | | | 2.66 | % |
Taxable-Equivalent Distribution Rate | | | | | | | | | | | | | | | 4.61 | | | | 3.17 | | | | 4.98 | |
SEC30-day Yield | | | | | | | | | | | | | | | 1.75 | | | | 1.10 | | | | 2.04 | |
Taxable-Equivalent SEC30-day Yield | | | | | | | | | | | | | | | 3.29 | | | | 2.06 | | | | 3.82 | |
Fund Profile
Credit Quality (% of total investments)6
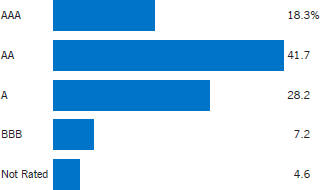
See Endnotes and Additional Disclosures in this report.
Past performance is no guarantee of future results. Returns are historical and are calculated by determining the percentage change in net asset value (NAV) or offering price (as applicable) with all distributions reinvested. Investment return and principal value will fluctuate so that shares, when redeemed, may be worth more or less than their original cost. Performance less than or equal to one year is cumulative. Performance is for the stated time period only; due to market volatility, the Fund’s current performance may be lower or higher than quoted. Returns are before taxes unless otherwise noted. For performance as of the most recentmonth-end, please refer to eatonvance.com.
Eaton Vance
New Jersey Municipal Income Fund
January 31, 2019
Performance1,2
Portfolio ManagerAdam A. Weigold, CFA
| | | | | | | | | | | | | | | | | | | | | | | | |
| % Average Annual Total Returns | | Class Inception Date | | | Performance Inception Date | | | Six Months | | | One Year | | | Five Years | | | Ten Years | |
Class A at NAV | | | 04/13/1994 | | | | 01/08/1991 | | | | 1.98 | % | | | 3.75 | % | | | 3.54 | % | | | 5.61 | % |
Class A with 4.75% Maximum Sales Charge | | | — | | | | — | | | | –2.83 | | | | –1.14 | | | | 2.53 | | | | 5.10 | |
Class C at NAV | | | 12/14/2005 | | | | 01/08/1991 | | | | 1.69 | | | | 2.97 | | | | 2.77 | | | | 4.84 | |
Class C with 1% Maximum Sales Charge | | | — | | | | — | | | | 0.69 | | | | 1.97 | | | | 2.77 | | | | 4.84 | |
Class I at NAV | | | 03/03/2008 | | | | 01/08/1991 | | | | 2.20 | | | | 3.96 | | | | 3.75 | | | | 5.83 | |
Bloomberg Barclays Municipal Bond Index | | | — | | | | — | | | | 2.05 | % | | | 3.26 | % | | | 3.57 | % | | | 4.55 | % |
Bloomberg Barclays 20 Year Municipal Bond Index | | | — | | | | — | | | | 2.09 | | | | 3.55 | | | | 4.67 | | | | 5.97 | |
| | | | | | |
| | | | | | | | | | | | | | | | | | | | | | | | |
| % Total Annual Operating Expense Ratios3 | | | | | | | | | | | Class A | | | Class C | | | Class I | |
| | | | | | | | | | | | | | | 0.73 | % | | | 1.48 | % | | | 0.53 | % |
| | | | | | |
| | | | | | | | | | | | | | | | | | | | | | | | |
| % Distribution Rates/Yields4 | | | | | | | | | | | Class A | | | Class C | | | Class I | |
Distribution Rate | | | | | | | | | | | | | | | 2.99 | % | | | 2.22 | % | | | 3.19 | % |
Taxable-Equivalent Distribution Rate | | | | | | | | | | | | | | | 5.55 | | | | 4.12 | | | | 5.92 | |
SEC30-day Yield | | | | | | | | | | | | | | | 2.10 | | | | 1.46 | | | | 2.40 | |
Taxable-Equivalent SEC30-day Yield | | | | | | | | | | | | | | | 3.90 | | | | 2.71 | | | | 4.46 | |
Fund Profile
Credit Quality (% of total investments)6
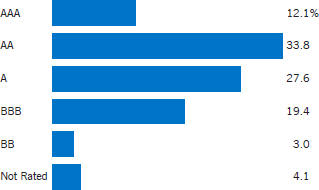
See Endnotes and Additional Disclosures in this report.
Past performance is no guarantee of future results. Returns are historical and are calculated by determining the percentage change in net asset value (NAV) or offering price (as applicable) with all distributions reinvested. Investment return and principal value will fluctuate so that shares, when redeemed, may be worth more or less than their original cost. Performance less than or equal to one year is cumulative. Performance is for the stated time period only; due to market volatility, the Fund’s current performance may be lower or higher than quoted. Returns are before taxes unless otherwise noted. For performance as of the most recentmonth-end, please refer to eatonvance.com.
Eaton Vance
Pennsylvania Municipal Income Fund
January 31, 2019
Performance1,2
Portfolio ManagerAdam A. Weigold, CFA
| | | | | | | | | | | | | | | | | | | | | | | | |
| % Average Annual Total Returns | | Class
Inception Date | | | Performance Inception Date | | | Six Months | | | One Year | | | Five Years | | | Ten Years | |
Class A at NAV | | | 06/01/1994 | | | | 01/08/1991 | | | | 1.57 | % | | | 3.08 | % | | | 3.09 | % | | | 4.73 | % |
Class A with 4.75% Maximum Sales Charge | | | — | | | | — | | | | –3.21 | | | | –1.86 | | | | 2.09 | | | | 4.22 | |
Class C at NAV | | | 01/13/2006 | | | | 01/08/1991 | | | | 1.20 | | | | 2.23 | | | | 2.30 | | | | 3.94 | |
Class C with 1% Maximum Sales Charge | | | — | | | | — | | | | 0.21 | | | | 1.24 | | | | 2.30 | | | | 3.94 | |
Class I at NAV | | | 03/03/2008 | | | | 01/08/1991 | | | | 1.68 | | | | 3.17 | | | | 3.27 | | | | 4.94 | |
Bloomberg Barclays Municipal Bond Index | | | — | | | | — | | | | 2.05 | % | | | 3.26 | % | | | 3.57 | % | | | 4.55 | % |
Bloomberg Barclays 20 Year Municipal Bond Index | | | — | | | | — | | | | 2.09 | | | | 3.55 | | | | 4.67 | | | | 5.97 | |
| | | | | | |
| | | | | | | | | | | | | | | | | | | | | | | | |
| % Total Annual Operating Expense Ratios3 | | | | | | | | | | | Class A | | | Class C | | | Class I | |
| | | | | | | | | | | | | | | 0.80 | % | | | 1.55 | % | | | 0.60 | % |
| | | | | | |
| | | | | | | | | | | | | | | | | | | | | | | | |
| % Distribution Rates/Yields4 | | | | | | | | | | | Class A | | | Class C | | | Class I | |
Distribution Rate | | | | | | | | | | | | | | | 3.74 | % | | | 2.96 | % | | | 3.94 | % |
Taxable-Equivalent Distribution Rate | | | | | | | | | | | | | | | 6.52 | | | | 5.16 | | | | 6.87 | |
SEC30-day Yield | | | | | | | | | | | | | | | 1.75 | | | | 1.09 | | | | 2.03 | |
Taxable-Equivalent SEC30-day Yield | | | | | | | | | | | | | | | 3.04 | | | | 1.90 | | | | 3.54 | |
| | | | | | |
| | | | | | | | | | | | | | | | | | | | | | | | |
| % Total Leverage5 | | | | | | | | | | | | | | | | | | |
Residual Interest Bond (RIB) Financing | | | | | | | | | | | | | | | | | | | | | | | 2.77 | % |
Fund Profile
Credit Quality (% of total investments)6,7
See Endnotes and Additional Disclosures in this report.
Past performance is no guarantee of future results. Returns are historical and are calculated by determining the percentage change in net asset value (NAV) or offering price (as applicable) with all distributions reinvested. Investment return and principal value will fluctuate so that shares, when redeemed, may be worth more or less than their original cost. Performance less than or equal to one year is cumulative. Performance is for the stated time period only; due to market volatility, the Fund’s current performance may be lower or higher than quoted. Returns are before taxes unless otherwise noted. For performance as of the most recentmonth-end, please refer to eatonvance.com.
Eaton Vance
Municipal Income Funds
January 31, 2019
Endnotes and Additional Disclosures
| 1 | Bloomberg Barclays Municipal Bond Index is an unmanaged index of municipal bonds traded in the U.S. Bloomberg Barclays 20 Year Municipal Bond Index is an unmanaged index of municipal bonds traded in the U.S. with maturities ranging from17-22 years. Unless otherwise stated, index returns do not reflect the effect of any applicable sales charges, commissions, expenses, taxes or leverage, as applicable. It is not possible to invest directly in an index. |
| 2 | Total Returns at NAV do not include applicable sales charges. If sales charges were deducted, the returns would be lower. Total Returns shown with maximum sales charge reflect the stated maximum sales charge. Unless otherwise stated, performance does not reflect the deduction of taxes on Fund distributions or redemptions of Fund shares. |
| | Performance prior to the inception date of a class may be linked to the performance of an older class of the Fund. This linked performance is adjusted for any applicable sales charge, but is not adjusted for class expense differences. If adjusted for such differences, the performance would be different. The performance of Class I for the Eaton Vance Arizona Municipal Income Fund and Eaton Vance Minnesota Municipal Income Fund is linked to Class A. Performance since inception for an index, if presented, is the performance since the Fund’s or oldest share class’ inception, as applicable. Performance presented in the Financial Highlights included in the financial statements is not linked. |
| 3 | Source: Fund prospectus. The expense ratios for the current reporting period can be found in the Financial Highlights section of this report. |
| 4 | The Distribution Rate is based on the Fund’s last regular distribution per share in the period (annualized) divided by the Fund’s NAV at the end of the period. The Fund’s distributions may be comprised of amounts characterized for federal income tax purposes astax-exempt income, qualified andnon-qualified ordinary dividends, capital gains and nondividend distributions, also known as return of capital. The Fund will determine the federal income tax character of distributions paid to a shareholder after the end of the calendar year. This is reported on the IRS form1099-DIV and provided to the shareholder shortly after eachyear-end. The Fund’s distributions are determined by the investment adviser based on its current assessment of the Fund’s long-term return potential. As portfolio and market conditions change, the rate of distributions paid by the Fund could change. Taxable-equivalent performance is based on the highest combined federal and state income tax rates, where applicable. Lower tax rates would result in lowertax-equivalent performance. Actual tax rates will vary depending on your income, exemptions and deductions. Rates do not include local taxes. The SEC Yield is a standardized measure based on the estimated yield to maturity of a fund’s investments over a30-day period and is based on the maximum offer price at the date specified. The SEC Yield is not based on the distributions made by the Fund, which may differ. |
| 5 | Fund employs RIB financing. The leverage created by RIB investments provides an opportunity for increased income but, at the same time, creates special risks (including the likelihood of greater volatility of NAV). The cost of leverage rises and falls with changes in short-term interest rates. See “Floating Rate Notes Issued in Conjunction with Securities Held” in the notes to the financial statements for more information about RIB financing. RIB leverage represents the amount of Floating Rate Notes outstanding at period end as a percentage of Fund net assets plus Floating Rate Notes. |
| 6 | Ratings are based on Moody’s Investors Service, Inc. (“Moody’s”), S&P Global Ratings (“S&P”) or Fitch Ratings (“Fitch”), as applicable. If securities are rated differently by the ratings agencies, the highest rating is applied. Ratings, which are subject to change, apply to the creditworthiness of the issuers of the underlying securities and not to the Fund or its shares. Credit ratings measure the quality of a bond based on the issuer’s creditworthiness, with ratings ranging from AAA, being the highest, to D, being the lowest based on S&P’s measures. Ratings of BBB or higher by S&P or Fitch (Baa or higher by Moody’s) are considered to be investment-grade quality. Credit ratings are based largely on the ratings agency’s analysis at the time of rating. The rating assigned to any particular security is not necessarily a reflection of the issuer’s current financial condition and does not necessarily reflect its assessment of the volatility of a security’s market value or of the liquidity of an investment in the security. Holdings designated as “Not Rated” (if any) are not rated by the national ratings agencies stated above. |
| 7 | The chart includes the municipal bonds held by a trust that issues residual interest bonds, consistent with the Portfolio of Investments. |
| | Fund profiles subject to change due to active management. |
Eaton Vance
Municipal Income Funds
January 31, 2019
Fund Expenses
Example: As a Fund shareholder, you incur two types of costs: (1) transaction costs, including sales charges (loads) on purchases and redemption fees (if applicable); and (2) ongoing costs, including management fees; distribution and/or service fees; and other Fund expenses. This Example is intended to help you understand your ongoing costs (in dollars) of Fund investing and to compare these costs with the ongoing costs of investing in other mutual funds. The Example is based on an investment of $1,000 invested at the beginning of the period and held for the entire period (August 1, 2018 – January 31, 2019).
Actual Expenses: The first section of each table below provides information about actual account values and actual expenses. You may use the information in this section, together with the amount you invested, to estimate the expenses that you paid over the period. Simply divide your account value by $1,000 (for example, an $8,600 account value divided by $1,000 = 8.6), then multiply the result by the number in the first section under the heading entitled “Expenses Paid During Period” to estimate the expenses you paid on your account during this period.
Hypothetical Example for Comparison Purposes: The second section of each table below provides information about hypothetical account values and hypothetical expenses based on the actual Fund expense ratio and an assumed rate of return of 5% per year (before expenses), which is not the actual Fund return. The hypothetical account values and expenses may not be used to estimate the actual ending account balance or expenses you paid for the period. You may use this information to compare the ongoing costs of investing in your Fund and other funds. To do so, compare this 5% hypothetical example with the 5% hypothetical examples that appear in the shareholder reports of the other funds.
Please note that the expenses shown in each table are meant to highlight your ongoing costs only and do not reflect any transactional costs, such as sales charges (loads) or redemption fees (if applicable). Therefore, the second section of each table is useful in comparing ongoing costs only, and will not help you determine the relative total costs of owning different funds. In addition, if these transactional costs were included, your costs would be higher.
Eaton Vance Arizona Municipal Income Fund
| | | | | | | | | | | | | | | | |
| | | Beginning
Account Value
(8/1/18) | | | Ending
Account Value
(1/31/19) | | | Expenses Paid
During Period*
(8/1/18 – 1/31/19) | | | Annualized
Expense
Ratio | |
| | | | |
Actual | | | | | | | | | | | | | | | | |
Class A | | $ | 1,000.00 | | | $ | 1,015.10 | | | $ | 3.66 | | | | 0.72 | % |
Class C | | $ | 1,000.00 | | | $ | 1,010.20 | | | $ | 7.45 | | | | 1.47 | % |
Class I | | $ | 1,000.00 | | | $ | 1,016.10 | | | $ | 2.64 | | | | 0.52 | % |
| | | | | |
Hypothetical | | | | | | | | | | | | | | | | |
(5% return per year before expenses) | | | | | | | | | | | | | | | | |
Class A | | $ | 1,000.00 | | | $ | 1,021.60 | | | $ | 3.67 | | | | 0.72 | % |
Class C | | $ | 1,000.00 | | | $ | 1,017.80 | | | $ | 7.48 | | | | 1.47 | % |
Class I | | $ | 1,000.00 | | | $ | 1,022.60 | | | $ | 2.65 | | | | 0.52 | % |
| * | Expenses are equal to the Fund’s annualized expense ratio for the indicated Class, multiplied by the average account value over the period, multiplied by 184/365 (to reflect the one-half year period). The Example assumes that the $1,000 was invested at the net asset value per share determined at the close of business on July 31, 2018. |
Eaton Vance
Municipal Income Funds
January 31, 2019
Fund Expenses — continued
Eaton Vance Connecticut Municipal Income Fund
| | | | | | | | | | | | | | | | |
| | | Beginning
Account Value
(8/1/18) | | | Ending
Account Value
(1/31/19) | | | Expenses Paid
During Period*
(8/1/18 – 1/31/19) | | | Annualized
Expense
Ratio | |
| | | | |
Actual | | | | | | | | | | | | | | | | |
Class A | | $ | 1,000.00 | | | $ | 1,016.10 | | | $ | 3.66 | | | | 0.72 | % |
Class C | | $ | 1,000.00 | | | $ | 1,012.30 | | | $ | 7.46 | | | | 1.47 | % |
Class I | | $ | 1,000.00 | | | $ | 1,017.20 | | | $ | 2.64 | | | | 0.52 | % |
| | | | | |
Hypothetical | | | | | | | | | | | | | | | | |
(5% return per year before expenses) | | | | | | | | | | | | | | | | |
Class A | | $ | 1,000.00 | | | $ | 1,021.60 | | | $ | 3.67 | | | | 0.72 | % |
Class C | | $ | 1,000.00 | | | $ | 1,017.80 | | | $ | 7.48 | | | | 1.47 | % |
Class I | | $ | 1,000.00 | | | $ | 1,022.60 | | | $ | 2.65 | | | | 0.52 | % |
| * | Expenses are equal to the Fund’s annualized expense ratio for the indicated Class, multiplied by the average account value over the period, multiplied by 184/365 (to reflect the one-half year period). The Example assumes that the $1,000 was invested at the net asset value per share determined at the close of business on July 31, 2018. |
Eaton Vance Minnesota Municipal Income Fund
| | | | | | | | | | | | | | | | |
| | | Beginning
Account Value
(8/1/18) | | | Ending
Account Value
(1/31/19) | | | Expenses Paid
During Period*
(8/1/18 – 1/31/19) | | | Annualized
Expense
Ratio | |
| | | | |
Actual | | | | | | | | | | | | | | | | |
Class A | | $ | 1,000.00 | | | $ | 1,018.30 | | | $ | 3.61 | | | | 0.71 | % |
Class C | | $ | 1,000.00 | | | $ | 1,015.10 | | | $ | 7.42 | | | | 1.46 | % |
Class I | | $ | 1,000.00 | | | $ | 1,020.40 | | | $ | 2.60 | | | | 0.51 | % |
| | | | | |
Hypothetical | | | | | | | | | | | | | | | | |
(5% return per year before expenses) | | | | | | | | | | | | | | | | |
Class A | | $ | 1,000.00 | | | $ | 1,021.60 | | | $ | 3.62 | | | | 0.71 | % |
Class C | | $ | 1,000.00 | | | $ | 1,017.80 | | | $ | 7.43 | | | | 1.46 | % |
Class I | | $ | 1,000.00 | | | $ | 1,022.60 | | | $ | 2.60 | | | | 0.51 | % |
| * | Expenses are equal to the Fund’s annualized expense ratio for the indicated Class, multiplied by the average account value over the period, multiplied by 184/365 (to reflect the one-half year period). The Example assumes that the $1,000 was invested at the net asset value per share determined at the close of business on July 31, 2018. |
Eaton Vance
Municipal Income Funds
January 31, 2019
Fund Expenses — continued
Eaton Vance New Jersey Municipal Income Fund
| | | | | | | | | | | | | | | | |
| | | Beginning
Account Value
(8/1/18) | | | Ending
Account Value
(1/31/19) | | | Expenses Paid
During Period*
(8/1/18 – 1/31/19) | | | Annualized
Expense
Ratio | |
| | | | |
Actual | | | | | | | | | | | | | | | | |
Class A | | $ | 1,000.00 | | | $ | 1,019.80 | | | $ | 3.72 | | | | 0.73 | % |
Class C | | $ | 1,000.00 | | | $ | 1,016.90 | | | $ | 7.52 | | | | 1.48 | % |
Class I | | $ | 1,000.00 | | | $ | 1,022.00 | | | $ | 2.70 | | | | 0.53 | % |
| | | | | |
Hypothetical | | | | | | | | | | | | | | | | |
(5% return per year before expenses) | | | | | | | | | | | | | | | | |
Class A | | $ | 1,000.00 | | | $ | 1,021.50 | | | $ | 3.72 | | | | 0.73 | % |
Class C | | $ | 1,000.00 | | | $ | 1,017.70 | | | $ | 7.53 | | | | 1.48 | % |
Class I | | $ | 1,000.00 | | | $ | 1,022.50 | | | $ | 2.70 | | | | 0.53 | % |
| * | Expenses are equal to the Fund’s annualized expense ratio for the indicated Class, multiplied by the average account value over the period, multiplied by 184/365 (to reflect the one-half year period). The Example assumes that the $1,000 was invested at the net asset value per share determined at the close of business on July 31, 2018. |
Eaton Vance Pennsylvania Municipal Income Fund
| | | | | | | | | | | | | | | | |
| | | Beginning
Account Value
(8/1/18) | | | Ending
Account Value
(1/31/19) | | | Expenses Paid
During Period*
(8/1/18 – 1/31/19) | | | Annualized
Expense
Ratio | |
| | | | |
Actual | | | | | | | | | | | | | | | | |
Class A | | $ | 1,000.00 | | | $ | 1,015.70 | | | $ | 4.22 | | | | 0.83 | % |
Class C | | $ | 1,000.00 | | | $ | 1,012.00 | | | $ | 8.01 | | | | 1.58 | % |
Class I | | $ | 1,000.00 | | | $ | 1,016.80 | | | $ | 3.20 | | | | 0.63 | % |
| | | | | |
Hypothetical | | | | | | | | | | | | | | | | |
(5% return per year before expenses) | | | | | | | | | | | | | | | | |
Class A | | $ | 1,000.00 | | | $ | 1,021.00 | | | $ | 4.23 | | | | 0.83 | % |
Class C | | $ | 1,000.00 | | | $ | 1,017.20 | | | $ | 8.03 | | | | 1.58 | % |
Class I | | $ | 1,000.00 | | | $ | 1,022.00 | | | $ | 3.21 | | | | 0.63 | % |
| * | Expenses are equal to the Fund’s annualized expense ratio for the indicated Class, multiplied by the average account value over the period, multiplied by 184/365 (to reflect the one-half year period). The Example assumes that the $1,000 was invested at the net asset value per share determined at the close of business on July 31, 2018. |
Eaton Vance
Arizona Municipal Income Fund
January 31, 2019
Portfolio of Investments (Unaudited)
| | | | | | | | |
| Tax-Exempt Investments — 97.0% | |
| Security | | Principal
Amount
(000’s omitted) | | | Value | |
|
| Education — 15.5% | |
| | |
Arizona Board of Regents, (Arizona State University), 5.00%, 7/1/36 | | $ | 1,150 | | | $ | 1,306,756 | |
| | |
Arizona Board of Regents, (Arizona State University), 5.00%, 7/1/37 | | | 170 | | | | 184,627 | |
| | |
Arizona Board of Regents, (Arizona State University), Prerefunded to 7/1/22, 5.00%, 7/1/37 | | | 830 | | | | 919,441 | |
| | |
Arizona Board of Regents, (University of Arizona), 5.00%, 6/1/38 | | | 1,500 | | | | 1,704,360 | |
| | |
Glendale Industrial Development Authority, (Midwestern University), 5.00%, 5/15/25 | | | 1,500 | | | | 1,633,665 | |
| | |
Northern Arizona University, 5.00%, 6/1/38 | | | 1,000 | | | | 1,116,670 | |
| | |
Pima County Community College District, 5.00%, 7/1/33(1) | | | 300 | | | | 353,694 | |
| | |
Pima County Community College District, 5.00%, 7/1/35(1) | | | 720 | | | | 841,082 | |
| | |
| | | | | | | $ | 8,060,295 | |
|
| Electric Utilities — 7.5% | |
| | |
Pima County Industrial Development Authority, (Tucson Electric Power Co.), 5.25%, 10/1/40 | | $ | 1,500 | | | $ | 1,565,055 | |
| | |
Pinal County Electrical District No. 3, 5.00%, 7/1/33 | | | 1,000 | | | | 1,141,220 | |
| | |
Salt River Project Agricultural Improvement and Power District, 5.00%, 1/1/35 | | | 1,000 | | | | 1,179,270 | |
| | |
| | | | | | | $ | 3,885,545 | |
|
| Escrowed / Prerefunded — 1.6% | |
| | |
Guam, Limited Obligation Bonds, Prerefunded to 12/1/19, 5.625%, 12/1/29 | | $ | 270 | | | $ | 278,818 | |
| | |
Guam, Limited Obligation Bonds, Prerefunded to 12/1/19, 5.75%, 12/1/34 | | | 295 | | | | 304,936 | |
| | |
Kyrene Elementary School District No. 28, Maricopa County, Prerefunded to 7/1/23, 5.50%, 7/1/30 | | | 200 | | | | 231,774 | |
| | |
| | | | | | | $ | 815,528 | |
|
| General Obligations — 10.0% | |
| | |
Chandler Unified School District No. 80, 4.00%, 7/1/33 | | $ | 225 | | | $ | 240,305 | |
| | |
Maricopa County Community College District, Prerefunded to 7/1/19, 3.00%, 7/1/23 | | | 785 | | | | 789,380 | |
| | |
Scottsdale Unified School District No. 48, 5.00%, 7/1/31 | | | 750 | | | | 888,877 | |
| | |
Tempe, 5.00%, 7/1/30 | | | 1,000 | | | | 1,223,440 | |
| | |
Tempe, 5.375%, 7/1/21 | | | 1,600 | | | | 1,708,368 | |
| | |
Western Maricopa Education Center District No. 402, 4.50%, 7/1/34 | | | 350 | | | | 378,382 | |
| | |
| | | | | | | $ | 5,228,752 | |
| | | | | | | | |
| Security | | Principal
Amount
(000’s omitted) | | | Value | |
|
| Hospital — 9.7% | |
| | |
Arizona Health Facilities Authority, (Scottsdale Lincoln Hospitals), 5.00%, 12/1/39 | | $ | 1,665 | | | $ | 1,812,885 | |
| | |
Maricopa County Industrial Development Authority, (Banner Health), 5.00%, 1/1/38 | | | 1,000 | | | | 1,124,120 | |
| | |
Maricopa County Industrial Development Authority, (HonorHealth), 5.00%, 9/1/32 | | | 400 | | | | 462,180 | |
| | |
Yavapai County Industrial Development Authority, (Yavapai Regional Medical Center), 5.25%, 8/1/33 | | | 500 | | | | 548,045 | |
| | |
Yuma Industrial Development Authority, (Yuma Regional Medical Center), 5.00%, 8/1/32 | | | 985 | | | | 1,104,185 | |
| | |
| | | | | | | $ | 5,051,415 | |
|
| Housing — 1.0% | |
| | |
Phoenix Industrial Development Authority, (Downtown Phoenix Student Housing,LLC - Arizona State University), 5.00%, 7/1/37 | | $ | 500 | | | $ | 542,130 | |
| |
| | | | $ | 542,130 | |
|
| Industrial Development Revenue — 1.7% | |
| | |
Maricopa County Pollution Control Corp., (El Paso Electric Co.), 4.50%, 8/1/42 | | $ | 850 | | | $ | 871,242 | |
| | |
| | | | | | | $ | 871,242 | |
|
| Insured – Electric Utilities — 2.8% | |
| | |
Mesa, Utility System Revenue, (NPFG), 5.00%, 7/1/23 | | $ | 430 | | | $ | 487,667 | |
| | |
Mesa, Utility System Revenue, (NPFG), Escrowed to Maturity, 5.00%, 7/1/23 | | | 450 | | | | 510,962 | |
| | |
Mesa, Utility System Revenue, (NPFG), Escrowed to Maturity, 5.00%, 7/1/23 | | | 120 | | | | 136,256 | |
| | |
Puerto Rico Electric Power Authority, (NPFG), 5.25%, 7/1/29 | | | 320 | | | | 343,299 | |
| | |
| | | | | | | $ | 1,478,184 | |
|
| Insured – General Obligations — 10.8% | |
| | |
Apache Junction Unified School District No. 43, (AGM), 5.00%, 7/1/24 | | $ | 1,200 | | | $ | 1,372,392 | |
| | |
Maricopa County Elementary School District No. 3, (AGM), 5.00%, 7/1/25 | | | 2,670 | | | | 3,154,765 | |
| | |
Sun City Fire District, (AGM), 4.00%, 1/1/37 | | | 1,000 | | | | 1,069,500 | |
| | |
| | | | | | | $ | 5,596,657 | |
|
| Insured – Lease Revenue / Certificates of Participation — 4.1% | |
| | |
Phoenix Civic Improvement Corp., (Civic Plaza), (NPFG), 5.50%, 7/1/41 | | $ | 1,635 | | | $ | 2,121,854 | |
| | |
| | | | | | | $ | 2,121,854 | |
| | | | |
| | 11 | | See Notes to Financial Statements. |
Eaton Vance
Arizona Municipal Income Fund
January 31, 2019
Portfolio of Investments (Unaudited) — continued
| | | | | | | | |
| Security | | Principal
Amount
(000’s omitted) | | | Value | |
|
| Insured – Special Tax Revenue — 2.8% | |
| | |
Glendale, Transportation Excise Tax Revenue, (AGM), 5.00%, 7/1/30 | | $ | 1,250 | | | $ | 1,448,388 | |
| | |
| | | | | | | $ | 1,448,388 | |
|
| Other Revenue — 2.2% | |
| | |
Salt Verde Financial Corp., Senior Gas Revenue, 5.00%, 12/1/37 | | $ | 1,000 | | | $ | 1,164,690 | |
| |
| | | | $ | 1,164,690 | |
|
| Senior Living / Life Care — 1.5% | |
| | |
Glendale Industrial Development Authority, (Terraces of Phoenix), 4.00%, 7/1/28 | | $ | 225 | | | $ | 222,559 | |
| | |
Tempe Industrial Development Authority, (Friendship Village of Tempe), 6.00%, 12/1/32 | | | 230 | | | | 241,969 | |
| | |
Tempe Industrial Development Authority, (Mirabella at ASU), 6.00%, 10/1/37(2) | | | 300 | | | | 325,017 | |
| | |
| | | | | | | $ | 789,545 | |
|
| Special Tax Revenue — 8.9% | |
| | |
Arizona Sports and Tourism Authority, (Multipurpose Stadium Facility), 5.00%, 7/1/29 | | $ | 1,000 | | | $ | 1,068,670 | |
| | |
Mesa, Excise Tax Revenue, 5.00%, 7/1/32 | | | 1,000 | | | | 1,093,160 | |
| | |
Queen Creek, Excise Tax and State Shared Revenue, 5.00%, 8/1/30 | | | 1,165 | | | | 1,363,726 | |
| | |
Tempe, Transit Excise Tax Revenue, 5.00%, 7/1/37 | | | 625 | | | | 683,012 | |
| | |
Tempe, Transit Excise Tax Revenue, Prerefunded to 7/1/22, 5.00%, 7/1/37 | | | 375 | | | | 414,754 | |
| | |
| | | | | | | $ | 4,623,322 | |
|
| Transportation — 6.4% | |
| | |
Arizona Transportation Board, Highway Revenue, 5.00%, 7/1/33 | | $ | 1,000 | | | $ | 1,136,550 | |
| | |
Phoenix Civic Improvement Corp., Airport Revenue, (AMT), 5.00%, 7/1/31 | | | 2,000 | | | | 2,211,840 | |
| | |
| | | | | | | $ | 3,348,390 | |
| | | | | | | | |
| Security | | Principal
Amount
(000’s omitted) | | | Value | |
|
| Water and Sewer — 10.5% | |
| | |
Central Arizona Water Conservation District, 5.00%, 1/1/35 | | $ | 1,500 | | | $ | 1,713,015 | |
| | |
Gilbert Water Resources Municipal Property Corp., 4.00%, 7/1/36 | | | 750 | | | | 794,865 | |
| | |
Phoenix Civic Improvement Corp., Water System Revenue, 5.00%, 7/1/39 | | | 1,500 | | | | 1,684,530 | |
| | |
Tucson, Water System Revenue, 5.00%, 7/1/32 | | | 545 | | | | 643,656 | |
| | |
Tucson, Water System Revenue, 5.00%, 7/1/35 | | | 530 | | | | 618,102 | |
| | |
| | | | | | | $ | 5,454,168 | |
| |
TotalTax-Exempt Investments — 97.0%
(identified cost $47,789,858) | | | $ | 50,480,105 | |
| |
Other Assets, Less Liabilities — 3.0% | | | $ | 1,534,519 | |
| |
Net Assets — 100.0% | | | $ | 52,014,624 | |
The percentage shown for each investment category in the Portfolio of Investments is based on net assets.
The Fund invests primarily in debt securities issued by Arizona municipalities. The ability of the issuers of the debt securities to meet their obligations may be affected by economic developments in a specific industry or municipality. In order to reduce the risk associated with such economic developments, at January 31, 2019, 21.1% of total investments are backed by bond insurance of various financial institutions and financial guaranty assurance agencies. The aggregate percentage insured by an individual financial institution or financial guaranty assurance agency ranged from 7.1% to 14.0% of total investments.
| (1) | When-issued security. |
| (2) | Security exempt from registration pursuant to Rule 144A under the Securities Act of 1933, as amended. These securities may be sold in certain transactions in reliance on an exemption from registration (normally to qualified institutional buyers). At January 31, 2019, the aggregate value of these securities is $325,017 or 0.6% of the Fund’s net assets. |
| | | | | | | | | | | | | | | | | | |
| Futures Contracts | |
| | | | | |
| Description | | Number of
Contracts | | Position | | Expiration
Date | | | Notional
Amount | | | Value/Unrealized
Depreciation | |
|
Interest Rate Futures | |
| | | | | |
| U.S. Long Treasury Bond | | 20 | | Short | | | 3/20/19 | | | $ | (2,933,750 | ) | | $ | (150,870 | ) |
| |
| | | | $ | (150,870 | ) |
| | | | |
| | 12 | | See Notes to Financial Statements. |
Eaton Vance
Arizona Municipal Income Fund
January 31, 2019
Portfolio of Investments (Unaudited) — continued
Abbreviations:
| | | | |
| | |
| AGM | | – | | Assured Guaranty Municipal Corp. |
| | |
| AMT | | – | | Interest earned from these securities may be considered a tax preference item for purposes of the Federal Alternative Minimum Tax. |
| | |
| NPFG | | – | | National Public Finance Guarantee Corp. |
| | | | |
| | 13 | | See Notes to Financial Statements. |
Eaton Vance
Connecticut Municipal Income Fund
January 31, 2019
Portfolio of Investments (Unaudited)
| | | | | | | | |
| Tax-Exempt Investments — 97.5% | |
| Security | | Principal
Amount
(000’s omitted) | | | Value | |
|
| Bond Bank — 1.6% | |
| | |
Connecticut, (Revolving Fund), Green Bonds, 5.00%, 5/1/34 | | $ | 1,000 | | | $ | 1,168,890 | |
| | |
| | | | | | | $ | 1,168,890 | |
|
| Education — 17.9% | |
| | |
Connecticut Health and Educational Facilities Authority, (Brunswick School), 5.00%, 7/1/31 | | $ | 500 | | | $ | 537,025 | |
| | |
Connecticut Health and Educational Facilities Authority, (Brunswick School), 5.00%, 7/1/32 | | | 1,125 | | | | 1,208,689 | |
| | |
Connecticut Health and Educational Facilities Authority, (Connecticut College), 5.00%, 7/1/30 | | | 1,255 | | | | 1,362,127 | |
| | |
Connecticut Health and Educational Facilities Authority, (Fairfield University), 4.00%, 7/1/47 | | | 2,000 | | | | 1,996,560 | |
| | |
Connecticut Health and Educational Facilities Authority, (Quinnipiac University), 5.00%, 7/1/34 | | | 1,475 | | | | 1,659,198 | |
| | |
Connecticut Health and Educational Facilities Authority, (Sacred Heart University), 5.00%, 7/1/37 | | | 450 | | | | 501,214 | |
| | |
Connecticut Health and Educational Facilities Authority, (The Taft School), 4.00%, 7/1/28 | | | 135 | | | | 152,364 | |
| | |
Connecticut Health and Educational Facilities Authority, (The Taft School), 4.00%, 7/1/29 | | | 100 | | | | 111,439 | |
| | |
Connecticut Health and Educational Facilities Authority, (The Taft School), 4.00%, 7/1/30 | | | 125 | | | | 137,004 | |
| | |
Connecticut Health and Educational Facilities Authority, (The Taft School), 4.00%, 7/1/33 | | | 430 | | | | 459,549 | |
| | |
Connecticut Health and Educational Facilities Authority, (The Taft School), 4.00%, 7/1/34 | | | 1,085 | | | | 1,151,391 | |
| | |
Connecticut Health and Educational Facilities Authority, (The Taft School), 4.00%, 7/1/36 | | | 430 | | | | 450,967 | |
| | |
Connecticut Health and Educational Facilities Authority, (University of New Haven), 5.00%, 7/1/35 | | | 850 | | | | 934,260 | |
| | |
Connecticut Health and Educational Facilities Authority, (Yale University), 5.00%, 7/1/27 | | | 1,000 | | | | 1,232,840 | |
| | |
University of Connecticut, 5.00%, 11/15/29 | | | 1,000 | | | | 1,100,820 | |
| | |
| | | | | | | $ | 12,995,447 | |
|
| Escrowed / Prerefunded — 9.1% | |
| | |
Connecticut, (Revolving Fund), Prerefunded to 6/1/19, 5.00%, 6/1/25 | | $ | 500 | | | $ | 505,555 | |
| | |
Connecticut Health and Educational Facilities Authority, (Fairfield University), Prerefunded to 7/1/20, 5.00%, 7/1/40 | | | 1,500 | | | | 1,569,645 | |
| | |
Connecticut Health and Educational Facilities Authority, (Middlesex Hospital), Prerefunded to 7/1/21, 5.00%, 7/1/24 | | | 1,000 | | | | 1,077,290 | |
| | |
Connecticut Health and Educational Facilities Authority, (Wesleyan University), Prerefunded to 7/1/20, 5.00%, 7/1/39 | | | 2,000 | | | | 2,092,860 | |
| | | | | | | | |
| Security | | Principal
Amount
(000’s omitted) | | | Value | |
|
| Escrowed / Prerefunded (continued) | |
| | |
Connecticut Health and Educational Facilities Authority,(Yale-New Haven Hospital), Prerefunded to 7/1/20, 5.75%, 7/1/34 | | $ | 1,000 | | | $ | 1,055,390 | |
| | |
Guam, Limited Obligation Bonds, Prerefunded to 12/1/19, 5.625%, 12/1/29 | | | 135 | | | | 139,409 | |
| | |
Guam, Limited Obligation Bonds, Prerefunded to 12/1/19, 5.75%, 12/1/34 | | | 150 | | | | 155,052 | |
| | |
| | | | | | | $ | 6,595,201 | |
|
| General Obligations — 18.7% | |
| | |
Colchester, 4.00%, 10/15/28 | | $ | 440 | | | $ | 484,409 | |
| | |
East Lyme, 4.00%, 7/15/22 | | | 350 | | | | 360,598 | |
| | |
East Lyme, 4.00%, 7/15/23 | | | 525 | | | | 540,724 | |
| | |
Enfield, 4.00%, 8/1/29 | | | 500 | | | | 560,720 | |
| | |
Fairfield, 5.00%, 1/1/23 | | | 1,000 | | | | 1,126,280 | |
| | |
Greenwich, 4.00%, 7/15/29 | | | 450 | | | | 491,603 | |
| | |
Greenwich, 4.00%, 7/15/30 | | | 250 | | | | 270,575 | |
| | |
Greenwich, 4.00%, 7/15/32 | | | 400 | | | | 428,688 | |
| | |
North Haven, 5.00%, 7/15/23 | | | 1,475 | | | | 1,683,299 | |
| | |
North Haven, 5.00%, 7/15/25 | | | 1,490 | | | | 1,760,092 | |
| | |
Norwalk, 4.00%, 7/1/26 | | | 1,975 | | | | 2,080,761 | |
| | |
Redding, 5.625%, 10/15/19 | | | 650 | | | | 668,330 | |
| | |
Stamford, 4.00%, 7/1/25 | | | 370 | | | | 388,826 | |
| | |
University of Connecticut, State General Obligation, 5.00%, 2/15/21 | | | 1,315 | | | | 1,318,419 | |
| | |
University of Connecticut, State General Obligation, 5.00%, 2/15/28 | | | 875 | | | | 877,188 | |
| | |
Wilton, 5.25%, 7/15/19 | | | 535 | | | | 543,881 | |
| | |
| | | | | | | $ | 13,584,393 | |
|
| Hospital — 10.5% | |
| | |
Connecticut Health and Educational Facilities Authority, (Ascension Health), 5.00%, 11/15/40 | | $ | 1,000 | | | $ | 1,020,420 | |
| | |
Connecticut Health and Educational Facilities Authority, (Stamford Hospital), 4.00%, 7/1/46 | | | 1,000 | | | | 988,470 | |
| | |
Connecticut Health and Educational Facilities Authority, (Trinity Health Corp.), 5.00%, 12/1/33 | | | 2,015 | | | | 2,305,241 | |
| | |
Connecticut Health and Educational Facilities Authority, (Western Connecticut Health Network), 5.00%, 7/1/29 | | | 1,000 | | | | 1,058,780 | |
| | |
Connecticut Health and Educational Facilities Authority,(Yale-New Haven Health), 5.00%, 7/1/31 | | | 500 | | | | 557,760 | |
| | |
Connecticut Health and Educational Facilities Authority,(Yale-New Haven Health), 5.00%, 7/1/34 | | | 1,520 | | | | 1,680,284 | |
| | |
| | | | | | | $ | 7,610,955 | |
| | | | |
| | 14 | | See Notes to Financial Statements. |
Eaton Vance
Connecticut Municipal Income Fund
January 31, 2019
Portfolio of Investments (Unaudited) — continued
| | | | | | | | |
| Security | | Principal
Amount
(000’s omitted) | | | Value | |
|
| Housing — 1.1% | |
| | |
Connecticut Housing Finance Authority, 4.00%, 11/15/38 | | $ | 750 | | | $ | 766,140 | |
| | |
| | | | | | | $ | 766,140 | |
|
| Industrial Development Revenue — 1.5% | |
| | |
Eastern Connecticut Resource Recovery Authority, (Wheelabrator Lisbon), (AMT), 5.50%, 1/1/20 | | $ | 1,070 | | | $ | 1,087,131 | |
| | |
| | | | | | | $ | 1,087,131 | |
|
| Insured – Education — 11.1% | |
| | |
Connecticut Health and Educational Facilities Authority, (Loomis Chaffee School), (AMBAC), 5.25%, 7/1/30 | | $ | 1,950 | | | $ | 2,446,295 | |
| | |
Connecticut Health and Educational Facilities Authority, (Loomis Chaffee School), (AMBAC), 5.25%, 7/1/31 | | | 2,050 | | | | 2,578,264 | |
| | |
Connecticut Health and Educational Facilities Authority, (Trinity College), (NPFG), 5.50%, 7/1/21 | | | 2,865 | | | | 3,017,561 | |
| | |
| | | | | | | $ | 8,042,120 | |
|
| Insured – General Obligations — 8.1% | |
| | |
Bridgeport, (AGM), 4.00%, 8/15/21 | | $ | 1,075 | | | $ | 1,125,342 | |
| | |
Bridgeport, (AGM), 5.00%, 8/15/32 | | | 1,120 | | | | 1,250,771 | |
| | |
Connecticut, (AMBAC), 5.25%, 6/1/20 | | | 1,000 | | | | 1,043,330 | |
| | |
Hartford, (AGC), 5.00%, 8/15/28 | | | 500 | | | | 508,060 | |
| | |
Hartford, (AGC), Prerefunded to 8/15/19, 5.00%, 8/15/28 | | | 500 | | | | 508,730 | |
| | |
Hartford, (AGM), 5.00%, 4/1/31 | | | 240 | | | | 257,122 | |
| | |
New Haven, (AGM), 5.00%, 8/1/25 | | | 1,000 | | | | 1,142,430 | |
| | |
| | | | | | | $ | 5,835,785 | |
|
| Insured – Transportation — 2.4% | |
| | |
Puerto Rico Highway and Transportation Authority, (AGC), 5.25%, 7/1/41 | | $ | 1,600 | | | $ | 1,710,032 | |
| | |
| | | | | | | $ | 1,710,032 | |
|
| Insured – Water and Sewer — 5.5% | |
| | |
South Central Connecticut Regional Water Authority, (NPFG), 5.25%, 8/1/24 | | $ | 3,420 | | | $ | 4,020,655 | |
| | |
| | | | | | | $ | 4,020,655 | |
|
| Senior Living / Life Care — 1.5% | |
| | |
Connecticut Health and Educational Facilities Authority, (Covenant Home, Inc.), 5.00%, 12/1/34 | | $ | 1,000 | | | $ | 1,114,180 | |
| | |
| | | | | | | $ | 1,114,180 | |
| | | | | | | | |
| Security | | Principal
Amount
(000’s omitted) | | | Value | |
|
| Special Tax Revenue — 3.0% | |
| | |
Connecticut, Special Tax Obligation, (Transportation Infrastructure), 5.00%, 1/1/29 | | $ | 2,000 | | | $ | 2,177,240 | |
| | |
| | | | | | | $ | 2,177,240 | |
|
| Student Loan — 1.2% | |
| | |
Connecticut Higher Education Supplemental Loan Authority, (AMT), 4.00%, 11/15/30 | | $ | 630 | | | $ | 642,298 | |
| | |
Connecticut Higher Education Supplemental Loan Authority, (AMT), 4.125%, 11/15/33 | | | 225 | | | | 229,189 | |
| | |
| | | | | | | $ | 871,487 | |
|
| Water and Sewer — 4.3% | |
| | |
Greater New Haven Water Pollution Control Authority, 5.00%, 8/15/32 | | $ | 1,000 | | | $ | 1,135,570 | |
| | |
Hartford County Metropolitan District, (Clean Water), 5.00%, 4/1/36 | | | 1,500 | | | | 1,616,940 | |
| | |
Stamford, (Water Pollution Control System), 5.00%, 9/15/29 | | | 200 | | | | 234,022 | |
| | |
Stamford, (Water Pollution Control System), 5.00%, 9/15/30 | | | 125 | | | | 145,677 | |
| |
| | | | $ | 3,132,209 | |
| |
TotalTax-Exempt Investments — 97.5%
(identified cost $67,592,140) | | | $ | 70,711,865 | |
| |
Other Assets, Less Liabilities — 2.5% | | | $ | 1,810,467 | |
| |
Net Assets — 100.0% | | | $ | 72,522,332 | |
The percentage shown for each investment category in the Portfolio of Investments is based on net assets.
The Fund invests primarily in debt securities issued by Connecticut municipalities. The ability of the issuers of the debt securities to meet their obligations may be affected by economic developments in a specific industry or municipality. In order to reduce the risk associated with such economic developments, at January 31, 2019, 27.7% of total investments are backed by bond insurance of various financial institutions and financial guaranty assurance agencies. The aggregate percentage insured by an individual financial institution or financial guaranty assurance agency ranged from 3.9% to 10.0% of total investments.
Abbreviations:
| | | | |
| | |
| AGC | | – | | Assured Guaranty Corp. |
| | |
| AGM | | – | | Assured Guaranty Municipal Corp. |
| | |
| AMBAC | | – | | AMBAC Financial Group, Inc. |
| | |
| AMT | | – | | Interest earned from these securities may be considered a tax preference item for purposes of the Federal Alternative Minimum Tax. |
| | |
| NPFG | | – | | National Public Finance Guarantee Corp. |
| | | | |
| | 15 | | See Notes to Financial Statements. |
Eaton Vance
Minnesota Municipal Income Fund
January 31, 2019
Portfolio of Investments (Unaudited)
| | | | | | | | |
| Tax-Exempt Investments — 97.6% | |
| Security | | Principal
Amount
(000’s omitted) | | | Value | |
|
| Bond Bank — 1.8% | |
| | |
Minnesota Public Facilities Authority, (Revolving Fund), 5.00%, 3/1/29 | | $ | 1,000 | | | $ | 1,187,550 | |
| | |
Minnesota Public Facilities Authority, (Revolving Fund), 5.00%, 3/1/30 | | | 1,000 | | | | 1,180,360 | |
| | |
| | | | | | | $ | 2,367,910 | |
|
| Education — 15.7% | |
| | |
Minnesota Higher Education Facilities Authority, (Carleton College), 5.00%, 3/1/29 | | $ | 2,250 | | | $ | 2,691,675 | |
| | |
Minnesota Higher Education Facilities Authority, (Carleton College), 5.00%, 3/1/31 | | | 1,000 | | | | 1,179,360 | |
| | |
Minnesota Higher Education Facilities Authority, (Carleton College), 5.00%, 3/1/34 | | | 500 | | | | 581,350 | |
| | |
Minnesota Higher Education Facilities Authority, (College of Saint Benedict), 4.00%, 3/1/36 | | | 400 | | | | 401,808 | |
| | |
Minnesota Higher Education Facilities Authority, (College of Saint Benedict), 5.00%, 3/1/37 | | | 1,500 | | | | 1,621,335 | |
| | |
Minnesota Higher Education Facilities Authority, (Gustavus Adolphus College), 5.00%, 10/1/35 | | | 565 | | | | 637,710 | |
| | |
Minnesota Higher Education Facilities Authority, (Macalester College), 5.00%, 3/1/27 | | | 500 | | | | 578,720 | |
| | |
Minnesota Higher Education Facilities Authority, (Macalester College), 5.00%, 3/1/28 | | | 1,010 | | | | 1,165,903 | |
| | |
Minnesota Higher Education Facilities Authority, (St. Catherine University), 5.00%, 10/1/32 | | | 500 | | | | 565,810 | |
| | |
Minnesota Higher Education Facilities Authority, (St. Olaf College), 4.00%, 10/1/35 | | | 500 | | | | 531,855 | |
| | |
Minnesota Higher Education Facilities Authority, (St. Olaf College), 5.00%, 12/1/29 | | | 1,815 | | | | 2,113,713 | |
| | |
Minnesota Higher Education Facilities Authority, (University of St. Thomas), 5.00%, 10/1/30 | | | 650 | | | | 765,817 | |
| | |
Minnesota Higher Education Facilities Authority, (University of St. Thomas), 5.00%, 4/1/35 | | | 750 | | | | 849,052 | |
| | |
Minnesota State Colleges and Universities, 5.00%, 10/1/28 | | | 1,375 | | | | 1,481,177 | |
| | |
Minnesota State Colleges and Universities, 5.00%, 10/1/30 | | | 1,455 | | | | 1,565,784 | |
| | |
University of Minnesota, 5.00%, 4/1/27 | | | 500 | | | | 597,360 | |
| | |
University of Minnesota, 5.00%, 8/1/27 | | | 625 | | | | 734,969 | |
| | |
University of Minnesota, 5.00%, 4/1/41 | | | 2,000 | | | | 2,262,760 | |
| | |
| | | | | | | $ | 20,326,158 | |
|
| Electric Utilities — 9.3% | |
| | |
Central Minnesota Municipal Power Agency, 5.00%, 1/1/32 | | $ | 2,100 | | | $ | 2,260,419 | |
| | |
Chaska, Electric System Revenue, 5.00%, 10/1/30 | | | 550 | | | | 630,206 | |
| | |
Hutchinson, Public Utility Revenue, 5.00%, 12/1/26 | | | 350 | | | | 386,428 | |
| | | | | | | | |
| Security | | Principal
Amount
(000’s omitted) | | | Value | |
|
| Electric Utilities (continued) | |
| | |
Minnesota Municipal Power Agency, 5.00%, 10/1/33 | | $ | 250 | | | $ | 281,795 | |
| | |
Minnesota Municipal Power Agency, 5.00%, 10/1/34 | | | 250 | | | | 281,513 | |
| | |
Minnesota Municipal Power Agency, 5.00%, 10/1/35 | | | 200 | | | | 224,874 | |
| | |
Northern Municipal Power Agency, 5.00%, 1/1/31 | | | 670 | | | | 759,733 | |
| | |
Northern Municipal Power Agency, 5.00%, 1/1/41 | | | 240 | | | | 267,130 | |
| | |
Rochester, Electric Utility Revenue, 5.00%, 12/1/29 | | | 700 | | | | 830,214 | |
| | |
Rochester, Electric Utility Revenue, 5.00%, 12/1/30 | | | 700 | | | | 823,655 | |
| | |
Rochester, Electric Utility Revenue, 5.00%, 12/1/42 | | | 820 | | | | 923,845 | |
| | |
St. Paul Port Authority, District Energy Revenue, 4.00%, 10/1/42 | | | 1,250 | | | | 1,286,862 | |
| | |
St. Paul Port Authority, District Energy Revenue, (AMT), 4.00%, 10/1/40 | | | 1,000 | | | | 1,015,340 | |
| | |
Western Minnesota Municipal Power Agency, 5.00%, 1/1/34 | | | 1,000 | | | | 1,116,740 | |
| | |
Western Minnesota Municipal Power Agency, 5.00%, 1/1/36 | | | 900 | | | | 1,019,331 | |
| | |
| | | | | | | $ | 12,108,085 | |
|
| Escrowed / Prerefunded — 5.9% | |
| | |
Guam, Limited Obligation Bonds, Prerefunded to 12/1/19, 5.625%, 12/1/29 | | $ | 270 | | | $ | 278,818 | |
| | |
Guam, Limited Obligation Bonds, Prerefunded to 12/1/19, 5.75%, 12/1/34 | | | 295 | | | | 304,936 | |
| | |
Minnesota Higher Education Facilities Authority, (Carleton College), Prerefunded to 3/1/19, 5.00%, 3/1/40 | | | 1,250 | | | | 1,253,262 | |
| | |
Minnesota Higher Education Facilities Authority, (Gustavus Adolphus College), Prerefunded to 10/1/19, 5.00%, 10/1/31 | | | 1,000 | | | | 1,021,490 | |
| | |
Minnesota Higher Education Facilities Authority, (St. Catherine University), Prerefunded to 10/1/22, 5.00%, 10/1/26 | | | 280 | | | | 310,635 | |
| | |
Minnesota Higher Education Facilities Authority, (St. Catherine University), Prerefunded to 10/1/22, 5.00%, 10/1/27 | | | 310 | | | | 343,917 | |
| | |
Minnesota Higher Education Facilities Authority, (St. Catherine University), Prerefunded to 10/1/22, 5.00%, 10/1/32 | | | 560 | | | | 621,270 | |
| | |
Minnesota Higher Education Facilities Authority, (University of St. Thomas), Prerefunded to 10/1/19, 5.00%, 10/1/39 | | | 1,000 | | | | 1,021,490 | |
| | |
St. Louis Park, (Park Nicollet Health Services), Prerefunded to 7/1/19, 5.75%, 7/1/39 | | | 1,000 | | | | 1,016,300 | |
| | |
University of Minnesota, Prerefunded to 12/1/20, 5.00%, 12/1/36 | | | 500 | | | | 529,980 | |
| | |
University of Minnesota, Prerefunded to 4/1/19, 5.125%, 4/1/34 | | | 1,000 | | | | 1,005,650 | |
| | |
| | | | | | | $ | 7,707,748 | |
| | | | |
| | 16 | | See Notes to Financial Statements. |
Eaton Vance
Minnesota Municipal Income Fund
January 31, 2019
Portfolio of Investments (Unaudited) — continued
| | | | | | | | |
| Security | | Principal
Amount
(000’s omitted) | | | Value | |
|
| General Obligations — 30.2% | |
| | |
Anoka-Hennepin Independent School District No. 11, 5.00%, 2/1/27 | | $ | 1,000 | | | $ | 1,211,510 | |
| | |
Anoka-Hennepin Independent School District No. 11, 5.00%, 2/1/28 | | | 1,040 | | | | 1,252,337 | |
| | |
Buffalo-Hanover-Montrose Independent School District No. 877, 4.00%, 2/1/24 | | | 2,000 | | | | 2,131,200 | |
| | |
Centennial Independent School District No. 12, Circle Pines, 0.00%, 2/1/28 | | | 1,000 | | | | 767,820 | |
| | |
Centennial Independent School District No. 12, Circle Pines, 0.00%, 2/1/35 | | | 350 | | | | 191,590 | |
| | |
Chaska Independent School District No. 112, 4.00%, 2/1/23 | | | 2,000 | | | | 2,130,000 | |
| | |
Cloquet Independent School District No. 94, 5.00%, 2/1/30 | | | 1,000 | | | | 1,159,420 | |
| | |
Duluth, 5.00%, 2/1/31 | | | 1,000 | | | | 1,161,540 | |
| | |
Duluth, 5.00%, 2/1/34 | | | 1,000 | | | | 1,146,330 | |
| | |
Elk River Area Independent School District No. 728, 4.00%, 2/1/32 | | | 2,000 | | | | 2,116,820 | |
| | |
Hennepin County, 5.00%, 12/1/35 | | | 2,000 | | | | 2,333,180 | |
| | |
Hennepin County Regional Railroad Authority, 4.00%, 12/1/29 | | | 1,500 | | | | 1,522,785 | |
| | |
Hopkins Independent School District No. 270, 4.00%, 2/1/25 | | | 1,250 | | | | 1,350,450 | |
| | |
Mahtomedi Independent School District No. 832, 5.00%, 2/1/31 | | | 1,000 | | | | 1,156,980 | |
| | |
Minneapolis-St. Paul Metropolitan Council, 5.00%, 3/1/28 | | | 2,500 | | | | 3,040,025 | |
| | |
Minnesota, 5.00%, 8/1/32 | | | 2,000 | | | | 2,317,380 | |
| | |
Minnesota, Prerefunded to 10/1/21, 5.00%, 10/1/27 | | | 30 | | | | 32,513 | |
| | |
Ramsey County, 4.00%, 2/1/24 | | | 500 | | | | 521,425 | |
| | |
Rosemount-Apple Valley-Eagan Independent School District No. 196, 4.00%, 2/1/28 | | | 2,000 | | | | 2,232,120 | |
| | |
Rosemount-Apple Valley-Eagan Independent School District No. 196, 5.00%, 2/1/27 | | | 1,000 | | | | 1,186,950 | |
| | |
Sartell-St. Stephen Independent School District No. 748, 0.00%, 2/1/32 | | | 1,350 | | | | 876,771 | |
| | |
Sartell-St. Stephen Independent School District No. 748, 0.00%, 2/1/37 | | | 1,500 | | | | 775,575 | |
| | |
Spring Lake Park Independent School District No. 16, 4.00%, 2/1/29 | | | 1,075 | | | | 1,181,468 | |
| | |
St. Louis Park Independent School District No. 283, 4.00%, 2/1/31 | | | 2,000 | | | | 2,167,800 | |
| | |
St. Paul, 5.00%, 12/1/27 | | | 750 | | | | 910,995 | |
| | |
St. Paul Independent School District No. 625, 4.00%, 2/1/25 | | | 1,000 | | | | 1,039,660 | |
| | |
Waconia Independent School District No. 110, 5.00%, 2/1/37 | | | 1,250 | | | | 1,422,137 | |
| | |
Waseca Independent School District No. 829, 4.00%, 2/1/28 | | | 1,575 | | | | 1,747,006 | |
| | |
| | | | | | | $ | 39,083,787 | |
|
| Hospital — 15.5% | |
| | |
Duluth Economic Development Authority, (Essentia Health Obligated Group), 5.00%, 2/15/37 | | $ | 1,000 | | | $ | 1,111,180 | |
| | | | | | | | |
| Security | | Principal
Amount
(000’s omitted) | | | Value | |
|
| Hospital (continued) | |
| | |
Kanabec County, (FirstLight Health System), 2.75%, 12/1/19 | | $ | 750 | | | $ | 750,045 | |
| | |
Maple Grove, (Maple Grove Hospital Corp.), 5.00%, 5/1/30 | | | 850 | | | | 980,654 | |
| | |
Maple Grove, (Maple Grove Hospital Corp.), 5.00%, 5/1/31 | | | 500 | | | | 571,340 | |
| | |
Maple Grove, (Maple Grove Hospital Corp.), 5.00%, 5/1/32 | | | 500 | | | | 567,825 | |
| | |
Minneapolis and St. Paul Housing and Redevelopment Authority, (Allina Health System), 5.00%, 11/15/29 | | | 915 | | | | 1,080,606 | |
| | |
Minneapolis and St. Paul Housing and Redevelopment Authority, (Children’s Health Care), 5.25%, 8/15/35 | | | 1,000 | | | | 1,048,430 | |
| | |
Minneapolis, (Fairview Health Services), 5.00%, 11/15/44 | | | 2,000 | | | | 2,177,060 | |
| | |
Rochester, (Mayo Clinic), 5.00%, 11/15/38 | | | 1,000 | | | | 1,033,200 | |
| | |
Rochester, (Olmsted Medical Center), 5.875%, 7/1/30 | | | 1,500 | | | | 1,577,280 | |
| | |
St. Cloud, (CentraCare Health System), 5.00%, 5/1/46 | | | 2,650 | | | | 2,893,349 | |
| | |
St. Cloud, (CentraCare Health System), 5.125%, 5/1/30 | | | 65 | | | | 67,567 | |
| | |
St. Paul Housing and Redevelopment Authority, (Allina Health System), 5.25%, 11/15/29 | | | 490 | | | | 504,935 | |
| | |
St. Paul Housing and Redevelopment Authority, (Fairview Health Services), 5.00%, 11/15/31 | | | 1,000 | | | | 1,155,840 | |
| | |
St. Paul Housing and Redevelopment Authority, (Fairview Health Services), 5.00%, 11/15/34 | | | 500 | | | | 569,215 | |
| | |
St. Paul Housing and Redevelopment Authority, (HealthPartners Obligated Group), 5.00%, 7/1/29 | | | 500 | | | | 570,405 | |
| | |
St. Paul Housing and Redevelopment Authority, (HealthPartners Obligated Group), 5.00%, 7/1/30 | | | 1,000 | | | | 1,131,350 | |
| | |
St. Paul Housing and Redevelopment Authority, (HealthPartners Obligated Group), 5.00%, 7/1/32 | | | 1,995 | | | | 2,228,455 | |
| | |
| | | | | | | $ | 20,018,736 | |
|
| Housing — 0.6% | |
| | |
Minnesota Housing Finance Agency, (FHLMC), (FNMA), (GNMA), 3.15%, 1/1/37 | | $ | 860 | | | $ | 814,678 | |
| | |
| | | | | | | $ | 814,678 | |
|
| Insured – Electric Utilities — 7.3% | |
| | |
Puerto Rico Electric Power Authority, (NPFG), 5.25%, 7/1/32 | | $ | 1,150 | | | $ | 1,226,981 | |
| | |
Puerto Rico Electric Power Authority, (NPFG), 5.25%, 7/1/35 | | | 305 | | | | 322,986 | |
| | |
Southern Minnesota Municipal Power Agency, (NPFG), 0.00%, 1/1/25 | | | 9,000 | | | | 7,844,220 | |
| | |
| | | | | | | $ | 9,394,187 | |
|
| Insured – Escrowed / Prerefunded — 0.4% | |
| | |
St. Cloud, (CentraCare Health System), (AGC), Prerefunded to 5/1/19, 5.50%, 5/1/39 | | $ | 500 | | | $ | 504,620 | |
| | |
| | | | | | | $ | 504,620 | |
| | | | |
| | 17 | | See Notes to Financial Statements. |
Eaton Vance
Minnesota Municipal Income Fund
January 31, 2019
Portfolio of Investments (Unaudited) — continued
| | | | | | | | |
| Security | | Principal
Amount
(000’s omitted) | | | Value | |
|
| Insured – Hospital — 0.6% | |
| | |
Minneapolis and St. Paul Housing and Redevelopment Authority, (Children’s Hospitals and Clinics), (AGM), 5.00%, 8/15/34 | | $ | 750 | | | $ | 781,087 | |
| | |
| | | | | | | $ | 781,087 | |
|
| Lease Revenue / Certificates of Participation — 2.5% | |
| | |
Anoka-Hennepin Independent School District No. 11, 5.00%, 2/1/34 | | $ | 1,000 | | | $ | 1,116,140 | |
| | |
Minnesota, 5.00%, 6/1/29 | | | 1,335 | | | | 1,497,750 | |
| | |
Minnetonka Independent School District No. 276, 5.00%, 3/1/29 | | | 560 | | | | 561,439 | |
| | |
| | | | | | | $ | 3,175,329 | |
|
| Other Revenue — 1.7% | |
| | |
Center City, (Hazelden Betty Ford Foundation), 4.00%, 11/1/28 | | $ | 825 | | | $ | 847,547 | |
| | |
Center City, (Hazelden Betty Ford Foundation), 5.00%, 11/1/27 | | | 400 | | | | 438,792 | |
| | |
Center City, (Hazelden Betty Ford Foundation), 5.00%, 11/1/29 | | | 300 | | | | 325,809 | |
| | |
Minneapolis, (YMCA of the Greater Twin Cities), 4.00%, 6/1/29 | | | 260 | | | | 281,422 | |
| | |
Minneapolis, (YMCA of the Greater Twin Cities), 4.00%, 6/1/30 | | | 250 | | | | 268,365 | |
| | |
Minneapolis, (YMCA of the Greater Twin Cities), 4.00%, 6/1/31 | | | 100 | | | | 106,056 | |
| | |
| | | | | | | $ | 2,267,991 | |
|
| Senior Living / Life Care — 3.5% | |
| | |
Apple Valley, (PHS Apple Valley Senior Housing, Inc.), 5.00%, 9/1/43 | | $ | 1,000 | | | $ | 1,044,930 | |
| | |
North Oaks, (Waverly Gardens), 4.00%, 10/1/25 | | | 1,600 | | | | 1,679,104 | |
| | |
North Oaks, (Waverly Gardens), 4.00%, 10/1/26 | | | 1,680 | | | | 1,754,323 | |
| | |
| | | | | | | $ | 4,478,357 | |
|
| Transportation — 2.6% | |
| | |
Minneapolis-St. Paul Metropolitan Airports Commission, 5.00%, 1/1/27 | | $ | 1,000 | | | $ | 1,208,660 | |
| | |
Minneapolis-St. Paul Metropolitan Airports Commission, Series 2010A, 5.00%, 1/1/35 | | | 1,000 | | | | 1,026,850 | |
| | |
Minneapolis-St. Paul Metropolitan Airports Commission, Series 2014A, 5.00%, 1/1/35 | | | 1,000 | | | | 1,108,930 | |
| | |
| | | | | | | $ | 3,344,440 | |
| |
TotalTax-Exempt Investments — 97.6%
(identified cost $123,180,196) | | | $ | 126,373,113 | |
| |
Other Assets, Less Liabilities — 2.4% | | | $ | 3,162,775 | |
| |
Net Assets — 100.0% | | | $ | 129,535,888 | |
The percentage shown for each investment category in the Portfolio of Investments is based on net assets.
The Fund invests primarily in debt securities issued by Minnesota municipalities. The ability of the issuers of the debt securities to meet their obligations may be affected by economic developments in a specific industry or municipality. In order to reduce the risk associated with such economic developments, at January 31, 2019, 8.5% of total investments are backed by bond insurance of various financial institutions and financial guaranty assurance agencies. The aggregate percentage insured by an individual financial institution or financial guaranty assurance agency ranged from 0.4% to 7.4% of total investments.
Abbreviations:
| | | | |
| | |
| AGC | | – | | Assured Guaranty Corp. |
| | |
| AGM | | – | | Assured Guaranty Municipal Corp. |
| | |
| AMT | | – | | Interest earned from these securities may be considered a tax preference item for purposes of the Federal Alternative Minimum Tax. |
| | |
| FHLMC | | – | | Federal Home Loan Mortgage Corp. |
| | |
| FNMA | | – | | Federal National Mortgage Association |
| | |
| GNMA | | – | | Government National Mortgage Association |
| | |
| NPFG | | – | | National Public Finance Guarantee Corp. |
| | | | |
| | 18 | | See Notes to Financial Statements. |
Eaton Vance
New Jersey Municipal Income Fund
January 31, 2019
Portfolio of Investments (Unaudited)
| | | | | | | | |
| Tax-Exempt Municipal Securities — 94.2% | |
| Security | | Principal
Amount
(000’s omitted) | | | Value | |
|
| Bond Bank — 0.7% | |
| | |
New Jersey Infrastructure Bank, Green Bonds, 4.00%, 9/1/43 | | $ | 1,055 | | | $ | 1,122,320 | |
| | |
| | | | | | | $ | 1,122,320 | |
|
| Education — 8.7% | |
| | |
New Jersey Educational Facilities Authority, (Montclair State University), 5.00%, 7/1/30 | | $ | 1,765 | | | $ | 1,990,690 | |
| | |
New Jersey Educational Facilities Authority, (Princeton University), 4.00%, 7/1/37 | | | 1,245 | | | | 1,337,852 | |
| | |
New Jersey Educational Facilities Authority, (Princeton University), 4.00%, 7/1/39 | | | 390 | | | | 416,391 | |
| | |
New Jersey Educational Facilities Authority, (Princeton University), 4.00%, 7/1/40 | | | 1,140 | | | | 1,213,667 | |
| | |
New Jersey Educational Facilities Authority, (Princeton University), 5.00%, 7/1/26 | | | 2,200 | | | | 2,563,704 | |
| | |
New Jersey Educational Facilities Authority, (Princeton University), 5.00%, 7/1/36 | | | 805 | | | | 948,065 | |
| | |
New Jersey Educational Facilities Authority, (Princeton University), 5.00%, 7/1/42 | | | 1,000 | | | | 1,158,100 | |
| | |
New Jersey Educational Facilities Authority, (University of Medicine and Dentistry), Prerefunded to 6/1/19, 7.50%, 12/1/32 | | | 2,565 | | | | 2,613,761 | |
| | |
New Jersey Institute of Technology, 5.00%, 7/1/32 | | | 980 | | | | 1,064,652 | |
| | |
| | | | | | | $ | 13,306,882 | |
|
| Escrowed / Prerefunded — 4.4% | |
| | |
New Jersey Economic Development Authority, (School Facilities Construction), Prerefunded to 6/15/19, 5.25%, 12/15/33 | | $ | 165 | | | $ | 167,171 | |
| | |
New Jersey Economic Development Authority, (The Seeing Eye, Inc.), Prerefunded to 6/1/22, 5.00%, 6/1/32 | | | 2,250 | | | | 2,488,230 | |
| | |
New Jersey Health Care Facilities Financing Authority, (Chilton Memorial Hospital), Prerefunded to 7/1/19, 5.50%, 7/1/29 | | | 1,135 | | | | 1,152,593 | |
| | |
New Jersey Health Care Facilities Financing Authority, (Chilton Memorial Hospital), Prerefunded to 7/1/19, 5.75%, 7/1/39 | | | 1,135 | | | | 1,153,739 | |
| | |
New Jersey Institute of Technology, Prerefunded to 7/1/22, 5.00%, 7/1/32 | | | 430 | | | | 477,395 | |
| | |
New Jersey Turnpike Authority, Prerefunded to 7/1/22, 5.00%, 1/1/30 | | | 1,215 | | | | 1,348,917 | |
| | |
| | | | | | | $ | 6,788,045 | |
|
| General Obligations — 11.4% | |
| | |
Burlington County Bridge Commission, 5.00%, 8/1/27 | | $ | 400 | | | $ | 489,440 | |
| | |
Burlington County Bridge Commission, 5.00%, 8/1/30 | | | 500 | | | | 608,810 | |
| | |
Burlington County Bridge Commission, 5.00%, 8/1/31 | | | 410 | | | | 494,591 | |
| | |
Burlington County Bridge Commission, 5.00%, 8/1/32 | | | 250 | | | | 299,947 | |
| | | | | | | | |
| Security | | Principal
Amount
(000’s omitted) | | | Value | |
|
| General Obligations (continued) | |
| | |
Burlington County Bridge Commission, 5.00%, 10/1/36 | | $ | 1,000 | | | $ | 1,164,730 | |
| | |
East Brunswick Board of Education, 4.00%, 8/1/34(1) | | | 1,200 | | | | 1,312,680 | |
| | |
Gloucester County Improvement Authority, 4.00%, 4/1/35 | | | 4,320 | | | | 4,562,050 | |
| | |
Jersey City, 5.00%, 11/1/33 | | | 800 | | | | 926,856 | |
| | |
Morris County Improvement Authority, (Lincoln Park), 4.00%, 3/15/27 | | | 700 | | | | 791,399 | |
| | |
New Jersey, 4.00%, 6/1/30 | | | 4,000 | | | | 4,174,200 | |
| | |
Ocean County, 4.00%, 9/1/29 | | | 480 | | | | 543,970 | |
| | |
Ocean County, 5.00%, 9/1/27 | | | 1,805 | | | | 2,231,323 | |
| | |
| | | | | | | $ | 17,599,996 | |
|
| Hospital — 14.9% | |
| | |
Camden County Improvement Authority, (Cooper Health System), 5.00%, 2/15/35 | | $ | 750 | | | $ | 803,978 | |
| | |
Camden County Improvement Authority, (Cooper Health System), 5.75%, 2/15/42 | | | 1,100 | | | | 1,187,120 | |
| | |
New Jersey Health Care Facilities Financing Authority, (AHS Hospital Corp.), 4.00%, 7/1/41 | | | 1,500 | | | | 1,523,355 | |
| | |
New Jersey Health Care Facilities Financing Authority, (AHS Hospital Corp.), 5.00%, 7/1/27 | | | 175 | | | | 175,509 | |
| | |
New Jersey Health Care Facilities Financing Authority, (Inspira Health Obligated Group), 4.00%, 7/1/47 | | | 500 | | | | 508,570 | |
| | |
New Jersey Health Care Facilities Financing Authority, (Inspira Health Obligated Group), 5.00%, 7/1/36 | | | 215 | | | | 242,314 | |
| | |
New Jersey Health Care Facilities Financing Authority, (Princeton HealthCare System), 5.00%, 7/1/32 | | | 1,415 | | | | 1,618,887 | |
| | |
New Jersey Health Care Facilities Financing Authority, (Princeton HealthCare System), 5.00%, 7/1/39 | | | 2,750 | | | | 3,058,770 | |
| | |
New Jersey Health Care Facilities Financing Authority, (Robert Wood Johnson University Hospital), 5.00%, 7/1/32 | | | 400 | | | | 449,208 | |
| | |
New Jersey Health Care Facilities Financing Authority, (Robert Wood Johnson University Hospital), 5.00%, 7/1/33 | | | 1,155 | | | | 1,292,745 | |
| | |
New Jersey Health Care Facilities Financing Authority, (RWJ Barnabas Health Obligated Group), 5.00%, 7/1/31 | | | 2,650 | | | | 3,072,118 | |
| | |
New Jersey Health Care Facilities Financing Authority, (RWJ Barnabas Health Obligated Group), 5.00%, 7/1/33 | | | 300 | | | | 344,739 | |
| | |
New Jersey Health Care Facilities Financing Authority, (St. Joseph’s Healthcare System Obligated Group), 4.00%, 7/1/34 | | | 1,000 | | | | 1,015,370 | |
| | |
New Jersey Health Care Facilities Financing Authority, (St. Joseph’s Healthcare System Obligated Group), 4.00%, 7/1/48 | | | 3,000 | | | | 2,918,910 | |
| | |
New Jersey Health Care Facilities Financing Authority, (Trinitas Regional Medical Center Obligated Group), 5.00%, 7/1/28 | | | 1,000 | | | | 1,140,500 | |
| | |
New Jersey Health Care Facilities Financing Authority, (Trinitas Regional Medical Center Obligated Group), 5.00%, 7/1/29 | | | 500 | | | | 567,395 | |
| | | | |
| | 19 | | See Notes to Financial Statements. |
Eaton Vance
New Jersey Municipal Income Fund
January 31, 2019
Portfolio of Investments (Unaudited) — continued
| | | | | | | | |
| Security | | Principal
Amount
(000’s omitted) | | | Value | |
|
| Hospital (continued) | |
| | |
New Jersey Health Care Facilities Financing Authority, (Virtua Health), 5.75%, 7/1/33 | | $ | 3,000 | | | $ | 3,049,530 | |
| | |
| | | | | | | $ | 22,969,018 | |
|
| Industrial Development Revenue — 4.7% | |
| | |
New Jersey Economic Development Authority, (Continental Airlines), (AMT), 5.50%, 6/1/33 | | $ | 1,875 | | | $ | 2,058,844 | |
| | |
New Jersey Economic Development Authority, (Continental Airlines), Series 2000A, (AMT), 5.625%, 11/15/30 | | | 255 | | | | 287,640 | |
| | |
New Jersey Economic Development Authority, (Continental Airlines), Series 2000B, (AMT), 5.625%, 11/15/30 | | | 430 | | | | 485,259 | |
| | |
New Jersey Economic Development Authority,(New Jersey-American Water Co., Inc.), (AMT), 5.70%, 10/1/39 | | | 4,370 | | | | 4,461,464 | |
| | |
| | | | | | | $ | 7,293,207 | |
|
| Insured – Electric Utilities — 2.7% | |
| | |
Puerto Rico Electric Power Authority, (NPFG), 5.25%, 7/1/34 | | $ | 3,935 | | | $ | 4,179,993 | |
| | |
| | | | | | | $ | 4,179,993 | |
|
| Insured – Escrowed / Prerefunded — 0.3% | |
| | |
New Jersey Economic Development Authority, (Motor Vehicle Surcharges), (NPFG), Escrowed to Maturity, 5.25%, 7/1/26 | | $ | 380 | | | $ | 464,345 | |
| | |
| | | | | | | $ | 464,345 | |
|
| Insured – General Obligations — 6.5% | |
| | |
Atlantic City, (AGM), 4.00%, 3/1/42 | | $ | 250 | | | $ | 255,970 | |
| | |
Atlantic City, (AGM), 5.00%, 3/1/37 | | | 1,500 | | | | 1,669,320 | |
| | |
Bayonne, (AGM), 5.00%, 8/1/25 | | | 615 | | | | 715,005 | |
| | |
Bayonne, (AGM), 5.00%, 8/1/26 | | | 865 | | | | 996,636 | |
| | |
Irvington Township, (AGM), 0.00%, 7/15/23 | | | 4,460 | | | | 4,005,749 | |
| | |
Lakewood Township, (BAM), 4.00%, 11/1/26 | | | 250 | | | | 278,485 | |
| | |
Lakewood Township, (BAM), 4.00%, 11/1/27 | | | 120 | | | | 133,591 | |
| | |
Paterson, (BAM), 5.00%, 1/15/26 | | | 1,305 | | | | 1,406,999 | |
| | |
Trenton, (BAM), 5.00%, 12/1/26 | | | 500 | | | | 577,290 | |
| | |
| | | | | | | $ | 10,039,045 | |
|
| Insured – Special Tax Revenue — 10.0% | |
| | |
Garden State Preservation Trust, (AGM), 0.00%, 11/1/24 | | $ | 6,000 | | | $ | 5,231,940 | |
| | |
New Jersey Economic Development Authority, (Motor Vehicle Surcharges), (NPFG), 5.25%, 7/1/26 | | | 1,620 | | | | 1,887,381 | |
| | | | | | | | |
| Security | | Principal
Amount
(000’s omitted) | | | Value | |
|
| Insured – Special Tax Revenue (continued) | |
| | |
New Jersey Economic Development Authority, (Motor Vehicle Surcharges), (XLCA), 0.00%, 7/1/26 | | $ | 6,500 | | | $ | 5,160,285 | |
| | |
New Jersey Economic Development Authority, (Motor Vehicle Surcharges), (XLCA), 0.00%, 7/1/27 | | | 3,590 | | | | 2,730,805 | |
| | |
Puerto Rico Sales Tax Financing Corp., (NPFG), 0.00%, 8/1/45 | | | 1,650 | | | | 371,267 | |
| | |
| | | | | | | $ | 15,381,678 | |
|
| Insured – Transportation — 2.0% | |
| | |
New Jersey Economic Development Authority, (The Goethals Bridge Replacement), (AGM), (AMT), 5.00%, 1/1/31 | | $ | 2,015 | | | $ | 2,189,942 | |
| | |
South Jersey Transportation Authority, (AGC), 5.50%, 11/1/33 | | | 850 | | | | 871,701 | |
| | |
| | | | | | | $ | 3,061,643 | |
|
| Lease Revenue / Certificates of Participation — 1.6% | |
| | |
New Jersey Economic Development Authority, (School Facilities Construction), 5.25%, 12/15/33 | | $ | 1,540 | | | $ | 1,556,078 | |
| | |
New Jersey Economic Development Authority, (School Facilities Construction), Prerefunded to 6/15/19, 5.25%, 12/15/33 | | | 795 | | | | 805,462 | |
| | |
| | | | | | | $ | 2,361,540 | |
|
| Other Revenue — 0.8% | |
| | |
New Jersey Economic Development Authority, (The Seeing Eye, Inc.), 5.00%, 6/1/32 | | $ | 1,000 | | | $ | 1,165,830 | |
| | |
| | | | | | | $ | 1,165,830 | |
|
| Senior Living / Life Care — 2.5% | |
| | |
New Jersey Economic Development Authority, (United Methodist Homes of New Jersey), 5.00%, 7/1/29 | | $ | 1,250 | | | $ | 1,310,825 | |
| | |
New Jersey Economic Development Authority, (United Methodist Homes of New Jersey), 5.00%, 7/1/34 | | | 2,450 | | | | 2,518,110 | |
| | |
| | | | | | | $ | 3,828,935 | |
|
| Special Tax Revenue — 0.5% | |
| | |
New Jersey Economic Development Authority, (Newark Downtown District Management Corp.), 5.125%, 6/15/27 | | $ | 275 | | | $ | 275,308 | |
| | |
New Jersey Economic Development Authority, (Newark Downtown District Management Corp.), 5.125%, 6/15/37 | | | 525 | | | | 525,425 | |
| | |
| | | | | | | $ | 800,733 | |
|
| Student Loan — 3.8% | |
| | |
New Jersey Higher Education Student Assistance Authority, (AMT), 3.25%, 12/1/29 | | $ | 2,000 | | | $ | 2,025,660 | |
| | | | |
| | 20 | | See Notes to Financial Statements. |
Eaton Vance
New Jersey Municipal Income Fund
January 31, 2019
Portfolio of Investments (Unaudited) — continued
| | | | | | | | |
| Security | | Principal
Amount
(000’s omitted) | | | Value | |
|
| Student Loan (continued) | |
| | |
New Jersey Higher Education Student Assistance Authority, (AMT), 3.688%, (3 mo. USD LIBOR + 0.95%), 6/1/36(2) | | $ | 2,880 | | | $ | 2,900,045 | |
| | |
New Jersey Higher Education Student Assistance Authority, (AMT), 4.00%, 12/1/34 | | | 950 | | | | 978,319 | |
| | |
| | | | | | | $ | 5,904,024 | |
|
| Transportation — 18.7% | |
| | |
Delaware River Port Authority of Pennsylvania and New Jersey, 5.00%, 1/1/28 | | $ | 2,000 | | | $ | 2,250,240 | |
| | |
Delaware River Port Authority of Pennsylvania and New Jersey, 5.00%, 1/1/33 | | | 1,000 | | | | 1,193,000 | |
| | |
Delaware River Port Authority of Pennsylvania and New Jersey, 5.00%, 1/1/35 | | | 2,270 | | | | 2,673,629 | |
| | |
Delaware River Port Authority of Pennsylvania and New Jersey, 5.00%, 1/1/36 | | | 1,250 | | | | 1,462,887 | |
| | |
New Jersey Economic Development Authority, (Port Newark Container Terminal, LLC), (AMT), 5.00%, 10/1/37 | | | 1,500 | | | | 1,603,125 | |
| | |
New Jersey Economic Development Authority, (The Goethals Bridge Replacement), (AMT), 5.375%, 1/1/43 | | | 275 | | | | 295,749 | |
| | |
New Jersey Transportation Trust Fund Authority, 5.00%, 6/15/38 | | | 3,220 | | | | 3,439,540 | |
| | |
New Jersey Turnpike Authority, 3.25%, 1/1/38 | | | 840 | | | | 810,415 | |
| | |
New Jersey Turnpike Authority, 4.00%, 1/1/43 | | | 950 | | | | 971,432 | |
| | |
New Jersey Turnpike Authority, 5.00%, 1/1/45 | | | 2,780 | | | | 3,056,777 | |
| | |
Newark Housing Authority, (Newark Marine Terminal), 4.00%, 1/1/37 | | | 1,500 | | | | 1,547,565 | |
| | |
Port Authority of New York and New Jersey, (AMT), 5.00%, 10/15/34 | | | 4,950 | | | | 5,584,837 | |
| | |
Port Authority of New York and New Jersey, (AMT), 5.00%, 10/15/35 | | | 2,545 | | | | 2,888,600 | |
| | |
South Jersey Transportation Authority, 5.00%, 11/1/31 | | | 1,000 | | | | 1,083,850 | |
| | |
| | | | | | | $ | 28,861,646 | |
| |
TotalTax-Exempt Municipal Securities — 94.2%
(identified cost $138,525,952) | | | $ | 145,128,880 | |
|
| Taxable Municipal Securities — 3.4% | |
| Security | | Principal
Amount
(000’s omitted) | | | Value | |
|
| General Obligations — 0.4% | |
| | |
Atlantic City, 7.50%, 3/1/40 | | $ | 445 | | | $ | 588,949 | |
| | |
| | | | | | | $ | 588,949 | |
| | | | | | | | |
| Security | | Principal
Amount
(000’s omitted) | | | Value | |
|
| Transportation — 3.0% | |
| | |
New Jersey Transportation Trust Fund Authority, 5.754%, 12/15/28(3) | | $ | 4,250 | | | $ | 4,678,400 | |
| | |
| | | | | | | $ | 4,678,400 | |
| |
Total Taxable Municipal Securities — 3.4%
(identified cost $5,100,704) | | | $ | 5,267,349 | |
| |
Total Investments — 97.6%
(identified cost $143,626,656) | | | $ | 150,396,229 | |
| |
Other Assets, Less Liabilities — 2.4% | | | $ | 3,727,875 | |
| |
Net Assets — 100.0% | | | $ | 154,124,104 | |
The percentage shown for each investment category in the Portfolio of Investments is based on net assets.
The Fund invests primarily in debt securities issued by New Jersey municipalities. The ability of the issuers of the debt securities to meet their obligations may be affected by economic developments in a specific industry or municipality. In order to reduce the risk associated with such economic developments, at January 31, 2019, 22.0% of total investments are backed by bond insurance of various financial institutions and financial guaranty assurance agencies. The aggregate percentage insured by an individual financial institution or financial guaranty assurance agency ranged from 0.6% to 10.0% of total investments.
| (1) | When-issued security. |
| (2) | Floating rate security. The stated interest rate represents the rate in effect at January 31, 2019. |
| (3) | Build America Bond. Represents taxable municipal obligation issued pursuant to the American Recovery and Reinvestment Act of 2009 or other legislation providing for the issuance of taxable municipal debt on which the issuer receives federal support. |
Abbreviations:
| | | | |
| | |
| AGC | | – | | Assured Guaranty Corp. |
| | |
| AGM | | – | | Assured Guaranty Municipal Corp. |
| | |
| AMT | | – | | Interest earned from these securities may be considered a tax preference item for purposes of the Federal Alternative Minimum Tax. |
| | |
| BAM | | – | | Build America Mutual Assurance Co. |
| | |
| LIBOR | | – | | London Interbank Offered Rate |
| | |
| NPFG | | – | | National Public Finance Guarantee Corp. |
| | |
| XLCA | | – | | XL Capital Assurance, Inc. |
Currency Abbreviations:
| | | | |
| | |
| USD | | – | | United States Dollar |
| | | | |
| | 21 | | See Notes to Financial Statements. |
Eaton Vance
Pennsylvania Municipal Income Fund
January 31, 2019
Portfolio of Investments (Unaudited)
| | | | | | | | |
| Tax-Exempt Municipal Securities — 100.0% | |
| Security | | Principal
Amount
(000’s omitted) | | | Value | |
|
| Cogeneration — 0.2% | |
| | |
Northampton County Industrial Development Authority, (Northampton Generating), (AMT), 5.00%, 12/31/23(1) | | $ | 1,323 | | | $ | 397,031 | |
| |
| | | | $ | 397,031 | |
|
| Education — 10.5% | |
| | |
Allegheny County Higher Education Building Authority, (Carnegie Mellon University), 5.00%, 8/1/27 | | $ | 1,665 | | | $ | 2,044,553 | |
| | |
Bucks County Industrial Development Authority, (George School), 5.00%, 9/15/34 | | | 1,000 | | | | 1,018,190 | |
| | |
Cumberland County Municipal Authority, (Dickinson College), 5.00%, 5/1/30 | | | 775 | | | | 894,807 | |
| | |
Cumberland County Municipal Authority, (Dickinson College), 5.00%, 5/1/31 | | | 1,145 | | | | 1,311,449 | |
| | |
Cumberland County Municipal Authority, (Dickinson College), 5.00%, 11/1/37 | | | 1,000 | | | | 1,082,660 | |
| | |
Northeastern Pennsylvania Hospital and Education Authority, (Wilkes University), 5.00%, 3/1/24 | | | 1,055 | | | | 1,151,543 | |
| | |
Pennsylvania Higher Educational Facilities Authority, (Drexel University), 4.00%, 5/1/36 | | | 4,000 | | | | 4,080,560 | |
| | |
Pennsylvania State University, 5.00%, 9/1/34 | | | 1,585 | | | | 1,841,453 | |
| | |
State Public School Building Authority, (Northampton County Area Community College), 5.50%, 3/1/31 | | | 2,645 | | | | 2,823,829 | |
| | |
Union County Higher Educational Facilities Financing Authority, (Bucknell University), 5.00%, 4/1/37 | | | 2,000 | | | | 2,165,440 | |
| |
| | | | $ | 18,414,484 | |
|
| Escrowed / Prerefunded — 12.8% | |
| | |
Chester County, Prerefunded to 7/15/19, 5.00%, 7/15/27 | | $ | 790 | | | $ | 801,842 | |
| | |
Chester County, Prerefunded to 7/15/19, 5.00%, 7/15/28 | | | 325 | | | | 329,872 | |
| | |
Chester County Health and Education Facilities Authority, (Jefferson Health System), Prerefunded to 5/15/20, 5.00%, 5/15/40 | | | 2,170 | | | | 2,258,861 | |
| | |
Dauphin County General Authority, (Pinnacle Health System), Prerefunded to 6/1/19, 6.00%, 6/1/29 | | | 2,015 | | | | 2,043,553 | |
| | |
Delaware County Regional Water Quality Control Authority, Prerefunded to 5/1/23, 5.00%, 5/1/33 | | | 1,750 | | | | 1,979,180 | |
| | |
Delaware River Port Authority of Pennsylvania and New Jersey, Prerefunded to 1/1/20, 5.00%, 1/1/35 | | | 775 | | | | 798,513 | |
| | |
Delaware River Port Authority of Pennsylvania and New Jersey, Prerefunded to 1/1/20, 5.00%, 1/1/40 | | | 415 | | | | 427,591 | |
| | |
Northampton County General Purpose Authority, (Lehigh University), Prerefunded to 5/15/19, 5.00%, 11/15/39 | | | 1,000 | | | | 1,009,620 | |
| | |
Pennsylvania Turnpike Commission, Prerefunded to 12/1/20, 5.45%, 12/1/35 | | | 4,220 | | | | 4,503,078 | |
| | | | | | | | |
| Security | | Principal
Amount
(000’s omitted) | | | Value | |
|
| Escrowed / Prerefunded (continued) | |
| | |
South Fork Municipal Authority, (Conemaugh Health System), Prerefunded to 7/1/20, 5.50%, 7/1/29 | | $ | 1,500 | | | $ | 1,576,815 | |
| | |
Southeastern Pennsylvania Transportation Authority, Federal Grant Receipts, Prerefunded to 6/1/21, 5.00%, 6/1/28 | | | 600 | | | | 644,796 | |
| | |
Washington County Industrial Development Authority, (Washington and Jefferson College), Prerefunded to 5/1/20, 5.25%, 11/1/30 | | | 2,300 | | | | 2,401,292 | |
| | |
Westmoreland County Municipal Authority, Prerefunded to 8/15/23, 5.00%, 8/15/32 | | | 2,345 | | | | 2,671,166 | |
| | |
Wilkes-Barre Finance Authority, (University of Scranton), Prerefunded to 11/1/20, 5.00%, 11/1/35 | | | 1,000 | | | | 1,055,480 | |
| |
| | | | $ | 22,501,659 | |
|
| General Obligations — 6.3% | |
| | |
Boyertown Area School District, 5.00%, 10/1/38 | | $ | 1,000 | | | $ | 1,107,480 | |
| | |
Chartiers Valley School District, 5.00%, 10/15/35 | | | 1,000 | | | | 1,133,450 | |
| | |
Chester County, 5.00%, 7/15/27 | | | 210 | | | | 213,081 | |
| | |
Chester County, 5.00%, 7/15/28 | | | 85 | | | | 86,239 | |
| | |
Delaware Valley Regional Finance Authority, 5.75%, 7/1/32 | | | 4,500 | | | | 5,756,310 | |
| | |
Hatboro-Horsham School District, 5.00%, 9/15/27 | | | 1,100 | | | | 1,233,375 | |
| | |
Owen J. Roberts School District, 5.00%, 5/15/28 | | | 535 | | | | 599,815 | |
| | |
Seneca Valley School District, 5.00%, 4/1/31 | | | 750 | | | | 894,480 | |
| |
| | | | $ | 11,024,230 | |
|
| Hospital — 13.0% | |
| | |
Allegheny County Hospital Development Authority, (University of Pittsburgh Medical Center), 5.50%, 8/15/34 | | $ | 3,000 | | | $ | 3,054,630 | |
| | |
Centre County Hospital Authority, (Mount Nittany Medical Center), 5.00%, 11/15/30 | | | 505 | | | | 574,831 | |
| | |
Chester County Health and Education Facilities Authority, (Jefferson Health System), 5.00%, 5/15/40 | | | 770 | | | | 793,493 | |
| | |
Dauphin County General Authority, (Pinnacle Health System), 6.00%, 6/1/29 | | | 2,205 | | | | 2,232,827 | |
| | |
Franklin County Industrial Development Authority, (The Chambersburg Hospital), 5.375%, 7/1/42 | | | 1,000 | | | | 1,042,780 | |
| | |
Indiana County Hospital Authority, (Indiana Regional Medical Center), 6.00%, 6/1/39 | | | 1,345 | | | | 1,445,808 | |
| | |
Lancaster County Hospital Authority, (University of Pennsylvania Health System), 5.00%, 8/15/36 | | | 650 | | | | 730,977 | |
| | |
Lehigh County General Purpose Authority, (Lehigh Valley Health Network), 4.00%, 7/1/33 | | | 2,700 | | | | 2,782,377 | |
| | |
Lehigh County General Purpose Authority, (Lehigh Valley Health Network), 4.00%, 7/1/35 | | | 950 | | | | 964,602 | |
| | |
Lycoming County Authority, (Susquehanna Health System), 5.75%, 7/1/39 | | | 3,250 | | | | 3,296,670 | |
| | |
Pennsylvania Higher Educational Facilities Authority, (University of Pennsylvania Health System), 4.00%, 8/15/42 | | | 150 | | | | 152,934 | |
| | | | |
| | 22 | | See Notes to Financial Statements. |
Eaton Vance
Pennsylvania Municipal Income Fund
January 31, 2019
Portfolio of Investments (Unaudited) — continued
| | | | | | | | |
| Security | | Principal
Amount
(000’s omitted) | | | Value | |
|
| Hospital (continued) | |
| | |
Pennsylvania Higher Educational Facilities Authority, (University of Pennsylvania Health System), 5.00%, 8/15/37 | | $ | 2,600 | | | $ | 2,922,166 | |
| | |
Pennsylvania Higher Educational Facilities Authority, (UPMC Health System), 5.00%, 5/15/31 | | | 2,550 | | | | 2,646,160 | |
| | |
Philadelphia Hospitals and Higher Education Facilities Authority, (Children’s Hospital of Philadelphia), 5.00%, 7/1/28 | | | 190 | | | | 203,659 | |
| |
| | | | $ | 22,843,914 | |
|
| Housing — 0.4% | |
| | |
Pennsylvania Higher Educational Facilities Authority, (University Properties, Inc.), 5.00%, 7/1/35 | | $ | 750 | | | $ | 781,042 | |
| |
| | | | $ | 781,042 | |
|
| Industrial Development Revenue — 1.3% | |
| | |
Luzerne County Industrial Development Authority, (Pennsylvania-American Water Co.), 5.50%, 12/1/39 | | $ | 1,200 | | | $ | 1,229,868 | |
| | |
Pennsylvania Economic Development Financing Authority, (Pennsylvania-American Water Co.), 6.20%, 4/1/39 | | | 1,000 | | | | 1,006,500 | |
| |
| | | | $ | 2,236,368 | |
|
| Insured – Electric Utilities — 1.1% | |
| | |
Puerto Rico Electric Power Authority, (NPFG), 5.25%, 7/1/34 | | $ | 1,475 | | | $ | 1,566,833 | |
| | |
Puerto Rico Electric Power Authority, (NPFG), 5.25%, 7/1/35 | | | 340 | | | | 360,050 | |
| |
| | | | $ | 1,926,883 | |
|
| Insured – Escrowed / Prerefunded — 15.9% | |
| | |
Erie School District, (NPFG), Escrowed to Maturity, 0.00%, 5/1/19 | | $ | 2,500 | | | $ | 2,489,900 | |
| | |
Erie School District, (NPFG), Escrowed to Maturity, 0.00%, 5/1/20 | | | 2,625 | | | | 2,565,019 | |
| | |
Erie School District, (NPFG), Escrowed to Maturity, 0.00%, 5/1/21 | | | 2,625 | | | | 2,515,485 | |
| | |
Erie School District, (NPFG), Escrowed to Maturity, 0.00%, 5/1/22 | | | 3,625 | | | | 3,402,896 | |
| | |
McKeesport Area School District, (AMBAC), Escrowed to Maturity, 0.00%, 10/1/25 | | | 2,320 | | | | 2,006,800 | |
| | |
State Public School Building Authority, (Harrisburg School District), (AGC), Prerefunded to 5/15/19, 4.75%, 11/15/33 | | | 2,000 | | | | 2,017,840 | |
| | |
State Public School Building Authority, (Harrisburg School District), (AGC), Prerefunded to 5/15/19, 5.00%, 11/15/33 | | | 1,335 | | | | 1,347,843 | |
| | |
State Public School Building Authority, (Harrisburg School District), (AGC), Prerefunded to 5/15/19, 5.00%, 11/15/33 | | | 335 | | | | 338,223 | |
| | |
State Public School Building Authority, (Harrisburg School District), (AGC), Prerefunded to 5/15/19, 5.00%, 11/15/33 | | | 330 | | | | 333,174 | |
| | |
Westmoreland County Municipal Authority, Series A, (FGIC), Escrowed to Maturity, 0.00%, 8/15/20 | | | 5,780 | | | | 5,617,640 | |
| | | | | | | | |
| Security | | Principal
Amount
(000’s omitted) | | | Value | |
|
| Insured – Escrowed / Prerefunded (continued) | |
| | |
Westmoreland County Municipal Authority, Series C, (FGIC), Escrowed to Maturity, 0.00%, 8/15/20 | | $ | 5,400 | | | $ | 5,248,314 | |
| |
| | | | $ | 27,883,134 | |
|
| Insured – General Obligations — 15.2% | |
| | |
Allentown City School District, (BAM), 5.00%, 6/1/31 | | $ | 500 | | | $ | 563,550 | |
| | |
Allentown City School District, (BAM), 5.00%, 6/1/32 | | | 1,000 | | | | 1,122,220 | |
| | |
Allentown City School District, (BAM), 5.00%, 6/1/33 | | | 1,000 | | | | 1,117,360 | |
| | |
Bethlehem Area School District, (BAM), 5.00%, 8/1/32 | | | 1,500 | | | | 1,720,515 | |
| | |
Cambria County, (BAM), 5.00%, 8/1/30 | | | 3,320 | | | | 3,730,750 | |
| | |
Coatesville Area School District, (AGM), 5.00%, 8/1/25 | | | 300 | | | | 341,985 | |
| | |
Elizabeth Forward School District, (NPFG), 0.00%, 9/1/21 | | | 2,170 | | | | 2,042,773 | |
| | |
Elizabeth Forward School District, (NPFG), 0.00%, 9/1/22 | | | 2,170 | | | | 1,991,192 | |
| | |
Elizabeth Forward School District, (NPFG), 0.00%, 9/1/23 | | | 2,170 | | | | 1,935,965 | |
| | |
Hazelton School District, (NPFG), 0.00%, 3/1/21 | | | 4,000 | | | | 3,804,480 | |
| | |
Hopewell School District, (AGM), 0.00%, 9/1/22 | | | 1,000 | | | | 921,170 | |
| | |
Hopewell School District, (AGM), 0.00%, 9/1/26 | | | 1,000 | | | | 816,760 | |
| | |
Lake-Lehman School District, (NPFG), 0.00%, 4/1/26 | | | 1,315 | | | | 1,091,450 | |
| | |
Luzerne County, (AGM), 5.00%, 11/15/29 | | | 1,000 | | | | 1,144,260 | |
| | |
McKeesport Area School District, (AGM), 5.00%, 3/1/38 | | | 60 | | | | 64,694 | |
| | |
McKeesport Area School District, (AMBAC), 0.00%, 10/1/25 | | | 1,100 | | | | 911,086 | |
| | |
Montour School District, (AGM), 5.00%, 4/1/32 | | | 1,000 | | | | 1,134,060 | |
| | |
Montour School District, (AGM), 5.00%, 4/1/33 | | | 1,960 | | | | 2,215,114 | |
| |
| | | | $ | 26,669,384 | |
|
| Insured – Hospital — 1.4% | |
| | |
Allegheny County Hospital Development Authority, (UPMC Health System), (NPFG), 6.00%, 7/1/24 | | $ | 2,000 | | | $ | 2,388,860 | |
| |
| | | | $ | 2,388,860 | |
|
| Insured – Lease Revenue / Certificates of Participation — 7.2% | |
| | |
Commonwealth Financing Authority, (AGC), 5.00%, 6/1/31 | | $ | 1,000 | | | $ | 1,009,200 | |
| | |
State Public School Building Authority, (Philadelphia School District), (AGM), 5.50%, 6/1/28(2) | | | 6,250 | | | | 7,588,187 | |
| | |
State Public School Building Authority, (Philadelphia School District), (AGM), 5.50%, 6/1/28 | | | 3,250 | | | | 3,945,858 | |
| |
| | | | $ | 12,543,245 | |
|
| Insured – Special Tax Revenue — 1.4% | |
| | |
Puerto Rico Infrastructure Financing Authority, (BHAC), (FGIC), 5.50%, 7/1/20 | | $ | 2,000 | | | $ | 2,094,400 | |
| | |
Puerto Rico Sales Tax Financing Corp., (NPFG), 0.00%, 8/1/45 | | | 1,490 | | | | 335,265 | |
| |
| | | | $ | 2,429,665 | |
| | | | |
| | 23 | | See Notes to Financial Statements. |
Eaton Vance
Pennsylvania Municipal Income Fund
January 31, 2019
Portfolio of Investments (Unaudited) — continued
| | | | | | | | |
| Security | | Principal
Amount
(000’s omitted) | | | Value | |
|
| Insured – Transportation — 2.4% | |
| | |
Pennsylvania Turnpike Commission, (AGM), 6.375%, 12/1/38 | | $ | 2,000 | | | $ | 2,502,220 | |
| | |
Puerto Rico Highway and Transportation Authority, (AGC), 5.50%, 7/1/31 | | | 1,500 | | | | 1,689,210 | |
| |
| | | | $ | 4,191,430 | |
|
| Insured – Water and Sewer — 1.9% | |
| | |
Allegheny County Sanitary Authority, (BAM), 5.00%, 12/1/28 | | $ | 1,000 | | | $ | 1,122,610 | |
| | |
Westmoreland County Municipal Authority, (FGIC), 0.00%, 8/15/19 | | | 2,235 | | | | 2,209,432 | |
| |
| | | | $ | 3,332,042 | |
|
| Lease Revenue / Certificates of Participation — 1.6% | |
| | |
Commonwealth Financing Authority, Tobacco Master Settlement Payment Revenue, 5.00%, 6/1/34 | | $ | 2,405 | | | $ | 2,712,239 | |
| |
| | | | $ | 2,712,239 | |
|
| Senior Living / Life Care — 3.3% | |
| | |
Cumberland County Municipal Authority, (Diakon Lutheran Social Ministries), 5.00%, 1/1/31 | | $ | 500 | | | $ | 563,215 | |
| | |
Cumberland County Municipal Authority, (Diakon Lutheran Social Ministries), 5.00%, 1/1/39 | | | 2,000 | | | | 2,165,620 | |
| | |
Franklin County Industrial Development Authority,(Menno-Haven, Inc.), 5.00%, 12/1/33 | | | 455 | | | | 472,877 | |
| | |
Lancaster County Hospital Authority, (Brethren Village), 5.125%, 7/1/37 | | | 1,265 | | | | 1,314,398 | |
| | |
Lancaster Industrial Development Authority, (Garden Spot Village), 5.375%, 5/1/28 | | | 300 | | | | 322,590 | |
| | |
Montgomery County Industrial Development Authority, (Whitemarsh Continuing Care Retirement Community), 5.00%, 1/1/33 | | | 1,000 | | | | 1,023,560 | |
| |
| | | | $ | 5,862,260 | |
|
| Special Tax Revenue — 0.5% | |
| | |
Puerto Rico Sales Tax Financing Corp., 0.00%, 8/1/38 | | $ | 7,500 | | | $ | 901,800 | |
| |
| | | | $ | 901,800 | |
|
| Transportation — 2.3% | |
| | |
Pennsylvania Economic Development Financing Authority, (Amtrak), (AMT), 5.00%, 11/1/41 | | $ | 1,960 | | | $ | 2,093,378 | |
| | |
Philadelphia, Airport Revenue, (AMT), 5.00%, 6/15/27 | | | 815 | | | | 864,552 | |
| | |
Philadelphia, Airport Revenue, (AMT), 5.00%, 7/1/37 | | | 1,000 | | | | 1,113,040 | |
| |
| | | | $ | 4,070,970 | |
| | | | | | | | |
| Security | | Principal
Amount
(000’s omitted) | | | Value | |
|
| Water and Sewer — 1.3% | |
| | |
Chester Water Authority, 5.00%, 12/1/35 | | $ | 795 | | | $ | 908,574 | |
| | |
Philadelphia, Water and Wastewater Revenue, 5.00%, 1/1/36 | | | 1,250 | | | | 1,308,325 | |
| |
| | | | $ | 2,216,899 | |
| |
TotalTax-Exempt Municipal Securities — 100.0%
(identified cost $167,444,456) | | | $ | 175,327,539 | |
|
| Taxable Municipal Securities — 0.1% | |
| Security | | Principal
Amount
(000’s omitted) | | | Value | |
|
| Cogeneration — 0.1% | |
| | |
Northampton County Industrial Development Authority, (Northampton Generating), 5.00%, 12/31/23(1) | | $ | 280 | | | $ | 83,975 | |
| |
Total Taxable Municipal Securities — 0.1%
(identified cost $279,921) | | | $ | 83,975 | |
| |
Total Investments — 100.1%
(identified cost $167,724,377) | | | $ | 175,411,514 | |
| |
Other Assets, Less Liabilities — (0.1)% | | | $ | (123,468 | ) |
| |
Net Assets — 100.0% | | | $ | 175,288,046 | |
The percentage shown for each investment category in the Portfolio of Investments is based on net assets.
The Fund invests primarily in debt securities issued by Pennsylvania municipalities. The ability of the issuers of the debt securities to meet their obligations may be affected by economic developments in a specific industry or municipality. In order to reduce the risk associated with such economic developments, at January 31, 2019, 46.4% of total investments are backed by bond insurance of various financial institutions and financial guaranty assurance agencies. The aggregate percentage insured by an individual financial institution or financial guaranty assurance agency ranged from 1.2% to 15.1% of total investments.
| (1) | Represents apayment-in-kind security which may pay interest in additional principal at the issuer’s discretion. |
| (2) | Security represents the municipal bond held by a trust that issues residual interest bonds (see Note 1H). |
| | | | |
| | 24 | | See Notes to Financial Statements. |
Eaton Vance
Pennsylvania Municipal Income Fund
January 31, 2019
Portfolio of Investments (Unaudited) — continued
Abbreviations:
| | | | |
| | |
| AGC | | – | | Assured Guaranty Corp. |
| | |
| AGM | | – | | Assured Guaranty Municipal Corp. |
| | |
| AMBAC | | – | | AMBAC Financial Group, Inc. |
| | |
| AMT | | – | | Interest earned from these securities may be considered a tax preference item for purposes of the Federal Alternative Minimum Tax. |
| | |
| BAM | | – | | Build America Mutual Assurance Co. |
| | |
| BHAC | | – | | Berkshire Hathaway Assurance Corp. |
| | |
| FGIC | | – | | Financial Guaranty Insurance Company |
| | |
| NPFG | | – | | National Public Finance Guarantee Corp. |
| | | | |
| | 25 | | See Notes to Financial Statements. |
Eaton Vance
Municipal Income Funds
January 31, 2019
Statements of Assets and Liabilities (Unaudited)
| | | | | | | | | | | | |
| | | January 31, 2019 | |
| Assets | | Arizona Fund | | | Connecticut Fund | | | Minnesota Fund | |
| | | |
Investments — | | | | | | | | | | | | |
| | | |
Identified cost | | $ | 47,789,858 | | | $ | 67,592,140 | | | $ | 123,180,196 | |
| | | |
Unrealized appreciation | | | 2,690,247 | | | | 3,119,725 | | | | 3,192,917 | |
| | | |
Investments, at value | | $ | 50,480,105 | | | $ | 70,711,865 | | | $ | 126,373,113 | |
| | | |
Cash | | $ | 2,324,303 | | | $ | 2,546,376 | | | $ | 1,734,495 | |
| | | |
Deposits for derivatives collateral — financial futures contracts | | | 50,229 | | | | — | | | | — | |
| | | |
Interest receivable | | | 312,237 | | | | 565,314 | | | | 1,570,339 | |
| | | |
Receivable for Fund shares sold | | | 255,864 | | | | 64,905 | | | | 153,428 | |
| | | |
Total assets | | $ | 53,422,738 | | | $ | 73,888,460 | | | $ | 129,831,375 | |
|
| Liabilities | |
| | | |
Payable for investments purchased | | $ | — | | | $ | 1,221,780 | | | $ | — | |
| | | |
Payable for when-issued securities | | | 1,191,120 | | | | — | | | | — | |
| | | |
Payable for variation margin on open financial futures contracts | | | 19,947 | | | | — | | | | — | |
| | | |
Payable for Fund shares redeemed | | | 114,717 | | | | 48,696 | | | | 120,667 | |
| | | |
Distributions payable | | | 16,115 | | | | 32,036 | | | | 65,187 | |
| | | |
Payable to affiliates: | | | | | | | | | | | | |
| | | |
Investment adviser fee | | | 10,448 | | | | 17,967 | | | | 36,291 | |
| | | |
Distribution and service fees | | | 9,307 | | | | 11,750 | | | | 15,029 | |
| | | |
Accrued expenses | | | 46,460 | | | | 33,899 | | | | 58,313 | |
| | | |
Total liabilities | | $ | 1,408,114 | | | $ | 1,366,128 | | | $ | 295,487 | |
| | | |
Net Assets | | $ | 52,014,624 | | | $ | 72,522,332 | | | $ | 129,535,888 | |
|
| Sources of Net Assets | |
| | | |
Paid-in capital | | $ | 49,111,667 | | | $ | 70,981,388 | | | $ | 127,641,877 | |
| | | |
Distributable earnings | | | 2,902,957 | | | | 1,540,944 | | | | 1,894,011 | |
| | | |
Net Assets | | $ | 52,014,624 | | | $ | 72,522,332 | | | $ | 129,535,888 | |
|
| Class A Shares | |
| | | |
Net Assets | | $ | 33,404,584 | | | $ | 51,184,307 | | | $ | 52,608,575 | |
| | | |
Shares Outstanding | | | 3,536,533 | | | | 5,135,915 | | | | 5,653,949 | |
| | | |
Net Asset Value and Redemption Price Per Share | | | | | | | | | | | | |
| | | |
(net assets ÷ shares of beneficial interest outstanding) | | $ | 9.45 | | | $ | 9.97 | | | $ | 9.30 | |
| | | |
Maximum Offering Price Per Share | | | | | | | | | | | | |
| | | |
(100 ÷ 95.25 of net asset value per share) | | $ | 9.92 | | | $ | 10.47 | | | $ | 9.76 | |
| |
| Class C Shares | | | | | |
| | | |
Net Assets | | $ | 4,284,450 | | | $ | 3,417,434 | | | $ | 6,855,809 | |
| | | |
Shares Outstanding | | | 407,904 | | | | 344,122 | | | | 685,083 | |
| | | |
Net Asset Value and Offering Price Per Share* | | | | | | | | | | | | |
| | | |
(net assets ÷ shares of beneficial interest outstanding) | | $ | 10.50 | | | $ | 9.93 | | | $ | 10.01 | |
| |
| Class I Shares | | | | | |
| | | |
Net Assets | | $ | 14,325,590 | | | $ | 17,920,591 | | | $ | 70,071,504 | |
| | | |
Shares Outstanding | | | 1,516,694 | | | | 1,797,589 | | | | 7,530,013 | |
| | | |
Net Asset Value, Offering Price and Redemption Price Per Share | | | | | | | | | | | | |
| | | |
(net assets ÷ shares of beneficial interest outstanding) | | $ | 9.45 | | | $ | 9.97 | | | $ | 9.31 | |
On sales of $50,000 or more, the offering price of Class A shares is reduced.
| * | Redemption price per share is equal to the net asset value less any applicable contingent deferred sales charge. |
| | | | |
| | 26 | | See Notes to Financial Statements. |
Eaton Vance
Municipal Income Funds
January 31, 2019
Statements of Assets and Liabilities (Unaudited) — continued
| | | | | | | | |
| | | January 31, 2019 | |
| Assets | | New Jersey Fund | | | Pennsylvania Fund | |
| | |
Investments — | | | | | | | | |
| | |
Identified cost | | $ | 143,626,656 | | | $ | 167,724,377 | |
| | |
Unrealized appreciation | | | 6,769,573 | | | | 7,687,137 | |
| | |
Investments, at value | | $ | 150,396,229 | | | $ | 175,411,514 | |
| | |
Cash | | $ | 4,158,534 | | | $ | 1,858,534 | |
| | |
Interest receivable | | | 1,008,555 | | | | 1,367,529 | |
| | |
Receivable for Fund shares sold | | | 691,946 | | | | 2,202,227 | |
| | |
Total assets | | $ | 156,255,264 | | | $ | 180,839,804 | |
|
| Liabilities | |
| | |
Payable for floating rate notes issued | | $ | — | | | $ | 4,999,975 | |
| | |
Payable for investments purchased | | | 257,437 | | | | — | |
| | |
Payable for when-issued securities | | | 1,296,048 | | | | — | |
| | |
Payable for Fund shares redeemed | | | 373,989 | | | | 243,092 | |
| | |
Distributions payable | | | 60,070 | | | | 125,025 | |
| | |
Payable to affiliates: | | | | | | | | |
| | |
Investment adviser fee | | | 47,242 | | | | 55,466 | |
| | |
Distribution and service fees | | | 29,136 | | | | 34,670 | |
| | |
Interest expense and fees payable | | | — | | | | 18,724 | |
| | |
Accrued expenses | | | 67,238 | | | | 74,806 | |
| | |
Total liabilities | | $ | 2,131,160 | | | $ | 5,551,758 | |
| | |
Net Assets | | $ | 154,124,104 | | | $ | 175,288,046 | |
|
| Sources of Net Assets | |
| | |
Paid-in capital | | $ | 154,884,505 | | | $ | 189,911,912 | |
| | |
Accumulated loss | | | (760,401 | ) | | | (14,623,866 | ) |
| | |
Net Assets | | $ | 154,124,104 | | | $ | 175,288,046 | |
|
| Class A Shares | |
| | |
Net Assets | | $ | 97,418,996 | | | $ | 112,375,380 | |
| | |
Shares Outstanding | | | 10,691,415 | | | | 13,270,101 | |
| | |
Net Asset Value and Redemption Price Per Share | | | | | | | | |
| | |
(net assets ÷ shares of beneficial interest outstanding) | | $ | 9.11 | | | $ | 8.47 | |
| | |
Maximum Offering Price Per Share | | | | | | | | |
| | |
(100 ÷ 95.25 of net asset value per share) | | $ | 9.56 | | | $ | 8.89 | |
|
| Class C Shares | |
| | |
Net Assets | | $ | 13,203,559 | | | $ | 15,647,996 | |
| | |
Shares Outstanding | | | 1,388,555 | | | | 1,784,676 | |
| | |
Net Asset Value and Offering Price Per Share* | | | | | | | | |
| | |
(net assets ÷ shares of beneficial interest outstanding) | | $ | 9.51 | | | $ | 8.77 | |
|
| Class I Shares | |
| | |
Net Assets | | $ | 43,501,549 | | | $ | 47,264,670 | |
| | |
Shares Outstanding | | | 4,771,893 | | | | 5,560,072 | |
| | |
Net Asset Value, Offering Price and Redemption Price Per Share | | | | | | | | |
| | |
(net assets ÷ shares of beneficial interest outstanding) | | $ | 9.12 | | | $ | 8.50 | |
On sales of $50,000 or more, the offering price of Class A shares is reduced.
| * | Redemption price per share is equal to the net asset value less any applicable contingent deferred sales charge. |
| | | | |
| | 27 | | See Notes to Financial Statements. |
Eaton Vance
Municipal Income Funds
January 31, 2019
Statements of Operations (Unaudited)
| | | | | | | | | | | | |
| | | Six Months Ended January 31, 2019 | |
| Investment Income | | Arizona Fund | | | Connecticut Fund | | | Minnesota Fund | |
| | | |
Interest | | $ | 895,533 | | | $ | 1,347,588 | | | $ | 2,194,540 | |
| | | |
Total investment income | | $ | 895,533 | | | $ | 1,347,588 | | | $ | 2,194,540 | |
|
| Expenses | |
| | | |
Investment adviser fee | | $ | 62,921 | | | $ | 107,630 | | | $ | 229,011 | |
| | | |
Distribution and service fees | | | | | | | | | | | | |
| | | |
Class A | | | 32,795 | | | | 53,506 | | | | 54,415 | |
| | | |
Class C | | | 23,167 | | | | 20,800 | | | | 41,515 | |
| | | |
Trustees’ fees and expenses | | | 1,658 | | | | 2,252 | | | | 3,832 | |
| | | |
Custodian fee | | | 18,641 | | | | 21,188 | | | | 27,804 | |
| | | |
Transfer and dividend disbursing agent fees | | | 8,403 | | | | 17,682 | | | | 29,597 | |
| | | |
Legal and accounting services | | | 22,720 | | | | 23,628 | | | | 24,831 | |
| | | |
Printing and postage | | | 3,774 | | | | 4,004 | | | | 5,587 | |
| | | |
Registration fees | | | 5,566 | | | | 2,320 | | | | 870 | |
| | | |
Interest expense and fees | | | — | | | | — | | | | 7,543 | |
| | | |
Miscellaneous | | | 9,435 | | | | 10,582 | | | | 16,102 | |
| | | |
Total expenses | | $ | 189,080 | | | $ | 263,592 | | | $ | 441,107 | |
| | | |
Net investment income | | $ | 706,453 | | | $ | 1,083,996 | | | $ | 1,753,433 | |
| | | |
| Realized and Unrealized Gain (Loss) | | | | | | | | | | | | |
| | | |
Net realized gain (loss) — | | | | | | | | | | | | |
| | | |
Investment transactions | | $ | 29,489 | | | $ | 22,168 | | | $ | (582,875 | ) |
| | | |
Financial futures contracts | | | 33,047 | | | | (48,819 | ) | | | — | |
| | | |
Net realized gain (loss) | | $ | 62,536 | | | $ | (26,651 | ) | | $ | (582,875 | ) |
| | | |
Change in unrealized appreciation (depreciation) — | | | | | | | | | | | | |
| | | |
Investments | | $ | 52,821 | | | $ | 61,518 | | | $ | 1,197,368 | |
| | | |
Financial futures contracts | | | (135,057 | ) | | | 7,116 | | | | — | |
| | | |
Net change in unrealized appreciation (depreciation) | | $ | (82,236 | ) | | $ | 68,634 | | | $ | 1,197,368 | |
| | | |
Net realized and unrealized gain (loss) | | $ | (19,700 | ) | | $ | 41,983 | | | $ | 614,493 | |
| | | |
Net increase in net assets from operations | | $ | 686,753 | | | $ | 1,125,979 | | | $ | 2,367,926 | |
| | | | |
| | 28 | | See Notes to Financial Statements. |
Eaton Vance
Municipal Income Funds
January 31, 2019
Statements of Operations (Unaudited) — continued
| | | | | | | | |
| | | Six Months Ended January 31, 2019 | |
| Investment Income | | New Jersey Fund | | | Pennsylvania Fund | |
| | |
Interest | | $ | 2,996,012 | | | $ | 4,036,696 | |
| | |
Total investment income | | $ | 2,996,012 | | | $ | 4,036,696 | |
|
| Expenses | |
| | |
Investment adviser fee | | $ | 271,771 | | | $ | 340,403 | |
| | |
Distribution and service fees | | | | | | | | |
| | |
Class A | | | 95,972 | | | | 109,892 | |
| | |
Class C | | | 78,674 | | | | 104,234 | |
| | |
Trustees’ fees and expenses | | | 4,604 | | | | 4,911 | |
| | |
Custodian fee | | | 29,088 | | | | 32,744 | |
| | |
Transfer and dividend disbursing agent fees | | | 34,204 | | | | 42,638 | |
| | |
Legal and accounting services | | | 33,857 | | | | 39,548 | |
| | |
Printing and postage | | | 5,856 | | | | 7,151 | |
| | |
Registration fees | | | 2,586 | | | | 2,380 | |
| | |
Interest expense and fees | | | — | | | | 71,869 | |
| | |
Miscellaneous | | | 13,756 | | | | 15,631 | |
| | |
Total expenses | | $ | 570,368 | | | $ | 771,401 | |
| | |
Net investment income | | $ | 2,425,644 | | | $ | 3,265,295 | |
|
| Realized and Unrealized Gain (Loss) | |
| | |
Net realized gain (loss) — | | | | | | | | |
| | |
Investment transactions | | $ | 122,463 | | | $ | (179,668 | ) |
| | |
Net realized gain (loss) | | $ | 122,463 | | | $ | (179,668 | ) |
| | |
Change in unrealized appreciation (depreciation) — | | | | | | | | |
| | |
Investments | | $ | 493,243 | | | $ | (491,413 | ) |
| | |
Net change in unrealized appreciation (depreciation) | | $ | 493,243 | | | $ | (491,413 | ) |
| | |
Net realized and unrealized gain (loss) | | $ | 615,706 | | | $ | (671,081 | ) |
| | |
Net increase in net assets from operations | | $ | 3,041,350 | | | $ | 2,594,214 | |
| | | | |
| | 29 | | See Notes to Financial Statements. |
Eaton Vance
Municipal Income Funds
January 31, 2019
Statements of Changes in Net Assets
| | | | | | | | | | | | |
| | | Six Months Ended January 31, 2019 (Unaudited) | |
| Increase (Decrease) in Net Assets | | Arizona Fund | | | Connecticut Fund | | | Minnesota Fund | |
| | | |
From operations — | | | | | | | | | | | | |
| | | |
Net investment income | | $ | 706,453 | | | $ | 1,083,996 | | | $ | 1,753,433 | |
| | | |
Net realized gain (loss) | | | 62,536 | | | | (26,651 | ) | | | (582,875 | ) |
| | | |
Net change in unrealized appreciation (depreciation) | | | (82,236 | ) | | | 68,634 | | | | 1,197,368 | |
| | | |
Net increase in net assets from operations | | $ | 686,753 | | | $ | 1,125,979 | | | $ | 2,367,926 | |
| | | |
Distributions to shareholders(1) — | | | | | | | | | | | | |
| | | |
Class A | | $ | (454,296 | ) | | $ | (798,283 | ) | | $ | (690,081 | ) |
| | | |
Class C | | | (49,215 | ) | | | (49,020 | ) | | | (78,112 | ) |
| | | |
Class I | | | (202,124 | ) | | | (233,795 | ) | | | (988,318 | ) |
| | | |
Total distributions to shareholders | | $ | (705,635 | ) | | $ | (1,081,098 | ) | | $ | (1,756,511 | ) |
| | | |
Transactions in shares of beneficial interest — | | | | | | | | | | | | |
| | | |
Proceeds from sale of shares | | | | | | | | | | | | |
| | | |
Class A | | $ | 2,121,654 | | | $ | 1,169,606 | | | $ | 3,243,602 | |
| | | |
Class C | | | 443,140 | | | | 32,611 | | | | 391,354 | |
| | | |
Class I | | | 3,391,698 | | | | 7,151,973 | | | | 16,482,509 | |
| | | |
Net asset value of shares issued to shareholders in payment of distributions declared | | | | | | | | | | | | |
| | | |
Class A | | | 400,716 | | | | 658,609 | | | | 627,437 | |
| | | |
Class C | | | 44,364 | | | | 36,551 | | | | 73,008 | |
| | | |
Class I | | | 163,249 | | | | 182,555 | | | | 623,434 | |
| | | |
Cost of shares redeemed | | | | | | | | | | | | |
| | | |
Class A | | | (3,341,148 | ) | | | (6,063,264 | ) | | | (9,764,919 | ) |
| | | |
Class C | | | (689,183 | ) | | | (735,358 | ) | | | (1,641,543 | ) |
| | | |
Class I | | | (2,522,606 | ) | | | (3,285,563 | ) | | | (21,142,745 | ) |
| | | |
Net asset value of shares converted | | | | | | | | | | | | |
| | | |
Class A | | | 535,898 | | | | 500,576 | | | | 1,484,516 | |
| | | |
Class C | | | (535,898 | ) | | | (500,576 | ) | | | (1,484,516 | ) |
| | | |
Net increase (decrease) in net assets from Fund share transactions | | $ | 11,884 | | | $ | (852,280 | ) | | $ | (11,107,863 | ) |
| | | |
Net decrease in net assets | | $ | (6,998 | ) | | $ | (807,399 | ) | | $ | (10,496,448 | ) |
| |
| Net Assets | | | | | |
| | | |
At beginning of period | | $ | 52,021,622 | | | $ | 73,329,731 | | | $ | 140,032,336 | |
| | | |
At end of period | | $ | 52,014,624 | | | $ | 72,522,332 | | | $ | 129,535,888 | |
| (1) | The current period presentation of distributions conforms with the Disclosure Update and Simplification Rule issued by the Securities and Exchange Commission, effective November 5, 2018. |
| | | | |
| | 30 | | See Notes to Financial Statements. |
Eaton Vance
Municipal Income Funds
January 31, 2019
Statements of Changes in Net Assets — continued
| | | | | | | | |
| | | Six Months Ended January 31, 2019 (Unaudited) | |
| Increase (Decrease) in Net Assets | | New Jersey Fund | | | Pennsylvania Fund | |
| | |
From operations — | | | | | | | | |
| | |
Net investment income | | $ | 2,425,644 | | | $ | 3,265,295 | |
| | |
Net realized gain (loss) | | | 122,463 | | | | (179,668 | ) |
| | |
Net change in unrealized appreciation (depreciation) | | | 493,243 | | | | (491,413 | ) |
| | |
Net increase in net assets from operations | | $ | 3,041,350 | | | $ | 2,594,214 | |
| | |
Distributions to shareholders(1) — | | | | | | | | |
| | |
Class A | | $ | (1,560,455 | ) | | $ | (2,092,143 | ) |
| | |
Class C | | | (207,032 | ) | | | (335,276 | ) |
| | |
Class I | | | (639,387 | ) | | | (897,761 | ) |
| | |
Total distributions to shareholders | | $ | (2,406,874 | ) | | $ | (3,325,180 | ) |
| | |
Transactions in shares of beneficial interest — | | | | | | | | |
| | |
Proceeds from sale of shares | | | | | | | | |
| | |
Class A | | $ | 1,363,428 | | | $ | 1,839,806 | |
| | |
Class C | | | 1,992,840 | | | | 495,564 | |
| | |
Class I | | | 23,197,523 | | | | 14,779,682 | |
| | |
Net asset value of shares issued to shareholders in payment of distributions declared | | | | | | | | |
| | |
Class A | | | 1,264,778 | | | | 1,834,156 | |
| | |
Class C | | | 178,323 | | | | 310,506 | |
| | |
Class I | | | 563,103 | | | | 376,742 | |
| | |
Cost of shares redeemed | | | | | | | | |
| | |
Class A | | | (7,832,780 | ) | | | (9,157,964 | ) |
| | |
Class C | | | (2,407,787 | ) | | | (2,276,435 | ) |
| | |
Class I | | | (12,820,457 | ) | | | (14,077,135 | ) |
| | |
Net asset value of shares converted | | | | | | | | |
| | |
Class A | | | 4,085,478 | | | | 5,768,772 | |
| | |
Class C | | | (4,085,478 | ) | | | (5,768,772 | ) |
| | |
Net increase (decrease) in net assets from Fund share transactions | | $ | 5,498,971 | | | $ | (5,875,078 | ) |
| | |
Net increase (decrease) in net assets | | $ | 6,133,447 | | | $ | (6,606,044 | ) |
|
| Net Assets | |
| | |
At beginning of period | | $ | 147,990,657 | | | $ | 181,894,090 | |
| | |
At end of period | | $ | 154,124,104 | | | $ | 175,288,046 | |
| (1) | The current period presentation of distributions conforms with the Disclosure Update and Simplification Rule issued by the Securities and Exchange Commission, effective November 5, 2018. |
| | | | |
| | 31 | | See Notes to Financial Statements. |
Eaton Vance
Municipal Income Funds
January 31, 2019
Statements of Changes in Net Assets — continued
| | | | | | | | | | | | |
| | | Year Ended July 31, 2018 | |
| Increase (Decrease) in Net Assets | | Arizona Fund | | | Connecticut Fund | | | Minnesota Fund | |
| | | |
From operations — | | | | | | | | | | | | |
| | | |
Net investment income | | $ | 1,665,311 | | | $ | 2,469,682 | | | $ | 3,863,466 | |
| | | |
Net realized gain | | | 1,016,261 | | | | 537,029 | | | | 13,709 | |
| | | |
Net change in unrealized appreciation (depreciation) | | | (1,873,751 | ) | | | (2,411,565 | ) | | | (3,670,645 | ) |
| | | |
Net increase in net assets from operations | | $ | 807,821 | | | $ | 595,146 | | | $ | 206,530 | |
| | | |
Distributions to shareholders — | | | | | | | | | | | | |
| | | |
From net investment income | | | | | | | | | | | | |
| | | |
Class A | | $ | (1,111,031 | ) | | $ | (1,817,459 | ) | | $ | (1,516,851 | ) |
| | | |
Class B | | | (2,240 | ) | | | (7,106 | ) | | | (302 | ) |
| | | |
Class C | | | (128,976 | ) | | | (127,819 | ) | | | (198,516 | ) |
| | | |
Class I | | | (474,900 | ) | | | (502,942 | ) | | | (2,202,579 | ) |
| | | |
Total distributions to shareholders | | $ | (1,717,147 | ) | | $ | (2,455,326 | ) | | $ | (3,918,248 | ) |
| | | |
Transactions in shares of beneficial interest — | | | | | | | | | | | | |
| | | |
Proceeds from sale of shares | | | | | | | | | | | | |
| | | |
Class A | | $ | 2,357,932 | | | $ | 2,885,116 | | | $ | 5,869,861 | |
| | | |
Class B | | | — | | | | 2,905 | | | | — | |
| | | |
Class C | | | 718,197 | | | | 198,245 | | | | 1,331,136 | |
| | | |
Class I | | | 4,675,712 | | | | 4,790,993 | | | | 27,056,131 | |
| | | |
Net asset value of shares issued to shareholders in payment of distributions declared | | | | | | | | | | | | |
| | | |
Class A | | | 992,340 | | | | 1,520,514 | | | | 1,404,749 | |
| | | |
Class B | | | 1,737 | | | | 2,877 | | | | 287 | |
| | | |
Class C | | | 113,099 | | | | 97,797 | | | | 184,648 | |
| | | |
Class I | | | 318,084 | | | | 331,246 | | | | 1,273,676 | |
| | | |
Cost of shares redeemed | | | | | | | | | | | | |
| | | |
Class A | | | (9,962,209 | ) | | | (7,912,013 | ) | | | (11,442,512 | ) |
| | | |
Class B | | | (13,210 | ) | | | (99,586 | ) | | | (403 | ) |
| | | |
Class C | | | (1,739,039 | ) | | | (1,426,567 | ) | | | (3,433,560 | ) |
| | | |
Class I | | | (8,452,947 | ) | | | (7,131,162 | ) | | | (27,648,263 | ) |
| | | |
Net asset value of shares converted | | | | | | | | | | | | |
| | | |
Class A | | | 111,980 | | | | 58,092 | | | | 43,829 | |
| | | |
Class B | | | (111,980 | ) | | | (58,092 | ) | | | (43,829 | ) |
| | | |
Net asset value of shares merged(1) | | | | | | | | | | | | |
| | | |
Class A | | | 106,634 | | | | 298,331 | | | | 6,434 | |
| | | |
Class B | | | (106,634 | ) | | | (298,331 | ) | | | (6,434 | ) |
| | | |
Net decrease in net assets from Fund share transactions | | $ | (10,990,304 | ) | | $ | (6,739,635 | ) | | $ | (5,404,250 | ) |
| | | |
Net decrease in net assets | | $ | (11,899,630 | ) | | $ | (8,599,815 | ) | | $ | (9,115,968 | ) |
| |
| Net Assets | | | | | |
| | | |
At beginning of year | | $ | 63,921,252 | | | $ | 81,929,546 | | | $ | 149,148,304 | |
| | | |
At end of year(2) | | $ | 52,021,622 | | | $ | 73,329,731 | | | $ | 140,032,336 | |
| (1) | At the close of business on April 5, 2018, Class B shares were merged into Class A shares. |
| (2) | Includes accumulated undistributed (distributions in excess of) net investment income of $244,256, $(35,395) and $44,831, respectively, at July 31, 2018. The requirement to disclose the corresponding amounts as of January 31, 2019 was eliminated. |
| | | | |
| | 32 | | See Notes to Financial Statements. |
Eaton Vance
Municipal Income Funds
January 31, 2019
Statements of Changes in Net Assets — continued
| | | | | | | | |
| | | Year Ended July 31, 2018 | |
| Increase (Decrease) in Net Assets | | New Jersey Fund | | | Pennsylvania Fund | |
| | |
From operations — | | | | | | | | |
| | |
Net investment income | | $ | 5,223,276 | | | $ | 7,382,406 | |
| | |
Net realized gain | | | 1,232,251 | | | | 518,984 | |
| | |
Net change in unrealized appreciation (depreciation) | | | (3,848,754 | ) | | | (5,891,183 | ) |
| | |
Net increase in net assets from operations | | $ | 2,606,773 | | | $ | 2,010,207 | |
| | |
Distributions to shareholders— | | | | | | | | |
| | |
From net investment income | | | | | | | | |
| | |
Class A | | $ | (3,554,266 | ) | | $ | (4,520,698 | ) |
| | |
Class B | | | — | | | | (12,912 | ) |
| | |
Class C | | | (533,723 | ) | | | (794,768 | ) |
| | |
Class I | | | (1,211,654 | ) | | | (1,935,642 | ) |
| | |
Total distributions to shareholders | | $ | (5,299,643 | ) | | $ | (7,264,020 | ) |
| | |
Transactions in shares of beneficial interest — | | | | | | | | |
| | |
Proceeds from sale of shares | | | | | | | | |
| | |
Class A | | $ | 5,620,283 | | | $ | 4,328,909 | |
| | |
Class C | | | 1,627,297 | | | | 679,608 | |
| | |
Class I | | | 21,075,842 | | | | 9,205,147 | |
| | |
Net asset value of shares issued to shareholders in payment of distributions declared | | | | | | | | |
| | |
Class A | | | 2,877,424 | | | | 3,972,725 | |
| | |
Class B | | | — | | | | 12,697 | |
| | |
Class C | | | 449,499 | | | | 732,412 | |
| | |
Class I | | | 1,007,381 | | | | 793,843 | |
| | |
Cost of shares redeemed | | | | | | | | |
| | |
Class A | | | (12,674,961 | ) | | | (19,060,766 | ) |
| | |
Class B | | | — | | | | (39,726 | ) |
| | |
Class C | | | (5,370,881 | ) | | | (7,358,261 | ) |
| | |
Class I | | | (20,942,941 | ) | | | (13,359,604 | ) |
| | |
Net asset value of shares converted | | | | | | | | |
| | |
Class A | | | — | | | | 512,989 | |
| | |
Class B | | | — | | | | (512,989 | ) |
| | |
Net asset value of shares merged(1) | | | | | | | | |
| | |
Class A | | | — | | | | 400,566 | |
| | |
Class B | | | — | | | | (400,566 | ) |
| | |
Net decrease in net assets from Fund share transactions | | $ | (6,331,057 | ) | | $ | (20,093,016 | ) |
| | |
Net decrease in net assets | | $ | (9,023,927 | ) | | $ | (25,346,829 | ) |
|
| Net Assets | |
| | |
At beginning of year | | $ | 157,014,584 | | | $ | 207,240,919 | |
| | |
At end of year(2) | | $ | 147,990,657 | | | $ | 181,894,090 | |
| (1) | At the close of business on April 5, 2018, Class B shares of Pennsylvania Fund were merged into Class A shares. |
| (2) | Includes accumulated undistributed net investment income of $1,239,482 and $131,751, respectively, at July 31, 2018. The requirement to disclose the corresponding amounts as of January 31, 2019 was eliminated. |
| | | | |
| | 33 | | See Notes to Financial Statements. |
Eaton Vance
Municipal Income Funds
January 31, 2019
Financial Highlights
| | | | | | | | | | | | | | | | | | | | | | | | |
| | | Arizona Fund — Class A | |
| | |
| | | Six Months Ended
January 31, 2019
(Unaudited) | | | Year Ended July 31, | |
| | | 2018 | | | 2017 | | | 2016 | | | 2015 | | | 2014 | |
| | | | | | | |
Net asset value — Beginning of period | | $ | 9.440 | | | $ | 9.580 | | | $ | 9.840 | | | $ | 9.540 | | | $ | 9.650 | | | $ | 9.300 | |
| | | | | | |
| Income (Loss) From Operations | | | | | | | | | | | | | | | | | | | | | | | | |
| | | | | | |
Net investment income(1) | | $ | 0.131 | | | $ | 0.276 | | | $ | 0.292 | | | $ | 0.321 | | | $ | 0.346 | | | $ | 0.378 | |
| | | | | | |
Net realized and unrealized gain (loss) | | | 0.010 | | | | (0.132 | ) | | | (0.262 | ) | | | 0.298 | | | | (0.088 | ) | | | 0.337 | |
| | | | | | |
Total income from operations | | $ | 0.141 | | | $ | 0.144 | | | $ | 0.030 | | | $ | 0.619 | | | $ | 0.258 | | | $ | 0.715 | |
| | | | | | |
| Less Distributions | | | | | | | | | | | | | | | | | | | | | | | | |
| | | | | | |
From net investment income | | $ | (0.131 | ) | | $ | (0.284 | ) | | $ | (0.290 | ) | | $ | (0.319 | ) | | $ | (0.368 | ) | | $ | (0.365 | ) |
| | | | | | |
Total distributions | | $ | (0.131 | ) | | $ | (0.284 | ) | | $ | (0.290 | ) | | $ | (0.319 | ) | | $ | (0.368 | ) | | $ | (0.365 | ) |
| | | | | | |
Net asset value — End of period | | $ | 9.450 | | | $ | 9.440 | | | $ | 9.580 | | | $ | 9.840 | | | $ | 9.540 | | | $ | 9.650 | |
| | | | | | |
Total Return(2) | | | 1.51 | %(3) | | | 1.53 | % | | | 0.35 | % | | | 6.60 | % | | | 2.67 | % | | | 7.84 | % |
|
| Ratios/Supplemental Data | |
| | | | | | |
Net assets, end of period (000’s omitted) | | $ | 33,405 | | | $ | 33,704 | | | $ | 40,674 | | | $ | 47,956 | | | $ | 47,736 | | | $ | 52,491 | |
| | | | | | |
Ratios (as a percentage of average daily net assets): | | | | | | | | | | | | | | | | | | | | | | | | |
| | | | | | |
Expenses excluding interest and fees(4) | | | 0.72 | %(5) | | | 0.71 | % | | | 0.71 | % | | | 0.69 | % | | | 0.72 | % | | | 0.73 | % |
| | | | | | |
Interest and fee expense(6) | | | — | | | | — | | | | — | | | | — | | | | — | | | | 0.03 | % |
| | | | | | |
Total expenses(4) | | | 0.72 | %(5) | | | 0.71 | % | | | 0.71 | % | | | 0.69 | % | | | 0.72 | % | | | 0.76 | % |
| | | | | | |
Net investment income | | | 2.77 | %(5) | | | 2.90 | % | | | 3.05 | % | | | 3.32 | % | | | 3.56 | % | | | 4.01 | % |
| | | | | | |
Portfolio Turnover | | | 3 | %(3) | | | 8 | % | | | 22 | % | | | 14 | % | | | 8 | % | | | 4 | % |
| (1) | Computed using average shares outstanding. |
| (2) | Returns are historical and are calculated by determining the percentage change in net asset value with all distributions reinvested and do not reflect the effect of sales charges. |
| (4) | Excludes the effect of custody fee credits, if any, of less than 0.005%. Effective September 1, 2015, custody fee credits, which were earned on cash deposit balances, were discontinued by the custodian. |
| (6) | Interest and fee expense relates to the liability for floating rate notes issued in conjunction with residual interest bond transactions (see Note 1H). |
| | | | |
| | 34 | | See Notes to Financial Statements. |
Eaton Vance
Municipal Income Funds
January 31, 2019
Financial Highlights — continued
| | | | | | | | | | | | | | | | | | | | | | | | |
| | | Arizona Fund — Class C | |
| | |
| | | Six Months Ended
January 31, 2019
(Unaudited) | | | Year Ended July 31, | |
| | | 2018 | | | 2017 | | | 2016 | | | 2015 | | | 2014 | |
| | | | | | | |
Net asset value — Beginning of period | | $ | 10.500 | | | $ | 10.650 | | | $ | 10.940 | | | $ | 10.610 | | | $ | 10.730 | | | $ | 10.340 | |
| | | | | | |
| Income (Loss) From Operations | | | | | | | | | | | | | | | | | | | | | | | | |
| | | | | | |
Net investment income(1) | | $ | 0.106 | | | $ | 0.227 | | | $ | 0.245 | | | $ | 0.275 | | | $ | 0.305 | | | $ | 0.343 | |
| | | | | | |
Net realized and unrealized gain (loss) | | | (0.000 | )(2) | | | (0.140 | ) | | | (0.293 | ) | | | 0.329 | | | | (0.097 | ) | | | 0.374 | |
| | | | | | |
Total income (loss) from operations | | $ | 0.106 | | | $ | 0.087 | | | $ | (0.048 | ) | | $ | 0.604 | | | $ | 0.208 | | | $ | 0.717 | |
| | | | | | |
| Less Distributions | | | | | | | | | | | | | | | | | | | | | | | | |
| | | | | | |
From net investment income | | $ | (0.106 | ) | | $ | (0.237 | ) | | $ | (0.242 | ) | | $ | (0.274 | ) | | $ | (0.328 | ) | | $ | (0.327 | ) |
| | | | | | |
Total distributions | | $ | (0.106 | ) | | $ | (0.237 | ) | | $ | (0.242 | ) | | $ | (0.274 | ) | | $ | (0.328 | ) | | $ | (0.327 | ) |
| | | | | | |
Net asset value — End of period | | $ | 10.500 | | | $ | 10.500 | | | $ | 10.650 | | | $ | 10.940 | | | $ | 10.610 | | | $ | 10.730 | |
| | | | | | |
Total Return(3) | | | 1.02 | %(4) | | | 0.83 | % | | | (0.41 | )% | | | 5.77 | % | | | 1.93 | % | | | 7.05 | % |
|
| Ratios/Supplemental Data | |
| | | | | | |
Net assets, end of period (000’s omitted) | | $ | 4,284 | | | $ | 5,025 | | | $ | 6,025 | | | $ | 6,592 | | | $ | 5,690 | | | $ | 5,792 | |
| | | | | | |
Ratios (as a percentage of average daily net assets): | | | | | | | | | | | | | | | | | | | | | | | | |
| | | | | | |
Expenses excluding interest and fees(5) | | | 1.47 | %(6) | | | 1.46 | % | | | 1.46 | % | | | 1.44 | % | | | 1.47 | % | | | 1.48 | % |
| | | | | | |
Interest and fee expense(7) | | | — | | | | — | | | | — | | | | — | | | | — | | | | 0.03 | % |
| | | | | | |
Total expenses(5) | | | 1.47 | %(6) | | | 1.46 | % | | | 1.46 | % | | | 1.44 | % | | | 1.47 | % | | | 1.51 | % |
| | | | | | |
Net investment income | | | 2.02 | %(6) | | | 2.15 | % | | | 2.30 | % | | | 2.56 | % | | | 2.83 | % | | | 3.28 | % |
| | | | | | |
Portfolio Turnover | | | 3 | %(4) | | | 8 | % | | | 22 | % | | | 14 | % | | | 8 | % | | | 4 | % |
| (1) | Computed using average shares outstanding. |
| (2) | Amount is less than $(0.0005). |
| (3) | Returns are historical and are calculated by determining the percentage change in net asset value with all distributions reinvested and do not reflect the effect of sales charges. |
| (5) | Excludes the effect of custody fee credits, if any, of less than 0.005%. Effective September 1, 2015, custody fee credits, which were earned on cash deposit balances, were discontinued by the custodian. |
| (7) | Interest and fee expense relates to the liability for floating rate notes issued in conjunction with residual interest bond transactions (see Note 1H). |
| | | | |
| | 35 | | See Notes to Financial Statements. |
Eaton Vance
Municipal Income Funds
January 31, 2019
Financial Highlights — continued
| | | | | | | | | | | | | | | | | | | | | | | | |
| | | Arizona Fund — Class I | |
| | |
| | | Six Months Ended
January 31, 2019
(Unaudited) | | | Year Ended July 31, | |
| | | 2018 | | | 2017 | | | 2016 | | | 2015 | | | 2014 | |
| | | | | | | |
Net asset value — Beginning of period | | $ | 9.440 | | | $ | 9.580 | | | $ | 9.830 | | | $ | 9.540 | | | $ | 9.640 | | | $ | 9.300 | |
| | | | | | |
| Income (Loss) From Operations | | | | | | | | | | | | | | | | | | | | | | | | |
| | | | | | |
Net investment income(1) | | $ | 0.140 | | | $ | 0.295 | | | $ | 0.310 | | | $ | 0.339 | | | $ | 0.368 | | | $ | 0.396 | |
| | | | | | |
Net realized and unrealized gain (loss) | | | 0.010 | | | | (0.132 | ) | | | (0.251 | ) | | | 0.289 | | | | (0.081 | ) | | | 0.328 | |
| | | | | | |
Total income from operations | | $ | 0.150 | | | $ | 0.163 | | | $ | 0.059 | | | $ | 0.628 | | | $ | 0.287 | | | $ | 0.724 | |
| | | | | | |
| Less Distributions | | | | | | | | | | | | | | | | | | | | | | | | |
| | | | | | |
From net investment income | | $ | (0.140 | ) | | $ | (0.303 | ) | | $ | (0.309 | ) | | $ | (0.338 | ) | | $ | (0.387 | ) | | $ | (0.384 | ) |
| | | | | | |
Total distributions | | $ | (0.140 | ) | | $ | (0.303 | ) | | $ | (0.309 | ) | | $ | (0.338 | ) | | $ | (0.387 | ) | | $ | (0.384 | ) |
| | | | | | |
Net asset value — End of period | | $ | 9.450 | | | $ | 9.440 | | | $ | 9.580 | | | $ | 9.830 | | | $ | 9.540 | | | $ | 9.640 | |
| | | | | | |
Total Return(2) | | | 1.61 | %(3) | | | 1.74 | % | | | 0.65 | % | | | 6.70 | % | | | 2.98 | % | | | 7.94 | % |
|
| Ratios/Supplemental Data | |
| | | | | | |
Net assets, end of period (000’s omitted) | | $ | 14,326 | | | $ | 13,292 | | | $ | 16,990 | | | $ | 12,390 | | | $ | 9,759 | | | $ | 9,136 | |
| | | | | | |
Ratios (as a percentage of average daily net assets): | | | | | | | | | | | | | | | | | | | | | | | | |
| | | | | | |
Expenses excluding interest and fees(4) | | | 0.52 | %(5) | | | 0.51 | % | | | 0.51 | % | | | 0.49 | % | | | 0.52 | % | | | 0.53 | % |
| | | | | | |
Interest and fee expense(6) | | | — | | | | — | | | | — | | | | — | | | | — | | | | 0.03 | % |
| | | | | | |
Total expenses(4) | | | 0.52 | %(5) | | | 0.51 | % | | | 0.51 | % | | | 0.49 | % | | | 0.52 | % | | | 0.56 | % |
| | | | | | |
Net investment income | | | 2.97 | %(5) | | | 3.10 | % | | | 3.24 | % | | | 3.50 | % | | | 3.79 | % | | | 4.20 | % |
| | | | | | |
Portfolio Turnover | | | 3 | %(3) | | | 8 | % | | | 22 | % | | | 14 | % | | | 8 | % | | | 4 | % |
| (1) | Computed using average shares outstanding. |
| (2) | Returns are historical and are calculated by determining the percentage change in net asset value with all distributions reinvested. |
| (4) | Excludes the effect of custody fee credits, if any, of less than 0.005%. Effective September 1, 2015, custody fee credits, which were earned on cash deposit balances, were discontinued by the custodian. |
| (6) | Interest and fee expense relates to the liability for floating rate notes issued in conjunction with residual interest bond transactions (see Note 1H). |
| | | | |
| | 36 | | See Notes to Financial Statements. |
Eaton Vance
Municipal Income Funds
January 31, 2019
Financial Highlights — continued
| | | | | | | | | | | | | | | | | | | | | | | | |
| | | Connecticut Fund — Class A | |
| | |
| | | Six Months Ended
January 31, 2019
(Unaudited) | | | Year Ended July 31, | |
| | | 2018 | | | 2017 | | | 2016 | | | 2015 | | | 2014 | |
| | | | | | | |
Net asset value — Beginning of period | | $ | 9.960 | | | $ | 10.200 | | | $ | 10.520 | | | $ | 10.240 | | | $ | 10.240 | | | $ | 9.890 | |
| | | | | | |
| Income (Loss) From Operations | | | | | | | | | | | | | | | | | | | | | | | | |
| | | | | | |
Net investment income(1) | | $ | 0.149 | | | $ | 0.324 | | | $ | 0.328 | | | $ | 0.351 | | | $ | 0.364 | | | $ | 0.386 | |
| | | | | | |
Net realized and unrealized gain (loss) | | | 0.010 | | | | (0.243 | ) | | | (0.323 | ) | | | 0.276 | | | | (0.004 | ) | | | 0.347 | |
| | | | | | |
Total income from operations | | $ | 0.159 | | | $ | 0.081 | | | $ | 0.005 | | | $ | 0.627 | | | $ | 0.360 | | | $ | 0.733 | |
| | | | | | |
| Less Distributions | | | | | | | | | | | | | | | | | | | | | | | | |
| | | | | | |
From net investment income | | $ | (0.149 | ) | | $ | (0.321 | ) | | $ | (0.325 | ) | | $ | (0.347 | ) | | $ | (0.360 | ) | | $ | (0.383 | ) |
| | | | | | |
Total distributions | | $ | (0.149 | ) | | $ | (0.321 | ) | | $ | (0.325 | ) | | $ | (0.347 | ) | | $ | (0.360 | ) | | $ | (0.383 | ) |
| | | | | | |
Net asset value — End of period | | $ | 9.970 | | | $ | 9.960 | | | $ | 10.200 | | | $ | 10.520 | | | $ | 10.240 | | | $ | 10.240 | |
| | | | | | |
Total Return(2) | | | 1.61 | %(3) | | | 0.82 | % | | | 0.08 | % | | | 6.22 | % | | | 3.53 | % | | | 7.56 | % |
|
| Ratios/Supplemental Data | |
| | | | | | |
Net assets, end of period (000’s omitted) | | $ | 51,184 | | | $ | 54,900 | | | $ | 59,405 | | | $ | 68,795 | | | $ | 72,210 | | | $ | 76,772 | |
| | | | | | |
Ratios (as a percentage of average daily net assets): | | | | | | | | | | | | | | | | | | | | | | | | |
| | | | | | |
Expenses excluding interest and fees(4) | | | 0.72 | %(5) | | | 0.73 | % | | | 0.70 | % | | | 0.72 | % | | | 0.72 | % | | | 0.71 | % |
| | | | | | |
Interest and fee expense(6) | | | — | | | | — | | | | — | | | | — | | | | 0.03 | % | | | 0.07 | % |
| | | | | | |
Total expenses(4) | | | 0.72 | %(5) | | | 0.73 | % | | | 0.70 | % | | | 0.72 | % | | | 0.75 | % | | | 0.78 | % |
| | | | | | |
Net investment income | | | 2.99 | %(5) | | | 3.22 | % | | | 3.20 | % | | | 3.38 | % | | | 3.52 | % | | | 3.87 | % |
| | | | | | |
Portfolio Turnover | | | 11 | %(3) | | | 10 | % | | | 11 | % | | | 7 | % | | | 2 | % | | | 6 | % |
| (1) | Computed using average shares outstanding. |
| (2) | Returns are historical and are calculated by determining the percentage change in net asset value with all distributions reinvested and do not reflect the effect of sales charges. |
| (4) | Excludes the effect of custody fee credits, if any, of less than 0.005%. Effective September 1, 2015, custody fee credits, which were earned on cash deposit balances, were discontinued by the custodian. |
| (6) | Interest and fee expense relates to the liability for floating rate notes issued in conjunction with residual interest bond transactions (see Note 1H). |
| | | | |
| | 37 | | See Notes to Financial Statements. |
Eaton Vance
Municipal Income Funds
January 31, 2019
Financial Highlights — continued
| | | | | | | | | | | | | | | | | | | | | | | | |
| | | Connecticut Fund — Class C | |
| | |
| | | Six Months Ended
January 31, 2019
(Unaudited) | | | Year Ended July 31, | |
| | | 2018 | | | 2017 | | | 2016 | | | 2015 | | | 2014 | |
| | | | | | | |
Net asset value — Beginning of period | | $ | 9.920 | | | $ | 10.160 | | | $ | 10.490 | | | $ | 10.200 | | | $ | 10.200 | | | $ | 9.860 | |
| | | | | | |
| Income (Loss) From Operations | | | | | | | | | | | | | | | | | | | | | | | | |
| | | | | | |
Net investment income(1) | | $ | 0.112 | | | $ | 0.247 | | | $ | 0.250 | | | $ | 0.271 | | | $ | 0.285 | | | $ | 0.310 | |
| | | | | | |
Net realized and unrealized gain (loss) | | | 0.009 | | | | (0.242 | ) | | | (0.333 | ) | | | 0.287 | | | | (0.003 | ) | | | 0.337 | |
| | | | | | |
Total income (loss) from operations | | $ | 0.121 | | | $ | 0.005 | | | $ | (0.083 | ) | | $ | 0.558 | | | $ | 0.282 | | | $ | 0.647 | |
| | | | | | |
| Less Distributions | | | | | | | | | | | | | | | | | | | | | | | | |
| | | | | | |
From net investment income | | $ | (0.111 | ) | | $ | (0.245 | ) | | $ | (0.247 | ) | | $ | (0.268 | ) | | $ | (0.282 | ) | | $ | (0.307 | ) |
| | | | | | |
Total distributions | | $ | (0.111 | ) | | $ | (0.245 | ) | | $ | (0.247 | ) | | $ | (0.268 | ) | | $ | (0.282 | ) | | $ | (0.307 | ) |
| | | | | | |
Net asset value — End of period | | $ | 9.930 | | | $ | 9.920 | | | $ | 10.160 | | | $ | 10.490 | | | $ | 10.200 | | | $ | 10.200 | |
| | | | | | |
Total Return(2) | | | 1.23 | %(3) | | | 0.06 | % | | | (0.77 | )% | | | 5.54 | % | | | 2.76 | % | | | 6.67 | % |
|
| Ratios/Supplemental Data | |
| | | | | | |
Net assets, end of period (000’s omitted) | | $ | 3,417 | | | $ | 4,588 | | | $ | 5,847 | | | $ | 7,020 | | | $ | 6,739 | | | $ | 6,447 | |
| | | | | | |
Ratios (as a percentage of average daily net assets): | | | | | | | | | | | | | | | | | | | | | | | | |
| | | | | | |
Expenses excluding interest and fees(4) | | | 1.47 | %(5) | | | 1.48 | % | | | 1.45 | % | | | 1.47 | % | | | 1.47 | % | | | 1.46 | % |
| | | | | | |
Interest and fee expense(6) | | | — | | | | — | | | | — | | | | — | | | | 0.03 | % | | | 0.07 | % |
| | | | | | |
Total expenses(4) | | | 1.47 | %(5) | | | 1.48 | % | | | 1.45 | % | | | 1.47 | % | | | 1.50 | % | | | 1.53 | % |
| | | | | | |
Net investment income | | | 2.25 | %(5) | | | 2.47 | % | | | 2.45 | % | | | 2.62 | % | | | 2.77 | % | | | 3.11 | % |
| | | | | | |
Portfolio Turnover | | | 11 | %(3) | | | 10 | % | | | 11 | % | | | 7 | % | | | 2 | % | | | 6 | % |
| (1) | Computed using average shares outstanding. |
| (2) | Returns are historical and are calculated by determining the percentage change in net asset value with all distributions reinvested and do not reflect the effect of sales charges. |
| (4) | Excludes the effect of custody fee credits, if any, of less than 0.005%. Effective September 1, 2015, custody fee credits, which were earned on cash deposit balances, were discontinued by the custodian. |
| (6) | Interest and fee expense relates to the liability for floating rate notes issued in conjunction with residual interest bond transactions (see Note 1H). |
| | | | |
| | 38 | | See Notes to Financial Statements. |
Eaton Vance
Municipal Income Funds
January 31, 2019
Financial Highlights — continued
| | | | | | | | | | | | | | | | | | | | | | | | |
| | | Connecticut Fund — Class I | |
| | |
| | | Six Months Ended
January 31, 2019
(Unaudited) | | | Year Ended July 31, | |
| | | 2018 | | | 2017 | | | 2016 | | | 2015 | | | 2014 | |
| | | | | | | |
Net asset value — Beginning of period | | $ | 9.960 | | | $ | 10.200 | | | $ | 10.520 | | | $ | 10.240 | | | $ | 10.240 | | | $ | 9.890 | |
|
| Income (Loss) From Operations | |
| | | | | | |
Net investment income(1) | | $ | 0.159 | | | $ | 0.344 | | | $ | 0.348 | | | $ | 0.371 | | | $ | 0.385 | | | $ | 0.406 | |
| | | | | | |
Net realized and unrealized gain (loss) | | | 0.010 | | | | (0.242 | ) | | | (0.322 | ) | | | 0.276 | | | | (0.004 | ) | | | 0.347 | |
| | | | | | |
Total income from operations | | $ | 0.169 | | | $ | 0.102 | | | $ | 0.026 | | | $ | 0.647 | | | $ | 0.381 | | | $ | 0.753 | |
|
| Less Distributions | |
| | | | | | |
From net investment income | | $ | (0.159 | ) | | $ | (0.342 | ) | | $ | (0.346 | ) | | $ | (0.367 | ) | | $ | (0.381 | ) | | $ | (0.403 | ) |
| | | | | | |
Total distributions | | $ | (0.159 | ) | | $ | (0.342 | ) | | $ | (0.346 | ) | | $ | (0.367 | ) | | $ | (0.381 | ) | | $ | (0.403 | ) |
| | | | | | |
Net asset value — End of period | | $ | 9.970 | | | $ | 9.960 | | | $ | 10.200 | | | $ | 10.520 | | | $ | 10.240 | | | $ | 10.240 | |
| | | | | | |
Total Return(2) | | | 1.72 | %(3) | | | 1.03 | % | | | 0.28 | % | | | 6.43 | % | | | 3.74 | % | | | 7.78 | % |
|
| Ratios/Supplemental Data | |
| | | | | | |
Net assets, end of period (000’s omitted) | | $ | 17,921 | | | $ | 13,842 | | | $ | 16,216 | | | $ | 12,826 | | | $ | 9,330 | | | $ | 9,987 | |
| | | | | | |
Ratios (as a percentage of average daily net assets): | | | | | | | | | | | | | | | | | | | | | | | | |
| | | | | | |
Expenses excluding interest and fees(4) | | | 0.52 | %(5) | | | 0.53 | % | | | 0.50 | % | | | 0.52 | % | | | 0.52 | % | | | 0.51 | % |
| | | | | | |
Interest and fee expense(6) | | | — | | | | — | | | | — | | | | — | | | | 0.03 | % | | | 0.07 | % |
| | | | | | |
Total expenses(4) | | | 0.52 | %(5) | | | 0.53 | % | | | 0.50 | % | | | 0.52 | % | | | 0.55 | % | | | 0.58 | % |
| | | | | | |
Net investment income | | | 3.18 | %(5) | | | 3.42 | % | | | 3.40 | % | | | 3.57 | % | | | 3.71 | % | | | 4.05 | % |
| | | | | | |
Portfolio Turnover | | | 11 | %(3) | | | 10 | % | | | 11 | % | | | 7 | % | | | 2 | % | | | 6 | % |
| (1) | Computed using average shares outstanding. |
| (2) | Returns are historical and are calculated by determining the percentage change in net asset value with all distributions reinvested. |
| (4) | Excludes the effect of custody fee credits, if any, of less than 0.005%. Effective September 1, 2015, custody fee credits, which were earned on cash deposit balances, were discontinued by the custodian. |
| (6) | Interest and fee expense relates to the liability for floating rate notes issued in conjunction with residual interest bond transactions (see Note 1H). |
| | | | |
| | 39 | | See Notes to Financial Statements. |
Eaton Vance
Municipal Income Funds
January 31, 2019
Financial Highlights — continued
| | | | | | | | | | | | | | | | | | | | | | | | |
| | | Minnesota Fund — Class A | |
| | |
| | | Six Months Ended
January 31, 2019
(Unaudited) | | | Year Ended July 31, | |
| | | 2018 | | | 2017 | | | 2016 | | | 2015 | | | 2014 | |
| | | | | | | |
Net asset value — Beginning of period | | $ | 9.250 | | | $ | 9.480 | | | $ | 9.770 | | | $ | 9.550 | | | $ | 9.580 | | | $ | 9.230 | |
|
| Income (Loss) From Operations | |
| | | | | | |
Net investment income(1) | | $ | 0.117 | | | $ | 0.241 | | | $ | 0.263 | | | $ | 0.288 | | | $ | 0.312 | | | $ | 0.319 | |
| | | | | | |
Net realized and unrealized gain (loss) | | | 0.050 | | | | (0.227 | ) | | | (0.289 | ) | | | 0.222 | | | | (0.033 | ) | | | 0.349 | |
| | | | | | |
Total income (loss) from operations | | $ | 0.167 | | | $ | 0.014 | | | $ | (0.026 | ) | | $ | 0.510 | | | $ | 0.279 | | | $ | 0.668 | |
|
| Less Distributions | |
| | | | | | |
From net investment income | | $ | (0.117 | ) | | $ | (0.244 | ) | | $ | (0.264 | ) | | $ | (0.290 | ) | | $ | (0.309 | ) | | $ | (0.318 | ) |
| | | | | | |
Total distributions | | $ | (0.117 | ) | | $ | (0.244 | ) | | $ | (0.264 | ) | | $ | (0.290 | ) | | $ | (0.309 | ) | | $ | (0.318 | ) |
| | | | | | |
Net asset value — End of period | | $ | 9.300 | | | $ | 9.250 | | | $ | 9.480 | | | $ | 9.770 | | | $ | 9.550 | | | $ | 9.580 | |
| | | | | | |
Total Return(2) | | | 1.83 | %(3) | | | 0.15 | % | | | (0.22 | )% | | | 5.42 | % | | | 2.94 | % | | | 7.36 | % |
|
| Ratios/Supplemental Data | |
| | | | | | |
Net assets, end of period (000’s omitted) | | $ | 52,609 | | | $ | 56,760 | | | $ | 62,310 | | | $ | 74,061 | | | $ | 71,598 | | | $ | 73,246 | |
| | | | | | |
Ratios (as a percentage of average daily net assets): | | | | | | | | | | | | | | | | | | | | | | | | |
| | | | | | |
Expenses(4) | | | 0.71 | %(5)(6) | | | 0.69 | % | | | 0.70 | % | | | 0.69 | % | | | 0.71 | % | | | 0.71 | % |
| | | | | | |
Net investment income | | | 2.53 | %(5) | | | 2.57 | % | | | 2.77 | % | | | 2.98 | % | | | 3.24 | % | | | 3.40 | % |
| | | | | | |
Portfolio Turnover | | | 4 | %(3) | | | 20 | % | | | 23 | % | | | 12 | % | | | 2 | % | | | 4 | % |
| (1) | Computed using average shares outstanding. |
| (2) | Returns are historical and are calculated by determining the percentage change in net asset value with all distributions reinvested and do not reflect the effect of sales charges. |
| (4) | Excludes the effect of custody fee credits, if any, of less than 0.005%. Effective September 1, 2015, custody fee credits, which were earned on cash deposit balances, were discontinued by the custodian. |
| (6) | Includes interest expense of 0.01% for the six months ended January 31, 2019. |
| | | | |
| | 40 | | See Notes to Financial Statements. |
Eaton Vance
Municipal Income Funds
January 31, 2019
Financial Highlights — continued
| | | | | | | | | | | | | | | | | | | | | | | | |
| | | Minnesota Fund — Class C | |
| | |
| | | Six Months Ended
January 31, 2019
(Unaudited) | | | Year Ended July 31, | |
| | | 2018 | | | 2017 | | | 2016 | | | 2015 | | | 2014 | |
| | | | | | | |
Net asset value — Beginning of period | | $ | 9.950 | | | $ | 10.200 | | | $ | 10.500 | | | $ | 10.270 | | | $ | 10.300 | | | $ | 9.920 | |
|
| Income (Loss) From Operations | |
| | | | | | |
Net investment income(1) | | $ | 0.089 | | | $ | 0.184 | | | $ | 0.206 | | | $ | 0.231 | | | $ | 0.257 | | | $ | 0.268 | |
| | | | | | |
Net realized and unrealized gain (loss) | | | 0.060 | | | | (0.247 | ) | | | (0.298 | ) | | | 0.233 | | | | (0.032 | ) | | | 0.378 | |
| | | | | | |
Total income (loss) from operations | | $ | 0.149 | | | $ | (0.063 | ) | | $ | (0.092 | ) | | $ | 0.464 | | | $ | 0.225 | | | $ | 0.646 | |
|
| Less Distributions | |
| | | | | | |
From net investment income | | $ | (0.089 | ) | | $ | (0.187 | ) | | $ | (0.208 | ) | | $ | (0.234 | ) | | $ | (0.255 | ) | | $ | (0.266 | ) |
| | | | | | |
Total distributions | | $ | (0.089 | ) | | $ | (0.187 | ) | | $ | (0.208 | ) | | $ | (0.234 | ) | | $ | (0.255 | ) | | $ | (0.266 | ) |
| | | | | | |
Net asset value — End of period | | $ | 10.010 | | | $ | 9.950 | | | $ | 10.200 | | | $ | 10.500 | | | $ | 10.270 | | | $ | 10.300 | |
| | | | | | |
Total Return(2) | | | 1.51 | %(3) | | | (0.62 | )% | | | (0.85 | )% | | | 4.57 | % | | | 2.19 | % | | | 6.60 | % |
|
| Ratios/Supplemental Data | |
| | | | | | |
Net assets, end of period (000’s omitted) | | $ | 6,856 | | | $ | 9,484 | | | $ | 11,668 | | | $ | 12,990 | | | $ | 11,636 | | | $ | 11,098 | |
| | | | | | |
Ratios (as a percentage of average daily net assets): | | | | | | | | | | | | | | | | | | | | | | | | |
| | | | | | |
Expenses(4) | | | 1.46 | %(5)(6) | | | 1.44 | % | | | 1.45 | % | | | 1.44 | % | | | 1.46 | % | | | 1.47 | % |
| | | | | | |
Net investment income | | | 1.79 | %(5) | | | 1.82 | % | | | 2.02 | % | | | 2.23 | % | | | 2.48 | % | | | 2.66 | % |
| | | | | | |
Portfolio Turnover | | | 4 | %(3) | | | 20 | % | | | 23 | % | | | 12 | % | | | 2 | % | | | 4 | % |
| (1) | Computed using average shares outstanding. |
| (2) | Returns are historical and are calculated by determining the percentage change in net asset value with all distributions reinvested and do not reflect the effect of sales charges. |
| (4) | Excludes the effect of custody fee credits, if any, of less than 0.005%. Effective September 1, 2015, custody fee credits, which were earned on cash deposit balances, were discontinued by the custodian. |
| (6) | Includes interest expense of 0.01% for the six months ended January 31, 2019. |
| | | | |
| | 41 | | See Notes to Financial Statements. |
Eaton Vance
Municipal Income Funds
January 31, 2019
Financial Highlights — continued
| | | | | | | | | | | | | | | | | | | | | | | | |
| | | Minnesota Fund — Class I | |
| | |
| | | Six Months Ended
January 31, 2019
(Unaudited) | | | Year Ended July 31, | |
| | | 2018 | | | 2017 | | | 2016 | | | 2015 | | | 2014 | |
| | | | | | | |
Net asset value — Beginning of period | | $ | 9.250 | | | $ | 9.480 | | | $ | 9.770 | | | $ | 9.550 | | | $ | 9.580 | | | $ | 9.230 | |
|
| Income (Loss) From Operations | |
| | | | | | |
Net investment income(1) | | $ | 0.127 | | | $ | 0.260 | | | $ | 0.280 | | | $ | 0.304 | | | $ | 0.330 | | | $ | 0.337 | |
| | | | | | |
Net realized and unrealized gain (loss) | | | 0.060 | | | | (0.227 | ) | | | (0.287 | ) | | | 0.225 | | | | (0.031 | ) | | | 0.349 | |
| | | | | | |
Total income (loss) from operations | | $ | 0.187 | | | $ | 0.033 | | | $ | (0.007 | ) | | $ | 0.529 | | | $ | 0.299 | | | $ | 0.686 | |
|
| Less Distributions | |
| | | | | | |
From net investment income | | $ | (0.127 | ) | | $ | (0.263 | ) | | $ | (0.283 | ) | | $ | (0.309 | ) | | $ | (0.329 | ) | | $ | (0.336 | ) |
| | | | | | |
Total distributions | | $ | (0.127 | ) | | $ | (0.263 | ) | | $ | (0.283 | ) | | $ | (0.309 | ) | | $ | (0.329 | ) | | $ | (0.336 | ) |
| | | | | | |
Net asset value — End of period | | $ | 9.310 | | | $ | 9.250 | | | $ | 9.480 | | | $ | 9.770 | | | $ | 9.550 | | | $ | 9.580 | |
| | | | | | |
Total Return(2) | | | 2.04 | %(3) | | | 0.36 | % | | | (0.02 | )% | | | 5.63 | % | | | 3.15 | % | | | 7.57 | % |
|
| Ratios/Supplemental Data | |
| | | | | | |
Net assets, end of period (000’s omitted) | | $ | 70,072 | | | $ | 73,789 | | | $ | 75,120 | | | $ | 59,486 | | | $ | 37,542 | | | $ | 25,888 | |
| | | | | | |
Ratios (as a percentage of average daily net assets): | | | | | | | | | | | | | | | | | | | | | | | | |
| | | | | | |
Expenses(4) | | | 0.51 | %(5)(6) | | | 0.49 | % | | | 0.50 | % | | | 0.49 | % | | | 0.51 | % | | | 0.51 | % |
| | | | | | |
Net investment income | | | 2.73 | %(5) | | | 2.77 | % | | | 2.96 | % | | | 3.15 | % | | | 3.43 | % | | | 3.60 | % |
| | | | | | |
Portfolio Turnover | | | 4 | %(3) | | | 20 | % | | | 23 | % | | | 12 | % | | | 2 | % | | | 4 | % |
| (1) | Computed using average shares outstanding. |
| (2) | Returns are historical and are calculated by determining the percentage change in net asset value with all distributions reinvested. |
| (4) | Excludes the effect of custody fee credits, if any, of less than 0.005%. Effective September 1, 2015, custody fee credits, which were earned on cash deposit balances, were discontinued by the custodian. |
| (6) | Includes interest expense of 0.01% for the six months ended January 31, 2019. |
| | | | |
| | 42 | | See Notes to Financial Statements. |
Eaton Vance
Municipal Income Funds
January 31, 2019
Financial Highlights — continued
| | | | | | | | | | | | | | | | | | | | | | | | |
| | | New Jersey Fund — Class A | |
| | |
| | | Six Months Ended
January 31, 2019
(Unaudited) | | | Year Ended July 31, | |
| | | 2018 | | | 2017 | | | 2016 | | | 2015 | | | 2014 | |
| | | | | | | |
Net asset value — Beginning of period | | $ | 9.080 | | | $ | 9.230 | | | $ | 9.520 | | | $ | 9.240 | | | $ | 9.310 | | | $ | 9.010 | |
| | | | | | |
| Income (Loss) From Operations | | | | | | | | | | | | | | | | | | | | | | | | |
| | | | | | |
Net investment income(1) | | $ | 0.149 | | | $ | 0.317 | | | $ | 0.326 | | | $ | 0.339 | | | $ | 0.337 | | | $ | 0.357 | |
| | | | | | |
Net realized and unrealized gain (loss) | | | 0.029 | | | | (0.146 | ) | | | (0.293 | ) | | | 0.277 | | | | (0.072 | ) | | | 0.299 | |
| | | | | | |
Total income from operations | | $ | 0.178 | | | $ | 0.171 | | | $ | 0.033 | | | $ | 0.616 | | | $ | 0.265 | | | $ | 0.656 | |
| | | | | | |
| Less Distributions | | | | | | | | | | | | | | | | | | | | | | | | |
| | | | | | |
From net investment income | | $ | (0.148 | ) | | $ | (0.321 | ) | | $ | (0.323 | ) | | $ | (0.336 | ) | | $ | (0.335 | ) | | $ | (0.356 | ) |
| | | | | | |
Total distributions | | $ | (0.148 | ) | | $ | (0.321 | ) | | $ | (0.323 | ) | | $ | (0.336 | ) | | $ | (0.335 | ) | | $ | (0.356 | ) |
| | | | | | |
Net asset value — End of period | | $ | 9.110 | | | $ | 9.080 | | | $ | 9.230 | | | $ | 9.520 | | | $ | 9.240 | | | $ | 9.310 | |
| | | | | | |
Total Return(2) | | | 1.98 | %(3) | | | 1.89 | % | | | 0.41 | % | | | 6.78 | % | | | 2.86 | % | | | 7.43 | % |
|
| Ratios/Supplemental Data | |
| | | | | | |
Net assets, end of period (000’s omitted) | | $ | 97,419 | | | $ | 98,224 | | | $ | 104,121 | | | $ | 117,155 | | | $ | 120,659 | | | $ | 135,265 | |
| | | | | | |
Ratios (as a percentage of average daily net assets): | | | | | | | | | | | | | | | | | | | | | | | | |
| | | | | | |
Expenses excluding interest and fees(4) | | | 0.73 | %(5) | | | 0.73 | % | | | 0.72 | % | | | 0.72 | % | | | 0.73 | % | | | 0.74 | % |
| | | | | | |
Interest and fee expense(6) | | | — | | | | — | | | | 0.01 | % | | | 0.03 | % | | | 0.02 | % | | | 0.03 | % |
| | | | | | |
Total expenses(4) | | | 0.73 | %(5) | | | 0.73 | % | | | 0.73 | % | | | 0.75 | % | | | 0.75 | % | | | 0.77 | % |
| | | | | | |
Net investment income | | | 3.28 | %(5) | | | 3.47 | % | | | 3.53 | % | | | 3.62 | % | | | 3.60 | % | | | 3.92 | % |
| | | | | | |
Portfolio Turnover | | | 22 | %(3) | | | 13 | % | | | 14 | % | | | 17 | % | | | 8 | % | | | 16 | % |
| (1) | Computed using average shares outstanding. |
| (2) | Returns are historical and are calculated by determining the percentage change in net asset value with all distributions reinvested and do not reflect the effect of sales charges. |
| (4) | Excludes the effect of custody fee credits, if any, of less than 0.005%. Effective September 1, 2015, custody fee credits, which were earned on cash deposit balances, were discontinued by the custodian. |
| (6) | Interest and fee expense relates to the liability for floating rate notes issued in conjunction with residual interest bond transactions (see Note 1H). |
| | | | |
| | 43 | | See Notes to Financial Statements. |
Eaton Vance
Municipal Income Funds
January 31, 2019
Financial Highlights — continued
| | | | | | | | | | | | | | | | | | | | | | | | |
| | | New Jersey Fund — Class C | |
| | |
| | | Six Months Ended
January 31, 2019
(Unaudited) | | | Year Ended July 31, | |
| | | 2018 | | | 2017 | | | 2016 | | | 2015 | | | 2014 | |
| | | | | | | |
Net asset value — Beginning of period | | $ | 9.470 | | | $ | 9.630 | | | $ | 9.930 | | | $ | 9.640 | | | $ | 9.710 | | | $ | 9.400 | |
|
| Income (Loss) From Operations | |
| | | | | | |
Net investment income(1) | | $ | 0.120 | | | $ | 0.259 | | | $ | 0.267 | | | $ | 0.280 | | | $ | 0.278 | | | $ | 0.300 | |
| | | | | | |
Net realized and unrealized gain (loss) | | | 0.039 | | | | (0.155 | ) | | | (0.302 | ) | | | 0.288 | | | | (0.072 | ) | | | 0.310 | |
| | | | | | |
Total income (loss) from operations | | $ | 0.159 | | | $ | 0.104 | | | $ | (0.035 | ) | | $ | 0.568 | | | $ | 0.206 | | | $ | 0.610 | |
|
| Less Distributions | |
| | | | | | |
From net investment income | | $ | (0.119 | ) | | $ | (0.264 | ) | | $ | (0.265 | ) | | $ | (0.278 | ) | | $ | (0.276 | ) | | $ | (0.300 | ) |
| | | | | | |
Total distributions | | $ | (0.119 | ) | | $ | (0.264 | ) | | $ | (0.265 | ) | | $ | (0.278 | ) | | $ | (0.276 | ) | | $ | (0.300 | ) |
| | | | | | |
Net asset value — End of period | | $ | 9.510 | | | $ | 9.470 | | | $ | 9.630 | | | $ | 9.930 | | | $ | 9.640 | | | $ | 9.710 | |
| | | | | | |
Total Return(2) | | | 1.69 | %(3) | | | 1.10 | % | | | (0.32 | )% | | | 5.97 | % | | | 2.13 | % | | | 6.59 | % |
|
| Ratios/Supplemental Data | |
| | | | | | |
Net assets, end of period (000’s omitted) | | $ | 13,204 | | | $ | 17,481 | | | $ | 21,115 | | | $ | 24,731 | | | $ | 23,141 | | | $ | 24,442 | |
| | | | | | |
Ratios (as a percentage of average daily net assets): | | | | | | | | | | | | | | | | | | | | | | | | |
| | | | | | |
Expenses excluding interest and fees(4) | | | 1.48 | %(5) | | | 1.48 | % | | | 1.47 | % | | | 1.47 | % | | | 1.48 | % | | | 1.49 | % |
| | | | | | |
Interest and fee expense(6) | | | — | | | | — | | | | 0.01 | % | | | 0.03 | % | | | 0.02 | % | | | 0.03 | % |
| | | | | | |
Total expenses(4) | | | 1.48 | %(5) | | | 1.48 | % | | | 1.48 | % | | | 1.50 | % | | | 1.50 | % | | | 1.52 | % |
| | | | | | |
Net investment income | | | 2.53 | %(5) | | | 2.72 | % | | | 2.78 | % | | | 2.86 | % | | | 2.85 | % | | | 3.16 | % |
| | | | | | |
Portfolio Turnover | | | 22 | %(3) | | | 13 | % | | | 14 | % | | | 17 | % | | | 8 | % | | | 16 | % |
| (1) | Computed using average shares outstanding. |
| (2) | Returns are historical and are calculated by determining the percentage change in net asset value with all distributions reinvested and do not reflect the effect of sales charges. |
| (4) | Excludes the effect of custody fee credits, if any, of less than 0.005%. Effective September 1, 2015, custody fee credits, which were earned on cash deposit balances, were discontinued by the custodian. |
| (6) | Interest and fee expense relates to the liability for floating rate notes issued in conjunction with residual interest bond transactions (see Note 1H). |
| | | | |
| | 44 | | See Notes to Financial Statements. |
Eaton Vance
Municipal Income Funds
January 31, 2019
Financial Highlights — continued
| | | | | | | | | | | | | | | | | | | | | | | | |
| | | New Jersey Fund — Class I | |
| | |
| | | Six Months Ended
January 31, 2019
(Unaudited) | | | Year Ended July 31, | |
| | | 2018 | | | 2017 | | | 2016 | | | 2015 | | | 2014 | |
| | | | | | | |
Net asset value — Beginning of period | | $ | 9.080 | | | $ | 9.230 | | | $ | 9.520 | | | $ | 9.240 | | | $ | 9.310 | | | $ | 9.010 | |
|
| Income (Loss) From Operations | |
| | | | | | |
Net investment income(1) | | $ | 0.157 | | | $ | 0.335 | | | $ | 0.345 | | | $ | 0.357 | | | $ | 0.355 | | | $ | 0.372 | |
| | | | | | |
Net realized and unrealized gain (loss) | | | 0.040 | | | | (0.146 | ) | | | (0.293 | ) | | | 0.278 | | | | (0.071 | ) | | | 0.302 | |
| | | | | | |
Total income from operations | | $ | 0.197 | | | $ | 0.189 | | | $ | 0.052 | | | $ | 0.635 | | | $ | 0.284 | | | $ | 0.674 | |
|
| Less Distributions | |
| | | | | | |
From net investment income | | $ | (0.157 | ) | | $ | (0.339 | ) | | $ | (0.342 | ) | | $ | (0.355 | ) | | $ | (0.354 | ) | | $ | (0.374 | ) |
| | | | | | |
Total distributions | | $ | (0.157 | ) | | $ | (0.339 | ) | | $ | (0.342 | ) | | $ | (0.355 | ) | | $ | (0.354 | ) | | $ | (0.374 | ) |
| | | | | | |
Net asset value — End of period | | $ | 9.120 | | | $ | 9.080 | | | $ | 9.230 | | | $ | 9.520 | | | $ | 9.240 | | | $ | 9.310 | |
| | | | | | |
Total Return(2) | | | 2.20 | %(3) | | | 2.09 | % | | | 0.61 | % | | | 7.00 | % | | | 3.07 | % | | | 7.64 | % |
|
| Ratios/Supplemental Data | |
| | | | | | |
Net assets, end of period (000’s omitted) | | $ | 43,502 | | | $ | 32,285 | | | $ | 31,778 | | | $ | 28,693 | | | $ | 24,873 | | | $ | 20,179 | |
| | | | | | |
Ratios (as a percentage of average daily net assets): | | | | | | | | | | | | | | | | | | | | | | | | |
| | | | | | |
Expenses excluding interest and fees(4) | | | 0.53 | %(5) | | | 0.53 | % | | | 0.52 | % | | | 0.52 | % | | | 0.53 | % | | | 0.53 | % |
| | | | | | |
Interest and fee expense(6) | | | — | | | | — | | | | 0.01 | % | | | 0.03 | % | | | 0.02 | % | | | 0.03 | % |
| | | | | | |
Total expenses(4) | | | 0.53 | %(5) | | | 0.53 | % | | | 0.53 | % | | | 0.55 | % | | | 0.55 | % | | | 0.56 | % |
| | | | | | |
Net investment income | | | 3.45 | %(5) | | | 3.66 | % | | | 3.74 | % | | | 3.80 | % | | | 3.80 | % | | | 4.07 | % |
| | | | | | |
Portfolio Turnover | | | 22 | %(3) | | | 13 | % | | | 14 | % | | | 17 | % | | | 8 | % | | | 16 | % |
| (1) | Computed using average shares outstanding. |
| (2) | Returns are historical and are calculated by determining the percentage change in net asset value with all distributions reinvested. |
| (4) | Excludes the effect of custody fee credits, if any, of less than 0.005%. Effective September 1, 2015, custody fee credits, which were earned on cash deposit balances, were discontinued by the custodian. |
| (6) | Interest and fee expense relates to the liability for floating rate notes issued in conjunction with residual interest bond transactions (see Note 1H). |
| | | | |
| | 45 | | See Notes to Financial Statements. |
Eaton Vance
Municipal Income Funds
January 31, 2019
Financial Highlights — continued
| | | | | | | | | | | | | | | | | | | | | | | | |
| | | Pennsylvania Fund — Class A | |
| | |
| | | Six Months Ended
January 31, 2019
(Unaudited) | | | Year Ended July 31, | |
| | | 2018 | | | 2017 | | | 2016 | | | 2015 | | | 2014 | |
| | | | | | | |
Net asset value — Beginning of period | | $ | 8.500 | | | $ | 8.730 | | | $ | 9.110 | | | $ | 8.900 | | | $ | 8.950 | | | $ | 8.750 | |
|
| Income (Loss) From Operations | |
| | | | | | |
Net investment income(1) | | $ | 0.159 | | | $ | 0.334 | | | $ | 0.323 | | | $ | 0.345 | | | $ | 0.355 | | | $ | 0.375 | |
| | | | | | |
Net realized and unrealized gain (loss) | | | (0.027 | ) | | | (0.236 | ) | | | (0.379 | ) | | | 0.207 | | | | (0.053 | ) | | | 0.197 | |
| | | | | | |
Total income (loss) from operations | | $ | 0.132 | | | $ | 0.098 | | | $ | (0.056 | ) | | $ | 0.552 | | | $ | 0.302 | | | $ | 0.572 | |
|
| Less Distributions | |
| | | | | | |
From net investment income | | $ | (0.162 | ) | | $ | (0.328 | ) | | $ | (0.324 | ) | | $ | (0.342 | ) | | $ | (0.352 | ) | | $ | (0.372 | ) |
| | | | | | |
Total distributions | | $ | (0.162 | ) | | $ | (0.328 | ) | | $ | (0.324 | ) | | $ | (0.342 | ) | | $ | (0.352 | ) | | $ | (0.372 | ) |
| | | | | | |
Net asset value — End of period | | $ | 8.470 | | | $ | 8.500 | | | $ | 8.730 | | | $ | 9.110 | | | $ | 8.900 | | | $ | 8.950 | |
| | | | | | |
Total Return(2) | | | 1.57 | %(3) | | | 1.16 | % | | | (0.58 | )% | | | 6.32 | % | | | 3.41 | % | | | 6.68 | % |
|
| Ratios/Supplemental Data | |
| | | | | | |
Net assets, end of period (000’s omitted) | | $ | 112,375 | | | $ | 112,508 | | | $ | 125,579 | | | $ | 147,706 | | | $ | 140,411 | | | $ | 147,461 | |
| | | | | | |
Ratios (as a percentage of average daily net assets): | | | | | | | | | | | | | | | | | | | | | | | | |
| | | | | | |
Expenses excluding interest and fees(4) | | | 0.76 | %(5) | | | 0.75 | % | | | 0.73 | % | | | 0.73 | % | | | 0.75 | % | | | 0.74 | % |
| | | | | | |
Interest and fee expense(6) | | | 0.07 | %(5) | | | 0.05 | % | | | 0.04 | % | | | 0.04 | % | | | 0.03 | % | | | 0.04 | % |
| | | | | | |
Total expenses(4) | | | 0.83 | %(5) | | | 0.80 | % | | | 0.77 | % | | | 0.77 | % | | | 0.78 | % | | | 0.78 | % |
| | | | | | |
Net investment income | | | 3.74 | %(5) | | | 3.89 | % | | | 3.67 | % | | | 3.84 | % | | | 3.95 | % | | | 4.25 | % |
| | | | | | |
Portfolio Turnover | | | 3 | %(3) | | | 9 | % | | | 4 | % | | | 8 | % | | | 5 | % | | | 4 | % |
| (1) | Computed using average shares outstanding. |
| (2) | Returns are historical and are calculated by determining the percentage change in net asset value with all distributions reinvested and do not reflect the effect of sales charges. |
| (4) | Excludes the effect of custody fee credits, if any, of less than 0.005%. Effective September 1, 2015, custody fee credits, which were earned on cash deposit balances, were discontinued by the custodian. |
| (6) | Interest and fee expense relates primarily to the liability for floating rate notes issued in conjunction with residual interest bond transactions (see Note 1H). |
| | | | |
| | 46 | | See Notes to Financial Statements. |
Eaton Vance
Municipal Income Funds
January 31, 2019
Financial Highlights — continued
| | | | | | | | | | | | | | | | | | | | | | | | |
| | | Pennsylvania Fund — Class C | |
| | |
| | | Six Months Ended
January 31, 2019
(Unaudited) | | | Year Ended July 31, | |
| | | 2018 | | | 2017 | | | 2016 | | | 2015 | | | 2014 | |
| | | | | | | |
Net asset value — Beginning of period | | $ | 8.800 | | | $ | 9.040 | | | $ | 9.430 | | | $ | 9.220 | | | $ | 9.270 | | | $ | 9.060 | |
|
| Income (Loss) From Operations | |
| | | | | | |
Net investment income(1) | | $ | 0.132 | | | $ | 0.279 | | | $ | 0.266 | | | $ | 0.287 | | | $ | 0.298 | | | $ | 0.319 | |
| | | | | | |
Net realized and unrealized gain (loss) | | | (0.028 | ) | | | (0.246 | ) | | | (0.389 | ) | | | 0.208 | | | | (0.053 | ) | | | 0.208 | |
| | | | | | |
Total income (loss) from operations | | $ | 0.104 | | | $ | 0.033 | | | $ | (0.123 | ) | | $ | 0.495 | | | $ | 0.245 | | | $ | 0.527 | |
|
| Less Distributions | |
| | | | | | |
From net investment income | | $ | (0.134 | ) | | $ | (0.273 | ) | | $ | (0.267 | ) | | $ | (0.285 | ) | | $ | (0.295 | ) | | $ | (0.317 | ) |
| | | | | | |
Total distributions | | $ | (0.134 | ) | | $ | (0.273 | ) | | $ | (0.267 | ) | | $ | (0.285 | ) | | $ | (0.295 | ) | | $ | (0.317 | ) |
| | | | | | |
Net asset value — End of period | | $ | 8.770 | | | $ | 8.800 | | | $ | 9.040 | | | $ | 9.430 | | | $ | 9.220 | | | $ | 9.270 | |
| | | | | | |
Total Return(2) | | | 1.20 | %(3) | | | 0.39 | % | | | (1.28 | )% | | | 5.44 | % | | | 2.66 | % | | | 5.92 | % |
|
| Ratios/Supplemental Data | |
| | | | | | |
Net assets, end of period (000’s omitted) | | $ | 15,648 | | | $ | 22,991 | | | $ | 29,651 | | | $ | 38,004 | | | $ | 32,695 | | | $ | 32,342 | |
| | | | | | |
Ratios (as a percentage of average daily net assets): | | | | | | | | | | | | | | | | | | | | | | | | |
| | | | | | |
Expenses excluding interest and fees(4) | | | 1.51 | %(5) | | | 1.50 | % | | | 1.48 | % | | | 1.48 | % | | | 1.50 | % | | | 1.49 | % |
| | | | | | |
Interest and fee expense(6) | | | 0.07 | %(5) | | | 0.05 | % | | | 0.04 | % | | | 0.04 | % | | | 0.03 | % | | | 0.04 | % |
| | | | | | |
Total expenses(4) | | | 1.58 | %(5) | | | 1.55 | % | | | 1.52 | % | | | 1.52 | % | | | 1.53 | % | | | 1.53 | % |
| | | | | | |
Net investment income | | | 2.99 | %(5) | | | 3.13 | % | | | 2.92 | % | | | 3.08 | % | | | 3.20 | % | | | 3.49 | % |
| | | | | | |
Portfolio Turnover | | | 3 | %(3) | | | 9 | % | | | 4 | % | | | 8 | % | | | 5 | % | | | 4 | % |
| (1) | Computed using average shares outstanding. |
| (2) | Returns are historical and are calculated by determining the percentage change in net asset value with all distributions reinvested and do not reflect the effect of sales charges. |
| (4) | Excludes the effect of custody fee credits, if any, of less than 0.005%. Effective September 1, 2015, custody fee credits, which were earned on cash deposit balances, were discontinued by the custodian. |
| (6) | Interest and fee expense relates primarily to the liability for floating rate notes issued in conjunction with residual interest bond transactions (see Note 1H). |
| | | | |
| | 47 | | See Notes to Financial Statements. |
Eaton Vance
Municipal Income Funds
January 31, 2019
Financial Highlights — continued
| | | | | | | | | | | | | | | | | | | | | | | | |
| | | Pennsylvania Fund — Class I | |
| | |
| | | Six Months Ended
January 31, 2019
(Unaudited) | | | Year Ended July 31, | |
| | | 2018 | | | 2017 | | | 2016 | | | 2015 | | | 2014 | |
| | | | | | | |
Net asset value — Beginning of period | | $ | 8.530 | | | $ | 8.760 | | | $ | 9.140 | | | $ | 8.940 | | | $ | 8.990 | | | $ | 8.790 | |
|
| Income (Loss) From Operations | |
| | | | | | |
Net investment income(1) | | $ | 0.168 | | | $ | 0.352 | | | $ | 0.342 | | | $ | 0.365 | | | $ | 0.375 | | | $ | 0.393 | |
| | | | | | |
Net realized and unrealized gain (loss) | | | (0.027 | ) | | | (0.235 | ) | | | (0.380 | ) | | | 0.197 | | | | (0.053 | ) | | | 0.198 | |
| | | | | | |
Total income (loss) from operations | | $ | 0.141 | | | $ | 0.117 | | | $ | (0.038 | ) | | $ | 0.562 | | | $ | 0.322 | | | $ | 0.591 | |
|
| Less Distributions | |
| | | | | | |
From net investment income | | $ | (0.171 | ) | | $ | (0.347 | ) | | $ | (0.342 | ) | | $ | (0.362 | ) | | $ | (0.372 | ) | | $ | (0.391 | ) |
| | | | | | |
Total distributions | | $ | (0.171 | ) | | $ | (0.347 | ) | | $ | (0.342 | ) | | $ | (0.362 | ) | | $ | (0.372 | ) | | $ | (0.391 | ) |
| | | | | | |
Net asset value — End of period | | $ | 8.500 | | | $ | 8.530 | | | $ | 8.760 | | | $ | 9.140 | | | $ | 8.940 | | | $ | 8.990 | |
| | | | | | |
Total Return(2) | | | 1.68 | %(3) | | | 1.37 | % | | | (0.36 | )% | | | 6.40 | % | | | 3.62 | % | | | 6.88 | % |
|
| Ratios/Supplemental Data | |
| | | | | | |
Net assets, end of period (000’s omitted) | | $ | 47,265 | | | $ | 46,396 | | | $ | 51,055 | | | $ | 53,322 | | | $ | 49,036 | | | $ | 39,754 | |
| | | | | | |
Ratios (as a percentage of average daily net assets): | | | | | | | | | | | | | | | | | | | | | | | | |
| | | | | | |
Expenses excluding interest and fees(4) | | | 0.56 | %(5) | | | 0.55 | % | | | 0.53 | % | | | 0.53 | % | | | 0.55 | % | | | 0.54 | % |
| | | | | | |
Interest and fee expense(6) | | | 0.07 | %(5) | | | 0.05 | % | | | 0.04 | % | | | 0.04 | % | | | 0.03 | % | | | 0.04 | % |
| | | | | | |
Total expenses(4) | | | 0.63 | %(5) | | | 0.60 | % | | | 0.57 | % | �� | | 0.57 | % | | | 0.58 | % | | | 0.58 | % |
| | | | | | |
Net investment income | | | 3.94 | %(5) | | | 4.09 | % | | | 3.88 | % | | | 4.03 | % | | | 4.15 | % | | | 4.43 | % |
| | | | | | |
Portfolio Turnover | | | 3 | %(3) | | | 9 | % | | | 4 | % | | | 8 | % | | | 5 | % | | | 4 | % |
| (1) | Computed using average shares outstanding. |
| (2) | Returns are historical and are calculated by determining the percentage change in net asset value with all distributions reinvested. |
| (4) | Excludes the effect of custody fee credits, if any, of less than 0.005%. Effective September 1, 2015, custody fee credits, which were earned on cash deposit balances, were discontinued by the custodian. |
| (6) | Interest and fee expense relates primarily to the liability for floating rate notes issued in conjunction with residual interest bond transactions (see Note 1H). |
| | | | |
| | 48 | | See Notes to Financial Statements. |
Eaton Vance
Municipal Income Funds
January 31, 2019
Notes to Financial Statements (Unaudited)
1 Significant Accounting Policies
Eaton Vance Municipals Trust (the Trust) is a Massachusetts business trust registered under the Investment Company Act of 1940, as amended (the 1940 Act), as anopen-end management investment company. The Trust presently consists of eighteen funds, five of which, eachnon-diversified, are included in these financial statements. They include Eaton Vance Arizona Municipal Income Fund (Arizona Fund), Eaton Vance Connecticut Municipal Income Fund (Connecticut Fund), Eaton Vance Minnesota Municipal Income Fund (Minnesota Fund), Eaton Vance New Jersey Municipal Income Fund (New Jersey Fund) and Eaton Vance Pennsylvania Municipal Income Fund (Pennsylvania Fund), (each individually referred to as the Fund, and collectively, the Funds). The Funds’ investment objective is to provide current income exempt from regular federal income tax and from particular state or local income or other taxes. The Funds offer three classes of shares. Class A shares are generally sold subject to a sales charge imposed at time of purchase. Class C shares are sold at net asset value and are generally subject to a contingent deferred sales charge (see Note 5). Effective January 25, 2019, Class C shares generally automatically convert to Class A shares ten years after their purchase as described in the Funds’ prospectus. Class I shares are sold at net asset value and are not subject to a sales charge. Each class represents apro-rata interest in the Fund, but votes separately on class-specific matters and (as noted below) is subject to different expenses. Realized and unrealized gains and losses are allocated daily to each class of shares based on the relative net assets of each class to the total net assets of the Fund. Net investment income, other than class-specific expenses, is allocated daily to each class of shares based upon the ratio of the value of each class’s paid shares to the total value of all paid shares. Each class of shares differs in its distribution plan and certain other class-specific expenses.
The following is a summary of significant accounting policies of the Funds. The policies are in conformity with accounting principles generally accepted in the United States of America (U.S. GAAP). Each Fund is an investment company and follows accounting and reporting guidance in the Financial Accounting Standards Board (FASB) Accounting Standards Codification Topic 946.
A Investment Valuation — The following methodologies are used to determine the market value or fair value of investments.
Debt Obligations. Debt obligations are generally valued on the basis of valuations provided by third party pricing services, as derived from such services’ pricing models. Inputs to the models may include, but are not limited to, reported trades, executable bid and ask prices, broker/dealer quotations, prices or yields of securities with similar characteristics, interest rates, anticipated prepayments, benchmark curves or information pertaining to the issuer, as well as industry and economic events. The pricing services may use a matrix approach, which considers information regarding securities with similar characteristics to determine the valuation for a security. Short-term debt obligations purchased with a remaining maturity of sixty days or less for which a valuation from a third party pricing service is not readily available may be valued at amortized cost, which approximates fair value.
Derivatives. Financial futures contracts are valued at the closing settlement price established by the board of trade or exchange on which they are traded.
Fair Valuation. Investments for which valuations or market quotations are not readily available or are deemed unreliable are valued at fair value using methods determined in good faith by or at the direction of the Trustees of a Fund in a manner that fairly reflects the security’s value, or the amount that a Fund might reasonably expect to receive for the security upon its current sale in the ordinary course. Each such determination is based on a consideration of relevant factors, which are likely to vary from one pricing context to another. These factors may include, but are not limited to, the type of security, the existence of any contractual restrictions on the security’s disposition, the price and extent of public trading in similar securities of the issuer or of comparable entities, quotations or relevant information obtained from broker/dealers or other market participants, information obtained from the issuer, analysts, and/or the appropriate stock exchange (for exchange-traded securities), an analysis of the entity’s financial condition, and an evaluation of the forces that influence the issuer and the market(s) in which the security is purchased and sold.
B Investment Transactions and Related Income — Investment transactions for financial statement purposes are accounted for on a trade date basis. Realized gains and losses on investments sold are determined on the basis of identified cost. Interest income is recorded on the basis of interest accrued, adjusted for amortization of premium or accretion of discount.
C Federal Taxes — Each Fund’s policy is to comply with the provisions of the Internal Revenue Code applicable to regulated investment companies and to distribute to shareholders each year substantially all of its taxable, if any, andtax-exempt net investment income, and all or substantially all of its net realized capital gains. Accordingly, no provision for federal income or excise tax is necessary. Each Fund intends to satisfy conditions which will enable it to designate distributions from the interest income generated by its investments innon-taxable municipal securities, which are exempt from regular federal income tax when received by each Fund, as exempt-interest dividends. The portion of such interest, if any, earned on private activity bonds issued after August 7, 1986, may be considered a tax preference item to shareholders.
As of January 31, 2019, the Funds had no uncertain tax positions that would require financial statement recognition,de-recognition, or disclosure. Each Fund files a U.S. federal income tax return annually after its fiscalyear-end, which is subject to examination by the Internal Revenue Service for a period of three years from the date of filing.
D Expenses — The majority of expenses of the Trust are directly identifiable to an individual fund. Expenses which are not readily identifiable to a specific fund are allocated taking into consideration, among other things, the nature and type of expense and the relative size of the funds.
E Legal Fees — Legal fees and other related expenses incurred as part of negotiations of the terms and requirement of capital infusions, or that are expected to result in the restructuring of, or a plan of reorganization for, an investment are recorded as realized losses. Ongoing expenditures to protect or enhance an investment are treated as operating expenses.
Eaton Vance
Municipal Income Funds
January 31, 2019
Notes to Financial Statements (Unaudited) — continued
F Use of Estimates — The preparation of the financial statements in conformity with U.S. GAAP requires management to make estimates and assumptions that affect the reported amounts of assets and liabilities at the date of the financial statements and the reported amounts of income and expense during the reporting period. Actual results could differ from those estimates.
G Indemnifications — Under the Trust’s organizational documents, its officers and Trustees may be indemnified against certain liabilities and expenses arising out of the performance of their duties to the Funds. Under Massachusetts law, if certain conditions prevail, shareholders of a Massachusetts business trust (such as the Trust) could be deemed to have personal liability for the obligations of the Trust. However, the Trust’s Declaration of Trust contains an express disclaimer of liability on the part of Fund shareholders and theBy-laws provide that the Trust shall assume the defense on behalf of any Fund shareholders. Moreover, theBy-laws also provide for indemnification out of Fund property of any shareholder held personally liable solely by reason of being or having been a shareholder for all loss or expense arising from such liability. Additionally, in the normal course of business, each Fund enters into agreements with service providers that may contain indemnification clauses. Each Fund’s maximum exposure under these arrangements is unknown as this would involve future claims that may be made against each Fund that have not yet occurred.
H Floating Rate Notes Issued in Conjunction with Securities Held — The Funds may invest in residual interest bonds, also referred to as inverse floating rate securities, whereby a Fund may sell a variable or fixed rate bond for cash to a Special-Purpose Vehicle (the SPV), (which is generally organized as a trust), while at the same time, buying a residual interest in the assets and cash flows of the SPV. The bond is deposited into the SPV with the same CUSIP number as the bond sold to the SPV by the Fund, and which may have been, but is not required to be, the bond purchased from the Fund (the Bond). The SPV also issues floating rate notes (Floating Rate Notes) which are sold to third-parties. The residual interest bond held by a Fund gives the Fund the right (1) to cause the holders of the Floating Rate Notes to generally tender their notes at par, and (2) to have the Bond held by the SPV transferred to the Fund, thereby terminating the SPV. Should the Fund exercise such right, it would generally pay the SPV the par amount due on the Floating Rate Notes and exchange the residual interest bond for the underlying Bond. Pursuant to generally accepted accounting principles for transfers and servicing of financial assets and extinguishment of liabilities, the Funds account for the transaction described above as a secured borrowing by including the Bond in their Portfolio of Investments and the Floating Rate Notes as a liability under the caption “Payable for floating rate notes issued” in their Statement of Assets and Liabilities. The Floating Rate Notes have interest rates that generally reset weekly and their holders have the option to tender their notes to the SPV for redemption at par at each reset date. Accordingly, the fair value of the payable for floating rate notes issued approximates its carrying value. If measured at fair value, the payable for floating rate notes would have been considered as Level 2 in the fair value hierarchy (see Note 10) at January 31, 2019. Interest expense related to a Fund’s liability with respect to Floating Rate Notes is recorded as incurred. The SPV may be terminated by the Fund, as noted above, or by the occurrence of certain termination events as defined in the trust agreement, such as a downgrade in the credit quality of the underlying Bond, bankruptcy of or payment failure by the issuer of the underlying Bond, the inability to remarket Floating Rate Notes that have been tendered due to insufficient buyers in the market, or the failure by the SPV to obtain renewal of the liquidity agreement under which liquidity support is provided for the Floating Rate Notes up to one year. At January 31, 2019, the amounts of the Funds’ Floating Rate Notes and related interest rates and collateral were as follows:
| | | | |
| | | Pennsylvania Fund | |
| |
Floating Rate Notes Outstanding | | $ | 4,999,975 | |
| |
Interest Rate or Range of Interest Rates (%) | | | 1.44 | |
| |
Collateral for Floating Rate Notes Outstanding | | $ | 7,588,187 | |
For the six months ended January 31, 2019, the Funds’ average settled Floating Rate Notes outstanding and the average interest rate (annualized) including fees were as follows:
| | | | |
| | | Pennsylvania Fund | |
| |
Average Floating Rate Notes Outstanding | | $ | 5,000,000 | |
| |
Average Interest Rate | | | 2.33 | % |
In certain circumstances, the Funds may enter into shortfall and forbearance agreements with brokers by which a Fund agrees to reimburse the broker for the difference between the liquidation value of the Bond held by the SPV and the liquidation value of the Floating Rate Notes, as well as any shortfalls in interest cash flows. The Funds had no shortfalls as of January 31, 2019.
The Funds may also purchase residual interest bonds in a secondary market transaction without first owning the underlying bond. Such transactions are not required to be treated as secured borrowings. Shortfall agreements, if any, related to residual interest bonds purchased in a secondary market transaction are disclosed in the Portfolio of Investments.
Eaton Vance
Municipal Income Funds
January 31, 2019
Notes to Financial Statements (Unaudited) — continued
The Funds’ investment policies and restrictions expressly permit investments in residual interest bonds. Such bonds typically offer the potential for yields exceeding the yields available on fixed rate bonds with comparable credit quality and maturity. These securities tend to underperform the market for fixed rate bonds in a rising long-term interest rate environment, but tend to outperform the market for fixed rate bonds when long-term interest rates decline. The value and income of residual interest bonds are generally more volatile than that of a fixed rate bond. The Funds’ investment policies do not allow the Funds to borrow money except as permitted by the 1940 Act. Management believes that the Funds’ restrictions on borrowing money and issuing senior securities (other than as specifically permitted) do not apply to Floating Rate Notes issued by the SPV and included as a liability in the Funds’ Statement of Assets and Liabilities. As secured indebtedness issued by an SPV, Floating Rate Notes are distinct from the borrowings and senior securities to which the Funds’ restrictions apply. Residual interest bonds held by the Funds are securities exempt from registration under Rule 144A of the Securities Act of 1933.
I Financial Futures Contracts — Upon entering into a financial futures contract, a Fund is required to deposit with the broker, either in cash or securities, an amount equal to a certain percentage of the contract amount (initial margin). Subsequent payments, known as variation margin, are made or received by the Fund each business day, depending on the daily fluctuations in the value of the underlying security, and are recorded as unrealized gains or losses by the Fund. Gains (losses) are realized upon the expiration or closing of the financial futures contracts. Should market conditions change unexpectedly, the Fund may not achieve the anticipated benefits of the financial futures contracts and may realize a loss. Futures contracts have minimal counterparty risk as they are exchange traded and the clearinghouse for the exchange is substituted as the counterparty, guaranteeing counterparty performance.
J When-Issued Securities and Delayed Delivery Transactions — The Funds may purchase or sell securities on a delayed delivery or when-issued basis. Payment and delivery may take place after the customary settlement period for that security. At the time the transaction is negotiated, the price of the security that will be delivered is fixed. The Funds maintain cash and/or security positions for these commitments such that sufficient liquid assets will be available to make payments upon settlement. Securities purchased on a delayed delivery or when-issued basis aremarked-to-market daily and begin earning interest on settlement date. Losses may arise due to changes in the market value of the underlying securities or if the counterparty does not perform under the contract.
K Interim Financial Statements — The interim financial statements relating to January 31, 2019 and for the six months then ended have not been audited by an independent registered public accounting firm, but in the opinion of the Funds’ management, reflect all adjustments, consisting only of normal recurring adjustments, necessary for the fair presentation of the financial statements.
2 Distributions to Shareholders and Income Tax Information
The net investment income of each Fund is determined daily and substantially all of the net investment income so determined is declared as a dividend to shareholders of record at the time of declaration. Distributions are declared separately for each class of shares. Distributions are paid monthly. Distributions of realized capital gains (reduced by available capital loss carryforwards from prior years) are made at least annually. Shareholders may reinvest income and capital gain distributions in additional shares of the same class of a Fund at the net asset value as of the reinvestment date or, at the election of the shareholder, receive distributions in cash. Distributions to shareholders are determined in accordance with income tax regulations, which may differ from U.S. GAAP. As required by U.S. GAAP, only distributions in excess of tax basis earnings and profits are reported in the financial statements as a return of capital. Permanent differences between book and tax accounting relating to distributions are reclassified topaid-in capital. For tax purposes, distributions from short-term capital gains are considered to be from ordinary income.
At July 31, 2018, the following Funds, for federal income tax purposes, had capital loss carryforwards and deferred capital losses which would reduce the respective Fund’s taxable income arising from future net realized gains on investment transactions, if any, to the extent permitted by the Internal Revenue Code, and thus would reduce the amount of distributions to shareholders, which would otherwise be necessary to relieve the Funds of any liability for federal income or excise tax. Under tax regulations, capital losses incurred in taxable years beginning after December 2010 are considered deferred capital losses and are treated as arising on the first day of a Fund’s next taxable year, retaining the same short-term or long-term character as when originally deferred. Deferred capital losses are required to be used prior to capital loss carryforwards, which carry an expiration date. As a result of this ordering rule, capital loss carryforwards may be more likely to expire unused. The amounts and expiration dates of the capital loss carryforwards, whose character is short-term, and the amounts of the deferred capital losses are as follows:
| | | | | | | | | | | | | | | | | | | | |
| Expiration Date | | Arizona Fund | | | Connecticut Fund | | | Minnesota Fund | | | New Jersey
Fund | | | Pennsylvania
Fund | |
| | | | | |
July 31, 2019 | | $ | — | | | $ | 685,091 | | | $ | 723,202 | | | $ | 3,741,998 | | | $ | 10,492,996 | |
| | | | | |
Total capital loss carryforwards | | $ | — | | | $ | 685,091 | | | $ | 723,202 | | | $ | 3,741,998 | | | $ | 10,492,996 | |
| | | | | |
Deferred capital losses: | | | | | | | | | | | | | | | | | | | | |
| | | | | |
Short-term | | $ | — | | | $ | 988,449 | | | $ | 134,173 | | | $ | 4,166,754 | | | $ | 5,380,145 | |
| | | | | |
Long-term | | $ | — | | | $ | — | | | $ | — | | | $ | 1,140,913 | | | $ | 6,866,466 | |
Eaton Vance
Municipal Income Funds
January 31, 2019
Notes to Financial Statements (Unaudited) — continued
The cost and unrealized appreciation (depreciation) of investments, including open derivative contracts, of each Fund at January 31, 2019, as determined on a federal income tax basis, were as follows:
| | | | | | | | | | | | | | | | | | | | |
| | | Arizona
Fund | | | Connecticut
Fund | | | Minnesota
Fund | | | New Jersey
Fund | | | Pennsylvania
Fund | |
| | | | | |
Aggregate cost | | $ | 47,751,644 | | | $ | 67,503,890 | | | $ | 123,083,691 | | | $ | 143,475,307 | | | $ | 162,183,920 | |
| | | | | |
Gross unrealized appreciation | | $ | 2,844,413 | | | $ | 3,364,309 | | | $ | 3,864,903 | | | $ | 7,240,964 | | | $ | 10,898,681 | |
| | | | | |
Gross unrealized depreciation | | | (266,822 | ) | | | (156,334 | ) | | | (575,481 | ) | | | (320,042 | ) | | | (2,671,062 | ) |
| | | | | |
Net unrealized appreciation | | $ | 2,577,591 | | | $ | 3,207,975 | | | $ | 3,289,422 | | | $ | 6,920,922 | | | $ | 8,227,619 | |
3 Investment Adviser Fee and Other Transactions with Affiliates
The investment adviser fee is earned by Boston Management and Research (BMR), a subsidiary of Eaton Vance Management (EVM), as compensation for management and investment advisory services rendered to each Fund. The fee is based upon a percentage of average daily net assets plus a percentage of gross income (i.e., income other than gains from the sale of securities) as presented in the following table and is payable monthly.
| | | | | | | | |
| Daily Net Assets | | Annual Asset Rate | | | Daily Income Rate | |
| | |
Up to $20 million | | | 0.10 | % | | | 1.00 | % |
| | |
$20 million up to $40 million | | | 0.20 | | | | 2.00 | |
| | |
$40 million up to $500 million | | | 0.30 | | | | 3.00 | |
On average daily net assets of $500 million or more, the rates are reduced.
For the six months ended January 31, 2019, investment adviser fees incurred by the Funds and the effective annual rates, as a percentage of average daily net assets, were as follows:
| | | | | | | | | | | | | | | | | | | | |
| | | Arizona Fund | | | Connecticut Fund | | | Minnesota Fund | | | New Jersey Fund | | | Pennsylvania Fund | |
| | | | | |
Investment Adviser Fee | | $ | 62,921 | | | $ | 107,630 | | | $ | 229,011 | | | $ | 271,771 | | | $ | 340,403 | |
| | | | | |
Effective Annual Rate | | | 0.25 | % | | | 0.30 | % | | | 0.34 | % | | | 0.36 | % | | | 0.39 | % |
EVM serves as the administrator of each Fund, but receives no compensation. EVM providessub-transfer agency and related services to the Funds pursuant to aSub-Transfer Agency Support Services Agreement. Eaton Vance Distributors, Inc. (EVD), an affiliate of EVM and the Funds’ principal underwriter, received a portion of the sales charge on sales of Class A shares of the Funds. EVD also received distribution and service fees from Class A and Class C shares (see Note 4) and contingent deferred sales charges (see Note 5).Sub-transfer agent fees earned by EVM, which are included in transfer and dividend disbursing agent fees on the Statements of Operations, and Class A sales charges that the Funds were informed were received by EVD for the six months ended January 31, 2019 were as follows:
| | | | | | | | | | | | | | | | | | | | |
| | | Arizona Fund | | | Connecticut Fund | | | Minnesota Fund | | | New Jersey Fund | | | Pennsylvania Fund | |
| | | | | |
EVM’sSub-Transfer Agent Fees | | $ | 1,678 | | | $ | 5,380 | | | $ | 7,786 | | | $ | 7,894 | | | $ | 10,623 | |
| | | | | |
EVD’s Class A Sales Charges | | $ | 2,614 | | | $ | 3,856 | | | $ | 3,232 | | | $ | 3,661 | | | $ | 4,524 | |
Trustees and officers of the Funds who are members of EVM’s or BMR’s organizations receive remuneration for their services to the Funds out of the investment adviser fee. Trustees of the Funds who are not affiliated with the investment adviser may elect to defer receipt of all or a percentage of their annual fees in accordance with the terms of the Trustees Deferred Compensation Plan. For the six months ended January 31, 2019, no significant amounts have been deferred. Certain officers and Trustees of the Funds are officers of the above organizations.
Eaton Vance
Municipal Income Funds
January 31, 2019
Notes to Financial Statements (Unaudited) — continued
4 Distribution Plans
Each Fund has in effect a distribution plan for Class A shares (Class A Plan) pursuant to Rule12b-1 under the 1940 Act. The Class A Plan provides that each Fund will pay EVD a distribution and service fee not exceeding 0.25% per annum of its average daily net assets attributable to Class A shares for distribution services and facilities provided to each Fund by EVD, as well as for personal services and/or the maintenance of shareholder accounts. The Trustees approved distribution and service fee payments equal to 0.20% per annum of each Fund’s average daily net assets attributable to Class A shares. Distribution and service fees paid or accrued to EVD for the six months ended January 31, 2019 for Class A shares amounted to the following:
| | | | | | | | | | | | | | | | | | | | |
| | | Arizona Fund | | | Connecticut Fund | | | Minnesota Fund | | | New Jersey Fund | | | Pennsylvania Fund | |
| | | | | |
Class A Distribution and Service Fees | | $ | 32,795 | | | $ | 53,506 | | | $ | 54,415 | | | $ | 95,972 | | | $ | 109,892 | |
Each Fund also has in effect a distribution plan for Class C shares (Class C Plan) pursuant to Rule12b-1 under the 1940 Act. Pursuant to the Class C Plan, each Fund pays EVD amounts equal to 0.75% per annum of its average daily net assets attributable to Class C shares for providing ongoing distribution services and facilities to the respective Funds. For the six months ended January 31, 2019, the Funds paid or accrued to EVD the following distribution fees:
| | | | | | | | | | | | | | | | | | | | |
| | | Arizona Fund | | | Connecticut Fund | | | Minnesota Fund | | | New Jersey Fund | | | Pennsylvania Fund | |
| | | | | |
Class C Distribution Fees | | $ | 18,290 | | | $ | 16,421 | | | $ | 32,775 | | | $ | 62,111 | | | $ | 82,290 | |
The Class C Plan also authorizes each Fund to make payments of service fees to EVD, financial intermediaries and other persons in amounts not exceeding 0.25% per annum of the average daily net assets attributable to Class C shares. The Trustees approved service fee payments equal to 0.20% per annum of each Fund’s average daily net assets attributable to Class C shares. Service fees paid or accrued are for personal services and/or the maintenance of shareholder accounts. They are separate and distinct from the Class C sales commissions and distribution fees payable to EVD. Service fees paid or accrued for the six months ended January 31, 2019 amounted to the following:
| | | | | | | | | | | | | | | | | | | | |
| | | Arizona Fund | | | Connecticut Fund | | | Minnesota
Fund | | | New Jersey Fund | | | Pennsylvania
Fund | |
| | | | | |
Class C Service Fees | | $ | 4,877 | | | $ | 4,379 | | | $ | 8,740 | | | $ | 16,563 | | | $ | 21,944 | |
Distribution and service fees are subject to the limitations contained in the Financial Industry Regulatory Authority Rule 2341(d).
5 Contingent Deferred Sales Charges
A contingent deferred sales charge (CDSC) of 1% generally is imposed on redemptions of Class C shares made within one year of purchase. Class A shares may be subject to a 1% CDSC if redeemed within eighteen months of purchase (depending on the circumstances of purchase). Generally, the CDSC is based upon the lower of the net asset value at date of redemption or date of purchase. No charge is levied on shares acquired by reinvestment of dividends or capital gain distributions. For the six months ended January 31, 2019, the Funds were informed that EVD received approximately the following amounts of CDSCs paid by Class A and Class C shareholders:
| | | | | | | | | | | | | | | | | | | | |
| | | Arizona Fund | | | Connecticut Fund | | | Minnesota Fund | | | New Jersey Fund | | | Pennsylvania Fund | |
| | | | | |
Class A | | $ | — | | | $ | — | | | $ | — | | | $ | 10,000 | | | $ | — | |
| | | | | |
Class C | | $ | — | | | $ | — | | | $ | — | | | $ | 1,000 | | | $ | — | |
Eaton Vance
Municipal Income Funds
January 31, 2019
Notes to Financial Statements (Unaudited) — continued
6 Purchases and Sales of Investments
Purchases and sales of investments, other than short-term obligations, for the six months ended January 31, 2019 were as follows:
| | | | | | | | | | | | | | | | | | | | |
| | | Arizona
Fund | | | Connecticut
Fund | | | Minnesota
Fund | | | New Jersey
Fund | | | Pennsylvania
Fund | |
| | | | | |
Purchases | | $ | 1,642,024 | | | $ | 10,096,950 | | | $ | 4,958,630 | | | $ | 37,533,138 | | | $ | 6,269,686 | |
| | | | | |
Sales | | $ | 1,291,379 | | | $ | 7,370,055 | | | $ | 16,219,122 | | | $ | 32,507,016 | | | $ | 16,915,338 | |
7 Shares of Beneficial Interest
Each Fund’s Declaration of Trust permits the Trustees to issue an unlimited number of full and fractional shares of beneficial interest (without par value). Such shares may be issued in a number of different series (such as the Funds) and classes. Transactions in Fund shares were as follows:
| | | | | | | | | | | | | | | | |
Arizona Fund | | | | | | | | | | | | |
| | | Six Months Ended January 31, 2019 (Unaudited) | |
| | | Class A | | | Class B | | | Class C | | | Class I | |
| | | | |
Sales | | | 225,324 | | | | — | | | | 42,686 | | | | 360,835 | |
| | | | |
Issued to shareholders electing to receive payments of distributions in Fund shares | | | 42,770 | | | | — | | | | 4,257 | | | | 17,427 | |
| | | | |
Redemptions | | | (357,461 | ) | | | — | | | | (66,427 | ) | | | (269,112 | ) |
| | | | |
Converted from Class C shares | | | 56,903 | | | | — | | | | — | | | | — | |
| | | | |
Converted to Class A shares | | | — | | | | — | | | | (51,146 | ) | | | — | |
| | | | |
Net increase (decrease) | | | (32,464 | ) | | | — | | | | (70,630 | ) | | | 109,150 | |
| |
| | | Year Ended July 31, 2018 | |
| | | Class A | | | Class B(1) | | | Class C | | | Class I | |
| | | | |
Sales | | | 249,531 | | | | — | | | | 67,846 | | | | 491,756 | |
| | | | |
Issued to shareholders electing to receive payments of distributions in Fund shares | | | 104,635 | | | | 164 | | | | 10,726 | | | | 33,576 | |
| | | | |
Redemptions | | | (1,053,523 | ) | | | (1,235 | ) | | | (165,480 | ) | | | (891,157 | ) |
| | | | |
Converted from Class B shares | | | 11,735 | | | | — | | | | — | | | | — | |
| | | | |
Converted to Class A shares | | | — | | | | (10,558 | ) | | | — | | | | — | |
| | | | |
Merger from Class B shares | | | 11,342 | | | | — | | | | — | | | | — | |
| | | | |
Merger to Class A shares | | | — | | | | (10,205 | ) | | | — | | | | — | |
| | | | |
Net decrease | | | (676,280 | ) | | | (21,834 | ) | | | (86,908 | ) | | | (365,825 | ) |
| (1) | At the close of business on April 5, 2018, Class B shares of Arizona Fund were merged into Class A shares. |
| | | | | | | | | | | | | | | | |
Connecticut Fund | | | | | | | | | | | | |
| | | Six Months Ended January 31, 2019 (Unaudited) | |
| | | Class A | | | Class B | | | Class C | | | Class I | |
| | | | |
Sales | | | 118,158 | | | | — | | | | 3,303 | | | | 721,815 | |
| | | | |
Issued to shareholders electing to receive payments of distributions in Fund shares | | | 66,540 | | | | — | | | | 3,708 | | | | 18,433 | |
| | | | |
Redemptions | | | (612,848 | ) | | | — | | | | (74,775 | ) | | | (332,447 | ) |
| | | | |
Converted from Class C shares | | | 50,368 | | | | — | | | | — | | | | — | |
| | | | |
Converted to Class A shares | | | — | | | | — | | | | (50,513 | ) | | | — | |
| | | | |
Net increase (decrease) | | | (377,782 | ) | | | — | | | | (118,277 | ) | | | 407,801 | |
Eaton Vance
Municipal Income Funds
January 31, 2019
Notes to Financial Statements (Unaudited) — continued
| | | | | | | | | | | | | | | | |
| | | Year Ended July 31, 2018 | |
| | | Class A | | | Class B(1) | | | Class C | | | Class I | |
| | | | |
Sales | | | 287,983 | | | | 289 | | | | 19,718 | | | | 477,978 | |
| | | | |
Issued to shareholders electing to receive payments of distributions in Fund shares | | | 151,595 | | | | 287 | | | | 9,783 | | | | 33,029 | |
| | | | |
Redemptions | | | (787,576 | ) | | | (10,063 | ) | | | (142,526 | ) | | | (711,103 | ) |
| | | | |
Converted from Class B shares | | | 5,767 | | | | — | | | | — | | | | — | |
| | | | |
Converted to Class A shares | | | — | | | | (5,792 | ) | | | — | | | | — | |
| | | | |
Merger from Class B shares | | | 30,050 | | | | — | | | | — | | | | — | |
| | | | |
Merger to Class A shares | | | — | | | | (30,191 | ) | | | — | | | | — | |
| | | | |
Net decrease | | | (312,181 | ) | | | (45,470 | ) | | | (113,025 | ) | | | (200,096 | ) |
| (1) | At the close of business on April 5, 2018, Class B shares of Connecticut Fund were merged into Class A shares. |
| | | | | | | | | | | | | | | | |
Minnesota Fund | | | | | | | | | | | | |
| | | Six Months Ended January 31, 2019 (Unaudited) | |
| | | Class A | | | Class B | | | Class C | | | Class I | |
| | | | |
Sales | | | 351,810 | | | | — | | | | 39,478 | | | | 1,789,010 | |
| | | | |
Issued to shareholders electing to receive payments of distributions in Fund shares | | | 68,200 | | | | — | | | | 7,381 | | | | 67,745 | |
| | | | |
Redemptions | | | (1,062,775 | ) | | | — | | | | (166,441 | ) | | | (2,304,036 | ) |
| | | | |
Converted from Class C shares | | | 160,040 | | | | — | | | | — | | | | — | |
| | | | |
Converted to Class A shares | | | — | | | | — | | | | (148,804 | ) | | | — | |
| | | | |
Net decrease | | | (482,725 | ) | | | — | | | | (268,386 | ) | | | (447,281 | ) |
| |
| | | Year Ended July 31, 2018 | |
| | | Class A | | | Class B(1) | | | Class C | | | Class I | |
| | | | |
Sales | | | 629,371 | | | | — | | | | 132,593 | | | | 2,885,704 | |
| | | | |
Issued to shareholders electing to receive payments of distributions in Fund shares | | | 150,407 | | | | 28 | | | | 18,382 | | | | 136,471 | |
| | | | |
Redemptions | | | (1,218,930 | ) | | | (42 | ) | | | (341,659 | ) | | | (2,965,746 | ) |
| | | | |
Converted from Class B shares | | | 4,633 | | | | — | | | | — | | | | — | |
| | | | |
Converted to Class A shares | | | — | | | | (4,305 | ) | | | — | | | | — | |
| | | | |
Merger from Class B shares | | | 696 | | | | — | | | | — | | | | — | |
| | | | |
Merger to Class A shares | | | — | | | | (647 | ) | | | — | | | | — | |
| | | | |
Net increase (decrease) | | | (433,823 | ) | | | (4,966 | ) | | | (190,684 | ) | | | 56,429 | |
| (1) | At the close of business on April 5, 2018, Class B shares of Minnesota Fund were merged into Class A shares. |
| | | | | | | | | | | | | | | | |
New Jersey Fund | | | | | | | | | | | | |
| | | Six Months Ended January 31, 2019 (Unaudited) | |
| | | Class A | | | Class B | | | Class C | | | Class I | |
| | | | |
Sales | | | 150,938 | | | | — | | | | 211,311 | | | | 2,572,867 | |
| | | | |
Issued to shareholders electing to receive payments of distributions in Fund shares | | | 140,116 | | | | — | | | | 18,927 | | | | 62,329 | |
| | | | |
Redemptions | | | (870,058 | ) | | | — | | | | (256,142 | ) | | | (1,418,659 | ) |
| | | | |
Converted from Class C shares | | | 449,943 | | | | — | | | | — | | | | — | |
| | | | |
Converted to Class A shares | | | — | | | | — | | | | (431,024 | ) | | | — | |
| | | | |
Net increase (decrease) | | | (129,061 | ) | | | — | | | | (456,928 | ) | | | 1,216,537 | |
Eaton Vance
Municipal Income Funds
January 31, 2019
Notes to Financial Statements (Unaudited) — continued
| | | | | | | | | | | | | | | | |
| | | Year Ended July 31, 2018 | |
| | | Class A | | | Class B | | | Class C | | | Class I | |
| | | | |
Sales | | | 613,867 | | | | — | | | | 170,804 | | | | 2,302,065 | |
| | | | |
Issued to shareholders electing to receive payments of distributions in Fund shares | | | 315,489 | | | | — | | | | 47,221 | | | | 110,440 | |
| | | | |
Redemptions | | | (1,388,011 | ) | | | — | | | | (564,547 | ) | | | (2,298,670 | ) |
| | | | |
Net increase (decrease) | | | (458,655 | ) | | | — | | | | (346,522 | ) | | | 113,835 | |
| | | | |
Pennsylvania Fund | | | | | | | | | | | | |
| | | Six Months Ended January 31, 2019 (Unaudited) | |
| | | Class A | | | Class B | | | Class C | | | Class I | |
| | | | |
Sales | | | 218,821 | | | | — | | | | 56,814 | | | | 1,744,572 | |
| | | | |
Issued to shareholders electing to receive payments of distributions in Fund shares | | | 217,635 | | | | — | | | | 35,578 | | | | 44,536 | |
| | | | |
Redemptions | | | (1,087,473 | ) | | | — | | | | (261,456 | ) | | | (1,667,794 | ) |
| | | | |
Converted from Class C shares | | | 681,926 | | | | — | | | | — | | | | — | |
| | | | |
Converted to Class A shares | | | — | | | | — | | | | (658,881 | ) | | | — | |
| | | | |
Net increase (decrease) | | | 30,909 | | | | — | | | | (827,945 | ) | | | 121,314 | |
| |
| | | Year Ended July 31, 2018 | |
| | | Class A | | | Class B(1) | | | Class C | | | Class I | |
| | | | |
Sales | | | 503,731 | | | | — | | | | 76,511 | | | | 1,067,282 | |
| | | | |
Issued to shareholders electing to receive payments of distributions in Fund shares | | | 463,417 | | | | 1,421 | | | | 82,469 | | | | 92,235 | |
| | | | |
Redemptions | | | (2,218,776 | ) | | | (4,473 | ) | | | (826,248 | ) | | | (1,546,682 | ) |
| | | | |
Converted from Class B shares | | | 59,168 | | | | — | | | | — | | | | — | |
| | | | |
Converted to Class A shares | | | — | | | | (57,165 | ) | | | — | | | | — | |
| | | | |
Merger from Class B shares | | | 47,172 | | | | — | | | | — | | | | — | |
| | | | |
Merger to Class A shares | | | — | | | | (45,574 | ) | | | — | | | | — | |
| | | | |
Net decrease | | | (1,145,288 | ) | | | (105,791 | ) | | | (667,268 | ) | | | (387,165 | ) |
| (1) | At the close of business on April 5, 2018, Class B shares of Pennsylvania Fund were merged into Class A shares. |
8 Line of Credit
The Funds participate with other portfolios and funds managed by EVM and its affiliates in a $625 million unsecured line of credit agreement with a group of banks, which is in effect through October 29, 2019. Borrowings are made by the Funds solely to facilitate the handling of unusual and/or unanticipated short-term cash requirements. Interest is charged to each Fund based on its borrowings at an amount above either the Eurodollar rate or Federal Funds rate. In addition, a fee computed at an annual rate of 0.15% on the daily unused portion of the line of credit is allocated among the participating portfolios and funds at the end of each quarter. Because the line of credit is not available exclusively to the Funds, a Fund may be unable to borrow some or all of its requested amounts at any particular time. Average borrowings by the Minnesota Fund and Pennsylvania Fund for the six months ended January 31, 2019 were $447,282 and $767,935, respectively, with average interest rates of 3.35% and 3.41%, respectively. Each of the other Funds did not have any significant borrowings or allocated fees during the six months ended January 31, 2019.
9 Financial Instruments
The Funds may trade in financial instruments withoff-balance sheet risk in the normal course of their investing activities. These financial instruments may include financial futures contracts and may involve, to a varying degree, elements of risk in excess of the amounts recognized for financial statement purposes. The notional or contractual amounts of these instruments represent the investment a Fund has in particular classes of financial instruments and do not necessarily represent the amounts potentially subject to risk. The measurement of the risks associated with these instruments is meaningful only when all related and offsetting transactions are considered. A summary of obligations under these financial instruments at January 31, 2019 is included in the Portfolio of Investments. At January 31, 2019, the Funds had sufficient cash and/or securities to cover commitments under these contracts.
Eaton Vance
Municipal Income Funds
January 31, 2019
Notes to Financial Statements (Unaudited) — continued
Each Fund is subject to interest rate risk in the normal course of pursuing its investment objective. Because the Funds hold fixed-rate bonds, the value of these bonds may decrease if interest rates rise. The Funds enter into U.S. Treasury futures contracts to hedge against changes in interest rates.
The fair values of open derivative instruments (not considered to be hedging instruments for accounting disclosure purposes) and whose primary underlying risk exposure is interest rate risk at January 31, 2019 were as follows:
| | | | |
| | | Arizona Fund | |
| |
Liability Derivative: | | | | |
| |
Futures Contracts | | $ | (150,870 | )(1) |
| |
Total | | $ | (150,870 | ) |
| (1) | Amount represents cumulative unrealized depreciation on futures contracts. Only the current day’s variation margin on open futures contracts is reported within the Statement of Assets and Liabilities as Receivable or Payable for variation margin on open financial futures contracts, as applicable. |
The effect of derivative instruments (not considered to be hedging instruments for accounting disclosure purposes) on the Statement of Operations and whose primary underlying risk exposure is interest rate risk for the six months ended January 31, 2019 was as follows:
| | | | | | | | |
| | | Arizona Fund | | | Connecticut Fund | |
| | |
Realized Gain (Loss) on Derivatives Recognized in Income | | $ | 33,047 | (1) | | $ | (48,819 | )(1) |
| | |
Change in Unrealized Appreciation (Depreciation) on Derivatives Recognized in Income | | $ | (135,057 | )(2) | | $ | 7,116 | (2) |
| (1) | Statement of Operations location: Net realized gain (loss) – Financial futures contracts. |
| (2) | Statement of Operations location: Change in unrealized appreciation (depreciation) – Financial futures contracts. |
The average notional cost of futures contracts outstanding during the six months ended January 31, 2019, which is indicative of the volume of this derivative type, was approximately as follows:
| | | | | | | | |
| | | Arizona Fund | | | Connecticut Fund | |
| | |
Average Notional Cost: | | | | | | | | |
| | |
Futures Contracts — Short | | $ | 2,832,000 | | | $ | 1,095,000 | |
10 Fair Value Measurements
Under generally accepted accounting principles for fair value measurements, a three-tier hierarchy to prioritize the assumptions, referred to as inputs, is used in valuation techniques to measure fair value. The three-tier hierarchy of inputs is summarized in the three broad levels listed below.
| • | | Level 1 – quoted prices in active markets for identical investments |
| • | | Level 2 – other significant observable inputs (including quoted prices for similar investments, interest rates, prepayment speeds, credit risk, etc.) |
| • | | Level 3 – significant unobservable inputs (including a fund’s own assumptions in determining the fair value of investments) |
In cases where the inputs used to measure fair value fall in different levels of the fair value hierarchy, the level disclosed is determined based on the lowest level input that is significant to the fair value measurement in its entirety. The inputs or methodology used for valuing securities are not necessarily an indication of the risk associated with investing in those securities.
Eaton Vance
Municipal Income Funds
January 31, 2019
Notes to Financial Statements (Unaudited) — continued
At January 31, 2019, the hierarchy of inputs used in valuing the Funds’ investments and open derivative instruments, which are carried at value, were as follows:
| | | | | | | | | | | | | | | | |
Arizona Fund | | | | | | | | | | | | |
| Asset Description | | Level 1 | | | Level 2 | | | Level 3 | | | Total | |
| | | | |
Tax-Exempt Investments | | $ | — | | | $ | 50,480,105 | | | $ | — | | | $ | 50,480,105 | |
| | | | |
Total Investments | | $ | — | | | $ | 50,480,105 | | | $ | — | | | $ | 50,480,105 | |
| | | | |
Liability Description | | | | | | | | | | | | | | | | |
| | | | |
Futures Contracts | | $ | (150,870 | ) | | $ | — | | | $ | — | | | $ | (150,870 | ) |
| | | | |
Total | | $ | (150,870 | ) | | $ | — | | | $ | — | | | $ | (150,870 | ) |
|
Connecticut Fund | |
| Asset Description | | Level 1 | | | Level 2 | | | Level 3 | | | Total | |
| | | | |
Tax-Exempt Investments | | $ | — | | | $ | 70,711,865 | | | $ | — | | | $ | 70,711,865 | |
| | | | |
Total Investments | | $ | — | | | $ | 70,711,865 | | | $ | — | | | $ | 70,711,865 | |
|
Minnesota Fund | |
| Asset Description | | Level 1 | | | Level 2 | | | Level 3 | | | Total | |
| | | | |
Tax-Exempt Investments | | $ | — | | | $ | 126,373,113 | | | $ | — | | | $ | 126,373,113 | |
| | | | |
Total Investments | | $ | — | | | $ | 126,373,113 | | | $ | — | | | $ | 126,373,113 | |
|
New Jersey Fund | |
| Asset Description | | Level 1 | | | Level 2 | | | Level 3 | | | Total | |
| | | | |
Tax-Exempt Municipal Securities | | $ | — | | | $ | 145,128,880 | | | $ | — | | | $ | 145,128,880 | |
| | | | |
Taxable Municipal Securities | | | — | | | | 5,267,349 | | | | — | | | | 5,267,349 | |
| | | | |
Total Investments | | $ | — | | | $ | 150,396,229 | | | $ | — | | | $ | 150,396,229 | |
|
Pennsylvania Fund | |
| Asset Description | | Level 1 | | | Level 2 | | | Level 3 | | | Total | |
| | | | |
Tax-Exempt Municipal Securities | | $ | — | | | $ | 175,327,539 | | | $ | — | | | $ | 175,327,539 | |
| | | | |
Taxable Municipal Securities | | | — | | | | 83,975 | | | | — | | | | 83,975 | |
| | | | |
Total Investments | | $ | — | | | $ | 175,411,514 | | | $ | — | | | $ | 175,411,514 | |
Eaton Vance
Municipal Income Funds
January 31, 2019
Special Meeting of Shareholders (Unaudited)
Each Fund held a Special Meeting of Shareholders on September 20, 2018 to elect the five Trustees listed below. The other Trustees named herein continue to serve as Trustees. The results of the vote with respect to each Fund were as follows:
| | | | | | | | | | | | | | | | |
| | | Arizona Municipal Income Fund | | | Connecticut Municipal
Income Fund | |
| | | Number of Shares | | | Number of Shares | |
| Nominee for Trustee | | For | | | Withheld | | | For | | | Withheld | |
| | | | |
Mark R. Fetting | | | 4,570,896 | | | | 12,678 | | | | 5,617,431 | | | | 161,347 | |
| | | | |
Keith Quinton | | | 4,515,575 | | | | 67,999 | | | | 5,617,431 | | | | 161,347 | |
| | | | |
Marcus L. Smith | | | 4,515,575 | | | | 67,999 | | | | 5,617,431 | | | | 161,347 | |
| | | | |
Susan J. Sutherland | | | 4,583,574 | | | | 0 | | | | 5,617,431 | | | | 161,347 | |
| | | | |
Scott E. Wennerholm | | | 4,519,615 | | | | 63,959 | | | | 5,617,431 | | | | 161,347 | |
Results are rounded to the nearest whole number. | | | | | | | | | | | | | | | | |
| | | Minnesota Municipal
Income Fund | | | New Jersey Municipal
Income Fund | |
| | | Number of Shares | | | Number of Shares | |
| Nominee for Trustee | | For | | | Withheld | | | For | | | Withheld | |
| | | | |
Mark R. Fetting | | | 13,355,426 | | | | 275,832 | | | | 12,867,326 | | | | 45,785 | |
| | | | |
Keith Quinton | | | 13,355,426 | | | | 275,832 | | | | 12,824,898 | | | | 88,214 | |
| | | | |
Marcus L. Smith | | | 13,355,426 | | | | 275,832 | | | | 12,867,326 | | | | 45,785 | |
| | | | |
Susan J. Sutherland | | | 13,369,206 | | | | 262,052 | | | | 12,867,755 | | | | 45,357 | |
| | | | |
Scott E. Wennerholm | | | 13,355,426 | | | | 275,832 | | | | 12,869,400 | | | | 43,712 | |
Results are rounded to the nearest whole number. | | | | | | | | | | | | | | | | |
| | | | | | | | | Pennsylvania Municipal
Income Fund | |
| | | | | | | | | Number of Shares | |
| Nominee for Trustee | | | | | | | | For | | | Withheld | |
| | | | |
Mark R. Fetting | | | | | | | | | | | 17,170,749 | | | | 157,176 | |
| | | | |
Keith Quinton | | | | | | | | | | | 17,171,445 | | | | 156,481 | |
| | | | |
Marcus L. Smith | | | | | | | | | | | 17,171,445 | | | | 156,481 | |
| | | | |
Susan J. Sutherland | | | | | | | | | | | 17,170,608 | | | | 157,318 | |
| | | | |
Scott E. Wennerholm | | | | | | | | | | | 17,170,749 | | | | 157,176 | |
Results are rounded to the nearest whole number.
Eaton Vance
Municipal Income Funds
January 31, 2019
Officers and Trustees
Officers of Eaton Vance Municipals Trust
Payson F. Swaffield
President
Maureen A. Gemma
Vice President, Secretary and Chief Legal Officer
James F. Kirchner
Treasurer
Richard F. Froio
Chief Compliance Officer
Trustees of Eaton Vance Municipals Trust
William H. Park
Chairperson
Thomas E. Faust Jr.*
Mark R. Fetting
Cynthia E. Frost
George J. Gorman
Valerie A. Mosley
Helen Frame Peters
Keith Quinton(1)
Marcus L. Smith(1)
Susan J. Sutherland
Scott E. Wennerholm
| (1) | Messrs. Quinton and Smith began serving as Trustees effective October 1, 2018. |
Eaton Vance Funds
IMPORTANT NOTICES
Privacy. The Eaton Vance organization is committed to ensuring your financial privacy. Each of the financial institutions identified below has in effect the following policy (“Privacy Policy”) with respect to nonpublic personal information about its customers:
| • | | Only such information received from you, through application forms or otherwise, and information about your Eaton Vance fund transactions will be collected. This may include information such as name, address, social security number, tax status, account balances and transactions. |
| • | | None of such information about you (or former customers) will be disclosed to anyone, except as permitted by law (which includes disclosure to employees necessary to service your account). In the normal course of servicing a customer’s account, Eaton Vance may share information with unaffiliated third parties that perform various required services such as transfer agents, custodians and broker-dealers. |
| • | | Policies and procedures (including physical, electronic and procedural safeguards) are in place that are designed to protect the confidentiality of such information. |
| • | | We reserve the right to change our Privacy Policy at any time upon proper notification to you. Customers may want to review our Privacy Policy periodically for changes by accessing the link on our homepage: www.eatonvance.com. |
Our pledge of privacy applies to the following entities within the Eaton Vance organization: the Eaton Vance Family of Funds, Eaton Vance Management, Eaton Vance Investment Counsel, Eaton Vance Distributors, Inc., Eaton Vance Trust Company, Eaton Vance Management (International) Limited, Eaton Vance Advisers International Ltd., Eaton Vance Management’s Real Estate Investment Group and Boston Management and Research. In addition, our Privacy Policy applies only to those Eaton Vance customers who are individuals and who have a direct relationship with us. If a customer’s account (i.e., fund shares) is held in the name of a third-party financial advisor/broker-dealer, it is likely that only such advisor’s privacy policies apply to the customer. This notice supersedes all previously issued privacy disclosures. For more information about Eaton Vance’s Privacy Policy, please call1-800-262-1122.
Delivery of Shareholder Documents. The Securities and Exchange Commission (SEC) permits funds to deliver only one copy of shareholder documents, including prospectuses, proxy statements and shareholder reports, to fund investors with multiple accounts at the same residential or post office box address. This practice is often called “householding” and it helps eliminate duplicate mailings to shareholders.Eaton Vance, or your financial advisor, may household the mailing of your documents indefinitely unless you instruct Eaton Vance, or your financial advisor, otherwise.If you would prefer that your Eaton Vance documents not be householded, please contact Eaton Vance at1-800-262-1122, or contact your financial advisor. Your instructions that householding not apply to delivery of your Eaton Vance documents will typically be effective within 30 days of receipt by Eaton Vance or your financial advisor.
Portfolio Holdings. Each Eaton Vance Fund and its underlying Portfolio(s) (if applicable) will file a schedule of portfolio holdings on FormN-Q with the SEC for the first and third quarters of each fiscal year. The FormN-Q will be available on the Eaton Vance website at www.eatonvance.com, by calling Eaton Vance at1-800-262-1122 or in the EDGAR database on the SEC’s website at www.sec.gov. FormN-Q may also be reviewed and copied at the SEC’s public reference room in Washington, D.C. (call1-800-732-0330 for information on the operation of the public reference room).
Proxy Voting. From time to time, funds are required to vote proxies related to the securities held by the funds. The Eaton Vance Funds or their underlying Portfolios (if applicable) vote proxies according to a set of policies and procedures approved by the Funds’ and Portfolios’ Boards. You may obtain a description of these policies and procedures and information on how the Funds or Portfolios voted proxies relating to portfolio securities during the most recent12-month period ended June 30, without charge, upon request, by calling1-800-262-1122 and by accessing the SEC’s website at www.sec.gov.
This Page Intentionally Left Blank
This Page Intentionally Left Blank
This Page Intentionally Left Blank
Investment Adviser
Boston Management and Research
Two International Place
Boston, MA 02110
Administrator
Eaton Vance Management
Two International Place
Boston, MA 02110
Principal Underwriter*
Eaton Vance Distributors, Inc.
Two International Place
Boston, MA 02110
(617)482-8260
Custodian
State Street Bank and Trust Company
State Street Financial Center, One Lincoln Street
Boston, MA 02111
Transfer Agent
BNY Mellon Investment Servicing (US) Inc.
Attn: Eaton Vance Funds
P.O. Box 9653
Providence, RI 02940-9653
(800)262-1122
Fund Offices
Two International Place
Boston, MA 02110
| * | FINRA BrokerCheck. Investors may check the background of their Investment Professional by contacting the Financial Industry Regulatory Authority (FINRA). FINRA BrokerCheck is a free tool to help investors check the professional background of current and former FINRA-registered securities firms and brokers. FINRA BrokerCheck is available by calling1-800-289-9999 and at www.FINRA.org. The FINRA BrokerCheck brochure describing this program is available to investors at www.FINRA.org. |

7703 1.31.19

Eaton Vance
Municipal Opportunities Fund
Semiannual Report
January 31, 2019
Important Note. Beginning on January 1, 2021, as permitted by regulations adopted by the Securities and Exchange Commission, paper copies of the Fund’s annual and semi-annual shareholder reports will no longer be sent by mail unless you specifically request paper copies of the reports. Instead, the reports will be made available on the Fund’s website (eatonvance.com/funddocuments), and you will be notified by mail each time a report is posted and provided with a website address to access the report.
If you already elected to receive shareholder reports electronically, you will not be affected by this change and you need not take any action. If you are a direct investor, you may elect to receive shareholder reports and other communications from the Fund electronically by signing up for e-Delivery at eatonvance.com/edelivery. If you own your shares through a financial intermediary (such as a broker-dealer or bank), you must contact your financial intermediary to sign up.
You may elect to receive all future Fund shareholder reports in paper free of charge. If you are a direct investor, you can inform the Fund that you wish to continue receiving paper copies of your shareholder reports by calling 1-800-262-1122. If you own these shares through a financial intermediary, you must contact your financial intermediary or follow instructions included with this disclosure, if applicable, to elect to continue to receive paper copies of your shareholder reports. Your election to receive reports in paper will apply to all Eaton Vance funds held directly or to all funds held through your financial intermediary, as applicable.

Commodity Futures Trading Commission Registration. Effective December 31, 2012, the Commodity Futures Trading Commission (“CFTC”) adopted certain regulatory changes that subject registered investment companies and advisers to regulation by the CFTC if a fund invests more than a prescribed level of its assets in certain CFTC-regulated instruments (including futures, certain options and swap agreements) or markets itself as providing investment exposure to such instruments. The Fund has claimed an exclusion from the definition of the term “commodity pool operator” under the Commodity Exchange Act. Accordingly, neither the Fund nor the adviser with respect to the operation of the Fund is subject to CFTC regulation. Because of its management of other strategies, the Fund’s adviser is registered with the CFTC as a commodity pool operator and a commodity trading advisor.
Fund shares are not insured by the FDIC and are not deposits or other obligations of, or guaranteed by, any depository institution. Shares are subject to investment risks, including possible loss of principal invested.
This report must be preceded or accompanied by a current summary prospectus or prospectus. Before investing, investors should consider carefully the investment objective, risks, and charges and expenses of a mutual fund. This and other important information is contained in the summary prospectus and prospectus, which can be obtained from a financial advisor. Prospective investors should read the prospectus carefully before investing. For further information, please call 1-800-262-1122.
Semiannual Report January 31, 2019
Eaton Vance
Municipal Opportunities Fund
Table of Contents
| | | | |
Performance | | | 2 | |
| |
Fund Profile | | | 2 | |
| |
Endnotes and Additional Disclosures | | | 3 | |
| |
Fund Expenses | | | 4 | |
| |
Financial Statements | | | 5 | |
| |
Special Meeting of Shareholders | | | 31 | |
| |
Officers and Trustees | | | 32 | |
| |
Important Notices | | | 33 | |
Eaton Vance
Municipal Opportunities Fund
January 31, 2019
Performance1,2
Portfolio ManagerAdam A. Weigold, CFA
| | | | | | | | | | | | | | | | | | | | | | | | |
| % Average Annual Total Returns | | Class
Inception Date | | | Performance
Inception Date | | | Six Months | | | One Year | | | Five Years | | | Since
Inception | |
Class A at NAV | | | 05/31/2011 | | | | 05/31/2011 | | | | 1.62 | % | | | 3.12 | % | | | 4.60 | % | | | 4.89 | % |
Class A with 4.75% Maximum Sales Charge | | | — | | | | — | | | | –3.19 | | | | –1.77 | | | | 3.58 | | | | 4.23 | |
Class C at NAV | | | 08/18/2014 | | | | 05/31/2011 | | | | 1.24 | | | | 2.27 | | | | 3.86 | | | | 4.41 | |
Class C with 1% Maximum Sales Charge | | | — | | | | — | | | | 0.24 | | | | 1.27 | | | | 3.86 | | | | 4.41 | |
Class I at NAV | | | 05/31/2011 | | | | 05/31/2011 | | | | 1.74 | | | | 3.38 | | | | 4.88 | | | | 5.18 | |
Bloomberg Barclays Municipal Bond Index | | | — | | | | — | | | | 2.05 | % | | | 3.26 | % | | | 3.57 | % | | | 3.94 | % |
| | | | | | |
| | | | | | | | | | | | | | | | | | | | | | | | |
| % Total Annual Operating Expense Ratios3 | | | | | | | | | | | Class A | | | Class C | | | Class I | |
| | | | | | | | | | | | | | | 0.95 | % | | | 1.71 | % | | | 0.70 | % |
| | | | | | |
| | | | | | | | | | | | | | | | | | | | | | | | |
| % Distribution Rates/Yields4 | | | | | | | | | | | Class A | | | Class C | | | Class I | |
Distribution Rate | | | | | | | | | | | | | | | 2.28 | % | | | 1.54 | % | | | 2.53 | % |
Taxable-Equivalent Distribution Rate | | | | | | | | | | | | | | | 3.85 | | | | 2.60 | | | | 4.27 | |
SEC30-day Yield | | | | | | | | | | | | | | | 2.02 | | | | 1.38 | | | | 2.37 | |
Taxable-Equivalent SEC30-day Yield | | | | | | | | | | | | | | | 3.42 | | | | 2.34 | | | | 4.01 | |
Fund Profile
Credit Quality (% of total investments)5
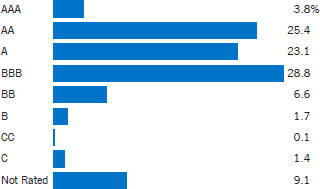
See Endnotes and Additional Disclosures in this report.
Past performance is no guarantee of future results. Returns are historical and are calculated by determining the percentage change in net asset value (NAV) or offering price (as applicable) with all distributions reinvested. Investment return and principal value will fluctuate so that shares, when redeemed, may be worth more or less than their original cost. Performance less than or equal to one year is cumulative. Performance is for the stated time period only; due to market volatility, the Fund’s current performance may be lower or higher than quoted. Returns are before taxes unless otherwise noted. For performance as of the most recentmonth-end, please refer to eatonvance.com.
Eaton Vance
Municipal Opportunities Fund
January 31, 2019
Endnotes and Additional Disclosures
| 1 | Bloomberg Barclays Municipal Bond Index is an unmanaged index of municipal bonds traded in the U.S. Unless otherwise stated, index returns do not reflect the effect of any applicable sales charges, commissions, expenses, taxes or leverage, as applicable. It is not possible to invest directly in an index. |
| 2 | Total Returns at NAV do not include applicable sales charges. If sales charges were deducted, the returns would be lower. Total Returns shown with maximum sales charge reflect the stated maximum sales charge. Unless otherwise stated, performance does not reflect the deduction of taxes on Fund distributions or redemptions of Fund shares. |
| | Performance prior to the inception date of a class may be linked to the performance of an older class of the Fund. This linked performance is adjusted for any applicable sales charge, but is not adjusted for class expense differences. If adjusted for such differences, the performance would be different. The performance of Class C is linked to Class A. Performance since inception for an index, if presented, is the performance since the Fund’s or oldest share class’ inception, as applicable. Performance presented in the Financial Highlights included in the financial statements is not linked. |
| 3 | Source: Fund prospectus. The expense ratios for the current reporting period can be found in the Financial Highlights section of this report. |
| 4 | The Distribution Rate is based on the Fund’s last regular distribution per share in the period (annualized) divided by the Fund’s NAV at the end of the period. The Fund’s distributions may be comprised of amounts characterized for federal income tax purposes astax-exempt income, qualified andnon-qualified ordinary dividends, capital gains and nondividend distributions, also known as return of capital. The Fund will determine the federal income tax character of distributions paid to a shareholder after the end of the calendar year. This is reported on the IRS form1099-DIV and provided to the shareholder shortly after eachyear-end. The Fund’s distributions are determined by the investment adviser based on its current assessment of the Fund’s long-term return potential. As portfolio and market conditions change, the rate of distributions paid by the Fund could change. Taxable-equivalent performance is based on the highest combined federal and state income tax rates, where applicable. Lower tax rates would result in lowertax-equivalent performance. Actual tax rates will vary depending on your income, exemptions and deductions. Rates do not include local taxes. The SEC Yield is a standardized measure based on the estimated yield to maturity of a fund’s investments over a30-day period and is based on the maximum offer price at the date specified. The SEC Yield is not based on the distributions made by the Fund, which may differ. |
| 5 | Ratings are based on Moody’s Investors Service, Inc. (“Moody’s”), S&P Global Ratings (“S&P”) or Fitch Ratings (“Fitch”), as applicable. If securities are rated differently by the ratings agencies, the highest rating is applied. Ratings, which are subject to change, apply to the creditworthiness of the issuers of the underlying securities and not to the Fund or its shares. Credit ratings measure the quality of a bond based on the issuer’s creditworthiness, with ratings ranging from AAA, being the highest, to D, being the lowest based on S&P’s measures. Ratings of BBB or higher by S&P or Fitch (Baa or higher by Moody’s) are considered to be investment-grade quality. Credit ratings are based largely on the ratings agency’s analysis at the time of rating. The rating assigned to any particular security is not necessarily a reflection of the issuer’s current financial condition and does not necessarily reflect its assessment of the volatility of a security’s market value or of the liquidity of an investment in the security. Holdings designated as “Not Rated” (if any) are not rated by the national ratings agencies stated above. |
| | Fund profile subject to change due to active management. |
Eaton Vance
Municipal Opportunities Fund
January 31, 2019
Fund Expenses
Example: As a Fund shareholder, you incur two types of costs: (1) transaction costs, including sales charges (loads) on purchases and redemption fees (if applicable); and (2) ongoing costs, including management fees; distribution and/or service fees; and other Fund expenses. This Example is intended to help you understand your ongoing costs (in dollars) of Fund investing and to compare these costs with the ongoing costs of investing in other mutual funds. The Example is based on an investment of $1,000 invested at the beginning of the period and held for the entire period (August 1, 2018 – January 31, 2019).
Actual Expenses: The first section of the table below provides information about actual account values and actual expenses. You may use the information in this section, together with the amount you invested, to estimate the expenses that you paid over the period. Simply divide your account value by $1,000 (for example, an $8,600 account value divided by $1,000 = 8.6), then multiply the result by the number in the first section under the heading entitled “Expenses Paid During Period” to estimate the expenses you paid on your account during this period.
Hypothetical Example for Comparison Purposes: The second section of the table below provides information about hypothetical account values and hypothetical expenses based on the actual Fund expense ratio and an assumed rate of return of 5% per year (before expenses), which is not the actual Fund return. The hypothetical account values and expenses may not be used to estimate the actual ending account balance or expenses you paid for the period. You may use this information to compare the ongoing costs of investing in your Fund and other funds. To do so, compare this 5% hypothetical example with the 5% hypothetical examples that appear in the shareholder reports of the other funds.
Please note that the expenses shown in the table are meant to highlight your ongoing costs only and do not reflect any transactional costs, such as sales charges (loads) or redemption fees (if applicable). Therefore, the second section of the table is useful in comparing ongoing costs only, and will not help you determine the relative total costs of owning different funds. In addition, if these transactional costs were included, your costs would be higher.
| | | | | | | | | | | | | | | | |
| | | Beginning
Account Value
(8/1/18) | | | Ending
Account Value
(1/31/19) | | | Expenses Paid
During Period*
(8/1/18 – 1/31/19) | | | Annualized
Expense
Ratio | |
| | | | |
Actual | | | | | | | | | | | | | | | | |
Class A | | $ | 1,000.00 | | | $ | 1,016.20 | | | $ | 4.83 | | | | 0.95 | % |
Class C | | $ | 1,000.00 | | | $ | 1,012.40 | | | $ | 8.62 | | | | 1.70 | % |
Class I | | $ | 1,000.00 | | | $ | 1,017.40 | | | $ | 3.56 | | | | 0.70 | % |
| | | | | |
Hypothetical | | | | | | | | | | | | | | | | |
(5% return per year before expenses) | | | | | | | | | | | | | | | | |
Class A | | $ | 1,000.00 | | | $ | 1,020.40 | | | $ | 4.84 | | | | 0.95 | % |
Class C | | $ | 1,000.00 | | | $ | 1,016.60 | | | $ | 8.64 | | | | 1.70 | % |
Class I | | $ | 1,000.00 | | | $ | 1,021.70 | | | $ | 3.57 | | | | 0.70 | % |
| * | Expenses are equal to the Fund’s annualized expense ratio for the indicated Class, multiplied by the average account value over the period, multiplied by 184/365 (to reflect the one-half year period). The Example assumes that the $1,000 was invested at the net asset value per share determined at the close of business on July 31, 2018. |
Eaton Vance
Municipal Opportunities Fund
January 31, 2019
Portfolio of Investments (Unaudited)
| | | | | | | | |
| Tax-Exempt Municipal Securities — 89.6% | |
| Security | | Principal
Amount
(000’s omitted) | | | Value | |
|
| Bond Bank — 0.5% | |
| | |
Ohio Water Development Authority, Water Pollution Control Loan Fund, 1.65%, (SIFMA + 0.22%), 12/1/20(1) | | $ | 5,000 | | | $ | 4,982,850 | |
| | |
| | | | | | | $ | 4,982,850 | |
|
| Cogeneration — 0.6% | |
| | |
New York City Industrial Development Agency, NY, (Brooklyn Navy Yard Cogeneration Partners, L.P.), (AMT), 5.65%, 10/1/28 | | $ | 6,260 | | | $ | 6,269,578 | |
| | |
| | | | | | | $ | 6,269,578 | |
|
| Education — 4.0% | |
| | |
Arizona State University, 5.00%, 7/1/33 | | $ | 500 | | | $ | 569,095 | |
| | |
Arizona State University, 5.00%, 7/1/34 | | | 580 | | | | 658,886 | |
| | |
Build NYC Resource Corp., NY, (Ethical Culture Fieldston School), 5.00%, 6/1/24 | | | 600 | | | | 689,172 | |
| | |
California Infrastructure and Economic Development Bank, (The Colburn School), 2.43%, (SIFMA + 1.00%), 6/1/20 (Put Date), 8/1/37(1) | | | 3,000 | | | | 3,016,950 | |
| | |
California Municipal Finance Authority, (California Lutheran University), 5.00%, 10/1/31 | | | 600 | | | | 698,310 | |
| | |
California Municipal Finance Authority, (California Lutheran University), 5.00%, 10/1/35 | | | 1,125 | | | | 1,285,020 | |
| | |
California Municipal Finance Authority, (California Lutheran University), 5.00%, 10/1/37 | | | 1,400 | | | | 1,583,036 | |
| | |
Capital Trust Agency, FL, (Florida Charter Educational Foundation, Inc.), 4.50%, 6/15/28(2) | | | 590 | | | | 588,631 | |
| | |
Delaware County Authority, PA, (Villanova University), 5.00%, 8/1/22 | | | 600 | | | | 664,266 | |
| | |
Florida Higher Educational Facilities Financing Authority, (Jacksonville University), 4.50%, 6/1/33(2) | | | 2,535 | | | | 2,585,193 | |
| | |
Massachusetts Development Finance Agency, (Dexter Southfield), 5.00%, 5/1/29 | | | 465 | | | | 524,897 | |
| | |
Massachusetts Development Finance Agency, (Dexter Southfield), 5.00%, 5/1/31 | | | 500 | | | | 559,835 | |
| | |
Massachusetts Development Finance Agency, (Dexter Southfield), 5.00%, 5/1/32 | | | 1,695 | | | | 1,890,671 | |
| | |
Massachusetts Development Finance Agency, (Tufts University), (SPA: U.S. Bank, N.A.), 1.52% 8/15/48(3) | | | 5,000 | | | | 5,000,000 | |
| | |
Monroe County Industrial Development Corp., NY, (Nazareth College of Rochester), 5.00%, 10/1/26 | | | 980 | | | | 1,127,647 | |
| | |
Monroe County Industrial Development Corp., NY, (Nazareth College of Rochester), 5.00%, 10/1/27 | | | 1,035 | | | | 1,199,472 | |
| | |
Monroe County Industrial Development Corp., NY, (St. John Fisher College), 5.00%, 6/1/21 | | | 1,000 | | | | 1,071,100 | |
| | |
Monroe County Industrial Development Corp., NY, (University of Rochester), Series 2017C, 5.00%, 7/1/29 | | | 650 | | | | 782,912 | |
| | | | | | | | |
| Security | | Principal
Amount
(000’s omitted) | | | Value | |
|
| Education (continued) | |
| | |
Monroe County Industrial Development Corp., NY, (University of Rochester), Series 2017D, 5.00%, 7/1/29 | | $ | 750 | | | $ | 903,360 | |
| | |
New Jersey Educational Facilities Authority, (Ramapo College), 5.00%, 7/1/26 | | | 2,460 | | | | 2,843,907 | |
| | |
New York Dormitory Authority, (Oneida-Herkimer-Madison BOCES), 5.00%, 8/15/22 | | | 510 | | | | 566,875 | |
| | |
New York Dormitory Authority, (Oneida-Herkimer-Madison BOCES), 5.00%, 8/15/23 | | | 275 | | | | 312,991 | |
| | |
New York Dormitory Authority, (Oneida-Herkimer-Madison BOCES), 5.00%, 8/15/24 | | | 300 | | | | 349,116 | |
| | |
New York Dormitory Authority, (Pratt Institute), 5.00%, 7/1/25 | | | 500 | | | | 574,310 | |
| | |
New York Dormitory Authority, (Pratt Institute), 5.00%, 7/1/26 | | | 545 | | | | 623,295 | |
| | |
Oregon Facilities Authority, (Linfield College), 5.00%, 10/1/25 | | | 1,000 | | | | 1,153,760 | |
| | |
Pinellas County Educational Facilities Authority, FL, (Pinellas Academy of Math and Science), 4.125%, 12/15/28(2) | | | 595 | | | | 602,199 | |
| | |
Pinellas County Educational Facilities Authority, FL, (Pinellas Academy of Math and Science), 5.00%, 12/15/38(2) | | | 2,690 | | | | 2,743,343 | |
| | |
Romeoville, IL, (Lewis University), 5.00%, 10/1/24 | | | 500 | | | | 552,765 | |
| | |
Romeoville, IL, (Lewis University), 5.00%, 10/1/26 | | | 500 | | | | 553,160 | |
| | |
University of Arkansas, 5.00%, 11/1/24 | | | 475 | | | | 553,038 | |
| | |
University of Arkansas, 5.00%, 11/1/25 | | | 500 | | | | 593,110 | |
| | |
University of Idaho, 5.00%, 4/1/24 | | | 500 | | | | 574,480 | |
| | |
University of North Carolina at Charlotte, 4.00%, 4/1/37 | | | 625 | | | | 649,181 | |
| | |
University of North Carolina at Greensboro, 5.00%, 4/1/27 | | | 400 | | | | 485,876 | |
| | |
West Virginia University, 1.96%, (SIFMA + 0.53%), 10/1/19 (Put Date), 10/1/41(1) | | | 3,500 | | | | 3,501,015 | |
| | |
| | | | | | | $ | 42,630,874 | |
|
| Electric Utilities — 3.8% | |
| | |
Arkansas River Power Authority, CO, 5.00%, 10/1/27 | | $ | 2,255 | | | $ | 2,523,548 | |
| | |
Arkansas River Power Authority, CO, 5.00%, 10/1/28 | | | 1,110 | | | | 1,247,340 | |
| | |
Arkansas River Power Authority, CO, 5.00%, 10/1/29 | | | 2,000 | | | | 2,233,540 | |
| | |
Long Island Power Authority, NY, Electric System Revenue, 2.514%, (70% of 1 mo. USD LIBOR + 0.75%), 10/1/23 (Put Date), 5/1/33(1) | | | 16,000 | | | | 16,033,440 | |
| | |
Long Island Power Authority, NY, Electric System Revenue, 5.00%, 9/1/29 | | | 500 | | | | 597,635 | |
| | |
Missouri Joint Municipal Electric Utility Commission, (Prairie State Energy Campus), 5.00%, 1/1/28 | | | 1,515 | | | | 1,827,848 | |
| | |
Monroe County Development Authority, GA, (Georgia Power Co.), 2.00% to 6/13/19 (Put Date), 7/1/25 | | | 2,000 | | | | 1,999,180 | |
| | | | |
| | 5 | | See Notes to Financial Statements. |
Eaton Vance
Municipal Opportunities Fund
January 31, 2019
Portfolio of Investments (Unaudited) — continued
| | | | | | | | |
| Security | | Principal
Amount
(000’s omitted) | | | Value | |
|
| Electric Utilities (continued) | |
| | |
Montgomery County Industrial Development Authority, PA, (Exelon Generation Co., LLC), 2.55% to 6/1/20 (Put Date), 6/1/29 | | $ | 1,750 | | | $ | 1,745,660 | |
| | |
Montgomery County Industrial Development Authority, PA, (Exelon Generation Co., LLC), (AMT), 2.70% to 4/1/20 (Put Date), 10/1/34 | | | 1,500 | | | | 1,496,745 | |
| | |
Nebraska Public Power District, 5.00%, 1/1/24 | | | 750 | | | | 857,700 | |
| | |
Omaha Public Power District, NE, 5.00%, 2/1/25 | | | 550 | | | | 642,395 | |
| | |
Public Power Generation Agency, NE, (Whelan Energy Center Unit 2), 5.00%, 1/1/25 | | | 2,525 | | | | 2,903,573 | |
| | |
Salem County Pollution Control Financing Authority, NJ, (Exelon Generation Co., LLC), (AMT), 2.50% to 3/1/19 (Put Date), 3/1/25 | | | 1,000 | | | | 999,790 | |
| | |
Unified Government of Wyandotte County/Kansas City, KS, Utility System Revenue, 5.00%, 9/1/26 | | | 1,165 | | | | 1,354,359 | |
| | |
Unified Government of Wyandotte County/Kansas City, KS, Utility System Revenue, 5.00%, 9/1/27 | | | 1,000 | | | | 1,161,220 | |
| | |
Vermont Public Power Supply Authority, (Swanton Peaking Facility), 5.00%, 7/1/25 | | | 520 | | | | 583,752 | |
| | |
Vermont Public Power Supply Authority, (Swanton Peaking Facility), 5.00%, 7/1/26 | | | 675 | | | | 762,629 | |
| | |
Vermont Public Power Supply Authority, (Swanton Peaking Facility), 5.00%, 7/1/27 | | | 660 | | | | 751,126 | |
| | |
Vermont Public Power Supply Authority, (Swanton Peaking Facility), 5.00%, 7/1/28 | | | 500 | | | | 565,875 | |
| | |
Vernon, CA, Electric System Revenue, 5.125%, 8/1/21 | | | 95 | | | | 96,401 | |
| | |
| | | | | | | $ | 40,383,756 | |
|
| Escrowed / Prerefunded — 0.1% | |
| | |
Oklahoma Development Finance Authority, (St. John Health System), Prerefunded to 2/15/22, 5.00%, 2/15/26 | | $ | 500 | | | $ | 547,290 | |
| | |
Vernon, CA, Electric System Revenue, Prerefunded to 8/1/19, 5.125%, 8/1/21 | | | 40 | | | | 40,702 | |
| | |
| | | | | | | $ | 587,992 | |
|
| General Obligations — 14.5% | |
| | |
Ann Arbor Public Schools, MI, 5.00%, 5/1/23 | | $ | 865 | | | $ | 978,280 | |
| | |
Ann Arbor Public Schools, MI, 5.00%, 5/1/27 | | | 1,000 | | | | 1,164,970 | |
| | |
Beaverton School District No. 48J, Washington and Multnomah Counties, OR, 5.00%, 6/15/25 | | | 1,865 | | | | 2,212,431 | |
| | |
Beaverton School District No. 48J, Washington and Multnomah Counties, OR, 5.00%, 6/15/26 | | | 2,000 | | | | 2,411,940 | |
| | |
Burlington, VT, 5.00%, 11/1/21 | | | 600 | | | | 646,770 | |
| | |
Burlington, VT, 5.00%, 11/1/22 | | | 500 | | | | 551,330 | |
| | |
Burlington, VT, 5.00%, 11/1/24 | | | 400 | | | | 456,328 | |
| | |
Burlington, VT, 5.00%, 11/1/25 | | | 500 | | | | 577,535 | |
| | | | | | | | |
| Security | | Principal
Amount
(000’s omitted) | | | Value | |
|
| General Obligations (continued) | |
| | |
California, 1.86%, (SIFMA + 0.43%), 12/1/23 (Put Date), 12/1/29(1) | | $ | 12,000 | | | $ | 11,970,480 | |
| | |
Chelsea School District, MI, 4.00%, 5/1/24 | | | 765 | | | | 844,017 | |
| | |
Chelsea School District, MI, 4.00%, 5/1/25 | | | 765 | | | | 853,465 | |
| | |
Chicago, IL, 5.00%, 12/1/22 | | | 2,230 | | | | 2,300,914 | |
| | |
Chicago, IL, 5.625%, 1/1/30 | | | 6,000 | | | | 6,685,320 | |
| | |
Chicago, IL, 6.00%, 1/1/38 | | | 4,000 | | | | 4,474,360 | |
| | |
Chicago Board of Education, IL, 5.00%, 12/1/25 | | | 6,195 | | | | 6,557,655 | |
| | |
Chicago Board of Education, IL, 5.00%, 12/1/26 | | | 2,905 | | | | 3,080,346 | |
| | |
Chicago Park District, IL, 5.00%, 1/1/24 | | | 500 | | | | 547,225 | |
| | |
Clackamas Community College District, OR, 0.00%, 6/15/21 | | | 385 | | | | 368,688 | |
| | |
Dallas, TX, 5.00%, 2/15/25 | | | 1,000 | | | | 1,169,630 | |
| | |
Delaware Valley Regional Finance Authority, PA, 2.448%, (67% of 1 mo. USD LIBOR + 0.76%), 9/1/24 (Put Date), 9/1/48(1) | | | 8,000 | | | | 7,950,080 | |
| | |
Durand Area Schools, MI, 5.00%, 5/1/22 | | | 840 | | | | 923,135 | |
| | |
Durand Area Schools, MI, 5.00%, 5/1/23 | | | 960 | | | | 1,078,618 | |
| | |
Elmira, NY, 3.75%, 7/16/19(2) | | | 2,000 | | | | 2,005,920 | |
| | |
Fern Ridge School District 28J, Lane and Douglas Counties, OR, 4.00%, 6/15/22 | | | 875 | | | | 938,735 | |
| | |
Fern Ridge School District 28J, Lane and Douglas Counties, OR, 4.00%, 6/15/23 | | | 960 | | | | 1,046,131 | |
| | |
Harper Creek Community Schools, MI, 4.00%, 5/1/25 | | | 1,070 | | | | 1,190,418 | |
| | |
Harper Creek Community Schools, MI, 4.00%, 5/1/26 | | | 1,045 | | | | 1,171,947 | |
| | |
Haslett Public Schools, MI, 4.00%, 5/1/25 | | | 1,780 | | | | 1,985,839 | |
| | |
Illinois, 5.00%, 11/1/19 | | | 5,000 | | | | 5,097,800 | |
| | |
Illinois, 5.00%, 8/1/20 | | | 3,000 | | | | 3,108,690 | |
| | |
Illinois, 5.00%, 10/1/22 | | | 2,000 | | | | 2,125,400 | |
| | |
Illinois, 5.00%, 2/1/24 | | | 5,000 | | | | 5,333,700 | |
| | |
Illinois, 5.00%, 2/1/25 | | | 10,000 | | | | 10,737,300 | |
| | |
Illinois, 5.00%, 2/1/27 | | | 5,000 | | | | 5,420,950 | |
| | |
Illinois, 5.00%, 2/1/28 | | | 10,000 | | | | 10,756,100 | |
| | |
Illinois, 5.00%, 11/1/28 | | | 10,000 | | | | 10,815,300 | |
| | |
Kane, Cook and DuPage Counties School District No. 46, IL, 5.00%, 1/1/26 | | | 900 | | | | 1,002,861 | |
| | |
Laredo Independent School District, TX, (PSF Guaranteed), 0.00%, 8/1/22 | | | 1,425 | | | | 1,330,722 | |
| | |
Manchester Community Schools, MI, 5.00%, 5/1/24 | | | 1,300 | | | | 1,498,107 | |
| | |
Manchester Community Schools, MI, 5.00%, 5/1/25 | | | 750 | | | | 880,507 | |
| | |
Massachusetts, 2.253%, (67% of 3 mo. USD LIBOR + 0.55%), 11/1/25(1) | | | 4,630 | | | | 4,609,952 | |
| | |
Mattawan Consolidated School, Van Buren and Kalamazoo Counties, MI, 5.00%, 5/1/26 | | | 750 | | | | 872,302 | |
| | |
Mattawan Consolidated School, Van Buren and Kalamazoo Counties, MI, 5.00%, 5/1/27 | | | 1,000 | | | | 1,156,750 | |
| | | | |
| | 6 | | See Notes to Financial Statements. |
Eaton Vance
Municipal Opportunities Fund
January 31, 2019
Portfolio of Investments (Unaudited) — continued
| | | | | | | | |
| Security | | Principal
Amount
(000’s omitted) | | | Value | |
|
| General Obligations (continued) | |
| | |
Mattawan Consolidated School, Van Buren and Kalamazoo Counties, MI, 5.00%, 5/1/28 | | $ | 500 | | | $ | 575,860 | |
| | |
Mobile County, AL, 5.00%, 6/1/23 | | | 860 | | | | 972,462 | |
| | |
Mobile County, AL, 5.00%, 6/1/24 | | | 250 | | | | 288,732 | |
| | |
New York, NY, 5.00%, 8/1/25 | | | 1,000 | | | | 1,132,860 | |
| | |
New York, NY, 5.00%, 8/1/29 | | | 450 | | | | 504,837 | |
| | |
Norfolk, VA, 5.00%, 9/1/33 | | | 1,850 | | | | 2,141,375 | |
| | |
Ottawa County, MI, 5.00%, 11/1/22 | | | 500 | | | | 559,750 | |
| | |
Ottawa County, MI, 5.00%, 11/1/24 | | | 250 | | | | 293,297 | |
| | |
Ottawa County, MI, 5.00%, 11/1/25 | | | 300 | | | | 358,368 | |
| | |
Roseville Community Schools, MI, 5.00%, 5/1/23 | | | 1,405 | | | | 1,578,602 | |
| | |
San Juan Unified School District, CA, (Election of 2012), 4.00%, 8/1/28 | | | 2,000 | | | | 2,281,500 | |
| | |
Saugatuck Public Schools, MI, 4.00%, 5/1/25 | | | 1,085 | | | | 1,213,855 | |
| | |
Sedgwick County Unified School District No. 265, KS, 5.00%, 10/1/26 | | | 1,000 | | | | 1,198,660 | |
| | |
Sherwood School District No. 88J, Washington, Clackamas and Yamhill Counties, OR, 5.00%, 6/15/24 | | | 2,000 | | | | 2,323,580 | |
| | |
St. Joseph Public Schools, MI, 5.00%, 5/1/28 | | | 1,880 | | | | 2,181,796 | |
| | |
St. Joseph Public Schools, MI, 5.00%, 5/1/29 | | | 1,650 | | | | 1,909,677 | |
| | |
Texas, (Texas Transportation Commission), 5.00%, 10/1/24 | | | 1,000 | | | | 1,168,460 | |
| | |
Thornapple Kellogg School, MI, 5.00%, 5/1/24 | | | 400 | | | | 458,564 | |
| | |
Upper Merion Area School District, PA, 5.00%, 1/15/29 | | | 500 | | | | 579,150 | |
| | |
Upper Merion Area School District, PA, 5.00%, 1/15/30 | | | 300 | | | | 346,221 | |
| | |
Walled Lake Consolidated School District, MI, 4.00%, 5/1/24 | | | 740 | | | | 815,273 | |
| | |
Will and Cook Counties Community High School District No. 210, IL, 5.00%, 1/1/29 | | | 685 | | | | 700,817 | |
| | |
| | | | | | | $ | 154,472,644 | |
|
| Hospital — 20.1% | |
| | |
Astoria Hospital Facilities Authority, OR, (Columbia Memorial Hospital), 5.00%, 8/1/41 | | $ | 940 | | | $ | 1,019,317 | |
| | |
Augusta Development Authority, GA, (AU Health System, Inc.), 5.00%, 7/1/26 | | | 2,525 | | | | 2,890,645 | |
| | |
Augusta Development Authority, GA, (AU Health System, Inc.), 5.00%, 7/1/27 | | | 2,635 | | | | 3,036,706 | |
| | |
Baxter County, AR, (Baxter Regional Medical Center), 5.00%, 9/1/19 | | | 620 | | | | 628,674 | |
| | |
Baxter County, AR, (Baxter Regional Medical Center), 5.00%, 9/1/21 | | | 1,140 | | | | 1,205,653 | |
| | |
Baxter County, AR, (Baxter Regional Medical Center), 5.00%, 9/1/23 | | | 930 | | | | 1,017,680 | |
| | |
Baxter County, AR, (Baxter Regional Medical Center), 5.00%, 9/1/25 | | | 1,125 | | | | 1,261,181 | |
| | | | | | | | |
| Security | | Principal
Amount
(000’s omitted) | | | Value | |
|
| Hospital (continued) | |
| | |
Baxter County, AR, (Baxter Regional Medical Center), Series A, 5.00%, 9/1/20 | | $ | 780 | | | $ | 808,322 | |
| | |
Baxter County, AR, (Baxter Regional Medical Center), Series A, 5.00%, 9/1/22 | | | 1,660 | | | | 1,788,667 | |
| | |
Baxter County, AR, (Baxter Regional Medical Center), Series A, 5.00%, 9/1/24 | | | 1,350 | | | | 1,497,137 | |
| | |
Baxter County, AR, (Baxter Regional Medical Center), Series A, 5.00%, 9/1/26 | | | 1,000 | | | | 1,128,820 | |
| | |
Baxter County, AR, (Baxter Regional Medical Center), Series B, 5.00%, 9/1/20 | | | 240 | | | | 248,714 | |
| | |
Baxter County, AR, (Baxter Regional Medical Center), Series B, 5.00%, 9/1/22 | | | 265 | | | | 285,540 | |
| | |
Baxter County, AR, (Baxter Regional Medical Center), Series B, 5.00%, 9/1/24 | | | 290 | | | | 321,607 | |
| | |
Baxter County, AR, (Baxter Regional Medical Center), Series B, 5.00%, 9/1/26 | | | 320 | | | | 361,222 | |
| | |
Boone County, MO, (Boone Hospital Center), 5.00%, 8/1/29 | | | 1,410 | | | | 1,530,893 | |
| | |
Boone County, MO, (Boone Hospital Center), 5.00%, 8/1/31 | | | 3,215 | | | | 3,449,309 | |
| | |
Calhoun County Hospital Finance Authority, MI, (Oaklawn Hospital), 5.00%, 2/15/28 | | | 1,740 | | | | 1,914,922 | |
| | |
Calhoun County Hospital Finance Authority, MI, (Oaklawn Hospital), 5.00%, 2/15/32 | | | 2,110 | | | | 2,262,658 | |
| | |
California Municipal Finance Authority, (NorthBay Healthcare Group), 5.00%, 11/1/23 | | | 100 | | | | 110,779 | |
| | |
California Municipal Finance Authority, (NorthBay Healthcare Group), 5.00%, 11/1/27 | | | 360 | | | | 399,906 | |
| | |
California Municipal Finance Authority, (NorthBay Healthcare Group), 5.00%, 11/1/28 | | | 300 | | | | 331,416 | |
| | |
California Municipal Finance Authority, (NorthBay Healthcare Group), 5.00%, 11/1/29 | | | 110 | | | | 120,971 | |
| | |
California Municipal Finance Authority, (NorthBay Healthcare Group), 5.00%, 11/1/30 | | | 150 | | | | 163,970 | |
| | |
California Municipal Finance Authority, (NorthBay Healthcare Group), 5.00%, 11/1/35 | | | 250 | | | | 267,460 | |
| | |
California Municipal Finance Authority, (NorthBay Healthcare Group), Series 2015, 5.00%, 11/1/25 | | | 200 | | | | 224,420 | |
| | |
California Statewide Communities Development Authority, (Cottage Health System Obligated Group), 5.00%, 11/1/26 | | | 425 | | | | 490,080 | |
| | |
California Statewide Communities Development Authority, (Loma Linda University Medical Center), 5.25%, 12/1/29 | | | 1,500 | | | | 1,647,945 | |
| | |
Connecticut Health and Educational Facilities Authority, (Hartford HealthCare Corp.), 2.664% (68% of 1 mo. USD LIBOR + 0.95%), 7/1/20 (Put Date), 7/1/49(1) | | | 13,665 | | | | 13,698,343 | |
| | |
Connecticut Health and Educational Facilities Authority, (Yale New Haven Health), 2.238% (67% of 1 mo. USD LIBOR + 0.55%), 7/1/19 (Put Date), 7/1/49(1) | | | 4,465 | | | | 4,465,134 | |
| | | | |
| | 7 | | See Notes to Financial Statements. |
Eaton Vance
Municipal Opportunities Fund
January 31, 2019
Portfolio of Investments (Unaudited) — continued
| | | | | | | | |
| Security | | Principal
Amount
(000’s omitted) | | | Value | |
|
| Hospital (continued) | |
| | |
Crawford County Hospital Authority, PA, (Meadville Medical Center), 6.00%, 6/1/36 | | $ | 1,910 | | | $ | 2,073,305 | |
| | |
Decatur Hospital Authority, TX, (Wise Regional Health System), 4.00%, 9/1/20 | | | 225 | | | | 229,966 | |
| | |
Decatur Hospital Authority, TX, (Wise Regional Health System), 5.00%, 9/1/21 | | | 330 | | | | 349,173 | |
| | |
Decatur Hospital Authority, TX, (Wise Regional Health System), 5.00%, 9/1/22 | | | 150 | | | | 161,838 | |
| | |
Decatur Hospital Authority, TX, (Wise Regional Health System), 5.00%, 9/1/23 | | | 200 | | | | 219,488 | |
| | |
Delaware Health Facilities Authority, (Beebe Medical Center), 5.00%, 6/1/30 | | | 600 | | | | 683,352 | |
| | |
Delaware Health Facilities Authority, (Beebe Medical Center), 5.00%, 6/1/31 | | | 1,200 | | | | 1,349,568 | |
| | |
Deschutes County Hospital Facilities Authority, OR, (St. Charles Health System), 4.00%, 1/1/33 | | | 500 | | | | 520,195 | |
| | |
Fredericksburg Economic Development Authority, VA, (Mary Washington Healthcare), 5.00%, 6/15/24 | | | 1,000 | | | | 1,128,490 | |
| | |
Halifax Hospital Medical Center, FL, 5.00%, 6/1/27 | | | 2,890 | | | | 3,298,039 | |
| | |
Halifax Hospital Medical Center, FL, 5.00%, 6/1/29 | | | 1,830 | | | | 2,063,874 | |
| | |
Illinois Finance Authority, (Presence Health Network), 3.75%, 2/15/34 | | | 3,145 | | | | 3,168,871 | |
| | |
Illinois Finance Authority, (Presence Health Network), 5.00%, 2/15/28 | | | 8,000 | | | | 9,485,280 | |
| | |
Illinois Finance Authority, (Silver Cross Hospital and Medical Centers), 5.00%, 8/15/23 | | | 1,000 | | | | 1,105,090 | |
| | |
Illinois Finance Authority, (Silver Cross Hospital and Medical Centers), 5.00%, 8/15/28 | | | 1,670 | | | | 1,875,159 | |
| | |
Indiana County Hospital Authority, PA, (Indiana Regional Medical Center), 5.125%, 6/1/26 | | | 475 | | | | 505,509 | |
| | |
Indiana County Hospital Authority, PA, (Indiana Regional Medical Center), 5.25%, 6/1/27 | | | 415 | | | | 442,178 | |
| | |
Indiana County Hospital Authority, PA, (Indiana Regional Medical Center), 5.375%, 6/1/28 | | | 455 | | | | 484,803 | |
| | |
Indiana Finance Authority, (Parkview Health), 5.00%, 11/1/26 | | | 1,200 | | | | 1,421,052 | |
| | |
Jefferson County Civic Facility Development Corp., NY, (Samaritan Medical Center), 4.00%, 11/1/29 | | | 505 | | | | 527,725 | |
| | |
Jefferson County Civic Facility Development Corp., NY, (Samaritan Medical Center), 4.00%, 11/1/30 | | | 1,605 | | | | 1,662,475 | |
| | |
Klamath Falls Intercommunity Hospital Authority, OR, (Sky Lakes Medical Center), 4.00%, 9/1/24 | | | 475 | | | | 517,019 | |
| | |
Klamath Falls Intercommunity Hospital Authority, OR, (Sky Lakes Medical Center), 4.00%, 9/1/25 | | | 550 | | | | 603,928 | |
| | |
Klamath Falls Intercommunity Hospital Authority, OR, (Sky Lakes Medical Center), 5.00%, 9/1/28 | | | 795 | | | | 923,631 | |
| | |
Klamath Falls Intercommunity Hospital Authority, OR, (Sky Lakes Medical Center), 5.00%, 9/1/31 | | | 600 | | | | 684,684 | |
| | | | | | | | |
| Security | | Principal
Amount
(000’s omitted) | | | Value | |
|
| Hospital (continued) | |
| | |
Lexington County Health Services District, Inc., SC, 5.00%, 11/1/27 | | $ | 200 | | | $ | 236,452 | |
| | |
Martin County Health Facilities Authority, FL, (Martin Memorial Medical Center), 5.00%, 11/15/24 | | | 1,000 | | | | 1,138,940 | |
| | |
Martin County Health Facilities Authority, FL, (Martin Memorial Medical Center), 5.00%, 11/15/28 | | | 1,830 | | | | 2,025,901 | |
| | |
Maryland Health and Higher Educational Facilities Authority, (Meritus Medical Center), 5.00%, 7/1/23 | | | 1,000 | | | | 1,115,670 | |
| | |
Maryland Health and Higher Educational Facilities Authority, (Meritus Medical Center), 5.00%, 7/1/24 | | | 1,775 | | | | 2,016,418 | |
| | |
Maryland Health and Higher Educational Facilities Authority, (Meritus Medical Center), 5.00%, 7/1/28 | | | 1,300 | | | | 1,467,492 | |
| | |
Massachusetts Development Finance Agency, (Lawrence General Hospital), 5.00%, 7/1/32 | | | 500 | | | | 545,455 | |
| | |
Massachusetts Development Finance Agency, (Milford Regional Medical Center), 5.00%, 7/15/27 | | | 125 | | | | 134,633 | |
| | |
Massachusetts Development Finance Agency, (South Shore Hospital), 5.00%, 7/1/25 | | | 500 | | | | 576,460 | |
| | |
Massachusetts Development Finance Agency, (South Shore Hospital), 5.00%, 7/1/27 | | | 1,100 | | | | 1,270,423 | |
| | |
Massachusetts Development Finance Agency, (UMass Memorial Health Care Obligated Group), 5.00%, 7/1/22 | | | 2,835 | | | | 3,025,654 | |
| | |
Massachusetts Development Finance Agency, (UMass Memorial Health Care Obligated Group), 5.00%, 7/1/26 | | | 1,150 | | | | 1,340,762 | |
| | |
Massachusetts Development Finance Agency, (UMass Memorial Health Care Obligated Group), 5.00%, 7/1/28 | | | 2,000 | | | | 2,324,300 | |
| | |
Massachusetts Development Finance Agency, (UMass Memorial Health Care Obligated Group), 5.00%, 7/1/29 | | | 2,700 | | | | 3,124,683 | |
| | |
Massachusetts Development Finance Agency, (UMass Memorial Health Care Obligated Group), Series I 2016, 5.00%, 7/1/27 | | | 1,150 | | | | 1,328,998 | |
| | |
Massachusetts Development Finance Agency, (UMass Memorial Health Care Obligated Group), Series L 2017, 5.00%, 7/1/27 | | | 1,460 | | | | 1,718,259 | |
| | |
Massachusetts Health and Educational Facilities Authority, (Lowell General Hospital), 4.75%, 7/1/25 | | | 285 | | | | 295,542 | |
| | |
Michigan Finance Authority, (McLaren Health Care), 2.463%, (68% of 1 mo. USD LIBOR + 0.75%), 10/15/20 (Put Date), 10/15/38(1) | | | 6,250 | | | | 6,277,500 | |
| | |
Michigan Finance Authority, (Oakwood Obligated Group), 5.00%, 11/1/27 | | | 1,400 | | | | 1,540,014 | |
| | |
Missouri Health and Educational Facilities Authority, (SSM Health Care), 5.00%, 6/1/26 | | | 1,000 | | | | 1,137,250 | |
| | |
Montana Facility Finance Authority, (Billings Clinic Obligated Group), 1.98%, (SIFMA + 0.55%), 8/15/23 (Put Date), 8/15/37(1) | | | 10,000 | | | | 9,951,700 | |
| | |
Nassau County Local Economic Assistance Corp., NY, (Catholic Health Services of Long Island), 5.00%, 7/1/29 | | | 1,000 | | | | 1,108,090 | |
| | | | |
| | 8 | | See Notes to Financial Statements. |
Eaton Vance
Municipal Opportunities Fund
January 31, 2019
Portfolio of Investments (Unaudited) — continued
| | | | | | | | |
| Security | | Principal
Amount
(000’s omitted) | | | Value | |
|
| Hospital (continued) | |
| | |
New Hampshire Health and Education Facilities Authority, (Concord Hospital), 5.00%, 10/1/32 | | $ | 500 | | | $ | 570,415 | |
| | |
New Hampshire Health and Education Facilities Authority, (Concord Hospital), 5.00%, 10/1/33 | | | 1,000 | | | | 1,135,950 | |
| | |
New Hampshire Health and Education Facilities Authority, (Concord Hospital), 5.00%, 10/1/34 | | | 1,070 | | | | 1,209,421 | |
| | |
New Hampshire Health and Education Facilities Authority, (Concord Hospital), 5.00%, 10/1/35 | | | 1,550 | | | | 1,744,494 | |
| | |
New Jersey Health Care Facilities Financing Authority, (Barnabas Health), 5.00%, 7/1/23 | | | 605 | | | | 666,184 | |
| | |
New Jersey Health Care Facilities Financing Authority, (Hunterdon Medical Center Obligated Group), 5.00%, 7/1/30 | | | 500 | | | | 555,370 | |
| | |
New Jersey Health Care Facilities Financing Authority, (Inspira Health Obligated Group), 5.00%, 7/1/29 | | | 2,600 | | | | 2,999,022 | |
| | |
New Jersey Health Care Facilities Financing Authority, (Princeton HealthCare System), 5.00%, 7/1/24 | | | 1,000 | | | | 1,155,260 | |
| | |
New Jersey Health Care Facilities Financing Authority, (Princeton HealthCare System), 5.00%, 7/1/28 | | | 1,305 | | | | 1,534,967 | |
| | |
New Jersey Health Care Facilities Financing Authority, (Princeton HealthCare System), 5.00%, 7/1/39 | | | 1,560 | | | | 1,735,157 | |
| | |
New Jersey Health Care Facilities Financing Authority, (St. Joseph’s Healthcare System Obligated Group), 4.00%, 7/1/48 | | | 20,000 | | | | 19,459,400 | |
| | |
New Jersey Health Care Facilities Financing Authority, (Trinitas Regional Medical Center Obligated Group), 5.00%, 7/1/27 | | | 1,000 | | | | 1,148,410 | |
| | |
New Jersey Health Care Facilities Financing Authority, (Trinitas Regional Medical Center Obligated Group), 5.00%, 7/1/29 | | | 500 | | | | 567,395 | |
| | |
New Jersey Health Care Facilities Financing Authority, (Virtua Health), 5.00%, 7/1/27 | | | 500 | | | | 566,035 | |
| | |
New York Dormitory Authority, (Memorial Sloan Kettering Cancer Center), 5.00%, 7/1/29 | | | 750 | | | | 908,468 | |
| | |
New York Dormitory Authority, (NYU Hospitals Center), 5.00%, 7/1/22 | | | 440 | | | | 485,725 | |
| | |
New York Dormitory Authority, (NYU Hospitals Center), 5.00%, 7/1/23 | | | 600 | | | | 677,748 | |
| | |
New York Dormitory Authority, (NYU Hospitals Center), 5.00%, 7/1/25 | | | 2,000 | | | | 2,346,020 | |
| | |
New York Dormitory Authority, (Orange Regional Medical Center), 5.00%, 12/1/22(2) | | | 700 | | | | 765,576 | |
| | |
New York Dormitory Authority, (Orange Regional Medical Center), 5.00%, 12/1/25(2) | | | 1,000 | | | | 1,140,360 | |
| | |
New York Dormitory Authority, (Orange Regional Medical Center), 5.00%, 12/1/27(2) | | | 500 | | | | 564,265 | |
| | |
New York Dormitory Authority, (Orange Regional Medical Center), 5.00%, 12/1/28(2) | | | 600 | | | | 673,416 | |
| | |
New York Dormitory Authority, (Orange Regional Medical Center), 5.00%, 12/1/29(2) | | | 450 | | | | 502,304 | |
| | | | | | | | |
| Security | | Principal
Amount
(000’s omitted) | | | Value | |
|
| Hospital (continued) | |
| | |
New York Dormitory Authority, (Orange Regional Medical Center), 5.00%, 12/1/30(2) | | $ | 1,000 | | | $ | 1,108,330 | |
| | |
New York Dormitory Authority, (Orange Regional Medical Center), 5.00%, 12/1/31(2) | | | 1,100 | | | | 1,211,848 | |
| | |
New York Dormitory Authority, (Orange Regional Medical Center), 5.00%, 12/1/32(2) | | | 1,100 | | | | 1,205,919 | |
| | |
New York Dormitory Authority, (Orange Regional Medical Center), 5.00%, 12/1/33(2) | | | 1,100 | | | | 1,203,290 | |
| | |
New York Dormitory Authority, (Orange Regional Medical Center), 5.00%, 12/1/34(2) | | | 1,200 | | | | 1,308,384 | |
| | |
New York Dormitory Authority, (Orange Regional Medical Center), 5.00%, 12/1/35(2) | | | 1,000 | | | | 1,087,360 | |
| | |
New York Dormitory Authority, (Orange Regional Medical Center), Series 2015,
5.00%, 12/1/26(2) | | | 300 | | | | 340,797 | |
| | |
New York Dormitory Authority, (Orange Regional Medical Center), Series 2017,
5.00%, 12/1/26(2) | | | 1,500 | | | | 1,740,690 | |
| | |
Norfolk Economic Development Authority, VA, (Bon Secours Health System, Inc.), Prerefunded to 11/1/22, 5.00%, 11/1/28 | | | 225 | | | | 249,725 | |
| | |
Northampton County General Purpose Authority, PA, (St. Luke’s University Health Network), 2.804%, (70% of 1 mo. USD LIBOR + 1.04%), 8/15/24 (Put Date), 8/15/48(1) | | | 1,000 | | | | 1,003,240 | |
| | |
Ohio, (University Hospitals Health System, Inc.), 5.00%, 1/15/27 | | | 850 | | | | 979,472 | |
| | |
Oklahoma Development Finance Authority, (OU Medicine), 5.00%, 8/15/33 | | | 3,165 | | | | 3,514,384 | |
| | |
Oregon Facilities Authority, (PeaceHealth), 5.00%, 11/15/29 | | | 500 | | | | 561,460 | |
| | |
Palm Beach County Health Facilities Authority, FL, (BRRH Corp. Obligated Group), 5.00%, 12/1/25 | | | 500 | | | | 562,730 | |
| | |
Rhode Island Health and Educational Building Corp., (Care New England Health System), 5.00%, 9/1/31 | | | 4,000 | | | | 4,321,480 | |
| | |
Southcentral Pennsylvania General Authority, (Hanover Hospital, Inc.), 5.00%, 12/1/25 | | | 1,530 | | | | 1,793,726 | |
| | |
Southcentral Pennsylvania General Authority, (Hanover Hospital, Inc.), 5.00%, 12/1/26 | | | 1,410 | | | | 1,639,477 | |
| | |
Southcentral Pennsylvania General Authority, (Hanover Hospital, Inc.), 5.00%, 12/1/28 | | | 1,550 | | | | 1,779,121 | |
| | |
St. Cloud, MN, (CentraCare Health System), 5.00%, 5/1/27 | | | 1,000 | | | | 1,171,850 | |
| | |
Tallahassee, FL, (Tallahassee Memorial HealthCare, Inc.), 5.00%, 12/1/22 | | | 475 | | | | 521,873 | |
| | |
Tallahassee, FL, (Tallahassee Memorial HealthCare, Inc.), 5.00%, 12/1/23 | | | 400 | | | | 447,492 | |
| | |
Tallahassee, FL, (Tallahassee Memorial HealthCare, Inc.), 5.00%, 12/1/24 | | | 500 | | | | 567,930 | |
| | |
Tallahassee, FL, (Tallahassee Memorial HealthCare, Inc.), 5.00%, 12/1/25 | | | 500 | | | | 574,585 | |
| | |
Tallahassee, FL, (Tallahassee Memorial HealthCare, Inc.), 5.00%, 12/1/26 | | | 500 | | | | 572,230 | |
| | | | |
| | 9 | | See Notes to Financial Statements. |
Eaton Vance
Municipal Opportunities Fund
January 31, 2019
Portfolio of Investments (Unaudited) — continued
| | | | | | | | |
| Security | | Principal
Amount
(000’s omitted) | | | Value | |
|
| Hospital (continued) | |
| | |
Tallahassee, FL, (Tallahassee Memorial HealthCare, Inc.), 5.00%, 12/1/27 | | $ | 500 | | | $ | 568,885 | |
| | |
Ward County, ND, (Trinity Obligated Group), 5.00%, 6/1/29 | | | 1,300 | | | | 1,470,521 | |
| | |
Ward County, ND, (Trinity Obligated Group), 5.00%, 6/1/30 | | | 1,815 | �� | | | 2,039,152 | |
| | |
Ward County, ND, (Trinity Obligated Group), 5.00%, 6/1/31 | | | 1,885 | | | | 2,101,869 | |
| | |
Ward County, ND, (Trinity Obligated Group), 5.00%, 6/1/34 | | | 3,000 | | | | 3,292,650 | |
| | |
Washington Health Care Facilities Authority, (Overlake Hospital Medical Center), 5.00%, 7/1/30 | | | 1,600 | | | | 1,867,552 | |
| | |
Washington Health Care Facilities Authority, (PeaceHealth), 5.00%, 11/15/26 | | | 1,000 | | | | 1,130,310 | |
| | |
Wisconsin Health and Educational Facilities Authority, (Ascension Senior Credit Group), 5.00%, 11/15/27 | | | 1,000 | | | | 1,174,890 | |
| | |
Yavapai County Industrial Development Authority, AZ, (Yavapai Regional Medical Center), 5.25%, 8/1/33 | | | 250 | | | | 274,023 | |
| | |
| | | | | | | $ | 214,261,986 | |
|
| Housing — 1.3% | |
| | |
East Hempfield Township Industrial Development Authority, PA, (Student Services, Inc.), 5.00%, 7/1/29 | | $ | 500 | | | $ | 537,670 | |
| | |
New Hope Cultural Education Facilities Finance Corp., TX, (CHF-Collegiate Housing Galveston I, LLC), 5.00%, 4/1/23 | | | 910 | | | | 951,232 | |
| | |
New Hope Cultural Education Facilities Finance Corp., TX, (CHF-Collegiate Housing Island Campus, LLC - Texas A&M University-Corpus Christi), 5.00%, 4/1/24 | | | 1,385 | | | | 1,443,004 | |
| | |
New Hope Cultural Education Facilities Finance Corp., TX, (CHF-Collegiate Housing Island Campus, LLC - Texas A&M University-Corpus Christi), 5.00%, 4/1/25 | | | 1,505 | | | | 1,568,827 | |
| | |
New Hope Cultural Education Facilities Finance Corp., TX, (CHF-Collegiate Housing Island Campus, LLC - Texas A&M University-Corpus Christi), 5.00%, 4/1/26 | | | 1,000 | | | | 1,040,810 | |
| | |
New Hope Cultural Education Facilities Finance Corp., TX, (CHF-Collegiate Housing Island Campus, LLC - Texas A&M University-Corpus Christi), 5.00%, 4/1/27 | | | 760 | | | | 789,875 | |
| | |
New Hope Cultural Education Facilities Finance Corp., TX, (CHF-Collegiate Housing Island Campus, LLC - Texas A&M University-Corpus Christi), 5.00%, 4/1/28 | | | 570 | | | | 588,462 | |
| | |
New Hope Cultural Education Facilities Finance Corp., TX, (CHF-Collegiate Housing Island Campus, LLC - Texas A&M University-Corpus Christi), 5.00%, 4/1/29 | | | 570 | | | | 584,159 | |
| | |
New Hope Cultural Education Facilities Finance Corp., TX, (CHF-Collegiate Housing Stephenville III, LLC - Tarleton State University), 5.00%, 4/1/23 | | | 400 | | | | 431,528 | |
| | |
New Hope Cultural Education Facilities Finance Corp., TX, (CHF-Collegiate Housing Stephenville III, LLC - Tarleton State University), 5.00%, 4/1/25 | | | 715 | | | | 786,393 | |
| | |
North Dakota Housing Finance Agency, (SIFMA + 0.40%), 2/1/22 (Put Date), 1/1/43(4) | | | 5,000 | | | | 5,001,250 | |
| | |
| | | | | | | $ | 13,723,210 | |
| | | | | | | | |
| Security | | Principal
Amount
(000’s omitted) | | | Value | |
|
| Industrial Development Revenue — 4.7% | |
| | |
Florida Development Finance Corp., (Waste Pro USA, Inc.), (AMT), 5.00% to 8/1/22 (Put Date), 8/1/29(2) | | $ | 1,250 | | | $ | 1,282,562 | |
| | |
Maine Finance Authority, (Casella Waste Systems, Inc.), (AMT), 4.375% to 8/1/25 (Put Date), 8/1/35(2) | | | 875 | | | | 882,630 | |
| | |
Maine Finance Authority, (Casella Waste Systems, Inc.), (AMT), 5.125% to 8/1/25 (Put Date), 8/1/35(2) | | | 940 | | | | 973,821 | |
| | |
Michigan Strategic Fund, (Waste Management, Inc.), (AMT), 2.85% to 8/2/21 (Put Date), 8/1/27 | | | 4,000 | | | | 4,032,680 | |
| | |
National Finance Authority, NH, (Waste Management, Inc.), (AMT), 2.18%, (SIFMA + 0.75%), 10/1/21 (Put Date), 10/1/33(1) | | | 2,500 | | | | 2,494,200 | |
| | |
New Hampshire Business Finance Authority, (United Illuminating Co.), 2.80% to 10/2/23 (Put Date), 10/1/33 | | | 1,500 | | | | 1,516,350 | |
| | |
New Jersey Economic Development Authority, (Continental Airlines), Series 2000B, (AMT), 5.625%, 11/15/30 | | | 215 | | | | 242,630 | |
| | |
New York State Environmental Facilities Corp., (Casella Waste Systems, Inc.), (AMT), 3.75% to 12/2/19 (Put Date), 12/1/44(2) | | | 7,775 | | | | 7,823,982 | |
| | |
Niagara Area Development Corp., NY, (Covanta), 3.50%, 11/1/24(2) | | | 1,820 | | | | 1,804,039 | |
| | |
Ohio Air Quality Development Authority, (Ohio Valley Electric Corp.), 5.625%, 10/1/19 | | | 9,385 | | | | 9,507,662 | |
| | |
Public Finance Authority, WI, (Celanese Corp.), (AMT), 5.00%, 12/1/25(2) | | | 1,000 | | | | 1,089,050 | |
| | |
Richland County, SC, (International Paper Co.), (AMT), 3.875%, 4/1/23 | | | 1,165 | | | | 1,216,132 | |
| | |
Rockdale County Development Authority, GA, (Pratt Paper, LLC), (AMT), 4.00%, 1/1/38(2) | | | 7,065 | | | | 6,827,899 | |
| | |
Washington Economic Development Finance Authority, (Columbia Pulp I, LLC), (AMT), 7.50%, 1/1/32(2) | | | 1,265 | | | | 1,418,482 | |
| | |
Whiting, IN, (BP Products North America, Inc.), (AMT), 2.18%, (SIFMA + 0.75%), 12/2/19 (Put Date), 12/1/44(1) | | | 9,000 | | | | 9,008,370 | |
| | |
| | | | | | | $ | 50,120,489 | |
|
| Insured – Education — 0.0%(5) | |
| | |
University of Puerto Rico, (NPFG), 5.00%, 6/1/25 | | $ | 120 | | | $ | 120,412 | |
| | |
| | | | | | | $ | 120,412 | |
|
| Insured – Electric Utilities — 1.0% | |
| | |
Paducah Electric Plant Board, KY, (AGM), 5.00%, 10/1/29 | | $ | 1,500 | | | $ | 1,707,150 | |
| | |
Puerto Rico Electric Power Authority, (AGC), 5.00%, 7/1/26 | | | 280 | | | | 289,439 | |
| | |
Puerto Rico Electric Power Authority, (NPFG), 5.25%, 7/1/22 | | | 3,500 | | | | 3,665,235 | |
| | |
Puerto Rico Electric Power Authority, (NPFG), 5.25%, 7/1/23 | | | 195 | | | | 206,041 | |
| | |
Puerto Rico Electric Power Authority, (NPFG), 5.25%, 7/1/25 | | | 170 | | | | 181,626 | |
| | | | |
| | 10 | | See Notes to Financial Statements. |
Eaton Vance
Municipal Opportunities Fund
January 31, 2019
Portfolio of Investments (Unaudited) — continued
| | | | | | | | |
| Security | | Principal
Amount
(000’s omitted) | | | Value | |
|
| Insured – Electric Utilities (continued) | |
| | |
Puerto Rico Electric Power Authority, (NPFG), 5.25%, 7/1/26 | | $ | 135 | | | $ | 144,715 | |
| | |
Puerto Rico Electric Power Authority, (NPFG), 5.25%, 7/1/29 | | | 685 | | | | 734,875 | |
| | |
Puerto Rico Electric Power Authority, (NPFG), 5.25%, 7/1/30 | | | 530 | | | | 567,434 | |
| | |
Puerto Rico Electric Power Authority, (NPFG), 5.25%, 7/1/34 | | | 125 | | | | 132,782 | |
| | |
Puerto Rico Electric Power Authority, (NPFG), Series PP, 5.00%, 7/1/25 | | | 1,165 | | | | 1,168,996 | |
| | |
Puerto Rico Electric Power Authority, (NPFG), Series SS, 5.00%, 7/1/25 | | | 1,820 | | | | 1,826,242 | |
| | |
| | | | | | | $ | 10,624,535 | |
|
| Insured – Escrowed / Prerefunded — 0.0%(5) | |
| | |
Cambria County, PA, (BAM), Escrowed to Maturity, 5.00%, 8/1/23 | | $ | 240 | | | $ | 273,106 | |
| | |
| | | | | | | $ | 273,106 | |
|
| Insured – General Obligations — 2.6% | |
| | |
Allegheny Valley School District, PA, (BAM), 5.00%, 11/1/22 | | $ | 350 | | | $ | 387,261 | |
| | |
Atlantic City, NJ, (BAM), 5.00%, 3/1/23 | | | 500 | | | | 551,400 | |
| | |
Atlantic City, NJ, (BAM), 5.00%, 3/1/24 | | | 300 | | | | 337,206 | |
| | |
Bayonne, NJ, (AGM), 5.00%, 8/1/23 | | | 300 | | | | 338,202 | |
| | |
Bayonne, NJ, (AGM), 5.00%, 8/1/24 | | | 300 | | | | 344,568 | |
| | |
Bayonne, NJ, (AGM), 5.00%, 8/1/25 | | | 885 | | | | 1,028,910 | |
| | |
Bayonne, NJ, (AGM), 5.00%, 8/1/26 | | | 915 | | | | 1,054,245 | |
| | |
Bellaire Public School District, MI, (AGM), 4.00%, 5/1/23 | | | 675 | | | | 730,080 | |
| | |
Bellaire Public School District, MI, (AGM), 4.00%, 5/1/24 | | | 685 | | | | 752,164 | |
| | |
Bellaire Public School District, MI, (AGM), 4.00%, 5/1/25 | | | 685 | | | | 759,973 | |
| | |
Bolingbrook, IL, (AGM), 5.00%, 1/1/24 | | | 1,000 | | | | 1,123,140 | |
| | |
Bolingbrook, IL, (AGM), 5.00%, 1/1/25 | | | 1,000 | | | | 1,141,810 | |
| | |
Cambria County, PA, (BAM), 5.00%, 8/1/23 | | | 1,260 | | | | 1,408,390 | |
| | |
Chicago Board of Education, IL, (AGM), 5.00%, 12/1/25 | | | 1,000 | | | | 1,130,250 | |
| | |
Chicago Board of Education, IL, (NPFG), 0.00%, 12/1/20 | | | 2,175 | | | | 2,064,401 | |
| | |
Chicago Board of Education, IL, (NPFG), 0.00%, 12/1/22 | | | 4,300 | | | | 3,801,157 | |
| | |
Detroit, MI, (AMBAC), 4.00%, 4/1/20 | | | 43 | | | | 42,622 | |
| | |
Detroit, MI, (AMBAC), 5.00%, 4/1/19 | | | 23 | | | | 23,035 | |
| | |
Detroit, MI, (AMBAC), 5.00%, 4/1/21 | | | 13 | | | | 13,041 | |
| | |
Detroit, MI, (AMBAC), 5.00%, 4/1/22 | | | 66 | | | | 64,694 | |
| | |
Detroit, MI, (AMBAC), 5.00%, 4/1/24 | | | 329 | | | | 321,596 | |
| | |
Luzerne County, PA, (AGM), 5.00%, 11/15/24 | | | 2,480 | | | | 2,820,256 | |
| | |
McHenry County Community Unit School District No. 12, IL, (AGM), 5.00%, 1/1/25 | | | 890 | | | | 986,948 | |
| | | | | | | | |
| Security | | Principal
Amount
(000’s omitted) | | | Value | |
|
| Insured – General Obligations (continued) | |
| | |
McHenry County Community Unit School District No. 12, IL, (AGM), 5.00%, 1/1/26 | | $ | 925 | | | $ | 1,020,821 | |
| | |
Monroe County Industrial Development Corp., NY, (Monroe Community College Association, Inc.), (AGM), 5.00%, 1/15/25 | | | 750 | | | | 845,670 | |
| | |
Proviso Township High School District No. 209, IL, (AGM), 5.00%, 12/1/28 | | | 1,000 | | | | 1,170,920 | |
| | |
Puerto Rico, (AGC), 5.00%, 7/1/34 | | | 310 | | | | 316,962 | |
| | |
Puerto Rico, (AGM), 5.00%, 7/1/35 | | | 1,055 | | | | 1,095,417 | |
| | |
Puerto Rico, (NPFG), 5.25%, 7/1/22 | | | 530 | | | | 536,021 | |
| | |
Puerto Rico Public Buildings Authority, (AMBAC), 5.45%, 7/1/30 | | | 930 | | | | 931,107 | |
| | |
Rockland County, NY, (AGM), 5.00%, 3/1/24 | | | 350 | | | | 400,974 | |
| | |
South Haven Public Schools, MI, (BAM), 4.00%, 5/1/27 | | | 785 | | | | 876,358 | |
| | |
| | | | | | | $ | 28,419,599 | |
|
| Insured – Housing — 0.1% | |
| | |
Maryland Economic Development Corp., (University of Maryland, College Park), (AGM), 4.00%, 6/1/21 | | $ | 400 | | | $ | 419,660 | |
| | |
New Hope Cultural Education Facilities Finance Corp., TX, (CHF-Collegiate Housing College Station I, LLC), (AGM), 4.00%, 4/1/22 | | | 445 | | | | 467,490 | |
| | |
New Hope Cultural Education Facilities Finance Corp., TX, (CHF-Collegiate Housing College Station I, LLC), (AGM), 4.00%, 4/1/24 | | | 400 | | | | 430,064 | |
| | |
| | | | | | | $ | 1,317,214 | |
|
| Insured – Lease Revenue / Certificates of Participation — 0.5% | |
| | |
Kentucky Asset/Liability Commission, (NPFG), 2.223%, (67% of 3 mo. USD LIBOR + 0.52%), 11/1/21(1) | | $ | 5,000 | | | $ | 4,992,650 | |
| | |
| | | | | | | $ | 4,992,650 | |
|
| Insured – Other Revenue — 0.1% | |
| | |
Albany Parking Authority, NY, (AGM), 5.00%, 7/15/24 | | $ | 300 | | | $ | 342,564 | |
| | |
Albany Parking Authority, NY, (AGM), 5.00%, 7/15/25 | | | 315 | | | | 363,850 | |
| | |
Puerto Rico Public Buildings Authority, (AGC), 5.00%, 7/1/36 | | | 120 | | | | 122,286 | |
| | |
| | | | | | | $ | 828,700 | |
|
| Insured – Special Tax Revenue — 0.4% | |
| | |
Illinois Sports Facilities Authority, (AMBAC), 0.00%, 6/15/22 | | $ | 500 | | | $ | 444,920 | |
| | |
Puerto Rico Convention Center District Authority, (AMBAC), 5.00%, 7/1/31 | | | 1,940 | | | | 1,941,164 | |
| | | | |
| | 11 | | See Notes to Financial Statements. |
Eaton Vance
Municipal Opportunities Fund
January 31, 2019
Portfolio of Investments (Unaudited) — continued
| | | | | | | | |
| Security | | Principal
Amount
(000’s omitted) | | | Value | |
|
| Insured – Special Tax Revenue (continued) | |
| | |
Puerto Rico Infrastructure Financing Authority, (AMBAC), 5.50%, 7/1/24 | | $ | 305 | | | $ | 329,766 | |
| | |
Puerto Rico Infrastructure Financing Authority, (AMBAC), 5.50%, 7/1/26 | | | 1,120 | | | | 1,227,218 | |
| | |
| | | | | | | $ | 3,943,068 | |
|
| Insured – Transportation — 2.8% | |
| | |
Cleveland, OH, Airport System Revenue, (AGM), 5.00%, 1/1/25 | | $ | 1,225 | | | $ | 1,412,572 | |
| | |
Metropolitan Transportation Authority, NY, (AGM), 2.419%, (69% of 1 mo. USD LIBOR + 0.68%), 4/6/21 (Put Date), 11/1/32(1) | | | 5,000 | | | | 5,029,250 | |
| | |
New Jersey Economic Development Authority, (The Goethals Bridge Replacement), (AGM), (AMT), 5.00%, 1/1/31 | | | 185 | | | | 201,062 | |
| | |
New Jersey Transportation Trust Fund Authority, (Transportation System), (AMBAC), 0.00%, 12/15/24 | | | 3,460 | | | | 2,864,015 | |
| | |
New York Transportation Development Corp., (LaGuardia Airport Terminal B Redevelopment), (AGM), (AMT), 4.00%, 7/1/32 | | | 2,000 | | | | 2,057,780 | |
| | |
Ohio, (Portsmouth Gateway Group, LLC), (AGM), (AMT), 5.00%, 12/31/26 | | | 1,000 | | | | 1,140,750 | |
| | |
Puerto Rico Highway and Transportation Authority, (AGC), 5.25%, 7/1/36 | | | 795 | | | | 864,443 | |
| | |
Puerto Rico Highway and Transportation Authority, (AGM), 5.00%, 7/1/32 | | | 1,675 | | | | 1,718,382 | |
| | |
Puerto Rico Highway and Transportation Authority, (AGM), 5.25%, 7/1/36 | | | 535 | | | | 581,759 | |
| | |
Puerto Rico Highway and Transportation Authority, (AGM), 5.50%, 7/1/31 | | | 100 | | | | 112,614 | |
| | |
Puerto Rico Highway and Transportation Authority, (AMBAC), 5.25%, 7/1/30 | | | 3,650 | | | | 3,948,497 | |
| | |
Puerto Rico Highway and Transportation Authority, (AMBAC), 5.25%, 7/1/31 | | | 2,710 | | | | 2,926,990 | |
| | |
Puerto Rico Highway and Transportation Authority, (AMBAC), 5.25%, 7/1/38 | | | 2,475 | | | | 2,623,005 | |
| | |
Puerto Rico Highway and Transportation Authority, (AMBAC), 5.50%, 7/1/29 | | | 1,320 | | | | 1,457,306 | |
| | |
Puerto Rico Highway and Transportation Authority, (NPFG), 5.25%, 7/1/23 | | | 380 | | | | 401,516 | |
| | |
Puerto Rico Highway and Transportation Authority, (NPFG), 5.25%, 7/1/32 | | | 100 | | | | 106,694 | |
| | |
Puerto Rico Highway and Transportation Authority, (NPFG), 5.25%, 7/1/33 | | | 200 | | | | 212,986 | |
| | |
Puerto Rico Highway and Transportation Authority, (NPFG), 5.25%, 7/1/35 | | | 2,180 | | | | 2,302,407 | |
| | |
| | | | | | | $ | 29,962,028 | |
| | | | | | | | |
| Security | | Principal
Amount
(000’s omitted) | | | Value | |
|
| Insured – Water and Sewer — 0.4% | |
| | |
Detroit, MI, Sewage Disposal System, (AGM), 5.00%, 7/1/39 | | $ | 175 | | | $ | 187,309 | |
| | |
Michigan Finance Authority, (Detroit Water and Sewerage Department), (AGM), 5.00%, 7/1/26 | | | 4,000 | | | | 4,552,480 | |
| | |
Puerto Rico Aqueduct and Sewer Authority, (AGC), 5.00%, 7/1/28 | | | 100 | | | | 103,110 | |
| | |
| | | | | | | $ | 4,842,899 | |
|
| Lease Revenue / Certificates of Participation — 1.8% | |
| | |
Commonwealth Financing Authority, PA, Tobacco Master Settlement Payment Revenue, 5.00%, 6/1/28 | | $ | 3,000 | | | $ | 3,522,120 | |
| | |
Commonwealth Financing Authority, PA, Tobacco Master Settlement Payment Revenue, 5.00%, 6/1/29 | | | 2,000 | | | | 2,339,160 | |
| | |
Commonwealth Financing Authority, PA, Tobacco Master Settlement Payment Revenue, 5.00%, 6/1/30 | | | 3,000 | | | | 3,479,490 | |
| | |
Michigan Strategic Fund, (Facility for Rare Isotope Beams), 5.00%, 3/1/27 | | | 1,000 | | | | 1,136,320 | |
| | |
New Jersey Economic Development Authority, (School Facilities Construction), 3.03%, (SIFMA + 1.60%), 3/1/28(1) | | | 7,500 | | | | 7,460,850 | |
| | |
Sunset Hills, MO, Certificates of Participation, 4.00%, 4/1/26 | | | 500 | | | | 542,880 | |
| | |
Sunset Hills, MO, Certificates of Participation, 4.00%, 4/1/27 | | | 500 | | | | 540,025 | |
| | |
| | | | | | | $ | 19,020,845 | |
|
| Other Revenue — 5.7% | |
| | |
Brooklyn Arena Local Development Corp., NY, (Barclays Center), 5.00%, 7/15/25 | | $ | 4,950 | | | $ | 5,647,752 | |
| | |
California Infrastructure and Economic Development Bank, (Academy of Motion Picture Arts and Sciences Obligated Group), 5.00%, 11/1/26 | | | 1,000 | | | | 1,149,210 | |
| | |
California Infrastructure and Economic Development Bank, (Academy of Motion Picture Arts and Sciences Obligated Group), 5.00%, 11/1/27 | | | 1,010 | | | | 1,157,228 | |
| | |
Cleveland-Cuyahoga County Port Authority, OH, (Playhouse Square Foundation), 5.00%, 12/1/28 | | | 1,450 | | | | 1,577,861 | |
| | |
District of Columbia, (Association of American Medical Colleges), 5.00%, 10/1/30 | | | 570 | | | | 629,371 | |
| | |
Kalispel Tribe of Indians, WA, Series A, 5.00%, 1/1/32(2) | | | 1,465 | | | | 1,579,519 | |
| | |
Kalispel Tribe of Indians, WA, Series B, 5.00%, 1/1/32(2) | | | 1,000 | | | | 1,078,170 | |
| | |
Kansas City Land Clearance for Redevelopment Authority, MO, (Convention Center Hotel), 5.00%, 2/1/40(2) | | | 4,550 | | | | 4,657,698 | |
| | |
Main Street Natural Gas, Inc., GA, 2.438%, (67% of 1 mo. USD LIBOR + 0.75%), 9/1/23 (Put Date), 4/1/48(1) | | | 5,500 | | | | 5,457,705 | |
| | |
Metropolitan Transportation Authority, NY, Dedicated Tax Fund Revenue, 1.88%, (SIFMA + 0.45%), 6/1/22 (Put Date),
11/1/26(1) | | | 9,705 | | | | 9,621,925 | |
| | | | |
| | 12 | | See Notes to Financial Statements. |
Eaton Vance
Municipal Opportunities Fund
January 31, 2019
Portfolio of Investments (Unaudited) — continued
| | | | | | | | |
| Security | | Principal
Amount
(000’s omitted) | | | Value | |
|
| Other Revenue (continued) | |
| | |
Morongo Band of Mission Indians, CA, 5.00%, 10/1/42(2) | | $ | 1,775 | | | $ | 1,821,399 | |
| | |
New Jersey Economic Development Authority, (The Seeing Eye, Inc.), 5.00%, 3/1/25 | | | 3,500 | | | | 4,063,010 | |
| | |
New Mexico Municipal Energy Acquisition Authority, (SPA: Royal Bank of Canada), 2.438%, (67% of 1 mo. USD LIBOR + 0.75%), 8/1/19 (Put Date), 11/1/39(1) | | | 1,300 | | | | 1,300,169 | |
| | |
Patriots Energy Group Financing Agency, SC, Gas Supply Revenue, (Liq: Royal Bank of Canada), 2.548%, (67% of 1 mo. USD LIBOR + 0.86%), 2/1/24 (Put Date),
10/1/48(1) | | | 7,500 | | | | 7,503,600 | |
| | |
Southeast Alabama Gas Supply District, (Project No. 2), 2.538%, (67% of 1 mo. USD LIBOR + 0.85%), 6/1/24 (Put Date), 6/1/49(1) | | | 3,000 | | | | 2,991,030 | |
| | |
Texas Municipal Gas Acquisition and Supply Corp. I, Gas Supply Revenue, 2.568%, (67% of 3 mo. USD LIBOR + 0.70%), 12/15/26(1) | | | 5,525 | | | | 5,491,242 | |
| | |
Texas Municipal Gas Acquisition and Supply Corp. III, Gas Supply Revenue, 5.00%, 12/15/30 | | | 100 | | | | 107,242 | |
| | |
Washington Health Care Facilities Authority, (Fred Hutchinson Cancer Research Center), 2.48%, (SIFMA + 1.05%), 7/3/23 (Put Date), 1/1/42(1) | | | 1,000 | | | | 1,017,610 | |
| | |
Washington Health Care Facilities Authority, (Fred Hutchinson Cancer Research Center), 2.788%, (67% of 1 mo. USD LIBOR + 1.10%), 7/1/22 (Put Date), 1/1/42(1) | | | 1,000 | | | | 1,011,500 | |
| | |
Will and Kankakee Counties Community Unit School District No. 255-U, IL, 5.00%, 6/1/26 | | | 635 | | | | 711,143 | |
| | |
Will and Kankakee Counties Community Unit School District No. 255-U, IL, 5.00%, 6/1/28 | | | 1,370 | | | | 1,520,892 | |
| | |
Will and Kankakee Counties Community Unit School District No. 255-U, IL, 5.00%, 6/1/29 | | | 700 | | | | 773,710 | |
| | |
| | | | | | | $ | 60,868,986 | |
|
| Senior Living / Life Care — 6.8% | |
| | |
Alexandria Industrial Development Authority, VA, (Goodwin House, Inc.), 5.00%, 10/1/21 | | $ | 500 | | | $ | 532,470 | |
| | |
Alexandria Industrial Development Authority, VA, (Goodwin House, Inc.), 5.00%, 10/1/22 | | | 605 | | | | 657,103 | |
| | |
Alexandria Industrial Development Authority, VA, (Goodwin House, Inc.), 5.00%, 10/1/23 | | | 350 | | | | 386,456 | |
| | |
Alexandria Industrial Development Authority, VA, (Goodwin House, Inc.), 5.00%, 10/1/24 | | | 310 | | | | 346,651 | |
| | |
Alexandria Industrial Development Authority, VA, (Goodwin House, Inc.), 5.00%, 10/1/25 | | | 445 | | | | 504,078 | |
| | |
Berks County Industrial Development Authority, PA, (Highlands at Wyomissing), 5.00%, 5/15/33 | | | 500 | | | | 536,015 | |
| | |
Buffalo and Erie County Industrial Land Development Corp., NY, (Orchard Park CCRC, Inc.), 5.00%, 11/15/26 | | | 1,730 | | | | 1,889,714 | |
| | | | | | | | |
| Security | | Principal
Amount
(000’s omitted) | | | Value | |
|
| Senior Living / Life Care (continued) | |
| | |
Buffalo and Erie County Industrial Land Development Corp., NY, (Orchard Park CCRC, Inc.), 5.00%, 11/15/27 | | $ | 1,320 | | | $ | 1,434,378 | |
| | |
Centerville, OH, (Graceworks Lutheran Services), 5.00%, 11/1/23 | | | 450 | | | | 477,617 | |
| | |
Centerville, OH, (Graceworks Lutheran Services), 5.00%, 11/1/24 | | | 705 | | | | 750,480 | |
| | |
Centerville, OH, (Graceworks Lutheran Services), 5.00%, 11/1/26 | | | 770 | | | | 815,522 | |
| | |
Centerville, OH, (Graceworks Lutheran Services), 5.00%, 11/1/27 | | | 425 | | | | 448,681 | |
| | |
Clackamas County Hospital Facility Authority, OR, (Mary’s Woods at Marylhurst), 2.80%, 5/15/24 | | | 1,150 | | | | 1,139,374 | |
| | |
Colorado Health Facilities Authority, (Frasier Meadows Retirement Community), 3.125%, 5/15/27 | | | 650 | | | | 641,329 | |
| | |
Colorado Health Facilities Authority, (Frasier Meadows Retirement Community), 5.00%, 5/15/24 | | | 525 | | | | 563,687 | |
| | |
Colorado Health Facilities Authority, (Frasier Meadows Retirement Community), 5.00%, 5/15/25 | | | 300 | | | | 324,282 | |
| | |
Colorado Health Facilities Authority, (Frasier Meadows Retirement Community), 5.00%, 5/15/26 | | | 350 | | | | 379,719 | |
| | |
Colorado Health Facilities Authority, (Frasier Meadows Retirement Community), 5.00%, 5/15/27 | | | 400 | | | | 434,992 | |
| | |
District of Columbia, (Ingleside at Rock Creek), 4.125%, 7/1/27 | | | 1,000 | | | | 1,003,970 | |
| | |
Glendale Industrial Development Authority, AZ, (Terraces of Phoenix), 4.00%, 7/1/28 | | | 225 | | | | 222,559 | |
| | |
Hanover County Economic Development Authority, VA, (Covenant Woods), 5.00%, 7/1/38 | | | 125 | | | | 128,800 | |
| | |
Hanover County Economic Development Authority, VA, (Covenant Woods), 5.00%, 7/1/48 | | | 465 | | | | 475,225 | |
| | |
Hanover County Economic Development Authority, VA, (Covenant Woods), 5.00%, 7/1/51 | | | 1,000 | | | | 1,019,900 | |
| | |
Howard County, MD, (Vantage House), 5.00%, 4/1/21 | | | 482 | | | | 492,382 | |
| | |
Howard County, MD, (Vantage House), 5.00%, 4/1/26 | | | 1,570 | | | | 1,639,912 | |
| | |
Howard County, MD, (Vantage House), 5.00%, 4/1/36 | | | 1,715 | | | | 1,741,291 | |
| | |
Illinois Finance Authority, (Plymouth Place, Inc.), 5.00%, 5/15/25 | | | 1,605 | | | | 1,712,551 | |
| | |
Lancaster County Hospital Authority, PA, (Brethren Village), 5.00%, 7/1/23 | | | 700 | | | | 743,113 | |
| | |
Lancaster County Hospital Authority, PA, (Brethren Village), 5.00%, 7/1/24 | | | 915 | | | | 973,716 | |
| | |
Lancaster County Hospital Authority, PA, (Brethren Village), 5.00%, 7/1/25 | | | 650 | | | | 695,116 | |
| | |
Lee County Industrial Development Authority, FL, (Shell Point), 5.50%, 11/15/21 | | | 95 | | | | 100,302 | |
| | |
Massachusetts Development Finance Agency, (Linden Ponds, Inc.), 5.00%, 11/15/28(2) | | | 1,200 | | | | 1,277,268 | |
| | |
Missouri Health and Educational Facilities Authority, (Lutheran Senior Services), 2.875% to 2/1/22 (Put Date), 2/1/34(6) | | | 1,000 | | | | 1,001,330 | |
| | | | |
| | 13 | | See Notes to Financial Statements. |
Eaton Vance
Municipal Opportunities Fund
January 31, 2019
Portfolio of Investments (Unaudited) — continued
| | | | | | | | |
| Security | | Principal
Amount
(000’s omitted) | | | Value | |
|
| Senior Living / Life Care (continued) | |
| | |
Montgomery County Industrial Development Authority, PA, (Whitemarsh Continuing Care Retirement Community), 4.00%, 1/1/23 | | $ | 2,000 | | | $ | 2,007,780 | |
| | |
Montgomery County Industrial Development Authority, PA, (Whitemarsh Continuing Care Retirement Community), 5.00%, 1/1/33 | | | 1,890 | | | | 1,934,528 | |
| | |
Multnomah County Hospital Facilities Authority, OR, (Mirabella at South Waterfront), 5.00%, 10/1/19 | | | 145 | | | | 147,433 | |
| | |
New Hope Cultural Education Facilities Finance Corp., TX, (Longhorn Village), 5.00%, 1/1/25 | | | 1,000 | | | | 1,054,280 | |
| | |
New Hope Cultural Education Facilities Finance Corp., TX, (Longhorn Village), 5.00%, 1/1/26 | | | 1,040 | | | | 1,097,699 | |
| | |
New Hope Cultural Education Facilities Finance Corp., TX, (Longhorn Village), 5.00%, 1/1/27 | | | 1,095 | | | | 1,155,652 | |
| | |
New Hope Cultural Education Facilities Finance Corp., TX, (Longhorn Village), 5.00%, 1/1/29 | | | 1,205 | | | | 1,255,248 | |
| | |
New Hope Cultural Education Facilities Finance Corp., TX, (Longhorn Village), 5.00%, 1/1/30 | | | 630 | | | | 653,285 | |
| | |
Palm Beach County Health Facilities Authority, FL, (Lifespace Communities, Inc.), 5.00%, 5/15/31 | | | 410 | | | | 442,505 | |
| | |
Palm Beach County Health Facilities Authority, FL, (Lifespace Communities, Inc.), 5.00%, 5/15/32 | | | 650 | | | | 694,980 | |
| | |
Public Finance Authority, WI, (Mary’s Woods at Marylhurst), 3.00%, 11/15/22(2) | | | 2,200 | | | | 2,200,220 | |
| | |
Public Finance Authority, WI, (Mary’s Woods at Marylhurst), 3.50%, 11/15/23(2) | | | 1,250 | | | | 1,250,325 | |
| | |
Rockville, MD, (Ingleside at King Farm), 3.00%, 11/1/25 | | | 1,750 | | | | 1,700,877 | |
| | |
Rockville, MD, (Ingleside at King Farm), 3.50%, 11/1/26 | | | 1,325 | | | | 1,315,182 | |
| | |
Salem Hospital Facility Authority, OR, (Capital Manor), 5.00%, 5/15/27 | | | 250 | | | | 280,948 | |
| | |
Salem Hospital Facility Authority, OR, (Capital Manor), 5.00%, 5/15/28 | | | 270 | | | | 302,424 | |
| | |
South Carolina Jobs-Economic Development Authority, (South Carolina Episcopal Home at Still Hopes), 5.00%, 4/1/28 | | | 1,675 | | | | 1,777,359 | |
| | |
South Carolina Jobs-Economic Development Authority, (South Carolina Episcopal Home at Still Hopes), 5.00%, 4/1/29 | | | 1,000 | | | | 1,052,600 | |
| | |
St. Louis County Industrial Development Authority, MO, (Friendship Village St. Louis Obligated Group), 5.00%, 9/1/27 | | | 1,930 | | | | 2,023,142 | |
| | |
St. Louis County Industrial Development Authority, MO, (St. Andrew’s Resources for Seniors Obligated Group), 5.00%, 12/1/25 | | | 1,305 | | | | 1,373,343 | |
| | |
Tarrant County Cultural Education Facilities Finance Corp., TX, (Buckner Senior Living - Ventana), 3.875%, 11/15/22 | | | 2,500 | | | | 2,472,600 | |
| | |
Tempe Industrial Development Authority, AZ, (Mirabella at ASU), 5.35%, 10/1/25(2) | | | 3,000 | | | | 3,083,460 | |
| | | | | | | | |
| Security | | Principal
Amount
(000’s omitted) | | | Value | |
|
| Senior Living / Life Care (continued) | |
| | |
Tulsa County Industrial Authority, OK, (Montereau, Inc.), 5.00%, 11/15/28 | | $ | 540 | | | $ | 588,109 | |
| | |
Tulsa County Industrial Authority, OK, (Montereau, Inc.), 5.00%, 11/15/29 | | | 400 | | | | 433,628 | |
| | |
Vermont Economic Development Authority, (Wake Robin Corp.), 5.00%, 5/1/23 | | | 1,690 | | | | 1,787,665 | |
| | |
Vermont Economic Development Authority, (Wake Robin Corp.), 5.00%, 5/1/25 | | | 745 | | | | 796,785 | |
| | |
Vermont Economic Development Authority, (Wake Robin Corp.), 5.00%, 5/1/26 | | | 585 | | | | 627,132 | |
| | |
Vermont Economic Development Authority, (Wake Robin Corp.), 5.00%, 5/1/27 | | | 500 | | | | 536,595 | |
| | |
Washington Housing Finance Commission, (Bayview Manor Homes), 4.00%, 7/1/26(2) | | | 1,445 | | | | 1,447,688 | |
| | |
Washington Housing Finance Commission, (Bayview Manor Homes), 5.00%, 7/1/31(2) | | | 750 | | | | 780,562 | |
| | |
Washington Housing Finance Commission, (Judson Park), 4.00%, 7/1/28(2) | | | 250 | | | | 245,948 | |
| | |
Westchester County Local Development Corp., NY, (Kendal on Hudson), 4.00%, 1/1/23 | | | 3,545 | | | | 3,705,411 | |
| | |
Westchester County Local Development Corp., NY, (Kendal on Hudson), 5.00%, 1/1/28 | | | 2,850 | | | | 3,028,353 | |
| | |
Wisconsin Health and Educational Facilities Authority, (Saint John’s Communities, Inc.), 4.00%, 9/15/25 | | | 500 | | | | 511,195 | |
| | |
Wisconsin Health and Educational Facilities Authority, (Saint John’s Communities, Inc.), 4.00%, 9/15/26 | | | 685 | | | | 697,405 | |
| | |
Wisconsin Health and Educational Facilities Authority, (Saint John’s Communities, Inc.), 4.00%, 9/15/27 | | | 1,015 | | | | 1,029,068 | |
| | |
Wisconsin Health and Educational Facilities Authority, (Saint John’s Communities, Inc.), 5.00%, 9/15/29 | | | 1,365 | | | | 1,426,616 | |
| | |
Wisconsin Health and Educational Facilities Authority, (Saint John’s Communities, Inc.), 5.00%, 9/15/30 | | | 500 | | | | 521,070 | |
| | |
| | | | | | | $ | 72,929,083 | |
|
| Special Tax Revenue — 3.1% | |
| | |
Atlanta, GA, (Atlantic Station), Tax Allocation Increments, 5.00%, 12/1/24 | | $ | 1,000 | | | $ | 1,148,140 | |
| | |
Atlanta Development Authority, GA, (New Downtown Atlanta Stadium), 5.00%, 7/1/24 | | | 1,500 | | | | 1,732,890 | |
| | |
Detroit Downtown Development Authority, MI, 0.00%, 7/1/20 | | | 50 | | | | 47,002 | |
| | |
Detroit Downtown Development Authority, MI, 0.00%, 7/1/21 | | | 75 | | | | 67,219 | |
| | |
Jurupa Public Financing Authority, CA, 5.00%, 9/1/25 | | | 735 | | | | 853,291 | |
| | |
Marquette Brownfield Redevelopment Authority, MI, 5.00%, 5/1/31 | | | 1,655 | | | | 1,899,096 | |
| | |
Michigan Finance Authority, Detroit Financial Recovery Income Tax Revenue, 4.50%, 10/1/29 | | | 2,145 | | | | 2,290,495 | |
| | | | |
| | 14 | | See Notes to Financial Statements. |
Eaton Vance
Municipal Opportunities Fund
January 31, 2019
Portfolio of Investments (Unaudited) — continued
| | | | | | | | |
| Security | | Principal
Amount
(000’s omitted) | | | Value | |
|
| Special Tax Revenue (continued) | |
| | |
New York City Transitional Finance Authority, NY, Future Tax Revenue, (SPA: JPMorgan Chase Bank, N.A.), 1.63%, 8/1/42(3) | | $ | 15,000 | | | $ | 15,000,000 | |
| | |
New York Dormitory Authority, Personal Income Tax Revenue, 5.00%, 2/15/27 | | | 4,000 | | | | 4,791,720 | |
| | |
South Village Community Development District, FL, 2.00%, 5/1/20 | | | 305 | | | | 304,847 | |
| | |
South Village Community Development District, FL, 2.00%, 5/1/21 | | | 100 | | | | 99,890 | |
| | |
South Village Community Development District, FL, 2.125%, 5/1/22 | | | 100 | | | | 99,858 | |
| | |
South Village Community Development District, FL, 2.375%, 5/1/23 | | | 100 | | | | 100,179 | |
| | |
South Village Community Development District, FL, 2.50%, 5/1/24 | | | 100 | | | | 100,096 | |
| | |
South Village Community Development District, FL, 2.75%, 5/1/25 | | | 100 | | | | 100,857 | |
| | |
South Village Community Development District, FL, 3.25%, 5/1/27 | | | 100 | | | | 102,598 | |
| | |
South Village Community Development District, FL, 4.35%, 5/1/26 | | | 520 | | | | 521,087 | |
| | |
Winter Garden Village at Fowler Groves Community Development District, FL, 3.75%, 5/1/31 | | | 4,000 | | | | 3,862,360 | |
| | |
| | | | | | | $ | 33,121,625 | |
|
| Student Loan — 0.1% | |
| | |
Connecticut Higher Education Supplemental Loan Authority, (AMT), 5.00%, 11/15/24 | | $ | 600 | | | $ | 667,938 | |
| | |
Massachusetts Educational Financing Authority, (AMT), 5.00%, 1/1/23 | | | 500 | | | | 551,160 | |
| | |
| | | | | | | $ | 1,219,098 | |
|
| Transportation — 12.4% | |
| | |
California Municipal Finance Authority, (LINXS Automated People Mover), (AMT), 5.00%, 12/31/34 | | $ | 1,700 | | | $ | 1,915,883 | |
| | |
California Municipal Finance Authority, (LINXS Automated People Mover), (AMT), 5.00%, 12/31/35 | | | 3,300 | | | | 3,702,138 | |
| | |
California Municipal Finance Authority, (LINXS Automated People Mover), (AMT), 5.00%, 12/31/36 | | | 3,910 | | | | 4,366,492 | |
| | |
California Municipal Finance Authority, (LINXS Automated People Mover), (AMT), 5.00%, 12/31/37 | | | 1,715 | | | | 1,905,073 | |
| | |
Central Texas Regional Mobility Authority, 5.00%, 1/1/25 | | | 350 | | | | 399,427 | |
| | |
Central Texas Regional Mobility Authority, 5.00%, 1/1/26 | | | 500 | | | | 575,180 | |
| | |
Central Texas Regional Mobility Authority, 5.00%, 1/1/27 | | | 550 | | | | 629,189 | |
| | |
Central Texas Regional Mobility Authority, 5.00%, 1/1/28 | | | 750 | | | | 854,183 | |
| | |
Central Texas Regional Mobility Authority, 5.00%, 1/1/29 | | | 600 | | | | 680,316 | |
| | | | | | | | |
| Security | | Principal
Amount
(000’s omitted) | | | Value | |
|
| Transportation (continued) | |
| | |
Chicago, IL, (Midway International Airport), (AMT), 5.00%, 1/1/25 | | $ | 7,255 | | | $ | 8,232,539 | |
| | |
Chicago, IL, (Midway International Airport), (AMT), 5.00%, 1/1/27 | | | 1,000 | | | | 1,102,140 | |
| | |
Chicago, IL, (O’Hare International Airport), (AMT), 5.00%, 1/1/21 | | | 3,000 | | | | 3,163,020 | |
| | |
Chicago, IL, (O’Hare International Airport), (AMT), 5.00%, 1/1/27 | | | 5,000 | | | | 5,612,400 | |
| | |
Colorado Bridge Enterprise, (Central 70 Project), (AMT), 4.00%, 12/31/26 | | | 3,950 | | | | 4,298,706 | |
| | |
Colorado Bridge Enterprise, (Central 70 Project), (AMT), 4.00%, 6/30/27 | | | 4,475 | | | | 4,871,127 | |
| | |
Colorado Bridge Enterprise, (Central 70 Project), (AMT), 4.00%, 12/31/27 | | | 2,425 | | | | 2,644,972 | |
| | |
Dallas and Fort Worth, TX, (Dallas/Fort Worth International Airport), 5.00%, 11/1/24 | | | 500 | | | | 568,250 | |
| | |
Denver City and County, CO, Airport System Revenue, 2.624%, (70% of 1 mo. USD LIBOR + 0.86%), 11/15/19 (Put Date), 11/15/31(1) | | | 2,040 | | | | 2,043,244 | |
| | |
Denver City and County, CO, Airport System Revenue, (AMT), 5.00%, 11/15/30 | | | 3,000 | | | | 3,502,860 | |
| | |
E-470 Public Highway Authority, CO, 2.738%, (67% of 1 mo. USD LIBOR + 1.05%), 9/1/21 (Put Date), 9/1/39(1) | | | 1,000 | | | | 1,008,110 | |
| | |
Greater Orlando Aviation Authority, FL, (AMT), 5.00%, 10/1/21 | | | 250 | | | | 269,248 | |
| | |
Illinois Toll Highway Authority, 5.00%, 1/1/27 | | | 1,250 | | | | 1,421,950 | |
| | |
Los Angeles Department of Airports, CA, (Los Angeles International Airport), (AMT), 5.00%, 5/15/25 | | | 3,105 | | | | 3,626,174 | |
| | |
Los Angeles Department of Airports, CA, (Los Angeles International Airport), (AMT), 5.00%, 5/15/27 | | | 2,700 | | | | 3,132,540 | |
| | |
Los Angeles Department of Airports, CA, (Los Angeles International Airport), (AMT), 5.00%, 5/15/34 | | | 1,710 | | | | 1,982,181 | |
| | |
Los Angeles Department of Airports, CA, (Los Angeles International Airport), (AMT), 5.00%, 5/15/36 | | | 2,515 | | | | 2,893,331 | |
| | |
Los Angeles Harbor Department, CA, (AMT), 5.00%, 8/1/26 | | | 1,230 | | | | 1,414,106 | |
| | |
Memphis-Shelby County Airport Authority, TN, (AMT), 5.00%, 7/1/27 | | | 1,330 | | | | 1,563,069 | |
| | |
Memphis-Shelby County Airport Authority, TN, (AMT), 5.00%, 7/1/29 | | | 1,470 | | | | 1,726,530 | |
| | |
Metropolitan Transportation Authority, NY, Green Bonds, 5.00%, 11/15/26 | | | 5,000 | | | | 5,874,800 | |
| | |
Metropolitan Washington Airports Authority, D.C., (AMT), 5.00%, 10/1/23 | | | 810 | | | | 912,554 | |
| | |
Miami-Dade County, FL, Aviation Revenue, 5.00%, 10/1/25 | | | 1,000 | | | | 1,152,780 | |
| | |
New Jersey Transportation Trust Fund Authority, (Transportation Program), 2.63%, (SIFMA + 1.20%), 12/15/21 (Put Date), 6/15/34(1) | | | 2,750 | | | | 2,774,200 | |
| | | | |
| | 15 | | See Notes to Financial Statements. |
Eaton Vance
Municipal Opportunities Fund
January 31, 2019
Portfolio of Investments (Unaudited) — continued
| | | | | | | | |
| Security | | Principal
Amount
(000’s omitted) | | | Value | |
|
| Transportation (continued) | |
| | |
New Orleans Aviation Board, LA, (AMT), 5.00%, 1/1/24 | | $ | 1,600 | | | $ | 1,794,656 | |
| | |
New Orleans Aviation Board, LA, (AMT), 5.00%, 1/1/25 | | | 1,600 | | | | 1,821,232 | |
| | |
New Orleans Aviation Board, LA, (AMT), 5.00%, 1/1/27 | | | 1,000 | | | | 1,125,390 | |
| | |
New York Transportation Development Corp., (Delta Airlines, Inc. - LaGuardia Airport Terminals C&D Redevelopment), (AMT), 5.00%, 1/1/28 | | | 10,000 | | | | 11,638,000 | |
| | |
New York Transportation Development Corp., (Terminal One Group Association, L.P.), (AMT), 5.00%, 1/1/22 | | | 5,520 | | | | 5,939,078 | |
| | |
North Texas Tollway Authority, 5.00%, 1/1/30 | | | 1,000 | | | | 1,149,480 | |
| | |
Pennsylvania Turnpike Commission, 2.13%, (SIFMA + 0.70%), 12/1/23(1) | | | 2,500 | | | | 2,495,475 | |
| | |
Pennsylvania Turnpike Commission, 2.31%, (SIFMA + 0.88%), 12/1/20(1) | | | 1,000 | | | | 1,005,480 | |
| | |
Pennsylvania Turnpike Commission, 2.58%, (SIFMA + 1.15%), 12/1/19(1) | | | 550 | | | | 551,309 | |
| | |
Phoenix Civic Improvement Corp., AZ, Airport Revenue, (AMT), 5.00%, 7/1/30 | | | 2,140 | | | | 2,497,466 | |
| | |
Port of Oakland, CA, (AMT), 5.00%, 11/1/24 | | | 2,300 | | | | 2,652,199 | |
| | |
Public Finance Authority, WI, (Denver International Airport Great Hall), (AMT), 5.00%, 9/30/24 | | | 435 | | | | 488,357 | |
| | |
Public Finance Authority, WI, (Denver International Airport Great Hall), (AMT), 5.00%, 9/30/25 | | | 700 | | | | 796,061 | |
| | |
Public Finance Authority, WI, (Denver International Airport Great Hall), (AMT), 5.00%, 9/30/26 | | | 500 | | | | 573,945 | |
| | |
Public Finance Authority, WI, (Denver International Airport Great Hall), (AMT), 5.00%, 9/30/27 | | | 700 | | | | 810,201 | |
| | |
San Jose, CA, Airport Revenue, (AMT), 5.00%, 3/1/27 | | | 1,500 | | | | 1,773,840 | |
| | |
South Jersey Transportation Authority, NJ, 5.00%, 11/1/26 | | | 500 | | | | 548,490 | |
| | |
South Jersey Transportation Authority, NJ, 5.00%, 11/1/27 | | | 500 | | | | 547,390 | |
| | |
South Jersey Transportation Authority, NJ, 5.00%, 11/1/28 | | | 750 | | | | 817,793 | |
| | |
South Jersey Transportation Authority, NJ, 5.00%, 11/1/29 | | | 1,450 | | | | 1,574,743 | |
| | |
Texas Transportation Commission, (Central Texas Turnpike System), 5.00%, 8/15/23 | | | 500 | | | | 555,155 | |
| | |
Triborough Bridge and Tunnel Authority, NY, 2.388%, (67% of 1 mo. USD LIBOR + 0.70%), 2/1/21 (Put Date), 1/1/32(1) | | | 9,820 | | | | 9,885,401 | |
| | |
| | | | | | | $ | 131,859,853 | |
|
| Water and Sewer — 2.2% | |
| | |
California Department of Water Resources, (Central Valley Project), 1.80%, (SIFMA + 0.37%), 12/1/22 (Put Date), 12/1/35(1) | | $ | 8,000 | | | $ | 7,995,040 | |
| | |
Cape Fear Public Utility Authority, NC, 4.00%, 8/1/32 | | | 445 | | | | 482,113 | |
| | |
Charleston, SC, Waterworks and Sewer System Revenue, 2.131%, (70% of 1 mo. USD LIBOR + 0.37%), 1/1/22 (Put Date), 1/1/35(1) | | | 5,000 | | | | 4,999,900 | |
| | |
Coldwater Local Development Finance Authority, MI, Series A, (AMT), 5.00%, 12/1/27 | | | 390 | | | | 440,053 | |
| | | | | | | | |
| Security | | Principal
Amount
(000’s omitted) | | | Value | |
|
| Water and Sewer (continued) | |
| | |
Coldwater Local Development Finance Authority, MI, Series B, (AMT), 5.00%, 12/1/27 | | $ | 505 | | | $ | 569,812 | |
| | |
Detroit, MI, Sewage Disposal System, 5.00%, 7/1/32 | | | 125 | | | | 134,595 | |
| | |
Detroit, MI, Water Supply System, 5.25%, 7/1/41 | | | 295 | | | | 314,266 | |
| | |
Michigan Finance Authority, (Detroit Water and Sewerage Department), (AMT), 5.00%, 7/1/44 | | | 1,000 | | | | 1,058,320 | |
| | |
Riverside, CA, Water System Revenue, 2.06%, (SIFMA + 0.63%), 1/15/20 (Put Date), 10/1/35(1) | | | 4,690 | | | | 4,692,814 | |
| | |
San Francisco City and County Public Utilities Commission, CA, Green Bonds, 5.00%, 11/1/37 | | | 2,575 | | | | 2,918,711 | |
| | |
| | | | | | | $ | 23,605,624 | |
| |
Total Tax-Exempt Municipal Securities — 89.6%
(identified cost $937,498,236) | | | $ | 955,382,704 | |
|
| Tax-Exempt Mortgage-Backed Securities — 0.1% | |
| Security | | Principal
Amount
(000’s omitted) | | | Value | |
|
| Housing — 0.1% | |
| | |
FRETE 2017-ML01 Trust, Class A, (Freddie Mac guaranteed), 3.001%, (1 mo. USD LIBOR + 0.50%), 1/25/33(1)(2) | | $ | 485 | | | $ | 484,431 | |
| |
Total Tax-Exempt Mortgage-Backed Securities — 0.1%
(identified cost $484,940) | | | $ | 484,431 | |
|
| Taxable Municipal Securities — 5.6% | |
| Security | | Principal
Amount
(000’s omitted) | | | Value | |
|
| Electric Utilities — 0.2% | |
| | |
Vernon, CA, Electric System Revenue, 4.05%, 8/1/23 | | $ | 2,000 | | | $ | 2,070,780 | |
| | |
| | | | | | | $ | 2,070,780 | |
|
| General Obligations — 2.0% | |
| | |
Atlantic City, NJ, 7.00%, 3/1/28 | | $ | 3,115 | | | $ | 3,517,583 | |
| | |
Chicago, IL, 7.375%, 1/1/33 | | | 3,250 | | | | 3,548,967 | |
| | |
Chicago, IL, 7.75%, 1/1/42 | | | 9,810 | | | | 11,822,031 | |
| | |
Chicago, IL, 7.781%, 1/1/35 | | | 2,600 | | | | 2,882,828 | |
| | |
| | | | | | | $ | 21,771,409 | |
| | | | |
| | 16 | | See Notes to Financial Statements. |
Eaton Vance
Municipal Opportunities Fund
January 31, 2019
Portfolio of Investments (Unaudited) — continued
| | | | | | | | |
| Security | | Principal
Amount
(000’s omitted) | | | Value | |
|
| Hospital — 0.7% | |
| | |
California Statewide Communities Development Authority, (Loma Linda University Medical Center), 6.00%, 12/1/24 | | $ | 7,250 | | | $ | 7,664,338 | |
| | |
| | | | | | | $ | 7,664,338 | |
|
| Insured – General Obligations — 0.9% | |
| | |
Detroit, MI, (AMBAC), 4.96%, 4/1/20 | | $ | 1,985 | | | $ | 1,982,977 | |
| | |
Detroit, MI, (AMBAC), 5.15%, 4/1/25 | | | 7,923 | | | | 7,833,119 | |
| | |
| | | | | | | $ | 9,816,096 | |
|
| Insured – Hospital — 0.2% | |
| | |
Oklahoma Development Finance Authority, (OU Medicine), (AGM), 4.65%, 8/15/30 | | $ | 1,500 | | | $ | 1,603,815 | |
| | |
| | | | | | | $ | 1,603,815 | |
|
| Insured – Special Tax Revenue — 0.4% | |
| | |
Successor Agency to Pittsburg Redevelopment Agency, CA, (AGM), 2.869%, 8/1/20 | | $ | 905 | | | $ | 904,231 | |
| | |
Successor Agency to Pittsburg Redevelopment Agency, CA, (AGM), 3.684%, 8/1/24 | | | 1,030 | | | | 1,057,130 | |
| | |
Successor Agency to San Bernardino County Redevelopment Agency, CA, (AGM), 3.25%, 9/1/22 | | | 350 | | | | 349,769 | |
| | |
Successor Agency to San Bernardino County Redevelopment Agency, CA, (AGM), 3.50%, 9/1/23 | | | 510 | | | | 514,111 | |
| | |
Successor Agency to San Bernardino County Redevelopment Agency, CA, (AGM), 3.75%, 9/1/25 | | | 500 | | | | 505,660 | |
| | |
Successor Agency to San Bernardino County Redevelopment Agency, CA, (AGM), 4.00%, 9/1/26 | | | 500 | | | | 509,240 | |
| | |
| | | | | | | $ | 3,840,141 | |
|
| Senior Living / Life Care — 0.8% | |
| | |
Berks County Industrial Development Authority, PA, (Highlands at Wyomissing), 3.95%, 5/15/24 | | $ | 1,450 | | | $ | 1,458,511 | |
| | |
St. Johns County Industrial Development Authority, FL, (Westminster St. Augustine), 5.50% to 8/1/24 (Put Date), 8/1/44 | | | 7,000 | | | | 6,814,080 | |
| | |
| | | | | | | $ | 8,272,591 | |
|
| Special Tax Revenue — 0.2% | |
| | |
New Jersey Economic Development Authority, (Motor Vehicle Surcharges), 3.29%, 7/1/19 | | $ | 1,000 | | | $ | 1,000,000 | |
| | |
New Jersey Economic Development Authority, (Motor Vehicle Surcharges), 3.65%, 7/1/21 | | | 500 | | | | 500,330 | |
| | |
New Jersey Economic Development Authority, (Motor Vehicle Surcharges), 3.80%, 7/1/22 | | | 1,000 | | | | 1,000,290 | |
| | |
| | | | | | | $ | 2,500,620 | |
| | | | | | | | |
| Security | | Principal
Amount
(000’s omitted) | | | Value | |
|
| Transportation — 0.2% | |
| | |
New York Transportation Development Corp., (LaGuardia Airport Terminal B Redevelopment), 3.573%, 7/1/29 | | $ | 2,000 | | | $ | 1,936,660 | |
| | |
| | | | | | | $ | 1,936,660 | |
| |
Total Taxable Municipal Securities — 5.6%
(identified cost $56,325,523) | | | $ | 59,476,450 | |
| | |
| Corporate Bonds & Notes — 1.8% | | | | | | | | |
| Security | | Principal
Amount
(000’s omitted) | | | Value | |
|
| Hospital — 1.8% | |
| | |
Care New England Health System, 5.50%, 9/1/26 | | $ | 11,000 | | | $ | 11,673,132 | |
| | |
Harnett Health System, Inc., 6.50% to 4/1/20 (Put Date), 4/1/32 | | | 4,035 | | | | 4,120,194 | |
| | |
St. Joseph’s Hospital & Medical Center, 3.926%, 7/1/22 | | | 3,175 | | | | 3,182,587 | |
| |
Total Corporate Bonds & Notes — 1.8%
(identified cost $17,991,436) | | | $ | 18,975,913 | |
| | |
| Closed-End Funds — 1.3% | | | | | | | | |
| Security | | Shares | | | Value | |
| | |
Nuveen AMT-Free Quality Municipal Income Fund | | | 275,000 | | | $ | 3,536,500 | |
| | |
Nuveen Quality Municipal Income Fund | | | 800,000 | | | | 10,520,000 | |
| |
Total Closed-End Funds — 1.3%
(identified cost $13,494,855) | | | $ | 14,056,500 | |
| |
Total Investments — 98.4%
(identified cost $1,025,794,990) | | | $ | 1,048,375,998 | |
| |
Other Assets, Less Liabilities — 1.6% | | | $ | 17,373,517 | |
| |
Net Assets — 100.0% | | | $ | 1,065,749,515 | |
The percentage shown for each investment category in the Portfolio of Investments is based on net assets.
At January 31, 2019, the concentration of the Fund’s investments in the various states and territories, determined as a percentage of net assets, is as follows:
| | | | |
| |
| Illinois | | | 14.2% | |
| |
| New York | | | 14.5% | |
| |
| Others, representing less than 10% individually | | | 69.7% | |
| | | | |
| | 17 | | See Notes to Financial Statements. |
Eaton Vance
Municipal Opportunities Fund
January 31, 2019
Portfolio of Investments (Unaudited) — continued
The Fund invests primarily in debt securities issued by municipalities. The ability of the issuers of the debt securities to meet their obligations may be affected by economic developments in a specific industry or municipality. In order to reduce the risk associated with such economic developments, at January 31, 2019, 9.6% of total investments are backed by bond insurance of various financial institutions and financial guaranty assurance agencies. The aggregate percentage insured by an individual financial institution or financial guaranty assurance agency ranged from 0.2% to 4.1% of total investments.
| (1) | Floating rate security. The stated interest rate represents the rate in effect at January 31, 2019. |
| (2) | Security exempt from registration pursuant to Rule 144A under the Securities Act of 1933, as amended. These securities may be sold in certain transactions in reliance on an exemption from registration (normally to qualified institutional buyers). At January 31, 2019, the aggregate value of these securities is $63,386,978 or 5.9% of the Fund’s net assets. |
| (3) | Variable rate demand obligation that may be tendered at par on any day for payment the same or next business day. The stated interest rate, which generally resets daily, is determined by the remarketing agent and represents the rate in effect at January 31, 2019. |
| (4) | When-issued, floating rate security whose interest rate will be determined after January 31, 2019. |
| (5) | Amount is less than 0.05%. |
| (6) | When-issued security. |
| | | | | | | | | | | | | | | | | | | | |
| Futures Contracts | |
| | | | | |
| Description | | Number of
Contracts | | | Position | | | Expiration
Date | | | Notional
Amount | | | Value/Unrealized
Depreciation | |
| | | | | |
Interest Rate Futures | | | | | | | | | | | | | | | | | | | | |
| | | | | |
| U.S. Long Treasury Bond | | | 150 | | | | Short | | | | 3/20/19 | | | $ | (22,003,125 | ) | | $ | (1,131,525 | ) |
| | | | | |
| | | | | | | | | | | | | | | | | | | $ | (1,131,525 | ) |
Abbreviations:
| | | | |
| | |
| AGC | | – | | Assured Guaranty Corp. |
| | |
| AGM | | – | | Assured Guaranty Municipal Corp. |
| | |
| AMBAC | | – | | AMBAC Financial Group, Inc. |
| | |
| AMT | | – | | Interest earned from these securities may be considered a tax preference item for purposes of the Federal Alternative Minimum Tax. |
| | |
| BAM | | – | | Build America Mutual Assurance Co. |
| | |
| LIBOR | | – | | London Interbank Offered Rate |
| | |
| Liq | | – | | Liquidity Provider |
| | |
| NPFG | | – | | National Public Finance Guarantee Corp. |
| | |
| PSF | | – | | Permanent School Fund |
| | |
| SIFMA | | – | | Securities Industry and Financial Markets Association Municipal Swap Index |
| | |
| SPA | | – | | Standby Bond Purchase Agreement |
Currency Abbreviations:
| | | | |
| | |
| USD | | – | | United States Dollar |
| | | | |
| | 18 | | See Notes to Financial Statements. |
Eaton Vance
Municipal Opportunities Fund
January 31, 2019
Statement of Assets and Liabilities (Unaudited)
| | | | |
| Assets | | January 31, 2019 | |
| |
Investments, at value (identified cost, $1,025,794,990) | | $ | 1,048,375,998 | |
| |
Cash | | | 10,002,889 | |
| |
Deposits for derivatives collateral — financial futures contracts | | | 376,185 | |
| |
Interest and dividends receivable | | | 8,750,730 | |
| |
Receivable for investments sold | | | 4,426,166 | |
| |
Receivable for Fund shares sold | | | 4,190,060 | |
| |
Total assets | | $ | 1,076,122,028 | |
| |
| Liabilities | | | | |
| |
Payable for when-issued securities | | $ | 5,996,970 | |
| |
Payable for variation margin on open financial futures contracts | | | 150,003 | |
| |
Payable for Fund shares redeemed | | | 3,095,537 | |
| |
Distributions payable | | | 353,597 | |
| |
Payable to affiliates: | | | | |
| |
Investment adviser and administration fee | | | 520,872 | |
| |
Distribution and service fees | | | 66,899 | |
| |
Accrued expenses | | | 188,635 | |
| |
Total liabilities | | $ | 10,372,513 | |
| |
Net Assets | | $ | 1,065,749,515 | |
| |
| Sources of Net Assets | | | | |
| |
Paid-in capital | | $ | 1,054,246,087 | |
| |
Distributable earnings | | | 11,503,428 | |
| |
Net Assets | | $ | 1,065,749,515 | |
| |
| Class A Shares | | | | |
| |
Net Assets | | $ | 125,811,727 | |
| |
Shares Outstanding | | | 10,548,730 | |
| |
Net Asset Value and Redemption Price Per Share | | | | |
| |
(net assets ÷ shares of beneficial interest outstanding) | | $ | 11.93 | |
| |
Maximum Offering Price Per Share | | | | |
| |
(100 ÷ 95.25 of net asset value per share) | | $ | 12.52 | |
| |
| Class C Shares | | | | |
| |
Net Assets | | $ | 47,676,844 | |
| |
Shares Outstanding | | | 3,998,683 | |
| |
Net Asset Value and Offering Price Per Share* | | | | |
| |
(net assets ÷ shares of beneficial interest outstanding) | | $ | 11.92 | |
| |
| Class I Shares | | | | |
| |
Net Assets | | $ | 892,260,944 | |
| |
Shares Outstanding | | | 74,696,308 | |
| |
Net Asset Value, Offering Price and Redemption Price Per Share | | | | |
| |
(net assets ÷ shares of beneficial interest outstanding) | | $ | 11.95 | |
On sales of $50,000 or more, the offering price of Class A shares is reduced.
| * | Redemption price per share is equal to the net asset value less any applicable contingent deferred sales charge. |
| | | | |
| | 19 | | See Notes to Financial Statements. |
Eaton Vance
Municipal Opportunities Fund
January 31, 2019
Statement of Operations (Unaudited)
| | | | |
| Investment Income | | Six Months Ended
January 31, 2019 | |
| |
Interest | | $ | 16,747,946 | |
| |
Dividends | | | 296,925 | |
| |
Total investment income | | $ | 17,044,871 | |
| |
| Expenses | | | | |
| |
Investment adviser and administration fee | | $ | 3,004,018 | |
| |
Distribution and service fees | | | | |
| |
Class A | | | 148,074 | |
| |
Class C | | | 249,360 | |
| |
Trustees’ fees and expenses | | | 29,261 | |
| |
Custodian fee | | | 125,419 | |
| |
Transfer and dividend disbursing agent fees | | | 177,043 | |
| |
Legal and accounting services | | | 36,164 | |
| |
Printing and postage | | | 34,612 | |
| |
Registration fees | | | 63,180 | |
| |
Miscellaneous | | | 99,323 | |
| |
Total expenses | | $ | 3,966,454 | |
| |
Net investment income | | $ | 13,078,417 | |
| |
| Realized and Unrealized Gain (Loss) | | | | |
| |
Net realized gain (loss) — | | | | |
| |
Investment transactions | | $ | (3,153,197 | ) |
| |
Financial futures contracts | | | 247,851 | |
| |
Net realized loss | | $ | (2,905,346 | ) |
| |
Change in unrealized appreciation (depreciation) — | | | | |
| |
Investments | | $ | 8,128,093 | |
| |
Financial futures contracts | | | (1,012,924 | ) |
| |
Net change in unrealized appreciation (depreciation) | | $ | 7,115,169 | |
| |
Net realized and unrealized gain | | $ | 4,209,823 | |
| |
Net increase in net assets from operations | | $ | 17,288,240 | |
| | | | |
| | 20 | | See Notes to Financial Statements. |
Eaton Vance
Municipal Opportunities Fund
January 31, 2019
Statements of Changes in Net Assets
| | | | | | | | |
| Increase (Decrease) in Net Assets | | Six Months Ended
January 31, 2019
(Unaudited) | | | Year Ended
July 31, 2018 | |
| | |
From operations — | | | | | | | | |
| | |
Net investment income | | $ | 13,078,417 | | | $ | 21,340,347 | |
| | |
Net realized gain (loss) | | | (2,905,346 | ) | | | 35,747 | |
| | |
Net change in unrealized appreciation (depreciation) | | | 7,115,169 | | | | (7,698,659 | ) |
| | |
Net increase in net assets from operations | | $ | 17,288,240 | | | $ | 13,677,435 | |
| | |
Distributions to shareholders(1) | | | | | | | | |
| | |
Class A | | $ | (1,393,504 | ) | | $ | (2,422,278 | ) |
| | |
Class C | | | (399,257 | ) | | | (711,094 | ) |
| | |
Class I | | | (11,122,716 | ) | | | (17,950,503 | ) |
| | |
Total distributions to shareholders | | $ | (12,915,477 | ) | | $ | (21,083,875 | ) |
| | |
Transactions in shares of beneficial interest — | | | | | | | | |
| | |
Proceeds from sale of shares | | | | | | | | |
| | |
Class A | | $ | 24,480,382 | | | $ | 42,770,177 | |
| | |
Class C | | | 4,766,963 | | | | 11,982,388 | |
| | |
Class I | | | 202,485,545 | | | | 399,788,818 | |
| | |
Net asset value of shares issued to shareholders in payment of distributions declared | | | | | | | | |
| | |
Class A | | | 1,300,145 | | | | 2,255,276 | |
| | |
Class C | | | 321,420 | | | | 577,126 | |
| | |
Class I | | | 9,205,119 | | | | 14,974,539 | |
| | |
Cost of shares redeemed | | | | | | | | |
| | |
Class A | | | (18,317,430 | ) | | | (39,876,785 | ) |
| | |
Class C | | | (8,343,636 | ) | | | (14,556,745 | ) |
| | |
Class I | | | (163,724,171 | ) | | | (198,297,827 | ) |
| | |
Net asset value of shares converted | | | | | | | | |
| | |
Class A | | | 820,185 | | | | — | |
| | |
Class C | | | (820,185 | ) | | | — | |
| | |
Net increase in net assets from Fund share transactions | | $ | 52,174,337 | | | $ | 219,616,967 | |
| | |
Net increase in net assets | | $ | 56,547,100 | | | $ | 212,210,527 | |
| | |
| Net Assets | | | | | | | | |
| | |
At beginning of period | | $ | 1,009,202,415 | | | $ | 796,991,888 | |
| | |
At end of period | | $ | 1,065,749,515 | | | $ | 1,009,202,415 | (2) |
| (1) | For the year ended July 31, 2018, the source of distributions was from net investment income. The current year presentation of distributions conforms with the Disclosure Update and Simplification Rule issued by the Securities and Exchange Commission, effective November 5, 2018. |
| (2) | Includes accumulated distributions in excess of net investment income of $(5,270) at July 31, 2018. The requirement to disclose the corresponding amount as of January 31, 2019 was eliminated. |
| | | | |
| | 21 | | See Notes to Financial Statements. |
Eaton Vance
Municipal Opportunities Fund
January 31, 2019
Financial Highlights
| | | | | | | | | | | | | | | | | | | | | | | | |
| | | Class A | |
| | |
| | | Six Months Ended
January 31, 2019
(Unaudited) | | | Year Ended July 31, | |
| | | 2018 | | | 2017 | | | 2016 | | | 2015 | | | 2014 | |
| | | | | | | |
Net asset value — Beginning of period | | $ | 11.880 | | | $ | 11.960 | | | $ | 12.250 | | | $ | 11.490 | | | $ | 11.180 | | | $ | 10.240 | |
| | | | | | |
| Income (Loss) From Operations | | | | | | | | | | | | | | | | | | | | | | | | |
| | | | | | |
Net investment income | | $ | 0.142 | (1) | | $ | 0.251 | (1) | | $ | 0.236 | | | $ | 0.218 | | | $ | 0.202 | | | $ | 0.242 | |
| | | | | | |
Net realized and unrealized gain (loss) | | | 0.048 | | | | (0.084 | ) | | | (0.239 | ) | | | 0.760 | | | | 0.319 | | | | 0.940 | |
| | | | | | |
Total income (loss) from operations | | $ | 0.190 | | | $ | 0.167 | | | $ | (0.003 | ) | | $ | 0.978 | | | $ | 0.521 | | | $ | 1.182 | |
| | | | | | |
| Less Distributions | | | | | | | | | | | | | | | | | | | | | | | | |
| | | | | | |
From net investment income | | $ | (0.140 | ) | | $ | (0.247 | ) | | $ | (0.236 | ) | | $ | (0.218 | ) | | $ | (0.202 | ) | | $ | (0.242 | ) |
| | | | | | |
From net realized gain | | | — | | | | — | | | | (0.051 | ) | | | — | | | | (0.009 | ) | | | — | |
| | | | | | |
Total distributions | | $ | (0.140 | ) | | $ | (0.247 | ) | | $ | (0.287 | ) | | $ | (0.218 | ) | | $ | (0.211 | ) | | $ | (0.242 | ) |
| | | | | | |
Net asset value — End of period | | $ | 11.930 | | | $ | 11.880 | | | $ | 11.960 | | | $ | 12.250 | | | $ | 11.490 | | | $ | 11.180 | |
| | | | | | |
Total Return(2) | | | 1.62 | %(3) | | | 1.41 | % | | | 0.04 | % | | | 8.59 | % | | | 4.68 | %(4) | | | 11.69 | %(4) |
| | | | | | |
| Ratios/Supplemental Data | | | | | | | | | | | | | | | | | | | | | | | | |
| | | | | | |
Net assets, end of period (000’s omitted) | | $ | 125,812 | | | $ | 116,961 | | | $ | 112,632 | | | $ | 154,283 | | | $ | 87,416 | | | $ | 16,715 | |
| | | | | | |
Ratios (as a percentage of average daily net assets): | | | | | | | | | | | | | | | | | | | | | | | | |
| | | | | | |
Expenses(5) | | | 0.95 | %(6) | | | 0.93 | % | | | 0.96 | % | | | 0.97 | % | | | 1.00 | %(4) | | | 1.09 | %(4) |
| | | | | | |
Net investment income | | | 2.38 | %(6) | | | 2.11 | % | | | 2.02 | % | | | 1.85 | % | | | 1.72 | % | | | 2.25 | % |
| | | | | | |
Portfolio Turnover | | | 18 | %(3) | | | 30 | % | | | 53 | % | | | 58 | % | | | 79 | % | | | 283 | % |
| (1) | Computed using average shares outstanding. |
| (2) | Returns are historical and are calculated by determining the percentage change in net asset value with all distributions reinvested and do not reflect the effect of sales charges. |
| (4) | The investment adviser and administrator reimbursed certain operating expenses (equal to 0.06% and 0.20% of average daily net assets for the years ended July 31, 2015 and 2014, respectively). Absent this reimbursement, total return would be lower. |
| (5) | Excludes the effect of custody fee credits, if any, of less than 0.005%. Effective September 1, 2015, custody fee credits, which were earned on cash deposit balances, were discontinued by the custodian. |
| | | | |
| | 22 | | See Notes to Financial Statements. |
Eaton Vance
Municipal Opportunities Fund
January 31, 2019
Financial Highlights — continued
| | | | | | | | | | | | | | | | | | | | |
| | | Class C | |
| | | |
| | | Six Months Ended
January 31, 2019
(Unaudited) | | | Year Ended July 31, | | | Period Ended
July 31, 2015(1) | |
| | | 2018 | | | 2017 | | | 2016 | |
| | | | | | |
Net asset value — Beginning of period | | $ | 11.870 | | | $ | 11.960 | | | $ | 12.250 | | | $ | 11.480 | | | $ | 11.270 | |
| | | | | |
| Income (Loss) From Operations | | | | | | | | | | | | | | | | | | | | |
| | | | | |
Net investment income | | $ | 0.097 | (2) | | $ | 0.161 | (2) | | $ | 0.146 | | | $ | 0.129 | | | $ | 0.103 | |
| | | | | |
Net realized and unrealized gain (loss) | | | 0.048 | | | | (0.093 | ) | | | (0.239 | ) | | | 0.770 | | | | 0.219 | |
| | | | | |
Total income (loss) from operations | | $ | 0.145 | | | $ | 0.068 | | | $ | (0.093 | ) | | $ | 0.899 | | | $ | 0.322 | |
| | | | | |
| Less Distributions | | | | | | | | | | | | | | | | | | | | |
| | | | | |
From net investment income | | $ | (0.095 | ) | | $ | (0.158 | ) | | $ | (0.146 | ) | | $ | (0.129 | ) | | $ | (0.103 | ) |
| | | | | |
From net realized gain | | | — | | | | — | | | | (0.051 | ) | | | — | | | | (0.009 | ) |
| | | | | |
Total distributions | | $ | (0.095 | ) | | $ | (0.158 | ) | | $ | (0.197 | ) | | $ | (0.129 | ) | | $ | (0.112 | ) |
| | | | | |
Net asset value — End of period | | $ | 11.920 | | | $ | 11.870 | | | $ | 11.960 | | | $ | 12.250 | | | $ | 11.480 | |
| | | | | |
Total Return(3) | | | 1.24 | %(4) | | | 0.57 | % | | | (0.71 | )% | | | 7.87 | % | | | 2.86 | %(4)(5) |
| | | | | |
| Ratios/Supplemental Data | | | | | | | | | | | | | | | | | | | | |
| | | | | |
Net assets, end of period (000’s omitted) | | $ | 47,677 | | | $ | 51,587 | | | $ | 54,001 | | | $ | 47,302 | | | $ | 21,534 | |
| | | | | |
Ratios (as a percentage of average daily net assets): | | | | | | | | | | | | | | | | | | | | |
| | | | | |
Expenses(6) | | | 1.70 | %(7) | | | 1.69 | % | | | 1.71 | % | | | 1.72 | % | | | 1.75 | %(5)(7) |
| | | | | |
Net investment income | | | 1.63 | %(7) | | | 1.35 | % | | | 1.27 | % | | | 1.09 | % | | | 0.91 | %(7) |
| | | | | |
Portfolio Turnover | | | 18 | %(4) | | | 30 | % | | | 53 | % | | | 58 | % | | | 79 | %(8) |
| (1) | For the period from the commencement of operations, August 18, 2014, to July 31, 2015. |
| (2) | Computed using average shares outstanding. |
| (3) | Returns are historical and are calculated by determining the percentage change in net asset value with all distributions reinvested and do not reflect the effect of sales charges. |
| (5) | The investment adviser and administrator reimbursed certain operating expenses (equal to 0.06% of average daily net assets for the period ended July 31, 2015). Absent this reimbursement, total return would be lower. |
| (6) | Excludes the effect of custody fee credits, if any, of less than 0.005%. Effective September 1, 2015, custody fee credits, which were earned on cash deposit balances, were discontinued by the custodian. |
| (8) | For the year ended July 31, 2015. |
| | | | |
| | 23 | | See Notes to Financial Statements. |
Eaton Vance
Municipal Opportunities Fund
January 31, 2019
Financial Highlights — continued
| | | | | | | | | | | | | | | | | | | | | | | | |
| | | Class I | |
| | |
| | | Six Months Ended
January 31, 2019
(Unaudited) | | | Year Ended July 31, | |
| | | 2018 | | | 2017 | | | 2016 | | | 2015 | | | 2014 | |
| | | | | | | |
Net asset value — Beginning of period | | $ | 11.900 | | | $ | 11.980 | | | $ | 12.270 | | | $ | 11.500 | | | $ | 11.190 | | | $ | 10.250 | |
| | | | | | |
| Income (Loss) From Operations | | | | | | | | | | | | | | | | | | | | | | | | |
| | | | | | |
Net investment income | | $ | 0.157 | (1) | | $ | 0.282 | (1) | | $ | 0.265 | | | $ | 0.248 | | | $ | 0.232 | | | $ | 0.269 | |
| | | | | | |
Net realized and unrealized gain (loss) | | | 0.048 | | | | (0.085 | ) | | | (0.239 | ) | | | 0.770 | | | | 0.319 | | | | 0.939 | |
| | | | | | |
Total income from operations | | $ | 0.205 | | | $ | 0.197 | | | $ | 0.026 | | | $ | 1.018 | | | $ | 0.551 | | | $ | 1.208 | |
| | | | | | |
| Less Distributions | | | | | | | | | | | | | | | | | | | | | | | | |
| | | | | | |
From net investment income | | $ | (0.155 | ) | | $ | (0.277 | ) | | $ | (0.265 | ) | | $ | (0.248 | ) | | $ | (0.232 | ) | | $ | (0.268 | ) |
| | | | | | |
From net realized gain | | | — | | | | — | | | | (0.051 | ) | | | — | | | | (0.009 | ) | | | — | |
| | | | | | |
Total distributions | | $ | (0.155 | ) | | $ | (0.277 | ) | | $ | (0.316 | ) | | $ | (0.248 | ) | | $ | (0.241 | ) | | $ | (0.268 | ) |
| | | | | | |
Net asset value — End of period | | $ | 11.950 | | | $ | 11.900 | | | $ | 11.980 | | | $ | 12.270 | | | $ | 11.500 | | | $ | 11.190 | |
| | | | | | |
Total Return(2) | | | 1.74 | %(3) | | | 1.67 | % | | | 0.29 | % | | | 8.95 | % | | | 4.94 | %(4) | | | 11.96 | %(4) |
| | | | | | |
| Ratios/Supplemental Data | | | | | | | | | | | | | | | | | | | | | | | | |
| | | | | | |
Net assets, end of period (000’s omitted) | | $ | 892,261 | | | $ | 840,654 | | | $ | 630,358 | | | $ | 501,541 | | | $ | 211,151 | | | $ | 42,549 | |
| | | | | | |
Ratios (as a percentage of average daily net assets): | | | | | | | | | | | | | | | | | | | | | | | | |
| | | | | | |
Expenses(5) | | | 0.70 | %(6) | | | 0.68 | % | | | 0.71 | % | | | 0.72 | % | | | 0.75 | %(4) | | | 0.84 | %(4) |
| | | | | | |
Net investment income | | | 2.63 | %(6) | | | 2.37 | % | | | 2.27 | % | | | 2.09 | % | | | 1.98 | % | | | 2.44 | % |
| | | | | | |
Portfolio Turnover | | | 18 | %(3) | | | 30 | % | | | 53 | % | | | 58 | % | | | 79 | % | | | 283 | % |
| (1) | Computed using average shares outstanding. |
| (2) | Returns are historical and are calculated by determining the percentage change in net asset value with all distributions reinvested. |
| (4) | The investment adviser and administrator reimbursed certain operating expenses (equal to 0.06% and 0.20% of average daily net assets for the years ended July 31, 2015 and 2014, respectively). Absent this reimbursement, total return would be lower. |
| (5) | Excludes the effect of custody fee credits, if any, of less than 0.005%. Effective September 1, 2015, custody fee credits, which were earned on cash deposit balances, were discontinued by the custodian. |
| | | | |
| | 24 | | See Notes to Financial Statements. |
Eaton Vance
Municipal Opportunities Fund
January 31, 2019
Notes to Financial Statements (Unaudited)
1 Significant Accounting Policies
Eaton Vance Municipal Opportunities Fund (the Fund) is a diversified series of Eaton Vance Municipals Trust (the Trust). The Trust is a Massachusetts business trust registered under the Investment Company Act of 1940, as amended (the 1940 Act), as an open-end management investment company. The Fund seeks to maximize after-tax total return. The Fund offers three classes of shares. Class A shares are generally sold subject to a sales charge imposed at time of purchase. Class C shares are sold at net asset value and are generally subject to a contingent deferred sales charge (see Note 5). Effective January 25, 2019, Class C shares generally automatically convert to Class A shares ten years after their purchase as described in the Fund’s prospectus. Class I shares are sold at net asset value and are not subject to a sales charge. Each class represents a pro-rata interest in the Fund, but votes separately on class-specific matters and (as noted below) is subject to different expenses. Realized and unrealized gains and losses are allocated daily to each class of shares based on the relative net assets of each class to the total net assets of the Fund. Net investment income, other than class-specific expenses, is allocated daily to each class of shares based upon the ratio of the value of each class’s paid shares to the total value of all paid shares. Each class of shares differs in its distribution plan and certain other class-specific expenses.
The following is a summary of significant accounting policies of the Fund. The policies are in conformity with accounting principles generally accepted in the United States of America (U.S. GAAP). The Fund is an investment company and follows accounting and reporting guidance in the Financial Accounting Standards Board (FASB) Accounting Standards Codification Topic 946.
A Investment Valuation — The following methodologies are used to determine the market value or fair value of investments.
Debt Obligations. Debt obligations are generally valued on the basis of valuations provided by third party pricing services, as derived from such services’ pricing models. Inputs to the models may include, but are not limited to, reported trades, executable bid and ask prices, broker/dealer quotations, prices or yields of securities with similar characteristics, interest rates, anticipated prepayments, benchmark curves or information pertaining to the issuer, as well as industry and economic events. The pricing services may use a matrix approach, which considers information regarding securities with similar characteristics to determine the valuation for a security. Short-term debt obligations purchased with a remaining maturity of sixty days or less for which a valuation from a third party pricing service is not readily available may be valued at amortized cost, which approximates fair value.
Equity Securities. Equity securities listed on a U.S. securities exchange generally are valued at the last sale or closing price on the day of valuation or, if no sales took place on such date, at the mean between the closing bid and ask prices on the exchange where such securities are principally traded. Equity securities listed on the NASDAQ Global or Global Select Market generally are valued at the NASDAQ official closing price. Unlisted or listed securities for which closing sales prices or closing quotations are not available are valued at the mean between the latest available bid and ask prices.
Derivatives. Financial futures contracts are valued at the closing settlement price established by the board of trade or exchange on which they are traded.
Fair Valuation. Investments for which valuations or market quotations are not readily available or are deemed unreliable are valued at fair value using methods determined in good faith by or at the direction of the Trustees of the Fund in a manner that fairly reflects the security’s value, or the amount that the Fund might reasonably expect to receive for the security upon its current sale in the ordinary course. Each such determination is based on a consideration of relevant factors, which are likely to vary from one pricing context to another. These factors may include, but are not limited to, the type of security, the existence of any contractual restrictions on the security’s disposition, the price and extent of public trading in similar securities of the issuer or of comparable companies or entities, quotations or relevant information obtained from broker/dealers or other market participants, information obtained from the issuer, analysts, and/or the appropriate stock exchange (for exchange-traded securities), an analysis of the company’s or entity’s financial condition, and an evaluation of the forces that influence the issuer and the market(s) in which the security is purchased and sold.
B Investment Transactions and Related Income — Investment transactions for financial statement purposes are accounted for on a trade date basis. Realized gains and losses on investments sold are determined on the basis of identified cost. Interest income is recorded on the basis of interest accrued, adjusted for amortization of premium or accretion of discount. Distributions from investment companies are recorded as dividend income, capital gains or return of capital based on the nature of the distribution.
C Federal Taxes — The Fund’s policy is to comply with the provisions of the Internal Revenue Code applicable to regulated investment companies and to distribute to shareholders each year substantially all of its taxable, if any, and tax-exempt net investment income, and all or substantially all of its net realized capital gains. Accordingly, no provision for federal income or excise tax is necessary. The Fund intends to satisfy conditions which will enable it to designate distributions from the interest and dividend income generated by its investments in non-taxable municipal securities, which are exempt from regular federal income tax when received by the Fund, as exempt-interest dividends. The portion of such interest, if any, earned on private activity bonds issued after August 7, 1986, may be considered a tax preference item to shareholders.
As of January 31, 2019, the Fund had no uncertain tax positions that would require financial statement recognition, de-recognition, or disclosure. The Fund files a U.S. federal income tax return annually after its fiscal year-end, which is subject to examination by the Internal Revenue Service for a period of three years from the date of filing.
D Expenses — The majority of expenses of the Trust are directly identifiable to an individual fund. Expenses which are not readily identifiable to a specific fund are allocated taking into consideration, among other things, the nature and type of expense and the relative size of the funds.
Eaton Vance
Municipal Opportunities Fund
January 31, 2019
Notes to Financial Statements (Unaudited) — continued
E Legal Fees — Legal fees and other related expenses incurred as part of negotiations of the terms and requirement of capital infusions, or that are expected to result in the restructuring of, or a plan of reorganization for, an investment are recorded as realized losses. Ongoing expenditures to protect or enhance an investment are treated as operating expenses.
F Use of Estimates — The preparation of the financial statements in conformity with U.S. GAAP requires management to make estimates and assumptions that affect the reported amounts of assets and liabilities at the date of the financial statements and the reported amounts of income and expense during the reporting period. Actual results could differ from those estimates.
G Indemnifications — Under the Trust’s organizational documents, its officers and Trustees may be indemnified against certain liabilities and expenses arising out of the performance of their duties to the Fund. Under Massachusetts law, if certain conditions prevail, shareholders of a Massachusetts business trust (such as the Trust) could be deemed to have personal liability for the obligations of the Trust. However, the Trust’s Declaration of Trust contains an express disclaimer of liability on the part of Fund shareholders and the By-laws provide that the Trust shall assume the defense on behalf of any Fund shareholders. Moreover, the By-laws also provide for indemnification out of Fund property of any shareholder held personally liable solely by reason of being or having been a shareholder for all loss or expense arising from such liability. Additionally, in the normal course of business, the Fund enters into agreements with service providers that may contain indemnification clauses. The Fund’s maximum exposure under these arrangements is unknown as this would involve future claims that may be made against the Fund that have not yet occurred.
H Financial Futures Contracts — Upon entering into a financial futures contract, the Fund is required to deposit with the broker, either in cash or securities, an amount equal to a certain percentage of the contract amount (initial margin). Subsequent payments, known as variation margin, are made or received by the Fund each business day, depending on the daily fluctuations in the value of the underlying security, and are recorded as unrealized gains or losses by the Fund. Gains (losses) are realized upon the expiration or closing of the financial futures contracts. Should market conditions change unexpectedly, the Fund may not achieve the anticipated benefits of the financial futures contracts and may realize a loss. Futures contracts have minimal counterparty risk as they are exchange traded and the clearinghouse for the exchange is substituted as the counterparty, guaranteeing counterparty performance.
I When-Issued Securities and Delayed Delivery Transactions — The Fund may purchase or sell securities on a delayed delivery or when-issued basis. Payment and delivery may take place after the customary settlement period for that security. At the time the transaction is negotiated, the price of the security that will be delivered is fixed. The Fund maintains cash and/or security positions for these commitments such that sufficient liquid assets will be available to make payments upon settlement. Securities purchased on a delayed delivery or when-issued basis are marked-to-market daily and begin earning interest on settlement date. Losses may arise due to changes in the market value of the underlying securities or if the counterparty does not perform under the contract.
J Interim Financial Statements — The interim financial statements relating to January 31, 2019 and for the six months then ended have not been audited by an independent registered public accounting firm, but in the opinion of the Fund’s management, reflect all adjustments, consisting only of normal recurring adjustments, necessary for the fair presentation of the financial statements.
2 Distributions to Shareholders and Income Tax Information
The net investment income of the Fund is determined daily and substantially all of the net investment income so determined is declared as a dividend to shareholders of record at the time of declaration. Distributions are declared separately for each class of shares. Distributions are paid monthly. Distributions of realized capital gains are made at least annually. Shareholders may reinvest income and capital gain distributions in additional shares of the same class of the Fund at the net asset value as of the reinvestment date or, at the election of the shareholder, receive distributions in cash. Distributions to shareholders are determined in accordance with income tax regulations, which may differ from U.S. GAAP. As required by U.S. GAAP, only distributions in excess of tax basis earnings and profits are reported in the financial statements as a return of capital. Permanent differences between book and tax accounting relating to distributions are reclassified to paid-in capital. For tax purposes, distributions from short-term capital gains are considered to be from ordinary income.
At July 31, 2018, the Fund, for federal income tax purposes, had deferred capital losses of $8,071,318 which would reduce its taxable income arising from future net realized gains on investment transactions, if any, to the extent permitted by the Internal Revenue Code, and thus would reduce the amount of distributions to shareholders, which would otherwise be necessary to relieve the Fund of any liability for federal income or excise tax. The deferred capital losses are treated as arising on the first day of the Fund’s next taxable year and retain the same short-term or long-term character as when originally deferred. Of the deferred capital losses at July 31, 2018, $8,071,318 are short-term.
The cost and unrealized appreciation (depreciation) of investments, including open derivative contracts, of the Fund at January 31, 2019, as determined on a federal income tax basis, were as follows:
| | | | |
| |
Aggregate cost | | $ | 1,024,883,032 | |
| |
Gross unrealized appreciation | | $ | 26,878,953 | |
| |
Gross unrealized depreciation | | | (4,517,512 | ) |
| |
Net unrealized appreciation | | $ | 22,361,441 | |
Eaton Vance
Municipal Opportunities Fund
January 31, 2019
Notes to Financial Statements (Unaudited) — continued
3 Investment Adviser and Administration Fee and Other Transactions with Affiliates
The investment adviser and administration fee is earned by Eaton Vance Management (EVM) as compensation for investment advisory and administrative services rendered to the Fund. The fee is computed at an annual rate of 0.60% of the Fund’s average daily net assets up to $500 million, 0.575% from $500 million up to $1 billion, 0.55% from $1 billion up to $2.5 billion and at reduced rates on daily net assets of $2.5 billion or more, and is payable monthly. For the six months ended January 31, 2019, the investment adviser and administration fee amounted to $3,004,018 or 0.59% (annualized) of the Fund’s average daily net assets. EVM provides sub-transfer agency and related services to the Fund pursuant to a Sub-Transfer Agency Support Services Agreement. For the six months ended January 31, 2019, EVM earned $3,790 from the Fund pursuant to such agreement, which is included in transfer and dividend disbursing agent fees on the Statement of Operations. The Fund was informed that Eaton Vance Distributors, Inc. (EVD), an affiliate of EVM and the Fund’s principal underwriter, received $4,583 as its portion of the sales charge on sales of Class A shares for the six months ended January 31, 2019. EVD also received distribution and service fees from Class A and Class C shares (see Note 4) and contingent deferred sales charges (see Note 5).
Trustees and officers of the Fund who are members of EVM’s organization receive remuneration for their services to the Fund out of the investment adviser and administration fee. Trustees of the Fund who are not affiliated with EVM may elect to defer receipt of all or a percentage of their annual fees in accordance with the terms of the Trustees Deferred Compensation Plan. For the six months ended January 31, 2019, no significant amounts have been deferred. Certain officers and Trustees of the Fund are officers of EVM.
4 Distribution Plans
The Fund has in effect a distribution plan for Class A shares (Class A Plan) pursuant to Rule 12b-1 under the 1940 Act. Pursuant to the Class A Plan, the Fund pays EVD a distribution and service fee of 0.25% per annum of its average daily net assets attributable to Class A shares for distribution services and facilities provided to the Fund by EVD, as well as for personal services and/or the maintenance of shareholder accounts. Distribution and service fees paid or accrued to EVD for the six months ended January 31, 2019 amounted to $148,074 for Class A shares. The Fund also has in effect a distribution plan for Class C shares (Class C Plan) pursuant to Rule 12b-1 under the 1940 Act. Pursuant to the Class C Plan, the Fund pays EVD amounts equal to 0.75% per annum of its average daily net assets attributable to Class C shares for providing ongoing distribution services and facilities to the Fund. For the six months ended January 31, 2019, the Fund paid or accrued to EVD $187,020 for Class C shares.
Pursuant to the Class C Plan, the Fund also makes payments of service fees to EVD, financial intermediaries and other persons in amounts equal to 0.25% per annum of its average daily net assets attributable to Class C shares. Service fees paid or accrued are for personal services and/or the maintenance of shareholder accounts. They are separate and distinct from the sales commissions and distribution fees payable to EVD. Service fees paid or accrued for the six months ended January 31, 2019 amounted to $62,340 for Class C shares.
Distribution and service fees are subject to the limitations contained in the Financial Industry Regulatory Authority Rule 2341(d).
5 Contingent Deferred Sales Charges
A contingent deferred sales charge (CDSC) of 1% generally is imposed on redemptions of Class C shares made within one year of purchase. Class A shares may be subject to a 1% CDSC if redeemed within 18 months of purchase (depending on the circumstances of purchase). Generally, the CDSC is based upon the lower of the net asset value at date of redemption or date of purchase. No charge is levied on shares acquired by reinvestment of dividends or capital gain distributions. For the six months ended January 31, 2019, the Fund was informed that EVD received less than $100 of CDSCs paid by Class C shareholders and no CDSCs paid by Class A shareholders.
6 Purchases and Sales of Investments
Purchases and sales of investments, other than short-term obligations, aggregated $218,837,756 and $178,765,116, respectively, for the six months ended January 31, 2019.
Eaton Vance
Municipal Opportunities Fund
January 31, 2019
Notes to Financial Statements (Unaudited) — continued
7 Shares of Beneficial Interest
The Fund’s Declaration of Trust permits the Trustees to issue an unlimited number of full and fractional shares of beneficial interest (without par value). Such shares may be issued in a number of different series (such as the Fund) and classes. Transactions in Fund shares were as follows:
| | | | | | | | |
| Class A | | Six Months Ended
January 31, 2019
(Unaudited) | | | Year Ended
July 31, 2018 | |
| | |
Sales | | | 2,074,206 | | | | 3,592,634 | |
| | |
Issued to shareholders electing to receive payments of distributions in Fund shares | | | 110,060 | | | | 189,820 | |
| | |
Redemptions | | | (1,552,213 | ) | | | (3,349,278 | ) |
| | |
Converted from Class C shares | | | 69,031 | | | | — | |
| | |
Net increase | | | 701,084 | | | | 433,176 | |
| | |
| Class C | | Six Months Ended
January 31, 2019
(Unaudited) | | | Year Ended
July 31, 2018 | |
| | |
Sales | | | 403,842 | | | | 1,004,685 | |
| | |
Issued to shareholders electing to receive payments of distributions in Fund shares | | | 27,218 | | | | 48,615 | |
| | |
Redemptions | | | (708,195 | ) | | | (1,223,805 | ) |
| | |
Converted to Class A shares | | | (69,009 | ) | | | — | |
| | |
Net decrease | | | (346,144 | ) | | | (170,505 | ) |
| | |
| Class I | | Six Months Ended
January 31, 2019
(Unaudited) | | | Year Ended
July 31, 2018 | |
| | |
Sales | | | 17,120,683 | | | | 33,485,781 | |
| | |
Issued to shareholders electing to receive payments of distributions in Fund shares | | | 777,928 | | | | 1,258,828 | |
| | |
Redemptions | | | (13,872,222 | ) | | | (16,683,300 | ) |
| | |
Net increase | | | 4,026,389 | | | | 18,061,309 | |
8 Line of Credit
The Fund participates with other portfolios and funds managed by EVM and its affiliates in a $625 million unsecured line of credit agreement with a group of banks, which is in effect through October 29, 2019. Borrowings are made by the Fund solely to facilitate the handling of unusual and/or unanticipated short-term cash requirements. Interest is charged to the Fund based on its borrowings at an amount above either the Eurodollar rate or Federal Funds rate. In addition, a fee computed at an annual rate of 0.15% on the daily unused portion of the line of credit is allocated among the participating portfolios and funds at the end of each quarter. Because the line of credit is not available exclusively to the Fund, it may be unable to borrow some or all of its requested amounts at any particular time. The Fund did not have any significant borrowings or allocated fees during the six months ended January 31, 2019.
9 Financial Instruments
The Fund may trade in financial instruments with off-balance sheet risk in the normal course of its investing activities. These financial instruments may include financial futures contracts and may involve, to a varying degree, elements of risk in excess of the amounts recognized for financial statement purposes. The notional or contractual amounts of these instruments represent the investment the Fund has in particular classes of financial instruments and do not necessarily represent the amounts potentially subject to risk. The measurement of the risks associated with these instruments is meaningful only when all related and offsetting transactions are considered. A summary of obligations under these financial instruments at January 31, 2019 is included in the Portfolio of Investments. At January 31, 2019, the Fund had sufficient cash and/or securities to cover commitments under these contracts.
Eaton Vance
Municipal Opportunities Fund
January 31, 2019
Notes to Financial Statements (Unaudited) — continued
The Fund is subject to interest rate risk in the normal course of pursuing its investment objective. Because the Fund holds fixed-rate bonds, the value of these bonds may decrease if interest rates rise. The Fund enters into U.S. Treasury futures contracts to hedge against changes in interest rates.
The fair value of open derivative instruments (not considered to be hedging instruments for accounting disclosure purposes) and whose primary underlying risk exposure is interest rate risk at January 31, 2019 was as follows:
| | | | | | | | |
| | | Fair Value | |
| Derivative | | Asset Derivative | | | Liability Derivative | |
| | |
Futures Contracts | | $ | — | | | $ | (1,131,525 | )(1) |
| (1) | Amount represents cumulative unrealized depreciation on futures contracts. Only the current day’s variation margin on open futures contracts is reported within the Statement of Assets and Liabilities as Receivable or Payable for variation margin on open financial futures contracts, as applicable. |
The effect of derivative instruments (not considered to be hedging instruments for accounting disclosure purposes) on the Statement of Operations and whose primary underlying risk exposure is interest rate risk for the six months ended January 31, 2019 was as follows:
| | | | | | | | |
| Derivative | | Realized Gain (Loss)
on Derivatives Recognized
in Income(1) | | | Change in Unrealized
Appreciation (Depreciation) on
Derivatives Recognized in Income(2) | |
| | |
Futures Contracts | | $ | 247,851 | | | $ | (1,012,924 | ) |
| (1) | Statement of Operations location: Net realized gain (loss) – Financial futures contracts. |
| (2) | Statement of Operations location: Change in unrealized appreciation (depreciation) – Financial futures contracts. |
The average notional cost of futures contracts (short) outstanding during the six months ended January 31, 2019, which is indicative of the volume of this derivative type, was approximately $21,239,000.
10 Fair Value Measurements
Under generally accepted accounting principles for fair value measurements, a three-tier hierarchy to prioritize the assumptions, referred to as inputs, is used in valuation techniques to measure fair value. The three-tier hierarchy of inputs is summarized in the three broad levels listed below.
| • | | Level 1 – quoted prices in active markets for identical investments |
| • | | Level 2 – other significant observable inputs (including quoted prices for similar investments, interest rates, prepayment speeds, credit risk, etc.) |
| • | | Level 3 – significant unobservable inputs (including a fund’s own assumptions in determining the fair value of investments) |
In cases where the inputs used to measure fair value fall in different levels of the fair value hierarchy, the level disclosed is determined based on the lowest level input that is significant to the fair value measurement in its entirety. The inputs or methodology used for valuing securities are not necessarily an indication of the risk associated with investing in those securities.
Eaton Vance
Municipal Opportunities Fund
January 31, 2019
Notes to Financial Statements (Unaudited) — continued
At January 31, 2019, the hierarchy of inputs used in valuing the Fund’s investments and open derivative instruments, which are carried at value, were as follows:
| | | | | | | | | | | | | | | | |
| Asset Description | | Level 1 | | | Level 2 | | | Level 3 | | | Total | |
| | | | |
Tax-Exempt Municipal Securities | | $ | — | | | $ | 955,382,704 | | | $ | — | | | $ | 955,382,704 | |
| | | | |
Tax-Exempt Mortgage-Backed Securities | | | — | | | | 484,431 | | | | — | | | | 484,431 | |
| | | | |
Taxable Municipal Securities | | | — | | | | 59,476,450 | | | | — | | | | 59,476,450 | |
| | | | |
Corporate Bonds & Notes | | | — | | | | 18,975,913 | | | | — | | | | 18,975,913 | |
| | | | |
Closed-End Funds | | | 14,056,500 | | | | — | | | | — | | | | 14,056,500 | |
| | | | |
Total Investments | | $ | 14,056,500 | | | $ | 1,034,319,498 | | | $ | — | | | $ | 1,048,375,998 | |
| | | | |
Liability Description | | | | | | | | | | | | | | | | |
| | | | |
Futures Contracts | | $ | (1,131,525 | ) | | $ | — | | | $ | — | | | $ | (1,131,525 | ) |
| | | | |
Total | | $ | (1,131,525 | ) | | $ | — | | | $ | — | | | $ | (1,131,525 | ) |
Eaton Vance
Municipal Opportunities Fund
January 31, 2019
Special Meeting of Shareholders (Unaudited)
The Fund held a Special Meeting of Shareholders on September 20, 2018 to elect the five Trustees listed below. The other Trustees named herein continue to serve as Trustees. The results of the vote with respect to the Fund were as follows:
| | | | | | | | |
| | | Number of Shares | |
| Nominee for Trustee | | For | | | Withheld | |
| | |
Mark R. Fetting | | | 78,408,568 | | | | 777,848 | |
| | |
Keith Quinton | | | 78,432,038 | | | | 754,378 | |
| | |
Marcus L. Smith | | | 78,447,634 | | | | 738,782 | |
| | |
Susan J. Sutherland | | | 78,456,590 | | | | 729,826 | |
| | |
Scott E. Wennerholm | | | 78,385,113 | | | | 801,304 | |
Results are rounded to the nearest whole number.
Eaton Vance
Municipal Opportunities Fund
January 31, 2019
Officers and Trustees
Officers of Eaton Vance Municipal Opportunities Fund
Payson F. Swaffield
President
Maureen A. Gemma
Vice President, Secretary and Chief Legal Officer
James F. Kirchner
Treasurer
Richard F. Froio
Chief Compliance Officer
Trustees of Eaton Vance Municipal Opportunities Fund
William H. Park
Chairperson
Thomas E. Faust Jr.*
Mark R. Fetting
Cynthia E. Frost
George J. Gorman
Valerie A. Mosley
Helen Frame Peters
Keith Quinton(1)
Marcus L. Smith(1)
Susan J. Sutherland
Scott E. Wennerholm
| (1) | Messrs. Quinton and Smith began serving as Trustees effective October 1, 2018. |
Eaton Vance Funds
IMPORTANT NOTICES
Privacy. The Eaton Vance organization is committed to ensuring your financial privacy. Each of the financial institutions identified below has in effect the following policy (“Privacy Policy”) with respect to nonpublic personal information about its customers:
| • | | Only such information received from you, through application forms or otherwise, and information about your Eaton Vance fund transactions will be collected. This may include information such as name, address, social security number, tax status, account balances and transactions. |
| • | | None of such information about you (or former customers) will be disclosed to anyone, except as permitted by law (which includes disclosure to employees necessary to service your account). In the normal course of servicing a customer’s account, Eaton Vance may share information with unaffiliated third parties that perform various required services such as transfer agents, custodians and broker-dealers. |
| • | | Policies and procedures (including physical, electronic and procedural safeguards) are in place that are designed to protect the confidentiality of such information. |
| • | | We reserve the right to change our Privacy Policy at any time upon proper notification to you. Customers may want to review our Privacy Policy periodically for changes by accessing the link on our homepage: www.eatonvance.com. |
Our pledge of privacy applies to the following entities within the Eaton Vance organization: the Eaton Vance Family of Funds, Eaton Vance Management, Eaton Vance Investment Counsel, Eaton Vance Distributors, Inc., Eaton Vance Trust Company, Eaton Vance Management (International) Limited, Eaton Vance Advisers International Ltd., Eaton Vance Management’s Real Estate Investment Group and Boston Management and Research. In addition, our Privacy Policy applies only to those Eaton Vance customers who are individuals and who have a direct relationship with us. If a customer’s account (i.e., fund shares) is held in the name of a third-party financial advisor/broker-dealer, it is likely that only such advisor’s privacy policies apply to the customer. This notice supersedes all previously issued privacy disclosures. For more information about Eaton Vance’s Privacy Policy, please call 1-800-262-1122.
Delivery of Shareholder Documents. The Securities and Exchange Commission (SEC) permits funds to deliver only one copy of shareholder documents, including prospectuses, proxy statements and shareholder reports, to fund investors with multiple accounts at the same residential or post office box address. This practice is often called “householding” and it helps eliminate duplicate mailings to shareholders.Eaton Vance, or your financial advisor, may household the mailing of your documents indefinitely unless you instruct Eaton Vance, or your financial advisor, otherwise.If you would prefer that your Eaton Vance documents not be householded, please contact Eaton Vance at 1-800-262-1122, or contact your financial advisor. Your instructions that householding not apply to delivery of your Eaton Vance documents will typically be effective within 30 days of receipt by Eaton Vance or your financial advisor.
Portfolio Holdings. Each Eaton Vance Fund and its underlying Portfolio(s) (if applicable) will file a schedule of portfolio holdings on Form N-Q with the SEC for the first and third quarters of each fiscal year. The Form N-Q will be available on the Eaton Vance website at www.eatonvance.com, by calling Eaton Vance at 1-800-262-1122 or in the EDGAR database on the SEC’s website at www.sec.gov. Form N-Q may also be reviewed and copied at the SEC’s public reference room in Washington, D.C. (call 1-800-732-0330 for information on the operation of the public reference room).
Proxy Voting. From time to time, funds are required to vote proxies related to the securities held by the funds. The Eaton Vance Funds or their underlying Portfolios (if applicable) vote proxies according to a set of policies and procedures approved by the Funds’ and Portfolios’ Boards. You may obtain a description of these policies and procedures and information on how the Funds or Portfolios voted proxies relating to portfolio securities during the most recent 12-month period ended June 30, without charge, upon request, by calling 1-800-262-1122 and by accessing the SEC’s website at www.sec.gov.
This Page Intentionally Left Blank
This Page Intentionally Left Blank
This Page Intentionally Left Blank
Investment Adviser and Administrator
Eaton Vance Management
Two International Place
Boston, MA 02110
Principal Underwriter*
Eaton Vance Distributors, Inc.
Two International Place
Boston, MA 02110
(617) 482-8260
Custodian
State Street Bank and Trust Company
State Street Financial Center, One Lincoln Street
Boston, MA 02111
Transfer Agent
BNY Mellon Investment Servicing (US) Inc.
Attn: Eaton Vance Funds
P.O. Box 9653
Providence, RI 02940-9653
(800) 262-1122
Fund Offices
Two International Place
Boston, MA 02110
| * | FINRA BrokerCheck. Investors may check the background of their Investment Professional by contacting the Financial Industry Regulatory Authority (FINRA). FINRA BrokerCheck is a free tool to help investors check the professional background of current and former FINRA-registered securities firms and brokers. FINRA BrokerCheck is available by calling 1-800-289-9999 and at www.FINRA.org. The FINRA BrokerCheck brochure describing this program is available to investors at www.FINRA.org. |

7778 1.31.19
Item 2. Code of Ethics
Not required in this filing.
Item 3. Audit Committee Financial Expert
Not required in this filing.
Item 4. Principal Accountant Fees and Services
Not required in this filing.
Item 5. Audit Committee of Listed Registrants
Not applicable.
Item 6. Schedule of Investments
Please see schedule of investments contained in the Report to Stockholders included under Item 1 of this FormN-CSR.
Item 7. Disclosure of Proxy Voting Policies and Procedures forClosed-End Management Investment Companies
Not applicable.
Item 8. Portfolio Managers ofClosed-End Management Investment Companies
Not applicable.
Item 9. Purchases of Equity Securities byClosed-End Management Investment Company and Affiliated Purchasers
Not applicable.
Item 10. Submission of Matters to a Vote of Security Holders
No material changes.
Item 11. Controls and Procedures
(a) It is the conclusion of the registrant’s principal executive officer and principal financial officer that the effectiveness of the registrant’s current disclosure controls and procedures (such disclosure controls and procedures having been evaluated within 90 days of the date of this filing) provide reasonable assurance that the information required to be disclosed by the registrant has been recorded, processed, summarized and reported within the time period specified in the Commission’s rules and forms and that the information required to be disclosed by the registrant has been accumulated and communicated to the registrant’s principal executive officer and principal financial officer in order to allow timely decisions regarding required disclosure.
(b) There have been no changes in the registrant’s internal controls over financial reporting during the second fiscal quarter of the period covered by this report that has materially affected, or is reasonably likely to materially affect, the registrant’s internal control over financial reporting.
Item 12. Disclosure of Securities Lending Activities forClosed-End Management Investment Companies
Not applicable.
Item 13. Exhibits
| | |
| |
| (a)(1) | | Registrant’s Code of Ethics – Not applicable (please see Item 2). |
| |
| (a)(2)(i) | | Treasurer’s Section 302 certification. |
| |
| (a)(2)(ii) | | President’s Section 302 certification. |
| |
| (b) | | Combined Section 906 certification. |
Signatures
Pursuant to the requirements of the Securities Exchange Act of 1934 and the Investment Company Act of 1940, the registrant has duly caused this report to be signed on its behalf by the undersigned, thereunto duly authorized.
Eaton Vance Municipals Trust
| | |
| By: | | /s/ Payson F. Swaffield |
| | Payson F. Swaffield |
| | President |
| |
| Date: | | March 22, 2019 |
Pursuant to the requirements of the Securities Exchange Act of 1934 and the Investment Company Act of 1940, this report has been signed below by the following persons on behalf of the registrant and in the capacities and on the dates indicated.
| | |
| By: | | /s/ James F. Kirchner |
| | James F. Kirchner |
| | Treasurer |
| |
| Date: | | March 22, 2019 |
| |
| By: | | /s/ Payson F. Swaffield |
| | Payson F. Swaffield |
| | President |
| |
| Date: | | March 22, 2019 |