UNITED STATES
SECURITIES AND EXCHANGE COMMISSION
Washington, D.C. 20549
Form N-CSR
CERTIFIED SHAREHOLDER REPORT OF REGISTERED
MANAGEMENT INVESTMENT COMPANIES
Investment Company Act File Number: 811-04409
Eaton Vance Municipals Trust
(Exact Name of Registrant as Specified in Charter)
Two International Place, Boston, Massachusetts 02110
(Address of Principal Executive Offices)
Maureen A. Gemma
Two International Place, Boston, Massachusetts 02110
(Name and Address of Agent for Services)
(617) 482-8260
(Registrant’s Telephone Number)
September 30
Date of Fiscal Year End
March 31, 2021
Date of Reporting Period
| Item 1. | Reports to Stockholders |

Eaton Vance
Municipal Income Funds
Semiannual Report
March 31, 2021
AMT-Free • National

Commodity Futures Trading Commission Registration. The Commodity Futures Trading Commission (“CFTC”) has adopted regulations that subject registered investment companies and advisers to regulation by the CFTC if a fund invests more than a prescribed level of its assets in certain CFTC-regulated instruments (including futures, certain options and swap agreements) or markets itself as providing investment exposure to such instruments. Each investment adviser has claimed an exclusion from the definition of “commodity pool operator” under the Commodity Exchange Act with respect to its management of each Fund. Accordingly, neither the Funds nor the adviser with respect to the operation of the Funds is subject to CFTC regulation. Because of its management of other strategies, each Fund’s adviser is registered with the CFTC as a commodity pool operator. Each adviser is also registered as a commodity trading advisor.
Fund shares are not insured by the FDIC and are not deposits or other obligations of, or guaranteed by, any depository institution. Shares are subject to investment risks, including possible loss of principal invested.
This report must be preceded or accompanied by a current summary prospectus or prospectus. Before investing, investors should consider carefully the investment objective, risks, and charges and expenses of a mutual fund. This and other important information is contained in the summary prospectus and prospectus, which can be obtained from a financial intermediary. Prospective investors should read the prospectus carefully before investing. For further information, please call 1-800-262-1122.
Semiannual Report March 31, 2021
Eaton Vance
Municipal Income Funds
Eaton Vance
AMT-Free Municipal Income Fund
March 31, 2021
Performance1,2
Portfolio Manager Cynthia J. Clemson
| | | | | | | | | | | | | | | | | | | | | | | | |
| % Average Annual Total Returns | | Class
Inception Date | | | Performance
Inception Date | | | Six Months | | | One Year | | | Five Years | | | Ten Years | |
| | | | | | |
Class A at NAV | | | 01/06/1998 | | | | 03/16/1978 | | | | 1.54 | % | | | 4.09 | % | | | 3.30 | % | | | 5.34 | % |
Class A with 4.75% Maximum Sales Charge | | | — | | | | — | | | | –3.27 | | | | –0.88 | | | | 2.30 | | | | 4.83 | |
| | | | | | |
Class C at NAV | | | 05/02/2006 | | | | 03/16/1978 | | | | 1.17 | | | | 3.44 | | | | 2.53 | | | | 4.56 | |
Class C with 1% Maximum Sales Charge | | | — | | | | — | | | | 0.17 | | | | 2.44 | | | | 2.53 | | | | 4.56 | |
| | | | | | |
Class I at NAV | | | 03/16/1978 | | | | 03/16/1978 | | | | 1.56 | | | | 4.36 | | | | 3.54 | | | | 5.59 | |
|
| |
| | | | | | |
Bloomberg Barclays Municipal Bond Index | | | — | | | | — | | | | 1.46 | % | | | 5.51 | % | | | 3.49 | % | | | 4.53 | % |
| | | | | | |
| % Total Annual Operating Expense Ratios3 | | | | | | | | | | | Class A | | | Class C | | | Class I | |
| | | | | | |
| | | | | | | | | | | | | | | 0.92 | % | | | 1.67 | % | | | 0.67 | % |
| | | | | | |
| % Distribution Rates/Yields4 | | | | | | | | | | | Class A | | | Class C | | | Class I | |
| | | | | | |
Distribution Rate | | | | | | | | | | | | | | | 2.75 | % | | | 2.05 | % | | | 3.01 | % |
Taxable-Equivalent Distribution Rate | | | | | | | | | | | | | | | 4.65 | | | | 3.46 | | | | 5.08 | |
| | | | | | |
SEC 30-day Yield | | | | | | | | | | | | | | | 0.81 | | | | 0.17 | | | | 1.09 | |
Taxable-Equivalent SEC 30-day Yield | | | | | | | | | | | | | | | 1.37 | | | | 0.28 | | | | 1.85 | |
| | | | | | |
| % Total Leverage5 | | | | | | | | | | | | | | | | | | |
| | | | | | |
| Residual Interest Bond (RIB) Financing | | | | | | | | | | | | | | | | | | | | | | | 5.15 | % |
Fund Profile
Credit Quality (% of total investments)6,7
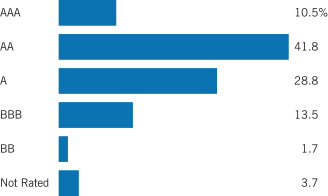
See Endnotes and Additional Disclosures in this report.
Past performance is no guarantee of future results. Returns are historical and are calculated by determining the percentage change in net asset value (NAV) or offering price (as applicable) with all distributions reinvested. Investment return and principal value will fluctuate so that shares, when redeemed, may be worth more or less than their original cost. Performance for periods less than or equal to one year is cumulative. Performance is for the stated time period only; due to market volatility, current Fund performance may be lower or higher than the quoted return. For performance as of the most recent month-end, please refer to eatonvance.com.
Eaton Vance
National Municipal Income Fund
March 31, 2021
Performance1,2
Portfolio Manager Craig R. Brandon, CFA
| | | | | | | | | | | | | | | | | | | | | | | | |
| % Average Annual Total Returns | | Class
Inception Date | | | Performance
Inception Date | | | Six Months | | | One Year | | | Five Years | | | Ten Years | |
| | | | | | |
Class A at NAV | | | 04/05/1994 | | | | 12/19/1985 | | | | 1.92 | % | | | 6.13 | % | | | 3.97 | % | | | 5.86 | % |
Class A with 4.75% Maximum Sales Charge | | | — | | | | — | | | | –2.92 | | | | 1.06 | | | | 2.96 | | | | 5.35 | |
| | | | | | |
Class C at NAV | | | 12/03/1993 | | | | 12/19/1985 | | | | 1.54 | | | | 5.34 | | | | 3.20 | | | | 5.08 | |
Class C with 1% Maximum Sales Charge | | | — | | | | — | | | | 0.54 | | | | 4.34 | | | | 3.20 | | | | 5.08 | |
| | | | | | |
Class I at NAV | | | 07/01/1999 | | | | 12/19/1985 | | | | 2.05 | | | | 6.39 | | | | 4.23 | | | | 6.13 | |
|
| |
| | | | | | |
Bloomberg Barclays Municipal Bond Index | | | — | | | | — | | | | 1.46 | % | | | 5.51 | % | | | 3.49 | % | | | 4.53 | % |
| | | | | | |
| % Total Annual Operating Expense Ratios3 | | | | | | | | | | | Class A | | | Class C | | | Class I | |
| | | | | | |
| | | | | | | | | | | | | | | 0.69 | % | | | 1.44 | % | | | 0.44 | % |
| | | | | | |
| % Distribution Rates/Yields4 | | | | | | | | | | | Class A | | | Class C | | | Class I | |
| | | | | | |
Distribution Rate | | | | | | | | | | | | | | | 2.15 | % | | | 1.38 | % | | | 2.40 | % |
Taxable-Equivalent Distribution Rate | | | | | | | | | | | | | | | 3.63 | | | | 2.33 | | | | 4.05 | |
| | | | | | |
SEC 30-day Yield | | | | | | | | | | | | | | | 0.88 | | | | 0.18 | | | | 1.17 | |
Taxable-Equivalent SEC 30-day Yield | | | | | | | | | | | | | | | 1.48 | | | | 0.30 | | | | 1.97 | |
| | | | | | |
| % Total Leverage5 | | | | | | | | | | | | | | | | | | |
| | | | | | |
| RIB Financing | | | | | | | | | | | | | | | | | | | | | | | 2.70 | % |
Fund Profile
Credit Quality (% of total investments)6,7
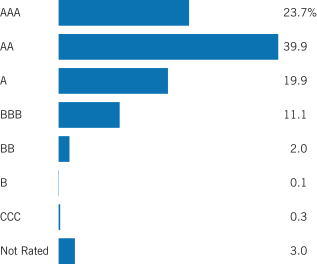
See Endnotes and Additional Disclosures in this report.
Past performance is no guarantee of future results. Returns are historical and are calculated by determining the percentage change in net asset value (NAV) or offering price (as applicable) with all distributions reinvested. Investment return and principal value will fluctuate so that shares, when redeemed, may be worth more or less than their original cost. Performance for periods less than or equal to one year is cumulative. Performance is for the stated time period only; due to market volatility, current Fund performance may be lower or higher than the quoted return. For performance as of the most recent month-end, please refer to eatonvance.com.
Eaton Vance
Municipal Income Funds
March 31, 2021
Endnotes and Additional Disclosures
| 1 | Bloomberg Barclays Municipal Bond Index is an unmanaged index of municipal bonds traded in the U.S. Unless otherwise stated, index returns do not reflect the effect of any applicable sales charges, commissions, expenses, taxes or leverage, as applicable. It is not possible to invest directly in an index. |
| 2 | Total Returns at NAV do not include applicable sales charges. If sales charges were deducted, the returns would be lower. Total Returns shown with maximum sales charge reflect the stated maximum sales charge. Unless otherwise stated, performance does not reflect the deduction of taxes on Fund distributions or redemptions of Fund shares. |
| 3 | Source: Fund prospectus. The expense ratios for the current reporting period can be found in the Financial Highlights section of this report. |
| 4 | The Distribution Rate is based on the Fund’s last regular distribution per share in the period (annualized) divided by the Fund’s NAV at the end of the period. The Fund’s distributions may be comprised of amounts characterized for federal income tax purposes as tax-exempt income, qualified and non-qualified ordinary dividends, capital gains and nondividend distributions, also known as return of capital. The Fund will determine the federal income tax character of distributions paid to a shareholder after the end of the calendar year. This is reported on the IRS form 1099-DIV and provided to the shareholder shortly after each year-end. The Fund’s distributions are determined by the investment adviser based on its current assessment of the Fund’s long-term return potential. As portfolio and market conditions change, the rate of distributions paid by the Fund could change. Taxable-equivalent performance is based on the highest combined federal and state income tax rates, where applicable. Lower tax rates would result in lower tax-equivalent performance. Actual tax rates will vary depending on your income, exemptions and deductions. Rates do not include local taxes. The SEC Yield is a standardized measure based on the estimated yield to maturity of a fund’s investments over a 30-day period and is based on the maximum offer price at the date specified. The SEC Yield is not based on the distributions made by the Fund, which may differ. |
| 5 | Fund employs RIB financing. The leverage created by RIB investments provides an opportunity for increased income but, at the same time, creates special risks (including the likelihood of greater volatility of NAV). The cost of leverage rises and falls with changes in short-term interest rates. See “Floating Rate Notes Issued in Conjunction with Securities Held” in the notes to the financial statements for more information about RIB financing. RIB leverage represents the amount of Floating Rate Notes outstanding at period end as a percentage of Fund net assets plus Floating Rate Notes. |
| 6 | For purposes of the Fund’s rating restrictions, ratings are based on Moody’s Investors Service, Inc. (“Moody’s”), S&P Global Ratings (“S&P”) or Fitch Ratings (“Fitch”), as applicable. If securities are rated differently by the ratings agencies, the highest rating is applied. Ratings, which are subject to change, apply to the creditworthiness of the issuers of the underlying securities and not to the Fund or its shares. Credit ratings measure the quality of a bond based on the issuer’s creditworthiness, with ratings ranging from AAA, being the highest, to D, being the lowest based on S&P’s measures. Ratings of BBB or higher by S&P or Fitch (Baa or higher by Moody’s) are considered to be investment-grade quality. Credit ratings are based |
| | largely on the ratings agency’s analysis at the time of rating. The rating assigned to any particular security is not necessarily a reflection of the issuer’s current financial condition and does not necessarily reflect its assessment of the volatility of a security’s market value or of the liquidity of an investment in the security. Holdings designated as “Not Rated” (if any) are not rated by the national ratings agencies stated above. |
| 7 | The chart includes the municipal bonds held by a trust that issues residual interest bonds, consistent with the Portfolio of Investments. |
Fund profiles subject to change due to active management.
Eaton Vance
Municipal Income Funds
March 31, 2021
Fund Expenses
Example: As a Fund shareholder, you incur two types of costs: (1) transaction costs, including sales charges (loads) on purchases and redemption fees (if applicable); and (2) ongoing costs, including management fees; distribution and/or service fees; and other Fund expenses. This Example is intended to help you understand your ongoing costs (in dollars) of Fund investing and to compare these costs with the ongoing costs of investing in other mutual funds. The Example is based on an investment of $1,000 invested at the beginning of the period and held for the entire period (October 1, 2020 – March 31, 2021).
Actual Expenses: The first section of each table below provides information about actual account values and actual expenses. You may use the information in this section, together with the amount you invested, to estimate the expenses that you paid over the period. Simply divide your account value by $1,000 (for example, an $8,600 account value divided by $1,000 = 8.6), then multiply the result by the number in the first section under the heading entitled “Expenses Paid During Period” to estimate the expenses you paid on your account during this period.
Hypothetical Example for Comparison Purposes: The second section of each table below provides information about hypothetical account values and hypothetical expenses based on the actual Fund expense ratio and an assumed rate of return of 5% per year (before expenses), which is not the actual Fund return. The hypothetical account values and expenses may not be used to estimate the actual ending account balance or expenses you paid for the period. You may use this information to compare the ongoing costs of investing in your Fund and other funds. To do so, compare this 5% hypothetical example with the 5% hypothetical examples that appear in the shareholder reports of the other funds.
Please note that the expenses shown in each table are meant to highlight your ongoing costs only and do not reflect any transactional costs, such as sales charges (loads) or redemption fees (if applicable). Therefore, the second section of each table is useful in comparing ongoing costs only, and will not help you determine the relative total costs of owning different funds. In addition, if these transactional costs were included, your costs would be higher.
Eaton Vance AMT-Free Municipal Income Fund
| | | | | | | | | | | | | | | | |
| | | Beginning
Account Value
(10/1/20) | | | Ending
Account Value
(3/31/21) | | | Expenses Paid
During Period*
(10/1/20 – 3/31/21) | | | Annualized
Expense
Ratio | |
| | | | |
Actual | | | | | | | | | | | | | | | | |
Class A | | $ | 1,000.00 | | | $ | 1,015.40 | | | $ | 4.07 | | | | 0.81 | % |
Class C | | $ | 1,000.00 | | | $ | 1,011.70 | | | $ | 7.82 | | | | 1.56 | % |
Class I | | $ | 1,000.00 | | | $ | 1,015.60 | | | $ | 2.81 | | | | 0.56 | % |
| | | | | |
Hypothetical | | | | | | | | | | | | | | | | |
(5% return per year before expenses) | | | | | | | | | | | | | | | | |
Class A | | $ | 1,000.00 | | | $ | 1,020.90 | | | $ | 4.08 | | | | 0.81 | % |
Class C | | $ | 1,000.00 | | | $ | 1,017.20 | | | $ | 7.85 | | | | 1.56 | % |
Class I | | $ | 1,000.00 | | | $ | 1,022.10 | | | $ | 2.82 | | | | 0.56 | % |
| * | Expenses are equal to the Fund’s annualized expense ratio for the indicated Class, multiplied by the average account value over the period, multiplied by 182/365 (to reflect the one-half year period). The Example assumes that the $1,000 was invested at the net asset value per share determined at the close of business on September 30, 2020. |
Eaton Vance
Municipal Income Funds
March 31, 2021
Fund Expenses — continued
Eaton Vance National Municipal Income Fund
| | | | | | | | | | | | | | | | |
| | | Beginning
Account Value
(10/1/20) | | | Ending
Account Value
(3/31/21) | | | Expenses Paid
During Period*
(10/1/20 – 3/31/21) | | | Annualized
Expense
Ratio | |
| | | | |
Actual | | | | | | | | | | | | | | | | |
Class A | | $ | 1,000.00 | | | $ | 1,019.20 | | | $ | 3.17 | | | | 0.63 | % |
Class C | | $ | 1,000.00 | | | $ | 1,015.40 | | | $ | 6.93 | | | | 1.38 | % |
Class I | | $ | 1,000.00 | | | $ | 1,020.50 | | | $ | 1.91 | | | | 0.38 | % |
| | | | | |
Hypothetical | | | | | | | | | | | | | | | | |
(5% return per year before expenses) | | | | | | | | | | | | | | | | |
Class A | | $ | 1,000.00 | | | $ | 1,021.80 | | | $ | 3.18 | | | | 0.63 | % |
Class C | | $ | 1,000.00 | | | $ | 1,018.10 | | | $ | 6.94 | | | | 1.38 | % |
Class I | | $ | 1,000.00 | | | $ | 1,023.00 | | | $ | 1.92 | | | | 0.38 | % |
| * | Expenses are equal to the Fund’s annualized expense ratio for the indicated Class, multiplied by the average account value over the period, multiplied by 182/365 (to reflect the one-half year period). The Example assumes that the $1,000 was invested at the net asset value per share determined at the close of business on September 30, 2020. |
Eaton Vance
AMT-Free Municipal Income Fund
March 31, 2021
Portfolio of Investments (Unaudited)
| | | | | | | | |
| Tax-Exempt Municipal Obligations — 99.0% | |
| Security | | Principal
Amount
(000’s omitted) | | | Value | |
|
| Bond Bank — 1.1% | |
| | |
Texas Water Development Board, 3.00%, 10/15/38 | | $ | 3,500 | | | $ | 3,909,045 | |
| | |
| | | | | | | $ | 3,909,045 | |
|
| Education — 5.4% | |
| | |
Connecticut Health and Educational Facilities Authority,
(Choate Rosemary Hall): | | | | | | |
| | |
4.00%, 7/1/38 | | $ | 315 | | | $ | 376,791 | |
| | |
4.00%, 7/1/39 | | | 380 | | | | 452,861 | |
| | |
4.00%, 7/1/42 | | | 860 | | | | 1,017,698 | |
| | |
5.00%, 7/1/32 | | | 175 | | | | 229,150 | |
| | |
Connecticut Health and Educational Facilities Authority, (Fairfield University), 5.00%, 7/1/46 | | | 5,000 | | | | 5,757,100 | |
| | |
Connecticut Health and Educational Facilities Authority,
(Sacred Heart University): | | | | | | |
| | |
4.00%, 7/1/45 | | | 875 | | | | 988,111 | |
| | |
5.00%, 7/1/40 | | | 900 | | | | 1,115,919 | |
| | |
| District of Columbia, (KIPP DC): | | | | | | |
| | |
4.00%, 7/1/39 | | | 100 | | | | 111,310 | |
| | |
4.00%, 7/1/44 | | | 100 | | | | 110,330 | |
| | |
4.00%, 7/1/49 | | | 135 | | | | 148,219 | |
| | |
Florida Development Finance Corp., (River City Science Academy), 4.00%, 7/1/45 | | | 200 | | | | 213,602 | |
| | |
Pennsylvania Higher Educational Facilities Authority, (Drexel University), 5.00%, 5/1/37 | | | 1,750 | | | | 2,060,993 | |
| | |
Pima County Community College District, AZ, 5.00%, 7/1/35 | | | 725 | | | | 903,800 | |
| | |
University of California, 5.25%, 5/15/35 | | | 3,555 | | | | 4,067,453 | |
| | |
Waco Education Finance Corp., TX, (Baylor University), 4.00%, 3/1/37 | | | 1,000 | | | | 1,157,590 | |
| | |
| | | | | | | $ | 18,710,927 | |
|
| Electric Utilities — 3.8% | |
| | |
| Long Island Power Authority, NY, Electric System Revenue: | | | | | | |
| | |
1.00%, 9/1/25 | | $ | 1,800 | | | $ | 1,819,044 | |
| | |
5.00%, 9/1/37 | | | 2,000 | | | | 2,588,640 | |
| | |
Lower Colorado River Authority, TX, (LCRA Transmission Services Corp.), 5.00%, 5/15/40 | | | 1,000 | | | | 1,242,960 | |
| | |
| New York Power Authority: | | | | | | |
| | |
4.00%, 11/15/45 | | | 2,285 | | | | 2,654,530 | |
| | |
4.00%, 11/15/50 | | | 715 | | | | 826,133 | |
| | |
| Northern Municipal Power Agency, MN: | | | | | | |
| | |
5.00%, 1/1/31 | | | 200 | | | | 237,302 | |
| | |
5.00%, 1/1/35 | | | 170 | | | | 199,379 | |
| | |
5.00%, 1/1/36 | | | 160 | | | | 187,240 | |
| | |
Utility Debt Securitization Authority, NY, 5.00%, 12/15/33 | | | 2,895 | | | | 3,250,419 | |
| | |
| | | | | | | $ | 13,005,647 | |
| | | | | | | | |
| Security | | Principal
Amount
(000’s omitted) | | | Value | |
|
| Escrowed / Prerefunded — 5.8% | |
| | |
California Health Facilities Financing Authority, (Sutter Health), Prerefunded to 8/15/21, 5.25%, 8/15/31 | | $ | 1,325 | | | $ | 1,349,618 | |
| | |
Henrico County Economic Development Authority, VA, (Bon Secours Health System, Inc.), Prerefunded to 11/1/22, 5.00%, 11/1/30 | | | 1,185 | | | | 1,275,013 | |
| | |
New Jersey Turnpike Authority, Prerefunded to 7/1/22, 5.00%, 1/1/30 | | | 3,060 | | | | 3,245,589 | |
| | |
North Carolina Capital Facilities Finance Agency, (Duke University), Prerefunded to 10/1/25, 5.00%, 10/1/41 | | | 1,480 | | | | 1,778,176 | |
| | |
Oklahoma Development Finance Authority, (St. John Health System), Prerefunded to 2/15/22, 5.00%, 2/15/34 | | | 2,035 | | | | 2,120,246 | |
| | |
Oregon Facilities Authority, (Lewis & Clark College), Prerefunded to 10/1/21, 5.625%, 10/1/36 | | | 1,050 | | | | 1,078,444 | |
| | |
Savannah Economic Development Authority, GA, Escrowed to Maturity, 0.00%, 12/1/21 | | | 6,000 | | | | 5,994,840 | |
| | |
West Virginia University, Prerefunded to 10/1/22, 5.00%, 10/1/31 | | | 3,000 | | | | 3,218,640 | |
| | |
| | | | | | | $ | 20,060,566 | |
|
| General Obligations — 15.9% | |
| | |
| California: | | | | | | |
| | |
5.00%, 4/1/35 | | $ | 2,125 | | | $ | 2,408,985 | |
| | |
5.25%, 10/1/29 | | | 560 | | | | 574,017 | |
| | |
5.25%, 10/1/32 | | | 3,480 | | | | 3,566,930 | |
| | |
Carrollton-Farmers Branch Independent School District, TX, (PSF Guaranteed), 3.00%, 2/15/41 | | | 1,000 | | | | 1,107,680 | |
| | |
| Chicago Board of Education, IL: | | | | | | |
| | |
5.00%, 12/1/21 | | | 230 | | | | 236,964 | |
| | |
5.00%, 12/1/42 | | | 260 | | | | 269,651 | |
| | |
5.00%, 12/1/44 | | | 1,405 | | | | 1,607,854 | |
| | |
| Chicago, IL: | | | | | | |
| | |
5.00%, 1/1/39 | | | 1,400 | | | | 1,646,918 | |
| | |
5.00%, 1/1/44 | | | 1,490 | | | | 1,732,900 | |
| | |
Corpus Christi Independent School District, TX, (PSF Guaranteed), 4.00%, 8/15/45 | | | 2,250 | | | | 2,640,015 | |
| | |
District of Columbia, 5.00%, 6/1/37(1) | | | 7,000 | | | | 8,590,120 | |
| | |
Fennville Public Schools, MI, 4.00%, 5/1/34 | | | 1,000 | | | | 1,153,130 | |
| | |
| Foothill-De Anza Community College District, CA: | | | | | | |
| | |
5.00%, 8/1/34 | | | 1,150 | | | | 1,318,268 | |
| | |
5.00%, 8/1/36 | | | 1,150 | | | | 1,315,807 | |
| | |
Gallatin County School District No. 44, MT, 4.00%, 6/1/35 | | | 520 | | | | 606,372 | |
| | |
| Illinois: | | | | | | |
| | |
4.00%, 6/1/33 | | | 1,000 | | | | 1,082,680 | |
| | |
4.00%, 11/1/40 | | | 1,000 | | | | 1,087,690 | |
| | |
5.00%, 5/1/35 | | | 2,000 | | | | 2,165,440 | |
| | |
5.50%, 5/1/39 | | | 205 | | | | 252,392 | |
| | |
5.75%, 5/1/45 | | | 210 | | | | 261,419 | |
| | | | |
| | 7 | | See Notes to Financial Statements. |
Eaton Vance
AMT-Free Municipal Income Fund
March 31, 2021
Portfolio of Investments (Unaudited) — continued
| | | | | | | | |
| Security | | Principal
Amount
(000’s omitted) | | | Value | |
|
| General Obligations (continued) | |
| | |
Kane, Cook and DuPage Counties School District No. 46, IL, 5.00%, 1/1/31 | | $ | 4,470 | | | $ | 5,008,814 | |
| | |
Lodi Unified School District, CA, (Election of 2016), 4.00%, 8/1/33 | | | 1,250 | | | | 1,468,687 | |
| | |
New York, NY, 4.00%, 8/1/42(1) | | | 7,000 | | | | 7,961,450 | |
| | |
Salem-Keizer School District No. 24J, OR, 0.00%, 6/15/24 | | | 1,220 | | | | 1,196,454 | |
| | |
Springfield School District No. 19, OR, 5.00%, 6/15/30 | | | 1,085 | | | | 1,277,674 | |
| | |
Union R-XI School District, MO, 5.00%, 3/1/38 | | | 2,100 | | | | 2,429,280 | |
| | |
University of Connecticut, 5.00%, 2/15/32 | | | 650 | | | | 726,005 | |
| | |
Washington, 5.00%, 6/1/38 | | | 710 | | | | 919,471 | |
| | |
| | | | | | | $ | 54,613,067 | |
|
| Hospital — 10.1% | |
| | |
California Health Facilities Financing Authority,
(St. Joseph Health System): | | | | | | |
| | |
5.00%, 7/1/33 | | $ | 1,720 | | | $ | 1,893,101 | |
| | |
5.00%, 7/1/37 | | | 2,300 | | | | 2,528,758 | |
| | |
California Statewide Communities Development Authority, (Loma Linda University Medical Center), 5.25%, 12/1/34 | | | 3,000 | | | | 3,386,970 | |
| | |
Chattanooga Health, Educational and Housing Facility Board, TN, (CommonSpirit Health), 4.00%, 8/1/37 | | | 1,250 | | | | 1,430,325 | |
| | |
Colorado Health Facilities Authority, (Vail Valley Medical Center), 5.00%, 1/15/35 | | | 2,000 | | | | 2,332,980 | |
| | |
| Delaware Health Facilities Authority, (Beebe Medical Center): | | | | | | |
| | |
5.00%, 6/1/36 | | | 3,730 | | | | 4,488,831 | |
| | |
5.00%, 6/1/37 | | | 1,000 | | | | 1,199,780 | |
| | |
Escambia County Health Facilities Authority, FL, (Baptist Health Care Corp. Obligated Group), 4.00%, 8/15/50 | | | 520 | | | | 573,263 | |
| | |
Massachusetts Development Finance Agency, (Children’s Hospital), 5.00%, 10/1/31 | | | 2,110 | | | | 2,398,395 | |
| | |
Missouri Health and Educational Facilities Authority, (Mercy Health), 5.00%, 11/15/47 | | | 3,000 | | | | 3,582,780 | |
| | |
Ohio, (University Hospitals Health Systems, Inc.), 5.00%, 1/15/36 | | | 2,500 | | | | 2,891,900 | |
| | |
Pennsylvania Higher Educational Facilities Authority,
(University of Pennsylvania Health System): | | | | | | |
| | |
5.00%, 8/15/23(2) | | | 500 | | | | 525,880 | |
| | |
5.00%, 8/15/24(2) | | | 550 | | | | 599,214 | |
| | |
5.00%, 8/15/25(2) | | | 500 | | | | 562,050 | |
| | |
5.00%, 8/15/26(2) | | | 600 | | | | 692,694 | |
| | |
Tarrant County Cultural Education Facilities Finance Corp., TX, (Cook Children’s Medical Center), 5.25%, 12/1/39(1) | | | 5,000 | | | | 5,579,450 | |
| | |
| | | | | | | $ | 34,666,371 | |
| | | | | | | | |
| Security | | Principal
Amount
(000’s omitted) | | | Value | |
|
| Housing — 0.7% | |
| | |
Phoenix Industrial Development Authority, AZ,
(Downtown Phoenix Student Housing, LLC -
Arizona State University): | | | | | | |
| | |
5.00%, 7/1/37 | | $ | 500 | | | $ | 568,440 | |
| | |
5.00%, 7/1/42 | | | 1,250 | | | | 1,403,713 | |
| | |
Texas Student Housing Corp., (University of North Texas), 9.375%, 7/1/06(3) | | | 285 | | | | 285,000 | |
| | |
| | | | | | | $ | 2,257,153 | |
|
| Industrial Development Revenue — 0.2% | |
| | |
George L. Smith II Georgia World Congress Center Authority, 4.00%, 1/1/36(2) | | $ | 715 | | | $ | 819,705 | |
| | |
| | | | | | | $ | 819,705 | |
|
| Insured – Education — 1.0% | |
| | |
Northern Illinois University, IL, (BAM), 5.00%, 4/1/31 | | $ | 950 | | | $ | 1,203,546 | |
| | |
Virginia College Building Authority, (Washington and Lee University), (NPFG), 5.25%, 1/1/31 | | | 1,750 | | | | 2,259,722 | |
| | |
| | | | | | | $ | 3,463,268 | |
|
| Insured – Electric Utilities — 1.1% | |
| | |
Ohio Municipal Electric Generation Agency, (NPFG), 0.00%, 2/15/29 | | $ | 2,865 | | | $ | 2,503,523 | |
| | |
Philadelphia, PA, Gas Works Revenue, (AGM), 4.00%, 8/1/45 | | | 1,000 | | | | 1,144,550 | |
| | |
| | | | | | | $ | 3,648,073 | |
|
| Insured – Escrowed / Prerefunded — 1.9% | |
| | |
Detroit, MI, Sewage Disposal System, (AGM), Prerefunded to 7/1/22, 5.00%, 7/1/39 | | $ | 4,825 | | | $ | 5,117,636 | |
| | |
Texas Transportation Commission, (Central Texas Turnpike System), (AMBAC), Escrowed to Maturity, 0.00%, 8/15/21 | | | 1,560 | | | | 1,559,267 | |
| | |
| | | | | | | $ | 6,676,903 | |
|
| Insured – General Obligations — 1.9% | |
| | |
Atlantic City, NJ, (AGM), 4.00%, 3/1/42 | | $ | 145 | | | $ | 157,936 | |
| | |
Chicago Board of Education, IL, (AGM), 5.00%, 12/1/24 | | | 505 | | | | 579,129 | |
| | |
| McCook, IL: | | | | | | |
| | |
(AGM), 4.00%, 12/1/29 | | | 240 | | | | 284,736 | |
| | |
(AGM), 4.00%, 12/1/30 | | | 200 | | | | 235,864 | |
| | |
(AGM), 4.00%, 12/1/33 | | | 500 | | | | 582,875 | |
| | |
(AGM), 4.00%, 12/1/34 | | | 190 | | | | 220,913 | |
| | |
Proviso Township High School District No. 209, IL, (AGM), 4.00%, 12/1/38 | | | 1,500 | | | | 1,688,880 | |
| | | | |
| | 8 | | See Notes to Financial Statements. |
Eaton Vance
AMT-Free Municipal Income Fund
March 31, 2021
Portfolio of Investments (Unaudited) — continued
| | | | | | | | |
| Security | | Principal
Amount
(000’s omitted) | | | Value | |
|
| Insured – General Obligations (continued) | |
| | |
| Yonkers, NY: | | | | | | |
| | |
(AGM), 4.00%, 2/15/35 | | $ | 800 | | | $ | 955,256 | |
| | |
(AGM), 5.00%, 2/15/31 | | | 810 | | | | 1,067,580 | |
| | |
(AGM), 5.00%, 2/15/33 | | | 720 | | | | 945,518 | |
| | |
| | | | | | | $ | 6,718,687 | |
|
| Insured – Lease Revenue / Certificates of Participation — 2.1% | |
| | |
Anaheim Public Financing Authority, CA, (Anaheim Public Improvements), (AGM), 0.00%, 9/1/31 | | $ | 8,680 | | | $ | 7,138,345 | |
| | |
| | | | | | | $ | 7,138,345 | |
|
| Insured – Other Revenue — 2.0% | |
| | |
Harris County-Houston Sports Authority, TX, (AGM), (NPFG), 0.00%, 11/15/34 | | $ | 10,600 | | | $ | 6,213,508 | |
| | |
New York City Industrial Development Agency, NY, (Yankee Stadium), (AGM), 3.00%, 3/1/38 | | | 555 | | | | 592,352 | |
| | |
| | | | | | | $ | 6,805,860 | |
|
| Insured – Special Tax Revenue — 3.5% | |
| | |
| Massachusetts, Dedicated Tax Revenue: | | | | | | |
| | |
(NPFG), 5.50%, 1/1/27 | | $ | 6,000 | | | $ | 7,417,320 | |
| | |
(NPFG), 5.50%, 1/1/30 | | | 2,565 | | | | 3,338,424 | |
| | |
Successor Agency to San Francisco City and County Redevelopment Agency, CA, (NPFG), 5.00%, 8/1/43 | | | 1,100 | | | | 1,253,395 | |
| | |
| | | | | | | $ | 12,009,139 | |
|
| Insured – Transportation — 8.6% | |
| | |
| Chicago, IL, (O’Hare International Airport): | | | | | | |
| | |
(AGM), 5.00%, 1/1/28 | | $ | 1,000 | | | $ | 1,079,410 | |
| | |
(AGM), 5.125%, 1/1/31 | | | 1,000 | | | | 1,075,940 | |
| | |
(AGM), 5.25%, 1/1/32 | | | 785 | | | | 846,159 | |
| | |
E-470 Public Highway Authority, CO, (NPFG), 0.00%, 9/1/39 | | | 7,120 | | | | 3,365,838 | |
| | |
| Metropolitan Transportation Authority, NY, Green Bonds: | | | | | | |
| | |
(AGM), 4.00%, 11/15/46 | | | 1,195 | | | | 1,336,954 | |
| | |
(AGM), 5.00%, 11/15/44 | | | 1,705 | | | | 2,056,400 | |
| | |
Pennsylvania Turnpike Commission, (AGM), 6.375%, 12/1/38 | | | 11,000 | | | | 14,586,550 | |
| | |
Texas Transportation Commission, (Central Texas Turnpike System), (AMBAC), 0.00%, 8/15/21 | | | 5,285 | | | | 5,276,650 | |
| | |
| | | | | | | $ | 29,623,901 | |
|
| Insured – Water and Sewer — 0.7% | |
| | |
Michigan Finance Authority, (Detroit Water and
Sewerage Department): | | | | | | |
| | |
(AGM), 5.00%, 7/1/32 | | $ | 655 | | | $ | 746,006 | |
| | | | | | | | |
| Security | | Principal
Amount
(000’s omitted) | | | Value | |
|
| Insured – Water and Sewer (continued) | |
| | |
Michigan Finance Authority, (Detroit Water and
Sewerage Department): (continued) | | | | | | |
| | |
(AGM), 5.00%, 7/1/33 | | $ | 565 | | | $ | 643,111 | |
| | |
(AGM), 5.00%, 7/1/35 | | | 280 | | | | 318,033 | |
| | |
(AGM), 5.00%, 7/1/37 | | | 565 | | | | 640,382 | |
| | |
| | | | | | | $ | 2,347,532 | |
|
| Lease Revenue / Certificates of Participation — 2.7% | |
| | |
Hudson Yards Infrastructure Corp., NY, 4.00%, 2/15/44 | | $ | 1,820 | | | $ | 2,010,172 | |
| | |
New Jersey Economic Development Authority,
(School Facilities Construction): | | | | | | |
| | |
4.00%, 6/15/34 | | | 500 | | | | 576,315 | |
| | |
4.00%, 6/15/35 | | | 400 | | | | 459,708 | |
| | |
4.00%, 6/15/38 | | | 600 | | | | 682,140 | |
| | |
4.00%, 6/15/39 | | | 650 | | | | 737,392 | |
| | |
4.00%, 6/15/40 | | | 700 | | | | 792,715 | |
| | |
4.00%, 6/15/46 | | | 315 | | | | 351,871 | |
| | |
5.00%, 6/15/37 | | | 3,000 | | | | 3,629,610 | |
| | |
| | | | | | | $ | 9,239,923 | |
|
| Other Revenue — 0.4% | |
| | |
Central Falls Detention Facility Corp., RI, 7.25%, 7/15/35(3) | | $ | 1,200 | | | $ | 216,000 | |
| | |
Mercer County Improvement Authority, NJ, 4.00%, 3/15/40 | | | 935 | | | | 1,090,790 | |
| | |
| | | | | | | $ | 1,306,790 | |
|
| Senior Living / Life Care — 3.6% | |
| | |
| National Finance Authority, NH, (The Vista): | | | | | | |
| | |
5.25%, 7/1/39(4) | | $ | 265 | | | $ | 262,218 | |
| | |
5.625%, 7/1/46(4) | | | 360 | | | | 360,068 | |
| | |
5.75%, 7/1/54(4) | | | 775 | | | | 777,193 | |
| | |
Palm Beach County Health Facilities Authority, FL,
(Sinai Residences of Boca Raton): | | | | | | |
| | |
7.25%, 6/1/39 | | | 570 | | | | 611,969 | |
| | |
7.50%, 6/1/49 | | | 2,690 | | | | 2,891,481 | |
| | |
Saint Louis County Industrial Development Authority, MO, (St. Andrew’s Resources for Seniors Obligated Group), 5.00%, 12/1/35 | | | 1,700 | | | | 1,765,603 | |
| | |
Tempe Industrial Development Authority, AZ,
(Friendship Village of Tempe): | | | | | | |
| | |
6.00%, 12/1/32 | | | 160 | | | | 162,770 | |
| | |
6.25%, 12/1/42 | | | 660 | | | | 670,712 | |
| | |
| Washington Housing Finance Commission, (Horizon House): | | | | | | |
| | |
5.00%, 1/1/32(4) | | | 1,575 | | | | 1,814,668 | |
| | |
5.00%, 1/1/38(4) | | | 2,325 | | | | 2,642,432 | |
| | | | |
| | 9 | | See Notes to Financial Statements. |
Eaton Vance
AMT-Free Municipal Income Fund
March 31, 2021
Portfolio of Investments (Unaudited) — continued
| | | | | | | | |
| Security | | Principal
Amount
(000’s omitted) | | | Value | |
|
| Senior Living / Life Care (continued) | |
| | |
Washington Housing Finance Commission, (Transforming Age), 5.00%, 1/1/34(4) | | $ | 245 | | | $ | 273,087 | |
| | |
| | | | | | | $ | 12,232,201 | |
|
| Special Tax Revenue — 5.5% | |
| | |
Connecticut, Special Tax Revenue, 4.00%, 5/1/36 | | $ | 3,500 | | | $ | 4,079,985 | |
| | |
Jurupa Public Financing Authority, CA, 5.00%, 9/1/31 | | | 1,200 | | | | 1,374,732 | |
| | |
Maryland Economic Development Corp., (Port Covington), 4.00%, 9/1/40 | | | 115 | | | | 127,140 | |
| | |
New York City Transitional Finance Authority, NY,
Future Tax Revenue: | | | | | | |
| | |
4.00%, 11/1/38 | | | 2,490 | | | | 2,871,543 | |
| | |
4.00%, 5/1/41 | | | 3,500 | | | | 4,008,550 | |
| | |
New York Dormitory Authority, Personal Income Tax Revenue, 4.00%, 3/15/36 | | | 1,500 | | | | 1,765,770 | |
| | |
New York State Urban Development Corp., Personal Income Tax Revenue, 4.00%, 3/15/34 | | | 3,065 | | | | 3,648,637 | |
| | |
River Hall Community Development District, FL, (Capital Improvements), 5.45%, 5/1/36 | | | 930 | | | | 935,134 | |
| | |
| | | | | | | $ | 18,811,491 | |
|
| Transportation — 14.4% | |
| | |
Central Texas Regional Mobility Authority, 5.00%, 1/1/45 | | $ | 1,550 | | | $ | 1,902,083 | |
| | |
| Chicago, IL, (O’Hare International Airport): | | | | | | |
| | |
4.00%, 1/1/35 | | | 2,500 | | | | 2,926,350 | |
| | |
4.00%, 1/1/36 | | | 2,750 | | | | 3,208,535 | |
| | |
Dallas and Fort Worth, TX, (Dallas/Fort Worth
International Airport): | | | | | | |
| | |
5.25%, 11/1/30 | | | 1,100 | | | | 1,231,329 | |
| | |
5.25%, 11/1/31 | | | 1,455 | | | | 1,626,734 | |
| | |
Grand Parkway Transportation Corp., TX, 5.125%, 10/1/43 | | | 1,100 | | | | 1,167,243 | |
| | |
| Memphis-Shelby County Airport Authority, TN: | | | | | | |
| | |
4.00%, 7/1/37 | | | 500 | | | | 581,305 | |
| | |
4.00%, 7/1/38 | | | 375 | | | | 435,338 | |
| | |
4.00%, 7/1/39 | | | 500 | | | | 578,310 | |
| | |
Miami-Dade County, FL, Aviation Revenue, 5.00%, 10/1/33 | | | 2,650 | | | | 3,031,838 | |
| | |
New Jersey Transportation Trust Fund Authority,
(Transportation Program): | | | | | | |
| | |
3.00%, 6/15/50 | | | 1,150 | | | | 1,139,363 | |
| | |
4.00%, 6/15/39 | | | 2,750 | | | | 3,119,737 | |
| | |
4.00%, 6/15/40 | | | 1,665 | | | | 1,885,529 | |
| | |
New Orleans Aviation Board, LA, 5.00%, 1/1/43 | | | 1,555 | | | | 1,843,872 | |
| | |
| New York Thruway Authority: | | | | | | |
| | |
5.00%, 1/1/38 | | | 2,000 | | | | 2,532,460 | |
| | |
5.00%, 1/1/46 | | | 1,875 | | | | 2,181,788 | |
| | | | | | | | |
| Security | | Principal
Amount
(000’s omitted) | | | Value | |
|
| Transportation (continued) | |
| | |
New York Transportation Development Corp.,
(Terminal 4 John F. Kennedy International Airport): | | | | | | |
| | |
4.00%, 12/1/40 | | $ | 3,000 | | | $ | 3,353,220 | |
| | |
4.00%, 12/1/41 | | | 2,900 | | | | 3,241,504 | |
| | |
Philadelphia, PA, Airport Revenue, 4.00%, 7/1/40 | | | 5,000 | | | | 5,701,150 | |
| | |
San Joaquin Hills Transportation Corridor Agency, CA, 5.00%, 1/15/34 | | | 5,235 | | | | 5,905,446 | |
| | |
Texas Private Activity Bond Surface Transportation Corp.,
(North Tarrant Express Managed Lanes Project): | | | | | | |
| | |
4.00%, 12/31/37 | | | 275 | | | | 315,865 | |
| | |
4.00%, 12/31/38 | | | 510 | | | | 584,067 | |
| | |
4.00%, 12/31/39 | | | 265 | | | | 302,760 | |
| | |
5.00%, 12/31/35 | | | 355 | | | | 443,274 | |
| | |
Texas Transportation Commission, 0.00%, 8/1/40 | | | 1,000 | | | | 470,300 | |
| | |
| | | | | | | $ | 49,709,400 | |
|
| Water and Sewer — 6.6% | |
| | |
Atlanta, GA, Water and Wastewater Revenue, 5.00%, 11/1/35(1) | | $ | 6,990 | | | $ | 8,678,574 | |
| | |
Eastern Municipal Water District Financing Authority, CA, 5.00%, 7/1/36 | | | 1,000 | | | | 1,321,920 | |
| | |
Fulton County, GA, Water and Sewerage Revenue, 4.00%, 1/1/32 | | | 1,375 | | | | 1,684,939 | |
| | |
New York City Municipal Water Finance Authority, NY,
(Water and Sewer System): | | | | | | |
| | |
4.00%, 6/15/41 | | | 4,000 | | | | 4,643,280 | |
| | |
5.00%, 6/15/48 | | | 4,400 | | | | 5,272,916 | |
| | |
San Diego Public Facilities Financing Authority, CA, Water Revenue, 4.00%, 8/1/40 | | | 1,000 | | | | 1,204,270 | |
| | |
| | | | | | | $ | 22,805,899 | |
| |
Total Tax-Exempt Municipal Obligations — 99.0%
(identified cost $315,894,317) | | | $ | 340,579,893 | |
| |
Other Assets, Less Liabilities — 1.0% | | | $ | 3,598,399 | |
| |
Net Assets — 100.0% | | | $ | 344,178,292 | |
The percentage shown for each investment category in the Portfolio of Investments is based on net assets.
At March 31, 2021, the concentration of the Fund’s investments in the various states, determined as a percentage of net assets, is as follows:
| | | | |
| |
| New York | | | 17.9% | |
| |
| California | | | 12.2% | |
| |
| Texas | | | 10.8% | |
| |
| Others, representing less than 10% individually | | | 58.1% | |
| | | | |
| | 10 | | See Notes to Financial Statements. |
Eaton Vance
AMT-Free Municipal Income Fund
March 31, 2021
Portfolio of Investments (Unaudited) — continued
The Fund invests primarily in debt securities issued by municipalities. The ability of the issuers of the debt securities to meet their obligations may be affected by economic developments in a specific industry or municipality. At March 31, 2021, 23.0% of total investments are backed by bond insurance of various financial institutions and financial guaranty assurance agencies. The aggregate percentage insured by an individual financial institution or financial guaranty assurance agency ranged from 0.4% to 14.8% of total investments.
| (1) | Security represents the municipal bond held by a trust that issues residual interest bonds (see Note 1H). |
| (2) | When-issued/delayed delivery security. |
| (3) | Defaulted security. Issuer has defaulted on the payment of interest and/or principal or has filed for bankruptcy. |
| (4) | Security exempt from registration under Rule 144A of the Securities Act of 1933, as amended. These securities may be sold in certain transactions in reliance on an exemption from registration (normally to qualified institutional buyers). At March 31, 2021, the aggregate value of these securities is $6,129,666 or 1.8% of the Fund’s net assets. |
Abbreviations:
| | | | |
| | |
| AGM | | – | | Assured Guaranty Municipal Corp. |
| | |
| AMBAC | | – | | AMBAC Financial Group, Inc. |
| | |
| BAM | | – | | Build America Mutual Assurance Co. |
| | |
| NPFG | | – | | National Public Finance Guarantee Corp. |
| | |
| PSF | | – | | Permanent School Fund |
| | | | |
| | 11 | | See Notes to Financial Statements. |
Eaton Vance
National Municipal Income Fund
March 31, 2021
Portfolio of Investments (Unaudited)
| | | | | | | | |
| Tax-Exempt Municipal Obligations — 92.2% | |
| Security | | Principal
Amount
(000’s omitted) | | | Value | |
|
| Bond Bank — 3.2% | |
| | |
Connecticut, (State Revolving Fund), Green Bonds, 5.00%, 3/1/28 | | $ | 10,000 | | | $ | 11,736,400 | |
| | |
Illinois Finance Authority, (Revolving Fund), Green Bonds, 4.00%, 7/1/32 | | | 11,480 | | | | 14,217,750 | |
| | |
Iowa Finance Authority, (State Revolving Fund), 5.00%, 8/1/32 | | | 12,000 | | | | 13,290,600 | |
| | |
New York State Environmental Facilities Corp., (State Revolving Fund), Green Bonds, 5.00%, 8/15/44 | | | 12,330 | | | | 15,529,142 | |
| | |
Ohio Water Development Authority, Water Pollution Control Loan Fund, 5.00%, 6/1/29 | | | 30,000 | | | | 39,179,700 | |
| | |
Rickenbacker Port Authority, OH, (OASBO Expanded Asset Pooled Financing Program), 5.375%, 1/1/32 | | | 11,310 | | | | 14,445,132 | |
| | |
Texas Water Development Board, (State Revolving Fund), 4.00%, 8/1/36 | | | 3,000 | | | | 3,662,970 | |
| | |
Wisconsin, Environmental Improvement Fund Revenue, Green Bonds, 5.00%, 6/1/36 | | | 5,000 | | | | 6,454,800 | |
| | |
| | | | | | | $ | 118,516,494 | |
|
| Cogeneration — 0.1% | |
| | |
Northampton County Industrial Development Authority, PA, (Northampton Generating), (AMT), 5.00%, 12/31/23(1) | | $ | 14,652 | | | $ | 3,663,079 | |
| | |
| | | | | | | $ | 3,663,079 | |
|
| Education — 5.6% | |
| | |
Allegheny County Higher Education Building Authority, PA, (Carnegie Mellon University), 5.00%, 8/1/27 | | $ | 3,335 | | | $ | 4,196,997 | |
| | |
Connecticut Health and Educational Facilities Authority, (Choate Rosemary Hall): | | | | | | | | |
| | |
4.00%, 7/1/36 | | | 480 | | | | 577,099 | |
| | |
4.00%, 7/1/37 | | | 150 | | | | 179,691 | |
| | |
5.00%, 7/1/29 | | | 220 | | | | 285,793 | |
| | |
Connecticut Health and Educational Facilities Authority, (Yale University), 5.00%, 7/1/27 | | | 5,000 | | | | 6,310,800 | |
| | |
District of Columbia, (District of Columbia International School), 5.00%, 7/1/49 | | | 2,290 | | | | 2,615,249 | |
| | |
Florida Development Finance Corp., (River City Science Academy), 4.00%, 7/1/45 | | | 400 | | | | 427,204 | |
| | |
Florida Higher Educational Facilities Financing Authority, (Jacksonville University), 4.75%, 6/1/38(2) | | | 2,245 | | | | 2,617,176 | |
| | |
Maryland Health and Higher Educational Facilities Authority, (Loyola University Maryland): | | | | | | | | |
| | |
5.00%, 10/1/22 | | | 500 | | | | 534,570 | |
| | |
5.00%, 10/1/23 | | | 500 | | | | 556,810 | |
| | |
5.00%, 10/1/24 | | | 500 | | | | 576,905 | |
| | | | | | | | |
| Security | | Principal
Amount
(000’s omitted) | | | Value | |
|
| Education (continued) | |
| | |
Maryland Health and Higher Educational Facilities Authority, (Stevenson University): | | | | | | | | |
| | |
4.00%, 6/1/36 | | $ | 400 | | | $ | 455,124 | |
| | |
4.00%, 6/1/38 | | | 500 | | | | 564,805 | |
| | |
4.00%, 6/1/40 | | | 500 | | | | 560,570 | |
| | |
4.00%, 6/1/46 | | | 1,000 | | | | 1,106,900 | |
| | |
5.00%, 6/1/28 | | | 200 | | | | 246,114 | |
| | |
5.00%, 6/1/30 | | | 350 | | | | 439,289 | |
| | |
Massachusetts Development Finance Agency, (Harvard University), 5.00%, 7/15/34 | | | 18,855 | | | | 22,873,755 | |
| | |
Michigan State University, 5.00%, 2/15/31 | | | 1,200 | | | | 1,535,304 | |
| | |
New Jersey Educational Facilities Authority, (Princeton University), 5.00%, 7/1/33 | | | 4,370 | | | | 5,442,354 | |
| | |
New York Dormitory Authority, (Columbia University), 5.00%, 10/1/38 | | | 19,045 | | | | 23,685,314 | |
| | |
New York Dormitory Authority, (Rockefeller University): | | | | | | | | |
| | |
5.00%, 7/1/35 | | | 2,750 | | | | 3,543,815 | |
| | |
5.00%, 7/1/53 | | | 15,000 | | | | 18,833,550 | |
| | |
| Purdue University, IN: | | | | | | |
| | |
5.00%, 7/1/30 | | | 600 | | | | 804,372 | |
| | |
5.00%, 7/1/31 | | | 1,000 | | | | 1,331,500 | |
| | |
5.00%, 7/1/35 | | | 685 | | | | 898,371 | |
| | |
5.00%, 7/1/36 | | | 1,500 | | | | 1,960,050 | |
| | |
Troy Capital Resource Corp., NY, (Rensselaer Polytechnic Institute), 5.00%, 9/1/39 | | | 6,000 | | | | 7,507,800 | |
| | |
University of California: | | | | | | | | |
| | |
5.25%, 5/15/36 | | | 5,720 | | | | 6,540,763 | |
| | |
5.25%, 5/15/37 | | | 13,000 | | | | 14,856,660 | |
| | |
5.25%, 5/15/38 | | | 7,700 | | | | 8,797,173 | |
| | |
Prerefunded to 5/15/24, 5.25%, 5/15/36 | | | 1,360 | | | | 1,568,760 | |
| | |
University of Virginia: | | | | | | | | |
| | |
5.00%, 4/1/38 | | | 13,205 | | | | 16,030,870 | |
| | |
5.00%, 4/1/39 | | | 40,970 | | | | 49,633,926 | |
| | |
Waco Education Finance Corp., TX, (Baylor University), 4.00%, 3/1/36 | | | 1,000 | | | | 1,160,980 | |
| | |
| | | | | | | $ | 209,256,413 | |
|
| Electric Utilities — 5.0% | |
| | |
Colorado Springs, CO, Utilities System Revenue: | | | | | | | | |
| | |
4.00%, 11/15/36 | | $ | 525 | | | $ | 640,999 | |
| | |
4.00%, 11/15/37 | | | 650 | | | | 790,881 | |
| | |
Long Island Power Authority, NY, Electric System Revenue, 1.00%, 9/1/25 | | | 7,020 | | | | 7,094,272 | |
| | |
Los Angeles Department of Water & Power, CA, Power System Revenue: | | | | | | | | |
| | |
5.00%, 7/1/38 | | | 6,130 | | | | 7,821,328 | |
| | |
5.00%, 7/1/42 | | | 1,870 | | | | 2,274,126 | |
| | | | |
| | 12 | | See Notes to Financial Statements. |
Eaton Vance
National Municipal Income Fund
March 31, 2021
Portfolio of Investments (Unaudited) — continued
| | | | | | | | |
| Security | | Principal
Amount
(000’s omitted) | | | Value | |
|
| Electric Utilities (continued) | |
| | |
Lower Colorado River Authority, TX, (LCRA Transmission Services Corp.), 5.00%, 5/15/45 | | $ | 1,500 | | | $ | 1,842,030 | |
| | |
New Smyrna Beach Utilities Commission, FL: | | | | | | | | |
| | |
4.00%, 10/1/31 | | | 880 | | | | 1,076,548 | |
| | |
4.00%, 10/1/41 | | | 435 | | | | 514,683 | |
| | |
4.00%, 10/1/42 | | | 300 | | | | 353,979 | |
| | |
4.00%, 10/1/45 | | | 700 | | | | 820,106 | |
| | |
New York Power Authority, 4.00%, 11/15/55 | | | 21,925 | | | | 25,234,359 | |
| | |
Omaha Public Power District, NE, 5.00%, 2/1/39 | | | 10,805 | | | | 12,483,341 | |
| | |
Public Power Generation Agency, NE, (Whelan Energy Center Unit 2), 5.00%, 1/1/28 | | | 6,025 | | | | 6,954,175 | |
| | |
Sacramento Municipal Utility District, CA: | | | | | | | | |
| | |
5.00%, 8/15/35 | | | 1,000 | | | | 1,321,960 | |
| | |
5.00%, 8/15/37 | | | 8,800 | | | | 11,549,736 | |
| | |
5.00%, 8/15/38 | | | 11,000 | | | | 14,393,500 | |
| | |
Green Bonds, 4.00%, 8/15/40 | | | 6,200 | | | | 7,440,682 | |
| | |
San Antonio, TX, Electric and Gas Systems Revenue, 4.00%, 2/1/30 | | | 2,000 | | | | 2,459,540 | |
| | |
Utility Debt Securitization Authority, NY: | | | | | | | | |
| | |
5.00%, 12/15/30(3) | | | 22,500 | | | | 25,301,025 | |
| | |
5.00%, 12/15/31(3) | | | 27,500 | | | | 30,907,800 | |
| | |
5.00%, 12/15/40 | | | 13,260 | | | | 16,392,012 | |
| | |
Series 2015, 5.00%, 12/15/33 | | | 10,000 | | | | 11,959,500 | |
| | |
| | | | | | | $ | 189,626,582 | |
|
| Escrowed / Prerefunded — 5.2% | |
| | |
Bexar County Health Facilities Development Corp., TX, (St. Luke’s Lutheran Hospital), Escrowed to Maturity, 7.00%, 5/1/21 | | $ | 860 | | | $ | 864,016 | |
| | |
California Health Facilities Financing Authority, (Sutter Health), Prerefunded to 8/15/21, 5.25%, 8/15/31 | | | 13,675 | | | | 13,929,081 | |
| | |
Columbia, SC, Waterworks and Sewer System Revenue, Prerefunded to 2/1/29, 5.00%, 2/1/49 | | | 2,340 | | | | 3,052,764 | |
| | |
Detroit, MI, Sewage Disposal System, Prerefunded to 7/1/22, 5.25%, 7/1/39 | | | 22,500 | | | | 23,934,150 | |
| | |
Detroit, MI, Water Supply System: | | | | | | | | |
| | |
Prerefunded to 7/1/21, 5.00%, 7/1/41 | | | 2,185 | | | | 2,210,652 | |
| | |
Prerefunded to 7/1/21, 5.25%, 7/1/41 | | | 56,420 | | | | 57,116,223 | |
| | |
Michigan Finance Authority, (Detroit Water and Sewerage Department), Prerefunded to 7/1/22, 5.00%, 7/1/44 | | | 8,090 | | | | 8,580,659 | |
| | |
New Jersey Turnpike Authority, Prerefunded to 7/1/24, 5.00%, 1/1/31 | | | 10,000 | | | | 11,517,200 | |
| | |
Oregon Department of Transportation, Prerefunded to 11/15/23, 5.00%, 11/15/38 | | | 250 | | | | 281,445 | |
| | |
Oregon Facilities Authority, (Lewis & Clark College), Prerefunded to 10/1/21, 5.625%, 10/1/36 | | | 9,930 | | | | 10,199,004 | |
| | | | | | | | |
| Security | | Principal
Amount
(000’s omitted) | | | Value | |
|
| Escrowed / Prerefunded (continued) | |
| | |
Rutgers State University, NJ, Prerefunded to 5/1/23, 5.00%, 5/1/43(3) | | $ | 37,000 | | | $ | 40,702,960 | |
| | |
Southwestern Illinois Development Authority, (Memorial Group, Inc.), Prerefunded to 11/1/23, 7.25%, 11/1/33 | | | 9,170 | | | | 10,793,915 | |
| | |
Unified Government of Wyandotte County/Kansas City, KS, Utility System Revenue, Prerefunded to 9/1/22, 5.00%, 9/1/32 | | | 10,000 | | | | 10,680,700 | |
| | |
| | | | | | | $ | 193,862,769 | |
|
| General Obligations — 22.4% | |
| | |
Allen Independent School District, TX, (PSF Guaranteed), 3.00%, 2/15/37 | | $ | 800 | | | $ | 897,624 | |
| | |
Anaheim Union High School District, CA, (Election of 2014): | | | | | | | | |
| | |
4.00%, 8/1/30 | | | 2,070 | | | | 2,440,282 | |
| | |
4.00%, 8/1/31 | | | 2,295 | | | | 2,690,681 | |
| | |
Antelope Valley Community College District, CA, (Election of 2016), 4.00%, 8/1/45 | | | 2,500 | | | | 2,930,100 | |
| | |
Arlington County, VA, 5.00%, 8/1/29 | | | 7,580 | | | | 10,023,489 | |
| | |
Belmont, MA, 4.00%, 3/15/32 | | | 3,030 | | | | 3,600,640 | |
| | |
Cabrillo Unified School District, CA, (Election of 2018): | | | | | | | | |
| | |
5.00%, 8/1/45 | | | 1,750 | | | | 2,155,387 | |
| | |
5.00%, 8/1/50 | | | 10,355 | | | | 12,696,369 | |
| | |
| California: | | | | | | |
| | |
0.50%, (SIFMA + 0.43%), 12/1/23 (Put Date), 12/1/29(4) | | | 15,000 | | | | 15,023,850 | |
| | |
4.00%, 3/1/38 | | | 4,650 | | | | 5,554,192 | |
| | |
5.00%, 12/1/22 | | | 5,000 | | | | 5,402,550 | |
| | |
5.00%, 3/1/34 | | | 3,145 | | | | 4,106,238 | |
| | |
5.00%, 3/1/35 | | | 23,410 | | | | 30,488,013 | |
| | |
5.00%, 3/1/35 | | | 5,000 | | | | 6,511,750 | |
| | |
5.00%, 4/1/35 | | | 4,000 | | | | 5,104,640 | |
| | |
Centennial School District No. 28Jt, OR, 5.00%, 6/15/45 | | | 10,000 | | | | 12,721,200 | |
| | |
Chester County, PA: | | | | | | | | |
| | |
4.00%, 7/15/39 | | | 500 | | | | 586,025 | |
| | |
4.00%, 7/15/40 | | | 500 | | | | 585,135 | |
| | |
Chicago Board of Education, IL: | | | | | | | | |
| | |
5.00%, 12/1/21 | | | 1,980 | | | | 2,039,954 | |
| | |
5.00%, 12/1/22 | | | 400 | | | | 427,692 | |
| | |
5.00%, 12/1/30 | | | 1,435 | | | | 1,786,417 | |
| | |
5.00%, 12/1/42 | | | 2,770 | | | | 2,872,822 | |
| | |
5.00%, 12/1/44 | | | 15,110 | | | | 17,291,582 | |
| | |
Chicago, IL: | | | | | | | | |
| | |
5.00%, 1/1/39 | | | 2,100 | | | | 2,470,377 | |
| | |
5.00%, 1/1/40 | | | 1,500 | | | | 1,760,985 | |
| | |
Clackamas Community College District, OR: | | | | | | | | |
| | |
5.00%, 6/15/38 | | | 760 | | | | 920,018 | |
| | |
5.00%, 6/15/39 | | | 1,000 | | | | 1,208,080 | |
| | |
5.00%, 6/15/40 | | | 1,250 | | | | 1,507,512 | |
| | | | |
| | 13 | | See Notes to Financial Statements. |
Eaton Vance
National Municipal Income Fund
March 31, 2021
Portfolio of Investments (Unaudited) — continued
| | | | | | | | |
| Security | | Principal
Amount
(000’s omitted) | | | Value | |
|
| General Obligations (continued) | |
| | |
Collin County Community College District, TX, 4.00%, 8/15/37 | | $ | 1,000 | | | $ | 1,185,150 | |
| | |
Collin County, TX, 4.00%, 2/15/36 | | | 5,705 | | | | 6,756,888 | |
| | |
Connecticut: | | | | | | | | |
| | |
3.00%, 1/15/33 | | | 7,000 | | | | 7,786,100 | |
| | |
4.00%, 1/15/37 | | | 15,000 | | | | 17,670,450 | |
| | |
Cypress-Fairbanks Independent School District, TX, (PSF Guaranteed), 4.00%, 2/15/37 | | | 3,000 | | | | 3,699,750 | |
| | |
Dallas Independent School District, TX, (PSF Guaranteed), 3.00%, 2/15/33 | | | 480 | | | | 545,482 | |
| | |
Dane County, WI: | | | | | | | | |
| | |
2.00%, 4/1/27 | | | 3,405 | | | | 3,654,791 | |
| | |
2.00%, 4/1/28 | | | 1,235 | | | | 1,322,450 | |
| | |
2.00%, 4/1/29 | | | 230 | | | | 245,146 | |
| | |
2.00%, 4/1/30 | | | 190 | | | | 201,560 | |
| | |
Desert Community College District, CA, 5.00%, 8/1/37 | | | 5,350 | | | | 6,330,922 | |
| | |
District of Columbia: | | | | | | | | |
| | |
5.00%, 10/15/30 | | | 4,000 | | | | 5,194,960 | |
| | |
5.00%, 10/15/32 | | | 10,000 | | | | 12,907,500 | |
| | |
Erie County, NY, 3.00%, 6/24/21 | | | 7,500 | | | | 7,548,525 | |
| | |
Forney Independent School District, TX, (PSF Guaranteed), 3.00%, 2/15/33 | | | 1,000 | | | | 1,137,310 | |
| | |
Frisco Independent School District, TX, (PSF Guaranteed), 4.00%, 2/15/45 | | | 2,765 | | | | 3,294,525 | |
| | |
Garden City Public Schools, MI: | | | | | | | | |
| | |
4.00%, 5/1/43 | | | 1,560 | | | | 1,830,457 | |
| | |
5.00%, 5/1/32 | | | 430 | | | | 561,210 | |
| | |
5.00%, 5/1/33 | | | 1,345 | | | | 1,747,949 | |
| | |
5.00%, 5/1/35 | | | 1,060 | | | | 1,368,704 | |
| | |
5.00%, 5/1/37 | | | 815 | | | | 1,044,830 | |
| | |
5.00%, 5/1/39 | | | 900 | | | | 1,151,424 | |
| | |
5.00%, 5/1/46 | | | 3,505 | | | | 4,442,342 | |
| | |
Hall County School District, GA, 4.00%, 2/1/38 | | | 1,500 | | | | 1,822,875 | |
| | |
Hartford County Metropolitan District, CT: | | | | | | | | |
| | |
5.00%, 7/15/23 | | | 1,000 | | | | 1,105,870 | |
| | |
5.00%, 7/15/24 | | | 1,000 | | | | 1,145,650 | |
| | |
Hawaii, 5.00%, 1/1/34 | | | 13,700 | | | | 17,012,523 | |
| | |
Hennepin County Regional Railroad Authority, MN, 5.00%, 12/1/30 | | | 4,040 | | | | 5,196,935 | |
| | |
Hermiston School District No. 8R, OR: | | | | | | | | |
| | |
0.00%, 6/15/42 | | | 6,475 | | | | 3,534,897 | |
| | |
0.00%, 6/15/45 | | | 4,595 | | | | 2,220,350 | |
| | |
Hillsboro School District No. 1J, OR: | | | | | | | | |
| | |
4.00%, 6/15/37 | | | 1,870 | | | | 2,252,920 | |
| | |
4.00%, 6/15/39 | | | 5,500 | | | | 6,586,635 | |
| | |
4.00%, 6/15/40 | | | 2,500 | | | | 2,986,500 | |
| | | | | | | | |
| Security | | Principal
Amount
(000’s omitted) | | | Value | |
|
| General Obligations (continued) | |
| | |
Howard County, MD: | | | | | | | | |
| | |
4.00%, 8/15/35 | | $ | 2,065 | | | $ | 2,532,371 | |
| | |
4.00%, 8/15/36 | | | 6,610 | | | | 8,075,173 | |
| | |
4.00%, 8/15/37 | | | 5,000 | | | | 6,086,500 | |
| | |
4.00%, 8/15/38 | | | 1,245 | | | | 1,506,002 | |
| | |
Hudsonville Public Schools, MI: | | | | | | | | |
| | |
4.00%, 5/1/37 | | | 1,500 | | | | 1,790,070 | |
| | |
4.00%, 5/1/39 | | | 1,060 | | | | 1,257,414 | |
| | |
4.00%, 5/1/44 | | | 1,975 | | | | 2,311,421 | |
| | |
Illinois: | | | | | | | | |
| | |
5.00%, 2/1/24 | | | 10,705 | | | | 11,913,487 | |
| | |
5.00%, 11/1/24 | | | 11,295 | | | | 12,829,200 | |
| | |
5.00%, 2/1/27 | | | 18,500 | | | | 20,330,205 | |
| | |
5.00%, 2/1/29 | | | 15,000 | | | | 17,555,400 | |
| | |
5.00%, 5/1/39 | | | 10,000 | | | | 10,765,400 | |
| | |
5.25%, 7/1/30 | | | 6,150 | | | | 6,605,223 | |
| | |
5.50%, 5/1/39 | | | 870 | | | | 1,071,127 | |
| | |
5.75%, 5/1/45 | | | 890 | | | | 1,107,917 | |
| | |
Issaquah School District No. 411, WA, 4.00%, 12/1/33 | | | 13,935 | | | | 17,047,243 | |
| | |
Johnson County, KS: | | | | | | | | |
| | |
2.00%, 9/1/33 | | | 2,370 | | | | 2,486,296 | |
| | |
3.00%, 9/1/30 | | | 2,415 | | | | 2,771,454 | |
| | |
Kane, Cook and DuPage Counties School District No. 46, IL: | | | | | | | | |
| | |
5.00%, 1/1/29 | | | 1,920 | | | | 2,151,994 | |
| | |
5.00%, 1/1/30 | | | 4,105 | | | | 4,601,007 | |
| | |
La Canada Unified School District, CA, (Election of 2017), 4.00%, 8/1/49 | | | 970 | | | | 1,108,681 | |
| | |
Lake Washington School District No. 414, WA, 4.00%, 12/1/28 | | | 10,000 | | | | 12,242,500 | |
| | |
Lodi Unified School District, CA, (Election of 2016): | | | | | | | | |
| | |
4.00%, 8/1/36 | | | 1,250 | | | | 1,457,813 | |
| | |
4.00%, 8/1/39 | | | 2,935 | | | | 3,399,699 | |
| | |
Lower Merion School District, PA, 4.00%, 11/15/28 | | | 2,000 | | | | 2,473,360 | |
| | |
Madison Metropolitan School District, WI, 4.00%, 3/1/30 | | | 2,450 | | | | 3,024,892 | |
| | |
Massachusetts: | | | | | | | | |
| | |
5.00%, 7/1/35 | | | 10,000 | | | | 11,721,900 | |
| | |
5.00%, 3/1/37 | | | 10,900 | | | | 12,200,588 | |
| | |
Metropolitan Government of Nashville and Davidson County, TN, 3.00%, 1/1/33 | | | 5,000 | | | | 5,699,900 | |
| | |
Minneapolis-St. Paul Metropolitan Council, MN, 4.00%, 3/1/30 | | | 1,250 | | | | 1,487,450 | |
| | |
Mississippi, 4.00%, 6/1/33 | | | 1,000 | | | | 1,228,820 | |
| | |
Montgomery, AL: | | | | | | | | |
| | |
3.00%, 12/1/24 | | | 500 | | | | 545,260 | |
| | |
3.00%, 12/1/25 | | | 500 | | | | 553,775 | |
| | |
5.00%, 12/1/26 | | | 500 | | | | 618,560 | |
| | |
5.00%, 12/1/27 | | | 500 | | | | 632,020 | |
| | | | |
| | 14 | | See Notes to Financial Statements. |
Eaton Vance
National Municipal Income Fund
March 31, 2021
Portfolio of Investments (Unaudited) — continued
| | | | | | | | |
| Security | | Principal
Amount
(000’s omitted) | | | Value | |
|
| General Obligations (continued) | |
| | |
New Jersey: | | | | | | | | |
| | |
5.00%, 6/1/25 | | $ | 5,000 | | | $ | 5,885,200 | |
| | |
5.00%, 6/1/27 | | | 4,000 | | | | 4,942,800 | |
| | |
5.00%, 6/1/29 | | | 3,000 | | | | 3,837,630 | |
| | |
| New York, NY: | | | | | | |
| | |
4.00%, 8/1/38 | | | 6,530 | | | | 7,537,318 | |
| | |
4.00%, 8/1/42(3) | | | 28,000 | | | | 31,845,800 | |
| | |
North Carolina, 5.00%, 6/1/30 | | | 10,000 | | | | 13,084,500 | |
| | |
Novi Community School District, MI: | | | | | | | | |
| | |
5.00%, 5/1/41 | | | 1,100 | | | | 1,389,355 | |
| | |
5.00%, 5/1/42 | | | 1,700 | | | | 2,140,827 | |
| | |
5.00%, 5/1/43 | | | 1,150 | | | | 1,444,757 | |
| | |
Ocean City, NJ, 2.25%, 9/15/32 | | | 1,760 | | | | 1,845,061 | |
| | |
Ocean County, NJ, 3.00%, 8/1/33 | | | 3,330 | | | | 3,755,208 | |
| | |
Oxnard Union High School District, CA, (Election of 2018), 5.00%, 8/1/43 | | | 3,750 | | | | 4,449,787 | |
| | |
Park City, UT, 4.00%, 2/1/31 | | | 3,490 | | | | 4,193,654 | |
| | |
Piscataway Township, NJ: | | | | | | | | |
| | |
2.00%, 10/15/36 | | | 1,600 | | | | 1,625,632 | |
| | |
3.00%, 10/15/32 | | | 1,610 | | | | 1,838,797 | |
| | |
Port of Houston Authority, TX, 3.00%, 10/1/39 | | | 1,325 | | | | 1,461,767 | |
| | |
Portland School District No. 1, OR, 4.00%, 6/15/32 | | | 3,945 | | | | 4,860,358 | |
| | |
Portland, OR: | | | | | | | | |
| | |
2021 Series A, 5.00%, 6/1/26 | | | 2,665 | | | | 3,264,971 | |
| | |
2021 Series B, 5.00%, 6/1/26 | | | 975 | | | | 1,194,502 | |
| | |
Prosper Independent School District, TX, (PSF Guaranteed): | | | | | | | | |
| | |
3.00%, 2/15/34 | | | 240 | | | | 274,198 | |
| | |
3.00%, 2/15/35 | | | 500 | | | | 569,540 | |
| | |
3.00%, 2/15/36 | | | 500 | | | | 567,320 | |
| | |
Richmond Community Schools, MI: | | | | | | | | |
| | |
4.00%, 5/1/36 | | | 2,200 | | | | 2,590,302 | |
| | |
4.00%, 5/1/37 | | | 2,655 | | | | 3,115,616 | |
| | |
4.00%, 5/1/38 | | | 2,665 | | | | 3,118,876 | |
| | |
4.00%, 5/1/39 | | | 2,665 | | | | 3,110,428 | |
| | |
Riverside Unified School District, CA, (Election of 2016): | | | | | | | | |
| | |
4.00%, 8/1/32 | | | 2,250 | | | | 2,642,962 | |
| | |
4.00%, 8/1/33 | | | 1,350 | | | | 1,584,373 | |
| | |
4.00%, 8/1/34 | | | 1,100 | | | | 1,287,583 | |
| | |
San Bernardino Community College District, CA, (Election of 2018): | | | | | | | | |
| | |
4.00%, 8/1/38 | | | 675 | | | | 780,374 | |
| | |
4.00%, 8/1/39 | | | 600 | | | | 692,250 | |
| | |
San Francisco Bay Area Rapid Transit District, CA, (Election of 2016), Green Bonds, 4.00%, 8/1/45 | | | 10,290 | | | | 12,066,466 | |
| | | | | | | | |
| Security | | Principal
Amount
(000’s omitted) | | | Value | |
|
| General Obligations (continued) | |
| | |
San Francisco Unified School District, CA, (Election of 2016): | | | | | | | | |
| | |
4.00%, 6/15/33 | | $ | 4,000 | | | $ | 4,715,800 | |
| | |
4.00%, 6/15/36 | | | 3,000 | | | | 3,507,390 | |
| | |
Scottsdale, AZ, 4.00%, 7/1/31 | | | 1,120 | | | | 1,398,040 | |
| | |
St. Paul, MN, 5.00%, 3/1/22(5) | | | 3,705 | | | | 3,861,203 | |
| | |
Tennessee, 5.00%, 9/1/28 | | | 3,000 | | | | 3,784,740 | |
| | |
Texas, (AMT), 4.50%, 8/1/28 | | | 1,585 | | | | 1,962,943 | |
| | |
Texas, (Texas Transportation Commission), Prerefunded to 10/1/24, 5.00%, 10/1/44 | | | 10,000 | | | | 11,626,200 | |
| | |
Virginia Beach, VA, 4.00%, 7/15/32 | | | 2,300 | | | | 2,794,408 | |
| | |
Walled Lake Consolidated School District, MI: | | | | | | | | |
| | |
5.00%, 5/1/41 | | | 700 | | | | 907,872 | |
| | |
5.00%, 5/1/42 | | | 1,000 | | | | 1,288,200 | |
| | |
5.00%, 5/1/45 | | | 1,365 | | | | 1,745,330 | |
| | |
5.00%, 5/1/50 | | | 2,500 | | | | 3,198,225 | |
| | |
Washington: | | | | | | | | |
| | |
5.00%, 2/1/33 | | | 13,140 | | | | 14,751,752 | |
| | |
5.00%, 8/1/34 | | | 12,915 | | | | 17,002,468 | |
| | |
5.00%, 6/1/36 | | | 6,280 | | | | 8,017,676 | |
| | |
5.00%, 8/1/36 | | | 13,010 | | | | 17,015,389 | |
| | |
5.00%, 2/1/37 | | | 3,695 | | | | 4,766,809 | |
| | |
5.00%, 8/1/38 | | | 25,430 | | | | 33,042,979 | |
| | |
5.00%, 2/1/39 | | | 1,445 | | | | 1,676,417 | |
| | |
5.00%, 6/1/39 | | | 2,125 | | | | 2,744,012 | |
| | |
5.00%, 6/1/41 | | | 2,000 | | | | 2,568,740 | |
| | |
Series 2021A, 5.00%, 8/1/35 | | | 20,890 | | | | 27,422,303 | |
| | |
Series R-2018D, 5.00%, 8/1/35 | | | 14,355 | | | | 17,756,417 | |
| | |
Washington County, OR, 4.00%, 3/1/30 | | | 1,000 | | | | 1,146,760 | |
| | |
West Linn-Wilsonville School District No. 3JT, OR: | | | | | | | | |
| | |
0.00%, 6/15/40 | | | 1,200 | | | | 744,984 | |
| | |
0.00%, 6/15/41 | | | 1,500 | | | | 898,980 | |
| | |
West Sonoma County Union High School District, CA, (Election of 2018): | | | | | | | | |
| | |
5.00%, 8/1/46 | | | 1,000 | | | | 1,222,690 | |
| | |
5.00%, 8/1/49 | | | 3,430 | | | | 4,182,645 | |
| | |
Wilmington, DE: | | | | | | | | |
| | |
5.00%, 1/1/33 | | | 1,000 | | | | 1,339,230 | |
| | |
5.00%, 1/1/35 | | | 1,330 | | | | 1,768,049 | |
| | |
Wisconsin, 5.00%, 5/1/38 | | | 22,500 | | | | 26,422,425 | |
| | |
| | | | | | | $ | 842,766,594 | |
|
| Hospital — 6.9% | |
| | |
Allegheny County Hospital Development Authority, PA, (UPMC Health System), 5.00%, 7/15/32 | | $ | 2,250 | | | $ | 2,885,580 | |
| | | | |
| | 15 | | See Notes to Financial Statements. |
Eaton Vance
National Municipal Income Fund
March 31, 2021
Portfolio of Investments (Unaudited) — continued
| | | | | | | | |
| Security | | Principal
Amount
(000’s omitted) | | | Value | |
|
| Hospital (continued) | |
| | |
Arlington County Industrial Development Authority, VA, (Virginia Hospital Center): | | | | | | | | |
| | |
4.00%, 7/1/38 | | $ | 1,000 | | | $ | 1,168,220 | |
| | |
4.00%, 7/1/45 | | | 3,000 | | | | 3,438,600 | |
| | |
Berks County Industrial Development Authority, PA, (Tower Health), 5.00%, 11/1/47 | | | 510 | | | | 511,607 | |
| | |
Brookhaven Development Authority, GA, (Children’s Healthcare of Atlanta), 5.00%, 7/1/31 | | | 755 | | | | 982,255 | |
| | |
Bucks County Industrial Development Authority, PA, (Grand View Hospital), 4.00%, 7/1/46 | | | 4,000 | | | | 4,253,880 | |
| | |
California Health Facilities Financing Authority, (St. Joseph Health System): | | | | | | | | |
| | |
5.00%, 7/1/33 | | | 17,530 | | | | 19,294,219 | |
| | |
5.00%, 7/1/37 | | | 25,465 | | | | 27,997,749 | |
| | |
Colorado Health Facilities Authority, (SCL Health System), 4.00%, 1/1/36 | | | 2,000 | | | | 2,359,920 | |
| | |
Connecticut Health and Educational Facilities Authority, (Nuvance Health), 4.00%, 7/1/34 | | | 2,455 | | | | 2,792,440 | |
| | |
DeKalb Private Hospital Authority, GA, (Children’s Healthcare of Atlanta), 5.00%, 7/1/31 | | | 1,000 | | | | 1,301,000 | |
| | |
Douglas County Hospital Authority No. 2, NE, (Children’s Hospital Obligated Group): | | | | | | | | |
| | |
4.00%, 11/15/36 | | | 425 | | | | 505,516 | |
| | |
4.00%, 11/15/41 | | | 590 | | | | 691,002 | |
| | |
Escambia County Health Facilities Authority, FL, (Baptist Health Care Corp. Obligated Group), 4.00%, 8/15/50 | | | 4,340 | | | | 4,784,546 | |
| | |
Fulton County Development Authority, GA, (Piedmont Healthcare, Inc.), 4.00%, 7/1/37 | | | 2,000 | | | | 2,337,480 | |
| | |
Hamilton County, OH, (UC Health), 5.00%, 9/15/50 | | | 8,000 | | | | 9,785,360 | |
| | |
Illinois Finance Authority, (Edward-Elmhurst Healthcare), 0.82%, (SIFMA + 0.75%), 7/1/23 (Put Date), 1/1/46(4) | | | 9,500 | | | | 9,507,790 | |
| | |
Illinois Finance Authority, (Presence Health Network): | | | | | | | | |
| | |
5.00%, 2/15/26 | | | 7,500 | | | | 9,042,225 | |
| | |
5.00%, 2/15/33 | | | 1,500 | | | | 1,806,525 | |
| | |
Kentucky Economic Development Finance Authority, (CommonSpirit Health), 5.00%, 8/1/44 | | | 6,000 | | | | 7,280,400 | |
| | |
Medford Hospital Facilities Authority, OR, (Asante Health System): | | | | | | | | |
| | |
4.00%, 8/15/50 | | | 2,000 | | | | 2,259,200 | |
| | |
5.00%, 8/15/45 | | | 3,000 | | | | 3,758,640 | |
| | |
Minneapolis and St. Paul Housing and Redevelopment Authority, MN, (Allina Health System), 5.00%, 11/15/23 | | | 1,700 | | | | 1,906,091 | |
| | |
Missouri Health and Educational Facilities Authority, (Mosaic Health System), 4.00%, 2/15/44 | | | 2,200 | | | | 2,505,558 | |
| | |
Missouri Health and Educational Facilities Authority, (SSM Health Care), 5.00%, 6/1/30 | | | 7,505 | | | | 8,468,942 | |
| | |
Montana Facility Finance Authority, (SCL Health System), 4.00%, 1/1/38 | | | 2,150 | | | | 2,519,994 | |
| | | | | | | | |
| Security | | Principal
Amount
(000’s omitted) | | | Value | |
|
| Hospital (continued) | |
| | |
New Jersey Health Care Facilities Financing Authority, (RWJ Barnabas Health Obligated Group), 5.00%, 7/1/33 | | $ | 5,000 | | | $ | 6,009,550 | |
| | |
New York Dormitory Authority, (Memorial Sloan-Kettering Cancer Center), 4.00%, 7/1/38 | | | 3,400 | | | | 3,971,200 | |
| | |
New York Dormitory Authority, (NYU Langone Hospitals Obligated Group): | | | | | | | | |
| | |
4.00%, 7/1/50 | | | 5,330 | | | | 6,084,302 | |
| | |
4.00%, 7/1/53 | | | 10,000 | | | | 11,343,600 | |
| | |
North Carolina Medical Care Commission, (Rex Healthcare), 4.00%, 7/1/40 | | | 1,400 | | | | 1,609,426 | |
| | |
Oklahoma Development Finance Authority, (OU Medicine): | | | | | | | | |
| | |
5.00%, 8/15/38 | | | 1,750 | | | | 2,088,940 | |
| | |
5.25%, 8/15/43 | | | 5,200 | | | | 6,264,804 | |
| | |
Oregon Facilities Authority, (Samaritan Health Services), 5.00%, 10/1/35 | | | 2,260 | | | | 2,640,674 | |
| | |
Oregon Health and Science University, 4.00%, 7/1/44 | | | 1,685 | | | | 1,943,900 | |
| | |
Pennsylvania Economic Development Financing Authority, (UPMC), 4.00%, 4/15/45 | | | 3,250 | | | | 3,745,072 | |
| | |
Pennsylvania Higher Educational Facilities Authority, (University of Pennsylvania Health System): | | | | | | | | |
| | |
5.00%, 8/15/23(5) | | | 500 | | | | 525,880 | |
| | |
5.00%, 8/15/24(5) | | | 550 | | | | 599,214 | |
| | |
5.00%, 8/15/25(5) | | | 500 | | | | 562,050 | |
| | |
5.00%, 8/15/26(5) | | | 600 | | | | 692,694 | |
| | |
Public Finance Authority, WI, (Blue Ridge HealthCare): | | | | | | | | |
| | |
5.00%, 1/1/36 | | | 470 | | | | 589,883 | |
| | |
5.00%, 1/1/37 | | | 500 | | | | 625,335 | |
| | |
Tampa, FL, (BayCare Health System), 5.00%, 11/15/46 | | | 10,500 | | | | 12,160,785 | |
| | |
Tarrant County Cultural Education Facilities Finance Corp., TX, (Cook Children’s Medical Center), 4.00%, 12/1/34 | | | 2,685 | | | | 3,191,418 | |
| | |
University of Kansas Hospital Authority, 5.00%, 9/1/45 | | | 25,500 | | | | 29,400,735 | |
| | |
Virginia Small Business Financing Authority, (Sentara Healthcare), 4.00%, 11/1/38 | | | 5,000 | | | | 5,788,400 | |
| | |
Washington Health Care Facilities Authority, (Overlake Hospital Medical Center), 5.00%, 7/1/42 | | | 2,250 | | | | 2,660,580 | |
| | |
West Virginia Hospital Finance Authority, (West Virginia United Health System Obligated Group), Prerefunded to 6/1/23, 5.375%, 6/1/38 | | | 21,895 | | | | 24,300,604 | |
| | |
| | | | | | | $ | 260,943,785 | |
|
| Housing — 0.4% | |
| | |
Maryland Economic Development Corp., (Morgan State University), Student Housing Revenue, 5.00%, 7/1/56 | | $ | 1,750 | | | $ | 2,059,855 | |
| | |
Massachusetts Housing Finance Agency, (Mill Road Apartments), 0.62%, (SIFMA + 0.55%), 11/1/23 (Put date), 11/1/48(4) | | | 3,920 | | | | 3,920,000 | |
| | |
Texas Student Housing Corp., (University of Northern Texas), 6.85%, 7/1/31 | | | 10,640 | | | | 10,638,723 | |
| | |
| | | | | | | $ | 16,618,578 | |
| | | | |
| | 16 | | See Notes to Financial Statements. |
Eaton Vance
National Municipal Income Fund
March 31, 2021
Portfolio of Investments (Unaudited) — continued
| | | | | | | | |
| Security | | Principal
Amount
(000’s omitted) | | | Value | |
|
| Industrial Development Revenue — 2.4% | |
| | |
Arkansas Development Finance Authority, (Big River Steel), (AMT), 4.50%, 9/1/49(2) | | $ | 1,000 | | | $ | 1,087,210 | |
| | |
George L. Smith II Georgia World Congress Center Authority, 4.00%, 1/1/54(5) | | | 3,690 | | | | 4,101,804 | |
| | |
Metropolitan Nashville Airport Authority, TN, (Aero Nashville), 5.20%, 7/1/26 | | | 265 | | | | 265,193 | |
| | |
Miami-Dade County Industrial Development Authority, FL, (Waste Management, Inc.), (AMT), 0.87%, (SIFMA + 0.80%), 11/1/21 (Put Date), 11/1/48(4) | | | 5,000 | | | | 5,000,750 | |
| | |
Mission Economic Development Corp., TX, (Waste Management, Inc.), (AMT), 0.87%, (SIFMA + 0.80%), 11/1/21 (Put Date), 11/1/48(4) | | | 10,000 | | | | 10,003,300 | |
| | |
New Jersey Economic Development Authority, (New Jersey-American Water Co., Inc.), (AMT), 2.20% to 12/3/29 (Put Date), 10/1/39 | | | 13,900 | | | | 14,570,536 | |
| | |
New York Transportation Development Corp., (Delta Air Lines, Inc. - LaGuardia Airport Terminals C&D Redevelopment): | | | | | | | | |
| | |
(AMT), 4.00%, 10/1/30 | | | 12,500 | | | | 14,521,750 | |
| | |
(AMT), 5.00%, 10/1/35 | | | 29,085 | | | | 36,238,165 | |
| | |
Tuscaloosa County Industrial Development Authority, AL, (Hunt Refining Co.), 5.25%, 5/1/44(2) | | | 3,685 | | | | 4,196,073 | |
| | |
Vermont Economic Development Authority, (Casella Waste Systems, Inc.), (AMT), 4.625% to 4/3/28 (Put Date), 4/1/36(2) | | | 475 | | | | 540,056 | |
| | |
| | | | | | | $ | 90,524,837 | |
|
| Insured – General Obligations — 0.8% | |
| | |
Grandville Public Schools, MI: | | | | | | | | |
| | |
(AGM), 4.00%, 5/1/35 | | $ | 785 | | | $ | 934,244 | |
| | |
(AGM), 4.00%, 5/1/36 | | | 1,045 | | | | 1,238,168 | |
| | |
(AGM), 4.00%, 5/1/37 | | | 1,000 | | | | 1,179,560 | |
| | |
(AGM), 4.00%, 5/1/38 | | | 1,000 | | | | 1,175,120 | |
| | |
(AGM), 4.00%, 5/1/39 | | | 1,000 | | | | 1,170,710 | |
| | |
(AGM), 4.00%, 5/1/40 | | | 650 | | | | 759,753 | |
| | |
Nassau County, NY, (AGM), 5.00%, 4/1/44 | | | 10,205 | | | | 12,721,961 | |
| | |
Santa Rosa High School District, CA, (Election of 2014), (AGM), 5.00%, 8/1/43 | | | 3,930 | | | | 4,685,661 | |
| | |
Ukiah Unified School District, CA, (Election of 2020): | | | | | | | | |
| | |
(AGM), 5.00%, 8/1/38 | | | 1,330 | | | | 1,632,987 | |
| | |
(AGM), 5.00%, 8/1/45 | | | 2,000 | | | | 2,418,780 | |
| | |
(AGM), 5.00%, 8/1/49 | | | 2,250 | | | | 2,712,870 | |
| | |
| | | | | | | $ | 30,629,814 | |
|
| Insured – Hospital — 0.1% | |
| | |
Connecticut Health and Educational Facilities Authority, (Hartford HealthCare Obligated Group), (AGM), 4.00%, 7/1/36 | | $ | 1,700 | | | $ | 1,947,537 | |
| | |
| | | | | | | $ | 1,947,537 | |
| | | | | | | | |
| Security | | Principal
Amount
(000’s omitted) | | | Value | |
|
| Insured – Other Revenue — 1.0% | |
| | |
Harris County-Houston Sports Authority, TX, (AGM), (NPFG), 0.00%, 11/15/34 | | $ | 58,155 | | | $ | 34,089,298 | |
| | |
New York City Industrial Development Agency, NY, (Queens Baseball Stadium), (AGM), 5.00%, 1/1/26 | | | 1,000 | | | | 1,200,660 | |
| | |
New York City Industrial Development Agency, NY, (Yankee Stadium): | | | | | | | | |
| | |
(AGM), 3.00%, 3/1/39 | | | 2,895 | | | | 3,067,223 | |
| | |
(AGM), 3.00%, 3/1/40 | | | 430 | | | | 452,958 | |
| | |
| | | | | | | $ | 38,810,139 | |
|
| Insured – Special Tax Revenue — 0.5% | |
| | |
Massachusetts, Dedicated Tax Revenue: | | | | | | | | |
| | |
(NPFG), 5.50%, 1/1/29 | | $ | 11,000 | | | $ | 14,095,840 | |
| | |
(NPFG), 5.50%, 1/1/30 | | | 3,080 | | | | 4,008,713 | |
| | |
| | | | | | | $ | 18,104,553 | |
|
| Insured – Transportation — 2.3% | |
| | |
E-470 Public Highway Authority, CO, (NPFG), 0.00%, 9/1/37 | | $ | 13,335 | | | $ | 6,999,141 | |
| | |
Kansas City Industrial Development Authority, MO, (Kansas City International Airport Terminal Modernization), (AGM), (AMT), 5.00%, 3/1/49 | | | 14,800 | | | | 17,752,896 | |
| | |
Metropolitan Transportation Authority, NY, Green Bonds: | | | | | | | | |
| | |
(AGM), 4.00%, 11/15/46 | | | 5,970 | | | | 6,679,176 | |
| | |
(AGM), 4.00%, 11/15/48(3) | | | 8,900 | | | | 10,027,096 | |
| | |
North Texas Tollway Authority, (AGC), 6.20%, 1/1/42 | | | 37,070 | | | | 43,840,836 | |
| | |
| | | | | | | $ | 85,299,145 | |
|
| Insured – Water and Sewer — 0.2% | |
| | |
Bloomington, IN, Sewage Works Revenue, Green Bonds: | | | | | | | | |
| | |
(BAM), 4.00%, 1/1/32 | | $ | 545 | | | $ | 664,883 | |
| | |
(BAM), 4.00%, 1/1/33 | | | 580 | | | | 706,620 | |
| | |
(BAM), 4.00%, 1/1/34 | | | 500 | | | | 605,925 | |
| | |
(BAM), 4.00%, 1/1/35 | | | 375 | | | | 452,295 | |
| | |
(BAM), 4.00%, 1/1/36 | | | 375 | | | | 451,054 | |
| | |
(BAM), 4.00%, 1/1/37 | | | 625 | | | | 748,775 | |
| | |
(BAM), 4.00%, 1/1/38 | | | 725 | | | | 865,650 | |
| | |
(BAM), 4.00%, 1/1/39 | | | 1,000 | | | | 1,189,160 | |
| | |
| | | | | | | $ | 5,684,362 | |
|
| Lease Revenue / Certificates of Participation — 2.7% | |
| | |
Florida Department of Transportation Financing Corp.: | | | | | | | | |
| | |
3.00%, 7/1/31 | | $ | 9,180 | | | $ | 10,570,035 | |
| | |
3.00%, 7/1/32 | | | 10,000 | | | | 11,461,300 | |
| | |
3.00%, 7/1/33 | | | 10,000 | | | | 11,399,900 | |
| | | | |
| | 17 | | See Notes to Financial Statements. |
Eaton Vance
National Municipal Income Fund
March 31, 2021
Portfolio of Investments (Unaudited) — continued
| | | | | | | | |
| Security | | Principal
Amount
(000’s omitted) | | | Value | |
|
| Lease Revenue / Certificates of Participation (continued) | |
| | |
Gwinnett County Water and Sewerage Authority, GA, 3.00%, 8/1/31 | | $ | 5,125 | | | $ | 5,924,859 | |
| | |
Hillsborough County, FL, 4.00%, 8/1/31 | | | 4,760 | | | | 5,819,576 | |
| | |
Hudson Yards Infrastructure Corp., NY, 4.00%, 2/15/44 | | | 2,420 | | | | 2,672,866 | |
| | |
Los Angeles County, CA, Tax and Revenue Anticipation Notes, 4.00%, 6/30/21 | | | 20,000 | | | | 20,193,200 | |
| | |
New Jersey Economic Development Authority, (Juvenile Justice Commission Facilities), 5.00%, 6/15/47 | | | 3,605 | | | | 4,202,276 | |
| | |
New Jersey Economic Development Authority, (School Facilities Construction): | | | | | | | | |
| | |
4.00%, 6/15/37 | | | 1,800 | | | | 2,052,918 | |
| | |
5.00%, 6/15/34 | | | 8,460 | | | | 10,337,528 | |
| | |
5.00%, 6/15/35 | | | 13,300 | | | | 16,202,459 | |
| | |
5.00%, 6/15/39 | | | 2,165 | | | | 2,625,842 | |
| | |
| | | | | | | $ | 103,462,759 | |
|
| Nursing Home — 0.1% | |
| | |
Mississippi Business Finance Corp., (Magnolia Healthcare), 7.99%, 7/1/25 | | $ | 4,940 | | | $ | 4,986,535 | |
| | |
| | | | | | | $ | 4,986,535 | |
|
| Other Revenue — 1.8% | |
| | |
Central Falls Detention Facility Corp., RI, 7.25%, 7/15/35(6) | | $ | 250 | | | $ | 45,000 | |
| | |
Cleveland-Cuyahoga County Port Authority, OH, (Playhouse Square Foundation), 5.25%, 12/1/38 | | | 750 | | | | 802,575 | |
| | |
DuPage County, IL, (The Morton Arboretum), Green Bonds, 3.00%, 5/15/47 | | | 5,085 | | | | 5,122,222 | |
| | |
Kalispel Tribe of Indians, WA: | | | | | | | | |
| | |
Series A, 5.25%, 1/1/38(2) | | | 1,865 | | | | 2,121,643 | |
| | |
Series B, 5.25%, 1/1/38(2) | | | 1,000 | | | | 1,137,610 | |
| | |
New York City Transitional Finance Authority, NY, (Building Aid), 5.00%, 7/15/43 | | | 23,295 | | | | 27,354,387 | |
| | |
New York City Trust for Cultural Resources, NY, (Whitney Museum of American Art), Green Bonds, 5.00%, 7/1/31 | | | 4,625 | | | | 6,229,598 | |
| | |
Oregon, Lottery Revenue, 5.00%, 4/1/36 | | | 4,045 | | | | 4,920,257 | |
| | |
Texas Municipal Gas Acquisition and Supply Corp. I, Gas Supply Revenue, 6.25%, 12/15/26 | | | 16,055 | | | | 18,869,120 | |
| | |
Washington Health Care Facilities Authority, (Fred Hutchinson Cancer Research Center), 1.173%, (67% of 1 mo. USD LIBOR + 1.10%), 7/1/22 (Put Date),
1/1/42(4) | | | 1,000 | | | | 1,004,090 | |
| | |
| | | | | | | $ | 67,606,502 | |
|
| Senior Living / Life Care — 0.7% | |
| | |
Clackamas County Hospital Facility Authority, OR, (Rose Villa): | | | | | | | | |
| | |
5.25%, 11/15/50 | | $ | 250 | | | $ | 267,850 | |
| | |
5.375%, 11/15/55 | | | 300 | | | | 321,933 | |
| | | | | | | | |
| Security | | Principal
Amount
(000’s omitted) | | | Value | |
|
| Senior Living / Life Care (continued) | |
| | |
Iowa Finance Authority, (Lifespace Communities, Inc.), 5.00%, 5/15/48 | | $ | 8,000 | | | $ | 9,044,320 | |
| | |
Logan County, CO, (TLC Care Choices, Inc.), 6.875%, 12/1/23(6) | | | 409 | | | | 98,200 | |
| | |
New Hope Cultural Education Facilities Finance Corp., TX, (Longhorn Village), 5.00%, 1/1/47 | | | 8,000 | | | | 8,581,120 | |
| | |
Rockville, MD, (Ingleside at King Farm): | | | | | | | | |
| | |
5.00%, 11/1/31 | | | 1,010 | | | | 1,076,933 | |
| | |
5.00%, 11/1/32 | | | 525 | | | | 558,878 | |
| | |
Tarrant County Cultural Education Facilities Finance Corp., TX, (MRC Stevenson Oaks): | | | | | | | | |
| | |
6.625%, 11/15/41 | | | 730 | | | | 812,709 | |
| | |
6.75%, 11/15/51 | | | 3,250 | | | | 3,601,845 | |
| | |
Wisconsin Health and Educational Facilities Authority, (Saint John’s Communities, Inc.): | | | | | | | | |
| | |
5.00%, 9/15/37 | | | 495 | | | | 510,087 | |
| | |
5.00%, 9/15/40 | | | 750 | | | | 785,085 | |
| | |
| | | | | | | $ | 25,658,960 | |
|
| Special Tax Revenue — 7.0% | |
| | |
Connecticut, Special Tax Revenue, 4.00%, 5/1/39 | | $ | 2,650 | | | $ | 3,059,452 | |
| | |
District of Columbia, Income Tax Revenue: | | | | | | | | |
| | |
4.00%, 5/1/45 | | | 6,500 | | | | 7,646,470 | |
| | |
5.00%, 3/1/39 | | | 5,060 | | | | 6,500,481 | |
| | |
Illinois Sports Facilities Authority: | | | | | | | | |
| | |
5.00%, 6/15/29 | | | 2,250 | | | | 2,705,963 | |
| | |
5.00%, 6/15/30 | | | 1,200 | | | | 1,426,140 | |
| | |
Maryland Economic Development Corp., (Port Covington), 4.00%, 9/1/40 | | | 1,285 | | | | 1,420,657 | |
| | |
Metropolitan Atlanta Rapid Transit Authority, GA, Sales Tax Revenue, 4.00%, 7/1/32 | | | 4,260 | | | | 5,251,941 | |
| | |
Nassau County Interim Finance Authority, NY, Sales Tax Revenue, 5.00%, 11/15/32 | | | 5,000 | | | | 6,766,500 | |
| | |
New River Community Development District, FL, (Capital Improvements): | | | | | | | | |
| | |
5.00%, 5/1/13(6) | | | 230 | | | | 0 | |
| | |
5.35%, 5/1/38(6) | | | 80 | | | | 0 | |
| | |
5.75%, 5/1/38 | | | 355 | | | | 357,922 | |
| | |
New York City Transitional Finance Authority, NY, Future Tax Revenue: | | | | | | | | |
| | |
4.00%, 11/1/35 | | | 11,380 | | | | 13,505,898 | |
| | |
4.00%, 8/1/38 | | | 5,000 | | | | 5,740,250 | |
| | |
4.00%, 5/1/42 | | | 5,695 | | | | 6,285,742 | |
| | |
5.00%, 8/1/35 | | | 10,485 | | | | 12,847,375 | |
| | |
5.00%, 5/1/36 | | | 4,050 | | | | 4,984,294 | |
| | |
5.00%, 5/1/39 | | | 9,240 | | | | 11,176,519 | |
| | |
2015 Series B, 5.00%, 8/1/39 | | | 4,585 | | | | 5,205,442 | |
| | |
2018 Series A, 5.00%, 8/1/39 | | | 11,845 | | | | 14,419,274 | |
| | | | |
| | 18 | | See Notes to Financial Statements. |
Eaton Vance
National Municipal Income Fund
March 31, 2021
Portfolio of Investments (Unaudited) — continued
| | | | | | | | |
| Security | | Principal
Amount
(000’s omitted) | | | Value | |
|
| Special Tax Revenue (continued) | |
| | |
New York Dormitory Authority, Personal Income Tax Revenue: | | | | | | | | |
| | |
4.00%, 3/15/36 | | $ | 18,500 | | | $ | 21,777,833 | |
| | |
5.00%, 2/15/45 | | | 9,995 | | | | 11,460,867 | |
| | |
5.00%, 2/15/48 | | | 8,940 | | | | 11,005,229 | |
| | |
New York Dormitory Authority, Sales Tax Revenue: | | | | | | | | |
| | |
5.00%, 3/15/36 | | | 7,840 | | | | 9,493,534 | |
| | |
5.00%, 3/15/40 | | | 10,000 | | | | 11,992,900 | |
| | |
(AMT), 5.00%, 3/15/27 | | | 1,620 | | | | 2,001,494 | |
| | |
(AMT), 5.00%, 3/15/28 | | | 1,705 | | | | 2,154,694 | |
| | |
(AMT), 5.00%, 3/15/29 | | | 1,790 | | | | 2,276,898 | |
| | |
(AMT), 5.00%, 3/15/31 | | | 970 | | | | 1,216,710 | |
| | |
(AMT), 5.00%, 3/15/32 | | | 2,070 | | | | 2,585,368 | |
| | |
New York State Urban Development Corp., Personal Income Tax Revenue: | | | | | | | | |
| | |
4.00%, 3/15/35 | | | 10,000 | | | | 11,754,400 | |
| | |
4.00%, 3/15/38 | | | 6,790 | | | | 7,918,226 | |
| | |
5.00%, 3/15/35 | | | 12,000 | | | | 14,172,840 | |
| | |
5.00%, 3/15/41 | | | 10,000 | | | | 12,303,500 | |
| | |
Puerto Rico Sales Tax Financing Corp.: | | | | | | | | |
| | |
4.329%, 7/1/40 | | | 5,536 | | | | 5,935,810 | |
| | |
4.784%, 7/1/58 | | | 2,219 | | | | 2,406,727 | |
| | |
San Francisco Bay Area Rapid Transit District, CA, Sales Tax Revenue: | | | | | | | | |
| | |
4.00%, 7/1/37 | | | 3,075 | | | | 3,569,337 | |
| | |
4.00%, 7/1/38 | | | 7,495 | | | | 8,681,009 | |
| | |
Southern Hills Plantation I Community Development District, FL: | | | | | | | | |
| | |
Series A1, 5.80%, 5/1/35 | | | 440 | | | | 376,983 | |
| | |
Series A2, 5.80%, 5/1/35 | | | 310 | | | | 246,875 | |
| | |
Sterling Hill Community Development District, FL, 6.20%, 5/1/35 | | | 1,532 | | | | 918,988 | |
| | |
Texas Transportation Commission, Prerefunded to 4/1/24, 5.00%, 4/1/33(3) | | | 10,000 | | | | 11,407,100 | |
| | |
| | | | | | | $ | 264,957,642 | |
|
| Student Loan — 0.1% | |
| | |
New Jersey Higher Education Student Assistance Authority, (AMT), 4.00%, 12/1/28 | | $ | 3,880 | | | $ | 4,159,942 | |
| | |
| | | | | | | $ | 4,159,942 | |
|
| Transportation — 20.2% | |
| | |
Atlanta, GA, Airport Revenue: | | | | | | | | |
| | |
(AMT), 4.00%, 7/1/34 | | $ | 3,480 | | | $ | 4,015,050 | |
| | |
(AMT), 4.00%, 7/1/36 | | | 5,000 | | | | 5,734,700 | |
| | | | | | | | |
| Security | | Principal
Amount
(000’s omitted) | | | Value | |
|
| Transportation (continued) | |
| | |
Austin, TX, Airport System Revenue, (AMT), 5.00%, 11/15/35 | | $ | 2,625 | | | $ | 3,277,444 | |
| | |
Central Texas Regional Mobility Authority, 5.00%, 1/1/36(5) | | | 500 | | | | 641,065 | |
| | |
Charleston County Airport District, SC, (AMT), 5.50%, 7/1/38 | | | 10,000 | | | | 11,046,500 | |
| | |
Chicago, IL, (Midway International Airport): | | | | | | | | |
| | |
5.00%, 1/1/33 | | | 3,830 | | | | 4,245,172 | |
| | |
(AMT), 5.00%, 1/1/34 | | | 5,250 | | | | 5,796,525 | |
| | |
Chicago, IL, (O’Hare International Airport): | | | | | | | | |
| | |
4.00%, 1/1/36 | | | 7,000 | | | | 8,167,180 | |
| | |
5.00%, 1/1/32 | | | 15,160 | | | | 19,409,045 | |
| | |
5.00%, 1/1/36 | | | 6,000 | | | | 7,008,480 | |
| | |
(AMT), 5.00%, 1/1/23 | | | 1,125 | | | | 1,216,215 | |
| | |
(AMT), 5.00%, 1/1/25 | | | 16,100 | | | | 17,354,995 | |
| | |
(AMT), 5.00%, 1/1/33 | | | 7,300 | | | | 8,351,492 | |
| | |
(AMT), 5.00%, 1/1/39 | | | 4,000 | | | | 4,806,560 | |
| | |
Dallas and Fort Worth, TX, (Dallas/Fort Worth International Airport): | | | | | | | | |
| | |
4.00%, 11/1/34 | | | 9,895 | | | | 11,888,348 | |
| | |
4.00%, 11/1/35 | | | 1,105 | | | | 1,323,204 | |
| | |
5.25%, 11/1/31 | | | 10,395 | | | | 11,621,922 | |
| | |
(AMT), 5.25%, 11/1/30 | | | 11,015 | | | | 12,258,153 | |
| | |
Delaware River and Bay Authority of Delaware and New Jersey: | | | | | | | | |
| | |
4.00%, 1/1/34 | | | 2,600 | | | | 3,052,972 | |
| | |
4.00%, 1/1/39 | | | 2,725 | | | | 3,131,488 | |
| | |
Denver City and County, CO, Airport System Revenue, (AMT), 5.00%, 12/1/37 | | | 10,000 | | | | 12,147,900 | |
| | |
Florida Department of Transportation, Turnpike System Revenue: | | | | | | | | |
| | |
3.00%, 7/1/33 | | | 6,420 | | | | 7,194,380 | |
| | |
4.00%, 7/1/32 | | | 6,170 | | | | 7,618,778 | |
| | |
Florida Development Finance Corp., (Brightline Florida Passenger Rail), Green Bonds, (AMT), 7.375%, 1/1/49(2) | | | 15,685 | | | | 15,469,331 | |
| | |
Harris County, TX, Toll Road Revenue: | | | | | | | | |
| | |
4.00%, 8/15/36 | | | 1,750 | | | | 2,122,575 | |
| | |
4.00%, 8/15/45 | | | 2,500 | | | | 2,940,950 | |
| | |
Hawaii, Airports System Revenue: | | | | | | | | |
| | |
(AMT), 5.00%, 7/1/30 | | | 1,420 | | | | 1,827,384 | |
| | |
(AMT), 5.00%, 7/1/41 | | | 2,935 | | | | 3,363,011 | |
| | |
(AMT), 5.00%, 7/1/48 | | | 10,000 | | | | 11,833,600 | |
| | |
Hawaii, Harbor System Revenue, (AMT), 4.00%, 7/1/36 | | | 180 | | | | 210,191 | |
| | |
Houston, TX, Airport System Revenue: | | | | | | | | |
| | |
(AMT), 4.00%, 7/1/35 | | | 1,500 | | | | 1,733,445 | |
| | |
(AMT), 4.00%, 7/1/36 | | | 2,000 | | | | 2,302,680 | |
| | | | |
| | 19 | | See Notes to Financial Statements. |
Eaton Vance
National Municipal Income Fund
March 31, 2021
Portfolio of Investments (Unaudited) — continued
| | | | | | | | |
| Security | | Principal
Amount
(000’s omitted) | | | Value | |
|
| Transportation (continued) | |
| | |
Kansas City Industrial Development Authority, MO, (Kansas City International Airport Terminal Modernization), (AMT), 5.00%, 3/1/46 | | $ | 17,130 | | | $ | 20,373,565 | |
| | |
Kansas Department of Transportation, 5.00%, 9/1/30 | | | 20,000 | | | | 22,974,800 | |
| | |
Los Angeles Department of Airports, CA, (Los Angeles International Airport): | | | | | | | | |
| | |
(AMT), 5.00%, 5/15/24 | | | 1,200 | | | | 1,366,944 | |
| | |
(AMT), 5.00%, 5/15/26 | | | 1,335 | | | | 1,613,895 | |
| | |
(AMT), 5.00%, 5/15/33 | | | 5,000 | | | | 6,193,650 | |
| | |
(AMT), 5.00%, 5/15/40 | | | 6,000 | | | | 6,894,060 | |
| | |
(AMT), 5.00%, 5/15/41 | | | 9,000 | | | | 10,419,120 | |
| | |
Louisiana Offshore Terminal Authority, (LOOP LLC), 2.00% to 10/1/22 (Put Date), 10/1/40 | | | 2,000 | | | | 2,017,320 | |
| | |
Love Field Airport Modernization Corp., TX, (AMT), 5.00%, 11/1/24 | | | 1,500 | | | | 1,721,655 | |
| | |
Maryland Economic Development Corp., (Transportation Facilities), 5.00%, 6/1/35 | | | 1,050 | | | | 1,202,418 | |
| | |
Massachusetts Port Authority: | | | | | | | | |
| | |
5.00%, 7/1/32 | | | 3,800 | | | | 4,889,916 | |
| | |
(AMT), 5.00%, 7/1/26 | | | 10,105 | | | | 12,276,059 | |
| | |
(AMT), 5.00%, 7/1/30 | | | 3,000 | | | | 3,818,700 | |
| | |
(AMT), 5.00%, 7/1/31 | | | 2,965 | | | | 3,756,210 | |
| | |
(AMT), 5.00%, 7/1/32 | | | 4,200 | | | | 5,299,896 | |
| | |
(AMT), 5.00%, 7/1/33 | | | 3,855 | | | | 4,852,443 | |
| | |
Memphis-Shelby County Airport Authority, TN: | | | | | | | | |
| | |
(AMT), 5.00%, 7/1/35 | | | 3,440 | | | | 4,156,724 | |
| | |
(AMT), 5.00%, 7/1/36 | | | 3,200 | | | | 3,855,360 | |
| | |
Metropolitan Washington Airports Authority, D.C.: | | | | | | | | |
| | |
(AMT), 5.00%, 10/1/28 | | | 4,500 | | | | 5,148,405 | |
| | |
(AMT), 5.00%, 10/1/32 | | | 10,000 | | | | 11,878,600 | |
| | |
(AMT), 5.00%, 10/1/42 | | | 2,000 | | | | 2,371,320 | |
| | |
Miami-Dade County, FL, Aviation Revenue: | | | | | | | | |
| | |
(AMT), 4.00%, 10/1/44 | | | 5,000 | | | | 5,579,550 | |
| | |
(AMT), 5.00%, 10/1/33 | | | 23,250 | | | | 26,427,810 | |
| | |
(AMT), 5.00%, 10/1/36 | | | 9,125 | | | | 10,378,957 | |
| | |
(AMT), 5.00%, 10/1/38 | | | 1,935 | | | | 2,344,872 | |
| | |
(AMT), 5.00%, 10/1/40 | | | 26,730 | | | | 31,702,315 | |
| | |
(AMT), 5.00%, 10/1/41 | | | 2,320 | | | | 2,791,958 | |
| | |
Minneapolis-St. Paul Metropolitan Airports Commission, MN, (AMT), 5.00%, 1/1/32 | | | 3,710 | | | | 4,587,378 | |
| | |
New Jersey Economic Development Authority, (Transit Transportation Project), 4.00%, 11/1/44 | | | 8,250 | | | | 9,140,257 | |
| | |
New Jersey Transportation Trust Fund Authority, (Transportation Program): | | | | | | | | |
| | |
1.27%, (SIFMA + 1.20%), 12/15/21 (Put Date), 6/15/34(4) | | | 2,275 | | | | 2,276,684 | |
| | |
4.00%, 6/15/36 | | | 6,635 | | | | 7,479,370 | |
| | | | | | | | |
| Security | | Principal
Amount
(000’s omitted) | | | Value | |
|
| Transportation (continued) | |
| | |
New Jersey Transportation Trust Fund Authority, (Transportation Program): (continued) | | | | | | | | |
| | |
4.00%, 6/15/39 | | $ | 8,000 | | | $ | 9,075,600 | |
| | |
4.00%, 6/15/40 | | | 3,335 | | | | 3,776,721 | |
| | |
4.00%, 6/15/45 | | | 18,500 | | | | 20,696,505 | |
| | |
5.00%, 6/15/45 | | | 13,205 | | | | 16,042,754 | |
| | |
New Jersey Turnpike Authority: | | | | | | | | |
| | |
Series 2015E, 5.00%, 1/1/31 | | | 2,680 | | | | 3,091,621 | |
| | |
Series 2017B, 5.00%, 1/1/31 | | | 3,560 | | | | 4,387,380 | |
| | |
New York Thruway Authority: | | | | | | | | |
| | |
4.00%, 1/1/41 | | | 9,950 | | | | 11,568,069 | |
| | |
4.00%, 1/1/42 | | | 10,000 | | | | 11,591,500 | |
| | |
4.00%, 1/1/43 | | | 10,000 | | | | 11,562,300 | |
| | |
5.00%, 1/1/36 | | | 12,500 | | | | 15,850,125 | |
| | |
5.00%, 1/1/39 | | | 1,845 | | | | 2,327,781 | |
| | |
5.00%, 1/1/40 | | | 17,155 | | | | 21,593,342 | |
| | |
New York Transportation Development Corp., (LaGuardia Airport Terminal B Redevelopment): | | | | | | | | |
| | |
(AMT), 5.00%, 7/1/41 | | | 1,705 | | | | 1,911,612 | |
| | |
(AMT), 5.00%, 7/1/46 | | | 14,325 | | | | 16,017,212 | |
| | |
(AMT), 5.25%, 1/1/50 | | | 1,180 | | | | 1,329,943 | |
| | |
New York Transportation Development Corp., (Terminal 4 John F. Kennedy International Airport): | | | | | | | | |
| | |
5.00%, 12/1/25 | | | 800 | | | | 939,192 | |
| | |
5.00%, 12/1/26 | | | 1,000 | | | | 1,203,860 | |
| | |
5.00%, 12/1/34 | | | 1,750 | | | | 2,172,013 | |
| | |
5.00%, 12/1/35 | | | 2,225 | | | | 2,767,678 | |
| | |
(AMT), 5.00%, 12/1/25 | | | 1,100 | | | | 1,283,227 | |
| | |
(AMT), 5.00%, 12/1/30 | | | 1,710 | | | | 2,156,549 | |
| | |
(AMT), 5.00%, 12/1/34 | | | 2,150 | | | | 2,664,259 | |
| | |
North Texas Tollway Authority, 5.00%, 1/1/29 | | | 5,000 | | | | 5,931,950 | |
| | |
Port Authority of New York and New Jersey: | | | | | | | | |
| | |
(AMT), 4.00%, 9/1/34 | | | 8,310 | | | | 9,047,928 | |
| | |
(AMT), 5.00%, 9/15/31 | | | 15,000 | | | | 18,505,200 | |
| | |
(AMT), 5.00%, 10/1/35 | | | 5,000 | | | | 5,981,650 | |
| | |
(AMT), 5.00%, 4/1/36 | | | 10,230 | | | | 12,190,579 | |
| | |
(AMT), 5.00%, 10/15/41(5) | | | 2,500 | | | | 3,100,375 | |
| | |
Port of Seattle, WA: | | | | | | | | |
| | |
(AMT), 5.00%, 4/1/23 | | | 2,000 | | | | 2,173,720 | |
| | |
(AMT), 5.00%, 4/1/24 | | | 2,165 | | | | 2,438,461 | |
| | |
(AMT), 5.00%, 4/1/25 | | | 1,500 | | | | 1,742,580 | |
| | |
Raleigh-Durham Airport Authority, NC, (AMT), Series 2020A, 5.00%, 5/1/36 | | | 1,000 | | | | 1,272,100 | |
| | |
Salt Lake City, UT, (Salt Lake City International Airport), (AMT), 5.00%, 7/1/38 | | | 7,165 | | | | 8,667,500 | |
| | | | |
| | 20 | | See Notes to Financial Statements. |
Eaton Vance
National Municipal Income Fund
March 31, 2021
Portfolio of Investments (Unaudited) — continued
| | | | | | | | |
| Security | | Principal
Amount
(000’s omitted) | | | Value | |
|
| Transportation (continued) | |
| | |
San Francisco City and County Airport Commission, CA, (San Francisco International Airport): | | | | | | | | |
| | |
(AMT), 5.00%, 5/1/41 | | $ | 25,630 | | | $ | 29,861,000 | |
| | |
(AMT), 5.00%, 5/1/44 | | | 8,535 | | | | 9,583,866 | |
| | |
(AMT), 5.00%, 5/1/46 | | | 5,000 | | | | 5,784,650 | |
| | |
Texas Private Activity Bond Surface Transportation Corp., (North Tarrant Express Managed Lanes Project): | | | | | | | | |
| | |
4.00%, 12/31/37 | | | 2,230 | | | | 2,561,378 | |
| | |
4.00%, 12/31/38 | | | 4,140 | | | | 4,741,252 | |
| | |
4.00%, 12/31/39 | | | 2,140 | | | | 2,444,929 | |
| | |
5.00%, 12/31/35 | | | 2,885 | | | | 3,602,384 | |
| | |
Texas Private Activity Bond Surface Transportation Corp., (North Tarrant Express Segment 3C), (AMT), 5.00%, 6/30/58 | | | 12,635 | | | | 15,101,984 | |
| | |
| | | | | | | $ | 761,643,675 | |
|
| Water and Sewer — 3.5% | |
| | |
Baltimore, MD, (Water Projects): | | | | | | | | |
| | |
4.00%, 7/1/40 | | $ | 470 | | | $ | 558,703 | |
| | |
4.00%, 7/1/45 | | | 1,005 | | | | 1,176,614 | |
| | |
Charlotte, NC, Water and Sewer System Revenue, 4.00%, 7/1/36 | | | 2,000 | | | | 2,458,480 | |
| | |
East Bay Municipal Utility District, CA, Water System Revenue: | | | | | | | | |
| | |
5.00%, 6/1/35 | | | 2,905 | | | | 3,594,879 | |
| | |
5.00%, 6/1/37 | | | 7,280 | | | | 8,578,679 | |
| | |
Green Bonds, 5.00%, 6/1/35 | | | 1,000 | | | | 1,297,010 | |
| | |
Green Bonds, 5.00%, 6/1/37 | | | 4,200 | | | | 5,415,732 | |
| | |
Eastern Municipal Water District Financing Authority, CA: | | | | | | | | |
| | |
4.00%, 7/1/38 | | | 1,200 | | | | 1,454,808 | |
| | |
5.00%, 7/1/37 | | | 1,300 | | | | 1,712,412 | |
| | |
Fulton County, GA, Water and Sewerage Revenue, 4.00%, 1/1/34 | | | 1,750 | | | | 2,123,398 | |
| | |
Grand Rapids, MI, Sanitary Sewer System Revenue, 5.00%, 1/1/45 | | | 1,245 | | | | 1,557,084 | |
| | |
Great Lakes Water Authority, MI: | | | | | | | | |
| | |
5.00%, 7/1/40 | | | 350 | | | | 435,631 | |
| | |
5.00%, 7/1/45 | | | 750 | | | | 921,225 | |
| | |
Horsham Water and Sewer Authority, PA: | | | | | | | | |
| | |
4.00%, 11/15/31 | | | 300 | | | | 364,803 | |
| | |
4.00%, 11/15/32 | | | 275 | | | | 333,135 | |
| | |
4.00%, 11/15/33 | | | 275 | | | | 331,108 | |
| | |
4.00%, 11/15/34 | | | 335 | | | | 402,034 | |
| | |
4.00%, 11/15/35 | | | 230 | | | | 275,317 | |
| | |
4.00%, 11/15/36 | | | 360 | | | | 428,551 | |
| | | | | | | | |
| Security | | Principal
Amount
(000’s omitted) | | | Value | |
|
| Water and Sewer (continued) | |
| | |
Madison Water and Wastewater Board, AL: | | | | | | | | |
| | |
4.00%, 12/1/32 | | $ | 335 | | | $ | 404,596 | |
| | |
4.00%, 12/1/33 | | | 260 | | | | 312,736 | |
| | |
4.00%, 12/1/34 | | | 350 | | | | 419,759 | |
| | |
4.00%, 12/1/36 | | | 610 | | | | 726,675 | |
| | |
4.00%, 12/1/38 | | | 535 | | | | 633,488 | |
| | |
4.00%, 12/1/39 | | | 240 | | | | 282,432 | |
| | |
Metropolitan Water District of Southern California, 5.00%, 7/1/38 | | | 4,270 | | | | 5,427,085 | |
| | |
Michigan Finance Authority, (Detroit Water and Sewerage Department): | | | | | | | | |
| | |
5.00%, 7/1/33 | | | 8,095 | | | | 9,214,134 | |
| | |
5.00%, 7/1/44 | | | 5 | | | | 5,264 | |
| | |
Missoula, MT, Water System Revenue: | | | | | | | | |
| | |
4.00%, 7/1/37 | | | 600 | | | | 700,368 | |
| | |
5.00%, 7/1/33 | | | 565 | | | | 708,934 | |
| | |
5.00%, 7/1/35 | | | 1,135 | | | | 1,416,684 | |
| | |
5.00%, 7/1/36 | | | 800 | | | | 995,592 | |
| | |
New York City Municipal Water Finance Authority, NY, (Water and Sewer System): | | | | | | | | |
| | |
4.00%, 6/15/24 | | | 2,755 | | | | 3,074,993 | |
| | |
5.00%, 6/15/35 | | | 3,955 | | | | 4,711,829 | |
| | |
5.00%, 6/15/48 | | | 12,960 | | | | 15,531,134 | |
| | |
Omaha, NE, Sanitary Sewerage System Revenue, 4.00%, 4/1/34 | | | 650 | | | | 792,220 | |
| | |
Orange County, FL, Water and Wastewater Utility Revenue, 5.00%, 10/1/38 | | | 10,060 | | | | 13,239,664 | |
| | |
Port St. Lucie, FL, Stormwater Utility Revenue: | | | | | | | | |
| | |
4.00%, 5/1/37 | | | 500 | | | | 584,780 | |
| | |
4.00%, 5/1/38 | | | 1,000 | | | | 1,167,090 | |
| | |
4.00%, 5/1/39 | | | 1,075 | | | | 1,251,053 | |
| | |
Salt Lake City, UT, Public Utilities Revenue: | | | | | | | | |
| | |
4.00%, 2/1/38 | | | 1,600 | | | | 1,898,000 | |
| | |
4.00%, 2/1/39 | | | 1,000 | | | | 1,183,060 | |
| | |
4.00%, 2/1/45 | | | 805 | | | | 938,831 | |
| | |
San Diego Public Facilities Financing Authority, CA, Water Revenue: | | | | | | | | |
| | |
4.00%, 8/1/38 | | | 1,000 | | | | 1,214,780 | |
| | |
4.00%, 8/1/39 | | | 1,250 | | | | 1,514,100 | |
| | |
4.00%, 8/1/45 | | | 3,400 | | | | 4,039,064 | |
| | |
Sarasota County, FL, Utility System Revenue: | | | | | | | | |
| | |
5.00%, 10/1/28 | | | 300 | | | | 389,559 | |
| | |
5.00%, 10/1/29 | | | 250 | | | | 331,410 | |
| | |
5.00%, 10/1/30 | | | 300 | | | | 404,553 | |
| | |
5.00%, 10/1/45 | | | 4,625 | | | | 5,899,881 | |
| | |
5.00%, 10/1/50 | | | 3,750 | | | | 4,757,287 | |
| | | | |
| | 21 | | See Notes to Financial Statements. |
Eaton Vance
National Municipal Income Fund
March 31, 2021
Portfolio of Investments (Unaudited) — continued
| | | | | | | | |
| Security | | Principal
Amount
(000’s omitted) | | | Value | |
|
| Water and Sewer (continued) | |
| | |
Tarrant Regional Water District, TX, Prerefunded to 3/1/24, 5.00%, 3/1/30 | | $ | 10,000 | | | $ | 11,371,100 | |
| | |
Trinity River Authority, TX, (Mountain Creek Regional Wastewater System), 4.00%, 8/1/36 | | | 695 | | | | 837,169 | |
| | |
Virginia Beach, VA, Storm Water Utility Revenue, 4.00%, 11/15/31 | | | 1,085 | | | | 1,308,857 | |
| | |
| | | | | | | $ | 131,107,764 | |
| |
Total Tax-Exempt Municipal Obligations — 92.2%
(identified cost $3,281,128,645) | | | $ | 3,469,838,460 | |
|
| Taxable Municipal Obligations — 4.2% | |
| Security | | Principal
Amount
(000’s omitted) | | | Value | |
| | |
| Cogeneration — 0.0%(7) | | | | | | |
| | |
Northampton County Industrial Development Authority, PA, (Northampton Generating), 5.00%, 12/31/23(1) | | $ | 4,942 | | | $ | 1,235,500 | |
| | |
| | | | | | | $ | 1,235,500 | |
|
| General Obligations — 1.1% | |
| | |
Bradley, IL, 2.45%, 12/15/36 | | $ | 520 | | | $ | 502,570 | |
| | |
Chicago, IL, 7.75%, 1/1/42 | | | 4,050 | | | | 4,492,746 | |
| | |
Detroit, MI, 2.96%, 4/1/27 | | | 1,000 | | | | 989,700 | |
| | |
Kauai County, HI: | | | | | | | | |
| | |
1.18%, 8/1/26(5) | | | 2,235 | | | | 2,225,456 | |
| | |
1.60%, 8/1/28(5) | | | 320 | | | | 317,539 | |
| | |
1.875%, 8/1/29(5) | | | 600 | | | | 594,498 | |
| | |
Lakeside School District No. 9, AR: | | | | | | | | |
| | |
1.25%, 4/1/32 | | | 1,320 | | | | 1,231,204 | |
| | |
1.55%, 4/1/35 | | | 1,425 | | | | 1,310,701 | |
| | |
1.65%, 4/1/36 | | | 1,365 | | | | 1,251,295 | |
| | |
1.80%, 4/1/37 | | | 1,515 | | | | 1,395,618 | |
| | |
1.85%, 4/1/38 | | | 610 | | | | 560,468 | |
| | |
1.90%, 4/1/39 | | | 1,605 | | | | 1,465,846 | |
| | |
Larkspur-Corte Madera School District, CA, (Election of 2011 and 2014), 2.302%, 8/1/36 | | | 1,405 | | | | 1,371,533 | |
| | |
Metropolitan Government of Nashville and Davidson County, TN, 1.486%, 7/1/31 | | | 2,840 | | | | 2,714,472 | |
| | |
New York, 1.50%, 3/15/26 | | | 19,870 | | | | 20,255,081 | |
| | |
Tustin Unified School District, CA, 2.254%, 8/1/36 | | | 1,155 | | | | 1,129,140 | |
| | |
| | | | | | | $ | 41,807,867 | |
| | | | | | | | |
| Security | | Principal
Amount
(000’s omitted) | | | Value | |
|
| Hospital — 1.0% | |
| | |
California Statewide Communities Development Authority, (Loma Linda University Medical Center), 6.00%, 12/1/24 | | $ | 34,250 | | | $ | 38,277,800 | |
| | |
| | | | | | | $ | 38,277,800 | |
|
| Insured – General Obligations — 0.3% | |
| | |
Bellwood, IL: | | | | | | | | |
| | |
(AGM), 3.00%, 12/1/36(5) | | $ | 1,000 | | | $ | 1,005,960 | |
| | |
(AGM), 3.07%, 12/1/37(5) | | | 1,250 | | | | 1,254,088 | |
| | |
Sterling, IL, (BAM), 2.70%, 11/1/37 | | | 1,075 | | | | 1,021,422 | |
| | |
Westland, MI: | | | | | | | | |
| | |
(BAM), 2.505%, 11/1/40 | | | 2,995 | | | | 2,849,173 | |
| | |
(BAM), 2.655%, 11/1/43 | | | 3,000 | | | | 2,876,280 | |
| | |
| | | | | | | $ | 9,006,923 | |
|
| Insured – Special Tax Revenue — 0.0%(7) | |
| | |
St. Clair County Board of Education, AL, (BAM), 2.14%, 2/1/30(5) | | $ | 500 | | | $ | 498,140 | |
| | |
| | | | | | | $ | 498,140 | |
|
| Insured – Transportation — 1.3% | |
| | |
Alameda Corridor Transportation Authority, CA: | | | | | | | | |
| | |
(AMBAC), 0.00%, 10/1/26 | | $ | 22,500 | | | $ | 19,676,025 | |
| | |
(AMBAC), 0.00%, 10/1/27 | | | 34,390 | | | | 28,845,644 | |
| | |
| | | | | | | $ | 48,521,669 | |
|
| Senior Living / Life Care — 0.1% | |
| | |
Montgomery County Industrial Development Authority, PA, (ACTS Retirement-Life Communities, Inc. Obligated Group), 2.45%, 11/15/23 | | $ | 1,250 | | | $ | 1,257,000 | |
| | |
| | | | | | | $ | 1,257,000 | |
|
| Water and Sewer — 0.4% | |
| | |
Tarrant Regional Water District, TX: | | | | | | | | |
| | |
1.70%, 9/1/33 | | $ | 7,585 | | | $ | 7,266,885 | |
| | |
2.00%, 9/1/36 | | | 9,010 | | | | 8,678,522 | |
| | |
| | | | | | | $ | 15,945,407 | |
| |
Total Taxable Municipal Obligations — 4.2%
(identified cost $148,123,437) | | | $ | 156,550,306 | |
| |
Total Investments — 96.4%
(identified cost $3,429,252,082) | | | $ | 3,626,388,766 | |
| |
Other Assets, Less Liabilities — 3.6% | | | $ | 134,684,639 | |
| |
Net Assets — 100.0% | | | $ | 3,761,073,405 | |
| | | | |
| | 22 | | See Notes to Financial Statements. |
Eaton Vance
National Municipal Income Fund
March 31, 2021
Portfolio of Investments (Unaudited) — continued
The percentage shown for each investment category in the Portfolio of Investments is based on net assets.
At March 31, 2021, the concentration of the Fund’s investments in the various states and territories, determined as a percentage of net assets, is as follows:
| | | | |
| |
| New York | | | 20.7% | |
| |
| California | | | 13.9% | |
| |
| Others, representing less than 10% individually | | | 61.8% | |
The Fund invests primarily in debt securities issued by municipalities. The ability of the issuers of the debt securities to meet their obligations may be affected by economic developments in a specific industry or municipality. At March 31, 2021, 6.6% of total investments are backed by bond insurance of various financial institutions and financial guaranty assurance agencies. The aggregate percentage insured by an individual financial institution or financial guaranty assurance agency ranged from 0.4% to 3.0% of total investments.
| (1) | Represents a payment-in-kind security which may pay interest in additional principal at the issuer’s discretion. |
| (2) | Security exempt from registration under Rule 144A of the Securities Act of 1933, as amended. These securities may be sold in certain transactions in reliance on an exemption from registration (normally to qualified institutional buyers). At March 31, 2021, the aggregate value of these securities is $27,169,099 or 0.7% of the Fund’s net assets. |
| (3) | Security represents the municipal bond held by a trust that issues residual interest bonds (see Note 1H). |
| (4) | Floating rate security. The stated interest rate represents the rate in effect at March 31, 2021. |
| (5) | When-issued/delayed delivery security. |
| (6) | Defaulted security. Issuer has defaulted on the payment of interest and/or principal or has filed for bankruptcy. |
| (7) | Amount is less than 0.05%. |
| | | | | | | | | | | | | | | | | | | | |
| Futures Contracts | |
| Description | | Number of
Contracts | | | Position | | | Expiration
Date | | | Notional
Amount | | | Value/Unrealized
Appreciation | |
| | | | | |
Interest Rate Futures | | | | | | | | | | | | | | | | | | | | |
| | | | | |
| U.S. Long Treasury Bond | | | (925 | ) | | | Short | | | | 6/21/21 | | | $ | (142,999,219 | ) | | $ | 4,218,574 | |
| | | | | |
| | | | | | | | | | | | | | | | | | | $ | 4,218,574 | |
Abbreviations:
| | | | |
| | |
| AGC | | – | | Assured Guaranty Corp. |
| | |
| AGM | | – | | Assured Guaranty Municipal Corp. |
| | |
| AMBAC | | – | | AMBAC Financial Group, Inc. |
| | |
| AMT | | – | | Interest earned from these securities may be considered a tax preference item for purposes of the Federal Alternative Minimum Tax. |
| | |
| BAM | | – | | Build America Mutual Assurance Co. |
| | |
| LIBOR | | – | | London Interbank Offered Rate |
| | |
| NPFG | | – | | National Public Finance Guarantee Corp. |
| | |
| PSF | | – | | Permanent School Fund |
| | |
| SIFMA | | – | | Securities Industry and Financial Markets Association Municipal Swap Index |
Currency Abbreviations:
| | | | |
| | |
| USD | | – | | United States Dollar |
| | | | |
| | 23 | | See Notes to Financial Statements. |
Eaton Vance
Municipal Income Funds
March 31, 2021
Statements of Assets and Liabilities (Unaudited)
| | | | | | | | |
| | | March 31, 2021 | |
| Assets | | AMT-Free Fund | | | National Fund | |
| | |
Investments — | | | | | | | | |
| | |
Identified cost | | $ | 315,894,317 | | | $ | 3,429,252,082 | |
| | |
Unrealized appreciation | | | 24,685,576 | | | | 197,136,684 | |
| | |
Investments, at value | | $ | 340,579,893 | | | $ | 3,626,388,766 | |
| | |
Cash | | $ | 23,124,311 | | | $ | 216,319,201 | |
| | |
Deposits for derivatives collateral — financial futures contracts | | | — | | | | 3,700,000 | |
| | |
Interest receivable | | | 3,754,854 | | | | 38,653,671 | |
| | |
Receivable for investments sold | | | 295,607 | | | | 5,725,058 | |
| | |
Receivable for Fund shares sold | | | 333,683 | | | | 8,389,629 | |
| | |
Receivable for variation margin on open financial futures contracts | | | — | | | | 404,688 | |
| | |
Total assets | | $ | 368,088,348 | | | $ | 3,899,581,013 | |
| |
| Liabilities | | | | | |
| | |
Payable for floating rate notes issued | | $ | 18,762,702 | | | $ | 104,604,568 | |
| | |
Payable for investments purchased | | | 1,099,950 | | | | — | |
| | |
Payable for when-issued/delayed delivery securities | | | 3,183,041 | | | | 23,174,967 | |
| | |
Payable for Fund shares redeemed | | | 431,161 | | | | 7,182,079 | |
| | |
Distributions payable | | | 122,004 | | | | 1,136,494 | |
| | |
Payable to affiliates: | | | | | | | | |
| | |
Investment adviser fee | | | 116,597 | | | | 920,250 | |
| | |
Distribution and service fees | | | 42,607 | | | | 425,718 | |
| | |
Interest expense and fees payable | | | 38,956 | | | | 201,791 | |
| | |
Accrued expenses | | | 113,038 | | | | 861,741 | |
| | |
Total liabilities | | $ | 23,910,056 | | | $ | 138,507,608 | |
| | |
Net Assets | | $ | 344,178,292 | | | $ | 3,761,073,405 | |
| |
| Sources of Net Assets | | | | | |
| | |
Paid-in capital | | $ | 345,671,069 | | | $ | 3,700,838,419 | |
| | |
Distributable earnings (accumulated loss) | | | (1,492,777 | ) | | | 60,234,986 | |
| | |
Net Assets | | $ | 344,178,292 | | | $ | 3,761,073,405 | |
| |
| Class A Shares | | | | | |
| | |
Net Assets | | $ | 159,878,031 | | | $ | 1,596,696,151 | |
| | |
Shares Outstanding | | | 17,268,649 | | | | 154,888,622 | |
| | |
Net Asset Value and Redemption Price Per Share | | | | | | | | |
| | |
(net assets ÷ shares of beneficial interest outstanding) | | $ | 9.26 | | | $ | 10.31 | |
| | |
Maximum Offering Price Per Share | | | | | | | | |
| | |
(100 ÷ 95.25 of net asset value per share) | | $ | 9.72 | | | $ | 10.82 | |
| |
| Class C Shares | | | | | |
| | |
Net Assets | | $ | 10,024,641 | | | $ | 98,666,947 | |
| | |
Shares Outstanding | | | 1,088,976 | | | | 9,572,202 | |
| | |
Net Asset Value and Offering Price Per Share* | | | | | | | | |
| | |
(net assets ÷ shares of beneficial interest outstanding) | | $ | 9.21 | | | $ | 10.31 | |
| |
| Class I Shares | | | | | |
| | |
Net Assets | | $ | 174,275,620 | | | $ | 2,065,710,307 | |
| | |
Shares Outstanding | | | 17,235,897 | | | | 200,400,500 | |
| | |
Net Asset Value, Offering Price and Redemption Price Per Share | | | | | | | | |
| | |
(net assets ÷ shares of beneficial interest outstanding) | | $ | 10.11 | | | $ | 10.31 | |
On sales of $50,000 or more, the offering price of Class A shares is reduced.
| * | Redemption price per share is equal to the net asset value less any applicable contingent deferred sales charge. |
| | | | |
| | 24 | | See Notes to Financial Statements. |
Eaton Vance
Municipal Income Funds
March 31, 2021
Statements of Operations (Unaudited)
| | | | | | | | |
| | | Six Months Ended March 31, 2021 | |
| Investment Income | | AMT-Free Fund | | | National Fund | |
| | |
Interest | | $ | 5,955,246 | | | $ | 53,039,131 | |
| | |
Total investment income | | $ | 5,955,246 | | | $ | 53,039,131 | |
|
| Expenses | |
| | |
Investment adviser fee | | $ | 696,020 | | | $ | 5,428,064 | |
| | |
Distribution and service fees | | | | | | | | |
| | |
Class A | | | 201,224 | | | | 2,033,888 | |
| | |
Class C | | | 58,828 | | | | 553,895 | |
| | |
Trustees’ fees and expenses | | | 8,990 | | | | 54,250 | |
| | |
Custodian fee | | | 43,540 | | | | 335,404 | |
| | |
Transfer and dividend disbursing agent fees | | | 44,486 | | | | 535,651 | |
| | |
Legal and accounting services | | | 34,002 | | | | 86,576 | |
| | |
Printing and postage | | | 1,709 | | | | 44,286 | |
| | |
Registration fees | | | 39,314 | | | | 103,610 | |
| | |
Interest expense and fees | | | 86,817 | | | | 330,256 | |
| | |
Miscellaneous | | | 23,188 | | | | 109,858 | |
| | |
Total expenses | | $ | 1,238,118 | | | $ | 9,615,738 | |
| | |
Net investment income | | $ | 4,717,128 | | | $ | 43,423,393 | |
|
| Realized and Unrealized Gain (Loss) | |
| | |
Net realized gain (loss) — | | | | | | | | |
| | |
Investment transactions | | $ | 1,293,199 | | | $ | 15,466,806 | |
| | |
Financial futures contracts | | | — | | | | 7,340,050 | |
| | |
Net realized gain | | $ | 1,293,199 | | | $ | 22,806,856 | |
| | |
Change in unrealized appreciation (depreciation) — | | | | | | | | |
| | |
Investments | | $ | (1,018,209 | ) | | $ | 166,759 | |
| | |
Financial futures contracts | | | — | | | | 4,218,574 | |
| | |
Net change in unrealized appreciation (depreciation) | | $ | (1,018,209 | ) | | $ | 4,385,333 | |
| | |
Net realized and unrealized gain | | $ | 274,990 | | | $ | 27,192,189 | |
| | |
Net increase in net assets from operations | | $ | 4,992,118 | | | $ | 70,615,582 | |
| | | | |
| | 25 | | See Notes to Financial Statements. |
Eaton Vance
Municipal Income Funds
March 31, 2021
Statements of Changes in Net Assets
| | | | | | | | |
| | | Six Months Ended March 31, 2021 (Unaudited) | |
| Increase (Decrease) in Net Assets | | AMT-Free Fund | | | National Fund | |
| | |
From operations — | | | | | | | | |
| | |
Net investment income | | $ | 4,717,128 | | | $ | 43,423,393 | |
| | |
Net realized gain | | | 1,293,199 | | | | 22,806,856 | |
| | |
Net change in unrealized appreciation (depreciation) | | | (1,018,209 | ) | | | 4,385,333 | |
| | |
Net increase in net assets from operations | | $ | 4,992,118 | | | $ | 70,615,582 | |
| | |
Distributions to shareholders — | | | | | | | | |
| | |
Class A | | $ | (2,295,165 | ) | | $ | (19,923,532 | ) |
| | |
Class C | | | (124,241 | ) | | | (947,215 | ) |
| | |
Class I | | | (2,695,668 | ) | | | (26,131,280 | ) |
| | |
Total distributions to shareholders | | $ | (5,115,074 | ) | | $ | (47,002,027 | ) |
| | |
Transactions in shares of beneficial interest — | | | | | | | | |
| | |
Proceeds from sale of shares | | | | | | | | |
| | |
Class A | | $ | 17,360,930 | | | $ | 75,907,992 | |
| | |
Class C | | | 874,330 | | | | 10,006,145 | |
| | |
Class I | | | 25,002,381 | | | | 484,353,214 | |
| | |
Net asset value of shares issued to shareholders in payment of distributions declared | | | | | | | | |
| | |
Class A | | | 1,978,485 | | | | 16,886,188 | |
| | |
Class C | | | 119,158 | | | | 845,680 | |
| | |
Class I | | | 2,281,342 | | | | 21,822,630 | |
| | |
Cost of shares redeemed | | | | | | | | |
| | |
Class A | | | (22,307,134 | ) | | | (159,284,094 | ) |
| | |
Class C | | | (1,822,288 | ) | | | (12,995,241 | ) |
| | |
Class I | | | (21,121,752 | ) | | | (248,955,860 | ) |
| | |
Net asset value of shares converted | | | | | | | | |
| | |
Class A | | | 4,268,580 | | | | 31,503,892 | |
| | |
Class C | | | (4,268,580 | ) | | | (31,503,892 | ) |
| | |
Net increase in net assets from Fund share transactions | | $ | 2,365,452 | | | $ | 188,586,654 | |
| | |
Net increase in net assets | | $ | 2,242,496 | | | $ | 212,200,209 | |
|
| Net Assets | |
| | |
At beginning of period | | $ | 341,935,796 | | | $ | 3,548,873,196 | |
| | |
At end of period | | $ | 344,178,292 | | | $ | 3,761,073,405 | |
| | | | |
| | 26 | | See Notes to Financial Statements. |
Eaton Vance
Municipal Income Funds
March 31, 2021
Statements of Changes in Net Assets – continued
| | | | | | | | |
| | | Year Ended September 30, 2020 | |
| Increase (Decrease) in Net Assets | | AMT-Free Fund | | | National Fund | |
| | |
From operations — | | | | | | | | |
| | |
Net investment income | | $ | 10,040,250 | | | $ | 87,611,878 | |
| | |
Net realized gain (loss) | | | (778,647 | ) | | | 32,976,127 | |
| | |
Net change in unrealized appreciation (depreciation) | | | (3,878,667 | ) | | | (3,801,019 | ) |
| | |
Net increase in net assets from operations | | $ | 5,382,936 | | | $ | 116,786,986 | |
| | |
Distributions to shareholders — | | | | | | | | |
| | |
Class A | | $ | (4,671,695 | ) | | $ | (44,576,688 | ) |
| | |
Class C | | | (421,058 | ) | | | (3,225,704 | ) |
| | |
Class I | | | (5,343,767 | ) | | | (45,916,178 | ) |
| | |
Total distributions to shareholders | | $ | (10,436,520 | ) | | $ | (93,718,570 | ) |
| | |
Transactions in shares of beneficial interest — | | | | | | | | |
| | |
Proceeds from sale of shares | | | | | | | | |
| | |
Class A | | $ | 23,022,478 | | | $ | 191,525,800 | |
| | |
Class C | | | 2,632,842 | | | | 28,102,719 | |
| | |
Class I | | | 148,037,705 | | | | 1,035,176,603 | |
| | |
Net asset value of shares issued to shareholders in payment of distributions declared | | | | | | | | |
| | |
Class A | | | 4,121,688 | | | | 37,938,752 | |
| | |
Class C | | | 351,377 | | | | 2,661,618 | |
| | |
Class I | | | 3,986,156 | | | | 38,645,320 | |
| | |
Cost of shares redeemed | | | | | | | | |
| | |
Class A | | | (20,744,572 | ) | | | (255,941,582 | ) |
| | |
Class C | | | (6,017,910 | ) | | | (46,493,384 | ) |
| | |
Class I | | | (124,755,998 | ) | | | (632,198,120 | ) |
| | |
Net asset value of shares converted | | | | | | | | |
| | |
Class A | | | 1,573,683 | | | | 26,478,940 | |
| | |
Class C | | | (1,573,683 | ) | | | (26,478,940 | ) |
| | |
Net increase in net assets from Fund share transactions | | $ | 30,633,766 | | | $ | 399,417,726 | |
| | |
Net increase in net assets | | $ | 25,580,182 | | | $ | 422,486,142 | |
|
| Net Assets | |
| | |
At beginning of year | | $ | 316,355,614 | | | $ | 3,126,387,054 | |
| | |
At end of year | | $ | 341,935,796 | | | $ | 3,548,873,196 | |
| | | | |
| | 27 | | See Notes to Financial Statements. |
Eaton Vance
Municipal Income Funds
March 31, 2021
Financial Highlights
| | | | | | | | | | | | | | | | | | | | | | | | |
| | | AMT-Free Fund — Class A | |
| | |
| | | Six Months Ended
March 31, 2021
(Unaudited) | | | Year Ended September 30, | |
| | | 2020 | | | 2019 | | | 2018 | | | 2017 | | | 2016 | |
| | | | | | | |
Net asset value — Beginning of period | | $ | 9.250 | | | $ | 9.250 | | | $ | 8.870 | | | $ | 9.130 | | | $ | 9.430 | | | $ | 9.210 | |
| | | | | | |
| Income (Loss) From Operations | | | | | | | | | | | | | | | | | | | | | | | | |
| | | | | | |
Net investment income(1) | | $ | 0.122 | | | $ | 0.274 | | | $ | 0.317 | | | $ | 0.336 | | | $ | 0.351 | | | $ | 0.358 | |
| | | | | | |
Net realized and unrealized gain (loss) | | | 0.021 | | | | 0.011 | (2) | | | 0.381 | | | | (0.262 | ) | | | (0.298 | ) | | | 0.218 | |
| | | | | | |
Total income from operations | | $ | 0.143 | | | $ | 0.285 | | | $ | 0.698 | | | $ | 0.074 | | | $ | 0.053 | | | $ | 0.576 | |
| | | | | | |
| Less Distributions | | | | | | | | | | | | | | | | | | | | | | | | |
| | | | | | |
From net investment income | | $ | (0.133 | ) | | $ | (0.285 | ) | | $ | (0.318 | ) | | $ | (0.334 | ) | | $ | (0.353 | ) | | $ | (0.356 | ) |
| | | | | | |
Total distributions | | $ | (0.133 | ) | | $ | (0.285 | ) | | $ | (0.318 | ) | | $ | (0.334 | ) | | $ | (0.353 | ) | | $ | (0.356 | ) |
| | | | | | |
Net asset value — End of period | | $ | 9.260 | | | $ | 9.250 | | | $ | 9.250 | | | $ | 8.870 | | | $ | 9.130 | | | $ | 9.430 | |
| | | | | | |
Total Return(3) | | | 1.54 | %(4) | | | 3.12 | % | | | 8.02 | % | | | 0.83 | % | | | 0.64 | % | | | 6.33 | % |
| | | | |
| Ratios/Supplemental Data | | | | | | | | | | | | | | | | | |
| | | | | | |
Net assets, end of period (000’s omitted) | | $ | 159,878 | | | $ | 158,729 | | | $ | 150,853 | | | $ | 139,623 | | | $ | 155,589 | | | $ | 198,762 | |
| | | | | | |
Ratios (as a percentage of average daily net assets): | | | | | | | | | | | | | | | | | | | | | | | | |
| | | | | | |
Expenses excluding interest and fees | | | 0.76 | %(5) | | | 0.78 | % | | | 0.81 | % | | | 0.81 | % | | | 0.82 | % | | | 0.81 | % |
| | | | | | |
Interest and fee expense(6) | | | 0.05 | %(5) | | | 0.14 | % | | | 0.23 | % | | | 0.24 | % | | | 0.16 | % | | | 0.10 | % |
| | | | | | |
Total expenses | | | 0.81 | %(5) | | | 0.92 | % | | | 1.04 | % | | | 1.05 | % | | | 0.98 | % | | | 0.91 | % |
| | | | | | |
Net investment income | | | 2.62 | %(5) | | | 2.97 | % | | | 3.51 | % | | | 3.74 | % | | | 3.86 | % | | | 3.81 | % |
| | | | | | |
Portfolio Turnover | | | 13 | %(4) | | | 58 | % | | | 33 | % | | | 18 | % | | | 33 | % | | | 21 | % |
| (1) | Computed using average shares outstanding. |
| (2) | The per share amount is not in accord with the net realized and unrealized gain (loss) for the period because of the timing of Fund share transactions and the amount of the per share realized and unrealized gains and losses at such time. |
| (3) | Returns are historical and are calculated by determining the percentage change in net asset value with all distributions reinvested and do not reflect the effect of sales charges. |
| (6) | Interest and fee expense relates to the liability for floating rate notes issued in conjunction with residual interest bond transactions (see Note 1H). |
| | | | |
| | 28 | | See Notes to Financial Statements. |
Eaton Vance
Municipal Income Funds
March 31, 2021
Financial Highlights — continued
| | | | | | | | | | | | | | | | | | | | | | | | |
| | | AMT-Free Fund — Class C | |
| | |
| | | Six Months Ended
March 31, 2021
(Unaudited) | | | Year Ended September 30, | |
| | | 2020 | | | 2019 | | | 2018 | | | 2017 | | | 2016 | |
| | | | | | | |
Net asset value — Beginning of period | | $ | 9.200 | | | $ | 9.200 | | | $ | 8.820 | | | $ | 9.080 | | | $ | 9.380 | | | $ | 9.160 | |
| | | | | | |
| Income (Loss) From Operations | | | | | | | | | | | | | | | | | | | | | | | | |
| | | | | | |
Net investment income(1) | | $ | 0.088 | | | $ | 0.204 | | | $ | 0.249 | | | $ | 0.267 | | | $ | 0.281 | | | $ | 0.286 | |
| | | | | | |
Net realized and unrealized gain (loss) | | | 0.020 | | | | 0.011 | (2) | | | 0.380 | | | | (0.262 | ) | | | (0.298 | ) | | | 0.218 | |
| | | | | | |
Total income (loss) from operations | | $ | 0.108 | | | $ | 0.215 | | | $ | 0.629 | | | $ | 0.005 | | | $ | (0.017 | ) | | $ | 0.504 | |
| | | | | | |
| Less Distributions | | | | | | | | | | | | | | | | | | | | | | | | |
| | | | | | |
From net investment income | | $ | (0.098 | ) | | $ | (0.215 | ) | | $ | (0.249 | ) | | $ | (0.265 | ) | | $ | (0.283 | ) | | $ | (0.284 | ) |
| | | | | | |
Total distributions | | $ | (0.098 | ) | | $ | (0.215 | ) | | $ | (0.249 | ) | | $ | (0.265 | ) | | $ | (0.283 | ) | | $ | (0.284 | ) |
| | | | | | |
Net asset value — End of period | | $ | 9.210 | | | $ | 9.200 | | | $ | 9.200 | | | $ | 8.820 | | | $ | 9.080 | | | $ | 9.380 | |
| | | | | | |
Total Return(3) | | | 1.17 | %(4) | | | 2.36 | % | | | 7.24 | % | | | 0.06 | % | | | (0.12 | )% | | | 5.56 | % |
| | | | |
| Ratios/Supplemental Data | | | | | | | | | | | | | | | | | |
| | | | | | |
Net assets, end of period (000’s omitted) | | $ | 10,025 | | | $ | 15,094 | | | $ | 19,715 | | | $ | 32,545 | | | $ | 39,099 | | | $ | 45,606 | |
| | | | | | |
Ratios (as a percentage of average daily net assets): | | | | | | | | | | | | | | | | | | | | | | | | |
| | | | | | |
Expenses excluding interest and fees | | | 1.51 | %(5) | | | 1.53 | % | | | 1.56 | % | | | 1.56 | % | | | 1.57 | % | | | 1.56 | % |
| | | | | | |
Interest and fee expense(6) | | | 0.05 | %(5) | | | 0.14 | % | | | 0.23 | % | | | 0.24 | % | | | 0.16 | % | | | 0.10 | % |
| | | | | | |
Total expenses | | | 1.56 | %(5) | | | 1.67 | % | | | 1.79 | % | | | 1.80 | % | | | 1.73 | % | | | 1.66 | % |
| | | | | | |
Net investment income | | | 1.90 | %(5) | | | 2.23 | % | | | 2.78 | % | | | 2.99 | % | | | 3.11 | % | | | 3.06 | % |
| | | | | | |
Portfolio Turnover | | | 13 | %(4) | | | 58 | % | | | 33 | % | | | 18 | % | | | 33 | % | | | 21 | % |
| (1) | Computed using average shares outstanding. |
| (2) | The per share amount is not in accord with the net realized and unrealized gain (loss) for the period because of the timing of Fund share transactions and the amount of the per share realized and unrealized gains and losses at such time. |
| (3) | Returns are historical and are calculated by determining the percentage change in net asset value with all distributions reinvested and do not reflect the effect of sales charges. |
| (6) | Interest and fee expense relates to the liability for floating rate notes issued in conjunction with residual interest bond transactions (see Note 1H). |
| | | | |
| | 29 | | See Notes to Financial Statements. |
Eaton Vance
Municipal Income Funds
March 31, 2021
Financial Highlights — continued
| | | | | | | | | | | | | | | | | | | | | | | | |
| | | AMT-Free Fund — Class I | |
| | |
| | | Six Months Ended
March 31, 2021
(Unaudited) | | | Year Ended September 30, | |
| | | 2020 | | | 2019 | | | 2018 | | | 2017 | | | 2016 | |
| | | | | | | |
Net asset value — Beginning of period | | $ | 10.110 | | | $ | 10.100 | | | $ | 9.680 | | | $ | 9.970 | | | $ | 10.300 | | | $ | 10.060 | |
| | | | | | |
| Income (Loss) From Operations | | | | | | | | | | | | | | | | | | | | | | | | |
| | | | | | |
Net investment income(1) | | $ | 0.146 | | | $ | 0.323 | | | $ | 0.370 | | | $ | 0.391 | | | $ | 0.407 | | | $ | 0.415 | |
| | | | | | |
Net realized and unrealized gain (loss) | | | 0.011 | | | | 0.023 | (2) | | | 0.422 | | | | (0.292 | ) | | | (0.327 | ) | | | 0.240 | |
| | | | | | |
Total income from operations | | $ | 0.157 | | | $ | 0.346 | | | $ | 0.792 | | | $ | 0.099 | | | $ | 0.080 | | | $ | 0.655 | |
| | | | | | |
| Less Distributions | | | | | | | | | | | | | | | | | | | | | | | | |
| | | | | | |
From net investment income | | $ | (0.157 | ) | | $ | (0.336 | ) | | $ | (0.372 | ) | | $ | (0.389 | ) | | $ | (0.410 | ) | | $ | (0.415 | ) |
| | | | | | |
Total distributions | | $ | (0.157 | ) | | $ | (0.336 | ) | | $ | (0.372 | ) | | $ | (0.389 | ) | | $ | (0.410 | ) | | $ | (0.415 | ) |
| | | | | | |
Net asset value — End of period | | $ | 10.110 | | | $ | 10.110 | | | $ | 10.100 | | | $ | 9.680 | | | $ | 9.970 | | | $ | 10.300 | |
| | | | | | |
Total Return(3) | | | 1.56 | %(4) | | | 3.48 | % | | | 8.34 | % | | | 1.02 | % | | | 0.87 | % | | | 6.60 | % |
| | | | |
| Ratios/Supplemental Data | | | | | | | | | | | | | | | | | |
| | | | | | |
Net assets, end of period (000’s omitted) | | $ | 174,276 | | | $ | 168,113 | | | $ | 145,788 | | | $ | 132,313 | | | $ | 154,177 | | | $ | 154,458 | |
| | | | | | |
Ratios (as a percentage of average daily net assets): | | | | | | | | | | | | | | | | | | | | | | | | |
| | | | | | |
Expenses excluding interest and fees | | | 0.51 | %(5) | | | 0.53 | % | | | 0.56 | % | | | 0.56 | % | | | 0.57 | % | | | 0.56 | % |
| | | | | | |
Interest and fee expense(6) | | | 0.05 | %(5) | | | 0.14 | % | | | 0.23 | % | | | 0.24 | % | | | 0.16 | % | | | 0.10 | % |
| | | | | | |
Total expenses | | | 0.56 | %(5) | | | 0.67 | % | | | 0.79 | % | | | 0.80 | % | | | 0.73 | % | | | 0.66 | % |
| | | | | | |
Net investment income | | | 2.87 | %(5) | | | 3.21 | % | | | 3.76 | % | | | 3.98 | % | | | 4.09 | % | | | 4.04 | % |
| | | | | | |
Portfolio Turnover | | | 13 | %(4) | | | 58 | % | | | 33 | % | | | 18 | % | | | 33 | % | | | 21 | % |
| (1) | Computed using average shares outstanding. |
| (2) | The per share amount is not in accord with the net realized and unrealized gain (loss) for the period because of the timing of Fund share transactions and the amount of the per share realized and unrealized gains and losses at such time. |
| (3) | Returns are historical and are calculated by determining the percentage change in net asset value with all distributions reinvested. |
| (6) | Interest and fee expense relates to the liability for floating rate notes issued in conjunction with residual interest bond transactions (see Note 1H). |
| | | | |
| | 30 | | See Notes to Financial Statements. |
Eaton Vance
Municipal Income Funds
March 31, 2021
Financial Highlights — continued
| | | | | | | | | | | | | | | | | | | | | | | | |
| | | National Fund — Class A | |
| | |
| | | Six Months Ended
March 31, 2021
(Unaudited) | | | Year Ended September 30, | |
| | | 2020 | | | 2019 | | | 2018 | | | 2017 | | | 2016 | |
| | | | | | | |
Net asset value — Beginning of period | | $ | 10.240 | | | $ | 10.140 | | | $ | 9.650 | | | $ | 9.930 | | | $ | 10.170 | | | $ | 9.810 | |
| | | | | | |
| Income (Loss) From Operations | | | | | | | | | | | | | | | | | | | | | | | | |
| | | | | | |
Net investment income(1) | | $ | 0.116 | | | $ | 0.265 | | | $ | 0.322 | | | $ | 0.350 | | | $ | 0.366 | | | $ | 0.385 | |
| | | | | | |
Net realized and unrealized gain (loss) | | | 0.080 | | | | 0.119 | | | | 0.491 | | | | (0.277 | ) | | | (0.242 | ) | | | 0.357 | |
| | | | | | |
Total income from operations | | $ | 0.196 | | | $ | 0.384 | | | $ | 0.813 | | | $ | 0.073 | | | $ | 0.124 | | | $ | 0.742 | |
| | | | | | |
| Less Distributions | | | | | | | | | | | | | | | | | | | | | | | | |
| | | | | | |
From net investment income | | $ | (0.126 | ) | | $ | (0.284 | ) | | $ | (0.323 | ) | | $ | (0.353 | ) | | $ | (0.364 | ) | | $ | (0.382 | ) |
| | | | | | |
Total distributions | | $ | (0.126 | ) | | $ | (0.284 | ) | | $ | (0.323 | ) | | $ | (0.353 | ) | | $ | (0.364 | ) | | $ | (0.382 | ) |
| | | | | | |
Net asset value — End of period | | $ | 10.310 | | | $ | 10.240 | | | $ | 10.140 | | | $ | 9.650 | | | $ | 9.930 | | | $ | 10.170 | |
| | | | | | |
Total Return(2) | | | 1.92 | %(3) | | | 3.84 | % | | | 8.57 | % | | | 0.76 | % | | | 1.31 | % | | | 7.68 | % |
| | | | |
| Ratios/Supplemental Data | | | | | | | | | | | | | | | | | |
| | | | | | |
Net assets, end of period (000’s omitted) | | $ | 1,596,696 | | | $ | 1,620,505 | | | $ | 1,605,407 | | | $ | 1,419,239 | | | $ | 1,600,127 | | | $ | 1,857,375 | |
| | | | | | |
Ratios (as a percentage of average daily net assets): | | | | | | | | | | | | | | | | | | | | | | | | |
| | | | | | |
Expenses excluding interest and fees | | | 0.61 | %(4) | | | 0.64 | % | | | 0.68 | % | | | 0.69 | % | | | 0.68 | % | | | 0.67 | % |
| | | | | | |
Interest and fee expense(5) | | | 0.02 | %(4) | | | 0.05 | % | | | 0.12 | % | | | 0.19 | % | | | 0.16 | % | | | 0.12 | % |
| | | | | | |
Total expenses | | | 0.63 | %(4) | | | 0.69 | % | | | 0.80 | % | | | 0.88 | % | | | 0.84 | % | | | 0.79 | % |
| | | | | | |
Net investment income | | | 2.25 | %(4) | | | 2.61 | % | | | 3.26 | % | | | 3.58 | % | | | 3.71 | % | | | 3.83 | % |
| | | | | | |
Portfolio Turnover | | | 33 | %(3) | | | 105 | % | | | 89 | % | | | 67 | % | | | 70 | % | | | 71 | % |
| (1) | Computed using average shares outstanding. |
| (2) | Returns are historical and are calculated by determining the percentage change in net asset value with all distributions reinvested and do not reflect the effect of sales charges. |
| (5) | Interest and fee expense relates to the liability for floating rate notes issued in conjunction with residual interest bond transactions (see Note 1H). |
| | | | |
| | 31 | | See Notes to Financial Statements. |
Eaton Vance
Municipal Income Funds
March 31, 2021
Financial Highlights — continued
| | | | | | | | | | | | | | | | | | | | | | | | |
| | | National Fund — Class C | |
| | |
| | | Six Months Ended
March 31, 2021
(Unaudited) | | | Year Ended September 30, | |
| | | 2020 | | | 2019 | | | 2018 | | | 2017 | | | 2016 | |
| | | | | | | |
Net asset value — Beginning of period | | $ | 10.240 | | | $ | 10.140 | | | $ | 9.650 | | | $ | 9.930 | | | $ | 10.170 | | | $ | 9.810 | |
| | | | | | |
| Income (Loss) From Operations | | | | | | | | | | | | | | | | | | | | | | | | |
| | | | | | |
Net investment income(1) | | $ | 0.078 | | | $ | 0.190 | | | $ | 0.252 | | | $ | 0.276 | | | $ | 0.292 | | | $ | 0.310 | |
| | | | | | |
Net realized and unrealized gain (loss) | | | 0.080 | | | | 0.119 | | | | 0.488 | | | | (0.276 | ) | | | (0.242 | ) | | | 0.357 | |
| | | | | | |
Total income from operations | | $ | 0.158 | | | $ | 0.309 | | | $ | 0.740 | | | $ | — | | | $ | 0.050 | | | $ | 0.667 | |
| | | | | | |
| Less Distributions | | | | | | | | | | | | | | | | | | | | | | | | |
| | | | | | |
From net investment income | | $ | (0.088 | ) | | $ | (0.209 | ) | | $ | (0.250 | ) | | $ | (0.280 | ) | | $ | (0.290 | ) | | $ | (0.307 | ) |
| | | | | | |
Total distributions | | $ | (0.088 | ) | | $ | (0.209 | ) | | $ | (0.250 | ) | | $ | (0.280 | ) | | $ | (0.290 | ) | | $ | (0.307 | ) |
| | | | | | |
Net asset value — End of period | | $ | 10.310 | | | $ | 10.240 | | | $ | 10.140 | | | $ | 9.650 | | | $ | 9.930 | | | $ | 10.170 | |
| | | | | | |
Total Return(2) | | | 1.54 | %(3) | | | 3.08 | % | | | 7.77 | % | | | 0.01 | % | | | 0.56 | % | | | 6.88 | % |
| | | | |
| Ratios/Supplemental Data | | | | | | | | | | | | | | | | | |
| | | | | | |
Net assets, end of period (000’s omitted) | | $ | 98,667 | | | $ | 131,330 | | | $ | 172,417 | | | $ | 363,026 | | | $ | 462,269 | | | $ | 576,664 | |
| | | | | | |
Ratios (as a percentage of average daily net assets): | | | | | | | | | | | | | | | | | | | | | | | | |
| | | | | | |
Expenses excluding interest and fees | | | 1.36 | %(4) | | | 1.39 | % | | | 1.43 | % | | | 1.44 | % | | | 1.43 | % | | | 1.42 | % |
| | | | | | |
Interest and fee expense(5) | | | 0.02 | %(4) | | | 0.05 | % | | | 0.12 | % | | | 0.19 | % | | | 0.16 | % | | | 0.12 | % |
| | | | | | |
Total expenses | | | 1.38 | %(4) | | | 1.44 | % | | | 1.55 | % | | | 1.63 | % | | | 1.59 | % | | | 1.54 | % |
| | | | | | |
Net investment income | | | 1.51 | %(4) | | | 1.87 | % | | | 2.57 | % | | | 2.83 | % | | | 2.96 | % | | | 3.08 | % |
| | | | | | |
Portfolio Turnover | | | 33 | %(3) | | | 105 | % | | | 89 | % | | | 67 | % | | | 70 | % | | | 71 | % |
| (1) | Computed using average shares outstanding. |
| (2) | Returns are historical and are calculated by determining the percentage change in net asset value with all distributions reinvested and do not reflect the effect of sales charges. |
| (5) | Interest and fee expense relates to the liability for floating rate notes issued in conjunction with residual interest bond transactions (see Note 1H). |
| | | | |
| | 32 | | See Notes to Financial Statements. |
Eaton Vance
Municipal Income Funds
March 31, 2021
Financial Highlights — continued
| | | | | | | | | | | | | | | | | | | | | | | | |
| | | National Fund — Class I | |
| | |
| | | Six Months Ended
March 31, 2021
(Unaudited) | | | Year Ended September 30, | |
| | | 2020 | | | 2019 | | | 2018 | | | 2017 | | | 2016 | |
| | | | | | | |
Net asset value — Beginning of period | | $ | 10.240 | | | $ | 10.140 | | | $ | 9.650 | | | $ | 9.930 | | | $ | 10.170 | | | $ | 9.810 | |
| | | | | | |
| Income (Loss) From Operations | | | | | | | | | | | | | | | | | | | | | | | | |
| | | | | | |
Net investment income(1) | | $ | 0.129 | | | $ | 0.289 | | | $ | 0.341 | | | $ | 0.374 | | | $ | 0.390 | | | $ | 0.410 | |
| | | | | | |
Net realized and unrealized gain (loss) | | | 0.080 | | | | 0.120 | | | | 0.495 | | | | (0.277 | ) | | | (0.241 | ) | | | 0.357 | |
| | | | | | |
Total income from operations | | $ | 0.209 | | | $ | 0.409 | | | $ | 0.836 | | | $ | 0.097 | | | $ | 0.149 | | | $ | 0.767 | |
| | | | | | |
| Less Distributions | | | | | | | | | | | | | | | | | | | | | | | | |
| | | | | | |
From net investment income | | $ | (0.139 | ) | | $ | (0.309 | ) | | $ | (0.346 | ) | | $ | (0.377 | ) | | $ | (0.389 | ) | | $ | (0.407 | ) |
| | | | | | |
Total distributions | | $ | (0.139 | ) | | $ | (0.309 | ) | | $ | (0.346 | ) | | $ | (0.377 | ) | | $ | (0.389 | ) | | $ | (0.407 | ) |
| | | | | | |
Net asset value — End of period | | $ | 10.310 | | | $ | 10.240 | | | $ | 10.140 | | | $ | 9.650 | | | $ | 9.930 | | | $ | 10.170 | |
| | | | | | |
Total Return(2) | | | 2.05 | %(3) | | | 4.10 | % | | | 8.83 | % | | | 1.01 | % | | | 1.56 | % | | | 7.94 | % |
| | | | |
| Ratios/Supplemental Data | | | | | | | | | | | | | | | | | |
| | | | | | |
Net assets, end of period (000’s omitted) | | $ | 2,065,710 | | | $ | 1,797,038 | | | $ | 1,348,563 | | | $ | 756,446 | | | $ | 777,063 | | | $ | 701,153 | |
| | | | | | |
Ratios (as a percentage of average daily net assets): | | | | | | | | | | | | | | | | | | | | | | | | |
| | | | | | |
Expenses excluding interest and fees | | | 0.36 | %(4) | | | 0.39 | % | | | 0.43 | % | | | 0.44 | % | | | 0.43 | % | | | 0.42 | % |
| | | | | | |
Interest and fee expense(5) | | | 0.02 | %(4) | | | 0.05 | % | | | 0.12 | % | | | 0.19 | % | | | 0.16 | % | | | 0.12 | % |
| | | | | | |
Total expenses | | | 0.38 | %(4) | | | 0.44 | % | | | 0.55 | % | | | 0.63 | % | | | 0.59 | % | | | 0.54 | % |
| | | | | | |
Net investment income | | | 2.50 | %(4) | | | 2.85 | % | | | 3.45 | % | | | 3.83 | % | | | 3.95 | % | | | 4.09 | % |
| | | | | | |
Portfolio Turnover | | | 33 | %(3) | | | 105 | % | | | 89 | % | | | 67 | % | | | 70 | % | | | 71 | % |
| (1) | Computed using average shares outstanding. |
| (2) | Returns are historical and are calculated by determining the percentage change in net asset value with all distributions reinvested. |
| (5) | Interest and fee expense relates to the liability for floating rate notes issued in conjunction with residual interest bond transactions (see Note 1H). |
| | | | |
| | 33 | | See Notes to Financial Statements. |
Eaton Vance
Municipal Income Funds
March 31, 2021
Notes to Financial Statements (Unaudited)
1 Significant Accounting Policies
Eaton Vance AMT-Free Municipal Income Fund (AMT-Free Fund) and Eaton Vance National Municipal Income Fund (National Fund) (each individually referred to as the Fund, and collectively, the Funds) are a diversified series of Eaton Vance Mutual Funds Trust and Eaton Vance Municipals Trust, respectively (collectively, the Trusts). The Trusts are Massachusetts business trusts registered under the Investment Company Act of 1940, as amended (the 1940 Act), as open-end management investment companies. Each Fund’s investment objective is to provide current income exempt from regular federal income tax. The Funds offer three classes of shares. Class A shares are generally sold subject to a sales charge imposed at time of purchase. Class C shares are sold at net asset value and are generally subject to a contingent deferred sales charge (see Note 5). Effective January 25, 2019, Class C shares generally automatically convert to Class A shares ten years after their purchase and, effective November 5, 2020, automatically convert to Class A shares eight years after their purchase as described in the Funds’ prospectus. Class I shares are sold at net asset value and are not subject to a sales charge. Each class represents a pro-rata interest in the Fund, but votes separately on class-specific matters and (as noted below) is subject to different expenses. Realized and unrealized gains and losses are allocated daily to each class of shares based on the relative net assets of each class to the total net assets of the Fund. Net investment income, other than class-specific expenses, is allocated daily to each class of shares based upon the ratio of the value of each class’s paid shares to the total value of all paid shares. Each class of shares differs in its distribution plan and certain other class-specific expenses.
The following is a summary of significant accounting policies of the Funds. The policies are in conformity with accounting principles generally accepted in the United States of America (U.S. GAAP). Each Fund is an investment company and follows accounting and reporting guidance in the Financial Accounting Standards Board (FASB) Accounting Standards Codification Topic 946.
A Investment Valuation — The following methodologies are used to determine the market value or fair value of investments.
Debt Obligations. Debt obligations are generally valued on the basis of valuations provided by third party pricing services, as derived from such services’ pricing models. Inputs to the models may include, but are not limited to, reported trades, executable bid and ask prices, broker/dealer quotations, prices or yields of securities with similar characteristics, interest rates, anticipated prepayments, benchmark curves or information pertaining to the issuer, as well as industry and economic events. The pricing services may use a matrix approach, which considers information regarding securities with similar characteristics to determine the valuation for a security. Short-term debt obligations purchased with a remaining maturity of sixty days or less for which a valuation from a third party pricing service is not readily available may be valued at amortized cost, which approximates fair value.
Derivatives. Financial futures contracts are valued at the closing settlement price established by the board of trade or exchange on which they are traded.
Fair Valuation. Investments for which valuations or market quotations are not readily available or are deemed unreliable are valued at fair value using methods determined in good faith by or at the direction of the Trustees of a Fund in a manner that most fairly reflects the security’s “fair value”, which is the amount that a Fund might reasonably expect to receive for the security upon its current sale in the ordinary course. Each such determination is based on a consideration of relevant factors, which are likely to vary from one pricing context to another. These factors may include, but are not limited to, the type of security, the existence of any contractual restrictions on the security’s disposition, the price and extent of public trading in similar securities of the issuer or of comparable entities, quotations or relevant information obtained from broker/dealers or other market participants, information obtained from the issuer, analysts, and/or the appropriate stock exchange (for exchange-traded securities), an analysis of the entity’s financial statements, and an evaluation of the forces that influence the issuer and the market(s) in which the security is purchased and sold.
B Investment Transactions and Related Income — Investment transactions for financial statement purposes are accounted for on a trade date basis. Realized gains and losses on investments sold are determined on the basis of identified cost. Interest income is recorded on the basis of interest accrued, adjusted for amortization of premium or accretion of discount.
C Federal Taxes — Each Fund’s policy is to comply with the provisions of the Internal Revenue Code applicable to regulated investment companies and to distribute to shareholders each year substantially all of its taxable, if any, and tax-exempt net investment income, and all or substantially all of its net realized capital gains. Accordingly, no provision for federal income or excise tax is necessary. Each Fund intends to satisfy conditions which will enable it to designate distributions from the interest income generated by its investments in non-taxable municipal securities, which are exempt from regular federal income tax when received by each Fund, as exempt-interest dividends. For National Fund, the portion of such interest, if any, earned on private activity bonds issued after August 7, 1986, may be considered a tax preference item to shareholders.
As of March 31, 2021, the Funds had no uncertain tax positions that would require financial statement recognition, de-recognition, or disclosure. Each Fund files a U.S. federal income tax return annually after its fiscal year-end, which is subject to examination by the Internal Revenue Service for a period of three years from the date of filing.
D Expenses — The majority of expenses of the Trusts are directly identifiable to an individual fund. Expenses which are not readily identifiable to a specific fund are allocated taking into consideration, among other things, the nature and type of expense and the relative size of the funds.
E Legal Fees — Legal fees and other related expenses incurred as part of negotiations of the terms and requirement of capital infusions, or that are expected to result in the restructuring of, or a plan of reorganization for, an investment are recorded as realized losses. Ongoing expenditures to protect or enhance an investment are treated as operating expenses.
F Use of Estimates — The preparation of the financial statements in conformity with U.S. GAAP requires management to make estimates and assumptions that affect the reported amounts of assets and liabilities at the date of the financial statements and the reported amounts of income and expense during the reporting period. Actual results could differ from those estimates.
Eaton Vance
Municipal Income Funds
March 31, 2021
Notes to Financial Statements (Unaudited) — continued
G Indemnifications — Under each Trust’s organizational documents, its officers and Trustees may be indemnified against certain liabilities and expenses arising out of the performance of their duties to the Funds. Under Massachusetts law, if certain conditions prevail, shareholders of a Massachusetts business trust (such as a Trust) could be deemed to have personal liability for the obligations of the Trust. However, each Trust’s Declaration of Trust contains an express disclaimer of liability on the part of Fund shareholders and the By-laws provide that the Trust shall assume, upon request by the shareholder, the defense on behalf of any Fund shareholders. Moreover, the By-laws also provide for indemnification out of Fund property of any shareholder held personally liable solely by reason of being or having been a shareholder for all loss or expense arising from such liability. Additionally, in the normal course of business, each Fund enters into agreements with service providers that may contain indemnification clauses. Each Fund’s maximum exposure under these arrangements is unknown as this would involve future claims that may be made against each Fund that have not yet occurred.
H Floating Rate Notes Issued in Conjunction with Securities Held — The Funds may invest in residual interest bonds, also referred to as inverse floating rate securities, whereby a Fund may sell a variable or fixed rate bond for cash to a Special-Purpose Vehicle (the SPV), (which is generally organized as a trust), while at the same time, buying a residual interest in the assets and cash flows of the SPV. The bond is deposited into the SPV with the same CUSIP number as the bond sold to the SPV by the Fund, and which may have been, but is not required to be, the bond purchased from the Fund (the Bond). The SPV also issues floating rate notes (Floating Rate Notes) which are sold to third-parties. The residual interest bond held by a Fund gives the Fund the right (1) to cause the holders of the Floating Rate Notes to generally tender their notes at par, and (2) to have the Bond held by the SPV transferred to the Fund, thereby terminating the SPV. Should the Fund exercise such right, it would generally pay the SPV the par amount due on the Floating Rate Notes and exchange the residual interest bond for the underlying Bond. Pursuant to generally accepted accounting principles for transfers and servicing of financial assets and extinguishment of liabilities, the Funds account for the transaction described above as a secured borrowing by including the Bond in their Portfolio of Investments and the Floating Rate Notes as a liability under the caption “Payable for floating rate notes issued” in their Statement of Assets and Liabilities. The Floating Rate Notes have interest rates that generally reset weekly and their holders have the option to tender their notes to the SPV for redemption at par at each reset date. Accordingly, the fair value of the payable for floating rate notes issued approximates its carrying value. If measured at fair value, the payable for floating rate notes would have been considered as Level 2 in the fair value hierarchy (see Note 10) at March 31, 2021. Interest expense related to a Fund’s liability with respect to Floating Rate Notes is recorded as incurred. The SPV may be terminated by the Fund, as noted above, or by the occurrence of certain termination events as defined in the trust agreement, such as a downgrade in the credit quality of the underlying Bond, bankruptcy of or payment failure by the issuer of the underlying Bond, the inability to remarket Floating Rate Notes that have been tendered due to insufficient buyers in the market, or the failure by the SPV to obtain renewal of the liquidity agreement under which liquidity support is provided for the Floating Rate Notes up to one year. At March 31, 2021, the amounts of the Funds’ Floating Rate Notes and related interest rates and collateral were as follows:
| | | | | | | | |
| | | AMT-Free
Fund | | | National Fund | |
| | |
Floating Rate Notes Outstanding | | $ | 18,762,702 | | | $ | 104,604,568 | |
| | |
Interest Rate or Range of Interest Rates (%) | | | 0.10 | | | | 0.10 - 0.17 | |
| | |
Collateral for Floating Rate Notes Outstanding | | $ | 30,809,594 | | | $ | 150,191,781 | |
For the six months ended March 31, 2021, the Funds’ average settled Floating Rate Notes outstanding and the average interest rate (annualized) including fees were as follows:
| | | | | | | | |
| | | AMT-Free
Fund | | | National Fund | |
| | |
Average Floating Rate Notes Outstanding | | $ | 24,508,516 | | | $ | 104,175,000 | |
| | |
Average Interest Rate | | | 0.71 | % | | | 0.64 | % |
In certain circumstances, the Funds may enter into shortfall and forbearance agreements with brokers by which a Fund agrees to reimburse the broker for the difference between the liquidation value of the Bond held by the SPV and the liquidation value of the Floating Rate Notes, as well as any shortfalls in interest cash flows. The Funds had no shortfalls as of March 31, 2021.
The Funds may also purchase residual interest bonds in a secondary market transaction without first owning the underlying bond. Such transactions are not required to be treated as secured borrowings. Shortfall agreements, if any, related to residual interest bonds purchased in a secondary market transaction are disclosed in the Portfolio of Investments.
The Funds’ investment policies and restrictions expressly permit investments in residual interest bonds. Such bonds typically offer the potential for yields exceeding the yields available on fixed rate bonds with comparable credit quality and maturity. These securities tend to underperform the market for fixed rate bonds in a rising long-term interest rate environment, but tend to outperform the market for fixed rate bonds when long-term interest rates decline. The value and income of residual interest bonds are generally more volatile than that of a fixed rate bond. The Funds’ investment policies do not allow the Funds to borrow money except as permitted by the 1940 Act. Management believes that the Funds’ restrictions on borrowing money and issuing senior
Eaton Vance
Municipal Income Funds
March 31, 2021
Notes to Financial Statements (Unaudited) — continued
securities (other than as specifically permitted) do not apply to Floating Rate Notes issued by the SPV and included as a liability in the Funds’ Statement of Assets and Liabilities. As secured indebtedness issued by an SPV, Floating Rate Notes are distinct from the borrowings and senior securities to which the Funds’ restrictions apply. Residual interest bonds held by the Funds are securities exempt from registration under Rule 144A of the Securities Act of 1933.
I Financial Futures Contracts — Upon entering into a financial futures contract, a Fund is required to deposit with the broker, either in cash or securities, an amount equal to a certain percentage of the contract amount (initial margin). Subsequent payments, known as variation margin, are made or received by the Fund each business day, depending on the daily fluctuations in the value of the underlying security, and are recorded as unrealized gains or losses by the Fund. Gains (losses) are realized upon the expiration or closing of the financial futures contracts. Should market conditions change unexpectedly, the Fund may not achieve the anticipated benefits of the financial futures contracts and may realize a loss. Futures contracts have minimal counterparty risk as they are exchange traded and the clearinghouse for the exchange is substituted as the counterparty, guaranteeing counterparty performance.
J When-Issued Securities and Delayed Delivery Transactions — The Funds may purchase or sell securities on a delayed delivery or when-issued basis. Payment and delivery may take place after the customary settlement period for that security. At the time the transaction is negotiated, the price of the security that will be delivered is fixed. The Funds maintain cash and/or security positions for these commitments such that sufficient liquid assets will be available to make payments upon settlement. Securities purchased on a delayed delivery or when-issued basis are marked-to-market daily and begin earning interest on settlement date. Losses may arise due to changes in the market value of the underlying securities or if the counterparty does not perform under the contract.
K Interim Financial Statements — The interim financial statements relating to March 31, 2021 and for the six months then ended have not been audited by an independent registered public accounting firm, but in the opinion of the Funds’ management, reflect all adjustments, consisting only of normal recurring adjustments, necessary for the fair presentation of the financial statements.
2 Distributions to Shareholders and Income Tax Information
The net investment income of each Fund is determined daily and substantially all of the net investment income so determined is declared as a dividend to shareholders of record at the time of declaration. Distributions are declared separately for each class of shares. Distributions are paid monthly. Distributions of realized capital gains are made at least annually. Shareholders may reinvest income and capital gain distributions in additional shares of the same class of a Fund at the net asset value as of the reinvestment date or, at the election of the shareholder, receive distributions in cash. Distributions to shareholders are determined in accordance with income tax regulations, which may differ from U.S. GAAP. As required by U.S. GAAP, only distributions in excess of tax basis earnings and profits are reported in the financial statements as a return of capital. Permanent differences between book and tax accounting relating to distributions are reclassified to paid-in capital. For tax purposes, distributions from short-term capital gains are considered to be from ordinary income.
At September 30, 2020, the following Funds, for federal income tax purposes, had deferred capital losses which would reduce the respective Fund’s taxable income arising from future net realized gains on investment transactions, if any, to the extent permitted by the Internal Revenue Code, and thus would reduce the amount of distributions to shareholders, which would otherwise be necessary to relieve the Funds of any liability for federal income or excise tax. The deferred capital losses are treated as arising on the first day of a Fund’s next taxable year and retain the same short-term or long-term character as when originally deferred. The amounts of the deferred capital losses are as follows:
| | | | | | | | |
| | | AMT-Free Fund | | | National Fund | |
| | |
Deferred capital losses: | | | | | | | | |
| | |
Short-term | | $ | 15,794,902 | | | $ | 111,957,326 | |
| | |
Long-term | | $ | 12,845,489 | | | $ | 54,324,542 | |
The cost and unrealized appreciation (depreciation) of investments, including open derivative contracts, of each Fund at March 31, 2021, as determined on a federal income tax basis, were as follows:
| | | | | | | | |
| | | AMT-Free
Fund | | | National Fund | |
| | |
Aggregate cost | | $ | 297,035,754 | | | $ | 3,323,059,637 | |
| | |
Gross unrealized appreciation | | $ | 26,996,924 | | | $ | 228,829,310 | |
| | |
Gross unrealized depreciation | | | (2,215,487 | ) | | | (25,886,175 | ) |
| | |
Net unrealized appreciation | | $ | 24,781,437 | | | $ | 202,943,135 | |
Eaton Vance
Municipal Income Funds
March 31, 2021
Notes to Financial Statements (Unaudited) — continued
3 Investment Adviser Fee and Other Transactions with Affiliates
The investment adviser fee is earned by Eaton Vance Management (EVM) for AMT-Free Fund and Boston Management and Research (BMR), an affiliate of EVM, for National Fund as compensation for management and investment advisory services rendered to each Fund. On March 1, 2021, Morgan Stanley acquired Eaton Vance Corp. (the “Transaction”) and EVM and BMR became indirect, wholly-owned subsidiaries of Morgan Stanley. In connection with the Transaction, AMT-Free Fund entered into a new investment advisory agreement with EVM and National Fund entered into a new investment advisory agreement with BMR (the “New Agreements”), which took effect on March 1, 2021. Pursuant to the New Agreements (and each Fund’s investment advisory agreement with EVM or BMR, as applicable, in effect prior to March 1, 2021), the fee is based upon a percentage of total daily net assets plus a percentage of total daily gross income (i.e., income other than gains from the sale of securities) as presented in the following table and is payable monthly.
| | | | | | | | |
| Daily Net Assets | | Annual Asset
Rate | | | Daily Income
Rate | |
| | |
Up to $500 million | | | 0.300 | % | | | 3.00 | % |
| | |
$500 million but less than $1 billion | | | 0.275 | | | | 2.75 | |
| | |
$1 billion but less than $1.5 billion | | | 0.250 | | | | 2.50 | |
| | |
$1.5 billion but less than $2 billion | | | 0.225 | | | | 2.25 | |
| | |
$2 billion but less than $3 billion | | | 0.200 | | | | 2.00 | |
| | |
$3 billion and over | | | 0.175 | | | | 1.75 | |
For the six months ended March 31, 2021, investment adviser fees incurred by the Funds and the effective annual rates, as a percentage of average daily net assets, were as follows:
| | | | | | | | |
| | | AMT-Free
Fund | | | National
Fund | |
| | |
Investment Adviser Fee | | $ | 696,020 | | | $ | 5,428,064 | |
| | |
Effective Annual Rate | | | 0.40 | % | | | 0.29 | % |
EVM serves as the administrator of each Fund, but receives no compensation. EVM provides sub-transfer agency and related services to the Funds pursuant to a Sub-Transfer Agency Support Services Agreement. Eaton Vance Distributors, Inc. (EVD), an affiliate of EVM and the Funds’ principal underwriter, received a portion of the sales charge on sales of Class A shares of the Funds. EVD also received distribution and service fees from Class A and Class C shares (see Note 4) and contingent deferred sales charges (see Note 5). Sub-transfer agent fees earned by EVM, which are included in transfer and dividend disbursing agent fees on the Statements of Operations, and Class A sales charges that the Funds were informed were received by EVD for the six months ended March 31, 2021 were as follows:
| | | | | | | | |
| | | AMT-Free
Fund | | | National
Fund | |
| | |
EVM’s Sub-Transfer Agent Fees | | $ | 448 | | | $ | 1,732 | |
| | |
EVD’s Class A Sales Charges | | $ | 5,368 | | | $ | 56,538 | |
Trustees and officers of the Funds who are members of EVM’s or BMR’s organizations receive remuneration for their services to the Funds out of the investment adviser fee. Trustees of the Funds who are not affiliated with the investment advisers may elect to defer receipt of all or a percentage of their annual fees in accordance with the terms of the Trustees Deferred Compensation Plan. For the six months ended March 31, 2021, no significant amounts have been deferred. Certain officers and Trustees of the Funds are officers of the above organizations.
4 Distribution Plans
Each Fund has in effect a distribution plan for Class A shares (Class A Plan) pursuant to Rule 12b-1 under the 1940 Act. Pursuant to the Class A Plan, each Fund pays EVD a distribution and service fee of 0.25% per annum of its average daily net assets attributable to Class A shares for distribution
Eaton Vance
Municipal Income Funds
March 31, 2021
Notes to Financial Statements (Unaudited) — continued
services and facilities provided to each Fund by EVD, as well as for personal services and/or the maintenance of shareholder accounts. Distribution and service fees paid or accrued to EVD for the six months ended March 31, 2021 for Class A shares amounted to the following:
| | | | | | | | |
| | | AMT-Free
Fund | | | National
Fund | |
| | |
Class A Distribution and Service Fees | | $ | 201,224 | | | $ | 2,033,888 | |
Each Fund also has in effect a distribution plan for Class C shares (Class C Plan) pursuant to Rule 12b-1 under the 1940 Act. Pursuant to the Class C Plan, each Fund pays EVD amounts equal to 0.75% per annum of its average daily net assets attributable to Class C shares for providing ongoing distribution services and facilities to the respective Funds. For the six months ended March 31, 2021, the Funds paid or accrued to EVD the following distribution fees:
| | | | | | | | |
| | | AMT-Free
Fund | | | National
Fund | |
| | |
Class C Distribution Fees | | $ | 44,121 | | | $ | 415,421 | |
The Class C Plan also authorizes each Fund to make payments of service fees to EVD, financial intermediaries and other persons in amounts equal to 0.25% per annum of the average daily net assets attributable to Class C shares. Service fees paid or accrued are for personal services and/or the maintenance of shareholder accounts. They are separate and distinct from the Class C sales commissions and distribution fees payable to EVD. Service fees paid or accrued for the six months ended March 31, 2021 amounted to the following:
| | | | | | | | |
| | | AMT-Free
Fund | | | National
Fund | |
| | |
Class C Service Fees | | $ | 14,707 | | | $ | 138,474 | |
Distribution and service fees are subject to the limitations contained in the Financial Industry Regulatory Authority Rule 2341(d).
5 Contingent Deferred Sales Charges
A contingent deferred sales charge (CDSC) of 1% generally is imposed on redemptions of Class C shares made within 12 months of purchase. Class A shares may be subject to a 1% CDSC if redeemed within 18 months of purchase (depending on the circumstances of purchase). Generally, the CDSC is based upon the lower of the net asset value at date of redemption or date of purchase. No charge is levied on shares acquired by reinvestment of dividends or capital gain distributions. For the six months ended March 31, 2021, the Funds were informed that EVD received approximately the following amounts of CDSCs paid by Class A and Class C shareholders:
| | | | | | | | |
| | | AMT-Free
Fund | | | National
Fund | |
| | |
Class A | | $ | 19,000 | | | $ | 49,000 | |
| | |
Class C | | $ | — | | | $ | 6,000 | |
6 Purchases and Sales of Investments
Purchases and sales of investments, other than short-term obligations, for the six months ended March 31, 2021 were as follows:
| | | | | | | | |
| | | AMT-Free
Fund | | | National Fund | |
| | |
Purchases | | $ | 44,833,078 | | | $ | 1,181,547,803 | |
| | |
Sales | | $ | 70,489,629 | | | $ | 1,246,421,297 | |
Eaton Vance
Municipal Income Funds
March 31, 2021
Notes to Financial Statements (Unaudited) — continued
7 Shares of Beneficial Interest
Each Fund’s Declaration of Trust permits the Trustees to issue an unlimited number of full and fractional shares of beneficial interest (without par value). Such shares may be issued in a number of different series (such as the Funds) and classes. Transactions in Fund shares were as follows:
| | | | | | | | | | | | |
AMT-Free Fund | | | | | | | | | |
| | | Six Months Ended March 31, 2021 (Unaudited) | |
| | | Class A | | | Class C | | | Class I | |
| | | |
Sales | | | 1,854,358 | | | | 93,904 | | | | 2,454,181 | |
| | | |
Issued to shareholders electing to receive payments of distributions in Fund shares | | | 212,544 | | | | 12,883 | | | | 224,426 | |
| | | |
Redemptions | | | (2,408,979 | ) | | | (197,192 | ) | | | (2,076,310 | ) |
| | | |
Converted from Class C shares | | | 458,442 | | | | — | | | | — | |
| | | |
Converted to Class A shares | | | — | | | | (460,988 | ) | | | — | |
| | | |
Net increase (decrease) | | | 116,365 | | | | (551,393 | ) | | | 602,297 | |
| |
| | | Year Ended September 30, 2020 | |
| | | Class A | | | Class C | | | Class I | |
| | | |
Sales | | | 2,489,112 | | | | 286,876 | | | | 14,620,548 | |
| | | |
Issued to shareholders electing to receive payments of distributions in Fund shares | | | 446,020 | | | | 38,242 | | | | 394,814 | |
| | | |
Redemptions | | | (2,260,135 | ) | | | (657,145 | ) | | | (12,811,555 | ) |
| | | |
Converted from Class C shares | | | 169,973 | | | | — | | | | — | |
| | | |
Converted to Class A shares | | | — | | | | (170,955 | ) | | | — | |
| | | |
Net increase (decrease) | | | 844,970 | | | | (502,982 | ) | | | 2,203,807 | |
| | | |
National Fund | | | | | | | | | |
| | | Six Months Ended March 31, 2021 (Unaudited) | |
| | | Class A | | | Class C | | | Class I | |
| | | |
Sales | | | 7,335,291 | | | | 968,251 | | | | 46,844,706 | |
| | | |
Issued to shareholders electing to receive payments of distributions in Fund shares | | | 1,634,968 | | | | 81,945 | | | | 2,112,739 | |
| | | |
Redemptions | | | (15,403,250 | ) | | | (1,259,077 | ) | | | (24,086,871 | ) |
| | | |
Converted from Class C shares | | | 3,045,621 | | | | — | | | | — | |
| | | |
Converted to Class A shares | | | — | | | | (3,045,646 | ) | | | — | |
| | | |
Net increase (decrease) | | | (3,387,370 | ) | | | (3,254,527 | ) | | | 24,870,574 | |
| |
| | | Year Ended September 30, 2020 | |
| | | Class A | | | Class C | | | Class I | |
| | | |
Sales | | | 18,938,747 | | | | 2,768,098 | | | | 102,367,062 | |
| | | |
Issued to shareholders electing to receive payments of distributions in Fund shares | | | 3,734,240 | | | | 262,024 | | | | 3,801,170 | |
| | | |
Redemptions | | | (25,343,714 | ) | | | (4,575,561 | ) | | | (63,630,096 | ) |
| | | |
Converted from Class C shares | | | 2,628,910 | | | | — | | | | — | |
| | | |
Converted to Class A shares | | | — | | | | (2,628,854 | ) | | | — | |
| | | |
Net increase (decrease) | | | (41,817 | ) | | | (4,174,293 | ) | | | 42,538,136 | |
Eaton Vance
Municipal Income Funds
March 31, 2021
Notes to Financial Statements (Unaudited) — continued
8 Financial Instruments
The Funds may trade in financial instruments with off-balance sheet risk in the normal course of their investing activities. These financial instruments may include financial futures contracts and may involve, to a varying degree, elements of risk in excess of the amounts recognized for financial statement purposes. The notional or contractual amounts of these instruments represent the investment a Fund has in particular classes of financial instruments and do not necessarily represent the amounts potentially subject to risk. The measurement of the risks associated with these instruments is meaningful only when all related and offsetting transactions are considered. A summary of obligations under these financial instruments at March 31, 2021 is included in the Portfolio of Investments. At March 31, 2021, National Fund had sufficient cash and/or securities to cover commitments under these contracts.
Each Fund is subject to interest rate risk in the normal course of pursuing its investment objective. Because the Funds hold fixed-rate bonds, the value of these bonds may decrease if interest rates rise. During the six months ended March 31, 2021, National Fund entered into U.S. Treasury futures contracts to hedge against changes in interest rates.
The fair value of open derivative instruments (not considered to be hedging instruments for accounting disclosure purposes) and whose primary underlying risk exposure is interest rate risk at March 31, 2021 were as follows:
| | | | |
| | | National
Fund | |
| |
Asset Derivative: | | | | |
| |
Futures Contracts | | $ | 4,218,574 | (1) |
| |
Total | | $ | 4,218,574 | |
| (1) | Only the current day’s variation margin on open futures contracts is reported within the Statement of Assets and Liabilities as Receivable or Payable for variation margin on open financial futures contracts, as applicable. |
The effect of derivative instruments (not considered to be hedging instruments for accounting disclosure purposes) on the Statement of Operations and whose primary underlying risk exposure is interest rate risk for the six months ended March 31, 2021 was as follows:
| | | | |
| | | National
Fund | |
| |
Realized Gain (Loss) on Derivatives Recognized in Income | | $ | 7,340,050 | (1) |
| |
Change in Unrealized Appreciation (Depreciation) on Derivatives Recognized in Income | | $ | 4,218,574 | (2) |
| (1) | Statement of Operations location: Net realized gain (loss) – Financial futures contracts. |
| (2) | Statement of Operations location: Change in unrealized appreciation (depreciation) – Financial futures contracts. |
The average notional cost of futures contracts outstanding during the six months ended March 31, 2021, which is indicative of the volume of this derivative type, was approximately as follows:
| | | | |
| | | National
Fund | |
| |
Average Notional Cost: | | | | |
| |
Futures Contracts — Short | | $ | 64,347,000 | |
9 Line of Credit
The Funds participate with other portfolios and funds managed by EVM and its affiliates in an $800 million unsecured line of credit agreement with a group of banks, which is in effect through October 26, 2021. Borrowings are made by the Funds solely for temporary purposes related to redemptions and other short-term cash needs. Interest is charged to each Fund based on its borrowings at an amount above either the Eurodollar rate or Federal Funds rate. In addition, a fee computed at an annual rate of 0.15% on the daily unused portion of the line of credit is allocated among the participating portfolios and funds at the end of each quarter. In connection with the renewal of the agreement in October 2020, an upfront fee and arrangement fee totaling $950,000 was incurred that was allocated to the participating portfolios and funds. Because the line of credit is not available exclusively to the Funds, a Fund may be unable to borrow some or all of its requested amounts at any particular time. The Funds did not have any significant borrowings or allocated fees during the six months ended March 31, 2021.
Eaton Vance
Municipal Income Funds
March 31, 2021
Notes to Financial Statements (Unaudited) — continued
10 Fair Value Measurements
Under generally accepted accounting principles for fair value measurements, a three-tier hierarchy to prioritize the assumptions, referred to as inputs, is used in valuation techniques to measure fair value. The three-tier hierarchy of inputs is summarized in the three broad levels listed below.
| • | | Level 1 – quoted prices in active markets for identical investments |
| • | | Level 2 – other significant observable inputs (including quoted prices for similar investments, interest rates, prepayment speeds, credit risk, etc.) |
| • | | Level 3 – significant unobservable inputs (including a fund’s own assumptions in determining the fair value of investments) |
In cases where the inputs used to measure fair value fall in different levels of the fair value hierarchy, the level disclosed is determined based on the lowest level input that is significant to the fair value measurement in its entirety. The inputs or methodology used for valuing securities are not necessarily an indication of the risk associated with investing in those securities.
At March 31, 2021, the hierarchy of inputs used in valuing the Funds’ investments and open derivative instruments, which are carried at value, were as follows:
| | | | | | | | | | | | | | | | |
AMT-Free Fund | |
| Asset Description | | Level 1 | | | Level 2 | | | Level 3 | | | Total | |
| | | | |
Tax-Exempt Municipal Obligations | | $ | — | | | $ | 340,579,893 | | | $ | — | | | $ | 340,579,893 | |
| | | | |
Total Investments | | $ | — | | | $ | 340,579,893 | | | $ | — | | | $ | 340,579,893 | |
|
National Fund | |
| Asset Description | | Level 1 | | | Level 2 | | | Level 3 | | | Total | |
| | | | |
Tax-Exempt Municipal Obligations | | $ | — | | | $ | 3,469,838,460 | | | $ | — | | | $ | 3,469,838,460 | |
| | | | |
Taxable Municipal Obligations | | | — | | | | 156,550,306 | | | | — | | | | 156,550,306 | |
| | | | |
Total Investments | | $ | — | | | $ | 3,626,388,766 | | | $ | — | | | $ | 3,626,388,766 | |
| | | | |
Futures Contracts | | $ | 4,218,574 | | | $ | — | | | $ | — | | | $ | 4,218,574 | |
| | | | |
Total | | $ | 4,218,574 | | | $ | 3,626,388,766 | | | $ | — | | | $ | 3,630,607,340 | |
11 Risks and Uncertainties
Pandemic Risk
An outbreak of respiratory disease caused by a novel coronavirus was first detected in China in late 2019 and subsequently spread internationally. This coronavirus has resulted in closing borders, enhanced health screenings, changes to healthcare service preparation and delivery, quarantines, cancellations, disruptions to supply chains and customer activity, as well as general concern and uncertainty. Health crises caused by outbreaks, such as the coronavirus outbreak, may exacerbate other pre-existing political, social and economic risks and disrupt normal market conditions and operations. The impact of this outbreak has negatively affected the worldwide economy, the economies of individual countries, individual companies, and the market in general, and may continue to do so in significant and unforeseen ways, as may other epidemics and pandemics that may arise in the future. Any such impact could adversely affect the Funds’ performance, or the performance of the securities in which the Funds invest.
Eaton Vance
AMT-Free Municipal Income Fund
March 31, 2021
Joint Special Meeting of Shareholders (Unaudited)
Eaton Vance AMT-Free Municipal Income Fund (the “Fund”) held a Joint Special Meeting of Shareholders with certain other Eaton Vance funds on February 18, 2021 in order to approve a new investment advisory agreement with Eaton Vance Management to serve as the Fund’s investment adviser (the “Proposal”). The shareholder meeting results are as follows:
| | | | | | | | | | | | | | | | |
| | | Number of Shares(1) | |
| | | For | | | Against | | | Abstain(2) | | | Broker
Non-Votes(2) | |
| | | | |
| | | | 18,083,259.880 | | | | 192,493.549 | | | | 1,345,470.082 | | | | 0 | |
| (1) | Fractional shares were voted proportionately. |
| (2) | Abstentions and broker non-votes (i.e., shares for which a broker returns a proxy but for which (i) the beneficial owner has not voted and (ii) the broker holding the shares does not have discretionary authority to vote on the particular matter) were treated as shares that were present at the meeting for purposes of establishing a quorum, but had the effect of a negative vote on the Proposal. |
Eaton Vance
National Municipal Income Fund
March 31, 2021
Joint Special Meeting of Shareholders (Unaudited)
Eaton Vance National Municipal Income Fund (the “Fund”) held a Joint Special Meeting of Shareholders with certain other Eaton Vance funds on February 18, 2021 in order to approve a new investment advisory agreement with Boston Management and Research to serve as the Fund’s investment adviser (the “Proposal”). The shareholder meeting results are as follows:
| | | | | | | | | | | | | | | | |
| | | Number of Shares(1) | |
| | | For | | | Against | | | Abstain(2) | | | Broker
Non-Votes(2) | |
| | | | |
| | | | 188,593,250.606 | | | | 3,531,690.600 | | | | 8,687,727.272 | | | | 0 | |
| (1) | Fractional shares were voted proportionately. |
| (2) | Abstentions and broker non-votes (i.e., shares for which a broker returns a proxy but for which (i) the beneficial owner has not voted and (ii) the broker holding the shares does not have discretionary authority to vote on the particular matter) were treated as shares that were present at the meeting for purposes of establishing a quorum, but had the effect of a negative vote on the Proposal. |
Eaton Vance
Municipal Income Funds
March 31, 2021
Board of Trustees’ Contract Approval
Overview of the Contract Review Process
Even though the following description of the Board’s (as defined below) consideration of investment advisory and, as applicable, sub-advisory agreements covers multiple funds, for purposes of this shareholder report, the description is only relevant as to Eaton Vance National Municipal Income Fund and Eaton Vance AMT-Free Municipal Income Fund.
| | | | |
| Fund | | Investment Adviser | | Investment Sub-Adviser |
| | |
Eaton Vance National Municipal Income Fund | | Boston Management and Research | | None |
| | |
Eaton Vance AMT-Free Municipal Income Fund | | Eaton Vance Management | | None |
At a meeting held on November 24, 2020 (the “November Meeting”), the Board of each Eaton Vance open-end Fund and portfolios in which each such Fund invests, as applicable (each, a “Fund” and, collectively, the “Funds”), including a majority of the Board members (the “Independent Trustees”) who are not “interested persons” (as defined in the Investment Company Act of 1940 (the “1940 Act”)) of the Funds, Eaton Vance Management (“EVM”) or Boston Management and Research (“BMR” and, together with EVM, the “Advisers”), voted to approve a new investment advisory agreement between each Fund and either EVM or BMR (the “New Investment Advisory Agreements”) and, for certain Funds, a new investment sub-advisory agreement between an Adviser and the applicable Sub-Adviser (the “New Investment Sub-Advisory Agreements”(1) and, together with the New Investment Advisory Agreements, the “New Agreements”), each of which is intended to go into effect upon the completion of the Transaction (as defined below), as more fully described below. In voting its approval of the New Agreements at the November Meeting, the Board relied on an order issued by the Securities and Exchange Commission in response to the impacts of the COVID-19 pandemic that provided temporary relief from the in-person meeting requirements under Section 15 of the 1940 Act.
In voting its approval of the New Agreements, the Board of each Fund relied upon the recommendation of its Contract Review Committee, which is a committee comprised exclusively of Independent Trustees. Prior to and during meetings leading up to the November Meeting, the Contract Review Committee reviewed and discussed information furnished by the Advisers, the Sub-Advisers, and Morgan Stanley, as requested by the Independent Trustees, that the Contract Review Committee considered reasonably necessary to evaluate the terms of the New Agreements and to form its recommendation. Such information included, among other things, the terms and anticipated impacts of Morgan Stanley’s pending acquisition of Eaton Vance Corp. (the “Transaction”) on the Funds and their shareholders. In addition to considering information furnished specifically to evaluate the impact of the Transaction on the Funds and their respective shareholders, the Board and its Contract Review Committee also considered information furnished for prior meetings of the Board and its committees, including information provided in connection with the annual contract review process for the Funds, which most recently culminated in April 2020 (the “2020 Annual Approval Process”).
The Board of each Fund, including the Independent Trustees, concluded that the applicable New Investment Advisory Agreement and, as applicable, New Investment Sub-Advisory Agreement, including the fees payable thereunder, was fair and reasonable, and it voted to approve the New Investment Advisory Agreement and, as applicable, New Investment Sub-Advisory Agreement and to recommend that shareholders do so as well.
Shortly after the announcement of the Transaction, the Board, including all of the Independent Trustees, met with senior representatives from the Advisers and Morgan Stanley at its meeting held on October 13, 2020 to discuss certain aspects of the Transaction and the expected impacts of the Transaction on the Funds and their shareholders. As part of the Board’s evaluation process, counsel to the Independent Trustees, on behalf of the Contract Review Committee, requested additional information to assist the Independent Trustees in their evaluation of the New Agreements and the implications of the Transaction, as well as other contractual arrangements that may be affected by the Transaction. The Contract Review Committee considered information furnished by the Advisers and Morgan Stanley, their respective affiliates, and, as applicable, the Sub-Advisers during meetings on November 5, 2020, November 10, 2020, November 13, 2020, November 17, 2020 and November 24, 2020.
During its meetings on November 10, 2020 and November 17, 2020, the Contract Review Committee further discussed the approval of the New Agreements with senior representatives of the Advisers, the Affiliated Sub-Advisers, and Morgan Stanley. The representatives from the Advisers, the Affiliated Sub-Advisers, and Morgan Stanley each made presentations to, and responded to questions from, the Independent Trustees. The Contract Review Committee considered the Advisers’, the Affiliated Sub-Advisers’ and Morgan Stanley’s responses related to the Transaction and specifically to the Funds, as well as information received in connection with the 2020 Annual Approval Process, with respect to its evaluation of the New Agreements. Among other information, the Board considered:
| (1) | With respect to certain of the Funds, the applicable Adviser is currently a party to a sub-advisory agreement (collectively, the “Current Sub-Advisory Agreements”) with Atlanta Capital Management Company, LLC (“Atlanta Capital”), BMO Global Asset Management (Asia) Limited, Eaton Vance Advisers International Ltd. (“EVAIL”), Goldman Sachs Asset Management, L.P., Hexavest Inc. (“Hexavest”), Parametric Portfolio Associates LLC (“Parametric”) or Richard Bernstein Advisors LLC (collectively, the “Sub-Advisers” and, with respect to Atlanta Capital, EVAIL, Hexavest and Parametric, each an affiliate of the Advisers, the “Affiliated Sub-Advisers”). Accordingly, references to the “Sub-Advisers,” the “Affiliated Sub-Advisers” or the “New Sub-Advisory Agreements” are not applicable to all Funds. |
Eaton Vance
Municipal Income Funds
March 31, 2021
Board of Trustees’ Contract Approval — continued
Information about the Transaction and its Terms
| | • | | Information about the material terms and conditions, and expected impacts, of the Transaction that relate to the Funds, including the expected impacts on the businesses conducted by the Advisers, the Affiliated Sub-Advisers and Eaton Vance Distributors, Inc., as the distributor of Fund shares; |
| | • | | Information about the advantages of the Transaction as they relate to the Funds and their shareholders; |
| | • | | A commitment that the Funds would not bear any expenses, directly or indirectly, in connection with the Transaction; |
| | • | | A commitment that, for a period of three years after the Closing, at least 75% of each Fund’s Board members must not be “interested persons” (as defined in the 1940 Act) of the investment adviser (or predecessor investment adviser, if applicable) pursuant to Section 15(f)(1)(A) of the 1940 Act; |
| | • | | A commitment that Morgan Stanley would use its reasonable best efforts to ensure that it did not impose any “unfair burden” (as that term is used in section 15(f)(1)(B) of the 1940 Act) on the Funds as a result of the Transaction; |
| | • | | Information with respect to personnel and/or other resources of the Advisers and their affiliates, including the Affiliated Sub-Advisers, as a result of the Transaction, as well as any expected changes to compensation, including any retention-based compensation intended to incentivize key personnel at the Advisers and their affiliates, including the Affiliated Sub-Advisers; |
| | • | | Information regarding any changes that are expected with respect to the Funds’ slate of officers as a result of the Transaction; |
Information about Morgan Stanley
| | • | | Information about Morgan Stanley’s overall business, including information about the advisory, brokerage and related businesses that Morgan Stanley operates; |
| | • | | Information about Morgan Stanley’s financial condition, including its access to capital and other resources required to support the investment advisory businesses related to the Funds; |
| | • | | Information on how the Funds are expected to fit within Morgan Stanley’s overall business strategy, and any changes that Morgan Stanley contemplates implementing to the Funds in the short- or long-term following the closing of the Transaction (the “Closing”); |
| | • | | Information regarding risk management functions at Morgan Stanley and its affiliates, including how existing risk management protocols and procedures may impact the Funds and/or the businesses of the Advisers and their affiliates, including the Affiliated Sub-Advisers, as they relate to the Funds; |
| | • | | Information on the anticipated benefits of the Transaction to the Funds with respect to potential additional distribution capabilities and the ability to access new markets and customer segments through Morgan Stanley’s distribution network, including, in particular, its institutional client base; |
| | • | | Information regarding the financial condition and reputation of Morgan Stanley, its worldwide presence, experience as a fund sponsor and manager, commitment to maintain a high level of cooperation with, and support to, the Funds, strong client service capabilities, and relationships in the asset management industry; |
Information about the New Agreements for Funds
| | • | | A representation that, after the Closing, all of the Funds will continue to be advised by their current Adviser and Sub-Adviser, as applicable; |
| | • | | Information regarding the terms of the New Agreements, including certain changes as compared to the current investment advisory agreement between each Fund and its Adviser (collectively, the “Current Advisory Agreements”) and, as applicable, the current investment sub-advisory agreement between a Fund and a Sub-Adviser (together with the Current Advisory Agreements, the “Current Agreements”); |
| | • | | Information confirming that the fee rates payable under the New Agreements are not changed as compared to the Current Agreements; |
| | • | | A representation that the New Agreements will not cause any diminution in the nature, extent and quality of services provided by the Advisers and the Sub-Advisers to the Funds and their respective shareholders, including with respect to compliance and other non-advisory services; |
Information about Fund Performance, Fees and Expenses
| | • | | A report from an independent data provider comparing the investment performance of each Fund (including, as relevant, total return data, income data, Sharpe ratios and information ratios) to the investment performance of comparable funds and, as applicable, benchmark indices, over various time periods as of the 2020 Annual Approval Process, as well as performance information as of a more recent date; |
| | • | | A report from an independent data provider comparing each Fund’s total expense ratio (and its components) to those of comparable funds as of the 2020 Annual Approval Process, as well as fee and expense information as of a more recent date; |
| | • | | In certain instances, data regarding investment performance relative to customized groups of peer funds and blended indices identified by the Advisers in consultation with the Portfolio Management Committee of the Board as of the 2020 Annual Approval Process, as well as corresponding performance information as of a more recent date; |
| | • | | Comparative information concerning the fees charged and services provided by the Adviser and the Sub-Adviser to each Fund in managing other accounts (which may include other mutual funds, collective investment funds and institutional accounts) using investment strategies and techniques similar to those used in managing such Fund(s), if any; |
| | • | | Profitability analyses of the Advisers and the Affiliated Sub-Advisers, as applicable, with respect to each of the Funds as of the 2020 Annual Approval Process, as well as information regarding the impact of the Transaction on profitability; |
Information about Portfolio Management and Trading
| | • | | Descriptions of the investment management services currently provided and expected to be provided to each Fund after the Transaction, as well as each of the Funds’ investment strategies and policies; |
Eaton Vance
Municipal Income Funds
March 31, 2021
Board of Trustees’ Contract Approval — continued
| | • | | The procedures and processes used to determine the fair value of Fund assets, when necessary, and actions taken to monitor and test the effectiveness of such procedures and processes; |
| | • | | Information about any changes to the policies and practices of the Advisers and, as applicable, each Fund’s Sub-Adviser with respect to trading, including their processes for seeking best execution of portfolio transactions; |
| | • | | Information regarding the impact on trading and access to capital markets associated with the Funds’ affiliations with Morgan Stanley and its affiliates, including potential restrictions with respect to the Funds’ ability to execute portfolio transactions with Morgan Stanley and its affiliates; |
Information about the Advisers and the Sub-Advisers
| | • | | Information about the financial results and condition of the Advisers and the Affiliated Sub-Advisers since the culmination of the 2020 Annual Approval Process and any material changes in financial condition that are reasonably expected to occur before and after the Closing; |
| | • | | Information regarding contemplated changes to the individual investment professionals whose responsibilities include portfolio management and investment research for the Funds, and, for portfolio managers and certain other investment professionals, information relating to their responsibilities with respect to managing other mutual funds and investment accounts, as applicable, post-Closing; |
| | • | | The Code of Ethics of the Advisers and their affiliates, including the Affiliated Sub-Advisers, together with information relating to compliance with, and the administration of, such codes; |
| | • | | Policies and procedures relating to proxy voting and the handling of corporate actions and class actions; |
| | • | | Information concerning the resources devoted to compliance efforts undertaken by the Advisers and their affiliates, including the Affiliated Sub-Advisers, including descriptions of their various compliance programs and their record of compliance; |
| | • | | Information concerning the business continuity and disaster recovery plans of the Advisers and their affiliates, including the Affiliated Sub-Advisers; |
| | • | | A description of the Advisers’ oversight of the Sub-Advisers, including with respect to regulatory and compliance issues, investment management and other matters; |
Other Relevant Information
| | • | | Information concerning the nature, cost and character of the administrative and other non-investment advisory services provided by the Advisers and their affiliates; |
| | • | | Information concerning oversight of the relationship with the custodian, subcustodians and fund accountants by EVM and/or administrator to each of the Funds; |
| | • | | Confirmation that the Advisers intend to continue to manage the Funds in a manner materially consistent with each Fund’s current investment objective(s) and principal investment strategies; |
| | • | | Information regarding Morgan Stanley’s commitment to maintaining competitive compensation arrangements to attract and retain highly qualified personnel; |
| | • | | Confirmation that the Advisers’ current senior management teams have indicated their strong support of the Transaction; and |
| | • | | Information regarding the fact that Morgan Stanley and Eaton Vance Corp. will each derive benefits from the Transaction and that, as a result, they have a financial interest in the matters that were being considered. |
As indicated above, the Board and its Contract Review Committee also considered information received at its regularly scheduled meetings throughout the year, which included information from portfolio managers and other investment professionals of the Advisers and the Sub-Advisers regarding investment and performance matters, and considered various investment and trading strategies used in pursuing the Funds’ investment objectives. The Board also received information regarding risk management techniques employed in connection with the management of the Funds. The Board and its committees evaluated issues pertaining to industry and regulatory developments, compliance procedures, fund governance and other issues with respect to the Funds, and received and participated in reports and presentations provided by the Advisers and their affiliates, including the Affiliated Sub-Advisers, with respect to such matters.
The Contract Review Committee was advised throughout the evaluation process by Goodwin Procter LLP, independent legal counsel for the Independent Trustees. The members of the Contract Review Committee, with the advice of such counsel, exercised their own business judgment in determining the material factors to be considered in evaluating the New Agreements and the weight to be given to each such factor. The conclusions reached with respect to the New Agreements were based on a comprehensive evaluation of all the information provided and not any single factor. Moreover, each Independent Trustee may have placed varying emphasis on particular factors in reaching conclusions with respect to the New Agreements.
Nature, Extent and Quality of Services
In considering whether to approve the New Agreements, the Board evaluated the nature, extent and quality of services currently provided to each Fund by the Advisers and, as applicable, the Sub-Advisers under the Current Agreements. In evaluating the nature, extent and quality of services to be provided by the Advisers and the Sub-Advisers under the New Agreements, the Board considered, among other information, the expected impact, if any, of the Transaction on the operations, facilities, organization and personnel of the Advisers and the Sub-Advisers, and that Morgan Stanley and the Advisers have advised the Board that, following the Transaction, there is not expected to be any diminution in the nature, extent and quality of services provided by the Advisers and the Sub-Advisers, as applicable, to the Funds and their shareholders, including compliance and other non-advisory services, and that there are not expected to be any changes in portfolio management personnel as a result of the Transaction.
Eaton Vance
Municipal Income Funds
March 31, 2021
Board of Trustees’ Contract Approval — continued
The Board also considered the financial resources of Morgan Stanley and the Advisers and the importance of having a Fund manager with, or with access to, significant organizational and financial resources. The Board considered the benefits to the Funds of being part of a larger combined organization with greater financial resources following the Transaction, particularly during periods of market disruptions and volatility. In this regard, the Board considered information provided by Morgan Stanley regarding its business and operating structure, scale of operation, leadership and reputation, distribution capabilities, and financial condition, as well as information on how the Funds are expected to fit within Morgan Stanley’s overall business strategy and any changes that Morgan Stanley contemplates in the short- or long-term following the Closing. The Board also noted Morgan Stanley’s and the Advisers’ commitment to keep the Board apprised of developments with respect to its long-term integration plans for the Advisers, the Affiliated Sub-Advisers, and existing Morgan Stanley affiliates and their respective personnel.
The Board considered the Advisers’ and the Sub-Advisers’ management capabilities and investment processes in light of the types of investments held by each Fund, including the education, experience and number of investment professionals and other personnel who provide portfolio management, investment research, and similar services to each Fund. In particular, the Board considered the abilities and experience of the Advisers’ and, as applicable, the Sub-Advisers’ investment professionals in implementing each Fund’s investment strategies. The Board also took into account the resources dedicated to portfolio management and other services, the compensation methods of the Advisers and other factors, including the reputation and resources of the Advisers to recruit and retain highly qualified research, advisory and supervisory investment professionals. With respect to the recruitment and retention of key personnel, the Board noted information from Morgan Stanley and the Advisers regarding the benefits of joining Morgan Stanley. In addition, the Board considered the time and attention devoted to the Funds by senior management, as well as the infrastructure, operational capabilities and support staff in place to assist in the portfolio management and operations of the Funds, including the provision of administrative services. With respect to the foregoing, the Board also considered information from the Advisers and Morgan Stanley regarding the anticipated impact of the Transaction on such matters. The Board also considered the business-related and other risks to which the Advisers or their affiliates may be subject in managing the Funds and in connection with the Transaction.
The Board considered the compliance programs of the Advisers and relevant affiliates thereof, including the Affiliated Sub-Advisers. The Board considered compliance and reporting matters regarding, among other things, personal trading by investment professionals, disclosure of portfolio holdings, late trading, frequent trading, portfolio valuation, business continuity and the allocation of investment opportunities. The Board also considered the responses of the Advisers and their affiliates to requests in recent years from regulatory authorities, such as the Securities and Exchange Commission and the Financial Industry Regulatory Authority. The Board also considered certain information relating to the compliance record of Morgan Stanley and its affiliates, including information requests in recent years from regulatory authorities. With respect to the foregoing, including the compliance programs of the Advisers and the Sub-Advisers, the Board noted information regarding the impacts of the Transaction, as well as the Advisers’ and Morgan Stanley’s commitment to keep the Board apprised of developments with respect to its long-term integration plans for the Advisers, the Affiliated Sub-Advisers and existing Morgan Stanley affiliates and their respective personnel.
The Board considered other administrative services provided and to be provided or overseen by the Advisers and their affiliates, including transfer agency and accounting services. The Board evaluated the benefits to shareholders of investing in a fund that is a part of a large fund complex offering exposure to a variety of asset classes and investment disciplines, as well as the ability, in many cases, to exchange an investment among different funds without incurring additional sales charges. The Board noted information that the Transaction was not expected to have any material impact on such matters in the near-term.
In evaluating the nature, extent and quality of the services to be provided under the New Agreements, the Board also considered investment performance information provided for each Fund in connection with the 2020 Annual Approval Process, as well as information provided as of a more recent date. In this regard, the Board compared each Fund’s investment performance to that of comparable funds identified by an independent data provider (the peer group), as well as appropriate benchmark indices and, for certain Funds, a custom peer group of similarly managed funds. The Board also considered, where applicable, Fund-specific performance explanations based on criteria established by the Board in connection with the 2020 Annual Approval Process and, where applicable, performance explanations as of a more recent date. In addition to the foregoing information, it was also noted that the Board has received and discussed with management information throughout the year at periodic intervals comparing each Fund’s performance against applicable benchmark indices and peer groups. In addition, the Board considered each Fund’s performance in light of overall financial market conditions. Where a Fund’s relative underperformance to its peers was significant during one or more specified periods, the Board noted the explanation from the applicable Adviser concerning the Fund’s relative performance versus its peer group.
After consideration of the foregoing factors, among others, and based on their review of the materials provided and the assurances received from, and recommendations of, the Advisers and Morgan Stanley, the Board determined that the Transaction was not expected to adversely affect the nature, extent and quality of services provided to the Funds by the Advisers and their affiliates, including the Affiliated Sub-Advisers, and that the Transaction was not expected to have an adverse effect on the ability of the Advisers and their affiliates, including the Affiliated Sub-Advisers, to provide those services. The Board concluded that the nature, extent and quality of services expected to be provided by the Advisers and the Sub-Advisers, taken as a whole, are appropriate and expected to be consistent with the terms of the New Agreements.
Management Fees and Expenses
The Board considered contractual fee rates payable by each Fund for advisory and administrative services (referred to collectively as “management fees”) in connection with the 2020 Annual Approval Process, as well as information provided as of a more recent date. As part of its review, the Board considered each Fund’s management fees and total expense ratio over various periods, as compared to those of comparable funds, before and after giving effect to any
Eaton Vance
Municipal Income Funds
March 31, 2021
Board of Trustees’ Contract Approval — continued
undertaking to waive fees or reimburse expenses. The Board also considered factors, and, where applicable, certain Fund-specific factors, that had an impact on a Fund’s total expense ratio relative to comparable funds, as identified by the Advisers in response to inquiries from the Contract Review Committee. The Board considered that the New Agreements do not change a Fund’s management fee rate or the computation method for calculating such fees, including any separately executed permanent contractual management fee reduction currently in place for the Fund.
The Board also received and considered, where applicable, information about the services offered and the fee rates charged by the Advisers and the Sub-Advisers to other types of accounts with investment objectives and strategies that are substantially similar to and/or managed in a similar investment style as a Fund. In this regard, the Board received information about the differences in the nature and scope of services the Advisers and the Sub-Advisers, as applicable, provide to the Funds as compared to other types of accounts and the material differences in compliance, reporting and other legal burdens and risks to the Advisers and such Sub-Advisers as between each Fund and other types of accounts.
After considering the foregoing information, and in light of the nature, extent and quality of the services expected to be provided by the Advisers and the Sub-Advisers, the Board concluded that the management fees charged for advisory and related services are reasonable with respect to its approval of the New Agreements.
Profitability and “Fall-Out” Benefits
During the 2020 Annual Approval Process, the Board considered the level of profits realized by the Advisers and relevant affiliates thereof, including the Affiliated Sub-Advisers, in providing investment advisory and administrative services to the Funds and to all Eaton Vance funds as a group. The Board considered the level of profits realized without regard to marketing support or other payments by the Advisers and their affiliates to third parties in respect of distribution or other services. In light of the foregoing factors and the nature, extent and quality of the services rendered, the profits realized by the Advisers and their affiliates, including the Sub-Advisers, were not deemed to be excessive by the Board.
The Board noted that Morgan Stanley and the Advisers are expected to realize, over time, cost savings from the Transaction based on eliminating duplicate corporate overhead expenses. The Board considered, however, information from the Advisers and Morgan Stanley that such cost savings are not expected to be realized immediately upon the Closing and that, accordingly, there are currently no specific expected changes in the levels of profitability associated with the advisory and other services provided to the Funds that are contemplated as a result of the Transaction. The Board noted that it will continue to receive information regarding profitability during its annual contract review processes, including the extent to which cost savings and/or other efficiencies result in changes to profitability levels.
The Board also considered direct or indirect fall-out benefits received by the Advisers and their affiliates, including the Affiliated Sub-Advisers, in connection with their respective relationships with the Funds, including the benefits of research services that may be available to the Advisers and their affiliates as a result of securities transactions effected for the Funds and other investment advisory clients. In evaluating the fall-out benefits to be received by the Advisers and their affiliates under the New Agreements, the Board considered whether the Transaction would have an impact on the fall-out benefits currently realized by the Advisers and their affiliates in connection with services provided pursuant to the Current Advisory Agreements.
The Board of each Fund considered that Morgan Stanley may derive reputational and other benefits from its ability to use the names of the Advisers and their affiliates in connection with operating and marketing the Funds. The Board considered that the Transaction, if completed, would significantly increase Morgan Stanley’s assets under management and expand Morgan Stanley’s investment capabilities.
Economies of Scale
The Board also considered the extent to which the Advisers and their affiliates, on the one hand, and the Funds, on the other hand, can expect to realize benefits from economies of scale as the assets of the Funds increase. The Board acknowledged the difficulty in accurately measuring the benefits resulting from economies of scale, if any, with respect to the management of any specific Fund or group of funds. As part of the 2020 Annual Approval Process, the Board reviewed data summarizing the increases and decreases in the assets of the Funds and of all Eaton Vance funds as a group over various time periods, and evaluated the extent to which the total expense ratio of each Fund and the profitability of the Advisers and their affiliates may have been affected by such increases or decreases.
The Board noted that Morgan Stanley and the Advisers are expected to benefit from possible growth of the Funds resulting from enhanced distribution capabilities, including with respect to the Funds’ potential access to Morgan Stanley’s institutional client base. Based upon the foregoing, the Board concluded that the Funds currently share in the benefits from economies of scale, if any, when they are realized by the Advisers, and that the Transaction is not expected to impede a Fund from continuing to benefit from any future economies of scale realized by its Adviser.
Conclusion
Based on its consideration of the foregoing, and such other information it deemed relevant, including the factors and conclusions described above, the Contract Review Committee recommended to the Board approval of the New Agreements. Based on the recommendation of the Contract Review Committee, the Board, including a majority of the Independent Trustees, unanimously voted to approve the New Agreements for the Funds and recommended that shareholders approve the New Agreements.
Eaton Vance
Municipal Income Funds
March 31, 2021
Officers and Trustees
Officers
Eric A. Stein
President
Deidre E. Walsh
Vice President
Maureen A. Gemma
Secretary and Chief Legal Officer
James F. Kirchner
Treasurer
Richard F. Froio
Chief Compliance Officer
Trustees
William H. Park
Chairperson
Thomas E. Faust Jr.*
Mark R. Fetting
Cynthia E. Frost
George J. Gorman
Valerie A. Mosley
Helen Frame Peters
Keith Quinton
Marcus L. Smith
Susan J. Sutherland
Scott E. Wennerholm
Eaton Vance Funds
| | |
| Privacy Notice | | April 2021 |
| | |
| |
| FACTS | | WHAT DOES EATON VANCE DO WITH YOUR
PERSONAL INFORMATION? |
| | | |
| |
| | |
| Why? | | Financial companies choose how they share your personal information. Federal law gives consumers the right to limit some but not all sharing. Federal law also requires us to tell you how we collect, share, and protect your personal information. Please read this notice carefully to understand what we do. |
| | |
| | | |
| What? | | The types of personal information we collect and share depend on the product or service you have with us. This information can include: ∎ Social Security number and income ∎ investment experience and risk tolerance ∎ checking account number and wire transfer instructions |
| | |
| | | |
| How? | | All financial companies need to share customers’ personal information to run their everyday business. In the section below, we list the reasons financial companies can share their customers’ personal information; the reasons Eaton Vance chooses to share; and whether you can limit this sharing. |
| | |
| | | |
| | | | |
Reasons we can share your
personal information | | Does Eaton Vance share? | | Can you limit this sharing? |
| For our everyday business purposes — such as to process your transactions, maintain your account(s), respond to court orders and legal investigations, or report to credit bureaus | | Yes | | No |
| For our marketing purposes — to offer our products and services to you | | Yes | | No |
| For joint marketing with other financial companies | | No | | We don’t share |
| For our investment management affiliates’ everyday business purposes — information about your transactions, experiences, and creditworthiness | | Yes | | Yes |
| For our affiliates’ everyday business purposes — information about your transactions and experiences | | Yes | | No |
| For our affiliates’ everyday business purposes — information about your creditworthiness | | No | | We don’t share |
| For our investment management affiliates to market to you | | Yes | | Yes |
| For our affiliates to market to you | | No | | We don’t share |
| For nonaffiliates to market to you | | No | | We don’t share |
| | |
| To limit our sharing | | Call toll-free 1-800-262-1122 or email: EVPrivacy@eatonvance.com Please note: If you are a new customer, we can begin sharing your information 30 days from the date we sent this notice. When you are no longer our customer, we continue to share your information as described in this notice. However, you can contact us at any time to limit our sharing. |
| | |
| | | |
| | |
| Questions? | | Call toll-free 1-800-262-1122 or email: EVPrivacy@eatonvance.com |
| | |
| | | |
Eaton Vance Funds
| | |
| Privacy Notice — continued | | April 2021 |
| | |
| Who we are |
| Who is providing this notice? | | Eaton Vance Management, Eaton Vance Distributors, Inc., Eaton Vance Trust Company, Eaton Vance Management (International) Limited, Eaton Vance Advisers International Ltd., Eaton Vance Global Advisors Limited, Eaton Vance Management’s Real Estate Investment Group, Boston Management and Research, Calvert Research and Management, Eaton Vance and Calvert Fund Families and our investment advisory affiliates (“Eaton Vance”) (see Investment Management Affiliates definition below) |
| What we do |
| How does Eaton Vance protect my personal information? | | To protect your personal information from unauthorized access and use, we use security measures that comply with federal law. These measures include computer safeguards and secured files and buildings. We have policies governing the proper handling of customer information by personnel and requiring third parties that provide support to adhere to appropriate security standards with respect to such information. |
| How does Eaton Vance collect my personal information? | | We collect your personal information, for example, when you ∎ open an account or make deposits or withdrawals from your account ∎ buy securities from us or make a wire transfer ∎ give us your contact information We also collect your personal information from others, such as credit bureaus, affiliates, or other companies. |
| Why can’t I limit all sharing? | | Federal law gives you the right to limit only ∎ sharing for affiliates’ everyday business purposes — information about your creditworthiness ∎ affiliates from using your information to market to you ∎ sharing for nonaffiliates to market to you State laws and individual companies may give you additional rights to limit sharing. See below for more on your rights under state law. |
| Definitions |
| Investment Management Affiliates | | Eaton Vance Investment Management Affiliates include registered investment advisers, registered broker-dealers, and registered and unregistered funds. Investment Management Affiliates does not include entities associated with Morgan Stanley Wealth Management, such as Morgan Stanley Smith Barney LLC and Morgan Stanley & Co. |
| Affiliates | | Companies related by common ownership or control. They can be financial and nonfinancial companies. ∎ Our affiliates include companies with a Morgan Stanley name and financial companies such as Morgan Stanley Smith Barney LLC and Morgan Stanley & Co. |
| Nonaffiliates | | Companies not related by common ownership or control. They can be financial and nonfinancial companies. ∎ Eaton Vance does not share with nonaffiliates so they can market to you. |
| Joint marketing | | A formal agreement between nonaffiliated financial companies that together market financial products or services to you. ∎ Eaton Vance doesn’t jointly market. |
| Other important information |
Vermont: Except as permitted by law, we will not share personal information we collect about Vermont residents with Nonaffiliates unless you provide us with your written consent to share such information. California: Except as permitted by law, we will not share personal information we collect about California residents with Nonaffiliates and we will limit sharing such personal information with our Affiliates to comply with California privacy laws that apply to us. |
Eaton Vance Funds
IMPORTANT NOTICES
Delivery of Shareholder Documents. The Securities and Exchange Commission (SEC) permits funds to deliver only one copy of shareholder documents, including prospectuses, proxy statements and shareholder reports, to fund investors with multiple accounts at the same residential or post office box address. This practice is often called “householding” and it helps eliminate duplicate mailings to shareholders. Eaton Vance, or your financial intermediary, may household the mailing of your documents indefinitely unless you instruct Eaton Vance, or your financial intermediary, otherwise. If you would prefer that your Eaton Vance documents not be householded, please contact Eaton Vance at 1-800-262-1122, or contact your financial intermediary. Your instructions that householding not apply to delivery of your Eaton Vance documents will typically be effective within 30 days of receipt by Eaton Vance or your financial intermediary.
Portfolio Holdings. Each Eaton Vance Fund and its underlying Portfolio(s) (if applicable) files a schedule of portfolio holdings on Part F to Form N-PORT with the SEC. Certain information filed on Form N-PORT may be viewed on the Eaton Vance website at www.eatonvance.com, by calling Eaton Vance at 1-800-262-1122 or in the EDGAR database on the SEC’s website at www.sec.gov.
Proxy Voting. From time to time, funds are required to vote proxies related to the securities held by the funds. The Eaton Vance Funds or their underlying Portfolios (if applicable) vote proxies according to a set of policies and procedures approved by the Funds’ and Portfolios’ Boards. You may obtain a description of these policies and procedures and information on how the Funds or Portfolios voted proxies relating to portfolio securities during the most recent 12-month period ended June 30, without charge, upon request, by calling 1-800-262-1122 and by accessing the SEC’s website at www.sec.gov.
Investment Advisers
AMT-Free Municipal Income Fund
Eaton Vance Management
Two International Place
Boston, MA 02110
National Municipal Income Fund
Boston Management and Research
Two International Place
Boston, MA 02110
Administrator
Eaton Vance Management
Two International Place
Boston, MA 02110
Principal Underwriter*
Eaton Vance Distributors, Inc.
Two International Place
Boston, MA 02110
(617) 482-8260
Custodian
State Street Bank and Trust Company
State Street Financial Center, One Lincoln Street
Boston, MA 02111
Transfer Agent
BNY Mellon Investment Servicing (US) Inc.
Attn: Eaton Vance Funds
P.O. Box 9653
Providence, RI 02940-9653
(800) 262-1122
Fund Offices
Two International Place
Boston, MA 02110
| * | FINRA BrokerCheck. Investors may check the background of their Investment Professional by contacting the Financial Industry Regulatory Authority (FINRA). FINRA BrokerCheck is a free tool to help investors check the professional background of current and former FINRA-registered securities firms and brokers. FINRA BrokerCheck is available by calling 1-800-289-9999 and at www.FINRA.org. The FINRA BrokerCheck brochure describing this program is available to investors at www.FINRA.org. |

7714 3.31.21

Eaton Vance
Municipal Income Funds
Semiannual Report
March 31, 2021
California Opportunities • Massachusetts • New York • Ohio

Commodity Futures Trading Commission Registration. The Commodity Futures Trading Commission (“CFTC”) has adopted regulations that subject registered investment companies and advisers to regulation by the CFTC if a fund invests more than a prescribed level of its assets in certain CFTC-regulated instruments (including futures, certain options and swap agreements) or markets itself as providing investment exposure to such instruments. The investment adviser has claimed an exclusion from the definition of “commodity pool operator” under the Commodity Exchange Act with respect to its management of each Fund. Accordingly, neither the Funds nor the adviser with respect to the operation of the Funds is subject to CFTC regulation. Because of its management of other strategies, the Funds’ adviser is registered with the CFTC as a commodity pool operator. The adviser is also registered as a commodity trading advisor.
Fund shares are not insured by the FDIC and are not deposits or other obligations of, or guaranteed by, any depository institution. Shares are subject to investment risks, including possible loss of principal invested.
This report must be preceded or accompanied by a current summary prospectus or prospectus. Before investing, investors should consider carefully the investment objective, risks, and charges and expenses of a mutual fund. This and other important information is contained in the summary prospectus and prospectus, which can be obtained from a financial intermediary. Prospective investors should read the prospectus carefully before investing. For further information, please call 1-800-262-1122.
Semiannual Report March 31, 2021
Eaton Vance
Municipal Income Funds
Eaton Vance
California Municipal Opportunities Fund
March 31, 2021
Performance1,2
Portfolio Managers Craig R. Brandon, CFA and Adam A. Weigold, CFA
| | | | | | | | | | | | | | | | | | | | | | | | |
| % Average Annual Total Returns | | Class
Inception Date | | | Performance
Inception Date | | | Six Months | | | One Year | | | Five Years | | | Ten Years | |
| | | | | | |
Class A at NAV | | | 05/27/1994 | | | | 12/19/1985 | | | | 1.01 | % | | | 5.42 | % | | | 3.22 | % | | | 5.30 | % |
Class A with 4.75% Maximum Sales Charge | | | — | | | | — | | | | –3.83 | | | | 0.39 | | | | 2.21 | | | | 4.80 | |
Class C at NAV | | | 08/31/2004 | | | | 12/19/1985 | | | | 0.56 | | | | 4.64 | | | | 2.44 | | | | 4.52 | |
Class C with 1% Maximum Sales Charge | | | — | | | | — | | | | –0.44 | | | | 3.64 | | | | 2.44 | | | | 4.52 | |
Class I at NAV | | | 03/03/2008 | | | | 12/19/1985 | | | | 1.13 | | | | 5.78 | | | | 3.47 | | | | 5.56 | |
|
| |
| | | | | | |
Bloomberg Barclays Municipal Bond Index | | | — | | | | — | | | | 1.46 | % | | | 5.51 | % | | | 3.49 | % | | | 4.53 | % |
Bloomberg Barclays California Municipal Bond Index | | | — | | | | — | | | | 1.01 | | | | 4.96 | | | | 3.37 | | | | 4.93 | |
| | | | | | |
| % Total Annual Operating Expense Ratios3 | | | | | | | | | | | Class A | | | Class C | | | Class I | |
| | | | | | |
| | | | | | | | | | | | | | | 0.72 | % | | | 1.47 | % | | | 0.47 | % |
| | | | | | |
| % Distribution Rates/Yields4 | | | | | | | | | | | Class A | | | Class C | | | Class I | |
| | | | | | |
Distribution Rate | | | | | | | | | | | | | | | 0.95 | % | | | 0.18 | % | | | 1.21 | % |
Taxable-Equivalent Distribution Rate | | | | | | | | | | | | | | | 2.07 | | | | 0.39 | | | | 2.64 | |
SEC 30-day Yield | | | | | | | | | | | | | | | 0.34 | | | | –0.38 | | | | 0.61 | |
Taxable-Equivalent SEC 30-day Yield | | | | | | | | | | | | | | | 0.75 | | | | –0.83 | | | | 1.32 | |
Fund Profile
Credit Quality (% of total investments)6
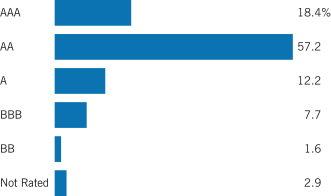
See Endnotes and Additional Disclosures in this report.
Past performance is no guarantee of future results. Returns are historical and are calculated by determining the percentage change in net asset value (NAV) or offering price (as applicable) with all distributions reinvested. Investment return and principal value will fluctuate so that shares, when redeemed, may be worth more or less than their original cost. Performance for periods less than or equal to one year is cumulative. Performance is for the stated time period only; due to market volatility, current Fund performance may be lower or higher than the quoted return. For performance as of the most recent month-end, please refer to eatonvance.com.
Eaton Vance
Massachusetts Municipal Income Fund
March 31, 2021
Performance1,2
Portfolio Manager Craig R. Brandon, CFA
| | | | | | | | | | | | | | | | | | | | | | | | |
| % Average Annual Total Returns | | Class
Inception Date | | | Performance
Inception Date | | | Six Months | | | One Year | | | Five Years | | | Ten Years | |
| | | | | | |
Class A at NAV | | | 12/07/1993 | | | | 04/18/1991 | | | | 0.45 | % | | | 3.53 | % | | | 2.53 | % | | | 4.59 | % |
Class A with 4.75% Maximum Sales Charge | | | — | | | | — | | | | –4.31 | | | | –1.36 | | | | 1.53 | | | | 4.09 | |
Class C at NAV | | | 05/02/2006 | | | | 04/18/1991 | | | | –0.00 | * | | | 2.70 | | | | 1.72 | | | | 3.80 | |
Class C with 1% Maximum Sales Charge | | | — | | | | — | | | | –1.00 | | | | 1.70 | | | | 1.72 | | | | 3.80 | |
Class I at NAV | | | 06/17/1993 | | | | 04/18/1991 | | | | 0.54 | | | | 3.81 | | | | 2.72 | | | | 4.81 | |
|
| |
| | | | | | |
Bloomberg Barclays Municipal Bond Index | | | — | | | | — | | | | 1.46 | % | | | 5.51 | % | | | 3.49 | % | | | 4.53 | % |
Bloomberg Barclays Massachusetts Municipal Bond Index | | | — | | | | — | | | | 0.83 | | | | 4.35 | | | | 3.21 | | | | 4.21 | |
| | | | | | |
* Amount is less than –0.005%. | | | | | | | | | | | | | | | | | | | | | | | | |
| | | | | | |
| % Total Annual Operating Expense Ratios3 | | | | | | | | | | | Class A | | | Class C | | | Class I | |
| | | | | | |
| | | | | | | | | | | | | | | 0.71 | % | | | 1.46 | % | | | 0.51 | % |
| | | | | | |
| % Distribution Rates/Yields4 | | | | | | | | | | | Class A | | | Class C | | | Class I | |
| | | | | | |
Distribution Rate | | | | | | | | | | | | | | | 1.69 | % | | | 0.93 | % | | | 1.90 | % |
Taxable-Equivalent Distribution Rate | | | | | | | | | | | | | | | 3.12 | | | | 1.72 | | | | 3.51 | |
SEC 30-day Yield | | | | | | | | | | | | | | | 0.45 | | | | –0.27 | | | | 0.67 | |
Taxable-Equivalent SEC 30-day Yield | | | | | | | | | �� | | | | | | 0.82 | | | | –0.50 | | | | 1.23 | |
| | | | | | |
| % Total Leverage5 | | | | | | | | | | | | | | | | | | |
| | | | | | |
Residual Interest Bond (RIB) Financing | | | | | | | | | | | | | | | | | | | | | | | 1.65 | % |
Fund Profile
Credit Quality (% of total investments)6,7
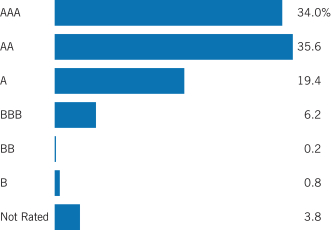
See Endnotes and Additional Disclosures in this report.
Past performance is no guarantee of future results. Returns are historical and are calculated by determining the percentage change in net asset value (NAV) or offering price (as applicable) with all distributions reinvested. Investment return and principal value will fluctuate so that shares, when redeemed, may be worth more or less than their original cost. Performance for periods less than or equal to one year is cumulative. Performance is for the stated time period only; due to market volatility, current Fund performance may be lower or higher than the quoted return. For performance as of the most recent month-end, please refer to eatonvance.com.
Eaton Vance
New York Municipal Income Fund
March 31, 2021
Performance1,2
Portfolio Manager Craig R. Brandon, CFA
| | | | | | | | | | | | | | | | | | | | | | | | |
| % Average Annual Total Returns | | Class
Inception Date | | | Performance
Inception Date | | | Six Months | | | One Year | | | Five Years | | | Ten Years | |
| | | | | | |
Class A at NAV | | | 04/15/1994 | | | | 08/30/1990 | | | | 2.15 | % | | | 4.95 | % | | | 3.29 | % | | | 5.17 | % |
Class A with 4.75% Maximum Sales Charge | | | — | | | | — | | | | –2.68 | | | | 0.00 | * | | | 2.30 | | | | 4.67 | |
Class C at NAV | | | 09/30/2003 | | | | 08/30/1990 | | | | 1.77 | | | | 4.07 | | | | 2.52 | | | | 4.39 | |
Class C with 1% Maximum Sales Charge | | | — | | | | — | | | | 0.78 | | | | 3.07 | | | | 2.52 | | | | 4.39 | |
Class I at NAV | | | 03/03/2008 | | | | 08/30/1990 | | | | 2.25 | | | | 5.15 | | | | 3.49 | | | | 5.38 | |
|
| |
| | | | | | |
Bloomberg Barclays Municipal Bond Index | | | — | | | | — | | | | 1.46 | % | | | 5.51 | % | | | 3.49 | % | | | 4.53 | % |
Bloomberg Barclays New York Municipal Bond Index | | | — | | | | — | | | | 2.06 | | | | 5.01 | | | | 3.18 | | | | 4.25 | |
| | | | | | |
* Amount is less than 0.005%. | | | | | | | | | | | | | | | | | | | | | | | | |
| | | | | | |
| % Total Annual Operating Expense Ratios3 | | | | | | | | | | | Class A | | | Class C | | | Class I | |
| | | | | | |
| | | | | | | | | | | | | | | 0.67 | % | | | 1.42 | % | | | 0.47 | % |
| | | | | | |
| % Distribution Rates/Yields4 | | | | | | | | | | | Class A | | | Class C | | | Class I | |
| | | | | | |
Distribution Rate | | | | | | | | | | | | | | | 1.44 | % | | | 0.67 | % | | | 1.64 | % |
Taxable-Equivalent Distribution Rate | | | | | | | | | | | | | | | 2.86 | | | | 1.33 | | | | 3.26 | |
SEC 30-day Yield | | | | | | | | | | | | | | | 0.80 | | | | 0.10 | | | | 1.04 | |
Taxable-Equivalent SEC 30-day Yield | | | | | | | | | | | | | | | 1.59 | | | | 0.19 | | | | 2.06 | |
Fund Profile
Credit Quality (% of total investments)6
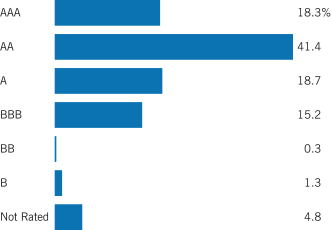
See Endnotes and Additional Disclosures in this report.
Past performance is no guarantee of future results. Returns are historical and are calculated by determining the percentage change in net asset value (NAV) or offering price (as applicable) with all distributions reinvested. Investment return and principal value will fluctuate so that shares, when redeemed, may be worth more or less than their original cost. Performance for periods less than or equal to one year is cumulative. Performance is for the stated time period only; due to market volatility, current Fund performance may be lower or higher than the quoted return. For performance as of the most recent month-end, please refer to eatonvance.com.
Eaton Vance
Ohio Municipal Income Fund
March 31, 2021
Performance1,2
Portfolio Manager Cynthia J. Clemson
| | | | | | | | | | | | | | | | | | | | | | | | |
| % Average Annual Total Returns | | Class
Inception Date | | | Performance
Inception Date | | | Six Months | | | One Year | | | Five Years | | | Ten Years | |
| | | | | | |
Class A at NAV | | | 12/07/1993 | | | | 04/18/1991 | | | | 1.01 | % | | | 4.85 | % | | | 3.28 | % | | | 4.79 | % |
Class A with 4.75% Maximum Sales Charge | | | — | | | | — | | | | –3.75 | | | | –0.09 | | | | 2.28 | | | | 4.28 | |
Class C at NAV | | | 02/03/2006 | | | | 04/18/1991 | | | | 0.52 | | | | 4.07 | | | | 2.49 | | | | 4.01 | |
Class C with 1% Maximum Sales Charge | | | — | | | | — | | | | –0.48 | | | | 3.07 | | | | 2.49 | | | | 4.01 | |
Class I at NAV | | | 08/03/2010 | | | | 04/18/1991 | | | | 1.00 | | | | 5.06 | | | | 3.47 | | | | 4.99 | |
|
| |
| | | | | | |
Bloomberg Barclays Municipal Bond Index | | | — | | | | — | | | | 1.46 | % | | | 5.51 | % | | | 3.49 | % | | | 4.53 | % |
Bloomberg Barclays Ohio Municipal Bond Index | | | — | | | | — | | | | 0.78 | | | | 5.14 | | | | 3.42 | | | | 4.55 | |
| | | | | | |
| % Total Annual Operating Expense Ratios3 | | | | | | | | | | | Class A | | | Class C | | | Class I | |
| | | | | | |
| | | | | | | | | | | | | | | 0.76 | % | | | 1.51 | % | | | 0.56 | % |
| | | | | | |
| % Distribution Rates/Yields4 | | | | | | | | | | | Class A | | | Class C | | | Class I | |
| | | | | | |
Distribution Rate | | | | | | | | | | | | | | | 2.62 | % | | | 1.86 | % | | | 2.82 | % |
Taxable-Equivalent Distribution Rate | | | | | | | | | | | | | | | 4.83 | | | | 3.43 | | | | 5.20 | |
SEC 30-day Yield | | | | | | | | | | | | | | | 0.96 | | | | 0.27 | | | | 1.21 | |
Taxable-Equivalent SEC 30-day Yield | | | | | | | | | | | | | | | 1.77 | | | | 0.49 | | | | 2.23 | |
| | | | | | |
| % Total Leverage5 | | | | | | | | | | | | | | | | | | |
| | | | | | |
RIB Financing | | | | | | | | | | | | | | | | | | | | | | | 4.68 | % |
Fund Profile
Credit Quality (% of total investments)6,7
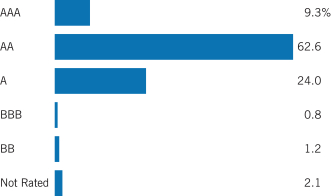
See Endnotes and Additional Disclosures in this report.
Past performance is no guarantee of future results. Returns are historical and are calculated by determining the percentage change in net asset value (NAV) or offering price (as applicable) with all distributions reinvested. Investment return and principal value will fluctuate so that shares, when redeemed, may be worth more or less than their original cost. Performance for periods less than or equal to one year is cumulative. Performance is for the stated time period only; due to market volatility, current Fund performance may be lower or higher than the quoted return. For performance as of the most recent month-end, please refer to eatonvance.com.
Eaton Vance
Municipal Income Funds
March 31, 2021
Endnotes and Additional Disclosures
| 1 | Bloomberg Barclays Municipal Bond Index is an unmanaged index of municipal bonds traded in the U.S. Bloomberg Barclays California Municipal Bond Index is an unmanaged index of California municipal bonds. Bloomberg Barclays Massachusetts Municipal Bond Index is an unmanaged index of Massachusetts municipal bonds. Bloomberg Barclays New York Municipal Bond Index is an unmanaged index of New York municipal bonds. Bloomberg Barclays Ohio Municipal Bond Index is an unmanaged index of Ohio municipal bonds. Unless otherwise stated, index returns do not reflect the effect of any applicable sales charges, commissions, expenses, taxes or leverage, as applicable. It is not possible to invest directly in an index. |
| 2 | Total Returns at NAV do not include applicable sales charges. If sales charges were deducted, the returns would be lower. Total Returns shown with maximum sales charge reflect the stated maximum sales charge. Unless otherwise stated, performance does not reflect the deduction of taxes on Fund distributions or redemptions of Fund shares. |
For California Municipal Opportunities Fund, performance prior to April 13, 2015 reflects the Fund’s performance under its former investment objective and strategy.
| 3 | Source: Fund prospectus. The expense ratios for the current reporting period can be found in the Financial Highlights section of this report. |
| 4 | The Distribution Rate is based on the Fund’s last regular distribution per share in the period (annualized) divided by the Fund’s NAV at the end of the period. The Fund’s distributions may be comprised of amounts characterized for federal income tax purposes as tax-exempt income, qualified and non-qualified ordinary dividends, capital gains and nondividend distributions, also known as return of capital. The Fund will determine the federal income tax character of distributions paid to a shareholder after the end of the calendar year. This is reported on the IRS form 1099-DIV and provided to the shareholder shortly after each year-end. The Fund’s distributions are determined by the investment adviser based on its current assessment of the Fund’s long-term return potential. As portfolio and market conditions change, the rate of distributions paid by the Fund could change. Taxable-equivalent performance is based on the highest combined federal and state income tax rates, where applicable. Lower tax rates would result in lower tax-equivalent performance. Actual tax rates will vary depending on your income, exemptions and deductions. Rates do not include local taxes. The SEC Yield is a standardized measure based on the estimated yield to maturity of a fund’s investments over a 30-day period and is based on the maximum offer price at the date specified. The SEC Yield is not based on the distributions made by the Fund, which may differ. |
| 5 | Fund employs RIB financing. The leverage created by RIB investments provides an opportunity for increased income but, at the same time, creates special risks (including the likelihood of greater volatility of NAV). The cost of leverage rises and falls with changes in short-term interest rates. See “Floating Rate Notes Issued in Conjunction with Securities Held” in the notes to the financial statements for more information about RIB financing. RIB leverage represents the amount of Floating Rate Notes outstanding at period end as a percentage of Fund net assets plus Floating Rate Notes. |
| 6 | For purposes of the Fund’s rating restrictions, ratings are based on Moody’s Investors Service, Inc. (“Moody’s”), S&P Global Ratings (“S&P”) or Fitch Ratings (“Fitch”), as applicable. If securities are rated differently by the ratings agencies, the highest rating is applied. Ratings, which are subject to change, apply to the creditworthiness of the issuers of the underlying securities and not to the Fund or its shares. Credit ratings measure the quality of a bond based on the issuer’s creditworthiness, with ratings ranging from AAA, being the highest, to D, being the lowest based on S&P’s measures. Ratings of BBB or higher by S&P or Fitch (Baa or higher by Moody’s) are considered to be investment-grade quality. Credit ratings are based largely on the ratings agency’s analysis at the time of rating. The rating assigned to any particular security is not necessarily a reflection of the issuer’s current financial condition and does not necessarily reflect its assessment of the volatility of a security’s market value or of the liquidity of an investment in the security. Holdings designated as “Not Rated” (if any) are not rated by the national ratings agencies stated above. |
| 7 | The chart includes the municipal bonds held by a trust that issues residual interest bonds, consistent with the Portfolio of Investments. |
Fund profiles subject to change due to active management.
Eaton Vance
Municipal Income Funds
March 31, 2021
Fund Expenses
Example: As a Fund shareholder, you incur two types of costs: (1) transaction costs, including sales charges (loads) on purchases and redemption fees (if applicable); and (2) ongoing costs, including management fees; distribution and/or service fees; and other Fund expenses. This Example is intended to help you understand your ongoing costs (in dollars) of Fund investing and to compare these costs with the ongoing costs of investing in other mutual funds. The Example is based on an investment of $1,000 invested at the beginning of the period and held for the entire period (October 1, 2020 – March 31, 2021).
Actual Expenses: The first section of each table below provides information about actual account values and actual expenses. You may use the information in this section, together with the amount you invested, to estimate the expenses that you paid over the period. Simply divide your account value by $1,000 (for example, an $8,600 account value divided by $1,000 = 8.6), then multiply the result by the number in the first section under the heading entitled “Expenses Paid During Period” to estimate the expenses you paid on your account during this period.
Hypothetical Example for Comparison Purposes: The second section of each table below provides information about hypothetical account values and hypothetical expenses based on the actual Fund expense ratio and an assumed rate of return of 5% per year (before expenses), which is not the actual Fund return. The hypothetical account values and expenses may not be used to estimate the actual ending account balance or expenses you paid for the period. You may use this information to compare the ongoing costs of investing in your Fund and other funds. To do so, compare this 5% hypothetical example with the 5% hypothetical examples that appear in the shareholder reports of the other funds.
Please note that the expenses shown in each table are meant to highlight your ongoing costs only and do not reflect any transactional costs, such as sales charges (loads) or redemption fees (if applicable). Therefore, the second section of each table is useful in comparing ongoing costs only, and will not help you determine the relative total costs of owning different funds. In addition, if these transactional costs were included, your costs would be higher.
Eaton Vance California Municipal Opportunities Fund
| | | | | | | | | | | | | | | | |
| | | Beginning
Account Value
(10/1/20) | | | Ending
Account Value
(3/31/21) | | | Expenses Paid
During Period*
(10/1/20 – 3/31/21) | | | Annualized
Expense
Ratio | |
| | | | |
Actual | | | | | | | | | | | | | | | | |
Class A | | $ | 1,000.00 | | | $ | 1,010.10 | | | $ | 3.46 | | | | 0.69 | % |
Class C | | $ | 1,000.00 | | | $ | 1,005.60 | | | $ | 7.20 | | | | 1.44 | % |
Class I | | $ | 1,000.00 | | | $ | 1,011.30 | | | $ | 2.26 | | | | 0.45 | % |
| | | | | |
Hypothetical | | | | | | | | | | | | | | | | |
(5% return per year before expenses) | | | | | | | | | | | | | | | | |
Class A | | $ | 1,000.00 | | | $ | 1,021.50 | | | $ | 3.48 | | | | 0.69 | % |
Class C | | $ | 1,000.00 | | | $ | 1,017.80 | | | $ | 7.24 | | | | 1.44 | % |
Class I | | $ | 1,000.00 | | | $ | 1,022.70 | | | $ | 2.27 | | | | 0.45 | % |
| * | Expenses are equal to the Fund’s annualized expense ratio for the indicated Class, multiplied by the average account value over the period, multiplied by 182/365 (to reflect the one-half year period). The Example assumes that the $1,000 was invested at the net asset value per share determined at the close of business on September 30, 2020. |
Eaton Vance
Municipal Income Funds
March 31, 2021
Fund Expenses — continued
Eaton Vance Massachusetts Municipal Income Fund
| | | | | | | | | | | | | | | | |
| | | Beginning
Account Value
(10/1/20) | | | Ending
Account Value
(3/31/21) | | | Expenses Paid
During Period*
(10/1/20 – 3/31/21) | | | Annualized
Expense
Ratio | |
| | | | |
Actual | | | | | | | | | | | | | | | | |
Class A | | $ | 1,000.00 | | | $ | 1,004.50 | | | $ | 3.30 | | | | 0.66 | % |
Class C | | $ | 1,000.00 | | | $ | 1,000.00 | | | $ | 7.03 | | | | 1.41 | % |
Class I | | $ | 1,000.00 | | | $ | 1,005.40 | | | $ | 2.30 | | | | 0.46 | % |
| | | | | |
Hypothetical | | | | | | | | | | | | | | | | |
(5% return per year before expenses) | | | | | | | | | | | | | | | | |
Class A | | $ | 1,000.00 | | | $ | 1,021.60 | | | $ | 3.33 | | | | 0.66 | % |
Class C | | $ | 1,000.00 | | | $ | 1,017.90 | | | $ | 7.09 | | | | 1.41 | % |
Class I | | $ | 1,000.00 | | | $ | 1,022.60 | | | $ | 2.32 | | | | 0.46 | % |
| * | Expenses are equal to the Fund’s annualized expense ratio for the indicated Class, multiplied by the average account value over the period, multiplied by 182/365 (to reflect the one-half year period). The Example assumes that the $1,000 was invested at the net asset value per share determined at the close of business on September 30, 2020. |
Eaton Vance New York Municipal Income Fund
| | | | | | | | | | | | | | | | |
| | | Beginning
Account Value
(10/1/20) | | | Ending
Account Value
(3/31/21) | | | Expenses Paid
During Period*
(10/1/20 – 3/31/21) | | | Annualized
Expense
Ratio | |
| | | | |
Actual | | | | | | | | | | | | | | | | |
Class A | | $ | 1,000.00 | | | $ | 1,021.50 | | | $ | 3.28 | | | | 0.65 | % |
Class C | | $ | 1,000.00 | | | $ | 1,017.70 | | | $ | 7.04 | | | | 1.40 | % |
Class I | | $ | 1,000.00 | | | $ | 1,022.50 | | | $ | 2.27 | | | | 0.45 | % |
| | | | | |
Hypothetical | | | | | | | | | | | | | | | | |
(5% return per year before expenses) | | | | | | | | | | | | | | | | |
Class A | | $ | 1,000.00 | | | $ | 1,021.70 | | | $ | 3.28 | | | | 0.65 | % |
Class C | | $ | 1,000.00 | | | $ | 1,018.00 | | | $ | 7.04 | | | | 1.40 | % |
Class I | | $ | 1,000.00 | | | $ | 1,022.70 | | | $ | 2.27 | | | | 0.45 | % |
| * | Expenses are equal to the Fund’s annualized expense ratio for the indicated Class, multiplied by the average account value over the period, multiplied by 182/365 (to reflect the one-half year period). The Example assumes that the $1,000 was invested at the net asset value per share determined at the close of business on September 30, 2020. |
Eaton Vance
Municipal Income Funds
March 31, 2021
Fund Expenses — continued
Eaton Vance Ohio Municipal Income Fund
| | | | | | | | | | | | | | | | |
| | | Beginning
Account Value
(10/1/20) | | | Ending
Account Value
(3/31/21) | | | Expenses Paid
During Period*
(10/1/20 – 3/31/21) | | | Annualized
Expense
Ratio | |
| | | | |
Actual | | | | | | | | | | | | | | | | |
Class A | | $ | 1,000.00 | | | $ | 1,010.10 | | | $ | 3.61 | | | | 0.72 | % |
Class C | | $ | 1,000.00 | | | $ | 1,005.20 | | | $ | 7.35 | | | | 1.47 | % |
Class I | | $ | 1,000.00 | | | $ | 1,010.00 | | | $ | 2.61 | | | | 0.52 | % |
| | | | | |
Hypothetical | | | | | | | | | | | | | | | | |
(5% return per year before expenses) | | | | | | | | | | | | | | | | |
Class A | | $ | 1,000.00 | | | $ | 1,021.30 | | | $ | 3.63 | | | | 0.72 | % |
Class C | | $ | 1,000.00 | | | $ | 1,017.60 | | | $ | 7.39 | | | | 1.47 | % |
Class I | | $ | 1,000.00 | | | $ | 1,022.30 | | | $ | 2.62 | | | | 0.52 | % |
| * | Expenses are equal to the Fund’s annualized expense ratio for the indicated Class, multiplied by the average account value over the period, multiplied by 182/365 (to reflect the one-half year period). The Example assumes that the $1,000 was invested at the net asset value per share determined at the close of business on September 30, 2020. |
Eaton Vance
California Municipal Opportunities Fund
March 31, 2021
Portfolio of Investments (Unaudited)
| | | | | | | | |
| Corporate Bonds — 0.8% | |
| Security | | Principal
Amount
(000’s omitted) | | | Value | |
|
| Other — 0.4% | |
| | |
Morongo Band of Mission Indians, 7.00%, 10/1/39(1) | | $ | 2,080 | | | $ | 2,415,296 | |
| |
| | | | $ | 2,415,296 | |
|
| Other Revenue — 0.4% | |
| | |
J. Paul Getty Trust (The), 0.39%, 1/1/24 | | $ | 3,000 | | | $ | 2,981,739 | |
| |
| | | | $ | 2,981,739 | |
| |
Total Corporate Bonds — 0.8%
(identified cost $5,080,000) | | | $ | 5,397,035 | |
|
| Tax-Exempt Mortgage-Backed Securities — 0.4% | |
| Security | | Principal
Amount
(000’s omitted) | | | Value | |
|
| Housing — 0.4% | |
| | |
California Housing Finance Agency, Municipal Certificates, Series 2021-1, Class A, 3.50%, 11/20/35 | | $ | 2,625 | | | $ | 2,997,278 | |
| |
Total Tax-Exempt Mortgage-Backed Securities — 0.4%
(identified cost $2,961,828) | | | $ | 2,997,278 | |
|
| Tax-Exempt Municipal Obligations — 87.0% | |
| Security | | Principal
Amount
(000’s omitted) | | | Value | |
|
| Education — 7.6% | |
| | |
California Education Notes Program, 2.00%, 1/31/22 | | $ | 4,850 | | | $ | 4,925,078 | |
| | |
California Educational Facilities Authority,
(Chapman University): | | | | | | |
| | |
5.00%, 4/1/22(2) | | | 665 | | | | 697,193 | |
| | |
5.00%, 4/1/23(2) | | | 550 | | | | 602,371 | |
| | |
5.00%, 4/1/24(2) | | | 525 | | | | 597,513 | |
| | |
5.00%, 4/1/25(2) | | | 425 | | | | 500,319 | |
| | |
5.00%, 4/1/26(2) | | | 475 | | | | 577,234 | |
| | |
5.00%, 4/1/27(2) | | | 475 | | | | 592,843 | |
| | |
5.00%, 4/1/28(2) | | | 395 | | | | 504,545 | |
| | |
5.00%, 4/1/29(2) | | | 425 | | | | 552,598 | |
| | |
5.00%, 4/1/30(2) | | | 425 | | | | 561,272 | |
| | |
5.00%, 4/1/31(2) | | | 475 | | | | 637,839 | |
| | |
California Educational Facilities Authority, (Stanford University), 5.00%, 5/1/45 | | | 400 | | | | 596,268 | |
| | | | | | | | |
| Security | | Principal
Amount
(000’s omitted) | | | Value | |
|
| Education (continued) | |
| | |
California Enterprise Development Authority,
(The Thacher School): | | | | | | |
| | |
4.00%, 9/1/32 | | $ | 425 | | | $ | 512,542 | |
| | |
4.00%, 9/1/34 | | | 400 | | | | 474,380 | |
| | |
California Municipal Finance Authority,
(University of the Pacific): | | | | | | |
| | |
4.00%, 11/1/35 | | | 1,000 | | | | 1,200,390 | |
| | |
4.00%, 11/1/37 | | | 1,000 | | | | 1,181,950 | |
| | |
4.00%, 11/1/42(2) | | | 1,620 | | | | 1,823,780 | |
| | |
California School Finance Authority,
(Green Dot Public Schools): | | | | | | |
| | |
5.00%, 8/1/28(1) | | | 380 | | | | 462,445 | |
| | |
5.00%, 8/1/38(1) | | | 2,500 | | | | 2,934,000 | |
| | |
California School Finance Authority,
(KIPP SoCal Public Schools): | | | | | | |
| | |
4.00%, 7/1/40(1) | | | 800 | | | | 920,080 | |
| | |
5.00%, 7/1/24(1) | | | 100 | | | | 113,342 | |
| | |
5.00%, 7/1/25(1) | | | 105 | | | | 122,432 | |
| | |
5.00%, 7/1/26(1) | | | 110 | | | | 131,696 | |
| | |
5.00%, 7/1/27(1) | | | 100 | | | | 122,651 | |
| | |
5.00%, 7/1/28(1) | | | 100 | | | | 124,775 | |
| | |
5.00%, 7/1/29(1) | | | 100 | | | | 126,851 | |
| | |
5.00%, 7/1/30(1) | | | 100 | | | | 128,492 | |
| | |
California State University, Prerefunded to 11/1/21, 5.25%, 11/1/31 | | | 1,465 | | | | 1,508,144 | |
| | |
Riverside County Office of Education, CA, 2.00%, 12/1/21 | | | 10,000 | | | | 10,124,500 | |
| | |
| University of California: | | | | | | |
| | |
0.03%, 5/15/48(3) | | | 15,000 | | | | 15,000,000 | |
| | |
5.00%, 5/15/35 | | | 4,215 | | | | 5,058,126 | |
| |
| | | | $ | 53,415,649 | |
|
| Electric Utilities — 2.6% | |
| | |
Glendale, CA, Electric System Revenue, 5.00%, 2/1/38 | | $ | 1,005 | | | $ | 1,188,222 | |
| | |
Modesto Irrigation District, CA, Electric System Revenue, 5.00%, 7/1/21(2) | | | 275 | | | | 278,226 | |
| | |
| Sacramento Municipal Utility District, CA: | | | | | | |
| | |
5.00%, 8/15/27 | | | 1,080 | | | | 1,098,986 | |
| | |
5.00%, 8/15/28 | | | 1,455 | | | | 1,480,040 | |
| | |
| Sacramento Municipal Utility District, CA, Green Bonds: | | | | | | |
| | |
4.00%, 8/15/40 | | | 1,575 | | | | 1,890,173 | |
| | |
5.00%, 8/15/36 | | | 7,000 | | | | 9,219,420 | |
| | |
| Southern California Public Power Authority, Green Bonds: | | | | | | |
| | |
5.00%, 7/1/25(2) | | | 1,600 | | | | 1,904,880 | |
| | |
5.00%, 7/1/26(2) | | | 750 | | | | 921,780 | |
| |
| | | | $ | 17,981,727 | |
| | | | |
| | 10 | | See Notes to Financial Statements. |
Eaton Vance
California Municipal Opportunities Fund
March 31, 2021
Portfolio of Investments (Unaudited) — continued
| | | | | | | | |
| Security | | Principal
Amount
(000’s omitted) | | | Value | |
|
| Escrowed / Prerefunded — 1.5% | |
| | |
| California Health Facilities Financing Authority, (Sutter Health): | | | | | | |
| | |
Prerefunded to 11/15/25, 5.00%, 11/15/32 | | $ | 1,040 | | | $ | 1,253,585 | |
| | |
Prerefunded to 11/15/25, 5.00%, 11/15/41 | | | 4,985 | | | | 6,008,769 | |
| | |
California Municipal Finance Authority,
(University of San Diego): | | | | | | |
| | |
Prerefunded to 10/1/21, 5.25%, 10/1/27 | | | 915 | | | | 938,021 | |
| | |
Prerefunded to 10/1/21, 5.25%, 10/1/28 | | | 960 | | | | 984,154 | |
| | |
San Francisco City and County Public Utilities Commission, CA, Water Revenue, Green Bonds, Prerefunded to 11/1/24, 5.00%, 11/1/39 | | | 890 | | | | 1,037,473 | |
| |
| | | | $ | 10,222,002 | |
|
| General Obligations — 35.7% | |
| | |
Allan Hancock Joint Community College District, CA, (Election of 2006), 4.00%, 8/1/40 | | $ | 3,500 | | | $ | 4,171,580 | |
| | |
| Anaheim Union High School District, CA, (Election of 2014): | | | | | | |
| | |
4.00%, 8/1/30 | | | 1,000 | | | | 1,178,880 | |
| | |
4.00%, 8/1/31 | | | 1,000 | | | | 1,172,410 | |
| | |
| Baldwin Park Unified School District, CA, (Election of 2018): | | | | | | |
| | |
3.00%, 8/1/35 | | | 170 | | | | 185,660 | |
| | |
3.00%, 8/1/36 | | | 200 | | | | 217,738 | |
| | |
3.00%, 8/1/37 | | | 300 | | | | 324,564 | |
| | |
3.00%, 8/1/38 | | | 325 | | | | 350,707 | |
| | |
3.00%, 8/1/39 | | | 450 | | | | 482,845 | |
| | |
4.00%, 8/1/30 | | | 100 | | | | 119,288 | |
| | |
4.00%, 8/1/32 | | | 100 | | | | 118,111 | |
| | |
4.00%, 8/1/33 | | | 100 | | | | 117,537 | |
| | |
4.00%, 8/1/34 | | | 100 | | | | 117,110 | |
| | |
Beverly Hills Unified School District, CA, (Election of 2018), 4.00%, 8/1/31 | | | 1,885 | | | | 2,223,848 | |
| | |
| Brisbane School District, CA, (Election of 2020): | | | | | | |
| | |
4.00%, 8/1/35 | | | 155 | | | | 182,289 | |
| | |
4.00%, 8/1/40 | | | 310 | | | | 361,888 | |
| | |
5.00%, 8/1/45 | | | 535 | | | | 652,925 | |
| | |
| Burlingame Elementary School District, CA, (Election of 2020): | | | | | | |
| | |
3.00%, 8/1/37 | | | 150 | | | | 165,669 | |
| | |
3.00%, 8/1/38 | | | 175 | | | | 191,301 | |
| | |
3.00%, 8/1/39 | | | 175 | | | | 190,085 | |
| | |
3.00%, 8/1/40 | | | 200 | | | | 215,912 | |
| | |
3.00%, 8/1/41 | | | 360 | | | | 387,511 | |
| | |
4.00%, 8/1/33 | | | 175 | | | | 211,766 | |
| | |
4.00%, 8/1/46 | | | 2,885 | | | | 3,357,361 | |
| | |
Cabrillo Unified School District, CA, (Election of 2018), 4.00%, 8/1/33 | | | 100 | | | | 118,299 | |
| | | | | | | | |
| Security | | Principal
Amount
(000’s omitted) | | | Value | |
|
| General Obligations (continued) | |
| | |
| California: | | | | | | |
| | |
0.45%, (SIFMA + 0.38%), 12/1/22 (Put Date), 12/1/27(4) | | $ | 1,000 | | | $ | 1,000,410 | |
| | |
0.50%, (SIFMA + 0.43%), 12/1/23 (Put Date), 12/1/29(4) | | | 3,000 | | | | 3,004,770 | |
| | |
3.00%, 3/1/22 | | | 1,270 | | | | 1,303,325 | |
| | |
3.00%, 9/1/35 | | | 1,010 | | | | 1,086,053 | |
| | |
4.00%, 3/1/36 | | | 7,845 | | | | 9,433,612 | |
| | |
4.00%, 3/1/38 | | | 3,765 | | | | 4,497,104 | |
| | |
5.00%, 12/1/21 | | | 2,360 | | | | 2,436,228 | |
| | |
5.00%, 10/1/22 | | | 250 | | | | 268,103 | |
| | |
5.00%, 3/1/35 | | | 5,850 | | | | 7,618,747 | |
| | |
5.00%, 3/1/35 | | | 2,000 | | | | 2,604,700 | |
| | |
5.00%, 4/1/35 | | | 1,000 | | | | 1,276,160 | |
| | |
5.00%, 4/1/38 | | | 2,260 | | | | 2,857,906 | |
| | |
| Chino Valley Unified School District, CA, (Election of 2016): | | | | | | |
| | |
4.00%, 8/1/45 | | | 3,000 | | | | 3,516,120 | |
| | |
5.00%, 8/1/38 | | | 650 | | | | 841,321 | |
| | |
5.00%, 8/1/39 | | | 650 | | | | 838,968 | |
| | |
5.00%, 8/1/40 | | | 925 | | | | 1,189,957 | |
| | |
Desert Community College District, CA, 5.00%, 8/1/37 | | | 7,395 | | | | 8,750,873 | |
| | |
| Franklin-McKinley School District, CA, (Election of 2020): | | | | | | |
| | |
4.00%, 8/1/35 | | | 100 | | | | 116,906 | |
| | |
4.00%, 8/1/36 | | | 100 | | | | 116,473 | |
| | |
4.00%, 8/1/37 | | | 205 | | | | 238,077 | |
| | |
4.00%, 8/1/39 | | | 245 | | | | 283,159 | |
| | |
4.00%, 8/1/40 | | | 415 | | | | 478,624 | |
| | |
| Fresno Unified School District, CA, (Election of 2016): | | | | | | |
| | |
4.00%, 8/1/30 | | | 570 | | | | 681,703 | |
| | |
4.00%, 8/1/31 | | | 475 | | | | 565,630 | |
| | |
4.00%, 8/1/33 | | | 565 | | | | 665,802 | |
| | |
4.00%, 8/1/34 | | | 185 | | | | 217,355 | |
| | |
| Geyserville Unified School District, CA, (Election of 2020): | | | | | | |
| | |
5.00%, 8/1/40 | | | 630 | | | | 786,857 | |
| | |
5.00%, 8/1/45 | | | 700 | | | | 866,516 | |
| | |
5.00%, 8/1/49 | | | 1,220 | | | | 1,505,602 | |
| | |
Gilroy Unified School District, CA, (Elections of 2008 and 2016), 4.00%, 8/1/30 | | | 245 | | | | 289,482 | |
| | |
| Gilroy Unified School District, CA, (Election of 2016): | | | | | | |
| | |
4.00%, 8/1/22 | | | 300 | | | | 315,330 | |
| | |
4.00%, 8/1/23 | | | 300 | | | | 326,646 | |
| | |
4.00%, 8/1/24 | | | 250 | | | | 280,560 | |
| | |
4.00%, 8/1/25 | | | 250 | | | | 288,195 | |
| | |
4.00%, 8/1/26 | | | 250 | | | | 295,123 | |
| | |
4.00%, 8/1/27 | | | 400 | | | | 481,512 | |
| | |
4.00%, 8/1/28 | | | 500 | | | | 612,320 | |
| | |
4.00%, 8/1/29 | | | 250 | | | | 303,605 | |
| | | | |
| | 11 | | See Notes to Financial Statements. |
Eaton Vance
California Municipal Opportunities Fund
March 31, 2021
Portfolio of Investments (Unaudited) — continued
| | | | | | | | |
| Security | | Principal
Amount
(000’s omitted) | | | Value | |
|
| General Obligations (continued) | |
| | |
Gilroy Unified School District, CA, (Election of 2016):
(continued) | | | | | | |
| | |
4.00%, 8/1/30 | | $ | 350 | | | $ | 422,131 | |
| | |
4.00%, 8/1/31 | | | 250 | | | | 300,217 | |
| | |
4.00%, 8/1/32 | | | 350 | | | | 417,690 | |
| | |
4.00%, 8/1/33 | | | 660 | | | | 782,793 | |
| | |
4.00%, 8/1/34 | | | 1,075 | | | | 1,267,909 | |
| | |
4.00%, 8/1/35 | | | 500 | | | | 587,555 | |
| | |
4.00%, 8/1/36 | | | 400 | | | | 468,000 | |
| | |
4.00%, 8/1/37 | | | 450 | | | | 524,970 | |
| | |
4.00%, 8/1/38 | | | 500 | | | | 581,465 | |
| | |
4.00%, 8/1/39 | | | 350 | | | | 406,080 | |
| | |
4.00%, 8/1/40 | | | 675 | | | | 780,995 | |
| | |
4.00%, 8/1/41 | | | 750 | | | | 865,012 | |
| | |
| Glendale Unified School District, CA, (Election of 2011): | | | | | | |
| | |
3.00%, 9/1/37 | | | 2,400 | | | | 2,624,184 | |
| | |
3.00%, 9/1/38 | | | 2,195 | | | | 2,377,887 | |
| | |
Hartnell Community College District, CA, (Election of 2016), 4.00%, 8/1/33 | | | 200 | | | | 237,824 | |
| | |
| La Canada Unified School District, CA, (Election of 2017): | | | | | | |
| | |
4.00%, 8/1/33 | | | 500 | | | | 594,560 | |
| | |
4.00%, 8/1/40 | | | 1,000 | | | | 1,160,010 | |
| | |
4.00%, 8/1/45 | | | 1,445 | | | | 1,657,820 | |
| | |
| Liberty Union High School District, CA, (Election of 2016): | | | | | | |
| | |
3.00%, 8/1/35 | | | 670 | | | | 739,017 | |
| | |
3.00%, 8/1/36 | | | 750 | | | | 824,662 | |
| | |
3.00%, 8/1/37 | | | 810 | | | | 885,046 | |
| | |
3.00%, 8/1/38 | | | 890 | | | | 963,576 | |
| | |
3.00%, 8/1/39 | | | 1,000 | | | | 1,072,990 | |
| | |
4.00%, 8/1/34 | | | 250 | | | | 294,483 | |
| | |
Long Beach Unified School District, CA, (Election of 2008), 4.00%, 8/1/32 | | | 1,275 | | | | 1,556,966 | |
| | |
| Madera Unified School District, CA, (Election of 2018): | | | | | | |
| | |
4.00%, 8/1/33 | | | 170 | | | | 201,238 | |
| | |
4.00%, 8/1/34 | | | 355 | | | | 417,895 | |
| | |
4.00%, 8/1/36 | | | 430 | | | | 501,806 | |
| | |
4.00%, 8/1/37 | | | 325 | | | | 378,170 | |
| | |
4.00%, 8/1/43 | | | 1,305 | | | | 1,496,496 | |
| | |
Manhattan Beach Unified School District, CA, (Election of 2016), 3.00%, 9/1/21 | | | 1,095 | | | | 1,107,954 | |
| | |
| Manteca Unified School District, CA, (Election of 2014): | | | | | | |
| | |
4.00%, 8/1/29 | | | 100 | | | | 120,579 | |
| | |
4.00%, 8/1/31 | | | 180 | | | | 214,344 | |
| | |
4.00%, 8/1/32 | | | 360 | | | | 427,129 | |
| | |
4.00%, 8/1/34 | | | 1,075 | | | | 1,266,275 | |
| | |
4.00%, 8/1/35 | | | 500 | | | | 587,555 | |
| | | | | | | | |
| Security | | Principal
Amount
(000’s omitted) | | | Value | |
|
| General Obligations (continued) | |
| | |
| Mariposa County Unified School District, CA, (Election of 2016): | | | | | | |
| | |
5.00%, 8/1/40 | | $ | 1,315 | | | $ | 1,569,347 | |
| | |
5.00%, 8/1/43 | | | 1,265 | | | | 1,508,234 | |
| | |
| Mendocino Unified School District, CA, (Election of 2020): | | | | | | |
| | |
4.00%, 8/1/29 | | | 185 | | | | 226,279 | |
| | |
4.00%, 8/1/40 | | | 500 | | | | 580,005 | |
| | |
4.00%, 8/1/44 | | | 1,000 | | | | 1,149,410 | |
| | |
4.00%, 8/1/49 | | | 3,020 | | | | 3,451,769 | |
| | |
| Menifee Union School District, CA: | | | | | | |
| | |
4.00%, 8/1/28 | | | 150 | | | | 183,101 | |
| | |
4.00%, 8/1/30 | | | 150 | | | | 187,439 | |
| | |
4.00%, 8/1/31 | | | 135 | | | | 167,125 | |
| | |
| Moreland School District, CA, (Election of 2020): | | | | | | |
| | |
3.00%, 8/1/21(2) | | | 575 | | | | 580,267 | |
| | |
3.00%, 8/1/22(2) | | | 520 | | | | 539,666 | |
| | |
3.00%, 8/1/40(2) | | | 510 | | | | 544,496 | |
| | |
4.00%, 8/1/30(2) | | | 110 | | | | 134,936 | |
| | |
4.00%, 8/1/31(2) | | | 115 | | | | 139,980 | |
| | |
4.00%, 8/1/33(2) | | | 200 | | | | 240,956 | |
| | |
4.00%, 8/1/34(2) | | | 320 | | | | 383,133 | |
| | |
4.00%, 8/1/38(2) | | | 700 | | | | 823,207 | |
| | |
Mt. San Antonio Community College District, CA, (Election of 2008), 5.00%, 6/1/33 | | | 750 | | | | 886,837 | |
| | |
Mt. San Jacinto Community College District, CA,
(Election of 2014): | | | | | | |
| | |
3.00%, 8/1/32 | | | 800 | | | | 894,112 | |
| | |
3.00%, 8/1/33 | | | 900 | | | | 1,000,854 | |
| | |
3.00%, 8/1/34 | | | 850 | | | | 939,862 | |
| | |
3.00%, 8/1/35 | | | 1,000 | | | | 1,103,010 | |
| | |
3.00%, 8/1/36 | | | 1,000 | | | | 1,099,550 | |
| | |
3.00%, 8/1/37 | | | 1,775 | | | | 1,939,454 | |
| | |
3.00%, 8/1/38 | | | 2,955 | | | | 3,199,290 | |
| | |
| Old Adobe Union School District, CA, (Election of 2018): | | | | | | |
| | |
4.00%, 8/1/33 | | | 200 | | | | 237,516 | |
| | |
4.00%, 8/1/37 | | | 200 | | | | 233,020 | |
| | |
4.00%, 8/1/38 | | | 300 | | | | 348,654 | |
| | |
4.00%, 8/1/39 | | | 375 | | | | 434,524 | |
| | |
4.00%, 8/1/40 | | | 200 | | | | 231,108 | |
| | |
4.00%, 8/1/42 | | | 405 | | | | 466,289 | |
| | |
4.00%, 8/1/44 | | | 750 | | | | 860,400 | |
| | |
4.00%, 8/1/48 | | | 2,625 | | | | 2,997,645 | |
| | |
5.00%, 8/1/44 | | | 1,860 | | | | 2,217,641 | |
| | |
| Oxnard Union High School District, CA, (Election of 2018): | | | | | | |
| | |
4.00%, 8/1/33 | | | 110 | | | | 130,213 | |
| | |
4.00%, 8/1/38 | | | 1,000 | | | | 1,133,980 | |
| | | | |
| | 12 | | See Notes to Financial Statements. |
Eaton Vance
California Municipal Opportunities Fund
March 31, 2021
Portfolio of Investments (Unaudited) — continued
| | | | | | | | |
| Security | | Principal
Amount
(000’s omitted) | | | Value | |
|
| General Obligations (continued) | |
| | |
Oxnard Union High School District, CA, (Election of 2018):
(continued) | | | | | | |
| | |
4.00%, 8/1/39 | | $ | 1,000 | | | $ | 1,156,490 | |
| | |
5.00%, 8/1/35 | | | 1,805 | | | | 2,179,989 | |
| | |
| Pittsburg Unified School District, CA, (Election of 2014): | | | | | | |
| | |
5.00%, 8/1/40 | | | 1,235 | | | | 1,473,874 | |
| | |
5.00%, 8/1/42 | | | 1,545 | | | | 1,836,820 | |
| | |
| Placer Union High School District, CA, (Election of 2018): | | | | | | |
| | |
4.00%, 8/1/34 | | | 1,000 | | | | 1,180,210 | |
| | |
4.00%, 8/1/40 | | | 2,030 | | | | 2,354,820 | |
| | |
5.00%, 8/1/45 | | | 3,175 | | | | 3,885,946 | |
| | |
| Portola Valley School District, CA, (Election of 2018): | | | | | | |
| | |
3.00%, 8/1/35 | | | 700 | | | | 787,220 | |
| | |
4.00%, 8/1/31 | | | 205 | | | | 255,207 | |
| | |
Riverside Unified School District, CA, (Election of 2016), 4.00%, 8/1/31 | | | 1,250 | | | | 1,471,350 | |
| | |
San Diego Community College District, CA, 4.00%, 8/1/34 | | | 4,500 | | | | 5,174,865 | |
| | |
San Francisco Bay Area Rapid Transit District, CA, (Election of 2004), Green Bonds, 4.00%, 8/1/37 | | | 1,500 | | | | 1,746,885 | |
| | |
San Francisco Bay Area Rapid Transit District, CA,
(Election of 2016), Green Bonds: | | | | | | |
| | |
4.00%, 8/1/34 | | | 3,285 | | | | 3,970,448 | |
| | |
4.00%, 8/1/35 | | | 1,200 | | | | 1,446,516 | |
| | |
4.00%, 8/1/44 | | | 1,200 | | | | 1,410,108 | |
| | |
4.00%, 8/1/45 | | | 8,295 | | | | 9,727,049 | |
| | |
5.00%, 8/1/34 | | | 1,765 | | | | 2,297,659 | |
| | |
5.00%, 8/1/35 | | | 250 | | | | 324,597 | |
| | |
| San Francisco City and County, CA: | | | | | | |
| | |
4.00%, 6/15/32 | | | 3,810 | | | | 4,574,362 | |
| | |
4.00%, 6/15/33 | | | 200 | | | | 239,270 | |
| | |
4.00%, 6/15/34 | | | 275 | | | | 327,968 | |
| | |
4.00%, 6/15/35 | | | 200 | | | | 237,988 | |
| | |
| San Francisco Unified School District, CA, (Election of 2016): | | | | | | |
| | |
4.00%, 6/15/34 | | | 3,855 | | | | 4,530,704 | |
| | |
4.00%, 6/15/35 | | | 2,000 | | | | 2,345,300 | |
| | |
| San Juan Unified School District, CA, (Election of 2016): | | | | | | |
| | |
3.00%, 8/1/35 | | | 1,900 | | | | 2,095,719 | |
| | |
3.00%, 8/1/36 | | | 3,000 | | | | 3,298,650 | |
| | |
4.00%, 8/1/31 | | | 590 | | | | 706,678 | |
| | |
4.00%, 8/1/33 | | | 3,300 | | | | 3,924,096 | |
| | |
4.00%, 8/1/34 | | | 2,800 | | | | 3,319,568 | |
| | |
| San Luis Coastal Unified School District, CA, (Election of 2014): | | | | | | |
| | |
5.00%, 8/1/36 | | | 3,550 | | | | 4,277,288 | |
| | |
5.00%, 8/1/37 | | | 1,835 | | | | 2,205,652 | |
| | |
San Luis Obispo County Community College District, CA, (Election of 2014), 4.00%, 8/1/37 | | | 500 | | | | 587,075 | |
| | | | | | | | |
| Security | | Principal
Amount
(000’s omitted) | | | Value | |
|
| General Obligations (continued) | |
| | |
| San Mateo-Foster City School District, CA, (Election of 2015): | | | | | | |
| | |
4.00%, 8/1/31 | | $ | 235 | | | $ | 289,612 | |
| | |
4.00%, 8/1/32 | | | 300 | | | | 367,674 | |
| | |
4.00%, 8/1/33 | | | 400 | | | | 487,908 | |
| | |
4.00%, 8/1/34 | | | 335 | | | | 406,077 | |
| | |
4.00%, 8/1/35 | | | 500 | | | | 602,280 | |
| | |
4.00%, 8/1/36 | | | 325 | | | | 389,012 | |
| | |
| San Mateo-Foster City School District, CA, (Election of 2020): | | | | | | |
| | |
3.00%, 8/1/22 | | | 6,145 | | | | 6,381,214 | |
| | |
4.00%, 8/1/31 | | | 290 | | | | 357,393 | |
| | |
4.00%, 8/1/32 | | | 200 | | | | 245,116 | |
| | |
4.00%, 8/1/33 | | | 300 | | | | 365,931 | |
| | |
4.00%, 8/1/34 | | | 410 | | | | 496,990 | |
| | |
4.00%, 8/1/35 | | | 260 | | | | 313,186 | |
| | |
4.00%, 8/1/36 | | | 275 | | | | 329,164 | |
| | |
San Rafael City Elementary School District, CA, (Election of 2015), 5.00%, 8/1/38 | | | 500 | | | | 621,300 | |
| | |
Santa Clara County, CA, (Election of 2008), 4.00%, 8/1/34 | | | 1,605 | | | | 1,882,970 | |
| | |
Santa Monica-Malibu Unified School District, CA, (School Facilities Improvement District No. 2), (Election of 2018), 4.00%, 8/1/37 | | | 815 | | | | 950,217 | |
| | |
Saugus Union School District, CA, (Election of 2014), 4.00%, 8/1/33 | | | 500 | | | | 609,565 | |
| | |
| Simi Valley Unified School District, CA, (Election of 2016): | | | | | | |
| | |
4.00%, 8/1/31 | | | 150 | | | | 179,084 | |
| | |
4.00%, 8/1/33 | | | 200 | | | | 236,750 | |
| | |
4.00%, 8/1/36 | | | 375 | | | | 440,167 | |
| | |
4.00%, 8/1/37 | | | 450 | | | | 526,666 | |
| | |
4.00%, 8/1/38 | | | 1,080 | | | | 1,260,835 | |
| | |
4.00%, 8/1/39 | | | 1,215 | | | | 1,415,135 | |
| | |
4.00%, 8/1/40 | | | 1,380 | | | | 1,600,814 | |
| | |
4.00%, 8/1/41 | | | 1,545 | | | | 1,787,673 | |
| | |
| Tahoe-Truckee Unified School District, CA, (Election of 2014): | | | | | | |
| | |
5.00%, 8/1/33 | | | 500 | | | | 606,765 | |
| | |
5.00%, 8/1/36 | | | 1,000 | | | | 1,206,590 | |
| | |
| Vacaville Unified School District, CA, (Election of 2014): | | | | | | |
| | |
4.00%, 8/1/33 | | | 140 | | | | 166,477 | |
| | |
4.00%, 8/1/42 | | | 2,145 | | | | 2,474,386 | |
| | |
Vista Unified School District, CA, (Election of 2018), 5.00%, 8/1/32 | | | 155 | | | | 201,519 | |
| | |
West Sonoma County Union High School District, CA,
(Election of 2018): | | | | | | |
| | |
5.00%, 8/1/37 | | | 500 | | | | 622,830 | |
| | |
5.00%, 8/1/40 | | | 1,125 | | | | 1,391,861 | |
| | |
5.00%, 8/1/43 | | | 1,000 | | | | 1,228,770 | |
| | | | |
| | 13 | | See Notes to Financial Statements. |
Eaton Vance
California Municipal Opportunities Fund
March 31, 2021
Portfolio of Investments (Unaudited) — continued
| | | | | | | | |
| Security | | Principal
Amount
(000’s omitted) | | | Value | |
|
| General Obligations (continued) | |
| | |
| Westminster School District, CA, (Election of 2016): | | | | | | |
| | |
5.00%, 8/1/38 | | $ | 400 | | | $ | 479,652 | |
| | |
5.00%, 8/1/39 | | | 585 | | | | 699,818 | |
| | |
5.00%, 8/1/42 | | | 1,000 | | | | 1,189,440 | |
| |
| | | | $ | 249,092,922 | |
|
| Health Care-Miscellaneous — 0.1% | |
| | |
California Municipal Finance Authority, (Institute on Aging), 5.00%, 8/15/24 | | $ | 570 | | | $ | 654,867 | |
| |
| | | | $ | 654,867 | |
|
| Hospital — 4.6% | |
| | |
California Health Facilities Financing Authority, (Adventist Health System/West), 4.00%, 3/1/39 | | $ | 3,415 | | | $ | 3,772,414 | |
| | |
| California Health Facilities Financing Authority, (City of Hope): | | | | | | |
| | |
5.00%, 11/15/32 | | | 735 | | | | 784,973 | |
| | |
5.00%, 11/15/35 | | | 1,050 | | | | 1,119,636 | |
| | |
California Health Facilities Financing Authority, (CommonSpirit Health), 4.00%, 4/1/35 | | | 3,500 | | | | 4,100,635 | |
| | |
California Health Facilities Financing Authority, (Lucile Packard Children’s Hospital at Stanford), 5.00%, 8/15/32 | | | 1,210 | | | | 1,435,447 | |
| | |
California Health Facilities Financing Authority, (Providence Health & Services), 5.00%, 10/1/44 | | | 4,100 | | | | 4,671,007 | |
| | |
California Health Facilities Financing Authority,
(Providence St. Joseph Health): | | | | | | |
| | |
5.00%, 10/1/30 | | | 400 | | | | 482,432 | |
| | |
5.00% to 10/1/27 (Put Date), 10/1/39 | | | 1,200 | | | | 1,503,312 | |
| | |
California Health Facilities Financing Authority, (St. Joseph Health System), 5.00%, 7/1/33 | | | 1,500 | | | | 1,650,960 | |
| | |
California Municipal Finance Authority,
(NorthBay Healthcare Group): | | | | | | |
| | |
5.00%, 11/1/24 | | | 800 | | | | 898,936 | |
| | |
5.00%, 11/1/26 | | | 500 | | | | 588,400 | |
| | |
5.00%, 11/1/27 | | | 165 | | | | 183,232 | |
| | |
5.00%, 11/1/29 | | | 105 | | | | 115,611 | |
| | |
5.00%, 11/1/30 | | | 150 | | | | 164,651 | |
| | |
Series 2015, 5.00%, 11/1/25 | | | 200 | | | | 223,866 | |
| | |
Series 2017A, 5.00%, 11/1/25 | | | 800 | | | | 921,264 | |
| | |
California Public Finance Authority,
(Henry Mayo Newhall Hospital): | | | | | | |
| | |
4.00%, 10/15/25 | | | 390 | | | | 439,663 | |
| | |
4.00%, 10/15/26 | | | 415 | | | | 475,793 | |
| | |
5.00%, 10/15/33 | | | 425 | | | | 492,945 | |
| | |
California Statewide Communities Development Authority, (Methodist Hospital of Southern California), 5.00%, 1/1/38 | | | 2,000 | | | | 2,367,140 | |
| | | | | | | | |
| Security | | Principal
Amount
(000’s omitted) | | | Value | |
|
| Hospital (continued) | |
| | |
Oroville, CA, (Oroville Hospital), 5.25%, 4/1/49 | | $ | 5,000 | | | $ | 5,667,000 | |
| |
| | | | $ | 32,059,317 | |
|
| Housing — 0.3% | |
| | |
Independent Cities Finance Authority, CA, (Union City Tropics), 5.00%, 5/15/48 | | $ | 2,000 | | | $ | 2,409,080 | |
| |
| | | | $ | 2,409,080 | |
|
| Industrial Development Revenue — 1.5% | |
| | |
California Pollution Control Financing Authority, (Republic Services, Inc.), Series 2017 A1, (AMT), 0.20%, 11/1/42(1)(5) | | $ | 7,500 | | | $ | 7,500,150 | |
| | |
California Pollution Control Financing Authority, (Waste Management, Inc.), (AMT), 2.50% to 5/1/24 (Put Date), 11/1/38 | | | 2,500 | | | | 2,649,075 | |
| |
| | | | $ | 10,149,225 | |
|
| Insured – Electric Utilities — 0.7% | |
| | |
| Puerto Rico Electric Power Authority: | | | | | | |
| | |
(NPFG), 5.00%, 7/1/23 | | $ | 125 | | | $ | 127,029 | |
| | |
(NPFG), 5.25%, 7/1/22 | | | 1,500 | | | | 1,547,100 | |
| | |
(NPFG), 5.25%, 7/1/32 | | | 2,100 | | | | 2,334,402 | |
| | |
(NPFG), Series QQ, 5.00%, 7/1/22 | | | 180 | | | | 182,505 | |
| | |
(NPFG), Series RR, 5.00%, 7/1/22 | | | 140 | | | | 141,949 | |
| | |
(NPFG), Series RR, 5.00%, 7/1/24 | | | 300 | | | | 306,261 | |
| | |
(NPFG), Series SS, 5.00%, 7/1/24 | | | 130 | | | | 132,713 | |
| |
| | | | $ | 4,771,959 | |
|
| Insured – General Obligations — 3.7% | |
| | |
Cambrian School District, CA, (Election of 2020), (AGM), 5.00%, 8/1/22(2) | | $ | 1,645 | | | $ | 1,750,115 | |
| | |
Compton Community College District, CA, (Election of 2014), (BAM), 5.00%, 8/1/36 | | | 1,690 | | | | 2,037,194 | |
| | |
Cotati-Rohnert Park Unified School District, CA,
(Election of 2016): | | | | | | |
| | |
(AGM), 5.00%, 8/1/33 | | | 710 | | | | 860,783 | |
| | |
(AGM), 5.00%, 8/1/34 | | | 825 | | | | 998,299 | |
| | |
(AGM), 5.00%, 8/1/35 | | | 955 | | | | 1,153,401 | |
| | |
(AGM), 5.00%, 8/1/36 | | | 1,015 | | | | 1,223,522 | |
| | |
(AGM), 5.00%, 8/1/37 | | | 1,135 | | | | 1,365,564 | |
| | |
(AGM), 5.00%, 8/1/38 | | | 1,175 | | | | 1,410,987 | |
| | |
| Galt Joint Union High School District, CA, (Election of 2016): | | | | | | |
| | |
(BAM), 5.00%, 8/1/37 | | | 500 | | | | 601,570 | |
| | |
(BAM), 5.00%, 8/1/38 | | | 500 | | | | 600,420 | |
| | |
(BAM), 5.00%, 8/1/43 | | | 1,000 | | | | 1,192,280 | |
| | | | |
| | 14 | | See Notes to Financial Statements. |
Eaton Vance
California Municipal Opportunities Fund
March 31, 2021
Portfolio of Investments (Unaudited) — continued
| | | | | | | | |
| Security | | Principal
Amount
(000’s omitted) | | | Value | |
|
| Insured – General Obligations (continued) | |
| | |
| Menifee Union School District, CA: | | | | | | |
| | |
(AGM), 4.00%, 8/1/33 | | $ | 225 | | | $ | 275,621 | |
| | |
(AGM), 4.00%, 8/1/35 | | | 330 | | | | 398,693 | |
| | |
(AGM), 4.00%, 8/1/37 | | | 300 | | | | 359,214 | |
| | |
| Paramount Unified School District, CA, (Election of 2016): | | | | | | |
| | |
(BAM), 4.00%, 8/1/35 | | | 150 | | | | 180,792 | |
| | |
(BAM), 4.00%, 8/1/36 | | | 200 | | | | 239,764 | |
| | |
Rio Elementary School District, CA, (Election of 2018), (BAM), 5.00%, 8/1/47 | | | 1,750 | | | | 2,127,160 | |
| | |
San Leandro Unified School District, CA, (Election of 2016), (BAM), 5.00%, 8/1/38 | | | 1,000 | | | | 1,228,590 | |
| | |
South Whittier School District, CA, (Election of 2016), (AGM), 4.00%, 8/1/45 | | | 1,000 | | | | 1,141,390 | |
| | |
| Ukiah Unified School District, CA, (Election of 2020): | | | | | | |
| | |
(AGM), 5.00%, 8/1/34 | | | 800 | | | | 992,736 | |
| | |
(AGM), 5.00%, 8/1/36 | | | 1,025 | | | | 1,265,188 | |
| | |
(AGM), 5.00%, 8/1/40 | | | 1,000 | | | | 1,222,490 | |
| | |
(AGM), 5.00%, 8/1/42 | | | 1,085 | | | | 1,320,022 | |
| | |
| Washington Unified School District, CA, (Election of 2020): | | | | | | |
| | |
(AGM), 4.00%, 8/1/34 | | | 250 | | | | 292,965 | |
| | |
(AGM), 4.00%, 8/1/35 | | | 285 | | | | 333,182 | |
| | |
(AGM), 4.00%, 8/1/36 | | | 320 | | | | 372,954 | |
| | |
Winters Joint Unified School District, CA, (Election of 2018), (AGM), 4.00%, 8/1/39 | | | 630 | | | | 728,122 | |
| |
| | | | $ | 25,673,018 | |
|
| Insured – Special Tax Revenue — 1.0% | |
| | |
| Dana Point Community Facilities District No. 2006-1, CA: | | | | | | |
| | |
(BAM), 4.00%, 9/1/37 | | $ | 600 | | | $ | 717,492 | |
| | |
(BAM), 4.00%, 9/1/41 | | | 2,000 | | | | 2,361,700 | |
| | |
| Lake Elsinore School Financing Authority, CA: | | | | | | |
| | |
(BAM), 5.00%, 10/1/36 | | | 1,570 | | | | 1,973,113 | |
| | |
(BAM), 5.00%, 10/1/37 | | | 470 | | | | 588,844 | |
| | |
Successor Agency to San Francisco City and County Redevelopment Agency, CA, (NPFG), 5.00%, 8/1/41 | | | 1,320 | | | | 1,509,011 | |
| |
| | | | $ | 7,150,160 | |
|
| Insured – Transportation — 1.1% | |
| | |
Alameda Corridor Transportation Authority, CA, (AGM), 5.00%, 10/1/37 | | $ | 5,075 | | | $ | 6,014,129 | |
| | |
San Joaquin Hills Transportation Corridor Agency, CA, (NPFG), 0.00%, 1/15/24 | | | 1,800 | | | | 1,727,568 | |
| |
| | | | $ | 7,741,697 | |
| | | | | | | | |
| Security | | Principal
Amount
(000’s omitted) | | | Value | |
|
| Other Revenue — 1.7% | |
| | |
California Infrastructure and Economic Development Bank,
(Academy of Motion Picture Arts and Sciences
Obligated Group): | | | | | | |
| | |
5.00%, 11/1/33 | | $ | 1,740 | | | $ | 1,942,832 | |
| | |
5.00%, 11/1/34 | | | 1,290 | | | | 1,438,956 | |
| | |
Green Bonds, 5.00%, 11/1/30 | | | 275 | | | | 366,168 | |
| | |
California Infrastructure and Economic Development Bank,
(California Academy of Sciences): | | | | | | |
| | |
Series 2018A, 0.455%, (70% of 1 mo. USD LIBOR + 0.38%), 8/1/21 (Put Date), 8/1/47(4) | | | 2,500 | | | | 2,499,950 | |
| | |
Series 2018B, 0.455%, (70% of 1 mo. USD LIBOR + 0.38%), 8/1/21 (Put Date), 8/1/47(4) | | | 450 | | | | 449,991 | |
| | |
California Infrastructure and Economic Development Bank, (The J. Paul Getty Trust), Series 2013A, 0.406%, (70% of 1 mo. USD LIBOR + 0.33%), 4/1/22 (Put Date), 10/1/47(4) | | | 4,800 | | | | 4,804,176 | |
| | |
Morongo Band of Mission Indians, CA, 5.00%, 10/1/42(1) | | | 440 | | | | 504,025 | |
| |
| | | | $ | 12,006,098 | |
|
| Senior Living / Life Care — 1.3% | |
| | |
ABAG Finance Authority for Nonprofit Corporations, CA, (Episcopal Senior Communities), 6.00%, 7/1/31 | | $ | 615 | | | $ | 622,392 | |
| | |
California Municipal Finance Authority, (Channing House), 5.00%, 5/15/37 | | | 250 | | | | 295,775 | |
| | |
California Municipal Finance Authority,
(HumanGood - California Obligated Group): | | | | | | |
| | |
4.00%, 10/1/34 | | | 755 | | | | 843,244 | |
| | |
4.00%, 10/1/37 | | | 3,300 | | | | 3,649,140 | |
| | |
California Municipal Finance Authority, (Mt. San Antonio Gardens), 5.00%, 11/15/39 | | | 1,000 | | | | 1,154,470 | |
| | |
California Statewide Communities Development Authority,
(American Baptist Homes of the West): | | | | | | |
| | |
5.00%, 10/1/23 | | | 500 | | | | 549,600 | |
| | |
5.00%, 10/1/26 | | | 500 | | | | 578,660 | |
| | |
5.00%, 10/1/27 | | | 780 | | | | 898,038 | |
| | |
California Statewide Communities Development Authority, (The Redwoods, a Community of Seniors), 5.125%, 11/15/35 | | | 715 | | | | 784,348 | |
| |
| | | | $ | 9,375,667 | |
|
| Solid Waste — 0.1% | |
| | |
Yolo County Public Agencies Financing Authority, CA, Solid Waste Revenue, 4.00%, 12/1/35 | | $ | 500 | | | $ | 593,330 | |
| |
| | | | $ | 593,330 | |
|
| Special Tax Revenue — 7.6% | |
| | |
Chula Vista Municipal Financing Authority, CA, 5.50%, 9/1/30 | | $ | 1,525 | | | $ | 1,692,613 | |
| | | | |
| | 15 | | See Notes to Financial Statements. |
Eaton Vance
California Municipal Opportunities Fund
March 31, 2021
Portfolio of Investments (Unaudited) — continued
| | | | | | | | |
| Security | | Principal
Amount
(000’s omitted) | | | Value | |
|
| Special Tax Revenue (continued) | |
| | |
Contra Costa Transportation Authority, CA, Sales Tax Revenue, 0.331%, (70% of 1 mo. USD LIBOR + 0.25%), 9/1/21 (Put Date), 3/1/34(4) | | $ | 7,000 | | | $ | 7,000,070 | |
| | |
Irvine Community Facilities District No. 2013-3, CA,
(Great Park): | | | | | | |
| | |
5.00%, 9/1/30 | | | 580 | | | | 657,848 | |
| | |
5.00%, 9/1/31 | | | 465 | | | | 525,980 | |
| | |
5.00%, 9/1/33 | | | 545 | | | | 613,708 | |
| | |
5.00%, 9/1/35 | | | 1,150 | | | | 1,348,778 | |
| | |
5.00%, 9/1/38 | | | 1,000 | | | | 1,165,770 | |
| | |
Series 2014, 5.00%, 9/1/32 | | | 450 | | | | 507,780 | |
| | |
Series 2014, 5.00%, 9/1/34 | | | 360 | | | | 404,687 | |
| | |
Series 2018, 5.00%, 9/1/32 | | | 625 | | | | 737,700 | |
| | |
Series 2018, 5.00%, 9/1/34 | | | 765 | | | | 898,974 | |
| | |
Los Angeles, CA, Tax and Revenue Anticipation Notes, 4.00%, 6/24/21 | | | 1,000 | | | | 1,008,980 | |
| | |
Los Angeles County Community Facilities District No. 3, CA, (Valencia/Newhall Area), 5.00%, 9/1/23 | | | 520 | | | | 530,332 | |
| | |
Los Angeles County Metropolitan Transportation Authority, CA, Sales Tax Revenue, 5.00%, 6/1/35 | | | 1,500 | | | | 1,803,810 | |
| | |
Santa Clara Valley Transportation Authority, CA, Sales Tax Revenue, (SPA: TD Bank, N.A.), 0.03%, 4/1/36(3) | | | 14,970 | | | | 14,970,000 | |
| | |
San Diego County Regional Transportation Commission, CA,
Sales Tax Revenue: | | | | | | |
| | |
(SPA: Bank of America, N.A.), 0.02%, 4/1/38(6) | | | 9,325 | | | | 9,325,000 | |
| | |
5.00%, 4/1/26 | | | 335 | | | | 409,688 | |
| | |
San Mateo County Transportation Authority, CA, Sales Tax Revenue, (LOC: Bank of America, N.A.), 0.03%, 6/1/49(3) | | | 6,000 | | | | 6,000,000 | |
| | |
South Orange County Public Financing Authority, CA,
Special Tax Revenue, (Ladera Ranch): | | | | | | |
| | |
5.00%, 8/15/27 | | | 515 | | | | 533,947 | |
| | |
5.00%, 8/15/28 | | | 775 | | | | 803,125 | |
| | |
Successor Agency to San Francisco City and County Redevelopment Agency, CA, 5.00%, 8/1/37 | | | 1,630 | | | | 1,887,165 | |
| |
| | | | $ | 52,825,955 | |
|
| Transportation — 8.9% | |
| | |
| Alameda Corridor Transportation Authority, CA: | | | | | | |
| | |
5.00%, 10/1/36 | | $ | 2,250 | | | $ | 2,642,152 | |
| | |
5.00%, 10/1/37 | | | 2,200 | | | | 2,575,452 | |
| | |
| Bay Area Toll Authority, CA, (San Francisco Bay Area): | | | | | | |
| | |
0.35%, (SIFMA + 0.28%), 4/1/24 (Put Date), 4/1/56(4) | | | 2,500 | | | | 2,502,275 | |
| | |
0.52%, (SIFMA + 0.45%), 4/1/26 (Put Date), 4/1/56(4) | | | 800 | | | | 802,136 | |
| | |
Burbank-Glendale-Pasadena Airport Authority, CA, (AMT), 5.00%, 7/1/22 | | | 1,000 | | | | 1,053,830 | |
| | | | | | | | |
| Security | | Principal
Amount
(000’s omitted) | | | Value | |
|
| Transportation (continued) | |
| | |
California Municipal Finance Authority, (LINXS Automated
People Mover): | | | | | | |
| | |
(AMT), 5.00%, 12/31/36 | | $ | 2,570 | | | $ | 3,095,334 | |
| | |
(AMT), 5.00%, 12/31/37 | | | 1,025 | | | | 1,231,373 | |
| | |
(AMT), 5.00%, 12/31/43 | | | 2,060 | | | | 2,434,529 | |
| | |
Long Beach, CA, Harbor Revenue, (AMT), 5.00%, 5/15/30 | | | 500 | | | | 611,910 | |
| | |
Los Angeles Department of Airports, CA,
(Los Angeles International Airport): | | | | | | |
| | |
(AMT), 5.00%, 5/15/25 | | | 1,500 | | | | 1,762,365 | |
| | |
(AMT), 5.00%, 5/15/29 | | | 1,000 | | | | 1,280,010 | |
| | |
(AMT), 5.00%, 5/15/33 | | | 1,675 | | | | 2,074,873 | |
| | |
(AMT), 5.00%, 5/15/41 | | | 1,660 | | | | 1,905,912 | |
| | |
(AMT), 5.00%, 5/15/46 | | | 4,500 | | | | 5,201,640 | |
| | |
Los Angeles Harbor Department, CA, (AMT), 5.00%, 8/1/21 | | | 1,000 | | | | 1,014,950 | |
| | |
| San Diego County Regional Airport Authority, CA: | | | | | | |
| | |
(AMT), 5.00%, 7/1/22 | | | 500 | | | | 528,520 | |
| | |
(AMT), 5.00%, 7/1/30 | | | 1,000 | | | | 1,212,300 | |
| | |
San Francisco City and County Airport Commission, CA,
(San Francisco International Airport): | | | | | | |
| | |
(AMT), 5.00%, 5/1/24 | | | 3,600 | | | | 3,612,456 | |
| | |
(AMT), 5.00%, 5/1/41 | | | 4,905 | | | | 5,714,717 | |
| | |
(AMT), 5.00%, 5/1/44 | | | 2,465 | | | | 2,767,924 | |
| | |
(AMT), 5.00%, 5/1/46 | | | 2,330 | | | | 2,695,647 | |
| | |
| San Jose, CA, Airport Revenue: | | | | | | |
| | |
(AMT), 5.00%, 3/1/24(2) | | | 750 | | | | 847,972 | |
| | |
(AMT), 5.00%, 3/1/25(2) | | | 815 | | | | 951,154 | |
| | |
(AMT), 5.00%, 3/1/26(2) | | | 1,535 | | | | 1,838,869 | |
| | |
(AMT), 5.00%, 3/1/37 | | | 1,735 | | | | 2,057,051 | |
| | |
(AMT), 5.00%, 3/1/41 | | | 3,000 | | | | 3,537,000 | |
| | |
(AMT), 5.00%, 3/1/47 | | | 5,500 | | | | 6,446,330 | |
| |
| | | | $ | 62,398,681 | |
|
| Water and Sewer — 7.0% | |
| | |
| Beverly Hills Public Financing Authority, CA, Water Revenue: | | | | | | |
| | |
4.00%, 6/1/33 | | $ | 125 | | | $ | 155,305 | |
| | |
4.00%, 6/1/34 | | | 175 | | | | 215,892 | |
| | |
4.00%, 6/1/35 | | | 125 | | | | 153,911 | |
| | |
4.00%, 6/1/36 | | | 325 | | | | 397,745 | |
| | |
4.00%, 6/1/37 | | | 500 | | | | 609,190 | |
| | |
4.00%, 6/1/38 | | | 2,250 | | | | 2,730,892 | |
| | |
4.00%, 6/1/39 | | | 1,715 | | | | 2,072,114 | |
| | |
4.00%, 6/1/40 | | | 1,080 | | | | 1,299,661 | |
| | |
California Department of Water Resources, 5.00%, 12/1/32 | | | 220 | | | | 278,489 | |
| | |
Dublin San Ramon Services District, CA, Water Revenue, 5.00%, 8/1/30 | | | 980 | | | | 1,230,047 | |
| | | | |
| | 16 | | See Notes to Financial Statements. |
Eaton Vance
California Municipal Opportunities Fund
March 31, 2021
Portfolio of Investments (Unaudited) — continued
| | | | | | | | |
| Security | | Principal
Amount
(000’s omitted) | | | Value | |
|
| Water and Sewer (continued) | |
| | |
East Bay Municipal Utility District, CA, Water System Revenue, 5.00%, 6/1/32 | | $ | 1,500 | | | $ | 1,774,365 | |
| | |
Eastern Municipal Water District, CA,
Water and Wastewater Revenue: | | | | | | |
| | |
0.32%, (SIFMA + 0.25%), 10/1/21 (Put Date), 7/1/46(4) | | | 2,000 | | | | 2,000,120 | |
| | |
0.381%, (70% of 1 mo. USD LIBOR + 0.30%), 10/1/21 (Put Date), 7/1/30(4) | | | 2,450 | | | | 2,450,441 | |
| | |
Los Angeles Department of Water and Power, CA, Water System Revenue, (SPA: TD Bank, N.A.), 0.04%, 7/1/51(3) | | | 14,000 | | | | 14,000,000 | |
| | |
Marin Public Financing Authority, CA, (Las Gallinas Valley Sanitary District), 4.00%, 4/1/26 | | | 1,000 | | | | 1,171,000 | |
| | |
Oceanside, CA, Water Revenue, 4.00%, 5/1/33 | | | 100 | | | | 122,442 | |
| | |
Orange County Sanitation District, CA, 5.00%, 2/1/22 | | | 300 | | | | 312,129 | |
| | |
Orange County Water District, CA, 5.00%, 8/15/33 | | | 200 | | | | 261,076 | |
| | |
| Pasadena, CA, Water Revenue: | | | | | | |
| | |
5.00%, 6/1/38 | | | 1,480 | | | | 1,919,575 | |
| | |
5.00%, 6/1/39 | | | 1,500 | | | | 1,939,905 | |
| | |
Petaluma, CA, Wastewater Revenue, 5.00%, 5/1/21 | | | 470 | | | | 471,669 | |
| | |
| Rancho California Water District Financing Authority: | | | | | | |
| | |
4.00%, 8/1/38 | | | 1,500 | | | | 1,799,160 | |
| | |
4.00%, 8/1/39 | | | 2,800 | | | | 3,349,220 | |
| | |
Ross Valley Public Financing Authority, CA, (Sanitary District No. 1 of Marin County), 5.00%, 1/1/39 | | | 500 | | | | 575,795 | |
| | |
San Diego Public Facilities Financing Authority, CA, Water
Revenue: | | | | | | |
| | |
4.00%, 8/1/36 | | | 1,000 | | | | 1,226,850 | |
| | |
4.00%, 8/1/37 | | | 1,000 | | | | 1,222,440 | |
| | |
South Gate Utility Authority, CA, Water Revenue, 4.00%, 10/1/34 | | | 2,360 | | | | 2,771,820 | |
| | |
| Upper Santa Clara Valley Joint Powers Authority, CA: | | | | | | |
| | |
4.00%, 8/1/45 | | | 1,320 | | | | 1,460,474 | |
| | |
5.00%, 8/1/35 | | | 50 | | | | 63,006 | |
| | |
5.00%, 8/1/36 | | | 300 | | | | 377,139 | |
| | |
5.00%, 8/1/37 | | | 300 | | | | 376,302 | |
| | |
5.00%, 8/1/38 | | | 250 | | | | 313,013 | |
| |
| | | | $ | 49,101,187 | |
| |
Total Tax-Exempt Municipal Obligations — 87.0%
(identified cost $587,215,170) | | | $ | 607,622,541 | |
| | | | | | | | |
| Taxable Municipal Obligations — 4.5% | |
| Security | | Principal
Amount
(000’s omitted) | | | Value | |
|
| General Obligations — 1.2% | |
| | |
| Ojai Unified School District, CA: | | | | | | |
| | |
2.019%, 8/1/31 | | $ | 480 | | | $ | 468,048 | |
| | |
2.519%, 8/1/36 | | | 400 | | | | 388,512 | |
| | |
| Tamalpais Union High School District, CA: | | | | | | |
| | |
1.414%, 8/1/30 | | | 475 | | | | 458,893 | |
| | |
1.514%, 8/1/31 | | | 1,500 | | | | 1,451,295 | |
| | |
| Tustin Unified School District, CA: | | | | | | |
| | |
1.654%, 8/1/30 | | | 1,230 | | | | 1,206,224 | |
| | |
1.754%, 8/1/31 | | | 1,510 | | | | 1,479,498 | |
| | |
1.854%, 8/1/32 | | | 1,070 | | | | 1,048,108 | |
| | |
1.954%, 8/1/33 | | | 590 | | | | 577,568 | |
| | |
2.649%, 8/1/42 | | | 1,125 | | | | 1,089,990 | |
| |
| | | | $ | 8,168,136 | |
|
| Hospital — 0.6% | |
| | |
California Statewide Communities Development Authority, (Loma Linda University Medical Center), 6.00%, 12/1/24 | | $ | 3,875 | | | $ | 4,330,700 | |
| |
| | | | $ | 4,330,700 | |
|
| Insured – General Obligations — 0.4% | |
| | |
Mojave Unified School District, CA, (BAM), 2.731%, 8/1/37 | | $ | 500 | | | $ | 500,700 | |
| | |
| Sanger Unified School District, CA: | | | | | | |
| | |
(BAM), 2.371%, 8/1/35 | | | 445 | | | | 433,350 | |
| | |
(BAM), 2.734%, 8/1/42 | | | 2,000 | | | | 1,943,360 | |
| |
| | | | $ | 2,877,410 | |
|
| Insured – Special Tax Revenue — 0.1% | |
| | |
Successor Agency to Pittsburg Redevelopment Agency, CA, (AGM), 3.388%, 8/1/22 | | $ | 955 | | | $ | 989,896 | |
| |
| | | | $ | 989,896 | |
|
| Insured – Transportation — 0.1% | |
| | |
Alameda Corridor Transportation Authority, CA, (AMBAC), 0.00%, 10/1/27 | | $ | 740 | | | $ | 620,697 | |
| |
| | | | $ | 620,697 | |
|
| Lease Revenue / Certificates of Participation — 1.2% | |
| | |
| Downey, CA, Pension Obligation Bonds: | | | | | | |
| | |
1.75%, 6/1/29 | | $ | 550 | | | $ | 527,775 | |
| | |
1.85%, 6/1/30 | | | 650 | | | | 623,018 | |
| | |
1.95%, 6/1/31 | | | 835 | | | | 798,519 | |
| | | | |
| | 17 | | See Notes to Financial Statements. |
Eaton Vance
California Municipal Opportunities Fund
March 31, 2021
Portfolio of Investments (Unaudited) — continued
| | | | | | | | |
| Security | | Principal
Amount
(000’s omitted) | | | Value | |
|
| Lease Revenue / Certificates of Participation (continued) | |
| | |
| Downey, CA, Pension Obligation Bonds: (continued) | | | | | | |
| | |
2.05%, 6/1/32 | | $ | 850 | | | $ | 811,758 | |
| | |
2.15%, 6/1/33 | | | 1,110 | | | | 1,057,353 | |
| | |
2.25%, 6/1/34 | | | 1,250 | | | | 1,188,537 | |
| | |
2.35%, 6/1/35 | | | 2,045 | | | | 1,942,505 | |
| | |
| Monterey Park, CA, Pension Obligation Bonds: | | | | | | |
| | |
2.193%, 6/1/33 | | | 560 | | | | 542,198 | |
| | |
2.293%, 6/1/34 | | | 750 | | | | 724,770 | |
| |
| | | | $ | 8,216,433 | |
|
| Special Tax Revenue — 0.2% | |
| | |
| Successor Agency to San Diego Redevelopment Agency, CA: | | | | | | |
| | |
3.25%, 9/1/22 | | $ | 250 | | | $ | 260,498 | |
| | |
3.375%, 9/1/23 | | | 250 | | | | 267,307 | |
| | |
3.50%, 9/1/24 | | | 250 | | | | 273,067 | |
| | |
3.625%, 9/1/25 | | | 250 | | | | 277,580 | |
| | |
3.75%, 9/1/26 | | | 250 | | | | 278,000 | |
| |
| | | | $ | 1,356,452 | |
|
| Transportation — 0.7% | |
| | |
Los Angeles Department of Airports, CA,
(Los Angeles International Airport): | | | | | | |
| | |
1.513%, 5/15/29 | | $ | 775 | | | $ | 741,745 | |
| | |
1.613%, 5/15/30 | | | 900 | | | | 857,115 | |
| | |
1.713%, 5/15/31 | | | 800 | | | | 758,912 | |
| | |
1.863%, 5/15/32 | | | 1,300 | | | | 1,229,605 | |
| | |
| San Jose, CA, Airport Revenue: | | | | | | |
| | |
0.65%, 3/1/24(2) | | | 250 | | | | 249,702 | |
| | |
1.359%, 3/1/26(2) | | | 250 | | | | 248,878 | |
| | |
1.732%, 3/1/27(2) | | | 250 | | | | 248,440 | |
| | |
2.21%, 3/1/29(2) | | | 500 | | | | 495,150 | |
| |
| | | | $ | 4,829,547 | |
| |
Total Taxable Municipal Obligations — 4.5%
(identified cost $31,672,179) | | | $ | 31,389,271 | |
| |
Total Investments — 92.7%
(identified cost $626,929,177) | | | $ | 647,406,125 | |
| |
Other Assets, Less Liabilities — 7.3% | | | $ | 50,678,963 | |
| |
Net Assets — 100.0% | | | $ | 698,085,088 | |
The percentage shown for each investment category in the Portfolio of Investments is based on net assets.
The Fund invests primarily in debt securities issued by California municipalities. The ability of the issuers of the debt securities to meet their obligations may be affected by economic developments in a specific industry or municipality. At March 31, 2021, 7.7% of total investments are backed by bond insurance of various financial institutions and financial guaranty assurance agencies. The aggregate percentage insured by an individual financial institution or financial guaranty assurance agency ranged from 0.1% to 3.8% of total investments.
| (1) | Security exempt from registration under Rule 144A of the Securities Act of 1933, as amended. These securities may be sold in certain transactions in reliance on an exemption from registration (normally to qualified institutional buyers). At March 31, 2021, the aggregate value of these securities is $15,606,235 or 2.2% of the Fund’s net assets. |
| (2) | When-issued security. |
| (3) | Variable rate demand obligation that may be tendered at par on any day for payment the same or next business day. The stated interest rate, which generally resets daily, is determined by the remarketing agent and represents the rate in effect at March 31, 2021. |
| (4) | Floating rate security. The stated interest rate represents the rate in effect at March 31, 2021. |
| (5) | Variable rate security that may be tendered at par quarterly. The stated interest rate, which resets quarterly, is determined by the remarketing agent and represents the rate in effect at March 31, 2021. |
| (6) | Variable rate demand obligation that may be tendered at par on any day for payment the lesser of 5 business days or 7 calendar days. The stated interest rate, which generally resets weekly, is determined by the remarketing agent and represents the rate in effect at March 31, 2021. |
Abbreviations:
| | | | |
| | |
| AGM | | – | | Assured Guaranty Municipal Corp. |
| | |
| AMBAC | | – | | AMBAC Financial Group, Inc. |
| | |
| AMT | | – | | Interest earned from these securities may be considered a tax preference item for purposes of the Federal Alternative Minimum Tax. |
| | |
| BAM | | – | | Build America Mutual Assurance Co. |
| | |
| LIBOR | | – | | London Interbank Offered Rate |
| | |
| LOC | | – | | Letter of Credit |
| | |
| NPFG | | – | | National Public Finance Guarantee Corp. |
| | |
| SIFMA | | – | | Securities Industry and Financial Markets Association Municipal Swap Index |
| | |
| SPA | | – | | Standby Bond Purchase Agreement |
Currency Abbreviations:
| | | | |
| | |
| USD | | - | | United States Dollar |
| | | | |
| | 18 | | See Notes to Financial Statements. |
Eaton Vance
Massachusetts Municipal Income Fund
March 31, 2021
Portfolio of Investments (Unaudited)
| | | | | | | | |
| Tax-Exempt Municipal Obligations — 80.7% | |
| Security | | Principal
Amount
(000’s omitted) | | | Value | |
|
| Bond Bank — 2.1% | |
| | |
Massachusetts Water Pollution Abatement Trust, 5.25%, 8/1/34 | | $ | 3,105 | | | $ | 4,514,856 | |
| | |
| | | | | | | $ | 4,514,856 | |
|
| Education — 18.4% | |
| | |
Massachusetts Development Finance Agency, (Babson College), 5.00%, 10/1/42 | | $ | 1,500 | | | $ | 1,793,640 | |
| | |
Massachusetts Development Finance Agency, (Berklee College of Music): | | | | | | | | |
| | |
5.00%, 10/1/29 | | | 1,000 | | | | 1,203,580 | |
| | |
5.00%, 10/1/39 | | | 2,000 | | | | 2,346,640 | |
| | |
Massachusetts Development Finance Agency, (Boston University): | | | | | | | | |
| | |
5.00%, 10/1/46 | | | 3,000 | | | | 3,586,380 | |
| | |
5.45%, 5/15/59 | | | 400 | | | | 523,096 | |
| | |
Series U-6C, (LOC: TD Bank, N.A.), 0.04%, 10/1/42(1) | | | 1,000 | | | | 1,000,000 | |
| | |
Series U-6E, (LOC: TD Bank, N.A.), 0.04%, 10/1/42(1) | | | 1,500 | | | | 1,500,000 | |
| | |
Massachusetts Development Finance Agency, (Dexter Southfield): | | | | | | | | |
| | |
5.00%, 5/1/33 | | | 1,550 | | | | 1,768,659 | |
| | |
5.00%, 5/1/35 | | | 1,660 | | | | 1,893,828 | |
| | |
Massachusetts Development Finance Agency, (Harvard University), 5.00%, 7/15/34 | | | 2,570 | | | | 3,117,770 | |
| | |
Massachusetts Development Finance Agency, (Northeastern University), 5.00%, 3/1/33 | | | 1,950 | | | | 2,169,667 | |
| | |
Massachusetts Development Finance Agency, (Olin College), 5.00%, 11/1/38 | | | 1,750 | | | | 1,936,742 | |
| | |
Massachusetts Development Finance Agency, (Suffolk University): | | | | | | | | |
| | |
5.00%, 7/1/31 | | | 620 | | | | 776,190 | |
| | |
5.00%, 7/1/32 | | | 770 | | | | 958,196 | |
| | |
5.00%, 7/1/38 | | | 340 | | | | 414,610 | |
| | |
Massachusetts Development Finance Agency, (Wentworth Institute of Technology), 5.00%, 10/1/36 | | | 1,575 | | | | 1,812,904 | |
| | |
Massachusetts Development Finance Agency, (Williams College), 5.00%, 7/1/46 | | | 2,000 | | | | 2,408,040 | |
| | |
Massachusetts Development Finance Agency, (Worcester Polytechnic Institute), 5.00%, 9/1/42 | | | 3,150 | | | | 3,759,682 | |
| | |
Massachusetts Health and Educational Facilities Authority, (Massachusetts Institute of Technology), 5.50%, 7/1/32 | | | 5,000 | | | | 7,153,700 | |
| | |
| | | | | | | $ | 40,123,324 | |
|
| Escrowed / Prerefunded — 1.0% | |
| | |
Massachusetts Development Finance Agency, (Partners HealthCare System), Prerefunded to 7/1/21, 5.00%, 7/1/44 | | $ | 1,100 | | | $ | 1,218,932 | |
| | | | | | | | |
| Security | | Principal
Amount
(000’s omitted) | | | Value | |
|
| Escrowed / Prerefunded (continued) | |
| | |
Massachusetts Development Finance Agency, (UMass Memorial), Prerefunded to 7/1/21, 5.50%, 7/1/31 | | $ | 1,040 | | | $ | 1,053,458 | |
| | |
| | | | | | | $ | 2,272,390 | |
|
| General Obligations — 28.6% | |
| | |
Acton-Boxborough Regional School District, MA, 5.00%, 3/1/32 | | $ | 2,075 | | | $ | 2,672,268 | |
| | |
Attleboro, MA, 3.00%, 10/15/36 | | | 2,630 | | | | 2,896,787 | |
| | |
Belmont, MA: | | | | | | | | |
| | |
4.00%, 2/15/29 | | | 1,195 | | | | 1,440,668 | |
| | |
4.00%, 2/15/30 | | | 1,245 | | | | 1,489,555 | |
| | |
4.00%, 2/15/31 | | | 1,045 | | | | 1,244,292 | |
| | |
4.00%, 3/15/31 | | | 2,910 | | | | 3,470,233 | |
| | |
Boston, MA, 4.00%, 3/1/31 | | | 3,000 | | | | 3,267,120 | |
| | |
| Danvers, MA: | | | | | | |
| | |
4.00%, 8/15/30 | | | 600 | | | | 724,146 | |
| | |
4.00%, 8/15/33 | | | 540 | | | | 644,225 | |
| | |
5.25%, 7/1/36 | | | 2,800 | | | | 2,832,648 | |
| | |
Franklin, MA: | | | | | | | | |
| | |
4.00%, 5/15/30 | | | 200 | | | | 240,000 | |
| | |
4.00%, 5/15/32 | | | 455 | | | | 539,612 | |
| | |
4.00%, 5/15/33 | | | 455 | | | | 536,017 | |
| | |
5.00%, 5/15/29 | | | 210 | | | | 268,273 | |
| | |
Harvard, MA: | | | | | | | | |
| | |
4.00%, 8/15/30 | | | 1,025 | | | | 1,237,083 | |
| | |
4.00%, 8/15/31 | | | 1,270 | | | | 1,526,184 | |
| | |
Hingham, MA: | | | | | | | | |
| | |
3.00%, 2/15/37 | | | 1,700 | | | | 1,876,766 | |
| | |
4.00%, 2/15/32 | | | 425 | | | | 509,788 | |
| | |
4.00%, 2/15/33 | | | 410 | | | | 489,991 | |
| | |
Lexington, MA, 4.00%, 2/1/29 | | | 1,855 | | | | 2,235,053 | |
| | |
Lincoln, MA: | | | | | | | | |
| | |
4.00%, 3/1/30 | | | 2,120 | | | | 2,538,276 | |
| | |
4.00%, 3/1/31 | | | 2,205 | | | | 2,627,699 | |
| | |
4.00%, 3/1/33 | | | 2,285 | | | | 2,704,001 | |
| | |
Manchester Essex Regional School District, MA: | | | | | | | | |
| | |
4.00%, 2/1/41 | | | 1,075 | | | | 1,235,207 | |
| | |
4.00%, 2/1/42 | | | 975 | | | | 1,117,604 | |
| | |
Massachusetts, 5.00%, 3/1/31 | | | 3,000 | | | | 3,376,980 | |
| | |
Medford, MA, 5.00%, 7/15/29 | | | 735 | | | | 942,351 | |
| | |
Plymouth, MA: | | | | | | | | |
| | |
2.00%, 6/10/21 | | | 1,000 | | | | 1,003,560 | |
| | |
5.00%, 5/1/26 | | | 710 | | | | 712,485 | |
| | |
5.00%, 5/1/28 | | | 1,160 | | | | 1,163,932 | |
| | |
5.00%, 5/1/31 | | | 1,090 | | | | 1,093,684 | |
| | |
5.00%, 5/1/32 | | | 1,000 | | | | 1,003,380 | |
| | | | |
| | 19 | | See Notes to Financial Statements. |
Eaton Vance
Massachusetts Municipal Income Fund
March 31, 2021
Portfolio of Investments (Unaudited) — continued
| | | | | | | | |
| Security | | Principal
Amount
(000’s omitted) | | | Value | |
|
| General Obligations (continued) | |
| | |
Shrewsbury, MA, 4.00%, 7/15/33 | | $ | 2,370 | | | $ | 2,823,286 | |
| | |
Swampscott, MA, 5.00%, 1/15/26 | | | 355 | | | | 432,340 | |
| | |
Weston, MA: | | | | | | | | |
| | |
4.00%, 1/15/31 | | | 1,275 | | | | 1,546,766 | |
| | |
4.00%, 1/15/32 | | | 1,495 | | | | 1,801,355 | |
| | |
Winchester, MA, 5.00%, 4/15/36 | | | 775 | | | | 777,581 | |
| | |
Worcester, MA, 2.00%, 2/1/22 | | | 5,000 | | | | 5,076,550 | |
| | |
| | | | | | | $ | 62,117,746 | |
|
| Hospital — 7.5% | |
| | |
Massachusetts Development Finance Agency, (Berkshire Health Systems), 5.00%, 10/1/27 | | $ | 1,100 | | | $ | 1,123,276 | |
| | |
Massachusetts Development Finance Agency, (Beth Israel Lahey Health): | | | | | | | | |
| | |
5.00%, 7/1/33 | | | 625 | | | | 790,562 | |
| | |
5.00%, 7/1/38 | | | 600 | | | | 746,034 | |
| | |
Massachusetts Development Finance Agency, (CareGroup), 5.00%, 7/1/27 | | | 1,000 | | | | 1,212,860 | |
| | |
Massachusetts Development Finance Agency, (Children’s Hospital), 5.00%, 10/1/31 | | | 1,840 | | | | 2,091,491 | |
| | |
Massachusetts Development Finance Agency, (Dana-Farber Cancer Institute), 5.00%, 12/1/36 | | | 1,690 | | | | 2,017,421 | |
| | |
Massachusetts Development Finance Agency, (Lahey Health System Obligated Group), 5.00%, 8/15/40 | | | 2,000 | | | | 2,326,340 | |
| | |
Massachusetts Development Finance Agency, (Partners HealthCare System), 5.00%, 7/1/37 | | | 1,600 | | | | 1,965,904 | |
| | |
Massachusetts Development Finance Agency, (South Shore Hospital), 5.00%, 7/1/41 | | | 2,795 | | | | 3,228,784 | |
| | |
Massachusetts Development Finance Agency, (UMass Memorial), 5.50%, 7/1/31 | | | 55 | | | | 55,643 | |
| | |
Massachusetts Development Finance Agency, (Wellforce), 5.00%, 7/1/21 | | | 800 | | | | 808,792 | |
| | |
| | | | | | | $ | 16,367,107 | |
|
| Housing — 1.4% | |
| | |
Massachusetts Housing Finance Agency, (Mill Road Apartments), 0.62%, (SIFMA + 0.55%), 11/1/23 (Put Date), 11/1/48(2) | | $ | 2,935 | | | $ | 2,935,000 | |
| | |
| | | | | | | $ | 2,935,000 | |
|
| Industrial Development Revenue — 0.7% | |
| | |
National Finance Authority, NH, (Covanta): | | | | | | | | |
| | |
4.625%, 11/1/42(3) | | $ | 670 | | | $ | 698,850 | |
| | |
(AMT), 4.875%, 11/1/42(3) | | | 740 | | | | 775,861 | |
| | |
| | | | | | | $ | 1,474,711 | |
| | | | | | | | |
| Security | | Principal
Amount
(000’s omitted) | | | Value | |
|
| Insured – Education — 3.5% | |
| | |
Massachusetts Development Finance Agency, (College of the Holy Cross), (AMBAC), 5.25%, 9/1/32(4) | | $ | 5,460 | | | $ | 7,651,644 | |
| | |
| | | | | | | $ | 7,651,644 | |
|
| Insured – Special Tax Revenue — 3.9% | |
| | |
Martha’s Vineyard Land Bank, MA, (BAM), 5.00%, 5/1/26 | | $ | 1,760 | | | $ | 2,028,330 | |
| | |
Massachusetts, Special Obligations, Dedicated Tax Revenue, (NPFG), 5.50%, 1/1/30 | | | 4,955 | | | | 6,449,081 | |
| | |
| | | | | | | $ | 8,477,411 | |
|
| Insured – Transportation — 3.7% | |
| | |
Massachusetts Turnpike Authority, Metropolitan Highway System, (NPFG), 0.00%, 1/1/22 | | $ | 8,000 | | | $ | 7,977,120 | |
| | |
| | | | | | | $ | 7,977,120 | |
|
| Senior Living / Life Care — 0.7% | |
| | |
Massachusetts Development Finance Agency, (Carleton-Willard Village): | | | | | | | | |
| | |
4.00%, 12/1/42 | | $ | 490 | | | $ | 521,683 | |
| | |
5.00%, 12/1/42 | | | 525 | | | | 592,709 | |
| | |
Massachusetts Development Finance Agency, (Linden Ponds, Inc.): | | | | | | | | |
| | |
5.00%, 11/15/33(3) | | | 205 | | | | 227,134 | |
| | |
5.00%, 11/15/38(3) | | | 135 | | | | 148,098 | |
| | |
| | | | | | | $ | 1,489,624 | |
|
| Special Tax Revenue — 1.9% | |
| | |
Massachusetts Bay Transportation Authority, Sales Tax Revenue: | | | | | | | | |
| | |
5.00%, 7/1/26 | | $ | 2,000 | | | $ | 2,455,080 | |
| | |
5.25%, 7/1/31 | | | 1,240 | | | | 1,709,737 | |
| | |
| | | | | | | $ | 4,164,817 | |
|
| Student Loan — 2.3% | |
| | |
Massachusetts Educational Financing Authority, (AMT), 5.00%, 7/1/21 | | $ | 5,000 | | | $ | 5,056,550 | |
| | |
| | | | | | | $ | 5,056,550 | |
|
| Transportation — 4.7% | |
| | |
Massachusetts Port Authority: | | | | | | | | |
| | |
(AMT), 5.00%, 7/1/31 | | $ | 1,555 | | | $ | 1,969,952 | |
| | |
(AMT), 5.00%, 7/1/34 | | | 2,110 | | | | 2,552,572 | |
| | |
(AMT), 5.00%, 7/1/43 | | | 3,000 | | | | 3,491,670 | |
| | |
Massachusetts, (Accelerated Bridge Program), 5.00%, 6/15/27 | | | 2,000 | | | | 2,273,720 | |
| | |
| | | | | | | $ | 10,287,914 | |
| | | | |
| | 20 | | See Notes to Financial Statements. |
Eaton Vance
Massachusetts Municipal Income Fund
March 31, 2021
Portfolio of Investments (Unaudited) — continued
| | | | | | | | |
| Security | | Principal
Amount
(000’s omitted) | | | Value | |
|
| Water and Sewer — 0.3% | |
| | |
Springfield Water and Sewer Commission, MA: | | | | | | | | |
| | |
4.00%, 4/15/30 | | $ | 225 | | | $ | 271,636 | |
| | |
4.00%, 4/15/33 | | | 335 | | | | 396,462 | |
| | |
| | | | | | | $ | 668,098 | |
| |
Total Tax-Exempt Municipal Obligations — 80.7%
(identified cost $161,518,857) | | | $ | 175,578,312 | |
|
| Taxable Municipal Obligations — 6.3% | |
| Security | | Principal
Amount
(000’s omitted) | | | Value | |
|
| Education — 3.9% | |
| | |
Massachusetts Development Finance Agency, (Berklee College of Music), 2.582%, 10/1/35 | | $ | 1,000 | | | $ | 918,810 | |
| | |
Massachusetts School Building Authority: | | | | | | | | |
| | |
2.95%, 5/15/43 | | | 2,500 | | | | 2,502,825 | |
| | |
3.395%, 10/15/40 | | | 2,000 | | | | 2,100,620 | |
| | |
University of Massachusetts Building Authority, 2.917%, 11/1/33 | | | 2,850 | | | | 2,995,835 | |
| | |
| | | | | | | $ | 8,518,090 | |
|
| General Obligations — 1.9% | |
| | |
Massachusetts, 2.514%, 7/1/41 | | $ | 4,000 | | | $ | 3,967,280 | |
| | |
| | | | | | | $ | 3,967,280 | |
|
| Insured – Hospital — 0.5% | |
| | |
Massachusetts Development Finance Agency, (Wellforce), (AGM), 3.89%, 7/1/25 | | $ | 1,000 | | | $ | 1,100,210 | |
| | |
| | | | | | | $ | 1,100,210 | |
| |
Total Taxable Municipal Obligations — 6.3%
(identified cost $13,393,720) | | | $ | 13,585,580 | |
| |
Total Investments — 87.0%
(identified cost $174,912,577) | | | $ | 189,163,892 | |
| |
Other Assets, Less Liabilities — 13.0% | | | $ | 28,370,718 | |
| |
Net Assets — 100.0% | | | $ | 217,534,610 | |
The percentage shown for each investment category in the Portfolio of Investments is based on net assets.
The Fund invests primarily in debt securities issued by Massachusetts municipalities. The ability of the issuers of the debt securities to meet their obligations may be affected by economic developments in a specific industry or municipality. At March 31, 2021, 13.3% of total investments are backed by bond insurance of various financial institutions and financial guaranty assurance agencies. The aggregate percentage insured by an individual financial institution or financial guaranty assurance agency ranged from 0.6% to 7.6% of total investments.
| (1) | Variable rate demand obligation that may be tendered at par on any day for payment the same or next business day. The stated interest rate, which generally resets daily, is determined by the remarketing agent and represents the rate in effect at March 31, 2021. |
| (2) | Floating rate security. The stated interest rate represents the rate in effect at March 31, 2021. |
| (3) | Security exempt from registration under Rule 144A of the Securities Act of 1933, as amended. These securities may be sold in certain transactions in reliance on an exemption from registration (normally to qualified institutional buyers). At March 31, 2021, the aggregate value of these securities is $1,849,943 or 0.9% of the Fund’s net assets. |
| (4) | Security represents the municipal bond held by a trust that issues residual interest bonds (see Note 1H). |
Abbreviations:
| | | | |
| | |
| AGM | | – | | Assured Guaranty Municipal Corp. |
| | |
| AMBAC | | – | | AMBAC Financial Group, Inc. |
| | |
| AMT | | – | | Interest earned from these securities may be considered a tax preference item for purposes of the Federal Alternative Minimum Tax. |
| | |
| BAM | | – | | Build America Mutual Assurance Co. |
| | |
| LOC | | – | | Letter of Credit |
| | |
| NPFG | | – | | National Public Finance Guarantee Corp. |
| | |
| SIFMA | | – | | Securities Industry and Financial Markets Association Municipal Swap Index |
| | | | |
| | 21 | | See Notes to Financial Statements. |
Eaton Vance
New York Municipal Income Fund
March 31, 2021
Portfolio of Investments (Unaudited)
| | | | | | | | |
| Corporate Bonds — 0.6% | |
| Security | | Principal
Amount
(000’s omitted) | | | Value | |
|
| Hospital — 0.6% | |
| | |
Montefiore Obligated Group, NY, 4.29%, 9/1/50 | | $ | 2,630 | | | $ | 2,696,153 | |
| |
Total Corporate Bonds — 0.6%
(identified cost $2,630,000) | | | $ | 2,696,153 | |
|
| Tax-Exempt Municipal Obligations — 84.4% | |
| Security | | Principal
Amount
(000’s omitted) | | | Value | |
|
| Bond Bank — 2.4% | |
| | |
New York State Environmental Facilities Corp., (New York City Municipal Water Finance Authority): | | | | | | | | |
| | |
5.00%, 6/15/35 | | $ | 1,000 | | | $ | 1,289,150 | |
| | |
5.00%, 6/15/36 | | | 1,140 | | | | 1,463,771 | |
| | |
New York State Environmental Facilities Corp., (State Revolving Fund), Green Bonds: | | | | | | | | |
| | |
4.00%, 10/15/34 | | | 400 | | | | 486,564 | |
| | |
4.00%, 10/15/38 | | | 750 | | | | 894,720 | |
| | |
5.00%, 4/15/33 | | | 400 | | | | 537,332 | |
| | |
5.00%, 10/15/33 | | | 250 | | | | 335,123 | |
| | |
5.00%, 8/15/44 | | | 4,840 | | | | 6,095,786 | |
| | |
| | | | | | | $ | 11,102,446 | |
|
| Cogeneration — 0.3% | |
| | |
Suffolk County Industrial Development Agency, NY, (Nissequogue Cogeneration Partners Facility), (AMT), 5.50%, 1/1/23 | | $ | 1,320 | | | $ | 1,331,220 | |
| | |
| | | | | | | $ | 1,331,220 | |
|
| Education — 11.4% | |
| | |
Albany Capital Resource Corp., NY, (Albany College of Pharmacy and Health Sciences), 5.00%, 12/1/30 | | $ | 250 | | | $ | 277,513 | |
| | |
Monroe County Industrial Development Corp., NY, (Nazareth College of Rochester): | | | | | | | | |
| | |
5.00%, 10/1/31 | | | 235 | | | | 276,097 | |
| | |
5.00%, 10/1/32 | | | 260 | | | | 303,813 | |
| | |
Monroe County Industrial Development Corp., NY, (True North Rochester Preparatory Charter School): | | | | | | | | |
| | |
5.00%, 6/1/40(1) | | | 430 | | | | 501,784 | |
| | |
5.00%, 6/1/59(1) | | | 1,600 | | | | 1,830,192 | |
| | |
New York Dormitory Authority, (Barnard College): | | | | | | | | |
| | |
4.00%, 7/1/34 | | | 450 | | | | 521,784 | |
| | |
4.00%, 7/1/36 | | | 300 | | | | 345,309 | |
| | |
4.00%, 7/1/37 | | | 700 | | | | 803,089 | |
| | | | | | | | |
| Security | | Principal
Amount
(000’s omitted) | | | Value | |
|
| Education (continued) | |
| | |
New York Dormitory Authority, (Brooklyn Law School), 5.00%, 7/1/33 | | $ | 1,650 | | | $ | 1,996,236 | |
| | |
New York Dormitory Authority, (Columbia University), 5.00%, 10/1/38 | | | 9,275 | | | | 11,534,854 | |
| | |
New York Dormitory Authority, (Cornell University), (SPA: U.S. Bank, N.A.), 0.04%, 7/1/39(2) | | | 3,000 | | | | 3,000,000 | |
| | |
New York Dormitory Authority, (Rochester Institute of Technology): | | | | | | | | |
| | |
5.00%, 7/1/29 | | | 1,060 | | | | 1,379,897 | |
| | |
5.00%, 7/1/37 | | | 1,450 | | | | 1,811,572 | |
| | |
5.00%, 7/1/38 | | | 1,425 | | | | 1,775,536 | |
| | |
5.00%, 7/1/40 | | | 1,265 | | | | 1,567,537 | |
| | |
New York Dormitory Authority, (Rockefeller University), Green Bonds, 5.00%, 7/1/50 | | | 8,950 | | | | 11,047,790 | |
| | |
New York Dormitory Authority, (Skidmore College), 5.25%, 7/1/31 | | | 250 | | | | 253,060 | |
| | |
Saratoga County Capital Resource Corp., NY, (Skidmore College): | | | | | | | | |
| | |
3.00%, 7/1/38 | | | 450 | | | | 474,660 | |
| | |
5.00%, 7/1/31(3) | | | 360 | | | | 466,535 | |
| | |
5.00%, 7/1/32(3) | | | 360 | | | | 465,232 | |
| | |
5.00%, 7/1/45 | | | 1,320 | | | | 1,640,021 | |
| | |
Syracuse Industrial Development Agency, NY, (Syracuse City School District), 4.00%, 5/1/36 | | | 855 | | | | 994,545 | |
| | |
Troy Capital Resource Corp., NY, (Rensselaer Polytechnic Institute): | | | | | | | | |
| | |
5.00%, 9/1/37 | | | 1,750 | | | | 2,202,427 | |
| | |
5.00%, 9/1/38 | | | 3,925 | | | | 4,924,815 | |
| | |
5.00%, 9/1/39 | | | 1,500 | | | | 1,876,950 | |
| | |
Yonkers Economic Development Corp., NY, (Lamartine/Warburton, LLC - Charter School of Educational Excellence), 5.00%, 10/15/40 | | | 775 | | | | 890,831 | |
| | |
| | | | | | | $ | 53,162,079 | |
|
| Electric Utilities — 5.4% | |
| | |
Long Island Power Authority, NY, Electric System Revenue: | | | | | | | | |
| | |
1.00%, 9/1/25 | | $ | 1,800 | | | $ | 1,819,044 | |
| | |
5.00%, 9/1/31 | | | 1,550 | | | | 2,059,717 | |
| | |
5.00%, 9/1/32 | | | 750 | | | | 990,690 | |
| | |
5.00%, 9/1/35 | | | 2,400 | | | | 2,997,624 | |
| | |
5.00%, 9/1/39 | | | 2,500 | | | | 3,087,675 | |
| | |
New York Power Authority: | | | | | | | | |
| | |
4.00%, 11/15/45 | | | 4,575 | | | | 5,314,869 | |
| | |
4.00%, 11/15/50 | | | 1,430 | | | | 1,652,265 | |
| | |
4.00%, 11/15/55 | | | 2,490 | | | | 2,865,841 | |
| | |
Prerefunded to 11/15/21, 5.00%, 11/15/31 | | | 1,000 | | | | 1,030,110 | |
| | | | |
| | 22 | | See Notes to Financial Statements. |
Eaton Vance
New York Municipal Income Fund
March 31, 2021
Portfolio of Investments (Unaudited) — continued
| | | | | | | | |
| Security | | Principal
Amount
(000’s omitted) | | | Value | |
|
| Electric Utilities (continued) | |
| | |
Utility Debt Securitization Authority, NY, 5.00%, 12/15/33 | | $ | 2,895 | | | $ | 3,250,419 | |
| | |
| | | | | | | $ | 25,068,254 | |
|
| Escrowed / Prerefunded — 0.5% | |
| | |
Geneva Development Corp., NY, (Hobart and William Smith Colleges), Series 2012, Prerefunded to 9/1/22, 5.00%, 9/1/32 | | $ | 1,250 | | | $ | 1,335,263 | |
| | |
Metropolitan Transportation Authority, NY, Prerefunded to 11/15/21, 5.00%, 11/15/27 | | | 940 | | | | 968,303 | |
| | |
| | | | | | | $ | 2,303,566 | |
|
| General Obligations — 5.5% | |
| | |
Bedford Village Fire District, NY: | | | | | | | | |
| | |
2.00%, 11/15/33 | | $ | 420 | | | $ | 432,340 | |
| | |
2.00%, 11/15/34 | | | 430 | | | | 440,995 | |
| | |
2.00%, 11/15/35 | | | 490 | | | | 498,462 | |
| | |
East Hampton Union Free School District, NY, 1.50%, 6/25/21 | | | 4,000 | | | | 4,011,800 | |
| | |
Erie County, NY, 3.00%, 6/24/21 | | | 1,500 | | | | 1,509,705 | |
| | |
Mamaroneck, NY, 2.00%, 3/15/30 | | | 105 | | | | 109,458 | |
| | |
New York City, NY: | | | | | | | | |
| | |
4.00%, 3/1/36 | | | 2,520 | | | | 2,943,562 | |
| | |
4.00%, 8/1/38 | | | 3,425 | | | | 3,953,340 | |
| | |
North Hempstead, NY: | | | | | | | | |
| | |
2.00%, 9/15/31 | | | 175 | | | | 181,638 | |
| | |
2.00%, 9/15/33 | | | 85 | | | | 86,346 | |
| | |
2.00%, 9/15/35 | | | 270 | | | | 272,344 | |
| | |
2.00%, 9/15/36 | | | 120 | | | | 120,562 | |
| | |
Northport-East Northport Union Free School District, NY, 3.00%, 11/1/30 | | | 370 | | | | 410,123 | |
| | |
Pelham Union Free School District, NY: | | | | | | | | |
| | |
2.00%, 11/1/31 | | | 2,280 | | | | 2,375,030 | |
| | |
2.00%, 11/1/32 | | | 1,605 | | | | 1,659,458 | |
| | |
2.00%, 11/1/33 | | | 580 | | | | 595,283 | |
| | |
2.00%, 11/1/34 | | | 2,015 | | | | 2,059,269 | |
| | |
2.00%, 11/1/35 | | | 2,225 | | | | 2,264,227 | |
| | |
Rensselaer County, NY, 4.00%, 8/15/30 | | | 170 | | | | 204,508 | |
| | |
Valley Stream, NY: | | | | | | | | |
| | |
2.25%, 5/15/27 | | | 250 | | | | 238,362 | |
| | |
2.375%, 5/15/28 | | | 255 | | | | 241,187 | |
| | |
Westchester County, NY: | | | | | | | | |
| | |
2.00%, 12/15/31 | | | 290 | | | | 301,185 | |
| | |
2.00%, 10/15/33 | | | 610 | | | | 628,276 | |
| | |
| | | | | | | $ | 25,537,460 | |
| | | | | | | | |
| Security | | Principal
Amount
(000’s omitted) | | | Value | |
|
| Hospital — 5.9% | |
| | |
Brookhaven Local Development Corp., NY, (Long Island Community Hospital): | | | | | | | | |
| | |
5.00%, 10/1/32 | | $ | 700 | | | $ | 890,449 | |
| | |
5.00%, 10/1/33 | | | 730 | | | | 923,895 | |
| | |
5.00%, 10/1/34 | | | 750 | | | | 942,337 | |
| | |
5.00%, 10/1/35 | | | 800 | | | | 1,000,496 | |
| | |
Jefferson County Civic Facility Development Corp., NY, (Samaritan Medical Center), 5.00%, 11/1/37 | | | 1,615 | | | | 1,873,045 | |
| | |
Monroe County Industrial Development Corp., NY, (Rochester Regional Health), 5.00%, 12/1/34 | | | 500 | | | | 636,530 | |
| | |
New York Dormitory Authority, (Catholic Health System Obligated Group): | | | | | | | | |
| | |
4.00%, 7/1/38 | | | 975 | | | | 1,095,861 | |
| | |
4.00%, 7/1/39 | | | 1,130 | | | | 1,266,753 | |
| | |
New York Dormitory Authority, (Montefiore Obligated Group), 5.00%, 8/1/30 | | | 750 | | | | 925,718 | |
| | |
New York Dormitory Authority, (NYU Hospitals Center), 5.00%, 7/1/30 | | | 3,480 | | | | 3,889,700 | |
| | |
New York Dormitory Authority, (NYU Langone Hospitals Obligated Group), 4.00%, 7/1/50 | | | 3,000 | | | | 3,424,560 | |
| | |
New York Dormitory Authority, (Orange Regional Medical Center): | | | | | | | | |
| | |
5.00%, 12/1/21(1) | | | 500 | | | | 514,200 | |
| | |
5.00%, 12/1/30(1) | | | 4,500 | | | | 5,272,245 | |
| | |
5.00%, 12/1/32(1) | | | 2,200 | | | | 2,552,946 | |
| | |
Suffolk County Economic Development Corp., NY, (Catholic Health Services of Long Island Obligated Group), 5.00%, 7/1/28 | | | 2,190 | | | | 2,213,586 | |
| | |
| | | | | | | $ | 27,422,321 | |
|
| Housing — 2.5% | |
| | |
Albany Capital Resource Corp., NY, (Empire Commons Student Housing, Inc.): | | | | | | | | |
| | |
5.00%, 5/1/28 | | $ | 300 | | | $ | 344,292 | |
| | |
5.00%, 5/1/29 | | | 540 | | | | 617,479 | |
| | |
5.00%, 5/1/30 | | | 635 | | | | 723,481 | |
| | |
5.00%, 5/1/31 | | | 450 | | | | 510,615 | |
| | |
5.00%, 5/1/32 | | | 1,095 | | | | 1,237,438 | |
| | |
New York City Housing Development Corp., NY: | | | | | | | | |
| | |
1.45%, 11/1/29 | | | 1,180 | | | | 1,173,274 | |
| | |
(SPA: Wells Fargo Bank, N.A.), 0.05%, 5/1/57(4) | | | 3,500 | | | | 3,500,000 | |
| | |
New York Mortgage Agency, 3.65%, 4/1/32 | | | 1,000 | | | | 1,086,400 | |
| | |
Westchester County Local Development Corp., NY, (Purchase Housing Corp. II): | | | | | | | | |
| | |
5.00%, 6/1/27 | | | 185 | | | | 215,473 | |
| | |
5.00%, 6/1/28 | | | 550 | | | | 636,130 | |
| | |
5.00%, 6/1/29 | | | 160 | | | | 183,866 | |
| | |
5.00%, 6/1/42 | | | 1,250 | | | | 1,383,587 | |
| | |
| | | | | | | $ | 11,612,035 | |
| | | | |
| | 23 | | See Notes to Financial Statements. |
Eaton Vance
New York Municipal Income Fund
March 31, 2021
Portfolio of Investments (Unaudited) — continued
| | | | | | | | |
| Security | | Principal
Amount
(000’s omitted) | | | Value | |
|
| Industrial Development Revenue — 3.2% | |
| | |
Build NYC Resource Corp., (Pratt Paper (NY), Inc.), (AMT), 4.50%, 1/1/25(1) | | $ | 615 | | | $ | 655,892 | |
| | |
New York Energy Research and Development Authority, (Rochester Gas and Electric Corp.), 2.875% to 7/1/25 (Put Date), 5/15/32 | | | 3,845 | | | | 4,183,898 | |
| | |
New York State Environmental Facilities Corp., (Casella Waste Systems, Inc.), (AMT), 2.875% to 12/3/29 (Put Date), 12/1/44(1) | | | 930 | | | | 951,148 | |
| | |
New York Transportation Development Corp., (Delta Air Lines, Inc. - LaGuardia Airport Terminals C&D Redevelopment), (AMT), 5.00%, 10/1/35 | | | 4,165 | | | | 5,189,340 | |
| | |
Niagara Area Development Corp., NY, (Covanta), (AMT), 4.75%, 11/1/42(1) | | | 4,000 | | | | 4,183,040 | |
| | |
| | | | | | | $ | 15,163,318 | |
|
| Insured – Education — 1.9% | |
| | |
New York Dormitory Authority, (CUNY Student Housing), (AMBAC), (BAM), 5.50%, 7/1/35 | | $ | 6,600 | | | $ | 9,138,756 | |
| | |
| | | | | | | $ | 9,138,756 | |
|
| Insured – Escrowed / Prerefunded — 2.2% | |
| | |
New York Dormitory Authority, (Memorial Sloan Kettering Cancer Center), (NPFG), Escrowed to Maturity, 0.00%, 7/1/30 | | $ | 11,530 | | | $ | 10,361,434 | |
| | |
| | | | | | | $ | 10,361,434 | |
|
| Insured – General Obligations — 4.5% | |
| | |
East Ramapo Central School District, NY, (AGM), 4.00%, 12/15/28 | | $ | 1,070 | | | $ | 1,250,445 | |
| | |
Monroe County, NY: | | | | | | | | |
| | |
(AGM), 5.00%, 6/1/29 | | | 300 | | | | 389,943 | |
| | |
(AGM), 5.00%, 6/1/30 | | | 1,420 | | | | 1,874,343 | |
| | |
Nassau County, NY, (AGM), 5.00%, 4/1/38 | | | 4,025 | | | | 5,105,995 | |
| | |
Oyster Bay, NY: | | | | | | | | |
| | |
(AGM), 4.00%, 3/1/26 | | | 925 | | | | 1,072,676 | |
| | |
(AGM), 4.00%, 3/1/27 | | | 800 | | | | 946,104 | |
| | |
(AGM), 4.00%, 3/1/28 | | | 950 | | | | 1,142,071 | |
| | |
(AGM), 4.00%, 8/1/28 | | | 1,995 | | | | 2,083,877 | |
| | |
Rockland County, NY: | | | | | | | | |
| | |
(AGM), 4.00%, 4/1/31 | | | 1,190 | | | | 1,408,829 | |
| | |
(AGM), 4.00%, 4/1/32 | | | 1,180 | | | | 1,390,382 | |
| | |
Yonkers, NY: | | | | | | | | |
| | |
(AGM), 2.00%, 2/15/40 | | | 635 | | | | 604,819 | |
| | |
(AGM), 3.00%, 2/15/39 | | | 600 | | | | 637,320 | |
| | |
(AGM), 4.00%, 2/15/35 | | | 675 | | | | 805,997 | |
| | |
(AGM), 4.00%, 2/15/37 | | | 1,200 | | | | 1,418,220 | |
| | |
(AGM), 5.00%, 2/15/33 | | | 600 | | | | 787,932 | |
| | |
| | | | | | | $ | 20,918,953 | |
| | | | | | | | |
| Security | | Principal
Amount
(000’s omitted) | | | Value | |
|
| Insured – Hospital — 0.4% | |
| | |
Oneida County Local Development Corp., NY, (Mohawk Valley Health System), (AGM), 5.00%, 12/1/30 | | $ | 1,500 | | | $ | 1,905,045 | |
| | |
| | | | | | | $ | 1,905,045 | |
|
| Insured – Lease Revenue / Certificates of Participation — 0.1% | |
| | |
Rensselaer City School District, NY, Certificates of Participation, (AGM), 5.00%, 6/1/26 | | $ | 210 | | | $ | 254,657 | |
| | |
| | | | | | | $ | 254,657 | |
|
| Insured – Other Revenue — 1.8% | |
| | |
New York City Industrial Development Agency, NY, (Queens Baseball Stadium), (AGM), 5.00%, 1/1/29 | | $ | 1,500 | | | $ | 1,917,960 | |
| | |
New York City Industrial Development Agency, NY, (Yankee Stadium): | | | | | | | | |
| | |
(AGC), 0.00%, 3/1/31 | | | 1,690 | | | | 1,362,208 | |
| | |
(AGM), 3.00%, 3/1/39 | | | 3,905 | | | | 4,137,308 | |
| | |
(AGM), 3.00%, 3/1/40 | | | 785 | | | | 826,911 | |
| | |
| | | | | | | $ | 8,244,387 | |
|
| Insured – Solid Waste — 0.5% | |
| | |
Onondaga County Resource Recovery Agency, NY: | | | | | | | | |
| | |
(AGM), (AMT), 5.00%, 5/1/30 | | $ | 275 | | | $ | 330,688 | |
| | |
(AGM), (AMT), 5.00%, 5/1/31 | | | 350 | | | | 419,506 | |
| | |
(AGM), (AMT), 5.00%, 5/1/32 | | | 450 | | | | 537,457 | |
| | |
(AGM), (AMT), 5.00%, 5/1/33 | | | 375 | | | | 446,059 | |
| | |
(AGM), (AMT), 5.00%, 5/1/34 | | | 500 | | | | 593,105 | |
| | |
| | | | | | | $ | 2,326,815 | |
|
| Insured – Transportation — 0.7% | |
| | |
Metropolitan Transportation Authority, NY, Green Bonds, (AGM), 5.00%, 11/15/44 | | $ | 2,765 | | | $ | 3,334,867 | |
| | |
| | | | | | | $ | 3,334,867 | |
|
| Lease Revenue / Certificates of Participation — 1.0% | |
| | |
Hudson Yards Infrastructure Corp., NY, 5.00%, 2/15/42 | | $ | 3,855 | | | $ | 4,519,371 | |
| | |
| | | | | | | $ | 4,519,371 | |
|
| Other Revenue — 5.0% | |
| | |
Battery Park City Authority, NY, Sustainability Bonds, 5.00%, 11/1/49 | | $ | 3,200 | | | $ | 4,055,776 | |
| | |
Build NYC Resource Corp., NY, (Children’s Aid Society): | | | | | | | | |
| | |
4.00%, 7/1/36 | | | 125 | | | | 144,393 | |
| | |
4.00%, 7/1/37 | | | 165 | | | | 189,974 | |
| | |
4.00%, 7/1/38 | | | 150 | | | | 172,229 | |
| | | | |
| | 24 | | See Notes to Financial Statements. |
Eaton Vance
New York Municipal Income Fund
March 31, 2021
Portfolio of Investments (Unaudited) — continued
| | | | | | | | |
| Security | | Principal
Amount
(000’s omitted) | | | Value | |
|
| Other Revenue (continued) | |
| | |
Chautauqua County Capital Resource Corp, NY, (Jamestown Center City Development Corp.), 2.50% to 5/1/22 (Put Date), 11/1/31 | | $ | 2,375 | | | $ | 2,385,497 | |
| | |
New York City Transitional Finance Authority, NY, (Building Aid): | | | | | | | | |
| | |
5.00%, 7/15/25 | | | 2,000 | | | | 2,378,500 | |
| | |
5.00%, 7/15/43 | | | 3,715 | | | | 4,362,376 | |
| | |
New York City Cultural Resources Trust, NY, (Lincoln Center for the Performing Arts, Inc.), 5.00%, 12/1/31 | | | 1,800 | | | | 2,348,838 | |
| | |
New York City Cultural Resources Trust, NY, (Whitney Museum of American Art), Green Bonds, 5.00%, 7/1/31 | | | 1,500 | | | | 2,020,410 | |
| | |
New York Liberty Development Corp., (7 World Trade Center), 5.00%, 9/15/32 | | | 5,000 | | | | 5,214,800 | |
| | |
| | | | | | | $ | 23,272,793 | |
|
| Senior Living / Life Care — 3.1% | |
| | |
Brookhaven Local Development Corp., NY, (Jefferson’s Ferry): | | | | | | | | |
| | |
4.00%, 11/1/45 | | $ | 1,650 | | | $ | 1,731,642 | |
| | |
5.25%, 11/1/30 | | | 650 | | | | 758,244 | |
| | |
5.25%, 11/1/31 | | | 650 | | | | 755,638 | |
| | |
Buffalo and Erie County Industrial Land Development Corp., NY, (Orchard Park CCRC, Inc.), 5.00%, 11/15/37 | | | 4,500 | | | | 4,890,780 | |
| | |
Suffolk County Economic Development Corp., NY, (Peconic Landing at Southold, Inc.), 5.00%, 12/1/40 | | | 2,000 | | | | 2,256,280 | |
| | |
Tompkins County Development Corp., NY, (Kendal at Ithaca), 5.00%, 7/1/34 | | | 100 | | | | 108,769 | |
| | |
Westchester County Local Development Corp., NY, (Kendal on Hudson): | | | | | | | | |
| | |
5.00%, 1/1/28 | | | 1,090 | | | | 1,148,838 | |
| | |
5.00%, 1/1/34 | | | 1,485 | | | | 1,549,271 | |
| | |
Westchester County Local Development Corp., NY, (Miriam Osborn Memorial Home Association): | | | | | | | | |
| | |
5.00%, 7/1/27 | | | 270 | | | | 310,160 | |
| | |
5.00%, 7/1/28 | | | 640 | | | | 731,821 | |
| | |
5.00%, 7/1/29 | | | 250 | | | | 284,663 | |
| | |
| | | �� | | | | $ | 14,526,106 | |
|
| Special Tax Revenue — 10.8% | |
| | |
Nassau County Interim Finance Authority, NY, Sales Tax Revenue: | | | | | | | | |
| | |
4.00%, 11/15/32 | | $ | 3,000 | | | $ | 3,766,320 | |
| | |
4.00%, 11/15/35 | | | 1,250 | | | | 1,547,137 | |
| | |
5.00%, 11/15/32 | | | 2,500 | | | | 3,383,250 | |
| | |
5.00%, 11/15/35 | | | 1,750 | | | | 2,345,472 | |
| | | | | | | | |
| Security | | Principal
Amount
(000’s omitted) | | | Value | |
|
| Special Tax Revenue (continued) | |
| | |
New York City Transitional Finance Authority, NY, Future Tax Revenue: | | | | | | | | |
| | |
4.00%, 11/1/38 | | $ | 3,010 | | | $ | 3,471,222 | |
| | |
4.00%, 5/1/41 | | | 5,420 | | | | 6,207,526 | |
| | |
5.00%, 5/1/39 | | | 2,160 | | | | 2,612,693 | |
| | |
5.00%, 11/1/39 | | | 5 | | | | 5,022 | |
| | |
New York Dormitory Authority, Personal Income Tax Revenue, 5.00%, 2/15/48 | | | 3,580 | | | | 4,407,016 | |
| | |
New York Dormitory Authority, Sales Tax Revenue: | | | | | | | | |
| | |
5.00%, 3/15/36 | | | 1,960 | | | | 2,373,384 | |
| | |
5.00%, 3/15/40 | | | 4,000 | | | | 4,877,320 | |
| | |
(AMT), 5.00%, 3/15/33 | | | 890 | | | | 1,107,578 | |
| | |
New York State Urban Development Corp., Personal Income Tax Revenue, 4.00%, 3/15/38 | | | 2,135 | | | | 2,489,752 | |
| | |
Sales Tax Asset Receivable Corp., NY: | | | | | | | | |
| | |
5.00%, 10/15/27 | | | 5,000 | | | | 5,784,000 | |
| | |
5.00%, 10/15/28 | | | 5,000 | | | | 5,778,300 | |
| | |
| | | | | | | $ | 50,155,992 | |
|
| Transportation — 12.5% | |
| | |
Albany County Airport Authority, NY: | | | | | | | | |
| | |
(AMT), 5.00%, 12/15/24 | | $ | 1,000 | | | $ | 1,151,640 | |
| | |
(AMT), 5.00%, 12/15/25 | | | 500 | | | | 593,140 | |
| | |
(AMT), 5.00%, 12/15/26 | | | 1,000 | | | | 1,214,720 | |
| | |
Buffalo and Fort Erie Public Bridge Authority, NY, 5.00%, 1/1/37 | | | 200 | | | | 236,462 | |
| | |
Nassau County Bridge Authority, NY, 5.00%, 10/1/40 | | | 1,915 | | | | 1,921,320 | |
| | |
New York Thruway Authority: | | | | | | | | |
| | |
5.00%, 1/1/33 | | | 1,910 | | | | 2,451,389 | |
| | |
5.00%, 1/1/37 | | | 775 | | | | 945,097 | |
| | |
5.00%, 1/1/38 | | | 3,000 | | | | 3,798,690 | |
| | |
5.00%, 1/1/39 | | | 210 | | | | 264,951 | |
| | |
5.00%, 1/1/40 | | | 1,940 | | | | 2,441,917 | |
| | |
Series 2016A, 5.00%, 1/1/33 | | | 3,125 | | | | 3,698,375 | |
| | |
New York Transportation Development Corp., (LaGuardia Airport Terminal B Redevelopment), (AMT), 5.00%, 7/1/46 | | | 8,100 | | | | 9,056,853 | |
| | |
New York Transportation Development Corp., (Terminal 4 John F. Kennedy International Airport): | | | | | | | | |
| | |
4.00%, 12/1/39 | | | 3,760 | | | | 4,204,770 | |
| | |
4.00%, 12/1/42 | | | 1,425 | | | | 1,589,673 | |
| | |
(AMT), 4.00%, 12/1/40 | | | 100 | | | | 111,503 | |
| | |
(AMT), 5.00%, 12/1/35 | | | 550 | | | | 680,900 | |
| | |
Niagara Frontier Transportation Authority, NY,
(Buffalo Niagara International Airport): | | | | | | |
| | |
(AMT), 5.00%, 4/1/26 | | | 1,210 | | | | 1,350,251 | |
| | |
(AMT), 5.00%, 4/1/28 | | | 525 | | | | 651,709 | |
| | | | |
| | 25 | | See Notes to Financial Statements. |
Eaton Vance
New York Municipal Income Fund
March 31, 2021
Portfolio of Investments (Unaudited) — continued
| | | | | | | | |
| Security | | Principal
Amount
(000’s omitted) | | | Value | |
|
| Transportation (continued) | |
| | |
Niagara Frontier Transportation Authority, NY,
(Buffalo Niagara International Airport): (continued) | | | | | | |
| | |
(AMT), 5.00%, 4/1/29 | | $ | 275 | | | $ | 346,052 | |
| | |
(AMT), 5.00%, 4/1/30 | | | 460 | | | | 572,079 | |
| | |
(AMT), 5.00%, 4/1/31 | | | 180 | | | | 222,010 | |
| | |
Port Authority of New York and New Jersey: | | | | | | | | |
| | |
4.00%, 7/15/38 | | | 3,000 | | | | 3,520,020 | |
| | |
6.125%, 6/1/94 | | | 2,500 | | | | 2,847,950 | |
| | |
(AMT), 4.00%, 3/15/30 | | | 4,000 | | | | 4,657,960 | |
| | |
(AMT), 4.00%, 9/1/38 | | | 1,000 | | | | 1,144,580 | |
| | |
(AMT), 5.00%, 10/15/35 | | | 1,520 | | | | 1,816,962 | |
| | |
(AMT), 5.00%, 11/15/37 | | | 1,250 | | | | 1,508,413 | |
| | |
Triborough Bridge and Tunnel Authority, NY: | | | | | | | | |
| | |
(LOC: State Street Bank and Trust Company), 0.06%, 1/1/32(2) | | | 1,165 | | | | 1,165,000 | |
| | |
(LOC: State Street Bank and Trust Company), 0.08%, 1/1/32(4) | | | 4,100 | | | | 4,100,000 | |
| | |
| | | | | | | $ | 58,264,386 | |
| | |
| Water and Sewer — 2.8% | | | | | | |
| | |
New York City Municipal Water Finance Authority, NY, (Water and Sewer System): | | | | | | | | |
| | |
4.00%, 6/15/37 | | $ | 1,000 | | | $ | 1,173,020 | |
| | |
4.00%, 6/15/40 | | | 1,700 | | | | 1,978,919 | |
| | |
4.00%, 6/15/41 | | | 1,000 | | | | 1,178,820 | |
| | |
5.00%, 6/15/35 | | | 1,630 | | | | 1,941,917 | |
| | |
5.00%, 6/15/48 | | | 2,200 | | | | 2,636,458 | |
| | |
5.00%, 6/15/48 | | | 1,920 | | | | 2,410,579 | |
| | |
(SPA: State Street Bank and Trust Company), 0.07%, 6/15/49(2) | | | 1,585 | | | | 1,585,000 | |
| | |
| | | | | | | $ | 12,904,713 | |
| |
Total Tax-Exempt Municipal Obligations — 84.4%
(identified cost $375,972,355) | | | $ | 392,830,974 | |
|
| Taxable Municipal Obligations — 2.4% | |
| Security | | Principal
Amount
(000’s omitted) | | | Value | |
|
| General Obligations — 2.2% | |
| | |
New York, 1.50%, 3/15/26 | | $ | 10,000 | | | $ | 10,193,800 | |
| | |
| | | | | | | $ | 10,193,800 | |
| | | | | | | | |
| Security | | Principal
Amount
(000’s omitted) | | | Value | |
|
| Insured – Other Revenue — 0.2% | |
| | |
New York City Industrial Development Agency, NY, (Queens Baseball Stadium): | | | | | | | | |
| | |
(AGM), 2.236%, 1/1/34 | | $ | 530 | | | $ | 498,778 | |
| | |
(AGM), 2.336%, 1/1/35 | | | 795 | | | | 748,405 | |
| | |
| | | | | | | $ | 1,247,183 | |
| |
Total Taxable Municipal Obligations — 2.4%
(identified cost $11,556,185) | | | $ | 11,440,983 | |
|
| Miscellaneous — 0.2% | |
| Security | | Units | | | Value | |
| | |
| Real Estate — 0.2% | | | | | | |
| | |
CMS Liquidating Trust(1)(5)(6) | | | 1,975,984 | | | $ | 873,385 | |
| |
Total Miscellaneous — 0.2%
(identified cost $1,280,000) | | | $ | 873,385 | |
| |
Total Investments — 87.6%
(identified cost $391,438,540) | | | $ | 407,841,495 | |
| |
Other Assets, Less Liabilities — 12.4% | | | $ | 57,475,927 | |
| |
Net Assets — 100.0% | | | $ | 465,317,422 | |
The percentage shown for each investment category in the Portfolio of Investments is based on net assets.
The Fund invests primarily in debt securities issued by New York municipalities. The ability of the issuers of the debt securities to meet their obligations may be affected by economic developments in a specific industry or municipality. At March 31, 2021, 14.2% of total investments are backed by bond insurance of various financial institutions and financial guaranty assurance agencies. The aggregate percentage insured by an individual financial institution or financial guaranty assurance agency ranged from 0.3% to 9.0% of total investments.
| (1) | Security exempt from registration under Rule 144A of the Securities Act of 1933, as amended. These securities may be sold in certain transactions in reliance on an exemption from registration (normally to qualified institutional buyers). At March 31, 2021, the aggregate value of these securities is $17,334,832 or 3.7% of the Fund’s net assets. |
| (2) | Variable rate demand obligation that may be tendered at par on any day for payment the same or next business day. The stated interest rate, which generally resets daily, is determined by the remarketing agent and represents the rate in effect at March 31, 2021. |
| (3) | When-issued security. |
| | | | |
| | 26 | | See Notes to Financial Statements. |
Eaton Vance
New York Municipal Income Fund
March 31, 2021
Portfolio of Investments (Unaudited) — continued
| (4) | Variable rate demand obligation that may be tendered at par on any day for payment the lesser of 5 business days or 7 calendar days. The stated interest rate, which generally resets weekly, is determined by the remarketing agent and represents the rate in effect at March 31, 2021. |
| (5) | Non-income producing security. |
| (6) | For fair value measurement disclosure purposes, security is categorized as Level 3 (see Note 10). |
| | | | | | | | | | | | | | | | | | | | |
| Futures Contracts | |
| Description | | Number of
Contracts | | | Position | | | Expiration
Date | | | Notional
Amount | | | Value/Unrealized
Appreciation
(Depreciation) | |
| | | | | |
Interest Rate Futures | | | | | | | | | | | | | | | | | | | | |
| | | | | |
| U.S. Long Treasury Bond | | | (113 | ) | | | Short | | | | 6/21/21 | | | $ | (17,469,094 | ) | | $ | 515,350 | |
| | | | | |
| | | | | | | | | | | | | | | | | | | $ | 515,350 | |
Abbreviations:
| | | | |
| | |
| AGC | | – | | Assured Guaranty Corp. |
| | |
| AGM | | – | | Assured Guaranty Municipal Corp. |
| | |
| AMBAC | | – | | AMBAC Financial Group, Inc. |
| | |
| AMT | | – | | Interest earned from these securities may be considered a tax preference item for purposes of the Federal Alternative Minimum Tax. |
| | |
| BAM | | – | | Build America Mutual Assurance Co. |
| | |
| LOC | | – | | Letter of Credit |
| | |
| NPFG | | – | | National Public Finance Guarantee Corp. |
| | |
| SPA | | – | | Standby Bond Purchase Agreement |
| | | | |
| | 27 | | See Notes to Financial Statements. |
Eaton Vance
Ohio Municipal Income Fund
March 31, 2021
Portfolio of Investments (Unaudited)
| | | | | | | | |
| Tax-Exempt Municipal Obligations — 101.6% | |
| Security | | Principal
Amount
(000’s omitted) | | | Value | |
|
| Bond Bank — 4.1% | |
| | |
Ohio Water Development Authority: | | | | | | | | |
| | |
4.00%, 6/1/36 | | $ | 1,500 | | | $ | 1,689,481 | |
| | |
5.00%, 12/1/35 | | | 2,000 | | | | 2,407,320 | |
| | |
Ohio Water Development Authority, Water Pollution Control Loan Fund, 5.00%, 12/1/40 | | | 1,000 | | | | 1,291,220 | |
| | |
Rickenbacker Port Authority, OH, (OASBO Expanded Asset Pooled Financing Program), 5.375%, 1/1/32 | | | 1,780 | | | | 2,273,416 | |
| | |
| | | | | | | $ | 7,661,437 | |
|
| Education — 12.1% | |
| | |
Bowling Green State University, OH: | | | | | | | | |
| | |
4.00%, 6/1/39 | | $ | 750 | | | $ | 868,702 | |
| | |
4.00%, 6/1/45 | | | 1,300 | | | | 1,481,740 | |
| | |
Kent State University, OH: | | | | | | | | |
| | |
5.00%, 5/1/37 | | | 215 | | | | 271,493 | |
| | |
5.00%, 5/1/38 | | | 250 | | | | 314,770 | |
| | |
5.00%, 5/1/39 | | | 265 | | | | 332,686 | |
| | |
5.00%, 5/1/40 | | | 405 | | | | 507,279 | |
| | |
Ohio Higher Educational Facility Commission, (Case Western Reserve University): | | | | | | | | |
| | |
5.00%, 12/1/26 | | | 350 | | | | 430,154 | |
| | |
5.00%, 12/1/27 | | | 300 | | | | 366,312 | |
| | |
5.00%, 12/1/40 | | | 1,000 | | | | 1,189,550 | |
| | |
Ohio Higher Educational Facility Commission, (Denison University), 5.25%, 11/1/46 | | | 1,355 | | | | 1,645,309 | |
| | |
Ohio Higher Educational Facility Commission, (Kenyon College), 4.00%, 7/1/40 | | | 1,000 | | | | 1,149,200 | |
| | |
Ohio Higher Educational Facility Commission, (Oberlin College): | | | | | | | | |
| | |
5.00%, 10/1/33 | | | 2,000 | | | | 2,211,440 | |
| | |
5.00%, 10/1/38 | | | 910 | | | | 1,006,205 | |
| | |
Ohio Higher Educational Facility Commission, (The College of Wooster), 5.00%, 9/1/36 | | | 1,000 | | | | 1,217,810 | |
| | |
Ohio Higher Educational Facility Commission, (University of Dayton), 5.00%, 12/1/32 | | | 550 | | | | 632,329 | |
| | |
Ohio State University, 5.00%, 12/1/29 | | | 1,060 | | | | 1,394,123 | |
| | |
Ohio University, 5.00%, 12/1/35 | | | 500 | | | | 597,190 | |
| | |
Port of Greater Cincinnati Development Authority, OH, (St. Xavier High School, Inc.): | | | | | | | | |
| | |
4.00%, 4/1/33 | | | 335 | | | | 385,193 | |
| | |
4.00%, 4/1/34 | | | 510 | | | | 581,782 | |
| | |
4.00%, 4/1/35 | | | 350 | | | | 398,286 | |
| | |
4.00%, 4/1/36 | | | 350 | | | | 396,855 | |
| | |
4.00%, 4/1/37 | | | 560 | | | | 632,621 | |
| | |
4.00%, 4/1/38 | | | 400 | | | | 450,544 | |
| | |
4.00%, 4/1/39 | | | 415 | | | | 466,033 | |
| | |
4.00%, 4/1/40 | | | 415 | | | | 461,447 | |
| | | | | | | | |
| Security | | Principal
Amount
(000’s omitted) | | | Value | |
|
| Education (continued) | |
| | |
University of Cincinnati, OH: | | | | | | | | |
| | |
5.00%, 6/1/34 | | $ | 585 | | | $ | 688,229 | |
| | |
5.00%, 6/1/45 | | | 2,000 | | | | 2,402,560 | |
| | |
| | | | | | | $ | 22,479,842 | |
|
| Electric Utilities — 2.9% | |
| | |
American Municipal Power, Inc., OH, (Combined Hydroelectric Projects), 5.00%, 2/15/29 | | $ | 1,000 | | | $ | 1,280,520 | |
| | |
American Municipal Power, Inc., OH, (Greenup Hydroelectric Facility), 5.00%, 2/15/46 | | | 1,000 | | | | 1,175,230 | |
| | |
American Municipal Power, Inc., OH, (Meldahl Hydroelectric): | | | | | | | | |
| | |
4.00%, 2/15/34 | | | 2,005 | | | | 2,228,718 | |
| | |
5.00%, 2/15/33 | | | 595 | | | | 705,123 | |
| | |
| | | | | | | $ | 5,389,591 | |
|
| Escrowed / Prerefunded — 3.9% | |
| | |
Cleveland, OH, Income Tax Revenue, (Bridges and Roadways Improvements), Prerefunded to 10/1/22, 5.00%, 10/1/32 | | $ | 500 | | | $ | 536,440 | |
| | |
Cleveland, OH, Income Tax Revenue, (Parks and Recreation Facilities Improvements), Prerefunded to 10/1/22, 5.00%, 10/1/35 | | | 1,000 | | | | 1,072,100 | |
| | |
Cuyahoga County, OH, Sales Tax Revenue, Prerefunded to 12/1/24, 5.00%, 12/1/35 | | | 1,000 | | | | 1,170,340 | |
| | |
Highland Local School District, OH: | | | | | | | | |
| | |
Prerefunded to 6/1/23, 5.00%, 12/1/37 | | | 540 | | | | 596,214 | |
| | |
Prerefunded to 6/1/23, 5.00%, 12/1/39 | | | 1,100 | | | | 1,214,510 | |
| | |
Lakewood City School District, OH, Prerefunded to 11/1/22, 5.00%, 11/1/36 | | | 1,030 | | | | 1,109,094 | |
| | |
Northeast Ohio Regional Sewer District, OH, Prerefunded to 11/15/24, 5.00%, 11/15/44 | | | 1,255 | | | | 1,463,719 | |
| | |
Ohio State University, Escrowed to Maturity, 5.00%, 12/1/29 | | | 45 | | | | 59,800 | |
| | |
Ohio, (Cleveland Clinic Health System), Prerefunded to 1/1/28, 4.00%, 1/1/43 | | | 20 | | | | 23,958 | |
| | |
| | | | | | | $ | 7,246,175 | |
|
| General Obligations — 7.6% | |
| | |
Butler County, OH, Special Tax Assessment, 5.50%, 12/1/28 | | $ | 1,000 | | | $ | 1,003,780 | |
| | |
Columbus City School District, OH, 5.00%, 12/1/30 | | | 1,500 | | | | 1,811,370 | |
| | |
Columbus, OH: | | | | | | | | |
| | |
5.00%, 4/1/40 | | | 1,900 | | | | 2,477,125 | |
| | |
5.00%, 4/1/41 | | | 1,325 | | | | 1,722,155 | |
| | |
Cuyahoga Community College District, OH: | | | | | | | | |
| | |
3.50%, 12/1/39 | | | 1,400 | | | | 1,503,348 | |
| | |
4.00%, 12/1/42 | | | 1,500 | | | | 1,715,595 | |
| | | | |
| | 28 | | See Notes to Financial Statements. |
Eaton Vance
Ohio Municipal Income Fund
March 31, 2021
Portfolio of Investments (Unaudited) — continued
| | | | | | | | |
| Security | | Principal
Amount
(000’s omitted) | | | Value | |
|
| General Obligations (continued) | |
| | |
Northwest Local School District, OH, Prerefunded to 12/1/23, 5.00%, 12/1/40 | | $ | 500 | | | $ | 563,100 | |
| | |
Ohio, 5.00%, 5/1/33 | | | 1,500 | | | | 1,851,450 | |
| | |
Streetsboro City School District, OH, 4.00%, 12/1/36 | | | 210 | | | | 246,635 | |
| | |
Westerville City School District, OH: | | | | | | | | |
| | |
4.00%, 12/1/32 | | | 425 | | | | 512,112 | |
| | |
4.00%, 12/1/33 | | | 625 | | | | 750,188 | |
| | |
| | | | | | | $ | 14,156,858 | |
|
| Hospital — 16.1% | |
| | |
Akron, OH, Bath and Copley Joint Township Hospital District, (Children’s Hospital Medical Center of Akron): | | | | | | | | |
| | |
5.00%, 11/15/32 | | $ | 2,450 | | | $ | 2,563,508 | |
| | |
5.00%, 11/15/38 | | | 1,155 | | | | 1,256,097 | |
| | |
Akron, OH, Bath and Copley Joint Township Hospital District, (Summa Health Obligated Group), 4.00%, 11/15/37 | | | 150 | | | | 171,561 | |
| | |
Allen County, OH, (Bon Secours Mercy Health, Inc.), 4.00%, 12/1/40 | | | 1,000 | | | | 1,160,010 | |
| | |
Allen County, OH, (Mercy Health), 4.00%, 8/1/47(1) | | | 5,150 | | | | 5,747,966 | |
| | |
Bluffton, OH, (Blanchard Valley Health System), 5.00%, 12/1/31 | | | 750 | | | | 905,520 | |
| | |
Butler County, OH, (UC Health): | | | | | | | | |
| | |
4.00%, 11/15/37 | | | 920 | | | | 1,038,726 | |
| | |
5.00%, 11/15/28 | | | 590 | | | | 729,978 | |
| | |
Franklin County, OH, (Nationwide Children’s Hospital), 5.00%, 11/1/34 | | | 750 | | | | 898,448 | |
| | |
Franklin County, OH, (OhioHealth Corp.), 5.00%, 5/15/40 | | | 1,200 | | | | 1,380,888 | |
| | |
Franklin County, OH, (Trinity Health Credit Group), 5.00%, 12/1/46 | | | 2,000 | | | | 2,371,100 | |
| | |
Hamilton County, OH, (UC Health), 5.00%, 9/15/45 | | | 1,125 | | | | 1,381,275 | |
| | |
Miami County, OH, (Kettering Health Network Obligated Group), 5.00%, 8/1/38 | | | 1,000 | | | | 1,226,270 | |
| | |
Middleburg Heights, OH, (Southwest General Health Center), 4.00%, 8/1/47 | | | 2,000 | | | | 2,246,280 | |
| | |
Montgomery County, OH, (Kettering Health Network Obligated Group), 4.00%, 8/1/41 | | | 500 | | | | 583,980 | |
| | |
Muskingum County, OH, (Genesis HealthCare System Obligated Group), 5.00%, 2/15/33 | | | 460 | | | | 481,192 | |
| | |
Ohio Higher Educational Facility Commission, (University Hospitals Health System, Inc.): | | | | | | | | |
| | |
5.00%, 1/15/27 | | | 1,500 | | | | 1,613,910 | |
| | |
5.00%, 1/15/29 | | | 450 | | | | 481,932 | |
| | |
Ohio, (Cleveland Clinic Health System), 4.00%, 1/1/43 | | | 2,190 | | | | 2,485,672 | |
| | |
Ohio, (University Hospitals Health Systems, Inc.), 3.00%, 1/15/45 | | | 1,000 | | | | 1,025,830 | |
| | |
Southeastern Ohio Port Authority, OH, (Memorial Health System Obligated Group), 5.00%, 12/1/24 | | | 215 | | | | 240,542 | |
| | |
| | | | | | | $ | 29,990,685 | |
| | | | | | | | |
| Security | | Principal
Amount
(000’s omitted) | | | Value | |
|
| Housing — 0.4% | |
| | |
Ohio Housing Finance Agency, 3.00%, 9/1/39 | | $ | 615 | | | $ | 645,922 | |
| | |
| | | | | | | $ | 645,922 | |
|
| Industrial Development Revenue — 1.9% | |
| | |
Cleveland, OH, (Continental Airlines), (AMT), 5.375%, 9/15/27 | | $ | 1,630 | | | $ | 1,635,118 | |
| | |
Ohio Air Quality Development Authority, (Pratt Paper, LLC), (AMT), 4.25%, 1/15/38(2) | | | 1,700 | | | | 1,881,016 | |
| | |
| | | | | | | $ | 3,516,134 | |
|
| Insured – Electric Utilities — 8.2% | |
| | |
Cleveland, OH, Public Power System Revenue: | | | | | | | | |
| | |
(AGM), 4.00%, 11/15/36 | | $ | 1,000 | | | $ | 1,177,350 | |
| | |
(AGM), 5.00%, 11/15/24 | | | 1,265 | | | | 1,467,868 | |
| | |
(NPFG), 0.00%, 11/15/27 | | | 2,540 | | | | 2,316,556 | |
| | |
Ohio Municipal Electric Generation Agency: | | | | | | | | |
| | |
(NPFG), 0.00%, 2/15/26 | | | 3,000 | | | | 2,831,730 | |
| | |
(NPFG), 0.00%, 2/15/27 | | | 2,500 | | | | 2,309,025 | |
| | |
(NPFG), 0.00%, 2/15/28 | | | 4,750 | | | | 4,275,190 | |
| | |
Puerto Rico Electric Power Authority, (NPFG), 5.25%, 7/1/34 | | | 770 | | | | 853,876 | |
| | |
| | | | | | | $ | 15,231,595 | |
|
| Insured – Escrowed / Prerefunded — 0.9% | |
| | |
Cleveland, OH, Airport System Revenue, (AGM), Prerefunded to 1/1/22, 5.00%, 1/1/30 | | $ | 1,170 | | | $ | 1,212,506 | |
| | |
Cleveland, OH, Public Power System Revenue, (AGM), Escrowed to Maturity, 5.00%, 11/15/24 | | | 235 | | | | 274,083 | |
| | |
Warrensville Heights City School District, OH, (BAM), Prerefunded to 12/1/24, 5.00%, 12/1/44 | | | 215 | | | | 250,767 | |
| | |
| | | | | | | $ | 1,737,356 | |
|
| Insured – General Obligations — 19.9% | |
| | |
Cincinnati City School District, OH, (AGM), 5.25%, 12/1/29(1) | | $ | 7,500 | | | $ | 10,032,675 | |
| | |
Cleveland, OH, (AMBAC), 5.50%, 10/1/23 | | | 2,105 | | | | 2,378,061 | |
| | |
Gahanna-Jefferson City School District, OH, (AGM), 4.00%, 12/1/44 | | | 1,500 | | | | 1,770,375 | |
| | |
Kettering City School District, OH, (AGM), 5.25%, 12/1/31 | | | 4,505 | | | | 5,713,241 | |
| | |
Mason City School District, OH, (AGM), 5.25%, 12/1/31 | | | 3,525 | | | | 4,683,385 | |
| | |
Springboro Community City School District, OH, (AGM), 5.25%, 12/1/30 | | | 5,000 | | | | 6,586,150 | |
| | |
Warrensville Heights City School District, OH, (BAM), 5.00%, 12/1/44 | | | 85 | | | | 95,711 | |
| | |
Westerville City School District, OH, (XLCA), 5.00%, 12/1/27 | | | 4,590 | | | | 5,694,079 | |
| | |
| | | | | | | $ | 36,953,677 | |
| | | | |
| | 29 | | See Notes to Financial Statements. |
Eaton Vance
Ohio Municipal Income Fund
March 31, 2021
Portfolio of Investments (Unaudited) — continued
| | | | | | | | |
| Security | | Principal
Amount
(000’s omitted) | | | Value | |
|
| Insured – Hospital — 1.0% | |
| | |
Lucas County, OH, (ProMedica Healthcare Obligated Group), (AGM), 4.00%, 11/15/45 | | $ | 1,725 | | | $ | 1,837,349 | |
| | |
| | | | | | | $ | 1,837,349 | |
|
| Insured – Transportation — 5.4% | |
| | |
Cleveland, OH, Airport System Revenue, (AGM), (AMT), 5.00%, 1/1/43 | | $ | 1,000 | | | $ | 1,168,260 | |
| | |
Ohio, (Portsmouth Gateway Group, LLC), (AGM), (AMT), 5.00%, 12/31/35 | | | 1,500 | | | | 1,711,980 | |
| | |
Ohio Turnpike Commission, (NPFG), 5.50%, 2/15/24 | | | 5,000 | | | | 5,486,000 | |
| | |
Puerto Rico Highway and Transportation Authority, (AGC), 5.25%, 7/1/41 | | | 1,300 | | | | 1,607,541 | |
| | |
| | | | | | | $ | 9,973,781 | |
|
| Insured – Water and Sewer — 2.4% | |
| | |
Newark, OH, Water System Revenue, (AGM), 5.00%, 12/1/39 | | $ | 3,680 | | | $ | 4,381,445 | |
| | |
| | | | | | | $ | 4,381,445 | |
|
| Other Revenue — 3.1% | |
| | |
Cuyahoga County, OH, (Cleveland Orchestra): | | | | | | | | |
| | |
5.00%, 1/1/33 | | $ | 400 | | | $ | 467,752 | |
| | |
5.00%, 1/1/34 | | | 300 | | | | 349,506 | |
| | |
5.00%, 1/1/35 | | | 500 | | | | 581,015 | |
| | |
5.00%, 1/1/41 | | | 725 | | | | 828,675 | |
| | |
Riversouth Authority, OH, (Lazarus Building Redevelopment), 5.75%, 12/1/27 | | | 1,980 | | | | 1,982,634 | |
| | |
Summit County Port Authority, OH, 5.00%, 12/1/31 | | | 1,410 | | | | 1,518,908 | |
| | |
| | | | | | | $ | 5,728,490 | |
|
| Senior Living / Life Care — 1.3% | |
| | |
Butler County Port Authority, OH, (Community First Solutions), 4.00%, 5/15/46 | | $ | 650 | | | $ | 726,609 | |
| | |
Lorain County Port Authority, OH, (Kendal at Oberlin), 5.00%, 11/15/30 | | | 580 | | | | 622,543 | |
| | |
Warren County, OH, (Otterbein Homes Obligated Group), 5.75%, 7/1/33 | | | 905 | | | | 978,477 | |
| | |
| | | | | | | $ | 2,327,629 | |
|
| Special Tax Revenue — 4.7% | |
| | |
Akron, OH, Income Tax Revenue: | | | | | | | | |
| | |
4.00%, 12/1/36 | | $ | 655 | | | $ | 733,181 | |
| | |
4.00%, 12/1/37 | | | 520 | | | | 580,824 | |
| | |
Delaware County, OH, Sales Tax Revenue, 5.00%, 12/1/28 | | | 2,000 | | | | 2,356,780 | |
| | |
Franklin County Convention Facilities Authority, OH, 5.00%, 12/1/26 | | | 1,000 | | | | 1,147,320 | |
| | | | | | | | |
| Security | | Principal
Amount
(000’s omitted) | | | Value | |
|
| Special Tax Revenue (continued) | |
| | |
Franklin County Convention Facilities Authority, OH, (Greater Columbus Convention Center Hotel Expansion), 5.00%, 12/1/39 | | $ | 525 | | | $ | 613,389 | |
| | |
Franklin County, OH, Sales Tax Revenue, 5.00%, 6/1/43 | | | 1,000 | | | | 1,224,280 | |
| | |
Greater Cleveland Regional Transit Authority, OH, Sales Tax Revenue, 5.00%, 12/1/31 | | | 435 | | | | 532,466 | |
| | |
Green, OH, Income Tax Revenue, (Community Learning Centers): | | | | | | | | |
| | |
5.00%, 12/1/26 | | | 570 | | | | 614,620 | |
| | |
5.00%, 12/1/28 | | | 940 | | | | 1,012,935 | |
| | |
| | | | | | | $ | 8,815,795 | |
|
| Transportation — 1.4% | |
| | |
Cleveland, OH, Airport System Revenue, (AMT), 5.00%, 1/1/27 | | $ | 625 | | | $ | 758,075 | |
| | |
Ohio Turnpike and Infrastructure Commission, 5.00%, 2/15/46 | | | 1,500 | | | | 1,917,945 | |
| | |
| | | | | | | $ | 2,676,020 | |
|
| Water and Sewer — 4.3% | |
| | |
Cleveland, OH, Water Pollution Control Revenue, 5.00%, 11/15/41 | | $ | 945 | | | $ | 1,097,457 | |
| | |
Columbus, OH, Sewerage System Revenue, 5.00%, 6/1/30 | | | 1,500 | | | | 1,818,975 | |
| | |
Hamilton County, OH, Sewer System Revenue, 5.00%, 12/1/35 | | | 1,000 | | | | 1,316,210 | |
| | |
Lancaster, OH, Wastewater System Revenue, 4.00%, 12/1/33 | | | 1,265 | | | | 1,416,167 | |
| | |
Toledo, OH, Water System Revenue, 5.00%, 11/15/41 | | | 2,000 | | | | 2,394,439 | |
| | |
| | | | | | | $ | 8,043,248 | |
| |
Total Tax-Exempt Municipal Obligations — 101.6%
(identified cost $170,690,905) | | | $ | 188,793,029 | |
| |
Other Assets, Less Liabilities — (1.6)% | | | $ | (2,980,668 | ) |
| |
Net Assets — 100.0% | | | $ | 185,812,361 | |
The percentage shown for each investment category in the Portfolio of Investments is based on net assets.
The Fund invests primarily in debt securities issued by Ohio municipalities. The ability of the issuers of the debt securities to meet their obligations may be affected by economic developments in a specific industry or municipality. At March 31, 2021, 37.1% of total investments are backed by bond insurance of various financial institutions and financial guaranty assurance agencies. The aggregate percentage insured by an individual financial institution or financial guaranty assurance agency ranged from 0.2% to 22.3% of total investments.
| (1) | Security represents the municipal bond held by a trust that issues residual interest bonds (see Note 1H). |
| (2) | Security exempt from registration under Rule 144A of the Securities Act of 1933, as amended. These securities may be sold in certain transactions in reliance on an exemption from registration (normally to qualified institutional buyers). At March 31, 2021, the aggregate value of these securities is $1,881,016 or 1.0% of the Fund’s net assets. |
| | | | |
| | 30 | | See Notes to Financial Statements. |
Eaton Vance
Ohio Municipal Income Fund
March 31, 2021
Portfolio of Investments (Unaudited) — continued
| | | | | | | | | | | | | | | | | | | | |
| Futures Contracts | |
| Description | | Number of
Contracts | | | Position | | | Expiration
Date | | | Notional
Amount | | | Value/Unrealized
Appreciation
(Depreciation) | |
| | | | | |
Interest Rate Futures | | | | | | | | | | | | | | | | | | | | |
| | | | | |
| U.S. Long Treasury Bond | | | (30 | ) | | | Short | | | | 6/21/21 | | | $ | (4,637,813 | ) | | $ | 136,819 | |
| | | | | |
| | | | | | | | | | | | | | | | | | | $ | 136,819 | |
Abbreviations:
| | | | |
| | |
| AGC | | – | | Assured Guaranty Corp. |
| | |
| AGM | | – | | Assured Guaranty Municipal Corp. |
| | |
| AMBAC | | – | | AMBAC Financial Group, Inc. |
| | |
| AMT | | – | | Interest earned from these securities may be considered a tax preference item for purposes of the Federal Alternative Minimum Tax. |
| | |
| BAM | | – | | Build America Mutual Assurance Co. |
| | |
| NPFG | | – | | National Public Finance Guarantee Corp. |
| | |
| XLCA | | – | | XL Capital Assurance, Inc. |
| | | | |
| | 31 | | See Notes to Financial Statements. |
Eaton Vance
Municipal Income Funds
March 31, 2021
Statements of Assets and Liabilities (Unaudited)
| | | | | | | | | | | | | | | | |
| | | March 31, 2021 | |
| Assets | | California
Opportunities Fund | | | Massachusetts Fund | | | New York Fund | | | Ohio Fund | |
| | | | |
Investments — | | | | | | | | | | | | | | | | |
| | | | |
Identified cost | | $ | 626,929,177 | | | $ | 174,912,577 | | | $ | 391,438,540 | | | $ | 170,690,905 | |
| | | | |
Unrealized appreciation | | | 20,476,948 | | | | 14,251,315 | | | | 16,402,955 | | | | 18,102,124 | |
| | | | |
Investments, at value | | $ | 647,406,125 | | | $ | 189,163,892 | | | $ | 407,841,495 | | | $ | 188,793,029 | |
| | | | |
Cash | | $ | 66,292,372 | | | $ | 30,525,705 | | | $ | 53,185,937 | | | $ | 1,518,207 | |
| | | | |
Deposits for derivatives collateral — financial futures contracts | | | — | | | | — | | | | 452,000 | | | | 120,047 | |
| | | | |
Interest receivable | | | 4,402,210 | | | | 1,733,402 | | | | 4,060,892 | | | | 2,249,261 | |
| | | | |
Receivable for investments sold | | | 227,689 | | | | — | | | | 223,477 | | | | 2,500,000 | |
| | | | |
Receivable for Fund shares sold | | | 2,240,399 | | | | 422,707 | | | | 1,290,582 | | | | 311,173 | |
| | | | |
Receivable for variation margin on open financial futures contracts | | | — | | | | — | | | | 49,438 | | | | 13,168 | |
| | | | |
Total assets | | $ | 720,568,795 | | | $ | 221,845,706 | | | $ | 467,103,821 | | | $ | 195,504,885 | |
| | | |
| Liabilities | | | | | | | | | | | | | |
| | | | |
Payable for floating rate notes issued | | $ | — | | | $ | 3,701,188 | | | $ | — | | | $ | 9,215,397 | |
| | | | |
Payable for when-issued securities | | | 20,707,024 | | | | — | | | | 907,200 | | | | — | |
| | | | |
Payable for Fund shares redeemed | | | 1,237,474 | | | | 378,924 | | | | 437,042 | | | | 245,918 | |
| | | | |
Distributions payable | | | 75,168 | | | | 56,426 | | | | 81,210 | | | | 48,848 | |
| | | | |
Payable to affiliates: | | | | | | | | | | | | | | | | |
| | | | |
Investment adviser fee | | | 201,054 | | | | 62,152 | | | | 134,992 | | | | 56,373 | |
| | | | |
Distribution and service fees | | | 57,517 | | | | 24,290 | | | | 63,634 | | | | 26,970 | |
| | | | |
Interest expense and fees payable | | | — | | | | 1,069 | | | | — | | | | 15,124 | |
| | | | |
Accrued expenses | | | 205,470 | | | | 87,047 | | | | 162,321 | | | | 83,894 | |
| | | | |
Total liabilities | | $ | 22,483,707 | | | $ | 4,311,096 | | | $ | 1,786,399 | | | $ | 9,692,524 | |
| | | | |
Net Assets | | $ | 698,085,088 | | | $ | 217,534,610 | | | $ | 465,317,422 | | | $ | 185,812,361 | |
| | | |
| Sources of Net Assets | | | | | | | | | | | | | |
| | | | |
Paid-in capital | | $ | 675,446,311 | | | $ | 203,698,417 | | | $ | 445,262,033 | | | $ | 176,816,429 | |
| | | | |
Distributable earnings | | | 22,638,777 | | | | 13,836,193 | | | | 20,055,389 | | | | 8,995,932 | |
| | | | |
Net Assets | | $ | 698,085,088 | | | $ | 217,534,610 | | | $ | 465,317,422 | | | $ | 185,812,361 | |
| | | |
| Class A Shares | | | | | | | | | | | | | |
| | | | |
Net Assets | | $ | 149,508,103 | | | $ | 101,167,891 | | | $ | 255,468,694 | | | $ | 109,830,755 | |
| | | | |
Shares Outstanding | | | 13,664,283 | �� | | | 11,271,047 | | | | 24,660,165 | | | | 11,827,952 | |
| | | | |
Net Asset Value and Redemption Price Per Share | | | | | | | | | | | | | | | | |
| | | | |
(net assets ÷ shares of beneficial interest outstanding) | | $ | 10.94 | | | $ | 8.98 | | | $ | 10.36 | | | $ | 9.29 | |
| | | | |
Maximum Offering Price Per Share | | | | | | | | | | | | | | | | |
| | | | |
(100 ÷ 95.25 of net asset value per share) | | $ | 11.49 | | | $ | 9.43 | | | $ | 10.88 | | | $ | 9.75 | |
| | | |
| Class C Shares | | | | | | | | | | | | | |
| | | | |
Net Assets | | $ | 30,569,120 | | | $ | 8,514,062 | | | $ | 25,844,435 | | | $ | 10,339,186 | |
| | | | |
Shares Outstanding | | | 3,022,787 | | | | 948,744 | | | | 2,493,659 | | | | 1,114,042 | |
| | | | |
Net Asset Value and Offering Price Per Share* | | | | | | | | | | | | | | | | |
| | | | |
(net assets ÷ shares of beneficial interest outstanding) | | $ | 10.11 | | | $ | 8.97 | | | $ | 10.36 | | | $ | 9.28 | |
| | | |
| Class I Shares | | | | | | | | | | | | | |
| | | | |
Net Assets | | $ | 518,007,865 | | | $ | 107,852,657 | | | $ | 184,004,293 | | | $ | 65,642,420 | |
| | | | |
Shares Outstanding | | | 47,313,384 | | | | 12,013,491 | | | | 17,765,885 | | | | 7,065,265 | |
| | | | |
Net Asset Value, Offering Price and Redemption Price Per Share | | | | | | | | | | | | | | | | |
| | | | |
(net assets ÷ shares of beneficial interest outstanding) | | $ | 10.95 | | | $ | 8.98 | | | $ | 10.36 | | | $ | 9.29 | |
On sales of $50,000 or more, the offering price of Class A shares is reduced.
| * | Redemption price per share is equal to the net asset value less any applicable contingent deferred sales charge. |
| | | | |
| | 32 | | See Notes to Financial Statements. |
Eaton Vance
Municipal Income Funds
March 31, 2021
Statements of Operations (Unaudited)
| | | | | | | | | | | | | | | | |
| | | Six Months Ended March 31, 2021 | |
| Investment Income | | California
Opportunities Fund | | | Massachusetts Fund | | | New York Fund | | | Ohio Fund | |
| | | | |
Interest | | $ | 6,396,344 | | | $ | 2,715,287 | | | $ | 5,120,728 | | | $ | 3,150,077 | |
| | | | |
Total investment income | | $ | 6,396,344 | | | $ | 2,715,287 | | | $ | 5,120,728 | | | $ | 3,150,077 | |
| | |
| Expenses | | | | | | | | | |
| | | | |
Investment adviser fee | | $ | 1,135,329 | | | $ | 362,909 | | | $ | 790,965 | | | $ | 331,523 | |
| | | | |
Distribution and service fees | | | | | | | | | | | | | | | | |
| | | | |
Class A | | | 187,937 | | | | 100,503 | | | | 246,812 | | | | 109,708 | |
| | | | |
Class C | | | 149,083 | | | | 42,353 | | | | 135,072 | | | | 48,098 | |
| | | | |
Trustees’ fees and expenses | | | 16,314 | | | | 5,517 | | | | 11,385 | | | | 4,884 | |
| | | | |
Custodian fee | | | 88,024 | | | | 27,204 | | | | 54,662 | | | | 24,302 | |
| | | | |
Transfer and dividend disbursing agent fees | | | 80,618 | | | | 26,675 | | | | 65,351 | | | | 29,266 | |
| | | | |
Legal and accounting services | | | 38,986 | | | | 30,514 | | | | 42,196 | | | | 26,440 | |
| | | | |
Printing and postage | | | 18,502 | | | | 8,671 | | | | 15,432 | | | | 10,354 | |
| | | | |
Registration fees | | | 1,471 | | | | 5,961 | | | | 2,897 | | | | 4,129 | |
| | | | |
Interest expense and fees | | | — | | | | 4,295 | | | | — | | | | 29,932 | |
| | | | |
Miscellaneous | | | 54,023 | | | | 14,391 | | | | 27,198 | | | | 20,165 | |
| | | | |
Total expenses | | $ | 1,770,287 | | | $ | 628,993 | | | $ | 1,391,970 | | | $ | 638,801 | |
| | | | |
Net investment income | | $ | 4,626,057 | | | $ | 2,086,294 | | | $ | 3,728,758 | | | $ | 2,511,276 | |
| | |
| Realized and Unrealized Gain (Loss) | | | | | | | | | |
| | | | |
Net realized gain (loss) — | | | | | | | | | | | | | | | | |
| | | | |
Investment transactions | | $ | 2,456,612 | | | $ | 10,004 | | | $ | 2,612,693 | | | $ | 162,494 | |
| | | | |
Financial futures contracts | | | — | | | | — | | | | 896,683 | | | | 506,024 | |
| | | | |
Net realized gain | | $ | 2,456,612 | | | $ | 10,004 | | | $ | 3,509,376 | | | $ | 668,518 | |
| | | | |
Change in unrealized appreciation (depreciation) — | | | | | | | | | | | | | | | | |
| | | | |
Investments | | $ | (1,280,851 | ) | | $ | (1,374,565 | ) | | $ | 1,792,484 | | | $ | (1,590,291 | ) |
| | | | |
Financial futures contracts | | | — | | | | — | | | | 515,350 | | | | 138,751 | |
| | | | |
Net change in unrealized appreciation (depreciation) | | $ | (1,280,851 | ) | | $ | (1,374,565 | ) | | $ | 2,307,834 | | | $ | (1,451,540 | ) |
| | | | |
Net realized and unrealized gain (loss) | | $ | 1,175,761 | | | $ | (1,364,561 | ) | | $ | 5,817,210 | | | $ | (783,022 | ) |
| | | | |
Net increase in net assets from operations | | $ | 5,801,818 | | | $ | 721,733 | | | $ | 9,545,968 | | | $ | 1,728,254 | |
| | | | |
| | 33 | | See Notes to Financial Statements. |
Eaton Vance
Municipal Income Funds
March 31, 2021
Statements of Changes in Net Assets
| | | | | | | | | | | | | | | | |
| | | Six Months Ended March 31, 2021 (Unaudited) | |
| Increase (Decrease) in Net Assets | | California
Opportunities Fund | | | Massachusetts Fund | | | New York Fund | | | Ohio Fund | |
| | | | |
From operations — | | | | | | | | | | | | | | | | |
| | | | |
Net investment income | | $ | 4,626,057 | | | $ | 2,086,294 | | | $ | 3,728,758 | | | $ | 2,511,276 | |
| | | | |
Net realized gain | | | 2,456,612 | | | | 10,004 | | | | 3,509,376 | | | | 668,518 | |
| | | | |
Net change in unrealized appreciation (depreciation) | | | (1,280,851 | ) | | | (1,374,565 | ) | | | 2,307,834 | | | | (1,451,540 | ) |
| | | | |
Net increase in net assets from operations | | $ | 5,801,818 | | | $ | 721,733 | | | $ | 9,545,968 | | | $ | 1,728,254 | |
| | | | |
Distributions to shareholders — | | | | | | | | | | | | | | | | |
| | | | |
Class A | | $ | (1,373,874 | ) | | $ | (1,014,712 | ) | | $ | (7,861,607 | ) | | $ | (1,455,592 | ) |
| | | | |
Class C | | | (164,886 | ) | | | (59,678 | ) | | | (799,041 | ) | | | (96,362 | ) |
| | | | |
Class I | | | (4,739,623 | ) | | | (1,126,576 | ) | | | (5,623,438 | ) | | | (940,109 | ) |
| | | | |
Total distributions to shareholders | | $ | (6,278,383 | ) | | $ | (2,200,966 | ) | | $ | (14,284,086 | ) | | $ | (2,492,063 | ) |
| | | | |
Transactions in shares of beneficial interest — | | | | | | | | | | | | | | | | |
| | | | |
Proceeds from sale of shares | | | | | | | | | | | | | | | | |
| | | | |
Class A | | $ | 13,977,736 | | | $ | 6,452,226 | | | $ | 20,128,732 | | | $ | 10,483,646 | |
| | | | |
Class C | | | 5,531,517 | | | | 792,986 | | | | 1,777,162 | | | | 2,148,382 | |
| | | | |
Class I | | | 161,147,887 | | | | 21,719,093 | | | | 35,234,222 | | | | 14,390,032 | |
| | | | |
Net asset value of shares issued to shareholders in payment of distributions declared | | | | | | | | | | | | | | | | |
| | | | |
Class A | | | 1,181,808 | | | | 863,050 | | | | 6,998,987 | | | | 1,269,354 | |
| | | | |
Class C | | | 155,990 | | | | 52,404 | | | | 704,408 | | | | 90,139 | |
| | | | |
Class I | | | 4,181,616 | | | | 904,964 | | | | 4,573,414 | | | | 838,017 | |
| | | | |
Cost of shares redeemed | | | | | | | | | | | | | | | | |
| | | | |
Class A | | | (14,500,363 | ) | | | (7,215,782 | ) | | | (12,847,264 | ) | | | (8,660,956 | ) |
| | | | |
Class C | | | (2,951,016 | ) | | | (426,671 | ) | | | (4,903,428 | ) | | | (1,375,969 | ) |
| | | | |
Class I | | | (56,892,202 | ) | | | (10,819,400 | ) | | | (19,489,669 | ) | | | (12,594,955 | ) |
| | | | |
Net asset value of shares converted | | | | | | | | | | | | | | | | |
| | | | |
Class A | | | 1,149,222 | | | | 1,656,967 | | | | 2,837,547 | | | | 1,292,130 | |
| | | | |
Class C | | | (1,149,222 | ) | | | (1,656,967 | ) | | | (2,837,547 | ) | | | (1,292,130 | ) |
| | | | |
Net increase in net assets from Fund share transactions | | $ | 111,832,973 | | | $ | 12,322,870 | | | $ | 32,176,564 | | | $ | 6,587,690 | |
| | | | |
Net increase in net assets | | $ | 111,356,408 | | | $ | 10,843,637 | | | $ | 27,438,446 | | | $ | 5,823,881 | |
| | |
| Net Assets | | | | | | | | | |
| | | | |
At beginning of period | | $ | 586,728,680 | | | $ | 206,690,973 | | | $ | 437,878,976 | | | $ | 179,988,480 | |
| | | | |
At end of period | | $ | 698,085,088 | | | $ | 217,534,610 | | | $ | 465,317,422 | | | $ | 185,812,361 | |
| | | | |
| | 34 | | See Notes to Financial Statements. |
Eaton Vance
Municipal Income Funds
March 31, 2021
Statements of Changes in Net Assets — continued
| | | | | | | | | | | | | | | | |
| | | Year Ended September 30, 2020 | |
| Increase (Decrease) in Net Assets | | California
Opportunities Fund | | | Massachusetts Fund | | | New York Fund | | | Ohio Fund | |
| | | | |
From operations — | | | | | | | | | | | | | | | | |
| | | | |
Net investment income | | $ | 8,431,209 | | | $ | 4,260,092 | | | $ | 8,759,776 | | | $ | 4,910,811 | |
| | | | |
Net realized gain (loss) | | | 1,985,246 | | | | 460,741 | | | | 10,832,917 | | | | (389,339 | ) |
| | | | |
Net change in unrealized appreciation (depreciation) | | | 5,412,163 | | | | 1,058,785 | | | | (7,165,169 | ) | | | 2,276,259 | |
| | | | |
Net increase in net assets from operations | | $ | 15,828,618 | | | $ | 5,779,618 | | | $ | 12,427,524 | | | $ | 6,797,731 | |
| | | | |
Distributions to shareholders — | | | | | | | | | | | | | | | | |
| | | | |
Class A | | $ | (2,986,808 | ) | | $ | (2,418,548 | ) | | $ | (5,208,432 | ) | | $ | (2,952,797 | ) |
| | | | |
Class C | | | (452,264 | ) | | | (205,672 | ) | | | (537,160 | ) | | | (255,331 | ) |
| | | | |
Class I | | | (6,608,798 | ) | | | (2,051,634 | ) | | | (3,536,895 | ) | | | (1,719,234 | ) |
| | | | |
Total distributions to shareholders | | $ | (10,047,870 | ) | | $ | (4,675,854 | ) | | $ | (9,282,487 | ) | | $ | (4,927,362 | ) |
| | | | |
Transactions in shares of beneficial interest — | | | | | | | | | | | | | | | | |
| | | | |
Proceeds from sale of shares | | | | | | | | | | | | | | | | |
| | | | |
Class A | | $ | 46,991,993 | | | $ | 11,415,559 | | | $ | 29,498,404 | | | $ | 12,868,702 | |
| | | | |
Class C | | | 10,573,188 | | | | 1,670,862 | | | | 4,316,098 | | | | 1,925,733 | |
| | | | |
Class I | | | 298,243,909 | | | | 47,876,460 | | | | 54,119,433 | | | | 20,950,152 | |
| | | | |
Net asset value of shares issued to shareholders in payment of distributions declared | | | | | | | | | | | | | | | | |
| | | | |
Class A | | | 2,519,326 | | | | 2,005,437 | | | | 4,608,951 | | | | 2,570,097 | |
| | | | |
Class C | | | 403,471 | | | | 177,513 | | | | 421,303 | | | | 219,886 | |
| | | | |
Class I | | | 5,947,402 | | | | 1,729,462 | | | | 2,837,054 | | | | 1,542,280 | |
| | | | |
Cost of shares redeemed | | | | | | | | | | | | | | | | |
| | | | |
Class A | | | (30,589,685 | ) | | | (9,169,777 | ) | | | (32,322,098 | ) | | | (14,807,589 | ) |
| | | | |
Class C | | | (8,987,297 | ) | | | (2,621,884 | ) | | | (12,588,531 | ) | | | (3,198,897 | ) |
| | | | |
Class I | | | (93,266,108 | ) | | | (17,130,824 | ) | | | (29,309,105 | ) | | | (9,767,980 | ) |
| | | | |
Net asset value of shares converted | | | | | | | | | | | | | | | | |
| | | | |
Class A | | | 672,084 | | | | 1,954,783 | | | | 1,758,196 | | | | 1,512,505 | |
| | | | |
Class C | | | (672,084 | ) | | | (1,954,783 | ) | | | (1,758,196 | ) | | | (1,512,505 | ) |
| | | | |
Net increase in net assets from Fund share transactions | | $ | 231,836,199 | | | $ | 35,952,808 | | | $ | 21,581,509 | | | $ | 12,302,384 | |
| | | | |
Net increase in net assets | | $ | 237,616,947 | | | $ | 37,056,572 | | | $ | 24,726,546 | | | $ | 14,172,753 | |
| | |
| Net Assets | | | | | | | | | |
| | | | |
At beginning of year | | $ | 349,111,733 | | | $ | 169,634,401 | | | $ | 413,152,430 | | | $ | 165,815,727 | |
| | | | |
At end of year | | $ | 586,728,680 | | | $ | 206,690,973 | | | $ | 437,878,976 | | | $ | 179,988,480 | |
| | | | |
| | 35 | | See Notes to Financial Statements. |
Eaton Vance
Municipal Income Funds
March 31, 2021
Financial Highlights
| | | | | | | | | | | | | | | | | | | | | | | | |
| | | California Opportunities Fund — Class A | |
| | |
| | | Six Months Ended
March 31, 2021
(Unaudited) | | | Year Ended September 30, | |
| | | 2020 | | | 2019 | | | 2018 | | | 2017 | | | 2016 | |
| | | | | | | |
Net asset value — Beginning of period | | $ | 10.930 | | | $ | 10.800 | | | $ | 10.210 | | | $ | 10.410 | | | $ | 10.740 | | | $ | 10.250 | |
| | | | | | |
| Income (Loss) From Operations | | | | | | | | | | | | | | | | | | | | | | | | |
| | | | | | |
Net investment income(1) | | $ | 0.071 | | | $ | 0.203 | | | $ | 0.258 | | | $ | 0.263 | | | $ | 0.262 | | | $ | 0.302 | |
| | | | | | |
Net realized and unrealized gain (loss) | | | 0.039 | | | | 0.177 | | | | 0.590 | | | | (0.200 | ) | | | (0.332 | ) | | | 0.491 | |
| | | | | | |
Total income (loss) from operations | | $ | 0.110 | | | $ | 0.380 | | | $ | 0.848 | | | $ | 0.063 | | | $ | (0.070 | ) | | $ | 0.793 | |
| | | | | | |
| Less Distributions | | | | | | | | | | | | | | | | | | | | | | | | |
| | | | | | |
From net investment income | | $ | (0.071 | ) | | $ | (0.214 | ) | | $ | (0.258 | ) | | $ | (0.263 | ) | | $ | (0.260 | ) | | $ | (0.303 | ) |
| | | | | | |
From net realized gain | | | (0.029 | ) | | | (0.036 | ) | | | — | | | | — | | | | — | | | | — | |
| | | | | | |
Total distributions | | $ | (0.100 | ) | | $ | (0.250 | ) | | $ | (0.258 | ) | | $ | (0.263 | ) | | $ | (0.260 | ) | | $ | (0.303 | ) |
| | | | | | |
Net asset value — End of period | | $ | 10.940 | | | $ | 10.930 | | | $ | 10.800 | | | $ | 10.210 | | | $ | 10.410 | | | $ | 10.740 | |
| | | | | | |
Total Return(2) | | | 1.01 | %(3) | | | 3.58 | % | | | 8.52 | % | | | 0.52 | % | | | (0.60 | )% | | | 7.83 | % |
| | | | |
| Ratios/Supplemental Data | | | �� | | | | | | | | | | | | | | |
| | | | | | |
Net assets, end of period (000’s omitted) | | $ | 149,508 | | | $ | 147,662 | | | $ | 126,381 | | | $ | 107,204 | | | $ | 124,821 | | | $ | 148,675 | |
| | | | | | |
Ratios (as a percentage of average daily net assets): | | | | | | | | | | | | | | | | | | | | | | | | |
| | | | | | |
Expenses excluding interest and fees | | | 0.69 | %(4) | | | 0.71 | % | | | 0.76 | % | | | 0.77 | % | | | 0.77 | % | | | 0.78 | % |
| | | | | | |
Interest and fee expense(5) | | | — | | | | 0.01 | % | | | 0.04 | % | | | 0.07 | % | | | 0.05 | % | | | 0.04 | % |
| | | | | | |
Total expenses | | | 0.69 | %(4) | | | 0.72 | % | | | 0.80 | % | | | 0.84 | % | | | 0.82 | % | | | 0.82 | % |
| | | | | | |
Net investment income | | | 1.30 | %(4) | | | 1.88 | % | | | 2.47 | % | | | 2.56 | % | | | 2.53 | % | | | 2.86 | % |
| | | | | | |
Portfolio Turnover | | | 66 | %(3) | | | 184 | % | | | 235 | % | | | 293 | % | | | 146 | % | | | 219 | % |
| (1) | Computed using average shares outstanding. |
| (2) | Returns are historical and are calculated by determining the percentage change in net asset value with all distributions reinvested and do not reflect the effect of sales charges. |
| (5) | Interest and fee expense relates to the liability for floating rate notes issued in conjunction with residual interest bond transactions (see Note 1H). |
| | | | |
| | 36 | | See Notes to Financial Statements. |
Eaton Vance
Municipal Income Funds
March 31, 2021
Financial Highlights — continued
| | | | | | | | | | | | | | | | | | | | | | | | |
| | | California Opportunities Fund — Class C | |
| | |
| | | Six Months Ended
March 31, 2021
(Unaudited) | | | Year Ended September 30, | |
| | | 2020 | | | 2019 | | | 2018 | | | 2017 | | | 2016 | |
| | | | | | | |
Net asset value — Beginning of period | | $ | 10.110 | | | $ | 9.990 | | | $ | 9.440 | | | $ | 9.620 | | | $ | 9.930 | | | $ | 9.480 | |
| | | | | | |
| Income (Loss) From Operations | | | | | | | | | | | | | | | | | | | | | | | | |
| | | | | | |
Net investment income(1) | | $ | 0.028 | | | $ | 0.113 | | | $ | 0.166 | | | $ | 0.172 | | | $ | 0.170 | | | $ | 0.198 | |
| | | | | | |
Net realized and unrealized gain (loss) | | | 0.029 | | | | 0.166 | | | | 0.550 | | | | (0.180 | ) | | | (0.311 | ) | | | 0.459 | |
| | | | | | |
Total income (loss) from operations | | $ | 0.057 | | | $ | 0.279 | | | $ | 0.716 | | | $ | (0.008 | ) | | $ | (0.141 | ) | | $ | 0.657 | |
| | | | | | |
| Less Distributions | | | | | | | | | | | | | | | | | | | | | | | | |
| | | | | | |
From net investment income | | $ | (0.028 | ) | | $ | (0.123 | ) | | $ | (0.166 | ) | | $ | (0.172 | ) | | $ | (0.169 | ) | | $ | (0.207 | ) |
| | | | | | |
From net realized gain | | | (0.029 | ) | | | (0.036 | ) | | | — | | | | — | | | | — | | | | — | |
| | | | | | |
Total distributions | | $ | (0.057 | ) | | $ | (0.159 | ) | | $ | (0.166 | ) | | $ | (0.172 | ) | | $ | (0.169 | ) | | $ | (0.207 | ) |
| | | | | | |
Net asset value — End of period | | $ | 10.110 | | | $ | 10.110 | | | $ | 9.990 | | | $ | 9.440 | | | $ | 9.620 | | | $ | 9.930 | |
| | | | | | |
Total Return(2) | | | 0.56 | %(3) | | | 2.83 | % | | | 7.66 | % | | | (0.08 | )% | | | (1.40 | )% | | | 6.98 | % |
| | | | |
| Ratios/Supplemental Data | | | | | | | | | | | | | | | | | |
| | | | | | |
Net assets, end of period (000’s omitted) | | $ | 30,569 | | | $ | 28,977 | | | $ | 27,616 | | | $ | 24,437 | | | $ | 30,020 | | | $ | 35,006 | |
| | | | | | |
Ratios (as a percentage of average daily net assets): | | | | | | | | | | | | | | | | | | | | | | | | |
| | | | | | |
Expenses excluding interest and fees | | | 1.44 | %(4) | | | 1.46 | % | | | 1.51 | % | | | 1.52 | % | | | 1.52 | % | | | 1.53 | % |
| | | | | | |
Interest and fee expense(5) | | | — | | | | 0.01 | % | | | 0.04 | % | | | 0.07 | % | | | 0.05 | % | | | 0.04 | % |
| | | | | | |
Total expenses | | | 1.44 | %(4) | | | 1.47 | % | | | 1.55 | % | | | 1.59 | % | | | 1.57 | % | | | 1.57 | % |
| | | | | | |
Net investment income | | | 0.55 | %(4) | | | 1.13 | % | | | 1.72 | % | | | 1.80 | % | | | 1.78 | % | | | 2.02 | % |
| | | | | | |
Portfolio Turnover | | | 66 | %(3) | | | 184 | % | | | 235 | % | | | 293 | % | | | 146 | % | | | 219 | % |
| (1) | Computed using average shares outstanding. |
| (2) | Returns are historical and are calculated by determining the percentage change in net asset value with all distributions reinvested and do not reflect the effect of sales charges. |
| (5) | Interest and fee expense relates to the liability for floating rate notes issued in conjunction with residual interest bond transactions (see Note 1H). |
| | | | |
| | 37 | | See Notes to Financial Statements. |
Eaton Vance
Municipal Income Funds
March 31, 2021
Financial Highlights — continued
| | | | | | | | | | | | | | | | | | | | | | | | |
| | | California Opportunities Fund — Class I | |
| | |
| | | Six Months Ended
March 31, 2021
(Unaudited) | | | Year Ended September 30, | |
| | | 2020 | | | 2019 | | | 2018 | | | 2017 | | | 2016 | |
| | | | | | | |
Net asset value — Beginning of period | | $ | 10.940 | | | $ | 10.810 | | | $ | 10.210 | | | $ | 10.420 | | | $ | 10.750 | | | $ | 10.260 | |
| | | | | | |
| Income (Loss) From Operations | | | | | | | | | | | | | | | | | | | | | | | | |
| | | | | | |
Net investment income(1) | | $ | 0.085 | | | $ | 0.225 | | | $ | 0.282 | | | $ | 0.289 | | | $ | 0.287 | | | $ | 0.312 | |
| | | | | | |
Net realized and unrealized gain (loss) | | | 0.039 | | | | 0.181 | | | | 0.602 | | | | (0.210 | ) | | | (0.331 | ) | | | 0.507 | |
| | | | | | |
Total income (loss) from operations | | $ | 0.124 | | | $ | 0.406 | | | $ | 0.884 | | | $ | 0.079 | | | $ | (0.044 | ) | | $ | 0.819 | |
| | | | | | |
| Less Distributions | | | | | | | | | | | | | | | | | | | | | | | | |
| | | | | | |
From net investment income | | $ | (0.085 | ) | | $ | (0.240 | ) | | $ | (0.284 | ) | | $ | (0.289 | ) | | $ | (0.286 | ) | | $ | (0.329 | ) |
| | | | | | |
From net realized gain | | | (0.029 | ) | | | (0.036 | ) | | | — | | | | — | | | | — | | | | — | |
| | | | | | |
Total distributions | | $ | (0.114 | ) | | $ | (0.276 | ) | | $ | (0.284 | ) | | $ | (0.289 | ) | | $ | (0.286 | ) | | $ | (0.329 | ) |
| | | | | | |
Net asset value — End of period | | $ | 10.950 | | | $ | 10.940 | | | $ | 10.810 | | | $ | 10.210 | | | $ | 10.420 | | | $ | 10.750 | |
| | | | | | |
Total Return(2) | | | 1.13 | %(3) | | | 3.82 | % | | | 8.79 | % | | | 0.77 | % | | | (0.35 | )% | | | 8.09 | % |
| | | | |
| Ratios/Supplemental Data | | | | | | | | | | | | | | | | | |
| | | | | | |
Net assets, end of period (000’s omitted) | | $ | 518,008 | | | $ | 410,090 | | | $ | 195,115 | | | $ | 116,940 | | | $ | 118,737 | | | $ | 109,169 | |
| | | | | | |
Ratios (as a percentage of average daily net assets): | | | | | | | | | | | | | | | | | | | | | | | | |
| | | | | | |
Expenses excluding interest and fees | | | 0.45 | %(4) | | | 0.46 | % | | | 0.51 | % | | | 0.51 | % | | | 0.52 | % | | | 0.52 | % |
| | | | | | |
Interest and fee expense(5) | | | — | | | | 0.01 | % | | | 0.04 | % | | | 0.07 | % | | | 0.05 | % | | | 0.04 | % |
| | | | | | |
Total expenses | | | 0.45 | %(4) | | | 0.47 | % | | | 0.55 | % | | | 0.58 | % | | | 0.57 | % | | | 0.56 | % |
| | | | | | |
Net investment income | | | 1.54 | %(4) | | | 2.08 | % | | | 2.68 | % | | | 2.80 | % | | | 2.77 | % | | | 2.93 | % |
| | | | | | |
Portfolio Turnover | | | 66 | %(3) | | | 184 | % | | | 235 | % | | | 293 | % | | | 146 | % | | | 219 | % |
| (1) | Computed using average shares outstanding. |
| (2) | Returns are historical and are calculated by determining the percentage change in net asset value with all distributions reinvested. |
(5) Interest and fee expense relates to the liability for floating rate notes issued in conjunction with residual interest bond transactions (see Note 1H).
| | | | |
| | 38 | | See Notes to Financial Statements. |
Eaton Vance
Municipal Income Funds
March 31, 2021
Financial Highlights — continued
| | | | | | | | | | | | | | | | | | | | | | | | |
| | | Massachusetts Fund — Class A | |
| | |
| | | Six Months Ended
March 31, 2021
(Unaudited) | | | Year Ended September 30, | |
| | | 2020 | | | 2019 | | | 2018 | | | 2017 | | | 2016 | |
| | | | | | | |
Net asset value — Beginning of period | | $ | 9.030 | | | $ | 8.980 | | | $ | 8.600 | | | $ | 8.890 | | | $ | 9.180 | | | $ | 9.030 | |
| | | | | | |
| Income (Loss) From Operations | | | | | | | | | | | | | | | | | | | | | | | | |
| | | | | | |
Net investment income(1) | | $ | 0.086 | | | $ | 0.206 | | | $ | 0.252 | | | $ | 0.265 | | | $ | 0.285 | | | $ | 0.304 | |
| | | | | | |
Net realized and unrealized gain (loss) | | | (0.045 | ) | | | 0.071 | | | | 0.382 | | | | (0.280 | ) | | | (0.292 | ) | | | 0.160 | |
| | | | | | |
Total income (loss) from operations | | $ | 0.041 | | | $ | 0.277 | | | $ | 0.634 | | | $ | (0.015 | ) | | $ | (0.007 | ) | | $ | 0.464 | |
| | | | | | |
| Less Distributions | | | | | | | | | | | | | | | | | | | | | | | | |
| | | | | | |
From net investment income | | $ | (0.091 | ) | | $ | (0.227 | ) | | $ | (0.254 | ) | | $ | (0.275 | ) | | $ | (0.283 | ) | | $ | (0.314 | ) |
| | | | | | |
Total distributions | | $ | (0.091 | ) | | $ | (0.227 | ) | | $ | (0.254 | ) | | $ | (0.275 | ) | | $ | (0.283 | ) | | $ | (0.314 | ) |
| | | | | | |
Net asset value — End of period | | $ | 8.980 | | | $ | 9.030 | | | $ | 8.980 | | | $ | 8.600 | | | $ | 8.890 | | | $ | 9.180 | |
| | | | | | |
Total Return(2) | | | 0.45 | %(3) | | | 3.13 | % | | | 7.48 | % | | | (0.17 | )% | | | (0.02 | )% | | | 5.20 | % |
| | | | |
| Ratios/Supplemental Data | | | | | | | | | | | | | | | | | |
| | | | | | |
Net assets, end of period (000’s omitted) | | $ | 101,168 | | | $ | 100,099 | | | $ | 93,288 | | | $ | 88,205 | | | $ | 99,934 | | | $ | 116,883 | |
| | | | | | |
Ratios (as a percentage of average daily net assets): | | | | | | | | | | | | | | | | | | | | | | | | |
| | | | | | |
Expenses excluding interest and fees | | | 0.66 | %(4) | | | 0.68 | % | | | 0.71 | % | | | 0.72 | % | | | 0.70 | % | | | 0.72 | % |
| | | | | | |
Interest and fee expense(5) | | | 0.00 | %(4)(6) | | | 0.03 | % | | | 0.05 | % | | | 0.05 | % | | | 0.06 | % | | | 0.06 | % |
| | | | | | |
Total expenses | | | 0.66 | %(4) | | | 0.71 | % | | | 0.76 | % | | | 0.77 | % | | | 0.76 | % | | | 0.78 | % |
| | | | | | |
Net investment income | | | 1.90 | %(4) | | | 2.30 | % | | | 2.87 | % | | | 3.03 | % | | | 3.21 | % | | | 3.31 | % |
| | | | | | |
Portfolio Turnover | | | 7 | %(3) | | | 15 | % | | | 49 | % | | | 41 | % | | | 28 | % | | | 17 | % |
| (1) | Computed using average shares outstanding. |
| (2) | Returns are historical and are calculated by determining the percentage change in net asset value with all distributions reinvested and do not reflect the effect of sales charges. |
| (5) | Interest and fee expense relates to the liability for floating rate notes issued in conjunction with residual interest bond transactions (see Note 1H). |
| (6) | Amount is less than 0.005%. |
| | | | |
| | 39 | | See Notes to Financial Statements. |
Eaton Vance
Municipal Income Funds
March 31, 2021
Financial Highlights — continued
| | | | | | | | | | | | | | | | | | | | | | | | |
| | | Massachusetts Fund — Class C | |
| | |
| | | Six Months Ended
March 31, 2021
(Unaudited) | | | Year Ended September 30, | |
| | | 2020 | | | 2019 | | | 2018 | | | 2017 | | | 2016 | |
| | | | | | | |
Net asset value — Beginning of period | | $ | 9.040 | | | $ | 8.990 | | | $ | 8.610 | | | $ | 8.890 | | | $ | 9.190 | | | $ | 9.040 | |
| | | | | | |
| Income (Loss) From Operations | | | | | | | | | | | | | | | | | | | | | | | | |
| | | | | | |
Net investment income(1) | | $ | 0.052 | | | $ | 0.140 | | | $ | 0.186 | | | $ | 0.200 | | | $ | 0.219 | | | $ | 0.234 | |
| | | | | | |
Net realized and unrealized gain (loss) | | | (0.062 | ) | | | 0.073 | | | | 0.382 | | | | (0.270 | ) | | | (0.302 | ) | | | 0.162 | |
| | | | | | |
Total income (loss) from operations | | $ | (0.010 | ) | | $ | 0.213 | | | $ | 0.568 | | | $ | (0.070 | ) | | $ | (0.083 | ) | | $ | 0.396 | |
| | | | | | |
| Less Distributions | | | | | | | | | | | | | | | | | | | | | | | | |
| | | | | | |
From net investment income | | $ | (0.060 | ) | | $ | (0.163 | ) | | $ | (0.188 | ) | | $ | (0.210 | ) | | $ | (0.217 | ) | | $ | (0.246 | ) |
| | | | | | |
Total distributions | | $ | (0.060 | ) | | $ | (0.163 | ) | | $ | (0.188 | ) | | $ | (0.210 | ) | | $ | (0.217 | ) | | $ | (0.246 | ) |
| | | | | | |
Net asset value — End of period | | $ | 8.970 | | | $ | 9.040 | | | $ | 8.990 | | | $ | 8.610 | | | $ | 8.890 | | | $ | 9.190 | |
| | | | | | |
Total Return(2) | | | (0.00 | )%(3)(4) | | | 2.40 | % | | | 6.55 | % | | | (0.80 | )% | | | (0.87 | )% | | | 4.41 | % |
| | | | |
| Ratios/Supplemental Data | | | | | | | | | | | | | | | | | |
| | | | | | |
Net assets, end of period (000’s omitted) | | $ | 8,514 | | | $ | 9,811 | | | $ | 12,518 | | | $ | 14,848 | | | $ | 19,219 | | | $ | 24,165 | |
| | | | | | |
Ratios (as a percentage of average daily net assets): | | | | | | | | | | | | | | | | | | | | | | | | |
| | | | | | |
Expenses excluding interest and fees | | | 1.41 | %(5) | | | 1.43 | % | | | 1.46 | % | | | 1.47 | % | | | 1.46 | % | | | 1.47 | % |
| | | | | | |
Interest and fee expense(6) | | | 0.00 | %(4)(5) | | | 0.03 | % | | | 0.05 | % | | | 0.05 | % | | | 0.06 | % | | | 0.06 | % |
| | | | | | |
Total expenses | | | 1.41 | %(5) | | | 1.46 | % | | | 1.51 | % | | | 1.52 | % | | | 1.52 | % | | | 1.53 | % |
| | | | | | |
Net investment income | | | 1.15 | %(5) | | | 1.56 | % | | | 2.12 | % | | | 2.29 | % | | | 2.47 | % | | | 2.55 | % |
| | | | | | |
Portfolio Turnover | | | 7 | %(3) | | | 15 | % | | | 49 | % | | | 41 | % | | | 28 | % | | | 17 | % |
| (1) | Computed using average shares outstanding. |
| (2) | Returns are historical and are calculated by determining the percentage change in net asset value with all distributions reinvested and do not reflect the effect of sales charges. |
| (4) | Amount is less than 0.005% or (0.005)%, as applicable. |
| (6) | Interest and fee expense relates to the liability for floating rate notes issued in conjunction with residual interest bond transactions (see Note 1H). |
| | | | |
| | 40 | | See Notes to Financial Statements. |
Eaton Vance
Municipal Income Funds
March 31, 2021
Financial Highlights — continued
| | | | | | | | | | | | | | | | | | | | | | | | |
| | | Massachusetts Fund — Class I | |
| | |
| | | Six Months Ended
March 31, 2021
(Unaudited) | | | Year Ended September 30, | |
| | | 2020 | | | 2019 | | | 2018 | | | 2017 | | | 2016 | |
| | | | | | | |
Net asset value — Beginning of period | | $ | 9.030 | | | $ | 8.980 | | | $ | 8.600 | | | $ | 8.880 | | | $ | 9.180 | | | $ | 9.030 | |
| | | | | | |
| Income (Loss) From Operations | | | | | | | | | | | | | | | | | | | | | | | | |
| | | | | | |
Net investment income(1) | | $ | 0.095 | | | $ | 0.222 | | | $ | 0.268 | | | $ | 0.283 | | | $ | 0.302 | | | $ | 0.320 | |
| | | | | | |
Net realized and unrealized gain (loss) | | | (0.046 | ) | | | 0.071 | | | | 0.384 | | | | (0.270 | ) | | | (0.301 | ) | | | 0.162 | |
| | | | | | |
Total income from operations | | $ | 0.049 | | | $ | 0.293 | | | $ | 0.652 | | | $ | 0.013 | | | $ | 0.001 | | | $ | 0.482 | |
| | | | | | |
| Less Distributions | | | | | | | | | | | | | | | | | | | | | | | | |
| | | | | | |
From net investment income | | $ | (0.099 | ) | | $ | (0.243 | ) | | $ | (0.272 | ) | | $ | (0.293 | ) | | $ | (0.301 | ) | | $ | (0.332 | ) |
| | | | | | |
Total distributions | | $ | (0.099 | ) | | $ | (0.243 | ) | | $ | (0.272 | ) | | $ | (0.293 | ) | | $ | (0.301 | ) | | $ | (0.332 | ) |
| | | | | | |
Net asset value — End of period | | $ | 8.980 | | | $ | 9.030 | | | $ | 8.980 | | | $ | 8.600 | | | $ | 8.880 | | | $ | 9.180 | |
| | | | | | |
Total Return(2) | | | 0.54 | %(3) | | | 3.31 | % | | | 7.69 | % | | | 0.15 | % | | | 0.07 | % | | | 5.40 | % |
| | | | |
| Ratios/Supplemental Data | | | | | | | | | | | | | | | | | |
| | | | | | |
Net assets, end of period (000’s omitted) | | $ | 107,853 | | | $ | 96,780 | | | $ | 63,829 | | | $ | 40,691 | | | $ | 45,551 | | | $ | 44,995 | |
| | | | | | |
Ratios (as a percentage of average daily net assets): | | | | | | | | | | | | | | | | | | | | | | | | |
| | | | | | |
Expenses excluding interest and fees | | | 0.46 | %(4) | | | 0.48 | % | | | 0.51 | % | | | 0.52 | % | | | 0.50 | % | | | 0.52 | % |
| | | | | | |
Interest and fee expense(5) | | | 0.00 | %(4)(6) | | | 0.03 | % | | | 0.05 | % | | | 0.05 | % | | | 0.06 | % | | | 0.06 | % |
| | | | | | |
Total expenses | | | 0.46 | %(4) | | | 0.51 | % | | | 0.56 | % | | | 0.57 | % | | | 0.56 | % | | | 0.58 | % |
| | | | | | |
Net investment income | | | 2.09 | %(4) | | | 2.48 | % | | | 3.05 | % | | | 3.23 | % | | | 3.41 | % | | | 3.49 | % |
| | | | | | |
Portfolio Turnover | | | 7 | %(3) | | | 15 | % | | | 49 | % | | | 41 | % | | | 28 | % | | | 17 | % |
| (1) | Computed using average shares outstanding. |
| (2) | Returns are historical and are calculated by determining the percentage change in net asset value with all distributions reinvested. |
| (5) | Interest and fee expense relates to the liability for floating rate notes issued in conjunction with residual interest bond transactions (see Note 1H). |
| (6) | Amount is less than 0.005%. |
| | | | |
| | 41 | | See Notes to Financial Statements. |
Eaton Vance
Municipal Income Funds
March 31, 2021
Financial Highlights — continued
| | | | | | | | | | | | | | | | | | | | | | | | |
| | | New York Fund — Class A | |
| | |
| | | Six Months Ended
March 31, 2021
(Unaudited) | | | Year Ended September 30, | |
| | | 2020 | | | 2019 | | | 2018 | | | 2017 | | | 2016 | |
| | | | | | | |
Net asset value — Beginning of period | | $ | 10.470 | | | $ | 10.380 | | | $ | 9.800 | | | $ | 10.110 | | | $ | 10.390 | | | $ | 10.070 | |
| | | | | | |
| Income (Loss) From Operations | | | | | | | | | | | | | | | | | | | | | | | | |
| | | | | | |
Net investment income(1) | | $ | 0.085 | | | $ | 0.216 | | | $ | 0.265 | | | $ | 0.285 | | | $ | 0.304 | | | $ | 0.326 | |
| | | | | | |
Net realized and unrealized gain (loss) | | | 0.139 | | | | 0.103 | | | | 0.580 | | | | (0.311 | ) | | | (0.276 | ) | | | 0.320 | |
| | | | | | |
Total income (loss) from operations | | $ | 0.224 | | | $ | 0.319 | | | $ | 0.845 | | | $ | (0.026 | ) | | $ | 0.028 | | | $ | 0.646 | |
| | | | | | |
| Less Distributions | | | | | | | | | | | | | | | | | | | | | | | | |
| | | | | | |
From net investment income | | $ | (0.085 | ) | | $ | (0.229 | ) | | $ | (0.265 | ) | | $ | (0.284 | ) | | $ | (0.308 | ) | | $ | (0.326 | ) |
| | | | | | |
From net realized gain | | | (0.249 | ) | | | — | | | | — | | | | — | | | | — | | | | — | |
| | | | | | |
Total distributions | | $ | (0.334 | ) | | $ | (0.229 | ) | | $ | (0.265 | ) | | $ | (0.284 | ) | | $ | (0.308 | ) | | $ | (0.326 | ) |
| | | | | | |
Net asset value — End of period | | $ | 10.360 | | | $ | 10.470 | | | $ | 10.380 | | | $ | 9.800 | | | $ | 10.110 | | | $ | 10.390 | |
| | | | | | |
Total Return(2) | | | 2.15 | %(3) | | | 3.11 | % | | | 8.74 | % | | | (0.26 | )% | | | 0.33 | % | | | 6.49 | % |
| | | | |
| Ratios/Supplemental Data | | | | | | | | | | | | | | | | | |
| | | | | | |
Net assets, end of period (000’s omitted) | | $ | 255,469 | | | $ | 240,960 | | | $ | 235,528 | | | $ | 218,892 | | | $ | 247,160 | | | $ | 291,077 | |
| | | | | | |
Ratios (as a percentage of average daily net assets): | | | | | | | | | | | | | | | | | | | | | | | | |
| | | | | | |
Expenses excluding interest and fees | | | 0.65 | %(4) | | | 0.67 | % | | | 0.69 | % | | | 0.70 | % | | | 0.70 | % | | | 0.70 | % |
| | | | | | |
Interest and fee expense | | | — | | | | — | | | | 0.04 | %(5) | | | 0.09 | %(5) | | | 0.07 | %(5) | | | 0.05 | %(5) |
| | | | | | |
Total expenses | | | 0.65 | %(4) | | | 0.67 | % | | | 0.73 | % | | | 0.79 | % | | | 0.77 | % | | | 0.75 | % |
| | | | | | |
Net investment income | | | 1.63 | %(4) | | | 2.07 | % | | | 2.63 | % | | | 2.86 | % | | | 3.02 | % | | | 3.16 | % |
| | | | | | |
Portfolio Turnover | | | 39 | %(3) | | | 125 | % | | | 114 | % | | | 75 | % | | | 56 | % | | | 38 | % |
| (1) | Computed using average shares outstanding. |
| (2) | Returns are historical and are calculated by determining the percentage change in net asset value with all distributions reinvested and do not reflect the effect of sales charges. |
| (5) | Interest and fee expense relates to the liability for floating rate notes issued in conjunction with residual interest bond transactions (see Note 1H). |
| | | | |
| | 42 | | See Notes to Financial Statements. |
Eaton Vance
Municipal Income Funds
March 31, 2021
Financial Highlights — continued
| | | | | | | | | | | | | | | | | | | | | | | | |
| | | New York Fund — Class C | |
| | |
| | | Six Months Ended
March 31, 2021
(Unaudited) | | | Year Ended September 30, | |
| | | 2020 | | | 2019 | | | 2018 | | | 2017 | | | 2016 | |
| | | | | | | |
Net asset value — Beginning of period | | $ | 10.470 | | | $ | 10.390 | | | $ | 9.800 | | | $ | 10.120 | | | $ | 10.390 | | | $ | 10.070 | |
| | | | | | |
| Income (Loss) From Operations | | | | | | | | | | | | | | | | | | | | | | | | |
| | | | | | |
Net investment income(1) | | $ | 0.046 | | | $ | 0.139 | | | $ | 0.192 | | | $ | 0.211 | | | $ | 0.229 | | | $ | 0.248 | |
| | | | | | |
Net realized and unrealized gain (loss) | | | 0.139 | | | | 0.093 | | | | 0.588 | | | | (0.321 | ) | | | (0.266 | ) | | | 0.320 | |
| | | | | | |
Total income (loss) from operations | | $ | 0.185 | | | $ | 0.232 | | | $ | 0.780 | | | $ | (0.110 | ) | | $ | (0.037 | ) | | $ | 0.568 | |
| | | | | | |
| Less Distributions | | | | | | | | | | | | | | | | | | | | | | | | |
| | | | | | |
From net investment income | | $ | (0.046 | ) | | $ | (0.152 | ) | | $ | (0.190 | ) | | $ | (0.210 | ) | | $ | (0.233 | ) | | $ | (0.248 | ) |
| | | | | | |
From net realized gain | | | (0.249 | ) | | | — | | | | — | | | | — | | | | — | | | | — | |
| | | | | | |
Total distributions | | $ | (0.295 | ) | | $ | (0.152 | ) | | $ | (0.190 | ) | | $ | (0.210 | ) | | $ | (0.233 | ) | | $ | (0.248 | ) |
| | | | | | |
Net asset value — End of period | | $ | 10.360 | | | $ | 10.470 | | | $ | 10.390 | | | $ | 9.800 | | | $ | 10.120 | | | $ | 10.390 | |
| | | | | | |
Total Return(2) | | | 1.77 | %(3) | | | 2.25 | % | | | 8.03 | % | | | (1.10 | )% | | | (0.32 | )% | | | 5.69 | % |
| | | | |
| Ratios/Supplemental Data | | | | | | | | | | | | | | | | | |
| | | | | | |
Net assets, end of period (000’s omitted) | | $ | 25,844 | | | $ | 31,347 | | | $ | 40,711 | | | $ | 55,817 | | | $ | 66,727 | | | $ | 80,371 | |
| | | | | | |
Ratios (as a percentage of average daily net assets): | | | | | | | | | | | | | | | | | | | | | | | | |
| | | | | | |
Expenses excluding interest and fees | | | 1.40 | %(4) | | | 1.42 | % | | | 1.44 | % | | | 1.45 | % | | | 1.45 | % | | | 1.44 | % |
| | | | | | |
Interest and fee expense | | | — | | | | — | | | | 0.04 | %(5) | | | 0.09 | %(5) | | | 0.07 | %(5) | | | 0.05 | %(5) |
| | | | | | |
Total expenses | | | 1.40 | %(4) | | | 1.42 | % | | | 1.48 | % | | | 1.54 | % | | | 1.52 | % | | | 1.49 | % |
| | | | | | |
Net investment income | | | 0.89 | %(4) | | | 1.33 | % | | | 1.91 | % | | | 2.11 | % | | | 2.27 | % | | | 2.40 | % |
| | | | | | |
Portfolio Turnover | | | 39 | %(3) | | | 125 | % | | | 114 | % | | | 75 | % | | | 56 | % | | | 38 | % |
| (1) | Computed using average shares outstanding. |
| (2) | Returns are historical and are calculated by determining the percentage change in net asset value with all distributions reinvested and do not reflect the effect of sales charges. |
| (5) | Interest and fee expense relates to the liability for floating rate notes issued in conjunction with residual interest bond transactions (see Note 1H). |
| | | | |
| | 43 | | See Notes to Financial Statements. |
Eaton Vance
Municipal Income Funds
March 31, 2021
Financial Highlights — continued
| | | | | | | | | | | | | | | | | | | | | | | | |
| | | New York Fund — Class I | |
| | |
| | | Six Months Ended
March 31, 2021
(Unaudited) | | | Year Ended September 30, | |
| | | 2020 | | | 2019 | | | 2018 | | | 2017 | | | 2016 | |
| | | | | | | |
Net asset value — Beginning of period | | $ | 10.470 | | | $ | 10.380 | | | $ | 9.800 | | | $ | 10.110 | | | $ | 10.390 | | | $ | 10.070 | |
| | | | | | |
| Income (Loss) From Operations | | | | | | | | | | | | | | | | | | | | | | | | |
| | | | | | |
Net investment income(1) | | $ | 0.095 | | | $ | 0.236 | | | $ | 0.285 | | | $ | 0.305 | | | $ | 0.322 | | | $ | 0.342 | |
| | | | | | |
Net realized and unrealized gain (loss) | | | 0.140 | | | | 0.103 | | | | 0.580 | | | | (0.311 | ) | | | (0.274 | ) | | | 0.324 | |
| | | | | | |
Total income (loss) from operations | | $ | 0.235 | | | $ | 0.339 | | | $ | 0.865 | | | $ | (0.006 | ) | | $ | 0.048 | | | $ | 0.666 | |
| | | | | | |
| Less Distributions | | | | | | | | | | | | | | | | | | | | | | | | |
| | | | | | |
From net investment income | | $ | (0.096 | ) | | $ | (0.249 | ) | | $ | (0.285 | ) | | $ | (0.304 | ) | | $ | (0.328 | ) | | $ | (0.346 | ) |
| | | | | | |
From net realized gain | | | (0.249 | ) | | | — | | | | — | | | | — | | | | — | | | | — | |
| | | | | | |
Total distributions | | $ | (0.345 | ) | | $ | (0.249 | ) | | $ | (0.285 | ) | | $ | (0.304 | ) | | $ | (0.328 | ) | | $ | (0.346 | ) |
| | | | | | |
Net asset value — End of period | | $ | 10.360 | | | $ | 10.470 | | | $ | 10.380 | | | $ | 9.800 | | | $ | 10.110 | | | $ | 10.390 | |
| | | | | | |
Total Return(2) | | | 2.25 | %(3) | | | 3.30 | % | | | 8.96 | % | | | (0.06 | )% | | | 0.53 | % | | | 6.70 | % |
| | | | |
| Ratios/Supplemental Data | | | | | | | | | | | | | | | | | |
| | | | | | |
Net assets, end of period (000’s omitted) | | $ | 184,004 | | | $ | 165,573 | | | $ | 136,913 | | | $ | 123,119 | | | $ | 126,524 | | | $ | 104,643 | |
| | | | | | |
Ratios (as a percentage of average daily net assets): | | | | | | | | | | | | | | | | | | | | | | | | |
| | | | | | |
Expenses excluding interest and fees | | | 0.45 | %(4) | | | 0.47 | % | | | 0.49 | % | | | 0.50 | % | | | 0.50 | % | | | 0.49 | % |
| | | | | | |
Interest and fee expense | | | — | | | | — | | | | 0.04 | %(5) | | | 0.09 | %(5) | | | 0.07 | %(5) | | | 0.05 | %(5) |
| | | | | | |
Total expenses | | | 0.45 | %(4) | | | 0.47 | % | | | 0.53 | % | | | 0.59 | % | | | 0.57 | % | | | 0.54 | % |
| | | | | | |
Net investment income | | | 1.83 | %(4) | | | 2.27 | % | | | 2.83 | % | | | 3.06 | % | | | 3.20 | % | | | 3.31 | % |
| | | | | | |
Portfolio Turnover | | | 39 | %(3) | | | 125 | % | | | 114 | % | | | 75 | % | | | 56 | % | | | 38 | % |
| (1) | Computed using average shares outstanding. |
| (2) | Returns are historical and are calculated by determining the percentage change in net asset value with all distributions reinvested. |
| (5) | Interest and fee expense relates to the liability for floating rate notes issued in conjunction with residual interest bond transactions (see Note 1H). |
| | | | |
| | 44 | | See Notes to Financial Statements. |
Eaton Vance
Municipal Income Funds
March 31, 2021
Financial Highlights — continued
| | | | | | | | | | | | | | | | | | | | | | | | |
| | | Ohio Fund — Class A | |
| | |
| | | Six Months Ended
March 31, 2021
(Unaudited) | | | Year Ended September 30, | |
| | | 2020 | | | 2019 | | | 2018 | | | 2017 | | | 2016 | |
| | | | | | | |
Net asset value — Beginning of period | | $ | 9.320 | | | $ | 9.210 | | | $ | 8.700 | | | $ | 9.020 | | | $ | 9.300 | | | $ | 9.060 | |
| | | | | | |
| Income (Loss) From Operations | | | | | | | | | | | | | | | | | | | | | | | | |
| | | | | | |
Net investment income(1) | | $ | 0.125 | | | $ | 0.262 | | | $ | 0.276 | | | $ | 0.283 | | | $ | 0.313 | | | $ | 0.329 | |
| | | | | | |
Net realized and unrealized gain (loss) | | | (0.031 | ) | | | 0.111 | | | | 0.506 | | | | (0.324 | ) | | | (0.283 | ) | | | 0.237 | |
| | | | | | |
Total income (loss) from operations | | $ | 0.094 | | | $ | 0.373 | | | $ | 0.782 | | | $ | (0.041 | ) | | $ | 0.030 | | | $ | 0.566 | |
| | | | | | |
| Less Distributions | | | | | | | | | | | | | | | | | | | | | | | | |
| | | | | | |
From net investment income | | $ | (0.124 | ) | | $ | (0.263 | ) | | $ | (0.272 | ) | | $ | (0.279 | ) | | $ | (0.310 | ) | | $ | (0.326 | ) |
| | | | | | |
Total distributions | | $ | (0.124 | ) | | $ | (0.263 | ) | | $ | (0.272 | ) | | $ | (0.279 | ) | | $ | (0.310 | ) | | $ | (0.326 | ) |
| | | | | | |
Net asset value — End of period | | $ | 9.290 | | | $ | 9.320 | | | $ | 9.210 | | | $ | 8.700 | | | $ | 9.020 | | | $ | 9.300 | |
| | | | | | |
Total Return(2) | | | 1.01 | %(3) | | | 4.11 | % | | | 9.12 | % | | | (0.45 | )% | | | 0.39 | % | | | 6.33 | % |
| | | | |
| Ratios/Supplemental Data | | | | | | | | | | | | | | | | | |
| | | | | | |
Net assets, end of period (000’s omitted) | | $ | 109,831 | | | $ | 105,917 | | | $ | 102,651 | | | $ | 97,736 | | | $ | 114,303 | | | $ | 136,271 | |
| | | | | | |
Ratios (as a percentage of average daily net assets): | | | | | | | | | | | | | | | | | | | | | | | | |
| | | | | | |
Expenses excluding interest and fees | | | 0.69 | %(4) | | | 0.69 | % | | | 0.71 | % | | | 0.71 | % | | | 0.72 | % | | | 0.71 | % |
| | | | | | |
Interest and fee expense(5) | | | 0.03 | %(4) | | | 0.07 | % | | | 0.13 | % | | | 0.14 | % | | | 0.11 | % | | | 0.05 | % |
| | | | | | |
Total expenses | | | 0.72 | %(4) | | | 0.76 | % | | | 0.84 | % | | | 0.85 | % | | | 0.83 | % | | | 0.76 | % |
| | | | | | |
Net investment income | | | 2.67 | %(4) | | | 2.84 | % | | | 3.08 | % | | | 3.20 | % | | | 3.48 | % | | | 3.56 | % |
| | | | | | |
Portfolio Turnover | | | 3 | %(3) | | | 11 | % | | | 11 | % | | | 13 | % | | | 10 | % | | | 9 | % |
| (1) | Computed using average shares outstanding. |
| (2) | Returns are historical and are calculated by determining the percentage change in net asset value with all distributions reinvested and do not reflect the effect of sales charges. |
| (5) | Interest and fee expense relates to the liability for floating rate notes issued in conjunction with residual interest bond transactions (see Note 1H). |
| | | | |
| | 45 | | See Notes to Financial Statements. |
Eaton Vance
Municipal Income Funds
March 31, 2021
Financial Highlights — continued
| | | | | | | | | | | | | | | | | | | | | | | | |
| | | Ohio Fund — Class C | |
| | |
| | | Six Months Ended
March 31, 2021
(Unaudited) | | | Year Ended September 30, | |
| | | 2020 | | | 2019 | | | 2018 | | | 2017 | | | 2016 | |
| | | | | | | |
Net asset value — Beginning of period | | $ | 9.320 | | | $ | 9.200 | | | $ | 8.700 | | | $ | 9.010 | | | $ | 9.300 | | | $ | 9.060 | |
| | | | | | |
| Income (Loss) From Operations | | | | | | | | | | | | | | | | | | | | | | | | |
| | | | | | |
Net investment income(1) | | $ | 0.090 | | | $ | 0.193 | | | $ | 0.209 | | | $ | 0.217 | | | $ | 0.245 | | | $ | 0.259 | |
| | | | | | |
Net realized and unrealized gain (loss) | | | (0.041 | ) | | | 0.121 | | | | 0.496 | | | | (0.314 | ) | | | (0.293 | ) | | | 0.237 | |
| | | | | | |
Total income (loss) from operations | | $ | 0.049 | | | $ | 0.314 | | | $ | 0.705 | | | $ | (0.097 | ) | | $ | (0.048 | ) | | $ | 0.496 | |
| | | | | | |
| Less Distributions | | | | | | | | | | | | | | | | | | | | | | | | |
| | | | | | |
From net investment income | | $ | (0.089 | ) | | $ | (0.194 | ) | | $ | (0.205 | ) | | $ | (0.213 | ) | | $ | (0.242 | ) | | $ | (0.256 | ) |
| | | | | | |
Total distributions | | $ | (0.089 | ) | | $ | (0.194 | ) | | $ | (0.205 | ) | | $ | (0.213 | ) | | $ | (0.242 | ) | | $ | (0.256 | ) |
| | | | | | |
Net asset value — End of period | | $ | 9.280 | | | $ | 9.320 | | | $ | 9.200 | | | $ | 8.700 | | | $ | 9.010 | | | $ | 9.300 | |
| | | | | | |
Total Return(2) | | | 0.52 | %(3) | | | 3.45 | % | | | 8.19 | % | | | (1.09 | )% | | | (0.47 | )% | | | 5.53 | % |
| | | | |
| Ratios/Supplemental Data | | | | | | | | | | | | | | | | | |
| | | | | | |
Net assets, end of period (000’s omitted) | | $ | 10,339 | | | $ | 10,805 | | | $ | 13,233 | | | $ | 19,191 | | | $ | 22,210 | | | $ | 24,822 | |
| | | | | | |
Ratios (as a percentage of average daily net assets): | | | | | | | | | | | | | | | | | | | | | | | | |
| | | | | | |
Expenses excluding interest and fees | | | 1.44 | %(4) | | | 1.44 | % | | | 1.47 | % | | | 1.46 | % | | | 1.47 | % | | | 1.46 | % |
| | | | | | |
Interest and fee expense(5) | | | 0.03 | %(4) | | | 0.07 | % | | | 0.13 | % | | | 0.14 | % | | | 0.11 | % | | | 0.05 | % |
| | | | | | |
Total expenses | | | 1.47 | %(4) | | | 1.51 | % | | | 1.60 | % | | | 1.60 | % | | | 1.58 | % | | | 1.51 | % |
| | | | | | |
Net investment income | | | 1.92 | %(4) | | | 2.09 | % | | | 2.35 | % | | | 2.45 | % | | | 2.73 | % | | | 2.80 | % |
| | | | | | |
Portfolio Turnover | | | 3 | %(3) | | | 11 | % | | | 11 | % | | | 13 | % | | | 10 | % | | | 9 | % |
| (1) | Computed using average shares outstanding. |
| (2) | Returns are historical and are calculated by determining the percentage change in net asset value with all distributions reinvested and do not reflect the effect of sales charges. |
| (5) | Interest and fee expense relates to the liability for floating rate notes issued in conjunction with residual interest bond transactions (see Note 1H). |
| | | | |
| | 46 | | See Notes to Financial Statements. |
Eaton Vance
Municipal Income Funds
March 31, 2021
Financial Highlights — continued
| | | | | | | | | | | | | | | | | | | | | | | | |
| | | Ohio Fund — Class I | |
| | |
| | | Six Months Ended
March 31, 2021
(Unaudited) | | | Year Ended September 30, | |
| | | 2020 | | | 2019 | | | 2018 | | | 2017 | | | 2016 | |
| | | | | | | |
Net asset value — Beginning of period | | $ | 9.330 | | | $ | 9.210 | | | $ | 8.710 | | | $ | 9.020 | | | $ | 9.310 | | | $ | 9.070 | |
| | | | | | |
| Income (Loss) From Operations | | | | | | | | | | | | | | | | | | | | | | | | |
| | | | | | |
Net investment income(1) | | $ | 0.134 | | | $ | 0.281 | | | $ | 0.293 | | | $ | 0.300 | | | $ | 0.331 | | | $ | 0.346 | |
| | | | | | |
Net realized and unrealized gain (loss) | | | (0.041 | ) | | | 0.121 | | | | 0.498 | | | | (0.313 | ) | | | (0.293 | ) | | | 0.239 | |
| | | | | | |
Total income (loss) from operations | | $ | 0.093 | | | $ | 0.402 | | | $ | 0.791 | | | $ | (0.013 | ) | | $ | 0.038 | | | $ | 0.585 | |
| | | | | | |
| Less Distributions | | | | | | | | | | | | | | | | | | | | | | | | |
| | | | | | |
From net investment income | | $ | (0.133 | ) | | $ | (0.282 | ) | | $ | (0.291 | ) | | $ | (0.297 | ) | | $ | (0.328 | ) | | $ | (0.345 | ) |
| | | | | | |
Total distributions | | $ | (0.133 | ) | | $ | (0.282 | ) | | $ | (0.291 | ) | | $ | (0.297 | ) | | $ | (0.328 | ) | | $ | (0.345 | ) |
| | | | | | |
Net asset value — End of period | | $ | 9.290 | | | $ | 9.330 | | | $ | 9.210 | | | $ | 8.710 | | | $ | 9.020 | | | $ | 9.310 | |
| | | | | | |
Total Return(2) | | | 1.00 | %(3) | | | 4.43 | % | | | 9.21 | % | | | (0.14 | )% | | | 0.48 | % | | | 6.54 | % |
| | | | |
| Ratios/Supplemental Data | | | | | | | | | | | | | | | | | |
| | | | | | |
Net assets, end of period (000’s omitted) | | $ | 65,642 | | | $ | 63,267 | | | $ | 49,932 | | | $ | 35,722 | | | $ | 32,065 | | | $ | 20,957 | |
| | | | | | |
Ratios (as a percentage of average daily net assets): | | | | | | | | | | | | | | | | | | | | | | | | |
| | | | | | |
Expenses excluding interest and fees | | | 0.49 | %(4) | | | 0.49 | % | | | 0.51 | % | | | 0.51 | % | | | 0.52 | % | | | 0.51 | % |
| | | | | | |
Interest and fee expense(5) | | | 0.03 | %(4) | | | 0.07 | % | | | 0.13 | % | | | 0.14 | % | | | 0.11 | % | | | 0.05 | % |
| | | | | | |
Total expenses | | | 0.52 | %(4) | | | 0.56 | % | | | 0.64 | % | | | 0.65 | % | | | 0.63 | % | | | 0.56 | % |
| | | | | | |
Net investment income | | | 2.88 | %(4) | | | 3.04 | % | | | 3.26 | % | | | 3.39 | % | | | 3.68 | % | | | 3.73 | % |
| | | | | | |
Portfolio Turnover | | | 3 | %(3) | | | 11 | % | | | 11 | % | | | 13 | % | | | 10 | % | | | 9 | % |
| (1) | Computed using average shares outstanding. |
| (2) | Returns are historical and are calculated by determining the percentage change in net asset value with all distributions reinvested. |
| (5) | Interest and fee expense relates to the liability for floating rate notes issued in conjunction with residual interest bond transactions (see Note 1H). |
| | | | |
| | 47 | | See Notes to Financial Statements. |
Eaton Vance
Municipal Income Funds
March 31, 2021
Notes to Financial Statements (Unaudited)
1 Significant Accounting Policies
Eaton Vance Municipals Trust (the Trust) is a Massachusetts business trust registered under the Investment Company Act of 1940, as amended (the 1940 Act), as an open-end management investment company. The Trust presently consists of eighteen funds, four of which, each non-diversified, are included in these financial statements. They include Eaton Vance California Municipal Opportunities Fund (California Opportunities Fund), Eaton Vance Massachusetts Municipal Income Fund (Massachusetts Fund), Eaton Vance New York Municipal Income Fund (New York Fund) and Eaton Vance Ohio Municipal Income Fund (Ohio Fund), (each individually referred to as the Fund, and collectively, the Funds). The investment objective of the Massachusetts Fund, New York Fund and Ohio Fund is to provide current income exempt from regular federal income tax and from particular state or local income or other taxes. The investment objective of the California Opportunities Fund is to seek to maximize after-tax total return. The Funds offer three classes of shares. Class A shares are generally sold subject to a sales charge imposed at time of purchase. Class C shares are sold at net asset value and are generally subject to a contingent deferred sales charge (see Note 5). Effective January 25, 2019, Class C shares generally automatically convert to Class A shares ten years after their purchase and, effective November 5, 2020, automatically convert to Class A shares eight years after their purchase as described in the Funds’ prospectus. Class I shares are sold at net asset value and are not subject to a sales charge. Each class represents a pro-rata interest in the Fund, but votes separately on class-specific matters and (as noted below) is subject to different expenses. Realized and unrealized gains and losses are allocated daily to each class of shares based on the relative net assets of each class to the total net assets of the Fund. Net investment income, other than class-specific expenses, is allocated daily to each class of shares based upon the ratio of the value of each class’s paid shares to the total value of all paid shares. Each class of shares differs in its distribution plan and certain other class-specific expenses.
The following is a summary of significant accounting policies of the Funds. The policies are in conformity with accounting principles generally accepted in the United States of America (U.S. GAAP). Each Fund is an investment company and follows accounting and reporting guidance in the Financial Accounting Standards Board (FASB) Accounting Standards Codification Topic 946.
A Investment Valuation — The following methodologies are used to determine the market value or fair value of investments.
Debt Obligations. Debt obligations are generally valued on the basis of valuations provided by third party pricing services, as derived from such services’ pricing models. Inputs to the models may include, but are not limited to, reported trades, executable bid and ask prices, broker/dealer quotations, prices or yields of securities with similar characteristics, interest rates, anticipated prepayments, benchmark curves or information pertaining to the issuer, as well as industry and economic events. The pricing services may use a matrix approach, which considers information regarding securities with similar characteristics to determine the valuation for a security. Short-term debt obligations purchased with a remaining maturity of sixty days or less for which a valuation from a third party pricing service is not readily available may be valued at amortized cost, which approximates fair value.
Derivatives. Financial futures contracts are valued at the closing settlement price established by the board of trade or exchange on which they are traded.
Fair Valuation. Investments for which valuations or market quotations are not readily available or are deemed unreliable are valued at fair value using methods determined in good faith by or at the direction of the Trustees of a Fund in a manner that most fairly reflects the security’s “fair value”, which is the amount that a Fund might reasonably expect to receive for the security upon its current sale in the ordinary course. Each such determination is based on a consideration of relevant factors, which are likely to vary from one pricing context to another. These factors may include, but are not limited to, the type of security, the existence of any contractual restrictions on the security’s disposition, the price and extent of public trading in similar securities of the issuer or of comparable entities, quotations or relevant information obtained from broker/dealers or other market participants, information obtained from the issuer, analysts, and/or the appropriate stock exchange (for exchange-traded securities), an analysis of the entity’s financial statements, and an evaluation of the forces that influence the issuer and the market(s) in which the security is purchased and sold.
B Investment Transactions and Related Income — Investment transactions for financial statement purposes are accounted for on a trade date basis. Realized gains and losses on investments sold are determined on the basis of identified cost. Interest income is recorded on the basis of interest accrued, adjusted for amortization of premium or accretion of discount.
C Federal Taxes — Each Fund’s policy is to comply with the provisions of the Internal Revenue Code applicable to regulated investment companies and to distribute to shareholders each year substantially all of its taxable, if any, and tax-exempt net investment income, and all or substantially all of its net realized capital gains. Accordingly, no provision for federal income or excise tax is necessary. Each Fund intends to satisfy conditions which will enable it to designate distributions from the interest income generated by its investments in non-taxable municipal securities, which are exempt from regular federal income tax when received by each Fund, as exempt-interest dividends. The portion of such interest, if any, earned on private activity bonds issued after August 7, 1986, may be considered a tax preference item to shareholders.
As of March 31, 2021, the Funds had no uncertain tax positions that would require financial statement recognition, de-recognition, or disclosure. Each Fund files a U.S. federal income tax return annually after its fiscal year-end, which is subject to examination by the Internal Revenue Service for a period of three years from the date of filing.
D Expenses — The majority of expenses of the Trust are directly identifiable to an individual fund. Expenses which are not readily identifiable to a specific fund are allocated taking into consideration, among other things, the nature and type of expense and the relative size of the funds.
E Legal Fees — Legal fees and other related expenses incurred as part of negotiations of the terms and requirement of capital infusions, or that are expected to result in the restructuring of, or a plan of reorganization for, an investment are recorded as realized losses. Ongoing expenditures to protect or enhance an investment are treated as operating expenses.
Eaton Vance
Municipal Income Funds
March 31, 2021
Notes to Financial Statements (Unaudited) — continued
F Use of Estimates — The preparation of the financial statements in conformity with U.S. GAAP requires management to make estimates and assumptions that affect the reported amounts of assets and liabilities at the date of the financial statements and the reported amounts of income and expense during the reporting period. Actual results could differ from those estimates.
G Indemnifications — Under the Trust’s organizational documents, its officers and Trustees may be indemnified against certain liabilities and expenses arising out of the performance of their duties to the Funds. Under Massachusetts law, if certain conditions prevail, shareholders of a Massachusetts business trust (such as the Trust) could be deemed to have personal liability for the obligations of the Trust. However, the Trust’s Declaration of Trust contains an express disclaimer of liability on the part of Fund shareholders and the By-laws provide that the Trust shall assume, upon request by the shareholder, the defense on behalf of any Fund shareholders. Moreover, the By-laws also provide for indemnification out of Fund property of any shareholder held personally liable solely by reason of being or having been a shareholder for all loss or expense arising from such liability. Additionally, in the normal course of business, each Fund enters into agreements with service providers that may contain indemnification clauses. Each Fund’s maximum exposure under these arrangements is unknown as this would involve future claims that may be made against each Fund that have not yet occurred.
H Floating Rate Notes Issued in Conjunction with Securities Held — The Funds may invest in residual interest bonds, also referred to as inverse floating rate securities, whereby a Fund may sell a variable or fixed rate bond for cash to a Special-Purpose Vehicle (the SPV), (which is generally organized as a trust), while at the same time, buying a residual interest in the assets and cash flows of the SPV. The bond is deposited into the SPV with the same CUSIP number as the bond sold to the SPV by the Fund, and which may have been, but is not required to be, the bond purchased from the Fund (the Bond). The SPV also issues floating rate notes (Floating Rate Notes) which are sold to third-parties. The residual interest bond held by a Fund gives the Fund the right (1) to cause the holders of the Floating Rate Notes to generally tender their notes at par, and (2) to have the Bond held by the SPV transferred to the Fund, thereby terminating the SPV. Should the Fund exercise such right, it would generally pay the SPV the par amount due on the Floating Rate Notes and exchange the residual interest bond for the underlying Bond. Pursuant to generally accepted accounting principles for transfers and servicing of financial assets and extinguishment of liabilities, the Funds account for the transaction described above as a secured borrowing by including the Bond in their Portfolio of Investments and the Floating Rate Notes as a liability under the caption “Payable for floating rate notes issued” in their Statement of Assets and Liabilities. The Floating Rate Notes have interest rates that generally reset weekly and their holders have the option to tender their notes to the SPV for redemption at par at each reset date. Accordingly, the fair value of the payable for floating rate notes issued approximates its carrying value. If measured at fair value, the payable for floating rate notes would have been considered as Level 2 in the fair value hierarchy (see Note 10) at March 31, 2021. Interest expense related to a Fund’s liability with respect to Floating Rate Notes is recorded as incurred. The SPV may be terminated by the Fund, as noted above, or by the occurrence of certain termination events as defined in the trust agreement, such as a downgrade in the credit quality of the underlying Bond, bankruptcy of or payment failure by the issuer of the underlying Bond, the inability to remarket Floating Rate Notes that have been tendered due to insufficient buyers in the market, or the failure by the SPV to obtain renewal of the liquidity agreement under which liquidity support is provided for the Floating Rate Notes up to one year. At March 31, 2021, the amounts of the Funds’ Floating Rate Notes and related interest rates and collateral were as follows:
| | | | | | | | |
| | | Massachusetts
Fund | | | Ohio
Fund | |
| | |
Floating Rate Notes Outstanding | | $ | 3,701,188 | | | $ | 9,215,397 | |
| | |
Interest Rate or Range of Interest Rates (%) | | | 0.10 | | | | 0.10-0.16 | |
| | |
Collateral for Floating Rate Notes Outstanding | | $ | 7,651,644 | | | $ | 15,780,641 | |
For the six months ended March 31, 2021, the Funds’ average settled Floating Rate Notes outstanding and the average interest rate (annualized) including fees were as follows:
| | | | | | | | |
| | | Massachusetts
Fund | | | Ohio
Fund | |
| | |
Average Floating Rate Notes Outstanding | | $ | 3,640,000 | | | $ | 9,120,000 | |
| | |
Average Interest Rate | | | 0.24 | % | | | 0.66 | % |
In certain circumstances, the Funds may enter into shortfall and forbearance agreements with brokers by which a Fund agrees to reimburse the broker for the difference between the liquidation value of the Bond held by the SPV and the liquidation value of the Floating Rate Notes, as well as any shortfalls in interest cash flows. The Funds had no shortfalls as of March 31, 2021.
The Funds may also purchase residual interest bonds in a secondary market transaction without first owning the underlying bond. Such transactions are not required to be treated as secured borrowings. Shortfall agreements, if any, related to residual interest bonds purchased in a secondary market transaction are disclosed in the Portfolio of Investments.
Eaton Vance
Municipal Income Funds
March 31, 2021
Notes to Financial Statements (Unaudited) — continued
The Funds’ investment policies and restrictions expressly permit investments in residual interest bonds. Such bonds typically offer the potential for yields exceeding the yields available on fixed rate bonds with comparable credit quality and maturity. These securities tend to underperform the market for fixed rate bonds in a rising long-term interest rate environment, but tend to outperform the market for fixed rate bonds when long-term interest rates decline. The value and income of residual interest bonds are generally more volatile than that of a fixed rate bond. The Funds’ investment policies do not allow the Funds to borrow money except as permitted by the 1940 Act. Management believes that the Funds’ restrictions on borrowing money and issuing senior securities (other than as specifically permitted) do not apply to Floating Rate Notes issued by the SPV and included as a liability in the Funds’ Statement of Assets and Liabilities. As secured indebtedness issued by an SPV, Floating Rate Notes are distinct from the borrowings and senior securities to which the Funds’ restrictions apply. Residual interest bonds held by the Funds are securities exempt from registration under Rule 144A of the Securities Act of 1933.
I Financial Futures Contracts — Upon entering into a financial futures contract, a Fund is required to deposit with the broker, either in cash or securities, an amount equal to a certain percentage of the contract amount (initial margin). Subsequent payments, known as variation margin, are made or received by the Fund each business day, depending on the daily fluctuations in the value of the underlying security, and are recorded as unrealized gains or losses by the Fund. Gains (losses) are realized upon the expiration or closing of the financial futures contracts. Should market conditions change unexpectedly, the Fund may not achieve the anticipated benefits of the financial futures contracts and may realize a loss. Futures contracts have minimal counterparty risk as they are exchange traded and the clearinghouse for the exchange is substituted as the counterparty, guaranteeing counterparty performance.
J When-Issued Securities and Delayed Delivery Transactions — The Funds may purchase or sell securities on a delayed delivery or when-issued basis. Payment and delivery may take place after the customary settlement period for that security. At the time the transaction is negotiated, the price of the security that will be delivered is fixed. The Funds maintain cash and/or security positions for these commitments such that sufficient liquid assets will be available to make payments upon settlement. Securities purchased on a delayed delivery or when-issued basis are marked-to-market daily and begin earning interest on settlement date. Losses may arise due to changes in the market value of the underlying securities or if the counterparty does not perform under the contract.
K Interim Financial Statements — The interim financial statements relating to March 31, 2021 and for the six months then ended have not been audited by an independent registered public accounting firm, but in the opinion of the Funds’ management, reflect all adjustments, consisting only of normal recurring adjustments, necessary for the fair presentation of the financial statements.
2 Distributions to Shareholders and Income Tax Information
The net investment income of each Fund is determined daily and substantially all of the net investment income so determined is declared as a dividend to shareholders of record at the time of declaration. Distributions are declared separately for each class of shares. Distributions are paid monthly. Distributions of realized capital gains are made at least annually. Shareholders may reinvest income and capital gain distributions in additional shares of the same class of a Fund at the net asset value as of the reinvestment date or, at the election of the shareholder, receive distributions in cash. Distributions to shareholders are determined in accordance with income tax regulations, which may differ from U.S. GAAP. As required by U.S. GAAP, only distributions in excess of tax basis earnings and profits are reported in the financial statements as a return of capital. Permanent differences between book and tax accounting relating to distributions are reclassified to paid-in capital. For tax purposes, distributions from short-term capital gains are considered to be from ordinary income.
At September 30, 2020, the following Funds, for federal income tax purposes, had deferred capital losses which would reduce the respective Fund’s taxable income arising from future net realized gains on investment transactions, if any, to the extent permitted by the Internal Revenue Code, and thus would reduce the amount of distributions to shareholders, which would otherwise be necessary to relieve the Funds of any liability for federal income or excise tax. The deferred capital losses are treated as arising on the first day of a Fund’s next taxable year and retain the same short-term or long-term character as when originally deferred. The amounts of the deferred capital losses are as follows:
| | | | | | | | | | | | | | | | |
| | | California
Opportunities
Fund | | | Massachusetts
Fund | | | New York
Fund | | | Ohio
Fund | |
| | | | |
Deferred capital losses: | | | | | | | | | | | | | | | | |
| | | | |
Short-term | | $ | — | | | $ | 499,676 | | | $ | — | | | $ | 5,298,973 | |
| | | | |
Long-term | | $ | — | | | $ | 47,684 | | | $ | — | | | $ | 4,977,725 | |
Eaton Vance
Municipal Income Funds
March 31, 2021
Notes to Financial Statements (Unaudited) — continued
The cost and unrealized appreciation (depreciation) of investments, including open derivative contracts, of each Fund at March 31, 2021, as determined on a federal income tax basis, were as follows:
| | | | | | | | | | | | | | | | |
| | | California
Opportunities
Fund | | | Massachusetts
Fund | | | New York
Fund | | | Ohio
Fund | |
| | | | |
Aggregate cost | | $ | 627,223,419 | | | $ | 171,102,375 | | | $ | 391,521,524 | | | $ | 161,262,339 | |
| | | | |
Gross unrealized appreciation | | $ | 22,613,748 | | | $ | 14,575,799 | | | $ | 19,068,245 | | | $ | 18,754,803 | |
| | | | |
Gross unrealized depreciation | | | (2,431,042 | ) | | | (215,470 | ) | | | (2,232,924 | ) | | | (302,691 | ) |
| | | | |
Net unrealized appreciation | | $ | 20,182,706 | | | $ | 14,360,329 | | | $ | 16,835,321 | | | $ | 18,452,112 | |
3 Investment Adviser Fee and Other Transactions with Affiliates
The investment adviser fee is earned by Boston Management and Research (BMR) as compensation for investment advisory services rendered to each Fund. On March 1, 2021, Morgan Stanley acquired Eaton Vance Corp. (the “Transaction”) and BMR became an indirect, wholly-owned subsidiary of Morgan Stanley. In connection with the Transaction, each Fund entered into a new investment advisory agreement (the “New Agreement”) with BMR, which took effect on March 1, 2021. Pursuant to the New Agreement (and each Fund’s investment advisory agreement with BMR in effect prior to March 1, 2021), the fee is based upon a percentage of total daily net assets plus a percentage of total daily gross income (i.e., income other than gains from the sale of securities) as presented in the following table (except for California Opportunities Fund) and is payable monthly.
| | | | | | | | |
| Daily Net Assets | | Annual Asset
Rate | | | Daily Income
Rate | |
| | |
Up to $20 million | | | 0.10 | % | | | 1.00 | % |
| | |
$20 million but less than $40 million | | | 0.20 | | | | 2.00 | |
| | |
$40 million but less than $500 million | | | 0.30 | | | | 3.00 | |
On daily net assets of $500 million or more, the rates are reduced. For California Opportunities Fund, the annual asset rate and daily income rate are as follows: 0.30% and 3.00%, respectively, on daily net assets of up to $500 million; 0.275% and 2.75%, respectively, on daily net assets of $500 million but less than $1 billion, and at reduced rates on daily net assets of $1 billion or more.
For the six months ended March 31, 2021, investment adviser fees incurred by the Funds and the effective annual rates, as a percentage of average daily net assets, were as follows:
| | | | | | | | | | | | | | | | |
| | | California
Opportunities
Fund | | | Massachusetts
Fund | | | New York
Fund | | | Ohio
Fund | |
| | | | |
Investment Adviser Fee | | $ | 1,135,329 | | | $ | 362,909 | | | $ | 790,965 | | | $ | 331,523 | |
| | | | |
Effective Annual Rate | | | 0.35 | % | | | 0.34 | % | | | 0.35 | % | | | 0.36 | % |
Eaton Vance Management (EVM), an affiliate of BMR and, effective March 1, 2021, an indirect, wholly-owned subsidiary of Morgan Stanley, serves as the administrator of each Fund, but receives no compensation. EVM provides sub-transfer agency and related services to the Funds pursuant to a Sub-Transfer Agency Support Services Agreement. Eaton Vance Distributors, Inc. (EVD), an affiliate of EVM and the Funds’ principal underwriter, received a portion of the sales charge on sales of Class A shares of the Funds. EVD also received distribution and service fees from Class A and Class C shares (see Note 4) and contingent deferred sales charges (see Note 5). Sub-transfer agent fees earned by EVM, which are included in transfer and dividend disbursing agent fees
Eaton Vance
Municipal Income Funds
March 31, 2021
Notes to Financial Statements (Unaudited) — continued
on the Statements of Operations, and Class A sales charges that the Funds were informed were received by EVD for the six months ended March 31, 2021 were as follows:
| | | | | | | | | | | | | | | | |
| | | California
Opportunities
Fund | | | Massachusetts
Fund | | | New York
Fund | | | Ohio
Fund | |
| | | | |
EVM’s Sub-Transfer Agent Fees | | $ | 306 | | | $ | 351 | | | $ | 434 | | | $ | 150 | |
| | | | |
EVD’s Class A Sales Charges | | $ | 6,295 | | | $ | 3,658 | | | $ | 13,642 | | | $ | 16,015 | |
Trustees and officers of the Funds who are members of EVM’s or BMR’s organizations receive remuneration for their services to the Funds out of the investment adviser fee. Trustees of the Funds who are not affiliated with the investment adviser may elect to defer receipt of all or a percentage of their annual fees in accordance with the terms of the Trustees Deferred Compensation Plan. For the six months ended March 31, 2021, no significant amounts have been deferred. Certain officers and Trustees of the Funds are officers of the above organizations.
4 Distribution Plans
Each Fund has in effect a distribution plan for Class A shares (Class A Plan) pursuant to Rule 12b-1 under the 1940 Act. The Class A Plan provides that each Fund will pay EVD a distribution and service fee not exceeding 0.25% per annum of its average daily net assets attributable to Class A shares for distribution services and facilities provided to each Fund by EVD, as well as for personal services and/or the maintenance of shareholder accounts. The Trustees approved distribution and service fee payments equal to 0.20% (0.25% for California Opportunities Fund) per annum of each Fund’s average daily net assets attributable to Class A shares. Distribution and service fees paid or accrued to EVD for the six months ended March 31, 2021 for Class A shares amounted to the following:
| | | | | | | | | | | | | | | | |
| | | California
Opportunities
Fund | | | Massachusetts
Fund | | | New York
Fund | | | Ohio
Fund | |
| | | | |
Class A Distribution and Service Fees | | $ | 187,937 | | | $ | 100,503 | | | $ | 246,812 | | | $ | 109,708 | |
Each Fund also has in effect a distribution plan for Class C shares (Class C Plan) pursuant to Rule 12b-1 under the 1940 Act. Pursuant to the Class C Plan, each Fund pays EVD amounts equal to 0.75% per annum of its average daily net assets attributable to Class C shares for providing ongoing distribution services and facilities to the respective Funds. For the six months ended March 31, 2021, the Funds paid or accrued to EVD the following distribution fees:
| | | | | | | | | | | | | | | | |
| | | California
Opportunities
Fund | | | Massachusetts
Fund | | | New York
Fund | | | Ohio
Fund | |
| | | | |
Class C Distribution Fees | | $ | 111,812 | | | $ | 33,437 | | | $ | 106,636 | | | $ | 37,972 | |
The Class C Plan also authorizes each Fund to make payments of service fees to EVD, financial intermediaries and other persons in amounts not exceeding 0.25% per annum of the average daily net assets attributable to Class C shares. The Trustees approved service fee payments equal to 0.20% (0.25% for California Opportunities Fund) per annum of each Fund’s average daily net assets attributable to Class C shares. Service fees paid or accrued are for personal services and/or the maintenance of shareholder accounts. They are separate and distinct from the Class C sales commissions and distribution fees payable to EVD. Service fees paid or accrued for the six months ended March 31, 2021 amounted to the following:
| | | | | | | | | | | | | | | | |
| | | California
Opportunities
Fund | | | Massachusetts
Fund | | | New York
Fund | | | Ohio
Fund | |
| | | | |
Class C Service Fees | | $ | 37,271 | | | $ | 8,916 | | | $ | 28,436 | | | $ | 10,126 | |
Distribution and service fees are subject to the limitations contained in the Financial Industry Regulatory Authority Rule 2341(d).
Eaton Vance
Municipal Income Funds
March 31, 2021
Notes to Financial Statements (Unaudited) — continued
5 Contingent Deferred Sales Charges
A contingent deferred sales charge (CDSC) of 1% generally is imposed on redemptions of Class C shares made within 12 months of purchase. Class A shares may be subject to a 1% CDSC if redeemed within 18 months of purchase (depending on the circumstances of purchase). Generally, the CDSC is based upon the lower of the net asset value at date of redemption or date of purchase. No charge is levied on shares acquired by reinvestment of dividends or capital gain distributions. For the six months ended March 31, 2021, the Funds were informed that EVD received approximately the following amounts of CDSCs paid by Class A and Class C shareholders:
| | | | | | | | | | | | | | | | |
| | | California
Opportunities
Fund | | | Massachusetts
Fund | | | New York
Fund | | | Ohio
Fund | |
| | | | |
Class A | | $ | 200 | | | $ | — | | | $ | — | | | $ | — | |
| | | | |
Class C | | $ | 1,000 | | | $ | — | | | $ | 3,000 | | | $ | 300 | |
6 Purchases and Sales of Investments
Purchases and sales of investments, other than short-term obligations, for the six months ended March 31, 2021 were as follows:
| | | | | | | | | | | | | | | | |
| | | California
Opportunities
Fund | | | Massachusetts
Fund | | | New York
Fund | | | Ohio
Fund | |
| | | | |
Purchases | | $ | 445,090,540 | | | $ | 14,235,937 | | | $ | 160,113,162 | | | $ | 13,659,091 | |
| | | | |
Sales | | $ | 381,259,314 | | | $ | 12,560,449 | | | $ | 160,652,838 | | | $ | 5,332,686 | |
7 Shares of Beneficial Interest
Each Fund’s Declaration of Trust permits the Trustees to issue an unlimited number of full and fractional shares of beneficial interest (without par value). Such shares may be issued in a number of different series (such as the Funds) and classes. Transactions in Fund shares were as follows:
| | | | | | | | | | | | |
California Opportunities Fund | | | | | | | | | |
| | | Six Months Ended March 31, 2021 (Unaudited) | |
| | | Class A | | | Class C | | | Class I | |
| | | |
Sales | | | 1,266,870 | | | | 543,774 | | | | 14,611,797 | |
| | | |
Issued to shareholders electing to receive payments of distributions in Fund shares | | | 107,237 | | | | 15,295 | | | | 379,222 | |
| | | |
Redemptions | | | (1,318,284 | ) | | | (290,422 | ) | | | (5,159,475 | ) |
| | | |
Converted from Class C shares | | | 103,909 | | | | — | | | | — | |
| | | |
Converted to Class A shares | | | — | | | | (112,420 | ) | | | — | |
| | | |
Net increase | | | 159,732 | | | | 156,227 | | | | 9,831,544 | |
| |
| | | Year Ended September 30, 2020 | |
| | | Class A | | | Class C | | | Class I | |
| | | |
Sales | | | 4,353,170 | | | | 1,054,708 | | | | 27,619,182 | |
| | | |
Issued to shareholders electing to receive payments of distributions in Fund shares | | | 233,475 | | | | 40,483 | | | | 550,014 | |
| | | |
Redemptions | | | (2,847,678 | ) | | | (926,093 | ) | | | (8,744,787 | ) |
| | | |
Converted from Class C shares | | | 62,761 | | | | — | | | | — | |
| | | |
Converted to Class A shares | | | — | | | | (67,889 | ) | | | — | |
| | | |
Net increase | | | 1,801,728 | | | | 101,209 | | | | 19,424,409 | |
Eaton Vance
Municipal Income Funds
March 31, 2021
Notes to Financial Statements (Unaudited) — continued
| | | | | | | | | | | | |
Massachusetts Fund | | | | | | | | | |
| | | Six Months Ended March 31, 2021 (Unaudited) | |
| | | Class A | | | Class C | | | Class I | |
| | | |
Sales | | | 711,614 | | | | 87,305 | | | | 2,396,568 | |
| | | |
Issued to shareholders electing to receive payments of distributions in Fund shares | | | 95,447 | | | | 5,796 | | | | 100,053 | |
| | | |
Redemptions | | | (798,446 | ) | | | (47,325 | ) | | | (1,195,409 | ) |
| | | |
Converted from Class C shares | | | 182,943 | | | | — | | | | — | |
| | | |
Converted to Class A shares | | | — | | | | (182,938 | ) | | | — | |
| | | |
Net increase (decrease) | | | 191,558 | | | | (137,162 | ) | | | 1,301,212 | |
| |
| | | Year Ended September 30, 2020 | |
| | | Class A | | | Class C | | | Class I | |
| | | |
Sales | | | 1,272,606 | | | | 185,726 | | | | 5,336,738 | |
| | | |
Issued to shareholders electing to receive payments of distributions in Fund shares | | | 223,214 | | | | 19,756 | | | | 192,513 | |
| | | |
Redemptions | | | (1,020,919 | ) | | | (293,865 | ) | | | (1,925,528 | ) |
| | | |
Converted from Class C shares | | | 218,881 | | | | — | | | | — | |
| | | |
Converted to Class A shares | | | — | | | | (218,863 | ) | | | — | |
| | | |
Net increase (decrease) | | | 693,782 | | | | (307,246 | ) | | | 3,603,723 | |
| | | |
New York Fund | | | | | | | | | |
| | | Six Months Ended March 31, 2021 (Unaudited) | |
| | | Class A | | | Class C | | | Class I | |
| | | |
Sales | | | 1,930,721 | | | | 169,919 | | | | 3,372,506 | |
| | | |
Issued to shareholders electing to receive payments of distributions in Fund shares | | | 672,631 | | | | 67,725 | | | | 439,514 | |
| | | |
Redemptions | | | (1,231,148 | ) | | | (469,200 | ) | | | (1,867,612 | ) |
| | | |
Converted from Class C shares | | | 268,290 | | | | — | | | | — | |
| | | |
Converted to Class A shares | | | — | | | | (268,263 | ) | | | — | |
| | | |
Net increase (decrease) | | | 1,640,494 | | | | (499,819 | ) | | | 1,944,408 | |
| |
| | | Year Ended September 30, 2020 | |
| | | Class A | | | Class C | | | Class I | |
| | | |
Sales | | | 2,826,972 | | | | 413,817 | | | | 5,202,310 | |
| | | |
Issued to shareholders electing to receive payments of distributions in Fund shares | | | 442,448 | | | | 40,441 | | | | 272,329 | |
| | | |
Redemptions | | | (3,100,933 | ) | | | (1,210,405 | ) | | | (2,841,917 | ) |
| | | |
Converted from Class C shares | | | 169,249 | | | | — | | | | — | |
| | | |
Converted to Class A shares | | | — | | | | (169,222 | ) | | | — | |
| | | |
Net increase (decrease) | | | 337,736 | | | | (925,369 | ) | | | 2,632,722 | |
Eaton Vance
Municipal Income Funds
March 31, 2021
Notes to Financial Statements (Unaudited) — continued
| | | | | | | | | | | | |
Ohio Fund | | | | | | | | | |
| | | Six Months Ended March 31, 2021 (Unaudited) | |
| | | Class A | | | Class C | | | Class I | |
| | | |
Sales | | | 1,119,395 | | | | 229,793 | | | | 1,537,599 | |
| | | |
Issued to shareholders electing to receive payments of distributions in Fund shares | | | 135,929 | | | | 9,661 | | | | 89,705 | |
| | | |
Redemptions | | | (927,481 | ) | | | (147,340 | ) | | | (1,345,040 | ) |
| | | |
Converted from Class C shares | | | 137,698 | | | | — | | | | — | |
| | | |
Converted to Class A shares | | | — | | | | (137,837 | ) | | | — | |
| | | |
Net increase (decrease) | | | 465,541 | | | | (45,723 | ) | | | 282,264 | |
| |
| | | Year Ended September 30, 2020 | |
| | | Class A | | | Class C | | | Class I | |
| | | |
Sales | | | 1,386,374 | | | | 207,595 | | | | 2,266,721 | |
| | | |
Issued to shareholders electing to receive payments of distributions in Fund shares | | | 278,037 | | | | 23,808 | | | | 166,691 | |
| | | |
Redemptions | | | (1,614,683 | ) | | | (345,970 | ) | | | (1,070,260 | ) |
| | | |
Converted from Class C shares | | | 163,567 | | | | — | | | | — | |
| | | |
Converted to Class A shares | | | — | | | | (163,645 | ) | | | — | |
| | | |
Net increase (decrease) | | | 213,295 | | | | (278,212 | ) | | | 1,363,152 | |
8 Line of Credit
The Funds participate with other portfolios and funds managed by EVM and its affiliates in an $800 million unsecured line of credit agreement with a group of banks, which is in effect through October 26, 2021. Borrowings are made by the Funds solely for temporary purposes related to redemptions and other short-term cash needs. Interest is charged to each Fund based on its borrowings at an amount above either the Eurodollar rate or Federal Funds rate. In addition, a fee computed at an annual rate of 0.15% on the daily unused portion of the line of credit is allocated among the participating portfolios and funds at the end of each quarter. In connection with the renewal of the agreement in October 2020, an upfront fee and arrangement fee totaling $950,000 was incurred that was allocated to the participating portfolios and funds. Because the line of credit is not available exclusively to the Funds, a Fund may be unable to borrow some or all of its requested amounts at any particular time. The Funds did not have any significant borrowings or allocated fees during the six months ended March 31, 2021.
9 Financial Instruments
The Funds may trade in financial instruments with off-balance sheet risk in the normal course of their investing activities. These financial instruments may include financial futures contracts and may involve, to a varying degree, elements of risk in excess of the amounts recognized for financial statement purposes. The notional or contractual amounts of these instruments represent the investment a Fund has in particular classes of financial instruments and do not necessarily represent the amounts potentially subject to risk. The measurement of the risks associated with these instruments is meaningful only when all related and offsetting transactions are considered. A summary of obligations under these financial instruments at March 31, 2021 is included in the Portfolio of Investments. At March 31, 2021, the Ohio and New York Funds had sufficient cash and/or securities to cover commitments under these contracts.
Each Fund is subject to interest rate risk in the normal course of pursuing its investment objective. Because the Funds hold fixed-rate bonds, the value of these bonds may decrease if interest rates rise. During the six months ended March 31, 2021, the Ohio and New York Funds entered into U.S. Treasury futures contracts to hedge against changes in interest rates.
Eaton Vance
Municipal Income Funds
March 31, 2021
Notes to Financial Statements (Unaudited) — continued
The fair values of open derivative instruments (not considered to be hedging instruments for accounting disclosure purposes) and whose primary underlying risk exposure is interest rate risk at March 31, 2021 were as follows:
| | | | | | | | |
| | | New York
Fund | | | Ohio
Fund | |
| | |
Asset Derivative: | | | | | | | | |
| | |
Futures Contracts | | $ | 515,350 | (1) | | $ | 136,819 | (1) |
| | |
Total | | $ | 515,350 | | | $ | 136,819 | |
| (1) | Only the current day’s variation margin on open futures contracts is reported within the Statements of Assets and Liabilities as Receivable or Payable for variation margin on open financial futures contracts, as applicable. |
The effect of derivative instruments (not considered to be hedging instruments for accounting disclosure purposes) on the Statements of Operations and whose primary underlying risk exposure is interest rate risk for the six months ended March 31, 2021 was as follows:
| | | | | | | | |
| | | New York
Fund | | | Ohio
Fund | |
| | |
Realized Gain (Loss) on Derivatives Recognized in Income | | $ | 896,683 | (1) | | $ | 506,024 | (1) |
| | |
Change in Unrealized Appreciation (Depreciation) on Derivatives Recognized in Income | | $ | 515,350 | (2) | | $ | 138,751 | (2) |
| (1) | Statements of Operations location: Net realized gain (loss) – Financial futures contracts. |
| (2) | Statements of Operations location: Change in unrealized appreciation (depreciation) – Financial futures contracts. |
The average notional cost of futures contracts outstanding during the six months ended March 31, 2021, which is indicative of the volume of this derivative type, was approximately as follows:
| | | | | | | | |
| | | New York
Fund | | | Ohio
Fund | |
| | |
Average Notional Cost: | | | | | | | | |
| | |
Futures Contracts — Short | | $ | 7,861,000 | | | $ | 5,128,000 | |
10 Fair Value Measurements
Under generally accepted accounting principles for fair value measurements, a three-tier hierarchy to prioritize the assumptions, referred to as inputs, is used in valuation techniques to measure fair value. The three-tier hierarchy of inputs is summarized in the three broad levels listed below.
| • | | Level 1 – quoted prices in active markets for identical investments |
| • | | Level 2 – other significant observable inputs (including quoted prices for similar investments, interest rates, prepayment speeds, credit risk, etc.) |
| • | | Level 3 – significant unobservable inputs (including a fund’s own assumptions in determining the fair value of investments) |
In cases where the inputs used to measure fair value fall in different levels of the fair value hierarchy, the level disclosed is determined based on the lowest level input that is significant to the fair value measurement in its entirety. The inputs or methodology used for valuing securities are not necessarily an indication of the risk associated with investing in those securities.
Eaton Vance
Municipal Income Funds
March 31, 2021
Notes to Financial Statements (Unaudited) — continued
At March 31, 2021, the hierarchy of inputs used in valuing the Funds’ investments and open derivative instruments, which are carried at value, were as follows:
| | | | | | | | | | | | | | | | |
California Opportunities Fund | |
| Asset Description | | Level 1 | | | Level 2 | | | Level 3 | | | Total | |
| | | | |
Corporate Bonds | | $ | — | | | $ | 5,397,035 | | | $ | — | | | $ | 5,397,035 | |
| | | | |
Tax-Exempt Mortgage-Backed Securities | | | — | | | | 2,997,278 | | | | — | | | | 2,997,278 | |
| | | | |
Tax-Exempt Municipal Obligations | | | — | | | | 607,622,541 | | | | — | | | | 607,622,541 | |
| | | | |
Taxable Municipal Obligations | | | — | | | | 31,389,271 | | | | — | | | | 31,389,271 | |
| | | | |
Total Investments | | $ | — | | | $ | 647,406,125 | | | $ | — | | | $ | 647,406,125 | |
| | | | |
Massachusetts Fund | | | | | | | | | | | | |
| Asset Description | | Level 1 | | | Level 2 | | | Level 3 | | | Total | |
| | | | |
Tax-Exempt Municipal Obligations | | $ | — | | | $ | 175,578,312 | | | $ | — | | | $ | 175,578,312 | |
| | | | |
Taxable Municipal Obligations | | | — | | | | 13,585,580 | | | | — | | | | 13,585,580 | |
| | | | |
Total Investments | | $ | — | | | $ | 189,163,892 | | | $ | — | | | $ | 189,163,892 | |
| | | | |
New York Fund | | | | | | | | | | | | |
| Asset Description | | Level 1 | | | Level 2 | | | Level 3* | | | Total | |
| | | | |
Corporate Bonds | | $ | — | | | $ | 2,696,153 | | | $ | — | | | $ | 2,696,153 | |
| | | | |
Tax-Exempt Municipal Obligations | | | — | | | | 392,830,974 | | | | — | | | | 392,830,974 | |
| | | | |
Taxable Municipal Obligations | | | — | | | | 11,440,983 | | | | — | | | | 11,440,983 | |
| | | | |
Miscellaneous | | | — | | | | — | | | | 873,385 | | | | 873,385 | |
| | | | |
Total Investments | | $ | — | | | $ | 406,968,110 | | | $ | 873,385 | | | $ | 407,841,495 | |
| | | | |
Futures Contracts | | $ | 515,350 | | | $ | — | | | $ | — | | | $ | 515,350 | |
| | | | |
Total | | $ | 515,350 | | | $ | 406,968,110 | | | $ | 873,385 | | | $ | 408,356,845 | |
| | | | |
Ohio Fund | | | | | | | | | | | | |
| Asset Description | | Level 1 | | | Level 2 | | | Level 3 | | | Total | |
| | | | |
Tax-Exempt Municipal Obligations | | $ | — | | | $ | 188,793,029 | | | $ | — | | | $ | 188,793,029 | |
| | | | |
Total Investments | | $ | — | | | $ | 188,793,029 | | | $ | — | | | $ | 188,793,029 | |
| | | | |
Futures Contracts | | $ | 136,819 | | | $ | — | | | $ | — | | | $ | 136,819 | |
| | | | |
Total | | $ | 136,819 | | | $ | 188,793,029 | | | $ | — | | | $ | 188,929,848 | |
| * | None of the unobservable inputs for Level 3 assets, individually or collectively, had a material impact on the New York Fund. |
Level 3 investments held by the New York Fund at the beginning and/or end of the period in relation to net assets were not significant and accordingly, a reconciliation of Level 3 assets for the six months ended March 31, 2021 is not presented.
Eaton Vance
Municipal Income Funds
March 31, 2021
Notes to Financial Statements (Unaudited) — continued
11 Risks and Uncertainties
Pandemic Risk
An outbreak of respiratory disease caused by a novel coronavirus was first detected in China in late 2019 and subsequently spread internationally. This coronavirus has resulted in closing borders, enhanced health screenings, changes to healthcare service preparation and delivery, quarantines, cancellations, disruptions to supply chains and customer activity, as well as general concern and uncertainty. Health crises caused by outbreaks, such as the coronavirus outbreak, may exacerbate other pre-existing political, social and economic risks and disrupt normal market conditions and operations. The impact of this outbreak has negatively affected the worldwide economy, the economies of individual countries, individual companies, and the market in general, and may continue to do so in significant and unforeseen ways, as may other epidemics and pandemics that may arise in the future. Any such
impact could adversely affect the Funds’ performance, or the performance of the securities in which the Funds invest.
Eaton Vance
Municipal Income Funds
March 31, 2021
Joint Special Meeting of Shareholders (Unaudited)
The Funds held a Joint Special Meeting of Shareholders with certain other Eaton Vance funds on February 18, 2021 in order to approve a new investment advisory agreement with Boston Management and Research to serve as the Funds’ investment adviser (the “Proposal”). The shareholder meeting results are as follows:
| | | | | | | | | | | | | | | | |
| | | Number of Shares(1) | |
| | | For | | | Against | | | Abstain(2) | | | Broker
Non-Votes(2) | |
| | | | |
California Municipal Opportunities Fund | | | 27,878,654.319 | | | | 502,961,035 | | | | 1,713,146.610 | | | | 0 | |
| | | | |
Massachusetts Municipal Income Fund | | | 12,024,356.697 | | | | 434,497.631 | | | | 772,728.455 | | | | 0 | |
| | | | |
New York Municipal Income Fund | | | 21,354,794.011 | | | | 344,738.132 | | | | 1,344,918.931 | | | | 0 | |
| | | | |
Ohio Municipal Income Fund | | | 9,929,539.805 | | | | 190,454.009 | | | | 698,260.420 | | | | 0 | |
| (1) | Fractional shares were voted proportionately. |
| (2) | Abstentions and broker non-votes (i.e., shares for which a broker returns a proxy but for which (i) the beneficial owner has not voted and (ii) the broker holding the shares does not have discretionary authority to vote on the particular matter) were treated as shares that were present at the meeting for purposes of establishing a quorum, but had the effect of a negative vote on the Proposal. |
Eaton Vance
Municipal Income Funds
March 31, 2021
Board of Trustees’ Contract Approval
Overview of the Contract Review Process
Even though the following description of the Board’s (as defined below) consideration of investment advisory and, as applicable, sub-advisory agreements covers multiple funds, for purposes of this shareholder report, the description is only relevant as to Eaton Vance California Municipal Opportunities Fund, Eaton Vance Massachusetts Municipal Income Fund, Eaton Vance New York Municipal Income Fund and Eaton Vance Ohio Municipal Income Fund.
| | | | |
| Fund | | Investment Adviser | | Investment Sub-Adviser |
| | |
Eaton Vance California Municipal Opportunities Fund | | Boston Management and Research | | None |
Eaton Vance Massachusetts Municipal Income Fund |
Eaton Vance New York Municipal Income Fund |
Eaton Vance Ohio Municipal Income Fund |
At a meeting held on November 24, 2020 (the “November Meeting”), the Board of each Eaton Vance open-end Fund and portfolios in which each such Fund invests, as applicable (each, a “Fund” and, collectively, the “Funds”), including a majority of the Board members (the “Independent Trustees”) who are not “interested persons” (as defined in the Investment Company Act of 1940 (the “1940 Act”)) of the Funds, Eaton Vance Management (“EVM”) or Boston Management and Research (“BMR” and, together with EVM, the “Advisers”), voted to approve a new investment advisory agreement between each Fund and either EVM or BMR (the “New Investment Advisory Agreements”) and, for certain Funds, a new investment sub-advisory agreement between an Adviser and the applicable Sub-Adviser (the “New Investment Sub-Advisory Agreements”(1) and, together with the New Investment Advisory Agreements, the “New Agreements”), each of which is intended to go into effect upon the completion of the Transaction (as defined below), as more fully described below. In voting its approval of the New Agreements at the November Meeting, the Board relied on an order issued by the Securities and Exchange Commission in response to the impacts of the COVID-19 pandemic that provided temporary relief from the in-person meeting requirements under Section 15 of the 1940 Act.
In voting its approval of the New Agreements, the Board of each Fund relied upon the recommendation of its Contract Review Committee, which is a committee comprised exclusively of Independent Trustees. Prior to and during meetings leading up to the November Meeting, the Contract Review Committee reviewed and discussed information furnished by the Advisers, the Sub-Advisers, and Morgan Stanley, as requested by the Independent Trustees, that the Contract Review Committee considered reasonably necessary to evaluate the terms of the New Agreements and to form its recommendation. Such information included, among other things, the terms and anticipated impacts of Morgan Stanley’s pending acquisition of Eaton Vance Corp. (the “Transaction”) on the Funds and their shareholders. In addition to considering information furnished specifically to evaluate the impact of the Transaction on the Funds and their respective shareholders, the Board and its Contract Review Committee also considered information furnished for prior meetings of the Board and its committees, including information provided in connection with the annual contract review process for the Funds, which most recently culminated in April 2020 (the “2020 Annual Approval Process”).
The Board of each Fund, including the Independent Trustees, concluded that the applicable New Investment Advisory Agreement and, as applicable, New Investment Sub-Advisory Agreement, including the fees payable thereunder, was fair and reasonable, and it voted to approve the New Investment Advisory Agreement and, as applicable, New Investment Sub-Advisory Agreement and to recommend that shareholders do so as well.
Shortly after the announcement of the Transaction, the Board, including all of the Independent Trustees, met with senior representatives from the Advisers and Morgan Stanley at its meeting held on October 13, 2020 to discuss certain aspects of the Transaction and the expected impacts of the Transaction on the Funds and their shareholders. As part of the Board’s evaluation process, counsel to the Independent Trustees, on behalf of the Contract Review Committee, requested additional information to assist the Independent Trustees in their evaluation of the New Agreements and the implications of the Transaction, as well as other contractual arrangements that may be affected by the Transaction. The Contract Review Committee considered information furnished by the Advisers and Morgan Stanley, their respective affiliates, and, as applicable, the Sub-Advisers during meetings on November 5, 2020, November 10, 2020, November 13, 2020, November 17, 2020 and November 24, 2020.
During its meetings on November 10, 2020 and November 17, 2020, the Contract Review Committee further discussed the approval of the New Agreements with senior representatives of the Advisers, the Affiliated Sub-Advisers, and Morgan Stanley. The representatives from the Advisers, the Affiliated Sub-Advisers, and Morgan Stanley each made presentations to, and responded to questions from, the Independent Trustees. The Contract Review Committee considered the Advisers’, the Affiliated Sub-Advisers’ and Morgan Stanley’s responses related to the Transaction and specifically to the Funds, as well as information received in connection with the 2020 Annual Approval Process, with respect to its evaluation of the New Agreements. Among other information, the Board considered:
| (1) | With respect to certain of the Funds, the applicable Adviser is currently a party to a sub-advisory agreement (collectively, the “Current Sub-Advisory Agreements”) with Atlanta Capital Management Company, LLC (“Atlanta Capital”), BMO Global Asset Management (Asia) Limited, Eaton Vance Advisers International Ltd. (“EVAIL”), Goldman Sachs Asset Management, L.P., Hexavest Inc. (“Hexavest”), Parametric Portfolio Associates LLC (“Parametric”) or Richard Bernstein Advisors LLC (collectively, the “Sub-Advisers” and, with respect to Atlanta Capital, EVAIL, Hexavest and Parametric, each an affiliate of the Advisers, the “Affiliated Sub-Advisers”). Accordingly, references to the “Sub-Advisers,” the “Affiliated Sub-Advisers” or the “New Sub-Advisory Agreements” are not applicable to all Funds. |
Eaton Vance
Municipal Income Funds
March 31, 2021
Board of Trustees’ Contract Approval — continued
Information about the Transaction and its Terms
| | • | | Information about the material terms and conditions, and expected impacts, of the Transaction that relate to the Funds, including the expected impacts on the businesses conducted by the Advisers, the Affiliated Sub-Advisers and Eaton Vance Distributors, Inc., as the distributor of Fund shares; |
| | • | | Information about the advantages of the Transaction as they relate to the Funds and their shareholders; |
| | • | | A commitment that the Funds would not bear any expenses, directly or indirectly, in connection with the Transaction; |
| | • | | A commitment that, for a period of three years after the Closing, at least 75% of each Fund’s Board members must not be “interested persons” (as defined in the 1940 Act) of the investment adviser (or predecessor investment adviser, if applicable) pursuant to Section 15(f)(1)(A) of the 1940 Act; |
| | • | | A commitment that Morgan Stanley would use its reasonable best efforts to ensure that it did not impose any “unfair burden” (as that term is used in section 15(f)(1)(B) of the 1940 Act) on the Funds as a result of the Transaction; |
| | • | | Information with respect to personnel and/or other resources of the Advisers and their affiliates, including the Affiliated Sub-Advisers, as a result of the Transaction, as well as any expected changes to compensation, including any retention-based compensation intended to incentivize key personnel at the Advisers and their affiliates, including the Affiliated Sub-Advisers; |
| | • | | Information regarding any changes that are expected with respect to the Funds’ slate of officers as a result of the Transaction; |
Information about Morgan Stanley
| | • | | Information about Morgan Stanley’s overall business, including information about the advisory, brokerage and related businesses that Morgan Stanley operates; |
| | • | | Information about Morgan Stanley’s financial condition, including its access to capital and other resources required to support the investment advisory businesses related to the Funds; |
| | • | | Information on how the Funds are expected to fit within Morgan Stanley’s overall business strategy, and any changes that Morgan Stanley contemplates implementing to the Funds in the short- or long-term following the closing of the Transaction (the “Closing”); |
| | • | | Information regarding risk management functions at Morgan Stanley and its affiliates, including how existing risk management protocols and procedures may impact the Funds and/or the businesses of the Advisers and their affiliates, including the Affiliated Sub-Advisers, as they relate to the Funds; |
| | • | | Information on the anticipated benefits of the Transaction to the Funds with respect to potential additional distribution capabilities and the ability to access new markets and customer segments through Morgan Stanley’s distribution network, including, in particular, its institutional client base; |
| | • | | Information regarding the financial condition and reputation of Morgan Stanley, its worldwide presence, experience as a fund sponsor and manager, commitment to maintain a high level of cooperation with, and support to, the Funds, strong client service capabilities, and relationships in the asset management industry; |
Information about the New Agreements for Funds
| | • | | A representation that, after the Closing, all of the Funds will continue to be advised by their current Adviser and Sub-Adviser, as applicable; |
| | • | | Information regarding the terms of the New Agreements, including certain changes as compared to the current investment advisory agreement between each Fund and its Adviser (collectively, the “Current Advisory Agreements”) and, as applicable, the current investment sub-advisory agreement between a Fund and a Sub-Adviser (together with the Current Advisory Agreements, the “Current Agreements”); |
| | • | | Information confirming that the fee rates payable under the New Agreements are not changed as compared to the Current Agreements; |
| | • | | A representation that the New Agreements will not cause any diminution in the nature, extent and quality of services provided by the Advisers and the Sub-Advisers to the Funds and their respective shareholders, including with respect to compliance and other non-advisory services; |
Information about Fund Performance, Fees and Expenses
| | • | | A report from an independent data provider comparing the investment performance of each Fund (including, as relevant, total return data, income data, Sharpe ratios and information ratios) to the investment performance of comparable funds and, as applicable, benchmark indices, over various time periods as of the 2020 Annual Approval Process, as well as performance information as of a more recent date; |
| | • | | A report from an independent data provider comparing each Fund’s total expense ratio (and its components) to those of comparable funds as of the 2020 Annual Approval Process, as well as fee and expense information as of a more recent date; |
| | • | | In certain instances, data regarding investment performance relative to customized groups of peer funds and blended indices identified by the Advisers in consultation with the Portfolio Management Committee of the Board as of the 2020 Annual Approval Process, as well as corresponding performance information as of a more recent date; |
| | • | | Comparative information concerning the fees charged and services provided by the Adviser and the Sub-Adviser to each Fund in managing other accounts (which may include other mutual funds, collective investment funds and institutional accounts) using investment strategies and techniques similar to those used in managing such Fund(s), if any; |
| | • | | Profitability analyses of the Advisers and the Affiliated Sub-Advisers, as applicable, with respect to each of the Funds as of the 2020 Annual Approval Process, as well as information regarding the impact of the Transaction on profitability; |
Eaton Vance
Municipal Income Funds
March 31, 2021
Board of Trustees’ Contract Approval — continued
Information about Portfolio Management and Trading
| | • | | Descriptions of the investment management services currently provided and expected to be provided to each Fund after the Transaction, as well as each of the Funds’ investment strategies and policies; |
| | • | | The procedures and processes used to determine the fair value of Fund assets, when necessary, and actions taken to monitor and test the effectiveness of such procedures and processes; |
| | • | | Information about any changes to the policies and practices of the Advisers and, as applicable, each Fund’s Sub-Adviser with respect to trading, including their processes for seeking best execution of portfolio transactions; |
| | • | | Information regarding the impact on trading and access to capital markets associated with the Funds’ affiliations with Morgan Stanley and its affiliates, including potential restrictions with respect to the Funds’ ability to execute portfolio transactions with Morgan Stanley and its affiliates; |
Information about the Advisers and the Sub-Advisers
| | • | | Information about the financial results and condition of the Advisers and the Affiliated Sub-Advisers since the culmination of the 2020 Annual Approval Process and any material changes in financial condition that are reasonably expected to occur before and after the Closing; |
| | • | | Information regarding contemplated changes to the individual investment professionals whose responsibilities include portfolio management and investment research for the Funds, and, for portfolio managers and certain other investment professionals, information relating to their responsibilities with respect to managing other mutual funds and investment accounts, as applicable, post-Closing; |
| | • | | The Code of Ethics of the Advisers and their affiliates, including the Affiliated Sub-Advisers, together with information relating to compliance with, and the administration of, such codes; |
| | • | | Policies and procedures relating to proxy voting and the handling of corporate actions and class actions; |
| | • | | Information concerning the resources devoted to compliance efforts undertaken by the Advisers and their affiliates, including the Affiliated Sub-Advisers, including descriptions of their various compliance programs and their record of compliance; |
| | • | | Information concerning the business continuity and disaster recovery plans of the Advisers and their affiliates, including the Affiliated Sub-Advisers; |
| | • | | A description of the Advisers’ oversight of the Sub-Advisers, including with respect to regulatory and compliance issues, investment management and other matters; |
Other Relevant Information
| | • | | Information concerning the nature, cost and character of the administrative and other non-investment advisory services provided by the Advisers and their affiliates; |
| | • | | Information concerning oversight of the relationship with the custodian, subcustodians and fund accountants by EVM and/or administrator to each of the Funds; |
| | • | | Confirmation that the Advisers intend to continue to manage the Funds in a manner materially consistent with each Fund’s current investment objective(s) and principal investment strategies; |
| | • | | Information regarding Morgan Stanley’s commitment to maintaining competitive compensation arrangements to attract and retain highly qualified personnel; |
| | • | | Confirmation that the Advisers’ current senior management teams have indicated their strong support of the Transaction; and |
| | • | | Information regarding the fact that Morgan Stanley and Eaton Vance Corp. will each derive benefits from the Transaction and that, as a result, they have a financial interest in the matters that were being considered. |
As indicated above, the Board and its Contract Review Committee also considered information received at its regularly scheduled meetings throughout the year, which included information from portfolio managers and other investment professionals of the Advisers and the Sub-Advisers regarding investment and performance matters, and considered various investment and trading strategies used in pursuing the Funds’ investment objectives. The Board also received information regarding risk management techniques employed in connection with the management of the Funds. The Board and its committees evaluated issues pertaining to industry and regulatory developments, compliance procedures, fund governance and other issues with respect to the Funds, and received and participated in reports and presentations provided by the Advisers and their affiliates, including the Affiliated Sub-Advisers, with respect to such matters.
The Contract Review Committee was advised throughout the evaluation process by Goodwin Procter LLP, independent legal counsel for the Independent Trustees. The members of the Contract Review Committee, with the advice of such counsel, exercised their own business judgment in determining the material factors to be considered in evaluating the New Agreements and the weight to be given to each such factor. The conclusions reached with respect to the New Agreements were based on a comprehensive evaluation of all the information provided and not any single factor. Moreover, each Independent Trustee may have placed varying emphasis on particular factors in reaching conclusions with respect to the New Agreements.
Nature, Extent and Quality of Services
In considering whether to approve the New Agreements, the Board evaluated the nature, extent and quality of services currently provided to each Fund by the Advisers and, as applicable, the Sub-Advisers under the Current Agreements. In evaluating the nature, extent and quality of services to be provided by the Advisers and the Sub-Advisers under the New Agreements, the Board considered, among other information, the expected impact, if any, of the
Eaton Vance
Municipal Income Funds
March 31, 2021
Board of Trustees’ Contract Approval — continued
Transaction on the operations, facilities, organization and personnel of the Advisers and the Sub-Advisers, and that Morgan Stanley and the Advisers have advised the Board that, following the Transaction, there is not expected to be any diminution in the nature, extent and quality of services provided by the Advisers and the Sub-Advisers, as applicable, to the Funds and their shareholders, including compliance and other non-advisory services, and that there are not expected to be any changes in portfolio management personnel as a result of the Transaction.
The Board also considered the financial resources of Morgan Stanley and the Advisers and the importance of having a Fund manager with, or with access to, significant organizational and financial resources. The Board considered the benefits to the Funds of being part of a larger combined organization with greater financial resources following the Transaction, particularly during periods of market disruptions and volatility. In this regard, the Board considered information provided by Morgan Stanley regarding its business and operating structure, scale of operation, leadership and reputation, distribution capabilities, and financial condition, as well as information on how the Funds are expected to fit within Morgan Stanley’s overall business strategy and any changes that Morgan Stanley contemplates in the short- or long-term following the Closing. The Board also noted Morgan Stanley’s and the Advisers’ commitment to keep the Board apprised of developments with respect to its long-term integration plans for the Advisers, the Affiliated Sub-Advisers, and existing Morgan Stanley affiliates and their respective personnel.
The Board considered the Advisers’ and the Sub-Advisers’ management capabilities and investment processes in light of the types of investments held by each Fund, including the education, experience and number of investment professionals and other personnel who provide portfolio management, investment research, and similar services to each Fund. In particular, the Board considered the abilities and experience of the Advisers’ and, as applicable, the Sub-Advisers’ investment professionals in implementing each Fund’s investment strategies. The Board also took into account the resources dedicated to portfolio management and other services, the compensation methods of the Advisers and other factors, including the reputation and resources of the Advisers to recruit and retain highly qualified research, advisory and supervisory investment professionals. With respect to the recruitment and retention of key personnel, the Board noted information from Morgan Stanley and the Advisers regarding the benefits of joining Morgan Stanley. In addition, the Board considered the time and attention devoted to the Funds by senior management, as well as the infrastructure, operational capabilities and support staff in place to assist in the portfolio management and operations of the Funds, including the provision of administrative services. With respect to the foregoing, the Board also considered information from the Advisers and Morgan Stanley regarding the anticipated impact of the Transaction on such matters. The Board also considered the business-related and other risks to which the Advisers or their affiliates may be subject in managing the Funds and in connection with the Transaction.
The Board considered the compliance programs of the Advisers and relevant affiliates thereof, including the Affiliated Sub-Advisers. The Board considered compliance and reporting matters regarding, among other things, personal trading by investment professionals, disclosure of portfolio holdings, late trading, frequent trading, portfolio valuation, business continuity and the allocation of investment opportunities. The Board also considered the responses of the Advisers and their affiliates to requests in recent years from regulatory authorities, such as the Securities and Exchange Commission and the Financial Industry Regulatory Authority. The Board also considered certain information relating to the compliance record of Morgan Stanley and its affiliates, including information requests in recent years from regulatory authorities. With respect to the foregoing, including the compliance programs of the Advisers and the Sub-Advisers, the Board noted information regarding the impacts of the Transaction, as well as the Advisers’ and Morgan Stanley’s commitment to keep the Board apprised of developments with respect to its long-term integration plans for the Advisers, the Affiliated Sub-Advisers and existing Morgan Stanley affiliates and their respective personnel.
The Board considered other administrative services provided and to be provided or overseen by the Advisers and their affiliates, including transfer agency and accounting services. The Board evaluated the benefits to shareholders of investing in a fund that is a part of a large fund complex offering exposure to a variety of asset classes and investment disciplines, as well as the ability, in many cases, to exchange an investment among different funds without incurring additional sales charges. The Board noted information that the Transaction was not expected to have any material impact on such matters in the near-term.
In evaluating the nature, extent and quality of the services to be provided under the New Agreements, the Board also considered investment performance information provided for each Fund in connection with the 2020 Annual Approval Process, as well as information provided as of a more recent date. In this regard, the Board compared each Fund’s investment performance to that of comparable funds identified by an independent data provider (the peer group), as well as appropriate benchmark indices and, for certain Funds, a custom peer group of similarly managed funds. The Board also considered, where applicable, Fund-specific performance explanations based on criteria established by the Board in connection with the 2020 Annual Approval Process and, where applicable, performance explanations as of a more recent date. In addition to the foregoing information, it was also noted that the Board has received and discussed with management information throughout the year at periodic intervals comparing each Fund’s performance against applicable benchmark indices and peer groups. In addition, the Board considered each Fund’s performance in light of overall financial market conditions. Where a Fund’s relative underperformance to its peers was significant during one or more specified periods, the Board noted the explanation from the applicable Adviser concerning the Fund’s relative performance versus its peer group.
After consideration of the foregoing factors, among others, and based on their review of the materials provided and the assurances received from, and recommendations of, the Advisers and Morgan Stanley, the Board determined that the Transaction was not expected to adversely affect the nature, extent and quality of services provided to the Funds by the Advisers and their affiliates, including the Affiliated Sub-Advisers, and that the Transaction was not expected to have an adverse effect on the ability of the Advisers and their affiliates, including the Affiliated Sub-Advisers, to provide those services. The Board concluded that the nature, extent and quality of services expected to be provided by the Advisers and the Sub-Advisers, taken as a whole, are appropriate and expected to be consistent with the terms of the New Agreements.
Eaton Vance
Municipal Income Funds
March 31, 2021
Board of Trustees’ Contract Approval — continued
Management Fees and Expenses
The Board considered contractual fee rates payable by each Fund for advisory and administrative services (referred to collectively as “management fees”) in connection with the 2020 Annual Approval Process, as well as information provided as of a more recent date. As part of its review, the Board considered each Fund’s management fees and total expense ratio over various periods, as compared to those of comparable funds, before and after giving effect to any undertaking to waive fees or reimburse expenses. The Board also considered factors, and, where applicable, certain Fund-specific factors, that had an impact on a Fund’s total expense ratio relative to comparable funds, as identified by the Advisers in response to inquiries from the Contract Review Committee. The Board considered that the New Agreements do not change a Fund’s management fee rate or the computation method for calculating such fees, including any separately executed permanent contractual management fee reduction currently in place for the Fund.
The Board also received and considered, where applicable, information about the services offered and the fee rates charged by the Advisers and the Sub-Advisers to other types of accounts with investment objectives and strategies that are substantially similar to and/or managed in a similar investment style as a Fund. In this regard, the Board received information about the differences in the nature and scope of services the Advisers and the Sub-Advisers, as applicable, provide to the Funds as compared to other types of accounts and the material differences in compliance, reporting and other legal burdens and risks to the Advisers and such Sub-Advisers as between each Fund and other types of accounts.
After considering the foregoing information, and in light of the nature, extent and quality of the services expected to be provided by the Advisers and the Sub-Advisers, the Board concluded that the management fees charged for advisory and related services are reasonable with respect to its approval of the New Agreements.
Profitability and “Fall-Out” Benefits
During the 2020 Annual Approval Process, the Board considered the level of profits realized by the Advisers and relevant affiliates thereof, including the Affiliated Sub-Advisers, in providing investment advisory and administrative services to the Funds and to all Eaton Vance funds as a group. The Board considered the level of profits realized without regard to marketing support or other payments by the Advisers and their affiliates to third parties in respect of distribution or other services. In light of the foregoing factors and the nature, extent and quality of the services rendered, the profits realized by the Advisers and their affiliates, including the Sub-Advisers, were not deemed to be excessive by the Board.
The Board noted that Morgan Stanley and the Advisers are expected to realize, over time, cost savings from the Transaction based on eliminating duplicate corporate overhead expenses. The Board considered, however, information from the Advisers and Morgan Stanley that such cost savings are not expected to be realized immediately upon the Closing and that, accordingly, there are currently no specific expected changes in the levels of profitability associated with the advisory and other services provided to the Funds that are contemplated as a result of the Transaction. The Board noted that it will continue to receive information regarding profitability during its annual contract review processes, including the extent to which cost savings and/or other efficiencies result in changes to profitability levels.
The Board also considered direct or indirect fall-out benefits received by the Advisers and their affiliates, including the Affiliated Sub-Advisers, in connection with their respective relationships with the Funds, including the benefits of research services that may be available to the Advisers and their affiliates as a result of securities transactions effected for the Funds and other investment advisory clients. In evaluating the fall-out benefits to be received by the Advisers and their affiliates under the New Agreements, the Board considered whether the Transaction would have an impact on the fall-out benefits currently realized by the Advisers and their affiliates in connection with services provided pursuant to the Current Advisory Agreements.
The Board of each Fund considered that Morgan Stanley may derive reputational and other benefits from its ability to use the names of the Advisers and their affiliates in connection with operating and marketing the Funds. The Board considered that the Transaction, if completed, would significantly increase Morgan Stanley’s assets under management and expand Morgan Stanley’s investment capabilities.
Economies of Scale
The Board also considered the extent to which the Advisers and their affiliates, on the one hand, and the Funds, on the other hand, can expect to realize benefits from economies of scale as the assets of the Funds increase. The Board acknowledged the difficulty in accurately measuring the benefits resulting from economies of scale, if any, with respect to the management of any specific Fund or group of funds. As part of the 2020 Annual Approval Process, the Board reviewed data summarizing the increases and decreases in the assets of the Funds and of all Eaton Vance funds as a group over various time periods, and evaluated the extent to which the total expense ratio of each Fund and the profitability of the Advisers and their affiliates may have been affected by such increases or decreases.
The Board noted that Morgan Stanley and the Advisers are expected to benefit from possible growth of the Funds resulting from enhanced distribution capabilities, including with respect to the Funds’ potential access to Morgan Stanley’s institutional client base. Based upon the foregoing, the Board concluded that the Funds currently share in the benefits from economies of scale, if any, when they are realized by the Advisers, and that the Transaction is not expected to impede a Fund from continuing to benefit from any future economies of scale realized by its Adviser.
Eaton Vance
Municipal Income Funds
March 31, 2021
Board of Trustees’ Contract Approval — continued
Conclusion
Based on its consideration of the foregoing, and such other information it deemed relevant, including the factors and conclusions described above, the Contract Review Committee recommended to the Board approval of the New Agreements. Based on the recommendation of the Contract Review Committee, the Board, including a majority of the Independent Trustees, unanimously voted to approve the New Agreements for the Funds and recommended that shareholders approve the New Agreements.
Eaton Vance
Municipal Income Funds
March 31, 2021
Officers and Trustees
Officers
Eric A. Stein
President
Deidre E. Walsh
Vice President
Maureen A. Gemma
Secretary and Chief Legal Officer
James F. Kirchner
Treasurer
Richard F. Froio
Chief Compliance Officer
Trustees
William H. Park
Chairperson
Thomas E. Faust Jr.*
Mark R. Fetting
Cynthia E. Frost
George J. Gorman
Valerie A. Mosley
Helen Frame Peters
Keith Quinton
Marcus L. Smith
Susan J. Sutherland
Scott E. Wennerholm
Eaton Vance Funds
| | |
| Privacy Notice | | April 2021 |
| | |
| |
| FACTS | | WHAT DOES EATON VANCE DO WITH YOUR
PERSONAL INFORMATION? |
| | | |
| |
| | |
| Why? | | Financial companies choose how they share your personal information. Federal law gives consumers the right to limit some but not all sharing. Federal law also requires us to tell you how we collect, share, and protect your personal information. Please read this notice carefully to understand what we do. |
| | |
| | | |
| What? | | The types of personal information we collect and share depend on the product or service you have with us. This information can include: ∎ Social Security number and income ∎ investment experience and risk tolerance ∎ checking account number and wire transfer instructions |
| | |
| | | |
| How? | | All financial companies need to share customers’ personal information to run their everyday business. In the section below, we list the reasons financial companies can share their customers’ personal information; the reasons Eaton Vance chooses to share; and whether you can limit this sharing. |
| | |
| | | |
| | | | |
Reasons we can share your
personal information | | Does Eaton Vance share? | | Can you limit this sharing? |
| For our everyday business purposes — such as to process your transactions, maintain your account(s), respond to court orders and legal investigations, or report to credit bureaus | | Yes | | No |
| For our marketing purposes — to offer our products and services to you | | Yes | | No |
| For joint marketing with other financial companies | | No | | We don’t share |
| For our investment management affiliates’ everyday business purposes — information about your transactions, experiences, and creditworthiness | | Yes | | Yes |
| For our affiliates’ everyday business purposes — information about your transactions and experiences | | Yes | | No |
| For our affiliates’ everyday business purposes — information about your creditworthiness | | No | | We don’t share |
| For our investment management affiliates to market to you | | Yes | | Yes |
| For our affiliates to market to you | | No | | We don’t share |
| For nonaffiliates to market to you | | No | | We don’t share |
| | |
| To limit our sharing | | Call toll-free 1-800-262-1122 or email: EVPrivacy@eatonvance.com Please note: If you are a new customer, we can begin sharing your information 30 days from the date we sent this notice. When you are no longer our customer, we continue to share your information as described in this notice. However, you can contact us at any time to limit our sharing. |
| | |
| | | |
| | |
| Questions? | | Call toll-free 1-800-262-1122 or email: EVPrivacy@eatonvance.com |
| | |
| | | |
Eaton Vance Funds
| | |
| Privacy Notice — continued | | April 2021 |
| | |
| Who we are |
| Who is providing this notice? | | Eaton Vance Management, Eaton Vance Distributors, Inc., Eaton Vance Trust Company, Eaton Vance Management (International) Limited, Eaton Vance Advisers International Ltd., Eaton Vance Global Advisors Limited, Eaton Vance Management’s Real Estate Investment Group, Boston Management and Research, Calvert Research and Management, Eaton Vance and Calvert Fund Families and our investment advisory affiliates (“Eaton Vance”) (see Investment Management Affiliates definition below) |
| What we do |
| How does Eaton Vance protect my personal information? | | To protect your personal information from unauthorized access and use, we use security measures that comply with federal law. These measures include computer safeguards and secured files and buildings. We have policies governing the proper handling of customer information by personnel and requiring third parties that provide support to adhere to appropriate security standards with respect to such information. |
| How does Eaton Vance collect my personal information? | | We collect your personal information, for example, when you ∎ open an account or make deposits or withdrawals from your account ∎ buy securities from us or make a wire transfer ∎ give us your contact information We also collect your personal information from others, such as credit bureaus, affiliates, or other companies. |
| Why can’t I limit all sharing? | | Federal law gives you the right to limit only ∎ sharing for affiliates’ everyday business purposes — information about your creditworthiness ∎ affiliates from using your information to market to you ∎ sharing for nonaffiliates to market to you State laws and individual companies may give you additional rights to limit sharing. See below for more on your rights under state law. |
| Definitions |
| Investment Management Affiliates | | Eaton Vance Investment Management Affiliates include registered investment advisers, registered broker-dealers, and registered and unregistered funds. Investment Management Affiliates does not include entities associated with Morgan Stanley Wealth Management, such as Morgan Stanley Smith Barney LLC and Morgan Stanley & Co. |
| Affiliates | | Companies related by common ownership or control. They can be financial and nonfinancial companies. ∎ Our affiliates include companies with a Morgan Stanley name and financial companies such as Morgan Stanley Smith Barney LLC and Morgan Stanley & Co. |
| Nonaffiliates | | Companies not related by common ownership or control. They can be financial and nonfinancial companies. ∎ Eaton Vance does not share with nonaffiliates so they can market to you. |
| Joint marketing | | A formal agreement between nonaffiliated financial companies that together market financial products or services to you. ∎ Eaton Vance doesn’t jointly market. |
| Other important information |
Vermont: Except as permitted by law, we will not share personal information we collect about Vermont residents with Nonaffiliates unless you provide us with your written consent to share such information. California: Except as permitted by law, we will not share personal information we collect about California residents with Nonaffiliates and we will limit sharing such personal information with our Affiliates to comply with California privacy laws that apply to us. |
Eaton Vance Funds
IMPORTANT NOTICES
Delivery of Shareholder Documents. The Securities and Exchange Commission (SEC) permits funds to deliver only one copy of shareholder documents, including prospectuses, proxy statements and shareholder reports, to fund investors with multiple accounts at the same residential or post office box address. This practice is often called “householding” and it helps eliminate duplicate mailings to shareholders. Eaton Vance, or your financial intermediary, may household the mailing of your documents indefinitely unless you instruct Eaton Vance, or your financial intermediary, otherwise. If you would prefer that your Eaton Vance documents not be householded, please contact Eaton Vance at 1-800-262-1122, or contact your financial intermediary. Your instructions that householding not apply to delivery of your Eaton Vance documents will typically be effective within 30 days of receipt by Eaton Vance or your financial intermediary.
Portfolio Holdings. Each Eaton Vance Fund and its underlying Portfolio(s) (if applicable) files a schedule of portfolio holdings on Part F to Form N-PORT with the SEC. Certain information filed on Form N-PORT may be viewed on the Eaton Vance website at www.eatonvance.com, by calling Eaton Vance at 1-800-262-1122 or in the EDGAR database on the SEC’s website at www.sec.gov.
Proxy Voting. From time to time, funds are required to vote proxies related to the securities held by the funds. The Eaton Vance Funds or their underlying Portfolios (if applicable) vote proxies according to a set of policies and procedures approved by the Funds’ and Portfolios’ Boards. You may obtain a description of these policies and procedures and information on how the Funds or Portfolios voted proxies relating to portfolio securities during the most recent 12-month period ended June 30, without charge, upon request, by calling 1-800-262-1122 and by accessing the SEC’s website at www.sec.gov.
This Page Intentionally Left Blank
This Page Intentionally Left Blank
This Page Intentionally Left Blank
Investment Adviser
Boston Management and Research
Two International Place
Boston, MA 02110
Administrator
Eaton Vance Management
Two International Place
Boston, MA 02110
Principal Underwriter*
Eaton Vance Distributors, Inc.
Two International Place
Boston, MA 02110
(617) 482-8260
Custodian
State Street Bank and Trust Company
State Street Financial Center, One Lincoln Street
Boston, MA 02111
Transfer Agent
BNY Mellon Investment Servicing (US) Inc.
Attn: Eaton Vance Funds
P.O. Box 9653
Providence, RI 02940-9653
(800) 262-1122
Fund Offices
Two International Place
Boston, MA 02110
| * | FINRA BrokerCheck. Investors may check the background of their Investment Professional by contacting the Financial Industry Regulatory Authority (FINRA). FINRA BrokerCheck is a free tool to help investors check the professional background of current and former FINRA-registered securities firms and brokers. FINRA BrokerCheck is available by calling 1-800-289-9999 and at www.FINRA.org. The FINRA BrokerCheck brochure describing this program is available to investors at www.FINRA.org. |

7708 3.31.21
Not required in this filing.
| Item 3. | Audit Committee Financial Expert |
Not required in this filing.
| Item 4. | Principal Accountant Fees and Services |
Not required in this filing.
| Item 5. | Audit Committee of Listed Registrants |
Not applicable.
| Item 6. | Schedule of Investments |
Please see schedule of investments contained in the Report to Stockholders included under Item 1 of this Form N-CSR.
| Item 7. | Disclosure of Proxy Voting Policies and Procedures for Closed-End Management Investment Companies |
Not applicable.
| Item 8. | Portfolio Managers of Closed-End Management Investment Companies |
Not applicable.
| Item 9. | Purchases of Equity Securities by Closed-End Management Investment Company and Affiliated Purchasers |
Not applicable.
| Item 10. | Submission of Matters to a Vote of Security Holders |
No material changes.
| Item 11. | Controls and Procedures |
(a) It is the conclusion of the registrant’s principal executive officer and principal financial officer that the effectiveness of the registrant’s current disclosure controls and procedures (such disclosure controls and procedures having been evaluated within 90 days of the date of this filing) provide reasonable assurance that the information required to be disclosed by the registrant has been recorded, processed, summarized and reported within the time period specified in the Commission’s rules and forms and that the information required to be disclosed by the registrant has been accumulated and communicated to the registrant’s principal executive officer and principal financial officer in order to allow timely decisions regarding required disclosure.
(b) There have been no changes in the registrant’s internal controls over financial reporting during the second fiscal quarter of the period covered by this report that has materially affected, or is reasonably likely to materially affect, the registrant’s internal control over financial reporting.
| Item 12. | Disclosure of Securities Lending Activities for Closed-End Management Investment Companies |
Not applicable.
Signatures
Pursuant to the requirements of the Securities Exchange Act of 1934 and the Investment Company Act of 1940, the registrant has duly caused this report to be signed on its behalf by the undersigned, thereunto duly authorized.
| | |
| Eaton Vance Municipals Trust |
| |
| By: | | /s/ Eric A. Stein |
| | Eric A. Stein |
| | President |
| |
| Date: | | May 24, 2021 |
Pursuant to the requirements of the Securities Exchange Act of 1934 and the Investment Company Act of 1940, this report has been signed below by the following persons on behalf of the registrant and in the capacities and on the dates indicated.
| | |
| By: | | /s/ James F. Kirchner |
| | James F. Kirchner |
| | Treasurer |
| |
| Date: | | May 24, 2021 |
| |
| By: | | /s/ Eric A. Stein |
| | Eric A. Stein |
| | President |
| |
| Date: | | May 24, 2021 |