UNITED STATES
SECURITIES AND EXCHANGE COMMISSION
Washington, D.C. 20549
FormN-CSR
CERTIFIED SHAREHOLDER REPORT OF REGISTERED
MANAGEMENT INVESTMENT COMPANIES
Investment Company Act File Number:811-04409
Eaton Vance Municipals Trust
(Exact Name of Registrant as Specified in Charter)
Two International Place, Boston, Massachusetts 02110
(Address of Principal Executive Offices)
Maureen A. Gemma
Two International Place, Boston, Massachusetts 02110
(Name and Address of Agent for Services)
(617)482-8260
(Registrant’s Telephone Number)
September 30
Date of Fiscal Year End
March 31, 2020
Date of Reporting Period
| Item 1. | Reports to Stockholders |

Eaton Vance
Municipal Income Funds
Semiannual Report
March 31, 2020
AMT-Free • National
Important Note. Beginning on January 1, 2021, as permitted by regulations adopted by the Securities and Exchange Commission, paper copies of each Fund’s annual and semi-annual shareholder reports will no longer be sent by mail unless you specifically request paper copies of the reports. Instead, the reports will be made available on the Funds’ website (eatonvance.com/funddocuments), and you will be notified by mail each time a report is posted and provided with a website address to access the report.
If you already elected to receive shareholder reports electronically, you will not be affected by this change and you need not take any action. If you are a direct investor, you may elect to receive shareholder reports and other communications from the Funds electronically by signing up fore-Delivery at eatonvance.com/edelivery. If you own your shares through a financial intermediary (such as a broker-dealer or bank), you must contact your financial intermediary to sign up.
You may elect to receive all future Fund shareholder reports in paper free of charge. If you are a direct investor, you can inform the Funds that you wish to continue receiving paper copies of your shareholder reports by calling1-800-262-1122. If you own these shares through a financial intermediary, you must contact your financial intermediary or follow instructions included with this disclosure, if applicable, to elect to continue to receive paper copies of your shareholder reports. Your election to receive reports in paper will apply to all Eaton Vance funds held directly or to all funds held through your financial intermediary, as applicable.

Commodity Futures Trading Commission Registration.Effective December 31, 2012, the Commodity Futures Trading Commission (“CFTC”) adopted certain regulatory changes that subject registered investment companies and advisers to regulation by the CFTC if a fund invests more than a prescribed level of its assets in certain CFTC-regulated instruments (including futures, certain options and swap agreements) or markets itself as providing investment exposure to such instruments. Each investment adviser has claimed an exclusion from the definition of “commodity pool operator” under the Commodity Exchange Act with respect to its management of each Fund. Accordingly neither the Funds nor the adviser with respect to the operation of the Funds is subject to CFTC regulation. Because of its management of other strategies, each Fund’s adviser is registered with the CFTC as a commodity pool operator. Each adviser is also registered as a commodity trading advisor.
Fund shares are not insured by the FDIC and are not deposits or other obligations of, or guaranteed by, any depository institution. Shares are subject to investment risks, including possible loss of principal invested.
This report must be preceded or accompanied by a current summary prospectus or prospectus. Before investing, investors should consider carefully the investment objective, risks, and charges and expenses of a mutual fund. This and other important information is contained in the summary prospectus and prospectus, which can be obtained from a financial intermediary. Prospective investors should read the prospectus carefully before investing. For further information, please call1-800-262-1122.
Semiannual ReportMarch 31, 2020
Eaton Vance
Municipal Income Funds
Table of Contents
| | | | |
| |
Performance and Fund Profile | | | | |
AMT-Free Municipal Income Fund | | | 2 | |
National Municipal Income Fund | | | 3 | |
| |
Endnotes and Additional Disclosures | | | 4 | |
| |
Fund Expenses | | | 5 | |
| |
Financial Statements | | | 7 | |
| |
Officers and Trustees | | | 41 | |
| |
Important Notices | | | 42 | |
Eaton Vance
AMT-Free Municipal Income Fund
March 31, 2020
Performance1,2
Portfolio Manager Cynthia J. Clemson
| | | | | | | | | | | | | | | | | | | | | | | | |
| % Average Annual Total Returns | | Class Inception Date | | | Performance
Inception Date | | | Six Months | | | One Year | | | Five Years | | | Ten Years | |
Class A at NAV | | | 01/06/1998 | | | | 03/16/1978 | | | | 0.60 | % | | | 4.70 | % | | | 3.33 | % | | | 4.50 | % |
Class A with 4.75% Maximum Sales Charge | | | — | | | | — | | | | –4.17 | | | | –0.27 | | | | 2.32 | | | | 4.00 | |
Class C at NAV | | | 05/02/2006 | | | | 03/16/1978 | | | | 0.11 | | | | 3.82 | | | | 2.54 | | | | 3.71 | |
Class C with 1% Maximum Sales Charge | | | — | | | | — | | | | –0.88 | | | | 2.82 | | | | 2.54 | | | | 3.71 | |
Class I at NAV | | | 03/16/1978 | | | | 03/16/1978 | | | | 0.70 | | | | 4.95 | | | | 3.56 | | | | 4.75 | |
Bloomberg Barclays Municipal Bond Index | | | — | | | | — | | | | 0.10 | % | | | 3.85 | % | | | 3.19 | % | | | 4.14 | % |
| | | | | | |
| % Total Annual Operating Expense Ratios3 | | | | | | | | | | | Class A | | | Class C | | | Class I | |
| | | | | | | | | | | | | | | 1.04 | % | | | 1.79 | % | | | 0.79 | % |
| | | | | | |
| % Distribution Rates/Yields4 | | | | | | | | | | | Class A | | | Class C | | | Class I | |
Distribution Rate | | | | | | | | | | | | | | | 2.85 | % | | | 2.10 | % | | | 3.11 | % |
Taxable-Equivalent Distribution Rate | | | | | | | | | | | | | | | 4.81 | | | | 3.55 | | | | 5.25 | |
SEC30-day Yield | | | | | | | | | | | | | | | 1.48 | | | | 0.83 | | | | 1.77 | |
Taxable-Equivalent SEC30-day Yield | | | | | | | | | | | | | | | 2.51 | | | | 1.40 | | | | 2.99 | |
| | | | | | |
| % Total Leverage5 | | | | | | | | | | | | | | | | | | |
Residual Interest Bond (RIB) Financing | | | | | | | | | | | | | | | | | | | | | | | 8.77 | % |
Fund Profile
Credit Quality (% of total investments)6,7
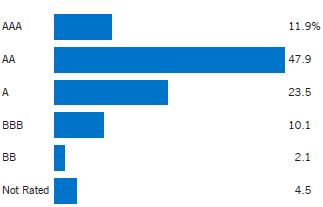
See Endnotes and Additional Disclosures in this report.
Past performance is no guarantee of future results. Returns are historical and are calculated by determining the percentage change in net asset value (NAV) or offering price (as applicable) with all distributions reinvested. Investment return and principal value will fluctuate so that shares, when redeemed, may be worth more or less than their original cost. Performance for periods less than or equal to one year is cumulative. Performance is for the stated time period only; due to market volatility, current Fund performance may be lower or higher than the quoted return. For performance as of the most recent month- end, please refer to eatonvance.com.
Eaton Vance
National Municipal Income Fund
March 31, 2020
Performance1,2
Portfolio Manager Craig R. Brandon, CFA
| | | | | | | | | | | | | | | | | | | | | | | | |
| % Average Annual Total Returns | | Class Inception Date | | | Performance
Inception Date | | | Six Months | | | One Year | | | Five Years | | | Ten Years | |
Class A at NAV | | | 04/05/1994 | | | | 12/19/1985 | | | | –0.28 | % | | | 4.04 | % | | | 3.71 | % | | | 4.70 | % |
Class A with 4.75% Maximum Sales Charge | | | — | | | | — | | | | –5.05 | | | | –0.88 | | | | 2.72 | | | | 4.19 | |
Class C at NAV | | | 12/03/1993 | | | | 12/19/1985 | | | | –0.64 | | | | 3.28 | | | | 2.94 | | | | 3.92 | |
Class C with 1% Maximum Sales Charge | | | — | | | | — | | | | –1.62 | | | | 2.28 | | | | 2.94 | | | | 3.92 | |
Class I at NAV | | | 07/01/1999 | | | | 12/19/1985 | | | | –0.15 | | | | 4.29 | | | | 3.97 | | | | 4.96 | |
Bloomberg Barclays Municipal Bond Index | | | — | | | | — | | | | 0.10 | % | | | 3.85 | % | | | 3.19 | % | | | 4.14 | % |
| | | | | | |
| % Total Annual Operating Expense Ratios3 | | | | | | | | | | | Class A | | | Class C | | | Class I | |
| | | | | | | | | | | | | | | 0.80 | % | | | 1.55 | % | | | 0.55 | % |
| | | | | | |
| % Distribution Rates/Yields4 | | | | | | | | | | | Class A | | | Class C | | | Class I | |
Distribution Rate | | | | | | | | | | | | | | | 2.68 | % | | | 1.92 | % | | | 2.94 | % |
Taxable-Equivalent Distribution Rate | | | | | | | | | | | | | | | 4.53 | | | | 3.24 | | | | 4.97 | |
SEC30-day Yield | | | | | | | | | | | | | | | 1.58 | | | | 0.92 | | | | 1.90 | |
Taxable-Equivalent SEC30-day Yield | | | | | | | | | | | | | | | 2.67 | | | | 1.55 | | | | 3.21 | |
| | | | | | |
| % Total Leverage5 | | | | | | | | | | | | | | | | | | |
RIB Financing | | | | | | | | | | | | | | | | | | | | | | | 3.46 | % |
Fund Profile
Credit Quality (% of total investments)6,7
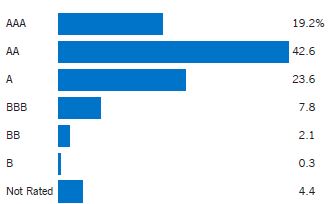
See Endnotes and Additional Disclosures in this report.
Past performance is no guarantee of future results. Returns are historical and are calculated by determining the percentage change in net asset value (NAV) or offering price (as applicable) with all distributions reinvested. Investment return and principal value will fluctuate so that shares, when redeemed, may be worth more or less than their original cost. Performance for periods less than or equal to one year is cumulative. Performance is for the stated time period only; due to market volatility, current Fund performance may be lower or higher than the quoted return. For performance as of the most recent month-end, please refer to eatonvance.com.
Eaton Vance
Municipal Income Funds
March 31, 2020
Endnotes and Additional Disclosures
| 1 | Bloomberg Barclays Municipal Bond Index is an unmanaged index of municipal bonds traded in the U.S. Unless otherwise stated, index returns do not reflect the effect of any applicable sales charges, commissions, expenses, taxes or leverage, as applicable. It is not possible to invest directly in an index. |
| 2 | Total Returns at NAV do not include applicable sales charges. If sales charges were deducted, the returns would be lower. Total Returns shown with maximum sales charge reflect the stated maximum sales charge. Unless otherwise stated, performance does not reflect the deduction of taxes on Fund distributions or redemptions of Fund shares. |
| 3 | Source: Fund prospectus. The expense ratios for the current reporting period can be found in the Financial Highlights section of this report. |
| 4 | The Distribution Rate is based on the Fund’s last regular distribution per share in the period (annualized) divided by the Fund’s NAV at the end of the period. The Fund’s distributions may be comprised of amounts characterized for federal income tax purposes astax-exempt income, qualified andnon-qualified ordinary dividends, capital gains and nondividend distributions, also known as return of capital. The Fund will determine the federal income tax character of distributions paid to a shareholder after the end of the calendar year. This is reported on the IRS form 1099- DIV and provided to the shareholder shortly after eachyear-end. The Fund’s distributions are determined by the investment adviser based on its current assessment of the Fund’s long-term return potential. As portfolio and market conditions change, the rate of distributions paid by the Fund could change. Taxable-equivalent performance is based on the highest combined federal and state income tax rates, where applicable. Lower tax rates would result in lowertax-equivalent performance. Actual tax rates will vary depending on your income, exemptions and deductions. Rates do not include local taxes. The SEC Yield is a standardized measure based on the estimated yield to maturity of a fund’s investments over a30-day period and is based on the maximum offer price at the date specified. The SEC Yield is not based on the distributions made by the Fund, which may differ. |
| 5 | Fund employs RIB financing. The leverage created by RIB investments provides an opportunity for increased income but, at the same time, creates special risks (including the likelihood of greater volatility of NAV). The cost of leverage rises and falls with changes in short-term interest rates. See “Floating Rate Notes Issued in Conjunction with Securities Held” in the notes to the financial statements for more information about RIB financing. RIB leverage represents the amount of Floating Rate Notes outstanding at period end as a percentage of Fund net assets plus Floating Rate Notes. |
| 6 | Ratings are based on Moody’s Investors Service, Inc. (“Moody’s”), S&P Global Ratings (“S&P”) or Fitch Ratings (“Fitch”), as applicable. If securities are rated differently by the ratings agencies, the highest rating is applied. Ratings, which are subject to change, apply to the creditworthiness of the issuers of the underlying securities and not to the Fund or its shares. Credit ratings measure the quality of a bond based on the issuer’s creditworthiness, with ratings ranging from AAA, being the highest, to D, being the lowest based on S&P’s measures. Ratings of BBB or higher by S&P or Fitch (Baa or higher by Moody’s) are considered to be investment-grade quality. Credit ratings are based largely on the ratings agency’s analysis at the time of rating. The rating assigned to any particular security is not necessarily a reflection of the issuer’s current financial condition and does not necessarily reflect its assessment of the volatility of a security’s market value or of the liquidity of an investment in the security. Holdings designated as “Not Rated” (if any) are not rated by the national ratings agencies stated above. |
| 7 | The chart includes the municipal bonds held by a trust that issues residual interest bonds, consistent with the Portfolio of Investments. |
| | Fund profiles subject to change due to active management. |
Eaton Vance
Municipal Income Funds
March 31, 2020
Fund Expenses
Example: As a Fund shareholder, you incur two types of costs: (1) transaction costs, including sales charges (loads) on purchases and redemption fees (if applicable); and (2) ongoing costs, including management fees; distribution and/or service fees; and other Fund expenses. This Example is intended to help you understand your ongoing costs (in dollars) of Fund investing and to compare these costs with the ongoing costs of investing in other mutual funds. The Example is based on an investment of $1,000 invested at the beginning of the period and held for the entire period (October 1, 2019 – March 31, 2020).
Actual Expenses: The first section of each table below provides information about actual account values and actual expenses. You may use the information in this section, together with the amount you invested, to estimate the expenses that you paid over the period. Simply divide your account value by $1,000 (for example, an $8,600 account value divided by $1,000 = 8.6), then multiply the result by the number in the first section under the heading entitled “Expenses Paid During Period” to estimate the expenses you paid on your account during this period.
Hypothetical Example for Comparison Purposes: The second section of each table below provides information about hypothetical account values and hypothetical expenses based on the actual Fund expense ratio and an assumed rate of return of 5% per year (before expenses), which is not the actual Fund return. The hypothetical account values and expenses may not be used to estimate the actual ending account balance or expenses you paid for the period. You may use this information to compare the ongoing costs of investing in your Fund and other funds. To do so, compare this 5% hypothetical example with the 5% hypothetical examples that appear in the shareholder reports of the other funds.
Please note that the expenses shown in each table are meant to highlight your ongoing costs only and do not reflect any transactional costs, such as sales charges (loads) or redemption fees (if applicable). Therefore, the second section of each table is useful in comparing ongoing costs only, and will not help you determine the relative total costs of owning different funds. In addition, if these transactional costs were included, your costs would be higher.
Eaton VanceAMT-Free Municipal Income Fund
| | | | | | | | | | | | | | | | |
| | | Beginning
Account Value
(10/1/19) | | | Ending
Account Value
(3/31/20) | | | Expenses Paid
During Period*
(10/1/19 – 3/31/20) | | | Annualized
Expense
Ratio | |
| | | | |
Actual | | | | | | | | | | | | | | | | |
Class A | | $ | 1,000.00 | | | $ | 1,006.00 | | | $ | 4.86 | | | | 0.97 | % |
Class C | | $ | 1,000.00 | | | $ | 1,001.10 | | | $ | 8.60 | | | | 1.72 | % |
Class I | | $ | 1,000.00 | | | $ | 1,007.00 | | | $ | 3.61 | | | | 0.72 | % |
| | | | | |
Hypothetical | | | | | | | | | | | | | | | | |
(5% return per year before expenses) | | | | | | | | | | | | | | | | |
Class A | | $ | 1,000.00 | | | $ | 1,020.20 | | | $ | 4.90 | | | | 0.97 | % |
Class C | | $ | 1,000.00 | | | $ | 1,016.40 | | | $ | 8.67 | | | | 1.72 | % |
Class I | | $ | 1,000.00 | | | $ | 1,021.40 | | | $ | 3.64 | | | | 0.72 | % |
| * | Expenses are equal to the Fund’s annualized expense ratio for the indicated Class, multiplied by the average account value over the period, multiplied by 183/366 (to reflect theone-half year period). The Example assumes that the $1,000 was invested at the net asset value per share determined at the close of business on September 30, 2019. |
Eaton Vance
Municipal Income Funds
March 31, 2020
Fund Expenses — continued
Eaton Vance National Municipal Income Fund
| | | | | | | | | | | | | | | | |
| | | Beginning
Account Value
(10/1/19) | | | Ending
Account Value
(3/31/20) | | | Expenses Paid
During Period*
(10/1/19 – 3/31/20) | | | Annualized
Expense
Ratio | |
| | | | |
Actual | | | | | | | | | | | | | | | | |
Class A | | $ | 1,000.00 | | | $ | 997.20 | | | $ | 3.59 | | | | 0.72 | % |
Class C | | $ | 1,000.00 | | | $ | 993.60 | | | $ | 7.33 | | | | 1.47 | % |
Class I | | $ | 1,000.00 | | | $ | 998.50 | | | $ | 2.35 | | | | 0.47 | % |
| | | | | |
Hypothetical | | | | | | | | | | | | | | | | |
(5% return per year before expenses) | | | | | | | | | | | | | | | | |
Class A | | $ | 1,000.00 | | | $ | 1,021.40 | | | $ | 3.64 | | | | 0.72 | % |
Class C | | $ | 1,000.00 | | | $ | 1,017.70 | | | $ | 7.42 | | | | 1.47 | % |
Class I | | $ | 1,000.00 | | | $ | 1,022.70 | | | $ | 2.38 | | | | 0.47 | % |
| * | Expenses are equal to the Fund’s annualized expense ratio for the indicated Class, multiplied by the average account value over the period, multiplied by 183/366 (to reflect theone-half year period). The Example assumes that the $1,000 was invested at the net asset value per share determined at the close of business on September 30, 2019. |
Eaton Vance
AMT-Free Municipal Income Fund
March 31, 2020
Portfolio of Investments (Unaudited)
| | | | | | | | | | | | |
| Tax-Exempt Investments — 107.4% | |
| Security | | | | | Principal
Amount
(000’s omitted) | | | Value | |
|
| Bond Bank — 3.2% | |
| | | |
New York State Environmental Facilities Corp., 5.00%, 10/15/35(1) | | | | | | $ | 9,900 | | | $ | 9,929,700 | |
| | | |
| | | | | | | | | | | $ | 9,929,700 | |
|
| Education — 6.5% | |
| | | |
Connecticut Health and Educational Facilities Authority, (Choate Rosemary Hall), 4.00%, 7/1/38 | | | | | | $ | 315 | | | $ | 373,054 | |
| | | |
Connecticut Health and Educational Facilities Authority, (Choate Rosemary Hall), 4.00%, 7/1/39 | | | | | | | 380 | | | | 448,594 | |
| | | |
Connecticut Health and Educational Facilities Authority, (Choate Rosemary Hall), 4.00%, 7/1/42 | | | | | | | 860 | | | | 1,012,504 | |
| | | |
Connecticut Health and Educational Facilities Authority, (Choate Rosemary Hall), 5.00%, 7/1/32 | | | | | | | 175 | | | | 232,346 | |
| | | |
Connecticut Health and Educational Facilities Authority, (Fairfield University), 5.00%, 7/1/46 | | | | | | | 5,000 | | | | 5,641,150 | |
| | | |
District of Columbia, (KIPP DC), 4.00%, 7/1/39 | | | | | | | 100 | | | | 101,084 | |
| | | |
District of Columbia, (KIPP DC), 4.00%, 7/1/44 | | | | | | | 100 | | | | 100,105 | |
| | | |
District of Columbia, (KIPP DC), 4.00%, 7/1/49 | | | | | | | 135 | | | | 133,441 | |
| | | |
North Carolina Capital Facilities Finance Agency, (Duke University), 5.00%, 10/1/41 | | | | | | | 1,480 | | | | 1,722,883 | |
| | | |
Pennsylvania Higher Educational Facilities Authority, (Drexel University), 5.00%, 5/1/37 | | | | | | | 1,750 | | | | 2,013,375 | |
| | | |
Pima County Community College District, AZ, 5.00%, 7/1/35 | | | | | | | 725 | | | | 898,427 | |
| | | |
University of California, 5.25%, 5/15/35 | | | | | | | 3,555 | | | | 4,053,660 | |
| | | |
West Virginia University, Prerefunded to 11/1/22, 5.00%, 10/1/31 | | | | | | | 3,000 | | | | 3,288,990 | |
| | | |
| | | | | | | | | | | $ | 20,019,613 | |
|
| Electric Utilities — 2.4% | |
| | | |
Chula Vista, CA, (San Diego Gas and Electric), 5.875%, 2/15/34 | | | | | | $ | 3,520 | | | $ | 3,532,953 | |
| | | |
Northern Municipal Power Agency, MN, 5.00%, 1/1/31 | | | | | | | 200 | | | | 240,520 | |
| | | |
Northern Municipal Power Agency, MN, 5.00%, 1/1/35 | | | | | | | 170 | | | | 201,637 | |
| | | |
Northern Municipal Power Agency, MN, 5.00%, 1/1/36 | | | | | | | 160 | | | | 189,248 | |
| | | |
Utility Debt Securitization Authority, NY, 5.00%, 12/15/33 | | | | | | | 2,895 | | | | 3,281,946 | |
| | | |
| | | | | | | | | | | $ | 7,446,304 | |
|
| Escrowed / Prerefunded — 6.7% | |
| | | |
Henrico County Economic Development Authority, VA, (Bon Secours Health System, Inc.), Prerefunded to 11/1/22, 5.00%, 11/1/30 | | | | | | $ | 1,185 | | | $ | 1,299,708 | |
| | | |
Massachusetts Development Finance Agency, (Tufts Medical Center), Prerefunded to 1/1/21, 6.75%, 1/1/36 | | | | | | | 470 | | | | 489,298 | |
| | | | | | | | | | | | |
| Security | | | | | Principal
Amount
(000’s omitted) | | | Value | |
|
| Escrowed / Prerefunded (continued) | |
| | | |
Massachusetts Development Finance Agency, (Tufts Medical Center), Prerefunded to 1/1/21, 6.75%, 1/1/36 | | | | | | $ | 315 | | | $ | 327,934 | |
| | | |
New Jersey Turnpike Authority, Prerefunded to 7/1/22, 5.00%, 1/1/30 | | | | | | | 3,060 | | | | 3,329,127 | |
| | | |
Oklahoma Development Finance Authority, (St. John Health System), Prerefunded to 2/15/22, 5.00%, 2/15/34 | | | | | | | 2,035 | | | | 2,180,258 | |
| | | |
Oregon Facilities Authority, (Lewis & Clark College), Prerefunded to 10/1/21, 5.625%, 10/1/36 | | | | | | | 1,050 | | | | 1,121,180 | |
| | | |
Savannah Economic Development Authority, GA, Escrowed to Maturity, 0.00%, 12/1/21 | | | | | | | 6,000 | | | | 5,877,840 | |
| | | |
Washington, Prerefunded to 2/1/21, 5.25%, 2/1/36(1) | | | | | | | 6,000 | | | | 6,205,200 | |
| | | |
| | | | | | | | | | | $ | 20,830,545 | |
|
| General Obligations — 22.0% | |
| | | |
California, 5.00%, 4/1/35 | | | | | | $ | 2,125 | | | $ | 2,410,239 | |
| | | |
California, 5.25%, 10/1/29 | | | | | | | 560 | | | | 594,373 | |
| | | |
California, 5.25%, 10/1/32 | | | | | | | 3,480 | | | | 3,691,445 | |
| | | |
Chicago, IL, 5.00%, 1/1/39 | | | | | | | 1,400 | | | | 1,418,004 | |
| | | |
Chicago, IL, 5.00%, 1/1/44 | | | | | | | 1,490 | | | | 1,496,407 | |
| | | |
Chicago Board of Education, IL, 5.00%, 12/1/21 | | | | | | | 230 | | | | 232,571 | |
| | | |
Chicago Board of Education, IL, 5.00%, 12/1/42 | | | | | | | 260 | | | | 259,267 | |
| | | |
Chicago Board of Education, IL, 5.00%, 12/1/44 | | | | | | | 1,405 | | | | 1,389,952 | |
| | | |
Chicago Board of Education, IL, 5.00%, 12/1/46 | | | | | | | 10 | | | | 9,819 | |
| | | |
District of Columbia, 5.00%, 6/1/37(1) | | | | | | | 7,000 | | | | 8,547,350 | |
| | | |
Fennville Public Schools, MI, 4.00%, 5/1/34 | | | | | | | 1,000 | | | | 1,145,550 | |
| | | |
Foothill-De Anza Community College District, CA, 5.00%, 8/1/34 | | | | | | | 1,150 | | | | 1,326,824 | |
| | | |
Foothill-De Anza Community College District, CA, 5.00%, 8/1/36 | | | | | | | 1,150 | | | | 1,322,638 | |
| | | |
Gallatin County School District No. 44, MT, 4.00%, 6/1/35 | | | | | | | 520 | | | | 604,131 | |
| | | |
Illinois, 4.00%, 6/1/33 | | | | | | | 2,000 | | | | 1,908,480 | |
| | | |
Illinois, 5.00%, 1/1/26 | | | | | | | 5,000 | | | | 5,260,600 | |
| | | |
Illinois, 5.00%, 5/1/35 | | | | | | | 2,000 | | | | 2,025,680 | |
| | | |
Kane, Cook and DuPage Counties School District No. 46, IL, 5.00%, 1/1/31 | | | | | | | 4,470 | | | | 5,021,956 | |
| | | |
Lodi Unified School District, CA, (Election of 2016), 4.00%, 8/1/33 | | | | | | | 1,250 | | | | 1,440,850 | |
| | | |
New York, NY, 4.00%, 10/1/35 | | | | | | | 3,655 | | | | 4,257,052 | |
| | | |
New York, NY, 4.00%, 3/1/36 | | | | | | | 2,520 | | | | 2,939,252 | |
| | | |
New York, NY, 4.00%, 8/1/42(1) | | | | | | | 7,000 | | | | 7,955,080 | |
| | | |
New York, NY, 5.00%, 3/1/40 | | | | | | | 1,750 | | | | 2,184,280 | |
| | | |
Renton School District No. 403, WA, 4.00%, 12/1/33 | | | | | | | 1,230 | | | | 1,472,236 | |
| | | |
Renton School District No. 403, WA, 4.00%, 12/1/34 | | | | | | | 1,300 | | | | 1,547,585 | |
| | | |
Salem-Keizer School District No. 24J, OR, 0.00%, 6/15/24 | | | | | | | 1,220 | | | | 1,150,972 | |
| | | |
San Rafael City High School District, CA, (Election of 2015), 4.00%, 8/1/36 | | | | | | | 1,190 | | | | 1,380,079 | |
| | | | |
| | 7 | | See Notes to Financial Statements. |
Eaton Vance
AMT-Free Municipal Income Fund
March 31, 2020
Portfolio of Investments (Unaudited) — continued
| | | | | | | | | | | | |
| Security | | | | | Principal
Amount
(000’s omitted) | | | Value | |
|
| General Obligations (continued) | |
| | | |
Springfield School District No. 19, OR, 5.00%, 6/15/30 | | | | | | $ | 1,085 | | | $ | 1,275,732 | |
| | | |
Union R-XI School District, MO, 5.00%, 3/1/38 | | | | | | | 2,100 | | | | 2,423,316 | |
| | | |
University of Connecticut, 5.00%, 2/15/32 | | | | | | | 650 | | | | 729,469 | |
| | | |
Washington, 5.00%, 6/1/38(2) | | | | | | | 710 | | | | 879,555 | |
| | | |
| | | | | | | | | | | $ | 68,300,744 | |
|
| Hospital — 13.2% | |
| | | |
California Health Facilities Financing Authority, (Catholic Healthcare West), 5.25%, 3/1/28 | | | | | | $ | 535 | | | $ | 546,813 | |
| | | |
California Health Facilities Financing Authority, (St. Joseph Health System), 5.00%, 7/1/33 | | | | | | | 1,720 | | | | 1,899,327 | |
| | | |
California Health Facilities Financing Authority, (St. Joseph Health System), 5.00%, 7/1/37 | | | | | | | 2,300 | | | | 2,522,456 | |
| | | |
California Health Facilities Financing Authority, (Sutter Health), 5.25%, 8/15/31 | | | | | | | 1,325 | | | | 1,396,855 | |
| | | |
California Statewide Communities Development Authority, (Loma Linda University Medical Center), 5.25%, 12/1/34 | | | | | | | 3,000 | | | | 3,309,540 | |
| | | |
Colorado Health Facilities Authority, (CommonSpirit Health), 4.00%, 8/1/39 | | | | | | | 1,250 | | | | 1,302,387 | |
| | | |
Colorado Health Facilities Authority, (Vail Valley Medical Center), 5.00%, 1/15/35 | | | | | | | 2,000 | | | | 2,372,400 | |
| | | |
Delaware Health Facilities Authority, (Beebe Medical Center), 5.00%, 6/1/36 | | | | | | | 3,730 | | | | 4,471,748 | |
| | | |
Delaware Health Facilities Authority, (Beebe Medical Center), 5.00%, 6/1/37 | | | | | | | 1,000 | | | | 1,195,500 | |
| | | |
Escambia County Health Facilities Authority, FL, (Baptist Health Care Corp. Obligated Group), 4.00%, 8/15/45 | | | | | | | 520 | | | | 550,124 | |
| | | |
Illinois Finance Authority, (Presence Health Network), 4.00%, 2/15/36 | | | | | | | 5,345 | | | | 5,810,229 | |
| | | |
Massachusetts Development Finance Agency, (Children’s Hospital), 5.00%, 10/1/31 | | | | | | | 2,110 | | | | 2,451,271 | |
| | | |
Missouri Health and Educational Facilities Authority, (Mercy Health), 5.00%, 11/15/47 | | | | | | | 3,000 | | | | 3,501,990 | |
| | | |
New York Dormitory Authority, (Montefiore Obligated Group), 4.00%, 9/1/45 | | | | | | | 1,000 | | | | 1,060,640 | |
| | | |
Ohio, (University Hospitals Health Systems, Inc.), 5.00%, 1/15/36 | | | | | | | 2,500 | | | | 2,851,525 | |
| | | |
Tarrant County Cultural Education Facilities Finance Corp., TX, (Cook Children’s Medical Center), 5.25%, 12/1/39(1) | | | | | | | 5,000 | | | | 5,561,150 | |
| | | |
| | | | | | | | | | | $ | 40,803,955 | |
|
| Housing — 0.7% | |
| | | |
Phoenix Industrial Development Authority, AZ, (Downtown Phoenix Student Housing, LLC - Arizona State University), 5.00%, 7/1/37 | | | | | | $ | 500 | | | $ | 561,190 | |
| | | | | | | | | | | | |
| Security | | | | | Principal
Amount
(000’s omitted) | | | Value | |
|
| Housing (continued) | |
| | | |
Phoenix Industrial Development Authority, AZ, (Downtown Phoenix Student Housing, LLC - Arizona State University), 5.00%, 7/1/42 | | | | | | $ | 1,250 | | | $ | 1,388,900 | |
| | | |
Texas Student Housing Corp., (University of North Texas), 9.375%, 7/1/06(3) | | | | | | | 285 | | | | 285,000 | |
| | | |
| | | | | | | | | | | $ | 2,235,090 | |
|
| Insured – Education — 1.1% | |
| | | |
Northern Illinois University, IL, (BAM), 5.00%, 4/1/31(2) | | | | | | $ | 950 | | | $ | 1,169,384 | |
| | | |
Virginia College Building Authority, (Washington and Lee University), (NPFG), 5.25%, 1/1/31 | | | | | | | 1,750 | | | | 2,295,755 | |
| | | |
| | | | | | | | | | | $ | 3,465,139 | |
|
| Insured – Electric Utilities — 0.8% | |
| | | |
Ohio Municipal Electric Generation Agency, (NPFG), 0.00%, 2/15/29 | | | | | | $ | 2,865 | | | $ | 2,379,039 | |
| | | |
| | | | | | | | | | | $ | 2,379,039 | |
|
| Insured – Escrowed / Prerefunded — 0.5% | |
| | | |
Texas Transportation Commission, (Central Texas Turnpike System), (AMBAC), Escrowed to Maturity, 0.00%, 8/15/21 | | | | | | $ | 1,560 | | | $ | 1,535,898 | |
| | | |
| | | | | | | | | | | $ | 1,535,898 | |
|
| Insured – General Obligations — 1.3% | |
| | | |
Atlantic City, NJ, (AGM), 4.00%, 3/1/42 | | | | | | $ | 145 | | | $ | 157,925 | |
| | | |
Chicago Board of Education, IL, (AGM), 5.00%, 12/1/24 | | | | | | | 505 | | | | 572,089 | |
| | | |
McCook, IL, (AGM), 4.00%, 12/1/29 | | | | | | | 240 | | | | 275,362 | |
| | | |
McCook, IL, (AGM), 4.00%, 12/1/30 | | | | | | | 200 | | | | 228,530 | |
| | | |
McCook, IL, (AGM), 4.00%, 12/1/33 | | | | | | | 500 | | | | 557,950 | |
| | | |
McCook, IL, (AGM), 4.00%, 12/1/34 | | | | | | | 440 | | | | 485,716 | |
| | | |
Proviso Township High School District No. 209, IL, (AGM), 4.00%, 12/1/38 | | | | | | | 1,500 | | | | 1,642,995 | |
| | | |
| | | | | | | | | | | $ | 3,920,567 | |
|
| Insured – Lease Revenue / Certificates of Participation — 2.2% | |
| | | |
Anaheim Public Financing Authority, CA, (Anaheim Public Improvements), (AGM), 0.00%, 9/1/31 | | | | | | $ | 8,680 | | | $ | 6,851,037 | |
| | | |
| | | | | | | | | | | $ | 6,851,037 | |
| | | | |
| | 8 | | See Notes to Financial Statements. |
Eaton Vance
AMT-Free Municipal Income Fund
March 31, 2020
Portfolio of Investments (Unaudited) — continued
| | | | | | | | | | | | |
| Security | | | | | Principal
Amount
(000’s omitted) | | | Value | |
|
| Insured – Other Revenue — 2.2% | |
| | | |
Harris County-Houston Sports Authority, TX, (AGM), (NPFG), 0.00%, 11/15/34 | | | | | | $ | 10,600 | | | $ | 6,739,056 | |
| | | |
| | | | | | | | | | | $ | 6,739,056 | |
|
| Insured – Special Tax Revenue — 5.7% | |
| | | |
Alabama Public School and College Authority, (AGM), 2.50%, 12/1/27 | | | | | | $ | 5,265 | | | $ | 5,269,686 | |
| | | |
Massachusetts, Dedicated Tax Revenue, (NPFG), 5.50%, 1/1/27 | | | | | | | 6,000 | | | | 7,551,480 | |
| | | |
Massachusetts, Dedicated Tax Revenue, (NPFG), 5.50%, 1/1/30 | | | | | | | 2,565 | | | | 3,414,836 | |
| | | |
Successor Agency to San Francisco City and County Redevelopment Agency, CA, (NPFG), 5.00%, 8/1/43 | | | | | | | 1,100 | | | | 1,278,508 | |
| | | |
| | | | | | | | | | | $ | 17,514,510 | |
|
| Insured – Transportation — 9.6% | |
| | | |
Chicago, IL, (O’Hare International Airport), (AGM), 5.00%, 1/1/28 | | | | | | $ | 1,000 | | | $ | 1,076,410 | |
| | | |
Chicago, IL, (O’Hare International Airport), (AGM), 5.125%, 1/1/31 | | | | | | | 1,000 | | | | 1,076,680 | |
| | | |
Chicago, IL, (O’Hare International Airport), (AGM), 5.25%, 1/1/32 | | | | | | | 785 | | | | 847,353 | |
| | | |
E-470 Public Highway Authority, CO, (NPFG), 0.00%, 9/1/39 | | | | | | | 7,120 | | | | 3,067,723 | |
| | | |
Metropolitan Transportation Authority, NY, Green Bonds, (AGM), 4.00%, 11/15/46 | | | | | | | 1,275 | | | | 1,326,306 | |
| | | |
Metropolitan Transportation Authority, NY, Green Bonds, (AGM), 5.00%, 11/15/44 | | | | | | | 2,470 | | | | 2,870,165 | |
| | | |
Pennsylvania Turnpike Commission, (AGM), 6.375%, 12/1/38 | | | | | | | 11,000 | | | | 14,453,560 | |
| | | |
Texas Transportation Commission, (Central Texas Turnpike System), (AMBAC), 0.00%, 8/15/21 | | | | | | | 5,285 | | | | 5,184,162 | |
| | | |
| | | | | | | | | | | $ | 29,902,359 | |
|
| Insured – Water and Sewer — 2.4% | |
| | | |
Detroit, MI, Sewage Disposal System, (AGM), 5.00%, 7/1/39 | | | | | | $ | 4,825 | | | $ | 5,195,512 | |
| | | |
Michigan Finance Authority, (Detroit Water and Sewerage Department), (AGM), 5.00%, 7/1/32 | | | | | | | 655 | | | | 735,984 | |
| | | |
Michigan Finance Authority, (Detroit Water and Sewerage Department), (AGM), 5.00%, 7/1/33 | | | | | | | 565 | | | | 639,546 | |
| | | |
Michigan Finance Authority, (Detroit Water and Sewerage Department), (AGM), 5.00%, 7/1/35 | | | | | | | 280 | | | | 315,963 | |
| | | |
Michigan Finance Authority, (Detroit Water and Sewerage Department), (AGM), 5.00%, 7/1/37 | | | | | | | 565 | | | | 635,105 | |
| | | |
| | | | | | | | | | | $ | 7,522,110 | |
| | | | | | | | | | | | |
| Security | | | | | Principal
Amount
(000’s omitted) | | | Value | |
|
| Lease Revenue / Certificates of Participation — 2.8% | |
| | | |
Hudson Yards Infrastructure Corp., NY, 4.00%, 2/15/44 | | | | | | $ | 5,020 | | | $ | 5,434,752 | |
| | | |
New Jersey Economic Development Authority, (School Facilities Construction), 5.00%, 6/15/37 | | | | | | | 3,000 | | | | 3,186,630 | |
| | | |
| | | | | | | | | | | $ | 8,621,382 | |
|
| Other Revenue — 1.4% | |
| | | |
Austin Convention Enterprises, Inc., TX, (Convention Center Hotel), 5.00%, 1/1/22 | | | | | | $ | 400 | | | $ | 404,216 | |
| | | |
Central Falls Detention Facility Corp., RI, 7.25%, 7/15/35(4) | | | | | | | 1,200 | | | | 216,000 | |
| | | |
Cleveland-Cuyahoga County Port Authority, OH, (Playhouse Square Foundation), 5.25%, 12/1/38 | | | | | | | 970 | | | | 1,001,942 | |
| | | |
Cleveland-Cuyahoga County Port Authority, OH, (Playhouse Square Foundation), 5.50%, 12/1/43 | | | | | | | 355 | | | | 368,596 | |
| | | |
Mercer County Improvement Authority, NJ, 4.00%, 3/15/40 | | | | | | | 935 | | | | 1,083,684 | |
| | | |
White Earth Band of Chippewa Indians, MN, 6.375%, 12/1/26(5) | | | | | | | 1,385 | | | | 1,376,053 | |
| | | |
| | | | | | | | | | | $ | 4,450,491 | |
|
| Senior Living / Life Care — 3.8% | |
| | | |
National Finance Authority, NH, (The Vista), 5.25%, 7/1/39(5) | | | | | | $ | 265 | | | $ | 250,261 | |
| | | |
National Finance Authority, NH, (The Vista), 5.625%, 7/1/46(5) | | | | | | | 360 | | | | 347,764 | |
| | | |
National Finance Authority, NH, (The Vista), 5.75%, 7/1/54(5) | | | | | | | 775 | | | | 751,262 | |
| | | |
Palm Beach County Health Facilities Authority, FL, (Sinai Residences of Boca Raton), 7.25%, 6/1/39 | | | | | | | 570 | | | | 598,015 | |
| | | |
Palm Beach County Health Facilities Authority, FL, (Sinai Residences of Boca Raton), 7.50%, 6/1/49 | | | | | | | 2,690 | | | | 2,823,935 | |
| | | |
Saint Louis County Industrial Development Authority, MO, (St. Andrew’s Resources for Seniors Obligated Group), 5.00%, 12/1/35 | | | | | | | 1,700 | | | | 1,672,698 | |
| | | |
Tempe Industrial Development Authority, AZ, (Friendship Village of Tempe), 6.00%, 12/1/32 | | | | | | | 160 | | | | 163,563 | |
| | | |
Tempe Industrial Development Authority, AZ, (Friendship Village of Tempe), 6.25%, 12/1/42 | | | | | | | 660 | | | | 673,173 | |
| | | |
Washington Housing Finance Commission, (Horizon House), 5.00%, 1/1/32(5) | | | | | | | 1,575 | | | | 1,693,141 | |
| | | |
Washington Housing Finance Commission, (Horizon House), 5.00%, 1/1/38(5) | | | | | | | 2,325 | | | | 2,470,987 | |
| | | |
Washington Housing Finance Commission, (Transforming Age), 5.00%, 1/1/34(5) | | | | | | | 245 | | | | 249,339 | |
| | | |
| | | | | | | | | | | $ | 11,694,138 | |
| | | | |
| | 9 | | See Notes to Financial Statements. |
Eaton Vance
AMT-Free Municipal Income Fund
March 31, 2020
Portfolio of Investments (Unaudited) — continued
| | | | | | | | | | | | |
| Security | | | | | Principal
Amount
(000’s omitted) | | | Value | |
|
| Special Tax Revenue — 4.3% | |
| | | |
Bridgeville, DE, (Heritage Shores Special Development District), 5.45%, 7/1/35 | | | | | | $ | 911 | | | $ | 847,968 | |
| | | |
Jurupa Public Financing Authority, CA, 5.00%, 9/1/31 | | | | | | | 1,200 | | | | 1,384,512 | |
| | | |
New York City Transitional Finance Authority, NY, Future Tax Revenue, 4.00%, 11/1/38 | | | | | | | 5,820 | | | | 6,650,921 | |
| | | |
New York City Transitional Finance Authority, NY, Future Tax Revenue, 5.00%, 11/1/37 | | | | | | | 1,000 | | | | 1,169,180 | |
| | | |
River Hall Community Development District, FL, (Capital Improvements), 5.45%, 5/1/36 | | | | | | | 930 | | | | 934,734 | |
| | | |
San Francisco Bay Area Rapid Transit District, CA, Sales Tax Revenue, 4.00%, 7/1/35 | | | | | | | 2,000 | | | | 2,276,120 | |
| | | |
| | | | | | | | | | | $ | 13,263,435 | |
|
| Transportation — 10.3% | |
| | | |
Central Texas Regional Mobility Authority, Prerefunded to 1/1/21, 5.75%, 1/1/31 | | | | | | $ | 415 | | | $ | 429,313 | |
| | | |
Dallas and Fort Worth, TX, (Dallas/Fort Worth International Airport), 5.25%, 11/1/30 | | | | | | | 1,100 | | | | 1,209,736 | |
| | | |
Dallas and Fort Worth, TX, (Dallas/Fort Worth International Airport), 5.25%, 11/1/31 | | | | | | | 1,455 | | | | 1,599,612 | |
| | | |
Delaware River Port Authority of Pennsylvania and New Jersey, 5.00%, 1/1/31 | | | | | | | 290 | | | | 326,485 | |
| | | |
Grand Parkway Transportation Corp., TX, 5.125%, 10/1/43 | | | | | | | 1,100 | | | | 1,149,027 | |
| | | |
Metropolitan Transportation Authority, NY, 5.00%, 11/15/35 | | | | | | | 325 | | | | 359,931 | |
| | | |
Miami-Dade County, FL, Aviation Revenue, 5.00%, 10/1/33 | | | | | | | 2,650 | | | | 2,947,118 | |
| | | |
New Orleans Aviation Board, LA, 5.00%, 1/1/43 | | | | | | | 1,555 | | | | 1,788,794 | |
| | | |
New York Thruway Authority, 3.00%, 1/1/49 | | | | | | | 4,190 | | | | 4,081,270 | |
| | | |
New York Thruway Authority, 5.00%, 1/1/38 | | | | | | | 2,000 | | | | 2,510,800 | |
| | | |
New York Thruway Authority, 5.00%, 1/1/46 | | | | | | | 4,000 | | | | 4,644,680 | |
| | | |
San Joaquin Hills Transportation Corridor Agency, CA, 5.00%, 1/15/34 | | | | | | | 5,235 | | | | 5,649,821 | |
| | | |
Texas Private Activity Bond Surface Transportation Corp., (LBJ Express Managed Lanes Project), 7.00%, 6/30/34 | | | | | | | 3,500 | | | | 3,527,370 | |
| | | |
Texas Private Activity Bond Surface Transportation Corp., (North Tarrant Express Managed Lanes Project), 4.00%, 12/31/37 | | | | | | | 440 | | | | 448,892 | |
| | | |
Texas Private Activity Bond Surface Transportation Corp., (North Tarrant Express Managed Lanes Project), 4.00%, 12/31/38 | | | | | | | 275 | | | | 279,656 | |
| | | |
Texas Private Activity Bond Surface Transportation Corp., (North Tarrant Express Managed Lanes Project), 4.00%, 12/31/39 | | | | | | | 265 | | | | 268,623 | |
| | | |
Texas Private Activity Bond Surface Transportation Corp., (North Tarrant Express Managed Lanes Project), 5.00%, 12/31/36 | | | | | | | 355 | | | | 400,238 | |
| | | | | | | | | | | | |
| Security | | | | | Principal
Amount
(000’s omitted) | | | Value | |
|
| Transportation (continued) | |
| | | |
Texas Transportation Commission, 0.00%, 8/1/40 | | | | | | $ | 1,000 | | | $ | 397,420 | |
| | | |
| | | | | | | | | | | $ | 32,018,786 | |
|
| Water and Sewer — 4.3% | |
| | | |
Atlanta, GA, Water and Wastewater Revenue, 5.00%, 11/1/35(1) | | | | | | $ | 6,990 | | | $ | 8,627,617 | |
| | | |
New York City Municipal Water Finance Authority, NY, (Water and Sewer System), 4.00%, 6/15/41 | | | | | | | 4,000 | | | | 4,552,680 | |
| | | |
| | | | | | | | | | | $ | 13,180,297 | |
| | | |
Total Tax-Exempt Investments — 107.4%
(identified cost $310,861,156) | | | | | | | | | | $ | 332,624,195 | |
| | | |
Other Assets, Less Liabilities — (7.4)% | | | | | | | | | | $ | (22,842,081 | ) |
| | | |
Net Assets — 100.0% | | | | | | | | | | $ | 309,782,114 | |
The percentage shown for each investment category in the Portfolio of Investments is based on net assets.
At March 31, 2020, the concentration of the Fund’s investments in the various states, determined as a percentage of net assets, is as follows:
| | | | |
| |
| New York | | | 21.0% | |
| |
| California | | | 15.1% | |
| |
| Illinois | | | 10.6% | |
| |
| Others, representing less than 10% individually | | | 60.7% | |
The Fund invests primarily in debt securities issued by municipalities. The ability of the issuers of the debt securities to meet their obligations may be affected by economic developments in a specific industry or municipality. At March 31, 2020, 24.0% of total investments are backed by bond insurance of various financial institutions and financial guaranty assurance agencies. The aggregate percentage insured by an individual financial institution or financial guaranty assurance agency ranged from 0.4% to 15.6% of total investments.
| (1) | Security represents the municipal bond held by a trust that issues residual interest bonds (see Note 1H). |
| (2) | When-issued security. |
| (3) | The issuer is in default on the payment of principal but continues to pay interest. |
| (4) | Defaulted security. Issuer has defaulted on the payment of interest and/or principal or has filed for bankruptcy. |
| (5) | Security exempt from registration pursuant to Rule 144A under the Securities Act of 1933, as amended. These securities may be sold in certain transactions in reliance on an exemption from registration (normally to qualified institutional buyers). At March 31, 2020, the aggregate value of these securities is $7,138,807 or 2.3% of the Fund’s net assets. |
| | | | |
| | 10 | | See Notes to Financial Statements. |
Eaton Vance
AMT-Free Municipal Income Fund
March 31, 2020
Portfolio of Investments (Unaudited) — continued
Abbreviations:
| | | | |
| | |
| AGM | | – | | Assured Guaranty Municipal Corp. |
| | |
| AMBAC | | – | | AMBAC Financial Group, Inc. |
| | |
| BAM | | – | | Build America Mutual Assurance Co. |
| | |
| NPFG | | – | | National Public Finance Guarantee Corp. |
| | | | |
| | 11 | | See Notes to Financial Statements. |
Eaton Vance
National Municipal Income Fund
March 31, 2020
Portfolio of Investments (Unaudited)
| | | | | | | | | | | | |
| Tax-Exempt Municipal Securities — 93.5% | |
| Security | | | | | Principal
Amount
(000’s omitted) | | | Value | |
|
| Bond Bank — 1.4% | |
| | | |
Connecticut, (State Revolving Fund), Green Bonds, 5.00%, 3/1/28 | | | | | | $ | 10,000 | | | $ | 11,777,700 | |
| | | |
Ohio Water Development Authority, Water Pollution Control Loan Fund, 5.00%, 6/1/29 | | | | | | | 10,000 | | | | 12,978,900 | |
| | | |
Rickenbacker Port Authority, OH, (OASBO Expanded Asset Pooled Financing Program), 5.375%, 1/1/32 | | | | | | | 13,045 | | | | 16,544,060 | |
| | | |
| | | | | | | | | | | $ | 41,300,660 | |
|
| Cogeneration — 0.1% | |
| | | |
Northampton County Industrial Development Authority, PA, (Northampton Generating), (AMT), 5.00%, 12/31/23(1) | | | | | | $ | 14,652 | | | $ | 3,663,079 | |
| | | |
| | | | | | | | | | | $ | 3,663,079 | |
|
| Education — 6.3% | |
| | | |
Allegheny County Higher Education Building Authority, PA, (Carnegie Mellon University), 5.00%, 8/1/27 | | | | | | $ | 3,335 | | | $ | 4,186,492 | |
| | | |
Bowling Green State University, OH, 4.00%, 6/1/38 | | | | | | | 440 | | | | 488,928 | |
| | | |
Connecticut Health and Educational Facilities Authority, (Choate Rosemary Hall), 4.00%, 7/1/36 | | | | | | | 480 | | | | 571,858 | |
| | | |
Connecticut Health and Educational Facilities Authority, (Choate Rosemary Hall), 4.00%, 7/1/37 | | | | | | | 300 | | | | 356,169 | |
| | | |
Connecticut Health and Educational Facilities Authority, (Choate Rosemary Hall), 5.00%, 7/1/29 | | | | | | | 220 | | | | 288,198 | |
| | | |
Connecticut Health and Educational Facilities Authority, (Choate Rosemary Hall), 5.00%, 7/1/30 | | | | | | | 185 | | | | 247,251 | |
| | | |
Connecticut Health and Educational Facilities Authority, (Choate Rosemary Hall), 5.00%, 7/1/31 | | | | | | | 250 | | | | 332,870 | |
| | | |
Connecticut Health and Educational Facilities Authority, (Yale University), 5.00%, 7/1/27 | | | | | | | 5,000 | | | | 6,283,600 | |
| | | |
District of Columbia, (District of Columbia International School), 5.00%, 7/1/54 | | | | | | | 2,290 | | | | 2,591,204 | |
| | | |
Florida Higher Educational Facilities Financing Authority, (Jacksonville University), 4.75%, 6/1/38(2) | | | | | | | 2,245 | | | | 2,132,099 | |
| | | |
Maryland Health and Higher Educational Facilities Authority, (Loyola University Maryland), 5.00%, 10/1/22 | | | | | | | 500 | | | | 539,020 | |
| | | |
Maryland Health and Higher Educational Facilities Authority, (Loyola University Maryland), 5.00%, 10/1/23 | | | | | | | 500 | | | | 552,775 | |
| | | |
Maryland Health and Higher Educational Facilities Authority, (Loyola University Maryland), 5.00%, 10/1/24 | | | | | | | 500 | | | | 566,795 | |
| | | |
Massachusetts Development Finance Agency, (Harvard University), 5.00%, 7/15/34 | | | | | | | 18,855 | | | | 22,494,015 | |
| | | | | | | | | | | | |
| Security | | | | | Principal
Amount
(000’s omitted) | | | Value | |
|
| Education (continued) | |
| | | |
Michigan State University, 5.00%, 2/15/31 | | | | | | $ | 1,200 | | | $ | 1,529,988 | |
| | | |
New Hampshire Health and Education Facilities Authority, (University System of New Hampshire), (SPA: State Street Bank and Trust Company), 0.85%, 7/1/33(3) | | | | | | | 6,825 | | | | 6,825,000 | |
| | | |
New Hampshire Health and Education Facilities Authority, (University System of New Hampshire), (SPA: Wells Fargo Bank, N.A.), 0.75%, 7/1/33(3) | | | | | | | 7,465 | | | | 7,465,000 | |
| | | |
New Hampshire Health and Education Facilities Authority, (University System of New Hampshire), (SPA: Wells Fargo Bank, N.A.), 0.85%, 7/1/33(3) | | | | | | | 2,535 | | | | 2,535,000 | |
| | | |
New Jersey Educational Facilities Authority, (Princeton University), 5.00%, 7/1/33 | | | | | | | 4,370 | | | | 5,404,248 | |
| | | |
New York Dormitory Authority, (Columbia University), 5.00%, 10/1/38 | | | | | | | 19,235 | | | | 23,496,514 | |
| | | |
Troy Capital Resource Corp., NY, (Rensselaer Polytechnic Institute), 5.00%, 9/1/39(4) | | | | | | | 6,000 | | | | 7,520,220 | |
| | | |
University of California, 5.25%, 5/15/36 | | | | | | | 7,080 | | | | 8,061,005 | |
| | | |
University of California, 5.25%, 5/15/37 | | | | | | | 13,000 | | | | 14,779,180 | |
| | | |
University of California, 5.25%, 5/15/38 | | | | | | | 7,700 | | | | 8,737,344 | |
| | | |
University of Virginia, 5.00%, 4/1/38 | | | | | | | 13,205 | | | | 15,987,557 | |
| | | |
University of Virginia, 5.00%, 4/1/39 | | | | | | | 40,970 | | | | 49,505,280 | |
| | | |
| | | | | | | | | | | $ | 193,477,610 | |
|
| Electric Utilities — 4.2% | |
| | | |
Los Angeles Department of Water & Power, CA, Power System Revenue, 5.00%, 7/1/38 | | | | | | $ | 6,130 | | | $ | 7,668,569 | |
| | | |
Los Angeles Department of Water & Power, CA, Power System Revenue, 5.00%, 7/1/42 | | | | | | | 1,870 | | | | 2,209,405 | |
| | | |
Mesa, AZ, Utility Systems Revenue, 5.00%, 7/1/33 | | | | | | | 1,180 | | | | 1,515,793 | |
| | | |
Omaha Public Power District, NE, 5.00%, 2/1/39 | | | | | | | 10,805 | | | | 12,560,272 | |
| | | |
Public Power Generation Agency, NE, (Whelan Energy Center Unit 2), 5.00%, 1/1/28 | | | | | | | 6,025 | | | | 6,994,422 | |
| | | |
San Antonio, TX, Electric and Gas Systems Revenue, 4.00%, 2/1/30 | | | | | | | 2,000 | | | | 2,433,980 | |
| | | |
Unified Government of Wyandotte County/Kansas City, KS, Utility System Revenue, 5.00%, 9/1/32 | | | | | | | 10,000 | | | | 10,852,100 | |
| | | |
Utility Debt Securitization Authority, NY, 5.00%, 12/15/30(5) | | | | | | | 22,500 | | | | 25,533,450 | |
| | | |
Utility Debt Securitization Authority, NY, 5.00%, 12/15/31(5) | | | | | | | 27,500 | | | | 31,207,550 | |
| | | |
Utility Debt Securitization Authority, NY, 5.00%, 12/15/33 | | | | | | | 10,000 | | | | 11,837,500 | |
| | | |
Utility Debt Securitization Authority, NY, 5.00%, 12/15/40 | | | | | | | 13,260 | | | | 16,087,828 | |
| | | |
| | | | | | | | | | | $ | 128,900,869 | |
| | | | |
| | 12 | | See Notes to Financial Statements. |
Eaton Vance
National Municipal Income Fund
March 31, 2020
Portfolio of Investments (Unaudited) — continued
| | | | | | | | | | | | |
| Security | | | | | Principal
Amount
(000’s omitted) | | | Value | |
|
| Escrowed / Prerefunded — 5.2% | |
| | | |
Bexar County Health Facilities Development Corp., TX, (St. Luke’s Lutheran Hospital), Escrowed to Maturity, 7.00%, 5/1/21 | | | | | | $ | 1,655 | | | $ | 1,709,433 | |
| | | |
Massachusetts Development Finance Agency, (Tufts Medical Center), Prerefunded to 1/1/21, 6.75%, 1/1/36 | | | | | | | 4,505 | | | | 4,689,975 | |
| | | |
Massachusetts Development Finance Agency, (Tufts Medical Center), Prerefunded to 1/1/21, 6.75%, 1/1/36 | | | | | | | 3,005 | | | | 3,128,385 | |
| | | |
North Carolina, Capital Improvement Limited Obligation Bonds, Prerefunded to 5/1/20, 5.25%, 5/1/31 | | | | | | | 16,475 | | | | 16,530,850 | |
| | | |
Oregon Department of Transportation, Prerefunded to 11/15/23, 5.00%, 11/15/38 | | | | | | | 250 | | | | 284,595 | |
| | | |
Oregon Facilities Authority, (Lewis & Clark College), Prerefunded to 10/1/21, 5.625%, 10/1/36 | | | | | | | 9,930 | | | | 10,603,155 | |
| | | |
Pennsylvania Turnpike Commission, Prerefunded to 12/1/20, 5.35%, 12/1/30 | | | | | | | 4,515 | | | | 4,638,169 | |
| | | |
Pennsylvania Turnpike Commission, Prerefunded to 12/1/20, 5.35%, 12/1/30 | | | | | | | 3,490 | | | | 3,585,207 | |
| | | |
Pennsylvania Turnpike Commission, Prerefunded to 12/1/20, 5.45%, 12/1/35 | | | | | | | 12,125 | | | | 12,463,651 | |
| | | |
Pennsylvania Turnpike Commission, Prerefunded to 12/1/20, 6.00%, 12/1/34 | | | | | | | 3,795 | | | | 3,903,196 | |
| | | |
Pennsylvania Turnpike Commission, Prerefunded to 12/1/20, 6.00%, 12/1/34 | | | | | | | 3,585 | | | | 3,687,209 | |
| | | |
Pennsylvania Turnpike Commission, Prerefunded to 12/1/20, 6.00%, 12/1/34 | | | | | | | 17,620 | | | | 18,122,346 | |
| | | |
Pennsylvania Turnpike Commission, Prerefunded to 12/1/20, 6.50%, 12/1/36 | | | | | | | 10,000 | | | | 10,341,000 | |
| | | |
Rutgers State University, NJ, Prerefunded to 5/1/23, 5.00%, 5/1/43(5) | | | | | | | 37,000 | | | | 41,370,440 | |
| | | |
Southwestern Illinois Development Authority, (Memorial Group, Inc.), Prerefunded to 11/1/23, 7.25%, 11/1/33 | | | | | | | 9,170 | | | | 11,076,260 | |
| | | |
Tarrant County Cultural Education Facilities Finance Corp., TX, (Scott & White Healthcare), Prerefunded to 8/15/20, 5.25%, 8/15/40 | | | | | | | 1,000 | | | | 1,015,390 | |
| | | |
Tarrant County Cultural Education Facilities Finance Corp., TX, (Scott & White Healthcare), Prerefunded to 8/15/20, 5.25%, 8/15/40 | | | | | | | 12,500 | | | | 12,692,375 | |
| | | |
| | | | | | | | | | | $ | 159,841,636 | |
|
| General Obligations — 15.4% | |
| | | |
Aiken County Consolidated School District, SC, 4.00%, 4/1/37 | | | | | | $ | 5,370 | | | $ | 6,236,342 | |
| | | |
Anaheim Union High School District, CA, (Election of 2014), 4.00%, 8/1/30 | | | | | | | 2,070 | | | | 2,418,919 | |
| | | |
Anaheim Union High School District, CA, (Election of 2014), 4.00%, 8/1/31 | | | | | | | 2,295 | | | | 2,674,341 | |
| | | | | | | | | | |
| Security | | | | Principal
Amount
(000’s omitted) | | | Value | |
|
| General Obligations (continued) | |
| | | |
Belmont, MA, 4.00%, 3/15/32 | | | | $ | 3,030 | | | $ | 3,553,069 | |
| | | |
California, 5.14%, (SIFMA + 0.43%), 12/1/23 (Put Date), 12/1/29(6) | | | | | 15,000 | | | | 14,878,350 | |
| | | |
California Education Notes Program, Fiscal Year2019-20 Note Participations, 5.00%, 6/30/20 | | | | | 5,245 | | | | 5,293,936 | |
| | | |
Chicago, IL, 5.00%, 1/1/39 | | | | | 2,100 | | | | 2,127,006 | |
| | | |
Chicago, IL, 5.00%, 1/1/40 | | | | | 1,500 | | | | 1,517,055 | |
| | | |
Chicago Board of Education, IL, 5.00%, 12/1/21 | | | | | 1,980 | | | | 2,002,136 | |
| | | |
Chicago Board of Education, IL, 5.00%, 12/1/42 | | | | | 2,770 | | | | 2,762,189 | |
| | | |
Chicago Board of Education, IL, 5.00%, 12/1/44 | | | | | 15,110 | | | | 14,948,172 | |
| | | |
Chicago Board of Education, IL, 5.00%, 12/1/46 | | | | | 85 | | | | 83,463 | |
| | | |
Clackamas Community College District, OR, 5.00%, (0.00% until 6/15/20), 6/15/38 | | | | | 760 | | | | 905,130 | |
| | | |
Clackamas Community College District, OR, 5.00%, (0.00% until 6/15/20), 6/15/39 | | | | | 1,000 | | | | 1,188,860 | |
| | | |
Clackamas Community College District, OR, 5.00%, (0.00% until 6/15/20), 6/15/40 | | | | | 1,250 | | | | 1,484,662 | |
| | | |
Connecticut, 4.00%, 1/15/37 | | | | | 15,000 | | | | 16,447,950 | |
| | | |
Desert Community College District, CA, 5.00%, 8/1/37 | | | | | 5,350 | | | | 6,290,797 | |
| | | |
District of Columbia, 5.00%, 10/15/30 | | | | | 4,000 | | | | 5,207,400 | |
| | | |
Hartford County Metropolitan District, CT, 5.00%, 7/15/23 | | | | | 1,000 | | | | 1,121,200 | |
| | | |
Hartford County Metropolitan District, CT, Series A, 5.00%, 7/15/24 | | | | | 500 | | | | 577,490 | |
| | | |
Hartford County Metropolitan District, CT, Series B, 5.00%, 7/15/24 | | | | | 1,000 | | | | 1,154,980 | |
| | | |
Hawaii, 5.00%, 1/1/34 | | | | | 13,700 | | | | 16,927,172 | |
| | | |
Hennepin County Regional Railroad Authority, MN, 5.00%, 12/1/30 | | | | | 4,040 | | | | 5,225,134 | |
| | | |
Hillsboro School District No. 1J, OR, 4.00%, 6/15/37 | | | | | 4,370 | | | | 5,155,027 | |
| | | |
Hillsboro School District No. 1J, OR, 4.00%, 6/15/39 | | | | | 8,000 | | | | 9,294,720 | |
| | | |
Hillsboro School District No. 1J, OR, 4.00%, 6/15/40 | | | | | 5,000 | | | | 5,826,450 | |
| | | |
Hudsonville Public Schools, MI, 4.00%, 5/1/37 | | | | | 1,500 | | | | 1,749,735 | |
| | | |
Hudsonville Public Schools, MI, 4.00%, 5/1/39 | | | | | 1,060 | | | | 1,226,770 | |
| | | |
Hudsonville Public Schools, MI, 4.00%, 5/1/44 | | | | | 1,975 | | | | 2,254,245 | |
| | | |
Illinois, 5.00%, 2/1/24 | | | | | 10,705 | | | | 11,168,848 | |
| | | |
Illinois, 5.00%, 11/1/24 | | | | | 11,295 | | | | 11,864,607 | |
| | | |
Illinois, 5.00%, 2/1/27 | | | | | 18,500 | | | | 19,047,785 | |
| | | |
Illinois, 5.00%, 2/1/29 | | | | | 15,000 | | | | 15,529,950 | |
| | | |
Illinois, 5.00%, 5/1/39 | | | | | 10,000 | | | | 10,066,700 | |
| | | |
Illinois, 5.25%, 7/1/30 | | | | | 6,150 | | | | 6,296,124 | |
| | | |
Johnson City, TN, 5.00%, 6/1/22 | | | | | 440 | | | | 475,332 | |
| | | |
Johnson City, TN, 5.00%, 6/1/24 | | | | | 505 | | | | 580,937 | |
| | | |
Kane, Cook and DuPage Counties School District No. 46, IL, 5.00%, 1/1/29 | | | | | 1,920 | | | | 2,159,309 | |
| | | | |
| | 13 | | See Notes to Financial Statements. |
Eaton Vance
National Municipal Income Fund
March 31, 2020
Portfolio of Investments (Unaudited) — continued
| | | | | | | | | | |
| Security | | | | Principal
Amount
(000’s omitted) | | | Value | |
|
| General Obligations (continued) | |
| | | |
Kane, Cook and DuPage Counties School District No. 46, IL, 5.00%, 1/1/30 | | | | $ | 4,105 | | | $ | 4,613,445 | |
| | | |
King County, WA, (SPA: TD Bank, N.A.), 0.75%, 1/1/46(3) | | | | | 5,735 | | | | 5,735,000 | |
| | | |
Klein Independent School District, TX, (PSF Guaranteed), 5.00%, 2/1/36 | | | | | 14,180 | | | | 14,601,004 | |
| | | |
Lodi Unified School District, CA, (Election of 2016), 4.00%, 8/1/36 | | | | | 1,250 | | | | 1,414,613 | |
| | | |
Lodi Unified School District, CA, (Election of 2016), 4.00%, 8/1/39 | | | | | 2,935 | | | | 3,255,150 | |
| | | |
Louisiana, 5.00%, 3/1/28 | | | | | 5,790 | | | | 7,236,400 | |
| | | |
Massachusetts, 5.00%, 7/1/35 | | | | | 10,000 | | | | 11,727,600 | |
| | | |
Massachusetts, 5.00%, 3/1/37 | | | | | 10,900 | | | | 12,288,878 | |
| | | |
Minneapolis-St. Paul Metropolitan Council, MN, 4.00%, 3/1/30 | | | | | 1,250 | | | | 1,486,650 | |
| | | |
New York, NY, 4.00%, 10/1/35 | | | | | 7,310 | | | | 8,514,103 | |
| | | |
New York, NY, 4.00%, 3/1/36 | | | | | 8,000 | | | | 9,084,480 | |
| | | |
New York, NY, 4.00%, 12/1/41 | | | | | 1,130 | | | | 1,275,691 | |
| | | |
New York, NY, 4.00%, 8/1/42(5) | | | | | 28,000 | | | | 31,820,320 | |
| | | |
New York, NY, 5.00%, 8/1/33 | | | | | 10,000 | | | | 11,928,700 | |
| | | |
Novi Community School District, MI, 5.00%, 5/1/41 | | | | | 1,100 | | | | 1,388,464 | |
| | | |
Novi Community School District, MI, 5.00%, 5/1/42 | | | | | 1,700 | | | | 2,139,178 | |
| | | |
Novi Community School District, MI, 5.00%, 5/1/43 | | | | | 1,150 | | | | 1,447,217 | |
| | | |
Onondaga County, NY, 4.00%, 6/1/28 | | | | | 2,275 | | | | 2,641,480 | |
| | | |
Oxnard Union High School District, CA, (Election of 2018), 5.00%, 8/1/43 | | | | | 3,750 | | | | 4,411,987 | |
| | | |
Paradise Valley Unified School District No. 69, AZ, 4.00%, 7/1/35 | | | | | 350 | | | | 413,427 | |
| | | |
Paradise Valley Unified School District No. 69, AZ, 4.00%, 7/1/36 | | | | | 500 | | | | 587,155 | |
| | | |
Paradise Valley Unified School District No. 69, AZ, 4.00%, 7/1/37 | | | | | 250 | | | | 292,183 | |
| | | |
Park City, UT, 4.00%, 2/1/31 | | | | | 3,490 | | | | 4,198,959 | |
| | | |
Randolph County, NC, Limited Obligation Bonds, 5.00%, 10/1/33 | | | | | 500 | | | | 640,785 | |
| | | |
Richmond Community Schools, MI, 4.00%, 5/1/36 | | | | | 2,200 | | | | 2,526,986 | |
| | | |
Richmond Community Schools, MI, 4.00%, 5/1/37 | | | | | 2,655 | | | | 3,040,798 | |
| | | |
Richmond Community Schools, MI, 4.00%, 5/1/38 | | | | | 2,665 | | | | 3,042,284 | |
| | | |
Richmond Community Schools, MI, 4.00%, 5/1/39 | | | | | 2,665 | | | | 3,032,690 | |
| | | |
Riverside Unified School District, CA, (Election of 2016), 4.00%, 8/1/32 | | | | | 2,250 | | | | 2,591,010 | |
| | | |
Riverside Unified School District, CA, (Election of 2016), 4.00%, 8/1/33 | | | | | 1,350 | | | | 1,541,160 | |
| | | |
Riverside Unified School District, CA, (Election of 2016), 4.00%, 8/1/34 | | | | | 1,100 | | | | 1,244,221 | |
| | | |
Tennessee, 5.00%, 9/1/28 | | | | | 4,785 | | | | 6,041,876 | |
| | | |
Texas, (Texas Transportation Commission), 5.00%, 10/1/44 | | | | | 10,000 | | | | 11,484,800 | |
| | | | | | | | | | | | |
| Security | | | | | Principal
Amount
(000’s omitted) | | | Value | |
|
| General Obligations (continued) | |
| | | |
Virginia Beach, VA, 4.00%, 7/15/32 | | | | | | $ | 2,300 | | | $ | 2,784,817 | |
| | | |
Washington, 5.00%, 2/1/33 | | | | | | | 13,140 | | | | 14,849,120 | |
| | | |
Washington, 5.00%, 8/1/35 | | | | | | | 14,455 | | | | 17,660,396 | |
| | | |
Washington, 5.00%, 6/1/39(4) | | | | | | | 2,125 | | | | 2,626,627 | |
| | | |
Washington, 5.00%, 2/1/40 | | | | | | | 4,755 | | | | 5,686,409 | |
| | | |
Washington, 5.00%, 6/1/41(4) | | | | | | | 2,000 | | | | 2,463,780 | |
| | | |
Washington County, OR, 4.00%, 3/1/30 | | | | | | | 1,000 | | | | 1,127,180 | |
| | | |
West Linn-Wilsonville School District No. 3JT, OR, 0.00%, 6/15/40 | | | | | | | 1,200 | | | | 708,324 | |
| | | |
West Linn-Wilsonville School District No. 3JT, OR, 0.00%, 6/15/41 | | | | | | | 1,500 | | | | 854,295 | |
| | | |
Wisconsin, 5.00%, 5/1/38 | | | | | | | 22,500 | | | | 26,407,350 | |
| | | |
| | | | | | | | | | | $ | 470,579,284 | |
|
| Hospital — 9.0% | |
| | | |
Allegheny County Hospital Development Authority, PA, (UPMC Health System), 5.00%, 7/15/32 | | | | | | $ | 2,250 | | | $ | 2,860,155 | |
| | | |
Arizona Industrial Development Authority, (Phoenix Children’s Hospital), (LOC: JPMorgan Chase Bank, N.A.), 0.75%, 2/1/48(3) | | | | | | | 6,605 | | | | 6,605,000 | |
| | | |
Brookhaven Development Authority, GA, (Children’s Healthcare of Atlanta), 5.00%, 7/1/31 | | | | | | | 755 | | | | 944,747 | |
| | | |
California Health Facilities Financing Authority, (Catholic Healthcare West), 5.25%, 3/1/28 | | | | | | | 5,700 | | | | 5,825,856 | |
| | | |
California Health Facilities Financing Authority, (St. Joseph Health System), 5.00%, 7/1/33 | | | | | | | 17,530 | | | | 19,357,678 | |
| | | |
California Health Facilities Financing Authority, (St. Joseph Health System), 5.00%, 7/1/37 | | | | | | | 25,465 | | | | 27,927,975 | |
| | | |
California Health Facilities Financing Authority, (Sutter Health), 5.25%, 8/15/31 | | | | | | | 13,675 | | | | 14,416,595 | |
| | | |
Colorado Health Facilities Authority, (CommonSpirit Health), 5.00%, 8/1/44 | | | | | | | 6,000 | | | | 6,483,600 | |
| | | |
Colorado Health Facilities Authority, (SCL Health System), 4.00%, 1/1/36 | | | | | | | 2,000 | | | | 2,224,800 | |
| | | |
Connecticut Health and Educational Facilities Authority, (Hartford HealthCare), 4.00%, 7/1/36 | | | | | | | 1,700 | | | | 1,920,541 | |
| | | |
Connecticut Health and Educational Facilities Authority, (Nuvance Health), 4.00%, 7/1/34 | | | | | | | 2,455 | | | | 2,814,191 | |
| | | |
DeKalb Private Hospital Authority, GA, (Children’s Healthcare of Atlanta), 5.00%, 7/1/31 | | | | | | | 1,000 | | | | 1,251,320 | |
| | | |
Escambia County Health Facilities Authority, FL, (Baptist Health Care Corp. Obligated Group), 4.00%, 8/15/45 | | | | | | | 4,350 | | | | 4,601,995 | |
| | | |
Fulton County Development Authority, GA, (Piedmont Healthcare, Inc.), 4.00%, 7/1/37 | | | | | | | 2,000 | | | | 2,188,680 | |
| | | |
Illinois Finance Authority, (Edward-Elmhurst Healthcare), 5.46%, (SIFMA + 0.75%), 7/1/23 (Put Date), 1/1/46(6) | | | | | | | 9,500 | | | | 9,527,550 | |
| | | | |
| | 14 | | See Notes to Financial Statements. |
Eaton Vance
National Municipal Income Fund
March 31, 2020
Portfolio of Investments (Unaudited) — continued
| | | | | | | | | | |
| Security | | | | Principal
Amount
(000’s omitted) | | | Value | |
|
| Hospital (continued) | |
| | | |
Illinois Finance Authority, (Northwestern Memorial Hospital), (SPA: JPMorgan Chase Bank, N.A.), 0.75%, 8/15/42(3) | | | | $ | 8,900 | | | $ | 8,900,000 | |
| | | |
Illinois Finance Authority, (Presence Health Network), 5.00%, 2/15/26 | | | | | 7,500 | | | | 8,565,975 | |
| | | |
Illinois Finance Authority, (Presence Health Network), 5.00%, 2/15/33 | | | | | 1,500 | | | | 1,709,685 | |
| | | |
Minneapolis and St. Paul Housing and Redevelopment Authority, MN, (Allina Health System), 5.00%, 11/15/23 | | | | | 1,700 | | | | 1,925,539 | |
| | | |
Minneapolis and St. Paul Housing and Redevelopment Authority, MN, (Allina Health System), 5.00%, 11/15/27 | | | | | 1,150 | | | | 1,442,261 | |
| | | |
Missouri Health and Educational Facilities Authority, (Mosaic Health System), 4.00%, 2/15/44 | | | | | 2,200 | | | | 2,430,582 | |
| | | |
Missouri Health and Educational Facilities Authority, (SSM Health Care), 5.00%, 6/1/30 | | | | | 7,505 | | | | 8,515,923 | |
| | | |
Montana Facility Finance Authority, (SCL Health System), 4.00%, 1/1/38 | | | | | 2,150 | | | | 2,366,785 | |
| | | |
New Mexico Hospital Equipment Loan Council, (Presbyterian Healthcare Services), (SPA: Wells Fargo Bank, N.A.), Series 2008C, 0.75%, 8/1/34(3) | | | | | 10,300 | | | | 10,300,000 | |
| | | |
New Mexico Hospital Equipment Loan Council, (Presbyterian Healthcare Services), (SPA: Wells Fargo Bank, N.A.), Series 2008D, 0.75%, 8/1/34(3) | | | | | 6,000 | | | | 6,000,000 | |
| | | |
New York Dormitory Authority, (Memorial Sloan-Kettering Cancer Center), 4.00%, 7/1/31 | | | | | 4,000 | | | | 4,773,440 | |
| | | |
New York Dormitory Authority, (Memorial Sloan-Kettering Cancer Center), 4.00%, 7/1/38 | | | | | 3,800 | | | | 4,420,654 | |
| | | |
New York Dormitory Authority, (NYU Langone Hospitals Obligated Group), 4.00%, 7/1/50 | | | | | 5,330 | | | | 5,755,654 | |
| | | |
New York Dormitory Authority, (NYU Langone Hospitals Obligated Group), 4.00%, 7/1/53 | | | | | 10,000 | | | | 10,780,300 | |
| | | |
North Carolina Medical Care Commission, (Rex Healthcare), 4.00%, 7/1/40 | | | | | 1,400 | | | | 1,525,552 | |
| | | |
Oklahoma Development Finance Authority, (OU Medicine), 5.00%, 8/15/38 | | | | | 1,750 | | | | 2,021,915 | |
| | | |
Oklahoma Development Finance Authority, (OU Medicine), 5.25%, 8/15/43 | | | | | 5,200 | | | | 5,990,764 | |
| | | |
Oregon Facilities Authority, (Samaritan Health Services), 5.00%, 10/1/35 | | | | | 2,260 | | | | 2,630,798 | |
| | | |
Oregon Health and Science University, 4.00%, 7/1/44 | | | | | 1,685 | | | | 1,903,073 | |
| | | |
Philadelphia Hospitals and Higher Education Facilities Authority, PA, (Children’s Hospital of Philadelphia), (SPA: Wells Fargo Bank, N.A.), 0.75%, 7/1/25(3) | | | | | 5,000 | | | | 5,000,000 | |
| | | |
Tarrant County Cultural Education Facilities Finance Corp., TX, (Cook Children’s Medical Center), 4.00%, 12/1/34 | | | | | 2,685 | | | | 3,066,028 | |
| | | |
University of Kansas Hospital Authority, 5.00%, 9/1/45 | | | | | 25,500 | | | | 29,253,345 | |
| | | | | | | | | | | | |
| Security | | | | | Principal
Amount
(000’s omitted) | | | Value | |
|
| Hospital (continued) | |
| | | |
Virginia Small Business Financing Authority, (Sentara Healthcare), 4.00%, 11/1/36 | | | | | | $ | 5,000 | | | $ | 5,490,350 | |
| | | |
Virginia Small Business Financing Authority, (Sentara Healthcare), 4.00%, 11/1/38 | | | | | | | 5,000 | | | | 5,442,950 | |
| | | |
Washington Health Care Facilities Authority, (Overlake Hospital Medical Center), 5.00%, 7/1/42 | | | | | | | 2,250 | | | | 2,662,942 | |
| | | |
West Virginia Hospital Finance Authority, (West Virginia United Health System Obligated Group), 5.375%, 6/1/38 | | | | | | | 21,895 | | | | 23,826,358 | |
| | | |
| | | | | | | | | | | $ | 275,651,556 | |
|
| Housing — 0.5% | |
| | | |
Massachusetts Housing Finance Agency, (Mill Road Apartments), 5.26%, (SIFMA + 0.55%), 11/1/23 (Put Date), 11/1/48(6) | | | | | | $ | 3,960 | | | $ | 3,960,000 | |
| | | |
Texas Student Housing Corp., (University of Northern Texas), 6.85%, 7/1/31 | | | | | | | 10,640 | | | | 10,275,261 | |
| | | |
| | | | | | | | | | | $ | 14,235,261 | |
|
| Industrial Development Revenue — 1.1% | |
| | | |
Metropolitan Nashville Airport Authority, TN, (Aero Nashville), 5.20%, 7/1/26 | | | | | | $ | 300 | | | $ | 301,641 | |
| | | |
Miami-Dade County Industrial Development Authority, FL, (Waste Management, Inc.), (AMT), 5.51%, (SIFMA + 0.80%), 11/1/21 (Put Date), 11/1/48(6) | | | | | | | 5,000 | | | | 5,006,050 | |
| | | |
Mission Economic Development Corp., TX, (Waste Management, Inc.), (AMT), 5.51%, (SIFMA + 0.80%), 11/1/21 (Put Date), 11/1/48(6) | | | | | | | 10,000 | | | | 10,013,000 | |
| | | |
New Jersey Economic Development Authority, (NewJersey-American Water Co., Inc.), (AMT), 2.20% to 12/3/29 (Put Date), 10/1/39 | | | | | | | 13,900 | | | | 13,994,520 | |
| | | |
Tuscaloosa County Industrial Development Authority, AL, (Hunt Refining Co.), 5.25%, 5/1/44(2) | | | | | | | 3,685 | | | | 3,567,301 | |
| | | |
Vermont Economic Development Authority, (Casella Waste Systems, Inc.), (AMT), 4.625% to 4/3/28 (Put Date), 4/1/36(2) | | | | | | | 475 | | | | 487,626 | |
| | | |
| | | | | | | | | | | $ | 33,370,138 | |
|
| Insured – Electric Utilities — 0.0%(7) | |
| | | |
Cleveland, OH, Public Power System Revenue, (AGM), 4.00%, 11/15/35 | | | | | | $ | 1,000 | | | $ | 1,143,560 | |
| | | |
| | | | | | | | | | | $ | 1,143,560 | |
|
| Insured – General Obligations — 1.1% | |
| | | |
Grandville Public Schools, MI, (AGM), 4.00%, 5/1/35 | | | | | | $ | 785 | | | $ | 929,259 | |
| | | |
Grandville Public Schools, MI, (AGM), 4.00%, 5/1/36 | | | | | | | 1,045 | | | | 1,232,180 | |
| | | | |
| | 15 | | See Notes to Financial Statements. |
Eaton Vance
National Municipal Income Fund
March 31, 2020
Portfolio of Investments (Unaudited) — continued
| | | | | | | | | | | | |
| Security | | | | | Principal
Amount
(000’s omitted) | | | Value | |
|
| Insured – General Obligations (continued) | |
| | | |
Grandville Public Schools, MI, (AGM), 4.00%, 5/1/37 | | | | | | $ | 1,000 | | | $ | 1,175,400 | |
| | | |
Grandville Public Schools, MI, (AGM), 4.00%, 5/1/38 | | | | | | | 1,000 | | | | 1,170,200 | |
| | | |
Grandville Public Schools, MI, (AGM), 4.00%, 5/1/39 | | | | | | | 1,000 | | | | 1,167,150 | |
| | | |
Grandville Public Schools, MI, (AGM), 4.00%, 5/1/40 | | | | | | | 650 | | | | 757,816 | |
| | | |
Nassau County, NY, (AGM), 5.00%, 4/1/44 | | | | | | | 10,205 | | | | 12,653,996 | |
| | | |
Pittsburg Unified School District Financing Authority, CA, (AGM), 5.00%, 9/1/47 | | | | | | | 6,890 | | | | 8,373,004 | |
| | | |
Santa Rosa High School District, CA, (Election of 2014), (AGM), 5.00%, 8/1/43 | | | | | | | 3,930 | | | | 4,600,654 | |
| | | |
| | | | | | | | | | | $ | 32,059,659 | |
|
| Insured – Hospital — 0.4% | |
| | | |
Medford Hospital Facilities Authority, OR, (Asante Health System), (AGM), 5.50%, 8/15/28 | | | | | | $ | 12,000 | | | $ | 12,192,360 | |
| | | |
| | | | | | | | | | | $ | 12,192,360 | |
|
| Insured – Other Revenue — 1.2% | |
| | | |
Harris County-Houston Sports Authority, TX, (AGM), (NPFG), 0.00%, 11/15/34 | | | | | | $ | 58,155 | | | $ | 36,972,623 | |
| | | |
| | | | | | | | | | | $ | 36,972,623 | |
|
| Insured – Special Tax Revenue — 0.6% | |
| | | |
Massachusetts, Dedicated Tax Revenue, (NPFG), 5.50%, 1/1/29 | | | | | | $ | 11,000 | | | $ | 14,445,750 | |
| | | |
Massachusetts, Dedicated Tax Revenue, (NPFG), 5.50%, 1/1/30 | | | | | | | 3,080 | | | | 4,100,466 | |
| | | |
| | | | | | | | | | | $ | 18,546,216 | |
|
| Insured – Transportation — 2.2% | |
| | | |
E-470 Public Highway Authority, CO, (NPFG), 0.00%, 9/1/37 | | | | | | $ | 13,335 | | | $ | 6,388,665 | |
| | | |
Metropolitan Transportation Authority, NY, Green Bonds, (AGM), 4.00%, 11/15/48(5) | | | | | | | 8,900 | | | | 9,271,664 | |
| | | |
Metropolitan Transportation Authority, NY, Green Bonds, Series 2019A, (AGM), 4.00%, 11/15/46 | | | | | | | 6,380 | | | | 6,636,731 | |
| | | |
Metropolitan Transportation Authority, NY, Green Bonds, Series 2019C, (AGM), 4.00%, 11/15/46 | | | | | | | 1,100 | | | | 1,148,609 | |
| | | |
North Texas Tollway Authority, (AGC), 6.20%, 1/1/42 | | | | | | | 37,070 | | | | 44,770,551 | |
| | | |
| | | | | | | | | | | $ | 68,216,220 | |
|
| Lease Revenue / Certificates of Participation — 1.5% | |
| | | |
Hillsborough County, FL, 4.00%, 8/1/31 | | | | | | $ | 4,840 | | | $ | 5,750,259 | |
| | | |
Hillsborough County, FL, 4.00%, 8/1/34 | | | | | | | 5,445 | | | | 6,411,596 | |
| | | |
Hudson Yards Infrastructure Corp., NY, 4.00%, 2/15/44 | | | | | | | 6,660 | | | | 7,210,249 | |
| | | | | | | | | | | | |
| Security | | | | | Principal
Amount
(000’s omitted) | | | Value | |
|
| Lease Revenue / Certificates of Participation (continued) | |
| | | |
New Jersey Economic Development Authority, (School Facilities Construction), 5.00%, 6/15/34 | | | | | | $ | 8,460 | | | $ | 9,071,489 | |
| | | |
New Jersey Economic Development Authority, (School Facilities Construction), 5.00%, 6/15/35 | | | | | | | 13,300 | | | | 14,212,247 | |
| | | |
New Jersey Economic Development Authority, (School Facilities Construction), 5.00%, 6/15/39 | | | | | | | 2,165 | | | | 2,298,472 | |
| | | |
| | | | | | | | | | | $ | 44,954,312 | |
|
| Nursing Home — 0.2% | |
| | | |
Mississippi Business Finance Corp., (Magnolia Healthcare), 7.99%, 7/1/25 | | | | | | $ | 5,715 | | | $ | 5,747,175 | |
| | | |
| | | | | | | | | | | $ | 5,747,175 | |
|
| Other Revenue — 3.3% | |
| | | |
Battery Park City Authority, NY, 5.00%, 11/1/40 | | | | | | $ | 1,000 | | | $ | 1,270,860 | |
| | | |
Central Falls Detention Facility Corp., RI, 7.25%, 7/15/35(8) | | | | | | | 250 | | | | 45,000 | |
| | | |
Kalispel Tribe of Indians, WA, Series A, 5.25%, 1/1/38(2) | | | | | | | 1,865 | | | | 1,989,433 | |
| | | |
Kalispel Tribe of Indians, WA, Series B, 5.25%, 1/1/38(2) | | | | | | | 1,000 | | | | 1,066,720 | |
| | | |
New York City Transitional Finance Authority, NY, (Building Aid), 5.00%, 7/15/33 | | | | | | | 10,000 | | | | 11,488,300 | |
| | | |
New York City Transitional Finance Authority, NY, (Building Aid), 5.00%, 7/15/43 | | | | | | | 24,950 | | | | 28,496,643 | |
| | | |
Texas Municipal Gas Acquisition and Supply Corp. I, Gas Supply Revenue, 6.25%, 12/15/26 | | | | | | | 17,960 | | | | 19,794,075 | |
| | | |
Texas Municipal Gas Acquisition and Supply Corp. III, Gas Supply Revenue, 5.00%, 12/15/30 | | | | | | | 4,845 | | | | 5,021,067 | |
| | | |
Texas Municipal Gas Acquisition and Supply Corp. III, Gas Supply Revenue, 5.00%, 12/15/32 | | | | | | | 29,755 | | | | 30,742,271 | |
| | | |
Washington Health Care Facilities Authority, (Fred Hutchinson Cancer Research Center), 1.72%, (67% of 1 mo. USD LIBOR + 1.10%), 7/1/22 (Put Date), 1/1/42(6) | | | | | | | 1,000 | | | | 1,004,310 | |
| | | |
| | | | | | | | | | | $ | 100,918,679 | |
|
| Senior Living / Life Care — 0.4% | |
| | | |
Delaware Economic Development Authority, (ACTS Retirement-Life Communities, Inc. Obligated Group), 5.00%, 11/15/48 | | | | | | $ | 2,500 | | | $ | 2,513,775 | |
| | | |
Logan County, CO, (TLC Care Choices, Inc.), 6.875%, 12/1/23(9) | | | | | | | 409 | | | | 110,475 | |
| | | |
New Hope Cultural Education Facilities Finance Corp., TX, (Longhorn Village), 5.00%, 1/1/47 | | | | | | | 8,000 | | | | 7,570,880 | |
| | | |
Rockville, MD, (Ingleside at King Farm), 5.00%, 11/1/31 | | | | | | | 1,010 | | | | 1,044,714 | |
| | | |
Rockville, MD, (Ingleside at King Farm), 5.00%, 11/1/32 | | | | | | | 525 | | | | 539,983 | |
| | | | |
| | 16 | | See Notes to Financial Statements. |
Eaton Vance
National Municipal Income Fund
March 31, 2020
Portfolio of Investments (Unaudited) — continued
| | | | | | | | | | | | |
| Security | | | | | Principal
Amount
(000’s omitted) | | | Value | |
|
| Senior Living / Life Care (continued) | |
| | | |
Wisconsin Health and Educational Facilities Authority, (Saint John’s Communities, Inc.), 5.00%, 9/15/40 | | | | | | $ | 750 | | | $ | 750,217 | |
| | | |
| | | | | | | | | | | $ | 12,530,044 | |
|
| Special Tax Revenue — 7.5% | |
| | | |
Illinois Sports Facilities Authority, 5.00%, 6/15/29 | | | | | | $ | 2,250 | | | $ | 2,361,465 | |
| | | |
Illinois Sports Facilities Authority, 5.00%, 6/15/30 | | | | | | | 1,200 | | | | 1,251,012 | |
| | | |
New River Community Development District, FL, (Capital Improvements), 5.00%, 5/1/13(8) | | | | | | | 230 | | | | 0 | |
| | | |
New River Community Development District, FL, (Capital Improvements), 5.35%, 5/1/38(8) | | | | | | | 80 | | | | 0 | |
| | | |
New River Community Development District, FL, (Capital Improvements),Series 2010A-2, 5.75%, 5/1/38 | | | | | | | 370 | | | | 314,215 | |
| | | |
New York City Transitional Finance Authority, NY, Future Tax Revenue, 4.00%, 5/1/37 | | | | | | | 7,235 | | | | 8,097,702 | |
| | | |
New York City Transitional Finance Authority, NY, Future Tax Revenue, 4.00%, 8/1/37 | | | | | | | 1,480 | | | | 1,637,768 | |
| | | |
New York City Transitional Finance Authority, NY, Future Tax Revenue, 4.00%, 8/1/38 | | | | | | | 5,000 | | | | 5,663,500 | |
| | | |
New York City Transitional Finance Authority, NY, Future Tax Revenue, 4.00%, 5/1/42 | | | | | | | 5,695 | | | | 6,225,318 | |
| | | |
New York City Transitional Finance Authority, NY, Future Tax Revenue, 5.00%, 2/1/35 | | | | | | | 9,000 | | | | 10,377,990 | |
| | | |
New York City Transitional Finance Authority, NY, Future Tax Revenue, 5.00%, 8/1/35 | | | | | | | 10,485 | | | | 12,649,943 | |
| | | |
New York City Transitional Finance Authority, NY, Future Tax Revenue, 5.00%, 5/1/36 | | | | | | | 4,050 | | | | 4,950,194 | |
| | | |
New York City Transitional Finance Authority, NY, Future Tax Revenue, 5.00%, 8/1/36 | | | | | | | 10,000 | | | | 11,646,300 | |
| | | |
New York City Transitional Finance Authority, NY, Future Tax Revenue, 5.00%, 5/1/39 | | | | | | | 9,240 | | | | 10,969,543 | |
| | | |
New York City Transitional Finance Authority, NY, Future Tax Revenue, 5.00%, 8/1/40 | | | | | | | 5,000 | | | | 5,947,850 | |
| | | |
New York City Transitional Finance Authority, NY, Future Tax Revenue, (SPA: Barclays Bank PLC), 0.85%, 11/1/44(3) | | | | | | | 20,000 | | | | 20,000,000 | |
| | | |
New York City Transitional Finance Authority, NY, Future Tax Revenue, 2015 Series B, 5.00%, 8/1/39 | | | | | | | 4,585 | | | | 5,198,886 | |
| | | |
New York City Transitional Finance Authority, NY, Future Tax Revenue, 2018 Series A, 5.00%, 8/1/39 | | | | | | | 11,845 | | | | 14,131,917 | |
| | | |
New York Dormitory Authority, Personal Income Tax Revenue, 5.00%, 2/15/45 | | | | | | | 10,000 | | | | 11,366,800 | |
| | | |
New York Dormitory Authority, Sales Tax Revenue, 5.00%, 3/15/36 | | | | | | | 7,840 | | | | 9,430,344 | |
| | | |
New York Dormitory Authority, Sales Tax Revenue, 5.00%, 3/15/40 | | | | | | | 10,000 | | | | 11,961,900 | |
| | | |
New York Dormitory Authority, Sales Tax Revenue, (AMT), 5.00%, 3/15/27 | | | | | | | 1,620 | | | | 2,002,822 | |
| | | | | | | | | | | | |
| Security | | | | | Principal
Amount
(000’s omitted) | | | Value | |
|
| Special Tax Revenue (continued) | |
| | | |
New York Dormitory Authority, Sales Tax Revenue, (AMT), 5.00%, 3/15/28 | | | | | | $ | 1,705 | | | $ | 2,125,470 | |
| | | |
New York Dormitory Authority, Sales Tax Revenue, (AMT), 5.00%, 3/15/29 | | | | | | | 1,790 | | | | 2,248,401 | |
| | | |
New York Dormitory Authority, Sales Tax Revenue, (AMT), 5.00%, 3/15/31 | | | | | | | 970 | | | | 1,209,144 | |
| | | |
New York Dormitory Authority, Sales Tax Revenue, (AMT), 5.00%, 3/15/32 | | | | | | | 2,070 | | | | 2,572,079 | |
| | | |
New York State Urban Development Corp., Personal Income Tax Revenue, 5.00%, 3/15/35 | | | | | | | 10,000 | | | | 11,691,400 | |
| | | |
New York State Urban Development Corp., Personal Income Tax Revenue, 5.00%, 3/15/41 | | | | | | | 10,000 | | | | 12,169,500 | |
| | | |
Puerto Rico Sales Tax Financing Corp., 4.329%, 7/1/40 | | | | | | | 5,536 | | | | 5,099,154 | |
| | | |
Puerto Rico Sales Tax Financing Corp., 4.784%, 7/1/58 | | | | | | | 2,219 | | | | 2,083,685 | |
| | | |
Puerto Rico Sales Tax Financing Corp., 5.00%, 7/1/58 | | | | | | | 10,000 | | | | 9,749,500 | |
| | | |
San Francisco Bay Area Rapid Transit District, CA, Sales Tax Revenue, 4.00%, 7/1/37 | | | | | | | 3,075 | | | | 3,474,012 | |
| | | |
San Francisco Bay Area Rapid Transit District, CA, Sales Tax Revenue, 4.00%, 7/1/38 | | | | | | | 7,495 | | | | 8,419,883 | |
| | | |
Southern Hills Plantation I Community Development District, FL, Series A1, 5.80%, 5/1/35 | | | | | | | 440 | | | | 378,422 | |
| | | |
Southern Hills Plantation I Community Development District, FL, Series A2, 5.80%, 5/1/35 | | | | | | | 310 | | | | 245,343 | |
| | | |
Sterling Hill Community Development District, FL, 6.20%, 5/1/35 | | | | | | | 1,532 | | | | 964,937 | |
| | | |
Texas Transportation Commission, 5.00%, 4/1/33(5) | | | | | | | 10,000 | | | | 11,396,600 | |
| | | |
| | | | | | | | | | | $ | 230,012,999 | |
|
| Student Loan — 0.2% | |
| | | |
New Jersey Higher Education Student Assistance Authority, (AMT), 4.00%, 12/1/28 | | | | | | $ | 4,970 | | | $ | 5,369,638 | |
| | | |
| | | | | | | | | | | $ | 5,369,638 | |
|
| Transportation — 25.3% | |
| | | |
Atlanta, GA, Airport Revenue, (AMT), 4.00%, 7/1/33 | | | | | | $ | 3,575 | | | $ | 3,902,041 | |
| | | |
Atlanta, GA, Airport Revenue, (AMT), 4.00%, 7/1/34 | | | | | | | 3,480 | | | | 3,785,718 | |
| | | |
Atlanta, GA, Airport Revenue, (AMT), 4.00%, 7/1/36 | | | | | | | 5,000 | | | | 5,400,000 | |
| | | |
Austin, TX, Airport System Revenue, (AMT), 5.00%, 11/15/35 | | | | | | | 2,625 | | | | 3,154,200 | |
| | | |
Charleston County Airport District, SC, (AMT), 5.50%, 7/1/38 | | | | | | | 10,000 | | | | 11,060,000 | |
| | | |
Chicago, IL, (Midway International Airport), 5.00%, 1/1/33 | | | | | | | 3,830 | | | | 4,258,577 | |
| | | |
Chicago, IL, (Midway International Airport), (AMT), 5.00%, 1/1/34 | | | | | | | 5,250 | | | | 5,751,637 | |
| | | |
Chicago, IL, (O’Hare International Airport), 5.00%, 1/1/36 | | | | | | | 6,000 | | | | 6,722,520 | |
| | | | |
| | 17 | | See Notes to Financial Statements. |
Eaton Vance
National Municipal Income Fund
March 31, 2020
Portfolio of Investments (Unaudited) — continued
| | | | | | | | | | |
| Security | | | | Principal
Amount
(000’s omitted) | | | Value | |
|
| Transportation (continued) | |
| | | |
Chicago, IL, (O’Hare International Airport), (AMT), 5.00%, 1/1/23 | | | | $ | 1,125 | | | $ | 1,206,911 | |
| | | |
Chicago, IL, (O’Hare International Airport), (AMT), 5.00%, 1/1/25 | | | | | 16,100 | | | | 17,174,514 | |
| | | |
Chicago, IL, (O’Hare International Airport), (AMT), 5.00%, 1/1/33 | | | | | 7,300 | | | | 8,038,395 | |
| | | |
Chicago, IL, (O’Hare International Airport), (AMT), 5.00%, 1/1/39 | | | | | 4,000 | | | | 4,555,880 | |
| | | |
Dallas and Fort Worth, TX, (Dallas/Fort Worth International Airport), 5.25%, 11/1/31 | | | | | 10,395 | | | | 11,428,159 | |
| | | |
Dallas and Fort Worth, TX, (Dallas/Fort Worth International Airport), (AMT), 5.25%, 11/1/30 | | | | | 11,015 | | | | 11,995,005 | |
| | | |
Delaware River and Bay Authority of Delaware and New Jersey, 4.00%, 1/1/34 | | | | | 2,600 | | | | 3,007,030 | |
| | | |
Delaware River and Bay Authority of Delaware and New Jersey, 4.00%, 1/1/39 | | | | | 3,225 | | | | 3,643,992 | |
| | | |
Delaware River Port Authority of Pennsylvania and New Jersey, 5.00%, 1/1/31 | | | | | 2,290 | | | | 2,578,105 | |
| | | |
Denver City and County, CO, Airport System Revenue, (AMT), 5.00%, 12/1/37 | | | | | 10,000 | | | | 11,727,600 | |
| | | |
Hawaii, Airports System Revenue, (AMT), 5.00%, 7/1/41 | | | | | 2,935 | | | | 3,251,217 | |
| | | |
Hawaii, Airports System Revenue, (AMT), 5.00%, 7/1/48 | | | | | 10,000 | | | | 11,060,500 | |
| | | |
Houston, TX, (United Airlines, Inc.), (AMT), 5.00%, 7/1/29 | | | | | 7,670 | | | | 7,631,650 | |
| | | |
Kansas City Industrial Development Authority, MO, (Kansas City International Airport Terminal Modernization), (AMT), 5.00%, 3/1/46 | | | | | 31,930 | | | | 35,607,697 | |
| | | |
Kansas Department of Transportation, 5.00%, 9/1/30 | | | | | 20,000 | | | | 22,820,800 | |
| | | |
Los Angeles Department of Airports, CA, (Los Angeles International Airport), 5.00%, 5/15/35(5) | | | | | 7,200 | | | | 7,229,016 | |
| | | |
Los Angeles Department of Airports, CA, (Los Angeles International Airport), (AMT), 5.00%, 5/15/24 | | | | | 1,200 | | | | 1,353,888 | |
| | | |
Los Angeles Department of Airports, CA, (Los Angeles International Airport), (AMT), 5.00%, 5/15/26 | | | | | 1,335 | | | | 1,571,442 | |
| | | |
Los Angeles Department of Airports, CA, (Los Angeles International Airport), (AMT), 5.00%, 5/15/30 | | | | | 5,325 | | | | 6,542,135 | |
| | | |
Los Angeles Department of Airports, CA, (Los Angeles International Airport), (AMT), 5.00%, 5/15/31 | | | | | 2,250 | | | | 2,752,583 | |
| | | |
Los Angeles Department of Airports, CA, (Los Angeles International Airport), (AMT), 5.00%, 5/15/32 | | | | | 6,100 | | | | 7,443,281 | |
| | | |
Los Angeles Department of Airports, CA, (Los Angeles International Airport), (AMT), 5.00%, 5/15/34 | | | | | 5,000 | | | | 6,066,700 | |
| | | |
Los Angeles Department of Airports, CA, (Los Angeles International Airport), (AMT), 5.00%, 5/15/40 | | | | | 6,000 | | | | 6,752,100 | |
| | | |
Los Angeles Department of Airports, CA, (Los Angeles International Airport), (AMT), 5.00%, 5/15/41 | | | | | 9,000 | | | | 10,192,230 | |
| | | |
Louisiana Offshore Terminal Authority, (LOOP LLC), 2.00% to 10/1/22 (Put Date), 10/1/40 | | | | | 2,000 | | | | 2,021,840 | |
| | | | | | | | | | |
| Security | | | | Principal
Amount
(000’s omitted) | | | Value | |
|
| Transportation (continued) | |
| | | |
Love Field Airport Modernization Corp., TX, (AMT), 5.00%, 11/1/24 | | | | $ | 1,500 | | | $ | 1,686,930 | |
| | | |
Maryland Economic Development Corp., (Transportation Facilities), 5.00%, 6/1/35 | | | | | 1,050 | | | | 1,137,381 | |
| | | |
Massachusetts Port Authority, 5.00%, 7/1/32 | | | | | 3,800 | | | | 4,819,616 | |
| | | |
Massachusetts Port Authority, (AMT), 5.00%, 7/1/26 | | | | | 10,105 | | | | 12,077,799 | |
| | | |
Massachusetts Port Authority, (AMT), 5.00%, 7/1/30 | | | | | 3,000 | | | | 3,755,280 | |
| | | |
Massachusetts Port Authority, (AMT), 5.00%, 7/1/31 | | | | | 2,965 | | | | 3,698,808 | |
| | | |
Massachusetts Port Authority, (AMT), 5.00%, 7/1/32 | | | | | 4,200 | | | | 5,205,942 | |
| | | |
Massachusetts Port Authority, (AMT), 5.00%, 7/1/33 | | | | | 3,855 | | | | 4,765,821 | |
| | | |
Memphis-Shelby County Airport Authority, TN, (AMT), 5.00%, 7/1/35 | | | | | 3,440 | | | | 4,013,620 | |
| | | |
Memphis-Shelby County Airport Authority, TN, (AMT), 5.00%, 7/1/36 | | | | | 3,200 | | | | 3,719,648 | |
| | | |
Metropolitan Transportation Authority, NY, 5.00%, 9/1/22 | | | | | 15,000 | | | | 15,870,150 | |
| | | |
Metropolitan Transportation Authority, NY, 5.25%, 11/15/33 | | | | | 4,250 | | | | 4,637,005 | |
| | | |
Metropolitan Transportation Authority, NY, Green Bonds, 0.00%, 11/15/32 | | | | | 16,050 | | | | 12,141,022 | |
| | | |
Metropolitan Washington Airports Authority, D.C., (AMT), 5.00%, 10/1/28 | | | | | 4,500 | | | | 5,049,495 | |
| | | |
Metropolitan Washington Airports Authority, D.C., (AMT), 5.00%, 10/1/30 | | | | | 5,840 | | | | 7,169,651 | |
| | | |
Metropolitan Washington Airports Authority, D.C., (AMT), 5.00%, 10/1/31 | | | | | 6,130 | | | | 7,484,056 | |
| | | |
Metropolitan Washington Airports Authority, D.C., (AMT), 5.00%, 10/1/32 | | | | | 10,000 | | | | 11,555,500 | |
| | | |
Metropolitan Washington Airports Authority, D.C., (AMT), 5.00%, 10/1/42 | | | | | 2,000 | | | | 2,297,940 | |
| | | |
Miami-Dade County, FL, Aviation Revenue, (AMT), 4.00%, 10/1/44 | | | | | 5,000 | | | | 5,311,950 | |
| | | |
Miami-Dade County, FL, Aviation Revenue, (AMT), 5.00%, 10/1/33 | | | | | 23,250 | | | | 25,595,925 | |
| | | |
Miami-Dade County, FL, Aviation Revenue, (AMT), 5.00%, 10/1/36 | | | | | 10,000 | | | | 11,000,100 | |
| | | |
Miami-Dade County, FL, Aviation Revenue, (AMT), 5.00%, 10/1/38 | | | | | 1,935 | | | | 2,210,950 | |
| | | |
Miami-Dade County, FL, Aviation Revenue, (AMT), 5.00%, 10/1/40 | | | | | 32,530 | | | | 36,584,539 | |
| | | |
Miami-Dade County, FL, Aviation Revenue, (AMT), 5.00%, 10/1/41 | | | | | 2,470 | | | | 2,808,020 | |
| | | |
Minneapolis-St. Paul Metropolitan Airports Commission, MN, (AMT), 5.00%, 1/1/32 | | | | | 3,710 | | | | 4,472,924 | |
| | | |
New Jersey Economic Development Authority, (Transit Transportation Project), 4.00%, 11/1/44 | | | | | 8,250 | | | | 8,042,925 | |
| | | |
New Jersey Transportation Trust Fund Authority, (Transportation Program), 5.91%, (SIFMA + 1.20%), 12/15/21 (Put Date), 6/15/34(6) | | | | | 2,275 | | | | 2,274,386 | |
| | | | |
| | 18 | | See Notes to Financial Statements. |
Eaton Vance
National Municipal Income Fund
March 31, 2020
Portfolio of Investments (Unaudited) — continued
| | | | | | | | | | |
| Security | | | | Principal
Amount
(000’s omitted) | | | Value | |
|
| Transportation (continued) | |
| | | |
New Jersey Turnpike Authority, Series 2014A, 5.00%, 1/1/31 | | | | $ | 10,000 | | | $ | 11,227,700 | |
| | | |
New Jersey Turnpike Authority, Series 2015E, 5.00%, 1/1/31 | | | | | 2,680 | | | | 3,045,740 | |
| | | |
New Jersey Turnpike Authority, Series 2017B, 5.00%, 1/1/31 | | | | | 3,560 | | | | 4,315,005 | |
| | | |
New York Thruway Authority, 3.00%, 1/1/49 | | | | | 9,310 | | | | 9,068,405 | |
| | | |
New York Thruway Authority, 4.00%, 1/1/41 | | | | | 10,000 | | | | 10,786,800 | |
| | | |
New York Thruway Authority, 4.00%, 1/1/42 | | | | | 15,395 | | | | 16,567,329 | |
| | | |
New York Thruway Authority, 4.00%, 1/1/43 | | | | | 10,000 | | | | 10,743,900 | |
| | | |
New York Thruway Authority, 5.00%, 1/1/36 | | | | | 12,500 | | | | 15,578,000 | |
| | | |
New York Thruway Authority, 5.00%, 1/1/39 | | | | | 1,845 | | | | 2,309,184 | |
| | | |
New York Thruway Authority, 5.00%, 1/1/40 | | | | | 17,155 | | | | 21,442,549 | |
| | | |
New York Transportation Development Corp., (LaGuardia Airport Terminal B Redevelopment), (AMT), 5.00%, 7/1/46 | | | | | 14,090 | | | | 14,303,604 | |
| | | |
North Texas Tollway Authority, 5.00%, 1/1/29 | | | | | 5,000 | | | | 5,835,400 | |
| | | |
Orlando-Orange County Expressway Authority, FL, Prerefunded to 7/1/20, 5.00%, 7/1/35 | | | | | 11,855 | | | | 11,966,793 | |
| | | |
Orlando-Orange County Expressway Authority, FL, Prerefunded to 7/1/20, 5.00%, 7/1/35 | | | | | 3,145 | | | | 3,174,657 | |
| | | |
Pennsylvania Turnpike Commission, Prerefunded to 12/1/20, 5.35%, 12/1/30 | | | | | 5,005 | | | | 5,141,536 | |
| | | |
Port Authority of New York and New Jersey, 5.00%, 5/1/40 | | | | | 3,585 | | | | 4,035,097 | |
| | | |
Port Authority of New York and New Jersey, (AMT), 4.00%, 9/1/34 | | | | | 10,800 | | | | 11,690,244 | |
| | | |
Port Authority of New York and New Jersey, (AMT), 5.00%, 9/15/31 | | | | | 15,000 | | | | 18,435,150 | |
| | | |
Port Authority of New York and New Jersey, (AMT), 5.00%, 10/1/35 | | | | | 5,000 | | | | 5,979,600 | |
| | | |
Port Authority of New York and New Jersey, (AMT), 5.00%, 4/1/36 | | | | | 11,230 | | | | 13,422,545 | |
| | | |
Port of Seattle, WA, (AMT), 5.00%, 4/1/23 | | | | | 2,000 | | | | 2,197,560 | |
| | | |
Port of Seattle, WA, (AMT), 5.00%, 4/1/24 | | | | | 2,165 | | | | 2,442,142 | |
| | | |
Port of Seattle, WA, (AMT), 5.00%, 4/1/25 | | | | | 1,500 | | | | 1,732,320 | |
| | | |
Raleigh-Durham Airport Authority, NC, (AMT), 5.00%, 5/1/36 | | | | | 1,000 | | | | 1,209,990 | |
| | | |
Salt Lake City, UT, (Salt Lake City International Airport), (AMT), 5.00%, 7/1/38 | | | | | 7,165 | | | | 8,215,174 | |
| | | |
San Francisco City and County Airport Commission, CA, (San Francisco International Airport), (AMT), 5.00%, 5/1/41 | | | | | 25,630 | | | | 28,625,634 | |
| | | |
San Francisco City and County Airport Commission, CA, (San Francisco International Airport), (AMT), 5.00%, 5/1/44 | | | | | 8,535 | | | | 9,362,041 | |
| | | | | | | | | | | | |
| Security | | | | | Principal
Amount
(000’s omitted) | | | Value | |
|
| Transportation (continued) | |
| | | |
San Francisco City and County Airport Commission, CA, (San Francisco International Airport), (AMT), 5.00%, 5/1/46 | | | | | | $ | 5,000 | | | $ | 5,543,400 | |
| | | |
Texas Private Activity Bond Surface Transportation Corp., (LBJ Express Managed Lanes Project), 7.00%, 6/30/34 | | | | | | | 29,200 | | | | 29,428,344 | |
| | | |
Texas Private Activity Bond Surface Transportation Corp., (North Tarrant Express Managed Lanes Project), 4.00%, 12/31/37 | | | | | | | 3,575 | | | | 3,647,251 | |
| | | |
Texas Private Activity Bond Surface Transportation Corp., (North Tarrant Express Managed Lanes Project), 4.00%, 12/31/38 | | | | | | | 2,245 | | | | 2,283,008 | |
| | | |
Texas Private Activity Bond Surface Transportation Corp., (North Tarrant Express Managed Lanes Project), 4.00%, 12/31/39 | | | | | | | 2,140 | | | | 2,169,254 | |
| | | |
Texas Private Activity Bond Surface Transportation Corp., (North Tarrant Express Managed Lanes Project), 5.00%, 12/31/36 | | | | | | | 2,885 | | | | 3,252,636 | |
| | | |
Texas Private Activity Bond Surface Transportation Corp., (North Tarrant Express Segment 3C), (AMT), 5.00%, 6/30/58 | | | | | | | 12,635 | | | | 13,552,175 | |
| | | |
| | | | | | | | | | | $ | 773,804,913 | |
|
| Water and Sewer — 6.4% | |
| | | |
Detroit, MI, Sewage Disposal System, 5.25%, 7/1/39 | | | | | | $ | 22,500 | | | $ | 24,133,950 | |
| | | |
Detroit, MI, Water Supply System, 5.00%, 7/1/41 | | | | | | | 2,185 | | | | 2,263,136 | |
| | | |
Detroit, MI, Water Supply System, 5.25%, 7/1/41 | | | | | | | 56,420 | | | | 58,781,741 | |
| | | |
East Bay Municipal Utility District, CA, Water System Revenue, 5.00%, 6/1/35 | | | | | | | 2,905 | | | | 3,532,799 | |
| | | |
East Bay Municipal Utility District, CA, Water System Revenue, 5.00%, 6/1/37 | | | | | | | 7,280 | | | | 8,484,112 | |
| | | |
East Bay Municipal Utility District, CA, Water System Revenue, Green Bonds, 5.00%, 6/1/35 | | | | | | | 1,000 | | | | 1,269,790 | |
| | | |
East Bay Municipal Utility District, CA, Water System Revenue, Green Bonds, 5.00%, 6/1/37 | | | | | | | 4,200 | | | | 5,274,864 | |
| | | |
Grand Rapids, MI, Sanitary Sewer System Revenue, 5.00%, 1/1/45 | | | | | | | 1,245 | | | | 1,558,205 | |
| | | |
Metropolitan Water District of Southern California, 5.00%, 7/1/35 | | | | | | | 7,500 | | | | 9,526,050 | |
| | | |
Metropolitan Water District of Southern California, 5.00%, 7/1/38 | | | | | | | 4,270 | | | | 5,354,879 | |
| | | |
Michigan Finance Authority, (Detroit Water and Sewerage Department), 5.00%, 7/1/33 | | | | | | | 8,095 | | | | 8,977,193 | |
| | | |
Michigan Finance Authority, (Detroit Water and Sewerage Department), 5.00%, 7/1/44 | | | | | | | 8,095 | | | | 8,588,957 | |
| | | |
Missoula, MT, Water System Revenue, 4.00%, 7/1/37 | | | | | | | 600 | | | | 683,814 | |
| | | |
Missoula, MT, Water System Revenue, 5.00%, 7/1/33 | | | | | | | 565 | | | | 707,092 | |
| | | |
Missoula, MT, Water System Revenue, 5.00%, 7/1/35 | | | | | | | 1,135 | | | | 1,411,406 | |
| | | | |
| | 19 | | See Notes to Financial Statements. |
Eaton Vance
National Municipal Income Fund
March 31, 2020
Portfolio of Investments (Unaudited) — continued
| | | | | | | | | | | | |
| Security | | | | | Principal
Amount
(000’s omitted) | | | Value | |
|
| Water and Sewer (continued) | |
| | | |
Missoula, MT, Water System Revenue, 5.00%, 7/1/36 | | | | | | $ | 800 | | | $ | 991,752 | |
| | | |
New York City Municipal Water Finance Authority, NY, (Water and Sewer System), 5.00%, 6/15/35 | | | | | | | 6,415 | | | | 7,559,308 | |
| | | |
New York City Municipal Water Finance Authority, NY, (Water and Sewer System), (SPA: JPMorgan Chase Bank, N.A.), 0.75%, 6/15/50(3) | | | | | | | 16,280 | | | | 16,280,000 | |
| | | |
New York City Municipal Water Finance Authority, NY, (Water and Sewer System), (SPA: PNC Bank, N.A.), 1.05%, 6/15/46(3) | | | | | | | 7,100 | | | | 7,100,000 | |
| | | |
New York City Municipal Water Finance Authority, NY, (Water and Sewer System), (SPA: PNC Bank, N.A.), 1.05%, 6/15/48(3) | | | | | | | 6,405 | | | | 6,405,000 | |
| | | |
Port St. Lucie, FL, Stormwater Utility Revenue, 4.00%, 5/1/37 | | | | | | | 500 | | | | 582,345 | |
| | | |
Port St. Lucie, FL, Stormwater Utility Revenue, 4.00%, 5/1/38 | | | | | | | 1,000 | | | | 1,160,700 | |
| | | |
Port St. Lucie, FL, Stormwater Utility Revenue, 4.00%, 5/1/39 | | | | | | | 1,075 | | | | 1,244,635 | |
| | | |
Tarrant Regional Water District, TX, 5.00%, 3/1/30 | | | | | | | 10,000 | | | | 11,364,600 | |
| | | |
Virginia Beach, VA, Storm Water Utility Revenue, 4.00%, 11/15/31 | | | | | | | 1,085 | | | | 1,297,617 | |
| | | |
| | | | | | | | | | | $ | 194,533,945 | |
| | | |
Total Tax-Exempt Municipal Securities — 93.5% (identified cost $2,742,973,300) | | | | | | | | | | $ | 2,858,022,436 | |
|
| Taxable Municipal Securities — 7.6% | |
| Security | | | | | Principal
Amount
(000’s omitted) | | | Value | |
| | | |
| Cogeneration — 0.0%(7) | | | | | | | | | |
| | | |
Northampton County Industrial Development Authority, PA, (Northampton Generating), 5.00%, 12/31/23(1) | | | | | | $ | 3,998 | | | $ | 999,460 | |
| | | |
| | | | | | | | | | | $ | 999,460 | |
|
| Education — 1.0% | |
| | | |
California State University, 2.965%, 11/1/39 | | | | | | $ | 9,000 | | | $ | 9,181,980 | |
| | | |
New York Dormitory Authority, (New York University), 2.219%, 7/1/35 | | | | | | | 12,500 | | | | 12,039,000 | |
| | | |
Red River Education Finance Corp., TX, (Texas Christian University), 3.317%, 3/15/40 | | | | | | | 10,000 | | | | 10,204,500 | |
| | | |
| | | | | | | | | | | $ | 31,425,480 | |
| | | | | | | | | | |
| Security | | | | Principal
Amount
(000’s omitted) | | | Value | |
|
| General Obligations — 3.0% | |
| | | |
Antelope Valley Community College District, CA, 2.568%, 8/1/34 | | | | $ | 3,300 | | | $ | 3,284,490 | |
| | | |
Antelope Valley Community College District, CA, 2.738%, 8/1/36 | | | | | 3,500 | | | | 3,488,135 | |
| | | |
Antelope Valley Community College District, CA, 2.768%, 8/1/37 | | | | | 2,930 | | | | 2,922,177 | |
| | | |
Austin Independent School District, TX, (PSF Guaranteed), 2.022%, 8/1/34 | | | | | 3,000 | | | | 2,975,790 | |
| | | |
Austin Independent School District, TX, (PSF Guaranteed), 2.122%, 8/1/36 | | | | | 2,000 | | | | 1,969,520 | |
| | | |
Austin Independent School District, TX, (PSF Guaranteed), 2.152%, 8/1/37 | | | | | 2,000 | | | | 1,961,420 | |
| | | |
Charlotte, NC, 1.574%, 7/1/24 | | | | | 1,075 | | | | 1,090,566 | |
| | | |
Charlotte, NC, 1.624%, 7/1/25 | | | | | 9,730 | | | | 9,878,772 | |
| | | |
Charlotte, NC, 1.775%, 7/1/26 | | | | | 7,490 | | | | 7,715,823 | |
| | | |
Charlotte, NC, 1.875%, 7/1/27 | | | | | 2,000 | | | | 2,046,140 | |
| | | |
Charlotte, NC, 2.055%, 7/1/30 | | | | | 1,310 | | | | 1,330,515 | |
| | | |
Charlotte, NC, 2.155%, 7/1/32 | | | | | 1,000 | | | | 1,007,020 | |
| | | |
Chicago, IL, 7.75%, 1/1/42 | | | | | 4,050 | | | | 4,612,383 | |
| | | |
Dekalb, Kane, LaSalle, Lee, Ogle, Winnebago and Boone Counties Community College District No. 523, IL, 2.747%, 2/1/32 | | | | | 1,250 | | | | 1,255,300 | |
| | | |
Dekalb, Kane, LaSalle, Lee, Ogle, Winnebago and Boone Counties Community College District No. 523, IL, 2.847%, 2/1/33 | | | | | 1,000 | | | | 1,006,170 | |
| | | |
Dekalb, Kane, LaSalle, Lee, Ogle, Winnebago and Boone Counties Community College District No. 523, IL, 2.927%, 2/1/34 | | | | | 1,000 | | | | 1,007,370 | |
| | | |
Dekalb, Kane, LaSalle, Lee, Ogle, Winnebago and Boone Counties Community College District No. 523, IL, 2.977%, 2/1/35 | | | | | 1,000 | | | | 1,007,160 | |
| | | |
Dekalb, Kane, LaSalle, Lee, Ogle, Winnebago and Boone Counties Community College District No. 523, IL, 3.017%, 2/1/36 | | | | | 710 | | | | 714,913 | |
| | | |
Denison Independent School District, TX, (PSF Guaranteed), 2.368%, 8/1/32 | | | | | 500 | | | | 506,100 | |
| | | |
Denison Independent School District, TX, (PSF Guaranteed), 2.418%, 8/1/33 | | | | | 550 | | | | 554,273 | |
| | | |
Denison Independent School District, TX, (PSF Guaranteed), 2.468%, 8/1/34 | | | | | 1,000 | | | | 1,006,690 | |
| | | |
Denison Independent School District, TX, (PSF Guaranteed), 2.518%, 8/1/35 | | | | | 1,000 | | | | 1,005,590 | |
| | | |
Denison Independent School District, TX, (PSF Guaranteed), 2.736%, 8/1/41 | | | | | 10,705 | | | | 10,706,285 | |
| | | |
Monroe Township Board of Education, NJ, 2.071%, 8/1/26 | | | | | 1,375 | | | | 1,400,561 | |
| | | |
Monroe Township Board of Education, NJ, 2.171%, 8/1/27 | | | | | 2,000 | | | | 2,041,980 | |
| | | | |
| | 20 | | See Notes to Financial Statements. |
Eaton Vance
National Municipal Income Fund
March 31, 2020
Portfolio of Investments (Unaudited) — continued
| | | | | | | | | | | | |
| Security | | | | | Principal
Amount
(000’s omitted) | | | Value | |
|
| General Obligations (continued) | |
| | | |
Oregon, 3.886%, 5/1/37 | | | | | | $ | 2,500 | | | $ | 2,708,525 | |
| | | |
United Independent School District, TX, (PSF Guaranteed), 2.353%, 8/15/32 | | | | | | | 2,780 | | | | 2,747,335 | |
| | | |
United Independent School District, TX, (PSF Guaranteed), 2.403%, 8/15/33 | | | | | | | 1,960 | | | | 1,930,561 | |
| | | |
West Linn-Wilsonville School District No. 3JT, OR, 2.294%, 6/15/31 | | | | | | | 2,815 | | | | 2,800,531 | |
| | | |
Wyandotte County Unified School District No. 500, KS, 3.00%, 9/1/40 | | | | | | | 13,750 | | | | 13,931,225 | |
| | | |
| | | | | | | | | | | $ | 90,613,320 | |
|
| Hospital — 1.2% | |
| | | |
California Statewide Communities Development Authority, (Loma Linda University Medical Center), 6.00%, 12/1/24 | | | | | | $ | 34,250 | | | $ | 35,856,325 | |
| | | |
| | | | | | | | | | | $ | 35,856,325 | |
|
| Insured-Transportation — 1.5% | |
| | | |
Alameda Corridor Transportation Authority, CA, (AMBAC), 0.00%, 10/1/26 | | | | | | $ | 22,500 | | | $ | 19,152,225 | |
| | | |
Alameda Corridor Transportation Authority, CA, (AMBAC), 0.00%, 10/1/27 | | | | | | | 34,390 | | | | 28,262,734 | |
| | | |
| | | | | | | | | | | $ | 47,414,959 | |
|
| Special Tax Revenue — 0.2% | |
| | | |
Sales Tax Securitization Corp., IL, 2.857%, 1/1/31 | | | | | | $ | 5,500 | | | $ | 5,773,020 | |
| | | |
| | | | | | | | | | | $ | 5,773,020 | |
|
| Transportation — 0.1% | |
| | | |
Ohio Turnpike and Infrastructure Commission, 3.096%, 2/15/40 | | | | | | $ | 3,000 | | | $ | 3,059,400 | |
| | | |
| | | | | | | | | | | $ | 3,059,400 | |
|
| Water and Sewer — 0.6% | |
| | | |
Narragansett Bay Commission, RI, Wastewater System Revenue, 2.404%, 9/1/34 | | | | | | $ | 2,410 | | | $ | 2,322,420 | |
| | | |
Narragansett Bay Commission, RI, Wastewater System Revenue, 2.464%, 9/1/35 | | | | | | | 3,315 | | | | 3,195,196 | |
| | | |
Narragansett Bay Commission, RI, Wastewater System Revenue, 2.544%, 9/1/36 | | | | | | | 5,000 | | | | 4,821,800 | |
| | | |
Narragansett Bay Commission, RI, Wastewater System Revenue, 2.624%, 9/1/37 | | | | | | | 4,000 | | | | 3,871,040 | |
| | | | | | | | | | | | |
| Security | | | | | Principal
Amount
(000’s omitted) | | | Value | |
|
| Water and Sewer (continued) | |
| | | |
South Central Connecticut Regional Water Authority, 3.162%, 8/1/40 | | | | | | $ | 3,750 | | | $ | 3,803,625 | |
| | | |
| | | | | | | | | | | $ | 18,014,081 | |
| | | |
Total Taxable Municipal Securities — 7.6%
(identified cost $223,425,873) | | | | | | | | | | $ | 233,156,045 | |
|
| Corporate Bonds & Notes — 0.2% | |
| Security | | | | | Principal
Amount
(000’s omitted) | | | Value | |
|
| Health Care — 0.2% | |
| | | |
Providence St. Joseph Health Obligated Group, 2.532%, 10/1/29 | | | | | | $ | 5,000 | | | $ | 4,910,996 | |
| | | |
Total Corporate Bonds & Notes — 0.2%
(identified cost $5,000,000) | | | | | | | | | | $ | 4,910,996 | |
| | | |
Total Investments — 101.3%
(identified cost $2,971,399,173) | | | | | | | | | | $ | 3,096,089,477 | |
| | | |
Other Assets, Less Liabilities — (1.3)% | | | | | | | | | | $ | (40,028,769 | ) |
| | | |
Net Assets — 100.0% | | | | | | | | | | $ | 3,056,060,708 | |
The percentage shown for each investment category in the Portfolio of Investments is based on net assets.
At March 31, 2020, the concentration of the Fund’s investments in the various states and territories, determined as a percentage of net assets, is as follows:
| | | | |
| |
| New York | | | 23.1% | |
| |
| California | | | 13.4% | |
| |
| Texas | | | 12.0% | |
| |
| Others, representing less than 10% individually | | | 52.8% | |
The Fund invests primarily in debt securities issued by municipalities. The ability of the issuers of the debt securities to meet their obligations may be affected by economic developments in a specific industry or municipality. At March 31, 2020, 7.0% of total investments are backed by bond insurance of various financial institutions and financial guaranty assurance agencies. The aggregate percentage insured by an individual financial institution or financial guaranty assurance agency ranged from 1.4% to 3.2% of total investments.
| (1) | Represents apayment-in-kind security which may pay interest in additional principal at the issuer’s discretion. |
| (2) | Security exempt from registration pursuant to Rule 144A under the Securities Act of 1933, as amended. These securities may be sold in certain transactions in reliance on an exemption from registration (normally to qualified institutional buyers). At March 31, 2020, the |
| | | | |
| | 21 | | See Notes to Financial Statements. |
Eaton Vance
National Municipal Income Fund
March 31, 2020
Portfolio of Investments (Unaudited) — continued
| | aggregate value of these securities is $9,243,179 or 0.3% of the Fund’s net assets. |
| (3) | Variable rate demand obligation that may be tendered at par on any day for payment the same or next business day. The stated interest rate, which generally resets daily, is determined by the remarketing agent and represents the rate in effect at March 31, 2020. |
| (4) | When-issued security. |
| (5) | Security represents the municipal bond held by a trust that issues residual interest bonds (see Note 1H). |
| (6) | Floating rate security. The stated interest rate represents the rate in effect at March 31, 2020. |
| (7) | Amount is less than 0.05%. |
| (8) | Defaulted security. Issuer has defaulted on the payment of interest and/or principal or has filed for bankruptcy. |
| (9) | Security is in default and making only partial interest payments. |
Abbreviations:
| | | | |
| | |
| AGC | | – | | Assured Guaranty Corp. |
| | |
| AGM | | – | | Assured Guaranty Municipal Corp. |
| | |
| AMBAC | | – | | AMBAC Financial Group, Inc. |
| | |
| AMT | | – | | Interest earned from these securities may be considered a tax preference item for purposes of the Federal Alternative Minimum Tax. |
| | |
| LIBOR | | – | | London Interbank Offered Rate |
| | |
| LOC | | – | | Letter of Credit |
| | |
| NPFG | | – | | National Public Finance Guarantee Corp. |
| | |
| PSF | | – | | Permanent School Fund |
| | |
| SIFMA | | – | | Securities Industry and Financial Markets Association Municipal Swap Index |
| | |
| SPA | | – | | Standby Bond Purchase Agreement |
Currency Abbreviations:
| | | | |
| | |
| USD | | – | | United States Dollar |
| | | | |
| | 22 | | See Notes to Financial Statements. |
Eaton Vance
Municipal Income Funds
March 31, 2020
Statements of Assets and Liabilities (Unaudited)
| | | | | | | | |
| | | March 31, 2020 | |
| Assets | | AMT-Free Fund | | | National Fund | |
| | |
Investments — | | | | | | | | |
| | |
Identified cost | | $ | 310,861,156 | | | $ | 2,971,399,173 | |
| | |
Unrealized appreciation | | | 21,763,039 | | | | 124,690,304 | |
| | |
Investments, at value | | $ | 332,624,195 | | | $ | 3,096,089,477 | |
| | |
Cash | | $ | 6,268,492 | | | $ | 9,924,941 | |
| | |
Interest receivable | | | 3,906,007 | | | | 33,319,991 | |
| | |
Receivable for investments sold | | | 38,041 | | | | 45,000 | |
| | |
Receivable for Fund shares sold | | | 141,434 | | | | 54,427,934 | |
| | |
Due from broker for floating rate notes issued | | | — | | | | 6,675,000 | |
| | |
Total assets | | $ | 342,978,169 | | | $ | 3,200,482,343 | |
|
| Liabilities | |
| | |
Payable for floating rate notes issued | | $ | 29,826,918 | | | $ | 109,885,969 | |
| | |
Payable for investments purchased | | | — | | | | 8,885,958 | |
| | |
Payable for when-issued securities | | | 2,052,513 | | | | 12,619,682 | |
| | |
Payable for Fund shares redeemed | | | 568,649 | | | | 8,918,515 | |
| | |
Distributions payable | | | 235,406 | | | | 1,098,389 | |
| | |
Payable to affiliates: | | | | | | | | |
| | |
Investment adviser fee | | | 121,090 | | | | 850,894 | |
| | |
Distribution and service fees | | | 46,439 | | | | 465,511 | |
| | |
Interest expense and fees payable | | | 210,550 | | | | 709,211 | |
| | |
Accrued expenses | | | 134,490 | | | | 987,506 | |
| | |
Total liabilities | | $ | 33,196,055 | | | $ | 144,421,635 | |
| | |
Net Assets | | $ | 309,782,114 | | | $ | 3,056,060,708 | |
| | |
| Sources of Net Assets | | | | | | | | |
| | |
Paid-in capital | | $ | 314,816,333 | | | $ | 3,105,884,200 | |
| | |
Accumulated loss | | | (5,034,219 | ) | | | (49,823,492 | ) |
| | |
Net Assets | | $ | 309,782,114 | | | $ | 3,056,060,708 | |
| | |
| Class A Shares | | | | | | | | |
| | |
Net Assets | | $ | 147,223,800 | | | $ | 1,556,037,564 | |
| | |
Shares Outstanding | | | 16,081,168 | | | | 156,080,874 | |
| | |
Net Asset Value and Redemption Price Per Share | | | | | | | | |
| | |
(net assets ÷ shares of beneficial interest outstanding) | | $ | 9.16 | | | $ | 9.97 | |
| | |
Maximum Offering Price Per Share | | | | | | | | |
| | |
(100 ÷ 95.25 of net asset value per share) | | $ | 9.62 | | | $ | 10.47 | |
| | |
| Class C Shares | | | | | | | | |
| | |
Net Assets | | $ | 17,690,292 | | | $ | 155,076,011 | |
| | |
Shares Outstanding | | | 1,943,509 | | | | 15,555,077 | |
| | |
Net Asset Value and Offering Price Per Share* | | | | | | | | |
| | |
(net assets ÷ shares of beneficial interest outstanding) | | $ | 9.10 | | | $ | 9.97 | |
| | |
| Class I Shares | | | | | | | | |
| | |
Net Assets | | $ | 144,868,022 | | | $ | 1,344,947,133 | |
| | |
Shares Outstanding | | | 14,488,802 | | | | 134,916,762 | |
| | |
Net Asset Value, Offering Price and Redemption Price Per Share | | | | | | | | |
| | |
(net assets ÷ shares of beneficial interest outstanding) | | $ | 10.00 | | | $ | 9.97 | |
On sales of $50,000 or more, the offering price of Class A shares is reduced.
| * | Redemption price per share is equal to the net asset value less any applicable contingent deferred sales charge. |
| | | | |
| | 23 | | See Notes to Financial Statements. |
Eaton Vance
Municipal Income Funds
March 31, 2020
Statements of Operations (Unaudited)
| | | | | | | | |
| | | Six Months Ended March 31, 2020 | |
| Investment Income | | AMT-Free Fund | | | National Fund | |
| | |
Interest | | $ | 6,578,120 | | | $ | 54,711,690 | |
| | |
Total investment income | | $ | 6,578,120 | | | $ | 54,711,690 | |
|
| Expenses | |
| | |
Investment adviser fee | | $ | 688,952 | | | $ | 5,084,164 | |
| | |
Distribution and service fees | | | | | | | | |
| | |
Class A | | | 187,012 | | | | 1,996,586 | |
| | |
Class C | | | 94,587 | | | | 835,365 | |
| | |
Trustees’ fees and expenses | | | 8,120 | | | | 54,250 | |
| | |
Custodian fee | | | 35,858 | | | | 301,556 | |
| | |
Transfer and dividend disbursing agent fees | | | 46,405 | | | | 612,904 | |
| | |
Legal and accounting services | | | 34,862 | | | | 78,837 | |
| | |
Printing and postage | | | 13,119 | | | | 131,054 | |
| | |
Registration fees | | | 38,820 | | | | 96,338 | |
| | |
Interest expense and fees | | | 307,739 | | | | 1,110,897 | |
| | |
Miscellaneous | | | 23,676 | | | | 94,684 | |
| | |
Total expenses | | $ | 1,479,150 | | | $ | 10,396,635 | |
| | |
Net investment income | | $ | 5,098,970 | | | $ | 44,315,055 | |
|
| Realized and Unrealized Gain (Loss) | |
| | |
Net realized gain (loss) — | | | | | | | | |
| | |
Investment transactions | | $ | (597,522 | ) | | $ | 15,127,568 | |
| | |
Net realized gain (loss) | | $ | (597,522 | ) | | $ | 15,127,568 | |
| | |
Change in unrealized appreciation (depreciation) — | | | | | | | | |
| | |
Investments | | $ | (7,819,413 | ) | | $ | (76,080,640 | ) |
| | |
Net change in unrealized appreciation (depreciation) | | $ | (7,819,413 | ) | | $ | (76,080,640 | ) |
| | |
Net realized and unrealized loss | | $ | (8,416,935 | ) | | $ | (60,953,072 | ) |
| | |
Net decrease in net assets from operations | | $ | (3,317,965 | ) | | $ | (16,638,017 | ) |
| | | | |
| | 24 | | See Notes to Financial Statements. |
Eaton Vance
Municipal Income Funds
March 31, 2020
Statements of Changes in Net Assets
| | | | | | | | |
| | | Six Months Ended March 31, 2020
(Unaudited) | |
| Increase (Decrease) in Net Assets | | AMT-Free Fund | | | National Fund | |
| | |
From operations — | | | | | | | | |
| | |
Net investment income | | $ | 5,098,970 | | | $ | 44,315,055 | |
| | |
Net realized gain (loss) | | | (597,522 | ) | | | 15,127,568 | |
| | |
Net change in unrealized appreciation (depreciation) | | | (7,819,413 | ) | | | (76,080,640 | ) |
| | |
Net decrease in net assets from operations | | $ | (3,317,965 | ) | | $ | (16,638,017 | ) |
| | |
Distributions to shareholders — | | | | | | | | |
| | |
Class A | | $ | (2,364,023 | ) | | $ | (22,674,518 | ) |
| | |
Class C | | | (228,982 | ) | | | (1,759,048 | ) |
| | |
Class I | | | (2,807,012 | ) | | | (22,304,924 | ) |
| | |
Total distributions to shareholders | | $ | (5,400,017 | ) | | $ | (46,738,490 | ) |
| | |
Transactions in shares of beneficial interest — | | | | | | | | |
| | |
Proceeds from sale of shares | | | | | | | | |
| | |
Class A | | $ | 8,282,512 | | | $ | 92,876,994 | |
| | |
Class C | | | 1,458,781 | | | | 15,130,550 | |
| | |
Class I | | | 104,517,020 | | | | 427,484,947 | |
| | |
Net asset value of shares issued to shareholders in payment of distributions declared | | | | | | | | |
| | |
Class A | | | 2,099,247 | | | | 19,322,248 | |
| | |
Class C | | | 184,734 | | | | 1,420,305 | |
| | |
Class I | | | 1,890,372 | | | | 18,927,145 | |
| | |
Cost of shares redeemed | | | | | | | | |
| | |
Class A | | | (13,181,425 | ) | | | (148,914,548 | ) |
| | |
Class C | | | (2,563,007 | ) | | | (16,676,642 | ) |
| | |
Class I | | | (100,543,752 | ) | | | (416,520,838 | ) |
| | |
Net asset value of shares converted | | | | | | | | |
| | |
Class A | | | 862,341 | | | | 14,107,669 | |
| | |
Class C | | | (862,341 | ) | | | (14,107,669 | ) |
| | |
Net increase (decrease) in net assets from Fund share transactions | | $ | 2,144,482 | | | $ | (6,949,839 | ) |
| | |
Net decrease in net assets | | $ | (6,573,500 | ) | | $ | (70,326,346 | ) |
|
| Net Assets | |
| | |
At beginning of period | | $ | 316,355,614 | | | $ | 3,126,387,054 | |
| | |
At end of period | | $ | 309,782,114 | | | $ | 3,056,060,708 | |
| | | | |
| | 25 | | See Notes to Financial Statements. |
Eaton Vance
Municipal Income Funds
March 31, 2020
Statements of Changes in Net Assets — continued
| | | | | | | | |
| | | Year Ended September 30, 2019 | |
| Increase (Decrease) in Net Assets | | AMT-Free Fund | | | National Fund | |
| | |
From operations — | | | | | | | | |
| | |
Net investment income | | $ | 10,837,542 | | | $ | 90,078,958 | |
| | |
Net realized gain | | | 496,446 | | | | 22,467,982 | |
| | |
Net change in unrealized appreciation (depreciation) | | | 12,485,361 | | | | 115,156,982 | |
| | |
Net increase in net assets from operations | | $ | 23,819,349 | | | $ | 227,703,922 | |
| | |
Distributions to shareholders — | | | | | | | | |
| | |
Class A | | $ | (5,125,467 | ) | | $ | (49,279,956 | ) |
| | |
Class B | | | — | | | | (23,586 | ) |
| | |
Class C | | | (675,044 | ) | | | (6,179,246 | ) |
| | |
Class I | | | (5,080,058 | ) | | | (34,955,784 | ) |
| | |
Total distributions to shareholders | | $ | (10,880,569 | ) | | $ | (90,438,572 | ) |
| | |
Transactions in shares of beneficial interest — | | | | | | | | |
| | |
Proceeds from sale of shares | | | | | | | | |
| | |
Class A | | $ | 17,120,080 | | | $ | 132,818,482 | |
| | |
Class B | | | — | | | | 15,727 | |
| | |
Class C | | | 3,443,300 | | | | 28,224,568 | |
| | |
Class I | | | 37,835,385 | | | | 787,247,276 | |
| | |
Net asset value of shares issued to shareholders in payment of distributions declared | | | | | | | | |
| | |
Class A | | | 4,583,249 | | | | 41,711,115 | |
| | |
Class B | | | — | | | | 20,042 | |
| | |
Class C | | | 558,182 | | | | 5,138,875 | |
| | |
Class I | | | 3,665,870 | | | | 29,299,489 | |
| | |
Cost of shares redeemed | | | | | | | | |
| | |
Class A | | | (27,446,522 | ) | | | (234,832,240 | ) |
| | |
Class B | | | — | | | | (416,016 | ) |
| | |
Class C | | | (7,032,598 | ) | | | (64,286,308 | ) |
| | |
Class I | | | (33,790,772 | ) | | | (276,494,610 | ) |
| | |
Net asset value of shares converted(1) | | | | | | | | |
| | |
Class A | | | 10,699,119 | | | | 170,804,852 | |
| | |
Class B | | | — | | | | (1,625,188 | ) |
| | |
Class C | | | (10,699,119 | ) | | | (169,179,664 | ) |
| | |
Net increase (decrease) in net assets from Fund share transactions | | $ | (1,063,826 | ) | | $ | 448,446,400 | |
| | |
Net increase in net assets | | $ | 11,874,954 | | | $ | 585,711,750 | |
|
| Net Assets | |
| | |
At beginning of year | | $ | 304,480,660 | | | $ | 2,540,675,304 | |
| | |
At end of year | | $ | 316,355,614 | | | $ | 3,126,387,054 | |
| (1) | Includes the conversion of Class B to Class A shares at the close of business on August 15, 2019 upon the termination of Class B. |
| | | | |
| | 26 | | See Notes to Financial Statements. |
Eaton Vance
Municipal Income Funds
March 31, 2020
Financial Highlights
| | | | | | | | | | | | | | | | | | | | | | | | |
| | | AMT-Free Fund — Class A | |
| | |
| | | Six Months Ended
March 31, 2020
(Unaudited) | | | Year Ended September 30, | |
| | | 2019 | | | 2018 | | | 2017 | | | 2016 | | | 2015 | |
| | | | | | | |
Net asset value — Beginning of period | | $ | 9.250 | | | $ | 8.870 | | | $ | 9.130 | | | $ | 9.430 | | | $ | 9.210 | | | $ | 9.350 | |
| | | | | | |
| Income (Loss) From Operations | | | | | | | | | | | | | | | | | | | | | | | | |
| | | | | | |
Net investment income(1) | | $ | 0.138 | | | $ | 0.317 | | | $ | 0.336 | | | $ | 0.351 | | | $ | 0.358 | | | $ | 0.374 | |
| | | | | | |
Net realized and unrealized gain (loss) | | | (0.082 | ) | | | 0.381 | | | | (0.262 | ) | | | (0.298 | ) | | | 0.218 | | | | (0.142 | ) |
| | | | | | |
Total income from operations | | $ | 0.056 | | | $ | 0.698 | | | $ | 0.074 | | | $ | 0.053 | | | $ | 0.576 | | | $ | 0.232 | |
| | | | | | |
| Less Distributions | | | | | | | | | | | | | | | | | | | | | | | | |
| | | | | | |
From net investment income | | $ | (0.146 | ) | | $ | (0.318 | ) | | $ | (0.334 | ) | | $ | (0.353 | ) | | $ | (0.356 | ) | | $ | (0.372 | ) |
| | | | | | |
Total distributions | | $ | (0.146 | ) | | $ | (0.318 | ) | | $ | (0.334 | ) | | $ | (0.353 | ) | | $ | (0.356 | ) | | $ | (0.372 | ) |
| | | | | | |
Net asset value — End of period | | $ | 9.160 | | | $ | 9.250 | | | $ | 8.870 | | | $ | 9.130 | | | $ | 9.430 | | | $ | 9.210 | |
| | | | | | |
Total Return(2) | | | 0.60 | %(3) | | | 8.02 | % | | | 0.83 | % | | | 0.64 | % | | | 6.33 | % | | | 2.52 | % |
| | | | | | |
| Ratios/Supplemental Data | | | | | | | | | | | | | | | | | | | | | | | | |
| | | | | | |
Net assets, end of period (000’s omitted) | | $ | 147,224 | | | $ | 150,853 | | | $ | 139,623 | | | $ | 155,589 | | | $ | 198,762 | | | $ | 194,227 | |
| | | | | | |
Ratios (as a percentage of average daily net assets): | | | | | | | | | | | | | | | | | | | | | | | | |
| | | | | | |
Expenses excluding interest and fees(4) | | | 0.79 | %(5) | | | 0.81 | % | | | 0.81 | % | | | 0.82 | % | | | 0.81 | % | | | 0.82 | % |
| | | | | | |
Interest and fee expense(6) | | | 0.18 | %(5) | | | 0.23 | % | | | 0.24 | % | | | 0.16 | % | | | 0.10 | % | | | 0.08 | % |
| | | | | | |
Total expenses(4) | | | 0.97 | %(5) | | | 1.04 | % | | | 1.05 | % | | | 0.98 | % | | | 0.91 | % | | | 0.90 | % |
| | | | | | |
Net investment income | | | 2.99 | %(5) | | | 3.51 | % | | | 3.74 | % | | | 3.86 | % | | | 3.81 | % | | | 4.02 | % |
| | | | | | |
Portfolio Turnover | | | 49 | %(3) | | | 33 | % | | | 18 | % | | | 33 | % | | | 21 | % | | | 17 | % |
| (1) | Computed using average shares outstanding. |
| (2) | Returns are historical and are calculated by determining the percentage change in net asset value with all distributions reinvested and do not reflect the effect of sales charges. |
| (4) | Excludes the effect of custody fee credits, if any, of less than 0.005%. Effective September 1, 2015, custody fee credits, which were earned on cash deposit balances, were discontinued by the custodian. |
| (6) | Interest and fee expense relates to the liability for floating rate notes issued in conjunction with residual interest bond transactions (see Note 1H). |
| | | | |
| | 27 | | See Notes to Financial Statements. |
Eaton Vance
Municipal Income Funds
March 31, 2020
Financial Highlights — continued
| | | | | | | | | | | | | | | | | | | | | | | | |
| | | AMT-Free Fund — Class C | |
| | |
| | | Six Months Ended
March 31, 2020
(Unaudited) | | | Year Ended September 30, | |
| | | 2019 | | | 2018 | | | 2017 | | | 2016 | | | 2015 | |
| | | | | | | |
Net asset value — Beginning of period | | $ | 9.200 | | | $ | 8.820 | | | $ | 9.080 | | | $ | 9.380 | | | $ | 9.160 | | | $ | 9.300 | |
| | | | | | |
| Income (Loss) From Operations | | | | | | | | | | | | | | | | | | | | | | | | |
| | | | | | |
Net investment income(1) | | $ | 0.103 | | | $ | 0.249 | | | $ | 0.267 | | | $ | 0.281 | | | $ | 0.286 | | | $ | 0.302 | |
| | | | | | |
Net realized and unrealized gain (loss) | | | (0.092 | ) | | | 0.380 | | | | (0.262 | ) | | | (0.298 | ) | | | 0.218 | | | | (0.142 | ) |
| | | | | | |
Total income (loss) from operations | | $ | 0.011 | | | $ | 0.629 | | | $ | 0.005 | | | $ | (0.017 | ) | | $ | 0.504 | | | $ | 0.160 | |
| | | | | | |
| Less Distributions | | | | | | | | | | | | | | | | | | | | | | | | |
| | | | | | |
From net investment income | | $ | (0.111 | ) | | $ | (0.249 | ) | | $ | (0.265 | ) | | $ | (0.283 | ) | | $ | (0.284 | ) | | $ | (0.300 | ) |
| | | | | | |
Total distributions | | $ | (0.111 | ) | | $ | (0.249 | ) | | $ | (0.265 | ) | | $ | (0.283 | ) | | $ | (0.284 | ) | | $ | (0.300 | ) |
| | | | | | |
Net asset value — End of period | | $ | 9.100 | | | $ | 9.200 | | | $ | 8.820 | | | $ | 9.080 | | | $ | 9.380 | | | $ | 9.160 | |
| | | | | | |
Total Return(2) | | | 0.11 | %(3) | | | 7.24 | % | | | 0.06 | % | | | (0.12 | )% | | | 5.56 | % | | | 1.75 | % |
| | | | | | |
| Ratios/Supplemental Data | | | | | | | | | | | | | | | | | | | | | | | | |
| | | | | | |
Net assets, end of period (000’s omitted) | | $ | 17,690 | | | $ | 19,715 | | | $ | 32,545 | | | $ | 39,099 | | | $ | 45,606 | | | $ | 41,903 | |
| | | | | | |
Ratios (as a percentage of average daily net assets): | | | | | | | | | | | | | | | | | | | | | | | | |
| | | | | | |
Expenses excluding interest and fees(4) | | | 1.54 | %(5) | | | 1.56 | % | | | 1.56 | % | | | 1.57 | % | | | 1.56 | % | | | 1.57 | % |
| | | | | | |
Interest and fee expense(6) | | | 0.18 | %(5) | | | 0.23 | % | | | 0.24 | % | | | 0.16 | % | | | 0.10 | % | | | 0.08 | % |
| | | | | | |
Total expenses(4) | | | 1.72 | %(5) | | | 1.79 | % | | | 1.80 | % | | | 1.73 | % | | | 1.66 | % | | | 1.65 | % |
| | | | | | |
Net investment income | | | 2.24 | %(5) | | | 2.78 | % | | | 2.99 | % | | | 3.11 | % | | | 3.06 | % | | | 3.27 | % |
| | | | | | |
Portfolio Turnover | | | 49 | %(3) | | | 33 | % | | | 18 | % | | | 33 | % | | | 21 | % | | | 17 | % |
| (1) | Computed using average shares outstanding. |
| (2) | Returns are historical and are calculated by determining the percentage change in net asset value with all distributions reinvested and do not reflect the effect of sales charges. |
| (4) | Excludes the effect of custody fee credits, if any, of less than 0.005%. Effective September 1, 2015, custody fee credits, which were earned on cash deposit balances, were discontinued by the custodian. |
| (6) | Interest and fee expense relates to the liability for floating rate notes issued in conjunction with residual interest bond transactions (see Note 1H). |
| | | | |
| | 28 | | See Notes to Financial Statements. |
Eaton Vance
Municipal Income Funds
March 31, 2020
Financial Highlights — continued
| | | | | | | | | | | | | | | | | | | | | | | | |
| | | AMT-Free Fund — Class I | |
| | |
| | | Six Months Ended
March 31, 2020
(Unaudited) | | | Year Ended September 30, | |
| | | 2019 | | | 2018 | | | 2017 | | | 2016 | | | 2015 | |
| | | | | | | |
Net asset value — Beginning of period | | $ | 10.100 | | | $ | 9.680 | | | $ | 9.970 | | | $ | 10.300 | | | $ | 10.060 | | | $ | 10.210 | |
| | | | | | |
| Income (Loss) From Operations | | | | | | | | | | | | | | | | | | | | | | | | |
| | | | | | |
Net investment income(1) | | $ | 0.163 | | | $ | 0.370 | | | $ | 0.391 | | | $ | 0.407 | | | $ | 0.415 | | | $ | 0.434 | |
| | | | | | |
Net realized and unrealized gain (loss) | | | (0.091 | ) | | | 0.422 | | | | (0.292 | ) | | | (0.327 | ) | | | 0.240 | | | | (0.152 | ) |
| | | | | | |
Total income from operations | | $ | 0.072 | | | $ | 0.792 | | | $ | 0.099 | | | $ | 0.080 | | | $ | 0.655 | | | $ | 0.282 | |
| | | | | | |
| Less Distributions | | | | | | | | | | | | | | | | | | | | | | | | |
| | | | | | |
From net investment income | | $ | (0.172 | ) | | $ | (0.372 | ) | | $ | (0.389 | ) | | $ | (0.410 | ) | | $ | (0.415 | ) | | $ | (0.432 | ) |
| | | | | | |
Total distributions | | $ | (0.172 | ) | | $ | (0.372 | ) | | $ | (0.389 | ) | | $ | (0.410 | ) | | $ | (0.415 | ) | | $ | (0.432 | ) |
| | | | | | |
Net asset value — End of period | | $ | 10.000 | | | $ | 10.100 | | | $ | 9.680 | | | $ | 9.970 | | | $ | 10.300 | | | $ | 10.060 | |
| | | | | | |
Total Return(2) | | | 0.70 | %(3) | | | 8.34 | % | | | 1.02 | % | | | 0.87 | % | | | 6.60 | % | | | 2.70 | % |
| | | | | | |
| Ratios/Supplemental Data | | | | | | | | | | | | | | | | | | | | | | | | |
| | | | | | |
Net assets, end of period (000’s omitted) | | $ | 144,868 | | | $ | 145,788 | | | $ | 132,313 | | | $ | 154,177 | | | $ | 154,458 | | | $ | 109,937 | |
| | | | | | |
Ratios (as a percentage of average daily net assets): | | | | | | | | | | | | | | | | | | | | | | | | |
| | | | | | |
Expenses excluding interest and fees(4) | | | 0.54 | %(5) | | | 0.56 | % | | | 0.56 | % | | | 0.57 | % | | | 0.56 | % | | | 0.57 | % |
| | | | | | |
Interest and fee expense(6) | | | 0.18 | %(5) | | | 0.23 | % | | | 0.24 | % | | | 0.16 | % | | | 0.10 | % | | | 0.08 | % |
| | | | | | |
Total expenses(4) | | | 0.72 | %(5) | | | 0.79 | % | | | 0.80 | % | | | 0.73 | % | | | 0.66 | % | | | 0.65 | % |
| | | | | | |
Net investment income | | | 3.22 | %(5) | | | 3.76 | % | | | 3.98 | % | | | 4.09 | % | | | 4.04 | % | | | 4.27 | % |
| | | | | | |
Portfolio Turnover | | | 49 | %(3) | | | 33 | % | | | 18 | % | | | 33 | % | | | 21 | % | | | 17 | % |
| (1) | Computed using average shares outstanding. |
| (2) | Returns are historical and are calculated by determining the percentage change in net asset value with all distributions reinvested. |
| (4) | Excludes the effect of custody fee credits, if any, of less than 0.005%. Effective September 1, 2015, custody fee credits, which were earned on cash deposit balances, were discontinued by the custodian. |
| (6) | Interest and fee expense relates to the liability for floating rate notes issued in conjunction with residual interest bond transactions (see Note 1H). |
| | | | |
| | 29 | | See Notes to Financial Statements. |
Eaton Vance
Municipal Income Funds
March 31, 2020
Financial Highlights — continued
| | | | | | | | | | | | | | | | | | | | | | | | |
| | | National Fund — Class A | |
| | |
| | | Six Months Ended
March 31, 2020
(Unaudited) | | | Year Ended September 30, | |
| | | 2019 | | | 2018 | | | 2017 | | | 2016 | | | 2015 | |
| | | | | | | |
Net asset value — Beginning of period | | $ | 10.140 | | | $ | 9.650 | | | $ | 9.930 | | | $ | 10.170 | | | $ | 9.810 | | | $ | 9.870 | |
| | | | | | |
| Income (Loss) From Operations | | | | | | | | | | | | | | | | | | | | | | | | |
| | | | | | |
Net investment income(1) | | $ | 0.136 | | | $ | 0.322 | | | $ | 0.350 | | | $ | 0.366 | | | $ | 0.385 | | | $ | 0.389 | |
| | | | | | |
Net realized and unrealized gain (loss) | | | (0.162 | ) | | | 0.491 | | | | (0.277 | ) | | | (0.242 | ) | | | 0.357 | | | | (0.064 | ) |
| | | | | | |
Total income (loss) from operations | | $ | (0.026 | ) | | $ | 0.813 | | | $ | 0.073 | | | $ | 0.124 | | | $ | 0.742 | | | $ | 0.325 | |
| | | | | | |
| Less Distributions | | | | | | | | | | | | | | | | | | | | | | | | |
| | | | | | |
From net investment income | | $ | (0.144 | ) | | $ | (0.323 | ) | | $ | (0.353 | ) | | $ | (0.364 | ) | | $ | (0.382 | ) | | $ | (0.385 | ) |
| | | | | | |
Total distributions | | $ | (0.144 | ) | | $ | (0.323 | ) | | $ | (0.353 | ) | | $ | (0.364 | ) | | $ | (0.382 | ) | | $ | (0.385 | ) |
| | | | | | |
Net asset value — End of period | | $ | 9.970 | | | $ | 10.140 | | | $ | 9.650 | | | $ | 9.930 | | | $ | 10.170 | | | $ | 9.810 | |
| | | | | | |
Total Return(2) | | | (0.28 | )%(3) | | | 8.57 | % | | | 0.76 | % | | | 1.31 | % | | | 7.68 | % | | | 3.35 | % |
| | | | | | |
| Ratios/Supplemental Data | | | | | | | | | | | | | | | | | | | | | | | | |
| | | | | | |
Net assets, end of period (000’s omitted) | | $ | 1,556,038 | | | $ | 1,605,407 | | | $ | 1,419,239 | | | $ | 1,600,127 | | | $ | 1,857,375 | | | $ | 1,899,324 | |
| | | | | | |
Ratios (as a percentage of average daily net assets): | | | | | | | | | | | | | | | | | | | | | | | | |
| | | | | | |
Expenses excluding interest and fees(4) | | | 0.65 | %(5) | | | 0.68 | % | | | 0.69 | % | | | 0.68 | % | | | 0.67 | % | | | 0.67 | % |
| | | | | | |
Interest and fee expense(6) | | | 0.07 | %(5) | | | 0.12 | % | | | 0.19 | % | | | 0.16 | % | | | 0.12 | % | | | 0.09 | % |
| | | | | | |
Total expenses(4) | | | 0.72 | %(5) | | | 0.80 | % | | | 0.88 | % | | | 0.84 | % | | | 0.79 | % | | | 0.76 | % |
| | | | | | |
Net investment income | | | 2.69 | %(5) | | | 3.26 | % | | | 3.58 | % | | | 3.71 | % | | | 3.83 | % | | | 3.94 | % |
| | | | | | |
Portfolio Turnover | | | 66 | %(3) | | | 89 | % | | | 67 | % | | | 70 | % | | | 71 | % | | | 57 | % |
| (1) | Computed using average shares outstanding. |
| (2) | Returns are historical and are calculated by determining the percentage change in net asset value with all distributions reinvested and do not reflect the effect of sales charges. |
| (4) | Excludes the effect of custody fee credits, if any, of less than 0.005%. Effective September 1, 2015, custody fee credits, which were earned on cash deposit balances, were discontinued by the custodian. |
| (6) | Interest and fee expense relates to the liability for floating rate notes issued in conjunction with residual interest bond transactions (see Note 1H). |
| | | | |
| | 30 | | See Notes to Financial Statements. |
Eaton Vance
Municipal Income Funds
March 31, 2020
Financial Highlights — continued
| | | | | | | | | | | | | | | | | | | | | | | | |
| | | National Fund — Class C | |
| | |
| | | Six Months Ended
March 31, 2020
(Unaudited) | | | Year Ended September 30, | |
| | | 2019 | | | 2018 | | | 2017 | | | 2016 | | | 2015 | |
| | | | | | | |
Net asset value — Beginning of period | | $ | 10.140 | | | $ | 9.650 | | | $ | 9.930 | | | $ | 10.170 | | | $ | 9.810 | | | $ | 9.870 | |
| | | | | | |
| Income (Loss) From Operations | | | | | | | | | | | | | | | | | | | | | | | | |
| | | | | | |
Net investment income(1) | | $ | 0.098 | | | $ | 0.252 | | | $ | 0.276 | | | $ | 0.292 | | | $ | 0.310 | | | $ | 0.315 | |
| | | | | | |
Net realized and unrealized gain (loss) | | | (0.161 | ) | | | 0.488 | | | | (0.276 | ) | | | (0.242 | ) | | | 0.357 | | | | (0.064 | ) |
| | | | | | |
Total income (loss) from operations | | $ | (0.063 | ) | | $ | 0.740 | | | $ | — | | | $ | 0.050 | | | $ | 0.667 | | | $ | 0.251 | |
| | | | | | |
| Less Distributions | | | | | | | | | | | | | | | | | | | | | | | | |
| | | | | | |
From net investment income | | $ | (0.107 | ) | | $ | (0.250 | ) | | $ | (0.280 | ) | | $ | (0.290 | ) | | $ | (0.307 | ) | | $ | (0.311 | ) |
| | | | | | |
Total distributions | | $ | (0.107 | ) | | $ | (0.250 | ) | | $ | (0.280 | ) | | $ | (0.290 | ) | | $ | (0.307 | ) | | $ | (0.311 | ) |
| | | | | | |
Net asset value — End of period | | $ | 9.970 | | | $ | 10.140 | | | $ | 9.650 | | | $ | 9.930 | | | $ | 10.170 | | | $ | 9.810 | |
| | | | | | |
Total Return(2) | | | (0.64 | )%(3) | | | 7.77 | % | | | 0.01 | % | | | 0.56 | % | | | 6.88 | % | | | 2.58 | % |
| | | | | | |
| Ratios/Supplemental Data | | | | | | | | | | | | | | | | | | | | | | | | |
| | | | | | |
Net assets, end of period (000’s omitted) | | $ | 155,076 | | | $ | 172,417 | | | $ | 363,026 | | | $ | 462,269 | | | $ | 576,664 | | | $ | 585,346 | |
| | | | | | |
Ratios (as a percentage of average daily net assets): | | | | | | | | | | | | | | | | | | | | | | | | |
| | | | | | |
Expenses excluding interest and fees(4) | | | 1.40 | %(5) | | | 1.43 | % | | | 1.44 | % | | | 1.43 | % | | | 1.42 | % | | | 1.42 | % |
| | | | | | |
Interest and fee expense(6) | | | 0.07 | %(5) | | | 0.12 | % | | | 0.19 | % | | | 0.16 | % | | | 0.12 | % | | | 0.09 | % |
| | | | | | |
Total expenses(4) | | | 1.47 | %(5) | | | 1.55 | % | | | 1.63 | % | | | 1.59 | % | | | 1.54 | % | | | 1.51 | % |
| | | | | | |
Net investment income | | | 1.94 | %(5) | | | 2.57 | % | | | 2.83 | % | | | 2.96 | % | | | 3.08 | % | | | 3.19 | % |
| | | | | | |
Portfolio Turnover | | | 66 | %(3) | | | 89 | % | | | 67 | % | | | 70 | % | | | 71 | % | | | 57 | % |
| (1) | Computed using average shares outstanding. |
| (2) | Returns are historical and are calculated by determining the percentage change in net asset value with all distributions reinvested and do not reflect the effect of sales charges. |
| (4) | Excludes the effect of custody fee credits, if any, of less than 0.005%. Effective September 1, 2015, custody fee credits, which were earned on cash deposit balances, were discontinued by the custodian. |
| (6) | Interest and fee expense relates to the liability for floating rate notes issued in conjunction with residual interest bond transactions (see Note 1H). |
| | | | |
| | 31 | | See Notes to Financial Statements. |
Eaton Vance
Municipal Income Funds
March 31, 2020
Financial Highlights — continued
| | | | | | | | | | | | | | | | | | | | | | | | |
| | | National Fund — Class I | |
| | |
| | | Six Months Ended
March 31, 2020
(Unaudited) | | | Year Ended September 30, | |
| | | 2019 | | | 2018 | | | 2017 | | | 2016 | | | 2015 | |
| | | | | | | |
Net asset value — Beginning of period | | $ | 10.140 | | | $ | 9.650 | | | $ | 9.930 | | | $ | 10.170 | | | $ | 9.810 | | | $ | 9.870 | |
| | | | | | |
| Income (Loss) From Operations | | | | | | | | | | | | | | | | | | | | | | | | |
| | | | | | |
Net investment income(1) | | $ | 0.149 | | | $ | 0.341 | | | $ | 0.374 | | | $ | 0.390 | | | $ | 0.410 | | | $ | 0.413 | |
| | | | | | |
Net realized and unrealized gain (loss) | | | (0.163 | ) | | | 0.495 | | | | (0.277 | ) | | | (0.241 | ) | | | 0.357 | | | | (0.063 | ) |
| | | | | | |
Total income (loss) from operations | | $ | (0.014 | ) | | $ | 0.836 | | | $ | 0.097 | | | $ | 0.149 | | | $ | 0.767 | | | $ | 0.350 | |
| | | | | | |
| Less Distributions | | | | | | | | | | | | | | | | | | | | | | | | |
| | | | | | |
From net investment income | | $ | (0.156 | ) | | $ | (0.346 | ) | | $ | (0.377 | ) | | $ | (0.389 | ) | | $ | (0.407 | ) | | $ | (0.410 | ) |
| | | | | | |
Total distributions | | $ | (0.156 | ) | | $ | (0.346 | ) | | $ | (0.377 | ) | | $ | (0.389 | ) | | $ | (0.407 | ) | | $ | (0.410 | ) |
| | | | | | |
Net asset value — End of period | | $ | 9.970 | | | $ | 10.140 | | | $ | 9.650 | | | $ | 9.930 | | | $ | 10.170 | | | $ | 9.810 | |
| | | | | | |
Total Return(2) | | | (0.15 | )%(3) | | | 8.83 | % | | | 1.01 | % | | | 1.56 | % | | | 7.94 | % | | | 3.50 | % |
| | | | | | |
| Ratios/Supplemental Data | | | | | | | | | | | | | | | | | | | | | | | | |
| | | | | | |
Net assets, end of period (000’s omitted) | | $ | 1,344,947 | | | $ | 1,348,563 | | | $ | 756,446 | | | $ | 777,063 | | | $ | 701,153 | | | $ | 674,696 | |
| | | | | | |
Ratios (as a percentage of average daily net assets): | | | | | | | | | | | | | | | | | | | | | | | | |
| | | | | | |
Expenses excluding interest and fees(4) | | | 0.40 | %(5) | | | 0.43 | % | | | 0.44 | % | | | 0.43 | % | | | 0.42 | % | | | 0.42 | % |
| | | | | | |
Interest and fee expense(6) | | | 0.07 | %(5) | | | 0.12 | % | | | 0.19 | % | | | 0.16 | % | | | 0.12 | % | | | 0.09 | % |
| | | | | | |
Total expenses(4) | | | 0.47 | %(5) | | | 0.55 | % | | | 0.63 | % | | | 0.59 | % | | | 0.54 | % | | | 0.51 | % |
| | | | | | |
Net investment income | | | 2.94 | %(5) | | | 3.45 | % | | | 3.83 | % | | | 3.95 | % | | | 4.09 | % | | | 4.19 | % |
| | | | | | |
Portfolio Turnover | | | 66 | %(3) | | | 89 | % | | | 67 | % | | | 70 | % | | | 71 | % | | | 57 | % |
| (1) | Computed using average shares outstanding. |
| (2) | Returns are historical and are calculated by determining the percentage change in net asset value with all distributions reinvested. |
| (4) | Excludes the effect of custody fee credits, if any, of less than 0.005%. Effective September 1, 2015, custody fee credits, which were earned on cash deposit balances, were discontinued by the custodian. |
| (6) | Interest and fee expense relates to the liability for floating rate notes issued in conjunction with residual interest bond transactions (see Note 1H). |
| | | | |
| | 32 | | See Notes to Financial Statements. |
Eaton Vance
Municipal Income Funds
March 31, 2020
Notes to Financial Statements (Unaudited)
1 Significant Accounting Policies
Eaton VanceAMT-Free Municipal Income Fund(AMT-Free Fund) and Eaton Vance National Municipal Income Fund (National Fund) (each individually referred to as the Fund, and collectively, the Funds) are a diversified series of Eaton Vance Mutual Funds Trust and Eaton Vance Municipals Trust, respectively (collectively, the Trusts). The Trusts are Massachusetts business trusts registered under the Investment Company Act of 1940, as amended (the 1940 Act), asopen-end management investment companies. The Funds’ investment objective is to provide current income exempt from regular federal income tax. The Funds offer three classes of shares. Class A shares are generally sold subject to a sales charge imposed at time of purchase. Class C shares are sold at net asset value and are generally subject to a contingent deferred sales charge (see Note 5). Effective January 25, 2019, Class C shares generally automatically convert to Class A shares ten years after their purchase as described in the Funds’ prospectus. Class I shares are sold at net asset value and are not subject to a sales charge. Each class represents apro-rata interest in the Fund, but votes separately on class-specific matters and (as noted below) is subject to different expenses. Realized and unrealized gains and losses are allocated daily to each class of shares based on the relative net assets of each class to the total net assets of the Fund. Net investment income, other than class-specific expenses, is allocated daily to each class of shares based upon the ratio of the value of each class’s paid shares to the total value of all paid shares. Each class of shares differs in its distribution plan and certain other class-specific expenses.
The following is a summary of significant accounting policies of the Funds. The policies are in conformity with accounting principles generally accepted in the United States of America (U.S. GAAP). Each Fund is an investment company and follows accounting and reporting guidance in the Financial Accounting Standards Board (FASB) Accounting Standards Codification Topic 946.
A Investment Valuation — The following methodologies are used to determine the market value or fair value of investments.
Debt Obligations. Debt obligations are generally valued on the basis of valuations provided by third party pricing services, as derived from such services’ pricing models. Inputs to the models may include, but are not limited to, reported trades, executable bid and ask prices, broker/dealer quotations, prices or yields of securities with similar characteristics, interest rates, anticipated prepayments, benchmark curves or information pertaining to the issuer, as well as industry and economic events. The pricing services may use a matrix approach, which considers information regarding securities with similar characteristics to determine the valuation for a security.Short-term debt obligations purchased with a remaining maturity of sixty days or less for which a valuation from a third party pricing service is not readily available may be valued at amortized cost, which approximates fair value.
Fair Valuation. Investments for which valuations or market quotations are not readily available or are deemed unreliable are valued at fair value using methods determined in good faith by or at the direction of the Trustees of a Fund in a manner that most fairly reflects the security’s “fair value”, which is the amount that a Fund might reasonably expect to receive for the security upon its current sale in the ordinary course. Each such determination is based on a consideration of relevant factors, which are likely to vary from one pricing context to another. These factors may include, but are not limited to, the type of security, the existence of any contractual restrictions on the security’s disposition, the price and extent of public trading in similar securities of the issuer or of comparable companies or entities, quotations or relevant information obtained from broker/dealers or other market participants, information obtained from the issuer, analysts, and/or the appropriate stock exchange (for exchange-traded securities), an analysis of the company’s or entity’s financial statements, and an evaluation of the forces that influence the issuer and the market(s) in which the security is purchased and sold.
B Investment Transactions and Related Income — Investment transactions for financial statement purposes are accounted for on a trade date basis. Realized gains and losses on investments sold are determined on the basis of identified cost. Interest income is recorded on the basis of interest accrued, adjusted for amortization of premium or accretion of discount.
C Federal Taxes — Each Fund’s policy is to comply with the provisions of the Internal Revenue Code applicable to regulated investment companies and to distribute to shareholders each year substantially all of its taxable, if any, andtax-exempt net investment income, and all or substantially all of its net realized capital gains. Accordingly, no provision for federal income or excise tax is necessary. Each Fund intends to satisfy conditions which will enable it to designate distributions from the interest income generated by its investments innon-taxable municipal securities, which are exempt from regular federal income tax when received by each Fund, as exempt-interest dividends. For National Fund, the portion of such interest, if any, earned on private activity bonds issued after August 7, 1986, may be considered a tax preference item to shareholders.
As of March 31, 2020, the Funds had no uncertain tax positions that would require financial statement recognition,de-recognition, or disclosure. Each Fund files a U.S. federal income tax return annually after its fiscalyear-end, which is subject to examination by the Internal Revenue Service for a period of three years from the date of filing.
D Expenses — The majority of expenses of the Trusts are directly identifiable to an individual fund. Expenses which are not readily identifiable to a specific fund are allocated taking into consideration, among other things, the nature and type of expense and the relative size of the funds.
E Legal Fees — Legal fees and other related expenses incurred as part of negotiations of the terms and requirement of capital infusions, or that are expected to result in the restructuring of, or a plan of reorganization for, an investment are recorded as realized losses. Ongoing expenditures to protect or enhance an investment are treated as operating expenses.
F Use of Estimates — The preparation of the financial statements in conformity with U.S. GAAP requires management to make estimates and assumptions that affect the reported amounts of assets and liabilities at the date of the financial statements and the reported amounts of income and expense during the reporting period. Actual results could differ from those estimates.
Eaton Vance
Municipal Income Funds
March 31, 2020
Notes to Financial Statements (Unaudited) — continued
G Indemnifications — Under each Trust’s organizational documents, its officers and Trustees may be indemnified against certain liabilities and expenses arising out of the performance of their duties to the Funds. Under Massachusetts law, if certain conditions prevail, shareholders of a Massachusetts business trust (such as a Trust) could be deemed to have personal liability for the obligations of the Trust. However, each Trust’s Declaration of Trust contains an express disclaimer of liability on the part of Fund shareholders and theBy-laws provide that the Trust shall assume, upon request by the shareholder, the defense on behalf of any Fund shareholders. Moreover, theBy-laws also provide for indemnification out of Fund property of any shareholder held personally liable solely by reason of being or having been a shareholder for all loss or expense arising from such liability. Additionally, in the normal course of business, each Fund enters into agreements with service providers that may contain indemnification clauses. Each Fund’s maximum exposure under these arrangements is unknown as this would involve future claims that may be made against each Fund that have not yet occurred.
H Floating Rate Notes Issued in Conjunction with Securities Held — The Funds may invest in residual interest bonds, also referred to as inverse floating rate securities, whereby a Fund may sell a variable or fixed rate bond for cash to a Special-Purpose Vehicle (the SPV), (which is generally organized as a trust), while at the same time, buying a residual interest in the assets and cash flows of the SPV. The bond is deposited into the SPV with the same CUSIP number as the bond sold to the SPV by the Fund, and which may have been, but is not required to be, the bond purchased from the Fund (the Bond). The SPV also issues floating rate notes (Floating Rate Notes) which are sold to third-parties. The residual interest bond held by a Fund gives the Fund the right (1) to cause the holders of the Floating Rate Notes to generally tender their notes at par, and (2) to have the Bond held by the SPV transferred to the Fund, thereby terminating the SPV. Should the Fund exercise such right, it would generally pay the SPV the par amount due on the Floating Rate Notes and exchange the residual interest bond for the underlying Bond. Pursuant to generally accepted accounting principles for transfers and servicing of financial assets and extinguishment of liabilities, the Funds account for the transaction described above as a secured borrowing by including the Bond in their Portfolio of Investments and the Floating Rate Notes as a liability under the caption “Payable for floating rate notes issued” in their Statement of Assets and Liabilities. The Floating Rate Notes have interest rates that generally reset weekly and their holders have the option to tender their notes to the SPV for redemption at par at each reset date. Accordingly, the fair value of the payable for floating rate notes issued approximates its carrying value. If measured at fair value, the payable for floating rate notes would have been considered as Level 2 in the fair value hierarchy (see Note 9) at March 31, 2020. Interest expense related to a Fund’s liability with respect to Floating Rate Notes is recorded as incurred. The SPV may be terminated by the Fund, as noted above, or by the occurrence of certain termination events as defined in the trust agreement, such as a downgrade in the credit quality of the underlying Bond, bankruptcy of or payment failure by the issuer of the underlying Bond, the inability to remarket Floating Rate Notes that have been tendered due to insufficient buyers in the market, or the failure by the SPV to obtain renewal of the liquidity agreement under which liquidity support is provided for the Floating Rate Notes up to one year. At March 31, 2020, the amounts of the Funds’ Floating Rate Notes and related interest rates and collateral were as follows:
| | | | | | | | |
| | | AMT-Free
Fund | | | National
Fund | |
| | |
Floating Rate Notes Outstanding | | $ | 29,826,918 | | | $ | 109,885,969 | |
| | |
Interest Rate or Range of Interest Rates (%) | | | 4.76 - 5.02 | | | | 4.14 - 5.02 | |
| | |
Collateral for Floating Rate Notes Outstanding | | $ | 46,826,097 | | | $ | 157,829,040 | |
For the six months ended March 31, 2020, the Funds’ average settled Floating Rate Notes outstanding and the average interest rate (annualized) including fees were as follows:
| | | | | | | | |
| | | AMT-Free
Fund | | | National
Fund | |
| | |
Average Floating Rate Notes Outstanding | | $ | 29,775,000 | | | $ | 111,006,694 | |
| | |
Average Interest Rate | | | 2.07 | % | | | 2.00 | % |
In certain circumstances, the Funds may enter into shortfall and forbearance agreements with brokers by which a Fund agrees to reimburse the broker for the difference between the liquidation value of the Bond held by the SPV and the liquidation value of the Floating Rate Notes, as well as any shortfalls in interest cash flows. The Funds had no shortfalls as of March 31, 2020.
The Funds may also purchase residual interest bonds in a secondary market transaction without first owning the underlying bond. Such transactions are not required to be treated as secured borrowings. Shortfall agreements, if any, related to residual interest bonds purchased in a secondary market transaction are disclosed in the Portfolio of Investments.
The Funds’ investment policies and restrictions expressly permit investments in residual interest bonds. Such bonds typically offer the potential for yields exceeding the yields available on fixed rate bonds with comparable credit quality and maturity. These securities tend to underperform the market for fixed rate bonds in a rising long-term interest rate environment, but tend to outperform the market for fixed rate bonds when long-term interest rates decline. The value and income of residual interest bonds are generally more volatile than that of a fixed rate bond. The Funds’ investment policies do not allow the
Eaton Vance
Municipal Income Funds
March 31, 2020
Notes to Financial Statements (Unaudited) — continued
Funds to borrow money except as permitted by the 1940 Act. Management believes that the Funds’ restrictions on borrowing money and issuing senior securities (other than as specifically permitted) do not apply to Floating Rate Notes issued by the SPV and included as a liability in the Funds’ Statement of Assets and Liabilities. As secured indebtedness issued by an SPV, Floating Rate Notes are distinct from the borrowings and senior securities to which the Funds’ restrictions apply. Residual interest bonds held by the Funds are securities exempt from registration under Rule 144A of the Securities Act of 1933.
I When-Issued Securities and Delayed Delivery Transactions — The Funds may purchase or sell securities on a delayed delivery or when-issued basis. Payment and delivery may take place after the customary settlement period for that security. At the time the transaction is negotiated, the price of the security that will be delivered is fixed. The Funds maintain cash and/or security positions for these commitments such that sufficient liquid assets will be available to make payments upon settlement. Securities purchased on a delayed delivery or when-issued basis aremarked-to-market daily and begin earning interest on settlement date. Losses may arise due to changes in the market value of the underlying securities or if the counterparty does not perform under the contract.
J Interim Financial Statements — The interim financial statements relating to March 31, 2020 and for the six months then ended have not been audited by an independent registered public accounting firm, but in the opinion of the Funds’ management, reflect all adjustments, consisting only of normal recurring adjustments, necessary for the fair presentation of the financial statements.
2 Distributions to Shareholders and Income Tax Information
The net investment income of each Fund is determined daily and substantially all of the net investment income so determined is declared as a dividend to shareholders of record at the time of declaration. Distributions are declared separately for each class of shares. Distributions are paid monthly. Distributions of realized capital gains are made at least annually. Shareholders may reinvest income and capital gain distributions in additional shares of the same class of a Fund at the net asset value as of the reinvestment date or, at the election of the shareholder, receive distributions in cash. Distributions to shareholders are determined in accordance with income tax regulations, which may differ from U.S. GAAP. As required by U.S. GAAP, only distributions in excess of tax basis earnings and profits are reported in the financial statements as a return of capital. Permanent differences between book and tax accounting relating to distributions are reclassified topaid-in capital. For tax purposes, distributions from short-term capital gains are considered to be from ordinary income.
At September 30, 2019, the following Funds, for federal income tax purposes, had deferred capital losses which would reduce the respective Fund’s taxable income arising from future net realized gains on investment transactions, if any, to the extent permitted by the Internal Revenue Code, and thus would reduce the amount of distributions to shareholders, which would otherwise be necessary to relieve the Funds of any liability for federal income or
excise tax. The deferred capital losses are treated as arising on the first day of a Fund’s next taxable year and retain the same short-term or long-term character as when originally deferred. The amounts of the deferred capital losses are as follows:
| | | | | | | | |
| | | AMT-Free
Fund | | | National
Fund | |
| | |
Deferred capital losses: | | | | | | | | |
| | |
Short-term | | $ | 14,481,444 | | | $ | 135,794,015 | |
| | |
Long-term | | $ | 13,406,119 | | | $ | 93,936,872 | |
The cost and unrealized appreciation (depreciation) of investments of each Fund at March 31, 2020, as determined on a federal income tax basis, were as follows:
| | | | | | | | |
| | | AMT-Free
Fund | | | National
Fund | |
| | |
Aggregate cost | | $ | 280,559,196 | | | $ | 2,828,828,342 | |
| | |
Gross unrealized appreciation | | $ | 25,019,856 | | | $ | 193,320,104 | |
| | |
Gross unrealized depreciation | | | (2,781,775 | ) | | | (35,944,938 | ) |
| | |
Net unrealized appreciation | | $ | 22,238,081 | | | $ | 157,375,166 | |
3 Investment Adviser Fee and Other Transactions with Affiliates
The investment adviser fee is earned by Eaton Vance Management (EVM) forAMT-Free Fund and Boston Management and Research (BMR), a subsidiary of EVM, for National Fund as compensation for management and investment advisory services rendered to each Fund. The fee is based upon a percentage
Eaton Vance
Municipal Income Funds
March 31, 2020
Notes to Financial Statements (Unaudited) — continued
of average daily net assets plus a percentage of gross income (i.e., income other than gains from the sale of securities) as presented in the following table and is payable monthly.
| | | | | | | | |
| Daily Net Assets | | Annual Asset
Rate | | | Daily Income
Rate | |
| | |
Up to $500 million | | | 0.300 | % | | | 3.00 | % |
| | |
$500 million up to $1 billion | | | 0.275 | | | | 2.75 | |
| | |
$1 billion up to $1.5 billion | | | 0.250 | | | | 2.50 | |
| | |
$1.5 billion up to $2 billion | | | 0.225 | | | | 2.25 | |
| | |
$2 billion up to $3 billion | | | 0.200 | | | | 2.00 | |
| | |
$3 billion and over | | | 0.175 | | | | 1.75 | |
For the six months ended March 31, 2020, investment adviser fees incurred by the Funds and the effective annual rates, as a percentage of average daily net assets, were as follows:
| | | | | | | | |
| | | AMT-Free
Fund | | | National
Fund | |
| | |
Investment Adviser Fee | | $ | 688,952 | | | $ | 5,084,164 | |
| | |
Effective Annual Rate | | | 0.41 | % | | | 0.32 | % |
EVM serves as the administrator of each Fund, but receives no compensation. EVM providessub-transfer agency and related services to the Funds pursuant to aSub-Transfer Agency Support Services Agreement. Eaton Vance Distributors, Inc. (EVD), an affiliate of EVM and the Funds’ principal underwriter, received a portion of the sales charge on sales of Class A shares of the Funds. EVD also received distribution and service fees from Class A and Class C shares (see Note 4) and contingent deferred sales charges (see Note 5).Sub-transfer agent fees earned by EVM, which are included in transfer and dividend disbursing agent fees on the Statements of Operations, and Class A sales charges that the Funds were informed were received by EVD for the six months ended March 31, 2020 were as follows:
| | | | | | | | |
| | | AMT-Free
Fund | | | National
Fund | |
| | |
EVM’sSub-Transfer Agent Fees | | $ | 6,289 | | | $ | 72,157 | |
| | |
EVD’s Class A Sales Charges | | $ | 7,320 | | | $ | 85,354 | |
Trustees and officers of the Funds who are members of EVM’s or BMR’s organizations receive remuneration for their services to the Funds out of the investment adviser fee. Trustees of the Funds who are not affiliated with the investment advisers may elect to defer receipt of all or a percentage of their annual fees in accordance with the terms of the Trustees Deferred Compensation Plan. For the six months ended March 31, 2020, no significant amounts have been deferred. Certain officers and Trustees of the Funds are officers of the above organizations.
4 Distribution Plans
Each Fund has in effect a distribution plan for Class A shares (Class A Plan) pursuant to Rule12b-1 under the 1940 Act. Pursuant to the Class A Plan, each Fund pays EVD a distribution and service fee of 0.25% per annum of its average daily net assets attributable to Class A shares for distribution services and facilities provided to each Fund by EVD, as well as for personal services and/or the maintenance of shareholder accounts. Distribution and service fees paid or accrued to EVD for the six months ended March 31, 2020 for Class A shares amounted to the following:
| | | | | | | | |
| | | AMT-Free
Fund | | | National
Fund | |
| | |
Class A Distribution and Service Fees | | $ | 187,012 | | | $ | 1,996,586 | |
Each Fund also has in effect a distribution plan for Class C shares (Class C Plan) pursuant to Rule12b-1 under the 1940 Act. Pursuant to the Class C Plan, each Fund pays EVD amounts equal to 0.75% per annum of its average daily net assets attributable to Class C shares for providing ongoing
Eaton Vance
Municipal Income Funds
March 31, 2020
Notes to Financial Statements (Unaudited) — continued
distribution services and facilities to the respective Funds. For the six months ended March 31, 2020, the Funds paid or accrued to EVD the following distribution fees:
| | | | | | | | |
| | | AMT-Free
Fund | | | National
Fund | |
| | |
Class C Distribution Fees | | $ | 70,940 | | | $ | 626,524 | |
The Class C Plan also authorizes each Fund to make payments of service fees to EVD, financial intermediaries and other persons in amounts equal to 0.25% per annum of the average daily net assets attributable to Class C shares. Service fees paid or accrued are for personal services and/or the maintenance of shareholder accounts. They are separate and distinct from the Class C sales commissions and distribution fees payable to EVD. Service fees paid or accrued for the six months ended March 31, 2020 amounted to the following:
| | | | | | | | |
| | | AMT-Free
Fund | | | National
Fund | |
| | |
Class C Service Fees | | $ | 23,647 | | | $ | 208,841 | |
Distribution and service fees are subject to the limitations contained in the Financial Industry Regulatory Authority Rule 2341(d).
5 Contingent Deferred Sales Charges
A contingent deferred sales charge (CDSC) of 1% generally is imposed on redemptions of Class C shares made within 12 months of purchase. Class A shares may be subject to a 1% CDSC if redeemed within 18 months of purchase (depending on the circumstances of purchase). Generally, the CDSC is based upon the lower of the net asset value at date of redemption or date of purchase. No charge is levied on shares acquired by reinvestment of dividends or capital gain distributions. For the six months ended March 31, 2020, the Funds were informed that EVD received approximately the following amounts of CDSCs paid by Class A and Class C shareholders:
| | | | | | | | |
| | | AMT-Free
Fund | | | National
Fund | |
| | |
Class A | | $ | 20 | | | $ | 8,000 | |
| | |
Class C | | $ | 40 | | | $ | 9,000 | |
6 Purchases and Sales of Investments
Purchases and sales of investments, other than short-term obligations, for the six months ended March 31, 2020 were as follows:
| | | | | | | | |
| | | AMT-Free
Fund | | | National
Fund | |
| | |
Purchases | | $ | 167,997,378 | | | $ | 2,111,038,998 | |
| | |
Sales | | $ | 169,371,131 | | | $ | 2,185,779,619 | |
Eaton Vance
Municipal Income Funds
March 31, 2020
Notes to Financial Statements (Unaudited) — continued
7 Shares of Beneficial Interest
Each Fund’s Declaration of Trust permits the Trustees to issue an unlimited number of full and fractional shares of beneficial interest (without par value). Such shares may be issued in a number of different series (such as the Funds) and classes. Transactions in Fund shares were as follows:
| | | | | | | | | | | | |
AMT-Free Fund | | | | | | | | | |
| | | Six Months Ended March 31, 2020 (Unaudited) | |
| | | Class A | | | Class C | | | Class I | |
| | | |
Sales | | | 891,322 | | | | 157,874 | | | | 10,258,252 | |
| | | |
Issued to shareholders electing to receive payments of distributions in Fund shares | | | 226,218 | | | | 20,024 | | | | 186,511 | |
| | | |
Redemptions | | | (1,436,902 | ) | | | (283,997 | ) | | | (10,385,754 | ) |
| | | |
Converted from Class C shares | | | 93,216 | | | | — | | | | — | |
| | | |
Converted to Class A shares | | | — | | | | (93,743 | ) | | | — | |
| | | |
Net increase (decrease) | | | (226,146 | ) | | | (199,842 | ) | | | 59,009 | |
| |
| | | Year Ended September 30, 2019 | |
| | | Class A | | | Class C | | | Class I | |
| | | |
Sales | | | 1,899,582 | | | | 386,747 | | | | 3,849,738 | |
| | | |
Issued to shareholders electing to receive payments of distributions in Fund shares | | | 507,029 | | | | 62,385 | | | | 371,109 | |
| | | |
Redemptions | | | (3,048,646 | ) | | | (790,414 | ) | | | (3,453,702 | ) |
| | | |
Converted from Class C shares | | | 1,200,770 | | | | — | | | | — | |
| | | |
Converted to Class A shares | | | — | | | | (1,206,708 | ) | | | — | |
| | | |
Net increase (decrease) | | | 558,735 | | | | (1,547,990 | ) | | | 767,145 | |
Eaton Vance
Municipal Income Funds
March 31, 2020
Notes to Financial Statements (Unaudited) — continued
| | | | | | | | | | | | | | | | |
National Fund | | | | | | | | | | | | |
| | | Six Months Ended March 31, 2020 (Unaudited) | |
| | | Class A | | | Class B | | | Class C | | | Class I | |
| | | | |
Sales | | | 9,239,855 | | | | — | | | | 1,488,676 | | | | 42,274,974 | |
| | | | |
Issued to shareholders electing to receive payments of distributions in Fund shares | | | 1,899,078 | | | | — | | | | 139,599 | | | | 1,859,775 | |
| | | | |
Redemptions | | | (14,789,146 | ) | | | — | | | | (1,660,987 | ) | | | (42,209,777 | ) |
| | | | |
Converted from Class C shares | | | 1,413,278 | | | | — | | | | — | | | | — | |
| | | | |
Converted to Class A shares | | | — | | | | — | | | | (1,413,233 | ) | | | — | |
| | | | |
Net increase (decrease) | | | (2,236,935 | ) | | | — | | | | (1,445,945 | ) | | | 1,924,972 | |
| |
| | | Year Ended September 30, 2019 | |
| | | Class A | | | Class B(1) | | | Class C | | | Class I | |
| | | | |
Sales | | | 13,405,753 | | | | 1,628 | | | | 2,854,164 | | | | 79,852,684 | |
| | | | |
Issued to shareholders electing to receive payments of distributions in Fund shares | | | 4,222,148 | | | | 2,056 | | | | 524,297 | | | | 2,955,582 | |
| | | | |
Redemptions | | | (23,904,165 | ) | | | (42,058 | ) | | | (6,560,819 | ) | | | (28,172,127 | ) |
| | | | |
Converted from Class B shares | | | 165,069 | | | | — | | | | — | | | | — | |
| | | | |
Converted from Class C shares | | | 17,419,337 | | | | — | | | | — | | | | — | |
| | | | |
Converted to Class A shares | | | — | | | | (165,036 | ) | | | (17,422,262 | ) | | | — | |
| | | | |
Net increase (decrease) | | | 11,308,142 | | | | (203,410 | ) | | | (20,604,620 | ) | | | 54,636,139 | |
| (1) | At the close of business on August 15, 2019, Class B shares of National Fund were converted into Class A and Class B was terminated. |
8 Line of Credit
The Funds participate with other portfolios and funds managed by EVM and its affiliates in an $800 million unsecured line of credit agreement with a group of banks, which is in effect through October 27, 2020. In connection with the renewal of the agreement on October 29, 2019, funds managed by Calvert Research and Management, an affiliate of EVM, were added as participating funds to the agreement and the borrowing limit was increased from $625 million. Borrowings are made by the Funds solely for temporary purposes related to redemptions and other short-term cash needs. Interest is charged to each Fund based on its borrowings at an amount above either the Eurodollar rate or Federal Funds rate. In addition, a fee computed at an annual rate of 0.15% on the daily unused portion of the line of credit is allocated among the participating portfolios and funds at the end of each quarter. Because the line of credit is not available exclusively to the Funds, a Fund may be unable to borrow some or all of its requested amounts at any particular time. The Funds did not have any significant borrowings or allocated fees during the six months ended March 31, 2020.
9 Fair Value Measurements
Under generally accepted accounting principles for fair value measurements, a three-tier hierarchy to prioritize the assumptions, referred to as inputs, is used in valuation techniques to measure fair value. The three-tier hierarchy of inputs is summarized in the three broad levels listed below.
| • | | Level 1 – quoted prices in active markets for identical investments |
| • | | Level 2 – other significant observable inputs (including quoted prices for similar investments, interest rates, prepayment speeds, credit risk, etc.) |
| • | | Level 3 – significant unobservable inputs (including a fund’s own assumptions in determining the fair value of investments) |
In cases where the inputs used to measure fair value fall in different levels of the fair value hierarchy, the level disclosed is determined based on the lowest level input that is significant to the fair value measurement in its entirety. The inputs or methodology used for valuing securities are not necessarily an indication of the risk associated with investing in those securities.
Eaton Vance
Municipal Income Funds
March 31, 2020
Notes to Financial Statements (Unaudited) — continued
At March 31, 2020, the hierarchy of inputs used in valuing the Funds’ investments, which are carried at value, were as follows:
| | | | | | | | | | | | | | | | |
AMT-Free Fund | | | | | | | | | | | | |
| Asset Description | | Level 1 | | | Level 2 | | | Level 3 | | | Total | |
| | | | |
Tax-Exempt Investments | | $ | — | | | $ | 332,624,195 | | | $ | — | | | $ | 332,624,195 | |
| | | | |
Total Investments | | $ | — | | | $ | 332,624,195 | | | $ | — | | | $ | 332,624,195 | |
| | | | |
National Fund | | | | | | | | | | | | |
| Asset Description | | Level 1 | | | Level 2 | | | Level 3 | | | Total | |
| | | | |
Tax-Exempt Municipal Securities | | $ | — | | | $ | 2,858,022,436 | | | $ | — | | | $ | 2,858,022,436 | |
| | | | |
Taxable Municipal Securities | | | — | | | | 233,156,045 | | | | — | | | | 233,156,045 | |
| | | | |
Corporate Bonds & Notes | | | — | | | | 4,910,996 | | | | — | | | | 4,910,996 | |
| | | | |
Total Investments | | $ | — | | | $ | 3,096,089,477 | | | $ | — | | | $ | 3,096,089,477 | |
10 Risks and Uncertainties
An outbreak of respiratory disease caused by a novel coronavirus that was first detected in China in December 2019 has spread rapidly internationally. This coronavirus has resulted in closing borders, enhanced health screenings, changes to healthcare service preparation and delivery, quarantines, cancellations, disruptions to supply chains and customer activity, as well as general concern and uncertainty. The impact of this outbreak has negatively affected the worldwide economy, as well as the economies of individual countries and individual companies and can affect the market in general in significant and unforeseen ways. Health crises caused by outbreaks, such as the coronavirus outbreak, may exacerbate otherpre-existing political, social and economic risks and disrupt normal market conditions and operations. The near-term impact of this coronavirus has resulted in substantial market volatility, which may have an adverse effect on the Funds’ investments.
Eaton Vance
Municipal Income Funds
March 31, 2020
Officers and Trustees
Officers of Eaton Vance Municipals Trust and Eaton Vance Mutual Funds Trust
Payson F. Swaffield
President
Maureen A. Gemma
Vice President, Secretary and Chief Legal Officer
James F. Kirchner
Treasurer
Richard F. Froio
Chief Compliance Officer
Trustees of Eaton Vance Municipals Trust and Eaton Vance Mutual Funds Trust
William H. Park
Chairperson
Thomas E. Faust Jr.*
Mark R. Fetting
Cynthia E. Frost
George J. Gorman
Valerie A. Mosley
Helen Frame Peters
Keith Quinton
Marcus L. Smith
Susan J. Sutherland
Scott E. Wennerholm
Eaton Vance Funds
IMPORTANT NOTICES
Privacy. The Eaton Vance organization is committed to ensuring your financial privacy. Each entity listed below has adopted a privacy policy and procedures (“Privacy Program”) Eaton Vance believes is reasonably designed to protect your personal information and to govern when and with whom Eaton Vance may share your personal information.
| • | | At the time of opening an account, Eaton Vance generally requires you to provide us with certain information such as name, address, social security number, tax status, account numbers, and account balances. This information is necessary for us to both open an account for you and to allow us to satisfy legal requirements such as applicable anti-money laundering reviews and know-your-customer requirements. |
| • | | On an ongoing basis, in the normal course of servicing your account, Eaton Vance may share your information with unaffiliated third parties that perform various services for Eaton Vance and/or your account. These third parties include transfer agents, custodians, broker/dealers and our professional advisers, including auditors, accountants, and legal counsel. Eaton Vance may additionally share your personal information with our affiliates. |
| • | | We believe our Privacy Program is reasonably designed to protect the confidentiality of your personal information and to prevent unauthorized access to that information. |
| • | | We reserve the right to change our Privacy Program at any time upon proper notification to you. You may want to review our Privacy Program periodically for changes by accessing the link on our homepage: www.eatonvance.com. |
Our pledge of protecting your personal information applies to the following entities within the Eaton Vance organization: the Eaton Vance Family of Funds, Eaton Vance Management, Eaton Vance Investment Counsel, Eaton Vance Distributors, Inc., Eaton Vance Trust Company, Eaton Vance Management (International) Limited, Eaton Vance Advisers International Limited, Eaton Vance Global Advisors Limited, Eaton Vance Management’s Real Estate Investment Group, Boston Management and Research, Calvert Research and Management, and Calvert Funds. This Privacy Notice supersedes all previously issued privacy disclosures. For more information about our Privacy Program or about how your personal information may be used, please call1-800-262-1122.
Delivery of Shareholder Documents. The Securities and Exchange Commission (SEC) permits funds to deliver only one copy of shareholder documents, including prospectuses, proxy statements and shareholder reports, to fund investors with multiple accounts at the same residential or post office box address. This practice is often called “householding” and it helps eliminate duplicate mailings to shareholders.Eaton Vance, or your financial intermediary, may household the mailing of your documents indefinitely unless you instruct Eaton Vance, or your financial intermediary, otherwise.If you would prefer that your Eaton Vance documents not be householded, please contact Eaton Vance at1-800-262-1122, or contact your financial intermediary. Your instructions that householding not apply to delivery of your Eaton Vance documents will typically be effective within 30 days of receipt by Eaton Vance or your financial intermediary.
Portfolio Holdings. Each Eaton Vance Fund and its underlying Portfolio(s) (if applicable) files a schedule of portfolio holdings on Part F toForm N-PORT with the SEC for the first and third quarters of each fiscal year. The FormN-PORT will be available on the Eaton Vance website at www.eatonvance.com, by calling Eaton Vance at1-800-262-1122 or in the EDGAR database on the SEC’s website at www.sec.gov.
Proxy Voting. From time to time, funds are required to vote proxies related to the securities held by the funds. The Eaton Vance Funds or their underlying Portfolios (if applicable) vote proxies according to a set of policies and procedures approved by the Funds’ and Portfolios’ Boards. You may obtain a description of these policies and procedures and information on how the Funds or Portfolios voted proxies relating to portfolio securities during the most recent12-month period ended June 30, without charge, upon request, by calling1-800-262-1122 and by accessing the SEC’s website at www.sec.gov.
This Page Intentionally Left Blank
This Page Intentionally Left Blank
Investment Advisers
AMT-Free Municipal Income Fund
Eaton Vance Management
Two International Place
Boston, MA 02110
National Municipal Income Fund
Boston Management and Research
Two International Place
Boston, MA 02110
Administrator
Eaton Vance Management
Two International Place
Boston, MA 02110
Principal Underwriter*
Eaton Vance Distributors, Inc.
Two International Place
Boston, MA 02110
(617)482-8260
Custodian
State Street Bank and Trust Company
State Street Financial Center, One Lincoln Street
Boston, MA 02111
Transfer Agent
BNY Mellon Investment Servicing (US) Inc.
Attn: Eaton Vance Funds
P.O. Box 9653
Providence, RI 02940-9653
(800)262-1122
Fund Offices
Two International Place
Boston, MA 02110
| * | FINRA BrokerCheck. Investors may check the background of their Investment Professional by contacting the Financial Industry Regulatory Authority (FINRA). FINRA BrokerCheck is a free tool to help investors check the professional background of current and former FINRA-registered securities firms and brokers. FINRA BrokerCheck is available by calling1-800-289-9999 and at www.FINRA.org. The FINRA BrokerCheck brochure describing this program is available to investors at www.FINRA.org. |

7714 3.31.20

Eaton Vance
Municipal Income Funds
Semiannual Report
March 31, 2020
California Opportunities • Massachusetts • New York • Ohio
Important Note. Beginning on January 1, 2021, as permitted by regulations adopted by the Securities and Exchange Commission, paper copies of each Fund’s annual and semi-annual shareholder reports will no longer be sent by mail unless you specifically request paper copies of the reports. Instead, the reports will be made available on the Funds’ website (eatonvance.com/funddocuments), and you will be notified by mail each time a report is posted and provided with a website address to access the report.
If you already elected to receive shareholder reports electronically, you will not be affected by this change and you need not take any action. If you are a direct investor, you may elect to receive shareholder reports and other communications from the Funds electronically by signing up fore-Delivery at eatonvance.com/edelivery. If you own your shares through a financial intermediary (such as a broker-dealer or bank), you must contact your financial intermediary to sign up.
You may elect to receive all future Fund shareholder reports in paper free of charge. If you are a direct investor, you can inform the Funds that you wish to continue receiving paper copies of your shareholder reports by calling1-800-262-1122. If you own these shares through a financial intermediary, you must contact your financial intermediary or follow instructions included with this disclosure, if applicable, to elect to continue to receive paper copies of your shareholder reports. Your election to receive reports in paper will apply to all Eaton Vance funds held directly or to all funds held through your financial intermediary, as applicable.

Commodity Futures Trading Commission Registration.Effective December 31, 2012, the Commodity Futures Trading Commission (“CFTC”) adopted certain regulatory changes that subject registered investment companies and advisers to regulation by the CFTC if a fund invests more than a prescribed level of its assets in certain CFTC-regulated instruments (including futures, certain options and swap agreements) or markets itself as providing investment exposure to such instruments. The investment adviser has claimed an exclusion from the definition of “commodity pool operator” under the Commodity Exchange Act with respect to its management of each Fund. Accordingly neither the Funds nor the adviser with respect to the operation of the Funds is subject to CFTC regulation. Because of its management of other strategies, the Funds’ adviser is registered with the CFTC as a commodity pool operator. The adviser is also registered as a commodity trading advisor.
Fund shares are not insured by the FDIC and are not deposits or other obligations of, or guaranteed by, any depository institution. Shares are subject to investment risks, including possible loss of principal invested.
This report must be preceded or accompanied by a current summary prospectus or prospectus. Before investing, investors should consider carefully the investment objective, risks, and charges and expenses of a mutual fund. This and other important information is contained in the summary prospectus and prospectus, which can be obtained from a financial intermediary. Prospective investors should read the prospectus carefully before investing. For further information, please call1-800-262-1122.
Semiannual Report March 31, 2020
Eaton Vance
Municipal Income Funds
Table of Contents
Eaton Vance
California Municipal Opportunities Fund
March 31, 2020
Performance1,2
Portfolio ManagersCraig R. Brandon, CFA and Adam A. Weigold, CFA
| | | | | | | | | | | | | | | | | | | | | | | | |
| % Average Annual Total Returns | | Class Inception Date | | | Performance
Inception Date | | | Six Months | | | One Year | | | Five Years | | | Ten Years | |
Class A at NAV | | | 05/27/1994 | | | | 12/19/1985 | | | | –0.76 | % | | | 3.65 | % | | | 3.27 | % | | | 4.44 | % |
Class A with 4.75% Maximum Sales Charge | | | — | | | | — | | | | –5.49 | | | | –1.26 | | | | 2.28 | | | | 3.93 | |
Class C at NAV | | | 08/31/2004 | | | | 12/19/1985 | | | | –1.18 | | | | 2.88 | | | | 2.50 | | | | 3.65 | |
Class C with 1% Maximum Sales Charge | | | — | | | | — | | | | –2.16 | | | | 1.88 | | | | 2.50 | | | | 3.65 | |
Class I at NAV | | | 03/03/2008 | | | | 12/19/1985 | | | | –0.74 | | | | 3.90 | | | | 3.50 | | | | 4.68 | |
Bloomberg Barclays Municipal Bond Index | | | — | | | | — | | | | 0.10 | % | | | 3.85 | % | | | 3.19 | % | | | 4.14 | % |
Bloomberg Barclays California Municipal Bond Index | | | — | | | | — | | | | 0.20 | | | | 4.21 | | | | 3.19 | | | | 4.60 | |
| | | | | | |
| | | | | | | | | | | | | | | | | | | | | | | | |
| % Total Annual Operating Expense Ratios3 | | | | | | | | | | | Class A | | | Class C | | | Class I | |
| | | | | | | | | | | | | | | 0.80 | % | | | 1.55 | % | | | 0.55 | % |
| | | | | | |
| | | | | | | | | | | | | | | | | | | | | | | | |
| % Distribution Rates/Yields4 | | | | | | | | | | | Class A | | | Class C | | | Class I | |
Distribution Rate | | | | | | | | | | | | | | | 2.25 | % | | | 1.47 | % | | | 2.49 | % |
Taxable-Equivalent Distribution Rate | | | | | | | | | | | | | | | 4.90 | | | | 3.20 | | | | 5.42 | |
SEC30-day Yield | | | | | | | | | | | | | | | 1.43 | | | | 0.74 | | | | 1.74 | |
Taxable-Equivalent SEC30-day Yield | | | | | | | | | | | | | | | 3.11 | | | | 1.60 | | | | 3.79 | |
| | | | | | |
| | | | | | | | | | | | | | | | | | | | | | | | |
| % Total Leverage5 | | | | | | | | | | | | | | | | | | |
Residual Interest Bond (RIB) Financing | | | | | | | | | | | | | | | | | | | | | | | 0.62 | % |
Fund Profile
Credit Quality (% of total investments)6,7
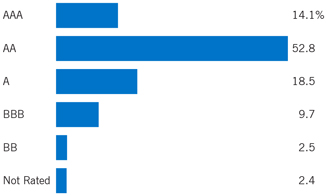
See Endnotes and Additional Disclosures in this report.
Past performance is no guarantee of future results. Returns are historical and are calculated by determining the percentage change in net asset value (NAV) or offering price (as applicable) with all distributions reinvested. Investment return and principal value will fluctuate so that shares, when redeemed, may be worth more or less than their original cost. Performance for periods less than or equal to one year is cumulative. Performance is for the stated time period only; due to market volatility, current Fund performance may be lower or higher than the quoted return. For performance as of the most recent month-end, please refer to eatonvance.com.
Eaton Vance
Massachusetts Municipal Income Fund
March 31, 2020
Performance1,2
Portfolio ManagerCraig R. Brandon, CFA
| | | | | | | | | | | | | | | | | | | | | | | | |
| % Average Annual Total Returns | | Class
Inception Date | | | Performance
Inception Date | | | Six Months | | | One Year | | | Five Years | | | Ten Years | |
Class A at NAV | | | 12/07/1993 | | | | 04/18/1991 | | | | 0.07 | % | | | 3.43 | % | | | 2.55 | % | | | 4.08 | % |
Class A with 4.75% Maximum Sales Charge | | | — | | | | — | | | | –4.71 | | | | –1.49 | | | | 1.55 | | | | 3.57 | |
Class C at NAV | | | 05/02/2006 | | | | 04/18/1991 | | | | –0.30 | | | | 2.66 | | | | 1.78 | | | | 3.30 | |
Class C with 1% Maximum Sales Charge | | | — | | | | — | | | | –1.29 | | | | 1.66 | | | | 1.78 | | | | 3.30 | |
Class I at NAV | | | 06/17/1993 | | | | 04/18/1991 | | | | 0.05 | | | | 3.52 | | | | 2.73 | | | | 4.27 | |
Bloomberg Barclays Municipal Bond Index | | | — | | | | — | | | | 0.10 | % | | | 3.85 | % | | | 3.19 | % | | | 4.14 | % |
Bloomberg Barclays Massachusetts Municipal Bond Index | | | — | | | | — | | | | 0.95 | | | | 4.62 | | | | 3.13 | | | | 3.99 | |
| | | | | | |
| | | | | | | | | | | | | | | | | | | | | | | | |
| % Total Annual Operating Expense Ratios3 | | | | | | | | | | | Class A | | | Class C | | | Class I | |
| | | | | | | | | | | | | | | 0.76 | % | | | 1.51 | % | | | 0.56 | % |
| | | | | | |
| | | | | | | | | | | | | | | | | | | | | | | | |
| % Distribution Rates/Yields4 | | | | | | | | | | | Class A | | | Class C | | | Class I | |
Distribution Rate | | | | | | | | | | | | | | | 2.69 | % | | | 1.97 | % | | | 2.88 | % |
Taxable-Equivalent Distribution Rate | | | | | | | | | | | | | | | 4.97 | | | | 3.64 | | | | 5.32 | |
SEC30-day Yield | | | | | | | | | | | | | | | 1.21 | | | | 0.54 | | | | 1.47 | |
Taxable-Equivalent SEC30-day Yield | | | | | | | | | | | | | | | 2.23 | | | | 1.00 | | | | 2.71 | |
| | | | | | |
| | | | | | | | | | | | | | | | | | | | | | | | |
| % Total Leverage5 | | | | | | | | | | | | | | | | | | |
RIB Financing | | | | | | | | | | | | | | | | | | | | | | | 2.03 | % |
Fund Profile
Credit Quality (% of total investments)6,7
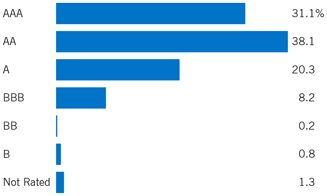
See Endnotes and Additional Disclosures in this report.
Past performance is no guarantee of future results. Returns are historical and are calculated by determining the percentage change in net asset value (NAV) or offering price (as applicable) with all distributions reinvested. Investment return and principal value will fluctuate so that shares, when redeemed, may be worth more or less than their original cost. Performance for periods less than or equal to one year is cumulative. Performance is for the stated time period only; due to market volatility, current Fund performance may be lower or higher than the quoted return. For performance as of the most recent month-end, please refer to eatonvance.com.
Eaton Vance
New York Municipal Income Fund
March 31, 2020
Performance1,2
Portfolio ManagerCraig R. Brandon, CFA
| | | | | | | | | | | | | | | | | | | | | | | | |
| % Average Annual Total Returns | | Class
Inception Date | | | Performance
Inception Date | | | Six Months | | | One Year | | | Five Years | | | Ten Years | |
Class A at NAV | | | 04/15/1994 | | | | 08/30/1990 | | | | 0.36 | % | | | 4.49 | % | | | 3.22 | % | | | 4.47 | % |
Class A with 4.75% Maximum Sales Charge | | | — | | | | — | | | | –4.43 | | | | –0.44 | | | | 2.21 | | | | 3.97 | |
Class C at NAV | | | 09/30/2003 | | | | 08/30/1990 | | | | –0.02 | | | | 3.71 | | | | 2.45 | | | | 3.70 | |
Class C with 1% Maximum Sales Charge | | | — | | | | — | | | | –1.01 | | | | 2.71 | | | | 2.45 | | | | 3.70 | |
Class I at NAV | | | 03/03/2008 | | | | 08/30/1990 | | | | 0.45 | | | | 4.70 | | | | 3.42 | | | | 4.68 | |
Bloomberg Barclays Municipal Bond Index | | | — | | | | — | | | | 0.10 | % | | | 3.85 | % | | | 3.19 | % | | | 4.14 | % |
Bloomberg Barclays New York Municipal Bond Index | | | — | | | | — | | | | –0.17 | | | | 3.30 | | | | 3.00 | | | | 3.91 | |
| | | | | | |
| | | | | | | | | | | | | | | | | | | | | | | | |
| % Total Annual Operating Expense Ratios3 | | | | | | | | | | | Class A | | | Class C | | | Class I | |
| | | | | | | | | | | | | | | 0.73 | % | | | 1.48 | % | | | 0.53 | % |
| | | | | | |
| | | | | | | | | | | | | | | | | | | | | | | | |
| % Distribution Rates/Yields4 | | | | | | | | | | | Class A | | | Class C | | | Class I | |
Distribution Rate | | | | | | | | | | | | | | | 2.29 | % | | | 1.53 | % | | | 2.48 | % |
Taxable-Equivalent Distribution Rate | | | | | | | | | | | | | | | 4.55 | | | | 3.04 | | | | 4.92 | |
SEC30-day Yield | | | | | | | | | | | | | | | 1.38 | | | | 0.70 | | | | 1.64 | |
Taxable-Equivalent SEC30-day Yield | | | | | | | | | | | | | | | 2.73 | | | | 1.40 | | | | 3.26 | |
Fund Profile
Credit Quality (% of total investments)6
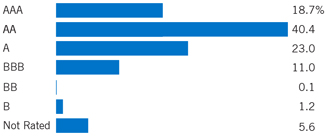
See Endnotes and Additional Disclosures in this report.
Past performance is no guarantee of future results. Returns are historical and are calculated by determining the percentage change in net asset value (NAV) or offering price (as applicable) with all distributions reinvested. Investment return and principal value will fluctuate so that shares, when redeemed, may be worth more or less than their original cost. Performance for periods less than or equal to one year is cumulative. Performance is for the stated time period only; due to market volatility, current Fund performance may be lower or higher than the quoted return. For performance as of the most recent month-end, please refer to eatonvance.com.
Eaton Vance
Ohio Municipal Income Fund
March 31, 2020
Performance1,2
Portfolio ManagerCynthia J. Clemson
| | | | | | | | | | | | | | | | | | | | | | | | |
| % Average Annual Total Returns | | Class
Inception Date | | | Performance
Inception Date | | | Six Months | | | One Year | | | Five Years | | | Ten Years | |
Class A at NAV | | | 12/07/1993 | | | | 04/18/1991 | | | | 0.30 | % | | | 4.03 | % | | | 3.14 | % | | | 3.98 | % |
Class A with 4.75% Maximum Sales Charge | | | — | | | | — | | | | –4.47 | | | | –0.91 | | | | 2.14 | | | | 3.47 | |
Class C at NAV | | | 02/03/2006 | | | | 04/18/1991 | | | | –0.08 | | | | 3.15 | | | | 2.35 | | | | 3.19 | |
Class C with 1% Maximum Sales Charge | | | — | | | | — | | | | –1.07 | | | | 2.15 | | | | 2.35 | | | | 3.19 | |
Class I at NAV | | | 08/03/2010 | | | | 04/18/1991 | | | | 0.40 | | | | 4.13 | | | | 3.32 | | | | 4.17 | |
Bloomberg Barclays Municipal Bond Index | | | — | | | | — | | | | 0.10 | % | | | 3.85 | % | | | 3.19 | % | | | 4.14 | % |
Bloomberg Barclays Ohio Municipal Bond Index | | | — | | | | — | | | | 0.61 | | | | 4.16 | | | | 3.25 | | | | 4.11 | |
| | | | | | |
| | | | | | | | | | | | | | | | | | | | | | | | |
| % Total Annual Operating Expense Ratios3 | | | | | | | | | | | Class A | | | Class C | | | Class I | |
| | | | | | | | | | | | | | | 0.84 | % | | | 1.59 | % | | | 0.64 | % |
| | | | | | |
| | | | | | | | | | | | | | | | | | | | | | | | |
| % Distribution Rates/Yields4 | | | | | | | | | | | Class A | | | Class C | | | Class I | |
Distribution Rate | | | | | | | | | | | | | | | 2.78 | % | | | 2.03 | % | | | 2.99 | % |
Taxable-Equivalent Distribution Rate | | | | | | | | | | | | | | | 5.13 | | | | 3.75 | | | | 5.52 | |
SEC30-day Yield | | | | | | | | | | | | | | | 1.50 | | | | 0.84 | | | | 1.77 | |
Taxable-Equivalent SEC30-day Yield | | | | | | | | | | | | | | | 2.76 | | | | 1.55 | | | | 3.27 | |
| | | | | | |
| | | | | | | | | | | | | | | | | | | | | | | | |
| % Total Leverage5 | | | | | | | | | | | | | | | | | | |
RIB Financing | | | | | | | | | | | | | | | | | | | | | | | 5.11 | % |
Fund Profile
Credit Quality (% of total investments)6,7
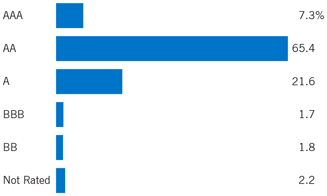
See Endnotes and Additional Disclosures in this report.
Past performance is no guarantee of future results. Returns are historical and are calculated by determining the percentage change in net asset value (NAV) or offering price (as applicable) with all distributions reinvested. Investment return and principal value will fluctuate so that shares, when redeemed, may be worth more or less than their original cost. Performance for periods less than or equal to one year is cumulative. Performance is for the stated time period only; due to market volatility, current Fund performance may be lower or higher than the quoted return. For performance as of the most recent month-end, please refer to eatonvance.com.
Eaton Vance
Municipal Income Funds
March 31, 2020
Endnotes and Additional Disclosures
| 1 | Bloomberg Barclays Municipal Bond Index is an unmanaged index of municipal bonds traded in the U.S. Bloomberg Barclays California Municipal Bond Index is an unmanaged index of California municipal bonds. Bloomberg Barclays Massachusetts Municipal Bond Index is an unmanaged index of Massachusetts municipal bonds. Bloomberg Barclays New York Municipal Bond Index is an unmanaged index of New York municipal bonds. Bloomberg Barclays Ohio Municipal Bond Index is an unmanaged index of Ohio municipal bonds. Unless otherwise stated, index returns do not reflect the effect of any applicable sales charges, commissions, expenses, taxes or leverage, as applicable. It is not possible to invest directly in an index. |
| 2 | Total Returns at NAV do not include applicable sales charges. If sales charges were deducted, the returns would be lower. Total Returns shown with maximum sales charge reflect the stated maximum sales charge. Unless otherwise stated, performance does not reflect the deduction of taxes on Fund distributions or redemptions of Fund shares. |
| | Performance prior to the inception date of a class may be linked to the performance of an older class of the Fund. This linked performance is adjusted for any applicable sales charge, but is not adjusted for class expense differences. If adjusted for such differences, the performance would be different. For Ohio Municipal Income Fund, the performance of Class I is linked to Class A. Performance presented in the Financial Highlights included in the financial statements is not linked. |
| | For California Municipal Opportunities Fund, performance prior to April 13, 2015 reflects the Fund’s performance under its former investment objective and strategy. |
| 3 | Source: Fund prospectus. The expense ratios for the current reporting period can be found in the Financial Highlights section of this report. |
| 4 | The Distribution Rate is based on the Fund’s last regular distribution per share in the period (annualized) divided by the Fund’s NAV at the end of the period. The Fund’s distributions may be comprised of amounts characterized for federal income tax purposes astax-exempt income, qualified andnon-qualified ordinary dividends, capital gains and nondividend distributions, also known as return of capital. The Fund will determine the federal income tax character of distributions paid to a shareholder after the end of the calendar year. This is reported on the IRS form 1099- DIV and provided to the shareholder shortly after eachyear-end. The Fund’s distributions are determined by the investment adviser based on its current assessment of the Fund’s long-term return potential. As portfolio and market conditions change, the rate of distributions paid by the Fund could change. Taxable-equivalent performance is based on the highest combined federal and state income tax rates, where applicable. Lower tax rates would result in lowertax-equivalent performance. Actual tax rates will vary depending on your income, exemptions and deductions. Rates do not include local taxes. The SEC Yield is a standardized measure based on the estimated yield to maturity of a fund’s investments over a30-day period and is based on the maximum offer price at the date specified. The SEC Yield is not based on the distributions made by the Fund, which may differ. |
| 5 | Fund employs RIB financing. The leverage created by RIB investments provides an opportunity for increased income but, at the same time, creates special risks (including the likelihood of greater volatility of NAV). The cost of leverage rises and falls with changes in short-term interest rates. See “Floating Rate Notes Issued in Conjunction with Securities Held” in the notes to the financial statements for more information about RIB financing. RIB leverage represents the amount of Floating Rate Notes outstanding at period end as a percentage of Fund net assets plus Floating Rate Notes. |
| 6 | Ratings are based on Moody’s Investors Service, Inc. (“Moody’s”), S&P Global Ratings (“S&P”) or Fitch Ratings (“Fitch”), as applicable. If securities are rated differently by the ratings agencies, the highest rating is applied. Ratings, which are subject to change, apply to the creditworthiness of the issuers of the underlying securities and not to the Fund or its shares. Credit ratings measure the quality of a bond based on the issuer’s creditworthiness, with ratings ranging from AAA, being the highest, to D, being the lowest based on S&P’s measures. Ratings of BBB or higher by S&P or Fitch (Baa or higher by Moody’s) are considered to be investment-grade quality. Credit ratings are based largely on the ratings agency’s analysis at the time of rating. The rating assigned to any particular security is not necessarily a reflection of the issuer’s current financial condition and does not necessarily reflect its assessment of the volatility of a security’s market value or of the liquidity of an investment in the security. Holdings designated as “Not Rated” (if any) are not rated by the national ratings agencies stated above. |
| 7 | The chart includes the municipal bonds held by a trust that issues residual interest bonds, consistent with the Portfolio of Investments. |
| | Fund profiles subject to change due to active management. |
Eaton Vance
Municipal Income Funds
March 31, 2020
Fund Expenses
Example: As a Fund shareholder, you incur two types of costs: (1) transaction costs, including sales charges (loads) on purchases and redemption fees (if applicable); and (2) ongoing costs, including management fees; distribution and/or service fees; and other Fund expenses. This Example is intended to help you understand your ongoing costs (in dollars) of Fund investing and to compare these costs with the ongoing costs of investing in other mutual funds. The Example is based on an investment of $1,000 invested at the beginning of the period and held for the entire period (October 1, 2019 – March 31, 2020).
Actual Expenses: The first section of each table below provides information about actual account values and actual expenses. You may use the information in this section, together with the amount you invested, to estimate the expenses that you paid over the period. Simply divide your account value by $1,000 (for example, an $8,600 account value divided by $1,000 = 8.6), then multiply the result by the number in the first section under the heading entitled “Expenses Paid During Period” to estimate the expenses you paid on your account during this period.
Hypothetical Example for Comparison Purposes: The second section of each table below provides information about hypothetical account values and hypothetical expenses based on the actual Fund expense ratio and an assumed rate of return of 5% per year (before expenses), which is not the actual Fund return. The hypothetical account values and expenses may not be used to estimate the actual ending account balance or expenses you paid for the period. You may use this information to compare the ongoing costs of investing in your Fund and other funds. To do so, compare this 5% hypothetical example with the 5% hypothetical examples that appear in the shareholder reports of the other funds.
Please note that the expenses shown in each table are meant to highlight your ongoing costs only and do not reflect any transactional costs, such as sales charges (loads) or redemption fees (if applicable). Therefore, the second section of each table is useful in comparing ongoing costs only, and will not help you determine the relative total costs of owning different funds. In addition, if these transactional costs were included, your costs would be higher.
Eaton Vance California Municipal Opportunities Fund
| | | | | | | | | | | | | | | | |
| | | Beginning
Account Value
(10/1/19) | | | Ending
Account Value
(3/31/20) | | | Expenses Paid
During Period*
(10/1/19 – 3/31/20) | | | Annualized
Expense
Ratio | |
|
Actual | |
Class A | | $ | 1,000.00 | | | $ | 992.40 | | | $ | 3.64 | | | | 0.73 | % |
Class C | | $ | 1,000.00 | | | $ | 988.20 | | | $ | 7.36 | | | | 1.48 | % |
Class I | | $ | 1,000.00 | | | $ | 992.60 | | | $ | 2.39 | | | | 0.48 | % |
| |
Hypothetical | |
(5% return per year before expenses) | |
Class A | | $ | 1,000.00 | | | $ | 1,021.40 | | | $ | 3.69 | | | | 0.73 | % |
Class C | | $ | 1,000.00 | | | $ | 1,017.60 | | | $ | 7.47 | | | | 1.48 | % |
Class I | | $ | 1,000.00 | | | $ | 1,022.60 | | | $ | 2.43 | | | | 0.48 | % |
| * | Expenses are equal to the Fund’s annualized expense ratio for the indicated Class, multiplied by the average account value over the period, multiplied by 183/366 (to reflect theone-half year period). The Example assumes that the $1,000 was invested at the net asset value per share determined at the close of business on September 30, 2019. |
Eaton Vance Massachusetts Municipal Income Fund
| | | | | | | | | | | | | | | | |
| | | Beginning
Account Value
(10/1/19) | | | Ending
Account Value
(3/31/20) | | | Expenses Paid
During Period*
(10/1/19 – 3/31/20) | | | Annualized
Expense
Ratio | |
|
Actual | |
Class A | | $ | 1,000.00 | | | $ | 1,000.70 | | | $ | 3.65 | | | | 0.73 | % |
Class C | | $ | 1,000.00 | | | $ | 997.00 | | | $ | 7.39 | | | | 1.48 | % |
Class I | | $ | 1,000.00 | | | $ | 1,000.50 | | | $ | 2.65 | | | | 0.53 | % |
| |
Hypothetical | |
(5% return per year before expenses) | |
Class A | | $ | 1,000.00 | | | $ | 1,021.40 | | | $ | 3.69 | | | | 0.73 | % |
Class C | | $ | 1,000.00 | | | $ | 1,017.60 | | | $ | 7.47 | | | | 1.48 | % |
Class I | | $ | 1,000.00 | | | $ | 1,022.40 | | | $ | 2.68 | | | | 0.53 | % |
| * | Expenses are equal to the Fund’s annualized expense ratio for the indicated Class, multiplied by the average account value over the period, multiplied by 183/366 (to reflect theone-half year period). The Example assumes that the $1,000 was invested at the net asset value per share determined at the close of business on September 30, 2019. |
Eaton Vance
Municipal Income Funds
March 31, 2020
Fund Expenses — continued
Eaton Vance New York Municipal Income Fund
| | | | | | | | | | | | | | | | |
| | | Beginning
Account Value
(10/1/19) | | | Ending
Account Value
(3/31/20) | | | Expenses Paid
During Period*
(10/1/19 – 3/31/20) | | | Annualized
Expense
Ratio | |
|
Actual | |
Class A | | $ | 1,000.00 | | | $ | 1,003.60 | | | $ | 3.36 | | | | 0.67 | % |
Class C | | $ | 1,000.00 | | | $ | 999.80 | | | $ | 7.10 | | | | 1.42 | % |
Class I | | $ | 1,000.00 | | | $ | 1,004.50 | | | $ | 2.36 | | | | 0.47 | % |
| |
Hypothetical | |
(5% return per year before expenses) | |
Class A | | $ | 1,000.00 | | | $ | 1,021.70 | | | $ | 3.39 | | | | 0.67 | % |
Class C | | $ | 1,000.00 | | | $ | 1,017.90 | | | $ | 7.16 | | | | 1.42 | % |
Class I | | $ | 1,000.00 | | | $ | 1,022.70 | | | $ | 2.38 | | | | 0.47 | % |
| * | Expenses are equal to the Fund’s annualized expense ratio for the indicated Class, multiplied by the average account value over the period, multiplied by 183/366 (to reflect theone-half year period). The Example assumes that the $1,000 was invested at the net asset value per share determined at the close of business on September 30, 2019. |
Eaton Vance Ohio Municipal Income Fund
| | | | | | | | | | | | | | | | |
| | | Beginning
Account Value
(10/1/19) | | | Ending
Account Value
(3/31/20) | | | Expenses Paid
During Period*
(10/1/19 – 3/31/20) | | | Annualized
Expense
Ratio | |
|
Actual | |
Class A | | $ | 1,000.00 | | | $ | 1,003.00 | | | $ | 4.01 | | | | 0.80 | % |
Class C | | $ | 1,000.00 | | | $ | 999.20 | | | $ | 7.75 | | | | 1.55 | % |
Class I | | $ | 1,000.00 | | | $ | 1,004.00 | | | $ | 3.01 | | | | 0.60 | % |
| |
Hypothetical | |
(5% return per year before expenses) | |
Class A | | $ | 1,000.00 | | | $ | 1,021.00 | | | $ | 4.04 | | | | 0.80 | % |
Class C | | $ | 1,000.00 | | | $ | 1,017.30 | | | $ | 7.82 | | | | 1.55 | % |
Class I | | $ | 1,000.00 | | | $ | 1,022.00 | | | $ | 3.03 | | | | 0.60 | % |
| * | Expenses are equal to the Fund’s annualized expense ratio for the indicated Class, multiplied by the average account value over the period, multiplied by 183/366 (to reflect theone-half year period). The Example assumes that the $1,000 was invested at the net asset value per share determined at the close of business on September 30, 2019. |
Eaton Vance
California Municipal Opportunities Fund
March 31, 2020
Portfolio of Investments (Unaudited)
| | | | | | | | |
| Tax-Exempt Municipal Securities — 92.2% | |
| Security | | Principal
Amount
(000’s omitted) | | | Value | |
|
| Education — 3.1% | |
| | |
California Educational Facilities Authority, (Claremont McKenna College), Prerefunded to 1/1/21, 5.25%, 1/1/30 | | $ | 1,000 | | | $ | 1,031,620 | |
| | |
California Enterprise Development Authority, (The Thacher School), 4.00%, 9/1/32 | | | 425 | | | | 511,441 | |
| | |
California Enterprise Development Authority, (The Thacher School), 4.00%, 9/1/34 | | | 400 | | | | 472,944 | |
| | |
California School Finance Authority, (Green Dot Public Schools), 5.00%, 8/1/28(1) | | | 380 | | | | 411,388 | |
| | |
California School Finance Authority, (Green Dot Public Schools), 5.00%, 8/1/38(1) | | | 2,500 | | | | 2,618,750 | |
| | |
California State University, Prerefunded to 11/1/21, 5.25%, 11/1/31 | | | 1,465 | | | | 1,562,628 | |
| | |
University of California, 5.00%, 5/15/35 | | | 4,215 | | | | 5,001,645 | |
| |
| | | | $ | 11,610,416 | |
|
| Electric Utilities — 3.4% | |
| | |
Chula Vista, (San Diego Gas and Electric), 5.875%, 2/15/34 | | $ | 895 | | | $ | 898,294 | |
| | |
Glendale, Electric System Revenue, 5.00%, 2/1/38 | | | 1,005 | | | | 1,175,056 | |
| | |
Sacramento Municipal Utility District, 5.00%, 8/15/27 | | | 1,080 | | | | 1,135,080 | |
| | |
Sacramento Municipal Utility District, 5.00%, 8/15/28 | | | 1,455 | | | | 1,527,779 | |
| | |
Southern California Public Power Authority, (LOC: U.S. Bank, N.A.), 0.80%, 7/1/36(2) | | | 800 | | | | 800,000 | |
| | |
Southern California Public Power Authority, (Canyon Power Project), 4.96%, (SIFMA + 0.25%), 5/1/21 (Put Date), 7/1/40(3) | | | 5,000 | | | | 5,000,850 | |
| | |
Southern California Public Power Authority, (Tieton Hydropower), 5.00%, 7/1/35 | | | 2,160 | | | | 2,178,252 | |
| |
| | | | $ | 12,715,311 | |
|
| Escrowed/Prerefunded — 0.7% | |
| | |
California Municipal Finance Authority, (University of San Diego), Prerefunded to 10/1/21, 5.25%, 10/1/27 | | $ | 915 | | | $ | 972,077 | |
| | |
California Municipal Finance Authority, (University of San Diego), Prerefunded to 10/1/21, 5.25%, 10/1/28 | | | 960 | | | | 1,019,885 | |
| | |
California Statewide Communities Development Authority, (Cottage Health System), Prerefunded to 11/1/20, 5.25%, 11/1/30 | | | 500 | | | | 512,385 | |
| |
| | | | $ | 2,504,347 | |
| | | | | | | | |
| Security | | Principal
Amount
(000’s omitted) | | | Value | |
|
| General Obligations — 21.0% | |
| | |
Anaheim Union High School District, (Election of 2014), 4.00%, 8/1/30 | | $ | 1,000 | | | $ | 1,168,560 | |
| | |
Anaheim Union High School District, (Election of 2014), 4.00%, 8/1/31 | | | 1,000 | | | | 1,165,290 | |
| | |
Beverly Hills Unified School District, (Election of 2018), 4.00%, 8/1/31 | | | 1,885 | | | | 2,203,678 | |
| | |
California, 5.00%, 9/1/20 | | | 1,650 | | | | 1,676,895 | |
| | |
California, 5.00%, 9/1/22 | | | 1,265 | | | | 1,381,329 | |
| | |
California, 5.50%, 11/1/35 | | | 2,500 | | | | 2,553,150 | |
| | |
California, 4.96%, (SIFMA + 0.25%), 5/1/21 (Put Date), 5/1/33(3) | | | 4,200 | | | | 4,184,082 | |
| | |
California, 5.14%, (SIFMA + 0.43%), 12/1/23 (Put Date), 12/1/29(3) | | | 3,000 | | | | 2,975,670 | |
| | |
California Education Notes Program, Fiscal Year2019-20 Note Participations, 5.00%, 6/30/20 | | | 2,065 | | | | 2,084,266 | |
| | |
Desert Community College District, 5.00%, 8/1/37 | | | 7,395 | | | | 8,695,411 | |
| | |
El Rancho Unified School District, (Election of 2016), 5.00%, 8/1/20 | | | 2,150 | | | | 2,177,993 | |
| | |
Gilroy Unified School District, (Elections of 2008 and 2016), 4.00%, 8/1/30 | | | 245 | | | | 285,560 | |
| | |
Gilroy Unified School District, (Elections of 2008 and 2016), 4.00%, 8/1/33 | | | 620 | | | | 714,662 | |
| | |
Lodi Unified School District, (Election of 2016), 4.00%, 8/1/32 | | | 725 | | | | 840,826 | |
| | |
Lodi Unified School District, (Election of 2016), 4.00%, 8/1/34 | | | 400 | | | | 458,004 | |
| | |
Lodi Unified School District, (Election of 2016), 4.00%, 8/1/35 | | | 650 | | | | 741,942 | |
| | |
Lodi Unified School District, (Election of 2016), 4.00%, 8/1/38 | | | 1,600 | | | | 1,777,440 | |
| | |
Long Beach Unified School District, (Election of 2008), 4.00%, 8/1/32 | | | 1,275 | | | | 1,507,126 | |
| | |
Los Rios Community College District, (Election of 2008), 5.00%, 8/1/31 | | | 115 | | | | 141,932 | |
| | |
Mariposa County Unified School District, (Election of 2016), 5.00%, 8/1/40 | | | 1,315 | | | | 1,549,635 | |
| | |
Mariposa County Unified School District, (Election of 2016), 5.00%, 8/1/43 | | | 1,265 | | | | 1,484,149 | |
| | |
Mt. San Antonio Community College District, (Election of 2008), 5.00%, 6/1/33 | | | 750 | | | | 874,860 | |
| | |
Ohlone Community College District, (Election of 2010), 4.00%, 8/1/24 | | | 350 | | | | 392,277 | |
| | |
Old Adobe Union School District, (Election of 2018), 5.00%, 8/1/44 | | | 1,860 | | | | 2,188,253 | |
| | |
Oxnard Union High School District, (Election of 2018), 4.00%, 8/1/38 | | | 1,000 | | | | 1,113,040 | |
| | |
Oxnard Union High School District, (Election of 2018), 5.00%, 8/1/35 | | | 1,805 | | | | 2,153,636 | |
| | | | |
| | 9 | | See Notes to Financial Statements. |
Eaton Vance
California Municipal Opportunities Fund
March 31, 2020
Portfolio of Investments (Unaudited) — continued
| | | | | | | | |
| Security | | Principal
Amount
(000’s omitted) | | | Value | |
|
| General Obligations (continued) | |
| | |
Palomar Community College District, 5.00%, 5/1/23 | | $ | 250 | | | $ | 277,745 | |
| | |
Pittsburg Unified School District Financing Authority, 4.00%, 9/1/21 | | | 200 | | | | 208,286 | |
| | |
Pittsburg Unified School District, (Election of 2014), 5.00%, 8/1/40 | | | 1,235 | | | | 1,456,176 | |
| | |
Pittsburg Unified School District, (Election of 2014), 5.00%, 8/1/42 | | | 1,545 | | | | 1,815,653 | |
| | |
Riverside Unified School District, (Election of 2016), 4.00%, 8/1/30 | | | 850 | | | | 990,080 | |
| | |
Riverside Unified School District, (Election of 2016), 4.00%, 8/1/31 | | | 1,250 | | | | 1,451,912 | |
| | |
San Diego Community College District, 4.00%, 8/1/34 | | | 4,500 | | | | 5,048,685 | |
| | |
San Francisco Bay Area Rapid Transit District, (Election of 2004), Green Bonds, 4.00%, 8/1/37 | | | 1,500 | | | | 1,692,960 | |
| | |
San Francisco Bay Area Rapid Transit District, (Election of 2016), Green Bonds, 4.00%, 8/1/36 | | | 1,500 | | | | 1,753,425 | |
| | |
San Francisco Bay Area Rapid Transit District, (Election of 2016), Green Bonds, 5.00%, 8/1/34 | | | 1,765 | | | | 2,250,975 | |
| | |
San Francisco Bay Area Rapid Transit District, (Election of 2016), Green Bonds, 5.00%, 8/1/35 | | | 250 | | | | 317,643 | |
| | |
San Luis Coastal Unified School District, (Election of 2014), 5.00%, 8/1/36 | | | 3,550 | | | | 4,244,060 | |
| | |
San Luis Coastal Unified School District, (Election of 2014), 5.00%, 8/1/37 | | | 1,835 | | | | 2,190,128 | |
| | |
Santa Clara County, (Election of 2008), 4.00%, 8/1/34 | | | 1,605 | | | | 1,837,741 | |
| | |
Santa Monica-Malibu Unified School District, (School Facilities Improvement District No. 2), (Election of 2018), 4.00%, 8/1/36 | | | 310 | | | | 351,952 | |
| | |
Santa Monica-Malibu Unified School District, (School Facilities Improvement District No. 2), (Election of 2018), 4.00%, 8/1/37 | | | 815 | | | | 919,842 | |
| | |
Sonoma Valley Unified School District, (Election of 2016), 4.00%, 8/1/37 | | | 350 | | | | 401,516 | |
| | |
Tahoe-Truckee Unified School District, (Election of 2014), 5.00%, 8/1/33 | | | 500 | | | | 599,750 | |
| | |
Tahoe-Truckee Unified School District, (Election of 2014), 5.00%, 8/1/36 | | | 1,000 | | | | 1,190,230 | |
| | |
Vista Unified School District, (Election of 2018), 5.00%, 8/1/28 | | | 160 | | | | 203,530 | |
| | |
Vista Unified School District, (Election of 2018), 5.00%, 8/1/32 | | | 155 | | | | 199,347 | |
| | |
Westminster School District, (Election of 2016), 5.00%, 8/1/38 | | | 400 | | | | 473,772 | |
| | |
Westminster School District, (Election of 2016), 5.00%, 8/1/39 | | | 585 | | | | 691,915 | |
| | |
Westminster School District, (Election of 2016), 5.00%, 8/1/42 | | | 1,000 | | | | 1,178,070 | |
| |
| | | | $ | 78,235,059 | |
| | | | | | | | |
| Security | | Principal
Amount
(000’s omitted) | | | Value | |
|
| Hospital — 10.2% | |
| | |
California Health Facilities Financing Authority, (Adventist Health System/West), 4.00%, 3/1/39 | | $ | 3,755 | | | $ | 3,975,118 | |
| | |
California Health Facilities Financing Authority, (City of Hope), 5.00%, 11/15/32 | | | 735 | | | | 797,975 | |
| | |
California Health Facilities Financing Authority, (City of Hope), 5.00%, 11/15/35 | | | 1,050 | | | | 1,135,701 | |
| | |
California Health Facilities Financing Authority, (Providence Health & Services), 5.00%, 10/1/44 | | | 4,100 | | | | 4,707,989 | |
| | |
California Health Facilities Financing Authority, (Providence St. Joseph Health), 5.00% to 10/1/27 (Put Date), 10/1/39 | | | 1,200 | | | | 1,416,372 | |
| | |
California Health Facilities Financing Authority, (St. Joseph Health System), 5.00%, 7/1/33 | | | 1,500 | | | | 1,656,390 | |
| | |
California Health Facilities Financing Authority, (Stanford Health Care), 4.00%, 8/15/50(4) | | | 3,000 | | | | 3,303,270 | |
| | |
California Health Facilities Financing Authority, (Sutter Health), 5.00%, 11/15/41 | | | 4,985 | | | | 5,669,390 | |
| | |
California Municipal Finance Authority, (NorthBay Healthcare Group), 5.00%, 11/1/24 | | | 800 | | | | 911,696 | |
| | |
California Municipal Finance Authority, (NorthBay Healthcare Group), 5.00%, 11/1/26 | | | 500 | | | | 592,890 | |
| | |
California Municipal Finance Authority, (NorthBay Healthcare Group), 5.00%, 11/1/27 | | | 165 | | | | 185,089 | |
| | |
California Municipal Finance Authority, (NorthBay Healthcare Group), 5.00%, 11/1/29 | | | 105 | | | | 116,893 | |
| | |
California Municipal Finance Authority, (NorthBay Healthcare Group), 5.00%, 11/1/30 | | | 150 | | | | 166,341 | |
| | |
California Municipal Finance Authority, (NorthBay Healthcare Group), Series 2015, 5.00%, 11/1/25 | | | 200 | | | | 225,950 | |
| | |
California Municipal Finance Authority, (NorthBay Healthcare Group), Series 2017A, 5.00%, 11/1/25 | | | 800 | | | | 931,184 | |
| | |
California Public Finance Authority, (Henry Mayo Newhall Hospital), 5.00%, 10/15/33 | | | 425 | | | | 490,412 | |
| | |
California Statewide Communities Development Authority, (Methodist Hospital of Southern California), 5.00%, 1/1/38 | | | 2,000 | | | | 2,373,340 | |
| | |
Michigan Hospital Finance Authority, (Ascension Health Senior Credit Group), 5.00%, 11/15/47 | | | 2,000 | | | | 2,391,640 | |
| | |
Oroville, (Oroville Hospital), 5.25%, 4/1/49 | | | 5,000 | | | | 5,567,200 | |
| | |
Washington Township Health Care District, 5.25%, 7/1/30 | | | 1,240 | | | | 1,252,189 | |
| |
| | | | $ | 37,867,029 | |
|
| Housing — 0.6% | |
| | |
Independent Cities Finance Authority, (Union City Tropics), 5.00%, 5/15/48 | | $ | 2,000 | | | $ | 2,210,280 | |
| |
| | | | $ | 2,210,280 | |
| | | | |
| | 10 | | See Notes to Financial Statements. |
Eaton Vance
California Municipal Opportunities Fund
March 31, 2020
Portfolio of Investments (Unaudited) — continued
| | | | | | | | |
| Security | | Principal
Amount
(000’s omitted) | | | Value | |
|
| Industrial Development Revenue — 2.0% | |
| | |
California Pollution Control Financing Authority, (Republic Services, Inc.), Series 2017 A1, (AMT), 1.17% to 4/15/20 (Put Date),
11/1/42(1) | | $ | 2,000 | | | $ | 1,999,880 | |
| | |
California Pollution Control Financing Authority, (Republic Services, Inc.), Series 2017 A2, (AMT), 1.17% to 4/15/20 (Put Date),
11/1/42(1) | | | 3,000 | | | | 2,999,820 | |
| | |
California Pollution Control Financing Authority, (Waste Management, Inc.), (AMT), 2.50% to 5/1/24 (Put Date), 11/1/38 | | | 2,500 | | | | 2,499,975 | |
| |
| | | | $ | 7,499,675 | |
|
| Insured – Electric Utilities — 1.2% | |
| | |
Puerto Rico Electric Power Authority, (NPFG), 5.00%, 7/1/23 | | $ | 125 | | | $ | 125,064 | |
| | |
Puerto Rico Electric Power Authority, (NPFG), 5.25%, 7/1/22 | | | 1,500 | | | | 1,538,850 | |
| | |
Puerto Rico Electric Power Authority, (NPFG), 5.25%, 7/1/32 | | | 2,100 | | | | 2,138,808 | |
| | |
Puerto Rico Electric Power Authority, (NPFG), Series QQ, 5.00%, 7/1/22 | | | 180 | | | | 180,128 | |
| | |
Puerto Rico Electric Power Authority, (NPFG), Series RR, 5.00%, 7/1/22 | | | 140 | | | | 140,099 | |
| | |
Puerto Rico Electric Power Authority, (NPFG), Series RR, 5.00%, 7/1/24 | | | 300 | | | | 300,126 | |
| | |
Puerto Rico Electric Power Authority, (NPFG), Series SS, 5.00%, 7/1/24 | | | 130 | | | | 130,054 | |
| |
| | | | $ | 4,553,129 | |
|
| Insured – General Obligations — 4.6% | |
| | |
Compton Community College District, (Election of 2014), (BAM), 5.00%, 8/1/36 | | $ | 1,690 | | | $ | 2,004,813 | |
| | |
Cotati-Rohnert Park Unified School District, (Election of 2016), (AGM), 5.00%, 8/1/33 | | | 710 | | | | 846,469 | |
| | |
Cotati-Rohnert Park Unified School District, (Election of 2016), (AGM), 5.00%, 8/1/34 | | | 825 | | | | 981,395 | |
| | |
Cotati-Rohnert Park Unified School District, (Election of 2016), (AGM), 5.00%, 8/1/35 | | | 955 | | | | 1,132,897 | |
| | |
Cotati-Rohnert Park Unified School District, (Election of 2016), (AGM), 5.00%, 8/1/36 | | | 1,015 | | | | 1,201,415 | |
| | |
Cotati-Rohnert Park Unified School District, (Election of 2016), (AGM), 5.00%, 8/1/37 | | | 1,135 | | | | 1,340,481 | |
| | |
Cotati-Rohnert Park Unified School District, (Election of 2016), (AGM), 5.00%, 8/1/38 | | | 1,175 | | | | 1,383,892 | |
| | |
Galt Joint Union High School District, (Election of 2016), (BAM), 5.00%, 8/1/37 | | | 500 | | | | 590,520 | |
| | |
Galt Joint Union High School District, (Election of 2016), (BAM), 5.00%, 8/1/38 | | | 500 | | | | 589,215 | |
| | | | | | | | |
| Security | | Principal
Amount
(000’s omitted) | | | Value | |
|
| Insured – General Obligations (continued) | |
| | |
Galt Joint Union High School District, (Election of 2016), (BAM), 5.00%, 8/1/43 | | $ | 1,000 | | | $ | 1,170,650 | |
| | |
Pittsburg Unified School District Financing Authority, (AGM), 5.00%, 9/1/47 | | | 2,555 | | | | 3,104,938 | |
| | |
Rio Elementary School District, (Election of 2018), (BAM), 5.00%, 8/1/47(4) | | | 1,250 | | | | 1,457,850 | |
| | |
San Leandro Unified School District, (Election of 2016), (BAM), 5.00%, 8/1/38 | | | 1,000 | | | | 1,222,750 | |
| |
| | | | $ | 17,027,285 | |
|
| Insured – Special Tax Revenue — 1.1% | |
| | |
Lake Elsinore School Financing Authority, (BAM), 5.00%, 10/1/36 | | $ | 1,570 | | | $ | 1,978,467 | |
| | |
Lake Elsinore School Financing Authority, (BAM), 5.00%, 10/1/37 | | | 470 | | | | 590,193 | |
| | |
Successor Agency to San Francisco City and County Redevelopment Agency, (NPFG), 5.00%, 8/1/41 | | | 1,320 | | | | 1,538,447 | |
| |
| | | | $ | 4,107,107 | |
|
| Insured – Transportation — 2.0% | |
| | |
Alameda Corridor Transportation Authority, (AGM), 5.00%, 10/1/37 | | $ | 5,075 | | | $ | 5,923,540 | |
| | |
San Joaquin Hills Transportation Corridor Agency, (NPFG), 0.00%, 1/15/24 | | | 1,800 | | | | 1,596,330 | |
| |
| | | | $ | 7,519,870 | |
|
| Lease Revenue/Certificates of Participation — 1.7% | |
| | |
Los Angeles, 5.00%, 6/25/20 | | $ | 415 | | | $ | 418,652 | |
| | |
Santa Clara County Financing Authority, 4.00%, 5/15/33 | | | 600 | | | | 665,472 | |
| | |
South San Francisco Public Facilities Financing Authority, (Police Station Project), 4.00%, 6/1/28 | | | 300 | | | | 362,181 | |
| | |
South San Francisco Public Facilities Financing Authority, (Police Station Project), 4.00%, 6/1/29 | | | 350 | | | | 429,394 | |
| | |
South San Francisco Public Facilities Financing Authority, (Police Station Project), 4.00%, 6/1/30 | | | 300 | | | | 370,149 | |
| | |
South San Francisco Public Facilities Financing Authority, (Police Station Project), 4.00%, 6/1/31 | | | 150 | | | | 183,719 | |
| | |
South San Francisco Public Facilities Financing Authority, (Police Station Project), 4.00%, 6/1/32 | | | 565 | | | | 684,091 | |
| | |
South San Francisco Public Facilities Financing Authority, (Police Station Project), 4.00%, 6/1/33 | | | 350 | | | | 422,559 | |
| | |
South San Francisco Public Facilities Financing Authority, (Police Station Project), 4.00%, 6/1/34 | | | 500 | | | | 596,360 | |
| | |
South San Francisco Public Facilities Financing Authority, (Police Station Project), 4.00%, 6/1/37 | | | 550 | | | | 648,587 | |
| | | | |
| | 11 | | See Notes to Financial Statements. |
Eaton Vance
California Municipal Opportunities Fund
March 31, 2020
Portfolio of Investments (Unaudited) — continued
| | | | | | | | |
| Security | | Principal
Amount
(000’s omitted) | | | Value | |
|
| Lease Revenue/Certificates of Participation (continued) | |
| | |
South San Francisco Public Facilities Financing Authority, (Police Station Project), 4.00%, 6/1/38 | | $ | 485 | | | $ | 569,477 | |
| | |
South San Francisco Public Facilities Financing Authority, (Police Station Project), 5.00%, 6/1/24 | | | 150 | | | | 173,547 | |
| | |
South San Francisco Public Facilities Financing Authority, (Police Station Project), 5.00%, 6/1/25 | | | 100 | | | | 119,217 | |
| | |
South San Francisco Public Facilities Financing Authority, (Police Station Project), 5.00%, 6/1/26 | | | 30 | | | | 36,773 | |
| | |
South San Francisco Public Facilities Financing Authority, (Police Station Project), 5.00%, 6/1/27 | | | 400 | | | | 503,212 | |
| |
| | | | $ | 6,183,390 | |
|
| Other Revenue — 5.0% | |
| | |
California Infrastructure and Economic Development Bank, (Academy of Motion Picture Arts and Sciences Obligated Group), 5.00%, 11/1/33 | | $ | 1,740 | | | $ | 1,941,875 | |
| | |
California Infrastructure and Economic Development Bank, (Academy of Motion Picture Arts and Sciences Obligated Group), 5.00%, 11/1/34 | | | 1,290 | | | | 1,438,234 | |
| | |
California Infrastructure and Economic Development Bank, (Academy of Motion Picture Arts and Sciences Obligated Group), Green Bonds, 5.00%, 11/1/30 | | | 275 | | | | 359,136 | |
| | |
California Infrastructure and Economic Development Bank, (California Academy of Sciences), Series 2018A, 1.043%, (70% of 1 mo. USD LIBOR + 0.38%), 8/1/21 (Put Date), 8/1/47(3) | | | 2,500 | | | | 2,502,350 | |
| | |
California Infrastructure and Economic Development Bank, (California Academy of Sciences), Series 2018B, 1.043%, (70% of 1 mo. USD LIBOR + 0.38%), 8/1/21 (Put Date), 8/1/47(3) | | | 450 | | | | 450,423 | |
| | |
California Infrastructure and Economic Development Bank, (The J. Paul Getty Trust), 1.437%, (70% of 1 mo. USD LIBOR + 0.33%), 4/1/22 (Put Date), 10/1/47(3) | | | 3,000 | | | | 2,983,800 | |
| | |
California Infrastructure and Economic Development Bank, (The J. Paul Getty Trust), Series 2011A, 1.31%, (70% of 1 mo. USD LIBOR + 0.20%), 4/1/21 (Put Date), 4/1/38(3) | | | 700 | | | | 696,857 | |
| | |
California Infrastructure and Economic Development Bank, (The J. Paul Getty Trust), Series 2012B, 1.31%, (70% of 1 mo. USD LIBOR + 0.20%), 4/1/21 (Put Date), 10/1/47(3) | | | 7,970 | | | | 7,934,215 | |
| | |
Morongo Band of Mission Indians, 5.00%, 10/1/42(1) | | | 440 | | | | 408,056 | |
| |
| | | | $ | 18,714,946 | |
| | | | | | | | |
| Security | | Principal
Amount
(000’s omitted) | | | Value | |
|
| Senior Living/Life Care — 3.4% | |
| | |
ABAG Finance Authority for Nonprofit Corporations, (Episcopal Senior Communities), 6.00%, 7/1/31 | | $ | 615 | | | $ | 635,486 | |
| | |
California Municipal Finance Authority, (Channing House), 5.00%, 5/15/37 | | | 250 | | | | 296,580 | |
| | |
California Municipal Finance Authority, (HumanGood - California Obligated Group), 4.00%, 10/1/31 | | | 1,000 | | | | 1,018,340 | |
| | |
California Municipal Finance Authority, (HumanGood - California Obligated Group), 4.00%, 10/1/32 | | | 500 | | | | 507,150 | |
| | |
California Municipal Finance Authority, (HumanGood - California Obligated Group), 4.00%, 10/1/33 | | | 1,100 | | | | 1,113,189 | |
| | |
California Municipal Finance Authority, (HumanGood - California Obligated Group), 4.00%, 10/1/34 | | | 755 | | | | 763,622 | |
| | |
California Municipal Finance Authority, (HumanGood - California Obligated Group), 4.00%, 10/1/36 | | | 1,620 | | | | 1,631,988 | |
| | |
California Municipal Finance Authority, (HumanGood - California Obligated Group), 4.00%, 10/1/37 | | | 1,800 | | | | 1,809,216 | |
| | |
California Municipal Finance Authority, (HumanGood - California Obligated Group), 5.00%, 10/1/44 | | | 1,000 | | | | 1,046,810 | |
| | |
California Municipal Finance Authority, (Mt. San Antonio Gardens), 5.00%, 11/15/39 | | | 1,000 | | | | 1,092,990 | |
| | |
California Statewide Communities Development Authority, (American Baptist Homes of the West), 5.00%, 10/1/23 | | | 500 | | | | 553,310 | |
| | |
California Statewide Communities Development Authority, (American Baptist Homes of the West), 5.00%, 10/1/26 | | | 500 | | | | 569,835 | |
| | |
California Statewide Communities Development Authority, (American Baptist Homes of the West), 5.00%, 10/1/27 | | | 780 | | | | 885,651 | |
| | |
California Statewide Communities Development Authority, (The Redwoods, a Community of Seniors), 5.125%, 11/15/35 | | | 715 | | | | 799,527 | |
| |
| | | | $ | 12,723,694 | |
|
| Solid Waste — 0.2% | |
| | |
Yolo County Public Agencies Financing Authority, Solid Waste Revenue, 4.00%, 12/1/35 | | $ | 500 | | | $ | 590,475 | |
| |
| | | | $ | 590,475 | |
|
| Special Tax Revenue — 5.7% | |
| | |
Chula Vista Municipal Financing Authority, 5.50%, 9/1/30 | | $ | 1,525 | | | $ | 1,719,560 | |
| | |
Contra Costa Transportation Authority, Sales Tax Revenue, 1.36%, (70% of 1 mo. USD LIBOR + 0.25%), 9/1/21 (Put Date), 3/1/34(3) | | | 7,000 | | | | 6,994,680 | |
| | |
Irvine Community Facilities DistrictNo. 2013-3, (Great Park), 5.00%, 9/1/30 | | | 580 | | | | 638,406 | |
| | | | |
| | 12 | | See Notes to Financial Statements. |
Eaton Vance
California Municipal Opportunities Fund
March 31, 2020
Portfolio of Investments (Unaudited) — continued
| | | | | | | | |
| Security | | Principal
Amount
(000’s omitted) | | | Value | |
|
| Special Tax Revenue (continued) | |
| | |
Irvine Community Facilities DistrictNo. 2013-3, (Great Park), 5.00%, 9/1/31 | | $ | 465 | | | $ | 508,524 | |
| | |
Irvine Community Facilities DistrictNo. 2013-3, (Great Park), 5.00%, 9/1/33 | | | 545 | | | | 593,897 | |
| | |
Irvine Community Facilities DistrictNo. 2013-3, (Great Park), 5.00%, 9/1/35 | | | 1,150 | | | | 1,294,981 | |
| | |
Irvine Community Facilities DistrictNo. 2013-3, (Great Park), 5.00%, 9/1/38 | | | 1,000 | | | | 1,118,490 | |
| | |
Irvine Community Facilities DistrictNo. 2013-3, (Great Park), Series 2014, 5.00%, 9/1/32 | | | 450 | | | | 490,878 | |
| | |
Irvine Community Facilities DistrictNo. 2013-3, (Great Park), Series 2014, 5.00%, 9/1/34 | | | 360 | | | | 391,766 | |
| | |
Irvine Community Facilities DistrictNo. 2013-3, (Great Park), Series 2018, 5.00%, 9/1/32 | | | 625 | | | | 709,150 | |
| | |
Irvine Community Facilities DistrictNo. 2013-3, (Great Park), Series 2018, 5.00%, 9/1/34 | | | 765 | | | | 865,100 | |
| | |
Los Angeles County Community Facilities District No. 3, (Valencia/Newhall Area), 5.00%, 9/1/23 | | | 520 | | | | 548,725 | |
| | |
Los Angeles County Metropolitan Transportation Authority, Sales Tax Revenue, 5.00%, 6/1/35 | | | 1,500 | | | | 1,815,825 | |
| | |
South Orange County Public Financing Authority, Special Tax Revenue, (Ladera Ranch), 5.00%, 8/15/27 | | | 515 | | | | 551,524 | |
| | |
South Orange County Public Financing Authority, Special Tax Revenue, (Ladera Ranch), 5.00%, 8/15/28 | | | 775 | | | | 830,188 | |
| | |
Successor Agency to San Francisco City and County Redevelopment Agency, 5.00%, 8/1/37 | | | 1,630 | | | | 1,919,781 | |
| |
| | | | $ | 20,991,475 | |
|
| Transportation — 19.3% | |
| | |
Alameda Corridor Transportation Authority, 5.00%, 10/1/36 | | $ | 2,250 | | | $ | 2,502,540 | |
| | |
Alameda Corridor Transportation Authority, 5.00%, 10/1/37 | | | 2,200 | | | | 2,441,208 | |
| | |
Bay Area Toll Authority, (San Francisco Bay Area), 1.887%, (70% of 3 mo. USD LIBOR + 0.55%), 4/1/21 (Put Date), 4/1/45(3) | | | 500 | | | | 499,960 | |
| | |
Burbank-Glendale-Pasadena Airport Authority, (AMT), 5.00%, 7/1/22 | | | 1,000 | | | | 1,068,980 | |
| | |
California Municipal Finance Authority, (LINXS Automated People Mover), (AMT), 5.00%, 12/31/36 | | | 2,570 | | | | 2,790,146 | |
| | |
California Municipal Finance Authority, (LINXS Automated People Mover), (AMT), 5.00%, 12/31/37 | | | 1,025 | | | | 1,109,050 | |
| | | | | | | | |
| Security | | Principal
Amount
(000’s omitted) | | | Value | |
|
| Transportation (continued) | |
| | |
California Municipal Finance Authority, (LINXS Automated People Mover), (AMT), 5.00%, 12/31/43 | | $ | 2,060 | | | $ | 2,198,803 | |
| | |
Long Beach, Harbor Revenue, (AMT), 5.00%, 5/15/30 | | | 500 | | | | 581,490 | |
| | |
Los Angeles Department of Airports, (Los Angeles International Airport), 5.00%, 5/15/35(5) | | | 3,080 | | | | 3,092,412 | |
| | |
Los Angeles Department of Airports, (Los Angeles International Airport), 5.25%, 5/15/28 | | | 4,990 | | | | 5,013,303 | |
| | |
Los Angeles Department of Airports, (Los Angeles International Airport), 5.25%, 5/15/29 | | | 2,875 | | | | 2,888,196 | |
| | |
Los Angeles Department of Airports, (Los Angeles International Airport), (AMT), 5.00%, 5/15/25 | | | 1,500 | | | | 1,731,015 | |
| | |
Los Angeles Department of Airports, (Los Angeles International Airport), (AMT), 5.00%, 5/15/29 | | | 1,000 | | | | 1,234,190 | |
| | |
Los Angeles Department of Airports, (Los Angeles International Airport), (AMT), 5.00%, 5/15/34 | | | 1,675 | | | | 2,032,345 | |
| | |
Los Angeles Department of Airports, (Los Angeles International Airport), (AMT), 5.00%, 5/15/41 | | | 1,660 | | | | 1,865,525 | |
| | |
Los Angeles Department of Airports, (Los Angeles International Airport), (AMT), 5.00%, 5/15/46 | | | 4,500 | | | | 5,058,585 | |
| | |
Los Angeles Harbor Department, 5.00%, 8/1/20 | | | 500 | | | | 506,510 | |
| | |
Los Angeles Harbor Department, (AMT), 5.00%, 8/1/21 | | | 1,000 | | | | 1,051,220 | |
| | |
Port of Oakland, (AMT), 5.00%, 5/1/20 | | | 1,100 | | | | 1,103,278 | |
| | |
San Diego County Regional Airport Authority, 5.00%, 7/1/23 | | | 3,915 | | | | 3,951,410 | |
| | |
San Diego County Regional Airport Authority, (AMT), 5.00%, 7/1/21 | | | 250 | | | | 260,640 | |
| | |
San Diego County Regional Airport Authority, (AMT), 5.00%, 7/1/22 | | | 500 | | | | 535,520 | |
| | |
San Diego County Regional Airport Authority, (AMT), 5.00%, 7/1/30 | | | 1,000 | | | | 1,181,190 | |
| | |
San Francisco City and County Airport Commission, (San Francisco International Airport), (AMT), 5.00%, 5/1/20 | | | 5,300 | | | | 5,314,045 | |
| | |
San Francisco City and County Airport Commission, (San Francisco International Airport), (AMT), 5.00%, 5/1/20 | | | 250 | | | | 250,663 | |
| | |
San Francisco City and County Airport Commission, (San Francisco International Airport), (AMT), 5.00%, 5/1/24 | | | 3,600 | | | | 3,724,164 | |
| | |
San Francisco City and County Airport Commission, (San Francisco International Airport), (AMT), 5.00%, 5/1/41 | | | 4,905 | | | | 5,478,296 | |
| | |
San Francisco City and County Airport Commission, (San Francisco International Airport), (AMT), 5.00%, 5/1/44 | | | 2,465 | | | | 2,703,859 | |
| | | | |
| | 13 | | See Notes to Financial Statements. |
Eaton Vance
California Municipal Opportunities Fund
March 31, 2020
Portfolio of Investments (Unaudited) — continued
| | | | | | | | |
| Security | | Principal
Amount
(000’s omitted) | | | Value | |
|
| Transportation (continued) | |
| | |
San Francisco City and County Airport Commission, (San Francisco International Airport), (AMT), 5.00%, 5/1/46 | | $ | 2,330 | | | $ | 2,583,224 | |
| | |
San Francisco City and County Airport Commission, (San Francisco International Airport), (AMT), 5.00%, 5/1/49 | | | 1,500 | | | | 1,727,310 | |
| | |
San Jose, Airport Revenue, (AMT), 5.00%, 3/1/37 | | | 1,735 | | | | 1,964,506 | |
| | |
San Jose, Airport Revenue, (AMT), 5.00%, 3/1/41 | | | 3,000 | | | | 3,371,070 | |
| |
| | | | $ | 71,814,653 | |
|
| Water and Sewer — 7.0% | |
| | |
Bakersfield, Wastewater Revenue, 5.00%, 9/15/31(4) | | $ | 1,350 | | | $ | 1,778,193 | |
| | |
Bakersfield, Wastewater Revenue, 5.00%, 9/15/32(4) | | | 1,620 | | | | 2,127,854 | |
| | |
California Department of Water Resources, 5.00%, 12/1/32 | | | 220 | | | | 272,930 | |
| | |
California Department of Water Resources, (Central Valley Project), 4.93%, (SIFMA+ 0.22%), 12/1/20 (Put Date), 12/1/35(3) | | | 3,700 | | | | 3,698,187 | |
| | |
East Bay Municipal Utility District, Water System Revenue, 5.00%, 6/1/32 | | | 1,500 | | | | 1,764,360 | |
| | |
Eastern Municipal Water District, Water and Wastewater Revenue, 1.407%, (70% of 1 mo. USD LIBOR + 0.30%), 10/1/21 (Put Date), 7/1/30(3) | | | 2,500 | | | | 2,502,350 | |
| | |
Eastern Municipal Water District, Water and Wastewater Revenue, 4.96%, (SIFMA + 0.25%), 10/1/21 (Put Date), 7/1/46(3) | | | 2,000 | | | | 1,999,920 | |
| | |
Los Angeles Department of Water and Power, Water System Revenue, (SPA: Royal Bank of Canada), 0.52%, 7/1/35(2) | | | 8,200 | | | | 8,200,000 | |
| | |
Metropolitan Water District of Southern California, 5.00%, 8/1/24 | | | 200 | | | | 232,262 | |
| | |
Orange County Water District, 5.00%, 8/15/33 | | | 200 | | | | 257,510 | |
| | |
Ross Valley Public Financing Authority, (Sanitary District No. 1 of Marin County), 5.00%, 1/1/39 | | | 500 | | | | 576,570 | |
| | |
San Francisco City and County Public Utilities Commission, Water Revenue, Green Bonds, 5.00%, 11/1/39 | | | 890 | | | | 1,007,978 | |
| | |
South Gate Utility Authority, Water Revenue, 4.00%, 10/1/34 | | | 1,500 | | | | 1,721,235 | |
| | |
| | | | | | | $ | 26,139,349 | |
| |
TotalTax-Exempt Municipal Securities — 92.2%
(identified cost $333,896,851) | | | $ | 343,007,490 | |
| | | | | | | | |
|
| Taxable Municipal Securities — 9.4% | |
| Security | | Principal
Amount
(000’s omitted) | | | Value | |
|
| Education — 2.1% | |
| | |
California State University, 2.834%, 11/1/37 | | $ | 3,500 | | | $ | 3,554,775 | |
| | |
California State University, 3.47%, 11/1/39 | | | 3,950 | | | | 4,193,557 | |
| | |
| | | | | | | $ | 7,748,332 | |
|
| General Obligations — 2.6% | |
| | |
Antelope Valley Community College District, 2.648%, 8/1/35 | | $ | 1,500 | | | $ | 1,499,520 | |
| | |
Antelope Valley Community College District, 2.818%, 8/1/38 | | | 1,725 | | | | 1,709,509 | |
| | |
Mt. San Antonio Community College District, 2.329%, 8/1/27 | | | 1,000 | | | | 1,040,840 | |
| | |
Mt. San Antonio Community College District, 2.919%, 8/1/34 | | | 1,250 | | | | 1,304,200 | |
| | |
Oxnard Union High School District, 2.477%, 8/1/37(4) | | | 2,410 | | | | 2,254,218 | |
| | |
Redding School District, (Election of 2018), 1.625%, 5/1/20 | | | 625 | | | | 625,369 | |
| | |
Sonoma Valley Unified School District, (Election of 2016), 1.60%, 5/1/20 | | | 1,230 | | | | 1,230,713 | |
| | |
| | | | | | | $ | 9,664,369 | |
|
| Hospital — 1.1% | |
| | |
California Statewide Communities Development Authority, (Loma Linda University Medical Center), 6.00%, 12/1/24 | | $ | 3,875 | | | $ | 4,056,738 | |
| | |
| | | | | | | $ | 4,056,738 | |
|
| Insured – General Obligations — 0.1% | |
| | |
Mountain View School District, (Election of 2016), (AGM), 1.65%, 5/1/20 | | $ | 325 | | | $ | 325,195 | |
| |
| | | | $ | 325,195 | |
|
| Insured – Lease Revenue/Certificates of Participation — 0.3% | |
| | |
Fresno Country, Pension Obligation Bonds, (NPFG), 0.00%, 8/15/20 | | $ | 1,000 | | | $ | 993,270 | |
| |
| | | | $ | 993,270 | |
|
| Insured – Special Tax Revenue — 0.3% | |
| | |
Successor Agency to Pittsburg Redevelopment Agency, (AGM), 3.388%, 8/1/22 | | $ | 955 | | | $ | 990,096 | |
| |
| | | | $ | 990,096 | |
| | | | |
| | 14 | | See Notes to Financial Statements. |
Eaton Vance
California Municipal Opportunities Fund
March 31, 2020
Portfolio of Investments (Unaudited) — continued
| | | | | | | | |
| Security | | Principal
Amount
(000’s omitted) | | | Value | |
|
| Insured-Transportation — 0.2% | |
| | |
Alameda Corridor Transportation Authority, (AMBAC), 0.00%, 10/1/27 | | $ | 740 | | | $ | 608,154 | |
| |
| | | | $ | 608,154 | |
|
| Special Tax Revenue — 0.3% | |
| | |
Successor Agency to San Diego Redevelopment Agency, 3.25%, 9/1/22 | | $ | 250 | | | $ | 261,093 | |
| | |
Successor Agency to San Diego Redevelopment Agency, 3.375%, 9/1/23 | | | 250 | | | | 265,513 | |
| | |
Successor Agency to San Diego Redevelopment Agency, 3.50%, 9/1/24 | | | 250 | | | | 270,380 | |
| | |
Successor Agency to San Diego Redevelopment Agency, 3.625%, 9/1/25 | | | 250 | | | | 274,040 | |
| | |
Successor Agency to San Diego Redevelopment Agency, 3.75%, 9/1/26 | | | 250 | | | | 274,397 | |
| |
| | | | $ | 1,345,423 | |
|
| Transportation — 1.9% | |
| | |
San Francisco City and County Airport Commission, (San Francisco International Airport), 2.901%, 5/1/20 | | $ | 2,300 | | | $ | 2,302,852 | |
| | |
San Francisco City and County Port Commission, 2.043%, 3/1/26 | | | 1,255 | | | | 1,272,758 | |
| | |
San Francisco City and County Port Commission, 2.143%, 3/1/27 | | | 1,000 | | | | 1,016,230 | |
| | |
San Francisco City and County Port Commission, 2.278%, 3/1/28 | | | 1,280 | | | | 1,301,312 | |
| | |
San Francisco City and County Port Commission, 2.328%, 3/1/29 | | | 1,365 | | | | 1,387,618 | |
| |
| | | | $ | 7,280,770 | |
|
| Water and Sewer — 0.5% | |
| | |
Anaheim Housing and Public Improvements Authority, Water System Revenue, 2.703%, 10/1/35 | | $ | 500 | | | $ | 501,195 | |
| | |
Anaheim Housing and Public Improvements Authority, Water System Revenue, 3.033%, 10/1/38 | | | 1,235 | | | | 1,251,648 | |
| |
| | | | $ | 1,752,843 | |
| |
Total Taxable Municipal Securities — 9.4%
(identified cost $34,401,361) | | | $ | 34,765,190 | |
| | | | | | | | |
|
| Corporate Bonds & Notes — 0.6% | |
| Security | | Principal
Amount
(000’s omitted) | | | Value | |
|
| Other — 0.6% | |
| | |
Morongo Band of Mission Indians, 7.00%, 10/1/39(1) | | $ | 2,080 | | | $ | 2,392,479 | |
| |
Total Corporate Bonds & Notes — 0.6%
(identified cost $2,080,000) | | | $ | 2,392,479 | |
| |
Total Investments — 102.2%
(identified cost $370,378,212) | | | $ | 380,165,159 | |
| |
Other Assets, Less Liabilities — (2.2)% | | | $ | (8,110,211 | ) |
| |
Net Assets — 100.0% | | | $ | 372,054,948 | |
The percentage shown for each investment category in the Portfolio of Investments is based on net assets.
The Fund invests primarily in debt securities issued by California municipalities. The ability of the issuers of the debt securities to meet their obligations may be affected by economic developments in a specific industry or municipality. At March 31, 2020, 9.5% of total investments are backed by bond insurance of various financial institutions and financial guaranty assurance agencies. The aggregate percentage insured by an individual financial institution or financial guaranty assurance agency ranged from 0.2% to 4.5% of total investments.
| | (1) | Security exempt from registration pursuant to Rule 144A under the Securities Act of 1933, as amended. These securities may be sold in certain transactions in reliance on an exemption from registration (normally to qualified institutional buyers). At March 31, 2020, the aggregate value of these securities is $10,830,373 or 2.9% of the Fund’s net assets. |
| | (2) | Variable rate demand obligation that may be tendered at par on any day for payment the same or next business day. The stated interest rate, which generally resets daily, is determined by the remarketing agent and represents the rate in effect at March 31, 2020. |
| | (3) | Floating rate security. The stated interest rate represents the rate in effect at March 31, 2020. |
| | (5) | Security represents the municipal bond held by a trust that issues residual interest bonds (see Note 1H). |
| | | | |
| | 15 | | See Notes to Financial Statements. |
Eaton Vance
California Municipal Opportunities Fund
March 31, 2020
Portfolio of Investments (Unaudited) — continued
Abbreviations:
| | | | |
| | |
| AGM | | – | | Assured Guaranty Municipal Corp. |
| | |
| AMBAC | | – | | AMBAC Financial Group, Inc. |
| | |
| AMT | | – | | Interest earned from these securities may be considered a tax preference item for purposes of the Federal Alternative Minimum Tax. |
| | |
| BAM | | – | | Build America Mutual Assurance Co. |
| | |
| LIBOR | | – | | London Interbank Offered Rate |
| | |
| LOC | | – | | Letter of Credit |
| | |
| NPFG | | – | | National Public Finance Guarantee Corp. |
| | |
| SIFMA | | – | | Securities Industry and Financial Markets Association Municipal Swap Index |
| | |
| SPA | | – | | Standby Bond Purchase Agreement |
Currency Abbreviations:
| | | | |
| | |
| USD | | – | | United States Dollar |
| | | | |
| | 16 | | See Notes to Financial Statements. |
Eaton Vance
Massachusetts Municipal Income Fund
March 31, 2020
Portfolio of Investments (Unaudited)
| | | | | | | | |
| Tax-Exempt Investments — 97.4% | |
| Security | | Principal
Amount
(000’s omitted) | | | Value | |
|
| Bond Bank — 2.6% | |
| | |
Massachusetts Water Pollution Abatement Trust, 5.25%, 8/1/34 | | $ | 3,105 | | | $ | 4,495,078 | |
| |
| | | | $ | 4,495,078 | |
|
| Education — 23.1% | |
| | |
Massachusetts Development Finance Agency, (Babson College), 5.00%, 10/1/42 | | $ | 1,500 | | | $ | 1,700,655 | |
| | |
Massachusetts Development Finance Agency, (Berklee College of Music), 5.00%, 10/1/29 | | | 1,000 | | | | 1,170,510 | |
| | |
Massachusetts Development Finance Agency, (Berklee College of Music), 5.00%, 10/1/39 | | | 2,000 | | | | 2,288,880 | |
| | |
Massachusetts Development Finance Agency, (Boston University), 5.00%, 10/1/46 | | | 3,000 | | | | 3,465,840 | |
| | |
Massachusetts Development Finance Agency, (Boston University), (LOC: TD Bank, N.A.), 0.65%, 10/1/42(1) | | | 1,500 | | | | 1,500,000 | |
| | |
Massachusetts Development Finance Agency, (Dexter Southfield), 5.00%, 5/1/33 | | | 1,550 | | | | 1,764,752 | |
| | |
Massachusetts Development Finance Agency, (Dexter Southfield), 5.00%, 5/1/35 | | | 1,660 | | | | 1,877,975 | |
| | |
Massachusetts Development Finance Agency, (Harvard University), 5.00%, 7/15/34 | | | 2,570 | | | | 3,066,010 | |
| | |
Massachusetts Development Finance Agency, (Milton Academy), 5.00%, 9/1/35 | | | 1,100 | | | | 1,116,500 | |
| | |
Massachusetts Development Finance Agency, (Northeastern University), 5.00%, 3/1/33 | | | 1,950 | | | | 2,192,365 | |
| | |
Massachusetts Development Finance Agency, (Olin College), 5.00%, 11/1/38 | | | 1,750 | | | | 1,917,650 | |
| | |
Massachusetts Development Finance Agency, (Suffolk University), 5.00%, 7/1/31 | | | 620 | | | | 728,314 | |
| | |
Massachusetts Development Finance Agency, (Suffolk University), 5.00%, 7/1/32 | | | 770 | | | | 904,250 | |
| | |
Massachusetts Development Finance Agency, (Suffolk University), 5.00%, 7/1/38 | | | 340 | | | | 390,354 | |
| | |
Massachusetts Development Finance Agency, (Wentworth Institute of Technology), 5.00%, 10/1/36 | | | 1,575 | | | | 1,753,684 | |
| | |
Massachusetts Development Finance Agency, (Williams College), 5.00%, 7/1/46 | | | 2,000 | | | | 2,360,560 | |
| | |
Massachusetts Development Finance Agency, (Worcester Polytechnic Institute), 5.00%, 9/1/42 | | | 3,150 | | | | 3,567,438 | |
| | |
Massachusetts Health and Educational Facilities Authority, (Massachusetts Institute of Technology), 5.50%, 7/1/32 | | | 5,000 | | | | 7,138,800 | |
| | |
Massachusetts Health and Educational Facilities Authority, (Tufts University), (SPA: Wells Fargo Bank, N.A.), 0.70%, 8/15/34(1) | | | 1,700 | | | | 1,700,000 | |
| |
| | | | $ | 40,604,537 | |
| | | | | | | | |
| Security | | Principal
Amount
(000’s omitted) | | | Value | |
|
| Escrowed/Prerefunded — 2.4% | |
| | |
Massachusetts Development Finance Agency, (Partners HealthCare System), Prerefunded to 7/1/21, 5.00%, 7/1/44 | | $ | 1,100 | | | $ | 1,234,959 | |
| | |
Massachusetts Development Finance Agency, (Tufts Medical Center), Prerefunded to 1/1/21, 7.25%, 1/1/32 | | | 760 | | | | 793,790 | |
| | |
Massachusetts Development Finance Agency, (Tufts Medical Center), Prerefunded to 1/1/21, 7.25%, 1/1/32 | | | 1,140 | | | | 1,190,684 | |
| | |
Massachusetts Development Finance Agency, (UMass Memorial), Prerefunded to 7/1/21, 5.50%, 7/1/31 | | | 1,040 | | | | 1,096,514 | |
| |
| | | | $ | 4,315,947 | |
|
| General Obligations — 28.1% | |
| | |
Belmont, 4.00%, 2/15/29 | | $ | 1,195 | | | $ | 1,426,065 | |
| | |
Belmont, 4.00%, 2/15/30 | | | 1,245 | | | | 1,476,545 | |
| | |
Belmont, 4.00%, 2/15/31 | | | 1,045 | | | | 1,231,115 | |
| | |
Belmont, 4.00%, 3/15/31 | | | 2,910 | | | | 3,432,549 | |
| | |
Boston, 4.00%, 3/1/31 | | | 3,000 | | | | 3,273,810 | |
| | |
Danvers, 4.00%, 8/15/30 | | | 600 | | | | 717,066 | |
| | |
Danvers, 4.00%, 8/15/33 | | | 540 | | | | 635,515 | |
| | |
Danvers, 5.25%, 7/1/36 | | | 2,800 | | | | 2,924,656 | |
| | |
Franklin, 4.00%, 5/15/30 | | | 200 | | | | 237,288 | |
| | |
Franklin, 4.00%, 5/15/32 | | | 455 | | | | 534,875 | |
| | |
Franklin, 4.00%, 5/15/33 | | | 455 | | | | 533,624 | |
| | |
Franklin, 5.00%, 5/15/29 | | | 210 | | | | 266,776 | |
| | |
Harvard, 4.00%, 8/15/30 | | | 1,025 | | | | 1,224,988 | |
| | |
Harvard, 4.00%, 8/15/31 | | | 1,270 | | | | 1,507,579 | |
| | |
Lexington, 4.00%, 2/1/29 | | | 1,855 | | | | 2,212,310 | |
| | |
Lincoln, 4.00%, 3/1/30 | | | 2,120 | | | | 2,516,122 | |
| | |
Lincoln, 4.00%, 3/1/31 | | | 2,205 | | | | 2,599,474 | |
| | |
Manchester Essex Regional School District, 4.00%, 2/1/41 | | | 1,075 | | | | 1,213,267 | |
| | |
Manchester Essex Regional School District, 4.00%, 2/1/42 | | | 975 | | | | 1,094,525 | |
| | |
Massachusetts, 5.00%, 3/1/31 | | | 3,000 | | | | 3,411,660 | |
| | |
Medford, 5.00%, 7/15/29 | | | 735 | | | | 937,118 | |
| | |
Plymouth, 5.00%, 5/1/26 | | | 710 | | | | 739,714 | |
| | |
Plymouth, 5.00%, 5/1/28 | | | 1,160 | | | | 1,206,620 | |
| | |
Plymouth, 5.00%, 5/1/31 | | | 1,090 | | | | 1,131,169 | |
| | |
Plymouth, 5.00%, 5/1/32 | | | 1,000 | | | | 1,037,440 | |
| | |
Shrewsbury, 4.00%, 7/15/33 | | | 2,370 | | | | 2,786,006 | |
| | |
Swampscott, 5.00%, 1/15/26 | | | 355 | | | | 432,919 | |
| | |
Wayland, 5.00%, 2/1/33 | | | 1,790 | | | | 1,840,872 | |
| | |
Wayland, 5.00%, 2/1/36 | | | 2,680 | | | | 2,753,244 | |
| | |
Weston, 4.00%, 1/15/31 | | | 1,275 | | | | 1,527,233 | |
| | |
Weston, 4.00%, 1/15/32 | | | 1,495 | | | | 1,778,945 | |
| | |
Winchester, 5.00%, 4/15/36 | | | 775 | | | | 801,381 | |
| |
| | | | $ | 49,442,470 | |
| | | | |
| | 17 | | See Notes to Financial Statements. |
Eaton Vance
Massachusetts Municipal Income Fund
March 31, 2020
Portfolio of Investments (Unaudited) — continued
| | | | | | | | |
| Security | | Principal
Amount
(000’s omitted) | | | Value | |
|
| Hospital — 10.6% | |
| | |
Massachusetts Development Finance Agency, (Berkshire Health Systems), 5.00%, 10/1/27 | | $ | 1,100 | | | $ | 1,159,675 | |
| | |
Massachusetts Development Finance Agency, (Beth Israel Lahey Health), 5.00%, 7/1/33 | | | 625 | | | | 766,794 | |
| | |
Massachusetts Development Finance Agency, (Beth Israel Lahey Health), 5.00%, 7/1/38 | | | 600 | | | | 723,600 | |
| | |
Massachusetts Development Finance Agency, (CareGroup), 5.00%, 7/1/27 | | | 1,000 | | | | 1,180,520 | |
| | |
Massachusetts Development Finance Agency, (Children’s Hospital), 5.00%, 10/1/31 | | | 1,840 | | | | 2,137,602 | |
| | |
Massachusetts Development Finance Agency, (Dana-Farber Cancer Institute), 5.00%, 12/1/36 | | | 1,690 | | | | 1,986,679 | |
| | |
Massachusetts Development Finance Agency, (Lahey Health System Obligated Group), 5.00%, 8/15/40 | | | 2,000 | | | | 2,267,060 | |
| | |
Massachusetts Development Finance Agency, (Partners HealthCare System), 5.00%, 7/1/37 | | | 1,600 | | | | 1,862,608 | |
| | |
Massachusetts Development Finance Agency, (South Shore Hospital), 5.00%, 7/1/41 | | | 2,795 | | | | 3,194,210 | |
| | |
Massachusetts Development Finance Agency, (UMass Memorial), 5.50%, 7/1/31 | | | 55 | | | | 57,533 | |
| | |
Massachusetts Development Finance Agency, (Wellforce), 5.00%, 7/1/21 | | | 800 | | | | 833,256 | |
| | |
Massachusetts Health and Educational Facilities Authority, (Lowell General Hospital), 5.125%, 7/1/35 | | | 1,645 | | | | 1,661,236 | |
| | |
Massachusetts Health and Educational Facilities Authority, (Southcoast Health System), 5.00%, 7/1/29 | | | 750 | | | | 752,550 | |
| |
| | | | $ | 18,583,323 | |
|
| Housing — 1.7% | |
| | |
Massachusetts Housing Finance Agency, (Mill Road Apartments), 5.26%, (SIFMA + 0.55%), 11/1/23 (Put Date), 11/1/48(2) | | $ | 2,970 | | | $ | 2,970,000 | |
| |
| | | | $ | 2,970,000 | |
|
| Industrial Development Revenue — 0.8% | |
| | |
National Finance Authority, (Covanta), 4.625%, 11/1/42(3) | | $ | 670 | | | $ | 644,975 | |
| | |
National Finance Authority, (Covanta), (AMT), 4.875%, 11/1/42(3) | | | 740 | | | | 737,462 | |
| |
| | | | $ | 1,382,437 | |
|
| Insured – Education — 4.3% | |
| | |
Massachusetts Development Finance Agency, (College of the Holy Cross), (AMBAC), 5.25%, 9/1/32(4) | | $ | 5,460 | | | $ | 7,593,167 | |
| |
| | | | $ | 7,593,167 | |
| | | | | | | | |
| Security | | Principal
Amount
(000’s omitted) | | | Value | |
|
| Insured – Special Tax Revenue — 4.9% | |
| | |
Martha’s Vineyard Land Bank, (BAM), 5.00%, 5/1/26 | | $ | 1,760 | | | $ | 2,041,248 | |
| | |
Massachusetts, Special Obligation, Dedicated Tax Revenue, (NPFG), 5.50%, 1/1/30 | | | 4,955 | | | | 6,596,691 | |
| |
| | | | $ | 8,637,939 | |
|
| Insured – Transportation — 4.4% | |
| | |
Massachusetts Turnpike Authority, Metropolitan Highway System, (NPFG), 0.00%, 1/1/22 | | $ | 8,000 | | | $ | 7,811,040 | |
| |
| | | | $ | 7,811,040 | |
|
| Senior Living/Life Care — 0.8% | |
| | |
Massachusetts Development Finance Agency, (Carleton-Willard Village), 4.00%, 12/1/42 | | $ | 490 | | | $ | 511,604 | |
| | |
Massachusetts Development Finance Agency, (Carleton-Willard Village), 5.00%, 12/1/42 | | | 525 | | | | 590,026 | |
| | |
Massachusetts Development Finance Agency, (Linden Ponds, Inc.), 5.00%, 11/15/33(3) | | | 205 | | | | 199,076 | |
| | |
Massachusetts Development Finance Agency, (Linden Ponds, Inc.), 5.00%, 11/15/38(3) | | | 135 | | | | 126,923 | |
| |
| | | | $ | 1,427,629 | |
|
| Special Tax Revenue — 2.4% | |
| | |
Massachusetts Bay Transportation Authority, Sales Tax Revenue, 5.00%, 7/1/26 | | $ | 2,000 | | | $ | 2,436,820 | |
| | |
Massachusetts Bay Transportation Authority, Sales Tax Revenue, 5.25%, 7/1/31 | | | 1,240 | | | | 1,712,130 | |
| |
| | | | $ | 4,148,950 | |
|
| Student Loan — 3.0% | |
| | |
Massachusetts Educational Financing Authority, (AMT), 5.00%, 7/1/21 | | $ | 5,000 | | | $ | 5,218,000 | |
| |
| | | | $ | 5,218,000 | |
|
| Transportation — 7.9% | |
| | |
Massachusetts, (Accelerated Bridge Program), 5.00%, 6/15/27 | | $ | 2,000 | | | $ | 2,294,780 | |
| | |
Massachusetts Port Authority, 5.00%, 7/1/28 | | | 3,750 | | | | 3,781,500 | |
| | |
Massachusetts Port Authority, (AMT), 5.00%, 7/1/31 | | | 1,555 | | | | 1,939,847 | |
| | |
Massachusetts Port Authority, (AMT), 5.00%, 7/1/34 | | | 2,110 | | | | 2,494,526 | |
| | |
Massachusetts Port Authority, (AMT), 5.00%, 7/1/43 | | | 3,000 | | | | 3,401,040 | |
| |
| | | | $ | 13,911,693 | |
|
| Water and Sewer — 0.4% | |
| | |
Springfield Water and Sewer Commission, 4.00%, 4/15/30 | | $ | 225 | | | $ | 270,817 | |
| | | | |
| | 18 | | See Notes to Financial Statements. |
Eaton Vance
Massachusetts Municipal Income Fund
March 31, 2020
Portfolio of Investments (Unaudited) — continued
| | | | | | | | |
| Security | | Principal
Amount
(000’s omitted) | | | Value | |
|
| Water and Sewer (continued) | |
| | |
Springfield Water and Sewer Commission, 4.00%, 4/15/33 | | $ | 335 | | | $ | 389,896 | |
| |
| | | | $ | 660,713 | |
| |
TotalTax-Exempt Investments — 97.4%
(identified cost $159,333,622) | | | $ | 171,202,923 | |
|
| Taxable Municipal Securities — 3.9% | |
| Security | | Principal
Amount
(000’s omitted) | | | Value | |
|
| Education — 3.3% | |
| | |
Massachusetts Development Finance Agency, (Berklee College of Music), 2.582%, 10/1/35 | | $ | 1,000 | | | $ | 958,600 | |
| | |
Massachusetts School Building Authority, 3.395%, 10/15/40 | | | 2,000 | | | | 2,052,220 | |
| | |
University of Massachusetts Building Authority, 2.917%, 11/1/33 | | | 2,850 | | | | 2,855,672 | |
| |
| | | | $ | 5,866,492 | |
|
| Insured – Hospital — 0.6% | |
| | |
Massachusetts Development Finance Agency, (Wellforce), (AGM), 3.89%, 7/1/25 | | $ | 1,000 | | | $ | 1,094,650 | |
| |
| | | | $ | 1,094,650 | |
| |
Total Taxable Municipal Securities — 3.9%
(identified cost $6,879,961) | | | $ | 6,961,142 | |
| |
Total Investments — 101.3%
(identified cost $166,213,583) | | | $ | 178,164,065 | |
| |
Other Assets, Less Liabilities — (1.3)% | | | $ | (2,318,578 | ) |
| |
Net Assets — 100.0% | | | $ | 175,845,487 | |
The percentage shown for each investment category in the Portfolio of Investments is based on net assets.
The Fund invests primarily in debt securities issued by Massachusetts municipalities. The ability of the issuers of the debt securities to meet their obligations may be affected by economic developments in a specific industry or municipality. At March 31, 2020, 14.1% of total investments are backed by bond insurance of various financial institutions and financial guaranty assurance agencies. The aggregate percentage insured by an individual financial institution or financial guaranty assurance agency ranged from 0.6% to 8.1% of total investments.
| | (1) | Variable rate demand obligation that may be tendered at par on any day for payment the same or next business day. The stated interest rate, which |
| | generally resets daily, is determined by the remarketing agent and represents the rate in effect at March 31, 2020. |
| | (2) | Floating rate security. The stated interest rate represents the rate in effect at March 31, 2020. |
| | (3) | Security exempt from registration pursuant to Rule 144A under the Securities Act of 1933, as amended. These securities may be sold in certain transactions in reliance on an exemption from registration (normally to qualified institutional buyers). At March 31, 2020, the aggregate value of these securities is $1,708,436 or 1.0% of the Fund’s net assets. |
| | (4) | Security represents the municipal bond held by a trust that issues residual interest bonds (see Note 1H). |
Abbreviations:
| | | | |
| | |
| AGM | | – | | Assured Guaranty Municipal Corp. |
| | |
| AMBAC | | – | | AMBAC Financial Group, Inc. |
| | |
| AMT | | – | | Interest earned from these securities may be considered a tax preference item for purposes of the Federal Alternative Minimum Tax. |
| | |
| BAM | | – | | Build America Mutual Assurance Co. |
| | |
| LOC | | – | | Letter of Credit |
| | |
| NPFG | | – | | National Public Finance Guarantee Corp. |
| | |
| SIFMA | | – | | Securities Industry and Financial Markets Association Municipal Swap Index |
| | |
| SPA | | – | | Standby Bond Purchase Agreement |
| | | | |
| | 19 | | See Notes to Financial Statements. |
Eaton Vance
New York Municipal Income Fund
March 31, 2020
Portfolio of Investments (Unaudited)
| | | | | | | | |
| Tax-Exempt Investments — 97.2% | |
| Security | | Principal
Amount
(000’s omitted) | | | Value | |
|
| Bond Bank — 1.5% | |
| | |
New York State Environmental Facilities Corp., 5.00%, 10/15/39 | | $ | 5,910 | | | $ | 5,927,139 | |
| |
| | | | $ | 5,927,139 | |
|
| Cogeneration — 0.4% | |
| | |
Suffolk County Industrial Development Agency, (Nissequogue Cogeneration Partners Facility), (AMT), 5.50%, 1/1/23 | | $ | 1,755 | | | $ | 1,770,637 | |
| |
| | | | $ | 1,770,637 | |
|
| Education — 16.2% | |
| | |
Albany Capital Resource Corp., (Albany College of Pharmacy and Health Sciences), 5.00%, 12/1/30 | | $ | 250 | | | $ | 267,958 | |
| | |
Dutchess County Local Development Corp., (Culinary Institute of America), 5.00%, 7/1/29 | | | 150 | | | | 166,049 | |
| | |
Dutchess County Local Development Corp., (Culinary Institute of America), 5.00%, 7/1/30 | | | 185 | | | | 204,003 | |
| | |
Dutchess County Local Development Corp., (Culinary Institute of America), 5.00%, 7/1/31 | | | 180 | | | | 197,584 | |
| | |
Dutchess County Local Development Corp., (Culinary Institute of America), 5.00%, 7/1/32 | | | 200 | | | | 218,664 | |
| | |
Dutchess County Local Development Corp., (Vassar College), 4.00%, 7/1/49(1) | | | 5,000 | | | | 5,689,850 | |
| | |
Geneva Development Corp., (Hobart and William Smith Colleges), Series 2012, 5.00%, 9/1/32 | | | 1,250 | | | | 1,356,512 | |
| | |
Monroe County Industrial Development Corp., (Nazareth College of Rochester), 5.00%, 10/1/31 | | | 235 | | | | 263,717 | |
| | |
Monroe County Industrial Development Corp., (Nazareth College of Rochester), 5.00%, 10/1/32 | | | 260 | | | | 290,423 | |
| | |
New York Dormitory Authority, (Barnard College), 4.00%, 7/1/34 | | | 450 | | | | 534,433 | |
| | |
New York Dormitory Authority, (Barnard College), 4.00%, 7/1/36 | | | 300 | | | | 352,569 | |
| | |
New York Dormitory Authority, (Barnard College), 4.00%, 7/1/37 | | | 700 | | | | 820,043 | |
| | |
New York Dormitory Authority, (Barnard College), 4.00%, 7/1/39 | | | 365 | | | | 425,039 | |
| | |
New York Dormitory Authority, (Barnard College), 4.00%, 7/1/40 | | | 325 | | | | 377,985 | |
| | |
New York Dormitory Authority, (Brooklyn Law School), 5.00%, 7/1/33 | | | 1,650 | | | | 1,895,107 | |
| | |
New York Dormitory Authority, (City University), 6.00%, 7/1/20 | | | 2,575 | | | | 2,606,389 | |
| | |
New York Dormitory Authority, (Columbia University), 5.00%, 10/1/38 | | | 9,370 | | | | 11,445,923 | |
| | | | | | | | |
| Security | | Principal
Amount
(000’s omitted) | | | Value | |
|
| Education (continued) | |
| | |
New York Dormitory Authority, (Cornell University), (SPA: U.S. Bank, N.A.),1.05%, 7/1/39(2) | | $ | 3,400 | | | $ | 3,400,000 | |
| | |
New York Dormitory Authority, (Culinary Institute of America), 5.50%, 7/1/33 | | | 350 | | | | 378,144 | |
| | |
New York Dormitory Authority, (Skidmore College), 5.25%, 7/1/31 | | | 250 | | | | 262,148 | |
| | |
New York Dormitory Authority, (The New School), Prerefunded to 7/1/20, 5.50%, 7/1/40 | | | 5,500 | | | | 5,559,620 | |
| | |
Onondaga Civic Development Corp., (Le Moyne College), 5.20%, 7/1/29 | | | 970 | | | | 976,615 | |
| | |
Onondaga Civic Development Corp., (Le Moyne College), 5.375%, 7/1/40 | | | 2,515 | | | | 2,530,568 | |
| | |
Onondaga County Cultural Resources Trust, (Syracuse University), 5.00%, 12/1/40 | | | 2,375 | | | | 3,025,180 | |
| | |
Onondaga County Cultural Resources Trust, (Syracuse University), 5.00%, 12/1/43 | | | 5,000 | | | | 6,333,450 | |
| | |
Syracuse Industrial Development Agency, (Syracuse City School District), (LOC: JPMorgan Chase Bank, N.A),
0.67%, 12/1/37(2) | | | 1,050 | | | | 1,050,000 | |
| | |
Syracuse Industrial Development Agency, (Syracuse City School District), 4.00%, 5/1/35 | | | 1,700 | | | | 1,985,651 | |
| | |
Syracuse Industrial Development Agency, (Syracuse City School District), 4.00%, 5/1/36 | | | 2,500 | | | | 2,904,450 | |
| | |
Troy Capital Resource Corp., (Rensselaer Polytechnic Institute), 5.00%, 9/1/36(1) | | | 1,500 | | | | 1,897,725 | |
| | |
Troy Capital Resource Corp., (Rensselaer Polytechnic Institute), 5.00%, 9/1/37(1) | | | 1,750 | | | | 2,206,015 | |
| | |
Troy Capital Resource Corp., (Rensselaer Polytechnic Institute), 5.00%, 9/1/38(1) | | | 3,925 | | | | 4,929,211 | |
| | |
Troy Capital Resource Corp., (Rensselaer Polytechnic Institute), 5.00%, 9/1/39(1) | | | 1,500 | | | | 1,880,055 | |
| |
| | | | $ | 66,431,080 | |
|
| Electric Utilities — 5.0% | |
| | |
Long Island Power Authority, Electric System Revenue, Series 2017, 5.00%, 9/1/37 | | $ | 250 | | | $ | 296,667 | |
| | |
New York Power Authority, 5.00%, 11/15/31 | | | 1,000 | | | | 1,060,600 | |
| | |
Utility Debt Securitization Authority, 5.00%, 6/15/26 | | | 395 | | | | 455,621 | |
| | |
Utility Debt Securitization Authority, 5.00%, 12/15/40 | | | 5,500 | | | | 6,672,930 | |
| | |
Utility Debt Securitization Authority, Series 2013, 5.00%, 12/15/33 | | | 2,895 | | | | 3,281,946 | |
| | |
Utility Debt Securitization Authority, Series 2015, 5.00%, 12/15/33 | | | 7,500 | | | | 8,878,125 | |
| |
| | | | $ | 20,645,889 | |
| | | | |
| | 20 | | See Notes to Financial Statements. |
Eaton Vance
New York Municipal Income Fund
March 31, 2020
Portfolio of Investments (Unaudited) — continued
| | | | | | | | |
| Security | | Principal
Amount
(000’s omitted) | | | Value | |
|
| Escrowed/Prerefunded — 0.9% | |
| | |
Dutchess County Local Development Corp., (Health Quest Systems, Inc.), Prerefunded to 7/1/20, 5.75%, 7/1/30 | | $ | 370 | | | $ | 374,096 | |
| | |
Dutchess County Local Development Corp., (Health Quest Systems, Inc.), Prerefunded to 7/1/20, 5.75%, 7/1/40 | | | 2,435 | | | | 2,461,955 | |
| | |
Metropolitan Transportation Authority, Prerefunded to 11/15/21, 5.00%, 11/15/27 | | | 940 | | | | 1,000,085 | |
| |
| | | | $ | 3,836,136 | |
|
| General Obligations — 9.5% | |
| | |
Amherst Central School District, 4.00%, 2/1/30 | | $ | 1,815 | | | $ | 2,121,989 | |
| | |
Amherst Central School District, 4.00%, 2/1/31 | | | 1,890 | | | | 2,199,658 | |
| | |
Babylon, 4.00%, 10/1/28 | | | 935 | | | | 1,114,099 | |
| | |
Chappaqua Central School District, 4.00%, 1/15/29 | | | 725 | | | | 879,476 | |
| | |
Chappaqua Central School District, 4.00%, 1/15/30 | | | 550 | | | | 677,331 | |
| | |
Dutchess County, 2019 Series B, 4.00%, 3/1/32 | | | 625 | | | | 720,975 | |
| | |
Longwood Central School District, 2.00%, 6/15/27 | | | 1,260 | | | | 1,255,968 | |
| | |
New York City, 4.00%, 10/1/35 | | | 3,650 | | | | 4,251,228 | |
| | |
New York City, 4.00%, 3/1/36 | | | 2,520 | | | | 2,939,252 | |
| | |
New York City, 4.00%, 12/1/41 | | | 470 | | | | 530,597 | |
| | |
New York City, 5.00%, 8/1/28 | | | 3,520 | | | | 4,177,536 | |
| | |
New York City, 5.00%, 3/1/40 | | | 1,750 | | | | 2,184,280 | |
| | |
New York City, 5.00%, 12/1/41 | | | 2,500 | | | | 3,043,550 | |
| | |
Onondaga County, 4.00%, 5/1/32 | | | 615 | | | | 724,581 | |
| | |
Onondaga County, 4.00%, 6/1/32 | | | 2,120 | | | | 2,426,934 | |
| | |
Valley Stream Central High School District, 4.00%, 6/15/32 | | | 765 | | | | 887,683 | |
| | |
Valley Stream Central High School District, 4.00%, 6/15/33 | | | 775 | | | | 896,783 | |
| | |
Valley Stream Central High School District, 4.00%, 6/15/34 | | | 635 | | | | 736,073 | |
| | |
Valley Stream, 2.25%, 5/15/27 | | | 250 | | | | 229,785 | |
| | |
Valley Stream, 2.375%, 5/15/28 | | | 255 | | | | 233,305 | |
| | |
Westchester County, 4.00%, 12/15/30 | | | 4,105 | | | | 4,853,588 | |
| | |
Westchester County, 4.00%, 1/15/32 | | | 150 | | | | 173,721 | |
| | |
Westchester County, 4.00%, 1/15/33 | | | 100 | | | | 115,586 | |
| | |
Westchester County, 4.00%, 1/15/34 | | | 215 | | | | 247,927 | |
| | |
Westchester County, 4.00%, 1/15/37 | | | 10 | | | | 11,439 | |
| | |
Westchester County, 4.00%, 1/15/38 | | | 520 | | | | 593,044 | |
| | |
Westchester County, 4.00%, 1/15/40 | | | 495 | | | | 562,736 | |
| |
| | | | $ | 38,789,124 | |
|
| Hospital — 8.4% | |
| | |
Jefferson County Civic Facility Development Corp., (Samaritan Medical Center), 5.00%, 11/1/37 | | $ | 1,615 | | | $ | 1,881,200 | |
| | |
New York Dormitory Authority, (Catholic Health System Obligated Group), 4.00%, 7/1/38 | | | 975 | | | | 1,049,802 | |
| | |
New York Dormitory Authority, (Catholic Health System Obligated Group), 4.00%, 7/1/39 | | | 1,105 | | | | 1,187,245 | |
| | | | | | | | |
| Security | | Principal
Amount
(000’s omitted) | | | Value | |
|
| Hospital (continued) | |
| | |
New York Dormitory Authority, (Memorial Sloan Kettering Cancer Center), 4.00%, 7/1/31 | | $ | 3,200 | | | $ | 3,818,752 | |
| | |
New York Dormitory Authority, (Memorial Sloan Kettering Cancer Center), 5.00%, 7/1/36 | | | 2,500 | | | | 3,148,925 | |
| | |
New York Dormitory Authority, (Montefiore Obligated Group), 4.00%, 9/1/39 | | | 700 | | | | 761,460 | |
| | |
New York Dormitory Authority, (Mount Sinai Hospital), Prerefunded to 7/1/20, 5.00%, 7/1/26 | | | 2,500 | | | | 2,524,650 | |
| | |
New York Dormitory Authority, (NYU Hospitals Center), 5.00%, 7/1/30 | | | 3,480 | | | | 3,998,868 | |
| | |
New York Dormitory Authority, (NYU Langone Hospitals Obligated Group), 4.00%, 7/1/50 | | | 4,875 | | | | 5,264,318 | |
| | |
New York Dormitory Authority, (Orange Regional Medical Center), 5.00%, 12/1/21(3) | | | 500 | | | | 527,705 | |
| | |
New York Dormitory Authority, (Orange Regional Medical Center), 5.00%, 12/1/30(3) | | | 4,500 | | | | 5,258,115 | |
| | |
New York Dormitory Authority, (Orange Regional Medical Center), 5.00%, 12/1/32(3) | | | 2,200 | | | | 2,543,728 | |
| | |
Suffolk County Economic Development Corp., (Catholic Health Services of Long Island Obligated Group), 5.00%, 7/1/28 | | | 2,190 | | | | 2,289,382 | |
| |
| | | | $ | 34,254,150 | |
|
| Housing — 2.6% | |
| | |
Albany Capital Resource Corp., (Empire Commons Student Housing, Inc.), 5.00%, 5/1/28 | | $ | 300 | | | $ | 353,913 | |
| | |
Albany Capital Resource Corp., (Empire Commons Student Housing, Inc.), 5.00%, 5/1/29 | | | 540 | | | | 635,504 | |
| | |
Albany Capital Resource Corp., (Empire Commons Student Housing, Inc.), 5.00%, 5/1/30 | | | 635 | | | | 745,312 | |
| | |
Albany Capital Resource Corp., (Empire Commons Student Housing, Inc.), 5.00%, 5/1/31 | | | 450 | | | | 526,856 | |
| | |
Albany Capital Resource Corp., (Empire Commons Student Housing, Inc.), 5.00%, 5/1/32 | | | 1,095 | | | | 1,278,982 | |
| | |
New York City Housing Development Corp., (SPA: Wells Fargo Bank, N.A.), 3.73%, 5/1/57(4) | | | 3,500 | | | | 3,500,000 | |
| | |
New York Mortgage Agency, 3.65%, 4/1/32 | | | 1,000 | | | | 1,085,820 | |
| | |
Westchester County Local Development Corp., (Purchase Housing Corp. II), 5.00%, 6/1/27 | | | 185 | | | | 211,940 | |
| | |
Westchester County Local Development Corp., (Purchase Housing Corp. II), 5.00%, 6/1/28 | | | 550 | | | | 628,260 | |
| | |
Westchester County Local Development Corp., (Purchase Housing Corp. II), 5.00%, 6/1/29 | | | 160 | | | | 181,712 | |
| | |
Westchester County Local Development Corp., (Purchase Housing Corp. II), 5.00%, 6/1/42 | | | 1,250 | | | | 1,366,287 | |
| |
| | | | $ | 10,514,586 | |
| | | | |
| | 21 | | See Notes to Financial Statements. |
Eaton Vance
New York Municipal Income Fund
March 31, 2020
Portfolio of Investments (Unaudited) — continued
| | | | | | | | |
| Security | | Principal
Amount
(000’s omitted) | | | Value | |
|
| Industrial Development Revenue — 3.6% | |
| | |
New York Energy Research and Development Authority, (New York Electric and Gas Corp.), 2.00% to 5/1/20 (Put Date), 6/1/29 | | $ | 6,000 | | | $ | 6,001,860 | |
| | |
New York Energy Research and Development Authority, (Rochester Gas and Electric Corp.), 2.875% to 7/1/25 (Put Date), 5/15/32 | | | 3,845 | | | | 4,079,161 | |
| | |
New York State Environmental Facilities Corp., (Casella Waste Systems, Inc.), (AMT), 2.875% to 12/3/29 (Put Date), 12/1/44(3) | | | 930 | | | | 828,072 | |
| | |
Niagara Area Development Corp., (Covanta), (AMT), 4.75%, 11/1/42(3) | | | 4,000 | | | | 3,918,440 | |
| |
| | | | $ | 14,827,533 | |
|
| Insured – Education — 2.2% | |
| | |
New York Dormitory Authority, (City University), (AMBAC), 5.50%, 7/1/35 | | $ | 6,600 | | | $ | 9,101,598 | |
| |
| | | | $ | 9,101,598 | |
|
| Insured – Escrowed/Prerefunded — 2.4% | |
| | |
New York Dormitory Authority, (Memorial Sloan Kettering Cancer Center), (NPFG), Escrowed to Maturity, 0.00%, 7/1/30 | | $ | 11,530 | | | $ | 9,842,700 | |
| |
| | | | $ | 9,842,700 | |
|
| Insured – General Obligations — 3.3% | |
| | |
East Ramapo Central School District, (AGM), 4.00%, 12/15/28 | | $ | 1,670 | | | $ | 1,843,312 | |
| | |
East Ramapo Central School District, (AGM), 5.00%, 12/15/26 | | | 1,340 | | | | 1,583,612 | |
| | |
Nassau County, (AGM), 5.00%, 4/1/38 | | | 4,025 | | | | 5,054,716 | |
| | |
Nassau County, (AGM), 5.00%, 4/1/46 | | | 2,475 | | | | 2,997,844 | |
| | |
Oyster Bay, (AGM), 4.00%, 8/1/28 | | | 1,995 | | | | 2,064,965 | |
| |
| | | | $ | 13,544,449 | |
|
| Insured – Other Revenue — 0.3% | |
| | |
New York City Industrial Development Agency, (Yankee Stadium), (AGC), 0.00%, 3/1/31 | | $ | 1,690 | | | $ | 1,307,435 | |
| |
| | | | $ | 1,307,435 | |
|
| Insured – Solid Waste — 0.6% | |
| | |
Onondaga County Resource Recovery Agency, (AGM), (AMT), 5.00%, 5/1/30 | | $ | 275 | | | $ | 333,748 | |
| | |
Onondaga County Resource Recovery Agency, (AGM), (AMT), 5.00%, 5/1/31 | | | 350 | | | | 423,301 | |
| | | | | | | | |
| Security | | Principal
Amount
(000’s omitted) | | | Value | |
|
| Insured – Solid Waste (continued) | |
| | |
Onondaga County Resource Recovery Agency, (AGM), (AMT), 5.00%, 5/1/32 | | $ | 450 | | | $ | 542,772 | |
| | |
Onondaga County Resource Recovery Agency, (AGM), (AMT), 5.00%, 5/1/33 | | | 475 | | | | 571,434 | |
| | |
Onondaga County Resource Recovery Agency, (AGM), (AMT), 5.00%, 5/1/34 | | | 500 | | | | 599,620 | |
| |
| | | | $ | 2,470,875 | |
|
| Insured – Transportation — 1.1% | |
| | |
Metropolitan Transportation Authority, Green Bonds, (AGM), 5.00%, 11/15/44 | | $ | 4,000 | | | $ | 4,648,040 | |
| |
| | | | $ | 4,648,040 | |
|
| Lease Revenue/Certificates of Participation — 2.5% | |
| | |
Hudson Yards Infrastructure Corp., 5.00%, 2/15/32 | | $ | 2,320 | | | $ | 2,822,767 | |
| | |
Hudson Yards Infrastructure Corp., 5.00%, 2/15/42 | | | 4,000 | | | | 4,737,640 | |
| | |
New York State Urban Development Corp., 5.70%, 4/1/20 | | | 2,440 | | | | 2,440,000 | |
| |
| | | | $ | 10,000,407 | |
|
| Other Revenue — 2.7% | |
| | |
Build NYC Resource Corp., (Children’s Aid Society), 4.00%, 7/1/36 | | $ | 125 | | | $ | 145,523 | |
| | |
Build NYC Resource Corp., (Children’s Aid Society), 4.00%, 7/1/37 | | | 165 | | | | 191,479 | |
| | |
Build NYC Resource Corp., (Children’s Aid Society), 4.00%, 7/1/38 | | | 150 | | | | 173,406 | |
| | |
New York City Transitional Finance Authority, (Building Aid), 5.00%, 7/15/37 | | | 575 | | | | 704,875 | |
| | |
New York City Transitional Finance Authority, (Building Aid), 5.00%, 7/15/43 | | | 3,985 | | | | 4,551,468 | |
| | |
New York Liberty Development Corp., (7 World Trade Center), 5.00%, 9/15/32 | | | 5,000 | | | | 5,292,800 | |
| |
| | | | $ | 11,059,551 | |
|
| Senior Living/Life Care — 3.1% | |
| | |
Brookhaven Local Development Corp., (Jefferson’s Ferry), 5.25%, 11/1/30 | | $ | 650 | | | $ | 707,206 | |
| | |
Brookhaven Local Development Corp., (Jefferson’s Ferry), 5.25%, 11/1/31 | | | 650 | | | | 705,159 | |
| | |
Buffalo and Erie County Industrial Land Development Corp., (Orchard Park CCRC, Inc.), 5.00%, 11/15/37 | | | 4,500 | | | | 4,614,885 | |
| | |
Suffolk County Economic Development Corp., (Peconic Landing at Southold, Inc.), 5.00%, 12/1/40(1) | | | 2,000 | | | | 2,008,620 | |
| | |
Suffolk County Economic Development Corp., (Peconic Landing at Southold, Inc.), 6.00%, 12/1/40 | | | 2,395 | | | | 2,470,898 | |
| | | | |
| | 22 | | See Notes to Financial Statements. |
Eaton Vance
New York Municipal Income Fund
March 31, 2020
Portfolio of Investments (Unaudited) — continued
| | | | | | | | |
| Security | | Principal
Amount
(000’s omitted) | | | Value | |
|
| Senior Living/Life Care (continued) | |
| | |
Tompkins County Development Corp., (Kendal at Ithaca), 5.00%, 7/1/34 | | $ | 100 | | | $ | 104,302 | |
| | |
Westchester County Local Development Corp., (Kendal on Hudson), 5.00%, 1/1/34 | | | 1,000 | | | | 1,020,490 | |
| | |
Westchester County Local Development Corp., (Miriam Osborn Memorial Home Association), 5.00%, 7/1/27 | | | 270 | | | | 310,816 | |
| | |
Westchester County Local Development Corp., (Miriam Osborn Memorial Home Association), 5.00%, 7/1/28 | | | 390 | | | | 449,506 | |
| | |
Westchester County Local Development Corp., (Miriam Osborn Memorial Home Association), 5.00%, 7/1/29 | | | 250 | | | | 286,650 | |
| |
| | | | $ | 12,678,532 | |
|
| Special Tax Revenue — 11.1% | |
| | |
New York City Transitional Finance Authority, Future Tax Revenue, 4.00%, 5/1/37 | | $ | 2,415 | | | $ | 2,702,964 | |
| | |
New York City Transitional Finance Authority, Future Tax Revenue, 4.00%, 8/1/37 | | | 1,320 | | | | 1,460,712 | |
| | |
New York City Transitional Finance Authority, Future Tax Revenue, 4.00%, 11/1/38 | | | 4,245 | | | | 4,851,059 | |
| | |
New York City Transitional Finance Authority, Future Tax Revenue, 5.00%, 5/1/36 | | | 1,605 | | | | 1,609,975 | |
| | |
New York City Transitional Finance Authority, Future Tax Revenue, 5.00%, 2/1/39 | | | 2,000 | | | | 2,354,120 | |
| | |
New York City Transitional Finance Authority, Future Tax Revenue, 5.00%, 5/1/39 | | | 2,160 | | | | 2,564,309 | |
| | |
New York City Transitional Finance Authority, Future Tax Revenue, 5.00%, 11/1/39 | | | 5,000 | | | | 5,105,400 | |
| | |
New York Convention Center Development Corp., Hotel Unit Fee, 0.00%, 11/15/28 | | | 175 | | | | 144,613 | |
| | |
New York Dormitory Authority, Personal Income Tax Revenue, 5.00%, 3/15/33 | | | 725 | | | | 747,301 | |
| | |
New York Dormitory Authority, Personal Income Tax Revenue, 5.00%, 2/15/44 | | | 7,500 | | | | 8,525,100 | |
| | |
New York Dormitory Authority, Sales Tax Revenue, 5.00%, 3/15/36 | | | 1,960 | | | | 2,357,586 | |
| | |
New York Dormitory Authority, Sales Tax Revenue, (AMT), 5.00%, 3/15/33 | | | 1,390 | | | | 1,721,974 | |
| | |
Sales Tax Asset Receivable Corp., 5.00%, 10/15/27 | | | 5,000 | | | | 5,755,450 | |
| | |
Sales Tax Asset Receivable Corp., 5.00%, 10/15/28 | | | 5,000 | | | | 5,743,600 | |
| |
| | | | $ | 45,644,163 | |
|
| Transportation — 18.0% | |
| | |
Albany County Airport Authority, (AMT), 5.00%, 12/15/24 | | $ | 1,000 | | | $ | 1,138,680 | |
| | |
Albany County Airport Authority, (AMT), 5.00%, 12/15/25 | | | 500 | | | | 581,215 | |
| | |
Albany County Airport Authority, (AMT), 5.00%, 12/15/26 | | | 1,000 | | | | 1,183,860 | |
| | |
Buffalo and Fort Erie Public Bridge Authority, 5.00%, 1/1/37 | | | 200 | | | | 238,382 | |
| | | | | | | | |
| Security | | Principal
Amount
(000’s omitted) | | | Value | |
|
| Transportation (continued) | |
| | |
Metropolitan Transportation Authority, 5.00%, 11/15/35 | | $ | 550 | | | $ | 609,114 | |
| | |
Metropolitan Transportation Authority, Green Bonds, 0.00%, 11/15/32 | | | 575 | | | | 434,959 | |
| | |
Metropolitan Transportation Authority, Green Bonds, 0.00%, 11/15/33 | | | 4,400 | | | | 3,230,436 | |
| | |
Nassau County Bridge Authority, 5.00%, 10/1/40 | | | 1,915 | | | | 1,949,623 | |
| | |
New York Thruway Authority, 3.00%, 1/1/46 | | | 1,700 | | | | 1,676,013 | |
| | |
New York Thruway Authority, 3.00%, 1/1/48 | | | 7,500 | | | | 7,334,700 | |
| | |
New York Thruway Authority, 4.00%, 1/1/50 | | | 2,625 | | | | 2,852,902 | |
| | |
New York Thruway Authority, 5.00%, 1/1/33 | | | 2,310 | | | | 2,916,652 | |
| | |
New York Thruway Authority, 5.00%, 1/1/36 | | | 2,500 | | | | 3,115,600 | |
| | |
New York Thruway Authority, 5.00%, 1/1/37 | | | 1,645 | | | | 1,992,227 | |
| | |
New York Thruway Authority, 5.00%, 1/1/38 | | | 3,000 | | | | 3,766,200 | |
| | |
New York Thruway Authority, 5.00%, 1/1/39 | | | 210 | | | | 262,834 | |
| | |
New York Thruway Authority, 5.00%, 1/1/40 | | | 1,940 | | | | 2,424,864 | |
| | |
New York Thruway Authority, 5.00%, 1/1/41 | | | 1,725 | | | | 2,016,284 | |
| | |
New York Thruway Authority, Series 2016A, 5.00%, 1/1/33 | | | 3,125 | | | | 3,699,437 | |
| | |
New York Transportation Development Corp., (LaGuardia Airport Terminal B Redevelopment), (AMT), 5.00%, 7/1/46 | | | 8,100 | | | | 8,222,796 | |
| | |
Niagara Frontier Transportation Authority, (Buffalo Niagara International Airport), (AMT), 5.00%, 4/1/26 | | | 1,210 | | | | 1,341,140 | |
| | |
Niagara Frontier Transportation Authority, (Buffalo Niagara International Airport), (AMT), 5.00%, 4/1/28 | | | 525 | | | | 634,982 | |
| | |
Niagara Frontier Transportation Authority, (Buffalo Niagara International Airport), (AMT), 5.00%, 4/1/29 | | | 275 | | | | 336,985 | |
| | |
Niagara Frontier Transportation Authority, (Buffalo Niagara International Airport), (AMT), 5.00%, 4/1/30 | | | 460 | | | | 562,447 | |
| | |
Niagara Frontier Transportation Authority, (Buffalo Niagara International Airport), (AMT), 5.00%, 4/1/31 | | | 180 | | | | 219,631 | |
| | |
Port Authority of New York and New Jersey, 6.125%, 6/1/94 | | | 2,500 | | | | 2,957,250 | |
| | |
Port Authority of New York and New Jersey, (AMT), 4.00%, 7/15/31 | | | 5,645 | | | | 5,865,211 | |
| | |
Port Authority of New York and New Jersey, (AMT), 4.00%, 9/1/38 | | | 1,000 | | | | 1,087,710 | |
| | |
Port Authority of New York and New Jersey, (AMT), 5.00%, 10/15/35 | | | 1,520 | | | | 1,802,370 | |
| | |
Port Authority of New York and New Jersey, (AMT), 5.00%, 11/15/37 | | | 1,250 | | | | 1,490,100 | |
| | |
Triborough Bridge and Tunnel Authority, (LOC: Citibank, N.A.), 0.70%, 1/1/32(2) | | | 1,005 | | | | 1,005,000 | |
| | |
Triborough Bridge and Tunnel Authority, (LOC: Citibank, N.A.), 0.70%, 11/1/32(2) | | | 1,495 | | | | 1,495,000 | |
| | |
Triborough Bridge and Tunnel Authority, (LOC: State Street Bank and Trust Company), 0.70%, 1/1/32(2) | | | 1,250 | | | | 1,250,000 | |
| | |
Triborough Bridge and Tunnel Authority, (LOC: U.S. Bank, N.A.), 1.10%, 1/1/31(2) | | | 4,000 | | | | 4,000,000 | |
| | |
| | | | | | | $ | 73,694,604 | |
| | | | |
| | 23 | | See Notes to Financial Statements. |
Eaton Vance
New York Municipal Income Fund
March 31, 2020
Portfolio of Investments (Unaudited) — continued
| | | | | | | | |
| Security | | Principal
Amount
(000’s omitted) | | | Value | |
|
| Water and Sewer — 1.8% | |
| | |
New York City Municipal Water Finance Authority, (Water and Sewer System), 4.00%, 6/15/37 | | $ | 1,000 | | | $ | 1,154,560 | |
| | |
New York City Municipal Water Finance Authority, (Water and Sewer System), 5.00%, 6/15/35 | | | 2,635 | | | | 3,105,031 | |
| | |
New York City Municipal Water Finance Authority, (Water and Sewer System), 5.00%, 6/15/40 | | | 1,330 | | | | 1,617,679 | |
| | |
New York City Municipal Water Finance Authority, (Water and Sewer System), (SPA: State Street Bank and Trust Company), 0.72%, 6/15/49(2) | | | 1,585 | | | | 1,585,000 | |
| | |
| | | | | | | $ | 7,462,270 | |
| |
TotalTax-Exempt Investments — 97.2%
(identified cost $383,674,520) | | | $ | 398,450,898 | |
|
| Taxable Municipal Securities — 1.2% | |
| Security | | Principal
Amount
(000’s omitted) | | | Value | |
|
| Education — 1.2% | |
| | |
New York Dormitory Authority, (New York University), 2.219%, 7/1/35 | | $ | 5,000 | | | $ | 4,815,600 | |
| |
Total Taxable Municipal Securities — 1.2%
(identified cost $5,000,000) | | | $ | 4,815,600 | |
|
| Corporate Bonds & Notes — 0.6% | |
| Security | | Principal
Amount
(000’s omitted) | | | Value | |
|
| Hospital — 0.6% | |
| | |
Montefiore Obligated Group, 4.287%, 9/1/50 | | $ | 2,630 | | | $ | 2,273,510 | |
| |
Total Corporate Bonds & Notes — 0.6%
(identified cost $2,630,000) | | | $ | 2,273,510 | |
| | | | | | | | |
| Miscellaneous — 0.2% | |
| Security | | Units | | | Value | |
|
| Real Estate— 0.2% | |
| | |
CMS Liquidating Trust(3)(5)(6) | | | 1,975,984 | | | $ | 982,064 | |
| |
Total Miscellaneous — 0.2%
(identified cost $1,280,000) | | | $ | 982,064 | |
| |
Total Investments — 99.2%
(identified cost $392,584,520) | | | $ | 406,522,072 | |
| |
Other Assets, Less Liabilities — 0.8% | | | $ | 3,390,495 | |
| |
Net Assets — 100.0% | | | $ | 409,912,567 | |
The percentage shown for each investment category in the Portfolio of Investments is based on net assets.
The Fund invests primarily in debt securities issued by New York municipalities. The ability of the issuers of the debt securities to meet their obligations may be affected by economic developments in a specific industry or municipality. At March 31, 2020, 10.1% of total investments are backed by bond insurance of various financial institutions and financial guaranty assurance agencies. The aggregate percentage insured by an individual financial institution or financial guaranty assurance agency ranged from 0.3% to 5.1% of total investments.
| | (1) | When-issued security. |
| | (2) | Variable rate demand obligation that may be tendered at par on any day for payment the same or next business day. The stated interest rate, which generally resets daily, is determined by the remarketing agent and represents the rate in effect at March 31, 2020. |
| | (3) | Security exempt from registration pursuant to Rule 144A under the Securities Act of 1933, as amended. These securities may be sold in certain transactions in reliance on an exemption from registration (normally to qualified institutional buyers). At March 31, 2020, the aggregate value of these securities is $14,058,124 or 3.4% of the Fund’s net assets. |
| | (4) | Variable rate demand obligation that may be tendered at par on any day for payment the lesser of 5 business days or 7 calendar days. The stated interest rate, which generally resets weekly, is determined by the remarketing agent and represents the rate in effect at March 31, 2020. |
| | (5) | For fair value measurement disclosure purposes, security is categorized as Level 3 (see Note 10). |
| | (6) | Non-income producing. |
Abbreviations:
| | | | |
| | |
| AGC | | – | | Assured Guaranty Corp. |
| | |
| AGM | | – | | Assured Guaranty Municipal Corp. |
| | |
| AMBAC | | – | | AMBAC Financial Group, Inc. |
| | |
| AMT | | – | | Interest earned from these securities may be considered a tax preference item for purposes of the Federal Alternative Minimum Tax. |
| | |
| LOC | | – | | Line of Credit |
| | |
| NPFG | | – | | National Public Finance Guarantee Corp. |
| | |
| SPA | | – | | Standby Bond Purchase Agreement |
| | | | |
| | 24 | | See Notes to Financial Statements. |
Eaton Vance
Ohio Municipal Income Fund
March 31, 2020
Portfolio of Investments (Unaudited)
| | | | | | | | |
| Tax-Exempt Investments — 103.2% | |
| Security | | Principal
Amount
(000’s omitted) | | | Value | |
|
| Bond Bank — 4.5% | |
| | |
Ohio Water Development Authority, 4.00%, 6/1/36 | | $ | 1,500 | | | $ | 1,673,190 | |
| | |
Ohio Water Development Authority, 5.00%, 12/1/35 | | | 2,000 | | | | 2,415,860 | |
| | |
Ohio Water Development Authority, Water Pollution Control Loan Fund, (Water Quality), 5.25%, 6/1/20 | | | 1,000 | | | | 1,006,820 | |
| | |
Rickenbacker Port Authority, (OASBO Expanded Asset Pooled Financing Program), 5.375%, 1/1/32 | | | 2,050 | | | | 2,599,872 | |
| |
| | | | $ | 7,695,742 | |
|
| Education — 11.0% | |
| | |
Bowling Green State University, 4.00%, 6/1/39 | | $ | 750 | | | $ | 831,352 | |
| | |
Kent State University, 5.00%, 5/1/30 | | | 1,185 | | | | 1,418,540 | |
| | |
Kent State University, 5.00%, 5/1/37 | | | 215 | | | | 274,888 | |
| | |
Kent State University, 5.00%, 5/1/38 | | | 250 | | | | 318,263 | |
| | |
Kent State University, 5.00%, 5/1/39 | | | 265 | | | | 336,500 | |
| | |
Kent State University, 5.00%, 5/1/40 | | | 405 | | | | 513,726 | |
| | |
Ohio Higher Educational Facility Commission, (Case Western Reserve University), 5.00%, 12/1/26 | | | 350 | | | | 429,688 | |
| | |
Ohio Higher Educational Facility Commission, (Case Western Reserve University), 5.00%, 12/1/27 | | | 300 | | | | 367,662 | |
| | |
Ohio Higher Educational Facility Commission, (Case Western Reserve University), 5.00%, 12/1/40 | | | 1,000 | | | | 1,187,080 | |
| | |
Ohio Higher Educational Facility Commission, (Case Western Reserve University), 6.50%, 10/1/20 | | | 110 | | | | 112,910 | |
| | |
Ohio Higher Educational Facility Commission, (Denison University), 5.25%, 11/1/46 | | | 1,355 | | | | 1,633,913 | |
| | |
Ohio Higher Educational Facility Commission, (Kenyon College), 4.00%, 7/1/40(1) | | | 1,000 | | | | 1,098,280 | |
| | |
Ohio Higher Educational Facility Commission, (Oberlin College), 5.00%, 10/1/33 | | | 2,000 | | | | 2,235,580 | |
| | |
Ohio Higher Educational Facility Commission, (Oberlin College), 5.00%, 10/1/38 | | | 910 | | | | 1,011,929 | |
| | |
Ohio Higher Educational Facility Commission, (The College of Wooster), 5.00%, 9/1/36 | | | 1,000 | | | | 1,231,400 | |
| | |
Ohio Higher Educational Facility Commission, (University of Dayton), 5.00%, 12/1/32 | | | 550 | | | | 616,336 | |
| | |
Ohio State University, 5.00%, 12/1/29 | | | 1,060 | | | | 1,398,341 | |
| | |
Ohio University, 5.00%, 12/1/35 | | | 500 | | | | 602,690 | |
| | |
University of Cincinnati, 5.00%, 6/1/34 | | | 585 | | | | 696,372 | |
| | |
University of Cincinnati, 5.00%, 6/1/45 | | | 2,000 | | | | 2,388,260 | |
| |
| | | | $ | 18,703,710 | |
|
| Electric Utilities — 3.1% | |
| | |
American Municipal Power, Inc., (Combined Hydroelectric Projects), 5.00%, 2/15/29 | | $ | 1,000 | | | $ | 1,285,170 | |
| | | | | | | | |
| Security | | Principal
Amount
(000’s omitted) | | | Value | |
|
| Electric Utilities (continued) | |
| | |
American Municipal Power, Inc., (Greenup Hydroelectric Facility), 5.00%, 2/15/46 | | $ | 1,000 | | | $ | 1,143,900 | |
| | |
American Municipal Power, Inc., (Meldahl Hydroelectric), 4.00%, 2/15/34 | | | 2,005 | | | | 2,193,189 | |
| | |
American Municipal Power, Inc., (Meldahl Hydroelectric), 5.00%, 2/15/33 | | | 595 | | | | 698,423 | |
| |
| | | | $ | 5,320,682 | |
|
| Escrowed/Prerefunded — 4.5% | |
| | |
Cleveland, Income Tax Revenue, (Bridges and Roadways Improvements), Prerefunded to 10/1/22, 5.00%, 10/1/32 | | $ | 500 | | | $ | 548,815 | |
| | |
Cleveland, Income Tax Revenue, (Parks and Recreation Facilities Improvements), 5.00%, 10/1/35 | | | 1,000 | | | | 1,096,330 | |
| | |
Highland Local School District, Prerefunded to 6/1/23, 5.00%, 12/1/37 | | | 540 | | | | 605,480 | |
| | |
Highland Local School District, Prerefunded to 6/1/23, 5.00%, 12/1/39 | | | 1,100 | | | | 1,233,386 | |
| | |
Lakewood City School District, Prerefunded to 11/1/22, 5.00%, 11/1/36 | | | 1,030 | | | | 1,131,084 | |
| | |
Northeast Ohio Regional Sewer District, Prerefunded to 11/15/24, 5.00%, 11/15/44 | | | 1,255 | | | | 1,474,223 | |
| | |
Ohio Higher Educational Facility Commission, (Summa Health System), Prerefunded to 5/15/20, 5.75%, 11/15/40 | | | 1,495 | | | | 1,503,133 | |
| | |
Ohio State University, Escrowed to Maturity, 5.00%, 12/1/29 | | | 45 | | | | 59,738 | |
| | |
Ohio, (Cleveland Clinic Health System), Prerefunded to 1/1/28, 4.00%, 1/1/43 | | | 20 | | | | 23,805 | |
| |
| | | | $ | 7,675,994 | |
|
| General Obligations — 5.7% | |
| | |
Butler County, Special Tax Assessment, 5.50%, 12/1/28 | | $ | 1,000 | | | $ | 1,003,420 | |
| | |
Columbus City School District, 5.00%, 12/1/30 | | | 1,500 | | | | 1,813,860 | |
| | |
Cuyahoga Community College District, 3.50%, 12/1/39 | | | 1,400 | | | | 1,494,038 | |
| | |
Cuyahoga Community College District, 4.00%, 12/1/42 | | | 1,500 | | | | 1,701,015 | |
| | |
Northwest Local School District, Prerefunded to 12/1/23, 5.00%, 12/1/40 | | | 500 | | | | 570,025 | |
| | |
Ohio, 5.00%, 5/1/33 | | | 1,500 | | | | 1,842,405 | |
| | |
Westerville City School District, 4.00%, 12/1/32 | | | 425 | | | | 511,798 | |
| | |
Westerville City School District, 4.00%, 12/1/33 | | | 625 | | | | 749,231 | |
| |
| | | | $ | 9,685,792 | |
|
| Hospital — 16.3% | |
| | |
Akron, Bath and Copley Joint Township Hospital District, (Children’s Hospital Medical Center of Akron), 5.00%, 11/15/32 | | $ | 2,450 | | | $ | 2,596,780 | |
| | | | |
| | 25 | | See Notes to Financial Statements. |
Eaton Vance
Ohio Municipal Income Fund
March 31, 2020
Portfolio of Investments (Unaudited) — continued
| | | | | | | | |
| Security | | Principal
Amount
(000’s omitted) | | | Value | |
|
| Hospital (continued) | |
| | |
Akron, Bath and Copley Joint Township Hospital District, (Children’s Hospital Medical Center of Akron), 5.00%, 11/15/38 | | $ | 1,155 | | | $ | 1,242,768 | |
| | |
Allen County, (Mercy Health), 4.00%, 8/1/47(2) | | | 5,150 | | | | 5,557,519 | |
| | |
Bluffton, (Blanchard Valley Health System), 5.00%, 12/1/31 | | | 750 | | | | 915,518 | |
| | |
Butler County, (UC Health), 4.00%, 11/15/37 | | | 920 | | | | 1,013,628 | |
| | |
Butler County, (UC Health), 5.00%, 11/15/28 | | | 590 | | | | 727,393 | |
| | |
Butler County, (Kettering Health Network Obligated Group), 5.25%, 4/1/31 | | | 2,500 | | | | 2,582,350 | |
| | |
Franklin County, (Nationwide Children’s Hospital), 5.00%, 11/1/34 | | | 750 | | | | 908,558 | |
| | |
Franklin County, (OhioHealth Corp.), 5.00%, 5/15/40 | | | 1,200 | | | | 1,395,192 | |
| | |
Franklin County, (Trinity Health Credit Group), 5.00%, 12/1/46 | | | 2,000 | | | | 2,303,880 | |
| | |
Miami County, (Kettering Health Network Obligated Group), 5.00%, 8/1/38 | | | 1,000 | | | | 1,175,070 | |
| | |
Muskingum County, (Genesis HealthCare System Obligated Group), 5.00%, 2/15/33 | | | 460 | | | | 495,452 | |
| | |
Ohio Higher Educational Facility Commission, (Summa Health System), 5.75%, 11/15/40 | | | 870 | | | | 874,307 | |
| | |
Ohio Higher Educational Facility Commission, (University Hospitals Health System, Inc.), 5.00%, 1/15/27 | | | 1,500 | | | | 1,638,285 | |
| | |
Ohio Higher Educational Facility Commission, (University Hospitals Health System, Inc.), 5.00%, 1/15/29 | | | 450 | | | | 489,555 | |
| | |
Ohio, (Cleveland Clinic Health System), 4.00%, 1/1/43 | | | 2,190 | | | | 2,428,316 | |
| | |
Ohio, (University Hospitals Health Systems, Inc.), 3.00%, 1/15/45 | | | 1,000 | | | | 944,730 | |
| | |
Southeastern Ohio Port Authority, (Memorial Health System Obligated Group), 5.00%, 12/1/24 | | | 215 | | | | 239,301 | |
| |
| | | | $ | 27,528,602 | |
|
| Housing — 0.5% | |
| | |
Ohio Housing Finance Agency, 3.00%, 9/1/39 | | $ | 750 | | | $ | 783,465 | |
| |
| | | | $ | 783,465 | |
|
| Industrial Development Revenue — 2.3% | |
| | |
Cleveland, (Continental Airlines), (AMT), 5.375%, 9/15/27 | | $ | 2,380 | | | $ | 2,371,837 | |
| | |
Ohio Air Quality Development Authority, (Pratt Paper, LLC), (AMT), 4.25%, 1/15/38(3) | | | 1,700 | | | | 1,565,887 | |
| |
| | | | $ | 3,937,724 | |
|
| Insured-Electric Utilities — 8.7% | |
| | |
Cleveland, Public Power System Revenue, (AGM), 4.00%, 11/15/38 | | $ | 1,000 | | | $ | 1,131,750 | |
| | |
Cleveland, Public Power System Revenue, (AGM), 5.00%, 11/15/24 | | | 1,265 | | | | 1,474,750 | |
| | | | | | | | |
| Security | | Principal
Amount
(000’s omitted) | | | Value | |
|
| Insured-Electric Utilities (continued) | |
| | |
Cleveland, Public Power System Revenue, (NPFG), 0.00%, 11/15/27 | | $ | 2,540 | | | $ | 2,169,033 | |
| | |
Ohio Municipal Electric Generation Agency, (NPFG), 0.00%, 2/15/26 | | | 3,000 | | | | 2,695,830 | |
| | |
Ohio Municipal Electric Generation Agency, (NPFG), 0.00%, 2/15/27 | | | 2,500 | | | | 2,193,075 | |
| | |
Ohio Municipal Electric Generation Agency, (NPFG), 0.00%, 2/15/28 | | | 4,750 | | | | 4,060,822 | |
| | |
Puerto Rico Electric Power Authority, (NPFG), 5.25%, 7/1/34 | | | 1,005 | | | | 1,015,181 | |
| |
| | | | $ | 14,740,441 | |
|
| Insured-Escrowed/Prerefunded — 0.9% | |
| | |
Cleveland, Airport System Revenue, (AGM), Prerefunded to 10/1/22, 5.00%, 1/1/30 | | $ | 1,170 | | | $ | 1,249,150 | |
| | |
Cleveland, Public Power System Revenue, (AGM), Escrowed to Maturity, 5.00%, 11/15/24 | | | 235 | | | | 275,472 | |
| |
| | | | $ | 1,524,622 | |
|
| Insured-General Obligations — 20.9% | |
| | |
Cincinnati City School District, 5.25%, 12/1/29(2) | | $ | 7,500 | | | $ | 10,014,525 | |
| | |
Cleveland, (AMBAC), 5.50%, 10/1/23 | | | 2,105 | | | | 2,411,909 | |
| | |
Kettering City School District, (AGM), 5.25%, 12/1/31 | | | 4,505 | | | | 5,752,164 | |
| | |
Mason City School District, (AGM), 5.25%, 12/1/31 | | | 3,525 | | | | 4,690,224 | |
| | |
Springboro Community City School District, (AGM), 5.25%, 12/1/30 | | | 5,000 | | | | 6,580,050 | |
| | |
Warrensville Heights City School District, (BAM), 5.00%, 12/1/44 | | | 300 | | | | 340,857 | |
| | |
Westerville City School District, (XLCA), 5.00%, 12/1/27 | | | 4,590 | | | | 5,681,227 | |
| |
| | | | $ | 35,470,956 | |
|
| Insured-Hospital — 1.1% | |
| | |
Lucas County, (ProMedica Healthcare Obligated Group), (AGM), 4.00%, 11/15/45 | | $ | 1,725 | | | $ | 1,783,253 | |
| |
| | | | $ | 1,783,253 | |
|
| Insured-Transportation — 6.4% | |
| | |
Cleveland, Airport System Revenue, (AGM), (AMT), 5.00%, 1/1/43 | | $ | 1,000 | | | $ | 1,155,480 | |
| | |
Ohio, (Portsmouth Gateway Group, LLC), (AGM), (AMT), 5.00%, 12/31/35 | | | 1,500 | | | | 1,708,650 | |
| | |
Ohio Turnpike Commission, (NPFG), 5.50%, 2/15/24 | | | 5,000 | | | | 5,602,350 | |
| | |
Puerto Rico Highway and Transportation Authority, (AGC), 5.25%, 7/1/41 | | | 2,250 | | | | 2,332,260 | |
| |
| | | | $ | 10,798,740 | |
| | | | |
| | 26 | | See Notes to Financial Statements. |
Eaton Vance
Ohio Municipal Income Fund
March 31, 2020
Portfolio of Investments (Unaudited) — continued
| | | | | | | | |
| Security | | Principal
Amount
(000’s omitted) | | | Value | |
|
| Insured-Water and Sewer — 2.6% | |
| | |
Newark, Water System Revenue, (AGM), 5.00%, 12/1/39 | | $ | 3,680 | | | $ | 4,345,786 | |
| |
| | | | $ | 4,345,786 | |
|
| Other Revenue — 3.6% | |
| | |
Cuyahoga County, (Cleveland Orchestra), 5.00%, 1/1/33 | | $ | 400 | | | $ | 483,996 | |
| | |
Cuyahoga County, (Cleveland Orchestra), 5.00%, 1/1/34 | | | 300 | | | | 361,932 | |
| | |
Cuyahoga County, (Cleveland Orchestra), 5.00%, 1/1/35 | | | 500 | | | | 601,070 | |
| | |
Cuyahoga County, (Cleveland Orchestra), 5.00%, 1/1/41 | | | 725 | | | | 857,371 | |
| | |
Riversouth Authority, (Lazarus Building Redevelopment), 5.75%, 12/1/27 | | | 2,175 | | | | 2,177,762 | |
| | |
Summit County Port Authority, 5.00%, 12/1/31 | | | 1,410 | | | | 1,542,737 | |
| |
| | | | $ | 6,024,868 | |
|
| Senior Living/Life Care — 1.0% | |
| | |
Lorain County Port Authority, (Kendal at Oberlin), 5.00%, 11/15/30 | | $ | 580 | | | $ | 635,523 | |
| | |
Warren County, (Otterbein Homes Obligated Group), 5.75%, 7/1/33 | | | 905 | | | | 1,015,211 | |
| |
| | | | $ | 1,650,734 | |
|
| Special Tax Revenue — 5.8% | |
| | |
Akron, Income Tax Revenue, 4.00%, 12/1/36 | | $ | 655 | | | $ | 736,456 | |
| | |
Akron, Income Tax Revenue, 4.00%, 12/1/37 | | | 520 | | | | 583,351 | |
| | |
Cuyahoga County, Sales Tax Revenue, 5.00%, 12/1/35 | | | 1,000 | | | | 1,151,620 | |
| | |
Delaware County, Sales Tax Revenue, 5.00%, 12/1/28 | | | 2,000 | | | | 2,364,500 | |
| | |
Franklin County Convention Facilities Authority, 5.00%, 12/1/26 | | | 1,000 | | | | 1,161,890 | |
| | |
Franklin County Convention Facilities Authority, (Greater Columbus Convention Center Hotel Expansion), 5.00%, 12/1/39 | | | 525 | | | | 453,201 | |
| | |
Franklin County, Sales Tax Revenue, 5.00%, 6/1/43 | | | 1,000 | | | | 1,232,580 | |
| | |
Greater Cleveland Regional Transit Authority, Sales Tax Revenue, 5.00%, 12/1/31 | | | 435 | | | | 531,566 | |
| | |
Green, Income Tax Revenue, (Community Learning Centers), 5.00%, 12/1/26 | | | 570 | | | | 626,179 | |
| | |
Green, Income Tax Revenue, (Community Learning Centers), 5.00%, 12/1/28 | | | 940 | | | | 1,031,603 | |
| |
| | | | $ | 9,872,946 | |
|
| Transportation — 0.4% | |
| | |
Cleveland, Airport System Revenue, (AMT), 5.00%, 1/1/27 | | $ | 625 | | | $ | 737,106 | |
| |
| | | | $ | 737,106 | |
| | | | | | | | |
| Security | | Principal
Amount
(000’s omitted) | | | Value | |
|
| Water and Sewer — 3.9% | |
| | |
Cleveland, Water Pollution Control Revenue, 5.00%, 11/15/41 | | $ | 945 | | | $ | 1,097,627 | |
| | |
Columbus, Sewerage System Revenue, 5.00%, 6/1/30 | | | 1,500 | | | | 1,813,860 | |
| | |
Lancaster, Wastewater System Revenue, 4.00%, 12/1/33 | | | 1,265 | | | | 1,390,324 | |
| | |
Toledo, Water System Revenue, 5.00%, 11/15/41 | | | 2,000 | | | | 2,366,600 | |
| | |
| | | | | | | $ | 6,668,411 | |
| |
TotalTax-Exempt Investments — 103.2%
(identified cost $159,216,111) | | | $ | 174,949,574 | |
| |
Other Assets, Less Liabilities — (3.2)% | | | $ | (5,460,050 | ) |
| |
Net Assets — 100.0% | | | $ | 169,489,524 | |
The percentage shown for each investment category in the Portfolio of Investments is based on net assets.
The Fund invests primarily in debt securities issued by Ohio municipalities. The ability of the issuers of the debt securities to meet their obligations may be affected by economic developments in a specific industry or municipality. At March 31, 2020, 33.5% of total investments are backed by bond insurance of various financial institutions and financial guaranty assurance agencies. The aggregate percentage insured by an individual financial institution or financial guaranty assurance agency ranged from 0.2% to 17.2% of total investments
| (1) | When-issued security. |
| (2) | Security represents the municipal bond held by a trust that issues residual interest bonds (see Note 1H). |
| (3) | Security exempt from registration pursuant to Rule 144A under the Securities Act of 1933, as amended. These securities may be sold in certain transactions in reliance on an exemption from registration (normally to qualified institutional buyers). At March 31, 2020, the aggregate value of these securities is $1,565,887 or 0.9% of the Fund’s net assets. |
| | | | |
| | 27 | | See Notes to Financial Statements. |
Eaton Vance
Ohio Municipal Income Fund
March 31, 2020
Portfolio of Investments (Unaudited) — continued
| | | | | | | | | | | | | | | | | | | | |
| Futures Contracts | |
| | | | | |
| Description | | Number of
Contracts | | | Position | | | Expiration
Date | | | Notional
Amount | | | Value/Unrealized
Depreciation | |
| | | | | |
Interest Rate Futures | | | | | | | | | | | | | | | | | | | | |
| | | | | |
| U.S. Long Treasury Bond | | | 30 | | | | Short | | | | 6/19/20 | | | $ | (5,371,875 | ) | | $ | (389,127 | ) |
| | | | | |
| | | | | | | | | | | | | | | | | | | $ | (389,127 | ) |
Abbreviations:
| | | | |
| | |
| AGC | | – | | Assured Guaranty Corp. |
| | |
| AGM | | – | | Assured Guaranty Municipal Corp. |
| | |
| AMBAC | | – | | AMBAC Financial Group, Inc. |
| | |
| AMT | | – | | Interest earned from these securities may be considered a tax preference item for purposes of the Federal Alternative Minimum Tax. |
| | |
| BAM | | – | | Build America Mutual Assurance Co. |
| | |
| NPFG | | – | | National Public Finance Guarantee Corp. |
| | |
| XLCA | | – | | XL Capital Assurance, Inc. |
| | | | |
| | 28 | | See Notes to Financial Statements. |
Eaton Vance
Municipal Income Funds
March 31, 2020
Statements of Assets and Liabilities (Unaudited)
| | | | | | | | | | | | | | | | |
| | | March 31, 2020 | |
| Assets | | California
Opportunities
Fund | | | Massachusetts
Fund | | | New York Fund | | | Ohio Fund | |
|
Investments — | |
| | | | |
Identified cost | | $ | 370,378,212 | | | $ | 166,213,583 | | | $ | 392,584,520 | | | $ | 159,216,111 | |
| | | | |
Unrealized appreciation | | | 9,786,947 | | | | 11,950,482 | | | | 13,937,552 | | | | 15,733,463 | |
| | | | |
Investments, at value | | $ | 380,165,159 | | | $ | 178,164,065 | | | $ | 406,522,072 | | | $ | 174,949,574 | |
| | | | |
Cash | | $ | 1,743,427 | | | $ | 51,542 | | | $ | 11,261,894 | | | $ | 2,764,526 | |
| | | | |
Deposits for derivatives collateral — financial futures contracts | | | — | | | | — | | | | — | | | | 195,000 | |
| | | | |
Interest receivable | | | 3,910,766 | | | | 1,697,164 | | | | 4,251,281 | | | | 2,249,765 | |
| | | | |
Receivable for investments sold | | | 4,070,207 | | | | — | | | | 17,897,064 | | | | — | |
| | | | |
Receivable for Fund shares sold | | | 1,525,914 | | | | 31,042 | | | | 601,960 | | | | 76,795 | |
| | | | |
Receivable for variation margin on open financial futures contracts | | | — | | | | — | | | | — | | | | 49,747 | |
| | | | |
Total assets | | $ | 391,415,473 | | | $ | 179,943,813 | | | $ | 440,534,271 | | | $ | 180,285,407 | |
| |
| Liabilities | | | | | |
| | | | |
Payable for floating rate notes issued | | $ | 2,310,000 | | | $ | 3,678,948 | | | $ | — | | | $ | 9,178,956 | |
| | | | |
Payable for investments purchased | | | 3,272,040 | | | | — | | | | 10,650,930 | | | | — | |
| | | | |
Payable for when-issued securities | | | 11,105,717 | | | | — | | | | 18,743,460 | | | | 1,101,530 | |
| | | | |
Payable for Fund shares redeemed | | | 2,238,193 | | | | 170,221 | | | | 717,608 | | | | 241,897 | |
| | | | |
Distributions payable | | | 81,620 | | | | 63,874 | | | | 117,662 | | | | 49,322 | |
| | | | |
Payable to affiliates: | | | | | | | | | | | | | | | | |
| | | | |
Investment adviser fee | | | 127,389 | | | | 52,333 | | | | 127,876 | | | | 52,071 | |
| | | | |
Distribution and service fees | | | 51,227 | | | | 25,019 | | | | 69,323 | | | | 27,323 | |
| | | | |
Interest expense and fees payable | | | 18,299 | | | | 10,548 | | | | — | | | | 49,535 | |
| | | | |
Accrued expenses | | | 156,040 | | | | 97,383 | | | | 194,845 | | | | 95,249 | |
| | | | |
Total liabilities | | $ | 19,360,525 | | | $ | 4,098,326 | | | $ | 30,621,704 | | | $ | 10,795,883 | |
| | | | |
Net Assets | | $ | 372,054,948 | | | $ | 175,845,487 | | | $ | 409,912,567 | | | $ | 169,489,524 | |
| |
| Sources of Net Assets | | | | | |
| | | | |
Paid-in capital | | $ | 363,964,550 | | | $ | 164,065,759 | | | $ | 391,132,574 | | | $ | 163,703,481 | |
| | | | |
Distributable earnings | | | 8,090,398 | | | | 11,779,728 | | | | 18,779,993 | | | | 5,786,043 | |
| | | | |
Net Assets | | $ | 372,054,948 | | | $ | 175,845,487 | | | $ | 409,912,567 | | | $ | 169,489,524 | |
| |
| Class A Shares | | | | | |
| | | | |
Net Assets | | $ | 123,180,442 | | | $ | 93,521,618 | | | $ | 230,945,706 | | | $ | 101,264,237 | |
| | | | |
Shares Outstanding | | | 11,656,158 | | | | 10,548,277 | | | | 22,410,485 | | | | 11,119,638 | |
|
Net Asset Value and Redemption Price Per Share | |
| | | | |
(net assets ÷ shares of beneficial interest outstanding) | | $ | 10.57 | | | $ | 8.87 | | | $ | 10.31 | | | $ | 9.11 | |
|
Maximum Offering Price Per Share | |
| | | | |
(100 ÷ 95.25 of net asset value per share) | | $ | 11.10 | | | $ | 9.31 | | | $ | 10.82 | | | $ | 9.56 | |
| |
| Class C Shares | | | | | |
| | | | |
Net Assets | | $ | 25,837,798 | | | $ | 10,998,832 | | | $ | 36,363,366 | | | $ | 12,253,394 | |
| | | | |
Shares Outstanding | | | 2,644,665 | | | | 1,240,212 | | | | 3,527,073 | | | | 1,346,290 | |
|
Net Asset Value and Offering Price Per Share* | |
| | | | |
(net assets ÷ shares of beneficial interest outstanding) | | $ | 9.77 | | | $ | 8.87 | | | $ | 10.31 | | | $ | 9.10 | |
| |
| Class I Shares | | | | | |
| | | | |
Net Assets | | $ | 223,036,708 | | | $ | 71,325,037 | | | $ | 142,603,495 | | | $ | 55,971,893 | |
| | | | |
Shares Outstanding | | | 21,094,414 | | | | 8,046,414 | | | | 13,842,182 | | | | 6,142,548 | |
|
Net Asset Value, Offering Price and Redemption Price Per Share | |
| | | | |
(net assets ÷ shares of beneficial interest outstanding) | | $ | 10.57 | | | $ | 8.86 | | | $ | 10.30 | | | $ | 9.11 | |
On sales of $50,000 or more, the offering price of Class A shares is reduced.
| * | Redemption price per share is equal to the net asset value less any applicable contingent deferred sales charge. |
| | | | |
| | 29 | | See Notes to Financial Statements. |
Eaton Vance
Municipal Income Funds
March 31, 2020
Statements of Operations (Unaudited)
| | | | | | | | | | | | | | | | |
| | | Six Months Ended March 31, 2020 | |
| Investment Income | | California
Opportunities Fund | | | Massachusetts Fund | | | New York Fund | | | Ohio Fund | |
| | | | |
Interest | | $ | 5,139,421 | | | $ | 2,739,321 | | | $ | 5,879,091 | | | $ | 3,090,840 | |
| | | | |
Total investment income | | $ | 5,139,421 | | | $ | 2,739,321 | | | $ | 5,879,091 | | | $ | 3,090,840 | |
|
| Expenses | |
| | | | |
Investment adviser fee | | $ | 720,901 | | | $ | 306,489 | | | $ | 762,173 | | | $ | 304,177 | |
| | | | |
Distribution and service fees | | | | | | | | | | | | | | | | |
| | | | |
Class A | | | 157,483 | | | | 94,343 | | | | 235,893 | | | | 103,873 | |
| | | | |
Class C | | | 145,209 | | | | 57,329 | | | | 184,214 | | | | 61,592 | |
| | | | |
Trustees’ fees and expenses | | | 9,550 | | | | 4,540 | | | | 10,412 | | | | 4,408 | |
| | | | |
Custodian fee | | | 39,867 | | | | 22,803 | | | | 49,982 | | | | 22,454 | |
| | | | |
Transfer and dividend disbursing agent fees | | | 49,677 | | | | 32,933 | | | | 82,294 | | | | 35,805 | |
| | | | |
Legal and accounting services | | | 35,880 | | | | 31,649 | | | | 40,009 | | | | 28,425 | |
| | | | |
Printing and postage | | | 10,476 | | | | 6,603 | | | | 14,530 | | | | 7,763 | |
| | | | |
Registration fees | | | 351 | | | | 6,608 | | | | 2,785 | | | | 4,635 | |
| | | | |
Interest expense and fees | | | 23,418 | | | | 38,861 | | | | — | | | | 88,816 | |
| | | | |
Miscellaneous | | | 23,448 | | | | 12,494 | | | | 22,185 | | | | 13,499 | |
| | | | |
Total expenses | | $ | 1,216,260 | | | $ | 614,652 | | | $ | 1,404,477 | | | $ | 675,447 | |
| | | | |
Net investment income | | $ | 3,923,161 | | | $ | 2,124,669 | | | $ | 4,474,614 | | | $ | 2,415,393 | |
|
| Realized and Unrealized Gain (Loss) | |
|
Net realized gain (loss) — | |
| | | | |
Investment transactions | | $ | (1,511,113 | ) | | $ | 372,000 | | | $ | 4,588,559 | | | $ | (4,648 | ) |
| | | | |
Financial futures contracts | | | — | | | | — | | | | — | | | | (60,748 | ) |
| | | | |
Net realized gain (loss) | | $ | (1,511,113 | ) | | $ | 372,000 | | | $ | 4,588,559 | | | $ | (65,396 | ) |
|
Change in unrealized appreciation (depreciation) — | |
| | | | |
Investments | | $ | (6,558,689 | ) | | $ | (2,616,613 | ) | | $ | (7,838,088 | ) | | $ | (1,574,880 | ) |
| | | | |
Financial futures contracts | | | — | | | | — | | | | — | | | | (495,008 | ) |
| | | | |
Net change in unrealized appreciation (depreciation) | | $ | (6,558,689 | ) | | $ | (2,616,613 | ) | | $ | (7,838,088 | ) | | $ | (2,069,888 | ) |
| | | | |
Net realized and unrealized loss | | $ | (8,069,802 | ) | | $ | (2,244,613 | ) | | $ | (3,249,529 | ) | | $ | (2,135,284 | ) |
| | | | |
Net increase (decrease) in net assets from operations | | $ | (4,146,641 | ) | | $ | (119,944 | ) | | $ | 1,225,085 | | | $ | 280,109 | |
| | | | |
| | 30 | | See Notes to Financial Statements. |
Eaton Vance
Municipal Income Funds
March 31, 2020
Statements of Changes in Net Assets
| | | | | | | | | | | | | | | | |
| | | Six Months Ended March 31, 2020 (Unaudited) | |
| Increase (Decrease) in Net Assets | | California
Opportunities Fund | | | Massachusetts Fund | | | New York Fund | | | Ohio Fund | |
| | | | |
From operations — | | | | | | | | | | | | | | | | |
| | | | |
Net investment income | | $ | 3,923,161 | | | $ | 2,124,669 | | | $ | 4,474,614 | | | $ | 2,415,393 | |
| | | | |
Net realized gain (loss) | | | (1,511,113 | ) | | | 372,000 | | | | 4,588,559 | | | | (65,396 | ) |
| | | | |
Net change in unrealized appreciation (depreciation) | | | (6,558,689 | ) | | | (2,616,613 | ) | | | (7,838,088 | ) | | | (2,069,888 | ) |
| | | | |
Net increase (decrease) in net assets from operations | | $ | (4,146,641 | ) | | $ | (119,944 | ) | | $ | 1,225,085 | | | $ | 280,109 | |
| | | | |
Distributions to shareholders — | | | | | | | | | | | | | | | | |
| | | | |
Class A | | $ | (1,748,445 | ) | | $ | (1,232,730 | ) | | $ | (2,677,884 | ) | | $ | (1,449,879 | ) |
| | | | |
Class C | | | (300,345 | ) | | | (113,009 | ) | | | (295,014 | ) | | | (132,239 | ) |
| | | | |
Class I | | | (3,350,567 | ) | | | (966,251 | ) | | | (1,748,009 | ) | | | (801,320 | ) |
| | | | |
Total distributions to shareholders | | $ | (5,399,357 | ) | | $ | (2,311,990 | ) | | $ | (4,720,907 | ) | | $ | (2,383,438 | ) |
| | | | |
Transactions in shares of beneficial interest — | | | | | | | | | | | | | | | | |
|
Proceeds from sale of shares | |
| | | | |
Class A | | $ | 12,084,384 | | | $ | 4,884,376 | | | $ | 10,903,087 | | | $ | 8,201,378 | |
| | | | |
Class C | | | 4,616,607 | | | | 802,627 | | | | 2,125,370 | | | | 1,057,150 | |
| | | | |
Class I | | | 83,894,278 | | | | 17,421,875 | | | | 20,605,180 | | | | 11,649,478 | |
| | | | |
Net asset value of shares issued to shareholders in payment of distributions declared | | | | | | | | | | | | | | | | |
| | | | |
Class A | | | 1,468,225 | | | | 1,018,479 | | | | 2,368,878 | | | | 1,264,999 | |
| | | | |
Class C | | | 266,881 | | | | 96,375 | | | | 227,278 | | | | 110,049 | |
| | | | |
Class I | | | 3,045,231 | | | | 822,880 | | | | 1,396,229 | | | | 718,328 | |
|
Cost of shares redeemed | |
| | | | |
Class A | | | (14,337,431 | ) | | | (5,371,400 | ) | | | (17,132,224 | ) | | | (10,464,844 | ) |
| | | | |
Class C | | | (5,439,601 | ) | | | (1,340,970 | ) | | | (5,290,304 | ) | | | (1,148,654 | ) |
| | | | |
Class I | | | (53,109,361 | ) | | | (9,691,222 | ) | | | (14,947,535 | ) | | | (5,610,758 | ) |
| | | | |
Net asset value of shares converted | | | | | | | | | | | | | | | | |
| | | | |
Class A | | | 349,293 | | | | 896,933 | | | | 1,060,010 | | | | 861,470 | |
| | | | |
Class C | | | (349,293 | ) | | | (896,933 | ) | | | (1,060,010 | ) | | | (861,470 | ) |
| | | | |
Net increase in net assets from Fund share transactions | | $ | 32,489,213 | | | $ | 8,643,020 | | | $ | 255,959 | | | $ | 5,777,126 | |
| | | | |
Net increase (decrease) in net assets | | $ | 22,943,215 | | | $ | 6,211,086 | | | $ | (3,239,863 | ) | | $ | 3,673,797 | |
|
| Net Assets | |
| | | | |
At beginning of period | | $ | 349,111,733 | | | $ | 169,634,401 | | | $ | 413,152,430 | | | $ | 165,815,727 | |
| | | | |
At end of period | | $ | 372,054,948 | | | $ | 175,845,487 | | | $ | 409,912,567 | | | $ | 169,489,524 | |
| | | | |
| | 31 | | See Notes to Financial Statements. |
Eaton Vance
Municipal Income Funds
March 31, 2020
Statements of Changes in Net Assets — continued
| | | | | | | | | | | | | | | | |
| | | Year Ended September 30, 2019 | |
| Increase (Decrease) in Net Assets | | California
Opportunities Fund | | | Massachusetts Fund | | | New York Fund | | | Ohio Fund | |
| | | | |
From operations — | | | | | | | | | | | | | | | | |
| | | | |
Net investment income | | $ | 7,208,139 | | | $ | 4,449,736 | | | $ | 10,301,223 | | | $ | 4,718,915 | |
| | | | |
Net realized gain (loss) | | | 3,344,446 | | | | (785,890 | ) | | | 7,935,111 | | | | (801,036 | ) |
| | | | |
Net change in unrealized appreciation (depreciation) | | | 13,217,445 | | | | 7,471,069 | | | | 14,674,014 | | | | 9,266,461 | |
| | | | |
Net increase in net assets from operations | | $ | 23,770,030 | | | $ | 11,134,915 | | | $ | 32,910,348 | | | $ | 13,184,340 | |
| | | | |
Distributions to shareholders — | | | | | | | | | | | | | | | | |
| | | | |
Class A | | $ | (2,845,527 | ) | | $ | (2,617,786 | ) | | $ | (5,962,314 | ) | | $ | (3,010,485 | ) |
| | | | |
Class C | | | (425,085 | ) | | | (276,851 | ) | | | (880,601 | ) | | | (341,351 | ) |
| | | | |
Class I | | | (3,923,470 | ) | | | (1,594,256 | ) | | | (3,446,566 | ) | | | (1,305,694 | ) |
| | | | |
Total distributions to shareholders | | $ | (7,194,082 | ) | | $ | (4,488,893 | ) | | $ | (10,289,481 | ) | | $ | (4,657,530 | ) |
| | | | |
Transactions in shares of beneficial interest — | | | | | | | | | | | | | | | | |
|
Proceeds from sale of shares | |
| | | | |
Class A | | $ | 26,840,390 | | | $ | 7,074,567 | | | $ | 23,062,535 | | | $ | 9,752,025 | |
| | | | |
Class C | | | 10,061,657 | | | | 2,222,218 | | | | 4,180,859 | | | | 1,911,311 | |
| | | | |
Class I | | | 99,897,563 | | | | 29,335,870 | | | | 46,049,651 | | | | 21,187,385 | |
| | | | |
Net asset value of shares issued to shareholders in payment of distributions declared | | | | | | | | | | | | | | | | |
| | | | |
Class A | | | 2,368,563 | | | | 2,152,136 | | | | 5,203,569 | | | | 2,599,469 | |
| | | | |
Class C | | | 372,221 | | | | 226,796 | | | | 703,105 | | | | 281,723 | |
| | | | |
Class I | | | 3,506,320 | | | | 1,336,234 | | | | 2,769,963 | | | | 1,105,526 | |
| | | | |
Cost of shares redeemed | | | | | | | | | | | | | | | | |
| | | | |
Class A | | | (19,531,208 | ) | | | (11,681,230 | ) | | | (33,788,717 | ) | | | (17,580,758 | ) |
| | | | |
Class C | | | (5,773,211 | ) | | | (1,658,955 | ) | | | (13,591,392 | ) | | | (4,326,972 | ) |
| | | | |
Class I | | | (33,787,892 | ) | | | (9,762,738 | ) | | | (41,886,708 | ) | | | (10,289,119 | ) |
| | | | |
Net asset value of shares converted | | | | | | | | | | | | | | | | |
| | | | |
Class A | | | 2,858,162 | | | | 3,645,073 | | | | 8,952,777 | | | | 4,624,174 | |
| | | | |
Class C | | | (2,858,162 | ) | | | (3,645,073 | ) | | | (8,952,777 | ) | | | (4,624,174 | ) |
| | | | |
Net increase (decrease) in net assets from Fund share transactions | | $ | 83,954,403 | | | $ | 19,244,898 | | | $ | (7,297,135 | ) | | $ | 4,640,590 | |
| | | | |
Net increase in net assets | | $ | 100,530,351 | | | $ | 25,890,920 | | | $ | 15,323,732 | | | $ | 13,167,400 | |
|
| Net Assets | |
| | | | |
At beginning of year | | $ | 248,581,382 | | | $ | 143,743,481 | | | $ | 397,828,698 | | | $ | 152,648,327 | |
| | | | |
At end of year | | $ | 349,111,733 | | | $ | 169,634,401 | | | $ | 413,152,430 | | | $ | 165,815,727 | |
| | | | |
| | 32 | | See Notes to Financial Statements. |
Eaton Vance
Municipal Income Funds
March 31, 2020
Financial Highlights
| | | | | | | | | | | | | | | | | | | | | | | | |
| | | California Opportunities Fund — Class A | |
| | |
| | | Six Months Ended
March 31, 2020
(Unaudited) | | | Year Ended September 30, | |
| | | 2019 | | | 2018 | | | 2017 | | | 2016 | | | 2015 | |
| | | | | | | |
Net asset value — Beginning of period | | $ | 10.800 | | | $ | 10.210 | | | $ | 10.410 | | | $ | 10.740 | | | $ | 10.250 | | | $ | 10.230 | |
| |
| Income (Loss) From Operations | | | | | |
| | | | | | |
Net investment income(1) | | $ | 0.107 | | | $ | 0.258 | | | $ | 0.263 | | | $ | 0.262 | | | $ | 0.302 | | | $ | 0.377 | |
| | | | | | |
Net realized and unrealized gain (loss) | | | (0.187 | ) | | | 0.590 | | | | (0.200 | ) | | | (0.332 | ) | | | 0.491 | | | | 0.018 | |
| | | | | | |
Total income (loss) from operations | | $ | (0.080 | ) | | $ | 0.848 | | | $ | 0.063 | | | $ | (0.070 | ) | | $ | 0.793 | | | $ | 0.395 | |
| |
| Less Distributions | | | | | |
| | | | | | |
From net investment income | | $ | (0.114 | ) | | $ | (0.258 | ) | | $ | (0.263 | ) | | $ | (0.260 | ) | | $ | (0.303 | ) | | $ | (0.375 | ) |
| | | | | | |
From net realized gain | | | (0.036 | ) | | | — | | | | — | | | | — | | | | — | | | | — | |
| | | | | | |
Total distributions | | $ | (0.150 | ) | | $ | (0.258 | ) | | $ | (0.263 | ) | | $ | (0.260 | ) | | $ | (0.303 | ) | | $ | (0.375 | ) |
| | | | | | |
Net asset value — End of period | | $ | 10.570 | | | $ | 10.800 | | | $ | 10.210 | | | $ | 10.410 | | | $ | 10.740 | | | $ | 10.250 | |
| | | | | | |
Total Return(2) | | | (0.76 | )%(3) | | | 8.52 | % | | | 0.52 | % | | | (0.60 | )% | | | 7.83 | % | | | 3.92 | % |
| |
| Ratios/Supplemental Data | | | | | |
| | | | | | |
Net assets, end of period (000’s omitted) | | $ | 123,180 | | | $ | 126,381 | | | $ | 107,204 | | | $ | 124,821 | | | $ | 148,675 | | | $ | 122,727 | |
| |
Ratios (as a percentage of average daily net assets): | | | | | |
| | | | | | |
Expenses excluding interest and fees(4) | | | 0.72 | %(5) | | | 0.76 | % | | | 0.77 | % | | | 0.77 | % | | | 0.78 | % | | | 0.84 | % |
| | | | | | |
Interest and fee expense(6) | | | 0.01 | %(5) | | | 0.04 | % | | | 0.07 | % | | | 0.05 | % | | | 0.04 | % | | | 0.04 | % |
| | | | | | |
Total expenses(4) | | | 0.73 | %(5) | | | 0.80 | % | | | 0.84 | % | | | 0.82 | % | | | 0.82 | % | | | 0.88 | % |
| | | | | | |
Net investment income | | | 1.99 | %(5) | | | 2.47 | % | | | 2.56 | % | | | 2.53 | % | | | 2.86 | % | | | 3.68 | % |
| | | | | | |
Portfolio Turnover | | | 92 | %(3) | | | 235 | % | | | 293 | % | | | 146 | % | | | 219 | % | | | 66 | % |
| (1) | Computed using average shares outstanding. |
| (2) | Returns are historical and are calculated by determining the percentage change in net asset value with all distributions reinvested and do not reflect the effect of sales charges. |
| (4) | Excludes the effect of custody fee credits, if any, of less than 0.005%. Effective September 1, 2015, custody fee credits, which were earned on cash deposit balances, were discontinued by the custodian. |
| (6) | Interest and fee expense relates to the liability for floating rate notes issued in conjunction with residual interest bond transactions (see Note 1H). |
| | | | |
| | 33 | | See Notes to Financial Statements. |
Eaton Vance
Municipal Income Funds
March 31, 2020
Financial Highlights — continued
| | | | | | | | | | | | | | | | | | | | | | | | |
| | | California Opportunities Fund — Class C | |
| | |
| | | Six Months Ended
March 31, 2020
(Unaudited) | | | Year Ended September 30, | |
| | | 2019 | | | 2018 | | | 2017 | | | 2016 | | | 2015 | |
| | | | | | | |
Net asset value — Beginning of period | | $ | 9.990 | | | $ | 9.440 | | | $ | 9.620 | | | $ | 9.930 | | | $ | 9.480 | | | $ | 9.460 | |
| |
| Income (Loss) From Operations | | | | | |
| | | | | | |
Net investment income(1) | | $ | 0.061 | | | $ | 0.166 | | | $ | 0.172 | | | $ | 0.170 | | | $ | 0.198 | | | $ | 0.277 | |
| | | | | | |
Net realized and unrealized gain (loss) | | | (0.178 | ) | | | 0.550 | | | | (0.180 | ) | | | (0.311 | ) | | | 0.459 | | | | 0.019 | |
| | | | | | |
Total income (loss) from operations | | $ | (0.117 | ) | | $ | 0.716 | | | $ | (0.008 | ) | | $ | (0.141 | ) | | $ | 0.657 | | | $ | 0.296 | |
| |
| Less Distributions | | | | | |
| | | | | | |
From net investment income | | $ | (0.067 | ) | | $ | (0.166 | ) | | $ | (0.172 | ) | | $ | (0.169 | ) | | $ | (0.207 | ) | | $ | (0.276 | ) |
| | | | | | |
From net realized gain | | | (0.036 | ) | | | — | | | | — | | | | — | | | | — | | | | — | |
| | | | | | |
Total distributions | | $ | (0.103 | ) | | $ | (0.166 | ) | | $ | (0.172 | ) | | $ | (0.169 | ) | | $ | (0.207 | ) | | $ | (0.276 | ) |
| | | | | | |
Net asset value — End of period | | $ | 9.770 | | | $ | 9.990 | | | $ | 9.440 | | | $ | 9.620 | | | $ | 9.930 | | | $ | 9.480 | |
| | | | | | |
Total Return(2) | | | (1.18 | )%(3) | | | 7.66 | % | | | (0.08 | )% | | | (1.40 | )% | | | 6.98 | % | | | 3.17 | % |
| |
| Ratios/Supplemental Data | | | | | |
| | | | | | |
Net assets, end of period (000’s omitted) | | $ | 25,838 | | | $ | 27,616 | | | $ | 24,437 | | | $ | 30,020 | | | $ | 35,006 | | | $ | 15,343 | |
| |
Ratios (as a percentage of average daily net assets): | | | | | |
| | | | | | |
Expenses excluding interest and fees(4) | | | 1.47 | %(5) | | | 1.51 | % | | | 1.52 | % | | | 1.52 | % | | | 1.53 | % | | | 1.59 | % |
| | | | | | |
Interest and fee expense(6) | | | 0.01 | %(5) | | | 0.04 | % | | | 0.07 | % | | | 0.05 | % | | | 0.04 | % | | | 0.04 | % |
| | | | | | |
Total expenses(4) | | | 1.48 | %(5) | | | 1.55 | % | | | 1.59 | % | | | 1.57 | % | | | 1.57 | % | | | 1.63 | % |
| | | | | | |
Net investment income | | | 1.23 | %(5) | | | 1.72 | % | | | 1.80 | % | | | 1.78 | % | | | 2.02 | % | | | 2.92 | % |
| | | | | | |
Portfolio Turnover | | | 92 | %(3) | | | 235 | % | | | 293 | % | | | 146 | % | | | 219 | % | | | 66 | % |
| (1) | Computed using average shares outstanding. |
| (2) | Returns are historical and are calculated by determining the percentage change in net asset value with all distributions reinvested and do not reflect the effect of sales charges. |
| (4) | Excludes the effect of custody fee credits, if any, of less than 0.005%. Effective September 1, 2015, custody fee credits, which were earned on cash deposit balances, were discontinued by the custodian. |
| (6) | Interest and fee expense relates to the liability for floating rate notes issued in conjunction with residual interest bond transactions (see Note 1H). |
| | | | |
| | 34 | | See Notes to Financial Statements. |
Eaton Vance
Municipal Income Funds
March 31, 2020
Financial Highlights — continued
| | | | | | | | | | | | | | | | | | | | | | | | |
| | | California Opportunities Fund — Class I | |
| | |
| | | Six Months Ended
March 31, 2020
(Unaudited) | | | Year Ended September 30, | |
| | | 2019 | | | 2018 | | | 2017 | | | 2016 | | | 2015 | |
| | | | | | | |
Net asset value — Beginning of period | | $ | 10.810 | | | $ | 10.210 | | | $ | 10.420 | | | $ | 10.750 | | | $ | 10.260 | | | $ | 10.240 | |
| |
| Income (Loss) From Operations | | | | | |
| | | | | | |
Net investment income(1) | | $ | 0.120 | | | $ | 0.282 | | | $ | 0.289 | | | $ | 0.287 | | | $ | 0.312 | | | $ | 0.403 | |
| | | | | | |
Net realized and unrealized gain (loss) | | | (0.197 | ) | | | 0.602 | | | | (0.210 | ) | | | (0.331 | ) | | | 0.507 | | | | 0.018 | |
| | | | | | |
Total income (loss) from operations | | $ | (0.077 | ) | | $ | 0.884 | | | $ | 0.079 | | | $ | (0.044 | ) | | $ | 0.819 | | | $ | 0.421 | |
| |
| Less Distributions | | | | | |
| | | | | | |
From net investment income | | $ | (0.127 | ) | | $ | (0.284 | ) | | $ | (0.289 | ) | | $ | (0.286 | ) | | $ | (0.329 | ) | | $ | (0.401 | ) |
| | | | | | |
From net realized gain | | | (0.036 | ) | | | — | | | | — | | | | — | | | | — | | | | — | |
| | | | | | |
Total distributions | | $ | (0.163 | ) | | $ | (0.284 | ) | | $ | (0.289 | ) | | $ | (0.286 | ) | | $ | (0.329 | ) | | $ | (0.401 | ) |
| | | | | | |
Net asset value — End of period | | $ | 10.570 | | | $ | 10.810 | | | $ | 10.210 | | | $ | 10.420 | | | $ | 10.750 | | | $ | 10.260 | |
| | | | | | |
Total Return(2) | | | (0.74 | )%(3) | | | 8.79 | % | | | 0.77 | % | | | (0.35 | )% | | | 8.09 | % | | | 4.18 | % |
| |
| Ratios/Supplemental Data | | | | | |
| | | | | | |
Net assets, end of period (000’s omitted) | | $ | 223,037 | | | $ | 195,115 | | | $ | 116,940 | | | $ | 118,737 | | | $ | 109,169 | | | $ | 21,945 | |
| |
Ratios (as a percentage of average daily net assets): | | | | | |
| | | | | | |
Expenses excluding interest and fees(4) | | | 0.47 | %(5) | | | 0.51 | % | | | 0.51 | % | | | 0.52 | % | | | 0.52 | % | | | 0.59 | % |
| | | | | | |
Interest and fee expense(6) | | | 0.01 | %(5) | | | 0.04 | % | | | 0.07 | % | | | 0.05 | % | | | 0.04 | % | | | 0.04 | % |
| | | | | | |
Total expenses(4) | | | 0.48 | %(5) | | | 0.55 | % | | | 0.58 | % | | | 0.57 | % | | | 0.56 | % | | | 0.63 | % |
| | | | | | |
Net investment income | | | 2.23 | %(5) | | | 2.68 | % | | | 2.80 | % | | | 2.77 | % | | | 2.93 | % | | | 3.92 | % |
| | | | | | |
Portfolio Turnover | | | 92 | %(3) | | | 235 | % | | | 293 | % | | | 146 | % | | | 219 | % | | | 66 | % |
| (1) | Computed using average shares outstanding. |
| (2) | Returns are historical and are calculated by determining the percentage change in net asset value with all distributions reinvested. |
| (4) | Excludes the effect of custody fee credits, if any, of less than 0.005%. Effective September 1, 2015, custody fee credits, which were earned on cash deposit balances, were discontinued by the custodian. |
| (6) | Interest and fee expense relates to the liability for floating rate notes issued in conjunction with residual interest bond transactions (see Note 1H). |
| | | | |
| | 35 | | See Notes to Financial Statements. |
Eaton Vance
Municipal Income Funds
March 31, 2020
Financial Highlights — continued
| | | | | | | | | | | | | | | | | | | | | | | | |
| | | Massachusetts Fund — Class A | |
| | |
| | | Six Months Ended
March 31, 2020
(Unaudited) | | | Year Ended September 30, | |
| | | 2019 | | | 2018 | | | 2017 | | | 2016 | | | 2015 | |
| | | | | | | |
Net asset value — Beginning of period | | $ | 8.980 | | | $ | 8.600 | | | $ | 8.890 | | | $ | 9.180 | | | $ | 9.030 | | | $ | 9.120 | |
|
| Income (Loss) From Operations | |
| | | | | | |
Net investment income(1) | | $ | 0.108 | | | $ | 0.252 | | | $ | 0.265 | | | $ | 0.285 | | | $ | 0.304 | | | $ | 0.322 | |
| | | | | | |
Net realized and unrealized gain (loss) | | | (0.101 | ) | | | 0.382 | | | | (0.280 | ) | | | (0.292 | ) | | | 0.160 | | | | (0.088 | ) |
| | | | | | |
Total income (loss) from operations | | $ | 0.007 | | | $ | 0.634 | | | $ | (0.015 | ) | | $ | (0.007 | ) | | $ | 0.464 | | | $ | 0.234 | |
|
| Less Distributions | |
| | | | | | |
From net investment income | | $ | (0.117 | ) | | $ | (0.254 | ) | | $ | (0.275 | ) | | $ | (0.283 | ) | | $ | (0.314 | ) | | $ | (0.324 | ) |
| | | | | | |
Total distributions | | $ | (0.117 | ) | | $ | (0.254 | ) | | $ | (0.275 | ) | | $ | (0.283 | ) | | $ | (0.314 | ) | | $ | (0.324 | ) |
| | | | | | |
Net asset value — End of period | | $ | 8.870 | | | $ | 8.980 | | | $ | 8.600 | | | $ | 8.890 | | | $ | 9.180 | | | $ | 9.030 | |
| | | | | | |
Total Return(2) | | | 0.07 | %(3) | | | 7.48 | % | | | (0.17 | )% | | | (0.02 | )% | | | 5.20 | % | | | 2.60 | % |
|
| Ratios/Supplemental Data | |
| | | | | | |
Net assets, end of period (000’s omitted) | | $ | 93,522 | | | $ | 93,288 | | | $ | 88,205 | | | $ | 99,934 | | | $ | 116,883 | | | $ | 109,990 | |
|
Ratios (as a percentage of average daily net assets): | |
| | | | | | |
Expenses excluding interest and fees(4) | | | 0.69 | %(5) | | | 0.71 | % | | | 0.72 | % | | | 0.70 | % | | | 0.72 | % | | | 0.72 | % |
| | | | | | |
Interest and fee expense(6) | | | 0.04 | %(5) | | | 0.05 | % | | | 0.05 | % | | | 0.06 | % | | | 0.06 | % | | | 0.05 | % |
| | | | | | |
Total expenses(4) | | | 0.73 | %(5) | | | 0.76 | % | | | 0.77 | % | | | 0.76 | % | | | 0.78 | % | | | 0.77 | % |
| | | | | | |
Net investment income | | | 2.40 | %(5) | | | 2.87 | % | | | 3.03 | % | | | 3.21 | % | | | 3.31 | % | | | 3.54 | % |
| | | | | | |
Portfolio Turnover | | | 11 | %(3) | | | 49 | % | | | 41 | % | | | 28 | % | | | 17 | % | | | 10 | % |
| (1) | Computed using average shares outstanding. |
| (2) | Returns are historical and are calculated by determining the percentage change in net asset value with all distributions reinvested and do not reflect the effect of sales charges. |
| (4) | Excludes the effect of custody fee credits, if any, of less than 0.005%. Effective September 1, 2015, custody fee credits, which were earned on cash deposit balances, were discontinued by the custodian. |
| (6) | Interest and fee expense relates to the liability for floating rate notes issued in conjunction with residual interest bond transactions (see Note 1H). |
| | | | |
| | 36 | | See Notes to Financial Statements. |
Eaton Vance
Municipal Income Funds
March 31, 2020
Financial Highlights — continued
| | | | | | | | | | | | | | | | | | | | | | | | |
| | | Massachusetts Fund — Class C | |
| | |
| | | Six Months Ended
March 31, 2020
(Unaudited) | | | Year Ended September 30, | |
| | | 2019 | | | 2018 | | | 2017 | | | 2016 | | | 2015 | |
| | | | | | | |
Net asset value — Beginning of period | | $ | 8.990 | | | $ | 8.610 | | | $ | 8.890 | | | $ | 9.190 | | | $ | 9.040 | | | $ | 9.120 | |
| |
| Income (Loss) From Operations | | | | | |
| | | | | | |
Net investment income(1) | | $ | 0.074 | | | $ | 0.186 | | | $ | 0.200 | | | $ | 0.219 | | | $ | 0.234 | | | $ | 0.252 | |
| | | | | | |
Net realized and unrealized gain (loss) | | | (0.110 | ) | | | 0.382 | | | | (0.270 | ) | | | (0.302 | ) | | | 0.162 | | | | (0.076 | ) |
| | | | | | |
Total income (loss) from operations | | $ | (0.036 | ) | | $ | 0.568 | | | $ | (0.070 | ) | | $ | (0.083 | ) | | $ | 0.396 | | | $ | 0.176 | |
| |
| Less Distributions | | | | | |
| | | | | | |
From net investment income | | $ | (0.084 | ) | | $ | (0.188 | ) | | $ | (0.210 | ) | | $ | (0.217 | ) | | $ | (0.246 | ) | | $ | (0.256 | ) |
| | | | | | |
Total distributions | | $ | (0.084 | ) | | $ | (0.188 | ) | | $ | (0.210 | ) | | $ | (0.217 | ) | | $ | (0.246 | ) | | $ | (0.256 | ) |
| | | | | | |
Net asset value — End of period | | $ | 8.870 | | | $ | 8.990 | | | $ | 8.610 | | | $ | 8.890 | | | $ | 9.190 | | | $ | 9.040 | |
| | | | | | |
Total Return(2) | | | (0.30 | )%(3) | | | 6.55 | % | | | (0.80 | )% | | | (0.87 | )% | | | 4.41 | % | | | 1.95 | % |
| |
| Ratios/Supplemental Data | | | | | |
| | | | | | |
Net assets, end of period (000’s omitted) | | $ | 10,999 | | | $ | 12,518 | | | $ | 14,848 | | | $ | 19,219 | | | $ | 24,165 | | | $ | 21,074 | |
| |
Ratios (as a percentage of average daily net assets): | | | | | |
| | | | | | |
Expenses excluding interest and fees(4) | | | 1.44 | %(5) | | | 1.46 | % | | | 1.47 | % | | | 1.46 | % | | | 1.47 | % | | | 1.47 | % |
| | | | | | |
Interest and fee expense(6) | | | 0.04 | %(5) | | | 0.05 | % | | | 0.05 | % | | | 0.06 | % | | | 0.06 | % | | | 0.05 | % |
| | | | | | |
Total expenses(4) | | | 1.48 | %(5) | | | 1.51 | % | | | 1.52 | % | | | 1.52 | % | | | 1.53 | % | | | 1.52 | % |
| | | | | | |
Net investment income | | | 1.65 | %(5) | | | 2.12 | % | | | 2.29 | % | | | 2.47 | % | | | 2.55 | % | | | 2.78 | % |
| | | | | | |
Portfolio Turnover | | | 11 | %(3) | | | 49 | % | | | 41 | % | | | 28 | % | | | 17 | % | | | 10 | % |
| (1) | Computed using average shares outstanding. |
| (2) | Returns are historical and are calculated by determining the percentage change in net asset value with all distributions reinvested and do not reflect the effect of sales charges. |
| (4) | Excludes the effect of custody fee credits, if any, of less than 0.005%. Effective September 1, 2015, custody fee credits, which were earned on cash deposit balances, were discontinued by the custodian. |
| (6) | Interest and fee expense relates to the liability for floating rate notes issued in conjunction with residual interest bond transactions (see Note 1H). |
| | | | |
| | 37 | | See Notes to Financial Statements. |
Eaton Vance
Municipal Income Funds
March 31, 2020
Financial Highlights — continued
| | | | | | | | | | | | | | | | | | | | | | | | |
| | | Massachusetts Fund — Class I | |
| | |
| | | Six Months Ended
March 31, 2020
(Unaudited) | | | Year Ended September 30, | |
| | | 2019 | | | 2018 | | | 2017 | | | 2016 | | | 2015 | |
| | | | | | | |
Net asset value — Beginning of period | | $ | 8.980 | | | $ | 8.600 | | | $ | 8.880 | | | $ | 9.180 | | | $ | 9.030 | | | $ | 9.120 | |
| |
| Income (Loss) From Operations | | | | | |
| | | | | | |
Net investment income(1) | | $ | 0.117 | | | $ | 0.268 | | | $ | 0.283 | | | $ | 0.302 | | | $ | 0.320 | | | $ | 0.338 | |
| | | | | | |
Net realized and unrealized gain (loss) | | | (0.111 | ) | | | 0.384 | | | | (0.270 | ) | | | (0.301 | ) | | | 0.162 | | | | (0.086 | ) |
| | | | | | |
Total income from operations | | $ | 0.006 | | | $ | 0.652 | | | $ | 0.013 | | | $ | 0.001 | | | $ | 0.482 | | | $ | 0.252 | |
| |
| Less Distributions | | | | | |
| | | | | | |
From net investment income | | $ | (0.126 | ) | | $ | (0.272 | ) | | $ | (0.293 | ) | | $ | (0.301 | ) | | $ | (0.332 | ) | | $ | (0.342 | ) |
| | | | | | |
Total distributions | | $ | (0.126 | ) | | $ | (0.272 | ) | | $ | (0.293 | ) | | $ | (0.301 | ) | | $ | (0.332 | ) | | $ | (0.342 | ) |
| | | | | | |
Net asset value — End of period | | $ | 8.860 | | | $ | 8.980 | | | $ | 8.600 | | | $ | 8.880 | | | $ | 9.180 | | | $ | 9.030 | |
| | | | | | |
Total Return(2) | | | 0.05 | %(3) | | | 7.69 | % | | | 0.15 | % | | | 0.07 | % | | | 5.40 | % | | | 2.80 | % |
| |
| Ratios/Supplemental Data | | | | | |
| | | | | | |
Net assets, end of period (000’s omitted) | | $ | 71,325 | | | $ | 63,829 | | | $ | 40,691 | | | $ | 45,551 | | | $ | 44,995 | | | $ | 32,876 | |
| | | | |
Ratios (as a percentage of average daily net assets): | | | | | | | | | | | | | | | | | |
| | | | | | |
Expenses excluding interest and fees(4) | | | 0.49 | %(5) | | | 0.51 | % | | | 0.52 | % | | | 0.50 | % | | | 0.52 | % | | | 0.52 | % |
| | | | | | |
Interest and fee expense(6) | | | 0.04 | %(5) | | | 0.05 | % | | | 0.05 | % | | | 0.06 | % | | | 0.06 | % | | | 0.05 | % |
| | | | | | |
Total expenses(4) | | | 0.53 | %(5) | | | 0.56 | % | | | 0.57 | % | | | 0.56 | % | | | 0.58 | % | | | 0.57 | % |
| | | | | | |
Net investment income | | | 2.60 | %(5) | | | 3.05 | % | | | 3.23 | % | | | 3.41 | % | | | 3.49 | % | | | 3.72 | % |
| | | | | | |
Portfolio Turnover | | | 11 | %(3) | | | 49 | % | | | 41 | % | | | 28 | % | | | 17 | % | | | 10 | % |
| (1) | Computed using average shares outstanding. |
| (2) | Returns are historical and are calculated by determining the percentage change in net asset value with all distributions reinvested. |
| (4) | Excludes the effect of custody fee credits, if any, of less than 0.005%. Effective September 1, 2015, custody fee credits, which were earned on cash deposit balances, were discontinued by the custodian. |
| (6) | Interest and fee expense relates to the liability for floating rate notes issued in conjunction with residual interest bond transactions (see Note 1H). |
| | | | |
| | 38 | | See Notes to Financial Statements. |
Eaton Vance
Municipal Income Funds
March 31, 2020
Financial Highlights — continued
| | | | | | | | | | | | | | | | | | | | | | | | |
| | | New York Fund — Class A | |
| | |
| | | Six Months Ended
March 31, 2020
(Unaudited) | | | Year Ended September 30, | |
| | | 2019 | | | 2018 | | | 2017 | | | 2016 | | | 2015 | |
| | | | | | | |
Net asset value — Beginning of period | | $ | 10.380 | | | $ | 9.800 | | | $ | 10.110 | | | $ | 10.390 | | | $ | 10.070 | | | $ | 10.140 | |
| |
| Income (Loss) From Operations | | | | | |
| | | | | | |
Net investment income(1) | | $ | 0.112 | | | $ | 0.265 | | | $ | 0.285 | | | $ | 0.304 | | | $ | 0.326 | | | $ | 0.365 | |
| | | | | | |
Net realized and unrealized gain (loss) | | | (0.064 | ) | | | 0.580 | | | | (0.311 | ) | | | (0.276 | ) | | | 0.320 | | | | (0.072 | ) |
| | | | | | |
Total income (loss) from operations | | $ | 0.048 | | | $ | 0.845 | | | $ | (0.026 | ) | | $ | 0.028 | | | $ | 0.646 | | | $ | 0.293 | |
| |
| Less Distributions | | | | | |
| | | | | | |
From net investment income | | $ | (0.118 | ) | | $ | (0.265 | ) | | $ | (0.284 | ) | | $ | (0.308 | ) | | $ | (0.326 | ) | | $ | (0.363 | ) |
| | | | | | |
Total distributions | | $ | (0.118 | ) | | $ | (0.265 | ) | | $ | (0.284 | ) | | $ | (0.308 | ) | | $ | (0.326 | ) | | $ | (0.363 | ) |
| | | | | | |
Net asset value — End of period | | $ | 10.310 | | | $ | 10.380 | | | $ | 9.800 | | | $ | 10.110 | | | $ | 10.390 | | | $ | 10.070 | |
| | | | | | |
Total Return(2) | | | 0.36 | %(3) | | | 8.74 | % | | | (0.26 | )% | | | 0.33 | % | | | 6.49 | % | | | 2.93 | % |
| |
| Ratios/Supplemental Data | | | | | |
| | | | | | |
Net assets, end of period (000’s omitted) | | $ | 230,946 | | | $ | 235,528 | | | $ | 218,892 | | | $ | 247,160 | | | $ | 291,077 | | | $ | 265,348 | |
| | | | |
Ratios (as a percentage of average daily net assets): | | | | | | | | | | | | | | | | | |
| | | | | | |
Expenses excluding interest and fees(4) | | | 0.67 | %(5) | | | 0.69 | % | | | 0.70 | % | | | 0.70 | % | | | 0.70 | % | | | 0.71 | % |
| | | | | | |
Interest and fee expense | | | — | | | | 0.04 | %(6) | | | 0.09 | %(6) | | | 0.07 | %(6) | | | 0.05 | %(6) | | | 0.05 | %(6) |
| | | | | | |
Total expenses(4) | | | 0.67 | %(5) | | | 0.73 | % | | | 0.79 | % | | | 0.77 | % | | | 0.75 | % | | | 0.76 | % |
| | | | | | |
Net investment income | | | 2.15 | %(5) | | | 2.63 | % | | | 2.86 | % | | | 3.02 | % | | | 3.16 | % | | | 3.61 | % |
| | | | | | |
Portfolio Turnover | | | 72 | %(3) | | | 114 | % | | | 75 | % | | | 56 | % | | | 38 | % | | | 8 | % |
| (1) | Computed using average shares outstanding. |
| (2) | Returns are historical and are calculated by determining the percentage change in net asset value with all distributions reinvested and do not reflect the effect of sales charges. |
| (4) | Excludes the effect of custody fee credits, if any, of less than 0.005%. Effective September 1, 2015, custody fee credits, which were earned on cash deposit balances, were discontinued by the custodian. |
| (6) | Interest and fee expense relates to the liability for floating rate notes issued in conjunction with residual interest bond transactions (see Note 1H). |
| | | | |
| | 39 | | See Notes to Financial Statements. |
Eaton Vance
Municipal Income Funds
March 31, 2020
Financial Highlights — continued
| | | | | | | | | | | | | | | | | | | | | | | | |
| | | New York Fund — Class C | |
| | |
| | | Six Months Ended
March 31, 2020
(Unaudited) | | | Year Ended September 30, | |
| | | 2019 | | | 2018 | | | 2017 | | | 2016 | | | 2015 | |
| | | | | | | |
Net asset value — Beginning of period | | $ | 10.390 | | | $ | 9.800 | | | $ | 10.120 | | | $ | 10.390 | | | $ | 10.070 | | | $ | 10.140 | |
| |
| Income (Loss) From Operations | | | | | |
| | | | | | |
Net investment income(1) | | $ | 0.073 | | | $ | 0.192 | | | $ | 0.211 | | | $ | 0.229 | | | $ | 0.248 | | | $ | 0.288 | |
| | | | | | |
Net realized and unrealized gain (loss) | | | (0.074 | ) | | | 0.588 | | | | (0.321 | ) | | | (0.266 | ) | | | 0.320 | | | | (0.071 | ) |
| | | | | | |
Total income (loss) from operations | | $ | (0.001 | ) | | $ | 0.780 | | | $ | (0.110 | ) | | $ | (0.037 | ) | | $ | 0.568 | | | $ | 0.217 | |
| |
| Less Distributions | | | | | |
| | | | | | |
From net investment income | | $ | (0.079 | ) | | $ | (0.190 | ) | | $ | (0.210 | ) | | $ | (0.233 | ) | | $ | (0.248 | ) | | $ | (0.287 | ) |
| | | | | | |
Total distributions | | $ | (0.079 | ) | | $ | (0.190 | ) | | $ | (0.210 | ) | | $ | (0.233 | ) | | $ | (0.248 | ) | | $ | (0.287 | ) |
| | | | | | |
Net asset value — End of period | | $ | 10.310 | | | $ | 10.390 | | | $ | 9.800 | | | $ | 10.120 | | | $ | 10.390 | | | $ | 10.070 | |
| | | | | | |
Total Return(2) | | | (0.02 | )%(3) | | | 8.03 | % | | | (1.10 | )% | | | (0.32 | )% | | | 5.69 | % | | | 2.17 | % |
| |
| Ratios/Supplemental Data | | | | | |
| | | | | | |
Net assets, end of period (000’s omitted) | | $ | 36,363 | | | $ | 40,711 | | | $ | 55,817 | | | $ | 66,727 | | | $ | 80,371 | | | $ | 62,713 | |
| | | | | | |
Ratios (as a percentage of average daily net assets): | | | | | | | | | | | | | | | | | | | | | | | | |
| | | | | | |
Expenses excluding interest and fees(4) | | | 1.42 | %(5) | | | 1.44 | % | | | 1.45 | % | | | 1.45 | % | | | 1.44 | % | | | 1.46 | % |
| | | | | | |
Interest and fee expense | | | — | | | | 0.04 | %(6) | | | 0.09 | %(6) | | | 0.07 | %(6) | | | 0.05 | %(6) | | | 0.05 | %(6) |
| | | | | | |
Total expenses(4) | | | 1.42 | %(5) | | | 1.48 | % | | | 1.54 | % | | | 1.52 | % | | | 1.49 | % | | | 1.51 | % |
| | | | | | |
Net investment income | | | 1.40 | %(5) | | | 1.91 | % | | | 2.11 | % | | | 2.27 | % | | | 2.40 | % | | | 2.85 | % |
| | | | | | |
Portfolio Turnover | | | 72 | %(3) | | | 114 | % | | | 75 | % | | | 56 | % | | | 38 | % | | | 8 | % |
| (1) | Computed using average shares outstanding. |
| (2) | Returns are historical and are calculated by determining the percentage change in net asset value with all distributions reinvested and do not reflect the effect of sales charges. |
| (4) | Excludes the effect of custody fee credits, if any, of less than 0.005%. Effective September 1, 2015, custody fee credits, which were earned on cash deposit balances, were discontinued by the custodian. |
| (6) | Interest and fee expense relates to the liability for floating rate notes issued in conjunction with residual interest bond transactions (see Note 1H). |
| | | | |
| | 40 | | See Notes to Financial Statements. |
Eaton Vance
Municipal Income Funds
March 31, 2020
Financial Highlights — continued
| | | | | | | | | | | | | | | | | | | | | | | | |
| | | New York Fund — Class I | |
| | |
| | | Six Months Ended
March 31, 2020
(Unaudited) | | | Year Ended September 30, | |
| | | 2019 | | | 2018 | | | 2017 | | | 2016 | | | 2015 | |
| | | | | | | |
Net asset value — Beginning of period | | $ | 10.380 | | | $ | 9.800 | | | $ | 10.110 | | | $ | 10.390 | | | $ | 10.070 | | | $ | 10.140 | |
| |
| Income (Loss) From Operations | | | | | |
| | | | | | |
Net investment income(1) | | $ | 0.122 | | | $ | 0.285 | | | $ | 0.305 | | | $ | 0.322 | | | $ | 0.342 | | | $ | 0.384 | |
| | | | | | |
Net realized and unrealized gain (loss) | | | (0.074 | ) | | | 0.580 | | | | (0.311 | ) | | | (0.274 | ) | | | 0.324 | | | | (0.071 | ) |
| | | | | | |
Total income (loss) from operations | | $ | 0.048 | | | $ | 0.865 | | | $ | (0.006 | ) | | $ | 0.048 | | | $ | 0.666 | | | $ | 0.313 | |
| |
| Less Distributions | | | | | |
| | | | | | |
From net investment income | | $ | (0.128 | ) | | $ | (0.285 | ) | | $ | (0.304 | ) | | $ | (0.328 | ) | | $ | (0.346 | ) | | $ | (0.383 | ) |
| | | | | | |
Total distributions | | $ | (0.128 | ) | | $ | (0.285 | ) | | $ | (0.304 | ) | | $ | (0.328 | ) | | $ | (0.346 | ) | | $ | (0.383 | ) |
| | | | | | |
Net asset value — End of period | | $ | 10.300 | | | $ | 10.380 | | | $ | 9.800 | | | $ | 10.110 | | | $ | 10.390 | | | $ | 10.070 | |
| | | | | | |
Total Return(2) | | | 0.45 | %(3) | | | 8.96 | % | | | (0.06 | )% | | | 0.53 | % | | | 6.70 | % | | | 3.14 | % |
| |
| Ratios/Supplemental Data | | | | | |
| | | | | | |
Net assets, end of period (000’s omitted) | | $ | 142,603 | | | $ | 136,913 | | | $ | 123,119 | | | $ | 126,524 | | | $ | 104,643 | | | $ | 52,507 | |
| | | | |
Ratios (as a percentage of average daily net assets): | | | | | | | | | | | | | | | | | |
| | | | | | |
Expenses excluding interest and fees(4) | | | 0.47 | %(5) | | | 0.49 | % | | | 0.50 | % | | | 0.50 | % | | | 0.49 | % | | | 0.51 | % |
| | | | | | |
Interest and fee expense | | | — | | | | 0.04 | %(6) | | | 0.09 | %(6) | | | 0.07 | %(6) | | | 0.05 | %(6) | | | 0.05 | %(6) |
| | | | | | |
Total expenses(4) | | | 0.47 | %(5) | | | 0.53 | % | | | 0.59 | % | | | 0.57 | % | | | 0.54 | % | | | 0.56 | % |
| | | | | | |
Net investment income | | | 2.35 | %(5) | | | 2.83 | % | | | 3.06 | % | | | 3.20 | % | | | 3.31 | % | | | 3.80 | % |
| | | | | | |
Portfolio Turnover | | | 72 | %(3) | | | 114 | % | | | 75 | % | | | 56 | % | | | 38 | % | | | 8 | % |
| (1) | Computed using average shares outstanding. |
| (2) | Returns are historical and are calculated by determining the percentage change in net asset value with all distributions reinvested. |
| (4) | Excludes the effect of custody fee credits, if any, of less than 0.005%. Effective September 1, 2015, custody fee credits, which were earned on cash deposit balances, were discontinued by the custodian. |
| (6) | Interest and fee expense relates to the liability for floating rate notes issued in conjunction with residual interest bond transactions (see Note 1H). |
| | | | |
| | 41 | | See Notes to Financial Statements. |
Eaton Vance
Municipal Income Funds
March 31, 2020
Financial Highlights — continued
| | | | | | | | | | | | | | | | | | | | | | | | |
| | | Ohio Fund — Class A | |
| | |
| | | Six Months Ended
March 31, 2020
(Unaudited) | | | Year Ended September 30, | |
| | | 2019 | | | 2018 | | | 2017 | | | 2016 | | | 2015 | |
| | | | | | | |
Net asset value — Beginning of period | | $ | 9.210 | | | $ | 8.700 | | | $ | 9.020 | | | $ | 9.300 | | | $ | 9.060 | | | $ | 9.180 | |
| |
| Income (Loss) From Operations | | | | | |
| | | | | | |
Net investment income(1) | | $ | 0.130 | | | $ | 0.276 | | | $ | 0.283 | | | $ | 0.313 | | | $ | 0.329 | | | $ | 0.348 | |
| | | | | | |
Net realized and unrealized gain (loss) | | | (0.102 | ) | | | 0.506 | | | | (0.324 | ) | | | (0.283 | ) | | | 0.237 | | | | (0.123 | ) |
| | | | | | |
Total income (loss) from operations | | $ | 0.028 | | | $ | 0.782 | | | $ | (0.041 | ) | | $ | 0.030 | | | $ | 0.566 | | | $ | 0.225 | |
| |
| Less Distributions | | | | | |
| | | | | | |
From net investment income | | $ | (0.128 | ) | | $ | (0.272 | ) | | $ | (0.279 | ) | | $ | (0.310 | ) | | $ | (0.326 | ) | | $ | (0.345 | ) |
| | | | | | |
Total distributions | | $ | (0.128 | ) | | $ | (0.272 | ) | | $ | (0.279 | ) | | $ | (0.310 | ) | | $ | (0.326 | ) | | $ | (0.345 | ) |
| | | | | | |
Net asset value — End of period | | $ | 9.110 | | | $ | 9.210 | | | $ | 8.700 | | | $ | 9.020 | | | $ | 9.300 | | | $ | 9.060 | |
| | | | | | |
Total Return(2) | | | 0.30 | %(3) | | | 9.12 | % | | | (0.45 | )% | | | 0.39 | % | | | 6.33 | % | | | 2.48 | % |
| |
| Ratios/Supplemental Data | | | | | |
| | | | | | |
Net assets, end of period (000’s omitted) | | $ | 101,264 | | | $ | 102,651 | | | $ | 97,736 | | | $ | 114,303 | | | $ | 136,271 | | | $ | 130,016 | |
| | | | |
Ratios (as a percentage of average daily net assets): | | | | | | | | | | | | | | | | | |
| | | | | | |
Expenses excluding interest and fees(4) | | | 0.70 | %(5) | | | 0.71 | % | | | 0.71 | % | | | 0.72 | % | | | 0.71 | % | | | 0.72 | % |
| | | | | | |
Interest and fee expense(6) | | | 0.10 | %(5) | | | 0.13 | % | | | 0.14 | % | | | 0.11 | % | | | 0.05 | % | | | 0.02 | % |
| | | | | | |
Total expenses(4) | | | 0.80 | %(5) | | | 0.84 | % | | | 0.85 | % | | | 0.83 | % | | | 0.76 | % | | | 0.74 | % |
| | | | | | |
Net investment income | | | 2.83 | %(5) | | | 3.08 | % | | | 3.20 | % | | | 3.48 | % | | | 3.56 | % | | | 3.81 | % |
| | | | | | |
Portfolio Turnover | | | 7 | %(3) | | | 11 | % | | | 13 | % | | | 10 | % | | | 9 | % | | | 4 | % |
| (1) | Computed using average shares outstanding. |
| (2) | Returns are historical and are calculated by determining the percentage change in net asset value with all distributions reinvested and do not reflect the effect of sales charges. |
| (4) | Excludes the effect of custody fee credits, if any, of less than 0.005%. Effective September 1, 2015, custody fee credits, which were earned on cash deposit balances, were discontinued by the custodian. |
| (6) | Interest and fee expense relates to the liability for floating rate notes issued in conjunction with residual interest bond transactions (see Note 1H). |
| | | | |
| | 42 | | See Notes to Financial Statements. |
Eaton Vance
Municipal Income Funds
March 31, 2020
Financial Highlights — continued
| | | | | | | | | | | | | | | | | | | | | | | | |
| | | Ohio Fund — Class C | |
| | |
| | | Six Months Ended
March 31, 2020
(Unaudited) | | | Year Ended September 30, | |
| | | 2019 | | | 2018 | | | 2017 | | | 2016 | | | 2015 | |
| | | | | | | |
Net asset value — Beginning of period | | $ | 9.200 | | | $ | 8.700 | | | $ | 9.010 | | | $ | 9.300 | | | $ | 9.060 | | | $ | 9.170 | |
| |
| Income (Loss) From Operations | | | | | |
| | | | | | |
Net investment income(1) | | $ | 0.096 | | | $ | 0.209 | | | $ | 0.217 | | | $ | 0.245 | | | $ | 0.259 | | | $ | 0.279 | |
| | | | | | |
Net realized and unrealized gain (loss) | | | (0.102 | ) | | | 0.496 | | | | (0.314 | ) | | | (0.293 | ) | | | 0.237 | | | | (0.113 | ) |
| | | | | | |
Total income (loss) from operations | | $ | (0.006 | ) | | $ | 0.705 | | | $ | (0.097 | ) | | $ | (0.048 | ) | | $ | 0.496 | | | $ | 0.166 | |
| |
| Less Distributions | | | | | |
| | | | | | |
From net investment income | | $ | (0.094 | ) | | $ | (0.205 | ) | | $ | (0.213 | ) | | $ | (0.242 | ) | | $ | (0.256 | ) | | $ | (0.276 | ) |
| | | | | | |
Total distributions | | $ | (0.094 | ) | | $ | (0.205 | ) | | $ | (0.213 | ) | | $ | (0.242 | ) | | $ | (0.256 | ) | | $ | (0.276 | ) |
| | | | | | |
Net asset value — End of period | | $ | 9.100 | | | $ | 9.200 | | | $ | 8.700 | | | $ | 9.010 | | | $ | 9.300 | | | $ | 9.060 | |
| | | | | | |
Total Return(2) | | | (0.08 | )%(3) | | | 8.19 | % | | | (1.09 | )% | | | (0.47 | )% | | | 5.53 | % | | | 1.83 | % |
| |
| Ratios/Supplemental Data | | | | | |
| | | | | | |
Net assets, end of period (000’s omitted) | | $ | 12,253 | | | $ | 13,233 | | | $ | 19,191 | | | $ | 22,210 | | | $ | 24,822 | | | $ | 21,899 | |
| | | | |
Ratios (as a percentage of average daily net assets): | | | | | | | | | | | | | | | | | |
| | | | | | |
Expenses excluding interest and fees(4) | | | 1.45 | %(5) | | | 1.46 | % | | | 1.46 | % | | | 1.47 | % | | | 1.46 | % | | | 1.47 | % |
| | | | | | |
Interest and fee expense(6) | | | 0.10 | %(5) | | | 0.13 | % | | | 0.14 | % | | | 0.11 | % | | | 0.05 | % | | | 0.02 | % |
| | | | | | |
Total expenses(4) | | | 1.55 | %(5) | | | 1.59 | % | | | 1.60 | % | | | 1.58 | % | | | 1.51 | % | | | 1.49 | % |
| | | | | | |
Net investment income | | | 2.08 | %(5) | | | 2.35 | % | | | 2.45 | % | | | 2.73 | % | | | 2.80 | % | | | 3.06 | % |
| | | | | | |
Portfolio Turnover | | | 7 | %(3) | | | 11 | % | | | 13 | % | | | 10 | % | | | 9 | % | | | 4 | % |
| (1) | Computed using average shares outstanding. |
| (2) | Returns are historical and are calculated by determining the percentage change in net asset value with all distributions reinvested and do not reflect the effect of sales charges. |
| (4) | Excludes the effect of custody fee credits, if any, of less than 0.005%. Effective September 1, 2015, custody fee credits, which were earned on cash deposit balances, were discontinued by the custodian. |
| (6) | Interest and fee expense relates to the liability for floating rate notes issued in conjunction with residual interest bond transactions (see Note 1H). |
| | | | |
| | 43 | | See Notes to Financial Statements. |
Eaton Vance
Municipal Income Funds
March 31, 2020
Financial Highlights — continued
| | | | | | | | | | | | | | | | | | | | | | | | |
| | | Ohio Fund — Class I | |
| | |
| | | Six Months Ended
March 31, 2020
(Unaudited) | | | Year Ended September 30, | |
| | | 2019 | | | 2018 | | | 2017 | | | 2016 | | | 2015 | |
| | | | | | | |
Net asset value — Beginning of period | | $ | 9.210 | | | $ | 8.710 | | | $ | 9.020 | | | $ | 9.310 | | | $ | 9.070 | | | $ | 9.180 | |
| |
| Income (Loss) From Operations | | | | | |
| | | | | | |
Net investment income(1) | | $ | 0.139 | | | $ | 0.293 | | | $ | 0.300 | | | $ | 0.331 | | | $ | 0.346 | | | $ | 0.366 | |
| | | | | | |
Net realized and unrealized gain (loss) | | | (0.101 | ) | | | 0.498 | | | | (0.313 | ) | | | (0.293 | ) | | | 0.239 | | | | (0.113 | ) |
| | | | | | |
Total income (loss) from operations | | $ | 0.038 | | | $ | 0.791 | | | $ | (0.013 | ) | | $ | 0.038 | | | $ | 0.585 | | | $ | 0.253 | |
| |
| Less Distributions | | | | | |
| | | | | | |
From net investment income | | $ | (0.138 | ) | | $ | (0.291 | ) | | $ | (0.297 | ) | | $ | (0.328 | ) | | $ | (0.345 | ) | | $ | (0.363 | ) |
| | | | | | |
Total distributions | | $ | (0.138 | ) | | $ | (0.291 | ) | | $ | (0.297 | ) | | $ | (0.328 | ) | | $ | (0.345 | ) | | $ | (0.363 | ) |
| | | | | | |
Net asset value — End of period | | $ | 9.110 | | | $ | 9.210 | | | $ | 8.710 | | | $ | 9.020 | | | $ | 9.310 | | | $ | 9.070 | |
| | | | | | |
Total Return(2) | | | 0.40 | %(3) | | | 9.21 | % | | | (0.14 | )% | | | 0.48 | % | | | 6.54 | % | | | 2.80 | % |
| |
| Ratios/Supplemental Data | | | | | |
| | | | | | |
Net assets, end of period (000’s omitted) | | $ | 55,972 | | | $ | 49,932 | | | $ | 35,722 | | | $ | 32,065 | | | $ | 20,957 | | | $ | 12,552 | |
| | | | |
Ratios (as a percentage of average daily net assets): | | | | | | | | | | | | | | | | | |
| | | | | | |
Expenses excluding interest and fees(4) | | | 0.50 | %(5) | | | 0.51 | % | | | 0.51 | % | | | 0.52 | % | | | 0.51 | % | | | 0.52 | % |
| | | | | | |
Interest and fee expense(6) | | | 0.10 | %(5) | | | 0.13 | % | | | 0.14 | % | | | 0.11 | % | | | 0.05 | % | | | 0.02 | % |
| | | | | | |
Total expenses(4) | | | 0.60 | %(5) | | | 0.64 | % | | | 0.65 | % | | | 0.63 | % | | | 0.56 | % | | | 0.54 | % |
| | | | | | |
Net investment income | | | 3.03 | %(5) | | | 3.26 | % | | | 3.39 | % | | | 3.68 | % | | | 3.73 | % | | | 4.00 | % |
| | | | | | |
Portfolio Turnover | | | 7 | %(3) | | | 11 | % | | | 13 | % | | | 10 | % | | | 9 | % | | | 4 | % |
| (1) | Computed using average shares outstanding. |
| (2) | Returns are historical and are calculated by determining the percentage change in net asset value with all distributions reinvested. |
| (4) | Excludes the effect of custody fee credits, if any, of less than 0.005%. Effective September 1, 2015, custody fee credits, which were earned on cash deposit balances, were discontinued by the custodian. |
| (6) | Interest and fee expense relates to the liability for floating rate notes issued in conjunction with residual interest bond transactions (see Note 1H). |
| | | | |
| | 44 | | See Notes to Financial Statements. |
Eaton Vance
Municipal Income Funds
March 31, 2020
Notes to Financial Statements (Unaudited)
1 Significant Accounting Policies
Eaton Vance Municipals Trust (the Trust) is a Massachusetts business trust registered under the Investment Company Act of 1940, as amended (the 1940 Act), as anopen-end management investment company. The Trust presently consists of eighteen funds, four of which, eachnon-diversified, are included in these financial statements. They include Eaton Vance California Municipal Opportunities Fund (California Opportunities Fund), Eaton Vance Massachusetts Municipal Income Fund (Massachusetts Fund), Eaton Vance New York Municipal Income Fund (New York Fund) and Eaton Vance Ohio Municipal Income Fund (Ohio Fund), (each individually referred to as the Fund, and collectively, the Funds). The investment objective of the Massachusetts Fund, New York Fund and Ohio Fund is to provide current income exempt from regular federal income tax and from particular state or local income or other taxes. The investment objective of the California Opportunities Fund is to seek to maximizeafter-tax total return. The Funds offer three classes of shares. Class A shares are generally sold subject to a sales charge imposed at time of purchase. Class C shares are sold at net asset value and are generally subject to a contingent deferred sales charge (see Note 5). Effective January 25, 2019, Class C shares generally automatically convert to Class A shares ten years after their purchase as described in the Funds’ prospectus. Class I shares are sold at net asset value and are not subject to a sales charge. Each class represents apro-rata interest in the Fund, but votes separately on class-specific matters and (as noted below) is subject to different expenses. Realized and unrealized gains and losses are allocated daily to each class of shares based on the relative net assets of each class to the total net assets of the Fund. Net investment income, other than class-specific expenses, is allocated daily to each class of shares based upon the ratio of the value of each class’s paid shares to the total value of all paid shares. Each class of shares differs in its distribution plan and certain other class-specific expenses.
The following is a summary of significant accounting policies of the Funds. The policies are in conformity with accounting principles generally accepted in the United States of America (U.S. GAAP). Each Fund is an investment company and follows accounting and reporting guidance in the Financial Accounting Standards Board (FASB) Accounting Standards Codification Topic 946.
A Investment Valuation — The following methodologies are used to determine the market value or fair value of investments.
Debt Obligations. Debt obligations are generally valued on the basis of valuations provided by third party pricing services, as derived from such services’ pricing models. Inputs to the models may include, but are not limited to, reported trades, executable bid and ask prices, broker/dealer quotations, prices or yields of securities with similar characteristics, interest rates, anticipated prepayments, benchmark curves or information pertaining to the issuer, as well as industry and economic events. The pricing services may use a matrix approach, which considers information regarding securities with similar characteristics to determine the valuation for a security. Short-term debt obligations purchased with a remaining maturity of sixty days or less for which a valuation from a third party pricing service is not readily available may be valued at amortized cost, which approximates fair value.
Derivatives. Financial futures contracts are valued at the closing settlement price established by the board of trade or exchange on which they are traded.
Fair Valuation. Investments for which valuations or market quotations are not readily available or are deemed unreliable are valued at fair value using methods determined in good faith by or at the direction of the Trustees of a Fund in a manner that most fairly reflects the security’s “fair value”, which is the amount that a Fund might reasonably expect to receive for the security upon its current sale in the ordinary course. Each such determination is based on a consideration of relevant factors, which are likely to vary from one pricing context to another. These factors may include, but are not limited to, the type of security, the existence of any contractual restrictions on the security’s disposition, the price and extent of public trading in similar securities of the issuer or of comparable entities, quotations or relevant information obtained from broker/dealers or other market participants, information obtained from the issuer, analysts, and/or the appropriate stock exchange (for exchange-traded securities), an analysis of the entity’s financial statements, and an evaluation of the forces that influence the issuer and the market(s) in which the security is purchased and sold.
B Investment Transactions and Related Income — Investment transactions for financial statement purposes are accounted for on a trade date basis. Realized gains and losses on investments sold are determined on the basis of identified cost. Interest income is recorded on the basis of interest accrued, adjusted for amortization of premium or accretion of discount.
C Federal Taxes — Each Fund’s policy is to comply with the provisions of the Internal Revenue Code applicable to regulated investment companies and to distribute to shareholders each year substantially all of its taxable, if any, andtax-exempt net investment income, and all or substantially all of its net realized capital gains. Accordingly, no provision for federal income or excise tax is necessary. Each Fund intends to satisfy conditions which will enable it to designate distributions from the interest income generated by its investments innon-taxable municipal securities, which are exempt from regular federal income tax when received by each Fund, as exempt-interest dividends. The portion of such interest, if any, earned on private activity bonds issued after August 7, 1986, may be considered a tax preference item to shareholders.
As of March 31, 2020, the Funds had no uncertain tax positions that would require financial statement recognition,de-recognition, or disclosure. Each Fund files a U.S. federal income tax return annually after its fiscalyear-end, which is subject to examination by the Internal Revenue Service for a period of three years from the date of filing.
D Expenses — The majority of expenses of the Trust are directly identifiable to an individual fund. Expenses which are not readily identifiable to a specific fund are allocated taking into consideration, among other things, the nature and type of expense and the relative size of the funds.
E Legal Fees — Legal fees and other related expenses incurred as part of negotiations of the terms and requirement of capital infusions, or that are expected to result in the restructuring of, or a plan of reorganization for, an investment are recorded as realized losses. Ongoing expenditures to protect or enhance an investment are treated as operating expenses.
Eaton Vance
Municipal Income Funds
March 31, 2020
Notes to Financial Statements (Unaudited) — continued
F Use of Estimates — The preparation of the financial statements in conformity with U.S. GAAP requires management to make estimates and assumptions that affect the reported amounts of assets and liabilities at the date of the financial statements and the reported amounts of income and expense during the reporting period. Actual results could differ from those estimates.
G Indemnifications — Under the Trust’s organizational documents, its officers and Trustees may be indemnified against certain liabilities and expenses arising out of the performance of their duties to the Funds. Under Massachusetts law, if certain conditions prevail, shareholders of a Massachusetts business trust (such as the Trust) could be deemed to have personal liability for the obligations of the Trust. However, the Trust’s Declaration of Trust contains an express disclaimer of liability on the part of Fund shareholders and theBy-laws provide that the Trust shall assume, upon request by the shareholder, the defense on behalf of any Fund shareholders. Moreover, theBy-laws also provide for indemnification out of Fund property of any shareholder held personally liable solely by reason of being or having been a shareholder for all loss or expense arising from such liability. Additionally, in the normal course of business, each Fund enters into agreements with service providers that may contain indemnification clauses. Each Fund’s maximum exposure under these arrangements is unknown as this would involve future claims that may be made against each Fund that have not yet occurred.
H Floating Rate Notes Issued in Conjunction with Securities Held — The Funds may invest in residual interest bonds, also referred to as inverse floating rate securities, whereby a Fund may sell a variable or fixed rate bond for cash to a Special-Purpose Vehicle (the SPV), (which is generally organized as a trust), while at the same time, buying a residual interest in the assets and cash flows of the SPV. The bond is deposited into the SPV with the same CUSIP number as the bond sold to the SPV by the Fund, and which may have been, but is not required to be, the bond purchased from the Fund (the Bond). The SPV also issues floating rate notes (Floating Rate Notes) which are sold to third-parties. The residual interest bond held by a Fund gives the Fund the right (1) to cause the holders of the Floating Rate Notes to generally tender their notes at par, and (2) to have the Bond held by the SPV transferred to the Fund, thereby terminating the SPV. Should the Fund exercise such right, it would generally pay the SPV the par amount due on the Floating Rate Notes and exchange the residual interest bond for the underlying Bond. Pursuant to generally accepted accounting principles for transfers and servicing of financial assets and extinguishment of liabilities, the Funds account for the transaction described above as a secured borrowing by including the Bond in their Portfolio of Investments and the Floating Rate Notes as a liability under the caption “Payable for floating rate notes issued” in their Statement of Assets and Liabilities. The Floating Rate Notes have interest rates that generally reset weekly and their holders have the option to tender their notes to the SPV for redemption at par at each reset date. Accordingly, the fair value of the payable for floating rate notes issued approximates its carrying value. If measured at fair value, the payable for floating rate notes would have been considered as Level 2 in the fair value hierarchy (see Note 10) at March 31, 2020. Interest expense related to a Fund’s liability with respect to Floating Rate Notes is recorded as incurred. The SPV may be terminated by the Fund, as noted above, or by the occurrence of certain termination events as defined in the trust agreement, such as a downgrade in the credit quality of the underlying Bond, bankruptcy of or payment failure by the issuer of the underlying Bond, the inability to remarket Floating Rate Notes that have been tendered due to insufficient buyers in the market, or the failure by the SPV to obtain renewal of the liquidity agreement under which liquidity support is provided for the Floating Rate Notes up to one year. At March 31, 2020, the amounts of the Funds’ Floating Rate Notes and related interest rates and collateral were as follows:
| | | | | | | | | | | | |
| | | California
Opportunities
Fund | | | Massachusetts
Fund | | | Ohio
Fund | |
| | | |
Floating Rate Notes Outstanding | | $ | 2,310,000 | | | $ | 3,678,948 | | | $ | 9,178,956 | |
| | | |
Interest Rate or Range of Interest Rates (%) | | | 5.01 | | | | 4.91 | | | | 3.00–3.25 | |
| | | |
Collateral for Floating Rate Notes Outstanding | | $ | 3,092,412 | | | $ | 7,593,167 | | | $ | 15,572,044 | |
For the six months ended March 31, 2020, the Funds’ average settled Floating Rate Notes outstanding and the average interest rate (annualized) including fees were as follows:
| | | | | | | | | | | | |
| | | California
Opportunities
Fund | | | Massachusetts
Fund | | | Ohio
Fund | |
| | | |
Average Floating Rate Notes Outstanding | | $ | 2,310,000 | | | $ | 3,640,000 | | | $ | 9,120,000 | |
| | | |
Average Interest Rate | | | 2.03 | % | | | 2.14 | % | | | 1.95 | % |
In certain circumstances, the Funds may enter into shortfall and forbearance agreements with brokers by which a Fund agrees to reimburse the broker for the difference between the liquidation value of the Bond held by the SPV and the liquidation value of the Floating Rate Notes, as well as any shortfalls in interest cash flows. The Funds had no shortfalls as of March 31, 2020.
The Funds may also purchase residual interest bonds in a secondary market transaction without first owning the underlying bond. Such transactions are not required to be treated as secured borrowings. Shortfall agreements, if any, related to residual interest bonds purchased in a secondary market transaction are disclosed in the Portfolio of Investments.
Eaton Vance
Municipal Income Funds
March 31, 2020
Notes to Financial Statements (Unaudited) — continued
The Funds’ investment policies and restrictions expressly permit investments in residual interest bonds. Such bonds typically offer the potential for yields exceeding the yields available on fixed rate bonds with comparable credit quality and maturity. These securities tend to underperform the market for fixed rate bonds in a rising long-term interest rate environment, but tend to outperform the market for fixed rate bonds when long-term interest rates decline. The value and income of residual interest bonds are generally more volatile than that of a fixed rate bond. The Funds’ investment policies do not allow the Funds to borrow money except as permitted by the 1940 Act. Management believes that the Funds’ restrictions on borrowing money and issuing senior securities (other than as specifically permitted) do not apply to Floating Rate Notes issued by the SPV and included as a liability in the Funds’ Statement of Assets and Liabilities. As secured indebtedness issued by an SPV, Floating Rate Notes are distinct from the borrowings and senior securities to which the Funds’ restrictions apply. Residual interest bonds held by the Funds are securities exempt from registration under Rule 144A of the Securities Act of 1933.
I Financial Futures Contracts — Upon entering into a financial futures contract, a Fund is required to deposit with the broker, either in cash or securities, an amount equal to a certain percentage of the contract amount (initial margin). Subsequent payments, known as variation margin, are made or received by the Fund each business day, depending on the daily fluctuations in the value of the underlying security, and are recorded as unrealized gains or losses by the Fund. Gains (losses) are realized upon the expiration or closing of the financial futures contracts. Should market conditions change unexpectedly, the Fund may not achieve the anticipated benefits of the financial futures contracts and may realize a loss. Futures contracts have minimal counterparty risk as they are exchange traded and the clearinghouse for the exchange is substituted as the counterparty, guaranteeing counterparty performance.
J When-Issued Securities and Delayed Delivery Transactions — The Funds may purchase or sell securities on a delayed delivery or when-issued basis. Payment and delivery may take place after the customary settlement period for that security. At the time the transaction is negotiated, the price of the security that will be delivered is fixed. The Funds maintain cash and/or security positions for these commitments such that sufficient liquid assets will be available to make payments upon settlement. Securities purchased on a delayed delivery or when-issued basis aremarked-to-market daily and begin earning interest on settlement date. Losses may arise due to changes in the market value of the underlying securities or if the counterparty does not perform under the contract.
K Interim Financial Statements — The interim financial statements relating to March 31, 2020 and for the six months then ended have not been audited by an independent registered public accounting firm, but in the opinion of the Funds’ management, reflect all adjustments, consisting only of normal recurring adjustments, necessary for the fair presentation of the financial statements.
2 Distributions to Shareholders and Income Tax Information
The net investment income of each Fund is determined daily and substantially all of the net investment income so determined is declared as a dividend to shareholders of record at the time of declaration. Distributions are declared separately for each class of shares. Distributions are paid monthly. Distributions of realized capital gains are made at least annually. Shareholders may reinvest income and capital gain distributions in additional shares of the same class of a Fund at the net asset value as of the reinvestment date or, at the election of the shareholder, receive distributions in cash. Distributions to shareholders are determined in accordance with income tax regulations, which may differ from U.S. GAAP. As required by U.S. GAAP, only distributions in excess of tax basis earnings and profits are reported in the financial statements as a return of capital. Permanent differences between book and tax accounting relating to distributions are reclassified topaid-in capital. For tax purposes, distributions from short-term capital gains are considered to be from ordinary income.
At September 30, 2019, the following Funds, for federal income tax purposes, had deferred capital losses which would reduce the respective Fund’s taxable income arising from future net realized gains on investment transactions, if any, to the extent permitted by the Internal Revenue Code, and thus would reduce the amount of distributions to shareholders, which would otherwise be necessary to relieve the Funds of any liability for federal income or excise tax. The deferred capital losses are treated as arising on the first day of a Fund’s next taxable year, retaining the same short-term or long-term character as when originally deferred. The amounts of the deferred capital losses are as follows:
| | | | | | | | | | | | | | | | |
| | | California
Opportunities
Fund | | | Massachusetts
Fund | | | New York
Fund | | | Ohio Fund | |
| | | | |
Deferred capital losses: | | | | | | | | | | | | | | | | |
| | | | |
Short-term | | $ | — | | | $ | 486,029 | | | $ | — | | | $ | 4,981,142 | |
| | | | |
Long-term | | $ | — | | | $ | 616,052 | | | $ | — | | | $ | 4,769,101 | |
Eaton Vance
Municipal Income Funds
March 31, 2020
Notes to Financial Statements (Unaudited) — continued
The cost and unrealized appreciation (depreciation) of investments, including open derivative contracts, of each Fund at March 31, 2020, as determined on a federal income tax basis, were as follows:
| | | | | | | | | | | | | | | | |
| | | California
Opportunities
Fund | | | Massachusetts
Fund | | | New York
Fund | | | Ohio
Fund | |
| | | | |
Aggregate cost | | $ | 368,395,406 | | | $ | 162,397,316 | | | $ | 392,610,163 | | | $ | 149,637,474 | |
| | | | |
Gross unrealized appreciation | | $ | 11,275,994 | | | $ | 12,382,123 | | | $ | 17,650,421 | | | $ | 16,632,541 | |
| | | | |
Gross unrealized depreciation | | | (1,816,241 | ) | | | (294,322 | ) | | | (3,738,512 | ) | | | (888,524 | ) |
| | | | |
Net unrealized appreciation | | $ | 9,459,753 | | | $ | 12,087,801 | | | $ | 13,911,909 | | | $ | 15,744,017 | |
3 Investment Adviser Fee and Other Transactions with Affiliates
The investment adviser fee is earned by Boston Management and Research (BMR), a subsidiary of Eaton Vance Management (EVM), as compensation for management and investment advisory services rendered to each Fund. The fee is based upon a percentage of average daily net assets plus a percentage of gross income (i.e., income other than gains from the sale of securities) as presented in the following table (except for California Opportunities Fund) and is payable monthly.
| | | | | | | | |
| Daily Net Assets | | Annual Asset
Rate | | | Daily Income
Rate | |
| | |
Up to $20 million | | | 0.10 | % | | | 1.00 | % |
| | |
$20 million up to $40 million | | | 0.20 | | | | 2.00 | |
| | |
$40 million up to $500 million | | | 0.30 | | | | 3.00 | |
On average daily net assets of $500 million or more, the rates are reduced. For California Opportunities Fund, the annual asset rate and daily income rate are 0.30% and 3.00%, respectively, on average daily net assets of up to $500 million and at reduced rates on daily net assets of $500 million or more.
For the six months ended March 31, 2020, investment adviser fees incurred by the Funds and the effective annual rates, as a percentage of average daily net assets, were as follows:
| | | | | | | | | | | | | | | | |
| | | California
Opportunities
Fund | | | Massachusetts
Fund | | | New York
Fund | | | Ohio
Fund | |
| | | | |
Investment Adviser Fee | | $ | 720,901 | | | $ | 306,489 | | | $ | 762,173 | | | $ | 304,177 | |
| | | | |
Effective Annual Rate | | | 0.38 | % | | | 0.35 | % | | | 0.37 | % | | | 0.36 | % |
EVM serves as the administrator of each Fund, but receives no compensation. EVM providessub-transfer agency and related services to the Funds pursuant to aSub-Transfer Agency Support Services Agreement. Eaton Vance Distributors, Inc. (EVD), an affiliate of EVM and the Funds’ principal underwriter, received a portion of the sales charge on sales of Class A shares of the Funds. EVD also received distribution and service fees from Class A and Class C shares (see Note 4) and contingent deferred sales charges (see Note 5).Sub-transfer agent fees earned by EVM, which are included in transfer and dividend disbursing agent fees on the Statements of Operations, and Class A sales charges that the Funds were informed were received by EVD for the six months ended March 31, 2020 were as follows:
| | | | | | | | | | | | | | | | |
| | | California
Opportunities
Fund | | | Massachusetts
Fund | | | New York
Fund | | | Ohio
Fund | |
| | | | |
EVM’sSub-Transfer Agent Fees | | $ | 6,197 | | | $ | 6,714 | | | $ | 17,390 | | | $ | 5,754 | |
| | | | |
EVD’s Class A Sales Charges | | $ | 7,512 | | | $ | 5,155 | | | $ | 13,999 | | | $ | 14,046 | |
Eaton Vance
Municipal Income Funds
March 31, 2020
Notes to Financial Statements (Unaudited) — continued
Trustees and officers of the Funds who are members of EVM’s or BMR’s organizations receive remuneration for their services to the Funds out of the investment adviser fee. Trustees of the Funds who are not affiliated with the investment adviser may elect to defer receipt of all or a percentage of their annual fees in accordance with the terms of the Trustees Deferred Compensation Plan. For the six months ended March 31, 2020, no significant amounts have been deferred. Certain officers and Trustees of the Funds are officers of the above organizations.
4 Distribution Plans
Each Fund has in effect a distribution plan for Class A shares (Class A Plan) pursuant to Rule12b-1 under the 1940 Act. The Class A Plan provides that each Fund will pay EVD a distribution and service fee not exceeding 0.25% per annum of its average daily net assets attributable to Class A shares for distribution services and facilities provided to each Fund by EVD, as well as for personal services and/or the maintenance of shareholder accounts. The Trustees approved distribution and service fee payments equal to 0.20% (0.25% for California Opportunities Fund) per annum of each Fund’s average daily net assets attributable to Class A shares. Distribution and service fees paid or accrued to EVD for the six months ended March 31, 2020 for Class A shares amounted to the following:
| | | | | | | | | | | | | | | | |
| | | California
Opportunities
Fund | | | Massachusetts
Fund | | | New York
Fund | | | Ohio
Fund | |
| | | | |
Class A Distribution and Service Fees | | $ | 157,483 | | | $ | 94,343 | | | $ | 235,893 | | | $ | 103,873 | |
Each Fund also has in effect a distribution plan for Class C shares (Class C Plan) pursuant to Rule12b-1 under the 1940 Act. Pursuant to the Class C Plan, each Fund pays EVD amounts equal to 0.75% per annum of its average daily net assets attributable to Class C shares for providing ongoing distribution services and facilities to the respective Funds. For the six months ended March 31, 2020, the Funds paid or accrued to EVD the following distribution fees:
| | | | | | | | | | | | | | | | |
| | | California
Opportunities
Fund | | | Massachusetts
Fund | | | New York
Fund | | | Ohio
Fund | |
| | | | |
Class C Distribution Fees | | $ | 108,907 | | | $ | 45,260 | | | $ | 145,432 | | | $ | 48,625 | |
The Class C Plan also authorizes each Fund to make payments of service fees to EVD, financial intermediaries and other persons in amounts not exceeding 0.25% per annum of the average daily net assets attributable to Class C shares. The Trustees approved service fee payments equal to 0.20% (0.25% for California Opportunities Fund) per annum of each Fund’s average daily net assets attributable to Class C shares. Service fees paid or accrued are for personal services and/or the maintenance of shareholder accounts. They are separate and distinct from the Class C sales commissions and distribution fees payable to EVD. Service fees paid or accrued for the six months ended March 31, 2020 amounted to the following:
| | | | | | | | | | | | | | | | |
| | | California
Opportunities
Fund | | | Massachusetts
Fund | | | New York
Fund | | | Ohio
Fund | |
| | | | |
Class C Service Fees | | $ | 36,302 | | | $ | 12,069 | | | $ | 38,782 | | | $ | 12,967 | |
Distribution and service fees are subject to the limitations contained in the Financial Industry Regulatory Authority Rule 2341(d).
Eaton Vance
Municipal Income Funds
March 31, 2020
Notes to Financial Statements (Unaudited) — continued
5 Contingent Deferred Sales Charges
A contingent deferred sales charge (CDSC) of 1% generally is imposed on redemptions of Class C shares made within 12 months of purchase. Class A shares may be subject to a 1% CDSC if redeemed within eighteen months of purchase (depending on the circumstances of purchase). Generally, the CDSC is based upon the lower of the net asset value at date of redemption or date of purchase. No charge is levied on shares acquired by reinvestment of dividends or capital gain distributions. For the six months ended March 31, 2020, the Funds were informed that EVD received approximately the following amounts of CDSCs paid by Class A and Class C shareholders:
| | | | | | | | | | | | | | | | |
| | | California
Opportunities
Fund | | | Massachusetts
Fund | | | New York
Fund | | | Ohio
Fund | |
| | | | |
Class A | | $ | 30,000 | | | $ | — | | | $ | — | | | $ | — | |
| | | | |
Class C | | $ | 300 | | | $ | 900 | | | $ | 2,000 | | | $ | 100 | |
6 Purchases and Sales of Investments
Purchases and sales of investments, other than short-term obligations, for the six months ended March 31, 2020 were as follows:
| | | | | | | | | | | | | | | | |
| | | California
Opportunities
Fund | | | Massachusetts
Fund | | | New York
Fund | | | Ohio
Fund | |
| | | | |
Purchases | | $ | 368,511,607 | | | $ | 30,855,935 | | | $ | 298,636,996 | | | $ | 17,667,789 | |
| | | | |
Sales | | $ | 341,345,184 | | | $ | 19,223,758 | | | $ | 295,941,661 | | | $ | 12,919,040 | |
7 Shares of Beneficial Interest
Each Fund’s Declaration of Trust permits the Trustees to issue an unlimited number of full and fractional shares of beneficial interest (without par value). Such shares may be issued in a number of different series (such as the Funds) and classes. Transactions in Fund shares were as follows:
| | | | | | | | | | | | |
California Opportunities Fund | | | |
| | | Six Months Ended March 31, 2020 (Unaudited) | |
| | | Class A | | | Class C | | | Class I | |
| | | |
Sales | | | 1,125,092 | | | | 461,883 | | | | 7,771,747 | |
| | | |
Issued to shareholders electing to receive payments of distributions in Fund shares | | | 136,140 | | | | 26,777 | | | | 282,081 | |
| | | |
Redemptions | | | (1,340,793 | ) | | | (573,763 | ) | | | (5,016,845 | ) |
| | | |
Converted from Class C shares | | | 32,896 | | | | — | | | | — | |
| | | |
Converted to Class A shares | | | — | | | | (35,583 | ) | | | — | |
| | | |
Net increase (decrease) | | | (46,665 | ) | | | (120,686 | ) | | | 3,036,983 | |
| | | |
| | | | | | | | | | | | |
| | | Year Ended September 30, 2019 | |
| | | Class A | | | Class C | | | Class I | |
| | | |
Sales | | | 2,568,377 | | | | 1,039,114 | | | | 9,538,091 | |
| | | |
Issued to shareholders electing to receive payments of distributions in Fund shares | | | 226,553 | | | | 38,540 | | | | 333,931 | |
| | | |
Redemptions | | | (1,874,523 | ) | | | (601,732 | ) | | | (3,265,728 | ) |
| | | |
Converted from Class C shares | | | 277,509 | | | | — | | | | — | |
| | | |
Converted to Class A shares | | | — | | | | (300,089 | ) | | | — | |
| | | |
Net increase | | | 1,197,916 | | | | 175,833 | | | | 6,606,294 | |
Eaton Vance
Municipal Income Funds
March 31, 2020
Notes to Financial Statements (Unaudited) — continued
| | | | | | | | | | | | |
Massachusetts Fund | | | |
| | | Six Months Ended March 31, 2020 (Unaudited) | |
| | | Class A | | | Class C | | | Class I | |
| | | |
Sales | | | 545,920 | | | | 88,703 | | | | 1,942,916 | |
| | | |
Issued to shareholders electing to receive payments of distributions in Fund shares | | | 113,140 | | | | 10,700 | | | | 91,460 | |
| | | |
Redemptions | | | (597,696 | ) | | | (151,155 | ) | | | (1,096,518 | ) |
| | | |
Converted from Class C shares | | | 101,206 | | | | — | | | | — | |
| | | |
Converted to Class A shares | | | — | | | | (101,188 | ) | | | — | |
| | | |
Net increase (decrease) | | | 162,570 | | | | (152,940 | ) | | | 937,858 | |
| | | |
| | | | | | | | | | | | |
| | | Year Ended September 30, 2019 | |
| | | Class A | | | Class C | | | Class I | |
| | | |
Sales | | | 805,225 | | | | 250,373 | | | | 3,347,077 | |
| | | |
Issued to shareholders electing to receive payments of distributions in Fund shares | | | 244,662 | | | | 25,824 | | | | 151,530 | |
| | | |
Redemptions | | | (1,333,729 | ) | | | (189,817 | ) | | | (1,120,013 | ) |
| | | |
Converted from Class C shares | | | 418,172 | | | | — | | | | — | |
| | | |
Converted to Class A shares | | | — | | | | (417,968 | ) | | | — | |
| | | |
Net increase (decrease) | | | 134,330 | | | | (331,588 | ) | | | 2,378,594 | |
| | | |
| | | | | | | | | | | | |
New York Fund | | | |
| | | Six Months Ended March 31, 2020 (Unaudited) | |
| | | Class A | | | Class C | | | Class I | |
| | | |
Sales | | | 1,046,489 | | | | 204,046 | | | | 1,981,459 | |
| | | |
Issued to shareholders electing to receive payments of distributions in Fund shares | | | 227,051 | | | | 21,776 | | | | 133,840 | |
| | | |
Redemptions | | | (1,647,192 | ) | | | (515,408 | ) | | | (1,461,872 | ) |
| | | |
Converted from Class C shares | | | 102,202 | | | | — | | | | — | |
| | | |
Converted to Class A shares | | | — | | | | (102,188 | ) | | | — | |
| | | |
Net increase (decrease) | | | (271,450 | ) | | | (391,774 | ) | | | 653,427 | |
| | | |
| | | | | | | | | | | | |
| | | Year Ended September 30, 2019 | |
| | | Class A | | | Class C | | | Class I | |
| | | |
Sales | | | 2,296,580 | | | | 416,538 | | | | 4,573,506 | |
| | | |
Issued to shareholders electing to receive payments of distributions in Fund shares | | | 516,401 | | | | 70,073 | | | | 274,908 | |
| | | |
Redemptions | | | (3,370,521 | ) | | | (1,359,455 | ) | | | (4,225,584 | ) |
| | | |
Converted from Class C shares | | | 902,117 | | | | — | | | | — | |
| | | |
Converted to Class A shares | | | — | | | | (901,779 | ) | | | — | |
| | | |
Net increase (decrease) | | | 344,577 | | | | (1,774,623 | ) | | | 622,830 | |
Eaton Vance
Municipal Income Funds
March 31, 2020
Notes to Financial Statements (Unaudited) — continued
| | | | | | | | | | | | |
Ohio Fund | | | |
| | | Six Months Ended March 31, 2020 (Unaudited) | |
| | | Class A | | | Class C | | | Class I | |
| | | |
Sales | | | 886,035 | | | | 114,319 | | | | 1,264,945 | |
| | | |
Issued to shareholders electing to receive payments of distributions in Fund shares | | | 137,042 | | | | 11,930 | | | | 77,771 | |
| | | |
Redemptions | | | (1,146,245 | ) | | | (124,230 | ) | | | (620,017 | ) |
| | | |
Converted from Class C shares | | | 93,690 | | | | — | | | | — | |
| | | |
Converted to Class A shares | | | — | | | | (93,706 | ) | | | — | |
| | | |
Net increase (decrease) | | | (29,478 | ) | | | (91,687 | ) | | | 722,699 | |
| | | |
| | | | | | | | | | | | |
| | | Year Ended September 30, 2019 | |
| | | Class A | | | Class C | | | Class I | |
| | | |
Sales | | | 1,075,739 | | | | 212,622 | | | | 2,354,267 | |
| | | |
Issued to shareholders electing to receive payments of distributions in Fund shares | | | 289,541 | | | | 31,541 | | | | 122,745 | |
| | | |
Redemptions | | | (1,972,282 | ) | | | (489,558 | ) | | | (1,159,967 | ) |
| | | |
Converted from Class C shares | | | 523,315 | | | | — | | | | — | |
| | | |
Converted to Class A shares | | | — | | | | (523,651 | ) | | | — | |
| | | |
Net increase (decrease) | | | (83,687 | ) | | | (769,046 | ) | | | 1,317,045 | |
8 Line of Credit
The Funds participate with other portfolios and funds managed by EVM and its affiliates in an $800 million unsecured line of credit agreement with a group of banks, which is in effect through October 27, 2020. In connection with the renewal of the agreement on October 29, 2019, funds managed by Calvert Research and Management, an affiliate of EVM, were added as participating funds to the agreement and the borrowing limit was increased from $625 million. Borrowings are made by the Funds solely for temporary purposes related to redemptions and other short-term cash needs. Interest is charged to each Fund based on its borrowings at an amount above either the Eurodollar rate or Federal Funds rate. In addition, a fee computed at an annual rate of 0.15% on the daily unused portion of the line of credit is allocated among the participating portfolios and funds at the end of each quarter. Because the line of credit is not available exclusively to the Funds, a Fund may be unable to borrow some or all of its requested amounts at any particular time. The Funds did not have any significant borrowings or allocated fees during the six months ended March 31, 2020.
9 Financial Instruments
The Funds may trade in financial instruments withoff-balance sheet risk in the normal course of their investing activities. These financial instruments may include financial futures contracts and may involve, to a varying degree, elements of risk in excess of the amounts recognized for financial statement purposes. The notional or contractual amounts of these instruments represent the investment a Fund has in particular classes of financial instruments and do not necessarily represent the amounts potentially subject to risk. The measurement of the risks associated with these instruments is meaningful only when all related and offsetting transactions are considered. A summary of obligations under these financial instruments at March 31, 2020 is included in the Portfolio of Investments. At March 31, 2020, the Ohio Fund had sufficient cash and/or securities to cover commitments under these contracts.
Each Fund is subject to interest rate risk in the normal course of pursuing its investment objective. Because the Funds hold fixed-rate bonds, the value of these bonds may decrease if interest rates rise. During the six months ended March 31, 2020, the Ohio Fund entered into U.S. Treasury futures contracts to hedge against changes in interest rates.
Eaton Vance
Municipal Income Funds
March 31, 2020
Notes to Financial Statements (Unaudited) — continued
The fair values of open derivative instruments (not considered to be hedging instruments for accounting disclosure purposes) and whose primary underlying risk exposure is interest rate risk at March 31, 2020 were as follows:
| | | | |
| | | Ohio
Fund | |
|
Liability Derivative: | |
| |
Futures Contracts | | $ | (389,127 | )(1) |
| |
Total | | $ | (389,127 | ) |
| (1) | Only the current day’s variation margin on open futures contracts is reported within the Statements of Assets and Liabilities as Receivable or Payable for variation margin on open financial futures contracts, as applicable. |
The effect of derivative instruments (not considered to be hedging instruments for accounting disclosure purposes) on the Statement of Operations and whose primary underlying risk exposure is interest rate risk for the six months ended March 31, 2020 was as follows:
| | | | |
| | | Ohio
Fund | |
| |
Realized Gain (Loss) on Derivatives Recognized in Income | | $ | (60,748 | )(1) |
| |
Change in Unrealized Appreciation (Depreciation) on Derivatives Recognized in Income | | $ | (495,008 | )(2) |
| (1) | Statement of Operations location: Net realized gain (loss) – Financial futures contracts. |
| (2) | Statement of Operations location: Change in unrealized appreciation (depreciation) – Financial futures contracts. |
The average notional cost of futures contracts outstanding during the six months ended March 31, 2020, which is indicative of the volume of this derivative type, was approximately as follows:
| | | | |
| | | Ohio Fund | |
|
Average Notional Cost: | |
| |
Futures Contracts — Short | | $ | 4,886,000 | |
10 Fair Value Measurements
Under generally accepted accounting principles for fair value measurements, a three-tier hierarchy to prioritize the assumptions, referred to as inputs, is used in valuation techniques to measure fair value. The three-tier hierarchy of inputs is summarized in the three broad levels listed below.
| • | | Level 1 – quoted prices in active markets for identical investments |
| • | | Level 2 – other significant observable inputs (including quoted prices for similar investments, interest rates, prepayment speeds, credit risk, etc.) |
| • | | Level 3 – significant unobservable inputs (including a fund’s own assumptions in determining the fair value of investments) |
In cases where the inputs used to measure fair value fall in different levels of the fair value hierarchy, the level disclosed is determined based on the lowest level input that is significant to the fair value measurement in its entirety. The inputs or methodology used for valuing securities are not necessarily an indication of the risk associated with investing in those securities.
Eaton Vance
Municipal Income Funds
March 31, 2020
Notes to Financial Statements (Unaudited) — continued
At March 31, 2020, the hierarchy of inputs used in valuing the Funds’ investments and open derivative instruments, which are carried at value, were as follows:
| | | | | | | | | | | | | | | | |
California Opportunities Fund | | | | | | | | | | | | |
| Asset Description | | Level 1 | | | Level 2 | | | Level 3 | | | Total | |
| | | | |
Tax-Exempt Municipal Securities | | $ | — | | | $ | 343,007,490 | | | $ | — | | | $ | 343,007,490 | |
| | | | |
Taxable Municipal Securities | | | — | | | | 34,765,190 | | | | — | | | | 34,765,190 | |
| | | | |
Corporate Bonds & Notes | | | — | | | | 2,392,479 | | | | — | | | | 2,392,479 | |
| | | | |
Total Investments | | $ | — | | | $ | 380,165,159 | | | $ | — | | | $ | 380,165,159 | |
|
Massachusetts Fund | |
| Asset Description | | Level 1 | | | Level 2 | | | Level 3 | | | Total | |
| | | | |
Tax-Exempt Investments | | $ | — | | | $ | 171,202,923 | | | $ | — | | | $ | 171,202,923 | |
| | | | |
Taxable Municipal Securities | | | — | | | | 6,961,142 | | | | — | | | | 6,961,142 | |
| | | | |
Total Investments | | $ | — | | | $ | 178,164,065 | | | $ | — | | | $ | 178,164,065 | |
|
New York Fund | |
| Asset Description | | Level 1 | | | Level 2 | | | Level 3* | | | Total | |
| | | | |
Tax-Exempt Investments | | $ | — | | | $ | 398,450,898 | | | $ | — | | | $ | 398,450,898 | |
| | | | |
Taxable Municipal Securities | | | — | | | | 4,815,600 | | | | — | | | | 4,815,600 | |
| | | | |
Corporate Bonds & Notes | | | — | | | | 2,273,510 | | | | — | | | | 2,273,510 | |
| | | | |
Miscellaneous | | | — | | | | — | | | | 982,064 | | | | 982,064 | |
| | | | |
Total Investments | | $ | — | | | $ | 405,540,008 | | | $ | 982,064 | | | $ | 406,522,072 | |
|
Ohio Fund | |
| Asset Description | | Level 1 | | | Level 2 | | | Level 3 | | | Total | |
| | | | |
Tax-Exempt Investments | | $ | — | | | $ | 174,949,574 | | | $ | — | | | $ | 174,949,574 | |
| | | | |
Total Investments | | $ | — | | | $ | 174,949,574 | | | $ | — | | | $ | 174,949,574 | |
| | | | |
Liability Description | | | | | | | | | | | | | | | | |
| | | | |
Futures Contracts | | $ | (389,127 | ) | | $ | — | | | $ | — | | | $ | (389,127 | ) |
| | | | |
Total | | $ | (389,127 | ) | | $ | — | | | $ | — | | | $ | (389,127 | ) |
| * | None of the unobservable inputs for Level 3 assets, individually or collectively, had a material impact on the New York Fund. |
Level 3 investments held by the New York Fund at the beginning and/or end of the period in relation to net assets were not significant and accordingly, a reconciliation of Level 3 assets for the six months ended March 31, 2020 is not presented.
11 Risks and Uncertainties
An outbreak of respiratory disease caused by a novel coronavirus that was first detected in China in December 2019 has spread rapidly internationally. This coronavirus has resulted in closing borders, enhanced health screenings, changes to healthcare service preparation and delivery, quarantines, cancellations, disruptions to supply chains and customer activity, as well as general concern and uncertainty. The impact of this outbreak has negatively affected the worldwide economy, as well as the economies of individual countries and individual companies and can affect the market in general in significant and unforeseen ways. Health crises caused by outbreaks, such as the coronavirus outbreak, may exacerbate otherpre-existing political, social and economic risks and disrupt normal market conditions and operations. The near-term impact of this coronavirus has resulted in substantial market volatility, which may have an adverse effect on the Funds’ investments.
Eaton Vance
Municipal Income Funds
March 31, 2020
Officers and Trustees
Officers
Payson F. Swaffield
President
Maureen A. Gemma
Vice President, Secretary and Chief Legal Officer
James F. Kirchner
Treasurer
Richard F. Froio
Chief Compliance Officer
Trustees
William H. Park
Chairperson
Thomas E. Faust Jr.*
Mark R. Fetting
Cynthia E. Frost
George J. Gorman
Valerie A. Mosley
Helen Frame Peters
Keith Quinton
Marcus L. Smith
Susan J. Sutherland
Scott E. Wennerholm
Eaton Vance Funds
IMPORTANT NOTICES
Privacy. The Eaton Vance organization is committed to ensuring your financial privacy. Each entity listed below has adopted a privacy policy and procedures (“Privacy Program”) Eaton Vance believes is reasonably designed to protect your personal information and to govern when and with whom Eaton Vance may share your personal information.
| • | | At the time of opening an account, Eaton Vance generally requires you to provide us with certain information such as name, address, social security number, tax status, account numbers, and account balances. This information is necessary for us to both open an account for you and to allow us to satisfy legal requirements such as applicable anti-money laundering reviews and know-your-customer requirements. |
| • | | On an ongoing basis, in the normal course of servicing your account, Eaton Vance may share your information with unaffiliated third parties that perform various services for Eaton Vance and/or your account. These third parties include transfer agents, custodians, broker/dealers and our professional advisers, including auditors, accountants, and legal counsel. Eaton Vance may additionally share your personal information with our affiliates. |
| • | | We believe our Privacy Program is reasonably designed to protect the confidentiality of your personal information and to prevent unauthorized access to that information. |
| • | | We reserve the right to change our Privacy Program at any time upon proper notification to you. You may want to review our Privacy Program periodically for changes by accessing the link on our homepage: www.eatonvance.com. |
Our pledge of protecting your personal information applies to the following entities within the Eaton Vance organization: the Eaton Vance Family of Funds, Eaton Vance Management, Eaton Vance Investment Counsel, Eaton Vance Distributors, Inc., Eaton Vance Trust Company, Eaton Vance Management (International) Limited, Eaton Vance Advisers International Limited, Eaton Vance Global Advisors Limited, Eaton Vance Management’s Real Estate Investment Group, Boston Management and Research, Calvert Research and Management, and Calvert Funds. This Privacy Notice supersedes all previously issued privacy disclosures. For more information about our Privacy Program or about how your personal information may be used, please call1-800-262-1122.
Delivery of Shareholder Documents. The Securities and Exchange Commission (SEC) permits funds to deliver only one copy of shareholder documents, including prospectuses, proxy statements and shareholder reports, to fund investors with multiple accounts at the same residential or post office box address. This practice is often called “householding” and it helps eliminate duplicate mailings to shareholders.Eaton Vance, or your financial intermediary, may household the mailing of your documents indefinitely unless you instruct Eaton Vance, or your financial intermediary, otherwise.If you would prefer that your Eaton Vance documents not be householded, please contact Eaton Vance at1-800-262-1122, or contact your financial intermediary. Your instructions that householding not apply to delivery of your Eaton Vance documents will typically be effective within 30 days of receipt by Eaton Vance or your financial intermediary.
Portfolio Holdings. Each Eaton Vance Fund and its underlying Portfolio(s) (if applicable) files a schedule of portfolio holdings on Part F toForm N-PORT with the SEC for the first and third quarters of each fiscal year. The FormN-PORT will be available on the Eaton Vance website at www.eatonvance.com, by calling Eaton Vance at1-800-262-1122 or in the EDGAR database on the SEC’s website at www.sec.gov.
Proxy Voting. From time to time, funds are required to vote proxies related to the securities held by the funds. The Eaton Vance Funds or their underlying Portfolios (if applicable) vote proxies according to a set of policies and procedures approved by the Funds’ and Portfolios’ Boards. You may obtain a description of these policies and procedures and information on how the Funds or Portfolios voted proxies relating to portfolio securities during the most recent12-month period ended June 30, without charge, upon request, by calling1-800-262-1122 and by accessing the SEC’s website at www.sec.gov.
Investment Adviser
Boston Management and Research
Two International Place
Boston, MA 02110
Administrator
Eaton Vance Management
Two International Place
Boston, MA 02110
Principal Underwriter*
Eaton Vance Distributors, Inc.
Two International Place
Boston, MA 02110
(617)482-8260
Custodian
State Street Bank and Trust Company
State Street Financial Center, One Lincoln Street
Boston, MA 02111
Transfer Agent
BNY Mellon Investment Servicing (US) Inc.
Attn: Eaton Vance Funds
P.O. Box 9653
Providence, RI 02940-9653
(800)262-1122
Fund Offices
Two International Place
Boston, MA 02110
| * | FINRA BrokerCheck. Investors may check the background of their Investment Professional by contacting the Financial Industry Regulatory Authority (FINRA). FINRA BrokerCheck is a free tool to help investors check the professional background of current and former FINRA-registered securities firms and brokers. FINRA BrokerCheck is available by calling1-800-289-9999 and at www.FINRA.org. The FINRA BrokerCheck brochure describing this program is available to investors at www.FINRA.org. |

7708 3.31.20
Not required in this filing.
| Item 3. | Audit Committee Financial Expert |
Not required in this filing.
| Item 4. | Principal Accountant Fees and Services |
Not required in this filing.
| Item 5. | Audit Committee of Listed Registrants |
Not applicable.
| Item 6. | Schedule of Investments |
Please see schedule of investments contained in the Report to Stockholders included under Item 1 of this FormN-CSR.
| Item 7. | Disclosure of Proxy Voting Policies and Procedures forClosed-End Management Investment Companies |
Not applicable.
| Item 8. | Portfolio Managers ofClosed-End Management Investment Companies |
Not applicable.
| Item 9. | Purchases of Equity Securities byClosed-End Management Investment Company and Affiliated Purchasers |
Not applicable.
| Item 10. | Submission of Matters to a Vote of Security Holders |
No material changes.
| Item 11. | Controls and Procedures |
(a) It is the conclusion of the registrant’s principal executive officer and principal financial officer that the effectiveness of the registrant’s current disclosure controls and procedures (such disclosure controls and procedures having been evaluated within 90 days of the date of this filing) provide reasonable assurance that the information required to be disclosed by the registrant has been recorded, processed, summarized and reported within the time period specified in the Commission’s rules and forms and that the information required to be disclosed by the registrant has been accumulated and communicated to the registrant’s principal executive officer and principal financial officer in order to allow timely decisions regarding required disclosure.
(b) There have been no changes in the registrant’s internal controls over financial reporting during the second fiscal quarter of the period covered by this report that has materially affected, or is reasonably likely to materially affect, the registrant’s internal control over financial reporting.
| Item 12. | Disclosure of Securities Lending Activities forClosed-End Management Investment Companies |
Not applicable.
Signatures
Pursuant to the requirements of the Securities Exchange Act of 1934 and the Investment Company Act of 1940, the registrant has duly caused this report to be signed on its behalf by the undersigned, thereunto duly authorized.
| | |
| Eaton Vance Municipals Trust |
| |
| By: | | /s/ Payson F. Swaffield |
| | Payson F. Swaffield |
| | President |
| |
| Date: | | May 26, 2020 |
Pursuant to the requirements of the Securities Exchange Act of 1934 and the Investment Company Act of 1940, this report has been signed below by the following persons on behalf of the registrant and in the capacities and on the dates indicated.
| | |
| By: | | /s/ James F. Kirchner |
| | James F. Kirchner |
| | Treasurer |
| |
| Date: | | May 26, 2020 |
| | |
| By: | | /s/ Payson F. Swaffield |
| | Payson F. Swaffield |
| | President |
| |
| Date: | | May 26, 2020 |