UNITED STATES
SECURITIES AND EXCHANGE COMMISSION
Washington, D.C. 20549
Form N-CSR
CERTIFIED SHAREHOLDER REPORT OF REGISTERED
MANAGEMENT INVESTMENT COMPANIES
Investment Company Act File Number: 811-04409
Eaton Vance Municipals Trust
(Exact Name of Registrant as Specified in Charter)
Two International Place, Boston, Massachusetts 02110
(Address of Principal Executive Offices)
Maureen A. Gemma
Two International Place, Boston, Massachusetts 02110
(Name and Address of Agent for Services)
(617) 482-8260
(Registrant’s Telephone Number)
July 31
Date of Fiscal Year End
January 31, 2021
Date of Reporting Period
| Item 1. | Reports to Stockholders |

Eaton Vance
Municipals Trust
Semiannual Report
January 31, 2021
Arizona • Connecticut • Minnesota • New Jersey • Pennsylvania

Commodity Futures Trading Commission Registration. The Commodity Futures Trading Commission (“CFTC”) has adopted regulations that subject registered investment companies and advisers to regulation by the CFTC if a fund invests more than a prescribed level of its assets in certain CFTC-regulated instruments (including futures, certain options and swap agreements) or markets itself as providing investment exposure to such instruments. The investment adviser has claimed an exclusion from the definition of “commodity pool operator” under the Commodity Exchange Act with respect to its management of each Fund. Accordingly, neither the Funds nor the adviser with respect to the operation of the Funds is subject to CFTC regulation. Because of its management of other strategies, the Funds’ adviser is registered with the CFTC as a commodity pool operator. The adviser is also registered as a commodity trading advisor.
Fund shares are not insured by the FDIC and are not deposits or other obligations of, or guaranteed by, any depository institution. Shares are subject to investment risks, including possible loss of principal invested.
This report must be preceded or accompanied by a current summary prospectus or prospectus. Before investing, investors should consider carefully the investment objective, risks, and charges and expenses of a mutual fund. This and other important information is contained in the summary prospectus and prospectus, which can be obtained from a financial intermediary. Prospective investors should read the prospectus carefully before investing. For further information, please call 1-800-262-1122.
Semiannual Report January 31, 2021
Eaton Vance
Municipal Income Funds
Eaton Vance
Arizona Municipal Income Fund
January 31, 2021
Performance1,2
Portfolio Managers Craig R. Brandon, CFA and Trevor G. Smith
| | | | | | | | | | | | | | | | | | | | | | | | |
| % Average Annual Total Returns | | Class
Inception Date | | | Performance
Inception Date | | | Six Months | | | One Year | | | Five Years | | | Ten Years | |
| | | | | | |
Class A at NAV | | | 12/13/1993 | | | | 07/25/1991 | | | | 1.64 | % | | | 3.36 | % | | | 3.33 | % | | | 4.60 | % |
Class A with 4.75% Maximum Sales Charge | | | — | | | | — | | | | –3.15 | | | | –1.53 | | | | 2.32 | | | | 4.09 | |
Class C at NAV | | | 12/16/2005 | | | | 07/25/1991 | | | | 1.23 | | | | 2.55 | | | | 2.56 | | | | 3.81 | |
Class C with 1% Maximum Sales Charge | | | — | | | | — | | | | 0.23 | | | | 1.55 | | | | 2.56 | | | | 3.81 | |
Class I at NAV | | | 08/03/2010 | | | | 07/25/1991 | | | | 1.74 | | | | 3.56 | | | | 3.56 | | | | 4.80 | |
|
| |
| | | | | | |
Bloomberg Barclays Municipal Bond Index | | | — | | | | — | | | | 2.01 | % | | | 4.01 | % | | | 3.79 | % | | | 4.77 | % |
Bloomberg Barclays Arizona Municipal Bond Index | | | — | | | | — | | | | 1.74 | | | | 3.68 | | | | 3.51 | | | | 4.70 | |
| | | | | | |
| % Total Annual Operating Expense Ratios3 | | | | | | | | | | | Class A | | | Class C | | | Class I | |
| | | | | | |
| | | | | | | | | | | | | | | 0.68 | % | | | 1.43 | % | | | 0.48 | % |
| | | | | | |
| % Distribution Rates/Yields4 | | | | | | | | | | | Class A | | | Class C | | | Class I | |
| | | | | | |
Distribution Rate | | | | | | | | | | | | | | | 1.90 | % | | | 1.14 | % | | | 2.11 | % |
Taxable-Equivalent Distribution Rate | | | | | | | | | | | | | | | 3.48 | | | | 2.09 | | | | 3.86 | |
SEC 30-day Yield | | | | | | | | | | | | | | | 0.38 | | | | –0.33 | | | | 0.60 | |
Taxable-Equivalent SEC 30-day Yield | | | | | | | | | | | | | | | 0.70 | | | | –0.61 | | | | 1.10 | |
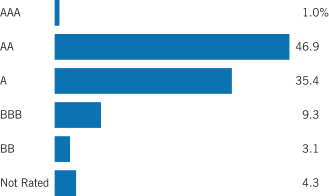
Fund Profile
Credit Quality (% of total investments)6
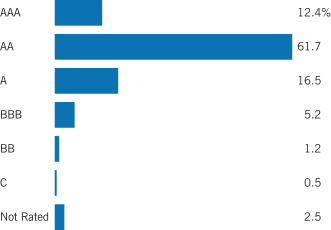
See Endnotes and Additional Disclosures in this report.
Past performance is no guarantee of future results. Returns are historical and are calculated by determining the percentage change in net asset value (NAV) or offering price (as applicable) with all distributions reinvested. Investment return and principal value will fluctuate so that shares, when redeemed, may be worth more or less than their original cost. Performance for periods less than or equal to one year is cumulative. Performance is for the stated time period only; due to market volatility, current Fund performance may be lower or higher than the quoted return. For performance as of the most recent month-end, please refer to eatonvance.com.
Eaton Vance
Connecticut Municipal Income Fund
January 31, 2021
Performance1,2
Portfolio Managers Cynthia J. Clemson and Trevor G. Smith
| | | | | | | | | | | | | | | | | | | | | | | | |
| % Average Annual Total Returns | | Class
Inception Date | | | Performance
Inception Date | | | Six Months | | | One Year | | | Five Years | | | Ten Years | |
| | | | | | |
Class A at NAV | | | 04/19/1994 | | | | 05/01/1992 | | | | 2.08 | % | | | 3.57 | % | | | 3.06 | % | | | 4.21 | % |
Class A with 4.75% Maximum Sales Charge | | | — | | | | — | | | | –2.80 | | | | –1.39 | | | | 2.06 | | | | 3.71 | |
Class C at NAV | | | 02/09/2006 | | | | 05/01/1992 | | | | 1.70 | | | | 2.71 | | | | 2.29 | | | | 3.44 | |
Class C with 1% Maximum Sales Charge | | | — | | | | — | | | | 0.70 | | | | 1.71 | | | | 2.29 | | | | 3.44 | |
Class I at NAV | | | 03/03/2008 | | | | 05/01/1992 | | | | 2.18 | | | | 3.69 | | | | 3.27 | | | | 4.42 | |
|
| |
| | | | | | |
Bloomberg Barclays Municipal Bond Index | | | — | | | | — | | | | 2.01 | % | | | 4.01 | % | | | 3.79 | % | | | 4.77 | % |
Bloomberg Barclays Connecticut Municipal Bond Index | | | — | | | | — | | | | 1.66 | | | | 4.03 | | | | 3.45 | | | | 3.85 | |
| | | | | | |
| % Total Annual Operating Expense Ratios3 | | | | | | | | | | | Class A | | | Class C | | | Class I | |
| | | | | | |
| | | | | | | | | | | | | | | 0.72 | % | | | 1.47 | % | | | 0.52 | % |
| | | | | | |
| % Distribution Rates/Yields4 | | | | | | | | | | | Class A | | | Class C | | | Class I | |
| | | | | | |
Distribution Rate | | | | | | | | | | | | | | | 2.21 | % | | | 1.44 | % | | | 2.41 | % |
Taxable-Equivalent Distribution Rate | | | | | | | | | | | | | | | 4.23 | | | | 2.76 | | | | 4.62 | |
SEC 30-day Yield | | | | | | | | | | | | | | | 0.40 | | | | –0.32 | | | | 0.62 | |
Taxable-Equivalent SEC 30-day Yield | | | | | | | | | | | | | | | 0.77 | | | | –0.61 | | | | 1.18 | |
Fund Profile
Credit Quality (% of total investments)6
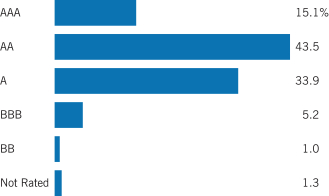
See Endnotes and Additional Disclosures in this report.
Past performance is no guarantee of future results. Returns are historical and are calculated by determining the percentage change in net asset value (NAV) or offering price (as applicable) with all distributions reinvested. Investment return and principal value will fluctuate so that shares, when redeemed, may be worth more or less than their original cost. Performance for periods less than or equal to one year is cumulative. Performance is for the stated time period only; due to market volatility, current Fund performance may be lower or higher than the quoted return. For performance as of the most recent month-end, please refer to eatonvance.com.
Eaton Vance
Minnesota Municipal Income Fund
January 31, 2021
Performance1,2
Portfolio Managers Craig R. Brandon, CFA and Christopher J. Eustance, CFA
| | | | | | | | | | | | | | | | | | | | | | | | |
| % Average Annual Total Returns | | Class
Inception Date | | | Performance
Inception Date | | | Six Months | | | One Year | | | Five Years | | | Ten Years | |
| | | | | | |
Class A at NAV | | | 12/09/1993 | | | | 07/29/1991 | | | | 1.19 | % | | | 2.98 | % | | | 2.84 | % | | | 4.19 | % |
Class A with 4.75% Maximum Sales Charge | | | — | | | | — | | | | –3.61 | | | | –1.94 | | | | 1.85 | | | | 3.68 | |
Class C at NAV | | | 12/21/2005 | | | | 07/29/1991 | | | | 0.88 | | | | 2.33 | | | | 2.08 | | | | 3.42 | |
Class C with 1% Maximum Sales Charge | | | — | | | | — | | | | –0.12 | | | | 1.33 | | | | 2.08 | | | | 3.42 | |
Class I at NAV | | | 08/03/2010 | | | | 07/29/1991 | | | | 1.29 | | | | 3.19 | | | | 3.04 | | | | 4.39 | |
|
| |
| | | | | | |
Bloomberg Barclays Municipal Bond Index | | | — | | | | — | | | | 2.01 | % | | | 4.01 | % | | | 3.79 | % | | | 4.77 | % |
Bloomberg Barclays Minnesota Municipal Bond Index | | | — | | | | — | | | | 1.41 | | | | 3.77 | | | | 3.28 | | | | 4.10 | |
| | | | | | |
| % Total Annual Operating Expense Ratios3 | | | | | | | | | | | Class A | | | Class C | | | Class I | |
| | | | | | |
| | | | | | | | | | | | | | | 0.66 | % | | | 1.41 | % | | | 0.46 | % |
| | | | | | |
| % Distribution Rates/Yields4 | | | | | | | | | | | Class A | | | Class C | | | Class I | |
| | | | | | |
Distribution Rate | | | | | | | | | | | | | | | 1.69 | % | | | 0.93 | % | | | 1.90 | % |
Taxable-Equivalent Distribution Rate | | | | | | | | | | | | | | | 3.42 | | | | 1.88 | | | | 3.85 | |
SEC 30-day Yield | | | | | | | | | | | | | | | 0.37 | | | | –0.35 | | | | 0.59 | |
Taxable-Equivalent SEC 30-day Yield | | | | | | | | | | | | | | | 0.75 | | | | –0.71 | | | | 1.19 | |
Fund Profile
Credit Quality (% of total investments)6
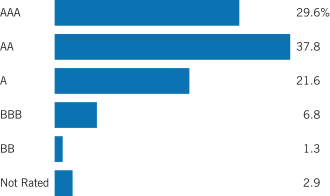
See Endnotes and Additional Disclosures in this report.
Past performance is no guarantee of future results. Returns are historical and are calculated by determining the percentage change in net asset value (NAV) or offering price (as applicable) with all distributions reinvested. Investment return and principal value will fluctuate so that shares, when redeemed, may be worth more or less than their original cost. Performance for periods less than or equal to one year is cumulative. Performance is for the stated time period only; due to market volatility, current Fund performance may be lower or higher than the quoted return. For performance as of the most recent month-end, please refer to eatonvance.com.
Eaton Vance
New Jersey Municipal Income Fund
January 31, 2021
Performance1,2
Portfolio Manager Adam A. Weigold, CFA
| | | | | | | | | | | | |
| % Average Annual Total Returns | | Class
Inception Date | | Performance
Inception Date | | Six Months | | One Year | | Five Years | | Ten Years |
| | | | | | | | | | | | | | | | | | | | | | | | |
| | | | | | |
Class A at NAV | | | 04/13/1994 | | | | 01/08/1991 | | | | 3.28 | % | | | 4.23 | % | | | 4.12 | % | | | 5.23 | % |
Class A with 4.75% Maximum Sales Charge | | | — | | | | — | | | | –1.61 | | | | –0.69 | | | | 3.11 | | | | 4.72 | |
Class C at NAV | | | 12/14/2005 | | | | 01/08/1991 | | | | 2.85 | | | | 3.33 | | | | 3.34 | | | | 4.44 | |
Class C with 1% Maximum Sales Charge | | | — | | | | — | | | | 1.85 | | | | 2.33 | | | | 3.34 | | | | 4.44 | |
Class I at NAV | | | 03/03/2008 | | | | 01/08/1991 | | | | 3.34 | | | | 4.37 | | | | 4.33 | | | | 5.44 | |
|
| |
| | | | | | |
Bloomberg Barclays Municipal Bond Index | | | — | | | | — | | | | 2.01 | % | | | 4.01 | % | | | 3.79 | % | | | 4.77 | % |
Bloomberg Barclays New Jersey Municipal Bond Index | | | — | | | | — | | | | 4.55 | | | | 4.97 | | | | 5.09 | | | | 5.38 | |
| | | | | | |
| % Total Annual Operating Expense Ratios3 | | | | | | | | | | | Class A | | | Class C | | | Class I | |
| | | | | | |
| | | | | | | | | | | | | | | 0.69 | % | | | 1.44 | % | | | 0.49 | % |
| | | | | | |
| % Distribution Rates/Yields4 | | | | | | | | | | | Class A | | | Class C | | | Class I | |
| | | | | | |
Distribution Rate | | | | | | | | | | | | | | | 2.39 | % | | | 1.72 | % | | | 2.50 | % |
Taxable-Equivalent Distribution Rate | | | | | | | | | | | | | | | 4.76 | | | | 3.42 | | | | 4.98 | |
SEC 30-day Yield | | | | | | | | | | | | | | | 0.75 | | | | 0.05 | | | | 0.99 | |
Taxable-Equivalent SEC 30-day Yield | | | | | | | | | | | | | | | 1.50 | | | | 0.10 | | | | 1.96 | |
Fund Profile
Credit Quality (% of total investments)6
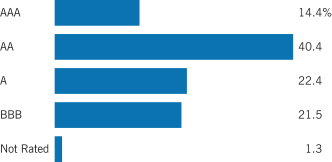
See Endnotes and Additional Disclosures in this report.
Past performance is no guarantee of future results. Returns are historical and are calculated by determining the percentage change in net asset value (NAV) or offering price (as applicable) with all distributions reinvested. Investment return and principal value will fluctuate so that shares, when redeemed, may be worth more or less than their original cost. Performance for periods less than or equal to one year is cumulative. Performance is for the stated time period only; due to market volatility, current Fund performance may be lower or higher than the quoted return. For performance as of the most recent month-end, please refer to eatonvance.com.
Eaton Vance
Pennsylvania Municipal Income Fund
January 31, 2021
Performance1,2
Portfolio Manager Christopher J. Eustance, CFA
| | | | | | | | | | | | | | | | | | | | | | | | |
| % Average Annual Total Returns | | Class
Inception Date | | | Performance
Inception Date | | | Six Months | | | One Year | | | Five Years | | | Ten Years | |
| | | | | | |
Class A at NAV | | | 06/01/1994 | | | | 01/08/1991 | | | | 2.13 | % | | | 3.83 | % | | | 3.00 | % | | | 4.35 | % |
Class A with 4.75% Maximum Sales Charge | | | — | | | | — | | | | –2.77 | | | | –1.16 | | | | 2.01 | | | | 3.85 | |
Class C at NAV | | | 01/13/2006 | | | | 01/08/1991 | | | | 1.72 | | | | 2.90 | | | | 2.23 | | | | 3.57 | |
Class C with 1% Maximum Sales Charge | | | — | | | | — | | | | 0.72 | | | | 1.90 | | | | 2.23 | | | | 3.57 | |
Class I at NAV | | | 03/03/2008 | | | | 01/08/1991 | | | | 2.23 | | | | 3.91 | | | | 3.21 | | | | 4.56 | |
|
| |
| | | | | | |
Bloomberg Barclays Municipal Bond Index | | | — | | | | — | | | | 2.01 | % | | | 4.01 | % | | | 3.79 | % | | | 4.77 | % |
Bloomberg Barclays Pennsylvania Municipal Bond Index | | | — | | | | — | | | | 2.54 | | | | 4.50 | | | | 4.19 | | | | 5.04 | |
| | | | | | |
| % Total Annual Operating Expense Ratios3 | | | | | | | | | | | Class A | | | Class C | | | Class I | |
| | | | | | |
| | | | | | | | | | | | | | | 0.76 | % | | | 1.51 | % | | | 0.56 | % |
| | | | | | |
| % Distribution Rates/Yields4 | | | | | | | | | | | Class A | | | Class C | | | Class I | |
| | | | | | |
Distribution Rate | | | | | | | | | | | | | | | 2.52 | % | | | 1.76 | % | | | 2.72 | % |
Taxable-Equivalent Distribution Rate | | | | | | | | | | | | | | | 4.49 | | | | 3.14 | | | | 4.85 | |
SEC 30-day Yield | | | | | | | | | | | | | | | 0.71 | | | | 0.01 | | | | 0.94 | |
Taxable-Equivalent SEC 30-day Yield | | | | | | | | | | | | | | | 1.27 | | | | 0.01 | | | | 1.68 | |
| | | | | | |
| % Total Leverage5 | | | | | | | | | | | | | | | | | | |
| | | | | | |
Residual Interest Bond (RIB) Financing | | | | | | | | | | | | | | | | | | | | | | | 2.48 | % |
Fund Profile
Credit Quality (% of total investments)6,7
See Endnotes and Additional Disclosures in this report.
Past performance is no guarantee of future results. Returns are historical and are calculated by determining the percentage change in net asset value (NAV) or offering price (as applicable) with all distributions reinvested. Investment return and principal value will fluctuate so that shares, when redeemed, may be worth more or less than their original cost. Performance for periods less than or equal to one year is cumulative. Performance is for the stated time period only; due to market volatility, current Fund performance may be lower or higher than the quoted return. For performance as of the most recent month-end, please refer to eatonvance.com.
Eaton Vance
Municipal Income Funds
January 31, 2021
Endnotes and Additional Disclosures
| 1 | Bloomberg Barclays Municipal Bond Index is an unmanaged index of municipal bonds traded in the U.S. Bloomberg Barclays Arizona Municipal Bond Index is an unmanaged index of Arizona municipal bonds. Bloomberg Barclays Connecticut Municipal Bond Index is an unmanaged index of Connecticut municipal bonds. Bloomberg Barclays Minnesota Municipal Bond Index is an unmanaged index of Minnesota municipal bonds. Bloomberg Barclays New Jersey Municipal Bond Index is an unmanaged index of New Jersey municipal bonds. Bloomberg Barclays Pennsylvania Municipal Bond Index is an unmanaged index of Pennsylvania municipal bonds. Unless otherwise stated, index returns do not reflect the effect of any applicable sales charges, commissions, expenses, taxes or leverage, as applicable. It is not possible to invest directly in an index. |
| 2 | Total Returns at NAV do not include applicable sales charges. If sales charges were deducted, the returns would be lower. Total Returns shown with maximum sales charge reflect the stated maximum sales charge. Unless otherwise stated, performance does not reflect the deduction of taxes on Fund distributions or redemptions of Fund shares. |
| 3 | Source: Fund prospectus. The expense ratios for the current reporting period can be found in the Financial Highlights section of this report. |
| 4 | The Distribution Rate is based on the Fund’s last regular distribution per share in the period (annualized) divided by the Fund’s NAV at the end of the period. The Fund’s distributions may be comprised of amounts characterized for federal income tax purposes as tax-exempt income, qualified and non-qualified ordinary dividends, capital gains and nondividend distributions, also known as return of capital. The Fund will determine the federal income tax character of distributions paid to a shareholder after the end of the calendar year. This is reported on the IRS form 1099- DIV and provided to the shareholder shortly after each year-end. The Fund’s distributions are determined by the investment adviser based on its current assessment of the Fund’s long-term return potential. As portfolio and market conditions change, the rate of distributions paid by the Fund could change. Taxable-equivalent performance is based on the highest combined federal and state income tax rates, where applicable. Lower tax rates would result in lower tax-equivalent performance. Actual tax rates will vary depending on your income, exemptions and deductions. Rates do not include local taxes. The SEC Yield is a standardized measure based on the estimated yield to maturity of a fund’s investments over a 30-day period and is based on the maximum offer price at the date specified. The SEC Yield is not based on the distributions made by the Fund, which may differ. |
| 5 | Fund employs RIB financing. The leverage created by RIB investments provides an opportunity for increased income but, at the same time, creates special risks (including the likelihood of greater volatility of NAV). The cost of leverage rises and falls with changes in short-term interest rates. See “Floating Rate Notes Issued in Conjunction with Securities Held” in the notes to the financial statements for more information about RIB financing. RIB leverage represents the amount of Floating Rate Notes outstanding at period end as a percentage of Fund net assets plus Floating Rate Notes. |
| 6 | For purposes of the Fund’s rating restrictions, ratings are based on Moody’s Investors Service, Inc. (“Moody’s”), S&P Global Ratings (“S&P”) or Fitch Ratings (“Fitch”), as applicable. If securities are rated differently by the ratings agencies, the highest rating is applied. Ratings, which are subject to change, apply to the creditworthiness of the issuers of the underlying securities and not to the Fund or its shares. Credit ratings measure the quality of a bond based on the issuer’s creditworthiness, with ratings ranging from AAA, being the highest, to D, being the lowest based on S&P’s measures. Ratings of BBB or higher by S&P or Fitch (Baa or higher by Moody’s) are considered to be investment-grade quality. Credit ratings are based largely on the ratings agency’s analysis at the time of rating. The rating assigned to any particular security is not necessarily a reflection of the issuer’s current financial condition and does not necessarily reflect its assessment of the volatility of a security’s market value or of the liquidity of an investment in the security. Holdings designated as “Not Rated” (if any) are not rated by the national ratings agencies stated above. |
| 7 | The chart includes the municipal bonds held by a trust that issues residual interest bonds, consistent with the Portfolio of Investments. |
Fund profiles subject to change due to active management.
Eaton Vance
Municipal Income Funds
January 31, 2021
Fund Expenses
Example: As a Fund shareholder, you incur two types of costs: (1) transaction costs, including sales charges (loads) on purchases and redemption fees (if applicable); and (2) ongoing costs, including management fees; distribution and/or service fees; and other Fund expenses. This Example is intended to help you understand your ongoing costs (in dollars) of Fund investing and to compare these costs with the ongoing costs of investing in other mutual funds. The Example is based on an investment of $1,000 invested at the beginning of the period and held for the entire period (August 1, 2020 – January 31, 2021).
Actual Expenses: The first section of each table below provides information about actual account values and actual expenses. You may use the information in this section, together with the amount you invested, to estimate the expenses that you paid over the period. Simply divide your account value by $1,000 (for example, an $8,600 account value divided by $1,000 = 8.6), then multiply the result by the number in the first section under the heading entitled “Expenses Paid During Period” to estimate the expenses you paid on your account during this period.
Hypothetical Example for Comparison Purposes: The second section of each table below provides information about hypothetical account values and hypothetical expenses based on the actual Fund expense ratio and an assumed rate of return of 5% per year (before expenses), which is not the actual Fund return. The hypothetical account values and expenses may not be used to estimate the actual ending account balance or expenses you paid for the period. You may use this information to compare the ongoing costs of investing in your Fund and other funds. To do so, compare this 5% hypothetical example with the 5% hypothetical examples that appear in the shareholder reports of the other funds.
Please note that the expenses shown in each table are meant to highlight your ongoing costs only and do not reflect any transactional costs, such as sales charges (loads) or redemption fees (if applicable). Therefore, the second section of each table is useful in comparing ongoing costs only, and will not help you determine the relative total costs of owning different funds. In addition, if these transactional costs were included, your costs would be higher.
Eaton Vance Arizona Municipal Income Fund
| | | | | | | | | | | | | | | | |
| | | Beginning
Account Value
(8/1/20) | | | Ending
Account Value
(1/31/21) | | | Expenses Paid
During Period*
(8/1/20 – 1/31/21) | | | Annualized
Expense
Ratio | |
| | | | |
Actual | | | | | | | | | | | | | | | | |
Class A | | $ | 1,000.00 | | | $ | 1,016.40 | | | $ | 3.41 | | | | 0.67 | % |
Class C | | $ | 1,000.00 | | | $ | 1,012.30 | | | $ | 7.20 | | | | 1.42 | % |
Class I | | $ | 1,000.00 | | | $ | 1,017.40 | | | $ | 2.39 | | | | 0.47 | % |
| | | | | |
Hypothetical | | | | | | | | | | | | | | | | |
(5% return per year before expenses) | | | | | | | | | | | | | | | | |
Class A | | $ | 1,000.00 | | | $ | 1,021.80 | | | $ | 3.41 | | | | 0.67 | % |
Class C | | $ | 1,000.00 | | | $ | 1,018.00 | | | $ | 7.22 | | | | 1.42 | % |
Class I | | $ | 1,000.00 | | | $ | 1,022.80 | | | $ | 2.40 | | | | 0.47 | % |
| * | Expenses are equal to the Fund’s annualized expense ratio for the indicated Class, multiplied by the average account value over the period, multiplied by 184/365 (to reflect the one-half year period). The Example assumes that the $1,000 was invested at the net asset value per share determined at the close of business on July 31, 2020. |
Eaton Vance
Municipal Income Funds
January 31, 2021
Fund Expenses — continued
Eaton Vance Connecticut Municipal Income Fund
| | | | | | | | | | | | | | | | |
| | | Beginning
Account Value
(8/1/20) | | | Ending
Account Value
(1/31/21) | | | Expenses Paid
During Period*
(8/1/20 – 1/31/21) | | | Annualized
Expense
Ratio | |
| | | | |
Actual | | | | | | | | | | | | | | | | |
Class A | | $ | 1,000.00 | | | $ | 1,020.80 | | | $ | 3.51 | | | | 0.69 | % |
Class C | | $ | 1,000.00 | | | $ | 1,017.00 | | | $ | 7.32 | | | | 1.44 | % |
Class I | | $ | 1,000.00 | | | $ | 1,021.80 | | | $ | 2.50 | | | | 0.49 | % |
| | | | | |
Hypothetical | | | | | | | | | | | | | | | | |
(5% return per year before expenses) | | | | | | | | | | | | | | | | |
Class A | | $ | 1,000.00 | | | $ | 1,021.70 | | | $ | 3.52 | | | | 0.69 | % |
Class C | | $ | 1,000.00 | | | $ | 1,017.90 | | | $ | 7.32 | | | | 1.44 | % |
Class I | | $ | 1,000.00 | | | $ | 1,022.70 | | | $ | 2.50 | | | | 0.49 | % |
| * | Expenses are equal to the Fund’s annualized expense ratio for the indicated Class, multiplied by the average account value over the period, multiplied by 184/365 (to reflect the one-half year period). The Example assumes that the $1,000 was invested at the net asset value per share determined at the close of business on July 31, 2020. |
Eaton Vance Minnesota Municipal Income Fund
| | | | | | | | | | | | | | | | |
| | | Beginning
Account Value
(8/1/20) | | | Ending
Account Value
(1/31/21) | | | Expenses Paid
During Period*
(8/1/20 – 1/31/21) | | | Annualized
Expense
Ratio | |
| | | | |
Actual | | | | | | | | | | | | | | | | |
Class A | | $ | 1,000.00 | | | $ | 1,011.90 | | | $ | 3.30 | | | | 0.65 | % |
Class C | | $ | 1,000.00 | | | $ | 1,008.80 | | | $ | 7.09 | | | | 1.40 | % |
Class I | | $ | 1,000.00 | | | $ | 1,012.90 | | | $ | 2.28 | | | | 0.45 | % |
| | | | | |
Hypothetical | | | | | | | | | | | | | | | | |
(5% return per year before expenses) | | | | | | | | | | | | | | | | |
Class A | | $ | 1,000.00 | | | $ | 1,021.90 | | | $ | 3.31 | | | | 0.65 | % |
Class C | | $ | 1,000.00 | | | $ | 1,018.10 | | | $ | 7.12 | | | | 1.40 | % |
Class I | | $ | 1,000.00 | | | $ | 1,022.90 | | | $ | 2.29 | | | | 0.45 | % |
| * | Expenses are equal to the Fund’s annualized expense ratio for the indicated Class, multiplied by the average account value over the period, multiplied by 184/365 (to reflect the one-half year period). The Example assumes that the $1,000 was invested at the net asset value per share determined at the close of business on July 31, 2020. |
Eaton Vance
Municipal Income Funds
January 31, 2021
Fund Expenses — continued
Eaton Vance New Jersey Municipal Income Fund
| | | | | | | | | | | | | | | | |
| | | Beginning
Account Value
(8/1/20) | | | Ending
Account Value
(1/31/21) | | | Expenses Paid
During Period*
(8/1/20 – 1/31/21) | | | Annualized
Expense
Ratio | |
| | | | |
Actual | | | | | | | | | | | | | | | | |
Class A | | $ | 1,000.00 | | | $ | 1,032.80 | | | $ | 3.43 | | | | 0.67 | % |
Class C | | $ | 1,000.00 | | | $ | 1,028.50 | | | $ | 7.26 | | | | 1.42 | % |
Class I | | $ | 1,000.00 | | | $ | 1,033.40 | | | $ | 2.41 | | | | 0.47 | % |
| | | | | |
Hypothetical | | | | | | | | | | | | | | | | |
(5% return per year before expenses) | | | | | | | | | | | | | | | | |
Class A | | $ | 1,000.00 | | | $ | 1,021.80 | | | $ | 3.41 | | | | 0.67 | % |
Class C | | $ | 1,000.00 | | | $ | 1,018.00 | | | $ | 7.22 | | | | 1.42 | % |
Class I | | $ | 1,000.00 | | | $ | 1,022.80 | | | $ | 2.40 | | | | 0.47 | % |
| * | Expenses are equal to the Fund’s annualized expense ratio for the indicated Class, multiplied by the average account value over the period, multiplied by 184/365 (to reflect the one-half year period). The Example assumes that the $1,000 was invested at the net asset value per share determined at the close of business on July 31, 2020. |
Eaton Vance Pennsylvania Municipal Income Fund
| | | | | | | | | | | | | | | | |
| | | Beginning
Account Value
(8/1/20) | | | Ending
Account Value
(1/31/21) | | | Expenses Paid
During Period*
(8/1/20 – 1/31/21) | | | Annualized
Expense
Ratio | |
| | | | |
Actual | | | | | | | | | | | | | | | | |
Class A | | $ | 1,000.00 | | | $ | 1,021.30 | | | $ | 3.62 | | | | 0.71 | % |
Class C | | $ | 1,000.00 | | | $ | 1,017.20 | | | $ | 7.37 | | | | 1.45 | % |
Class I | | $ | 1,000.00 | | | $ | 1,022.30 | | | $ | 2.60 | | | | 0.51 | % |
| | | | | |
Hypothetical | | | | | | | | | | | | | | | | |
(5% return per year before expenses) | | | | | | | | | | | | | | | | |
Class A | | $ | 1,000.00 | | | $ | 1,021.60 | | | $ | 3.62 | | | | 0.71 | % |
Class C | | $ | 1,000.00 | | | $ | 1,017.90 | | | $ | 7.38 | | | | 1.45 | % |
Class I | | $ | 1,000.00 | | | $ | 1,022.60 | | | $ | 2.60 | | | | 0.51 | % |
| * | Expenses are equal to the Fund’s annualized expense ratio for the indicated Class, multiplied by the average account value over the period, multiplied by 184/365 (to reflect the one-half year period). The Example assumes that the $1,000 was invested at the net asset value per share determined at the close of business on July 31, 2020. |
Eaton Vance
Arizona Municipal Income Fund
January 31, 2021
Portfolio of Investments (Unaudited)
| | | | | | | | |
| Tax-Exempt Municipal Securities — 91.6% | |
| Security | | Principal
Amount
(000’s omitted) | | | Value | |
|
| Education — 16.1% | |
| | |
Arizona Industrial Development Authority, (Academies of Math & Science), 5.00%, 7/1/39(1) | | $ | 250 | | | $ | 288,943 | |
| | |
Arizona Industrial Development Authority, (Doral Academy of Nevada), 5.00%, 7/15/39(1) | | | 55 | | | | 62,689 | |
| | |
Arizona Industrial Development Authority, (Doral Academy of Nevada), 5.00%, 7/15/40(1) | | | 350 | | | | 398,041 | |
| | |
Arizona Industrial Development Authority, (Pinecrest Academy of Nevada), 4.00%, 7/15/40(1) | | | 60 | | | | 63,323 | |
| | |
Arizona Industrial Development Authority, (Pinecrest Academy of Nevada), 4.00%, 7/15/50(1) | | | 60 | | | | 62,432 | |
| | |
Arizona State University, 5.00%, 7/1/36 | | | 1,150 | | | | 1,348,019 | |
| | |
Arizona State University, 5.00%, 7/1/37 | | | 170 | | | | 180,271 | |
| | |
Arizona State University, Green Bonds, 5.00%, 7/1/40 | | | 1,000 | | | | 1,294,660 | |
| | |
Arizona State University, Prerefunded to 7/1/22, 5.00%, 7/1/37 | | | 830 | | | | 885,610 | |
| | |
Glendale Industrial Development Authority, (Midwestern University), 5.00%, 5/15/25 | | | 1,500 | | | | 1,582,965 | |
| | |
Glendale Industrial Development Authority, (Midwestern University), 5.00%, 5/15/31 | | | 175 | | | | 228,163 | |
| | |
Northern Arizona University, 5.00%, 6/1/38 | | | 1,000 | | | | 1,179,920 | |
| | |
Pima County Community College District, 5.00%, 7/1/33 | | | 300 | | | | 381,669 | |
| | |
Pima County Community College District, 5.00%, 7/1/35 | | | 720 | | | | 911,390 | |
| | |
University of Arizona, 5.00%, 6/1/38 | | | 1,500 | | | | 1,804,005 | |
| | |
University of Arizona, 5.00%, 8/1/38 | | | 600 | | | | 783,186 | |
| | |
University of Arizona, 5.00%, 6/1/42 | | | 500 | | | | 640,875 | |
| |
| | | | $ | 12,096,161 | |
|
| Electric Utilities — 6.0% | |
| | |
Mesa, Utility Systems Revenue, 4.00%, 7/1/31 | | $ | 1,160 | | | $ | 1,348,024 | |
| | |
Mesa, Utility Systems Revenue, 4.00%, 7/1/34 | | | 500 | | | | 626,785 | |
| | |
Pinal County Electrical District No. 3, 5.00%, 7/1/33 | | | 1,000 | | | | 1,221,860 | |
| | |
Salt River Project Agricultural Improvement and Power District, 5.00%, 1/1/35 | | | 1,000 | | | | 1,273,060 | |
| |
| | | | $ | 4,469,729 | |
|
| Escrowed / Prerefunded — 0.3% | |
| | |
Kyrene Elementary School District No. 28, Maricopa County, Prerefunded to 7/1/23, 5.50%, 7/1/30 | | $ | 200 | | | $ | 225,876 | |
| |
| | | | $ | 225,876 | |
|
| General Obligations — 11.9% | |
| | |
Agua Fria Union High School District No. 216, 4.00%, 7/1/36 | | $ | 1,000 | | | $ | 1,220,580 | |
| | |
Chandler Unified School District No. 80, 4.00%, 7/1/33 | | | 225 | | | | 260,388 | |
| | |
Flagstaff, 4.00%, 7/1/28 | | | 110 | | | | 136,852 | |
| | | | | | | | |
| Security | | Principal
Amount
(000’s omitted) | | | Value | |
|
| General Obligations (continued) | |
| | |
Kyrene Elementary School District No. 28, 4.00%, 7/1/35 | | $ | 130 | | | $ | 159,206 | |
| | |
Kyrene Elementary School District No. 28, 4.00%, 7/1/36 | | | 175 | | | | 213,602 | |
| | |
Paradise Valley Unified School District No. 69, 4.00%, 7/1/38 | | | 350 | | | | 435,158 | |
| | |
Paradise Valley Unified School District No. 69, 4.00%, 7/1/39 | | | 600 | | | | 745,338 | |
| | |
Paradise Valley Unified School District No. 69, 4.00%, 7/1/40 | | | 1,000 | | | | 1,241,270 | |
| | |
Peoria Unified School District No. 11, 4.00%, 7/1/31 | | | 350 | | | | 420,042 | |
| | |
Phoenix Union High School District No. 210, 4.00%, 7/1/39 | | | 300 | | | | 363,237 | |
| | |
Scottsdale Unified School District No. 48, 5.00%, 7/1/31 | | | 750 | | | | 947,970 | |
| | |
Tempe, 5.00%, 7/1/30 | | | 1,000 | | | | 1,309,200 | |
| | |
Tempe, 5.375%, 7/1/21 | | | 1,060 | | | | 1,083,225 | |
| | |
Western Maricopa Education Center District No. 402, 4.50%, 7/1/34 | | | 350 | | | | 391,009 | |
| |
| | | | $ | 8,927,077 | |
|
| Hospital — 9.3% | |
| | |
Arizona Health Facilities Authority, (Scottsdale Lincoln Hospitals), 5.00%, 12/1/39 | | $ | 1,665 | | | $ | 1,914,450 | |
| | |
Arizona Industrial Development Authority, (Phoenix Children’s Hospital), 3.00%, 2/1/39 | | | 1,000 | | | | 1,085,300 | |
| | |
Maricopa County Industrial Development Authority, (Banner Health), 4.00%, 1/1/44 | | | 500 | | | | 589,475 | |
| | |
Maricopa County Industrial Development Authority, (Banner Health), 5.00%, 1/1/38 | | | 1,000 | | | | 1,218,080 | |
| | |
Maricopa County Industrial Development Authority, (HonorHealth), 5.00%, 9/1/32 | | | 400 | | | | 501,100 | |
| | |
Yavapai County Industrial Development Authority, (Yavapai Regional Medical Center), 5.25%, 8/1/33 | | | 500 | | | | 549,390 | |
| | |
Yuma Industrial Development Authority, (Yuma Regional Medical Center), 5.00%, 8/1/32 | | | 985 | | | | 1,107,820 | |
| |
| | | | $ | 6,965,615 | |
|
| Housing — 1.9% | |
| | |
Phoenix Industrial Development Authority, (Downtown Phoenix Student Housing, LLC - Arizona State University), 5.00%, 7/1/37 | | $ | 500 | | | $ | 564,955 | |
| | |
Phoenix Industrial Development Authority, (Downtown Phoenix Student Housing II, LLC - Arizona State University), 5.00%, 7/1/39 | | | 500 | | | | 569,075 | |
| | |
Phoenix Industrial Development Authority, (Downtown Phoenix Student Housing II, LLC - Arizona State University), 5.00%, 7/1/44 | | | 250 | | | | 281,190 | |
| |
| | | | $ | 1,415,220 | |
|
| Industrial Development Revenue — 1.5% | |
| | |
Maricopa County Pollution Control Corp., (El Paso Electric Co.), 3.60%, 2/1/40 | | $ | 250 | | | $ | 279,585 | |
| | | | |
| | 11 | | See Notes to Financial Statements.g |
Eaton Vance
Arizona Municipal Income Fund
January 31, 2021
Portfolio of Investments (Unaudited) — continued
| | | | | | | | |
| Security | | Principal
Amount
(000’s omitted) | | | Value | |
|
| Industrial Development Revenue (continued) | |
| | |
Maricopa County Pollution Control Corp., (El Paso Electric Co.), 4.50%, 8/1/42 | | $ | 850 | | | $ | 881,824 | |
| |
| | | | $ | 1,161,409 | |
|
| Insured – Electric Utilities — 2.3% | |
| | |
Mesa, Utility Systems Revenue, (NPFG), 5.00%, 7/1/23 | | $ | 430 | | | $ | 480,039 | |
| | |
Mesa, Utility Systems Revenue, (NPFG), Escrowed to Maturity, 5.00%, 7/1/23 | | | 120 | | | | 134,080 | |
| | |
Mesa, Utility Systems Revenue, (NPFG), Escrowed to Maturity, 5.00%, 7/1/23 | | | 450 | | | | 502,218 | |
| | |
Puerto Rico Electric Power Authority, (NPFG), 5.25%, 7/1/29 | | | 320 | | | | 348,774 | |
| | |
Puerto Rico Electric Power Authority, (NPFG), Series SS, 5.00%, 7/1/25 | | | 220 | | | | 222,889 | |
| |
| | | | $ | 1,688,000 | |
|
| Insured – General Obligations — 12.4% | |
| | |
Apache Junction Unified School District No. 43, (AGM), 5.00%, 7/1/24 | | $ | 1,200 | | | $ | 1,387,200 | |
| | |
Glendale Union High School District No. 205, (AGM), 3.00%, 7/1/35 | | | 1,000 | | | | 1,137,240 | |
| | |
Marana Unified School District No. 6, (AGM), 4.00%, 7/1/37 | | | 500 | | | | 612,885 | |
| | |
Maricopa County Elementary School District No. 3, (AGM), 5.00%, 7/1/25 | | | 2,670 | | | | 3,203,332 | |
| | |
Maricopa County Elementary School District No. 66, (BAM), 4.00%, 7/1/33 | | | 435 | | | | 536,255 | |
| | |
Maricopa County Elementary School District No. 66, (BAM), 4.00%, 7/1/34 | | | 230 | | | | 282,567 | |
| | |
Maricopa County Elementary School District No. 66, (BAM), 4.00%, 7/1/37 | | | 375 | | | | 456,135 | |
| | |
Maricopa County Elementary School District No. 66, (BAM), 4.00%, 7/1/39 | | | 400 | | | | 483,892 | |
| | |
Sun City Fire District, (AGM), 4.00%, 1/1/37 | | | 1,000 | | | | 1,160,610 | |
| |
| | | | $ | 9,260,116 | |
|
| Insured – Lease Revenue / Certificates of Participation — 3.5% | |
| | |
Phoenix Civic Improvement Corp., (Civic Plaza), (NPFG), 5.50%, 7/1/41 | | $ | 1,635 | | | $ | 2,640,623 | |
| |
| | | | $ | 2,640,623 | |
|
| Insured – Special Tax Revenue — 2.4% | |
| | |
Glendale, Transportation Excise Tax Revenue, (AGM), 5.00%, 7/1/30 | | $ | 1,250 | | | $ | 1,491,825 | |
| | |
Puerto Rico Infrastructure Financing Authority, (AMBAC), 0.00%, 7/1/28 | | | 450 | | | | 330,917 | |
| |
| | | | $ | 1,822,742 | |
| | | | | | | | |
| Security | | Principal
Amount
(000’s omitted) | | | Value | |
|
| Other Revenue — 1.9% | |
| | |
Salt Verde Financial Corp., Senior Gas Revenue, 5.00%, 12/1/37 | | $ | 1,000 | | | $ | 1,459,350 | |
| |
| | | | $ | 1,459,350 | |
|
| Senior Living / Life Care — 1.4% | |
| | |
Glendale Industrial Development Authority, (Royal Oaks - Inspirata Pointe), 5.00%, 5/15/41 | | $ | 500 | | | $ | 570,400 | |
| | |
Glendale Industrial Development Authority, (Terraces of Phoenix), 4.00%, 7/1/28 | | | 225 | | | | 233,888 | |
| | |
Tempe Industrial Development Authority, (Friendship Village of Tempe), 6.00%, 12/1/32 | | | 230 | | | | 235,147 | |
| |
| | | | $ | 1,039,435 | |
|
| Special Tax Revenue — 8.6% | |
| | |
Arizona Sports and Tourism Authority, (Multipurpose Stadium Facility), 5.00%, 7/1/29 | | $ | 1,000 | | | $ | 1,047,510 | |
| | |
Mesa, Excise Tax Revenue, 4.00%, 7/1/33 | | | 200 | | | | 251,580 | |
| | |
Mesa, Excise Tax Revenue, 4.00%, 7/1/37 | | | 250 | | | | 307,783 | |
| | |
Mesa, Excise Tax Revenue, Prerefunded to 7/1/22, 5.00%, 7/1/32 | | | 1,000 | | | | 1,068,470 | |
| | |
Pinal County, Pledged Revenue, 4.00%, 8/1/33 | | | 600 | | | | 714,810 | |
| | |
Pinal County, Pledged Revenue, 4.00%, 8/1/36 | | | 500 | | | | 590,820 | |
| | |
Queen Creek, Excise Tax and State Shared Revenue, 5.00%, 8/1/30 | | | 1,165 | | | | 1,437,260 | |
| | |
Tempe, Transit Excise Tax Revenue, 5.00%, 7/1/37 | | | 625 | | | | 664,319 | |
| | |
Tempe, Transit Excise Tax Revenue, Prerefunded to 7/1/22, 5.00%, 7/1/37 | | | 375 | | | | 400,402 | |
| |
| | | | $ | 6,482,954 | |
|
| Transportation — 4.5% | |
| | |
Arizona Transportation Board, Highway Revenue, 5.00%, 7/1/33 | | $ | 1,000 | | | $ | 1,143,890 | |
| | |
Phoenix Civic Improvement Corp., Airport Revenue, (AMT), 5.00%, 7/1/31 | | | 2,000 | | | | 2,193,980 | |
| |
| | | | $ | 3,337,870 | |
|
| Water and Sewer — 7.6% | |
| | |
Central Arizona Water Conservation District, 5.00%, 1/1/35 | | $ | 1,500 | | | $ | 1,802,025 | |
| | |
Gilbert Water Resources Municipal Property Corp., 4.00%, 7/1/36 | | | 750 | | | | 862,642 | |
| | |
Phoenix Civic Improvement Corp., Water System Revenue, 5.00%, 7/1/39 | | | 1,500 | | | | 1,722,420 | |
| | |
Tucson, Water System Revenue, 5.00%, 7/1/32 | | | 545 | | | | 684,242 | |
| | |
Tucson, Water System Revenue, 5.00%, 7/1/35 | | | 530 | | | | 660,025 | |
| |
| | | | $ | 5,731,354 | |
| |
Total Tax-Exempt Municipal Securities — 91.6%
(identified cost $62,445,171) | | | $ | 68,723,531 | |
| | | | |
| | 12 | | See Notes to Financial Statements. |
Eaton Vance
Arizona Municipal Income Fund
January 31, 2021
Portfolio of Investments (Unaudited) — continued
| | | | | | | | |
| Taxable Municipal Securities — 2.8% | |
| Security | | Principal
Amount
(000’s omitted) | | | Value | |
|
| General Obligations — 0.8% | |
| | |
Scottsdale, 1.93%, 7/1/39(2) | | $ | 550 | | | $ | 545,946 | |
| |
| | | | $ | 545,946 | |
|
| Special Tax Revenue — 2.0% | |
| | |
Scottsdale Municipal Property Corp., Excise Tax Revenue, 1.656%, 7/1/32(2) | | $ | 1,500 | | | $ | 1,519,320 | |
| |
| | | | $ | 1,519,320 | |
| |
Total Taxable Municipal Securities — 2.8%
(identified cost $2,044,093) | | | $ | 2,065,266 | |
| |
Total Investments — 94.4%
(identified cost $64,489,264) | | | $ | 70,788,797 | |
| |
Other Assets, Less Liabilities — 5.6% | | | $ | 4,205,039 | |
| |
Net Assets — 100.0% | | | $ | 74,993,836 | |
The percentage shown for each investment category in the Portfolio of Investments is based on net assets.
The Fund invests primarily in debt securities issued by Arizona municipalities. The ability of the issuers of the debt securities to meet their obligations may be affected by economic developments in a specific industry or municipality. At January 31, 2021, 21.8% of total investments are backed by bond insurance of various financial institutions and financial guaranty assurance agencies. The aggregate percentage insured by an individual financial institution or financial guaranty assurance agency ranged from 0.5% to 12.7% of total investments.
| (1) | Security exempt from registration under Rule 144A of the Securities Act of 1933, as amended. These securities may be sold in certain transactions in reliance on an exemption from registration (normally to qualified institutional buyers). At January 31, 2021, the aggregate value of these securities is $875,428 or 1.2% of the Fund’s net assets. |
| (2) | When-issued security. |
Abbreviations:
| | | | |
| | |
| AGM | | – | | Assured Guaranty Municipal Corp. |
| | |
| AMBAC | | – | | AMBAC Financial Group, Inc. |
| | |
| AMT | | – | | Interest earned from these securities may be considered a tax preference item for purposes of the Federal Alternative Minimum Tax. |
| | |
| BAM | | – | | Build America Mutual Assurance Co. |
| | |
| NPFG | | – | | National Public Finance Guarantee Corp. |
| | | | |
| | 13 | | See Notes to Financial Statements. |
Eaton Vance
Connecticut Municipal Income Fund
January 31, 2021
Portfolio of Investments (Unaudited)
| | | | | | | | |
| Tax-Exempt Investments — 97.7% | |
| Security | | Principal
Amount
(000’s omitted) | | | Value | |
|
| Bond Bank — 1.5% | |
| | |
Connecticut, (Revolving Fund), Green Bonds, 5.00%, 5/1/34 | | $ | 1,000 | | | $ | 1,246,100 | |
| |
| | | | $ | 1,246,100 | |
|
| Education — 21.1% | |
| | |
Connecticut Health and Educational Facilities Authority, (Brunswick School), 5.00%, 7/1/31 | | $ | 500 | | | $ | 530,065 | |
| | |
Connecticut Health and Educational Facilities Authority, (Brunswick School), 5.00%, 7/1/32 | | | 1,125 | | | | 1,192,151 | |
| | |
Connecticut Health and Educational Facilities Authority, (Choate Rosemary Hall), 4.00%, 7/1/33 | | | 340 | | | | 428,723 | |
| | |
Connecticut Health and Educational Facilities Authority, (Choate Rosemary Hall), 4.00%, 7/1/34 | | | 335 | | | | 419,946 | |
| | |
Connecticut Health and Educational Facilities Authority, (Choate Rosemary Hall), 4.00%, 7/1/35 | | | 310 | | | | 386,533 | |
| | |
Connecticut Health and Educational Facilities Authority, (Connecticut College), Prerefunded to 7/1/22, 5.00%, 7/1/30 | | | 1,255 | | | | 1,340,930 | |
| | |
Connecticut Health and Educational Facilities Authority, (Fairfield University), 4.00%, 7/1/47 | | | 2,450 | | | | 2,766,221 | |
| | |
Connecticut Health and Educational Facilities Authority, (Quinnipiac University), 5.00%, 7/1/34 | | | 1,475 | | | | 1,761,947 | |
| | |
Connecticut Health and Educational Facilities Authority, (Sacred Heart University), 5.00%, 7/1/33 | | | 275 | | | | 355,641 | |
| | |
Connecticut Health and Educational Facilities Authority, (Sacred Heart University), 5.00%, 7/1/37 | | | 450 | | | | 538,236 | |
| | |
Connecticut Health and Educational Facilities Authority, (The Taft School), 4.00%, 7/1/28 | | | 135 | | | | 165,869 | |
| | |
Connecticut Health and Educational Facilities Authority, (The Taft School), 4.00%, 7/1/29 | | | 100 | | | | 121,459 | |
| | |
Connecticut Health and Educational Facilities Authority, (The Taft School), 4.00%, 7/1/30 | | | 125 | | | | 150,236 | |
| | |
Connecticut Health and Educational Facilities Authority, (The Taft School), 4.00%, 7/1/33 | | | 430 | | | | 508,879 | |
| | |
Connecticut Health and Educational Facilities Authority, (The Taft School), 4.00%, 7/1/34 | | | 1,085 | | | | 1,280,474 | |
| | |
Connecticut Health and Educational Facilities Authority, (The Taft School), 4.00%, 7/1/36 | | | 430 | | | | 504,764 | |
| | |
Connecticut Health and Educational Facilities Authority, (University of New Haven), 5.00%, 7/1/34 | | | 810 | | | | 969,246 | |
| | |
Connecticut Health and Educational Facilities Authority, (University of New Haven), 5.00%, 7/1/35 | | | 850 | | | | 1,012,843 | |
| | |
Connecticut Health and Educational Facilities Authority, (Yale University), 1.10% to 2/7/23 (Put Date), 7/1/48 | | | 500 | | | | 508,310 | |
| | |
Connecticut Health and Educational Facilities Authority, (Yale University), 5.00%, 7/1/27 | | | 1,000 | | | | 1,291,820 | |
| | |
University of Connecticut, 5.00%, 11/15/29 | | | 1,000 | | | | 1,073,690 | |
| |
| | | | $ | 17,307,983 | |
| | | | | | | | |
| Security | | Principal
Amount
(000’s omitted) | | | Value | |
|
| Escrowed / Prerefunded — 8.3% | |
| | |
Connecticut Health and Educational Facilities Authority, (Middlesex Hospital), Prerefunded to 7/1/21, 5.00%, 7/1/24 | | $ | 1,000 | | | $ | 1,020,230 | |
| | |
Connecticut Health and Educational Facilities Authority, (Western Connecticut Health Network), Prerefunded to 7/1/21, 5.00%, 7/1/29 | | | 1,000 | | | | 1,020,020 | |
| | |
Greater New Haven Water Pollution Control Authority, Prerefunded to 8/15/24, 5.00%, 8/15/32 | | | 1,000 | | | | 1,170,210 | |
| | |
Hartford County Metropolitan District, (Clean Water), Prerefunded to 4/1/22, 5.00%, 4/1/36 | | | 1,500 | | | | 1,585,470 | |
| | |
Norwalk, Prerefunded to 7/1/21, 4.00%, 7/1/26 | | | 1,975 | | | | 2,007,193 | |
| |
| | | | $ | 6,803,123 | |
|
| General Obligations — 19.6% | |
| | |
Colchester, 4.00%, 10/15/28 | | $ | 440 | | | $ | 494,107 | |
| | |
Connecticut, 3.00%, 1/15/32 | | | 500 | | | | 577,165 | |
| | |
Connecticut, 4.00%, 1/15/36 | | | 1,000 | | | | 1,218,920 | |
| | |
Connecticut, 5.00%, 10/1/22 | | | 250 | | | | 250,978 | |
| | |
Connecticut, 5.00%, 4/15/30 | | | 1,150 | | | | 1,518,977 | |
| | |
Connecticut, 5.00%, 4/15/39 | | | 100 | | | | 127,478 | |
| | |
Darien, 4.00%, 8/1/37 | | | 1,310 | | | | 1,569,432 | |
| | |
East Haddam, 3.00%, 12/1/35 | | | 400 | | | | 453,488 | |
| | |
East Haddam, 3.00%, 12/1/37 | | | 290 | | | | 325,690 | |
| | |
Enfield, 4.00%, 8/1/29 | | | 500 | | | | 594,825 | |
| | |
Fairfield, 5.00%, 1/1/23 | | | 1,000 | | | | 1,093,460 | |
| | |
Greenwich, 4.00%, 7/15/29 | | | 450 | | | | 503,595 | |
| | |
Greenwich, 4.00%, 7/15/30 | | | 250 | | | | 278,970 | |
| | |
Greenwich, 4.00%, 7/15/32 | | | 400 | | | | 444,436 | |
| | |
Guilford, 3.00%, 8/1/34 | | | 500 | | | | 580,430 | |
| | |
New Canaan, 5.00%, 4/1/27 | | | 250 | | | | 322,040 | |
| | |
North Haven, 5.00%, 7/15/23 | | | 1,475 | | | | 1,651,307 | |
| | |
North Haven, 5.00%, 7/15/25 | | | 1,490 | | | | 1,806,297 | |
| | |
Rocky Hill, 4.00%, 1/15/33 | | | 1,000 | | | | 1,197,830 | |
| | |
Stamford, 4.00%, 7/1/25 | | | 370 | | | | 375,820 | |
| | |
Trumbull, 4.00%, 9/1/32 | | | 610 | | | | 738,076 | |
| |
| | | | $ | 16,123,321 | |
|
| Hospital — 9.2% | |
| | |
Connecticut Health and Educational Facilities Authority, (Nuvance Health), 4.00%, 7/1/41 | | $ | 1,500 | | | $ | 1,739,595 | |
| | |
Connecticut Health and Educational Facilities Authority, (Stamford Hospital), 4.00%, 7/1/46 | | | 1,000 | | | | 1,088,000 | |
| | |
Connecticut Health and Educational Facilities Authority, (Trinity Health Corp.), 5.00%, 12/1/33 | | | 2,000 | | | | 2,437,580 | |
| | |
Connecticut Health and Educational Facilities Authority, (Yale-New Haven Health), 5.00%, 7/1/31 | | | 500 | | | | 567,435 | |
| | | | |
| | 14 | | See Notes to Financial Statements. |
Eaton Vance
Connecticut Municipal Income Fund
January 31, 2021
Portfolio of Investments (Unaudited) — continued
| | | | | | | | |
| Security | | Principal
Amount
(000’s omitted) | | | Value | |
|
| Hospital (continued) | |
| | |
Connecticut Health and Educational Facilities Authority, (Yale-New Haven Health), 5.00%, 7/1/34 | | $ | 1,520 | | | $ | 1,715,335 | |
| |
| | | | $ | 7,547,945 | |
|
| Housing — 2.4% | |
| | |
Connecticut Housing Finance Authority, 4.00%, 11/15/38 | | $ | 750 | | | $ | 851,670 | |
| | |
Connecticut Housing Finance Authority, (FHLMC), (FNMA), (GNMA), 3.20%, 11/15/33 | | | 1,000 | | | | 1,083,030 | |
| |
| | | | $ | 1,934,700 | |
|
| Insured – Education — 7.8% | |
| | |
Connecticut Health and Educational Facilities Authority, (Loomis Chaffee School), (AMBAC), 5.25%, 7/1/30 | | $ | 1,950 | | | $ | 2,607,715 | |
| | |
Connecticut Health and Educational Facilities Authority, (Loomis Chaffee School), (AMBAC), 5.25%, 7/1/31 | | | 2,050 | | | | 2,794,847 | |
| | |
Connecticut Health and Educational Facilities Authority, (Trinity College), (NPFG), 5.50%, 7/1/21 | | | 1,005 | | | | 1,026,678 | |
| |
| | | | $ | 6,429,240 | |
|
| Insured – Escrowed/Prerefunded — 1.3% | |
| | |
Bridgeport, (AGM), Escrowed to Maturity, 4.00%, 8/15/21 | | $ | 1,075 | | | $ | 1,097,403 | |
| |
| | | | $ | 1,097,403 | |
|
| Insured – General Obligations — 6.3% | |
| | |
Bridgeport, (AGM), 5.00%, 8/15/32 | | $ | 1,120 | | | $ | 1,339,442 | |
| | |
Hamden, (BAM), 5.00%, 8/1/32 | | | 500 | | | | 655,985 | |
| | |
Hamden, (BAM), 5.00%, 8/1/35 | | | 500 | | | | 647,180 | |
| | |
Hartford, (AGC), 5.00%, 8/15/28 | | | 500 | | | | 501,865 | |
| | |
Hartford, (AGM), 5.00%, 4/1/31 | | | 240 | | | | 251,700 | |
| | |
New Haven, (AGM), 5.00%, 8/1/25 | | | 1,000 | | | | 1,149,140 | |
| | |
Windham, (BAM), 4.00%, 8/15/37 | | | 500 | | | | 606,300 | |
| |
| | | | $ | 5,151,612 | |
|
| Insured – Hospital — 1.4% | |
| | |
Connecticut Health and Educational Facilities Authority, (Hartford HealthCare Obligated Group), (AGM), 4.00%, 7/1/37 | | $ | 1,000 | | | $ | 1,177,360 | |
| |
| | | | $ | 1,177,360 | |
|
| Insured – Transportation — 2.4% | |
| | |
Puerto Rico Highway and Transportation Authority, (AGC), 5.25%, 7/1/41 | | $ | 1,600 | | | $ | 1,960,448 | |
| |
| | | | $ | 1,960,448 | |
| | | | | | | | |
| Security | | Principal
Amount
(000’s omitted) | | | Value | |
|
| Insured – Water and Sewer — 4.9% | |
| | |
South Central Connecticut Regional Water Authority, (NPFG), 5.25%, 8/1/24 | | $ | 3,420 | | | $ | 4,020,586 | |
| |
| | | | $ | 4,020,586 | |
|
| Senior Living / Life Care — 2.4% | |
| | |
Connecticut Health and Educational Facilities Authority, (Covenant Home, Inc.), 5.00%, 12/1/34 | | $ | 1,000 | | | $ | 1,191,120 | |
| | |
Connecticut Health and Educational Facilities Authority, (McLean Affiliates, Inc.), 3.25%, 1/1/27(1) | | | 250 | | | | 254,400 | |
| | |
Connecticut Health and Educational Facilities Authority, (McLean Affiliates, Inc.), 5.00%, 1/1/45(1) | | | 500 | | | | 543,195 | |
| |
| | | | $ | 1,988,715 | |
|
| Special Tax Revenue — 2.6% | |
| | |
Connecticut, Special Tax Obligation, (Transportation Infrastructure), 5.00%, 1/1/29 | | $ | 2,000 | | | $ | 2,170,560 | |
| |
| | | | $ | 2,170,560 | |
|
| Student Loan — 1.7% | |
| | |
Connecticut Higher Education Supplemental Loan Authority, (AMT), 4.00%, 11/15/30 | | $ | 555 | | | $ | 588,777 | |
| | |
Connecticut Higher Education Supplemental Loan Authority, (AMT), 4.125%, 11/15/33 | | | 210 | | | | 225,622 | |
| | |
Connecticut Higher Education Supplemental Loan Authority, (AMT), 5.00%, 11/15/28 | | | 250 | | | | 301,360 | |
| | |
Connecticut Higher Education Supplemental Loan Authority, (AMT), 5.00%, 11/15/29 | | | 250 | | | | 304,908 | |
| |
| | | | $ | 1,420,667 | |
|
| Transportation — 1.3% | |
| | |
Connecticut Airport Authority, (Ground Transportation Center), (AMT), 4.00%, 7/1/49 | | $ | 1,000 | | | $ | 1,098,360 | |
| |
| | | | $ | 1,098,360 | |
|
| Water and Sewer — 3.5% | |
| | |
South Central Connecticut Regional Water Authority, 4.00%, 8/1/34 | | $ | 450 | | | $ | 537,354 | |
| | |
South Central Connecticut Regional Water Authority, 5.00%, 8/1/32 | | | 355 | | | | 469,427 | |
| | |
Stamford, (Water Pollution Control System), 4.00%, 4/1/44 | | | 1,000 | | | | 1,194,190 | |
| | |
Stamford, (Water Pollution Control System), 5.00%, 9/15/29 | | | 200 | | | | 241,220 | |
| | |
Stamford, (Water Pollution Control System), 5.00%, 9/15/30 | | | 125 | | | | 150,509 | |
| | |
Stamford, (Water Pollution Control System), 5.00%, 4/1/33 | | | 100 | | | | 132,066 | |
| | | | |
| | 15 | | See Notes to Financial Statements. |
Eaton Vance
Connecticut Municipal Income Fund
January 31, 2021
Portfolio of Investments (Unaudited) — continued
| | | | | | | | |
| Security | | Principal
Amount
(000’s omitted) | | | Value | |
|
| Water and Sewer (continued) | |
| | |
Stamford, (Water Pollution Control System), 5.00%, 4/1/34 | | $ | 100 | | | $ | 131,625 | |
| |
| | | | $ | 2,856,391 | |
| |
Total Tax-Exempt Investments — 97.7%
(identified cost $73,688,574) | | | $ | 80,334,514 | |
| |
Other Assets, Less Liabilities — 2.3% | | | $ | 1,921,706 | |
| |
Net Assets — 100.0% | | | $ | 82,256,220 | |
The percentage shown for each investment category in the Portfolio of Investments is based on net assets.
The Fund invests primarily in debt securities issued by Connecticut municipalities. The ability of the issuers of the debt securities to meet their obligations may be affected by economic developments in a specific industry or municipality. At January 31, 2021, 24.7% of total investments are backed by bond insurance of various financial institutions and financial guaranty assurance agencies. The aggregate percentage insured by an individual financial institution or financial guaranty assurance agency ranged from 2.4% to 6.7% of total investments.
| (1) | Security exempt from registration under Rule 144A of the Securities Act of 1933, as amended. These securities may be sold in certain transactions in reliance on an exemption from registration (normally to qualified institutional buyers). At January 31, 2021, the aggregate value of these securities is $797,595 or 1.0% of the Fund’s net assets. |
Abbreviations:
| | | | |
| | |
| AGC | | – | | Assured Guaranty Corp. |
| | |
| AGM | | – | | Assured Guaranty Municipal Corp. |
| | |
| AMBAC | | – | | AMBAC Financial Group, Inc. |
| | |
| AMT | | – | | Interest earned from these securities may be considered a tax preference item for purposes of the Federal Alternative Minimum Tax. |
| | |
| BAM | | – | | Build America Mutual Assurance Co. |
| | |
| FHLMC | | – | | Federal Home Loan Mortgage Corp. |
| | |
| FNMA | | – | | Federal National Mortgage Association |
| | |
| GNMA | | – | | Government National Mortgage Association |
| | |
| NPFG | | – | | National Public Finance Guarantee Corp. |
| | | | |
| | 16 | | See Notes to Financial Statements. |
Eaton Vance
Minnesota Municipal Income Fund
January 31, 2021
Portfolio of Investments (Unaudited)
| | | | | | | | |
| Tax-Exempt Investments — 95.2% | |
| Security | | Principal
Amount
(000’s omitted) | | | Value | |
|
| Bond Bank — 1.3% | |
| | |
Minnesota Public Facilities Authority, (Revolving Fund), 5.00%, 3/1/29 | | $ | 1,000 | | | $ | 1,232,560 | |
| | |
Minnesota Public Facilities Authority, (Revolving Fund), 5.00%, 3/1/30 | | | 1,000 | | | | 1,229,730 | |
| |
| | | | $ | 2,462,290 | |
|
| Education — 15.7% | |
| | |
Minnesota Higher Education Facilities Authority, (Carleton College), 5.00%, 3/1/29 | | $ | 2,250 | | | $ | 2,812,275 | |
| | |
Minnesota Higher Education Facilities Authority, (Carleton College), 5.00%, 3/1/31 | | | 1,000 | | | | 1,238,600 | |
| | |
Minnesota Higher Education Facilities Authority, (Carleton College), 5.00%, 3/1/34 | | | 500 | | | | 613,060 | |
| | |
Minnesota Higher Education Facilities Authority, (College of Saint Benedict), 4.00%, 3/1/36 | | | 400 | | | | 432,056 | |
| | |
Minnesota Higher Education Facilities Authority, (College of Saint Benedict), 5.00%, 3/1/37 | | | 1,500 | | | | 1,677,705 | |
| | |
Minnesota Higher Education Facilities Authority, (College of St. Scholastica), 4.00%, 12/1/40 | | | 1,850 | | | | 2,062,750 | |
| | |
Minnesota Higher Education Facilities Authority, (Gustavus Adolphus College), 5.00%, 10/1/35 | | | 565 | | | | 655,038 | |
| | |
Minnesota Higher Education Facilities Authority, (Macalester College), 5.00%, 3/1/27 | | | 500 | | | | 585,640 | |
| | |
Minnesota Higher Education Facilities Authority, (Macalester College), 5.00%, 3/1/28 | | | 1,010 | | | | 1,178,114 | |
| | |
Minnesota Higher Education Facilities Authority, (St. Catherine University), 5.00%, 10/1/32 | | | 500 | | | | 613,200 | |
| | |
Minnesota Higher Education Facilities Authority, (St. Olaf College), 4.00%, 10/1/35 | | | 500 | | | | 558,465 | |
| | |
Minnesota Higher Education Facilities Authority, (St. Olaf College), 5.00%, 12/1/29 | | | 1,815 | | | | 2,139,831 | |
| | |
Minnesota Higher Education Facilities Authority, (University of St. Thomas), 4.00%, 10/1/32 | | | 910 | | | | 1,073,026 | |
| | |
Minnesota Higher Education Facilities Authority, (University of St. Thomas), 4.00%, 10/1/36 | | | 500 | | | | 561,305 | |
| | |
Minnesota Higher Education Facilities Authority, (University of St. Thomas), 4.00%, 10/1/37 | | | 500 | | | | 559,995 | |
| | |
Minnesota Higher Education Facilities Authority, (University of St. Thomas), 5.00%, 10/1/30 | | | 650 | | | | 797,154 | |
| | |
Minnesota Higher Education Facilities Authority, (University of St. Thomas), 5.00%, 10/1/34 | | | 250 | | | | 316,020 | |
| | |
Minnesota Higher Education Facilities Authority, (University of St. Thomas), 5.00%, 4/1/35 | | | 750 | | | | 872,843 | |
| | |
Minnesota State Colleges and Universities, 5.00%, 10/1/26 | | | 1,535 | | | | 1,913,132 | |
| | |
Minnesota State Colleges and Universities, 5.00%, 10/1/28 | | | 1,375 | | | | 1,417,075 | |
| | |
Minnesota State Colleges and Universities, 5.00%, 10/1/30 | | | 1,455 | | | | 1,497,835 | |
| | | | | | | | |
| Security | | Principal
Amount
(000’s omitted) | | | Value | |
|
| Education (continued) | |
| | |
St. Paul Housing and Redevelopment Authority, (Hmong College Prep Academy), 5.00%, 9/1/40 | | $ | 1,000 | | | $ | 1,198,600 | |
| | |
St. Paul Housing and Redevelopment Authority, (Hmong College Prep Academy), 5.00%, 9/1/43 | | | 1,000 | | | | 1,189,280 | |
| | |
University of Minnesota, 5.00%, 4/1/27 | | | 500 | | | | 619,040 | |
| | |
University of Minnesota, 5.00%, 8/1/27 | | | 625 | | | | 751,219 | |
| | |
University of Minnesota, 5.00%, 4/1/41 | | | 2,000 | | | | 2,383,340 | |
| |
| | | | $ | 29,716,598 | |
|
| Electric Utilities — 7.0% | |
| | |
Central Minnesota Municipal Power Agency, 5.00%, 1/1/32 | | $ | 2,100 | | | $ | 2,189,019 | |
| | |
Chaska, Electric System Revenue, 5.00%, 10/1/30 | | | 550 | | | | 657,090 | |
| | |
Hutchinson, Public Utility Revenue, 5.00%, 12/1/26 | | | 350 | | | | 379,099 | |
| | |
Minnesota Municipal Power Agency, 5.00%, 10/1/33 | | | 250 | | | | 288,882 | |
| | |
Minnesota Municipal Power Agency, 5.00%, 10/1/34 | | | 250 | | | | 288,883 | |
| | |
Minnesota Municipal Power Agency, 5.00%, 10/1/35 | | | 200 | | | | 231,106 | |
| | |
Northern Municipal Power Agency, 5.00%, 1/1/30 | | | 460 | | | | 561,945 | |
| | |
Northern Municipal Power Agency, 5.00%, 1/1/31 | | | 670 | | | | 797,776 | |
| | |
Northern Municipal Power Agency, 5.00%, 1/1/41 | | | 240 | | | | 284,810 | |
| | |
Rochester, Electric Utility Revenue, 5.00%, 12/1/29 | | | 700 | | | | 871,535 | |
| | |
Rochester, Electric Utility Revenue, 5.00%, 12/1/30 | | | 700 | | | | 871,080 | |
| | |
Rochester, Electric Utility Revenue, 5.00%, 12/1/42 | | | 820 | | | | 996,858 | |
| | |
St. Paul Port Authority, District Energy Revenue, 4.00%, 10/1/42 | | | 1,250 | | | | 1,412,125 | |
| | |
St. Paul Port Authority, District Energy Revenue, (AMT), 4.00%, 10/1/40 | | | 1,000 | | | | 1,118,760 | |
| | |
Western Minnesota Municipal Power Agency, 5.00%, 1/1/34 | | | 1,000 | | | | 1,201,880 | |
| | |
Western Minnesota Municipal Power Agency, 5.00%, 1/1/36 | | | 900 | | | | 1,077,849 | |
| |
| | | | $ | 13,228,697 | |
|
| Escrowed / Prerefunded — 1.2% | |
| | |
Minnesota Higher Education Facilities Authority, (St. Catherine University), Prerefunded to 10/1/22, 5.00%, 10/1/26 | | $ | 280 | | | $ | 302,560 | |
| | |
Minnesota Higher Education Facilities Authority, (St. Catherine University), Prerefunded to 10/1/22, 5.00%, 10/1/27 | | | 310 | | | | 334,977 | |
| | |
Minnesota Higher Education Facilities Authority, (St. Catherine University), Prerefunded to 10/1/22, 5.00%, 10/1/32 | | | 560 | | | | 605,119 | |
| | |
Western Minnesota Municipal Power Agency, Prerefunded to 1/1/24, 5.00%, 1/1/34 | | | 1,000 | | | | 1,140,960 | |
| |
| | | | $ | 2,383,616 | |
|
| General Obligations — 41.9% | |
| | |
Andover, 4.00%, 2/1/30 | | $ | 795 | | | $ | 965,019 | |
| | |
Anoka-Hennepin Independent School District No. 11, 5.00%, 2/1/27 | | | 1,000 | | | | 1,271,470 | |
| | | | |
| | 17 | | See Notes to Financial Statements. |
Eaton Vance
Minnesota Municipal Income Fund
January 31, 2021
Portfolio of Investments (Unaudited) — continued
| | | | | | | | |
| Security | | Principal
Amount
(000’s omitted) | | | Value | |
|
| General Obligations (continued) | |
| | |
Anoka-Hennepin Independent School District No. 11, 5.00%, 2/1/28 | | $ | 1,040 | | | $ | 1,314,529 | |
| | |
Brainerd Independent School District No. 181, 5.00%, 2/1/25 | | | 575 | | | | 684,469 | |
| | |
Brooklyn Center, 4.00%, 2/1/30 | | | 1,060 | | | | 1,281,890 | |
| | |
Buffalo-Hanover-Montrose Independent School District No. 877, 4.00%, 2/1/24 | | | 2,000 | | | | 2,074,840 | |
| | |
Burnsville, 3.00%, 12/20/32 | | | 620 | | | | 720,725 | |
| | |
Burnsville, 4.00%, 12/20/31 | | | 640 | | | | 827,629 | |
| | |
Centennial Independent School District No. 12, Circle Pines, 0.00%, 2/1/28 | | | 1,000 | | | | 874,540 | |
| | |
Centennial Independent School District No. 12, Circle Pines, 0.00%, 2/1/35 | | | 350 | | | | 221,627 | |
| | |
Chaska Independent School District No. 112, 4.00%, 2/1/23 | | | 2,000 | | | | 2,073,220 | |
| | |
Cloquet Independent School District No. 94, 5.00%, 2/1/30 | | | 2,000 | | | | 2,362,340 | |
| | |
Dilworth-Glyndon-Felton Independent School District No. 2164, 4.00%, 2/1/27 | | | 730 | | | | 855,056 | |
| | |
Duluth, 5.00%, 2/1/34 | | | 1,000 | | | | 1,211,090 | |
| | |
Duluth, Series 2016A, 5.00%, 2/1/31 | | | 1,000 | | | | 1,216,040 | |
| | |
Duluth, Series 2019C, 5.00%, 2/1/31 | | | 500 | | | | 653,500 | |
| | |
Eden Prairie Independent School District No. 272, 5.00%, 2/1/30 | | | 1,000 | | | | 1,283,230 | |
| | |
Edina Independent School District No. 273, 5.00%, 2/1/28 | | | 1,625 | | | | 2,063,848 | |
| | |
Elk River Area Independent School District No. 728, 4.00%, 2/1/32 | | | 2,000 | | | | 2,173,560 | |
| | |
Hennepin County Regional Railroad Authority, 5.00%, 12/1/32 | | | 675 | | | | 888,347 | |
| | |
Hennepin County, 5.00%, 12/1/35 | | | 2,000 | | | | 2,510,900 | |
| | |
Hennepin County, 5.00%, 12/15/36 | | | 500 | | | | 656,595 | |
| | |
Hopkins Independent School District No. 270, 4.00%, 2/1/25 | | | 1,250 | | | | 1,342,175 | |
| | |
Lakeville, 3.00%, 2/1/31 | | | 595 | | | | 688,391 | |
| | |
Mahtomedi Independent School District No. 832, 5.00%, 2/1/31 | | | 1,000 | | | | 1,183,350 | |
| | |
Mankato Area Public Schools Independent School District No. 77, 4.00%, 2/1/38 | | | 640 | | | | 762,535 | |
| | |
Maple Grove, 4.00%, 2/1/29 | | | 520 | | | | 646,656 | |
| | |
Maple River Independent School District No. 2135, 4.00%, 2/1/38 | | | 1,315 | | | | 1,609,902 | |
| | |
Minneapolis Special School District No. 1, 4.00%, 2/1/33 | | | 1,500 | | | | 1,850,745 | |
| | |
Minneapolis Special School District No. 1, 5.00%, 2/1/32 | | | 1,500 | | | | 1,920,675 | |
| | |
Minneapolis-St. Paul Metropolitan Council, 4.00%, 3/1/30 | | | 1,000 | | | | 1,222,860 | |
| | |
Minneapolis-St. Paul Metropolitan Council, 5.00%, 3/1/28 | | | 2,500 | | | | 3,170,925 | |
| | |
Minnesota, 5.00%, 8/1/32 | | | 2,000 | | | | 2,396,860 | |
| | |
Minnesota, 5.00%, 8/1/34 | | | 500 | | | | 649,030 | |
| | |
Minnesota, 5.00%, 10/1/34 | | | 1,000 | | | | 1,268,480 | |
| | |
Minnesota, 5.00%, 8/1/37 | | | 1,250 | | | | 1,655,500 | |
| | |
Minnesota, 5.00%, 8/1/39 | | | 2,000 | | | | 2,700,660 | |
| | |
Minnesota, Prerefunded to 10/1/21, 5.00%, 10/1/27 | | | 30 | | | | 30,963 | |
| | | | | | | | |
| Security | | Principal
Amount
(000’s omitted) | | | Value | |
|
| General Obligations (continued) | |
| | |
North St. Paul-Maplewood-Oakdale Independent School District No. 622, 4.00%, 2/1/31 | | $ | 2,050 | | | $ | 2,460,554 | |
| | |
North St. Paul-Maplewood-Oakdale Independent School District No. 622, 5.00%, 2/1/33 | | | 1,000 | | | | 1,263,040 | |
| | |
Plymouth, 4.00%, 2/1/30 | | | 390 | | | | 485,269 | |
| | |
Rochester Independent School District No. 535, 4.00%, 2/1/23 | | | 2,375 | | | | 2,555,286 | |
| | |
Rochester Independent School District No. 535, 4.00%, 2/1/26 | | | 1,160 | | | | 1,373,057 | |
| | |
Rosemount-Apple Valley-Eagan Independent School District No. 196, 4.00%, 2/1/28 | | | 2,000 | | | | 2,335,000 | |
| | |
Rosemount-Apple Valley-Eagan Independent School District No. 196, 5.00%, 2/1/27 | | | 1,000 | | | | 1,225,990 | |
| | |
Russell-Tyler-Ruthton Independent School District No. 2902, 5.00%, 2/1/27 | | | 1,400 | | | | 1,778,154 | |
| | |
Sartell-St. Stephen Independent School District No. 748, 0.00%, 2/1/32 | | | 1,350 | | | | 1,038,717 | |
| | |
Sartell-St. Stephen Independent School District No. 748, 0.00%, 2/1/37 | | | 1,500 | | | | 943,350 | |
| | |
Scott County, 4.00%, 12/1/34 | | | 2,000 | | | | 2,423,540 | |
| | |
Spring Lake Park Independent School District No. 16, 4.00%, 2/1/29 | | | 1,075 | | | | 1,238,389 | |
| | |
St. Louis Park Independent School District No. 283, 4.00%, 2/1/31 | | | 2,000 | | | | 2,345,040 | |
| | |
St. Louis Park Independent School District No. 283, 5.00%, 2/1/29 | | | 845 | | | | 1,099,125 | |
| | |
St. Louis Park, 4.00%, 2/1/28 | | | 1,000 | | | | 1,196,510 | |
| | |
St. Paul, 5.00%, 12/1/27 | | | 750 | | | | 947,490 | |
| | |
Waseca Independent School District No. 829, 4.00%, 2/1/28 | | | 1,575 | | | | 1,826,165 | |
| | |
Watertown-Mayer Independent School District No. 111, 0.00%, 2/1/36 | | | 1,000 | | | | 733,200 | |
| | |
Worthington Independent School District No. 518, 4.00%, 2/1/31 | | | 730 | | | | 844,340 | |
| |
| | | | $ | 79,396,387 | |
|
| Hospital — 9.1% | |
| | |
Duluth Economic Development Authority, (Essentia Health Obligated Group), 5.00%, 2/15/37 | | $ | 1,000 | | | $ | 1,213,490 | |
| | |
Maple Grove, (Maple Grove Hospital Corp.), 5.00%, 5/1/30 | | | 850 | | | | 1,031,789 | |
| | |
Maple Grove, (Maple Grove Hospital Corp.), 5.00%, 5/1/31 | | | 500 | | | | 603,225 | |
| | |
Maple Grove, (Maple Grove Hospital Corp.), 5.00%, 5/1/32 | | | 500 | | | | 599,355 | |
| | |
Minneapolis and St. Paul Housing and Redevelopment Authority, (Allina Health System), 5.00%, 11/15/27 | | | 750 | | | | 966,218 | |
| | |
Minneapolis and St. Paul Housing and Redevelopment Authority, (Allina Health System), 5.00%, 11/15/29 | | | 915 | | | | 1,146,769 | |
| | |
Minneapolis, (Fairview Health Services), 5.00%, 11/15/28 | | | 225 | | | | 268,549 | |
| | |
Minneapolis, (Fairview Health Services), (LOC: Wells Fargo Bank, N.A.), 0.01%, 11/15/48(1) | | | 1,650 | | | | 1,650,000 | |
| | |
St. Cloud, (CentraCare Health System), 5.00%, 5/1/46 | | | 2,650 | | | | 3,126,470 | |
| | | | |
| | 18 | | See Notes to Financial Statements. |
Eaton Vance
Minnesota Municipal Income Fund
January 31, 2021
Portfolio of Investments (Unaudited) — continued
| | | | | | | | |
| Security | | Principal
Amount
(000’s omitted) | | | Value | |
|
| Hospital (continued) | |
| | |
St. Cloud, (CentraCare Health System), 5.125%, 5/1/30 | | $ | 65 | | | $ | 65,214 | |
| | |
St. Paul Housing and Redevelopment Authority, (Fairview Health Services), 5.00%, 11/15/31 | | | 1,000 | | | | 1,246,350 | |
| | |
St. Paul Housing and Redevelopment Authority, (Fairview Health Services), 5.00%, 11/15/34 | | | 500 | | | | 617,175 | |
| | |
St. Paul Housing and Redevelopment Authority, (Fairview Health Services), 5.00%, 11/15/47 | | | 500 | | | | 599,690 | |
| | |
St. Paul Housing and Redevelopment Authority, (HealthPartners Obligated Group), 5.00%, 7/1/29 | | | 500 | | | | 591,590 | |
| | |
St. Paul Housing and Redevelopment Authority, (HealthPartners Obligated Group), 5.00%, 7/1/30 | | | 1,000 | | | | 1,180,780 | |
| | |
St. Paul Housing and Redevelopment Authority, (HealthPartners Obligated Group), 5.00%, 7/1/32 | | | 1,995 | | | | 2,338,479 | |
| |
| | | | $ | 17,245,143 | |
|
| Housing — 2.5% | |
| | |
Minnesota Housing Finance Agency, 2.15%, 7/1/45 | | $ | 1,000 | | | $ | 1,015,280 | |
| | |
Minnesota Housing Finance Agency, 4.00%, 8/1/42 | | | 1,815 | | | | 2,197,275 | |
| | |
Minnesota Housing Finance Agency, (FHLMC), (FNMA), (GNMA), 2.40%, 1/1/35 | | | 870 | | | | 924,218 | |
| | |
Minnesota Housing Finance Agency, (FHLMC), (FNMA), (GNMA), 3.15%, 1/1/37 | | | 565 | | | | 605,025 | |
| |
| | | | $ | 4,741,798 | |
|
| Insured – Electric Utilities — 5.5% | |
| | |
Puerto Rico Electric Power Authority, (NPFG), 5.25%, 7/1/32 | | $ | 1,150 | | | $ | 1,272,372 | |
| | |
Puerto Rico Electric Power Authority, (NPFG), 5.25%, 7/1/35 | | | 305 | | | | 342,524 | |
| | |
Southern Minnesota Municipal Power Agency, (NPFG), 0.00%, 1/1/25 | | | 9,000 | | | | 8,739,630 | |
| |
| | | | $ | 10,354,526 | |
|
| Insured – Hospital — 1.2% | |
| | |
Minneapolis, (Fairview Health Services), (AGM), 5.00%, 11/15/44 | | $ | 2,000 | | | $ | 2,306,720 | |
| |
| | | | $ | 2,306,720 | |
|
| Lease Revenue / Certificates of Participation — 2.4% | |
| | |
Anoka-Hennepin Independent School District No. 11, 5.00%, 2/1/34 | | $ | 1,000 | | | $ | 1,128,240 | |
| | |
Minnesota, 5.00%, 6/1/29 | | | 1,335 | | | | 1,478,446 | |
| | |
St. Paul Independent School District No. 625, 5.00%, 2/1/27 | | | 1,500 | | | | 1,897,035 | |
| |
| | | | $ | 4,503,721 | |
| | | | | | | | |
| Security | | Principal
Amount
(000’s omitted) | | | Value | |
|
| Other Revenue — 1.2% | |
| | |
Center City, (Hazelden Betty Ford Foundation), 4.00%, 11/1/28 | | $ | 825 | | | $ | 904,844 | |
| | |
Center City, (Hazelden Betty Ford Foundation), 4.00%, 11/1/34 | | | 500 | | | | 574,230 | |
| | |
Center City, (Hazelden Betty Ford Foundation), 5.00%, 11/1/27 | | | 400 | | | | 455,104 | |
| | |
Center City, (Hazelden Betty Ford Foundation), 5.00%, 11/1/29 | | | 300 | | | | 338,730 | |
| |
| | | | $ | 2,272,908 | |
|
| Senior Living / Life Care — 2.7% | |
| | |
Apple Valley, (PHS Apple Valley Senior Housing, Inc.), 5.00%, 9/1/43 | | $ | 1,000 | | | $ | 1,047,860 | |
| | |
North Oaks, (Waverly Gardens), 4.00%, 10/1/25 | | | 1,600 | | | | 1,759,024 | |
| | |
North Oaks, (Waverly Gardens), 4.00%, 10/1/26 | | | 1,680 | | | | 1,841,280 | |
| | |
Wayzata, (Folkestone Senior Living Community), 4.00%, 8/1/44 | | | 435 | | | | 445,570 | |
| |
| | | | $ | 5,093,734 | |
|
| Transportation — 3.5% | |
| | |
Minneapolis-St. Paul Metropolitan Airports Commission, 5.00%, 1/1/27 | | $ | 1,000 | | | $ | 1,263,050 | |
| | |
Minneapolis-St. Paul Metropolitan Airports Commission, 5.00%, 1/1/35 | | | 1,000 | | | | 1,118,290 | |
| | |
Minneapolis-St. Paul Metropolitan Airports Commission, (AMT), 5.00%, 1/1/25 | | | 1,000 | | | | 1,128,180 | |
| | |
Minneapolis-St. Paul Metropolitan Airports Commission, (AMT), 5.00%, 1/1/28 | | | 1,250 | | | | 1,577,087 | |
| | |
Minneapolis-St. Paul Metropolitan Airports Commission, (AMT), 5.00%, 1/1/33 | | | 1,200 | | | | 1,518,912 | |
| |
| | | | $ | 6,605,519 | |
| |
Total Tax-Exempt Investments — 95.2%
(identified cost $167,852,143) | | | $ | 180,311,657 | |
| |
Other Assets, Less Liabilities — 4.8% | | | $ | 9,169,256 | |
| |
Net Assets — 100.0% | | | $ | 189,480,913 | |
The percentage shown for each investment category in the Portfolio of Investments is based on net assets.
The Fund invests primarily in debt securities issued by Minnesota municipalities. The ability of the issuers of the debt securities to meet their obligations may be affected by economic developments in a specific industry or municipality. At January 31, 2021, 7.0% of total investments are backed by bond insurance of various financial institutions and financial guaranty assurance agencies. The aggregate percentage insured by an individual financial institution or financial guaranty assurance agency ranged from 1.3% to 5.7% of total investments.
| (1) | Variable rate demand obligation that may be tendered at par on any day for payment the same or next business day. The stated interest rate, which generally resets daily, is determined by the remarketing agent and represents the rate in effect at January 31, 2021. |
| | | | |
| | 19 | | See Notes to Financial Statements. |
Eaton Vance
Minnesota Municipal Income Fund
January 31, 2021
Portfolio of Investments (Unaudited) — continued
Abbreviations:
| | | | |
| | |
| AGM | | – | | Assured Guaranty Municipal Corp. |
| | |
| AMT | | – | | Interest earned from these securities may be considered a tax preference item for purposes of the Federal Alternative Minimum Tax. |
| | |
| FHLMC | | – | | Federal Home Loan Mortgage Corp. |
| | |
| FNMA | | – | | Federal National Mortgage Association |
| | |
| GNMA | | – | | Government National Mortgage Association |
| | |
| LOC | | – | | Letter of Credit |
| | |
| NPFG | | – | | National Public Finance Guarantee Corp. |
| | | | |
| | 20 | | See Notes to Financial Statements. |
Eaton Vance
New Jersey Municipal Income Fund
January 31, 2021
Portfolio of Investments (Unaudited)
| | | | | | | | |
Tax-Exempt Municipal Securities — 92.8% | |
| Security | | Principal
Amount
(000’s omitted) | | | Value | |
|
| Education — 2.3% | |
| | |
New Jersey Educational Facilities Authority, (Montclair State University), 5.00%, 7/1/30 | | $ | 1,765 | | | $ | 2,010,864 | |
| | |
New Jersey Educational Facilities Authority, (Princeton University), 5.00%, 7/1/42 | | | 1,000 | | | | 1,254,440 | |
| | |
New Jersey Educational Facilities Authority, (Stevens Institute of Technology), Green Bonds, 5.00%, 7/1/45 | | | 1,000 | | | | 1,230,940 | |
| |
| | | | $ | 4,496,244 | |
|
| Escrowed / Prerefunded — 1.2% | |
| | |
New Jersey Economic Development Authority, (The Seeing Eye, Inc.), Prerefunded to 6/1/22, 5.00%, 6/1/32 | | $ | 2,250 | | | $ | 2,388,758 | |
| |
| | | | $ | 2,388,758 | |
|
| General Obligations — 21.4% | |
| | |
Bergen County Improvement Authority, 5.00%, 8/1/42 | | $ | 1,250 | | | $ | 1,660,562 | |
| | |
Bergen County, 3.00%, 7/15/29 | | | 2,000 | | | | 2,301,280 | |
| | |
Burlington County Bridge Commission, 5.00%, 8/1/27 | | | 400 | | | | 512,928 | |
| | |
Burlington County Bridge Commission, 5.00%, 8/1/30 | | | 500 | | | | 645,525 | |
| | |
Burlington County Bridge Commission, 5.00%, 8/1/31 | | | 410 | | | | 527,186 | |
| | |
Burlington County Bridge Commission, 5.00%, 8/1/32 | | | 250 | | | | 320,007 | |
| | |
Burlington County Bridge Commission, 5.00%, 10/1/36 | | | 1,000 | | | | 1,235,900 | |
| | |
Chester Township, 2.00%, 10/1/28 | | | 1,385 | | | | 1,495,412 | |
| | |
Chester Township, 2.00%, 10/1/29 | | | 1,415 | | | | 1,510,838 | |
| | |
Chester Township, 2.00%, 10/1/30 | | | 495 | | | | 523,012 | |
| | |
East Brunswick Board of Education, 4.00%, 8/1/34 | | | 1,200 | | | | 1,470,384 | |
| | |
East Brunswick, 2.00%, 7/15/30 | | | 2,925 | | | | 3,108,544 | |
| | |
Essex County, 2.00%, 9/1/31 | | | 2,420 | | | | 2,602,783 | |
| | |
Essex County, 2.00%, 9/1/32 | | | 2,935 | | | | 3,129,943 | |
| | |
Gloucester County Improvement Authority, 4.00%, 4/1/35 | | | 2,000 | | | | 2,279,000 | |
| | |
Gloucester County Improvement Authority, 4.00%, 5/15/35 | | | 300 | | | | 363,933 | |
| | |
Jersey City, 5.00%, 11/1/33 | | | 800 | | | | 992,656 | |
| | |
Monmouth County Improvement Authority, 3.00%, 12/1/34 | | | 425 | | | | 493,055 | |
| | |
Monmouth County Improvement Authority, 3.00%, 12/1/35 | | | 500 | | | | 577,940 | |
| | |
Monmouth County Improvement Authority, 3.00%, 12/1/36 | | | 250 | | | | 287,823 | |
| | |
Monmouth County Improvement Authority, 4.00%, 12/1/35 | | | 550 | | | | 686,741 | |
| | |
Monmouth County Improvement Authority, 4.00%, 12/1/36 | | | 750 | | | | 932,452 | |
| | |
Monmouth County Improvement Authority, 4.00%, 12/1/37 | | | 635 | | | | 787,197 | |
| | |
Monmouth County Improvement Authority, 4.00%, 12/1/38 | | | 270 | | | | 333,790 | |
| | |
New Jersey, 4.00%, 6/1/30 | | | 1,000 | | | | 1,242,850 | |
| | |
Ocean City, 2.00%, 10/15/30 | | | 2,205 | | | | 2,349,251 | |
| | |
Passaic County Improvement Authority, 3.00%, 8/15/36 | | | 110 | | | | 124,738 | |
| | |
Passaic County Improvement Authority, 3.00%, 8/15/38 | | | 150 | | | | 169,004 | |
| | | | | | | | |
| Security | | Principal
Amount
(000’s omitted) | | | Value | |
|
| General Obligations (continued) | |
| | |
Passaic County Improvement Authority, 4.00%, 8/15/32 | | $ | 185 | | | $ | 233,409 | |
| | |
Passaic County Improvement Authority, 4.00%, 8/15/33 | | | 110 | | | | 138,081 | |
| | |
Passaic County Improvement Authority, 4.00%, 8/15/34 | | | 100 | | | | 125,119 | |
| | |
Piscataway Township, 2.00%, 10/15/37 | | | 1,600 | | | | 1,602,144 | |
| | |
Piscataway Township, 3.00%, 10/15/30 | | | 1,750 | | | | 2,058,927 | |
| | |
Princeton, 2.00%, 12/15/31 | | | 1,065 | | | | 1,138,964 | |
| | |
Ridgewood, 3.00%, 8/1/32 | | | 1,390 | | | | 1,630,915 | |
| | |
Union County, 2.00%, 3/1/31 | | | 1,500 | | | | 1,600,035 | |
| |
| | | | $ | 41,192,328 | |
|
| Hospital — 15.4% | |
| | |
Camden County Improvement Authority, (Cooper Health System), 5.00%, 2/15/35 | | $ | 750 | | | $ | 822,240 | |
| | |
Camden County Improvement Authority, (Cooper Health System), 5.75%, 2/15/42 | | | 1,100 | | | | 1,181,818 | |
| | |
New Jersey Health Care Facilities Financing Authority, (AHS Hospital Corp.), 5.00%, 7/1/27 | | | 175 | | | | 175,595 | |
| | |
New Jersey Health Care Facilities Financing Authority, (Hackensack Meridian Health Obligated Group), 5.00%, 7/1/28 | | | 100 | | | | 126,742 | |
| | |
New Jersey Health Care Facilities Financing Authority, (Inspira Health Obligated Group), 5.00%, 7/1/36 | | | 215 | | | | 264,663 | |
| | |
New Jersey Health Care Facilities Financing Authority, (Princeton HealthCare System), 5.00%, 7/1/32 | | | 590 | | | | 727,281 | |
| | |
New Jersey Health Care Facilities Financing Authority, (Princeton HealthCare System), 5.00%, 7/1/39 | | | 2,750 | | | | 3,311,825 | |
| | |
New Jersey Health Care Facilities Financing Authority, (Robert Wood Johnson University Hospital), 5.00%, 7/1/32 | | | 50 | | | | 57,860 | |
| | |
New Jersey Health Care Facilities Financing Authority, (Robert Wood Johnson University Hospital), 5.00%, 7/1/33 | | | 1,155 | | | | 1,335,076 | |
| | |
New Jersey Health Care Facilities Financing Authority, (RWJ Barnabas Health Obligated Group), 5.00%, 7/1/31 | | | 2,355 | | | | 2,908,472 | |
| | |
New Jersey Health Care Facilities Financing Authority, (RWJ Barnabas Health Obligated Group), 5.00%, 7/1/33 | | | 4,300 | | | | 5,288,957 | |
| | |
New Jersey Health Care Facilities Financing Authority, (St. Joseph’s Healthcare System Obligated Group), 3.00%, 7/1/32 | | | 1,100 | | | | 1,182,962 | |
| | |
New Jersey Health Care Facilities Financing Authority, (St. Joseph’s Healthcare System Obligated Group), 3.125%, 7/1/33 | | | 835 | | | | 900,439 | |
| | |
New Jersey Health Care Facilities Financing Authority, (St. Joseph’s Healthcare System Obligated Group), 4.00%, 7/1/48 | | | 3,000 | | | | 3,344,280 | |
| | |
New Jersey Health Care Facilities Financing Authority, (Trinitas Regional Medical Center Obligated Group), 5.00%, 7/1/28 | | | 1,000 | | | | 1,201,200 | |
| | |
New Jersey Health Care Facilities Financing Authority, (Trinitas Regional Medical Center Obligated Group), 5.00%, 7/1/29 | | | 500 | | | | 597,540 | |
| | | | |
| | 21 | | See Notes to Financial Statements. |
Eaton Vance
New Jersey Municipal Income Fund
January 31, 2021
Portfolio of Investments (Unaudited) — continued
| | | | | | | | |
| Security | | Principal
Amount
(000’s omitted) | | | Value | |
|
| Hospital (continued) | |
| | |
New Jersey Health Care Facilities Financing Authority, (Valley Health System Obligated Group), 4.00%, 7/1/39 | | $ | 5,230 | | | $ | 6,208,899 | |
| |
| | | | $ | 29,635,849 | |
|
| Housing — 1.6% | |
| | |
New Jersey Housing and Mortgage Finance Agency, SFMR, (AMT), 3.80%, 10/1/32 | | $ | 2,820 | | | $ | 3,133,076 | |
| |
| | | | $ | 3,133,076 | |
|
| Industrial Development Revenue — 4.6% | |
| | |
New Jersey Economic Development Authority, (Middlesex Water Co.), (AMT), 5.00%, 8/1/59 | | $ | 3,000 | | | $ | 3,672,390 | |
| | |
New Jersey Economic Development Authority, (New Jersey Natural Gas Co.), 3.375%, 4/1/38 | | | 3,000 | | | | 3,130,380 | |
| | |
New Jersey Economic Development Authority, (New Jersey-American Water Co., Inc.), (AMT), 2.20% to 12/3/29 (Put Date), 10/1/39 | | | 1,850 | | | | 2,001,644 | |
| |
| | | | $ | 8,804,414 | |
|
| Insured – Electric Utilities — 2.3% | |
| | |
Puerto Rico Electric Power Authority, (NPFG), 5.25%, 7/1/34 | | $ | 3,935 | | | $ | 4,393,900 | |
| |
| | | | $ | 4,393,900 | |
|
| Insured – Escrowed / Prerefunded — 0.2% | |
| | |
New Jersey Economic Development Authority, (Motor Vehicle Surcharges), (NPFG), Escrowed to Maturity, 5.25%, 7/1/26 | | $ | 380 | | | $ | 478,143 | |
| |
| | | | $ | 478,143 | |
|
| Insured – General Obligations — 5.7% | |
| | |
Atlantic City, (AGM), 4.00%, 3/1/42 | | $ | 250 | | | $ | 278,572 | |
| | |
Atlantic City, (AGM), 5.00%, 3/1/37 | | | 1,500 | | | | 1,793,220 | |
| | |
Bayonne, (AGM), 5.00%, 8/1/25 | | | 615 | | | | 741,598 | |
| | |
Bayonne, (AGM), 5.00%, 8/1/26 | | | 865 | | | | 1,038,346 | |
| | |
East Orange, (AGM), 5.00%, 10/15/29 | | | 130 | | | | 174,733 | |
| | |
East Orange, (AGM), 5.00%, 10/15/30 | | | 175 | | | | 232,880 | |
| | |
East Orange, (AGM), 5.00%, 10/15/31 | | | 400 | | | | 528,644 | |
| | |
Irvington Township, (AGM), 0.00%, 7/15/23 | | | 3,775 | | | | 3,711,014 | |
| | |
Lakewood Township, (BAM), 4.00%, 11/1/26 | | | 250 | | | | 296,342 | |
| | |
Lakewood Township, (BAM), 4.00%, 11/1/27 | | | 120 | | | | 144,250 | |
| | |
Paterson, (BAM), 5.00%, 1/15/26 | | | 1,305 | | | | 1,406,568 | |
| | |
Trenton, (BAM), 5.00%, 12/1/26 | | | 500 | | | | 600,640 | |
| |
| | | | $ | 10,946,807 | |
| | | | | | | | |
| Security | | Principal
Amount
(000’s omitted) | | | Value | |
|
| Insured – Special Tax Revenue — 8.2% | |
| | |
Garden State Preservation Trust, (AGM), 0.00%, 11/1/24 | | $ | 6,000 | | | $ | 5,821,860 | |
| | |
New Jersey Economic Development Authority, (Motor Vehicle Surcharges), (NPFG), 5.25%, 7/1/26 | | | 1,620 | | | | 1,999,453 | |
| | |
New Jersey Economic Development Authority, (Motor Vehicle Surcharges), (XLCA), 0.00%, 7/1/26 | | | 6,500 | | | | 6,140,485 | |
| | |
New Jersey Economic Development Authority, (Motor Vehicle Surcharges), (XLCA), 0.00%, 7/1/27 | | | 1,900 | | | | 1,757,557 | |
| |
| | | | $ | 15,719,355 | |
|
| Insured – Transportation — 1.5% | |
| | |
New Jersey Economic Development Authority, (The Goethals Bridge Replacement), (AGM), (AMT), 5.00%, 1/1/31 | | $ | 2,015 | | | $ | 2,280,114 | |
| | |
South Jersey Transportation Authority, (AGM), 5.00%, 11/1/33 | | | 500 | | | | 654,180 | |
| |
| | | | $ | 2,934,294 | |
|
| Lease Revenue / Certificates of Participation — 0.6% | |
| | |
New Jersey Economic Development Authority, (School Facilities Construction), 4.00%, 6/15/36 | | $ | 900 | | | $ | 1,064,520 | |
| |
| | | | $ | 1,064,520 | |
|
| Other Revenue — 2.3% | |
| | |
Mercer County Improvement Authority, 4.00%, 4/1/32 | | $ | 1,500 | | | $ | 1,846,140 | |
| | |
Mercer County Improvement Authority, 5.00%, 4/1/34 | | | 1,000 | | | | 1,317,160 | |
| | |
New Jersey Economic Development Authority, (The Seeing Eye, Inc.), 5.00%, 6/1/32 | | | 1,000 | | | | 1,205,770 | |
| |
| | | | $ | 4,369,070 | |
|
| Senior Living / Life Care — 2.0% | |
| | |
New Jersey Economic Development Authority, (United Methodist Homes of New Jersey), 5.00%, 7/1/29 | | $ | 1,250 | | | $ | 1,359,750 | |
| | |
New Jersey Economic Development Authority, (United Methodist Homes of New Jersey), 5.00%, 7/1/34 | | | 2,450 | | | | 2,570,222 | |
| |
| | | | $ | 3,929,972 | |
|
| Student Loan — 3.9% | |
| | |
New Jersey Higher Education Student Assistance Authority, (AMT), 1.175%, (3 mo. USD LIBOR + 0.95%), 6/1/36(1) | | $ | 2,325 | | | $ | 2,325,814 | |
| | |
New Jersey Higher Education Student Assistance Authority, (AMT), 3.25%, 12/1/29 | | | 1,840 | | | | 1,927,400 | |
| | |
New Jersey Higher Education Student Assistance Authority, (AMT), 3.35%, 12/1/29 | | | 2,035 | | | | 2,168,801 | |
| | |
New Jersey Higher Education Student Assistance Authority, (AMT), 4.00%, 12/1/34 | | | 950 | | | | 1,036,060 | |
| |
| | | | $ | 7,458,075 | |
| | | | |
| | 22 | | See Notes to Financial Statements. |
Eaton Vance
New Jersey Municipal Income Fund
January 31, 2021
Portfolio of Investments (Unaudited) — continued
| | | | | | | | |
| Security | | Principal
Amount
(000’s omitted) | | | Value | |
|
| Transportation — 19.6% | |
| | |
Delaware River and Bay Authority of Delaware and New Jersey, 4.00%, 1/1/39 | | $ | 1,000 | | | $ | 1,159,330 | |
| | |
Delaware River Port Authority of Pennsylvania and New Jersey, 5.00%, 1/1/28 | | | 2,000 | | | | 2,251,400 | |
| | |
Delaware River Port Authority of Pennsylvania and New Jersey, 5.00%, 1/1/33 | | | 1,000 | | | | 1,290,440 | |
| | |
Delaware River Port Authority of Pennsylvania and New Jersey, 5.00%, 1/1/35 | | | 2,270 | | | | 2,914,408 | |
| | |
Delaware River Port Authority of Pennsylvania and New Jersey, 5.00%, 1/1/36 | | | 1,250 | | | | 1,602,262 | |
| | |
New Jersey Economic Development Authority, (Port Newark Container Terminal, LLC), (AMT), 5.00%, 10/1/37 | | | 1,500 | | | | 1,755,930 | |
| | |
New Jersey Economic Development Authority, (The Goethals Bridge Replacement), (AMT), 5.375%, 1/1/43 | | | 275 | | | | 305,267 | |
| | |
New Jersey Economic Development Authority, (Transit Transportation Project), 4.00%, 11/1/38 | | | 375 | | | | 435,128 | |
| | |
New Jersey Economic Development Authority, (Transit Transportation Project), 4.00%, 11/1/39 | | | 375 | | | | 434,205 | |
| | |
New Jersey Transportation Trust Fund Authority, 3.00%, 6/15/50 | | | 2,000 | | | | 2,072,980 | |
| | |
New Jersey Transportation Trust Fund Authority, 4.00%, 6/15/40 | | | 1,500 | | | | 1,757,145 | |
| | |
New Jersey Transportation Trust Fund Authority, 5.00%, 6/15/38 | | | 3,220 | | | | 3,961,276 | |
| | |
New Jersey Turnpike Authority, 4.00%, 1/1/42(2) | | | 480 | | | | 577,493 | |
| | |
New Jersey Turnpike Authority, 4.00%, 1/1/48 | | | 1,500 | | | | 1,736,430 | |
| | |
New Jersey Turnpike Authority, 5.00%, 1/1/31 | | | 375 | | | | 447,311 | |
| | |
New Jersey Turnpike Authority, 5.00%, 1/1/37 | | | 1,420 | | | | 1,760,473 | |
| | |
New Jersey Turnpike Authority, 5.00%, 1/1/45 | | | 2,780 | | | | 3,150,574 | |
| | |
Newark Housing Authority, (Newark Marine Terminal), 4.00%, 1/1/37 | | | 1,500 | | | | 1,669,680 | |
| | |
Port Authority of New York and New Jersey, (AMT), 5.00%, 10/15/34 | | | 2,305 | | | | 2,737,372 | |
| | |
Port Authority of New York and New Jersey, (AMT), 5.00%, 10/15/35 | | | 2,530 | | | | 3,111,571 | |
| | |
Port Authority of New York and New Jersey, (AMT), 5.00%, 11/15/36 | | | 1,160 | | | | 1,417,427 | |
| | |
South Jersey Transportation Authority, 5.00%, 11/1/31 | | | 1,000 | | | | 1,145,340 | |
| |
| | | | $ | 37,693,442 | |
| |
Total Tax-Exempt Municipal Securities — 92.8%
(identified cost $163,605,637) | | | $ | 178,638,247 | |
| | | | | | | | |
| Taxable Municipal Securities — 3.9% | |
| Security | | Principal
Amount
(000’s omitted) | | | Value | |
| | |
| General Obligations — 1.3% | | | | | | |
| | |
Atlantic City, 7.50%, 3/1/40 | | $ | 445 | | | $ | 641,298 | |
| | |
Monroe Township Board of Education, 2.729%, 8/1/33 | | | 700 | | | | 745,220 | |
| | |
Monroe Township Board of Education, 2.849%, 8/1/35 | | | 1,000 | | | | 1,067,630 | |
| |
| | | | $ | 2,454,148 | |
|
| Transportation — 2.6% | |
| | |
New Jersey Transportation Trust Fund Authority, 5.754%, 12/15/28(3) | | $ | 4,250 | | | $ | 5,143,053 | |
| |
| | | | $ | 5,143,053 | |
| |
Total Taxable Municipal Securities — 3.9%
(identified cost $6,739,564) | | | $ | 7,597,201 | |
| |
Total Investments — 96.7%
(identified cost $170,345,201) | | | $ | 186,235,448 | |
| |
Other Assets, Less Liabilities — 3.3% | | | $ | 6,344,115 | |
| |
Net Assets — 100.0% | | | $ | 192,579,563 | |
The percentage shown for each investment category in the Portfolio of Investments is based on net assets.
The Fund invests primarily in debt securities issued by New Jersey municipalities. The ability of the issuers of the debt securities to meet their obligations may be affected by economic developments in a specific industry or municipality. At January 31, 2021, 18.5% of total investments are backed by bond insurance of various financial institutions and financial guaranty assurance agencies. The aggregate percentage insured by an individual financial institution or financial guaranty assurance agency ranged from 1.3% to 9.3% of total investments.
| (1) | Floating rate security. The stated interest rate represents the rate in effect at January 31, 2021. |
| (2) | When-issued security. |
| (3) | Build America Bond. Represents taxable municipal obligation issued pursuant to the American Recovery and Reinvestment Act of 2009 or other legislation providing for the issuance of taxable municipal debt on which the issuer receives federal support. |
| | | | |
| | 23 | | See Notes to Financial Statements. |
Eaton Vance
New Jersey Municipal Income Fund
January 31, 2021
Portfolio of Investments (Unaudited) — continued
Abbreviations:
| | | | |
| | |
| AGM | | – | | Assured Guaranty Municipal Corp. |
| | |
| AMT | | – | | Interest earned from these securities may be considered a tax preference item for purposes of the Federal Alternative Minimum Tax. |
| | |
| BAM | | – | | Build America Mutual Assurance Co. |
| | |
| LIBOR | | – | | London Interbank Offered Rate |
| | |
| NPFG | | – | | National Public Finance Guarantee Corp. |
| | |
| SFMR | | – | | Single Family Mortgage Revenue |
| | |
| XLCA | | – | | XL Capital Assurance, Inc. |
Currency Abbreviations:
| | | | |
| | |
| USD | | – | | United States Dollar |
| | | | |
| | 24 | | See Notes to Financial Statements. |
Eaton Vance
Pennsylvania Municipal Income Fund
January 31, 2021
Portfolio of Investments (Unaudited)
| | | | | | | | |
Tax-Exempt Municipal Securities — 101.1% | |
| Security | | Principal
Amount
(000’s omitted) | | | Value | |
|
| Bond Bank — 3.6% | |
| | |
Delaware Valley Regional Finance Authority, 2.00%, 10/1/29(1) | | $ | 400 | | | $ | 429,020 | |
| | |
Delaware Valley Regional Finance Authority, 5.75%, 7/1/32 | | | 4,500 | | | | 6,610,230 | |
| |
| | | | $ | 7,039,250 | |
|
| Cogeneration — 0.2% | |
| | |
Northampton County Industrial Development Authority, (Northampton Generating), (AMT), 5.00%, 12/31/23(2) | | $ | 1,323 | | | $ | 330,859 | |
| |
| | | | $ | 330,859 | |
|
| Education — 12.2% | |
| | |
Adams County General Authority, (Gettysburg College), 4.00%, 8/15/45 | | $ | 1,250 | | | $ | 1,441,975 | |
| | |
Allegheny County Higher Education Building Authority, (Carnegie Mellon University), 5.00%, 8/1/27 | | | 1,665 | | | | 2,144,870 | |
| | |
Allegheny County Higher Education Building Authority, (Duquesne University), 4.00%, 3/1/40 | | | 2,000 | | | | 2,337,780 | |
| | |
Cumberland County Municipal Authority, (Dickinson College), 5.00%, 5/1/30 | | | 775 | | | | 929,953 | |
| | |
Cumberland County Municipal Authority, (Dickinson College), 5.00%, 5/1/31 | | | 1,145 | | | | 1,370,588 | |
| | |
Cumberland County Municipal Authority, (Dickinson College), 5.00%, 11/1/37 | | | 1,000 | | | | 1,064,710 | |
| | |
Delaware County Authority, (Haverford College), 5.00%, 10/1/42 | | | 1,470 | | | | 1,744,464 | |
| | |
Delaware County Authority, (Villanova University), 5.00%, 8/1/40 | | | 1,120 | | | | 1,282,209 | |
| | |
Northampton County General Purpose Authority, (Lehigh University), 4.00%, 11/15/35 | | | 500 | | | | 571,605 | |
| | |
Pennsylvania Higher Educational Facilities Authority, (Drexel University), 4.00%, 5/1/36 | | | 4,000 | | | | 4,416,640 | |
| | |
Pennsylvania State University, 5.00%, 9/1/34 | | | 1,585 | | | | 1,941,292 | |
| | |
State Public School Building Authority, (Northampton County Area Community College), Prerefunded to 3/1/21, 5.50%, 3/1/31 | | | 2,645 | | | | 2,656,506 | |
| | |
Union County Higher Educational Facilities Financing Authority, (Bucknell University), Prerefunded to 4/1/22, 5.00%, 4/1/37 | | | 2,000 | | | | 2,112,760 | |
| |
| | | | $ | 24,015,352 | |
|
| Escrowed / Prerefunded — 1.4% | |
| | |
Hatboro-Horsham School District, Prerefunded to 3/15/23, 5.00%, 9/15/27 | | $ | 1,100 | | | $ | 1,213,344 | |
| | |
Lancaster Industrial Development Authority, (Garden Spot Village), Prerefunded to 5/1/23, 5.375%, 5/1/28 | | | 300 | | | | 334,935 | |
| | | | | | | | |
| Security | | Principal
Amount
(000’s omitted) | | | Value | |
|
| Escrowed / Prerefunded (continued) | |
| | |
Owen J. Roberts School District, Prerefunded to 5/15/23, 5.00%, 5/15/28 | | $ | 535 | | | $ | 594,455 | |
| | |
Southeastern Pennsylvania Transportation Authority, Federal Grant Receipts, Prerefunded to 6/1/21, 5.00%, 6/1/28 | | | 600 | | | | 609,696 | |
| |
| | | | $ | 2,752,430 | |
|
| General Obligations — 9.2% | |
| | |
Allegheny County, 4.00%, 11/1/45 | | $ | 1,000 | | | $ | 1,213,740 | |
| | |
Allegheny County, 5.00%, 11/1/43 | | | 1,000 | | | | 1,254,860 | |
| | |
Boyertown Area School District, 5.00%, 10/1/38 | | | 1,000 | | | | 1,131,400 | |
| | |
Chartiers Valley School District, 5.00%, 10/15/35 | | | 1,000 | | | | 1,176,840 | |
| | |
Chester County, 4.00%, 7/15/37 | | | 500 | | | | 605,235 | |
| | |
Chester County, 4.00%, 7/15/38 | | | 500 | | | | 603,710 | |
| | |
Cumberland Valley School District, 4.00%, 11/15/38 | | | 750 | | | | 888,878 | |
| | |
Franklin Regional School District, 4.00%, 5/1/45 | | | 500 | | | | 583,185 | |
| | |
Lehigh County, 4.00%, 11/15/32 | | | 1,000 | | | | 1,217,520 | |
| | |
Lower Paxton Township, 4.00%, 4/1/43 | | | 300 | | | | 352,089 | |
| | |
Lower Paxton Township, 4.00%, 4/1/45 | | | 310 | | | | 362,086 | |
| | |
Marple Newtown School District, 4.00%, 6/1/33 | | | 500 | | | | 606,990 | |
| | |
Marple Newtown School District, 4.00%, 6/1/34 | | | 350 | | | | 424,452 | |
| | |
Penn-Delco School District, 4.00%, 6/1/45 | | | 1,500 | | | | 1,700,400 | |
| | |
Pennsylvania, 4.00%, 5/1/34 | | | 1,000 | | | | 1,235,980 | |
| | |
Phoenixville Area School District, 4.00%, 11/15/29 | | | 525 | | | | 639,513 | |
| | |
Phoenixville Area School District, 4.00%, 11/15/30 | | | 500 | | | | 604,595 | |
| | |
Seneca Valley School District, 5.00%, 4/1/31 | | | 750 | | | | 967,237 | |
| | |
Swatara Township, 4.00%, 10/1/45 | | | 1,250 | | | | 1,449,087 | |
| | |
Upper Dublin School District, 4.00%, 11/15/29(1) | | | 230 | | | | 290,870 | |
| | |
Upper Dublin School District, 4.00%, 9/15/40 | | | 225 | | | | 265,019 | |
| | |
West Shore School District, 4.00%, 11/15/33 | | | 430 | | | | 524,703 | |
| |
| | | | $ | 18,098,389 | |
|
| Hospital — 15.7% | |
| | |
Allegheny County Hospital Development Authority, (UPMC Health System), 4.00%, 7/15/39 | | $ | 2,000 | | | $ | 2,349,880 | |
| | |
Allegheny County Hospital Development Authority, (UPMC Health System), 5.00%, 7/15/33 | | | 1,000 | | | | 1,302,750 | |
| | |
Berks County Industrial Development Authority, (Tower Health), 4.00%, 11/1/38 | | | 210 | | | | 218,530 | |
| | |
Berks County Industrial Development Authority, (Tower Health), 4.00%, 11/1/47 | | | 1,000 | | | | 1,023,820 | |
| | |
Berks County Industrial Development Authority, (Tower Health), 5.00%, 11/1/26 | | | 250 | | | | 290,623 | |
| | |
Berks County Industrial Development Authority, (Tower Health), 5.00%, 11/1/34 | | | 150 | | | | 169,563 | |
| | | | |
| | 25 | | See Notes to Financial Statements. |
Eaton Vance
Pennsylvania Municipal Income Fund
January 31, 2021
Portfolio of Investments (Unaudited) — continued
| | | | | | | | |
| Security | | Principal
Amount
(000’s omitted) | | | Value | |
|
| Hospital (continued) | |
| | |
Berks County Municipal Authority, (Tower Health), 5.00% to 2/1/25 (Put Date), 2/1/40 | | $ | 500 | | | $ | 559,855 | |
| | |
Bucks County Industrial Development Authority, (St. Luke’s University Health Network), 4.00%, 8/15/38 | | | 1,500 | | | | 1,718,535 | |
| | |
Centre County Hospital Authority, (Mount Nittany Medical Center), 5.00%, 11/15/30 | | | 505 | | | | 599,324 | |
| | |
Chester County Health and Education Facilities Authority, (Main Line Health System), 5.00%, 10/1/31 | | | 1,350 | | | | 1,708,236 | |
| | |
Chester County Health and Education Facilities Authority, (Main Line Health System), 5.00%, 10/1/35 | | | 2,000 | | | | 2,500,180 | |
| | |
Geisinger Authority, (Geisinger Health System), 4.00%, 4/1/39 | | | 1,500 | | | | 1,803,495 | |
| | |
Geisinger Authority, (Geisinger Health System), 4.00%, 4/1/50 | | | 1,500 | | | | 1,754,145 | |
| | |
Indiana County Hospital Authority, (Indiana Regional Medical Center), 6.00%, 6/1/39 | | | 1,345 | | | | 1,429,802 | |
| | |
Lancaster County Hospital Authority, (University of Pennsylvania Health System), 5.00%, 8/15/36 | | | 650 | | | | 796,848 | |
| | |
Lehigh County General Purpose Authority, (Lehigh Valley Health Network), 4.00%, 7/1/33 | | | 2,700 | | | | 2,803,032 | |
| | |
Lehigh County General Purpose Authority, (Lehigh Valley Health Network), 4.00%, 7/1/35 | | | 1,000 | | | | 1,133,620 | |
| | |
Montgomery County Higher Education and Health Authority, (Thomas Jefferson University Obligated Group), 4.00%, 9/1/34 | | | 1,000 | | | | 1,169,410 | |
| | |
Montgomery County Higher Education and Health Authority, (Thomas Jefferson University Obligated Group), 5.00%, 9/1/33 | | | 1,000 | | | | 1,272,850 | |
| | |
Montgomery County Higher Education and Health Authority, (Thomas Jefferson University Obligated Group), 5.00%, 9/1/37 | | | 1,000 | | | | 1,232,160 | |
| | |
Pennsylvania Higher Educational Facilities Authority, (University of Pennsylvania Health System), 4.00%, 8/15/42 | | | 150 | | | | 173,040 | |
| | |
Pennsylvania Higher Educational Facilities Authority, (University of Pennsylvania Health System), 5.00%, 8/15/37 | | | 2,600 | | | | 3,221,400 | |
| | |
Philadelphia Hospitals and Higher Education Facilities Authority, (Children’s Hospital of Philadelphia), 5.00%, 7/1/28 | | | 190 | | | | 193,661 | |
| | |
Southcentral Pennsylvania General Authority, (WellSpan Health Obligated Group), 5.00%, 6/1/36 | | | 1,000 | | | | 1,295,960 | |
| |
| | | | $ | 30,720,719 | |
|
| Housing — 1.1% | |
| | |
Pennsylvania Higher Educational Facilities Authority, (University Properties, Inc.), 5.00%, 7/1/35 | | $ | 750 | | | $ | 784,673 | |
| | |
Pennsylvania Housing Finance Agency, SFMR, 2.35%, 10/1/40 | | | 1,405 | | | | 1,460,778 | |
| |
| | | | $ | 2,245,451 | |
| | | | | | | | |
| Security | | Principal
Amount
(000’s omitted) | | | Value | |
|
| Industrial Development Revenue — 0.8% | |
| | |
Pennsylvania Economic Development Financing Authority, (Waste Management, Inc.), 2.15%, 11/1/21 | | $ | 1,500 | | | $ | 1,521,255 | |
| |
| | | | $ | 1,521,255 | |
|
| Insured – Electric Utilities — 1.0% | |
| | |
Puerto Rico Electric Power Authority, (NPFG), 5.25%, 7/1/34 | | $ | 1,475 | | | $ | 1,647,015 | |
| | |
Puerto Rico Electric Power Authority, (NPFG), 5.25%, 7/1/35 | | | 340 | | | | 381,830 | |
| |
| | | | $ | 2,028,845 | |
|
| Insured – Escrowed/Prerefunded — 5.7% | |
| | |
Cambria County, (BAM), Prerefunded to 8/1/24, 5.00%, 8/1/30 | | $ | 2,270 | | | $ | 2,647,796 | |
| | |
Erie School District, (NPFG), Escrowed to Maturity, 0.00%, 5/1/21 | | | 2,625 | | | | 2,623,714 | |
| | |
Erie School District, (NPFG), Escrowed to Maturity, 0.00%, 5/1/22 | | | 3,625 | | | | 3,612,385 | |
| | |
McKeesport Area School District, (AMBAC), Escrowed to Maturity, 0.00%, 10/1/25 | | | 2,320 | | | | 2,266,593 | |
| |
| | | | $ | 11,150,488 | |
|
| Insured – General Obligations — 17.1% | |
| | |
Allentown City School District, (BAM), 5.00%, 6/1/31 | | $ | 500 | | | $ | 603,445 | |
| | |
Allentown City School District, (BAM), 5.00%, 6/1/32 | | | 1,000 | | | | 1,204,010 | |
| | |
Allentown City School District, (BAM), 5.00%, 6/1/33 | | | 1,000 | | | | 1,199,980 | |
| | |
Armstrong School District, (BAM), 4.00%, 3/15/35 | | | 500 | | | | 598,455 | |
| | |
Armstrong School District, (BAM), 4.00%, 3/15/38 | | | 1,000 | | | | 1,186,260 | |
| | |
Bethlehem Area School District, (BAM), 5.00%, 8/1/32 | | | 1,500 | | | | 1,784,385 | |
| | |
Cambria County, (AGM), 4.00%, 8/1/35 | | | 700 | | | | 797,244 | |
| | |
Cambria County, (BAM), 5.00%, 8/1/30 | | | 1,050 | | | | 1,204,623 | |
| | |
Coatesville Area School District, (AGM), 5.00%, 8/1/25 | | | 300 | | | | 357,024 | |
| | |
Elizabeth Forward School District, (NPFG), 0.00%, 9/1/21 | | | 2,170 | | | | 2,158,217 | |
| | |
Elizabeth Forward School District, (NPFG), 0.00%, 9/1/22 | | | 2,170 | | | | 2,135,041 | |
| | |
Elizabeth Forward School District, (NPFG), 0.00%, 9/1/23 | | | 2,170 | | | | 2,107,743 | |
| | |
Erie School District, (AGM), 4.00%, 4/1/33 | | | 1,000 | | | | 1,180,080 | |
| | |
Hazelton School District, (NPFG), 0.00%, 3/1/21 | | | 4,000 | | | | 3,997,640 | |
| | |
Hopewell School District, (AGM), 0.00%, 9/1/22 | | | 1,000 | | | | 989,950 | |
| | |
Hopewell School District, (AGM), 0.00%, 9/1/26 | | | 1,000 | | | | 943,050 | |
| | |
Lake-Lehman School District, (NPFG), 0.00%, 4/1/26 | | | 1,315 | | | | 1,248,698 | |
| | |
Lancaster School District, (AGM), 4.00%, 6/1/35 | | | 900 | | | | 1,089,090 | |
| | |
Lancaster School District, (AGM), 4.00%, 6/1/36 | | | 350 | | | | 422,216 | |
| | |
Luzerne County, (AGM), 5.00%, 11/15/29 | | | 1,000 | | | | 1,194,840 | |
| | |
McKeesport Area School District, (AGM), 5.00%, 3/1/38 | | | 60 | | | | 65,581 | |
| | |
McKeesport Area School District, (AMBAC), 0.00%, 10/1/25 | | | 1,100 | | | | 1,038,169 | |
| | |
Montour School District, (AGM), 5.00%, 4/1/32 | | | 1,000 | | | | 1,187,130 | |
| | |
Montour School District, (AGM), 5.00%, 4/1/33 | | | 1,960 | | | | 2,322,835 | |
| | | | |
| | 26 | | See Notes to Financial Statements. |
Eaton Vance
Pennsylvania Municipal Income Fund
January 31, 2021
Portfolio of Investments (Unaudited) — continued
| | | | | | | | |
| Security | | Principal
Amount
(000’s omitted) | | | Value | |
|
| Insured – General Obligations (continued) | |
| | |
Philadelphia School District, (AGM), 5.00%, 9/1/34 | | $ | 1,000 | | | $ | 1,289,620 | |
| | |
Upper Darby School District, (AGM), 4.00%, 4/1/40 | | | 500 | | | | 584,905 | |
| | |
Upper Darby School District, (AGM), 4.00%, 4/1/41 | | | 655 | | | | 764,254 | |
| |
| | | | $ | 33,654,485 | |
|
| Insured – Hospital — 1.2% | |
| | |
Allegheny County Hospital Development Authority, (UPMC Health System), (NPFG), 6.00%, 7/1/24 | | $ | 2,000 | | | $ | 2,379,760 | |
| |
| | | | $ | 2,379,760 | |
|
| Insured – Lease Revenue / Certificates of Participation — 6.4% | |
| | |
State Public School Building Authority, (Philadelphia School District), (AGM), 5.50%, 6/1/28(3) | | $ | 6,250 | | | $ | 8,198,625 | |
| | |
State Public School Building Authority, (Philadelphia School District), (AGM), 5.50%, 6/1/28 | | | 3,250 | | | | 4,263,285 | |
| |
| | | | $ | 12,461,910 | |
|
| Insured – Transportation — 2.3% | |
| | |
Pennsylvania Turnpike Commission, (AGM), 6.375%, 12/1/38 | | $ | 2,000 | | | $ | 2,675,960 | |
| | |
Puerto Rico Highway and Transportation Authority, (AGC), 5.50%, 7/1/31 | | | 1,500 | | | | 1,829,850 | |
| |
| | | | $ | 4,505,810 | |
|
| Insured – Water and Sewer — 3.5% | |
| | |
Allegheny County Sanitary Authority, (BAM), 5.00%, 12/1/28 | | $ | 1,000 | | | $ | 1,128,520 | |
| | |
Greater Johnstown Water Authority, Sewer Revenue, (AGM), 4.00%, 8/15/38 | | | 1,740 | | | | 2,042,812 | |
| | |
Pittsburgh Water and Sewer Authority, (AGM), 4.00%, 9/1/34 | | | 2,000 | | | | 2,465,340 | |
| | |
Pittsburgh Water and Sewer Authority, (AGM), 4.00%, 9/1/45 | | | 1,000 | | | | 1,195,090 | |
| |
| | | | $ | 6,831,762 | |
|
| Lease Revenue / Certificates of Participation — 1.9% | |
| | |
Bucks County Community College Authority, 5.00%, 6/15/38 | | $ | 605 | | | $ | 768,205 | |
| | |
Commonwealth Financing Authority, Tobacco Master Settlement Payment Revenue, 5.00%, 6/1/34 | | | 2,405 | | | | 3,018,034 | |
| |
| | | | $ | 3,786,239 | |
|
| Other Revenue — 0.6% | |
| | |
Allentown Neighborhood Improvement Zone Development Authority, (City Center Project), Series 2018, 5.00%, 5/1/42(4) | | $ | 1,000 | | | $ | 1,160,430 | |
| |
| | | | $ | 1,160,430 | |
| | | | | | | | |
| Security | | Principal
Amount
(000’s omitted) | | | Value | |
|
| Senior Living / Life Care — 4.2% | |
| | |
Cumberland County Municipal Authority, (Diakon Lutheran Social Ministries), 5.00%, 1/1/31 | | $ | 500 | | | $ | 618,350 | |
| | |
Cumberland County Municipal Authority, (Diakon Lutheran Social Ministries), 5.00%, 1/1/39 | | | 2,000 | | | | 2,382,260 | |
| | |
Franklin County Industrial Development Authority, (Menno-Haven, Inc.), 5.00%, 12/1/29 | | | 815 | | | | 918,415 | |
| | |
Franklin County Industrial Development Authority, (Menno-Haven, Inc.), 5.00%, 12/1/33 | | | 455 | | | | 501,342 | |
| | |
Lancaster County Hospital Authority, (Brethren Village), 5.125%, 7/1/37 | | | 1,265 | | | | 1,373,815 | |
| | |
Montgomery County Industrial Development Authority, (ACTS Retirement-Life Communities, Inc. Obligated Group), 4.00%, 11/15/43 | | | 200 | | | | 225,838 | |
| | |
Montgomery County Industrial Development Authority, (ACTS Retirement-Life Communities, Inc. Obligated Group), 5.00%, 11/15/45 | | | 1,000 | | | | 1,208,530 | |
| | |
Montgomery County Industrial Development Authority, (Whitemarsh Continuing Care Retirement Community), 5.00%, 1/1/33 | | | 1,000 | | | | 1,073,760 | |
| |
| | | | $ | 8,302,310 | |
|
| Special Tax Revenue — 0.6% | |
| | |
Puerto Rico Sales Tax Financing Corp., 0.00%, 7/1/24 | | $ | 18 | | | $ | 17,148 | |
| | |
Puerto Rico Sales Tax Financing Corp., 0.00%, 7/1/27 | | | 34 | | | | 30,641 | |
| | |
Puerto Rico Sales Tax Financing Corp., 0.00%, 7/1/29 | | | 34 | | | | 29,042 | |
| | |
Puerto Rico Sales Tax Financing Corp., 0.00%, 7/1/31 | | | 43 | | | | 33,924 | |
| | |
Puerto Rico Sales Tax Financing Corp., 0.00%, 7/1/33 | | | 49 | | | | 35,782 | |
| | |
Puerto Rico Sales Tax Financing Corp., 0.00%, 7/1/46 | | | 463 | | | | 146,516 | |
| | |
Puerto Rico Sales Tax Financing Corp., 0.00%, 7/1/51 | | | 377 | | | | 86,684 | |
| | |
Puerto Rico Sales Tax Financing Corp., 4.329%, 7/1/40 | | | 183 | | | | 202,726 | |
| | |
Puerto Rico Sales Tax Financing Corp., 4.50%, 7/1/34 | | | 36 | | | | 39,629 | |
| | |
Puerto Rico Sales Tax Financing Corp., 4.536%, 7/1/53 | | | 5 | | | | 5,537 | |
| | |
Puerto Rico Sales Tax Financing Corp., 4.55%, 7/1/40 | | | 18 | | | | 20,206 | |
| | |
Puerto Rico Sales Tax Financing Corp., 4.75%, 7/1/53 | | | 132 | | | | 148,052 | |
| | |
Puerto Rico Sales Tax Financing Corp., 4.784%, 7/1/58 | | | 73 | | | | 82,088 | |
| | |
Puerto Rico Sales Tax Financing Corp., 5.00%, 7/1/58 | | | 334 | | | | 380,830 | |
| |
| | | | $ | 1,258,805 | |
|
| Transportation — 8.2% | |
| | |
Delaware River Joint Toll Bridge Commission of Pennsylvania and New Jersey, 5.00%, 7/1/32 | | $ | 1,500 | | | $ | 1,877,925 | |
| | |
Delaware River Joint Toll Bridge Commission of Pennsylvania and New Jersey, 5.00%, 7/1/42 | | | 1,500 | | | | 1,831,440 | |
| | |
Delaware River Port Authority of Pennsylvania and New Jersey, 5.00%, 1/1/38 | | | 2,470 | | | | 3,154,684 | |
| | |
Pennsylvania Economic Development Financing Authority, (Amtrak), (AMT), 5.00%, 11/1/41 | | | 1,960 | | | | 2,085,773 | |
| | | | |
| | 27 | | See Notes to Financial Statements. |
Eaton Vance
Pennsylvania Municipal Income Fund
January 31, 2021
Portfolio of Investments (Unaudited) — continued
| | | | | | | | |
| Security | | Principal
Amount
(000’s omitted) | | | Value | |
|
| Transportation (continued) | |
| | |
Pennsylvania Turnpike Commission, 4.00%, 12/1/45 | | $ | 250 | | | $ | 294,603 | |
| | |
Pennsylvania Turnpike Commission, 5.00%, 12/1/37 | | | 1,500 | | | | 1,902,975 | |
| | |
Pennsylvania Turnpike Commission, 5.00%, 12/1/45 | | | 1,000 | | | | 1,307,870 | |
| | |
Philadelphia, Airport Revenue, (AMT), 5.00%, 6/15/27 | | | 815 | | | | 828,056 | |
| | |
Philadelphia, Airport Revenue, (AMT), 5.00%, 7/1/33 | | | 1,250 | | | | 1,525,325 | |
| | |
Philadelphia, Airport Revenue, (AMT), 5.00%, 7/1/37 | | | 1,000 | | | | 1,208,900 | |
| |
| | | | $ | 16,017,551 | |
|
| Water and Sewer — 4.2% | |
| | |
Chester Water Authority, 5.00%, 12/1/35 | | $ | 795 | | | $ | 927,964 | |
| | |
Horsham Water and Sewer Authority, 4.00%, 11/15/37 | | | 270 | | | | 329,635 | |
| | |
Horsham Water and Sewer Authority, 4.00%, 11/15/38 | | | 500 | | | | 609,115 | |
| | |
Horsham Water and Sewer Authority, 4.00%, 11/15/39 | | | 500 | | | | 607,190 | |
| | |
Horsham Water and Sewer Authority, 4.00%, 11/15/40 | | | 500 | | | | 605,455 | |
| | |
Luzerne County Industrial Development Authority, (Pennsylvania-American Water Co.), (AMT), 2.45% to 12/3/29 (Put Date), 12/1/39 | | | 750 | | | | 828,832 | |
| | |
Pennsylvania Economic Development Financing Authority, (Pennsylvania-American Water Co.), 3.00%, 4/1/39 | | | 2,500 | | | | 2,753,225 | |
| | |
Philadelphia, Water and Wastewater Revenue, 5.00%, 11/1/45 | | | 1,150 | | | | 1,505,143 | |
| |
| | | | $ | 8,166,559 | |
| |
Total Tax-Exempt Municipal Securities — 101.1%
(identified cost $182,385,528) | | | $ | 198,428,659 | |
|
| Taxable Municipal Securities — 0.1% | |
| Security | | Principal
Amount
(000’s omitted) | | | Value | |
|
| Cogeneration — 0.1% | |
| | |
Northampton County Industrial Development Authority, (Northampton Generating), 5.00%, 12/31/23(2) | | $ | 446 | | | $ | 111,590 | |
| |
Total Taxable Municipal Securities — 0.1%
(identified cost $446,367) | | | $ | 111,590 | |
| |
Total Investments — 101.2%
(identified cost $182,831,895) | | | $ | 198,540,249 | |
| |
Other Assets, Less Liabilities — (1.2)% | | | $ | (2,284,448 | ) |
| |
Net Assets — 100.0% | | | $ | 196,255,801 | |
The percentage shown for each investment category in the Portfolio of Investments is based on net assets.
The Fund invests primarily in debt securities issued by Pennsylvania municipalities. The ability of the issuers of the debt securities to meet their obligations may be affected by economic developments in a specific industry or municipality. At January 31, 2021, 36.8% of total investments are backed by bond insurance of various financial institutions and financial guaranty assurance agencies. The aggregate percentage insured by an individual financial institution or financial guaranty assurance agency ranged from 0.9% to 17.1% of total investments.
| (1) | When-issued security. |
| (2) | Represents a payment-in-kind security which may pay interest in additional principal at the issuer’s discretion. |
| (3) | Security represents the municipal bond held by a trust that issues residual interest bonds (see Note 1H). |
| (4) | Security exempt from registration under Rule 144A of the Securities Act of 1933, as amended. These securities may be sold in certain transactions in reliance on an exemption from registration (normally to qualified institutional buyers). At January 31, 2021, the aggregate value of these securities is $1,160,430 or 0.6% of the Fund’s net assets. |
Abbreviations:
| | | | |
| | |
| AGC | | – | | Assured Guaranty Corp. |
| | |
| AGM | | – | | Assured Guaranty Municipal Corp. |
| | |
| AMBAC | | – | | AMBAC Financial Group, Inc. |
| | |
| AMT | | – | | Interest earned from these securities may be considered a tax preference item for purposes of the Federal Alternative Minimum Tax. |
| | |
| BAM | | – | | Build America Mutual Assurance Co. |
| | |
| NPFG | | – | | National Public Finance Guarantee Corp. |
| | |
| SFMR | | – | | Single Family Mortgage Revenue |
| | | | |
| | 28 | | See Notes to Financial Statements. |
Eaton Vance
Municipal Income Funds
January 31, 2021
Statements of Assets and Liabilities (Unaudited)
| | | | | | | | | | | | |
| | | January 31, 2021 | |
| Assets | | Arizona Fund | | | Connecticut Fund | | | Minnesota Fund | |
| | | |
Investments — | | | | | | | | | | | | |
| | | |
Identified cost | | $ | 64,489,264 | | | $ | 73,688,574 | | | $ | 167,852,143 | |
| | | |
Unrealized appreciation | | | 6,299,533 | | | | 6,645,940 | | | | 12,459,514 | |
| | | |
Investments, at value | | $ | 70,788,797 | | | $ | 80,334,514 | | | $ | 180,311,657 | |
| | | |
Cash | | $ | 6,008,825 | | | $ | 1,523,685 | | | $ | 6,110,944 | |
| | | |
Interest receivable | | | 394,655 | | | | 606,774 | | | | 2,255,306 | |
| | | |
Receivable for investments sold | | | 2,821,257 | | | | — | | | | 2,198,475 | |
| | | |
Receivable for Fund shares sold | | | 74,881 | | | | 127,341 | | | | 223,775 | |
| | | |
Total assets | | $ | 80,088,415 | | | $ | 82,592,314 | | | $ | 191,100,157 | |
| | | |
| Liabilities | | | | | | | | | | | | |
| | | |
Payable for when-issued securities | | $ | 4,829,557 | | | $ | — | | | $ | 695,000 | |
| | | |
Payable for Fund shares redeemed | | | 171,605 | | | | 210,478 | | | | 683,251 | |
| | | |
Distributions payable | | | 15,926 | | | | 27,796 | | | | 84,478 | |
| | | |
Payable to affiliates: | | | | | | | | | | | | |
| | | |
Investment adviser fee | | | 17,567 | | | | 20,450 | | | | 53,066 | |
| | | |
Distribution and service fees | | | 10,230 | | | | 12,621 | | | | 14,817 | |
| | | |
Accrued expenses | | | 49,694 | | | | 64,749 | | | | 88,632 | |
| | | |
Total liabilities | | $ | 5,094,579 | | | $ | 336,094 | | | $ | 1,619,244 | |
| | | |
Net Assets | | $ | 74,993,836 | | | $ | 82,256,220 | | | $ | 189,480,913 | |
| | | |
| Sources of Net Assets | | | | | | | | | | | | |
| | | |
Paid-in capital | | $ | 68,908,866 | | | $ | 76,658,147 | | | $ | 177,833,348 | |
| | | |
Distributable earnings | | | 6,084,970 | | | | 5,598,073 | | | | 11,647,565 | |
| | | |
Net Assets | | $ | 74,993,836 | | | $ | 82,256,220 | | | $ | 189,480,913 | |
| | | |
| Class A Shares | | | | | | | | | | | | |
| | | |
Net Assets | | $ | 42,005,949 | | | $ | 54,551,794 | | | $ | 63,207,036 | |
| | | |
Shares Outstanding | | | 4,219,601 | | | | 5,226,498 | | | | 6,404,479 | |
| | | |
Net Asset Value and Redemption Price Per Share | | | | | | | | | | | | |
| | | |
(net assets ÷ shares of beneficial interest outstanding) | | $ | 9.95 | | | $ | 10.44 | | | $ | 9.87 | |
| | | |
Maximum Offering Price Per Share | | | | | | | | | | | | |
| | | |
(100 ÷ 95.25 of net asset value per share) | | $ | 10.45 | | | $ | 10.96 | | | $ | 10.36 | |
| | | |
| Class C Shares | | | | | | | | | | | | |
| | | |
Net Assets | | $ | 3,856,250 | | | $ | 4,180,004 | | | $ | 4,911,194 | |
| | | |
Shares Outstanding | | | 348,530 | | | | 401,984 | | | | 462,643 | |
| | | |
Net Asset Value and Offering Price Per Share* | | | | | | | | | | | | |
| | | |
(net assets ÷ shares of beneficial interest outstanding) | | $ | 11.06 | | | $ | 10.40 | | | $ | 10.62 | |
| | | |
| Class I Shares | | | | | | | | | | | | |
| | | |
Net Assets | | $ | 29,131,637 | | | $ | 23,524,422 | | | $ | 121,362,683 | |
| | | |
Shares Outstanding | | | 2,926,578 | | | | 2,253,410 | | | | 12,296,898 | |
| | | |
Net Asset Value, Offering Price and Redemption Price Per Share | | | | | | | | | | | | |
| | | |
(net assets ÷ shares of beneficial interest outstanding) | | $ | 9.95 | | | $ | 10.44 | | | $ | 9.87 | |
On sales of $50,000 or more, the offering price of Class A shares is reduced.
| * | Redemption price per share is equal to the net asset value less any applicable contingent deferred sales charge. |
| | | | |
| | 29 | | See Notes to Financial Statements. |
Eaton Vance
Municipal Income Funds
January 31, 2021
Statements of Assets and Liabilities (Unaudited) — continued
| | | | | | | | |
| | | January 31, 2021 | |
| Assets | | New Jersey Fund | | | Pennsylvania Fund | |
| | |
Investments — | | | | | | | | |
| | |
Identified cost | | $ | 170,345,201 | | | $ | 182,831,895 | |
| | |
Unrealized appreciation | | | 15,890,247 | | | | 15,708,354 | |
| | |
Investments, at value | | $ | 186,235,448 | | | $ | 198,540,249 | |
| | |
Cash | | $ | 5,848,955 | | | $ | 2,011,736 | |
| | |
Interest receivable | | | 1,195,639 | | | | 1,674,992 | |
| | |
Receivable for investments sold | | | — | | | | 646,374 | |
| | |
Receivable for Fund shares sold | | | 334,749 | | | | 478,138 | |
| | |
Total assets | | $ | 193,614,791 | | | $ | 203,351,489 | |
| | |
| Liabilities | | | | | | | | |
| | |
Payable for floating rate notes issued | | $ | — | | | $ | 5,000,025 | |
| | |
Payable for when-issued securities | | | 571,594 | | | | 1,310,124 | |
| | |
Payable for Fund shares redeemed | | | 229,733 | | | | 501,467 | |
| | |
Distributions payable | | | 60,455 | | | | 93,983 | |
| | |
Payable to affiliates: | | | | | | | | |
| | |
Investment adviser fee | | | 54,730 | | | | 59,052 | |
| | |
Distribution and service fees | | | 25,966 | | | | 27,776 | |
| | |
Interest expense and fees payable | | | — | | | | 5,431 | |
| | |
Accrued expenses | | | 92,750 | | | | 97,830 | |
| | |
Total liabilities | | $ | 1,035,228 | | | $ | 7,095,688 | |
| | |
Net Assets | | $ | 192,579,563 | | | $ | 196,255,801 | |
| | |
| Sources of Net Assets | | | | | | | | |
| | |
Paid-in capital | | $ | 176,826,313 | | | $ | 192,934,363 | |
| | |
Distributable earnings | | | 15,753,250 | | | | 3,321,438 | |
| | |
Net Assets | | $ | 192,579,563 | | | $ | 196,255,801 | |
| | |
| Class A Shares | | | | | | | | |
| | |
Net Assets | | $ | 105,355,370 | | | $ | 117,874,810 | |
| | |
Shares Outstanding | | | 10,709,558 | | | | 13,381,922 | |
| | |
Net Asset Value and Redemption Price Per Share | | | | | | | | |
| | |
(net assets ÷ shares of beneficial interest outstanding) | | $ | 9.84 | | | $ | 8.81 | |
| | |
Maximum Offering Price Per Share | | | | | | | | |
| | |
(100 ÷ 95.25 of net asset value per share) | | $ | 10.33 | | | $ | 9.25 | |
| | |
| Class C Shares | | | | | | | | |
| | |
Net Assets | | $ | 10,450,730 | | | $ | 9,631,998 | |
| | |
Shares Outstanding | | | 1,018,429 | | | | 1,055,983 | |
| | |
Net Asset Value and Offering Price Per Share* | | | | | | | | |
| | |
(net assets ÷ shares of beneficial interest outstanding) | | $ | 10.26 | | | $ | 9.12 | |
| | |
| Class I Shares | | | | | | | | |
| | |
Net Assets | | $ | 76,773,463 | | | $ | 68,748,993 | |
| | |
Shares Outstanding | | | 7,796,152 | | | | 7,775,537 | |
| | |
Net Asset Value, Offering Price and Redemption Price Per Share | | | | | | | | |
| | |
(net assets ÷ shares of beneficial interest outstanding) | | $ | 9.85 | | | $ | 8.84 | |
On sales of $50,000 or more, the offering price of Class A shares is reduced.
| * | Redemption price per share is equal to the net asset value less any applicable contingent deferred sales charge. |
| | | | |
| | 30 | | See Notes to Financial Statements. |
Eaton Vance
Municipal Income Funds
January 31, 2021
Statements of Operations (Unaudited)
| | | | | | | | | | | | |
| | | Six Months Ended January 31, 2021 | |
| Investment Income | | Arizona Fund | | | Connecticut Fund | | | Minnesota Fund | |
| | | |
Interest | | $ | 988,377 | | | $ | 1,240,707 | | | $ | 2,276,305 | |
| | | |
Total investment income | | $ | 988,377 | | | $ | 1,240,707 | | | $ | 2,276,305 | |
| | | |
| Expenses | | | | | | | | | | | | |
| | | |
Investment adviser fee | | $ | 95,150 | | | $ | 119,329 | | | $ | 316,515 | |
| | | |
Distribution and service fees | | | | | | | | | | | | |
| | | |
Class A | | | 39,169 | | | | 53,852 | | | | 61,928 | |
| | | |
Class C | | | 20,322 | | | | 22,378 | | | | 28,053 | |
| | | |
Trustees’ fees and expenses | | | 2,102 | | | | 2,254 | | | | 4,866 | |
| | | |
Custodian fee | | | 13,046 | | | | 13,279 | | | | 24,181 | |
| | | |
Transfer and dividend disbursing agent fees | | | 8,256 | | | | 13,043 | | | | 26,181 | |
| | | |
Legal and accounting services | | | 21,420 | | | | 30,516 | | | | 21,487 | |
| | | |
Printing and postage | | | 3,791 | | | | 4,606 | | | | 6,438 | |
| | | |
Registration fees | | | 6,376 | | | | 3,132 | | | | 5,104 | |
| | | |
Miscellaneous | | | 13,023 | | | | 12,393 | | | | 21,125 | |
| | | |
Total expenses | | $ | 222,655 | | | $ | 274,782 | | | $ | 515,878 | |
| | | |
Net investment income | | $ | 765,722 | | | $ | 965,925 | | | $ | 1,760,427 | |
| | | |
| Realized and Unrealized Gain (Loss) | | | | | | | | | | | | |
| | | |
Net realized gain (loss) — | | | | | | | | | | | | |
| | | |
Investment transactions | | $ | 105,079 | | | $ | 107,264 | | | $ | 25,995 | |
| | | |
Net realized gain | | $ | 105,079 | | | $ | 107,264 | | | $ | 25,995 | |
| | | |
Change in unrealized appreciation (depreciation) — | | | | | | | | | | | | |
| | | |
Investments | | $ | 322,397 | | | $ | 577,915 | | | $ | 518,726 | |
| | | |
Net change in unrealized appreciation (depreciation) | | $ | 322,397 | | | $ | 577,915 | | | $ | 518,726 | |
| | | |
Net realized and unrealized gain | | $ | 427,476 | | | $ | 685,179 | | | $ | 544,721 | |
| | | |
Net increase in net assets from operations | | $ | 1,193,198 | | | $ | 1,651,104 | | | $ | 2,305,148 | |
| | | | |
| | 31 | | See Notes to Financial Statements. |
Eaton Vance
Municipal Income Funds
January 31, 2021
Statements of Operations (Unaudited) — continued
| | | | | | | | |
| | | Six Months Ended January 31, 2021 | |
| Investment Income | | New Jersey Fund | | | Pennsylvania Fund | |
| | |
Interest | | $ | 2,639,097 | | | $ | 3,278,560 | |
| | |
Total investment income | | $ | 2,639,097 | | | $ | 3,278,560 | |
| | |
| Expenses | | | | | | | | |
| | |
Investment adviser fee | | $ | 315,258 | | | $ | 355,173 | |
| | |
Distribution and service fees | | | | | | | | |
| | |
Class A | | | 102,673 | | | | 120,316 | |
| | |
Class C | | | 50,115 | | | | 53,648 | |
| | |
Trustees’ fees and expenses | | | 4,845 | | | | 5,020 | |
| | |
Custodian fee | | | 23,564 | | | | 24,351 | |
| | |
Transfer and dividend disbursing agent fees | | | 30,166 | | | | 33,127 | |
| | |
Legal and accounting services | | | 28,447 | | | | 32,837 | |
| | |
Printing and postage | | | 7,409 | | | | 8,234 | |
| | |
Registration fees | | | 3,552 | | | | 2,773 | |
| | |
Interest expense and fees | | | — | | | | 19,647 | |
| | |
Miscellaneous | | | 17,522 | | | | 20,824 | |
| | |
Total expenses | | $ | 583,551 | | | $ | 675,950 | |
| | |
Net investment income | | $ | 2,055,546 | | | $ | 2,602,610 | |
| | |
| Realized and Unrealized Gain (Loss) | | | | | | | | |
| | |
Net realized gain (loss) — | | | | | | | | |
| | |
Investment transactions | | $ | 1,451,980 | | | $ | 84,785 | |
| | |
Net realized gain | | $ | 1,451,980 | | | $ | 84,785 | |
| | |
Change in unrealized appreciation (depreciation) — | | | | | | | | |
| | |
Investments | | $ | 2,414,853 | | | $ | 1,514,443 | |
| | |
Net change in unrealized appreciation (depreciation) | | $ | 2,414,853 | | | $ | 1,514,443 | |
| | |
Net realized and unrealized gain | | $ | 3,866,833 | | | $ | 1,599,228 | |
| | |
Net increase in net assets from operations | | $ | 5,922,379 | | | $ | 4,201,838 | |
| | | | |
| | 32 | | See Notes to Financial Statements. |
Eaton Vance
Municipal Income Funds
January 31, 2021
Statements of Changes in Net Assets
| | | | | | | | | | | | |
| | | Six Months Ended January 31, 2021 (Unaudited) | |
| Increase (Decrease) in Net Assets | | Arizona Fund | | | Connecticut Fund | | | Minnesota Fund | |
| | | |
From operations — | | | | | | | | | | | | |
| | | |
Net investment income | | $ | 765,722 | | | $ | 965,925 | | | $ | 1,760,427 | |
| | | |
Net realized gain | | | 105,079 | | | | 107,264 | | | | 25,995 | |
| | | |
Net change in unrealized appreciation (depreciation) | | | 322,397 | | | | 577,915 | | | | 518,726 | |
| | | |
Net increase in net assets from operations | | $ | 1,193,198 | | | $ | 1,651,104 | | | $ | 2,305,148 | |
| | | |
Distributions to shareholders — | | | | | | | | | | | | |
| | | |
Class A | | $ | (474,503 | ) | | $ | (637,546 | ) | | $ | (542,046 | ) |
| | | |
Class C | | | (36,790 | ) | | | (38,103 | ) | | | (29,481 | ) |
| | | |
Class I | | | (339,392 | ) | | | (289,157 | ) | | | (1,194,580 | ) |
| | | |
Total distributions to shareholders | | $ | (850,685 | ) | | $ | (964,806 | ) | | $ | (1,766,107 | ) |
| | | |
Transactions in shares of beneficial interest — | | | | | | | | | | | | |
| | | |
Proceeds from sale of shares | | | | | | | | | | | | |
| | | |
Class A | | $ | 7,656,771 | | | $ | 2,855,073 | | | $ | 4,821,525 | |
| | | |
Class C | | | 246,887 | | | | 439,793 | | | | 414,398 | |
| | | |
Class I | | | 8,431,136 | | | | 4,148,714 | | | | 19,827,405 | |
| | | |
Net asset value of shares issued to shareholders in payment of distributions declared | | | | | | | | | | | | |
| | | |
Class A | | | 438,606 | | | | 521,688 | | | | 495,643 | |
| | | |
Class C | | | 32,993 | | | | 29,231 | | | | 28,190 | |
| | | |
Class I | | | 283,558 | | | | 238,481 | | | | 697,167 | |
| | | |
Cost of shares redeemed | | | | | | | | | | | | |
| | | |
Class A | | | (5,668,803 | ) | | | (2,312,164 | ) | | | (3,626,220 | ) |
| | | |
Class C | | | (367,475 | ) | | | (983,721 | ) | | | (1,203,130 | ) |
| | | |
Class I | | | (2,357,548 | ) | | | (2,606,325 | ) | | | (21,574,228 | ) |
| | | |
Net asset value of shares converted | | | | | | | | | | | | |
| | | |
Class A | | | 559,384 | | | | 532,520 | | | | 951,539 | |
| | | |
Class C | | | (559,384 | ) | | | (532,520 | ) | | | (951,539 | ) |
| | | |
Net increase (decrease) in net assets from Fund share transactions | | $ | 8,696,125 | | | $ | 2,330,770 | | | $ | (119,250 | ) |
| | | |
Net increase in net assets | | $ | 9,038,638 | | | $ | 3,017,068 | | | $ | 419,791 | |
|
| Net Assets | |
| | | |
At beginning of period | | $ | 65,955,198 | | | $ | 79,239,152 | | | $ | 189,061,122 | |
| | | |
At end of period | | $ | 74,993,836 | | | $ | 82,256,220 | | | $ | 189,480,913 | |
| | | | |
| | 33 | | See Notes to Financial Statements. |
Eaton Vance
Municipal Income Funds
January 31, 2021
Statements of Changes in Net Assets — continued
| | | | | | | | |
| | | Six Months Ended January 31, 2021 (Unaudited) | |
| Increase (Decrease) in Net Assets | | New Jersey Fund | | | Pennsylvania Fund | |
| | |
From operations — | | | | | | | | |
| | |
Net investment income | | $ | 2,055,546 | | | $ | 2,602,610 | |
| | |
Net realized gain | | | 1,451,980 | | | | 84,785 | |
| | |
Net change in unrealized appreciation (depreciation) | | | 2,414,853 | | | | 1,514,443 | |
| | |
Net increase in net assets from operations | | $ | 5,922,379 | | | $ | 4,201,838 | |
| | |
Distributions to shareholders — | | | | | | | | |
| | |
Class A | | $ | (1,306,521 | ) | | $ | (1,567,059 | ) |
| | |
Class C | | | (98,402 | ) | | | (104,388 | ) |
| | |
Class I | | | (940,039 | ) | | | (933,904 | ) |
| | |
Total distributions to shareholders | | $ | (2,344,962 | ) | | $ | (2,605,351 | ) |
| | |
Transactions in shares of beneficial interest — | | | | | | | | |
| | |
Proceeds from sale of shares | | | | | | | | |
| | |
Class A | | $ | 5,812,907 | | | $ | 12,527,553 | |
| | |
Class C | | | 1,564,311 | | | | 1,537,575 | |
| | |
Class I | | | 12,745,303 | | | | 7,379,552 | |
| | |
Net asset value of shares issued to shareholders in payment of distributions declared | | | | | | | | |
| | |
Class A | | | 1,053,164 | | | | 1,385,123 | |
| | |
Class C | | | 88,751 | | | | 100,255 | |
| | |
Class I | | | 819,937 | | | | 539,292 | |
| | |
Cost of shares redeemed | | | | | | | | |
| | |
Class A | | | (5,233,510 | ) | | | (14,780,256 | ) |
| | |
Class C | | | (851,760 | ) | | | (1,450,089 | ) |
| | |
Class I | | | (4,664,487 | ) | | | (4,419,557 | ) |
| | |
Net asset value of shares converted | | | | | | | | |
| | |
Class A | | | 1,342,388 | | | | 2,447,969 | |
| | |
Class C | | | (1,342,388 | ) | | | (2,447,969 | ) |
| | |
Net increase in net assets from Fund share transactions | | $ | 11,334,616 | | | $ | 2,819,448 | |
| | |
Net increase in net assets | | $ | 14,912,033 | | | $ | 4,415,935 | |
|
| Net Assets | |
| | |
At beginning of period | | $ | 177,667,530 | | | $ | 191,839,866 | |
| | |
At end of period | | $ | 192,579,563 | | | $ | 196,255,801 | |
| | | | |
| | 34 | | See Notes to Financial Statements. |
Eaton Vance
Municipal Income Funds
January 31, 2021
Statements of Changes in Net Assets — continued
| | | | | | | | | | | | |
| | | Year Ended July 31, 2020 | |
| Increase (Decrease) in Net Assets | | Arizona Fund | | | Connecticut Fund | | | Minnesota Fund | |
| | | |
From operations — | | | | | | | | | | | | |
| | | |
Net investment income | | $ | 1,529,200 | | | $ | 2,056,242 | | | $ | 3,578,292 | |
| | | |
Net realized loss | | | (250,179 | ) | | | (160,420 | ) | | | (233,269 | ) |
| | | |
Net change in unrealized appreciation (depreciation) | | | 1,463,596 | | | | 1,012,384 | | | | 4,157,426 | |
| | | |
Net increase in net assets from operations | | $ | 2,742,617 | | | $ | 2,908,206 | | | $ | 7,502,449 | |
| | | |
Distributions to shareholders — | | | | | | | | | | | | |
| | | |
Class A | | $ | (977,929 | ) | | $ | (1,422,574 | ) | | $ | (1,159,653 | ) |
| | | |
Class C | | | (80,631 | ) | | | (117,076 | ) | | | (76,219 | ) |
| | | |
Class I | | | (615,498 | ) | | | (640,861 | ) | | | (2,396,498 | ) |
| | | |
Total distributions to shareholders | | $ | (1,674,058 | ) | | $ | (2,180,511 | ) | | $ | (3,632,370 | ) |
| | | |
Transactions in shares of beneficial interest — | | | | | | | | | | | | |
| | | |
Proceeds from sale of shares | | | | | | | | | | | | |
| | | |
Class A | | $ | 7,679,489 | | | $ | 4,168,210 | | | $ | 7,424,971 | |
| | | |
Class C | | | 890,501 | | | | 3,428,981 | | | | 1,871,942 | |
| | | |
Class I | | | 9,005,843 | | | | 7,296,142 | | | | 61,762,354 | |
| | | |
Net asset value of shares issued to shareholders in payment of distributions declared | | | | | | | | | | | | |
| | | |
Class A | | | 878,308 | | | | 1,163,854 | | | | 1,059,723 | |
| | | |
Class C | | | 72,136 | | | | 83,172 | | | | 72,137 | |
| | | |
Class I | | | 504,262 | | | | 551,758 | | | | 1,335,288 | |
| | | |
Cost of shares redeemed | | | | | | | | | | | | |
| | | |
Class A | | | (5,425,121 | ) | | | (6,273,154 | ) | | | (8,269,156 | ) |
| | | |
Class C | | | (479,913 | ) | | | (2,561,998 | ) | | | (1,146,056 | ) |
| | | |
Class I | | | (6,833,118 | ) | | | (7,483,677 | ) | | | (32,168,716 | ) |
| | | |
Net asset value of shares converted | | | | | | | | | | | | |
| | | |
Class A | | | 341,308 | | | | 578,889 | | | | 928,174 | |
| | | |
Class C | | | (341,308 | ) | | | (578,889 | ) | | | (928,174 | ) |
| | | |
Net increase in net assets from Fund share transactions | | $ | 6,292,387 | | | $ | 373,288 | | | $ | 31,942,487 | |
| | | |
Net increase in net assets | | $ | 7,360,946 | | | $ | 1,100,983 | | | $ | 35,812,566 | |
|
| Net Assets | |
| | | |
At beginning of year | | $ | 58,594,252 | | | $ | 78,138,169 | | | $ | 153,248,556 | |
| | | |
At end of year | | $ | 65,955,198 | | | $ | 79,239,152 | | | $ | 189,061,122 | |
| | | | |
| | 35 | | See Notes to Financial Statements. |
Eaton Vance
Municipal Income Funds
January 31, 2021
Statements of Changes in Net Assets — continued
| | | | | | | | |
| | | Year Ended July 31, 2020 | |
| Increase (Decrease) in Net Assets | | New Jersey Fund | | | Pennsylvania Fund | |
| | |
From operations — | | | | | | | | |
| | |
Net investment income | | $ | 4,385,880 | | | $ | 5,878,532 | |
| | |
Net realized gain | | | 2,225,869 | | | | 267,084 | |
| | |
Net change in unrealized appreciation (depreciation) | | | 1,107,614 | | | | 1,687,135 | |
| | |
Net increase in net assets from operations | | $ | 7,719,363 | | | $ | 7,832,751 | |
| | |
Distributions to shareholders — | | | | | | | | |
| | |
Class A | | $ | (2,820,650 | ) | | $ | (3,643,461 | ) |
| | |
Class C | | | (249,774 | ) | | | (297,475 | ) |
| | |
Class I | | | (1,721,744 | ) | | | (2,005,858 | ) |
| | |
Total distributions to shareholders | | $ | (4,792,168 | ) | | $ | (5,946,794 | ) |
| | |
Transactions in shares of beneficial interest — | | | | | | | | |
| | |
Proceeds from sale of shares | | | | | | | | |
| | |
Class A | | $ | 8,927,822 | | | $ | 7,615,079 | |
| | |
Class C | | | 2,885,135 | | | | 3,303,877 | |
| | |
Class I | | | 25,482,707 | | | | 18,225,918 | |
| | |
Net asset value of shares issued to shareholders in payment of distributions declared | | | | | | | | |
| | |
Class A | | | 2,287,052 | | | | 3,228,660 | |
| | |
Class C | | | 206,889 | | | | 263,395 | |
| | |
Class I | | | 1,505,557 | | | | 1,058,411 | |
| | |
Cost of shares redeemed | | | | | | | | |
| | |
Class A | | | (15,252,973 | ) | | | (17,432,539 | ) |
| | |
Class C | | | (3,183,068 | ) | | | (3,541,938 | ) |
| | |
Class I | | | (12,625,477 | ) | | | (8,720,269 | ) |
| | |
Net asset value of shares converted | | | | | | | | |
| | |
Class A | | | 1,474,689 | | | | 1,410,255 | |
| | |
Class C | | | (1,474,689 | ) | | | (1,410,255 | ) |
| | |
Net increase in net assets from Fund share transactions | | $ | 10,233,644 | | | $ | 4,000,594 | |
| | |
Net increase in net assets | | $ | 13,160,839 | | | $ | 5,886,551 | |
|
| Net Assets | |
| | |
At beginning of year | | $ | 164,506,691 | | | $ | 185,953,315 | |
| | |
At end of year | | $ | 177,667,530 | | | $ | 191,839,866 | |
| | | | |
| | 36 | | See Notes to Financial Statements. |
Eaton Vance
Municipal Income Funds
January 31, 2021
Financial Highlights
| | | | | | | | | | | | | | | | | | | | | | | | |
| | | Arizona Fund — Class A | |
| | |
| | | Six Months Ended
January 31, 2021
(Unaudited) | | | Year Ended July 31, | |
| | | 2020 | | | 2019 | | | 2018 | | | 2017 | | | 2016 | |
| | | | | | | |
Net asset value — Beginning of period | | $ | 9.910 | | | $ | 9.750 | | | $ | 9.440 | | | $ | 9.580 | | | $ | 9.840 | | | $ | 9.540 | |
| | | | | | |
| Income (Loss) From Operations | | | | | | | | | | | | | | | | | | | | | | | | |
| | | | | | |
Net investment income(1) | | $ | 0.108 | | | $ | 0.238 | | | $ | 0.258 | | | $ | 0.276 | | | $ | 0.292 | | | $ | 0.321 | |
| | | | | | |
Net realized and unrealized gain (loss) | | | 0.053 | | | | 0.182 | | | | 0.310 | | | | (0.132 | ) | | | (0.262 | ) | | | 0.298 | |
| | | | | | |
Total income from operations | | $ | 0.161 | | | $ | 0.420 | | | $ | 0.568 | | | $ | 0.144 | | | $ | 0.030 | | | $ | 0.619 | |
| | | | | | |
| Less Distributions | | | | | | | | | | | | | | | | | | | | | | | | |
| | | | | | |
From net investment income | | $ | (0.121 | ) | | $ | (0.260 | ) | | $ | (0.258 | ) | | $ | (0.284 | ) | | $ | (0.290 | ) | | $ | (0.319 | ) |
| | | | | | |
Total distributions | | $ | (0.121 | ) | | $ | (0.260 | ) | | $ | (0.258 | ) | | $ | (0.284 | ) | | $ | (0.290 | ) | | $ | (0.319 | ) |
| | | | | | |
Net asset value — End of period | | $ | 9.950 | | | $ | 9.910 | | | $ | 9.750 | | | $ | 9.440 | | | $ | 9.580 | | | $ | 9.840 | |
| | | | | | |
Total Return(2) | | | 1.64 | %(3) | | | 4.38 | % | | | 6.12 | % | | | 1.53 | % | | | 0.35 | % | | | 6.60 | % |
| | | | | | |
| Ratios/Supplemental Data | | | | | | | | | | | | | | | | | | | | | | | | |
| | | | | | |
Net assets, end of period (000’s omitted) | | $ | 42,006 | | | $ | 38,854 | | | $ | 34,704 | | | $ | 33,704 | | | $ | 40,674 | | | $ | 47,956 | |
| | | | | | |
Ratios (as a percentage of average daily net assets): | | | | | | | | | | | | | | | | | | | | | | | | |
| | | | | | |
Expenses(4) | | | 0.67 | %(5) | | | 0.68 | % | | | 0.70 | % | | | 0.71 | % | | | 0.71 | % | | | 0.69 | % |
| | | | | | |
Net investment income | | | 2.17 | %(5) | | | 2.44 | % | | | 2.73 | % | | | 2.90 | % | | | 3.05 | % | | | 3.32 | % |
| | | | | | |
Portfolio Turnover | | | 13 | %(3) | | | 16 | % | | | 6 | % | | | 8 | % | | | 22 | % | | | 14 | % |
| (1) | Computed using average shares outstanding. |
| (2) | Returns are historical and are calculated by determining the percentage change in net asset value with all distributions reinvested and do not reflect the effect of sales charges. |
| (4) | Excludes the effect of custody fee credits, if any, of less than 0.005%. Effective September 1, 2015, custody fee credits, which were earned on cash deposit balances, were discontinued by the custodian. |
| | | | |
| | 37 | | See Notes to Financial Statements. |
Eaton Vance
Municipal Income Funds
January 31, 2021
Financial Highlights — continued
| | | | | | | | | | | | | | | | | | | | | | | | |
| | | Arizona Fund — Class C | |
| | |
| | | Six Months Ended
January 31, 2021
(Unaudited) | | | Year Ended July 31, | |
| | | 2020 | | | 2019 | | | 2018 | | | 2017 | | | 2016 | |
| | | | | | | |
Net asset value — Beginning of period | | $ | 11.020 | | | $ | 10.840 | | | $ | 10.500 | | | $ | 10.650 | | | $ | 10.940 | | | $ | 10.610 | |
| | | | | | |
| Income (Loss) From Operations | | | | | | | | | | | | | | | | | | | | | | | | |
| | | | | | |
Net investment income(1) | | $ | 0.079 | | | $ | 0.183 | | | $ | 0.208 | | | $ | 0.227 | | | $ | 0.245 | | | $ | 0.275 | |
| | | | | | |
Net realized and unrealized gain (loss) | | | 0.056 | | | | 0.208 | | | | 0.339 | | | | (0.140 | ) | | | (0.293 | ) | | | 0.329 | |
| | | | | | |
Total income (loss) from operations | | $ | 0.135 | | | $ | 0.391 | | | $ | 0.547 | | | $ | 0.087 | | | $ | (0.048 | ) | | $ | 0.604 | |
| | | | | | |
| Less Distributions | | | | | | | | | | | | | | | | | | | | | | | | |
| | | | | | |
From net investment income | | $ | (0.095 | ) | | $ | (0.211 | ) | | $ | (0.207 | ) | | $ | (0.237 | ) | | $ | (0.242 | ) | | $ | (0.274 | ) |
| | | | | | |
Total distributions | | $ | (0.095 | ) | | $ | (0.211 | ) | | $ | (0.207 | ) | | $ | (0.237 | ) | | $ | (0.242 | ) | | $ | (0.274 | ) |
| | | | | | |
Net asset value — End of period | | $ | 11.060 | | | $ | 11.020 | | | $ | 10.840 | | | $ | 10.500 | | | $ | 10.650 | | | $ | 10.940 | |
| | | | | | |
Total Return(2) | | | 1.23 | %(3) | | | 3.65 | % | | | 5.28 | % | | | 0.83 | % | | | (0.41 | )% | | | 5.77 | % |
| | | | | | |
| Ratios/Supplemental Data | | | | | | | | | | | | | | | | | | | | | | | | |
| | | | | | |
Net assets, end of period (000’s omitted) | | $ | 3,856 | | | $ | 4,490 | | | $ | 4,279 | | | $ | 5,025 | | | $ | 6,025 | | | $ | 6,592 | |
| | | | | | |
Ratios (as a percentage of average daily net assets): | | | | | | | | | | | | | | | | | | | | | | | | |
| | | | | | |
Expenses(4) | | | 1.42 | %(5) | | | 1.43 | % | | | 1.45 | % | | | 1.46 | % | | | 1.46 | % | | | 1.44 | % |
| | | | | | |
Net investment income | | | 1.44 | %(5) | | | 1.69 | % | | | 1.98 | % | | | 2.15 | % | | | 2.30 | % | | | 2.56 | % |
| | | | | | |
Portfolio Turnover | | | 13 | %(3) | | | 16 | % | | | 6 | % | | | 8 | % | | | 22 | % | | | 14 | % |
| (1) | Computed using average shares outstanding. |
| (2) | Returns are historical and are calculated by determining the percentage change in net asset value with all distributions reinvested and do not reflect the effect of sales charges. |
| (4) | Excludes the effect of custody fee credits, if any, of less than 0.005%. Effective September 1, 2015, custody fee credits, which were earned on cash deposit balances, were discontinued by the custodian. |
| | | | |
| | 38 | | See Notes to Financial Statements. |
Eaton Vance
Municipal Income Funds
January 31, 2021
Financial Highlights — continued
| | | | | | | | | | | | | | | | | | | | | | | | |
| | | Arizona Fund — Class I | |
| | |
| | | Six Months Ended
January 31, 2021
(Unaudited) | | | Year Ended July 31, | |
| | | 2020 | | | 2019 | | | 2018 | | | 2017 | | | 2016 | |
| | | | | | | |
Net asset value — Beginning of period | | $ | 9.910 | | | $ | 9.750 | | | $ | 9.440 | | | $ | 9.580 | | | $ | 9.830 | | | $ | 9.540 | |
| | | | | | |
| Income (Loss) From Operations | | | | | | | | | | | | | | | | | | | | | | | | |
| | | | | | |
Net investment income(1) | | $ | 0.117 | | | $ | 0.257 | | | $ | 0.276 | | | $ | 0.295 | | | $ | 0.310 | | | $ | 0.339 | |
| | | | | | |
Net realized and unrealized gain (loss) | | | 0.053 | | | | 0.184 | | | | 0.310 | | | | (0.132 | ) | | | (0.251 | ) | | | 0.289 | |
| | | | | | |
Total income from operations | | $ | 0.170 | | | $ | 0.441 | | | $ | 0.586 | | | $ | 0.163 | | | $ | 0.059 | | | $ | 0.628 | |
| | | | | | |
| Less Distributions | | | | | | | | | | | | | | | | | | | | | | | | |
| | | | | | |
From net investment income | | $ | (0.130 | ) | | $ | (0.281 | ) | | $ | (0.276 | ) | | $ | (0.303 | ) | | $ | (0.309 | ) | | $ | (0.338 | ) |
| | | | | | |
Total distributions | | $ | (0.130 | ) | | $ | (0.281 | ) | | $ | (0.276 | ) | | $ | (0.303 | ) | | $ | (0.309 | ) | | $ | (0.338 | ) |
| | | | | | |
Net asset value — End of period | | $ | 9.950 | | | $ | 9.910 | | | $ | 9.750 | | | $ | 9.440 | | | $ | 9.580 | | | $ | 9.830 | |
| | | | | | |
Total Return(2) | | | 1.74 | %(3) | | | 4.60 | % | | | 6.33 | % | | | 1.74 | % | | | 0.65 | % | | | 6.70 | % |
| | | | | | |
| Ratios/Supplemental Data | | | | | | | | | | | | | | | | | | | | | | | | |
| | | | | | |
Net assets, end of period (000’s omitted) | | $ | 29,132 | | | $ | 22,611 | | | $ | 19,612 | | | $ | 13,292 | | | $ | 16,990 | | | $ | 12,390 | |
| | | | | | |
Ratios (as a percentage of average daily net assets): | | | | | | | | | | | | | | | | | | | | | | | | |
| | | | | | |
Expenses(4) | | | 0.47 | %(5) | | | 0.48 | % | | | 0.49 | % | | | 0.51 | % | | | 0.51 | % | | | 0.49 | % |
| | | | | | |
Net investment income | | | 2.36 | %(5) | | | 2.64 | % | | | 2.91 | % | | | 3.10 | % | | | 3.24 | % | | | 3.50 | % |
| | | | | | |
Portfolio Turnover | | | 13 | %(3) | | | 16 | % | | | 6 | % | | | 8 | % | | | 22 | % | | | 14 | % |
| (1) | Computed using average shares outstanding. |
| (2) | Returns are historical and are calculated by determining the percentage change in net asset value with all distributions reinvested. |
| (4) | Excludes the effect of custody fee credits, if any, of less than 0.005%. Effective September 1, 2015, custody fee credits, which were earned on cash deposit balances, were discontinued by the custodian. |
| | | | |
| | 39 | | See Notes to Financial Statements. |
Eaton Vance
Municipal Income Funds
January 31, 2021
Financial Highlights — continued
| | | | | | | | | | | | | | | | | | | | | | | | |
| | | Connecticut Fund — Class A | |
| | |
| | | Six Months Ended
January 31, 2021
(Unaudited) | | | Year Ended July 31, | |
| | | 2020 | | | 2019 | | | 2018 | | | 2017 | | | 2016 | |
| | | | | | | |
Net asset value — Beginning of period | | $ | 10.350 | | | $ | 10.230 | | | $ | 9.960 | | | $ | 10.200 | | | $ | 10.520 | | | $ | 10.240 | |
| | | | | | |
| Income (Loss) From Operations | | | | | | | | | | | | | | | | | | | | | | | | |
| | | | | | |
Net investment income(1) | | $ | 0.123 | | | $ | 0.265 | | | $ | 0.296 | | | $ | 0.324 | | | $ | 0.328 | | | $ | 0.351 | |
| | | | | | |
Net realized and unrealized gain (loss) | | | 0.090 | | | | 0.136 | | | | 0.269 | | | | (0.243 | ) | | | (0.323 | ) | | | 0.276 | |
| | | | | | |
Total income from operations | | $ | 0.213 | | | $ | 0.401 | | | $ | 0.565 | | | $ | 0.081 | | | $ | 0.005 | | | $ | 0.627 | |
| | | | | | |
| Less Distributions | | | | | | | | | | | | | | | | | | | | | | | | |
| | | | | | |
From net investment income | | $ | (0.123 | ) | | $ | (0.281 | ) | | $ | (0.295 | ) | | $ | (0.321 | ) | | $ | (0.325 | ) | | $ | (0.347 | ) |
| | | | | | |
Total distributions | | $ | (0.123 | ) | | $ | (0.281 | ) | | $ | (0.295 | ) | | $ | (0.321 | ) | | $ | (0.325 | ) | | $ | (0.347 | ) |
| | | | | | |
Net asset value — End of period | | $ | 10.440 | | | $ | 10.350 | | | $ | 10.230 | | | $ | 9.960 | | | $ | 10.200 | | | $ | 10.520 | |
| | | | | | |
Total Return(2) | | | 2.08 | %(3) | | | 3.99 | % | | | 5.78 | % | | | 0.82 | % | | | 0.08 | % | | | 6.22 | % |
| | | | | | |
| Ratios/Supplemental Data | | | | | | | | | | | | | | | | | | | | | | | | |
| | | | | | |
Net assets, end of period (000’s omitted) | | $ | 54,552 | | | $ | 52,501 | | | $ | 52,275 | | | $ | 54,900 | | | $ | 59,405 | | | $ | 68,795 | |
| | | | | | |
Ratios (as a percentage of average daily net assets): | | | | | | | | | | | | | | | | | | | | | | | | |
| | | | | | |
Expenses(4) | | | 0.69 | %(5) | | | 0.72 | % | | | 0.73 | % | | | 0.73 | % | | | 0.70 | % | | | 0.72 | % |
| | | | | | |
Net investment income | | | 2.37 | %(5) | | | 2.59 | % | | | 2.97 | % | | | 3.22 | % | | | 3.20 | % | | | 3.38 | % |
| | | | | | |
Portfolio Turnover | | | 8 | %(3) | | | 26 | % | | | 16 | % | | | 10 | % | | | 11 | % | | | 7 | % |
| (1) | Computed using average shares outstanding. |
| (2) | Returns are historical and are calculated by determining the percentage change in net asset value with all distributions reinvested and do not reflect the effect of sales charges. |
| (4) | Excludes the effect of custody fee credits, if any, of less than 0.005%. Effective September 1, 2015, custody fee credits, which were earned on cash deposit balances, were discontinued by the custodian. |
| | | | |
| | 40 | | See Notes to Financial Statements. |
Eaton Vance
Municipal Income Funds
January 31, 2021
Financial Highlights — continued
| | | | | | | | | | | | | | | | | | | | | | | | |
| | | Connecticut Fund — Class C | |
| | |
| | | Six Months Ended
January 31, 2021
(Unaudited) | | | Year Ended July 31, | |
| | | 2020 | | | 2019 | | | 2018 | | | 2017 | | | 2016 | |
| | | | | | | |
Net asset value — Beginning of period | | $ | 10.310 | | | $ | 10.190 | | | $ | 9.920 | | | $ | 10.160 | | | $ | 10.490 | | | $ | 10.200 | |
| | | | | | |
| Income (Loss) From Operations | | | | | | | | | | | | | | | | | | | | | | | | |
| | | | | | |
Net investment income(1) | | $ | 0.084 | | | $ | 0.187 | | | $ | 0.220 | | | $ | 0.247 | | | $ | 0.250 | | | $ | 0.271 | |
| | | | | | |
Net realized and unrealized gain (loss) | | | 0.090 | | | | 0.136 | | | | 0.269 | | | | (0.242 | ) | | | (0.333 | ) | | | 0.287 | |
| | | | | | |
Total income (loss) from operations | | $ | 0.174 | | | $ | 0.323 | | | $ | 0.489 | | | $ | 0.005 | | | $ | (0.083 | ) | | $ | 0.558 | |
| | | | | | |
| Less Distributions | | | | | | | | | | | | | | | | | | | | | | | | |
| | | | | | |
From net investment income | | $ | (0.084 | ) | | $ | (0.203 | ) | | $ | (0.219 | ) | | $ | (0.245 | ) | | $ | (0.247 | ) | | $ | (0.268 | ) |
| | | | | | |
Total distributions | | $ | (0.084 | ) | | $ | (0.203 | ) | | $ | (0.219 | ) | | $ | (0.245 | ) | | $ | (0.247 | ) | | $ | (0.268 | ) |
| | | | | | |
Net asset value — End of period | | $ | 10.400 | | | $ | 10.310 | | | $ | 10.190 | | | $ | 9.920 | | | $ | 10.160 | | | $ | 10.490 | |
| | | | | | |
Total Return(2) | | | 1.70 | %(3) | | | 3.21 | % | | | 5.01 | % | | | 0.06 | % | | | (0.77 | )% | | | 5.54 | % |
| | | | | | |
| Ratios/Supplemental Data | | | | | | | | | | | | | | | | | | | | | | | | |
| | | | | | |
Net assets, end of period (000’s omitted) | | $ | 4,180 | | | $ | 5,194 | | | $ | 4,782 | | | $ | 4,588 | | | $ | 5,847 | | | $ | 7,020 | |
| | | | | | |
Ratios (as a percentage of average daily net assets): | | | | | | | | | | | | | | | | | | | | | | | | |
| | | | | | |
Expenses(4) | | | 1.44 | %(5) | | | 1.47 | % | | | 1.47 | % | | | 1.48 | % | | | 1.45 | % | | | 1.47 | % |
| | | | | | |
Net investment income | | | 1.62 | %(5) | | | 1.84 | % | | | 2.21 | % | | | 2.47 | % | | | 2.45 | % | | | 2.62 | % |
| | | | | | |
Portfolio Turnover | | | 8 | %(3) | | | 26 | % | | | 16 | % | | | 10 | % | | | 11 | % | | | 7 | % |
| (1) | Computed using average shares outstanding. |
| (2) | Returns are historical and are calculated by determining the percentage change in net asset value with all distributions reinvested and do not reflect the effect of sales charges. |
| (4) | Excludes the effect of custody fee credits, if any, of less than 0.005%. Effective September 1, 2015, custody fee credits, which were earned on cash deposit balances, were discontinued by the custodian. |
| | | | |
| | 41 | | See Notes to Financial Statements. |
Eaton Vance
Municipal Income Funds
January 31, 2021
Financial Highlights — continued
| | | | | | | | | | | | | | | | | | | | | | | | |
| | | Connecticut Fund — Class I | |
| | |
| | | Six Months Ended
January 31, 2021
(Unaudited) | | | Year Ended July 31, | |
| | | 2020 | | | 2019 | | | 2018 | | | 2017 | | | 2016 | |
| | | | | | | |
Net asset value — Beginning of period | | $ | 10.350 | | | $ | 10.230 | | | $ | 9.960 | | | $ | 10.200 | | | $ | 10.520 | | | $ | 10.240 | |
| | | | | | |
| Income (Loss) From Operations | | | | | | | | | | | | | | | | | | | | | | | | |
| | | | | | |
Net investment income(1) | | $ | 0.134 | | | $ | 0.286 | | | $ | 0.316 | | | $ | 0.344 | | | $ | 0.348 | | | $ | 0.371 | |
| | | | | | |
Net realized and unrealized gain (loss) | | | 0.090 | | | | 0.136 | | | | 0.269 | | | | (0.242 | ) | | | (0.322 | ) | | | 0.276 | |
| | | | | | |
Total income from operations | | $ | 0.224 | | | $ | 0.422 | | | $ | 0.585 | | | $ | 0.102 | | | $ | 0.026 | | | $ | 0.647 | |
| | | | | | |
| Less Distributions | | | | | | | | | | | | | | | | | | | | | | | | |
| | | | | | |
From net investment income | | $ | (0.134 | ) | | $ | (0.302 | ) | | $ | (0.315 | ) | | $ | (0.342 | ) | | $ | (0.346 | ) | | $ | (0.367 | ) |
| | | | | | |
Total distributions | | $ | (0.134 | ) | | $ | (0.302 | ) | | $ | (0.315 | ) | | $ | (0.342 | ) | | $ | (0.346 | ) | | $ | (0.367 | ) |
| | | | | | |
Net asset value — End of period | | $ | 10.440 | | | $ | 10.350 | | | $ | 10.230 | | | $ | 9.960 | | | $ | 10.200 | | | $ | 10.520 | |
| | | | | | |
Total Return(2) | | | 2.18 | %(3) | | | 4.20 | % | | | 6.00 | % | | | 1.03 | % | | | 0.28 | % | | | 6.43 | % |
| | | | | | |
| Ratios/Supplemental Data | | | | | | | | | | | | | | | | | | | | | | | | |
| | | | | | |
Net assets, end of period (000’s omitted) | | $ | 23,524 | | | $ | 21,544 | | | $ | 21,081 | | | $ | 13,842 | | | $ | 16,216 | | | $ | 12,826 | |
| | | | | | |
Ratios (as a percentage of average daily net assets): | | | | | | | | | | | | | | | | | | | | | | | | |
| | | | | | |
Expenses(4) | | | 0.49 | %(5) | | | 0.52 | % | | | 0.53 | % | | | 0.53 | % | | | 0.50 | % | | | 0.52 | % |
| | | | | | |
Net investment income | | | 2.57 | %(5) | | | 2.80 | % | | | 3.16 | % | | | 3.42 | % | | | 3.40 | % | | | 3.57 | % |
| | | | | | |
Portfolio Turnover | | | 8 | %(3) | | | 26 | % | | | 16 | % | | | 10 | % | | | 11 | % | | | 7 | % |
| (1) | Computed using average shares outstanding. |
| (2) | Returns are historical and are calculated by determining the percentage change in net asset value with all distributions reinvested. |
| (4) | Excludes the effect of custody fee credits, if any, of less than 0.005%. Effective September 1, 2015, custody fee credits, which were earned on cash deposit balances, were discontinued by the custodian. |
| | | | |
| | 42 | | See Notes to Financial Statements. |
Eaton Vance
Municipal Income Funds
January 31, 2021
Financial Highlights — continued
| | | | | | | | | | | | | | | | | | | | | | | | |
| | | Minnesota Fund — Class A | |
| | |
| | | Six Months Ended
January 31, 2021
(Unaudited) | | | Year Ended July 31, | |
| | | 2020 | | | 2019 | | | 2018 | | | 2017 | | | 2016 | |
| | | | | | | |
Net asset value — Beginning of period | | $ | 9.840 | | | $ | 9.610 | | | $ | 9.250 | | | $ | 9.480 | | | $ | 9.770 | | | $ | 9.550 | |
| | | | | | |
| Income (Loss) From Operations | | | | | | | | | | | | | | | | | | | | | | | | |
| | | | | | |
Net investment income(1) | | $ | 0.086 | | | $ | 0.187 | | | $ | 0.224 | | | $ | 0.241 | | | $ | 0.263 | | | $ | 0.288 | |
| | | | | | |
Net realized and unrealized gain (loss) | | | 0.031 | | | | 0.233 | | | | 0.361 | | | | (0.227 | ) | | | (0.289 | ) | | | 0.222 | |
| | | | | | |
Total income (loss) from operations | | $ | 0.117 | | | $ | 0.420 | | | $ | 0.585 | | | $ | 0.014 | | | $ | (0.026 | ) | | $ | 0.510 | |
| | | | | | |
| Less Distributions | | | | | | | | | | | | | | | | | | | | | | | | |
| | | | | | |
From net investment income | | $ | (0.087 | ) | | $ | (0.190 | ) | | $ | (0.225 | ) | | $ | (0.244 | ) | | $ | (0.264 | ) | | $ | (0.290 | ) |
| | | | | | |
Total distributions | | $ | (0.087 | ) | | $ | (0.190 | ) | | $ | (0.225 | ) | | $ | (0.244 | ) | | $ | (0.264 | ) | | $ | (0.290 | ) |
| | | | | | |
Net asset value — End of period | | $ | 9.870 | | | $ | 9.840 | | | $ | 9.610 | | | $ | 9.250 | | | $ | 9.480 | | | $ | 9.770 | |
| | | | | | |
Total Return(2) | | | 1.19 | %(3) | | | 4.42 | % | | | 6.42 | % | | | 0.15 | % | | | (0.22 | )% | | | 5.42 | % |
| | | | | | |
| Ratios/Supplemental Data | | | | | | | | | | | | | | | | | | | | | | | | |
| | | | | | |
Net assets, end of period (000’s omitted) | | $ | 63,207 | | | $ | 60,367 | | | $ | 57,812 | | | $ | 56,760 | | | $ | 62,310 | | | $ | 74,061 | |
| | | | | | |
Ratios (as a percentage of average daily net assets): | | | | | | | | | | | | | | | | | | | | | | | | |
| | | | | | |
Expenses(4) | | | 0.65 | %(5) | | | 0.66 | % | | | 0.70 | % | | | 0.69 | % | | | 0.70 | % | | | 0.69 | % |
| | | | | | |
Net investment income | | | 1.74 | %(5) | | | 1.93 | % | | | 2.41 | % | | | 2.57 | % | | | 2.77 | % | | | 2.98 | % |
| | | | | | |
Portfolio Turnover | | | 7 | %(3) | | | 14 | % | | | 21 | % | | | 20 | % | | | 23 | % | | | 12 | % |
| (1) | Computed using average shares outstanding. |
| (2) | Returns are historical and are calculated by determining the percentage change in net asset value with all distributions reinvested and do not reflect the effect of sales charges. |
| (4) | Excludes the effect of custody fee credits, if any, of less than 0.005%. Effective September 1, 2015, custody fee credits, which were earned on cash deposit balances, were discontinued by the custodian. |
| | | | |
| | 43 | | See Notes to Financial Statements. |
Eaton Vance
Municipal Income Funds
January 31, 2021
Financial Highlights — continued
| | | | | | | | | | | | | | | | | | | | | | | | |
| | | Minnesota Fund — Class C | |
| | |
| | | Six Months Ended
January 31, 2021
(Unaudited)
| | | Year Ended July 31, | |
| | | 2020 | | | 2019 | | | 2018 | | | 2017 | | | 2016 | |
| | | | | | | |
Net asset value — Beginning of period | | $ | 10.580 | | | $ | 10.330 | | | $ | 9.950 | | | $ | 10.200 | | | $ | 10.500 | | | $ | 10.270 | |
| | | | | | |
| Income (Loss) From Operations | | | | | | | | | | | | | | | | | | | | | | | | |
| | | | | | |
Net investment income(1) | | $ | 0.053 | | | $ | 0.123 | | | $ | 0.168 | | | $ | 0.184 | | | $ | 0.206 | | | $ | 0.231 | |
| | | | | | |
Net realized and unrealized gain (loss) | | | 0.040 | | | | 0.253 | | | | 0.379 | | | | (0.247 | ) | | | (0.298 | ) | | | 0.233 | |
| | | | | | |
Total income (loss) from operations | | $ | 0.093 | | | $ | 0.376 | | | $ | 0.547 | | | $ | (0.063 | ) | | $ | (0.092 | ) | | $ | 0.464 | |
| | | | | | |
| Less Distributions | | | | | | | | | | | | | | | | | | | | | | | | |
| | | | | | |
From net investment income | | $ | (0.053 | ) | | $ | (0.126 | ) | | $ | (0.167 | ) | | $ | (0.187 | ) | | $ | (0.208 | ) | | $ | (0.234 | ) |
| | | | | | |
Total distributions | | $ | (0.053 | ) | | $ | (0.126 | ) | | $ | (0.167 | ) | | $ | (0.187 | ) | | $ | (0.208 | ) | | $ | (0.234 | ) |
| | | | | | |
Net asset value — End of period | | $ | 10.620 | | | $ | 10.580 | | | $ | 10.330 | | | $ | 9.950 | | | $ | 10.200 | | | $ | 10.500 | |
| | | | | | |
Total Return(2) | | | 0.88 | %(3) | | | 3.67 | % | | | 5.56 | % | | | (0.62 | )% | | | (0.85 | )% | | | 4.57 | % |
| | | | | | |
| Ratios/Supplemental Data | | | | | | | | | | | | | | | | | | | | | | | | |
| | | | | | |
Net assets, end of period (000’s omitted) | | $ | 4,911 | | | $ | 6,616 | | | $ | 6,595 | | | $ | 9,484 | | | $ | 11,668 | | | $ | 12,990 | |
| | | | | | |
Ratios (as a percentage of average daily net assets): | | | | | | | | | | | | | | | | | | | | | | | | |
| | | | | | |
Expenses(4) | | | 1.40 | %(5) | | | 1.41 | % | | | 1.46 | % | | | 1.44 | % | | | 1.45 | % | | | 1.44 | % |
| | | | | | |
Net investment income | | | 0.99 | %(5) | | | 1.18 | % | | | 1.68 | % | | | 1.82 | % | | | 2.02 | % | | | 2.23 | % |
| | | | | | |
Portfolio Turnover | | | 7 | %(3) | | | 14 | % | | | 21 | % | | | 20 | % | | | 23 | % | | | 12 | % |
| (1) | Computed using average shares outstanding. |
| (2) | Returns are historical and are calculated by determining the percentage change in net asset value with all distributions reinvested and do not reflect the effect of sales charges. |
| (4) | Excludes the effect of custody fee credits, if any, of less than 0.005%. Effective September 1, 2015, custody fee credits, which were earned on cash deposit balances, were discontinued by the custodian. |
| | | | |
| | 44 | | See Notes to Financial Statements. |
Eaton Vance
Municipal Income Funds
January 31, 2021
Financial Highlights — continued
| | | | | | | | | | | | | | | | | | | | | | | | |
| | | Minnesota Fund — Class I | |
| | |
| | | Six Months Ended
January 31, 2021
(Unaudited) | | | Year Ended July 31, | |
| | | 2020 | | | 2019 | | | 2018 | | | 2017 | | | 2016 | |
| | | | | | | |
Net asset value — Beginning of period | | $ | 9.840 | | | $ | 9.610 | | | $ | 9.250 | �� | | $ | 9.480 | | | $ | 9.770 | | | $ | 9.550 | |
| | | | | | |
| Income (Loss) From Operations | | | | | | | | | | | | | | | | | | | | | | | | |
| | | | | | |
Net investment income(1) | | $ | 0.096 | | | $ | 0.205 | | | $ | 0.242 | | | $ | 0.260 | | | $ | 0.280 | | | $ | 0.304 | |
| | | | | | |
Net realized and unrealized gain (loss) | | | 0.030 | | | | 0.234 | | | | 0.361 | | | | (0.227 | ) | | | (0.287 | ) | | | 0.225 | |
| | | | | | |
Total income (loss) from operations | | $ | 0.126 | | | $ | 0.439 | | | $ | 0.603 | | | $ | 0.033 | | | $ | (0.007 | ) | | $ | 0.529 | |
| | | | | | |
| Less Distributions | | | | | | | | | | | | | | | | | | | | | | | | |
| | | | | | |
From net investment income | | $ | (0.096 | ) | | $ | (0.209 | ) | | $ | (0.243 | ) | | $ | (0.263 | ) | | $ | (0.283 | ) | | $ | (0.309 | ) |
| | | | | | |
Total distributions | | $ | (0.096 | ) | | $ | (0.209 | ) | | $ | (0.243 | ) | | $ | (0.263 | ) | | $ | (0.283 | ) | | $ | (0.309 | ) |
| | | | | | |
Net asset value — End of period | | $ | 9.870 | | | $ | 9.840 | | | $ | 9.610 | | | $ | 9.250 | | | $ | 9.480 | | | $ | 9.770 | |
| | | | | | |
Total Return(2) | | | 1.29 | %(3) | | | 4.63 | % | | | 6.64 | % | | | 0.36 | % | | | (0.02 | )% | | | 5.63 | % |
| | | | | | |
| Ratios/Supplemental Data | | | | | | | | | | | | | | | | | | | | | | | | |
| | | | | | |
Net assets, end of period (000’s omitted) | | $ | 121,363 | | | $ | 122,078 | | | $ | 88,841 | | | $ | 73,789 | | | $ | 75,120 | | | $ | 59,486 | |
| | | | | | |
Ratios (as a percentage of average daily net assets): | | | | | | | | | | | | | | | | | | | | | | | | |
| | | | | | |
Expenses(4) | | | 0.45 | %(5) | | | 0.46 | % | | | 0.50 | % | | | 0.49 | % | | | 0.50 | % | | | 0.49 | % |
| | | | | | |
Net investment income | | | 1.94 | %(5) | | | 2.13 | % | | | 2.59 | % | | | 2.77 | % | | | 2.96 | % | | | 3.15 | % |
| | | | | | |
Portfolio Turnover | | | 7 | %(3) | | | 14 | % | | | 21 | % | | | 20 | % | | | 23 | % | | | 12 | % |
| (1) | Computed using average shares outstanding. |
| (2) | Returns are historical and are calculated by determining the percentage change in net asset value with all distributions reinvested. |
| (4) | Excludes the effect of custody fee credits, if any, of less than 0.005%. Effective September 1, 2015, custody fee credits, which were earned on cash deposit balances, were discontinued by the custodian. |
| | | | |
| | 45 | | See Notes to Financial Statements. |
Eaton Vance
Municipal Income Funds
January 31, 2021
Financial Highlights — continued
| | | | | | | | | | | | | | | | | | | | | | | | |
| | | New Jersey Fund — Class A | |
| | |
| | | Six Months Ended
January 31, 2021
(Unaudited) | | | Year Ended July 31, | |
| | | 2020 | | | 2019 | | | 2018 | | | 2017 | | | 2016 | |
| | | | | | | |
Net asset value — Beginning of period | | $ | 9.650 | | | $ | 9.480 | | | $ | 9.080 | | | $ | 9.230 | | | $ | 9.520 | | | $ | 9.240 | |
| | | | | | |
| Income (Loss) From Operations | | | | | | | | | | | | | | | | | | | | | | | | |
| | | | | | |
Net investment income(1) | | $ | 0.107 | | | $ | 0.244 | | | $ | 0.287 | | | $ | 0.317 | | | $ | 0.326 | | | $ | 0.339 | |
| | | | | | |
Net realized and unrealized gain (loss) | | | 0.207 | | | | 0.193 | | | | 0.398 | | | | (0.146 | ) | | | (0.293 | ) | | | 0.277 | |
| | | | | | |
Total income from operations | | $ | 0.314 | | | $ | 0.437 | | | $ | 0.685 | | | $ | 0.171 | | | $ | 0.033 | | | $ | 0.616 | |
| | | | | | |
| Less Distributions | | | | | | | | | | | | | | | | | | | | | | | | |
| | | | | | |
From net investment income | | $ | (0.124 | ) | | $ | (0.267 | ) | | $ | (0.285 | ) | | $ | (0.321 | ) | | $ | (0.323 | ) | | $ | (0.336 | ) |
| | | | | | |
Total distributions | | $ | (0.124 | ) | | $ | (0.267 | ) | | $ | (0.285 | ) | | $ | (0.321 | ) | | $ | (0.323 | ) | | $ | (0.336 | ) |
| | | | | | |
Net asset value — End of period | | $ | 9.840 | | | $ | 9.650 | | | $ | 9.480 | | | $ | 9.080 | | | $ | 9.230 | | | $ | 9.520 | |
| | | | | | |
Total Return(2) | | | 3.28 | %(3) | | | 4.68 | % | | | 7.69 | % | | | 1.89 | % | | | 0.41 | % | | �� | 6.78 | % |
| | | | | | |
| Ratios/Supplemental Data | | | | | | | | | | | | | | | | | | | | | | | | |
| | | | | | |
Net assets, end of period (000’s omitted) | | $ | 105,355 | | | $ | 100,417 | | | $ | 101,283 | | | $ | 98,224 | | | $ | 104,121 | | | $ | 117,155 | |
| | | | | | |
Ratios (as a percentage of average daily net assets): | | | | | | | | | | | | | | | | | | | | | | | | |
| | | | | | |
Expenses excluding interest and fees(4) | | | 0.67 | %(5) | | | 0.69 | % | | | 0.72 | % | | | 0.73 | % | | | 0.72 | % | | | 0.72 | % |
| | | | | | |
Interest and fee expense(6) | | | — | | | | — | | | | — | | | | — | | | | 0.01 | % | | | 0.03 | % |
| | | | | | |
Total expenses(4) | | | 0.67 | %(5) | | | 0.69 | % | | | 0.72 | % | | | 0.73 | % | | | 0.73 | % | | | 0.75 | % |
| | | | | | |
Net investment income | | | 2.20 | %(5) | | | 2.57 | % | | | 3.14 | % | | | 3.47 | % | | | 3.53 | % | | | 3.62 | % |
| | | | | | |
Portfolio Turnover | | | 23 | %(3) | | | 37 | % | | | 39 | % | | | 13 | % | | | 14 | % | | | 17 | % |
| (1) | Computed using average shares outstanding. |
| (2) | Returns are historical and are calculated by determining the percentage change in net asset value with all distributions reinvested and do not reflect the effect of sales charges. |
| (4) | Excludes the effect of custody fee credits, if any, of less than 0.005%. Effective September 1, 2015, custody fee credits, which were earned on cash deposit balances, were discontinued by the custodian. |
| (6) | Interest and fee expense relates to the liability for floating rate notes issued in conjunction with residual interest bond transactions (see Note 1H). |
| | | | |
| | 46 | | See Notes to Financial Statements. |
Eaton Vance
Municipal Income Funds
January 31, 2021
Financial Highlights — continued
| | | | | | | | | | | | | | | | | | | | | | | | |
| | | New Jersey Fund — Class C | |
| | |
| | | Six Months Ended
January 31, 2021
(Unaudited) | | | Year Ended July 31, | |
| | | 2020 | | | 2019 | | | 2018 | | | 2017 | | | 2016 | |
| | | | | | | |
Net asset value — Beginning of period | | $ | 10.070 | | | $ | 9.890 | | | $ | 9.470 | | | $ | 9.630 | | | $ | 9.930 | | | $ | 9.640 | |
| | | | | | |
| Income (Loss) From Operations | | | | | | | | | | | | | | | | | | | | | | | | |
| | | | | | |
Net investment income(1) | | $ | 0.074 | | | $ | 0.180 | | | $ | 0.229 | | | $ | 0.259 | | | $ | 0.267 | | | $ | 0.280 | |
| | | | | | |
Net realized and unrealized gain (loss) | | | 0.211 | | | | 0.205 | | | | 0.416 | | | | (0.155 | ) | | | (0.302 | ) | | | 0.288 | |
| | | | | | |
Total income (loss) from operations | | $ | 0.285 | | | $ | 0.385 | | | $ | 0.645 | | | $ | 0.104 | | | $ | (0.035 | ) | | $ | 0.568 | |
| | | | | | |
| Less Distributions | | | | | | | | | | | | | | | | | | | | | | | | |
| | | | | | |
From net investment income | | $ | (0.095 | ) | | $ | (0.205 | ) | | $ | (0.225 | ) | | $ | (0.264 | ) | | $ | (0.265 | ) | | $ | (0.278 | ) |
| | | | | | |
Total distributions | | $ | (0.095 | ) | | $ | (0.205 | ) | | $ | (0.225 | ) | | $ | (0.264 | ) | | $ | (0.265 | ) | | $ | (0.278 | ) |
| | | | | | |
Net asset value — End of period | | $ | 10.260 | | | $ | 10.070 | | | $ | 9.890 | | | $ | 9.470 | | | $ | 9.630 | | | $ | 9.930 | |
| | | | | | |
Total Return(2) | | | 2.85 | %(3) | | | 3.94 | % | | | 6.92 | % | | | 1.10 | % | | | (0.32 | )% | | | 5.97 | % |
| | | | | | |
| Ratios/Supplemental Data | | | | | | | | | | | | | | | | | | | | | | | | |
| | | | | | |
Net assets, end of period (000’s omitted) | | $ | 10,451 | | | $ | 10,804 | | | $ | 12,202 | | | $ | 17,481 | | | $ | 21,115 | | | $ | 24,731 | |
| | | | | | |
Ratios (as a percentage of average daily net assets): | | | | | | | | | | | | | | | | | | | | | | | | |
| | | | | | |
Expenses excluding interest and fees(4) | | | 1.42 | %(5) | | | 1.44 | % | | | 1.47 | % | | | 1.48 | % | | | 1.47 | % | | | 1.47 | % |
| | | | | | |
Interest and fee expense(6) | | | — | | | | — | | | | — | | | | — | | | | 0.01 | % | | | 0.03 | % |
| | | | | | |
Total expenses(4) | | | 1.42 | %(5) | | | 1.44 | % | | | 1.47 | % | | | 1.48 | % | | | 1.48 | % | | | 1.50 | % |
| | | | | | |
Net investment income | | | 1.45 | %(5) | | | 1.81 | % | | | 2.41 | % | | | 2.72 | % | | | 2.78 | % | | | 2.86 | % |
| | | | | | |
Portfolio Turnover | | | 23 | %(3) | | | 37 | % | | | 39 | % | | | 13 | % | | | 14 | % | | | 17 | % |
| (1) | Computed using average shares outstanding. |
| (2) | Returns are historical and are calculated by determining the percentage change in net asset value with all distributions reinvested and do not reflect the effect of sales charges. |
| (4) | Excludes the effect of custody fee credits, if any, of less than 0.005%. Effective September 1, 2015, custody fee credits, which were earned on cash deposit balances, were discontinued by the custodian. |
| (6) | Interest and fee expense relates to the liability for floating rate notes issued in conjunction with residual interest bond transactions (see Note 1H). |
| | | | |
| | 47 | | See Notes to Financial Statements. |
Eaton Vance
Municipal Income Funds
January 31, 2021
Financial Highlights — continued
| | | | | | | | | | | | | | | | | | | | | | | | |
| | | New Jersey Fund — Class I | |
| | |
| | | Six Months Ended
January 31, 2021
(Unaudited) | | | Year Ended July 31, | |
| | | 2020 | | | 2019 | | | 2018 | | | 2017 | | | 2016 | |
| | | | | | | |
Net asset value — Beginning of period | | $ | 9.660 | | | $ | 9.480 | | | $ | 9.080 | | | $ | 9.230 | | | $ | 9.520 | | | $ | 9.240 | |
| | | | | | |
| Income (Loss) From Operations | | | | | | | | | | | | | | | | | | | | | | | | |
| | | | | | |
Net investment income(1) | | $ | 0.117 | | | $ | 0.262 | | | $ | 0.303 | | | $ | 0.335 | | | $ | 0.345 | | | $ | 0.357 | |
| | | | | | |
Net realized and unrealized gain (loss) | | | 0.203 | | | | 0.202 | | | | 0.400 | | | | (0.146 | ) | | | (0.293 | ) | | | 0.278 | |
| | | | | | |
Total income from operations | | $ | 0.320 | | | $ | 0.464 | | | $ | 0.703 | | | $ | 0.189 | | | $ | 0.052 | | | $ | 0.635 | |
| | | | | | |
| Less Distributions | | | | | | | | | | | | | | | | | | | | | | | | |
| | | | | | |
From net investment income | | $ | (0.130 | ) | | $ | (0.284 | ) | | $ | (0.303 | ) | | $ | (0.339 | ) | | $ | (0.342 | ) | | $ | (0.355 | ) |
| | | | | | |
Total distributions | | $ | (0.130 | ) | | $ | (0.284 | ) | | $ | (0.303 | ) | | $ | (0.339 | ) | | $ | (0.342 | ) | | $ | (0.355 | ) |
| | | | | | |
Net asset value — End of period | | $ | 9.850 | | | $ | 9.660 | | | $ | 9.480 | | | $ | 9.080 | | | $ | 9.230 | | | $ | 9.520 | |
| | | | | | |
Total Return(2) | | | 3.34 | %(3) | | | 4.97 | % | | | 7.91 | % | | | 2.09 | % | | | 0.61 | % | | | 7.00 | % |
| | | | | | |
| Ratios/Supplemental Data | | | | | | | | | | | | | | | | | | | | | | | | |
| | | | | | |
Net assets, end of period (000’s omitted) | | $ | 76,773 | | | $ | 66,447 | | | $ | 51,021 | | | $ | 32,285 | | | $ | 31,778 | | | $ | 28,693 | |
| | | | | | |
Ratios (as a percentage of average daily net assets): | | | | | | | | | | | | | | | | | | | | | | | | |
| | | | | | |
Expenses excluding interest and fees(4) | | | 0.47 | %(5) | | | 0.49 | % | | | 0.52 | % | | | 0.53 | % | | | 0.52 | % | | | 0.52 | % |
| | | | | | |
Interest and fee expense(6) | | | — | | | | — | | | | — | | | | — | | | | 0.01 | % | | | 0.03 | % |
| | | | | | |
Total expenses(4) | | | 0.47 | %(5) | | | 0.49 | % | | | 0.52 | % | | | 0.53 | % | | | 0.53 | % | | | 0.55 | % |
| | | | | | |
Net investment income | | | 2.40 | %(5) | | | 2.76 | % | | | 3.30 | % | | | 3.66 | % | | | 3.74 | % | | | 3.80 | % |
| | | | | | |
Portfolio Turnover | | | 23 | %(3) | | | 37 | % | | | 39 | % | | | 13 | % | | | 14 | % | | | 17 | % |
| (1) | Computed using average shares outstanding. |
| (2) | Returns are historical and are calculated by determining the percentage change in net asset value with all distributions reinvested. |
| (4) | Excludes the effect of custody fee credits, if any, of less than 0.005%. Effective September 1, 2015, custody fee credits, which were earned on cash deposit balances, were discontinued by the custodian. |
| (6) | Interest and fee expense relates to the liability for floating rate notes issued in conjunction with residual interest bond transactions (see Note 1H). |
| | | | |
| | 48 | | See Notes to Financial Statements. |
Eaton Vance
Municipal Income Funds
January 31, 2021
Financial Highlights — continued
| | | | | | | | | | | | | | | | | | | | | | | | |
| | | Pennsylvania Fund — Class A | |
| | |
| | | Six Months Ended
January 31, 2021
(Unaudited) | | | Year Ended July 31, | |
| | | 2020 | | | 2019 | | | 2018 | | | 2017 | | | 2016 | |
| | | | | | | |
Net asset value — Beginning of period | | $ | 8.740 | | | $ | 8.650 | | | $ | 8.500 | | | $ | 8.730 | | | $ | 9.110 | | | $ | 8.900 | |
| | | | | | |
| Income (Loss) From Operations | | | | | | | | | | | | | | | | | | | | | | | | |
| | | | | | |
Net investment income(1) | | $ | 0.114 | | | $ | 0.269 | | | $ | 0.310 | | | $ | 0.334 | | | $ | 0.323 | | | $ | 0.345 | |
| | | | | | |
Net realized and unrealized gain (loss) | | | 0.070 | | | | 0.093 | | | | 0.153 | | | | (0.236 | ) | | | (0.379 | ) | | | 0.207 | |
| | | | | | |
Total income (loss) from operations | | $ | 0.184 | | | $ | 0.362 | | | $ | 0.463 | | | $ | 0.098 | | | $ | (0.056 | ) | | $ | 0.552 | |
| | | | | | |
| Less Distributions | | | | | | | | | | | | | | | | | | | | | | | | |
| | | | | | |
From net investment income | | $ | (0.114 | ) | | $ | (0.272 | ) | | $ | (0.313 | ) | | $ | (0.328 | ) | | $ | (0.324 | ) | | $ | (0.342 | ) |
| | | | | | |
Total distributions | | $ | (0.114 | ) | | $ | (0.272 | ) | | $ | (0.313 | ) | | $ | (0.328 | ) | | $ | (0.324 | ) | | $ | (0.342 | ) |
| | | | | | |
Net asset value — End of period | | $ | 8.810 | | | $ | 8.740 | | | $ | 8.650 | | | $ | 8.500 | | | $ | 8.730 | | | $ | 9.110 | |
| | | | | | |
Total Return(2) | | | 2.13 | %(3) | | | 4.26 | % | | | 5.58 | % | | | 1.16 | % | | | (0.58 | )% | | | 6.32 | % |
| | | | | | |
| Ratios/Supplemental Data | | | | | | | | | | | | | | | | | | | | | | | | |
| | | | | | |
Net assets, end of period (000’s omitted) | | $ | 117,875 | | | $ | 115,340 | | | $ | 119,324 | | | $ | 112,508 | | | $ | 125,579 | | | $ | 147,706 | |
| | | | | | |
Ratios (as a percentage of average daily net assets): | | | | | | | | | | | | | | | | | | | | | | | | |
| | | | | | |
Expenses excluding interest and fees(4) | | | 0.69 | %(5) | | | 0.71 | % | | | 0.75 | % | | | 0.75 | % | | | 0.73 | % | | | 0.73 | % |
| | | | | | |
Interest and fee expense(6) | | | 0.02 | %(5) | | | 0.05 | % | | | 0.07 | % | | | 0.05 | % | | | 0.04 | % | | | 0.04 | % |
| | | | | | |
Total expenses(4) | | | 0.71 | %(5) | | | 0.76 | % | | | 0.82 | % | | | 0.80 | % | | | 0.77 | % | | | 0.77 | % |
| | | | | | |
Net investment income | | | 2.60 | %(5) | | | 3.11 | % | | | 3.65 | % | | | 3.89 | % | | | 3.67 | % | | | 3.84 | % |
| | | | | | |
Portfolio Turnover | | | 11 | %(3) | | | 20 | % | | | 18 | % | | | 9 | % | | | 4 | % | | | 8 | % |
| (1) | Computed using average shares outstanding. |
| (2) | Returns are historical and are calculated by determining the percentage change in net asset value with all distributions reinvested and do not reflect the effect of sales charges. |
| (4) | Excludes the effect of custody fee credits, if any, of less than 0.005%. Effective September 1, 2015, custody fee credits, which were earned on cash deposit balances, were discontinued by the custodian. |
| (6) | Interest and fee expense relates to the liability for floating rate notes issued in conjunction with residual interest bond transactions (see Note 1H). |
| | | | |
| | 49 | | See Notes to Financial Statements. |
Eaton Vance
Municipal Income Funds
January 31, 2021
Financial Highlights — continued
| | | | | | | | | | | | | | | | | | | | | | | | |
| | | Pennsylvania Fund — Class C | |
| | |
| | | Six Months Ended
January 31, 2021
(Unaudited) | | | Year Ended July 31, | |
| | | 2020 | | | 2019 | | | 2018 | | | 2017 | | | 2016 | |
| | | | | | | |
Net asset value — Beginning of period | | $ | 9.050 | | | $ | 8.960 | | | $ | 8.800 | | | $ | 9.040 | | | $ | 9.430 | | | $ | 9.220 | |
| | | | | | |
| Income (Loss) From Operations | | | | | | | | | | | | | | | | | | | | | | | | |
| | | | | | |
Net investment income(1) | | $ | 0.084 | | | $ | 0.211 | | | $ | 0.257 | | | $ | 0.279 | | | $ | 0.266 | | | $ | 0.287 | |
| | | | | | |
Net realized and unrealized gain (loss) | | | 0.070 | | | | 0.093 | | | | 0.161 | | | | (0.246 | ) | | | (0.389 | ) | | | 0.208 | |
| | | | | | |
Total income (loss) from operations | | $ | 0.154 | | | $ | 0.304 | | | $ | 0.418 | | | $ | 0.033 | | | $ | (0.123 | ) | | $ | 0.495 | |
| | | | | | |
| Less Distributions | | | | | | | | | | | | | | | | | | | | | | | | |
| | | | | | |
From net investment income | | $ | (0.084 | ) | | $ | (0.214 | ) | | $ | (0.258 | ) | | $ | (0.273 | ) | | $ | (0.267 | ) | | $ | (0.285 | ) |
| | | | | | |
Total distributions | | $ | (0.084 | ) | | $ | (0.214 | ) | | $ | (0.258 | ) | | $ | (0.273 | ) | | $ | (0.267 | ) | | $ | (0.285 | ) |
| | | | | | |
Net asset value — End of period | | $ | 9.120 | | | $ | 9.050 | | | $ | 8.960 | | | $ | 8.800 | | | $ | 9.040 | | | $ | 9.430 | |
| | | | | | |
Total Return(2) | | | 1.72 | %(3) | | | 3.45 | % | | | 4.84 | % | | | 0.39 | % | | | (1.28 | )% | | | 5.44 | % |
| | | | | | |
| Ratios/Supplemental Data | | | | | | | | | | | | | | | | | | | | | | | | |
| | | | | | |
Net assets, end of period (000’s omitted) | | $ | 9,632 | | | $ | 11,815 | | | $ | 13,088 | | | $ | 22,991 | | | $ | 29,651 | | | $ | 38,004 | |
| | | | | | |
Ratios (as a percentage of average daily net assets): | | | | | | | | | | | | | | | | | | | | | | | | |
| | | | | | |
Expenses excluding interest and fees(4) | | | 1.43 | %(5) | | | 1.46 | % | | | 1.50 | % | | | 1.50 | % | | | 1.48 | % | | | 1.48 | % |
| | | | | | |
Interest and fee expense(6) | | | 0.02 | %(5) | | | 0.05 | % | | | 0.07 | % | | | 0.05 | % | | | 0.04 | % | | | 0.04 | % |
| | | | | | |
Total expenses(4) | | | 1.45 | %(5) | | | 1.51 | % | | | 1.57 | % | | | 1.55 | % | | | 1.52 | % | | | 1.52 | % |
| | | | | | |
Net investment income | | | 1.85 | %(5) | | | 2.36 | % | | | 2.93 | % | | | 3.13 | % | | | 2.92 | % | | | 3.08 | % |
| | | | | | |
Portfolio Turnover | | | 11 | %(3) | | | 20 | % | | | 18 | % | | | 9 | % | | | 4 | % | | | 8 | % |
| (1) | Computed using average shares outstanding. |
| (2) | Returns are historical and are calculated by determining the percentage change in net asset value with all distributions reinvested and do not reflect the effect of sales charges. |
| (4) | Excludes the effect of custody fee credits, if any, of less than 0.005%. Effective September 1, 2015, custody fee credits, which were earned on cash deposit balances, were discontinued by the custodian. |
| (6) | Interest and fee expense relates to the liability for floating rate notes issued in conjunction with residual interest bond transactions (see Note 1H). |
| | | | |
| | 50 | | See Notes to Financial Statements. |
Eaton Vance
Municipal Income Funds
January 31, 2021
Financial Highlights — continued
| | | | | | | | | | | | | | | | | | | | | | | | |
| | | Pennsylvania Fund — Class I | |
| | |
| | | Six Months Ended
January 31, 2021
(Unaudited) | | | Year Ended July 31, | |
| | | 2020 | | | 2019 | | | 2018 | | | 2017 | | | 2016 | |
| | | | | | | |
Net asset value — Beginning of period | | $ | 8.770 | | | $ | 8.690 | | | $ | 8.530 | | | $ | 8.760 | | | $ | 9.140 | | | $ | 8.940 | |
| | | | | | |
| Income (Loss) From Operations | | | | | | | | | | | | | | | | | | | | | | | | |
| | | | | | |
Net investment income(1) | | $ | 0.123 | | | $ | 0.287 | | | $ | 0.328 | | | $ | 0.352 | | | $ | 0.342 | | | $ | 0.365 | |
| | | | | | |
Net realized and unrealized gain (loss) | | | 0.071 | | | | 0.083 | | | | 0.163 | | | | (0.235 | ) | | | (0.380 | ) | | | 0.197 | |
| | | | | | |
Total income (loss) from operations | | $ | 0.194 | | | $ | 0.370 | | | $ | 0.491 | | | $ | 0.117 | | | $ | (0.038 | ) | | $ | 0.562 | |
| | | | | | |
| Less Distributions | | | | | | | | | | | | | | | | | | | | | | | | |
| | | | | | |
From net investment income | | $ | (0.124 | ) | | $ | (0.290 | ) | | $ | (0.331 | ) | | $ | (0.347 | ) | | $ | (0.342 | ) | | $ | (0.362 | ) |
| | | | | | |
Total distributions | | $ | (0.124 | ) | | $ | (0.290 | ) | | $ | (0.331 | ) | | $ | (0.347 | ) | | $ | (0.342 | ) | | $ | (0.362 | ) |
| | | | | | |
Net asset value — End of period | | $ | 8.840 | | | $ | 8.770 | | | $ | 8.690 | | | $ | 8.530 | | | $ | 8.760 | | | $ | 9.140 | |
| | | | | | |
Total Return(2) | | | 2.23 | %(3) | | | 4.34 | % | | | 5.90 | % | | | 1.37 | % | | | (0.36 | )% | | | 6.40 | % |
| | | | | | |
| Ratios/Supplemental Data | | | | | | | | | | | | | | | | | | | | | | | | |
| | | | | | |
Net assets, end of period (000’s omitted) | | $ | 68,749 | | | $ | 64,685 | | | $ | 53,541 | | | $ | 46,396 | | | $ | 51,055 | | | $ | 53,322 | |
| | | | | | |
Ratios (as a percentage of average daily net assets): | | | | | | | | | | | | | | | | | | | | | | | | |
| | | | | | |
Expenses excluding interest and fees(4) | | | 0.49 | %(5) | | | 0.51 | % | | | 0.54 | % | | | 0.55 | % | | | 0.53 | % | | | 0.53 | % |
| | | | | | |
Interest and fee expense(6) | | | 0.02 | %(5) | | | 0.05 | % | | | 0.07 | % | | | 0.05 | % | | | 0.04 | % | | | 0.04 | % |
| | | | | | |
Total expenses(4) | | | 0.51 | %(5) | | | 0.56 | % | | | 0.61 | % | | | 0.60 | % | | | 0.57 | % | | | 0.57 | % |
| | | | | | |
Net investment income | | | 2.80 | %(5) | | | 3.31 | % | | | 3.84 | % | | | 4.09 | % | | | 3.88 | % | | | 4.03 | % |
| | | | | | |
Portfolio Turnover | | | 11 | %(3) | | | 20 | % | | | 18 | % | | | 9 | % | | | 4 | % | | | 8 | % |
| (1) | Computed using average shares outstanding. |
| (2) | Returns are historical and are calculated by determining the percentage change in net asset value with all distributions reinvested. |
| (4) | Excludes the effect of custody fee credits, if any, of less than 0.005%. Effective September 1, 2015, custody fee credits, which were earned on cash deposit balances, were discontinued by the custodian. |
| (6) | Interest and fee expense relates to the liability for floating rate notes issued in conjunction with residual interest bond transactions (see Note 1H). |
| | | | |
| | 51 | | See Notes to Financial Statements. |
Eaton Vance
Municipal Income Funds
January 31, 2021
Notes to Financial Statements (Unaudited)
1 Significant Accounting Policies
Eaton Vance Municipals Trust (the Trust) is a Massachusetts business trust registered under the Investment Company Act of 1940, as amended (the 1940 Act), as an open-end management investment company. The Trust presently consists of eighteen funds, five of which, each non-diversified, are included in these financial statements. They include Eaton Vance Arizona Municipal Income Fund (Arizona Fund), Eaton Vance Connecticut Municipal Income Fund (Connecticut Fund), Eaton Vance Minnesota Municipal Income Fund (Minnesota Fund), Eaton Vance New Jersey Municipal Income Fund (New Jersey Fund) and Eaton Vance Pennsylvania Municipal Income Fund (Pennsylvania Fund), (each individually referred to as the Fund, and collectively, the Funds). The Funds’ investment objective is to provide current income exempt from regular federal income tax and from particular state or local income or other taxes. The Funds offer three classes of shares. Class A shares are generally sold subject to a sales charge imposed at time of purchase. Class C shares are sold at net asset value and are generally subject to a contingent deferred sales charge (see Note 5). Effective January 25, 2019, Class C shares generally automatically convert to Class A shares ten years after their purchase and, effective November 5, 2020, automatically convert to Class A shares eight years after their purchase as described in the Funds’ prospectus. Class I shares are sold at net asset value and are not subject to a sales charge. Each class represents a pro-rata interest in the Fund, but votes separately on class-specific matters and (as noted below) is subject to different expenses. Realized and unrealized gains and losses are allocated daily to each class of shares based on the relative net assets of each class to the total net assets of the Fund. Net investment income, other than class-specific expenses, is allocated daily to each class of shares based upon the ratio of the value of each class’s paid shares to the total value of all paid shares. Each class of shares differs in its distribution plan and certain other class-specific expenses.
The following is a summary of significant accounting policies of the Funds. The policies are in conformity with accounting principles generally accepted in the United States of America (U.S. GAAP). Each Fund is an investment company and follows accounting and reporting guidance in the Financial Accounting Standards Board (FASB) Accounting Standards Codification Topic 946.
A Investment Valuation — The following methodologies are used to determine the market value or fair value of investments.
Debt Obligations. Debt obligations are generally valued on the basis of valuations provided by third party pricing services, as derived from such services’ pricing models. Inputs to the models may include, but are not limited to, reported trades, executable bid and ask prices, broker/dealer quotations, prices or yields of securities with similar characteristics, interest rates, anticipated prepayments, benchmark curves or information pertaining to the issuer, as well as industry and economic events. The pricing services may use a matrix approach, which considers information regarding securities with similar characteristics to determine the valuation for a security. Short-term debt obligations purchased with a remaining maturity of sixty days or less for which a valuation from a third party pricing service is not readily available may be valued at amortized cost, which approximates fair value.
Fair Valuation. Investments for which valuations or market quotations are not readily available or are deemed unreliable are valued at fair value using methods determined in good faith by or at the direction of the Trustees of a Fund in a manner that most fairly reflects the security’s “fair value”, which is the amount that a Fund might reasonably expect to receive for the security upon its current sale in the ordinary course. Each such determination is based on a consideration of relevant factors, which are likely to vary from one pricing context to another. These factors may include, but are not limited to, the type of security, the existence of any contractual restrictions on the security’s disposition, the price and extent of public trading in similar securities of the issuer or of comparable entities, quotations or relevant information obtained from broker/dealers or other market participants, information obtained from the issuer, analysts, and/or the appropriate stock exchange (for exchange-traded securities), an analysis of the entity’s financial statements, and an evaluation of the forces that influence the issuer and the market(s) in which the security is purchased and sold.
B Investment Transactions and Related Income — Investment transactions for financial statement purposes are accounted for on a trade date basis. Realized gains and losses on investments sold are determined on the basis of identified cost. Interest income is recorded on the basis of interest accrued, adjusted for amortization of premium or accretion of discount.
C Federal Taxes — Each Fund’s policy is to comply with the provisions of the Internal Revenue Code applicable to regulated investment companies and to distribute to shareholders each year substantially all of its taxable, if any, and tax-exempt net investment income, and all or substantially all of its net realized capital gains. Accordingly, no provision for federal income or excise tax is necessary. Each Fund intends to satisfy conditions which will enable it to designate distributions from the interest income generated by its investments in non-taxable municipal securities, which are exempt from regular federal income tax when received by each Fund, as exempt-interest dividends. The portion of such interest, if any, earned on private activity bonds issued after August 7, 1986, may be considered a tax preference item to shareholders.
As of January 31, 2021, the Funds had no uncertain tax positions that would require financial statement recognition, de-recognition, or disclosure. Each Fund files a U.S. federal income tax return annually after its fiscal year-end, which is subject to examination by the Internal Revenue Service for a period of three years from the date of filing.
D Expenses — The majority of expenses of the Trust are directly identifiable to an individual fund. Expenses which are not readily identifiable to a specific fund are allocated taking into consideration, among other things, the nature and type of expense and the relative size of the funds.
E Legal Fees — Legal fees and other related expenses incurred as part of negotiations of the terms and requirement of capital infusions, or that are expected to result in the restructuring of, or a plan of reorganization for, an investment are recorded as realized losses. Ongoing expenditures to protect or enhance an investment are treated as operating expenses.
Eaton Vance
Municipal Income Funds
January 31, 2021
Notes to Financial Statements (Unaudited) — continued
F Use of Estimates — The preparation of the financial statements in conformity with U.S. GAAP requires management to make estimates and assumptions that affect the reported amounts of assets and liabilities at the date of the financial statements and the reported amounts of income and expense during the reporting period. Actual results could differ from those estimates.
G Indemnifications — Under the Trust’s organizational documents, its officers and Trustees may be indemnified against certain liabilities and expenses arising out of the performance of their duties to the Funds. Under Massachusetts law, if certain conditions prevail, shareholders of a Massachusetts business trust (such as the Trust) could be deemed to have personal liability for the obligations of the Trust. However, the Trust’s Declaration of Trust contains an express disclaimer of liability on the part of Fund shareholders and the By-laws provide that the Trust shall assume, upon request by the shareholder, the defense on behalf of any Fund shareholders. Moreover, the By-laws also provide for indemnification out of Fund property of any shareholder held personally liable solely by reason of being or having been a shareholder for all loss or expense arising from such liability. Additionally, in the normal course of business, each Fund enters into agreements with service providers that may contain indemnification clauses. Each Fund’s maximum exposure under these arrangements is unknown as this would involve future claims that may be made against each Fund that have not yet occurred.
H Floating Rate Notes Issued in Conjunction with Securities Held — The Funds may invest in residual interest bonds, also referred to as inverse floating rate securities, whereby a Fund may sell a variable or fixed rate bond for cash to a Special-Purpose Vehicle (the SPV), (which is generally organized as a trust), while at the same time, buying a residual interest in the assets and cash flows of the SPV. The bond is deposited into the SPV with the same CUSIP number as the bond sold to the SPV by the Fund, and which may have been, but is not required to be, the bond purchased from the Fund (the Bond). The SPV also issues floating rate notes (Floating Rate Notes) which are sold to third-parties. The residual interest bond held by a Fund gives the Fund the right (1) to cause the holders of the Floating Rate Notes to generally tender their notes at par, and (2) to have the Bond held by the SPV transferred to the Fund, thereby terminating the SPV. Should the Fund exercise such right, it would generally pay the SPV the par amount due on the Floating Rate Notes and exchange the residual interest bond for the underlying Bond. Pursuant to generally accepted accounting principles for transfers and servicing of financial assets and extinguishment of liabilities, the Funds account for the transaction described above as a secured borrowing by including the Bond in their Portfolio of Investments and the Floating Rate Notes as a liability under the caption “Payable for floating rate notes issued” in their Statement of Assets and Liabilities. The Floating Rate Notes have interest rates that generally reset weekly and their holders have the option to tender their notes to the SPV for redemption at par at each reset date. Accordingly, the fair value of the payable for floating rate notes issued approximates its carrying value. If measured at fair value, the payable for floating rate notes would have been considered as Level 2 in the fair value hierarchy (see Note 9) at January 31, 2021. Interest expense related to a Fund’s liability with respect to Floating Rate Notes is recorded as incurred. The SPV may be terminated by the Fund, as noted above, or by the occurrence of certain termination events as defined in the trust agreement, such as a downgrade in the credit quality of the underlying Bond, bankruptcy of or payment failure by the issuer of the underlying Bond, the inability to remarket Floating Rate Notes that have been tendered due to insufficient buyers in the market, or the failure by the SPV to obtain renewal of the liquidity agreement under which liquidity support is provided for the Floating Rate Notes up to one year. At January 31, 2021, the amounts of the Funds’ Floating Rate Notes and related interest rates and collateral were as follows:
| | | | |
| | | Pennsylvania
Fund | |
| |
Floating Rate Notes Outstanding | | $ | 5,000,025 | |
| |
Interest Rate or Range of Interest Rates (%) | | | 0.13 | |
| |
Collateral for Floating Rate Notes Outstanding | | $ | 8,198,625 | |
For the six months ended January 31, 2021, the Funds’ average settled Floating Rate Notes outstanding and the average interest rate (annualized) including fees were as follows:
| | | | |
| | | Pennsylvania
Fund | |
| |
Average Floating Rate Notes Outstanding | | $ | 5,000,000 | |
| |
Average Interest Rate | | | 0.78 | % |
In certain circumstances, the Funds may enter into shortfall and forbearance agreements with brokers by which a Fund agrees to reimburse the broker for the difference between the liquidation value of the Bond held by the SPV and the liquidation value of the Floating Rate Notes, as well as any shortfalls in interest cash flows. The Funds had no shortfalls as of January 31, 2021.
The Funds may also purchase residual interest bonds in a secondary market transaction without first owning the underlying bond. Such transactions are not required to be treated as secured borrowings. Shortfall agreements, if any, related to residual interest bonds purchased in a secondary market transaction are disclosed in the Portfolio of Investments.
Eaton Vance
Municipal Income Funds
January 31, 2021
Notes to Financial Statements (Unaudited) — continued
The Funds’ investment policies and restrictions expressly permit investments in residual interest bonds. Such bonds typically offer the potential for yields exceeding the yields available on fixed rate bonds with comparable credit quality and maturity. These securities tend to underperform the market for fixed rate bonds in a rising long-term interest rate environment, but tend to outperform the market for fixed rate bonds when long-term interest rates decline. The value and income of residual interest bonds are generally more volatile than that of a fixed rate bond. The Funds’ investment policies do not allow the Funds to borrow money except as permitted by the 1940 Act. Management believes that the Funds’ restrictions on borrowing money and issuing senior securities (other than as specifically permitted) do not apply to Floating Rate Notes issued by the SPV and included as a liability in the Funds’ Statement of Assets and Liabilities. As secured indebtedness issued by an SPV, Floating Rate Notes are distinct from the borrowings and senior securities to which the Funds’ restrictions apply. Residual interest bonds held by the Funds are securities exempt from registration under Rule 144A of the Securities Act of 1933.
I When-Issued Securities and Delayed Delivery Transactions — The Funds may purchase or sell securities on a delayed delivery or when-issued basis. Payment and delivery may take place after the customary settlement period for that security. At the time the transaction is negotiated, the price of the security that will be delivered is fixed. The Funds maintain cash and/or security positions for these commitments such that sufficient liquid assets will be available to make payments upon settlement. Securities purchased on a delayed delivery or when-issued basis are marked-to-market daily and begin earning interest on settlement date. Losses may arise due to changes in the market value of the underlying securities or if the counterparty does not perform under the contract.
J Interim Financial Statements — The interim financial statements relating to January 31, 2021 and for the six months then ended have not been audited by an independent registered public accounting firm, but in the opinion of the Funds’ management, reflect all adjustments, consisting only of normal recurring adjustments, necessary for the fair presentation of the financial statements.
2 Distributions to Shareholders and Income Tax Information
The net investment income of each Fund is determined daily and substantially all of the net investment income so determined is declared as a dividend to shareholders of record at the time of declaration. Distributions are declared separately for each class of shares. Distributions are paid monthly. Distributions of realized capital gains are made at least annually. Shareholders may reinvest income and capital gain distributions in additional shares of the same class of a Fund at the net asset value as of the reinvestment date or, at the election of the shareholder, receive distributions in cash. Distributions to shareholders are determined in accordance with income tax regulations, which may differ from U.S. GAAP. As required by U.S. GAAP, only distributions in excess of tax basis earnings and profits are reported in the financial statements as a return of capital. Permanent differences between book and tax accounting relating to distributions are reclassified to paid-in capital. For tax purposes, distributions from short-term capital gains are considered to be from ordinary income.
At July 31, 2020, the following Funds, for federal income tax purposes, had deferred capital losses which would reduce the respective Fund’s taxable income arising from future net realized gains on investment transactions, if any, to the extent permitted by the Internal Revenue Code, and thus would reduce the amount of distributions to shareholders, which would otherwise be necessary to relieve the Funds of any liability for federal income or excise tax. The deferred capital losses are treated as arising on the first day of a Fund’s next taxable year and retain the same short-term or long-term character as when originally deferred. The amounts of the deferred capital losses are as follows:
| | | | | | | | | | | | | | | | | | | | |
| | | Arizona
Fund | | | Connecticut
Fund | | | Minnesota
Fund | | | New Jersey
Fund | | | Pennsylvania
Fund | |
| | | | | |
Deferred capital losses: | | | | | | | | | | | | | | | | | | | | |
| | | | | |
Short-term | | $ | 181,636 | | | $ | 1,142,682 | | | $ | 531,244 | | | $ | 2,293,599 | | | $ | 5,486,952 | |
| | | | | |
Long-term | | $ | 192,565 | | | $ | — | | | $ | 384,623 | | | $ | — | | | $ | 7,493,631 | |
The cost and unrealized appreciation (depreciation) of investments of each Fund at January 31, 2021, as determined on a federal income tax basis, were as follows:
| | | | | | | | | | | | | | | | | | | | |
| | | Arizona Fund | | | Connecticut
Fund | | | Minnesota
Fund | | | New Jersey
Fund | | | Pennsylvania
Fund | |
| | | | | |
Aggregate cost | | $ | 64,434,973 | | | $ | 73,670,027 | | | $ | 167,774,221 | | | $ | 170,119,832 | | | $ | 177,638,155 | |
| | | | | |
Gross unrealized appreciation | | $ | 6,361,637 | | | $ | 6,664,487 | | | $ | 12,546,406 | | | $ | 16,115,655 | | | $ | 17,141,245 | |
| | | | | |
Gross unrealized depreciation | | | (7,813 | ) | | | — | | | | (8,970 | ) | | | (39 | ) | | | (1,239,176 | ) |
| | | | | |
Net unrealized appreciation | | $ | 6,353,824 | | | $ | 6,664,487 | | | $ | 12,537,436 | | | $ | 16,115,616 | | | $ | 15,902,069 | |
Eaton Vance
Municipal Income Funds
January 31, 2021
Notes to Financial Statements (Unaudited) — continued
3 Investment Adviser Fee and Other Transactions with Affiliates
The investment adviser fee is earned by Boston Management and Research (BMR), a subsidiary of Eaton Vance Management (EVM) and an indirect subsidiary of Eaton Vance Corp., as compensation for management and investment advisory services rendered to each Fund. The fee is based upon a percentage of average daily net assets plus a percentage of gross income (i.e., income other than gains from the sale of securities) as presented in the following table and is payable monthly.
| | | | | | | | |
| Daily Net Assets | | Annual Asset
Rate | | | Daily Income
Rate | |
| | |
Up to $20 million | | | 0.10 | % | | | 1.00 | % |
| | |
$20 million but less than $40 million | | | 0.20 | | | | 2.00 | |
| | |
$40 million but less than $500 million | | | 0.30 | | | | 3.00 | |
On average daily net assets of $500 million or more, the rates are reduced.
For the six months ended January 31, 2021, investment adviser fees incurred by the Funds and the effective annual rates, as a percentage of average daily net assets, were as follows:
| | | | | | | | | | | | | | | | | | | | |
| | | Arizona
Fund | | | Connecticut
Fund | | | Minnesota
Fund | | | New Jersey
Fund | | | Pennsylvania
Fund | |
| | | | | |
Investment Adviser Fee | | $ | 95,150 | | | $ | 119,329 | | | $ | 316,515 | | | $ | 315,258 | | | $ | 355,173 | |
| | | | | |
Effective Annual Rate | | | 0.27 | % | | | 0.29 | % | | | 0.33 | % | | | 0.34 | % | | | 0.36 | % |
EVM serves as the administrator of each Fund, but receives no compensation. EVM provides sub-transfer agency and related services to the Funds pursuant to a Sub-Transfer Agency Support Services Agreement. Eaton Vance Distributors, Inc. (EVD), an affiliate of EVM and the Funds’ principal underwriter, received a portion of the sales charge on sales of Class A shares of the Funds. EVD also received distribution and service fees from Class A and Class C shares (see Note 4) and contingent deferred sales charges (see Note 5). Sub-transfer agent fees earned by EVM, which are included in transfer and dividend disbursing agent fees on the Statements of Operations, and Class A sales charges that the Funds were informed were received by EVD for the six months ended January 31, 2021 were as follows:
| | | | | | | | | | | | | | | | | | | | |
| | | Arizona
Fund | | | Connecticut
Fund | | | Minnesota
Fund | | | New Jersey
Fund | | | Pennsylvania
Fund | |
| | | | | |
EVM’s Sub-Transfer Agent Fees | | $ | 32 | | | $ | 95 | | | $ | 156 | | | $ | 111 | | | $ | 198 | |
| | | | | |
EVD’s Class A Sales Charges | | $ | 1,510 | | | $ | 3,705 | | | $ | 1,179 | | | $ | 12,415 | | | $ | 14,667 | |
Trustees and officers of the Funds who are members of EVM’s or BMR’s organizations receive remuneration for their services to the Funds out of the investment adviser fee. Trustees of the Funds who are not affiliated with the investment adviser may elect to defer receipt of all or a percentage of their annual fees in accordance with the terms of the Trustees Deferred Compensation Plan. For the six months ended January 31, 2021, no significant amounts have been deferred. Certain officers and Trustees of the Funds are officers of the above organizations.
4 Distribution Plans
Each Fund has in effect a distribution plan for Class A shares (Class A Plan) pursuant to Rule 12b-1 under the 1940 Act. The Class A Plan provides that each Fund will pay EVD a distribution and service fee not exceeding 0.25% per annum of its average daily net assets attributable to Class A shares for distribution services and facilities provided to each Fund by EVD, as well as for personal services and/or the maintenance of shareholder accounts. The Trustees approved distribution and service fee payments equal to 0.20% per annum of each Fund’s average daily net assets attributable to Class A shares. Distribution and service fees paid or accrued to EVD for the six months ended January 31, 2021 for Class A shares amounted to the following:
| | | | | | | | | | | | | | | | | | | | |
| | | Arizona
Fund | | | Connecticut
Fund | | | Minnesota
Fund | | | New Jersey
Fund | | | Pennsylvania
Fund | |
| | | | | |
Class A Distribution and Service Fees | | $ | 39,169 | | | $ | 53,852 | | | $ | 61,928 | | | $ | 102,673 | | | $ | 120,316 | |
Eaton Vance
Municipal Income Funds
January 31, 2021
Notes to Financial Statements (Unaudited) — continued
Each Fund also has in effect a distribution plan for Class C shares (Class C Plan) pursuant to Rule 12b-1 under the 1940 Act. Pursuant to the Class C Plan, each Fund pays EVD amounts equal to 0.75% per annum of its average daily net assets attributable to Class C shares for providing ongoing distribution services and facilities to the respective Funds. For the six months ended January 31, 2021, the Funds paid or accrued to EVD the following distribution fees:
| | | | | | | | | | | | | | | | | | |
| | | Arizona
Fund | | Connecticut
Fund | | | Minnesota
Fund | | | New Jersey
Fund | | | Pennsylvania
Fund | |
| | | | | |
Class C Distribution Fees | | $16,044 | | $ | 17,667 | | | $ | 22,147 | | | $ | 39,565 | | | $ | 42,354 | |
The Class C Plan also authorizes each Fund to make payments of service fees to EVD, financial intermediaries and other persons in amounts not exceeding 0.25% per annum of the average daily net assets attributable to Class C shares. The Trustees approved service fee payments equal to 0.20% per annum of each Fund’s average daily net assets attributable to Class C shares. Service fees paid or accrued are for personal services and/or the maintenance of shareholder accounts. They are separate and distinct from the Class C sales commissions and distribution fees payable to EVD. Service fees paid or accrued for the six months ended January 31, 2021 amounted to the following:
| | | | | | | | | | | | | | | | | | | | |
| | | Arizona
Fund | | | Connecticut
Fund | | | Minnesota
Fund | | | New Jersey
Fund | | | Pennsylvania
Fund | |
| | | | | |
Class C Service Fees | | $ | 4,278 | | | $ | 4,711 | | | $ | 5,906 | | | $ | 10,550 | | | $ | 11,294 | |
Distribution and service fees are subject to the limitations contained in the Financial Industry Regulatory Authority Rule 2341(d).
5 Contingent Deferred Sales Charges
A contingent deferred sales charge (CDSC) of 1% generally is imposed on redemptions of Class C shares made within 12 months of purchase. Class A shares may be subject to a 1% CDSC if redeemed within 18 months of purchase (depending on the circumstances of purchase). Generally, the CDSC is based upon the lower of the net asset value at date of redemption or date of purchase. No charge is levied on shares acquired by reinvestment of dividends or capital gain distributions. For the six months ended January 31, 2021, the Funds were informed that EVD received approximately the following amounts of CDSCs paid by Class A and Class C shareholders:
| | | | | | | | | | | | | | | | | | | | |
| | | Arizona
Fund | | | Connecticut
Fund | | | Minnesota
Fund | | | New Jersey
Fund | | | Pennsylvania
Fund | |
| | | | | |
Class A | | $ | — | | | $ | — | | | $ | — | | | $ | — | | | $ | — | |
| | | | | |
Class C | | $ | — | | | $ | 400 | | | $ | 30 | | | $ | 200 | | | $ | — | |
6 Purchases and Sales of Investments
Purchases and sales of investments, other than short-term obligations, for the six months ended January 31, 2021 were as follows:
| | | | | | | | | | | | | | | | | | | | |
| | | Arizona Fund | | | Connecticut
Fund | | | Minnesota
Fund | | | New Jersey
Fund | | | Pennsylvania
Fund | |
| | | | | |
Purchases | | $ | 14,443,901 | | | $ | 6,664,488 | | | $ | 13,377,827 | | | $ | 45,268,158 | | | $ | 26,966,880 | |
| | | | | |
Sales | | $ | 8,431,421 | | | $ | 6,427,854 | | | $ | 13,941,348 | | | $ | 41,850,565 | | | $ | 22,507,760 | |
Eaton Vance
Municipal Income Funds
January 31, 2021
Notes to Financial Statements (Unaudited) — continued
7 Shares of Beneficial Interest
Each Fund’s Declaration of Trust permits the Trustees to issue an unlimited number of full and fractional shares of beneficial interest (without par value). Such shares may be issued in a number of different series (such as the Funds) and classes. Transactions in Fund shares were as follows:
| | | | | | | | | | | | |
Arizona Fund | | | |
| | | Six Months Ended January 31, 2021 (Unaudited) | |
| | | Class A | | | Class C | | | Class I | |
| | | |
Sales | | | 774,993 | | | | 22,437 | | | | 854,965 | |
| | | |
Issued to shareholders electing to receive payments of distributions in Fund shares | | | 44,471 | | | | 3,011 | | | | 28,750 | |
| | | |
Redemptions | | | (575,471 | ) | | | (33,454 | ) | | | (238,267 | ) |
| | | |
Converted from Class C shares | | | 56,572 | | | | — | | | | — | |
| | | |
Converted to Class A shares | | | — | | | | (50,905 | ) | | | — | |
| | | |
Net increase (decrease) | | | 300,565 | | | | (58,911 | ) | | | 645,448 | |
| |
| | | Year Ended July 31, 2020 | |
| | | Class A | | | Class C | | | Class I | |
| | | |
Sales | | | 788,669 | | | | 81,865 | | | | 920,668 | |
| | | |
Issued to shareholders electing to receive payments of distributions in Fund shares | | | 89,854 | | | | 6,635 | | | | 51,583 | |
| | | |
Redemptions | | | (554,286 | ) | | | (44,087 | ) | | | (702,817 | ) |
| | | |
Converted from Class C shares | | | 35,136 | | | | — | | | | — | |
| | | |
Converted to Class A shares | | | — | | | | (31,588 | ) | | | — | |
| | | |
Net increase | | | 359,373 | | | | 12,825 | | | | 269,434 | |
| |
Connecticut Fund | | | |
| | | Six Months Ended January 31, 2021 (Unaudited) | |
| | | Class A | | | Class C | | | Class I | |
| | | |
Sales | | | 276,535 | | | | 42,499 | | | | 401,544 | |
| | | |
Issued to shareholders electing to receive payments of distributions in Fund shares | | | 50,491 | | | | 2,842 | | | | 23,076 | |
| | | |
Redemptions | | | (223,920 | ) | | | (95,380 | ) | | | (252,194 | ) |
| | | |
Converted from Class C shares | | | 51,383 | | | | — | | | | — | |
| | | |
Converted to Class A shares | | | — | | | | (51,578 | ) | | | — | |
| | | |
Net increase (decrease) | | | 154,489 | | | | (101,617 | ) | | | 172,426 | |
| |
| | | Year Ended July 31, 2020 | |
| | | Class A | | | Class C | | | Class I | |
| | | |
Sales | | | 407,309 | | | | 335,684 | | | | 714,677 | |
| | | |
Issued to shareholders electing to receive payments of distributions in Fund shares | | | 113,777 | | | | 8,159 | | | | 53,904 | |
| | | |
Redemptions | | | (617,590 | ) | | | (252,754 | ) | | | (748,448 | ) |
| | | |
Converted from Class C shares | | | 56,606 | | | | — | | | | — | |
| | | |
Converted to Class A shares | | | — | | | | (56,797 | ) | | | — | |
| | | |
Net increase (decrease) | | | (39,898 | ) | | | 34,292 | | | | 20,133 | |
Eaton Vance
Municipal Income Funds
January 31, 2021
Notes to Financial Statements (Unaudited) — continued
| | | | | | | | | | | | |
Minnesota Fund | | | |
| | | Six Months Ended January 31, 2021 (Unaudited) | |
| | | Class A | | | Class C | | | Class I | |
| | | |
Sales | | | 491,666 | | | | 39,219 | | | | 2,021,222 | |
| | | |
Issued to shareholders electing to receive payments of distributions in Fund shares | | | 50,532 | | | | 2,673 | | | | 71,079 | |
| | | |
Redemptions | | | (369,399 | ) | | | (114,238 | ) | | | (2,201,070 | ) |
| | | |
Converted from Class C shares | | | 96,876 | | | | — | | | | — | |
| | | |
Converted to Class A shares | | | — | | | | (90,087 | ) | | | — | |
| | | |
Net increase (decrease) | | | 269,675 | | | | (162,433 | ) | | | (108,769 | ) |
| |
| | | Year Ended July 31, 2020 | |
| | | Class A | | | Class C | | | Class I | |
| | | |
Sales | | | 770,575 | | | | 179,788 | | | | 6,394,783 | |
| | | |
Issued to shareholders electing to receive payments of distributions in Fund shares | | | 109,526 | | | | 6,933 | | | | 137,976 | |
| | | |
Redemptions | | | (858,196 | ) | | | (110,269 | ) | | | (3,372,136 | ) |
| | | |
Converted from Class C shares | | | 96,353 | | | | — | | | | — | |
| | | |
Converted to Class A shares | | | — | | | | (89,571 | ) | | | — | |
| | | |
Net increase (decrease) | | | 118,258 | | | | (13,119 | ) | | | 3,160,623 | |
| |
New Jersey Fund | | | |
| | | Six Months Ended January 31, 2021 (Unaudited) | |
| | | Class A | | | Class C | | | Class I | |
| | | |
Sales | | | 601,283 | | | | 154,604 | | | | 1,313,886 | |
| | | |
Issued to shareholders electing to receive payments of distributions in Fund shares | | | 108,856 | | | | 8,798 | | | | 84,676 | |
| | | |
Redemptions | | | (542,229 | ) | | | (84,633 | ) | | | (481,800 | ) |
| | | |
Converted from Class C shares | | | 138,748 | | | | — | | | | — | |
| | | |
Converted to Class A shares | | | — | | | | (132,978 | ) | | | — | |
| | | |
Net increase (decrease) | | | 306,658 | | | | (54,209 | ) | | | 916,762 | |
| |
| | | Year Ended July 31, 2020 | |
| | | Class A | | | Class C | | | Class I | |
| | | |
Sales | | | 938,030 | | | | 288,996 | | | | 2,684,117 | |
| | | |
Issued to shareholders electing to receive payments of distributions in Fund shares | | | 240,011 | | | | 20,800 | | | | 157,937 | |
| | | |
Redemptions | | | (1,617,764 | ) | | | (322,171 | ) | | | (1,344,206 | ) |
| | | |
Converted from Class C shares | | | 155,395 | | | | — | | | | — | |
| | | |
Converted to Class A shares | | | — | | | | (148,932 | ) | | | — | |
| | | |
Net increase (decrease) | | | (284,328 | ) | | | (161,307 | ) | | | 1,497,848 | |
Eaton Vance
Municipal Income Funds
January 31, 2021
Notes to Financial Statements (Unaudited) — continued
| | | | | | | | | | | | |
Pennsylvania Fund | | | |
| | | Six Months Ended January 31, 2021 (Unaudited) | |
| | | Class A | | | Class C | | | Class I | |
| | | |
Sales | | | 1,438,325 | | | | 170,614 | | | | 844,019 | |
| | | |
Issued to shareholders electing to receive payments of distributions in Fund shares | | | 158,967 | | | | 11,116 | | | | 61,634 | |
| | | |
Redemptions | | | (1,694,876 | ) | | | (160,667 | ) | | | (504,430 | ) |
| | | |
Converted from Class C shares | | | 280,360 | | | | — | | | | — | |
| | | |
Converted to Class A shares | | | — | | | | (270,709 | ) | | | — | |
| | | |
Net increase (decrease) | | | 182,776 | | | | (249,646 | ) | | | 401,223 | |
| |
| | | Year Ended July 31, 2020 | |
| | | Class A | | | Class C | | | Class I | |
| | | |
Sales | | | 881,652 | | | | 369,812 | | | | 2,097,455 | |
| | | |
Issued to shareholders electing to receive payments of distributions in Fund shares | | | 373,257 | | | | 29,403 | | | | 121,952 | |
| | | |
Redemptions | | | (2,007,822 | ) | | | (396,067 | ) | | | (1,008,027 | ) |
| | | |
Converted from Class C shares | | | 163,587 | | | | — | | | | — | |
| | | |
Converted to Class A shares | | | — | | | | (157,986 | ) | | | — | |
| | | |
Net increase (decrease) | | | (589,326 | ) | | | (154,838 | ) | | | 1,211,380 | |
8 Line of Credit
The Funds participate with other portfolios and funds managed by EVM and its affiliates in an $800 million unsecured line of credit agreement with a group of banks, which is in effect through October 26, 2021. Borrowings are made by the Funds solely for temporary purposes related to redemptions and other short-term cash needs. Interest is charged to each Fund based on its borrowings at an amount above either the Eurodollar rate or Federal Funds rate. In addition, a fee computed at an annual rate of 0.15% on the daily unused portion of the line of credit is allocated among the participating portfolios and funds at the end of each quarter. In connection with the renewal of the agreement in October 2020, an upfront fee and arrangement fee totaling $950,000 was incurred that was allocated to the participating portfolios and funds. Because the line of credit is not available exclusively to the Funds, a Fund may be unable to borrow some or all of its requested amounts at any particular time. The Funds did not have any significant borrowings or allocated fees during the six months ended January 31, 2021.
9 Fair Value Measurements
Under generally accepted accounting principles for fair value measurements, a three-tier hierarchy to prioritize the assumptions, referred to as inputs, is used in valuation techniques to measure fair value. The three-tier hierarchy of inputs is summarized in the three broad levels listed below.
| • | | Level 1 – quoted prices in active markets for identical investments |
| • | | Level 2 – other significant observable inputs (including quoted prices for similar investments, interest rates, prepayment speeds, credit risk, etc.) |
| • | | Level 3 – significant unobservable inputs (including a fund’s own assumptions in determining the fair value of investments) |
In cases where the inputs used to measure fair value fall in different levels of the fair value hierarchy, the level disclosed is determined based on the lowest level input that is significant to the fair value measurement in its entirety. The inputs or methodology used for valuing securities are not necessarily an indication of the risk associated with investing in those securities.
Eaton Vance
Municipal Income Funds
January 31, 2021
Notes to Financial Statements (Unaudited) — continued
At January 31, 2021, the hierarchy of inputs used in valuing the Funds’ investments, which are carried at value, were as follows:
| | | | | | | | | | | | | | | | |
Arizona Fund | | | | | | | | | | | | |
| Asset Description | | Level 1 | | | Level 2 | | | Level 3 | | | Total | |
| | | | |
Tax-Exempt Municipal Securities | | $ | — | | | $ | 68,723,531 | | | $ | — | | | $ | 68,723,531 | |
| | | | |
Taxable Municipal Securities | | | — | | | | 2,065,266 | | | | — | | | | 2,065,266 | |
| | | | |
Total Investments | | $ | — | | | $ | 70,788,797 | | | $ | — | | | $ | 70,788,797 | |
| | | | |
Connecticut Fund | | | | | | | | | | | | |
| Asset Description | | Level 1 | | | Level 2 | | | Level 3 | | | Total | |
| | | | |
Tax-Exempt Investments | | $ | — | | | $ | 80,334,514 | | | $ | — | | | $ | 80,334,514 | |
| | | | |
Total Investments | | $ | — | | | $ | 80,334,514 | | | $ | — | | | $ | 80,334,514 | |
| | | | |
Minnesota Fund | | | | | | | | | | | | |
| Asset Description | | Level 1 | | | Level 2 | | | Level 3 | | | Total | |
| | | | |
Tax-Exempt Investments | | $ | — | | | $ | 180,311,657 | | | $ | — | | | $ | 180,311,657 | |
| | | | |
Total Investments | | $ | — | | | $ | 180,311,657 | | | $ | — | | | $ | 180,311,657 | |
| | | | |
New Jersey Fund | | | | | | | | | | | | |
| Asset Description | | Level 1 | | | Level 2 | | | Level 3 | | | Total | |
| | | | |
Tax-Exempt Municipal Securities | | $ | — | | | $ | 178,638,247 | | | $ | — | | | $ | 178,638,247 | |
| | | | |
Taxable Municipal Securities | | | — | | | | 7,597,201 | | | | — | | | | 7,597,201 | |
| | | | |
Total Investments | | $ | — | | | $ | 186,235,448 | | | $ | — | | | $ | 186,235,448 | |
| | | | |
Pennsylvania Fund | | | | | | | | | | | | |
| Asset Description | | Level 1 | | | Level 2 | | | Level 3 | | | Total | |
| | | | |
Tax-Exempt Municipal Securities | | $ | — | | | $ | 198,428,659 | | | $ | — | | | $ | 198,428,659 | |
| | | | |
Taxable Municipal Securities | | | — | | | | 111,590 | | | | — | | | | 111,590 | |
| | | | |
Total Investments | | $ | — | | | $ | 198,540,249 | | | $ | — | | | $ | 198,540,249 | |
10 Risks and Uncertainties
Pandemic Risk
An outbreak of respiratory disease caused by a novel coronavirus was first detected in China in December 2019 and subsequently spread internationally. This coronavirus has resulted in closing borders, enhanced health screenings, changes to healthcare service preparation and delivery, quarantines, cancellations, disruptions to supply chains and customer activity, as well as general concern and uncertainty. Health crises caused by outbreaks, such as the coronavirus outbreak, may exacerbate other pre-existing political, social and economic risks and disrupt normal market conditions and operations. The impact of this outbreak has negatively affected the worldwide economy, the economies of individual countries, individual companies, and the market in general, and may continue to do so in significant and unforeseen ways, as may other epidemics and pandemics that may arise in the future. Any such impact could adversely affect the Funds’ performance, or the performance of the securities in which the Funds invest.
11 Additional Information
On October 8, 2020, Morgan Stanley and Eaton Vance Corp. (“Eaton Vance”) announced that they had entered into a definitive agreement under which Morgan Stanley would acquire Eaton Vance. Under the Investment Company Act of 1940, as amended, consummation of this transaction may have been deemed to result in the automatic termination of an Eaton Vance Fund’s investment advisory agreement, and, where applicable, any related sub-advisory agreement. On November 24, 2020, each Fund’s Board approved a new investment advisory agreement. The new investment advisory agreement was approved by Fund shareholders at a joint special meeting of shareholders held on February 18, 2021, and became effective upon the consummation of the transaction on March 1, 2021.
Eaton Vance
Municipal Income Funds
January 31, 2021
Board of Trustees’ Contract Approval
Overview of the Contract Review Process
Even though the following description of the Board’s (as defined below) consideration of investment advisory and, as applicable, sub-advisory agreements covers multiple funds, for purposes of this shareholder report, the description is only relevant as to Eaton Vance Arizona Municipal Income Fund, Eaton Vance Connecticut Municipal Income Fund, Eaton Vance Minnesota Municipal Income Fund, Eaton Vance New Jersey Municipal Income Fund, Eaton Vance Pennsylvania Municipal Income Fund.
| | | | |
| Fund | | Investment Adviser | | Investment Sub-Adviser |
| | |
Eaton Vance Arizona Municipal Income Fund | | Boston Management and Research | | None |
Eaton Vance Connecticut Municipal Income Fund |
Eaton Vance Minnesota Municipal Income Fund |
Eaton Vance New Jersey Municipal Income Fund |
Eaton Vance Pennsylvania Municipal Income Fund |
At a meeting held on November 24, 2020 (the “November Meeting”), the Board of each Eaton Vance open-end Fund and portfolios in which each such Fund invests, as applicable (each, a “Fund” and, collectively, the “Funds”), including a majority of the Board members (the “Independent Trustees”) who are not “interested persons” (as defined in the Investment Company Act of 1940 (the “1940 Act”)) of the Funds, Eaton Vance Management (“EVM”) or Boston Management and Research (“BMR” and, together with EVM, the “Advisers”), voted to approve a new investment advisory agreement between each Fund and either EVM or BMR (the “New Investment Advisory Agreements”) and, for certain Funds, a new investment sub-advisory agreement between an Adviser and the applicable Sub-Adviser (the “New Investment Sub-Advisory Agreements”(1) and, together with the New Investment Advisory Agreements, the “New Agreements”), each of which is intended to go into effect upon the completion of the Transaction (as defined below), as more fully described below. In voting its approval of the New Agreements at the November Meeting, the Board relied on an order issued by the Securities and Exchange Commission in response to the impacts of the COVID-19 pandemic that provided temporary relief from the in-person meeting requirements under Section 15 of the 1940 Act.
In voting its approval of the New Agreements, the Board of each Fund relied upon the recommendation of its Contract Review Committee, which is a committee comprised exclusively of Independent Trustees. Prior to and during meetings leading up to the November Meeting, the Contract Review Committee reviewed and discussed information furnished by the Advisers, the Sub-Advisers, and Morgan Stanley, as requested by the Independent Trustees, that the Contract Review Committee considered reasonably necessary to evaluate the terms of the New Agreements and to form its recommendation. Such information included, among other things, the terms and anticipated impacts of Morgan Stanley’s pending acquisition of Eaton Vance Corp. (the “Transaction”) on the Funds and their shareholders. In addition to considering information furnished specifically to evaluate the impact of the Transaction on the Funds and their respective shareholders, the Board and its Contract Review Committee also considered information furnished for prior meetings of the Board and its committees, including information provided in connection with the annual contract review process for the Funds, which most recently culminated in April 2020 (the “2020 Annual Approval Process”).
The Board of each Fund, including the Independent Trustees, concluded that the applicable New Investment Advisory Agreement and, as applicable, New Investment Sub-Advisory Agreement, including the fees payable thereunder, was fair and reasonable, and it voted to approve the New Investment Advisory Agreement and, as applicable, New Investment Sub-Advisory Agreement and to recommend that shareholders do so as well.
Shortly after the announcement of the Transaction, the Board, including all of the Independent Trustees, met with senior representatives from the Advisers and Morgan Stanley at its meeting held on October 13, 2020 to discuss certain aspects of the Transaction and the expected impacts of the Transaction on the Funds and their shareholders. As part of the Board’s evaluation process, counsel to the Independent Trustees, on behalf of the Contract Review Committee, requested additional information to assist the Independent Trustees in their evaluation of the New Agreements and the implications of the Transaction, as well as other contractual arrangements that may be affected by the Transaction. The Contract Review Committee considered information furnished by the Advisers and Morgan Stanley, their respective affiliates, and, as applicable, the Sub-Advisers during meetings on November 5, 2020, November 10, 2020, November 13, 2020, November 17, 2020 and November 24, 2020.
During its meetings on November 10, 2020 and November 17, 2020, the Contract Review Committee further discussed the approval of the New Agreements with senior representatives of the Advisers, the Affiliated Sub-Advisers, and Morgan Stanley. The representatives from the Advisers, the Affiliated Sub-Advisers, and Morgan Stanley each made presentations to, and responded to questions from, the Independent Trustees. The Contract Review
| (1) | With respect to certain of the Funds, the applicable Adviser is currently a party to a sub-advisory agreement (collectively, the “Current Sub-Advisory Agreements”) with Atlanta Capital Management Company, LLC (“Atlanta Capital”), BMO Global Asset Management (Asia) Limited, Eaton Vance Advisers International Ltd. (“EVAIL”), Goldman Sachs Asset Management, L.P., Hexavest Inc. (“Hexavest”), Parametric Portfolio Associates LLC (“Parametric”) or Richard Bernstein Advisors LLC (collectively, the “Sub-Advisers” and, with respect to Atlanta Capital, EVAIL, Hexavest and Parametric, each an affiliate of the Advisers, the “Affiliated Sub-Advisers”). Accordingly, references to the “Sub-Advisers,” the “Affiliated Sub-Advisers” or the “New Sub-Advisory Agreements” are not applicable to all Funds. |
Eaton Vance
Municipal Income Funds
January 31, 2021
Board of Trustees’ Contract Approval — continued
Committee considered the Advisers’, the Affiliated Sub-Advisers’ and Morgan Stanley’s responses related to the Transaction and specifically to the Funds, as well as information received in connection with the 2020 Annual Approval Process, with respect to its evaluation of the New Agreements. Among other information, the Board considered:
Information about the Transaction and its Terms
| | • | | Information about the material terms and conditions, and expected impacts, of the Transaction that relate to the Funds, including the expected impacts on the businesses conducted by the Advisers, the Affiliated Sub-Advisers and Eaton Vance Distributors, Inc., as the distributor of Fund shares; |
| | • | | Information about the advantages of the Transaction as they relate to the Funds and their shareholders; |
| | • | | A commitment that the Funds would not bear any expenses, directly or indirectly, in connection with the Transaction; |
| | • | | A commitment that, for a period of three years after the Closing, at least 75% of each Fund’s Board members must not be “interested persons” (as defined in the 1940 Act) of the investment adviser (or predecessor investment adviser, if applicable) pursuant to Section 15(f)(1)(A) of the 1940 Act; |
| | • | | A commitment that Morgan Stanley would use its reasonable best efforts to ensure that it did not impose any “unfair burden” (as that term is used in section 15(f)(1)(B) of the 1940 Act) on the Funds as a result of the Transaction; |
| | • | | Information with respect to personnel and/or other resources of the Advisers and their affiliates, including the Affiliated Sub-Advisers, as a result of the Transaction, as well as any expected changes to compensation, including any retention-based compensation intended to incentivize key personnel at the Advisers and their affiliates, including the Affiliated Sub-Advisers; |
| | • | | Information regarding any changes that are expected with respect to the Funds’ slate of officers as a result of the Transaction; |
Information about Morgan Stanley
| | • | | Information about Morgan Stanley’s overall business, including information about the advisory, brokerage and related businesses that Morgan Stanley operates; |
| | • | | Information about Morgan Stanley’s financial condition, including its access to capital and other resources required to support the investment advisory businesses related to the Funds; |
| | • | | Information on how the Funds are expected to fit within Morgan Stanley’s overall business strategy, and any changes that Morgan Stanley contemplates implementing to the Funds in the short- or long-term following the closing of the Transaction (the “Closing”); |
| | • | | Information regarding risk management functions at Morgan Stanley and its affiliates, including how existing risk management protocols and procedures may impact the Funds and/or the businesses of the Advisers and their affiliates, including the Affiliated Sub-Advisers, as they relate to the Funds; |
| | • | | Information on the anticipated benefits of the Transaction to the Funds with respect to potential additional distribution capabilities and the ability to access new markets and customer segments through Morgan Stanley’s distribution network, including, in particular, its institutional client base; |
| | • | | Information regarding the financial condition and reputation of Morgan Stanley, its worldwide presence, experience as a fund sponsor and manager, commitment to maintain a high level of cooperation with, and support to, the Funds, strong client service capabilities, and relationships in the asset management industry; |
Information about the New Agreements for Funds
| | • | | A representation that, after the Closing, all of the Funds will continue to be advised by their current Adviser and Sub-Adviser, as applicable; |
| | • | | Information regarding the terms of the New Agreements, including certain changes as compared to the current investment advisory agreement between each Fund and its Adviser (collectively, the “Current Advisory Agreements”) and, as applicable, the current investment sub-advisory agreement between a Fund and a Sub-Adviser (together with the Current Advisory Agreements, the “Current Agreements”); |
| | • | | Information confirming that the fee rates payable under the New Agreements are not changed as compared to the Current Agreements; |
| | • | | A representation that the New Agreements will not cause any diminution in the nature, extent and quality of services provided by the Advisers and the Sub-Advisers to the Funds and their respective shareholders, including with respect to compliance and other non-advisory services; |
Information about Fund Performance, Fees and Expenses
| | • | | A report from an independent data provider comparing the investment performance of each Fund (including, as relevant, total return data, income data, Sharpe ratios and information ratios) to the investment performance of comparable funds and, as applicable, benchmark indices, over various time periods as of the 2020 Annual Approval Process, as well as performance information as of a more recent date; |
| | • | | A report from an independent data provider comparing each Fund’s total expense ratio (and its components) to those of comparable funds as of the 2020 Annual Approval Process, as well as fee and expense information as of a more recent date; |
| | • | | In certain instances, data regarding investment performance relative to customized groups of peer funds and blended indices identified by the Advisers in consultation with the Portfolio Management Committee of the Board as of the 2020 Annual Approval Process, as well as corresponding performance information as of a more recent date; |
| | • | | Comparative information concerning the fees charged and services provided by the Adviser and the Sub-Adviser to each Fund in managing other accounts (which may include other mutual funds, collective investment funds and institutional accounts) using investment strategies and techniques similar to those used in managing such Fund(s), if any; |
Eaton Vance
Municipal Income Funds
January 31, 2021
Board of Trustees’ Contract Approval — continued
| | • | | Profitability analyses of the Advisers and the Affiliated Sub-Advisers, as applicable, with respect to each of the Funds as of the 2020 Annual Approval Process, as well as information regarding the impact of the Transaction on profitability; |
Information about Portfolio Management and Trading
| | • | | Descriptions of the investment management services currently provided and expected to be provided to each Fund after the Transaction, as well as each of the Funds’ investment strategies and policies; |
| | • | | The procedures and processes used to determine the fair value of Fund assets, when necessary, and actions taken to monitor and test the effectiveness of such procedures and processes; |
| | • | | Information about any changes to the policies and practices of the Advisers and, as applicable, each Fund’s Sub-Adviser with respect to trading, including their processes for seeking best execution of portfolio transactions; |
| | • | | Information regarding the impact on trading and access to capital markets associated with the Funds’ affiliations with Morgan Stanley and its affiliates, including potential restrictions with respect to the Funds’ ability to execute portfolio transactions with Morgan Stanley and its affiliates; |
Information about the Advisers and the Sub-Advisers
| | • | | Information about the financial results and condition of the Advisers and the Affiliated Sub-Advisers since the culmination of the 2020 Annual Approval Process and any material changes in financial condition that are reasonably expected to occur before and after the Closing; |
| | • | | Information regarding contemplated changes to the individual investment professionals whose responsibilities include portfolio management and investment research for the Funds, and, for portfolio managers and certain other investment professionals, information relating to their responsibilities with respect to managing other mutual funds and investment accounts, as applicable, post-Closing; |
| | • | | The Code of Ethics of the Advisers and their affiliates, including the Affiliated Sub-Advisers, together with information relating to compliance with, and the administration of, such codes; |
| | • | | Policies and procedures relating to proxy voting and the handling of corporate actions and class actions; |
| | • | | Information concerning the resources devoted to compliance efforts undertaken by the Advisers and their affiliates, including the Affiliated Sub-Advisers, including descriptions of their various compliance programs and their record of compliance; |
| | • | | Information concerning the business continuity and disaster recovery plans of the Advisers and their affiliates, including the Affiliated Sub-Advisers; |
| | • | | A description of the Advisers’ oversight of the Sub-Advisers, including with respect to regulatory and compliance issues, investment management and other matters; |
Other Relevant Information
| | • | | Information concerning the nature, cost and character of the administrative and other non-investment advisory services provided by the Advisers and their affiliates; |
| | • | | Information concerning oversight of the relationship with the custodian, subcustodians and fund accountants by EVM and/or administrator to each of the Funds; |
| | • | | Confirmation that the Advisers intend to continue to manage the Funds in a manner materially consistent with each Fund’s current investment objective(s) and principal investment strategies; |
| | • | | Information regarding Morgan Stanley’s commitment to maintaining competitive compensation arrangements to attract and retain highly qualified personnel; |
| | • | | Confirmation that the Advisers’ current senior management teams have indicated their strong support of the Transaction; and |
| | • | | Information regarding the fact that Morgan Stanley and Eaton Vance Corp. will each derive benefits from the Transaction and that, as a result, they have a financial interest in the matters that were being considered. |
As indicated above, the Board and its Contract Review Committee also considered information received at its regularly scheduled meetings throughout the year, which included information from portfolio managers and other investment professionals of the Advisers and the Sub-Advisers regarding investment and performance matters, and considered various investment and trading strategies used in pursuing the Funds’ investment objectives. The Board also received information regarding risk management techniques employed in connection with the management of the Funds. The Board and its committees evaluated issues pertaining to industry and regulatory developments, compliance procedures, fund governance and other issues with respect to the Funds, and received and participated in reports and presentations provided by the Advisers and their affiliates, including the Affiliated Sub-Advisers, with respect to such matters.
The Contract Review Committee was advised throughout the evaluation process by Goodwin Procter LLP, independent legal counsel for the Independent Trustees. The members of the Contract Review Committee, with the advice of such counsel, exercised their own business judgment in determining the material factors to be considered in evaluating the New Agreements and the weight to be given to each such factor. The conclusions reached with respect to the New Agreements were based on a comprehensive evaluation of all the information provided and not any single factor. Moreover, each Independent Trustee may have placed varying emphasis on particular factors in reaching conclusions with respect to the New Agreements.
Eaton Vance
Municipal Income Funds
January 31, 2021
Board of Trustees’ Contract Approval — continued
Nature, Extent and Quality of Services
In considering whether to approve the New Agreements, the Board evaluated the nature, extent and quality of services currently provided to each Fund by the Advisers and, as applicable, the Sub-Advisers under the Current Agreements. In evaluating the nature, extent and quality of services to be provided by the Advisers and the Sub-Advisers under the New Agreements, the Board considered, among other information, the expected impact, if any, of the Transaction on the operations, facilities, organization and personnel of the Advisers and the Sub-Advisers, and that Morgan Stanley and the Advisers have advised the Board that, following the Transaction, there is not expected to be any diminution in the nature, extent and quality of services provided by the Advisers and the Sub-Advisers, as applicable, to the Funds and their shareholders, including compliance and other non-advisory services, and that there are not expected to be any changes in portfolio management personnel as a result of the Transaction.
The Board also considered the financial resources of Morgan Stanley and the Advisers and the importance of having a Fund manager with, or with access to, significant organizational and financial resources. The Board considered the benefits to the Funds of being part of a larger combined organization with greater financial resources following the Transaction, particularly during periods of market disruptions and volatility. In this regard, the Board considered information provided by Morgan Stanley regarding its business and operating structure, scale of operation, leadership and reputation, distribution capabilities, and financial condition, as well as information on how the Funds are expected to fit within Morgan Stanley’s overall business strategy and any changes that Morgan Stanley contemplates in the short- or long-term following the Closing. The Board also noted Morgan Stanley’s and the Advisers’ commitment to keep the Board apprised of developments with respect to its long-term integration plans for the Advisers, the Affiliated Sub-Advisers, and existing Morgan Stanley affiliates and their respective personnel.
The Board considered the Advisers’ and the Sub-Advisers’ management capabilities and investment processes in light of the types of investments held by each Fund, including the education, experience and number of investment professionals and other personnel who provide portfolio management, investment research, and similar services to each Fund. In particular, the Board considered the abilities and experience of the Advisers’ and, as applicable, the Sub-Advisers’ investment professionals in implementing each Fund’s investment strategies. The Board also took into account the resources dedicated to portfolio management and other services, the compensation methods of the Advisers and other factors, including the reputation and resources of the Advisers to recruit and retain highly qualified research, advisory and supervisory investment professionals. With respect to the recruitment and retention of key personnel, the Board noted information from Morgan Stanley and the Advisers regarding the benefits of joining Morgan Stanley. In addition, the Board considered the time and attention devoted to the Funds by senior management, as well as the infrastructure, operational capabilities and support staff in place to assist in the portfolio management and operations of the Funds, including the provision of administrative services. With respect to the foregoing, the Board also considered information from the Advisers and Morgan Stanley regarding the anticipated impact of the Transaction on such matters. The Board also considered the business-related and other risks to which the Advisers or their affiliates may be subject in managing the Funds and in connection with the Transaction.
The Board considered the compliance programs of the Advisers and relevant affiliates thereof, including the Affiliated Sub-Advisers. The Board considered compliance and reporting matters regarding, among other things, personal trading by investment professionals, disclosure of portfolio holdings, late trading, frequent trading, portfolio valuation, business continuity and the allocation of investment opportunities. The Board also considered the responses of the Advisers and their affiliates to requests in recent years from regulatory authorities, such as the Securities and Exchange Commission and the Financial Industry Regulatory Authority. The Board also considered certain information relating to the compliance record of Morgan Stanley and its affiliates, including information requests in recent years from regulatory authorities. With respect to the foregoing, including the compliance programs of the Advisers and the Sub-Advisers, the Board noted information regarding the impacts of the Transaction, as well as the Advisers’ and Morgan Stanley’s commitment to keep the Board apprised of developments with respect to its long-term integration plans for the Advisers, the Affiliated Sub-Advisers and existing Morgan Stanley affiliates and their respective personnel.
The Board considered other administrative services provided and to be provided or overseen by the Advisers and their affiliates, including transfer agency and accounting services. The Board evaluated the benefits to shareholders of investing in a fund that is a part of a large fund complex offering exposure to a variety of asset classes and investment disciplines, as well as the ability, in many cases, to exchange an investment among different funds without incurring additional sales charges. The Board noted information that the Transaction was not expected to have any material impact on such matters in the near-term.
In evaluating the nature, extent and quality of the services to be provided under the New Agreements, the Board also considered investment performance information provided for each Fund in connection with the 2020 Annual Approval Process, as well as information provided as of a more recent date. In this regard, the Board compared each Fund’s investment performance to that of comparable funds identified by an independent data provider (the peer group), as well as appropriate benchmark indices and, for certain Funds, a custom peer group of similarly managed funds. The Board also considered, where applicable, Fund-specific performance explanations based on criteria established by the Board in connection with the 2020 Annual Approval Process and, where applicable, performance explanations as of a more recent date. In addition to the foregoing information, it was also noted that the Board has received and discussed with management information throughout the year at periodic intervals comparing each Fund’s performance against applicable benchmark indices and peer groups. In addition, the Board considered each Fund’s performance in light of overall financial market conditions. Where a Fund’s relative underperformance to its peers was significant during one or more specified periods, the Board noted the explanation from the applicable Adviser concerning the Fund’s relative performance versus its peer group.
Eaton Vance
Municipal Income Funds
January 31, 2021
Board of Trustees’ Contract Approval — continued
After consideration of the foregoing factors, among others, and based on their review of the materials provided and the assurances received from, and recommendations of, the Advisers and Morgan Stanley, the Board determined that the Transaction was not expected to adversely affect the nature, extent and quality of services provided to the Funds by the Advisers and their affiliates, including the Affiliated Sub-Advisers, and that the Transaction was not expected to have an adverse effect on the ability of the Advisers and their affiliates, including the Affiliated Sub-Advisers, to provide those services. The Board concluded that the nature, extent and quality of services expected to be provided by the Advisers and the Sub-Advisers, taken as a whole, are appropriate and expected to be consistent with the terms of the New Agreements.
Management Fees and Expenses
The Board considered contractual fee rates payable by each Fund for advisory and administrative services (referred to collectively as “management fees”) in connection with the 2020 Annual Approval Process, as well as information provided as of a more recent date. As part of its review, the Board considered each Fund’s management fees and total expense ratio over various periods, as compared to those of comparable funds, before and after giving effect to any undertaking to waive fees or reimburse expenses. The Board also considered factors, and, where applicable, certain Fund-specific factors, that had an impact on a Fund’s total expense ratio relative to comparable funds, as identified by the Advisers in response to inquiries from the Contract Review Committee. The Board considered that the New Agreements do not change a Fund’s management fee rate or the computation method for calculating such fees, including any separately executed permanent contractual management fee reduction currently in place for the Fund.
The Board also received and considered, where applicable, information about the services offered and the fee rates charged by the Advisers and the Sub-Advisers to other types of accounts with investment objectives and strategies that are substantially similar to and/or managed in a similar investment style as a Fund. In this regard, the Board received information about the differences in the nature and scope of services the Advisers and the Sub-Advisers, as applicable, provide to the Funds as compared to other types of accounts and the material differences in compliance, reporting and other legal burdens and risks to the Advisers and such Sub-Advisers as between each Fund and other types of accounts.
After considering the foregoing information, and in light of the nature, extent and quality of the services expected to be provided by the Advisers and the Sub-Advisers, the Board concluded that the management fees charged for advisory and related services are reasonable with respect to its approval of the New Agreements.
Profitability and “Fall-Out” Benefits
During the 2020 Annual Approval Process, the Board considered the level of profits realized by the Advisers and relevant affiliates thereof, including the Affiliated Sub-Advisers, in providing investment advisory and administrative services to the Funds and to all Eaton Vance funds as a group. The Board considered the level of profits realized without regard to marketing support or other payments by the Advisers and their affiliates to third parties in respect of distribution or other services. In light of the foregoing factors and the nature, extent and quality of the services rendered, the profits realized by the Advisers and their affiliates, including the Sub-Advisers, were not deemed to be excessive by the Board.
The Board noted that Morgan Stanley and the Advisers are expected to realize, over time, cost savings from the Transaction based on eliminating duplicate corporate overhead expenses. The Board considered, however, information from the Advisers and Morgan Stanley that such cost savings are not expected to be realized immediately upon the Closing and that, accordingly, there are currently no specific expected changes in the levels of profitability associated with the advisory and other services provided to the Funds that are contemplated as a result of the Transaction. The Board noted that it will continue to receive information regarding profitability during its annual contract review processes, including the extent to which cost savings and/or other efficiencies result in changes to profitability levels.
The Board also considered direct or indirect fall-out benefits received by the Advisers and their affiliates, including the Affiliated Sub-Advisers, in connection with their respective relationships with the Funds, including the benefits of research services that may be available to the Advisers and their affiliates as a result of securities transactions effected for the Funds and other investment advisory clients. In evaluating the fall-out benefits to be received by the Advisers and their affiliates under the New Agreements, the Board considered whether the Transaction would have an impact on the fall-out benefits currently realized by the Advisers and their affiliates in connection with services provided pursuant to the Current Advisory Agreements.
The Board of each Fund considered that Morgan Stanley may derive reputational and other benefits from its ability to use the names of the Advisers and their affiliates in connection with operating and marketing the Funds. The Board considered that the Transaction, if completed, would significantly increase Morgan Stanley’s assets under management and expand Morgan Stanley’s investment capabilities.
Economies of Scale
The Board also considered the extent to which the Advisers and their affiliates, on the one hand, and the Funds, on the other hand, can expect to realize benefits from economies of scale as the assets of the Funds increase. The Board acknowledged the difficulty in accurately measuring the benefits resulting from economies of scale, if any, with respect to the management of any specific Fund or group of funds. As part of the 2020 Annual Approval Process, the Board reviewed data summarizing the increases and decreases in the assets of the Funds and of all Eaton Vance funds as a group over various time periods, and evaluated the extent to which the total expense ratio of each Fund and the profitability of the Advisers and their affiliates may have been affected by such increases or decreases.
Eaton Vance
Municipal Income Funds
January 31, 2021
Board of Trustees’ Contract Approval — continued
The Board noted that Morgan Stanley and the Advisers are expected to benefit from possible growth of the Funds resulting from enhanced distribution capabilities, including with respect to the Funds’ potential access to Morgan Stanley’s institutional client base. Based upon the foregoing, the Board concluded that the Funds currently share in the benefits from economies of scale, if any, when they are realized by the Advisers, and that the Transaction is not expected to impede a Fund from continuing to benefit from any future economies of scale realized by its Adviser.
Conclusion
Based on its consideration of the foregoing, and such other information it deemed relevant, including the factors and conclusions described above, the Contract Review Committee recommended to the Board approval of the New Agreements. Based on the recommendation of the Contract Review Committee, the Board, including a majority of the Independent Trustees, unanimously voted to approve the New Agreements for the Funds and recommended that shareholders approve the New Agreements.
Eaton Vance
Municipal Income Funds
January 31, 2021
Officers and Trustees
Officers of Eaton Vance Municipals Trust
Eric A. Stein
President
Deidre E. Walsh
Vice President
Maureen A. Gemma
Secretary and Chief Legal Officer
James F. Kirchner
Treasurer
Richard F. Froio
Chief Compliance Officer
Trustees of Eaton Vance Municipals Trust
William H. Park
Chairperson
Thomas E. Faust Jr.*
Mark R. Fetting
Cynthia E. Frost
George J. Gorman
Valerie A. Mosley
Helen Frame Peters
Keith Quinton
Marcus L. Smith
Susan J. Sutherland
Scott E. Wennerholm
Eaton Vance Funds
IMPORTANT NOTICES
Privacy. The Eaton Vance organization is committed to ensuring your financial privacy. Each entity listed below has adopted privacy policy and procedures (“Privacy Program”) Eaton Vance believes is reasonably designed to protect your personal information and to govern when and with whom Eaton Vance may share your personal information.
| • | | At the time of opening an account, Eaton Vance generally requires you to provide us with certain information such as name, address, social security number, tax status, account numbers, and account balances. This information is necessary for us to both open an account for you and to allow us to satisfy legal requirements such as applicable anti-money laundering reviews and know-your-customer requirements. |
| • | | On an ongoing basis, in the normal course of servicing your account, Eaton Vance may share your information with unaffiliated third parties that perform various services for Eaton Vance and/or your account. These third parties include transfer agents, custodians, broker/dealers and our professional advisers including auditors, accountants, and legal counsel. Eaton Vance may share your personal information with our affiliates. Eaton Vance may also share your information as required or permitted by applicable law. |
| • | | We have adopted a Privacy Program we believe is reasonably designed to protect the confidentiality of your personal information and to prevent unauthorized access to your information. |
| • | | We reserve the right to change our Privacy Program at any time upon proper notification to you. You may want to review our Privacy Program periodically for changes by accessing the link on our homepage: www.eatonvance.com. |
Our pledge of protecting your personal information applies to the following entities within the Eaton Vance organization: the Eaton Vance Family of Funds, Eaton Vance Management, Eaton Vance WaterOak Advisors, Eaton Vance Distributors, Inc., Eaton Vance Trust Company, Eaton Vance Management (International) Limited, Eaton Vance Advisers International Ltd., Eaton Vance Global Advisors Limited, Eaton Vance Management’s Real Estate Investment Group, Boston Management and Research, Calvert Research and Management, and Calvert Funds. This notice supersedes all previously issued privacy disclosures. For more information about Eaton Vance’s Privacy Program or about how your personal information may be used, please call 1-800-262-1122.
Delivery of Shareholder Documents. The Securities and Exchange Commission (SEC) permits funds to deliver only one copy of shareholder documents, including prospectuses, proxy statements and shareholder reports, to fund investors with multiple accounts at the same residential or post office box address. This practice is often called “householding” and it helps eliminate duplicate mailings to shareholders. Eaton Vance, or your financial intermediary, may household the mailing of your documents indefinitely unless you instruct Eaton Vance, or your financial intermediary, otherwise. If you would prefer that your Eaton Vance documents not be householded, please contact Eaton Vance at 1-800-262-1122, or contact your financial intermediary. Your instructions that householding not apply to delivery of your Eaton Vance documents will typically be effective within 30 days of receipt by Eaton Vance or your financial intermediary.
Portfolio Holdings. Each Eaton Vance Fund and its underlying Portfolio(s) (if applicable) files a schedule of portfolio holdings on Part F to Form N-PORT with the SEC. Certain information filed on Form N-PORT may be viewed on the Eaton Vance website at www.eatonvance.com, by calling Eaton Vance at 1-800-262-1122 or in the EDGAR database on the SEC’s website at www.sec.gov.
Proxy Voting. From time to time, funds are required to vote proxies related to the securities held by the funds. The Eaton Vance Funds or their underlying Portfolios (if applicable) vote proxies according to a set of policies and procedures approved by the Funds’ and Portfolios’ Boards. You may obtain a description of these policies and procedures and information on how the Funds or Portfolios voted proxies relating to portfolio securities during the most recent 12-month period ended June 30, without charge, upon request, by calling 1-800-262-1122 and by accessing the SEC’s website at www.sec.gov.
Investment Adviser
Boston Management and Research
Two International Place
Boston, MA 02110
Administrator
Eaton Vance Management
Two International Place
Boston, MA 02110
Principal Underwriter*
Eaton Vance Distributors, Inc.
Two International Place
Boston, MA 02110
(617) 482-8260
Custodian
State Street Bank and Trust Company
State Street Financial Center, One Lincoln Street
Boston, MA 02111
Transfer Agent
BNY Mellon Investment Servicing (US) Inc.
Attn: Eaton Vance Funds
P.O. Box 9653
Providence, RI 02940-9653
(800) 262-1122
Fund Offices
Two International Place
Boston, MA 02110
| * | FINRA BrokerCheck. Investors may check the background of their Investment Professional by contacting the Financial Industry Regulatory Authority (FINRA). FINRA BrokerCheck is a free tool to help investors check the professional background of current and former FINRA-registered securities firms and brokers. FINRA BrokerCheck is available by calling 1-800-289-9999 and at www.FINRA.org. The FINRA BrokerCheck brochure describing this program is available to investors at www.FINRA.org. |

7703 1.31.21

Eaton Vance
Municipal Opportunities Fund
Semiannual Report
January 31, 2021

Commodity Futures Trading Commission Registration. The Commodity Futures Trading Commission (“CFTC”) has adopted regulations that subject registered investment companies and advisers to regulation by the CFTC if a fund invests more than a prescribed level of its assets in certain CFTC-regulated instruments (including futures, certain options and swap agreements) or markets itself as providing investment exposure to such instruments. The investment adviser has claimed an exclusion from the definition of “commodity pool operator” under the Commodity Exchange Act with respect to its management of the Fund. Accordingly, neither the Fund nor the adviser with respect to the operation of the Fund is subject to CFTC regulation. Because of its management of other strategies, the Fund’s adviser is registered with the CFTC as a commodity pool operator. The adviser is also registered as a commodity trading advisor.
Fund shares are not insured by the FDIC and are not deposits or other obligations of, or guaranteed by, any depository institution. Shares are subject to investment risks, including possible loss of principal invested.
This report must be preceded or accompanied by a current summary prospectus or prospectus. Before investing, investors should consider carefully the investment objective, risks, and charges and expenses of a mutual fund. This and other important information is contained in the summary prospectus and prospectus, which can be obtained from a financial intermediary. Prospective investors should read the prospectus carefully before investing. For further information, please call 1-800-262-1122.
Semiannual Report January 31, 2021
Eaton Vance
Municipal Opportunities Fund
Eaton Vance
Municipal Opportunities Fund
January 31, 2021
Performance1,2
Portfolio Manager Adam A. Weigold, CFA
| | | | | | | | | | | | | | | | | | | | | | | | |
| % Average Annual Total Returns | | Class Inception Date | | | Performance Inception Date | | | Six Months | | | One Year | | | Five Years | | | Since Inception | |
| | | | | | |
Class A at NAV | | | 05/31/2011 | | | | 05/31/2011 | | | | 4.37 | % | | | 3.77 | % | | | 3.54 | % | | | 5.03 | % |
Class A with 4.75% Maximum Sales Charge | | | — | | | | — | | | | –0.55 | | | | –1.19 | | | | 2.55 | | | | 4.50 | |
Class C at NAV | | | 08/18/2014 | | | | 05/31/2011 | | | | 3.89 | | | | 2.92 | | | | 2.77 | | | | 4.48 | |
Class C with 1% Maximum Sales Charge | | | — | | | | — | | | | 2.89 | | | | 1.92 | | | | 2.77 | | | | 4.48 | |
Class I at NAV | | | 05/31/2011 | | | | 05/31/2011 | | | | 4.49 | | | | 4.03 | | | | 3.81 | | | | 5.31 | |
|
| |
| | | | | | |
Bloomberg Barclays Municipal Bond Index | | | — | | | | — | | | | 2.01 | % | | | 4.01 | % | | | 3.79 | % | | | 4.42 | % |
| | | | | | |
| % Total Annual Operating Expense Ratios3 | | | | | | | | | | | Class A | | | Class C | | | Class I | |
| | | | | | |
| | | | | | | | | | | | | | | 0.92 | % | | | 1.67 | % | | | 0.67 | % |
| | | | | | |
| % Distribution Rates/Yields4 | | | | | | | | | | | Class A | | | Class C | | | Class I | |
| | | | | | |
Distribution Rate | | | | | | | | | | | | | | | 2.12 | % | | | 1.38 | % | | | 2.37 | % |
Taxable-Equivalent Distribution Rate | | | | | | | | | | | | | | | 3.58 | | | | 2.33 | | | | 4.00 | |
SEC 30-day Yield | | | | | | | | | | | | | | | 0.94 | | | | 0.25 | | | | 1.23 | |
Taxable-Equivalent SEC 30-day Yield | | | | | | | | | | | | | | | 1.59 | | | | 0.42 | | | | 2.08 | |
Fund Profile
Credit Quality (% of total investments)5
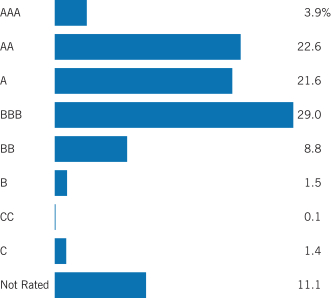
See Endnotes and Additional Disclosures in this report.
Past performance is no guarantee of future results. Returns are historical and are calculated by determining the percentage change in net asset value (NAV) or offering price (as applicable) with all distributions reinvested. Investment return and principal value will fluctuate so that shares, when redeemed, may be worth more or less than their original cost. Performance for periods less than or equal to one year is cumulative. Performance is for the stated time period only; due to market volatility, current Fund performance may be lower or higher than the quoted return. For performance as of the most recent month-end, please refer to eatonvance.com.
Eaton Vance
Municipal Opportunities Fund
January 31, 2021
Endnotes and Additional Disclosures
| 1 | Bloomberg Barclays Municipal Bond Index is an unmanaged index of municipal bonds traded in the U.S. Unless otherwise stated, index returns do not reflect the effect of any applicable sales charges, commissions, expenses, taxes or leverage, as applicable. It is not possible to invest directly in an index. |
| 2 | Total Returns at NAV do not include applicable sales charges. If sales charges were deducted, the returns would be lower. Total Returns shown with maximum sales charge reflect the stated maximum sales charge. Unless otherwise stated, performance does not reflect the deduction of taxes on Fund distributions or redemptions of Fund shares. |
Performance prior to the inception date of a class may be linked to the performance of an older class of the Fund. This linked performance is adjusted for any applicable sales charge, but is not adjusted for class expense differences. If adjusted for such differences, the performance would be different. The performance of Class C is linked to Class A. Performance since inception for an index, if presented, is the performance since the Fund’s or oldest share class’ inception, as applicable. Performance presented in the Financial Highlights included in the financial statements is not linked.
| 3 | Source: Fund prospectus. The expense ratios for the current reporting period can be found in the Financial Highlights section of this report. |
| 4 | The Distribution Rate is based on the Fund’s last regular distribution per share in the period (annualized) divided by the Fund’s NAV at the end of the period. The Fund’s distributions may be comprised of amounts characterized for federal income tax purposes as tax-exempt income, qualified and non-qualified ordinary dividends, capital gains and nondividend distributions, also known as return of capital. The Fund will determine the federal income tax character of distributions paid to a shareholder after the end of the calendar year. This is reported on the IRS form 1099-DIV and provided to the shareholder shortly after each year-end. The Fund’s distributions are determined by the investment adviser based on its current assessment of the Fund’s long-term return potential. As portfolio and market conditions change, the rate of distributions paid by the Fund could change. Taxable-equivalent performance is based on the highest combined federal and state income tax rates, where applicable. Lower tax rates would result in lower tax-equivalent performance. Actual tax rates will vary depending on your income, exemptions and deductions. Rates do not include local taxes. The SEC Yield is a standardized measure based on the estimated yield to maturity of a fund’s investments over a 30-day period and is based on the maximum offer price at the date specified. The SEC Yield is not based on the distributions made by the Fund, which may differ. |
| 5 | For purposes of the Fund’s rating restrictions, ratings are based on Moody’s Investors Service, Inc. (“Moody’s”), S&P Global Ratings (“S&P”) or Fitch Ratings (“Fitch”), as applicable. If securities are rated differently by the ratings agencies, the highest rating is applied. Ratings, which are subject to change, apply to the creditworthiness of the issuers of the underlying securities and not to the Fund or its shares. Credit ratings measure the quality of a bond based on the issuer’s creditworthiness, with ratings ranging from AAA, being the highest, to D, being the lowest based on S&P’s measures. Ratings of BBB or higher by S&P or Fitch (Baa or higher by Moody’s) are considered to be investment-grade quality. Credit ratings are based |
| | largely on the ratings agency’s analysis at the time of rating. The rating assigned to any particular security is not necessarily a reflection of the issuer’s current financial condition and does not necessarily reflect its assessment of the volatility of a security’s market value or of the liquidity of an investment in the security. Holdings designated as “Not Rated” (if any) are not rated by the national ratings agencies stated above. |
Fund profile subject to change due to active management.
Eaton Vance
Municipal Opportunities Fund
January 31, 2021
Fund Expenses
Example: As a Fund shareholder, you incur two types of costs: (1) transaction costs, including sales charges (loads) on purchases and redemption fees (if applicable); and (2) ongoing costs, including management fees; distribution and/or service fees; and other Fund expenses. This Example is intended to help you understand your ongoing costs (in dollars) of Fund investing and to compare these costs with the ongoing costs of investing in other mutual funds. The Example is based on an investment of $1,000 invested at the beginning of the period and held for the entire period (August 1, 2020 – January 31, 2021).
Actual Expenses: The first section of the table below provides information about actual account values and actual expenses. You may use the information in this section, together with the amount you invested, to estimate the expenses that you paid over the period. Simply divide your account value by $1,000 (for example, an $8,600 account value divided by $1,000 = 8.6), then multiply the result by the number in the first section under the heading entitled “Expenses Paid During Period” to estimate the expenses you paid on your account during this period.
Hypothetical Example for Comparison Purposes: The second section of the table below provides information about hypothetical account values and hypothetical expenses based on the actual Fund expense ratio and an assumed rate of return of 5% per year (before expenses), which is not the actual Fund return. The hypothetical account values and expenses may not be used to estimate the actual ending account balance or expenses you paid for the period. You may use this information to compare the ongoing costs of investing in your Fund and other funds. To do so, compare this 5% hypothetical example with the 5% hypothetical examples that appear in the shareholder reports of the other funds.
Please note that the expenses shown in the table are meant to highlight your ongoing costs only and do not reflect any transactional costs, such as sales charges (loads) or redemption fees (if applicable). Therefore, the second section of the table is useful in comparing ongoing costs only, and will not help you determine the relative total costs of owning different funds. In addition, if these transactional costs were included, your costs would be higher.
| | | | | | | | | | | | | | | | |
| | | Beginning
Account Value
(8/1/20) | | | Ending
Account Value
(1/31/21) | | | Expenses Paid
During Period*
(8/1/20 – 1/31/21) | | | Annualized
Expense
Ratio | |
| | | | |
Actual | | | | | | | | | | | | | | | | |
Class A | | $ | 1,000.00 | | | $ | 1,043.70 | | | $ | 4.74 | | | | 0.92 | % |
Class C | | $ | 1,000.00 | | | $ | 1,038.90 | | | $ | 8.58 | | | | 1.67 | % |
Class I | | $ | 1,000.00 | | | $ | 1,044.90 | | | $ | 3.45 | | | | 0.67 | % |
| | | | | |
Hypothetical | | | | | | | | | | | | | | | | |
(5% return per year before expenses) | | | | | | | | | | | | | | | | |
Class A | | $ | 1,000.00 | | | $ | 1,020.60 | | | $ | 4.69 | | | | 0.92 | % |
Class C | | $ | 1,000.00 | | | $ | 1,016.80 | | | $ | 8.49 | | | | 1.67 | % |
Class I | | $ | 1,000.00 | | | $ | 1,021.80 | | | $ | 3.41 | | | | 0.67 | % |
| * | Expenses are equal to the Fund’s annualized expense ratio for the indicated Class, multiplied by the average account value over the period, multiplied by 184/365 (to reflect the one-half year period). The Example assumes that the $1,000 was invested at the net asset value per share determined at the close of business on July 31, 2020. |
Eaton Vance
Municipal Opportunities Fund
January 31, 2021
Portfolio of Investments (Unaudited)
| | | | | | | | |
| Corporate Bonds & Notes — 1.1% | |
| Security | | Principal
Amount
(000’s omitted) | | | Value | |
|
| Hospital — 1.1% | |
| | |
Care New England Health System, 5.50%, 9/1/26 | | $ | 11,000 | | | $ | 11,156,942 | |
| | |
Harnett Health System, Inc., 4.25% to 4/1/25 (Put Date), 4/1/32 | | | 3,685 | | | | 3,629,725 | |
| |
Total Corporate Bonds & Notes — 1.1%
(identified cost $14,504,401) | | | $ | 14,786,667 | |
|
| Tax-Exempt Mortgage-Backed Securities — 0.0%(1) | |
| Security | | Principal
Amount
(000’s omitted) | | | Value | |
|
| Housing — 0.0%(1) | |
| | |
FRETE 2017-ML01 Trust, Class A, (Freddie Mac guaranteed), 0.627%, (1 mo. USD LIBOR + 0.50%), 1/25/33(2)(3) | | $ | 472 | | | $ | 475,077 | |
| |
Total Tax-Exempt Mortgage-Backed Securities — 0.0%(1)
(identified cost $471,812) | | | $ | 475,077 | |
|
| Tax-Exempt Municipal Securities — 84.7% | |
| Security | | Principal
Amount
(000’s omitted) | | | Value | |
|
| Bond Bank — 1.3% | |
| | |
Delaware Valley Regional Finance Authority, PA, 0.856%, (67% of 1 mo. USD LIBOR + 0.76%), 9/1/24 (Put Date), 9/1/48(3) | | $ | 8,000 | | | $ | 7,988,240 | |
| | |
Illinois Finance Authority, (Revolving Fund), Green Bonds, 4.00%, 1/1/32 | | | 7,800 | | | | 9,964,500 | |
| |
| | | | $ | 17,952,740 | |
|
| Education — 3.9% | |
| | |
Arizona Industrial Development Authority, (Academies of Math & Science), 5.00%, 7/1/39(2) | | $ | 525 | | | $ | 606,779 | |
| | |
Arizona Industrial Development Authority, (Doral Academy of Nevada), 3.55%, 7/15/29(2) | | | 1,360 | | | | 1,462,354 | |
| | |
Arizona Industrial Development Authority, (Pinecrest Academy of Nevada), 4.00%, 7/15/40(2) | | | 865 | | | | 912,904 | |
| | |
Arizona State University, 5.00%, 7/1/33 | | | 500 | | | | 570,990 | |
| | |
Arizona State University, 5.00%, 7/1/34 | | | 580 | | | | 661,449 | |
| | |
Build NYC Resource Corp., NY, (Ethical Culture Fieldston School), 5.00%, 6/1/24 | | | 600 | | | | 684,522 | |
| | | | | | | | |
| Security | | Principal
Amount
(000’s omitted) | | | Value | |
|
| Education (continued) | |
| | |
California Municipal Finance Authority, (California Lutheran University), 5.00%, 10/1/31 | | $ | 600 | | | $ | 751,008 | |
| | |
California Municipal Finance Authority, (California Lutheran University), 5.00%, 10/1/35 | | | 1,125 | | | | 1,388,160 | |
| | |
California Municipal Finance Authority, (California Lutheran University), 5.00%, 10/1/37 | | | 1,400 | | | | 1,718,990 | |
| | |
California School Finance Authority, (KIPP SoCal Public Schools), 5.00%, 7/1/39(2) | | | 1,000 | | | | 1,280,030 | |
| | |
California School Finance Authority, (KIPP SoCal Public Schools), 5.00%, 7/1/49(2) | | | 1,000 | | | | 1,257,160 | |
| | |
Capital Trust Agency, FL, (Florida Charter Educational Foundation, Inc.),
4.50%, 6/15/28(2) | | | 550 | | | | 588,418 | |
| | |
Delaware County Authority, PA, (Villanova University), 5.00%, 8/1/22 | | | 600 | | | | 642,096 | |
| | |
District of Columbia, (District of Columbia International School), 5.00%, 7/1/39 | | | 680 | | | | 816,136 | |
| | |
District of Columbia, (KIPP DC), 4.00%, 7/1/39 | | | 280 | | | | 317,089 | |
| | |
District of Columbia, (KIPP DC), 4.00%, 7/1/44 | | | 270 | | | | 301,909 | |
| | |
District of Columbia, (Rocketship DC Obligated Group), 5.00%, 6/1/39(2) | | | 1,425 | | | | 1,594,262 | |
| | |
Florida Higher Educational Facilities Financing Authority, (Jacksonville University), 4.50%, 6/1/33(2) | | | 2,535 | | | | 2,915,630 | |
| | |
Florida Higher Educational Facilities Financing Authority, (Ringling College of Art and Design), 5.00%, 3/1/32 | | | 315 | | | | 381,323 | |
| | |
Florida Higher Educational Facilities Financing Authority, (Ringling College of Art and Design), 5.00%, 3/1/33 | | | 355 | | | | 426,749 | |
| | |
Florida Higher Educational Facilities Financing Authority, (Ringling College of Art and Design), 5.00%, 3/1/34 | | | 350 | | | | 420,455 | |
| | |
Massachusetts Development Finance Agency, (Dexter Southfield), 5.00%, 5/1/31 | | | 500 | | | | 579,275 | |
| | |
Massachusetts Development Finance Agency, (Dexter Southfield), 5.00%, 5/1/32 | | | 1,695 | | | | 1,958,606 | |
| | |
Massachusetts Development Finance Agency, (Suffolk University), 5.00%, 7/1/28 | | | 525 | | | | 668,446 | |
| | |
Massachusetts Development Finance Agency, (Suffolk University), 5.00%, 7/1/29 | | | 500 | | | | 645,115 | |
| | |
Massachusetts Development Finance Agency, (Suffolk University), 5.00%, 7/1/30 | | | 715 | | | | 910,095 | |
| | |
Michigan Finance Authority, (Cesar Chavez Academy), 5.00%, 2/1/33 | | | 830 | | | | 927,567 | |
| | |
Monroe County Industrial Development Corp., NY, (Nazareth College of Rochester), 5.00%, 10/1/26 | | | 980 | | | | 1,164,779 | |
| | |
Monroe County Industrial Development Corp., NY, (Nazareth College of Rochester), 5.00%, 10/1/27 | | | 1,035 | | | | 1,253,913 | |
| | |
Monroe County Industrial Development Corp., NY, (University of Rochester), Series 2017C, 5.00%, 7/1/29 | | | 650 | | | | 821,243 | |
| | |
Monroe County Industrial Development Corp., NY, (University of Rochester), Series 2017D, 5.00%, 7/1/29 | | | 750 | | | | 947,588 | |
| | | | |
| | 5 | | See Notes to Financial Statements. |
Eaton Vance
Municipal Opportunities Fund
January 31, 2021
Portfolio of Investments (Unaudited) — continued
| | | | | | | | |
| Security | | Principal
Amount
(000’s omitted) | | | Value | |
|
| Education (continued) | |
| | |
New Jersey Educational Facilities Authority, (Ramapo College), 5.00%, 7/1/26 | | $ | 2,460 | | | $ | 2,913,796 | |
| | |
New York Dormitory Authority, (Oneida-Herkimer-Madison BOCES), 5.00%, 8/15/22 | | | 510 | | | | 541,181 | |
| | |
New York Dormitory Authority, (Oneida-Herkimer-Madison BOCES), 5.00%, 8/15/23 | | | 275 | | | | 302,184 | |
| | |
New York Dormitory Authority, (Oneida-Herkimer-Madison BOCES), 5.00%, 8/15/24 | | | 300 | | | | 340,257 | |
| | |
New York Dormitory Authority, (Pratt Institute), Prerefunded to 7/1/24, 5.00%, 7/1/25 | | | 500 | | | | 581,425 | |
| | |
New York Dormitory Authority, (Pratt Institute), Prerefunded to 7/1/24, 5.00%, 7/1/26 | | | 545 | | | | 633,753 | |
| | |
Philadelphia Industrial Development Authority, PA, (La Salle University), 5.00%, 5/1/25 | | | 910 | | | | 986,185 | |
| | |
Philadelphia Industrial Development Authority, PA, (La Salle University), 5.00%, 5/1/26 | | | 1,850 | | | | 2,030,208 | |
| | |
Philadelphia Industrial Development Authority, PA, (La Salle University), 5.00%, 5/1/29 | | | 1,000 | | | | 1,101,390 | |
| | |
Pinellas County Educational Facilities Authority, FL, (Pinellas Academy of Math and Science), 4.125%, 12/15/28(2) | | | 540 | | | | 597,645 | |
| | |
Pinellas County Educational Facilities Authority, FL, (Pinellas Academy of Math and Science), 5.00%, 12/15/38(2) | | | 2,690 | | | | 3,122,444 | |
| | |
Public Finance Authority, WI, (North Carolina Leadership Academy), 5.00%, 6/15/39(2) | | | 205 | | | | 219,614 | |
| | |
Public Finance Authority, WI, (North Carolina Leadership Academy), 5.00%, 6/15/49(2) | | | 260 | | | | 275,402 | |
| | |
Public Finance Authority, WI, (Roseman University of Health Sciences), 5.00%, 4/1/40(2) | | | 840 | | | | 975,895 | |
| | |
Public Finance Authority, WI, (Roseman University of Health Sciences), 5.00%, 4/1/50(2) | | | 1,010 | | | | 1,154,228 | |
| | |
Romeoville, IL, (Lewis University), 5.00%, 10/1/24 | | | 500 | | | | 563,805 | |
| | |
Romeoville, IL, (Lewis University), 5.00%, 10/1/26 | | | 500 | | | | 569,215 | |
| | |
University of Arkansas, 5.00%, 11/1/24 | | | 450 | | | | 528,822 | |
| | |
University of Arkansas, 5.00%, 11/1/25 | | | 500 | | | | 609,450 | |
| | |
University of Idaho, 5.00%, 4/1/24 | | | 500 | | | | 574,345 | |
| | |
University of North Carolina at Charlotte, 4.00%, 4/1/37 | | | 625 | | | | 689,563 | |
| | |
University of North Carolina at Greensboro, 5.00%, 4/1/27 | | | 400 | | | | 506,316 | |
| | |
University of Pittsburgh, PA, 0.40%, (SIFMA + 0.36%), 2/15/24(3) | | | 3,000 | | | | 3,011,730 | |
| | |
Yonkers Economic Development Corp., NY, (Lamartine/Warburton, LLC – Charter School of Educational Excellence), 5.00%, 10/15/49 | | | 285 | | | | 322,298 | |
| | |
Yonkers Economic Development Corp., NY, (Lamartine/Warburton, LLC – Charter School of Educational Excellence), 5.00%, 10/15/54 | | | 430 | | | | 484,541 | |
| |
| | | | $ | 53,210,732 | |
| | | | | | | | |
| Security | | Principal
Amount
(000’s omitted) | | | Value | |
|
| Electric Utilities — 2.7% | |
| | |
American Municipal Power, Inc., OH, (Prairie State Energy Campus), 5.00%, 2/15/36 | | $ | 5,000 | | | $ | 6,490,950 | |
| | |
Arkansas River Power Authority, CO, 5.00%, 10/1/27 | | | 2,255 | | | | 2,755,858 | |
| | |
Arkansas River Power Authority, CO, 5.00%, 10/1/28 | | | 1,110 | | | | 1,381,129 | |
| | |
Arkansas River Power Authority, CO, 5.00%, 10/1/29 | | | 2,000 | | | | 2,474,160 | |
| | |
Hawaii Department of Budget and Finance, (Hawaiian Electric Co.), 3.20%, 7/1/39 | | | 4,505 | | | | 4,942,886 | |
| | |
Long Island Power Authority, NY, Electric System Revenue, 0.851%, (70% of 1 mo. USD LIBOR + 0.75%), 10/1/23 (Put Date), 5/1/33(3) | | | 6,000 | | | | 6,008,400 | |
| | |
Long Island Power Authority, NY, Electric System Revenue, 1.00%, 9/1/25 | | | 3,600 | | | | 3,665,484 | |
| | |
Long Island Power Authority, NY, Electric System Revenue, 5.00%, 9/1/29 | | | 500 | | | | 639,905 | |
| | |
Missouri Joint Municipal Electric Utility Commission, (Prairie State Energy Campus), 5.00%, 1/1/28 | | | 1,515 | | | | 1,938,139 | |
| | |
Nebraska Public Power District, 5.00%, 1/1/24 | | | 750 | | | | 851,040 | |
| | |
Omaha Public Power District, NE, 5.00%, 2/1/25 | | | 550 | | | | 651,805 | |
| | |
Public Power Generation Agency, NE, (Whelan Energy Center Unit 2), 5.00%, 1/1/25 | | | 2,525 | | | | 2,972,203 | |
| | |
Unified Government of Wyandotte County/Kansas City, KS, Utility System Revenue, 5.00%, 9/1/26 | | | 1,165 | | | | 1,399,561 | |
| | |
Unified Government of Wyandotte County/Kansas City, KS, Utility System Revenue, 5.00%, 9/1/27 | | | 1,000 | | | | 1,197,140 | |
| |
| | | | $ | 37,368,660 | |
|
| Escrowed / Prerefunded — 0.1% | |
| | |
Detroit, MI, Sewage Disposal System, Prerefunded to 7/1/22, 5.00%, 7/1/32 | | $ | 125 | | | $ | 133,651 | |
| | |
Detroit, MI, Water Supply System, Prerefunded to 7/1/21, 5.25%, 7/1/41 | | | 295 | | | | 301,334 | |
| | |
District of Columbia, (Association of American Medical Colleges), Prerefunded to 10/1/23, 5.00%, 10/1/30 | | | 570 | | | | 643,632 | |
| | |
Norfolk Economic Development Authority, VA, (Bon Secours Health System, Inc.), Prerefunded to 11/1/22, 5.00%, 11/1/28 | | | 225 | | | | 243,621 | |
| |
| | | | $ | 1,322,238 | |
|
| General Obligations — 8.5% | |
| | |
Ann Arbor Public Schools, MI, 5.00%, 5/1/23 | | $ | 10 | | | $ | 11,080 | |
| | |
Ann Arbor Public Schools, MI, 5.00%, 5/1/27 | | | 1,000 | | | | 1,193,910 | |
| | |
Bergen County, NJ, 3.00%, 7/15/30 | | | 2,185 | | | | 2,500,995 | |
| | |
Burlington, VT, 5.00%, 11/1/24 | | | 400 | | | | 469,084 | |
| | |
Champaign County Community Unit School District No. 4, IL, 5.00%, 1/1/33 | | | 1,650 | | | | 2,094,890 | |
| | |
Chicago Board of Education, IL, 0.00%, 12/1/25 | | | 3,500 | | | | 3,273,585 | |
| | |
Chicago Board of Education, IL, 5.00%, 12/1/26 | | | 2,905 | | | | 3,542,560 | |
| | | | |
| | 6 | | See Notes to Financial Statements. |
Eaton Vance
Municipal Opportunities Fund
January 31, 2021
Portfolio of Investments (Unaudited) — continued
| | | | | | | | |
| Security | | Principal
Amount
(000’s omitted) | | | Value | |
|
| General Obligations (continued) | |
| | |
Chicago Park District, IL, 5.00%, 1/1/24 | | $ | 500 | | | $ | 558,380 | |
| | |
Chicago, IL, 5.00%, 1/1/28 | | | 3,000 | | | | 3,684,900 | |
| | |
Chicago, IL, 5.00%, 1/1/30 | | | 9,780 | | | | 12,374,536 | |
| | |
Chicago, IL, 5.625%, 1/1/30 | | | 6,000 | | | | 7,282,500 | |
| | |
Chicago, IL, 6.00%, 1/1/38 | | | 4,000 | | | | 4,873,200 | |
| | |
Connecticut, 5.00%, 4/15/34 | | | 1,000 | | | | 1,292,930 | |
| | |
Dallas, TX, 5.00%, 2/15/25 | | | 1,000 | | | | 1,189,940 | |
| | |
District of Columbia, 5.00%, 10/15/32 | | | 10,000 | | | | 13,277,400 | |
| | |
Heard County Public Facilities Authority, GA, (Heard County School District), 4.00%, 3/1/29 | | | 850 | | | | 1,044,531 | |
| | |
Hermiston School District No. 8R, OR, 0.00%, 6/15/43 | | | 3,165 | | | | 1,690,395 | |
| | |
Illinois, 3.25%, 11/1/26 | | | 2,400 | | | | 2,575,392 | |
| | |
Illinois, 5.00%, 11/1/24 | | | 2,750 | | | | 3,099,003 | |
| | |
Illinois, 5.50%, 5/1/39 | | | 1,740 | | | | 2,187,110 | |
| | |
Illinois, 5.75%, 5/1/45 | | | 1,780 | | | | 2,245,363 | |
| | |
Johnson County, KS, 2.00%, 9/1/32 | | | 1,510 | | | | 1,644,903 | |
| | |
Kane, Cook and DuPage Counties School District No. 46, IL, 5.00%, 1/1/26 | | | 900 | | | | 1,019,277 | |
| | |
Kane, Cook and DuPage Counties School District No. 46, IL, 5.00%, 1/1/29 | | | 2,000 | | | | 2,256,360 | |
| | |
Mattawan Consolidated School, Van Buren and Kalamazoo Counties, MI, 5.00%, 5/1/26 | | | 750 | | | | 900,698 | |
| | |
Mattawan Consolidated School, Van Buren and Kalamazoo Counties, MI, 5.00%, 5/1/27 | | | 1,000 | | | | 1,196,240 | |
| | |
Mattawan Consolidated School, Van Buren and Kalamazoo Counties, MI, 5.00%, 5/1/28 | | | 500 | | | | 596,485 | |
| | |
New Jersey, 4.00%, 6/1/32 | | | 1,150 | | | | 1,458,637 | |
| | |
New York, NY, 5.00%, 8/1/29 | | | 450 | | | | 501,750 | |
| | |
Ottawa County, MI, 5.00%, 11/1/22 | | | 500 | | | | 542,480 | |
| | |
Ottawa County, MI, 5.00%, 11/1/24 | | | 195 | | | | 230,277 | |
| | |
Passaic County Improvement Authority, NJ, (Passaic County Community College), 5.375%, 7/1/41 | | | 1,535 | | | | 2,395,107 | |
| | |
Portland School District No. 1, OR, 3.00%, 6/15/33 | | | 5,000 | | | | 5,816,750 | |
| | |
Portland School District No. 1, OR, 3.00%, 6/15/34 | | | 5,000 | | | | 5,771,850 | |
| | |
Sedgwick County Unified School District No. 265, KS, 5.00%, 10/1/26 | | | 1,000 | | | | 1,260,340 | |
| | |
Sonoma County Junior College District, CA, (Election of 2014), 4.00%, 8/1/33 | | | 3,000 | | | | 3,739,200 | |
| | |
St. Joseph Public Schools, MI, 5.00%, 5/1/28 | | | 1,880 | | | | 2,241,035 | |
| | |
St. Joseph Public Schools, MI, 5.00%, 5/1/29 | | | 1,650 | | | | 1,963,038 | |
| | |
Thornapple Kellogg School, MI, 5.00%, 5/1/24 | | | 400 | | | | 460,292 | |
| | |
Upper Merion Area School District, PA, 5.00%, 1/15/29 | | | 500 | | | | 588,540 | |
| | |
Upper Merion Area School District, PA, 5.00%, 1/15/30 | | | 300 | | | | 352,866 | |
| | |
Washington, 5.00%, 6/1/35(4) | | | 2,500 | | | | 3,359,250 | |
| | |
Washington, 5.00%, 6/1/36(4) | | | 2,200 | | | | 2,945,756 | |
| | |
Washington, 5.00%, 6/1/37(4) | | | 2,500 | | | | 3,336,350 | |
| | | | | | | | |
| Security | | Principal
Amount
(000’s omitted) | | | Value | |
|
| General Obligations (continued) | |
| | |
Will and Cook Counties Community High School District No. 210, IL, 0.00%, 1/1/27 | | $ | 65 | | | $ | 58,215 | |
| | |
Will and Cook Counties Community High School District No. 210, IL, 5.00%, 1/1/29 | | | 1,185 | | | | 1,253,576 | |
| |
| | | | $ | 116,350,956 | |
|
| Hospital — 18.2% | |
| | |
Astoria Hospital Facilities Authority, OR, (Columbia Memorial Hospital), 5.00%, 8/1/41 | | $ | 940 | | | $ | 1,095,288 | |
| | |
Augusta Development Authority, GA, (AU Health System, Inc.), 5.00%, 7/1/26 | | | 2,525 | | | | 2,959,350 | |
| | |
Augusta Development Authority, GA, (AU Health System, Inc.), 5.00%, 7/1/27 | | | 2,635 | | | | 3,143,792 | |
| | |
Baxter County, AR, (Baxter Regional Medical Center), 5.00%, 9/1/21 | | | 1,140 | | | | 1,161,090 | |
| | |
Baxter County, AR, (Baxter Regional Medical Center), 5.00%, 9/1/23 | | | 930 | | | | 1,002,707 | |
| | |
Baxter County, AR, (Baxter Regional Medical Center), 5.00%, 9/1/25 | | | 1,125 | | | | 1,272,971 | |
| | |
Baxter County, AR, (Baxter Regional Medical Center), Series A, 5.00%, 9/1/22 | | | 1,660 | | | | 1,742,386 | |
| | |
Baxter County, AR, (Baxter Regional Medical Center), Series A, 5.00%, 9/1/24 | | | 1,350 | | | | 1,492,182 | |
| | |
Baxter County, AR, (Baxter Regional Medical Center), Series A, 5.00%, 9/1/26 | | | 1,000 | | | | 1,151,750 | |
| | |
Baxter County, AR, (Baxter Regional Medical Center), Series B, 5.00%, 9/1/22 | | | 265 | | | | 278,152 | |
| | |
Baxter County, AR, (Baxter Regional Medical Center), Series B, 5.00%, 9/1/24 | | | 290 | | | | 320,543 | |
| | |
Baxter County, AR, (Baxter Regional Medical Center), Series B, 5.00%, 9/1/26 | | | 320 | | | | 368,560 | |
| | |
Berks County Municipal Authority, PA, (Tower Health), 5.00% to 2/1/25 (Put Date), 2/1/40 | | | 3,000 | | | | 3,359,130 | |
| | |
Boone County, MO, (Boone Hospital Center), 5.00%, 8/1/29 | | | 1,410 | | | | 1,579,990 | |
| | |
Boone County, MO, (Boone Hospital Center), 5.00%, 8/1/31 | | | 3,215 | | | | 3,580,192 | |
| | |
Calhoun County Hospital Finance Authority, MI, (Oaklawn Hospital), 5.00%, 2/15/32 | | | 2,110 | | | | 2,432,619 | |
| | |
California Municipal Finance Authority, (NorthBay Healthcare Group), 5.00%, 11/1/23 | | | 100 | | | | 110,223 | |
| | |
California Municipal Finance Authority, (NorthBay Healthcare Group), 5.00%, 11/1/27 | | | 360 | | | | 406,080 | |
| | |
California Municipal Finance Authority, (NorthBay Healthcare Group), 5.00%, 11/1/28 | | | 300 | | | | 337,194 | |
| | |
California Municipal Finance Authority, (NorthBay Healthcare Group), 5.00%, 11/1/29 | | | 110 | | | | 123,173 | |
| | |
California Municipal Finance Authority, (NorthBay Healthcare Group), 5.00%, 11/1/30 | | | 150 | | | | 167,538 | |
| | | | |
| | 7 | | See Notes to Financial Statements. |
Eaton Vance
Municipal Opportunities Fund
January 31, 2021
Portfolio of Investments (Unaudited) — continued
| | | | | | | | |
| Security | | Principal
Amount
(000’s omitted) | | | Value | |
|
| Hospital (continued) | |
| | |
California Municipal Finance Authority, (NorthBay Healthcare Group), 5.00%, 11/1/35 | | $ | 250 | | | $ | 276,640 | |
| | |
California Municipal Finance Authority, (NorthBay Healthcare Group), Series 2015, 5.00%, 11/1/25 | | | 200 | | | | 227,238 | |
| | |
California Statewide Communities Development Authority, (Cottage Health System Obligated Group), Prerefunded to 11/1/24, 5.00%, 11/1/26 | | | 425 | | | | 499,201 | |
| | |
Connecticut Health and Educational Facilities Authority, (Griffin Hospital), 5.00%, 7/1/50(2) | | | 3,730 | | | | 4,238,063 | |
| | |
Conway, AR, (Conway Regional Medical Center), 5.00%, 8/1/28 | | | 500 | | | | 600,380 | |
| | |
Conway, AR, (Conway Regional Medical Center), 5.00%, 8/1/29 | | | 200 | | | | 238,434 | |
| | |
Crawford County Hospital Authority, PA, (Meadville Medical Center), 6.00%, 6/1/36 | | | 2,660 | | | | 2,986,435 | |
| | |
Crawford County Hospital Authority, PA, (Meadville Medical Center), 6.00%, 6/1/51 | | | 4,715 | | | | 5,168,394 | |
| | |
Darke County, OH, (Wayne HealthCare), 4.00%, 9/1/40 | | | 1,000 | | | | 1,065,110 | |
| | |
Darke County, OH, (Wayne HealthCare), 4.00%, 9/1/45 | | | 2,580 | | | | 2,710,729 | |
| | |
Decatur Hospital Authority, TX, (Wise Regional Health System), 5.00%, 9/1/21 | | | 330 | | | | 336,841 | |
| | |
Decatur Hospital Authority, TX, (Wise Regional Health System), 5.00%, 9/1/22 | | | 150 | | | | 158,411 | |
| | |
Decatur Hospital Authority, TX, (Wise Regional Health System), 5.00%, 9/1/23 | | | 200 | | | | 218,550 | |
| | |
Delaware Health Facilities Authority, (Beebe Medical Center), 5.00%, 6/1/30 | | | 600 | | | | 748,764 | |
| | |
Delaware Health Facilities Authority, (Beebe Medical Center), 5.00%, 6/1/31 | | | 1,200 | | | | 1,491,336 | |
| | |
Deschutes County Hospital Facilities Authority, OR, (St. Charles Health System), 4.00%, 1/1/33 | | | 500 | | | | 559,250 | |
| | |
Doylestown Hospital Authority, PA, (Doylestown Health), 4.00%, 7/1/45 | | | 315 | | | | 336,515 | |
| | |
Doylestown Hospital Authority, PA, (Doylestown Health), 5.00%, 7/1/46 | | | 850 | | | | 943,160 | |
| | |
Doylestown Hospital Authority, PA, (Doylestown Health), 5.00%, 7/1/49 | | | 2,375 | | | | 2,726,619 | |
| | |
Escambia County Health Facilities Authority, FL, (Baptist Health Care Corp. Obligated Group), 4.00%, 8/15/50 | | | 16,330 | | | | 18,774,438 | |
| | |
Escambia County Health Facilities Authority, FL, (Baptist Health Care Corp. Obligated Group), 5.00%, 8/15/36 | | | 3,900 | | | | 4,993,443 | |
| | |
Escambia County Health Facilities Authority, FL, (Baptist Health Care Corp. Obligated Group), 5.00%, 8/15/37 | | | 6,015 | | | | 7,677,726 | |
| | |
Escambia County Health Facilities Authority, FL, (Baptist Health Care Corp. Obligated Group), 5.00%, 8/15/38 | | | 1,360 | | | | 1,731,226 | |
| | |
Escambia County Health Facilities Authority, FL, (Baptist Health Care Corp. Obligated Group), 5.00%, 8/15/40 | | | 4,080 | | | | 5,184,905 | |
| | |
Fredericksburg Economic Development Authority, VA, (Mary Washington Healthcare), 5.00%, 6/15/24 | | | 1,000 | | | | 1,144,610 | |
| | | | | | | | |
| Security | | Principal
Amount
(000’s omitted) | | | Value | |
|
| Hospital (continued) | |
| | |
Glynn-Brunswick Memorial Hospital Authority, GA, (Southeast Georgia Health System), 4.00%, 8/1/35 | | $ | 750 | | | $ | 883,402 | |
| | |
Glynn-Brunswick Memorial Hospital Authority, GA, (Southeast Georgia Health System), 4.00%, 8/1/36 | | | 750 | | | | 880,163 | |
| | |
Glynn-Brunswick Memorial Hospital Authority, GA, (Southeast Georgia Health System), 4.00%, 8/1/37 | | | 750 | | | | 875,835 | |
| | |
Glynn-Brunswick Memorial Hospital Authority, GA, (Southeast Georgia Health System), 4.00%, 8/1/38 | | | 1,750 | | | | 2,037,682 | |
| | |
Halifax Hospital Medical Center, FL, 5.00%, 6/1/27 | | | 2,890 | | | | 3,470,370 | |
| | |
Halifax Hospital Medical Center, FL, 5.00%, 6/1/29 | | | 1,830 | | | | 2,175,358 | |
| | |
Illinois Finance Authority, (Presence Health Network), 3.75%, 2/15/34 | | | 3,145 | | | | 3,575,456 | |
| | |
Illinois Finance Authority, (Presence Health Network), 5.00%, 2/15/28 | | | 8,000 | | | | 10,090,320 | |
| | |
Illinois Finance Authority, (Silver Cross Hospital and Medical Centers), 5.00%, 8/15/23 | | | 1,000 | | | | 1,108,430 | |
| | |
Illinois Finance Authority, (Silver Cross Hospital and Medical Centers), 5.00%, 8/15/28 | | | 1,670 | | | | 1,955,987 | |
| | |
Indiana County Hospital Authority, PA, (Indiana Regional Medical Center), 5.125%, 6/1/26 | | | 475 | | | | 501,999 | |
| | |
Indiana County Hospital Authority, PA, (Indiana Regional Medical Center), 5.25%, 6/1/27 | | | 415 | | | | 438,833 | |
| | |
Indiana County Hospital Authority, PA, (Indiana Regional Medical Center), 5.375%, 6/1/28 | | | 455 | | | | 481,163 | |
| | |
Indiana Finance Authority, (Parkview Health), 5.00%, 11/1/26 | | | 1,200 | | | | 1,509,180 | |
| | |
Jefferson County Civic Facility Development Corp., NY, (Samaritan Medical Center), 4.00%, 11/1/29 | | | 505 | | | | 562,095 | |
| | |
Jefferson County Civic Facility Development Corp., NY, (Samaritan Medical Center), 4.00%, 11/1/30 | | | 1,605 | | | | 1,774,440 | |
| | |
Jefferson County Civic Facility Development Corp., NY, (Samaritan Medical Center), 5.00%, 11/1/26 | | | 1,375 | | | | 1,643,785 | |
| | |
Jefferson County Civic Facility Development Corp., NY, (Samaritan Medical Center), 5.00%, 11/1/27 | | | 1,440 | | | | 1,751,342 | |
| | |
Klamath Falls Intercommunity Hospital Authority, OR, (Sky Lakes Medical Center), 4.00%, 9/1/24 | | | 475 | | | | 528,357 | |
| | |
Klamath Falls Intercommunity Hospital Authority, OR, (Sky Lakes Medical Center), 4.00%, 9/1/25 | | | 550 | | | | 625,235 | |
| | |
Klamath Falls Intercommunity Hospital Authority, OR, (Sky Lakes Medical Center), 5.00%, 9/1/28 | | | 795 | | | | 951,321 | |
| | |
Klamath Falls Intercommunity Hospital Authority, OR, (Sky Lakes Medical Center), 5.00%, 9/1/31 | | | 600 | | | | 707,982 | |
| | |
Lexington County Health Services District, Inc., SC, 5.00%, 11/1/27 | | | 200 | | | | 256,644 | |
| | |
Maine Health and Higher Educational Facilities Authority, (Northern Light Eastern Maine Medical Center), 5.00%, 7/1/34 | | | 960 | | | | 1,260,835 | |
| | |
Maine Health and Higher Educational Facilities Authority, (Northern Light Eastern Maine Medical Center), 5.00%, 7/1/35 | | | 1,510 | | | | 1,977,541 | |
| | | | |
| | 8 | | See Notes to Financial Statements. |
Eaton Vance
Municipal Opportunities Fund
January 31, 2021
Portfolio of Investments (Unaudited) — continued
| | | | | | | | |
| Security | | Principal
Amount
(000’s omitted) | | | Value | |
|
| Hospital (continued) | |
| | |
Maine Health and Higher Educational Facilities Authority, (Northern Light Eastern Maine Medical Center), 5.00%, 7/1/36 | | $ | 1,615 | | | $ | 2,107,543 | |
| | |
Maine Health and Higher Educational Facilities Authority, (Northern Light Eastern Maine Medical Center), 5.00%, 7/1/37 | | | 1,690 | | | | 2,198,166 | |
| | |
Maine Health and Higher Educational Facilities Authority, (Northern Light Eastern Maine Medical Center), 5.00%, 7/1/38 | | | 1,780 | | | | 2,308,678 | |
| | |
Maine Health and Higher Educational Facilities Authority, (Northern Light Eastern Maine Medical Center), 5.00%, 7/1/39 | | | 1,865 | | | | 2,412,918 | |
| | |
Maine Health and Higher Educational Facilities Authority, (Northern Light Eastern Maine Medical Center), 5.00%, 7/1/40 | | | 1,960 | | | | 2,529,792 | |
| | |
Massachusetts Development Finance Agency, (Atrius Health), 4.00%, 6/1/49 | | | 850 | | | | 955,230 | |
| | |
Massachusetts Development Finance Agency, (Atrius Health), 5.00%, 6/1/39 | | | 710 | | | | 881,302 | |
| | |
Massachusetts Development Finance Agency, (Lawrence General Hospital), 5.00%, 7/1/32 | | | 500 | | | | 495,185 | |
| | |
Massachusetts Development Finance Agency, (Milford Regional Medical Center), 5.00%, 7/15/27 | | | 125 | | | | 134,951 | |
| | |
Massachusetts Development Finance Agency, (Milford Regional Medical Center), 5.00%, 7/15/33(2) | | | 320 | | | | 386,390 | |
| | |
Massachusetts Development Finance Agency, (Milford Regional Medical Center), 5.00%, 7/15/34(2) | | | 300 | | | | 361,074 | |
| | |
Massachusetts Development Finance Agency, (Milford Regional Medical Center), 5.00%, 7/15/35(2) | | | 275 | | | | 330,039 | |
| | |
Massachusetts Development Finance Agency, (Milford Regional Medical Center), 5.00%, 7/15/36(2) | | | 235 | | | | 281,041 | |
| | |
Massachusetts Development Finance Agency, (Milford Regional Medical Center), 5.00%, 7/15/37(2) | | | 245 | | | | 292,060 | |
| | |
Massachusetts Development Finance Agency, (Milford Regional Medical Center), 5.00%, 7/15/46(2) | | | 1,390 | | | | 1,628,051 | |
| | |
Massachusetts Development Finance Agency, (UMass Memorial Health Care Obligated Group), 5.00%, 7/1/27 | | | 1,460 | | | | 1,832,373 | |
| | |
Massachusetts Development Finance Agency, (UMass Memorial Health Care Obligated Group), 5.00%, 7/1/28 | | | 2,000 | | | | 2,486,620 | |
| | |
Massachusetts Development Finance Agency, (UMass Memorial Health Care Obligated Group), 5.00%, 7/1/29 | | | 2,700 | | | | 3,337,038 | |
| | |
Massachusetts Development Finance Agency, (Wellforce), 5.00%, 7/1/27 | | | 1,430 | | | | 1,756,669 | |
| | |
Massachusetts Development Finance Agency, (Wellforce), 5.00%, 7/1/28 | | | 1,250 | | | | 1,565,312 | |
| | |
Michigan Finance Authority, (Oakwood Obligated Group), 5.00%, 11/1/27 | | | 1,400 | | | | 1,510,586 | |
| | | | | | | | |
| Security | | Principal
Amount
(000’s omitted) | | | Value | |
|
| Hospital (continued) | |
| | |
Missouri Health and Educational Facilities Authority, (SSM Health Care), 5.00%, 6/1/26 | | $ | 1,000 | | | $ | 1,145,440 | |
| | |
Montgomery County Higher Education and Health Authority, PA, (Holy Redeemer Health System), 5.00%, 10/1/27 | | | 1,250 | | | | 1,381,975 | |
| | |
Nassau County Local Economic Assistance Corp., NY, (Catholic Health Services of Long Island), 5.00%, 7/1/29 | | | 1,000 | | | | 1,130,650 | |
| | |
New Hampshire Health and Education Facilities Authority, (Concord Hospital), 5.00%, 10/1/32 | | | 500 | | | | 611,600 | |
| | |
New Hampshire Health and Education Facilities Authority, (Concord Hospital), 5.00%, 10/1/33 | | | 1,000 | | | | 1,218,990 | |
| | |
New Hampshire Health and Education Facilities Authority, (Concord Hospital), 5.00%, 10/1/34 | | | 1,070 | | | | 1,301,505 | |
| | |
New Hampshire Health and Education Facilities Authority, (Concord Hospital), 5.00%, 10/1/35 | | | 1,550 | | | | 1,880,987 | |
| | |
New Jersey Health Care Facilities Financing Authority, (Barnabas Health), 5.00%, 7/1/23 | | | 605 | | | | 646,896 | |
| | |
New Jersey Health Care Facilities Financing Authority, (Hunterdon Medical Center Obligated Group), Prerefunded to 7/1/24, 5.00%, 7/1/30 | | | 500 | | | | 581,240 | |
| | |
New Jersey Health Care Facilities Financing Authority, (Inspira Health Obligated Group), 5.00%, 7/1/29 | | | 2,600 | | | | 3,180,398 | |
| | |
New Jersey Health Care Facilities Financing Authority, (Princeton HealthCare System), 5.00%, 7/1/24 | | | 1,000 | | | | 1,161,560 | |
| | |
New Jersey Health Care Facilities Financing Authority, (St. Joseph’s Healthcare System Obligated Group), 4.00%, 7/1/48 | | | 7,500 | | | | 8,360,700 | |
| | |
New Jersey Health Care Facilities Financing Authority, (St. Joseph’s Healthcare System Obligated Group), 5.00%, 7/1/30 | | | 30 | | | | 36,377 | |
| | |
New Jersey Health Care Facilities Financing Authority, (Trinitas Regional Medical Center Obligated Group), 5.00%, 7/1/29 | | | 500 | | | | 597,540 | |
| | |
New Jersey Health Care Facilities Financing Authority, (Valley Health System Obligated Group), 4.00%, 7/1/35 | | | 1,000 | | | | 1,200,720 | |
| | |
New Jersey Health Care Facilities Financing Authority, (Valley Health System Obligated Group), 4.00%, 7/1/36 | | | 1,000 | | | | 1,196,740 | |
| | |
New Jersey Health Care Facilities Financing Authority, (Valley Health System Obligated Group), 4.00%, 7/1/37 | | | 1,000 | | | | 1,193,070 | |
| | |
New Jersey Health Care Facilities Financing Authority, (Virtua Health), 5.00%, 7/1/27 | | | 500 | | | | 567,050 | |
| | |
New York Dormitory Authority, (Catholic Health System Obligated Group), 5.00%, 7/1/34 | | | 550 | | | | 681,505 | |
| | |
New York Dormitory Authority, (Catholic Health System Obligated Group), 5.00%, 7/1/35 | | | 625 | | | | 769,719 | |
| | |
New York Dormitory Authority, (Catholic Health System Obligated Group), 5.00%, 7/1/36 | | | 550 | | | | 675,180 | |
| | |
New York Dormitory Authority, (Memorial Sloan Kettering Cancer Center), 5.00%, 7/1/29 | | | 750 | | | | 958,372 | |
| | |
New York Dormitory Authority, (NYU Hospitals Center), 5.00%, 7/1/22 | | | 440 | | | | 468,829 | |
| | | | |
| | 9 | | See Notes to Financial Statements. |
Eaton Vance
Municipal Opportunities Fund
January 31, 2021
Portfolio of Investments (Unaudited) — continued
| | | | | | | | |
| Security | | Principal
Amount
(000’s omitted) | | | Value | |
|
| Hospital (continued) | |
| | |
New York Dormitory Authority, (NYU Hospitals Center), 5.00%, 7/1/23 | | $ | 600 | | | $ | 665,658 | |
| | |
New York Dormitory Authority, (NYU Hospitals Center), 5.00%, 7/1/25 | | | 2,000 | | | | 2,389,820 | |
| | |
New York Dormitory Authority, (Orange Regional Medical Center), 5.00%, 12/1/33(2) | | | 1,100 | | | | 1,261,359 | |
| | |
New York Dormitory Authority, (Orange Regional Medical Center), 5.00%, 12/1/34(2) | | | 1,200 | | | | 1,374,216 | |
| | |
New York Dormitory Authority, (Orange Regional Medical Center), 5.00%, 12/1/35(2) | | | 1,000 | | | | 1,143,250 | |
| | |
New York Dormitory Authority, (Orange Regional Medical Center), Series 2015, 5.00%, 12/1/32(2) | | | 1,100 | | | | 1,264,131 | |
| | |
New York Dormitory Authority, (Orange Regional Medical Center), Series 2017, 5.00%, 12/1/32(2) | | | 1,500 | | | | 1,782,615 | |
| | |
Northampton County General Purpose Authority, PA, (St. Luke’s University Health Network), 1.141%, (70% of 1 mo. USD LIBOR + 1.04%), 8/15/24 (Put Date), 8/15/48(3) | | | 1,000 | | | | 1,008,290 | |
| | |
Ohio, (University Hospitals Health System, Inc.), 5.00%, 1/15/27 | | | 850 | | | | 1,034,212 | |
| | |
Oklahoma Development Finance Authority, (OU Medicine), 5.00%, 8/15/33 | | | 3,165 | | | | 3,815,376 | |
| | |
Oregon Facilities Authority, (PeaceHealth), 5.00%, 11/15/29 | | | 500 | | | | 566,005 | |
| | |
Oregon Facilities Authority, (Samaritan Health Services), 5.00%, 10/1/29 | | | 300 | | | | 392,421 | |
| | |
Oregon Facilities Authority, (Samaritan Health Services), 5.00%, 10/1/40 | | | 875 | | | | 1,102,701 | |
| | |
Oroville, CA, (Oroville Hospital), 5.00%, 4/1/31 | | | 1,705 | | | | 2,049,001 | |
| | |
Oroville, CA, (Oroville Hospital), 5.25%, 4/1/34 | | | 2,000 | | | | 2,423,120 | |
| | |
Rhode Island Health and Educational Building Corp., (Care New England Health System), 5.00%, 9/1/31 | | | 4,000 | | | | 4,446,320 | |
| | |
Savannah Hospital Authority, GA, (St. Joseph’s/Candler Health System, Inc.), 4.00%, 7/1/43 | | | 2,500 | | | | 2,849,575 | |
| | |
Southcentral Pennsylvania General Authority, (Hanover Hospital, Inc.), 5.00%, 12/1/25 | | | 1,530 | | | | 1,841,998 | |
| | |
Southcentral Pennsylvania General Authority, (Hanover Hospital, Inc.), 5.00%, 12/1/26 | | | 1,410 | | | | 1,689,829 | |
| | |
Southcentral Pennsylvania General Authority, (Hanover Hospital, Inc.), 5.00%, 12/1/28 | | | 1,550 | | | | 1,832,224 | |
| | |
St. Cloud, MN, (CentraCare Health System), 5.00%, 5/1/27 | | | 1,000 | | | | 1,217,670 | |
| | |
Tallahassee, FL, (Tallahassee Memorial HealthCare, Inc.), 5.00%, 12/1/26 | | | 500 | | | | 588,315 | |
| | |
Tallahassee, FL, (Tallahassee Memorial HealthCare, Inc.), 5.00%, 12/1/27 | | | 500 | | | | 585,445 | |
| | |
Virginia Small Business Financing Authority, (Sentara Healthcare), 4.00%, 11/1/39 | | | 2,750 | | | | 3,276,597 | |
| | |
Ward County, ND, (Trinity Obligated Group), 5.00%, 6/1/29 | | | 1,300 | | | | 1,565,512 | |
| | |
Ward County, ND, (Trinity Obligated Group), 5.00%, 6/1/30 | | | 1,815 | | | | 2,165,930 | |
| | | | | | | | |
| Security | | Principal
Amount
(000’s omitted) | | | Value | |
|
| Hospital (continued) | |
| | |
Ward County, ND, (Trinity Obligated Group), 5.00%, 6/1/31 | | $ | 1,885 | | | $ | 2,240,718 | |
| | |
Ward County, ND, (Trinity Obligated Group), 5.00%, 6/1/34 | | | 3,000 | | | | 3,515,280 | |
| | |
Washington Health Care Facilities Authority, (Overlake Hospital Medical Center), 5.00%, 7/1/30 | | | 1,600 | | | | 1,993,680 | |
| | |
Washington Health Care Facilities Authority, (PeaceHealth), Prerefunded to 5/15/24, 5.00%, 11/15/26 | | | 1,000 | | | | 1,152,860 | |
| | |
Wisconsin Health and Educational Facilities Authority, (Ascension Senior Credit Group), 5.00%, 11/15/27 | | | 1,000 | | | | 1,238,570 | |
| | |
Yavapai County Industrial Development Authority, AZ, (Yavapai Regional Medical Center), 5.25%, 8/1/33 | | | 250 | | | | 274,695 | |
| |
| | | | $ | 250,630,537 | |
|
| Housing — 2.9% | |
| | |
California Municipal Finance Authority, (CHF-Riverside II, LLC), 5.00%, 5/15/32 | | $ | 415 | | | $ | 519,402 | |
| | |
California Municipal Finance Authority, (CHF-Riverside II, LLC), 5.00%, 5/15/33 | | | 2,870 | | | | 3,573,580 | |
| | |
California Municipal Finance Authority, (CHF-Riverside II, LLC), 5.00%, 5/15/34 | | | 915 | | | | 1,135,140 | |
| | |
California Municipal Finance Authority, (CHF-Riverside II, LLC), 5.00%, 5/15/36 | | | 1,260 | | | | 1,551,740 | |
| | |
California Municipal Finance Authority, (CHF-Riverside II, LLC), 5.00%, 5/15/37 | | | 1,495 | | | | 1,835,755 | |
| | |
California Municipal Finance Authority, (CHF-Riverside II, LLC), 5.00%, 5/15/38 | | | 500 | | | | 612,170 | |
| | |
East Hempfield Township Industrial Development Authority, PA, (Student Services, Inc.), 5.00%, 7/1/29 | | | 500 | | | | 512,030 | |
| | |
Independent Cities Finance Authority, CA, (Union City Tropics), 4.00%, 5/15/32 | | | 1,060 | | | | 1,236,702 | |
| | |
Independent Cities Finance Authority, CA, (Union City Tropics), 4.00%, 5/15/33 | | | 1,100 | | | | 1,273,470 | |
| | |
Maryland Economic Development Corp., (Bowie State University), Student Housing Revenue, 4.00%, 7/1/32 | | | 300 | | | | 341,664 | |
| | |
Maryland Economic Development Corp., (Bowie State University), Student Housing Revenue, 4.00%, 7/1/33 | | | 330 | | | | 374,408 | |
| | |
Maryland Economic Development Corp., (Bowie State University), Student Housing Revenue, 4.00%, 7/1/34 | | | 340 | | | | 383,707 | |
| | |
Maryland Economic Development Corp., (Bowie State University), Student Housing Revenue, 4.00%, 7/1/35 | | | 350 | | | | 393,201 | |
| | |
Maryland Economic Development Corp., (Bowie State University), Student Housing Revenue, 4.00%, 7/1/40 | | | 450 | | | | 497,943 | |
| | |
Maryland Economic Development Corp., (Bowie State University), Student Housing Revenue, 4.00%, 7/1/50 | | | 935 | | | | 1,020,637 | |
| | |
Maryland Economic Development Corp., (Bowie State University), Student Housing Revenue, 5.00%, 7/1/55 | | | 2,200 | | | | 2,583,218 | |
| | |
New Hope Cultural Education Facilities Finance Corp., TX, (CHF-Collegiate Housing Galveston I, LLC), 5.00%, 4/1/23 | | | 910 | | | | 950,158 | |
| | | | |
| | 10 | | See Notes to Financial Statements. |
Eaton Vance
Municipal Opportunities Fund
January 31, 2021
Portfolio of Investments (Unaudited) — continued
| | | | | | | | |
| Security | | Principal
Amount
(000’s omitted) | | | Value | |
|
| Housing (continued) | |
| | |
New York City Housing Development Corp., NY, 2.10% to 10/1/29 (Put Date), 11/1/46 | | $ | 8,295 | | | $ | 8,988,545 | |
| | |
Phoenix Industrial Development Authority, AZ, (Downtown Phoenix Student Housing, LLC - Arizona State University), 5.00%, 7/1/31 | | | 355 | | | | 409,777 | |
| | |
Phoenix Industrial Development Authority, AZ, (Downtown Phoenix Student Housing II, LLC - Arizona State University), 5.00%, 7/1/35 | | | 770 | | | | 886,840 | |
| | |
Phoenix Industrial Development Authority, AZ, (Downtown Phoenix Student Housing II, LLC - Arizona State University), 5.00%, 7/1/37 | | | 1,235 | | | | 1,413,482 | |
| | |
Phoenix Industrial Development Authority, AZ, (Downtown Phoenix Student Housing II, LLC - Arizona State University), 5.00%, 7/1/39 | | | 860 | | | | 978,809 | |
| | |
Phoenix Industrial Development Authority, AZ, (Downtown Phoenix Student Housing II, LLC - Arizona State University), 5.00%, 7/1/59 | | | 1,500 | | | | 1,667,340 | |
| | |
Public Finance Authority, WI, (NC A&T Real Estate Foundation, LLC), 5.00%, 6/1/27 | | | 705 | | | | 815,622 | |
| | |
Public Finance Authority, WI, (NC A&T Real Estate Foundation, LLC), 5.00%, 6/1/28 | | | 665 | | | | 778,615 | |
| | |
Public Finance Authority, WI, (NC A&T Real Estate Foundation, LLC), 5.00%, 6/1/29 | | | 365 | | | | 431,722 | |
| | |
Public Finance Authority, WI, (NC A&T Real Estate Foundation, LLC), 5.00%, 6/1/34 | | | 2,560 | | | | 2,957,286 | |
| | |
Public Finance Authority, WI, (NC A&T Real Estate Foundation, LLC), 5.00%, 6/1/39 | | | 1,595 | | | | 1,815,923 | |
| |
| | | | $ | 39,938,886 | |
|
| Industrial Development Revenue — 4.1% | |
| | |
Arkansas Development Finance Authority, (Big River Steel), Green Bonds, (AMT), 4.75%, 9/1/49(2) | | $ | 4,000 | | | $ | 4,498,960 | |
| | |
Florida Development Finance Corp., (Waste Pro USA, Inc.), (AMT), 5.00%, 5/1/29(2) | | | 2,155 | | | | 2,341,278 | |
| | |
Florida Development Finance Corp., (Waste Pro USA, Inc.), (AMT), 5.00% to 8/1/22 (Put Date), 8/1/29(2) | | | 2,250 | | | | 2,351,453 | |
| | |
Illinois Finance Authority, (Navistar International Corp.), 4.75% to 8/1/30 (Put Date), 10/15/40(2) | | | 2,190 | | | | 2,367,215 | |
| | |
Maine Finance Authority, (Casella Waste Systems, Inc.), (AMT), 4.375% to 8/1/25 (Put Date), 8/1/35(2) | | | 875 | | | | 973,516 | |
| | |
Maine Finance Authority, (Casella Waste Systems, Inc.), (AMT), 5.125% to 8/1/25 (Put Date), 8/1/35(2) | | | 940 | | | | 1,076,197 | |
| | |
Michigan Strategic Fund, (Waste Management, Inc.), (AMT), 2.85% to 8/2/21 (Put Date), 8/1/27 | | | 4,000 | | | | 4,053,360 | |
| | |
National Finance Authority, NH, (Waste Management, Inc.), (AMT), 0.79%, (SIFMA + 0.75%), 10/1/21 (Put Date), 10/1/33(3) | | | 2,500 | | | | 2,500,650 | |
| | |
New Hampshire Business Finance Authority, (United Illuminating Co.), 2.80% to 10/2/23 (Put Date), 10/1/33 | | | 1,500 | | | | 1,583,055 | |
| | | | | | | | |
| Security | | Principal
Amount
(000’s omitted) | | | Value | |
|
| Industrial Development Revenue (continued) | |
| | |
New Jersey Economic Development Authority, (Continental Airlines), (AMT), 5.625%, 11/15/30 | | $ | 215 | | | $ | 241,221 | |
| | |
New Jersey Economic Development Authority, (New Jersey Natural Gas Co.), (AMT), 2.45% to 4/1/26 (Put Date), 4/1/59 | | | 2,500 | | | | 2,667,100 | |
| | |
New York State Environmental Facilities Corp., (Casella Waste Systems, Inc.), (AMT), 2.875% to 12/3/29 (Put Date), 12/1/44(2) | | | 1,675 | | | | 1,743,407 | |
| | |
New York Transportation Development Corp., (Delta Air Lines, Inc. - LaGuardia Airport Terminals C&D Redevelopment), (AMT), 5.00%, 1/1/34 | | | 5,000 | | | | 5,961,950 | |
| | |
Niagara Area Development Corp., NY, (Covanta), 3.50%, 11/1/24(2) | | | 1,920 | | | | 2,013,485 | |
| | |
Pennsylvania Economic Development Financing Authority, (Covanta), Green Bonds, (AMT), 3.25%, 8/1/39(2) | | | 5,500 | | | | 5,626,170 | |
| | |
Public Finance Authority, WI, (Celanese Corp.), (AMT), 5.00%, 12/1/25 | | | 1,000 | | | | 1,179,870 | |
| | |
Rockdale County Development Authority, GA, (Pratt Paper, LLC), (AMT), 4.00%, 1/1/38(2) | | | 9,045 | | | | 10,096,119 | |
| | |
Tuscaloosa County Industrial Development Authority, AL, (Hunt Refining Co.), 4.50%, 5/1/32(2) | | | 4,595 | | | | 5,206,319 | |
| |
| | | | $ | 56,481,325 | |
|
| Insured – Education — 0.1% | |
| | |
Missouri Southern State University, (AGM), 4.00%, 10/1/33 | | $ | 220 | | | $ | 251,255 | |
| | |
Missouri Southern State University, (AGM), 4.00%, 10/1/35 | | | 125 | | | | 141,943 | |
| | |
Missouri Southern State University, (AGM), 4.00%, 10/1/36 | | | 150 | | | | 169,753 | |
| | |
Missouri Southern State University, (AGM), 4.00%, 10/1/37 | | | 85 | | | | 95,912 | |
| | |
Missouri Southern State University, (AGM), 4.00%, 10/1/38 | | | 70 | | | | 78,775 | |
| | |
Missouri Southern State University, (AGM), 4.00%, 10/1/39 | | | 55 | | | | 61,760 | |
| | |
University of Puerto Rico, (NPFG), 5.00%, 6/1/25 | | | 120 | | | | 121,576 | |
| |
| | | | $ | 920,974 | |
|
| Insured – Electric Utilities — 1.0% | |
| | |
Brownsville, TX, Utility System Revenue, (AGM), 4.00%, 9/1/45 | | $ | 1,505 | | | $ | 1,814,789 | |
| | |
Paducah Electric Plant Board, KY, (AGM), 5.00%, 10/1/29 | | | 1,500 | | | | 1,811,310 | |
| | |
Puerto Rico Electric Power Authority, (AGC), 5.00%, 7/1/26 | | | 280 | | | | 290,184 | |
| | |
Puerto Rico Electric Power Authority, (NPFG), 5.25%, 7/1/22 | | | 3,500 | | | | 3,596,425 | |
| | |
Puerto Rico Electric Power Authority, (NPFG), 5.25%, 7/1/23 | | | 335 | | | | 349,522 | |
| | |
Puerto Rico Electric Power Authority, (NPFG), 5.25%, 7/1/25 | | | 170 | | | | 181,324 | |
| | |
Puerto Rico Electric Power Authority, (NPFG), 5.25%, 7/1/26 | | | 135 | | | | 144,771 | |
| | |
Puerto Rico Electric Power Authority, (NPFG), 5.25%, 7/1/29 | | | 1,110 | | | | 1,209,811 | |
| | |
Puerto Rico Electric Power Authority, (NPFG), 5.25%, 7/1/30 | | | 530 | | | | 580,811 | |
| | |
Puerto Rico Electric Power Authority, (NPFG), 5.25%, 7/1/34 | | | 125 | | | | 139,578 | |
| | |
Puerto Rico Electric Power Authority, (NPFG), 5.25%, 7/1/35 | | | 125 | | | | 140,379 | |
| | | | |
| | 11 | | See Notes to Financial Statements. |
Eaton Vance
Municipal Opportunities Fund
January 31, 2021
Portfolio of Investments (Unaudited) — continued
| | | | | | | | |
| Security | | Principal
Amount
(000’s omitted) | | | Value | |
|
| Insured – Electric Utilities (continued) | |
| | |
Puerto Rico Electric Power Authority, (NPFG), Series PP, 5.00%, 7/1/25 | | $ | 1,165 | | | $ | 1,180,296 | |
| | |
Puerto Rico Electric Power Authority, (NPFG), Series SS, 5.00%, 7/1/25 | | | 1,820 | | | | 1,843,897 | |
| |
| | | | $ | 13,283,097 | |
|
| Insured – Escrowed / Prerefunded — 0.1% | |
| | |
Bolingbrook, IL, (AGM), Escrowed to Maturity, 5.00%, 1/1/24 | | $ | 875 | | | $ | 995,592 | |
| | |
Cambria County, PA, (BAM), Escrowed to Maturity, 5.00%, 8/1/23 | | | 240 | | | | 268,747 | |
| | |
Cambria County, PA, (BAM), Escrowed to Maturity, 5.00%, 8/1/23 | | | 275 | | | | 307,940 | |
| | |
Detroit, MI, Sewage Disposal System, (AGM), Prerefunded to 7/1/22, 5.00%, 7/1/39 | | | 175 | | | | 187,112 | |
| |
| | | | $ | 1,759,391 | |
|
| Insured – General Obligations — 2.6% | |
| | |
Atlantic City, NJ, (BAM), 5.00%, 3/1/23 | | $ | 500 | | | $ | 544,765 | |
| | |
Atlantic City, NJ, (BAM), 5.00%, 3/1/24 | | | 300 | | | | 339,405 | |
| | |
Bayonne, NJ, (AGM), 5.00%, 8/1/23 | | | 300 | | | | 334,899 | |
| | |
Bayonne, NJ, (AGM), 5.00%, 8/1/24 | | | 300 | | | | 348,474 | |
| | |
Bayonne, NJ, (AGM), 5.00%, 8/1/25 | | | 885 | | | | 1,067,177 | |
| | |
Bayonne, NJ, (AGM), 5.00%, 8/1/26 | | | 915 | | | | 1,098,366 | |
| | |
Bolingbrook, IL, (AGM), 5.00%, 1/1/24 | | | 125 | | | | 141,294 | |
| | |
Bolingbrook, IL, (AGM), 5.00%, 1/1/25 | | | 1,000 | | | | 1,171,150 | |
| | |
Cambria County, PA, (AGM), 4.00%, 8/1/34 | | | 745 | | | | 851,826 | |
| | |
Cambria County, PA, (BAM), 5.00%, 8/1/23 | | | 985 | | | | 1,092,276 | |
| | |
Chicago Board of Education, IL, (AGM), 5.00%, 12/1/25 | | | 1,000 | | | | 1,206,040 | |
| | |
Chicago Board of Education, IL, (NPFG), 0.00%, 12/1/22 | | | 4,300 | | | | 4,228,749 | |
| | |
Chicago Board of Education, IL, (NPFG), 0.00%, 12/1/26 | | | 1,580 | | | | 1,454,627 | |
| | |
Chicago Board of Education, IL, (NPFG), 0.00%, 12/1/28 | | | 1,560 | | | | 1,359,228 | |
| | |
Community College District No. 536, IL, (Lewis and Clark Community College), (AGM), 4.00%, 5/1/29 | | | 500 | | | | 584,930 | |
| | |
Detroit, MI, (AMBAC), 5.00%, 4/1/21 | | | 13 | | | | 13,145 | |
| | |
Detroit, MI, (AMBAC), 5.00%, 4/1/22 | | | 66 | | | | 64,913 | |
| | |
Detroit, MI, (AMBAC), 5.00%, 4/1/24 | | | 329 | | | | 316,728 | |
| | |
Luzerne County, PA, (AGM), 5.00%, 11/15/24 | | | 2,480 | | | | 2,876,998 | |
| | |
McCook, IL, (AGM), 4.00%, 12/1/24 | | | 200 | | | | 225,722 | |
| | |
McCook, IL, (AGM), 4.00%, 12/1/25 | | | 275 | | | | 319,033 | |
| | |
McCook, IL, (AGM), 4.00%, 12/1/26 | | | 260 | | | | 308,394 | |
| | |
McCook, IL, (AGM), 4.00%, 12/1/27 | | | 300 | | | | 362,691 | |
| | |
McCook, IL, (AGM), 4.00%, 12/1/28 | | | 300 | | | | 368,961 | |
| | |
McHenry County Community Unit School District No. 12, IL, (AGM), 5.00%, 1/1/25 | | | 890 | | | | 1,002,968 | |
| | | | | | | | |
| Security | | Principal
Amount
(000’s omitted) | | | Value | |
|
| Insured – General Obligations (continued) | |
| | |
McHenry County Community Unit School District No. 12, IL, (AGM), 5.00%, 1/1/26 | | $ | 925 | | | $ | 1,042,123 | |
| | |
Monroe County Industrial Development Corp., NY, (Monroe Community College Association, Inc.), (AGM), 5.00%, 1/15/25 | | | 750 | | | | 843,315 | |
| | |
Proviso Township High School District No. 209, IL, (AGM), 5.00%, 12/1/28 | | | 1,000 | | | | 1,295,550 | |
| | |
Puerto Rico Public Buildings Authority, (AMBAC), 5.45%, 7/1/30 | | | 930 | | | | 947,038 | |
| | |
Puerto Rico Public Buildings Authority, (NPFG), 6.00%, 7/1/28 | | | 2,685 | | | | 2,762,006 | |
| | |
Puerto Rico, (AGC), 5.00%, 7/1/34 | | | 310 | | | | 321,451 | |
| | |
Puerto Rico, (AGM), 5.00%, 7/1/35 | | | 1,055 | | | | 1,111,485 | |
| | |
Puerto Rico, (NPFG), 5.25%, 7/1/22 | | | 530 | | | | 534,897 | |
| | |
Puerto Rico, (NPFG), 6.00%, 7/1/27 | | | 570 | | | | 586,348 | |
| | |
Rockland County, NY, (AGM), 5.00%, 3/1/24 | | | 350 | | | | 400,592 | |
| | |
Vauxmont Metropolitan District, CO, (AGM), 5.00%, 12/1/34 | | | 1,140 | | | | 1,462,027 | |
| | |
Vauxmont Metropolitan District, CO, (AGM), 5.00%, 12/1/50 | | | 1,500 | | | | 1,848,585 | |
| | |
Will and Cook Counties Community High School District No. 210, IL, (AGM), 0.00%, 1/1/28 | | | 500 | | | | 449,865 | |
| | |
Will and Cook Counties Community High School District No. 210, IL, (BAM), 0.00%, 1/1/33 | | | 200 | | | | 155,020 | |
| |
| | | | $ | 35,443,061 | |
|
| Insured – Housing — 0.1% | |
| | |
Maryland Economic Development Corp., (University of Maryland, College Park), (AGM), 4.00%, 6/1/21 | | $ | 400 | | | $ | 403,836 | |
| | |
New Hope Cultural Education Facilities Finance Corp., TX, (CHF-Collegiate Housing College Station I, LLC), (AGM), 4.00%, 4/1/22 | | | 445 | | | | 458,617 | |
| | |
New Hope Cultural Education Facilities Finance Corp., TX, (CHF-Collegiate Housing College Station I, LLC), (AGM), 4.00%, 4/1/24 | | | 400 | | | | 432,764 | |
| |
| | | | $ | 1,295,217 | |
|
| Insured – Lease Revenue / Certificates of Participation — 0.2% | |
| | |
Georgia Local Government 1998A Grantor Trust, Certificates of Participation, (NPFG), 4.75%, 6/1/28 | | $ | 800 | | | $ | 911,984 | |
| | |
Kentucky Asset/Liability Commission, (NPFG), 0.694%, (67% of 3 mo. USD LIBOR + 0.55%), 11/1/25(3) | | | 2,000 | | | | 1,974,380 | |
| |
| | | | $ | 2,886,364 | |
|
| Insured – Other Revenue — 0.1% | |
| | |
Albany Parking Authority, NY, (AGM), 5.00%, 7/15/24 | | $ | 300 | | | $ | 346,086 | |
| | |
Albany Parking Authority, NY, (AGM), 5.00%, 7/15/25 | | | 315 | | | | 375,225 | |
| | | | |
| | 12 | | See Notes to Financial Statements. |
Eaton Vance
Municipal Opportunities Fund
January 31, 2021
Portfolio of Investments (Unaudited) — continued
| | | | | | | | |
| Security | | Principal
Amount
(000’s omitted) | | | Value | |
|
| Insured – Other Revenue (continued) | |
| | |
Puerto Rico Public Buildings Authority, (AGC), 5.00%, 7/1/36 | | $ | 120 | | | $ | 123,806 | |
| |
| | | | $ | 845,117 | |
|
| Insured – Special Tax Revenue — 1.0% | |
| | |
Illinois Sports Facilities Authority, (AGM), 5.00%, 6/15/27 | | $ | 2,325 | | | $ | 2,627,924 | |
| | |
Illinois Sports Facilities Authority, (AMBAC), 0.00%, 6/15/22 | | | 500 | | | | 490,160 | |
| | |
Puerto Rico Convention Center District Authority, (AMBAC), 5.00%, 7/1/31 | | | 3,325 | | | | 3,368,657 | |
| | |
Puerto Rico Infrastructure Financing Authority, (AMBAC), 0.00%, 7/1/43 | | | 955 | | | | 362,652 | |
| | |
Puerto Rico Infrastructure Financing Authority, (AMBAC), 5.50%, 7/1/24 | | | 305 | | | | 331,258 | |
| | |
Puerto Rico Infrastructure Financing Authority, (AMBAC), 5.50%, 7/1/26 | | | 1,145 | | | | 1,274,339 | |
| | |
Sales Tax Securitization Corp., IL, (BAM), 5.00%, 1/1/37 | | | 4,000 | | | | 5,108,360 | |
| |
| | | | $ | 13,563,350 | |
|
| Insured – Transportation — 2.3% | |
| | |
Cleveland, OH, Airport System Revenue, (AGM), 5.00%, 1/1/25 | | $ | 1,225 | | | $ | 1,430,518 | |
| | |
Metropolitan Transportation Authority, NY, (AGM), 0.779%, (69% of 1 mo. USD LIBOR + 0.68%), 4/6/21 (Put Date), 11/1/32(3) | | | 5,000 | | | | 4,995,550 | |
| | |
New Jersey Economic Development Authority, (The Goethals Bridge Replacement), (AGM), (AMT), 5.00%, 1/1/31 | | | 185 | | | | 209,341 | |
| | |
New Jersey Transportation Trust Fund Authority, (Transportation System), (AMBAC), 0.00%, 12/15/28 | | | 1,185 | | | | 1,051,782 | |
| | |
New York Transportation Development Corp., (LaGuardia Airport Terminal B Redevelopment), (AGM), (AMT), 4.00%, 7/1/32 | | | 2,000 | | | | 2,199,980 | |
| | |
Ohio, (Portsmouth Gateway Group, LLC), (AGM), (AMT), 5.00%, 12/31/26 | | | 1,000 | | | | 1,178,970 | |
| | |
Puerto Rico Highway and Transportation Authority, (AGC), 5.25%, 7/1/36 | | | 795 | | | | 967,762 | |
| | |
Puerto Rico Highway and Transportation Authority, (AGM), 5.00%, 7/1/32 | | | 1,675 | | | | 1,739,705 | |
| | |
Puerto Rico Highway and Transportation Authority, (AGM), 5.25%, 7/1/36 | | | 535 | | | | 651,464 | |
| | |
Puerto Rico Highway and Transportation Authority, (AGM), 5.50%, 7/1/31 | | | 100 | | | | 121,990 | |
| | |
Puerto Rico Highway and Transportation Authority, (AMBAC), 5.25%, 7/1/30 | | | 3,650 | | | | 4,027,045 | |
| | |
Puerto Rico Highway and Transportation Authority, (AMBAC), 5.25%, 7/1/31 | | | 2,760 | | | | 3,041,023 | |
| | |
Puerto Rico Highway and Transportation Authority, (AMBAC), 5.25%, 7/1/38 | | | 2,475 | | | | 2,725,594 | |
| | | | | | | | |
| Security | | Principal
Amount
(000’s omitted) | | | Value | |
|
| Insured – Transportation (continued) | |
| | |
Puerto Rico Highway and Transportation Authority, (AMBAC), 5.50%, 7/1/29 | | $ | 1,320 | | | $ | 1,481,132 | |
| | |
Puerto Rico Highway and Transportation Authority, (NPFG), 5.00%, 7/1/29 | | | 2,570 | | | | 2,603,744 | |
| | |
Puerto Rico Highway and Transportation Authority, (NPFG), 5.25%, 7/1/23 | | | 380 | | | | 396,473 | |
| | |
Puerto Rico Highway and Transportation Authority, (NPFG), 5.25%, 7/1/32 | | | 100 | | | | 110,641 | |
| | |
Puerto Rico Highway and Transportation Authority, (NPFG), 5.25%, 7/1/33 | | | 200 | | | | 221,996 | |
| | |
Puerto Rico Highway and Transportation Authority, (NPFG), 5.25%, 7/1/35 | | | 2,470 | | | | 2,755,804 | |
| |
| | | | $ | 31,910,514 | |
|
| Insured – Water and Sewer — 0.3% | |
| | |
Michigan Finance Authority, (Detroit Water and Sewerage Department), (AGM), 5.00%, 7/1/26 | | $ | 4,000 | | | $ | 4,601,920 | |
| |
| | | | $ | 4,601,920 | |
|
| Lease Revenue / Certificates of Participation — 0.8% | |
| | |
Commonwealth Financing Authority, PA, Tobacco Master Settlement Payment Revenue, 5.00%, 6/1/28 | | $ | 3,000 | | | $ | 3,886,200 | |
| | |
Commonwealth Financing Authority, PA, Tobacco Master Settlement Payment Revenue, 5.00%, 6/1/29 | | | 2,000 | | | | 2,570,380 | |
| | |
Commonwealth Financing Authority, PA, Tobacco Master Settlement Payment Revenue, 5.00%, 6/1/30 | | | 3,000 | | | | 3,830,040 | |
| | |
Michigan Strategic Fund, (Facility for Rare Isotope Beams), 5.00%, 3/1/27 | | | 1,000 | | | | 1,135,350 | |
| |
| | | | $ | 11,421,970 | |
|
| Other Revenue — 6.0% | |
| | |
Allentown Neighborhood Improvement Zone Development Authority, PA, (City Center Project), Series 2017, 5.00%, 5/1/42(2) | | $ | 7,000 | | | $ | 7,958,370 | |
| | |
Allentown Neighborhood Improvement Zone Development Authority, PA, (City Center Project), Series 2018, 5.00%, 5/1/42(2) | | | 4,500 | | | | 5,221,935 | |
| | |
Black Belt Energy Gas District, AL, 0.41%, (SIFMA + 0.37%), 10/1/26 (Put Date), 10/1/49(3) | | | 5,000 | | | | 4,919,050 | |
| | |
Buckeye Tobacco Settlement Financing Authority, OH, 4.00%, 6/1/37 | | | 2,000 | | | | 2,437,380 | |
| | |
Buckeye Tobacco Settlement Financing Authority, OH, 4.00%, 6/1/38 | | | 2,000 | | | | 2,424,120 | |
| | |
Buckeye Tobacco Settlement Financing Authority, OH, 5.00%, 6/1/36 | | | 2,000 | | | | 2,626,020 | |
| | |
California Infrastructure and Economic Development Bank, (Academy of Motion Picture Arts and Sciences Obligated Group), 5.00%, 11/1/26 | | | 1,000 | | | | 1,128,930 | |
| | | | |
| | 13 | | See Notes to Financial Statements. |
Eaton Vance
Municipal Opportunities Fund
January 31, 2021
Portfolio of Investments (Unaudited) — continued
| | | | | | | | |
| Security | | Principal
Amount
(000’s omitted) | | | Value | |
|
| Other Revenue (continued) | |
| | |
California Infrastructure and Economic Development Bank, (Academy of Motion Picture Arts and Sciences Obligated Group), 5.00%, 11/1/27 | | $ | 1,010 | | | $ | 1,137,836 | |
| | |
Cleveland-Cuyahoga County Port Authority, OH, (Playhouse Square Foundation), 5.00%, 12/1/28 | | | 1,320 | | | | 1,430,128 | |
| | |
Kalispel Tribe of Indians, WA, Series A, 5.00%, 1/1/32(2) | | | 1,465 | | | | 1,688,149 | |
| | |
Kalispel Tribe of Indians, WA, Series B, 5.00%, 1/1/32(2) | | | 1,000 | | | | 1,152,320 | |
| | |
Kansas City Land Clearance for Redevelopment Authority, MO, (Convention Center Hotel), 5.00%, 2/1/40(2) | | | 4,550 | | | | 4,876,963 | |
| | |
Main Street Natural Gas, Inc., GA, 0.846%, (67% of 1 mo. USD LIBOR + 0.75%), 9/1/23 (Put Date), 4/1/48(3) | | | 5,500 | | | | 5,511,550 | |
| | |
Metropolitan Transportation Authority, NY, Dedicated Tax Fund Revenue, 0.49%, (SIFMA + 0.45%), 6/1/22 (Put Date), 11/1/26(3) | | | 8,295 | | | | 8,287,783 | |
| | |
Morongo Band of Mission Indians, CA, 5.00%, 10/1/42(2) | | | 1,775 | | | | 1,998,260 | |
| | |
New Jersey Economic Development Authority, (The Seeing Eye, Inc.), 5.00%, 3/1/25 | | | 3,500 | | | | 4,094,090 | |
| | |
New York City Cultural Resources Trust, NY, (Lincoln Center for the Performing Arts, Inc.), 4.00%, 12/1/35 | | | 1,250 | | | | 1,526,288 | |
| | |
New York City Cultural Resources Trust, NY, (Whitney Museum of American Art), Green Bonds, 5.00%, 7/1/31 | | | 3,750 | | | | 5,259,900 | |
| | |
Salt Verde Financial Corp., AZ, Senior Gas Revenue, 5.25%, 12/1/27 | | | 5,200 | | | | 6,606,444 | |
| | |
Southeast Alabama Gas Supply District, (Project No. 2), 0.946%, (67% of 1 mo. USD LIBOR + 0.85%), 6/1/24 (Put Date), 6/1/49(3) | | | 3,000 | | | | 2,997,270 | |
| | |
Texas Municipal Gas Acquisition and Supply Corp. I, Gas Supply Revenue, 0.845%, (67% of 3 mo. USD LIBOR + 0.70%), 12/15/26(3) | | | 4,430 | | | | 4,416,045 | |
| | |
Texas Municipal Gas Acquisition and Supply Corp. III, Gas Supply Revenue, Prerefunded to 2/25/21, 5.00%, 12/15/30 | | | 100 | | | | 109,437 | |
| | |
Washington Health Care Facilities Authority, (Fred Hutchinson Cancer Research Center), 1.182%, (67% of 1 mo. USD LIBOR + 1.10%), 7/1/22 (Put Date),
1/1/42(3) | | | 1,000 | | | | 1,005,150 | |
| | |
Will and Kankakee Counties Community Unit School District No. 255-U, IL, 5.00%, 6/1/26 | | | 635 | | | | 754,729 | |
| | |
Will and Kankakee Counties Community Unit School District No. 255-U, IL, 5.00%, 6/1/28 | | | 1,370 | | | | 1,617,997 | |
| | |
Will and Kankakee Counties Community Unit School District No. 255-U, IL, 5.00%, 6/1/29 | | | 700 | | | | 826,714 | |
| |
| | | | $ | 82,012,858 | |
|
| Senior Living / Life Care — 9.7% | |
| | |
Alexandria Industrial Development Authority, VA, (Goodwin House, Inc.), 5.00%, 10/1/21 | | $ | 500 | | | $ | 512,990 | |
| | |
Alexandria Industrial Development Authority, VA, (Goodwin House, Inc.), 5.00%, 10/1/22 | | | 605 | | | | 643,684 | |
| | | | | | | | |
| Security | | Principal
Amount
(000’s omitted) | | | Value | |
|
| Senior Living / Life Care (continued) | |
| | |
Alexandria Industrial Development Authority, VA, (Goodwin House, Inc.), 5.00%, 10/1/23 | | $ | 350 | | | $ | 384,857 | |
| | |
Alexandria Industrial Development Authority, VA, (Goodwin House, Inc.), 5.00%, 10/1/24 | | | 310 | | | | 351,382 | |
| | |
Alexandria Industrial Development Authority, VA, (Goodwin House, Inc.), 5.00%, 10/1/25 | | | 445 | | | | 518,830 | |
| | |
Berks County Industrial Development Authority, PA, (Highlands at Wyomissing), 5.00%, 5/15/33 | | | 500 | | | | 564,950 | |
| | |
Buffalo and Erie County Industrial Land Development Corp., NY, (Orchard Park CCRC, Inc.), 5.00%, 11/15/26 | | | 1,730 | | | | 1,963,169 | |
| | |
Buffalo and Erie County Industrial Land Development Corp., NY, (Orchard Park CCRC, Inc.), 5.00%, 11/15/27 | | | 1,320 | | | | 1,489,554 | |
| | |
Centerville, OH, (Graceworks Lutheran Services), 5.00%, 11/1/23 | | | 450 | | | | 473,909 | |
| | |
Centerville, OH, (Graceworks Lutheran Services), 5.00%, 11/1/24 | | | 705 | | | | 753,039 | |
| | |
Centerville, OH, (Graceworks Lutheran Services), 5.00%, 11/1/26 | | | 770 | | | | 839,662 | |
| | |
Centerville, OH, (Graceworks Lutheran Services), 5.00%, 11/1/27 | | | 425 | | | | 467,283 | |
| | |
Clackamas County Hospital Facility Authority, OR, (Rose Villa), 3.25%, 11/15/25 | | | 1,500 | | | | 1,515,225 | |
| | |
Clackamas County Hospital Facility Authority, OR, (Rose Villa), 5.00%, 11/15/27 | | | 285 | | | | 317,929 | |
| | |
Clackamas County Hospital Facility Authority, OR, (Rose Villa), 5.00%, 11/15/28 | | | 300 | | | | 333,069 | |
| | |
Clackamas County Hospital Facility Authority, OR, (Rose Villa), 5.00%, 11/15/29 | | | 315 | | | | 348,069 | |
| | |
Clackamas County Hospital Facility Authority, OR, (Rose Villa), 5.00%, 11/15/30 | | | 330 | | | | 363,545 | |
| | |
Clackamas County Hospital Facility Authority, OR, (Rose Villa), 5.125%, 11/15/40 | | | 260 | | | | 281,923 | |
| | |
Clackamas County Hospital Facility Authority, OR, (Rose Villa), 5.375%, 11/15/55 | | | 300 | | | | 324,291 | |
| | |
Colorado Health Facilities Authority, (Christian Living Neighborhoods), 4.00%, 1/1/29 | | | 600 | | | | 662,886 | |
| | |
Colorado Health Facilities Authority, (Christian Living Neighborhoods), 4.00%, 1/1/38 | | | 550 | | | | 571,940 | |
| | |
Colorado Health Facilities Authority, (Christian Living Neighborhoods), 5.00%, 1/1/38 | | | 1,210 | | | | 1,345,217 | |
| | |
Colorado Health Facilities Authority, (Frasier Meadows Retirement Community), 5.00%, 5/15/24 | | | 525 | | | | 570,817 | |
| | |
Colorado Health Facilities Authority, (Frasier Meadows Retirement Community), 5.00%, 5/15/25 | | | 300 | | | | 333,648 | |
| | |
Colorado Health Facilities Authority, (Frasier Meadows Retirement Community), 5.00%, 5/15/26 | | | 350 | | | | 397,520 | |
| | |
Colorado Health Facilities Authority, (Frasier Meadows Retirement Community), 5.00%, 5/15/27 | | | 400 | | | | 463,116 | |
| | |
District of Columbia, (Ingleside at Rock Creek), 4.125%, 7/1/27 | | | 1,000 | | | | 1,019,160 | |
| | | | |
| | 14 | | See Notes to Financial Statements. |
Eaton Vance
Municipal Opportunities Fund
January 31, 2021
Portfolio of Investments (Unaudited) — continued
| | | | | | | | |
| Security | | Principal
Amount
(000’s omitted) | | | Value | |
|
| Senior Living / Life Care (continued) | |
| | |
Franklin County Industrial Development Authority, PA, (Menno-Haven, Inc.), 5.00%, 12/1/29 | | $ | 195 | | | $ | 219,744 | |
| | |
Franklin County Industrial Development Authority, PA, (Menno-Haven, Inc.), 5.00%, 12/1/30 | | | 500 | | | | 559,800 | |
| | |
Franklin County Industrial Development Authority, PA, (Menno-Haven, Inc.), 5.00%, 12/1/39 | | | 370 | | | | 401,587 | |
| | |
Glendale Industrial Development Authority, AZ, (Terraces of Phoenix), 4.00%, 7/1/28 | | | 225 | | | | 233,888 | |
| | |
Hanover County Economic Development Authority, VA, (Covenant Woods), 5.00%, 7/1/38 | | | 125 | | | | 131,716 | |
| | |
Hanover County Economic Development Authority, VA, (Covenant Woods), 5.00%, 7/1/48 | | | 465 | | | | 485,176 | |
| | |
Hanover County Economic Development Authority, VA, (Covenant Woods), 5.00%, 7/1/51 | | | 1,000 | | | | 1,041,680 | |
| | |
Howard County, MD, (Vantage House), 5.00%, 4/1/21 | | | 169 | | | | 169,490 | |
| | |
Howard County, MD, (Vantage House), 5.00%, 4/1/26 | | | 1,570 | | | | 1,632,078 | |
| | |
Howard County, MD, (Vantage House), 5.00%, 4/1/36 | | | 2,035 | | | | 2,106,835 | |
| | |
Illinois Finance Authority, (Lifespace Communities, Inc.), 5.00%, 5/15/27 | | | 370 | | | | 420,342 | |
| | |
Illinois Finance Authority, (Plymouth Place, Inc.), 5.00%, 5/15/25 | | | 1,605 | | | | 1,691,124 | |
| | |
Iowa Finance Authority, (Lifespace Communities, Inc.), 5.00%, 5/15/55 | | | 2,075 | | | | 2,370,397 | |
| | |
Lancaster County Hospital Authority, PA, (Brethren Village), 5.00%, 7/1/23 | | | 700 | | | | 739,550 | |
| | |
Lancaster County Hospital Authority, PA, (Brethren Village), 5.00%, 7/1/24 | | | 915 | | | | 984,723 | |
| | |
Lancaster County Hospital Authority, PA, (Brethren Village), 5.00%, 7/1/25 | | | 650 | | | | 711,516 | |
| | |
Lee County Industrial Development Authority, FL, (Shell Point), 5.50%, 11/15/21 | | | 30 | | | | 30,962 | |
| | |
Massachusetts Development Finance Agency, (Linden Ponds, Inc.), 5.00%, 11/15/28(2) | | | 1,200 | | | | 1,353,588 | |
| | |
Missouri Health and Educational Facilities Authority, (Lutheran Senior Services), 4.00%, 2/1/30 | | | 1,500 | | | | 1,720,695 | |
| | |
Missouri Health and Educational Facilities Authority, (Lutheran Senior Services), 4.00%, 2/1/32 | | | 395 | | | | 446,879 | |
| | |
Missouri Health and Educational Facilities Authority, (Lutheran Senior Services), 4.00%, 2/1/33 | | | 865 | | | | 970,513 | |
| | |
Missouri Health and Educational Facilities Authority, (Lutheran Senior Services), 4.00%, 2/1/34 | | | 1,280 | | | | 1,428,224 | |
| | |
Missouri Health and Educational Facilities Authority, (Lutheran Senior Services), 4.00%, 2/1/35 | | | 310 | | | | 343,517 | |
| | |
Missouri Health and Educational Facilities Authority, (Lutheran Senior Services), 5.00%, 2/1/46 | | | 1,480 | | | | 1,651,325 | |
| | |
Montgomery County Industrial Development Authority, PA, (Waverly Heights, Ltd.), 4.00%, 12/1/30 | | | 200 | | | | 222,726 | |
| | |
Montgomery County Industrial Development Authority, PA, (Waverly Heights, Ltd.), 4.00%, 12/1/31 | | | 150 | | | | 166,350 | |
| | | | | | | | |
| Security | | Principal
Amount
(000’s omitted) | | | Value | |
|
| Senior Living / Life Care (continued) | |
| | |
Montgomery County Industrial Development Authority, PA, (Waverly Heights, Ltd.), 4.00%, 12/1/32 | | $ | 200 | | | $ | 220,890 | |
| | |
Montgomery County Industrial Development Authority, PA, (Waverly Heights, Ltd.), 4.00%, 12/1/33 | | | 100 | | | | 110,078 | |
| | |
Montgomery County Industrial Development Authority, PA, (Waverly Heights, Ltd.), 4.00%, 12/1/34 | | | 200 | | | | 219,346 | |
| | |
Montgomery County Industrial Development Authority, PA, (Waverly Heights, Ltd.), 4.00%, 12/1/35 | | | 350 | | | | 383,303 | |
| | |
Montgomery County Industrial Development Authority, PA, (Waverly Heights, Ltd.), 4.00%, 12/1/36 | | | 350 | | | | 382,694 | |
| | |
Montgomery County Industrial Development Authority, PA, (Waverly Heights, Ltd.), 4.00%, 12/1/37 | | | 300 | | | | 327,474 | |
| | |
Montgomery County Industrial Development Authority, PA, (Waverly Heights, Ltd.), 4.00%, 12/1/38 | | | 300 | | | | 326,955 | |
| | |
Montgomery County Industrial Development Authority, PA, (Whitemarsh Continuing Care Retirement Community), 4.00%, 1/1/23 | | | 195 | | | | 199,594 | |
| | |
Montgomery County Industrial Development Authority, PA, (Whitemarsh Continuing Care Retirement Community), 5.00%, 1/1/33 | | | 1,890 | | | | 2,029,406 | |
| | |
National Finance Authority, NH, (The Vista), 5.25%, 7/1/39(2) | | | 920 | | | | 964,234 | |
| | |
National Finance Authority, NH, (The Vista), 5.625%, 7/1/46(2) | | | 560 | | | | 592,805 | |
| | |
National Finance Authority, NH, (The Vista), 5.75%, 7/1/54(2) | | | 1,725 | | | | 1,830,553 | |
| | |
New Hope Cultural Education Facilities Finance Corp., TX, (Longhorn Village), 5.00%, 1/1/25 | | | 1,000 | | | | 1,104,830 | |
| | |
New Hope Cultural Education Facilities Finance Corp., TX, (Longhorn Village), 5.00%, 1/1/26 | | | 1,040 | | | | 1,149,439 | |
| | |
New Hope Cultural Education Facilities Finance Corp., TX, (Longhorn Village), 5.00%, 1/1/27 | | | 1,095 | | | | 1,207,916 | |
| | |
New Hope Cultural Education Facilities Finance Corp., TX, (Longhorn Village), 5.00%, 1/1/29 | | | 1,205 | | | | 1,326,368 | |
| | |
New Hope Cultural Education Facilities Finance Corp., TX, (Longhorn Village), 5.00%, 1/1/30 | | | 630 | | | | 691,942 | |
| | |
New Mexico Hospital Equipment Loan Council, (Haverland Carter Lifestyle Group), 5.00%, 7/1/30 | | | 430 | | | | 505,052 | |
| | |
New Mexico Hospital Equipment Loan Council, (Haverland Carter Lifestyle Group), 5.00%, 7/1/31 | | | 670 | | | | 784,670 | |
| | |
New Mexico Hospital Equipment Loan Council, (Haverland Carter Lifestyle Group), 5.00%, 7/1/32 | | | 295 | | | | 344,657 | |
| | |
New Mexico Hospital Equipment Loan Council, (Haverland Carter Lifestyle Group), 5.00%, 7/1/33 | | | 305 | | | | 355,142 | |
| | |
New Mexico Hospital Equipment Loan Council, (Haverland Carter Lifestyle Group), 5.00%, 7/1/34 | | | 195 | | | | 226,184 | |
| | |
New Mexico Hospital Equipment Loan Council, (Haverland Carter Lifestyle Group), 5.00%, 7/1/39 | | | 3,075 | | | | 3,529,239 | |
| | |
New Mexico Hospital Equipment Loan Council, (Haverland Carter Lifestyle Group), 5.00%, 7/1/49 | | | 8,875 | | | | 10,064,516 | |
| | | | |
| | 15 | | See Notes to Financial Statements. |
Eaton Vance
Municipal Opportunities Fund
January 31, 2021
Portfolio of Investments (Unaudited) — continued
| | | | | | | | |
| Security | | Principal
Amount
(000’s omitted) | | | Value | |
|
| Senior Living / Life Care (continued) | |
| | |
Norfolk Redevelopment and Housing Authority, VA, (Fort Norfolk Retirement Community, Inc. - Harbor’s Edge), 4.00%, 1/1/29 | | $ | 1,335 | | | $ | 1,391,350 | |
| | |
Norfolk Redevelopment and Housing Authority, VA, (Fort Norfolk Retirement Community, Inc. - Harbor’s Edge), 5.25%, 1/1/54 | | | 250 | | | | 266,913 | |
| | |
Palm Beach County Health Facilities Authority, FL, (Lifespace Communities, Inc.), 5.00%, 5/15/28 | | | 255 | | | | 288,479 | |
| | |
Palm Beach County Health Facilities Authority, FL, (Lifespace Communities, Inc.), 5.00%, 5/15/30 | | | 1,300 | | | | 1,462,045 | |
| | |
Palm Beach County Health Facilities Authority, FL, (Lifespace Communities, Inc.), 5.00%, 5/15/31 | | | 775 | | | | 905,921 | |
| | |
Palm Beach County Health Facilities Authority, FL, (Lifespace Communities, Inc.), 5.00%, 5/15/32 | | | 650 | | | | 756,983 | |
| | |
Palm Beach County Health Facilities Authority, FL, (Lifespace Communities, Inc.), 5.00%, 5/15/53 | | | 2,465 | | | | 2,818,777 | |
| | |
Polk County Industrial Development Authority, FL, (Carpenter’s Home Estates, Inc.), 5.00%, 1/1/39 | | | 400 | | | | 442,528 | |
| | |
Public Finance Authority, WI, (Penick Village), 5.00%, 9/1/39(2) | | | 1,540 | | | | 1,624,007 | |
| | |
Salem Hospital Facility Authority, OR, (Capital Manor), 5.00%, 5/15/27 | | | 250 | | | | 294,290 | |
| | |
Salem Hospital Facility Authority, OR, (Capital Manor), 5.00%, 5/15/28 | | | 270 | | | | 316,786 | |
| | |
Santa Fe, NM, (El Castillo Retirement Residences), 5.00%, 5/15/34 | | | 650 | | | | 726,329 | |
| | |
Santa Fe, NM, (El Castillo Retirement Residences), 5.00%, 5/15/39 | | | 480 | | | | 530,880 | |
| | |
South Carolina Jobs-Economic Development Authority, (Bishop Gadsden Episcopal Retirement Community), 4.00%, 4/1/34 | | | 600 | | | | 650,574 | |
| | |
South Carolina Jobs-Economic Development Authority, (Bishop Gadsden Episcopal Retirement Community), 5.00%, 4/1/44 | | | 1,285 | | | | 1,438,776 | |
| | |
South Carolina Jobs-Economic Development Authority, (Bishop Gadsden Episcopal Retirement Community), 5.00%, 4/1/49 | | | 1,510 | | | | 1,681,430 | |
| | |
South Carolina Jobs-Economic Development Authority, (South Carolina Episcopal Home at Still Hopes), 5.00%, 4/1/28 | | | 1,675 | | | | 1,842,048 | |
| | |
South Carolina Jobs-Economic Development Authority, (South Carolina Episcopal Home at Still Hopes), 5.00%, 4/1/29 | | | 1,000 | | | | 1,097,790 | |
| | |
South Carolina Jobs-Economic Development Authority, (South Carolina Episcopal Home at Still Hopes), 5.00%, 4/1/38 | | | 2,000 | | | | 2,161,060 | |
| | |
South Carolina Jobs-Economic Development Authority, (Woodlands at Furman), 5.00%, 11/15/42 | | | 300 | | | | 321,816 | |
| | |
South Carolina Jobs-Economic Development Authority, (Woodlands at Furman), 5.00%, 11/15/54 | | | 1,000 | | | | 1,058,650 | |
| | | | | | | | |
| Security | | Principal
Amount
(000’s omitted) | | | Value | |
|
| Senior Living / Life Care (continued) | |
| | |
St. Louis County Industrial Development Authority, MO, (Friendship Village St. Louis Obligated Group), 5.00%, 9/1/27 | | $ | 1,930 | | | $ | 2,240,614 | |
| | |
St. Louis County Industrial Development Authority, MO, (Friendship Village St. Louis Obligated Group), 5.00%, 9/1/38 | | | 5,225 | | | | 5,878,020 | |
| | |
St. Louis County Industrial Development Authority, MO, (St. Andrew’s Resources for Seniors Obligated Group), 5.00%, 12/1/25 | | | 995 | | | | 1,046,690 | |
| | |
Suffolk County Economic Development Corp., NY, (Peconic Landing at Southold, Inc.), 5.00%, 12/1/29 | | | 500 | | | | 579,030 | |
| | |
Tarrant County Cultural Education Facilities Finance Corp., TX, (MRC Stevenson Oaks), 6.875%, 11/15/55 | | | 4,650 | | | | 5,251,617 | |
| | |
Tempe Industrial Development Authority, AZ, (Mirabella at ASU), 5.35%, 10/1/25(2) | | | 3,000 | | | | 3,035,160 | |
| | |
Tulsa County Industrial Authority, OK, (Montereau, Inc.), 5.00%, 11/15/28 | | | 540 | | | | 611,685 | |
| | |
Tulsa County Industrial Authority, OK, (Montereau, Inc.), 5.00%, 11/15/29 | | | 400 | | | | 451,740 | |
| | |
Vermont Economic Development Authority, (Wake Robin Corp.), 5.00%, 5/1/23 | | | 1,690 | | | | 1,762,095 | |
| | |
Vermont Economic Development Authority, (Wake Robin Corp.), 5.00%, 5/1/25 | | | 745 | | | | 799,355 | |
| | |
Vermont Economic Development Authority, (Wake Robin Corp.), 5.00%, 5/1/26 | | | 585 | | | | 634,286 | |
| | |
Vermont Economic Development Authority, (Wake Robin Corp.), 5.00%, 5/1/27 | | | 500 | | | | 547,015 | |
| | |
Washington Housing Finance Commission, (Bayview Manor Homes), 4.00%, 7/1/26(2) | | | 1,105 | | | | 1,150,161 | |
| | |
Washington Housing Finance Commission, (Bayview Manor Homes), 5.00%, 7/1/31(2) | | | 750 | | | | 811,605 | |
| | |
Washington Housing Finance Commission, (Judson Park), 4.00%, 7/1/28(2) | | | 250 | | | | 265,688 | |
| | |
Washington Housing Finance Commission, (Transforming Age), 5.00%, 1/1/27(2) | | | 840 | | | | 947,864 | |
| | |
Washington Housing Finance Commission, (Transforming Age), 5.00%, 1/1/28(2) | | | 445 | | | | 507,523 | |
| | |
Washington Housing Finance Commission, (Transforming Age), 5.00%, 1/1/29(2) | | | 460 | | | | 522,873 | |
| | |
Washington Housing Finance Commission, (Transforming Age), 5.00%, 1/1/34(2) | | | 500 | | | | 557,295 | |
| | |
Washington Housing Finance Commission, (Transforming Age), 5.00%, 1/1/39(2) | | | 750 | | | | 827,212 | |
| | |
Wayzata, MN, (Folkestone Senior Living Community), 3.25%, 8/1/29 | | | 500 | | | | 505,785 | |
| | |
Wayzata, MN, (Folkestone Senior Living Community), 3.375%, 8/1/30 | | | 425 | | | | 431,294 | |
| | |
Wayzata, MN, (Folkestone Senior Living Community), 3.75%, 8/1/36 | | | 250 | | | | 255,360 | |
| | | | |
| | 16 | | See Notes to Financial Statements. |
Eaton Vance
Municipal Opportunities Fund
January 31, 2021
Portfolio of Investments (Unaudited) — continued
| | | | | | | | |
| Security | | Principal
Amount
(000’s omitted) | | | Value | |
|
| Senior Living / Life Care (continued) | |
| | |
Wayzata, MN, (Folkestone Senior Living Community), 3.75%, 8/1/37 | | $ | 500 | | | $ | 508,455 | |
| | |
Wayzata, MN, (Folkestone Senior Living Community), 4.00%, 8/1/38 | | | 175 | | | | 179,783 | |
| | |
Wayzata, MN, (Folkestone Senior Living Community), 4.00%, 8/1/39 | | | 125 | | | | 128,416 | |
| | |
Wayzata, MN, (Folkestone Senior Living Community), 5.00%, 8/1/31 | | | 350 | | | | 377,801 | |
| | |
Wayzata, MN, (Folkestone Senior Living Community), 5.00%, 8/1/32 | | | 250 | | | | 269,253 | |
| | |
Wayzata, MN, (Folkestone Senior Living Community), 5.00%, 8/1/33 | | | 350 | | | | 376,467 | |
| | |
Wayzata, MN, (Folkestone Senior Living Community), 5.00%, 8/1/34 | | | 100 | | | | 107,528 | |
| | |
Wayzata, MN, (Folkestone Senior Living Community), 5.00%, 8/1/35 | | | 100 | | | | 107,459 | |
| | |
Westchester County Local Development Corp., NY, (Kendal on Hudson), 4.00%, 1/1/23 | | | 2,410 | | | | 2,514,835 | |
| | |
Westchester County Local Development Corp., NY, (Kendal on Hudson), 5.00%, 1/1/28 | | | 3,390 | | | | 3,605,028 | |
| | |
Wisconsin Health and Educational Facilities Authority, (Saint John’s Communities, Inc.), 4.00%, 9/15/25 | | | 500 | | | | 526,570 | |
| | |
Wisconsin Health and Educational Facilities Authority, (Saint John’s Communities, Inc.), 4.00%, 9/15/26 | | | 685 | | | | 719,421 | |
| | |
Wisconsin Health and Educational Facilities Authority, (Saint John’s Communities, Inc.), 4.00%, 9/15/27 | | | 1,015 | | | | 1,063,882 | |
| | |
Wisconsin Health and Educational Facilities Authority, (Saint John’s Communities, Inc.), 5.00%, 9/15/29 | | | 1,365 | | | | 1,461,369 | |
| | |
Wisconsin Health and Educational Facilities Authority, (Saint John’s Communities, Inc.), 5.00%, 9/15/30 | | | 500 | | | | 534,510 | |
| |
| | | | $ | 133,101,552 | |
|
| Special Tax Revenue — 3.9% | |
| | |
Atlanta Development Authority, GA, (New Downtown Atlanta Stadium), 5.00%, 7/1/24 | | $ | 1,500 | | | $ | 1,684,470 | |
| | |
Atlanta, GA, (Atlantic Station), Tax Allocation Increments, 5.00%, 12/1/24 | | | 1,000 | | | | 1,139,870 | |
| | |
Baltimore, MD, (Harbor Point),
3.25%, 6/1/31(2) | | | 220 | | | | 228,422 | |
| | |
Baltimore, MD, (Harbor Point),
3.30%, 6/1/32(2) | | | 250 | | | | 257,883 | |
| | |
Baltimore, MD, (Harbor Point),
3.35%, 6/1/33(2) | | | 270 | | | | 278,826 | |
| | |
Baltimore, MD, (Harbor Point),
3.40%, 6/1/34(2) | | | 285 | | | | 294,585 | |
| | |
Baltimore, MD, (Harbor Point),
3.45%, 6/1/35(2) | | | 310 | | | | 321,011 | |
| | |
Baltimore, MD, (Harbor Point),
3.50%, 6/1/39(2) | | | 650 | | | | 664,885 | |
| | |
Detroit Downtown Development Authority, MI, 0.00%, 7/1/21 | | | 75 | | | | 73,944 | |
| | |
Franklin County Convention Facilities Authority, OH, (Greater Columbus Convention Center Hotel Expansion), 5.00%, 12/1/36 | | | 1,360 | | | | 1,447,638 | |
| | | | | | | | |
| Security | | Principal
Amount
(000’s omitted) | | | Value | |
|
| Special Tax Revenue (continued) | |
| | |
Franklin County Convention Facilities Authority, OH, (Greater Columbus Convention Center Hotel Expansion), 5.00%, 12/1/37 | | $ | 650 | | | $ | 690,014 | |
| | |
Franklin County Convention Facilities Authority, OH, (Greater Columbus Convention Center Hotel Expansion), 5.00%, 12/1/39 | | | 905 | | | | 960,449 | |
| | |
Illinois Sports Facilities Authority, 5.00%, 6/15/28 | | | 2,000 | | | | 2,340,280 | |
| | |
Illinois, Sales Tax Revenue, 4.00%, 6/15/27 | | | 1,065 | | | | 1,186,048 | |
| | |
Illinois, Sales Tax Revenue, 4.00%, 6/15/28 | | | 2,170 | | | | 2,403,709 | |
| | |
Illinois, Sales Tax Revenue, 4.00%, 6/15/29 | | | 8,280 | | | | 9,116,280 | |
| | |
Irving, TX, Hotel Occupancy Tax Revenue, 5.00%, 8/15/31 | | | 225 | | | | 257,180 | |
| | |
Irving, TX, Hotel Occupancy Tax Revenue, 5.00%, 8/15/33 | | | 300 | | | | 339,720 | |
| | |
Irving, TX, Hotel Occupancy Tax Revenue, 5.00%, 8/15/35 | | | 150 | | | | 168,929 | |
| | |
Jurupa Public Financing Authority, CA, 5.00%, 9/1/25 | | | 735 | | | | 851,321 | |
| | |
Marquette Brownfield Redevelopment Authority, MI, 5.00%, 5/1/31 | | | 1,655 | | | | 2,031,148 | |
| | |
Michigan Finance Authority, Detroit Financial Recovery Income Tax Revenue, 4.50%, 10/1/29 | | | 2,145 | | | | 2,262,739 | |
| | |
New York Dormitory Authority, Personal Income Tax Revenue, 5.00%, 2/15/27 | | | 4,000 | | | | 4,996,880 | |
| | |
Puerto Rico Sales Tax Financing Corp., 5.00%, 7/1/58 | | | 4,881 | | | | 5,565,365 | |
| | |
Sales Tax Securitization Corp., IL, 5.00%, 1/1/30 | | | 2,000 | | | | 2,617,640 | |
| | |
San Francisco Bay Area Rapid Transit District, CA, Sales Tax Revenue, 4.00%, 7/1/34 | | | 1,615 | | | | 1,935,222 | |
| | |
South Village Community Development District, FL, 2.00%, 5/1/21 | | | 100 | | | | 100,387 | |
| | |
South Village Community Development District, FL, 2.125%, 5/1/22 | | | 100 | | | | 101,191 | |
| | |
South Village Community Development District, FL, 2.375%, 5/1/23 | | | 100 | | | | 102,859 | |
| | |
South Village Community Development District, FL, 2.50%, 5/1/24 | | | 100 | | | | 104,097 | |
| | |
South Village Community Development District, FL, 2.75%, 5/1/25 | | | 100 | | | | 106,305 | |
| | |
South Village Community Development District, FL, 3.25%, 5/1/27 | | | 100 | | | | 108,638 | |
| | |
South Village Community Development District, FL, 4.35%, 5/1/26 | | | 420 | | | | 443,554 | |
| | |
Sparks, NV, (Legends at Sparks Marina), 2.75%, 6/15/28(2) | | | 3,250 | | | | 3,326,212 | |
| | |
St. Louis Land Clearance for Redevelopment Authority, MO, (Kiel Opera House Renovation), 3.875%, 10/1/35 | | | 990 | | | | 953,944 | |
| | |
Winter Garden Village at Fowler Groves Community Development District, FL, 3.75%, 5/1/31 | | | 4,000 | | | | 4,204,080 | |
| |
| | | | $ | 53,665,725 | |
|
| Student Loan — 0.8% | |
| | |
Connecticut Higher Education Supplemental Loan Authority, (AMT), 5.00%, 11/15/24 | | $ | 600 | | | $ | 693,852 | |
| | | | |
| | 17 | | See Notes to Financial Statements. |
Eaton Vance
Municipal Opportunities Fund
January 31, 2021
Portfolio of Investments (Unaudited) — continued
| | | | | | | | |
| Security | | Principal
Amount
(000’s omitted) | | | Value | |
|
| Student Loan (continued) | |
| | |
Massachusetts Educational Financing Authority, (AMT), 5.00%, 7/1/22 | | $ | 1,000 | | | $ | 1,066,000 | |
| | |
Massachusetts Educational Financing Authority, (AMT), 5.00%, 1/1/23 | | | 500 | | | | 544,045 | |
| | |
New Jersey Higher Education Student Assistance Authority, (AMT), 3.35%, 12/1/29 | | | 7,610 | | | | 8,110,357 | |
| |
| | | | $ | 10,414,254 | |
|
| Transportation — 13.4% | |
| | |
Austin, TX, Airport System Revenue, (AMT), 5.00%, 11/15/32 | | $ | 1,690 | | | $ | 2,170,281 | |
| | |
Austin, TX, Airport System Revenue, (AMT), 5.00%, 11/15/33 | | | 1,720 | | | | 2,199,622 | |
| | |
California Municipal Finance Authority, (LINXS Automated People Mover), (AMT), 5.00%, 12/31/34 | | | 1,700 | | | | 2,100,384 | |
| | |
California Municipal Finance Authority, (LINXS Automated People Mover), (AMT), 5.00%, 12/31/35 | | | 3,300 | | | | 4,065,831 | |
| | |
California Municipal Finance Authority, (LINXS Automated People Mover), (AMT), 5.00%, 12/31/36 | | | 3,910 | | | | 4,803,279 | |
| | |
California Municipal Finance Authority, (LINXS Automated People Mover), (AMT), 5.00%, 12/31/37 | | | 1,715 | | | | 2,101,853 | |
| | |
Central Texas Regional Mobility Authority, 5.00%, 1/1/25 | | | 350 | | | | 409,902 | |
| | |
Central Texas Regional Mobility Authority, 5.00%, 1/1/26 | | | 500 | | | | 594,925 | |
| | |
Central Texas Regional Mobility Authority, 5.00%, 1/1/27 | | | 550 | | | | 651,750 | |
| | |
Central Texas Regional Mobility Authority, 5.00%, 1/1/28 | | | 750 | | | | 886,545 | |
| | |
Central Texas Regional Mobility Authority, 5.00%, 1/1/29 | | | 600 | | | | 707,484 | |
| | |
Chicago, IL, (Midway International Airport), (AMT), 5.00%, 1/1/25 | | | 7,255 | | | | 8,398,896 | |
| | |
Chicago, IL, (Midway International Airport), (AMT), 5.00%, 1/1/27 | | | 1,000 | | | | 1,117,990 | |
| | |
Chicago, IL, (O’Hare International Airport), (AMT), 5.00%, 1/1/27 | | | 5,000 | | | | 5,830,400 | |
| | |
Colorado Bridge Enterprise, (Central 70 Project), (AMT), 4.00%, 12/31/26 | | | 3,950 | | | | 4,591,124 | |
| | |
Colorado Bridge Enterprise, (Central 70 Project), (AMT), 4.00%, 6/30/27 | | | 4,475 | | | | 5,243,313 | |
| | |
Colorado Bridge Enterprise, (Central 70 Project), (AMT), 4.00%, 12/31/27 | | | 2,425 | | | | 2,862,882 | |
| | |
Colorado Bridge Enterprise, (Central 70 Project), (AMT), 4.00%, 6/30/30 | | | 790 | | | | 904,653 | |
| | |
Dallas and Fort Worth, TX, (Dallas/Fort Worth International Airport), 5.00%, 11/1/24 | | | 500 | | | | 565,350 | |
| | |
Denver City and County, CO, Airport System Revenue, (AMT), 5.00%, 11/15/30 | | | 6,955 | | | | 8,670,381 | |
| | |
Florida Development Finance Corp., (Brightline Florida Passenger Rail), Green Bonds, (AMT), 7.375%, 1/1/49(2) | | | 17,925 | | | | 17,505,376 | |
| | |
Greater Orlando Aviation Authority, FL, (AMT), 5.00%, 10/1/21 | | | 250 | | | | 257,650 | |
| | | | | | | | |
| Security | | Principal
Amount
(000’s omitted) | | | Value | |
|
| Transportation (continued) | |
| | |
Hawaii, Airports System Revenue, 5.00%, 7/1/33 | | $ | 10,000 | | | $ | 13,375,600 | |
| | |
Illinois Toll Highway Authority, 5.00%, 1/1/27 | | | 1,250 | | | | 1,414,112 | |
| | |
Kansas City Industrial Development Authority, MO, (Kansas City International Airport Terminal Modernization), (AMT), 5.00%, 3/1/30 | | | 1,000 | | | | 1,274,930 | |
| | |
Kansas City Industrial Development Authority, MO, (Kansas City International Airport Terminal Modernization), (AMT), 5.00%, 3/1/32 | | | 1,000 | | | | 1,263,880 | |
| | |
Kansas City Industrial Development Authority, MO, (Kansas City International Airport Terminal Modernization), (AMT), 5.00%, 3/1/33 | | | 2,000 | | | | 2,515,180 | |
| | |
Kansas City Industrial Development Authority, MO, (Kansas City International Airport Terminal Modernization), (AMT), 5.00%, 3/1/34 | | | 1,800 | | | | 2,255,922 | |
| | |
Los Angeles Department of Airports, CA, (Los Angeles International Airport), (AMT), 5.00%, 5/15/25 | | | 3,105 | | | | 3,710,910 | |
| | |
Los Angeles Department of Airports, CA, (Los Angeles International Airport), (AMT), 5.00%, 5/15/27 | | | 2,700 | | | | 3,196,530 | |
| | |
Los Angeles Department of Airports, CA, (Los Angeles International Airport), (AMT), 5.00%, 5/15/34 | | | 1,710 | | | | 2,148,940 | |
| | |
Los Angeles Department of Airports, CA, (Los Angeles International Airport), (AMT), 5.00%, 5/15/36 | | | 2,515 | | | | 3,144,731 | |
| | |
Los Angeles Harbor Department, CA, (AMT), 5.00%, 8/1/26 | | | 1,230 | | | | 1,418,707 | |
| | |
Maryland Economic Development Corp., (Seagirt Marine Terminal), (AMT), 5.00%, 6/1/44 | | | 500 | | | | 567,915 | |
| | |
Maryland Economic Development Corp., (Seagirt Marine Terminal), (AMT), 5.00%, 6/1/49 | | | 750 | | | | 847,162 | |
| | |
Memphis-Shelby County Airport Authority, TN, (AMT), 5.00%, 7/1/27 | | | 1,330 | | | | 1,658,882 | |
| | |
Memphis-Shelby County Airport Authority, TN, (AMT), 5.00%, 7/1/29 | | | 1,470 | | | | 1,855,507 | |
| | |
Metropolitan Washington Airports Authority, D.C., (AMT), 5.00%, 10/1/23 | | | 810 | | | | 909,938 | |
| | |
Miami-Dade County, FL, Aviation Revenue, 4.00%, 10/1/39 | | | 1,675 | | | | 2,018,844 | |
| | |
Miami-Dade County, FL, Aviation Revenue, 5.00%, 10/1/25 | | | 1,000 | | | | 1,171,800 | |
| | |
Miami-Dade County, FL, Aviation Revenue, (AMT), 5.00%, 10/1/34 | | | 5,000 | | | | 5,705,400 | |
| | |
New Jersey Turnpike Authority, 5.00%, 1/1/32 | | | 4,520 | | | | 5,163,829 | |
| | |
New Orleans Aviation Board, LA, (AMT), 5.00%, 1/1/24 | | | 1,600 | | | | 1,803,088 | |
| | |
New Orleans Aviation Board, LA, (AMT), 5.00%, 1/1/25 | | | 1,600 | | | | 1,867,072 | |
| | |
New Orleans Aviation Board, LA, (AMT), 5.00%, 1/1/27 | | | 1,000 | | | | 1,158,930 | |
| | |
New York Transportation Development Corp., (LaGuardia Airport Terminal B Redevelopment), (AMT), 5.00%, 7/1/41 | | | 1,705 | | | | 1,926,957 | |
| | |
New York Transportation Development Corp., (LaGuardia Airport Terminal B Redevelopment), (AMT), 5.00%, 7/1/46 | | | 235 | | | | 264,669 | |
| | |
New York Transportation Development Corp., (LaGuardia Airport Terminal B Redevelopment), (AMT), 5.25%, 1/1/50 | | | 1,175 | | | | 1,331,369 | |
| | | | |
| | 18 | | See Notes to Financial Statements. |
Eaton Vance
Municipal Opportunities Fund
January 31, 2021
Portfolio of Investments (Unaudited) — continued
| | | | | | | | |
| Security | | Principal
Amount
(000’s omitted) | | | Value | |
|
| Transportation (continued) | |
| | |
North Texas Tollway Authority, 5.00%, 1/1/30 | | $ | 1,000 | | | $ | 1,205,900 | |
| | |
Pennsylvania Turnpike Commission, 5.00%, 12/1/37 | | | 6,000 | | | | 7,611,900 | |
| | |
Phoenix Civic Improvement Corp., AZ, Airport Revenue, (AMT), 5.00%, 7/1/30 | | | 2,140 | | | | 2,653,814 | |
| | |
Port Authority of New York and New Jersey, (AMT), 5.00%, 10/15/33(4) | | | 2,080 | | | | 2,744,643 | |
| | |
Port Authority of New York and New Jersey, (AMT), 5.00%, 10/15/34(4) | | | 2,200 | | | | 2,886,906 | |
| | |
Port Authority of New York and New Jersey, (AMT), 5.00%, 10/15/35(4) | | | 2,000 | | | | 2,611,160 | |
| | |
Port Authority of New York and New Jersey, (AMT), 5.00%, 10/15/36(4) | | | 2,150 | | | | 2,796,225 | |
| | |
Port of Oakland, CA, (AMT), 5.00%, 11/1/24 | | | 2,300 | | | | 2,673,865 | |
| | |
Port of Portland, OR, (Portland International Airport), (AMT), 5.00%, 7/1/32 | | | 1,500 | | | | 1,928,220 | |
| | |
Port of Portland, OR, (Portland International Airport), (AMT), 5.00%, 7/1/33 | | | 1,405 | | | | 1,797,754 | |
| | |
Port of Portland, OR, (Portland International Airport), (AMT), 5.00%, 7/1/34 | | | 1,510 | | | | 1,926,262 | |
| | |
San Jose, CA, Airport Revenue, (AMT), 5.00%, 3/1/27 | | | 1,500 | | | | 1,873,995 | |
| | |
San Jose, CA, Airport Revenue, (AMT), 5.00%, 3/1/41 | | | 5,000 | | | | 6,043,100 | |
| | |
Texas Private Activity Bond Surface Transportation Corp., (North Tarrant Express Managed Lanes Project), 5.00%, 12/31/34 | | | 3,000 | | | | 3,862,830 | |
| | |
Texas Private Activity Bond Surface Transportation Corp., (North Tarrant Express Managed Lanes Project), 5.00%, 12/31/35 | | | 1,000 | | | | 1,283,410 | |
| |
| | | | $ | 184,510,659 | |
|
| Water and Sewer — 0.6% | |
| | |
Cape Fear Public Utility Authority, NC, 4.00%, 8/1/32 | | $ | 445 | | | $ | 521,469 | |
| | |
Coldwater Local Development Finance Authority, MI, Series A, (AMT), 5.00%, 12/1/27 | | | 390 | | | | 454,420 | |
| | |
Coldwater Local Development Finance Authority, MI, Series B, (AMT), 5.00%, 12/1/27 | | | 505 | | | | 588,416 | |
| | |
Luzerne County Industrial Development Authority, PA, (Pennsylvania-American Water Co.), (AMT), 2.45% to 12/3/29 (Put Date), 12/1/39 | | | 2,750 | | | | 3,039,052 | |
| | |
San Francisco City and County Public Utilities Commission, CA, Green Bonds, Prerefunded to 11/1/24, 5.00%, 11/1/37 | | | 2,575 | | | | 3,035,127 | |
| |
| | | | $ | 7,638,484 | |
| |
Total Tax-Exempt Municipal Securities — 84.7%
(identified cost $1,085,847,842) | | | $ | 1,162,530,581 | |
| | | | | | | | |
| Taxable Municipal Securities — 4.3% | |
| Security | | Principal
Amount
(000’s omitted) | | | Value | |
| | |
| Electric Utilities — 0.2% | | | | | | |
| | |
Vernon, CA, Electric System Revenue, 4.05%, 8/1/23 | | $ | 2,000 | | | $ | 2,099,220 | |
| |
| | | | $ | 2,099,220 | |
|
| General Obligations — 1.9% | |
| | |
Atlantic City, NJ, 7.00%, 3/1/28 | | $ | 2,910 | | | $ | 3,409,211 | |
| | |
Chicago, IL, 7.375%, 1/1/33 | | | 3,250 | | | | 4,219,052 | |
| | |
Chicago, IL, 7.75%, 1/1/42 | | | 3,811 | | | | 4,300,180 | |
| | |
Chicago, IL, 7.781%, 1/1/35 | | | 2,600 | | | | 3,534,752 | |
| | |
Lakeside School District No. 9, AR, 1.10%, 4/1/31(4) | | | 2,295 | | | | 2,249,513 | |
| | |
Lakeside School District No. 9, AR, 1.45%, 4/1/34(4) | | | 2,390 | | | | 2,351,258 | |
| | |
Metropolitan Government of Nashville and Davidson County, TN, 1.386%, 7/1/30(4) | | | 4,250 | | | | 4,262,070 | |
| | |
Scottsdale, AZ, 1.47%, 7/1/34(4) | | | 1,080 | | | | 1,071,684 | |
| | |
Scottsdale, AZ, 1.57%, 7/1/35(4) | | | 550 | | | | 545,402 | |
| |
| | | | $ | 25,943,122 | |
|
| Hospital — 0.6% | |
| | |
California Statewide Communities Development Authority, (Loma Linda University Medical Center), 6.00%, 12/1/24 | | $ | 7,250 | | | $ | 8,145,737 | |
| |
| | | | $ | 8,145,737 | |
|
| Insured – General Obligations — 0.8% | |
| | |
Addison Fire Protection District No. 1, IL, (BAM), 1.642%, 12/30/29(4) | | $ | 560 | | | $ | 575,730 | |
| | |
Addison Fire Protection District No. 1, IL, (BAM), 1.942%, 12/30/31(4) | | | 505 | | | | 519,145 | |
| | |
Addison Fire Protection District No. 1, IL, (BAM), 2.402%, 12/30/34(4) | | | 400 | | | | 410,552 | |
| | |
Detroit, MI, (AMBAC), 5.15%, 4/1/25 | | | 7,923 | | | | 7,922,091 | |
| | |
Sterling, IL, (BAM), 2.45%, 11/1/34 | | | 740 | | | | 759,077 | |
| | |
Sterling, IL, (BAM), 2.65%, 11/1/36 | | | 1,325 | | | | 1,358,364 | |
| |
| | | | $ | 11,544,959 | |
|
| Insured – Hospital — 0.1% | |
| | |
Oklahoma Development Finance Authority, (OU Medicine), (AGM), 4.65%, 8/15/30 | | $ | 1,500 | | | $ | 1,770,015 | |
| |
| | | | $ | 1,770,015 | |
|
| Insured – Special Tax Revenue — 0.2% | |
| | |
Successor Agency to Pittsburg Redevelopment Agency, CA, (AGM), 3.684%, 8/1/24 | | $ | 1,030 | | | $ | 1,098,474 | |
| | | | |
| | 19 | | See Notes to Financial Statements. |
Eaton Vance
Municipal Opportunities Fund
January 31, 2021
Portfolio of Investments (Unaudited) — continued
| | | | | | | | |
| Security | | Principal
Amount
(000’s omitted) | | | Value | |
|
| Insured – Special Tax Revenue (continued) | |
| | |
Successor Agency to San Bernardino County Redevelopment Agency, CA, (AGM), 3.25%, 9/1/22 | | $ | 350 | | | $ | 363,479 | |
| | |
Successor Agency to San Bernardino County Redevelopment Agency, CA, (AGM), 3.50%, 9/1/23 | | | 510 | | | | 543,089 | |
| | |
Successor Agency to San Bernardino County Redevelopment Agency, CA, (AGM), 3.75%, 9/1/25 | | | 500 | | | | 554,095 | |
| | |
Successor Agency to San Bernardino County Redevelopment Agency, CA, (AGM), 4.00%, 9/1/26 | | | 500 | | | | 552,290 | |
| |
| | | | $ | 3,111,427 | |
|
| Senior Living / Life Care — 0.1% | |
| | |
Berks County Industrial Development Authority, PA, (Highlands at Wyomissing), 3.95%, 5/15/24 | | $ | 1,450 | | | $ | 1,490,121 | |
| |
| | | | $ | 1,490,121 | |
|
| Special Tax Revenue — 0.3% | |
| | |
Louisiana, Highway Improvement Revenue, 1.592%, 6/15/30(4) | | $ | 400 | | | $ | 405,632 | |
| | |
New Jersey Economic Development Authority, (Motor Vehicle Surcharges), 3.65%, 7/1/21 | | | 500 | | | | 505,060 | |
| | |
New Jersey Economic Development Authority, (Motor Vehicle Surcharges), 3.80%, 7/1/22 | | | 1,000 | | | | 1,032,070 | |
| | |
Ohio County Commission, WV, (Fort Henry Economic Opportunity Development District - The Highlands), 5.25%, 3/1/31 | | | 335 | | | | 335,657 | |
| | |
Scottsdale Municipal Property Corp., AZ, Excise Tax Revenue, 1.406%, 7/1/29(4) | | | 2,500 | | | | 2,533,975 | |
| |
| | | | $ | 4,812,394 | |
|
| Water and Sewer — 0.1% | |
| | |
Honolulu City and County, HI, Wastewater System Revenue, 1.473%, 7/1/30 | | $ | 750 | | | $ | 755,235 | |
| |
| | | | $ | 755,235 | |
| |
Total Taxable Municipal Securities — 4.3%
(identified cost $55,216,914) | | | $ | 59,672,230 | |
| |
Total Investments — 90.1%
(identified cost $1,156,040,969) | | | $ | 1,237,464,555 | |
| |
Other Assets, Less Liabilities — 9.9% | | | $ | 135,724,842 | |
| |
Net Assets — 100.0% | | | $ | 1,373,189,397 | |
The percentage shown for each investment category in the Portfolio of Investments is based on net assets.
At January 31, 2021, the concentration of the Fund’s investments in the various states and territories, determined as a percentage of net assets, is as follows:
| | | | |
| |
| Illinois | | | 11.9% | |
| |
| Others, representing less than 10% individually | | | 78.2% | |
The Fund invests primarily in debt securities issued by municipalities. The ability of the issuers of the debt securities to meet their obligations may be affected by economic developments in a specific industry or municipality. At January 31, 2021, 9.9% of total investments are backed by bond insurance of various financial institutions and financial guaranty assurance agencies. The aggregate percentage insured by an individual financial institution or financial guaranty assurance agency ranged from 0.1% to 4.3% of total investments.
| (1) | Amount is less than 0.05%. |
| (2) | Security exempt from registration under Rule 144A of the Securities Act of 1933, as amended. These securities may be sold in certain transactions in reliance on an exemption from registration (normally to qualified institutional buyers). At January 31, 2021, the aggregate value of these securities is $130,838,015 or 9.5% of the Fund’s net assets. |
| (3) | Floating rate security. The stated interest rate represents the rate in effect at January 31, 2021. |
| (4) | When-issued/delayed delivery security. |
Abbreviations:
| | | | |
| | |
| AGC | | – | | Assured Guaranty Corp. |
| | |
| AGM | | – | | Assured Guaranty Municipal Corp. |
| | |
| AMBAC | | – | | AMBAC Financial Group, Inc. |
| | |
| AMT | | – | | Interest earned from these securities may be considered a tax preference item for purposes of the Federal Alternative Minimum Tax. |
| | |
| BAM | | – | | Build America Mutual Assurance Co. |
| | |
| LIBOR | | – | | London Interbank Offered Rate |
| | |
| NPFG | | – | | National Public Finance Guarantee Corp. |
| | |
| SIFMA | | – | | Securities Industry and Financial Markets Association Municipal Swap Index |
Currency Abbreviations:
| | | | |
| | |
| USD | | – | | United States Dollar |
| | | | |
| | 20 | | See Notes to Financial Statements. |
Eaton Vance
Municipal Opportunities Fund
January 31, 2021
Statement of Assets and Liabilities (Unaudited)
| | | | |
| Assets | | January 31, 2021 | |
| |
Investments, at value (identified cost, $1,156,040,969) | | $ | 1,237,464,555 | |
| |
Cash | | | 138,268,815 | |
| |
Interest receivable | | | 10,315,825 | |
| |
Receivable for investments sold | | | 44,510,121 | |
| |
Receivable for Fund shares sold | | | 2,471,545 | |
| |
Total assets | | $ | 1,433,030,861 | |
| |
| Liabilities | | | | |
| |
Payable for when-issued/delayed delivery securities | | $ | 55,457,655 | |
| |
Payable for Fund shares redeemed | | | 2,833,290 | |
| |
Distributions payable | | | 387,057 | |
| |
Payable to affiliates: | | | | |
| |
Investment adviser and administration fee | | | 671,292 | |
| |
Distribution and service fees | | | 60,462 | |
| |
Accrued expenses | | | 431,708 | |
| |
Total liabilities | | $ | 59,841,464 | |
| |
Net Assets | | $ | 1,373,189,397 | |
| |
| Sources of Net Assets | | | | |
| |
Paid-in capital | | $ | 1,285,377,084 | |
| |
Distributable earnings | | | 87,812,313 | |
| |
Net Assets | | $ | 1,373,189,397 | |
| |
| Class A Shares | | | | |
| |
Net Assets | | $ | 128,723,155 | |
| |
Shares Outstanding | | | 10,113,701 | |
| |
Net Asset Value and Redemption Price Per Share | | | | |
| |
(net assets ÷ shares of beneficial interest outstanding) | | $ | 12.73 | |
| |
Maximum Offering Price Per Share | | | | |
| |
(100 ÷ 95.25 of net asset value per share) | | $ | 13.36 | |
| |
| Class C Shares | | | | |
| |
Net Assets | | $ | 39,101,013 | |
| |
Shares Outstanding | | | 3,073,173 | |
| |
Net Asset Value and Offering Price Per Share* | | | | |
| |
(net assets ÷ shares of beneficial interest outstanding) | | $ | 12.72 | |
| |
| Class I Shares | | | | |
| |
Net Assets | | $ | 1,205,365,229 | |
| |
Shares Outstanding | | | 94,572,931 | |
| |
Net Asset Value, Offering Price and Redemption Price Per Share | | | | |
| |
(net assets ÷ shares of beneficial interest outstanding) | | $ | 12.75 | |
On sales of $50,000 or more, the offering price of Class A shares is reduced.
| * | Redemption price per share is equal to the net asset value less any applicable contingent deferred sales charge. |
| | | | |
| | 21 | | See Notes to Financial Statements. |
Eaton Vance
Municipal Opportunities Fund
January 31, 2021
Statement of Operations (Unaudited)
| | | | |
| Investment Income | | Six Months Ended
January 31, 2021 | |
| |
Interest | | $ | 20,977,477 | |
| |
Dividends | | | 172,465 | |
| |
Total investment income | | $ | 21,149,942 | |
| |
| Expenses | | | | |
| |
Investment adviser and administration fee | | $ | 3,993,800 | |
| |
Distribution and service fees | | | | |
| |
Class A | | | 161,718 | |
| |
Class C | | | 202,575 | |
| |
Trustees’ fees and expenses | | | 33,773 | |
| |
Custodian fee | | | 151,173 | |
| |
Transfer and dividend disbursing agent fees | | | 204,158 | |
| |
Legal and accounting services | | | 63,458 | |
| |
Printing and postage | | | 30,337 | |
| |
Registration fees | | | 60,739 | |
| |
Interest expense and fees | | | 1,667 | |
| |
Miscellaneous | | | 123,272 | |
| |
Total expenses | | $ | 5,026,670 | |
| |
Net investment income | | $ | 16,123,272 | |
| |
| Realized and Unrealized Gain (Loss) | | | | |
| |
Net realized gain (loss) — | | | | |
| |
Investment transactions | | $ | 20,064,092 | |
| |
Net realized gain | | $ | 20,064,092 | |
| |
Change in unrealized appreciation (depreciation) — | | | | |
| |
Investments | | $ | 22,627,087 | |
| |
Net change in unrealized appreciation (depreciation) | | $ | 22,627,087 | |
| |
Net realized and unrealized gain | | $ | 42,691,179 | |
| |
Net increase in net assets from operations | | $ | 58,814,451 | |
| | | | |
| | 22 | | See Notes to Financial Statements. |
Eaton Vance
Municipal Opportunities Fund
January 31, 2021
Statements of Changes in Net Assets
| | | | | | | | |
| Increase (Decrease) in Net Assets | | Six Months Ended
January 31, 2021
(Unaudited) | | | Year Ended
July 31, 2020 | |
| | |
From operations — | | | | | | | | |
| | |
Net investment income | | $ | 16,123,272 | | | $ | 32,567,573 | |
| | |
Net realized gain (loss) | | | 20,064,092 | | | | (5,867,471 | ) |
| | |
Net change in unrealized appreciation (depreciation) | | | 22,627,087 | | | | 2,513,103 | |
| | |
Net increase in net assets from operations | | $ | 58,814,451 | | | $ | 29,213,205 | |
| | |
Distributions to shareholders — | | | | | | | | |
| | |
Class A | | $ | (1,393,304 | ) | | $ | (2,725,376 | ) |
| | |
Class C | | | (284,550 | ) | | | (647,375 | ) |
| | |
Class I | | | (14,586,492 | ) | | | (28,898,436 | ) |
| | |
Total distributions to shareholders | | $ | (16,264,346 | ) | | $ | (32,271,187 | ) |
| | |
Transactions in shares of beneficial interest — | | | | | | | | |
| | |
Proceeds from sale of shares | | | | | | | | |
| | |
Class A | | $ | 10,464,090 | | | $ | 33,587,569 | |
| | |
Class C | | | 1,207,363 | | | | 8,321,332 | |
| | |
Class I | | | 150,113,073 | | | | 541,100,650 | |
| | |
Net asset value of shares issued to shareholders in payment of distributions declared | | | | | | | | |
| | |
Class A | | | 1,248,161 | | | | 2,499,134 | |
| | |
Class C | | | 246,928 | | | | 514,318 | |
| | |
Class I | | | 12,275,157 | | | | 24,283,320 | |
| | |
Cost of shares redeemed | | | | | | | | |
| | |
Class A | | | (17,163,393 | ) | | | (34,220,640 | ) |
| | |
Class C | | | (4,778,272 | ) | | | (13,958,348 | ) |
| | |
Class I | | | (239,601,579 | ) | | | (446,174,826 | ) |
| | |
Net asset value of shares converted | | | | | | | | |
| | |
Class A | | | 741,010 | | | | 483,395 | |
| | |
Class C | | | (741,010 | ) | | | (483,395 | ) |
| | |
Net increase (decrease) in net assets from Fund share transactions | | $ | (85,988,472 | ) | | $ | 115,952,509 | |
| | |
Net increase (decrease) in net assets | | $ | (43,438,367 | ) | | $ | 112,894,527 | |
|
| Net Assets | |
| | |
At beginning of period | | $ | 1,416,627,764 | | | $ | 1,303,733,237 | |
| | |
At end of period | | $ | 1,373,189,397 | | | $ | 1,416,627,764 | |
| | | | |
| | 23 | | See Notes to Financial Statements. |
Eaton Vance
Municipal Opportunities Fund
January 31, 2021
Financial Highlights
| | | | | | | | | | | | | | | | | | | | | | | | |
| | | Class A | |
| | |
| | | Six Months Ended
January 31, 2021
(Unaudited) | | | Year Ended July 31, | |
| | | 2020 | | | 2019 | | | 2018 | | | 2017 | | | 2016 | |
| | | | | | | |
Net asset value — Beginning of period | | $ | 12.330 | | | $ | 12.310 | | | $ | 11.880 | | | $ | 11.960 | | | $ | 12.250 | | | $ | 11.490 | |
| | | | | | |
| Income (Loss) From Operations | | | | | | | | | | | | | | | | | | | | | | | | |
| | | | | | |
Net investment income | | $ | 0.133 | (1) | | $ | 0.262 | (1) | | $ | 0.277 | (1) | | $ | 0.251 | (1) | | $ | 0.236 | | | $ | 0.218 | |
| | | | | | |
Net realized and unrealized gain (loss) | | | 0.402 | | | | 0.018 | (2) | | | 0.427 | | | | (0.084 | ) | | | (0.239 | ) | | | 0.760 | |
| | | | | | |
Total income (loss) from operations | | $ | 0.535 | | | $ | 0.280 | | | $ | 0.704 | | | $ | 0.167 | | | $ | (0.003 | ) | | $ | 0.978 | |
| | | | | | |
| Less Distributions | | | | | | | | | | | | | | | | | | | | | | | | |
| | | | | | |
From net investment income | | $ | (0.135 | ) | | $ | (0.260 | ) | | $ | (0.274 | ) | | $ | (0.247 | ) | | $ | (0.236 | ) | | $ | (0.218 | ) |
| | | | | | |
From net realized gain | | | — | | | | — | | | | — | | | | — | | | | (0.051 | ) | | | — | |
| | | | | | |
Total distributions | | $ | (0.135 | ) | | $ | (0.260 | ) | | $ | (0.274 | ) | | $ | (0.247 | ) | | $ | (0.287 | ) | | $ | (0.218 | ) |
| | | | | | |
Net asset value — End of period | | $ | 12.730 | | | $ | 12.330 | | | $ | 12.310 | | | $ | 11.880 | | | $ | 11.960 | | | $ | 12.250 | |
| | | | | | |
Total Return(3) | | | 4.37 | %(4) | | | 2.32 | % | | | 6.02 | % | | | 1.41 | % | | | 0.04 | % | | | 8.59 | % |
| | | | | | |
| Ratios/Supplemental Data | | | | | | | | | | | | | | | | | | | | | | | | |
| | | | | | |
Net assets, end of period (000’s omitted) | | $ | 128,723 | | | $ | 129,416 | | | $ | 127,094 | | | $ | 116,961 | | | $ | 112,632 | | | $ | 154,283 | |
| | | | | | |
Ratios (as a percentage of average daily net assets): | | | | | | | | | | | | | | | | | | | | | | | | |
| | | | | | |
Expenses excluding interest and fees(5) | | | 0.92 | %(6) | | | 0.92 | % | | | 0.94 | % | | | 0.93 | % | | | 0.96 | % | | | 0.97 | % |
| | | | | | |
Interest and fee expense(7) | | | 0.00 | %(6)(8) | | | 0.00 | %(8) | | | — | | | | — | | | | — | | | | — | |
| | | | | | |
Total expenses(5) | | | 0.92 | %(6) | | | 0.92 | % | | | 0.94 | % | | | 0.93 | % | | | 0.96 | % | | | 0.97 | % |
| | | | | | |
Net investment income | | | 2.13 | %(6) | | | 2.15 | % | | | 2.32 | % | | | 2.11 | % | | | 2.02 | % | | | 1.85 | % |
| | | | | | |
Portfolio Turnover | | | 17 | %(4) | | | 56 | % | | | 34 | % | | | 30 | % | | | 53 | % | | | 58 | % |
| (1) | Computed using average shares outstanding. |
| (2) | The per share amount is not in accord with the net realized and unrealized gain (loss) on investments for the period because of the timing of sales of Fund shares and the amount of the per share realized and unrealized gains and losses at such time. |
| (3) | Returns are historical and are calculated by determining the percentage change in net asset value with all distributions reinvested and do not reflect the effect of sales charges. |
| (5) | Excludes the effect of custody fee credits, if any, of less than 0.005%. Effective September 1, 2015, custody fee credits, which were earned on cash deposit balances, were discontinued by the custodian. |
| (7) | Interest and fee expense relates to the liability for floating rate notes issued in conjunction with residual interest bond transactions (see Note 1H). |
| (8) | Amount is less than 0.005%. |
| | | | |
| | 24 | | See Notes to Financial Statements. |
Eaton Vance
Municipal Opportunities Fund
January 31, 2021
Financial Highlights — continued
| | | | | | | | | | | | | | | | | | | | | | | | |
| | | Class C | |
| | |
| | | Six Months Ended
January 31, 2021
(Unaudited) | | | Year Ended July 31, | |
| | | 2020 | | | 2019 | | | 2018 | | | 2017 | | | 2016 | |
| | | | | | | |
Net asset value — Beginning of period | | $ | 12.330 | | | $ | 12.300 | | | $ | 11.870 | | | $ | 11.960 | | | $ | 12.250 | | | $ | 11.480 | |
| | | | | | |
| Income (Loss) From Operations | | | | | | | | | | | | | | | | | | | | | | | | |
| | | | | | |
Net investment income | | $ | 0.087 | (1) | | $ | 0.171 | (1) | | $ | 0.188 | (1) | | $ | 0.161 | (1) | | $ | 0.146 | | | $ | 0.129 | |
| | | | | | |
Net realized and unrealized gain (loss) | | | 0.391 | | | | 0.027 | (2) | | | 0.426 | | | | (0.093 | ) | | | (0.239 | ) | | | 0.770 | |
| | | | | | |
Total income (loss) from operations | | $ | 0.478 | | | $ | 0.198 | | | $ | 0.614 | | | $ | 0.068 | | | $ | (0.093 | ) | | $ | 0.899 | |
| | | | | | |
| Less Distributions | | | | | | | | | | | | | | | | | | | | | | | | |
| | | | | | |
From net investment income | | $ | (0.088 | ) | | $ | (0.168 | ) | | $ | (0.184 | ) | | $ | (0.158 | ) | | $ | (0.146 | ) | | $ | (0.129 | ) |
| | | | | | |
From net realized gain | | | — | | | | — | | | | — | | | | — | | | | (0.051 | ) | | | — | |
| | | | | | |
Total distributions | | $ | (0.088 | ) | | $ | (0.168 | ) | | $ | (0.184 | ) | | $ | (0.158 | ) | | $ | (0.197 | ) | | $ | (0.129 | ) |
| | | | | | |
Net asset value — End of period | | $ | 12.720 | | | $ | 12.330 | | | $ | 12.300 | | | $ | 11.870 | | | $ | 11.960 | | | $ | 12.250 | |
| | | | | | |
Total Return(3) | | | 3.89 | %(4) | | | 1.64 | % | | | 5.23 | % | | | 0.57 | % | | | (0.71 | )% | | | 7.87 | % |
| | | | | | |
| Ratios/Supplemental Data | | | | | | | | | | | | | | | | | | | | | | | | |
| | | | | | |
Net assets, end of period (000’s omitted) | | $ | 39,101 | | | $ | 41,939 | | | $ | 47,617 | | | $ | 51,587 | | | $ | 54,001 | | | $ | 47,302 | |
| | | | | | |
Ratios (as a percentage of average daily net assets): | | | | | | | | | | | | | | | | | | | | | | | | |
| | | | | | |
Expenses excluding interest and fees(5) | | | 1.67 | %(6) | | | 1.67 | % | | | 1.69 | % | | | 1.69 | % | | | 1.71 | % | | | 1.72 | % |
| | | | | | |
Interest and fee expense(7) | | | 0.00 | %(6)(8) | | | 0.00 | %(8) | | | — | | | | — | | | | — | | | | — | |
| | | | | | |
Total expenses(5) | | | 1.67 | %(6) | | | 1.67 | % | | | 1.69 | % | | | 1.69 | % | | | 1.71 | % | | | 1.72 | % |
| | | | | | |
Net investment income | | | 1.38 | %(6) | | | 1.40 | % | | | 1.57 | % | | | 1.35 | % | | | 1.27 | % | | | 1.09 | % |
| | | | | | |
Portfolio Turnover | | | 17 | %(4) | | | 56 | % | | | 34 | % | | | 30 | % | | | 53 | % | | | 58 | % |
| (1) | Computed using average shares outstanding. |
| (2) | The per share amount is not in accord with the net realized and unrealized gain (loss) on investments for the period because of the timing of sales of Fund shares and the amount of the per share realized and unrealized gains and losses at such time. |
| (3) | Returns are historical and are calculated by determining the percentage change in net asset value with all distributions reinvested and do not reflect the effect of sales charges. |
| (5) | Excludes the effect of custody fee credits, if any, of less than 0.005%. Effective September 1, 2015, custody fee credits, which were earned on cash deposit balances, were discontinued by the custodian. |
| (7) | Interest and fee expense relates to the liability for floating rate notes issued in conjunction with residual interest bond transactions (see Note 1H). |
| (8) | Amount is less than 0.005%. |
| | | | |
| | 25 | | See Notes to Financial Statements. |
Eaton Vance
Municipal Opportunities Fund
January 31, 2021
Financial Highlights — continued
| | | | | | | | | | | | | | | | | | | | | | | | |
| | | Class I | |
| | |
| | | Six Months Ended
January 31, 2021
(Unaudited) | | | Year Ended July 31, | |
| | | 2020 | | | 2019 | | | 2018 | | | 2017 | | | 2016 | |
| | | | | | | |
Net asset value — Beginning of period | | $ | 12.350 | | | $ | 12.320 | | | $ | 11.900 | | | $ | 11.980 | | | $ | 12.270 | | | $ | 11.500 | |
| | | | | | |
| Income (Loss) From Operations | | | | | | | | | | | | | | | | | | | | | | | | |
| | | | | | |
Net investment income | | $ | 0.149 | (1) | | $ | 0.293 | (1) | | $ | 0.306 | (1) | | $ | 0.282 | (1) | | $ | 0.265 | | | $ | 0.248 | |
| | | | | | |
Net realized and unrealized gain (loss) | | | 0.401 | | | | 0.028 | (2) | | | 0.418 | | | | (0.085 | ) | | | (0.239 | ) | | | 0.770 | |
| | | | | | |
Total income from operations | | $ | 0.550 | | | $ | 0.321 | | | $ | 0.724 | | | $ | 0.197 | | | $ | 0.026 | | | $ | 1.018 | |
| | | | | | |
| Less Distributions | | | | | | | | | | | | | | | | | | | | | | | | |
| | | | | | |
From net investment income | | $ | (0.150 | ) | | $ | (0.291 | ) | | $ | (0.304 | ) | | $ | (0.277 | ) | | $ | (0.265 | ) | | $ | (0.248 | ) |
| | | | | | |
From net realized gain | | | — | | | | — | | | | — | | | | — | | | | (0.051 | ) | | | — | |
| | | | | | |
Total distributions | | $ | (0.150 | ) | | $ | (0.291 | ) | | $ | (0.304 | ) | | $ | (0.277 | ) | | $ | (0.316 | ) | | $ | (0.248 | ) |
| | | | | | |
Net asset value — End of period | | $ | 12.750 | | | $ | 12.350 | | | $ | 12.320 | | | $ | 11.900 | | | $ | 11.980 | | | $ | 12.270 | |
| | | | | | |
Total Return(3) | | | 4.49 | %(4) | | | 2.66 | % | | | 6.19 | % | | | 1.67 | % | | | 0.29 | % | | | 8.95 | % |
| | | | | | |
| Ratios/Supplemental Data | | | | | | | | | | | | | | | | | | | | | | | | |
| | | | | | |
Net assets, end of period (000’s omitted) | | $ | 1,205,365 | | | $ | 1,245,273 | | | $ | 1,129,022 | | | $ | 840,654 | | | $ | 630,358 | | | $ | 501,541 | |
| | | | | | |
Ratios (as a percentage of average daily net assets): | | | | | | | | | | | | | | | | | | | | | | | | |
| | | | | | |
Expenses excluding interest and fees(5) | | | 0.67 | %(6) | | | 0.67 | % | | | 0.69 | % | | | 0.68 | % | | | 0.71 | % | | | 0.72 | % |
| | | | | | |
Interest and fee expense(7) | | | 0.00 | %(6)(8) | | | 0.00 | %(8) | | | — | | | | — | | | | — | | | | — | |
| | | | | | |
Total expenses(5) | | | 0.67 | %(6) | | | 0.67 | % | | | 0.69 | % | | | 0.68 | % | | | 0.71 | % | | | 0.72 | % |
| | | | | | |
Net investment income | | | 2.38 | %(6) | | | 2.40 | % | | | 2.56 | % | | | 2.37 | % | | | 2.27 | % | | | 2.09 | % |
| | | | | | |
Portfolio Turnover | | | 17 | %(4) | | | 56 | % | | | 34 | % | | | 30 | % | | | 53 | % | | | 58 | % |
| (1) | Computed using average shares outstanding. |
| (2) | The per share amount is not in accord with the net realized and unrealized gain (loss) on investments for the period because of the timing of sales of Fund shares and the amount of the per share realized and unrealized gains and losses at such time. |
| (3) | Returns are historical and are calculated by determining the percentage change in net asset value with all distributions reinvested. |
| (5) | Excludes the effect of custody fee credits, if any, of less than 0.005%. Effective September 1, 2015, custody fee credits, which were earned on cash deposit balances, were discontinued by the custodian. |
| (7) | Interest and fee expense relates to the liability for floating rate notes issued in conjunction with residual interest bond transactions (see Note 1H). |
| (8) | Amount is less than 0.005%. |
| | | | |
| | 26 | | See Notes to Financial Statements. |
Eaton Vance
Municipal Opportunities Fund
January 31, 2021
Notes to Financial Statements (Unaudited)
1 Significant Accounting Policies
Eaton Vance Municipal Opportunities Fund (the Fund) is a diversified series of Eaton Vance Municipals Trust (the Trust). The Trust is a Massachusetts business trust registered under the Investment Company Act of 1940, as amended (the 1940 Act), as an open-end management investment company. The Fund seeks to maximize after-tax total return. The Fund offers three classes of shares. Class A shares are generally sold subject to a sales charge imposed at time of purchase. Class C shares are sold at net asset value and are generally subject to a contingent deferred sales charge (see Note 5). Effective January 25, 2019, Class C shares generally automatically convert to Class A shares ten years after their purchase and, effective November 5, 2020, automatically convert to Class A shares eight years after their purchase as described in the Fund’s prospectus. Class I shares are sold at net asset value and are not subject to a sales charge. Each class represents a pro-rata interest in the Fund, but votes separately on class-specific matters and (as noted below) is subject to different expenses. Realized and unrealized gains and losses are allocated daily to each class of shares based on the relative net assets of each class to the total net assets of the Fund. Net investment income, other than class-specific expenses, is allocated daily to each class of shares based upon the ratio of the value of each class’s paid shares to the total value of all paid shares. Each class of shares differs in its distribution plan and certain other class-specific expenses.
The following is a summary of significant accounting policies of the Fund. The policies are in conformity with accounting principles generally accepted in the United States of America (U.S. GAAP). The Fund is an investment company and follows accounting and reporting guidance in the Financial Accounting Standards Board (FASB) Accounting Standards Codification Topic 946.
A Investment Valuation — The following methodologies are used to determine the market value or fair value of investments.
Debt Obligations. Debt obligations are generally valued on the basis of valuations provided by third party pricing services, as derived from such services’ pricing models. Inputs to the models may include, but are not limited to, reported trades, executable bid and ask prices, broker/dealer quotations, prices or yields of securities with similar characteristics, interest rates, anticipated prepayments, benchmark curves or information pertaining to the issuer, as well as industry and economic events. The pricing services may use a matrix approach, which considers information regarding securities with similar characteristics to determine the valuation for a security. Short-term debt obligations purchased with a remaining maturity of sixty days or less for which a valuation from a third party pricing service is not readily available may be valued at amortized cost, which approximates fair value.
Fair Valuation. Investments for which valuations or market quotations are not readily available or are deemed unreliable are valued at fair value using methods determined in good faith by or at the direction of the Trustees of the Fund in a manner that most fairly reflects the security’s “fair value”, which is the amount that the Fund might reasonably expect to receive for the security upon its current sale in the ordinary course. Each such determination is based on a consideration of relevant factors, which are likely to vary from one pricing context to another. These factors may include, but are not limited to, the type of security, the existence of any contractual restrictions on the security’s disposition, the price and extent of public trading in similar securities of the issuer or of comparable companies or entities, quotations or relevant information obtained from broker/dealers or other market participants, information obtained from the issuer, analysts, and/or the appropriate stock exchange (for exchange-traded securities), an analysis of the company’s or entity’s financial statements, and an evaluation of the forces that influence the issuer and the market(s) in which the security is purchased and sold.
B Investment Transactions and Related Income — Investment transactions for financial statement purposes are accounted for on a trade date basis. Realized gains and losses on investments sold are determined on the basis of identified cost. Interest income is recorded on the basis of interest accrued, adjusted for amortization of premium or accretion of discount. Distributions from investment companies are recorded as dividend income, capital gains or return of capital based on the nature of the distribution.
C Federal Taxes — The Fund’s policy is to comply with the provisions of the Internal Revenue Code applicable to regulated investment companies and to distribute to shareholders each year substantially all of its taxable, if any, and tax-exempt net investment income, and all or substantially all of its net realized capital gains. Accordingly, no provision for federal income or excise tax is necessary. The Fund intends to satisfy conditions which will enable it to designate distributions from the interest and dividend income generated by its investments in non-taxable municipal securities, which are exempt from regular federal income tax when received by the Fund, as exempt-interest dividends. The portion of such interest, if any, earned on private activity bonds issued after August 7, 1986, may be considered a tax preference item to shareholders.
As of January 31, 2021, the Fund had no uncertain tax positions that would require financial statement recognition, de-recognition, or disclosure. The Fund files a U.S. federal income tax return annually after its fiscal year-end, which is subject to examination by the Internal Revenue Service for a period of three years from the date of filing.
D Expenses — The majority of expenses of the Trust are directly identifiable to an individual fund. Expenses which are not readily identifiable to a specific fund are allocated taking into consideration, among other things, the nature and type of expense and the relative size of the funds.
E Legal Fees — Legal fees and other related expenses incurred as part of negotiations of the terms and requirement of capital infusions, or that are expected to result in the restructuring of, or a plan of reorganization for, an investment are recorded as realized losses. Ongoing expenditures to protect or enhance an investment are treated as operating expenses.
F Use of Estimates — The preparation of the financial statements in conformity with U.S. GAAP requires management to make estimates and assumptions that affect the reported amounts of assets and liabilities at the date of the financial statements and the reported amounts of income and expense during the reporting period. Actual results could differ from those estimates.
Eaton Vance
Municipal Opportunities Fund
January 31, 2021
Notes to Financial Statements (Unaudited) — continued
G Indemnifications — Under the Trust’s organizational documents, its officers and Trustees may be indemnified against certain liabilities and expenses arising out of the performance of their duties to the Fund. Under Massachusetts law, if certain conditions prevail, shareholders of a Massachusetts business trust (such as the Trust) could be deemed to have personal liability for the obligations of the Trust. However, the Trust’s Declaration of Trust contains an express disclaimer of liability on the part of Fund shareholders and the By-laws provide that the Trust shall assume, upon request by the shareholder, the defense on behalf of any Fund shareholders. Moreover, the By-laws also provide for indemnification out of Fund property of any shareholder held personally liable solely by reason of being or having been a shareholder for all loss or expense arising from such liability. Additionally, in the normal course of business, the Fund enters into agreements with service providers that may contain indemnification clauses. The Fund’s maximum exposure under these arrangements is unknown as this would involve future claims that may be made against the Fund that have not yet occurred.
H Floating Rate Notes Issued in Conjunction with Securities Held — The Fund may invest in residual interest bonds, also referred to as inverse floating rate securities, whereby the Fund may sell a variable or fixed rate bond for cash to a Special-Purpose Vehicle (the SPV), (which is generally organized as a trust), while at the same time, buying a residual interest in the assets and cash flows of the SPV. The bond is deposited into the SPV with the same CUSIP number as the bond sold to the SPV by the Fund, and which may have been, but is not required to be, the bond purchased from the Fund (the Bond). The SPV also issues floating rate notes (Floating Rate Notes) which are sold to third-parties. The residual interest bond held by the Fund gives the Fund the right (1) to cause the holders of the Floating Rate Notes to generally tender their notes at par, and (2) to have the Bond held by the SPV transferred to the Fund, thereby terminating the SPV. Should the Fund exercise such right, it would generally pay the SPV the par amount due on the Floating Rate Notes and exchange the residual interest bond for the underlying Bond. Pursuant to generally accepted accounting principles for transfers and servicing of financial assets and extinguishment of liabilities, the Fund accounts for the transaction described above as a secured borrowing by including the Bond in its Portfolio of Investments and the Floating Rate Notes as a liability under the caption “Payable for floating rate notes issued” in its Statement of Assets and Liabilities. The Floating Rate Notes have interest rates that generally reset weekly and their holders have the option to tender their notes to the SPV for redemption at par at each reset date. Accordingly, the fair value of the payable for floating rate notes issued approximates its carrying value. If measured at fair value, the payable for floating rate notes would have been considered as Level 2 in the fair value hierarchy (see Note 9) at January 31, 2021. Interest expense related to the Fund’s liability with respect to Floating Rate Notes is recorded as incurred. The SPV may be terminated by the Fund, as noted above, or by the occurrence of certain termination events as defined in the trust agreement, such as a downgrade in the credit quality of the underlying Bond, bankruptcy of or payment failure by the issuer of the underlying Bond, the inability to remarket Floating Rate Notes that have been tendered due to insufficient buyers in the market, or the failure by the SPV to obtain renewal of the liquidity agreement under which liquidity support is provided for the Floating Rate Notes up to one year. At January 31, 2021, the Fund had no Floating Rate Notes outstanding. For the six months ended January 31, 2021, the Fund’s average settled Floating Rate Notes outstanding and the average interest rate (annualized) including fees were $293,478 and 1.13%, respectively.
In certain circumstances, the Fund may enter into shortfall and forbearance agreements with brokers by which the Fund agrees to reimburse the broker for the difference between the liquidation value of the Bond held by the SPV and the liquidation value of the Floating Rate Notes, as well as any shortfalls in interest cash flows. The Fund had no shortfalls as of January 31, 2021.
The Fund may also purchase residual interest bonds in a secondary market transaction without first owning the underlying bond. Such transactions are not required to be treated as secured borrowings. Shortfall agreements, if any, related to residual interest bonds purchased in a secondary market transaction are disclosed in the Portfolio of Investments.
The Fund’s investment policies and restrictions expressly permit investments in residual interest bonds. Such bonds typically offer the potential for yields exceeding the yields available on fixed rate bonds with comparable credit quality and maturity. These securities tend to underperform the market for fixed rate bonds in a rising long-term interest rate environment, but tend to outperform the market for fixed rate bonds when long-term interest rates decline. The value and income of residual interest bonds are generally more volatile than that of a fixed rate bond. The Fund’s investment policies do not allow the Fund to borrow money except as permitted by the 1940 Act. Management believes that the Fund’s restrictions on borrowing money and issuing senior securities (other than as specifically permitted) do not apply to Floating Rate Notes issued by the SPV and included as a liability in the Fund’s Statement of Assets and Liabilities. As secured indebtedness issued by an SPV, Floating Rate Notes are distinct from the borrowings and senior securities to which the Fund’s restrictions apply. Residual interest bonds held by the Fund are securities exempt from registration under Rule 144A of the Securities Act of 1933.
I When-Issued Securities and Delayed Delivery Transactions — The Fund may purchase or sell securities on a delayed delivery or when-issued basis. Payment and delivery may take place after the customary settlement period for that security. At the time the transaction is negotiated, the price of the security that will be delivered is fixed. The Fund maintains cash and/or security positions for these commitments such that sufficient liquid assets will be available to make payments upon settlement. Securities purchased on a delayed delivery or when-issued basis are marked-to-market daily and begin earning interest on settlement date. Losses may arise due to changes in the market value of the underlying securities or if the counterparty does not perform under the contract.
J Interim Financial Statements — The interim financial statements relating to January 31, 2021 and for the six months then ended have not been audited by an independent registered public accounting firm, but in the opinion of the Fund’s management, reflect all adjustments, consisting only of normal recurring adjustments, necessary for the fair presentation of the financial statements.
Eaton Vance
Municipal Opportunities Fund
January 31, 2021
Notes to Financial Statements (Unaudited) — continued
2 Distributions to Shareholders and Income Tax Information
The net investment income of the Fund is determined daily and substantially all of the net investment income so determined is declared as a dividend to shareholders of record at the time of declaration. Distributions are declared separately for each class of shares. Distributions are paid monthly. Distributions of realized capital gains are made at least annually. Shareholders may reinvest income and capital gain distributions in additional shares of the same class of the Fund at the net asset value as of the reinvestment date or, at the election of the shareholder, receive distributions in cash. Distributions to shareholders are determined in accordance with income tax regulations, which may differ from U.S. GAAP. As required by U.S. GAAP, only distributions in excess of tax basis earnings and profits are reported in the financial statements as a return of capital. Permanent differences between book and tax accounting relating to distributions are reclassified to paid-in capital. For tax purposes, distributions from short-term capital gains are considered to be from ordinary income.
At July 31, 2020, the Fund, for federal income tax purposes, had deferred capital losses of $14,479,931 which would reduce its taxable income arising from future net realized gains on investment transactions, if any, to the extent permitted by the Internal Revenue Code, and thus would reduce the amount of distributions to shareholders, which would otherwise be necessary to relieve the Fund of any liability for federal income or excise tax. The deferred capital losses are treated as arising on the first day of the Fund’s next taxable year and retain the same short-term or long-term character as when originally deferred. Of the deferred capital losses at July 31, 2020, $12,134,740 are short-term and $2,345,191 are long-term.
The cost and unrealized appreciation (depreciation) of investments of the Fund at January 31, 2021, as determined on a federal income tax basis, were as follows:
| | | | |
| |
Aggregate cost | | $ | 1,156,783,484 | |
| |
Gross unrealized appreciation | | $ | 81,473,424 | |
| |
Gross unrealized depreciation | | | (792,353 | ) |
| |
Net unrealized appreciation | | $ | 80,681,071 | |
3 Investment Adviser and Administration Fee and Other Transactions with Affiliates
The investment adviser and administration fee is earned by Eaton Vance Management (EVM), a wholly-owned subsidiary of Eaton Vance Corp., as compensation for investment advisory and administrative services rendered to the Fund. The fee is computed at an annual rate of 0.60% of the Fund’s average daily net assets up to $500 million, 0.575% from $500 million up to $1 billion, 0.55% from $1 billion up to $2.5 billion and at reduced rates on daily net assets of $2.5 billion or more, and is payable monthly. For the six months ended January 31, 2021, the investment adviser and administration fee amounted to $3,993,800 or 0.58% (annualized) of the Fund’s average daily net assets. EVM provides sub-transfer agency and related services to the Fund pursuant to a Sub-Transfer Agency Support Services Agreement. For the six months ended January 31, 2021, EVM earned $3,802 from the Fund pursuant to such agreement, which is included in transfer and dividend disbursing agent fees on the Statement of Operations. The Fund was informed that Eaton Vance Distributors, Inc. (EVD), an affiliate of EVM and the Fund’s principal underwriter, received $5,322 as its portion of the sales charge on sales of Class A shares for the six months ended January 31, 2021. EVD also received distribution and service fees from Class A and Class C shares (see Note 4) and contingent deferred sales charges (see Note 5).
Trustees and officers of the Fund who are members of EVM’s organization receive remuneration for their services to the Fund out of the investment adviser and administration fee. Trustees of the Fund who are not affiliated with EVM may elect to defer receipt of all or a percentage of their annual fees in accordance with the terms of the Trustees Deferred Compensation Plan. For the six months ended January 31, 2021, no significant amounts have been deferred. Certain officers and Trustees of the Fund are officers of EVM.
4 Distribution Plans
The Fund has in effect a distribution plan for Class A shares (Class A Plan) pursuant to Rule 12b-1 under the 1940 Act. Pursuant to the Class A Plan, the Fund pays EVD a distribution and service fee of 0.25% per annum of its average daily net assets attributable to Class A shares for distribution services and facilities provided to the Fund by EVD, as well as for personal services and/or the maintenance of shareholder accounts. Distribution and service fees paid or accrued to EVD for the six months ended January 31, 2021 amounted to $161,718 for Class A shares. The Fund also has in effect a distribution plan for Class C shares (Class C Plan) pursuant to Rule 12b-1 under the 1940 Act. Pursuant to the Class C Plan, the Fund pays EVD amounts equal to 0.75% per annum of its average daily net assets attributable to Class C shares for providing ongoing distribution services and facilities to the Fund. For the six months ended January 31, 2021, the Fund paid or accrued to EVD $151,931 for Class C shares.
Pursuant to the Class C Plan, the Fund also makes payments of service fees to EVD, financial intermediaries and other persons in amounts equal to 0.25% per annum of its average daily net assets attributable to Class C shares. Service fees paid or accrued are for personal services and/or the maintenance of shareholder accounts. They are separate and distinct from the sales commissions and distribution fees payable to EVD. Service fees paid or accrued for the six months ended January 31, 2021 amounted to $50,644 for Class C shares.
Eaton Vance
Municipal Opportunities Fund
January 31, 2021
Notes to Financial Statements (Unaudited) — continued
Distribution and service fees are subject to the limitations contained in the Financial Industry Regulatory Authority Rule 2341(d).
5 Contingent Deferred Sales Charges
A contingent deferred sales charge (CDSC) of 1% generally is imposed on redemptions of Class C shares made within 12 months of purchase. Class A shares may be subject to a 1% CDSC if redeemed within 18 months of purchase (depending on the circumstances of purchase). Generally, the CDSC is based upon the lower of the net asset value at date of redemption or date of purchase. No charge is levied on shares acquired by reinvestment of dividends or capital gain distributions. For the six months ended January 31, 2021, the Fund was informed that EVD received approximately $2,000 and $3,000 of CDSCs paid by Class A and Class C shareholders, respectively.
6 Purchases and Sales of Investments
Purchases and sales of investments, other than short-term obligations and including paydowns, aggregated $226,596,397 and $387,776,673, respectively, for the six months ended January 31, 2021.
7 Shares of Beneficial Interest
The Fund’s Declaration of Trust permits the Trustees to issue an unlimited number of full and fractional shares of beneficial interest (without par value). Such shares may be issued in a number of different series (such as the Fund) and classes. Transactions in Fund shares were as follows:
| | | | | | | | |
| Class A | | Six Months Ended
January 31, 2021
(Unaudited) | | | Year Ended
July 31, 2020 | |
| | |
Sales | | | 845,298 | | | | 2,755,631 | |
| | |
Issued to shareholders electing to receive payments of distributions in Fund shares | | | 100,496 | | | | 204,632 | |
| | |
Redemptions | | | (1,384,698 | ) | | | (2,835,592 | ) |
| | |
Converted from Class C shares | | | 59,676 | | | | 39,693 | |
| | |
Net increase (decrease) | | | (379,228 | ) | | | 164,364 | |
| | |
| Class C | | Six Months Ended
January 31, 2021
(Unaudited) | | | Year Ended
July 31, 2020 | |
| | |
Sales | | | 97,316 | | | | 681,942 | |
| | |
Issued to shareholders electing to receive payments of distributions in Fund shares | | | 19,898 | | | | 42,165 | |
| | |
Redemptions | | | (385,820 | ) | | | (1,153,964 | ) |
| | |
Converted to Class A shares | | | (59,719 | ) | | | (39,709 | ) |
| | |
Net decrease | | | (328,325 | ) | | | (469,566 | ) |
| | |
| Class I | | Six Months Ended
January 31, 2021
(Unaudited) | | | Year Ended
July 31, 2020 | |
| | |
Sales | | | 12,101,885 | | | | 44,448,190 | |
| | |
Issued to shareholders electing to receive payments of distributions in Fund shares | | | 986,806 | | | | 1,986,723 | |
| | |
Redemptions | | | (19,340,917 | ) | | | (37,230,570 | ) |
| | |
Net increase (decrease) | | | (6,252,226 | ) | | | 9,204,343 | |
Eaton Vance
Municipal Opportunities Fund
January 31, 2021
Notes to Financial Statements (Unaudited) — continued
8 Line of Credit
The Fund participates with other portfolios and funds managed by EVM and its affiliates in an $800 million unsecured line of credit agreement with a group of banks, which is in effect through October 26, 2021. Borrowings are made by the Fund solely for temporary purposes related to redemptions and other short-term cash needs. Interest is charged to the Fund based on its borrowings at an amount above either the Eurodollar rate or Federal Funds rate. In addition, a fee computed at an annual rate of 0.15% on the daily unused portion of the line of credit is allocated among the participating portfolios and funds at the end of each quarter. In connection with the renewal of the agreement in October 2020, an upfront fee and arrangement fee totaling $950,000 was incurred that was allocated to the participating portfolios and funds. Because the line of credit is not available exclusively to the Fund, it may be unable to borrow some or all of its requested amounts at any particular time. The Fund did not have any significant borrowings or allocated fees during the six months ended January 31, 2021.
9 Fair Value Measurements
Under generally accepted accounting principles for fair value measurements, a three-tier hierarchy to prioritize the assumptions, referred to as inputs, is used in valuation techniques to measure fair value. The three-tier hierarchy of inputs is summarized in the three broad levels listed below.
| • | | Level 1 – quoted prices in active markets for identical investments |
| • | | Level 2 – other significant observable inputs (including quoted prices for similar investments, interest rates, prepayment speeds, credit risk, etc.) |
| • | | Level 3 – significant unobservable inputs (including a fund’s own assumptions in determining the fair value of investments) |
In cases where the inputs used to measure fair value fall in different levels of the fair value hierarchy, the level disclosed is determined based on the lowest level input that is significant to the fair value measurement in its entirety. The inputs or methodology used for valuing securities are not necessarily an indication of the risk associated with investing in those securities.
At January 31, 2021, the hierarchy of inputs used in valuing the Fund’s investments, which are carried at value, were as follows:
| | | | | | | | | | | | | | | | |
| Asset Description | | Level 1 | | | Level 2 | | | Level 3 | | | Total | |
| | | | |
Corporate Bonds & Notes | | $ | — | | | $ | 14,786,667 | | | $ | — | | | $ | 14,786,667 | |
| | | | |
Tax-Exempt Mortgage-Backed Securities | | | — | | | | 475,077 | | | | — | | | | 475,077 | |
| | | | |
Tax-Exempt Municipal Securities | | | — | | | | 1,162,530,581 | | | | — | | | | 1,162,530,581 | |
| | | | |
Taxable Municipal Securities | | | — | | | | 59,672,230 | | | | — | | | | 59,672,230 | |
| | | | |
Total Investments | | $ | — | | | $ | 1,237,464,555 | | | $ | — | | | $ | 1,237,464,555 | |
10 Risks and Uncertainties
Pandemic Risk
An outbreak of respiratory disease caused by a novel coronavirus was first detected in China in December 2019 and subsequently spread internationally. This coronavirus has resulted in closing borders, enhanced health screenings, changes to healthcare service preparation and delivery, quarantines, cancellations, disruptions to supply chains and customer activity, as well as general concern and uncertainty. Health crises caused by outbreaks, such as the coronavirus outbreak, may exacerbate other pre-existing political, social and economic risks and disrupt normal market conditions and operations. The impact of this outbreak has negatively affected the worldwide economy, the economies of individual countries, individual companies, and the market in general, and may continue to do so in significant and unforeseen ways, as may other epidemics and pandemics that may arise in the future. Any such impact could adversely affect the Fund’s performance, or the performance of the securities in which the Fund invests.
11 Additional Information
On October 8, 2020, Morgan Stanley and Eaton Vance Corp. (“Eaton Vance”) announced that they had entered into a definitive agreement under which Morgan Stanley would acquire Eaton Vance. Under the Investment Company Act of 1940, as amended, consummation of this transaction may have been deemed to result in the automatic termination of an Eaton Vance Fund’s investment advisory agreement, and, where applicable, any related sub-advisory agreement. On November 24, 2020, the Fund’s Board approved a new investment advisory and administrative agreement. The new investment advisory and administrative agreement was approved by Fund shareholders at a joint special meeting of shareholders held on February 18, 2021, and became effective upon the consummation of the transaction on March 1, 2021.
Eaton Vance
Municipal Opportunities Fund
January 31, 2021
Board of Trustees’ Contract Approval
Overview of the Contract Review Process
Even though the following description of the Board’s (as defined below) consideration of investment advisory and, as applicable, sub-advisory agreements covers multiple funds, for purposes of this shareholder report, the description is only relevant as to Eaton Vance Municipal Opportunities Fund.
| | | | |
| Fund | | Investment Adviser | | Investment Sub-Adviser |
| | |
Eaton Vance Municipal Opportunities Fund | | Eaton Vance Management | | None |
At a meeting held on November 24, 2020 (the “November Meeting”), the Board of each Eaton Vance open-end Fund and portfolios in which each such Fund invests, as applicable (each, a “Fund” and, collectively, the “Funds”), including a majority of the Board members (the “Independent Trustees”) who are not “interested persons” (as defined in the Investment Company Act of 1940 (the “1940 Act”)) of the Funds, Eaton Vance Management (“EVM”) or Boston Management and Research (“BMR” and, together with EVM, the “Advisers”), voted to approve a new investment advisory agreement between each Fund and either EVM or BMR (the “New Investment Advisory Agreements”) and, for certain Funds, a new investment sub-advisory agreement between an Adviser and the applicable Sub-Adviser (the “New Investment Sub-Advisory Agreements”(1) and, together with the New Investment Advisory Agreements, the “New Agreements”), each of which is intended to go into effect upon the completion of the Transaction (as defined below), as more fully described below. In voting its approval of the New Agreements at the November Meeting, the Board relied on an order issued by the Securities and Exchange Commission in response to the impacts of the COVID-19 pandemic that provided temporary relief from the in-person meeting requirements under Section 15 of the 1940 Act.
In voting its approval of the New Agreements, the Board of each Fund relied upon the recommendation of its Contract Review Committee, which is a committee comprised exclusively of Independent Trustees. Prior to and during meetings leading up to the November Meeting, the Contract Review Committee reviewed and discussed information furnished by the Advisers, the Sub-Advisers, and Morgan Stanley, as requested by the Independent Trustees, that the Contract Review Committee considered reasonably necessary to evaluate the terms of the New Agreements and to form its recommendation. Such information included, among other things, the terms and anticipated impacts of Morgan Stanley’s pending acquisition of Eaton Vance Corp. (the “Transaction”) on the Funds and their shareholders. In addition to considering information furnished specifically to evaluate the impact of the Transaction on the Funds and their respective shareholders, the Board and its Contract Review Committee also considered information furnished for prior meetings of the Board and its committees, including information provided in connection with the annual contract review process for the Funds, which most recently culminated in April 2020 (the “2020 Annual Approval Process”).
The Board of each Fund, including the Independent Trustees, concluded that the applicable New Investment Advisory Agreement and, as applicable, New Investment Sub-Advisory Agreement, including the fees payable thereunder, was fair and reasonable, and it voted to approve the New Investment Advisory Agreement and, as applicable, New Investment Sub-Advisory Agreement and to recommend that shareholders do so as well.
Shortly after the announcement of the Transaction, the Board, including all of the Independent Trustees, met with senior representatives from the Advisers and Morgan Stanley at its meeting held on October 13, 2020 to discuss certain aspects of the Transaction and the expected impacts of the Transaction on the Funds and their shareholders. As part of the Board’s evaluation process, counsel to the Independent Trustees, on behalf of the Contract Review Committee, requested additional information to assist the Independent Trustees in their evaluation of the New Agreements and the implications of the Transaction, as well as other contractual arrangements that may be affected by the Transaction. The Contract Review Committee considered information furnished by the Advisers and Morgan Stanley, their respective affiliates, and, as applicable, the Sub-Advisers during meetings on November 5, 2020, November 10, 2020, November 13, 2020, November 17, 2020 and November 24, 2020.
During its meetings on November 10, 2020 and November 17, 2020, the Contract Review Committee further discussed the approval of the New Agreements with senior representatives of the Advisers, the Affiliated Sub-Advisers, and Morgan Stanley. The representatives from the Advisers, the Affiliated Sub-Advisers, and Morgan Stanley each made presentations to, and responded to questions from, the Independent Trustees. The Contract Review Committee considered the Advisers’, the Affiliated Sub-Advisers’ and Morgan Stanley’s responses related to the Transaction and specifically to the Funds, as well as information received in connection with the 2020 Annual Approval Process, with respect to its evaluation of the New Agreements. Among other information, the Board considered:
Information about the Transaction and its Terms
| | • | | Information about the material terms and conditions, and expected impacts, of the Transaction that relate to the Funds, including the expected impacts on the businesses conducted by the Advisers, the Affiliated Sub-Advisers and Eaton Vance Distributors, Inc., as the distributor of Fund shares; |
| (1) | With respect to certain of the Funds, the applicable Adviser is currently a party to a sub-advisory agreement (collectively, the “Current Sub-Advisory Agreements”) with Atlanta Capital Management Company, LLC (“Atlanta Capital”), BMO Global Asset Management (Asia) Limited, Eaton Vance Advisers International Ltd. (“EVAIL”), Goldman Sachs Asset Management, L.P., Hexavest Inc. (“Hexavest”), Parametric Portfolio Associates LLC (“Parametric”) or Richard Bernstein Advisors LLC (collectively, the “Sub-Advisers” and, with respect to Atlanta Capital, EVAIL, Hexavest and Parametric, each an affiliate of the Advisers, the “Affiliated Sub-Advisers”). Accordingly, references to the “Sub-Advisers,” the “Affiliated Sub-Advisers” or the “New Sub-Advisory Agreements” are not applicable to all Funds. |
Eaton Vance
Municipal Opportunities Fund
January 31, 2021
Board of Trustees’ Contract Approval — continued
| | • | | Information about the advantages of the Transaction as they relate to the Funds and their shareholders; |
| | • | | A commitment that the Funds would not bear any expenses, directly or indirectly, in connection with the Transaction; |
| | • | | A commitment that, for a period of three years after the Closing, at least 75% of each Fund’s Board members must not be “interested persons” (as defined in the 1940 Act) of the investment adviser (or predecessor investment adviser, if applicable) pursuant to Section 15(f)(1)(A) of the 1940 Act; |
| | • | | A commitment that Morgan Stanley would use its reasonable best efforts to ensure that it did not impose any “unfair burden” (as that term is used in section 15(f)(1)(B) of the 1940 Act) on the Funds as a result of the Transaction; |
| | • | | Information with respect to personnel and/or other resources of the Advisers and their affiliates, including the Affiliated Sub-Advisers, as a result of the Transaction, as well as any expected changes to compensation, including any retention-based compensation intended to incentivize key personnel at the Advisers and their affiliates, including the Affiliated Sub-Advisers; |
| | • | | Information regarding any changes that are expected with respect to the Funds’ slate of officers as a result of the Transaction; |
Information about Morgan Stanley
| | • | | Information about Morgan Stanley’s overall business, including information about the advisory, brokerage and related businesses that Morgan Stanley operates; |
| | • | | Information about Morgan Stanley’s financial condition, including its access to capital and other resources required to support the investment advisory businesses related to the Funds; |
| | • | | Information on how the Funds are expected to fit within Morgan Stanley’s overall business strategy, and any changes that Morgan Stanley contemplates implementing to the Funds in the short- or long-term following the closing of the Transaction (the “Closing”); |
| | • | | Information regarding risk management functions at Morgan Stanley and its affiliates, including how existing risk management protocols and procedures may impact the Funds and/or the businesses of the Advisers and their affiliates, including the Affiliated Sub-Advisers, as they relate to the Funds; |
| | • | | Information on the anticipated benefits of the Transaction to the Funds with respect to potential additional distribution capabilities and the ability to access new markets and customer segments through Morgan Stanley’s distribution network, including, in particular, its institutional client base; |
| | • | | Information regarding the financial condition and reputation of Morgan Stanley, its worldwide presence, experience as a fund sponsor and manager, commitment to maintain a high level of cooperation with, and support to, the Funds, strong client service capabilities, and relationships in the asset management industry; |
Information about the New Agreements for Funds
| | • | | A representation that, after the Closing, all of the Funds will continue to be advised by their current Adviser and Sub-Adviser, as applicable; |
| | • | | Information regarding the terms of the New Agreements, including certain changes as compared to the current investment advisory agreement between each Fund and its Adviser (collectively, the “Current Advisory Agreements”) and, as applicable, the current investment sub-advisory agreement between a Fund and a Sub-Adviser (together with the Current Advisory Agreements, the “Current Agreements”); |
| | • | | Information confirming that the fee rates payable under the New Agreements are not changed as compared to the Current Agreements; |
| | • | | A representation that the New Agreements will not cause any diminution in the nature, extent and quality of services provided by the Advisers and the Sub-Advisers to the Funds and their respective shareholders, including with respect to compliance and other non-advisory services; |
Information about Fund Performance, Fees and Expenses
| | • | | A report from an independent data provider comparing the investment performance of each Fund (including, as relevant, total return data, income data, Sharpe ratios and information ratios) to the investment performance of comparable funds and, as applicable, benchmark indices, over various time periods as of the 2020 Annual Approval Process, as well as performance information as of a more recent date; |
| | • | | A report from an independent data provider comparing each Fund’s total expense ratio (and its components) to those of comparable funds as of the 2020 Annual Approval Process, as well as fee and expense information as of a more recent date; |
| | • | | In certain instances, data regarding investment performance relative to customized groups of peer funds and blended indices identified by the Advisers in consultation with the Portfolio Management Committee of the Board as of the 2020 Annual Approval Process, as well as corresponding performance information as of a more recent date; |
| | • | | Comparative information concerning the fees charged and services provided by the Adviser and the Sub-Adviser to each Fund in managing other accounts (which may include other mutual funds, collective investment funds and institutional accounts) using investment strategies and techniques similar to those used in managing such Fund(s), if any; |
| | • | | Profitability analyses of the Advisers and the Affiliated Sub-Advisers, as applicable, with respect to each of the Funds as of the 2020 Annual Approval Process, as well as information regarding the impact of the Transaction on profitability; |
Information about Portfolio Management and Trading
| | • | | Descriptions of the investment management services currently provided and expected to be provided to each Fund after the Transaction, as well as each of the Funds’ investment strategies and policies; |
Eaton Vance
Municipal Opportunities Fund
January 31, 2021
Board of Trustees’ Contract Approval — continued
| | • | | The procedures and processes used to determine the fair value of Fund assets, when necessary, and actions taken to monitor and test the effectiveness of such procedures and processes; |
| | • | | Information about any changes to the policies and practices of the Advisers and, as applicable, each Fund’s Sub-Adviser with respect to trading, including their processes for seeking best execution of portfolio transactions; |
��
| | • | | Information regarding the impact on trading and access to capital markets associated with the Funds’ affiliations with Morgan Stanley and its affiliates, including potential restrictions with respect to the Funds’ ability to execute portfolio transactions with Morgan Stanley and its affiliates; |
Information about the Advisers and the Sub-Advisers
| | • | | Information about the financial results and condition of the Advisers and the Affiliated Sub-Advisers since the culmination of the 2020 Annual Approval Process and any material changes in financial condition that are reasonably expected to occur before and after the Closing; |
| | • | | Information regarding contemplated changes to the individual investment professionals whose responsibilities include portfolio management and investment research for the Funds, and, for portfolio managers and certain other investment professionals, information relating to their responsibilities with respect to managing other mutual funds and investment accounts, as applicable, post-Closing; |
| | • | | The Code of Ethics of the Advisers and their affiliates, including the Affiliated Sub-Advisers, together with information relating to compliance with, and the administration of, such codes; |
| | • | | Policies and procedures relating to proxy voting and the handling of corporate actions and class actions; |
| | • | | Information concerning the resources devoted to compliance efforts undertaken by the Advisers and their affiliates, including the Affiliated Sub-Advisers, including descriptions of their various compliance programs and their record of compliance; |
| | • | | Information concerning the business continuity and disaster recovery plans of the Advisers and their affiliates, including the Affiliated Sub-Advisers; |
| | • | | A description of the Advisers’ oversight of the Sub-Advisers, including with respect to regulatory and compliance issues, investment management and other matters; |
Other Relevant Information
| | • | | Information concerning the nature, cost and character of the administrative and other non-investment advisory services provided by the Advisers and their affiliates; |
| | • | | Information concerning oversight of the relationship with the custodian, subcustodians and fund accountants by EVM and/or administrator to each of the Funds; |
| | • | | Confirmation that the Advisers intend to continue to manage the Funds in a manner materially consistent with each Fund’s current investment objective(s) and principal investment strategies; |
| | • | | Information regarding Morgan Stanley’s commitment to maintaining competitive compensation arrangements to attract and retain highly qualified personnel; |
| | • | | Confirmation that the Advisers’ current senior management teams have indicated their strong support of the Transaction; and |
| | • | | Information regarding the fact that Morgan Stanley and Eaton Vance Corp. will each derive benefits from the Transaction and that, as a result, they have a financial interest in the matters that were being considered. |
As indicated above, the Board and its Contract Review Committee also considered information received at its regularly scheduled meetings throughout the year, which included information from portfolio managers and other investment professionals of the Advisers and the Sub-Advisers regarding investment and performance matters, and considered various investment and trading strategies used in pursuing the Funds’ investment objectives. The Board also received information regarding risk management techniques employed in connection with the management of the Funds. The Board and its committees evaluated issues pertaining to industry and regulatory developments, compliance procedures, fund governance and other issues with respect to the Funds, and received and participated in reports and presentations provided by the Advisers and their affiliates, including the Affiliated Sub-Advisers, with respect to such matters.
The Contract Review Committee was advised throughout the evaluation process by Goodwin Procter LLP, independent legal counsel for the Independent Trustees. The members of the Contract Review Committee, with the advice of such counsel, exercised their own business judgment in determining the material factors to be considered in evaluating the New Agreements and the weight to be given to each such factor. The conclusions reached with respect to the New Agreements were based on a comprehensive evaluation of all the information provided and not any single factor. Moreover, each Independent Trustee may have placed varying emphasis on particular factors in reaching conclusions with respect to the New Agreements.
Nature, Extent and Quality of Services
In considering whether to approve the New Agreements, the Board evaluated the nature, extent and quality of services currently provided to each Fund by the Advisers and, as applicable, the Sub-Advisers under the Current Agreements. In evaluating the nature, extent and quality of services to be provided by the Advisers and the Sub-Advisers under the New Agreements, the Board considered, among other information, the expected impact, if any, of the Transaction on the operations, facilities, organization and personnel of the Advisers and the Sub-Advisers, and that Morgan Stanley and the Advisers have advised the Board that, following the Transaction, there is not expected to be any diminution in the nature, extent and quality of services provided by the Advisers and the Sub-Advisers, as applicable, to the Funds and their shareholders, including compliance and other non-advisory services, and that there are not expected to be any changes in portfolio management personnel as a result of the Transaction.
Eaton Vance
Municipal Opportunities Fund
January 31, 2021
Board of Trustees’ Contract Approval — continued
The Board also considered the financial resources of Morgan Stanley and the Advisers and the importance of having a Fund manager with, or with access to, significant organizational and financial resources. The Board considered the benefits to the Funds of being part of a larger combined organization with greater financial resources following the Transaction, particularly during periods of market disruptions and volatility. In this regard, the Board considered information provided by Morgan Stanley regarding its business and operating structure, scale of operation, leadership and reputation, distribution capabilities, and financial condition, as well as information on how the Funds are expected to fit within Morgan Stanley’s overall business strategy and any changes that Morgan Stanley contemplates in the short- or long-term following the Closing. The Board also noted Morgan Stanley’s and the Advisers’ commitment to keep the Board apprised of developments with respect to its long-term integration plans for the Advisers, the Affiliated Sub-Advisers, and existing Morgan Stanley affiliates and their respective personnel.
The Board considered the Advisers’ and the Sub-Advisers’ management capabilities and investment processes in light of the types of investments held by each Fund, including the education, experience and number of investment professionals and other personnel who provide portfolio management, investment research, and similar services to each Fund. In particular, the Board considered the abilities and experience of the Advisers’ and, as applicable, the Sub-Advisers’ investment professionals in implementing each Fund’s investment strategies. The Board also took into account the resources dedicated to portfolio management and other services, the compensation methods of the Advisers and other factors, including the reputation and resources of the Advisers to recruit and retain highly qualified research, advisory and supervisory investment professionals. With respect to the recruitment and retention of key personnel, the Board noted information from Morgan Stanley and the Advisers regarding the benefits of joining Morgan Stanley. In addition, the Board considered the time and attention devoted to the Funds by senior management, as well as the infrastructure, operational capabilities and support staff in place to assist in the portfolio management and operations of the Funds, including the provision of administrative services. With respect to the foregoing, the Board also considered information from the Advisers and Morgan Stanley regarding the anticipated impact of the Transaction on such matters. The Board also considered the business-related and other risks to which the Advisers or their affiliates may be subject in managing the Funds and in connection with the Transaction.
The Board considered the compliance programs of the Advisers and relevant affiliates thereof, including the Affiliated Sub-Advisers. The Board considered compliance and reporting matters regarding, among other things, personal trading by investment professionals, disclosure of portfolio holdings, late trading, frequent trading, portfolio valuation, business continuity and the allocation of investment opportunities. The Board also considered the responses of the Advisers and their affiliates to requests in recent years from regulatory authorities, such as the Securities and Exchange Commission and the Financial Industry Regulatory Authority. The Board also considered certain information relating to the compliance record of Morgan Stanley and its affiliates, including information requests in recent years from regulatory authorities. With respect to the foregoing, including the compliance programs of the Advisers and the Sub-Advisers, the Board noted information regarding the impacts of the Transaction, as well as the Advisers’ and Morgan Stanley’s commitment to keep the Board apprised of developments with respect to its long-term integration plans for the Advisers, the Affiliated Sub-Advisers and existing Morgan Stanley affiliates and their respective personnel.
The Board considered other administrative services provided and to be provided or overseen by the Advisers and their affiliates, including transfer agency and accounting services. The Board evaluated the benefits to shareholders of investing in a fund that is a part of a large fund complex offering exposure to a variety of asset classes and investment disciplines, as well as the ability, in many cases, to exchange an investment among different funds without incurring additional sales charges. The Board noted information that the Transaction was not expected to have any material impact on such matters in the near-term.
In evaluating the nature, extent and quality of the services to be provided under the New Agreements, the Board also considered investment performance information provided for each Fund in connection with the 2020 Annual Approval Process, as well as information provided as of a more recent date. In this regard, the Board compared each Fund’s investment performance to that of comparable funds identified by an independent data provider (the peer group), as well as appropriate benchmark indices and, for certain Funds, a custom peer group of similarly managed funds. The Board also considered, where applicable, Fund-specific performance explanations based on criteria established by the Board in connection with the 2020 Annual Approval Process and, where applicable, performance explanations as of a more recent date. In addition to the foregoing information, it was also noted that the Board has received and discussed with management information throughout the year at periodic intervals comparing each Fund’s performance against applicable benchmark indices and peer groups. In addition, the Board considered each Fund’s performance in light of overall financial market conditions. Where a Fund’s relative underperformance to its peers was significant during one or more specified periods, the Board noted the explanation from the applicable Adviser concerning the Fund’s relative performance versus its peer group.
After consideration of the foregoing factors, among others, and based on their review of the materials provided and the assurances received from, and recommendations of, the Advisers and Morgan Stanley, the Board determined that the Transaction was not expected to adversely affect the nature, extent and quality of services provided to the Funds by the Advisers and their affiliates, including the Affiliated Sub-Advisers, and that the Transaction was not expected to have an adverse effect on the ability of the Advisers and their affiliates, including the Affiliated Sub-Advisers, to provide those services. The Board concluded that the nature, extent and quality of services expected to be provided by the Advisers and the Sub-Advisers, taken as a whole, are appropriate and expected to be consistent with the terms of the New Agreements.
Management Fees and Expenses
The Board considered contractual fee rates payable by each Fund for advisory and administrative services (referred to collectively as “management fees”) in connection with the 2020 Annual Approval Process, as well as information provided as of a more recent date. As part of its review, the Board considered each Fund’s management fees and total expense ratio over various periods, as compared to those of comparable funds, before and after giving effect to any
Eaton Vance
Municipal Opportunities Fund
January 31, 2021
Board of Trustees’ Contract Approval — continued
undertaking to waive fees or reimburse expenses. The Board also considered factors, and, where applicable, certain Fund-specific factors, that had an impact on a Fund’s total expense ratio relative to comparable funds, as identified by the Advisers in response to inquiries from the Contract Review Committee. The Board considered that the New Agreements do not change a Fund’s management fee rate or the computation method for calculating such fees, including any separately executed permanent contractual management fee reduction currently in place for the Fund.
The Board also received and considered, where applicable, information about the services offered and the fee rates charged by the Advisers and the Sub-Advisers to other types of accounts with investment objectives and strategies that are substantially similar to and/or managed in a similar investment style as a Fund. In this regard, the Board received information about the differences in the nature and scope of services the Advisers and the Sub-Advisers, as applicable, provide to the Funds as compared to other types of accounts and the material differences in compliance, reporting and other legal burdens and risks to the Advisers and such Sub-Advisers as between each Fund and other types of accounts.
After considering the foregoing information, and in light of the nature, extent and quality of the services expected to be provided by the Advisers and the Sub-Advisers, the Board concluded that the management fees charged for advisory and related services are reasonable with respect to its approval of the New Agreements.
Profitability and “Fall-Out” Benefits
During the 2020 Annual Approval Process, the Board considered the level of profits realized by the Advisers and relevant affiliates thereof, including the Affiliated Sub-Advisers, in providing investment advisory and administrative services to the Funds and to all Eaton Vance funds as a group. The Board considered the level of profits realized without regard to marketing support or other payments by the Advisers and their affiliates to third parties in respect of distribution or other services. In light of the foregoing factors and the nature, extent and quality of the services rendered, the profits realized by the Advisers and their affiliates, including the Sub-Advisers, were not deemed to be excessive by the Board.
The Board noted that Morgan Stanley and the Advisers are expected to realize, over time, cost savings from the Transaction based on eliminating duplicate corporate overhead expenses. The Board considered, however, information from the Advisers and Morgan Stanley that such cost savings are not expected to be realized immediately upon the Closing and that, accordingly, there are currently no specific expected changes in the levels of profitability associated with the advisory and other services provided to the Funds that are contemplated as a result of the Transaction. The Board noted that it will continue to receive information regarding profitability during its annual contract review processes, including the extent to which cost savings and/or other efficiencies result in changes to profitability levels.
The Board also considered direct or indirect fall-out benefits received by the Advisers and their affiliates, including the Affiliated Sub-Advisers, in connection with their respective relationships with the Funds, including the benefits of research services that may be available to the Advisers and their affiliates as a result of securities transactions effected for the Funds and other investment advisory clients. In evaluating the fall-out benefits to be received by the Advisers and their affiliates under the New Agreements, the Board considered whether the Transaction would have an impact on the fall-out benefits currently realized by the Advisers and their affiliates in connection with services provided pursuant to the Current Advisory Agreements.
The Board of each Fund considered that Morgan Stanley may derive reputational and other benefits from its ability to use the names of the Advisers and their affiliates in connection with operating and marketing the Funds. The Board considered that the Transaction, if completed, would significantly increase Morgan Stanley’s assets under management and expand Morgan Stanley’s investment capabilities.
Economies of Scale
The Board also considered the extent to which the Advisers and their affiliates, on the one hand, and the Funds, on the other hand, can expect to realize benefits from economies of scale as the assets of the Funds increase. The Board acknowledged the difficulty in accurately measuring the benefits resulting from economies of scale, if any, with respect to the management of any specific Fund or group of funds. As part of the 2020 Annual Approval Process, the Board reviewed data summarizing the increases and decreases in the assets of the Funds and of all Eaton Vance funds as a group over various time periods, and evaluated the extent to which the total expense ratio of each Fund and the profitability of the Advisers and their affiliates may have been affected by such increases or decreases.
The Board noted that Morgan Stanley and the Advisers are expected to benefit from possible growth of the Funds resulting from enhanced distribution capabilities, including with respect to the Funds’ potential access to Morgan Stanley’s institutional client base. Based upon the foregoing, the Board concluded that the Funds currently share in the benefits from economies of scale, if any, when they are realized by the Advisers, and that the Transaction is not expected to impede a Fund from continuing to benefit from any future economies of scale realized by its Adviser.
Conclusion
Based on its consideration of the foregoing, and such other information it deemed relevant, including the factors and conclusions described above, the Contract Review Committee recommended to the Board approval of the New Agreements. Based on the recommendation of the Contract Review Committee, the Board, including a majority of the Independent Trustees, unanimously voted to approve the New Agreements for the Funds and recommended that shareholders approve the New Agreements.
Eaton Vance
Municipal Opportunities Fund
January 31, 2021
Officers and Trustees
Officers
Eric A. Stein
President
Deidre E. Walsh
Vice President
Maureen A. Gemma
Vice President, Secretary and Chief Legal Officer
James F. Kirchner
Treasurer
Richard F. Froio
Chief Compliance Officer
Trustees
William H. Park
Chairperson
Thomas E. Faust Jr.*
Mark R. Fetting
Cynthia E. Frost
George J. Gorman
Valerie A. Mosley
Helen Frame Peters
Keith Quinton
Marcus L. Smith
Susan J. Sutherland
Scott E. Wennerholm
Eaton Vance Funds
IMPORTANT NOTICES
Privacy. The Eaton Vance organization is committed to ensuring your financial privacy. Each entity listed below has adopted privacy policy and procedures (“Privacy Program”) Eaton Vance believes is reasonably designed to protect your personal information and to govern when and with whom Eaton Vance may share your personal information.
| • | | At the time of opening an account, Eaton Vance generally requires you to provide us with certain information such as name, address, social security number, tax status, account numbers, and account balances. This information is necessary for us to both open an account for you and to allow us to satisfy legal requirements such as applicable anti-money laundering reviews and know-your-customer requirements. |
| • | | On an ongoing basis, in the normal course of servicing your account, Eaton Vance may share your information with unaffiliated third parties that perform various services for Eaton Vance and/or your account. These third parties include transfer agents, custodians, broker/dealers and our professional advisers including auditors, accountants, and legal counsel. Eaton Vance may share your personal information with our affiliates. Eaton Vance may also share your information as required or permitted by applicable law. |
| • | | We have adopted a Privacy Program we believe is reasonably designed to protect the confidentiality of your personal information and to prevent unauthorized access to your information. |
| • | | We reserve the right to change our Privacy Program at any time upon proper notification to you. You may want to review our Privacy Program periodically for changes by accessing the link on our homepage: www.eatonvance.com. |
Our pledge of protecting your personal information applies to the following entities within the Eaton Vance organization: the Eaton Vance Family of Funds, Eaton Vance Management, Eaton Vance WaterOak Advisors, Eaton Vance Distributors, Inc., Eaton Vance Trust Company, Eaton Vance Management (International) Limited, Eaton Vance Advisers International Ltd., Eaton Vance Global Advisors Limited, Eaton Vance Management’s Real Estate Investment Group, Boston Management and Research, Calvert Research and Management, and Calvert Funds. This notice supersedes all previously issued privacy disclosures. For more information about Eaton Vance’s Privacy Program or about how your personal information may be used, please call 1-800-262-1122.
Delivery of Shareholder Documents. The Securities and Exchange Commission (SEC) permits funds to deliver only one copy of shareholder documents, including prospectuses, proxy statements and shareholder reports, to fund investors with multiple accounts at the same residential or post office box address. This practice is often called “householding” and it helps eliminate duplicate mailings to shareholders. Eaton Vance, or your financial intermediary, may household the mailing of your documents indefinitely unless you instruct Eaton Vance, or your financial intermediary, otherwise. If you would prefer that your Eaton Vance documents not be householded, please contact Eaton Vance at 1-800-262-1122, or contact your financial intermediary. Your instructions that householding not apply to delivery of your Eaton Vance documents will typically be effective within 30 days of receipt by Eaton Vance or your financial intermediary.
Portfolio Holdings. Each Eaton Vance Fund and its underlying Portfolio(s) (if applicable) files a schedule of portfolio holdings on Part F to Form N-PORT with the SEC. Certain information filed on Form N-PORT may be viewed on the Eaton Vance website at www.eatonvance.com, by calling Eaton Vance at 1-800-262-1122 or in the EDGAR database on the SEC’s website at www.sec.gov.
Proxy Voting. From time to time, funds are required to vote proxies related to the securities held by the funds. The Eaton Vance Funds or their underlying Portfolios (if applicable) vote proxies according to a set of policies and procedures approved by the Funds’ and Portfolios’ Boards. You may obtain a description of these policies and procedures and information on how the Funds or Portfolios voted proxies relating to portfolio securities during the most recent 12-month period ended June 30, without charge, upon request, by calling 1-800-262-1122 and by accessing the SEC’s website at www.sec.gov.
This Page Intentionally Left Blank
This Page Intentionally Left Blank
Investment Adviser and Administrator
Eaton Vance Management
Two International Place
Boston, MA 02110
Principal Underwriter*
Eaton Vance Distributors, Inc.
Two International Place
Boston, MA 02110
(617) 482-8260
Custodian
State Street Bank and Trust Company
State Street Financial Center, One Lincoln Street
Boston, MA 02111
Transfer Agent
BNY Mellon Investment Servicing (US) Inc.
Attn: Eaton Vance Funds
P.O. Box 9653
Providence, RI 02940-9653
(800) 262-1122
Fund Offices
Two International Place
Boston, MA 02110
| * | FINRA BrokerCheck. Investors may check the background of their Investment Professional by contacting the Financial Industry Regulatory Authority (FINRA). FINRA BrokerCheck is a free tool to help investors check the professional background of current and former FINRA-registered securities firms and brokers. FINRA BrokerCheck is available by calling 1-800-289-9999 and at www.FINRA.org. The FINRA BrokerCheck brochure describing this program is available to investors at www.FINRA.org. |

7778 1.31.21
Not required in this filing.
| Item 3. | Audit Committee Financial Expert |
Not required in this filing.
| Item 4. | Principal Accountant Fees and Services |
Not required in this filing.
| Item 5. | Audit Committee of Listed Registrants |
Not applicable.
| Item 6. | Schedule of Investments |
Please see schedule of investments contained in the Report to Stockholders included under Item 1 of this Form N-CSR.
| Item 7. | Disclosure of Proxy Voting Policies and Procedures for Closed-End Management Investment Companies |
Not applicable.
| Item 8. | Portfolio Managers of Closed-End Management Investment Companies |
Not applicable.
| Item 9. | Purchases of Equity Securities by Closed-End Management Investment Company and Affiliated Purchasers |
Not applicable.
| Item 10. | Submission of Matters to a Vote of Security Holders |
No material changes.
| Item 11. | Controls and Procedures |
(a) It is the conclusion of the registrant’s principal executive officer and principal financial officer that the effectiveness of the registrant’s current disclosure controls and procedures (such disclosure controls and procedures having been evaluated within 90 days of the date of this filing) provide reasonable assurance that the information required to be disclosed by the registrant has been recorded, processed, summarized and reported within the time period specified in the Commission’s rules and forms and that the information required to be disclosed by the registrant has been accumulated and communicated to the registrant’s principal executive officer and principal financial officer in order to allow timely decisions regarding required disclosure.
(b) There have been no changes in the registrant’s internal controls over financial reporting during the period covered by this report that has materially affected, or is reasonably likely to materially affect, the registrant’s internal control over financial reporting.
| Item 12. | Disclosure of Securities Lending Activities for Closed-End Management Investment Companies |
Not applicable.
Signatures
Pursuant to the requirements of the Securities Exchange Act of 1934 and the Investment Company Act of 1940, the registrant has duly caused this report to be signed on its behalf by the undersigned, thereunto duly authorized.
| | |
| Eaton Vance Municipals Trust |
| |
| By: | | /s/ Eric A. Stein |
| | Eric A. Stein |
| | President |
| |
| Date: | | March 22, 2021 |
Pursuant to the requirements of the Securities Exchange Act of 1934 and the Investment Company Act of 1940, this report has been signed below by the following persons on behalf of the registrant and in the capacities and on the dates indicated.
| | |
| By: | | /s/ James F. Kirchner |
| | James F. Kirchner |
| | Treasurer |
| |
| Date: | | March 22, 2021 |
| | |
| By: | | /s/ Eric A. Stein |
| | Eric A. Stein |
| | President |
| |
| Date: | | March 22, 2021 |