0000778365eatonvance:EATONVANCEIndexBloombergConnecticutMunicipalBondIndex19117AdditionalIndexMember2018-08-310000778365eatonvance:EATONVANCEIndexBloombergMinnesotaMunicipalBondIndex19127AdditionalIndexMember2023-02-280000778365eatonvance:EATONVANCEIndexBloombergMunicipalBondIndex19349BroadBasedIndexMember2019-04-30
UNITED STATES
SECURITIES AND EXCHANGE COMMISSION
Washington, D.C. 20549
Form N-CSR
CERTIFIED SHAREHOLDER REPORT OF REGISTERED
MANAGEMENT INVESTMENT COMPANIES
Investment Company Act File Number: 811-04409
Eaton Vance Municipals Trust
(Exact Name of Registrant as Specified in Charter)
One Post Office Square, Boston, Massachusetts 02109
(Address of Principal Executive Offices)
Deidre E. Walsh
One Post Office Square, Boston, Massachusetts 02109
(Name and Address of Agent for Services)
(617) 482-8260
(Registrant’s Telephone Number)
July 31
Date of Fiscal Year End
July 31, 2024
Date of Reporting Period
Item 1. Reports to Stockholders
(a)
Eaton Vance Arizona Municipal Income Fund
Annual Shareholder Report July 31, 2024
This annual shareholder report contains important information about the Eaton Vance Arizona Municipal Income Fund for the period of August 1, 2023 to July 31, 2024. You can find additional information about the Fund at www.eatonvance.com/open-end-mutual-fund-documents.php. You can also request this information by contacting us at 1-800-262-1122.
What were the Fund costs for the last year?
(based on a hypothetical $10,000 investment)
| Class Name | Costs of a $10,000 investment | Costs paid as a percentage of a $10,000 investment |
|---|
| Class A | $75 | 0.73% |
How did the Fund perform last year and what affected its performance?
Key contributors to (↑) and detractors from (↓) performance, relative to the Bloomberg Municipal Bond Index (the Index):
↑ Security selections and an overweight position in bonds rated BBB and below helped returns as lower-rated bonds outperformed higher-rated bonds
↑ Security selections and an underweight exposure to AAA-rated bonds helped the Fund’s returns as AAA bonds generally underperformed lower-rated bonds
↑ Security selections in the water & sewer sector contributed to the Fund’s Index-relative performance during the period
↓ An underweight position in bonds with 22+ years remaining to maturity hurt returns as longer-maturity bonds outperformed shorter-maturity bonds
↓ An underweight position in A-rated bonds hurt Index-relative returns as A-rated bonds generally outperformed higher-rated bonds during the period
↓ Security selections and an overweight position in the electric utilities sector, which underperformed the Index, also weighed on Index-relative returns
Comparison of the change in value of a $10,000 investment for the period indicated.

| Class A with Maximum Sales Charge | Bloomberg Municipal Bond Index | Bloomberg Arizona Municipal Bond Index |
|---|
| 7/14 | $9,675 | $10,000 | $10,000 |
| 8/14 | $9,784 | $10,121 | $10,113 |
| 9/14 | $9,814 | $10,131 | $10,125 |
| 10/14 | $9,874 | $10,201 | $10,190 |
| 11/14 | $9,853 | $10,218 | $10,216 |
| 12/14 | $9,943 | $10,270 | $10,265 |
| 1/15 | $10,114 | $10,452 | $10,451 |
| 2/15 | $9,990 | $10,344 | $10,334 |
| 3/15 | $10,024 | $10,374 | $10,371 |
| 4/15 | $9,971 | $10,320 | $10,322 |
| 5/15 | $9,928 | $10,291 | $10,295 |
| 6/15 | $9,895 | $10,282 | $10,286 |
| 7/15 | $9,934 | $10,356 | $10,362 |
| 8/15 | $9,942 | $10,377 | $10,383 |
| 9/15 | $9,993 | $10,452 | $10,459 |
| 10/15 | $10,032 | $10,493 | $10,507 |
| 11/15 | $10,104 | $10,535 | $10,537 |
| 12/15 | $10,206 | $10,609 | $10,598 |
| 1/16 | $10,310 | $10,736 | $10,737 |
| 2/16 | $10,284 | $10,753 | $10,757 |
| 3/16 | $10,353 | $10,787 | $10,783 |
| 4/16 | $10,445 | $10,866 | $10,860 |
| 5/16 | $10,482 | $10,895 | $10,876 |
| 6/16 | $10,627 | $11,069 | $11,027 |
| 7/16 | $10,589 | $11,075 | $11,038 |
| 8/16 | $10,658 | $11,090 | $11,034 |
| 9/16 | $10,620 | $11,035 | $10,985 |
| 10/16 | $10,527 | $10,919 | $10,890 |
| 11/16 | $10,163 | $10,512 | $10,525 |
| 12/16 | $10,277 | $10,635 | $10,639 |
| 1/17 | $10,302 | $10,705 | $10,706 |
| 2/17 | $10,352 | $10,780 | $10,789 |
| 3/17 | $10,379 | $10,803 | $10,807 |
| 4/17 | $10,450 | $10,882 | $10,897 |
| 5/17 | $10,607 | $11,054 | $11,059 |
| 6/17 | $10,567 | $11,015 | $11,012 |
| 7/17 | $10,626 | $11,104 | $11,088 |
| 8/17 | $10,696 | $11,188 | $11,163 |
| 9/17 | $10,677 | $11,131 | $11,095 |
| 10/17 | $10,669 | $11,159 | $11,125 |
| 11/17 | $10,639 | $11,099 | $11,051 |
| 12/17 | $10,777 | $11,215 | $11,172 |
| 1/18 | $10,646 | $11,083 | $11,038 |
| 2/18 | $10,594 | $11,050 | $11,002 |
| 3/18 | $10,643 | $11,090 | $11,047 |
| 4/18 | $10,612 | $11,051 | $11,007 |
| 5/18 | $10,745 | $11,177 | $11,123 |
| 6/18 | $10,763 | $11,187 | $11,140 |
| 7/18 | $10,789 | $11,214 | $11,157 |
| 8/18 | $10,792 | $11,243 | $11,181 |
| 9/18 | $10,736 | $11,170 | $11,110 |
| 10/18 | $10,670 | $11,101 | $11,051 |
| 11/18 | $10,764 | $11,224 | $11,170 |
| 12/18 | $10,870 | $11,359 | $11,294 |
| 1/19 | $10,952 | $11,444 | $11,380 |
| 2/19 | $11,013 | $11,506 | $11,437 |
| 3/19 | $11,154 | $11,688 | $11,610 |
| 4/19 | $11,202 | $11,732 | $11,652 |
| 5/19 | $11,319 | $11,893 | $11,796 |
| 6/19 | $11,355 | $11,937 | $11,837 |
| 7/19 | $11,450 | $12,033 | $11,936 |
| 8/19 | $11,602 | $12,223 | $12,114 |
| 9/19 | $11,520 | $12,125 | $11,999 |
| 10/19 | $11,520 | $12,147 | $12,031 |
| 11/19 | $11,533 | $12,177 | $12,058 |
| 12/19 | $11,560 | $12,215 | $12,093 |
| 1/20 | $11,752 | $12,434 | $12,308 |
| 2/20 | $11,910 | $12,594 | $12,472 |
| 3/20 | $11,519 | $12,137 | $11,975 |
| 4/20 | $11,367 | $11,985 | $11,922 |
| 5/20 | $11,729 | $12,366 | $12,291 |
| 6/20 | $11,780 | $12,468 | $12,368 |
| 7/20 | $11,951 | $12,678 | $12,543 |
| 8/20 | $11,893 | $12,619 | $12,489 |
| 9/20 | $11,895 | $12,621 | $12,492 |
| 10/20 | $11,860 | $12,583 | $12,455 |
| 11/20 | $12,031 | $12,773 | $12,640 |
| 12/20 | $12,103 | $12,851 | $12,705 |
| 1/21 | $12,147 | $12,933 | $12,761 |
| 2/21 | $11,936 | $12,728 | $12,579 |
| 3/21 | $11,993 | $12,806 | $12,654 |
| 4/21 | $12,087 | $12,913 | $12,745 |
| 5/21 | $12,143 | $12,952 | $12,777 |
| 6/21 | $12,163 | $12,988 | $12,796 |
| 7/21 | $12,243 | $13,095 | $12,904 |
| 8/21 | $12,212 | $13,047 | $12,870 |
| 9/21 | $12,108 | $12,953 | $12,777 |
| 10/21 | $12,091 | $12,915 | $12,746 |
| 11/21 | $12,174 | $13,025 | $12,846 |
| 12/21 | $12,182 | $13,046 | $12,861 |
| 1/22 | $11,892 | $12,689 | $12,522 |
| 2/22 | $11,839 | $12,644 | $12,487 |
| 3/22 | $11,522 | $12,234 | $12,090 |
| 4/22 | $11,257 | $11,895 | $11,741 |
| 5/22 | $11,341 | $12,072 | $11,906 |
| 6/22 | $11,214 | $11,874 | $11,724 |
| 7/22 | $11,436 | $12,188 | $12,018 |
| 8/22 | $11,218 | $11,921 | $11,773 |
| 9/22 | $10,862 | $11,463 | $11,315 |
| 10/22 | $10,797 | $11,368 | $11,219 |
| 11/22 | $11,201 | $11,900 | $11,708 |
| 12/22 | $11,213 | $11,934 | $11,762 |
| 1/23 | $11,492 | $12,277 | $12,068 |
| 2/23 | $11,238 | $11,999 | $11,804 |
| 3/23 | $11,456 | $12,265 | $12,057 |
| 4/23 | $11,444 | $12,237 | $12,018 |
| 5/23 | $11,356 | $12,131 | $11,918 |
| 6/23 | $11,449 | $12,253 | $12,002 |
| 7/23 | $11,462 | $12,301 | $12,067 |
| 8/23 | $11,349 | $12,124 | $11,904 |
| 9/23 | $11,067 | $11,769 | $11,581 |
| 10/23 | $10,901 | $11,669 | $11,498 |
| 11/23 | $11,595 | $12,409 | $12,180 |
| 12/23 | $11,873 | $12,698 | $12,473 |
| 1/24 | $11,850 | $12,633 | $12,397 |
| 2/24 | $11,867 | $12,649 | $12,423 |
| 3/24 | $11,858 | $12,649 | $12,411 |
| 4/24 | $11,744 | $12,492 | $12,277 |
| 5/24 | $11,762 | $12,455 | $12,259 |
| 6/24 | $11,953 | $12,646 | $12,445 |
| 7/24 | $12,057 | $12,762 | $12,544 |
Average Annual Total Returns (%)
| 1 Year | 5 Years | 10 Years |
|---|
| Class A | 5.15% | 1.03% | 2.22% |
| Class A with 3.25% Maximum Sales Charge | 1.70% | 0.36% | 1.89% |
| Bloomberg Municipal Bond Index | 3.74% | 1.18% | 2.47% |
| Bloomberg Arizona Municipal Bond Index | 3.95% | 1.00% | 2.29% |
Performance does not reflect the deduction of taxes that a shareholder would pay on Fund distributions or redemption of Fund shares. Performance assumes that all dividends and distributions, if any, were reinvested. For more recent performance information, visit www.eatonvance.com/performance.php.
THE FUND'S PAST PERFORMANCE IS NO GUARANTEE OF FUTURE RESULTS.
| Total Net Assets | $79,377,824 |
| # of Portfolio Holdings | 91 |
| Portfolio Turnover Rate | 58% |
| Total Advisory Fees Paid | $232,134 |
What did the Fund invest in?
The following tables reflect what the Fund invested in as of the report date.
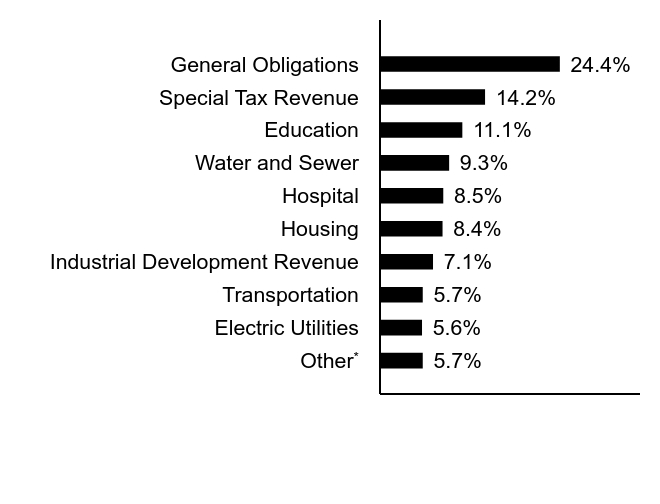
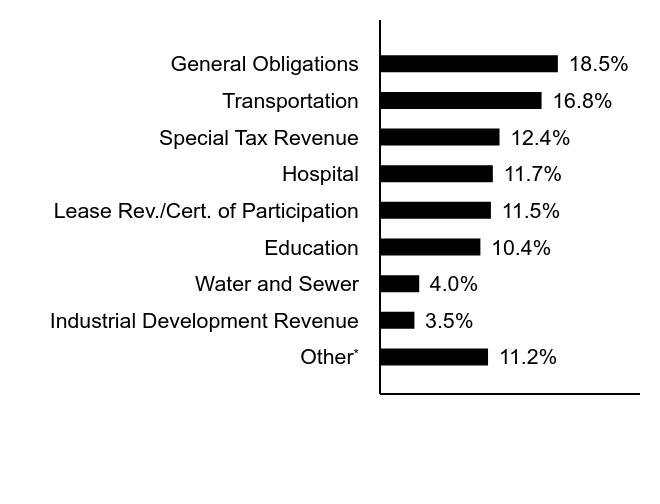
Sector Allocation (% of total investments)
| Value | Value |
|---|
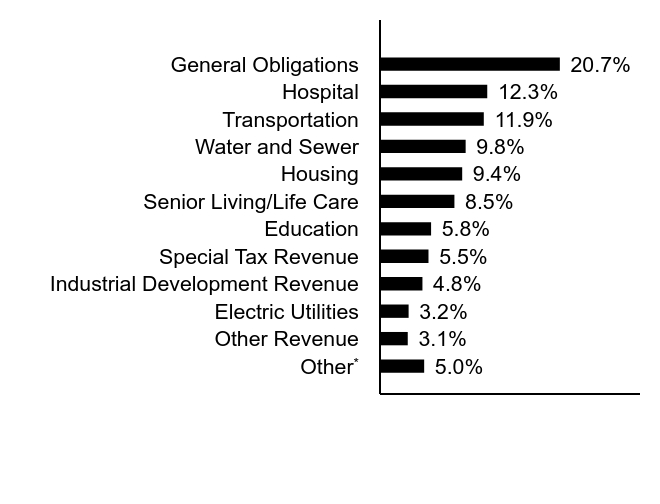
OtherFootnote Reference* | 5.7% |
| Electric Utilities | 5.6% |
| Transportation | 5.7% |
| Industrial Development Revenue | 7.1% |
| Housing | 8.4% |
| Hospital | 8.5% |
| Water and Sewer | 9.3% |
| Education | 11.1% |
| Special Tax Revenue | 14.2% |
| General Obligations | 24.4% |
| Footnote | Description |
Footnote* | Sectors less than 3% each |
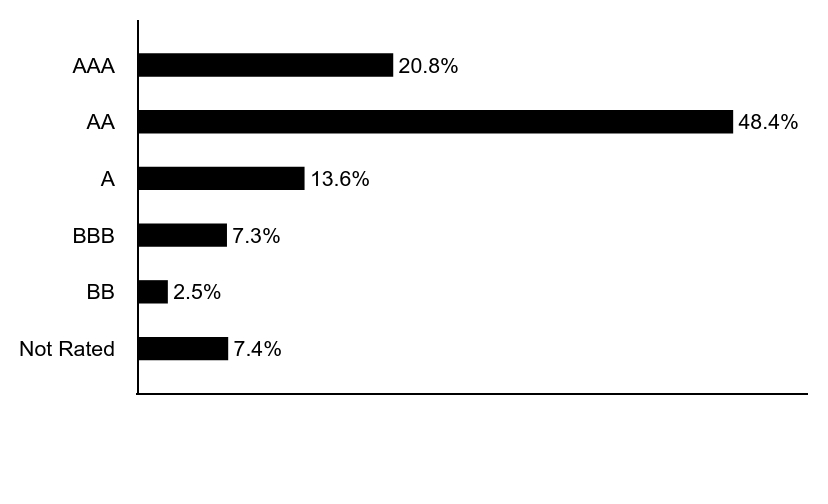
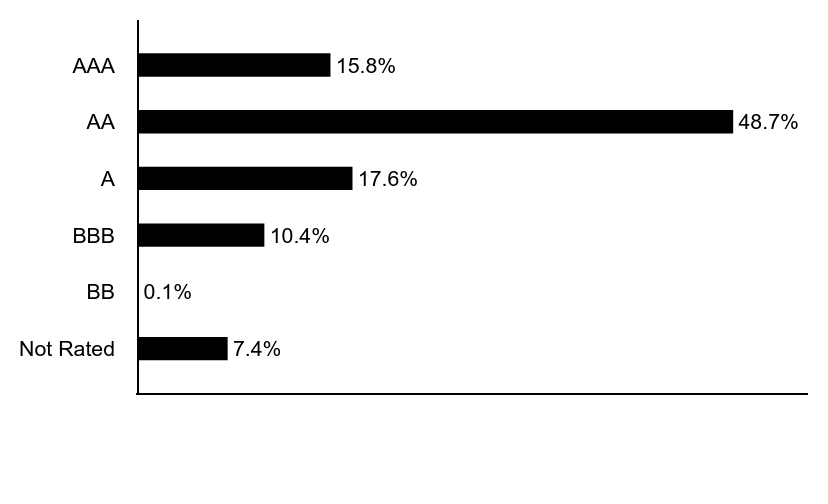
Credit Quality (% of total investments)Footnote Referencea
| Value | Value |
|---|
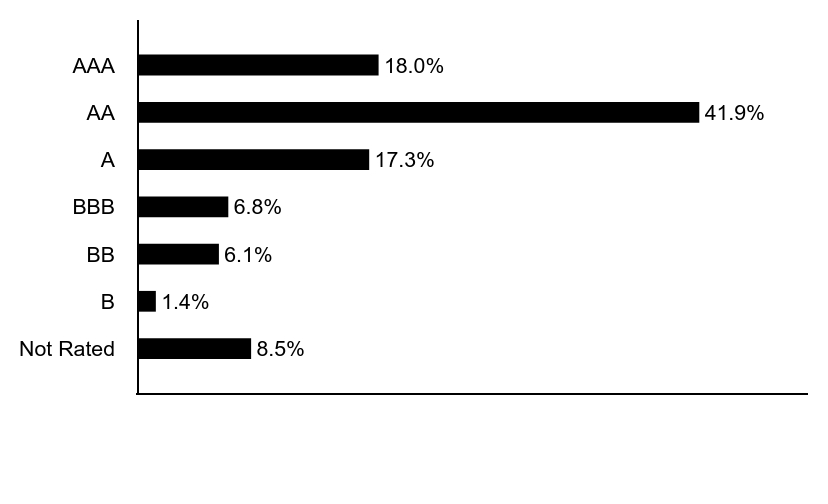
| Not Rated | 7.4% |
| BB | 2.5% |
| BBB | 7.3% |
| A | 13.6% |
| AA | 48.4% |
| AAA | 20.8% |
| Footnote | Description |
Footnotea | Ratings are based on Moody’s Investors Service, Inc. (“Moody’s”), S&P Global Ratings (“S&P”) or Fitch Ratings (“Fitch”). If securities are rated differently by the ratings agencies, the highest rating is applied. Moody's ratings are converted to the S&P and Fitch scale with ratings ranging from AAA, being the highest, to D, being the lowest. Ratings of BBB or higher are considered to be investment-grade quality. Holdings designated as “Not Rated” (if any) are not rated by the national ratings agencies stated above. |
If you wish to view additional information about the Fund, including the prospectus, statement of additional information, financial statements and holdings, please scan the QR code or visit www.eatonvance.com/open-end-mutual-fund-documents.php. For proxy information, please visit www.eatonvance.com/proxyvoting.
The Funds may deliver a single copy of certain required shareholder documents (including prospectuses, shareholder reports, and proxy materials) to investors with the same last name and the same address. Your participation will continue indefinitely unless you instruct otherwise by calling 1-800-262-1122 or by contacting your financial intermediary. Your instruction will typically be effective within 30 days of receipt.
Not FDIC Insured | May Lose Value | No Bank Guarantee
Annual Shareholder Report July 31, 2024
Eaton Vance Arizona Municipal Income Fund
Annual Shareholder Report July 31, 2024
This annual shareholder report contains important information about the Eaton Vance Arizona Municipal Income Fund for the period of August 1, 2023 to July 31, 2024. You can find additional information about the Fund at www.eatonvance.com/open-end-mutual-fund-documents.php. You can also request this information by contacting us at 1-800-262-1122.
What were the Fund costs for the last year?
(based on a hypothetical $10,000 investment)
| Class Name | Costs of a $10,000 investment | Costs paid as a percentage of a $10,000 investment |
|---|
| Class C | $151 | 1.48% |
How did the Fund perform last year and what affected its performance?
Key contributors to (↑) and detractors from (↓) performance, relative to the Bloomberg Municipal Bond Index (the Index):
↑ Security selections and an overweight position in bonds rated BBB and below helped returns as lower-rated bonds outperformed higher-rated bonds
↑ Security selections and an underweight exposure to AAA-rated bonds helped the Fund’s returns as AAA bonds generally underperformed lower-rated bonds
↑ Security selections in the water & sewer sector contributed to the Fund’s Index-relative performance during the period
↓ An underweight position in bonds with 22+ years remaining to maturity hurt returns as longer-maturity bonds outperformed shorter-maturity bonds
↓ An underweight position in A-rated bonds hurt Index-relative returns as A-rated bonds generally outperformed higher-rated bonds during the period
↓ Security selections and an overweight position in the electric utilities sector, which underperformed the Index, also weighed on Index-relative returns
Comparison of the change in value of a $10,000 investment for the period indicated.
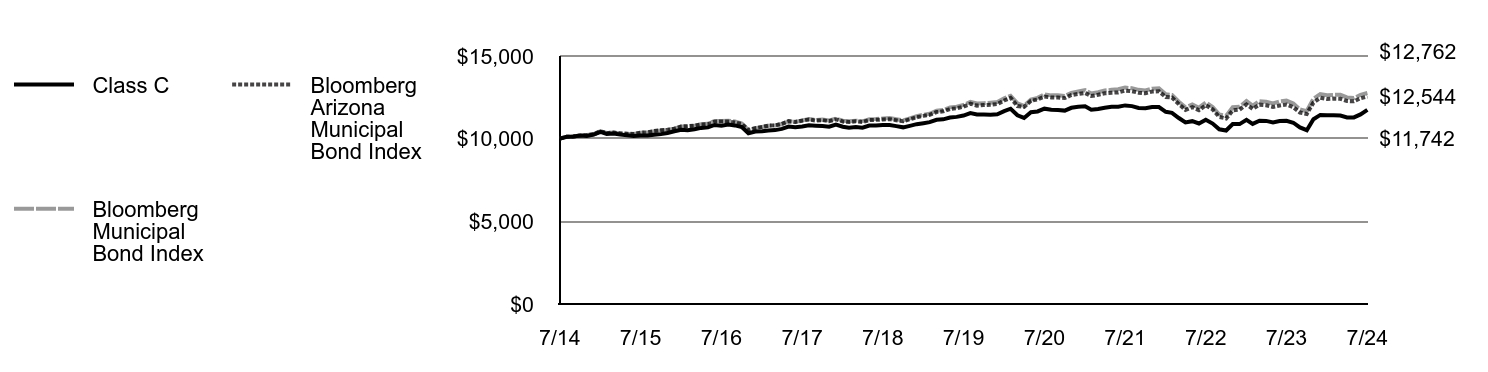
| Class C | Bloomberg Municipal Bond Index | Bloomberg Arizona Municipal Bond Index |
|---|
| 7/14 | $10,000 | $10,000 | $10,000 |
| 8/14 | $10,117 | $10,121 | $10,113 |
| 9/14 | $10,132 | $10,131 | $10,125 |
| 10/14 | $10,184 | $10,201 | $10,190 |
| 11/14 | $10,162 | $10,218 | $10,216 |
| 12/14 | $10,251 | $10,270 | $10,265 |
| 1/15 | $10,415 | $10,452 | $10,451 |
| 2/15 | $10,289 | $10,344 | $10,334 |
| 3/15 | $10,307 | $10,374 | $10,371 |
| 4/15 | $10,247 | $10,320 | $10,322 |
| 5/15 | $10,204 | $10,291 | $10,295 |
| 6/15 | $10,160 | $10,282 | $10,286 |
| 7/15 | $10,193 | $10,356 | $10,362 |
| 8/15 | $10,188 | $10,377 | $10,383 |
| 9/15 | $10,241 | $10,452 | $10,459 |
| 10/15 | $10,274 | $10,493 | $10,507 |
| 11/15 | $10,346 | $10,535 | $10,537 |
| 12/15 | $10,447 | $10,609 | $10,598 |
| 1/16 | $10,538 | $10,736 | $10,737 |
| 2/16 | $10,511 | $10,753 | $10,757 |
| 3/16 | $10,571 | $10,787 | $10,783 |
| 4/16 | $10,651 | $10,866 | $10,860 |
| 5/16 | $10,682 | $10,895 | $10,876 |
| 6/16 | $10,830 | $11,069 | $11,027 |
| 7/16 | $10,781 | $11,075 | $11,038 |
| 8/16 | $10,850 | $11,090 | $11,034 |
| 9/16 | $10,801 | $11,035 | $10,985 |
| 10/16 | $10,702 | $10,919 | $10,890 |
| 11/16 | $10,326 | $10,512 | $10,525 |
| 12/16 | $10,436 | $10,635 | $10,639 |
| 1/17 | $10,455 | $10,705 | $10,706 |
| 2/17 | $10,497 | $10,780 | $10,789 |
| 3/17 | $10,518 | $10,803 | $10,807 |
| 4/17 | $10,589 | $10,882 | $10,897 |
| 5/17 | $10,728 | $11,054 | $11,059 |
| 6/17 | $10,688 | $11,015 | $11,012 |
| 7/17 | $10,737 | $11,104 | $11,088 |
| 8/17 | $10,806 | $11,188 | $11,163 |
| 9/17 | $10,785 | $11,131 | $11,095 |
| 10/17 | $10,763 | $11,159 | $11,125 |
| 11/17 | $10,723 | $11,099 | $11,051 |
| 12/17 | $10,853 | $11,215 | $11,172 |
| 1/18 | $10,720 | $11,083 | $11,038 |
| 2/18 | $10,660 | $11,050 | $11,002 |
| 3/18 | $10,699 | $11,090 | $11,047 |
| 4/18 | $10,668 | $11,051 | $11,007 |
| 5/18 | $10,794 | $11,177 | $11,123 |
| 6/18 | $10,796 | $11,187 | $11,140 |
| 7/18 | $10,826 | $11,214 | $11,157 |
| 8/18 | $10,824 | $11,243 | $11,181 |
| 9/18 | $10,760 | $11,170 | $11,110 |
| 10/18 | $10,685 | $11,101 | $11,051 |
| 11/18 | $10,776 | $11,224 | $11,170 |
| 12/18 | $10,878 | $11,359 | $11,294 |
| 1/19 | $10,937 | $11,444 | $11,380 |
| 2/19 | $10,998 | $11,506 | $11,437 |
| 3/19 | $11,140 | $11,688 | $11,610 |
| 4/19 | $11,169 | $11,732 | $11,652 |
| 5/19 | $11,280 | $11,893 | $11,796 |
| 6/19 | $11,318 | $11,937 | $11,837 |
| 7/19 | $11,398 | $12,033 | $11,936 |
| 8/19 | $11,551 | $12,223 | $12,114 |
| 9/19 | $11,463 | $12,125 | $11,999 |
| 10/19 | $11,458 | $12,147 | $12,031 |
| 11/19 | $11,454 | $12,177 | $12,058 |
| 12/19 | $11,473 | $12,215 | $12,093 |
| 1/20 | $11,662 | $12,434 | $12,308 |
| 2/20 | $11,810 | $12,594 | $12,472 |
| 3/20 | $11,414 | $12,137 | $11,975 |
| 4/20 | $11,254 | $11,985 | $11,922 |
| 5/20 | $11,604 | $12,366 | $12,291 |
| 6/20 | $11,646 | $12,468 | $12,368 |
| 7/20 | $11,814 | $12,678 | $12,543 |
| 8/20 | $11,747 | $12,619 | $12,489 |
| 9/20 | $11,735 | $12,621 | $12,492 |
| 10/20 | $11,698 | $12,583 | $12,455 |
| 11/20 | $11,867 | $12,773 | $12,640 |
| 12/20 | $11,927 | $12,851 | $12,705 |
| 1/21 | $11,960 | $12,933 | $12,761 |
| 2/21 | $11,747 | $12,728 | $12,579 |
| 3/21 | $11,792 | $12,806 | $12,654 |
| 4/21 | $11,870 | $12,913 | $12,745 |
| 5/21 | $11,925 | $12,952 | $12,777 |
| 6/21 | $11,936 | $12,988 | $12,796 |
| 7/21 | $12,012 | $13,095 | $12,904 |
| 8/21 | $11,968 | $13,047 | $12,870 |
| 9/21 | $11,860 | $12,953 | $12,777 |
| 10/21 | $11,840 | $12,915 | $12,746 |
| 11/21 | $11,919 | $13,025 | $12,846 |
| 12/21 | $11,909 | $13,046 | $12,861 |
| 1/22 | $11,626 | $12,689 | $12,522 |
| 2/22 | $11,564 | $12,644 | $12,487 |
| 3/22 | $11,248 | $12,234 | $12,090 |
| 4/22 | $10,978 | $11,895 | $11,741 |
| 5/22 | $11,058 | $12,072 | $11,906 |
| 6/22 | $10,919 | $11,874 | $11,724 |
| 7/22 | $11,142 | $12,188 | $12,018 |
| 8/22 | $10,913 | $11,921 | $11,773 |
| 9/22 | $10,564 | $11,463 | $11,315 |
| 10/22 | $10,492 | $11,368 | $11,219 |
| 11/22 | $10,885 | $11,900 | $11,708 |
| 12/22 | $10,880 | $11,934 | $11,762 |
| 1/23 | $11,140 | $12,277 | $12,068 |
| 2/23 | $10,893 | $11,999 | $11,804 |
| 3/23 | $11,090 | $12,265 | $12,057 |
| 4/23 | $11,075 | $12,237 | $12,018 |
| 5/23 | $10,983 | $12,131 | $11,918 |
| 6/23 | $11,071 | $12,253 | $12,002 |
| 7/23 | $11,078 | $12,301 | $12,067 |
| 8/23 | $10,964 | $12,124 | $11,904 |
| 9/23 | $10,681 | $11,769 | $11,581 |
| 10/23 | $10,511 | $11,669 | $11,498 |
| 11/23 | $11,178 | $12,409 | $12,180 |
| 12/23 | $11,436 | $12,698 | $12,473 |
| 1/24 | $11,412 | $12,633 | $12,397 |
| 2/24 | $11,412 | $12,649 | $12,423 |
| 3/24 | $11,400 | $12,649 | $12,411 |
| 4/24 | $11,286 | $12,492 | $12,277 |
| 5/24 | $11,285 | $12,455 | $12,259 |
| 6/24 | $11,469 | $12,646 | $12,445 |
| 7/24 | $11,742 | $12,762 | $12,544 |
Average Annual Total Returns (%)
| 1 Year | 5 Years | 10 Years |
|---|
| Class C | 4.37% | 0.29% | 1.62% |
| Class C with 1% Maximum Deferred Sales Charge | 3.37% | 0.29% | 1.62% |
| Bloomberg Municipal Bond Index | 3.74% | 1.18% | 2.47% |
| Bloomberg Arizona Municipal Bond Index | 3.95% | 1.00% | 2.29% |
Performance does not reflect the deduction of taxes that a shareholder would pay on Fund distributions or redemption of Fund shares. Performance assumes that all dividends and distributions, if any, were reinvested. For more recent performance information, visit www.eatonvance.com/performance.php.
THE FUND'S PAST PERFORMANCE IS NO GUARANTEE OF FUTURE RESULTS.
| Total Net Assets | $79,377,824 |
| # of Portfolio Holdings | 91 |
| Portfolio Turnover Rate | 58% |
| Total Advisory Fees Paid | $232,134 |
What did the Fund invest in?
The following tables reflect what the Fund invested in as of the report date.
Sector Allocation (% of total investments)
| Value | Value |
|---|
OtherFootnote Reference* | 5.7% |
| Electric Utilities | 5.6% |
| Transportation | 5.7% |
| Industrial Development Revenue | 7.1% |
| Housing | 8.4% |
| Hospital | 8.5% |
| Water and Sewer | 9.3% |
| Education | 11.1% |
| Special Tax Revenue | 14.2% |
| General Obligations | 24.4% |
| Footnote | Description |
Footnote* | Sectors less than 3% each |
Credit Quality (% of total investments)Footnote Referencea
| Value | Value |
|---|
| Not Rated | 7.4% |
| BB | 2.5% |
| BBB | 7.3% |
| A | 13.6% |
| AA | 48.4% |
| AAA | 20.8% |
| Footnote | Description |
Footnotea | Ratings are based on Moody’s Investors Service, Inc. (“Moody’s”), S&P Global Ratings (“S&P”) or Fitch Ratings (“Fitch”). If securities are rated differently by the ratings agencies, the highest rating is applied. Moody's ratings are converted to the S&P and Fitch scale with ratings ranging from AAA, being the highest, to D, being the lowest. Ratings of BBB or higher are considered to be investment-grade quality. Holdings designated as “Not Rated” (if any) are not rated by the national ratings agencies stated above. |
If you wish to view additional information about the Fund, including the prospectus, statement of additional information, financial statements and holdings, please scan the QR code or visit www.eatonvance.com/open-end-mutual-fund-documents.php. For proxy information, please visit www.eatonvance.com/proxyvoting.
The Funds may deliver a single copy of certain required shareholder documents (including prospectuses, shareholder reports, and proxy materials) to investors with the same last name and the same address. Your participation will continue indefinitely unless you instruct otherwise by calling 1-800-262-1122 or by contacting your financial intermediary. Your instruction will typically be effective within 30 days of receipt.
Not FDIC Insured | May Lose Value | No Bank Guarantee
Annual Shareholder Report July 31, 2024
Eaton Vance Arizona Municipal Income Fund
Annual Shareholder Report July 31, 2024
This annual shareholder report contains important information about the Eaton Vance Arizona Municipal Income Fund for the period of August 1, 2023 to July 31, 2024. You can find additional information about the Fund at www.eatonvance.com/open-end-mutual-fund-documents.php. You can also request this information by contacting us at 1-800-262-1122.
What were the Fund costs for the last year?
(based on a hypothetical $10,000 investment)
| Class Name | Costs of a $10,000 investment | Costs paid as a percentage of a $10,000 investment |
|---|
| Class I | $54 | 0.53% |
How did the Fund perform last year and what affected its performance?
Key contributors to (↑) and detractors from (↓) performance, relative to the Bloomberg Municipal Bond Index (the Index):
↑ Security selections and an overweight position in bonds rated BBB and below helped returns as lower-rated bonds outperformed higher-rated bonds
↑ Security selections and an underweight exposure to AAA-rated bonds helped the Fund’s returns as AAA bonds generally underperformed lower-rated bonds
↑ Security selections in the water & sewer sector contributed to the Fund’s Index-relative performance during the period
↓ An underweight position in bonds with 22+ years remaining to maturity hurt returns as longer-maturity bonds outperformed shorter-maturity bonds
↓ An underweight position in A-rated bonds hurt Index-relative returns as A-rated bonds generally outperformed higher-rated bonds during the period
↓ Security selections and an overweight position in the electric utilities sector, which underperformed the Index, also weighed on Index-relative returns
Comparison of the change in value of a $1,000,000 investment for the period indicated.

| Class I | Bloomberg Municipal Bond Index | Bloomberg Arizona Municipal Bond Index |
|---|
| 7/14 | $1,000,000 | $1,000,000 | $1,000,000 |
| 8/14 | $1,012,533 | $1,012,107 | $1,011,325 |
| 9/14 | $1,015,745 | $1,013,136 | $1,012,474 |
| 10/14 | $1,022,090 | $1,020,082 | $1,019,011 |
| 11/14 | $1,020,139 | $1,021,847 | $1,021,573 |
| 12/14 | $1,029,576 | $1,027,003 | $1,026,462 |
| 1/15 | $1,047,501 | $1,045,205 | $1,045,135 |
| 2/15 | $1,034,844 | $1,034,424 | $1,033,362 |
| 3/15 | $1,038,530 | $1,037,411 | $1,037,092 |
| 4/15 | $1,032,097 | $1,031,968 | $1,032,245 |
| 5/15 | $1,028,897 | $1,029,117 | $1,029,526 |
| 6/15 | $1,025,595 | $1,028,179 | $1,028,573 |
| 7/15 | $1,029,833 | $1,035,627 | $1,036,219 |
| 8/15 | $1,030,853 | $1,037,660 | $1,038,333 |
| 9/15 | $1,036,273 | $1,045,177 | $1,045,926 |
| 10/15 | $1,040,538 | $1,049,332 | $1,050,701 |
| 11/15 | $1,048,119 | $1,053,504 | $1,053,746 |
| 12/15 | $1,058,976 | $1,060,906 | $1,059,834 |
| 1/16 | $1,068,800 | $1,073,565 | $1,073,710 |
| 2/16 | $1,067,384 | $1,075,253 | $1,075,722 |
| 3/16 | $1,074,754 | $1,078,659 | $1,078,337 |
| 4/16 | $1,084,419 | $1,086,590 | $1,086,045 |
| 5/16 | $1,087,415 | $1,089,529 | $1,087,626 |
| 6/16 | $1,103,692 | $1,106,862 | $1,102,692 |
| 7/16 | $1,098,816 | $1,107,538 | $1,103,800 |
| 8/16 | $1,107,310 | $1,109,032 | $1,103,417 |
| 9/16 | $1,103,505 | $1,103,497 | $1,098,512 |
| 10/16 | $1,094,069 | $1,091,920 | $1,088,975 |
| 11/16 | $1,056,415 | $1,051,197 | $1,052,510 |
| 12/16 | $1,068,364 | $1,063,538 | $1,063,879 |
| 1/17 | $1,071,220 | $1,070,549 | $1,070,624 |
| 2/17 | $1,076,554 | $1,077,983 | $1,078,944 |
| 3/17 | $1,079,523 | $1,080,323 | $1,080,710 |
| 4/17 | $1,087,104 | $1,088,162 | $1,089,701 |
| 5/17 | $1,103,659 | $1,105,432 | $1,105,868 |
| 6/17 | $1,099,696 | $1,101,468 | $1,101,160 |
| 7/17 | $1,106,005 | $1,110,379 | $1,108,793 |
| 8/17 | $1,113,420 | $1,118,829 | $1,116,322 |
| 9/17 | $1,111,648 | $1,113,141 | $1,109,501 |
| 10/17 | $1,111,021 | $1,115,858 | $1,112,503 |
| 11/17 | $1,108,127 | $1,109,883 | $1,105,123 |
| 12/17 | $1,122,673 | $1,121,483 | $1,117,199 |
| 1/18 | $1,109,214 | $1,108,280 | $1,103,783 |
| 2/18 | $1,103,983 | $1,104,969 | $1,100,193 |
| 3/18 | $1,109,209 | $1,109,047 | $1,104,671 |
| 4/18 | $1,106,223 | $1,105,089 | $1,100,735 |
| 5/18 | $1,120,209 | $1,117,744 | $1,112,329 |
| 6/18 | $1,122,290 | $1,118,698 | $1,113,979 |
| 7/18 | $1,125,223 | $1,121,412 | $1,115,729 |
| 8/18 | $1,125,645 | $1,124,292 | $1,118,100 |
| 9/18 | $1,120,069 | $1,117,014 | $1,111,034 |
| 10/18 | $1,113,300 | $1,110,135 | $1,105,133 |
| 11/18 | $1,123,333 | $1,122,422 | $1,116,971 |
| 12/18 | $1,134,600 | $1,135,861 | $1,129,355 |
| 1/19 | $1,143,358 | $1,144,448 | $1,138,011 |
| 2/19 | $1,149,838 | $1,150,575 | $1,143,657 |
| 3/19 | $1,164,740 | $1,168,763 | $1,160,953 |
| 4/19 | $1,169,966 | $1,173,156 | $1,165,151 |
| 5/19 | $1,182,426 | $1,189,329 | $1,179,649 |
| 6/19 | $1,186,377 | $1,193,721 | $1,183,666 |
| 7/19 | $1,196,462 | $1,203,341 | $1,193,603 |
| 8/19 | $1,212,614 | $1,222,322 | $1,211,395 |
| 9/19 | $1,204,236 | $1,212,524 | $1,199,871 |
| 10/19 | $1,204,446 | $1,214,697 | $1,203,107 |
| 11/19 | $1,206,002 | $1,217,735 | $1,205,832 |
| 12/19 | $1,208,969 | $1,221,453 | $1,209,295 |
| 1/20 | $1,229,328 | $1,243,398 | $1,230,793 |
| 2/20 | $1,246,028 | $1,259,432 | $1,247,229 |
| 3/20 | $1,205,352 | $1,213,749 | $1,197,532 |
| 4/20 | $1,189,657 | $1,198,516 | $1,192,204 |
| 5/20 | $1,227,732 | $1,236,643 | $1,229,056 |
| 6/20 | $1,233,320 | $1,246,821 | $1,236,813 |
| 7/20 | $1,251,431 | $1,267,820 | $1,254,260 |
| 8/20 | $1,245,582 | $1,261,872 | $1,248,873 |
| 9/20 | $1,244,827 | $1,262,139 | $1,249,243 |
| 10/20 | $1,242,551 | $1,258,348 | $1,245,537 |
| 11/20 | $1,260,625 | $1,277,337 | $1,264,026 |
| 12/20 | $1,268,374 | $1,285,118 | $1,270,505 |
| 1/21 | $1,273,164 | $1,293,308 | $1,276,143 |
| 2/21 | $1,251,306 | $1,272,759 | $1,257,894 |
| 3/21 | $1,257,504 | $1,280,608 | $1,265,431 |
| 4/21 | $1,267,539 | $1,291,350 | $1,274,534 |
| 5/21 | $1,273,643 | $1,295,202 | $1,277,689 |
| 6/21 | $1,275,913 | $1,298,759 | $1,279,648 |
| 7/21 | $1,284,492 | $1,309,530 | $1,290,352 |
| 8/21 | $1,281,491 | $1,304,724 | $1,287,029 |
| 9/21 | $1,270,822 | $1,295,309 | $1,277,655 |
| 10/21 | $1,269,251 | $1,291,521 | $1,274,616 |
| 11/21 | $1,278,177 | $1,302,516 | $1,284,602 |
| 12/21 | $1,279,243 | $1,304,617 | $1,286,120 |
| 1/22 | $1,248,924 | $1,268,906 | $1,252,196 |
| 2/22 | $1,243,554 | $1,264,360 | $1,248,733 |
| 3/22 | $1,210,551 | $1,223,373 | $1,209,041 |
| 4/22 | $1,182,892 | $1,189,535 | $1,174,131 |
| 5/22 | $1,191,932 | $1,207,206 | $1,190,626 |
| 6/22 | $1,178,696 | $1,187,434 | $1,172,403 |
| 7/22 | $1,202,241 | $1,218,808 | $1,201,753 |
| 8/22 | $1,179,531 | $1,192,096 | $1,177,302 |
| 9/22 | $1,142,326 | $1,146,342 | $1,131,485 |
| 10/22 | $1,135,705 | $1,136,809 | $1,121,882 |
| 11/22 | $1,178,371 | $1,189,982 | $1,170,816 |
| 12/22 | $1,179,854 | $1,193,388 | $1,176,200 |
| 1/23 | $1,209,360 | $1,227,669 | $1,206,842 |
| 2/23 | $1,182,855 | $1,199,909 | $1,180,446 |
| 3/23 | $1,205,978 | $1,226,532 | $1,205,703 |
| 4/23 | $1,204,954 | $1,223,730 | $1,201,783 |
| 5/23 | $1,195,884 | $1,213,125 | $1,191,827 |
| 6/23 | $1,205,809 | $1,225,277 | $1,200,204 |
| 7/23 | $1,207,460 | $1,230,125 | $1,206,710 |
| 8/23 | $1,195,665 | $1,212,415 | $1,190,361 |
| 9/23 | $1,166,146 | $1,176,881 | $1,158,094 |
| 10/23 | $1,148,877 | $1,166,866 | $1,149,807 |
| 11/23 | $1,222,292 | $1,240,940 | $1,217,971 |
| 12/23 | $1,251,741 | $1,269,782 | $1,247,251 |
| 1/24 | $1,249,522 | $1,263,297 | $1,239,693 |
| 2/24 | $1,251,557 | $1,264,919 | $1,242,278 |
| 3/24 | $1,250,799 | $1,264,879 | $1,241,069 |
| 4/24 | $1,238,969 | $1,249,214 | $1,227,680 |
| 5/24 | $1,241,041 | $1,245,550 | $1,225,944 |
| 6/24 | $1,261,398 | $1,264,642 | $1,244,542 |
| 7/24 | $1,272,165 | $1,276,168 | $1,254,419 |
Average Annual Total Returns (%)
| 1 Year | 5 Years | 10 Years |
|---|
| Class I | 5.36% | 1.23% | 2.43% |
| Bloomberg Municipal Bond Index | 3.74% | 1.18% | 2.47% |
| Bloomberg Arizona Municipal Bond Index | 3.95% | 1.00% | 2.29% |
Performance does not reflect the deduction of taxes that a shareholder would pay on Fund distributions or redemption of Fund shares. Performance assumes that all dividends and distributions, if any, were reinvested. For more recent performance information, visit www.eatonvance.com/performance.php.
THE FUND'S PAST PERFORMANCE IS NO GUARANTEE OF FUTURE RESULTS.
| Total Net Assets | $79,377,824 |
| # of Portfolio Holdings | 91 |
| Portfolio Turnover Rate | 58% |
| Total Advisory Fees Paid | $232,134 |
What did the Fund invest in?
The following tables reflect what the Fund invested in as of the report date.
Sector Allocation (% of total investments)
| Value | Value |
|---|
OtherFootnote Reference* | 5.7% |
| Electric Utilities | 5.6% |
| Transportation | 5.7% |
| Industrial Development Revenue | 7.1% |
| Housing | 8.4% |
| Hospital | 8.5% |
| Water and Sewer | 9.3% |
| Education | 11.1% |
| Special Tax Revenue | 14.2% |
| General Obligations | 24.4% |
| Footnote | Description |
Footnote* | Sectors less than 3% each |
Credit Quality (% of total investments)Footnote Referencea
| Value | Value |
|---|
| Not Rated | 7.4% |
| BB | 2.5% |
| BBB | 7.3% |
| A | 13.6% |
| AA | 48.4% |
| AAA | 20.8% |
| Footnote | Description |
Footnotea | Ratings are based on Moody’s Investors Service, Inc. (“Moody’s”), S&P Global Ratings (“S&P”) or Fitch Ratings (“Fitch”). If securities are rated differently by the ratings agencies, the highest rating is applied. Moody's ratings are converted to the S&P and Fitch scale with ratings ranging from AAA, being the highest, to D, being the lowest. Ratings of BBB or higher are considered to be investment-grade quality. Holdings designated as “Not Rated” (if any) are not rated by the national ratings agencies stated above. |
If you wish to view additional information about the Fund, including the prospectus, statement of additional information, financial statements and holdings, please scan the QR code or visit www.eatonvance.com/open-end-mutual-fund-documents.php. For proxy information, please visit www.eatonvance.com/proxyvoting.
The Funds may deliver a single copy of certain required shareholder documents (including prospectuses, shareholder reports, and proxy materials) to investors with the same last name and the same address. Your participation will continue indefinitely unless you instruct otherwise by calling 1-800-262-1122 or by contacting your financial intermediary. Your instruction will typically be effective within 30 days of receipt.
Not FDIC Insured | May Lose Value | No Bank Guarantee
Annual Shareholder Report July 31, 2024
Eaton Vance Connecticut Municipal Income Fund
Annual Shareholder Report July 31, 2024
This annual shareholder report contains important information about the Eaton Vance Connecticut Municipal Income Fund for the period of August 1, 2023 to July 31, 2024. You can find additional information about the Fund at www.eatonvance.com/open-end-mutual-fund-documents.php. You can also request this information by contacting us at 1-800-262-1122.
What were the Fund costs for the last year?
(based on a hypothetical $10,000 investment)
| Class Name | Costs of a $10,000 investment | Costs paid as a percentage of a $10,000 investment |
|---|
| Class A | $73 | 0.71% |
How did the Fund perform last year and what affected its performance?
Key contributors to (↑) and detractors from (↓) performance, relative to the Bloomberg Municipal Bond Index (the Index):
↑ Security selections and an underweight position in the special tax sector, which underperformed the Index during the period, contributed to returns
↑ Security selections and an underweight position in AA-rated bonds helped Index-relative returns as AA bonds generally underperformed lower-rated bonds
↑ Security selections and an overweight position in bonds rated BBB and below helped returns as lower-rated bonds generally outperformed higher-rated bonds
↓ An underweight position in bonds with 22+ years remaining to maturity hurt returns as longer-maturity bonds generally outperformed shorter-maturity bonds
↓ An overweight position in the education sector, which underperformed the Index, detracted from the Fund’s Index-relative returns during the period
↓ An out-of-Index exposure to bonds with effective maturities of under one year hurt returns as shorter-maturity bonds underperformed longer-maturity bonds
Comparison of the change in value of a $10,000 investment for the period indicated.
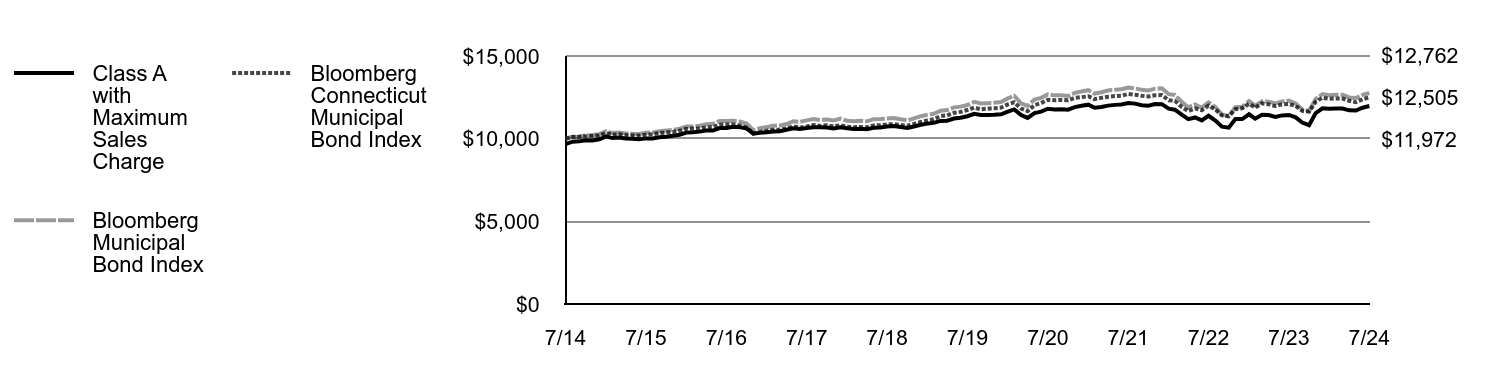
| Class A with Maximum Sales Charge | Bloomberg Municipal Bond Index | Bloomberg Connecticut Municipal Bond Index |
|---|
| 7/14 | $9,675 | $10,000 | $10,000 |
| 8/14 | $9,817 | $10,121 | $10,099 |
| 9/14 | $9,837 | $10,131 | $10,095 |
| 10/14 | $9,904 | $10,201 | $10,151 |
| 11/14 | $9,895 | $10,218 | $10,157 |
| 12/14 | $9,961 | $10,270 | $10,193 |
| 1/15 | $10,142 | $10,452 | $10,345 |
| 2/15 | $10,037 | $10,344 | $10,242 |
| 3/15 | $10,065 | $10,374 | $10,266 |
| 4/15 | $10,017 | $10,320 | $10,222 |
| 5/15 | $9,989 | $10,291 | $10,192 |
| 6/15 | $9,960 | $10,282 | $10,181 |
| 7/15 | $10,017 | $10,356 | $10,242 |
| 8/15 | $10,016 | $10,377 | $10,267 |
| 9/15 | $10,084 | $10,452 | $10,338 |
| 10/15 | $10,122 | $10,493 | $10,374 |
| 11/15 | $10,171 | $10,535 | $10,404 |
| 12/15 | $10,239 | $10,609 | $10,474 |
| 1/16 | $10,366 | $10,736 | $10,601 |
| 2/16 | $10,386 | $10,753 | $10,610 |
| 3/16 | $10,425 | $10,787 | $10,614 |
| 4/16 | $10,494 | $10,866 | $10,683 |
| 5/16 | $10,493 | $10,895 | $10,692 |
| 6/16 | $10,642 | $11,069 | $10,845 |
| 7/16 | $10,640 | $11,075 | $10,853 |
| 8/16 | $10,718 | $11,090 | $10,851 |
| 9/16 | $10,696 | $11,035 | $10,792 |
| 10/16 | $10,612 | $10,919 | $10,670 |
| 11/16 | $10,302 | $10,512 | $10,314 |
| 12/16 | $10,359 | $10,635 | $10,410 |
| 1/17 | $10,387 | $10,705 | $10,474 |
| 2/17 | $10,436 | $10,780 | $10,540 |
| 3/17 | $10,453 | $10,803 | $10,535 |
| 4/17 | $10,543 | $10,882 | $10,629 |
| 5/17 | $10,633 | $11,054 | $10,748 |
| 6/17 | $10,589 | $11,015 | $10,665 |
| 7/17 | $10,648 | $11,104 | $10,739 |
| 8/17 | $10,697 | $11,188 | $10,830 |
| 9/17 | $10,694 | $11,131 | $10,772 |
| 10/17 | $10,669 | $11,159 | $10,809 |
| 11/17 | $10,614 | $11,099 | $10,747 |
| 12/17 | $10,695 | $11,215 | $10,815 |
| 1/18 | $10,627 | $11,083 | $10,719 |
| 2/18 | $10,582 | $11,050 | $10,694 |
| 3/18 | $10,601 | $11,090 | $10,704 |
| 4/18 | $10,576 | $11,051 | $10,685 |
| 5/18 | $10,659 | $11,177 | $10,799 |
| 6/18 | $10,677 | $11,187 | $10,813 |
| 7/18 | $10,736 | $11,214 | $10,860 |
| 8/18 | $10,762 | $11,243 | $10,881 |
| 9/18 | $10,702 | $11,170 | $10,826 |
| 10/18 | $10,642 | $11,101 | $10,783 |
| 11/18 | $10,735 | $11,224 | $10,892 |
| 12/18 | $10,839 | $11,359 | $11,014 |
| 1/19 | $10,909 | $11,444 | $11,108 |
| 2/19 | $10,959 | $11,506 | $11,179 |
| 3/19 | $11,074 | $11,688 | $11,360 |
| 4/19 | $11,090 | $11,732 | $11,410 |
| 5/19 | $11,216 | $11,893 | $11,564 |
| 6/19 | $11,264 | $11,937 | $11,621 |
| 7/19 | $11,357 | $12,033 | $11,734 |
| 8/19 | $11,505 | $12,223 | $11,881 |
| 9/19 | $11,434 | $12,125 | $11,779 |
| 10/19 | $11,439 | $12,147 | $11,816 |
| 11/19 | $11,443 | $12,177 | $11,845 |
| 12/19 | $11,470 | $12,215 | $11,877 |
| 1/20 | $11,639 | $12,434 | $12,076 |
| 2/20 | $11,767 | $12,594 | $12,197 |
| 3/20 | $11,433 | $12,137 | $11,823 |
| 4/20 | $11,256 | $11,985 | $11,664 |
| 5/20 | $11,542 | $12,366 | $12,031 |
| 6/20 | $11,636 | $12,468 | $12,150 |
| 7/20 | $11,809 | $12,678 | $12,357 |
| 8/20 | $11,765 | $12,619 | $12,325 |
| 9/20 | $11,777 | $12,621 | $12,342 |
| 10/20 | $11,754 | $12,583 | $12,319 |
| 11/20 | $11,906 | $12,773 | $12,469 |
| 12/20 | $11,987 | $12,851 | $12,511 |
| 1/21 | $12,055 | $12,933 | $12,563 |
| 2/21 | $11,872 | $12,728 | $12,396 |
| 3/21 | $11,918 | $12,806 | $12,467 |
| 4/21 | $11,999 | $12,913 | $12,536 |
| 5/21 | $12,044 | $12,952 | $12,574 |
| 6/21 | $12,068 | $12,988 | $12,592 |
| 7/21 | $12,158 | $13,095 | $12,703 |
| 8/21 | $12,120 | $13,047 | $12,661 |
| 9/21 | $12,024 | $12,953 | $12,591 |
| 10/21 | $11,998 | $12,915 | $12,547 |
| 11/21 | $12,090 | $13,025 | $12,623 |
| 12/21 | $12,087 | $13,046 | $12,635 |
| 1/22 | $11,813 | $12,689 | $12,325 |
| 2/22 | $11,753 | $12,644 | $12,287 |
| 3/22 | $11,454 | $12,234 | $11,926 |
| 4/22 | $11,179 | $11,895 | $11,664 |
| 5/22 | $11,282 | $12,072 | $11,828 |
| 6/22 | $11,102 | $11,874 | $11,717 |
| 7/22 | $11,386 | $12,188 | $12,002 |
| 8/22 | $11,098 | $11,921 | $11,771 |
| 9/22 | $10,727 | $11,463 | $11,406 |
| 10/22 | $10,668 | $11,368 | $11,352 |
| 11/22 | $11,184 | $11,900 | $11,785 |
| 12/22 | $11,184 | $11,934 | $11,834 |
| 1/23 | $11,473 | $12,277 | $12,110 |
| 2/23 | $11,208 | $11,999 | $11,876 |
| 3/23 | $11,439 | $12,265 | $12,134 |
| 4/23 | $11,427 | $12,237 | $12,075 |
| 5/23 | $11,319 | $12,131 | $11,970 |
| 6/23 | $11,406 | $12,253 | $12,071 |
| 7/23 | $11,433 | $12,301 | $12,098 |
| 8/23 | $11,288 | $12,124 | $11,981 |
| 9/23 | $10,971 | $11,769 | $11,681 |
| 10/23 | $10,815 | $11,669 | $11,638 |
| 11/23 | $11,547 | $12,409 | $12,234 |
| 12/23 | $11,834 | $12,698 | $12,476 |
| 1/24 | $11,813 | $12,633 | $12,416 |
| 2/24 | $11,830 | $12,649 | $12,434 |
| 3/24 | $11,822 | $12,649 | $12,429 |
| 4/24 | $11,713 | $12,492 | $12,290 |
| 5/24 | $11,705 | $12,455 | $12,206 |
| 6/24 | $11,873 | $12,646 | $12,382 |
| 7/24 | $11,972 | $12,762 | $12,505 |
Average Annual Total Returns (%)
| 1 Year | 5 Years | 10 Years |
|---|
| Class A | 4.67% | 1.05% | 2.15% |
| Class A with 3.25% Maximum Sales Charge | 1.30% | 0.39% | 1.81% |
| Bloomberg Municipal Bond Index | 3.74% | 1.18% | 2.47% |
| Bloomberg Connecticut Municipal Bond Index | 3.36% | 1.28% | 2.26% |
Performance does not reflect the deduction of taxes that a shareholder would pay on Fund distributions or redemption of Fund shares. Performance assumes that all dividends and distributions, if any, were reinvested. For more recent performance information, visit www.eatonvance.com/performance.php.
THE FUND'S PAST PERFORMANCE IS NO GUARANTEE OF FUTURE RESULTS.
| Total Net Assets | $115,390,887 |
| # of Portfolio Holdings | 116 |
| Portfolio Turnover Rate | 41% |
| Total Advisory Fees Paid | $354,241 |
What did the Fund invest in?
The following tables reflect what the Fund invested in as of the report date.
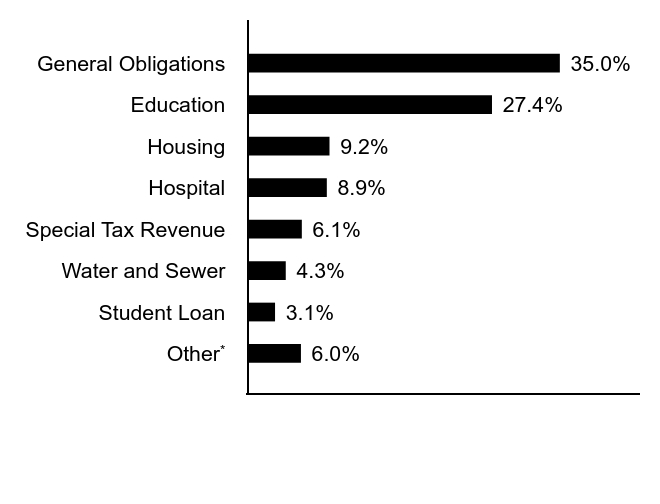
Sector Allocation (% of total investments)
| Value | Value |
|---|
OtherFootnote Reference* | 6.0% |
| Student Loan | 3.1% |
| Water and Sewer | 4.3% |
| Special Tax Revenue | 6.1% |
| Hospital | 8.9% |
| Housing | 9.2% |
| Education | 27.4% |
| General Obligations | 35.0% |
| Footnote | Description |
Footnote* | Sectors less than 3% each |
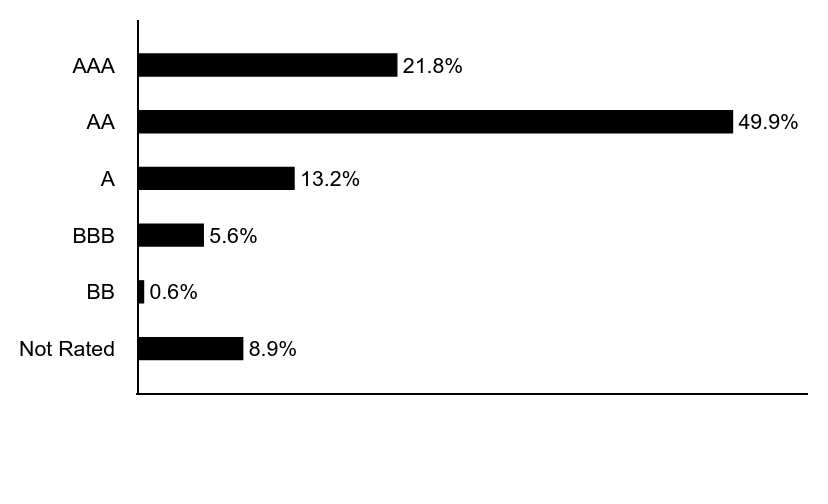
Credit Quality (% of total investments)Footnote Referencea
| Value | Value |
|---|
| Not Rated | 8.9% |
| BB | 0.6% |
| BBB | 5.6% |
| A | 13.2% |
| AA | 49.9% |
| AAA | 21.8% |
| Footnote | Description |
Footnotea | Ratings are based on Moody’s Investors Service, Inc. (“Moody’s”), S&P Global Ratings (“S&P”) or Fitch Ratings (“Fitch”). If securities are rated differently by the ratings agencies, the highest rating is applied. Moody's ratings are converted to the S&P and Fitch scale with ratings ranging from AAA, being the highest, to D, being the lowest. Ratings of BBB or higher are considered to be investment-grade quality. Holdings designated as “Not Rated” (if any) are not rated by the national ratings agencies stated above. |
If you wish to view additional information about the Fund, including the prospectus, statement of additional information, financial statements and holdings, please scan the QR code or visit www.eatonvance.com/open-end-mutual-fund-documents.php. For proxy information, please visit www.eatonvance.com/proxyvoting.
The Funds may deliver a single copy of certain required shareholder documents (including prospectuses, shareholder reports, and proxy materials) to investors with the same last name and the same address. Your participation will continue indefinitely unless you instruct otherwise by calling 1-800-262-1122 or by contacting your financial intermediary. Your instruction will typically be effective within 30 days of receipt.
Not FDIC Insured | May Lose Value | No Bank Guarantee
Annual Shareholder Report July 31, 2024
Eaton Vance Connecticut Municipal Income Fund
Annual Shareholder Report July 31, 2024
This annual shareholder report contains important information about the Eaton Vance Connecticut Municipal Income Fund for the period of August 1, 2023 to July 31, 2024. You can find additional information about the Fund at www.eatonvance.com/open-end-mutual-fund-documents.php. You can also request this information by contacting us at 1-800-262-1122.
What were the Fund costs for the last year?
(based on a hypothetical $10,000 investment)
| Class Name | Costs of a $10,000 investment | Costs paid as a percentage of a $10,000 investment |
|---|
| Class C | $149 | 1.46% |
How did the Fund perform last year and what affected its performance?
Key contributors to (↑) and detractors from (↓) performance, relative to the Bloomberg Municipal Bond Index (the Index):
↑ Security selections and an underweight position in the special tax sector, which underperformed the Index during the period, contributed to returns
↑ Security selections and an underweight position in AA-rated bonds helped Index-relative returns as AA bonds generally underperformed lower-rated bonds
↑ Security selections and an overweight position in bonds rated BBB and below helped returns as lower-rated bonds generally outperformed higher-rated bonds
↓ An underweight position in bonds with 22+ years remaining to maturity hurt returns as longer-maturity bonds generally outperformed shorter-maturity bonds
↓ An overweight position in the education sector, which underperformed the Index, detracted from the Fund’s Index-relative returns during the period
↓ An out-of-Index exposure to bonds with effective maturities of under one year hurt returns as shorter-maturity bonds underperformed longer-maturity bonds
Comparison of the change in value of a $10,000 investment for the period indicated.
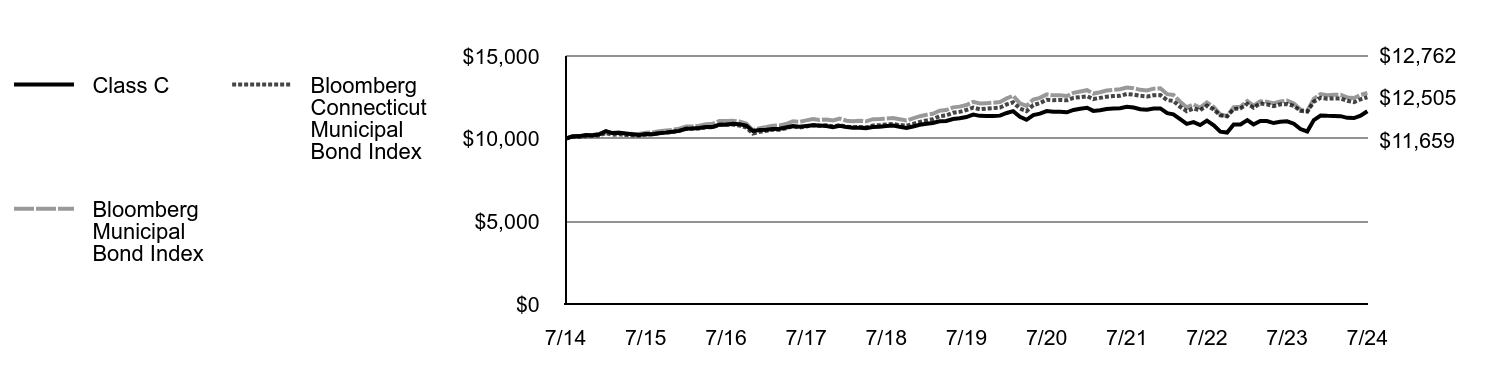
| Class C | Bloomberg Municipal Bond Index | Bloomberg Connecticut Municipal Bond Index |
|---|
| 7/14 | $10,000 | $10,000 | $10,000 |
| 8/14 | $10,141 | $10,121 | $10,099 |
| 9/14 | $10,155 | $10,131 | $10,095 |
| 10/14 | $10,218 | $10,201 | $10,151 |
| 11/14 | $10,212 | $10,218 | $10,157 |
| 12/14 | $10,264 | $10,270 | $10,193 |
| 1/15 | $10,455 | $10,452 | $10,345 |
| 2/15 | $10,340 | $10,344 | $10,242 |
| 3/15 | $10,353 | $10,374 | $10,266 |
| 4/15 | $10,306 | $10,320 | $10,222 |
| 5/15 | $10,270 | $10,291 | $10,192 |
| 6/15 | $10,224 | $10,282 | $10,181 |
| 7/15 | $10,276 | $10,356 | $10,242 |
| 8/15 | $10,268 | $10,377 | $10,267 |
| 9/15 | $10,332 | $10,452 | $10,338 |
| 10/15 | $10,365 | $10,493 | $10,374 |
| 11/15 | $10,418 | $10,535 | $10,404 |
| 12/15 | $10,472 | $10,609 | $10,474 |
| 1/16 | $10,595 | $10,736 | $10,601 |
| 2/16 | $10,609 | $10,753 | $10,610 |
| 3/16 | $10,642 | $10,787 | $10,614 |
| 4/16 | $10,706 | $10,866 | $10,683 |
| 5/16 | $10,708 | $10,895 | $10,692 |
| 6/16 | $10,844 | $11,069 | $10,845 |
| 7/16 | $10,845 | $11,075 | $10,853 |
| 8/16 | $10,908 | $11,090 | $10,851 |
| 9/16 | $10,878 | $11,035 | $10,792 |
| 10/16 | $10,785 | $10,919 | $10,670 |
| 11/16 | $10,463 | $10,512 | $10,314 |
| 12/16 | $10,525 | $10,635 | $10,410 |
| 1/17 | $10,536 | $10,705 | $10,474 |
| 2/17 | $10,579 | $10,780 | $10,540 |
| 3/17 | $10,601 | $10,803 | $10,535 |
| 4/17 | $10,675 | $10,882 | $10,629 |
| 5/17 | $10,760 | $11,054 | $10,748 |
| 6/17 | $10,718 | $11,015 | $10,665 |
| 7/17 | $10,761 | $11,104 | $10,739 |
| 8/17 | $10,804 | $11,188 | $10,830 |
| 9/17 | $10,794 | $11,131 | $10,772 |
| 10/17 | $10,762 | $11,159 | $10,809 |
| 11/17 | $10,699 | $11,099 | $10,747 |
| 12/17 | $10,775 | $11,215 | $10,815 |
| 1/18 | $10,699 | $11,083 | $10,719 |
| 2/18 | $10,658 | $11,050 | $10,694 |
| 3/18 | $10,659 | $11,090 | $10,704 |
| 4/18 | $10,638 | $11,051 | $10,685 |
| 5/18 | $10,704 | $11,177 | $10,799 |
| 6/18 | $10,727 | $11,187 | $10,813 |
| 7/18 | $10,768 | $11,214 | $10,860 |
| 8/18 | $10,798 | $11,243 | $10,881 |
| 9/18 | $10,720 | $11,170 | $10,826 |
| 10/18 | $10,653 | $11,101 | $10,783 |
| 11/18 | $10,740 | $11,224 | $10,892 |
| 12/18 | $10,837 | $11,359 | $11,014 |
| 1/19 | $10,901 | $11,444 | $11,108 |
| 2/19 | $10,944 | $11,506 | $11,179 |
| 3/19 | $11,052 | $11,688 | $11,360 |
| 4/19 | $11,072 | $11,732 | $11,410 |
| 5/19 | $11,191 | $11,893 | $11,564 |
| 6/19 | $11,232 | $11,937 | $11,621 |
| 7/19 | $11,307 | $12,033 | $11,734 |
| 8/19 | $11,459 | $12,223 | $11,881 |
| 9/19 | $11,380 | $12,125 | $11,779 |
| 10/19 | $11,366 | $12,147 | $11,816 |
| 11/19 | $11,374 | $12,177 | $11,845 |
| 12/19 | $11,393 | $12,215 | $11,877 |
| 1/20 | $11,555 | $12,434 | $12,076 |
| 2/20 | $11,664 | $12,594 | $12,197 |
| 3/20 | $11,324 | $12,137 | $11,823 |
| 4/20 | $11,142 | $11,985 | $11,664 |
| 5/20 | $11,430 | $12,366 | $12,031 |
| 6/20 | $11,517 | $12,468 | $12,150 |
| 7/20 | $11,670 | $12,678 | $12,357 |
| 8/20 | $11,629 | $12,619 | $12,325 |
| 9/20 | $11,623 | $12,621 | $12,342 |
| 10/20 | $11,593 | $12,583 | $12,319 |
| 11/20 | $11,736 | $12,773 | $12,469 |
| 12/20 | $11,808 | $12,851 | $12,511 |
| 1/21 | $11,868 | $12,933 | $12,563 |
| 2/21 | $11,680 | $12,728 | $12,396 |
| 3/21 | $11,718 | $12,806 | $12,467 |
| 4/21 | $11,790 | $12,913 | $12,536 |
| 5/21 | $11,828 | $12,952 | $12,574 |
| 6/21 | $11,843 | $12,988 | $12,592 |
| 7/21 | $11,925 | $13,095 | $12,703 |
| 8/21 | $11,880 | $13,047 | $12,661 |
| 9/21 | $11,778 | $12,953 | $12,591 |
| 10/21 | $11,745 | $12,915 | $12,547 |
| 11/21 | $11,827 | $13,025 | $12,623 |
| 12/21 | $11,829 | $13,046 | $12,635 |
| 1/22 | $11,541 | $12,689 | $12,325 |
| 2/22 | $11,475 | $12,644 | $12,287 |
| 3/22 | $11,186 | $12,234 | $11,926 |
| 4/22 | $10,898 | $11,895 | $11,664 |
| 5/22 | $11,004 | $12,072 | $11,828 |
| 6/22 | $10,821 | $11,874 | $11,717 |
| 7/22 | $11,091 | $12,188 | $12,002 |
| 8/22 | $10,803 | $11,921 | $11,771 |
| 9/22 | $10,423 | $11,463 | $11,406 |
| 10/22 | $10,370 | $11,368 | $11,352 |
| 11/22 | $10,855 | $11,900 | $11,785 |
| 12/22 | $10,860 | $11,934 | $11,834 |
| 1/23 | $11,122 | $12,277 | $12,110 |
| 2/23 | $10,858 | $11,999 | $11,876 |
| 3/23 | $11,075 | $12,265 | $12,134 |
| 4/23 | $11,069 | $12,237 | $12,075 |
| 5/23 | $10,944 | $12,131 | $11,970 |
| 6/23 | $11,022 | $12,253 | $12,071 |
| 7/23 | $11,053 | $12,301 | $12,098 |
| 8/23 | $10,906 | $12,124 | $11,981 |
| 9/23 | $10,580 | $11,769 | $11,681 |
| 10/23 | $10,433 | $11,669 | $11,638 |
| 11/23 | $11,124 | $12,409 | $12,234 |
| 12/23 | $11,394 | $12,698 | $12,476 |
| 1/24 | $11,379 | $12,633 | $12,416 |
| 2/24 | $11,376 | $12,649 | $12,434 |
| 3/24 | $11,361 | $12,649 | $12,429 |
| 4/24 | $11,261 | $12,492 | $12,290 |
| 5/24 | $11,246 | $12,455 | $12,206 |
| 6/24 | $11,389 | $12,646 | $12,382 |
| 7/24 | $11,659 | $12,762 | $12,505 |
Average Annual Total Returns (%)
| 1 Year | 5 Years | 10 Years |
|---|
| Class C | 3.89% | 0.31% | 1.55% |
| Class C with 1% Maximum Deferred Sales Charge | 2.89% | 0.31% | 1.55% |
| Bloomberg Municipal Bond Index | 3.74% | 1.18% | 2.47% |
| Bloomberg Connecticut Municipal Bond Index | 3.36% | 1.28% | 2.26% |
Performance does not reflect the deduction of taxes that a shareholder would pay on Fund distributions or redemption of Fund shares. Performance assumes that all dividends and distributions, if any, were reinvested. For more recent performance information, visit www.eatonvance.com/performance.php.
THE FUND'S PAST PERFORMANCE IS NO GUARANTEE OF FUTURE RESULTS.
| Total Net Assets | $115,390,887 |
| # of Portfolio Holdings | 116 |
| Portfolio Turnover Rate | 41% |
| Total Advisory Fees Paid | $354,241 |
What did the Fund invest in?
The following tables reflect what the Fund invested in as of the report date.
Sector Allocation (% of total investments)
| Value | Value |
|---|
OtherFootnote Reference* | 6.0% |
| Student Loan | 3.1% |
| Water and Sewer | 4.3% |
| Special Tax Revenue | 6.1% |
| Hospital | 8.9% |
| Housing | 9.2% |
| Education | 27.4% |
| General Obligations | 35.0% |
| Footnote | Description |
Footnote* | Sectors less than 3% each |
Credit Quality (% of total investments)Footnote Referencea
| Value | Value |
|---|
| Not Rated | 8.9% |
| BB | 0.6% |
| BBB | 5.6% |
| A | 13.2% |
| AA | 49.9% |
| AAA | 21.8% |
| Footnote | Description |
Footnotea | Ratings are based on Moody’s Investors Service, Inc. (“Moody’s”), S&P Global Ratings (“S&P”) or Fitch Ratings (“Fitch”). If securities are rated differently by the ratings agencies, the highest rating is applied. Moody's ratings are converted to the S&P and Fitch scale with ratings ranging from AAA, being the highest, to D, being the lowest. Ratings of BBB or higher are considered to be investment-grade quality. Holdings designated as “Not Rated” (if any) are not rated by the national ratings agencies stated above. |
If you wish to view additional information about the Fund, including the prospectus, statement of additional information, financial statements and holdings, please scan the QR code or visit www.eatonvance.com/open-end-mutual-fund-documents.php. For proxy information, please visit www.eatonvance.com/proxyvoting.
The Funds may deliver a single copy of certain required shareholder documents (including prospectuses, shareholder reports, and proxy materials) to investors with the same last name and the same address. Your participation will continue indefinitely unless you instruct otherwise by calling 1-800-262-1122 or by contacting your financial intermediary. Your instruction will typically be effective within 30 days of receipt.
Not FDIC Insured | May Lose Value | No Bank Guarantee
Annual Shareholder Report July 31, 2024
Eaton Vance Connecticut Municipal Income Fund
Annual Shareholder Report July 31, 2024
This annual shareholder report contains important information about the Eaton Vance Connecticut Municipal Income Fund for the period of August 1, 2023 to July 31, 2024. You can find additional information about the Fund at www.eatonvance.com/open-end-mutual-fund-documents.php. You can also request this information by contacting us at 1-800-262-1122.
What were the Fund costs for the last year?
(based on a hypothetical $10,000 investment)
| Class Name | Costs of a $10,000 investment | Costs paid as a percentage of a $10,000 investment |
|---|
| Class I | $52 | 0.51% |
How did the Fund perform last year and what affected its performance?
Key contributors to (↑) and detractors from (↓) performance, relative to the Bloomberg Municipal Bond Index (the Index):
↑ Security selections and an underweight position in the special tax sector, which underperformed the Index during the period, contributed to returns
↑ Security selections and an underweight position in AA-rated bonds helped Index-relative returns as AA bonds generally underperformed lower-rated bonds
↑ Security selections and an overweight position in bonds rated BBB and below helped returns as lower-rated bonds generally outperformed higher-rated bonds
↓ An underweight position in bonds with 22+ years remaining to maturity hurt returns as longer-maturity bonds generally outperformed shorter-maturity bonds
↓ An overweight position in the education sector, which underperformed the Index, detracted from the Fund’s Index-relative returns during the period
↓ An out-of-Index exposure to bonds with effective maturities of under one year hurt returns as shorter-maturity bonds underperformed longer-maturity bonds
Comparison of the change in value of a $1,000,000 investment for the period indicated.
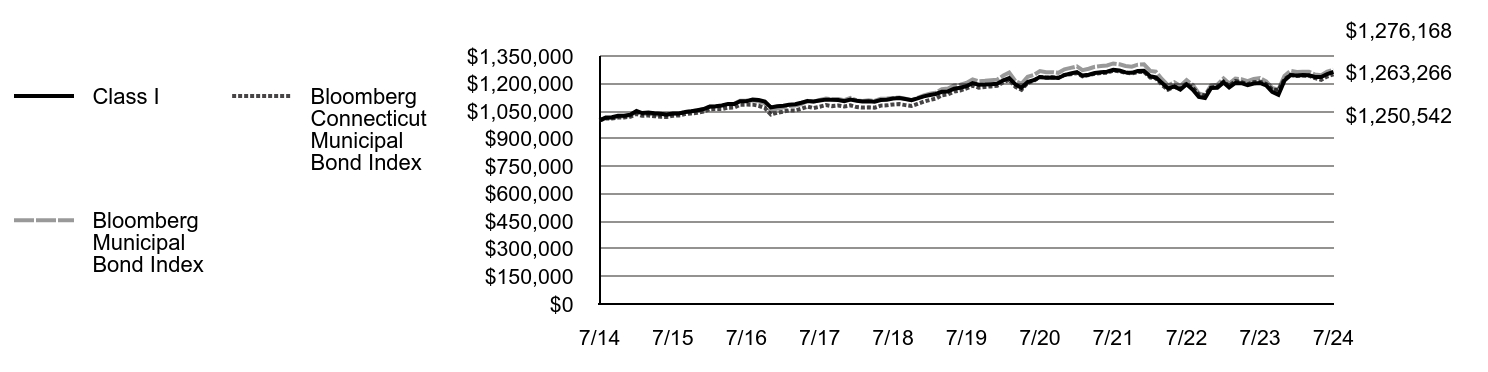
| Class I | Bloomberg Municipal Bond Index | Bloomberg Connecticut Municipal Bond Index |
|---|
| 7/14 | $1,000,000 | $1,000,000 | $1,000,000 |
| 8/14 | $1,014,855 | $1,012,107 | $1,009,882 |
| 9/14 | $1,017,068 | $1,013,136 | $1,009,478 |
| 10/14 | $1,024,175 | $1,020,082 | $1,015,112 |
| 11/14 | $1,024,376 | $1,021,847 | $1,015,710 |
| 12/14 | $1,030,470 | $1,027,003 | $1,019,268 |
| 1/15 | $1,050,363 | $1,045,205 | $1,034,529 |
| 2/15 | $1,039,590 | $1,034,424 | $1,024,200 |
| 3/15 | $1,041,760 | $1,037,411 | $1,026,594 |
| 4/15 | $1,037,938 | $1,031,968 | $1,022,232 |
| 5/15 | $1,035,172 | $1,029,117 | $1,019,197 |
| 6/15 | $1,031,354 | $1,028,179 | $1,018,066 |
| 7/15 | $1,037,414 | $1,035,627 | $1,024,177 |
| 8/15 | $1,037,475 | $1,037,660 | $1,026,670 |
| 9/15 | $1,044,696 | $1,045,177 | $1,033,806 |
| 10/15 | $1,048,845 | $1,049,332 | $1,037,391 |
| 11/15 | $1,055,086 | $1,053,504 | $1,040,400 |
| 12/15 | $1,061,334 | $1,060,906 | $1,047,358 |
| 1/16 | $1,074,690 | $1,073,565 | $1,060,149 |
| 2/16 | $1,076,889 | $1,075,253 | $1,061,006 |
| 3/16 | $1,081,116 | $1,078,659 | $1,061,417 |
| 4/16 | $1,088,474 | $1,086,590 | $1,068,322 |
| 5/16 | $1,088,517 | $1,089,529 | $1,069,209 |
| 6/16 | $1,104,218 | $1,106,862 | $1,084,463 |
| 7/16 | $1,104,125 | $1,107,538 | $1,085,314 |
| 8/16 | $1,112,465 | $1,109,032 | $1,085,145 |
| 9/16 | $1,110,323 | $1,103,497 | $1,079,162 |
| 10/16 | $1,101,787 | $1,091,920 | $1,066,976 |
| 11/16 | $1,069,820 | $1,051,197 | $1,031,377 |
| 12/16 | $1,075,953 | $1,063,538 | $1,041,024 |
| 1/17 | $1,078,999 | $1,070,549 | $1,047,361 |
| 2/17 | $1,084,227 | $1,077,983 | $1,053,977 |
| 3/17 | $1,087,295 | $1,080,323 | $1,053,457 |
| 4/17 | $1,095,742 | $1,088,162 | $1,062,899 |
| 5/17 | $1,105,299 | $1,105,432 | $1,074,844 |
| 6/17 | $1,101,948 | $1,101,468 | $1,066,533 |
| 7/17 | $1,107,240 | $1,110,379 | $1,073,922 |
| 8/17 | $1,112,498 | $1,118,829 | $1,082,957 |
| 9/17 | $1,112,334 | $1,113,141 | $1,077,216 |
| 10/17 | $1,109,984 | $1,115,858 | $1,080,878 |
| 11/17 | $1,104,383 | $1,109,883 | $1,074,750 |
| 12/17 | $1,113,059 | $1,121,483 | $1,081,504 |
| 1/18 | $1,106,129 | $1,108,280 | $1,071,894 |
| 2/18 | $1,102,773 | $1,104,969 | $1,069,423 |
| 3/18 | $1,103,764 | $1,109,047 | $1,070,449 |
| 4/18 | $1,101,403 | $1,105,089 | $1,068,549 |
| 5/18 | $1,110,166 | $1,117,744 | $1,079,859 |
| 6/18 | $1,112,294 | $1,118,698 | $1,081,295 |
| 7/18 | $1,118,602 | $1,121,412 | $1,086,040 |
| 8/18 | $1,121,503 | $1,124,292 | $1,088,061 |
| 9/18 | $1,115,469 | $1,117,014 | $1,082,581 |
| 10/18 | $1,109,426 | $1,110,135 | $1,078,257 |
| 11/18 | $1,119,272 | $1,122,422 | $1,089,226 |
| 12/18 | $1,130,321 | $1,135,861 | $1,101,370 |
| 1/19 | $1,137,816 | $1,144,448 | $1,110,791 |
| 2/19 | $1,143,191 | $1,150,575 | $1,117,925 |
| 3/19 | $1,155,326 | $1,168,763 | $1,135,985 |
| 4/19 | $1,157,226 | $1,173,156 | $1,141,046 |
| 5/19 | $1,171,685 | $1,189,329 | $1,156,373 |
| 6/19 | $1,176,935 | $1,193,721 | $1,162,117 |
| 7/19 | $1,185,680 | $1,203,341 | $1,173,423 |
| 8/19 | $1,202,537 | $1,222,322 | $1,188,059 |
| 9/19 | $1,194,057 | $1,212,524 | $1,177,892 |
| 10/19 | $1,194,781 | $1,214,697 | $1,181,610 |
| 11/19 | $1,196,621 | $1,217,735 | $1,184,545 |
| 12/19 | $1,198,390 | $1,221,453 | $1,187,732 |
| 1/20 | $1,217,487 | $1,243,398 | $1,207,566 |
| 2/20 | $1,229,902 | $1,259,432 | $1,219,670 |
| 3/20 | $1,195,149 | $1,213,749 | $1,182,330 |
| 4/20 | $1,176,908 | $1,198,516 | $1,166,444 |
| 5/20 | $1,208,203 | $1,236,643 | $1,203,142 |
| 6/20 | $1,218,267 | $1,246,821 | $1,215,010 |
| 7/20 | $1,235,424 | $1,267,820 | $1,235,684 |
| 8/20 | $1,232,136 | $1,261,872 | $1,232,478 |
| 9/20 | $1,232,424 | $1,262,139 | $1,234,150 |
| 10/20 | $1,230,275 | $1,258,348 | $1,231,858 |
| 11/20 | $1,246,340 | $1,277,337 | $1,246,868 |
| 12/20 | $1,255,001 | $1,285,118 | $1,251,055 |
| 1/21 | $1,262,359 | $1,293,308 | $1,256,251 |
| 2/21 | $1,243,347 | $1,272,759 | $1,239,614 |
| 3/21 | $1,248,367 | $1,280,608 | $1,246,690 |
| 4/21 | $1,257,053 | $1,291,350 | $1,253,597 |
| 5/21 | $1,262,057 | $1,295,202 | $1,257,448 |
| 6/21 | $1,264,704 | $1,298,759 | $1,259,219 |
| 7/21 | $1,274,440 | $1,309,530 | $1,270,324 |
| 8/21 | $1,270,683 | $1,304,724 | $1,266,056 |
| 9/21 | $1,260,831 | $1,295,309 | $1,259,050 |
| 10/21 | $1,258,302 | $1,291,521 | $1,254,662 |
| 11/21 | $1,268,092 | $1,302,516 | $1,262,349 |
| 12/21 | $1,269,256 | $1,304,617 | $1,263,472 |
| 1/22 | $1,239,507 | $1,268,906 | $1,232,460 |
| 2/22 | $1,233,340 | $1,264,360 | $1,228,693 |
| 3/22 | $1,203,417 | $1,223,373 | $1,192,593 |
| 4/22 | $1,173,499 | $1,189,535 | $1,166,403 |
| 5/22 | $1,184,542 | $1,207,206 | $1,182,834 |
| 6/22 | $1,167,051 | $1,187,434 | $1,171,716 |
| 7/22 | $1,195,829 | $1,218,808 | $1,200,166 |
| 8/22 | $1,165,851 | $1,192,096 | $1,177,070 |
| 9/22 | $1,127,080 | $1,146,342 | $1,140,595 |
| 10/22 | $1,120,990 | $1,136,809 | $1,135,194 |
| 11/22 | $1,175,428 | $1,189,982 | $1,178,476 |
| 12/22 | $1,176,930 | $1,193,388 | $1,183,368 |
| 1/23 | $1,206,198 | $1,227,669 | $1,210,987 |
| 2/23 | $1,178,558 | $1,199,909 | $1,187,639 |
| 3/23 | $1,203,017 | $1,226,532 | $1,213,403 |
| 4/23 | $1,202,032 | $1,223,730 | $1,207,505 |
| 5/23 | $1,190,783 | $1,213,125 | $1,196,978 |
| 6/23 | $1,200,135 | $1,225,277 | $1,207,122 |
| 7/23 | $1,203,190 | $1,230,125 | $1,209,841 |
| 8/23 | $1,189,446 | $1,212,415 | $1,198,143 |
| 9/23 | $1,155,036 | $1,176,881 | $1,168,116 |
| 10/23 | $1,138,704 | $1,166,866 | $1,163,806 |
| 11/23 | $1,215,998 | $1,240,940 | $1,223,371 |
| 12/23 | $1,246,492 | $1,269,782 | $1,247,589 |
| 1/24 | $1,244,457 | $1,263,297 | $1,241,561 |
| 2/24 | $1,246,429 | $1,264,919 | $1,243,371 |
| 3/24 | $1,245,828 | $1,264,879 | $1,242,867 |
| 4/24 | $1,235,871 | $1,249,214 | $1,229,047 |
| 5/24 | $1,235,179 | $1,245,550 | $1,220,579 |
| 6/24 | $1,251,823 | $1,264,642 | $1,238,210 |
| 7/24 | $1,263,266 | $1,276,168 | $1,250,542 |
Average Annual Total Returns (%)
| 1 Year | 5 Years | 10 Years |
|---|
| Class I | 4.99% | 1.27% | 2.36% |
| Bloomberg Municipal Bond Index | 3.74% | 1.18% | 2.47% |
| Bloomberg Connecticut Municipal Bond Index | 3.36% | 1.28% | 2.26% |
Performance does not reflect the deduction of taxes that a shareholder would pay on Fund distributions or redemption of Fund shares. Performance assumes that all dividends and distributions, if any, were reinvested. For more recent performance information, visit www.eatonvance.com/performance.php.
THE FUND'S PAST PERFORMANCE IS NO GUARANTEE OF FUTURE RESULTS.
| Total Net Assets | $115,390,887 |
| # of Portfolio Holdings | 116 |
| Portfolio Turnover Rate | 41% |
| Total Advisory Fees Paid | $354,241 |
What did the Fund invest in?
The following tables reflect what the Fund invested in as of the report date.
Sector Allocation (% of total investments)
| Value | Value |
|---|
OtherFootnote Reference* | 6.0% |
| Student Loan | 3.1% |
| Water and Sewer | 4.3% |
| Special Tax Revenue | 6.1% |
| Hospital | 8.9% |
| Housing | 9.2% |
| Education | 27.4% |
| General Obligations | 35.0% |
| Footnote | Description |
Footnote* | Sectors less than 3% each |
Credit Quality (% of total investments)Footnote Referencea
| Value | Value |
|---|
| Not Rated | 8.9% |
| BB | 0.6% |
| BBB | 5.6% |
| A | 13.2% |
| AA | 49.9% |
| AAA | 21.8% |
| Footnote | Description |
Footnotea | Ratings are based on Moody’s Investors Service, Inc. (“Moody’s”), S&P Global Ratings (“S&P”) or Fitch Ratings (“Fitch”). If securities are rated differently by the ratings agencies, the highest rating is applied. Moody's ratings are converted to the S&P and Fitch scale with ratings ranging from AAA, being the highest, to D, being the lowest. Ratings of BBB or higher are considered to be investment-grade quality. Holdings designated as “Not Rated” (if any) are not rated by the national ratings agencies stated above. |
If you wish to view additional information about the Fund, including the prospectus, statement of additional information, financial statements and holdings, please scan the QR code or visit www.eatonvance.com/open-end-mutual-fund-documents.php. For proxy information, please visit www.eatonvance.com/proxyvoting.
The Funds may deliver a single copy of certain required shareholder documents (including prospectuses, shareholder reports, and proxy materials) to investors with the same last name and the same address. Your participation will continue indefinitely unless you instruct otherwise by calling 1-800-262-1122 or by contacting your financial intermediary. Your instruction will typically be effective within 30 days of receipt.
Not FDIC Insured | May Lose Value | No Bank Guarantee
Annual Shareholder Report July 31, 2024
Eaton Vance Minnesota Municipal Income Fund
Annual Shareholder Report July 31, 2024
This annual shareholder report contains important information about the Eaton Vance Minnesota Municipal Income Fund for the period of August 1, 2023 to July 31, 2024. You can find additional information about the Fund at www.eatonvance.com/open-end-mutual-fund-documents.php. You can also request this information by contacting us at 1-800-262-1122.
What were the Fund costs for the last year?
(based on a hypothetical $10,000 investment)
| Class Name | Costs of a $10,000 investment | Costs paid as a percentage of a $10,000 investment |
|---|
| Class A | $72 | 0.71% |
How did the Fund perform last year and what affected its performance?
Key contributors to (↑) and detractors from (↓) performance, relative to the Bloomberg Municipal Bond Index (the Index):
↑ Security selections and an overweight exposure to bonds with 17+ years to maturity helped as longer-maturity bonds outperformed shorter-maturity bonds
↑ Security selections and an overweight position in the health care sector, which outperformed the Index, contributed to the Fund’s performance
↑ Security selections and an underweight position in AA-rated bonds helped returns during a period when AA-rated bonds underperformed lower-rated bonds
↓ Security selections and an underweight position in BBB-rated bonds detracted from returns as lower-rated bonds generally outperformed higher-rated bonds
↓ Security selections in bonds with 4-6 years remaining to maturity detracted from the Fund’s Index-relative performance during the period
↓ An underweight position in the transportation sector, which outperformed the Index during the period, detracted from the Fund’s Index-relative returns
Comparison of the change in value of a $10,000 investment for the period indicated.
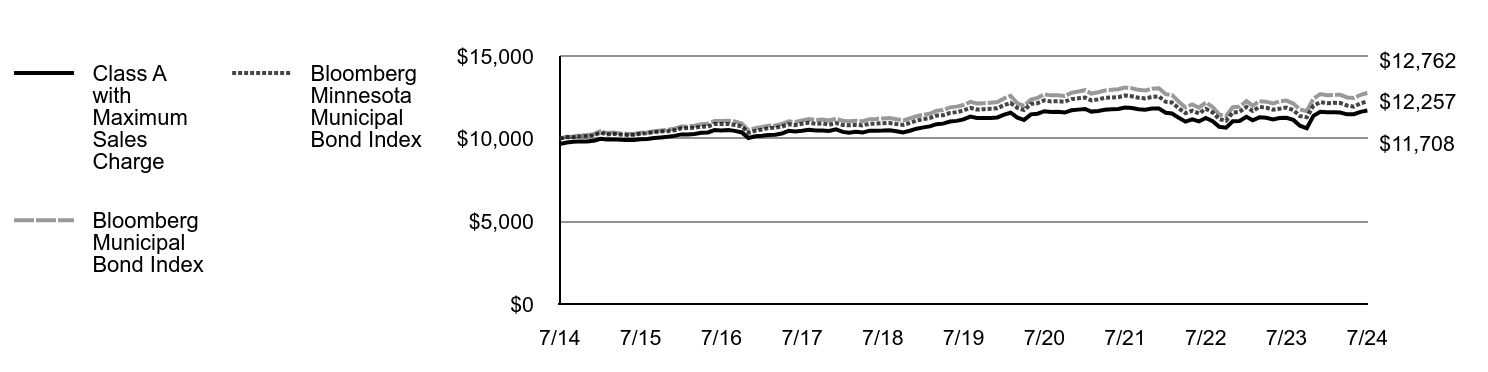
| Class A with Maximum Sales Charge | Bloomberg Municipal Bond Index | Bloomberg Minnesota Municipal Bond Index |
|---|
| 7/14 | $9,675 | $10,000 | $10,000 |
| 8/14 | $9,772 | $10,121 | $10,096 |
| 9/14 | $9,809 | $10,131 | $10,087 |
| 10/14 | $9,836 | $10,201 | $10,140 |
| 11/14 | $9,822 | $10,218 | $10,151 |
| 12/14 | $9,868 | $10,270 | $10,195 |
| 1/15 | $9,996 | $10,452 | $10,364 |
| 2/15 | $9,951 | $10,344 | $10,255 |
| 3/15 | $9,957 | $10,374 | $10,292 |
| 4/15 | $9,931 | $10,320 | $10,249 |
| 5/15 | $9,916 | $10,291 | $10,227 |
| 6/15 | $9,922 | $10,282 | $10,232 |
| 7/15 | $9,959 | $10,356 | $10,302 |
| 8/15 | $9,975 | $10,377 | $10,333 |
| 9/15 | $10,034 | $10,452 | $10,404 |
| 10/15 | $10,071 | $10,493 | $10,436 |
| 11/15 | $10,110 | $10,535 | $10,452 |
| 12/15 | $10,168 | $10,609 | $10,503 |
| 1/16 | $10,257 | $10,736 | $10,625 |
| 2/16 | $10,249 | $10,753 | $10,646 |
| 3/16 | $10,284 | $10,787 | $10,660 |
| 4/16 | $10,363 | $10,866 | $10,723 |
| 5/16 | $10,376 | $10,895 | $10,733 |
| 6/16 | $10,518 | $11,069 | $10,881 |
| 7/16 | $10,499 | $11,075 | $10,887 |
| 8/16 | $10,523 | $11,090 | $10,892 |
| 9/16 | $10,472 | $11,035 | $10,832 |
| 10/16 | $10,377 | $10,919 | $10,742 |
| 11/16 | $10,037 | $10,512 | $10,352 |
| 12/16 | $10,149 | $10,635 | $10,471 |
| 1/17 | $10,172 | $10,705 | $10,546 |
| 2/17 | $10,218 | $10,780 | $10,638 |
| 3/17 | $10,240 | $10,803 | $10,659 |
| 4/17 | $10,307 | $10,882 | $10,733 |
| 5/17 | $10,473 | $11,054 | $10,864 |
| 6/17 | $10,431 | $11,015 | $10,820 |
| 7/17 | $10,476 | $11,104 | $10,905 |
| 8/17 | $10,542 | $11,188 | $10,962 |
| 9/17 | $10,499 | $11,131 | $10,904 |
| 10/17 | $10,500 | $11,159 | $10,925 |
| 11/17 | $10,467 | $11,099 | $10,839 |
| 12/17 | $10,567 | $11,215 | $10,946 |
| 1/18 | $10,412 | $11,083 | $10,833 |
| 2/18 | $10,358 | $11,050 | $10,807 |
| 3/18 | $10,414 | $11,090 | $10,833 |
| 4/18 | $10,368 | $11,051 | $10,803 |
| 5/18 | $10,481 | $11,177 | $10,899 |
| 6/18 | $10,481 | $11,187 | $10,910 |
| 7/18 | $10,492 | $11,214 | $10,939 |
| 8/18 | $10,514 | $11,243 | $10,952 |
| 9/18 | $10,445 | $11,170 | $10,883 |
| 10/18 | $10,376 | $11,101 | $10,830 |
| 11/18 | $10,479 | $11,224 | $10,952 |
| 12/18 | $10,605 | $11,359 | $11,096 |
| 1/19 | $10,684 | $11,444 | $11,182 |
| 2/19 | $10,741 | $11,506 | $11,240 |
| 3/19 | $10,877 | $11,688 | $11,395 |
| 4/19 | $10,909 | $11,732 | $11,418 |
| 5/19 | $11,033 | $11,893 | $11,557 |
| 6/19 | $11,076 | $11,937 | $11,606 |
| 7/19 | $11,165 | $12,033 | $11,703 |
| 8/19 | $11,336 | $12,223 | $11,865 |
| 9/19 | $11,251 | $12,125 | $11,761 |
| 10/19 | $11,246 | $12,147 | $11,784 |
| 11/19 | $11,255 | $12,177 | $11,810 |
| 12/19 | $11,286 | $12,215 | $11,836 |
| 1/20 | $11,456 | $12,434 | $12,033 |
| 2/20 | $11,568 | $12,594 | $12,159 |
| 3/20 | $11,270 | $12,137 | $11,855 |
| 4/20 | $11,135 | $11,985 | $11,730 |
| 5/20 | $11,471 | $12,366 | $12,103 |
| 6/20 | $11,512 | $12,468 | $12,146 |
| 7/20 | $11,659 | $12,678 | $12,314 |
| 8/20 | $11,616 | $12,619 | $12,252 |
| 9/20 | $11,621 | $12,621 | $12,263 |
| 10/20 | $11,579 | $12,583 | $12,234 |
| 11/20 | $11,717 | $12,773 | $12,391 |
| 12/20 | $11,757 | $12,851 | $12,442 |
| 1/21 | $11,798 | $12,933 | $12,487 |
| 2/21 | $11,637 | $12,728 | $12,317 |
| 3/21 | $11,677 | $12,806 | $12,376 |
| 4/21 | $11,754 | $12,913 | $12,472 |
| 5/21 | $11,782 | $12,952 | $12,487 |
| 6/21 | $11,799 | $12,988 | $12,509 |
| 7/21 | $11,888 | $13,095 | $12,613 |
| 8/21 | $11,855 | $13,047 | $12,562 |
| 9/21 | $11,775 | $12,953 | $12,478 |
| 10/21 | $11,754 | $12,915 | $12,432 |
| 11/21 | $11,818 | $13,025 | $12,528 |
| 12/21 | $11,821 | $13,046 | $12,548 |
| 1/22 | $11,569 | $12,689 | $12,227 |
| 2/22 | $11,524 | $12,644 | $12,194 |
| 3/22 | $11,259 | $12,234 | $11,834 |
| 4/22 | $11,031 | $11,895 | $11,543 |
| 5/22 | $11,170 | $12,072 | $11,689 |
| 6/22 | $11,043 | $11,874 | $11,527 |
| 7/22 | $11,256 | $12,188 | $11,804 |
| 8/22 | $11,053 | $11,921 | $11,583 |
| 9/22 | $10,717 | $11,463 | $11,183 |
| 10/22 | $10,664 | $11,368 | $11,088 |
| 11/22 | $11,055 | $11,900 | $11,579 |
| 12/22 | $11,064 | $11,934 | $11,624 |
| 1/23 | $11,320 | $12,277 | $11,917 |
| 2/23 | $11,108 | $11,999 | $11,678 |
| 3/23 | $11,292 | $12,265 | $11,924 |
| 4/23 | $11,265 | $12,237 | $11,877 |
| 5/23 | $11,165 | $12,131 | $11,750 |
| 6/23 | $11,252 | $12,253 | $11,813 |
| 7/23 | $11,261 | $12,301 | $11,878 |
| 8/23 | $11,137 | $12,124 | $11,730 |
| 9/23 | $10,787 | $11,769 | $11,366 |
| 10/23 | $10,626 | $11,669 | $11,298 |
| 11/23 | $11,377 | $12,409 | $11,984 |
| 12/23 | $11,621 | $12,698 | $12,214 |
| 1/24 | $11,599 | $12,633 | $12,144 |
| 2/24 | $11,604 | $12,649 | $12,172 |
| 3/24 | $11,583 | $12,649 | $12,151 |
| 4/24 | $11,472 | $12,492 | $12,007 |
| 5/24 | $11,477 | $12,455 | $11,935 |
| 6/24 | $11,624 | $12,646 | $12,130 |
| 7/24 | $11,708 | $12,762 | $12,257 |
Average Annual Total Returns (%)
| 1 Year | 5 Years | 10 Years |
|---|
| Class A | 3.95% | 0.95% | 1.92% |
| Class A with 3.25% Maximum Sales Charge | 0.58% | 0.29% | 1.59% |
| Bloomberg Municipal Bond Index | 3.74% | 1.18% | 2.47% |
| Bloomberg Minnesota Municipal Bond Index | 3.19% | 0.93% | 2.05% |
Performance does not reflect the deduction of taxes that a shareholder would pay on Fund distributions or redemption of Fund shares. Performance assumes that all dividends and distributions, if any, were reinvested. For more recent performance information, visit www.eatonvance.com/performance.php.
THE FUND'S PAST PERFORMANCE IS NO GUARANTEE OF FUTURE RESULTS.
| Total Net Assets | $247,709,568 |
| # of Portfolio Holdings | 152 |
| Portfolio Turnover Rate | 48% |
| Total Advisory Fees Paid | $887,103 |
What did the Fund invest in?
The following tables reflect what the Fund invested in as of the report date.
Sector Allocation (% of total investments)
| Value | Value |
|---|
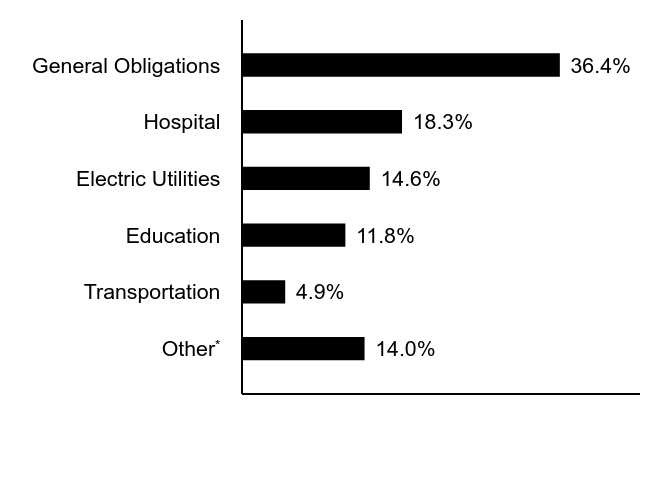
OtherFootnote Reference* | 14.0% |
| Transportation | 4.9% |
| Education | 11.8% |
| Electric Utilities | 14.6% |
| Hospital | 18.3% |
| General Obligations | 36.4% |
| Footnote | Description |
Footnote* | Sectors less than 3% each |
Credit Quality (% of total investments)Footnote Referencea
| Value | Value |
|---|
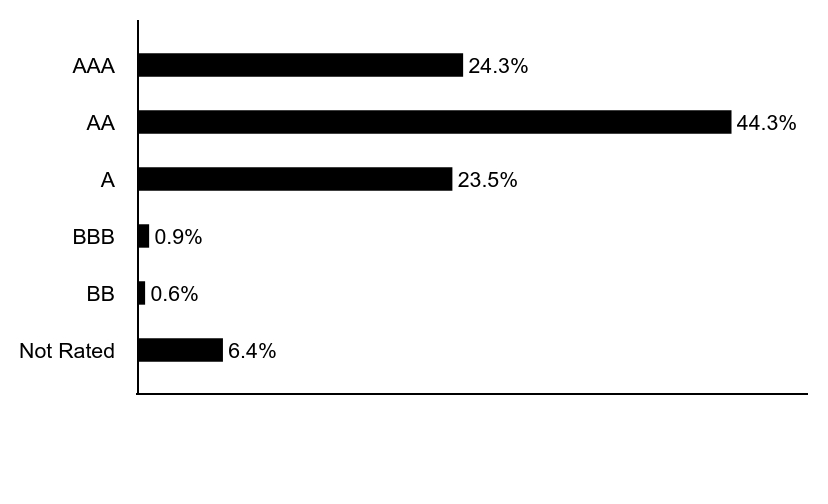
| Not Rated | 6.4% |
| BB | 0.6% |
| BBB | 0.9% |
| A | 23.5% |
| AA | 44.3% |
| AAA | 24.3% |
| Footnote | Description |
Footnotea | Ratings are based on Moody’s Investors Service, Inc. (“Moody’s”), S&P Global Ratings (“S&P”) or Fitch Ratings (“Fitch”). If securities are rated differently by the ratings agencies, the highest rating is applied. Moody's ratings are converted to the S&P and Fitch scale with ratings ranging from AAA, being the highest, to D, being the lowest. Ratings of BBB or higher are considered to be investment-grade quality. Holdings designated as “Not Rated” (if any) are not rated by the national ratings agencies stated above. |
If you wish to view additional information about the Fund, including the prospectus, statement of additional information, financial statements and holdings, please scan the QR code or visit www.eatonvance.com/open-end-mutual-fund-documents.php. For proxy information, please visit www.eatonvance.com/proxyvoting.
The Funds may deliver a single copy of certain required shareholder documents (including prospectuses, shareholder reports, and proxy materials) to investors with the same last name and the same address. Your participation will continue indefinitely unless you instruct otherwise by calling 1-800-262-1122 or by contacting your financial intermediary. Your instruction will typically be effective within 30 days of receipt.
Not FDIC Insured | May Lose Value | No Bank Guarantee
Annual Shareholder Report July 31, 2024
Eaton Vance Minnesota Municipal Income Fund
Annual Shareholder Report July 31, 2024
This annual shareholder report contains important information about the Eaton Vance Minnesota Municipal Income Fund for the period of August 1, 2023 to July 31, 2024. You can find additional information about the Fund at www.eatonvance.com/open-end-mutual-fund-documents.php. You can also request this information by contacting us at 1-800-262-1122.
What were the Fund costs for the last year?
(based on a hypothetical $10,000 investment)
| Class Name | Costs of a $10,000 investment | Costs paid as a percentage of a $10,000 investment |
|---|
| Class C | $148 | 1.46% |
How did the Fund perform last year and what affected its performance?
Key contributors to (↑) and detractors from (↓) performance, relative to the Bloomberg Municipal Bond Index (the Index):
↓ Security selections and an underweight position in BBB-rated bonds detracted from returns as lower-rated bonds generally outperformed higher-rated bonds
↓ Security selections in bonds with 4-6 years remaining to maturity detracted from the Fund’s Index-relative performance during the period
↓ An underweight position in the transportation sector, which outperformed the Index during the period, detracted from the Fund’s Index-relative returns
↑ Security selections and an overweight exposure to bonds with 17+ years to maturity helped as longer-maturity bonds outperformed shorter-maturity bonds
↑ Security selections and an overweight position in the health care sector, which outperformed the Index, contributed to the Fund’s performance
↑ Security selections and an underweight position in AA-rated bonds helped returns during a period when AA-rated bonds underperformed lower-rated bonds
Comparison of the change in value of a $10,000 investment for the period indicated.
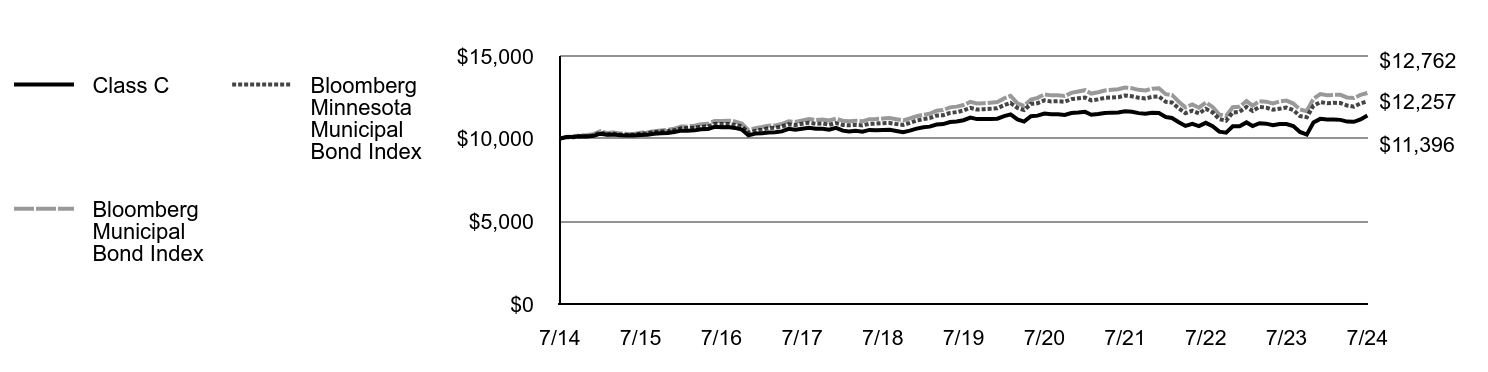
| Class C | Bloomberg Municipal Bond Index | Bloomberg Minnesota Municipal Bond Index |
|---|
| 7/14 | $10,000 | $10,000 | $10,000 |
| 8/14 | $10,099 | $10,121 | $10,096 |
| 9/14 | $10,120 | $10,131 | $10,087 |
| 10/14 | $10,151 | $10,201 | $10,140 |
| 11/14 | $10,133 | $10,218 | $10,151 |
| 12/14 | $10,173 | $10,270 | $10,195 |
| 1/15 | $10,301 | $10,452 | $10,364 |
| 2/15 | $10,244 | $10,344 | $10,255 |
| 3/15 | $10,244 | $10,374 | $10,292 |
| 4/15 | $10,206 | $10,320 | $10,249 |
| 5/15 | $10,187 | $10,291 | $10,227 |
| 6/15 | $10,188 | $10,282 | $10,232 |
| 7/15 | $10,219 | $10,356 | $10,302 |
| 8/15 | $10,230 | $10,377 | $10,333 |
| 9/15 | $10,291 | $10,452 | $10,404 |
| 10/15 | $10,322 | $10,493 | $10,436 |
| 11/15 | $10,345 | $10,535 | $10,452 |
| 12/15 | $10,406 | $10,609 | $10,503 |
| 1/16 | $10,485 | $10,736 | $10,625 |
| 2/16 | $10,472 | $10,753 | $10,646 |
| 3/16 | $10,502 | $10,787 | $10,660 |
| 4/16 | $10,572 | $10,866 | $10,723 |
| 5/16 | $10,579 | $10,895 | $10,733 |
| 6/16 | $10,719 | $11,069 | $10,881 |
| 7/16 | $10,686 | $11,075 | $10,887 |
| 8/16 | $10,703 | $11,090 | $10,892 |
| 9/16 | $10,650 | $11,035 | $10,832 |
| 10/16 | $10,556 | $10,919 | $10,742 |
| 11/16 | $10,199 | $10,512 | $10,352 |
| 12/16 | $10,310 | $10,635 | $10,471 |
| 1/17 | $10,327 | $10,705 | $10,546 |
| 2/17 | $10,366 | $10,780 | $10,638 |
| 3/17 | $10,382 | $10,803 | $10,659 |
| 4/17 | $10,441 | $10,882 | $10,733 |
| 5/17 | $10,592 | $11,054 | $10,864 |
| 6/17 | $10,547 | $11,015 | $10,820 |
| 7/17 | $10,595 | $11,104 | $10,905 |
| 8/17 | $10,652 | $11,188 | $10,962 |
| 9/17 | $10,607 | $11,131 | $10,904 |
| 10/17 | $10,602 | $11,159 | $10,925 |
| 11/17 | $10,546 | $11,099 | $10,839 |
| 12/17 | $10,656 | $11,215 | $10,946 |
| 1/18 | $10,484 | $11,083 | $10,833 |
| 2/18 | $10,429 | $11,050 | $10,807 |
| 3/18 | $10,476 | $11,090 | $10,833 |
| 4/18 | $10,418 | $11,051 | $10,803 |
| 5/18 | $10,529 | $11,177 | $10,899 |
| 6/18 | $10,514 | $11,187 | $10,910 |
| 7/18 | $10,529 | $11,214 | $10,939 |
| 8/18 | $10,534 | $11,243 | $10,952 |
| 9/18 | $10,465 | $11,170 | $10,883 |
| 10/18 | $10,386 | $11,101 | $10,830 |
| 11/18 | $10,487 | $11,224 | $10,952 |
| 12/18 | $10,610 | $11,359 | $11,096 |
| 1/19 | $10,689 | $11,444 | $11,182 |
| 2/19 | $10,727 | $11,506 | $11,240 |
| 3/19 | $10,858 | $11,688 | $11,395 |
| 4/19 | $10,883 | $11,732 | $11,418 |
| 5/19 | $11,003 | $11,893 | $11,557 |
| 6/19 | $11,038 | $11,937 | $11,606 |
| 7/19 | $11,115 | $12,033 | $11,703 |
| 8/19 | $11,278 | $12,223 | $11,865 |
| 9/19 | $11,183 | $12,125 | $11,761 |
| 10/19 | $11,183 | $12,147 | $11,784 |
| 11/19 | $11,186 | $12,177 | $11,810 |
| 12/19 | $11,209 | $12,215 | $11,836 |
| 1/20 | $11,360 | $12,434 | $12,033 |
| 2/20 | $11,469 | $12,594 | $12,159 |
| 3/20 | $11,166 | $12,137 | $11,855 |
| 4/20 | $11,036 | $11,985 | $11,730 |
| 5/20 | $11,361 | $12,366 | $12,103 |
| 6/20 | $11,394 | $12,468 | $12,146 |
| 7/20 | $11,522 | $12,678 | $12,314 |
| 8/20 | $11,477 | $12,619 | $12,252 |
| 9/20 | $11,476 | $12,621 | $12,263 |
| 10/20 | $11,431 | $12,583 | $12,234 |
| 11/20 | $11,551 | $12,773 | $12,391 |
| 12/20 | $11,582 | $12,851 | $12,442 |
| 1/21 | $11,624 | $12,933 | $12,487 |
| 2/21 | $11,449 | $12,728 | $12,317 |
| 3/21 | $11,491 | $12,806 | $12,376 |
| 4/21 | $11,555 | $12,913 | $12,472 |
| 5/21 | $11,575 | $12,952 | $12,487 |
| 6/21 | $11,585 | $12,988 | $12,509 |
| 7/21 | $11,659 | $13,095 | $12,613 |
| 8/21 | $11,623 | $13,047 | $12,562 |
| 9/21 | $11,544 | $12,953 | $12,478 |
| 10/21 | $11,507 | $12,915 | $12,432 |
| 11/21 | $11,560 | $13,025 | $12,528 |
| 12/21 | $11,556 | $13,046 | $12,548 |
| 1/22 | $11,309 | $12,689 | $12,227 |
| 2/22 | $11,252 | $12,644 | $12,194 |
| 3/22 | $10,994 | $12,234 | $11,834 |
| 4/22 | $10,771 | $11,895 | $11,543 |
| 5/22 | $10,891 | $12,072 | $11,689 |
| 6/22 | $10,759 | $11,874 | $11,527 |
| 7/22 | $10,958 | $12,188 | $11,804 |
| 8/22 | $10,758 | $11,921 | $11,583 |
| 9/22 | $10,426 | $11,463 | $11,183 |
| 10/22 | $10,362 | $11,368 | $11,088 |
| 11/22 | $10,744 | $11,900 | $11,579 |
| 12/22 | $10,747 | $11,934 | $11,624 |
| 1/23 | $10,983 | $12,277 | $11,917 |
| 2/23 | $10,765 | $11,999 | $11,678 |
| 3/23 | $10,936 | $12,265 | $11,924 |
| 4/23 | $10,907 | $12,237 | $11,877 |
| 5/23 | $10,811 | $12,131 | $11,750 |
| 6/23 | $10,885 | $12,253 | $11,813 |
| 7/23 | $10,888 | $12,301 | $11,878 |
| 8/23 | $10,759 | $12,124 | $11,730 |
| 9/23 | $10,406 | $11,769 | $11,366 |
| 10/23 | $10,246 | $11,669 | $11,298 |
| 11/23 | $10,972 | $12,409 | $11,984 |
| 12/23 | $11,197 | $12,698 | $12,214 |
| 1/24 | $11,161 | $12,633 | $12,144 |
| 2/24 | $11,161 | $12,649 | $12,172 |
| 3/24 | $11,137 | $12,649 | $12,151 |
| 4/24 | $11,033 | $12,492 | $12,007 |
| 5/24 | $11,021 | $12,455 | $11,935 |
| 6/24 | $11,159 | $12,646 | $12,130 |
| 7/24 | $11,396 | $12,762 | $12,257 |
Average Annual Total Returns (%)
| 1 Year | 5 Years | 10 Years |
|---|
| Class C | 3.11% | 0.20% | 1.31% |
| Class C with 1% Maximum Deferred Sales Charge | 2.11% | 0.20% | 1.31% |
| Bloomberg Municipal Bond Index | 3.74% | 1.18% | 2.47% |
| Bloomberg Minnesota Municipal Bond Index | 3.19% | 0.93% | 2.05% |
Performance does not reflect the deduction of taxes that a shareholder would pay on Fund distributions or redemption of Fund shares. Performance assumes that all dividends and distributions, if any, were reinvested. For more recent performance information, visit www.eatonvance.com/performance.php.
THE FUND'S PAST PERFORMANCE IS NO GUARANTEE OF FUTURE RESULTS.
| Total Net Assets | $247,709,568 |
| # of Portfolio Holdings | 152 |
| Portfolio Turnover Rate | 48% |
| Total Advisory Fees Paid | $887,103 |
What did the Fund invest in?
The following tables reflect what the Fund invested in as of the report date.
Sector Allocation (% of total investments)
| Value | Value |
|---|
OtherFootnote Reference* | 14.0% |
| Transportation | 4.9% |
| Education | 11.8% |
| Electric Utilities | 14.6% |
| Hospital | 18.3% |
| General Obligations | 36.4% |
| Footnote | Description |
Footnote* | Sectors less than 3% each |
Credit Quality (% of total investments)Footnote Referencea
| Value | Value |
|---|
| Not Rated | 6.4% |
| BB | 0.6% |
| BBB | 0.9% |
| A | 23.5% |
| AA | 44.3% |
| AAA | 24.3% |
| Footnote | Description |
Footnotea | Ratings are based on Moody’s Investors Service, Inc. (“Moody’s”), S&P Global Ratings (“S&P”) or Fitch Ratings (“Fitch”). If securities are rated differently by the ratings agencies, the highest rating is applied. Moody's ratings are converted to the S&P and Fitch scale with ratings ranging from AAA, being the highest, to D, being the lowest. Ratings of BBB or higher are considered to be investment-grade quality. Holdings designated as “Not Rated” (if any) are not rated by the national ratings agencies stated above. |
If you wish to view additional information about the Fund, including the prospectus, statement of additional information, financial statements and holdings, please scan the QR code or visit www.eatonvance.com/open-end-mutual-fund-documents.php. For proxy information, please visit www.eatonvance.com/proxyvoting.
The Funds may deliver a single copy of certain required shareholder documents (including prospectuses, shareholder reports, and proxy materials) to investors with the same last name and the same address. Your participation will continue indefinitely unless you instruct otherwise by calling 1-800-262-1122 or by contacting your financial intermediary. Your instruction will typically be effective within 30 days of receipt.
Not FDIC Insured | May Lose Value | No Bank Guarantee
Annual Shareholder Report July 31, 2024
Eaton Vance Minnesota Municipal Income Fund
Annual Shareholder Report July 31, 2024
This annual shareholder report contains important information about the Eaton Vance Minnesota Municipal Income Fund for the period of August 1, 2023 to July 31, 2024. You can find additional information about the Fund at www.eatonvance.com/open-end-mutual-fund-documents.php. You can also request this information by contacting us at 1-800-262-1122.
What were the Fund costs for the last year?
(based on a hypothetical $10,000 investment)
| Class Name | Costs of a $10,000 investment | Costs paid as a percentage of a $10,000 investment |
|---|
| Class I | $52 | 0.51% |
How did the Fund perform last year and what affected its performance?
Key contributors to (↑) and detractors from (↓) performance, relative to the Bloomberg Municipal Bond Index (the Index):
↑ Security selections and an overweight exposure to bonds with 17+ years to maturity helped as longer-maturity bonds outperformed shorter-maturity bonds
↑ Security selections and an overweight position in the health care sector, which outperformed the Index, contributed to the Fund’s performance
↑ Security selections and an underweight position in AA-rated bonds helped returns during a period when AA-rated bonds underperformed lower-rated bonds
↓ Security selections and an underweight position in BBB-rated bonds detracted from returns as lower-rated bonds generally outperformed higher-rated bonds
↓ Security selections in bonds with 4-6 years remaining to maturity detracted from the Fund’s Index-relative performance during the period
↓ An underweight position in the transportation sector, which outperformed the Index during the period, detracted from the Fund’s Index-relative returns
Comparison of the change in value of a $1,000,000 investment for the period indicated.
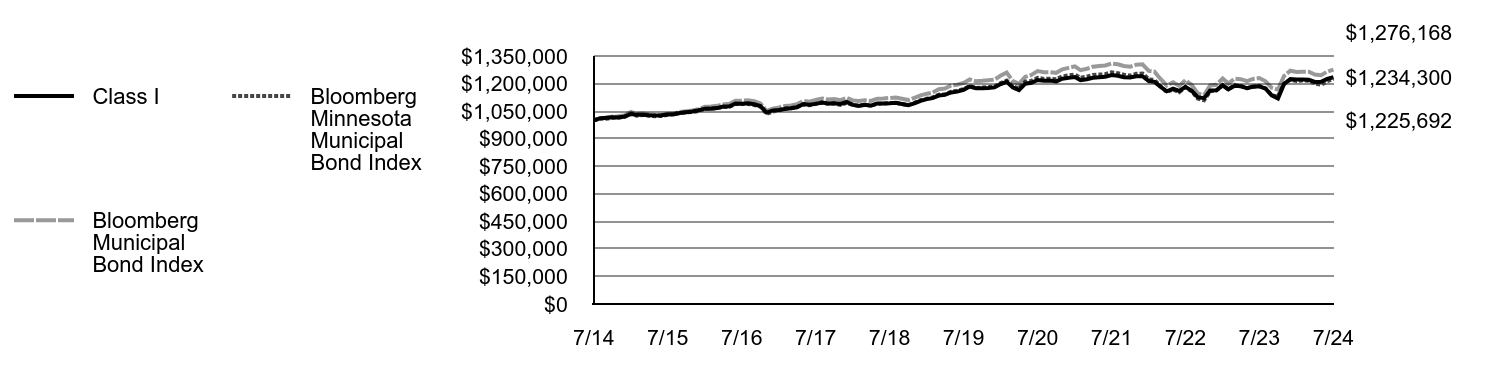
| Class I | Bloomberg Municipal Bond Index | Bloomberg Minnesota Municipal Bond Index |
|---|
| 7/14 | $1,000,000 | $1,000,000 | $1,000,000 |
| 8/14 | $1,010,239 | $1,012,107 | $1,009,632 |
| 9/14 | $1,014,214 | $1,013,136 | $1,008,729 |
| 10/14 | $1,017,127 | $1,020,082 | $1,014,041 |
| 11/14 | $1,015,845 | $1,021,847 | $1,015,074 |
| 12/14 | $1,020,835 | $1,027,003 | $1,019,505 |
| 1/15 | $1,034,273 | $1,045,205 | $1,036,414 |
| 2/15 | $1,029,737 | $1,034,424 | $1,025,483 |
| 3/15 | $1,030,482 | $1,037,411 | $1,029,214 |
| 4/15 | $1,028,052 | $1,031,968 | $1,024,880 |
| 5/15 | $1,026,671 | $1,029,117 | $1,022,698 |
| 6/15 | $1,027,437 | $1,028,179 | $1,023,193 |
| 7/15 | $1,031,460 | $1,035,627 | $1,030,153 |
| 8/15 | $1,033,262 | $1,037,660 | $1,033,339 |
| 9/15 | $1,039,519 | $1,045,177 | $1,040,357 |
| 10/15 | $1,043,512 | $1,049,332 | $1,043,589 |
| 11/15 | $1,047,772 | $1,053,504 | $1,045,195 |
| 12/15 | $1,055,045 | $1,060,906 | $1,050,317 |
| 1/16 | $1,063,289 | $1,073,565 | $1,062,514 |
| 2/16 | $1,062,612 | $1,075,253 | $1,064,574 |
| 3/16 | $1,066,506 | $1,078,659 | $1,066,050 |
| 4/16 | $1,074,836 | $1,086,590 | $1,072,343 |
| 5/16 | $1,076,402 | $1,089,529 | $1,073,292 |
| 6/16 | $1,091,283 | $1,106,862 | $1,088,123 |
| 7/16 | $1,089,490 | $1,107,538 | $1,088,655 |
| 8/16 | $1,092,171 | $1,109,032 | $1,089,174 |
| 9/16 | $1,087,046 | $1,103,497 | $1,083,215 |
| 10/16 | $1,077,410 | $1,091,920 | $1,074,157 |
| 11/16 | $1,042,269 | $1,051,197 | $1,035,231 |
| 12/16 | $1,053,995 | $1,063,538 | $1,047,132 |
| 1/17 | $1,056,659 | $1,070,549 | $1,054,618 |
| 2/17 | $1,061,531 | $1,077,983 | $1,063,805 |
| 3/17 | $1,065,201 | $1,080,323 | $1,065,904 |
| 4/17 | $1,071,210 | $1,088,162 | $1,073,275 |
| 5/17 | $1,088,617 | $1,105,432 | $1,086,391 |
| 6/17 | $1,084,413 | $1,101,468 | $1,082,022 |
| 7/17 | $1,089,242 | $1,110,379 | $1,090,492 |
| 8/17 | $1,096,366 | $1,118,829 | $1,096,151 |
| 9/17 | $1,092,039 | $1,113,141 | $1,090,447 |
| 10/17 | $1,092,305 | $1,115,858 | $1,092,495 |
| 11/17 | $1,089,061 | $1,109,883 | $1,083,893 |
| 12/17 | $1,099,721 | $1,121,483 | $1,094,603 |
| 1/18 | $1,083,778 | $1,108,280 | $1,083,270 |
| 2/18 | $1,078,292 | $1,104,969 | $1,080,664 |
| 3/18 | $1,084,240 | $1,109,047 | $1,083,318 |
| 4/18 | $1,079,705 | $1,105,089 | $1,080,285 |
| 5/18 | $1,091,592 | $1,117,744 | $1,089,871 |
| 6/18 | $1,091,790 | $1,118,698 | $1,090,960 |
| 7/18 | $1,093,122 | $1,121,412 | $1,093,898 |
| 8/18 | $1,095,578 | $1,124,292 | $1,095,163 |
| 9/18 | $1,088,614 | $1,117,014 | $1,088,328 |
| 10/18 | $1,081,637 | $1,110,135 | $1,082,970 |
| 11/18 | $1,092,572 | $1,122,422 | $1,095,157 |
| 12/18 | $1,105,821 | $1,135,861 | $1,109,629 |
| 1/19 | $1,115,463 | $1,144,448 | $1,118,155 |
| 2/19 | $1,120,416 | $1,150,575 | $1,123,981 |
| 3/19 | $1,134,758 | $1,168,763 | $1,139,524 |
| 4/19 | $1,138,323 | $1,173,156 | $1,141,833 |
| 5/19 | $1,151,408 | $1,189,329 | $1,155,735 |
| 6/19 | $1,156,125 | $1,193,721 | $1,160,641 |
| 7/19 | $1,165,644 | $1,203,341 | $1,170,289 |
| 8/19 | $1,183,634 | $1,222,322 | $1,186,461 |
| 9/19 | $1,174,954 | $1,212,524 | $1,176,055 |
| 10/19 | $1,174,692 | $1,214,697 | $1,178,376 |
| 11/19 | $1,175,776 | $1,217,735 | $1,180,993 |
| 12/19 | $1,179,261 | $1,221,453 | $1,183,621 |
| 1/20 | $1,197,170 | $1,243,398 | $1,203,347 |
| 2/20 | $1,209,103 | $1,259,432 | $1,215,945 |
| 3/20 | $1,178,078 | $1,213,749 | $1,185,453 |
| 4/20 | $1,164,186 | $1,198,516 | $1,172,975 |
| 5/20 | $1,199,505 | $1,236,643 | $1,210,340 |
| 6/20 | $1,204,011 | $1,246,821 | $1,214,580 |
| 7/20 | $1,219,566 | $1,267,820 | $1,231,379 |
| 8/20 | $1,215,315 | $1,261,872 | $1,225,233 |
| 9/20 | $1,216,058 | $1,262,139 | $1,226,313 |
| 10/20 | $1,211,835 | $1,258,348 | $1,223,409 |
| 11/20 | $1,226,435 | $1,277,337 | $1,239,050 |
| 12/20 | $1,230,894 | $1,285,118 | $1,244,228 |
| 1/21 | $1,235,352 | $1,293,308 | $1,248,724 |
| 2/21 | $1,218,641 | $1,272,759 | $1,231,697 |
| 3/21 | $1,223,087 | $1,280,608 | $1,237,625 |
| 4/21 | $1,231,337 | $1,291,350 | $1,247,157 |
| 5/21 | $1,234,537 | $1,295,202 | $1,248,717 |
| 6/21 | $1,236,511 | $1,298,759 | $1,250,896 |
| 7/21 | $1,245,998 | $1,309,530 | $1,261,293 |
| 8/21 | $1,242,806 | $1,304,724 | $1,256,224 |
| 9/21 | $1,234,590 | $1,295,309 | $1,247,843 |
| 10/21 | $1,232,586 | $1,291,521 | $1,243,196 |
| 11/21 | $1,239,504 | $1,302,516 | $1,252,843 |
| 12/21 | $1,240,036 | $1,304,617 | $1,254,791 |
| 1/22 | $1,213,774 | $1,268,906 | $1,222,728 |
| 2/22 | $1,209,267 | $1,264,360 | $1,219,442 |
| 3/22 | $1,181,676 | $1,223,373 | $1,183,439 |
| 4/22 | $1,157,948 | $1,189,535 | $1,154,268 |
| 5/22 | $1,172,693 | $1,207,206 | $1,168,852 |
| 6/22 | $1,159,565 | $1,187,434 | $1,152,699 |
| 7/22 | $1,182,146 | $1,218,808 | $1,180,406 |
| 8/22 | $1,161,050 | $1,192,096 | $1,158,297 |
| 9/22 | $1,125,914 | $1,146,342 | $1,118,292 |
| 10/22 | $1,120,495 | $1,136,809 | $1,108,837 |
| 11/22 | $1,161,828 | $1,189,982 | $1,157,945 |
| 12/22 | $1,162,967 | $1,193,388 | $1,162,380 |
| 1/23 | $1,190,100 | $1,227,669 | $1,191,695 |
| 2/23 | $1,167,943 | $1,199,909 | $1,167,810 |
| 3/23 | $1,187,490 | $1,226,532 | $1,192,375 |
| 4/23 | $1,184,902 | $1,223,730 | $1,187,744 |
| 5/23 | $1,174,497 | $1,213,125 | $1,175,050 |
| 6/23 | $1,183,889 | $1,225,277 | $1,181,286 |
| 7/23 | $1,185,077 | $1,230,125 | $1,187,827 |
| 8/23 | $1,172,134 | $1,212,415 | $1,173,008 |
| 9/23 | $1,135,480 | $1,176,881 | $1,136,555 |
| 10/23 | $1,118,752 | $1,166,866 | $1,129,849 |
| 11/23 | $1,197,998 | $1,240,940 | $1,198,397 |
| 12/23 | $1,223,932 | $1,269,782 | $1,221,433 |
| 1/24 | $1,221,841 | $1,263,297 | $1,214,366 |
| 2/24 | $1,222,545 | $1,264,919 | $1,217,170 |
| 3/24 | $1,220,485 | $1,264,879 | $1,215,056 |
| 4/24 | $1,209,074 | $1,249,214 | $1,200,691 |
| 5/24 | $1,209,764 | $1,245,550 | $1,193,539 |
| 6/24 | $1,225,463 | $1,264,642 | $1,212,958 |
| 7/24 | $1,234,300 | $1,276,168 | $1,225,692 |
Average Annual Total Returns (%)
| 1 Year | 5 Years | 10 Years |
|---|
| Class I | 4.15% | 1.15% | 2.13% |
| Bloomberg Municipal Bond Index | 3.74% | 1.18% | 2.47% |
| Bloomberg Minnesota Municipal Bond Index | 3.19% | 0.93% | 2.05% |
Performance does not reflect the deduction of taxes that a shareholder would pay on Fund distributions or redemption of Fund shares. Performance assumes that all dividends and distributions, if any, were reinvested. For more recent performance information, visit www.eatonvance.com/performance.php.
THE FUND'S PAST PERFORMANCE IS NO GUARANTEE OF FUTURE RESULTS.
| Total Net Assets | $247,709,568 |
| # of Portfolio Holdings | 152 |
| Portfolio Turnover Rate | 48% |
| Total Advisory Fees Paid | $887,103 |
What did the Fund invest in?
The following tables reflect what the Fund invested in as of the report date.
Sector Allocation (% of total investments)
| Value | Value |
|---|
OtherFootnote Reference* | 14.0% |
| Transportation | 4.9% |
| Education | 11.8% |
| Electric Utilities | 14.6% |
| Hospital | 18.3% |
| General Obligations | 36.4% |
| Footnote | Description |
Footnote* | Sectors less than 3% each |
Credit Quality (% of total investments)Footnote Referencea
| Value | Value |
|---|
| Not Rated | 6.4% |
| BB | 0.6% |
| BBB | 0.9% |
| A | 23.5% |
| AA | 44.3% |
| AAA | 24.3% |
| Footnote | Description |
Footnotea | Ratings are based on Moody’s Investors Service, Inc. (“Moody’s”), S&P Global Ratings (“S&P”) or Fitch Ratings (“Fitch”). If securities are rated differently by the ratings agencies, the highest rating is applied. Moody's ratings are converted to the S&P and Fitch scale with ratings ranging from AAA, being the highest, to D, being the lowest. Ratings of BBB or higher are considered to be investment-grade quality. Holdings designated as “Not Rated” (if any) are not rated by the national ratings agencies stated above. |
If you wish to view additional information about the Fund, including the prospectus, statement of additional information, financial statements and holdings, please scan the QR code or visit www.eatonvance.com/open-end-mutual-fund-documents.php. For proxy information, please visit www.eatonvance.com/proxyvoting.
The Funds may deliver a single copy of certain required shareholder documents (including prospectuses, shareholder reports, and proxy materials) to investors with the same last name and the same address. Your participation will continue indefinitely unless you instruct otherwise by calling 1-800-262-1122 or by contacting your financial intermediary. Your instruction will typically be effective within 30 days of receipt.
Not FDIC Insured | May Lose Value | No Bank Guarantee
Annual Shareholder Report July 31, 2024
Eaton Vance Municipal Opportunities Fund
Annual Shareholder Report July 31, 2024
This annual shareholder report contains important information about the Eaton Vance Municipal Opportunities Fund for the period of August 1, 2023 to July 31, 2024. You can find additional information about the Fund at www.eatonvance.com/open-end-mutual-fund-documents.php. You can also request this information by contacting us at 1-800-262-1122.
This report describes changes to the Fund that occurred during the reporting period.
What were the Fund costs for the last year?
(based on a hypothetical $10,000 investment)
| Class Name | Costs of a $10,000 investment | Costs paid as a percentage of a $10,000 investment |
|---|
| Class A | $98 | 0.95% |
How did the Fund perform last year and what affected its performance?
Key contributors to (↑) and detractors from (↓) performance, relative to the Bloomberg Municipal Bond Index (the Index):
↑ Security selections and an overweight position in bonds rated BBB and below helped returns as lower-rated bonds outperformed higher-rated bonds
↑ Security selections in California bonds, which underperformed the Index during the period, contributed to the Fund’s Index-relative returns
↑ Security selections in local general obligation bonds, which underperformed the Index during the period, contributed to Index-relative returns
↓ Security selections and an underweight position in A-rated bonds, which generally outperformed higher-rated bonds during the period, hurt returns
↓ An underweight exposure to bonds with 22+ years remaining to maturity hurt returns as longer-maturity bonds outperformed shorter-maturity bonds
↓ Security selections in the IDR/PCR sector (industrial development revenue/pollution control revenue) detracted from returns during the period
Comparison of the change in value of a $10,000 investment for the period indicated.
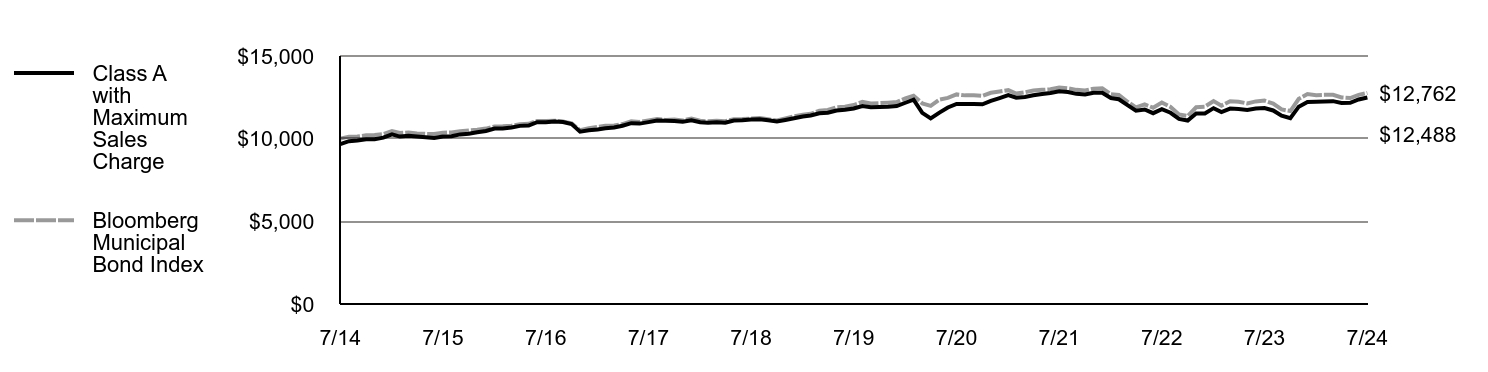
| Class A with Maximum Sales Charge | Bloomberg Municipal Bond Index |
|---|
| 7/14 | $9,675 | $10,000 |
| 8/14 | $9,847 | $10,121 |
| 9/14 | $9,891 | $10,131 |
| 10/14 | $9,961 | $10,201 |
| 11/14 | $9,960 | $10,218 |
| 12/14 | $10,059 | $10,270 |
| 1/15 | $10,263 | $10,452 |
| 2/15 | $10,126 | $10,344 |
| 3/15 | $10,182 | $10,374 |
| 4/15 | $10,134 | $10,320 |
| 5/15 | $10,086 | $10,291 |
| 6/15 | $10,041 | $10,282 |
| 7/15 | $10,127 | $10,356 |
| 8/15 | $10,144 | $10,377 |
| 9/15 | $10,259 | $10,452 |
| 10/15 | $10,304 | $10,493 |
| 11/15 | $10,385 | $10,535 |
| 12/15 | $10,464 | $10,609 |
| 1/16 | $10,612 | $10,736 |
| 2/16 | $10,619 | $10,753 |
| 3/16 | $10,678 | $10,787 |
| 4/16 | $10,774 | $10,866 |
| 5/16 | $10,797 | $10,895 |
| 6/16 | $11,000 | $11,069 |
| 7/16 | $10,998 | $11,075 |
| 8/16 | $11,031 | $11,090 |
| 9/16 | $11,002 | $11,035 |
| 10/16 | $10,882 | $10,919 |
| 11/16 | $10,421 | $10,512 |
| 12/16 | $10,504 | $10,635 |
| 1/17 | $10,549 | $10,705 |
| 2/17 | $10,625 | $10,780 |
| 3/17 | $10,672 | $10,803 |
| 4/17 | $10,783 | $10,882 |
| 5/17 | $10,938 | $11,054 |
| 6/17 | $10,911 | $11,015 |
| 7/17 | $11,002 | $11,104 |
| 8/17 | $11,102 | $11,188 |
| 9/17 | $11,082 | $11,131 |
| 10/17 | $11,070 | $11,159 |
| 11/17 | $11,022 | $11,099 |
| 12/17 | $11,114 | $11,215 |
| 1/18 | $10,995 | $11,083 |
| 2/18 | $10,969 | $11,050 |
| 3/18 | $10,998 | $11,090 |
| 4/18 | $10,964 | $11,051 |
| 5/18 | $11,096 | $11,177 |
| 6/18 | $11,108 | $11,187 |
| 7/18 | $11,158 | $11,214 |
| 8/18 | $11,170 | $11,243 |
| 9/18 | $11,116 | $11,170 |
| 10/18 | $11,044 | $11,101 |
| 11/18 | $11,133 | $11,224 |
| 12/18 | $11,231 | $11,359 |
| 1/19 | $11,338 | $11,444 |
| 2/19 | $11,399 | $11,506 |
| 3/19 | $11,534 | $11,688 |
| 4/19 | $11,565 | $11,732 |
| 5/19 | $11,701 | $11,893 |
| 6/19 | $11,751 | $11,937 |
| 7/19 | $11,829 | $12,033 |
| 8/19 | $11,975 | $12,223 |
| 9/19 | $11,899 | $12,125 |
| 10/19 | $11,910 | $12,147 |
| 11/19 | $11,930 | $12,177 |
| 12/19 | $11,969 | $12,215 |
| 1/20 | $12,172 | $12,434 |
| 2/20 | $12,358 | $12,594 |
| 3/20 | $11,563 | $12,137 |
| 4/20 | $11,225 | $11,985 |
| 5/20 | $11,578 | $12,366 |
| 6/20 | $11,885 | $12,468 |
| 7/20 | $12,103 | $12,678 |
| 8/20 | $12,104 | $12,619 |
| 9/20 | $12,098 | $12,621 |
| 10/20 | $12,081 | $12,583 |
| 11/20 | $12,281 | $12,773 |
| 12/20 | $12,450 | $12,851 |
| 1/21 | $12,631 | $12,933 |
| 2/21 | $12,482 | $12,728 |
| 3/21 | $12,520 | $12,806 |
| 4/21 | $12,625 | $12,913 |
| 5/21 | $12,700 | $12,952 |
| 6/21 | $12,766 | $12,988 |
| 7/21 | $12,870 | $13,095 |
| 8/21 | $12,825 | $13,047 |
| 9/21 | $12,711 | $12,953 |
| 10/21 | $12,667 | $12,915 |
| 11/21 | $12,775 | $13,025 |
| 12/21 | $12,775 | $13,046 |
| 1/22 | $12,455 | $12,689 |
| 2/22 | $12,382 | $12,644 |
| 3/22 | $12,031 | $12,234 |
| 4/22 | $11,693 | $11,895 |
| 5/22 | $11,766 | $12,072 |
| 6/22 | $11,541 | $11,874 |
| 7/22 | $11,780 | $12,188 |
| 8/22 | $11,567 | $11,921 |
| 9/22 | $11,197 | $11,463 |
| 10/22 | $11,097 | $11,368 |
| 11/22 | $11,521 | $11,900 |
| 12/22 | $11,520 | $11,934 |
| 1/23 | $11,845 | $12,277 |
| 2/23 | $11,613 | $11,999 |
| 3/23 | $11,821 | $12,265 |
| 4/23 | $11,798 | $12,237 |
| 5/23 | $11,732 | $12,131 |
| 6/23 | $11,827 | $12,253 |
| 7/23 | $11,856 | $12,301 |
| 8/23 | $11,706 | $12,124 |
| 9/23 | $11,396 | $11,769 |
| 10/23 | $11,235 | $11,669 |
| 11/23 | $11,934 | $12,409 |
| 12/23 | $12,213 | $12,698 |
| 1/24 | $12,236 | $12,633 |
| 2/24 | $12,248 | $12,649 |
| 3/24 | $12,270 | $12,649 |
| 4/24 | $12,162 | $12,492 |
| 5/24 | $12,173 | $12,455 |
| 6/24 | $12,371 | $12,646 |
| 7/24 | $12,488 | $12,762 |
Average Annual Total Returns (%)
| 1 Year | 5 Years | 10 Years |
|---|
| Class A | 5.36% | 1.10% | 2.59% |
| Class A with 3.25% Maximum Sales Charge | 1.97% | 0.44% | 2.24% |
| Bloomberg Municipal Bond Index | 3.74% | 1.18% | 2.47% |
Performance does not reflect the deduction of taxes that a shareholder would pay on Fund distributions or redemption of Fund shares. Performance assumes that all dividends and distributions, if any, were reinvested. For more recent performance information, visit www.eatonvance.com/performance.php.
THE FUND'S PAST PERFORMANCE IS NO GUARANTEE OF FUTURE RESULTS.
| Total Net Assets | $655,366,494 |
| # of Portfolio Holdings | 360 |
| Portfolio Turnover Rate | 118% |
| Total Advisory Fees Paid | $3,410,907 |
What did the Fund invest in?
The following tables reflect what the Fund invested in as of the report date.
Sector Allocation (% of total investments)
| Value | Value |
|---|
OtherFootnote Reference* | 5.0% |
| Other Revenue | 3.1% |
| Electric Utilities | 3.2% |
| Industrial Development Revenue | 4.8% |
| Special Tax Revenue | 5.5% |
| Education | 5.8% |
| Senior Living/Life Care | 8.5% |
| Housing | 9.4% |
| Water and Sewer | 9.8% |
| Transportation | 11.9% |
| Hospital | 12.3% |
| General Obligations | 20.7% |
| Footnote | Description |
Footnote* | Sectors less than 3% each |
Credit Quality (% of total investments)Footnote Referencea
| Value | Value |
|---|
| Not Rated | 8.5% |
| B | 1.4% |
| BB | 6.1% |
| BBB | 6.8% |
| A | 17.3% |
| AA | 41.9% |
| AAA | 18.0% |
| Footnote | Description |
Footnotea | Ratings are based on Moody’s Investors Service, Inc. (“Moody’s”), S&P Global Ratings (“S&P”) or Fitch Ratings (“Fitch”). If securities are rated differently by the ratings agencies, the highest rating is applied. Moody's ratings are converted to the S&P and Fitch scale with ratings ranging from AAA, being the highest, to D, being the lowest. Ratings of BBB or higher are considered to be investment-grade quality. Holdings designated as “Not Rated” (if any) are not rated by the national ratings agencies stated above. |
This is a summary of certain changes to the Fund since July 31, 2023. For more complete information, you may review the Fund’s next prospectus, which we expect to be available by December 1, 2024 at www.eatonvance.com/open-end-mutual-fund-documents.php or upon request by contacting us at
1-800-262-1122.
Effective December 31, 2023, the investment adviser and administrator has agreed to reimburse the Fund’s expenses to the extent that total annual operating expenses (relating to ordinary operating expenses only and excluding such expenses such as brokerage commissions, acquired fund fees and expenses of unaffiliated funds, borrowing costs (including borrowing costs of any acquired funds), taxes or litigation expenses) exceed 0.92% of the Fund’s average daily net assets for Class A. This agreement may be changed or terminated after November 30, 2024.
If you wish to view additional information about the Fund, including the prospectus, statement of additional information, financial statements and holdings, please scan the QR code or visit www.eatonvance.com/open-end-mutual-fund-documents.php. For proxy information, please visit www.eatonvance.com/proxyvoting.
The Funds may deliver a single copy of certain required shareholder documents (including prospectuses, shareholder reports, and proxy materials) to investors with the same last name and the same address. Your participation will continue indefinitely unless you instruct otherwise by calling 1-800-262-1122 or by contacting your financial intermediary. Your instruction will typically be effective within 30 days of receipt.
Not FDIC Insured | May Lose Value | No Bank Guarantee
Annual Shareholder Report July 31, 2024
Eaton Vance Municipal Opportunities Fund
Annual Shareholder Report July 31, 2024
This annual shareholder report contains important information about the Eaton Vance Municipal Opportunities Fund for the period of August 1, 2023 to July 31, 2024. You can find additional information about the Fund at www.eatonvance.com/open-end-mutual-fund-documents.php. You can also request this information by contacting us at 1-800-262-1122.
This report describes changes to the Fund that occurred during the reporting period.
What were the Fund costs for the last year?
(based on a hypothetical $10,000 investment)
| Class Name | Costs of a $10,000 investment | Costs paid as a percentage of a $10,000 investment |
|---|
| Class C | $174 | 1.70% |
How did the Fund perform last year and what affected its performance?
Key contributors to (↑) and detractors from (↓) performance, relative to the Bloomberg Municipal Bond Index (the Index):
↑ Security selections and an overweight position in bonds rated BBB and below helped returns as lower-rated bonds outperformed higher-rated bonds
↑ Security selections in California bonds, which underperformed the Index during the period, contributed to the Fund’s Index-relative returns
↑ Security selections in local general obligation bonds, which underperformed the Index during the period, contributed to Index-relative returns
↓ Security selections and an underweight position in A-rated bonds, which generally outperformed higher-rated bonds during the period, hurt returns
↓ An underweight exposure to bonds with 22+ years remaining to maturity hurt returns as longer-maturity bonds outperformed shorter-maturity bonds
↓ Security selections in the IDR/PCR sector (industrial development revenue/pollution control revenue) detracted from returns during the period
Comparison of the change in value of a $10,000 investment for the period indicated.
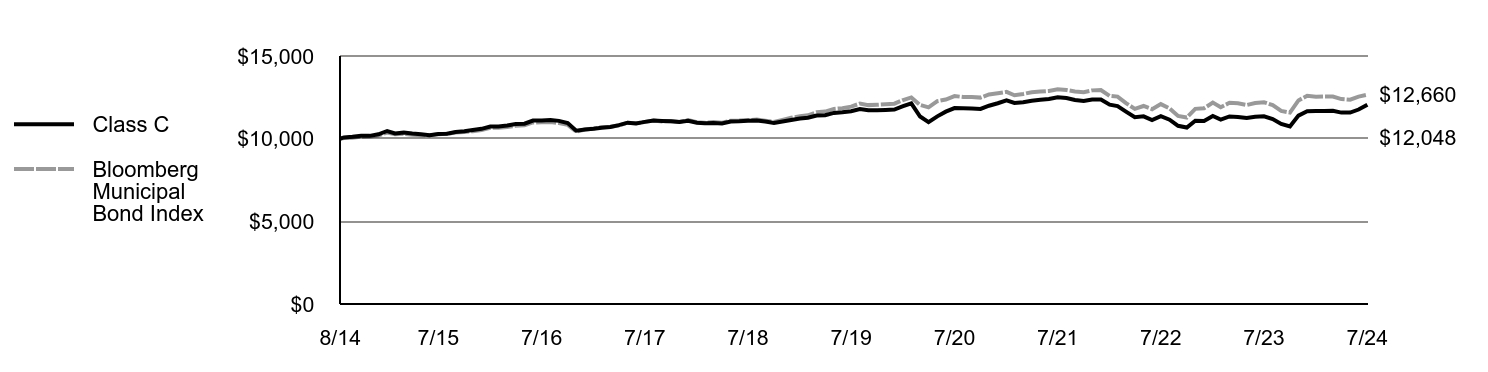
| Class C | Bloomberg Municipal Bond Index |
|---|
| 8/14 | $10,000 | $10,000 |
| 8/14 | $10,075 | $10,040 |
| 9/14 | $10,113 | $10,051 |
| 10/14 | $10,176 | $10,120 |
| 11/14 | $10,169 | $10,137 |
| 12/14 | $10,262 | $10,188 |
| 1/15 | $10,464 | $10,369 |
| 2/15 | $10,318 | $10,262 |
| 3/15 | $10,368 | $10,292 |
| 4/15 | $10,312 | $10,238 |
| 5/15 | $10,266 | $10,209 |
| 6/15 | $10,205 | $10,200 |
| 7/15 | $10,286 | $10,274 |
| 8/15 | $10,296 | $10,294 |
| 9/15 | $10,407 | $10,369 |
| 10/15 | $10,455 | $10,410 |
| 11/15 | $10,521 | $10,451 |
| 12/15 | $10,595 | $10,525 |
| 1/16 | $10,738 | $10,650 |
| 2/16 | $10,739 | $10,667 |
| 3/16 | $10,792 | $10,701 |
| 4/16 | $10,882 | $10,779 |
| 5/16 | $10,907 | $10,809 |
| 6/16 | $11,096 | $10,981 |
| 7/16 | $11,096 | $10,987 |
| 8/16 | $11,123 | $11,002 |
| 9/16 | $11,077 | $10,947 |
| 10/16 | $10,950 | $10,832 |
| 11/16 | $10,479 | $10,428 |
| 12/16 | $10,555 | $10,551 |
| 1/17 | $10,594 | $10,620 |
| 2/17 | $10,663 | $10,694 |
| 3/17 | $10,704 | $10,717 |
| 4/17 | $10,818 | $10,795 |
| 5/17 | $10,967 | $10,966 |
| 6/17 | $10,923 | $10,927 |
| 7/17 | $11,017 | $11,015 |
| 8/17 | $11,101 | $11,099 |
| 9/17 | $11,074 | $11,043 |
| 10/17 | $11,055 | $11,070 |
| 11/17 | $11,010 | $11,010 |
| 12/17 | $11,085 | $11,126 |
| 1/18 | $10,968 | $10,995 |
| 2/18 | $10,927 | $10,962 |
| 3/18 | $10,949 | $11,002 |
| 4/18 | $10,917 | $10,963 |
| 5/18 | $11,032 | $11,088 |
| 6/18 | $11,047 | $11,098 |
| 7/18 | $11,080 | $11,125 |
| 8/18 | $11,094 | $11,153 |
| 9/18 | $11,034 | $11,081 |
| 10/18 | $10,955 | $11,013 |
| 11/18 | $11,037 | $11,135 |
| 12/18 | $11,127 | $11,268 |
| 1/19 | $11,217 | $11,353 |
| 2/19 | $11,270 | $11,414 |
| 3/19 | $11,397 | $11,595 |
| 4/19 | $11,421 | $11,638 |
| 5/19 | $11,557 | $11,799 |
| 6/19 | $11,599 | $11,842 |
| 7/19 | $11,659 | $11,938 |
| 8/19 | $11,795 | $12,126 |
| 9/19 | $11,714 | $12,029 |
| 10/19 | $11,717 | $12,050 |
| 11/19 | $11,739 | $12,080 |
| 12/19 | $11,761 | $12,117 |
| 1/20 | $11,962 | $12,335 |
| 2/20 | $12,138 | $12,494 |
| 3/20 | $11,340 | $12,041 |
| 4/20 | $11,001 | $11,890 |
| 5/20 | $11,350 | $12,268 |
| 6/20 | $11,634 | $12,369 |
| 7/20 | $11,850 | $12,577 |
| 8/20 | $11,844 | $12,518 |
| 9/20 | $11,830 | $12,521 |
| 10/20 | $11,797 | $12,483 |
| 11/20 | $11,994 | $12,672 |
| 12/20 | $12,142 | $12,749 |
| 1/21 | $12,311 | $12,830 |
| 2/21 | $12,159 | $12,626 |
| 3/21 | $12,198 | $12,704 |
| 4/21 | $12,292 | $12,811 |
| 5/21 | $12,348 | $12,849 |
| 6/21 | $12,404 | $12,884 |
| 7/21 | $12,507 | $12,991 |
| 8/21 | $12,456 | $12,943 |
| 9/21 | $12,337 | $12,850 |
| 10/21 | $12,277 | $12,812 |
| 11/21 | $12,373 | $12,921 |
| 12/21 | $12,366 | $12,942 |
| 1/22 | $12,057 | $12,588 |
| 2/22 | $11,970 | $12,543 |
| 3/22 | $11,624 | $12,136 |
| 4/22 | $11,299 | $11,801 |
| 5/22 | $11,353 | $11,976 |
| 6/22 | $11,129 | $11,780 |
| 7/22 | $11,362 | $12,091 |
| 8/22 | $11,150 | $11,826 |
| 9/22 | $10,776 | $11,372 |
| 10/22 | $10,673 | $11,278 |
| 11/22 | $11,084 | $11,805 |
| 12/22 | $11,076 | $11,839 |
| 1/23 | $11,372 | $12,179 |
| 2/23 | $11,152 | $11,904 |
| 3/23 | $11,345 | $12,168 |
| 4/23 | $11,316 | $12,140 |
| 5/23 | $11,245 | $12,035 |
| 6/23 | $11,329 | $12,155 |
| 7/23 | $11,350 | $12,203 |
| 8/23 | $11,189 | $12,028 |
| 9/23 | $10,895 | $11,675 |
| 10/23 | $10,735 | $11,576 |
| 11/23 | $11,395 | $12,311 |
| 12/23 | $11,655 | $12,597 |
| 1/24 | $11,670 | $12,532 |
| 2/24 | $11,674 | $12,548 |
| 3/24 | $11,688 | $12,548 |
| 4/24 | $11,577 | $12,393 |
| 5/24 | $11,581 | $12,356 |
| 6/24 | $11,762 | $12,546 |
| 7/24 | $12,048 | $12,660 |
Average Annual Total Returns (%)
| 1 Year | 5 Years | Since Inception 8/18/14 |
|---|
| Class C | 4.57% | 0.36% | 1.89% |
| Class C with 1% Maximum Deferred Sales Charge | 3.57% | 0.36% | 1.89% |
| Bloomberg Municipal Bond Index | 3.74% | 1.18% | 2.40% |
Performance does not reflect the deduction of taxes that a shareholder would pay on Fund distributions or redemption of Fund shares. Performance assumes that all dividends and distributions, if any, were reinvested. For more recent performance information, visit www.eatonvance.com/performance.php.
THE FUND'S PAST PERFORMANCE IS NO GUARANTEE OF FUTURE RESULTS.
| Total Net Assets | $655,366,494 |
| # of Portfolio Holdings | 360 |
| Portfolio Turnover Rate | 118% |
| Total Advisory Fees Paid | $3,410,907 |
What did the Fund invest in?
The following tables reflect what the Fund invested in as of the report date.
Sector Allocation (% of total investments)
| Value | Value |
|---|
OtherFootnote Reference* | 5.0% |
| Other Revenue | 3.1% |
| Electric Utilities | 3.2% |
| Industrial Development Revenue | 4.8% |
| Special Tax Revenue | 5.5% |
| Education | 5.8% |
| Senior Living/Life Care | 8.5% |
| Housing | 9.4% |
| Water and Sewer | 9.8% |
| Transportation | 11.9% |
| Hospital | 12.3% |
| General Obligations | 20.7% |
| Footnote | Description |
Footnote* | Sectors less than 3% each |
Credit Quality (% of total investments)Footnote Referencea
| Value | Value |
|---|
| Not Rated | 8.5% |
| B | 1.4% |
| BB | 6.1% |
| BBB | 6.8% |
| A | 17.3% |
| AA | 41.9% |
| AAA | 18.0% |
| Footnote | Description |
Footnotea | Ratings are based on Moody’s Investors Service, Inc. (“Moody’s”), S&P Global Ratings (“S&P”) or Fitch Ratings (“Fitch”). If securities are rated differently by the ratings agencies, the highest rating is applied. Moody's ratings are converted to the S&P and Fitch scale with ratings ranging from AAA, being the highest, to D, being the lowest. Ratings of BBB or higher are considered to be investment-grade quality. Holdings designated as “Not Rated” (if any) are not rated by the national ratings agencies stated above. |
This is a summary of certain changes to the Fund since July 31, 2023. For more complete information, you may review the Fund’s next prospectus, which we expect to be available by December 1, 2024 at www.eatonvance.com/open-end-mutual-fund-documents.php or upon request by contacting us at
1-800-262-1122.
Effective December 31, 2023, the investment adviser and administrator has agreed to reimburse the Fund’s expenses to the extent that total annual operating expenses (relating to ordinary operating expenses only and excluding such expenses such as brokerage commissions, acquired fund fees and expenses of unaffiliated funds, borrowing costs (including borrowing costs of any acquired funds), taxes or litigation expenses) exceed 1.67% of the Fund’s average daily net assets for Class C. This agreement may be changed or terminated after November 30, 2024.
If you wish to view additional information about the Fund, including the prospectus, statement of additional information, financial statements and holdings, please scan the QR code or visit www.eatonvance.com/open-end-mutual-fund-documents.php. For proxy information, please visit www.eatonvance.com/proxyvoting.
The Funds may deliver a single copy of certain required shareholder documents (including prospectuses, shareholder reports, and proxy materials) to investors with the same last name and the same address. Your participation will continue indefinitely unless you instruct otherwise by calling 1-800-262-1122 or by contacting your financial intermediary. Your instruction will typically be effective within 30 days of receipt.
Not FDIC Insured | May Lose Value | No Bank Guarantee
Annual Shareholder Report July 31, 2024
Eaton Vance Municipal Opportunities Fund
Annual Shareholder Report July 31, 2024
This annual shareholder report contains important information about the Eaton Vance Municipal Opportunities Fund for the period of August 1, 2023 to July 31, 2024. You can find additional information about the Fund at www.eatonvance.com/open-end-mutual-fund-documents.php. You can also request this information by contacting us at 1-800-262-1122.
This report describes changes to the Fund that occurred during the reporting period.
What were the Fund costs for the last year?
(based on a hypothetical $10,000 investment)
| Class Name | Costs of a $10,000 investment | Costs paid as a percentage of a $10,000 investment |
|---|
| Class I | $72 | 0.70% |
How did the Fund perform last year and what affected its performance?
Key contributors to (↑) and detractors from (↓) performance, relative to the Bloomberg Municipal Bond Index (the Index):
↑ Security selections and an overweight position in bonds rated BBB and below helped returns as lower-rated bonds outperformed higher-rated bonds
↑ Security selections in California bonds, which underperformed the Index during the period, contributed to the Fund’s Index-relative returns
↑ Security selections in local general obligation bonds, which underperformed the Index during the period, contributed to Index-relative returns
↓ Security selections and an underweight position in A-rated bonds, which generally outperformed higher-rated bonds during the period, hurt returns
↓ An underweight exposure to bonds with 22+ years remaining to maturity hurt returns as longer-maturity bonds outperformed shorter-maturity bonds
↓ Security selections in the IDR/PCR sector (industrial development revenue/pollution control revenue) detracted from returns during the period
Comparison of the change in value of a $1,000,000 investment for the period indicated.
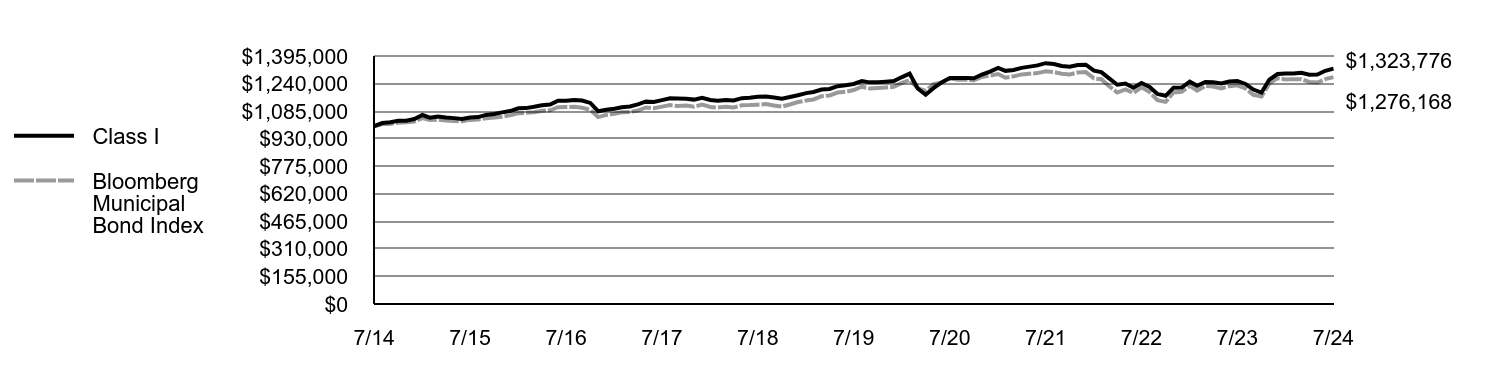
| Class I | Bloomberg Municipal Bond Index |
|---|
| 7/14 | $1,000,000 | $1,000,000 |
| 8/14 | $1,017,967 | $1,012,107 |
| 9/14 | $1,022,768 | $1,013,136 |
| 10/14 | $1,030,211 | $1,020,082 |
| 11/14 | $1,031,246 | $1,021,847 |
| 12/14 | $1,040,719 | $1,027,003 |
| 1/15 | $1,063,006 | $1,045,205 |
| 2/15 | $1,048,151 | $1,034,424 |
| 3/15 | $1,055,024 | $1,037,411 |
| 4/15 | $1,049,351 | $1,031,968 |
| 5/15 | $1,045,579 | $1,029,117 |
| 6/15 | $1,040,198 | $1,028,179 |
| 7/15 | $1,049,403 | $1,035,627 |
| 8/15 | $1,051,303 | $1,037,660 |
| 9/15 | $1,063,501 | $1,045,177 |
| 10/15 | $1,069,300 | $1,049,332 |
| 11/15 | $1,077,857 | $1,053,504 |
| 12/15 | $1,085,366 | $1,060,906 |
| 1/16 | $1,100,990 | $1,073,565 |
| 2/16 | $1,101,927 | $1,075,253 |
| 3/16 | $1,109,221 | $1,078,659 |
| 4/16 | $1,118,415 | $1,086,590 |
| 5/16 | $1,121,962 | $1,089,529 |
| 6/16 | $1,143,280 | $1,106,862 |
| 7/16 | $1,143,272 | $1,107,538 |
| 8/16 | $1,147,010 | $1,109,032 |
| 9/16 | $1,144,197 | $1,103,497 |
| 10/16 | $1,131,074 | $1,091,920 |
| 11/16 | $1,084,341 | $1,051,197 |
| 12/16 | $1,092,202 | $1,063,538 |
| 1/17 | $1,098,141 | $1,070,549 |
| 2/17 | $1,106,165 | $1,077,983 |
| 3/17 | $1,111,302 | $1,080,323 |
| 4/17 | $1,123,042 | $1,088,162 |
| 5/17 | $1,139,468 | $1,105,432 |
| 6/17 | $1,136,857 | $1,101,468 |
| 7/17 | $1,146,602 | $1,110,379 |
| 8/17 | $1,157,244 | $1,118,829 |
| 9/17 | $1,155,371 | $1,113,141 |
| 10/17 | $1,154,424 | $1,115,858 |
| 11/17 | $1,149,682 | $1,109,883 |
| 12/17 | $1,159,514 | $1,121,483 |
| 1/18 | $1,147,274 | $1,108,280 |
| 2/18 | $1,143,880 | $1,104,969 |
| 3/18 | $1,147,176 | $1,109,047 |
| 4/18 | $1,144,774 | $1,105,089 |
| 5/18 | $1,157,846 | $1,117,744 |
| 6/18 | $1,160,320 | $1,118,698 |
| 7/18 | $1,165,752 | $1,121,412 |
| 8/18 | $1,167,245 | $1,124,292 |
| 9/18 | $1,161,910 | $1,117,014 |
| 10/18 | $1,154,616 | $1,110,135 |
| 11/18 | $1,164,115 | $1,122,422 |
| 12/18 | $1,174,635 | $1,135,861 |
| 1/19 | $1,186,089 | $1,144,448 |
| 2/19 | $1,192,661 | $1,150,575 |
| 3/19 | $1,206,059 | $1,168,763 |
| 4/19 | $1,209,588 | $1,173,156 |
| 5/19 | $1,225,010 | $1,189,329 |
| 6/19 | $1,230,487 | $1,193,721 |
| 7/19 | $1,237,887 | $1,203,341 |
| 8/19 | $1,254,378 | $1,222,322 |
| 9/19 | $1,246,795 | $1,212,524 |
| 10/19 | $1,247,144 | $1,214,697 |
| 11/19 | $1,250,507 | $1,217,735 |
| 12/19 | $1,253,874 | $1,221,453 |
| 1/20 | $1,276,429 | $1,243,398 |
| 2/20 | $1,296,178 | $1,259,432 |
| 3/20 | $1,212,162 | $1,213,749 |
| 4/20 | $1,176,989 | $1,198,516 |
| 5/20 | $1,215,293 | $1,236,643 |
| 6/20 | $1,246,639 | $1,246,821 |
| 7/20 | $1,270,786 | $1,267,820 |
| 8/20 | $1,271,209 | $1,261,872 |
| 9/20 | $1,270,789 | $1,262,139 |
| 10/20 | $1,269,308 | $1,258,348 |
| 11/20 | $1,290,580 | $1,277,337 |
| 12/20 | $1,307,574 | $1,285,118 |
| 1/21 | $1,327,908 | $1,293,308 |
| 2/21 | $1,311,475 | $1,272,759 |
| 3/21 | $1,316,778 | $1,280,608 |
| 4/21 | $1,328,103 | $1,291,350 |
| 5/21 | $1,335,211 | $1,295,202 |
| 6/21 | $1,342,348 | $1,298,759 |
| 7/21 | $1,354,659 | $1,309,530 |
| 8/21 | $1,350,249 | $1,304,724 |
| 9/21 | $1,338,555 | $1,295,309 |
| 10/21 | $1,334,185 | $1,291,521 |
| 11/21 | $1,344,720 | $1,302,516 |
| 12/21 | $1,346,142 | $1,304,617 |
| 1/22 | $1,312,685 | $1,268,906 |
| 2/22 | $1,304,168 | $1,264,360 |
| 3/22 | $1,267,593 | $1,223,373 |
| 4/22 | $1,233,332 | $1,189,535 |
| 5/22 | $1,240,174 | $1,207,206 |
| 6/22 | $1,216,774 | $1,187,434 |
| 7/22 | $1,243,303 | $1,218,808 |
| 8/22 | $1,221,136 | $1,192,096 |
| 9/22 | $1,181,301 | $1,146,342 |
| 10/22 | $1,171,025 | $1,136,809 |
| 11/22 | $1,217,050 | $1,189,982 |
| 12/22 | $1,217,178 | $1,193,388 |
| 1/23 | $1,250,680 | $1,227,669 |
| 2/23 | $1,227,497 | $1,199,909 |
| 3/23 | $1,248,617 | $1,226,532 |
| 4/23 | $1,247,557 | $1,223,730 |
| 5/23 | $1,240,887 | $1,213,125 |
| 6/23 | $1,251,122 | $1,225,277 |
| 7/23 | $1,254,523 | $1,230,125 |
| 8/23 | $1,237,775 | $1,212,415 |
| 9/23 | $1,206,391 | $1,176,881 |
| 10/23 | $1,189,662 | $1,166,866 |
| 11/23 | $1,262,603 | $1,240,940 |
| 12/23 | $1,293,581 | $1,269,782 |
| 1/24 | $1,296,274 | $1,263,297 |
| 2/24 | $1,296,636 | $1,264,919 |
| 3/24 | $1,300,410 | $1,264,879 |
| 4/24 | $1,289,245 | $1,249,214 |
| 5/24 | $1,290,722 | $1,245,550 |
| 6/24 | $1,311,930 | $1,264,642 |
| 7/24 | $1,323,776 | $1,276,168 |
Average Annual Total Returns (%)
| 1 Year | 5 Years | 10 Years |
|---|
| Class I | 5.53% | 1.35% | 2.84% |
| Bloomberg Municipal Bond Index | 3.74% | 1.18% | 2.47% |
Performance does not reflect the deduction of taxes that a shareholder would pay on Fund distributions or redemption of Fund shares. Performance assumes that all dividends and distributions, if any, were reinvested. For more recent performance information, visit www.eatonvance.com/performance.php.
THE FUND'S PAST PERFORMANCE IS NO GUARANTEE OF FUTURE RESULTS.
| Total Net Assets | $655,366,494 |
| # of Portfolio Holdings | 360 |
| Portfolio Turnover Rate | 118% |
| Total Advisory Fees Paid | $3,410,907 |
What did the Fund invest in?
The following tables reflect what the Fund invested in as of the report date.
Sector Allocation (% of total investments)
| Value | Value |
|---|
OtherFootnote Reference* | 5.0% |
| Other Revenue | 3.1% |
| Electric Utilities | 3.2% |
| Industrial Development Revenue | 4.8% |
| Special Tax Revenue | 5.5% |
| Education | 5.8% |
| Senior Living/Life Care | 8.5% |
| Housing | 9.4% |
| Water and Sewer | 9.8% |
| Transportation | 11.9% |
| Hospital | 12.3% |
| General Obligations | 20.7% |
| Footnote | Description |
Footnote* | Sectors less than 3% each |
Credit Quality (% of total investments)Footnote Referencea
| Value | Value |
|---|
| Not Rated | 8.5% |
| B | 1.4% |
| BB | 6.1% |
| BBB | 6.8% |
| A | 17.3% |
| AA | 41.9% |
| AAA | 18.0% |
| Footnote | Description |
Footnotea | Ratings are based on Moody’s Investors Service, Inc. (“Moody’s”), S&P Global Ratings (“S&P”) or Fitch Ratings (“Fitch”). If securities are rated differently by the ratings agencies, the highest rating is applied. Moody's ratings are converted to the S&P and Fitch scale with ratings ranging from AAA, being the highest, to D, being the lowest. Ratings of BBB or higher are considered to be investment-grade quality. Holdings designated as “Not Rated” (if any) are not rated by the national ratings agencies stated above. |
This is a summary of certain changes to the Fund since July 31, 2023. For more complete information, you may review the Fund’s next prospectus, which we expect to be available by December 1, 2024 at www.eatonvance.com/open-end-mutual-fund-documents.php or upon request by contacting us at
1-800-262-1122.
Effective December 31, 2023, the investment adviser and administrator has agreed to reimburse the Fund’s expenses to the extent that total annual operating expenses (relating to ordinary operating expenses only and excluding such expenses such as brokerage commissions, acquired fund fees and expenses of unaffiliated funds, borrowing costs (including borrowing costs of any acquired funds), taxes or litigation expenses) exceed 0.67% of the Fund’s average daily net assets for Class I. This agreement may be changed or terminated after November 30, 2024.
If you wish to view additional information about the Fund, including the prospectus, statement of additional information, financial statements and holdings, please scan the QR code or visit www.eatonvance.com/open-end-mutual-fund-documents.php. For proxy information, please visit www.eatonvance.com/proxyvoting.
The Funds may deliver a single copy of certain required shareholder documents (including prospectuses, shareholder reports, and proxy materials) to investors with the same last name and the same address. Your participation will continue indefinitely unless you instruct otherwise by calling 1-800-262-1122 or by contacting your financial intermediary. Your instruction will typically be effective within 30 days of receipt.
Not FDIC Insured | May Lose Value | No Bank Guarantee
Annual Shareholder Report July 31, 2024
Eaton Vance New Jersey Municipal Income Fund
Annual Shareholder Report July 31, 2024
This annual shareholder report contains important information about the Eaton Vance New Jersey Municipal Income Fund for the period of August 1, 2023 to July 31, 2024. You can find additional information about the Fund at www.eatonvance.com/open-end-mutual-fund-documents.php. You can also request this information by contacting us at 1-800-262-1122.
What were the Fund costs for the last year?
(based on a hypothetical $10,000 investment)
| Class Name | Costs of a $10,000 investment | Costs paid as a percentage of a $10,000 investment |
|---|
| Class A | $73 | 0.72% |
How did the Fund perform last year and what affected its performance?
Key contributors to (↑) and detractors from (↓) performance, relative to the Bloomberg Municipal Bond Index (the Index):
↑ Security selections and an overweight position in BBB-rated bonds helped returns as lower-rated bonds generally outperformed higher-rated bonds
↑ Security selections in bonds with 22+ years remaining to maturity contributed to the Fund’s Index-relative performance during the period
↑ An out-of-Index exposure to taxable municipal bonds helped Index-relative returns as taxable municipal bonds outperformed tax-exempt municipal bonds
↓ Security selections in bonds with 12-17 years remaining to maturity detracted from the Fund’s Index-relative performance during the period
↓ Security selections in the IDR/PCR sector (industrial development revenue/pollution control revenue) detracted from returns during the period
↓ An overweight position in bonds with coupon rates of less than 4%, excluding zero-coupon bonds, detracted from Index-relative returns during the period
Comparison of the change in value of a $10,000 investment for the period indicated.
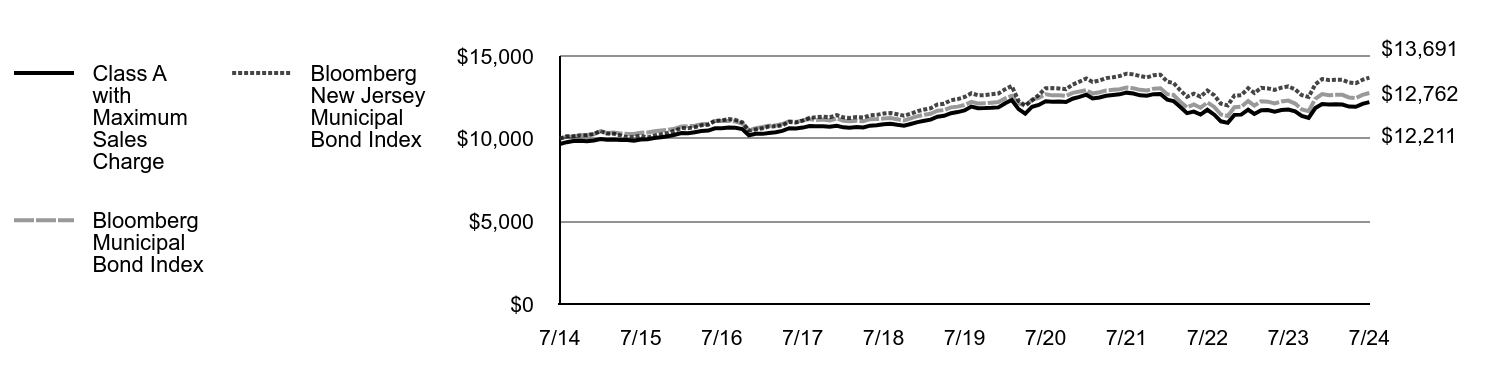
| Class A with Maximum Sales Charge | Bloomberg Municipal Bond Index | Bloomberg New Jersey Municipal Bond Index |
|---|
| 7/14 | $9,675 | $10,000 | $10,000 |
| 8/14 | $9,787 | $10,121 | $10,142 |
| 9/14 | $9,858 | $10,131 | $10,150 |
| 10/14 | $9,876 | $10,201 | $10,202 |
| 11/14 | $9,842 | $10,218 | $10,206 |
| 12/14 | $9,892 | $10,270 | $10,280 |
| 1/15 | $9,984 | $10,452 | $10,464 |
| 2/15 | $9,940 | $10,344 | $10,305 |
| 3/15 | $9,949 | $10,374 | $10,304 |
| 4/15 | $9,915 | $10,320 | $10,196 |
| 5/15 | $9,923 | $10,291 | $10,083 |
| 6/15 | $9,879 | $10,282 | $10,089 |
| 7/15 | $9,952 | $10,356 | $10,177 |
| 8/15 | $9,960 | $10,377 | $10,074 |
| 9/15 | $10,045 | $10,452 | $10,191 |
| 10/15 | $10,087 | $10,493 | $10,262 |
| 11/15 | $10,140 | $10,535 | $10,343 |
| 12/15 | $10,236 | $10,609 | $10,484 |
| 1/16 | $10,343 | $10,736 | $10,641 |
| 2/16 | $10,331 | $10,753 | $10,631 |
| 3/16 | $10,394 | $10,787 | $10,695 |
| 4/16 | $10,458 | $10,866 | $10,808 |
| 5/16 | $10,487 | $10,895 | $10,846 |
| 6/16 | $10,629 | $11,069 | $11,084 |
| 7/16 | $10,627 | $11,075 | $11,112 |
| 8/16 | $10,680 | $11,090 | $11,181 |
| 9/16 | $10,654 | $11,035 | $11,136 |
| 10/16 | $10,583 | $10,919 | $10,991 |
| 11/16 | $10,208 | $10,512 | $10,487 |
| 12/16 | $10,294 | $10,635 | $10,558 |
| 1/17 | $10,290 | $10,705 | $10,630 |
| 2/17 | $10,344 | $10,780 | $10,731 |
| 3/17 | $10,386 | $10,803 | $10,749 |
| 4/17 | $10,474 | $10,882 | $10,805 |
| 5/17 | $10,631 | $11,054 | $11,014 |
| 6/17 | $10,616 | $11,015 | $10,977 |
| 7/17 | $10,670 | $11,104 | $11,089 |
| 8/17 | $10,760 | $11,188 | $11,260 |
| 9/17 | $10,747 | $11,131 | $11,298 |
| 10/17 | $10,744 | $11,159 | $11,336 |
| 11/17 | $10,718 | $11,099 | $11,302 |
| 12/17 | $10,785 | $11,215 | $11,421 |
| 1/18 | $10,686 | $11,083 | $11,288 |
| 2/18 | $10,658 | $11,050 | $11,257 |
| 3/18 | $10,701 | $11,090 | $11,304 |
| 4/18 | $10,673 | $11,051 | $11,278 |
| 5/18 | $10,787 | $11,177 | $11,409 |
| 6/18 | $10,817 | $11,187 | $11,440 |
| 7/18 | $10,872 | $11,214 | $11,517 |
| 8/18 | $10,902 | $11,243 | $11,554 |
| 9/18 | $10,836 | $11,170 | $11,479 |
| 10/18 | $10,781 | $11,101 | $11,390 |
| 11/18 | $10,884 | $11,224 | $11,509 |
| 12/18 | $10,999 | $11,359 | $11,665 |
| 1/19 | $11,088 | $11,444 | $11,765 |
| 2/19 | $11,153 | $11,506 | $11,838 |
| 3/19 | $11,327 | $11,688 | $12,064 |
| 4/19 | $11,380 | $11,732 | $12,111 |
| 5/19 | $11,543 | $11,893 | $12,328 |
| 6/19 | $11,608 | $11,937 | $12,390 |
| 7/19 | $11,708 | $12,033 | $12,519 |
| 8/19 | $11,944 | $12,223 | $12,747 |
| 9/19 | $11,847 | $12,125 | $12,620 |
| 10/19 | $11,848 | $12,147 | $12,635 |
| 11/19 | $11,863 | $12,177 | $12,681 |
| 12/19 | $11,892 | $12,215 | $12,735 |
| 1/20 | $12,145 | $12,434 | $12,995 |
| 2/20 | $12,337 | $12,594 | $13,182 |
| 3/20 | $11,788 | $12,137 | $12,286 |
| 4/20 | $11,515 | $11,985 | $12,009 |
| 5/20 | $11,934 | $12,366 | $12,312 |
| 6/20 | $12,038 | $12,468 | $12,646 |
| 7/20 | $12,257 | $12,678 | $13,047 |
| 8/20 | $12,233 | $12,619 | $13,059 |
| 9/20 | $12,247 | $12,621 | $13,035 |
| 10/20 | $12,222 | $12,583 | $12,987 |
| 11/20 | $12,415 | $12,773 | $13,270 |
| 12/20 | $12,531 | $12,851 | $13,449 |
| 1/21 | $12,659 | $12,933 | $13,640 |
| 2/21 | $12,428 | $12,728 | $13,431 |
| 3/21 | $12,491 | $12,806 | $13,517 |
| 4/21 | $12,594 | $12,913 | $13,663 |
| 5/21 | $12,644 | $12,952 | $13,715 |
| 6/21 | $12,682 | $12,988 | $13,785 |
| 7/21 | $12,783 | $13,095 | $13,929 |
| 8/21 | $12,729 | $13,047 | $13,890 |
| 9/21 | $12,622 | $12,953 | $13,789 |
| 10/21 | $12,595 | $12,915 | $13,708 |
| 11/21 | $12,694 | $13,025 | $13,833 |
| 12/21 | $12,698 | $13,046 | $13,867 |
| 1/22 | $12,364 | $12,689 | $13,451 |
| 2/22 | $12,280 | $12,644 | $13,370 |
| 3/22 | $11,918 | $12,234 | $12,920 |
| 4/22 | $11,543 | $11,895 | $12,535 |
| 5/22 | $11,633 | $12,072 | $12,723 |
| 6/22 | $11,457 | $11,874 | $12,536 |
| 7/22 | $11,747 | $12,188 | $12,908 |
| 8/22 | $11,452 | $11,921 | $12,630 |
| 9/22 | $11,050 | $11,463 | $12,112 |
| 10/22 | $10,956 | $11,368 | $12,009 |
| 11/22 | $11,439 | $11,900 | $12,606 |
| 12/22 | $11,453 | $11,934 | $12,628 |
| 1/23 | $11,750 | $12,277 | $13,048 |
| 2/23 | $11,495 | $11,999 | $12,764 |
| 3/23 | $11,725 | $12,265 | $13,074 |
| 4/23 | $11,727 | $12,237 | $13,041 |
| 5/23 | $11,634 | $12,131 | $12,952 |
| 6/23 | $11,731 | $12,253 | $13,082 |
| 7/23 | $11,759 | $12,301 | $13,159 |
| 8/23 | $11,650 | $12,124 | $12,985 |
| 9/23 | $11,377 | $11,769 | $12,633 |
| 10/23 | $11,254 | $11,669 | $12,520 |
| 11/23 | $11,849 | $12,409 | $13,286 |
| 12/23 | $12,099 | $12,698 | $13,603 |
| 1/24 | $12,072 | $12,633 | $13,544 |
| 2/24 | $12,075 | $12,649 | $13,569 |
| 3/24 | $12,063 | $12,649 | $13,563 |
| 4/24 | $11,941 | $12,492 | $13,402 |
| 5/24 | $11,931 | $12,455 | $13,357 |
| 6/24 | $12,104 | $12,646 | $13,561 |
| 7/24 | $12,211 | $12,762 | $13,691 |
Average Annual Total Returns (%)
| 1 Year | 5 Years | 10 Years |
|---|
| Class A | 3.81% | 0.84% | 2.35% |
| Class A with 3.25% Maximum Sales Charge | 0.41% | 0.17% | 2.02% |
| Bloomberg Municipal Bond Index | 3.74% | 1.18% | 2.47% |
| Bloomberg New Jersey Municipal Bond Index | 4.04% | 1.80% | 3.19% |
Performance does not reflect the deduction of taxes that a shareholder would pay on Fund distributions or redemption of Fund shares. Performance assumes that all dividends and distributions, if any, were reinvested. For more recent performance information, visit www.eatonvance.com/performance.php.
THE FUND'S PAST PERFORMANCE IS NO GUARANTEE OF FUTURE RESULTS.
| Total Net Assets | $151,085,148 |
| # of Portfolio Holdings | 96 |
| Portfolio Turnover Rate | 52% |
| Total Advisory Fees Paid | $539,080 |
What did the Fund invest in?
The following tables reflect what the Fund invested in as of the report date.
Sector Allocation (% of total investments)
| Value | Value |
|---|
OtherFootnote Reference* | 11.2% |
| Industrial Development Revenue | 3.5% |
| Water and Sewer | 4.0% |
| Education | 10.4% |
| Lease Rev./Cert. of Participation | 11.5% |
| Hospital | 11.7% |
| Special Tax Revenue | 12.4% |
| Transportation | 16.8% |
| General Obligations | 18.5% |
| Footnote | Description |
Footnote* | Sectors less than 3% each |
Credit Quality (% of total investments)Footnote Referencea
| Value | Value |
|---|
| Not Rated | 7.4% |
| BB | 0.1% |
| BBB | 10.4% |
| A | 17.6% |
| AA | 48.7% |
| AAA | 15.8% |
| Footnote | Description |
Footnotea | Ratings are based on Moody’s Investors Service, Inc. (“Moody’s”), S&P Global Ratings (“S&P”) or Fitch Ratings (“Fitch”). If securities are rated differently by the ratings agencies, the highest rating is applied. Moody's ratings are converted to the S&P and Fitch scale with ratings ranging from AAA, being the highest, to D, being the lowest. Ratings of BBB or higher are considered to be investment-grade quality. Holdings designated as “Not Rated” (if any) are not rated by the national ratings agencies stated above. |
If you wish to view additional information about the Fund, including the prospectus, statement of additional information, financial statements and holdings, please scan the QR code or visit www.eatonvance.com/open-end-mutual-fund-documents.php. For proxy information, please visit www.eatonvance.com/proxyvoting.
The Funds may deliver a single copy of certain required shareholder documents (including prospectuses, shareholder reports, and proxy materials) to investors with the same last name and the same address. Your participation will continue indefinitely unless you instruct otherwise by calling 1-800-262-1122 or by contacting your financial intermediary. Your instruction will typically be effective within 30 days of receipt.
Not FDIC Insured | May Lose Value | No Bank Guarantee
Annual Shareholder Report July 31, 2024
Eaton Vance New Jersey Municipal Income Fund
Annual Shareholder Report July 31, 2024
This annual shareholder report contains important information about the Eaton Vance New Jersey Municipal Income Fund for the period of August 1, 2023 to July 31, 2024. You can find additional information about the Fund at www.eatonvance.com/open-end-mutual-fund-documents.php. You can also request this information by contacting us at 1-800-262-1122.
What were the Fund costs for the last year?
(based on a hypothetical $10,000 investment)
| Class Name | Costs of a $10,000 investment | Costs paid as a percentage of a $10,000 investment |
|---|
| Class C | $149 | 1.47% |
How did the Fund perform last year and what affected its performance?
Key contributors to (↑) and detractors from (↓) performance, relative to the Bloomberg Municipal Bond Index (the Index):
↓ Security selections in bonds with 12-17 years remaining to maturity detracted from the Fund’s Index-relative performance during the period
↓ Security selections in the IDR/PCR sector (industrial development revenue/pollution control revenue) detracted from returns during the period
↓ An overweight position in bonds with coupon rates of less than 4%, excluding zero-coupon bonds, detracted from Index-relative returns during the period
↑ Security selections and an overweight position in BBB-rated bonds helped returns as lower-rated bonds generally outperformed higher-rated bonds
↑ Security selections in bonds with 22+ years remaining to maturity contributed to the Fund’s Index-relative performance during the period
↑ An out-of-Index exposure to taxable municipal bonds helped Index-relative returns as taxable municipal bonds outperformed tax-exempt municipal bonds
Comparison of the change in value of a $10,000 investment for the period indicated.
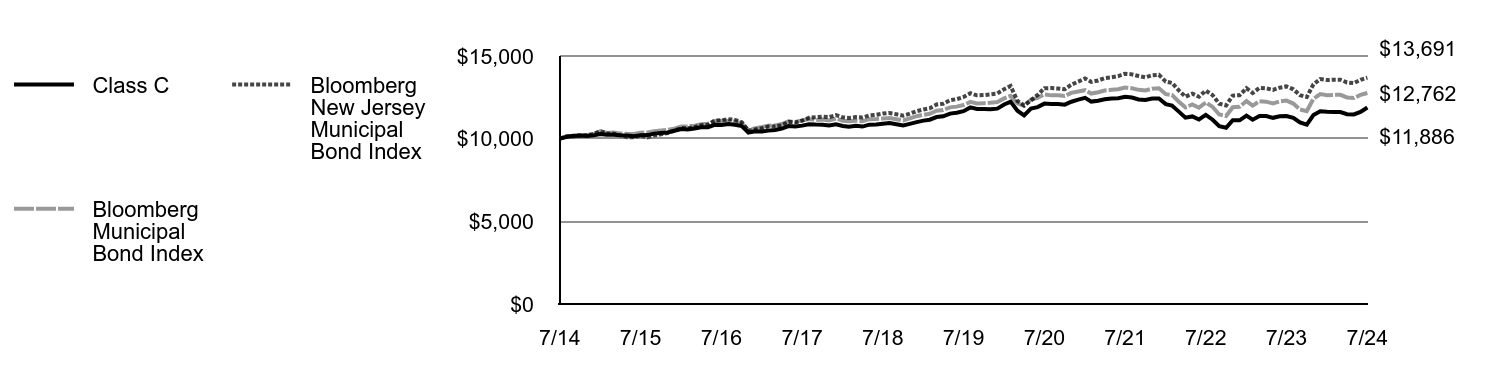
| Class C | Bloomberg Municipal Bond Index | Bloomberg New Jersey Municipal Bond Index |
|---|
| 7/14 | $10,000 | $10,000 | $10,000 |
| 8/14 | $10,116 | $10,121 | $10,142 |
| 9/14 | $10,182 | $10,131 | $10,150 |
| 10/14 | $10,194 | $10,201 | $10,202 |
| 11/14 | $10,155 | $10,218 | $10,206 |
| 12/14 | $10,199 | $10,270 | $10,280 |
| 1/15 | $10,286 | $10,452 | $10,464 |
| 2/15 | $10,237 | $10,344 | $10,305 |
| 3/15 | $10,240 | $10,374 | $10,304 |
| 4/15 | $10,202 | $10,320 | $10,196 |
| 5/15 | $10,195 | $10,291 | $10,083 |
| 6/15 | $10,146 | $10,282 | $10,089 |
| 7/15 | $10,213 | $10,356 | $10,177 |
| 8/15 | $10,216 | $10,377 | $10,074 |
| 9/15 | $10,305 | $10,452 | $10,191 |
| 10/15 | $10,341 | $10,493 | $10,262 |
| 11/15 | $10,377 | $10,535 | $10,343 |
| 12/15 | $10,476 | $10,609 | $10,484 |
| 1/16 | $10,577 | $10,736 | $10,641 |
| 2/16 | $10,559 | $10,753 | $10,631 |
| 3/16 | $10,616 | $10,787 | $10,695 |
| 4/16 | $10,684 | $10,866 | $10,808 |
| 5/16 | $10,696 | $10,895 | $10,846 |
| 6/16 | $10,841 | $11,069 | $11,084 |
| 7/16 | $10,822 | $11,075 | $11,112 |
| 8/16 | $10,879 | $11,090 | $11,181 |
| 9/16 | $10,838 | $11,035 | $11,136 |
| 10/16 | $10,763 | $10,919 | $10,991 |
| 11/16 | $10,370 | $10,512 | $10,487 |
| 12/16 | $10,449 | $10,635 | $10,558 |
| 1/17 | $10,440 | $10,705 | $10,630 |
| 2/17 | $10,487 | $10,780 | $10,731 |
| 3/17 | $10,522 | $10,803 | $10,749 |
| 4/17 | $10,614 | $10,882 | $10,805 |
| 5/17 | $10,761 | $11,054 | $11,014 |
| 6/17 | $10,741 | $11,015 | $10,977 |
| 7/17 | $10,788 | $11,104 | $11,089 |
| 8/17 | $10,870 | $11,188 | $11,260 |
| 9/17 | $10,851 | $11,131 | $11,298 |
| 10/17 | $10,843 | $11,159 | $11,336 |
| 11/17 | $10,801 | $11,099 | $11,302 |
| 12/17 | $10,872 | $11,215 | $11,421 |
| 1/18 | $10,771 | $11,083 | $11,288 |
| 2/18 | $10,728 | $11,050 | $11,257 |
| 3/18 | $10,775 | $11,090 | $11,304 |
| 4/18 | $10,731 | $11,051 | $11,278 |
| 5/18 | $10,846 | $11,177 | $11,409 |
| 6/18 | $10,859 | $11,187 | $11,440 |
| 7/18 | $10,906 | $11,214 | $11,517 |
| 8/18 | $10,941 | $11,243 | $11,554 |
| 9/18 | $10,872 | $11,170 | $11,479 |
| 10/18 | $10,802 | $11,101 | $11,390 |
| 11/18 | $10,896 | $11,224 | $11,509 |
| 12/18 | $11,000 | $11,359 | $11,665 |
| 1/19 | $11,091 | $11,444 | $11,765 |
| 2/19 | $11,148 | $11,506 | $11,838 |
| 3/19 | $11,309 | $11,688 | $12,064 |
| 4/19 | $11,354 | $11,732 | $12,111 |
| 5/19 | $11,516 | $11,893 | $12,328 |
| 6/19 | $11,572 | $11,937 | $12,390 |
| 7/19 | $11,661 | $12,033 | $12,519 |
| 8/19 | $11,892 | $12,223 | $12,747 |
| 9/19 | $11,793 | $12,125 | $12,620 |
| 10/19 | $11,788 | $12,147 | $12,635 |
| 11/19 | $11,784 | $12,177 | $12,681 |
| 12/19 | $11,817 | $12,215 | $12,735 |
| 1/20 | $12,064 | $12,434 | $12,995 |
| 2/20 | $12,240 | $12,594 | $13,182 |
| 3/20 | $11,689 | $12,137 | $12,286 |
| 4/20 | $11,411 | $11,985 | $12,009 |
| 5/20 | $11,815 | $12,366 | $12,312 |
| 6/20 | $11,908 | $12,468 | $12,646 |
| 7/20 | $12,120 | $12,678 | $13,047 |
| 8/20 | $12,092 | $12,619 | $13,059 |
| 9/20 | $12,100 | $12,621 | $13,035 |
| 10/20 | $12,058 | $12,583 | $12,987 |
| 11/20 | $12,235 | $12,773 | $13,270 |
| 12/20 | $12,363 | $12,851 | $13,449 |
| 1/21 | $12,466 | $12,933 | $13,640 |
| 2/21 | $12,242 | $12,728 | $13,431 |
| 3/21 | $12,296 | $12,806 | $13,517 |
| 4/21 | $12,387 | $12,913 | $13,663 |
| 5/21 | $12,429 | $12,952 | $13,715 |
| 6/21 | $12,447 | $12,988 | $13,785 |
| 7/21 | $12,536 | $13,095 | $13,929 |
| 8/21 | $12,491 | $13,047 | $13,890 |
| 9/21 | $12,374 | $12,953 | $13,789 |
| 10/21 | $12,342 | $12,915 | $13,708 |
| 11/21 | $12,429 | $13,025 | $13,833 |
| 12/21 | $12,426 | $13,046 | $13,867 |
| 1/22 | $12,092 | $12,689 | $13,451 |
| 2/22 | $12,007 | $12,644 | $13,370 |
| 3/22 | $11,636 | $12,234 | $12,920 |
| 4/22 | $11,267 | $11,895 | $12,535 |
| 5/22 | $11,344 | $12,072 | $12,723 |
| 6/22 | $11,162 | $11,874 | $12,536 |
| 7/22 | $11,440 | $12,188 | $12,908 |
| 8/22 | $11,145 | $11,921 | $12,630 |
| 9/22 | $10,751 | $11,463 | $12,112 |
| 10/22 | $10,658 | $11,368 | $12,009 |
| 11/22 | $11,115 | $11,900 | $12,606 |
| 12/22 | $11,110 | $11,934 | $12,628 |
| 1/23 | $11,392 | $12,277 | $13,048 |
| 2/23 | $11,149 | $11,999 | $12,764 |
| 3/23 | $11,371 | $12,265 | $13,074 |
| 4/23 | $11,366 | $12,237 | $13,041 |
| 5/23 | $11,261 | $12,131 | $12,952 |
| 6/23 | $11,358 | $12,253 | $13,082 |
| 7/23 | $11,366 | $12,301 | $13,159 |
| 8/23 | $11,258 | $12,124 | $12,985 |
| 9/23 | $10,986 | $11,769 | $12,633 |
| 10/23 | $10,854 | $11,669 | $12,520 |
| 11/23 | $11,424 | $12,409 | $13,286 |
| 12/23 | $11,663 | $12,698 | $13,603 |
| 1/24 | $11,632 | $12,633 | $13,544 |
| 2/24 | $11,615 | $12,649 | $13,569 |
| 3/24 | $11,611 | $12,649 | $13,563 |
| 4/24 | $11,480 | $12,492 | $13,402 |
| 5/24 | $11,465 | $12,455 | $13,357 |
| 6/24 | $11,618 | $12,646 | $13,561 |
| 7/24 | $11,886 | $12,762 | $13,691 |
Average Annual Total Returns (%)
| 1 Year | 5 Years | 10 Years |
|---|
| Class C | 3.12% | 0.10% | 1.74% |
| Class C with 1% Maximum Deferred Sales Charge | 2.12% | 0.10% | 1.74% |
| Bloomberg Municipal Bond Index | 3.74% | 1.18% | 2.47% |
| Bloomberg New Jersey Municipal Bond Index | 4.04% | 1.80% | 3.19% |
Performance does not reflect the deduction of taxes that a shareholder would pay on Fund distributions or redemption of Fund shares. Performance assumes that all dividends and distributions, if any, were reinvested. For more recent performance information, visit www.eatonvance.com/performance.php.
THE FUND'S PAST PERFORMANCE IS NO GUARANTEE OF FUTURE RESULTS.
| Total Net Assets | $151,085,148 |
| # of Portfolio Holdings | 96 |
| Portfolio Turnover Rate | 52% |
| Total Advisory Fees Paid | $539,080 |
What did the Fund invest in?
The following tables reflect what the Fund invested in as of the report date.
Sector Allocation (% of total investments)
| Value | Value |
|---|
OtherFootnote Reference* | 11.2% |
| Industrial Development Revenue | 3.5% |
| Water and Sewer | 4.0% |
| Education | 10.4% |
| Lease Rev./Cert. of Participation | 11.5% |
| Hospital | 11.7% |
| Special Tax Revenue | 12.4% |
| Transportation | 16.8% |
| General Obligations | 18.5% |
| Footnote | Description |
Footnote* | Sectors less than 3% each |
Credit Quality (% of total investments)Footnote Referencea
| Value | Value |
|---|
| Not Rated | 7.4% |
| BB | 0.1% |
| BBB | 10.4% |
| A | 17.6% |
| AA | 48.7% |
| AAA | 15.8% |
| Footnote | Description |
Footnotea | Ratings are based on Moody’s Investors Service, Inc. (“Moody’s”), S&P Global Ratings (“S&P”) or Fitch Ratings (“Fitch”). If securities are rated differently by the ratings agencies, the highest rating is applied. Moody's ratings are converted to the S&P and Fitch scale with ratings ranging from AAA, being the highest, to D, being the lowest. Ratings of BBB or higher are considered to be investment-grade quality. Holdings designated as “Not Rated” (if any) are not rated by the national ratings agencies stated above. |
If you wish to view additional information about the Fund, including the prospectus, statement of additional information, financial statements and holdings, please scan the QR code or visit www.eatonvance.com/open-end-mutual-fund-documents.php. For proxy information, please visit www.eatonvance.com/proxyvoting.
The Funds may deliver a single copy of certain required shareholder documents (including prospectuses, shareholder reports, and proxy materials) to investors with the same last name and the same address. Your participation will continue indefinitely unless you instruct otherwise by calling 1-800-262-1122 or by contacting your financial intermediary. Your instruction will typically be effective within 30 days of receipt.
Not FDIC Insured | May Lose Value | No Bank Guarantee
Annual Shareholder Report July 31, 2024
Eaton Vance New Jersey Municipal Income Fund
Annual Shareholder Report July 31, 2024
This annual shareholder report contains important information about the Eaton Vance New Jersey Municipal Income Fund for the period of August 1, 2023 to July 31, 2024. You can find additional information about the Fund at www.eatonvance.com/open-end-mutual-fund-documents.php. You can also request this information by contacting us at 1-800-262-1122.
What were the Fund costs for the last year?
(based on a hypothetical $10,000 investment)
| Class Name | Costs of a $10,000 investment | Costs paid as a percentage of a $10,000 investment |
|---|
| Class I | $53 | 0.52% |
How did the Fund perform last year and what affected its performance?
Key contributors to (↑) and detractors from (↓) performance, relative to the Bloomberg Municipal Bond Index (the Index):
↑ Security selections and an overweight position in BBB-rated bonds helped returns as lower-rated bonds generally outperformed higher-rated bonds
↑ Security selections in bonds with 22+ years remaining to maturity contributed to the Fund’s Index-relative performance during the period
↑ An out-of-Index exposure to taxable municipal bonds helped Index-relative returns as taxable municipal bonds outperformed tax-exempt municipal bonds
↓ Security selections in bonds with 12-17 years remaining to maturity detracted from the Fund’s Index-relative performance during the period
↓ Security selections in the IDR/PCR sector (industrial development revenue/pollution control revenue) detracted from returns during the period
↓ An overweight position in bonds with coupon rates of less than 4%, excluding zero-coupon bonds, detracted from Index-relative returns during the period
Comparison of the change in value of a $1,000,000 investment for the period indicated.
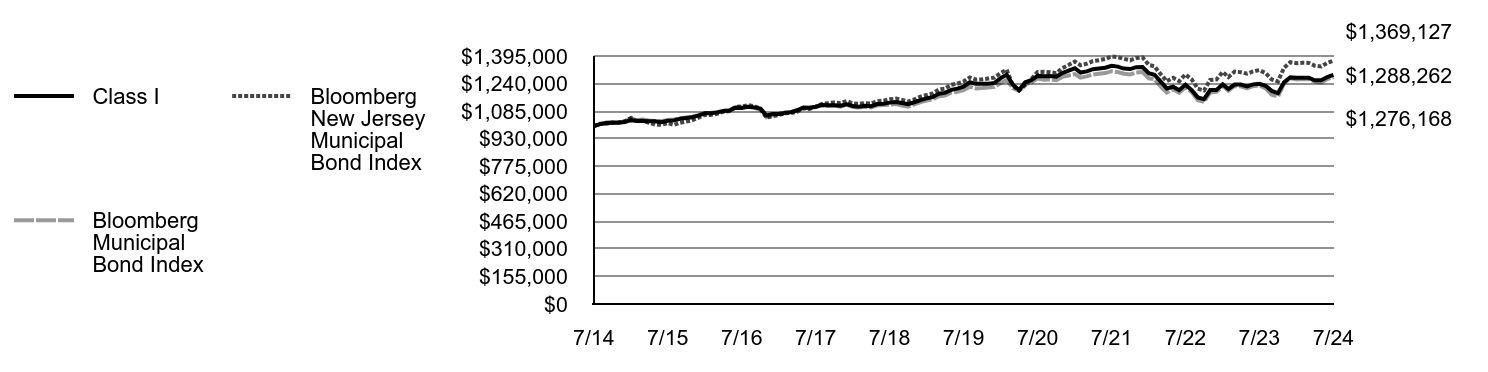
| Class I | Bloomberg Municipal Bond Index | Bloomberg New Jersey Municipal Bond Index |
|---|
| 7/14 | $1,000,000 | $1,000,000 | $1,000,000 |
| 8/14 | $1,011,735 | $1,012,107 | $1,014,152 |
| 9/14 | $1,019,248 | $1,013,136 | $1,014,981 |
| 10/14 | $1,021,321 | $1,020,082 | $1,020,196 |
| 11/14 | $1,019,009 | $1,021,847 | $1,020,581 |
| 12/14 | $1,023,264 | $1,027,003 | $1,028,006 |
| 1/15 | $1,034,103 | $1,045,205 | $1,046,383 |
| 2/15 | $1,029,662 | $1,034,424 | $1,030,504 |
| 3/15 | $1,029,644 | $1,037,411 | $1,030,419 |
| 4/15 | $1,027,405 | $1,031,968 | $1,019,611 |
| 5/15 | $1,027,387 | $1,029,117 | $1,008,253 |
| 6/15 | $1,022,929 | $1,028,179 | $1,008,856 |
| 7/15 | $1,030,688 | $1,035,627 | $1,017,725 |
| 8/15 | $1,032,872 | $1,037,660 | $1,007,364 |
| 9/15 | $1,041,828 | $1,045,177 | $1,019,069 |
| 10/15 | $1,046,294 | $1,049,332 | $1,026,230 |
| 11/15 | $1,050,810 | $1,053,504 | $1,034,287 |
| 12/15 | $1,060,964 | $1,060,906 | $1,048,421 |
| 1/16 | $1,072,324 | $1,073,565 | $1,064,086 |
| 2/16 | $1,072,314 | $1,075,253 | $1,063,050 |
| 3/16 | $1,077,960 | $1,078,659 | $1,069,536 |
| 4/16 | $1,085,860 | $1,086,590 | $1,080,774 |
| 5/16 | $1,087,973 | $1,089,529 | $1,084,572 |
| 6/16 | $1,104,027 | $1,106,862 | $1,108,395 |
| 7/16 | $1,102,829 | $1,107,538 | $1,111,219 |
| 8/16 | $1,109,643 | $1,109,032 | $1,118,141 |
| 9/16 | $1,106,019 | $1,103,497 | $1,113,567 |
| 10/16 | $1,098,846 | $1,091,920 | $1,099,132 |
| 11/16 | $1,060,041 | $1,051,197 | $1,048,652 |
| 12/16 | $1,069,214 | $1,063,538 | $1,055,841 |
| 1/17 | $1,068,969 | $1,070,549 | $1,063,001 |
| 2/17 | $1,074,665 | $1,077,983 | $1,073,099 |
| 3/17 | $1,079,227 | $1,080,323 | $1,074,879 |
| 4/17 | $1,089,748 | $1,088,162 | $1,080,525 |
| 5/17 | $1,105,078 | $1,105,432 | $1,101,406 |
| 6/17 | $1,103,718 | $1,101,468 | $1,097,729 |
| 7/17 | $1,109,542 | $1,110,379 | $1,108,912 |
| 8/17 | $1,119,091 | $1,118,829 | $1,125,968 |
| 9/17 | $1,117,859 | $1,113,141 | $1,129,766 |
| 10/17 | $1,117,791 | $1,115,858 | $1,133,595 |
| 11/17 | $1,115,248 | $1,109,883 | $1,130,181 |
| 12/17 | $1,123,614 | $1,121,483 | $1,142,057 |
| 1/18 | $1,113,543 | $1,108,280 | $1,128,760 |
| 2/18 | $1,109,572 | $1,104,969 | $1,125,720 |
| 3/18 | $1,115,444 | $1,109,047 | $1,130,357 |
| 4/18 | $1,112,692 | $1,105,089 | $1,127,820 |
| 5/18 | $1,124,736 | $1,117,744 | $1,140,940 |
| 6/18 | $1,126,873 | $1,118,698 | $1,144,001 |
| 7/18 | $1,132,755 | $1,121,412 | $1,151,715 |
| 8/18 | $1,136,096 | $1,124,292 | $1,155,380 |
| 9/18 | $1,130,642 | $1,117,014 | $1,147,926 |
| 10/18 | $1,123,887 | $1,110,135 | $1,139,003 |
| 11/18 | $1,134,802 | $1,122,422 | $1,150,905 |
| 12/18 | $1,146,982 | $1,135,861 | $1,166,480 |
| 1/19 | $1,157,640 | $1,144,448 | $1,176,474 |
| 2/19 | $1,163,384 | $1,150,575 | $1,183,826 |
| 3/19 | $1,183,045 | $1,168,763 | $1,206,352 |
| 4/19 | $1,187,485 | $1,173,156 | $1,211,063 |
| 5/19 | $1,204,709 | $1,189,329 | $1,232,846 |
| 6/19 | $1,211,631 | $1,193,721 | $1,239,047 |
| 7/19 | $1,222,322 | $1,203,341 | $1,251,890 |
| 8/19 | $1,247,199 | $1,222,322 | $1,274,662 |
| 9/19 | $1,238,536 | $1,212,524 | $1,261,984 |
| 10/19 | $1,238,881 | $1,214,697 | $1,263,514 |
| 11/19 | $1,239,341 | $1,217,735 | $1,268,059 |
| 12/19 | $1,243,820 | $1,221,453 | $1,273,541 |
| 1/20 | $1,270,528 | $1,243,398 | $1,299,498 |
| 2/20 | $1,289,407 | $1,259,432 | $1,318,162 |
| 3/20 | $1,233,556 | $1,213,749 | $1,228,610 |
| 4/20 | $1,203,857 | $1,198,516 | $1,200,939 |
| 5/20 | $1,247,824 | $1,236,643 | $1,231,190 |
| 6/20 | $1,258,834 | $1,246,821 | $1,264,591 |
| 7/20 | $1,283,110 | $1,267,820 | $1,304,652 |
| 8/20 | $1,280,801 | $1,261,872 | $1,305,883 |
| 9/20 | $1,282,398 | $1,262,139 | $1,303,481 |
| 10/20 | $1,278,554 | $1,258,348 | $1,298,748 |
| 11/20 | $1,298,920 | $1,277,337 | $1,326,978 |
| 12/20 | $1,312,509 | $1,285,118 | $1,344,877 |
| 1/21 | $1,326,008 | $1,293,308 | $1,364,032 |
| 2/21 | $1,301,876 | $1,272,759 | $1,343,082 |
| 3/21 | $1,308,659 | $1,280,608 | $1,351,662 |
| 4/21 | $1,320,894 | $1,291,350 | $1,366,264 |
| 5/21 | $1,324,864 | $1,295,202 | $1,371,510 |
| 6/21 | $1,328,965 | $1,298,759 | $1,378,456 |
| 7/21 | $1,339,659 | $1,309,530 | $1,392,868 |
| 8/21 | $1,335,441 | $1,304,724 | $1,388,991 |
| 9/21 | $1,324,410 | $1,295,309 | $1,378,931 |
| 10/21 | $1,321,600 | $1,291,521 | $1,370,804 |
| 11/21 | $1,332,216 | $1,302,516 | $1,383,262 |
| 12/21 | $1,332,899 | $1,304,617 | $1,386,750 |
| 1/22 | $1,298,080 | $1,268,906 | $1,345,124 |
| 2/22 | $1,289,485 | $1,264,360 | $1,336,975 |
| 3/22 | $1,250,388 | $1,223,373 | $1,292,016 |
| 4/22 | $1,212,718 | $1,189,535 | $1,253,483 |
| 5/22 | $1,222,301 | $1,207,206 | $1,272,271 |
| 6/22 | $1,202,757 | $1,187,434 | $1,253,576 |
| 7/22 | $1,233,373 | $1,218,808 | $1,290,844 |
| 8/22 | $1,202,624 | $1,192,096 | $1,262,985 |
| 9/22 | $1,162,071 | $1,146,342 | $1,211,177 |
| 10/22 | $1,152,399 | $1,136,809 | $1,200,889 |
| 11/22 | $1,203,266 | $1,189,982 | $1,260,566 |
| 12/22 | $1,203,545 | $1,193,388 | $1,262,823 |
| 1/23 | $1,234,888 | $1,227,669 | $1,304,763 |
| 2/23 | $1,209,708 | $1,199,909 | $1,276,390 |
| 3/23 | $1,234,161 | $1,226,532 | $1,307,440 |
| 4/23 | $1,234,520 | $1,223,730 | $1,304,116 |
| 5/23 | $1,223,513 | $1,213,125 | $1,295,238 |
| 6/23 | $1,235,419 | $1,225,277 | $1,308,224 |
| 7/23 | $1,238,591 | $1,230,125 | $1,315,943 |
| 8/23 | $1,227,335 | $1,212,415 | $1,298,516 |
| 9/23 | $1,198,769 | $1,176,881 | $1,263,302 |
| 10/23 | $1,186,050 | $1,166,866 | $1,251,975 |
| 11/23 | $1,247,360 | $1,240,940 | $1,328,629 |
| 12/23 | $1,275,368 | $1,269,782 | $1,360,274 |
| 1/24 | $1,272,782 | $1,263,297 | $1,354,446 |
| 2/24 | $1,273,231 | $1,264,919 | $1,356,903 |
| 3/24 | $1,272,230 | $1,264,879 | $1,356,270 |
| 4/24 | $1,258,106 | $1,249,214 | $1,340,162 |
| 5/24 | $1,258,772 | $1,245,550 | $1,335,723 |
| 6/24 | $1,275,751 | $1,264,642 | $1,356,078 |
| 7/24 | $1,288,262 | $1,276,168 | $1,369,127 |
Average Annual Total Returns (%)
| 1 Year | 5 Years | 10 Years |
|---|
| Class I | 4.01% | 1.06% | 2.56% |
| Bloomberg Municipal Bond Index | 3.74% | 1.18% | 2.47% |
| Bloomberg New Jersey Municipal Bond Index | 4.04% | 1.80% | 3.19% |
Performance does not reflect the deduction of taxes that a shareholder would pay on Fund distributions or redemption of Fund shares. Performance assumes that all dividends and distributions, if any, were reinvested. For more recent performance information, visit www.eatonvance.com/performance.php.
THE FUND'S PAST PERFORMANCE IS NO GUARANTEE OF FUTURE RESULTS.
| Total Net Assets | $151,085,148 |
| # of Portfolio Holdings | 96 |
| Portfolio Turnover Rate | 52% |
| Total Advisory Fees Paid | $539,080 |
What did the Fund invest in?
The following tables reflect what the Fund invested in as of the report date.
Sector Allocation (% of total investments)
| Value | Value |
|---|
OtherFootnote Reference* | 11.2% |
| Industrial Development Revenue | 3.5% |
| Water and Sewer | 4.0% |
| Education | 10.4% |
| Lease Rev./Cert. of Participation | 11.5% |
| Hospital | 11.7% |
| Special Tax Revenue | 12.4% |
| Transportation | 16.8% |
| General Obligations | 18.5% |
| Footnote | Description |
Footnote* | Sectors less than 3% each |
Credit Quality (% of total investments)Footnote Referencea
| Value | Value |
|---|
| Not Rated | 7.4% |
| BB | 0.1% |
| BBB | 10.4% |
| A | 17.6% |
| AA | 48.7% |
| AAA | 15.8% |
| Footnote | Description |
Footnotea | Ratings are based on Moody’s Investors Service, Inc. (“Moody’s”), S&P Global Ratings (“S&P”) or Fitch Ratings (“Fitch”). If securities are rated differently by the ratings agencies, the highest rating is applied. Moody's ratings are converted to the S&P and Fitch scale with ratings ranging from AAA, being the highest, to D, being the lowest. Ratings of BBB or higher are considered to be investment-grade quality. Holdings designated as “Not Rated” (if any) are not rated by the national ratings agencies stated above. |
If you wish to view additional information about the Fund, including the prospectus, statement of additional information, financial statements and holdings, please scan the QR code or visit www.eatonvance.com/open-end-mutual-fund-documents.php. For proxy information, please visit www.eatonvance.com/proxyvoting.
The Funds may deliver a single copy of certain required shareholder documents (including prospectuses, shareholder reports, and proxy materials) to investors with the same last name and the same address. Your participation will continue indefinitely unless you instruct otherwise by calling 1-800-262-1122 or by contacting your financial intermediary. Your instruction will typically be effective within 30 days of receipt.
Not FDIC Insured | May Lose Value | No Bank Guarantee
Annual Shareholder Report July 31, 2024
Eaton Vance Pennsylvania Municipal Income Fund
Annual Shareholder Report July 31, 2024
This annual shareholder report contains important information about the Eaton Vance Pennsylvania Municipal Income Fund for the period of August 1, 2023 to July 31, 2024. You can find additional information about the Fund at www.eatonvance.com/open-end-mutual-fund-documents.php. You can also request this information by contacting us at 1-800-262-1122.
This report describes changes to the Fund that occurred during the reporting period.
What were the Fund costs for the last year?
(based on a hypothetical $10,000 investment)
| Class Name | Costs of a $10,000 investment | Costs paid as a percentage of a $10,000 investment |
|---|
| Class A | $77 | 0.75% |
How did the Fund perform last year and what affected its performance?
Key contributors to (↑) and detractors from (↓) performance, relative to the Bloomberg Municipal Bond Index (the Index):
↑ Security selections and an overweight exposure to bonds with 17+ years to maturity helped as longer-maturity bonds outperformed shorter-maturity bonds
↑ Security selections and an overweight position in bonds rated BBB and below helped returns as lower-rated bonds generally outperformed higher-rated bonds
↑ Security selections and an overweight position in the transportation sector, which outperformed the Index during the period, contributed to returns
↓ Security selections in A-rated bonds detracted from the Fund’s Index-relative returns during the period
↓ Security selections and an overweight exposure to the water & sewer sector, which underperformed the Index during the period, detracted from returns
↓ An overweight position in the education sector, which underperformed the Index during the period, detracted from Index-relative returns
Comparison of the change in value of a $10,000 investment for the period indicated.
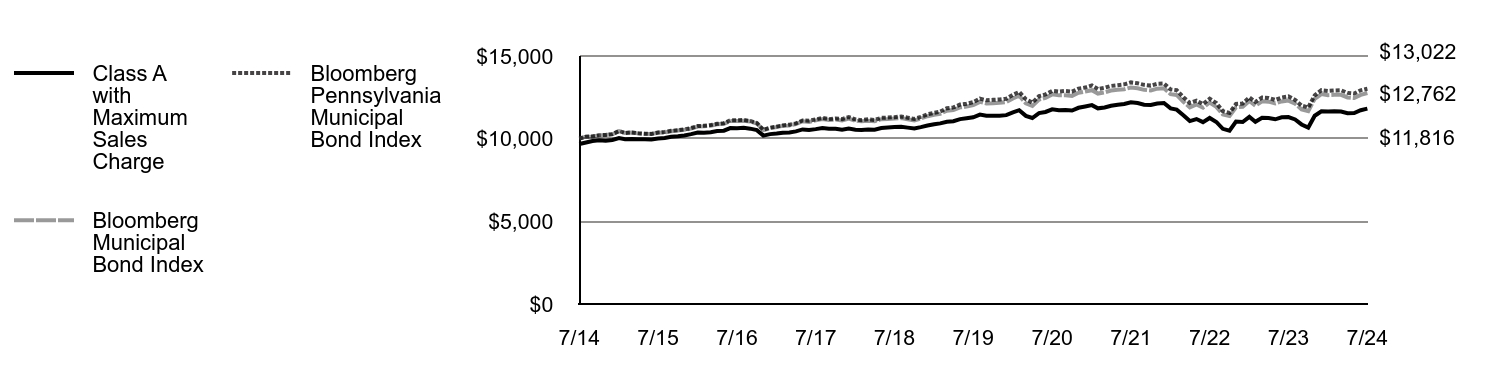
| Class A with Maximum Sales Charge | Bloomberg Municipal Bond Index | Bloomberg Pennsylvania Municipal Bond Index |
|---|
| 7/14 | $9,675 | $10,000 | $10,000 |
| 8/14 | $9,772 | $10,121 | $10,124 |
| 9/14 | $9,859 | $10,131 | $10,136 |
| 10/14 | $9,902 | $10,201 | $10,207 |
| 11/14 | $9,880 | $10,218 | $10,221 |
| 12/14 | $9,923 | $10,270 | $10,275 |
| 1/15 | $10,032 | $10,452 | $10,460 |
| 2/15 | $9,965 | $10,344 | $10,343 |
| 3/15 | $9,986 | $10,374 | $10,377 |
| 4/15 | $9,962 | $10,320 | $10,325 |
| 5/15 | $9,961 | $10,291 | $10,299 |
| 6/15 | $9,949 | $10,282 | $10,287 |
| 7/15 | $10,005 | $10,356 | $10,375 |
| 8/15 | $10,038 | $10,377 | $10,404 |
| 9/15 | $10,117 | $10,452 | $10,475 |
| 10/15 | $10,150 | $10,493 | $10,508 |
| 11/15 | $10,194 | $10,535 | $10,563 |
| 12/15 | $10,272 | $10,609 | $10,640 |
| 1/16 | $10,374 | $10,736 | $10,766 |
| 2/16 | $10,361 | $10,753 | $10,780 |
| 3/16 | $10,393 | $10,787 | $10,822 |
| 4/16 | $10,460 | $10,866 | $10,899 |
| 5/16 | $10,481 | $10,895 | $10,937 |
| 6/16 | $10,641 | $11,069 | $11,114 |
| 7/16 | $10,637 | $11,075 | $11,118 |
| 8/16 | $10,656 | $11,090 | $11,131 |
| 9/16 | $10,605 | $11,035 | $11,066 |
| 10/16 | $10,518 | $10,919 | $10,951 |
| 11/16 | $10,185 | $10,512 | $10,530 |
| 12/16 | $10,275 | $10,635 | $10,665 |
| 1/17 | $10,309 | $10,705 | $10,730 |
| 2/17 | $10,364 | $10,780 | $10,802 |
| 3/17 | $10,374 | $10,803 | $10,843 |
| 4/17 | $10,442 | $10,882 | $10,925 |
| 5/17 | $10,558 | $11,054 | $11,103 |
| 6/17 | $10,531 | $11,015 | $11,090 |
| 7/17 | $10,576 | $11,104 | $11,164 |
| 8/17 | $10,645 | $11,188 | $11,255 |
| 9/17 | $10,605 | $11,131 | $11,181 |
| 10/17 | $10,602 | $11,159 | $11,218 |
| 11/17 | $10,537 | $11,099 | $11,183 |
| 12/17 | $10,607 | $11,215 | $11,307 |
| 1/18 | $10,542 | $11,083 | $11,163 |
| 2/18 | $10,527 | $11,050 | $11,119 |
| 3/18 | $10,560 | $11,090 | $11,169 |
| 4/18 | $10,544 | $11,051 | $11,132 |
| 5/18 | $10,641 | $11,177 | $11,262 |
| 6/18 | $10,675 | $11,187 | $11,276 |
| 7/18 | $10,699 | $11,214 | $11,301 |
| 8/18 | $10,723 | $11,243 | $11,341 |
| 9/18 | $10,668 | $11,170 | $11,270 |
| 10/18 | $10,613 | $11,101 | $11,191 |
| 11/18 | $10,697 | $11,224 | $11,315 |
| 12/18 | $10,795 | $11,359 | $11,472 |
| 1/19 | $10,867 | $11,444 | $11,564 |
| 2/19 | $10,926 | $11,506 | $11,633 |
| 3/19 | $11,024 | $11,688 | $11,838 |
| 4/19 | $11,058 | $11,732 | $11,891 |
| 5/19 | $11,181 | $11,893 | $12,062 |
| 6/19 | $11,238 | $11,937 | $12,111 |
| 7/19 | $11,296 | $12,033 | $12,211 |
| 8/19 | $11,456 | $12,223 | $12,424 |
| 9/19 | $11,381 | $12,125 | $12,322 |
| 10/19 | $11,385 | $12,147 | $12,348 |
| 11/19 | $11,389 | $12,177 | $12,371 |
| 12/19 | $11,422 | $12,215 | $12,418 |
| 1/20 | $11,585 | $12,434 | $12,650 |
| 2/20 | $11,721 | $12,594 | $12,828 |
| 3/20 | $11,379 | $12,137 | $12,385 |
| 4/20 | $11,249 | $11,985 | $12,179 |
| 5/20 | $11,545 | $12,366 | $12,572 |
| 6/20 | $11,615 | $12,468 | $12,678 |
| 7/20 | $11,777 | $12,678 | $12,891 |
| 8/20 | $11,723 | $12,619 | $12,845 |
| 9/20 | $11,734 | $12,621 | $12,885 |
| 10/20 | $11,705 | $12,583 | $12,844 |
| 11/20 | $11,868 | $12,773 | $13,026 |
| 12/20 | $11,948 | $12,851 | $13,092 |
| 1/21 | $12,028 | $12,933 | $13,219 |
| 2/21 | $11,835 | $12,728 | $12,998 |
| 3/21 | $11,886 | $12,806 | $13,081 |
| 4/21 | $11,992 | $12,913 | $13,191 |
| 5/21 | $12,056 | $12,952 | $13,237 |
| 6/21 | $12,094 | $12,988 | $13,286 |
| 7/21 | $12,200 | $13,095 | $13,403 |
| 8/21 | $12,156 | $13,047 | $13,350 |
| 9/21 | $12,055 | $12,953 | $13,256 |
| 10/21 | $12,038 | $12,915 | $13,209 |
| 11/21 | $12,131 | $13,025 | $13,320 |
| 12/21 | $12,155 | $13,046 | $13,334 |
| 1/22 | $11,831 | $12,689 | $12,979 |
| 2/22 | $11,758 | $12,644 | $12,933 |
| 3/22 | $11,418 | $12,234 | $12,510 |
| 4/22 | $11,064 | $11,895 | $12,160 |
| 5/22 | $11,187 | $12,072 | $12,298 |
| 6/22 | $11,001 | $11,874 | $12,092 |
| 7/22 | $11,252 | $12,188 | $12,416 |
| 8/22 | $11,009 | $11,921 | $12,154 |
| 9/22 | $10,595 | $11,463 | $11,666 |
| 10/22 | $10,479 | $11,368 | $11,559 |
| 11/22 | $11,034 | $11,900 | $12,096 |
| 12/22 | $11,005 | $11,934 | $12,127 |
| 1/23 | $11,320 | $12,277 | $12,494 |
| 2/23 | $11,020 | $11,999 | $12,222 |
| 3/23 | $11,267 | $12,265 | $12,487 |
| 4/23 | $11,255 | $12,237 | $12,461 |
| 5/23 | $11,171 | $12,131 | $12,342 |
| 6/23 | $11,290 | $12,253 | $12,485 |
| 7/23 | $11,308 | $12,301 | $12,558 |
| 8/23 | $11,164 | $12,124 | $12,345 |
| 9/23 | $10,860 | $11,769 | $11,999 |
| 10/23 | $10,673 | $11,669 | $11,885 |
| 11/23 | $11,386 | $12,409 | $12,622 |
| 12/23 | $11,657 | $12,698 | $12,934 |
| 1/24 | $11,647 | $12,633 | $12,884 |
| 2/24 | $11,652 | $12,649 | $12,913 |
| 3/24 | $11,642 | $12,649 | $12,927 |
| 4/24 | $11,543 | $12,492 | $12,770 |
| 5/24 | $11,548 | $12,455 | $12,730 |
| 6/24 | $11,719 | $12,646 | $12,927 |
| 7/24 | $11,816 | $12,762 | $13,022 |
Average Annual Total Returns (%)
| 1 Year | 5 Years | 10 Years |
|---|
| Class A | 4.50% | 0.90% | 2.02% |
| Class A with 3.25% Maximum Sales Charge | 1.09% | 0.24% | 1.68% |
| Bloomberg Municipal Bond Index | 3.74% | 1.18% | 2.47% |
| Bloomberg Pennsylvania Municipal Bond Index | 3.70% | 1.29% | 2.67% |
Performance does not reflect the deduction of taxes that a shareholder would pay on Fund distributions or redemption of Fund shares. Performance assumes that all dividends and distributions, if any, were reinvested. For more recent performance information, visit www.eatonvance.com/performance.php.
THE FUND'S PAST PERFORMANCE IS NO GUARANTEE OF FUTURE RESULTS.
| Total Net Assets | $165,294,458 |
| # of Portfolio Holdings | 105 |
| Portfolio Turnover Rate | 61% |
| Total Advisory Fees Paid | $602,108 |
What did the Fund invest in?
The following tables reflect what the Fund invested in as of the report date.
Sector Allocation (% of total investments)
| Value | Value |
|---|
OtherFootnote Reference* | 6.5% |
| Electric Utilities | 3.1% |
| Bond Bank | 3.9% |
| Housing | 4.1% |
| Lease Rev./Cert. of Participation | 4.6% |
| Special Tax Revenue | 5.0% |
| Water and Sewer | 9.0% |
| Education | 12.9% |
| General Obligations | 13.7% |
| Hospital | 18.4% |
| Transportation | 18.8% |
| Footnote | Description |
Footnote* | Sectors less than 3% each |
Credit Quality (% of total investments)Footnote Referencea
| Value | Value |
|---|
| Not Rated | 5.0% |
| B | 0.5% |
| BB | 2.0% |
| BBB | 7.9% |
| A | 27.6% |
| AA | 55.4% |
| AAA | 1.6% |
| Footnote | Description |
Footnotea | Ratings are based on Moody’s Investors Service, Inc. (“Moody’s”), S&P Global Ratings (“S&P”) or Fitch Ratings (“Fitch”). If securities are rated differently by the ratings agencies, the highest rating is applied. Moody's ratings are converted to the S&P and Fitch scale with ratings ranging from AAA, being the highest, to D, being the lowest. Ratings of BBB or higher are considered to be investment-grade quality. Holdings designated as “Not Rated” (if any) are not rated by the national ratings agencies stated above. |
This is a summary of certain changes to the Fund since July 31, 2023. For more complete information, you may review the Fund’s next prospectus, which we expect to be available by December 1, 2024 at www.eatonvance.com/open-end-mutual-fund-documents.php or upon request by contacting us at
1-800-262-1122.
The net expense ratio decreased from the prior fiscal year primarily due to a decrease in expenses related to financing activities.
If you wish to view additional information about the Fund, including the prospectus, statement of additional information, financial statements and holdings, please scan the QR code or visit www.eatonvance.com/open-end-mutual-fund-documents.php. For proxy information, please visit www.eatonvance.com/proxyvoting.
The Funds may deliver a single copy of certain required shareholder documents (including prospectuses, shareholder reports, and proxy materials) to investors with the same last name and the same address. Your participation will continue indefinitely unless you instruct otherwise by calling 1-800-262-1122 or by contacting your financial intermediary. Your instruction will typically be effective within 30 days of receipt.
Not FDIC Insured | May Lose Value | No Bank Guarantee
Annual Shareholder Report July 31, 2024
Eaton Vance Pennsylvania Municipal Income Fund
Annual Shareholder Report July 31, 2024
This annual shareholder report contains important information about the Eaton Vance Pennsylvania Municipal Income Fund for the period of August 1, 2023 to July 31, 2024. You can find additional information about the Fund at www.eatonvance.com/open-end-mutual-fund-documents.php. You can also request this information by contacting us at 1-800-262-1122.
This report describes changes to the Fund that occurred during the reporting period.
What were the Fund costs for the last year?
(based on a hypothetical $10,000 investment)
| Class Name | Costs of a $10,000 investment | Costs paid as a percentage of a $10,000 investment |
|---|
| Class C | $153 | 1.50% |
How did the Fund perform last year and what affected its performance?
Key contributors to (↑) and detractors from (↓) performance, relative to the Bloomberg Municipal Bond Index (the Index):
↑ Security selections and an overweight exposure to bonds with 17+ years to maturity helped as longer-maturity bonds outperformed shorter-maturity bonds
↑ Security selections and an overweight position in bonds rated BBB and below helped returns as lower-rated bonds generally outperformed higher-rated bonds
↑ Security selections and an overweight position in the transportation sector, which outperformed the Index during the period, contributed to returns
↓ Security selections in A-rated bonds detracted from the Fund’s Index-relative returns during the period
↓ Security selections and an overweight exposure to the water & sewer sector, which underperformed the Index during the period, detracted from returns
↓ An overweight position in the education sector, which underperformed the Index during the period, detracted from Index-relative returns
Comparison of the change in value of a $10,000 investment for the period indicated.
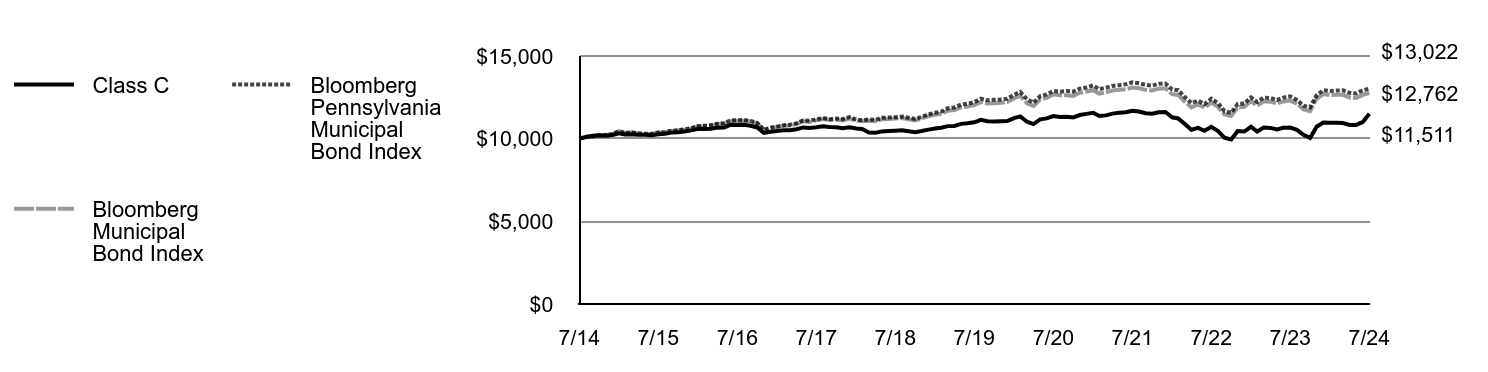
| Class C | Bloomberg Municipal Bond Index | Bloomberg Pennsylvania Municipal Bond Index |
|---|
| 7/14 | $10,000 | $10,000 | $10,000 |
| 8/14 | $10,092 | $10,121 | $10,124 |
| 9/14 | $10,173 | $10,131 | $10,136 |
| 10/14 | $10,211 | $10,201 | $10,207 |
| 11/14 | $10,183 | $10,218 | $10,221 |
| 12/14 | $10,221 | $10,270 | $10,275 |
| 1/15 | $10,324 | $10,452 | $10,460 |
| 2/15 | $10,252 | $10,344 | $10,343 |
| 3/15 | $10,268 | $10,374 | $10,377 |
| 4/15 | $10,239 | $10,320 | $10,325 |
| 5/15 | $10,233 | $10,291 | $10,299 |
| 6/15 | $10,205 | $10,282 | $10,287 |
| 7/15 | $10,266 | $10,356 | $10,375 |
| 8/15 | $10,293 | $10,377 | $10,404 |
| 9/15 | $10,366 | $10,452 | $10,475 |
| 10/15 | $10,393 | $10,493 | $10,508 |
| 11/15 | $10,431 | $10,535 | $10,563 |
| 12/15 | $10,503 | $10,609 | $10,640 |
| 1/16 | $10,598 | $10,736 | $10,766 |
| 2/16 | $10,580 | $10,753 | $10,780 |
| 3/16 | $10,606 | $10,787 | $10,822 |
| 4/16 | $10,667 | $10,866 | $10,899 |
| 5/16 | $10,682 | $10,895 | $10,937 |
| 6/16 | $10,845 | $11,069 | $11,114 |
| 7/16 | $10,824 | $11,075 | $11,118 |
| 8/16 | $10,837 | $11,090 | $11,131 |
| 9/16 | $10,781 | $11,035 | $11,066 |
| 10/16 | $10,679 | $10,919 | $10,951 |
| 11/16 | $10,346 | $10,512 | $10,530 |
| 12/16 | $10,418 | $10,635 | $10,665 |
| 1/17 | $10,457 | $10,705 | $10,730 |
| 2/17 | $10,506 | $10,780 | $10,802 |
| 3/17 | $10,510 | $10,803 | $10,843 |
| 4/17 | $10,571 | $10,882 | $10,925 |
| 5/17 | $10,680 | $11,054 | $11,103 |
| 6/17 | $10,647 | $11,015 | $11,090 |
| 7/17 | $10,686 | $11,104 | $11,164 |
| 8/17 | $10,747 | $11,188 | $11,255 |
| 9/17 | $10,703 | $11,131 | $11,181 |
| 10/17 | $10,694 | $11,159 | $11,218 |
| 11/17 | $10,626 | $11,099 | $11,183 |
| 12/17 | $10,689 | $11,215 | $11,307 |
| 1/18 | $10,620 | $11,083 | $11,163 |
| 2/18 | $10,587 | $11,050 | $11,119 |
| 3/18 | $10,374 | $11,090 | $11,169 |
| 4/18 | $10,354 | $11,051 | $11,132 |
| 5/18 | $10,440 | $11,177 | $11,262 |
| 6/18 | $10,466 | $11,187 | $11,276 |
| 7/18 | $10,484 | $11,214 | $11,301 |
| 8/18 | $10,502 | $11,243 | $11,341 |
| 9/18 | $10,444 | $11,170 | $11,270 |
| 10/18 | $10,386 | $11,101 | $11,191 |
| 11/18 | $10,461 | $11,224 | $11,315 |
| 12/18 | $10,548 | $11,359 | $11,472 |
| 1/19 | $10,610 | $11,444 | $11,564 |
| 2/19 | $10,661 | $11,506 | $11,633 |
| 3/19 | $10,759 | $11,688 | $11,838 |
| 4/19 | $10,773 | $11,732 | $11,891 |
| 5/19 | $10,895 | $11,893 | $12,062 |
| 6/19 | $10,931 | $11,937 | $12,111 |
| 7/19 | $10,992 | $12,033 | $12,211 |
| 8/19 | $11,137 | $12,223 | $12,424 |
| 9/19 | $11,060 | $12,125 | $12,322 |
| 10/19 | $11,045 | $12,147 | $12,348 |
| 11/19 | $11,056 | $12,177 | $12,371 |
| 12/19 | $11,069 | $12,215 | $12,418 |
| 1/20 | $11,240 | $12,434 | $12,650 |
| 2/20 | $11,350 | $12,594 | $12,828 |
| 3/20 | $11,024 | $12,137 | $12,385 |
| 4/20 | $10,884 | $11,985 | $12,179 |
| 5/20 | $11,167 | $12,366 | $12,572 |
| 6/20 | $11,226 | $12,468 | $12,678 |
| 7/20 | $11,371 | $12,678 | $12,891 |
| 8/20 | $11,314 | $12,619 | $12,845 |
| 9/20 | $11,318 | $12,621 | $12,885 |
| 10/20 | $11,285 | $12,583 | $12,844 |
| 11/20 | $11,430 | $12,773 | $13,026 |
| 12/20 | $11,499 | $12,851 | $13,092 |
| 1/21 | $11,566 | $12,933 | $13,219 |
| 2/21 | $11,369 | $12,728 | $12,998 |
| 3/21 | $11,409 | $12,806 | $13,081 |
| 4/21 | $11,514 | $12,913 | $13,191 |
| 5/21 | $11,567 | $12,952 | $13,237 |
| 6/21 | $11,595 | $12,988 | $13,286 |
| 7/21 | $11,688 | $13,095 | $13,403 |
| 8/21 | $11,639 | $13,047 | $13,350 |
| 9/21 | $11,540 | $12,953 | $13,256 |
| 10/21 | $11,505 | $12,915 | $13,209 |
| 11/21 | $11,597 | $13,025 | $13,320 |
| 12/21 | $11,613 | $13,046 | $13,334 |
| 1/22 | $11,294 | $12,689 | $12,979 |
| 2/22 | $11,222 | $12,644 | $12,933 |
| 3/22 | $10,889 | $12,234 | $12,510 |
| 4/22 | $10,544 | $11,895 | $12,160 |
| 5/22 | $10,652 | $12,072 | $12,298 |
| 6/22 | $10,475 | $11,874 | $12,092 |
| 7/22 | $10,713 | $12,188 | $12,416 |
| 8/22 | $10,458 | $11,921 | $12,154 |
| 9/22 | $10,059 | $11,463 | $11,666 |
| 10/22 | $9,948 | $11,368 | $11,559 |
| 11/22 | $10,464 | $11,900 | $12,096 |
| 12/22 | $10,432 | $11,934 | $12,127 |
| 1/23 | $10,727 | $12,277 | $12,494 |
| 2/23 | $10,434 | $11,999 | $12,222 |
| 3/23 | $10,668 | $12,265 | $12,487 |
| 4/23 | $10,651 | $12,237 | $12,461 |
| 5/23 | $10,555 | $12,131 | $12,342 |
| 6/23 | $10,659 | $12,253 | $12,485 |
| 7/23 | $10,669 | $12,301 | $12,558 |
| 8/23 | $10,533 | $12,124 | $12,345 |
| 9/23 | $10,237 | $11,769 | $11,999 |
| 10/23 | $10,047 | $11,669 | $11,885 |
| 11/23 | $10,718 | $12,409 | $12,622 |
| 12/23 | $10,972 | $12,698 | $12,934 |
| 1/24 | $10,957 | $12,633 | $12,884 |
| 2/24 | $10,956 | $12,649 | $12,913 |
| 3/24 | $10,942 | $12,649 | $12,927 |
| 4/24 | $10,832 | $12,492 | $12,770 |
| 5/24 | $10,831 | $12,455 | $12,730 |
| 6/24 | $10,995 | $12,646 | $12,927 |
| 7/24 | $11,511 | $12,762 | $13,022 |
Average Annual Total Returns (%)
| 1 Year | 5 Years | 10 Years |
|---|
| Class C | 3.82% | 0.15% | 1.42% |
| Class C with 1% Maximum Deferred Sales Charge | 2.82% | 0.15% | 1.42% |
| Bloomberg Municipal Bond Index | 3.74% | 1.18% | 2.47% |
| Bloomberg Pennsylvania Municipal Bond Index | 3.70% | 1.29% | 2.67% |
Performance does not reflect the deduction of taxes that a shareholder would pay on Fund distributions or redemption of Fund shares. Performance assumes that all dividends and distributions, if any, were reinvested. For more recent performance information, visit www.eatonvance.com/performance.php.
THE FUND'S PAST PERFORMANCE IS NO GUARANTEE OF FUTURE RESULTS.
| Total Net Assets | $165,294,458 |
| # of Portfolio Holdings | 105 |
| Portfolio Turnover Rate | 61% |
| Total Advisory Fees Paid | $602,108 |
What did the Fund invest in?
The following tables reflect what the Fund invested in as of the report date.
Sector Allocation (% of total investments)
| Value | Value |
|---|
OtherFootnote Reference* | 6.5% |
| Electric Utilities | 3.1% |
| Bond Bank | 3.9% |
| Housing | 4.1% |
| Lease Rev./Cert. of Participation | 4.6% |
| Special Tax Revenue | 5.0% |
| Water and Sewer | 9.0% |
| Education | 12.9% |
| General Obligations | 13.7% |
| Hospital | 18.4% |
| Transportation | 18.8% |
| Footnote | Description |
Footnote* | Sectors less than 3% each |
Credit Quality (% of total investments)Footnote Referencea
| Value | Value |
|---|
| Not Rated | 5.0% |
| B | 0.5% |
| BB | 2.0% |
| BBB | 7.9% |
| A | 27.6% |
| AA | 55.4% |
| AAA | 1.6% |
| Footnote | Description |
Footnotea | Ratings are based on Moody’s Investors Service, Inc. (“Moody’s”), S&P Global Ratings (“S&P”) or Fitch Ratings (“Fitch”). If securities are rated differently by the ratings agencies, the highest rating is applied. Moody's ratings are converted to the S&P and Fitch scale with ratings ranging from AAA, being the highest, to D, being the lowest. Ratings of BBB or higher are considered to be investment-grade quality. Holdings designated as “Not Rated” (if any) are not rated by the national ratings agencies stated above. |
This is a summary of certain changes to the Fund since July 31, 2023. For more complete information, you may review the Fund’s next prospectus, which we expect to be available by December 1, 2024 at www.eatonvance.com/open-end-mutual-fund-documents.php or upon request by contacting us at
1-800-262-1122.
The net expense ratio decreased from the prior fiscal year primarily due to a decrease in expenses related to financing activities.
If you wish to view additional information about the Fund, including the prospectus, statement of additional information, financial statements and holdings, please scan the QR code or visit www.eatonvance.com/open-end-mutual-fund-documents.php. For proxy information, please visit www.eatonvance.com/proxyvoting.
The Funds may deliver a single copy of certain required shareholder documents (including prospectuses, shareholder reports, and proxy materials) to investors with the same last name and the same address. Your participation will continue indefinitely unless you instruct otherwise by calling 1-800-262-1122 or by contacting your financial intermediary. Your instruction will typically be effective within 30 days of receipt.
Not FDIC Insured | May Lose Value | No Bank Guarantee
Annual Shareholder Report July 31, 2024
Eaton Vance Pennsylvania Municipal Income Fund
Annual Shareholder Report July 31, 2024
This annual shareholder report contains important information about the Eaton Vance Pennsylvania Municipal Income Fund for the period of August 1, 2023 to July 31, 2024. You can find additional information about the Fund at www.eatonvance.com/open-end-mutual-fund-documents.php. You can also request this information by contacting us at 1-800-262-1122.
This report describes changes to the Fund that occurred during the reporting period.
What were the Fund costs for the last year?
(based on a hypothetical $10,000 investment)
| Class Name | Costs of a $10,000 investment | Costs paid as a percentage of a $10,000 investment |
|---|
| Class I | $56 | 0.55% |
How did the Fund perform last year and what affected its performance?
Key contributors to (↑) and detractors from (↓) performance, relative to the Bloomberg Municipal Bond Index (the Index):
↑ Security selections and an overweight exposure to bonds with 17+ years to maturity helped as longer-maturity bonds outperformed shorter-maturity bonds
↑ Security selections and an overweight position in bonds rated BBB and below helped returns as lower-rated bonds generally outperformed higher-rated bonds
↑ Security selections and an overweight position in the transportation sector, which outperformed the Index during the period, contributed to returns
↓ Security selections in A-rated bonds detracted from the Fund’s Index-relative returns during the period
↓ Security selections and an overweight exposure to the water & sewer sector, which underperformed the Index during the period, detracted from returns
↓ An overweight position in the education sector, which underperformed the Index during the period, detracted from Index-relative returns
Comparison of the change in value of a $1,000,000 investment for the period indicated.

| Class I | Bloomberg Municipal Bond Index | Bloomberg Pennsylvania Municipal Bond Index |
|---|
| 7/14 | $1,000,000 | $1,000,000 | $1,000,000 |
| 8/14 | $1,010,188 | $1,012,107 | $1,012,422 |
| 9/14 | $1,018,177 | $1,013,136 | $1,013,643 |
| 10/14 | $1,022,846 | $1,020,082 | $1,020,658 |
| 11/14 | $1,021,815 | $1,021,847 | $1,022,088 |
| 12/14 | $1,026,452 | $1,027,003 | $1,027,538 |
| 1/15 | $1,036,742 | $1,045,205 | $1,045,977 |
| 2/15 | $1,031,110 | $1,034,424 | $1,034,294 |
| 3/15 | $1,032,293 | $1,037,411 | $1,037,658 |
| 4/15 | $1,031,201 | $1,031,968 | $1,032,451 |
| 5/15 | $1,030,132 | $1,029,117 | $1,029,895 |
| 6/15 | $1,029,099 | $1,028,179 | $1,028,735 |
| 7/15 | $1,036,158 | $1,035,627 | $1,037,452 |
| 8/15 | $1,039,753 | $1,037,660 | $1,040,362 |
| 9/15 | $1,048,049 | $1,045,177 | $1,047,466 |
| 10/15 | $1,051,638 | $1,049,332 | $1,050,815 |
| 11/15 | $1,055,212 | $1,053,504 | $1,056,321 |
| 12/15 | $1,063,524 | $1,060,906 | $1,063,958 |
| 1/16 | $1,074,222 | $1,073,565 | $1,076,612 |
| 2/16 | $1,073,004 | $1,075,253 | $1,077,977 |
| 3/16 | $1,077,759 | $1,078,659 | $1,082,165 |
| 4/16 | $1,083,658 | $1,086,590 | $1,089,876 |
| 5/16 | $1,087,191 | $1,089,529 | $1,093,723 |
| 6/16 | $1,103,873 | $1,106,862 | $1,111,379 |
| 7/16 | $1,102,509 | $1,107,538 | $1,111,771 |
| 8/16 | $1,105,883 | $1,109,032 | $1,113,075 |
| 9/16 | $1,100,782 | $1,103,497 | $1,106,599 |
| 10/16 | $1,090,829 | $1,091,920 | $1,095,099 |
| 11/16 | $1,056,512 | $1,051,197 | $1,053,049 |
| 12/16 | $1,066,112 | $1,063,538 | $1,066,471 |
| 1/17 | $1,069,771 | $1,070,549 | $1,072,985 |
| 2/17 | $1,075,649 | $1,077,983 | $1,080,217 |
| 3/17 | $1,078,098 | $1,080,323 | $1,084,315 |
| 4/17 | $1,084,088 | $1,088,162 | $1,092,484 |
| 5/17 | $1,096,344 | $1,105,432 | $1,110,321 |
| 6/17 | $1,093,670 | $1,101,468 | $1,108,992 |
| 7/17 | $1,098,535 | $1,110,379 | $1,116,389 |
| 8/17 | $1,105,896 | $1,118,829 | $1,125,516 |
| 9/17 | $1,103,214 | $1,113,141 | $1,118,058 |
| 10/17 | $1,101,789 | $1,115,858 | $1,121,781 |
| 11/17 | $1,096,570 | $1,109,883 | $1,118,333 |
| 12/17 | $1,102,793 | $1,121,483 | $1,130,669 |
| 1/18 | $1,097,512 | $1,108,280 | $1,116,299 |
| 2/18 | $1,094,794 | $1,104,969 | $1,111,932 |
| 3/18 | $1,098,480 | $1,109,047 | $1,116,908 |
| 4/18 | $1,097,001 | $1,105,089 | $1,113,200 |
| 5/18 | $1,107,259 | $1,117,744 | $1,126,228 |
| 6/18 | $1,110,937 | $1,118,698 | $1,127,611 |
| 7/18 | $1,113,645 | $1,121,412 | $1,130,094 |
| 8/18 | $1,116,369 | $1,124,292 | $1,134,091 |
| 9/18 | $1,110,839 | $1,117,014 | $1,127,006 |
| 10/18 | $1,106,612 | $1,110,135 | $1,119,112 |
| 11/18 | $1,114,245 | $1,122,422 | $1,131,504 |
| 12/18 | $1,124,629 | $1,135,861 | $1,147,213 |
| 1/19 | $1,132,323 | $1,144,448 | $1,156,394 |
| 2/19 | $1,138,634 | $1,150,575 | $1,163,312 |
| 3/19 | $1,150,317 | $1,168,763 | $1,183,759 |
| 4/19 | $1,152,682 | $1,173,156 | $1,189,143 |
| 5/19 | $1,165,671 | $1,189,329 | $1,206,152 |
| 6/19 | $1,171,794 | $1,193,721 | $1,211,113 |
| 7/19 | $1,179,403 | $1,203,341 | $1,221,061 |
| 8/19 | $1,194,944 | $1,222,322 | $1,242,405 |
| 9/19 | $1,187,318 | $1,212,524 | $1,232,214 |
| 10/19 | $1,187,902 | $1,214,697 | $1,234,847 |
| 11/19 | $1,188,586 | $1,217,735 | $1,237,058 |
| 12/19 | $1,192,215 | $1,221,453 | $1,241,754 |
| 1/20 | $1,210,731 | $1,243,398 | $1,264,993 |
| 2/20 | $1,223,755 | $1,259,432 | $1,282,815 |
| 3/20 | $1,188,354 | $1,213,749 | $1,238,537 |
| 4/20 | $1,175,001 | $1,198,516 | $1,217,870 |
| 5/20 | $1,206,058 | $1,236,643 | $1,257,193 |
| 6/20 | $1,213,490 | $1,246,821 | $1,267,774 |
| 7/20 | $1,230,623 | $1,267,820 | $1,289,113 |
| 8/20 | $1,226,557 | $1,261,872 | $1,284,531 |
| 9/20 | $1,226,552 | $1,262,139 | $1,288,490 |
| 10/20 | $1,223,785 | $1,258,348 | $1,284,385 |
| 11/20 | $1,240,925 | $1,277,337 | $1,302,579 |
| 12/20 | $1,250,946 | $1,285,118 | $1,309,170 |
| 1/21 | $1,258,043 | $1,293,308 | $1,321,863 |
| 2/21 | $1,238,176 | $1,272,759 | $1,299,795 |
| 3/21 | $1,243,664 | $1,280,608 | $1,308,105 |
| 4/21 | $1,254,959 | $1,291,350 | $1,319,129 |
| 5/21 | $1,261,868 | $1,295,202 | $1,323,669 |
| 6/21 | $1,265,984 | $1,298,759 | $1,328,575 |
| 7/21 | $1,277,337 | $1,309,530 | $1,340,339 |
| 8/21 | $1,272,884 | $1,304,724 | $1,335,025 |
| 9/21 | $1,262,625 | $1,295,309 | $1,325,570 |
| 10/21 | $1,261,011 | $1,291,521 | $1,320,872 |
| 11/21 | $1,272,446 | $1,302,516 | $1,331,989 |
| 12/21 | $1,273,730 | $1,304,617 | $1,333,416 |
| 1/22 | $1,240,051 | $1,268,906 | $1,297,913 |
| 2/22 | $1,234,143 | $1,264,360 | $1,293,320 |
| 3/22 | $1,197,392 | $1,223,373 | $1,251,045 |
| 4/22 | $1,160,559 | $1,189,535 | $1,215,976 |
| 5/22 | $1,173,648 | $1,207,206 | $1,229,795 |
| 6/22 | $1,154,439 | $1,187,434 | $1,209,209 |
| 7/22 | $1,180,892 | $1,218,808 | $1,241,644 |
| 8/22 | $1,155,674 | $1,192,096 | $1,215,365 |
| 9/22 | $1,112,528 | $1,146,342 | $1,166,623 |
| 10/22 | $1,100,669 | $1,136,809 | $1,155,850 |
| 11/22 | $1,158,927 | $1,189,982 | $1,209,585 |
| 12/22 | $1,156,089 | $1,193,388 | $1,212,739 |
| 1/23 | $1,189,211 | $1,227,669 | $1,249,412 |
| 2/23 | $1,158,038 | $1,199,909 | $1,222,199 |
| 3/23 | $1,184,123 | $1,226,532 | $1,248,662 |
| 4/23 | $1,183,059 | $1,223,730 | $1,246,140 |
| 5/23 | $1,174,422 | $1,213,125 | $1,234,214 |
| 6/23 | $1,185,608 | $1,225,277 | $1,248,495 |
| 7/23 | $1,189,185 | $1,230,125 | $1,255,763 |
| 8/23 | $1,174,402 | $1,212,415 | $1,234,457 |
| 9/23 | $1,142,710 | $1,176,881 | $1,199,864 |
| 10/23 | $1,121,725 | $1,166,866 | $1,188,479 |
| 11/23 | $1,198,242 | $1,240,940 | $1,262,217 |
| 12/23 | $1,226,846 | $1,269,782 | $1,293,394 |
| 1/24 | $1,226,018 | $1,263,297 | $1,288,350 |
| 2/24 | $1,226,790 | $1,264,919 | $1,291,268 |
| 3/24 | $1,225,998 | $1,264,879 | $1,292,674 |
| 4/24 | $1,214,213 | $1,249,214 | $1,276,997 |
| 5/24 | $1,216,555 | $1,245,550 | $1,272,957 |
| 6/24 | $1,234,743 | $1,264,642 | $1,292,661 |
| 7/24 | $1,245,083 | $1,276,168 | $1,302,214 |
Average Annual Total Returns (%)
| 1 Year | 5 Years | 10 Years |
|---|
| Class I | 4.70% | 1.09% | 2.21% |
| Bloomberg Municipal Bond Index | 3.74% | 1.18% | 2.47% |
| Bloomberg Pennsylvania Municipal Bond Index | 3.70% | 1.29% | 2.67% |
Performance does not reflect the deduction of taxes that a shareholder would pay on Fund distributions or redemption of Fund shares. Performance assumes that all dividends and distributions, if any, were reinvested. For more recent performance information, visit www.eatonvance.com/performance.php.
THE FUND'S PAST PERFORMANCE IS NO GUARANTEE OF FUTURE RESULTS.
| Total Net Assets | $165,294,458 |
| # of Portfolio Holdings | 105 |
| Portfolio Turnover Rate | 61% |
| Total Advisory Fees Paid | $602,108 |
What did the Fund invest in?
The following tables reflect what the Fund invested in as of the report date.
Sector Allocation (% of total investments)
| Value | Value |
|---|
OtherFootnote Reference* | 6.5% |
| Electric Utilities | 3.1% |
| Bond Bank | 3.9% |
| Housing | 4.1% |
| Lease Rev./Cert. of Participation | 4.6% |
| Special Tax Revenue | 5.0% |
| Water and Sewer | 9.0% |
| Education | 12.9% |
| General Obligations | 13.7% |
| Hospital | 18.4% |
| Transportation | 18.8% |
| Footnote | Description |
Footnote* | Sectors less than 3% each |
Credit Quality (% of total investments)Footnote Referencea
| Value | Value |
|---|
| Not Rated | 5.0% |
| B | 0.5% |
| BB | 2.0% |
| BBB | 7.9% |
| A | 27.6% |
| AA | 55.4% |
| AAA | 1.6% |
| Footnote | Description |
Footnotea | Ratings are based on Moody’s Investors Service, Inc. (“Moody’s”), S&P Global Ratings (“S&P”) or Fitch Ratings (“Fitch”). If securities are rated differently by the ratings agencies, the highest rating is applied. Moody's ratings are converted to the S&P and Fitch scale with ratings ranging from AAA, being the highest, to D, being the lowest. Ratings of BBB or higher are considered to be investment-grade quality. Holdings designated as “Not Rated” (if any) are not rated by the national ratings agencies stated above. |
This is a summary of certain changes to the Fund since July 31, 2023. For more complete information, you may review the Fund’s next prospectus, which we expect to be available by December 1, 2024 at www.eatonvance.com/open-end-mutual-fund-documents.php or upon request by contacting us at
1-800-262-1122.
The net expense ratio decreased from the prior fiscal year primarily due to a decrease in expenses related to financing activities.
If you wish to view additional information about the Fund, including the prospectus, statement of additional information, financial statements and holdings, please scan the QR code or visit www.eatonvance.com/open-end-mutual-fund-documents.php. For proxy information, please visit www.eatonvance.com/proxyvoting.
The Funds may deliver a single copy of certain required shareholder documents (including prospectuses, shareholder reports, and proxy materials) to investors with the same last name and the same address. Your participation will continue indefinitely unless you instruct otherwise by calling 1-800-262-1122 or by contacting your financial intermediary. Your instruction will typically be effective within 30 days of receipt.
Not FDIC Insured | May Lose Value | No Bank Guarantee
Annual Shareholder Report July 31, 2024
(b) Not applicable.
Item 2. Code of Ethics
The registrant (sometimes referred to as the “Fund”) has adopted a code of ethics applicable to its Principal Executive Officer, Principal Financial Officer and Principal Accounting Officer. The registrant undertakes to provide a copy of such code of ethics to any person upon request, without charge, by calling 1-800-262-1122. The registrant has not amended the code of ethics as described in Form N-CSR during the period covered by this report. The registrant has not granted any waiver, including an implicit waiver, from a provision of the code of ethics as described in Form N-CSR during the period covered by this report.
Item 3. Audit Committee Financial Expert
The registrant’s Board of Trustees (the “Board”) has designated George J. Gorman and Scott E. Wennerholm, each an independent trustee, as audit committee financial experts. Mr. Gorman is a certified public accountant who is the Principal at George J. Gorman LLC (a consulting firm). Previously, Mr. Gorman served in various capacities at Ernst & Young LLP (a registered public accounting firm), including as Senior Partner. Mr. Gorman also has experience serving as an independent trustee and audit committee financial expert of other mutual fund complexes. Mr. Wennerholm is a private investor. Previously, Mr. Wennerholm served as a Trustee at Wheelock College (postsecondary institution), as a Consultant at GF Parish Group (executive recruiting firm), Chief Operating Officer and Executive Vice President at BNY Mellon Asset Management (investment management firm), Chief Operating Officer and Chief Financial Officer at Natixis Global Asset Management (investment management firm), and Vice President at Fidelity Investments Institutional Services (investment management firm).
Item 4. Principal Accountant Fees and Services
Eaton Vance Arizona Municipal Income Fund, Eaton Vance Connecticut Municipal Income Fund, Eaton Vance Minnesota Municipal Income Fund, Eaton Vance Municipal Opportunities Fund, Eaton Vance New Jersey Municipal Income Fund and Eaton Vance Pennsylvania Municipal Income Fund (the “Fund(s)”) are series of Eaton Vance Municipals Trust (the “Trust”), a Massachusetts business trust, which, including the Funds, contains a total of 18 series (the “Series”). The Trust is registered under the Investment Company Act of 1940 as an open-end management investment company. This Form N-CSR relates to the Funds’ annual reports.
(a)-(d)
The following tables present the aggregate fees billed to each Fund for the Funds’ fiscal years ended July 31, 2023 and July 31, 2024 by the registrant’s principal accountant, Deloitte & Touche LLP (“D&T”), for professional services rendered for the audit of the Funds’ annual financial statements and fees billed for other services rendered by D&T during those periods.
Eaton Vance Arizona Municipal Income Fund
| | | | | | | | |
Fiscal Years Ended | | 7/31/2023 | | | 7/31/2024 | |
Audit Fees | | $ | 41,600 | | | $ | 43,400 | |
Audit-Related Fees(1) | | $ | 0 | | | $ | 0 | |
Tax Fees(2) | | $ | 0 | | | $ | 0 | |
All Other Fees(3) | | $ | 0 | | | $ | 0 | |
| | | | | | | | |
Total | | $ | 41,600 | | | $ | 43,400 | |
| | | | | | | | |
Eaton Vance Connecticut Municipal Income Fund
| | | | | | | | |
Fiscal Years Ended | | 7/31/2023 | | | 7/31/2024 | |
Audit Fees | | $ | 40,800 | | | $ | 45,400 | |
Audit-Related Fees(1) | | $ | 0 | | | $ | 0 | |
Tax Fees(2) | | $ | 0 | | | $ | 0 | |
All Other Fees(3) | | $ | 0 | | | $ | 0 | |
| | | | | | | | |
Total | | $ | 40,800 | | | $ | 45,400 | |
| | | | | | | | |
Eaton Vance Minnesota Municipal Income Fund
| | | | | | | | |
Fiscal Years Ended | | 7/31/2023 | | | 7/31/2024 | |
Audit Fees | | $ | 41,600 | | | $ | 45,400 | |
Audit-Related Fees(1) | | $ | 0 | | | $ | 0 | |
Tax Fees(2) | | $ | 0 | | | $ | 0 | |
All Other Fees(3) | | $ | 0 | | | $ | 0 | |
| | | | | | | | |
Total | | $ | 41,600 | | | $ | 45,400 | |
| | | | | | | | |
Eaton Vance Municipal Opportunities Fund
| | | | | | | | |
Fiscal Years Ended | | 7/31/2023 | | | 7/31/2024 | |
Audit Fees | | $ | 50,900 | | | $ | 58,400 | |
Audit-Related Fees(1) | | $ | 0 | | | $ | 0 | |
Tax Fees(2) | | $ | 0 | | | $ | 0 | |
All Other Fees(3) | | $ | 0 | | | $ | 0 | |
| | | | | | | | |
Total | | $ | 50,900 | | | $ | 58,400 | |
| | | | | | | | |
Eaton Vance New Jersey Municipal Income Fund
| | | | | | | | |
Fiscal Years Ended | | 7/31/2023 | | | 7/31/2024 | |
Audit Fees | | $ | 54,300 | | | $ | 58,400 | |
Audit-Related Fees(1) | | $ | 0 | | | $ | 0 | |
Tax Fees(2) | | $ | 0 | | | $ | 0 | |
All Other Fees(3) | | $ | 0 | | | $ | 0 | |
| | | | | | | | |
Total | | $ | 54,300 | | | $ | 58,400 | |
| | | | | | | | |
Eaton Vance Pennsylvania Municipal Income Fund
| | | | | | | | |
Fiscal Years Ended | | 7/31/2023 | | | 7/31/2024 | |
Audit Fees | | $ | 54,800 | | | $ | 58,400 | |
Audit-Related Fees(1) | | $ | 0 | | | $ | 0 | |
Tax Fees(2) | | $ | 0 | | | $ | 0 | |
All Other Fees(3) | | $ | 0 | | | $ | 0 | |
| | | | | | | | |
Total | | $ | 54,800 | | | $ | 58,400 | |
| | | | | | | | |
| (1) | Audit-related fees consist of the aggregate fees billed for assurance and related services that are reasonably related to the performance of the audit of the registrant’s financial statements and are not reported under the category of audit fees. |
| (2) | Tax fees consist of the aggregate fees billed for professional services rendered by the principal accountant relating to tax compliance, tax advice, and tax planning and specifically include fees for tax return preparation and other related tax compliance/planning matters. |
| (3) | All other fees consist of the aggregate fees billed for products and services provided by the principal accountant other than audit, audit-related, and tax services. |
The Series comprising the Trust have varying fiscal year ends (July 31, August 31, and September 30). The following table presents the aggregate audit, audit-related, tax, and other fees billed to all of the Series in the Trust by D&T for the last two fiscal years of each Series.
| | | | | | | | | | | | | | | | | | | | | | | | |
Fiscal Years Ended | | 8/31/22 | | | 9/30/22 | | | 7/31/23 | | | 8/31/23 | | | 9/30/23 | | | 7/31/24 | |
Audit Fees | | $ | 286,950 | | | $ | 321,150 | | | $ | 284,000 | | | $ | 290,100 | | | $ | 323,400 | | | $ | 309,400 | |
Audit-Related Fees(1) | | $ | 0 | | | $ | 0 | | | $ | 0 | | | $ | 0 | | | $ | 0 | | | $ | 0 | |
Tax Fees(2) | | $ | 350 | | | $ | 3,650 | | | $ | 0 | | | $ | 0 | | | $ | 0 | | | $ | 0 | |
All Other Fees(3) | | $ | 0 | | | $ | 0 | | | $ | 0 | | | $ | 0 | | | $ | 0 | | | $ | 0 | |
| | | | | | | | | | | | | | | | | | | | | | | | |
Total | | $ | 287,300 | | | $ | 324,800 | | | $ | 284,000 | | | $ | 290,100 | | | $ | 323,400 | | | $ | 309,400 | |
| | | | | | | | | | | | | | | | | | | | | | | | |
| (1) | Audit-related fees consist of the aggregate fees billed for assurance and related services that are reasonable related to the performance of the audit of the registrant’s financial statements and are not reported under the category of audit fees. |
| (2) | Tax fees consist of the aggregate fees billed for professional services rendered by the principal accountant relating to tax compliance, tax advice, and tax planning and specifically include fees for tax return preparation and other related tax compliance/planning matters. |
| (3) | All other fees consist of the aggregate fees billed for products and services provided by the principal accountant other than audit, audit-related, and tax services. |
(e)(1) The registrant’s audit committee has adopted policies and procedures relating to the pre-approval of services provided by the registrant’s principal accountant (the “Pre-Approval Policies”). The Pre-Approval Policies establish a framework intended to assist the audit committee in the proper discharge of its pre-approval responsibilities. As a general matter, the Pre-Approval Policies (i) specify certain types of audit, audit-related, tax, and other services determined to be pre-approved by the audit committee; and (ii) delineate specific procedures governing the mechanics of the pre-approval process, including the approval and monitoring of audit and non-audit service fees. Unless a service is specifically pre-approved under the Pre-Approval Policies, it must be separately pre-approved by the audit committee.
The Pre-Approval Policies and the types of audit and non-audit services pre-approved therein must be reviewed and ratified by the registrant’s audit committee at least annually. The registrant’s audit committee maintains full responsibility for the appointment, compensation, and oversight of the work of the registrant’s principal accountant.
(e)(2) No services described in paragraphs (b)-(d) above were approved by the registrant’s audit committee pursuant to the “de minimis exception” set forth in Rule 2-01(c)(7)(i)(C) of Regulation S-X.
(f) Not applicable.
(g) The following table presents (i) the aggregate non-audit fees (i.e., fees for audit-related, tax, and other services) billed for services rendered to all of the Series in the Trust by D&T for the last two fiscal years of each Series; and (ii) the aggregate non-audit fees (i.e., fees for audit-related, tax, and other services) billed for services rendered to the Eaton Vance organization by D&T for the same time period.
| | | | | | | | | | | | | | | | | | | | | | | | |
Fiscal Years Ended | | 8/31/22 | | | 9/30/22 | | | 7/31/23 | | | 8/31/23 | | | 9/30/23 | | | 7/31/24 | |
Registrant(1) | | $ | 350 | | | $ | 3,650 | | | $ | 0 | | | $ | 0 | | | $ | 0 | | | $ | 0 | |
Eaton Vance(2) | | $ | 0 | | | $ | 52,836 | | | $ | 52,836 | | | $ | 52,836 | | | $ | 52,836 | | | $ | 18,490 | |
| (1) | Includes all of the Series in the Trust. |
| (2) | The investment adviser to the Series, as well as any of its affiliates that provide ongoing services to the Series, are subsidiaries of Morgan Stanley. |
(h) The registrant’s audit committee has considered whether the provision by the registrant’s principal accountant of non-audit services to the registrant’s investment adviser and any entity controlling, controlled by, or under common control with the adviser that provides ongoing services to the registrant that were not pre-approved pursuant to Rule 2-01(c)(7)(ii) of Regulation S-X is compatible with maintaining the principal accountant’s independence.
(i) Not applicable.
(j) Not applicable.
Item 5. Audit Committee of Listed Registrants
Not applicable.
Item 6. Schedule of Investments
(a) Please see schedule of investments contained in the Financial Statements and Financial Highlights included under Item 7 of this Form N-CSR.
(b) Not applicable.
Item 7. Financial Statements and Financial Highlights for Open-End Management Investment Companies
Eaton Vance
Municipals Trust
Annual Financial Statements and Additional Information
July 31, 2024
Arizona • Connecticut • Minnesota • New Jersey • Pennsylvania
This report must be preceded or accompanied by a current summary prospectus or prospectus. Before investing, investors should consider carefully the investment objective, risks, and charges and expenses of a mutual fund. This and other important information is contained in the prospectus and/or statement of additional information, which can be obtained by calling 1-800-262-1122 or from a financial intermediary. Prospective investors should read the prospectus carefully before investing.
Annual Financial Statements and Additional Information July 31, 2024
Eaton Vance
Municipal Income Funds
Eaton Vance
Arizona Municipal Income Fund
July 31, 2024
| Tax-Exempt Municipal Obligations — 97.0% |
| Security | Principal
Amount
(000's omitted) | Value |
| Education — 10.9% |
| Arizona Industrial Development Authority, (Academies of Math & Science), 5.00%, 7/1/39(1) | $ | 250 | $ 253,467 |
| Arizona Industrial Development Authority, (Doral Academy of Nevada), 5.00%, 7/15/40(1) | | 1,050 | 1,062,264 |
| Arizona Industrial Development Authority, (Pinecrest Academy of Nevada), 4.00%, 7/15/50(1) | | 60 | 50,750 |
| Arizona Industrial Development Authority, (Somerset Academy of Las Vegas), 3.00%, 12/15/31(1) | | 475 | 436,891 |
| Arizona State University, 5.00%, 7/1/36 | | 1,150 | 1,167,066 |
| Glendale Industrial Development Authority, AZ, (Midwestern University Foundation), (AMT), 2.125%, 7/1/33 | | 250 | 203,588 |
| La Paz County Industrial Development Authority, AZ, (Harmony Public Schools), 4.00%, 2/15/41 | | 430 | 390,457 |
| Maricopa County Industrial Development Authority, AZ, (Legacy Traditional Schools): | | | |
| 4.00%, 7/1/41(1) | | 500 | 481,355 |
| 4.25%, 7/1/44 | | 500 | 484,510 |
| Northern Arizona University, 5.00%, 6/1/38 | | 1,000 | 1,025,950 |
| Phoenix Industrial Development Authority, AZ, (Legacy Traditional Schools), 5.00%, 7/1/46(1) | | 500 | 504,780 |
| University of Arizona: | | | |
| 5.00%, 6/1/38 | | 1,500 | 1,541,670 |
| 5.00%, 6/1/42 | | 1,000 | 1,058,470 |
| | | | $ 8,661,218 |
| Electric Utilities — 4.6% |
| Mesa, AZ, Utility Systems Revenue, 4.00%, 7/1/37 | $ | 1,500 | $ 1,499,925 |
| Salt River Project Agricultural Improvement and Power District, AZ: | | | |
| 5.00%, 1/1/45 | | 1,000 | 1,071,250 |
| 5.00%, 1/1/50 | | 1,000 | 1,082,490 |
| | | | $ 3,653,665 |
| General Obligations — 11.9% |
| Chandler Unified School District No. 80, AZ, 4.00%, 7/1/37 | $ | 750 | $ 770,460 |
| Glendale, AZ, 5.00%, 7/1/43 | | 550 | 610,484 |
| Paradise Valley Unified School District No. 69, AZ, 4.00%, 7/1/42 | | 1,550 | 1,561,237 |
| Puerto Rico: | | | |
| 0.00%, 7/1/33 | | 750 | 505,980 |
| 5.625%, 7/1/29 | | 1,000 | 1,074,520 |
| Scottsdale, AZ, 4.00%, 7/1/39 | | 1,500 | 1,552,395 |
| Security | Principal
Amount
(000's omitted) | Value |
| General Obligations (continued) |
| Tempe, AZ: | | | |
| 5.00%, 7/1/43 | $ | 1,000 | $ 1,114,010 |
| 5.00%, 7/1/44 | | 2,000 | 2,241,180 |
| | | | $ 9,430,266 |
| Hospital — 8.6% |
| Arizona Health Facilities Authority, (Scottsdale Lincoln Hospitals): | | | |
| 5.00%, 12/1/39 | $ | 1,665 | $ 1,675,256 |
| 5.00%, 12/1/42 | | 1,000 | 1,006,160 |
| Maricopa County Industrial Development Authority, AZ, (Banner Health): | | | |
| 4.00%, 1/1/44 | | 500 | 492,685 |
| 4.00%, 1/1/48 | | 1,350 | 1,283,391 |
| Maricopa County Industrial Development Authority, AZ, (HonorHealth), 5.00%, 9/1/32 | | 400 | 422,912 |
| Phoenix Industrial Development Authority, AZ, (Mayo Clinic), 3.75%, 11/15/57 | | 1,000 | 898,760 |
| Yuma Industrial Development Authority, AZ, (Yuma Regional Medical Center), 5.00%, 8/1/32 | | 1,005 | 1,005,493 |
| | | | $ 6,784,657 |
| Housing — 8.3% |
| Arizona Industrial Development Authority, (Hacienda Del Rio), (FNMA), 4.50%, 6/1/41 | $ | 1,000 | $ 1,024,550 |
| Arizona Industrial Development Authority, (University at West Glendale), 5.00% to 9/1/26 (Put Date), 3/1/45 | | 1,000 | 1,027,500 |
| Maricopa County and Phoenix Industrial Development Authorities, AZ: | | | |
| (FHLMC), (FNMA), (GNMA), 4.10%, 9/1/36 | | 530 | 533,768 |
| (FHLMC), (FNMA), (GNMA), 4.65%, 9/1/44 | | 1,000 | 1,012,210 |
| (FHLMC), (FNMA), (GNMA), 4.85%, 9/1/54 | | 300 | 304,485 |
| (GNMA), 4.45%, 9/1/44 | | 1,000 | 998,760 |
| Phoenix Industrial Development Authority, AZ, (Downtown Phoenix Student Housing II, LLC - Arizona State University): | | | |
| 5.00%, 7/1/39 | | 500 | 515,145 |
| 5.00%, 7/1/44 | | 250 | 255,265 |
| Phoenix Industrial Development Authority, AZ, (Downtown Phoenix Student Housing, LLC - Arizona State University): | | | |
| 5.00%, 7/1/27 | | 415 | 428,118 |
| 5.00%, 7/1/37 | | 500 | 514,945 |
| | | | $ 6,614,746 |
| Industrial Development Revenue — 7.1% |
| Chandler Industrial Development Authority, AZ, (Intel Corp.), (AMT), 5.00% to 9/1/27 (Put Date), 9/1/52 | $ | 2,000 | $ 2,063,100 |
1
See Notes to Financial Statements.
Eaton Vance
Arizona Municipal Income Fund
July 31, 2024
Portfolio of Investments — continued
| Security | Principal
Amount
(000's omitted) | Value |
| Industrial Development Revenue (continued) |
| Maricopa County Industrial Development Authority, AZ, (Commercial Metals Co.), (AMT), 4.00%, 10/15/47(1) | $ | 500 | $ 462,160 |
| Maricopa County Pollution Control Corp., AZ, (El Paso Electric Co.): | | | |
| 3.60%, 2/1/40 | | 250 | 229,763 |
| 4.50%, 8/1/42 | | 850 | 849,974 |
| Yavapai County Industrial Development Authority, AZ, (Waste Management, Inc.), (AMT), 4.25%, 3/1/28 | | 2,000 | 2,005,200 |
| | | | $ 5,610,197 |
| Insured - Electric Utilities — 0.9% |
| Puerto Rico Electric Power Authority: | | | |
| (NPFG), 5.25%, 7/1/29 | $ | 485 | $ 477,580 |
| Series SS, (NPFG), 5.00%, 7/1/25 | | 245 | 244,042 |
| | | | $ 721,622 |
| Insured - General Obligations — 11.7% |
| Cartwright Elementary School District No. 83, AZ: | | | |
| (AGM), 5.25%, 7/1/42 | $ | 1,390 | $ 1,538,424 |
| (BAM), 5.00%, 7/1/43 | | 650 | 710,801 |
| Maricopa County Elementary School District No. 3, AZ, (AGM), 5.00%, 7/1/25 | | 2,670 | 2,717,846 |
| Maricopa County Elementary School District No. 25, AZ, (AGM), 4.375%, 7/1/42 | | 2,120 | 2,190,554 |
| Marana Unified School District No. 6, AZ: | | | |
| (AGM), 5.00%, 7/1/41 | | 750 | 834,143 |
| (AGM), 5.00%, 7/1/42 | | 725 | 803,097 |
| Vail Unified School District No. 20, AZ, (BAM), 4.00%, 7/1/43 | | 500 | 502,800 |
| | | | $ 9,297,665 |
| Insured - Lease Revenue/Certificates of Participation — 1.9% |
| Higley Unified School District No. 60, AZ, Certificates of Participation: | | | |
| (AGM), 4.125%, 6/1/42 | $ | 500 | $ 503,275 |
| (AGM), 4.25%, 6/1/47 | | 1,000 | 989,730 |
| | | | $ 1,493,005 |
| Insured - Special Tax Revenue — 4.8% |
| Glendale, AZ, Transportation Excise Tax Revenue, (AGM), Prerefunded to 7/1/25, 5.00%, 7/1/30 | $ | 1,250 | $ 1,271,825 |
| Phoenix Civic Improvement Corp., AZ, (Civic Plaza), (NPFG), 5.50%, 7/1/41 | | 1,635 | 2,030,098 |
| Sedona, AZ, Excise Tax Revenue: | | | |
| (AGM), 5.00%, 7/1/42 | | 250 | 272,742 |
| Security | Principal
Amount
(000's omitted) | Value |
| Insured - Special Tax Revenue (continued) |
| Sedona, AZ, Excise Tax Revenue: (continued) | | | |
| (AGM), 5.00%, 7/1/54 | $ | 250 | $ 265,000 |
| | | | $ 3,839,665 |
| Other Revenue — 1.9% |
| Salt Verde Financial Corp., AZ, Senior Gas Revenue, 5.00%, 12/1/37 | $ | 1,355 | $ 1,496,652 |
| | | | $ 1,496,652 |
| Senior Living/Life Care — 2.0% |
| Glendale Industrial Development Authority, AZ, (Royal Oaks - Inspirata Pointe), 5.00%, 5/15/41 | $ | 500 | $ 494,920 |
| Glendale Industrial Development Authority, AZ, (Terraces of Phoenix), 4.00%, 7/1/28 | | 195 | 189,278 |
| Tempe Industrial Development Authority, AZ, (Friendship Village of Tempe): | | | |
| 4.00%, 12/1/29 | | 380 | 375,311 |
| 4.00%, 12/1/30 | | 500 | 492,550 |
| | | | $ 1,552,059 |
| Special Tax Revenue — 8.2% |
| American Samoa Economic Development Authority, 5.00%, 9/1/38(1) | $ | 200 | $ 202,260 |
| Bullhead City, AZ, Excise Taxes Revenue: | | | |
| 0.75%, 7/1/25 | | 40 | 38,671 |
| 1.30%, 7/1/28 | | 500 | 453,065 |
| 2.10%, 7/1/36 | | 580 | 466,697 |
| 2.55%, 7/1/46 | | 1,250 | 895,150 |
| 4.00%, 7/1/32 | | 275 | 282,554 |
| Marana, AZ, Pledged Excise Tax Revenue: | | | |
| 4.00%, 7/1/44 | | 1,000 | 1,000,120 |
| 5.00%, 7/1/36 | | 200 | 215,054 |
| 5.00%, 7/1/37 | | 275 | 295,482 |
| Maricopa, AZ, Pledged Revenue, 5.25%, 7/15/42 | | 600 | 678,252 |
| Phoenix Civic Improvement Corp., AZ, Excise Tax Revenue, 4.00%, 7/1/45 | | 1,000 | 1,002,130 |
| Puerto Rico Sales Tax Financing Corp., 5.00%, 7/1/58 | | 1,000 | 1,005,250 |
| | | | $ 6,534,685 |
| Transportation — 5.0% |
| Phoenix Civic Improvement Corp., AZ, Airport Revenue: | | | |
| (AMT), 4.00%, 7/1/37 | $ | 1,500 | $ 1,508,340 |
| (AMT), 4.00%, 7/1/38 | | 1,000 | 1,002,310 |
| (AMT), 5.00%, 7/1/49 | | 1,455 | 1,493,150 |
| | | | $ 4,003,800 |
2
See Notes to Financial Statements.
Eaton Vance
Arizona Municipal Income Fund
July 31, 2024
Portfolio of Investments — continued
| Security | Principal
Amount
(000's omitted) | Value |
| Water and Sewer — 9.2% |
| Central Arizona Water Conservation District, 5.00%, 1/1/35 | $ | 1,500 | $ 1,533,285 |
| Gilbert Water Resources Municipal Property Corp., AZ: | | | |
| 4.00%, 7/1/36 | | 750 | 754,403 |
| Green Bonds, 4.00%, 7/15/47 | | 1,000 | 990,380 |
| Phoenix Civic Improvement Corp., AZ, Wastewater System Revenue: | | | |
| 5.00%, 7/1/28 | | 860 | 861,195 |
| 5.00%, 7/1/39 | | 1,000 | 1,139,580 |
| 5.25%, 7/1/47 | | 1,800 | 2,020,914 |
| | | | $ 7,299,757 |
Total Tax-Exempt Municipal Obligations
(identified cost $75,709,747) | | | $ 76,993,659 |
| Taxable Municipal Obligations — 1.6% |
| Security | Principal
Amount
(000's omitted) | Value |
| Education — 0.1% |
| Arizona Industrial Development Authority, (Doral Academy of Northern Nevada), 3.375%, 7/15/25(1) | $ | 70 | $ 68,366 |
| | | | $ 68,366 |
| General Obligations — 0.6% |
| Maricopa, AZ, 5.09%, 7/1/25 | $ | 500 | $ 500,925 |
| | | | $ 500,925 |
| Special Tax Revenue — 0.9% |
| Cottonwood, AZ, Pledged Revenue, 2.625%, 7/1/35 | $ | 850 | $ 684,828 |
| | | | $ 684,828 |
Total Taxable Municipal Obligations
(identified cost $1,420,000) | | | $ 1,254,119 |
| Security | Notional
Amount
(000's omitted) | Value |
| Transportation — 0.5% |
| HTA TRRB 2005L-745190UR7 Assured Custodial Trust, 5.25%, 7/1/41 | $ | 452 | $ 442,224 |
Total Trust Units
(identified cost $447,393) | | | $ 442,224 |
Total Investments — 99.1%
(identified cost $77,577,140) | | | $ 78,690,002 |
| Other Assets, Less Liabilities — 0.9% | | | $ 687,822 |
| Net Assets — 100.0% | | | $ 79,377,824 |
| The percentage shown for each investment category in the Portfolio of Investments is based on net assets. |
| (1) | Security exempt from registration under Rule 144A of the Securities Act of 1933, as amended. These securities may be sold in certain transactions in reliance on an exemption from registration (normally to qualified institutional buyers). At July 31, 2024, the aggregate value of these securities is $3,522,293 or 4.4% of the Fund's net assets. |
| The Fund invests primarily in debt securities issued by Arizona municipalities. The ability of the issuers of the debt securities to meet their obligations may be affected by economic developments in a specific industry or municipality. At July 31, 2024, 19.5% of total investments are backed by bond insurance of various financial institutions and financial guaranty assurance agencies. The aggregate percentage insured by an individual financial institution or financial guaranty assurance agency ranged from 1.5% to 14.5% of total investments. |
| Abbreviations: |
| AGM | – Assured Guaranty Municipal Corp. |
| AMT | – Interest earned from these securities may be considered a tax preference item for purposes of the Federal Alternative Minimum Tax. |
| BAM | – Build America Mutual Assurance Co. |
| FHLMC | – Federal Home Loan Mortgage Corp. |
| FNMA | – Federal National Mortgage Association |
| GNMA | – Government National Mortgage Association |
| NPFG | – National Public Finance Guarantee Corp. |
3
See Notes to Financial Statements.
Eaton Vance
Connecticut Municipal Income Fund
July 31, 2024
| Security | Principal
Amount
(000's omitted) | Value |
| Education — 0.8% |
| Yale University, 0.873%, 4/15/25 | $ | 1,000 | $ 971,001 |
Total Corporate Bonds
(identified cost $928,000) | | | $ 971,001 |
| Tax-Exempt Municipal Obligations — 93.2% |
| Security | Principal
Amount
(000's omitted) | Value |
| Bond Bank — 1.8% |
| Connecticut, (Revolving Fund): | | | |
| Green Bonds, 5.00%, 5/1/34 | $ | 1,000 | $ 1,049,350 |
| Green Bonds, 5.00%, 5/1/37 | | 1,000 | 1,044,510 |
| | | | $ 2,093,860 |
| Education — 22.3% |
| Connecticut Health and Educational Facilities Authority, (Avon Old Farms School): | | | |
| 4.00%, 7/1/41 | $ | 600 | $ 587,712 |
| 5.00%, 7/1/30 | | 175 | 191,179 |
| Connecticut Health and Educational Facilities Authority, (Brunswick School): | | | |
| 5.00%, 7/1/36 | | 530 | 604,333 |
| 5.00%, 7/1/37 | | 375 | 428,141 |
| 5.00%, 7/1/38 | | 250 | 283,293 |
| Connecticut Health and Educational Facilities Authority, (Connecticut College), 4.00%, 7/1/36 | | 1,225 | 1,227,621 |
| Connecticut Health and Educational Facilities Authority, (Fairfield University), 4.00%, 7/1/42 | | 2,500 | 2,494,525 |
| Connecticut Health and Educational Facilities Authority, (Hopkins School), 5.25%, 7/1/47 | | 1,725 | 1,861,258 |
| Connecticut Health and Educational Facilities Authority, (Quinnipiac University): | | | |
| 4.125%, 7/1/41 | | 975 | 975,614 |
| 5.00%, 7/1/34 | | 1,475 | 1,507,052 |
| 5.00%, 7/1/48 | | 1,000 | 1,058,220 |
| Connecticut Health and Educational Facilities Authority, (Sacred Heart University): | | | |
| 4.00%, 7/1/45 | | 1,000 | 977,730 |
| 5.00%, 7/1/37 | | 810 | 837,815 |
| Connecticut Health and Educational Facilities Authority, (The Taft School): | | | |
| 4.00%, 7/1/28 | | 135 | 139,410 |
| 4.00%, 7/1/29 | | 100 | 103,409 |
| Security | Principal
Amount
(000's omitted) | Value |
| Education (continued) |
| Connecticut Health and Educational Facilities Authority, (The Taft School): (continued) | | | |
| 4.00%, 7/1/30 | $ | 125 | $ 129,094 |
| 4.00%, 7/1/33 | | 430 | 439,155 |
| 4.00%, 7/1/34 | | 1,130 | 1,153,380 |
| 4.00%, 7/1/36 | | 560 | 568,954 |
| Connecticut Health and Educational Facilities Authority, (University of New Haven): | | | |
| 5.00%, 7/1/34 | | 810 | 827,204 |
| 5.00%, 7/1/35 | | 850 | 866,940 |
| Connecticut Health and Educational Facilities Authority, (Wesleyan University), 3.93%, 7/1/40(1) | | 3,100 | 3,100,000 |
| Connecticut Health and Educational Facilities Authority, (Yale University): | | | |
| 2.00% to 7/1/26 (Put Date), 7/1/42 | | 1,785 | 1,730,022 |
| 2.80% to 2/10/26 (Put Date), 7/1/48 | | 2,000 | 1,986,000 |
| University of Connecticut, 5.50%, 11/15/53 | | 1,500 | 1,708,470 |
| | | | $ 25,786,531 |
| Escrowed/Prerefunded — 1.0% |
| Connecticut Higher Education Supplemental Loan Authority, (AMT), Prerefunded to 11/15/25, 4.125%, 11/15/33 | $ | 150 | $ 151,227 |
| Greater New Haven Water Pollution Control Authority, CT, Prerefunded to 8/15/24, 5.00%, 8/15/32 | | 1,000 | 1,000,730 |
| | | | $ 1,151,957 |
| General Obligations — 22.6% |
| Colchester, CT, 4.00%, 10/15/28 | $ | 440 | $ 440,836 |
| Connecticut: | | | |
| 4.00%, 6/15/34 | | 1,500 | 1,502,025 |
| 4.00%, 1/15/38 | | 1,000 | 1,024,570 |
| 4.00%, 6/15/39 | | 300 | 307,605 |
| 4.00%, 6/15/41 | | 300 | 303,999 |
| Social Bonds, 4.00%, 1/15/43 | | 1,000 | 1,007,720 |
| Social Bonds, 5.00%, 11/15/42 | | 1,500 | 1,664,250 |
| Darien, CT, 4.00%, 4/15/48 | | 1,125 | 1,127,509 |
| East Haddam, CT: | | | |
| 3.00%, 12/1/35 | | 400 | 368,408 |
| 3.00%, 12/1/37 | | 335 | 303,430 |
| East Lyme, CT, 5.00%, 8/8/24 | | 1,500 | 1,500,420 |
| Ellington, CT: | | | |
| 3.00%, 9/15/33 | | 280 | 260,786 |
| 3.00%, 9/15/35 | | 210 | 190,884 |
| Groton, CT: | | | |
| Green Bonds, 4.00%, 4/1/40 | | 1,410 | 1,433,180 |
4
See Notes to Financial Statements.
Eaton Vance
Connecticut Municipal Income Fund
July 31, 2024
Portfolio of Investments — continued
| Security | Principal
Amount
(000's omitted) | Value |
| General Obligations (continued) |
| Groton, CT: (continued) | | | |
| Green Bonds, 4.125%, 4/1/41 | $ | 1,410 | $ 1,436,240 |
| Naugatuck, CT, 5.25%, 10/15/43 | | 275 | 306,848 |
| North Haven, CT, 5.00%, 7/15/25 | | 1,490 | 1,520,098 |
| Norwalk, CT, 4.00%, 8/15/47 | | 1,425 | 1,436,571 |
| Puerto Rico: | | | |
| 0.00%, 7/1/33 | | 750 | 505,980 |
| 5.625%, 7/1/27 | | 340 | 354,960 |
| 5.625%, 7/1/29 | | 1,250 | 1,343,150 |
| South Windsor, CT, 4.00%, 2/1/43 | | 1,425 | 1,446,489 |
| Waterbury, CT, 5.00%, 8/1/37 | | 1,150 | 1,286,838 |
| West Haven, CT, 4.00%, 9/15/36 | | 1,500 | 1,507,305 |
| Westport, CT: | | | |
| 4.00%, 5/15/41 | | 500 | 513,700 |
| 4.00%, 5/15/42 | | 500 | 511,715 |
| 4.00%, 5/15/43 | | 500 | 510,085 |
| Windsor Locks, CT: | | | |
| 4.125%, 7/15/41 | | 640 | 661,741 |
| 4.25%, 7/15/48 | | 1,280 | 1,301,517 |
| | | | $ 26,078,859 |
| Hospital — 8.0% |
| Connecticut Health and Educational Facilities Authority, (Connecticut Children's Medical Center), 4.00%, 7/15/43 | $ | 1,535 | $ 1,493,509 |
| Connecticut Health and Educational Facilities Authority, (Nuvance Health), 4.00%, 7/1/49 | | 1,500 | 1,405,320 |
| Connecticut Health and Educational Facilities Authority, (Stamford Hospital), 4.00%, 7/1/46 | | 1,620 | 1,509,662 |
| Connecticut Health and Educational Facilities Authority, (Trinity Health Corp.), 5.00%, 12/1/33 | | 2,000 | 2,051,760 |
| Connecticut Health and Educational Facilities Authority, (Yale-New Haven Health): | | | |
| 5.00%, 7/1/31 | | 500 | 501,245 |
| 5.00%, 7/1/34 | | 1,520 | 1,523,785 |
| 5.00%, 7/1/46 | | 150 | 164,344 |
| 5.00% to 7/1/29 (Put Date), 7/1/49 | | 500 | 540,750 |
| | | | $ 9,190,375 |
| Housing — 9.1% |
| Connecticut Housing Finance Authority: | | | |
| 4.00%, 11/15/38 | $ | 750 | $ 753,195 |
| Social Bonds, 4.20%, 11/15/38 | | 1,000 | 1,016,900 |
| Social Bonds, (FHLMC), (FNMA), (GNMA), 4.00%, 5/15/35 | | 700 | 709,107 |
| Security | Principal
Amount
(000's omitted) | Value |
| Housing (continued) |
| Connecticut Housing Finance Authority: (continued) | | | |
| Social Bonds, (FHLMC), (FNMA), (GNMA), 4.45%, 11/15/44 | $ | 2,000 | $ 2,000,340 |
| Social Bonds, (FHLMC), (FNMA), (GNMA), 4.55%, 11/15/37 | | 1,000 | 1,036,500 |
| Sustainability Bonds, 4.05%, 11/15/42 | | 1,000 | 1,001,110 |
| Norwalk Housing Authority, CT, (Monterey Village Apartments), (FNMA), 4.40%, 9/1/42 | | 2,000 | 2,008,880 |
| Waterbury Housing Authority, CT, Social Bonds, (FNMA), 4.25%, 7/1/39 | | 2,000 | 2,011,160 |
| | | | $ 10,537,192 |
| Insured - Education — 3.9% |
| Connecticut Health and Educational Facilities Authority, (Loomis Chaffee School): | | | |
| (AMBAC), Escrowed to Maturity, 5.25%, 7/1/30 | $ | 1,950 | $ 2,202,174 |
| (AMBAC), Escrowed to Maturity, 5.25%, 7/1/31 | | 2,050 | 2,354,609 |
| | | | $ 4,556,783 |
| Insured - General Obligations — 7.5% |
| Bridgeport, CT, (AGM), 5.00%, 8/15/33 | $ | 2,455 | $ 2,538,127 |
| Hamden, CT, (BAM), 5.00%, 8/15/32 | | 1,375 | 1,537,786 |
| New Britain, CT: | | | |
| (BAM), 4.00%, 3/1/47 | | 2,000 | 1,961,380 |
| (BAM), 5.00%, 3/1/47 | | 1,000 | 1,066,580 |
| New Haven, CT: | | | |
| (AGM), 5.00%, 8/1/25 | | 1,000 | 1,001,280 |
| (BAM), 5.25%, 8/1/43 | | 500 | 552,420 |
| | | | $ 8,657,573 |
| Insured - Hospital — 0.9% |
| Connecticut Health and Educational Facilities Authority, (Hartford HealthCare Obligated Group), (AGM), 4.00%, 7/1/37 | $ | 1,000 | $ 1,028,350 |
| | | | $ 1,028,350 |
| Insured - Water and Sewer — 3.0% |
| South Central Connecticut Regional Water Authority, (NPFG), 5.25%, 8/1/24 | $ | 3,420 | $ 3,420,000 |
| | | | $ 3,420,000 |
| Senior Living/Life Care — 1.9% |
| Connecticut Health and Educational Facilities Authority, (Covenant Home, Inc.): | | | |
| 5.00%, 12/1/25 | $ | 500 | $ 503,985 |
| 5.00%, 12/1/34 | | 1,000 | 1,026,450 |
5
See Notes to Financial Statements.
Eaton Vance
Connecticut Municipal Income Fund
July 31, 2024
Portfolio of Investments — continued
| Security | Principal
Amount
(000's omitted) | Value |
| Senior Living/Life Care (continued) |
| Connecticut Health and Educational Facilities Authority, (Jerome Home), 4.00%, 7/1/31 | $ | 235 | $ 230,399 |
| Connecticut Health and Educational Facilities Authority, (McLean Affiliates, Inc.), 5.00%, 1/1/45(2) | | 500 | 456,375 |
| | | | $ 2,217,209 |
| Special Tax Revenue — 6.0% |
| American Samoa Economic Development Authority, 5.00%, 9/1/38(2) | $ | 200 | $ 202,260 |
| Connecticut, Special Tax Obligation Bonds: | | | |
| 4.00%, 8/1/35 | | 2,000 | 2,002,260 |
| 4.00%, 5/1/38 | | 1,000 | 1,030,410 |
| 5.00%, 7/1/39 | | 500 | 570,095 |
| Metropolitan Transportation Authority, NY, Green Bonds, 5.00%, 11/15/36 | | 500 | 584,730 |
| New York City Transitional Finance Authority, NY, Future Tax Revenue, 5.00%, 11/1/35 | | 1,000 | 1,164,120 |
| Puerto Rico Sales Tax Financing Corp., 5.00%, 7/1/58 | | 1,360 | 1,367,140 |
| | | | $ 6,921,015 |
| Student Loan — 3.1% |
| Connecticut Higher Education Supplemental Loan Authority: | | | |
| (AMT), 4.00%, 11/15/36 | $ | 600 | $ 597,906 |
| (AMT), 4.125%, 11/15/40 | | 1,750 | 1,748,477 |
| (AMT), 4.25%, 11/15/38 | | 695 | 702,596 |
| (AMT), 5.00%, 11/15/28 | | 250 | 262,148 |
| (AMT), 5.00%, 11/15/29 | | 225 | 235,591 |
| | | | $ 3,546,718 |
| Transportation — 0.8% |
| Connecticut Airport Authority, (Ground Transportation Center), (AMT), 4.00%, 7/1/49 | $ | 1,000 | $ 919,860 |
| | | | $ 919,860 |
| Water and Sewer — 1.3% |
| Stamford, CT, (Water Pollution Control System): | | | |
| 4.00%, 4/1/44 | $ | 1,000 | $ 1,002,420 |
| 5.00%, 9/15/29 | | 200 | 204,486 |
| 5.00%, 9/15/30 | | 125 | 127,735 |
| 5.00%, 4/1/34 | | 100 | 109,457 |
| | | | $ 1,444,098 |
Total Tax-Exempt Municipal Obligations
(identified cost $106,666,459) | | | $107,550,380 |
| Taxable Municipal Obligations — 4.5% |
| Security | Principal
Amount
(000's omitted) | Value |
| General Obligations — 4.5% |
| Connecticut: | | | |
| 2.40%, 8/15/24 | $ | 1,000 | $ 998,740 |
| 3.136%, 4/15/25 | | 770 | 759,212 |
| 4.807%, 5/1/31 | | 1,000 | 1,017,310 |
| Naugatuck, CT: | | | |
| 1.14%, 9/15/26 | | 200 | 186,638 |
| 1.40%, 9/15/27 | | 250 | 228,813 |
| 1.60%, 9/15/28 | | 255 | 229,566 |
| 1.79%, 9/15/29 | | 750 | 665,205 |
| Norwalk, CT, 1.381%, 7/15/29 | | 1,000 | 873,180 |
| Watertown, CT, 2.25%, 10/15/33 | | 290 | 237,475 |
Total Taxable Municipal Obligations
(identified cost $5,322,904) | | | $ 5,196,139 |
| Security | Notional
Amount
(000's omitted) | Value |
| Transportation — 0.5% |
| HTA TRRB 2005L-745190R75 Assured Custodial Trust, 5.25%, 7/1/41 | $ | 550 | $ 538,693 |
Total Trust Units
(identified cost $554,324) | | | $ 538,693 |
Total Investments — 99.0%
(identified cost $113,471,687) | | | $114,256,213 |
| Other Assets, Less Liabilities — 1.0% | | | $ 1,134,674 |
| Net Assets — 100.0% | | | $115,390,887 |
| The percentage shown for each investment category in the Portfolio of Investments is based on net assets. |
| (1) | Variable rate demand obligation that may be tendered at par on any day for payment the lesser of 5 business days or 7 calendar days. The stated interest rate, which generally resets weekly, is determined by the remarketing agent and represents the rate in effect at July 31, 2024. |
| (2) | Security exempt from registration under Rule 144A of the Securities Act of 1933, as amended. These securities may be sold in certain transactions in reliance on an exemption from registration (normally to qualified institutional buyers). At July 31, 2024, the aggregate value of these securities is $658,635 or 0.6% of the Fund's net assets. |
6
See Notes to Financial Statements.
Eaton Vance
Connecticut Municipal Income Fund
July 31, 2024
Portfolio of Investments — continued
| The Fund invests primarily in debt securities issued by Connecticut municipalities. The ability of the issuers of the debt securities to meet their obligations may be affected by economic developments in a specific industry or municipality. At July 31, 2024, 15.5% of total investments are backed by bond insurance of various financial institutions and financial guaranty assurance agencies. The aggregate percentage insured by an individual financial institution or financial guaranty assurance agency ranged from 3.0% to 4.5% of total investments. |
| Abbreviations: |
| AGM | – Assured Guaranty Municipal Corp. |
| AMBAC | – AMBAC Financial Group, Inc. |
| AMT | – Interest earned from these securities may be considered a tax preference item for purposes of the Federal Alternative Minimum Tax. |
| BAM | – Build America Mutual Assurance Co. |
| FHLMC | – Federal Home Loan Mortgage Corp. |
| FNMA | – Federal National Mortgage Association |
| GNMA | – Government National Mortgage Association |
| NPFG | – National Public Finance Guarantee Corp. |
7
See Notes to Financial Statements.
Eaton Vance
Minnesota Municipal Income Fund
July 31, 2024
| Tax-Exempt Municipal Obligations — 99.9% |
| Security | Principal
Amount
(000's omitted) | Value |
| Bond Bank — 0.8% |
| Minnesota Rural Water Finance Authority, Inc., 4.375%, 4/1/25 | $ | 2,000 | $ 2,000,960 |
| | | | $ 2,000,960 |
| Education — 11.9% |
| Minneapolis, MN, (University Gateway), (SPA: Wells Fargo Bank, N.A.), 3.55%, 12/1/40(1) | $ | 1,500 | $ 1,500,000 |
| Minnesota Higher Education Facilities Authority, (Carleton College): | | | |
| 5.00%, 3/1/34 | | 500 | 521,860 |
| 5.00%, 3/1/53 | | 5,000 | 5,345,800 |
| Minnesota Higher Education Facilities Authority, (College of Saint Benedict), 5.00%, 3/1/37 | | 750 | 758,842 |
| Minnesota Higher Education Facilities Authority, (Gustavus Adolphus College), 5.00%, 10/1/35 | | 490 | 510,717 |
| Minnesota Higher Education Facilities Authority, (Macalester College): | | | |
| 5.00%, 3/1/27 | | 500 | 504,975 |
| 5.00%, 3/1/28 | | 1,010 | 1,019,868 |
| Minnesota Higher Education Facilities Authority, (St. Olaf College): | | | |
| 4.00%, 10/1/35 | | 500 | 502,305 |
| 4.00%, 10/1/50 | | 1,500 | 1,430,460 |
| 5.00%, 12/1/29 | | 1,815 | 1,855,874 |
| Minnesota Higher Education Facilities Authority, (University of St. Thomas): | | | |
| 4.125%, 10/1/53 | | 1,000 | 993,040 |
| 5.00%, 10/1/30 | | 650 | 680,862 |
| 5.00%, 10/1/34 | | 250 | 269,013 |
| 5.00%, 4/1/35 | | 750 | 764,880 |
| 5.00%, 10/1/49 | | 1,500 | 1,603,515 |
| Series 2017A, 4.00%, 10/1/37 | | 500 | 502,010 |
| Series 2019, 4.00%, 10/1/37 | | 500 | 505,045 |
| Green Bonds, 5.00%, 10/1/52 | | 2,000 | 2,094,920 |
| St. Paul Housing and Redevelopment Authority, MN, (Hmong College Prep Academy), 5.00%, 9/1/43 | | 1,200 | 1,211,844 |
| University of Minnesota: | | | |
| 5.00%, 4/1/38 | | 2,000 | 2,157,980 |
| 5.00%, 9/1/39 | | 1,500 | 1,555,065 |
| 5.00%, 9/1/40 | | 1,000 | 1,034,000 |
| 5.00%, 11/1/42 | | 2,000 | 2,176,760 |
| | | | $ 29,499,635 |
| Security | Principal
Amount
(000's omitted) | Value |
| Electric Utilities — 9.6% |
| Chaska, MN, Electric System Revenue, 5.00%, 10/1/30 | $ | 550 | $ 561,924 |
| Hutchinson, MN, Public Utility Revenue, 5.00%, 12/1/26 | | 350 | 350,553 |
| Minnesota Municipal Power Agency: | | | |
| 4.00%, 10/1/41 | | 3,415 | 3,398,471 |
| 5.00%, 10/1/33 | | 250 | 250,650 |
| 5.00%, 10/1/34 | | 250 | 250,635 |
| 5.00%, 10/1/35 | | 200 | 200,484 |
| 5.00%, 10/1/47 | | 3,210 | 3,259,851 |
| Northern Municipal Power Agency, MN: | | | |
| 5.00%, 1/1/25 | | 325 | 327,376 |
| 5.00%, 1/1/26 | | 375 | 384,428 |
| 5.00%, 1/1/27 | | 640 | 666,579 |
| 5.00%, 1/1/30 | | 460 | 479,752 |
| 5.00%, 1/1/41 | | 240 | 245,359 |
| Series 2016, 5.00%, 1/1/31 | | 670 | 687,762 |
| Series 2024, 5.00%, 1/1/31 | | 550 | 605,253 |
| Rochester, MN, Electric Utility Revenue, 5.00%, 12/1/42 | | 4,480 | 4,581,920 |
| St. Paul Port Authority, MN, District Energy Revenue: | | | |
| Series 2017-3, 4.00%, 10/1/42 | | 1,250 | 1,175,450 |
| Series 2017-4, (AMT), 4.00%, 10/1/40 | | 1,000 | 904,560 |
| Series 2021-2, (AMT), 4.00%, 10/1/40 | | 1,100 | 995,016 |
| Western Minnesota Municipal Power Agency: | | | |
| 5.00%, 1/1/25 | | 750 | 756,203 |
| 5.00%, 1/1/27 | | 750 | 786,495 |
| 5.00%, 1/1/29 | | 1,000 | 1,087,780 |
| 5.00%, 1/1/30 | | 750 | 829,057 |
| 5.00%, 1/1/36 | | 900 | 918,090 |
| | | | $ 23,703,648 |
| General Obligations — 35.6% |
| Brooklyn Center Independent School District No. 286, MN, 4.00%, 2/1/40 | $ | 2,000 | $ 2,014,620 |
| Cass Lake-Bena Independent School District No. 115, MN, 4.00%, 2/1/38 | | 1,400 | 1,441,608 |
| Centennial Independent School District No. 12, MN: | | | |
| 0.00%, 2/1/28 | | 1,000 | 890,400 |
| 0.00%, 2/1/35 | | 350 | 231,273 |
| Cloquet Independent School District No. 94, MN, 5.00%, 2/1/30 | | 1,000 | 1,009,210 |
| Duluth, MN: | | | |
| 5.00%, 2/1/32 | | 1,000 | 1,024,670 |
| Series 2016A, 5.00%, 2/1/31 | | 1,000 | 1,026,000 |
| Forest Lake Independent School District No. 831, MN, 4.00%, 2/1/40 | | 2,220 | 2,280,673 |
8
See Notes to Financial Statements.
Eaton Vance
Minnesota Municipal Income Fund
July 31, 2024
Portfolio of Investments — continued
| Security | Principal
Amount
(000's omitted) | Value |
| General Obligations (continued) |
| GFW Independent School District No. 2365, MN, 4.125%, 2/1/52 | $ | 2,250 | $ 2,224,035 |
| Hawley Independent School District No. 150, MN, 4.25%, 2/1/46 | | 2,250 | 2,270,092 |
| Hennepin County Regional Railroad Authority, MN, 5.00%, 12/1/32 | | 675 | 730,978 |
| Hennepin County, MN: | | | |
| 5.00%, 12/1/29 | | 1,050 | 1,164,608 |
| 5.00%, 12/1/38 | | 1,915 | 2,177,929 |
| 5.00%, 12/1/43 | | 3,000 | 3,368,250 |
| (SPA: TD Bank, N.A.), 3.55%, 12/1/38(1) | | 3,260 | 3,260,000 |
| Jordan Independent School District No. 717, MN, 4.00%, 2/1/42 | | 1,300 | 1,316,276 |
| Mahtomedi Independent School District No. 832, MN, 5.00%, 2/1/31 | | 1,000 | 1,008,360 |
| Maple River Independent School District No. 2135, MN: | | | |
| 4.00%, 2/1/45 | | 1,200 | 1,196,712 |
| 4.00%, 2/1/50 | | 1,500 | 1,450,230 |
| Minneapolis Special School District No. 1, MN, 4.00%, 2/1/37 | | 1,255 | 1,293,252 |
| Minneapolis, MN, 5.00%, 12/1/40 | | 4,170 | 4,654,262 |
| Minneapolis-St. Paul Metropolitan Council, MN: | | | |
| 4.00%, 3/1/43 | | 2,000 | 2,011,440 |
| 4.00%, 3/1/44 | | 3,000 | 3,000,060 |
| 5.00%, 3/1/29 | | 1,800 | 1,967,040 |
| Minnesota: | | | |
| 4.00%, 9/1/41 | | 2,000 | 2,048,380 |
| 5.00%, 8/1/34 | | 500 | 534,820 |
| 5.00%, 10/1/34 | | 500 | 533,550 |
| 5.00%, 8/1/38 | | 1,135 | 1,288,112 |
| 5.00%, 8/1/40 | | 1,500 | 1,649,550 |
| 5.00%, 8/1/42 | | 2,820 | 3,181,806 |
| Puerto Rico, 5.625%, 7/1/29 | | 1,500 | 1,611,780 |
| Ramsey County, MN, 4.00%, 2/1/43 | | 2,940 | 2,991,597 |
| Rice County, MN, 4.00%, 2/1/52 | | 3,000 | 2,899,770 |
| Robbinsdale Independent School District No. 281, MN, 4.375%, 2/1/41 | | 1,680 | 1,760,069 |
| Rosemount, MN: | | | |
| 4.00%, 2/1/44 | | 2,480 | 2,492,970 |
| 4.00%, 2/1/48 | | 1,885 | 1,847,093 |
| Rosemount-Apple Valley-Eagan Independent School District No. 196, MN, 4.00%, 2/1/44 | | 3,000 | 3,002,160 |
| Round Lake-Brewster Independent School District No. 2907, MN, 4.00%, 2/1/46 | | 2,680 | 2,637,388 |
| Sartell-St. Stephen Independent School District No. 748, MN: | | | |
| 0.00%, 2/1/32 | | 1,350 | 989,645 |
| Security | Principal
Amount
(000's omitted) | Value |
| General Obligations (continued) |
| Sartell-St. Stephen Independent School District No. 748, MN: (continued) | | | |
| 0.00%, 2/1/37 | $ | 1,500 | $ 866,505 |
| Scott County, MN, 4.00%, 12/1/34 | | 2,000 | 2,101,080 |
| South Washington County Independent School District No. 833, MN, 4.00%, 2/1/44 | | 3,000 | 2,964,420 |
| St. Francis, MN: | | | |
| 4.00%, 2/1/47 | | 920 | 900,045 |
| 4.125%, 2/1/53 | | 795 | 774,012 |
| St. Paul, MN, 5.00%, 12/1/27 | | 750 | 785,190 |
| St. Peter Independent School District No. 508, MN: | | | |
| 4.00%, 2/1/45(2) | | 500 | 493,660 |
| 5.00%, 2/1/41(2) | | 1,240 | 1,342,870 |
| Stillwater Independent School District No. 834, 4.00%, 2/1/43 | | 2,500 | 2,530,000 |
| Washington County, MN, 5.00%, 2/1/42 | | 1,940 | 2,187,195 |
| Watertown-Mayer Independent School District No. 111, MN, 0.00%, 2/1/36 | | 1,000 | 612,960 |
| | | | $ 88,038,605 |
| Hospital — 17.6% |
| Duluth Economic Development Authority, MN, (Essentia Health Obligated Group): | | | |
| 5.00%, 2/15/37 | $ | 1,200 | $ 1,245,168 |
| 5.00%, 2/15/48 | | 3,000 | 3,057,630 |
| Duluth Economic Development Authority, MN, (St. Luke's Hospital of Duluth Obligated Group): | | | |
| 4.00%, 6/15/34 | | 520 | 544,643 |
| 5.25%, 6/15/52 | | 2,000 | 2,166,780 |
| Maple Grove, MN, (Maple Grove Hospital Corp.): | | | |
| 5.00%, 5/1/31 | | 500 | 512,545 |
| 5.00%, 5/1/32 | | 500 | 511,080 |
| Minneapolis and St. Paul Housing and Redevelopment Authority, MN, (Allina Health System), 5.00%, 11/15/29 | | 915 | 947,491 |
| Minneapolis, MN, (Allina Health System): | | | |
| 4.00%, 11/15/37 | | 3,250 | 3,285,815 |
| 5.00% to 11/15/28 (Put Date), 11/15/52 | | 2,000 | 2,124,860 |
| Minneapolis, MN, (Fairview Health Services), (LOC: Wells Fargo Bank, N.A.), 3.95%, 11/15/48(3) | | 7,155 | 7,155,000 |
| Minnesota Agricultural and Economic Development Board, (HealthPartners Obligated Group): | | | |
| 4.00%, 1/1/49 | | 2,000 | 1,930,340 |
| 5.25%, 1/1/54 | | 2,500 | 2,708,275 |
| Rochester, MN, (Mayo Clinic): | | | |
| 4.00%, 11/15/48 | | 5,000 | 4,950,050 |
| 5.00%, 11/15/57 | | 2,500 | 2,688,175 |
9
See Notes to Financial Statements.
Eaton Vance
Minnesota Municipal Income Fund
July 31, 2024
Portfolio of Investments — continued
| Security | Principal
Amount
(000's omitted) | Value |
| Hospital (continued) |
| Rochester, MN, (Mayo Clinic): (continued) | | | |
| (SPA: Northern Trust Co.), 3.60%, 11/15/38(1) | $ | 3,590 | $ 3,590,000 |
| St. Cloud, MN, (CentraCare Health System), 5.00%, 5/1/46 | | 2,650 | 2,674,327 |
| St. Paul Housing and Redevelopment Authority, MN, (Fairview Health Services), 5.00%, 11/15/31 | | 500 | 516,940 |
| St. Paul Housing and Redevelopment Authority, MN, (HealthPartners Obligated Group): | | | |
| 5.00%, 7/1/29 | | 2,000 | 2,019,220 |
| 5.00%, 7/1/33 | | 1,000 | 1,008,740 |
| | | | $ 43,637,079 |
| Housing — 2.2% |
| Minnesota Housing Finance Agency: | | | |
| 2.15%, 7/1/45 | $ | 900 | $ 596,457 |
| (FHLMC), (FNMA), (GNMA), 2.40%, 1/1/35 | | 605 | 510,620 |
| (FHLMC), (FNMA), (GNMA), 3.15%, 1/1/37 | | 285 | 255,292 |
| Social Bonds, (FHLMC), (FNMA), (GNMA), 4.45%, 7/1/38 | | 1,000 | 1,029,260 |
| Social Bonds, (FHLMC), (FNMA), (GNMA), 4.50%, 7/1/43 | | 2,000 | 2,012,580 |
| Social Bonds, (FHLMC), (FNMA), (GNMA), 6.00%, 7/1/53 | | 990 | 1,069,200 |
| | | | $ 5,473,409 |
| Insured - Electric Utilities — 5.2% |
| Northern Municipal Power Agency, MN: | | | |
| (AGM), 5.00%, 1/1/28 | $ | 475 | $ 504,455 |
| (AGM), 5.00%, 1/1/29 | | 1,025 | 1,102,623 |
| (AGM), 5.00%, 1/1/31 | | 575 | 635,921 |
| Puerto Rico Electric Power Authority, (NPFG), 5.25%, 7/1/32 | | 1,150 | 1,136,637 |
| Sauk Centre Public Utilities Commission Electric Revenue, MN, (AGM), 4.50%, 12/1/53 | | 505 | 506,641 |
| Southern Minnesota Municipal Power Agency, (NPFG), 0.00%, 1/1/25 | | 9,000 | 8,856,540 |
| | | | $ 12,742,817 |
| Insured - General Obligations — 0.2% |
| Alexandria Lake Area Sanitation District, MN, (AGM), 4.125%, 2/1/43 | $ | 500 | $ 496,830 |
| | | | $ 496,830 |
| Security | Principal
Amount
(000's omitted) | Value |
| Insured - Hospital — 0.8% |
| Minneapolis, MN, (Fairview Health Services), (AGM), 5.00%, 11/15/44 | $ | 2,000 | $ 2,019,560 |
| | | | $ 2,019,560 |
| Lease Revenue/Certificates of Participation — 2.5% |
| Anoka-Hennepin Independent School District No. 11, MN, 5.00%, 2/1/34 | $ | 1,000 | $ 1,001,210 |
| Minnesota, 5.00%, 3/1/27 | | 3,000 | 3,160,200 |
| Minnesota Housing Finance Agency, 4.00%, 8/1/39 | | 2,055 | 2,075,797 |
| | | | $ 6,237,207 |
| Other Revenue — 1.6% |
| Minnesota Municipal Gas Agency: | | | |
| (Liq: Royal Bank of Canada), 4.00% to 12/1/27 (Put Date), 12/1/52 | $ | 2,000 | $ 2,018,820 |
| (Liq: Royal Bank of Canada), 4.585%, (67% of SOFR + 1.00%), 12/1/52(4) | | 2,000 | 2,001,860 |
| | | | $ 4,020,680 |
| Senior Living/Life Care — 2.3% |
| Apple Valley, MN, (PHS Apple Valley Senior Housing, Inc.): | | | |
| 4.50%, 9/1/53 | $ | 940 | $ 877,856 |
| 5.00%, 9/1/43 | | 1,000 | 1,002,880 |
| North Oaks, MN, (Waverly Gardens): | | | |
| 4.00%, 10/1/25 | | 1,600 | 1,605,360 |
| 4.00%, 10/1/26 | | 1,680 | 1,688,585 |
| Wayzata, MN, (Folkestone Senior Living Community), 4.00%, 8/1/44 | | 595 | 550,845 |
| | | | $ 5,725,526 |
| Special Tax Revenue — 1.3% |
| American Samoa Economic Development Authority, 5.00%, 9/1/38(5) | $ | 200 | $ 202,260 |
| Puerto Rico Sales Tax Financing Corp., 5.00%, 7/1/58 | | 3,000 | 3,015,750 |
| | | | $ 3,218,010 |
| Student Loan — 2.2% |
| Minnesota Office of Higher Education, Supplemental Student Loan Program Revenue, (AMT), 4.00%, 11/1/42 | $ | 5,680 | $ 5,467,227 |
| | | | $ 5,467,227 |
10
See Notes to Financial Statements.
Eaton Vance
Minnesota Municipal Income Fund
July 31, 2024
Portfolio of Investments — continued
| Security | Principal
Amount
(000's omitted) | Value |
| Transportation — 4.9% |
| Minneapolis-St. Paul Metropolitan Airports Commission, MN: | | | |
| 5.00%, 1/1/35 | $ | 500 | $ 571,690 |
| 5.00%, 1/1/52(2) | | 2,000 | 2,152,740 |
| (AMT), 5.00%, 1/1/25 | | 750 | 754,268 |
| (AMT), 5.00%, 1/1/33 | | 1,200 | 1,265,436 |
| (AMT), 5.00%, 1/1/49 | | 2,000 | 2,048,880 |
| (AMT), 5.25%, 1/1/44(2) | | 3,200 | 3,475,008 |
| (AMT), 5.25%, 1/1/47 | | 1,750 | 1,868,720 |
| | | | $ 12,136,742 |
| Water and Sewer — 1.2% |
| St. Paul, MN, Water Revenue, 4.00%, 12/1/47 | $ | 3,000 | $ 2,964,600 |
| | | | $ 2,964,600 |
Total Tax-Exempt Municipal Obligations
(identified cost $246,199,880) | | | $247,382,535 |
| Short-Term Investments — 1.0% |
| Municipal Tax-Exempt Commercial Paper — 1.0% | | | |
| Security | Principal
Amount
(000's omitted) | Value |
| Hennepin County, MN, 3.60%, 9/5/24 | $ | 2,500 | 2,500,321 |
Total Municipal Tax-Exempt Commercial Paper
(identified cost $2,500,000) | | | $ 2,500,321 |
Total Short-Term Investments
(identified cost $2,500,000) | | | $ 2,500,321 |
Total Investments — 100.9%
(identified cost $248,699,880) | | | $249,882,856 |
| Other Assets, Less Liabilities — (0.9)% | | | $ (2,173,288) |
| Net Assets — 100.0% | | | $247,709,568 |
| The percentage shown for each investment category in the Portfolio of Investments is based on net assets. |
| (1) | Variable rate demand obligation that may be tendered at par on any day for payment the lesser of 5 business days or 7 calendar days. The stated interest rate, which generally resets weekly, is determined by the remarketing agent and represents the rate in effect at July 31, 2024. |
| (2) | When-issued security. |
| (3) | Variable rate demand obligation that may be tendered at par on any day for payment the same or next business day. The stated interest rate, which generally resets daily, is determined by the remarketing agent and represents the rate in effect at July 31, 2024. |
| (4) | Floating rate security. The stated interest rate represents the rate in effect at July 31, 2024. |
| (5) | Security exempt from registration under Rule 144A of the Securities Act of 1933, as amended. These securities may be sold in certain transactions in reliance on an exemption from registration (normally to qualified institutional buyers). At July 31, 2024, the aggregate value of these securities is $202,260 or 0.1% of the Fund's net assets. |
| The Fund invests primarily in debt securities issued by Minnesota municipalities. The ability of the issuers of the debt securities to meet their obligations may be affected by economic developments in a specific industry or municipality. At July 31, 2024, 6.1% of total investments are backed by bond insurance of various financial institutions and financial guaranty assurance agencies. The aggregate percentage insured by an individual financial institution or financial guaranty assurance agency ranged from 2.1% to 4.0% of total investments. |
| Abbreviations: |
| AGM | – Assured Guaranty Municipal Corp. |
| AMT | – Interest earned from these securities may be considered a tax preference item for purposes of the Federal Alternative Minimum Tax. |
| FHLMC | – Federal Home Loan Mortgage Corp. |
| FNMA | – Federal National Mortgage Association |
| GNMA | – Government National Mortgage Association |
| Liq | – Liquidity Provider |
| LOC | – Letter of Credit |
| NPFG | – National Public Finance Guarantee Corp. |
| SOFR | – Secured Overnight Financing Rate |
| SPA | – Standby Bond Purchase Agreement |
11
See Notes to Financial Statements.
Eaton Vance
New Jersey Municipal Income Fund
July 31, 2024
| Tax-Exempt Municipal Obligations — 94.6% |
| Security | Principal
Amount
(000's omitted) | Value |
| Bond Bank — 0.7% |
| New Jersey Infrastructure Bank: | | | |
| Green Bonds, 5.00%, 9/1/38 | $ | 500 | $ 569,765 |
| Green Bonds, 5.00%, 9/1/49 | | 500 | 560,075 |
| | | | $ 1,129,840 |
| Education — 5.7% |
| Essex County Improvement Authority, NJ, (Friends of TEAM Charter Schools, Inc.), Social Bonds, 4.00%, 6/15/56 | $ | 1,550 | $ 1,379,484 |
| New Jersey Educational Facilities Authority, (Institute for Advanced Study), (SPA: TD Bank, N.A.), 3.50%, 7/1/31(1) | | 2,900 | 2,900,000 |
| New Jersey Educational Facilities Authority, (Princeton University): | | | |
| 4.00%, 3/1/53 | | 2,000 | 1,999,220 |
| 5.00%, 3/1/43 | | 2,000 | 2,272,060 |
| | | | $ 8,550,764 |
| General Obligations — 10.8% |
| Bergen County Improvement Authority, NJ, (Bergen New Bridge Medical Center), 5.00%, 8/1/42 | $ | 2,575 | $ 2,878,953 |
| Bergen County Improvement Authority, NJ, (County Courthouse Project), 5.00%, 6/1/54 | | 3,000 | 3,340,800 |
| Bergen County Improvement Authority, NJ, (Guaranteed Governmental Pooled Project), 4.50%, 5/28/25 | | 1,000 | 1,008,820 |
| Burlington County Bridge Commission, NJ, 5.00%, 8/1/32 | | 250 | 270,178 |
| Chester Township, NJ: | | | |
| 2.00%, 10/1/29 | | 1,000 | 909,820 |
| 2.00%, 10/1/30 | | 320 | 284,083 |
| Essex County, NJ, 2.00%, 9/1/32 | | 2,935 | 2,509,249 |
| Hudson County Improvement Authority, NJ, 4.50%, 7/11/25 | | 1,000 | 1,012,120 |
| Jersey City, NJ, 5.00%, 11/1/33 | | 600 | 634,350 |
| Monmouth County Improvement Authority, NJ, 3.00%, 12/1/36 | | 100 | 91,542 |
| Morris County Improvement Authority, NJ: | | | |
| 3.00%, 3/1/35 | | 145 | 137,528 |
| 3.00%, 3/1/36 | | 150 | 138,639 |
| 3.00%, 3/1/37 | | 160 | 144,291 |
| 3.00%, 3/1/39 | | 275 | 240,584 |
| 3.00%, 3/1/41 | | 290 | 247,045 |
| Passaic County Improvement Authority, NJ: | | | |
| 3.00%, 8/15/36 | | 110 | 101,330 |
| 3.00%, 8/15/38 | | 150 | 135,042 |
| Security | Principal
Amount
(000's omitted) | Value |
| General Obligations (continued) |
| Puerto Rico, 5.625%, 7/1/29 | $ | 1,000 | $ 1,074,520 |
| Summit, NJ, 3.00%, 7/15/45 | | 1,360 | 1,159,427 |
| | | | $ 16,318,321 |
| Hospital — 11.7% |
| New Jersey Health Care Facilities Financing Authority, (AHS Hospital Corp.), 5.00%, 7/1/27 | $ | 105 | $ 105,075 |
| New Jersey Health Care Facilities Financing Authority, (Hackensack Meridian Health, Inc.), 5.00%, 7/1/35 | | 2,795 | 2,914,067 |
| New Jersey Health Care Facilities Financing Authority, (Robert Wood Johnson University Hospital): | | | |
| 5.00%, 7/1/32 | | 50 | 50,030 |
| 5.00%, 7/1/33 | | 1,155 | 1,155,681 |
| New Jersey Health Care Facilities Financing Authority, (RWJ Barnabas Health), 4.25%, 7/1/54 | | 4,000 | 4,027,040 |
| New Jersey Health Care Facilities Financing Authority, (St. Joseph's Healthcare System Obligated Group): | | | |
| 3.00%, 7/1/32 | | 1,100 | 998,041 |
| 3.125%, 7/1/33 | | 835 | 753,821 |
| 4.00%, 7/1/48 | | 3,000 | 2,731,470 |
| New Jersey Health Care Facilities Financing Authority, (Virtua Health): | | | |
| (LOC: JPMorgan Chase Bank, N.A.), 3.35%, 7/1/43(2) | | 4,370 | 4,370,000 |
| (LOC: TD Bank, N.A.), 3.00%, 7/1/43(1) | | 550 | 550,000 |
| | | | $ 17,655,225 |
| Housing — 2.4% |
| New Jersey Housing and Mortgage Finance Agency, SFMR: | | | |
| Social Bonds, 4.50%, 10/1/42 | $ | 1,975 | $ 1,989,536 |
| Social Bonds, 4.55%, 10/1/44 | | 1,600 | 1,607,856 |
| | | | $ 3,597,392 |
| Industrial Development Revenue — 3.5% |
| New Jersey Economic Development Authority, (New Jersey-American Water Co., Inc.): | | | |
| (AMT), 1.10% to 12/1/27 (Put Date), 11/1/29 | $ | 2,000 | $ 1,768,280 |
| (AMT), 3.75% to 6/1/28 (Put Date), 11/1/34 | | 750 | 755,033 |
| New Jersey Economic Development Authority, (New Jersey Natural Gas Co.), 3.375%, 4/1/38 | | 3,000 | 2,758,440 |
| | | | $ 5,281,753 |
| Insured - Education — 4.7% |
| Gloucester County Improvement Authority, NJ, (Rowan University), (BAM), 5.00%, 7/1/54 | $ | 3,000 | $ 3,215,520 |
12
See Notes to Financial Statements.
Eaton Vance
New Jersey Municipal Income Fund
July 31, 2024
Portfolio of Investments — continued
| Security | Principal
Amount
(000's omitted) | Value |
| Insured - Education (continued) |
| New Jersey Educational Facilities Authority, (Montclair State University): | | | |
| (AGM), 5.00%, 7/1/43 | $ | 2,150 | $ 2,405,699 |
| (AGM), 5.00%, 7/1/44 | | 1,330 | 1,484,892 |
| | | | $ 7,106,111 |
| Insured - Electric Utilities — 2.0% |
| Puerto Rico Electric Power Authority, (NPFG), 5.25%, 7/1/34 | $ | 3,020 | $ 2,985,421 |
| | | | $ 2,985,421 |
| Insured - Escrowed/Prerefunded — 0.3% |
| New Jersey Economic Development Authority, (Motor Vehicle Surcharges), (NPFG), Escrowed to Maturity, 5.25%, 7/1/26 | $ | 380 | $ 395,546 |
| | | | $ 395,546 |
| Insured - General Obligations — 5.4% |
| Atlantic City, NJ, (AGM), 5.00%, 3/1/37 | $ | 1,500 | $ 1,552,890 |
| Jersey City Board of Education, NJ, (AGM), 4.00%, 8/15/40 | | 1,000 | 1,027,790 |
| Montclair Board of Education, NJ, (BAM), 4.00%, 1/15/43 | | 4,200 | 4,267,284 |
| Paterson, NJ, (BAM), 5.00%, 1/15/26 | | 1,305 | 1,306,905 |
| | | | $ 8,154,869 |
| Insured - Special Tax Revenue — 10.9% |
| Garden State Preservation Trust, NJ, (AGM), 0.00%, 11/1/24 | $ | 6,000 | $ 5,949,540 |
| New Jersey Economic Development Authority, (Motor Vehicle Surcharges): | | | |
| (AGC), 0.00%, 7/1/26 | | 6,500 | 6,050,330 |
| (AGC), 0.00%, 7/1/27 | | 1,900 | 1,702,305 |
| (NPFG), 5.25%, 7/1/26 | | 1,620 | 1,666,964 |
| Newark, NJ, (Mulberry Pedestrian Bridge Redevelopment), (AGM), 5.00%, 11/15/42 | | 1,000 | 1,116,370 |
| | | | $ 16,485,509 |
| Insured - Transportation — 1.3% |
| New Jersey Economic Development Authority, (The Goethals Bridge Replacement), (AGM), (AMT), 5.00%, 1/1/31 | $ | 2,015 | $ 2,017,398 |
| | | | $ 2,017,398 |
| Security | Principal
Amount
(000's omitted) | Value |
| Insured - Water and Sewer — 2.7% |
| Passaic Valley Water Commission, NJ, Water Supply System Revenue: | | | |
| (AGM), 4.00%, 12/1/53 | $ | 3,000 | $ 2,969,310 |
| (AGM), 5.00%, 12/1/42 | | 1,000 | 1,108,490 |
| | | | $ 4,077,800 |
| Lease Revenue/Certificates of Participation — 8.6% |
| Burlington County Bridge Commission, NJ, 4.50%, 8/5/25(3) | $ | 1,000 | $ 1,011,100 |
| New Jersey Economic Development Authority, (Portal North Bridge), 5.25%, 11/1/47 | | 1,700 | 1,850,875 |
| New Jersey Transportation Trust Fund Authority, (Transportation Program): | | | |
| 4.00%, 6/15/39 | | 1,000 | 1,006,960 |
| 5.00%, 6/15/46 | | 1,500 | 1,625,790 |
| 2019 Series AA, 5.00%, 6/15/38 | | 3,220 | 3,402,638 |
| 2023 Series AA, 5.00%, 6/15/38 | | 1,000 | 1,118,720 |
| New Jersey Transportation Trust Fund Authority, (Transportation System), 4.00%, 6/15/36 | | 1,500 | 1,523,145 |
| Union County Improvement Authority, NJ, 4.125%, 4/15/54 | | 1,500 | 1,502,475 |
| | | | $ 13,041,703 |
| Other Revenue — 2.7% |
| Tobacco Settlement Financing Corp., NJ, 5.25%, 6/1/46 | $ | 3,965 | $ 4,107,899 |
| | | | $ 4,107,899 |
| Special Tax Revenue — 1.5% |
| American Samoa Economic Development Authority, 5.00%, 9/1/38(4) | $ | 200 | $ 202,260 |
| Puerto Rico Sales Tax Financing Corp., 5.00%, 7/1/58 | | 1,995 | 2,005,474 |
| | | | $ 2,207,734 |
| Student Loan — 3.0% |
| New Jersey Higher Education Student Assistance Authority: | | | |
| 6.561%, (90-day SOFR Average + 0. 95%), 6/1/36(5) | $ | 1,095 | $ 1,092,044 |
| (AMT), 3.25%, 12/1/29 | | 470 | 456,130 |
| (AMT), 4.00%, 12/1/34 | | 255 | 254,133 |
| (AMT), 5.00%, 12/1/29 | | 1,565 | 1,654,596 |
| (AMT), 5.25%, 12/1/54 | | 1,000 | 1,019,720 |
| | | | $ 4,476,623 |
| Transportation — 15.4% |
| Delaware River and Bay Authority, 5.00%, 1/1/49 | $ | 1,125 | $ 1,225,957 |
13
See Notes to Financial Statements.
Eaton Vance
New Jersey Municipal Income Fund
July 31, 2024
Portfolio of Investments — continued
| Security | Principal
Amount
(000's omitted) | Value |
| Transportation (continued) |
| Delaware River Port Authority of Pennsylvania and New Jersey, 5.00%, 1/1/36 | $ | 1,250 | $ 1,345,150 |
| New Jersey Economic Development Authority, (The Goethals Bridge Replacement), (AMT), 5.375%, 1/1/43 | | 275 | 275,223 |
| New Jersey Turnpike Authority: | | | |
| 4.125%, 1/1/54 | | 1,400 | 1,398,642 |
| 4.50%, 1/1/48 | | 2,000 | 2,069,120 |
| 5.25%, 1/1/49 | | 2,000 | 2,223,660 |
| Newark Housing Authority, NJ, (Newark Marine Terminal), 4.00%, 1/1/37 | | 1,500 | 1,514,895 |
| Port Authority of New York and New Jersey: | | | |
| (AMT), 5.00%, 10/15/35 | | 2,530 | 2,604,989 |
| (AMT), 5.00%, 11/15/36 | | 2,000 | 2,051,680 |
| (AMT), 5.00%, 8/1/37 | | 1,000 | 1,076,740 |
| (AMT), 5.00%, 7/15/40 | | 1,375 | 1,477,410 |
| (AMT), 5.00%, 1/15/47 | | 1,000 | 1,056,690 |
| South Jersey Port Corp., NJ, (AMT), 5.00%, 1/1/42 | | 2,325 | 2,388,868 |
| South Jersey Transportation Authority, NJ: | | | |
| 4.625%, 11/1/47 | | 1,500 | 1,539,090 |
| 5.00%, 11/1/31 | | 1,000 | 1,002,850 |
| | | | $ 23,250,964 |
| Water and Sewer — 1.3% |
| Jersey City Municipal Utilities Authority, NJ, 5.00%, 5/1/25 | $ | 2,000 | $ 2,020,340 |
| | | | $ 2,020,340 |
Total Tax-Exempt Municipal Obligations
(identified cost $141,932,839) | | | $142,861,212 |
| Taxable Municipal Obligations — 5.1% |
| Security | Principal
Amount
(000's omitted) | Value |
| General Obligations — 2.3% |
| Atlantic City, NJ, 7.50%, 3/1/40 | $ | 455 | $ 523,869 |
| Monroe Township Board of Education, NJ: | | | |
| 1.126%, 3/1/26 | | 585 | 552,725 |
| 1.357%, 3/1/27 | | 500 | 461,790 |
| 1.547%, 3/1/28 | | 500 | 452,940 |
| 2.729%, 8/1/33 | | 700 | 602,175 |
| 2.849%, 8/1/35 | | 1,000 | 836,660 |
| | | | $ 3,430,159 |
| Security | Principal
Amount
(000's omitted) | Value |
| Lease Revenue/Certificates of Participation — 2.8% |
| New Jersey Transportation Trust Fund Authority, 5.754%, 12/15/28(6) | $ | 4,250 | $ 4,316,513 |
| | | | $ 4,316,513 |
Total Taxable Municipal Obligations
(identified cost $8,215,961) | | | $ 7,746,672 |
Total Investments — 99.7%
(identified cost $150,148,800) | | | $150,607,884 |
| Other Assets, Less Liabilities — 0.3% | | | $ 477,264 |
| Net Assets — 100.0% | | | $151,085,148 |
| The percentage shown for each investment category in the Portfolio of Investments is based on net assets. |
| (1) | Variable rate demand obligation that may be tendered at par on any day for payment the lesser of 5 business days or 7 calendar days. The stated interest rate, which generally resets weekly, is determined by the remarketing agent and represents the rate in effect at July 31, 2024. |
| (2) | Variable rate demand obligation that may be tendered at par on any day for payment the same or next business day. The stated interest rate, which generally resets daily, is determined by the remarketing agent and represents the rate in effect at July 31, 2024. |
| (3) | When-issued security. |
| (4) | Security exempt from registration under Rule 144A of the Securities Act of 1933, as amended. These securities may be sold in certain transactions in reliance on an exemption from registration (normally to qualified institutional buyers). At July 31, 2024, the aggregate value of these securities is $202,260 or 0.1% of the Fund's net assets. |
| (5) | Floating rate security. The stated interest rate represents the rate in effect at July 31, 2024. |
| (6) | Build America Bond. Represents taxable municipal obligation issued pursuant to the American Recovery and Reinvestment Act of 2009 or other legislation providing for the issuance of taxable municipal debt on which the issuer receives federal support. |
| The Fund invests primarily in debt securities issued by New Jersey municipalities. The ability of the issuers of the debt securities to meet their obligations may be affected by economic developments in a specific industry or municipality. At July 31, 2024, 27.4% of total investments are backed by bond insurance of various financial institutions and financial guaranty assurance agencies. The aggregate percentage insured by an individual financial institution or financial guaranty assurance agency ranged from 3.4% to 13.0% of total investments. |
14
See Notes to Financial Statements.
Eaton Vance
New Jersey Municipal Income Fund
July 31, 2024
Portfolio of Investments — continued
| Abbreviations: |
| AGC | – Assured Guaranty Corp. |
| AGM | – Assured Guaranty Municipal Corp. |
| AMT | – Interest earned from these securities may be considered a tax preference item for purposes of the Federal Alternative Minimum Tax. |
| BAM | – Build America Mutual Assurance Co. |
| LOC | – Letter of Credit |
| NPFG | – National Public Finance Guarantee Corp. |
| SFMR | – Single Family Mortgage Revenue |
| SOFR | – Secured Overnight Financing Rate |
| SPA | – Standby Bond Purchase Agreement |
15
See Notes to Financial Statements.
Eaton Vance
Pennsylvania Municipal Income Fund
July 31, 2024
| Tax-Exempt Municipal Obligations — 96.5% |
| Security | Principal
Amount
(000's omitted) | Value |
| Bond Bank — 3.9% |
| Delaware Valley Regional Finance Authority, PA: | | | |
| 5.75%, 7/1/32 | $ | 4,500 | $ 5,208,525 |
| (LOC: TD Bank, N.A.), 3.50%, 3/1/52(1) | | 1,200 | 1,200,000 |
| | | | $ 6,408,525 |
| Cogeneration — 0.1% |
| Northampton County Industrial Development Authority, PA, (Northampton Generating), (AMT), 5.00%, 6/30/27(2) | $ | 1,323 | $ 238,218 |
| | | | $ 238,218 |
| Education — 11.5% |
| Allegheny County Higher Education Building Authority, PA, (Carnegie Mellon University), 4.035%, (70% of SOFR + 0.29%), 8/1/27 (Put Date), 2/1/33(3) | $ | 1,600 | $ 1,573,488 |
| Bethlehem Redevelopment Authority, PA, (Moravian University): | | | |
| 4.00%, 10/1/38 | | 60 | 59,012 |
| 5.25%, 10/1/49 | | 1,600 | 1,671,680 |
| Bucks County Industrial Development Authority, PA, (George School), 3.75%, 9/15/43 | | 525 | 486,455 |
| Delaware County Authority, PA, (Haverford College), 5.00%, 10/1/42 | | 1,075 | 1,103,498 |
| Delaware County Authority, PA, (Villanova University), 5.00%, 8/1/45 | | 2,715 | 2,742,964 |
| Lehigh County General Purpose Authority, PA, (Lehigh Valley Academy Regional Charter School), 4.00%, 6/1/57 | | 2,000 | 1,699,920 |
| Pennsylvania Economic Development Financing Authority, (Villanova University), 4.00%, 8/1/54 | | 3,010 | 2,934,720 |
| Pennsylvania Higher Educational Facilities Authority, (Bryn Mawr College), 4.00%, 12/1/48 | | 2,500 | 2,444,625 |
| Pennsylvania State University, 5.00%, 9/1/49 | | 3,000 | 3,167,460 |
| Philadelphia Authority for Industrial Development, PA, (Temple University), 5.00%, 4/1/45 | | 1,035 | 1,038,974 |
| | | | $ 18,922,796 |
| Electric Utilities — 2.4% |
| Philadelphia, PA, Gas Works Revenue: | | | |
| 5.00%, 8/1/47 | $ | 3,000 | $ 3,061,320 |
| (LOC: TD Bank, N.A.), 3.65%, 8/1/31(1) | | 925 | 925,000 |
| | | | $ 3,986,320 |
| Security | Principal
Amount
(000's omitted) | Value |
| General Obligations — 8.3% |
| Allegheny County, PA, 5.00%, 11/1/43 | $ | 1,690 | $ 1,768,822 |
| Bethel Park School District, PA, 5.25%, 8/1/43 | | 2,100 | 2,348,955 |
| Cornwall-Lebanon School District, PA, 4.00%, 2/15/47 | | 1,250 | 1,225,337 |
| Delaware County, PA, 5.00%, 8/1/46 | | 2,200 | 2,393,072 |
| Lower Merion School District, PA, 1.50%, 11/15/25 | | 2,660 | 2,575,465 |
| Lower Paxton Township, PA, 5.00%, 4/1/49 | | 1,000 | 1,053,630 |
| Muhlenberg School District, PA, 5.00%, 5/15/49 | | 1,000 | 1,063,080 |
| Puerto Rico: | | | |
| 5.625%, 7/1/29 | | 500 | 537,260 |
| 5.75%, 7/1/31 | | 750 | 831,458 |
| | | | $ 13,797,079 |
| Hospital — 16.6% |
| Allegheny County Hospital Development Authority, PA, (Allegheny Health Network Obligated Group): | | | |
| 4.00%, 4/1/44 | $ | 1,750 | $ 1,661,030 |
| 5.00%, 4/1/47 | | 2,220 | 2,267,397 |
| Chester County Health and Education Facilities Authority, PA, (Main Line Health System), 4.00%, 10/1/42 | | 1,265 | 1,242,673 |
| Geisinger Authority, PA, (Geisinger Health System): | | | |
| 4.00%, 4/1/39 | | 2,000 | 2,005,500 |
| 5.00%, 2/15/45 | | 2,150 | 2,193,236 |
| Lancaster County Hospital Authority, PA, (Penn State Health), 5.00%, 11/1/46 | | 1,500 | 1,565,025 |
| Lehigh County General Purpose Authority, PA, (Lehigh Valley Health Network), 4.00%, 7/1/49 | | 2,000 | 1,882,540 |
| Montgomery County Higher Education and Health Authority, PA, (Thomas Jefferson University Obligated Group), 5.00%, 5/1/57 | | 2,000 | 2,073,100 |
| Northampton County General Purpose Authority, PA, (St. Luke's University Health Network), (LOC: TD Bank, N.A.), 4.05%, 8/15/54(4) | | 1,000 | 1,000,000 |
| Pennsylvania Economic Development Financing Authority, (UPMC), 4.00%, 11/15/42 | | 3,000 | 2,880,150 |
| Pennsylvania Higher Educational Facilities Authority, (Thomas Jefferson University), 5.00%, 9/1/45 | | 2,000 | 2,007,380 |
| Pennsylvania Higher Educational Facilities Authority, (University of Pennsylvania Health System), 4.00%, 8/15/38 | | 2,225 | 2,256,573 |
| Southcentral Pennsylvania General Authority, (WellSpan Health Obligated Group): | | | |
| 4.00%, 6/1/49 | | 3,000 | 2,868,120 |
| (SPA: U.S. Bank, N.A.), 4.10%, 6/1/35(4) | | 1,500 | 1,500,000 |
| | | | $ 27,402,724 |
16
See Notes to Financial Statements.
Eaton Vance
Pennsylvania Municipal Income Fund
July 31, 2024
Portfolio of Investments — continued
| Security | Principal
Amount
(000's omitted) | Value |
| Housing — 4.1% |
| Pennsylvania Housing Finance Agency, SFMR: | | | |
| 2.50%, 10/1/45 | $ | 1,350 | $ 982,517 |
| Social Bonds, 4.40%, 10/1/38 | | 1,000 | 1,023,950 |
| Social Bonds, 4.75%, 10/1/49 | | 2,000 | 2,022,520 |
| Social Bonds, 5.00%, 10/1/50 | | 1,100 | 1,137,180 |
| Sustainability Bonds, 5.45%, 4/1/51 | | 1,500 | 1,582,965 |
| | | | $ 6,749,132 |
| Industrial Development Revenue — 2.1% |
| Luzerne County Industrial Development Authority, PA, (Pennsylvania-American Water Co.), (AMT), 2.45% to 12/3/29 (Put Date), 12/1/39 | $ | 750 | $ 681,150 |
| Montgomery County Industrial Development Authority, PA, (Constellation Energy Generation LLC), 4.10% to 4/3/28 (Put Date), 4/1/53 | | 2,000 | 2,044,400 |
| Pennsylvania Economic Development Financing Authority, (Covanta), Green Bonds, (AMT), 3.25%, 8/1/39(5) | | 1,000 | 809,500 |
| | | | $ 3,535,050 |
| Insured - Education — 1.3% |
| State Public School Building Authority, PA, (Delaware County Community College): | | | |
| (BAM), 4.00%, 10/1/42 | $ | 1,000 | $ 977,140 |
| (BAM), 4.125%, 10/1/48 | | 1,250 | 1,193,050 |
| | | | $ 2,170,190 |
| Insured - Electric Utilities — 0.7% |
| Puerto Rico Electric Power Authority, (NPFG), 5.25%, 7/1/34 | $ | 1,130 | $ 1,117,062 |
| | | | $ 1,117,062 |
| Insured - Escrowed/Prerefunded — 1.4% |
| McKeesport Area School District, PA, (AMBAC), Escrowed to Maturity, 0.00%, 10/1/25 | $ | 2,320 | $ 2,236,387 |
| | | | $ 2,236,387 |
| Insured - General Obligations — 4.1% |
| Cambria County, PA, (BAM), 5.00%, 8/1/30 | $ | 1,050 | $ 1,051,512 |
| Cumberland Valley School District, PA, (AGM), 5.00%, 11/15/42 | | 1,410 | 1,558,867 |
| Hopewell School District, PA, (AGM), 0.00%, 9/1/26 | | 1,000 | 928,420 |
| Lake-Lehman School District, PA, (NPFG), 0.00%, 4/1/26 | | 1,315 | 1,234,680 |
| Lancaster School District, PA, (AGM), 4.00%, 6/1/36 | | 60 | 60,809 |
| Northern Lebanon School District, PA, (BAM), 3.00%, 9/1/42 | | 2,245 | 1,916,332 |
| | | | $ 6,750,620 |
| Security | Principal
Amount
(000's omitted) | Value |
| Insured - Hospital — 1.6% |
| Northampton County General Purpose Authority, PA, (St. Luke's University Health Network), (AGM), 5.00%, 8/15/49 | $ | 2,500 | $ 2,715,525 |
| | | | $ 2,715,525 |
| Insured - Transportation — 3.7% |
| Allegheny County Airport Authority, PA, (Pittsburgh International Airport): | | | |
| (AGM), (AMT), 5.50%, 1/1/41 | $ | 1,000 | $ 1,122,020 |
| (AGM), (AMT), 5.50%, 1/1/42 | | 1,000 | 1,117,790 |
| Pennsylvania Economic Development Financing Authority, (PennDOT Major Bridges Package One), (AGM), (AMT), 5.50%, 6/30/42 | | 1,500 | 1,656,570 |
| Pennsylvania Turnpike Commission, (AGM), 6.375%, 12/1/38 | | 2,000 | 2,196,780 |
| | | | $ 6,093,160 |
| Insured - Water and Sewer — 6.5% |
| Allegheny County Sanitary Authority, PA, (BAM), 5.00%, 12/1/28 | $ | 1,000 | $ 1,001,230 |
| Bucks County Water and Sewer Authority, PA, (AGM), 4.25%, 12/1/47 | | 1,200 | 1,198,428 |
| Philadelphia, PA, Water and Wastewater Revenue, (AGM), 5.00%, 9/1/43 | | 3,500 | 3,846,955 |
| Pittsburgh Water and Sewer Authority, PA, (AGM), 5.50%, 9/1/47 | | 4,250 | 4,751,628 |
| | | | $ 10,798,241 |
| Lease Revenue/Certificates of Participation — 3.7% |
| Commonwealth Financing Authority, PA, 5.00%, 6/1/35 | $ | 2,950 | $ 3,140,364 |
| Pennsylvania Economic Development Financing Authority, (Pennsylvania Rapid Bridge Replacement), 5.00%, 12/31/34 | | 2,970 | 3,011,253 |
| | | | $ 6,151,617 |
| Senior Living/Life Care — 2.3% |
| Franklin County Industrial Development Authority, PA, (Menno-Haven, Inc.): | | | |
| 5.00%, 12/1/29 | $ | 815 | $ 826,345 |
| 5.00%, 12/1/33 | | 455 | 461,866 |
| Lancaster County Hospital Authority, PA, (Brethren Village), 5.25%, 7/1/41 | | 1,260 | 1,258,538 |
17
See Notes to Financial Statements.
Eaton Vance
Pennsylvania Municipal Income Fund
July 31, 2024
Portfolio of Investments — continued
| Security | Principal
Amount
(000's omitted) | Value |
| Senior Living/Life Care (continued) |
| Montgomery County Industrial Development Authority, PA, (ACTS Retirement-Life Communities, Inc. Obligated Group), 4.00%, 11/15/43 | $ | 200 | $ 189,660 |
| Montgomery County Industrial Development Authority, PA, (Whitemarsh Continuing Care Retirement Community), 5.00%, 1/1/33 | | 1,000 | 1,000,850 |
| | | | $ 3,737,259 |
| Special Tax Revenue — 4.9% |
| Allentown Neighborhood Improvement Zone Development Authority, PA, (City Center Project), 5.00%, 5/1/42(5) | $ | 1,750 | $ 1,754,550 |
| American Samoa Economic Development Authority, 5.00%, 9/1/38(5) | | 200 | 202,260 |
| Pennsylvania Turnpike Commission, 4.00%, 12/1/51 | | 1,000 | 922,630 |
| Puerto Rico Sales Tax Financing Corp.: | | | |
| 0.00%, 7/1/27 | | 34 | 30,473 |
| 0.00%, 7/1/29 | | 34 | 28,294 |
| 0.00%, 7/1/31 | | 43 | 32,995 |
| 0.00%, 7/1/33 | | 60 | 42,333 |
| 0.00%, 7/1/46 | | 500 | 166,930 |
| 0.00%, 7/1/51 | | 402 | 97,847 |
| 4.50%, 7/1/34 | | 100 | 100,165 |
| 4.536%, 7/1/53 | | 5 | 4,813 |
| 5.00%, 7/1/58 | | 2,533 | 2,546,298 |
| Southeastern Pennsylvania Transportation Authority, 5.25%, 6/1/47 | | 2,000 | 2,196,540 |
| | | | $ 8,126,128 |
| Transportation — 14.9% |
| Allegheny County Airport Authority, PA, (Pittsburgh International Airport): | | | |
| (AMT), 4.00%, 1/1/37 | $ | 5,000 | $ 5,006,200 |
| (AMT), 5.00%, 1/1/56 | | 1,000 | 1,032,830 |
| Pennsylvania Economic Development Financing Authority, (PennDOT Major Bridges Package One), (AMT), 5.25%, 6/30/53 | | 1,500 | 1,550,415 |
| Pennsylvania Turnpike Commission: | | | |
| 4.00%, 12/1/43 | | 1,750 | 1,755,180 |
| 4.25%, 12/1/41 | | 1,125 | 1,165,849 |
| 4.25%, 12/1/44 | | 1,380 | 1,412,471 |
| 4.36%, (SIFMA + 0.85%), 7/15/26 (Put Date), 7/15/41(3) | | 1,000 | 1,000,410 |
| 5.00%, 12/1/46 | | 1,835 | 1,869,296 |
| 5.00%, 12/1/48 | | 1,500 | 1,630,155 |
| Philadelphia, PA, Airport Revenue: | | | |
| 5.00%, 7/1/47 | | 3,955 | 4,054,350 |
| (AMT), 5.00%, 7/1/33 | | 1,000 | 1,078,800 |
| Security | Principal
Amount
(000's omitted) | Value |
| Transportation (continued) |
| Philadelphia, PA, Airport Revenue: (continued) | | | |
| (AMT), 5.00%, 7/1/51 | $ | 3,000 | $ 3,112,410 |
| | | | $ 24,668,366 |
| Water and Sewer — 2.4% |
| Clairton Municipal Authority, PA: | | | |
| 4.00%, 12/1/38 | $ | 1,000 | $ 1,002,020 |
| 4.375%, 12/1/42 | | 1,845 | 1,867,435 |
| Philadelphia, PA, Water and Wastewater Revenue, 5.00%, 10/1/43 | | 1,000 | 1,052,950 |
| | | | $ 3,922,405 |
Total Tax-Exempt Municipal Obligations
(identified cost $155,692,985) | | | $159,526,804 |
| Taxable Municipal Obligations — 2.7% |
| Security | Principal
Amount
(000's omitted) | Value |
| Cogeneration — 0.1% |
| Northampton County Industrial Development Authority, PA, (Northampton Generating), 5.00%, 6/30/27(2) | $ | 729 | $ 131,215 |
| | | | $ 131,215 |
| General Obligations — 1.1% |
| Pennsylvania, 4.65%, 2/15/26(6) | $ | 1,855 | $ 1,849,101 |
| | | | $ 1,849,101 |
| Lease Revenue/Certificates of Participation — 0.8% |
| Commonwealth Financing Authority, PA, 3.864%, 6/1/38 | $ | 1,500 | $ 1,381,665 |
| | | | $ 1,381,665 |
18
See Notes to Financial Statements.
Eaton Vance
Pennsylvania Municipal Income Fund
July 31, 2024
Portfolio of Investments — continued
| Security | Principal
Amount
(000's omitted) | Value |
| Other Revenue — 0.7% |
| Philadelphia Industrial Development Authority, PA, City Service Agreement Revenue, 3.964%, 4/15/26 | $ | 1,075 | $ 1,062,057 |
| | | | $ 1,062,057 |
Total Taxable Municipal Obligations
(identified cost $4,968,828) | | | $ 4,424,038 |
Total Investments — 99.2%
(identified cost $160,661,813) | | | $163,950,842 |
| Other Assets, Less Liabilities — 0.8% | | | $ 1,343,616 |
| Net Assets — 100.0% | | | $165,294,458 |
| The percentage shown for each investment category in the Portfolio of Investments is based on net assets. |
| (1) | Variable rate demand obligation that may be tendered at par on any day for payment the lesser of 5 business days or 7 calendar days. The stated interest rate, which generally resets weekly, is determined by the remarketing agent and represents the rate in effect at July 31, 2024. |
| (2) | Represents a payment-in-kind security which may pay interest in additional principal at the issuer’s discretion. |
| (3) | Floating rate security. The stated interest rate represents the rate in effect at July 31, 2024. |
| (4) | Variable rate demand obligation that may be tendered at par on any day for payment the same or next business day. The stated interest rate, which generally resets daily, is determined by the remarketing agent and represents the rate in effect at July 31, 2024. |
| (5) | Security exempt from registration under Rule 144A of the Securities Act of 1933, as amended. These securities may be sold in certain transactions in reliance on an exemption from registration (normally to qualified institutional buyers). At July 31, 2024, the aggregate value of these securities is $2,766,310 or 1.7% of the Fund's net assets. |
| (6) | Build America Bond. Represents taxable municipal obligation issued pursuant to the American Recovery and Reinvestment Act of 2009 or other legislation providing for the issuance of taxable municipal debt on which the issuer receives federal support. |
| The Fund invests primarily in debt securities issued by Pennsylvania municipalities. The ability of the issuers of the debt securities to meet their obligations may be affected by economic developments in a specific industry or municipality. At July 31, 2024, 19.4% of total investments are backed by bond insurance of various financial institutions and financial guaranty assurance agencies. The aggregate percentage insured by an individual financial institution or financial guaranty assurance agency ranged from 1.4% to 12.9% of total investments. |
| Abbreviations: |
| AGM | – Assured Guaranty Municipal Corp. |
| AMBAC | – AMBAC Financial Group, Inc. |
| AMT | – Interest earned from these securities may be considered a tax preference item for purposes of the Federal Alternative Minimum Tax. |
| BAM | – Build America Mutual Assurance Co. |
| LOC | – Letter of Credit |
| NPFG | – National Public Finance Guarantee Corp. |
| SFMR | – Single Family Mortgage Revenue |
| SIFMA | – Securities Industry and Financial Markets Association Municipal Swap Index |
| SOFR | – Secured Overnight Financing Rate |
| SPA | – Standby Bond Purchase Agreement |
19
See Notes to Financial Statements.
Eaton Vance
Municipal Income Funds
July 31, 2024
Statements of Assets and Liabilities
| | July 31, 2024 |
| | Arizona Fund | Connecticut Fund | Minnesota Fund |
| Assets | | | |
| Investments: | | | |
| Identified cost | $77,577,140 | $113,471,687 | $248,699,880 |
| Unrealized appreciation | 1,112,862 | 784,526 | 1,182,976 |
| Investments, at value | $78,690,002 | $114,256,213 | $249,882,856 |
| Cash | $133,991 | $356,204 | $2,794,661 |
| Interest receivable | 479,077 | 1,033,741 | 3,082,319 |
| Receivable for investments sold | — | — | 5,025 |
| Receivable for Fund shares sold | 356,325 | 11,796 | 157,774 |
| Trustees' deferred compensation plan | 20,922 | 31,235 | 21,622 |
| Total assets | $79,680,317 | $115,689,189 | $255,944,257 |
| Liabilities | | | |
| Payable for when-issued securities | $— | $— | $7,439,615 |
| Payable for Fund shares redeemed | 143,662 | 59,784 | 434,422 |
| Distributions payable | 14,054 | 71,634 | 110,743 |
| Payable to affiliates: | | | |
| Investment adviser fee | 20,762 | 32,636 | 78,951 |
| Distribution and service fees | 7,033 | 8,762 | 12,948 |
| Trustees' deferred compensation plan | 20,922 | 31,235 | 21,622 |
| Payable for legal and accounting services | 53,298 | 48,829 | 53,426 |
| Accrued expenses | 42,762 | 45,422 | 82,962 |
| Total liabilities | $302,493 | $298,302 | $8,234,689 |
| Net Assets | $79,377,824 | $115,390,887 | $247,709,568 |
| Sources of Net Assets | | | |
| Paid-in capital | $80,451,881 | $117,339,123 | $254,443,208 |
| Accumulated loss | (1,074,057) | (1,948,236) | (6,733,640) |
| Net Assets | $79,377,824 | $115,390,887 | $247,709,568 |
| Class A Shares | | | |
| Net Assets | $33,450,935 | $40,577,858 | $66,444,569 |
| Shares Outstanding | 3,704,063 | 4,278,462 | 7,352,121 |
Net Asset Value and Redemption Price Per Share
(net assets ÷ shares of beneficial interest outstanding) | $9.03 | $9.48 | $9.04 |
Maximum Offering Price Per Share
(100 ÷ 96.75 of net asset value per share) | $9.33 | $9.80 | $9.34 |
| Class C Shares | | | |
| Net Assets | $1,656,322 | $2,292,415 | $2,105,211 |
| Shares Outstanding | 165,000 | 242,593 | 216,587 |
Net Asset Value and Offering Price Per Share*
(net assets ÷ shares of beneficial interest outstanding) | $10.04 | $9.45 | $9.72 |
| Class I Shares | | | |
| Net Assets | $44,270,567 | $72,520,614 | $179,159,788 |
| Shares Outstanding | 4,902,072 | 7,644,585 | 19,824,448 |
Net Asset Value, Offering Price and Redemption Price Per Share
(net assets ÷ shares of beneficial interest outstanding) | $9.03 | $9.49 | $9.04 |
| On sales of $100,000 or more, the offering price of Class A shares is reduced. |
| * | Redemption price per share is equal to the net asset value less any applicable contingent deferred sales charge. |
20
See Notes to Financial Statements.
Eaton Vance
Municipal Income Funds
July 31, 2024
Statements of Assets and Liabilities — continued
| | July 31, 2024 |
| | New Jersey Fund | Pennsylvania Fund |
| Assets | | |
| Investments: | | |
| Identified cost | $150,148,800 | $160,661,813 |
| Unrealized appreciation | 459,084 | 3,289,029 |
| Investments, at value | $150,607,884 | $163,950,842 |
| Cash | $826,682 | $91,372 |
| Interest receivable | 1,038,607 | 1,749,606 |
| Receivable for investments sold | — | 75,000 |
| Receivable for Fund shares sold | 51,207 | 41,748 |
| Trustees' deferred compensation plan | 62,957 | 71,939 |
| Total assets | $152,587,337 | $165,980,507 |
| Liabilities | | |
| Payable for when-issued securities | $1,010,210 | $— |
| Payable for Fund shares redeemed | 181,161 | 297,205 |
| Distributions payable | 58,266 | 106,137 |
| Payable to affiliates: | | |
| Investment adviser fee | 46,275 | 52,746 |
| Distribution and service fees | 16,622 | 17,104 |
| Trustees' deferred compensation plan | 62,957 | 71,939 |
| Payable for legal and accounting services | 67,102 | 77,590 |
| Accrued expenses | 59,596 | 63,328 |
| Total liabilities | $1,502,189 | $686,049 |
| Net Assets | $151,085,148 | $165,294,458 |
| Sources of Net Assets | | |
| Paid-in capital | $159,721,422 | $182,700,826 |
| Accumulated loss | (8,636,274) | (17,406,368) |
| Net Assets | $151,085,148 | $165,294,458 |
| Class A Shares | | |
| Net Assets | $75,776,797 | $84,636,034 |
| Shares Outstanding | 8,767,494 | 10,858,953 |
Net Asset Value and Redemption Price Per Share
(net assets ÷ shares of beneficial interest outstanding) | $8.64 | $7.79 |
Maximum Offering Price Per Share
(100 ÷ 96.75 of net asset value per share) | $8.93 | $8.05 |
| Class C Shares | | |
| Net Assets | $4,555,096 | $3,498,896 |
| Shares Outstanding | 505,672 | 433,438 |
Net Asset Value and Offering Price Per Share*
(net assets ÷ shares of beneficial interest outstanding) | $9.01 | $8.07 |
| Class I Shares | | |
| Net Assets | $70,753,255 | $77,159,528 |
| Shares Outstanding | 8,170,575 | 9,861,928 |
Net Asset Value, Offering Price and Redemption Price Per Share
(net assets ÷ shares of beneficial interest outstanding) | $8.66 | $7.82 |
| On sales of $100,000 or more, the offering price of Class A shares is reduced. |
| * | Redemption price per share is equal to the net asset value less any applicable contingent deferred sales charge. |
21
See Notes to Financial Statements.
Eaton Vance
Municipal Income Funds
July 31, 2024
| | Year Ended July 31, 2024 |
| | Arizona Fund | Connecticut Fund | Minnesota Fund |
| Investment Income | | | |
| Interest income | $2,956,577 | $4,004,593 | $8,926,241 |
| Total investment income | $2,956,577 | $4,004,593 | $8,926,241 |
| Expenses | | | |
| Investment adviser fee | $232,134 | $354,241 | $887,103 |
| Distribution and service fees: | | | |
| Class A | 62,483 | 86,378 | 131,765 |
| Class C | 18,549 | 24,506 | 21,404 |
| Trustees’ fees and expenses | 5,304 | 7,350 | 15,482 |
| Custodian fee | 27,218 | 32,306 | 57,762 |
| Transfer and dividend disbursing agent fees | 21,258 | 38,880 | 76,434 |
| Legal and accounting services | 59,828 | 58,770 | 70,982 |
| Printing and postage | 6,072 | 8,570 | 14,604 |
| Registration fees | 18,590 | 9,029 | 13,991 |
| Miscellaneous | 30,634 | 30,646 | 49,627 |
| Total expenses | $482,070 | $650,676 | $1,339,154 |
| Net investment income | $2,474,507 | $3,353,917 | $7,587,087 |
| Realized and Unrealized Gain (Loss) | | | |
| Net realized gain (loss): | | | |
| Investment transactions | $(657,089) | $(426,251) | $(3,428,427) |
| Net realized loss | $(657,089) | $(426,251) | $(3,428,427) |
| Change in unrealized appreciation (depreciation): | | | |
| Investments | $1,839,124 | $1,943,207 | $4,571,882 |
| Net change in unrealized appreciation (depreciation) | $1,839,124 | $1,943,207 | $4,571,882 |
| Net realized and unrealized gain | $1,182,035 | $1,516,956 | $1,143,455 |
| Net increase in net assets from operations | $3,656,542 | $4,870,873 | $8,730,542 |
22
See Notes to Financial Statements.
Eaton Vance
Municipal Income Funds
July 31, 2024
Statements of Operations — continued
| | Year Ended July 31, 2024 |
| | New Jersey Fund | Pennsylvania Fund |
| Investment Income | | |
| Interest income | $6,021,196 | $7,016,746 |
| Total investment income | $6,021,196 | $7,016,746 |
| Expenses | | |
| Investment adviser fee | $539,080 | $602,108 |
| Distribution and service fees: | | |
| Class A | 153,133 | 168,062 |
| Class C | 49,633 | 34,264 |
| Trustees’ fees and expenses | 9,971 | 10,684 |
| Custodian fee | 40,510 | 42,456 |
| Transfer and dividend disbursing agent fees | 67,184 | 75,414 |
| Legal and accounting services | 78,682 | 88,598 |
| Printing and postage | 10,348 | 12,022 |
| Registration fees | 9,057 | 7,090 |
| Miscellaneous | 32,814 | 36,295 |
| Total expenses | $990,412 | $1,076,993 |
| Net investment income | $5,030,784 | $5,939,753 |
| Realized and Unrealized Gain (Loss) | | |
| Net realized gain (loss): | | |
| Investment transactions | $(2,197,869) | $(2,667,233) |
| Net realized loss | $(2,197,869) | $(2,667,233) |
| Change in unrealized appreciation (depreciation): | | |
| Investments | $2,954,174 | $4,153,968 |
| Net change in unrealized appreciation (depreciation) | $2,954,174 | $4,153,968 |
| Net realized and unrealized gain | $756,305 | $1,486,735 |
| Net increase in net assets from operations | $5,787,089 | $7,426,488 |
23
See Notes to Financial Statements.
Eaton Vance
Municipal Income Funds
July 31, 2024
Statements of Changes in Net Assets
| | Year Ended July 31, 2024 |
| | Arizona Fund | Connecticut Fund | Minnesota Fund |
| Increase (Decrease) in Net Assets | | | |
| From operations: | | | |
| Net investment income | $2,474,507 | $3,353,917 | $7,587,087 |
| Net realized loss | (657,089) | (426,251) | (3,428,427) |
| Net change in unrealized appreciation (depreciation) | 1,839,124 | 1,943,207 | 4,571,882 |
| Net increase in net assets from operations | $3,656,542 | $4,870,873 | $8,730,542 |
| Distributions to shareholders: | | | |
| Class A | $(975,667) | $(1,281,637) | $(2,038,278) |
| Class C | (46,183) | (57,129) | (52,736) |
| Class I | (1,416,634) | (1,919,577) | (5,467,413) |
| Total distributions to shareholders | $(2,438,484) | $(3,258,343) | $(7,558,427) |
| Transactions in shares of beneficial interest: | | | |
| Class A | $3,231,651 | $(6,105,101) | $(674,908) |
| Class C | (390,763) | (414,254) | (225,370) |
| Class I | (1,993,997) | 17,545,576 | 11,937,166 |
| Net increase in net assets from Fund share transactions | $846,891 | $11,026,221 | $11,036,888 |
| Net increase in net assets | $2,064,949 | $12,638,751 | $12,209,003 |
| Net Assets | | | |
| At beginning of year | $77,312,875 | $102,752,136 | $235,500,565 |
| At end of year | $79,377,824 | $115,390,887 | $247,709,568 |
24
See Notes to Financial Statements.
Eaton Vance
Municipal Income Funds
July 31, 2024
Statements of Changes in Net Assets — continued
| | Year Ended July 31, 2024 |
| | New Jersey Fund | Pennsylvania Fund |
| Increase (Decrease) in Net Assets | | |
| From operations: | | |
| Net investment income | $5,030,784 | $5,939,753 |
| Net realized loss | (2,197,869) | (2,667,233) |
| Net change in unrealized appreciation (depreciation) | 2,954,174 | 4,153,968 |
| Net increase in net assets from operations | $5,787,089 | $7,426,488 |
| Distributions to shareholders: | | |
| Class A | $(2,327,697) | $(3,046,165) |
| Class C | (119,366) | (103,576) |
| Class I | (2,227,327) | (2,753,599) |
| Total distributions to shareholders | $(4,674,390) | $(5,903,340) |
| Transactions in shares of beneficial interest: | | |
| Class A | $(4,630,536) | $(2,600,532) |
| Class C | (1,510,820) | (699,809) |
| Class I | 4,518,613 | 8,118,383 |
| Net increase (decrease) in net assets from Fund share transactions | $(1,622,743) | $4,818,042 |
| Net increase (decrease) in net assets | $(510,044) | $6,341,190 |
| Net Assets | | |
| At beginning of year | $151,595,192 | $158,953,268 |
| At end of year | $151,085,148 | $165,294,458 |
25
See Notes to Financial Statements.
Eaton Vance
Municipal Income Funds
July 31, 2024
Statements of Changes in Net Assets — continued
| | Year Ended July 31, 2023 |
| | Arizona Fund | Connecticut Fund | Minnesota Fund |
| Increase (Decrease) in Net Assets | | | |
| From operations: | | | |
| Net investment income | $2,035,608 | $2,580,676 | $5,284,192 |
| Net realized loss | (693,204) | (832,131) | (2,496,431) |
| Net change in unrealized appreciation (depreciation) | (910,949) | (1,239,606) | (2,716,831) |
| Net increase in net assets from operations | $431,455 | $508,939 | $70,930 |
| Distributions to shareholders: | | | |
| Class A | $(810,851) | $(1,216,579) | $(1,222,153) |
| Class C | (39,204) | (51,421) | (35,332) |
| Class I | (1,167,606) | (1,275,740) | (4,020,452) |
| Total distributions to shareholders | $(2,017,661) | $(2,543,740) | $(5,277,937) |
| Transactions in shares of beneficial interest: | | | |
| Class A | $(728,950) | $(533,329) | $13,702,008 |
| Class C | (303,408) | (191,356) | (132,083) |
| Class I | 13,427,486 | 17,045,876 | 22,473,003 |
| Net increase in net assets from Fund share transactions | $12,395,128 | $16,321,191 | $36,042,928 |
| Net increase in net assets | $10,808,922 | $14,286,390 | $30,835,921 |
| Net Assets | | | |
| At beginning of year | $66,503,953 | $88,465,746 | $204,664,644 |
| At end of year | $77,312,875 | $102,752,136 | $235,500,565 |
26
See Notes to Financial Statements.
Eaton Vance
Municipal Income Funds
July 31, 2024
Statements of Changes in Net Assets — continued
| | Year Ended July 31, 2023 |
| | New Jersey Fund | Pennsylvania Fund |
| Increase (Decrease) in Net Assets | | |
| From operations: | | |
| Net investment income | $4,360,042 | $5,124,905 |
| Net realized loss | (3,006,798) | (4,097,586) |
| Net change in unrealized appreciation (depreciation) | (1,324,856) | (260,135) |
| Net increase in net assets from operations | $28,388 | $767,184 |
| Distributions to shareholders: | | |
| Class A | $(2,324,990) | $(2,737,401) |
| Class C | (131,824) | (109,776) |
| Class I | (1,834,979) | (2,152,618) |
| Total distributions to shareholders | $(4,291,793) | $(4,999,795) |
| Transactions in shares of beneficial interest: | | |
| Class A | $(5,119,843) | $(1,658,297) |
| Class C | (609,124) | (982,369) |
| Class I | 7,531,108 | 9,926,079 |
| Net increase in net assets from Fund share transactions | $1,802,141 | $7,285,413 |
| Net increase (decrease) in net assets | $(2,461,264) | $3,052,802 |
| Net Assets | | |
| At beginning of year | $154,056,456 | $155,900,466 |
| At end of year | $151,595,192 | $158,953,268 |
27
See Notes to Financial Statements.
Eaton Vance
Municipal Income Funds
July 31, 2024
| | Arizona Fund — Class A |
| | Year Ended July 31, |
| | 2024 | 2023 | 2022 | 2021 | 2020 |
| Net asset value — Beginning of year | $8.86 | $9.08 | $9.93 | $9.91 | $9.75 |
| Income (Loss) From Operations | | | | | |
| Net investment income(1) | $0.28 | $0.24 | $0.20 | $0.21 | $0.24 |
| Net realized and unrealized gain (loss) | 0.17 | (0.22) | (0.85) | 0.03 | 0.18 |
| Total income (loss) from operations | $0.45 | $0.02 | $(0.65) | $0.24 | $0.42 |
| Less Distributions | | | | | |
| From net investment income | $(0.28) | $(0.24) | $(0.20) | $(0.22) | $(0.26) |
| Total distributions | $(0.28) | $(0.24) | $(0.20) | $(0.22) | $(0.26) |
| Net asset value — End of year | $9.03 | $8.86 | $9.08 | $9.93 | $9.91 |
| Total Return(2) | 5.15% | 0.23% | (6.59)% | 2.44% | 4.38% |
| Ratios/Supplemental Data | | | | | |
| Net assets, end of year (000’s omitted) | $33,451 | $29,664 | $31,125 | $41,643 | $38,854 |
| Ratios (as a percentage of average daily net assets):(3) | | | | | |
| Total expenses | 0.73% | 0.73% | 0.69% | 0.67% | 0.68% |
| Net expenses | 0.73% | 0.73% | 0.69% | 0.67% | 0.68% |
| Net investment income | 3.17% | 2.71% | 2.11% | 2.08% | 2.44% |
| Portfolio Turnover | 58% | 36% | 19% | 26% | 16% |
| (1) | Computed using average shares outstanding. |
| (2) | Returns are historical and are calculated by determining the percentage change in net asset value with all distributions reinvested and do not reflect the effect of sales charges. |
| (3) | Total expenses do not reflect amounts reimbursed and/or waived by the adviser and certain of its affiliates, if applicable. Net expenses are net of all reductions and represent the net expenses paid by the Fund. |
28
See Notes to Financial Statements.
Eaton Vance
Municipal Income Funds
July 31, 2024
Financial Highlights — continued
| | Arizona Fund — Class C |
| | Year Ended July 31, |
| | 2024 | 2023 | 2022 | 2021 | 2020 |
| Net asset value — Beginning of year | $9.85 | $10.10 | $11.04 | $11.02 | $10.84 |
| Income (Loss) From Operations | | | | | |
| Net investment income(1) | $0.24 | $0.19 | $0.14 | $0.15 | $0.18 |
| Net realized and unrealized gain (loss) | 0.18 | (0.25) | (0.94) | 0.03 | 0.21 |
| Total income (loss) from operations | $0.42 | $(0.06) | $(0.80) | $0.18 | $0.39 |
| Less Distributions | | | | | |
| From net investment income | $(0.23) | $(0.19) | $(0.14) | $(0.16) | $(0.21) |
| Total distributions | $(0.23) | $(0.19) | $(0.14) | $(0.16) | $(0.21) |
| Net asset value — End of year | $10.04 | $9.85 | $10.10 | $11.04 | $11.02 |
| Total Return(2) | 4.37% | (0.57)% | (7.24)% | 1.67% | 3.65% |
| Ratios/Supplemental Data | | | | | |
| Net assets, end of year (000’s omitted) | $1,656 | $2,012 | $2,384 | $3,684 | $4,490 |
| Ratios (as a percentage of average daily net assets):(3) | | | | | |
| Total expenses | 1.48% | 1.48% | 1.44% | 1.42% | 1.43% |
| Net expenses | 1.48% | 1.48% | 1.44% | 1.42% | 1.43% |
| Net investment income | 2.41% | 1.95% | 1.35% | 1.35% | 1.69% |
| Portfolio Turnover | 58% | 36% | 19% | 26% | 16% |
| (1) | Computed using average shares outstanding. |
| (2) | Returns are historical and are calculated by determining the percentage change in net asset value with all distributions reinvested and do not reflect the effect of sales charges. |
| (3) | Total expenses do not reflect amounts reimbursed and/or waived by the adviser and certain of its affiliates, if applicable. Net expenses are net of all reductions and represent the net expenses paid by the Fund. |
29
See Notes to Financial Statements.
Eaton Vance
Municipal Income Funds
July 31, 2024
Financial Highlights — continued
| | Arizona Fund — Class I |
| | Year Ended July 31, |
| | 2024 | 2023 | 2022 | 2021 | 2020 |
| Net asset value — Beginning of year | $8.86 | $9.08 | $9.93 | $9.91 | $9.75 |
| Income (Loss) From Operations | | | | | |
| Net investment income(1) | $0.30 | $0.26 | $0.22 | $0.22 | $0.26 |
| Net realized and unrealized gain (loss) | 0.16 | (0.22) | (0.85) | 0.04 | 0.18 |
| Total income (loss) from operations | $0.46 | $0.04 | $(0.63) | $0.26 | $0.44 |
| Less Distributions | | | | | |
| From net investment income | $(0.29) | $(0.26) | $(0.22) | $(0.24) | $(0.28) |
| Total distributions | $(0.29) | $(0.26) | $(0.22) | $(0.24) | $(0.28) |
| Net asset value — End of year | $9.03 | $8.86 | $9.08 | $9.93 | $9.91 |
| Total Return(2) | 5.36% | 0.43% | (6.40)% | 2.64% | 4.60% |
| Ratios/Supplemental Data | | | | | |
| Net assets, end of year (000’s omitted) | $44,271 | $45,637 | $32,995 | $36,212 | $22,611 |
| Ratios (as a percentage of average daily net assets):(3) | | | | | |
| Total expenses | 0.53% | 0.54% | 0.49% | 0.47% | 0.48% |
| Net expenses | 0.53% | 0.54% | 0.49% | 0.47% | 0.48% |
| Net investment income | 3.37% | 2.92% | 2.31% | 2.26% | 2.64% |
| Portfolio Turnover | 58% | 36% | 19% | 26% | 16% |
| (1) | Computed using average shares outstanding. |
| (2) | Returns are historical and are calculated by determining the percentage change in net asset value with all distributions reinvested. |
| (3) | Total expenses do not reflect amounts reimbursed and/or waived by the adviser and certain of its affiliates, if applicable. Net expenses are net of all reductions and represent the net expenses paid by the Fund. |
30
See Notes to Financial Statements.
Eaton Vance
Municipal Income Funds
July 31, 2024
Financial Highlights — continued
| | Connecticut Fund — Class A |
| | Year Ended July 31, |
| | 2024 | 2023 | 2022 | 2021 | 2020 |
| Net asset value — Beginning of year | $9.33 | $9.54 | $10.41 | $10.35 | $10.23 |
| Income (Loss) From Operations | | | | | |
| Net investment income(1) | $0.28 | $0.25 | $0.21 | $0.24 | $0.26 |
| Net realized and unrealized gain (loss) | 0.15 | (0.21) | (0.87) | 0.06 | 0.14 |
| Total income (loss) from operations | $0.43 | $0.04 | $(0.66) | $0.30 | $0.40 |
| Less Distributions | | | | | |
| From net investment income | $(0.28) | $(0.25) | $(0.21) | $(0.24) | $(0.28) |
| Total distributions | $(0.28) | $(0.25) | $(0.21) | $(0.24) | $(0.28) |
| Net asset value — End of year | $9.48 | $9.33 | $9.54 | $10.41 | $10.35 |
| Total Return(2) | 4.67% | 0.41% | (6.36)% | 2.95% | 3.99% |
| Ratios/Supplemental Data | | | | | |
| Net assets, end of year (000’s omitted) | $40,578 | $46,055 | $47,639 | $52,924 | $52,501 |
| Ratios (as a percentage of average daily net assets):(3) | | | | | |
| Total expenses | 0.71% | 0.71% | 0.69% | 0.69% | 0.72% |
| Net expenses | 0.71% | 0.71% | 0.69% | 0.69% | 0.72% |
| Net investment income | 3.06% | 2.67% | 2.15% | 2.34% | 2.59% |
| Portfolio Turnover | 41% | 32% | 31% | 19% | 26% |
| (1) | Computed using average shares outstanding. |
| (2) | Returns are historical and are calculated by determining the percentage change in net asset value with all distributions reinvested and do not reflect the effect of sales charges. |
| (3) | Total expenses do not reflect amounts reimbursed and/or waived by the adviser and certain of its affiliates, if applicable. Net expenses are net of all reductions and represent the net expenses paid by the Fund. |
31
See Notes to Financial Statements.
Eaton Vance
Municipal Income Funds
July 31, 2024
Financial Highlights — continued
| | Connecticut Fund — Class C |
| | Year Ended July 31, |
| | 2024 | 2023 | 2022 | 2021 | 2020 |
| Net asset value — Beginning of year | $9.30 | $9.51 | $10.37 | $10.31 | $10.19 |
| Income (Loss) From Operations | | | | | |
| Net investment income(1) | $0.21 | $0.18 | $0.14 | $0.16 | $0.19 |
| Net realized and unrealized gain (loss) | 0.15 | (0.22) | (0.86) | 0.06 | 0.13 |
| Total income (loss) from operations | $0.36 | $(0.04) | $(0.72) | $0.22 | $0.32 |
| Less Distributions | | | | | |
| From net investment income | $(0.21) | $(0.17) | $(0.14) | $(0.16) | $(0.20) |
| Total distributions | $(0.21) | $(0.17) | $(0.14) | $(0.16) | $(0.20) |
| Net asset value — End of year | $9.45 | $9.30 | $9.51 | $10.37 | $10.31 |
| Total Return(2) | 3.89% | (0.34)% | (6.99)% | 2.19% | 3.21% |
| Ratios/Supplemental Data | | | | | |
| Net assets, end of year (000’s omitted) | $2,292 | $2,663 | $2,926 | $3,815 | $5,194 |
| Ratios (as a percentage of average daily net assets):(3) | | | | | |
| Total expenses | 1.46% | 1.46% | 1.44% | 1.44% | 1.47% |
| Net expenses | 1.46% | 1.46% | 1.44% | 1.44% | 1.47% |
| Net investment income | 2.31% | 1.92% | 1.40% | 1.59% | 1.84% |
| Portfolio Turnover | 41% | 32% | 31% | 19% | 26% |
| (1) | Computed using average shares outstanding. |
| (2) | Returns are historical and are calculated by determining the percentage change in net asset value with all distributions reinvested and do not reflect the effect of sales charges. |
| (3) | Total expenses do not reflect amounts reimbursed and/or waived by the adviser and certain of its affiliates, if applicable. Net expenses are net of all reductions and represent the net expenses paid by the Fund. |
32
See Notes to Financial Statements.
Eaton Vance
Municipal Income Funds
July 31, 2024
Financial Highlights — continued
| | Connecticut Fund — Class I |
| | Year Ended July 31, |
| | 2024 | 2023 | 2022 | 2021 | 2020 |
| Net asset value — Beginning of year | $9.33 | $9.54 | $10.41 | $10.35 | $10.23 |
| Income (Loss) From Operations | | | | | |
| Net investment income(1) | $0.30 | $0.27 | $0.23 | $0.26 | $0.29 |
| Net realized and unrealized gain (loss) | 0.16 | (0.22) | (0.87) | 0.06 | 0.13 |
| Total income (loss) from operations | $0.46 | $0.05 | $(0.64) | $0.32 | $0.42 |
| Less Distributions | | | | | |
| From net investment income | $(0.30) | $(0.26) | $(0.23) | $(0.26) | $(0.30) |
| Total distributions | $(0.30) | $(0.26) | $(0.23) | $(0.26) | $(0.30) |
| Net asset value — End of year | $9.49 | $9.33 | $9.54 | $10.41 | $10.35 |
| Total Return(2) | 4.99% | 0.62% | (6.17)% | 3.16% | 4.20% |
| Ratios/Supplemental Data | | | | | |
| Net assets, end of year (000’s omitted) | $72,521 | $54,034 | $37,901 | $26,420 | $21,544 |
| Ratios (as a percentage of average daily net assets):(3) | | | | | |
| Total expenses | 0.51% | 0.50% | 0.49% | 0.49% | 0.52% |
| Net expenses | 0.51% | 0.50% | 0.49% | 0.49% | 0.52% |
| Net investment income | 3.26% | 2.88% | 2.37% | 2.53% | 2.80% |
| Portfolio Turnover | 41% | 32% | 31% | 19% | 26% |
| (1) | Computed using average shares outstanding. |
| (2) | Returns are historical and are calculated by determining the percentage change in net asset value with all distributions reinvested. |
| (3) | Total expenses do not reflect amounts reimbursed and/or waived by the adviser and certain of its affiliates, if applicable. Net expenses are net of all reductions and represent the net expenses paid by the Fund. |
33
See Notes to Financial Statements.
Eaton Vance
Municipal Income Funds
July 31, 2024
Financial Highlights — continued
| | Minnesota Fund — Class A |
| | Year Ended July 31, |
| | 2024 | 2023 | 2022 | 2021 | 2020 |
| Net asset value — Beginning of year | $8.97 | $9.18 | $9.86 | $9.84 | $9.61 |
| Income (Loss) From Operations | | | | | |
| Net investment income(1) | $0.28 | $0.21 | $0.16 | $0.17 | $0.19 |
| Net realized and unrealized gain (loss) | 0.07 | (0.21) | (0.68) | 0.02 | 0.23 |
| Total income (loss) from operations | $0.35 | $0.00(2) | $(0.52) | $0.19 | $0.42 |
| Less Distributions | | | | | |
| From net investment income | $(0.28) | $(0.21) | $(0.16) | $(0.17) | $(0.19) |
| Total distributions | $(0.28) | $(0.21) | $(0.16) | $(0.17) | $(0.19) |
| Net asset value — End of year | $9.04 | $8.97 | $9.18 | $9.86 | $9.84 |
| Total Return(3) | 3.95% | 0.05% | (5.31)% | 1.96% | 4.42% |
| Ratios/Supplemental Data | | | | | |
| Net assets, end of year (000’s omitted) | $66,445 | $66,796 | $54,415 | $62,712 | $60,367 |
| Ratios (as a percentage of average daily net assets):(4) | | | | | |
| Total expenses | 0.71% | 0.70% | 0.66% | 0.65% | 0.66% |
| Net expenses | 0.71% | 0.70% | 0.66% | 0.65% | 0.66% |
| Net investment income | 3.11% | 2.36% | 1.64% | 1.73% | 1.93% |
| Portfolio Turnover | 48% | 27% | 23% | 9% | 14% |
| (1) | Computed using average shares outstanding. |
| (2) | Amount is less than $0.005. |
| (3) | Returns are historical and are calculated by determining the percentage change in net asset value with all distributions reinvested and do not reflect the effect of sales charges. |
| (4) | Total expenses do not reflect amounts reimbursed and/or waived by the adviser and certain of its affiliates, if applicable. Net expenses are net of all reductions and represent the net expenses paid by the Fund. |
34
See Notes to Financial Statements.
Eaton Vance
Municipal Income Funds
July 31, 2024
Financial Highlights — continued
| | Minnesota Fund — Class C |
| | Year Ended July 31, |
| | 2024 | 2023 | 2022 | 2021 | 2020 |
| Net asset value — Beginning of year | $9.65 | $9.87 | $10.60 | $10.58 | $10.33 |
| Income (Loss) From Operations | | | | | |
| Net investment income(1) | $0.23 | $0.16 | $0.09 | $0.10 | $0.12 |
| Net realized and unrealized gain (loss) | 0.06 | (0.22) | (0.73) | 0.02 | 0.25 |
| Total income (loss) from operations | $0.29 | $(0.06) | $(0.64) | $0.12 | $0.37 |
| Less Distributions | | | | | |
| From net investment income | $(0.22) | $(0.16) | $(0.09) | $(0.10) | $(0.12) |
| Total distributions | $(0.22) | $(0.16) | $(0.09) | $(0.10) | $(0.12) |
| Net asset value — End of year | $9.72 | $9.65 | $9.87 | $10.60 | $10.58 |
| Total Return(2) | 3.11% | (0.64)% | (6.01)% | 1.19% | 3.67% |
| Ratios/Supplemental Data | | | | | |
| Net assets, end of year (000’s omitted) | $2,105 | $2,314 | $2,505 | $4,478 | $6,616 |
| Ratios (as a percentage of average daily net assets):(3) | | | | | |
| Total expenses | 1.46% | 1.45% | 1.41% | 1.40% | 1.41% |
| Net expenses | 1.46% | 1.45% | 1.41% | 1.40% | 1.41% |
| Net investment income | 2.35% | 1.60% | 0.88% | 0.99% | 1.18% |
| Portfolio Turnover | 48% | 27% | 23% | 9% | 14% |
| (1) | Computed using average shares outstanding. |
| (2) | Returns are historical and are calculated by determining the percentage change in net asset value with all distributions reinvested and do not reflect the effect of sales charges. |
| (3) | Total expenses do not reflect amounts reimbursed and/or waived by the adviser and certain of its affiliates, if applicable. Net expenses are net of all reductions and represent the net expenses paid by the Fund. |
35
See Notes to Financial Statements.
Eaton Vance
Municipal Income Funds
July 31, 2024
Financial Highlights — continued
| | Minnesota Fund — Class I |
| | Year Ended July 31, |
| | 2024 | 2023 | 2022 | 2021 | 2020 |
| Net asset value — Beginning of year | $8.97 | $9.18 | $9.86 | $9.84 | $9.61 |
| Income (Loss) From Operations | | | | | |
| Net investment income(1) | $0.30 | $0.23 | $0.17 | $0.19 | $0.21 |
| Net realized and unrealized gain (loss) | 0.06 | (0.21) | (0.67) | 0.02 | 0.23 |
| Total income (loss) from operations | $0.36 | $0.02 | $(0.50) | $0.21 | $0.44 |
| Less Distributions | | | | | |
| From net investment income | $(0.29) | $(0.23) | $(0.18) | $(0.19) | $(0.21) |
| Total distributions | $(0.29) | $(0.23) | $(0.18) | $(0.19) | $(0.21) |
| Net asset value — End of year | $9.04 | $8.97 | $9.18 | $9.86 | $9.84 |
| Total Return(2) | 4.15% | 0.25% | (5.12)% | 2.17% | 4.63% |
| Ratios/Supplemental Data | | | | | |
| Net assets, end of year (000’s omitted) | $179,160 | $166,391 | $147,745 | $129,437 | $122,078 |
| Ratios (as a percentage of average daily net assets):(3) | | | | | |
| Total expenses | 0.51% | 0.50% | 0.46% | 0.45% | 0.46% |
| Net expenses | 0.51% | 0.50% | 0.46% | 0.45% | 0.46% |
| Net investment income | 3.31% | 2.56% | 1.84% | 1.93% | 2.13% |
| Portfolio Turnover | 48% | 27% | 23% | 9% | 14% |
| (1) | Computed using average shares outstanding. |
| (2) | Returns are historical and are calculated by determining the percentage change in net asset value with all distributions reinvested. |
| (3) | Total expenses do not reflect amounts reimbursed and/or waived by the adviser and certain of its affiliates, if applicable. Net expenses are net of all reductions and represent the net expenses paid by the Fund. |
36
See Notes to Financial Statements.
Eaton Vance
Municipal Income Funds
July 31, 2024
Financial Highlights — continued
| | New Jersey Fund — Class A |
| | Year Ended July 31, |
| | 2024 | 2023 | 2022 | 2021 | 2020 |
| Net asset value — Beginning of year | $8.58 | $8.82 | $9.82 | $9.65 | $9.48 |
| Income (Loss) From Operations | | | | | |
| Net investment income(1) | $0.28 | $0.25 | $0.20 | $0.20 | $0.24 |
| Net realized and unrealized gain (loss) | 0.04 | (0.25) | (0.99) | 0.21 | 0.20 |
| Total income (loss) from operations | $0.32 | $0.00(2) | $(0.79) | $0.41 | $0.44 |
| Less Distributions | | | | | |
| From net investment income | $(0.26) | $(0.24) | $(0.20) | $(0.24) | $(0.27) |
| From net realized gain | — | — | (0.01) | — | — |
| Total distributions | $(0.26) | $(0.24) | $(0.21) | $(0.24) | $(0.27) |
| Net asset value — End of year | $8.64 | $8.58 | $8.82 | $9.82 | $9.65 |
| Total Return(3) | 3.81% | 0.10% | (8.10)% | 4.29% | 4.68% |
| Ratios/Supplemental Data | | | | | |
| Net assets, end of year (000’s omitted) | $75,777 | $79,905 | $87,385 | $107,117 | $100,417 |
| Ratios (as a percentage of average daily net assets):(4) | | | | | |
| Total expenses | 0.72% | 0.72% | 0.69% | 0.67% | 0.69% |
| Net expenses | 0.72% | 0.72% | 0.69% | 0.67% | 0.69% |
| Net investment income | 3.28% | 2.90% | 2.13% | 2.09% | 2.57% |
| Portfolio Turnover | 52% | 23% | 24% | 39% | 37% |
| (1) | Computed using average shares outstanding. |
| (2) | Amount is less than $0.005. |
| (3) | Returns are historical and are calculated by determining the percentage change in net asset value with all distributions reinvested and do not reflect the effect of sales charges. |
| (4) | Total expenses do not reflect amounts reimbursed and/or waived by the adviser and certain of its affiliates, if applicable. Net expenses are net of all reductions and represent the net expenses paid by the Fund. |
37
See Notes to Financial Statements.
Eaton Vance
Municipal Income Funds
July 31, 2024
Financial Highlights — continued
| | New Jersey Fund — Class C |
| | Year Ended July 31, |
| | 2024 | 2023 | 2022 | 2021 | 2020 |
| Net asset value — Beginning of year | $8.94 | $9.19 | $10.23 | $10.07 | $9.89 |
| Income (Loss) From Operations | | | | | |
| Net investment income(1) | $0.22 | $0.19 | $0.13 | $0.14 | $0.18 |
| Net realized and unrealized gain (loss) | 0.05 | (0.25) | (1.02) | 0.20 | 0.21 |
| Total income (loss) from operations | $0.27 | $(0.06) | $(0.89) | $0.34 | $0.39 |
| Less Distributions | | | | | |
| From net investment income | $(0.20) | $(0.19) | $(0.14) | $(0.18) | $(0.21) |
| From net realized gain | — | — | (0.01) | — | — |
| Total distributions | $(0.20) | $(0.19) | $(0.15) | $(0.18) | $(0.21) |
| Net asset value — End of year | $9.01 | $8.94 | $9.19 | $10.23 | $10.07 |
| Total Return(2) | 3.12% | (0.65)% | (8.75)% | 3.43% | 3.94% |
| Ratios/Supplemental Data | | | | | |
| Net assets, end of year (000’s omitted) | $4,555 | $6,058 | $6,865 | $9,904 | $10,804 |
| Ratios (as a percentage of average daily net assets):(3) | | | | | |
| Total expenses | 1.47% | 1.47% | 1.44% | 1.42% | 1.44% |
| Net expenses | 1.47% | 1.47% | 1.44% | 1.42% | 1.44% |
| Net investment income | 2.52% | 2.15% | 1.37% | 1.35% | 1.81% |
| Portfolio Turnover | 52% | 23% | 24% | 39% | 37% |
| (1) | Computed using average shares outstanding. |
| (2) | Returns are historical and are calculated by determining the percentage change in net asset value with all distributions reinvested and do not reflect the effect of sales charges. |
| (3) | Total expenses do not reflect amounts reimbursed and/or waived by the adviser and certain of its affiliates, if applicable. Net expenses are net of all reductions and represent the net expenses paid by the Fund. |
38
See Notes to Financial Statements.
Eaton Vance
Municipal Income Funds
July 31, 2024
Financial Highlights — continued
| | New Jersey Fund — Class I |
| | Year Ended July 31, |
| | 2024 | 2023 | 2022 | 2021 | 2020 |
| Net asset value — Beginning of year | $8.60 | $8.83 | $9.83 | $9.66 | $9.48 |
| Income (Loss) From Operations | | | | | |
| Net investment income(1) | $0.30 | $0.27 | $0.22 | $0.22 | $0.26 |
| Net realized and unrealized gain (loss) | 0.04 | (0.24) | (0.99) | 0.20 | 0.20 |
| Total income (loss) from operations | $0.34 | $0.03 | $(0.77) | $0.42 | $0.46 |
| Less Distributions | | | | | |
| From net investment income | $(0.28) | $(0.26) | $(0.22) | $(0.25) | $(0.28) |
| From net realized gain | — | — | (0.01) | — | — |
| Total distributions | $(0.28) | $(0.26) | $(0.23) | $(0.25) | $(0.28) |
| Net asset value — End of year | $8.66 | $8.60 | $8.83 | $9.83 | $9.66 |
| Total Return(2) | 4.01% | 0.42% | (7.93)% | 4.41% | 4.97% |
| Ratios/Supplemental Data | | | | | |
| Net assets, end of year (000’s omitted) | $70,753 | $65,632 | $59,806 | $80,634 | $66,447 |
| Ratios (as a percentage of average daily net assets):(3) | | | | | |
| Total expenses | 0.52% | 0.52% | 0.49% | 0.47% | 0.49% |
| Net expenses | 0.52% | 0.52% | 0.49% | 0.47% | 0.49% |
| Net investment income | 3.48% | 3.10% | 2.32% | 2.29% | 2.76% |
| Portfolio Turnover | 52% | 23% | 24% | 39% | 37% |
| (1) | Computed using average shares outstanding. |
| (2) | Returns are historical and are calculated by determining the percentage change in net asset value with all distributions reinvested. |
| (3) | Total expenses do not reflect amounts reimbursed and/or waived by the adviser and certain of its affiliates, if applicable. Net expenses are net of all reductions and represent the net expenses paid by the Fund. |
39
See Notes to Financial Statements.
Eaton Vance
Municipal Income Funds
July 31, 2024
Financial Highlights — continued
| | Pennsylvania Fund — Class A |
| | Year Ended July 31, |
| | 2024 | 2023 | 2022 | 2021 | 2020 |
| Net asset value — Beginning of year | $7.73 | $7.94 | $8.83 | $8.74 | $8.65 |
| Income (Loss) From Operations | | | | | |
| Net investment income(1) | $0.28 | $0.25 | $0.21 | $0.22 | $0.27 |
| Net realized and unrealized gain (loss) | 0.06 | (0.22) | (0.89) | 0.09 | 0.09 |
| Total income (loss) from operations | $0.34 | $0.03 | $(0.68) | $0.31 | $0.36 |
| Less Distributions | | | | | |
| From net investment income | $(0.28) | $(0.24) | $(0.21) | $(0.22) | $(0.27) |
| Total distributions | $(0.28) | $(0.24) | $(0.21) | $(0.22) | $(0.27) |
| Net asset value — End of year | $7.79 | $7.73 | $7.94 | $8.83 | $8.74 |
| Total Return(2) | 4.50% | 0.49% | (7.77)% | 3.59% | 4.26% |
| Ratios/Supplemental Data | | | | | |
| Net assets, end of year (000’s omitted) | $84,636 | $86,461 | $90,612 | $112,748 | $115,340 |
| Ratios (as a percentage of average daily net assets):(3) | | | | | |
| Expenses excluding interest and fees | 0.75% | 0.74% | 0.71% | 0.69% | 0.71% |
| Interest and fee expense(4) | — | 0.10% | 0.03% | 0.02% | 0.05% |
| Total expenses | 0.75% | 0.84% | 0.74% | 0.71% | 0.76% |
| Net expenses | 0.75% | 0.84% | 0.74% | 0.71% | 0.76% |
| Net investment income | 3.65% | 3.24% | 2.47% | 2.51% | 3.11% |
| Portfolio Turnover | 61% | 80% | 36% | 34% | 20% |
| (1) | Computed using average shares outstanding. |
| (2) | Returns are historical and are calculated by determining the percentage change in net asset value with all distributions reinvested and do not reflect the effect of sales charges. |
| (3) | Total expenses do not reflect amounts reimbursed and/or waived by the adviser and certain of its affiliates, if applicable. Net expenses are net of all reductions and represent the net expenses paid by the Fund. |
| (4) | Interest and fee expense relates to the liability for floating rate notes issued in conjunction with residual interest bond transactions (see Note 1H). |
40
See Notes to Financial Statements.
Eaton Vance
Municipal Income Funds
July 31, 2024
Financial Highlights — continued
| | Pennsylvania Fund — Class C |
| | Year Ended July 31, |
| | 2024 | 2023 | 2022 | 2021 | 2020 |
| Net asset value — Beginning of year | $8.00 | $8.22 | $9.14 | $9.05 | $8.96 |
| Income (Loss) From Operations | | | | | |
| Net investment income(1) | $0.23 | $0.20 | $0.15 | $0.16 | $0.21 |
| Net realized and unrealized gain (loss) | 0.07 | (0.23) | (0.92) | 0.09 | 0.09 |
| Total income (loss) from operations | $0.30 | $(0.03) | $(0.77) | $0.25 | $0.30 |
| Less Distributions | | | | | |
| From net investment income | $(0.23) | $(0.19) | $(0.15) | $(0.16) | $(0.21) |
| Total distributions | $(0.23) | $(0.19) | $(0.15) | $(0.16) | $(0.21) |
| Net asset value — End of year | $8.07 | $8.00 | $8.22 | $9.14 | $9.05 |
| Total Return(2) | 3.82% | (0.42)% | (8.34)% | 2.78% | 3.45% |
| Ratios/Supplemental Data | | | | | |
| Net assets, end of year (000’s omitted) | $3,499 | $4,188 | $5,317 | $7,781 | $11,815 |
| Ratios (as a percentage of average daily net assets):(3) | | | | | |
| Expenses excluding interest and fees | 1.50% | 1.49% | 1.46% | 1.44% | 1.46% |
| Interest and fee expense(4) | — | 0.10% | 0.03% | 0.02% | 0.05% |
| Total expenses | 1.50% | 1.59% | 1.49% | 1.46% | 1.51% |
| Net expenses | 1.50% | 1.59% | 1.49% | 1.46% | 1.51% |
| Net investment income | 2.90% | 2.49% | 1.71% | 1.77% | 2.36% |
| Portfolio Turnover | 61% | 80% | 36% | 34% | 20% |
| (1) | Computed using average shares outstanding. |
| (2) | Returns are historical and are calculated by determining the percentage change in net asset value with all distributions reinvested and do not reflect the effect of sales charges. |
| (3) | Total expenses do not reflect amounts reimbursed and/or waived by the adviser and certain of its affiliates, if applicable. Net expenses are net of all reductions and represent the net expenses paid by the Fund. |
| (4) | Interest and fee expense relates to the liability for floating rate notes issued in conjunction with residual interest bond transactions (see Note 1H). |
41
See Notes to Financial Statements.
Eaton Vance
Municipal Income Funds
July 31, 2024
Financial Highlights — continued
| | Pennsylvania Fund — Class I |
| | Year Ended July 31, |
| | 2024 | 2023 | 2022 | 2021 | 2020 |
| Net asset value — Beginning of year | $7.76 | $7.97 | $8.86 | $8.77 | $8.69 |
| Income (Loss) From Operations | | | | | |
| Net investment income(1) | $0.30 | $0.27 | $0.22 | $0.24 | $0.29 |
| Net realized and unrealized gain (loss) | 0.05 | (0.22) | (0.88) | 0.09 | 0.08 |
| Total income (loss) from operations | $0.35 | $0.05 | $(0.66) | $0.33 | $0.37 |
| Less Distributions | | | | | |
| From net investment income | $(0.29) | $(0.26) | $(0.23) | $(0.24) | $(0.29) |
| Total distributions | $(0.29) | $(0.26) | $(0.23) | $(0.24) | $(0.29) |
| Net asset value — End of year | $7.82 | $7.76 | $7.97 | $8.86 | $8.77 |
| Total Return(2) | 4.70% | 0.70% | (7.55)% | 3.80% | 4.34% |
| Ratios/Supplemental Data | | | | | |
| Net assets, end of year (000’s omitted) | $77,160 | $68,304 | $59,972 | $66,737 | $64,685 |
| Ratios (as a percentage of average daily net assets):(3) | | | | | |
| Expenses excluding interest and fees | 0.55% | 0.54% | 0.51% | 0.49% | 0.51% |
| Interest and fee expense(4) | — | 0.10% | 0.03% | 0.02% | 0.05% |
| Total expenses | 0.55% | 0.64% | 0.54% | 0.51% | 0.56% |
| Net expenses | 0.55% | 0.64% | 0.54% | 0.51% | 0.56% |
| Net investment income | 3.85% | 3.45% | 2.67% | 2.71% | 3.31% |
| Portfolio Turnover | 61% | 80% | 36% | 34% | 20% |
| (1) | Computed using average shares outstanding. |
| (2) | Returns are historical and are calculated by determining the percentage change in net asset value with all distributions reinvested. |
| (3) | Total expenses do not reflect amounts reimbursed and/or waived by the adviser and certain of its affiliates, if applicable. Net expenses are net of all reductions and represent the net expenses paid by the Fund. |
| (4) | Interest and fee expense relates to the liability for floating rate notes issued in conjunction with residual interest bond transactions (see Note 1H). |
42
See Notes to Financial Statements.
Eaton Vance
Municipal Income Funds
July 31, 2024
Notes to Financial Statements
1 Significant Accounting Policies
Eaton Vance Municipals Trust (the Trust) is a Massachusetts business trust registered under the Investment Company Act of 1940, as amended (the 1940 Act), as an open-end management investment company. The Trust presently consists of eighteen funds, five of which, each non-diversified, are included in these financial statements. They include Eaton Vance Arizona Municipal Income Fund (Arizona Fund), Eaton Vance Connecticut Municipal Income Fund (Connecticut Fund), Eaton Vance Minnesota Municipal Income Fund (Minnesota Fund), Eaton Vance New Jersey Municipal Income Fund (New Jersey Fund) and Eaton Vance Pennsylvania Municipal Income Fund (Pennsylvania Fund), (each individually referred to as the Fund, and collectively, the Funds). The Funds’ investment objective is to provide current income exempt from regular federal income tax and from particular state or local income or other taxes. The Funds offer three classes of shares. Class A shares are generally sold subject to a sales charge imposed at time of purchase. Class C shares are sold at net asset value and are generally subject to a contingent deferred sales charge (see Note 5). Effective November 5, 2020, Class C shares automatically convert to Class A shares eight years after their purchase as described in the Funds’ prospectus. Class I shares are sold at net asset value and are not subject to a sales charge. Each class represents a pro rata interest in the Fund, but votes separately on class-specific matters and (as noted below) is subject to different expenses. Realized and unrealized gains and losses are allocated daily to each class of shares based on the relative net assets of each class to the total net assets of the Fund. Net investment income, other than class-specific expenses, is allocated daily to each class of shares based upon the ratio of the value of each class’s paid shares to the total value of all paid shares. Each class of shares differs in its distribution plan and certain other class-specific expenses.
The following is a summary of significant accounting policies of the Funds. The policies are in conformity with accounting principles generally accepted in the United States of America (U.S. GAAP). Each Fund is an investment company and follows accounting and reporting guidance in the Financial Accounting Standards Board (FASB) Accounting Standards Codification Topic 946.
A Investment Valuation—The following methodologies are used to determine the market value or fair value of investments.
Debt Obligations. Debt obligations are generally valued on the basis of valuations provided by third party pricing services, as derived from such services’ pricing models. Inputs to the models may include, but are not limited to, reported trades, executable bid and ask prices, broker/dealer quotations, prices or yields of securities with similar characteristics, interest rates, anticipated prepayments, benchmark curves or information pertaining to the issuer, as well as industry and economic events. The pricing services may use a matrix approach, which considers information regarding securities with similar characteristics to determine the valuation for a security. Short-term debt obligations purchased with a remaining maturity of sixty days or less for which a valuation from a third party pricing service is not readily available may be valued at amortized cost, which approximates fair value.
Fair Valuation. In connection with Rule 2a-5 of the 1940 Act, the Trustees have designated a Fund’s investment adviser as its valuation designee. Investments for which valuations or market quotations are not readily available or are deemed unreliable are valued by the investment adviser, as valuation designee, at fair value using methods that most fairly reflect the security’s “fair value”, which is the amount that a Fund might reasonably expect to receive for the security upon its current sale in the ordinary course. Each such determination is based on a consideration of relevant factors, which are likely to vary from one pricing context to another. These factors may include, but are not limited to, the type of security, the existence of any contractual restrictions on the security’s disposition, the price and extent of public trading in similar securities of the issuer or of comparable companies or entities, quotations or relevant information obtained from broker/dealers or other market participants, information obtained from the issuer, analysts, and/or the appropriate stock exchange (for exchange-traded securities), an analysis of the companies or entity’s financial statements, and an evaluation of the forces that influence the issuer and the market(s) in which the security is purchased and sold.
B Investment Transactions and Related Income—Investment transactions for financial statement purposes are accounted for on a trade date basis. Realized gains and losses on investments sold are determined on the basis of identified cost. Interest income is recorded on the basis of interest accrued, adjusted for amortization of premium or accretion of discount.
C Federal Taxes—Each Fund's policy is to comply with the provisions of the Internal Revenue Code applicable to regulated investment companies and to distribute to shareholders each year substantially all of its taxable, if any, and tax-exempt net investment income, and all or substantially all of its net realized capital gains. Accordingly, no provision for federal income or excise tax is necessary. Each Fund intends to satisfy conditions which will enable it to designate distributions from the interest income generated by its investments in non-taxable municipal securities, which are exempt from regular federal income tax when received by each Fund, as exempt-interest dividends. The portion of such interest, if any, earned on private activity bonds issued after August 7, 1986, may be considered a tax preference item to shareholders.
As of July 31, 2024, the Funds had no uncertain tax positions that would require financial statement recognition, de-recognition, or disclosure. Each Fund files a U.S. federal income tax return annually after its fiscal year-end, which is subject to examination by the Internal Revenue Service for a period of three years from the date of filing.
D Expenses—The majority of expenses of the Trust are directly identifiable to an individual fund. Expenses which are not readily identifiable to a specific fund are allocated taking into consideration, among other things, the nature and type of expense and the relative size of the funds.
E Legal Fees— Legal fees and other related expenses incurred as part of negotiations of the terms and requirement of capital infusions, or that are expected to result in the restructuring of, or a plan of reorganization for, an investment are recorded as realized losses. Ongoing expenditures to protect or enhance an investment are treated as operating expenses.
Eaton Vance
Municipal Income Funds
July 31, 2024
Notes to Financial Statements — continued
F Use of Estimates—The preparation of the financial statements in conformity with U.S. GAAP requires management to make estimates and assumptions that affect the reported amounts of assets and liabilities at the date of the financial statements and the reported amounts of income and expense during the reporting period. Actual results could differ from those estimates.
G Indemnifications—Under the Trust’s organizational documents, its officers and Trustees may be indemnified against certain liabilities and expenses arising out of the performance of their duties to the Funds. Under Massachusetts law, if certain conditions prevail, shareholders of a Massachusetts business trust (such as the Trust) could be deemed to have personal liability for the obligations of the Trust. However, the Trust’s Declaration of Trust contains an express disclaimer of liability on the part of Fund shareholders and the By-laws provide that the Trust shall assume, upon request by the shareholder, the defense on behalf of any Fund shareholders. Moreover, the By-laws also provide for indemnification out of Fund property of any shareholder held personally liable solely by reason of being or having been a shareholder for all loss or expense arising from such liability. Additionally, in the normal course of business, each Fund enters into agreements with service providers that may contain indemnification clauses. Each Fund’s maximum exposure under these arrangements is unknown as this would involve future claims that may be made against each Fund that have not yet occurred.
H Floating Rate Notes Issued in Conjunction with Securities Held—The Funds may invest in residual interest bonds, also referred to as inverse floating rate securities, whereby a Fund may sell a variable or fixed rate bond for cash to a Special-Purpose Vehicle (the SPV), (which is generally organized as a trust), while at the same time, buying a residual interest in the assets and cash flows of the SPV. The bond is deposited into the SPV with the same CUSIP number as the bond sold to the SPV by the Fund, and which may have been, but is not required to be, the bond purchased from the Fund (the Bond). The SPV also issues floating rate notes (Floating Rate Notes) which are sold to third-parties. The residual interest bond held by a Fund gives the Fund the right (1) to cause the holders of the Floating Rate Notes to generally tender their notes at par, and (2) to have the Bond held by the SPV transferred to the Fund, thereby terminating the SPV. Should the Fund exercise such right, it would generally pay the SPV the par amount due on the Floating Rate Notes and exchange the residual interest bond for the underlying Bond. Pursuant to generally accepted accounting principles for transfers and servicing of financial assets and extinguishment of liabilities, the Funds account for the transaction described above as a secured borrowing by including the Bond in their Portfolio of Investments and the Floating Rate Notes as a liability under the caption “Payable for floating rate notes issued” in their Statement of Assets and Liabilities. The Floating Rate Notes have interest rates that generally reset weekly and their holders have the option to tender their notes to the SPV for redemption at par at each reset date. Accordingly, the fair value of the payable for floating rate notes issued approximates its carrying value. Interest expense related to a Fund’s liability with respect to Floating Rate Notes is recorded as incurred. The SPV may be terminated by the Fund, as noted above, or by the occurrence of certain termination events as defined in the trust agreement, such as a downgrade in the credit quality of the underlying Bond, bankruptcy of or payment failure by the issuer of the underlying Bond, the inability to remarket Floating Rate Notes that have been tendered due to insufficient buyers in the market, or the failure by the SPV to obtain renewal of the liquidity agreement under which liquidity support is provided for the Floating Rate Notes up to one year. The Funds did not have any floating rate notes outstanding at July 31, 2024.
In certain circumstances, the Funds may enter into shortfall and forbearance agreements with brokers by which a Fund agrees to reimburse the broker for the difference between the liquidation value of the Bond held by the SPV and the liquidation value of the Floating Rate Notes, as well as any shortfalls in interest cash flows. The Funds had no shortfalls as of July 31, 2024.
The Funds may also purchase residual interest bonds in a secondary market transaction without first owning the underlying bond. Such transactions are not required to be treated as secured borrowings. Shortfall agreements, if any, related to residual interest bonds purchased in a secondary market transaction are disclosed in the Portfolio of Investments.
The Funds' investment policies and restrictions expressly permit investments in residual interest bonds. Such bonds typically offer the potential for yields exceeding the yields available on fixed rate bonds with comparable credit quality and maturity. These securities tend to underperform the market for fixed rate bonds in a rising long-term interest rate environment, but tend to outperform the market for fixed rate bonds when long-term interest rates decline. The value and income of residual interest bonds are generally more volatile than that of a fixed rate bond. The Funds' investment policies do not allow the Funds to borrow money except as permitted by the 1940 Act. Effective August 19, 2022, the Funds began operating under Rule 18f-4 under the 1940 Act, which, among other things, governs the use of derivative investments and certain financing transactions by registered investment companies. As of the date of this report, consistent with Rule 18f-4, the Funds have elected to treat their investments in residual interest bonds, along with similar financing transactions, as derivatives transactions subject to the Funds’ value-at-risk (VaR)-based limits on leverage risk. The Funds may change this election (and elect to treat these investments and other similar financing transactions like bank borrowings subject to the asset coverage requirements of Section 18 of the 1940 Act) at any time. Residual interest bonds held by the Funds are securities exempt from registration under Rule 144A of the Securities Act of 1933.
I When-Issued Securities and Delayed Delivery Transactions—The Funds may purchase securities on a delayed delivery or when-issued basis. Payment and delivery may take place after the customary settlement period for that security. At the time the transaction is negotiated, the price of the security that will be delivered is fixed. The Funds maintain cash and/or security positions for these commitments such that sufficient liquid assets will be available to make payments upon settlement. Securities purchased on a delayed delivery or when-issued basis are marked-to-market daily and begin earning interest on settlement date. Such security purchases are subject to the risk that when delivered they will be worth less than the agreed upon payment price. Losses may also arise if the counterparty does not perform under the contract.
Eaton Vance
Municipal Income Funds
July 31, 2024
Notes to Financial Statements — continued
2 Distributions to Shareholders and Income Tax Information
The net investment income of each Fund is determined daily and substantially all of the net investment income so determined is declared as a dividend to shareholders of record at the time of declaration. Distributions are declared separately for each class of shares. Distributions are paid monthly. Distributions of realized capital gains are made at least annually. Shareholders may reinvest income and capital gain distributions in additional shares of the same class of a Fund at the net asset value as of the reinvestment date or, at the election of the shareholder, receive distributions in cash. Distributions to shareholders are determined in accordance with income tax regulations, which may differ from U.S. GAAP. As required by U.S. GAAP, only distributions in excess of tax basis earnings and profits are reported in the financial statements as a return of capital. Permanent differences between book and tax accounting relating to distributions are reclassified to paid-in capital. For tax purposes, distributions from short-term capital gains are considered to be from ordinary income.
The tax character of distributions declared for the years ended July 31, 2024 and July 31, 2023 was as follows:
| | Year Ended July 31, 2024 |
| | Arizona
Fund | Connecticut
Fund | Minnesota
Fund | New Jersey
Fund | Pennsylvania
Fund |
| Tax-exempt income | $2,324,347 | $3,152,216 | $7,526,529 | $4,410,907 | $5,712,308 |
| Ordinary income | $114,137 | $106,127 | $31,898 | $263,483 | $191,032 |
| | Year Ended July 31, 2023 |
| | Arizona
Fund | Connecticut
Fund | Minnesota
Fund | New Jersey
Fund | Pennsylvania
Fund |
| Tax-exempt income | $1,915,929 | $2,489,305 | $5,277,937 | $4,028,201 | $4,920,661 |
| Ordinary income | $101,732 | $54,435 | $ — | $263,592 | $79,134 |
As of July 31, 2024, the components of distributable earnings (accumulated loss) on a tax basis were as follows:
| | Arizona
Fund | Connecticut
Fund | Minnesota
Fund | New Jersey
Fund | Pennsylvania
Fund |
| Undistributed tax-exempt income | $ 14,051 | $ 44,296 | $ 110,745 | $ 53,826 | $ 106,137 |
| Deferred capital losses | (2,279,111) | (2,838,105) | (7,952,430) | (9,501,620) | (20,901,822) |
| Net unrealized appreciation | 1,205,057 | 917,207 | 1,218,788 | 869,786 | 3,495,454 |
| Distributions payable | (14,054) | (71,634) | (110,743) | (58,266) | (106,137) |
| Accumulated loss | $(1,074,057) | $(1,948,236) | $(6,733,640) | $(8,636,274) | $(17,406,368) |
At July 31, 2024, the following Funds, for federal income tax purposes, had deferred capital losses which would reduce the respective Fund’s taxable income arising from future net realized gains on investment transactions, if any, to the extent permitted by the Internal Revenue Code, and thus would reduce the amount of distributions to shareholders, which would otherwise be necessary to relieve the Funds of any liability for federal income or excise tax. The deferred capital losses are treated as arising on the first day of a Fund’s next taxable year and retain the same short-term or long-term character as when originally deferred. The amounts of the deferred capital losses are as follows:
| | Arizona
Fund | Connecticut
Fund | Minnesota
Fund | New Jersey
Fund | Pennsylvania
Fund |
| Deferred capital losses: | | | | | |
| Short-term | $515,723 | $1,335,010 | $1,242,077 | $2,156,709 | $7,130,267 |
| Long-term | $1,763,388 | $1,503,095 | $6,710,353 | $7,344,911 | $13,771,555 |
Eaton Vance
Municipal Income Funds
July 31, 2024
Notes to Financial Statements — continued
The cost and unrealized appreciation (depreciation) of investments of each Fund at July 31, 2024, as determined on a federal income tax basis, were as follows:
| | Arizona
Fund | Connecticut
Fund | Minnesota
Fund | New Jersey
Fund | Pennsylvania
Fund |
| Aggregate cost | $77,484,945 | $113,339,006 | $248,664,068 | $149,738,098 | $160,455,388 |
| Gross unrealized appreciation | $2,048,210 | $1,992,146 | $3,291,636 | $2,938,775 | $5,400,593 |
| Gross unrealized depreciation | (843,153) | (1,074,939) | (2,072,848) | (2,068,989) | (1,905,139) |
| Net unrealized appreciation | $1,205,057 | $917,207 | $1,218,788 | $869,786 | $3,495,454 |
3 Investment Adviser Fee and Other Transactions with Affiliates
The investment adviser fee is earned by Boston Management and Research (BMR), an indirect, wholly-owned subsidiary of Morgan Stanley, as compensation for investment advisory services rendered to each Fund. The investment adviser fee is based upon a percentage of total daily net assets plus a percentage of total daily gross income (i.e., income other than gains from the sale of securities) as follows and is payable monthly:
| Total Daily Net Assets | Annual Asset
Rate | Daily Income
Rate |
| Up to $20 million | 0.100% | 1.000% |
| $20 million but less than $40 million | 0.200% | 2.000% |
| $40 million but less than $500 million | 0.300% | 3.000% |
| $500 million but less than $1 billion | 0.275% | 2.750% |
| $1 billion but less than $1.5 billion | 0.250% | 2.500% |
| $1.5 billion but less than $2 billion | 0.225% | 2.250% |
| $2 billion but less than $3 billion | 0.200% | 2.000% |
| $3 billion and over | 0.175% | 1.750% |
For the year ended July 31, 2024, investment adviser fees incurred by the Funds and the effective annual rates, as a percentage of average daily net assets, were as follows:
| | Arizona
Fund | Connecticut
Fund | Minnesota
Fund | New Jersey
Fund | Pennsylvania
Fund |
| Investment Adviser Fee | $232,134 | $354,241 | $887,103 | $539,080 | $602,108 |
| Effective Annual Rate | 0.31% | 0.33% | 0.38% | 0.36% | 0.38% |
Eaton Vance Management (EVM), an affiliate of BMR, serves as the administrator of each Fund, but receives no compensation.
EVM provides sub-transfer agency and related services to the Funds pursuant to a Sub-Transfer Agency Support Services Agreement. Eaton Vance Distributors, Inc. (EVD), an affiliate of EVM and the Funds’ principal underwriter, received a portion of the sales charge on sales of Class A shares of the Funds. Morgan Stanley affiliated broker-dealers, which may be deemed to be affiliates of BMR, EVM and EVD, also received a portion of the sales charge on sales of Class A shares. EVD also received distribution and service fees from Class A and Class C shares (see Note 4) and contingent deferred sales
Eaton Vance
Municipal Income Funds
July 31, 2024
Notes to Financial Statements — continued
charges (see Note 5). Sub-transfer agent fees earned by EVM, which are included in transfer and dividend disbursing agent fees on the Statements of Operations, and Class A sales charges that the Funds were informed were received by EVD and Morgan Stanley affiliated broker-dealers for the year ended July 31, 2024 were as follows:
| | Arizona
Fund | Connecticut
Fund | Minnesota
Fund | New Jersey
Fund | Pennsylvania
Fund |
| EVM's Sub-Transfer Agent Fees | $3,108 | $8,994 | $11,222 | $13,134 | $17,172 |
| EVD's Class A Sales Charges | $3,670 | $2,742 | $3,236 | $4,471 | $5,002 |
| Morgan Stanley affiliated broker-dealers’ Class A Sales Charges | $ — | $1,985 | $ — | $ — | $1,821 |
Trustees and officers of the Funds who are members of EVM’s or BMR’s organizations receive remuneration for their services to the Funds out of the investment adviser fee. Trustees of the Funds who are not affiliated with the investment adviser may elect to defer receipt of all or a percentage of their annual fees in accordance with the terms of the Trustees Deferred Compensation Plan. Certain officers and Trustees of the Funds are officers of the above organizations.
4 Distribution Plans
Each Fund has in effect a distribution plan for Class A shares (Class A Plan) pursuant to Rule 12b-1 under the 1940 Act. The Class A Plan provides that each Fund will pay EVD a distribution and service fee not exceeding 0.25% per annum of its average daily net assets attributable to Class A shares for distribution services and facilities provided to each Fund by EVD, as well as for personal services and/or the maintenance of shareholder accounts. The Trustees approved distribution and service fee payments equal to 0.20% per annum of each Fund’s average daily net assets attributable to Class A shares. Distribution and service fees paid or accrued to EVD for the year ended July 31, 2024 for Class A shares amounted to the following:
| | Arizona
Fund | Connecticut
Fund | Minnesota
Fund | New Jersey
Fund | Pennsylvania
Fund |
| Class A Distribution and Service Fees | $62,483 | $86,378 | $131,765 | $153,133 | $168,062 |
Each Fund also has in effect a distribution plan for Class C shares (Class C Plan) pursuant to Rule 12b-1 under the 1940 Act. Pursuant to the Class C Plan, each Fund pays EVD amounts equal to 0.75% per annum of its average daily net assets attributable to Class C shares for providing ongoing distribution services and facilities to the respective Funds. For the year ended July 31, 2024, the Funds paid or accrued to EVD the following distribution fees:
| | Arizona
Fund | Connecticut
Fund | Minnesota
Fund | New Jersey
Fund | Pennsylvania
Fund |
| Class C Distribution Fees | $14,644 | $19,347 | $16,898 | $39,184 | $27,050 |
The Class C Plan also authorizes each Fund to make payments of service fees to EVD, financial intermediaries and other persons in amounts not exceeding 0.25% per annum of the average daily net assets attributable to Class C shares. The Trustees approved service fee payments equal to 0.20% per annum of each Fund’s average daily net assets attributable to Class C shares. Service fees paid or accrued are for personal services and/or the maintenance of shareholder accounts. They are separate and distinct from the Class C sales commissions and distribution fees payable to EVD. Service fees paid or accrued for the year ended July 31, 2024 amounted to the following:
| | Arizona
Fund | Connecticut
Fund | Minnesota
Fund | New Jersey
Fund | Pennsylvania
Fund |
| Class C Service Fees | $3,905 | $5,159 | $4,506 | $10,449 | $7,214 |
Distribution and service fees are subject to the limitations contained in the Financial Industry Regulatory Authority Rule 2341(d).
Eaton Vance
Municipal Income Funds
July 31, 2024
Notes to Financial Statements — continued
5 Contingent Deferred Sales Charges
A contingent deferred sales charge (CDSC) of 1% generally is imposed on redemptions of Class C shares made within 12 months of purchase. Class A shares may be subject to a 0.75% CDSC if redeemed within 12 months of purchase (depending on the circumstances of purchase). Generally, the CDSC is based upon the lower of the net asset value at date of redemption or date of purchase. No charge is levied on shares acquired by reinvestment of dividends or capital gain distributions. For the year ended July 31, 2024, the Funds were informed that EVD received the following amounts of CDSCs paid by Class A and Class C shareholders:
| | Arizona
Fund | Connecticut
Fund | Minnesota
Fund | New Jersey
Fund | Pennsylvania
Fund |
| Class A | $978 | $ — | $ — | $ — | $7,500 |
| Class C | $194 | $ —(1) | $ —(1) | $452 | $ — |
| (1) | Amount is less than $100. |
6 Purchases and Sales of Investments
Purchases and sales of investments, other than short-term obligations and including maturities, for the year ended July 31, 2024 were as follows:
| | Arizona
Fund | Connecticut
Fund | Minnesota
Fund | New Jersey
Fund | Pennsylvania
Fund |
| Purchases | $46,034,138 | $52,959,627 | $130,889,776 | $82,766,117 | $106,093,969 |
| Sales | $43,901,078 | $43,078,968 | $110,774,670 | $77,768,847 | $97,172,444 |
7 Shares of Beneficial Interest
Each Fund’s Declaration of Trust permits the Trustees to issue an unlimited number of full and fractional shares of beneficial interest (without par value). Such shares may be issued in a number of different series (such as the Funds) and classes. Transactions in Fund shares, including direct exchanges pursuant to share class conversions, were as follows:
| Arizona Fund | | | |
| | | Year Ended
July 31, 2024 | | Year Ended
July 31, 2023 |
| | | Shares | Amount | Shares | Amount |
| Class A | | | | | |
| Sales | | 820,406 | $ 7,289,089 | 483,227 | $ 4,233,695 |
| Issued to shareholders electing to receive payments of distributions in Fund shares | | 102,856 | 911,608 | 85,520 | 754,353 |
| Redemptions | | (565,641) | (4,969,046) | (648,733) | (5,716,998) |
| Net increase (decrease) | | 357,621 | $ 3,231,651 | (79,986) | $ (728,950) |
| Class C | | | | | |
| Sales | | 15,116 | $ 147,787 | 21,070 | $ 208,484 |
| Issued to shareholders electing to receive payments of distributions in Fund shares | | 4,336 | 42,652 | 3,795 | 37,183 |
| Redemptions | | (58,665) | (581,202) | (56,749) | (549,075) |
| Net decrease | | (39,213) | $ (390,763) | (31,884) | $ (303,408) |
Eaton Vance
Municipal Income Funds
July 31, 2024
Notes to Financial Statements — continued
| Arizona Fund (continued) | | | |
| | | Year Ended
July 31, 2024 | | Year Ended
July 31, 2023 |
| | | Shares | Amount | Shares | Amount |
| Class I | | | | | |
| Sales | | 1,810,284 | $16,003,136 | 2,977,813 | $26,334,321 |
| Issued to shareholders electing to receive payments of distributions in Fund shares | | 149,685 | 1,324,946 | 123,715 | 1,091,844 |
| Redemptions | | (2,206,300) | (19,322,079) | (1,585,475) | (13,998,679) |
| Net increase (decrease) | | (246,331) | $(1,993,997) | 1,516,053 | $13,427,486 |
| Connecticut Fund | | | |
| | | Year Ended
July 31, 2024 | | Year Ended
July 31, 2023 |
| | | Shares | Amount | Shares | Amount |
| Class A | | | | | |
| Sales | | 793,011 | $ 7,438,757 | 378,050 | $ 3,529,728 |
| Issued to shareholders electing to receive payments of distributions in Fund shares | | 117,843 | 1,095,940 | 112,838 | 1,044,987 |
| Redemptions | | (1,567,957) | (14,639,798) | (547,348) | (5,108,044) |
| Net decrease | | (657,103) | $(6,105,101) | (56,460) | $ (533,329) |
| Class C | | | | | |
| Sales | | 30,852 | $ 287,684 | 43,093 | $ 399,663 |
| Issued to shareholders electing to receive payments of distributions in Fund shares | | 4,732 | 43,863 | 4,328 | 39,920 |
| Redemptions | | (79,493) | (745,801) | (68,691) | (630,939) |
| Net decrease | | (43,909) | $ (414,254) | (21,270) | $ (191,356) |
| Class I | | | | | |
| Sales | | 3,378,377 | $31,417,587 | 3,415,246 | $31,752,067 |
| Issued to shareholders electing to receive payments of distributions in Fund shares | | 145,926 | 1,360,740 | 98,551 | 913,386 |
| Redemptions | | (1,669,320) | (15,232,751) | (1,695,129) | (15,619,577) |
| Net increase | | 1,854,983 | $17,545,576 | 1,818,668 | $17,045,876 |
Eaton Vance
Municipal Income Funds
July 31, 2024
Notes to Financial Statements — continued
| Minnesota Fund | | | |
| | | Year Ended
July 31, 2024 | | Year Ended
July 31, 2023 |
| | | Shares | Amount | Shares | Amount |
| Class A | | | | | |
| Sales | | 1,410,375 | $12,608,380 | 3,139,418 | $ 28,191,682 |
| Issued to shareholders electing to receive payments of distributions in Fund shares | | 223,424 | 1,991,662 | 133,044 | 1,189,561 |
| Redemptions | | (1,727,383) | (15,274,950) | (1,756,964) | (15,679,235) |
| Net increase (decrease) | | (93,584) | $ (674,908) | 1,515,498 | $ 13,702,008 |
| Class C | | | | | |
| Sales | | 54,149 | $ 518,902 | 71,330 | $ 688,376 |
| Issued to shareholders electing to receive payments of distributions in Fund shares | | 5,203 | 49,885 | 3,419 | 32,878 |
| Redemptions | | (82,550) | (794,157) | (88,762) | (853,337) |
| Net decrease | | (23,198) | $ (225,370) | (14,013) | $ (132,083) |
| Class I | | | | | |
| Sales | | 8,638,765 | $76,849,840 | 11,853,734 | $106,345,883 |
| Issued to shareholders electing to receive payments of distributions in Fund shares | | 455,129 | 4,061,175 | 282,434 | 2,526,186 |
| Redemptions | | (7,817,770) | (68,973,849) | (9,689,215) | (86,399,066) |
| Net increase | | 1,276,124 | $11,937,166 | 2,446,953 | $ 22,473,003 |
| New Jersey Fund | | | |
| | | Year Ended
July 31, 2024 | | Year Ended
July 31, 2023 |
| | | Shares | Amount | Shares | Amount |
| Class A | | | | | |
| Sales | | 456,939 | $ 3,919,675 | 971,379 | $ 8,269,573 |
| Issued to shareholders electing to receive payments of distributions in Fund shares | | 221,270 | 1,887,120 | 223,691 | 1,903,747 |
| Redemptions | | (1,221,750) | (10,437,331) | (1,797,114) | (15,293,163) |
| Net decrease | | (543,541) | $(4,630,536) | (602,044) | $(5,119,843) |
| Class C | | | | | |
| Sales | | 65,536 | $ 586,594 | 76,058 | $ 679,325 |
| Issued to shareholders electing to receive payments of distributions in Fund shares | | 11,920 | 105,926 | 13,019 | 115,510 |
| Redemptions | | (249,094) | (2,203,340) | (158,961) | (1,403,959) |
| Net decrease | | (171,638) | $(1,510,820) | (69,884) | $ (609,124) |
Eaton Vance
Municipal Income Funds
July 31, 2024
Notes to Financial Statements — continued
| New Jersey Fund (continued) | | | |
| | | Year Ended
July 31, 2024 | | Year Ended
July 31, 2023 |
| | | Shares | Amount | Shares | Amount |
| Class I | | | | | |
| Sales | | 2,680,371 | $22,795,301 | 4,251,864 | $36,346,691 |
| Issued to shareholders electing to receive payments of distributions in Fund shares | | 234,095 | 2,001,808 | 187,695 | 1,601,906 |
| Redemptions | | (2,377,000) | (20,278,496) | (3,578,517) | (30,417,489) |
| Net increase | | 537,466 | $ 4,518,613 | 861,042 | $ 7,531,108 |
| Pennsylvania Fund | | | |
| | | Year Ended
July 31, 2024 | | Year Ended
July 31, 2023 |
| | | Shares | Amount | Shares | Amount |
| Class A | | | | | |
| Sales | | 1,318,479 | $10,027,155 | 1,503,864 | $11,594,025 |
| Issued to shareholders electing to receive payments of distributions in Fund shares | | 354,293 | 2,716,764 | 315,285 | 2,420,615 |
| Redemptions | | (2,001,819) | (15,344,451) | (2,040,396) | (15,672,937) |
| Net decrease | | (329,047) | $(2,600,532) | (221,247) | $(1,658,297) |
| Class C | | | | | |
| Sales | | 94,089 | $ 752,135 | 132,006 | $ 1,043,092 |
| Issued to shareholders electing to receive payments of distributions in Fund shares | | 12,468 | 98,893 | 13,129 | 104,314 |
| Redemptions | | (196,449) | (1,550,837) | (268,287) | (2,129,775) |
| Net decrease | | (89,892) | $ (699,809) | (123,152) | $ (982,369) |
| Class I | | | | | |
| Sales | | 3,023,481 | $23,249,422 | 4,349,671 | $33,466,988 |
| Issued to shareholders electing to receive payments of distributions in Fund shares | | 244,395 | 1,881,486 | 189,918 | 1,464,401 |
| Redemptions | | (2,211,281) | (17,012,525) | (3,257,126) | (25,005,310) |
| Net increase | | 1,056,595 | $ 8,118,383 | 1,282,463 | $ 9,926,079 |
8 Line of Credit
The Funds participate with other portfolios and funds managed by EVM and its affiliates in a $650 million unsecured revolving line of credit agreement with a group of banks, which is in effect through October 22, 2024. In connection with the renewal of the agreement on October 24, 2023, the borrowing limit was decreased from $725 million. Borrowings are made by the Funds solely for temporary purposes related to redemptions and other short-term cash needs. Interest is charged to each Fund based on its borrowings at an amount above either the Secured Overnight Financing Rate (SOFR) or Federal Funds rate. In addition, a fee computed at an annual rate of 0.15% on the daily unused portion of the line of credit is allocated among the participating portfolios and funds at the end of each quarter. In connection with the renewal of the agreement in October 2023, an arrangement fee of $150,000 was incurred that was allocated to the participating portfolios and funds. Because the line of credit is not available exclusively to the Funds, a Fund may be unable to borrow some or all of its requested amounts at any particular time. The Funds did not have any significant borrowings or allocated fees during the year ended July 31, 2024.
Eaton Vance
Municipal Income Funds
July 31, 2024
Notes to Financial Statements — continued
9 Fair Value Measurements
Under generally accepted accounting principles for fair value measurements, a three-tier hierarchy to prioritize the assumptions, referred to as inputs, is used in valuation techniques to measure fair value. The three-tier hierarchy of inputs is summarized in the three broad levels listed below.
| • | Level 1 – quoted prices in active markets for identical investments |
| • | Level 2 – other significant observable inputs (including quoted prices for similar investments, interest rates, prepayment speeds, credit risk, etc.) |
| • | Level 3 – significant unobservable inputs (including a fund's own assumptions in determining the fair value of investments) |
In cases where the inputs used to measure fair value fall in different levels of the fair value hierarchy, the level disclosed is determined based on the lowest level input that is significant to the fair value measurement in its entirety. The inputs or methodology used for valuing securities are not necessarily an indication of the risk associated with investing in those securities.
At July 31, 2024, the hierarchy of inputs used in valuing the Funds' investments, which are carried at fair value, were as follows:
| Arizona Fund | | | | |
| Asset Description | Level 1 | Level 2 | Level 3 | Total |
| Tax-Exempt Municipal Obligations | $ — | $ 76,993,659 | $ — | $ 76,993,659 |
| Taxable Municipal Obligations | — | 1,254,119 | — | 1,254,119 |
| Trust Units | — | 442,224 | — | 442,224 |
| Total Investments | $ — | $ 78,690,002 | $ — | $ 78,690,002 |
| Connecticut Fund | | | | |
| Asset Description | Level 1 | Level 2 | Level 3 | Total |
| Corporate Bonds | $ — | $ 971,001 | $ — | $ 971,001 |
| Tax-Exempt Municipal Obligations | — | 107,550,380 | — | 107,550,380 |
| Taxable Municipal Obligations | — | 5,196,139 | — | 5,196,139 |
| Trust Units | — | 538,693 | — | 538,693 |
| Total Investments | $ — | $114,256,213 | $ — | $114,256,213 |
| Minnesota Fund | | | | |
| Asset Description | Level 1 | Level 2 | Level 3 | Total |
| Tax-Exempt Municipal Obligations | $ — | $247,382,535 | $ — | $247,382,535 |
| Short-Term Investments | — | 2,500,321 | — | 2,500,321 |
| Total Investments | $ — | $249,882,856 | $ — | $249,882,856 |
| New Jersey Fund | | | | |
| Asset Description | Level 1 | Level 2 | Level 3 | Total |
| Tax-Exempt Municipal Obligations | $ — | $142,861,212 | $ — | $142,861,212 |
| Taxable Municipal Obligations | — | 7,746,672 | — | 7,746,672 |
| Total Investments | $ — | $150,607,884 | $ — | $150,607,884 |
Eaton Vance
Municipal Income Funds
July 31, 2024
Notes to Financial Statements — continued
| Pennsylvania Fund | | | | |
| Asset Description | Level 1 | Level 2 | Level 3 | Total |
| Tax-Exempt Municipal Obligations | $ — | $159,526,804 | $ — | $159,526,804 |
| Taxable Municipal Obligations | — | 4,424,038 | — | 4,424,038 |
| Total Investments | $ — | $163,950,842 | $ — | $163,950,842 |
Eaton Vance
Municipal Income Funds
July 31, 2024
Report of Independent Registered Public Accounting Firm
To the Trustees of Eaton Vance Municipals Trust and Shareholders of Eaton Vance Arizona Municipal Income Fund, Eaton Vance Connecticut Municipal Income Fund, Eaton Vance Minnesota Municipal Income Fund, Eaton Vance New Jersey Municipal Income Fund and Eaton Vance Pennsylvania Municipal Income Fund:
Opinion on the Financial Statements and Financial Highlights
We have audited the accompanying statements of assets and liabilities of Eaton Vance Arizona Municipal Income Fund, Eaton Vance Connecticut Municipal Income Fund, Eaton Vance Minnesota Municipal Income Fund, Eaton Vance New Jersey Municipal Income Fund and Eaton Vance Pennsylvania Municipal Income Fund (collectively, the “Funds”) (certain of the funds constituting Eaton Vance Municipals Trust), including the portfolios of investments, as of July 31, 2024, the related statements of operations for the year then ended, the statements of changes in net assets for each of the two years in the period then ended, the financial highlights for each of the five years in the period then ended, and the related notes. In our opinion, the financial statements and financial highlights present fairly, in all material respects, the financial position of each of the Funds as of July 31, 2024, and the results of their operations for the year then ended, the changes in their net assets for each of the two years in the period then ended, and the financial highlights for each of the five years in the period then ended, in conformity with accounting principles generally accepted in the United States of America.
Basis for Opinion
These financial statements and financial highlights are the responsibility of the Funds' management. Our responsibility is to express an opinion on the Funds' financial statements and financial highlights based on our audits. We are a public accounting firm registered with the Public Company Accounting Oversight Board (United States) (PCAOB) and are required to be independent with respect to the Funds in accordance with the U.S. federal securities laws and the applicable rules and regulations of the Securities and Exchange Commission and the PCAOB.
We conducted our audits in accordance with the standards of the PCAOB. Those standards require that we plan and perform the audit to obtain reasonable assurance about whether the financial statements and financial highlights are free of material misstatement, whether due to error or fraud. The Funds are not required to have, nor were we engaged to perform, an audit of their internal control over financial reporting. As part of our audits, we are required to obtain an understanding of internal control over financial reporting but not for the purpose of expressing an opinion on the effectiveness of the Funds’ internal control over financial reporting. Accordingly, we express no such opinion.
Our audits included performing procedures to assess the risks of material misstatement of the financial statements and financial highlights, whether due to error or fraud, and performing procedures that respond to those risks. Such procedures included examining, on a test basis, evidence regarding the amounts and disclosures in the financial statements and financial highlights. Our audits also included evaluating the accounting principles used and significant estimates made by management, as well as evaluating the overall presentation of the financial statements and financial highlights. Our procedures included confirmation of securities owned as of July 31, 2024, by correspondence with the custodian and brokers; when replies were not received from brokers, we performed other auditing procedures. We believe that our audits provide a reasonable basis for our opinion.
/s/ Deloitte & Touche LLP
Boston, Massachusetts
September 18, 2024
We have served as the auditor of one or more Eaton Vance investment companies since 1959.
Eaton Vance
Municipal Income Funds
July 31, 2024
Federal Tax Information (Unaudited)
The Form 1099-DIV you receive in February 2025 will show the tax status of all distributions paid to your account in calendar year 2024. Shareholders are advised to consult their own tax adviser with respect to the tax consequences of their investment in the Funds. As required by the Internal Revenue Code and/or regulations, shareholders must be notified regarding the status of exempt-interest dividends.
Exempt-Interest Dividends. For the fiscal year ended July 31, 2024, the Funds designate the following percentages of distributions from net investment income as exempt-interest dividends:
| Arizona Municipal Income Fund | 95.32% |
| Connecticut Municipal Income Fund | 96.74% |
| Minnesota Municipal Income Fund | 99.58% |
| New Jersey Municipal Income Fund | 94.36% |
| Pennsylvania Municipal Income Fund | 96.76% |
Eaton Vance
Municipal Income Funds
July 31, 2024
Board of Trustees’ Contract Approval
Overview of the Contract Review Process
The Investment Company Act of 1940, as amended (the “1940 Act”), provides, in substance, that the investment advisory agreement between a fund and its investment adviser will continue in effect from year-to-year only if its continuation is approved on an annual basis by a vote of the fund’s board of trustees, including a majority of the trustees who are not “interested persons” of the fund (“independent trustees”), cast in person at a meeting called for the purpose of considering such approval.
At a meeting held on June 6, 2024, the Boards of Trustees/Directors (collectively, the “Board”) that oversee the registered investment companies advised by Eaton Vance Management or its affiliate, Boston Management and Research (the “Eaton Vance Funds”), including a majority of the independent trustees (the “Independent Trustees”), voted to approve the continuation of existing investment advisory agreements and sub-advisory agreements1 for each of the Eaton Vance Funds for an additional one-year period. The Board relied upon the affirmative recommendation of its Contract Review Committee, which is a committee comprised of all of the Independent Trustees. Prior to making its recommendation, the Contract Review Committee reviewed information furnished by the adviser and sub-adviser to each of the Eaton Vance Funds (including information specifically requested by the Board) for a series of meetings held between April and June 2024, as well as certain additional information provided in response to specific requests from the Independent Trustees as members of the Contract Review Committee. Members of the Contract Review Committee also considered information received at prior meetings of the Board and its committees, to the extent such information was relevant to the Contract Review Committee’s annual evaluation of the investment advisory agreements and sub-advisory agreements.
In connection with its evaluation of the investment advisory agreements and sub-advisory agreements, the Board considered various information relating to the Eaton Vance Funds. This included information applicable to all or groups of Eaton Vance Funds, which is referenced immediately below, and information applicable to the particular Eaton Vance Fund covered by this report (each “Eaton Vance Fund” is referred to below as a “fund”). (For funds that invest through one or more underlying portfolios, references to “each fund” in this section may include information that was considered at the portfolio-level.)
Information about Fees, Performance and Expenses
• A report from an independent data provider comparing advisory and other fees paid by each fund to such fees paid by comparable funds, as identified by the independent data provider (“comparable funds”);
• A report from an independent data provider comparing each fund’s total expense ratio (and its components) to those of comparable funds;
• A report from an independent data provider comparing the investment performance of each fund (including, as relevant, total return data, income data, Sharpe ratios, and information ratios) to the investment performance of comparable funds and, as applicable, benchmark indices, over various time periods;
• In certain instances, data regarding investment performance relative to customized groups of peer funds and blended indices identified by the adviser in consultation with the Portfolio Management Committee of the Board (a committee exclusively comprised of Independent Trustees);
• Comparative information concerning the fees charged and services provided by the adviser and sub-adviser to each fund in managing other accounts (which may include other funds, collective investment trusts and institutional accounts) with the same or substantially similar investment objective as the fund and with a significant overlap in holdings based on criteria set by the Board, if any;
• Profitability analyses with respect to the adviser and sub-adviser to each of the funds;
Information about Portfolio Management and Trading
• Descriptions of the investment management services provided to each fund, as well as each of the funds’ investment strategies and policies;
• The procedures and processes used by the adviser to determine the value of fund assets, including, when necessary, the determination of “fair value” by the adviser in its role as each funds’ valuation designee and actions taken to monitor and test the effectiveness of such procedures and processes;
• Information about the policies and practices of each fund’s adviser and sub-adviser with respect to trading, including their processes for seeking best execution of portfolio transactions;
• Information about the allocation of brokerage transactions and the benefits, if any, received by the adviser and sub-adviser to each fund as a result of brokerage allocation, including, as applicable, information concerning the acquisition of research through client commission arrangements and policies with respect to “soft dollars”;
• Data relating to the portfolio turnover rate of each fund and related information regarding active management in the context of particular strategies;
Information about each Adviser and Sub-adviser
• Reports detailing the financial results and condition of the adviser and sub-adviser to each fund;
1 Not all Eaton Vance Funds have entered into a sub-advisory agreement with a sub-adviser. Accordingly, references to “sub-adviser” or “sub-advisory agreement” in this “Overview” section may not be applicable to the particular Eaton Vance Fund covered by this report. Eaton Vance Management and Boston Management and Research are referred to collectively as the “adviser.”
Eaton Vance
Municipal Income Funds
July 31, 2024
Board of Trustees’ Contract Approval — continued
• Information regarding the individual investment professionals whose responsibilities include portfolio management and investment research for the funds, and, for portfolio managers and certain other investment professionals, information relating to their responsibilities with respect to managing other funds and investment accounts, as applicable;
• Information regarding the adviser’s and its parent company’s (Morgan Stanley’s) efforts to retain and attract talented investment professionals, including in the context of a competitive marketplace for talent;
• Information regarding the adviser’s compensation methodology for its investment professionals and the incentives and accountability it creates, along with investment professionals’ investments in the fund(s) they manage;
• The personal trading codes of ethics of the adviser and its affiliates and the sub-adviser of each fund, together with information relating to compliance with, and the administration of, such codes;
• Policies and procedures relating to proxy voting, including regular reporting with respect to fund proxy voting activities;
• Information regarding the handling of corporate actions and class actions, as well as information regarding litigation and other regulatory matters;
• Information concerning the resources devoted to compliance efforts undertaken by the adviser and its affiliates and the sub-adviser of each fund, including descriptions of their various compliance programs and their record of compliance and remediation;
• Information concerning the business continuity and disaster recovery plans of the adviser and its affiliates and the sub-adviser of each fund;
• A description of the adviser’s oversight of sub-advisers, including with respect to regulatory and compliance issues, investment management and other matters;
Other Relevant Information
• Information regarding ongoing initiatives to further integrate and harmonize, where applicable, the investment management and other departments of the adviser and its affiliates with the overall investment management infrastructure of Morgan Stanley, in light of Morgan Stanley’s acquisition of Eaton Vance Corp. on March 1, 2021;
• Information concerning the nature, cost, and character of the administrative and other non-investment advisory services provided by the adviser and its affiliates;
• Information concerning oversight of the relationship with the custodian, subcustodians, fund accountants, and other third-party service providers by the adviser and/or administrator to each of the funds;
• Information concerning efforts to implement policies and procedures with respect to various regulations applicable to the funds, including Rule 12d1-4 (the Fund-of-Funds Rule), Rule 18f-4 (the Derivatives Rule), and Rule 2a-5 (the Fair Valuation Rule);
• For an Eaton Vance Fund structured as an exchange-listed closed-end fund, information concerning the benefits of the closed-end fund structure, as well as, where relevant, the closed-end fund’s market prices (including as compared to the closed-end fund’s net asset value (NAV)), trading volume data, continued use of auction preferred shares (where applicable), distribution rates, and other relevant matters;
• The risks that the adviser and/or its affiliates incur in connection with the management and operation of the funds, including, among others, litigation, regulatory, entrepreneurial, and other business risks (and the associated costs of such risks); and
• The terms of each investment advisory agreement and sub-advisory agreement.
During the various meetings of the Board and its committees over the course of the year leading up to the June 6, 2024 meeting, the Board and its committees received information from portfolio managers and other investment professionals of the adviser and sub-advisers of the funds regarding investment and performance matters, and considered various investment and trading strategies used in pursuing the funds’ investment objectives. The Board and its committees also received information regarding risk management techniques employed in connection with the management of the funds. The Board and its committees evaluated issues pertaining to industry and regulatory developments, compliance procedures, fund governance, and other issues with respect to the funds, and received and participated in reports and presentations provided by the adviser and sub-advisers, with respect to such matters. In addition to the formal meetings of the Board and its committees, the Independent Trustees held regular video or telephone conferences to discuss, among other topics, matters relating to the continuation of investment advisory agreements and sub-advisory agreements.
The Contract Review Committee was advised throughout the contract review process by Kirkland & Ellis LLP, independent legal counsel for the Independent Trustees. The members of the Contract Review Committee, with the advice of such counsel, exercised their own business judgment in determining the material factors to be considered in evaluating each investment advisory agreement and sub-advisory agreement and the weight to be given to each such factor. The conclusions reached with respect to each investment advisory agreement and sub-advisory agreement were based on a comprehensive evaluation of all the information provided and not any single factor. Moreover, each member of the Contract Review Committee may have placed varying emphasis on particular factors in reaching conclusions with respect to each investment advisory agreement and sub-advisory agreement. In evaluating each investment advisory agreement and sub-advisory agreement, including the fee structures and other terms contained in such agreements, the members of the Contract Review Committee were also informed by multiple years of analysis and discussion with the adviser and sub-adviser to each of the Eaton Vance Funds.
Eaton Vance
Municipal Income Funds
July 31, 2024
Board of Trustees’ Contract Approval — continued
Results of the Contract Review Process
Based on its consideration of the foregoing, and such other information it deemed relevant, including the factors and conclusions described below, the Contract Review Committee concluded that the continuation of the investment advisory agreements between each of the following funds:
• Eaton Vance Arizona Municipal Income Fund
• Eaton Vance Connecticut Municipal Income Fund
• Eaton Vance Minnesota Municipal Income Fund
• Eaton Vance New Jersey Municipal Income Fund
• Eaton Vance Pennsylvania Municipal Income Fund
(the “Funds”) and Boston Management and Research (the “Adviser”), including their respective fee structures, are in the interests of shareholders and, therefore, recommended to the Board approval of each agreement. Based on the recommendation of the Contract Review Committee, the Board, including a majority of the Independent Trustees, voted to approve continuation of the investment advisory agreement for each Fund.
Nature, Extent and Quality of Services
In considering whether to approve the investment advisory agreements for the Funds, the Board evaluated the nature, extent and quality of services provided to the Funds by the Adviser.
The Board considered the Adviser’s management capabilities and investment processes in light of the types of investments held by each Fund, including the education and experience of the investment professionals who provide services to the Funds, including recent changes to such personnel, where relevant. In particular, the Board considered, where relevant, the abilities and experience of the Adviser’s investment professionals in analyzing factors such as credit risk, tax efficiency, and special considerations relevant to investing in municipal bonds. The Board considered the Adviser’s municipal bond team, which includes investment professionals and credit specialists who provide services to the Funds. The Board also took into account the resources dedicated to portfolio management and other services, the compensation methods of the Adviser and other factors, including the reputation and resources of the Adviser to recruit and retain highly qualified research, advisory and supervisory investment professionals. In addition, the Board considered the time and attention devoted to the Eaton Vance Funds, including each Fund, by senior management, as well as the infrastructure, operational capabilities and support staff in place to assist in the portfolio management and operations of the Funds, including the provision of administrative services. The Board also considered the business-related and other risks to which the Adviser or its affiliates may be subject in managing the Funds.
The Board considered the compliance programs of the Adviser and relevant affiliates thereof. The Board considered compliance and reporting matters regarding, among other things, personal trading by investment professionals, disclosure of portfolio holdings, compliance with policies and procedures, portfolio valuation, business continuity and the allocation of investment opportunities. The Board also considered relevant examinations of the Adviser and its affiliates by regulatory authorities, such as the Securities and Exchange Commission and the Financial Industry Regulatory Authority.
The Board considered other administrative services provided or overseen by Eaton Vance Management and its affiliates, including transfer agency and accounting services. The Board evaluated the benefits to shareholders of investing in a fund that is a part of a large fund complex offering exposure to a variety of asset classes and investment disciplines, as well as the ability, in many cases, to exchange an investment among different funds without incurring additional sales charges.
After consideration of the foregoing factors, among others, the Board concluded that the nature, extent and quality of services provided by the Adviser, taken as a whole, are appropriate and consistent with the terms of the investment advisory agreements.
Fund Performance
The Board compared each Fund’s investment performance to that of comparable funds identified by an independent data provider (the peer group), as well as appropriate benchmark indices, and, where relevant, a customized peer group of similarly managed funds, and assessed each Fund’s performance on the basis of total return and current income return. The Board’s review included comparative performance data with respect to each Fund for the one-, three-, five- and ten-year periods ended December 31, 2023.
In this regard, the Board noted each Fund’s performance relative to its peer group, custom peer group, if applicable, and primary and secondary benchmark indexes for the three-year period, as follows:
Eaton Vance
Municipal Income Funds
July 31, 2024
| | Performance Relative to: |
| Fund | Median of
Peers | Median of
Custom Peers | Primary
Index | Secondary
Index |
| Eaton Vance Arizona Municipal Income Fund | Higher | Higher | Lower | Lower |
| Eaton Vance Connecticut Municipal Income Fund | Higher | Higher | Lower | Lower |
| Eaton Vance Minnesota Municipal Income Fund | Higher | n/a | Higher | Higher |
| Eaton Vance New Jersey Municipal Income Fund | Lower | n/a | Lower | Lower |
| Eaton Vance Pennsylvania Municipal Income Fund | Consistent | n/a | Lower | Lower |
The Board considered, among other things, the Adviser’s efforts to generate competitive levels of tax exempt current income over time through investments that, relative to its comparable funds, focus on higher quality municipal bonds with longer maturities. With respect to Eaton Vance New Jersey Municipal Income Fund, the Board noted certain actions taken by the Adviser to address Fund performance, including improved performance as of a more recent period, and determined to continue to monitor and evaluate their effectiveness over time. With respect to all other Funds, the Board concluded that the performance of each Fund was satisfactory.
Management Fees and Expenses
The Board considered contractual fee rates payable by each Fund for advisory and administrative services (referred to collectively as “management fees”). As part of its review, the Board considered each Fund’s management fees and total expense ratio for the one-year period ended December 31, 2023, as compared to those of comparable funds, before and after giving effect to any undertaking to waive fees or reimburse expenses. The Board also considered factors that had an impact on each Fund’s total expense ratio relative to comparable funds.
After considering the foregoing information, and in light of the nature, extent and quality of the services provided by the Adviser, the Board concluded that the management fees charged for advisory and related services are reasonable.
Profitability and “Fall-Out” Benefits
The Board considered the level of profits realized by the Adviser and relevant affiliates thereof in providing investment advisory and administrative services to each Fund and to all Eaton Vance Funds as a group. The Board considered the level of profits realized without regard to marketing support or other payments by the Adviser and its affiliates to third parties in respect of distribution or other services.
The Board concluded that, in light of the foregoing factors and the nature, extent and quality of the services rendered, the profits realized by the Adviser and its affiliates are not excessive.
The Board also considered direct or indirect fall-out benefits received by the Adviser and its affiliates in connection with their respective relationships with the Funds, including the benefits of research services that may be available to the Adviser as a result of securities transactions effected for the Funds and other investment advisory clients.
Economies of Scale
In reviewing management fees and profitability, the Board also considered the extent to which the Adviser and its affiliates, on the one hand, and each Fund, on the other hand, can expect to realize benefits from economies of scale as the assets of each Fund increase. The Board acknowledged the difficulty in accurately measuring the benefits resulting from economies of scale, if any, with respect to the management of any specific fund or group of funds. To assist in the evaluation of the sharing of any economies of scale, the Board received data showing for recent years, asset levels, Adviser profitability and total expense ratios. Based upon the foregoing, the Board concluded that each Fund currently shares in the benefits from economies of scale, if any, when they are realized by the Adviser. The Board also concluded that the structure of each advisory fee, which includes breakpoints at several asset levels, will allow each Fund to continue to benefit from any economies of scale in the future.
This Page Intentionally Left Blank
Eaton Vance
Municipal Opportunities Fund
Annual Financial Statements and Additional Information
July 31, 2024
This report must be preceded or accompanied by a current summary prospectus or prospectus. Before investing, investors should consider carefully the investment objective, risks, and charges and expenses of a mutual fund. This and other important information is contained in the prospectus and/or statement of additional information, which can be obtained by calling 1-800-262-1122 or from a financial intermediary. Prospective investors should read the prospectus carefully before investing.
Annual Financial Statements and Additional Information July 31, 2024
Eaton Vance
Municipal Opportunities Fund
Eaton Vance
Municipal Opportunities Fund
July 31, 2024
| Security | Principal
Amount
(000's omitted) | Value |
| Education — 0.8% |
| Grand Canyon University, 4.125%, 10/1/24 | $ | 5,000 | $ 4,957,892 |
| | | | $ 4,957,892 |
| Hospital — 0.4% |
| Harnett Health System, Inc., 4.25% to 4/1/25 (Put Date), 4/1/32(1) | $ | 2,800 | $ 2,758,000 |
| | | | $ 2,758,000 |
Total Corporate Bonds
(identified cost $7,564,480) | | | $ 7,715,892 |
| Tax-Exempt Mortgage-Backed Securities — 0.1% |
| Security | Principal
Amount
(000's omitted) | Value |
| Housing — 0.1% |
| FRETE 2017-ML01 Trust, (Freddie Mac guaranteed), 5.964%, (30-day SOFR Average + 0.50%), 1/25/33(2)(3) | $ | 446 | $ 444,083 |
Total Tax-Exempt Mortgage-Backed Securities
(identified cost $445,858) | | | $ 444,083 |
| Tax-Exempt Municipal Obligations — 92.9% |
| Security | Principal
Amount
(000's omitted) | Value |
| Bond Bank — 1.5% |
| Delaware Valley Regional Finance Authority, PA, 4.417%, (67% of 1 mo. SOFR + 0.76%), 9/1/24 (Put Date), 9/1/48(3) | $ | 8,000 | $ 8,000,320 |
| Virginia Resources Authority, (Pooled Financing Program), 5.25%, 11/1/47 | | 1,850 | 2,075,126 |
| | | | $ 10,075,446 |
| Education — 4.3% |
| Arlington Higher Education Finance Corp., TX, (Harmony Public Schools), (PSF Guaranteed), 4.00%, 2/15/49 | $ | 1,500 | $ 1,448,115 |
| California Municipal Finance Authority, (California Lutheran University), 5.00%, 10/1/37 | | 1,400 | 1,461,992 |
| Capital Trust Agency, FL, (Florida Charter Educational Foundation, Inc.), 4.50%, 6/15/28(2) | | 430 | 427,566 |
| Security | Principal
Amount
(000's omitted) | Value |
| Education (continued) |
| Connecticut Health and Educational Facilities Authority, (Yale University), 3.80%, 7/1/36(4) | $ | 1,000 | $ 1,000,000 |
| Kansas Development Finance Authority, (Kansas State University), 3.00%, 4/1/38 | | 2,585 | 2,282,400 |
| Michigan Finance Authority, (Cesar Chavez Academy), 5.00%, 2/1/33 | | 830 | 821,277 |
| Pinellas County Educational Facilities Authority, FL, (Pinellas Academy of Math and Science): | | | |
| 4.125%, 12/15/28(2) | | 380 | 378,408 |
| 5.00%, 12/15/38(2) | | 2,690 | 2,736,483 |
| Public Finance Authority, WI, (North Carolina Leadership Academy): | | | |
| 5.00%, 6/15/39(2) | | 140 | 140,015 |
| 5.00%, 6/15/49(2) | | 260 | 248,927 |
| Public Finance Authority, WI, (Roseman University of Health Sciences): | | | |
| 5.00%, 4/1/40(2) | | 795 | 823,079 |
| 5.00%, 4/1/50(2) | | 960 | 972,682 |
| University of Alabama, 3.00%, 7/1/38 | | 5,000 | 4,368,850 |
| University of California: | | | |
| 5.00%, 5/15/38 | | 6,410 | 7,515,597 |
| 5.00%, 5/15/41 | | 3,000 | 3,455,370 |
| | | | $ 28,080,761 |
| Electric Utilities — 3.0% |
| Fayetteville, NC, Public Works Commission Revenue, 4.50%, 3/1/49 | $ | 425 | $ 442,170 |
| Los Angeles Department of Water and Power, CA, Power System Revenue, 5.00%, 7/1/39 | | 5,935 | 6,908,221 |
| Lower Colorado River Authority, TX, (LCRA Transmission Services Corp.), 5.25%, 5/15/36 | | 1,000 | 1,127,530 |
| Mesa, AZ, Utility Systems Revenue, 4.00%, 7/1/37 | | 2,375 | 2,374,953 |
| Missouri Joint Municipal Electric Utility Commission, (MoPEP Facilities), Green Bonds, 5.25%, 12/1/39 | | 1,000 | 1,105,400 |
| South Carolina Public Service Authority: | | | |
| 5.00%, 12/1/49 | | 3,250 | 3,263,487 |
| 5.25%, 12/1/33 | | 2,000 | 2,286,720 |
| 5.25%, 12/1/34 | | 2,000 | 2,284,780 |
| | | | $ 19,793,261 |
| Escrowed/Prerefunded — 0.1% |
| Illinois Finance Authority, (Plymouth Place, Inc.), Escrowed to Maturity, 5.00%, 5/15/25 | $ | 355 | $ 359,587 |
| Public Finance Authority, WI, (Roseman University of Health Sciences), Prerefunded to 4/1/30, 5.00%, 4/1/50(2) | | 50 | 55,157 |
| | | | $ 414,744 |
1
See Notes to Financial Statements.
Eaton Vance
Municipal Opportunities Fund
July 31, 2024
Portfolio of Investments — continued
| Security | Principal
Amount
(000's omitted) | Value |
| General Obligations — 17.6% |
| ABC Unified School District, CA, (Election of 2018), 4.00%, 8/1/47 | $ | 5,000 | $ 5,048,950 |
| Bend, OR, 5.00%, 6/1/40 | | 3,590 | 4,107,858 |
| Beverly Hills Unified School District, CA, (Election of 2018), 3.25%, 8/1/42 | | 2,500 | 2,259,775 |
| Bristol, VA, 5.00%, 9/1/27 | | 1,915 | 1,947,995 |
| California: | | | |
| 5.00%, 4/1/42 | | 6,440 | 6,746,995 |
| 5.00%, 11/1/42 | | 5,000 | 5,594,750 |
| Cecil County, MD, 4.50%, 8/1/53 | | 3,150 | 3,247,335 |
| Cedar Hill Independent School District, TX, (PSF Guaranteed), 4.00%, 2/15/50(5) | | 3,000 | 2,895,720 |
| Charles County, MD, 4.25%, 10/1/47 | | 2,885 | 2,951,615 |
| Chicago Board of Education, IL: | | | |
| 4.00%, 12/1/35 | | 2,000 | 1,953,760 |
| 5.00%, 12/1/32 | | 2,000 | 2,066,440 |
| 5.25%, 12/1/35 | | 2,750 | 2,756,600 |
| 5.50%, 12/1/37 | | 5,000 | 5,469,550 |
| Coldwater Local Development Finance Authority, MI, Series A, (AMT), 5.00%, 12/1/27 | | 390 | 391,755 |
| Comal Independent School District, TX, (PSF Guaranteed), 4.00%, 2/1/49 | | 4,000 | 3,892,360 |
| Connecticut: | | | |
| 4.00%, 6/15/34 | | 5,000 | 5,006,750 |
| Social Bonds, 4.00%, 1/15/43 | | 5,000 | 5,038,600 |
| District of Columbia, 4.00%, 2/1/46 | | 2,615 | 2,555,143 |
| Falls Church, VA, 3.00%, 7/15/42 | | 2,295 | 1,956,143 |
| Fort Bend Independent School District, TX, (PSF Guaranteed), 4.00%, 8/15/49 | | 1,000 | 967,570 |
| Grand Prairie Independent School District, TX, (PSF Guaranteed): | | | |
| 4.00%, 2/15/31 | | 1,715 | 1,718,790 |
| 4.00%, 2/15/35 | | 2,000 | 1,997,760 |
| Hermiston School District No. 8R, OR, 0.00%, 6/15/43 | | 2,665 | 1,157,090 |
| Hurst-Euless-Bedford Independent School District, TX, (PSF Guaranteed), 4.00%, 8/15/50 | | 3,125 | 3,028,031 |
| Illinois: | | | |
| 4.00%, 7/1/37 | | 2,000 | 2,001,300 |
| 5.25%, 5/1/45 | | 2,000 | 2,200,940 |
| 5.50%, 5/1/39 | | 1,980 | 2,170,951 |
| 5.75%, 5/1/45 | | 1,780 | 1,939,915 |
| Kenosha County, WI: | | | |
| 1.50%, 9/1/29 | | 640 | 571,782 |
| 1.50%, 9/1/30 | | 480 | 414,427 |
| Lamar Consolidated Independent School District, TX, (PSF Guaranteed), 5.00%, 2/15/49(5) | | 1,200 | 1,306,776 |
| Security | Principal
Amount
(000's omitted) | Value |
| General Obligations (continued) |
| Mountain View Whisman School District, CA, (Election of 2020), 4.00%, 9/1/42(5) | $ | 2,000 | $ 2,064,540 |
| New York, NY, (SPA: JPMorgan Chase Bank, N.A.), 4.05%, 3/1/40(4) | | 4,000 | 4,000,000 |
| Palm Springs Unified School District, CA, (Election of 2016), 5.00%, 8/1/42 | | 1,500 | 1,732,575 |
| Palo Alto Unified School District, CA, (Election of 2018), 3.25%, 8/1/42 | | 2,500 | 2,258,425 |
| Pasadena Independent School District, TX, (PSF Guaranteed), 5.00%, 2/15/48 | | 1,500 | 1,631,220 |
| Puerto Rico, 0.00%, 7/1/33 | | 489 | 330,012 |
| Riverview Gardens School District, MO: | | | |
| 5.50%, 4/1/36 | | 1,790 | 2,017,384 |
| 5.50%, 4/1/38 | | 855 | 957,591 |
| San Bernardino Community College District, CA, (Election of 2018), 4.125%, 8/1/49 | | 10 | 10,075 |
| San Diego Unified School District, CA, (Election of 2008), 5.00%, 7/1/39 | | 2,825 | 3,336,014 |
| Sarpy County School District 0037, NE, 5.00%, 12/15/27 | | 1,500 | 1,537,755 |
| Sunnyvale School District, CA, (Election of 2018), 5.00%, 9/1/43(5) | | 1,000 | 1,121,060 |
| University City School District, MO: | | | |
| 5.25%, 2/15/41 | | 1,000 | 1,104,530 |
| 5.25%, 2/15/43 | | 2,115 | 2,316,137 |
| Virginia, 2.00%, 6/1/28 | | 2,195 | 2,046,333 |
| Waxahachie Independent School District, TX, (PSF Guaranteed), 4.00%, 2/15/49 | | 2,250 | 2,185,583 |
| Wayne County School District No. 17, NE, 5.00%, 12/15/43 | | 1,000 | 1,049,220 |
| | | | $115,061,880 |
| Hospital — 12.1% |
| Arizona Industrial Development Authority, (Phoenix Children's Hospital), (LOC: TD Bank, N.A.), 4.05%, 2/1/48(4) | $ | 1,250 | $ 1,250,000 |
| Arlington County Industrial Development Authority, VA, (Virginia Hospital Center), 4.00%, 7/1/45 | | 2,330 | 2,249,671 |
| Brookhaven Development Authority, GA, (Children's Healthcare of Atlanta), 4.00%, 7/1/49 | | 1,985 | 1,936,030 |
| Calhoun County Hospital Finance Authority, MI, (Oaklawn Hospital), 5.00%, 2/15/32 | | 2,110 | 2,123,736 |
| California Municipal Finance Authority, (NorthBay Healthcare Group), 5.00%, 11/1/28 | | 300 | 300,063 |
| Charlotte-Mecklenburg Hospital Authority, NC, (Atrium Health), (LOC: Royal Bank of Canada), 4.00%, 1/15/42(4) | | 4,500 | 4,500,000 |
| Colorado Health Facilities Authority, (CommonSpirit Health), 5.00%, 11/1/42 | | 500 | 542,345 |
2
See Notes to Financial Statements.
Eaton Vance
Municipal Opportunities Fund
July 31, 2024
Portfolio of Investments — continued
| Security | Principal
Amount
(000's omitted) | Value |
| Hospital (continued) |
| Crawford County Hospital Authority, PA, (Meadville Medical Center): | | | |
| 6.00%, 6/1/36 | $ | 2,660 | $ 2,718,360 |
| 6.00%, 6/1/51 | | 4,715 | 4,746,496 |
| Darke County, OH, (Wayne HealthCare): | | | |
| 4.00%, 9/1/40 | | 1,000 | 869,080 |
| 4.00%, 9/1/45 | | 2,580 | 2,097,076 |
| Fairfax County Industrial Development Authority, VA, (Inova Health System): | | | |
| 4.00%, 5/15/48 | | 505 | 490,830 |
| 4.125%, 5/15/54(5) | | 5,000 | 4,882,874 |
| Illinois Finance Authority, (Silver Cross Hospital and Medical Centers), 5.00%, 8/15/28 | | 1,670 | 1,690,524 |
| Jefferson County Civic Facility Development Corp., NY, (Samaritan Medical Center): | | | |
| 4.00%, 11/1/29 | | 505 | 481,634 |
| 4.00%, 11/1/30 | | 1,605 | 1,517,913 |
| 5.00%, 11/1/26 | | 1,375 | 1,372,635 |
| 5.00%, 11/1/27 | | 1,440 | 1,438,387 |
| Lancaster County Hospital Authority, PA, (Penn State Health), 5.00%, 11/1/41 | | 1,950 | 2,050,171 |
| Maricopa County Industrial Development Authority, AZ, (Banner Health), 4.00%, 1/1/44 | | 4,375 | 4,310,994 |
| Michigan Finance Authority, (Henry Ford Health System), 4.00%, 11/15/46 | | 2,000 | 1,867,580 |
| Michigan Finance Authority, (McLaren Health Care), 4.00%, 2/15/47 | | 6,200 | 5,838,478 |
| Michigan Finance Authority, (Trinity Health Credit Group): | | | |
| 4.00%, 12/1/40 | | 2,595 | 2,597,413 |
| 4.00%, 12/1/49 | | 3,000 | 2,865,150 |
| Minnesota Agricultural and Economic Development Board, (HealthPartners Obligated Group), 4.00%, 1/1/49 | | 2,300 | 2,219,891 |
| Missouri Health and Educational Facilities Authority, (Mercy Health): | | | |
| 4.00%, 11/15/47 | | 4,000 | 3,782,520 |
| 4.00%, 11/15/49 | | 3,005 | 2,808,503 |
| Nassau County Local Economic Assistance Corp., NY, (Catholic Health Services of Long Island), 5.00%, 7/1/29 | | 1,000 | 1,000,720 |
| New Jersey Health Care Facilities Financing Authority, (Inspira Health Obligated Group), 5.00%, 7/1/27 | | 470 | 472,035 |
| Oroville, CA, (Oroville Hospital): | | | |
| 5.00%, 4/1/31 | | 1,705 | 1,245,861 |
| 5.25%, 4/1/34 | | 1,900 | 1,396,823 |
| South Broward Hospital District, FL, 4.00%, 5/1/48 | | 1,985 | 1,912,289 |
| Southcentral Pennsylvania General Authority, (Hanover Hospital, Inc.), 5.00%, 12/1/28 | | 1,550 | 1,580,644 |
| Security | Principal
Amount
(000's omitted) | Value |
| Hospital (continued) |
| Virginia Commonwealth University Health System Authority, 4.00%, 7/1/54 | $ | 5,000 | $ 4,792,850 |
| Virginia Small Business Financing Authority, (Bon Secours Mercy Health, Inc.), 4.00%, 12/1/49 | | 1,190 | 1,143,614 |
| Virginia Small Business Financing Authority, (Sentara Healthcare), 4.00%, 11/1/36 | | 2,000 | 2,060,180 |
| | | | $ 79,153,370 |
| Housing — 9.1% |
| Alabama Housing Finance Authority, SFMR, (FHLMC), (FNMA), (GNMA), 4.45%, 10/1/44(5) | $ | 2,590 | $ 2,590,518 |
| Arizona Industrial Development Authority, (Hacienda Del Rio), (FNMA), 4.50%, 6/1/41 | | 2,200 | 2,254,010 |
| California Municipal Finance Authority, (CHF-Riverside II, LLC), 5.00%, 5/15/37 | | 1,825 | 1,939,519 |
| Connecticut Housing Finance Authority, (Housing Mortgage Finance): | | | |
| 0.75%, 11/15/27 | | 1,250 | 1,115,462 |
| 1.10%, 11/15/29 | | 3,950 | 3,405,097 |
| Delaware State Housing Authority, (FHLMC), (FNMA), (GNMA), 4.45%, 7/1/44(5) | | 2,215 | 2,214,203 |
| Georgia Housing and Finance Authority, 2.40%, 12/1/41 | | 2,120 | 1,613,278 |
| Louisiana Housing Corp., (Home Ownership Program), SFMR: | | | |
| (FHLMC), (FNMA), (GNMA), 4.50%, 12/1/44 | | 2,860 | 2,865,348 |
| (FHLMC), (FNMA), (GNMA), 4.80%, 12/1/43 | | 820 | 849,807 |
| Maine Housing Authority: | | | |
| Social Bonds, 4.50%, 11/15/43 | | 590 | 593,741 |
| Social Bonds, 4.55%, 11/15/44 | | 2,000 | 2,010,760 |
| Social Bonds, 4.75%, 11/15/43 | | 2,950 | 3,035,963 |
| Maricopa County and Phoenix Industrial Development Authorities, AZ: | | | |
| (FHLMC), (FNMA), (GNMA), 4.625%, 9/1/44 | | 1,365 | 1,379,005 |
| (FHLMC), (FNMA), (GNMA), 4.65%, 9/1/44 | | 1,050 | 1,062,821 |
| (GNMA), 4.60%, 9/1/49 | | 1,000 | 1,002,000 |
| Maryland Department of Housing and Community Development Administration, Social Bonds, (FHLMC), (FNMA), (GNMA), 4.55%, 9/1/44 | | 500 | 502,570 |
| Maryland Economic Development Corp., (Bowie State University), Student Housing Revenue, 4.00%, 7/1/35 | | 350 | 343,343 |
| Massachusetts Housing Finance Agency: | | | |
| Social Bonds, (FHLMC), (FNMA), (GNMA), 4.35%, 12/1/42 | | 500 | 501,540 |
| Social Bonds, (FHLMC), (FNMA), (GNMA), 4.50%, 12/1/44 | | 1,250 | 1,252,137 |
| Missouri Housing Development Commission, (FHLMC), (FNMA), (GNMA), 2.55%, 11/1/40 | | 1,500 | 1,207,560 |
3
See Notes to Financial Statements.
Eaton Vance
Municipal Opportunities Fund
July 31, 2024
Portfolio of Investments — continued
| Security | Principal
Amount
(000's omitted) | Value |
| Housing (continued) |
| Nebraska Investment Finance Authority, Social Bonds, (FHLMC), (FNMA), (GNMA), 4.55%, 9/1/44 | $ | 2,000 | $ 2,010,280 |
| New Jersey Housing and Mortgage Finance Agency, SFMR, Social Bonds, 4.55%, 10/1/44 | | 1,600 | 1,607,856 |
| New York City Housing Development Corp., NY, Sustainability Bonds, 2.85%, 11/1/39 | | 2,975 | 2,499,476 |
| North Dakota Housing Finance Agency, Social Bonds, 4.50%, 7/1/43 | | 2,200 | 2,213,838 |
| Norwalk Housing Authority, CT, (Monterey Village Apartments), (FNMA), 4.40%, 9/1/42 | | 2,585 | 2,596,477 |
| Oklahoma Housing Finance Agency, (FHLMC), (FNMA), (GNMA), 4.75%, 9/1/48 | | 600 | 615,192 |
| Oregon Housing and Community Services Department, 4.60%, 7/1/44 | | 1,500 | 1,513,890 |
| Pennsylvania Housing Finance Agency, SFMR, Social Bonds, 4.45%, 10/1/44 | | 2,000 | 2,000,340 |
| Phoenix Industrial Development Authority, AZ, (Downtown Phoenix Student Housing II, LLC - Arizona State University), 5.00%, 7/1/37 | | 1,235 | 1,280,991 |
| Phoenix Industrial Development Authority, AZ, (Downtown Phoenix Student Housing, LLC - Arizona State University), 5.00%, 7/1/31 | | 355 | 368,444 |
| Public Finance Authority, WI, (NC A&T Real Estate Foundation, LLC): | | | |
| 5.00%, 6/1/34 | | 2,560 | 2,659,686 |
| 5.00%, 6/1/39 | | 1,595 | 1,636,247 |
| Tennessee Housing Development Agency, (Residential Finance Program), Social Bonds, (FHLMC), (FNMA), (GNMA), 4.45%, 7/1/44 | | 750 | 750,150 |
| Texas Department of Housing and Community Affairs, (GNMA), 4.80%, 7/1/43 | | 2,800 | 2,888,844 |
| Virginia Housing Development Authority: | | | |
| 4.55%, 10/1/49 | | 1,100 | 1,098,262 |
| 5.125%, 11/1/43 | | 1,845 | 1,972,877 |
| | | | $ 59,451,532 |
| Industrial Development Revenue — 5.0% |
| Hawaii Department of Budget and Finance, (Hawaiian Electric Co.), 3.20%, 7/1/39 | $ | 6,005 | $ 4,530,592 |
| Luzerne County Industrial Development Authority, PA, (Pennsylvania-American Water Co.), (AMT), 2.45% to 12/3/29 (Put Date), 12/1/39 | | 2,750 | 2,497,550 |
| Maine Finance Authority, (Casella Waste Systems, Inc.): | | | |
| (AMT), 4.375% to 8/1/25 (Put Date), 8/1/35(2) | | 875 | 873,766 |
| (AMT), 5.125% to 8/1/25 (Put Date), 8/1/35(2) | | 940 | 945,499 |
| National Finance Authority, NH, (Covanta), Green Bonds, (AMT), 3.75% to 7/2/40 (Put Date), 7/1/45(2) | | 5,500 | 4,654,100 |
| Security | Principal
Amount
(000's omitted) | Value |
| Industrial Development Revenue (continued) |
| New Jersey Economic Development Authority, (Continental Airlines), (AMT), 5.625%, 11/15/30 | $ | 215 | $ 216,817 |
| New Jersey Economic Development Authority, (New Jersey Natural Gas Co.), (AMT), 2.45% to 4/1/26 (Put Date), 4/1/59 | | 2,500 | 2,447,600 |
| New York State Environmental Facilities Corp., (Casella Waste Systems, Inc.), (AMT), 2.875% to 12/3/29 (Put Date), 12/1/44(2) | | 1,175 | 1,092,104 |
| New York Transportation Development Corp., (Delta Air Lines, Inc. - LaGuardia Airport Terminals C&D Redevelopment): | | | |
| (AMT), 5.00%, 1/1/34 | | 5,000 | 5,155,700 |
| (AMT), 6.00%, 4/1/35 | | 1,385 | 1,563,734 |
| Niagara Area Development Corp., NY, (Covanta), 3.50%, 11/1/24(2) | | 1,920 | 1,919,463 |
| Public Finance Authority, WI, (Celanese Corp.), (AMT), 5.00%, 12/1/25 | | 1,000 | 1,005,560 |
| Public Finance Authority, WI, (Waste Management, Inc.), (AMT), 1.10% to 6/1/26 (Put Date), 7/1/29 | | 6,500 | 6,162,130 |
| | | | $ 33,064,615 |
| Insured - Education — 0.1% |
| Monroe County Industrial Development Corp., NY, (Monroe Community College Association, Inc.), (AGM), 5.00%, 1/15/25 | $ | 750 | $ 751,065 |
| | | | $ 751,065 |
| Insured - Electric Utilities — 0.3% |
| Puerto Rico Electric Power Authority: | | | |
| (AGC), 5.00%, 7/1/26 | $ | 280 | $ 279,981 |
| (NPFG), 5.25%, 7/1/25 | | 170 | 169,211 |
| (NPFG), 5.25%, 7/1/29 | | 1,110 | 1,093,017 |
| (NPFG), 5.25%, 7/1/30 | | 530 | 521,520 |
| (NPFG), 5.25%, 7/1/34 | | 100 | 98,855 |
| | | | $ 2,162,584 |
| Insured - General Obligations — 0.9% |
| Chicago Board of Education, IL: | | | |
| (NPFG), 0.00%, 12/1/26 | $ | 1,580 | $ 1,441,071 |
| (NPFG), 0.00%, 12/1/28 | | 1,560 | 1,304,503 |
| Little Rock School District, AR, (BAM), 4.00%, 2/1/49 | | 3,000 | 2,890,830 |
| Will and Cook Counties Community High School District No. 210, IL: | | | |
| (AGM), 0.00%, 1/1/28 | | 500 | 440,495 |
| (BAM), 0.00%, 1/1/33 | | 200 | 143,262 |
| | | | $ 6,220,161 |
4
See Notes to Financial Statements.
Eaton Vance
Municipal Opportunities Fund
July 31, 2024
Portfolio of Investments — continued
| Security | Principal
Amount
(000's omitted) | Value |
| Insured - Hospital — 0.3% |
| Grand Forks, ND, (Altru Health System), (AGM), 3.00%, 12/1/51 | $ | 2,500 | $ 1,911,600 |
| | | | $ 1,911,600 |
| Insured - Lease Revenue/Certificates of Participation — 0.5% |
| Millard School District Local Building Authority, UT, (BAM), 4.25%, 5/15/54 | $ | 2,250 | $ 2,252,677 |
| New Jersey Transportation Trust Fund Authority, (Transportation System), (AMBAC), 0.00%, 12/15/28 | | 1,185 | 1,018,650 |
| | | | $ 3,271,327 |
| Insured - Special Tax Revenue — 1.0% |
| Sales Tax Securitization Corp., IL, (BAM), 5.00%, 1/1/37 | $ | 4,000 | $ 4,310,480 |
| St. Clair County Board of Education, AL, (BAM), 4.00%, 2/1/44(5) | | 2,000 | 1,968,957 |
| | | | $ 6,279,437 |
| Insured - Transportation — 2.0% |
| Allegheny County Airport Authority, PA, (Pittsburgh International Airport): | | | |
| (AGM), (AMT), 4.00%, 1/1/46 | $ | 5,000 | $ 4,844,800 |
| (AGM), (AMT), 5.25%, 1/1/38 | | 1,000 | 1,113,640 |
| Colorado Bridge and Tunnel Enterprise, (AGM), 5.00%, 12/1/44 | | 945 | 1,041,399 |
| Houston, TX, Airport System Revenue, (AGM), (AMT), 5.00%, 7/1/38 | | 1,000 | 1,088,650 |
| Love Field Airport Modernization Corp., TX, (AGM), (AMT), 4.00%, 11/1/37 | | 2,840 | 2,847,867 |
| New Jersey Economic Development Authority, (The Goethals Bridge Replacement), (AGM), (AMT), 5.00%, 1/1/31 | | 185 | 185,220 |
| New York Transportation Development Corp., (LaGuardia Airport Terminal B Redevelopment), (AGM), (AMT), 4.00%, 7/1/32 | | 2,000 | 1,993,380 |
| | | | $ 13,114,956 |
| Insured - Water and Sewer — 0.4% |
| Carmel, IN, Waterworks Revenue, (BAM), 4.25%, 5/1/53 | $ | 1,700 | $ 1,648,762 |
| Southwestern Pennsylvania Water Authority, (AGM), 3.00%, 9/15/32 | | 1,000 | 938,360 |
| | | | $ 2,587,122 |
| Lease Revenue/Certificates of Participation — 1.6% |
| California Public Works Board, 4.50%, 9/1/35 | $ | 4,910 | $ 4,911,620 |
| Chesterfield County Economic Development Authority, VA, (County Mobility), 4.00%, 4/1/50 | | 1,000 | 980,350 |
| Security | Principal
Amount
(000's omitted) | Value |
| Lease Revenue/Certificates of Participation (continued) |
| Franklin Township Multiple School Building Corp., IN: | | | |
| 5.00%, 7/15/42(5) | $ | 1,550 | $ 1,705,945 |
| 5.00%, 7/15/43(5) | | 2,155 | 2,360,178 |
| Will and Kankakee Counties Community Unit School District No. 255-U, IL, 5.00%, 6/1/29 | | 700 | 709,849 |
| | | | $ 10,667,942 |
| Other Revenue — 3.2% |
| Black Belt Energy Gas District, AL: | | | |
| 3.98%, (SIFMA + 0.37%), 10/1/26 (Put Date), 10/1/49(3) | $ | 5,000 | $ 4,923,250 |
| 5.50% to 2/1/29 (Put Date), 6/1/49 | | 2,500 | 2,660,400 |
| California Infrastructure and Economic Development Bank, (Los Angeles County Museum of Art), 4.31%, (SIFMA + 0.70%), 6/1/26 (Put Date), 12/1/50(3) | | 2,300 | 2,299,517 |
| Cleveland-Cuyahoga County Port Authority, OH, (Playhouse Square Foundation), 5.00%, 12/1/28 | | 895 | 916,802 |
| Kalispel Tribe of Indians, WA: | | | |
| Series A, 5.00%, 1/1/32(2) | | 1,455 | 1,506,216 |
| Series B, 5.00%, 1/1/32(2) | | 1,000 | 1,035,200 |
| Main Street Natural Gas, Inc., GA, Gas Supply Revenue, 5.00% to 12/1/30 (Put Date), 5/1/54 | | 2,000 | 2,122,820 |
| Morongo Band of Mission Indians, CA, 5.00%, 10/1/42(2) | | 1,775 | 1,792,147 |
| Texas Municipal Gas Acquisition and Supply Corp. I, Gas Supply Revenue, 4.453%, (67% of 3 mo. SOFR + 0.70%), 12/15/26(3) | | 2,440 | 2,445,026 |
| Texas Municipal Gas Acquisition and Supply Corp. II, Gas Supply Revenue, 4.391%, (66% of 3 mo. SOFR + 0.86%), 9/15/27(3) | | 1,280 | 1,277,594 |
| | | | $ 20,978,972 |
| Senior Living/Life Care — 8.9% |
| Arizona Industrial Development Authority, AZ, (Mirabella at ASU), 5.35% to 1/1/27 (Put Date), 10/1/28(2) | $ | 2,525 | $ 2,351,381 |
| Buffalo and Erie County Industrial Land Development Corp., NY, (Orchard Park CCRC, Inc.): | | | |
| 5.00%, 11/15/26 | | 1,730 | 1,755,120 |
| 5.00%, 11/15/27 | | 1,320 | 1,339,496 |
| Centerville, OH, (Graceworks Lutheran Services): | | | |
| 5.00%, 11/1/24 | | 705 | 705,508 |
| 5.00%, 11/1/26 | | 770 | 774,004 |
| 5.00%, 11/1/27 | | 425 | 427,495 |
| Clackamas County Hospital Facility Authority, OR, (Rose Villa): | | | |
| 5.00%, 11/15/28 | | 300 | 306,078 |
| 5.00%, 11/15/29 | | 315 | 320,900 |
| 5.00%, 11/15/30 | | 330 | 335,676 |
5
See Notes to Financial Statements.
Eaton Vance
Municipal Opportunities Fund
July 31, 2024
Portfolio of Investments — continued
| Security | Principal
Amount
(000's omitted) | Value |
| Senior Living/Life Care (continued) |
| Clackamas County Hospital Facility Authority, OR, (Rose Villa): (continued) | | | |
| 5.375%, 11/15/55 | $ | 300 | $ 292,218 |
| Colorado Health Facilities Authority, (Christian Living Neighborhoods), 4.00%, 1/1/29 | | 600 | 587,142 |
| Colorado Health Facilities Authority, (Frasier Meadows Retirement Community): | | | |
| 5.00%, 5/15/25 | | 300 | 301,152 |
| 5.00%, 5/15/26 | | 350 | 353,430 |
| 5.00%, 5/15/27 | | 400 | 406,940 |
| District of Columbia, (Ingleside at Rock Creek), 4.125%, 7/1/27 | | 530 | 527,896 |
| Franklin County Industrial Development Authority, PA, (Menno-Haven, Inc.): | | | |
| 5.00%, 12/1/30 | | 500 | 507,745 |
| 5.00%, 12/1/39 | | 370 | 368,405 |
| Glendale Industrial Development Authority, AZ, (Terraces of Phoenix), 4.00%, 7/1/28 | | 180 | 174,719 |
| Howard County, MD, (Vantage House): | | | |
| 5.00%, 4/1/26 | | 675 | 673,137 |
| 5.00%, 4/1/36 | | 2,035 | 1,970,185 |
| Illinois Finance Authority, (Lifespace Communities, Inc.), 5.00%, 5/15/27 | | 370 | 370,907 |
| Illinois Finance Authority, (Presbyterian Homes Obligated Group), 4.31%, (SIFMA + 0.70%), 5/1/26 (Put Date), 5/1/42(3) | | 1,090 | 1,073,955 |
| Lancaster County Hospital Authority, PA, (Brethren Village), 5.00%, 7/1/25 | | 650 | 650,085 |
| Massachusetts Development Finance Agency, (Linden Ponds, Inc.), 5.00%, 11/15/28(2) | | 1,200 | 1,254,492 |
| Missouri Health and Educational Facilities Authority, (Lutheran Senior Services), 4.00%, 2/1/35 | | 310 | 310,378 |
| Montgomery County Industrial Development Authority, PA, (Waverly Heights, Ltd.): | | | |
| 4.00%, 12/1/30 | | 200 | 200,214 |
| 4.00%, 12/1/31 | | 150 | 150,165 |
| 4.00%, 12/1/32 | | 200 | 200,048 |
| 4.00%, 12/1/33 | | 100 | 99,995 |
| 4.00%, 12/1/34 | | 200 | 199,782 |
| 4.00%, 12/1/35 | | 350 | 348,985 |
| 4.00%, 12/1/36 | | 350 | 347,417 |
| 4.00%, 12/1/38 | | 300 | 294,669 |
| Montgomery County Industrial Development Authority, PA, (Whitemarsh Continuing Care Retirement Community), 5.00%, 1/1/33 | | 1,890 | 1,891,606 |
| National Finance Authority, NH, (The Vista): | | | |
| 5.25%, 7/1/39(2) | | 920 | 921,242 |
| 5.75%, 7/1/54(2) | | 1,725 | 1,726,691 |
| Security | Principal
Amount
(000's omitted) | Value |
| Senior Living/Life Care (continued) |
| New Hope Cultural Education Facilities Finance Corp., TX, (Longhorn Village): | | | |
| 5.00%, 1/1/25 | $ | 1,000 | $ 999,910 |
| 5.00%, 1/1/26 | | 1,040 | 1,040,655 |
| 5.00%, 1/1/27 | | 1,095 | 1,096,927 |
| 5.00%, 1/1/29 | | 1,205 | 1,209,832 |
| 5.00%, 1/1/30 | | 630 | 633,100 |
| New Mexico Hospital Equipment Loan Council, (Haverland Carter Lifestyle Group): | | | |
| 5.00%, 7/1/30 | | 430 | 430,434 |
| 5.00%, 7/1/33 | | 285 | 282,563 |
| 5.00%, 7/1/34 | | 195 | 192,444 |
| 5.00%, 7/1/39 | | 2,450 | 2,288,447 |
| Norfolk Redevelopment and Housing Authority, VA, (Fort Norfolk Retirement Community, Inc. - Harbor's Edge), 4.00%, 1/1/29 | | 1,335 | 1,289,290 |
| Palm Beach County Health Facilities Authority, FL, (Lifespace Communities, Inc.): | | | |
| 5.00%, 5/15/28 | | 255 | 255,704 |
| 5.00%, 5/15/30 | | 300 | 301,035 |
| 5.00%, 5/15/31 | | 775 | 784,385 |
| 5.00%, 5/15/32 | | 650 | 657,703 |
| Public Finance Authority, WI, (Penick Village), 5.00%, 9/1/39(2) | | 1,540 | 1,484,606 |
| Santa Fe, NM, (El Castillo Retirement Residences): | | | |
| 5.00%, 5/15/34 | | 650 | 659,061 |
| 5.00%, 5/15/39 | | 480 | 480,974 |
| South Carolina Jobs-Economic Development Authority, (Bishop Gadsden Episcopal Retirement Community), 4.00%, 4/1/34 | | 600 | 588,180 |
| South Carolina Jobs-Economic Development Authority, (South Carolina Episcopal Home at Still Hopes): | | | |
| 5.00%, 4/1/28 | | 1,675 | 1,687,764 |
| 5.00%, 4/1/29 | | 1,000 | 1,008,860 |
| St. Louis County Industrial Development Authority, MO, (Friendship Village of St. Louis Obligated Group), 5.00%, 9/1/27 | | 1,930 | 1,968,542 |
| St. Louis County Industrial Development Authority, MO, (St. Andrew's Resources for Seniors Obligated Group), 5.00%, 12/1/25 | | 425 | 426,258 |
| Suffolk County Economic Development Corp., NY, (Peconic Landing at Southold, Inc.), 5.00%, 12/1/29 | | 500 | 516,385 |
| Tarrant County Cultural Education Facilities Finance Corp., TX, (MRC Stevenson Oaks), 6.875%, 11/15/55 | | 4,650 | 4,380,160 |
| Tulsa County Industrial Authority, OK, (Montereau, Inc.): | | | |
| 5.00%, 11/15/28 | | 540 | 550,611 |
| 5.00%, 11/15/29 | | 400 | 408,476 |
6
See Notes to Financial Statements.
Eaton Vance
Municipal Opportunities Fund
July 31, 2024
Portfolio of Investments — continued
| Security | Principal
Amount
(000's omitted) | Value |
| Senior Living/Life Care (continued) |
| Vermont Economic Development Authority, (Wake Robin Corp.): | | | |
| 5.00%, 5/1/25 | $ | 745 | $ 747,935 |
| 5.00%, 5/1/26 | | 585 | 590,610 |
| Virginia Beach Development Authority, VA, (Westminster-Canterbury on Chesapeake Bay), 6.25%, 9/1/30 | | 2,000 | 2,078,040 |
| Washington Housing Finance Commission, (Bayview Manor Homes): | | | |
| 4.00%, 7/1/26(2) | | 415 | 407,044 |
| 5.00%, 7/1/31(2) | | 985 | 986,379 |
| Washington Housing Finance Commission, (Judson Park), 4.00%, 7/1/28(2) | | 190 | 183,768 |
| Washington Housing Finance Commission, (Transforming Age): | | | |
| 5.00%, 1/1/27(2) | | 840 | 839,202 |
| 5.00%, 1/1/28(2) | | 445 | 443,736 |
| 5.00%, 1/1/29(2) | | 460 | 457,461 |
| 5.00%, 1/1/34(2) | | 500 | 489,330 |
| 5.00%, 1/1/39(2) | | 750 | 704,430 |
| | | | $ 58,069,499 |
| Special Tax Revenue — 2.6% |
| Baltimore, MD, (Harbor Point): | | | |
| 3.45%, 6/1/35(2) | $ | 310 | $ 276,520 |
| 3.50%, 6/1/39(2) | | 650 | 567,301 |
| Bullhead City, AZ, Excise Taxes Revenue: | | | |
| 2.10%, 7/1/36 | | 585 | 470,720 |
| 2.55%, 7/1/46 | | 1,265 | 905,892 |
| Marana, AZ, Pledged Excise Tax Revenue, 4.00%, 7/1/44 | | 1,250 | 1,250,150 |
| Massachusetts School Building Authority: | | | |
| 3.375%, 8/15/30 | | 1,665 | 1,648,433 |
| 4.00%, 11/15/35 | | 1,990 | 2,000,328 |
| 4.00%, 1/15/39 | | 5,000 | 4,978,800 |
| Michigan Finance Authority, Detroit Financial Recovery Income Tax Revenue, 4.50%, 10/1/29 | | 2,145 | 2,146,287 |
| New York City Transitional Finance Authority, NY, Future Tax Revenue, 4.00%, 8/1/48 | | 1,760 | 1,727,334 |
| South Village Community Development District, FL: | | | |
| 2.75%, 5/1/25 | | 95 | 94,211 |
| 3.25%, 5/1/27 | | 95 | 93,227 |
| 4.35%, 5/1/26 | | 185 | 185,709 |
| St. Louis Land Clearance for Redevelopment Authority, MO, (Kiel Opera House Renovation), 3.875%, 10/1/35 | | 770 | 702,509 |
| | | | $ 17,047,421 |
| Security | Principal
Amount
(000's omitted) | Value |
| Student Loan — 0.6% |
| Connecticut Higher Education Supplemental Loan Authority, (AMT), 4.125%, 11/15/40 | $ | 4,250 | $ 4,246,302 |
| | | | $ 4,246,302 |
| Transportation — 10.3% |
| Bay Area Toll Authority, CA, Toll Bridge Revenue, (San Francisco Bay Area): | | | |
| 4.06%, (SIFMA + 0.45%), 4/1/26 (Put Date), 4/1/56(3) | $ | 3,200 | $ 3,185,024 |
| (LOC: Barclays Bank PLC), 3.90%, 4/1/55(4) | | 1,100 | 1,100,000 |
| California Infrastructure and Economic Development Bank, (Brightline West Passenger Rail), (AMT), 8.00% to 8/15/25 (Put Date), 1/1/50(2)(5) | | 1,670 | 1,692,963 |
| Colorado Bridge Enterprise, (Central 70 Project), (AMT), 4.00%, 12/31/28 | | 2,760 | 2,758,730 |
| Denver City and County, CO, Airport System Revenue, (AMT), 4.00%, 12/1/43 | | 6,250 | 6,117,812 |
| Indianapolis Local Public Improvement Bond Bank, IN, (Indianapolis Airport Authority), (AMT), 5.00%, 1/1/31 | | 2,385 | 2,572,986 |
| Los Angeles Department of Airports, CA, (Los Angeles International Airport): | | | |
| (AMT), 5.00%, 5/15/36 | | 3,080 | 3,244,472 |
| (AMT), 5.00%, 5/15/45 | | 4,925 | 4,945,734 |
| Memphis-Shelby County Airport Authority, TN, (AMT), 5.00%, 7/1/35 | | 1,995 | 2,068,875 |
| Metropolitan Washington Airports Authority, D.C.: | | | |
| (AMT), 5.00%, 10/1/31 | | 1,000 | 1,003,190 |
| (AMT), 5.00%, 10/1/38 | | 1,600 | 1,731,936 |
| Miami-Dade County, FL, Aviation Revenue, (AMT), 5.00%, 10/1/36(5) | | 2,600 | 2,841,644 |
| Oklahoma Turnpike Authority, 5.50%, 1/1/53 | | 4,165 | 4,603,283 |
| Philadelphia, PA, Airport Revenue, (AMT), 5.00%, 7/1/42 | | 2,990 | 3,049,322 |
| Port of Seattle, WA: | | | |
| (AMT), 4.00%, 5/1/43 | | 5,000 | 4,696,050 |
| (AMT), 5.00%, 5/1/37 | | 2,100 | 2,164,449 |
| (AMT), 5.00%, 5/1/37 | | 3,000 | 3,091,260 |
| San Diego County Regional Airport Authority, CA, (San Diego International Airport), (AMT), 5.25%, 7/1/38 | | 4,500 | 5,001,255 |
| San Francisco City and County Airport Commission, CA, (San Francisco International Airport), (AMT), 5.00%, 5/1/44 | | 5,000 | 5,160,150 |
| San Jose, CA, Airport Revenue, (AMT), 5.00%, 3/1/47 | | 3,000 | 3,041,460 |
| Texas Private Activity Bond Surface Transportation Corp., (North Tarrant Express Managed Lanes Project), 5.00%, 12/31/34 | | 3,000 | 3,208,770 |
| | | | $ 67,279,365 |
7
See Notes to Financial Statements.
Eaton Vance
Municipal Opportunities Fund
July 31, 2024
Portfolio of Investments — continued
| Security | Principal
Amount
(000's omitted) | Value |
| Water and Sewer — 7.5% |
| Austin, TX, Water and Wastewater System Revenue, 5.00%, 11/15/49 | $ | 2,750 | $ 3,009,022 |
| Corpus Christi, TX, Utility System Revenue, 4.00%, 7/15/48 | | 5,305 | 5,113,808 |
| Hampton Roads Sanitation District, VA, Wastewater Revenue, 5.00%, 7/1/41(5) | | 2,000 | 2,277,320 |
| King County, WA, Sewer Revenue, 4.00%, 7/1/41 | | 3,000 | 2,967,270 |
| Los Angeles Department of Water and Power, CA, Water System Revenue, (SPA: Barclays Bank PLC), 3.88%, 7/1/45(4) | | 3,000 | 3,000,000 |
| Metropolitan Water District of Southern California, 5.00%, 4/1/37 | | 2,615 | 3,111,196 |
| New York City Municipal Water Finance Authority, NY, (Water and Sewer System): | | | |
| 5.00%, 6/15/43 | | 4,000 | 4,468,960 |
| 5.25%, 6/15/52 | | 3,000 | 3,294,390 |
| Oklahoma Water Resources Board, (Clean Water Program): | | | |
| 5.00%, 4/1/38(5) | | 1,650 | 1,913,554 |
| 5.00%, 4/1/41(5) | | 1,870 | 2,121,216 |
| 5.00%, 4/1/44(5) | | 1,650 | 1,849,469 |
| Portland, OR, Sewer System Revenue, 5.00%, 5/1/37 | | 1,000 | 1,161,350 |
| San Diego Public Facilities Financing Authority, CA, Wastewater System Revenue, 5.00%, 5/15/44(5) | | 2,420 | 2,759,115 |
| San Francisco City and County Public Utilities Commission, CA, Wastewater Revenue, Green Bonds, 5.00%, 10/1/45 | | 2,200 | 2,491,830 |
| Suffolk County Water Authority, NY, 3.25%, 6/1/42 | | 3,500 | 3,137,785 |
| Tacoma, WA, Sewer Revenue, 4.00%, 12/1/48 | | 2,500 | 2,463,475 |
| Trinity River Authority, TX, Denton Creek Wastewater Treatment System Revenue, 5.00%, 2/1/41(5) | | 1,790 | 1,994,830 |
| Walton County Water and Sewerage Authority, GA, 5.00%, 2/1/53 | | 2,000 | 2,154,760 |
| | | | $ 49,289,350 |
Total Tax-Exempt Municipal Obligations
(identified cost $605,977,216) | | | $608,972,712 |
| Taxable Municipal Obligations — 9.8% |
| Security | Principal
Amount
(000's omitted) | Value |
| Education — 0.9% |
| University of California: | | | |
| 3.349%, 7/1/29 | $ | 1,150 | $ 1,107,657 |
| Security | Principal
Amount
(000's omitted) | Value |
| Education (continued) |
| University of California: (continued) | | | |
| 5.35%, 7/1/41(6) | $ | 4,900 | $ 4,900,000 |
| | | | $ 6,007,657 |
| General Obligations — 2.7% |
| Atlantic City, NJ, 7.00%, 3/1/28 | $ | 1,765 | $ 1,848,467 |
| California: | | | |
| 7.50%, 4/1/34(7) | | 2,310 | 2,731,252 |
| 7.55%, 4/1/39(7) | | 2,725 | 3,354,666 |
| Chicago, IL: | | | |
| 7.375%, 1/1/33 | | 3,069 | 3,398,733 |
| 7.781%, 1/1/35 | | 2,600 | 3,008,382 |
| Collin County, TX, 1.683%, 2/15/30 | | 100 | 87,607 |
| Larkspur-Corte Madera School District, CA, (Election of 2011 and 2014), 2.002%, 8/1/33 | | 650 | 526,831 |
| Marin Community College District, CA, 2.14%, 8/1/34 | | 1,500 | 1,200,885 |
| Mattawan Consolidated School, MI, 1.966%, 5/1/32 | | 1,100 | 913,121 |
| Puerto Rico, GO Contingent Value Instrument, 0.00%, 11/1/43 | | 1,296 | 795,242 |
| | | | $ 17,865,186 |
| Hospital — 0.2% |
| California Infrastructure and Economic Development Bank, (Adventist Health Energy), 5.929%, 7/1/34 | $ | 1,000 | $ 1,014,640 |
| | | | $ 1,014,640 |
| Housing — 0.7% |
| Maine Housing Authority, (SPA: TD Bank, N.A.), 5.35%, 11/15/50(6) | $ | 3,400 | $ 3,400,000 |
| New York Housing Finance Agency, (Liq: Barclays Bank PLC), 5.35%, 11/1/45(6) | | 1,400 | 1,400,000 |
| | | | $ 4,800,000 |
| Insured - General Obligations — 0.5% |
| Altoona Area School District, PA, (BAM), 2.288%, 12/1/34 | $ | 750 | $ 600,990 |
| Detroit, MI, (AMBAC), 5.15%, 4/1/25 | | 1,728 | 1,721,748 |
| Effingham County Industrial Development Authority, GA, (BAM), 6.00%, 4/1/48 | | 1,000 | 1,015,740 |
| | | | $ 3,338,478 |
| Insured - Special Tax Revenue — 0.5% |
| Bexar County, TX, Venue Project Revenue, (AGM), 2.434%, 8/15/33 | $ | 1,505 | $ 1,233,709 |
| Rio Elementary School District Community Facilities District No. 1, CA, (BAM), 2.457%, 9/1/32 | | 1,500 | 1,253,160 |
8
See Notes to Financial Statements.
Eaton Vance
Municipal Opportunities Fund
July 31, 2024
Portfolio of Investments — continued
| Security | Principal
Amount
(000's omitted) | Value |
| Insured - Special Tax Revenue (continued) |
| Successor Agency to San Bernardino County Redevelopment Agency, CA: | | | |
| (AGM), 3.75%, 9/1/25 | $ | 500 | $ 490,690 |
| (AGM), 4.00%, 9/1/26 | | 500 | 488,750 |
| | | | $ 3,466,309 |
| Insured - Transportation — 0.2% |
| Alameda Corridor Transportation Authority, CA, (AGM), 0.00%, 10/1/38 | $ | 2,500 | $ 1,136,675 |
| | | | $ 1,136,675 |
| Special Tax Revenue — 1.7% |
| Los Angeles County Metropolitan Transportation Authority, CA, Sales Tax Revenue, 4.726%, 7/1/27 | $ | 2,000 | $ 2,020,700 |
| Massachusetts School Building Authority, Social Bonds, 1.753%, 8/15/30 | | 2,000 | 1,760,380 |
| Ohio County Commission, WV, (Fort Henry Economic Opportunity Development District - The Highlands), 5.25%, 3/1/31 | | 335 | 328,742 |
| Oneida Indian Nation of New York, NY, 7.25%, 9/1/34(2) | | 3,500 | 3,530,240 |
| Successor Agency to San Jose Redevelopment Agency, CA, 3.375%, 8/1/34 | | 3,900 | 3,561,597 |
| | | | $ 11,201,659 |
| Water and Sewer — 2.4% |
| Metropolitan Water District of Southern California, (SPA: TD Bank, N.A.), 5.35%, 7/1/37(6) | $ | 15,600 | $ 15,600,000 |
| | | | $ 15,600,000 |
Total Taxable Municipal Obligations
(identified cost $64,390,993) | | | $ 64,430,604 |
| U.S. Treasury Obligations — 0.8% |
| Security | Principal
Amount
(000's omitted) | Value |
| U.S. Treasury Notes, 5.00%, 8/31/25 | $ | 5,500 | $ 5,516,006 |
Total U.S. Treasury Obligations
(identified cost $5,502,750) | | | $ 5,516,006 |
Total Investments — 104.8%
(identified cost $683,881,297) | | | $687,079,297 |
| Other Assets, Less Liabilities — (4.8)% | | | $(31,712,803) |
| Net Assets — 100.0% | | | $655,366,494 |
| The percentage shown for each investment category in the Portfolio of Investments is based on net assets. |
| (1) | For fair value measurement disclosure purposes, security is categorized as Level 3 (see Note 10). |
| (2) | Security exempt from registration under Rule 144A of the Securities Act of 1933, as amended. These securities may be sold in certain transactions in reliance on an exemption from registration (normally to qualified institutional buyers). At July 31, 2024, the aggregate value of these securities is $38,361,681 or 5.9% of the Fund's net assets. |
| (3) | Floating rate security. The stated interest rate represents the rate in effect at July 31, 2024. |
| (4) | Variable rate demand obligation that may be tendered at par on any day for payment the same or next business day. The stated interest rate, which generally resets daily, is determined by the remarketing agent and represents the rate in effect at July 31, 2024. |
| (5) | When-issued security. |
| (6) | Variable rate demand obligation that may be tendered at par on any day for payment the lesser of 5 business days or 7 calendar days. The stated interest rate, which generally resets weekly, is determined by the remarketing agent and represents the rate in effect at July 31, 2024. |
| (7) | Build America Bond. Represents taxable municipal obligation issued pursuant to the American Recovery and Reinvestment Act of 2009 or other legislation providing for the issuance of taxable municipal debt on which the issuer receives federal support. |
| At July 31, 2024, the concentration of the Fund’s investments in the various states and territories, determined as a percentage of net assets, is as follows: |
| California | 21.5% |
| Others, representing less than 10% individually | 81.3% |
| The Fund invests primarily in debt securities issued by municipalities. The ability of the issuers of the debt securities to meet their obligations may be affected by economic developments in a specific industry or municipality. At July 31, 2024, 6.4% of total investments are backed by bond insurance of various financial institutions and financial guaranty assurance agencies. The aggregate percentage insured by an individual financial institution or financial guaranty assurance agency ranged from less than 0.05% to 3.0% of total investments. |
9
See Notes to Financial Statements.
Eaton Vance
Municipal Opportunities Fund
July 31, 2024
Portfolio of Investments — continued
| Abbreviations: |
| AGC | – Assured Guaranty Corp. |
| AGM | – Assured Guaranty Municipal Corp. |
| AMBAC | – AMBAC Financial Group, Inc. |
| AMT | – Interest earned from these securities may be considered a tax preference item for purposes of the Federal Alternative Minimum Tax. |
| BAM | – Build America Mutual Assurance Co. |
| FHLMC | – Federal Home Loan Mortgage Corp. |
| FNMA | – Federal National Mortgage Association |
| GNMA | – Government National Mortgage Association |
| Liq | – Liquidity Provider |
| LOC | – Letter of Credit |
| NPFG | – National Public Finance Guarantee Corp. |
| PSF | – Permanent School Fund |
| SFMR | – Single Family Mortgage Revenue |
| SIFMA | – Securities Industry and Financial Markets Association Municipal Swap Index |
| SOFR | – Secured Overnight Financing Rate |
| SPA | – Standby Bond Purchase Agreement |
10
See Notes to Financial Statements.
Eaton Vance
Municipal Opportunities Fund
July 31, 2024
Statement of Assets and Liabilities
| | July 31, 2024 |
| Assets | |
| Investments, at value (identified cost $683,881,297) | $687,079,297 |
| Cash | 3,679,668 |
| Interest receivable | 5,840,390 |
| Receivable for investments sold | 2,276,199 |
| Receivable for Fund shares sold | 1,533,694 |
| Receivable from affiliates | 35,171 |
| Trustees' deferred compensation plan | 72,847 |
| Total assets | $700,517,266 |
| Liabilities | |
| Payable for investments purchased | $2,257,498 |
| Payable for when-issued securities | 40,562,108 |
| Payable for Fund shares redeemed | 1,525,519 |
| Distributions payable | 120,478 |
| Payable to affiliates: | |
| Investment adviser and administration fee | 322,166 |
| Distribution and service fees | 21,891 |
| Trustees' deferred compensation plan | 72,847 |
| Accrued expenses | 268,265 |
| Total liabilities | $45,150,772 |
| Net Assets | $655,366,494 |
| Sources of Net Assets | |
| Paid-in capital | $707,879,342 |
| Accumulated loss | (52,512,848) |
| Net Assets | $655,366,494 |
| Class A Shares | |
| Net Assets | $60,358,054 |
| Shares Outstanding | 5,317,822 |
Net Asset Value and Redemption Price Per Share
(net assets ÷ shares of beneficial interest outstanding) | $11.35 |
Maximum Offering Price Per Share
(100 ÷ 96.75 of net asset value per share) | $11.73 |
| Class C Shares | |
| Net Assets | $10,907,815 |
| Shares Outstanding | 961,343 |
Net Asset Value and Offering Price Per Share*
(net assets ÷ shares of beneficial interest outstanding) | $11.35 |
| Class I Shares | |
| Net Assets | $584,100,625 |
| Shares Outstanding | 51,394,428 |
Net Asset Value, Offering Price and Redemption Price Per Share
(net assets ÷ shares of beneficial interest outstanding) | $11.37 |
| On sales of $100,000 or more, the offering price of Class A shares is reduced. |
| * | Redemption price per share is equal to the net asset value less any applicable contingent deferred sales charge. |
11
See Notes to Financial Statements.
Eaton Vance
Municipal Opportunities Fund
July 31, 2024
| | Year Ended |
| | July 31, 2024 |
| Investment Income | |
| Interest income | $26,060,542 |
| Total investment income | $26,060,542 |
| Expenses | |
| Investment adviser and administration fee | $3,590,901 |
| Distribution and service fees: | |
| Class A | 146,179 |
| Class C | 131,660 |
| Trustees’ fees and expenses | 39,715 |
| Custodian fee | 151,428 |
| Transfer and dividend disbursing agent fees | 224,492 |
| Legal and accounting services | 87,802 |
| Printing and postage | 8,846 |
| Registration fees | 92,389 |
| Interest expense and fees | 69,170 |
| Miscellaneous | 104,719 |
| Total expenses | $4,647,301 |
| Deduct: | |
| Waiver and/or reimbursement of expenses by affiliates | $179,994 |
| Total expense reductions | $179,994 |
| Net expenses | $4,467,307 |
| Net investment income | $21,593,235 |
| Realized and Unrealized Gain (Loss) | |
| Net realized gain (loss): | |
| Investment transactions | $3,714,573 |
| Futures contracts | 402,465 |
| Net realized gain | $4,117,038 |
| Change in unrealized appreciation (depreciation): | |
| Investments | $10,038,450 |
| Net change in unrealized appreciation (depreciation) | $10,038,450 |
| Net realized and unrealized gain | $14,155,488 |
| Net increase in net assets from operations | $35,748,723 |
12
See Notes to Financial Statements.
Eaton Vance
Municipal Opportunities Fund
July 31, 2024
Statements of Changes in Net Assets
| | Year Ended July 31, |
| | 2024 | 2023 |
| Increase (Decrease) in Net Assets | | |
| From operations: | | |
| Net investment income | $21,593,235 | $18,370,294 |
| Net realized gain (loss) | 4,117,038 | (21,953,179) |
| Net change in unrealized appreciation (depreciation) | 10,038,450 | 2,085,765 |
| Net increase (decrease) in net assets from operations | $35,748,723 | $(1,497,120) |
| Distributions to shareholders: | | |
| Class A | $(1,911,386) | $(1,878,168) |
| Class C | (331,160) | (414,887) |
| Class I | (18,686,601) | (15,983,846) |
| Total distributions to shareholders | $(20,929,147) | $(18,276,901) |
| Transactions in shares of beneficial interest: | | |
| Class A | $(1,923,021) | $(16,224,578) |
| Class C | (4,682,182) | (8,289,225) |
| Class I | 80,369,501 | (138,227,894) |
| Net increase (decrease) in net assets from Fund share transactions | $73,764,298 | $(162,741,697) |
| Net increase (decrease) in net assets | $88,583,874 | $(182,515,718) |
| Net Assets | | |
| At beginning of year | $566,782,620 | $749,298,338 |
| At end of year | $655,366,494 | $566,782,620 |
13
See Notes to Financial Statements.
Eaton Vance
Municipal Opportunities Fund
July 31, 2024
| | Class A |
| | Year Ended July 31, |
| | 2024 | 2023 | 2022 | 2021 | 2020 |
| Net asset value — Beginning of year | $11.13 | $11.39 | $12.87 | $12.33 | $12.31 |
| Income (Loss) From Operations | | | | | |
| Net investment income(1) | $0.38 | $0.33 | $0.21 | $0.23 | $0.26 |
| Net realized and unrealized gain (loss) | 0.20 | (0.26) | (1.28) | 0.54 | 0.02(2) |
| Total income (loss) from operations | $0.58 | $0.07 | $(1.07) | $0.77 | $0.28 |
| Less Distributions | | | | | |
| From net investment income | $(0.36) | $(0.33) | $(0.22) | $(0.23) | $(0.26) |
| From net realized gain | — | — | (0.19) | — | — |
| Total distributions | $(0.36) | $(0.33) | $(0.41) | $(0.23) | $(0.26) |
| Net asset value — End of year | $11.35 | $11.13 | $11.39 | $12.87 | $12.33 |
| Total Return(3) | 5.36% | 0.65% | (8.47)% | 6.34% | 2.32% |
| Ratios/Supplemental Data | | | | | |
| Net assets, end of year (000’s omitted) | $60,358 | $61,217 | $79,594 | $127,729 | $129,416 |
| Ratios (as a percentage of average daily net assets): | | | | | |
| Expenses excluding interest and fees | 0.94%(4) | 0.98% | 0.93% | 0.92% | 0.92% |
| Interest and fee expense(5) | 0.01% | 0.01% | — | 0.00%(6) | 0.00%(6) |
| Total expenses | 0.95%(4) | 0.99% | 0.93% | 0.92% | 0.92% |
| Net investment income | 3.38% | 2.95% | 1.77% | 1.84% | 2.15% |
| Portfolio Turnover | 118% | 98% | 35% | 62% | 56% |
| (1) | Computed using average shares outstanding. |
| (2) | The per share amount is not in accord with the net realized and unrealized gain (loss) for the period because of the timing of Fund share transactions and the amount of the per share realized and unrealized gains and losses at such time. |
| (3) | Returns are historical and are calculated by determining the percentage change in net asset value with all distributions reinvested and do not reflect the effect of sales charges. |
| (4) | The investment adviser and administrator reimbursed certain operating expenses (equal to 0.03% of average daily net assets for the year ended July 31, 2024). Absent this reimbursement, total return would be lower. |
| (5) | Interest and fee expense relates to the liability for floating rate notes issued in conjunction with residual interest bond transactions (see Note 1H). |
| (6) | Amount is less than 0.005%. |
14
See Notes to Financial Statements.
Eaton Vance
Municipal Opportunities Fund
July 31, 2024
Financial Highlights — continued
| | Class C |
| | Year Ended July 31, |
| | 2024 | 2023 | 2022 | 2021 | 2020 |
| Net asset value — Beginning of year | $11.13 | $11.39 | $12.87 | $12.33 | $12.30 |
| Income (Loss) From Operations | | | | | |
| Net investment income(1) | $0.29 | $0.24 | $0.12 | $0.14 | $0.17 |
| Net realized and unrealized gain (loss) | 0.21 | (0.26) | (1.28) | 0.54 | 0.03(2) |
| Total income (loss) from operations | $0.50 | $(0.02) | $(1.16) | $0.68 | $0.20 |
| Less Distributions | | | | | |
| From net investment income | $(0.28) | $(0.24) | $(0.13) | $(0.14) | $(0.17) |
| From net realized gain | — | — | (0.19) | — | — |
| Total distributions | $(0.28) | $(0.24) | $(0.32) | $(0.14) | $(0.17) |
| Net asset value — End of year | $11.35 | $11.13 | $11.39 | $12.87 | $12.33 |
| Total Return(3) | 4.57% | (0.11)% | (9.15)% | 5.55% | 1.64% |
| Ratios/Supplemental Data | | | | | |
| Net assets, end of year (000’s omitted) | $10,908 | $15,391 | $24,274 | $36,398 | $41,939 |
| Ratios (as a percentage of average daily net assets): | | | | | |
| Expenses excluding interest and fees | 1.69%(4) | 1.73% | 1.68% | 1.67% | 1.67% |
| Interest and fee expense(5) | 0.01% | 0.01% | — | 0.00%(6) | 0.00%(6) |
| Total expenses | 1.70%(4) | 1.74% | 1.68% | 1.67% | 1.67% |
| Net investment income | 2.63% | 2.20% | 1.03% | 1.11% | 1.40% |
| Portfolio Turnover | 118% | 98% | 35% | 62% | 56% |
| (1) | Computed using average shares outstanding. |
| (2) | The per share amount is not in accord with the net realized and unrealized gain (loss) for the period because of the timing of Fund share transactions and the amount of the per share realized and unrealized gains and losses at such time. |
| (3) | Returns are historical and are calculated by determining the percentage change in net asset value with all distributions reinvested and do not reflect the effect of sales charges. |
| (4) | The investment adviser and administrator reimbursed certain operating expenses (equal to 0.03% of average daily net assets for the year ended July 31, 2024). Absent this reimbursement, total return would be lower. |
| (5) | Interest and fee expense relates to the liability for floating rate notes issued in conjunction with residual interest bond transactions (see Note 1H). |
| (6) | Amount is less than 0.005%. |
15
See Notes to Financial Statements.
Eaton Vance
Municipal Opportunities Fund
July 31, 2024
Financial Highlights — continued
| | Class I |
| | Year Ended July 31, |
| | 2024 | 2023 | 2022 | 2021 | 2020 |
| Net asset value — Beginning of year | $11.15 | $11.41 | $12.89 | $12.35 | $12.32 |
| Income (Loss) From Operations | | | | | |
| Net investment income(1) | $0.40 | $0.36 | $0.24 | $0.27 | $0.29 |
| Net realized and unrealized gain (loss) | 0.21 | (0.26) | (1.28) | 0.54 | 0.03(2) |
| Total income (loss) from operations | $0.61 | $0.10 | $(1.04) | $0.81 | $0.32 |
| Less Distributions | | | | | |
| From net investment income | $(0.39) | $(0.36) | $(0.25) | $(0.27) | $(0.29) |
| From net realized gain | — | — | (0.19) | — | — |
| Total distributions | $(0.39) | $(0.36) | $(0.44) | $(0.27) | $(0.29) |
| Net asset value — End of year | $11.37 | $11.15 | $11.41 | $12.89 | $12.35 |
| Total Return(3) | 5.53% | 0.90% | (8.22)% | 6.60% | 2.66% |
| Ratios/Supplemental Data | | | | | |
| Net assets, end of year (000’s omitted) | $584,101 | $490,175 | $645,430 | $1,202,483 | $1,245,273 |
| Ratios (as a percentage of average daily net assets): | | | | | |
| Expenses excluding interest and fees | 0.69%(4) | 0.73% | 0.67% | 0.67% | 0.67% |
| Interest and fee expense(5) | 0.01% | 0.01% | — | 0.00%(6) | 0.00%(6) |
| Total expenses | 0.70%(4) | 0.74% | 0.67% | 0.67% | 0.67% |
| Net investment income | 3.63% | 3.19% | 2.01% | 2.10% | 2.40% |
| Portfolio Turnover | 118% | 98% | 35% | 62% | 56% |
| (1) | Computed using average shares outstanding. |
| (2) | The per share amount is not in accord with the net realized and unrealized gain (loss) for the period because of the timing of Fund share transactions and the amount of the per share realized and unrealized gains and losses at such time. |
| (3) | Returns are historical and are calculated by determining the percentage change in net asset value with all distributions reinvested. |
| (4) | The investment adviser and administrator reimbursed certain operating expenses (equal to 0.03% of average daily net assets for the year ended July 31, 2024). Absent this reimbursement, total return would be lower. |
| (5) | Interest and fee expense relates to the liability for floating rate notes issued in conjunction with residual interest bond transactions (see Note 1H). |
| (6) | Amount is less than 0.005%. |
16
See Notes to Financial Statements.
Eaton Vance
Municipal Opportunities Fund
July 31, 2024
Notes to Financial Statements
1 Significant Accounting Policies
Eaton Vance Municipal Opportunities Fund (the Fund) is a diversified series of Eaton Vance Municipals Trust (the Trust). The Trust is a Massachusetts business trust registered under the Investment Company Act of 1940, as amended (the 1940 Act), as an open-end management investment company. The Fund seeks to maximize after-tax total return. The Fund offers three classes of shares. Class A shares are generally sold subject to a sales charge imposed at time of purchase. Class C shares are sold at net asset value and are generally subject to a contingent deferred sales charge (see Note 5). Effective November 5, 2020, Class C shares automatically convert to Class A shares eight years after their purchase as described in the Fund’s prospectus. Class I shares are sold at net asset value and are not subject to a sales charge. Each class represents a pro rata interest in the Fund, but votes separately on class-specific matters and (as noted below) is subject to different expenses. Realized and unrealized gains and losses are allocated daily to each class of shares based on the relative net assets of each class to the total net assets of the Fund. Net investment income, other than class-specific expenses, is allocated daily to each class of shares based upon the ratio of the value of each class’s paid shares to the total value of all paid shares. Each class of shares differs in its distribution plan and certain other class-specific expenses.
The following is a summary of significant accounting policies of the Fund. The policies are in conformity with accounting principles generally accepted in the United States of America (U.S. GAAP). The Fund is an investment company and follows accounting and reporting guidance in the Financial Accounting Standards Board (FASB) Accounting Standards Codification Topic 946.
A Investment Valuation—The following methodologies are used to determine the market value or fair value of investments.
Debt Obligations. Debt obligations are generally valued on the basis of valuations provided by third party pricing services, as derived from such services’ pricing models. Inputs to the models may include, but are not limited to, reported trades, executable bid and ask prices, broker/dealer quotations, prices or yields of securities with similar characteristics, interest rates, anticipated prepayments, benchmark curves or information pertaining to the issuer, as well as industry and economic events. The pricing services may use a matrix approach, which considers information regarding securities with similar characteristics to determine the valuation for a security. Short-term debt obligations purchased with a remaining maturity of sixty days or less for which a valuation from a third party pricing service is not readily available may be valued at amortized cost, which approximates fair value.
Fair Valuation. In connection with Rule 2a-5 of the 1940 Act, the Trustees have designated the Fund’s investment adviser as its valuation designee. Investments for which valuations or market quotations are not readily available or are deemed unreliable are valued by the investment adviser, as valuation designee, at fair value using methods that most fairly reflect the security’s “fair value”, which is the amount that the Fund might reasonably expect to receive for the security upon its current sale in the ordinary course. Each such determination is based on a consideration of relevant factors, which are likely to vary from one pricing context to another. These factors may include, but are not limited to, the type of security, the existence of any contractual restrictions on the security’s disposition, the price and extent of public trading in similar securities of the issuer or of comparable companies or entities, quotations or relevant information obtained from broker/dealers or other market participants, information obtained from the issuer, analysts, and/or the appropriate stock exchange (for exchange-traded securities), an analysis of the company’s or entity’s financial statements, and an evaluation of the forces that influence the issuer and the market(s) in which the security is purchased and sold.
B Investment Transactions and Related Income—Investment transactions for financial statement purposes are accounted for on a trade date basis. Realized gains and losses on investments sold are determined on the basis of identified cost. Interest income is recorded on the basis of interest accrued, adjusted for amortization of premium or accretion of discount.
C Federal Taxes—The Fund's policy is to comply with the provisions of the Internal Revenue Code applicable to regulated investment companies and to distribute to shareholders each year substantially all of its taxable, if any, and tax-exempt net investment income, and all or substantially all of its net realized capital gains. Accordingly, no provision for federal income or excise tax is necessary. The Fund intends to satisfy conditions which will enable it to designate distributions from the interest income generated by its investments in non-taxable municipal securities, which are exempt from regular federal income tax when received by the Fund, as exempt-interest dividends. The portion of such interest, if any, earned on private activity bonds issued after August 7, 1986, may be considered a tax preference item to shareholders.
As of July 31, 2024, the Fund had no uncertain tax positions that would require financial statement recognition, de-recognition, or disclosure. The Fund files a U.S. federal income tax return annually after its fiscal year-end, which is subject to examination by the Internal Revenue Service for a period of three years from the date of filing.
D Expenses—The majority of expenses of the Trust are directly identifiable to an individual fund. Expenses which are not readily identifiable to a specific fund are allocated taking into consideration, among other things, the nature and type of expense and the relative size of the funds.
E Legal Fees— Legal fees and other related expenses incurred as part of negotiations of the terms and requirement of capital infusions, or that are expected to result in the restructuring of, or a plan of reorganization for, an investment are recorded as realized losses. Ongoing expenditures to protect or enhance an investment are treated as operating expenses.
F Use of Estimates—The preparation of the financial statements in conformity with U.S. GAAP requires management to make estimates and assumptions that affect the reported amounts of assets and liabilities at the date of the financial statements and the reported amounts of income and expense during the reporting period. Actual results could differ from those estimates.
Eaton Vance
Municipal Opportunities Fund
July 31, 2024
Notes to Financial Statements — continued
G Indemnifications—Under the Trust’s organizational documents, its officers and Trustees may be indemnified against certain liabilities and expenses arising out of the performance of their duties to the Fund. Under Massachusetts law, if certain conditions prevail, shareholders of a Massachusetts business trust (such as the Trust) could be deemed to have personal liability for the obligations of the Trust. However, the Trust’s Declaration of Trust contains an express disclaimer of liability on the part of Fund shareholders and the By-laws provide that the Trust shall assume, upon request by the shareholder, the defense on behalf of any Fund shareholders. Moreover, the By-laws also provide for indemnification out of Fund property of any shareholder held personally liable solely by reason of being or having been a shareholder for all loss or expense arising from such liability. Additionally, in the normal course of business, the Fund enters into agreements with service providers that may contain indemnification clauses. The Fund’s maximum exposure under these arrangements is unknown as this would involve future claims that may be made against the Fund that have not yet occurred.
H Floating Rate Notes Issued in Conjunction with Securities Held—The Fund may invest in residual interest bonds, also referred to as inverse floating rate securities, whereby the Fund may sell a variable or fixed rate bond for cash to a Special-Purpose Vehicle (the SPV), (which is generally organized as a Fund), while at the same time, buying a residual interest in the assets and cash flows of the SPV. The bond is deposited into the SPV with the same CUSIP number as the bond sold to the SPV by the Fund, and which may have been, but is not required to be, the bond purchased from the Fund (the Bond). The SPV also issues floating rate notes (Floating Rate Notes) which are sold to third-parties. The residual interest bond held by the Fund gives the Fund the right (1) to cause the holders of the Floating Rate Notes to generally tender their notes at par, and (2) to have the Bond held by the SPV transferred to the Fund, thereby terminating the SPV. Should the Fund exercise such right, it would generally pay the SPV the par amount due on the Floating Rate Notes and exchange the residual interest bond for the underlying Bond. Pursuant to generally accepted accounting principles for transfers and servicing of financial assets and extinguishment of liabilities, the Fund accounts for the transaction described above as a secured borrowing by including the Bond in its Portfolio of Investments and the Floating Rate Notes as a liability under the caption “Payable for floating rate notes issued” in its Statement of Assets and Liabilities. The Floating Rate Notes have interest rates that generally reset weekly and their holders have the option to tender their notes to the SPV for redemption at par at each reset date. Accordingly, the fair value of the payable for floating rate notes issued approximates its carrying value. If measured at fair value, the payable for floating rate notes would have been considered as Level 2 in the fair value hierarchy (see Note 10) at July 31, 2024. Interest expense related to the Fund's liability with respect to Floating Rate Notes is recorded as incurred. The SPV may be terminated by the Fund, as noted above, or by the occurrence of certain termination events as defined in the Fund agreement, such as a downgrade in the credit quality of the underlying Bond, bankruptcy of or payment failure by the issuer of the underlying Bond, the inability to remarket Floating Rate Notes that have been tendered due to insufficient buyers in the market, or the failure by the SPV to obtain renewal of the liquidity agreement under which liquidity support is provided for the Floating Rate Notes up to one year. The Fund had no Floating Rate Notes outstanding at July 31, 2024. For the year ended July 31, 2024, the Fund's average settled Floating Rate Notes outstanding and the average interest rate including fees were $1,698,361 and 4.07%, respectively.
In certain circumstances, the Fund may enter into shortfall and forbearance agreements with brokers by which the Fund agrees to reimburse the broker for the difference between the liquidation value of the Bond held by the SPV and the liquidation value of the Floating Rate Notes, as well as any shortfalls in interest cash flows. The Fund had no shortfalls as of July 31, 2024.
The Fund may also purchase residual interest bonds in a secondary market transaction without first owning the underlying bond. Such transactions are not required to be treated as secured borrowings. Shortfall agreements, if any, related to residual interest bonds purchased in a secondary market transaction are disclosed in the Portfolio of Investments.
The Fund's investment policies and restrictions expressly permit investments in residual interest bonds. Such bonds typically offer the potential for yields exceeding the yields available on fixed rate bonds with comparable credit quality and maturity. These securities tend to underperform the market for fixed rate bonds in a rising long-term interest rate environment, but tend to outperform the market for fixed rate bonds when long-term interest rates decline. The value and income of residual interest bonds are generally more volatile than that of a fixed rate bond. The Fund's investment policies do not allow the Fund to borrow money except as permitted by the 1940 Act. Effective August 19, 2022, the Fund began operating under Rule 18f-4 under the 1940 Act, which, among other things, governs the use of derivative investments and certain financing transactions by registered investment companies. As of the date of this report, consistent with Rule 18f-4, the Fund has elected to treat its investments in residual interest bonds, along with similar financing transactions, as derivatives transactions subject to the Fund's value-at-risk (VaR)-based limits on leverage risk. The Fund may change this election (and elect to treat these investments and other similar financing transactions like bank borrowings subject to the asset coverage requirements of Section 18 of the 1940 Act) at any time. Residual interest bonds held by the Fund are securities exempt from registration under Rule 144A of the Securities Act of 1933.
I Futures Contracts —Upon entering into a futures contract, the Fund is required to deposit with the broker, either in cash or securities, an amount equal to a certain percentage of the contract amount (initial margin). Subsequent payments, known as variation margin, are made or received by the Fund each business day, depending on the daily fluctuations in the value of the underlying security, and are recorded as unrealized gains or losses by the Fund. Gains (losses) are realized upon the expiration or closing of the futures contracts. Should market conditions change unexpectedly, the Fund may not achieve the anticipated benefits of the futures contracts and may realize a loss. Futures contracts have minimal counterparty risk as they are exchange traded and the clearinghouse for the exchange is substituted as the counterparty, guaranteeing counterparty performance.
J When-Issued Securities and Delayed Delivery Transactions—The Fund may purchase securities on a delayed delivery or when-issued basis. Payment and delivery may take place after the customary settlement period for that security. At the time the transaction is negotiated, the price of the security that will be delivered is fixed. The Fund maintains cash and/or security positions for these commitments such that sufficient liquid assets will be available to make payments upon settlement. Securities purchased on a delayed delivery or when-issued basis are marked-to-market daily and begin earning interest
Eaton Vance
Municipal Opportunities Fund
July 31, 2024
Notes to Financial Statements — continued
on settlement date. Such security purchases are subject to the risk that when delivered they will be worth less than the agreed upon payment price. Losses may also arise if the counterparty does not perform under the contract.
2 Distributions to Shareholders and Income Tax Information
The net investment income of the Fund is determined daily and substantially all of the net investment income so determined is declared as a dividend to shareholders of record at the time of declaration. Distributions are declared separately for each class of shares. Distributions are paid monthly. Distributions of realized capital gains are made at least annually. Shareholders may reinvest income and capital gain distributions in additional shares of the same class of the Fund at the net asset value as of the reinvestment date or, at the election of the shareholder, receive distributions in cash. Distributions to shareholders are determined in accordance with income tax regulations, which may differ from U.S. GAAP. As required by U.S. GAAP, only distributions in excess of tax basis earnings and profits are reported in the financial statements as a return of capital. Permanent differences between book and tax accounting relating to distributions are reclassified to paid-in capital. For tax purposes, distributions from short-term capital gains are considered to be from ordinary income.
The tax character of distributions declared for the years ended July 31, 2024 and July 31, 2023 was as follows:
| | Year Ended July 31, |
| | 2024 | 2023 |
| Tax-exempt income | $18,239,948 | $16,014,042 |
| Ordinary income | $2,689,199 | $2,262,859 |
As of July 31, 2024, the components of distributable earnings (accumulated loss) on a tax basis were as follows:
| Undistributed tax-exempt income | $ 113,333 |
| Deferred capital losses | (56,669,988) |
| Net unrealized appreciation | 4,164,285 |
| Distributions payable | (120,478) |
| Accumulated loss | $(52,512,848) |
At July 31, 2024, the Fund, for federal income tax purposes, had deferred capital losses of $56,669,988 which would reduce its taxable income arising from future net realized gains on investment transactions, if any, to the extent permitted by the Internal Revenue Code, and thus would reduce the amount of distributions to shareholders, which would otherwise be necessary to relieve the Fund of any liability for federal income or excise tax. The deferred capital losses are treated as arising on the first day of the Fund’s next taxable year and retain the same short-term or long-term character as when originally deferred. Of the deferred capital losses at July 31, 2024, $18,247,701 are short-term and $38,422,287 are long-term.
The cost and unrealized appreciation (depreciation) of investments of the Fund at July 31, 2024, as determined on a federal income tax basis, were as follows:
| Aggregate cost | $682,915,012 |
| Gross unrealized appreciation | $12,764,436 |
| Gross unrealized depreciation | (8,600,151) |
| Net unrealized appreciation | $4,164,285 |
Eaton Vance
Municipal Opportunities Fund
July 31, 2024
Notes to Financial Statements — continued
3 Investment Adviser and Administration Fee and Other Transactions with Affiliates
The investment adviser and administration fee is earned by Eaton Vance Management (EVM), an indirect, wholly-owned subsidiary of Morgan Stanley, as compensation for investment advisory and administrative services rendered to the Fund. The investment adviser and administration fee is computed at an annual rate as a percentage of the Fund’s average daily net assets as follows and is payable monthly:
| Average Daily Net Assets | Annual Fee Rate |
| Up to $500 million | 0.600% |
| $500 million but less than $1 billion | 0.575% |
| $1 billion but less than $2.5 billion | 0.550% |
| $2.5 billion but less than $5 billion | 0.530% |
| $5 billion and over | 0.515% |
For the year ended July 31, 2024, the Fund's investment adviser and administration fee amounted to $3,590,901 or 0.60% of the Fund’s average daily net assets.
Effective December 1, 2023, EVM has agreed to reimburse the Fund’s operating expenses to the extent that total annual operating expenses (relating to ordinary operating expenses only and excluding such expenses as brokerage commissions, acquired fund fees and expenses of unaffiliated funds, borrowing costs, taxes or litigation expenses) exceed 0.92%, 1.67% and 0.67% of the Fund’s average daily net assets for Class A, Class C and Class I, respectively. This agreement may be changed or terminated after November 30, 2024. Pursuant to this agreement, EVM was allocated $179,994 of the Fund’s operating expenses for the year ended July 31, 2024.
EVM provides sub-transfer agency and related services to the Fund pursuant to a Sub-Transfer Agency Support Services Agreement. For the year ended July 31, 2024, EVM earned $8,128 from the Fund pursuant to such agreement, which is included in transfer and dividend disbursing agent fees on the Statement of Operations. The Fund was informed that Eaton Vance Distributors, Inc. (EVD), an affiliate of EVM and the Fund's principal underwriter, received $3,048 as its portion of the sales charge on sales of Class A shares for the year ended July 31, 2024. The Fund was informed that Morgan Stanley affiliated broker-dealers, which may be deemed affiliates of EVM and EVD, also received a portion of the sales charge on sales of Class A shares for the year ended July 31, 2024 in the amount of $1,762. EVD also received distribution and service fees from Class A and Class C shares (see Note 4) and contingent deferred sales charges (see Note 5).
Trustees and officers of the Fund who are members of EVM’s organization receive remuneration for their services to the Fund out of the investment adviser and administration fee. Trustees of the Fund who are not affiliated with EVM may elect to defer receipt of all or a percentage of their annual fees in accordance with the terms of the Trustees Deferred Compensation Plan. Certain officers and Trustees of the Fund are officers of EVM.
4 Distribution Plan
The Fund has in effect a distribution plan for Class A shares (Class A Plan) pursuant to Rule 12b-1 under the 1940 Act. Pursuant to the Class A Plan, the Fund pays EVD a distribution and service fee of 0.25% per annum of its average daily net assets attributable to Class A shares for distribution services and facilities provided to the Fund by EVD, as well as for personal services and/or the maintenance of shareholder accounts. Distribution and service fees paid or accrued to EVD for the year ended July 31, 2024 amounted to $146,179 for Class A shares.
The Fund also has in effect a distribution plan for Class C shares (Class C Plan) pursuant to Rule 12b-1 under the 1940 Act. Pursuant to the Class C Plan, the Fund pays EVD amounts equal to 0.75% per annum of its average daily net assets attributable to Class C shares for providing ongoing distribution services and facilities to the Fund. For the year ended July 31, 2024, the Fund paid or accrued to EVD $98,745 for Class C shares.
Pursuant to the Class C Plan, the Fund also makes payments of service fees to EVD, financial intermediaries and other persons in amounts equal to 0.25% per annum of its average daily net assets attributable to that class. Service fees paid or accrued are for personal services and/or the maintenance of shareholder accounts. They are separate and distinct from the sales commissions and distribution fees payable to EVD. Service fees paid or accrued for the year ended July 31, 2024 amounted to $32,915 for Class C shares.
Distribution and service fees are subject to the limitations contained in the Financial Industry Regulatory Authority Rule 2341(d).
Eaton Vance
Municipal Opportunities Fund
July 31, 2024
Notes to Financial Statements — continued
5 Contingent Deferred Sales Charges
A contingent deferred sales charge (CDSC) of 1% generally is imposed on redemptions of Class C shares made within 12 months of purchase. Class A shares may be subject to a 0.75% CDSC if redeemed within 12 months of purchase (depending on the circumstances of purchase). Generally, the CDSC is based upon the lower of the net asset value at date of redemption or date of purchase. No charge is levied on shares acquired by reinvestment of dividends or capital gain distributions. For the year ended July 31, 2024, the Fund was informed that EVD received $1,452 and $2,053 of CDSCs paid by Class A and Class C shareholders, respectively.
6 Purchases and Sales of Investments
Purchases and sales of investments, other than short-term obligations and including maturities, for the year ended July 31, 2024 were as follows:
| | Purchases | Sales |
| Investments (non-U.S. Government) | $817,566,308 | $725,347,883 |
| U.S. Government and Agency Securities | 5,504,941 | — |
| | $823,071,249 | $725,347,883 |
7 Shares of Beneficial Interest
The Fund’s Declaration of Trust permits the Trustees to issue an unlimited number of full and fractional shares of beneficial interest (without par value). Such shares may be issued in a number of different series (such as the Fund) and classes. Transactions in Fund shares, including direct exchanges pursuant to share class conversions, were as follows:
| | Year Ended
July 31, 2024 | | Year Ended
July 31, 2023 |
| | Shares | Amount | | Shares | Amount |
| Class A | | | | | |
| Sales | 1,433,544 | $ 15,898,752 | | 2,048,553 | $ 22,521,094 |
| Issued to shareholders electing to receive payments of distributions in Fund shares | 156,935 | 1,740,743 | | 151,407 | 1,674,093 |
| Redemptions | (1,772,973) | (19,562,516) | | (3,685,045) | (40,419,765) |
| Net decrease | (182,494) | $ (1,923,021) | | (1,485,085) | $(16,224,578) |
| Class C | | | | | |
| Sales | 116,343 | $ 1,293,237 | | 224,477 | $ 2,486,891 |
| Issued to shareholders electing to receive payments of distributions in Fund shares | 28,267 | 313,075 | | 33,686 | 372,409 |
| Redemptions | (566,583) | (6,288,494) | | (1,005,989) | (11,148,525) |
| Net decrease | (421,973) | $ (4,682,182) | | (747,826) | $ (8,289,225) |
| Class I | | | | | |
| Sales | 26,844,361 | $295,215,567 | | 23,349,812 | $259,411,972 |
| Issued to shareholders electing to receive payments of distributions in Fund shares | 1,532,680 | 17,053,644 | | 1,249,629 | 13,835,000 |
| Redemptions | (20,964,085) | (231,899,710) | | (37,184,269) | (411,474,866) |
| Net increase (decrease) | 7,412,956 | $ 80,369,501 | | (12,584,828) | $(138,227,894) |
Eaton Vance
Municipal Opportunities Fund
July 31, 2024
Notes to Financial Statements — continued
8 Line of Credit
The Fund participates with other portfolios and funds managed by EVM and its affiliates in a $650 million unsecured revolving line of credit agreement with a group of banks, which is in effect through October 22, 2024. In connection with the renewal of the agreement on October 24, 2023, the borrowing limit was decreased from $725 million. Borrowings are made by the Fund solely for temporary purposes related to redemptions and other short-term cash needs. Interest is charged to the Fund based on its borrowings at an amount above either the Secured Overnight Financing Rate (SOFR) or Federal Funds rate. In addition, a fee computed at an annual rate of 0.15% on the daily unused portion of the line of credit is allocated among the participating portfolios and funds at the end of each quarter. In connection with the renewal of the agreement in October 2023, an arrangement fee of $150,000 was incurred that was allocated to the participating portfolios and funds. Because the line of credit is not available exclusively to the Fund, it may be unable to borrow some or all of its requested amounts at any particular time. The Fund did not have any significant borrowings or allocated fees during the year ended July 31, 2024.
9 Financial Instruments
The Fund may trade in financial instruments with off-balance sheet risk in the normal course of its investing activities. These financial instruments may include futures contracts and may involve, to a varying degree, elements of risk in excess of the amounts recognized for financial statement purposes. The notional or contractual amounts of these instruments represent the investment the Fund has in particular classes of financial instruments and do not necessarily represent the amounts potentially subject to risk. The measurement of the risks associated with these instruments is meaningful only when all related and offsetting transactions are considered. At July 31, 2024, there were no obligations outstanding under these financial instruments.
The Fund is subject to interest rate risk in the normal course of pursuing its investment objective. Because the Fund holds fixed-rate bonds, the value of these bonds may decrease if interest rates rise. During the year ended July 31, 2024, the Fund entered into U.S. Treasury futures contracts to hedge against changes in interest rates.
The effect of derivative instruments (not considered to be hedging instruments for accounting disclosure purposes) on the Statement of Operations and whose primary underlying risk exposure is interest rate risk for the year ended July 31, 2024 was as follows:
| Derivative | Realized Gain (Loss)
on Derivatives Recognized
in Income(1) | Change in Unrealized
Appreciation (Depreciation) on
Derivatives Recognized in Income |
| Futures contracts | $402,465 | $ — |
| (1) | Statement of Operations location: Net realized gain (loss): Futures contracts. |
The average notional cost of futures contracts (short) outstanding during the year ended July 31, 2024, which is indicative of the volume of this derivative type, was approximately $2,502,000.
10 Fair Value Measurements
Under generally accepted accounting principles for fair value measurements, a three-tier hierarchy to prioritize the assumptions, referred to as inputs, is used in valuation techniques to measure fair value. The three-tier hierarchy of inputs is summarized in the three broad levels listed below.
| • | Level 1 – quoted prices in active markets for identical investments |
| • | Level 2 – other significant observable inputs (including quoted prices for similar investments, interest rates, prepayment speeds, credit risk, etc.) |
| • | Level 3 – significant unobservable inputs (including a fund's own assumptions in determining the fair value of investments) |
In cases where the inputs used to measure fair value fall in different levels of the fair value hierarchy, the level disclosed is determined based on the lowest level input that is significant to the fair value measurement in its entirety. The inputs or methodology used for valuing securities are not necessarily an indication of the risk associated with investing in those securities.
Eaton Vance
Municipal Opportunities Fund
July 31, 2024
Notes to Financial Statements — continued
At July 31, 2024, the hierarchy of inputs used in valuing the Fund's investments, which are carried at fair value, were as follows:
| Asset Description | Level 1 | Level 2 | Level 3* | Total |
| Corporate Bonds | $ — | $ 4,957,892 | $2,758,000 | $ 7,715,892 |
| Tax-Exempt Mortgage-Backed Securities | — | 444,083 | — | 444,083 |
| Tax-Exempt Municipal Obligations | — | 608,972,712 | — | 608,972,712 |
| Taxable Municipal Obligations | — | 64,430,604 | — | 64,430,604 |
| U.S. Treasury Obligations | — | 5,516,006 | — | 5,516,006 |
| Total Investments | $ — | $684,321,297 | $2,758,000 | $687,079,297 |
| * | None of the unobservable inputs for Level 3 assets, individually or collectively, had a material impact on the Fund. |
Eaton Vance
Municipal Opportunities Fund
July 31, 2024
Report of Independent Registered Public Accounting Firm
To the Trustees of Eaton Vance Municipals Trust and Shareholders of Eaton Vance Municipal Opportunities Fund:
Opinion on the Financial Statements and Financial Highlights
We have audited the accompanying statement of assets and liabilities of Eaton Vance Municipal Opportunities Fund (the "Fund") (one of the funds constituting Eaton Vance Municipals Trust), including the portfolio of investments, as of July 31, 2024, the related statement of operations for the year then ended, the statements of changes in net assets for each of the two years in the period then ended, the financial highlights for each of the five years in the period then ended, and the related notes. In our opinion, the financial statements and financial highlights present fairly, in all material respects, the financial position of the Fund as of July 31, 2024, and the results of its operations for the year then ended, the changes in its net assets for each of the two years in the period then ended, and the financial highlights for each of the five years in the period then ended, in conformity with accounting principles generally accepted in the United States of America.
Basis for Opinion
These financial statements and financial highlights are the responsibility of the Fund's management. Our responsibility is to express an opinion on the Fund's financial statements and financial highlights based on our audits. We are a public accounting firm registered with the Public Company Accounting Oversight Board (United States) (PCAOB) and are required to be independent with respect to the Fund in accordance with the U.S. federal securities laws and the applicable rules and regulations of the Securities and Exchange Commission and the PCAOB.
We conducted our audits in accordance with the standards of the PCAOB. Those standards require that we plan and perform the audit to obtain reasonable assurance about whether the financial statements and financial highlights are free of material misstatement, whether due to error or fraud. The Fund is not required to have, nor were we engaged to perform, an audit of its internal control over financial reporting. As part of our audits, we are required to obtain an understanding of internal control over financial reporting but not for the purpose of expressing an opinion on the effectiveness of the Fund’s internal control over financial reporting. Accordingly, we express no such opinion.
Our audits included performing procedures to assess the risks of material misstatement of the financial statements and financial highlights, whether due to error or fraud, and performing procedures that respond to those risks. Such procedures included examining, on a test basis, evidence regarding the amounts and disclosures in the financial statements and financial highlights. Our audits also included evaluating the accounting principles used and significant estimates made by management, as well as evaluating the overall presentation of the financial statements and financial highlights. Our procedures included confirmation of securities owned as of July 31, 2024, by correspondence with the custodian and brokers; when replies were not received from brokers, we performed other auditing procedures. We believe that our audits provide a reasonable basis for our opinion.
/s/ Deloitte & Touche LLP
Boston, Massachusetts
September 18, 2024
We have served as the auditor of one or more Eaton Vance investment companies since 1959.
Eaton Vance
Municipal Opportunities Fund
July 31, 2024
Federal Tax Information (Unaudited)
The Form 1099-DIV you receive in February 2025 will show the tax status of all distributions paid to your account in calendar year 2024. Shareholders are advised to consult their own tax adviser with respect to the tax consequences of their investment in the Fund. As required by the Internal Revenue Code and/or regulations, shareholders must be notified regarding exempt-interest dividends.
Exempt-Interest Dividends. For the fiscal year ended July 31, 2024, the Fund designates 87.15% of distributions from net investment income as an exempt-interest dividend.
Eaton Vance
Municipal Opportunities Fund
July 31, 2024
Board of Trustees’ Contract Approval
Overview of the Contract Review Process
The Investment Company Act of 1940, as amended (the “1940 Act”), provides, in substance, that the investment advisory agreement between a fund and its investment adviser will continue in effect from year-to-year only if its continuation is approved on an annual basis by a vote of the fund’s board of trustees, including a majority of the trustees who are not “interested persons” of the fund (“independent trustees”), cast in person at a meeting called for the purpose of considering such approval.
At a meeting held on June 6, 2024, the Boards of Trustees/Directors (collectively, the “Board”) that oversee the registered investment companies advised by Eaton Vance Management or its affiliate, Boston Management and Research (the “Eaton Vance Funds”), including a majority of the independent trustees (the “Independent Trustees”), voted to approve the continuation of existing investment advisory agreements and sub-advisory agreements1 for each of the Eaton Vance Funds for an additional one-year period. The Board relied upon the affirmative recommendation of its Contract Review Committee, which is a committee comprised of all of the Independent Trustees. Prior to making its recommendation, the Contract Review Committee reviewed information furnished by the adviser and sub-adviser to each of the Eaton Vance Funds (including information specifically requested by the Board) for a series of meetings held between April and June 2024, as well as certain additional information provided in response to specific requests from the Independent Trustees as members of the Contract Review Committee. Members of the Contract Review Committee also considered information received at prior meetings of the Board and its committees, to the extent such information was relevant to the Contract Review Committee’s annual evaluation of the investment advisory agreements and sub-advisory agreements.
In connection with its evaluation of the investment advisory agreements and sub-advisory agreements, the Board considered various information relating to the Eaton Vance Funds. This included information applicable to all or groups of Eaton Vance Funds, which is referenced immediately below, and information applicable to the particular Eaton Vance Fund covered by this report (each “Eaton Vance Fund” is referred to below as a “fund”). (For funds that invest through one or more underlying portfolios, references to “each fund” in this section may include information that was considered at the portfolio-level.)
Information about Fees, Performance and Expenses
• A report from an independent data provider comparing advisory and other fees paid by each fund to such fees paid by comparable funds, as identified by the independent data provider (“comparable funds”);
• A report from an independent data provider comparing each fund’s total expense ratio (and its components) to those of comparable funds;
• A report from an independent data provider comparing the investment performance of each fund (including, as relevant, total return data, income data, Sharpe ratios, and information ratios) to the investment performance of comparable funds and, as applicable, benchmark indices, over various time periods;
• In certain instances, data regarding investment performance relative to customized groups of peer funds and blended indices identified by the adviser in consultation with the Portfolio Management Committee of the Board (a committee exclusively comprised of Independent Trustees);
• Comparative information concerning the fees charged and services provided by the adviser and sub-adviser to each fund in managing other accounts (which may include other funds, collective investment trusts and institutional accounts) with the same or substantially similar investment objective as the fund and with a significant overlap in holdings based on criteria set by the Board, if any;
• Profitability analyses with respect to the adviser and sub-adviser to each of the funds;
Information about Portfolio Management and Trading
• Descriptions of the investment management services provided to each fund, as well as each of the funds’ investment strategies and policies;
• The procedures and processes used by the adviser to determine the value of fund assets, including, when necessary, the determination of “fair value” by the adviser in its role as each funds’ valuation designee and actions taken to monitor and test the effectiveness of such procedures and processes;
• Information about the policies and practices of each fund’s adviser and sub-adviser with respect to trading, including their processes for seeking best execution of portfolio transactions;
• Information about the allocation of brokerage transactions and the benefits, if any, received by the adviser and sub-adviser to each fund as a result of brokerage allocation, including, as applicable, information concerning the acquisition of research through client commission arrangements and policies with respect to “soft dollars”;
• Data relating to the portfolio turnover rate of each fund and related information regarding active management in the context of particular strategies;
Information about each Adviser and Sub-adviser
• Reports detailing the financial results and condition of the adviser and sub-adviser to each fund;
1 Not all Eaton Vance Funds have entered into a sub-advisory agreement with a sub-adviser. Accordingly, references to “sub-adviser” or “sub-advisory agreement” in this “Overview” section may not be applicable to the particular Eaton Vance Fund covered by this report. Eaton Vance Management and Boston Management and Research are referred to collectively as the “adviser.”
Eaton Vance
Municipal Opportunities Fund
July 31, 2024
Board of Trustees’ Contract Approval — continued
• Information regarding the individual investment professionals whose responsibilities include portfolio management and investment research for the funds, and, for portfolio managers and certain other investment professionals, information relating to their responsibilities with respect to managing other funds and investment accounts, as applicable;
• Information regarding the adviser’s and its parent company’s (Morgan Stanley’s) efforts to retain and attract talented investment professionals, including in the context of a competitive marketplace for talent;
• Information regarding the adviser’s compensation methodology for its investment professionals and the incentives and accountability it creates, along with investment professionals’ investments in the fund(s) they manage;
• The personal trading codes of ethics of the adviser and its affiliates and the sub-adviser of each fund, together with information relating to compliance with, and the administration of, such codes;
• Policies and procedures relating to proxy voting, including regular reporting with respect to fund proxy voting activities;
• Information regarding the handling of corporate actions and class actions, as well as information regarding litigation and other regulatory matters;
• Information concerning the resources devoted to compliance efforts undertaken by the adviser and its affiliates and the sub-adviser of each fund, including descriptions of their various compliance programs and their record of compliance and remediation;
• Information concerning the business continuity and disaster recovery plans of the adviser and its affiliates and the sub-adviser of each fund;
• A description of the adviser’s oversight of sub-advisers, including with respect to regulatory and compliance issues, investment management and other matters;
Other Relevant Information
• Information regarding ongoing initiatives to further integrate and harmonize, where applicable, the investment management and other departments of the adviser and its affiliates with the overall investment management infrastructure of Morgan Stanley, in light of Morgan Stanley’s acquisition of Eaton Vance Corp. on March 1, 2021;
• Information concerning the nature, cost, and character of the administrative and other non-investment advisory services provided by the adviser and its affiliates;
• Information concerning oversight of the relationship with the custodian, subcustodians, fund accountants, and other third-party service providers by the adviser and/or administrator to each of the funds;
• Information concerning efforts to implement policies and procedures with respect to various regulations applicable to the funds, including Rule 12d1-4 (the Fund-of-Funds Rule), Rule 18f-4 (the Derivatives Rule), and Rule 2a-5 (the Fair Valuation Rule);
• For an Eaton Vance Fund structured as an exchange-listed closed-end fund, information concerning the benefits of the closed-end fund structure, as well as, where relevant, the closed-end fund’s market prices (including as compared to the closed-end fund’s net asset value (NAV)), trading volume data, continued use of auction preferred shares (where applicable), distribution rates, and other relevant matters;
• The risks that the adviser and/or its affiliates incur in connection with the management and operation of the funds, including, among others, litigation, regulatory, entrepreneurial, and other business risks (and the associated costs of such risks); and
• The terms of each investment advisory agreement and sub-advisory agreement.
During the various meetings of the Board and its committees over the course of the year leading up to the June 6, 2024 meeting, the Board and its committees received information from portfolio managers and other investment professionals of the adviser and sub-advisers of the funds regarding investment and performance matters, and considered various investment and trading strategies used in pursuing the funds’ investment objectives. The Board and its committees also received information regarding risk management techniques employed in connection with the management of the funds. The Board and its committees evaluated issues pertaining to industry and regulatory developments, compliance procedures, fund governance, and other issues with respect to the funds, and received and participated in reports and presentations provided by the adviser and sub-advisers, with respect to such matters. In addition to the formal meetings of the Board and its committees, the Independent Trustees held regular video or telephone conferences to discuss, among other topics, matters relating to the continuation of investment advisory agreements and sub-advisory agreements.
The Contract Review Committee was advised throughout the contract review process by Kirkland & Ellis LLP, independent legal counsel for the Independent Trustees. The members of the Contract Review Committee, with the advice of such counsel, exercised their own business judgment in determining the material factors to be considered in evaluating each investment advisory agreement and sub-advisory agreement and the weight to be given to each such factor. The conclusions reached with respect to each investment advisory agreement and sub-advisory agreement were based on a comprehensive evaluation of all the information provided and not any single factor. Moreover, each member of the Contract Review Committee may have placed varying emphasis on particular factors in reaching conclusions with respect to each investment advisory agreement and sub-advisory agreement. In evaluating each investment advisory agreement and sub-advisory agreement, including the fee structures and other terms contained in such agreements, the members of the Contract Review Committee were also informed by multiple years of analysis and discussion with the adviser and sub-adviser to each of the Eaton Vance Funds.
Eaton Vance
Municipal Opportunities Fund
July 31, 2024
Board of Trustees’ Contract Approval — continued
Results of the Contract Review Process
Based on its consideration of the foregoing, and such other information it deemed relevant, including the factors and conclusions described below, the Contract Review Committee concluded that the continuation of the investment advisory and administrative agreement between Eaton Vance Municipal Opportunities Fund (the “Fund”) and Eaton Vance Management (the “Adviser”), including its fee structure, is in the interests of shareholders and, therefore, recommended to the Board approval of the agreement. Based on the recommendation of the Contract Review Committee, the Board, including a majority of the Independent Trustees, voted to approve continuation of the investment advisory and administrative agreement for the Fund.
Nature, Extent and Quality of Services
In considering whether to approve the investment advisory and administrative agreement for the Fund, the Board evaluated the nature, extent and quality of services provided to the Fund by the Adviser.
The Board considered the Adviser’s management capabilities and investment processes in light of the types of investments held by the Fund, including the education and experience of the investment professionals who provide services to the Fund. In particular, the Board considered, where relevant, the abilities and experience of the Adviser’s investment professionals in analyzing factors relevant to investing in municipal bonds, Treasury securities and other securities backed by the U.S. government or its agencies. The Board considered the Adviser’s municipal bond team, which includes investment professionals and credit specialists who provide services to the Fund. The Board also took into account the resources dedicated to portfolio management and other services, the compensation methods of the Adviser and other factors, including the reputation and resources of the Adviser to recruit and retain highly qualified research, advisory and supervisory investment professionals. In addition, the Board considered the time and attention devoted to the Eaton Vance Funds, including the Fund, by senior management, as well as the infrastructure, operational capabilities and support staff in place to assist in the portfolio management and operations of the Fund, including the provision of administrative services. The Board also considered the business-related and other risks to which the Adviser or its affiliates may be subject in managing the Fund.
The Board considered the compliance programs of the Adviser and relevant affiliates thereof. The Board considered compliance and reporting matters regarding, among other things, personal trading by investment professionals, disclosure of portfolio holdings, compliance with policies and procedures, portfolio valuation, business continuity and the allocation of investment opportunities. The Board also considered relevant examinations of the Adviser and its affiliates by regulatory authorities, such as the Securities and Exchange Commission and the Financial Industry Regulatory Authority.
The Board considered other administrative services provided or overseen by Eaton Vance Management and its affiliates, including transfer agency and accounting services. The Board evaluated the benefits to shareholders of investing in a fund that is a part of a large fund complex offering exposure to a variety of asset classes and investment disciplines, as well as the ability, in many cases, to exchange an investment among different funds without incurring additional sales charges.
After consideration of the foregoing factors, among others, the Board concluded that the nature, extent and quality of services provided by the Adviser, taken as a whole, are appropriate and consistent with the terms of the investment advisory and administrative agreement.
Fund Performance
The Board compared the Fund’s investment performance to that of comparable funds identified by an independent data provider (the peer group), as well as an appropriate benchmark index. The Board’s review included comparative performance data with respect to the Fund for the one-, three-, five- and ten-year periods ended December 31, 2023. In this regard, the Board noted that the performance of the Fund was consistent with the median performance of the Fund’s peer group for the three-year period. The Board also noted that the performance of the Fund was lower than its benchmark index for the three-year period. The Board concluded that the performance of the Fund was satisfactory.
Management Fees and Expenses
The Board considered contractual fee rates payable by the Fund for advisory and administrative services (referred to collectively as “management fees”). As part of its review, the Board considered the Fund’s management fees and total expense ratio for the one-year period ended December 31, 2023, as compared to those of comparable funds, before and after giving effect to any undertaking to waive fees or reimburse expenses. The Board also considered certain Fund specific factors that had an impact on the Fund’s total expense ratio relative to comparable funds, as identified by management in response to inquiries from the Contract Review Committee.
After considering the foregoing information, and in light of the nature, extent and quality of the services provided by the Adviser, the Board concluded that the management fees charged for advisory and related services are reasonable.
Profitability and “Fall-Out” Benefits
The Board considered the level of profits realized by the Adviser and relevant affiliates thereof in providing investment advisory and administrative services to the Fund and to all Eaton Vance Funds as a group. The Board considered the level of profits realized without regard to marketing support or other payments by the Adviser and its affiliates to third parties in respect of distribution or other services.
Eaton Vance
Municipal Opportunities Fund
July 31, 2024
Board of Trustees’ Contract Approval — continued
The Board concluded that, in light of the foregoing factors and the nature, extent and quality of the services rendered, the profits realized by the Adviser and its affiliates are not excessive.
The Board also considered direct or indirect fall-out benefits received by the Adviser and its affiliates in connection with their respective relationships with the Fund, including the benefits of research services that may be available to the Adviser as a result of securities transactions effected for the Fund and other investment advisory clients.
Economies of Scale
In reviewing management fees and profitability, the Board also considered the extent to which the Adviser and its affiliates, on the one hand, and the Fund, on the other hand, can expect to realize benefits from economies of scale as the assets of the Fund increase. The Board acknowledged the difficulty in accurately measuring the benefits resulting from economies of scale, if any, with respect to the management of any specific fund or group of funds. To assist in the evaluation of the sharing of any economies of scale, the Board received data showing for recent years, asset levels, Adviser profitability and total expense ratios. Based upon the foregoing, the Board concluded that the Fund currently shares in the benefits from economies of scale, if any, when they are realized by the Adviser. The Board also concluded that the structure of the advisory fee, which includes breakpoints at several asset levels, will allow the Fund to continue to benefit from any economies of scale in the future.
This Page Intentionally Left Blank
This Page Intentionally Left Blank
This Page Intentionally Left Blank
Item 8. Changes in and Disagreements with Accountants for Open-End Management Investment Companies
Not applicable.
Item 9. Proxy Disclosures for Open-End Management Investment Companies
Not applicable.
Item 10. Remuneration Paid to Directors, Officers, and Others of Open-End Management Investment Companies
The information is disclosed as part of the Financial Statements included in Item 7 of this Form N-CSR.
Item 11. Statement Regarding Basis for Approval of Investment Advisory Contract
The information is included in Item 7 of this Form N-CSR.
Item 12. Disclosure of Proxy Voting Policies and Procedures for Closed-End Management Investment Companies
Not applicable.
Item 13. Portfolio Managers of Closed-End Management Investment Companies
Not applicable.
Item 14. Purchases of Equity Securities by Closed-End Management Investment Company and Affiliated Purchasers
Not applicable.
Item 15. Submission of Matters to a Vote of Security Holders
There have been no material changes to the procedures by which shareholders may recommend nominee to the Funds’ Board of Trustees since the Funds last provided disclosure in response to this item.
Item 16. Controls and Procedures
| (a) | It is the conclusion of the registrant’s principal executive officer and principal financial officer that the effectiveness of the registrant’s current disclosure controls and procedures (such disclosure controls and procedures having been evaluated within 90 days of the date of this filing) provide reasonable assurance that the information required to be disclosed by the registrant has been recorded, processed, summarized and reported within the time period specified in the Commission’s rules and forms and that the information required to be disclosed by the registrant has been accumulated and communicated to the registrant’s principal executive officer and principal financial officer in order to allow timely decisions regarding required disclosure. |
| (b) | There have been no changes in the registrant’s internal controls over financial reporting during the period covered by this report that has materially affected, or is reasonably likely to materially affect, the registrant’s internal control over financial reporting. |
Item 17. Disclosure of Securities Lending Activities for Closed-End Management Investment Companies
Not applicable.
Item 18. Recovery of Erroneously Awarded Compensation
Not applicable.
Item 19. Exhibits
Signatures
Pursuant to the requirements of the Securities Exchange Act of 1934 and the Investment Company Act of 1940, the registrant has duly caused this report to be signed on its behalf by the undersigned, thereunto duly authorized.
Eaton Vance Municipals Trust
| | |
| By: | | /s/ Kenneth A. Topping |
| | Kenneth A. Topping |
| | Principal Executive Officer |
| |
| Date: | | September 23, 2024 |
Pursuant to the requirements of the Securities Exchange Act of 1934 and the Investment Company Act of 1940, this report has been signed below by the following persons on behalf of the registrant and in the capacities and on the dates indicated.
| | |
| By: | | /s/ James F. Kirchner |
| | James F. Kirchner |
| | Principal Financial Officer |
| |
| Date: | | September 23, 2024 |
| |
| By: | | /s/ Kenneth A. Topping |
| | Kenneth A. Topping |
| | Principal Executive Officer |
| |
| Date: | | September 23, 2024 |