UNITED STATES
SECURITIES AND EXCHANGE COMMISSION
Washington, D.C. 20549
FORM N-CSR
CERTIFIED SHAREHOLDER REPORT OF REGISTERED
MANAGEMENT INVESTMENT COMPANIES
Investment Company Act file number 811-04447
Brandywine Fund, Inc.
(Exact name of registrant as specified in charter)
P.O. Box 4166
Greenville, DE 19807
(Address of principal executive offices) (Zip code)
William F. D’Alonzo
P.O. Box 4166
Greenville, Delaware 19807
(Name and address of agent for service)
(302) 656-3017
Registrant's telephone number, including area code:
Date of fiscal year end: September 30
Date of reporting period: March 31, 2013
Item 1. Reports to Stockholders.
| Managed by Friess Associates, LLC | Semi-Annual Report | March 31, 2013 |
Dear Fellow Shareholders:
The sort of sticky macro situations that not too long ago were likely to give the market pause did little to diminish enthusiasm for stocks in the March quarter. Encouraging economic data points kept investor spirits up, helping lift major indexes to record levels.
Brandywine Fund grew 10.78 percent in the March quarter, outpacing a 9.82 percent gain in the Russell 3000 Growth Index. The Russell 3000 Index gained 11.07 percent.
Brandywine Blue Fund grew 10.19 percent in the quarter versus a 9.54 percent gain in the Russell 1000 Growth Index. The Russell 1000 and S&P 500 Indexes gained 10.96 and 10.61 percent.
Relative strength outside of the growth category showed that, even though conditions were broadly positive, investors didn’t altogether throw caution to the wind. The strongest sectors in the quarter were among the most defensive and least economically sensitive, namely health care, consumer staples and utilities.
Domestically, there were lingering elements of the fiscal cliff. Within the European Union, there was an election outcome that raised questions about Italy’s commitment to austerity and a banking crisis in Cyprus that required a bailout. While those factors might have helped influence which companies outperformed, confidence in the sustainability of the U.S. recovery kept the general market mood solidly upbeat.
Continued improvements on the housing and jobs fronts were embraced as major positives given their roles as persistent economic impediments in recent years. The Federal Reserve’s stated commitment to an accommodative stance bolstered confidence that trends should continue moving in the right direction.
Every economic sector represented in the Brandywine Funds portfolios gained ground during the March quarter. The same pattern was evident in the Russell 3000 Growth and Russell 1000 Growth Indexes.
Reflecting the cautious component of the market’s March-quarter optimism, cyclical sectors posted more muted returns than most other sectors. Although the technology sector trailed most other sectors in the Brandywine portfolio, technology companies were the biggest contributors to the Fund’s relative performance versus the Russell 3000 Growth Index. Technology holdings comprised Brandywine’s largest percentage of assets and outperformed the technology sector within the index.
Brandywine Blue enjoyed a near-parallel experience with Brandywine, with technology holdings posting below-market returns yet representing the most significant contributors to relative results due to performance versus the sector within the Russell 1000 Growth Index. Technology holdings accounted for Brandywine Blue’s second largest position and represented an underweight position versus the index, which also aided results.
| Cumulative Total Return | | |
| Quarter | 10.78 | 10.19 |
| One Year | 1.09 | 0.45 |
| Five Years | -16.72 | -12.44 |
| Ten Years | 66.93 | 78.44 |
| Inception | 1161.96* | 644.26** |
| Annualized Total Return | | |
| Five Years | -3.59 | -2.62 |
| Ten Years | 5.26 | 5.96 |
| Inception | 9.75* | 9.45** |
| *12/30/85 **1/10/91 | | |
| Expense Ratio*** | | |
| Brandywine | 1.08% |
| Brandywine Blue | 1.23% |
| ***As stated in the Prospectus dated January 31, 2013 | | |
| | | |
Performance data quoted represent past performance; past performance does not guarantee future results. The investment return and principal value of an investment will fluctuate so that an investor’s shares, when redeemed, may be worth more or less than their original cost. Current performance of the Funds may be lower or higher than the performance quoted. Performance data current to the most recent month end may be obtained by visiting www.brandywinefunds.com. |
While technology-related contributors included holdings such as Marvell Technology Group Ltd. (Brandywine), Maxim Integrated Products Inc. (Brandywine Blue) and The Priceline Group (both Funds), something that wasn’t held due to a decision from a previous period notably contributed to performance advantages over benchmarks in the March quarter. Apple, which both Funds sold last year, was the biggest detractor from March-quarter performance in the Russell 3000 Growth and Russell 1000 Growth Indexes.
The health care sector, which posted the Russell 3000 Growth Index’s highest return, was a pronounced contributor to Brandywine’s results. The Fund’s holdings from the health care sector, which were modestly underweight versus the index, outperformed the sector within the benchmark.
Celgene Corp. was the biggest contributor to overall performance in both funds. Celgene, which grew December-quarter earnings 26 percent, gained ground on signs that its product portfolio could be poised to expand, reducing the company’s reliance on its core drug, the cancer treatment Revlimid. Celgene won approval for one drug and reported phase III trial results for two others during the March quarter.
Despite holding Celgene, health care was not a material influence on Brandywine Blue’s performance versus the Russell 1000 Growth Index. The financial sector was the Fund’s second biggest performance driver relative to the index. Holdings from the financial sector represented an overweight position relative to the index while outperforming the sector within the index. The Allstate Corp. (both Funds) and XL Group PLC (Brandywine Blue) rose as disciplined underwriting and policy pricing leverage enabled the insurers to exceed December-quarter earnings expectations in the wake of hurricane damage in the Northeast.
Industrial holdings were also noteworthy contributors for Brandywine. Industrial holdings outperformed the sector as a whole while being equally weighted compared with the Russell 3000 Growth Index. Air Lease Corp. (Brandywine), an aircraft leasing company, and Verisk Analytics Inc. (both Funds), which provides risk-related business intelligence technology and services, were standout performers. Air Lease and Verisk grew December-quarter earnings 58 and 26 percent, respectively, beating estimates in both instances.
The energy sector was a key contributor for Brandywine Blue. Energy holdings represented an overweight position versus the Russell 1000 Growth Index while outperforming the overall energy sector. Valero Energy, the second largest contributor to the Fund’s March-quarter return, was the sector’s primary performance driver. Valero earned $1.88 per share in the December quarter versus a year ago loss, topping the consensus estimate by 55 percent.
For more on holdings that influenced March-quarter performance, please see Roses & Thorns on page 4 for Brandywine and page 6 for Brandywine Blue.
We’re pleased to announce that, after sharing the title of Co-Chief Investment Officer with me since our initial announcement six months ago, Scott Gates becomes the Chief Investment Officer of Friess Associates at the start of the June quarter. Given his investment track record, work ethic and leadership skills, we’re thrilled Scott will oversee and inspire the Friess research team in the years to come. I look forward to continuing to work closely with Scott in my roles as Chief Executive Officer of Friess Associates and President of the Brandywine Funds.
We’re encouraged about the just-completed quarter and optimistic about the current climate as we move forward. The market got what has been its favorite macro reason to falter in recent years – uncertainty in Europe – and reached new highs. We’re seeing a greater focus on fundamentals, and we believe that bodes well for the rest of the year.
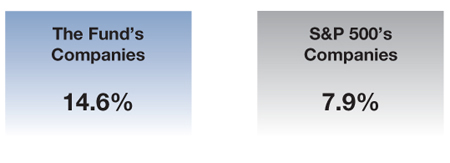
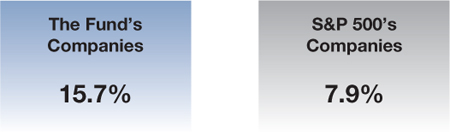
Based on consensus estimates, the average 2013 earnings growth rates for the companies held in Brandywine and Brandywine Blue are 14.6 and 15.7 percent, respectively. The average earnings growth rate for the companies in the S&P 500 Index is 7.9 percent.
We’re grateful for the opportunity to serve you. Thanks for your confidence in our earnings-driven investment approach and the team that implements it.
|  |
| Bill D’Alonzo | |
| Brandywine Funds President | April 5, 2013 |
| Capital Gains Update... |
| The Brandywine Funds finished the first half of their fiscal year in net loss positions mainly consisting of net loss carry-forwards from previous periods. The Funds will not make capital gains distributions, which are taxable events for shareholders in taxable accounts, until gains are realized in excess of accumulated net loss amounts. Please check upcoming reports for updates. |
Brandywine Fund
Portfolio Characteristics as of March 31, 2013
% Change in Top Ten Holdings From Book Cost
| 1. | Lennar Corp. | +10.0% | | 6. | | Marvell Technology Group Ltd. | +20.6% |
| 2. | Weyerhaeuser Co. | +14.3% | | 7. | | Wabtec Corp. | +79.6% |
| 3. | Qualcomm Inc. | +24.2% | | 8. | | Potlatch Corp. | +18.9% |
| 4. | Celgene Corp. | +122.2% | | 9. | | Vantiv Inc. | +29.3% |
| 5. | Priceline.com Inc. | +7.2% | | 10. | | Analog Devices Inc. | +5.0% |
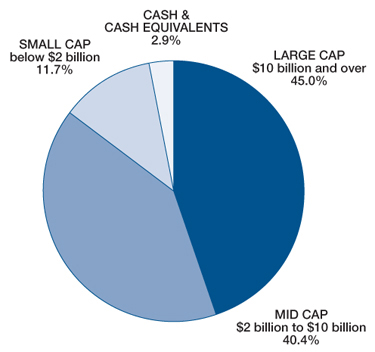
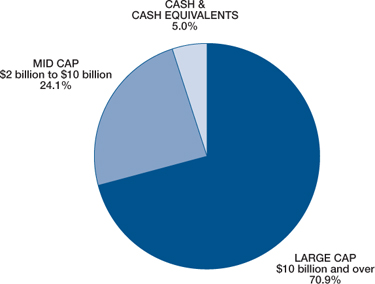
| Estimated Earnings Growth Rate | The Portfolio’s Market Capitalization |
| of the Fund’s Investments | |
| | |
 |  |
| |
| Forecasted Increase in Earnings Per Share |
| 2013 vs 2012 |
| |
| Source: Consensus estimates from FactSet Research Systems Inc. |
| |
This is not a forecast of the Fund’s future performance. Earnings growth for a Fund holding does not guarantee a corresponding increase in the market value of the holding or the Fund. As of March 31, 2013, the S&P 500 Index’s average annual total returns for 1, 5 and 10 years were 13.96, 5.81 and 8.53 percent. |
| |
| |
| |
| |
| | |
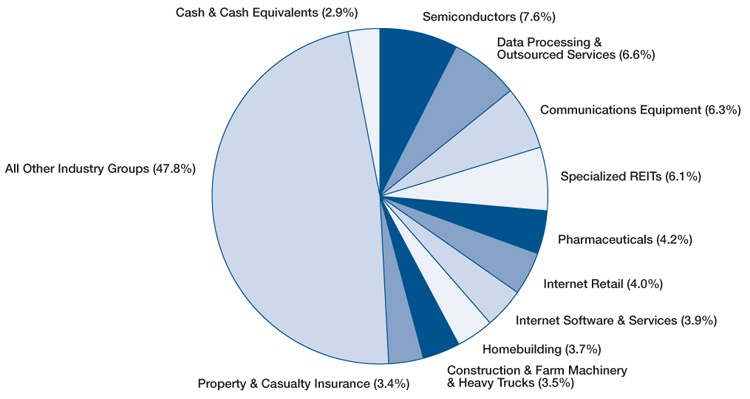
Top Ten Industry Groups
Brandywine Fund
March Quarter “Roses and Thorns”
| Biggest $ Winners | | % Gain | Reason for Move |
| Celgene Corp. | $ 10.2 | 45.9 | The biopharmaceutical manufacturer that develops treatments for cancer and immunological diseases grew December-quarter earnings 26 percent. Shares gained ground during the quarter as new products showed promise to reduce the company’s reliance on its cancer drug Revlimid. The Food and Drug Administration approved Pomalyst, a new oral treatment for patients with multiple myeloma that have resisted prior treatments. Celgene also announced positive phase III clinical trial results for Apremilist for use in treating psoriasis. |
Marvell Technology Group Ltd. | $4.2 | 20.5 | The semiconductor maker turned in better-than-expected January-quarter revenues and earnings as demand strengthened from its mobile, connectivity and storage customers. We believe the company stands to gain market share in its storage and mobile businesses through new sales related to solid state drives and design wins in the Chinese mobile market. A solid balance sheet has allowed Marvell to aggressively repurchase shares. |
| Air Lease Corp. | $4.0 | 33.2 | The provider of aircraft leasing services grew December-quarter earnings 58 percent, beating the consensus estimate. The company’s large order book reflects its ability to secure low-cost capital amid strong demand trends for new, fuel-efficient aircraft. The company’s planes are often used ahead of those owned in a given customer’s fleet, as they are frequently more fuel efficient and cost effective. |
Tempur-Pedic International Inc. | $ 3.9 | 30.0 | The manufacturer and distributor of viscoelastic mattresses and pillows topped December-quarter earnings estimates by 9 percent. Tempur-Pedic should benefit from its recent acquisition of coiled-spring mattress competitor Sealy, which is expected to add to earnings right away due to the company’s enhanced ability to offer a wider array of products to the domestic and international markets. |
Church & Dwight Co. Inc. | $3.5 | 19.7 | The maker of a broad range of consumer and specialty products under the Arm & Hammer brand name grew December-quarter earnings 8 percent and raised guidance for 2013. The company continued to leverage the success of its premium products, driving strong organic sales growth. Additionally, its acquisition of vitamin manufacturer Avid Health is expected to add growth as Avid incorporates Church & Dwight’s manufacturing and marketing expertise. |
| Biggest $ Losers | | % Loss | Reason for Move |
| InvenSense Inc. | $4.2 | 26.2 | The provider of micro-electromechanical gyroscopes for motion processing in consumer electronics grew December-quarter earnings 90 percent, beating the consensus estimate by 13 percent. Despite the strong results, shares declined as investors questioned the company’s competitive position after management struck a conservative tone regarding overall business conditions. |
| Ellie Mae Inc. | $3.4 | 24.3 | The electronic mortgage processor more than doubled December-quarter earnings, topping Wall Street estimates by 29 percent. Revenue increased 60 percent during the quarter. A shift in its business model from license fees to software-as-a-service has created earnings volatility while at the same time investors have expressed concerns that mortgage volumes would slow. We sold Ellie Mae during the quarter to fund an idea with greater near-term earnings visibility. |
Nuance Communications Inc. | $3.3 | 13.7 | The provider of voice-recognition solutions grew December-quarter sales 29 percent, but came up a penny short of the consensus earnings estimate. While Nuance should continue to benefit longer term as manufacturing customers incorporate more voice-enabled features in their products, shares fell after management lowered 2013 guidance to reflect near-term headwinds in health care and emerging markets. We sold Nuance during the quarter to fund an idea with better near-term earnings visibility. |
| Bob Evans Farms Inc. | $1.0 | 8.2 | The operator of family-style restaurants concentrated in the Midwest exceeded January-quarter earnings estimates. Investors expressed disappointment regarding the price the company received for its sale of Mimi’s restaurants. Additionally, supply chain changes made it more difficult to gauge profit-margin performance. We sold Bob Evans during the quarter to fund an idea with greater near-term earnings potential. |
United States Steel Corp. | $1.0 | 12.4 | The integrated steel producer beat the consensus earnings estimate in the December quarter as the market for hot rolled steel showed price and volume improvements. Still, shares fell when a competitor announced it would bring on additional steel supply next year. We sold United States Steel during the quarter to fund an idea with greater near-term earnings visibility. |
All gains/losses are calculated on an average cost basis from December 31, 2012 through March 31, 2013.
Brandywine Blue Fund
Portfolio Characteristics as of March 31, 2013
% Change in Top Ten Holdings From Book Cost
| 1. | Weyerhaeuser Co. | +12.7% | | 6. | | XL Group PLC | +48.4% |
| 2. | Qualcomm Inc. | +23.7% | | 7. | | Verisk Analytics Inc. | +27.5% |
| 3. | Lennar Corp. | +11.2% | | 8. | | Marsh & McLennan Cos. Inc. | +16.8% |
| 4. | The Allstate Corp. | +48.1% | | 9. | | VF Corp. | +6.4% |
| 5. | Comcast Corp. | +23.8% | | 10. | | Celgene Corp. | +123.4% |
| Estimated Earnings Growth Rate | The Portfolio’s Market Capitalization |
| of the Fund’s Investments | |
| | |
 |  |
| |
| Forecasted Increase in Earnings Per Share |
| 2013 vs 2012 |
| |
| Source: Consensus estimates from FactSet Research Systems Inc. |
| |
This is not a forecast of the Fund’s future performance. Earnings growth for a Fund holding does not guarantee a corresponding increase in the market value of the holding or the Fund. As of March 31, 2013, the S&P 500 Index’s average annual total returns for 1, 5 and 10 years were 13.96, 5.81 and 8.53 percent. |
| |
| | |
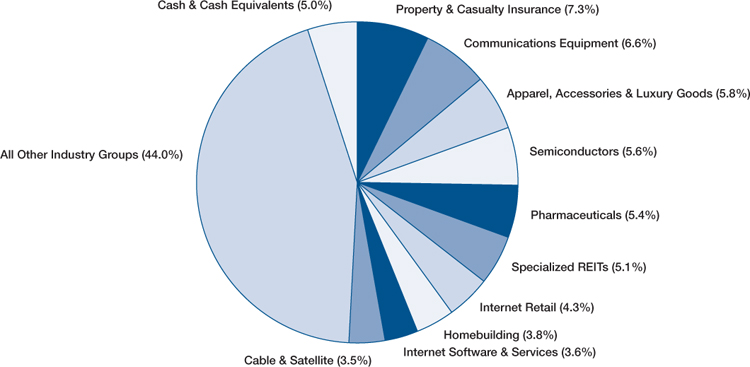
Top Ten Industry Groups
Brandywine Blue Fund
March Quarter “Roses and Thorns”
| Biggest $ Winners | | % Gain | Reason for Move |
| Celgene Corp. | $6.2 | 47.0 | The biopharmaceutical manufacturer that develops treatments for cancer and immunological diseases grew December-quarter earnings 26 percent. Shares gained ground during the quarter as new products showed promise to reduce the company’s reliance on its cancer drug Revlimid. The Food and Drug Administration approved Pomalyst, a new oral treatment for patients with multiple myeloma that have resisted prior treatments. Celgene also announced positive phase III clinical trial results for Apremilist for use in treating psoriasis. |
| Valero Energy Corp. | $4.3 | 22.7 | The largest independent refiner in the U.S. grew December-quarter earnings to $1.88 per share from a loss of $0.21 a year ago, topping estimates by 55 percent. Valero benefitted from its capacity to process cheaper heavy crude oil as structural changes from new pipeline projects provide Gulf of Mexico refiners like Valero greater access to domestic oil sources. We sold Valero at an overall gain during the quarter. |
| The Allstate Corp. | $3.5 | 22.1 | The property and casualty insurer beat the per-share, December-quarter consensus earnings estimate by $0.64. Premium growth and related profit margin improvement in the company’s personal property line helped offset losses related to Hurricane Sandy damage. The company’s conservative approach to homeowner underwriting helped its bottom line while firming housing prices and better economic conditions supported policy price increases. |
| XL Group PLC | $3.1 | 20.9 | The global provider of insurance and reinsurance grew December-quarter earnings to $0.13 per share from a loss of $0.25 a year ago, beating estimates. Shares traded higher as the company experienced broad-based improvement in property and casualty rates. Better-than-expected loss ratios also helped enhance profitability. |
| Verisk Analytics Inc. | $3.0 | 20.8 | The provider of risk-related data and software information services to the property, casualty, health care and mortgage industries grew December-quarter earnings 26 percent, beating estimates by 16 percent. Revenue grew 18 percent, driven by a 29 percent increase in organic growth for the company’s health care segment. Verisk’s recent acquisition of Argus added to sales in the financial services category. |
| Biggest $ Losers | | % Loss | Reason for Move |
Nuance Communications Inc. | $2.3 | 14.9 | The provider of voice-recognition solutions grew December-quarter sales 29 percent, but came up a penny short of the consensus earnings estimate. While Nuance should continue to benefit longer term as manufacturing customers incorporate more voice-enabled features in their products, shares fell after management lowered 2013 guidance to reflect near-term headwinds in health care and emerging markets. We sold Nuance during the quarter to fund an idea with better near-term earnings visibility. |
Michael Kors Holdings Ltd. | $1.1 | 7.8 | The luxury lifestyle brand grew December-quarter earnings 129 percent to $0.64 per share, beating estimates. Revenue increased 70 percent to $637 million, well above Wall Street’s forecast for $540 million. Despite the strong results, shares traded lower following the company’s secondary offering. Based on our research, we expect continued strong same-store sales and new growth associated with an expanding store base. |
| Limited Brands Inc. | $0.7 | 5.2 | The owner of mall-based retail chains, including Victoria’s Secret, Bath and Body Works, and Express, grew January-quarter earnings 17 percent, topping estimates. Sales grew 10 percent during the quarter. Shares traded lower as same-store sales during the month of December were lower than expected at Victoria’s Secret. We sold Limited during the quarter to fund an idea with better near-term earnings potential. |
| The Mosaic Co. | $0.5 | 3.3 | The producer of concentrated phosphate and potash crop fertilizers grew February-quarter earnings 38 percent, beating estimates. Performance was driven by higher-than-forecast volumes, causing some investors to express concern that pricing was being sacrificed. We expect Mosaic to benefit from strengthening emerging market demand and from the expiration of a tolling agreement, which should contribute to more profitable potash sales. |
| Joy Global Inc. | $0.4 | 3.4 | The manufacturer of mining equipment beat earnings estimates by 18 percent in the January quarter. While Joy Global appears to be solidly positioned to benefit from increasing global demand for commodities, shares traded lower on concerns related to slowing demand from China and continued weakness in U.S. coal markets. Risk we perceived through negative trade checks from coal mining customers prompted us to sell Joy Global during the quarter. |
All gains/losses are calculated on an average cost basis from December 31, 2012 through March 31, 2013.
Brandywine Fund, Inc.
Statement of Assets and Liabilities
March 31, 2013 (Unaudited)
| Assets: | | | |
| Investments in securities, at value (cost $727,603,300) | | $ | 833,628,623 | |
| Receivable from investments sold | | | 21,104,438 | |
| Dividends receivable | | | 295,079 | |
| Prepaid expenses | | | 38,452 | |
| Receivable from shareholders for purchases | | | 18,974 | |
| Cash | | | 417 | |
| Total assets | | $ | 855,085,983 | |
| | | | | |
| Liabilities: | | | | |
| Payable for investments purchased | | $ | 15,029,628 | |
| Payable to shareholders for redemptions | | | 1,657,831 | |
| Other liabilities | | | 158,380 | |
| Total liabilities | | | 16,845,839 | |
| | | | | |
| Net Assets: | | | | |
| Capital Stock, $0.01 par value; 500,000,000 shares authorized; 32,241,358 shares outstanding | | | 1,584,503,058 | |
| Net unrealized appreciation on investments | | | 106,025,323 | |
| Accumulated net realized loss on investments | | | (852,696,710 | ) |
| Undistributed net investment income | | | 408,473 | |
| Net assets | | | 838,240,144 | |
| Total liabilities and net assets | | $ | 855,085,983 | |
| | | | | |
| Calculation of net asset value per share: | | | | |
Net asset value, offering and redemption price per share ($838,240,144 ÷ 32,241,358 shares outstanding) | | $ | 26.00 | |
The accompanying notes to financial statements are an integral part of this statement.
Schedule of Investments
March 31, 2013 (Unaudited)
| Shares | | | | Cost | | | Value | |
| | | | | | | |
| Long-Term Investments - 97.1% (a) | | | | | | |
| Common Stocks - 91.0% (a) | | | | | | |
| | | | | | | | | |
| CONSUMER DISCRETIONARY | | | | | | |
| | | | | | | | | |
| | | Apparel Retail - 1.3% | | | | | | |
| | 181,200 | | Genesco Inc.* | | $ | 11,294,516 | | | $ | 10,888,308 | |
| | | | | | | | | | | | |
| | | | Apparel, Accessories & Luxury Goods - 2.2% | | | | | | | | |
| | 110,100 | | VF Corp. | | | 16,698,697 | | | | 18,469,275 | |
| | | | | | | | | | | | |
| | | | Automotive Retail - 0.9% | | | | | | | | |
| | 70,300 | | Asbury Automotive Group Inc.* | | | 2,612,216 | | | | 2,579,307 | |
| | 11,720 | | AutoZone Inc.* | | | 4,611,278 | | | | 4,650,144 | |
| | | | | | | | | | | | |
| | | | Cable & Satellite - 1.1% | | | | | | | | |
| | 214,200 | | Comcast Corp. | | | 8,683,596 | | | | 8,998,542 | |
| | | | | | | | | | | | |
| | | | Department Stores - 1.4% | | | | | | | | |
| | 280,700 | | Macy’s Inc. | | | 11,496,996 | | | | 11,744,488 | |
| | | | | | | | | | | | |
| | | | General Merchandise Stores - 0.8% | | | | | | | | |
| | 145,800 | | Dollar Tree Inc.* | | | 6,951,036 | | | | 7,061,094 | |
| | | | | | | | | | | | |
| | | | Home Furnishing - 2.0% | | | | | | | | |
| | 343,800 | | Tempur-Pedic International Inc.* | | | 13,125,852 | | | | 17,062,794 | |
| | | | | | | | | | | | |
| | | | Home Furnishing Retail - 1.5% | | | | | | | | |
| | 560,700 | | Pier 1 Imports Inc. | | | 11,207,681 | | | | 12,896,100 | |
| | | | | | | | | | | | |
| | | | Homebuilding - 3.7% | | | | | | | | |
| | 711,200 | | Lennar Corp. | | | 26,810,345 | | | | 29,500,576 | |
| | 46,000 | | The Ryland Group Inc. | | | 1,610,375 | | | | 1,914,520 | |
| | | | | | | | | | | | |
| | | | Housewares & Specialties - 1.5% | | | | | | | | |
| | 284,500 | | Jarden Corp.* | | | 12,004,374 | | | | 12,190,825 | |
| | | | | | | | | | | | |
| | | | Internet Retail - 4.0% | | | | | | | | |
| | 35,770 | | Priceline.com Inc.* | | | 22,944,686 | | | | 24,607,256 | |
| | 175,400 | | TripAdvisor Inc.* | | | 8,344,745 | | | | 9,212,008 | |
| | | | | | | | | | | | |
| | | | Motorcycle Manufacturers - 0.9% | | | | | | | | |
| | 135,100 | | Harley-Davidson Inc. | | | 7,311,143 | | | | 7,200,830 | |
| | | | | | | | | | | | |
| | | | Restaurants - 1.4% | | | | | | | | |
| | 211,400 | | Starbucks Corp. | | | 10,508,534 | | | | 12,041,344 | |
| | | | Total Consumer Discretionary | | | 176,216,070 | | | | 191,017,411 | |
| | | | | | | | | | | | |
| | | | This sector is 8.4% above your Fund’s cost. | | | | | | | | |
| | | | | | | | | |
| CONSUMER STAPLES | | | | | | | | |
| | | | | | | | | | | | |
| | | | Household Products - 2.4% | | | | | | | | |
| | 311,700 | | Church & Dwight Co. Inc. | | | 12,304,899 | | | | 20,145,171 | |
| | | | Total Consumer Staples | | | 12,304,899 | | | | 20,145,171 | |
| | | | | | | | | | | | |
| | | | This sector is 63.7% above your Fund’s cost. | | | | | | | | |

Brandywine Fund, Inc.
Schedule of Investments (Continued)
March 31, 2013 (Unaudited)
| Shares | | | | Cost | | | Value | |
| | | | | | | |
| Long-Term Investments - 97.1% (a) (Continued) | | | | | | |
| Common Stocks - 91.0% (a) (Continued) | | | | | | |
| | | | | | | | | |
| ENERGY | | | | | | |
| | | | | | | | | |
| | | Oil & Gas Equipment & Services - 1.8% | | | | | | |
| | 231,600 | | Oceaneering International Inc. | | $ | 12,509,530 | | | $ | 15,380,556 | |
| | | | | | | | | | | | |
| | | | Oil & Gas Exploration & Production - 0.7% | | | | | | | | |
| | 652,100 | | Kodiak Oil & Gas Corp.* | | | 6,099,398 | | | | 5,927,589 | |
| | | | Total Energy | | | 18,608,928 | | | | 21,308,145 | |
| | | | | | | | | | | | |
| | | | This sector is 14.5% above your Fund’s cost. | | | | | | | | |
| | | | | | | | | |
| FINANCIALS | | | | | | | | |
| | | | | | | | | | | | |
| | | | Property & Casualty Insurance - 3.4% | | | | | | | | |
| | 385,100 | | The Allstate Corp. | | | 12,901,126 | | | | 18,896,857 | |
| | 363,100 | | First American Financial Corp. | | | 8,561,267 | | | | 9,284,467 | |
| | | | Total Financials | | | 21,462,393 | | | | 28,181,324 | |
| | | | | | | | | | | | |
| | | | This sector is 31.3% above your Fund’s cost. | | | | | | | | |
| | | | | | | | | |
| HEALTH CARE | | | | | | | | |
| | | | | | | | | | | | |
| | | | Biotechnology - 3.1% | | | | | | | | |
| | 220,600 | | Celgene Corp.* | | | 11,506,685 | | | | 25,569,746 | |
| | | | | | | | | | | | |
| | | | Life Sciences Tools & Services - 0.9% | | | | | | | | |
| | 239,300 | | ICON PLC - SP-ADR* | | | 5,459,636 | | | | 7,726,997 | |
| | | | | | | | | | | | |
| | | | Pharmaceuticals - 4.2% | | | | | | | | |
| | 175,100 | | Actavis Inc.* | | | 12,997,027 | | | | 16,128,461 | |
| | 499,900 | | Forest Laboratories Inc.* | | | 18,729,164 | | | | 19,016,196 | |
| | | | Total Health Care | | | 48,692,512 | | | | 68,441,400 | |
| | | | | | | | | | | | |
| | | | This sector is 40.6% above your Fund’s cost. | | | | | | | | |
| | | | | | | | | |
| INDUSTRIALS | | | | | | | | |
| | | | | | | | | | | | |
| | | | Construction & Engineering - 2.9% | | | | | | | | |
| | 362,200 | | MasTec Inc.* | | | 10,313,613 | | | | 10,558,130 | |
| | 476,200 | | Quanta Services Inc.* | | | 13,735,757 | | | | 13,609,796 | |
| | | | | | | | | | | | |
| | | | Construction & Farm Machinery & Heavy Trucks - 3.5% | | | | | | | | |
| | 120,300 | | Oshkosh Corp.* | | | 5,004,647 | | | | 5,111,547 | |
| | 237,300 | | Wabtec Corp. | | | 13,494,185 | | | | 24,230,703 | |
| | | | | | | | | | | | |
| | | | Electrical Components & Equipment - 2.3% | | | | | | | | |
| | 307,800 | | Eaton Corp. PLC | | | 19,190,778 | | | | 18,852,750 | |
| | | | | | | | | | | | |
| | | | Environmental & Facilities Services - 1.1% | | | | | | | | |
| | 296,496 | | Tetra Tech Inc.* | | | 6,483,845 | | | | 9,040,163 | |
| | | | | | | | | | | | |
| | | | Human Resource & Employment Services - 1.3% | | | | | | | | |
| | 161,300 | | Korn/Ferry International* | | | 2,947,958 | | | | 2,880,818 | |
| | 216,600 | | Robert Half International Inc. | | | 5,822,862 | | | | 8,128,998 | |
| | | | | | | | | | | | |
| | | | Industrial Conglomerates - 0.9% | | | | | | | | |
| | 109,200 | | Carlisle Cos. Inc. | | | 7,344,337 | | | | 7,402,668 | |
| | | | | | | | | | | | |
| | | | Research & Consulting Services - 2.3% | | | | | | | | |
| | 307,085 | | Verisk Analytics Inc.* | | | 14,824,280 | | | | 18,925,649 | |
| | | | | | | | | | | | |
| | | | Trading Companies & Distributors - 2.9% | | | | | | | | |
| | 532,300 | | Air Lease Corp. | | | 10,814,445 | | | | 15,607,036 | |
| | 272,200 | | MRC Global Inc.* | | | 8,098,762 | | | | 8,963,546 | |
| | | | | | | | | | | | |
| | | | Trucking - 1.1% | | | | | | | | |
| | 401,400 | | Hertz Global Holdings Inc.* | | | 7,826,821 | | | | 8,935,164 | |
| | | | Total Industrials | | | 125,902,290 | | | | 152,246,968 | |
| | | | | | | | | | | | |
| | | | This sector is 20.9% above your Fund’s cost. | | | | | | | | |
| | | | | | | | | |
| INFORMATION TECHNOLOGY | | | | | | | | |
| | | | | | | | | | | | |
| | | | Application Software - 2.7% | | | | | | | | |
| | 175,000 | | Autodesk Inc.* | | | 6,823,769 | | | | 7,217,000 | |
| | 453,300 | | Informatica Corp.* | | | 13,973,326 | | | | 15,625,251 | |
| | | | | | | | | | | | |
| | | | Communications Equipment - 6.3% | | | | | | | | |
| | 984,900 | | Cisco Systems Inc. | | | 20,814,208 | | | | 20,594,259 | |
| | 131,700 | | Plantronics Inc. | | | 4,877,072 | | | | 5,819,823 | |
| | 394,000 | | Qualcomm Inc. | | | 21,233,055 | | | | 26,378,300 | |
| | | | | | | | | | | | |
| | | | Computer Storage & Peripherals - 2.2% | | | | | | | | |
| | 296,000 | | NetApp Inc.* | | | 10,095,234 | | | | 10,111,360 | |
| | 193,895 | | Synaptics Inc.* | | | 7,529,567 | | | | 7,889,588 | |
| | | | | | | | | | | | |
| | | | Data Processing & Outsourced Services - 6.6% | | | | | | | | |
| | 293,300 | | Global Payments Inc. | | | 14,644,320 | | | | 14,565,278 | |
| | 924,000 | | Vantiv Inc.* | | | 16,969,589 | | | | 21,935,760 | |
| | 110,000 | | Visa Inc. | | | 12,754,685 | | | | 18,682,400 | |
| | | | | | | | | | | | |
| | | | Electronic Components - 1.4% | | | | | | | | |
| | 1,125,400 | | InvenSense Inc.* | | | 16,275,992 | | | | 12,019,272 | |
| | | | | | | | | | | | |
| | | | Internet Software & Services - 3.9% | | | | | | | | |
| | 400,800 | | Blucora Inc.* | | | 6,269,097 | | | | 6,204,384 | |
| | 182,100 | | eBay Inc.* | | | 9,339,212 | | | | 9,873,462 | |
| | 12,805 | | Google Inc.* | | | 9,575,316 | | | | 10,167,554 | |
| | 204,500 | | Trulia Inc.* | | | 6,290,771 | | | | 6,417,210 | |
| | | | | | | | | | | | |
| | | | Semiconductors - 7.6% | | | | | | | | |
| | 458,810 | | Analog Devices Inc. | | | 20,318,646 | | | | 21,330,077 | |
| | 2,321,800 | | Marvell Technology Group Ltd. | | | 20,372,571 | | | | 24,564,644 | |
| | 2,176,600 | | ON Semiconductor Corp.* | | | 17,704,565 | | | | 18,022,248 | |
| | | | Total Information Technology | | | 235,860,995 | | | | 257,417,870 | |
| | | | | | | | | | | | |
| | | | This sector is 9.1% above your Fund’s cost. | | | | | | | | |
| | | | | | | | | |
| MATERIALS | | | | | | | | |
| | | | | | | | | | | | |
| | | | Fertilizers & Agricultural Chemicals - 2.5% | | | | | | | | |
| | 357,400 | | The Mosaic Co. | | | 22,003,608 | | | | 21,304,614 | |
| | | | | | | | | | | | |
| | | | Forest Products - 0.3% | | | | | | | | |
| | 34,800 | | Deltic Timber Corp. | | | 2,363,298 | | | | 2,391,456 | |
| | | | Total Materials | | | 24,366,906 | | | | 23,696,070 | |
| | | | | | | | | | | | |
| | | | This sector is 2.8% below your Fund’s cost. | | | | | | | | |
| | | | | | | | | | | | |
| | | | Total common stocks | | | 663,414,993 | | | | 762,454,359 | |

Brandywine Fund, Inc.
Schedule of Investments (Continued)
March 31, 2013 (Unaudited)
| Shares | | | | Cost | | | Value | |
| | | | | | | |
| Long-Term Investments - 97.1% (a) (Continued) | | | | | | |
| REITs - 6.1% (a) | | | | | | |
| | | | | | | | | |
| FINANCIALS | | | | | | |
| | | Specialized REITs - 6.1% | | | | | | |
| | 44,000 | | Plum Creek Timber Co. Inc. | | $ | 2,186,688 | | | $ | 2,296,800 | |
| | 479,000 | | Potlatch Corp. | | | 18,469,776 | | | | 21,966,940 | |
| | 859,800 | | Weyerhaeuser Co. | | | 23,601,843 | | | | 26,980,524 | |
| | | | Total Financials | | | 44,258,307 | | | | 51,244,264 | |
| | | | | | | | | | | | |
| | | | This sector is 15.8% above your Fund’s cost. | | | | | | | | |
| | | | | | | | | | | | |
| | | | Total REITs | | | 44,258,307 | | | | 51,244,264 | |
| | | | | | | | | | | | |
| | | | Total long-term investments | | | 707,673,300 | | | | 813,698,623 | |
| | | | | | | | | | | | |
| Principal | | | | | | | | | | |
| Amount | | | | | | | | |
| | | | | | | | | |
| Short-Term Investment - 2.4% (a) | | | | | | | | |
| | | | | | | | | | | | |
| | | | Commercial Paper - 2.4% | | | | | | | | |
| $ | 19,930,000 | | Prudential Funding LLC, | | | | | | | | |
| | | | due 04/01/13, | | | | | | | | |
| | | | discount of 0.10% | | | 19,930,000 | | | | 19,930,000 | |
| | | | Total short-term investments | | | 19,930,000 | | | | 19,930,000 | |
| | | | Total investments - 99.5% | | $ | 727,603,300 | | | | 833,628,623 | |
| | | | Cash and receivables | | | | | | | | |
| | | | less liabilities - 0.5% (a) | | | | | | | 4,611,521 | |
| | | | TOTAL NET ASSETS - 100.0% | | | | | | $ | 838,240,144 | |
(a) Percentages for the various classifications relate to net assets.
* Non-dividend paying security.
SP-ADR - Sponsored American Depositary Receipt
The accompanying notes to financial statements are an integral part of this schedule.
Statement of Operations
For the Six Months Ended March 31, 2013 (Unaudited)
| Income: | | | |
| Dividends | | $ | 6,581,472 | |
| Interest | | | 11,481 | |
| Total income | | | 6,592,953 | |
| | | | | |
| Expenses: | | | | |
| Management fees | | | 4,567,265 | |
| Transfer agent fees | | | 236,882 | |
| Printing and postage expense | | | 69,184 | |
| Board of Directors fees and expenses | | | 62,644 | |
| Administrative and accounting services | | | 53,074 | |
| Professional fees | | | 47,558 | |
| Custodian fees | | | 43,390 | |
| Insurance expense | | | 18,819 | |
| Registration fees | | | 18,220 | |
| Other expenses | | | 5,266 | |
| Total expenses | | | 5,122,302 | |
| Net Investment Income | | | 1,470,651 | |
| Net Realized Gain on Investments | | | 80,126,455 | |
| Net Decrease in Unrealized Appreciation on Investments | | | (43,301,810 | ) |
| Net Gain on Investments | | | 36,824,645 | |
| Net Increase in Net Assets Resulting From Operations | | $ | 38,295,296 | |
The accompanying notes to financial statements are an integral part of this statement.
Brandywine Fund, Inc.
Statements of Changes in Net Assets
For the Six Months Ended March 31, 2013 (Unaudited)
and for the Year Ended September 30, 2012
| | | 2013 | | | 2012 | |
| Operations: | | | | | | |
| Net investment income (loss) | | $ | 1,470,651 | | | $ | (2,773,297 | ) |
| Net realized gain (loss) on investments | | | 80,126,455 | | | | (56,163,510 | ) |
| Net (decrease) increase in unrealized appreciation on investments | | | (43,301,810 | ) | | | 242,170,921 | |
| Net increase in net assets resulting from operations | | | 38,295,296 | | | | 183,234,114 | |
| | | | | | | | | |
| Fund Share Activities: | | | | | | | | |
| Proceeds from shares issued (287,262 and 2,238,021 shares, respectively) | | | 6,868,025 | | | | 53,827,129 | |
| Cost of shares redeemed (11,211,757 and 21,603,021 shares, respectively) | | | (269,466,928 | ) | | | (511,388,432 | ) |
| Net decrease in net assets derived from Fund share activities | | | (262,598,903 | ) | | | (457,561,303 | ) |
| Total Decrease | | | (224,303,607 | ) | | | (274,327,189 | ) |
| | | | | | | | | |
| Net Assets at the Beginning of the Period | | | 1,062,543,751 | | | | 1,336,870,940 | |
| Net Assets at the End of the Period | | $ | 838,240,144 | | | $ | 1,062,543,751 | |
| (Includes undistributed net investment income of $408,473 and $0, respectively) | | | | | | | | |
Financial Highlights
(Selected data for each share of the Fund outstanding throughout each period)
| | | For the Six Months | | | | | | | | | | | | | | | | |
| | | Ended March 31, 2013 | | | Years Ended September 30, | |
| | | (Unaudited) | | | 2012 | | | 2011 | | | 2010 | | | 2009 | | | 2008 | |
| PER SHARE OPERATING PERFORMANCE: | | | | | | | | | | | | | | | | | | |
| Net asset value, beginning of period | | $ | 24.62 | | | $ | 21.38 | | | $ | 22.02 | | | $ | 21.11 | | | $ | 26.86 | | | $ | 40.98 | |
| | | | | | | | | | | | | | | | | | | | | | | | | |
| Income from investment operations: | | | | | | | | | | | | | | | | | | | | | | | | |
Net investment income (loss)(1) | | | 0.04 | | | | (0.05 | ) | | | (0.09 | ) | | | (0.07 | ) | | | (0.05 | ) | | | (0.18 | ) |
| Net realized and unrealized gains (losses) | | | | | | | | | | | | | | | | | | | | | | | | |
| on investments | | | 1.34 | | | | 3.29 | | | | (0.55 | ) | | | 0.98 | | | | (5.59 | ) | | | (8.72 | ) |
| Total from investment operations | | | 1.38 | | | | 3.24 | | | | (0.64 | ) | | | 0.91 | | | | (5.64 | ) | | | (8.90 | ) |
| | | | | | | | | | | | | | | | | | | | | | | | | |
| Less distributions: | | | | | | | | | | | | | | | | | | | | | | | | |
| Distributions from net investment income | | | — | | | | — | | | | — | | | | — | | | | — | | | | — | |
| Distributions from net realized gains | | | — | | | | — | | | | — | | | | — | | | | (0.11 | ) | | | (5.22 | ) |
| Total from distributions | | | — | | | | — | | | | — | | | | — | | | | (0.11 | ) | | | (5.22 | ) |
| Net asset value, end of period | | $ | 26.00 | | | $ | 24.62 | | | $ | 21.38 | | | $ | 22.02 | | | $ | 21.11 | | | $ | 26.86 | |
| TOTAL RETURN | | | 5.61 | %(a) | | | 15.15 | % | | | (2.91 | %) | | | 4.31 | % | | | (20.98 | %) | | | (25.16 | %) |
| | | | | | | | | | | | | | | | | | | | | | | | | |
| RATIOS/SUPPLEMENTAL DATA: | | | | | | | | | | | | | | | | | | | | | | | | |
| Net assets, end of period (in 000’s $) | | | 838,240 | | | | 1,062,544 | | | | 1,336,871 | | | | 1,755,754 | | | | 2,281,681 | | | | 3,421,787 | |
| Ratio of expenses to average net assets | | | 1.12 | %(b) * | | | 1.08 | % | | | 1.09 | % | | | 1.11 | % | | | 1.10 | % | | | 1.08 | % |
| Ratio of net investment income (loss) | | | | | | | | | | | | | | | | | | | | | | | | |
| to average net assets | | | 0.32 | %(b) | | | (0.23 | %) | | | (0.36 | %) | | | (0.33 | %) | | | (0.25 | %) | | | (0.54 | %) |
| Portfolio turnover rate | | | 120 | %(a) | | | 256 | % | | | 234 | % | | | 225 | % | | | 239 | % | | | 210 | % |
| (1) | Net investment income (loss) per share was calculated using average shares outstanding. |
| (a) | Not Annualized. |
| (b) | Annualized. |
| * | Interest expense is less than 0.005% of average net assets. |
The accompanying notes to financial statements are an integral part of these statements.
| Definitions and Disclosures |
| Must be preceded or accompanied by a prospectus. Please refer to the prospectus for important information about the investment company, including investment objectives, risks, charges and expenses. |
| Past performance is not a guarantee of future results. |
| Mutual fund investing involves risk. Principal loss is possible. The Funds invest in mid-cap companies, which involve additional risks such as limited liquidity and greater volatility. Investments in foreign securities, even though publicly traded in the United States, may involve risks which are in addition to those inherent in domestic investments. Current and future portfolio holdings are subject to risk. |
| Fund holdings and sector weightings are subject to change at any time and are not recommendations to buy or sell any securities. Securities discussed were not held by the Funds as of March 31, 2013, unless listed in the accompanying schedules of investments. Book Value is the net asset value of a company, calculated by subtracting total liabilities from total assets. Earnings growth rates quoted for the Funds refer solely to the estimated earnings growth rates of the average investment holding of the Funds based on consensus estimates from Baseline Financial Services, Inc. (Baseline) and not to the actual performance of the Funds themselves. Baseline provides analytical information and services to the investment community. |
| The Russell 1000, Russell 1000 Growth, Russell 3000, Russell 3000 Growth and S&P 500 Indexes are unmanaged indexes commonly used to measure the performance of U.S. stocks. You cannot invest directly in an index. As of March 31, 2013, the Russell 1000 Index’s average annual total returns for 1, 5 and 10 years were 14.43, 6.15 and 8.97 percent; the Russell 1000 Growth Index’s were 10.09, 7.30 and 8.62 percent; the Russell 3000 Index’s were 14.56, 6.32 and 9.15 percent; the Russell 3000 Growth Index’s were 10.42, 7.44 and 8.84 percent; and the S&P 500 Index’s were 13.96, 5.81 and 8.53 percent. |
Brandywine Blue Fund
Statement of Assets and Liabilities
March 31, 2013 (Unaudited)
| Assets: | | | |
| Investments in securities, at value (cost $419,725,629) | | $ | 477,593,644 | |
| Receivable from investments sold | | | 15,961,214 | |
| Dividends receivable | | | 322,118 | |
| Receivable from shareholders for purchases | | | 244,813 | |
| Prepaid expenses | | | 32,885 | |
| Cash | | | 369 | |
| Total assets | | $ | 494,155,043 | |
| | | | | |
| Liabilities: | | | | |
| Payable for investments purchased | | $ | 8,097,308 | |
| Payable to shareholders for redemptions | | | 913,072 | |
| Other liabilities | | | 126,643 | |
| Total liabilities | | | 9,137,023 | |
| | | | | |
| Net Assets: | | | | |
| Capital Stock, $0.01 par value; 500,000,000 shares authorized; 17,936,161 shares outstanding | | | 1,544,371,094 | |
| Net unrealized appreciation on investments | | | 57,868,015 | |
| Accumulated net realized loss on investments | | | (1,116,528,197 | ) |
| Undistributed net investment loss | | | (692,892 | ) |
| Net assets | | | 485,018,020 | |
| Total liabilities and net assets | | $ | 494,155,043 | |
| | | | | |
| Calculation of net asset value per share: | | | | |
Net asset value, offering and redemption price per share ($485,018,020 ÷ 17,936,161 shares outstanding) | | $ | 27.04 | |
The accompanying notes to financial statements are an integral part of this statement.
Brandywine Blue Fund
Schedule of Investments
March 31, 2013 (Unaudited)
| Shares | | | | Cost | | | Value | |
| | | | | | | |
| Long-Term Investments - 95.0% (a) | | | | | | |
| Common Stocks - 89.9% (a) | | | | | | |
| | | | | | | |
| CONSUMER DISCRETIONARY | | | | | | |
| | | | | | | | | |
| | | Apparel, Accessories & Luxury Goods - 5.8% | | | | | | |
| | 224,400 | | Michael Kors Holdings Ltd.* | | $ | 13,800,600 | | | $ | 12,743,676 | |
| | 92,250 | | VF Corp. | | | 14,541,619 | | | | 15,474,938 | |
| | | | | | | | | | | | |
| | | | Automobile Manufacturers - 1.2% | | | | | | | | |
| | 158,300 | | Honda Motor Co. Ltd. SP-ADR | | | 5,510,952 | | | | 6,056,558 | |
| | | | | | | | | | | | |
| | | | Automotive Retail - 1.4% | | | | | | | | |
| | 17,010 | | AutoZone Inc.* | | | 6,665,353 | | | | 6,749,058 | |
| | | | | | | | | | | | |
| | | | Cable & Satellite - 3.5% | | | | | | | | |
| | 399,500 | | Comcast Corp. | | | 13,553,541 | | | | 16,782,995 | |
| | | | | | | | | | | | |
| | | | Department Stores - 2.1% | | | | | | | | |
| | 247,700 | | Macy’s Inc. | | | 10,140,011 | | | | 10,363,768 | |
| | | | | | | | | | | | |
| | | | General Merchandise Stores - 1.4% | | | | | | | | |
| | 138,900 | | Dollar Tree Inc.* | | | 6,634,022 | | | | 6,726,927 | |
| | | | | | | | | | | | |
| | | | Homebuilding - 3.8% | | | | | | | | |
| | 449,500 | | Lennar Corp. | | | 16,764,317 | | | | 18,645,259 | |
| | | | | | | | | | | | |
| | | | Internet Retail - 4.3% | | | | | | | | |
| | 19,870 | | Priceline.com Inc.* | | | 12,998,580 | | | | 13,669,169 | |
| | 138,200 | | TripAdvisor Inc.* | | | 6,415,249 | | | | 7,258,264 | |
| | | | | | | | | | | | |
| | | | Motorcycle Manufacturers - 2.2% | | | | | | | | |
| | 202,600 | | Harley-Davidson Inc. | | | 10,903,151 | | | | 10,798,580 | |
| | | | | | | | | | | | |
| | | | Restaurants - 2.7% | | | | | | | | |
| | 232,500 | | Starbucks Corp. | | | 11,576,954 | | | | 13,243,200 | |
| | | | Total Consumer Discretionary | | | 129,504,349 | | | | 138,512,392 | |
| | | | | | | | | | | | |
| | | | This sector is 7.0% above your Fund’s cost. | | | | | | | | |
| | | | | | | | | |
| CONSUMER STAPLES | | | | | | | | |
| | | | | | | | | | | | |
| | | | Household Products - 2.7% | | | | | | | | |
| | 201,000 | | Church & Dwight Co. Inc. | | | 9,965,581 | | | | 12,990,630 | |
| | | | Total Consumer Staples | | | 9,965,581 | | | | 12,990,630 | |
| | | | | | | | | | | | |
| | | | This sector is 30.4% above your Fund’s cost. | | | | | | | | |
| | | | | | | | | |
| ENERGY | | | | | | | | |
| | | | | | | | | | | | |
| | | | Oil & Gas Equipment & Services - 2.8% | | | | | | | | |
| | 202,700 | | Oceaneering International Inc. | | | 10,967,745 | | | | 13,461,307 | |
| | | | Total Energy | | | 10,967,745 | | | | 13,461,307 | |
| | | | | | | | | | | | |
| | | | This sector is 22.7% above your Fund’s cost. | | | | | | | | |
| | | | | | | | | |
| FINANCIALS | | | | | | | | |
| | | | | | | | | | | | |
| | | | Insurance Brokers - 3.3% | | | | | | | | |
| | 417,000 | | Marsh & McLennan Cos. Inc. | | | 13,553,162 | | | | 15,833,490 | |
| | | | | | | | | | | | |
| | | | Property & Casualty Insurance - 7.3% | | | | | | | | |
| | 375,600 | | The Allstate Corp. | | | 12,447,885 | | | | 18,430,692 | |
| | 552,300 | | XL Group PLC | | | 11,275,906 | | | | 16,734,690 | |
| | | | Total Financials | | | 37,276,953 | | | | 50,998,872 | |
| | | | | | | | | | | | |
| | | | This sector is 36.8% above your Fund’s cost. | | | | | | | | |
| | | | | | | | | |
| HEALTH CARE | | | | | | | | |
| | | | | | | | | | | | |
| | | | Biotechnology - 3.1% | | | | | | | | |
| | 131,400 | | Celgene Corp.* | | | 6,818,123 | | | | 15,230,574 | |
| | | | | | | | | | | | |
| | | | Health Care Distributors - 2.8% | | | | | | | | |
| | 323,600 | | Cardinal Health Inc. | | | 13,617,471 | | | | 13,468,232 | |
| | | | | | | | | | | | |
| | | | Pharmaceuticals - 5.4% | | | | | | | | |
| | 152,800 | | Actavis Inc.* | | | 11,318,063 | | | | 14,074,408 | |
| | 313,877 | | Forest Laboratories Inc.* | | | 11,705,033 | | | | 11,939,881 | |
| | | | Total Health Care | | | 43,458,690 | | | | 54,713,095 | |
| | | | | | | | | | | | |
| | | | This sector is 25.9% above your Fund’s cost. | | | | | | | | |
| | | | | | | | | |
| INDUSTRIALS | | | | | | | | |
| | | | | | | | | | | | |
| | | | Construction & Engineering - 2.1% | | | | | | | | |
| | 350,000 | | Quanta Services Inc.* | | | 9,994,380 | | | | 10,003,000 | |
| | | | | | | | | | | | |
| | | | Electrical Components & Equipment - 2.6% | | | | | | | | |
| | 204,900 | | Eaton Corp. PLC | | | 12,761,247 | | | | 12,550,125 | |
| | | | | | | | | | | | |
| | | | Research & Consulting Services - 3.4% | | | | | | | | |
| | 267,500 | | Verisk Analytics Inc.* | | | 12,930,672 | | | | 16,486,025 | |
| | | | | | | | | | | | |
| | | | Trucking - 1.9% | | | | | | | | |
| | 408,700 | | Hertz Global Holdings Inc.* | | | 7,961,094 | | | | 9,097,662 | |
| | | | Total Industrials | | | 43,647,393 | | | | 48,136,812 | |
| | | | | | | | | | | | |
| | | | This sector is 10.3% above your Fund’s cost. | | | | | | | | |
| | | | | | | | | |
| INFORMATION TECHNOLOGY | | | | | | | | |
| | | | | | | | | | | | |
| | | | Application Software - 1.7% | | | | | | | | |
| | 203,800 | | Autodesk Inc.* | | | 7,749,246 | | | | 8,404,712 | |
| | | | | | | | | | | | |
| | | | Communications Equipment - 6.6% | | | | | | | | |
| | 630,600 | | Cisco Systems Inc. | | | 13,313,476 | | | | 13,185,846 | |
| | 281,700 | | Qualcomm Inc. | | | 15,242,866 | | | | 18,859,815 | |
| | | | | | | | | | | | |
| | | | Computer Storage & Peripherals - 1.4% | | | | | | | | |
| | 192,000 | | NetApp Inc.* | | | 6,467,185 | | | | 6,558,720 | |
| | | | | | | | | | | | |
| | | | Data Processing & Outsourced Services - 2.3% | | | | | | | | |
| | 66,400 | | Visa Inc. | | | 7,697,281 | | | | 11,277,376 | |
| | | | | | | | | | | | |
| | | | Internet Software & Services - 3.6% | | | | | | | | |
| | 213,800 | | eBay Inc.* | | | 10,935,743 | | | | 11,592,236 | |
| | 7,095 | | Google Inc.* | | | 5,303,459 | | | | 5,633,643 | |
| | | | | | | | | | | | |
| | | | Semiconductors - 5.6% | | | | | | | | |
| | 271,100 | | Analog Devices Inc. | | | 12,002,646 | | | | 12,603,439 | |
| | 451,000 | | Maxim Integrated Products Inc. | | | 12,271,371 | | | | 14,725,150 | |
| | | | Total Information Technology | | | 90,983,273 | | | | 102,840,937 | |
| | | | | | | | | | | | |
| | | | This sector is 13.0% above your Fund’s cost. | | | | | | | | |
| | | | | | | | | |
| MATERIALS | | | | | | | | |
| | | | Commodity Chemicals - 0.1% | | | | | | | | |
| | 11,400 | | LyondellBasell Industries NV | | | 674,770 | | | | 721,506 | |
Brandywine Blue Fund
Schedule of Investments (Continued)
March 31, 2013 (Unaudited)
| Shares | | | | Cost | | | Value | |
| | | | | | | |
| Long-Term Investments - 95.0% (a) (Continued) | | | | | | |
| Common Stocks - 89.9% (a) (Continued) | | | | | | |
| | | | | | | | | |
| | | Fertilizers & Agricultural Chemicals - 2.8% | | | | | | |
| | 226,100 | | The Mosaic Co. | | $ | 13,926,125 | | | $ | 13,477,821 | |
| | | | Total Materials | | | 14,600,895 | | | | 14,199,327 | |
| | | | | | | | | | | | |
| | | | This sector is 2.8% below your Fund’s cost. | | | | | | | | |
| | | | | | | | | | | | |
| | | | Total common stocks | | | 380,404,879 | | | | 435,853,372 | |
| | | | | | | | | |
| REITs - 5.1%(a) | | | | | | | | |
| | | | | | | | | |
| FINANCIALS | | | | | | | | |
| | | | Specialized REITs - 5.1% | | | | | | | | |
| | 104,900 | | Plum Creek Timber Co. Inc. | | | 5,226,922 | | | | 5,475,780 | |
| | 613,400 | | Weyerhaeuser Co. | | | 17,077,828 | | | | 19,248,492 | |
| | | | Total Financials | | | 22,304,750 | | | | 24,724,272 | |
| | | | | | | | | | | | |
| | | | This sector is 10.8% above your Fund’s cost. | | | | | | | | |
| | | | | | | | | | | | |
| | | | Total REITs | | | 22,304,750 | | | | 24,724,272 | |
| | | | | | | | | | | | |
| | | | Total long-term investments | | | 402,709,629 | | | | 460,577,644 | |
| | | | | | | | | | | | |
| Principal | | | | | | | | | | |
| Amount | | | | | | | | |
| | | | | | | | | |
| Short-Term Investment - 3.5% (a) | | | | | | | | |
| | | | | | | | | | | | |
| | | | Commercial Paper - 3.5% | | | | | | | | |
| $ | 17,016,000 | | Prudential Funding LLC, | | | | | | | | |
| | | | due 04/01/13, | | | | | | | | |
| | | | discount of 0.10% | | | 17,016,000 | | | | 17,016,000 | |
| | | | Total commercial paper | | | 17,016,000 | | | | 17,016,000 | |
| | | | Total investments - 98.5% | | $ | 419,725,629 | | | | 477,593,644 | |
| | | | Cash and receivables | | | | | | | | |
| | | | less liabilities - 1.5% (a) | | | | | | | 7,424,376 | |
| | | | TOTAL NET ASSETS - 100.0% | | | | | | $ | 485,018,020 | |
(a) Percentages for the various classifications relate to net assets.
* Non-dividend paying security.
SP-ADR - Sponsored American Depositary Receipt
The accompanying notes to financial statements are an integral part of this schedule.
Statement of Operations
For the Six Months Ended March 31, 2013 (Unaudited)
| Income: | | | |
| Dividends (net of foreign withholding tax of $19,265) | | $ | 5,327,102 | |
| Interest | | | 10,479 | |
| Total income | | | 5,337,581 | |
| | | | | |
| Expenses: | | | | |
| Management fees | | | 2,593,338 | |
| Transfer agent fees | | | 237,092 | |
| Printing and postage expense | | | 132,589 | |
| Board of Directors fees and expenses | | | 62,079 | |
| Registration fees | | | 32,168 | |
| Professional fees | | | 31,113 | |
| Administrative and accounting services | | | 21,536 | |
| Custodian fees | | | 14,425 | |
| Insurance expense | | | 13,593 | |
| Other expenses | | | 747 | |
| Total expenses | | | 3,138,680 | |
| Net Investment Income | | | 2,198,901 | |
| Net Realized Gain on Investments | | | 60,434,650 | |
| Net Decrease in Unrealized Appreciation on Investments | | | (27,773,493 | ) |
| Net Gain on Investments | | | 32,661,157 | |
| Net Increase in Net Assets Resulting From Operations | | $ | 34,860,058 | |
The accompanying notes to financial statements are an integral part of this statement.
Brandywine Blue Fund
Statements of Changes in Net Assets
For the Six Months Ended March 31, 2013 (Unaudited)
and for the Year Ended September 30, 2012
| | | 2013 | | | 2012 | |
| Operations: | | | | | | |
| Net investment income (loss) | | $ | 2,198,901 | | | $ | (5,345,963 | ) |
| Net realized gain on investments | | | 60,434,650 | | | | 131,712,811 | |
| Net (decrease) increase in unrealized appreciation on investments | | | (27,773,493 | ) | | | 80,454,040 | |
| Net increase in net assets resulting from operations | | | 34,860,058 | | | | 206,820,888 | |
| | | | | | | | | |
| Fund Share Activities: | | | | | | | | |
| Proceeds from shares issued (1,179,210 and 5,382,266 shares, respectively) | | | 29,855,615 | | | | 132,061,615 | |
| Cost of shares redeemed (8,344,849 and 49,468,159 shares, respectively) | | | (207,319,585 | ) | | | (1,198,777,852 | ) |
| Net decrease in net assets derived from Fund share activities | | | (177,463,970 | ) | | | (1,066,716,237 | ) |
| Total Decrease | | | (142,603,912 | ) | | | (859,895,349 | ) |
| | | | | | | | | |
| Net Assets at the Beginning of the Period | | | 627,621,932 | | | | 1,487,517,281 | |
| Net Assets at the End of the Period | | $ | 485,018,020 | | | $ | 627,621,932 | |
| (Includes undistributed net investment income of $0 and $0, respectively) | | | | | | | | |
Financial Highlights
(Selected data for each share of the Fund outstanding throughout each period)
| | | For the Six Months | | | | | | | | | | | | | | | | |
| | | Ended March 31, 2013 | | | Years Ended September 30, | |
| | | (Unaudited) | | | 2012 | | | 2011 | | | 2010 | | | 2009 | | | 2008 | |
| PER SHARE OPERATING PERFORMANCE: | | | | | | | | | | | | | | | | | | |
| Net asset value, beginning of period | | $ | 25.00 | | | $ | 21.50 | | | $ | 21.78 | | | $ | 20.67 | | | $ | 23.86 | | | $ | 38.18 | |
| | | | | | | | | | | | | | | | | | | | | | | | | |
| Income from investment operations: | | | | | | | | | | | | | | | | | | | | | | | | |
Net investment income (loss) (1) | | | 0.11 | | | | (0.11 | ) | | | (0.10 | ) | | | (0.06 | ) | | | 0.04 | | | | (0.07 | ) |
| Net realized and unrealized gains (losses) | | | | | | | | | | | | | | | | | | | | | | | | |
| on investments | | | 1.93 | | | | 3.61 | | | | (0.18 | ) | | | 1.24 | | | | (3.23 | ) | | | (10.38 | ) |
| Total from investment operations | | | 2.04 | | | | 3.50 | | | | (0.28 | ) | | | 1.18 | | | | (3.19 | ) | | | (10.45 | ) |
| | | | | | | | | | | | | | | | | | | | | | | | | |
| Less distributions: | | | | | | | | | | | | | | | | | | | | | | | | |
| Distributions from net investment income | | | — | | | | — | | | | — | | | | (0.07 | ) | | | — | | | | — | |
| Distributions from net realized gains | | | — | | | | — | | | | — | | | | — | | | | — | | | | (3.87 | ) |
| Total from distributions | | | — | | | | — | | | | — | | | | (0.07 | ) | | | — | | | | (3.87 | ) |
| Net asset value, end of period | | $ | 27.04 | | | $ | 25.00 | | | $ | 21.50 | | | $ | 21.78 | | | $ | 20.67 | | | $ | 23.86 | |
| TOTAL RETURN | | | 8.16 | %(a) | | | 16.28 | % | | | (1.29 | %) | | | 5.71 | % | | | (13.37 | %) | | | (30.70 | %) |
| | | | | | | | | | | | | | | | | | | | | | | | | |
| RATIOS/SUPPLEMENTAL DATA: | | | | | | | | | | | | | | | | | | | | | | | | |
| Net assets, end of period (in 000’s $) | | | 485,018 | | | | 627,622 | | | | 1,487,517 | | | | 2,057,591 | | | | 2,461,907 | | | | 3,323,668 | |
| Ratio of expenses to average net assets | | | 1.21 | %(b) | | | 1.23 | % | | | 1.18 | % | | | 1.17 | % | | | 1.16 | % | | | 1.13 | % |
| Ratio of net investment income (loss) | | | | | | | | | | | | | | | | | | | | | | | | |
| to average net assets | | | 0.85 | %(b) | | | (0.46 | %) | | | (0.38 | %) | | | (0.27 | %) | | | 0.21 | % | | | (0.23 | %) |
| Portfolio turnover rate | | | 114 | %(a) | | | 243 | % | | | 250 | % | | | 212 | % | | | 261 | % | | | 267 | % |
(1)Net investment income (loss) per share was calculated using average shares outstanding.
(a)Not Annualized.
(b)Annualized.
The accompanying notes to financial statements are an integral part of these statements.
The Brandywine Funds
Notes to Financial Statements
March 31, 2013 (Unaudited)
| (1) | Summary of Significant Accounting Policies |
| | | | |
| | The following is a summary of significant accounting policies of Brandywine Fund, Inc. (the “Brandywine Fund”) and Brandywine Blue Fund (the “Blue Fund,” one of two Funds in a series of the Brandywine Blue Fund, Inc.) (collectively the “Funds”). Each Fund is registered as a diversified open-end management company under the Investment Company Act of 1940 (the “Act”), as amended. The assets and liabilities of each Fund are segregated and a shareholder’s interest is limited to the Fund in which the shareholder owns shares. The Brandywine Fund was incorporated under the laws of Maryland on October 9, 1985. The Blue Fund was incorporated under the laws of Maryland on November 13, 1990. The investment objective of each Fund is to produce long-term capital appreciation principally through investing in common stocks. |
| | | | |
| | (a) | Each security, excluding short-term investments, is valued at the last sale price reported by the principal security exchange on which the issue is traded. Securities that are traded on the Nasdaq Markets are valued at the Nasdaq Official Closing Price, or if no sale is reported, the latest bid price. Securities which are traded over-the-counter are valued at the latest bid price. Securities for which quotations are not readily available are valued at fair value as determined by the investment adviser under the supervision of the Board of Directors. The fair value of a security may differ from the last quoted price and the Fund may not be able to sell a security at the estimated fair value. Market quotations may not be available, for example, if trading in particular securities has halted during the day and not resumed prior to the close of trading on the New York Stock Exchange. As of March 31, 2013, there were no securities that were internally fair valued. Short-term investments with maturities of 60 days or less are valued at amortized cost which approximates value. For financial reporting purposes, investment transactions are recorded on the trade date; however, for purposes of executing shareholder transactions, the Funds record changes in holdings of portfolio securities no later than the first business day after the trade date in accordance with Rule 2a-4 of the Act. Accordingly, certain differences between net asset value for financial reporting and for executing shareholder transactions may arise. |
| | | | |
| | | The Funds adopted the provisions of the Financial Accounting Standards Board (“FASB”) Accounting Standards Codification “Fair Value Measurements and Disclosures” Topic 820 (“ASC 820”), effective October 1, 2008. Under ASC 820, fair value is defined as the price that would be received to sell an asset or paid to transfer a liability (i.e., the “exit price”) in an orderly transaction between market participants at the measurement date. |
| | | | |
| | | Fair value is defined as the price that the Funds would receive upon selling an investment or transferring a liability in an orderly transaction to an independent buyer in the principal or most advantageous market for the investment. A three-tier hierarchy is used to maximize the use of observable market data and minimize the use of unobservable inputs and to establish classification of fair value measurements for disclosure purposes. Observable inputs reflect the assumptions market participants would use in pricing the asset or liability. Observable inputs are based on market data obtained from sources independent of the reporting entity. Unobservable inputs reflect the reporting entity’s own assumptions about the assumptions market participants would use in pricing the asset or liability. Unobservable inputs are based on the best information available in the circumstances. The following is a summary of the three-tiered hierarchy of valuation input levels. |
| | | | |
| | | Level 1 – | Inputs are unadjusted and prices are determined using quoted prices in active markets for identical securities. |
| | | | |
| | | Level 2 – | Prices are determined using other significant observable inputs (including quoted prices for similar securities, interest rates, prepayment speeds, credit risk, etc.). |
| | | | |
| | | Level 3 – | Prices are determined using significant unobservable inputs (including management’s assumptions in determining the fair value of investments). |
| | | | |
| | | The inputs or methodologies used for valuing securities are not an indication of the risks associated with investing in those securities. The following is a summary of each Fund’s fair value measurements as of the end of the reporting period: |
| | | Brandywine Fund | | Blue Fund |
| | Valuation Inputs | Investments in Securities | | Investments in Securities |
| | Level 1 – Common Stocks | | $ | 762,454,359 | | | | $ | 435,853,372 | |
| | REITs | | | 51,244,264 | | | | | 24,724,272 | |
| | Total Level 1 | | | 813,698,623 | | | | | 460,577,644 | |
| | Level 2 – Short-Term Commercial Paper | | | 19,930,000 | | | | | 17,016,000 | |
| | Level 3 – | | | — | | | | | — | |
| | Total | | $ | 833,628,623 | | | | $ | 477,593,644 | |
| | | It is the Funds’ policy to recognize transfers between levels at the end of the quarterly reporting period. There were no transfers between levels during the period ended March 31, 2013. |
The Brandywine Funds
Notes to Financial Statements (Continued)
March 31, 2013 (Unaudited)
| (1) | Summary of Significant Accounting Policies (Continued) |
| | | |
| | | See the Schedules of Investments for the investments detailed by industry classification. |
| | | |
| | | On May 12, 2011, the FASB issued Accounting Standards Update No. 2011-04 (“ASU No. 2011-04”) modifying ASC 820. At the same time, the International Accounting Standards Board (“IASB”) issued International Financial Reporting Standard (“IFRS”) 13, Fair Value Measurement. The objective of the FASB and IASB is convergence of their guidance on fair value measurements and disclosures. Specifically, the ASU requires reporting entities to: i) disclose the amounts of any transfers between Level 1 and Level 2 and the reasons for the transfers; ii) disclose for Level 3 fair value measurements: a) quantitative information about significant unobservable inputs used; b) a description of the valuation processes used by the reporting entity and; c) a narrative description of the sensitivity of the fair value measurement to changes in unobservable inputs if a change in those inputs might result in a significantly higher or lower fair value measurement. The effective date of ASU No. 2011-04 is for interim and annual periods beginning after December 15, 2011. ASU No. 2011-04 has been adopted by the Funds and there has been no material impact to the disclosures. |
| | | |
| | (b) | Net realized gains and losses on sales of securities are computed on the identified cost basis. |
| | | |
| | (c) | Dividend income is recorded on the ex-dividend date. Interest income is recorded on the accrual basis. |
| | | |
| | (d) | The preparation of financial statements in conformity with accounting principles generally accepted in the United States of America (“GAAP”) requires management to make estimates and assumptions that affect the reported amounts of assets and liabilities and disclosure of contingent assets and liabilities at the date of the financial statements and the reported amounts of revenues and expenses during the reporting period. Actual results could differ from these estimates. |
| | | |
| | (e) | No provision has been made for Federal income taxes since the Funds have elected to be taxed as “regulated investment companies” (“RICs”) and intend to distribute substantially all net investment company taxable income and net capital gains to shareholders and otherwise comply with the provisions of the Internal Revenue Code applicable to regulated investment companies. |
| | | |
| | (f) | The Funds have reviewed all open tax years and major jurisdictions, which include Federal and the state of Maryland, and concluded that there are no significant uncertain tax positions that would require recognition in the financial statements. Open tax years are those that are open for exam by taxing authorities and, as of March 31, 2013, open Federal tax years include the tax years ended September 30, 2009 through 2012. The Funds have no examinations in progress and are also not aware of any tax positions for which it is reasonably possible that the total amounts of unrecognized tax benefits will significantly change in the next twelve months. |
| | | |
| | (g) | GAAP requires that permanent differences between income for financial reporting and tax purposes be reclassified in the capital accounts. For the year ended September 30, 2012 the reclassifications were as follows: |
| | | | Undistributed | | | Accumulated | | | | |
| | | | Net Investment | | | Net Realized | | | | |
| | | | Loss | | | Loss | | | Paid In Capital | |
| | Brandywine Fund | | $ | 1,711,119 | | | $ | — | | | $ | (1,711,119 | ) |
| | Blue Fund | | | 2,454,170 | | | | (2 | ) | | | (2,454,168 | ) |
| (2) | Investment Adviser and Management Agreements and Transactions With Related Parties |
| | |
| | Each Fund has a management agreement with Friess Associates, LLC (the “Adviser”), with whom certain Officers and a Director of the Funds are affiliated, to serve as investment adviser and manager. Under the terms of the agreements, each Fund will pay the Adviser a monthly management fee at the annual rate of one percent (1%) on the daily net assets of such Fund. |
| | |
| | The Adviser entered into sub-advisory agreements with its affiliate, Friess Associates of Delaware, LLC (the “Sub-Adviser”), to assist it in the day-to-day management of each of the Funds. The Adviser and, if so delegated, the Sub-Adviser supervise the investment portfolios of the Funds, directing the purchase and sale of investment securities in the day-to-day management of the Funds. The Adviser pays the Sub-Adviser a fee equal to 110% of the monthly expenses the Sub-Adviser incurs in performing its services as Sub-Adviser. This relationship does not increase the annual management fee the Funds pay to the Adviser. |
| | |
| | The Adviser has voluntarily agreed to reimburse each Fund for expenses over 2% of the daily net assets of the Fund. No such reimbursements were required for the six months ended March 31, 2013. |
| | |
| | Each of the Funds currently pay the five independent directors annual fees of $23,300 each. The lead independent director and chairman of the audit committee are paid an additional $8,000 and $5,000 annually, respectively, divided proportionately among all the Funds. All of the corresponding fees the directors receive are paid quarterly to the directors and then invested on the payment date in shares of the Funds at the net asset value of the Funds on the payment date. The Funds also reimburse directors for travel costs incurred in order to attend meetings of the Board of Directors. For the six months ended March 31, 2013, the Funds expensed the following directors fees and costs: |
The Brandywine Funds
Notes to Financial Statements (Continued)
March 31, 2013 (Unaudited)
| (2) | Investment Adviser and Management Agreements and Transactions With Related Parties (Continued) |
| | | Brandywine | Blue |
| | | Fund | Fund |
| | Directors Fees and Travel Costs Paid during the Period | $62,644 | $62,079 |
| | Under the Funds’ organizational documents, each Director, officer, employee or other agent of the Fund (including the Funds’ investment manager) is indemnified, to the extent permitted by the Act, against certain liabilities that may arise out of performance of their duties to the Funds. Additionally, in the normal course of business, the Funds enter into contracts that contain a variety of indemnification clauses. The Funds’ maximum exposure under these arrangements is unknown as this would involve future claims that may be made against the Funds that have not yet occurred. However, the Funds have not had prior claims or losses pursuant to these contracts and believes the risk of loss to be remote. |
| | |
| | At March 31, 2013, two financial intermediaries are the record owners of approximately 25%, in aggregate, of the Blue Fund’s shares. |
| | |
| (3) | Credit Agreements |
| | |
| | U.S. Bank, National Association, has made available to each Fund a $50,000,000 unsecured credit facility pursuant to Credit Agreements effective October 28, 2011, for the purpose of having cash available to cover incoming redemptions. Principal and interest of such loan under the Credit Agreements are due not more than 20 days after the date of the loan. Amounts under the credit facilities bear interest at a rate per annum equal to the current prime rate minus one percent on the amount borrowed. During the six months ended March 31, 2013, the Brandywine Fund had an outstanding average daily balance of $38,637 under its Credit Agreement and paid and average interest rate of 2.25%. The maximum amount outstanding during the period was $2,344,000. Interest expense amounted to $440 for the six months ended March 31, 2013 and is included in Other expenses in the Statement of Operations. The Brandywine Fund did not have a loan outstanding on March 31, 2013. The Blue Fund has not borrowed against its Credit Agreement. The Credit Agreements are renewable annually on October 24. |
| | |
| (4) | Distributions to Shareholders |
| | |
| | Net investment income and net realized gains, if any, are distributed to shareholders at least annually. |
| | |
| (5) | Investment Transactions |
| | |
| | For the six months ended March 31, 2013, purchases and proceeds of sales of investment securities (excluding short-term investments) for the Funds were as follows: |
| | | | | | | Sale | |
| | | | Purchases | | | Proceeds | |
| | Brandywine Fund | | $ | 1,090,200,371 | | | $ | 1,357,870,057 | |
| | Blue Fund | | | 580,439,040 | | | | 755,841,934 | |
| (6) | Income Tax Information |
| | |
| | The following information for the Funds is presented on an income tax basis as of September 30, 2012: |
| | | | | | | Gross | | | Gross | | | Net Unrealized | | | Distributable | | | Distributable | |
| | | | Cost of | | | Unrealized | | | Unrealized | | | Appreciation | | | Ordinary | | | Long-Term | |
| | | | Investments | | | Appreciation | | | Depreciation | | | on Investments | | | Income | | | Capital Gains | |
| | Brandywine Fund | | $ | 916,282,843 | | | $ | 157,652,055 | | | $ | (8,837,799 | ) | | $ | 148,814,256 | | | $ | — | | | $ | — | |
| | Blue Fund | | | 544,325,559 | | | | 87,297,860 | | | | (2,592,678 | ) | | | 84,705,182 | | | | — | | | | — | |
| | The difference, if any, between the cost amounts for financial statement and federal income tax purposes is due primarily to timing differences in recognizing certain gains and losses in security transactions. |
| | |
| | On December 22, 2010, the Regulated Investment Company Modernization Act of 2010 (the “RIC Act”) was enacted, which changed various technical rules governing the tax treatment of RICs. The changes are generally effective for taxable years beginning after the date of enactment. Capital losses incurred in taxable years beginning after the date of enactment may now be carried forward indefinitely, and retain the character of the original loss. Post-enactment losses must be utilized prior to pre-enactment losses. Under pre-enactment law, capital losses could be carried forward for up to eight years, and carried forward as short-term capital loss, irrespective of the character of the original loss. The RIC Act now allows RICs to elect to “push” to the first day of the next taxable year all or part of any late year ordinary loss, which is defined as the sum of the specified post-October losses and other post-December ordinary losses, over the specified post-October gains and other post-December ordinary gains. This reduces the circumstances under which a RIC might be required to file amended Forms 1099 to restate previously reported distributions. |
The Brandywine Funds
Notes to Financial Statements (Continued)
March 31, 2013 (Unaudited)
| (6) | Income Tax Information (Continued) |
| | |
| | The tax components of dividends paid during the years ended September 30, 2012 and 2011, capital loss carryovers, which may be used to offset future capital gains, subject to Internal Revenue Code limitations, tax basis post-October losses as of September 30, 2012, which are not recognized for tax purposes until the first day of the following fiscal year, and late year ordinary losses are: |
| | | | September 30, 2012 | | | September 30, 2011 | |
| | | | Ordinary | | | Long-Term | | | Net Capital | | | | | | Late Year | | | Ordinary | | | Long-Term | |
| | | | Income | | | Capital Gains | | | Loss | | | Post-October | | | Ordinary | | | Income | | | Capital Gains | |
| | | | Distributions | | | Distributions | | | Carryovers | | | Losses | | | Losses | | | Distributions | | | Distributions | |
| | Brandywine Fund | | $ | — | | | $ | — | | | $ | 915,525,170 | | | $ | 16,798,317 | | | $ | 1,062,178 | | | $ | — | | | $ | — | |
| | Blue Fund | | | — | | | | — | | | | 1,176,026,522 | | | | — | | | | 2,891,793 | | | | — | | | | — | |
| | | | | | | | | | Post-Enactment | | |
| | | | Net Capital Loss Carryovers Expiring | | | Capital Loss | | |
| | | | 2017 | | | 2018 | | | Carryforwards | | |
| | Brandywine Fund | | $ | 368,372,189 | | | $ | 503,144,209 | | | $ | 44,008,772 | | (Short-Term) |
| | Blue Fund | | | 980,140,290 | | | | 195,886,232 | | | | — | | |
| | Since there were no ordinary distributions paid for the Funds for the year ended September 30, 2012, there were no distributions designated as qualifying for the dividends received deduction for corporate shareholders nor as qualified dividend income under the Jobs and Growth Tax Relief Act of 2003. |
Cost Discussion
Mutual fund shareholders incur two types of costs: (1) transaction costs, including sales charges (loads) on purchase payments, reinvested dividends, or other distributions; redemption fees; and exchange fees; and (2) ongoing costs, including management fees; distribution [and/or service] (12b-1) fees; and other fund expenses. Brandywine and Brandywine Blue do not have 12b-1 distribution fees. This example is intended to help you understand your ongoing costs (in dollars) of investing in the Brandywine Funds and to compare these costs with the ongoing costs of investing in other mutual funds.
In addition to the costs highlighted and described below, the only Fund transaction costs you might currently incur would be wire fees ($15 per wire), if you choose to have proceeds from a redemption wired to your bank account instead of receiving a check. Additionally, U.S. Bank charges an annual processing fee ($15) if you maintain an IRA account with the Funds. To determine your total costs of investing in the Funds, you would need to add any applicable wire or IRA processing fees you’ve incurred during the period to the costs provided in the example below.
The example is based on an investment of $1,000 invested at the beginning of the period and held for the entire period from October 1, 2012 through March 31, 2013.
Actual Expenses
The first line of the table below provides information about actual account values and actual expenses. You may use the information in this line, together with the amount you invested, to estimate the expenses that you paid over the period. Simply divide your account value by $1,000 (for example, an $8,600 account value divided by $1,000 = 8.6), then multiply the result by the number in the first line under the heading entitled “Expenses Paid During Period” to estimate the expenses you paid on your account during this period.
Hypothetical Example for Comparison Purposes
The second line of the table below provides information about hypothetical account values and hypothetical expenses based on the Fund’s actual expense ratio and an assumed rate of return of 5% per year before expenses, which is not the Fund’s actual return. The hypothetical account values and expenses may not be used to estimate the actual ending account balance or expenses you paid for the period. You may use this information to compare the ongoing costs of investing in the Funds and other funds. To do so, compare this 5% hypothetical example with the 5% hypothetical examples that appear in the shareholder reports of the other funds.
Please note that the expenses shown in the table are meant to highlight your ongoing costs only and do not reflect any transactional costs. While the Brandywine Funds currently do not assess sales charges, redemption or exchange fees, other funds do, and those costs will not be reflected in their expense example tables. Therefore, the second line of the table is useful in comparing ongoing costs only, and will not help you determine the relative total costs of owning different funds.
| | | | Expenses Paid During Period* |
| Brandywine Actual | $1,000.00 | $1,056.50 | $5.74 |
| Hypothetical (5% return before expenses) | $1,000.00 | $1,019.35 | $5.64 |
| Brandywine Blue Actual | $1,000.00 | $1,081.60 | $6.28 |
| Hypothetical (5% return before expenses) | $1,000.00 | $1,018.90 | $6.09 |
| * | Expenses are equal to the Funds’ annualized expense ratios of 1.12% and 1.21%, multiplied by the average account value over the period, multiplied by 182/365 (to reflect the one-half year period between October 1, 2012 and March 31, 2013). |
Brandywine Funds Advisory Agreements
On December 3, 2012, the Board of Directors (“Directors”) of the Funds approved the continuation of the advisory agreements with Friess Associates, LLC (“Friess”). Prior to approving the continuation of the advisory agreements, the Directors considered:
•the nature, extent and quality of the services provided by Friess
•the investment performance of the Funds and Friess
•the costs of the services to be provided and profits to be realized by Friess from its relationship with the Funds
•the extent to which economies of scale would be realized as the Funds grow and whether fee levels reflect these economies of scale
•the expense ratios of the Funds
•management fees of other advisers with similar strategies
•the manner in which portfolio transactions for the Funds are conducted, including the use of soft dollars
•Friess’ launch of a new dividend growth product and its lower management fee
In considering the nature, extent and quality of the services provided by Friess, the Directors reviewed a report describing the portfolio management, shareholder communication and servicing, and regulatory compliance services provided by Friess to the Funds. The Directors concluded that Friess was providing essential services to the Funds.
The Directors discussed the continued underperformance of the Funds and addressed questions regarding Friess’ launch of a new dividend growth product, with a lower management fee than the Funds. Friess provided an in-depth discussion of the performance of the Funds. The Directors were satisfied that management was taking appropriate actions with respect to each Fund’s investment performance and requested continued reports on the performance of each of the Funds. The Directors concluded that, under the circumstances, the performance of each of the Funds was consistent with continuation of the advisory agreements. The Directors noted that the new product has an investment strategy that is substantially different from the Funds, making a different fee structure appropriate.
In concluding that the advisory fees payable by the Funds were reasonable, the Directors reviewed a report of the costs of services provided, and the profits realized by Friess from its relationship with the Funds and concluded that such profits were reasonable and not excessive. The Directors also reviewed reports comparing the expense ratios and advisory fees paid by the Funds to those paid by other comparable mutual funds and concluded that the advisory fees paid by the Funds were higher than the average advisory fees paid by comparable mutual funds, but the expense ratios of the Funds were lower than the average expense ratios of comparable mutual funds. The Directors also considered the Funds’ portfolio turnover rate, and noted that Friess had incurred additional costs notwithstanding the recent decrease in the Funds’ net assets as it augmented shareholder servicing fees in excess of those approved by the Board to enable the Funds’ availability on various retirement platforms. The Directors concluded that, under the circumstances, the profits to be realized by Friess from its relationship with the Funds were reasonable.
The Directors noted that the fees would not be adjusted if economies of scale were realized during the current contract period as the Funds grew, but did not consider that factor to be significant in light of the other factors considered, particularly the fact that the profits were reasonable and not excessive.
Finally, the Directors reviewed reports discussing the manner in which portfolio transactions for the Funds were conducted, including the use of soft dollars. Based on these reports, the Directors concluded that the research obtained by Friess was beneficial to the Funds and that Friess was executing the Funds’ portfolio transactions in a manner designed to obtain best execution for the Funds.
Additional Director Information, Proxy Voting Policy
and Quarterly Portfolio Schedules
For additional information about the Directors and Officers or for a description of the policies and procedures that the Funds use to determine how to vote proxies relating to portfolio securities, please call (800) 656-3017 and request a Statement of Additional Information. One will be mailed to you free of charge. The Statement of Additional Information is also available on the website of the Securities and Exchange Commission (the “Commission”) at http://www.sec.gov or the Funds’ website at http://www.brandywinefunds.com. Information on how the Funds voted proxies relating to portfolio securities is available on the Funds’ website or the website of the Commission no later than August 31 for the prior twelve months ending June 30. The Funds file their complete schedule of portfolio holdings with the Commission for the first and third quarters of each fiscal year on Form N-Q. The Funds’ Forms N-Q are available on the Commission’s website. The Funds’ Forms N-Q may be reviewed and copied at the Commission’s Public Reference Room in Washington, D.C. Information on the operation of the Public Reference Room may be obtained by calling 1-800-SEC-0330.
Board of Directors
|  |  |
| William F. D’Alonzo | C. Quentin S. Jackson | Stuart A. McFarland |
| CEO and CIO | Former President and CEO | Managing Partner |
| Friess Associates | Nuclear Electric Insurance Limited | Federal City Capital Advisors, LLC |
 |  |  |
| Thomas D. Wren | Stephen M. Wynne | James W. Zug |
| Former Senior Adviser | Former CEO | Former Senior Partner |
| Promontory Financial Group, LLC | BNY Mellon, U.S. Funds Services | PricewaterhouseCoopers LLP |
| | | |
 |  | |
| |
| The Brandywine Funds |
| P.O. Box 4166 |
| Greenville, DE 19807 |
| (800) 656-3017 |
| www.brandywinefunds.com |
| bfunds@friess.com |
| |
| |
| |
| Foster S. Friess | | |
| Founder | | |
| | | |
Investment Adviser: Friess Associates, LLC | Administrator, Accountant & Transfer Agent: U.S. Bancorp Fund Services, LLC |
Investment Sub-Adviser: Friess Associates of Delaware, LLC | Independent Registered Public Accounting Firm: PricewaterhouseCoopers LLP |
Custodian: U.S. Bank, N.A. | Distributor: Quasar Distributors, LLC |
Legal Counsel: Foley & Lardner LLP | |
Officers: William D’Alonzo, Chairman and President;
Joseph Fields, Vice President; Scott Gates, Vice President; Gordon Kaiser, Vice President and Treasurer;
David Marky, Chief Compliance Officer and Vice President; Colleen Rowley, Secretary
Report Editor: Chris Aregood Report Staff: David Marky, Adam Rieger
Item 2. Code of Ethics.
Not applicable for semi-annual reports.
Item 3. Audit Committee Financial Expert.
Not applicable for semi-annual reports.
Item 4. Principal Accountant Fees and Services.
Not applicable for semi-annual reports.
Item 5. Audit Committee of Listed Registrants.
Not applicable to registrants who are not listed issuers (as defined in Rule 10A-3 under the Securities Exchange Act of 1934).
Item 6. Investments.
| (a) | Schedule of Investments is included as part of the report to shareholders filed under Item 1 of this Form. |
Item 7. Disclosure of Proxy Voting Policies and Procedures for Closed-End Management Investment Companies
Not applicable to open-end investment companies.
Item 8. Portfolio Managers of Closed-End Management Investment Companies.
Not applicable to open-end investment companies.
Item 9. Purchases of Equity Securities By Closed-End Management Investment Company and Affiliated Purchasers.
Not applicable to open-end investment companies.
Item 10. Submission of Matters to a Vote of Security Holders.
Not applicable.
Item 11. Controls and Procedures.
| (a) | The Registrant’s President/Chief Executive Officer and Treasurer/Chief Financial Officer have reviewed the Registrant's disclosure controls and procedures (as defined in Rule 30a-3(c) under the Investment Company Act of 1940 (the "Act")) as of a date within 90 days of the filing of this report, as required by Rule 30a-3(b) under the Act and Rules 13a-15(b) or 15d-15(b) under the Securities Exchange Act of 1934. Based on their review, such officers have concluded that the disclosure controls and procedures are effective in ensuring that information required to be disclosed in this report is appropriately recorded, processed, summarized and reported and made known to them by others within the Registrant and by the Registrant's service provider. |
| (b) | There were no changes in the Registrant’s internal control over financial reporting (as defined in Rule 30a-3(d) under the Act) that occurred during the second fiscal quarter of the period covered by this report that has materially affected, or is reasonably likely to materially affect, the Registrant's internal control over financial reporting. |
Item 12. Exhibits.
| (a) | (1) Any code of ethics or amendment thereto, that is the subject of the disclosure required by Item 2, to the extent that the Registrant intends to satisfy Item 2 requirements through filing an exhibit. Not applicable. |
(2) A separate certification for each principal executive and principal financial officer pursuant to Section 302 of the Sarbanes-Oxley Act of 2002. Filed herewith.
(3) Any written solicitation to purchase securities under Rule 23c-1 under the Act sent or given during the period covered by the report by or on behalf of the Registrant to 10 or more persons. Not applicable to open-end investment companies.
| (b) | Certifications pursuant to Section 906 of the Sarbanes-Oxley Act of 2002. Furnished herewith. |
SIGNATURES
Pursuant to the requirements of the Securities Exchange Act of 1934 and the Investment Company Act of 1940, the registrant has duly caused this report to be signed on its behalf by the undersigned, thereunto duly authorized.
Brandywine Fund, Inc.
Registrant
By /s/William F. D’Alonzo
William F. D’Alonzo, President, Principal Executive Officer
Date April 22, 2013
Pursuant to the requirements of the Securities Exchange Act of 1934 and the Investment Company Act of 1940, this report has been signed below by the following persons on behalf of the Registrant and in the capacities and on the dates indicated.
Brandywine Fund, Inc.
Registrant
By /s/William F. D’Alonzo
William F. D’Alonzo, President, Principal Executive Officer
Date April 22, 2013
Brandywine Fund, Inc.
Registrant
By /s/Gordon Kaiser
Gordon Kaiser, Treasurer, Principal Financial Officer
Date April 22, 2013