UNITED STATES
SECURITIES AND EXCHANGE COMMISSION
Washington, D.C. 20549
FORM N-CSR
CERTIFIED SHAREHOLDER REPORT OF REGISTERED
MANAGEMENT INVESTMENT COMPANIES
Investment Company Act file number 811-04447
Brandywine Fund, Inc.
(Exact name of registrant as specified in charter)
P.O. Box 4166
Greenville, DE 19807
(Address of principal executive offices) (Zip code)
William F. D’Alonzo
P.O. Box 4166
Greenville, Delaware 19807
(Name and address of agent for service)
(302) 656-3017
Registrant's telephone number, including area code:
Date of fiscal year end: September 30
Date of reporting period: March 31, 2012
Item 1. Reports to Stockholders.
| Managed by Friess Associates, LLC | Semi-Annual Report | March 31, 2012 |
Dear Fellow Shareholders:
Ebbing angst regarding Europe and rising confidence in the U.S. economy set an overtly positive tone for stocks in the March quarter. The relative calm on the macro front let investors get back to the business of judging companies on their individual merits.
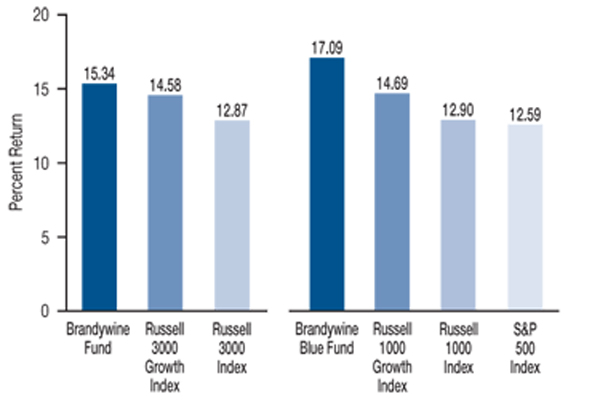
Brandywine Fund grew 15.34 percent in the March quarter, leading gains in the Russell 3000 and Russell 3000 Growth Indexes of 12.87 and 14.58 percent. Brandywine Blue Fund’s 17.09 percent return outpaced gains in the S&P 500, Russell 1000 and Russell 1000 Growth Indexes of 12.59, 12.90 and 14.69 percent.
March-Quarter Performance
Valuations at the start of the period reflected the outsized influence of macro concerns leading into the quarter. The weight of those concerns lifted as Greece secured new bailout financing and the U.S. economy produced a series of positive data points in areas such as employment, retail sales and manufacturing.
Earnings remained healthy, though there was a fair share of adjustment as company managements and equity analysts factored slower economic growth into their 2012 earnings forecasts. In this climate, companies that delivered earnings growth that exceeded expectations were well rewarded for their ability to execute. Conversely, companies that fell short of estimates were punished as if they were likely to disappoint again.
Running counter to the prevailing trend, consensus earnings estimates for 69 percent of Brandywine’s holdings increased in the first three months of the year. Calendar-year estimates rose for 65 percent of Brandywine Blue’s holdings at the same time. The comparable figure for the companies of the S&P 500 Index was 40 percent.
Positive earnings surprises were reported with less-than-average frequency during the three months through March, according to a study by Bank of America Merrill Lynch. Still, that scarcity appeared to raise the appeal of the companies that did surprise to the upside. The technology sector posted the strongest return within the S&P 500 Index in the March quarter. The study showed that technology companies reported the highest percentage of positive fourth-quarter earnings surprises (reported from January through March) in the index.
| Cumulative Total Return | | |
| Quarter | 15.34 | 17.09 |
| One Year | -11.31 | 0.30 |
| Five Years | -16.35 | -7.71 |
| Ten Years | 29.87 | 55.55 |
| Inception | 1,148.37* | 640.95** |
| | | |
| Annualized Total Return | | |
| Five Years | -3.51 | -1.59 |
| Ten Years | 2.65 | 4.52 |
| Inception | 10.09* | 9.90** |
| *12/30/85 **1/10/91 | | |
| | | |
| Expense Ratio*** | | |
| Brandywine | 1.09% |
| Brandywine Blue | 1.18% |
***As stated in the Prospectus dated January 31, 2012
Performance data quoted represent past performance; past performance does not guarantee future results. The investment return and principal value of an investment will fluctuate so that an investor’s shares, when redeemed, may be worth more or less than their original cost. Current performance of the Funds may be lower or higher than the performance quoted. Performance data current to the most recent month end may be obtained by visiting www.brandywinefunds.com.
With a strong economically sensitive component to most technology businesses, the technology sector may enjoy a certain measure of improved earnings visibility given more predictable, albeit slower, nature of the economic backdrop expected this year. Moreover, on the product side, our research leads us to believe that current inventory levels are so well attuned to current end-market trends that upticks in demand can spur earnings-boosting price increases.
Technology holdings, which comprised the largest percentage of assets in both Funds, contributed the most to March-quarter returns. They also provided the biggest boost for Brandywine and Brandywine Blue versus their respective benchmarks.
Seagate Technology was a standout performer for both Funds. Industry consolidation and last year’s floods in Thailand have changed the competitive landscape and supply dynamics in the hard disk drive business. Benefiting from the acquisition of Samsung’s hard-drive business and less harmed by the flooding than its main competitor, Seagate seized a unique opportunity to capture significant market share. The company quadrupled year-over-year earnings in the December quarter, topping the consensus estimate by 22 percent amid supply strains that kept upward pressure on prices.
Apple again made major contributions to total gains in the Brandywine Funds as the company’s incredible rise brought its market cap past $500 billion. When the company reached that milestone in late February, CNNMoney pointed out that it made Apple worth more than Saudi Arabia (based on GDP). Other top performers included VeriFone in Brandywine and EMC Corp. in Brandywine Blue, holdings that beat estimates in their most recently reported quarters with 35 and 17 percent earnings growth, respectively.
Consumer discretionary holdings, which represented the second largest percentage of assets in Brandywine, also made a notable contribution to the Fund’s performance versus the Russell 3000 Growth Index. Investors applauded Dick’s Sporting Goods (Brandywine only) after disciplined expense control and nimble inventory management enabled the company to overcome slow sales of cold weather gear during the mild winter months. Dick’s grew December-quarter earnings 16 percent. Polaris Industries, Tractor Supply Co. and Steven Madden Ltd. (all Brandywine only) also rose in the wake of expectation-beating earnings growth of 16, 43 and 33 percent, respectively, in the December quarter.
Although consumer discretionary companies helped Brandywine Blue’s cause, energy holdings provided a more pronounced boost versus the Russell 1000 Growth. Pioneer Natural Resources was a top overall performer at a time when energy produced one of the most muted returns among sectors within the index. Rising oil prices brought attention to Pioneer’s domestic oil production capacity and its recently acquired control of a company that supplies a critical ingredient used in on-shore oil production. The company beat estimates with 129 percent December-quarter earnings growth.
In relative terms, the Brandywine Funds also benefited from what they didn’t hold. Due to a lack of earnings strength among consumer staples companies, both Funds maintained very limited exposure to the consumer staples sector. That worked in their favor during the March quarter, when the sector’s results trailed the overall market’s return by a notable margin.
For more on holdings that influenced March-quarter performance, please see Roses & Thorns on page 4 for Brandywine and page 6 for Brandywine Blue.
Holdings from the technology, consumer discretionary and industrial sectors comprise the largest percentages of assets in the Brandywine portfolio. Holdings from the technology, consumer discretionary and energy sectors currently represent Brandywine Blue’s largest positions.
We were encouraged to see a strong relationship between earnings performance and stock prices in the March quarter. While Europe’s sovereign debt situation, upcoming elections, Iran and other macro matters are likely to influence stocks at various times, we think the combination of strong corporate balance sheets and a slow-but-steady economic backdrop put individual companies in a position to win the majority of the market’s attention.
We also believe companies that post strong growth and exceed expectations will continue to stand out. Given the earnings strength we have isolated on the individual-company level, we think that should bode well for the Brandywine Funds.
At the end of March, we wished a fond farewell to Lynda Campbell, who was Vice President, Secretary and Treasurer of the Brandywine Funds. Lynda joined Friess Associates only weeks prior to Brandywine’s launch at the end of 1985. We thank Lynda for more than 26 years of contributions and wish her a happy and healthy retirement.
We’re grateful for your continued confidence.
 |  |
| Bill D’Alonzo | |
| Brandywine Funds President | April 9, 2012 |

Brandywine Fund
Portfolio Characteristics as of March 31, 2012
% Change in Top Ten Holdings From Book Cost
| 1. | Apple Inc. | +134.1% | | 6. | | eBay Inc. | +13.6% |
| 2. | VeriFone Systems Inc. | +34.1% | | 7. | | Robert Half International Inc. | +15.2% |
| 3. | Qualcomm Inc. | +24.4% | | 8. | | Big Lots Inc. | -3.8% |
| 4. | VF Corp. | +19.4% | | 9. | | Accenture PLC | +13.2% |
| 5. | Wabtec Corp. | +25.4% | | 10. | | Dick’s Sporting Goods Inc. | +44.4% |
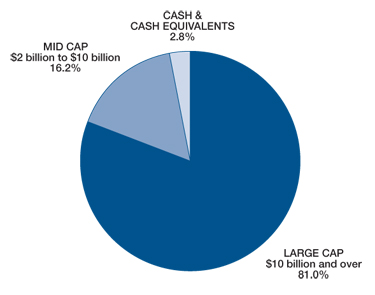
| Estimated Earnings Growth Rate | The Portfolio’s Market Capitalization |
| of the Fund’s Investments | 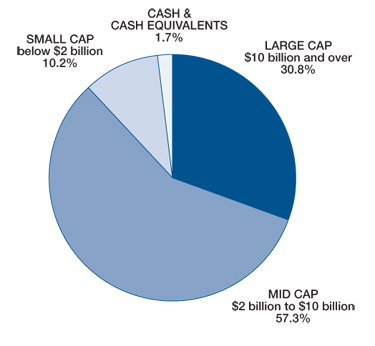 |
| | |
| The Fund’s | S&P 500’s |
| Companies | Companies |
| 20.2% | 9.0% |
| Forecasted Increase in Earnings Per Share 2012 vs 2011 Source: Consensus estimates from Baseline Financial Services, Inc. This is not a forecast of the Fund’s future performance. Earnings growth for a Fund holding does not guarantee a corresponding increase in the market value of the holding or the Fund. As of March 31, 2012, the S&P 500 Index’s average annual total returns for 1, 5 and 10 years were 8.54, 2.01 and 4.12 percent. |
| |
| |
| | | |
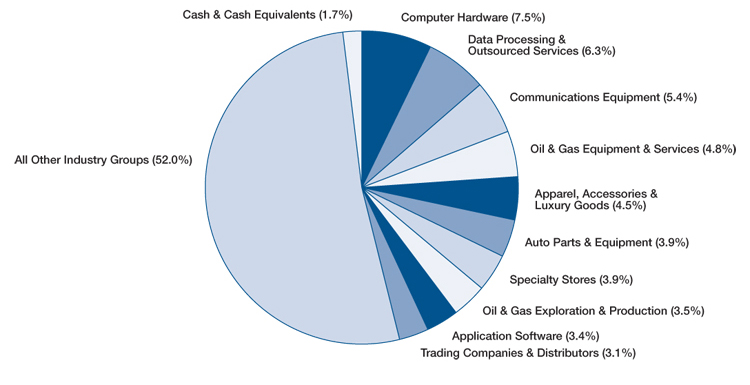
Top Ten Industry Groups
Brandywine Fund
March Quarter “Roses and Thorns”
| | $ Gain | | |
| Biggest $ Winners | (in millions) | % Gain | Reason for Move |
| Apple Inc. | $26.9 | 44.7 | The maker of personal computers, software and mobile computing devices grew December-quarter earnings 116 percent, beating estimates by 38 percent. Revenue increased 73 percent, reflecting the company’s continued success in the high-growth markets for smartphones and tablets. Shipments of Apple’s iPhone and iPad increased 128 and 111 percent, respectively, during the quarter. The company announced that in September it will begin paying quarterly dividends totaling more than $10 billion annually. |
Seagate Technology PLC | $17.5 | 50.7 | The maker of hard disk drives quadrupled earnings during the December quarter to $1.32 per share, beating estimates by 22 percent. Unlike factories owned by competitors, Seagate’s plants weren’t hit directly by last year’s floods in Thailand, helping the company recover quickly. Shares gained ground after management raised sales and profit forecasts for 2012, as drive shortages provided pricing power. |
| VeriFone Systems Inc. | $13.4 | 36.6 | The provider of electronic point-of-sale payment terminals grew January-quarter earnings 35 percent, beating estimates by 12 percent. With dominant market-share and leading-edge technology, VeriFone is well positioned to benefit from a global migration toward electronic and wireless payments. The company’s future growth prospects are tied to terminal upgrades associated with EMV technology, which replaces magnetic strips on the backs of credit and debit cards with embedded microchips. |
Dick’s Sporting Goods Inc. | $7.8 | 30.0 | The sporting goods retailer grew December-quarter earnings 16 percent as new store growth, improving online sales and a greater mix of high-performance merchandise offset difficult year-over-year sales comparisons and unseasonably warm weather patterns. Profit margin improvements stemmed from system upgrades and a new regional pricing strategy. The company also issued its first dividend ever in the fourth quarter. |
| Qualcomm Inc. | $7.3 | 23.6 | The developer of digital wireless communications products and services using CDMA (code division multiple access) technology grew December-quarter earnings 18 percent, beating the consensus estimate. A broad array of handset makers, all of which pay Qualcomm a royalty fee to allow devices to function on 3G networks, incorporated more of the company’s chips in mobile devices. Chip unit shipments increased 32 percent during the quarter. |
| | $ Loss | | |
| Biggest $ Losers | (in millions) | % Loss | Reason for Move |
Allscripts Healthcare Solutions Inc. | $4.7 | 15.2 | The developer of financial and clinical software for physician practices and hospitals grew December-quarter earnings 25 percent. Shares fell following conservative forward guidance that included lower-than-expected bookings growth. While Allscripts experienced growth across its business segments, investors grew concerned that the company might be losing share to competitors that provided more optimistic outlooks. |
| Rowan Companies Inc. | $3.8 | 13.2 | The provider of offshore contract drilling services topped revenue forecasts in the December quarter as international demand strengthened and lease rates improved for its high-specification jack-up rigs. Shares fell following Rowan’s announcement that it would redomicile in the U.K., creating the possibility that it would no longer trade on U.S. exchanges. |
| Vera Bradley Inc. | $2.3 | 18.0 | The maker of handbags and accessories grew January-quarter earnings 28 percent, beating the consensus estimate. Revenue jumped 23 percent. Despite raising 2012 guidance, shares retraced on conservative April-quarter guidance stemming from the company’s inability to yield a “breakout pattern” from its spring line. |
McDermott International Inc. | $2.2 | 8.1 | The engineering and construction company serving the offshore oil and gas industry gave up ground as oil prices pulled back from highs reached early in the year. Our research shows McDermott’s construction segment remains well positioned to capitalize on new business opportunities amid elevated global offshore capital spending. McDermott announced it was awarded a $2 billion contract from oil and natural gas producer INPEX during the quarter, representing the largest subsea contract in the company’s history. |
| Ancestry.com Inc. | $2.0 | 24.2 | The online provider of genealogy research tools grew December-quarter earnings 21 percent, beating the consensus estimate by 18 percent. Revenues grew 26 percent. Shares fell as viewership trended lower for NBC’s “Who Do You Think You Are?” television series, which Ancestry.com uses as a marketing platform. We sold Ancestry.com during the quarter to fund an idea with better near-term earnings visibility. |
All gains/losses are calculated on an average cost basis
Brandywine Blue Fund
Portfolio Characteristics as of March 31, 2012
% Change in Top Ten Holdings From Book Cost
| 1. | Apple Inc. | +265.3% | | 6. | | BorgWarner Inc. | +37.6% |
| 2. | eBay Inc. | +14.9% | | 7. | | Accenture PLC | +12.8% |
| 3. | Pioneer Natural Resources Co. | +35.7% | | 8. | | Celgene Corp. | +47.9% |
| 4. | Qualcomm Inc. | +22.8% | | 9. | | Ford Motor Co. | +4.1% |
| 5. | EMC Corp. | +35.6% | | 10. | | Cisco Systems Inc. | +14.7% |
Estimated Earnings Growth Rate of the Fund’s Investments | The Portfolio’s Market Capitalization |
| | |  |
| The Fund’s | S&P 500’s |
| Companies | Companies |
| 17.2% | 9.0% |
| | |
Forecasted Increase in Earnings Per Share 2012 vs 2011 Source: Consensus estimates from Baseline Financial Services, Inc. This is not a forecast of the Fund’s future performance. Earnings growth for a Fund holding does not guarantee a corresponding increase in the market value of the holding or the Fund. As of March 31, 2012, the S&P 500 Index’s average annual total returns for 1, 5 and 10 years were 8.54, 2.01 and 4.12 percent. |
| | |
| | |
| | |
| | |
| | |
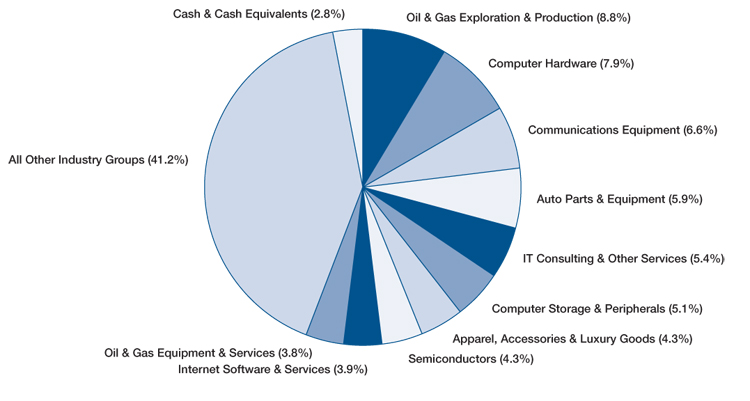
Top Ten Industry Groups
Brandywine Blue Fund
March Quarter “Roses and Thorns”
| | $ Gain | | |
| Biggest $ Winners | (in millions) | % Gain | Reason for Move |
| Apple Inc. | $35.3 | 47.5 | The maker of personal computers, software and mobile computing devices grew December-quarter earnings 116 percent, beating estimates by 38 percent. Revenue increased 73 percent, reflecting the company’s continued success in the high-growth markets for smartphones and tablets. Shipments of Apple’s iPhone and iPad increased 128 and 111 percent, respectively, during the quarter. The company announced that in September it will begin paying quarterly dividends totaling more than $10 billion annually. |
Seagate Technology PLC | $23.2 | 54.7 | The maker of hard disk drives quadrupled earnings during the December quarter to $1.32 per share, beating estimates by 22 percent. Unlike factories owned by competitors, Seagate’s plants weren’t hit directly by last year’s floods in Thailand, helping the company recover quickly. Shares gained ground after management raised sales and profit forecasts for 2012, as drive shortages provided pricing power. |
| EMC Corp. | $13.4 | 37.8 | The provider of hardware, software and services for enterprise network storage grew December-quarter earnings 17 percent, beating the consensus estimate. EMC’s storage business remains tied to new technology trends that utilize massive amounts of digital data. The company’s 80 percent stake in VMware exposes it to cloud computing, desktop virtualization and other fast-growing segments of the storage market. |
| BorgWarner Inc. | $11.7 | 31.6 | The supplier of technologies for engines and transmissions that improve fuel economy and performance while reducing emissions grew December-quarter earnings 34 percent, beating the consensus estimate. More of the company’s technologies have been incorporated into a greater number of vehicles amid rebounding auto production and increasing fuel economy and emissions regulations worldwide. Efforts to control costs throughout the industry slump pushed operating profit margins to record highs. |
Pioneer Natural Resources Co. | $10.7 | 24.6 | The oil and gas exploration and development company grew December-quarter earnings 129 percent, beating estimates by 14 percent. Revenue grew 44 percent. Shares gained ground as production growth guidance moved higher for the company’s acreage positions in high-margin, oil-levered properties in the Texas Permian Basin and Eagle Ford Shale. Pioneer’s recent acquisition of Carmeuse Industrial Sand, which mines sand used in oil-well fracking applications, is expected to provide considerable cost advantages. |
| | $ Loss | | |
| Biggest $ Losers | (in millions) | % Loss | Reason for Move |
| Electronic Arts Inc. | $4.0 | 11.4 | The video game developer grew December-quarter earnings 68 percent, beating estimates. Despite a strong reception to the company’s new online game Star Wars: The Old Republic, shares fell as spending on video games in general didn’t keep pace with levels achieved last holiday season. We sold Electronic Arts during the quarter on concerns that forward expectations would prove difficult to meet given the pullback in spending. |
| The Mosaic Co. | $2.1 | 6.2 | The producer of concentrated phosphate and potash crop fertilizers lost ground as customers remained cautious amid uncertainty about the direction of grain and fertilizer prices. While U.S. farmers are widely expected to plant the most corn acreage since World War II this year, demand for fertilizer has been sluggish amid high prices. As a result, dealers were slower than usual in securing fertilizer inventory. |
| SanDisk Corp. | $1.7 | 4.8 | The maker of flash-memory cards beat December-quarter earnings estimates but gave a sales forecast that fell short of estimates, sending shares lower. We sold SanDisk in February, concerned that supplies of flash memory and other electronic components used in consumer electronics were starting to outpace demand. In early April, SanDisk cut its forecast for March-quarter sales, citing weaker-than-expected pricing and demand. |
Anadarko Petroleum Corp. | $1.5 | 4.0 | The oil and gas exploration and production company grew December-quarter earnings 193 percent, beating the consensus estimate by 37 percent. Revenue growth of 17 percent also came in above expectations. Shares retraced despite the strong results, as oil prices fell in March following a run-up early in the year. Our research shows Anadarko’s broad portfolio of domestic and international assets allows it to effectively shift its operations toward higher-profit oil production while also funding ongoing development and discovery expenditures in frontier markets. |
| Norfolk Southern Corp. | $1.2 | 3.6 | The railroad operator grew December-quarter earnings 42 percent, beating estimates. Shares fell as declining natural gas prices and more stringent carbon pollution standards for new coal-fired power plants resulted in lower demand for thermal coal transportation. While Norfolk’s improving intermodal business helps offset lost volumes, we sold our position during the quarter on concerns that coal-related issues would continue to create an overhang on shares. |
All gains/losses are calculated on an average cost basis
Brandywine Fund, Inc.
Statement of Assets and Liabilities
March 31, 2012 (Unaudited)
| Assets: | | | |
| Investments in securities, at value (cost $1,126,581,436) | | $ | 1,309,142,349 | |
| Receivable from investments sold | | | 27,788,751 | |
| Receivable from shareholders for purchases | | | 200,976 | |
| Dividends and interest receivable | | | 63,283 | |
| Total assets | | $ | 1,337,195,359 | |
| | | | | |
| Liabilities: | | | | |
| Payable for investments purchased | | $ | 34,608,644 | |
| Payable to shareholders for redemptions | | | 1,206,293 | |
| Payable to adviser for management fees | | | 1,114,575 | |
| Other liabilities | | | 192,135 | |
| Total liabilities | | | 37,121,647 | |
| | | | | |
| Net Assets: | | | | |
| Capital Stock, $0.01 par value; 500,000,000 shares authorized; 50,546,734 shares outstanding | | | 2,025,476,323 | |
| Net unrealized appreciation on investments | | | 182,560,913 | |
| Accumulated net realized loss on investments | | | (907,963,524 | ) |
| Net assets | | | 1,300,073,712 | |
| Total liabilities and net assets | | $ | 1,337,195,359 | |
| | | | | |
| Calculation of net asset value per share: | | | | |
Net asset value, offering and redemption price per share ($1,300,073,712 ÷ 50,546,734 shares outstanding) | | $ | 25.72 | |
The accompanying notes to financial statements are an integral part of this statement.
Schedule of Investments
March 31, 2012 (Unaudited)
| Shares | | | | Cost | | | Value | |
| | | | | | | | | |
| Common Stocks - 98.3% (a) | | | | | | |
| | | | | | | | | |
| CONSUMER DISCRETIONARY | | | | | | |
| | | | | | | | | |
| | | Apparel Retail - 2.5% | | | | | | |
| | 669,400 | | Chico’s FAS Inc. | | $ | 10,303,966 | | | $ | 10,107,940 | |
| | 201,500 | | Express Inc.* | | | 4,232,730 | | | | 5,033,470 | |
| | 84,600 | | The Finish Line Inc. | | | 1,445,030 | | | | 1,795,212 | |
| | 224,300 | | Genesco Inc.* | | | 9,881,731 | | | | 16,071,095 | |
| | | | | | | | | | | | |
| | | | Apparel, Accessories & Luxury Goods - 4.5% | | | | | | | | |
| | 160,200 | | Coach Inc. | | | 9,692,549 | | | | 12,380,256 | |
| | 342,900 | | Vera Bradley Inc.* | | | 12,619,774 | | | | 10,352,151 | |
| | 246,300 | | VF Corp. | | | 30,123,726 | | | | 35,954,874 | |
| | | | | | | | | | | | |
| | | | Auto Parts & Equipment - 3.9% | | | | | | | | |
| | 457,300 | | Allison Transmission Holdings Inc.* | | | 10,776,070 | | | | 10,920,324 | |
| | 320,100 | | BorgWarner Inc.* | | | 27,086,281 | | | | 26,997,234 | |
| | 808,100 | | Dana Holding Corp.* | | | 12,059,047 | | | | 12,525,550 | |
| | | | | | | | | | | | |
| | | | Automobile Manufacturers - 1.9% | | | | | | | | |
| | 1,986,200 | | Ford Motor Co. | | | 23,956,423 | | | | 24,807,638 | |
| | | | | | | | | | | | |
| | | | Broadcasting - 0.8% | | | | | | | | |
| | 213,000 | | Discovery Communications Inc.* | | | 8,117,543 | | | | 9,985,440 | |
| | | | | | | | | | | | |
| | | | Consumer Electronics - 0.8% | | | | | | | | |
| | 229,000 | | Harman International | | | | | | | | |
| | | | Industries Inc. | | | 10,731,344 | | | | 10,719,490 | |
| | | | | | | | | | | | |
| | | | Footwear - 0.8% | | | | | | | | |
| | 237,600 | | Steven Madden Ltd.* | | | 7,949,794 | | | | 10,157,400 | |
| | | | | | | | | | | | |
| | | | General Merchandise Stores - 2.5% | | | | | | | | |
| | 743,300 | | Big Lots Inc.* | | | 33,233,818 | | | | 31,976,766 | |
| | | | | | | | | | | | |
| | | | Home Furnishing Retail - 0.2% | | | | | | | | |
| | 92,250 | | Select Comfort Corp.* | | | 1,176,067 | | | | 2,987,978 | |
| | | | | | | | | | | | |
| | | | Specialty Stores - 3.9% | | | | | | | | |
| | 602,200 | | Dick’s Sporting Goods Inc. | | | 20,056,813 | | | | 28,953,776 | |
| | 622,800 | | GNC Holdings Inc. | | | 14,897,884 | | | | 21,729,492 | |
| | | | Total Consumer Discretionary | | | 248,340,590 | | | | 283,456,086 | |
| | | | | | | | | | | | |
| | | | This sector is 14.1% above your Fund’s cost. | | | | | | | | |
| | | | | | | | | | | | |
| CONSUMER STAPLES | | | | | | | | |
| | | | | | | | | | | | |
| | | | Household Products - 2.1% | | | | | | | | |
| | 548,800 | | Church & Dwight Co. Inc. | | | 22,059,683 | | | | 26,995,472 | |
| | | | Total Consumer Staple | | | 22,059,683 | | | | 26,995,472 | |
| | | | | | | | | | | | |
| | | | This sector is 22.4% above your Fund’s cost. | | | | | | | | |
| | | | | | | | | | | | |
| ENERGY | | | | | | | | |
| | | | | | | | | | | | |
| | | | Oil & Gas Drilling - 1.0% | | | | | | | | |
| | 410,300 | | Rowan Companies Inc.* | | | 15,105,769 | | | | 13,511,179 | |
Brandywine Fund, Inc.
Schedule of Investments (Continued)
March 31, 2012 (Unaudited)
| Shares | | | | Cost | | | Value | |
| | | | | | | | | |
| Common Stocks - 98.3% (a) (Continued) | | | | | | |
| | | | | | | | | |
| | | Oil & Gas Equipment & Services - 4.8% | | | | | | |
| | 126,400 | | Key Energy Services Inc.* | | $ | 1,650,133 | | | $ | 1,952,880 | |
| | 120,400 | | Lufkin Industries Inc. | | | 9,204,527 | | | | 9,710,260 | |
| | 1,909,100 | | McDermott International Inc.* | | | 26,614,502 | | | | 24,455,571 | |
| | 264,500 | | Oil States International Inc.* | | | 18,615,901 | | | | 20,646,870 | |
| | 378,800 | | Weatherford International Ltd.* | | | 5,423,550 | | | | 5,716,092 | |
| | | | | | | | | | | | |
| | | | Oil & Gas Exploration & Production - 3.5% | | | | | | | | |
| | 101,400 | | Anadarko Petroleum Corp. | | | 7,806,830 | | | | 7,943,676 | |
| | 345,200 | | Energy XXI Ltd.* | | | 7,459,478 | | | | 12,465,172 | |
| | 77,400 | | Stone Energy Corp.* | | | 2,008,994 | | | | 2,212,866 | |
| | 409,400 | | Whiting Petroleum Corp.* | | | 18,307,583 | | | | 22,230,420 | |
| | | | Total Energy | | | 112,197,267 | | | | 120,844,986 | |
| | | | | | | | | | | | |
| | | | This sector is 7.7% above your Fund’s cost. | | | | | | | | |
| | | | | | | | | | | | |
| FINANCIALS | | | | | | | | |
| | | | | | | | | | | | |
| | | | Regional Banks - 0.0% | | | | | | | | |
| | 14,000 | | Cathay General Bancorp | | | 247,373 | | | | 247,800 | |
| | | | | | | | | | | | |
| | | | Residential REITs - 0.4% | | | | | | | | |
| | 85,400 | | Camden Property Trust | | | 5,574,806 | | | | 5,615,050 | |
| | | | Total Financials | | | 5,822,179 | | | | 5,862,850 | |
| | | | | | | | | | | | |
| | | | This sector is 0.7% above your Fund’s cost. | | | | | | | | |
| | | | | | | | | | | | |
| HEALTH CARE | | | | | | | | |
| | | | | | | | | | | | |
| | | | Biotechnology - 2.0% | | | | | | | | |
| | 338,200 | | Celgene Corp.* | | | 17,701,205 | | | | 26,217,264 | |
| | | | | | | | | | | | |
| | | | Health Care Technology - 2.0% | | | | | | | | |
| | 1,574,200 | | Allscripts Healthcare | | | | | | | | |
| | | | Solutions Inc.* | | | 30,801,306 | | | | 26,131,720 | |
| | | | | | | | | | | | |
| | | | Life Sciences Tools & Services - 0.9% | | | | | | | | |
| | 261,300 | | Agilent Technologies Inc.* | | | 8,458,231 | | | | 11,630,463 | |
| | | | | | | | | | | | |
| | | | Managed Health Care - 1.6% | | | | | | | | |
| | 352,800 | | UnitedHealth Group Inc. | | | 19,642,893 | | | | 20,794,032 | |
| | | | | | | | | | | | |
| | | | Pharmaceuticals - 0.7% | | | | | | | | |
| | 348,900 | | Impax Laboratories Inc.* | | | 6,096,365 | | | | 8,575,962 | |
| | | | Total Health Care | | | 82,700,000 | | | | 93,349,441 | |
| | | | | | | | | | | | |
| | | | This sector is 12.9% above your Fund’s cost. | | | | | | | | |
| | | | | | | | | | | | |
| INDUSTRIALS | | | | | | | | |
| | | | | | | | | | | | |
| | | | Construction & Engineering - 0.6% | | | | | | | | |
| | 404,500 | | MasTec Inc.* | | | 7,265,487 | | | | 7,317,405 | |
| | | | | | | | | | | | |
| | | | Construction & Farm Machinery & Heavy Trucks - 3.0% | | | | | | | | |
| | 156,300 | | Titan International Inc. | | | 3,945,962 | | | | 3,696,495 | |
| | 466,300 | | Wabtec Corp. | | | 28,034,466 | | | | 35,145,031 | |
| | | | | | | | | | | | |
| | | | Diversified Support Services - 2.0% | | | | | | | | |
| | 664,000 | | Cintas Corp. | | | 25,020,502 | | | | 25,975,680 | |
| | | | | | | | | | | | |
| | | | Electrical Components & Equipment - 1.0% | | | | | | | | |
| | 62,317 | | Generac Holdings Inc.* | | | 1,738,768 | | | | 1,529,882 | |
| | 411,200 | | General Cable Corp.* | | | 11,957,336 | | | | 11,957,696 | |
| | | | | | | | | | | | |
| | | | Environmental & Facilities Services - 0.7% | | | | | | | | |
| | 338,200 | | Tetra Tech Inc.* | | | 7,403,924 | | | | 8,914,952 | |
| | | | | | | | | | | | |
| | | | Heavy Electrical Equipment - 2.1% | | | | | | | | |
| | 1,066,200 | | The Babcock & Wilcox Co. * | | | 27,022,278 | | | | 27,454,650 | |
| | | | | | | | | | | | |
| | | | Human Resource & Employment Services - 2.5% | | | | | | | | |
| | 1,078,500 | | Robert Half International Inc. | | | 28,367,781 | | | | 32,678,550 | |
| | | | | | | | | | | | |
| | | | Marine - 1.4% | | | | | | | | |
| | 284,724 | | Kirby Corp.* | | | 16,441,330 | | | | 18,731,992 | |
| | | | | | | | | | | | |
| | | | Railroads - 1.5% | | | | | | | | |
| | 271,000 | | Kansas City Southern* | | | 15,974,459 | | | | 19,427,990 | |
| | | | | | | | | | | | |
| | | | Trading Companies & Distributors - 3.1% | | | | | | | | |
| | 348,000 | | United Rentals Inc.* | | | 14,663,681 | | | | 14,925,720 | |
| | 379,700 | | WESCO International Inc.* | | | 24,545,232 | | | | 24,798,207 | |
| | | | | | | | | | | | |
| | | | Trucking - 2.9% | | | | | | | | |
| | 871,800 | | Hertz Global Holdings Inc.* | | | 12,225,321 | | | | 13,111,872 | |
| | 422,500 | | Landstar System Inc. | | | 23,505,392 | | | | 24,386,700 | |
| | | | Total Industrials | | | 248,111,919 | | | | 270,052,822 | |
| | | | | | | | | | | | |
| | | | This sector is 8.8% above your Fund’s cost. | | | | | | | | |
| | | | | | | | | | | | |
| INFORMATION TECHNOLOGY | | | | | | | | |
| | | | | | | | | | | | |
| | | | Application Software - 3.4% | | | | | | | | |
| | 355,500 | | Autodesk Inc.* | | | 14,964,233 | | | | 15,044,760 | |
| | 2,132,900 | | Cadence Design Systems Inc.* | | | 23,726,214 | | | | 25,253,536 | |
| | 258,505 | | Mentor Graphics Corp.* | | | 3,537,444 | | | | 3,841,384 | |
| | | | | | | | | | | | |
| | | | Communications Equipment - 5.4% | | | | | | | | |
| | 225,700 | | ADTRAN Inc. | | | 7,821,143 | | | | 7,039,583 | |
| | 1,263,800 | | Cisco Systems Inc. | | | 23,146,800 | | | | 26,729,370 | |
| | 534,100 | | Qualcomm Inc. | | | 29,202,274 | | | | 36,329,482 | |
| | | | | | | | | | | | |
| | | | Computer Hardware - 7.5% | | | | | | | | |
| | 139,484 | | Apple Inc.* | | | 35,725,848 | | | | 83,616,473 | |
| | 365,000 | | Diebold Inc. | | | 11,723,958 | | | | 14,059,800 | |
| | | | | | | | | | | | |
| | | | Computer Storage & Peripherals - 1.8% | | | | | | | | |
| | 182,100 | | Fusion-io Inc.* | | | 4,694,628 | | | | 5,173,461 | |
| | 667,900 | | Seagate Technology PLC | | | 11,324,219 | | | | 17,999,905 | |
| | | | | | | | | | | | |
| | | | Data Processing & Outsourced Services - 6.3% | | | | | | | | |
| | 108,038 | | FleetCor Technologies Inc.* | | | 3,546,874 | | | | 4,188,633 | |
| | 590,900 | | Jack Henry & Associates Inc. | | | 19,434,161 | | | | 20,161,508 | |
| | 847,200 | | Vantiv Inc.* | | | 15,084,323 | | | | 16,630,536 | |
| | 769,190 | | VeriFone Systems Inc.* | | | 29,741,909 | | | | 39,897,886 | |
| | | | | | | | | | | | |
| | | | Internet Software & Services - 2.6% | | | | | | | | |
| | 910,600 | | eBay Inc.* | | | 29,566,696 | | | | 33,592,034 | |
| | | | | | | | | | | | |
| | | | IT Consulting & Other Services - 2.3% | | | | | | | | |
| | 471,200 | | Accenture PLC | | | 26,859,840 | | | | 30,392,400 | |
| | | | | | | | | | | | |
| | | | Semiconductors - 2.9% | | | | | | | | |
| | 428,400 | | Broadcom Corp. | | | 15,787,544 | | | | 16,836,120 | |
| | 243,700 | | Mellanox Technologies Ltd* | | | 7,641,249 | | | | 10,193,971 | |
| | 541,500 | | OmniVision Technologies Inc.* | | | 9,578,807 | | | | 10,830,000 | |
| | | | Total Information Technology | | | 323,108,164 | | | | 417,810,842 | |
| | | | | | | | | | | | |
| | | | This sector is 29.3% above your Fund’s cost. | | | | | | | | |
Brandywine Fund, Inc.
Schedule of Investments (Continued)
March 31, 2012 (Unaudited)
| Shares | | | | | | | Value | |
| | | | | | | | | |
| Common Stocks - 98.3% (a) (Continued) | | | | | | |
| | | | | | | | | |
| MATERIALS | | | | | | | | |
| | | | | | | | | |
| | | Diversified Chemicals - 2.0% | | | | | | |
| | 617,600 | | Cabot Corp. | | $ | 25,397,560 | | | $ | 26,359,168 | |
| | | | | | | | | | | | |
| | | | Precious Metals & Minerals - 1.2% | | | | | | | | |
| | 1,245,600 | | Stillwater Mining Co.* | | | 14,453,380 | | | | 15,744,384 | |
| | | | | | | | | | | | |
| | | | Steel - 1.3% | | | | | | | | |
| | 335,000 | | Carpenter Technology Corp. | | | 13,221,446 | | | | 17,497,050 | |
| | | | Total Materials | | | 53,072,386 | | | | 59,600,602 | |
| | | | | | | | | | | | |
| | | | This sector is 12.3% above your Fund’s cost. | | | | | | | | |
| | | | | | | | | | | | |
| | | | Total common stocks | | | 1,095,412,188 | | | | 1,277,973,101 | |
| | | | | | | | | | | | |
| Principal | | | | | | | | | | |
| Amount | | | | | | | | | |
| | | | | | | | | | | | |
| Short-Term Investments - 2.4% (a) | | | | | | | | |
| | | | | | | | | | | | |
| | | | Commercial Paper - 2.3% | | | | | | | | |
| $ | 29,900,000 | | Prudential Funding, LLC, | | | | | | | | |
| | | | due 04/02/12, discount of 0.10% | | | 29,899,917 | | | | 29,899,917 | |
| | | | | | | | | | | | |
| | | | Variable Rate Demand Note - 0.1% | | | | | | | | |
| | 1,269,331 | | American Family Financial | | | | | | | | |
| | | | Services, 0.10% | | | 1,269,331 | | | | 1,269,331 | |
| | | | Total short-term investments | | | 31,169,248 | | | | 31,169,248 | |
| | | | Total investments - 100.7% | | $ | 1,126,581,436 | | | | 1,309,142,349 | |
| | | | Liabilities, less | | | | | | | | |
| | | | other assets - (0.7%) (a) | | | | | | | (9,068,637 | ) |
| | | | TOTAL NET ASSETS - 100.0% | | | | | | $ | 1,300,073,712 | |
(a) Percentages for the various classifications relate to net assets.
* Non-dividend paying security.
The accompanying notes to financial statements are an integral part of this schedule.
Statement of Operations
For the Six Months Ended March 31, 2012 (Unaudited)
| Income: | | | |
| Dividends | | $ | 4,068,440 | |
| Interest | | | 16,768 | |
| Total income | | | 4,085,208 | |
| | | | | |
| Expenses: | | | | |
| Management fees | | | 6,665,936 | |
| Transfer agent fees | | | 344,764 | |
| Printing and postage expense | | | 97,027 | |
| Administrative and accounting services | | | 79,200 | |
| Board of Directors fees and expenses | | | 64,078 | |
| Custodian fees | | | 48,938 | |
| Professional fees | | | 38,589 | |
| Registration fees | | | 25,971 | |
| Insurance expense | | | 23,460 | |
| Other expenses | | | 4,950 | |
| Total expenses | | | 7,392,913 | |
| Net Investment Loss | | | (3,307,705 | ) |
| Net Realized Loss on Investments | | | (31,303,869 | ) |
| Net Increase in Unrealized Appreciation on Investments | | | 275,404,701 | |
| Net Gain on Investments | | | 244,100,832 | |
| Net Increase in Net Assets Resulting From Operations | | $ | 240,793,127 | |
The accompanying notes to financial statements are an integral part of this statement.
Brandywine Fund, Inc.
Statements of Changes in Net Assets
For the Six Months Ended March 31, 2012 (Unaudited)
and for the Year Ended September 30, 2011
| | | 2012 | | | 2011 | |
| Operations: | | | | | | |
| Net investment loss | | $ | (3,307,705 | ) | | $ | (6,541,486 | ) |
| Net realized (loss) gain on investments | | | (31,303,869 | ) | | | 317,490,769 | |
| Net increase (decrease) in unrealized appreciation on investments | | | 275,404,701 | | | | (266,737,876 | ) |
| Net increase in net assets resulting from operations | | | 240,793,127 | | | | 44,211,407 | |
| | | | | | | | | |
| Fund Share Activities: | | | | | | | | |
| Proceeds from shares issued (1,504,123 and 7,644,065 shares, respectively) | | | 36,047,781 | | | | 196,448,187 | |
| Cost of shares redeemed (13,488,242 and 24,862,946 shares, respectively) | | | (313,638,136 | ) | | | (659,542,217 | ) |
| Net decrease in net assets derived from Fund share activities | | | (277,590,355 | ) | | | (463,094,030 | ) |
| Total Decrease | | | (36,797,228 | ) | | | (418,882,623 | ) |
| | | | | | | | | |
| Net Assets at the Beginning of the Period | | | 1,336,870,940 | | | | 1,755,753,563 | |
| Net Assets at the End of the Period | | $ | 1,300,073,712 | | | $ | 1,336,870,940 | |
(Includes undistributed net investment income of $0 and $0, respectively)
Financial Highlights
(Selected data for each share of the Fund outstanding throughout each period)
| | | | | | | | | | | | | | | | | | | |
| | | For the Six Months | | | | | | | | | | | | | | | | |
| | | Ended March 31, 2012 | | | Years Ended September 30, | |
| | | | | | | | | 2010 | | | 2009 | | | 2008 | | | 2007 | |
| | | | | | | | | | | | | | | | | | | |
| PER SHARE OPERATING PERFORMANCE: | | | | | | | | | | | | | | | | | | |
| Net asset value, beginning of period | | $ | 21.38 | | | $ | 22.02 | | | $ | 21.11 | | | $ | 26.86 | | | $ | 40.98 | | | $ | 32.27 | |
| | | | | | | | | | | | | | | | | | | | | | | | | |
| Income from investment operations: | | | | | | | | | | | | | | | | | | | | | | | | |
Net investment loss(1) | | | (0.06 | ) | | | (0.09 | ) | | | (0.07 | ) | | | (0.05 | ) | | | (0.18 | ) | | | (0.19 | ) |
| Net realized and unrealized gains (losses) | | | | | | | | | | | | | | | | | | | | | | | | |
| on investments | | | 4.40 | | | | (0.55 | ) | | | 0.98 | | | | (5.59 | ) | | | (8.72 | ) | | | 9.15 | |
| | | | | | | | | | | | | | | | | | | | | | | | | |
| Total from investment operations | | | 4.34 | | | | (0.64 | ) | | | 0.91 | | | | (5.64 | ) | | | (8.90 | ) | | | 8.96 | |
| | | | | | | | | | | | | | | | | | | | | | | | | |
| Less distributions: | | | | | | | | | | | | | | | | | | | | | | | | |
| Distributions from net investment income | | | — | | | | — | | | | — | | | | — | | | | — | | | | — | |
| Distributions from net realized gains | | | — | | | | — | | | | — | | | | (0.11 | ) | | | (5.22 | ) | | | (0.25 | ) |
| | | | | | | | | | | | | | | | | | | | | | | | | |
| Total from distributions | | | — | | | | — | | | | — | | | | (0.11 | ) | | | (5.22 | ) | | | (0.25 | ) |
| | | | | | | | | | | | | | | | | | | | | | | | | |
| Net asset value, end of period | | $ | 25.72 | | | $ | 21.38 | | | $ | 22.02 | | | $ | 21.11 | | | $ | 26.86 | | | $ | 40.98 | |
| | | | | | | | | | | | | | | | | | | | | | | | | |
| TOTAL RETURN | | | 20.30 | %(a) | | | (2.91 | %) | | | 4.31 | % | | | (20.98 | %) | | | (25.16 | %) | | | 27.90 | % |
| | | | | | | | | | | | | | | | | | | | | | | | | |
| Ratios/Supplemental Data: | | | | | | | | | | | | | | | | | | | | | | | | |
| Net assets, end of period (in 000’s $) | | | 1,300,074 | | | | 1,336,871 | | | | 1,755,754 | | | | 2,281,681 | | | | 3,421,787 | | | | 4,851,268 | |
| Ratio of expenses to average net assets | | | 1.11 | %(b) | | | 1.09 | % | | | 1.11 | % | | | 1.10 | % | | | 1.08 | % | | | 1.08 | % |
| Ratio of net investment loss | | | | | | | | | | | | | | | | | | | | | | | | |
| to average net assets | | | (0.50 | %)(b) | | | (0.36 | %) | | | (0.33 | %) | | | (0.25 | %) | | | (0.54 | %) | | | (0.54 | %) |
| Portfolio turnover rate | | | 121 | %(a) | | | 234 | % | | | 225 | % | | | 239 | % | | | 210 | % | | | 162 | % |
| | | | | | | | | | | | | | | | | | | | | | | | | |
| (1) | | Net investment loss per share was calculated using average shares outstanding. |
| (a) | | Not Annualized. |
| (b) | | Annualized. |
The accompanying notes to financial statements are an integral part of these statements.
Definitions and Disclosures
Must be preceded or accompanied by a prospectus. Please refer to the prospectus for important information about the investment company, including investment objectives, risks, charges and expenses.
Past performance is not a guarantee of future results.
Mutual fund investing involves risk. Principal loss is possible. The Funds invest in mid-cap companies, which involve additional risks such as limited liquidity and greater volatility. Investments in foreign securities, even though publicly traded in the United States, may involve risks which are in addition to those inherent in domestic investments. Current and future portfolio holdings are subject to risk.
Fund holdings and sector weightings are subject to change at any time and are not recommendations to buy or sell any securities. Securities discussed were not held by the Funds as of March 31, 2012, unless listed in the accompanying schedules of investments. Book Value is the net asset value of a company, calculated by subtracting total liabilities from total assets. Earnings growth rates quoted for the Funds refer solely to the estimated earnings growth rates of the average investment holding of the Funds based on consensus estimates from Baseline Financial Services, Inc. (Baseline) and not to the actual performance of the Funds themselves. Baseline provides analytical information and services to the investment community.
The Russell 1000, Russell 1000 Growth, Russell 3000, Russell 3000 Growth and S&P 500 Indexes are unmanaged indexes commonly used to measure the performance of U.S. stocks. You cannot invest directly in an index. As of March 31, 2012, the Russell 1000 Index’s average annual total returns for 1, 5 and 10 years were 7.86, 2.19 and 4.53 percent; the Russell 1000 Growth Index’s were 11.02, 5.10 and 4.28 percent; the Russell 3000 Index’s were 7.18, 2.18 and 4.67 percent; the Russell 3000 Growth Index’s were 10.14, 5.02 and 4.42 percent; and the S&P 500 Index’s were 8.54, 2.01 and 4.12 percent. |
Brandywine Blue Fund
Statement of Assets and Liabilities
March 31, 2012 (Unaudited)
| Assets: | | | |
| Investments in securities, at value (cost $1,163,859,067) | | $ | 1,400,771,360 | |
| Receivable from investments sold | | | 45,895,721 | |
| Receivable from shareholders for purchases | | | 1,158,100 | |
| Dividends and interest receivable | | | 307,407 | |
| Cash | | | 126,928 | |
| Total assets | | $ | 1,448,259,516 | |
| | | | | |
| Liabilities: | | | | |
| Payable for investments purchased | | $ | 59,588,389 | |
| Payable to shareholders for redemptions | | | 2,051,291 | |
| Payable to adviser for management fees | | | 1,167,758 | |
| Other liabilities | | | 355,687 | |
| Total liabilities | | | 63,163,125 | |
| | | | | |
| Net Assets: | | | | |
| Capital Stock, $0.01 par value; 500,000,000 shares authorized; 51,456,691 shares outstanding | | | 2,360,634,478 | |
| Net unrealized appreciation on investments | | | 236,912,293 | |
| Accumulated net realized loss on investments | | | (1,212,450,380 | ) |
| Net assets | | | 1,385,096,391 | |
| Total liabilities and net assets | | $ | 1,448,259,516 | |
| | | | | |
| Calculation of net asset value per share: | | | | |
Net asset value, offering and redemption price per share ($1,385,096,391 ÷ 51,456,691 shares outstanding) | | $ | 26.92 | |
The accompanying notes to financial statements are an integral part of this statement.
Brandywine Blue Fund
Schedule of Investments
March 31, 2012 (Unaudited)
| Shares | | | | Cost | | | Value | |
| | | | | | | | | |
| Common Stocks - 97.2% (a) | | | | | | |
| | | | | | | |
| CONSUMER DISCRETIONARY | | | | | | |
| | | | | | | | | |
| | | Apparel, Accessories & Luxury Goods - 4.3% | | | | | | |
| | 267,800 | | Coach Inc. | | $ | 15,820,558 | | | $ | 20,695,584 | |
| | 264,250 | | VF Corp. | | | 27,930,878 | | | | 38,575,215 | |
| | | | | | | | | | | | |
| | | | Auto Parts & Equipment - 5.9% | | | | | | | | |
| | 549,600 | | BorgWarner Inc.* | | | 33,678,431 | | | | 46,353,264 | |
| | 1,068,300 | | Johnson Controls Inc. | | | 35,820,541 | | | | 34,698,384 | |
| | | | | | | | | | | | |
| | | | Automobile Manufacturers - 3.0% | | | | | | | | |
| | 3,360,500 | | Ford Motor Co. | | | 40,302,263 | | | | 41,972,645 | |
| | | | | | | | | | | | |
| | | | Broadcasting - 2.2% | | | | | | | | |
| | 664,700 | | Discovery Communications Inc.* | | | 25,274,174 | | | | 31,161,136 | |
| | | | | | | | | | | | |
| | | | Home Improvement Retail - 1.9% | | | | | | | | |
| | 828,800 | | Lowe’s Companies Inc. | | | 24,304,002 | | | | 26,007,744 | |
| | | | | | | | | | | | |
| | | | Home Furnishing Retail - 2.7% | | | | | | | | |
| | 570,100 | | Bed Bath & Beyond Inc.* | | | 34,199,772 | | | | 37,495,477 | |
| | | | | | | | | | | | |
| | | | Hotels, Resorts & Cruise Lines - 2.4% | | | | | | | | |
| | 578,100 | | Starwood Hotels & Resorts | | | | | | | | |
| | | | Worldwide Inc. | | | 31,700,661 | | | | 32,610,621 | |
| | | | Total Consumer Discretionary | | | 269,031,280 | | | | 309,570,070 | |
| | | | | | | | | | | | |
| | | | This sector is 15.1% above your Fund’s cost. | | | | | | | | |
| | | | | | | | | | | | |
| CONSUMER STAPLES | | | | | | | | |
| | | | | | | | | | | | |
| | | | Drug Retail - 2.5% | | | | | | | | |
| | 772,700 | | CVS Caremark Corp. | | | 33,252,826 | | | | 34,616,960 | |
| | | | | | | | | | | | |
| | | | Household Products - 0.5% | | | | | | | | |
| | 154,100 | | Church & Dwight Co. Inc. | | | 6,587,087 | | | | 7,580,179 | |
| | | | Total Consumer Staples | | | 39,839,913 | | | | 42,197,139 | |
| | | | | | | | | | | | |
| | | | This sector is 5.9% above your Fund’s cost. | | | | | | | | |
| | | | | | | | | | | | |
| ENERGY | | | | | | | | | | |
| | | | | | | | | | | | |
| | | | Oil & Gas Equipment & Services - 3.8% | | | | | | | | |
| | 494,000 | | National Oilwell Varco Inc. | | | 38,535,001 | | | | 39,258,180 | |
| | 872,000 | | Weatherford International Ltd.* | | | 13,345,027 | | | | 13,158,480 | |
| | | | | | | | | | | | |
| | | | Oil & Gas Exploration & Production - 8.8% | | | | | | | | |
| | 473,600 | | Anadarko Petroleum Corp. | | | 38,816,521 | | | | 37,101,824 | |
| | 460,300 | | Pioneer Natural Resources Co. | | | 37,851,742 | | | | 51,364,877 | |
| | 630,500 | | Whiting Petroleum Corp.* | | | 30,639,898 | | | | 34,236,150 | |
| | | | Total Energy | | | 159,188,189 | | | | 175,119,511 | |
| | | | | | | | | | | | |
| | | | This sector is 10.0% above your Fund’s cost. | | | | | | | | |
| | | | | | | | | | | | |
| FINANCIALS | | | | | | | | | | |
| | | | | | | | | | | | |
| | | | Investment Banking & Brokerage - 2.6% | | | | | | | | |
| | 1,842,500 | | Morgan Stanley | | | 35,535,044 | | | | 36,186,700 | |
| | | | Total Financials | | | 35,535,044 | | | | 36,186,700 | |
| | | | | | | | | | | | |
| | | | This sector is 1.8% above your Fund’s cost. | | | | | | | | |
| | | | | | | | | | | | |
| HEALTH CARE | | | | | | | | | | |
| | | | | | | | | | | | |
| | | | Biotechnology - 3.3% | | | | | | | | |
| | 581,800 | | Celgene Corp.* | | | 30,503,909 | | | | 45,101,136 | |
| | | | | | | | | | | | |
| | | | Life Sciences Tools & Services - 2.1% | | | | | | | | |
| | 666,300 | | Agilent Technologies Inc.* | | | 21,918,810 | | | | 29,657,013 | |
| | | | | | | | | | | | |
| | | | Managed Health Care - 2.4% | | | | | | | | |
| | 565,800 | | UnitedHealth Group Inc. | | | 31,543,656 | | | | 33,348,252 | |
| | | | Total Health Care | | | 83,966,375 | | | | 108,106,401 | |
| | | | | | | | | | | | |
| | | | This sector is 28.7% above your Fund’s cost. | | | | | | | | |
| | | | | | | | | | | | |
| INDUSTRIALS | | | | | | | | | | |
| | | | | | | | | | | | |
| | | | Construction & Engineering - 2.4% | | | | | | | | |
| | 555,000 | | Fluor Corp. | | | 33,735,607 | | | | 33,322,200 | |
| | | | | | | | | | | | |
| | | | Industrial Machinery - 2.4% | | | | | | | | |
| | 793,300 | | Ingersoll-Rand PLC | | | 31,812,347 | | | | 32,802,955 | |
| | | | | | | | | | | | |
| | | | Railroads - 2.8% | | | | | | | | |
| | 552,409 | | Kansas City Southern* | | | 30,825,830 | | | | 39,602,201 | |
| | | | | | | | | | | | |
| | | | Trucking - 2.6% | | | | | | | | |
| | 2,394,600 | | Hertz Global Holdings Inc.* | | | 32,054,710 | | | | 36,014,784 | |
| | | | Total Industrials | | | 128,428,494 | | | | 141,742,140 | |
| | | | | | | | | | | | |
| | | | This sector is 10.4% above your Fund’s cost. | | | | | | | | |
| | | | | | | | | | | | |
| INFORMATION TECHNOLOGY | | | | | | | | |
| | | | | | | | | | | | |
| | | | Application Software - 2.0% | | | | | | | | |
| | 654,300 | | Autodesk Inc.* | | | 27,605,644 | | | | 27,689,976 | |
| | | | | | | | | | | | |
| | | | Communications Equipment - 6.6% | | | | | | | | |
| | 1,920,200 | | Cisco Systems Inc. | | | 35,402,253 | | | | 40,612,230 | |
| | 751,200 | | Qualcomm Inc. | | | 41,623,056 | | | | 51,096,624 | |
| | | | | | | | | | | | |
| | | | Computer Hardware - 7.9% | | | | | | | | |
| | 181,500 | | Apple Inc.* | | | 29,784,624 | | | | 108,803,806 | |
| | | | | | | | | | | | |
| | | | Computer Storage & Peripherals - 5.1% | | | | | | | | |
| | 1,565,400 | | EMC Corp.* | | | 34,491,479 | | | | 46,774,152 | |
| | 871,900 | | Seagate Technology PLC | | | 14,200,608 | | | | 23,497,705 | |
| | | | | | | | | | | | |
| | | | Internet Software & Services - 3.9% | | | | | | | | |
| | 1,449,100 | | eBay Inc.* | | | 46,537,532 | | | | 53,457,299 | |
| | | | | | | | | | | | |
| | | | IT Consulting & Other Services - 5.4% | | | | | | | | |
| | 715,000 | | Accenture PLC | | | 40,894,606 | | | | 46,117,500 | |
| | 140,160 | | International Business | | | | | | | | |
| | | | Machines Corp. | | | 29,273,874 | | | | 29,244,384 | |
| | | | | | | | | | | | |
| | | | Semiconductors - 4.3% | | | | | | | | |
| | 667,300 | | Broadcom Corp. | | | 24,523,025 | | | | 26,224,890 | |
| | 2,183,700 | | NVIDIA Corp.* | | | 32,855,285 | | | | 33,607,143 | |
| | | | | | | | | | | | |
| | | | Systems Software - 2.7% | | | | | | | | |
| | 583,900 | | Check Point Software | | | | | | | | |
| | | | Technologies Ltd.* | | | 26,623,920 | | | | 37,276,176 | |
| | | | Total Information Technology | | | 383,815,906 | | | | 524,401,885 | |
| | | | | | | | | | | | |
| | | | This sector is 36.6% above your Fund’s cost. | | | | | | | | |
Brandywine Blue Fund
Schedule of Investments (Continued)
March 31, 2012 (Unaudited)
| Shares | | | | Cost | | | Value | |
| | | | | | | | | |
| Common Stocks - 97.2% (a) (Continued) | | | | | | |
| | | | | | | | | |
| MATERIALS | | | | | | | | |
| | | | | | | | | |
| | | Fertilizers & Agricultural Chemicals - 0.7% | | | | | | |
| | 167,900 | | The Mosaic Co. | | $ | 9,889,542 | | | $ | 9,283,190 | |
| | | | Total Materials | | | 9,889,542 | | | | 9,283,190 | |
| | | | | | | | | | | | |
| | | | This sector is 6.1% below your Fund’s cost. | | | | | | | | |
| | | | | | | | | | | | |
| | | | Total common stocks | | | 1,109,694,743 | | | | 1,346,607,036 | |
| | | | | | | | | | | | |
| Principal | | | | | | | | | | |
| Amount | | | | | | | | |
| | | | | | | | | | | | |
| Short-Term Investments - 3.9% (a) | | | | | | | | |
| | | | | | | | | | | | |
| | | | Commercial Paper - 3.7% | | | | | | | | |
| $ | 52,000,000 | | Prudential Funding, LLC, | | | | | | | | |
| | | | due 04/02/12, discount of 0.10% | | | 51,999,856 | | | | 51,999,856 | |
| | | | | | | | | | | | |
| | | | Variable Rate Demand Note - 0.2% | | | | | | | | |
| | 2,164,468 | | American Family Financial | | | | | | | | |
| | | | Services, 0.10% | | | 2,164,468 | | | | 2,164,468 | |
| | | | Total short-term investments | | | 54,164,324 | | | | 54,164,324 | |
| | | | | | | | | | | | |
| | | | Total investments - 101.1% | | $ | 1,163,859,067 | | | | 1,400,771,360 | |
| | | | Liabilities, less | | | | | | | | |
| | | | other assets - (1.1%) (a) | | | | | | | (15,674,969 | ) |
| | | | TOTAL NET ASSETS - 100.0% | | | | | | $ | 1,385,096,391 | |
(a) Percentages for the various classifications relate to net assets.
* Non-dividend paying security.
The accompanying notes to financial statements are an integral part of this schedule.
Statement of Operations
For the Six Months Ended March 31, 2012 (Unaudited)
| Income: | | | |
| Dividends | | $ | 3,840,930 | |
| Interest | | | 35,721 | |
| Total income | | | 3,876,651 | |
| | | | | |
| Expenses: | | | | |
| Management fees | | | 7,011,875 | |
| Transfer agent fees | | | 796,428 | |
| Printing and postage expense | | | 457,054 | |
| Administrative and accounting services | | | 72,156 | |
| Board of Directors fees and expenses | | | 63,852 | |
| Registration fees | | | 45,445 | |
| Custodian fees | | | 43,364 | |
| Professional fees | | | 38,825 | |
| Insurance expense | | | 25,680 | |
| Other expenses | | | 4,357 | |
| Total expenses | | | 8,559,036 | |
| | | | | |
| Net Investment Loss | | | (4,682,385 | ) |
| Net Realized Gain on Investments | | | 96,225,278 | |
| Net Increase in Unrealized Appreciation on Investments | | | 231,724,825 | |
| Net Gain on Investments | | | 327,950,103 | |
| Net Increase in Net Assets Resulting From Operations | | $ | 323,267,718 | |
The accompanying notes to financial statements are an integral part of this statement.
Brandywine Blue Fund
Statements of Changes in Net Assets
For the Six Months Ended March 31, 2012 (Unaudited)
and for the Year Ended September 30, 2011
| | | 2012 | | | 2011 | |
| Operations: | | | | | | |
| Net investment loss | | $ | (4,682,385 | ) | | $ | (8,129,716 | ) |
| Net realized gain on investments | | | 96,225,278 | | | | 216,689,924 | |
| Net increase (decrease) in unrealized appreciation on investments | | | 231,724,825 | | | | (171,710,740 | ) |
| Net increase in net assets resulting from operations | | | 323,267,718 | | | | 36,849,468 | |
| | | | | | | | | |
| Fund Share Activities: | | | | | | | | |
| Proceeds from shares issued (2,977,249 and 15,420,697 shares, respectively) | | | 72,674,261 | | | | 387,493,439 | |
| Cost of shares redeemed (20,708,251 and 40,706,584 shares, respectively) | | | (498,362,869 | ) | | | (994,416,731 | ) |
| Net decrease in net assets derived from Fund share activities | | | (425,688,608 | ) | | | (606,923,292 | ) |
| Total Decrease | | | (102,420,890 | ) | | | (570,073,824 | ) |
| | | | | | | | | |
| Net Assets at the Beginning of the Period | | | 1,487,517,281 | | | | 2,057,591,105 | |
| Net Assets at the End of the Period | | $ | 1,385,096,391 | | | $ | 1,487,517,281 | |
| (Includes undistributed net investment income of $0 and $0, respectively) | | | | | | | | |
Financial Highlights
(Selected data for each share of the Fund outstanding throughout each period)
| | | For the Six Months | | | | | | | | | | | | | | | | |
| | | Ended March 31, 2012 | | | Years Ended September 30, | |
| | | | | | 2011 | | | | | | 2009 | | | | | | 2007 | |
| | | | | | | | | | | | | | | | | | | |
| PER SHARE OPERATING PERFORMANCE: | | | | | | | | | | | | | | | | | | |
| Net asset value, beginning of period | | $ | 21.50 | | | $ | 21.78 | | | $ | 20.67 | | | $ | 23.86 | | | $ | 38.18 | | | $ | 31.15 | |
| | | | | | | | | | | | | | | | | | | | | | | | | |
| Income from investment operations: | | | | | | | | | | | | | | | | | | | | | | | | |
Net investment (loss) income(1) | | | (0.08 | ) | | | (0.10 | ) | | | (0.06 | ) | | | 0.04 | | | | (0.07 | ) | | | (0.02 | ) |
| Net realized and unrealized gains (losses) | | | | | | | | | | | | | | | | | | | | | | | | |
| on investments | | | 5.50 | | | | (0.18 | ) | | | 1.24 | | | | (3.23 | ) | | | (10.38 | ) | | | 8.15 | |
| | | | | | | | | | | | | | | | | | | | | | | | | |
| Total from investment operations | | | 5.42 | | | | (0.28 | ) | | | 1.18 | | | | (3.19 | ) | | | (10.45 | ) | | | 8.13 | |
| | | | | | | | | | | | | | | | | | | | | | | | | |
| Less distributions: | | | | | | | | | | | | | | | | | | | | | | | | |
| Distributions from net investment income | | | — | | | | — | | | | (0.07 | ) | | | — | | | | — | | | | — | |
| Distributions from net realized gains | | | — | | | | — | | | | — | | | | — | | | | (3.87 | ) | | | (1.10 | ) |
| | | | | | | | | | | | | | | | | | | | | | | | | |
| Total from distributions | | | — | | | | — | | | | (0.07 | ) | | | — | | | | (3.87 | ) | | | (1.10 | ) |
| | | | | | | | | | | | | | | | | | | | | | | | | |
| Net asset value, end of period | | $ | 26.92 | | | $ | 21.50 | | | $ | 21.78 | | | $ | 20.67 | | | $ | 23.86 | | | $ | 38.18 | |
| | | | | | | | | | | | | | | | | | | | | | | | | |
| TOTAL RETURN | | | 25.21 | %(a) | | | (1.29 | %) | | | 5.71 | % | | | (13.37 | %) | | | (30.70 | %) | | | 26.82 | % |
| | | | | | | | | | | | | | | | | | | | | | | | | |
| Ratios/Supplemental Data: | | | | | | | | | | | | | | | | | | | | | | | | |
| Net assets, end of period (in 000’s $) | | | 1,385,096 | | | | 1,487,517 | | | | 2,057,591 | | | | 2,461,907 | | | | 3,323,668 | | | | 3,304,281 | |
| Ratio of expenses to average net assets | | | 1.22 | %(b) | | | 1.18 | % | | | 1.17 | % | | | 1.16 | % | | | 1.13 | % | | | 1.12 | % |
| Ratio of net investment (loss) income | | | | | | | | | | | | | | | | | | | | | | | | |
| to average net assets | | | (0.67 | %)(b) | | | (0.38 | %) | | | (0.27 | %) | | | 0.21 | % | | | (0.23 | %) | | | (0.06 | %) |
| Portfolio turnover rate | | | 114 | %(a) | | | 250 | % | | | 212 | % | | | 261 | % | | | 267 | % | | | 184 | % |
| | | | | | | | | | | | | | | | | | | | | | | | | |
(1) | | Net investment (loss) income per share was calculated using average shares outstanding. |
(a) | | Not Annualized. |
(b) | | Annualized. |
The accompanying notes to financial statements are an integral part of these statements.
The Brandywine Funds
Notes to Financial Statements
March 31, 2012 (Unaudited)
| (1) | Summary of Significant Accounting Policies |
| | |
| | The following is a summary of significant accounting policies of Brandywine Fund, Inc. (the “Brandywine Fund”) and Brandywine Blue Fund (the “Blue Fund,” one of two Funds in a series of the Brandywine Blue Fund, Inc.) (collectively the “Funds”). Each Fund is registered as a diversified open-end management company under the Investment Company Act of 1940 (the “Act”), as amended. The assets and liabilities of each Fund are segregated and a shareholder’s interest is limited to the Fund in which the shareholder owns shares. The Brandywine Fund was incorporated under the laws of Maryland on October 9, 1985. The Blue Fund was incorporated under the laws of Maryland on November 13, 1990. The investment objective of each Fund is to produce long-term capital appreciation principally through investing in common stocks. |
| | (a) | Each security, excluding short-term investments, is valued at the last sale price reported by the principal security exchange on which the issue is traded. Securities that are traded on the Nasdaq Markets are valued at the Nasdaq Official Closing Price, or if no sale is reported, the latest bid price. Securities which are traded over-the-counter are valued at the latest bid price. Securities for which quotations are not readily available are valued at fair value as determined by the investment adviser under the supervision of the Board of Directors. The fair value of a security may differ from the last quoted price and the Fund may not be able to sell a security at the estimated fair value. Market quotations may not be available, for example, if trading in particular securities has halted during the day and not resumed prior to the close of trading on the New York Stock Exchange. As of March 31, 2012, there were no securities that were internally fair valued. Short-term investments with maturities of 60 days or less are valued at amortized cost which approximates value. For financial reporting purposes, investment transactions are recorded on the trade date; however, for purposes of executing shareholder transactions, the Funds record changes in holdings of portfolio securities no later than the first business day after the trade date in accordance with Rule 2a-4 of the Act. Accordingly, certain differences between net asset value for financial reporting and for executing shareholder transactions may arise. |
| | | |
| | | The Funds adopted the provisions of the Financial Accounting Standards Board (“FASB”) Accounting Standards Codification “Fair Value Measurements and Disclosures” Topic 820 (“ASC 820”), effective October 1, 2008. Under ASC 820, fair value is defined as the price that would be received to sell an asset or paid to transfer a liability (i.e., the “exit price”) in an orderly transaction between market participants at the measurement date. |
| | | |
| | | In determining fair value, the Funds use various valuation approaches. ASC 820 establishes a fair value hierarchy for inputs used in measuring fair value that maximizes the use of observable inputs and minimizes the use of unobservable inputs by generally requiring that the most observable inputs be used when available. Observable inputs are those that market participants would use in pricing the asset or liability based on market data obtained from sources independent of the Funds. Unobservable inputs reflect the Funds’ assumptions about the inputs market participants would use in pricing the asset or liability developed based on the best information available in the circumstances. The inputs or methodologies used for valuing securities are not necessarily an indication of the risks associated with investing in those securities. |
| | | |
| | | The fair value hierarchy is categorized into three levels based on the inputs as follows: |
| | | |
| | Level 1 – | Valuations based on unadjusted quoted prices in active markets for identical assets. |
| | | |
| | Level 2 – | Valuations based on quoted prices for similar securities or in markets that are not active or for which all significant inputs are observable, either directly or indirectly. |
| | | |
| | Level 3 – | Valuations based on inputs that are unobservable and significant to the overall fair value measurement. |
| | | The following table summarizes the Funds’ investments as of March 31, 2012, based on the inputs used to value them: |
| | | |
| | | Brandywine Fund | | | Blue Fund | |
| Valuation Inputs | | Investments in Securities | | | Investments in Securities | |
| Level 1 – Common Stocks | | $ | 1,277,973,101 | | | $ | 1,346,607,036 | |
| | | | | | | | | |
| Level 2 – Short-Term Commercial Paper | | | 29,899,917 | | | | 51,999,856 | |
| Variable Rate Demand Notes | | | 1,269,331 | | | | 2,164,468 | |
| Total Level 2 | | | 31,169,248 | | | | 54,164,324 | |
| | | | | | | | | |
| Level 3 – | | | — | | | | — | |
| Total | | $ | 1,309,142,349 | | | $ | 1,400,771,360 | |
The Brandywine Funds
Notes to Financial Statements (Continued)
March 31, 2012 (Unaudited)
| (1) | Summary of Significant Accounting Policies (Continued) |
| | | |
| | | It is the Funds’ policy to recognize transfers between levels at the end of the quarterly reporting period. There were no transfers between levels during the period ended March 31, 2012. |
| | | |
| | | See the Schedules of Investments for the investments detailed by industry classification. |
| | | |
| | | On May 12, 2011, the FASB issued Accounting Standards Update No. 2011-04 (“ASU No. 2011-04”) modifying ACS 820. At the same time, the International Accounting Standards Board (“IASB”) issued International Financial Reporting Standard (“IFRS”) 13, Fair Value Measurement. The objective of the FASB and IASB is convergence of their guidance on fair value measurements and disclosures. Specifically, the ASU requires reporting entities to: i) disclose the amounts of any transfers between Level 1 and Level 2 and the reasons for the transfers; ii) disclose for Level 3 fair value measurements: a) quantitative information about significant unobservable inputs used; b) a description of the valuationprocesses used bythereportingentityand; c)a narrative description of the sensitivity of the fair value measurement to changes in unobservable inputs if a change in those inputs might result in a significantly higher or lower fair value measurement. The effective date of ASU No. 2011-04 is for interim and annual periods beginning after December 15, 2011. ASU No. 2011-04 has been adopted by the Funds and there has been no material impact to the disclosures. |
| | | |
| | (b) | Net realized gains and losses on sales of securities are computed on the identified cost basis. |
| | | |
| | (c) | Dividend income is recorded on the ex-dividend date. Interest income is recorded on the accrual basis. |
| | | |
| | (d) | The Funds have investments in short-term variable rate demand notes, which are unsecured instruments. The Funds may be susceptible to credit risk with respect to these notes to the extent the issuer defaults on its payment obligation. The Funds’ policy is to monitor the creditworthiness of the issuer and nonperformance by these counterparties is not anticipated. |
| | | |
| | (e) | The preparation of financial statements in conformity with accounting principles generally accepted in the United States of America (“GAAP”) requires management to make estimates and assumptions that affect the reported amounts of assets and liabilities and disclosure of contingent assets and liabilities at the date of the financial statements and the reported amounts of revenues and expenses during the reporting period. Actual results could differ from these estimates. |
| | | |
| | (f) | No provision has been made for Federal income taxes since the Funds have elected to be taxed as “regulated investment companies” and intend to distribute substantially all net investment company taxable income and net capital gains to shareholders and otherwise comply with the provisions of the Internal Revenue Code applicable to regulated investment companies. |
| | | |
| | (g) | The Funds have reviewed all open tax years and major jurisdictions, which include Federal and the state of Maryland, and concluded that there are no significant uncertain tax positions that would require recognition in the financial statements. Open tax years are those that are open for exam by taxing authorities and, as of March 31, 2012, open Federal tax years include the tax years ended September 30, 2008 through 2011. The Funds have no examinations in progress and are also not aware of any tax positions for which it is reasonably possible that the total amounts of unrecognized tax benefits will significantly change in the next twelve months. |
| | | |
| | (h) | GAAP requires that permanent differences between income for financial reporting and tax purposes be reclassified in the capital accounts. For the year ended September 30, 2011 the reclassifications were as follows: |
| | | Undistributed | | | Accumulated | | | | |
| | | Net Investment | | | Net Realized | | | | |
| | | Income | | | Loss | | | Paid In Capital | |
| Brandywine Fund | | $ | 6,541,486 | | | $ | (69 | ) | | $ | (6,541,417 | ) |
| Blue Fund | | | 8,129,716 | | | | (506 | ) | | | (8,129,210 | ) |
| (2) | Investment Adviser and Management Agreements and Transactions With Related Parties |
| | |
| | Each Fund has a management agreement with Friess Associates, LLC (the “Adviser”), with whom certain Officers and a Director of the Funds are affiliated, to serve as investment adviser and manager. Under the terms of the agreements, each Fund will pay the Adviser a monthly management fee at the annual rate of one percent (1%) on the daily net assets of such Fund. |
| | |
| | The Adviser entered into sub-advisory agreements with its affiliate, Friess Associates of Delaware, LLC (the “Sub-Adviser”), to assist it in the day-to-day management of each of the Funds. The Adviser and, if so delegated, the Sub-Adviser supervise the investment portfolios of the Funds, directing the purchase and sale of investment securities in the day-to-day management of the Funds. The Adviser pays the Sub-Adviser a fee equal to 110% of the monthly expenses the Sub-Adviser incurs in performing its services as Sub-Adviser. This relationship does not increase the annual management fee the Funds pay to the Adviser. |
The Brandywine Funds
Notes to Financial Statements (Continued)
March 31, 2012 (Unaudited)
| (2) | Investment Adviser and Management Agreements and Transactions With Related Parties (Continued) |
| | |
| | The Adviser has voluntarily agreed to reimburse each Fund for expenses over 2% of the daily net assets of the Fund. No such reimbursements were required for the six months ended March 31, 2012. |
| | |
| | Each of the Funds currently pay the five independent directors annual fees of $23,300 each. The lead independent director and chairman of the audit committee are paid an additional $8,000 and $5,000 annually, respectively, divided proportionately among all the Funds. All of the corresponding fees the directors receive are paid quarterly to the directors and then invested on the payment date in shares of the Funds at the net asset value of the Funds on the payment date. The Funds also reimburse directors for travel costs incurred in order to attend meetings of the Board of Directors. For the six months ended March 31, 2012, the Funds expensed the following directors fees and costs: |
| | | | Brandywine | | | Blue | |
| | | | Fund | | | Fund | |
| | Directors Fees and Travel Costs Paid during the Period | | $ | 64,078 | | | $ | 63,852 | |
| | | | | | | | | | |
| | Under the Funds’ organizational documents, each Director, officer, employee or other agent of the Fund (including the Funds’ investment manager) is indemnified, to the extent permitted by the Act, against certain liabilities that may arise out of performance of their duties to the Funds. Additionally, in the normal course of business, the Funds enter into contracts that contain a variety of indemnification clauses. The Funds’ maximum exposure under these arrangements is unknown as this would involve future claims that may be made against the Funds that have not yet occurred. However, the Funds have not had prior claims or losses pursuant to these contracts and believes the risk of loss to be remote. |
| | |
| | At March 31, 2012, one financial intermediary is the record owner of approximately 31% of the Blue Fund’s shares. |
| | |
| (3) | Credit Agreements |
| | |
| | U.S. Bank, N.A. has made available to each Fund a $50,000,000 unsecured credit facility pursuant to Credit Agreements effective October 28, 2011, for the purpose of having cash available to cover incoming redemptions. Principal and interest of such loan under the Credit Agreements are due not more than 20 days after the date of the loan. Amounts under the credit facilities bear interest at a rate per annum equal to the current prime rate minus one percent on the amount borrowed. During the six months ended March 31, 2012, neither Fund borrowed against their Credit Agreement. The Credit Agreements are renewable annually on October 24. |
| | |
| (4) | Distributions to Shareholders |
| | |
| | Net investment income and net realized gains, if any, are distributed to shareholders at least annually. |
| | |
| (5) | Investment Transactions |
| | |
| | For the six months ended March 31, 2012, purchases and proceeds of sales of investment securities (excluding short-term investments) for the Funds were as follows: |
| | | | | | | Sale | |
| | | | Purchases | | | Proceeds | |
| | Brandywine Fund | | $ | 1,593,565,543 | | | $ | 1,854,159,439 | |
| | Blue Fund | | | 1,507,313,863 | | | | 1,921,917,796 | |
| (6) | Income Tax Information |
| | |
| | The following information for the Funds is presented on an income tax basis as of September 30, 2011: |
| | | | | | | Gross | | | Gross | | | Net Unrealized | | | Distributable | | | Distributable | |
| | | | Cost of | | | Unrealized | | | Unrealized | | | Depreciation | | | Ordinary | | | Long-Term | |
| | | | Investments | | | Appreciation | | | Depreciation | | | on Investments | | | Income | | | Capital Gains | |
| | Brandywine Fund | | $ | 1,429,423,058 | | | $ | 48,741,257 | | | $ | (146,728,301 | ) | | $ | (97,987,044 | ) | | $ — | | | $ — | |
| | Blue Fund | | | 1,544,405,817 | | | | 112,038,542 | | | | (117,098,725 | ) | | | (5,060,183 | ) | | | — | | | | — | |
| | The difference, if any, between the cost amounts for financial statement and federal income tax purposes is due primarily to timing differences in recognizing certain gains and losses in security transactions. |
The Brandywine Funds
Notes to Financial Statements (Continued)
March 31, 2012 (Unaudited)
| (6) | Income Tax Information (Continued) |
| | |
| | The tax components of dividends paid during the years ended September 30, 2011 and 2010, capital loss carryovers, which may be used to offset future capital gains, subject to Internal Revenue Code limitations (expiring in 2017 and 2018), as of September 30, 2011, and tax basis post-October losses as of September 30, 2011, which are not recognized for tax purposes until the first day of the following fiscal year are: |
| | | | September 30, 2011 | | | | September 30, 2010 | |
| | | | Ordinary | | | Long-Term | | | Net Capital | | | | | | Ordinary | | | Long-Term | |
| �� | | | Income | | | Capital Gains | | | Loss | | | Post-October | | | Income | | | Capital Gains | |
| | | | Distributions | | | Distributions | | | Carryovers | | | Losses | | | Distributions | | | Distributions | |
| | Brandywine Fund | | $ | — | | | $ | — | | | $ | 871,516,398 | | | $ | — | | | $ | — | | | $ | — | |
| | Blue Fund | | | — | | | | — | | | | 1,298,428,007 | | | | — | | | | 7,553,091 | | | | — | |
| | Since there were no ordinary distributions paid for the Funds’ for the year ended September 30, 2011, there were no distributions designated as qualifying for the dividends received deduction for corporate shareholders nor as qualified dividend income under the Jobs and Growth Tax Relief Act of 2003 (unaudited). |
Cost Discussion
Mutual fund shareholders incur two types of costs: (1) transaction costs, including sales charges (loads) on purchase payments, reinvested dividends, or other distributions; redemption fees; and exchange fees; and (2) ongoing costs, including management fees; distribution [and/or service] (12b-1) fees; and other fund expenses. Brandywine and Brandywine Blue do not have 12b-1 distribution fees. This example is intended to help you understand your ongoing costs (in dollars) of investing in the Brandywine Funds and to compare these costs with the ongoing costs of investing in other mutual funds.
In addition to the costs highlighted and described below, the only Fund transaction costs you might currently incur would be wire fees ($15 per wire), if you choose to have proceeds from a redemption wired to your bank account instead of receiving a check. Additionally, U.S. Bank charges an annual processing fee ($15) if you maintain an IRA account with the Funds. To determine your total costs of investing in the Funds, you would need to add any applicable wire or IRA processing fees you’ve incurred during the period to the costs provided in the example below.
The example is based on an investment of $1,000 invested at the beginning of the period and held for the entire period from October 1, 2011 through March 31, 2012.
Actual Expenses
The first line of the table below provides information about actual account values and actual expenses. You may use the information in this line, together with the amount you invested, to estimate the expenses that you paid over the period. Simply divide your account value by $1,000 (for example, an $8,600 account value divided by $1,000 = 8.6), then multiply the result by the number in the first line under the heading entitled “Expenses Paid During Period” to estimate the expenses you paid on your account during this period.
Hypothetical Example for Comparison Purposes
The second line of the table below provides information about hypothetical account values and hypothetical expenses based on the Fund’s actual expense ratio and an assumed rate of return of 5% per year before expenses, which is not the Fund’s actual return. The hypothetical account values and expenses may not be used to estimate the actual ending account balance or expenses you paid for the period. You may use this information to compare the ongoing costs of investing in the Funds and other funds. To do so, compare this 5% hypothetical example with the 5% hypothetical examples that appear in the shareholder reports of the other funds.
Please note that the expenses shown in the table are meant to highlight your ongoing costs only and do not reflect any transactional costs. While the Brandywine Funds currently do not assess sales charges, redemption or exchange fees, other funds do, and those costs will not be reflected in their expense example tables. Therefore, the second line of the table is useful in comparing ongoing costs only, and will not help you determine the relative total costs of owning different funds.
| | Beginning | Ending | |
| | Account | Account | Expenses Paid |
| | Value | Value | During Period* |
| | 10/01/11 | 3/31/12 | 10/01/11-3/31/12 |
| Brandywine Actual | $1,000.00 | $1,203.00 | $6.11 |
| Hypothetical (5% return before expenses) | $1,000.00 | $1,019.40 | $5.60 |
| Brandywine Blue Actual | $1,000.00 | $1,252.10 | $6.87 |
| Hypothetical (5% return before expenses) | $1,000.00 | $1,018.90 | $6.16 |
| * | Expenses are equal to the Funds’ annualized expense ratios of 1.11% and 1.22%, multiplied by the average account value over the period, multiplied by 183/366 (to reflect the one-half year period between October 1, 2011 and March 31, 2012). |
Brandywine Funds Advisory Agreements
On December 5, 2011, the Board of Directors (“Directors”) of the Funds approved the continuation of the advisory agreements with Friess Associates, LLC (“Friess”). Prior to approving the continuation of the advisory agreements, the Directors considered:
| | • | | the nature, extent and quality of the services provided by Friess |
| | | | |
| | • | | the investment performance of the Funds |
| | | | |
| | • | | the costs of the services to be provided and profits to be realized by Friess from its relationship with the Funds |
| | | | |
| | • | | the extent to which economies of scale would be realized as the Funds grow and whether fee levels reflect these economies of scale |
| | | | |
| | • | | the expense ratios of the Funds |
| | | | |
| | • | | other revenue to Friess and its affiliates from their relationship with the Funds |
| | | | |
| | • | | the manner in which portfolio transactions for the Funds are conducted, including the use of soft dollars |
In considering the nature, extent and quality of the services provided by Friess, the Directors reviewed a report describing the portfolio management, shareholder communication and servicing, and regulatory compliance services provided by Friess to the Funds. The Directors concluded that Friess was providing essential services to the Funds. In particular, the Directors concluded that Friess was preparing reports to shareholders in addition to those required by law and continued to generate increased written communications, at Friess’ expense, to support shareholders.
The Directors compared the performance of the Funds to benchmark indexes over various periods of time and concluded that the performance of the Funds warranted the continuation of the advisory agreements.
In concluding that the advisory fees payable by the Funds were reasonable, the Directors reviewed a report of the costs of services provided, and the profits realized by Friess from its relationship with the Funds and concluded that such profits were reasonable and not excessive. The Directors also reviewed reports comparing the expense ratios and advisory fees paid by the Funds to those paid by other comparable mutual funds and concluded that the advisory fees paid by the Funds were higher than the average advisory fees paid by comparable mutual funds, but the expense ratios of the Funds were lower than the average expense ratios of comparable mutual funds. The Directors also considered the Funds’ portfolio turnover rate and that all clients of Friess pay the same 1% advisory fee. They noted that this fee would not be adjusted if economies of scale were realized during the current contract period as the Funds grew, but did not consider that factor to be significant in light of the other factors considered, particularly the fact that the profits were reasonable and not excessive. The Directors noted that having the same fee for all clients eliminated conflicts of interest that would be present if Friess charged different fees to different clients.
Finally, the Directors reviewed reports discussing the manner in which portfolio transactions for the Funds were conducted, including the use of soft dollars. Based on these reports, the Directors concluded that the research obtained by Friess was beneficial to the Funds and that Friess was executing the Funds’ portfolio transactions in a manner designed to obtain best execution for the Funds.
Additional Director Information, Proxy Voting Policy and Quarterly Portfolio Schedules
For additional information about the Directors and Officers or for a description of the policies and procedures that the Funds use to determine how to vote proxies relating to portfolio securities, please call (800) 656-3017 and request a Statement of Additional Information. One will be mailed to you free of charge. The Statement of Additional Information is also available on the website of the Securities and Exchange Commission (the “Commission”) at http://www.sec.gov or the Funds’ website at http://www.brandywinefunds.com. Information on how the Funds voted proxies relating to portfolio securities is available on the Funds’ website or the website of the Commission no later than August 31 for the prior twelve months ending June 30. The Funds file their complete schedule of portfolio holdings with the Commission for the first and third quarters of each fiscal year on Form N-Q. The Funds’ Forms N-Q are available on the Commission’s website. The Funds’ Forms N-Q may be reviewed and copied at the Commission’s Public Reference Room in Washington, D.C. Information on the operation of the Public Reference Room may be obtained by calling 1-800-SEC-0330.
Board of Directors
| | | |
|  |  |
| | | |
| William F. D’Alonzo | C. Quentin S. Jackson | Stuart A. McFarland |
| CEO and CIO | Former President and CEO | Managing Partner |
| Friess Associates | Nuclear Electric Insurance Limited | Federal City Capital Advisors, LLC |
| | | |
 |  |  |
| | | |
| Thomas D. Wren | Stephen M. Wynne | James W. Zug |
| Former Senior Advisor | Former CEO | Former Senior Partner |
| Promontory Financial Group, LLC | BNY Mellon, U.S. Funds Services | PricewaterhouseCoopers LLP |
| | | | | |
| |  |  | The Brandywine Funds | |
| | | | | |
| | Foster S. Friess | | | |
| | Founder | | | |
| | | | | |
| | | | | |
| | | | | |
Investment Adviser: Friess Associates, LLC | Administrator, Accountant & Transfer Agent: U.S. Bancorp Fund Services, LLC |
Investment Sub-Adviser: Friess Associates of Delaware, LLC | Independent Registered Public Accounting Firm: PricewaterhouseCoopers LLP |
Custodian: U.S. Bank, N.A. | Distributor: Quasar Distributors, LLC |
Legal Counsel: Foley & Lardner LLP | |
Officers: William D’Alonzo, Chairman and President;
Joseph Fields, Vice President; Scott Gates, Vice President;
Gordon Kaiser, Vice President and Treasurer; David Marky, Chief Compliance Officer and Vice President; Colleen Rowley, Secretary
Report Editor: Chris Aregood Report Staff: David Marky, Adam Rieger
4/12
Item 2. Code of Ethics.
Not applicable for semi-annual reports.
Item 3. Audit Committee Financial Expert.
Not applicable for semi-annual reports.
Item 4. Principal Accountant Fees and Services.
Not applicable for semi-annual reports.
Item 5. Audit Committee of Listed Registrants.
Not applicable to registrants who are not listed issuers (as defined in Rule 10A-3 under the Securities Exchange Act of 1934).
Item 6. Schedule of Investments.
| (a) | The Schedule of Investments in securities of unaffiliated issuers is included as part of the report to shareholders filed under Item 1 of this Form. |
Item 7. Disclosure of Proxy Voting Policies and Procedures for Closed-End Management Investment Companies
Not applicable.
Item 8. Portfolio Managers of Closed-End Management Investment Companies.
Not applicable.
Item 9. Purchases of Equity Securities By Closed-End Management Investment Company and Affiliated Purchasers.
Not applicable.
Item 10. Submission of Matters to a Vote of Security Holders.
None.
Item 11. Controls and Procedures.
| (a) | The Registrant’s disclosure controls and procedures are periodically evaluated. As of April 19, 2012, the date of the last evaluation, the Registrant’s officers have concluded that the Registrant’s disclosure controls and procedures are adequate. |
| (b) | The Registrant’s internal controls are periodically evaluated. There were no changes in the Registrant’s internal control over financial reporting that occurred during the second fiscal quarter of the period covered by this report that have materially affected, or are reasonably likely to materially affect, such controls. |
Item 12. Exhibits.
| (a) | (1) Any code of ethics or amendment thereto. Not applicable. |
(2) Certifications pursuant to Section 302 of the Sarbanes-Oxley Act of 2002. Filed herewith.
(3) Any written solicitation to purchase securities under Rule 23c-1 under the Act sent or given during the period covered by the report by or on behalf of the Registrant to 10 or more persons. Not applicable to open-end investment companies.
| (b) | Certification pursuant to Section 906 of the Sarbanes-Oxley Act of 2002. Furnished herewith. |
SIGNATURES
Pursuant to the requirements of the Securities Exchange Act of 1934 and the Investment Company Act of 1940, the registrant has duly caused this report to be signed on its behalf by the undersigned, thereunto duly authorized.
Brandywine Fund, Inc.
Registrant
By /s/William F. D’Alonzo
William F. D’Alonzo, President, Principal Executive Officer
Date April 19, 2012
Pursuant to the requirements of the Securities Exchange Act of 1934 and the Investment Company Act of 1940, this report has been signed below by the following persons on behalf of the registrant and in the capacities and on the dates indicated.
Brandywine Fund, Inc.
Registrant
By /s/William F. D’Alonzo
William F. D’Alonzo, President, Principal Executive Officer
Brandywine Fund, Inc.
Registrant
By /s/Gordon Kaiser
Gordon Kaiser, Treasurer, Principal Financial Officer