UNITED STATES
SECURITIES AND EXCHANGE COMMISSION
Washington, D.C. 20549
FORM N-CSR
CERTIFIED SHAREHOLDER REPORT OF REGISTERED
MANAGEMENT INVESTMENT COMPANIES
Investment Company Act file number
811-04447
Brandywine Fund, Inc.
(Exact name of registrant as specified in charter)
P.O. Box 4166
Greenville, DE 19807
(Address of principal executive offices) (Zip code)
William F. D’Alonzo
Friess Associates, LLC
P.O. Box 4166
Greenville, Delaware 19807
(Name and address of agent for service)
(302) 656-3017
Registrant's telephone number, including area code:
Date of fiscal year end: September 30
Date of reporting period: 03/31/2009
Item 1. Reports to Stockholders.
| Managed by Friess Associates, LLC | Semi-Annual Report | March 31, 2009 |
Dear Fellow Shareholders:
The stock market’s descent accelerated in the March quarter, at one point pushing major market barometers back to 1996 levels. Then beaten-down financials and other areas hit hard in the downturn led a late-quarter rally that regained some of the market’s previously lost ground.
Brandywine Fund declined 7.23 percent in the March quarter versus declines in the Russell 3000 and Russell 3000 Growth Indexes of 10.80 and 4.54 percent. Brandywine Blue Fund declined 9.54 percent as the S&P 500, Russell 1000 and Russell 1000 Growth Indexes declined 11.01, 10.45 and 4.12 percent.
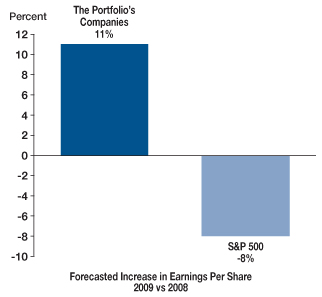
Even with the big March rally that finished the quarter, indexes ended the period at levels that made it seem as if the dot-com bubble, collapse and hard-earned recovery that followed never happened. We all know those events did take place and, as we did throughout that time, your team stayed focused on reasonably priced companies with the ability to grow earnings in the near-term.
During the first two months of the quarter, market sentiment reflected rising fears about the recession and the possibility that the government could nationalize beleaguered banks. Remaining focused on visible earnings trends served the Brandywine Funds well during this time of heightened anxiety. Both Funds contained their declines better than their respective benchmarks on a year-to-date basis through the market low on March 9.
The relative performance advantage shrank in the subsequent rally as attitudes toward the issues that concerned investors the most earlier in the quarter abruptly moved to the opposite extreme. Companies from the financial, materials and industrial sectors drove indexes higher even as their earnings outlooks continued to deteriorate.
In March, downward revisions to consensus earnings estimates for financial companies in the S&P 500 Index outnumbered upward revisions 10-to-2, according to Banc of America Securities – Merrill Lynch. The ratio for both the materials and industrial companies in the index was 10-to-1. Given the poor earnings conditions in these areas, the Brandywine Funds had very little exposure to sectors that fared especially well in the rally.
Looking at the quarter as a whole, holdings from the consumer discretionary sector gained ground for Brandywine and contributed most to the Fund’s performance versus its benchmarks.
Family Dollar Stores and Dollar Tree were top contributors to Brandywine’s results as cost-conscious consumers drove solid earnings gains. Family Dollar and Dollar Tree beat estimates in their most recently reported quarters with 14 and 11 percent year-over-year earnings growth.
Auto parts retailers O’Reilly Automotive and AutoZone were also standout performers for Brandywine as economic conditions encouraged more do-it-yourself repair work and closing dealership service centers reduced competition for do-it-for-me corner garages.
| | Brandywine | Brandywine Blue |
| Cumulative Total Return | % Change | % Change |
| Quarter | -7.23 | -9.54 |
| One Year | -40.00 | -42.12 |
| Five Years | -13.68 | -15.94 |
| Ten Years | 18.06 | 19.91 |
| Inception | 809.09* | 391.93** |
| | |
| Annualized Total Return | | |
| Five Years | -2.90 | -3.41 |
| Ten Years | 1.67 | 1.83 |
| Inception | 9.96* | 9.14** |
| *12/30/85 **1/10/91 | | |
| | |
| Expense Ratio*** | | |
| Brandywine | 1.08% |
| Brandywine Blue | 1.13% |
| ***As stated in the Prospectus dated January 30, 2009 | | |
Performance data quoted represent past performance; past performance does not guarantee future results. The investment return and principal value of an investment will fluctuate so that an investor’s shares, when redeemed, may be worth more or less than their original cost. Current performance of the Funds may be lower or higher than the performance quoted. Performance data current to the most recent month end may be obtained by visiting www.brandywinefunds.com.
O’Reilly and AutoZone grew earnings 6 and 22 percent in their most recent quarters, beating estimates in both instances.
A similar but less pronounced trend developed in the Brandywine Blue portfolio, where the holdings sensitive to consumer discretion that fared best benefited from broad trends in a difficult economic environment. Like Brandywine, Brandywine Blue held AutoZone. Brandywine Blue also held Apollo Group, a for-profit education provider that is experiencing significant enrollment gains amid rising unemployment. The operator of the University of Phoenix grew February-quarter earnings 88 percent, topping estimates by 18 percent.
Brandywine Blue’s most significant relative performance boost versus the S&P 500 and Russell 1000 Indexes came from health care holdings. St. Jude Medical was a notable contributor as its medical devices used for cardiac conditions proved to be non-discretionary purchases. The company exceeded estimates with 11 percent December-quarter earnings growth. Teva Pharmaceutical Industries (both Funds), which also beat December-quarter expectations, continued to benefit from increasing adoption of generic pharmaceuticals.
Technology holdings were a positive influence on Brandywine’s results that contributed significantly to the Fund’s performance against its benchmarks. Notable performers included Check Point Software and Nuance Communications, which surpassed December-quarter earnings estimates with 9 and 33 percent growth, respectively.
Holdings from the consumer staples sector detracted from results versus benchmarks for both Funds, a trend that was especially evident against growth indexes. Given the aggressive nature of the late-quarter rally, companies traditionally considered to be “defensive” in many cases failed to attract much attention.
Brandywine’s health care holdings, which generated breakeven results versus the Russell 3000 Index, were the largest detractors from performance versus the Russell 3000 Growth Index. Brandywine Blue’s health care holdings, the Fund’s biggest contributor to results relative to the S&P 500 and Russell 1000 Indexes, were a negative influence on performance against the Russell 1000 Growth Index.
For more information on the holdings that influenced March-quarter performance, please see Roses & Thorns on page 4 for Brandywine and page 6 for Brandywine Blue.
Three months ago at this time we discussed a tough quarter that ended with a rally. The rally seemed to “discount an economic quick-fix, with the very stocks punished in the summer and fall leading the way on optimism for an economy revived by government-led infrastructure spending,” as we wrote at the time. The just-completed March-quarter had a very similar feel, complete with a government-sponsored plan to tackle the credit crisis.
We continue to believe patience is necessary to navigate the often-manic market backdrop. There won’t be one event, one government plan or one rally that marks an end to the stock market’s slump. We see it as a progression, and any rallies that occur absent the fundamentals to warrant them will eventually prove themselves to be mirages. As we write this letter, less than one week since the end of the March quarter, the day’s top headline reads: “Rally Stumbles on Bank Worries.”
We want the recession to end as much as the next American, but we don’t think it’s prudent to risk prematurely investing in companies whose fortunes hinge on an abrupt economic turnaround. Right now, we continue to isolate the highest concentrations of earnings potential in the consumer discretionary, health care and technology sectors. Despite their recent runs, we don’t see much in the way of earnings strength in the financial, industrial, energy and materials sectors.
Macro signals can be mixed and hard to interpret. Should investors be encouraged that the rate of home price declines is slowing or concerned about the still-large inventory of unsold homes? Should we applaud that credit spreads are coming down or boo the fact that they remain high enough to inhibit corporate capital expenditures? Is the stimulus a good thing or will its impact on the budget deficit invite unintended consequences?
Answers are easier to come by on the individual-company level. As big an influence as broad factors can be on stocks during times like these, each company’s operational performance plays the primary role in determining its share price over time.
Thanks for your confidence in our company-by-company investment strategy and the team that implements it.
 | |
| Bill D’Alonzo | |
| Brandywine Funds President | April 7, 2009 |
Brandywine Fund
% Change in Top Ten Holdings From Book Cost as of March 31, 2009
| 1. | Affiliated Computer Services, Inc. | -1.7% | | 6. | | Life Technologies Corp. | +8.0% |
| 2. | Family Dollar Stores, Inc. | +24.8% | | 7. | | Church & Dwight Co., Inc. | -4.4% |
| 3. | ITT Educational Services, Inc. | +5.6% | | 8. | | Comcast Corp. | -16.8% |
| 4. | Check Point Software Technologies Ltd. | -1.8% | | 9. | | Ralcorp Holdings, Inc. | -15.8% |
| 5. | Everest Re Group, Ltd. | +2.0% | | 10. | | Teva Pharmaceutical Industries Ltd. | +5.5% |
| Earnings Growth | The Portfolio’s Market Capitalization |
| | |
| |
All figures are dollar weighted and based on data from Baseline. March 31, 2009.
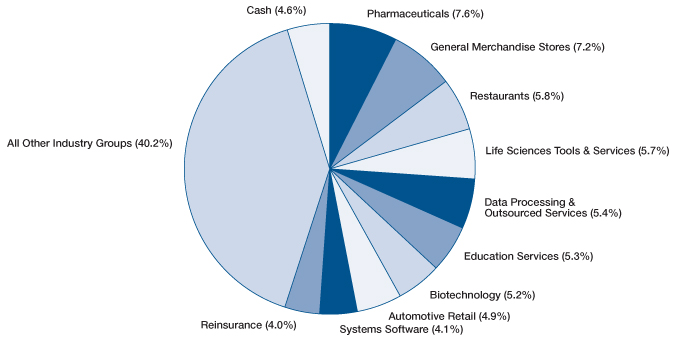
Top Ten Industry Groups
Brandywine Fund
March Quarter “Roses and Thorns”
| | $ Gain | | |
| Biggest $ Winners | (in millions) | % Gain | Reason for Move |
| Family Dollar Stores, Inc. | $23.2 | 28.4 | The discount retailer grew November-quarter earnings 20 percent, beating estimates by 5 percent. While second-quarter earnings haven’t been reported yet, same-store sales grew 6.4 percent in the three months through February. Cost-conscious customers have been increasingly attracted to Family Dollar’s low-priced consumable products, boosting sales and helping insulate it from the challenges non-value-oriented retailers currently face. |
Check Point Software Technologies Ltd. | $20.4 | 17.3 | December-quarter earnings grew 9 percent, beating estimates. Despite a challenging environment for capital spending on technology, protecting corporate networks remains a necessity and demand is solid for the company’s VPN/firewall products. Check Point’s recent purchase of Nokia’s security business is expected to provide synergies as Nokia’s appliance hardware portfolio allows the company to better provide customers with a complete security solution. |
| $9.2 | 16.8 | The aftermarket auto parts retailer grew December-quarter earnings 6 percent to $0.37 per share, beating estimates by 23 percent. The sharp falloff in new car purchases has been accompanied by an increase in cars on the road in need of maintenance and repair. Same-store sales increased 4 percent during the quarter, marking 16 consecutive years of positive comparable sales growth since O’Reilly became a public company. |
| Dollar Tree, Inc. | $7.7 | 11.7 | The largest single-price-point retailer in the country grew January-quarter earnings 11 percent. Sales rose 7 percent, marking the fourth consecutive quarter of year-over-year growth. Customers continue to be attracted to the strong value proposition Dollar Tree offers on consumer staples, particularly given its strategy of focusing on basics such as food and cleaning products. |
| $7.2 | 12.8 | The leading supplier of microcontrollers, which are semiconductors used across a wide array of electronic devices, is well positioned to weather the challenging economic environment. Due to its focus on 8-bit standard microcontrollers, which are used in everything from remote controls to vacuum cleaners, Microchip enjoys a broad, diversified customer base and is maintaining its strong balance sheet and cash flow profile despite the downturn. |
| | $ Loss | | |
| Biggest $ Losers | (in millions) | % Loss | Reason for Move |
| Pactiv Corp. | $37.5 | 46.9 | The supplier of specialty food packaging and consumer products including Hefty trash bags grew December-quarter earnings 18 percent, beating estimates by 10 percent. While fundamentals remain solid, shares traded lower on concerns that prices for the company’s resin-based products would come under pressure as oil prices declined. Questions regarding future pension fund obligations also weighed on shares. We sold Pactiv during the quarter to fund an idea with greater near-term earnings visibility. |
| Perrigo Co. | $28.7 | 34.7 | The manufacturer of store brand over-the-counter pharmaceuticals and consumer products lowered its fiscal 2009 outlook as higher-than-expected raw material costs impacted profitability for its vitamin and nutritional supplement business. A competitor’s bankruptcy created an opportunity for Perrigo in this business segment, but also forced the company to ramp up manufacturing ahead of schedule. It plans to bring manufacturing back in house to address the input cost issues. |
| W.R. Berkley Corp. | $24.9 | 27.7 | Aggressive pricing by struggling competitors receiving government assistance and an unforeseen loss in the company’s investment portfolio weighed on shares of the specialty insurance company during the quarter. We sold W.R. Berkley during the quarter as the weak pricing environment, while unsustainable, continues to overshadow the company’s strong capital position and capacity advantages. |
| Harris Corp. | $23.2 | 23.2 | The maker of communications devices used by the military grew December-quarter earnings 24 percent, beating estimates by 6 percent. Despite strong results, Harris lost ground as government orders were pushed out for its communications division while budgetary decisions were debated. We sold Harris to fund an idea with greater near-term earnings visibility. |
| Comcast Corp. | $19.1 | 19.2 | The largest cable-TV operator in the U.S. grew December-quarter earnings 35 percent, beating estimates by 23 percent. Shares fell on lower-than-expected new customer additions and fears that economic woes would prompt customers to cancel their service. Shares gained back some ground in March. Comcast’s strong balance sheet and ample cash flow should help it continue to perform well in a difficult environment. |
All gains/losses are calculated on an average cost basis
Brandywine Blue Fund
% Change in Top Ten Holdings From Book Cost as of March 31, 2009
| 1. | Teva Pharmaceutical Industries Ltd. | +2.2% | | 6. | | Yum! Brands, Inc. | +3.6% |
| 2. | Safeway Inc. | -20.2% | | 7. | | McDonald’s Corp. | +2.0% |
| 3. | Comcast Corp. | -19.0% | | 8. | | Baxter International Inc. | -8.6% |
| 4. | Abbott Laboratories | -15.8% | | 9. | | Express Scripts, Inc. | -29.2% |
| 5. | Kroger Co. | -17.5% | | 10. | | SAIC, Inc. | -4.1% |
| Earnings Growth | The Portfolio’s Market Capitalization |
| | |
| |
All figures are dollar weighted and based on data from Baseline. March 31, 2009.
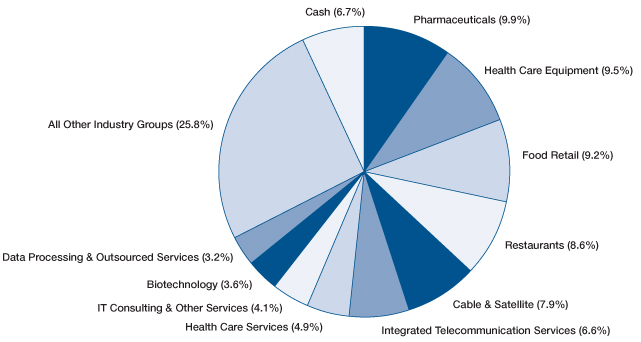
Top Ten Industry Groups
Brandywine Blue Fund
March Quarter “Roses and Thorns”
| | $ Gain | | |
| Biggest $ Winners | (in millions) | % Gain | Reason for Move |
| St. Jude Medical, Inc. | $11.2 | 11.6 | The medical device manufacturer targeting the cardiovascular and neuromodulation markets grew December-quarter earnings 8 percent, beating estimates. The majority of St. Jude’s sales are tied to its cardiac-rhythm management devices, where demand remains intact regardless of economic conditions. St. Jude’s strong distribution network, leading position in the pacemaker segment, and new defibrillator and cardiac resynchronization therapy products are helping it gain market share. |
| AutoZone, Inc. | $11.2 | 10.3 | AutoZone grew February-quarter earnings 22 percent, beating estimates by 10 percent. Consumers continue to defer new car purchases while at the same time lower gas prices encourage more driving, both of which lead to more maintenance requirements and help boost store traffic for the auto parts retailer. The company is also positioned to capitalize on more commercial opportunities should car dealerships continue to struggle. We sold AutoZone as it approached its price target. |
Teva Pharmaceuticals Industries Ltd. | $7.4 | 5.9 | The world’s leading generic drug manufacturer grew December-quarter earnings 10 percent, beating estimates. Revenues rose 11 percent, driven by stronger-than-expected sales of Copaxone, used to treat multiple sclerosis, and higher prices for generics. With patents set to expire for numerous blockbuster drugs, economic conditions highlighting the need for lower-priced medications and an Administration firmly supporting generics, Teva should continue to benefit. |
| Apollo Group Inc. | $6.3 | 4.7 | The largest for-profit education provider grew February-quarter earnings 88 percent, beating estimates by 18 percent. Apollo benefits from the challenging economic environment as more students enroll in its programs amid rising unemployment. With only 3 percent of revenue coming from private student loans, the company is less exposed than others to current credit-market tightening. Margins continue to improve as higher enrollment growth coincides with moderating promotional expenses. |
International Business Machines Corp. | $4.8 | 8.3 | The global provider of information technology solutions grew December-quarter earnings 17 percent, beating estimates. While not immune to the economic contraction hitting its end markets, IBM’s results are buoyed by its services and software business, aggressive cost cuts and growth in international markets. The company also reconfirmed its 2009 earnings outlook and entered into talks to purchase a competitor during the quarter. |
| | $ Loss | | |
| Biggest $ Losers | (in millions) | % Loss | Reason for Move |
| Comcast Corp. | $28.3 | 19.2 | The largest cable-TV operator in the U.S. grew December-quarter earnings 35 percent, beating estimates by 23 percent. Shares fell on lower-than-expected new customer additions and fears that economic woes would prompt customers to cancel their service. Shares gained back some ground in March. Comcast’s strong balance sheet and ample cash flow should help it continue to perform well in a difficult environment. |
| Kroger Co. | $26.7 | 19.7 | The operator of the largest supermarket chain in the U.S. grew January-quarter earnings 10 percent, beating estimates. While Kroger’s industry leading private-label program allows it to compete with discount operators in the current economic environment, investors migrated away from consumer staples and into the financial and other sectors on speculation of a quick recovery. We believe Kroger will continue to differentiate itself from competitors, gain market share and attract investor attention. |
| General Mills, Inc. | $25.5 | 21.8 | Higher costs weighed on February-quarter profits for the world’s sixth-largest food company, even as sales rose for its top brands as more consumers ate at home. While the company provided a brighter outlook for its fiscal year, we sold on concerns that lower input costs would take longer than expected to materialize. |
| Safeway Inc. | $21.5 | 15.1 | The nation’s second-largest grocer grew December-quarter earnings 16 percent. Rising unemployment forced the company to cut costs and prices more aggressively than planned to remain competitive in some markets. Additionally, shares traded lower as investors migrated into beaten-down companies rallying on speculation of a quick economic recovery. Safeway continues to benefit from its focus on offering values at a time when food cost inflation has consumers looking for ways to lower their grocery bills. |
| Wal-Mart Stores, Inc. | $20.7 | 9.3 | The world’s largest retailer fell after January-quarter profits came up short of expectations, due in large part to the effects of foreign currency translation. We continue to believe Wal-Mart is uniquely positioned to benefit and capture market share as consumers search for value in a challenging environment, evidenced by a 5.1 percent increase in February same-store sales. |
All gains/losses are calculated on an average cost basis
Brandywine Fund, Inc.
Statement of Assets and Liabilities
March 31, 2009 (Unaudited)
| Assets: | | | |
| Investments in securities, at value (cost $2,143,070,084) | | $ | 2,174,003,746 | |
| Receivable from investments sold | | | 39,084,282 | |
| Receivable from shareholders for purchases | | | 1,436,638 | |
| Dividends and interest receivable | | | 1,100,885 | |
| Other assets | | | 13,623 | |
| Total assets | | $ | 2,215,639,174 | |
| | | | | |
| Liabilities: | | | | |
| Payable to brokers for securities purchased | | $ | 31,005,998 | |
| Payable to adviser for management fees | | | 1,786,870 | |
| Payable to shareholders for redemptions | | | 940,090 | |
| Other liabilities | | | 292,008 | |
| Total liabilities | | | 34,024,966 | |
| | | | | |
| Net Assets: | | | | |
| Capital Stock, $0.01 par value; 500,000,000 shares authorized; 116,487,285 shares outstanding | | | 3,561,541,432 | |
| Net unrealized appreciation on investments | | | 30,933,662 | |
| Accumulated net realized loss on investments | | | (1,410,860,886 | ) |
| Net assets | | | 2,181,614,208 | |
| Total liabilities and net assets | | $ | 2,215,639,174 | |
| | | | | |
| Calculation of net asset value per share: | | | | |
Net asset value, offering and redemption price per share ($2,181,614,208 ÷ 116,487,285 shares outstanding) | | $ | 18.73 | |
The accompanying notes to financial statements are an integral part of this statement.
Schedule of Investments
March 31, 2009
(Unaudited)
| Shares | | | | Cost | | | Value | |
| | | | | | | | | |
| Common Stocks - 95.4% (a) | | | | | | |
| | | | | | | | | |
| CONSUMER DISCRETIONARY | | | | | | |
| | | | | | | | | |
| | | Apparel Retail - 0.4% | | | | | | |
| | 291,200 | | The Buckle, Inc. | | $ | 8,511,645 | | | $ | 9,298,016 | |
| | | | | | | | | | | | |
| | | | Automotive Retail - 4.9% | | | | | | | | |
| | 1,049,000 | | Advance Auto Parts, Inc. | | | 39,454,578 | | | | 43,092,920 | |
| | 1,835,900 | | O’Reilly Automotive, Inc.* | | | 53,723,246 | | | | 64,274,859 | |
| | | | | | | | | | | | |
| | | | Cable & Satellite - 3.7% | | | | | | | | |
| | 5,886,500 | | Comcast Corp. | | | 96,482,420 | | | | 80,291,860 | |
| | | | | | | | | | | | |
| | | | Computer & Electronics Retail - 2.3% | | | | | | | | |
| | 1,792,500 | | GameStop Corp.* | | | 47,074,882 | | | | 50,225,850 | |
| | | | | | | | | | | | |
| | | | Education Services - 5.3% | | | | | | | | |
| | 1,028,100 | | Corinthian Colleges, Inc.* | | | 19,107,599 | | | | 19,996,545 | |
| | 787,700 | | ITT Educational Services, Inc.* | | | 90,606,684 | | | | 95,642,534 | |
| | | | | | | | | | | | |
| | | | General Merchandise Stores - 7.2% | | | | | | | | |
| | 1,193,400 | | Dollar Tree, Inc.* | | | 45,393,103 | | | | 53,165,970 | |
| | 3,142,400 | | Family Dollar Stores, Inc. | | | 84,003,083 | | | | 104,861,888 | |
| | | | | | | | | | | | |
| | | | Homefurnishing Retail - 0.0% | | | | | | | | |
| | 33,400 | | Aaron Rents, Inc. | | | 734,920 | | | | 890,444 | |
| | | | | | | | | | | | |
| | | | Restaurants - 5.8% | | | | | | | | |
| | 1,831,700 | | Burger King Holdings Inc. | | | 37,735,457 | | | | 42,037,515 | |
| | 1,238,100 | | McDonald’s Corp. | | | 66,504,179 | | | | 67,563,117 | |
| | 3,195,300 | | Wendy’s/Arby’s Group, Inc. | | | 16,845,927 | | | | 16,072,359 | |
| | | | | | | | | | | | |
| | | | Specialized Consumer Services - 0.0% | | | | | | | | |
| | 38,100 | | Hillenbrand, Inc. | | | 600,053 | | | | 609,981 | |
| | 5,300 | | Matthews International Corp. | | | 167,503 | | | | 152,693 | |
| | | | | | | | | | | | |
| | | | Total Consumer Discretionary | | | 606,945,279 | | | | 648,176,551 | |
| | | | | | | | | | | | |
| | | | This sector is 6.8% above your Fund’s cost. | | | | | | | | |
| | | | | | | | | |
| CONSUMER STAPLES | | | | | | | | |
| | | | | | | | | | | | |
| | | | Food Retail - 3.3% | | | | | | | | |
| | 571,700 | | Kroger Co. | | | 14,244,596 | | | | 12,131,474 | |
| | 2,957,100 | | Safeway Inc. | | | 58,361,056 | | | | 59,703,849 | |
| | | | | | | | | | | | |
| | | | Household Products - 3.8% | | | | | | | | |
| | 1,584,500 | | Church & Dwight Co., Inc. | | | 86,589,511 | | | | 82,758,435 | |
| | | | | | | | | | | | |
| | | | Hypermarkets & Super Centers - 0.8% | | | | | | | | |
| | 571,000 | | BJ’s Wholesale Club, Inc.* | | | 16,867,908 | | | | 18,266,290 | |
Brandywine Fund, Inc.
Schedule of Investments (Continued)
March 31, 2009
(Unaudited)
| Shares | | | | Cost | | | Value | |
| | | | | | | | | |
| Common Stocks - 95.4% (a) (Continued) | | | | | | |
| | | | | | | | | |
| | | Packaged Foods & Meats - 4.0% | | | | | | |
| | 600,900 | | Flowers Foods, Inc. | | $ | 13,378,542 | | | $ | 14,109,132 | |
| | 1,362,700 | | Ralcorp Holdings, Inc.* | | | 87,218,618 | | | | 73,422,276 | |
| | | | | | | | | | | | |
| | | | Personal Products - 0.4% | | | | | | | | |
| | 137,000 | | Chattem, Inc.* | | | 8,838,861 | | | | 7,678,850 | |
| | | | | | | | | | | | |
| | | | Total Consumer Staples | | | 285,499,092 | | | | 268,070,306 | |
| | | | | | | | | | | | |
| | | | This sector is 6.1% below your Fund’s cost. | | | | | | | | |
| | | | | | | | | |
| FINANCIALS | | | | | | | | |
| | | | | | | | | | | | |
| | | | Property & Casualty Insurance - 0.2% | | | | | | | | |
| | 67,900 | | The Navigators Group, Inc.* | | | 3,573,415 | | | | 3,203,522 | |
| | 20,900 | | ProAssurance Corp.* | | | 1,024,450 | | | | 974,358 | |
| | | | | | | | | | | | |
| | | | Reinsurance - 4.0% | | | | | | | | |
| | 1,242,700 | | Everest Re Group, Ltd. | | | 86,237,255 | | | | 87,983,160 | |
| | | | | | | | | | | | |
| | | | Total Financials | | | 90,835,120 | | | | 92,161,040 | |
| | | | | | | | | | | | |
| | | | This sector is 1.5% above your Fund’s cost. | | | | | | | | |
| | | | | | | | | |
| HEALTH CARE | | | | | | | | |
| | | | | | | | | | | | |
| | | | Biotechnology - 5.2% | | | | | | | | |
| | 758,700 | | Cephalon, Inc.* | | | 50,991,894 | | | | 51,667,470 | |
| | 1,331,300 | | Gilead Sciences, Inc.* | | | 61,659,185 | | | | 61,665,816 | |
| | | | | | | | | | | | |
| | | | Health Care Distributors - 1.6% | | | | | | | | |
| | 1,066,700 | | AmerisourceBergen Corp. | | | 33,102,470 | | | | 34,838,422 | |
| | | | | | | | | | | | |
| | | | Health Care Equipment - 3.0% | | | | | | | | |
| | 1,297,000 | | Baxter International Inc. | | | 71,502,459 | | | | 66,432,340 | |
| | | | | | | | | | | | |
| | | | Health Care Services - 2.9% | | | | | | | | |
| | 1,364,254 | | Express Scripts, Inc.* | | | 65,277,715 | | | | 62,987,607 | |
| | | | | | | | | | | | |
| | | | Life Sciences Tools & Services - 5.7% | | | | | | | | |
| | 986,900 | | Covance Inc.* | | | 37,230,404 | | | | 35,163,247 | |
| | 145,188 | | ICON PLC - SP-ADR* | | | 3,110,379 | | | | 2,344,786 | |
| | 2,574,300 | | Life Technologies Corp.* | | | 77,444,301 | | | | 83,613,264 | |
| | 101,700 | | Thermo Fisher Scientific, Inc.* | | | 3,320,088 | | | | 3,627,639 | |
| | | | | | | | | | | | |
| | | | Managed Health Care - 0.6% | | | | | | | | |
| | 432,300 | | AMERIGROUP Corp.* | | | 10,617,508 | | | | 11,905,542 | |
| | | | | | | | | | | | |
| | | | Pharmaceuticals - 7.6% | | | | | | | | |
| | 1,223,400 | | Abbott Laboratories | | | 67,585,975 | | | | 58,356,180 | |
| | 481,500 | | Perrigo Co. | | | 17,945,192 | | | | 11,955,645 | |
| | 1,597,100 | | Teva Pharmaceutical Industries | | | | | | | | |
| | | | Ltd. SP-ADR | | | 68,183,211 | | | | 71,949,355 | |
| | 744,800 | | Watson Pharmaceuticals, Inc.* | | | 19,916,367 | | | | 23,170,728 | |
| | | | | | | | | | | | |
| | | | Total Health Care | | | 587,887,148 | | | | 579,678,041 | |
| | | | | | | | | | | | |
| | | | This sector is 1.4% below your Fund’s cost. | | | | | | | | |
| | | | | | | | | |
| INDUSTRIALS | | | | | | | | |
| | | | | | | | | | | | |
| | | | Industrial Conglomerates - 0.8% | | | | | | | | |
| | 1,341,900 | | McDermott International, Inc.* | | | 18,886,909 | | | | 17,968,041 | |
| | | | | | | | | | | | |
| | | | Total Industrials | | | 18,886,909 | | | | 17,968,041 | |
| | | | | | | | | | | | |
| | | | This sector is 4.9% below your Fund’s cost. | | | | | | | | |
| | | | | | | | | |
| INFORMATION TECHNOLOGY | | | | | | | | |
| | | | | | | | | | | | |
| | | | Application Software - 1.7% | | | | | | | | |
| | 3,368,800 | | Nuance Communications, Inc.* | | | 29,164,912 | | | | 36,585,168 | |
| | | | | | | | | | | | |
| | | | Communications Equipment - 0.9% | | | | | | | | |
| | 484,400 | | Arris Group Inc.* | | | 3,084,004 | | | | 3,570,028 | |
| | 559,500 | | Harris Corp. | | | 20,789,914 | | | | 16,191,930 | |
| | | | | | | | | | | | |
| | | | Data Processing & Outsourced Services - 5.4% | | | | | | | | |
| | 2,393,800 | | Affiliated Computer Services, Inc.* | | | 116,603,588 | | | | 114,639,082 | |
| | 112,100 | | Metavante Technologies, Inc.* | | | 2,032,714 | | | | 2,237,516 | |
| | | | | | | | | | | | |
| | | | Internet Software & Services - 0.4% | | | | | | | | |
| | 230,300 | | Open Text Corp.* | | | 7,937,078 | | | | 7,931,532 | |
| | | | | | | | | | | | |
| | | | IT Consulting & Other Services - 1.1% | | | | | | | | |
| | 1,283,300 | | SAIC, Inc.* | | | 24,430,997 | | | | 23,959,211 | |
| | | | | | | | | | | | |
| | | | Semiconductors - 1.9% | | | | | | | | |
| | 1,872,300 | | Microchip Technology Inc. | | | 34,503,152 | | | | 39,674,037 | |
| | 98,400 | | Silicon Laboratories Inc.* | | | 2,701,417 | | | | 2,597,760 | |
| | | | | | | | | | | | |
| | | | Systems Software - 4.1% | | | | | | | | |
| | 4,002,300 | | Check Point Software | | | | | | | | |
| | | | Technologies Ltd.* | | | 90,536,216 | | | | 88,891,083 | |
| | | | | | | | | | | | |
| | | | Total Information Technology | | | 331,783,992 | | | | 336,277,347 | |
| | | | | | | | | | | | |
| | | | This sector is 1.4% above your Fund’s cost. | | | | | | | | |
| | | | | | | | | |
| MATERIALS | | | | | | | | |
| | | | | | | | | | | | |
| | | | Commodity Chemicals - 0.1% | | | | | | | | |
| | 86,200 | | Calgon Carbon Corp.* | | | 1,269,795 | | | | 1,221,454 | |
| | | | | | | | | | | | |
| | | | Fertilizers & Agricultural Chemicals - 1.8% | | | | | | | | |
| | 391,000 | | Scotts Miracle-Gro Co. | | | 11,743,014 | | | | 13,567,700 | |
| | 916,100 | | Terra Industries Inc. | | | 22,304,790 | | | | 25,733,249 | |
| | | | | | | | | | | | |
| | | | Metal & Glass Containers - 1.8% | | | | | | | | |
| | 1,331,000 | | Crown Holdings, Inc.* | | | 31,781,092 | | | | 30,253,630 | |
| | 175,600 | | Silgan Holdings Inc. | | | 7,758,742 | | | | 9,226,024 | |
| | | | | | | | | | | | |
| | | | Total Materials | | | 74,857,433 | | | | 80,002,057 | |
| | | | | | | | | | | | |
| | | | This sector is 6.9% above your Fund’s cost. | | | | | | | | |
Brandywine Fund, Inc.
Schedule of Investments (Continued)
March 31, 2009
(Unaudited)
| Shares or | | | | | | | | |
| Principal | | | | | | | | |
| Amount | | | | Cost | | | Value | |
| | | | | | | | | |
| Common Stocks - 95.4% (a) (Continued) | | | | | | |
| | | | | | | | | |
| TELECOMMUNICATION SERVICES | | | | | | |
| | | | | | | | | |
| | | Integrated Telecommunication Services - 2.2% | | | | | | |
| | 1,573,200 | | Verizon Communications Inc. | | $ | 43,244,581 | | | $ | 47,510,640 | |
| | | | | | | | | | | | |
| | | | Wireless Telecommunication Services - 0.2% | | | | | | | | |
| | 334,900 | | Syniverse Holdings Inc.* | | | 4,564,658 | | | | 5,278,024 | |
| | | | | | | | | | | | |
| | | | Total Telecommunication Services | | | 47,809,239 | | | | 52,788,664 | |
| | | | | | | | | | | | |
| | | | This sector is 10.4% above your Fund’s cost. | | | | | | | | |
| | | | | | | | | |
| UTILITIES | | | | | | | | |
| | | | | | | | | | | | |
| | | | Gas Utilities - 0.3% | | | | | | | | |
| | 160,200 | | South Jersey Industries, Inc. | | | 5,291,173 | | | | 5,607,000 | |
| | | | | | | | | | | | |
| | | | Total Utilities | | | 5,291,173 | | | | 5,607,000 | |
| | | | | | | | | | | | |
| | | | This sector is 6.0% above your Fund’s cost. | | | | | | | | |
| | | | | | | | | | | | |
| | | | Total common stocks | | | 2,049,795,385 | | | | 2,080,729,047 | |
| | | | | | | | | | | | |
| Short-Term Investments - 4.3% (a) | | | | | | | | |
| | | | | | | | | | | | |
| | | | Commercial Paper - 4.3% | | | | | | | | |
| $ | 93,200,000 | | Toyota Motor Credit Corp., | | | | | | | | |
| | | | due 4/01/09, | | | | | | | | |
| | | | discount of 0.22% | | | 93,200,000 | | | | 93,200,000 | |
| | | | | | | | | | | | |
| | | | Variable Rate Demand Note - 0.0% | | | | | | | | |
| | 74,699 | | American Family Financial | | | | | | | | |
| | | | Services, 0.10% | | | 74,699 | | | | 74,699 | |
| | | | | | | | | | | | |
| | | | Total short-term investments | | | 93,274,699 | | | | 93,274,699 | |
| | | | | | | | | | | | |
| | | | Total investments - 99.7% | | $ | 2,143,070,084 | | | | 2,174,003,746 | |
| | | | | | | | | | | | |
| | | | Cash and receivables, less | | | | | | | | |
| | | | liabilities - 0.3% (a) | | | | | | | 7,610,462 | |
| | | | | | | | | | | | |
| | | | TOTAL NET ASSETS - 100.0% | | | | | | $ | 2,181,614,208 | |
| * | Non-dividend paying security. |
| (a) | Percentages for the various classifications relate to net assets. |
ADR - American Depositary Receipts.
The accompanying notes to financial statements are an integral part of this schedule.
Statement of Operations
For the Six Months Ended March 31, 2009
(Unaudited)
| Income: | | | |
| Dividends | | $ | 10,971,159 | |
| Interest | | | 392,959 | |
| Total income | | | 11,364,118 | |
| | | | | |
| Expenses: | | | | |
| Management fees | | | 11,935,741 | |
| Transfer agent fees | | | 641,441 | |
| Printing and postage expense | | | 173,176 | |
| Administrative and accounting services | | | 139,662 | |
| Custodian fees | | | 70,574 | |
| Board of Directors fees and expenses | | | 54,621 | |
| Registration fees | | | 38,575 | |
| Professional fees | | | 38,380 | |
| Insurance expense | | | 27,192 | |
| Other expenses | | | 5,002 | |
| Total expenses | | | 13,124,364 | |
| Net Investment Loss | | | (1,760,246 | ) |
Net Realized Loss on Investments | | | (1,189,971,379 | ) |
| Net Increase in Unrealized Appreciation on Investments | | | 177,922,646 | |
Net Loss on Investments | | | (1,012,048,733 | ) |
| Net Decrease in Net Assets Resulting From Operations | | $ | (1,013,808,979 | ) |
The accompanying notes to financial statements are an integral part of this statement.
Brandywine Fund, Inc.
Statements of Changes in Net Assets
For the Six Months Ended March 31, 2009 (Unaudited)
and for the Year Ended September 30, 2008
| | | 2009 | | | 2008 | |
| Operations: | | | | | | |
| Net investment loss | | $ | (1,760,246 | ) | | $ | (23,595,813 | ) |
| Net realized loss on investments | | | (1,189,971,379 | ) | | | (74,950,120 | ) |
| Net increase (decrease) in unrealized appreciation on investments | | | 177,922,646 | | | | (1,082,904,525 | ) |
| Net decrease in net assets resulting from operations | | | (1,013,808,979 | ) | | | (1,181,450,458 | ) |
| | | | | | | | | |
| Distributions to Shareholders: | | | | | | | | |
| Distributions from net realized gains ($0.11450 and $5.22252 per share, respectively) | | | (14,327,226 | ) | | | (628,623,195 | ) |
| | | | | | | | | |
| Fund Share Activities: | | | | | | | | |
| Proceeds from shares issued (5,506,719 and 12,943,440 shares, respectively) | | | 109,397,631 | | | | 446,449,782 | |
| Net asset value of shares issued in distributions reinvested (655,907 and 15,978,665 shares, respectively) | | | 13,715,026 | | | | 599,258,536 | |
| Cost of shares redeemed (17,059,535 and 19,927,339 shares, respectively) | | | (335,149,670 | ) | | | (665,114,852 | ) |
| Net (decrease) increase in net assets derived from Fund share activities | | | (212,037,013 | ) | | | 380,593,466 | |
| | | | | | | | | |
| Total Decrease | | | (1,240,173,218 | ) | | | (1,429,480,187 | ) |
| | | | | | | | | |
| Net Assets at the Beginning of the Period | | | 3,421,787,426 | | | | 4,851,267,613 | |
| Net Assets at the End of the Period | | $ | 2,181,614,208 | | | $ | 3,421,787,426 | |
| (Includes accumulated net investment loss of $0 and $0, respectively) | | | | | | | | |
Financial Highlights
(Selected data for each share of the Fund outstanding throughout each period)
| | For the Six Months | | | | | | | | | | | | | | | |
| | ended March 31, 2009 | | Years Ended September 30, | |
| | (Unaudited) | | 2008 | | | 2007 | | | 2006 | | | 2005 | | | 2004 | |
| | | | | | | | | | | | | | | | | | | |
| PER SHARE OPERATING PERFORMANCE: | | | | | | | | | | | | | | | | | | |
| Net asset value, beginning of period | | $ | 26.86 | | | $ | 40.98 | | | $ | 32.27 | | | $ | 31.50 | | | $ | 24.19 | | | $ | 21.30 | |
| | | | | | | | | | | | | | | | | | | | | | | | | |
| Income from investment operations: | | | | | | | | | | | | | | | | | | | | | | | | |
Net investment loss(1) | | | (0.02 | ) | | | (0.18 | ) | | | (0.19 | ) | | | (0.10 | ) | | | (0.08 | ) | | | (0.13 | ) |
| Net realized and unrealized (losses) gains | | | | | | | | | | | | | | | | | | | | | | | | |
on investments | | | (8.00 | ) | | | (8.72 | ) | | | 9.15 | | | | 0.87 | | | | 7.39 | | | | 3.02 | |
| Total from investment operations | | | (8.02 | ) | | | (8.90 | ) | | | 8.96 | | | | 0.77 | | | | 7.31 | | | | 2.89 | |
| | | | | | | | | | | | | | | | | | | | | | | | | |
| Less distributions: | | | | | | | | | | | | | | | | | | | | | | | | |
| Distributions from net investment income | | | — | | | | — | | | | — | | | | — | | | | — | | | | — | |
| Distributions from net realized gains | | | (0.11 | ) | | | (5.22 | ) | | | (0.25 | ) | | | — | | | | — | | | | — | |
| Total from distributions | | | (0.11 | ) | | | (5.22 | ) | | | (0.25 | ) | | | — | | | | — | | | | — | |
| Net asset value, end of period | | $ | 18.73 | | | $ | 26.86 | | | $ | 40.98 | | | $ | 32.27 | | | $ | 31.50 | | | $ | 24.19 | |
| | | | | | | | | | | | | | | | | | | | | | | | | |
| TOTAL RETURN | | | (29.89 | %)(a) | | | (25.16 | %) | | | 27.90 | % | | | 2.44 | % | | | 30.22 | % | | | 13.57 | % |
| | | | | | | | | | | | | | | | | | | | | | | | | |
| RATIOS/SUPPLEMENTAL DATA: | | | | | | | | | | | | | | | | | | | | | | | | |
| Net assets, end of period (in 000’s $) | | | 2,181,614 | | | | 3,421,787 | | | | 4,851,268 | | | | 4,066,292 | | | | 3,995,582 | | | | 3,586,793 | |
| Ratio of expenses to average net assets | | | 1.10 | %(b) | | | 1.08 | % | | | 1.08 | % | | | 1.08 | % | | | 1.08 | % | | | 1.08 | % |
Ratio of net investment loss to average net assets | | | (0.15 | %)(b) | | | (0.54 | %) | | | (0.54 | %) | | | (0.31 | %) | | | (0.25 | %) | | | (0.55 | %) |
| Portfolio turnover rate | | | 123 | %(a) | | | 210 | % | | | 162 | % | | | 200 | % | | | 183 | % | | | 247 | % |
| (1) | Net investment loss per share was calculated using average shares outstanding. |
The accompanying notes to financial statements are an integral part of these statements.
| | Definitions and Disclosures | |
| | Performance data quoted represent past performance; past performance does not guarantee future results. The investment return and principal value of an investment will fluctuate so that an investor’s shares, when redeemed, may be worth more or less than their original cost. Current performance of the Funds may be lower or higher than the performance quoted. Performance data current to the most recent month end may be obtained by visiting www.brandywinefunds.com. | |
| | The Funds’ investment objectives, risks, charges and expenses must be considered carefully before investing. The prospectus contains this and other important information about the investment companies, and it may be obtained by calling 1-800-656-3017, or visiting www.brandywinefunds.com. Read it carefully before investing. | |
| | Fund holdings and sector weightings are subject to change at any time and are not recommendations to buy or sell any securities. Securities discussed were not held by the Funds as of 3/31/09, unless listed in the accompanying schedules of investments. Earnings growth rates quoted for the Funds refer solely to the estimated earnings growth rates of the average investment holding of the Funds based on consensus estimates from Baseline and not to the actual performance of the Funds themselves. Baseline Financial Services, Inc. (Baseline) provides analytical information and services to the investment community. | |
| | The Russell 1000, Russell 1000 Growth, Russell 3000, Russell 3000 Growth and S&P 500 Indexes are unmanaged indexes commonly used to measure the performance of U.S. stocks. You cannot invest directly in an index. As of March 31, 2009, the Russell 1000 Index’s average annual total returns for 1, 5 and 10 years were -38.27, -4.54 and -2.57 percent; the Russell 1000 Growth Index’s were -34.28, -4.38 and -5.26 percent; the Russell 3000 Index’s were -38.20, -4.59 and -2.25 percent; the Russell 3000 Growth Index’s were -34.42, -4.44 and -4.99 percent; and the S&P 500 Index’s were -38.09, -4.76 and -3.00 percent. | |
Brandywine Blue Fund
Statement of Assets and Liabilities
March 31, 2009 (Unaudited)
| Assets: | | | |
| Investments in securities, at value (cost $2,789,084,722) | | $ | 2,665,913,961 | |
| Receivable from investments sold | | | 10,915,407 | |
| Receivable from shareholders for purchases | | | 7,561,247 | |
| Dividends and interest receivable | | | 1,946,967 | |
| Total assets | | $ | 2,686,337,582 | |
| | | | | |
| Liabilities: | | | | |
| Payable to brokers for securities purchased | | $ | 188,920,286 | |
| Payable to shareholders for redemptions | | | 3,292,632 | |
| Payable to adviser for management fees | | | 2,066,287 | |
| Other liabilities | | | 556,464 | |
| Total liabilities | | | 194,835,669 | |
| | | | | |
| Net Assets: | | | | |
| Capital Stock, $0.01 par value; 500,000,000 shares authorized; 138,959,360 shares outstanding | | | 4,315,722,211 | |
| Net unrealized depreciation on investments | | | (123,170,761 | ) |
| Accumulated net realized loss on investments | | | (1,703,501,596 | ) |
| Accumulated net invested income | | | 2,452,059 | |
| Net assets | | | 2,491,501,913 | |
| Total liabilities and net assets | | $ | 2,686,337,582 | |
| | | | | |
| Calculation of net asset value per share: | | | | |
Net asset value, offering and redemption price per share ($2,491,501,913 ÷ 138,959,360 shares outstanding) | | $ | 17.93 | |
The accompanying notes to financial statements are an integral part of this statement.
Brandywine Blue Fund
Schedule of Investments
March 31, 2009
(Unaudited)
| Shares | | | | Cost | | | Value | |
| | | | | | | | | |
| Common Stocks - 93.3% (a) | | | | | | |
| | | | | | | | | |
| CONSUMER DISCRETIONARY | | | | | | |
| | | | | | | | | |
| | | Apparel Retail - 2.4% | | | | | | |
| | 2,349,400 | | The TJX Companies, Inc. | | $ | 61,608,930 | | | $ | 60,238,616 | |
| | | | | | | | | | | | |
| | | | Cable & Satellite - 7.9% | | | | | | | | |
| | 8,725,200 | | Comcast Corp. | | | 146,890,059 | | | | 119,011,728 | |
| | 3,459,600 | | The DIRECTV Group, Inc.* | | | 73,628,314 | | | | 78,844,284 | |
| | | | | | | | | | | | |
| | | | Education Services - 2.8% | | | | | | | | |
| | 875,400 | | Apollo Group Inc.* | | | 60,955,897 | | | | 68,570,082 | |
| | | | | | | | | | | | |
| | | | General Merchandise Stores - 2.1% | | | | | | | | |
| | 1,490,000 | | Target Corp. | | | 50,930,137 | | | | 51,241,100 | |
| | | | | | | | | | | | |
| | | | Restaurants - 8.6% | | | | | | | | |
| | 1,953,600 | | McDonald’s Corp. | | | 104,561,943 | | | | 106,607,952 | |
| | 3,930,200 | | Yum! Brands, Inc. | | | 104,232,246 | | | | 108,001,896 | |
| | | | | | | | | | | | |
| | | | Total Consumer Discretionary | | | 602,807,526 | | | | 592,515,658 | |
| | | | | | | | | | | | |
| | | | This sector is 1.7% below your Fund’s cost. | | | | | | | | |
| | | | | | | | | |
| CONSUMER STAPLES | | | | | | | | |
| | | | | | | | | | | | |
| | | | Food Retail - 9.2% | | | | | | | | |
| | 5,143,500 | | Kroger Co. | | | 132,366,821 | | | | 109,145,070 | |
| | 6,000,900 | | Safeway Inc. | | | 151,783,702 | | | | 121,158,171 | |
| | | | | | | | | | | | |
| | | | Household Products - 3.2% | | | | | | | | |
| | 1,355,800 | | Colgate-Palmolive Co. | | | 80,394,988 | | | | 79,965,084 | |
| | | | | | | | | | | | |
| | | | Hypermarkets & Super Centers - 2.7% | | | | | | | | |
| | 1,311,200 | | Wal-Mart Stores, Inc. | | | 64,024,193 | | | | 68,313,520 | |
| | | | | | | | | | | | |
| | | | Total Consumer Staples | | | 428,569,704 | | | | 378,581,845 | |
| | | | | | | | | | | | |
| | | | This sector is 11.7% below your Fund’s cost. | | | | | | | | |
| | | | | | | | | |
| FINANCIALS | | | | | | | | |
| | | | | | | | | | | | |
| | | | Insurance Brokers - 1.8% | | | | | | | | |
| | 1,093,600 | | Aon Corp. | | | 48,107,358 | | | | 44,640,752 | |
| | | | | | | | | | | | |
| | | | Total Financials | | | 48,107,358 | | | | 44,640,752 | |
| | | | | | | | | | | | |
| | | | This sector is 7.2% below your Fund’s cost. | | | | | | | | |
| | | | | | | | | |
| HEALTH CARE | | | | | | | | |
| | | | | | | | | | | | |
| | | | Biotechnology - 3.6% | | | | | | | | |
| | 1,931,600 | | Gilead Sciences, Inc.* | | | 67,481,907 | | | | 89,471,712 | |
| | | | | | | | | | | | |
| | | | Health Care Equipment - 9.5% | | | | | | | | |
| | 2,067,000 | | Baxter International Inc. | | | 115,805,351 | | | | 105,871,740 | |
| | 909,400 | | Becton, Dickinson & Co. | | | 65,709,621 | | | | 61,148,056 | |
| | 1,926,100 | | St. Jude Medical, Inc.* | | | 75,130,469 | | | | 69,975,213 | |
| | | | | | | | | | | | |
| | | | Health Care Services - 4.9 % | | | | | | | | |
| | 2,176,700 | | Express Scripts, Inc.* | | | 141,981,362 | | | | 100,498,239 | |
| | 524,800 | | Fresenius Medical Care | | | | | | | | |
| | | | AG & Co. KgaA ADR | | | 24,673,002 | | | | 20,309,760 | |
| | | | | | | | | | | | |
| | | | Life Sciences Tools & Services - 1.6% | | | | | | | | |
| | 1,141,502 | | Thermo Fisher Scientific, Inc.* | | | 40,280,564 | | | | 40,717,377 | |
| | | | | | | | | | | | |
| | | | Pharmaceuticals - 9.9% | | | | | | | | |
| | 2,378,900 | | Abbott Laboratories | | | 134,800,084 | | | | 113,473,530 | |
| | 2,959,400 | | Teva Pharmaceutical Industries | | | | | | | | |
| | | | Ltd. SP-ADR | | | 130,453,778 | | | | 133,320,970 | |
| | | | | | | | | | | | |
| | | | Total Health Care | | | 796,316,138 | | | | 734,786,597 | |
| | | | | | | | | | | | |
| | | | This sector is 7.7% below your Fund’s cost. | | | | | | | | |
| | | | | | | | | |
| INFORMATION TECHNOLOGY | | | | | | | | |
| | | | | | | | | | | | |
| | | | Application Software - 1.3% | | | | | | | | |
| | 1,224,600 | | Intuit Inc.* | | | 36,548,339 | | | | 33,064,200 | |
| | | | | | | | | | | | |
| | | | Communications Equipment - 0.5% | | | | | | | | |
| | 421,500 | | Harris Corp. | | | 13,913,005 | | | | 12,198,210 | |
| | | | | | | | | | | | |
| | | | Computer Hardware - 2.5% | | | | | | | | |
| | 649,500 | | International Business | | | | | | | | |
| | | | Machines Corp. | | | 58,094,028 | | | | 62,930,055 | |
| | | | | | | | | | | | |
| | | | Data Processing & Outsourced Services - 3.2% | | | | | | | | |
| | 1,441,100 | | Visa Inc. | | | 78,209,693 | | | | 80,125,160 | |
| | | | | | | | | | | | |
| | | | Home Entertainment Software - 2.4% | | | | | | | | |
| | 5,640,600 | | Activision Blizzard, Inc.* | | | 55,520,876 | | | | 59,000,676 | |
| | | | | | | | | | | | |
| | | | Internet Software & Services - 1.3% | | | | | | | | |
| | 91,300 | | Google Inc.* | | | 31,820,624 | | | | 31,777,878 | |
| | | | | | | | | | | | |
| | | | IT Consulting & Other Services - 4.1% | | | | | | | | |
| | 379,400 | | Cognizant Technology | | | | | | | | |
| | | | Solutions Corp.* | | | 7,998,872 | | | | 7,887,726 | |
| | 5,024,400 | | SAIC, Inc.* | | | 97,783,155 | | | | 93,805,548 | |
| | | | | | | | | | | | |
| | | | Total Information Technology | | | 379,888,592 | | | | 380,789,453 | |
| | | | | | | | | | | | |
| | | | This sector is 0.2% above your Fund’s cost. | | | | | | | | |
| | | | | | | | | |
| MATERIALS | | | | | | | | |
| | | | | | | | | | | | |
| | | | Specialty Chemicals - 1.2% | | | | | | | | |
| | 844,100 | | Ecolab Inc. | | | 27,333,494 | | | | 29,315,593 | |
| | | | | | | | | | | | |
| | | | Total Materials | | | 27,333,494 | | | | 29,315,593 | |
| | | | | | | | | | | | |
| | | | This sector is 7.3% above your Fund’s cost. | | | | | | | | |
Brandywine Blue Fund
Schedule of Investments (Continued)
March 31, 2009
(Unaudited)
| Shares or | | | | | | | | |
| Principal | | | | | | | | |
| Amount | | | | Cost | | | Value | |
| | | | | | | | | |
| Common Stocks - 93.3% (a) (Continued) | | | | | | |
| | | | | | | | | |
| TELECOMMUNICATION SERVICES | | | | | | |
| | | | | | | | | |
| | | Integrated Telecommunication Services - 6.6% | | | | | | |
| | 3,396,000 | | AT&T Inc. | | $ | 91,583,475 | | | $ | 85,579,200 | |
| | 2,581,200 | | Verizon Communications Inc. | | | 72,725,812 | | | | 77,952,240 | |
| | | | | | | | | | | | |
| | | | Total Telecommunication Services | | | 164,309,287 | | | | 163,531,440 | |
| | | | | | | | | | | | |
| | | | This sector is 0.5% below your Fund’s cost. | | | | | | | | |
| | | | | | | | | | | | |
| | | | Total common stocks | | | 2,447,332,099 | | | | 2,324,161,338 | |
| | | | | | | | | |
| Short-Term Investments - 13.7% (a) | | | | | | | | |
| | | | | | | | | | | | |
| | | | Commercial Paper - 13.7% | | | | | | | | |
| $ | 316,400,000 | | Toyota Motor Credit Corp., | | | | | | | | |
| | | | due 4/01/09, | | | | | | | | |
| | | | discount of 0.22% | | | 316,400,000 | | | | 316,400,000 | |
| | 25,000,000 | | Goldman Sachs Group, | | | | | | | | |
| | | | due 4/07/09, | | | | | | | | |
| | | | discount of 0.15% | | | 24,999,375 | | | | 24,999,375 | |
| | | | Total commercial paper | | | 341,399,375 | | | | 341,399,375 | |
| | | | | | | | | | | | |
| | | | Variable Rate Demand Note - 0.0% | | | | | | | | |
| | 353,248 | | American Family Financial | | | | | | | | |
| | | | Services, 0.10% | | | 353,248 | | | | 353,248 | |
| | | | | | | | | | | | |
| | | | Total short-term investments | | | 341,752,623 | | | | 341,752,623 | |
| | | | | | | | | | | | |
| | | | Total investments - 107.0% | | $ | 2,789,084,722 | | | | 2,665,913,961 | |
| | | | | | | | | | | | |
| | | | Liabilities, less cash and | | | | | | | | |
| | | | receivables - (7.0%) (a) | | | | | | | (174,412,048 | ) |
| | | | | | | | | | | | |
| | | | TOTAL NET ASSETS - 100.0% | | | | | | $ | 2,491,501,913 | |
| * | Non-dividend paying security. |
| (a) | Percentages for the various classifications relate to net assets. |
ADR - American Depositary Receipts.
The accompanying notes to financial statements are an integral part of this schedule.
Statement of Operations
For the Six Months Ended March 31, 2009
(Unaudited)
| Income: | | | |
| Dividends | | $ | 17,068,437 | |
| Interest | | | 1,072,896 | |
| Total income | | | 18,141,333 | |
| Expenses: | | | | |
| Management fees | | | 13,531,393 | |
| Transfer agent fees | | | 1,111,967 | |
| Printing and postage expense | | | 662,858 | |
| Administrative and accounting services | | | 146,587 | |
| Custodian fees | | | 71,805 | |
| Board of Directors fees and expenses | | | 55,005 | |
| Professional fees | | | 41,416 | |
| Registration fees | | | 39,216 | |
| Insurance expense | | | 25,051 | |
| Other expenses | | | 3,976 | |
| Total expenses | | | 15,689,274 | |
| Net Investment Income | | | 2,452,059 | |
| Net Realized Loss on Investments | | | (1,012,416,208 | ) |
| Net Increase in Unrealized Appreciation on Investments | | | 177,290,836 | |
| Net Loss on Investments | | | (835,125,372 | ) |
| Net Decrease in Net Assets Resulting From Operations | | $ | (832,673,313 | ) |
The accompanying notes to financial statements are an integral part of this statement.
Brandywine Blue Fund
Statements of Changes in Net Assets
For the Six Months Ended March 31, 2009 (Unaudited)
and for the Year Ended September 30, 2008
| | | 2009 | | | 2008 | |
| Operations: | | | | | | |
| Net investment income (loss) | | $ | 2,452,059 | | | $ | (8,740,683 | ) |
| Net realized loss on investments | | | (1,012,416,208 | ) | | | (638,841,633 | ) |
| Net increase (decrease) in unrealized appreciation on investments | | | 177,290,836 | | | | (730,032,110 | ) |
| Net decrease in net assets resulting from operations | | | (832,673,313 | ) | | | (1,377,614,426 | ) |
| | | | | | | | | |
| Distributions to Shareholders: | | | | | | | | |
| Distributions from net realized gains ($3.86974 per share) | | | — | | | | (356,221,835 | ) |
| | | | | | | | | |
| Fund Share Activities: | | | | | | | | |
| Proceeds from shares issued (43,335,687 and 70,794,329 shares, respectively) | | | 829,899,743 | | | | 2,277,198,544 | |
| Net asset value of shares issued in distributions reinvested (8,447,066 shares) | | | — | | | | 303,519,359 | |
| Cost of shares redeemed (43,670,033 and 26,495,404 shares, respectively) | | | (829,392,551 | ) | | | (827,494,470 | ) |
| Net increase in net assets derived from Fund share activities | | | 507,192 | | | | 1,753,223,433 | |
| Total (Decrease) Increase | | | (832,166,121 | ) | | | 19,387,172 | |
| | | | | | | | | |
| Net Assets at the Beginning of the Period | | | 3,323,668,034 | | | | 3,304,280,862 | |
| | | | | | | | | |
| Net Assets at the End of the Period | | $ | 2,491,501,913 | | | $ | 3,323,668,034 | |
| (Includes accumulated net investment income of $2,452,059 and $0, respectively) | | | | | | | | |
Financial Highlights
(Selected data for each share of the Fund outstanding throughout each period)
| | For the Six Months | | | | | | | | | | | | | | | |
| | ended March 31, 2009 | | Years Ended September 30, | |
| | (Unaudited) | | 2008 | | | 2007 | | | 2006 | | | 2005 | | | 2004 | |
| | | | | | | | | | | | | | | | | | | |
| PER SHARE OPERATING PERFORMANCE: | | | | | | | | | | | | | | | | | | |
| Net asset value, beginning of period | | $ | 23.86 | | | $ | 38.18 | | | $ | 31.15 | | | $ | 31.33 | | | $ | 25.21 | | | $ | 21.40 | |
| | | | | | | | | | | | | | | | | | | | | | | | | |
| Income from investment operations: | | | | | | | | | | | | | | | | | | | | | | | | |
Net investment income (loss)(1) | | | 0.02 | | | | (0.07 | ) | | | (0.02 | ) | | | (0.00 | )* | | | (0.04 | ) | | | (0.08 | ) |
| Net realized and unrealized (losses) gains | | | | | | | | | | | | | | | | | | | | | | | | |
on investments | | | (5.95 | ) | | | (10.38 | ) | | | 8.15 | | | | 0.96 | | | | 6.16 | | | | 3.89 | |
| Total from investment operations | | | (5.93 | ) | | | (10.45 | ) | | | 8.13 | | | | 0.96 | | | | 6.12 | | | | 3.81 | |
| | | | | | | | | | | | | | | | | | | | | | | | | |
| Less distributions: | | | | | | | | | | | | | | | | | | | | | | | | |
| Distributions from net investment income | | | — | | | | — | | | | — | | | | — | | | | — | | | | — | |
| Distributions from net realized gains | | | — | | | | (3.87 | ) | | | (1.10 | ) | | | (1.14 | ) | | | — | | | | — | |
| Total from distributions | | | — | | | | (3.87 | ) | | | (1.10 | ) | | | (1.14 | ) | | | — | | | | — | |
| Net asset value, end of period | | $ | 17.93 | | | $ | 23.86 | | | $ | 38.18 | | | $ | 31.15 | | | $ | 31.33 | | | $ | 25.21 | |
| | | | | | | | | | | | | | | | | | | | | | | | | |
| TOTAL RETURN | | | (24.85 | %)(a) | | | (30.70 | %) | | | 26.82 | % | | | 3.47 | % | | | 24.28 | % | | | 17.80 | % |
| | | | | | | | | | | | | | | | | | | | | | | | | |
| RATIOS/SUPPLEMENTAL DATA: | | | | | | | | | | | | | | | | | | | | | | | | |
| Net assets, end of period (in 000’s $) | | | 2,491,502 | | | | 3,323,668 | | | | 3,304,281 | | | | 1,856,496 | | | | 1,230,936 | | | | 531,516 | |
| Ratio of expenses to average net assets | | | 1.16 | %(b) | | | 1.13 | % | | | 1.12 | % | | | 1.10 | % | | | 1.12 | % | | | 1.13 | % |
Ratio of net investment income (loss) to average net assets | | | 0.18 | %(b) | | | (0.23 | %) | | | (0.06 | %) | | | (0.02 | %) | | | (0.13 | %) | | | (0.32 | %) |
| Portfolio turnover rate | | | 123 | %(a) | | | 267 | % | | | 184 | % | | | 207 | % | | | 181 | % | | | 247 | % |
| (1) | Net investment income (loss) per share was calculated using average shares outstanding. |
| * | Amount less then $0.005 per share. |
The accompanying notes to financial statements are an integral part of these statements.
The Brandywine Funds
Notes to Financial Statements
March 31, 2009 (Unaudited)
| (1) | Summary of Significant Accounting Policies |
| | The following is a summary of significant accounting policies of Brandywine Fund, Inc. (the “Brandywine Fund”) and Brandywine Blue Fund (the “Blue Fund,” one of two Funds in a series of the Brandywine Blue Fund, Inc.) (collectively the “Brandywine Funds” or the “Funds”). Each Fund is registered as a diversified open-end management company under the Investment Company Act of 1940 (the “Act”), as amended. The assets and liabilities of each Fund are segregated and a shareholder’s interest is limited to the Fund in which the shareholder owns shares. The Brandywine Fund was incorporated under the laws of Maryland on October 9, 1985. The Blue Fund was incorporated under the laws of Maryland on November 13, 1990. The investment objective of each Fund is to produce long-term capital appreciation principally through investing in common stocks. |
| (a) | Each security, excluding short-term investments, is valued at the last sale price reported by the principal security exchange on which the issue is traded. Securities that are traded on the Nasdaq Markets are valued at the Nasdaq Official Closing Price, or if no sale is reported, the latest bid price. Securities which are traded over-the-counter are valued at the latest bid price. Securities for which quotations are not readily available are valued at fair value as determined by the investment adviser under the supervision of the Board of Directors. The fair value of a security may differ from the last quoted price and the Fund may not be able to sell a security at the fair value. Market quotations may not be available, for example, if trading in particular securities has halted during the day and not resumed prior to the close of trading on the New York Stock Exchange. Short-term investments with maturities of 60 days or less are valued at amortized cost which approximates value. For financial reporting purposes, investment transactions are recorded on the trade date; however, for purposes of executing shareholder transactions, the Funds record changes in holdings of portfolio securities no later than the first business day after the trade date in accordance with Rule 2a-4 of the Investment Company Act. Accordingly, certain differences between net asset value for financial reporting and for executing shareholder transactions may arise. |
| | The Funds adopted the provisions of Statement of Financial Accounting Standards No. 157, “Fair Value Measurements” (“SFAS No. 157”), effective October 1, 2008. Under SFAS No. 157, fair value is defined as the price that would be received to sell an asset or paid to transfer a liability (i.e., the “exit price”) in an orderly transaction between market participants at the measurement date. |
| | In determining fair value, the Funds use various valuation approaches. SFAS No. 157 establishes a fair value hierarchy for inputs used in measuring fair value that maximizes the use of observable inputs and minimizes the use of unobservable inputs by requiring that the most observable inputs be used when available. Observable inputs are those that market participants would use in pricing the asset or liability based on market data obtained from sources independent of the Funds. Unobservable inputs reflect the Funds’ assumptions about the inputs market participants would use in pricing the asset or liability developed based on the best information available in the circumstances. |
| | The fair value hierarchy is categorized into three levels based on the inputs as follows: |
| | Level 1 – Valuations based on unadjusted quoted prices in active markets for identical assets. |
| | Level 2 – Valuations based on quoted prices in markets that are not active or for which all significant inputs are observable, either directly or indirectly. |
| | Level 3 – Valuations based on inputs that are unobservable and significant to the overall fair value measurement. |
| | The securities in each of the Funds that are classified as Level 1 consist of publicly-traded common stock securities. |
| | The securities classified as Level 2 consist of short-term commercial paper and demand notes. |
| | The following table summarizes the Funds’ investments as of March 31, 2009, based on the inputs used to value them: |
| | | Brandywine Fund | | | Blue Fund | |
| Valuation Inputs | | Investments in Securities | | | Investments in Securities | |
| Level 1 – Quoted prices | | $ | 2,080,729,047 | | | $ | 2,324,161,338 | |
| Level 2 – Other significant observable inputs | | | 93,274,699 | | | | 341,752,623 | |
| Level 3 – Significant unobservable inputs | | | — | | | | — | |
| Total | | $ | 2,174,003,746 | | | $ | 2,665,913,961 | |
| (b) | Net realized gains and losses on sales of securities are computed on the identified cost basis. |
| (c) | Dividend income is recorded on the ex-dividend date. Interest income is recorded on the accrual basis. |
| (d) | The Funds have investments in short-term variable rate demand notes, which are unsecured instruments. The Funds may be susceptible to credit risk with respect to these notes to the extent the issuer defaults on its payment obligation. The Funds’ policy is to monitor the creditworthiness of the issuer and nonperformance by these counterparties is not anticipated. |
| (e) | Accounting principles generally accepted in the United States of America (“GAAP”) require that permanent differences between income for financial reporting and tax purposes be reclassified in the capital accounts. |
The Brandywine Funds
Notes to Financial Statements (Continued)
March 31, 2009 (Unaudited)
| (1) | Summary of Significant Accounting Policies (Continued) |
| (f) | The preparation of financial statements in conformity with GAAP requires management to make estimates and assumptions that affect the reported amounts of assets and liabilities and disclosure of contingent assets and liabilities at the date of the financial statements and the reported amounts of revenues and expenses during the reporting period. Actual results could differ from these estimates. |
| (g) | No provision has been made for Federal income taxes since the Funds have elected to be taxed as “regulated investment companies” and intend to distribute substantially all net investment company taxable income and net capital gains to shareholders and otherwise comply with the provisions of the Internal Revenue Code applicable to regulated investment companies. |
| (h) | Effective March 31, 2008, the Funds adopted Financial Accounting Standards Board interpretation No. 48 (FIN 48), “Accounting for Uncertainty in Income Taxes”. FIN 48 requires the evaluation of tax positions taken on previously filed tax returns or expected to be taken on future returns. These positions must meet a “more-likely-than-not” standard that, based on the technical merits, have a more than fifty percent likelihood of being sustained upon examination. In evaluating whether a tax position has met the recognition threshold, the Funds must presume that the position will be examined by the appropriate taxing authority that has full knowledge of all relevant information. Tax positions not deemed to meet the “more-likely-than-not” threshold are recorded as a tax expense in the current year. |
| | FIN 48 requires the Funds to analyze all open tax years, as defined by the Statue of Limitations, for all major jurisdictions. Open tax years are those that are open for exam by taxing authorities. Major jurisdictions for the Funds include Federal and the state of Maryland. As of March 31, 2009, open Federal and Maryland tax years include the tax years ended September 30, 2005 through 2008. The Funds have no examinations in progress. |
| | The Funds have reviewed all open tax years and major jurisdictions and concluded that the adoption of FIN 48 resulted in no effect to the Funds’ financial position or results of operations. There is no tax liability resulting from unrecognized tax benefits relating to uncertain income tax positions taken or expected to be taken on the tax return for the fiscal year-end September 30, 2009. The Funds are also not aware of any tax positions for which it is reasonably possible that the total amounts of unrecognized tax benefits will significantly change in the next twelve months. |
| (2) | Investment Adviser and Management Agreements and Transactions With Related Parties |
| | Each Fund has a management agreement with Friess Asso-ciates, LLC (the “Adviser”), with whom certain Officers and Directors of the Funds are affiliated, to serve as investment adviser and manager. Under the terms of the agreements, each Fund will pay the Adviser a monthly management fee at the annual rate of one percent (1%) on the daily net assets of such Fund. |
| | The Adviser entered into sub-advisory agreements with its affiliate, Friess Associates of Delaware, LLC (the “Sub-Adviser”), to assist it in the day-to-day management of each of the Funds. The Adviser and, if so delegated, the Sub-Adviser supervise the investment portfolios of the Funds, directing the purchase and sale of investment securities in the day-to-day management of the Funds. The Adviser pays the Sub-Adviser a fee equal to 110% of the monthly expenses the Sub-Adviser incurs in performing its services as Sub-Adviser. This relationship does not increase the annual management fee the Funds pay to the Adviser. |
| | Each of the Funds pay the five independent directors annual fees of $20,500 each. The lead independent director and chairman of the audit committee are paid an additional $5,000 annually, divided proportionately among all the Brandwine Funds. All of the corresponding fees the directors receive are paid quarterly to the directors and then invested on the payment date in shares of the Funds at the net asset value of the Funds on the payment date. The Funds also reimburse directors for travel costs incurred in order to attend meetings of the Board of Directors. For the six months ended March 31, 2009, the Funds expensed the following directors fees and costs: |
| | Brandywine | Blue |
| | Fund | Fund |
| Directors Fees and Travel Costs Paid during the Period | $54,621 | $55,005 |
| | Under the Funds’ organizational documents, each Director, officer, employee or other agent of the Fund (including the Funds’ investment manager) is indemnified, to the extent permitted by the Act, against certain liabilities that may arise out of performance of their duties to the Funds. Additionally, in the normal course of business, the Funds enter into contracts that contain a variety of indemnification clauses. The Funds’ maximum exposure under these arrangements is unknown as this would involve future claims that may be made against the Funds that have not yet occurred. However, the Funds have not had prior claims or losses pursuant to these contracts and believe the risk of loss to be remote. |
The Brandywine Funds
Notes to Financial Statements (Continued)
March 31, 2009 (Unaudited)
| | U.S. Bank, N.A. has made available to each Fund a credit facility pursuant to Credit Agreements effective July 22, 2004, for the purpose of having cash available to cover incoming redemptions. Each of the Funds has a $50,000,000 credit facility. Principal and interest of such loan under the Credit Agreements are due not more than 31 days after the date of the loan. Amounts under the credit facilities bear interest at a rate per annum equal to the current prime rate minus one on the amount borrowed. Advances will be collateralized by securities owned by the respective Fund. During the six months ended March 31, 2009, neither Fund borrowed against their Agreement. The Credit Agreements expire on December 18, 2009. |
| (4) | Distributions to Shareholders |
| | Net investment income and net realized gains, if any, are distributed to shareholders at least annually. |
| (5) | Investment Transactions and Related Costs |
| | For the six months ended March 31, 2009, purchases and proceeds of sales of investment securities (excluding short-term investments) for the Funds were as follows: |
| | | Purchases | | | | | | | | | Ratio of Costs to Average Net Assets |
| Brandywine Fund | | $ | 2,979,473,204 | | | $ | 3,099,532,650 | | | $ | 7,442,814 | | | | 0.31% |
| Blue Fund | | | 3,379,309,957 | | | | 3,129,697,556 | | | | 6,680,590 | | | | 0.25% |
| | Transaction costs represent the total commissions paid by each Fund on its respective purchases and sales of investment securities. These costs are added to the cost basis of the securities purchased and are deducted from the proceeds of securities sold, thereby reducing the realized gains or increasing the realized losses upon the sale of the securities. |
| (6) | Income Tax Information |
| | The following information for the Funds is presented on an income tax basis as of March 31, 2009: |
| | | | | | | | | | | | Net Unrealized | |
| | | | | | Gross | | | Gross | | | Appreciation | |
| | | Cost of | | | Unrealized | | | Unrealized | | | (Depreciation) | |
| | | Investments | | | Appreciation | | | Depreciation | | | on Investments | |
| Brandywine Fund | | $ | 2,149,197,717 | | | $ | 108,496,350 | | | $ | 83,690,321 | | | $ | 24,806,029 | |
| Blue Fund | | | 2,811,450,698 | | | | 65,057,343 | | | | 210,594,080 | | | | (145,536,737 | ) |
| | The following information for the Funds is presented on an income tax basis as of September 30, 2008: |
| | | | | | Gross | | | Gross | | | Net Unrealized | | | Distributable | | | Distributable | |
| | | Cost of | | | Unrealized | | | Unrealized | | | Depreciation | | | Ordinary | | | Long-Term | |
| | | Investments | | | Appreciation | | | Depreciation | | | on Investments | | | Income | | | Capital Gains | |
| Brandywine Fund | | $ | 3,582,284,307 | | | $ | 171,697,505 | | | $ | 324,030,313 | | | $ | 152,332,808 | | | $ | 14,327,152 | | | $ | — | |
| Blue Fund | | | 3,507,069,732 | | | | 87,183,457 | | | | 391,506,251 | | | | 304,322,794 | | | | — | | | | — | |
| | The difference, if any, between the cost amounts for financial statement and federal income tax purposes is due primarily to timing differences in recognizing certain gains and losses in security transactions. |
| | The tax components of dividends paid during the years ended September 30, 2008 and 2007, capital loss carryovers, which may be used to offset future capital gains, subject to Internal Revenue Code limitations as of September 30, 2008, and tax basis post-October losses as of September 30, 2008, which are not recognized for tax purposes until the first day of the following fiscal year are: |
| | | September 30, 2008 | | | September 30, 2007 | |
| | | Ordinary | | | Long-Term | | | Net Capital | | | | | | Ordinary | | | Long-Term | |
| | | Income | | | Capital Gains | | | Loss | | | Post-October | | | Income | | | Capital Gains | |
| | | Distributions | | | Distributions | | | Carryovers | | | Losses | | | Distributions | | | Distributions | |
| Brandywine Fund | | $ | 220,366,098 | | | $ | 408,257,097 | | | $ | — | | | $ | 215,545,609 | | | $ | — | | | $ | 30,419,122 | |
| Blue Fund | | | 228,628,373 | | | | 127,593,462 | | | | — | | | | 687,224,192 | | | | 19,042,368 | | | | 48,228,925 | |
| | For corporate shareholders in the Brandywine and Blue Funds, the percentage of dividend income distributed for the year ended September 30, 2008, which is designated as qualifying for the dividends received deduction is 14% and 15%, respectively (unaudited). |
| | For the shareholders in the Brandywine and Blue Funds, the percentage of dividend income distributed for the year ended September 30, 2008, which is designated as qualified dividend income under the Jobs and Growth Tax Relief Act of 2003 is 14% and 15%, respectively (unaudited). |
Cost Discussion
Mutual fund shareholders incur two types of costs: (1) transaction costs, including sales charges (loads) on purchase payments, reinvested dividends, or other distributions; redemption fees; and exchange fees; and (2) ongoing costs, including management fees; distribution [and/or service] (12b-1) fees; and other fund expenses. Brandywine and Brandywine Blue do not have 12b-1 distribution fees. This example is intended to help you understand your ongoing costs (in dollars) of investing in the Brandywine Funds and to compare these costs with the ongoing costs of investing in other mutual funds.
In addition to the costs highlighted and described below, the only Fund transaction costs you might currently incur would be wire fees ($15 per wire), if you choose to have proceeds from a redemption wired to your bank account instead of receiving a check. Additionally, U.S. Bank charges an annual processing fee ($15) if you maintain an IRA account with the Funds. To determine your total costs of investing in the Funds, you would need to add any applicable wire or IRA processing fees you’ve incurred during the period to the costs provided in the example below.
The example is based on an investment of $1,000 invested at the beginning of the period and held for the entire period from October 1, 2008 through March 31, 2009.
Actual Expenses
The first line of the table below provides information about actual account values and actual expenses. You may use the information in this line, together with the amount you invested, to estimate the expenses that you paid over the period. Simply divide your account value by $1,000 (for example, an $8,600 account value divided by $1,000 = 8.6), then multiply the result by the number in the first line under the heading entitled “Expenses Paid During Period” to estimate the expenses you paid on your account during this period.
Hypothetical Example for Comparison Purposes
The second line of the table below provides information about hypothetical account values and hypothetical expenses based on each Fund’s actual expense ratio and an assumed rate of return of 5% per year before expenses, which is not the Fund’s actual return. The hypothetical account values and expenses may not be used to estimate the actual ending account balance or expenses you paid for the period. You may use this information to compare the ongoing costs of investing in the Funds and other funds. To do so, compare this 5% hypothetical example with the 5% hypothetical examples that appear in the shareholder reports of the other funds.
Please note that the expenses shown in the table are meant to highlight your ongoing costs only and do not reflect any transactional costs. While the Brandywine Funds currently do not assess sales charges, redemption or exchange fees, other funds do, and those costs will not be reflected in their expense example tables. Therefore, the second line of the table is useful in comparing ongoing costs only, and will not help you determine the relative total costs of owning different funds.
| | Beginning | Ending | |
| | Account | Account | Expenses Paid |
| | Value | Value | During Period* |
| | 10/01/08 | 3/31/09 | 10/01/08-3/31/09 |
| Brandywine Actual | $1,000.00 | $701.10 | $4.67 |
| Hypothetical (5% return before expenses) | $1,000.00 | $1,019.40 | $5.54 |
| Brandywine Blue Actual | $1,000.00 | $751.80 | $5.07 |
| Hypothetical (5% return before expenses) | $1,000.00 | $1,019.10 | $5.84 |
| * | Expenses are equal to the Funds’ annualized expense ratios of 1.10% and 1.16%, multiplied by the average account value over the period, multiplied by 182/365 (to reflect the one-half year period between October 1, 2008 and March 31, 2009). |
Additional Director Information, Proxy Voting Policy
and Quarterly Portfolio Schedules
For additional information about the Directors and Officers or for a description of the policies and procedures that the Funds use to determine how to vote proxies relating to portfolio securities, please call (800) 656-3017 and request a Statement of Additional Information. One will be mailed to you free of charge. The Statement of Additional Information is also available on the website of the Securities and Exchange Commission (the “Commission”) at http://www.sec.gov or the Funds’ website at http://www.brandywinefunds.com. Information on how the Funds voted proxies relating to portfolio securities is available on the Funds’ website or the website of the Commission no later than August 31 for the prior 12 months ending June 30. The Funds file their complete schedule of portfolio holdings with the Commission for the first and third quarters of each fiscal year on Form N-Q. The Funds’ Forms N-Q are available on the Commission’s website. The Funds’ Forms N-Q may be reviewed and copied at the Commission’s Public Reference Room in Washington, D.C., and that information on the operation of the Public Reference Room may be obtained by calling 1-800-SEC-0330.
Brandywine Funds Advisory Agreements
On December 17, 2008, the Board of Directors (“Directors”) of the Funds approved the continuation of the advisory agreements with Friess Associates, LLC (“Friess”). Prior to approving the continuation of the advisory agreements, the Directors considered:
| • | the nature, extent and quality of the services provided by Friess |
| • | the investment performance of the Funds |
| • | the costs of the services to be provided and profits to be realized by Friess from its relationship with the Funds |
| • | the extent to which economies of scale would be realized as the Funds grow and whether fee levels reflect these economies of scale |
| • | the expense ratios of the Funds |
| • | the manner in which portfolio transactions for the Funds are conducted, including the use of soft dollars |
In considering the nature, extent and quality of the services provided by Friess, the Directors reviewed a report describing the portfolio management, shareholder communication and support and regulatory compliance services provided by Friess to the Funds. The Directors concluded that Friess was providing essential services to the Funds. In particular, the Directors concluded that Friess was preparing reports to shareholders in addition to those required by law and had added both research and client services personnel in the last year, at Friess’ expense, to continue executing at a high level for shareholders.
The Directors compared the performance of the Funds to benchmark indexes over various periods of time and concluded that the performance of the Funds warranted the continuation of the advisory agreements.
In concluding that the advisory fees payable by the Funds were reasonable, the Directors reviewed a report of the costs of services provided, and the profits realized by Friess from its relationship with the Funds and concluded that such profits were reasonable and not excessive. The Directors also reviewed reports comparing the expense ratios and advisory fees paid by the Funds to those paid by other comparable mutual funds and concluded that the advisory fees paid by the Funds were higher than the average advisory fees paid by comparable mutual funds, but the expense ratios of the Funds were lower than the average expense ratios of comparable mutual funds. The Directors also considered the Funds’ portfolio turnover rate noting that Friess was not a “closet indexer.” The Directors also noted that all clients of Friess pay the same 1% advisory fee. They noted that this fee would not be adjusted if economies of scale were realized during the current contract period as the Funds grew, but did not consider that factor to be significant in light of the other factors considered, particularly the fact that the profits were reasonable and not excessive. The Directors noted that having the same fee for all clients eliminated conflicts of interest that would be present if Friess charged different fees to different clients.
Finally, the Directors reviewed reports discussing the manner in which portfolio transactions for the Funds were conducted, including the use of soft dollars. Based on these reports, the Directors concluded that the research obtained by Friess was beneficial to the Funds and that Friess was executing the Funds’ portfolio transactions in a manner designed to obtain best execution for the Funds.
| Capital Gains Update . . . |
| Six months into the fiscal year, it seems unlikely that the Brandywine Funds will distribute capital gains for fiscal 2009. Both Brandywine and Brandywine Blue finished the March quarter in net realized loss positions. Gains and losses realized through the sale of holdings between now and September 30 ultimately will determine whether the Funds make distributions for fiscal 2009. Please check future quarterly reports for updates. |
Board of Directors
| | |
| William F. D’Alonzo | Quentin Jackson | Stuart A. McFarland |
| CEO and CIO | Former President and CEO | Managing Partner |
| Friess Associates | Nuclear Electric Insurance Limited | Federal City Capital Advisors, LLC |
| | |
| W. Richard Scarlett, III | Thomas D. Wren | James W. Zug |
| Regional Chairman | Senior Advisor | Former Senior Partner |
| State of Wyoming Wells Fargo Bank | Promontory Financial Group, LLC | PricewaterhouseCoopers LLP |
| | |
| |
| The Brandywine Funds |
| P.O. Box 4166 |
| Greenville, DE 19807 |
| (800) 656-3017 |
| www.brandywinefunds.com |
| bfunds@friess.com |
| |
| | | |
| Foster S. Friess | | |
| Founder | | |
Investment Adviser: Friess Associates, LLC | Transfer Agent: U.S. Bancorp Fund Services, LLC |
Investment Sub-Adviser: Friess Associates of Delaware, LLC | Independent Registered Public Accounting Firm: PricewaterhouseCoopers LLP |
Custodian: U.S. Bank, N.A. | Legal Counsel: Foley & Lardner LLP |
Officers: William D’Alonzo, Chairman and President;
Lynda Campbell, Vice President, Secretary and Treasurer; Joseph Fields, Vice President;
Gordon Kaiser, Vice President; David Marky, Chief Compliance Officer, Vice President and Assistant Secretary
Report Editor: Chris Aregood Report Staff: Rebecca Kotsifas, David Marky, Adam Rieger
Item 2. Code of Ethics.
Not applicable.
Item 3. Audit Committee Financial Expert.
Not applicable.
Item 4. Principal Accountant Fees and Services.
Not applicable.
Item 5. Audit Committee of Listed Registrants.
Not applicable.
Item 6. Schedule of Investments.
The schedule of investments in securities of unaffiliated issuers is included as part of the report to shareholders filed under Item 1.
Item 7. Disclosure of Proxy Voting Policies and Procedures for Closed-End Management Investment Companies.
Not applicable.
Item 8. Portfolio Managers of Closed-End Management Investment Companies.
Not applicable.
Item 9. Purchases of Equity Securities by Closed-End Management Investment Company and Affiliated Purchasers.
Not applicable.
Item 10. Submission of Matters to a Vote of Security Holders.
None.
Item 11. Controls and Procedures.
| (a) | The disclosure controls and procedures of the Brandywine Fund, Inc. are periodically evaluated. As of April 17, 2009, the date of the last evaluation, we concluded that our disclosure controls and procedures are adequate. |
| (b) | The internal controls of the Brandywine Fund, Inc. are periodically evaluated. There were no changes to Brandywine Fund’s internal control over financial reporting that occurred during the first fiscal quarter of the period covered by this report that have materially affected, or are reasonably likely to materially affect, such controls. |
Item 12. Exhibits.
| (a) | Any code of ethics or amendment thereto. Not applicable. |
| (b) | Certifications pursuant to Section 302 of the Sarbanes-Oxley Act of 2002. Filed herewith. |
| (c) | Certification pursuant to Section 906 of the Sarbanes-Oxley Act of 2002. Filed herewith. |
SIGNATURES
Pursuant to the requirements of the Securities Exchange Act of 1934 and the Investment Company Act of 1940, the registrant has duly caused this report to be signed on its behalf by the undersigned, thereunto duly authorized.
Brandywine Fund, Inc.
Registrant
By /s/William F. D’Alonzo
William F. D’Alonzo Principal Executive Officer
Date April 17, 2009
Pursuant to the requirements of the Securities Exchange Act of 1934 and the Investment Company Act of 1940, this report has been signed below by the following persons on behalf of the registrant and in the capacities and on the dates indicated.
Brandywine Fund, Inc.
Registrant
By /s/ Lynda J. Campbell
Lynda J. Campbell, Principal Financial Officer
Date April 17, 2009