UNITED STATES
SECURITIES AND EXCHANGE COMMISSION
Washington, D.C. 20549
FORM N-CSR
CERTIFIED SHAREHOLDER REPORT OF REGISTERED
MANAGEMENT INVESTMENT COMPANIES
Investment Company Act file number
811-04447
Brandywine Fund, Inc.
(Exact name of registrant as specified in charter)
3711 Kennett Pike
Greenville, DE 19807
(Address of principal executive offices) (Zip code)
William F. D’Alonzo
Friess Associates, LLC
3711 Kennett Pike
Greenville, Delaware 19807
(Name and address of agent for service)
(302) 656-3017
Registrant's telephone number, including area code:
Date of fiscal year end: September 30
Date of reporting period: 03/31/2007
Item 1. Reports to Stockholders.
| Managed by Friess Associates, LLC | Semi-Annual Report | March 31, 2007 |
Dear Fellow Shareholders:
Stocks managed to continue on an upward trajectory in the March quarter despite a briefly disruptive bout of volatility. After a big one-day drop in Chinese stocks spooked markets worldwide, investors appeared to find little cause for lasting concern.
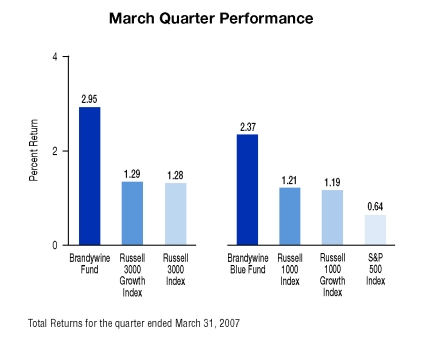
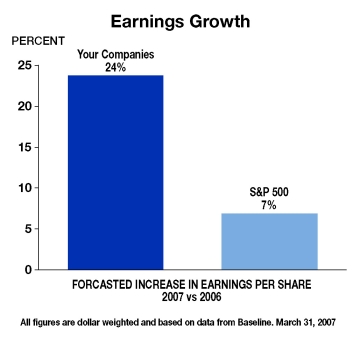
Brandywine Fund grew 2.95 percent in the March quarter, outpacing gains in the Russell 3000 and Russell 3000 Growth Indexes of 1.28 and 1.29 percent. Brandywine Blue Fund rose 2.37 percent versus gains in the S&P 500, Russell 1000 and Russell 1000 Growth Indexes of 0.64, 1.21 and 1.19 percent.
Your team continues to isolate the greatest earnings strength among companies from the technology and industrial sectors and, as a result, those areas represented the two largest concentrations of assets within the portfolios during the March quarter. While our commitment to technology proved a modest drag on quarterly results, holdings from the industrial sector more than offset the impact.
With new commercial airliners in production and military projects ongoing, the aerospace market continued to fuel a flurry of industrial activity. Even though the current aerospace upswing is common knowledge, in many cases the company-specific details still catch the investment community by surprise.
We first isolated Precision Castparts as a mid-cap company for the Brandywine portfolio in January 2005. In October of the same year, we added the company to Brandywine Blue as it grew into large-cap territory. Precision Castparts so far has exceeded earnings estimates in eight of the nine quarters it reported during its tenure as a holding. Most recently, the company grew December-quarter earnings 66 percent from year-ago levels, topping estimates by 13 percent. Precision Castparts was the largest contributor to March-quarter results in both Funds.
| | Brandywine | Brandywine Blue |
Cumulative Total Return | % Change | % Change |
Quarter | 2.95 | 2.37 |
One Year | 4.63 | 5.52 |
Five Years | 55.26 | 68.54 |
Ten Years | 126.03 | 142.40 |
Inception | 1,392.42* | 702.82** |
Five Years | 9.20 | 11.00 |
Ten Years | 8.50 | 9.26 |
Inception | 13.56* | 13.70** |
Brandywine | 1.08% |
Brandywine Blue | 1.12% |
Performance data quoted represent past performance; past performance does not guarantee future results. The investment return and principal value of an investment will fluctuate so that an investor’s shares, when redeemed, may be worth more or less than their original cost. Current performance of the Funds may be lower or higher than the performance quoted. Performance data current to the most recent month end may be obtained by visiting www.brandywinefunds.com. Other standout performers from the industrial sector included BE Aerospace (Brandywine), Fluor Corp. (Brandywine Blue) and Rockwell Collins (both Funds). All three companies beat December-quarter earnings expectations.
Companies from the materials sector played a smaller role in the portfolios but, thanks to the magnitude of their gains, contributed significantly to performance versus benchmarks. Allegheny Technologies, the top contributor to December-quarter results in both Funds, again boosted performance in the March quarter. The company’s place in the aerospace food chain as a supplier of high-performance metals continues to yield strong results. Allegheny topped estimates with 70 percent December-quarter earnings growth.
Mosaic Co. (Brandywine Blue), Crown Holdings (Brandywine) and Reliance Steel & Aluminum (Brandywine) also added to the sector’s positive influence.
Health-care holdings aided performance, especially for Brandywine Blue. While both Funds benefited from a solid gain in Baxter International, Brandywine Blue enjoyed an added boost from Gilead Sciences. The company grew December-quarter earnings 44 percent, topping estimates by 15 percent.
As a group, technology holdings declined only modestly. Still, given that most other economic sectors fared better and technology companies comprised the largest percentage of assets in the Brandywine Funds, technology holdings detracted the most from results versus benchmarks. Three of the five most negative influences on total gains in both Funds hailed from the technology sector.
Most holdings matched muted performance among technology stocks in general. Others such as Seagate Technology (Brandywine Blue) appeared to shoulder added weight applied by near-term investor perceptions.
Brandywine Blue added Seagate during the quarter at what seemed like a good time based on company-specific fundamentals. With competitive advantages in cost and technology, the hard-drive maker looks poised for accelerating earnings growth driven by robust storage demand and leveraging opportunities related to its acquisition of Maxtor. But the beginning of the year is seasonally slow, making it harder for Seagate to attract attention. A drop in flash memory prices prompted investors to focus on the potential use of flash in small electronic devices that currently use hard drives.
Comcast Corp. was the primary reason the consumer discretionary sector weighed on results. Comcast entered the quarter with exceptional share-price momentum, which stalled soon after the company announced an increase in its capital spending plans for 2007. While the higher spending didn’t sit well with investors, the spending boost aims to accelerate subscriber growth before aspiring new entrants from the telecom industry fully develop the services they need to compete meaningfully for cable customers. During the quarter, the potential near-term implications overshadowed the longer-term promise of Comcast’s strategy.
For more information on the holdings that influenced March-quarter performance the most, please see Roses & Thorns on page 4 for Brandywine and page 6 for Brandywine Blue.
We’re delighted to announce that Mira Lee joins the Friess research team this month. Mira spent the past five years with J. & W. Seligman & Co., where she employed a bottom-up, research-based approach to pick stocks for the firm’s small- and mid-cap growth team. Prior to that, Mira’s career included stints with Morgan Stanley Asia, New Era Networks and Accenture. She earned an undergraduate degree from Dartmouth College, an MBA from the Harvard Business School and the Chartered Financial Analyst designation.
As the June quarter begins, your team will continue to search for new opportunities to capitalize on earnings growth. We’ll also reassess each existing holding, from March-quarter contributors such as Precision Castparts to detractors such as Seagate, to evaluate whether the reasoning behind our initial purchase decisions remain valid. Our research process is perpetual, and the constantly changing pool of insights we gather determines which companies we believe belong in the portfolios.
The market was due for a wakeup call and, even though the one it received during the March quarter was a fleeting influence on share prices in general, we were encouraged by the way the rebound took shape. Our investment strategy performs best when investors focus on individual-company fundamentals. Relative performance improved in the wake of the downturn, which we hope turns out to be an early sign that investors are committed to a renewed focus on company-by-company earnings trends going forward.
We’re grateful for the opportunity to put our research-driven investment approach to work on your behalf.
| Bill D’Alonzo | |
| Brandywine Funds President | April 5, 2007 |
Brandywine Fund
Percent Change in Top Ten Holdings From Book Cost
| 1. | Precision Castparts Corp. | +178.4% | 6. | | Comcast Corp. | +21.2% |
| 2. | Oracle Corp. | +4.4% | 7. | | Allegheny Technologies, Inc. | +79.0% |
| 3. | Apple, Inc. | +4.4% | 8. | | Rockwell Collins, Inc. | +24.5% |
| 4. | Yahoo! Inc. | -0.5% | 9. | | Cisco Systems Inc. | -4.7% |
| 5. | Baxter International Inc. | +16.7% | 10. | | Harris Corp. | +29.1% |
Brandywine Fund
March Quarter "Roses and Thorns"
| | $ Gain | | |
Biggest $ Winners | (in millions) | % Gain | Reason for Move |
| $68.1 | 32.9 | The manufacturer of engineered metal products grew December-quarter earnings 66 percent, beating estimates by 13 percent. Revenues grew 60 percent, driven by aerospace demand for specialty metals. Synergies associated with its acquisition of Special Metals Corporation continue to enhance productivity and profit margins. |
Allegheny Technologies, Inc. | $25.6 | 17.7 | The specialty materials producer grew December-quarter earnings 70 percent, topping estimates. Revenues rose 56 percent on increasing demand for materials such as titanium and nickel-based alloys used by the aerospace and defense industries. The company secured its two largest-ever contracts in the quarter and plans to invest as much as $450 million in new production capacity this year. |
| Baxter International Inc. | $20.8 | 13.5 | December-quarter earnings topped estimates by 8 percent as revenue rose 11 percent to $2.8 billion. Baxter’s bioscience business was the primary contributor to results, with sales of blood products and treatments such as the hemophilia drug Advate rising 18 percent. New management has bolstered the company’s financial health and future earnings prospects by divesting underperforming operations, diversifying its offerings and increasing the pipeline of products in development. |
| Apple, Inc. | $15.7 | 9.5 | December-quarter earnings jumped 75 percent, beating estimates by 46 percent. At its January Macworld event, Apple announced the iPhone, Apple TV and a partnership with Paramount, sending shares higher. We believe investors underestimate iPhone’s potential to boost revenue and earnings through hardware, services and accessories. Apple is aiming to quickly capture 1 percent market share of the mobile phone market, representing 10 million units, in 2008. |
| Harris Corp. | $13.4 | 13.2 | The maker of communications devices used by the military grew December-quarter earnings 31 percent, beating estimates. Revenues jumped 21 percent, reflecting strong demand for Harris’ Falcon II radios from the U.S. army and international customers. Harris also benefits from increasing sales of broadcast infrastructure equipment as local news stations migrate to high-definition broadcasts. |
| | $ Loss | | |
Biggest $ Losers | (in millions) | % Loss | Reason for Move |
| Comcast Corp. | $32.3 | 15.2 | The largest cable-TV operator in the U.S. gave back ground gained previously on concerns related to higher-than-expected 2007 capital expenditure guidance. We believe the increased spending is positive and directly related to surging new customer additions for Comcast’s triple-play package of cable, internet and phone services. Comcast is adding over 500,000 new voice customers per quarter while many regional telephone companies are still in the process of rolling out broadband infrastructure. |
Weatherford International Ltd. | $14.5 | 10.1 | The provider of advanced-technology oil well drilling services grew December-quarter earnings 36 percent, topping estimates. Concerns about mild weather patterns in the U.S. and increasing fuel stockpiles overshadowed the company’s strengthening international sales. We sold Weatherford during the quarter, locking in a substantial long-term gain. |
| NVIDIA Corp. | $14.3 | 15.3 | January-quarter earnings doubled to $0.53, topping estimates by 23 percent. The manufacturer of computer chips that provide high-performance, interactive 3D graphics for personal computers and gaming consoles came under pressure on concerns related to AMD’s acquisition of graphics-chip competitor ATI. Our research shows that NVIDIA’s budding relationship with Intel is more than offsetting business lost with AMD. |
| BEA Systems, Inc. | $12.5 | 12.4 | BEA develops enterprise application and service infrastructure software that allows companies in a diverse group of industries to respond more quickly and cost-effectively to changing market conditions. While top- and bottom-line growth topped December-quarter estimates, the company’s license growth guidance for the March quarter was lower than expected. We sold BEA as new license forecasts created a back-end loaded year and increased its risk profile. |
Agilent Technologies, Inc. | $12.3 | 7.9 | The manufacturer of test and measurement products for the communications, electronics, life sciences and chemical analysis markets grew January-quarter earnings 22 percent. Strength in the company’s bio-analytical business made up for weakness experienced in its electronic measurement segment. We sold Agilent on concerns that this imbalance would continue and that weakness in electronics outside of the seasonally slow January quarter would be harder to offset. |
All gains/losses are calculated on an average cost basis
Brandywine Blue Fund
Percent Change in Top Ten Holdings From Book Cost
| 1. | Oracle Corp. | +1.2% | 6. | | Lyondell Chemical Co. | -0.1% |
| 2. | Baxter International Inc. | +15.8% | 7. | | Cameron International Corp. | +11.8% |
| 3. | Comcast Corp. | +19.6% | 8. | | Rockwell Collins, Inc. | +28.1% |
| 4. | Yahoo! Inc. | -0.5% | 9. | | Precision Castparts Corp. | +84.4% |
| 5. | Cisco Systems Inc. | -8.1% | 10. | | Apple, Inc. | +17.2% |
Brandywine Blue Fund
March Quarter "Roses and Thorns"
| | $ Gain | | |
Biggest $ Winners | (in millions) | % Gain | Reason for Move |
| $19.8 | 32.5 | The manufacturer of engineered metal products grew December-quarter earnings 66 percent, beating estimates by 13 percent. Revenues grew 60 percent, driven by aerospace demand for specialty metals. Synergies associated with its acquisition of Special Metals Corporation continue to enhance productivity and profit margins. |
MEMC Electronic Materials, Inc. | $18.5 | 31.4 | December-quarter earnings jumped 70 percent, topping estimates by 15 percent. Strengthening demand from customers in the solar-energy market is boosting pricing power and profitability for the company’s semiconductor wafers. MEMC benefits from its strategic decision to direct more of its polysilicon toward its solar wafer business. |
Cameron International Corp. | $13.7 | 18.3 | The international manufacturer of oil and gas pressure-control equipment grew December-quarter earnings 96 percent, beating estimates. Revenues rose 76 percent and backlogged orders increased 64 percent. Exploration and production activity in international oil and gas markets, where Cameron does 80 percent of its business, is driving orders for pipes, valves and other subsea equipment. |
| Baxter International Inc. | $13.0 | 13.5 | December-quarter earnings topped estimates by 8 percent as revenue rose 11 percent to $2.8 billion. Baxter’s bioscience business was the primary contributor to results, with sales of blood products and treatments such as the hemophilia drug Advate rising 18 percent. New management has bolstered the company’s financial health and future earnings prospects by divesting underperforming operations, diversifying its offerings and increasing the pipeline of products in development. |
Allegheny Technologies, Inc. | $11.5 | 17.6 | The specialty materials producer grew December-quarter earnings 70 percent, topping estimates. Revenues rose 56 percent on increasing demand for materials such as titanium and nickel-based alloys used by the aerospace and defense industries. The company secured its two largest-ever contracts in the quarter and plans to invest as much as $450 million in new production capacity this year. |
| | $ Loss | | |
Biggest $ Losers | (in millions) | % Loss | Reason for Move |
| NVIDIA Corp. | $11.2 | 9.1 | January-quarter earnings doubled to $0.53, topping estimates by 23 percent. The manufacturer of computer chips that provide high-performance, interactive 3D graphics for personal computers and gaming consoles came under pressure on concerns related to AMD’s acquisition of graphics-chip competitor ATI. Our research shows that NVIDIA’s budding relationship with Intel is more than offsetting business lost with AMD. |
| Seagate Technology | $10.5 | 16.7 | The manufacturer of rigid hard drives that provide memory storage for computers and other electronic devices topped December-quarter earnings estimates by 22 percent. Shares fell during the quarter on concerns that flash memory could replace the company’s micro drives in small electronics devices. As demand for storage products continues to strengthen, Seagate benefits not only from its entrenched position in the computer and consumer-electronics markets, but also from new opportunities related to increasing uses for its portable storage solutions. |
| Comcast Corp. | $8.9 | 8.0 | The largest cable-TV operator in the U.S. gave back ground gained previously on concerns related to higher-than-expected 2007 capital expenditure guidance. We believe the increased spending is positive and directly related to surging new customer additions for Comcast’s triple-play package of cable, internet and phone services. Comcast is adding over 500,000 new voice customers per quarter while many regional telephone companies are still in the process of rolling out broadband infrastructure. |
Weatherford International Ltd. | $8.6 | 9.9 | The provider of advanced-technology oil well drilling services grew December-quarter earnings 36 percent, topping estimates. Concerns about mild weather patterns in the U.S. and increasing fuel stockpiles overshadowed the company’s strengthening international sales. We sold Weatherford during the quarter, locking in a substantial long-term gain. |
| Cisco Systems Inc. | $8.3 | 8.1 | The world’s largest provider of networking products for enterprises and service providers grew January-quarter earnings 27 percent, topping estimates. Investors cooled on technology companies in general given their strong performance coming into 2007 and resulting more difficult year-over-year comparables they face in the quarters ahead. Cisco has numerous growth opportunities over the near-to-intermediate term, including unified communications, emerging markets and the commercial segment. |
All gains/losses are calculated on an average cost basis
Brandywine Fund, Inc.
Statement of Net Assets
March 31, 2007
(Unaudited)
Shares | | | Cost | | Value |
| | | | | | | | |
Common Stocks - 97.7% (a) | | | | | |
| | | | | | | | |
CONSUMER DISCRETIONARY | | | | | |
| | | Advertising - 0.1 % | | | | | |
| 124,800 | | National CineMedia, Inc.* | $ | 2,774,155 | | $ | 3,332,160 |
| | | | | | | | |
| | | Apparel Retail - 0.7 % | | | | | |
| 830,700 | | Dress Barn, Inc.* | | 19,912,349 | | | 17,286,867 |
| 335,800 | | J. Crew Group, Inc.* | | 12,100,140 | | | 13,489,086 |
| | | | | | | | |
| | | Apparel, Accessories & Luxury Goods - 1.5 % | | | | | |
| 894,800 | | Phillips-Van Heusen Corp. | | 51,044,554 | | | 52,614,240 |
| 387,500 | | The Warnaco Group, Inc.* | | 10,687,907 | | | 11,005,000 |
| | | | | | | | |
| | | Broadcasting & Cable TV - 4.1 % | | | | | |
| 6,663,450 | | Comcast Corp.* | | 142,622,155 | | | 172,916,528 |
| | | | | | | | |
| | | Footwear - 0.4 % | | | | | |
| 67,100 | | Deckers Outdoor Corp.* | | 3,856,453 | | | 4,765,442 |
| 529,700 | | Iconix Brand Group, Inc.* | | 10,316,988 | | | 10,805,880 |
| | | | | | | | |
| | | Restaurants - 0.5 % | | | | | |
| 1,026,700 | | Burger King Holdings Inc. | | 22,580,406 | | | 22,176,720 |
| | | | | | | | |
| | | Specialty Stores - 1.1 % | | | | | |
| 1,310,800 | | Office Depot, Inc.* | | 46,316,453 | | | 46,061,512 |
| | | | | | | | |
| | | Total Consumer Discretionary | | 322,211,560 | | | 354,453,435 |
| | | | | | | | |
| | | This sector is 10.0% above your Fund’s cost. | | | | | |
| | | | | | | | |
CONSUMER STAPLES | | | | | |
| | | | | | | | |
| | | Personal Products - 0.8 % | | | | | |
| 682,300 | | Bare Escentuals, Inc.* | | 23,592,116 | | | 24,474,101 |
| 513,500 | | Nu Skin Enterprises, Inc. | | 8,955,799 | | | 8,483,020 |
| | | | | | | | |
| | | Total Consumer Staples | | 32,547,915 | | | 32,957,121 |
| | | | | | | | |
| | | This sector is 1.3% above your Fund’s cost. | | | | | |
| | | | | | | | |
ENERGY | | | | | |
| | | Oil & Gas Equipment & Services - 2.8 % | | | | | |
| 1,351,000 | | FMC Technologies, Inc.* | | 82,143,586 | | | 94,245,760 |
| 557,600 | | Oceaneering International, Inc.* | | 21,906,688 | | | 23,486,112 |
| | | | | | | | |
| | | Oil & Gas Exploration & Production - 1.4 % | | | | | |
| 602,000 | | Cabot Oil & Gas Corp. | | 35,204,451 | | | 40,526,640 |
| 623,200 | | Range Resources Corp. | | 19,249,643 | | | 20,814,880 |
| | | | | | | | |
| | | Total Energy | | 158,504,368 | | | 179,073,392 |
| | | | | | | | |
| | | This sector is 13.0% above your Fund’s cost. | | | | | |
| | | | | | | | |
FINANCIALS | | | | | |
| | | | | | | | |
| | | Asset Management & Custody Banks - 0.5 % | | | | | |
| 922,400 | | Amvescap PLC - SP-ADR | | 22,574,103 | | | 20,385,040 |
| | | | | | | | |
| | | Insurance Brokers - 0.2 % | | | | | |
| 175,300 | | Hilb Rogal and Hobbs Co. | | 8,331,425 | | | 8,598,465 |
| | | | | | | | |
| | | Multi-line Insurance - 1.3 % | | | | | |
| 1,826,300 | | HCC Insurance Holdings, Inc. | | 57,799,488 | | | 56,250,040 |
| | | | | | | | |
| | | Property & Casualty Insurance - 0.0 % | | | | | |
| 20,900 | | ProAssurance Corp.* | | 1,024,450 | | | 1,069,035 |
| | | | | | | | |
| | | Total Financials | | 89,729,466 | | | 86,302,580 |
| | | | | | | | |
| | | This sector is 3.8% below your Fund’s cost. | | | | | |
| | | | | | | | |
HEALTH CARE | | | | | |
| | | | | | | | |
| | | Health Care Equipment - 4.3 % | | | | | |
| 186,200 | | American Medical Systems | | | | | |
| | | Holdings, Inc.* | | 3,219,054 | | | 3,941,854 |
| 3,314,200 | | Baxter International Inc. | | 149,587,128 | | | 174,558,914 |
| 160,100 | | Thoratec Corp.* | | 3,140,485 | | | 3,346,090 |
| | | | | | | | |
| | | Health Care Services - 0.7 % | | | | | |
| 142,000 | | AMN Healthcare Services, Inc.* | | 3,317,788 | | | 3,212,040 |
| 502,900 | | DaVita, Inc.* | | 27,250,730 | | | 26,814,628 |
| | | | | | | | |
| | | Life Sciences Tools & Services - 5.1 % | | | | | |
| 996,300 | | Covance Inc.* | | 58,354,787 | | | 59,120,442 |
| 1,632,300 | | Pharmaceutical Product | | | | | |
| | | Development, Inc. | | 55,390,327 | | | 54,992,187 |
| 2,171,700 | | Thermo Fisher Scientific, Inc.* | | 72,269,772 | | | 101,526,975 |
| | | | | | | | |
| | | Pharmaceuticals - 0.3 % | | | | | |
| 133,100 | | K-V Pharmaceutical Co.* | | 3,185,394 | | | 3,291,563 |
| 120,500 | | Medicis Pharmaceutical Corp. | | 4,264,786 | | | 3,713,810 |
| 440,300 | | Warner Chilcott Ltd.* | | 6,502,526 | | | 6,520,843 |
| | | | | | | | |
| | | Total Health Care | | 386,482,777 | | | 441,039,346 |
| | | | | | | | |
| | | This sector is 14.1% above your Fund’s cost. | | | | | |
| | | | | | | | |
| INDUSTRIALS | | | | | |
| | | | | | | | |
| | | Aerospace & Defense - 13.1 % | | | | | |
| 550,200 | | AerCap Holdings N.V.* | | 12,992,382 | | | 16,016,322 |
| 1,625,000 | | BE Aerospace, Inc.* | | 43,661,679 | | | 51,512,500 |
| 663,700 | | Goodrich Corp. | | 27,278,347 | | | 34,167,276 |
| 35,300 | | Hexcel Corp.* | | 659,108 | | | 700,705 |
| 59,700 | | Moog Inc.* | | 2,022,222 | | | 2,486,505 |
| 2,645,900 | | Precision Castparts Corp. | | 98,877,440 | | | 275,305,895 |
| 2,055,300 | | Rockwell Collins, Inc. | | 110,468,818 | | | 137,561,229 |
| 1,133,500 | | Spirit Aerosystems Holdings Inc.* | | 30,971,648 | | | 36,101,975 |
| 61,600 | | Triumph Group, Inc. | | 3,286,293 | | | 3,408,944 |
| | | | | | | | |
| | | Construction & Engineering - 1.3 % | | | | | |
| 700,800 | | Chicago Bridge & Iron | | | | | |
| | | Co. N.V. NYS | | 17,461,121 | | | 21,549,600 |
| 255,300 | | EMCOR Group, Inc.* | | 15,032,805 | | | 15,057,594 |
| 159,800 | | Granite Construction Inc. | | 8,029,220 | | | 8,830,548 |
| 118,100 | | Washington Group | | | | | |
| | | International, Inc.* | | 6,090,480 | | | 7,844,202 |
| | | | | | | | |
| | | Construction & Farm Machinery & Heavy Trucks - 0.7 % | | | | | |
| 89,000 | | Astec Industries, Inc.* | | 3,028,147 | | | 3,582,250 |
| 387,300 | | Bucyrus International, Inc. | | 18,124,078 | | | 19,945,950 |
| 266,200 | | Force Protection, Inc.* | | 4,439,507 | | | 4,993,912 |
Brandywine Fund, Inc.
Statement of Net Assets (Continued)
March 31, 2007
(Unaudited)
Shares | | | Cost | | Value |
| | | | | | | | |
Common Stocks - 97.7% (a) (Continued) | | | | | |
| | | | | | | | |
| | | Diversified Commercial & Professional Services - 0.2 % | | | | | |
| 153,200 | | IHS Inc.* | $ | 5,132,200 | | $ | 6,298,052 |
| 145,400 | | Mobile Mini, Inc.* | | 4,078,044 | | | 3,893,812 |
| | | | | | | | |
| | | Electrical Components & Equipment - 2.5 % | | | | | |
| 592,500 | | Acuity Brands, Inc. | | 30,766,719 | | | 32,255,700 |
| 288,900 | | Genlyte Group Inc.* | | 22,023,940 | | | 20,381,895 |
| 1,552,100 | | Suntech Power | | | | | |
| | | Holdings Co., Ltd. ADR* | | 42,121,608 | | | 53,718,181 |
| | | | | | | | |
| | | Environmental & Facilities Services - 1.3 % | | | | | |
| 1,159,650 | | Republic Services, Inc. | | 31,048,141 | | | 32,261,463 |
| 545,250 | | Waste Connections, Inc.* | | 12,526,446 | | | 16,324,785 |
| 172,300 | | Waste Management, Inc. | | 6,243,329 | | | 5,928,843 |
| | | | | | | | |
| | | Human Resource & Employment Services - 0.5 % | | | | | |
| 22,900 | | Resources Connection, Inc.* | | 773,649 | | | 732,571 |
| 442,200 | | Watson Wyatt Worldwide Inc. | | 21,503,047 | | | 21,513,030 |
| | | | | | | | |
| | | Industrial Conglomerates - 2.0 % | | | | | |
| 1,718,000 | | McDermott International, Inc.* | | 30,133,122 | | | 84,147,640 |
| | | | | | | | |
| | | Industrial Machinery - 0.0 % | | | | | |
| 35,700 | | Barnes Group Inc. | | 756,754 | | | 821,457 |
| | | | | | | | |
| | | Marine - 0.7 % | | | | | |
| 87,200 | | American Commercial Lines Inc.* | | 2,228,662 | | | 2,742,440 |
| 364,700 | | Eagle Bulk Shipping Inc. | | 5,082,250 | | | 7,071,533 |
| 314,600 | | Kirby Corp.* | | 11,190,655 | | | 11,004,708 |
| 567,500 | | Ultrapetrol Bahamas Ltd.* | | 6,242,500 | | | 9,522,650 |
| | | | | | | | |
| | | Railroads - 0.1 % | | | | | |
| 111,300 | | Genesee & Wyoming Inc.* | | 2,897,791 | | | 2,961,693 |
| | | | | | | | |
| | | Trading Companies & Distributors - 0.0 % | | | | | |
| 23,000 | | H&E Equipment Services, Inc.* | | 572,548 | | | 494,500 |
| | | | | | | | |
| | | Total Industrials | | 637,744,700 | | | 951,140,360 |
| | | | | | | | |
| | | This sector is 49.1% above your Fund’s cost. | | | | | |
| | | | | | | | |
| INFORMATION TECHNOLOGY | | | | | |
| | | | | | | | |
| | | Application Software - 2.4 % | | | | | |
| 116,200 | | Ansoft Corp.* | | 3,274,807 | | | 3,676,568 |
| 986,000 | | Autodesk, Inc.* | | 34,053,354 | | | 37,073,600 |
| 997,900 | | Mentor Graphics Corp.* | | 13,824,669 | | | 16,305,686 |
| 1,347,200 | | Nuance Communications, Inc.* | | 14,216,791 | | | 20,625,632 |
| 1,174,680 | | Parametric Technology Corp.* | | 18,305,858 | | | 22,424,641 |
| | | | | | | | |
| | | Communications Equipment - 8.6 % | | | | | |
| 5,372,600 | | Cisco Systems Inc.* | | 143,863,288 | | | 137,162,478 |
| 3,858,600 | | Corning Inc.* | | 86,522,649 | | | 87,744,564 |
| 2,624,800 | | Harris Corp. | | 103,574,334 | | | 133,733,560 |
| 128,200 | | NICE Systems Ltd. SP-ADR* | | 3,829,156 | | | 4,361,364 |
| 35,200 | | Plantronics, Inc. | | 828,949 | | | 831,424 |
| | | | | | | | |
| | | Computer Hardware - 7.0 % | | | | | |
| 1,948,700 | | Apple, Inc.* | | 173,375,490 | | | 181,053,717 |
| 2,898,800 | | Hewlett-Packard Co. | | 92,638,029 | | | 116,357,832 |
| | | | | | | | |
| | | Computer Storage & Peripherals - 0.1% | | | | | |
| 167,700 | | Synaptics Inc.* | | 5,229,089 | | | 4,289,766 |
| | | | | | | | |
| | | Data Processing & Outsourced Services - 4.8 % | | | | | |
| 885,600 | | Alliance Data Systems Corp.* | | 57,655,850 | | | 54,570,672 |
| 2,174,800 | | CheckFree Corp.* | | 88,501,262 | | | 80,663,332 |
| 1,498,100 | | Fidelity National | | | | | |
| | | Information Services, Inc. | | 56,943,394 | | | 68,103,626 |
| | | | | | | | |
| | | Electronic Manufacturing Services - 0.4 % | | | | | |
| 1,617,000 | | Flextronics International Ltd.* | | 17,061,082 | | | 17,689,980 |
| | | | | | | | |
| | | Home Entertainment Software - 0.3 % | | | | | |
| 706,100 | | Activision, Inc.* | | 12,744,863 | | | 13,373,534 |
| | | | | | | | |
| | | Internet Software & Services - 4.7 % | | | | | |
| 809,600 | | aQuantive, Inc.* | | 19,762,017 | | | 22,595,936 |
| 5,632,800 | | Yahoo! Inc.* | | 177,180,911 | | | 176,250,312 |
| | | | | | | | |
| | | IT Consulting & Other Services - 1.3 % | | | | | |
| 1,403,300 | | Accenture Ltd. | | 41,674,110 | | | 54,083,182 |
| | | | | | | | |
| | | Semiconductor Equipment - 1.0 % | | | | | |
| 71,400 | | Advanced Energy Industries, Inc.* | | 1,390,583 | | | 1,502,256 |
| 225,700 | | FEI Co.* | | 5,642,500 | | | 8,138,742 |
| 644,300 | | Varian Semiconductor | | | | | |
| | | Equipment Associates, Inc.* | | 31,145,431 | | | 34,392,734 |
| | | | | | | | |
| | | Semiconductors - 1.4 % | | | | | |
| 614,900 | | Atheros Communications* | | 14,426,732 | | | 14,714,557 |
| 536,900 | | Microsemi Corp.* | | 10,590,830 | | | 11,172,889 |
| 903,600 | | NVIDIA Corp.* | | 25,377,268 | | | 26,005,608 |
| 52,900 | | Standard Microsystems Corp.* | | 1,550,430 | | | 1,615,566 |
| 360,200 | | Zoran Corp.* | | 6,267,187 | | | 6,130,604 |
| | | | | | | | |
| | | Systems Software - 5.1 % | | | | | |
| 268,100 | | MICROS Systems, Inc.* | | 10,969,592 | | | 14,474,719 |
| 11,241,100 | | Oracle Corp.* | | 195,286,514 | | | 203,801,143 |
| | | | | | | | |
| | | Total Information Technology | | 1,467,707,019 | | | 1,574,920,224 |
| | | | | | | | |
| | | This sector is 7.3% above your Fund’s cost. | | | | | |
| | | | | | | | |
MATERIALS | | | | | |
| | | | | | | | |
| | | Aluminum - 0.3 % | | | | | |
| 186,500 | | Kaiser Aluminum Corp.* | | 11,438,714 | | | 14,547,000 |
| | | | | | | | |
| | | Commodity Chemicals - 2.5 % | | | | | |
| 3,500,200 | | Lyondell Chemical Co. | | 104,462,695 | | | 104,900,994 |
| | | | | | | | |
| | | Diversified Metals & Mining - 0.6 % | | | | | |
| 266,600 | | RTI International Metals, Inc.* | | 13,111,669 | | | 24,263,266 |
| | | | | | | | |
| | | Fertilizers & Agricultural Chemicals - 0.8 % | | | | | |
| 863,200 | | CF Industries Holdings, Inc. | | 33,296,645 | | | 33,276,360 |
| | | | | | | | |
| | | Metal & Glass Containers - 1.7 % | | | | | |
| 260,900 | | AptarGroup, Inc. | | 17,229,015 | | | 17,462,037 |
| 2,173,500 | | Crown Holdings, Inc.* | | 39,580,696 | | | 53,163,810 |
| | | | | | | | |
| | | Steel - 4.7 % | | | | | |
| 1,596,100 | | Allegheny Technologies, Inc. | | 95,139,114 | | | 170,287,909 |
| 564,900 | | Reliance Steel & Aluminum Co. | | 21,635,572 | | | 27,341,160 |
| | | | | | | | |
| | | Total Materials | | 335,894,120 | | | 445,242,536 |
| | | | | | | | |
| | | This sector is 32.6% above your Fund’s cost. | | | | | |
Brandywine Fund, Inc.
Statement of Net Assets (Continued)
March 31, 2007
(Unaudited)
Shares | | | Cost | | Value |
| | | | | | | | |
Common Stocks - 97.7% (a) (Continued) | | | | | |
| | | | | | | | |
| TELECOMMUNICATION SERVICES | | | | | |
| | | | | | | | |
| | | Integrated Telecommunication Services - 1.3 % | | | | | |
| 576,200 | | AT&T Inc. | $ | 19,894,209 | | $ | 22,719,566 |
| 1,168,200 | | NeuStar, Inc.* | | 37,352,501 | | | 33,223,608 |
| | | | | | | | |
| | | Wireless Telecommunication Services - 0.5 % | | | | | |
| 271,100 | | NII Holdings Inc.* | | 17,167,413 | | | 20,110,198 |
| | | | | | | | |
| | | Total Telecommunication Services | | 74,414,123 | | | 76,053,372 |
| | | | | | | | |
| | | This sector is 2.2% above your Fund’s cost. | | | | | |
| | | | | | | | |
| | | Total common stocks | | 3,505,236,048 | | | 4,141,182,366 |
| | | | | | | | |
Principal | | | | | | | |
Amount | | | | | | | |
| | | | | | | | |
Short-Term Investments - 1.6% (a) | | | | | |
| | | | | | | | |
| | | Commercial Paper - 1.6 % | | | | | |
| $46,000,000 | | Countrywide Financial Corp., | | | | | |
| | | due 04/02/07, discount of 5.35% | | 45,993,164 | | | 45,993,164 |
| 20,000,000 | | Countrywide Financial Corp., | | | | | |
| | | due 04/03/07, discount of 5.41% | | 19,993,989 | | | 19,993,989 |
| | | Total commercial paper | | 65,987,153 | | | 65,987,153 |
| | | | | | | | |
| | | Variable Rate Demand Note 0.0 % | | | | | |
| 2,182,424 | | U.S. Bank, N.A., 5.07% | | 2,182,424 | | | 2,182,424 |
| | | Total short-term investments | | 68,169,577 | | | 68,169,577 |
| | | Total investments | $ | 3,573,405,625 | | | 4,209,351,943 |
| | | Cash and receivables, less | | | | | |
| | | liabilities 0.7% (a) | | | | | 28,610,951 |
| | | Net Assets | | | | $ | 4,237,962,894 |
| | | Net Asset Value Per Share | | | | | |
| | | ($0.01 par value, 500,000,000 | | | | | |
| | | shares authorized), offering | | | | | |
| | | and redemption price | | | | | |
| | | ($4,237,962,894 / 120,043,837 | | | | | |
| | | shares outstanding) | | | | $ | 35.30 |
* Non-dividend paying security.
(a) Percentages for the various classifications relate to net assets.
ADR - American Depositary Receipts
N.V. - Netherlands Antillies Limited Liability Corp.
NYS - New York Registered Shares
The accompanying notes to financial statements are an integral part of this statement.
Brandywine Fund, Inc.
Statement of Operations
For the Six Months Ended March 31, 2007
(Unaudited)
Income: | | | |
| Dividends | | $ | 10,051,111 |
| Interest | | | 1,700,373 |
| Total income | | | 11,751,484 |
| | | | |
Expenses: | | | |
| Management fees | | | 21,063,294 |
| Transfer agent fees | | | 845,247 |
| Administrative and accounting services | | | 310,615 |
| Printing and postage expense | | | 169,388 |
| Custodian fees | | | 118,294 |
| Board of Directors fees and expenses | | | 71,292 |
| Registration fees | | | 32,965 |
| Professional fees | | | 26,836 |
| Insurance expense | | | 23,941 |
| Other expenses | | | 7,422 |
| Total expenses | | | 22,669,294 |
Net Investment Loss | | | (10,917,810) |
Net Realized Gain on Investments | | | 185,439,075 |
Net Increase in Unrealized Appreciation on Investments | | | 231,039,866 |
Net Gain on Investments | | | 416,478,941 |
Net Increase in Net Assets Resulting From Operations | | $ | 405,561,131 |
Statements of Changes in Net Assets
For the Six Months Ended March 31, 2007 (Unaudited)
and for the Year Ended September 30, 2006
| | | 2007 | | 2006 | |
Operations: | | | | | |
| Net investment loss | | $ | (10,917,810 | ) | $ | (12,539,911 | ) |
| Net realized gain on investments | | | 185,439,075 | | | 328,031,774 | |
| Net increase (decrease) in unrealized appreciation on investments | | | 231,039,866 | | | (219,420,419 | ) |
| Net increase in net assets resulting from operations | | | 405,561,131 | | | 96,071,444 | |
| | | | | | | | |
Distributions to Shareholders: | | | | | | | |
| Distributions from net realized gains ($0.24662 per share) | | | (30,419,122 | ) | | — | |
| | | | | | | | |
Fund Share Activities: | | | | | | | |
| Proceeds from shares issued (3,459,497 and 15,270,588 shares, respectively) | | | 119,338,551 | | | 490,003,223 | |
| Net asset value of shares issued in distributions reinvested (840,556 shares) | | | 28,878,771 | | | — | |
| Cost of shares redeemed (10,245,491 and 16,126,696 shares, respectively) | | | (351,688,804 | ) | | (515,363,981 | ) |
| Net decrease in net assets derived from Fund share activities | | | (203,471,482 | ) | | (25,360,758 | ) |
| | | | | | | | |
Total Increase | | | 171,670,527 | | | 70,710,686 | |
| | | | | | | | |
Net Assets at the Beginning of the Period | | | 4,066,292,367 | | | 3,995,581,681 | |
Net Assets at the End of the Period | | $ | 4,237,962,894 | | $ | 4,066,292,367 | |
| (Includes accumulated net investment loss of $0 and $0, respectively) | | | | | | | |
The accompanying notes to financial statements are an integral part of these statements.
Brandywine Fund, Inc.
Financial Highlights
(Selected data for each share of the Fund outstanding throughout each period)
| | | For the Six Months | | | |
| | | ended March 31, 2007 | | Years Ended September 30, | |
| | | (Unaudited) | | 2006 | | 2005 | | 2004 | | 2003 | | 2002 | |
| PER SHARE OPERATING PERFORMANCE: | | | | | | | | | | | |
| Net asset value, beginning of period | | $ | 32.27 | | $ | 31.50 | | $ | 24.19 | | $ | 21.30 | | $ | 19.08 | | $ | 22.93 | |
| | | | | | | | | | | | | | | | | | | | |
| Income from investment operations: | | | | | | | | | | | | | | | | | | | |
Net investment loss(1) | | | (0.09 | ) | | (0.10 | ) | | (0.08 | ) | | (0.13 | ) | | (0.10 | ) | | (0.12 | ) |
| Net realized and unrealized gains (losses) | | | | | | | | | | | | | | | | | | |
| on investments | | | 3.37 | | | 0.87 | | | 7.39 | | | 3.02 | | | 2.32 | | | (3.73 | ) |
| Total from investment operations | | | 3.28 | | | 0.77 | | | 7.31 | | | 2.89 | | | 2.22 | | | (3.85 | ) |
| | | | | | | | | | | | | | | | | | | | |
| Less distributions: | | | | | | | | | | | | | | | | | | | |
| Dividend from net investment income | | | — | | | — | | | — | | | — | | | — | | | — | |
| Distributions from net realized gains | | | (0.25 | ) | | — | | | — | | | — | | | — | | | — | |
| Total from distributions | | | (0.25 | ) | | — | | | — | | | — | | | — | | | — | |
| Net asset value, end of period | | $ | 35.30 | | $ | 32.27 | | $ | 31.50 | | $ | 24.19 | | $ | 21.30 | | $ | 19.08 | |
| | | | | | | | | | | | | | | | | | | | |
| TOTAL INVESTMENT RETURN | | | 10.18 | %(a) | | 2.44 | % | | 30.22 | % | | 13.57 | % | | 11.64 | % | | (16.79 | %) |
| | | | | | | | | | | | | | | | | | | | |
| RATIOS/SUPPLEMENTAL DATA: | | | | | | | | | | | | | | | | | | | |
| Net assets, end of period (in 000’s $) | | | 4,237,963 | | | 4,066,292 | | | 3,995,582 | | | 3,586,793 | | | 3,385,590 | | | 3,196,859 | |
| Ratio of expenses to average net assets | | | 1.08 | % (b) | | 1.08 | % | | 1.08 | % | | 1.08 | % | | 1.09 | % | | 1.08 | % |
| Ratio of net investment loss | | | | | | | | | | | | | | | | | | | |
| to average net assets | | | (0.52 | %) (b) | | (0.31 | %) | | (0.25 | %) | | (0.55 | %) | | (0.53 | %) | | (0.52 | %) |
| Portfolio turnover rate | | | 89.9 | % (a) | | 199.9 | % | | 183.4 | % | | 247.0 | % | | 279.3 | % | | 272.9 | % |
(a) Not Annualized.
(b) Annualized.
(1) Net investment loss per share was calculated using average shares outstanding.
The accompanying notes to financial statements are an integral part of this statement.
| Definitions and Disclosures Performance data quoted represent past performance; past performance does not guarantee future results. The investment return and principal value of an investment will fluctuate so that an investor’s shares, when redeemed, may be worth more or less than their original cost. Current performance of the Funds may be lower or higher than the performance quoted. Performance data current to the most recent month end may be obtained by visiting www.brandywinefunds.com. The Funds’ investment objectives, risks, charges and expenses must be considered carefully before investing. The prospectus contains this and other important information about the investment companies, and it may be obtained by calling 1-800-656-3017, or visiting www.brandywinefunds.com. Read it carefully before investing. Fund holdings and sector weightings are subject to change at any time and are not recommendations to buy or sell any securities. Securities discussed were not held by the Funds as of 03/31/07, unless listed in the accompanying financial statements. References to the earnings growth rates of the Funds refer solely to the estimated earnings growth rates of the average investment holding of the Funds based on consensus estimates from Baseline and not to the actual performance of the Funds themselves. Baseline Financial Services, Inc. (Baseline) provides analytical information and services to the investment community. The Russell 3000 Index measures the performance of the 3,000 largest U.S. companies based on total market capitalization, which represents approximately 98% of the investable U.S. equity market. The Russell 3000 Growth Index measures the performance of those Russell 3000 Index companies with higher price-to-book ratios and higher forecasted growth values. The stocks in this index are also members of either the Russell 1000 Growth or the Russell 2000 Growth Index. The Russell 1000 Index measures the performance of the 1,000 largest companies in the Russell 3000 Index, which represents approximately 92% of the total market capitalization of the Russell 3000 Index. The Russell 1000 Growth Index measures the performance of those Russell 1000 companies with higher price-to-book ratios and higher forecasted growth values. The S&P 500 Index is a market-value weighted index consisting of 500 U.S. stocks chosen for market size, liquidity and industry group representation. You cannot invest directly in an index. As of March 31, 2007 the Russell 1000 Index’s average annual total returns for 1, 5 and 10 years were 11.84, 6.92 and 8.61 percent; the Russell 1000 Growth Index’s were 7.06, 3.47 and 5.51 percent; the Russell 3000 Index’s were 11.28, 7.23 and 8.69 percent; the Russell 3000 Growth Index’s were 6.53, 3.81 and 5.53 percent; and the S&P 500 Index’s were 11.83, 6.26 and 8.20 percent. |
Brandywine Blue Fund
Statement of Net Assets
March 31, 2007
(Unaudited)
Shares | | | Cost | | Value |
| | | | | | | | |
Common Stocks - 94.0% (a) | | | | | |
| | | | | | | | |
CONSUMER DISCRETIONARY | | | | | |
| | | | | | | | |
| | | Broadcasting & Cable TV - 4.3 % | | | | | |
| 3,913,650 | | Comcast Corp.* | $ | 84,942,444 | | $ | 101,559,217 |
| | | | | | | | |
| | | Specialty Stores - 1.5 % | | | | | |
| 1,020,200 | | Office Depot, Inc.* | | 35,952,273 | | | 35,849,828 |
| | | | | | | | |
| | | Total Consumer Discretionary | | 120,894,717 | | | 137,409,045 |
| | | | | | | | |
| | | This sector is 13.7% above your Fund’s cost. | | | | | |
| | | | | | | | |
CONSUMER STAPLES | | | | | |
| | | | | | | | |
| | | Agricultural Products - 3.0 % | | | | | |
| 1,907,500 | | Archer-Daniels-Midland Co. | | 65,510,894 | | | 70,005,250 |
| | | | | | | | |
| | | Total Consumer Staples | | 65,510,894 | | | 70,005,250 |
| | | | | | | | |
| | | This sector is 6.9% above your Fund’s cost. | | | | | |
| | | | | | | | |
ENERGY | | | | | |
| | | | | | | | |
| | | Oil & Gas Equipment & Services - 3.8 % | | | | | |
| 1,416,400 | | Cameron International Corp.* | | 79,555,234 | | | 88,935,756 |
| | | | | | | | |
| | | Total Energy | | 79,555,234 | | | 88,935,756 |
| | | | | | | | |
| | | This sector is 11.8% above your Fund’s cost. | | | | | |
| | | | | | | | |
FINANCIALS | | | | | |
| | | | | | | | |
| | | Asset Management & Custody Banks - 0.6 % | | | | | |
| 619,300 | | Amvescap PLC - SP-ADR | | 15,174,012 | | | 13,686,530 |
| | | | | | | | |
| | | Total Financials | | 15,174,012 | | | 13,686,530 |
| | | | | | | | |
| | | This sector is 9.8% below your Fund’s cost. | | | | | |
| | | | | | | | |
| | | HEALTH CARE | | | | | |
| | | | | | | | |
| | | Biotechnology - 2.8 % | | | | | |
| 848,500 | | Gilead Sciences, Inc.* | | 57,504,793 | | | 64,910,250 |
| | | | | | | | |
| | | Health Care Equipment - 5.0 % | | | | | |
| 2,076,600 | | Baxter International Inc. | | 94,458,406 | | | 109,374,522 |
| 190,400 | | Varian Medical Systems, Inc.* | | 9,019,947 | | | 9,080,176 |
| | | | | | | | |
| | | Health Care Services - 0.5 % | | | | | |
| 224,600 | | DaVita, Inc.* | | 12,421,716 | | | 11,975,672 |
| | | | | | | | |
| | | Life Sciences Tools & Services - 2.6 % | | | | | |
| 1,303,700 | | Thermo Fisher Scientific, Inc.* | | 44,607,783 | | | 60,947,975 |
| | | | | | | | |
| | | Pharmaceuticals - 2.7 % | | | | | |
| 1,132,000 | | Abbott Laboratories | | 63,348,053 | | | 63,165,600 |
| | | | | | | | |
| | | Total Health Care | | 281,360,698 | | | 319,454,195 |
| | | | | | | | |
| | | This sector is 13.5% above your Fund’s cost. | | | | | |
| | | | | | | | |
| INDUSTRIALS | | | | | |
| | | | | | | | |
| | | Aerospace & Defense - 7.7 % | | | | | |
| 351,400 | | Goodrich Corp. | | 17,024,802 | | | 18,090,072 |
| 776,200 | | Precision Castparts Corp. | | 43,804,698 | | | 80,763,610 |
| 1,247,500 | | Rockwell Collins, Inc. | | 65,161,664 | | | 83,495,175 |
| | | | | | | | |
| | | Construction & Engineering - 2.3 % | | | | | |
| 612,600 | | Fluor Corp. | | 52,472,227 | | | 54,962,472 |
| | | | | | | | |
| | | Electrical Components & Equipment - 2.3 % | | | | | |
| 1,263,900 | | Emerson Electric Co. | | 50,969,578 | | | 54,461,451 |
| | | | | | | | |
| | | Environmental & Facilities Services - 0.3 % | | | | | |
| 174,500 | | Waste Management, Inc. | | 6,338,472 | | | 6,004,545 |
| | | | | | | | |
| | | Industrial Machinery - 1.9 % | | | | | |
| 934,800 | | Dover Corp. | | 41,142,615 | | | 45,627,588 |
| | | | | | | | |
| | | Total Industrials | | 276,914,056 | | | 343,404,913 |
| | | | | | | | |
| | | This sector is 24.0% above your Fund’s cost. | | | | | |
| | | | | | | | |
INFORMATION TECHNOLOGY | | | | | |
| | | | | | | | |
| | | Application Software - 4.2 % | | | | | |
| 1,460,200 | | Adobe Systems Inc.* | | 60,871,894 | | | 60,890,340 |
| 1,014,000 | | Autodesk, Inc.* | | 35,301,059 | | | 38,126,400 |
| | | | | | | | |
| | | Communications Equipment - 9.1 % | | | | | |
| 3,697,800 | | Cisco Systems Inc.* | | 102,712,787 | | | 94,404,834 |
| 2,626,400 | | Corning Inc.* | | 58,880,317 | | | 59,724,336 |
| 446,900 | | Research In Motion Ltd.* | | 59,105,273 | | | 60,997,381 |
| | | | | | | | |
| | | Computer Hardware - 6.4 % | | | | | |
| 863,800 | | Apple, Inc.* | | 68,496,395 | | | 80,255,658 |
| 1,779,300 | | Hewlett-Packard Co. | | 59,366,552 | | | 71,421,102 |
| | | | | | | | |
| | | Computer Storage & Peripherals - 2.2 % | | | | | |
| 2,261,100 | | Seagate Technology | | 63,225,167 | | | 52,683,630 |
| | | | | | | | |
| | | Data Processing & Outsourced Services - 2.5 % | | | | | |
| 1,308,400 | | Fidelity National Information | | | | | |
| | | Services, Inc. | | 51,625,426 | | | 59,479,864 |
| | | | | | | | |
| | | Electronic Manufacturing Services - 0.8 % | | | | | |
| 1,698,900 | | Flextronics International Ltd.* | | 18,233,404 | | | 18,585,966 |
| | | | | | | | |
| | | Internet Software & Services - 4.1 % | | | | | |
| 3,044,900 | | Yahoo! Inc.* | | 95,747,555 | | | 95,274,921 |
| | | | | | | | |
| | | IT Consulting & Other Services - 1.8 % | | | | | |
| 1,084,800 | | Accenture Ltd. | | 33,071,996 | | | 41,808,192 |
| | | | | | | | |
| | | Semiconductors - 2.8 % | | | | | |
| 2,310,600 | | NVIDIA Corp.* | | 68,791,141 | | | 66,499,068 |
| | | | | | | | |
| | | Systems Software - 4.7 % | | | | | |
| 6,045,300 | | Oracle Corp.* | | 108,250,435 | | | 109,601,289 |
| | | | | | | | |
| | | Total Information Technology | | 883,679,401 | | | 909,752,981 |
| | | | | | | | |
| | | This sector is 3.0% above your Fund’s cost. | | | | | |
| | | | | | | | |
MATERIALS | | | | | |
| | | | | | | | |
| | | Commodity Chemicals - 3.8 % | | | | | |
| 2,972,100 | | Lyondell Chemical Co. | | 89,139,275 | | | 89,073,837 |
| | | | | | | | |
| | | Fertilizers & Agricultural Chemicals - 2.9 % | | | | | |
| 2,558,500 | | The Mosaic Co.* | | 58,567,116 | | | 68,209,610 |
Brandywine Blue Fund
Statement of Net Assets (Continued)
March 31, 2007
(Unaudited)
Shares | | | Cost | | Value |
| | | | | | | | |
Common Stocks - 94.0% (a) (Continued) | | | | | |
| | | | | | | | |
| | | Steel - 3.3 % | | | | | |
| 721,000 | | Allegheny Technologies, Inc. | $ | 46,056,552 | | $ | 76,923,490 |
| | | | | | | | |
| | | Total Materials | | 193,762,943 | | | 234,206,937 |
| | | | | | | | |
| | | This sector is 20.9% above your Fund’s cost. | | | | | |
| | | | | | | | |
| | | TELECOMMUNICATION SERVICES | | | | | |
| | | | | | | | |
| | | Integrated Telecommunication Services - 1.4 % | | | | | |
| 848,100 | | AT&T Inc. | | 29,383,652 | | | 33,440,583 |
| | | | | | | | |
| | | Wireless Telecommunication Services - 2.7 % | | | | | |
| 846,900 | | NII Holdings Inc.* | | 48,000,504 | | | 62,823,042 |
| | | | | | | | |
| | | Total Telecommunication Services | | 77,384,156 | | | 96,263,625 |
| | | | | | | | |
| | | This sector is 24.4% above your Fund’s cost. | | | | | |
| | | | | | | | |
| | | Total common stocks | | 1,994,236,111 | | | 2,213,119,232 |
| | | | | | | | |
Principal | | | | | | | |
Amount | | | | | | | |
| | | | | | | | |
Short-Term Investments - 5.0% (a) | | | | | |
| | | | | | | | |
| | | Commercial Paper - 4.9 % | | | | | |
| $64,000,000 | | Countrywide Financial Corp., | | | | | |
| | | due 04/03/07, | | | | | |
| | | discounts of 5.35%-5.41% | | 63,980,931 | | | 63,980,931 |
| | | | | | | | |
| 50,000,000 | | Countrywide Financial Corp., | | | | | |
| | | due 04/04/07, discount of 5.40% | | 49,977,500 | | | 49,977,500 |
| | | | | | | | |
| | | Total commercial paper | | 113,958,431 | | | 113,958,431 |
| | | | | | | | |
| | | Variable Rate Demand Note 0.1 % | | | | | |
| 2,544,407 | | U.S. Bank, N.A., 5.07% | | 2,544,407 | | | 2,544,407 |
| | | | | | | | |
| | | Total short-term investments | | 116,502,838 | | | 116,502,838 |
| | | | | | | | |
| | | Total investments | $ | 2,110,738,949 | | | 2,329,622,070 |
| | | | | | | | |
| | | Cash and receivables, less | | | | | |
| | | liabilities 1.0% (a) | | | | | 24,671,817 |
| | | | | | | | |
| | | Net Assets | | | | $ | 2,354,293,887 |
| | | | | | | | |
| | | Net Asset Value Per Share | | | | | |
| | | ($0.01 par value, 100,000,000 | | | | | |
| | | shares authorized), offering | | | | | |
| | | and redemption price | | | | | |
| | | ($2,354,293,887 / 72,547,257 | | | | | |
| | | shares outstanding) | | | | $ | 32.45 |
* Non-dividend paying security.
(a) Percentages for the various classifications relate to net assets.
ADR - American Depositary Receipts
Statement of Operations
For the Six Months Ended March 31, 2007
(Unaudited)
Income: | | | |
| Dividends | | $ | 7,713,378 | |
| Interest | | | 3,029,421 | |
| Total income | | | 10,742,799 | |
Expenses: | | | | |
| Management fees | | | 10,687,867 | |
| Transfer agent fees | | | 668,200 | |
| Printing and postage expense | | | 293,551 | |
| Registration fees | | | 116,262 | |
| Administrative and accounting services | | | 73,675 | |
| Custodian fees | | | 60,207 | |
| Board of Directors fees and expenses | | | 37,892 | |
| Professional fees | | | 26,724 | |
| Insurance expense | | | 11,584 | |
| Other expenses | | | 2,304 | |
| Total expenses | | | 11,978,266 | |
Net Investment Loss | | | (1,235,467 | ) |
Net Realized Gain on Investments | | | 73,922,859 | |
Net Increase in Unrealized Appreciation on Investments | | | 80,589,379 | |
Net Gain on Investments | | | 154,512,238 | |
Net Increase in Net Assets Resulting From Operations | | $ | 153,276,771 | |
The accompanying notes to financial statements are an integral part of these statements.
Brandywine Blue Fund
Statements of Changes in Net Assets
For the Six Months Ended March 31, 2007 (Unaudited)
and for the Year Ended September 30, 2006
| | | 2007 | | 2006 | |
Operations: | | | | | |
| Net investment loss | | $ | (1,235,467 | ) | $ | (245,481 | ) |
| Net realized gain on investments | | | 73,922,859 | | | 63,165,548 | |
| Net increase (decrease) in unrealized appreciation on investments | | | 80,589,379 | | | (6,301,103 | ) |
| Net increase in net assets resulting from operations | | | 153,276,771 | | | 56,618,964 | |
| | | | | | | | |
Distributions to Shareholders: | | | | | | | |
| Distributions from net realized gains ($1.09995 and $1.13878 per share, respectively) | | | (67,271,293 | ) | | (46,370,407 | ) |
Fund Share Activities: | | | | | | | |
| Proceeds from shares issued (17,150,331 and 28,256,976 shares, respectively) | | | 546,091,788 | | | 862,455,609 | |
| Net asset value of shares issued in distributions reinvested (1,820,755 and 1,398,550 shares, respectively) | | | 57,780,654 | | | 38,795,788 | |
| Cost of shares redeemed (6,013,654 and 9,349,252 shares, respectively) | | | (192,079,717 | ) | | (285,940,533 | ) |
| Net increase in net assets derived from Fund share activities | | | 411,792,725 | | | 615,310,864 | |
Total Increase | | | 497,798,203 | | | 625,559,421 | |
| | | | | | | | |
Net Assets at the Beginning of the Period | | | 1,856,495,684 | | | 1,230,936,263 | |
Net Assets at the End of the Period | | $ | 2,354,293,887 | | $ | 1,856,495,684 | |
| (Includes accumulated net investment loss of $0 and $0, respectively) | | | | | | | |
Financial Highlights
(Selected data for each share of the Fund outstanding throughout each period)
| | | For the Six Months | | | |
| | | ended March 31, 2007 | | Years Ended September 30, | |
| | | (Unaudited) | | 2006 | | 2005 | | 2004 | | 2003 | | 2002 | |
| PER SHARE OPERATING PERFORMANCE: | | | | | | | | | | | |
| Net asset value, beginning of period | | $ | 31.15 | | $ | 31.33 | | $ | 25.21 | | $ | 21.40 | | $ | 18.30 | | $ | 21.31 | |
| | | | | | | | | | | | | | | | | | | | |
| Income from investment operations: | | | | | | | | | | | | | | | | | | | |
Net investment loss(1) | | | (0.02 | ) | | (0.00 | )* | | (0.04 | ) | | (0.08 | ) | | (0.08 | ) | | (0.05 | ) |
| Net realized and unrealized gains (losses) | | | | | | | | | | | | | | | | | |
| on investments | | | 2.42 | | | 0.96 | | | 6.16 | | | 3.89 | | | 3.18 | | | (2.96 | ) |
| Total from investment operations | | | 2.40 | | | 0.96 | | | 6.12 | | | 3.81 | | | 3.10 | | | (3.01 | ) |
| | | | | | | | | | | | | | | | | | | | |
| Less distributions: | | | | | | | | | | | | | | | | | | | |
| Dividend from net investment income | | | — | | | — | | | — | | | — | | | — | | | — | |
| Distributions from net realized gains | | | (1.10 | ) | | (1.14 | ) | | — | | | — | | | — | | | — | |
| Total from distributions | | | (1.10 | ) | | (1.14 | ) | | — | | | — | | | — | | | — | |
| Net asset value, end of period | | $ | 32.45 | | $ | 31.15 | | $ | 31.33 | | $ | 25.21 | | $ | 21.40 | | $ | 18.30 | |
| | | | | | | | | | | | | | | | | | | | |
| TOTAL RETURN | | | 7.79 | %(a) | | 3.47 | % | | 24.28 | % | | 17.80 | % | | 16.94 | % | | (14.12 | %) |
| | | | | | | | | | | | | | | | | | | | |
| RATIOS/SUPPLEMENTAL DATA: | | | | | | | | | | | | | | | | | | | |
| Net assets, end of period (in 000’s $) | | | 2,354,294 | | | 1,856,496 | | | 1,230,936 | | | 531,516 | | | 312,726 | | | 217,738 | |
| Ratio of expenses to average net assets | | | 1.12 | %(b) | | 1.10 | % | | 1.12 | % | | 1.13 | % | | 1.14 | % | | 1.13 | % |
| Ratio of net investment loss | | | | | | | | | | | | | | | | | | | |
| to average net assets | | | (0.12 | )%(b) | | (0.02 | %) | | (0.13 | %) | | (0.32 | %) | | (0.41 | %) | | (0.26 | %) |
| Portfolio turnover rate | | | 100.2 | %(a) | | 207.0 | % | | 180.5 | % | | 247.4 | % | | 300.0 | % | | 310.7 | % |
(a) Not Annualized.
(b) Annualized.
(1) Net investment loss per share was calculated using average shares outstanding.
* Amount less than $0.005 per share.
The accompanying notes to financial statements are an integral part of these statements.
The Brandywine Funds
Notes to Financial Statements
March 31, 2007 (Unaudited)
(1) | Summary of Significant Accounting Policies |
| | The following is a summary of significant accounting policies of Brandywine Fund, Inc. (the "Brandywine Fund") and Brandywine Blue Fund (the "Blue Fund," one of two Funds in a series of the Brandywine Blue Fund, Inc.) (collectively the "Brandywine Funds" or the "Funds"). Each Fund is registered as a diversified open-end management company under the Investment Company Act of 1940, as amended. The assets and liabilities of each Fund are segregated and a shareholder’s interest is limited to the Fund in which the shareholder owns shares. The Brandywine Fund was incorporated under the laws of Maryland on October 9, 1985. The Blue Fund was incorporated under the laws of Maryland on November 13, 1990. The investment objective of each Fund is to produce long-term capital appreciation principally through investing in common stocks. |
| | (a) | Each security, excluding short-term investments, is valued at the last sale price reported by the principal security exchange on which the issue is traded. Securities that are traded on the Nasdaq Markets (Nasdaq Global Select Market, Nasdaq Global Market and Nasdaq Capital Market formerly known as the Nasdaq National Market or the Nasdaq SmallCap Market) are valued at the Nasdaq Official Closing Price, or if no sale is reported, the latest bid price. Securities which are traded over-the-counter are valued at the latest bid price. Securities for which quotations are not readily available are valued at fair value as determined by the investment adviser under the supervision of the Board of Directors. The fair value of a security may differ from the last quoted price and the Fund may not be able to sell a security at the fair value. Market quotations may not be available, for example, if trading in particular securities has halted during the day and not resumed prior to the close of trading on the New York Stock Exchange. Short-term investments with maturities of 60 days or less are valued at amortized cost which approximates value. For financial reporting purposes, investment transactions are recorded on the trade date; however, for purposes of executing shareholder transactions, the Funds record changes in holdings of portfolio securities no later than the first business day after the trade date in accordance with Rule 2a-4 of the Investment Company Act. Accordingly, certain differences between net asset value for financial reporting and for executing shareholder transactions may arise. |
| | | In September 2006, the Financial Accounting Standards Board issued its new Standard No. 157, "Fair Value Measurements" ("FAS 157"). FAS 157 is designed to unify guidance for the measurement of fair value of all types of assets, including financial instruments, and certain liabilities, throughout a number of accounting standards. FAS 157 also establishes a hierarchy for measuring fair value in generally accepted accounting principles and expands financial statement disclosures about fair value measurements that are relevant to mutual funds. FAS 157 is effective for financial statements issued for fiscal years beginning after November 15, 2007, and earlier adoption is permitted. At this time, management believes the adoption of FAS 157 will have no material impact on the financial statements of the Funds. |
| | (b) | Net realized gains and losses on sales of securities are -computed on the identified cost basis. |
| | (c) | Dividend income is recorded on the ex-dividend date. Interest income is recorded on the accrual basis. |
| | (d) | The Funds have investments in short-term variable rate demand notes, which are unsecured instruments. The Funds may be susceptible to credit risk with respect to these notes to the extent the issuer defaults on its payment obligation. The Funds’ policy is to monitor the creditworthiness of the issuer and nonperformance by these counterparties is not anticipated. |
| | (e) | Accounting principles generally accepted in the United States of America ("GAAP") require that permanent differences between income for financial reporting and tax purposes be reclassified in the capital accounts. |
| | (f) | The preparation of financial statements in conformity with GAAP requires management to make estimates and assumptions that affect the reported amounts of assets and liabilities and disclosure of contingent assets and liabilities at the date of the financial statements and the reported amounts of revenues and expenses during the reporting period. Actual results could differ from these estimates. |
| | (g) | No provision has been made for Federal income taxes since the Funds have elected to be taxed as "regulated investment companies" and intend to distribute substantially all net investment company taxable income and net capital gains to shareholders and otherwise comply with the provisions of the Internal Revenue Code applicable to regulated investment companies. |
| | | On July 13, 2006, the Financial Accounting Standards Board ("FASB") released FASB Interpretation No. 48 "Accounting for Uncertainty in Income Taxes" ("FIN 48"). FIN 48 provides guidance for how uncertain tax positions should be recognized, measured, presented and disclosed in the financial statements. FIN 48 requires the evaluation of tax positions taken or expected to be taken in the course of preparing the Funds’ tax returns to determine whether the tax positions are "more-likely-than-not" of being sustained by the applicable tax authority. Tax positions not deemed to meet the more-likely-than-not threshold would be recorded as a tax benefit or expense in the current year. Adoption of FIN 48 is required for fiscal years beginning after December 15, 2006 and is to be applied to all open tax years as of the effective date. At this time, management is evaluating the implications of FIN 48 and its impact in the financial statements, but does not anticipate that FIN 48 will have a material impact on the Funds’ financial statements. |
(2) | Investment Adviser and Management Agreements and Transactions With Related Parties |
| | Each Fund has a management agreement with Friess Asso-ciates, LLC (the "Adviser"), with whom certain Officers and Directors of the Funds are affiliated, to serve as investment adviser and manager. Under the terms of the agreements, each Fund will pay the Adviser a monthly management fee at the annual rate of one percent (1%) on the daily net assets of such Fund. Also, the Adviser is reimbursed for administrative services rendered to each Fund by a consultant paid by the Adviser. |
The Brandywine Funds
Notes to Financial Statements (Continued)
March 31, 2007 (Unaudited)
(2) Investment Adviser and Management Agreements and Transactions With Related Parties (Continued)
| | The Adviser entered into sub-advisory agreements with its affiliate, Friess Associates of Delaware, LLC (the "Sub-Adviser"), to assist it in the day-to-day management of each of the Funds. The Adviser and, if so delegated, the Sub-Adviser supervise the investment portfolios of the Funds, directing the purchase and sale of investment securities in the day-to-day management of the Funds. The Adviser pays the Sub-Adviser a fee equal to 110% of the monthly expenses the Sub-Adviser incurs in performing its services as Sub-Adviser. This relationship does not increase the annual management fee the Funds pay to the Adviser. |
| | The Brandywine Fund and Blue Fund pay each of the six independent directors annual fees of $25,000 and $16,000, respectively, reinvested in shares of each Fund. The lead independent director and chairman of the audit committee are paid an additional $5,000 annually, reinvested in shares of the Funds, divided proportionately among all the Funds. The Funds also reimburse directors for travel costs incurred in order to attend meetings of the Board of Directors. For the six months ended March 31, 2007, the Funds expensed the following directors fees and costs: |
| | | Brandywine | | Blue | |
| | | Fund | | Fund | |
| Directors Fees and Travel Costs Paid during the Period | | $ | 71,292 | | $ | 37,892 | |
| | | In the normal course of business the Funds enter into contracts with service providers that contain general indemnification clauses. The Funds’ maximum exposure under these arrangements is unknown as this would involve future claims that may be made against the Funds that have not yet occurred. However, based on experience, the Funds expect the risk of loss to be remote. |
| | U.S. Bank, N.A. has made available to each Fund a credit facility pursuant to Credit Agreements effective July 22, 2004, for the purpose of having cash available to cover incoming redemptions. The Brandywine Fund has a $50,000,000 credit facility and the Blue Fund has a $10,000,000 credit facility. Principal and interest of such loan under the Credit Agreements are due not more than 31 days after the date of the loan. Amounts under the credit facilities bear interest at a rate per annum equal to the current prime rate minus one on the amount borrowed. Advances will be collateralized by securities owned by the respective Fund. During the six months ended March 31, 2007, neither Fund borrowed against their Agreement. The Credit Agreements expire on December 18, 2007. |
(4) | Distributions to Shareholders |
| | Net investment income and net realized gains, if any, are distributed to shareholders at least annually. |
(5) | Investment Transactions and Related Costs |
| | For the six months ended March 31, 2007, purchases and proceeds of sales of investment securities (excluding short-term investments) for the Funds were as follows: |
| | | | | Sale | | Transaction | | Ratio of Cost to | |
| | | Purchases | | Proceeds | | Cost | | Average Net Assets | |
| Brandywine Fund | | $ | 3,720,163,939 | | $ | 4,006,600,463 | | $ | 10,014,232 | | | 0.24 | % |
| Blue Fund | | | 2,265,109,186 | | | 2,005,925,159 | | | 5,528,069 | | | 0.26 | |
| | Transaction cost represents the total commissions paid by each Fund on its respective purchases and sales of investment securities. These costs are added to the cost basis of the securities purchased and are deducted from the proceeds of securities sold, thereby reducing the realized gains or increasing the realized losses upon the sale of the securities. |
(6) | Accounts Payable and Accrued Liabilities |
| | As of March 31, 2007, liabilities of each Fund included the following: |
| | | Brandywine | | Blue | |
| | | Fund | | Fund | |
| Payable to brokers for investments purchased | | $ | 46,082,022 | | $ | 54,846,805 | |
| Payable to Adviser for management fees | | | 3,553,842 | | | 1,949,884 | |
| Due to custodian | | | 383,044 | | | — | |
| Payable to shareholders for redemptions | | | 138,991 | | | 271,130 | |
| Other liabilities | | | 613,255 | | | 371,936 | |
The Brandywine Funds
Notes to Financial Statements (Continued)
March 31, 2007 (Unaudited)
| | As of March 31, 2007, the sources of net assets were as follows: |
| | | Brandywine | | Blue | |
| | | Fund | | Fund | |
| Fund shares issued and outstanding | | $ | 3,454,794,868 | | $ | 2,067,249,231 | |
| Net unrealized appreciation on investments | | | 635,946,318 | | | 218,883,121 | |
| Accumulated net realized gains | | | 147,221,708 | | | 68,161,535 | |
| | | $ | 4,237,962,894 | | $ | 2,354,293,887 | |
(8) | Income Tax Information |
| | The following information for the Funds is presented on an income tax basis as of March 31, 2007: |
| | | | | Gross | | Gross | | Net Unrealized | |
| | | Cost of | | Unrealized | | Unrealized | | Appreciation | |
| | | Investments | | Appreciation | | Depreciation | | on Investments | |
| Brandywine Fund | | $ | 3,579,172,128 | | $ | 671,373,297 | | $ | 41,193,482 | | $ | 630,179,815 | |
| Blue Fund | | | 2,110,904,754 | | | 248,412,047 | | | 29,694,731 | | | 218,717,316 | |
| | The following information for the Funds is presented on an income tax basis as of September 30, 2006: |
| | | | | Gross | | Gross | | Net Unrealized | | Distributable | | Distributable | |
| | | Cost of | | Unrealized | | Unrealized | | Appreciation | | Ordinary | | Long-Term | |
| | | Investments | | Appreciation | | Depreciation | | on Investments | | Income | | Capital Gains | |
| Brandywine Fund | | $ | 3,699,932,056 | | $ | 465,411,251 | | $ | 65,804,562 | | $ | 399,606,689 | | $ | — | | $ | 8,419,328 | |
| Blue Fund | | | 1,727,351,110 | | | 151,320,166 | | | 13,128,696 | | | 138,191,470 | | | 14,618,964 | | $ | 48,228,743 | |
| | The difference, if any, between the cost amounts for financial statement and federal income tax purposes is due primarily to timing differences in recognizing certain gains and losses in security transactions. |
| | The tax components of dividends paid during the years ended September 30, 2006 and 2005, capital loss carryovers, which may be used to offset future capital gains, subject to Internal Revenue Code limitations as of September 30, 2006, and tax basis post-October losses as of September 30, 2006, which are not recognized for tax purposes until the first day of the following fiscal year are: |
| | | | | September 30, 2005 | |
| | | Ordinary | | Long-Term | | Net Capital | | | | Ordinary | | Long-Term | |
| | | Income | | Capital Gains | | Loss | | Post-October | | Income | | Capital Gains | |
| | | Distributions | | Distributions | | Carryovers | | Losses | | Distributions | | Distributions | |
| Brandywine Fund | | $ | — | | $ | — | | $ | — | | $ | — | | $ | — | | $ | — | |
| Blue Fund | | | 35,062,637 | | | 11,307,770 | | $ | — | | $ | — | | $ | — | | $ | — | |
| | The Brandywine Fund has utilized $324,643,003 of its capital loss carryovers during the year ended September 30, 2006. |
| | For corporate shareholders in the Blue Fund, the percentage of dividend income distributed for the year ended September 30, 2006, which is designated as qualifying for the dividends received deduction is 18% (unaudited). |
| | For the shareholders in the Blue Fund, the percentage of dividend income distributed for the year ended September 30, 2006, which is designated as qualified dividend income under the Jobs and Growth Tax Relief Act of 2003 is 18% (unaudited). |
Since there were no ordinary distributions paid for the Brandywine Fund for the year ended September 30, 2006, there were no distributions designated as qualifying for the dividends received deduction for corporate shareholders nor as qualified dividend income under the Jobs and Growth Tax Relief Act of 2003 (unaudited).
Cost Discussion
Mutual fund shareholders incur two types of costs: (1) transaction costs, including sales charges (loads) on purchase payments, reinvested dividends, or other distributions; redemption fees; and exchange fees; and (2) ongoing costs, including management fees; distribution [and/or service] (12b-1) fees; and other fund expenses. Brandywine and Brandywine Blue do not have 12b-1 distribution fees. This example is intended to help you understand your ongoing costs (in dollars) of investing in the Brandywine Funds and to compare these costs with the ongoing costs of investing in other mutual funds.
In addition to the costs highlighted and described below, the only Fund transaction costs you might currently incur would be wire fees ($15 per wire), if you choose to have proceeds from a redemption wired to your bank account instead of receiving a check. Additionally, U.S. Bank charges an annual processing fee ($15) if you maintain an IRA account with the Funds. To determine your total costs of investing in the Funds, you would need to add any applicable wire or IRA processing fees you’ve incurred during the period to the costs provided in the example below.
The example is based on an investment of $1,000 invested at the beginning of the period and held for the entire period from October 1, 2006 through March 31, 2007.
Actual Expenses
The first line of the table below provides information about actual account values and actual expenses. You may use the information in this line, together with the amount you invested, to estimate the expenses that you paid over the period. Simply divide your account value by $1,000 (for example, an $8,600 account value divided by $1,000 = 8.6), then multiply the result by the number in the first line under the heading entitled "Expenses Paid During Period" to estimate the expenses you paid on your account during this period.
Hypothetical Example for Comparison Purposes
The second line of the table below provides information about hypothetical account values and hypothetical expenses based on the Fund’s actual expense ratio and an assumed rate of return of 5% per year before expenses, which is not the Fund’s actual return. The hypothetical account values and expenses may not be used to estimate the actual ending account balance or expenses you paid for the period. You may use this information to compare the ongoing costs of investing in the Fund and other funds. To do so, compare this 5% hypothetical example with the 5% hypothetical examples that appear in the shareholder reports of the other funds.
Please note that the expenses shown in the table are meant to highlight your ongoing costs only and do not reflect any transactional costs. While the Brandywine Funds currently do not assess sales charges, redemption or exchange fees, other funds do, and those costs will not be reflected in their expense example tables. Therefore, the second line of the table is useful in comparing ongoing costs only, and will not help you determine the relative total costs of owning different funds.
| | Beginning | Ending | |
| | Account | Account | Expenses Paid |
| | Value | Value | During Period* |
| | 10/01/06 | 3/31/07 | 10/01/06-3/31/07 |
| Brandywine Actual $1,000 | $1,000.00 | $1,101.80 | $5.66 |
| Hypothetical (5% return before expenses) | $1,000.00 | $1,019.50 | $5.44 |
| Brandywine Blue Actual $1,000 | $1,000.00 | $1,077.90 | $5.80 |
| Hypothetical (5% return before expenses) | $1,000.00 | $1,019.30 | $5.64 |
| * | Expenses are equal to the Funds’ annualized expense ratios of 1.08% and 1.12%, multiplied by the average account value over the period, multiplied by 182/365 (to reflect the one-half year period between October 1, 2006 and March 31, 2007). |
Additional Director Information, Proxy Voting Policy
and Quarterly Portfolio Schedules
For additional information about the Directors and Officers or for a description of the policies and procedures that the Funds use to determine how to vote proxies relating to portfolio securities, please call (800) 656-3017 and request a Statement of Additional Information. One will be mailed to you free of charge. The Statement of Additional Information is also available on the website of the Securities and Exchange Commission (the "Commission") at http://www.sec.gov. Information on how the Funds voted proxies relating to portfolio securities during the twelve month period ending June 30, 2006 is available on the Funds’ website at http://www.brandywinefunds.com or the website of the Commission. The Funds file their complete schedule of portfolio holdings with the Commission for the first and third quarters of each fiscal year on Form N-Q. The Funds’ Forms N-Q are available on the Commission’s website. The Funds’ Forms N-Q may be reviewed and copied at the Commission’s Public Reference Room in Washington, DC, and that information on the operation of the Public Reference Room may be obtained by calling 1-800-SEC-0330.
Brandywine Funds Advisory Agreements
On December 4, 2006, the Board of Directors of the Funds approved the continuation of the advisory agreements with Friess Associates, LLC ("Friess"). Prior to approving the continuation of the advisory agreements, the Board considered:
| | • | the nature, extent and quality of the services provided by Friess |
| | • | the investment performance of the Funds |
| | • | the costs of the services to be provided and profits to be realized by Friess from its relationship with the Funds |
| | • | the extent to which economies of scale would be realized as the Funds grow and whether fee levels reflect these economies of scale |
| | • | the expense ratios of the Funds |
| | • | the manner in which portfolio transactions for the Funds are conducted, including the use of soft dollars |
In considering the nature, extent and quality of the services provided by Friess, the Board of Directors reviewed a report describing the portfolio management, shareholder communication and support and regulatory compliance services provided by Friess to the Funds. The Board concluded that Friess was providing essential services to the Funds. In particular, the Board concluded that Friess was preparing reports to shareholders in addition to those required by law.
The Directors compared the performance of the Funds to benchmark indices over various periods of time and concluded that the performance of the Funds warranted the continuation of the advisory agreements.
In concluding that the advisory fees payable by the Funds were reasonable, the Directors reviewed a report of the costs of services provided, and the profits realized by Friess from its relationship with the Funds and concluded that such profits were reasonable and not excessive. The Directors also reviewed reports comparing the expense ratios and advisory fees paid by the Funds to those paid by other comparable mutual funds and concluded that the advisory fees paid by the Funds were higher than the average advisory fees paid by comparable mutual funds, but the expense ratios of the Funds were lower than the average expense ratios of comparable mutual funds. The Directors also considered the Funds’ portfolio turnover rate noting that Friess was not a "closet indexer". The Directors also noted that all clients of Friess pay the same 1% advisory fee. They noted that this fee would not be adjusted if economies of scale were realized during the current contract period as the Funds grew, but did not consider that factor to be significant in light of the other factors considered, particularly the fact that the profits were reasonable and not excessive. The Directors noted that having the same fee for all clients eliminated conflicts of interest that would be present if Friess charged different fees to different clients.
Finally, the Board reviewed reports discussing the manner in which portfolio transactions for the Funds were conducted, including the use of soft dollars. Based on these reports, the Board concluded that the research obtained by Friess was beneficial to the Funds and that Friess was executing the Funds portfolio transactions in a manner designed to obtain best execution for the Funds.
Capital Gains Update . . . Halfway through the fiscal year it appears the Brandywine Funds could be on their way to distributing capital gains in October. Brandywine Fund finished the March quarter with realized gains representing $1.23 per share. Brandywine Blue Fund finished with realized gains of $0.94 per share. These realized gain figures are provided to keep shareholders updated on the status of the capital gains situation as the fiscal year progresses. Gains and losses realized over the next six months will determine whether distributions are in order and, if so, dictate the amounts of capital gains to be distributed. |
| March-Quarter Milestone . . . Net asset values for the Brandywine Funds reached all-time highs (after adjusting for all distributions paid) during the week of February 19. To get an idea of how far the Funds have come, consider that a $10 investment made on Brandywine’s December 30, 1985 inception date grew to more than $149 at the end of March. The same investment in the Russell 3000 Growth Index in that period would be worth just over $79. Ten dollars put to work in Brandywine Blue on its January 10, 1991 debut would be worth more than $80, whereas the same investment in the Russell 1000 Growth Index would be worth less than $48. |
Board of Directors
| | | |
| Robert F. Birch | William F. D’Alonzo | Foster S. Friess | Quentin Jackson |
| President and Director | CEO and CIO | Chairman | Former President and CEO |
| New America High Income Fund | Friess Associates | Friess Associates | Nuclear Electric Insurance Limited |
| | | |
| Stuart A. McFarland | W. Richard Scarlett, III | Thomas D. Wren | James W. Zug |
| Managing Partner | Chairman and CEO | Former Treasurer | Former Senior Partner |
| Federal City Capital Advisors, LLC | United Bancorporation of Wyoming, Inc. | MBNA Corporation | PricewaterhouseCoopers LLP |
| Deep Springs Capital Partners, LLC | | | |
P.O. Box 4166, Greenville, DE 19807
(800) 656-3017 www.brandywinefunds.com bfunds@friess.com
Investment Adviser: Friess Associates, LLC | Transfer Agent: U.S. Bancorp Fund Services, LLC |
Investment Sub-Adviser: Friess Associates of Delaware, LLC | Independent Registered Public Accounting Firm: PricewaterhouseCoopers LLP |
Custodian: U.S. Bank, N.A. | Legal Counsel: Foley & Lardner LLP |
Officers: Foster Friess, Founder; William D’Alonzo, Chairman and President;
Lynda Campbell, Vice President and Secretary; Christopher Long, Vice President and Treasurer;
David Marky, Chief Compliance Officer, Vice President and Assistant Secretary; and Paul Robinson, Vice President
Report Editor: Chris Aregood Report Staff: David Marky, Adam Rieger
Item 2. Code of Ethics.
Not applicable.
Item 3. Audit Committee Financial Expert.
Not applicable.
Item 4. Principal Accountant Fees and Services.
Not applicable.
Item 5. Audit Committee of Listed Registrants.
Not applicable.
Item 6. Schedule of Investments.
Not applicable.
Item 7. Disclosure of Proxy Voting Policies and Procedures for Closed-End Management Investment Companies.
Not applicable.
Item 8. Portfolio Managers of Closed-End Management Investment Companies.
Not applicable.
Item 9. Purchases of Equity Securities by Closed-End Management Investment Company and Affiliated Purchasers.
Not applicable.
Item 10. Submission of Matters to a Vote of Security Holders.
None.
Item 11. Controls and Procedures.
| (a) | The disclosure controls and procedures of the Brandywine Fund, Inc. are periodically evaluated. As of April 18, 2007, the date of the last evaluation, we concluded that our disclosure controls and procedures are adequate. |
| (b) | The internal controls of the Brandywine Fund, Inc. are periodically evaluated. There were no changes to Brandywine Fund’s internal control over financial reporting that occurred during the first fiscal quarter of the period covered by this report that have materially affected, or are reasonably likely to materially affect, such controls. |
Item 12. Exhibits.
| (a) | Any code of ethics or amendment thereto. Not applicable. |
| (b) | Certifications pursuant to Section 302 of the Sarbanes-Oxley Act of 2002. Filed herewith. |
| (c) | Certification pursuant to Section 906 of the Sarbanes-Oxley Act of 2002. Filed herewith. |
SIGNATURES
Pursuant to the requirements of the Securities Exchange Act of 1934 and the Investment Company Act of 1940, the registrant has duly caused this report to be signed on its behalf by the undersigned, thereunto duly authorized.
Brandywine Fund, Inc.
Registrant
By /s/William F. D’Alonzo
William F. D’Alonzo Principal Executive Officer
Date April 18, 2007
Pursuant to the requirements of the Securities Exchange Act of 1934 and the Investment Company Act of 1940, this report has been signed below by the following persons on behalf of the registrant and in the capacities and on the dates indicated.
Brandywine Fund, Inc.
Registrant
By /s/Christopher G. Long
Christopher G. Long, Principal Financial Officer
Date April 18, 2007