UNITED STATES
SECURITIES AND EXCHANGE COMMISSION
Washington, D.C. 20549
FORM N-CSR
CERTIFIED SHAREHOLDER REPORT OF REGISTERED
MANAGEMENT INVESTMENT COMPANIES
Investment Company Act file number 811-04447
Brandywine Fund, Inc.
(Exact name of registrant as specified in charter)
P.O. Box 4166
Greenville, DE 19807
(Address of principal executive offices) (Zip code)
William F. D’Alonzo
Friess Associates, LLC
P.O. Box 4166
Greenville, Delaware 19807
(Name and address of agent for service)
(302) 656-3017
Registrant's telephone number, including area code:
Date of fiscal year end: September 30
Date of reporting period: March 31, 2010
Item 1. Reports to Stockholders.
| Managed by Friess Associates, LLC | Semi-Annual Report | March 31, 2010 |
Dear Fellow Shareholders:
Investors remained optimistic about the economic recovery, fueling a generally upbeat March-quarter environment. Smaller stocks outperformed larger ones and value won preference over growth, but gains were broadly enjoyed overall.
Brandywine Fund grew 5.34 percent in the March quarter. The Russell 3000 and Russell 3000 Growth Indexes gained 5.94 and 4.87 percent. Brandywine Blue Fund grew 6.16 percent, outpacing gains in the S&P 500, Russell 1000 and Russell 1000 Growth Indexes of 5.39, 5.70 and 4.65 percent.
Reflecting the market’s heightened economic expectations, the consumer discretionary and industrial sectors fared particularly well within benchmarks during the quarter. The financial sector, which paused in late 2009 after running for the previous two quarters, resumed its climb as credit trends showed more signs of improvement.
Consumer discretionary holdings contributed most to March-quarter performance versus benchmarks for the Brandywine Funds. Home Depot, the second largest holding in both Funds at the end of March, climbed as same-store sales turned positive for the first time in three years and efficiency initiatives positioned the company to capitalize on the turnaround. Home Depot topped estimates with 26 percent January-quarter earnings growth. Brandywine also benefited from the performance of Limited Brands and Williams-Sonoma, which exceeded January-quarter estimates with 49 and 177 percent earnings growth, respectively.
Ford Motor Co. was Brandywine Blue’s biggest contributor to relative performance from the sector and its biggest contributor to overall performance. The company continued to capture market share from struggling competitors thanks to a compelling lineup of new models and its comparatively firm financial footing. Ford earned $0.43 per share in the December quarter versus a $1.37 per share year-ago loss on a 21 percent increase in revenue. Mattel, which is experiencing sales growth as the release of Toy Story 3 approaches, also aided Brandywine Blue’s results after beating estimates with 65 percent December-quarter earnings growth.
Holdings from the financial sector were the next biggest boost to Brandywine’s relative results despite playing a limited role in the portfolio. SEI Investments Co. was a top Brandywine performer as new product offerings, contract wins and an improved investment environment enabled the company to reignite revenue growth in the December quarter, spurring a 12 percent earnings gain. Fifth Third Bancorp (both Funds) and Webster Financial (Brandywine) gained ground as investors applauded their exposure to commercial and industrial credit markets, where conditions are improving, and their relative lack of exposure to commercial real estate, where conditions are not.
| | Brandywine | Brandywine Blue |
| Cumulative Total Return | % Change | % Change |
| Quarter | 5.34 | 6.16 |
| One Year | 23.33 | 28.24 |
| Five Years | -2.77 | -0.84 |
| Ten Years | -17.61 | -9.24 |
| Inception | 1021.20* | 530.86** |
| Five Years | -0.56 | -0.17 |
| Ten Years | -1.92 | -0.97 |
| Inception | 10.48* | 10.06** |
| Brandywine | 1.10% |
| Brandywine Blue | 1.16% |
***As stated in the Prospectus dated January 29, 2010
Performance data quoted represent past performance; past performance does not guarantee future results. The investment return and principal value of an investment will fluctuate so that an investor’s shares, when redeemed, may be worth more or less than their original cost. Current performance of the Funds may be lower or higher than the performance quoted. Performance data current to the most recent month end may be obtained by visiting www.brandywinefunds.com.
Health care holdings were the second largest contributors to Brandywine Blue’s results versus benchmarks. Express Scripts (both Funds) paused briefly during what was a roughly year-long rally in its share price amid uncertainty regarding the health care bill before resuming its rise as passage of the bill became increasingly certain. A pharmacy benefits manager that fills the majority of the prescriptions it processes with generic drugs, the company beat estimates with 13 percent December-quarter earnings growth. Celgene and St. Jude Medical (both Brandywine Blue) also played a role in the Fund’s health care strength.
Despite sharing Smith International as one of their top performers, the Brandywine Funds experienced different outcomes in terms of the energy sector’s impact on performance versus benchmarks. Other holdings in the Brandywine portfolio, such as Comstock Resources and Exco Resources, offset Smith’s contribution, making energy a slight performance detractor. In Brandywine Blue, Smith was supported by gains in Cameron International and Williams Companies, helping generate a notable contribution to performance against benchmarks.
While technology holdings gained ground during the quarter, they were the most significant detractors from performance versus benchmarks for Brandywine and Brandywine Blue. Technology holdings comprised the largest percentages of assets in both instances. During the March quarter, which is a seasonally slower period for many technology companies, the sector moved modestly higher in a more pronounced market advance. Large commitments to technology at a time when the sector was weaker than most other sectors within the indexes impacted relative results negatively.
For more information on companies that influenced March-quarter performance, see Roses & Thorns on page 4 for Brandywine and page 6 for Brandywine Blue.
As recently as the fall of last year, most people running businesses were flying blind in what were more uncertain times. Customers and suppliers to these businesses were in the same situation. There was great risk to spending on future growth – technology, inventory, personnel, research and development, etc. – because there was little evidence the demand existed to warrant the expenditures. Management teams adjusted the size and ambitions of their companies to fit the limited future potential that was evident in that environment.
Today’s environment is different. The bigger business risk now is not spending. Everyone’s visibility is improved. Failing to commit the funds to meet rebounding demand could bring serious competitive consequences. Conversely, wisely targeted capital expenditures could yield robust returns.
Companies that became leaner in the downturn that are now capitalizing on developing opportunities enjoy unusual earnings leverage. Even small increases in revenue translate into sizable expansion in incremental profits given the considerable cost structure rationalization most companies have undergone.
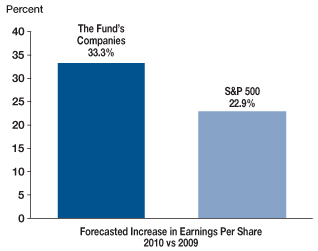
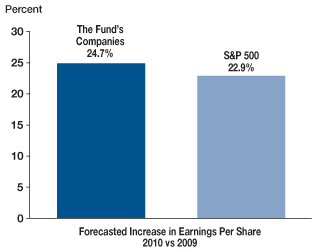
The average Brandywine holding is expected to grow earnings by one-third in 2010. Consensus estimates put the average Brandywine Blue holding on pace to grow earnings by one-fourth. We believe Wall Street underestimates the earnings leverage enjoyed by the companies in the Brandywine Funds, making their earnings growth rates higher based on our internal forecasts.
Although technology wasn’t the place to be in the March quarter, we believe it remains one of the most fruitful areas going forward given the concentration of earnings strength we’ve identified in the sector. Companies the Brandywine Funds hold offer innovative products and services designed to meet demand driven by the business world’s continued push for productivity improvement, exploding data storage needs, strains on networks driven by wireless devices and their applications, PC upgrades and other forces.
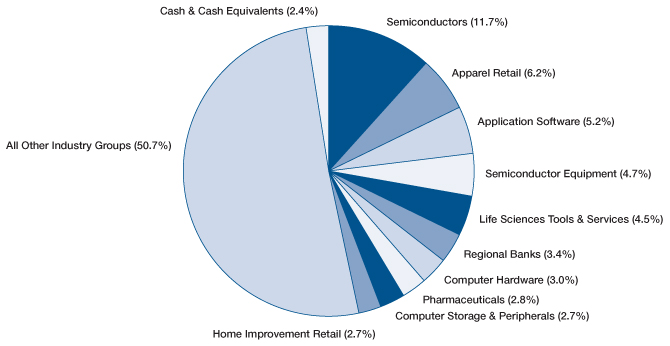
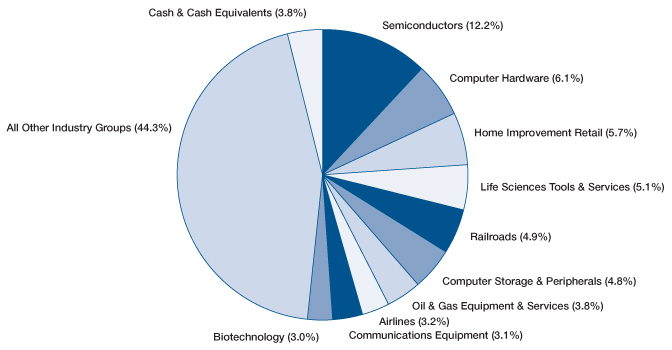
Technology holdings comprise the largest percentages of assets in Brandywine and Brandywine Blue. Holdings from the consumer discretionary and industrial sectors make up the next largest positions in Brandywine. The next largest positions after technology in Brandywine Blue are the health care and consumer discretionary sectors, which represent about equal percentages of assets.
On the operational front, Jon Fenn is retiring from his role as a Research Team Leader after 16 years with Friess Associates. Jon plans to spend more time with his family and on some land conservation efforts that he’s very passionate about. We wish Jon a long and happy retirement.
We’re encouraged that performance trends moved in the right direction in the March quarter. We also recognize that we still have a long way to go to appropriately reward the confidence you showed in us during last year’s challenges. We’re grateful for your long-term focus and continued support.
 |  |
| Bill D’Alonzo | |
| Brandywine Funds President | April 9, 2010 |
Brandywine Fund
Portfolio Characteristics as of March 31, 2010
% Change in Top Ten Holdings From Book Cost
| 1. | McDermott International, Inc. | +90.0% | | 6. | | SEI Investments Co. | +24.2% |
| 2. | The Home Depot, Inc. | +12.4% | | 7. | | Fifth Third Bancorp | +9.7% |
| 3. | Albemarle Corp. | +14.6% | | 8. | | Maxim Integrated Products, Inc. | +38.7% |
| 4. | Cisco Systems, Inc. | +16.9% | | 9. | | NII Holdings Inc. | +13.5% |
| 5. | J.B. Hunt Transport Services, Inc. | +34.6% | | 10. | | Marvell Technology Group Ltd. | +6.3% |
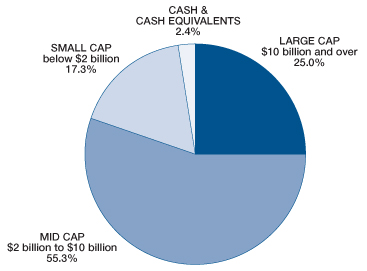
| Forecasted Earnings Growth Rate | The Portfolio’s Market Capitalization |
| of the Fund’s Holdings | |
| | |
 |  |
| | |
This is not a forecast of the Fund’s future performance. The percentage quoted under “The Fund’s Companies” represents the average forecasted earnings growth rate of the investment holdings in the Fund based on consensus estimates from Baseline Financial Services, Inc., as of March 31, 2010. Growth rates reflect year-over-year comparisons of aggregate earnings per share. Earnings growth for a Fund holding does not guarantee a corresponding increase in the market value of the holding or the Fund. | |
Top Ten Industry Groups
Brandywine Fund
March Quarter “Roses and Thorns”
| | $ Gain | | |
| Biggest $ Winners | (in millions) | % Gain | Reason for Move |
| Smith International, Inc. | $10.5 | 42.1 | The provider of oil and natural-gas drilling products and services gained ground in the March quarter on news that the company would be acquired by rival oilfield-services provider Schlumberger Ltd. We sold Smith following the announcement as shares quickly reached our target price. |
| SEI Investments Co. | $9.1 | 24.5 | December-quarter earnings grew 12 percent, beating consensus estimates. The global provider of asset management services and investment-related technology solutions benefits from tight cost controls and investments made in product development during the downturn. Specifically, investments in the firm’s Global Wealth platform are helping attract new private banking, advisor and trust customers. |
| VMware Inc. | $7.5 | 26.3 | The global vendor providing virtualization software for server operating systems, allowing information technology departments to cut costs by consolidating applications onto fewer computers, beat December-quarter consensus earnings estimates by 19 percent. VMware’s entrenched position in server virtualization provides it with a strong customer base to sell its newest desktop product. We sold VMware when shares hit our target price. |
| Williams-Sonoma, Inc. | $7.0 | 30.1 | The retailer that operates under the Williams-Sonoma, Pottery Barn, Pottery Barn Kids and Chambers brands grew January-quarter earnings 177 percent, beating estimates by 16 percent. Management increased 2010 earnings guidance due to sales rebounding on strong response to spring goods at a time when tight inventory management is positively impacting profit margins. |
| Illumina, Inc. | $6.6 | 21.5 | The maker of life-sciences products beat December-quarter consensus earnings estimates. Shares gained ground following the company’s unveiling of a next generation gene sequencing system that significantly reduces the time and costs associated with decoding a person’s genome. The product launch is also expected to result in higher revenue from supplies associated with the new instrument. |
| | $ Loss | | |
| Biggest $ Losers | (in millions) | % Loss | Reason for Move |
| Foster Wheeler AG | $9.0 | 20.5 | The construction and engineering company serving the energy industry beat December-quarter earnings estimates. Shares fell on concerns that backlogged business and profit margins for the company’s construction and power groups would remain under pressure for longer than anticipated despite the company’s expansion into high-growth foreign markets. We sold Foster Wheeler to fund an idea with greater near-term earnings visibility. |
| LSI Corp. | $7.3 | 15.2 | The manufacturer of integrated circuits and storage systems grew December-quarter earnings 200 percent, beating estimates by 64 percent and posting its first year-over-year sales increase in over a year. Shares fell following modest earnings guidance that didn’t match more robust forecasts from direct competitors. Additionally, the company’s storage semiconductor business experienced weakness as some customers adjusted inventory levels at year end. We sold LSI to fund an idea with greater near-term earnings visibility. |
| FTI Consulting, Inc. | $6.9 | 21.5 | FTI Consulting, which advises businesses on litigation, bankruptcies and restructuring, grew December-quarter earnings 22 percent, falling short of consensus estimates by $0.02 per share. Shares declined on concerns related to a slowdown in the company’s corporate finance/restructuring business as the demand environment shifts to the company’s more cyclical business segments. We sold FTI Consulting during the quarter to fund an idea with greater near-term earnings upside. |
| Amazon.com, Inc. | $5.4 | 11.7 | The online retailer grew December-quarter earnings 63 percent, beating estimates by 18 percent. Despite strong results, shares gave back some ground as investors grew more cautious on the outlook for the company’s Kindle e-reader as Apple prepared to launch its new iPad product. We sold Amazon.com during the quarter, locking in a substantial overall gain from our original cost. |
| EXCO Resources, Inc. | $4.9 | 13.3 | The oil and gas exploration and production company grew December-quarter earnings 123 percent, beating estimates by 32 percent. While shares gave back some previously gained ground during the March quarter, we expect increasing activity in Haynesville Shale, located in North Louisiana and East Texas, and Marcellus Shale, located in Appalachia, to drive growth going forward. EXCO has worked to improve its balance sheet while expanding its acreage in high-growth shale gas through acquisitions and joint ventures. |
All gains/losses are calculated on an average cost basis
Brandywine Blue Fund
Portfolio Characteristics as of March 31, 2010
% Change in Top Ten Holdings From Book Cost
| 1. | Apple Inc. | +41.9% | | 6. | | Celgene Corp. | +46.4% |
| 2. | The Home Depot, Inc. | +14.3% | | 7. | | EMC Corp. | +11.5% |
| 3. | Delta Air Lines, Inc. | +17.0% | | 8. | | Cameron International Corp. | +5.4% |
| 4. | Thermo Fisher Scientific, Inc. | +24.5% | | 9. | | Hewlett-Packard Co. | +55.7% |
| 5. | Cisco Systems, Inc. | +17.9% | | 10. | | St. Jude Medical, Inc. | +10.4% |
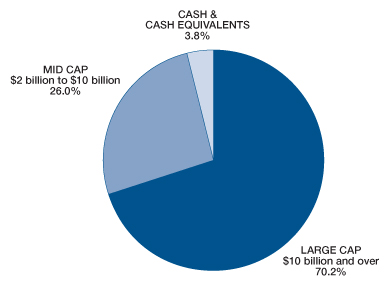
| Forecasted Earnings Growth Rate | The Portfolio’s Market Capitalization |
| of the Fund’s Holdings | |
| | |
 |  |
| | |
This is not a forecast of the Fund’s future performance. The percentage quoted under “The Fund’s Companies” represents the average forecasted earnings growth rate of the investment holdings in the Fund based on consensus estimates from Baseline Financial Services, Inc., as of March 31, 2010. Growth rates reflect year-over-year comparisons of aggregate earnings per share. Earnings growth for a Fund holding does not guarantee a corresponding increase in the market value of the holding or the Fund. | |
Top Ten Industry Groups
Brandywine Blue Fund
March Quarter “Roses and Thorns”
| | $ Gain | | |
| Biggest $ Winners | (in millions) | % Gain | Reason for Move |
| Ford Motor Co. | $20.7 | 35.5 | The domestic car and truck manufacturer grew December-quarter earnings to $0.43 per share from a loss of $1.37 a year ago, beating consensus estimates by 65 percent. Efforts to control costs and improve the quality and breadth of offerings during the downturn are driving sales and market share gains. We sold Ford, locking in a gain, on concerns that investors were overly optimistic on the benefits the company would derive from Toyota’s recalls. |
| Smith International, Inc. | $16.5 | 42.1 | The provider of oil and natural-gas drilling products and services gained ground in the March quarter on news that the company would be acquired by rival oilfield-services provider Schlumberger Ltd. We sold Smith following the announcement as shares quickly reached our target price. |
| Delta Air Lines, Inc. | $10.8 | 16.4 | The largest domestic airline with $28 billion in revenue in 2009 and a current fleet of over 1,000 aircraft grew December-quarter earnings 29 percent. A recovery in high-margin business travel is leading to higher revenues per passenger and helping offset higher fuel prices. Additionally, cost and operating synergies associated with the company’s merger with Northwest in 2008 are expected to continue throughout 2010. |
| VMware Inc. | $8.7 | 26.2 | The global vendor providing virtualization software for server operating systems, allowing information technology departments to cut costs by consolidating applications onto fewer computers, beat December-quarter consensus earnings estimates by 19 percent. VMware’s entrenched position in server virtualization provides it with a strong customer base to sell its newest desktop product. We sold VMware when shares hit our target price. |
| Apple Inc. | $8.1 | 11.5 | The maker of personal computers, iPods, iPhones and, now, iPads grew December-quarter earnings 47 percent, beating estimates by 77 percent. Revenues increased 32 percent as momentum picked up across Apple’s computing and mobile communications product lines. A strong April launch of the company’s new iPad tablet device and upcoming upgrades and carrier expansion of its iPhone platform are expected to drive continued growth. |
| | $ Loss | | |
| Biggest $ Losers | (in millions) | % Loss | Reason for Move |
| CONSOL Energy Inc. | $7.5 | 21.2 | The producer of coal and natural gas beat December-quarter earnings estimates. Shares retraced after CONSOL struck a deal to acquire Marcellus Shale wells and drilling rights from Dominion Resources, disappointing some investors more focused on the company’s metallurgical and thermal coal exposure. We believe the shift toward a more balanced portfolio of energy assets will benefit the company over time. |
| Amazon.com, Inc. | $7.0 | 11.4 | The online retailer grew December-quarter earnings 63 percent, beating estimates by 18 percent. Despite strong results, shares gave back some ground as investors grew more cautious on the outlook for the company’s Kindle e-reader as Apple prepared to launch its new iPad product. We sold Amazon.com during the quarter, locking in a substantial overall gain from our original cost. |
| Analog Devices, Inc. | $5.6 | 8.8 | The maker of integrated circuits used in electronics products grew January-quarter earnings 139 percent, beating estimates by 13 percent. Shares traded lower during the quarter as investors expressed concerns that modestly building inventory levels for the industry would result in lower order rates for chips in the future. Our research shows that order strength continues to reflect rebounding demand from the company’s industrial and medical end markets. |
| Ingersoll-Rand PLC | $5.4 | 10.9 | The diversified manufacturer, which makes Bobcat loading equipment and Thermo King refrigeration trucks, turned in lighter-than-expected sales as some customers pushed purchase decisions later into the year. We sold Ingersoll-Rand during the quarter on concerns that its Trane division experienced some challenges at the start of the air conditioning season following a restructuring. |
| NVIDIA Corp. | $4.5 | 7.2 | The manufacturer of high-level graphics chips for personal computers and gaming consoles grew January-quarter earnings 228 percent, beating estimates by 15 percent. As NVIDIA struggled to meet demand, concerns arose that personal-computer makers were building stockpiles to guard against future shortages. Our research indicates that strong order flow from depressed levels, not double-ordering, is driving demand. |
All gains/losses are calculated on an average cost basis
Brandywine Fund, Inc.
Statement of Assets and Liabilities
March 31, 2010 (Unaudited)
| Assets: | | | |
| Investments in securities, at value (cost $1,818,640,550) | | $ | 2,112,255,105 | |
| Receivable from investments sold | | | 42,698,921 | |
| Net dividends and interest receivable | | | 1,477,869 | |
| Receivable from shareholders for purchases | | | 635,105 | |
| Total assets | | $ | 2,157,067,000 | |
| | | | | |
| Liabilities: | | | | |
| Payable to brokers for investments purchased | | $ | 33,544,203 | |
| Payable to shareholders for redemptions | | | 2,072,556 | |
| Payable to adviser for management fees | | | 1,786,170 | |
| Other liabilities | | | 261,538 | |
| Total liabilities | | | 37,664,467 | |
| | | | | |
| Net Assets: | | | | |
| Capital Stock, $0.01 par value; 500,000,000 shares authorized; 91,763,961 shares outstanding | | | 3,038,495,372 | |
| Net unrealized appreciation on investments | | | 293,614,555 | |
| Accumulated net realized loss on investments | | | (1,212,707,394 | ) |
| Net assets | | | 2,119,402,533 | |
| Total liabilities and net assets | | $ | 2,157,067,000 | |
| | | | | |
| Calculation of net asset value per share: | | | | |
Net asset value, offering and redemption price per share ($2,119,402,533 ÷ 91,763,961 shares outstanding) | | $ | 23.10 | |
The accompanying notes to financial statements are an integral part of this statement.
Schedule of Investments
March 31, 2010 (Unaudited)
| Shares | | | | Cost | | | Value | |
| | | | | | | | | |
| Common Stocks - 97.6% (a) | | | | | | |
| | | | | | | | | |
| CONSUMER DISCRETIONARY | | | | | | |
| | | | | | | | | |
| | | Apparel Retail - 6.2% | | | | | | |
| | 1,749,400 | | American Eagle Outfitters, Inc. | | $ | 32,946,930 | | | $ | 32,398,888 | |
| | 477,700 | | AnnTaylor Stores Corp.* | | | 7,092,532 | | | | 9,888,390 | |
| | 110,500 | | The Buckle, Inc. | | | 4,077,374 | | | | 4,061,980 | |
| | 1,091,600 | | Chico’s FAS, Inc. | | | 13,416,005 | | | | 15,740,872 | |
| | 901,800 | | Collective Brands, Inc.* | | | 19,004,077 | | | | 20,506,932 | |
| | 410,600 | | J. Crew Group, Inc.* | | | 18,404,393 | | | | 18,846,540 | |
| | 112,800 | | Jos. A. Bank Clothiers, Inc.* | | | 5,936,283 | | | | 6,164,520 | |
| | 719,400 | | Limited Brands, Inc. | | | 12,630,655 | | | | 17,711,628 | |
| | 173,700 | | Urban Outfitters, Inc.* | | | 6,608,594 | | | | 6,605,811 | |
| | | | | | | | | | | | |
| | | | Auto Parts & Equipment - 0.3% | | | | | | | | |
| | 447,900 | | ArvinMeritor, Inc.* | | | 4,977,078 | | | | 5,979,465 | |
| | | | | | | | | | | | |
| | | | Automobile Manufacturers - 0.6% | | | | | | | | |
| | 403,300 | | Thor Industries, Inc. | | | 10,582,728 | | | | 12,183,693 | |
| | | | | | | | | | | | |
| | | | Automotive Retail - 0.4% | | | | | | | | |
| | 363,100 | | CarMax, Inc.* | | | 8,943,662 | | | | 9,121,072 | |
| | | | | | | | | | | | |
| | | | Broadcasting - 0.5% | | | | | | | | |
| | 331,900 | | Discovery Communications, Inc.* | | | 7,240,865 | | | | 11,214,901 | |
| | | | | | | | | | | | |
| | | | Department Stores - 0.9% | | | | | | | | |
| | 352,100 | | Kohl’s Corp.* | | | 19,886,169 | | | | 19,288,038 | |
| | | | | | | | | | | | |
| | | | Distributors - 0.6% | | | | | | | | |
| | 636,900 | | LKQ Corp.* | | | 11,142,546 | | | | 12,929,070 | |
| | | | | | | | | | | | |
| | | | Education Services - 0.4% | | | | | | | | |
| | 409,500 | | Education Management Corp.* | | | 7,371,000 | | | | 8,968,050 | |
| | | | | | | | | | | | |
| | | | General Merchandise Stores - 0.9% | | | | | | | | |
| | 532,100 | | Big Lots, Inc.* | | | 16,041,306 | | | | 19,379,082 | |
| | | | | | | | | | | | |
| | | | Home Furnishing Retail - 1.4% | | | | | | | | |
| | 1,126,600 | | Williams-Sonoma, Inc. | | | 22,762,327 | | | | 29,618,314 | |
| | | | | | | | | | | | |
| | | | Home Furnishings - 1.0% | | | | | | | | |
| | 976,900 | | Leggett & Platt, Inc. | | | 20,903,737 | | | | 21,140,116 | |
| | | | | | | | | | | | |
| | | | Home Improvement Retail - 2.7% | | | | | | | | |
| | 1,501,400 | | The Home Depot, Inc. | | | 43,205,408 | | | | 48,570,290 | |
| | 253,500 | | Lumber Liquidators Holdings, Inc.* | | | 6,054,350 | | | | 6,760,845 | |
| | | | | | | | | | | | |
| | | | Leisure Products - 1.5% | | | | | | | | |
| | 1,371,600 | | Mattel, Inc. | | | 24,620,168 | | | | 31,190,184 | |
| | | | | | | | | | | | |
| | | | Specialty Stores - 0.1% | | | | | | | | |
| | 96,400 | | Hibbett Sports Inc.* | | | 1,861,910 | | | | 2,465,912 | |
| | | | | | | | | | | | |
| | | | Total Consumer Discretionary | | | 325,710,097 | | | | 370,734,593 | |
| | | | | | | | | | | | |
| | | | This sector is 13.8% above your Fund’s cost. | | | | | | | | |
| | | | | | | | | |
| CONSUMER STAPLES | | | | | | | | |
| | | | | | | | | | | | |
| | | | Drug Retail - 1.3% | | | | | | | | |
| | 724,900 | | CVS Caremark Corp. | | | 25,733,988 | | | | 26,502,344 | |
Brandywine Fund, Inc.
Schedule of Investments (Continued)
March 31, 2010 (Unaudited)
| Shares | | | | Cost | | | Value | |
| | | | | | | | | |
| Common Stocks - 97.6% (a) (Continued) | | | | | | |
| | | | | | | | | |
| | | Personal Products - 1.1% | | | | | | |
| | 499,800 | | NBTY, Inc.* | | $ | 11,530,781 | | | $ | 23,980,404 | |
| | | | | | | | | | | | |
| | | | Total Consumer Staples | | | 37,264,769 | | | | 50,482,748 | |
| | | | | | | | | | | | |
| | | | This sector is 35.5% above your Fund’s cost. | | | | | | | | |
| | | | | | | | | |
| ENERGY | | | | | | | | |
| | | | | | | | | | | | |
| | | | Oil & Gas Equipment & Services - 1.0% | | | | | | | | |
| | 349,400 | | Schlumberger Ltd. | | | 22,263,198 | | | | 22,172,924 | |
| | | | | | | | | | | | |
| | | | Oil & Gas Exploration & Production - 1.7% | | | | | | | | |
| | 96,300 | | Berry Petroleum Co. | | | 2,816,775 | | | | 2,711,808 | |
| | 1,654,200 | | EXCO Resources, Inc. | | | 24,880,145 | | | | 30,404,196 | |
| | 237,400 | | Rex Energy Corp.* | | | 2,663,610 | | | | 2,703,986 | |
| | | | | | | | | | | | |
| | | | Total Energy | | | 52,623,728 | | | | 57,992,914 | |
| | | | | | | | | | | | |
| | | | This sector is 10.2% above your Fund’s cost. | | | | | | | | |
| | | | | | | | | |
| FINANCIALS | | | | | | | | |
| | | | | | | | | | | | |
| | | | Asset Management & Custody Banks - 2.1% | | | | | | | | |
| | 2,015,500 | | SEI Investments Co. | | | 35,652,672 | | | | 44,280,535 | |
| | | | | | | | | | | | |
| | | | Other Diversified Financial Services - 1.8% | | | | | | | | |
| | 843,600 | | JPMorgan Chase & Co. | | | 35,901,612 | | | | 37,751,100 | |
| | | | | | | | | | | | |
| | | | Regional Banks - 3.4% | | | | | | | | |
| | 3,066,200 | | Fifth Third Bancorp | | | 37,978,667 | | | | 41,669,658 | |
| | 190,700 | | Signature Bank* | | | 6,596,098 | | | | 7,065,435 | |
| | 240,500 | | SunTrust Banks, Inc. | | | 5,965,991 | | | | 6,442,995 | |
| | 855,600 | | Webster Financial Corp. | | | 13,040,529 | | | | 14,964,444 | |
| | 87,800 | | Wintrust Financial Corp. | | | 2,916,146 | | | | 3,267,038 | |
| | | | | | | | | | | | |
| | | | Thrifts & Mortgage Finance - 0.4% | | | | | | | | |
| | 703,300 | | Ocwen Financial Corp.* | | | 6,660,911 | | | | 7,799,597 | |
| | | | | | | | | | | | |
| | | | Total Financials | | | 144,712,626 | | | | 163,240,802 | |
| | | | | | | | | | | | |
| | | | This sector is 12.8% above your Fund’s cost. | | | | | | | | |
| | | | | | | | | |
| HEALTH CARE | | | | | | | | |
| | | | | | | | | | | | |
| | | | Biotechnology - 0.3% | | | | | | | | |
| | 260,500 | | Martek Biosciences Corp.* | | | 5,501,463 | | | | 5,863,855 | |
| | | | | | | | | | | | |
| | | | Health Care Equipment - 0.6% | | | | | | | | |
| | 299,000 | | Masimo Corp. | | | 7,726,008 | | | | 7,938,450 | |
| | 119,200 | | Sirona Dental Systems, Inc.* | | | 4,070,412 | | | | 4,533,176 | |
| | | | | | | | | | | | |
| | | | Health Care Services - 1.0% | | | | | | | | |
| | 225,200 | | Emdeon, Inc.* | | | 3,574,243 | | | | 3,720,304 | |
| | 146,976 | | Express Scripts, Inc.* | | | 6,607,312 | | | | 14,956,278 | |
| | 40,691 | | MEDNAX, Inc.* | | | 2,040,764 | | | | 2,367,809 | |
| | | | | | | | | | | | |
| | | | Health Care Supplies - 1.4% | | | | | | | | |
| | 746,300 | | Inverness Medical Innovations, Inc.* | | | 27,306,092 | | | | 29,068,385 | |
| | | | | | | | | | | | |
| | | | Health Care Technology - 1.0% | | | | | | | | |
| | 419,800 | | Eclipsys Corp.* | | | 7,219,271 | | | | 8,345,624 | |
| | 594,300 | | MedAssets Inc.* | | | 11,944,807 | | | | 12,480,300 | |
| | | | | | | | | | | | |
| | | | Life Sciences Tools & Services - 4.5% | | | | | | | | |
| | 153,400 | | Covance, Inc.* | | | 5,411,723 | | | | 9,417,226 | |
| | 490,100 | | Illumina, Inc.* | | | 13,611,308 | | | | 19,064,890 | |
| | 523,900 | | Life Technologies Corp.* | | | 21,876,341 | | | | 27,384,253 | |
| | 176,200 | | Luminex Corp.* | | | 3,026,727 | | | | 2,965,446 | |
| | 762,600 | | Thermo Fisher Scientific, Inc.* | | | 35,966,978 | | | | 39,228,144 | |
| | | | | | | | | | | | |
| | | | Pharmaceuticals - 2.8% | | | | | | | | |
| | 459,500 | | Impax Laboratories, Inc.* | | | 8,034,600 | | | | 8,215,860 | |
| | 424,500 | | Shire PLC | | | 24,406,193 | | | | 28,000,020 | |
| | 884,700 | | Warner Chilcott PLC* | | | 23,351,622 | | | | 22,604,085 | |
| | | | | | | | | | | | |
| | | | Total Health Care | | | 211,675,864 | | | | 246,154,105 | |
| | | | | | | | | | | | |
| | | | This sector is 16.3% above your Fund’s cost. | | | | | | | | |
| | | | | | | | | |
| INDUSTRIALS | | | | | | | | |
| | | | | | | | | | | | |
| | | | Aerospace & Defense - 0.3% | | | | | | | | |
| | 77,600 | | American Science and | | | | | | | | |
| | | | Engineering, Inc. | | | 5,976,088 | | | | 5,813,792 | |
| | | | | | | | | | | | |
| | | | Air Freight & Logistics - 0.7% | | | | | | | | |
| | 45,600 | | FedEx Corp. | | | 3,356,258 | | | | 4,259,040 | |
| | 361,500 | | Hub Group, Inc.* | | | 9,406,356 | | | | 10,114,770 | |
| | | | | | | | | | | | |
| | | | Airlines - 2.6% | | | | | | | | |
| | 1,477,900 | | AirTran Holdings, Inc.* | | | 7,721,269 | | | | 7,507,732 | |
| | 167,800 | | Allegiant Travel Co.* | | | 8,483,313 | | | | 9,708,908 | |
| | 2,539,200 | | Delta Air Lines, Inc.* | | | 32,626,588 | | | | 37,046,928 | |
| | | | | | | | | | | | |
| | | | Building Products - 1.5% | | | | | | | | |
| | 2,055,500 | | Masco Corp. | | | 28,804,965 | | | | 31,901,360 | |
| | | | | | | | | | | | |
| | | | Construction & Engineering - 0.4% | | | | | | | | |
| | 476,200 | | MasTec Inc.* | | | 5,777,979 | | | | 6,004,882 | |
| | 184,000 | | Orion Marine Group, Inc.* | | | 3,573,989 | | | | 3,321,200 | |
| | | | | | | | | | | | |
| | | | Construction & Farm Machinery & Heavy Trucks - 1.2% | | | | | | | | |
| | 398,800 | | Bucyrus International, Inc. | | | 26,533,916 | | | | 26,316,812 | |
| | | | | | | | | | | | |
| | | | Electrical Components & Equipment - 0.6% | | | | | | | | |
| | 529,700 | | EnerSys* | | | 12,349,604 | | | | 13,062,402 | |
| | | | | | | | | | | | |
| | | | Industrial Conglomerates - 2.6% | | | | | | | | |
| | 2,111,700 | | McDermott International, Inc.* | | | 29,916,494 | | | | 56,846,964 | |
| | | | | | | | | | | | |
| | | | Industrial Machinery - 0.6% | | | | | | | | |
| | 457,000 | | Kennametal Inc. | | | 11,833,094 | | | | 12,850,840 | |
| | | | Marine Ports & Services - 0.2% | | | | | | | | |
| | 117,100 | | Aegean Marine Petroleum | | | | | | | | |
| | | | Network Inc. | | | 3,835,025 | | | | 3,323,298 | |
| | | | | | | | | | | | |
| | | | Trucking - 2.2% | | | | | | | | |
| | 1,285,800 | | J. B. Hunt Transport Services, Inc. | | | 34,286,135 | | | | 46,134,504 | |
| | | | | | | | | | | | |
| | | | Total Industrials | | | 224,481,073 | | | | 274,213,432 | |
| | | | | | | | | | | | |
| | | | This sector is 22.2% above your Fund’s cost. | | | | | | | | |
Brandywine Fund, Inc.
Schedule of Investments (Continued)
March 31, 2010 (Unaudited)
| Shares | | | | Cost | | | Value | |
| | | | | | | | | |
| Common Stocks - 97.6% (a) (Continued) | | | | | | |
| | | | | | | | | |
| INFORMATION TECHNOLOGY | | | | | | |
| | | | | | | | | |
| | | Application Software - 5.2% | | | | | | |
| | 632,300 | | Citrix Systems, Inc.* | | $ | 26,986,696 | | | $ | 30,015,281 | |
| | 1,763,900 | | Compuware Corp.* | | | 13,557,676 | | | | 14,816,760 | |
| | 84,800 | | JDA Software Group, Inc.* | | | 1,992,324 | | | | 2,359,136 | |
| | 474,000 | | Longtop Financial | | | | | | | | |
| | | | Technologies Ltd. SP-ADR* | | | 15,662,639 | | | | 15,267,540 | |
| | 2,292,700 | | Nuance Communications, Inc.* | | | 19,272,157 | | | | 38,150,528 | |
| | 295,800 | | SuccessFactors, Inc.* | | | 4,561,816 | | | | 5,632,032 | |
| | 140,800 | | Taleo Corp.* | | | 2,886,891 | | | | 3,648,128 | |
| | | | | | | | | | | | |
| | | | Communications Equipment - 2.4% | | | | | | | | |
| | 1,831,500 | | Cisco Systems, Inc.* | | | 40,766,004 | | | | 47,673,945 | |
| | 119,500 | | Plantronics, Inc. | | | 3,144,592 | | | | 3,737,960 | |
| | | | | | | | | | | | |
| | | | Computer Hardware - 3.0% | | | | | | | | |
| | 146,360 | | Apple Inc.* | | | 30,468,296 | | | | 34,384,355 | |
| | 536,800 | | Hewlett-Packard Co. | | | 25,958,461 | | | | 28,530,920 | |
| | 120,900 | | NCR Corp.* | | | 1,668,722 | | | | 1,668,420 | |
| | | | | | | | | | | | |
| | | | Computer Storage & Peripherals - 2.7% | | | | | | | | |
| | 1,060,800 | | NetApp, Inc.* | | | 31,960,392 | | | | 34,539,648 | |
| | 1,073,100 | | QLogic Corp.* | | | 17,771,852 | | | | 21,783,930 | |
| | | | | | | | | | | | |
| | | | Data Processing & Outsourced Services - 2.6% | | | | | | | | |
| | 941,400 | | Lender Processing Services, Inc. | | | 35,993,729 | | | | 35,537,850 | |
| | 211,800 | | Visa Inc. | | | 14,530,348 | | | | 19,280,154 | |
| | | | | | | | | | | | |
| | | | Internet Software & Services - 1.0% | | | | | | | | |
| | 174,200 | | DealerTrack Holdings Inc.* | | | 2,557,623 | | | | 2,975,336 | |
| | 322,600 | | VistaPrint N. V.* | | | 13,060,161 | | | | 18,468,850 | |
| | | | | | | | | | | | |
| | | | IT Consulting & Other Services - 0.3% | | | | | | | | |
| | 145,300 | | CACI International, Inc.* | | | 5,119,349 | | | | 7,097,905 | |
| | | | | | | | | | | | |
| | | | Semiconductor Equipment - 4.7% | | | | | | | | |
| | 2,447,200 | | MEMC Electronic Materials, Inc.* | | | 33,650,855 | | | | 37,515,576 | |
| | 1,317,500 | | Novellus Systems, Inc.* | | | 28,733,023 | | | | 32,937,500 | |
| | 2,450,800 | | Teradyne, Inc.* | | | 26,844,483 | | | | 27,375,436 | |
| | | | | | | | | | | | |
| | | | Semiconductors - 11.7% | | | | | | | | |
| | 1,096,600 | | Altera Corp. | | | 21,454,927 | | | | 26,658,346 | |
| | 352,000 | | Atheros Communications* | | | 6,062,113 | | | | 13,625,920 | |
| | 270,800 | | Cavium Networks, Inc.* | | | 5,769,040 | | | | 6,732,088 | |
| | 1,851,500 | | Cypress Semiconductor Corp.* | | | 18,564,428 | | | | 21,292,250 | |
| | 1,942,200 | | Marvell Technology Group Ltd.* | | | 37,228,505 | | | | 39,582,036 | |
| | 2,117,800 | | Maxim Integrated Products, Inc. | | | 29,597,993 | | | | 41,064,142 | |
| | 904,400 | | Microsemi Corp.* | | | 15,108,185 | | | | 15,682,296 | |
| | 1,884,900 | | NVIDIA Corp.* | | | 25,373,997 | | | | 32,759,562 | |
| | 3,396,700 | | ON Semiconductor Corp.* | | | 26,430,859 | | | | 27,173,600 | |
| | 225,300 | | Power Integrations, Inc. | | | 9,139,026 | | | | 9,282,360 | |
| | 284,700 | | Silicon Laboratories Inc.* | | | 10,012,154 | | | | 13,571,649 | |
| | | | | | | | | | | | |
| | | | Systems Software - 1.7% | | | | | | | | |
| | 963,100 | | Rovi Corp.* | | | 33,891,952 | | | | 35,759,903 | |
| | | | | | | | | | | | |
| | | | Total Information Technology | | | 635,781,268 | | | | 746,581,342 | |
| | | | | | | | | | | | |
| | | | This sector is 17.4% above your Fund’s cost | | | | | | | | |
| | | | | | | | | |
| MATERIALS | | | | | | | | |
| | | | | | | | | | | | |
| | | | Commodity Chemicals - 0.2% | | | | | | | | |
| | 295,000 | | Calgon Carbon Corp.* | | | 5,051,261 | | | | 5,050,400 | |
| | | | | | | | | | | | |
| | | | Diversified Chemicals - 0.4% | | | | | | | | |
| | 590,700 | | Solutia, Inc.* | | | 9,664,191 | | | | 9,516,177 | |
| | | | | | | | | | | | |
| | | | Metal & Glass Containers - 0.8% | | | | | | | | |
| | 330,800 | | Greif Inc. | | | 18,066,579 | | | | 18,167,536 | |
| | | | | | | | | | | | |
| | | | Paper Packaging - 0.5% | | | | | | | | |
| | 421,900 | | Packaging Corp. of America | | | 10,458,393 | | | | 10,382,959 | |
| | | | | | | | | | | | |
| | | | Specialty Chemicals - 2.4% | | | | | | | | |
| | 1,132,300 | | Albemarle Corp. | | | 42,131,916 | | | | 48,269,949 | |
| | | | | | | | | | | | |
| | | | Steel - 1.3% | | | | | | | | |
| | 466,800 | | Allegheny Technologies, Inc. | | | 19,683,106 | | | | 25,202,532 | |
| | 63,000 | | Carpenter Technology Corp. | | | 2,206,446 | | | | 2,305,800 | |
| | | | | | | | | | | | |
| | | | Total Materials | | | 107,261,892 | | | | 118,895,353 | |
| | | | | | | | | | | | |
| | | | This sector is 10.8% above your Fund’s cost. | | | | | | | | |
| | | | | | | | | |
| TELECOMMUNICATION SERVICES | | | | | | | | |
| | | | | | | | | | | | |
| | | | Wireless Telecommunication Services - 1.9% | | | | | | | | |
| | 975,900 | | NII Holdings Inc.* | | | 35,825,411 | | | | 40,655,994 | |
| | | | | | | | | | | | |
| | | | Total Telecommunication Services | | | 35,825,411 | | | | 40,655,994 | |
| | | | | | | | | | | | |
| | | | This sector is 13.5% above your Fund’s cost | | | | | | | | |
| | | | | | | | | | | | |
| | | | Total common stocks | | | 1,775,336,728 | | | | 2,068,951,283 | |
| Principal | | | | | | | | |
| Amount | | | | | | | | |
| | | | | | | | | |
| Short-Term Investments - 2.1% (a) | | | | | | |
| | | | | | | | | |
| | | Commercial Paper - 1.9% | | | | | | |
| $ | 39,600,000 | | Union Bank NA Cayman, | | | | | | |
| | | | due 04/01/10, discount of 0.13% | | | 39,600,000 | | | | 39,600,000 | |
| | | | | | | | | | | | |
| | | | Variable Rate Demand Note - 0.2% | | | | | | | | |
| | 3,703,822 | | American Family Financial | | | | | | | | |
| | | | Services, 0.10% | | | 3,703,822 | | | | 3,703,822 | |
| | | | | | | | | | | | |
| | | | Total short-term investments | | | 43,303,822 | | | | 43,303,822 | |
| | | | | | | | | | | | |
| | | | Total investments - 99.7% | | $ | 1,818,640,550 | | | | 2,112,255,105 | |
| | | | | | | | | | | | |
| | | | Other assets less | | | | | | | | |
| | | | liabilities - 0.3% (a) | | | | | | | 7,147,428 | |
| | | | | | | | | | | | |
| | | | TOTAL NET ASSETS - 100.0% | | | | | | $ | 2,119,402,533 | |
* Non-dividend paying security.
(a) Percentages for the various classifications relate to net assets.
N.V. - Netherlands Antillies Limited Liability Corp.
SP-ADR - Sponsored American Depositary Receipts
The accompanying notes to financial statements are an integral part of this schedule.
Brandywine Fund, Inc.
Statement of Operations
For the Six Months Ended March 31, 2010 (Unaudited)
| Income: | | | |
| Dividends | | $ | 9,642,194 | |
| Interest | | | 31,382 | |
| Total income | | | 9,673,576 | |
| | | | | |
| Expenses: | | | | |
| Management fees | | | 10,487,111 | |
| Transfer agent fees | | | 611,475 | |
| Printing and postage expense | | | 134,365 | |
| Administrative and accounting services | | | 113,923 | |
| Custodian fees | | | 70,165 | |
| Board of Directors fees and expenses | | | 56,645 | |
| Professional fees | | | 35,650 | |
| Registration fees | | | 34,640 | |
| Insurance expense | | | 25,995 | |
| Other expenses | | | 9,395 | |
| Total expenses | | | 11,579,364 | |
| Net Investment Loss | | | (1,905,788 | ) |
| Net Realized Gain on Investments | | | 149,599,116 | |
| Net Increase in Unrealized Appreciation on Investments | | | 41,037,666 | |
| Net Gain on Investments | | | 190,636,782 | |
| Net Increase in Net Assets Resulting From Operations | | $ | 188,730,994 | |
Statements of Changes in Net Assets
For the Six Months Ended March 31, 2010 (Unaudited)
and for the Year Ended September 30, 2009
| | | 2010 | | | 2009 | |
| Operations: | | | | | | |
| Net investment loss | | $ | (1,905,788 | ) | | $ | (5,851,739 | ) |
| Net realized gain (loss) on investments | | | 149,599,116 | | | | (1,141,417,077 | ) |
| Net increase in unrealized appreciation on investments | | | 41,037,666 | | | | 399,565,873 | |
| Net increase (decrease) in net assets resulting from operations | | | 188,730,994 | | | | (747,702,943 | ) |
| | | | | | | | | |
| Distributions to Shareholders: | | | | | | | | |
| Distributions from net realized gains ($0.1145 per share) | | | — | | | (14,327,226) | |
| | | | | | | | | |
| Fund Share Activities: | | | | | | | | |
| Proceeds from shares issued (3,675,169 and 8,247,123 shares, respectively) | | | 80,095,158 | | | | 163,040,216 | |
| Net asset value of shares issued in distributions reinvested (655,907 shares) | | | — | | | | 13,715,026 | |
| Cost of shares redeemed (20,020,264 and 28,178,168 shares, respectively) | | | (431,104,163 | ) | | | (554,831,955 | ) |
| Net decrease in net assets derived from Fund share activities | | | (351,009,005 | ) | | | (378,076,713 | ) |
| Total Decrease | | | (162,278,011 | ) | | | (1,140,106,882 | ) |
| | | | | | | | | |
| Net Assets at the Beginning of the Period | | | 2,281,680,544 | | | | 3,421,787,426 | |
| Net Assets at the End of the Period | | $ | 2,119,402,533 | | | $ | 2,281,680,544 | |
| (Includes undistributed net investment income of $0 and $0, respectively) | | | | | | | | |
The accompanying notes to financial statements are an integral part of these statements.
Brandywine Fund, Inc.
Financial Highlights
(Selected data for each share of the Fund outstanding throughout each period)
| | | For the Six Months | | | | | | | | | | | | | | | | |
| | | ended March 31, 2010 | | | Years Ended September 30, | |
| | | (Unaudited) | | | 2009 | | | 2008 | | | 2007 | | | 2006 | | | 2005 | |
| | | | | | | | | | | | | | | | | | | |
| | | | | | | | | | | | | | | | | | | |
| PER SHARE OPERATING PERFORMANCE: | | | | | | | | | | | | | | | | | | |
| Net asset value, beginning of period | | $ | 21.11 | | | $ | 26.86 | | | $ | 40.98 | | | $ | 32.27 | | | $ | 31.50 | | | $ | 24.19 | |
| | | | | | | | | | | | | | | | | | | | | | | | | |
| Income from investment operations: | | | | | | | | | | | | | | | | | | | | | | | | |
Net investment loss(1) | | | (0.02 | ) | | | (0.05 | ) | | | (0.18 | ) | | | (0.19 | ) | | | (0.10 | ) | | | (0.08 | ) |
| Net realized and unrealized gains (losses) | | | | | | | | | | | | | | | | | | | | | | | | |
| on investments | | | 2.01 | | | | (5.59 | ) | | | (8.72 | ) | | | 9.15 | | | | 0.87 | | | | 7.39 | |
| Total from investment operations | | | 1.99 | | | | (5.64 | ) | | | (8.90 | ) | | | 8.96 | | | | 0.77 | | | | 7.31 | |
| | | | | | | | | | | | | | | | | | | | | | | | | |
| Less distributions: | | | | | | | | | | | | | | | | | | | | | | | | |
| Distributions from net investment income | | | — | | | | — | | | | — | | | | — | | | | — | | | | — | |
| Distributions from net realized gains | | | — | | | | (0.11 | ) | | | (5.22 | ) | | | (0.25 | ) | | | — | | | | — | |
| Total from distributions | | | — | | | | (0.11 | ) | | | (5.22 | ) | | | (0.25 | ) | | | — | | | | — | |
| Net asset value, end of period | | $ | 23.10 | | | $ | 21.11 | | | $ | 26.86 | | | $ | 40.98 | | | $ | 32.27 | | | $ | 31.50 | |
| | | | | | | | | | | | | | | | | | | | | | | | | |
| TOTAL RETURN | | | 9.43 | %(a) | | | (20.98 | %) | | | (25.16 | %) | | | 27.90 | % | | | 2.44 | % | | | 30.22 | % |
| | | | | | | | | | | | | | | | | | | | | | | | | |
| RATIOS/SUPPLEMENTAL DATA: | | | | | | | | | | | | | | | | | | | | | | | | |
| Net assets, end of period (in 000’s $) | | | 2,119,403 | | | | 2,281,681 | | | | 3,421,787 | | | | 4,851,268 | | | | 4,066,292 | | | | 3,995,582 | |
| Ratio of expenses to average net assets | | | 1.11 | %(b) | | | 1.10 | % | | | 1.08 | % | | | 1.08 | % | | | 1.08 | % | | | 1.08 | % |
| Ratio of net investment loss | | | | | | | | | | | | | | | | | | | | | | | | |
| to average net assets | | | (0.18 | %)(b) | | | (0.25 | %) | | | (0.54 | %) | | | (0.54 | %) | | | (0.31 | %) | | | (0.25 | %) |
| Portfolio turnover rate | | | 102 | %(a) | | | 239 | % | | | 210 | % | | | 162 | % | | | 200 | % | | | 183 | % |
(1) | Net investment loss per share was calculated using average shares outstanding. |
The accompanying notes to financial statements are an integral part of this statement.
| | Definitions and Disclosures Performance data quoted represent past performance; past performance does not guarantee future results. The investment return and principal value of an investment will fluctuate so that an investor’s shares, when redeemed, may be worth more or less than their original cost. Current performance of the Funds may be lower or higher than the performance quoted. Performance data current to the most recent month end may be obtained by visiting www.brandywinefunds.com. The Funds’ investment objectives, risks, charges and expenses must be considered carefully before investing. The prospectus contains this and other important information about the investment companies, and it may be obtained by calling 1-800-656-3017, or visiting www.brandywinefunds.com. Read it carefully before investing. Fund holdings and sector weightings are subject to change at any time and are not recommendations to buy or sell any securities. Securities discussed were not held by the Funds as of 3/31/10, unless listed in the accompanying schedules of investments. Forecasted earnings growth rates quoted for the Funds’ holdings refer solely to the estimated earnings growth rates of the average investment holding of the Funds based on consensus estimates from Baseline Financial Services, Inc. (Baseline) and not to the actual performance of the Funds themselves. Baseline provides analytical information and services to the investment community. The Russell 1000, Russell 1000 Growth, Russell 3000, Russell 3000 Growth and S&P 500 Indexes are unmanaged indexes commonly used to measure the performance of U.S. stocks. You cannot invest directly in an index. As of March 31, 2010, the Russell 1000 Index’s average annual total returns for 1, 5 and 10 years were 51.60, 2.31 and -0.36 percent; the Russell 1000 Growth Index’s were 49.75, 3.42 and -4.21 percent; the Russell 3000 Index’s were 52.44, 2.39 and -0.07 percent; the Russell 3000 Growth Index’s were 50.50, 3.46 and -4.01 percent; and the S&P 500 Index’s were 49.77, 1.92 and -0.65 percent. | |
Brandywine Blue Fund
Statement of Assets and Liabilities
March 31, 2010 (Unaudited)
| Assets: | | | |
| Investments in securities, at value (cost $2,012,482,012) | | $ | 2,278,624,315 | |
| Receivable from investments sold | | | 66,012,097 | |
| Receivable from shareholders for purchases | | | 3,655,643 | |
| Net dividends and interest receivable | | | 818,379 | |
| Total assets | | $ | 2,349,110,434 | |
| | | | | |
| Liabilities: | | | | |
| Payable to brokers for investments purchased | | $ | 38,052,220 | |
| Payable to shareholders for redemptions | | | 8,732,882 | |
| Payable to adviser for management fees | | | 1,961,670 | |
| Other liabilities | | | 499,251 | |
| Total liabilities | | | 49,246,023 | |
| | | | | |
| Net Assets: | | | | |
| Capital Stock, $0.01 par value; 500,000,000 shares authorized; 100,365,436 shares outstanding | | | 3,530,314,770 | |
| Net unrealized appreciation on investments | | | 266,142,303 | |
| Accumulated net realized loss on investments | | | (1,496,592,662 | ) |
| Net assets | | | 2,299,864,411 | |
| Total liabilities and net assets | | $ | 2,349,110,434 | |
| | | | | |
| Calculation of net asset value per share: | | | | |
Net asset value, offering and redemption price per share ($2,299,864,411 ÷ 100,365,436 shares outstanding) | | $ | 22.91 | |
The accompanying notes to financial statements are an integral part of this statement.
Schedule of Investments
March 31, 2010 (Unaudited)
| Shares | | | | Cost | | | Value | |
| | | | | | | | | |
| Common Stocks - 96.2% (a) | | | | | | |
| | | | | | | | | |
| CONSUMER DISCRETIONARY | | | | | | |
| | | | | | | | | |
| | | Apparel Retail - 0.7% | | | | | | |
| | 408,300 | | Urban Outfitters, Inc.* | | $ | 15,539,439 | | | $ | 15,527,649 | |
| | | | | | | | | | | | |
| | | | Apparel, Accessories & Luxury Goods - 2.2% | | | | | | | | |
| | 1,152,300 | | Coach, Inc. | | | 40,532,089 | | | | 45,538,896 | |
| | 69,600 | | VF Corp. | | | 5,583,124 | | | | 5,578,440 | |
| | | | | | | | | | | | |
| | | | Broadcasting - 1.1% | | | | | | | | |
| | 729,800 | | Discovery Communications, Inc.* | | | 16,006,655 | | | | 24,659,942 | |
| | | | | | | | | | | | |
| | | | Department Stores - 1.4% | | | | | | | | |
| | 588,700 | | Kohl’s Corp.* | | | 33,442,749 | | | | 32,248,986 | |
| | | | | | | | | | | | |
| | | | General Merchandise Stores - 2.3% | | | | | | | | |
| | 1,011,400 | | Target Corp. | | | 49,801,760 | | | | 53,199,640 | |
| | | | | | | | | | | | |
| | | | Home Improvement Retail - 5.7% | | | | | | | | |
| | 2,311,900 | | The Home Depot, Inc. | | | 65,458,010 | | | | 74,789,965 | |
| | 2,344,800 | | Lowe’s Companies, Inc. | | | 55,344,838 | | | | 56,837,952 | |
| | | | | | | | | | | | |
| | | | Leisure Products - 1.9% | | | | | | | | |
| | 1,892,300 | | Mattel, Inc. | | | 33,960,685 | | | | 43,030,902 | |
| | | | | | | | | | | | |
| | | | Total Consumer Discretionary | | | 315,669,349 | | | | 351,412,372 | |
| | | | | | | | | | | | |
| | | | This sector is 11.3% above your Fund’s cost. | | | | | | | | |
| | | | | | | | | |
| CONSUMER STAPLES | | | | | | | | |
| | | | | | | | | | | | |
| | | | Drug Retail - 2.3% | | | | | | | | |
| | 1,464,700 | | CVS Caremark Corp. | | | 52,302,900 | | | | 53,549,432 | |
| | | | | | | | | | | | |
| | | | Total Consumer Staples | | | 52,302,900 | | | | 53,549,432 | |
| | | | | | | | | | | | |
| | | | This sector is 2.4% above your Fund’s cost. | | | | | | | | |
| | | | | | | | | |
| ENERGY | | | | | | | | |
| | | | | | | | | | | | |
| | | | Coal & Consumable Fuels - 1.2% | | | | | | | | |
| | 655,000 | | CONSOL Energy Inc. | | | 35,444,958 | | | | 27,942,300 | |
| | | | | | | | | | | | |
| | | | Integrated Oil & Gas - 2.5% | | | | | | | | |
| | 670,200 | | Occidental Petroleum Corp. | | | 55,300,003 | | | | 56,658,708 | |
| | | | | | | | | | | | |
| | | | Oil & Gas Equipment & Services - 3.8% | | | | | | | | |
| | 1,488,400 | | Cameron International Corp.* | | | 60,502,508 | | | | 63,792,824 | |
| | 382,500 | | Schlumberger Ltd. | | | 24,369,209 | | | | 24,273,450 | |
| | | | | | | | | | | | |
| | | | Oil & Gas Storage & Transportation - 2.6% | | | | | | | | |
| | 2,617,000 | | The Williams Companies, Inc. | | | 46,943,790 | | | | 60,452,700 | |
| | | | | | | | | | | | |
| | | | Total Energy | | | 222,560,468 | | | | 233,119,982 | |
| | | | | | | | | | | | |
| | | | This sector is 4.7% above your Fund’s cost. | | | | | | | | |
Brandywine Blue Fund
Schedule of Investments (Continued)
March 31, 2010 (Unaudited)
| Shares | | | | Cost | | | Value | |
| | | | | | | | | |
| Common Stocks - 96.2% (a) (Continued) | | | | | | |
| | | | | | | | | |
| FINANCIALS | | | | | | |
| | | | | | | | | |
| | | Other Diversified Financial Services - 1.8% | | | | | | |
| | 923,500 | | JPMorgan Chase & Co. | | $ | 39,281,341 | | | $ | 41,326,625 | |
| | | | | | | | | | | | |
| | | | Regional Banks - 2.9% | | | | | | | | |
| | 4,320,400 | | Fifth Third Bancorp | | | 53,359,060 | | | | 58,714,236 | |
| | 265,500 | | SunTrust Banks, Inc. | | | 6,584,796 | | | | 7,112,745 | |
| | | | | | | | | | | | |
| | | | Total Financials | | | 99,225,197 | | | | 107,153,606 | |
| | | | | | | | | | | | |
| | | | This sector is 8.0% above your Fund’s cost. | | | | | | | | |
| | | | | | | | | |
| HEALTH CARE | | | | | | | | |
| | | | | | | | | | | | |
| | | | Biotechnology - 3.0% | | | | | | | | |
| | 1,131,500 | | Celgene Corp.* | | | 47,875,784 | | | | 70,107,740 | |
| | | | | | | | | | | | |
| | | | Health Care Distributors - 1.3% | | | | | | | | |
| | 450,600 | | McKesson Corp. | | | 26,954,221 | | | | 29,613,432 | |
| | | | | | | | | | | | |
| | | | Health Care Equipment - 2.7% | | | | | | | | |
| | 1,501,000 | | St. Jude Medical, Inc.* | | | 55,824,100 | | | | 61,616,050 | |
| | | | | | | | | | | | |
| | | | Health Care Services - 1.0% | | | | | | | | |
| | 229,600 | | Express Scripts, Inc.* | | | 10,461,039 | | | | 23,364,096 | |
| | | | | | | | | | | | |
| | | | Life Sciences Tools & Services - 5.1% | | | | | | | | |
| | 820,200 | | Life Technologies Corp.* | | | 36,247,945 | | | | 42,871,854 | |
| | 1,406,400 | | Thermo Fisher Scientific, Inc.* | | | 58,109,297 | | | | 72,345,216 | |
| | | | | | | | | | | | |
| | | | Pharmaceuticals - 2.8% | | | | | | | | |
| | 539,003 | | Shire PLC | | | 31,204,669 | | | | 35,552,638 | |
| | 1,162,300 | | Warner Chilcott PLC* | | | 30,884,994 | | | | 29,696,765 | |
| | | | | | | | | | | | |
| | | | Total Health Care | | | 297,562,049 | | | | 365,167,791 | |
| | | | | | | | | | | | |
| | | | This sector is 22.7% above your Fund’s cost. | | | | | | | | |
| | | | | | | | | |
| INDUSTRIALS | | | | | | | | |
| | | | | | | | | | | | |
| | | | Air Freight & Logistics - 1.2% | | | | | | | | |
| | 301,200 | | FedEx Corp. | | | 19,767,756 | | | | 28,132,080 | |
| | | | | | | | | | | | |
| | | | Airlines - 3.2% | | | | | | | | |
| | 4,996,900 | | Delta Air Lines, Inc.* | | | 62,306,751 | | | | 72,904,771 | |
| | | | | | | | | | | | |
| | | | Railroads - 4.9% | | | | | | | | |
| | 910,900 | | Canadian Pacific Railway Ltd. | | | 48,260,086 | | | | 51,229,016 | |
| | 815,800 | | Union Pacific Corp. | | | 58,650,641 | | | | 59,798,140 | |
| | | | | | | | | | | | |
| | | | Trading Companies & Distributors - 2.2% | | | | | | | | |
| | 475,300 | | W.W. Grainger, Inc. | | | 47,636,740 | | | | 51,389,436 | |
| | | | | | | | | | | | |
| | | | Total Industrials | | | 236,621,974 | | | | 263,453,443 | |
| | | | | | | | | | | | |
| | | | This sector is 11.3% above your Fund’s cost. | | | | | | | | |
| | | | | | | | | |
| INFORMATION TECHNOLOGY | | | | | | | | |
| | | | | | | | | | | | |
| | | | Application Software - 1.7% | | | | | | | | |
| | 805,700 | | Citrix Systems, Inc.* | | | 34,310,699 | | | | 38,246,579 | |
| | | | | | | | | | | | |
| | | | Communications Equipment - 3.1% | | | | | | | | |
| | 2,721,200 | | Cisco Systems, Inc.* | | | 60,069,741 | | | | 70,832,836 | |
| | | | | | | | | | | | |
| | | | Computer Hardware - 6.1% | | | | | | | | |
| | 333,800 | | Apple Inc.* | | | 55,280,664 | | | | 78,419,634 | |
| | 1,189,500 | | Hewlett-Packard Co. | | | 40,613,558 | | | | 63,221,925 | |
| | | | | | | | | | | | |
| | | | Computer Storage & Peripherals - 4.8% | | | | | | | | |
| | 3,687,200 | | EMC Corp.* | | | 59,630,065 | | | | 66,517,088 | |
| | 1,326,100 | | NetApp, Inc.* | | | 40,009,199 | | | | 43,177,816 | |
| | | | | | | | | | | | |
| | | | Data Processing & Outsourced Services - 1.5% | | | | | | | | |
| | 384,100 | | Visa Inc. | | | 20,105,009 | | | | 34,964,623 | |
| | | | | | | | | | | | |
| | | | Electronic Manufacturing Services - 2.1% | | | | | | | | |
| | 6,140,700 | | Flextronics International Ltd.* | | | 47,075,523 | | | | 48,143,088 | |
| | | �� | | | | | | | | | |
| | | | Internet Software & Services - 2.4% | | | | | | | | |
| | 97,110 | | Google, Inc.* | | | 57,179,241 | | | | 55,062,341 | |
| | | | | | | | | | | | |
| | | | Semiconductors - 12.2% | | | | | | | | |
| | 695,000 | | Altera Corp. | | | 14,229,149 | | | | 16,895,450 | |
| | 1,857,400 | | Analog Devices, Inc. | | | 50,984,667 | | | | 53,530,268 | |
| | 863,000 | | Broadcom Corp. | | | 18,263,861 | | | | 28,634,340 | |
| | 2,011,300 | | Intel Corp. | | | 45,136,658 | | | | 44,771,538 | |
| | 1,426,200 | | Linear Technology Corp. | | | 41,707,265 | | | | 40,332,936 | |
| | 2,362,900 | | Marvell Technology Group Ltd.* | | | 45,455,832 | | | | 48,155,902 | |
| | 2,950,400 | | NVIDIA Corp.* | | | 42,470,976 | | | | 51,277,952 | |
| | | | | | | | | | | | |
| | | | Total Information Technology | | | 672,522,107 | | | | 782,184,316 | |
| | | | | | | | | | | | |
| | | | This sector is 16.3% above your Fund’s cost. | | | | | | | | |
| | | | | | | | | |
| TELECOMMUNICATION SERVICES | | | | | | | | |
| | | | | | | | | | | | |
| | | | Wireless Telecommunication Services - 2.5% | | | | | | | | |
| | 1,366,000 | | NII Holdings Inc.* | | | 50,342,155 | | | | 56,907,560 | |
| | | | | | | | | | | | |
| | | | Total Telecommunication Services | | | 50,342,155 | | | | 56,907,560 | |
| | | | | | | | | | | | |
| | | | This sector is 13.0% above your Fund’s cost. | | | | | | | | |
| | | | | | | | | | | | |
| | | | Total common stocks | | | 1,946,806,199 | | | | 2,212,948,502 | |
| | | | | | | | | | | | |
| Principal | | | | | | | | | | |
| Amount | | | | | | | | | | |
| | | | | | | | | | | | |
| Short-Term Investments - 2.9% (a) | | | | | | | | |
| | | | | | | | | | | | |
| | | | Commercial Paper - 2.7% | | | | | | | | |
| $ | 62,200,000 | | Union Bank NA Cayman, | | | | | | | | |
| | | | due 04/01/10, discount of 0.13% | | | 62,200,000 | | | | 62,200,000 | |
| | | | | | | | | | | | |
| | | | Variable Rate Demand Note - 0.2% | | | | | | | | |
| | 3,475,813 | | American Family Financial | | | | | | | | |
| | | | Services, 0.10% | | | 3,475,813 | | | | 3,475,813 | |
| | | | | | | | | | | | |
| | | | Total short-term investments | | | 65,675,813 | | | | 65,675,813 | |
| | | | | | | | | | | | |
| | | | Total investments - 99.1% | | $ | 2,012,482,012 | | | | 2,278,624,315 | |
| | | | | | | | | | | | |
| | | | Other assets less | | | | | | | | |
| | | | liabilities - 0.9% (a) | | | | | | | 21,240,096 | |
| | | | | | | | | | | | |
| | | | TOTAL NET ASSETS - 100.0% | | | | | | $ | 2,299,864,411 | |
| * | Non-dividend paying security. |
| (a) | Percentages for the various classifications relate to net assets. |
The accompanying notes to financial statements are an integral part of this schedule.
Brandywine Blue Fund
Statement of Operations
For the Six Months Ended March 31, 2010 (Unaudited)
| Income: | | | |
| Dividends | | $ | 11,027,644 | |
| Interest | | | 49,439 | |
| Total income | | | 11,077,083 | |
| | | | | |
| Expenses: | | | | |
| Management fees | | | 11,650,596 | |
| Transfer agent fees | | | 1,062,585 | |
| Printing and postage expense | | | 469,565 | |
| Administrative and accounting services | | | 117,239 | |
| Registration fees | | | 97,890 | |
| Custodian fees | | | 65,215 | |
| Board of Directors fees and expenses | | | 54,345 | |
| Professional fees | | | 33,400 | |
| Insurance expense | | | 29,995 | |
| Other expenses | | | 9,195 | |
| Total expenses | | | 13,590,025 | |
| Net Investment Loss | | | (2,512,942 | ) |
| Net Realized Gain on Investments | | | 196,191,011 | |
| Net Increase in Unrealized Appreciation on Investments | | | 52,352,624 | |
| Net Gain on Investments | | | 248,543,635 | |
| Net Increase in Net Assets Resulting From Operations | | $ | 246,030,693 | |
Statements of Changes in Net Assets
For the Six Months Ended March 31, 2010 (Unaudited)
and for the Year Ended September 30, 2009
| | | 2010 | | | 2009 | |
| Operations: | | | | | | |
| Net investment (loss) income | | $ | (2,512,942 | ) | | $ | 5,355,551 | |
| Net realized gain (loss) on investments | | | 196,191,011 | | | | (1,001,698,285 | ) |
| Net increase in unrealized appreciation on investments | | | 52,352,624 | | | | 514,251,276 | |
| Net increase (decrease) in net assets resulting from operations | | | 246,030,693 | | | | (482,091,458 | ) |
| | | | | | | | | |
| Distributions to Shareholders: | | | | | | | | |
| Distributions from net investment income ($0.06695 per share) | | | (7,553,091 | ) | | | — | |
| | | | | | | | | |
| Fund Share Activities: | | | | | | | | |
| Proceeds from shares issued (14,347,916 and 62,850,433 shares, respectively) | | | 314,001,105 | | | | 1,204,228,339 | |
| Net asset value of shares issued in distributions reinvested (706,297 shares) | | | 6,963,858 | | | | — | |
| Cost of shares redeemed (33,793,024 and 83,039,892 shares, respectively) | | | (721,484,730 | ) | | | (1,583,898,339 | ) |
| Net decrease in net assets derived from Fund share activities | | | (400,519,767 | ) | | | (379,670,000 | ) |
| Total Decrease | | | (162,042,165 | ) | | | (861,761,458 | ) |
| | | | | | | | | |
| Net Assets at the Beginning of the Period | | | 2,461,906,576 | | | | 3,323,668,034 | |
| Net Assets at the End of the Period | | $ | 2,299,864,411 | | | $ | 2,461,906,576 | |
| (Includes undistributed net investment income of $0 and $5,355,551, respectively) | | | | | | | | |
The accompanying notes to financial statements are an integral part of these statements.
Brandywine Blue Fund
Financial Highlights
(Selected data for each share of the Fund outstanding throughout each period)
| | | For the Six Months | | | | | | | | | | | | | | | | |
| | | ended March 31, 2010 | | | Years Ended September 30, | |
| | | (Unaudited) | | | 2009 | | | 2008 | | | 2007 | | | 2006 | | | 2005 | |
| | | | | | | | | | | | | | | | | | | |
| PER SHARE OPERATING PERFORMANCE: | | | | | | | | | | | | | | | | | | |
| Net asset value, beginning of period | | $ | 20.67 | | | $ | 23.86 | | | $ | 38.18 | | | $ | 31.15 | | | $ | 31.33 | | | $ | 25.21 | |
| | | | | | | | | | | | | | | | | | | | | | | | | |
| Income from investment operations: | | | | | | | | | | | | | | | | | | | | | | | | |
Net investment (loss) income(1) | | | (0.02 | ) | | | 0.04 | | | | (0.07 | ) | | | (0.02 | ) | | | (0.00 | )* | | | (0.04 | ) |
| Net realized and unrealized gains (losses) | | | | | | | | | | | | | | | | | | | | | | | | |
| on investments | | | 2.33 | | | | (3.23 | ) | | | (10.38 | ) | | | 8.15 | | | | 0.96 | | | | 6.16 | |
| Total from investment operations | | | 2.31 | | | | (3.19 | ) | | | (10.45 | ) | | | 8.13 | | | | 0.96 | | | | 6.12 | |
| | | | | | | | | | | | | | | | | | | | | | | | | |
| Less distributions: | | | | | | | | | | | | | | | | | | | | | | | | |
| Distributions from net investment income | | | (0.07 | ) | | | — | | | | — | | | | — | | | | — | | | | — | |
| Distributions from net realized gains | | | — | | | | — | | | | (3.87 | ) | | | (1.10 | ) | | | (1.14 | ) | | | — | |
| Total from distributions | | | (0.07 | ) | | | — | | | | (3.87 | ) | | | (1.10 | ) | | | (1.14 | ) | | | — | |
| Net asset value, end of period | | $ | 22.91 | | | $ | 20.67 | | | $ | 23.86 | | | $ | 38.18 | | | $ | 31.15 | | | $ | 31.33 | |
| | | | | | | | | | | | | | | | | | | | | | | | | |
| TOTAL RETURN | | | 11.19 | %(a) | | | (13.37 | %) | | | (30.70 | %) | | | 26.82 | % | | | 3.47 | % | | | 24.28 | % |
| | | | | | | | | | | | | | | | | | | | | | | | | |
| RATIOS/SUPPLEMENTAL DATA: | | | | | | | | | | | | | | | | | | | | | | | | |
| Net assets, end of period (in 000’s $) | | | 2,299,864 | | | | 2,461,907 | | | | 3,323,668 | | | | 3,304,281 | | | | 1,856,496 | | | | 1,230,936 | |
| Ratio of expenses to average net assets | | | 1.17 | %(b) | | | 1.16 | % | | | 1.13 | % | | | 1.12 | % | | | 1.10 | % | | | 1.12 | % |
| Ratio of net investment (loss) income | | | | | | | | | | | | | | | | | | | | | | | | |
| to average net assets | | | (0.22 | %)(b) | | | 0.21 | % | | | (0.23 | %) | | | (0.06 | %) | | | (0.02 | %) | | | (0.13 | %) |
| Portfolio turnover rate | | | 95 | %(a) | | | 261 | % | | | 267 | % | | | 184 | % | | | 207 | % | | | 181 | % |
| (1) | Net investment (loss) income per share was calculated using average shares outstanding. |
| * | Amount less then $0.005 per share. |
The accompanying notes to financial statements are an integral part of this statement.
The Brandywine Funds
Notes to Financial Statements
March 31, 2010 (Unaudited)
(1)Summary of Significant Accounting Policies
The following is a summary of significant accounting policies of Brandywine Fund, Inc. (the “Brandywine Fund”) and Brandywine Blue Fund (the “Blue Fund,” one of two Funds in a series of the Brandywine Blue Fund, Inc.) (collectively the “Brandywine Funds” or the “Funds”). Each Fund is registered as a diversified open-end management company under the Investment Company Act of 1940 (the “Act”), as amended. The assets and liabilities of each Fund are segregated and a shareholder’s interest is limited to the Fund in which the shareholder owns shares. The Brandywine Fund was incorporated under the laws of Maryland on October 9, 1985. The Blue Fund was incorporated under the laws of Maryland on November 13, 1990. The investment objective of each Fund is to produce long-te rm capital appreciation principally through investing in common stocks.
| (a) | Each security, excluding short-term investments, is valued at the last sale price reported by the principal security exchange on which the issue is traded. Securities that are traded on the Nasdaq Markets are valued at the Nasdaq Official Closing Price, or if no sale is reported, the latest bid price. Securities which are traded over-the-counter are valued at the latest bid price. Securities for which quotations are not readily available are valued at fair value as determined by the investment adviser under the supervision of the Board of Directors. The fair value of a security may differ from the last quoted price and the Fund may not be able to sell a security at the estimated fair value. Market quotations may not be available, for example, if trading in particular securities has halted during the day and not resumed prior to th e close of trading on the New York Stock Exchange. As of March 31, 2010, there were no securities that were internally fair valued. Short-term investments with maturities of 60 days or less are valued at amortized cost which approximates value. For financial reporting purposes, investment transactions are recorded on the trade date; however, for purposes of executing shareholder transactions, the Funds record changes in holdings of portfolio securities no later than the first business day after the trade date in accordance with Rule 2a-4 of the Act. Accordingly, certain differences between net asset value for financial reporting and for executing shareholder transactions may arise. |
| | The Funds adopted the provisions of the Financial Accounting Standards Board (“FASB”) Accounting Standards Codification “Fair Value Measurements and Disclosures” Topic 820 (“ASC 820”), effective October 1, 2008. Under ASC 820, fair value is defined as the price that would be received to sell an asset or paid to transfer a liability (i.e., the “exit price”) in an orderly transaction between market participants at the measurement date. |
The Brandywine Funds
Notes to Financial Statements (Continued)
March 31, 2010 (Unaudited)
(1)Summary of Significant Accounting Policies (Continued)
| | In determining fair value, the Funds use various valuation approaches. ASC 820 establishes a fair value hierarchy for inputs used in measuring fair value that maximizes the use of observable inputs and minimizes the use of unobservable inputs by generally requiring that the most observable inputs be used when available. Observable inputs are those that market participants would use in pricing the asset or liability based on market data obtained from sources independent of the Funds. Unobservable inputs reflect the Funds’ assumptions about the inputs market participants would use in pricing the asset or liability developed based on the best information available in the circumstances. The inputs or methodologies used for valuing securities are not necessarily an indication of the risks associated with investing in those securi ties. |
| | The fair value hierarchy is categorized into three levels based on the inputs as follows: |
| | Level 1 – | Valuations based on unadjusted quoted prices in active markets for identical assets. |
| | Level 2 – | Valuations based on quoted prices for similar securities or in markets that are not active or for which all significant inputs are observable, either directly or indirectly. |
| | Level 3 – | Valuations based on inputs that are unobservable and significant to the overall fair value measurement. |
| | The following table summarizes the Funds’ investments as of March 31, 2010, based on the inputs used to value them: |
| | | | | Brandywine Fund | | | Blue Fund | |
| | Valuation Inputs | | Investments in Securities | | | Investments in Securities | |
| | Level 1 – | Common Stocks | | $ | 2,068,951,283 | | | $ | 2,212,948,502 | |
| | Level 2 – | Short-Term Commercial Paper | | | 39,600,000 | | | | 62,200,000 | |
| | | Variable Rate Demand Notes | | | 3,703,822 | | | | 3,475,813 | |
| | | Total Level 2 | | | 43,303,822 | | | | 65,675,813 | |
| | Level 3 – | | | | — | | | | — | |
| | Total | | | $ | 2,112,255,105 | | | $ | 2,278,624,315 | |
| (b) | Net realized gains and losses on sales of securities are computed on the identified cost basis. |
| (c) | Dividend income is recorded on the ex-dividend date. Interest income is recorded on the accrual basis. |
| (d) | The Funds have investments in short-term variable rate demand notes, which are unsecured instruments. The Funds may be susceptible to credit risk with respect to these notes to the extent the issuer defaults on its payment obligation. The Funds’ policy is to monitor the creditworthiness of the issuer and nonperformance by these counterparties is not anticipated. |
| (e) | Accounting principles generally accepted in the United States of America (“GAAP”) require that permanent differences between income for financial reporting and tax purposes be reclassified in the capital accounts. |
| (f) | The preparation of financial statements in conformity with GAAP requires management to make estimates and assumptions that affect the reported amounts of assets and liabilities and disclosure of contingent assets and liabilities at the date of the financial statements and the reported amounts of revenues and expenses during the reporting period. Actual results could differ from these estimates. |
| (g) | No provision has been made for Federal income taxes since the Funds have elected to be taxed as “regulated investment companies” and intend to distribute substantially all net investment company taxable income and net capital gains to shareholders and otherwise comply with the provisions of the Internal Revenue Code applicable to regulated investment companies. |
| (h) | The Funds have reviewed all open tax years and major jurisdictions, which include Federal and the state of Maryland, and concluded that there are no significant uncertain tax positions that would require recognition in the financial statements. Open tax years are those that are open for exam by taxing authorities and, as of March 31, 2010, open Federal tax years include the tax years ended September 30, 2006 through 2009. The Funds have no examinations in progress and are also not aware of any tax positions for which it is reasonably possible that the total amounts of unrecognized tax benefits will significantly change in the next twelve months. |
(2)Investment Adviser and Management Agreements and Transactions With Related Parties
Each Fund has a management agreement with Friess Associates, LLC (the “Adviser”), with whom certain Officers and a Director of the Funds are affiliated, to serve as investment adviser and manager. Under the terms of the agreements, each Fund will pay the Adviser a monthly management fee at the annual rate of one percent (1%) on the daily net assets of such Fund.
The Adviser entered into sub-advisory agreements with its affiliate, Friess Associates of Delaware, LLC (the “Sub-Adviser”), to assist it in the day-to-day management of each of the Funds. The Adviser and, if so delegated, the Sub-Adviser supervise the investment portfolios of the Funds, directing the purchase and sale of investment securities in the day-to-day management of the
The Brandywine Funds
Notes to Financial Statements (Continued)
March 31, 2010 (Unaudited)
(2)Investment Adviser and Management Agreements and Transactions With Related Parties (Continued)
Funds. The Adviser pays the Sub-Adviser a fee equal to 110% of the monthly expenses the Sub-Adviser incurs in performing its services as Sub-Adviser. This relationship does not increase the annual management fee the Funds pay to the Adviser.
Each of the Funds pay the five independent directors annual fees of $20,500 each. The lead independent director and chairman of the audit committee are paid an additional $5,000 annually, divided proportionately among all the Brandwine Funds. All of the corresponding fees the directors receive are paid quarterly to the directors and then invested on the payment date in shares of the Funds at the net asset value of the Funds on the payment date. The Funds also reimburse directors for travel costs incurred in order to attend meetings of the Board of Directors. For the six months ended March 31, 2010, the Funds expensed the following directors fees and costs:
| | | Brandywine | Blue |
| | | Fund | Fund |
| | Directors Fees and Travel Costs Paid during the Period | $56,645 | $54,345 |
Under the Funds’ organizational documents, each director, officer, employee or other agent of the Fund (including the Funds’ investment manager) is indemnified, to the extent permitted by the Act, against certain liabilities that may arise out of performance of their duties to the Funds. Additionally, in the normal course of business, the Funds enter into contracts that contain a variety of indemnification clauses. The Funds’ maximum exposure under these arrangements is unknown as this would involve future claims that may be made against the Funds that have not yet occurred. However, the Funds have not had prior claims or losses pursuant to these contracts and believe the risk of loss to be remote.
(3)Credit Agreement
U.S. Bank, N.A. has made available to each Fund a credit facility pursuant to Credit Agreements effective July 22, 2004, for the purpose of having cash available to cover incoming redemptions. Each of the Funds has a $50,000,000 credit facility. Principal and interest of such loan under the Credit Agreements are due not more than 31 days after the date of the loan. Amounts under the credit facilities bear interest at a rate per annum equal to the current prime rate minus one percent on the amount borrowed. Advances will be collateralized by securities owned by the respective Fund. During the six months ended March 31, 2010, neither Fund borrowed against their Agreement. The Credit Agreements expire on December 18, 2010.
(4)Distributions to Shareholders
Net investment income and net realized gains, if any, are distributed to shareholders at least annually.
(5)Investment Transactions and Related Costs
For the six months ended March 31, 2010, purchases and proceeds of sales of investment securities (excluding short-term investments) for the Funds were as follows:
| | | | | | | Sale | | | Transaction | | | Ratio of Costs to | |
| | | | Purchases | | | Proceeds | | | Costs | | | Average Net Assets | |
| | Brandywine Fund | | $ | 2,078,375,508 | | | $ | 2,444,568,570 | | | $ | 5,586,850 | | | | 0.27% | |
| | Blue Fund | | | 2,136,495,402 | | | | 2,568,291,502 | | | | 5,350,104 | | | | 0.23 | |
Transaction costs represent the total commissions paid by each Fund on its respective purchases and sales of investment securities. These costs are added to the cost basis of the securities purchased and are deducted from the proceeds of securities sold, thereby reducing the realized gains or increasing the realized losses upon the sale of the securities.
(6)Income Tax Information
The following information for the Funds is presented on an income tax basis as of September 30, 2009:
| | | | | | | Gross | | | Gross | | | Net Unrealized | | | Distributable | | | Distributable | |
| | | | Cost of | | | Unrealized | | | Unrealized | | | Appreciation | | | Ordinary | | | Long-Term | |
| | | | Investments | | | Appreciation | | | Depreciation | | | on Investments | | | Income | | | Capital Gains | |
| | Brandywine Fund | | $ | 2,034,454,063 | | | $ | 268,388,805 | | | $ | 26,723,723 | | | $ | 241,665,082 | | | $ | — | | | $ | — | |
| | Blue Fund | | | 2,244,272,043 | | | | 220,775,131 | | | | 14,730,036 | | | | 206,045,095 | | | | 5,355,551 | | | | — | |
The difference, if any, between the cost amounts for financial statement and federal income tax purposes is due primarily to timing differences in recognizing certain gains and losses in security transactions.
The tax components of dividends paid during the years ended September 30, 2009 and 2008, capital loss carryovers, which may be used to offset future capital gains, subject to Internal Revenue Code limitations (expiring in 2017), as of September 30, 2009, and tax basis post-October losses as of September 30, 2009, which are not recognized for tax purposes until the first day of the following fiscal year are:
The Brandywine Funds
Notes to Financial Statements (Continued)
March 31, 2010 (Unaudited)
(6)Income Tax Information (Continued)
| | | | September 30, 2009 | | | September 30, 2008 | |
| | | | Ordinary | | | Long-Term | | | Net Capital | | | | | | Ordinary | | | Long-Term | |
| | | | Income | | | Capital Gains | | | Loss | | | Post-October | | | Income | | | Capital Gains | |
| | | | Distributions | | | Distributions | | | Carryovers | | | Losses | | | Distributions | | | Distributions | |
| | Brandywine Fund | | $ | 14,327,152 | | | $ | — | | | $ | 687,183,259 | | | $ | 664,211,443 | | | $ | 220,366,098 | | | $ | 408,257,097 | |
| | Blue Fund | | | — | | | | — | | | | 1,309,430,618 | | | | 375,608,473 | | | | 228,628,373 | | | | 127,593,462 | |
For corporate shareholders in the Brandywine Fund, the percentage of dividend income distributed for the year ended September 30, 2009, which is designated as qualifying for the dividends received deduction is 49.4% (unaudited).
For the shareholders in the Brandywine Fund, the percentage of dividend income distributed for the year ended September 30, 2009, which is designated as qualified dividend income under the Jobs and Growth Tax Relief Act of 2003 is 39.7% (unaudited).
Since there were no ordinary distributions paid for the Blue Fund for the year ended September 30, 2009, there were no distributions designated as qualifying for the dividends received deduction for corporate shareholders nor as qualified dividend income under the Jobs and Growth Tax Relief Act of 2003 (unaudited).
(7) Subsequent Events
Management has evaluated related events and transactions that occurred subsequent to March 31, 2010 through the date of issuance of the Funds’ financial statements. There were no events or transactions that occurred during this period that materially impacted the amounts or disclosures in the Funds’ financial statements.
Cost Discussion
Mutual fund shareholders incur two types of costs: (1) transaction costs, including sales charges (loads) on purchase payments, reinvested dividends, or other distributions; redemption fees; and exchange fees; and (2) ongoing costs, including management fees; distribution [and/or service] (12b-1) fees; and other fund expenses. Brandywine and Brandywine Blue do not have 12b-1 distribution fees. This example is intended to help you understand your ongoing costs (in dollars) of investing in the Brandywine Funds and to compare these costs with the ongoing costs of investing in other mutual funds.
In addition to the costs highlighted and described below, the only Fund transaction costs you might currently incur would be wire fees ($15 per wire), if you choose to have proceeds from a redemption wired to your bank account instead of receiving a check. Additionally, U.S. Bank charges an annual processing fee ($15) if you maintain an IRA account with the Funds. To determine your total costs of investing in the Funds, you would need to add any applicable wire or IRA processing fees you’ve incurred during the period to the costs provided in the example below.
The example is based on an investment of $1,000 invested at the beginning of the period and held for the entire period from October 1, 2009 through March 31, 2010.
Actual Expenses
The first line of the table below provides information about actual account values and actual expenses. You may use the information in this line, together with the amount you invested, to estimate the expenses that you paid over the period. Simply divide your account value by $1,000 (for example, an $8,600 account value divided by $1,000 = 8.6), then multiply the result by the number in the first line under the heading entitled “Expenses Paid During Period” to estimate the expenses you paid on your account during this period.
Hypothetical Example for Comparison Purposes
The second line of the table below provides information about hypothetical account values and hypothetical expenses based on the Fund’s actual expense ratio and an assumed rate of return of 5% per year before expenses, which is not the Fund’s actual return. The hypothetical account values and expenses may not be used to estimate the actual ending account balance or expenses you paid for the period. You may use this information to compare the ongoing costs of investing in the Funds and other funds. To do so, compare this 5% hypothetical example with the 5% hypothetical examples that appear in the shareholder reports of the other funds.
Please note that the expenses shown in the table are meant to highlight your ongoing costs only and do not reflect any transactional costs. While the Brandywine Funds currently do not assess sales charges, redemption or exchange fees, other funds do, and those costs will not be reflected in their expense example tables. Therefore, the second line of the table is useful in comparing ongoing costs only, and will not help you determine the relative total costs of owning different funds.
| | Beginning | Ending | |
| | Account | Account | Expenses Paid |
| | Value | Value | During Period* |
| | 10/01/09 | 3/31/10 | 10/01/09-3/31/10 |
| Brandywine Actual | $1,000.00 | $1,094.30 | $5.79 |
| Hypothetical (5% return before expenses) | $1,000.00 | $1,019.40 | $5.59 |
| Brandywine Blue Actual | $1,000.00 | $1,111.90 | $6.16 |
| Hypothetical (5% return before expenses) | $1,000.00 | $1,019.10 | $5.89 |
| * | Expenses are equal to the Funds’ annualized expense ratios of 1.11% and 1.17%, multiplied by the average account value over the period, multiplied by 182/365 (to reflect the one-half year period between October 1, 2009 and March 31, 2010). |
Brandywine Funds Advisory Agreements
On December 7, 2009, the Board of Directors (“Directors”) of the Funds approved the continuation of the advisory agreements with Friess Associates, LLC (“Friess”). Prior to approving the continuation of the advisory agreements, the Directors considered:
| • | the nature, extent and quality of the services provided by Friess |
| • | the investment performance of the Funds |
| • | the costs of the services to be provided and profits to be realized by Friess from its relationship with the Funds |
| • | the extent to which economies of scale would be realized as the Funds grow and whether fee levels reflect these economies of scale |
| • | the expense ratios of the Funds |
| • | other revenue to Friess and its affiliates from their relationship with the Funds |
| • | the manner in which portfolio transactions for the Funds are conducted, including the use of soft dollars |
In considering the nature, extent and quality of the services provided by Friess, the Directors reviewed a report describing the portfolio management, shareholder communication and servicing and regulatory compliance services provided by Friess to the Funds. The Directors concluded that Friess was providing essential services to the Funds. In particular, the Directors concluded that Friess was preparing reports to shareholders in addition to those required by law and continued to generate increased written communications, at Friess’ expense, to support shareholders.
The Directors compared the performance of the Funds to benchmark indexes over various periods of time and concluded that the performance of the Funds warranted the continuation of the advisory agreements.
In concluding that the advisory fees payable by the Funds were reasonable, the Directors reviewed a report of the costs of services provided, and the profits realized by Friess from its relationship with the Funds and concluded that such profits were reasonable and not excessive. The Directors also reviewed reports comparing the expense ratios and advisory fees paid by the Funds to those paid by other comparable mutual funds and concluded that the advisory fees paid by the Funds were higher than the average advisory fees paid by comparable mutual funds, but the expense ratios of the Funds were lower than the average expense ratios of comparable mutual funds. The Directors also noted that all clients of Friess pay the same 1% advisory fee. They noted that this fee would not be adjusted if economies of scale were realized during the current contract period as the Funds grew, but did not consider that factor to be significant in light of the other factors considered, particularly the fact that the profits were reasonable and not excessive. The Directors noted that having the same fee for all clients eliminated conflicts of interest that would be present if Friess charged different fees to different clients.
Finally, the Directors reviewed reports discussing the manner in which portfolio transactions for the Funds were conducted, including the use of soft dollars. Based on these reports, the Directors concluded that the research obtained by Friess was beneficial to the Funds and that Friess was executing the Funds’ portfolio transactions in a manner designed to obtain best execution for the Funds.
Additional Director Information, Proxy Voting Policy
and Quarterly Portfolio Schedules
For additional information about the Directors and Officers or for a description of the policies and procedures that the Funds use to determine how to vote proxies relating to portfolio securities, please call (800) 656-3017 and request a Statement of Additional Information. One will be mailed to you free of charge. The Statement of Additional Information is also available on the website of the Securities and Exchange Commission (the “Commission”) at http://www.sec.gov or the Funds’ website at http://www.brandywinefunds.com. Information on how the Funds voted proxies relating to portfolio securities is available on the Funds’ website or the website of the Commission no later than August 31 for the prior twelve months ending June 30. The Funds file their complete schedule of portfolio holdings with the Commi ssion for the first and third quarters of each fiscal year on Form N-Q. The Funds’ Forms N-Q are available on the Commission’s website. The Funds’ Forms N-Q may be reviewed and copied at the Commission’s Public Reference Room in Washington, D.C. Information on the operation of the Public Reference Room may be obtained by calling 1-800-SEC-0330.
Board of Directors
 |  |  |
| William F. D’Alonzo | Quentin Jackson | Stuart A. McFarland |
| CEO and CIO | Former President and CEO | Managing Partner |
| Friess Associates | Nuclear Electric Insurance Limited | Federal City Capital Advisors, LLC |
 |  |  |
| W. Richard Scarlett, III | Thomas D. Wren | James W. Zug |
| Former President & CEO | Senior Adviser | Former Senior Partner |
| Jackson State Bank & Trust | Promontory Financial Group, LLC | PricewaterhouseCoopers LLP |
 | | |
| | |
 | |
| The Brandywine Funds |
| P.O. Box 4166 |
| Greenville, DE 19807 |
| (800) 656-3017 |
| www.brandywinefunds.com |
| bfunds@friess.com |
| |
| |
| Foster S. Friess | | |
| Founder | | |
Investment Adviser: Friess Associates, LLC | Administrator, Accountant & Transfer Agent: U.S. Bancorp Fund Services, LLC |
Investment Sub-Adviser: Friess Associates of Delaware, LLC | Independent Registered Public Accounting Firm: PricewaterhouseCoopers LLP |
Custodian: U.S. Bank, N.A. | Legal Counsel: Foley & Lardner LLP |
Officers: William D’Alonzo, Chairman and President;
Lynda Campbell, Vice President, Secretary and Treasurer; Joseph Fields, Vice President;
Gordon Kaiser, Vice President; David Marky, Chief Compliance Officer, Vice President and Assistant Secretary
Report Editor: Chris Aregood Report Staff: David Marky, Adam Rieger
20
Item 2. Code of Ethics.
Not applicable.
Item 3. Audit Committee Financial Expert.
Not applicable.
Item 4. Principal Accountant Fees and Services.
Not applicable.
Item 5. Audit Committee of Listed Registrants.
Not applicable.
Item 6. Schedule of Investments.
| (a) | The Schedule of Investments in securities of unaffiliated issuers is included as part of the report to shareholders filed under Item 1 of this Form. |
Item 7. Disclosure of Proxy Voting Policies and Procedures for Closed-End Management Investment Companies.
Not applicable.
Item 8. Portfolio Managers of Closed-End Management Investment Companies.
Not applicable.
Item 9. Purchases of Equity Securities by Closed-End Management Investment Company and Affiliated Purchasers.
Not applicable.
Item 10. Submission of Matters to a Vote of Security Holders.
None.
Item 11. Controls and Procedures.
| (a) | The disclosure controls and procedures of the Brandywine Fund, Inc. are periodically evaluated. As of April 20, 2010, the date of the last evaluation, we concluded that our disclosure controls and procedures are adequate. |
| (b) | The internal controls of the Brandywine Fund, Inc. are periodically evaluated. There were no changes to Brandywine Fund’s internal control over financial reporting that occurred during the first fiscal quarter of the period covered by this report that have materially affected, or are reasonably likely to materially affect, such controls. |
Item 12. Exhibits.
| (a) | (1) Any code of ethics or amendment thereto. Not applicable. |
(2) Certifications pursuant to Section 302 of the Sarbanes-Oxley Act of 2002. Filed herewith.
(3) Any written solicitation to purchase securities under Rule 23c-1 under the Act sent or given during the period covered by the report by or on behalf of the Registrant to 10 or more persons. Not Applicable.
| (b) | Certification pursuant to Section 906 of the Sarbanes-Oxley Act of 2002. Furnished herewith. |
SIGNATURES
Pursuant to the requirements of the Securities Exchange Act of 1934 and the Investment Company Act of 1940, the registrant has duly caused this report to be signed on its behalf by the undersigned, thereunto duly authorized.
Brandywine Fund, Inc.
Registrant
By /s/William F. D’Alonzo
William F. D’Alonzo, Principal Executive Officer
Date April 20, 2010
Pursuant to the requirements of the Securities Exchange Act of 1934 and the Investment Company Act of 1940, this report has been signed below by the following persons on behalf of the registrant and in the capacities and on the dates indicated.
Brandywine Fund, Inc.
Registrant
By /s/Lynda J. Campbell
Lynda J. Campbell, Principal Financial Officer
Date April 20, 2010