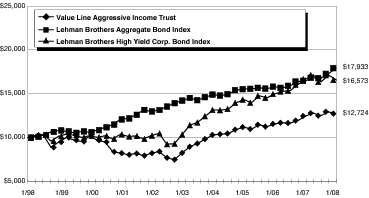
Value Line Aggressive Income Trust
The Value Line Family of Funds
1950 — The Value Line Fund seeks long-term growth of capital. Current income is a secondary objective.
1952 — Value Line Income and Growth Fund’s primary investment objective is income, as high and dependable as is consistent with reasonable risk. Capital growth to increase total return is a secondary objective.
1956 — The Value Line Premier Growth Fund seeks long-term growth of capital. No consideration is given to current income in the choice of investments.
1972 — Value Line Larger Companies Fund’s sole investment objective is to realize capital growth.
1979 — The Value Line Cash Fund, a money market fund, seeks to secure as high a level of current income as is consistent with maintaining liquidity and preserving capital. An investment in the Fund is not insured or guaranteed by the Federal Deposit Insurance Corporation or any other government agency. Although the Fund seeks to preserve the value of your investment at $1.00 per share, it is possible to lose money by investing in the Fund.
1981 — Value Line U.S. Government Securities Fund seeks maximum income without undue risk to capital. Under normal conditions, at least 80% of the value of its net assets will be invested in securities issued or guaranteed by the U.S. Government and its agencies and instrumentalities.
1983 — Value Line Centurion Fund* seeks long-term growth of capital.
1984 — The Value Line Tax Exempt Fund seeks to provide investors with the maximum income exempt from federal income taxes while avoiding undue risk to principal. The fund may be subject to state and local taxes and the Alternative Minimum Tax (if applicable).
1985 — Value Line Convertible Fund seeks high current income together with capital appreciation primarily from convertible securities ranked 1 or 2 for year-ahead performance by the Value Line Convertible Ranking System.
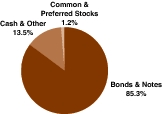
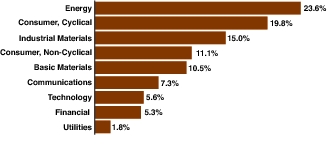
1986 ��� Value Line Aggressive Income Trust seeks to maximize current income.
1987 — Value Line New York Tax Exempt Trust seeks to provide New York taxpayers with the maximum income exempt from New York State, New York City and federal income taxes while avoiding undue risk to principal. The Trust may be subject to state and local taxes and the Alternative Minimum Tax (if applicable).
1987 — Value Line Strategic Asset Management Trust* seeks to achieve a high total investment return consistent with reasonable risk.
1993 — Value Line Emerging Opportunities Fund invests primarily in common stocks or securities convertible into common stock, with its primary objective being long-term growth of capital.
1993 — Value Line Asset Allocation Fund seeks high total investment return, consistent with reasonable risk. The Fund invests in stocks, bonds and money market instruments utilizing quantitative modeling to determine the asset mix.
| * | | Only available through the purchase of Guardian Investor, a tax deferred variable annuity, or ValuePlus, a variable life insurance policy. |
For more complete information about any of the Value Line Funds, including charges and expenses, send for a prospectus from Value Line Securities, Inc., 220 East 42nd Street, New York, New York 10017-5891 or call 1-800-243-2729, 9am – 5pm CST, Monday – Friday, or visit us at www.vlfunds.com. Read the prospectus carefully before you invest or send money.
24
Item 2. Code of Ethics
(a) The Registrant has adopted a Code of Ethics that applies to its principal executive officer, and principal financial officer and principal accounting officer.
(f) Pursuant to item 12(a), the Registrant is attaching as an exhibit a copy of its Code of Ethics that applies to its principal executive officer, and principal financial officer and principal accounting officer.
Item 3. Audit Committee Financial Expert.
(a)(1)The Registrant has an Audit Committee Financial Expert serving on its Audit Committee.
(2) The Registrant’s Board has designated John W. Chandler, a member of the Registrant’s Audit Committee, as the Registrant’s Audit Committee Financial Expert. Mr. Chandler is an independent director who is a senior consultant with Academic Search Consultation Service. He spent most of his professional career at Williams College, where he served as a faculty member, Dean of the Faculty, and President (1973-85). He
also served as President of Hamilton College (1968-73), and as President of the Association of American Colleges and Universities (1985-90). He has also previously served as Trustee Emeritus and Chairman of the Board of Trustees of Duke University.
A person who is designated as an “audit committee financial expert” shall not make such person an "expert" for any purpose, including without limitation under Section 11 of the Securities Act of 1933 or under applicable fiduciary laws, as a result of being designated or identified as an audit committee financial expert. The designation or identification of a person as an audit committee financial expert does not impose on such person any duties, obligations, or liabilities that are greater than the duties, obligations, and liabilities imposed on such person as a member of the audit committee and Board of Trustees in the absence of such designation or identification.
Item 4. Principal Accountant Fees and Services
(a)Audit Fees 2008 $ 4,448
(b) Audit-Related fees – None.
(c) Tax Preparation Fees 2008 $7,707
(d) All Other Fees – None
(e) (1) Audit Committee Pre-Approval Policy. All services to be performed for the Registrant by PricewaterhouseCoopers LLP must be pre-approved by the audit committee.
(e) (2) Not applicable.
(f) Not applicable.
(g) Aggregate Non-Audit Fees 2008 $ 2,770
(h) Not applicable.
Item 11. Controls and Procedures.
| (a) | The registrant’s principal executive officer and principal financial officer have concluded that the registrant’s disclosure controls and procedures (as defined in rule 30a-2(c) under the Act (17 CFR 270.30a-2(c) ) based on their evaluation of these controls and procedures as of a date within 90 days of the filing date of this report, are appropriately designed to ensure that material information relating to the registrant is made known to such officers and are operating effectively. |
| (b) | The registrant’s principal executive officer and principal financial officer have determined that there have been no significant changes in the registrant’s internal controls or in other factors that could significantly affect these controls subsequent to the date of their evaluation, including corrective actions with regard to significant deficiencies and material weaknesses. |
Item 12. Exhibits.
| (a) | Code of Business Conduct and Ethics for Principal Executive and Senior Financial Officers attached hereto as Exhibit 99.COE |
| (b) | (1) Certification pursuant to Rule 30a-2(a) under the Investment Company Act of 1940 (17 CFR 270.30a-2) attached hereto as Exhibit 99.CERT. |
| | (2) Certification pursuant to Section 906 of the Sarbanes-Oxley Act of 2002 attached hereto as Exhibit 99.906.CERT. |
SIGNATURES
Pursuant to the requirements of the Securities Exchange Act of 1934 and the Investment Company Act of 1940, the registrant has duly caused this report to be signed on its behalf by the undersigned, thereunto duly authorized.
| Jean B. Buttner, President |
Pursuant to the requirements of the Securities Exchange Act of 1934 and the Investment Company Act of 1940, this report has been signed below by the following persons on behalf of the registrant and in the capacities and on the dates indicated.
| Jean B. Buttner, President, Principal Executive Officer |
By: | /s/ Stephen R. Anastasio |
| Stephen R. Anastasio, Treasurer, Principal Financial Officer |