UNITED STATES
SECURITIES AND EXCHANGE COMMISSION
Washington, D.C. 20549
FORM N-CSR
CERTIFIED SHAREHOLDER REPORT OF REGISTERED
MANAGEMENT INVESTMENT COMPANIES
Investment Company Act file Number _811-04471_
Value Line Aggressive Income Trust
(Exact name of registrant as specified in charter)
220 East 42nd Street, New York, N.Y. 10017
(Address of principal executive offices) (Zip Code)
Registrant’s telephone number, including area code: 212-907-1500
Date of fiscal year end: January 31, 2009
Date of reporting period: January 31, 2009
Item I. Reports to Stockholders.
A copy of the Annual Report to Stockholders for the period ended 1/31/09 is included with this Form.
| INVESTMENT ADVISER | EULAV Asset Management, LLC 220 East 42nd Street New York, NY 10017-5891 | A N N U A L R E P O R T |
| J a n u a r y 3 1 , 2 0 0 9 | ||
| DISTRIBUTOR | Value Line Securities, Inc. | |
| 220 East 42nd Street | ||
| New York, NY 10017-5891 | ||
| CUSTODIAN BANK | State Street Bank and Trust Co. | |
| 225 Franklin Street | ||
| Boston, MA 02110 | ||
| SHAREHOLDER | State Street Bank and Trust Co. | |
| SERVICING AGENT | c/o BFDS | |
| P.O. Box 219729 | Value Line Aggressive Income Trust | |
| Kansas City, MO 64121-9729 | ||
| INDEPENDENT | PricewaterhouseCoopers LLP | |
| REGISTERED PUBLIC | 300 Madison Avenue | |
| ACCOUNTING FIRM | New York, NY 10017 | |
| LEGAL COUNSEL | Peter D. Lowenstein, Esq. | |
| 496 Valley Road | ||
| Cos Cob, CT 06807 | ||
| TRUSTEES | Joyce E. Heinzerling | |
| Francis C. Oakley | ||
| David H. Porter | ||
| Paul Craig Roberts | ||
| Thomas T. Sarkany | ||
| Nancy-Beth Sheerr | ||
| Daniel S. Vandivort | ||
| OFFICERS | Mitchell E. Appel | |
| President | ||
| Howard A. Brecher | ||
| Vice President and Secretary | ||
| Emily D. Washington | ||
| Treasurer | ||
 | ||
| This audited report is issued for information to shareholders. It is not authorized for distribution to prospective investors unless preceded or accompanied by a currently effective prospectus of the Trust (obtainable from the Distributor). | ||
| #00063842 | ||
Value Line Aggressive Income Trust
| To Our Value Line Aggressive |
To Our Shareholders (unaudited):
For the twelve months ended January 31, 2009, the Value Line Aggressive Income Trust had a loss of 13.42%. Notwithstanding this loss, the Fund outperformed the average high-yield bond fund, as measured by Lipper Analytical Services(1), which lost 20.90%, and the Barclays U.S. Corporate High Yield Index(2), a proxy for the overall high-yield market, which was down 20.67% for the same period.
The past year was one of the most challenging in the roughly 20-year history of the high-yield bond asset class. The combination of a weak domestic housing market and a contraction in the U.S. economy in the second half of the year led to a significant tightening of credit conditions for corporate debt securities. Yield spreads between U.S. Treasuries and high-yield corporate debt widened notably. This was partly due to forecasts for a significant increase in defaults for corporate securities. Moody’s expects the default rate to increase to the mid-teen level by year end 2009, from the roughly 5% level at the end of 2008. While the Federal Reserve has reduced short-term interest rates to practically zero and introduced a series of financial bailout programs with the U.S. Treasury, it would seem that the market needs more time to work off the excesses of the past few years.
Given this backdrop, the Fund has limited its investment holdings in the lowest rated securities (CCC), and has maintained a relatively high cash position of over 10%, both of which helped performance during the past year. As attractive investment opportunities present themselves, we will invest some of this cash to increase the current yield of the Fund.
Given the current economic concerns, we continue to focus our investments in the more liquid and stronger credits available in the high-yield sector. Energy-related securities continue to account for the largest sector weighting of the Fund, although some reduction in this area has taken place in the past six months. Preserving capital in difficult market environments, while allowing for an attractive dividend yield, remains our goal. We thank you for your continued investment with us.
| Sincerely, | |
| Mitchell Appel, | |
| President | |
| March 13, 2009 |
| (1) | The Lipper High Current Yield Bond Funds Average aims at high (relative) current yield from fixed income securities, has no quality or maturity restrictions, and tends to invest in lower grade debt issues. An investment cannot be made in the Peer Group Average. |
| (2) | The Barclays U.S. Corporate High Yield Index is representative of the broad based fixed-income market. It includes non-investment grade corporate bonds. The returns for the Index do not reflect charges, expenses, or taxes, and it is not possible to directly invest in this unmanaged Index. |
2
Value Line Aggressive Income Trust
| Income Trust Shareholders |
Economic Observations (unaudited)
The recession is in full bloom, having hit this country with its worst business setback in several generations. Meanwhile, the downturn is spreading overseas with ferocity, creating a global crisis.
The current situation is traceable to several events, beginning with the sharp declines in housing construction, home sales, and real estate prices. We also have seen a reduction in credit availability, a high level of bank failures, rising foreclosure rates, increasing unemployment, a contraction in retailing and auto activity, and sharp declines in manufacturing and nonmanufacturing. These developments are consistent with a deep and prolonged recession. As 2009 proceeds, we are facing a serious worldwide contraction that will at best end by late this year. Government reaction to this global upheaval is likely to involve attempts to foster infrastructure rebuilding and stabilize employment. It is hoped that such efforts will shorten the downturn’s duration and reduce its severity.
Meanwhile, inflation, which had earlier moved sharply higher in this country due to dramatic increases in oil, food, and commodity prices, has moderated noticeably, thanks to even more dramatic declines in energy prices. Our expectation is that, absent a more potent long-term business expansion than we now project, inflation should remain in check for the most part over the next year or two. In fact, there is the possibility that we could see selective bouts of deflation along the way, especially if consumer demand falters for any extended period of time. By early next decade, however, the massive government spending now being undertaken to hopefully lead us out of the recession, will generate somewhat higher inflation.
3
Value Line Aggressive Income Trust
| (unaudited) |
The following graph compares the performance of the Value Line Aggressive Income Trust to that of the Barclays Capital Aggregate Bond Index and the Barclays Capital U.S. Corporate High Yield Index. The Value Line Aggressive Income Trust is a professionally managed mutual fund, while the Indices are not available for investment and are unmanaged. The returns for the Indices do not reflect charges, expenses or taxes but do include the reinvestment of dividends. The comparison is shown for illustrative purposes only.
Comparison of a change in Value of a $10,000 Investment in
the Value Line Aggressive Income Trust and the Barclays Capital Aggregate Bond Index
and the Barclays Capital U.S. Corporate High Yield Index*
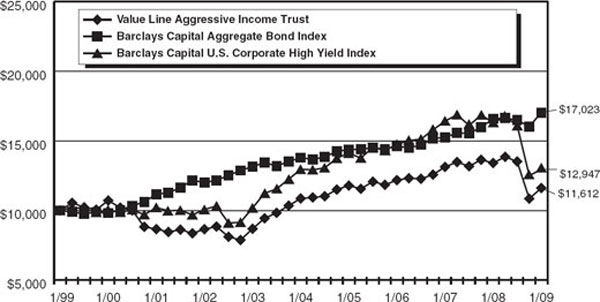
| * | The Barclays Capital Aggregate Bond Index is representative of the broad based fixed-income market. It includes non-investment grade corporate bonds. The returns for the Index do not reflect charges, expenses, or taxes, which are deducted from the Trust’s returns, and it is not possible to directly invest in this unmanaged Index. The Barclays Capital U.S. Corporate High Yield Index is representative of the broad based fixed-income market. It includes non-investment grade corporate bonds. The returns for the Index do not reflect charges, expenses, or taxes, which are deducted from the Trust’s returns, and it is not possible to directly invest in this unmanaged Index. |
| Performance Data:** | ||||||||
Average Annual Total Return | Growth of an Assumed Investment of $10,000 | |||||||
1 year ended 1/31/09 | (13.42 | )% | $ | 8,658 | ||||
| 5 years ended 1/31/09 | 1.35 | % | $ | 10,691 | ||||
| 10 years ended 1/31/09 | 1.51 | % | $ | 11,612 | ||||
| ** | The performance data quoted represent past performance and are no guarantee of future performance. The average annual total returns and growth of an assumed investment of $10,000 include dividends reinvested and capital gains distributions accepted in shares. The investment return and principal value of an investment will fluctuate so that an investment, when redeemed, may be worth more or less than its original cost. The performance data and graph do not reflect the deduction of taxes that a shareholder would pay on trust distributions or the redemption of trust shares. |
4
Value Line Aggressive Income Trust
| TRUST EXPENSES (unaudited): |
Example
As a shareholder of the Trust, you incur ongoing costs, including management fees, distribution and service (12b-1) fees, and other Trust expenses. This Example is intended to help you understand your ongoing costs (in dollars) of investing in the Trust and to compare these costs with the ongoing costs of investing in other mutual funds.
The Example is based on an investment of $1,000 invested at the beginning of the period and held for the entire period (August 1, 2008 through January 31, 2009).
Actual Expenses
The first line of the table below provides information about actual account values and actual expenses. You may use the information in this line, together with the amount you invested, to estimate the expenses that you paid over the period. Simply divide your account value by $1,000 (for example an $8,600 account value divided by $1,000 = 8.6), then multiply the result by the number in the first line under the heading “Expenses Paid During Period” to estimate the expenses you paid on your account during this period.
Hypothetical Example for Comparison Purposes
The second line of the table below provides information about hypothetical account values and hypothetical expenses based on the Trust’s actual expense ratio and an assumed rate of return of 5% per year before expenses, which is not the Trust’s actual return. The hypothetical account values and expenses may not be used to estimate the actual ending account balance or expenses you paid for the period. You may use this information to compare the ongoing costs of investing in the Trust and other funds. To do so, compare this 5% hypothetical example with the 5% hypothetical examples that appear in the shareholder reports of the other funds.
Please note that the expenses shown in the table are meant to highlight your ongoing costs only and do not reflect any transactional costs, such as sales charges (loads), redemption fees, or exchange fees. Therefore, the table is useful in comparing ongoing costs only, and will not help you determine the relative total costs of owning different funds. In addition, if transactional costs were included, your costs would have been higher.
Beginning account value 8/1/08 | Ending account value 1/31/09 | Expenses paid during period 8/1/08 thru 1/31/09* | ||||||||||
| Actual | $ | 1,000.00 | $ | 859.00 | $ | 4.77 | ||||||
| Hypothetical (5% return before expenses) | $ | 1,000.00 | $ | 1,020.01 | $ | 5.18 | ||||||
| * | Expenses are equal to the Trust’s annualized expense ratio of 1.02%, multiplied by the average account value over the period, multiplied by 184/366 to reflect the one-half year period. This expense ratio may differ from the expense ratio shown in the Financial Highlights. |
5
Value Line Aggressive Income Trust
| Portfolio Highlights at January 31, 2009 (unaudited) |
Ten Largest Holdings
| Issue | Principal Amount | Value | Percentage of Net Assets | |||||||||
| Gulfmark Offshore, Inc., Guaranteed Notes, 7.75%, 7/15/14 | $ | 1,100,000 | $ | 858,000 | 3.31 | % | ||||||
| Williams Companies, Inc., Notes, 7.13%, 9/1/11 | $ | 600,000 | $ | 588,000 | 2.27 | % | ||||||
| Citizens Communications Co., Notes, 9.25%, 5/15/11 | $ | 500,000 | $ | 503,750 | 1.94 | % | ||||||
| Ferrellgas Escrow LLC/Ferrellgas Finance Escrow Corp., Senior Notes, 6.75%, 5/1/14 | $ | 600,000 | $ | 480,000 | 1.85 | % | ||||||
| Celestica, Inc., Senior Subordinated Notes, 7.88%, 7/1/11 | $ | 500,000 | $ | 472,500 | 1.82 | % | ||||||
| EchoStar DBS Corp., Senior Notes, 6.63%, 10/1/14 | $ | 500,000 | $ | 455,000 | 1.76 | % | ||||||
| Plains Exploration & Production Co., Senior Notes, 7.75%, 6/15/15 | $ | 500,000 | $ | 453,125 | 1.75 | % | ||||||
| KCS Energy, Inc., Senior Notes, 7.13%, 4/1/12 | $ | 500,000 | $ | 435,000 | 1.68 | % | ||||||
| Payless ShoeSource, Inc., Senior Subordinated Notes, 8.25%, 8/1/13 | $ | 500,000 | $ | 420,000 | 1.62 | % | ||||||
| Whiting Petroleum Corp., Senior Notes, 7.25%, 5/1/13 | $ | 500,000 | $ | 412,500 | 1.59 | % | ||||||
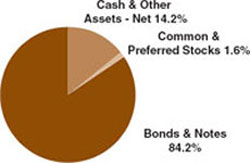
| Asset Allocation — Percentage of Net Assets |
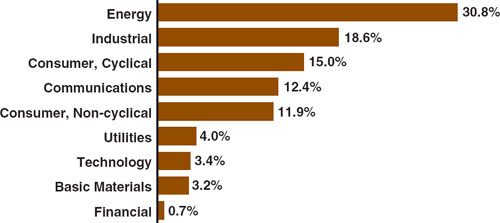
| Sector Weightings — Percentage of Total Investment Securities |
6
Value Line Aggressive Income Trust
| Schedule of Investments | January 31, 2009 |
Principal Amount | Value | ||||||
| CORPORATE BONDS & NOTES (79.6%) | |||||||
| AEROSPACE/DEFENSE (1.3%) | |||||||
| $ | 350,000 | Alliant Techsystems, Inc., Senior Subordinated Notes, 6.75%, 4/1/16 | $ | 336,000 | |||
| AUTO & TRUCK (0.6%) | |||||||
| 500,000 | Ford Motor Co., Global Landmark Securities, 7.45%, 7/16/31 | 110,000 | |||||
| 400,000 | General Motors Corp., Debentures, 8.25%, 7/15/23 | 54,000 | |||||
| 164,000 | |||||||
| AUTO PARTS (0.7%) | |||||||
| 300,000 | ArvinMeritor, Inc., Senior Notes, 8.13%, 9/15/15 | 117,000 | |||||
| 350,000 | Lear Corp., Senior Notes Ser. B, 8.75%, 12/1/16 | 66,500 | |||||
| 183,500 | |||||||
| CABLE TV (1.4%) | |||||||
| 400,000 | MediaCom LLC, Senior Notes, 9.50%, 1/15/13 | 352,000 | |||||
| CHEMICAL - SPECIALTY (0.8%) | |||||||
| 500,000 | PolyOne Corp., Senior Notes, 8.88%, 5/1/12 | 220,000 | |||||
COMPUTER & PERIPHERALS (0.6%) | |||||||
| 250,000 | Unisys Corp., Senior Notes, 6.88%, 3/15/10 | 157,500 | |||||
| DRUG (1.5%) | |||||||
| 500,000 | Elan Finance PLC, Senior Notes, 7.75%, 11/15/11 | 395,000 | |||||
| ELECTRICAL EQUIPMENT (2.5%) | |||||||
| 400,000 | Baldor Electric Co., Senior Notes, 8.63%, 2/15/17 | 336,000 | |||||
| 400,000 | General Cable Corp., Senior Notes, 7.13%, 4/1/17 | 320,000 | |||||
| 656,000 | |||||||
| ELECTRICAL UTILITY - CENTRAL (0.9%) | |||||||
| 300,000 | Texas Competitive Electric Holdings Co. LLC, 10.25%, 11/1/15 | 222,000 | |||||
Principal Amount | Value | ||||||
| ELECTRICAL UTILITY - EAST (1.5%) | |||||||
| $ | 400,000 | NRG Energy, Inc., Senior Notes, 7.38%, 2/1/16 | $ | 381,000 | |||
| ELECTRONICS (1.8%) | |||||||
| 500,000 | Celestica, Inc., Senior Subordinated Notes, 7.88%, 7/1/11 | 472,500 | |||||
| ENTERTAINMENT (3.0%) | |||||||
| 500,000 | EchoStar DBS Corp., Senior Notes, 6.63%, 10/1/14 | 455,000 | |||||
| 400,000 | Hughes Network Systems LLC, Senior Notes, 9.50%, 4/15/14 | 332,000 | |||||
| 787,000 | |||||||
| ENVIRONMENTAL (1.5%) | |||||||
| 400,000 | Allied Waste North America, Inc., Senior Notes, 7.88%, 4/15/13 | 401,000 | |||||
| FINANCIAL SERVICES - DIVERSIFIED (0.2%) | |||||||
| 81,000 | Broadridge Financial Solutions, Inc., 6.13%, 6/1/17 | 56,814 | |||||
| FOOD PROCESSING (2.2%) | |||||||
| 300,000 | Chiquita Brands International, Inc., Senior Notes, 7.50%, 11/1/14 | 237,000 | |||||
| 300,000 | Dean Foods Co., Senior Notes, 7.00%, 6/1/16 | 277,500 | |||||
| 500,000 | Pilgrim’s Pride Corp., Senior Subordinated Notes, 8.38%, 5/1/17 (1) | 65,000 | |||||
| 579,500 | |||||||
| HOME BUILDING (1.5%) | |||||||
| 400,000 | Toll Corp., Senior Subordinated Notes, 8.25%, 2/1/11 | 390,000 | |||||
| HOTEL/GAMING (2.2%) | |||||||
| 500,000 | Boyd Gaming Corp., Senior Subordinated Notes, 6.75%, 4/15/14 | 332,500 | |||||
| 400,000 | MGM Mirage, Senior Notes, 6.75%, 4/1/13 | 232,000 | |||||
| 564,500 | |||||||
See Notes to Financial Statements.
7
Value Line Aggressive Income Trust
| Schedule of Investments |
Principal Amount | Value | ||||||
| MACHINERY (3.0%) | |||||||
| $ | 350,000 | Case New Holland, Inc., Senior Notes, 7.13%, 3/1/14 | $ | 253,750 | |||
| 400,000 | Terex Corp., Senior Subordinated Notes, 8.00%, 11/15/17 | 332,000 | |||||
| 300,000 | United Rentals North America, Inc., 7.75%, 11/15/13 | 195,000 | |||||
| 780,750 | |||||||
| MEDICAL SERVICES (2.6%) | |||||||
| 400,000 | Community Health Systems, Inc., Senior Notes, 8.88%, 7/15/15 | 385,000 | |||||
| 350,000 | Psychiatric Solutions, Inc., Senior Subordinated Notes, 7.75%, 7/15/15 | 287,000 | |||||
| 672,000 | |||||||
| MEDICAL SUPPLIES (1.2%) | |||||||
| 310,000 | Fisher Scientific International, Inc., Senior Subordinated Notes, 6.13%, 7/1/15 | 305,350 | |||||
| METALS & MINING DIVERSIFIED (1.9%) | |||||||
| 250,000 | Freeport-McMoRan Copper & Gold, Inc., Senior Notes, 6.88%, 2/1/14 | 231,487 | |||||
| 300,000 | Freeport-McMoRan Copper & Gold, Inc., 8.25%, 4/1/15 | 255,375 | |||||
| 486,862 | |||||||
| NATURAL GAS - DISTRIBUTION (4.1%) | |||||||
| 350,000 | AmeriGas Partners L.P., Senior Notes, 7.25%, 5/20/15 | 323,750 | |||||
| 500,000 | Berry Petroleum Co., Senior Subordinated Notes, 8.25%, 11/1/16 | 261,250 | |||||
| 600,000 | Ferrellgas Escrow LLC/Ferrellgas Finance Escrow Corp., Senior Notes, 6.75%, 5/1/14 | 480,000 | |||||
| 1,065,000 | |||||||
| NATURAL GAS - DIVERSIFIED (5.8%) | |||||||
| 300,000 | Chesapeake Energy Corp., Senior Notes, 7.50%, 6/15/14 | 271,500 | |||||
Principal Amount | Value | ||||||
| $ | 350,000 | Dynegy Holdings, Inc., Senior Notes, 7.50%, 6/1/15 | $ | 278,250 | |||
| 400,000 | Newfield Exploration Co., Senior Notes, 6.63%, 9/1/14 | 358,000 | |||||
| 600,000 | Williams Companies, Inc., Notes, 7.13%, 9/1/11 | 588,000 | |||||
| 1,495,750 | |||||||
| OILFIELD SERVICES/EQUIPMENT (8.1%) | |||||||
| 400,000 | Complete Production Services, Inc., Senior Notes, 8.00%, 12/15/16 | 280,000 | |||||
| 1,100,000 | Gulfmark Offshore, Inc., Guaranteed Notes, 7.75%, 7/15/14 | 858,000 | |||||
| 250,000 | North American Energy Partners, Inc., 8.75%, 12/1/11 | 195,000 | |||||
| 500,000 | W&T Offshore, Inc., Senior Notes, 8.25%, 6/15/14 (2) | 345,000 | |||||
| 500,000 | Whiting Petroleum Corp., Senior Notes, 7.25%, 5/1/13 | 412,500 | |||||
| 2,090,500 | |||||||
| PETROLEUM - INTEGRATED (1.0%) | |||||||
| 350,000 | Tesoro Corp., Notes, 6.50%, 6/1/17 | 260,750 | |||||
| PETROLEUM - PRODUCING (12.5%) | |||||||
| 350,000 | Cimarex Energy Co., Senior Notes, 7.13%, 5/1/17 | 302,750 | |||||
| 500,000 | Encore Acquisition Co., Senior Subordinated Notes, 6.25%, 4/15/14 | 407,500 | |||||
| 300,000 | Frontier Oil Corp., 8.50%, 9/15/16 | 285,000 | |||||
| 500,000 | KCS Energy, Inc., Senior Notes, 7.13%, 4/1/12 | 435,000 | |||||
| 300,000 | PetroHawk Energy Corp., Senior Notes, 7.88%, 6/1/15 (2) | 251,250 | |||||
| 428,000 | PetroQuest Energy, Inc., Senior Notes, 10.38%, 5/15/12 | 329,560 | |||||
| 500,000 | Plains Exploration & Production Co., Senior Notes, 7.75%, 6/15/15 | 453,125 | |||||
See Notes to Financial Statements.
8
Value Line Aggressive Income Trust
| January 31, 2009 |
Principal Amount | Value | ||||||
| $ | 325,000 | Regency Energy Partners L.P./ Regency Energy Finance Corp., Senior Notes, 8.38%, 12/15/13 | $ | 251,875 | |||
| 300,000 | Stone Energy Corp., Senior Subordinated Notes, 8.25%, 12/15/11 | 231,000 | |||||
| 350,000 | Swift Energy Co., Senior Notes, 7.63%, 7/15/11 | 301,000 | |||||
| 3,248,060 | |||||||
| POWER (1.1%) | |||||||
| 350,000 | Reliant Energy, Inc., Senior Notes, 7.63%, 6/15/14 | 286,125 | |||||
| RENTAL AUTO/EQUIPMENT (0.8%) | |||||||
| 300,000 | Hertz Corp., 8.88%, 1/1/14 | 195,750 | |||||
| RETAIL - AUTOMOTIVE (0.9%) | |||||||
| 500,000 | PEP Boys-Manny Moe & Jack, Senior Subordinated Notes, 7.50%, 12/15/14 | 227,500 | |||||
| RETAIL - SPECIAL LINES (2.2%) | |||||||
| 300,000 | NBTY, Inc., Senior Subordinated Notes, 7.13%, 10/1/15 | 237,750 | |||||
| 350,000 | Phillips-Van Heusen Corp., Senior Notes, 7.25%, 2/15/11 | 328,125 | |||||
| 565,875 | |||||||
| RETAIL STORE (1.0%) | |||||||
| 410,000 | Dillard’s, Inc., Notes, 7.85%, 10/1/12 | 246,000 | |||||
| SEMICONDUCTOR (1.3%) | |||||||
| 200,000 | Advanced Micro Devices, Inc., Senior Notes, 7.75%, 11/1/12 | 66,000 | |||||
| 500,000 | Freescale Semiconductor, Inc., Guaranteed Notes, 8.88%, 12/15/14 | 110,000 | |||||
| 300,000 | Seagate Technology HDD Holdings, 6.80%, 10/1/16 | 159,000 | |||||
| 335,000 | |||||||
Principal Amount | Value | ||||||
| SHOE (1.6%) | |||||||
| $ | 500,000 | Payless ShoeSource, Inc., Senior Subordinated Notes, 8.25%, 8/1/13 | $ | 420,000 | |||
| TELECOMMUNICATION SERVICES (5.6%) | |||||||
| 500,000 | Citizens Communications Co., Notes, 9.25%, 5/15/11 | 503,750 | |||||
| 350,000 | Cricket Communications, Inc., 9.38%, 11/1/14 | 318,500 | |||||
| 350,000 | Sprint Capital Corp., 8.38%, 3/15/12 | 280,000 | |||||
| 350,000 | Windstream Corp., Senior Notes, 8.13%, 8/1/13 | 344,750 | |||||
| 1,447,000 | |||||||
| TRUCKING (0.7%) | |||||||
| 200,000 | Ryder System, Inc., Senior Notes, 4.63%, 4/1/10 | 191,681 | |||||
| TOTAL CORPORATE BONDS & NOTES | |||||||
| (Cost $26,246,644) | 20,638,267 | ||||||
| CONVERTIBLE CORPORATE BONDS & NOTES (4.6%) | |||||||
| COMPUTER & PERIPHERALS (0.8%) | |||||||
| 100,000 | Maxtor Corp. Senior Notes, 2.38%, 8/15/12 | 57,500 | |||||
| 300,000 | SanDisk Corp. 1.00%, 5/15/13 | 159,750 | |||||
| 217,250 | |||||||
| ELECTRICAL EQUIPMENT (0.6%) | |||||||
| 250,000 | General Cable Corp. Senior Notes, 1.00%, 10/15/12 | 162,813 | |||||
| MEDICAL SERVICES (1.3%) | |||||||
| 250,000 | LifePoint Hospitals, Inc. Senior Subordinated Debentures, 3.50%, 5/15/14 | 176,875 | |||||
| 200,000 | LifePoint Hospitals, Inc. Senior Subordinated Debentures, 3.25%, 8/15/25 | 147,750 | |||||
| 324,625 | |||||||
See Notes to Financial Statements.
9
Value Line Aggressive Income Trust
| Schedule of Investments |
Principal Amount | Value | ||||||
| MEDICAL SUPPLIES (0.2%) | |||||||
| $ | 100,000 | Affymetrix, Inc. 3.50%, 1/15/38 | $ | 50,500 | |||
| METALS FABRICATING (0.5%) | |||||||
| 250,000 | Trinity Industries, Inc. Subordinated Notes, 3.88%, 6/1/36 | 125,313 | |||||
| OILFIELD SERVICES/EQUIPMENT (0.4%) | |||||||
| 200,000 | Helix Energy Solutions Group, Inc. 3.25%, 12/15/25 | 97,250 | |||||
| SEMICONDUCTOR (0.2%) | |||||||
| 100,000 | Yingli Green Energy Holding Co. Ltd. 0.0% 12/15/12 (3) | 47,250 | |||||
| TELECOMMUNICATION SERVICES (0.6%) | |||||||
| 250,000 | NII Holdings, Inc. 3.13%, 6/15/12 | 166,562 | |||||
| TOTAL CONVERTIBLE CORPORATE BONDS & NOTES | |||||||
| (Cost $1,438,910) | 1,191,563 | ||||||
| Shares | |||||||
| COMMON STOCKS (1.4%) | |||||||
| BANK (0.4%) | |||||||
| 5,000 | Wells Fargo & Co. | 94,500 | |||||
| CANADIAN ENERGY (0.2%) | |||||||
| 5,000 | Pengrowth Energy Trust | 41,550 | |||||
| NATURAL GAS - DISTRIBUTION (0.1%) | |||||||
| 5,000 | Atlas Pipeline Partners L.P. | 37,500 | |||||
| OIL/GAS DISTRIBUTION (0.3%) | |||||||
| 2,500 | Energy Transfer Partners L.P. | 87,325 | |||||
| PETROLEUM - INTEGRATED (0.4%) | |||||||
| 2,000 | Total S.A. ADR | 99,560 | |||||
| TOTAL COMMON STOCKS | |||||||
| (Cost $379,372) | 360,435 | ||||||
| Shares | Value | ||||||
| PREFERRED STOCKS (0.2%) | |||||||
| R.E.I.T. (0.2%) | |||||||
| 3,000 | Health Care REIT, Inc. Series F 7 5/8% | $ | 60,570 | ||||
| TOTAL PREFERRED STOCKS | |||||||
| (Cost $75,000) | 60,570 | ||||||
TOTAL INVESTMENT SECURITIES (85.8%) | |||||||
| (Cost $28,139,926) | 22,250,835 | ||||||
Principal Amount | |||||||
| REPURCHASE AGREEMENT (11.6%) | |||||||
| $ | 3,000,000 | With Morgan Stanley, 0.18%, dated 1/30/09, due 2/2/09, delivery value $3,000,045 (collateralized by $2,530,000 U.S. Treasury Bonds 5.25%, due 2/15/29, with a value of $3,051,572) | 3,000,000 | ||||
TOTAL REPURCHASE AGREEMENTS | |||||||
| (Cost $3,000,000) | 3,000,000 | ||||||
| CASH AND OTHER ASSETS IN EXCESS OF LIABILITIES (2.6%) | 673,260 | ||||||
| NET ASSETS (100%) | $ | 25,924,095 | |||||
| NET ASSET VALUE OFFERING AND REDEMPTION PRICE, PER OUTSTANDING SHARE ($25,924,095 ÷ 6,666,153 shares outstanding) | $ | 3.89 | |||||
| (1) | Security is currently in default. |
| (2) | Pursuant to Rule 144A under the Securities Act of 1933, this security can only be sold to qualified institutional investors. |
| (3) | Zero-coupon bond. |
| ADR | American Depositary Receipt. |
See Notes to Financial Statements.
10
Value Line Aggressive Income Trust
| Statement of Assets and Liabilities at January 31, 2009 |
| Assets: | ||||
| Investment securities, at value (Cost - $28,139,926) | $ | 22,250,835 | ||
| Repurchase agreement (Cost - $3,000,000) | 3,000,000 | |||
| Cash | 621,179 | |||
| Interest and dividends receivable | 514,175 | |||
| Receivable for trust shares sold | 75,000 | |||
| Receivable for securities sold | 71,000 | |||
| Prepaid expenses | 19,894 | |||
| Total Assets | 26,552,083 | |||
| Liabilities: | ||||
| Payable for securities purchased | 539,208 | |||
| Dividends payable to shareholders | 37,179 | |||
| Payable for trust shares repurchased | 20,037 | |||
| Accrued expenses: | ||||
| Advisory fee | 7,534 | |||
| Service and distribution plan fees | 3,213 | |||
| Trustees’ fees and expenses | 931 | |||
| Other | 19,886 | |||
Total Liabilities | 627,988 | |||
| Net Assets | $ | 25,924,095 | ||
| Net assets consist of: | ||||
| Shares of beneficial interest, at $0.01 par value (authorized unlimited, outstanding 6,666,153 shares) | $ | 66,662 | ||
| Additional paid-in capital | 59,471,985 | |||
| Distributions in excess of net investment income | (36,918 | ) | ||
| Accumulated net realized loss on investments and foreign currency | (27,688,537 | ) | ||
| Net unrealized depreciation of investments and foreign currency translations | (5,889,097 | ) | ||
| Net Assets | $ | 25,924,095 | ||
| Net Asset Value, Offering and Redemption Price per Outstanding Share ($25,924,095 ÷ 6,666,153 shares outstanding) | $ | 3.89 |
| Statement of Operations for the Year Ended January 31, 2009 |
| Investment Income: | ||||
| Interest | $ | 2,355,321 | ||
| Dividends (net of foreign withholding tax of $1,252) | 27,279 | |||
| Total Income | 2,382,600 | |||
| Expenses: | ||||
| Advisory fee | 219,501 | |||
| Service and distribution plan fees | 73,167 | |||
| Printing and postage | 39,759 | |||
| Transfer agent fees | 33,550 | |||
| Custodian fees | 28,360 | |||
| Registration and filing fees | 24,548 | |||
| Auditing and legal fees | 10,752 | |||
| Trustees’ fees and expenses | 2,935 | |||
| Other | 5,003 | |||
| Total Expenses Before Custody Credits and Fees Waived | 437,575 | |||
| Less: Advisory Fee Waived | (117,067 | ) | ||
| Less: Service and Distribution Plan Fees Waived | (29,267 | ) | ||
| Less: Custody Credits | (3,484 | ) | ||
| Net Expenses | 287,757 | |||
| Net Investment Income | 2,094,843 | |||
| Net Realized and Unrealized Loss on Investments and Foreign Exchange Transactions: | ||||
| Net Realized Loss | (1,051,210 | ) | ||
| Change in Net Unrealized Appreciation/(Depreciation) | (5,295,392 | ) | ||
Net Realized Loss and Change in Net Unrealized Appreciation/(Depreciation) on Investments and Foreign Exchange Transactions | (6,346,602 | ) | ||
| Net Decrease in Net Assets from Operations | $ | (4,251,759 | ) |
See Notes to Financial Statements.
11
Value Line Aggressive Income Trust
| Statement of Changes in Net Assets for the Years Ended January 31, 2009 and 2008 |
Year Ended January 31, 2009 | Year Ended January 31, 2008 | |||||||
| Operations: | ||||||||
| Net investment income | $ | 2,094,843 | $ | 2,384,024 | ||||
| Net realized loss on investments and foreign currency | (1,051,210 | ) | (54,940 | ) | ||||
| Change in net unrealized appreciation/(depreciation) | (5,295,392 | ) | (1,515,148 | ) | ||||
| Net increase/(decrease) in net assets from operations | (4,251,759 | ) | 813,936 | |||||
| Distributions to Shareholders: | ||||||||
| Net investment income | (2,074,111 | ) | (2,388,478 | ) | ||||
| Trust Share Transactions: | ||||||||
| Proceeds from sale of shares | 3,664,679 | 1,738,540 | ||||||
| Proceeds from reinvestment of distributions to shareholders | 1,585,465 | 1,774,585 | ||||||
| Cost of shares repurchased* | (5,459,613 | ) | (6,819,594 | |||||
| Net decrease in net assets from Trust share transactions | (209,469 | ) | (3,306,469 | ) | ||||
| Total Decrease in Net Assets | (6,535,339 | ) | (4,881,011 | ) | ||||
| Net Assets: | ||||||||
| Beginning of year | 32,459,434 | 37,340,445 | ||||||
| End of year | $ | 25,924,095 | $ | 32,459,434 | ||||
| Distributions in excess of net investment income, at end of year | $ | (36,918 | ) | $ | (43,690 | ) | ||
| * | Net of redemption fees (see Note 1K and Note 2). |
See Notes to Financial Statements.
12
| Value Line Aggressive Income Trust | |
| Notes to Financial Statements | January 31, 2009 |
1. Significant Accounting Policies
Value Line Aggressive Income Trust (the “Trust”) is registered under the Investment Company Act of 1940, as amended, as a diversified, open-end management investment company. The primary investment objective of the Trust is to maximize current income through investment in a diversified portfolio of high-yield fixed-income securities. As a secondary investment objective, the Trust will seek capital appreciation, but only when consistent with its primary objective. Lower rated or unrated (i.e., high-yield) securities are more likely to react to developments affecting market risk (general market liquidity) and credit risk (issuers’ inability to meet principal and interest payments on their obligations) than are more highly rated securities, which react primarily to movements in the general level of interest rates. The ability of issuers of debt securities held by the Trust to meet their obligations may be affected by economic developments in a specific industry. The following significant accounting policies are in conformity with generally accepted accounting principles for investment companies. Such policies are consistently followed by the Trust in the preparation of its financial statements. Generally accepted accounting principles may require management to make estimates and assumptions that affect the reported amounts and disclosures in the financial statements. Actual results may differ from those estimates.
(A) Security Valuation. The Trustees have determined that the value of bonds and other fixed income corporate securities be calculated on the valuation date by reference to valuations obtained from an independent pricing service that determines valuations for normal institutional-size trading units of debt securities, without exclusive reliance upon quoted prices. This service takes into account appropriate factors such as institutional-size trading in similar groups of securities, yield, quality, coupon rate, maturity, type of issue, trading characteristics and other market data in determining valuations. Securities, other than bonds and other fixed income securities, not priced in this manner are valued at the midpoint between the latest available and representative bid and asked prices or, when stock exchange valuations are used, at the latest quoted sale price as of the regular close of business of the New York Stock Exchange on the valuation date. Other assets and securities for which market valuations are not readily available are valued at their fair value as the Trustees may determine. In addition, the Trust may use the fair value of a security when the closing price on the primary exchange where the security is traded no longer reflects the value of a security due to factors affecting one or more relevant securities markets or the specific issuer. Short term instruments with maturities of 60 days or less, at the date of purchase, are valued at amortized cost which approximates market value.
(B) Fair Value Measurements. The Trust adopted Financial Accounting Standards Board Statement of Financial Accounting Standards No. 157, Fair Value Measurements (“FAS 157”), effective February 1, 2008. In accordance with FAS 157, fair value is defined as the price that the Trust would receive upon selling an investment in a timely transaction to an independent buyer in the principal or most advantageous market of the investment. FAS 157 established a three-tier hierarchy to maximize the use of observable market data and minimize the use of unobservable inputs and to establish classification of fair value measurements for disclosure purposes. Inputs refer broadly to the assumptions that market participants would use in pricing the asset or liability, including assumptions about risk, for example, the risk inherent in a particular valuation technique used to measure fair value including such a pricing model and/or the risk inherent in the inputs to the valuation technique. Inputs may be observable or unobservable. Observable inputs are inputs that reflect the assumptions market participants would use in pricing the asset or liability developed based on market data obtained from sources independent of the reporting entity. Unobservable inputs are inputs that reflect the reporting entity’s own assumptions about the assumptions market participants would use in pricing the asset or liability
13
Value Line Aggressive Income Trust
| Notes to Financial Statements |
developed based on the best information available in the circumstances. The three-tier hierarchy of inputs is summarized in the three broad Levels listed below.
| • | Level 1 — quoted prices in active markets for identical investments |
| • | Level 2 — other significant observable inputs (including quoted prices for similar investments, interest rates, prepayment speeds, credit risk, etc.) |
| • | Level 3 — significant unobservable inputs (including the Trust’s own assumptions in determining the fair value of investments) |
The following is a summary of the inputs used as of January 31, 2009 in valuing the Trust’s investments carried at value:
| Valuation Inputs | Investments in Securities | Other Financial Instruments* | ||||||
| Level 1 — Quoted Prices | $ | 421,005 | — | |||||
| Level 2 — Other Significant Observable Inputs | 24,829,830 | — | ||||||
| Level 3 — Significant Unobservable Inputs | — | — | ||||||
| Total | $ | 25,250,835 | — | |||||
| * | Other financial instruments include futures, forwards and swap contracts. |
For the year ended January 31, 2009, there were no Level 3 investments.
(C) Repurchase Agreements. In connection with repurchase agreements, the Trust’s custodian takes possession of the underlying collateral securities, the value of which exceeds the principal amount of the repurchase transaction, including accrued interest. To the extent that any repurchase transaction exceeds one business day, it is the Trust’s policy to mark-to-market the collateral on a daily basis to ensure the adequacy of the collateral. In the event of default of the obligation to repurchase, the Trust has the right to liquidate the collateral and apply the proceeds in satisfaction of the obligation. Under certain circumstances, in the event of default or bankruptcy by the other party to the agreement, realization and/or retention of the collateral or proceeds may be subject to legal proceedings.
(D) Distributions. It is the policy of the Trust to distribute all of its net investment income to shareholders. Dividends from net investment income will be declared daily and paid monthly. Net realized capital gains, if any, are distributed to shareholders annually or more frequently if necessary to comply with the Internal Revenue Code. Income dividends and capital gains distributions are automatically reinvested in additional shares of the Trust unless the shareholder has requested otherwise. Income earned by the Trust on weekends, holidays and other days on which the Trust is closed for business is declared as a dividend on the next day on which the Trust is open for business.
(E) Federal Income Taxes. It is the Trust’s policy to comply with the requirements of the Internal Revenue Code applicable to regulated investment companies, including the distribution requirements of the Tax Reform Act of 1986, and to distribute all of its taxable income to its shareholders. Therefore, no federal income tax provision is required.
(F) Foreign Currency Translation. The books and records of the Trust are maintained in U.S. dollars. Assets and liabilities which are denominated in foreign currencies
14
| Value Line Aggressive Income Trust |
| January 31, 2009 |
are translated to U.S. dollars at the prevailing rates of exchange. The Trust does not isolate changes in the value of investments caused by foreign exchange rate differences from the changes due to other circumstances.
Income and expenses are translated to U.S. dollars based upon the rates of exchange on the respective dates of such transactions.
Net realized foreign exchange gains or losses arise from currency fluctuations realized between the trade and settlement dates on securities transactions, the differences between the U.S. dollar amounts of dividends, interest, and foreign withholding taxes recorded by the Trust and the U.S. dollar equivalent of the amounts actually received or paid. Net unrealized foreign exchange gains and losses arise from changes in the value of assets and liabilities, other than investments, at the end of fiscal period, resulting from changes in the exchange rates. The effect of the change in foreign exchange rates on the value of investments is included in realized gain/loss on investments and change in net unrealized appreciation/(depreciation) on investments.
(G) Representations and Indemnifications. In the normal course of business, the Trust enters into contracts that contain a variety of representations and warranties which provide general indemnifications. The Trust’s maximum exposure under these arrangements is unknown, as this would involve future claims that may be made against the Trust that have not yet occurred. However, based on experience, the Trust expects the risk of loss to be remote.
(H) Security Transactions. Securities transactions are recorded on a trade date basis. Realized gains and losses from securities transactions are recorded on the identified-cost basis. Interest income, adjusted for amortization of discount and premium, is earned from settlement date and recognized on the accrual basis. Dividend income is recorded on the ex-dividend date.
(I) Accounting for Real Estate Investment Trusts. The Trust owns shares of Real Estate Investment Trusts (“REITs”) which report information on the source of their distributions annually. Distributions received from REITs during the year which represent a return of capital are recorded as a reduction of cost and distributions which represent a capital gain dividend are recorded as a realized long-term capital gain on investments.
(J) Foreign Taxes. The Trust may be subject to foreign taxes on income, gains on investments, or currency repatriation, a portion of which may be recoverable. The Trust will accrue such taxes and recoveries as applicable, based upon its current interpretation of tax rules and regulations that exist in the markets in which it invests.
(K) Redemption Fees. The Trust charges a 2% redemption fee on shares held for less than 120 days. Such fees are retained by the Trust and accounted for as paid in capital.
| 2. | Trust Share Transactions and Distributions to Shareholders |
Transactions in shares of beneficial interest in the Trust were as follows:
Year Ended January 31, 2009 | Year Ended January 31, 2008 | |||||||
| Shares sold | 860,199 | 347,176 | ||||||
| Shares issued to shareholders in reinvestment of dividends | 366,094 | 355,495 | ||||||
| Shares repurchased | (1,275,156 | ) | (1,367,552 | ) | ||||
| Net decrease | (48,863 | ) | (664,881 | ) | ||||
| Dividends per share from net investment income | $ | 0.3140 | $ | 0.3387 | ||||
15
| Value Line Aggressive Income Trust |
| Notes to Financial Statements |
Redemption fees of $5,692 and $4,099 were retained by the Trust for the year ended January 31, 2009 and the year ended January 31, 2008, respectively.
| 3. | Purchases and Sales of Securities |
Purchases and sales of investment securities, excluding short-term securities, were as follows:
Year Ended January 31, 2009 | ||||
| Purchases: | ||||
| Investment Securities | $ | 13,340,674 | ||
| Sales: | ||||
| Investment Securities | $ | 10,229,055 | ||
| 4. | Income Taxes |
At January 31, 2009, information on the tax components of capital is as follows:
| Cost of investments for tax purposes | $ | 31,139,926 | ||
| Gross tax unrealized appreciation | $ | 113,076 | ||
| Gross tax unrealized depreciation | (6,002,167 | ) | ||
| Net tax unrealized depreciation on investments | $ | (5,889,091 | ) | |
| Undistributed ordinary income | $ | 26,724 | ||
| Capital loss carryforward, expires January 31, 2010 | (20,653,696 | ) | ||
| Capital loss carryforward, expires January 31, 2011 | (5,624,767 | ) | ||
| Capital loss carryforward, expires January 31, 2017 | (911,547 | ) | ||
| Capital loss carryforward, at January 31, 2009 | $ | (27,190,010 | ) |
During the year ended January 31, 2009, as permitted under federal income tax regulations, the Trust elected to defer $498,586 of post-October net capital and currency losses to the next taxable year.
During the year ended January 31, 2009, $20,922,783 of the Trust’s capital loss carryforwards expired.
To the extent future capital gains are offset by capital losses, the Trust does not anticipate distributing any such gains to the shareholders. It is uncertain whether the Trust will be able to realize the benefits of the losses before they expire.
The tax composition of dividends to shareholders for the years ended January 31, 2009 and January 31, 2008 were as follows:
| 2009 | 2008 | |||||||
| Ordinary income | $ | 2,074,111 | $ | 2,388,478 | ||||
Permanent book-tax differences relating to the classifications of certain distributions and income in the current year were reclassified within the composition of the net asset accounts. The Trust increased distributions in excess of net investment income by $13,960, increased accumulated net realized gain/loss on investments by $20,936,743 and decreased additional paid-in capital by $20,922,783. Net assets were not affected by these reclassifications. These reclassifications are primarily due to differing treatments, for tax purposes, of foreign currency, expired capital loss carryforward, interest write-off, and consent payments.
| 5. | Investment Advisory Fee, Service and Distribution Fees and Transactions With Affiliates |
On June 30, 2008, Value Line, Inc. (“Value line”) reorganized its investment management division into EULAV Asset Management, LLC (“EULAV”), a newly formed, wholly-owned subsidiary. As part of the reorganization, each advisory agreement was transferred from Value Line to EULAV and EULAV replaced Value Line as the Trust’s investment adviser. The portfolio managers, who are now employees of EULAV, have not changed as a result of the reorganization.
16
| Value Line Aggressive Income Trust |
| January 31, 2009 |
An advisory fee of $219,501 was paid or payable to Value Line or EULAV, (the “Adviser”), for the year ended January 31, 2009. This was computed at an annual rate of 0.75 of 1% per year on the first $100 million of the Trust’s average daily net assets for the year, and 0.50 of 1% on the average daily net assets in excess thereof. The Adviser provides research, investment programs and supervision of the investment portfolio and pays costs of administrative services and office space. The Adviser also provides persons, satisfactory to the Trust’s Trustees, to act as officers of the Trust and pays their salaries. Direct expenses of the Trust are charged to the Trust while common expenses of the Value Line Funds are allocated proportionately based upon the funds’ respective net assets. The Trust bears all other costs and expenses. Effective June 1, 2007 and 2008, the Adviser contractually agreed to reduce the Trust’s advisory fee by 0.40% for one year periods. The fees waived amounted to $117,067 for the year ended January 31, 2009. The Adviser has no right to recoup previously waived amounts.
The Trust has a Service and Distribution Plan (the “Plan”). The Plan, adopted pursuant to Rule 12b-1 under the Investment Company Act of 1940, compensates Value Line Securities, Inc., (the “Distributor”), a wholly-owned subsidiary of Value Line, for advertising, marketing and distributing the Trust’s shares and for servicing the Trust’s shareholders at an annual rate of 0.25% of the Trust’s average daily net assets. Fees amounting to $73,167, before fee waivers, were accrued under the Plan for the year ended January 31, 2009. Effective June 1, 2007 and 2008, the Distributor contractually agreed to reduce the 12b-1 fee by 0.10% for one year periods. The fees waived amounted to $29,267 for the year ended January 31, 2009. The Distributor has no right to recoup previously waived amounts.
For the year ended January 31, 2009, the Trust’s expenses were reduced by $3,484 under a custody credit arrangement with the custodian.
Certain officers, employees and a director of Value Line, and the Distributor, are also officers and a Trustee of the Trust. At January 31, 2009, the officers and Trustee as a group owned 901 shares of beneficial interest in the Trust, representing less than 1% of the outstanding shares.
| 6. | Other |
By letter dated June 15, 2005, the staff of the Northeast Regional Office of the Securities and Exchange Commission (“SEC”) informed Value Line that it was conducting an investigation in the matter of Value Line Securities, Inc. (“VLS”). Value Line has supplied numerous documents to the SEC in response to its requests and various individuals, including employees and former employees of Value Line, trustees of the Trust and others, have provided testimony to the SEC. On May 8, 2008, the SEC issued a formal order of private investigation regarding whether VLS’ brokerage charges and related expense reimbursements from the Value Line Funds (“Funds”) during periods prior to 2005 were excessive and whether adequate disclosure was made to the SEC and the Boards of Directors and shareholders of the Funds. Thereafter, certain officers of Value Line, who are former officers of the Funds, asserted their constitutional privilege not to provide testimony. Value Line has informed the Funds that it believes that the SEC has completed the fact finding phase of its investigation and Value Line will seek to settle this matter with the SEC. Although management of Value Line cannot determine the effect that the investigation will have on Value Line’s financial statements, it believes that any settlement is likely to be material to it and has informed the Funds of its belief, in light of settlement discussions to date, that there are no loss contingencies that should be accrued or disclosed in the Trust’s financial statements and that the resolution of this matter is not likely to have a materially adverse effect on the ability of the Adviser or VLS to perform their respective contracts with the Trust.
| 7. | Subsequent Event |
On March 12, 2009, the Adviser contractually agreed to waive .30% of the advisory fee for the period June 1, 2009 through May 31, 2010 and the Distributor agreed to waive 10% of the Rule 12b-1 fee for the same period.
17
| Value Line Aggressive Income Trust |
| Financial Highlights |
Selected data for a share of beneficial interest outstanding throughout each year:
| Years Ended January 31, | ||||||||||||||||||||
| 2009 | 2008 | 2007 | 2006 | 2005 | ||||||||||||||||
| Net asset value, beginning of year | $ | 4.83 | $ | 5.06 | $ | 5.01 | $ | 5.16 | $ | 5.06 | ||||||||||
| Income from investment operations: | ||||||||||||||||||||
| Net investment income | 0.32 | 0.34 | 0.32 | 0.31 | 0.33 | |||||||||||||||
| Net gains or (losses) on securities (both realized and unrealized) | (0.95 | ) | (0.23 | ) | 0.05 | (0.15 | ) | 0.09 | ||||||||||||
| Total from investment operations | (0.63 | ) | 0.11 | 0.37 | 0.16 | 0.42 | ||||||||||||||
| Redemption fees | 0.00 | (3) | 0.00 | (3) | 0.00 | (3) | 0.00 | (3) | 0.01 | |||||||||||
| Less distributions: | ||||||||||||||||||||
| Dividends from net investment income | (0.31 | ) | (0.34 | ) | (0.32 | ) | (0.31 | ) | (0.33 | ) | ||||||||||
Net asset value, end of year | $ | 3.89 | $ | 4.83 | $ | 5.06 | $ | 5.01 | $ | 5.16 | ||||||||||
Total return | (13.42 | )% | 2.14 | % | 7.80 | % | 3.32 | % | 8.55 | % | ||||||||||
| Ratios/Supplemental Data: | ||||||||||||||||||||
| Net assets, end of year (in thousands) | $ | 25,924 | $ | 32,459 | $ | 37,340 | $ | 43,761 | $ | 59,919 | ||||||||||
Ratio of expenses to average net assets(1) | 1.50 | % | 1.28 | % | 1.50 | % | 1.45 | % | 1.39 | % | ||||||||||
Ratio of expenses to average net assets(2) | 0.98 | % | 0.77 | % | 1.04 | % | 1.45 | % | 1.39 | % | ||||||||||
| Ratio of net investment income to average net assets | 7.17 | % | 6.76 | % | 6.54 | % | 6.19 | % | 6.28 | % | ||||||||||
| Portfolio turnover rate | 39 | % | 30 | % | 31 | % | 27 | % | 69 | % | ||||||||||
| (1) | Ratio reflects expenses grossed up for custody credit arrangement and grossed up for the waiver of a portion of the advisory fee by the Adviser and a portion of the service and distribution plan fees by the Distributor. The ratio of expenses to average net assets, net of custody credits, but exclusive of the waiver of a portion of the advisory fee by the Adviser and the waiver of the service and distribution plan fees by the Distributor, would have been 1.48% for the year ended January 31, 2009, 1.27% for the year ended January 31, 2008 1.49% for the year ended January 31, 2007 and would not have changed for the other years shown. |
| (2) | Ratio reflects expenses net of the waiver of a portion of the advisory fee by the Adviser and a portion of the service and distribution plan fees by the Distributor and net of the custody credit arrangement. |
| (3) | Amount is less than $.01 per share. |
| See Notes to Financial Statements. |
18
| Value Line Aggressive Income Trust |
| Report of Independent Registered Public Accounting Firm |
To the Board of Trustees and Shareholders of Value Line Aggressive Income Trust
In our opinion, the accompanying statement of assets and liabilities, including the schedule of investments, and the related statements of operations and of changes in net assets and the financial highlights present fairly, in all material respects, the financial position of Value Line Aggressive Income Trust (the “Trust”) at January 31, 2009, the results of its operations for the year then ended, the changes in its net assets for each of the two years in the period then ended and the financial highlights for each of the five years in the period then ended, in conformity with accounting principles generally accepted in the United States of America. These financial statements and financial highlights (hereafter referred to as “financial statements”) are the responsibility of the Trust’s management; our responsibility is to express an opinion on these financial statements based on our audits. We conducted our audits of these financial statements in accordance with the standards of the Public Company Accounting Oversight Board (United States). Those standards require that we plan and perform the audit to obtain reasonable assurance about whether the financial statements are free of material misstatement. An audit includes examining, on a test basis, evidence supporting the amounts and disclosures in the financial statements, assessing the accounting principles used and significant estimates made by management, and evaluating the overall financial statement presentation. We believe that our audits, which included confirmation of securities at January 31, 2009 by correspondence with the custodian and brokers, provide a reasonable basis for our opinion.
PricewaterhouseCoopers LLP
New York, New York
March 30, 2009
19
| Value Line Aggressive Income Trust | ||
| Federal Tax Notice (unaudited) | ||
| For corporate taxpayers 0.32% of the ordinary income distributions paid during the fiscal year ended January 31, 2009 qualify for the corporate dividends received deduction. | ||
| During the fiscal year ended January 31, 2009, 0.88% of the ordinary income distributions are treated as qualified dividends. | ||
The Trust files its complete schedule of portfolio holdings with the Securities and Exchange Commission (“SEC”) for the first and third quarters of each fiscal year on Form N-Q. The Trust’s Forms N-Q are available on the SEC’s website at http://www.sec.gov and may be reviewed and copied at the SEC’s Public Reference Room in Washington, D.C. Information on the operation of the Public Reference Room may be obtained by calling 1-800-SEC-0330.
A description of the policies and procedures that the Trust uses to determine how to vote proxies relating to portfolio securities, and information regarding how the Trust voted these proxies during the most recent 12-month period ended June 30 is available through the Trust’s website at http://www.vlfunds.com and on the SEC’s website at http://www.sec.gov. The description of the policies and procedures is also available without charge, upon request, by calling 1-800-243-2729.
20
| Value Line Aggressive Income Trust |
| Management of the Trust |
MANAGEMENT INFORMATION
The business and affairs of the Trust are managed by the Trust’s officers under the direction of the Board of Trustees. The following table sets forth information on each Trustee and Officer of the Trust. Each Trustee serves as a director or trustee of each of the 14 Value Line Funds. Each Trustee serves until his or her successor is elected and qualified.
| Name, Address, and Age | Position | Length of Time Served | Principal Occupation During the Past 5 Years | Other Directorships Held by Trustee | ||||||
Interested Trustee* | ||||||||||
Thomas T. Sarkany Age 62 | Trustee | Since 2008 | Mutual Fund Marketing Director of Value Line Securities, Inc. (the “Distributor”). | None | ||||||
Non-Interested Trustees | ||||||||||
Joyce E. Heinzerling 500 East 77th Street New York, NY 10162 Age 53 | Trustee | Since 2008 | General Counsel, Archery Capital LLC (private investment fund) | Burnham Investors Trust, since 2004 (4 funds). | ||||||
Francis C. Oakley 54 Scott Hill Road Williamstown, MA 01267 Age 77 | Trustee (Lead Independent Trustee since 2008) | Since 2000 | Professor of History, Williams College, (1961–2002). Professor Emeritus since 2002; President Emeritus since 1994 and President, (1985 – 1994); Chairman (1993–1997) and Interim President (2002–2003) of the American Council of Learned Societies. Trustee since 1997 and Chairman of the Board since 2005, National Humanities Center. | None | ||||||
David H. Porter 5 Birch Run Drive Saratoga Springs, NY 12866 Age 73 | Trustee | Since 1997 | Visiting Professor of Classics, Williams College, since 1999; President Emeritus, Skidmore College since 1999 and President, 1987–1998. | None | ||||||
Paul Craig Roberts 169 Pompano St. Panama City Beach, FL 32413 Age 69 | Trustee | Since 1983 | Chairman, Institute for Political Economy. | None | ||||||
21
Value Line Aggressive Income Trust
| Management of the Trust |
| Name, Address, and Age | Position | Length of Time Served | Principal Occupation During the Past 5 Years | Other Directorships Held by Trustee | |||||
Nancy-Beth Sheerr 1409 Beaumont Drive Gladwyne, PA 19035 Age 59 | Trustee | Since 1996 | Senior Financial Advisor, Veritable L.P. (investment adviser) since 2004; Senior Financial Advisor, Hawthorn, (2001–2004). | None | |||||
Daniel S. Vandivort 59 Indian Head Road Riverside, CT 06878 Age 54 | Trustee | Since 2008 | President, Chief Investment Officer, Weiss, Peck and Greer/Robeco Investment Management 2005–2007; Managing Director, Weiss, Peck and Greer, 1995–2005. | None | |||||
| Officers | |||||||||
Mitchell E. Appel Age 38 | President | Since 2008 | President of each of the Value Line Funds since June 2008; Chief Financial Officer of Value Line since April 2008 and from September 2005 to November 2007; Treasurer from June 2005 to September 2005; Chief Financial Officer of XTF Asset Management from November 2007 to April 2008; Chief Financial Officer of Circle Trust Company from January 2003 to May 2005; Chief Financial Officer of the Distributor since April 2008. | ||||||
Howard A. Brecher Age 55 | Vice President and Secretary | Since 2008 | Vice President and Secretary of each of the Value Line Funds since June 2008; Vice President, Secretary and a Director of Value Line; Vice President of the Distributor and Secretary since June 2008; Vice President, Secretary, Treasurer, General Counsel and a Director of Arnold Bernhard & Co., Inc. | ||||||
Emily D. Washington Age 30 | Treasurer | Since 2008 | Treasurer and Chief Financial Officer (Principal Financial and Accounting Officer) of each of the Value Line Funds since August 2008; Associate Director of Mutual Fund Accounting at Value Line until August 2008. | ||||||
| * | Mr. Sarkany is an “interested person” as defined in the Investment Company Act of 1940 by virtue of his position with the Distributor. |
| Unless otherwise indicated, the address for each of the above officers is c/o Value Line Funds, 220 East 42nd Street, New York, NY 10017. | |
| The Trust’s Statement of Additional Information (SAI) includes additional information about the Trust’s Trustees and is available, without charge, upon request by calling 1-800-243-2729 or on the Trust’s website, www.vlfunds.com. |
22
| Value Line Aggressive Income Trust |
[This page is intentionally left blank.]
23
Value Line Aggressive Income Trust
| The Value Line Family of Funds |
1950 — The Value Line Fund seeks long-term growth of capital. Current income is a secondary objective.
1952 — Value Line Income and Growth Fund’s primary investment objective is income, as high and dependable as is consistent with reasonable risk. Capital growth to increase total return is a secondary objective.
1956 — The Value Line Premier Growth Fund seeks long-term growth of capital. No consideration is given to current income in the choice of investments.
1972 — Value Line Larger Companies Fund’s sole investment objective is to realize capital growth.
1979 — The Value Line Cash Fund, a money market fund, seeks to secure as high a level of current income as is consistent with maintaining liquidity and preserving capital. An investment in the Fund is not insured or guaranteed by the Federal Deposit Insurance Corporation or any other government agency. Although the Fund seeks to preserve the value of your investment at $1.00 per share, it is possible to lose money by investing in the Fund.
1981 — Value Line U.S. Government Securities Fund seeks maximum income without undue risk to capital. Under normal conditions, at least 80% of the value of its net assets will be invested in securities issued or guaranteed by the U.S. Government and its agencies and instrumentalities.
1983 — Value Line Centurion Fund* seeks long-term growth of capital.
1984 — The Value Line Tax Exempt Fund seeks to provide investors with the maximum income exempt from federal income taxes while avoiding undue risk to principal. The fund may be subject to state and local taxes and the Alternative Minimum Tax (if applicable).
1985 — Value Line Convertible Fund seeks high current income together with capital appreciation primarily from convertible securities ranked 1 or 2 for year-ahead performance by the Value Line Convertible Ranking System.
1986 — Value Line Aggressive Income Trust seeks to maximize current income.
1987 — Value Line New York Tax Exempt Trust seeks to provide New York taxpayers with the maximum income exempt from New York State, New York City and federal income taxes while avoiding undue risk to principal. The Trust may be subject to state and local taxes and the Alternative Minimum Tax (if applicable).
1987 — Value Line Strategic Asset Management Trust* seeks to achieve a high total investment return consistent with reasonable risk.
1993 — Value Line Emerging Opportunities Fund invests primarily in common stocks or securities convertible into common stock, with its primary objective being long-term growth of capital.
1993 — Value Line Asset Allocation Fund seeks high total investment return, consistent with reasonable risk. The Fund invests in stocks, bonds and money market instruments utilizing quantitative modeling to determine the asset mix.
| * | Only available through the purchase of Guardian Investor, a tax deferred variable annuity, or ValuePlus, a variable life insurance policy. |
For more complete information about any of the Value Line Funds, including charges and expenses, send for a prospectus from Value Line Securities, Inc., 220 East 42nd Street, New York, New York 10017-5891 or call 1-800-243-2729, 9am - 5pm CST, Monday - Friday, or visit us at www.vlfunds.com. Read the prospectus carefully before you invest or send money.
24
Item 2. Code of Ethics
(a) The Registrant has adopted a Code of Ethics that applies to its principal executive officer, and principal financial officer and principal accounting officer.
(f) Pursuant to item 12(a), the Registrant is attaching as an exhibit a copy of its Code of Ethics that applies to its principal executive officer, and principal financial officer and principal accounting officer.
Item 3. Audit Committee Financial Expert.
(a)(1)The Registrant has an Audit Committee Financial Expert serving on its Audit Committee.
(2) The Registrant’s Board has designated Daniel S. Vandivort, a member of the Registrant’s Audit Committee, as the Registrant’s Audit Committee Financial Expert. Mr. Vandivort is an independent director who has served as President, Chief Investment Officer to Weis, Peck and Greer/Robeco Investment Management. He has also previously served as Managing Director for Weis, Peck and Greer (1995-2005).
A person who is designated as an “audit committee financial expert” shall not make such person an "expert" for any purpose, including without limitation under Section 11 of the Securities Act of 1933 or under applicable fiduciary laws, as a result of being designated or identified as an audit committee financial expert. The designation or identification of a person as an audit committee financial expert does not impose on such person any duties, obligations, or liabilities that are greater than the duties, obligations, and liabilities imposed on such person as a member of the audit committee and Board of Trustees in the absence of such designation or identification.
Item 4. Principal Accountant Fees and Services
| (a) | Audit Fees 2009 $ 5,204 | |
| (b) | Audit-Related fees – None. | |
| (c) | Tax Preparation Fees 2009 $7,757 | |
| (d) | All Other Fees – None | |
| (e) (1) | Audit Committee Pre-Approval Policy. All services to be performed for the Registrant by PricewaterhouseCoopers LLP must be pre-approved by the audit committee. | |
| (e) (2) | Not applicable. | |
| (f) | Not applicable. | |
| (g) | Aggregate Non-Audit Fees 2009 $ 3,790 | |
| (h) | Not applicable. |
Item 11. Controls and Procedures.
| (a) | The registrant’s principal executive officer and principal financial officer have concluded that the registrant’s disclosure controls and procedures (as defined in rule 30a-2(c) under the Act (17 CFR 270.30a-2(c) ) based on their evaluation of these controls and procedures as of a date within 90 days of the filing date of this report, are appropriately designed to ensure that material information relating to the registrant is made known to such officers and are operating effectively. | |
| (b) | The registrant’s principal executive officer and principal financial officer have determined that there have been no significant changes in the registrant’s internal controls or in other factors that could significantly affect these controls subsequent to the date of their evaluation, including corrective actions with regard to significant deficiencies and material weaknesses. |
Item 12. Exhibits.
| (a) | Code of Business Conduct and Ethics for Principal Executive and Senior Financial Officers attached hereto as Exhibit 99.2R CODE ETH. | |
| (b) | (1) Certification pursuant to Rule 30a-2(a) under the Investment Company Act of 1940 (17 CFR 270.30a-2) attached hereto as Exhibit 99.CERT. | |
| (2) Certification pursuant to Section 906 of the Sarbanes-Oxley Act of 2002 attached hereto as Exhibit 99.906.CERT. |
SIGNATURES
Pursuant to the requirements of the Securities Exchange Act of 1934 and the Investment Company Act of 1940, the registrant has duly caused this report to be signed on its behalf by the undersigned, thereunto duly authorized.
| By | /s/ Mitchell E. Appel | |
| Mitchell E. Appel, President | ||
| Date: |
Pursuant to the requirements of the Securities Exchange Act of 1934 and the Investment Company Act of 1940, this report has been signed below by the following persons on behalf of the registrant and in the capacities and on the dates indicated.
| By: | /s/ Mitchell E. Appel | |
| Mitchell E. Appel, President, Principal Executive Officer | ||
| By: | /s/ Emily D. Washington | |
| Emily D. Washington, Treasurer, Principal Financial Officer | ||
| Date: | ||