Enclosed is your annual report for the year ended January 31, 2012. We encourage you to carefully review this report, which includes economic observations, your Trust’s performance data and highlights, schedule of investments, and financial statements.
The year 2011 produced solid returns for high yield securities. GDP growth improved through the course of 2011, ending the year with a 2.8% gain. This was an improvement from the first quarter of 2011 which showed a meager gain of 0.42%. Corporate profits were solid and balance sheets were healthier. Defaults of below investment grade companies were at low historical levels. Such conditions produced a healthy environment for high yield securities.
Tempering the positive U.S. environment was the development of a banking and debt crisis in Europe, which threatened the stability of the European Union and created systemic risk globally for other countries and the overall global economic system. Global stock markets experienced ongoing volatility and heavy intraday losses, causing investors to flee to the safety of U.S. Treasury securities, and the U.S. dollar. The returns of riskier equity assets suffered versus the safer U.S. government securities.
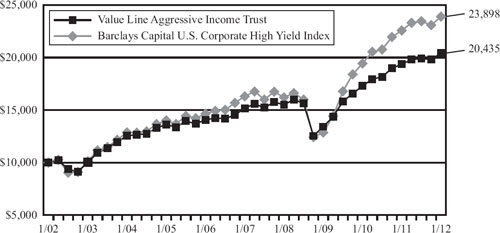
The high yield market fared much better than equities within this crisis environment. Higher quality, high yield issues outperformed the lower rated bonds, CCC and below. Your Trust maintained a conservative stance with the portfolio and did not purchase the lower rated securities. As a result, the Trust’s fiscal year return of 5.48% was greater than the 3.86% return of the Lipper High Current Yield Bond Funds Average(1), but trailed its benchmark, Barclays Capital U.S. Corporate High Yield Index(2), which rose 5.83%.
The Trust continues to seek good risk/reward investment opportunities in an effort to maintain the current yield of the Trust in a continuing low interest rate environment. We have swapped several issues of lower yield for higher yielding issues without giving up any meaningful credit quality.
Preserving capital in difficult market environments, while allowing for an attractive income yield, remains our goal.
As always, your confidence in Value Line Funds is appreciated and we look forward to serving your future investment needs.
The first half of 2011 saw the broad U.S. stock market rising on the heels of strengthening corporate profits. The S&P 500 returned 6% for the first six months of the year despite significant global economic concerns. Several members of the European Union continued to face a serious debt crisis including Greece, Portugal, Ireland, and Spain. Further, the nuclear disaster in Japan and the geopolitical upheaval in commodity markets added to investor concerns. At home, disappointing job growth in the United States kept the national unemployment rate firmly above 9% for the second quarter.
By mid-year there was mounting evidence that the U.S. recovery had slowed to a crawl. Consumer spending, which accounts for roughly 70% of economic activity, declined in June for the first time in 2 years. First quarter GDP was up by only 0.4%, and second quarter GDP growth, while stronger, was still disappointing at 1.3%. Employment growth in July lagged June numbers, and it was reported that the level of new factory orders decreased. By August, only 58% of the population was working, the lowest level in nearly 3 decades. Housing prices remained almost uniformly weak. There were additional pressures on the market coming from Europe stemming from the sovereign debt crisis and increasing fears of a double dip recession.
Much of the summer was consumed by the drama of the U.S. debt ceiling negotiations, resulting in an 11th hour deal that appeared to satisfy few constituents. It surely did not satisfy Standard & Poors who felt that the $2.1 trillion deficit reduction over 10 years was insufficient to solve the country’s debt problem. The rating agency proceeded to downgrade U.S. Treasury debt from AAA to AA+. Within a few days the rating agency imposed the same rating cut on the long-term debt of several U.S. Agencies including Fannie Mae and Freddie Mac. The other major rating agencies, Moody’s and Fitch, maintained AAA ratings for U.S. Treasury debt as well as for the U.S. Agencies. Investor confidence plunged on the heels of the debt ceiling debacle and the U.S. Treasury debt downgrade. Returns for the S&P 500 turned negative in August giving up its returns for the year.
The bond market rallied as stocks took a dive. Yields fell and prices rose across fixed income markets as investors looked for safer havens. Despite the rating downgrade, investor demand for Treasuries soared, and by early September, 10-year Treasury note yields had fallen to an all-time low of 1.90%. This downward pressure on Treasury yields came largely from an employment report showing no new jobs being added in August. While modestly better job creation was reported in September, it was not enough to move the unemployment level below 9.1%.
The market posted a strong rally in final quarter of 2011. Investors increased their purchase of risk assets as news regarding progress in the European debt crisis began to emerge and U.S. economic data came in slightly better than expected. The S&P 500 Index closed out the year with a gain of 2.1%.
The following graph compares the performance of the Value Line Aggressive Income Trust to that of the Barclays Capital U.S. Corporate High Yield Index (the “Index”). The Value Line Aggressive Income Trust is a professionally managed mutual fund, while the Index is not available for investment and is unmanaged. The returns for the Index do not reflect charges, expenses or taxes, but do include the reinvestment of dividends. The comparison is shown for illustrative purposes only.
U.S. Corporate High Yield Index*
As a shareholder of the Trust, you incur ongoing costs, including management fees, distribution and service (12b-1) fees, and other Trust expenses. This Example is intended to help you understand your ongoing costs (in dollars) of investing in the Trust and to compare these costs with the ongoing costs of investing in other mutual funds.
The Example is based on an investment of $1,000 invested at the beginning of the period and held for the entire period (August 1, 2011 through January 31, 2012).
The first line of the table below provides information about actual account values and actual expenses. You may use the information in this line, together with the amount you invested, to estimate the expenses that you paid over the period. Simply divide your account value by $1,000 (for example an $8,600 account value divided by $1,000 = 8.6), then multiply the result by the number in the first line under the heading “Expenses Paid During Period” to estimate the expenses you paid on your account during this period.
The second line of the table below provides information about hypothetical account values and hypothetical expenses based on the Trust’s actual expense ratio and an assumed rate of return of 5% per year before expenses, which is not the Trust’s actual return. The hypothetical account values and expenses may not be used to estimate the actual ending account balance or expenses you paid for the period. You may use this information to compare the ongoing costs of investing in the Trust and other funds. To do so, compare this 5% hypothetical example with the 5% hypothetical examples that appear in the shareholder reports of other funds.
Please note that the expenses shown in the table are meant to highlight your ongoing costs only and do not reflect any transactional costs, such as sales charges (loads), redemption fees, or exchange fees. Therefore, the table is useful in comparing ongoing costs only and will not help you determine the relative total costs of owning different funds. In addition, if transactional costs were included, your costs would have been higher.
See Notes to Financial Statements.
See Notes to Financial Statements.
See Notes to Financial Statements.
Value Line Aggressive Income Trust
| | | | | | | | |
Principal Amount | | | | Value | |
| | | | CONSUMER, CYCLICAL (0.3%) | | | | |
| $ | 100,000 | | Navistar International Corp., 3.00%, 10/15/14 | | $ | 115,875 | |
| | | | CONSUMER, NON-CYCLICAL (1.4%) | | | | |
| | 100,000 | | Avis Budget Group, Inc., Convertible Fixed, 3.50%, 10/1/14 | | | 115,375 | |
| | 250,000 | | LifePoint Hospitals, Inc., Senior Subordinated Debentures, 3.50%, 5/15/14 | | | 263,750 | |
| | 89,000 | | Omnicare, Inc., 3.25%, 12/15/35 | | | 84,772 | |
| | | | | | | 463,897 | |
| | | | TOTAL CONVERTIBLE CORPORATE BONDS & NOTES (Cost $942,342) (3.2%) | | | 1,042,897 | |
| | | | | | | | |
| Shares | | | | Value | |
| CONVERTIBLE PREFERRED STOCKS (0.8%) | | | | |
| | | | CONSUMER, CYCLICAL (0.2%) | | | | |
| | 2,000 | | General Motors Co., Convertible Fixed, Series B, 4.75% | | | 80,120 | |
| | | | | | | | |
| | | | ENERGY (0.2%) | | | | |
| | 1,000 | | Apache Corp., Convertible Fixed, Series D, 6.00% | | | 57,430 | |
| | | | | | | | |
| | | | FINANCIAL (0.4%) | | | | |
| | 2,000 | | Hartford Financial Services Group, Inc. (The), 7.25% | | | 41,240 | |
| | 100 | | Bank of America Corp., Series L, 7.25% | | | 92,147 | |
| | | | | | | 133,387 | |
| | | | TOTAL CONVERTIBLE PREFERRED STOCKS (Cost $308,712) (0.8%) | | | 270,937 | |
| | | | | | | | |
| Shares | | | | Value | |
| COMMON STOCKS (0.5%) | | | | |
| | | | FINANCIALS (0.2%) | | | | |
| $ | 3,000 | | Hospitality Properties Trust | | $ | 72,690 | |
| | | | | | | | |
| | | | UTILITIES (0.3%) | | | | |
| | 2,000 | | FirstEnergy Corp. | | | 84,440 | |
| | | | TOTAL COMMON STOCKS (Cost $141,751) (0.5%) | | | 157,130 | |
| PREFERRED STOCKS (0.3%) | | | | |
| | | | FINANCIALS (0.3%) | | | | |
| | 3,000 | | Health Care REIT, Inc., Series F, 7.63% | | | 77,850 | |
| | | | TOTAL PREFERRED STOCKS (Cost $75,000) (0.3%) | | | 77,850 | |
| | | | TOTAL INVESTMENT SECURITIES (97.0%) (Cost $29,822,167) | | | 31,222,563 | |
| CASH AND OTHER ASSETS IN EXCESS OF LIABILITIES (3.0%) | | | 980,501 | |
| NET ASSETS (100%) | | $ | 32,203,064 | |
| NET ASSET VALUE OFFERING AND REDEMPTION PRICE, PER OUTSTANDING SHARE ($32,203,064 ÷ 6,541,740 shares outstanding) | | $ | 4.92 | |
(1) | Pursuant to Rule 144A under the Securities Act of 1933, this security can only be sold to qualified institutional investors. |
| REIT | Real Estate Investment Trust. |
See Notes to Financial Statements.
Value Line Aggressive Income Trust
| Statement of Assets and Liabilities |
| at January 31, 2012 |
| | | | | |
| Assets: | | | | |
| Investment securities, at value (Cost - $29,822,167) | | $ | 31,222,563 | |
| Cash | | | 671,106 | |
| Interest and dividends receivable | | | 533,644 | |
| Prepaid expenses | | | 14,360 | |
| Receivable for trust shares sold | | | 13,064 | |
| Other | | | 6,381 | |
| Total Assets | | | 32,461,118 | |
| | | | | |
| Liabilities: | | | | |
| Payable for securities purchased | | | 157,746 | |
| Dividends payable to shareholders | | | 37,871 | |
| Payable for trust shares redeemed | | | 17,579 | |
| Accrued expenses: | | | | |
| Advisory fee | | | 14,956 | |
| Service and distribution plan fees | | | 4,089 | |
| Other | | | 25,813 | |
| Total Liabilities | | | 258,054 | |
| Net Assets | | $ | 32,203,064 | |
| Net assets consist of: | | | | |
| Shares of beneficial interest, at $0.01 par value (authorized unlimited, outstanding 6,541,740 shares) | | $ | 65,417 | |
| Additional paid-in capital | | | 32,532,008 | |
| Distributions in excess of net investment income | | | (37,870 | ) |
| Accumulated net realized loss on investments | | | (1,756,887 | ) |
| Net unrealized appreciation of investments | | | 1,400,396 | |
| Net Assets | | $ | 32,203,064 | |
| Net Asset Value, Offering and Redemption Price per Outstanding Share ($32,203,064 ÷ 6,541,740 shares outstanding) | | $ | 4.92 | |
| Statement of Operations |
| for the Year Ended January 31, 2012 |
| Investment Income: | | | | |
| Interest | | $ | 2,325,519 | |
| Dividends | | | 34,130 | |
| Total Income | | | 2,359,649 | |
| Expenses: | | | | |
| Advisory fee | | | 245,685 | |
| Service and distribution plan fees | | | 81,895 | |
| Auditing and legal fees | | | 38,140 | |
| Printing and postage | | | 35,810 | |
| Transfer agent fees | | | 34,352 | |
| Custodian fees | | | 27,343 | |
| Registration and filing fees | | | 26,660 | |
| Trustees’ fees and expenses | | | 6,541 | |
| Insurance | | | 4,403 | |
| Other | | | 6,931 | |
| Total Expenses Before Fees Waived and Custody Credits | | | 507,760 | |
| Less: Advisory Fees Waived | | | (65,516 | ) |
| Less: Service and Distribution Plan Fees Waived | | | (32,758 | ) |
| Less: Custody Credits | | | (117 | ) |
| Net Expenses | | | 409,369 | |
| Net Investment Income | | | 1,950,280 | |
| | | | | |
| Net Realized and Unrealized Gain/(Loss) on Investments: | | | | |
| Net Realized Gain | | | 1,085,696 | |
| Change in Net Unrealized Appreciation/(Depreciation) | | | (1,326,754 | ) |
| Net Realized Gain and Change in Net Unrealized Appreciation/(Depreciation) on Investments | | | (241,058 | ) |
Net Increase in Net Assets from Operations | | $ | 1,709,222 | |
See Notes to Financial Statements.
Value Line Aggressive Income Trust
| |
| Statement of Changes in Net Assets |
| for the Years Ended January 31, 2012 and 2011 |
| | | Year Ended January 31, 2012 | | Year Ended January 31, 2011 | |
| Operations: | | | | | | | |
| Net investment income | | $ | 1,950,280 | | $ | 2,210,230 | |
| Net realized gain on investments | | | 1,085,696 | | | 1,419,052 | |
| Change in net unrealized appreciation/(depreciation) | | | (1,326,754 | ) | | 387,736 | |
| Net increase in net assets from operations | | | 1,709,222 | | | 4,017,018 | |
| | | | | | | | |
| Distributions to Shareholders: | | | | | | | |
| Net investment income | | | (1,950,884 | ) | | (2,207,166 | ) |
| | | | | | | | |
| Trust Share Transactions: | | | | | | | |
| Proceeds from sale of shares | | | 2,010,996 | | | 2,439,245 | |
| Proceeds from reinvestment of dividends to shareholders | | | 1,495,168 | | | 1,743,738 | |
| Cost of shares redeemed* | | | (5,946,471 | ) | | (8,894,522 | ) |
| Net decrease in net assets from Trust share transactions | | | (2,440,307 | ) | | (4,711,539 | ) |
| Total Decrease in Net Assets | | | (2,681,969 | ) | | (2,901,687 | ) |
| | | | | | | | |
| Net Assets: | | | | | | | |
| Beginning of year | | | 34,885,033 | | | 37,786,720 | |
| End of year | | $ | 32,203,064 | | $ | 34,885,033 | |
| Distributions in excess of net investment income, at end of year | | $ | (37,870 | ) | $ | (38,747 | ) |
| * | Net of redemption fees (see Note 1K and Note 2). |
See Notes to Financial Statements.
Value Line Aggressive Income Trust
| |
| Notes to Financial Statements |
| 1. | Significant Accounting Policies |
Value Line Aggressive Income Trust (the “Trust”) is registered under the Investment Company Act of 1940, as amended, as a diversified, open-end management investment company. The primary investment objective of the Trust is to maximize current income through investment in a diversified portfolio of high-yield fixed-income securities. As a secondary investment objective, the Trust will seek capital appreciation, but only when consistent with its primary objective. Lower rated or unrated (i.e., high-yield) securities are more likely to react to developments affecting market risk (general market liquidity) and credit risk (issuers’ inability to meet principal and interest payments on their obligations) than are more highly rated securities, which react primarily to movements in the general level of interest rates. The ability of issuers of debt securities held by the Trust to meet their obligations may be affected by economic developments in a specific industry.
The following significant accounting policies are in conformity with generally accepted accounting principles for investment companies. Such policies are consistently followed by the Trust in the preparation of its financial statements. Generally accepted accounting principles require management to make estimates and assumptions that affect the reported amounts and disclosures in the financial statements. Actual results may differ from those estimates.
(A) Security Valuation: The Trustees have determined that the value of bonds and other fixed income corporate securities be calculated on the valuation date by reference to valuations obtained from an independent pricing service that determines valuations for normal institutional-size trading units of debt securities, without exclusive reliance upon quoted prices. This service takes into account appropriate factors such as institutional-size trading in similar groups of securities, yield, quality, coupon rate, maturity, type of issue, trading characteristics and other market data in determining valuations. Securities, other than bonds and other fixed income securities, not priced in this manner are valued at the midpoint between the latest available and representative bid and asked prices or, when stock valuations are used, at the latest quoted sale price as of the regular close of business of the New York Stock Exchange on the valuation date. Other assets and securities for which market valuations are not readily available are valued at their fair value as the Trustees may determine. In addition, the Trust may use the fair value of a security when the closing price on the primary exchange where the security is traded no longer reflects the value of a security due to factors affecting one or more relevant securities markets or the specific issuer. Short term instruments with maturities of 60 days or less, at the date of purchase, are valued at amortized cost which approximates market value.
(B) Fair Value Measurements: The Trust follows fair valuation accounting standards (FASB ASC 820-10) which establish a definition of fair value and set out a hierarchy for measuring fair value. These standards require additional disclosures about the various inputs and valuation techniques used to develop the measurements of fair value and a discussion of changes in valuation techniques and related inputs during the period. These inputs are summarized in the three broad levels listed below:
| | |
| • | Level 1 – Inputs that reflect unadjusted quoted prices in active markets for identical assets or liabilities that the Trust has the ability to access at the measurement date; |
| | |
| • | Level 2 – Inputs other than quoted prices that are observable for the asset or liability either directly or indirectly, including inputs in markets that are not considered to be active; |
| | |
| • | Level 3 – Inputs that are unobservable. |
Transfers between investment levels may occur as the markets fluctuate and/or the availability of data used in an investment’s valuation changes. The inputs or methodologies used for valuing securities are not necessarily an indication of the risk associated with investing in those securities.
Value Line Aggressive Income Trust
The following table summarizes the inputs used to value the Trust’s investments in securities as of January 31, 2012:
| | | | | | | | | | | | | | |
Investments in Securities: | | Level 1 | | Level 2 | | Level 3 | | Total | |
| Assets | | | | | | | | | | | | | |
| Corporate Bonds & Notes | | $ | 0 | | $ | 29,673,749 | | $ | 0 | | $ | 29,673,749 | |
| Convertible Corporate Bonds & Notes | | | 0 | | | 1,042,897 | | | 0 | | | 1,042,897 | |
Convertible Preferred Stocks | | | 270,937 | | | 0 | | | 0 | | | 270,937 | |
| Common Stocks | | | 157,130 | | | 0 | | | 0 | | | 157,130 | |
| Preferred Stocks | | | 77,850 | | | 0 | | | 0 | | | 77,850 | |
| Total Investments in Securities | | $ | 505,917 | | $ | 30,716,646 | | $ | 0 | | $ | 31,222,563 | |
In May 2011, the Financial Accounting Standards Board (“FASB”) issued Accounting Standards Update No. 2011-04, “Fair Value Measurements and Disclosures (Topic 820) – Amendments to Achieve Common Fair Value Measurement and Disclosure Requirements in U.S. GAAP and IFRSs” (“ASU 2011-04”). ASU 2011-04 clarifies the application of existing fair value measurement requirements, changes in certain principles related to measuring fair value, and requires additional disclosures about fair value measurements.
Specifically, the guidance specifies that the concepts of highest and best use and valuation of premise in a fair value measurement are only relevant when measuring the fair value of nonfinancial assets whereas they are not relevant when measuring the fair value of financial assets and liabilities.
Required disclosures are expanded under the new guidance, especially for fair value measurements that are categorized within Level 3 of the fair value hierarchy, for which quantitative information about the unobservable inputs used, and a narrative description of the valuation processes in place and sensitivity of recurring Level 3 measurements to changes in unobservable inputs will be required. Entities will also be required to disclose the categorization by level of the fair value hierarchy for items that are not measured at fair value in the statement of financial position but for which the fair value is required to be disclosed.
ASU 2011-04 is effective for annual periods beginning after December 15, 2011 and is to be applied prospectively. The Trust is currently assessing the impact of this guidance on its financial statements.
The Trust follows the updated provisions surrounding fair value measurements and disclosures on transfers in and out of all levels of the fair value hierarchy on a gross basis and the reasons for the transfers as well as to disclosures about the valuation techniques and inputs used to measure fair value for investments that fall in either Level 2 or Level 3 fair value hierarchy.
For the year ended January 31, 2012, there was no significant transfer activity between Level 1 and Level 2.
For the year ended January 31, 2012, there were no Level 3 investments. The Schedule of Investments includes a breakdown of the Schedule’s investments by category.
(C) Repurchase Agreements: In connection with transactions in repurchase agreements, the Trust’s custodian takes possession of the underlying collateral securities, the value of which exceeds the principal amount of the repurchase transaction, including accrued interest. To the extent that any repurchase transaction exceeds one business day, it is the Trust’s policy to mark-to-market on a daily basis to ensure the adequacy of the collateral. In the event of default of the obligation to repurchase, the Trust has the right to liquidate the collateral and apply the proceeds in satisfaction of the obligation. Under certain circumstances, in the event of default or bankruptcy by the other party to the agreement, realization and/or retention of the collateral or proceeds may be subject to legal proceedings. There were no open repurchase agreements at January 31, 2012.
Value Line Aggressive Income Trust
| |
| Notes to Financial Statements |
(D) Distributions: It is the policy of the Trust to distribute all of its net investment income to shareholders. Dividends from net investment income will be declared daily and paid monthly. Net realized capital gains, if any, are distributed to shareholders annually or more frequently if necessary to comply with the Internal Revenue Code. Income dividends and capital gains distributions are automatically reinvested in additional shares of the Trust unless the shareholder has requested otherwise. Income earned by the Trust on weekends, holidays and other days on which the Trust is closed for business is declared as a dividend on the next day on which the Trust is open for business.
(E) Federal Income Taxes: It is the Trust’s policy to comply with the requirements of the Internal Revenue Code applicable to regulated investment companies, including the distribution requirements of the Tax Reform Act of 1986, and to distribute all of its taxable income to its shareholders. Therefore, no federal income tax provision is required.
Management has analyzed the Trust’s tax positions taken on federal and state income tax returns for all open tax years (fiscal years ended January 31, 2009 through January 31, 2012), and has concluded that no provision for federal or state income tax is required in the Trust’s financial statements. The Trust’s federal and state income tax returns for tax years for which the applicable statutes of limitations have not expired are subject to examination by the Internal Revenue Service and state departments of revenue.
(F) Foreign Currency Translation: The books and records of the Trust are maintained in U.S. dollars. Assets and liabilities which are denominated in foreign currencies are translated to U.S. dollars at the prevailing rates of exchange. The Trust does not isolate changes in the value of investments caused by foreign exchange rate differences from the changes due to other circumstances.
Income and expenses are translated to U.S. dollars based upon the rates of exchange on the respective dates of such transactions.
Net realized foreign exchange gains or losses arise from currency fluctuations realized between the trade and settlement dates on securities transactions, the differences between the U.S. dollar amounts of dividends, interest, and foreign withholding taxes recorded by the Trust, and the U.S. dollar equivalent of the amounts actually received or paid. Net unrealized foreign exchange gains and losses arise from changes in the value of assets and liabilities, other than investments, at the end of the fiscal period, resulting from changes in the exchange rates. The effect of the change in foreign exchange rates on the value of investments is included in realized gain/loss on investments and change in net unrealized appreciation/ (depreciation) on investments.
(G) Representations and Indemnifications: In the normal course of business, the Trust enters into contracts that contain a variety of representations and warranties which provide general indemnifications. The Trust’s maximum exposure under these arrangements is unknown, as this would involve future claims that may be made against the Trust that have not yet occurred. However, based on experience, the Trust expects the risk of loss to be remote.
(H) Security Transactions: Securities transactions are recorded on a trade date basis. Realized gains and losses from security transactions are recorded on the identified-cost basis. Interest income, adjusted for amortization of discount and premium, is earned from settlement date and recognized on the accrual basis. Dividend income is recorded on the ex-dividend date.
(I) Accounting for Real Estate Investment Trusts: The Trust owns shares of Real Estate Investment Trusts (“REITs”) which report information on the source of their distributions annually. Distributions received from REITs during the year which represent a return of capital are recorded as a reduction of cost and distributions which represent a capital gain dividend are recorded as a realized long-term capital gain on investments.
Value Line Aggressive Income Trust
(J) Foreign Taxes: The Trust may be subject to foreign taxes on income, gains on investments, or currency repatriation, a portion of which may be recoverable. The Trust will accrue such taxes and recoveries as applicable, based upon its current interpretation of tax rules and regulations that exist in the markets in which it invests.
(K) Redemption Fees: The Trust charges a 2% redemption fee on shares held for less than 120 days. Such fees are retained by the Trust and accounted for as paid in capital.
(L) Subsequent Events: Management has evaluated all subsequent transactions and events through the date on which these financial statements were issued, and except as already included in the notes to these financial statements, has determined that no additional items require disclosure.
| | |
| 2. | Trust Share Transactions and Distributions to Shareholders |
Transactions in shares of beneficial interest in the Trust were as follows:
| | | | | | | |
| | | Year Ended January 31, 2012 | | Year Ended January 31, 2011 |
| Shares sold | | | 413,006 | | | | 510,978 | |
| Shares issued to shareholders in reinvestment of dividends | | | 307,024 | | | | 364,174 | |
| Shares redeemed | | | (1,220,003 | ) | | | (1,867,909 | ) |
| Net decrease | | | (499,973 | ) | | | (992,757 | ) |
| Dividends per share from net investment income | | $ | 0.2899 | | | $ | 0.2960 | |
Redemption fees of $1,747 and $5,016 were retained by the Trust for the year ended January 31, 2012 and the year ended January 31, 2011, respectively.
| | |
| 3. | Purchases and Sales of Securities |
Purchases and sales of investment securities, excluding short-term securities, were as follows:
| | | Year Ended January 31, 2012 | |
| Purchases: | | | | |
| Investment Securities | | $ | 15,711,443 | |
| Sales: | | | | |
| Investment Securities | | $ | 15,834,191 | |
At January 31, 2012, information on the tax components of capital is as follows:
| Cost of investments for tax purposes | | $ | 29,806,036 | |
| Gross tax unrealized appreciation | | $ | 1,772,091 | |
| Gross tax unrealized depreciation | | | (355,564 | ) |
| Net tax unrealized appreciation on investments | | $ | 1,416,527 | |
| Capital loss carryforward, expires January 31, 2018 | | $ | (1,752,040 | ) |
During the year ended January 31, 2012, as permitted under federal income tax regulations, the Trust elected to defer $20,978 of post-October net short term capital losses to the next taxable year and utilized $1,118,391 of capital loss carryforwards.
To the extent future capital gains are offset by capital losses, the Trust does not anticipate distributing any such gains to shareholders.
It is uncertain whether the Trust will be able to realize the benefits of the losses before they expire.
The tax composition of dividends to shareholders for the years ended January 31, 2012 and January 31, 2011 were as follows:
| | | 2012 | | | 2011 | |
| Ordinary income | | $ | 1,950,884 | | | $ | 2,207,166 | |
Value Line Aggressive Income Trust
| Notes to Financial Statements |
Permanent book-tax differences relating to the classifications of certain distributions and income in the current year were reclassified within the composition of the net asset accounts. The Trust decreased distributions in excess of net investment income by $1,481, decreased accumulated net realized loss on investments by $10,560, and decreased additional paid-in-capital by $12,041. Net assets were not affected by these reclassifications. These reclassifications are primarily due to differing treatments for tax purposes of distributions, investments in partnerships and consent payments.
On December 22, 2010, the Regulated Investment Company Modernization Act of 2010 (“the Act”) was signed by the President. Under the Act, net capital losses recognized by the Trust after January 31, 2011, may get carried forward indefinitely, and retain their character as short-term and/or long term losses. Prior to this Act pre-enactment net capital losses incurred by the Trust were carried forward for eight years and treated as short-term losses. The Act requires under the transition that post-enactment net capital losses are used before pre-enactment net capital losses.
| | |
| 5. | Investment Advisory Fee, Service and Distribution Fees and Transactions With Affiliates |
An advisory fee of $245,685 was paid or payable to EULAV Asset Management (the “Adviser”) for the year ended January 31, 2012. This was computed at an annual rate of 0.75% on the first $100 million of the Trust’s average daily net assets during the period, and 0.50 % on the average daily net assets in excess thereof prior to any fee waivers. The Adviser provides research, investment programs, supervision of the investment portfolio and pays costs of administrative services and office space. The Adviser also provides persons, satisfactory to the Trust’s Trustees, to act as officers of the Trust and pays their salaries. Effective June 1, 2007 and 2008, the Adviser contractually agreed to reduce the Trust’s advisory fee by 0.40% for one year periods. Effective June 1, 2009, the Adviser contractually agreed to waive 0.30% of the advisory fee for a one year period. Effective June 1, 2010 through May 31, 2012, the Adviser contractually agreed to waive 0.20% of the advisory fee for a one year period. The fees waived amounted to $65,516 for the year ended January 31, 2012. The Adviser has no right to recoup previously waived amounts.
The Trust has a Service and Distribution Plan (the “Plan”), adopted pursuant to Rule 12b-1 under the Investment Company Act of 1940, which compensates EULAV Securities LLC (the “Distributor”) for advertising, marketing and distributing the Trust’s shares and for servicing the Trust’s shareholders at an annual rate of 0.25% of the Trust’s average daily net assets. Fees amounting to $81,895 before fee waivers were accrued under the Plan for the year ended January 31, 2012. Effective June 1, 2007 through May 31, 2012, the Distributor contractually agreed to reduce the 12b-1 fee by 0.10% for one year periods. The fees waived amounted to $32,758 for the year ended January 31, 2012. The Distributor has no right to recoup previously waived amounts.
For the year ended January 31, 2012, the Trust’s expenses were reduced by $117 under a custody credit arrangement with the custodian.
Direct expenses of the Trust are charged to the Trust while common expenses of the Value Line Funds are allocated proportionately based upon the Funds’ respective net assets. The Trust bears all other costs and expenses.
Certain officers and a Trustee of the Adviser are also officers and a Trustee of the Trust. At January 31, 2012, the officers and Trustee as a group owned 1,296 shares of beneficial interest in the Trust, which represents less than 1% of the outstanding shares.
Value Line Aggressive Income Trust
Selected data for a share of beneficial interest outstanding throughout each year:
| | | | | | | | | | | | | | | | |
| | | Years Ended January 31, | |
| | | 2012 | | | 2011 | | | 2010 | | | 2009 | | | 2008 | |
| Net asset value, beginning of year | | $ | 4.95 | | | $ | 4.70 | | | $ | 3.89 | | | $ | 4.83 | | | $ | 5.06 | |
Income from investment operations: | | | | | | | | | | | | | | | | | | | | |
| Net investment income | | | 0.29 | | | | 0.30 | | | | 0.28 | | | | 0.32 | | | | 0.34 | |
| Net gains or (losses) on securities (both realized and unrealized) | | | (0.03 | ) | | | 0.25 | | | | 0.81 | | | | (0.95 | ) | | | (0.23 | ) |
| Total from investment operations | | | 0.26 | | | | 0.55 | | | | 1.09 | | | | (0.63 | ) | | | 0.11 | |
| Redemption fees | | | 0.00 | (1) | | | 0.00 | (1) | | | 0.00 | (1) | | | 0.00 | (1) | | | 0.00 | (1) |
| | | | | | | | | | | | | | | | | | | | | |
| Less distributions: | | | | | | | | | | | | | | | | | | | | |
| Dividends from net investment income | | | (0.29 | ) | | | (0.30 | ) | | | (0.28 | ) | | | (0.31 | ) | | | (0.34 | ) |
| | | | | | | | | | | | | | | | | | | | | |
| Net asset value, end of year | | $ | 4.92 | | | $ | 4.95 | | | $ | 4.70 | | | $ | 3.89 | | | $ | 4.83 | |
| Total return | | | 5.48 | % | | | 12.01 | % | | | 28.92 | % | | | (13.42 | )% | | | 2.14 | % |
| | | | | | | | | | | | | | | | | | | | | |
| Ratios/Supplemental Data: | | | | | | | | | | | | | | | | | | | | |
| Net assets, end of year (in thousands) | | $ | 32,203 | | | $ | 34,885 | | | $ | 37,787 | | | $ | 25,924 | | | $ | 32,459 | |
Ratio of expenses to average net assets(2) | | | 1.55 | % | | | 1.48 | %(3) | | | 1.56 | % | | | 1.50 | % | | | 1.28 | % |
Ratio of expenses to average net assets(4) | | | 1.25 | % | | | 1.13 | %(5) | | | 1.13 | % | | | 0.98 | % | | | 0.77 | % |
| Ratio of net investment income to average net assets | | | 5.95 | % | | | 6.20 | % | | | 6.51 | % | | | 7.17 | % | | | 6.76 | % |
| Portfolio turnover rate | | | 50 | % | | | 42 | % | | | 51 | % | | | 39 | % | | | 30 | % |
| (1) | Amount is less than $.01 per share. |
| | |
| (2) | Ratio reflects expenses grossed up for custody credit arrangement and grossed up for the waivers of a portion of the advisory fee by the Adviser and a portion of the service and distribution plan fees by the Distributor. The ratio of expenses to average net assets, net of custody credits, but exclusive of the fee waivers would have been 1.48% for the year ended January 31, 2009, 1.27% for the year ended January 31, 2008 and would have been unchanged for the other years shown. |
| | |
| (3) | Ratio reflects expenses grossed up for the reimbursement by Value Line, Inc. of certain expenses incurred by the Trust. |
| | |
| (4) | Ratio reflects expenses net of the custody credit arrangement and net of the waivers of a portion of the advisory fee by the Adviser and a portion of the service and distribution plan fees by the Distributor. |
| | |
| (5) | Ratio reflects expenses net of the reimbursement by Value Line, Inc. of certain expenses incurred by the Trust. |
See Notes to Financial Statements.
Value Line Aggressive Income Trust
| |
| Report of Independent Registered Public Accounting Firm |
To the Board of Trustees and Shareholders of
Value Line Aggressive Income Trust:
In our opinion, the accompanying statement of assets and liabilities, including the schedule of investments, and the related statements of operations and of changes in net assets and the financial highlights present fairly, in all material respects, the financial position of Value Line Aggressive Income Trust (the “Trust”) at January 31, 2012, the results of its operations for the year then ended, the changes in its net assets for each of the two years in the period then ended and the financial highlights for each of the five years in the period then ended, in conformity with accounting principles generally accepted in the United States of America. These financial statements and financial highlights (hereafter referred to as “financial statements”) are the responsibility of the Trust’s management. Our responsibility is to express an opinion on these financial statements based on our audits. We conducted our audits of these financial statements in accordance with the standards of the Public Company Accounting Oversight Board (United States). Those standards require that we plan and perform the audit to obtain reasonable assurance about whether the financial statements are free of material misstatement. An audit includes examining, on a test basis, evidence supporting the amounts and disclosures in the financial statements, assessing the accounting principles used and significant estimates made by management, and evaluating the overall financial statement presentation. We believe that our audits, which included confirmation of securities at January 31, 2012 by correspondence with the custodian and brokers, provide a reasonable basis for our opinion.
PricewaterhouseCoopers LLP
New York, New York
March 23, 2012
Value Line Aggressive Income Trust
FACTORS CONSIDERED BY THE BOARD IN APPROVING CONTINUANCE OF
THE INVESTMENT ADVISORY AGREEMENT
FOR VALUE LINE AGGRESSIVE INCOME TRUST
The Investment Company Act of 1940 (the “1940 Act”) requires the Board of Trustees (the “Board”), including a majority of Trustees who are not “interested persons” of Value Line Aggressive Income Trust (the “Trust”), as that term is defined in the 1940 Act (the “Independent Trustees”), to annually consider the continuance of the Trust’s investment advisory agreement (“Agreement”) with its investment adviser, EULAV Asset Management.1
In considering whether the continuance of the Agreement was in the best interests of the Trust and its shareholders, the Board requested and the Adviser provided such information as the Board deemed to be reasonably necessary to evaluate the terms of the Agreement. At meetings held throughout the year, including the meeting specifically focused upon the review of the Agreement, the Independent Trustees met in executive sessions separately from the non-Independent Trustee of the Trust and any officers of the Adviser. In selecting the Adviser and approving the continuance of the Agreement, the Independent Trustees relied upon the assistance of counsel to the Independent Trustees.
Both in the meeting that specifically addressed the continuance of the Agreement and at other meetings, the Board, including the Independent Trustees, received materials relating to the Adviser’s investment and management services under the Agreement. These materials included information on: (i) the investment performance of the Trust, compared to a peer group of funds consisting of the Trust and all retail and institutional high current yield funds regardless of asset size or primary channel of distribution (the “Performance Universe”), and its benchmark index, each as classified by Lipper Inc., an independent evaluation service (“Lipper”); (ii) the investment process, portfolio holdings, investment restrictions, valuation procedures, and financial statements for the Trust; (iii) sales and redemption data with respect to the Trust; (iv) the general investment outlook in the markets in which the Trust invests; (v) arrangements with respect to the distribution of the Trust’s shares; (vi) the allocation and cost of the Trust’s brokerage (none of which was effected through any affiliate of the Adviser); and (vii) the overall nature, quality and extent of services provided by the Adviser.
As part of their review, the Board requested, and the Adviser provided, additional information in order to evaluate the quality of the Adviser’s services and the reasonableness of its fees under the Agreement. In a separate executive session, the Independent Trustees reviewed information, which included data comparing: (i) the Trust’s management fee rate, transfer agent and custodian fee rates, service fee (including 12b-1 fees) rates, and the rate of the Trust’s other non-management fees, to those incurred by a peer group of funds consisting of the Trust and 11 other retail no-load high current yield funds (excluding outliers), as selected objectively by Lipper (“Expense Group”), and a peer group of funds consisting of the Trust, the Expense Group and all other retail no-load high current yield funds (excluding outliers), as selected objectively by Lipper (“Expense Universe”); (ii) the Trust’s expense ratio to those of its Expense Group and Expense Universe; and (iii) the Trust’s investment performance over various time periods to the average performance of the Performance Universe as well as the appropriate Lipper Index, as selected objectively by Lipper (the “Lipper Index”).
1 For periods prior to December 23, 2010, the term “Adviser” means the Adviser’s predecessor entities that previously served as the Trust’s adviser, EULAV Asset Management, LLC and Value Line, Inc. (“VLI”). In accordance with the 1940 Act, the Agreement had a two-year initial term ending December 2012. Nevertheless, the Board determined to consider the Agreement’s continuance annually and undertook that review in June 2011. |
Value Line Aggressive Income Trust
In the separate executive session, the Independent Trustees also reviewed information regarding: (a) the financial results and condition of the Adviser both before and after its restructuring on December 23, 2010,2 and the Adviser’s and certain of its affiliates’ profitability from the services that have been performed for the Trust and the Value Line family of funds; (b) the Adviser’s investment management staffing and resources; (c) the ownership, control and day-today management of the Adviser, including representations of VLI that it does not “control” (as that term is defined in the 1940 Act) either the Adviser or Value Line Securities, Inc. (the “Distributor”)3 after the restructuring; and (d) the Trust’s potential for achieving economies of scale. In support of its review of the statistical information, the Board was provided with a detailed description of the methodology used by Lipper to determine the Expense Group, the Expense Universe and the Performance Universe to prepare its information.
The following summarizes matters considered by the Board in connection with its continuance of the Agreement. However, the Board did not identify any single factor as all-important or controlling, and the summary does not detail all the matters that were considered.
Investment Performance. The Board reviewed the Trust’s overall investment performance and compared it to its Performance Universe and the Lipper Index. The Board noted that the Trust underperformed the Performance Universe average and the Lipper Index for the one-year and three-year periods ended March 31, 2011 but performed substantially the same as the Performance Universe average and Lipper Index for the five-year and ten-year periods ended March 31, 2011.
The Adviser’s Personnel and Methods. The Board reviewed the background of the portfolio manager responsible for the daily management of the Trust’s portfolio, seeking to achieve the Trust’s investment objectives and adhering to the Trust’s investment strategies. The Independent Trustees also engaged in discussions with the Adviser’s senior management responsible for the overall functioning of the Trust’s investment operations. The Board viewed favorably (i) the Adviser’s commitment of resources to acquire analytic tools in support of the portfolio management and compliance functions, (ii) actions taken by the Adviser to attract and retain personnel, including improvements to the Adviser’s employee benefit programs and increased merit-based compensation for certain staff members, and (iii) that the Adviser continues to receive the Value Line ranking systems without cost. The Board concluded that the Trust’s management team and the Adviser’s overall resources were adequate and that the Adviser had investment management capabilities and personnel essential to performing its duties under the Agreement.
Management Fee and Expenses. The Board considered the Adviser’s fee rate under the Agreement relative to the management fee rates applicable to the funds in the Expense Group and Expense Universe averages, both before and after applicable fee waivers. The Board noted that the Adviser and the Board previously agreed that the Adviser would contractually waive a portion of the Trust’s management fee equal to 0.20% on the first $100 million of the Trust’s average daily net assets, thereby reducing the management fee rate from 0.75% to 0.55% on the first $100 million of the Trust’s average daily net assets for the one-year period ended May 31 2011, and that the Adviser and the Board had agreed to extend this contractual management fee waiver through May 31, 2012. Such waiver cannot be changed during the contractual waiver period without the Board’s approval. The Board noted that, for the most recent fiscal year for which audited financial data was available, the Trust’s management fee rate was less than that of the Expense Group average and the Expense Universe average after giving effect to fee waivers applicable to certain funds in the Expense Group and Expense Universe. The Board noted that the Trust’s management fee rate was higher than that of the Expense Group average before giving effect to fee waivers applicable to certain funds in the Expense Group. The Board concluded that the Trust’s management fee rate was satisfactory for the purpose of approving continuance of the Agreement.
2 On December 23, 2010, the Adviser was restructured as a Delaware statutory trust and renamed EULAV Asset Management. It had formerly been organized as a limited liability company named EULAV Asset Management, LLC. |
3 On December 23, 2010, the Distributor was restructured as a Delaware limited liability company with the name EULAV Securities LLC and became a wholly-owned subsidiary of the Adviser. No other changes were made to the Distributor’s organization, including its operations and personnel. |
Value Line Aggressive Income Trust
The Board also considered the Trust’s total expense ratio relative to its Expense Group and Expense Universe averages. The Board noted that the Distributor and the Board previously agreed that the Distributor would contractually waive a portion of the Trust’s Rule 12b-1 fee, effectively reducing the Trust’s Rule 12b-1 fee rate from 0.25% to 0.15% of the Trust’s average daily net assets for the one-year period ended May 31, 2011 and that the Distributor and the Board have currently agreed to extend this contractual Rule 12b-1 fee waiver through May 31, 2012. Such waiver cannot be changed during the contractual waiver period without the Board’s approval. The Board noted that, for the most recent fiscal year for which audited financial data is available, the Trust’s expense ratio was higher than that of the Expense Group average and the Expense Universe average, after giving effect to fee waivers applicable to the Trust and certain funds in the Expense Group and Universe. The Board concluded that the average expense ratio was satisfactory for the purpose of approving continuance of the Agreement.
Nature, Extent and Quality of Services. The Board considered the nature, extent and quality of other services provided by the Adviser and the Distributor. At meetings held throughout the year, the Board reviewed the resources and effectiveness of the Adviser’s overall compliance program, as well as the services provided by the Distributor. The Board viewed favorably the additional resources devoted by the Adviser to enhance its and the Trust’s overall compliance program as well as steps being undertaken to enhance the shareholders’ experience with the Trust, such as a more robust website. The Board reviewed the services provided by the Adviser and its affiliates in supervising the Trust’s third party service providers. Based on this review, the Board concluded that the nature, quality, cost, and extent of such other services provided by the Adviser and its affiliates were satisfactory, reliable and beneficial to the Trust’s shareholders.
Profitability. The Board considered the level of profitability of the Adviser and its affiliates with respect to the Trust individually and in the aggregate for all the funds within the Value Line group of funds, including the impact of the restructuring and certain actions taken during prior years. These actions included the reduction (voluntary in some instances and contractual in other instances) of management and/or Rule 12b-1 fees for certain funds, the Adviser’s termination of the use of soft dollar research, and the cessation of trading through the Distributor. The Board also considered the Adviser’s continued attention to the rationalization and differentiation of funds within the Value Line group of funds to better identify opportunities for savings and efficiencies among the funds. The Board concluded that the profitability of the Adviser and its affiliates with respect to the Trust, including the financial results derived from the Trust’s Agreement, were within a range the Board considered reasonable.
Other Benefits. The Board also considered the character and amount of other direct and incidental benefits received by the Adviser and its affiliates from their association with the Trust. The Board concluded that potential “fallout” benefits that the Adviser and its affiliates may receive, such as greater name recognition, appear to be reasonable, and may in some cases benefit the Trust.
Value Line Aggressive Income Trust
Economies of Scale. The Board considered that, given the current and anticipated size of the Trust, any perceived and potential economies of scale were not yet a significant consideration for the Trust and that the addition of break points to the fee structure was not currently necessary.
Fees and Services Provided for Other Comparable Funds/Accounts Managed by the Adviser and its Affiliates. The Board was informed by the Adviser that the Adviser does not manage any non-mutual fund account that has similar objectives and policies as those of the Trust.
Conclusion. The Board examined the totality of the information it was provided at the meeting specifically addressing approval of the Agreement and at other meetings held during the past year and did not identify any single controlling factor. Based on its evaluation of all material factors deemed relevant and with the advice of independent counsel, the Board concluded that the rate at which the Trust pays a management fee to the Adviser under the Agreement does not constitute a fee that is so disproportionately large as to bear no reasonable relationship to the services rendered and that could not have been the product of arm’s-length bargaining. Further, the Board concluded that the Trust’s Agreement, and the management fee rate thereunder, is fair and reasonable and voted to continue the Agreement as in the best interest of the Trust and its shareholders.
Value Line Aggressive Income Trust
| |
| Federal Tax Notice (unaudited) |
| For corporate taxpayers 1.01% of the ordinary income distributions paid during the fiscal year ended January 31, 2012 qualify for the corporate dividends received deduction. |
| |
| During the fiscal year ended January 31, 2012, 1.01% of the ordinary income distributions are treated as qualified dividends. |
The Trust files its complete schedule of portfolio holdings with the Securities and Exchange Commission (“SEC”) for the first and third quarters of each fiscal year on Form N-Q. The Trust’s Forms N-Q are available on the SEC’s website at http://www.sec.gov and may be reviewed and copied at the SEC’s Public Reference Room in Washington, D.C. Information on the operation of the Public Reference Room may be obtained by calling 1-800-SEC-0330.
A description of the policies and procedures that the Trust uses to determine how to vote proxies relating to portfolio securities, and information regarding how the Trust voted these proxies for the 12-month period ended June 30 is available through the Trust’s website at http://www.vlfunds.com and on the SEC’s website at http://www.sec.gov. The description of the policies and procedures is also available without charge, upon request, by calling 1-800-243-2729.
Value Line Aggressive Income Trust
MANAGEMENT INFORMATION
The business and affairs of the Trust are managed by the Trust’s officers under the direction of the Board of Trustees. The following table sets forth information on each Trustee and Officer of the Trust. Each Trustee serves as a director or trustee of each of the 13 Value Line Funds. Each Trustee serves until his or her successor is elected and qualified.
| | | | | | | | | |
| Name, Address, and YOB | | Position | | Length of Time Served | | Principal Occupation During the Past 5 Years | | Other Directorships Held by Trustee |
| Interested Trustee* | | | | | | | | |
Mitchell E. Appel YOB: 1970 | | Trustee | | Since 2010 | | President of each of the Value Line Funds since June 2008; Chief Financial Officer of Value Line, Inc. (“Value Line”) from April 2008 to December 2010 and from September 2005 to November 2007; Director from February 2010 to December 2010; Chief Financial Officer of XTF Asset Management from November 2007 to April 2008; Chief Financial Officer of the Distributor since April 2008 and President since February 2009; President of the Adviser since February 2009, Trustee since December 2010 and Treasurer since January 2011. | | None |
| Non-Interested Trustees | | | | | | | | |
Joyce E. Heinzerling 500 East 77th Street New York, NY 10162 YOB: 1956 | | Trustee | | Since 2008 | | President, Meridian Fund Advisers LLC. (consultants) since April 2009; General Counsel, Archery Capital LLC (private investment fund) until April 2009. | | Burnham Investors Trust, since 2004 (4 funds). |
Francis C. Oakley 54 Scott Hill Road Williamstown, MA 01267 YOB: 1931 | | Trustee | | Since 2000 | | Professor of History, Williams College, (1961-2002). Professor Emeritus since 2002; President Emeritus since 1994 and President, (1985-1994); Chairman (1993-1997) and Interim President (2002-2003) of the American Council of Learned Societies. Trustee since 1997 and Chairman of the Board since 2005, National Humanities Center. | | None |
David H. Porter 5 Birch Run Drive Saratoga Springs, NY 12866 YOB: 1935 | | Trustee | | Since 1997 | | Professor, Skidmore College since 2008; Visiting Professor of Classics, Williams College, (1999-2008); President Emeritus, Skidmore College since 1999 and President, (1987-1998). | | None |
Value Line Aggressive Income Trust
| Name, Address, and YOB | | Position | | Length of Time Served | | Principal Occupation During the Past 5 Years | | Other Directorships Held by Trustee |
Paul Craig Roberts 169 Pompano St. Panama City Beach, FL 32413 YOB: 1939 | | Trustee | | Since 1986 | | Chairman, Institute for Political Economy. | | None |
Nancy-Beth Sheerr 1409 Beaumont Drive Gladwyne, PA 19035 YOB: 1949 | | Trustee | | Since 1996 | | Senior Financial Adviser, Veritable L.P. (Investment Adviser). | | None |
Daniel S. Vandivort 59 Indian Head Road Riverside, CT 06878 YOB: 1954 | | Trustee (Lead Independent Trustee since 2010) | | Since 2008 | | President, Chief Investment Officer, Weiss, Peck and Greer/Robeco Investment Management (2005-2007); Managing Director, Weiss, Peck and Greer, (1995-2005). | | None |
| Officers | | | | | | |
Mitchell E. Appel YOB: 1970 | | President | | Since 2008 | | President of each of the Value Line Funds since June 2008; Chief Financial Officer of Value Line from April 2008 to December 2010 and from September 2005 to November 2007; Director from February 2010 to December 2010; Chief Financial Officer of XTF Asset Management from November 2007 to April 2008; Chief Financial Officer of the Distributor since April 2008 and President since February 2009; President of the Adviser since February 2009, Trustee since December 2010 and Treasurer since January 2011. |
Michael J. Wagner YOB: 1950 | | Chief Compliance Officer | | Since 2009 | | Chief Compliance Officer of Value Line Funds since June 2009; President of Northern Lights Compliance Service, LLC (formerly Fund Compliance Services, LLC (2006 – present)) and Senior Vice President (2004 – 2006) and President and Chief Operations Officer (2003 – 2006) of Gemini Fund Services, LLC; Director of Constellation Trust Company until 2008. |
Emily D. Washington YOB: 1979 | | Treasurer and Secretary | | Since 2008 | | Treasurer and Chief Financial Officer (Principal Financial and Accounting Officer) of each of the Value Line Funds since August 2008 and secretary since 2010; Associate Director of Mutual Fund Accounting at Value Line until August 2008. |
| * | Mr. Appel is an “interested person” as defined in the Investment Company Act of 1940 by virtue of his position with the Adviser and Distributor. |
Unless otherwise indicated, the address for each of the above officers is c/o Value Line Funds, 7 Times Square, New York, NY 10036.
| |
| The Trust’s Statement of Additional Information (SAI) includes additional information about the Trust’s Trustees and is available, without charge, upon request by calling 1-800-243-2729 or on the Trust’s website, www.vlfunds.com. |
Value Line Aggressive Income Trust
[This Page Intentionally Left Blank.]
Value Line Aggressive Income Trust
| |
| The Value Line Family of Funds |
1950 — The Value Line Fund seeks long-term growth of capital. Current income is a secondary objective.
1952 — Value Line Income and Growth Fund’s primary investment objective is income, as high and dependable as is consistent with reasonable risk. Capital growth to increase total return is a secondary objective.
1956 — Value Line Premier Growth Fund seeks long-term growth of capital. No consideration is given to current income in the choice of investments.
1972 — Value Line Larger Companies Fund’s sole investment objective is to realize capital growth.
1979 — Value Line U.S. Government Money Market Fund, a money market fund, seeks to secure as high a level of current income as is consistent with maintaining liquidity and preserving capital. An investment in the Fund is not insured or guaranteed by the Federal Deposit Insurance Corporation or any other government agency. Although the Fund seeks to preserve the value of your investment at $1.00 per share, it is possible to lose money by investing in the Fund.
1981 — Value Line U.S. Government Securities Fund seeks maximum income without undue risk to capital. Under normal conditions, at least 80% of the value of its net assets will be invested in securities issued or guaranteed by the U.S. Government and its agencies and instrumentalities.
1983 — Value Line Centurion Fund* seeks long-term growth of capital.
1984 — The Value Line Tax Exempt Fund seeks to provide investors with the maximum income exempt from federal income taxes while avoiding undue risk to principal. The fund may be subject to state and local taxes and the Alternative Minimum Tax (if applicable).
1986 — Value Line Aggressive Income Trust seeks to maximize current income.
1987 — Value Line New York Tax Exempt Trust seeks to provide New York taxpayers with the maximum income exempt from New York State, New York City and federal income taxes while avoiding undue risk to principal. The Trust may be subject to state and local taxes and the Alternative Minimum Tax (if applicable).
1987 — Value Line Strategic Asset Management Trust* seeks to achieve a high total investment return consistent with reasonable risk.
1993 — Value Line Emerging Opportunities Fund invests in US common stocks of small capitalization companies, with its primary objective being long-term growth of capital.
1993 — Value Line Asset Allocation Fund seeks high total investment return, consistent with reasonable risk. The Fund invests in stocks, bonds and money market instruments utilizing quantitative modeling to determine the asset mix.
| | |
| * | Only available through the purchase of Guardian Investor, a tax deferred variable annuity, or ValuePlus, a variable life insurance policy. |
For more complete information about any of the Value Line Funds, including charges and expenses, send for a prospectus from EULAV Securities LLC, 7 Times Square, New York, New York 10036-6524 or call 1-800-243-2729, 9am–5pm CST, Monday–Friday, or visit us at www.vlfunds.com. Read the prospectus carefully before you invest or send money.