UNITED STATES
SECURITIES AND EXCHANGE COMMISSION
Washington, D.C. 20549
FORM N-CSR
CERTIFIED SHAREHOLDER REPORT OF REGISTERED
MANAGEMENT INVESTMENT COMPANIES
Investment Company Act file Number _811- 04471
Value Line Core Bond Fund
(Exact name of registrant as specified in charter)
7 Times Square, New York, N.Y. 10036
(Address of principal executive offices) (Zip Code)
Registrant’s telephone number, including area code: 212-907-1900
Date of fiscal year end: December 31, 2013
Date of reporting period: December 31, 2013
Item I Reports to Stockholders
A copy of the Annual Report to Stockholders for the period ended 12/31/13 is included with this Form.
Annual Report
December 31, 2013
| |
| Value Line Premier Growth Fund, Inc. |
| (VALSX) |
| |
| The Value Line Fund, Inc. |
(VLIFX) |
| |
| Value Line Income and Growth Fund, Inc. |
| (VALIX) |
| |
| Value Line Larger Companies Fund, Inc. |
| (VALLX) |
| |
| Value Line Core Bond Fund |
| (VAGIX) |
| |
This audited report is issued for information to shareholders. It is not authorized for distribution to prospective investors unless preceded or accompanied by a currently effective prospectus of the Fund (obtainable from the Distributor).
#00110946
Table of Contents | |
| | |
| President’s Letter with Economic, and Market Commentary | 3 |
| | |
| Value Line Premier Growth Fund, Inc.: | |
| Manager Discussion of Fund Performance | 6 |
| Portfolio Highlights | 8 |
| Schedule of Investments | 10 |
| | |
| The Value Line Fund, Inc.: | |
| Manager Discussion of Fund Performance | 13 |
| Portfolio Highlights | 15 |
| Schedule of Investments | 17 |
| | |
| Value Line Income and Growth Fund, Inc.: | |
| Manager Discussion of Fund Performance | 19 |
| Portfolio Highlights | 22 |
| Schedule of Investments | 24 |
| | |
| Value Line Larger Companies Fund, Inc.: | |
| Manager Discussion of Fund Performance | 30 |
| Portfolio Highlights | 32 |
| Schedule of Investments | 34 |
| | |
| Value Line Core Bond Fund: | |
| Manager Discussion of Fund Performance | 36 |
| Portfolio Highlights | 38 |
| Schedule of Investments | 40 |
| | |
| Statements of Assets and Liabilities | 46 |
| | |
| Statements of Operations | 47 |
| | |
| Statements of Changes in Net Assets | 48 |
| | |
| Financial Highlights | 52 |
| | |
| Notes to Financial Statements | 54 |
| | |
| Report of Independent Registered Public Accounting Firm | 65 |
| | |
| Fund Expenses | 66 |
| | |
| Federal Tax Notice | 67 |
| | |
| Management of the Funds | 68 |
| President’s Letter (unaudited) |
| |
Dear Fellow Shareholders:
We are pleased to present you with this annual report for Value Line Premier Growth Fund, Inc., The Value Line Fund, Inc., Value Line Income and Growth Fund, Inc., Value Line Larger Companies Fund, Inc. and Value Line Core Bond Fund (individually, a “Fund” and collectively, the “Funds”) for the 12 months ended December 31, 2013. We are especially excited to present this annual report in its new format, revised to be more informative, more useful and more reader-friendly.
The 12 months ended December 31, 2013 were rewarding ones for the equity and hybrid Value Line Funds but challenging ones for the fixed income Value Line Funds, as investors generally focused on the economic recovery despite persistent volatility. At the same time, the annual period was highlighted by several of the Funds being recognized for their long-term performance.
| ● | Value Line Premier Growth Fund, Inc. outpaced its peers for the three-, five- and ten-year periods ended December 31, 2013, as noted by leading independent mutual fund advisory service Lipper Inc.1 (multi-cap growth category). Lipper also awarded its top Lipper Leader rating of 5 to the Fund for Preservationi versus its peers as of December 31, 2013. Additionally, the Fund earned an Overall four-star rating from Morningstar2 in the mid-cap growth category among 638 funds as of December 31, 2013 based on risk-adjusted returns. Morningstar gave the Fund a Risk rating of Below Average.ii |
| | |
| ● | The Value Line Fund, Inc. was named a Lipper Leader1 for overall Preservation versus its peers as of December 2013.iii |
| | |
| ● | Value Line Income and Growth Fund, Inc. outpaced its peers for the three-, five- and ten-year periods ended December 31, 2013, as noted by Lipper Inc.1 (mixed-asset target allocation moderate category). The Fund also earned an Overall four- star rating from Morningstar2 in the moderate allocation category among 739 funds as of December 31, 2013 based on risk- adjusted returns.iv The Fund, along with Value Line Premier Growth Fund, Inc., was featured in various national publications for its consistent performance over multiple time periods. |
Also a highlight of the annual period was Value Line Core Bond Fund transitioning to a new, more efficient strategy. Value Line Core Bond Fund, having changed its strategy to be a broad-based intermediate-term investment grade bond fund in December 2012, enjoyed significantly increased assets with the merger of the Value Line U.S. Government Securities Fund, Inc. into the Fund in March 2013. The Fund has already begun to realize the benefits of a larger, more efficiently managed fund, and the investment adviser, EULAV Asset Management (the “Adviser”) permanently reduced the management fee in February 2013.
On the following pages, the Funds’ portfolio managers discuss the management of their respective Funds over the annual period. The discussions highlight key factors influencing recent performance of the Funds. You will also find a schedule of investments and financial statements for each of the Funds.
Before reviewing the performance of your individual mutual fund investment, we encourage you to take a brief look at the major factors affecting the financial markets over the 12 months ended December 31, 2013, especially given the newsworthy events of the year. With the exciting developments and performance results of the Funds during 2013, we also invite you to take this time to consider a broader diversification strategy by including additional Value Line Funds, which you can read about on the following pages, in your investment portfolio.
Economic Review
U.S. real Gross Domestic Product (GDP) was lackluster with growth in the first half of 2013 at less than 2% in the first and second calendar quarters. The U.S. economy faced strong headwinds, including increases in the payroll tax and disruptions from the sequester budget cuts. Third quarter GDP, however, turned sharply upward, coming in at 4.1%, as boosted by higher consumer spending, increased business investment and rising inventories. Estimates for fourth quarter GDP suggest the U.S. economy may have ended the year with more momentum than had been anticipated.
Despite the growing economy, inflation remained modest. Consumer prices stayed in check, with the Consumer Price Index (CPI) rising just 1.5% before seasonal adjustment. Limited wage growth and declining energy prices contributed to the relatively benign inflation scenario. The U.S. also saw moderate job growth, as reflected in a drop in unemployment from 7.8% at the close of 2012 to 6.7% at the close of 2013. The makeup of job growth, however, was somewhat disappointing, with hiring generally concentrated in sectors representative of low-wage jobs.
In recognition of the improving U.S. economy, the Federal Reserve (the “Fed”) had ongoing—and well-publicized—discussions throughout the year about the possibility of reducing its monthly bond-buying program. Speculation about the timing and magnitude of the tapering had a great impact on both the equity and fixed income markets. Ultimately, Fed Chair Ben Bernanke kept the focus on key market data as the basis for the decision on tapering. As unemployment dropped close to the Fed’s stated target of 6.5%, the Fed finally announced in December 2013 that it would modestly reduce its monthly bond purchases—from $85 billion to $75 billion—beginning in January 2014. At the same time, the Fed reaffirmed its commitment to maintaining low short-term interest rates, with the targeted federal funds rate not likely to exceed 0.25%. At the end of the annual period, the appointment of Janet Yellen as new Fed Chair was seen by the financial markets as likely to not steer the Fed too far off the course set by Ben Bernanke.
Equity Market Review
U.S. equities, as measured by the S&P 500® Index3, posted robust double-digit gains for 2013, supported by a significantly stronger real estate market, steady growth in manufacturing and a modest drop in the national unemployment rate.
Stocks began the year strong upon the announcement of a partial bi-partisan deal regarding the federal budget, debt ceiling and government shutdown—which drove a generally steady climb through May 2013. The S&P 500® Index subsequently dropped between the end of May and the end of June, as fears of over-bought conditions, an imminent end to the quantitative easing program by the Fed and worries over second quarter corporate earnings arose. The U.S. equity market snapped back to post solid gains after reasonably good earnings reports and what were perceived as dovish words by Fed members that eased investors’ concerns. A notable acceleration in market appreciation occurred in early October in response to the Fed’s surprise announcement in September that it would not yet begin tapering its asset purchases. This announcement combined with improving employment reports to drive the S&P 500® Index higher between early October and the end of December. Also boosting the U.S. equity market’s gain at the end of the annual period was the Fed’s announcement, ending seven months of speculation, that it would finally but gradually begin to taper its asset purchases in January 2014. A particularly notable catalyst for the U.S. equity market during the annual period was the expansion of the price/earnings multiple investors were willing to pay, as the price/earnings multiple of the S&P 500® Index expanded from 14x to 17x by the end of December 2013. The S&P 500® Index posted 45 new all-time closing highs in 2013, including a new closing high on the final day of trading. The last time the Index closed the year with a new high was in 1999.
All ten sectors of the S&P 500® Index posted positive double-digit absolute performance for the year, with the consumer discretionary, health care and industrials sectors leading the way. Telecommunication services and utilities, both traditionally considered defensive sectors, were the weakest sectors during the annual period.
Fixed Income Market Review
The broad U.S. fixed income market, as measured by the Barclays U.S. Aggregate Bond Index4, posted negative returns during the annual period. The U.S. fixed income market faced several headwinds, including speculation of the Fed tapering its bond-buying program and Congressional discord resulting in protracted budget disputes and a partial U.S. government shutdown for 16 days. Economic indicators, while mixed, were generally improving during the year.
Against this backdrop, interest rates rose across the spectrum of maturities, but most dramatically in the intermediate segment of the yield curve. The rise in interest rates helped propel investor demand for investment grade and high yield corporate bonds at the expense of owning U.S. Treasuries. In turn, spread, or non-U.S. Treasury, sectors of the U.S. fixed income market were the best performers in the Barclays U.S. Aggregate Bond Index during the annual period. Generally speaking, lower quality bonds outpaced higher quality bonds, as investors sought yield amidst the underlying support of a growing economy. U.S. Treasuries posted negative returns overall.
* * *
We thank you for trusting us to be a part of your long-term, comprehensive investment strategy. We appreciate your confidence in the Value Line Funds and look forward to serving your investment needs in the years ahead just as we have been helping to secure generations’ financial futures for more than 60 years—based on solid fundamentals, sound investment principles and the power of disciplined and rigorous analytics. If you have any questions or would like additional information on these or other Value Line Funds, we invite you to contact your investment representative or visit us at www.vlfunds.com.
| Sincerely, |
| |
| /s/ Mitchell Appel | |
| Mitchell Appel |
| President of the Value Line Funds |
Past performance does not guarantee future results. Investment return and principal value of an investment can fluctuate so that an investor’s shares, when redeemed, may be worth more or less than their original cost; and that current performance may be lower or higher than the performance data quoted. Investors should carefully consider the investment objective, risks, charges and expense of a fund. This and other important information about a fund is contained in the fund’s prospectus. A copy of our funds’ prospectuses can be obtained free of charge by going to our website at www.vlfunds.com or calling 800.243.2729.
| 1 | Lipper Leader ratings are derived from highly sophisticated formulas that analyze funds against clearly defined criteria. Funds are compared to similar funds, and only those that trust stand out are awarded Lipper Leader status. Funds are ranked against their peers on each of four measures: Total Return, Consistent Return, Preservation and Expense. A fifth measure, Tax Efficiency, applies in the United States. Scores are subject to change every month and are calculated for the following periods: 3-year, 5-year, 10-year and overall. The overall calculation is based on an equal-weighted average of percentile ranks for each measure over 3-year, 5-year and 10-year periods (if applicable). For each measure, the highest 20% of funds in each peer group are named Lipper Leaders. The next 20% receive a rating of 4: the middle 20% are rated 3: the next 20% are rated 2; and the lowest 20% are rated 1. |
| | |
| | i | For Value Line Premier Growth Fund, Inc.: Preservation 5 rating for 3-year (10,671 funds); 5-year (9,050 funds) and overall (10,671 funds) periods ended December 31, 2013; 4 rating for 10-year (5,264 funds) period ended December 31, 2013. |
| | |
| | iii | For The Value Line Fund, Inc.: overall Preservation (10,671 funds); 3-year 5 rating (10,671 funds); 5-year 5 rating (9,050 funds) and 10-year 3 rating (5,264 funds) periods ended December 31, 2013. |
| | |
| 2 | The Morningstar RatingTM for funds methodology rates funds based on an enhanced Morningstar Risk-Adjusted Return measure, which also accounts for the effects of all sales charges, loads, or redemption fees. Funds are ranked by their Morningstar Risk-Adjusted Return scores and stars are assigned using the following scale: 5 stars for top 10%; 4 starts next 22.5%; 3 stars next 35%; 2 stars next 22.5%; 1 star for bottom 10%. Funds are rated for up to three periods: the trailing three-, five- and 10-years. For a fund that does not change categories during the evaluation period, the overall rating is calculated using the following weights: At least 3 years, but less than 5 years uses 100% three-year rating. At least 5 years but less than 10 years uses 60% five-year ratings/40% three-year rating. At least 10 years uses 50% ten-year rating/30% five-year rating/20% three-year rating. |
| | |
| | ii | For Value Line Premier Growth Fund, Inc.: Four-star rating for 3-year (638 funds), 10-year (416 funds) and Overall (638 funds) periods ended December 31, 2013; 5-year period ended December 31, 2013 3 stars/548 funds). Morningstar Risk: Below Average for the 5-year, 10-year and Overall periods ended December 31, 2013; Low for the 3- year period ended December 31, 2013. |
| | |
| | iv | For Value Line Income and Growth Fund, Inc.: Overall four-star rating (739 funds); 3-year 3 stars (739 funds), 5-year 3 stars (674 funds), 10-year 5 stars (422 funds) for periods ended December 31, 2013. All in the moderate allocation category. |
| | |
| 3 | The S&P 500® Index consists of 500 stocks that are traded on the New York Stock Exchange, American Stock Exchange and the NASDAQ national Market System and is representative of the broad stock market. This is an unmanaged index and does not reflect charges, expenses or taxes, and it is not possible to directly invest in this index. |
| | |
| 4 | The Barclays U.S. Aggregate Bond Index is a broad-based benchmark that measures the investment grade, U.S. dollar- denominated, fixed-rate taxable bond market, including U.S. Treasuries, government-related and corporate securities, MBS (agency fixed-rate and hybrid ARM pass-throughs), ABS and CMBS. This is an unmanaged index and does reflect charges, expenses or taxes, which are deducted from the Fund’s return. It is not possible to directly invest in this index. |
| VALUE LINE PREMIER GROWTH FUND, INC. |
| |
INVESTMENT OBJECTIVE AND STRATEGY
The Fund primarily seeks long-term growth of capital.
To achieve the Fund’s goal, the Fund’s investment adviser invests at least 80% of the Fund’s net assets in a diversified portfolio of U.S. equity securities with favorable growth prospects. In selecting securities for purchase or sale, the Adviser generally analyzes the issuer of a security using fundamental factors such as growth potential and earnings estimates and quantitative factors such as historical earnings, earnings momentum and price momentum. The Fund may invest in small, mid or large capitalization companies, including foreign companies. There are no set limitations of investments according to a company’s size, or to a sector weighting.
Manager Discussion of Fund Performance
Below, Value Line Premier Growth Fund, Inc. portfolio manager Stephen E. Grant discusses the Fund’s performance and positioning for the 12 months ended December 31, 2013.
How did the Fund perform during the annual period?
The Fund generated a total return of 26.56% during the 12 months ended December 31, 2013. This compares to the 32.39% return of the Fund’s benchmark, the S&P 500® Index, during the same period.
What key factors were responsible for the Fund’s performance during the 12-month reporting period?
While the Fund generated robust double-digit absolute gains, its underperformance of the S&P 500® Index during the 12-month reporting period can be attributed primarily to stock selection. Sector allocation overall was effective.
Which equity market sectors most significantly affected Fund performance?
Stock selection in the financials, health care, consumer staples and consumer discretionary sectors detracted from the Fund’s performance most during the annual period. In financials, an underweighted exposure to the strongly performing insurance industry hurt most. In health care, a lesser exposure than the S&P 500® Index to the strongly performing biotechnology industry particularly dampened results. In consumer staples, holdings of select foreign companies, via American Depositary Receipts (ADRs), proved disappointing. In consumer discretionary, we missed the rallies in select stocks that performed well. (An ADR is a negotiable certificate issued by a U.S. bank representing a specified number of shares in a foreign stock that is traded on a U.S. exchange.) Holding an average 3% position in cash during a period when the U.S. equity market rallied also hurt.
Partially offsetting these detractors were the positive contributions made by effective stock selection in the information technology sector, having an overweighted allocation in the strongly performing industrials sector, and both stock selection in and having an underweighted allocation to the lagging energy sector.
Which stocks detracted significantly from the Fund’s performance during the annual period?
During the annual period, among the stocks that detracted most from the Fund’s relative performance were several foreign banks, including Colombia’s Bancolombia, India’s HDFC Bank, Brazil’s Itau Unibanco Holding and Chile’s Banco de Chile. In health care, overweighted positions in laggards such as cardiovascular device manufacturer Edwards Lifesciences, pharmacy benefits management services provider Catamaran and surgical systems manufacturer Intuitive Surgical detracted. In consumer discretionary, we missed the rallies in online retailer Amazon.com, online travel company priceline.com, entertainment subscription company Netflix and entertainment giant The Walt Disney Company, and thus these positions detracted on a relative basis.
What were some of the Fund’s best-performing individual stocks?
Among the individual stocks that contributed most to the Fund’s relative results were two sizable positions in the information technology sector—namely, Alliance Data Systems, which provides data-driven and transaction-based marketing and customer loyalty solutions, and MasterCard, which is a global payment solutions company that provides a variety of services in support of the credit, debt and related payment programs of financial institutions. Avoiding several laggards in the information technology sector, such as Apple, IBM and Oracle, also boosted the Fund’s results.
Several Fund positions in the industrials sector added value. Top contributors in the sector were human resources firm Towers Watson, rail transportation equipment manufacturer Wabtec, inland tank barge fleet operator Kirby and renewable energy equipment manufacturer EnerSys.
In the energy sector, a position in Core Laboratories was an outstanding performer. Core Laboratories provides reservoir description, production enhancement and reservoir management services for oil and gas producers.
How did the Fund use derivatives and similar instruments during the reporting period?
The Fund did not use derivatives during the reporting period.
Did the Fund make any significant purchases or sales during the fiscal year?
During the fiscal year, we initiated a Fund position in Chevron. Whereas this large integrated oil company had inconsistent results prior to 2003, over the past decade it has demonstrated the ability to consistently grow its earnings and stock price. We added to the Fund’s long-time position in supplemental insurance company Aflac because it came through the 2008-09 world financial crisis in good shape and because we believe the company is now back on track to add to its long-term record of consistent growth in its earnings and stock price. In each case, we purchased shares as a dip in their respective share prices offered what we believed to be an attractive entry point.
A Fund position in Warnaco Group was eliminated because the company was acquired by PVH, combining to form one of the largest global branded lifestyle apparel companies in the world, with a diversified portfolio of brands, including Calvin Klein, Tommy Hilfiger, Van Heusen, IZOD, ARROW, Bass, Speedo, Olga and Warner’s. We sold the Fund’s position in food retailer Harris Teeter Supermarkets after its stock rose in response to a takeover bid by competitor Kroger.
Were there any notable changes in the Fund’s weightings during the 12-month period?
There were no material changes in the Fund’s sector weightings during the 12-month period ended December 31, 2013.
How was the Fund positioned relative to its benchmark index at the end of December 2013?
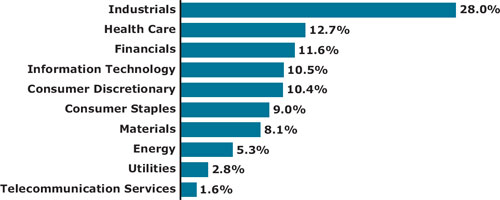
As of December 31, 2013, the Fund was overweighted relative to the S&P 500® Index in the industrials and materials sectors. The Fund was underweighted relative to the S&P 500® Index in the energy, financials and information technology sectors and rather neutrally weighted relative to the Index in the consumer discretionary, consumer staples, health care, utilities, telecommunication services sectors on the same date.
What is your tactical view and strategy for the months ahead?
Calendar year 2013 saw lower quality stocks outperform higher quality stocks, as investors became more bold and more confident in the economy and the financial system. Speculative stocks, such as those of biotechnology companies, and Initial Public Offerings, such as those of Facebook and Twitter, outperformed the broad U.S. equity market, along with the more cyclical, economically-sensitive stocks. Lagging were the more consistent, “steady-eddy,” long-term growth stocks in which we traditionally invest, i.e., those companies that have established strongholds in their market or market niche through proprietary products or services, which, in our view, gives them greater control of their own destiny and makes them less subject to ups and downs of the economy. We consider the Fund’s underperformance of the S&P 500® Index in 2013 as part of the natural ebb and flow of the market, as the lower quality stocks that performed poorly in 2011 and 2012 regained some ground. We do not know whether the trends of 2013 will continue into the new year, but, regardless of market trends and conditions, we do not intend to vary from our strategy of investing in high quality securities with a long-term perspective. Our portfolio turnover and trading costs have remained lower than many of our peers, as we have patience with a consistent grower until a change in the company’s strategy or its earnings and stock performance give solid reason to sell.
As always, we intend to stay true to our time-tested investment discipline going forward.
| Value Line Premier Growth Fund, Inc. |
| Portfolio Highlights at December 31, 2013 (unaudited) |
| Ten Largest Holdings | | | | | | | | | |
| | | | | | | | | | |
| | | | | | | | | Percentage of |
| Issue | | Shares | | | Value | | | Net Assets |
| MasterCard, Inc. Class A | | | 8,600 | | | $ | 7,184,956 | | | | 1.8 | % |
| ANSYS, Inc. | | | 60,000 | | | | 5,232,000 | | | | 1.3 | % |
| Alliance Data Systems Corp. | | | 19,400 | | | | 5,100,842 | | | | 1.3 | % |
| AMETEK, Inc. | | | 96,750 | | | | 5,095,822 | | | | 1.3 | % |
| Alexion Pharmaceuticals, Inc. | | | 37,800 | | | | 5,029,668 | | | | 1.3 | % |
| Roper Industries, Inc. | | | 36,000 | | | | 4,992,480 | | | | 1.2 | % |
| Precision Castparts Corp. | | | 17,800 | | | | 4,793,540 | | | | 1.2 | % |
| AMBEV S.A. ADR | | | 650,000 | | | | 4,777,500 | | | | 1.2 | % |
| Danaher Corp. | | | 61,000 | | | | 4,709,200 | | | | 1.2 | % |
| Affiliated Managers Group, Inc. | | | 21,000 | | | | 4,554,480 | | | | 1.1 | % |
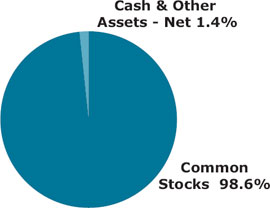
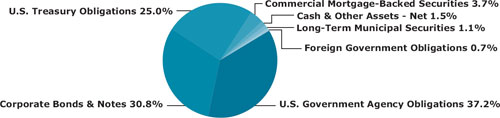
| Asset Allocation – Percentage of Net Assets |
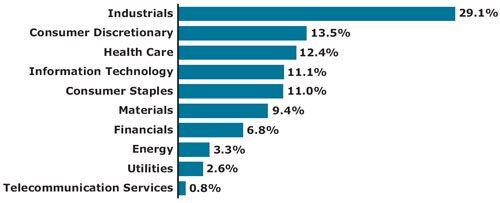
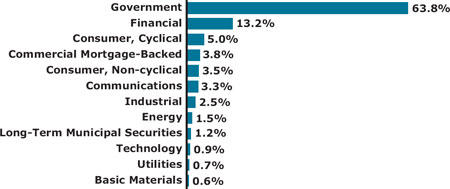
| Sector Weightings – Percentage of Total Investment Securities* |
*Sector weightings exclude short-term investments.
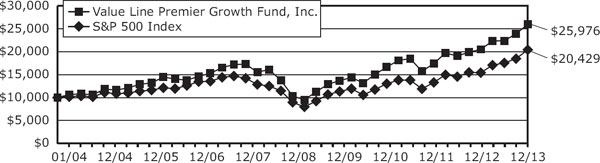
The following graph compares the performance of the Value Line Premier Growth Fund, Inc. to that of the S&P 500 Index (the “Index”). The Value Line Premier Growth Fund, Inc. is a professionally managed mutual fund, while the Index is not available for investment and is unmanaged. The returns for the Index do not reflect charges, expenses or taxes but do include the reinvestment of dividends. The comparison is shown for illustrative purposes only.
Comparison of a Change in Value of a $10,000 Investment in the Value Line Premier Growth Fund, Inc. and the S&P 500 Index*
| | | Average Annual | | Growth of an Assumed | |
| | | Total Return | | Investment of $10,000 | |
| 1 year ended 12/31/13 | | | 26.56 | % | | $12,656 | |
| 5 years ended 12/31/13 | | | 20.20 | % | | $25,096 | |
| 10 years ended 12/31/13 | | | 10.02 | % | | $25,976 | |
| * | The Standard and Poor’s 500 Index is an unmanaged index that is representative of the larger-capitalization stocks traded in the United States. |
| ** | The performance data quoted represent past performance and are no guarantee of future performance. The average annual total returns and growth of an assumed investment of $10,000 include dividends reinvested and capital gains distributions accepted in shares. The investment return and principal value of an investment will fluctuate so that an investment, when redeemed, may be worth more or less than its original cost. The performance data and graph do not reflect the deduction of taxes that a shareholder would pay on fund distributions or the redemption of fund shares. |
Value Line Premier Growth Fund, Inc. Schedule of Investments |
| | | | | | | |
| Shares | | | | | Value | |
COMMON STOCKS (98.6%) | | | | |
| | | CONSUMER DISCRETIONARY (10.3%) | | | | |
| 8,400 | | AutoZone, Inc. * | | $ | 4,014,696 | |
| 56,000 | | BorgWarner, Inc. | | | 3,130,960 | |
| 40,000 | | Brinker International, Inc. | | | 1,853,600 | |
| 10,500 | | Buckle, Inc. (The) (1) | | | 551,880 | |
| 36,000 | | Dick’s Sporting Goods, Inc. | | | 2,091,600 | |
| 23,800 | | Domino’s Pizza, Inc. | | | 1,657,670 | |
| 23,000 | | Genuine Parts Co. | | | 1,913,370 | |
| 15,200 | | Gildan Activewear, Inc. (1) | | | 810,312 | |
| 27,000 | | Johnson Controls, Inc. | | | 1,385,100 | |
| 112,000 | | LKQ Corp. * | | | 3,684,800 | |
| 24,000 | | McDonald’s Corp. | | | 2,328,720 | |
| 27,000 | | NIKE, Inc. Class B | | | 2,123,280 | |
| 18,000 | | O’Reilly Automotive, Inc. * | | | 2,316,780 | |
| 13,000 | | Penn National Gaming, Inc. * | | | 186,290 | |
| 40,000 | | Starbucks Corp. | | | 3,135,600 | |
| 68,600 | | TJX Companies, Inc. (The) | | | 4,371,878 | |
| 21,600 | | VF Corp. | | | 1,346,544 | |
| 33,600 | | Wolverine World Wide, Inc. | | | 1,141,056 | |
| 44,000 | | Yum! Brands, Inc. | | | 3,326,840 | |
| | | | | | 41,370,976 | |
| | | | | | | |
| | | CONSUMER STAPLES (8.9%) | | | | |
| 650,000 | | AMBEV S.A. ADR | | | 4,777,500 | |
| 71,000 | | BRF S.A. ADR (1) | | | 1,481,770 | |
| 17,000 | | British American Tobacco PLC ADR | | | 1,826,140 | |
| 21,300 | | Brown-Forman Corp. Class B | | | 1,609,641 | |
| 24,000 | | Bunge Ltd. | | | 1,970,640 | |
| 48,400 | | Church & Dwight Co., Inc. | | | 3,207,952 | |
| 16,800 | | Coca-Cola Femsa, S.A.B. de C.V. ADR (1) | | | 2,045,736 | |
| 14,000 | | Costco Wholesale Corp. | | | 1,666,140 | |
| 23,400 | | Energizer Holdings, Inc. | | | 2,532,816 | |
| 89,812 | | Flowers Foods, Inc. | | | 1,928,264 | |
| 20,000 | | Fomento Economico Mexicano S.A.B. de C.V. ADR | | | 1,957,400 | |
| 64,000 | | General Mills, Inc. | | | 3,194,240 | |
| 43,000 | | Hormel Foods Corp. | | | 1,942,310 | |
| 3,000 | | McCormick & Co., Inc. | | | 206,760 | |
| 29,000 | | PepsiCo, Inc. | | | 2,405,260 | |
| 22,000 | | Reynolds American, Inc. | | | 1,099,780 | |
| 32,000 | | Whole Foods Market, Inc. | | | 1,850,560 | |
| | | | | | 35,702,909 | |
| | | | | | | |
| | | ENERGY (5.3%) | | | | |
| 18,000 | | Chevron Corp. | | | 2,248,380 | |
| 8,600 | | CNOOC Ltd. ADR | | | 1,613,876 | |
| 14,600 | | Core Laboratories N.V. | | | 2,787,870 | |
| 17,000 | | Enbridge, Inc. | | | 742,560 | |
| 28,000 | | EQT Corp. | | | 2,513,840 | |
| 70,000 | | EMC Technologies, Inc. * | | | 3,654,700 | |
| 51,400 | | Noble Energy, Inc. | | | 3,500,854 | |
| Shares | | | | | Value | |
| 9,000 | | Oceaneering International, Inc. | | $ | 709,920 | |
| 5,000 | | Oil States International, Inc. * | | | 508,600 | |
| 5,346 | | Pioneer Natural Resources Co. | | | 984,038 | |
| 26,000 | | TransCanada Corp. (1) | | | 1,187,160 | |
| 25,600 | | Ultrapar Participacoes S.A. ADR | | | 605,440 | |
| | | | | | 21,057,238 | |
| | | | | | | |
| | | FINANCIALS (11.4%) | | | | |
| 8,000 | | ACE Ltd. | | | 828,240 | |
| 21,000 | | Affiliated Managers Group, Inc. * | | | 4,554,480 | |
| 52,600 | | AFLAC, Inc. | | | 3,513,680 | |
| 3,000 | | Alleghany Corp. * | | | 1,199,880 | |
| 36,000 | | American Tower Corp. REIT | | | 2,873,520 | |
| 45,000 | | Arch Capital Group Ltd. * | | | 2,686,050 | |
| 8,316 | | Banco de Chile ADR (1) | | | 730,145 | |
| 13,300 | | Bank of Montreal | | | 886,578 | |
| 22,100 | | Bank of Nova Scotia | | | 1,382,355 | |
| 7,700 | | BlackRock, Inc. | | | 2,436,819 | |
| 16,000 | | BRE Properties, Inc. REIT | | | 875,360 | |
| 9,400 | | Brown & Brown, Inc. | | | 295,066 | |
| 9,400 | | Camden Property Trust REIT | | | 534,672 | |
| 3,200 | | Canadian Imperial Bank of Commerce | | | 273,312 | |
| 18,000 | | Digital Realty Trust, Inc. (1) | | | 884,160 | |
| 23,200 | | Equity Lifestyle Properties, Inc. REIT | | | 840,536 | |
| 9,400 | | Essex Property Trust, Inc. REIT (1) | | | 1,348,994 | |
| 2,600 | | Everest Re Group Ltd. | | | 405,262 | |
| 13,000 | | Gaming and Leisure Properties, Inc. REIT * | | | 660,530 | |
| 75,500 | | HDFC Bank Ltd. ADR | | | 2,600,220 | |
| 22,000 | | M&T Bank Corp. (1) | | | 2,561,240 | |
| 15,000 | | MetLife, Inc. | | | 808,800 | |
| 10,000 | | PartnerRe Ltd. | | | 1,054,300 | |
| 27,000 | | Portfolio Recovery Associates, Inc. * | | | 1,426,680 | |
| 5,000 | | Principal Financial Group, Inc. | | | 246,550 | |
| 30,000 | | ProAssurance Corp. | | | 1,454,400 | |
| 21,500 | | Prudential Financial, Inc. | | | 1,982,730 | |
| 26,000 | | Royal Bank of Canada | | | 1,747,980 | |
| 17,000 | | Stifel Financial Corp. * | | | 814,640 | |
| 17,000 | | T. Rowe Price Group, Inc. | | | 1,424,090 | |
| 8,000 | | Taubman Centers, Inc. REIT | | | 511,360 | |
| 7,400 | | Toronto-Dominion Bank (The) | | | 697,376 | |
| 30,000 | | Wells Fargo & Co. | | | 1,362,000 | |
| | | | | | 45,902,005 | |
| | | | | | | |
| | | HEALTH CARE (12.5%) | | | | |
| 37,800 | | Alexion Pharmaceuticals, Inc. * | | | 5,029,668 | |
| 17,200 | | Allergan, Inc. | | | 1,910,576 | |
| 15,200 | | Bayer AG ADR | | | 2,158,400 | |
| 14,500 | | Becton, Dickinson & Co. | | | 1,602,105 | |
| Shares | | | | | Value | |
| 2,000 | | Bio-Rad Laboratories, Inc. Class A * | | $ | 247,220 | |
| 14,800 | | Bio-Reference Laboratories, Inc. * (1) | | | 377,992 | |
| 17,000 | | C.R. Bard, Inc. | | | 2,276,980 | |
| 56,000 | | Catamaran Corp. * | | | 2,658,880 | |
| 63,000 | | Cerner Corp. * | | | 3,511,620 | |
| 6,200 | | Cooper Cos., Inc. (The) | | | 767,808 | |
| 6,000 | | DaVita HealthCare Partners, Inc. * | | | 380,220 | |
| 10,000 | | DENTSPLY International, Inc. | | | 484,800 | |
| 26,000 | | Edwards Lifesciences Corp. * | | | 1,709,760 | |
| 46,000 | | Express Scripts Holding Co. * | | | 3,231,040 | |
| 38,800 | | Henry Schein, Inc. * | | | 4,433,288 | |
| 24,000 | | IDEXX Laboratories, Inc. * | | | 2,552,880 | |
| 15,000 | | McKesson Corp. | | | 2,421,000 | |
| 14,000 | | Mednax, Inc. * | | | 747,320 | |
| 14,700 | | Mettler-Toledo International, Inc. * | | | 3,566,073 | |
| 6,500 | | MWI Veterinary Supply, Inc. * | | | 1,108,835 | |
| 17,800 | | Novo Nordisk A/S ADR | | | 3,288,728 | |
| 4,000 | | ResMed, Inc. (1) | | | 188,320 | |
| 23,000 | | Teva Pharmaceutical Industries Ltd. ADR | | | 921,840 | |
| 29,000 | | Thermo Fisher Scientific, Inc. | | | 3,229,150 | |
| 11,000 | | Universal Health Services, Inc. Class B | | | 893,860 | |
| 7,000 | | WellPoint, Inc. | | | 646,730 | |
| | | | | | 50,345,093 | |
| | | | | | | |
| | | INDUSTRIALS (27.6%) | | | | |
| 85,000 | | ABB Ltd. ADR * | | | 2,257,600 | |
| 25,300 | | Acuity Brands, Inc. | | | 2,765,796 | |
| 96,750 | | AMETEK, Inc. | | | 5,095,822 | |
| 39,200 | | AZZ, Inc. | | | 1,915,312 | |
| 59,800 | | Canadian National Railway Co. | | | 3,409,796 | |
| 31,000 | | Chicago Bridge & Iron Co. N.V. | | | 2,577,340 | |
| 35,000 | | CLARCOR, Inc. | | | 2,252,250 | |
| 10,000 | | Clean Harbors, Inc. * | | | 599,600 | |
| 61,000 | | Danaher Corp. | | | 4,709,200 | |
| 56,000 | | Donaldson Co., Inc. | | | 2,433,760 | |
| 26,000 | | EnerSys | | | 1,822,340 | |
| 14,800 | | Equifax, Inc. | | | 1,022,532 | |
| 18,000 | | Esterline Technologies Corp. * | | | 1,835,280 | |
| 30,000 | | Fastenal Co. | | | 1,425,300 | |
| 15,000 | | FedEx Corp. | | | 2,156,550 | |
| 12,000 | | Flowserve Corp. | | | 945,960 | |
| 16,000 | | General Dynamics Corp. | | | 1,528,800 | |
| 6,000 | | Graco, Inc. | | | 468,720 | |
| 29,062 | | HEICO Corp. | | | 1,684,143 | |
| 47,850 | | IDEX Corp. | | | 3,533,722 | |
| 12,600 | | IHS, Inc. Class A * | | | 1,508,220 | |
| 31,776 | | Iron Mountain, Inc. | | | 964,402 | |
| 9,000 | | ITT Corp. | | | 390,780 | |
See Notes to Financial Statements. |
| 10 |
| Shares | | | | | Value | |
| 33,000 | | J.B. Hunt Transport Services, Inc. | | $ | 2,550,900 | |
| 21,000 | | Kansas City Southern | | | 2,600,430 | |
| 38,000 | | Kirby Corp. * | | | 3,771,500 | |
| 5,000 | | L-3 Communications Holdings, Inc. | | | 534,300 | |
| 26,000 | | Lincoln Electric Holdings, Inc. | | | 1,854,840 | |
| 12,000 | | Oshkosh Corp. | | | 604,560 | |
| 33,000 | | Parker Hannifin Corp. | | | 4,245,120 | |
| 17,800 | | Precision Castparts Corp. | | | 4,793,540 | |
| 66,500 | | Republic Services, Inc. | | | 2,207,800 | |
| 9,000 | | Rockwell Automation, Inc. | | | 1,063,440 | |
| 54,000 | | Rollins, Inc. | | | 1,635,660 | |
| 36,000 | | Roper Industries, Inc. | | | 4,992,480 | |
| 50,700 | | Rush Enterprises, Inc. Class A * | | | 1,503,255 | |
| 1,000 | | Snap-on, Inc. | | | 109,520 | |
| 37,600 | | Stericycle, Inc. * | | | 4,367,992 | |
| 23,000 | | Teledyne Technologies, Inc. * | | | 2,112,780 | |
| 66,000 | | Toro Co. (The) | | | 4,197,600 | |
| 14,700 | | Towers Watson & Co. Class A | | | 1,875,867 | |
| 20,000 | | Union Pacific Corp. | | | 3,360,000 | |
| 31,000 | | United Technologies Corp. | | | 3,527,800 | |
| 15,700 | | Valmont Industries, Inc. (1) | | | 2,341,184 | |
| 12,600 | | W.W. Grainger, Inc. | | | 3,218,292 | |
| 42,800 | | Wabtec Corp. | | | 3,178,756 | |
| 67,600 | | Waste Connections, Inc. | | | 2,949,388 | |
| | | | | | 110,900,229 | |
| | | | | | | |
| | | INFORMATION TECHNOLOGY (10.3%) | | | | |
| 25,000 | | Accenture PLC Class A | | | 2,055,500 | |
| 19,400 | | Alliance Data Systems Corp. * | | | 5,100,842 | |
| 30,800 | | Amphenol Corp. Class A | | | 2,746,744 | |
| 9,700 | | Anixter International Inc. | | | 871,448 | |
| 60,000 | | ANSYS, Inc. * | | | 5,232,000 | |
| 17,000 | | Automatic Data Processing, Inc. | | | 1,373,770 | |
| 42,000 | | Cognizant Technology Solutions Corp. Class A * | | | 4,241,160 | |
| 14,600 | | Equinix, Inc. * | | | 2,590,770 | |
| 16,400 | | Fiserv, Inc. * | | | 968,420 | |
| 8,600 | | MasterCard, Inc. Class A | | | 7,184,956 | |
| 11,200 | | MICROS Systems, Inc. * | | | 642,544 | |
| 75,000 | | Salesforce.com, Inc. * | | | 4,139,250 | |
| 51,000 | | Trimble Navigation Ltd. * | | | 1,769,700 | |
| 3,800 | | Ultimate Software Group, Inc. (The) * | | | 582,236 | |
| 20,300 | | WEX, Inc. * | | | 2,010,309 | |
| | | | | | 41,509,649 | |
| Shares | | | | | Value | |
| | | MATERIALS (8.0%) | | | | |
| 15,000 | | Air Products & Chemicals, Inc. | | $ | 1,676,700 | |
| 8,000 | | Airgas, Inc. | | | 894,800 | |
| 3,600 | | Albemarle Corp. | | | 228,204 | |
| 30,700 | | AptarGroup, Inc. | | | 2,081,767 | |
| 20,000 | | Ball Corp. | | | 1,033,200 | |
| 11,800 | | BASF SE ADR (1) | | | 1,271,922 | |
| 4,000 | | Compass Minerals International, Inc. | | | 320,200 | |
| 29,000 | | Crown Holdings, Inc. * | | | 1,292,530 | |
| 1,200 | | Cytec Industries, Inc. | | | 111,792 | |
| 43,000 | | Ecolab, Inc. | | | 4,483,610 | |
| 40,000 | | FMC Corp. | | | 3,018,400 | |
| 6,600 | | NewMarket Corp. (1) | | | 2,205,390 | |
| 31,000 | | Praxair, Inc. | | | 4,030,930 | |
| 24,000 | | Rockwood Holdings, Inc. | | | 1,726,080 | |
| 20,200 | | Scotts Miracle-Gro Co. (The) Class A | | | 1,256,844 | |
| 30,000 | | Sigma-Aldrich Corp. | | | 2,820,300 | |
| 12,800 | | Syngenta AG ADR | | | 1,023,232 | |
| 39,000 | | Valspar Corp. (The) | | | 2,780,310 | |
| | | | | | 32,256,211 | |
| | | | | | | |
| | | TELECOMMUNICATION SERVICES (1.6%) | | | | |
| 36,000 | | Crown Castle International Corp. * | | | 2,643,480 | |
| 43,000 | | SBA Communications Corp. Class A * | | | 3,863,120 | |
| | | | | | 6,506,600 | |
| | | | | | | |
| | | UTILITIES (2.7%) | | | | |
| 165,600 | | Cia de Saneamento Basico do Estado de Sao Paulo ADR (1) | | | 1,877,904 | |
| 20,000 | | ITC Holdings Corp. | | | 1,916,400 | |
| 17,400 | | MDU Resources Group, Inc. | | | 531,570 | |
| 13,000 | | NextEra Energy, Inc. | | | 1,113,060 | |
| 32,000 | | ONEOK, Inc. | | | 1,989,760 | |
| 52,000 | | Questar Corp. | | | 1,195,480 | |
| 14,000 | | Sempra Energy | | | 1,256,640 | |
| 26,800 | | Wisconsin Energy Corp. | | | 1,107,912 | |
| | | | | | 10,988,726 | |
| | | | | | | |
| | | TOTAL COMMON STOCKS (Cost $188,819,815) (98.6%) | | | 396,539,636 | |
| Principal | | | | | | |
| Amount | | | | | Value | |
SHORT-TERM INVESTMENTS (4.7%) | | | | |
| | | | | | | | |
| | | | REPURCHASE AGREEMENTS (1.1%) | | | | |
| $ | 4,100,000 | | With Morgan Stanley, 0.01%, dated 12/31/13, due 01/02/14, delivery value $4,100,002 (collateralized by $4,175,000 U.S.Treasury Notes 1.000% due 03/31/17, with a value of $4,195,567) | | $ | 4,100,000 | |
| | | | JOINT REPURCHASE AGREEMENTS (INVESTMENTS OF CASH COLLATERAL FOR SECURITIES ON LOAN) (3.6%) | | | | |
| | 5,347,820 | | Joint Repurchase Agreement with Morgan Stanley, 0.02%, dated 12/31/13, due 01/02/14, delivery value $5,347,826 (collateralized by $5,454,778 U.S. Treasury Bonds 4.250% - 8.000% due 11/15/21 - 11/15/40 and U.S. Treasury Notes 2.625% - 2.750% due 11/15/20 - 11/15/23, with a value of $5,427,020) | | | 5,347,820 | |
| | 7,894,401 | | Joint Repurchase Agreement with Barclays, 0.01%, dated 12/31/13, due 01/02/14, delivery value $7,894,405 (collateralized by $8,052,300 U.S. Treasury Inflation Indexed Notes 1.250% - 1.875% due 04/15/14 - 07/15/15, with a value of $7,991,429) | | | 7,894,401 | |
| See Notes to Financial Statements. |
| 11 |
Schedule of Investments (continued) |
| Principal | | | | | | |
| Amount | | | | | Value | |
| $ | 1,273,290 | | Joint Repurchase Agreement with Citigroup, 0.01%, dated 12/31/13, due 01/02/14, delivery value $1,273,291 (collateralized by $1,298,770 U.S. Treasury Bills 0.000% due 02/20/14, with a value of $1,298,770) | | $ | 1,273,290 | |
| | | | | | | 14,515,511 | |
| | | | TOTAL SHORT-TERM INVESTMENTS
(Cost $18,615,511) (4.7%) | | | 18,615,511 | |
| Principal | | | | | | |
| Amount | | | | | Value | |
| | | | TOTAL INVESTMENT SECURITIES (103.3%) (Cost $207,435,326) | | $ | 415,155,147 | |
| | | | | |
| EXCESS OF LIABILITIES OVER CASH AND OTHER ASSETS (-3.3%) | | | (13,082,195 | ) |
| NET ASSETS (100%) | | $ | 402,072,952 | |
| | | | | |
| NET ASSET VALUE OFFERING AND REDEMPTION PRICE, PER OUTSTANDING SHARE ($402,072,952 ÷ 11,828,557 shares outstanding) | | $ | 33.99 | |
| * | Non-income producing. |
| (1) | A portion or all of the security was held on loan. As of December 31, 2013, the market value of the securities on loan was $15,893,168. |
| ADR | American Depositary Receipt. |
| REIT | Real Estate Investment Trust. |
The following table summarizes the inputs used to value the Fund’s investments in securities as of December 31, 2013 (See Note 1B):
| Value Line Premier Growth Fund, Inc. | | Level 1 | | | Level 2 | | | Level 3 | | | Total | |
| Assets: | | | | | | | | | | | | |
| Common Stocks | | $ | 396,539,636 | | | $ | — | | | $ | — | | | $ | 396,539,636 | |
| Short-Term Investment | | | — | | | | 18,615,511 | | | | — | | | | 18,615,511 | |
| Total | | $ | 396,539,636 | | | $ | 18,615,511 | | | $ | — | | | $ | 415,155,147 | |
See Notes to Financial Statements. |
| 12 |
| THE VALUE LINE FUND, INC. |
| |
| |
| INVESTMENT OBJECTIVE AND STRATEGY |
The Fund’s primary investment objective is long-term growth of capital. Current income is a secondary investment objective.
To achieve the Fund’s investment objectives the Advisor invests substantially all of the Fund’s net assets in common stocks. While the Fund is actively managed by the Adviser, the Adviser relies primarily on the rankings of companies by the Value Line Timeliness™ Ranking System (the “Ranking System”) in selecting securities for purchase or sale. The Fund’s investments principally are selected from common stocks ranked 1, 2 or 3 by the Ranking System at the time of purchase. The Adviser will determine the percentage of the Fund’s assets invested in each stock based on the stock’s relative attractiveness.
Manager Discussion of Fund Performance
Below, The Value Line Fund, Inc. portfolio manager Stephen E. Grant discusses the Fund’s performance and positioning for the 12 months ended December 31, 2013.
How did the Fund perform during the annual period?
The Fund generated a total return of 30.86% during the 12 months ended December 31, 2013. This compares to the 32.39% return of the Fund’s benchmark, the S&P 500® Index, during the same period.
What key factors were responsible for the Fund’s performance during the 12-month reporting period?
While the Fund generated robust double-digit absolute gains, its underperformance of the S&P 500® Index during the 12-month reporting period can be attributed primarily to holding a position in cash during a strong rally in the U.S. equity market. Stock selection and sector allocation overall provided mixed results.
Which equity market sectors most significantly affected Fund performance?
Stock selection in the health care sector detracted from the Fund’s performance during the annual period. A lesser exposure than the S&P 500® Index to the strongly performing biotechnology industry particularly dampened results. Having an underweighted allocation to the financials sector, which outpaced the S&P 500® Index during the annual period, and an overweighted position in the materials sector, which lagged the S&P 500® Index during the annual period, also detracted. Perhaps most significantly, holding an average 2% position in cash during a period when the U.S. equity market rallied hurt.
Offsetting these detractors were the positive contributions made by effective stock selection in the information technology, consumer staples and energy sectors, having an overweighted allocation in the strongly performing industrials sector, and having an underweighted allocation to the lagging energy sector.
Which stocks detracted significantly from the Fund’s performance during the annual period?
During the annual period, among the stocks that detracted most from the Fund’s relative performance were overweighted positions in several health care laggards. These included positions in cardiovascular device manufacturer Edwards Lifesciences, pharmacy benefits management services provider Catamaran and surgical systems manufacturer Intuitive Surgical.
What were some of the Fund’s best-performing individual stocks?
Among the individual stocks that contributed most to the Fund’s relative results were three sizable positions in the information technology sector—namely, Alliance Data Systems, which provides data-driven and transaction-based marketing and customer loyalty solutions; MasterCard, which is a global payment solutions company that provides a variety of services in support of the credit, debt and related payment programs of financial institutions; and Open Text, which provides intranet, extranet and corporate portal solutions to organizations. Avoiding several laggards in the information technology sector, such as Apple, IBM and Oracle, boosted the Fund’s results as well.
Several Fund positions in the industrials sector added value. Top contributors in the sector were inland tank barge fleet operator Kirby, construction and engineering services firm Chicago Bridge & Iron, flow control equipment manufacturer IDEX, food preparation equipment manufacturer Middleby and aerospace and defense company HEICO.
In the consumer staples sector, positions in brewer The Boston Beer Company, food products manufacturer Hormel Foods and bakery foods producer Flowers Foods were outstanding performers. We also successfully avoided positions in several giant-capitalization laggards during the annual period, including The Coca-Cola Company, Altria Group, The Wal-Mart Stores and Procter & Gamble.
How did the Fund use derivatives and similar instruments during the reporting period?
The Fund did not use derivatives during the reporting period.
Did the Fund make any significant purchases or sales during the fiscal year?
In our view, the Fund was under-represented in the energy sector, so to enhance diversification, we were glad to identify two stocks that we believed well deserved to be in the portfolio—Chevron, one of the world’s largest integrated oil companies, and EQT, an integrated energy company with emphasis on Appalachian area natural gas supply, transmission and distribution. Both companies had inconsistent results prior to 2003, but over the past decade have demonstrated the ability to consistently grow their earnings and stock price. In each case, we purchased shares as a dip in their respective share prices offered what we believed to be an attractive entry point.
We initiated a Fund position in insurance company Prudential because, in our view, its earnings and stock price appeared to be back on a good growth track after struggling in the wake of the country’s financial crisis.
We reduced the Fund’s position in rail freight transportation company Union Pacific, taking profits after a strong run. We eliminated the Fund’s position in leather goods retailer Coach, as the company reported worse than expected earnings results. We sold the Fund’s position in food retailer Harris Teeter Supermarkets after its stock rose in response to a takeover bid by competitor Kroger.
Were there any notable changes in the Fund’s weightings during the 12-month period?
There were no material changes in the Fund’s sector weightings during the 12-month period ended December 31, 2013.
How was the Fund positioned relative to its benchmark index at the end of December 2013?
As of December 31, 2013, the Fund was overweighted relative to the S&P 500® Index in the industrials, consumer discretionary and materials sectors. The Fund was underweighted relative to the S&P 500® Index in the energy, financials and information technology sectors and rather neutrally weighted relative to the Index in the health care, consumer staples, utilities and telecommunication services sectors on the same date.
What is your tactical view and strategy for the months ahead?
Calendar year 2013 saw lower quality stocks outperform higher quality stocks, as investors became more bold and more confident in the economy and the financial system. Speculative stocks, such as those of biotechnology companies, and Initial Public Offerings, such as those of Facebook and Twitter, outperformed the broad U.S. equity market, along with the more cyclical, economically-sensitive stocks. Lagging were the more consistent, “steady-eddy,” long-term growth stocks in which we traditionally invest, i.e., those companies that have established strongholds in their market or market niche through proprietary products or services, which, in our view, gives them greater control of their own destiny and makes them less subject to ups and downs of the economy. We consider the Fund’s underperformance of the S&P 500® Index in 2013 as part of the natural ebb and flow of the market, as the lower quality stocks that performed poorly in 2011 and 2012 regained some ground. We do not know whether the trends of 2013 will continue into the new year, but, regardless of market trends and conditions, we do not intend to vary from our strategy of investing in high quality securities with a long-term perspective. Our portfolio turnover and trading costs have remained lower than many of our peers, as we have patience with a consistent grower until a change in the company’s strategy or its earnings and stock performance give solid reason to sell.
As always, we intend to stay true to our time-tested investment discipline going forward.
| The Value Line Fund, Inc. |
| Portfolio Highlights at December 31, 2013 (unaudited) |
Ten Largest Holdings
| | | | | | | | | | | | | |
| | | | | | | | | | | Percentage of |
| Issue | | Shares | | | Value | | | Net Assets |
| Rollins, Inc. | | | 75,600 | | | $ | 2,289,924 | | | | 1.8 | % |
| Alliance Data Systems Corp. | | | 8,300 | | | | 2,182,319 | | | | 1.7 | % |
| TJX Companies, Inc. (The) | | | 32,000 | | | | 2,039,360 | | | | 1.6 | % |
| AMETEK, Inc. | | | 36,750 | | | | 1,935,622 | | | | 1.5 | % |
| MasterCard, Inc. Class A | | | 2,300 | | | | 1,921,558 | | | | 1.5 | % |
| AutoZone, Inc. | | | 4,000 | | | | 1,911,760 | | | | 1.5 | % |
| Yum! Brands, Inc. | | | 24,800 | | | | 1,875,128 | | | | 1.5 | % |
| Affiliated Managers Group, Inc. | | | 8,000 | | | | 1,735,040 | | | | 1.4 | % |
| Church & Dwight Co., Inc. | | | 26,000 | | | | 1,723,280 | | | | 1.4 | % |
| Roper Industries, Inc. | | | 12,400 | | | | 1,719,632 | | | | 1.4 | % |
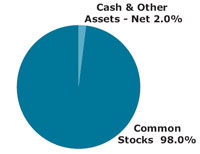
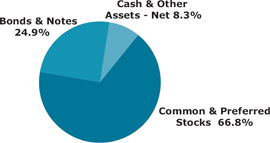
Asset Allocation – Percentage of Net Assets
| Sector Weightings – Percentage of Total Investment Securities* |
*Sector weightings exclude short-term investments.
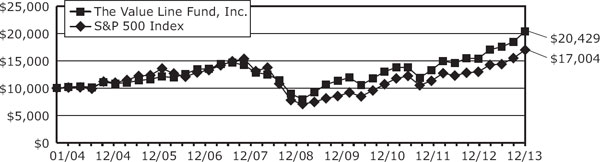
The following graph compares the performance of The Value Line Fund, Inc. to that of the S&P 500 Index (the “Index”). The Value Line Fund, Inc. is a professionally managed mutual fund, while the Index is not available for investment and is unmanaged. The returns for the Index do not reflect charges, expenses or taxes, but do include the reinvestment of dividends. The comparison is shown for illustrative purposes only.
| |
| Comparison of a Change in Value of a $10,000 Investment in The Value Line Fund, Inc. and the S&P 500 Index* |
| |
|
| | | | | | | | |
| Performance Data: ** | | | | | | | |
| | | | | | | | |
| | | Average Annual | | | Growth of an Assumed | |
| | | Total Return | | | Investment of $10,000 | |
| 1 year ended 12/31/13 | | 30.86 | % | | | $13,086 | |
| 5 years ended 12/31/13 | | 16.87 | % | | | $21,800 | |
| 10 years ended 12/31/13 | | 5.45 | % | | | $17,004 | |
| * | The Standard and Poor’s 500 Stock Index is an unmanaged index that is representative of the larger-capitalization stocks traded in the United States. |
| ** | The performance data quoted represent past performance and are no guarantee of future performance. The average annual total returns and growth of an assumed investment of $10,000 include dividends reinvested and capital gains distributions accepted in shares. The investment return and principal value of an investment will fluctuate so that an investment, when redeemed, may be worth more or less than its original cost. The performance data and graph do not reflect the deduction of taxes that a shareholder would pay on fund distributions or the redemption of fund shares. |
| The Value Line Fund, Inc. | |
| Schedule of Investments | December 31, 2013 |
| | | | | | | |
| Shares | | | | | Value | |
| COMMON STOCKS (98.0%) | | | | |
| | | | | | | |
| | | CONSUMER DISCRETIONARY (13.2%) | | | | |
| 4,000 | | AutoZone, Inc. * | | $ | 1,911,760 | |
| 13,600 | | BorgWarner, Inc. | | | 760,376 | |
| 22,400 | | Brinker International, Inc. | | | 1,038,016 | |
| 6,000 | | Buckle, Inc. (The) (1) | | | 315,360 | |
| 7,600 | | Buffalo Wild Wings, Inc. * | | | 1,118,720 | |
| 12,300 | | Dick’s Sporting Goods, Inc. | | | 714,630 | |
| 7,000 | | Domino’s Pizza, Inc. | | | 487,550 | |
| 8,700 | | Gildan Activewear, Inc. | | | 463,797 | |
| 33,000 | | LKQ Corp. * | | | 1,085,700 | |
| 15,300 | | McDonald’s Corp. | | | 1,484,559 | |
| 10,000 | | NIKE, Inc. Class B | | | 786,400 | |
| 3,200 | | O’Reilly Automotive, Inc. * | | | 411,872 | |
| 10,400 | | Penn National Gaming, Inc. * | | | 149,032 | |
| 9,300 | | Starbucks Corp. | | | 729,027 | |
| 32,000 | | TJX Companies, Inc. (The) | | | 2,039,360 | |
| 10,400 | | VF Corp. | | | 648,336 | |
| 16,800 | | Wolverine World Wide, Inc. | | | 570,528 | |
| 24,800 | | Yum! Brands, Inc. | | | 1,875,128 | |
| | | | | | 16,590,151 | |
| | | | | | | |
| | | CONSUMER STAPLES (10.8%) | | | | |
| 3,100 | | Boston Beer Co., Inc. (The) Class A * | | | 749,549 | |
| 4,900 | | British American Tobacco PLC ADR | | | 526,358 | |
| 4,000 | | Bunge Ltd. | | | 328,440 | |
| 11,400 | | Casey’s General Stores, Inc. | | | 800,850 | |
| 26,000 | | Church & Dwight Co., Inc. | | | 1,723,280 | |
| 7,000 | | Costco Wholesale Corp. | | | 833,070 | |
| 7,500 | | Energizer Holdings, Inc. | | | 811,800 | |
| 40,500 | | Flowers Foods, Inc. | | | 869,535 | |
| 19,000 | | General Mills, Inc. | | | 948,290 | |
| 33,000 | | Hormel Foods Corp. | | | 1,490,610 | |
| 15,700 | | Ingredion, Inc. | | | 1,074,822 | |
| 18,100 | | J&J Snack Foods Corp. | | | 1,603,479 | |
| 9,000 | | PepsiCo, Inc. | | | 746,460 | |
| 6,000 | | Reynolds American, Inc. | | | 299,940 | |
| 12,000 | | Whole Foods Market, Inc. | | | 693,960 | |
| | | | | | 13,500,443 | |
| | | ENERGY (3.2%) | | | | |
| 6,000 | | Chevron Corp. | | | 749,460 | |
| 2,000 | | Core Laboratories N.V. | | | 381,900 | |
| 14,000 | | Enbridge, Inc. | | | 611,520 | |
| 10,000 | | EQT Corp. | | | 897,800 | |
| 5,600 | | FMC Technologies, Inc. * | | | 292,376 | |
| 13,400 | | Noble Energy, Inc. | | | 912,674 | |
| 2,600 | | Oceaneering International, Inc. | | | 205,088 | |
| | | | | | 4,050,818 | |
| | | | | | | |
| | | FINANCIALS (6.6%) | | | | |
| 8,000 | | Affiliated Managers Group, Inc. * | | | 1,735,040 | |
| 20,000 | | AFLAC, Inc. | | | 1,336,000 | |
| | | | | | | |
| Shares | | | | | Value | |
| 9,000 | | American Tower Corp. REIT | | $ | 718,380 | |
| 3,000 | | BlackRock, Inc. | | | 949,410 | |
| 500 | | Everest Re Group Ltd. | | | 77,935 | |
| 10,400 | | Gaming and Leisure Properties, Inc. REIT * | | | 528,424 | |
| 6,300 | | M&T Bank Corp. (1) | | | 733,446 | |
| 4,400 | | MetLife, Inc. | | | 237,248 | |
| 2,000 | | PartnerRe Ltd. | | | 210,860 | |
| 5,000 | | Prudential Financial, Inc. | | | 461,100 | |
| 8,000 | | Royal Bank of Canada | | | 537,840 | |
| 4,900 | | Stifel Financial Corp. * | | | 234,808 | |
| 6,600 | | T. Rowe Price Group, Inc. | | | 552,882 | |
| | | | | | 8,313,373 | |
| | | | | | | |
| | | HEALTH CARE (12.1%) | | | | |
| 11,600 | | Alexion Pharmaceuticals, Inc. * | | | 1,543,496 | |
| 9,600 | | Allergan, Inc. | | | 1,066,368 | |
| 5,800 | | C.R. Bard, Inc. | | | 776,852 | |
| 13,740 | | Catamaran Corp. * | | | 652,375 | |
| 20,400 | | Cerner Corp. * | | | 1,137,096 | |
| 800 | | Cooper Cos., Inc. (The) | | | 99,072 | |
| 1,500 | | DaVita HealthCare Partners, Inc. * | | | 95,055 | |
| 3,900 | | DENTSPLY International, Inc. | | | 189,072 | |
| 6,000 | | Edwards Lifesciences Corp. * | | | 394,560 | |
| 15,340 | | Express Scripts Holding Co * | | | 1,077,482 | |
| 12,700 | | Henry Schein, Inc. * | | | 1,451,102 | |
| 5,400 | | IDEXX Laboratories, Inc. * | | | 574,398 | |
| 4,800 | | McKesson Corp. | | | 774,720 | |
| 16,800 | | Mednax, Inc. * | | | 896,784 | |
| 4,700 | | Mettler-Toledo International, Inc. * | | | 1,140,173 | |
| 9,100 | | Novo Nordisk A/S ADR | | | 1,681,316 | |
| 10,000 | | Teva Pharmaceutical Industries Ltd. ADR | | | 400,800 | |
| 10,200 | | Thermo Fisher Scientific, Inc. | | | 1,135,770 | |
| 1,400 | | Universal Health Services, Inc. Class B | | | 113,764 | |
| | | | | | 15,200,255 | |
| | | | | | | |
| | | INDUSTRIALS (28.5%) | | | | |
| 7,800 | | Acuity Brands, Inc. | | | 852,696 | |
| 36,750 | | AMETEK, Inc. | | | 1,935,622 | |
| 22,200 | | Canadian National Railway Co. | | | 1,265,844 | |
| 800 | | Canadian Pacific Railway Ltd. | | | 121,056 | |
| 10,000 | | Chicago Bridge & Iron Co. N.V. | | | 831,400 | |
| 15,000 | | CLARCOR, Inc. | | | 965,250 | |
| 6,000 | | Clean Harbors, Inc. * | | | 359,760 | |
| 20,700 | | Danaher Corp. | | | 1,598,040 | |
| 31,000 | | Donaldson Co., Inc. | | | 1,347,260 | |
| 4,800 | | Equifax, Inc. | | | 331,632 | |
| 2,400 | | Esterline Technologies Corp. * | | | 244,704 | |
| 8,000 | | Fastenal Co. | | | 380,080 | |
| 7,000 | | FedEx Corp. | | | 1,006,390 | |
| | | | | | | |
| Shares | | | | | Value | |
| 7,900 | | General Dynamics Corp. | | $ | 754,845 | |
| 7,300 | | Graco, Inc. | | | 570,276 | |
| 13,983 | | HEICO Corp. | | | 810,315 | |
| 15,000 | | IDEX Corp. | | | 1,107,750 | |
| 3,500 | | IHS, Inc. Class A * | | | 418,950 | |
| 5,850 | | ITT Corp. | | | 254,007 | |
| 6,800 | | J.B. Hunt Transport Services, Inc. | | | 525,640 | |
| 8,200 | | Kansas City Southern | | | 1,015,406 | |
| 14,700 | | Kirby Corp. * | | | 1,458,975 | |
| 5,400 | | L-3 Communications Holdings, Inc. | | | 577,044 | |
| 2,000 | | Lincoln Electric Holdings, Inc. | | | 142,680 | |
| 2,300 | | Middleby Corp. (The) * | | | 551,931 | |
| 2,500 | | Oshkosh Corp. | | | 125,950 | |
| 9,200 | | Parker Hannifin Corp. | | | 1,183,488 | |
| 5,700 | | Precision Castparts Corp. | | | 1,535,010 | |
| 19,000 | | Republic Services, Inc. | | | 630,800 | |
| 2,800 | | Rockwell Automation, Inc. | | | 330,848 | |
| 75,600 | | Rollins, Inc. | | | 2,289,924 | |
| 12,400 | | Roper Industries, Inc. | | | 1,719,632 | |
| 12,000 | | Stericycle, Inc. * | | | 1,394,040 | |
| 15,600 | | Toro Co. (The) | | | 992,160 | |
| 4,800 | | Union Pacific Corp. | | | 806,400 | |
| 11,400 | | United Technologies Corp. | | | 1,297,320 | |
| 5,600 | | Valmont Industries, Inc. | | | 835,072 | |
| 4,900 | | W.W. Grainger, Inc. | | | 1,251,558 | |
| 10,500 | | Wabtec Corp. | | | 779,835 | |
| 25,300 | | Waste Connections, Inc. | | | 1,103,839 | |
| | | | | | 35,703,429 | |
| | | | | | | |
| | | INFORMATION TECHNOLOGY (10.9%) | | | | |
| 17,800 | | Accenture PLC Class A | | | 1,463,516 | |
| 8,300 | | Alliance Data Systems Corp. * | | | 2,182,319 | |
| 7,000 | | Amphenol Corp. Class A | | | 624,260 | |
| 3,700 | | Anixter International, Inc. | | | 332,408 | |
| 13,500 | | ANSYS, Inc. * | | | 1,177,200 | |
| 6,500 | | Automatic Data Processing, Inc. | | | 525,265 | |
| 16,000 | | Cognizant Technology Solutions Corp. Class A * | | | 1,615,680 | |
| 3,500 | | Equinix, Inc. * | | | 621,075 | |
| 5,400 | | Fiserv, Inc. * | | | 318,870 | |
| 2,300 | | MasterCard, Inc. Class A | | | 1,921,558 | |
| 2,800 | | MICROS Systems, Inc. * | | | 160,636 | |
| 8,800 | | Open Text Corp. | | | 809,248 | |
| 24,000 | | Salesforce.com, Inc. * | | | 1,324,560 | |
| 6,100 | | WEX, Inc. * | | | 604,083 | |
| | | | | | 13,680,678 | |
| | | | | | | |
| | | MATERIALS (9.3%) | | | | |
| 3,000 | | Airgas, Inc. | | | 335,550 | |
| 12,000 | | Ball Corp. | | | 619,920 | |
| 25,600 | | Crown Holdings, Inc. * | | | 1,140,992 | |
| 12,000 | | Ecolab, Inc. | | | 1,251,240 | |
| 22,400 | | FMC Corp. | | | 1,690,304 | |
| 2,000 | | NewMarket Corp. | | | 668,300 | |
| 10,000 | | Packaging Corp. of America | | | 632,800 | |
| 10,300 | | Praxair, Inc. | | | 1,339,309 | |
See Notes to Financial Statements. |
| 17 |
| Schedule of Investments (continued) |
| | | | | | | |
| Shares | | | | | Value | |
| 12,000 | | Scotts Miracle-Gro Co. (The) Class A | | $ | 746,640 | |
| 11,400 | | Sigma-Aldrich Corp. | | | 1,071,714 | |
| 25,900 | | Silgan Holdings, Inc. | | | 1,243,718 | |
| 12,400 | | Valspar Corp. (The) | | | 883,996 | |
| | | | | | 11,624,483 | |
| | | | | | | |
| | | TELECOMMUNICATION SERVICES (0.8%) | | | | |
| 13,000 | | Crown Castle International Corp. * | | | 954,590 | |
| | | | | | | |
| | | UTILITIES (2.6%) | | | | |
| 10,000 | | ITC Holdings Corp. | | | 958,200 | |
| 4,000 | | NextEra Energy, Inc. | | | 342,480 | |
| 15,000 | | ONEOK, Inc. | | | 932,700 | |
| 23,000 | | Questar Corp. | | | 528,770 | |
| 10,900 | | Wisconsin Energy Corp. | | | 450,606 | |
| | | | | | 3,212,756 | |
| | | | | | | |
| | | TOTAL COMMON STOCKS
(Cost $65,914,055) (98.0%) | | | 122,830,976 | |
| | | | | | | | |
| Principal | | | | | | |
| Amount | | | | | Value | |
| SHORT-TERM INVESTMENTS (2.0%) | | | | |
| | | | | | | | |
| | | | REPURCHASE AGREEMENTS (1.2%) | | | | |
| $ | 1,500,000 | | With Morgan Stanley, 0.01%, dated 12/31/13, due 01/02/14, delivery value $1,500,001 (collateralized by $1,530,000 U.S. Treasury Notes 1.000% due 03/31/17, with a value of $1,537,537) | | $ | 1,500,000 | |
| | | | | | | | |
| Principal | | | | | | |
| Amount | | | | | Value | |
| | | | JOINT REPURCHASE AGREEMENTS (INVESTMENTS OF CASH COLLATERAL FOR SECURITIES ON LOAN) (0.8%) | | | | |
| $ | 352,513 | | Joint Repurchase Agreement with Morgan Stanley, 0.02%, dated 12/31/13, due 01/02/14, delivery value $352,514 (collateralized by $359,564 U.S. Treasury Bonds 4.250% - 8.000% due 11/15/21 - 11/15/40 and U.S. Treasury Notes 2.625% - 2.750% due 11/15/20 - 11/15/23, with a value of $357,734) | | $ | 352,513 | |
| | 520,377 | | Joint Repurchase Agreement with Barclays, 0.01%, dated 12/31/13, due 01/02/14, delivery value $520,377 (collateralized by $530,785 U.S. Treasury Inflation Indexed Notes 1.250% - 1.875% due 04/15/14 - 07/15/15, with a value of $526,773) | | | 520,377 | |
| | | | | | | | |
| Principal | | | | |
| Amount | | | Value | |
| $ | 83,932 | | Joint Repurchase Agreement with Citigroup, 0.01%, dated 12/31/13, due 01/02/14, delivery value $83,932 (collateralized by $85,611 U.S. Treasury Bills 0.000% due 02/20/14, with a value of $85,611) | | $ | 83,932 | |
| | | | | | | 956,822 | |
| | | | | | | | |
| | | | TOTAL SHORT-TERM INVESTMENTS (Cost $2,456,822) (2.0%) | | | 2,456,822 | |
| | | | | | | | |
| | | | TOTAL INVESTMENT SECURITIES (100.0%) (Cost $68,370,877) | | $ | 125,287,798 | |
| | | | | |
EXCESS OF LIABILITIES OVER CASH AND OTHER ASSETS (0.0%) | | | (19,763 | ) |
| | $ | 125,268,035 | |
| | | | | | | | |
NET ASSET VALUE OFFERING AND REDEMPTION PRICE, PER OUTSTANDING SHARE ($125,268,035 ÷ 9,278,231 shares outstanding) | | $ | 13.50 | |
| | |
| * | Non-income producing. |
| (1) | A portion or all of the security was held on loan. As of December 31, 2013, the market value of the securities on loan was $1,048,806. |
| ADR | American Depositary Receipt. |
| REIT | Real Estate Investment Trust. |
The following table summarizes the inputs used to value the Fund’s investments in securities as of December 31, 2013 (See Note 1B):
| | | | | | | | | | | | | |
| The Value Line Fund, Inc. | | Level 1 | | | Level 2 | | | Level 3 | | | Total | |
| Assets: | | | | | | | | | | | | |
| Common Stocks | | $ | 122,830,976 | | | $ | — | | | $ | — | | | $ | 122,830,976 | |
| Short-Term Investments | | | — | | | | 2,456,822 | | | | — | | | | 2,456,822 | |
| Total | | $ | 122,830,976 | | | $ | 2,456,822 | | | $ | — | | | $ | 125,287,798 | |
See Notes to Financial Statements. |
| 18 |
| VALUE LINE INCOME AND GROWTH FUND, INC. |
| |
| |
| INVESTMENT OBJECTIVE AND STRATEGY |
The Fund’s primary investment objective is income, as high and dependable as is consistent with reasonable risk. Capital growth to increase total return is a secondary objective.
To achieve the Fund’s goals, the Adviser invests not less than 50% of the Fund’s net assets in common or preferred stocks or securities convertible into common stock which may or may not pay dividends. The balance of the Fund’s net assets are primarily invested in U.S. government securities, money market securities and investment grade debt securities rated at the time of purchase from the highest (AAA) to medium (BBB) quality. Although the Fund can invest in companies of any size, it generally invests in U.S. securities issued by larger, more established companies (those with a market capitalization of more than $5 billion).
| |
Manager Discussion of Fund Performance |
Below, Value Line Income and Growth Fund, Inc. portfolio managers Mark T. Spellman and Liane Rosenberg discuss the Fund’s performance and positioning for the 12 months ended December 31, 2013.
How did the Fund perform during the annual period?
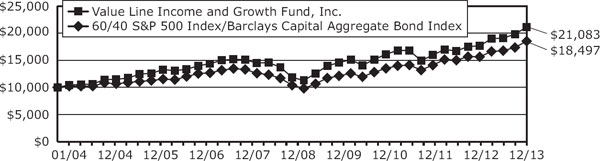
The Fund generated a total return of 19.55% during the 12 months ended December 31, 2013. This compares to the 18.62% return of the Fund’s blended benchmark, comprised 60% of the S&P 500® Index and 40% of the Barclays U.S. Aggregate Bond Index (the “Barclays Index”), during the same period.
What key factors were responsible for the Fund’s performance during the 12-month reporting period?
The Fund benefited most from effective asset allocation. Throughout the 12-month reporting period, the Fund was underweighted fixed income and overweighted equities. With U.S. equities, as measured by the S&P 500® Index, up 32.39% during the annual period, and bonds, as measured by the Barclays Index, posting a return of -2.02%, this asset allocation clearly added value. Stock selection overall within the equity portion of the Fund also proved beneficial.
Which equity market sectors most significantly affected Fund performance?
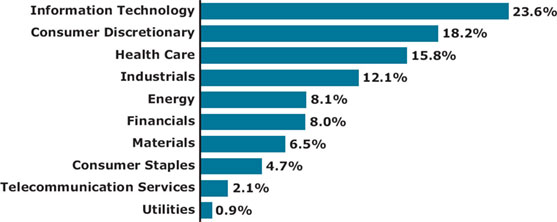
Stock selection in the information technology, industrials, utilities and health care sectors contributed most positively to the Fund’s results. The Fund also benefited from having underweighted allocations to the information technology and energy sectors, which each lagged the S&P 500® Index during the annual period, and from having an overweighted allocation to the industrials sector, which outpaced the S&P 500® Index during the annual period.
Only partially offsetting these positive contributors was stock selection in the consumer discretionary and energy sectors, which detracted. Having an overweighted allocation to utilities, which lagged the S&P 500® Index during the annual period, and having underweighted exposures to the consumer discretionary and health care sectors, which outpaced the broad U.S. equity market during the annual period, also hurt.
What were some of the Fund’s best-performing individual stocks?
Contributing most to the Fund’s relative results were retail food and drug chain operator Safeway, financial services provider Charles Schwab and construction and engineering services firm Chicago Bridge & Iron. Safeway performed well, as its restructuring program added value and its store performance improved. Shares of Charles Schwab rose, as its fee revenue and market share increased with the stock market’s rally. Chicago Bridge & Iron’s shares rose significantly, as its bookings for new construction projects rose and as its acquisition of a competitor positively impacted its results.
Which stocks detracted significantly from the Fund’s performance during the annual period?
During the annual period, the stocks that detracted most from the Fund’s performance were Canadian gold producer Yamana Gold, data storage center real estate investment trust (REIT) Digital Realty Trust and offshore oil and gas drilling contractor Diamond Offshore Drilling. Shares of Yamana Gold fell significantly reflecting the precipitous decline in the price of gold bullion. Digital Realty Trust performed poorly along with the broad REIT industry. The company also posted less than expected operating results. Diamond Offshore Drilling saw its shares decline due to poor fundamentals in offshore drilling as well as company-specific shortfalls.
Did the equity portion of the Fund make any significant purchases or sales?
During the fiscal year, we initiated positions in semiconductor device manufacturer Qualcomm, specialty pharmaceuticals company Allergan and Canadian telecommunications carrier BCE. We established a position in Qualcomm when the stock declined after an earnings disappointment, and we considered it an attractive entry point based on a longer-term perspective. We purchased Allergan after a dip in its share price, as we felt the fundamental outlook for the company was positive and the market had overreacted to news that it was delaying final studies for drugs to treat age-related macular degeneration and baldness. We initiated a position in BCE, as we believe its dividend yield is attractive and its shares, at the time of purchase, undervalued.
We sold the Fund’s position in integrated utilities company The Southern Company, as we became increasingly bearish on the outlook for this stock and on electric utilities in general. We exited the Fund’s position in clinical laboratory test provider Laboratory Corporation of America, after it hit the price target we had established for the company.
Were there any notable changes in the equity portion of the Fund’s weightings during the 12-month period?
During the annual period, we decreased weightings in the utilities sector and in the REITs industry, and we increased positions in the information technology and financials sectors.
How was the equity portion of the Fund positioned relative to its benchmark index at the end of December 2013?
As of December 31, 2013, the Fund was overweighted relative to the S&P 500® Index in the industrials, utilities, financials, telecommunication services and consumer staples sectors. The Fund was underweighted relative to the S&P 500® Index in the consumer discretionary, materials, information technology, energy and health care sectors on the same date.
What was the duration strategy of the fixed income portion of the Fund?
We kept the fixed income portion of the Fund’s duration short relative to that of the Barclays Index. As interest rates rose, this duration positioning contributed positively to relative results.
Which fixed income market segments most significantly affected Fund performance?
Overall, the fixed income portion of the Fund underperformed its benchmark, the Barclays Index. Detracting most from relative results was security selection within the securitized sector. Within the securitized sector, we held an overweighted allocation to seven-year to 10-year maturities. The flattening yield curve benefited shorter-term and longer-term maturities, where the Fund was underweight, but hurt the intermediate segment of the yield curve.
Conversely, having an underweighted allocation to U.S. Treasuries, the worst performing sector in the Barclays Index during the annual period, contributed most positively to the fixed income portion of the Fund’s performance. An overweighted allocation to corporate bonds also added value, as this sector experienced steady spread tightening throughout the year. Within the Fund’s corporate bond allocation, a heavier weighting in bonds of financial institutions proved beneficial.
Were there any notable changes in the fixed income portion of the Fund’s weightings during the 12-month period?
The most significant sector shifts in the fixed income portion of the Fund were a reduction in U.S. Treasuries and an increase in corporate bonds, both investment grade and high yield.
How was the fixed income portion of the Fund positioned relative to its benchmark index at the end of December 2013?
As of December 31, 2013, the fixed income portion of the Fund was overweight relative to the Barclays Index in corporate bonds. The Fund was underweight relative to the Barclays Index in U.S. Treasuries and government-related securities and was rather neutrally weighted to the benchmark index in the securitized sector on the same date.
How did the Fund’s overall asset allocation shift from beginning to end of the annual period?
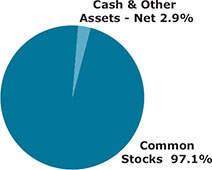
At the end of December 2012, the Fund had a weighting of 63% in stocks, 4% in bonds convertible into common stocks, 28% in fixed income securities and 3% in cash equivalents. By mid-year 2013, cash levels began to rise due to net sales in the equity portion of the Fund, as stock-specific price targets were hit and shares sold to take profits. Due primarily to market appreciation and depreciation, at the end of December 2013, the Fund had a weighting of 66% in stocks, 4% in bonds convertible into common stocks, 22% in fixed income securities and 8% in cash equivalents.
How did the Fund use derivatives and similar instruments during the reporting period?
During the reporting period, the Fund made limited use of covered equity call writing as a method of generating additional income for the Fund. Covered equity call writing is an options strategy whereby an investor holds a long position in an asset and writes, or sells, call options on that same asset in an attempt to generate increased income from the asset.
What is your tactical view and strategy for the months ahead?
Our view ahead for the U.S. equity market was a bit more cautious at the end of 2013 than it was at the start of the year, but we continued to believe many opportunities remain to purchase quality stocks with historically high dividend yields, relatively low payout ratios, good balance sheets and cash flow generation, and a track record of consistently raising their dividends. We remained comfortable at the end of the annual period with the Fund’s underweighted allocation to fixed income, as we saw better return potential in other asset classes.
As always, our goal is to preserve capital in the near term while generating solid total return (i.e., income plus capital appreciation) over the long term and across economic cycles.
Value Line Income and Growth Fund, Inc. Portfolio Highlights at December 31, 2013 (unaudited) |
| |
| Ten Largest Holdings |
| | | | | | | | | Percentage of |
| Issue | | Shares | | | Value | | | Net Assets |
| Google, Inc. Class A | | | 3,900 | | | $ | 4,370,769 | | | | 1.3 | % |
| Raytheon Co. | | | 38,900 | | | | 3,528,230 | | | | 1.1 | % |
| Intel Corp. | | | 129,000 | | | | 3,348,840 | | | | 1.0 | % |
| Exxon Mobil Corp. | | | 33,000 | | | | 3,339,600 | | | | 1.0 | % |
| Johnson & Johnson | | | 36,100 | | | | 3,306,399 | | | | 1.0 | % |
| JPMorgan Chase & Co. | | | 55,600 | | | | 3,251,488 | | | | 1.0 | % |
| Microsoft Corp. | | | 84,800 | | | | 3,174,064 | | | | 1.0 | % |
| Charles Schwab Corp. (The) | | | 120,000 | | | | 3,120,000 | | | | 0.9 | % |
| Discover Financial Services | | | 54,500 | | | | 3,049,275 | | | | 0.9 | % |
| Chicago Bridge & Iron Co. N.V. | | | 35,000 | | | | 2,909,900 | | | | 0.9 | % |
Asset Allocation – Percentage of Net Assets
| Sector Weightings – Percentage of Total Investment Securities* |
*Sector weightings exclude short-term investments.
The following graph compares the performance of the Value Line Income and Growth Fund, Inc. to that of the 60/40 S&P 500 Index/Barclays Capital Aggregate Bond Index, (the “Index”). The Value Line Income and Growth Fund, Inc. is a professionally managed mutual fund, while the Index is not available for investment and is unmanaged. The returns for the Index do not reflect charges, expenses or taxes, but do include the reinvestment of dividends. The comparison is shown for illustrative purposes only.
| Comparison of a Change in Value of a $10,000 Investment in the Value Line Income and Growth Fund, Inc. and 60/40 S&P 500 Index/Barclays Capital Aggregate Bond Index* |
| Performance Data: ** | | | | | | | |
| | | | | | | |
| | | Average Annual | | | Growth of an Assumed | |
| | | Total Return | | | Investment of $10,000 | |
| 1 year ended 12/31/13 | | 19.55 | % | | | $11,955 | |
| 5 years ended 12/31/13 | | 12.26 | % | | | $17,829 | |
| 10 years ended 12/31/13 | | 7.74 | % | | | $21,083 | |
| * | The 60/40 S&P 500 Index/Barclays Capital Aggregate Bond Index is an unmanaged custom Index that is representative of 60% weighting of the S&P 500 Index which consists of larger-capitalization stocks traded in the United States and a 40% weighting of the Barclays Capital Aggregate Bond Index which consists of investment grade, U.S. dollar denominated, fixed-rate taxable bond market, including Treasuries, government-related and corporate securities, MBS (agency fixed-rate and hybrid ARM pass-through’s) ABS, and CMBS. |
| ** | The performance data quoted represent past performance and are no guarantee of future performance. The average annual total returns and growth of an assumed investment of $10,000 include dividends reinvested and capital gains distributions accepted in shares. The investment return and principal value of an investment will fluctuate so that an investment, when redeemed, may be worth more or less than its original cost. The performance data and graph do not reflect the deduction of taxes that a shareholder would pay on fund distributions or the redemption of fund shares. |
Value Line Income and Growth Fund, Inc. Schedule of Investments |
| | | | | | | | |
| Shares | | | | | Value | |
| COMMON STOCKS (66.1%) | | | | |
| | | | | | | | |
| | | | CONSUMER DISCRETIONARY (6.7%) | | | | |
| | 25,300 | | Brinker International, Inc. | | $ | 1,172,402 | |
| | 40,000 | | Comcast Corp. Class A | | | 1,995,200 | |
| | 30,200 | | DIRECTV * | | | 2,086,518 | |
| | 5,494 | | General Motors Co. * | | | 224,540 | |
| | 13,600 | | Home Depot, Inc. | | | 1,119,824 | |
| | 29,000 | | Las Vegas Sands Corp. | | | 2,287,230 | |
| | 39,000 | | Lowe’s Cos., Inc. | | | 1,932,450 | |
| | 28,300 | | McDonald’s Corp. | | | 2,745,949 | |
| | 97,600 | | Staples, Inc. | | | 1,550,864 | |
| | 25,400 | | Target Corp. | | | 1,607,058 | |
| | 12,700 | | Time Warner Cable, Inc. | | | 1,720,850 | |
| | 27,200 | | TJX Companies, Inc. (The) | | | 1,733,456 | |
| | 24,400 | | Walt Disney Co. (The) | | | 1,864,160 | |
| | | | | | | 22,040,501 | |
| | | | | | | | |
| | | | CONSUMER STAPLES (6.6%) | | | | |
| | 31,200 | | Coca-Cola Co. (The) | | | 1,288,872 | |
| | 33,400 | | CVS Caremark Corp. | | | 2,390,438 | |
| | 35,400 | | Dr. Pepper Snapple Group, Inc. | | | 1,724,688 | |
| | 42,900 | | General Mills, Inc. | | | 2,141,139 | |
| | 17,600 | | Ingredion, Inc. | | | 1,204,896 | |
| | 42,900 | | Kroger Co. (The) | | | 1,695,837 | |
| | 26,300 | | PepsiCo, Inc. | | | 2,181,322 | |
| | 33,000 | | Procter & Gamble Co. (The) | | | 2,686,530 | |
| | 65,158 | | Safeway, Inc. | | | 2,122,196 | |
| | 27,300 | | Wal-Mart Stores, Inc. | | | 2,148,237 | |
| | 39,000 | | Walgreen Co. | | | 2,240,160 | |
| | | | | | | 21,824,315 | |
| | | | | | | | |
| | | | ENERGY (7.2%) | | | | |
| | 44,000 | | Boardwalk Pipeline Partners L.P. | | | 1,122,880 | |
| | 21,500 | | Chevron Corp. | | | 2,685,565 | |
| | 27,300 | | Conoco Phillips | | | 1,928,745 | |
| | 17,200 | | Diamond Offshore Drilling, Inc. | | | 979,024 | |
| | 37,455 | | Ensco PLC Class A | | | 2,141,677 | |
| | 21,000 | | Enterprise Products Partners L.P. | | | 1,392,300 | |
| | 33,000 | | Exxon Mobil Corp. | | | 3,339,600 | |
| | 16,100 | | Hess Corp. | | | 1,336,300 | |
| | 25,600 | | Royal Dutch Shell PLC ADR (1) | | | 1,922,816 | |
| | 31,200 | | Schlumberger Ltd. | | | 2,811,432 | |
| | 29,500 | | Total S.A. ADR | | | 1,807,465 | |
| | 24,400 | | TransCanada Corp. (1) | | | 1,114,104 | |
| | 24,000 | | Transocean Ltd. (1) | | | 1,186,080 | |
| | | | | | | 23,767,988 | |
| | | | FINANCIALS (11.3%) | | | | |
| | 10,700 | | Ameriprise Financial, Inc. | | | 1,231,035 | |
| | 27,300 | | Bank of Montreal | | | 1,819,818 | |
| | 6,800 | | BlackRock, Inc. | | | 2,151,996 | |
| | | | | | | | |
| Shares | | | | | Value | |
| | 23,000 | | Canadian Imperial Bank of Commerce | | $ | 1,964,430 | |
| | 24,400 | | Capital One Financial Corp. | | | 1,869,284 | |
| | 120,000 | | Charles Schwab Corp. (The) | | | 3,120,000 | |
| | 54,500 | | Discover Financial Services | | | 3,049,275 | |
| | 53,760 | | Hartford Financial Services Group, Inc. | | | 1,947,725 | |
| | 25,400 | | Health Care REIT, Inc. | | | 1,360,678 | |
| | 55,600 | | JPMorgan Chase & Co. | | | 3,251,488 | |
| | 19,500 | | M&T Bank Corp. (1) | | | 2,270,190 | |
| | 9,072 | | MetLife, Inc. | | | 489,162 | |
| | 16,600 | | PartnerRe Ltd. | | | 1,750,138 | |
| | 114,000 | | People’s United Financial, Inc. | | | 1,723,680 | |
| | 29,200 | | Prudential Financial, Inc. | | | 2,692,824 | |
| | 33,100 | | State Street Corp. | | | 2,429,209 | |
| | 71,200 | | U.S. Bancorp | | | 2,876,480 | |
| | 31,200 | | Wells Fargo & Co. | | | 1,416,480 | |
| | 1 | | Wintrust Financial Corp. | | | 37 | |
| | | | | | | 37,413,929 | |
| | | | | | | | |
| | | | HEALTH CARE (8.0%) | | | | |
| | 13,700 | | Actavis PLC * | | | 2,301,600 | |
| | 12,000 | | Allergan, Inc. | | | 1,332,960 | |
| | 12,700 | | Amgen, Inc. | | | 1,449,832 | |
| | 11,700 | | Becton, Dickinson & Co. | | | 1,292,733 | |
| | 22,400 | | Bristol-Myers Squibb Co. | | | 1,190,560 | |
| | 22,500 | | Eli Lilly & Co. | | | 1,147,500 | |
| | 21,000 | | Gilead Sciences, Inc. * | | | 1,578,150 | |
| | 36,100 | | Johnson & Johnson | | | 3,306,399 | |
| | 47,800 | | Merck & Co., Inc. | | | 2,392,390 | |
| | 15,600 | | Novartis AG ADR | | | 1,253,928 | |
| | 93,388 | | Pfizer, Inc. | | | 2,860,474 | |
| | 33,200 | | Sanofi-Aventis ADR | | | 1,780,516 | |
| | 45,237 | | Teva Pharmaceutical Industries Ltd. ADR | | | 1,813,099 | |
| | 11,000 | | Thermo Fisher Scientific, Inc. | | | 1,224,850 | |
| | 20,000 | | UnitedHealth Group, Inc. | | | 1,506,000 | |
| | | | | | | 26,430,991 | |
| | | | | | | | |
| | | | INDUSTRIALS (8.8%) | | | | |
| | 44,100 | | ADT Corp. (The) | | | 1,784,727 | |
| | 19,400 | | Canadian National Railway Co. | | | 1,106,188 | |
| | 35,000 | | Chicago Bridge & Iron Co. N.V. | | | 2,909,900 | |
| | 23,400 | | Cintas Corp. | | | 1,394,406 | |
| | 16,500 | | Emerson Electric Co. | | | 1,157,970 | |
| | 29,415 | | Expeditors International of Washington, Inc. | | | 1,301,614 | |
| | 16,200 | | FedEx Corp. | | | 2,329,074 | |
| | 12,600 | | General Dynamics Corp. | | | 1,203,930 | |
| | 13,500 | | Illinois Tool Works, Inc. | | | 1,135,080 | |
| | 10,700 | | Lockheed Martin Corp. | | | 1,590,662 | |
| | 15,600 | | MSC Industrial Direct Co., Inc. Class A | | | 1,261,572 | |
| | 10,600 | | Northrop Grumman Corp. | | | 1,214,866 | |
| | 38,900 | | Raytheon Co. | | | 3,528,230 | |
| | 35,100 | | Republic Services, Inc. | | | 1,165,320 | |
| | | | | | | | |
| Shares | | | | | Value | |
| | 25,300 | | Tyco International Ltd. | | $ | 1,038,312 | |
| | 12,700 | | Union Pacific Corp. | | | 2,133,600 | |
| | 25,300 | | United Technologies Corp. | | | 2,879,140 | |
| | | | | | | 29,134,591 | |
| | | | | | | | |
| | | | INFORMATION TECHNOLOGY (11.8%) | | | | |
| | 30,200 | | Accenture PLC Class A | | | 2,483,044 | |
| | 20,400 | | Adobe Systems, Inc.* | | | 1,221,552 | |
| | 3,000 | | Apple, Inc. | | | 1,683,330 | |
| | 24,400 | | Automatic Data Processing, Inc. | | | 1,971,764 | |
| | 39,000 | | Avago Technologies Ltd. | | | 2,062,710 | |
| | 11,900 | | Cognizant Technology Solutions Corp. Class A * | | | 1,201,662 | |
| | 47,300 | | eBay, Inc. * | | | 2,596,297 | |
| | 93,442 | | EMC Corp. | | | 2,350,066 | |
| | 3,900 | | Google, Inc. Class A * | | | 4,370,769 | |
| | 32,200 | | Harris Corp. | | | 2,247,882 | |
| | 129,000 | | Intel Corp. | | | 3,348,840 | |
| | 15,000 | | International Business Machines Corp. | | | 2,813,550 | |
| | 84,800 | | Microsoft Corp. | | | 3,174,064 | |
| | 48,500 | | Oracle Corp. | | | 1,855,610 | |
| | 26,300 | | QUALCOMM, Inc. | | | 1,952,775 | |
| | 30,000 | | SAP AG ADR (1) | | | 2,614,200 | |
| | 21,400 | | TE Connectivity Ltd. | | | 1,179,354 | |
| | | | | | | 39,127,469 | |
| | | | | | | | |
| | | | MATERIALS (1.5%) | | | | |
| | 17,600 | | BHP Billiton Ltd. ADR (1) | | | 1,200,320 | |
| | 28,000 | | E.I. du Pont de Nemours & Co. | | | 1,819,160 | |
| | 34,600 | | OCI Partners L.P. * | | | 954,960 | |
| | 14,600 | | Rockwood Holdings, Inc. | | | 1,050,032 | |
| | | | | | | 5,024,472 | |
| | | | | | | | |
| | | | TELECOMMUNICATION SERVICES (2.0%) | | | | |
| | 78,000 | | AT&T, Inc. | | | 2,742,480 | |
| | 50,000 | | BCE, Inc. | | | 2,164,500 | |
| | 34,100 | | Verizon Communications, Inc. | | | 1,675,674 | |
| | | | | | | 6,582,654 | |
| | | | | | | | |
| | | | UTILITIES (2.2%) | | | | |
| | 24,900 | | AGL Resources, Inc. | | | 1,176,027 | |
| | 25,400 | | American Electric Power Company, Inc. | | | 1,187,196 | |
| | 53,000 | | American States Water Co. | | | 1,522,690 | |
| | 11,700 | | Sempra Energy | | | 1,050,192 | |
| | 26,300 | | Wisconsin Energy Corp. | | | 1,087,242 | |
| | 39,100 | | Xcel Energy, Inc. | | | 1,092,454 | |
| | | | | | | 7,115,801 | |
| | | | | | | | |
| | | | TOTAL COMMON STOCKS | | | | |
| | | | (Cost $143,381,458) (66.1%) | | | 218,462,711 | |
See Notes to Financial Statements. |
| 24 |
| | | | | | | | |
| Shares | | | | | Value | |
| PREFERRED STOCKS (0.0%) | | | | |
| | | | | | | | |
| | | | FINANCIALS (0.0%) | | | | |
| | 5,000 | | MetLife, Inc., Series B, 6.50% | | $ | 124,500 | |
| | | | | | | | |
| | | | TOTAL PREFERRED STOCKS | | | | |
| | | | (Cost $125,000) (0.0%) | | | 124,500 | |
| | | | | | | | |
| CONVERTIBLE PREFERRED STOCKS (0.7%) | | | | |
| | | | | | | | |
| | | | CONSUMER STAPLES (0.2%) | | | | |
| | 4,000 | | Bunge Ltd., 4.88% | | | 430,200 | |
| | 2,500 | | Post Holdings, Inc., 3.75% (2) | | | 295,748 | |
| | | | | | | 725,948 | |
| | | | | | | | |
| | | | FINANCIALS (0.5%) | | | | |
| | 6,000 | | AMG Capital Trust II, Convertible Fixed, 5.15% | | | 379,500 | |
| | 250 | | Huntington Bancshares, Inc., Series A, 8.50% (1) | | | 316,250 | |
| | 1,000 | | KeyCorp, Series A, 7.75%(1) | | | 129,000 | |
| | 16,000 | | MetLife, Inc., 5.00% | | | 504,640 | |
| | 250 | | Wells Fargo & Co., Series L, 7.50% | | | 276,250 | |
| | 2,000 | | Weyerhaeuser Co., Series A, 6.38% | | | 112,080 | |
| | | | | | | 1,717,720 | |
| | | | | | | | |
| | | | HEALTH CARE (0.0%) | | | | |
| | 1,800 | | National Healthcare Corp., Series A, 0.80% | | | 26,100 | |
| | | | | | | | |
| | | | TOTAL CONVERTIBLE PREFERRED STOCKS | | | | |
| | | | (Cost $1,797,801) (0.7%) | | | 2,469,768 | |
| | | | | | | | |
| Principal | | | | | | |
| Amount | | | | | Value | |
| U.S. TREASURY OBLIGATIONS (6.0%) | | | | |
| | | | | | | | |
| $ | 1,000,000 | | U.S. Treasury Bonds, 5.25%, 2/15/29 | | | 1,203,750 | |
| | 350,000 | | U.S. Treasury Bonds, 3.13%, 11/15/41 | | | 302,313 | |
| | 250,000 | | U.S. Treasury Bonds, 2.75%, 8/15/42 | | | 198,086 | |
| | 1,000,000 | | U.S. Treasury Bonds, 2.88%, 5/15/43 | | | 810,469 | |
| | 1,000,000 | | U.S. Treasury Notes, 0.50%, 10/15/14 | | | 1,002,812 | |
| | 1,250,000 | | U.S. Treasury Notes, 0.38%, 11/15/14 | | | 1,252,392 | |
| | 1,000,000 | | U.S. Treasury Notes, 0.38%, 4/15/15 | | | 1,002,305 | |
| | 2,000,000 | | U.S. Treasury Notes, 1.00%, 9/30/16 | | | 2,017,188 | |
| | 1,450,000 | | U.S. Treasury Notes, 1.00%,10/31/16 | | | 1,460,988 | |
| | | | | | | | |
| Principal | | | | | | |
| Amount | | | | | Value | |
| $ | 1,000,000 | | U.S. Treasury Notes, 0.88%, 11/30/16 | | $ | 1,003,203 | |
| | 300,000 | | U.S. Treasury Notes, 0.63%, 5/31/17 | | | 296,086 | |
| | 1,250,000 | | U.S. Treasury Notes, 0.75%, 12/31/17 | | | 1,222,265 | |
| | 350,000 | | U.S. Treasury Notes, 0.75%, 3/31/18 | | | 340,047 | |
| | 1,400,000 | | U.S. Treasury Notes, 1.38%, 9/30/18 | | | 1,382,937 | |
| | 1,750,000 | | U.S. Treasury Notes, 1.38%, 11/30/18 | | | 1,723,750 | |
| | 600,000 | | U.S. Treasury Notes, 1.38%, 2/28/19 | | | 587,625 | |
| | 250,000 | | U.S. Treasury Notes, 1.38%, 1/31/20 | | | 239,121 | |
| | 1,050,000 | | U.S. Treasury Notes, 3.63%, 2/15/20 | | | 1,142,860 | |
| | 800,000 | | U.S. Treasury Notes, 1.25%, 2/29/20 | | | 757,313 | |
| | 750,000 | | U.S. Treasury Notes, 2.13%, 8/15/21 | | | 726,562 | |
| | 1,000,000 | | U.S. Treasury Notes, 2.00%, 11/15/21 | | | 954,453 | |
| | 150,000 | | U.S. Treasury Notes, 2.00%, 2/15/23 | | | 139,148 | |
| | 250,000 | | U.S. Treasury Notes, 2.50%, 8/15/23 | | | 240,078 | |
| | | | | | | | |
| | | | TOTAL U.S. TREASURY OBLIGATIONS | | | | |
| | | | (Cost $20,219,324) (6.0%) | | | 20,005,751 | |
| | | | | | | | |
| COMMERCIAL MORTGAGE-BACKED SECURITIES (0.4%) | | | | |
| | 500,000 | | FHLMC Multifamily Structured Pass-Through Certificates, Series K710, Class A2, 1.88%, 5/25/19 | | | 489,389 | |
| | 246,507 | | GNMA Series 2013-12, Class AB, 1.83%, 11/16/52 | | | 235,052 | |
| | 250,000 | | GNMA Series 2013-12, Class B, 2.45%, 11/16/52 (3) | | | 230,492 | |
| | 250,000 | | UBS-Barclays Commercial Mortgage Trust, Series 2012-C4, Class A5, 2.85%, 12/10/45 | | | 233,027 | |
| | | | | | | | |
| | | | TOTAL COMMERCIAL MORTGAGE-BACKED SECURITIES | | | | |
| | | | (Cost $1,277,045) (0.4%) | | | 1,187,960 | |
| | | | | | | |
| Principal | | | | | | |
| Amount | | | | | Value | |
| CORPORATE BONDS & NOTES (6.4%) | | | | |
| | | | | | | | |
| | | | BASIC MATERIALS (0.4%) | | | | |
| | | | | | | | |
| $ | 250,000 | | LYB International Finance B.V., Guaranteed Notes, 4.00%, 7/15/23 | | $ | 246,764 | |
| | 375,000 | | PPG Industries, Inc., Senior Unsecured Notes, 3.60%, 11/15/20 | | | 380,565 | |
| | 560,000 | | Southern Copper Corp., Senior Unsecured Notes, 6.38%, 7/27/15 | | | 600,804 | |
| | | | | | | 1,228,133 | |
| | | | | | | | |
| | | | COMMUNICATIONS (0.6%) | | | | |
| | 250,000 | | America Movil S.A.B. de C.V., Senior Unsecured Notes, 3.13%, 7/16/22 | | | 230,787 | |
| | 150,000 | | Comcast Corp., Guaranteed Notes, 6.40%, 3/1/40 | | | 173,081 | |
| | 250,000 | | DIRECTV Holdings LLC / DIRECTV Financing Co., Inc., Guaranteed Notes, 3.80%, 3/15/22 | | | 240,159 | |
| | 250,000 | | Harris Corp., Senior Unsecured Notes, 4.40%, 12/15/20 | | | 259,148 | |
| | 200,000 | | MetroPCS Wireless, Inc., Guaranteed Notes, 6.63%, 11/15/20 | | | 212,000 | |
| | 200,000 | | Motorola Solutions, Inc., Senior Unsecured Notes, 6.00%, 11/15/17 | | | 227,491 | |
| | 250,000 | | Time Warner, Inc., Guaranteed Notes, 3.15%, 7/15/15 | | | 258,998 | |
| | 150,000 | | Verizon Communications, Inc., Senior Unsecured Notes, 1.25%, 11/3/14 | | | 150,874 | |
| | 333,000 | | Viacom, Inc., Senior Unsecured Notes, 4.38%, 9/15/14 | | | 341,685 | |
| | | | | | | 2,094,223 | |
| | | | | | | | |
| | | | CONSUMER, CYCLICAL (1.0%) | | | | |
| | 250,000 | | CVS Caremark Corp., Senior Unsecured Notes, 6.60%, 3/15/19 | | | 295,846 | |
| | 275,000 | | D.R. Horton, Inc., Guaranteed Notes, 6.50%, 4/15/16 | | | 300,437 | |
| | 150,000 | | Delphi Corp., Guaranteed Notes, 6.13%, 5/15/21 | | | 166,313 | |
| | 150,000 | | Hanesbrands, Inc., Guaranteed Notes, 6.38%, 12/15/20 | | | 163,875 | |
| See Notes to Financial Statements. |
| 25 |
| |
| Schedule of Investments (continued) |
| | | | | | | | |
| Principal | | | | | | |
| Amount | | | | | Value | |
| $ | 250,000 | | Home Depot, Inc. (The), Senior Unsecured Notes, 3.95%, 9/15/20 | | $ | 266,724 | |
| | 205,000 | | Lennar Corp., Series B, Guaranteed Notes, 5.60%, 5/31/15 | | | 215,250 | |
| | 500,000 | | Lowe’s Cos., Inc., Senior Unsecured Notes, 2.13%, 4/15/16 | | | 512,841 | |
| | 500,000 | | Nordstrom, Inc., Senior Unsecured Notes, 4.75%, 5/1/20 | | | 547,180 | |
| | 150,000 | | Royal Caribbean Cruises, Ltd., Senior Unsecured Notes, 5.25%, 11/15/22 | | | 150,000 | |
| | 250,000 | | Wyndham Worldwide Corp., Senior Unsecured Notes, 3.90%, 3/1/23 | | | 235,492 | |
| | 500,000 | | Wynn Las Vegas LLC/Wynn Las Vegas Capital Corp., Senior Unsecured Notes, 5.38%, 3/15/22 | | | 505,000 | |
| | | | | | | 3,358,958 | |
| | | | | | | | |
| | | | CONSUMER, NON-CYCLICAL (0.6%) | | | | |
| | 250,000 | | Celgene Corp., Senior Unsecured Notes, 2.30%, 8/15/18 | | | 248,627 | |
| | 250,000 | | Cigna Corp., Senior Unsecured Notes, 2.75%, 11/15/16 | | | 260,206 | |
| | 150,000 | | Constellation Brands, Inc., Guaranteed Notes, 3.75%, 5/1/21 | | | 141,000 | |
| | 250,000 | | Hawk Acquisition Sub, Inc., Secured Notes, 4.25%, 10/15/20 (2) | | | 241,875 | |
| | 500,000 | | Humana, Inc., Senior Notes, 6.45%, 6/1/16 | | | 558,708 | |
| | 250,000 | | Kroger Co. (The), Senior Unsecured Notes, 3.40%, 4/15/22 | | | 242,495 | |
| | 200,000 | | Mylan, Inc., Senior Unsecured Notes, 1.35%, 11/29/16 | | | 199,633 | |
| | | | | | | 1,892,544 | |
| | | | | | | | |
| | | | ENERGY (0.5%) | | | | |
| | 500,000 | | Devon Energy Corp., Senior Unsecured Notes, 2.40%, 7/15/16 | | | 514,145 | |
| | 500,000 | | Enterprise Products Operating LLC, Guaranteed Notes, 4.85%, 8/15/42 | | | 470,884 | |
| | 250,000 | | Marathon Oil Corp., Senior Unsecured Notes, 2.80%, 11/1/22 | | | 230,402 | |
| | | | | | | | |
| Principal | | | | | | |
| Amount | | | | | Value | |
| $ | 500,000 | | Shell International Finance B.V., Guaranteed Notes, 4.55%, 8/12/43 | | $ | 487,671 | |
| | | | | | | 1,703,102 | |
| | | | | | | | |
| | | | FINANCIAL (2.4%) | | | | |
| | 200,000 | | Aircastle, Ltd., Senior Unsecured Notes, 4.63%, 12/15/18 | | | 201,500 | |
| | 250,000 | | American Express Co., Senior Unsecured Notes, 0.83%, 5/22/18 (3) | | | 249,827 | |
| | 250,000 | | American International Group, Inc., Senior Unsecured Notes, 4.88%, 6/1/22 | | | 268,706 | |
| | 250,000 | | Bank of America Corp. MTN, Senior Unsecured Notes, 3.30%, 1/11/23 | | | 236,567 | |
| | 250,000 | | Bank of Montreal MTN, Senior Unsecured Notes, 2.50%, 1/11/17 | | | 257,522 | |
| | 150,000 | | Bank of New York Mellon Corp. (The), Senior Unsecured Notes, 5.45%, 5/15/19 | | | 170,426 | |
| | 250,000 | | Berkshire Hathaway, Inc., Senior Unsecured Notes, 3.75%, 8/15/21 (1) | | | 257,758 | |
| | 140,000 | | BlackRock, Inc., Series 2, Senior Unsecured Notes, 5.00%, 12/10/19 | | | 158,073 | |
| | 250,000 | | Boston Properties L.P., Senior Unsecured Notes, 3.13%, 9/1/23 | | | 228,347 | |
| | 250,000 | | Capital One NA/ Mclean, Senior Notes, 1.50%, 3/22/18 | | | 243,120 | |
| | 250,000 | | CIT Group, Inc., Senior Unsecured Notes, 5.00%, 5/15/17 | | | 266,875 | |
| | 250,000 | | Cooperatieve Centrale Raiffeisen-Boerenleenbank BA, Guaranteed Notes, 3.95%, 11/9/22 | | | 242,248 | |
| | 250,000 | | Credit Agricole S.A., Senior Unsecured Notes, 2.13%, 4/17/18 (2) | | | 248,373 | |
| | 500,000 | | Fifth Third Bank, Senior Unsecured Notes, 1.45%, 2/28/18 | | | 487,206 | |
| | 500,000 | | Ford Motor Credit Co. LLC, Senior Unsecured Notes, 2.38%, 1/16/18 | | | 504,980 | |
| | 250,000 | | General Electric Capital Corp. MTN, Senior Unsecured Notes,1.00%, 8/11/15 (3) | | | 251,904 | |
| | 300,000 | | General Motors Financial Co., Inc., Senior Unsecured Notes, 3.25%, 5/15/18 (2) | | | 300,000 | |
| | | | | | | | |
| Principal | | | | | | |
| Amount | | | | | Value | |
| $ | 500,000 | | Goldman Sachs Group, Inc. (The), Senior Unsecured Notes, 5.75%, 1/24/22 | | $ | 562,844 | |
| | 500,000 | | JPMorgan Chase & Co., Senior Unsecured Notes, 4.50%, 1/24/22 | | | 528,865 | |
| | 500,000 | | Morgan Stanley, Senior Unsecured Notes, 4.75%, 3/22/17 | | | 545,659 | |
| | 200,000 | | PNC Funding Corp., Guaranteed Notes, 3.30%, 3/8/22 | | | 196,529 | |
| | 250,000 | | Societe Generale S.A., Senior Unsecured Notes, 5.20%, 4/15/21 | | | 274,814 | |
| | 250,000 | | State Street Corp., Senior Unsecured Notes, 1.35%, 5/15/18 | | | 241,948 | |
| | 168,000 | | Wachovia Bank NA, Subordinated Notes, 4.80%, 11/1/14 | | | 174,238 | |
| | 500,000 | | Wells Fargo & Co. MTN, Senior Unsecured Notes, 3.50%, 3/8/22 | | | 500,132 | |
| | 100,000 | | Weyerhaeuser Co., Senior Unsecured Notes, 6.95%, 10/1/27 | | | 115,359 | |
| | 100,000 | | XLIT, Ltd., Guaranteed Notes, 5.25%, 12/15/43 | | | 100,670 | |
| | | | | | | 7,814,490 | |
| | | | | | | | |
| | | | INDUSTRIAL (0.3%) | | | | |
| | 254,000 | | Masco Corp., Senior Unsecured Notes, 6.13%, 10/3/16 | | | 284,480 | |
| | 314,000 | | Thermo Fisher Scientific, Inc., Senior Unsecured Notes, 3.20%, 3/1/16 | | | 328,285 | |
| | 500,000 | | Union Pacific Corp., Senior Unsecured Notes, 4.00%, 2/1/21 | | | 521,736 | |
| | | | | | | 1,134,501 | |
| | | | | | | | |
| | | | TECHNOLOGY (0.1%) | | | | |
| | 100,000 | | Microsoft Corp., Senior Unsecured Notes, 3.63%, 12/15/23 | | | 100,156 | |
| | 250,000 | | Oracle Corp., Senior Unsecured Notes, 5.00%, 7/8/19 . | | | 283,022 | |
| | | | | | | 383,178 | |
| | | | | | | | |
| | | | UTILITIES (0.5%) | | | | |
| | 250,000 | | Alabama Power Co., Senior Unsecured Notes, 3.85%, 12/1/42 | | | 213,247 | |
| | 500,000 | | Dominion Resources, Inc., Senior Unsecured Notes, 2.25%, 9/1/15 | | | 512,407 | |
| | 250,000 | | Florida Power & Light Co., 4.05%, 6/1/42 | | | 228,501 | |
| See Notes to Financial Statements. |
| 26 |
| | | | | | | | |
| Principal | | | | | | |
| Amount | | | | | Value | |
| $ | 500,000 | | Sempra Energy, Senior Unsecured Notes, 2.00%, 3/15/14 | | $ | 501,545 | |
| | 250,000 | | South Carolina Electric & Gas Co., 4.35%, 2/1/42 . | | | 232,200 | |
| | | | | | | 1,687,900 | |
| | | | TOTAL CORPORATE BONDS & NOTES
(Cost $21,367,876) (6.4%) | | | 21,297,029 | |
| | | | | |
| CONVERTIBLE CORPORATE BONDS & NOTES (3.6%) | | | | |
| | | | | | | | |
| | | | BASIC MATERIALS (0.2%) | | | | |
| | 100,000 | | Allegheny Technologies, Inc., Convertible Fixed, 4.25%, 6/1/14 | | | 103,375 | |
| | 100,000 | | ArcelorMittal, Senior Notes, 5.00%, 5/15/14 (1) | | | 101,188 | |
| | 350,000 | | Steel Dynamics, Inc., Guaranteed Notes, 5.13%, 6/15/14 | | | 411,906 | |
| | | | | | | 616,469 | |
| | | | | | | | |
| | | | COMMUNICATIONS (0.2%) | | | | |
| | 300,000 | | Equinix, Inc., Convertible Fixed, 4.75%, 6/15/16 | | | 655,125 | |
| | 100,000 | | VeriSign, Inc., Junior Subordinated Debentures, 3.25%, 8/15/37 (2) | | | 180,375 | |
| | | | | | | 835,500 | |
| | | | | | | | |
| | | | CONSUMER, CYCLICAL (0.3%) | | | | |
| | 150,000 | | Home Inns & Hotels Management, Inc., Senior Notes, 2.00%, 12/15/15 (2) | | | 156,563 | |
| | 200,000 | | International Game Technology, Senior Unsecured Notes, 3.25%, 5/1/14 (1) | | | 212,000 | |
| | 200,000 | | MGM Resorts International, Guaranteed Senior Notes, 4.25%, 4/15/15 | | | 275,000 | |
| | 300,000 | | Navistar International Corp., Senior Subordinated Notes, 3.00%, 10/15/14 | | | 306,750 | |
| | | | | | | 950,313 | |
| | | | | | | | |
| | | | CONSUMER, NON-CYCLICAL (0.6%) | | | | |
| | 1,000,000 | | Alere, Inc., Convertible Fixed, 3.00%, 5/15/16 | | | 1,123,750 | |
| | 100,000 | | Gilead Sciences, Inc., Convertible Fixed, Series D, 1.63%, 5/1/16 | | | 329,812 | |
| | | | | | | | |
| Principal | | | | | | |
| Amount | | | | | Value | |
| $ | 300,000 | | Insulet Corp., Senior Unsecured Notes, 3.75%, 6/15/16 | | $ | 440,625 | |
| | 123,000 | | Salix Pharmaceuticals Ltd., Senior Unsecured Notes, 2.75%, 5/15/15 | | | 242,003 | |
| | | | | | | 2,136,190 | |
| | | | | | | | |
| | | | ENERGY (0.3%) | | | | |
| | 250,000 | | Goodrich Petroleum Corp., Senior Unsecured Notes, 5.00%, 10/1/29 | | | 254,063 | |
| | 800,000 | | Peabody Energy Corp., Junior Subordinate Debentures, 4.75%, 12/15/41 (1) | | | 632,500 | |
| | | | | | | 886,563 | |
| | | | | | | | |
| | | | FINANCIAL (0.4%) | | | | |
| | 150,000 | | Digital Realty Trust L.P., Guaranteed Notes, 5.50%, 4/15/29 (2) | | | 190,875 | |
| | 300,000 | | Fidelity National Financial, Inc. 4.25%, 8/15/18 | | | 490,500 | |
| | 100,000 | | ProLogis, Guaranteed Notes, 3.25%, 3/15/15 | | | 111,625 | |
| | 200,000 | | SL Green Operating Partnership L.P., Convertible Fixed, 3.00%, 10/15/17 (2) | | | 248,875 | |
| | 200,000 | | Tower Group, Inc., Senior Notes Convertible, 5.00%, 9/15/14 | | | 169,375 | |
| | | | | | | 1,211,250 | |
| | | | | | | | |
| | | | INDUSTRIAL (0.5%) | | | | |
| | 100,000 | | AGCO Corp., Senior Subordinated Notes, 1.25%, 12/15/36 | | | 145,813 | |
| | 150,000 | | Alliant Techsystems, Inc., Guaranteed Notes, 3.00%, 8/15/24 | | | 240,094 | |
| | 250,000 | | Bristow Group, Inc., Guaranteed Notes, 3.00%, 6/15/38 | | | 306,562 | |
| | 200,000 | | EnerSys, Senior Notes, 3.38%, 6/1/38 (4) | | | 352,625 | |
| | 150,000 | | MasTec, Inc., Convertible Fixed, 4.00%, 6/15/14 | | | 311,906 | |
| | 300,000 | | Trinity Industries, Inc., Subordinated Notes Convertible, 3.88%, 6/1/36 | | | 395,062 | |
| | | | | | | 1,752,062 | |
| | | | | | | | |
| | | | TECHNOLOGY (1.1%) | | | | |
| | 350,000 | | CACI International, Inc., Senior Subordinate Debenture, 2.13%, 5/1/14 | | | 468,781 | |
| | 350,000 | | CSG Systems International, Inc., Senior Subordinate Debenture, 3.00%, 3/1/17 (2) | | | 468,781 | |
| | | | | | | | |
| Principal | | | | | | |
| Amount | | | | | Value | |
| $ | 150,000 | | Intel Corp., Junior Subordinated Notes, 3.25%, 8/1/39 | | $ | 203,906 | |
| | 200,000 | | Lam Research Corp., Senior Unsecured Notes, 1.25%, 5/15/18 (1) | | | 243,250 | |
| | 150,000 | | SanDisk Corp., Senior Unsecured Notes, 1.50%, 8/15/17 | | | 221,063 | |
| | 200,000 | | Xilinx, Inc., Senior Notes, 2.63%, 6/15/17 | | | 319,000 | |
| | 1,000,000 | | Xilinx, Inc., Subordinated Debentures, 3.13%, 3/15/37 | | | 1,583,125 | |
| | | | | | | 3,507,906 | |
| | | | | | | | |
| | | | TOTAL CONVERTIBLE CORPORATE BONDS & NOTES
(Cost $9,154,916) (3.6%) | | | 11,896,253 | |
| | | | | |
| FOREIGN GOVERNMENT OBLIGATIONS (0.2%) | | | | |
| | 250,000 | | International Bank for Reconstruction & Development, Senior Unsecured Notes, 0.50%, 4/15/16 | | | 249,604 | |
| | 250,000 | | Mexico Government International Bond, Senior Unsecured Notes, 5.13%, 1/15/20 | | | 277,000 | |
| | | | TOTAL FOREIGN GOVERNMENT OBLIGATIONS
(Cost $526,433) (0.2%) | | | 526,604 | |
| | | | | |
| LONG-TERM MUNICIPAL SECURITIES (0.3%) | | | | |
| | | | | | | | |
| | | | CALIFORNIA (0.1%) | | | | |
| | 250,000 | | San Francisco Bay Area Rapid Transit District, Revenue Bonds, Series B, 4.09%, 7/1/32 | | | 227,162 | |
| | | | | | | | |
| | | | NEW YORK (0.1%) | | | | |
| | 200,000 | | City of New York, General Obligation Unlimited, Subser. D2, 2.60%, 8/1/20 | | | 194,900 | |
| | 185,000 | | Metropolitan Transportation Authority, Build America Bonds, Revenue Bonds, Ser. C-1, 5.12%, 11/15/19 | | | 200,588 | |
| | | | | | | 395,488 | |
| |
| See Notes to Financial Statements. |
| 27 |
| Schedule of Investments (continued) |
| |
| | | | | | | | |
Principal Amount | | | | | Value | |
| | | | TEXAS (0.1%) | | | | |
| $ | 250,000 | | Tarrant County Cultural Education Facilities Finance Corp., Revenue Bonds, Baylor Health Care System Project, Series C, 4.45%, 11/15/43 | | $ | 211,933 | |
| | | | | | | | |
| | | | TOTAL LONG-TERM MUNICIPAL SECURITIES (Cost $906,426) (0.3%) | | | 834,583 | |
| | | | | | | | |
| | U.S. GOVERNMENT AGENCY OBLIGATIONS (8.0%) | | | | |
| | 500,000 | | FHLB, 1.13%, 3/10/17 | | | 502,720 | |
| | 250,000 | | FHLB, 3.13%, 12/8/17 | | | 265,894 | |
| | 175,000 | | FHLB, 2.75%, 6/8/18 | | | 182,550 | |
| | 250,000 | | FHLB, 1.63%, 2/27/19 | | | 246,312 | |
| | 415,000 | | FHLB, 4.13%, 12/13/19 | | | 455,374 | |
| | 1,000,000 | | FHLB, 3.25%, 6/9/23 | | | 992,905 | |
| | 467,757 | | FHLMC, Series 4151, Class PA, 2.00%, 1/15/33 | | | 447,265 | |
| | 125,107 | | FHLMC Gold PC Pool #A46044, 5.00%, 7/1/35 | | | 134,977 | |
| | 425,854 | | FHLMC Gold PC Pool #A47613, 5.00%, 11/1/35 | | | 459,681 | |
| | 100,000 | | FHLMC Gold PC Pool #A89430, 4.50%, 10/1/39 | | | 105,864 | |
| | 250,000 | | FHLMC Gold PC Pool #C09055, 4.00%, 12/1/43 | | | 257,002 | |
| | 18,568 | | FHLMC Gold PC Pool #G05205, 5.00%, 1/1/39 | | | 20,024 | |
| | 365,475 | | FHLMC Gold PC Pool #J17969, 3.00%, 2/1/27 | | | 372,566 | |
| | 135,828 | | FHLMC Pool #A84814, 4.50%, 3/1/39 | | | 143,694 | |
| | 839,249 | | FHLMC Pool #A86830, 4.50%, 6/1/39 | | | 889,234 | |
| | 108,696 | | FHLMC Pool #A96997, 4.50%, 2/1/41 | | | 115,169 | |
| | 385,215 | | FHLMC Pool #A97264, 4.00%, 2/1/41 | | | 395,933 | |
| | 400,098 | | FHLMC Pool #C09027, 3.00%, 2/1/43 | | | 379,517 | |
| | 74,270 | | FHLMC Pool #G08521, 3.00%, 1/1/43 | | | 70,449 | |
| | 1,065,100 | | FHLMC Pool #J13314, 3.50%, 10/1/25 | | | 1,111,037 | |
| | | | | | | | |
| | Principal Amount | | | | | Value | |
| $ | 872,069 | | FHLMC Pool #Q04096, 4.00%, 10/1/41 | | $ | 896,327 | |
| | 180,419 | | FHLMC Pool #Q06884, 3.50%, 3/1/42 | | | 179,218 | |
| | 109,024 | | FHLMC Pool #Q11077, 3.50%, 9/1/42 | | | 108,298 | |
| | 500,000 | | FNMA, 2.00%, 9/21/15 | | | 513,752 | |
| | 500,000 | | FNMA, 0.38%, 12/21/15 | | | 499,235 | |
| | 1,000,000 | | FNMA, 0.88%,5/21/18 | | | 967,312 | |
| | 436,223 | | FNMA Pool #745275, 5.00%, 2/1/36 | | | 473,438 | |
| | 51,118 | | FNMA Pool #832199, 4.50%, 7/1/35 | | | 54,206 | |
| | 72,734 | | FNMA Pool #973333, 4.50%, 2/1/38 | | | 76,981 | |
| | 274,476 | | FNMA Pool #AA0466, 4.50%, 2/1/39 | | | 290,615 | |
| | 15,730 | | FNMA Pool #AB1259, 5.00%, 7/1/40 | | | 17,112 | |
| | 967,100 | | FNMA Pool #AB1796, 3.50%, 11/1/40 | | | 961,813 | |
| | 260,193 | | FNMA Pool #AB2660, 3.50%, 5/1/21 | | | 273,497 | |
| | 164,910 | | FNMA Pool #AB3218, 3.50%, 7/1/31 | | | 167,917 | |
| | 700,264 | | FNMA Pool #AB3900, 3.00%, 11/1/26 | | | 715,423 | |
| | 25,494 | | FNMA Pool AB3943, 4.00%, 11/1/41 | | | 26,264 | |
| | 439,006 | | FNMA Pool #AB5231, 2.50%, 5/1/27 | | | 435,992 | |
| | 254,339 | | FNMA Pool #AC5822, 4.50%, 5/1/40 | | | 269,592 | |
| | 423,131 | | FNMA Pool #AD7128, 4.50%, 7/1/40 | | | 448,427 | |
| | 269,186 | | FNMA Pool #AD8529, 4.50%, 8/1/40 | | | 285,301 | |
| | 889,806 | | FNMA Pool #AE9759, 4.00%, 12/1/40 | | | 916,782 | |
| | 247,422 | | FNMA Pool #AH2084, 4.00%, 12/1/40 | | | 254,873 | |
| | 452,278 | | FNMA Pool #AH4493, 4.50%, 2/1/41 | | | 479,319 | |
| | 882,992 | | FNMA Pool #AH6186, 4.00%, 2/1/41 | | | 909,617 | |
| | 601,540 | | FNMA Pool #AH8932, 4.50%, 4/1/41 | | | 637,670 | |
| | 1,093,123 | | FNMA Pool #AJ9278, 3.50%, 12/1/41 | | | 1,087,022 | |
| | 31,258 | | FNMA Pool #AK6513, 4.00%, 3/1/42 | | | 32,195 | |
| | 648,579 | | FNMA Pool #AL0160, 4.50%, 5/1/41 | | | 689,484 | |
| | 900,001 | | FNMA Pool #AL0657, 5.00%, 8/1/41 | | | 982,202 | |
| | 84,269 | | FNMA Pool #AL3192, 5.00%, 5/1/42 | | | 91,963 | |
| | 434,978 | | FNMA Pool #AQ1853, 3.00%, 11/1/42 | | | 413,381 | |
| | | | | | | | |
Principal Amount | | | | | Value | |
| $ | 497,470 | | FNMA Pool #AS0865, 2.50%, 10/1/28 | | $ | 492,913 | |
| | 200,000 | | FNMA Pool #AS1529, 3.00%, 1/1/29 | | | 204,500 | |
| | 796,401 | | FNMA Pool #AT8849, 4.00%, 6/1/43 | | | 820,320 | |
| | 249,571 | | FNMA Pool #AU3621, 3.00%, 7/1/43 | | | 237,235 | |
| | 449,269 | | FNMA Pool #AU5409, 3.00%, 8/1/43 | | | 427,078 | |
| | 299,592 | | FNMA Pool #AU6562, 3.50%, 12/1/43 | | | 297,919 | |
| | 349,402 | | FNMA Pool #AU7025, 3.00%, 11/1/43 | | | 332,091 | |
| | 56,976 | | FNMA Pool #MA0406, 4.50%, 5/1/30 | | | 60,685 | |
| | 222,108 | | FNMA Pool #MA0577, 3.50%, 11/1/20 | | | 233,454 | |
| | 471,722 | | FNMA REMIC Trust Series 2013-18, Class AE, 2.00%, 3/25/28 | | | 448,733 | |
| | 321,530 | | FNMA REMIC Trust Series 2013-41, Class WD, 2.00%, 11/25/42 | | | 308,938 | |
| | 126,022 | | GNMA I Pool #539285, 3.00%, 5/15/42 | | | 121,944 | |
| | 176,055 | | GNMA I Pool #744842, 3.00%, 5/15/42 | | | 170,358 | |
| | 500,000 | | GNMA II Pool #MA1521, 3.50%, 12/20/43 | | | 507,110 | |
| | 250,000 | | GNMA TBA, 3.00%, 1/1/44 | | | 241,543 | |
| | | | | | | | |
| | | | TOTAL U.S. GOVERNMENT AGENCY OBLIGATIONS (Cost $27,139,092) (8.0%) | | | 26,608,216 | |
| | | | | | | | |
| | SHORT-TERM INVESTMENTS (11.1%) | | | | |
| | | | | | | | |
| | | | REPURCHASE AGREEMENTS (8.0%) | | | | |
| | 26,300,000 | | With Morgan Stanley, 0.01%, dated 12/31/13, due 01/02/14, delivery value $26,300,015 (collateralized by $26,760,000 U.S. Treasury Notes 1.000% due 03/31/17, with a value of $26,891,824) | | | 26,300,000 | |
| See Notes to Financial Statements. |
| |
| 28 |
| | | | | | | | |
Principal Amount | | | | | Value | |
| | | | JOINT REPURCHASE AGREEMENTS (INVESTMENTS OF CASH COLLATERAL FOR SECURITIES ON LOAN) (3.1%) | | | | |
| $ | 3,794,575 | | Joint Repurchase Agreement with Morgan Stanley, 0.02%, dated 12/31/13, due 01/02/14, delivery value $3,794,579 (collateralized by $3,870,467 U.S. Treasury Bonds 4.250% - 8.000% due 11/15/21 - 11/15/40 and U.S. Treasury Notes 2.625% - 2.750% due 11/15/20 - 11/15/23, with a value of $3,850,772) | | $ | 3,794,575 | |
| | 5,601,515 | | Joint Repurchase Agreement with Barclays, 0.01%, dated 12/31/13, due 01/02/14, delivery value $5,601,518 (collateralized by $5,713,553 U.S. Treasury Inflation Indexed Notes 1.250% - 1.875% due 04/15/14 - 07/15/15, with a value of $5,670,362) | | | 5,601,515 | |
| | | | | | | | |
Principal Amount | | | | | Value | |
| $ | 903,470 | | Joint Repurchase Agreement with Citigroup, 0.01%, dated 12/31/13, due 01/02/14, delivery value $903,471 (collateralized by $921,549 U. S. Treasury Bills 0.000% due 02/20/14, with a value of $921,549) | | $ | 903,470 | |
| | | | | | | 10,299,560 | |
| | | | | | | | |
| | | | TOTAL SHORT-TERM INVESTMENTS (Cost $36,599,560) (11.1%) | | | 36,599,560 | |
| | | | | | | | |
| | | | TOTAL INVESTMENT SECURITIES (102.8%) (Cost $262,494,931) | | $ | 340,012,935 | |
| | | | | | | | |
| EXCESS OF LIABILITIES OVER CASH AND OTHER ASSETS (-2.8%) | | | (9,314,832) | |
| | | | | | | | |
Principal Amount | | | | | Value | |
| NET ASSETS (100%) | | $ | 330,698,103 | |
| | | | | | |
| NET ASSET VALUE OFFERING AND REDEMPTION PRICE, PER OUTSTANDING SHARE ($330,698,103 ÷ 33,679,337 shares outstanding) | | $ | 9.82 | |
| | | | | | | | |
| * | | Non-income producing. | | | | |
| (1) | | A portion or all of the security was held on loan. As of December 31, 2013, the market value of the securities on loan was $11,304,497. | |
| (2) | | Pursuant to Rule 144A under the Securities Act of 1933, this security can only be sold to qualified institutional investors. | |
| (3) | | The rate shown on floating rate securities is the rate at the end of the reporting period. The rate changes monthly. | |
| (4) | | Step Bond - The rate shown is as of December 31, 2013 and will reset at a future date. | | | | |
| ADR | | American Depositary Receipt. | | | | |
| FHLB | | Federal Home Loan Bank. | | | | |
| FHLMC | | Federal Home Loan Mortgage Corp. | | | | |
| FNMA | | Federal National Mortgage Association. | | | | |
| GNMA | | Government National Mortgage Association. | | | | |
| MTN | | Medium Term Note. | | | | |
| REIT | | Real Estate Investment Trust. | | | | |
| TBA | | To Be Announced. | | | | |
The following table summarizes the inputs used to value the Fund’s investments in securities as of December 31, 2013 (See Note 1B):
| | | | | | | | | | | | | |
| Value Line Income and Growth Fund, Inc. | | Level 1 | | | Level 2 | | | Level 3 | | | Total | |
| Assets: | | | | | | | | | | | | |
| Common Stocks | | $ | 218,462,711 | | | $ | — | | | $ | — | | | $ | 218,462,711 | |
| Preferred Stocks | | | 124,500 | | | | — | | | | — | | | | 124,500 | |
| Convertible Preferred Stocks | | | 1,794,520 | | | | 675,248 | | | | — | | | | 2,469,768 | |
| U.S. Treasury Obligations | | | — | | | | 20,005,751 | | | | — | | | | 20,005,751 | |
| Commercial Mortgage-Backed Securities | | | — | | | | 1,187,960 | | | | — | | | | 1,187,960 | |
| Corporate Bonds & Notes | | | — | | | | 21,297,029 | | | | — | | | | 21,297,029 | |
| Convertible Corporate Bonds & Notes | | | — | | | | 11,896,253 | | | | — | | | | 11,896,253 | |
| Foreign Government Obligations | | | — | | | | 526,604 | | | | — | | | | 526,604 | |
| Long-Term Municipal Securities | | | — | | | | 834,583 | | | | — | | | | 834,583 | |
| U.S. Government Agency Obligations | | | — | | | | 26,608,216 | | | | — | | | | 26,608,216 | |
| Short-Term Investments | | | — | | | | 36,599,560 | | | | — | | | | 36,599,560 | |
| Total | | $ | 220,381,731 | | | $ | 119,631,204 | | | $ | — | | | $ | 340,012,935 | |
| See Notes to Financial Statements. |
| 29 |
| VALUE LINE LARGER COMPANIES FUND, INC. |
| |
INVESTMENT OBJECTIVE AND STRATEGY
The Fund’s investment objective is to realize capital growth.
To achieve the Fund’s investment objective the Adviser invests substantially all of the Fund’s assets in common stock. While the Fund is actively managed by the Adviser, the Adviser relies primarily on the rankings of companies by the Value Line Timeliness™ Ranking System (the “Ranking System”) in selecting securities for purchase or sale. The Fund’s investments usually, as measured by the number and total value of purchases, are selected from common stocks of the 100 largest companies by capitalization that are ranked 1, 2, or 3 by the Ranking System. The Adviser will determine the percentage of the Fund’s assets invested in each stock based on the stock’s relative attractiveness.
Manager Discussion of Fund Performance |
Below, Value Line Larger Companies Fund, Inc. portfolio manager Mark T. Spellman discusses the Fund’s performance and positioning for the 12 months ended December 31, 2013.
How did the Fund perform during the annual period?
The Fund generated a total return of 30.05% during the 12 months ended December 31, 2013. This compares to the 32.39% return of the Fund’s benchmark, the S&P 500® Index, during the same annual period.
What key factors were responsible for the Fund’s performance during the 12-month reporting period?
While the Fund generated robust double-digit absolute gains, its underperformance of the S&P 500® Index during the 12-month reporting period can be attributed primarily to sector allocation. Stock selection overall proved effective.
Which equity market sectors most significantly affected Fund performance?
Overweighted allocations to and stock selection in the information technology and materials sectors, which each lagged the S&P 500® Index during the annual period, detracted from the Fund’s performance. Having an underweighted allocation to financials, which outpaced the S&P 500® Index during the annual period, also dampened results.
Partially offsetting these detractors were the positive contributions made by overweighted allocations to the consumer discretionary and health care sectors, which each outpaced the S&P 500® Index during the annual period. Having an underweighted allocation to energy, which underperformed the S&P 500® Index during the annual period, also boosted relative results. Effective stock selection in the health care sector added value as well.
Which stocks detracted significantly from the Fund’s performance during the annual period?
During the annual period, the stocks that detracted most from the Fund’s performance were U.K.-based international resources company BHP Billiton, Canadian gold producer Yamana Gold and U.S. security services provider ADT. BHP Billiton’s shares declined as global natural resource prices dropped. Shares of Yamana Gold fell significantly along with the precipitous decline in the price of gold bullion. ADT performed poorly on weaker than expected reported results. We sold the Fund’s position in Yamana Gold by the end of the annual period.
What were some of the Fund’s best-performing individual stocks?
The individual stocks that contributed most to the Fund’s relative results were all U.S.-based companies—casino resort and convention center owner and operator Las Vegas Sands, Internet-based airline and hotel services provider priceline.com and pharmaceuticals manufacturer Actavis, each of which posted robust double-digit gains during the annual period. Las Vegas Sands performed well, as gaming revenue and profit both in the U.S. and abroad rebounded with improved global economic conditions. Shares of priceline.com were up strongly as its reported results were better than anticipated. Actavis saw its shares soar as the generic drug company’s results were better than expected, and investors responded favorably to the company’s accretive acquisition of Ireland-based Warner Chilcott.
How did the Fund use derivatives and similar instruments during the reporting period?
The Fund did not use derivatives during the reporting period.
Did the Fund make any significant purchases or sales during the fiscal year?
During the fiscal year, we initiated Fund positions in apparel and accessories designer Ralph Lauren and applications software provider Salesforce.com, in each case as a dip in their respective share prices offered what we believed to be an attractive entry point into the companies. We established a Fund position in investment management company Franklin Resources, as its upside potential appeared attractive to us given its asset flows and the strong equity market.
We sold the Fund’s position in semiconductor device manufacturer Altera, as broad semiconductor industry fundamentals began to deteriorate, in our view. We eliminated the Fund’s position in leather goods retailer Coach, as the company reported worse than expected earnings results. We exited the Fund’s position in agricultural chemicals producer Potash Corp. of Saskatchewan after it reported disappointing results, and we detected a deterioration in industry fundamentals.
Were there any notable changes in the Fund’s weightings during the 12-month period?
There were no material changes in the Fund’s sector weightings during the 12-month period ended December 31, 2013.
How was the Fund positioned relative to its benchmark index at the end of December 2013?
As of December 31, 2013, the Fund was overweighted relative to the S&P 500® Index in the consumer discretionary, information technology, materials, health care and industrials sectors. The Fund was underweighted relative to the S&P 500® Index in the financials, consumer staples and energy sectors and rather neutrally weighted relative to the Index in the utilities and telecommunication services sectors on the same date.
What is your tactical view and strategy for the months ahead?
As we look toward 2014, we intend to continue to look for and to emphasize larger-capitalization stocks that generally are ranked in the higher categories of 1, 2 or 3 in the Value Line TimelinessII Ranking System. As of December 31, 2013, a majority of the Fund’s assets were in stocks that met these criteria. The Fund’s weighted average price-earnings and debt-to-capital ratios were below that of the S&P 500® Index, while its historical sales growth, earnings growth, return on assets and return on equity were all higher than the Index. We seek to maintain these Fund portfolio characteristics going forward.
As always, our goal is to generate solid returns through capital growth across market cycles.
| Value Line Larger Companies Fund, Inc. |
| Portfolio Highlights at December 31, 2013 (unaudited) |
Ten Largest Holdings
| | | | | | | | | | | |
| Issue | | Shares | | Value | | Percentage of Net Assets | |
| Google, Inc. Class A | | | 3,700 | | $ | 4,146,627 | | 2.0 | % | |
| Apple, Inc. | | | 6,500 | | | 3,647,215 | | 1.7 | % | |
| Actavis PLC | | | 20,000 | | | 3,360,000 | | 1.6 | % | |
| Gilead Sciences, Inc. | | | 42,000 | | | 3,156,300 | | 1.5 | % | |
| NIKE, Inc. Class B | | | 40,000 | | | 3,145,600 | | 1.5 | % | |
| Las Vegas Sands Corp. | | | 39,000 | | | 3,075,930 | | 1.5 | % | |
| McKesson Corp. | | | 19,000 | | | 3,066,600 | | 1.4 | % | |
| Starbucks Corp. | | | 39,000 | | | 3,057,210 | | 1.4 | % | |
| Priceline.com, Inc. | | | 2,600 | | | 3,022,240 | | 1.4 | % | |
| Danaher Corp. | | | 39,000 | | | 3,010,800 | | 1.4 | % | |
Asset Allocation – Percentage of Net Assets
| Sector Weightings – Percentage of Total Investment Securities* |
*Sector weightings exclude short-term investments.
The following graph compares the performance of the Value Line Larger Companies Fund, Inc. to that of the S&P 500 Index (the “Index”). The Value Line Larger Companies Fund, Inc. is a professionally managed mutual fund, while the Index is not available for investment and is unmanaged. The returns for the Index do not reflect charges, expenses or taxes, but do include the reinvestment of dividends. The comparison is shown for illustrative purposes only.
| Comparison of a Change in Value of a $10,000 Investment in the Value Line Larger Companies Fund, Inc. and the S&P 500 Index* |
| | | | | | | | |
| | | Average Annual Total Return | | Growth of an Assumed Investment of $10,000 | |
| 1 year ended 12/31/13 | | 30.05 | % | | $ | 13,005 | |
| 5 years ended 12/31/13 | | 14.84 | % | | $ | 19,973 | |
| 10 years ended 12/31/13 | | 6.65 | % | | $ | 19,044 | |
| * | The Standard and Poor’s 500 Stock Index is an unmanaged index that is representative of the larger-capitalization stocks traded in the United States. |
| ** | The performance data quoted represent past performance and are no guarantee of future performance. The average annual total returns and growth of an assumed investment of $10,000 include dividends reinvested and capital gains distributions accepted in shares. The investment return and principal value of an investment will fluctuate so that an investment, when redeemed, may be worth more or less than its original cost. The performance data and graph do not reflect the deduction of taxes that a shareholder would pay on fund distributions or the redemption of fund shares. |
Value Line Larger Companies Fund, Inc. Schedule of Investments |
| Shares | | | | | Value | |
| COMMON STOCKS (97.1%) | | | | |
| | | | | | | | |
| | | | CONSUMER DISCRETIONARY (17.7%) | |
| | 5,000 | | AutoZone, Inc. * | | $ | 2,389,700 | |
| | 60,000 | | Comcast Corp. Class A | | | 2,992,800 | |
| | 42,000 | | DIRECTV * | | | 2,901,780 | |
| | 39,000 | | Las Vegas Sands Corp. | | | 3,075,930 | |
| | 24,000 | | McDonald’s Corp. | | | 2,328,720 | |
| | 40,000 | | NIKE, Inc. Class B | | | 3,145,600 | |
| | 2,600 | | Priceline.com, Inc. * | | | 3,022,240 | |
| | 13,000 | | Ralph Lauren Corp. | | | 2,295,410 | |
| | 39,000 | | Starbucks Corp. | | | 3,057,210 | |
| | 33,000 | | Target Corp. | | | 2,087,910 | |
| | 41,000 | | TJX Companies, Inc. (The) | | | 2,612,930 | |
| | 30,000 | | Viacom, Inc. Class B | | | 2,620,200 | |
| | 36,000 | | Walt Disney Co. (The) | | | 2,750,400 | |
| | 28,000 | | Yum! Brands, Inc. | | | 2,117,080 | |
| | | | | | | 37,397,910 | |
| | | | | | | | |
| | | | CONSUMER STAPLES (4.6%) | |
| | 24,000 | | Costco Wholesale Corp. | | | 2,856,240 | |
| | 29,000 | | CVS Caremark Corp. | | | 2,075,530 | |
| | 44,000 | | General Mills, Inc. | | | 2,196,040 | |
| | 31,000 | | PepsiCo, Inc. | | | 2,571,140 | |
| | | | | | | 9,698,950 | |
| | | | | | | | |
| | | | ENERGY (7.8%) | | | | |
| | 37,000 | | Cameron International Corp. * | | | 2,202,610 | |
| | 16,000 | | Chevron Corp. | | | 1,998,560 | |
| | 39,000 | | Enterprise Products Partners L.P. | | | 2,585,700 | |
| | 15,000 | | EOG Resources, Inc. | | | 2,517,600 | |
| | 26,000 | | Exxon Mobil Corp. | | | 2,631,200 | |
| | 28,000 | | Schlumberger Ltd. | | | 2,523,080 | |
| | 45,000 | | TransCanada Corp. (1) | | | 2,054,700 | |
| | | | | | | 16,513,450 | |
| | | | | |
| | | | FINANCIALS (7.8%) | |
| | 19,000 | | American Tower Corp. REIT | | | 1,516,580 | |
| | 8,000 | | BlackRock, Inc. | | | 2,531,760 | |
| | 37,000 | | Capital One Financial Corp. | | | 2,834,570 | |
| | 30,000 | | Franklin Resources, Inc. | | | 1,731,900 | |
| | 48,000 | | JPMorgan Chase & Co. | | | 2,807,040 | |
| | 21,700 | | M&T Bank Corp. (1) | | | 2,526,314 | |
| | 65,000 | | U.S. Bancorp | | | 2,626,000 | |
| | | | | | | 16,574,164 | |
| | | | | |
| | | | HEALTH CARE (15.3%) | |
| | 20,000 | | Actavis PLC * | | | 3,360,000 | |
| | 23,000 | | Allergan, Inc. | | | 2,554,840 | |
| | 23,000 | | Amgen, Inc. | | | 2,625,680 | |
| | 10,000 | | Biogen Idec, Inc. * | | | 2,797,500 | |
| | 45,000 | | Bristol-Myers Squibb Co. | | | 2,391,750 | |
| | 36,000 | | Express Scripts Holding Co. * | | | 2,528,640 | |
| | 42,000 | | Gilead Sciences, Inc. * | | | 3,156,300 | |
| | 19,000 | | McKesson Corp. | | | 3,066,600 | |
| | | | | | | | |
| Shares | | | | | Value | |
| | 27,000 | | Novartis AG ADR | | $ | 2,170,260 | |
| | 15,000 | | Novo Nordisk A/S ADR | | | 2,771,400 | |
| | 19,000 | | Thermo Fisher Scientific, Inc. | | | 2,115,650 | |
| | 38,000 | | UnitedHealth Group, Inc. | | | 2,861,400 | |
| | | | | | | 32,400,020 | |
| | | | | | | | |
| | | | INDUSTRIALS (11.7%) | | |
| | 53,000 | | ADT Corp. (The) | | | 2,144,910 | |
| | 19,000 | | Boeing Co. (The) | | | 2,593,310 | |
| | 44,000 | | Canadian National Railway Co. | | | 2,508,880 | |
| | 39,000 | | Danaher Corp. | | | 3,010,800 | |
| | 53,085 | | Expeditors International of Washington, Inc. | | | 2,349,011 | |
| | 19,000 | | FedEx Corp. | | | 2,731,630 | |
| | 10,000 | | Precision Castparts Corp. | | | 2,693,000 | |
| | 40,000 | | Tyco International Ltd. | | | 1,641,600 | |
| | 15,000 | | Union Pacific Corp. | | | 2,520,000 | |
| | 23,000 | | United Technologies Corp. | | | 2,617,400 | |
| | | | | | | 24,810,541 | |
| | | | | | | | |
| | | | INFORMATION TECHNOLOGY (23.0%) | |
| | 34,000 | | Accenture PLC Class A | | | 2,795,480 | |
| | 6,500 | | Apple, Inc. | | | 3,647,215 | |
| | 49,700 | | ARM Holdings PLC ADR | | | 2,720,578 | |
| | 27,000 | | Cognizant Technology Solutions Corp. Class A * | | | 2,726,460 | |
| | 52,000 | | eBay, Inc. * | | | 2,854,280 | |
| | 95,000 | | EMC Corp. | | | 2,389,250 | |
| | 3,700 | | Google, Inc. Class A * | | | 4,146,627 | |
| | 91,000 | | Intel Corp. | | | 2,362,360 | |
| | 12,000 | | International Business Machines Corp. | | | 2,250,840 | |
| | 33,900 | | Intuit, Inc. | | | 2,587,248 | |
| | 36,071 | | Motorola Solutions, Inc. | | | 2,434,793 | |
| | 57,000 | | Oracle Corp. | | | 2,180,820 | |
| | 36,000 | | QUALCOMM, Inc. | | | 2,673,000 | |
| | 49,000 | | Salesforce.com, Inc. * | | | 2,704,310 | |
| | 29,900 | | SAP AG ADR (1) | | | 2,605,486 | |
| | 55,000 | | Texas Instruments, Inc. | | | 2,415,050 | |
| | 13,000 | | Visa, Inc. Class A | | | 2,894,840 | |
| | 24,000 | | VMware, Inc. Class A * | | | 2,153,040 | |
| | | | | | | 48,541,677 | |
| | | | | | | | |
| | | | MATERIALS (6.3%) | | | | |
| | 18,000 | | Air Products & Chemicals, | | | | |
| | | | Inc. | | | 2,012,040 | |
| | 32,000 | | BHP Billiton Ltd. ADR (1) | | | 2,182,400 | |
| | 33,000 | | E.I. du Pont de Nemours & Co. | | | 2,144,010 | |
| | 25,000 | | Ecolab, Inc. | | | 2,606,750 | |
| | 19,000 | | Monsanto Co. | | | 2,214,450 | |
| | 16,000 | | Praxair, Inc. | | | 2,080,480 | |
| | | | | | | 13,240,130 | |
| Shares | | | | | Value | |
| | | | TELECOMMUNICATION SERVICES (2.0%) | | | | |
| | 92,000 | | America Movil S.A.B. de C.V. Series L, ADR (1) | | $ | 2,150,040 | |
| | 50,000 | | BCE, Inc. | | | 2,164,500 | |
| | | | | | | 4,314,540 | |
| | | | | | | | |
| | | | UTILITIES (0.9%) | | | | |
| | 26,333 | | Duke Energy Corp. | | | 1,817,240 | |
| | | | | | | | |
| | | | TOTAL COMMON STOCKS | | | | |
| | | | (Cost $119,157,923) (97.1%) | | | 205,308,622 | |
| | | | | | | | |
Principal
Amount | | | | | Value | |
| SHORT-TERM INVESTMENTS (6.2%) | | | | |
| | | | | | | | |
| | | | REPURCHASE AGREEMENTS (2.8%) | | | | |
| $ | 6,000,000 | | With Morgan Stanley, 0.01%, dated 12/31/13, due 01/02/14, delivery value $6,000,003 (collateralized by $6,105,000 U.S. Treasury Notes 1.000% due 03/31/17, with a value of $6,135,074) | | | 6,000,000 | |
| | | | | | | | |
| | | | JOINT REPURCHASE AGREEMENTS (INVESTMENTS OF CASH COLLATERAL FOR SECURITIES ON LOAN) (3.4%) | | | | |
| | 2,618,773 | | Joint Repurchase Agreement with Morgan Stanley, 0.02%, dated 12/31/13, due 01/02/14, delivery value $2,618,776 (collateralized by $2,671,149 U.S. Treasury Bonds 4.250% - 8.000% due 11/15/21 - 11/15/40 and U.S. Treasury Notes 2.625% - 2.750% due 11/15/20 - 11/15/23, with a value of $2,657,557) | | | 2,618,773 | |
| See Notes to Financial Statements. |
| 34 |
Principal
Amount | | | | | Value | |
| $ | 3,865,808 | | Joint Repurchase Agreement with Barclays, 0.01%, dated 12/31/13, due 01/02/14, delivery value $3,865,810 (collateralized by $3,943,129 U.S. Treasury Inflation Indexed Notes 1.250% - 1.875% due 04/15/14 - 07/15/15, with a value of $3,913,321) | | $ | 3,865,808 | |
| | | | | | | | |
Principal
Amount | | | | Value | |
| $ | 623,517 | | Joint Repurchase Agreement with Citigroup, 0.01%, dated 12/31/13, due 01/02/14, delivery value $623,518 (collateralized by $635,994 U.S. Treasury Bills 0.000% due 02/20/14, with a value of $635,994) | | $ | 623,517 | |
| | | | | | | 7,108,098 | |
| | | | | | | | |
| | | | TOTAL SHORT-TERM INVESTMENTS | | | | |
| | | | (Cost $13,108,098) (6.2%) | | | 13,108,098 | |
| | | | | | | | |
| | | | TOTAL INVESTMENT SECURITIES | | | | |
| | | | (103.3%) (Cost $132,266,021) | | $ | 218,416,720 | |
| | | | | | | | |
Principal Amount | | | | Value | |
| EXCESS OF LIABILITIES OVER CASH AND OTHER ASSETS (-3.3%) | | $ | (6,908,252 | ) |
| NET ASSETS (100%) | | $ | 211,508,468 | |
| | | | | |
| NET ASSET VALUE OFFERING AND REDEMPTION PRICE, PER OUTSTANDING SHARE ($211,508,468 ÷ 8,270,759 shares outstanding) | | $ | 25.57 | |
| * | Non-income producing. |
| (1) | A portion or all of the security was held on loan. As of December 31, 2013, the market value of the securities on loan was $7,803,401. |
| ADR | American Depositary Receipt. |
| REIT | Real Estate Investment Trust. |
The following table summarizes the inputs used to value the Fund’s investments in securities as of December 31, 2013 (See Note 1B):
| Value Line Larger Companies Fund, Inc. | | Level 1 | | | Level 2 | | | Level 3 | | | Total | |
| Assets: | | | | | | | | | | | | |
| Common Stocks | | $ | 205,308,622 | | | $ | — | | | $ | — | | | $ | 205,308,622 | |
| Short-Term Investments | | | — | | | | 13,108,098 | | | | — | | | | 13,108,098 | |
| Total | | $ | 205,308,622 | | | $ | 13,108,098 | | | $ | — | | | $ | 218,416,720 | |
| See Notes to Financial Statements. |
| 35 |
| VALUE LINE CORE BOND FUND |
INVESTMENT OBJECTIVE AND STRATEGY
The investment objective of the Fund is to maximize current income. Capital appreciation is a secondary objective but only when consistent with the Fund’s primary objective.
The Fund invests primarily in a diversified portfolio of primarily investment grade, fixed income obligations, including securities issued or guaranteed by the U.S. government, its agencies or instrumentalities (U.S. government securities), mortgage-backed securities, asset-backed securities, corporate bonds, and other fixed income securities. Under normal circumstances, the Fund invests at least 80% of its assets in fixed income securities. The Fund invests in debt securities of any maturity, and there is no limit on the Fund’s maximum average portfolio maturity.
Manager Discussion of Fund Performance
Effective December 31, 2013, Value Line Core Bond Fund’s fiscal year-end was changed from January 31 to December 31. Thus, below, Fund portfolio managers Liane Rosenberg and Jeffrey D. Geffen discuss the Fund’s performance and positioning for the 11 months ended December 31, 2013.
How did the Fund perform during the reporting period?
The Fund generated a total return of -3.13% during the 11 months ended December 31, 2013 (the reporting period). This compares to the -1.33% return of the Fund’s benchmark, the Barclays U.S. Aggregate Bond Index (the “Barclays Index”), during the same period.
What key factors were responsible for the Fund’s performance during the reporting period?
The Fund underperformed its benchmark, the Barclays Index, due primarily to issue selection, especially within the securitized and corporate bond sectors. Sector allocation overall and duration positioning contributed positively.
Which fixed income market sectors most significantly affected Fund performance?
Detracting most from relative results was security selection within the securitized sector. Within the securitized sector, we held an overweighted allocation to seven-year to 10-year maturities. However, this intermediate “belly” of the curve underperformed because the U.S. Treasury yield curve flattened during the reporting period, which means yield differentials between longer-term and shorter-term maturities narrowed. The flattening yield curve benefited shorter-term and longer-term maturities, where the Fund was underweight, but hurt the intermediate segment of the yield curve, and thus, such positioning hurt. Some of this detracting effect was offset by having a shorter duration than the Barclays Index in the securitized sector, especially in the mortgage-backed securities sub-sector, as interest rates markedly increased during the year.
Also detracting from the Fund’s results was security selection amongst longer-maturity corporate bonds. While maintaining an underweight exposure relative to the Barclays Index, a position in a long-dated electric utility bond—issued by Alabama Power—lost ground during the reporting period. A position in a long-dated bond issued by broadcasting company Comcast also declined during the reporting period. There were no serious credit problems with either of these credits, but longer maturity bonds generally were out of favor.
On the positive side, having an underweighted allocation to U.S. Treasuries, which was the worst performing sector in the Barclays Index during the reporting period, contributed to the Fund’s performance. An overweighted allocation to corporate bonds also added significant value, as this sector experienced steady spread tightening throughout the year. (Spread tightening is when the yield differential between a non-U.S. Treasury sector and the U.S. Treasury sector narrows.) Within the Fund’s corporate bond allocation, an underweight to utilities bonds and overweights to financials and industrials bonds proved beneficial, as utilities bonds underperformed both financials and industrials bonds during the reporting period. Our corporate credit bias toward bonds rated BBB also buoyed the Fund’s results, as this market segment of the investment grade corporate bond sector outperformed higher quality bonds during the reporting period.
A modest out-of-benchmark exposure to high yield corporate bonds boosted relative results, as high yield corporate bonds outperformed investment grade corporate bonds.
What was the Fund’s duration strategy?
Duration positioning in the Fund contributed most positively to the Fund’s performance relative to the Barclays Index during the reporting period. Based upon expectations of a bias toward rising interest rates, we kept the Fund’s duration short relative to that of the Barclays Index. As interest rates did rise significantly during the reporting period, this duration positioning contributed positively to relative results. Duration is a measure of the Fund’s sensitivity to changes in interest rates.
How did yield curve positioning decisions affect the Fund’s performance?
Yield curve positioning had a rather neutral effect on the Fund’s performance during the reporting period, but did detract at certain points. For example, the Fund was overweighted in the intermediate segment of the yield curve, or spectrum of maturities. When the Federal Reserve (the Fed) first started talking seriously in May 2013 about tapering its asset purchases, the yield curve started to flatten, meaning the differential in yields between longer-term and shorter-term maturities narrowed. The flattening yield curve benefited shorter-term and longer-term maturities, where the Fund was underweight, but hurt the intermediate segment of the yield curve, and thus, such positioning hurt.
How did the Fund use derivatives and similar instruments during the reporting period?
The Fund did not use derivatives during the reporting period.
Were there any notable changes in the Fund’s weightings during the reporting period?
We increased the Fund’s allocation to corporate bonds, both investment grade and high yield, during the reporting period, as we sought to take advantage of what we considered to be attractive spreads and yields. The high yield corporate bond market performed particularly strongly, as it gained alongside the rallying U.S. equity market. Concurrently, we reduced the Fund’s exposure to U.S. Treasuries, using the proceeds to invest in spread, or non-U.S. Treasury, fixed income sectors. We kept the Fund’s duration within a neutral to half-year short stance compared to that of the Barclays Index.
How was the Fund positioned relative to its benchmark index at the end of December 2013?
At the end of December 2013, the Fund was significantly overweight relative to the Barclays Index in the corporate bond sector and more modestly overweight in the securitized sector. As of December 31, 2013, the Fund was significantly underweight the Barclays Index in U.S. Treasuries and more modestly underweight in government-related securities. The Fund had an approximately 2% allocation to cash equivalents at the end of the reporting period.
What is your tactical view and strategy for the months ahead?
We expect performance of the fixed income asset class to be highly sensitive in the months ahead to Fed policy and the timetable for its tapering actions. Also, economic factors, including jobs growth, unemployment, Gross Domestic Product and inflation are likely to be critical factors that may impact the fixed income market ahead. While Fed tapering of the bond purchase program is scheduled to begin in January 2014, any sustained economic weakness could affect the Fed’s current course. We also believe there may continue to be interest rate volatility with the ultimate bias toward higher rates.
Given this view, at the end of the reporting period, we continued to favor corporate bonds over U.S. Treasuries within the Fund, especially corporate bonds rated BBB, or mid-grade credits, and high yield corporate bonds. We believe corporate bonds’ comparatively higher investment income is likely to remain attractive to investors, and we expect the technicals, or supply and demand factors, within the sector to remain supportive. That is, we expect to see modest new issuance relative to strong investor demand. In our view, corporate bonds were also at a relatively strong point in the credit cycle at the end of the reporting period, with relatively low debt and high cash levels. All that said, we do not expect to significantly increase the Fund’s overall exposure from end-of-year levels given how tight spreads have become.
Of course, any significant weakening in the U.S. economy will lead us to re-evaluate the Fund’s duration stance as well as its sector allocation. Similarly, any significant deterioration in overall credit metrics would likely lead to a reduction in overall corporate exposure. As we continue to seek to maximize current income, we maintain a long-term investment perspective.
| Value Line Core Bond Fund |
| Portfolio Highlights at December 31, 2013 (unaudited) |
Ten Largest Holdings
| | | | | | | | | | |
| | | Principal | | | | Percentage of |
| Issue | | Amount | | Value | | Net Assets |
| FHLMC Gold PC Pool #C09004, 3.50%, 7/1/42 | | $1,883,353 | | | $1,870,822 | | | 2.2 | % |
| U.S. Treasury Notes, 0.88%, 12/31/16 | | 1,650,000 | | | 1,653,610 | | | 1.9 | % |
| FHLB, 5.00%, 12/21/15 | | 1,500,000 | | | 1,634,504 | | | 1.9 | % |
| U.S. Treasury Notes, 1.00%, 8/31/16 | | 1,500,000 | | | 1,514,062 | | | 1.8 | % |
| U.S. Treasury Notes, 0.75%, 12/31/17 | | 1,500,000 | | | 1,466,718 | | | 1.7 | % |
| FNMA Pool #MA1107, 3.50%, 7/1/32 | | 1,390,018 | | | 1,415,535 | | | 1.7 | % |
| FNMA, 7.25%, 5/15/30 | | 1,000,000 | | | 1,372,718 | | | 1.6 | % |
| U.S. Treasury Notes, 2.00%, 2/15/22 | | 1,400,000 | | | 1,328,578 | | | 1.6 | % |
| U.S. Treasury Notes, 1.38%, 11/30/15 | | 1,250,000 | | | 1,274,170 | | | 1.5 | % |
| FHLMC, 2.00%, 8/25/16 | | 1,000,000 | | | 1,034,112 | | | 1.2 | % |
| Asset Allocation – Percentage of Net Assets | | | | | | | | | |
| Sector Weightings – Percentage of Total Investment Securities* |
*Sector weightings exclude short-term investments.
Coupon Distribution
| | | Percentage of |
| | | Fund’s Investments |
| Less than 4% | | 61.0 | % |
| 4-4.99% | | 17.1 | % |
| 5-5.99% | | 11.1 | % |
| 6-6.99% | | 5.6 | % |
| 7-7.99% | | 4.6 | % |
| 8-8.99% | | 0.6 | % |
The following graph compares the performance of the Value Line Core Bond Fund to that of the Barclays Capital U.S. Corporate High Yield Index and the Barclays Capital Aggregate Bond Index (the “Indices”). The Value Line Core Bond Fund is a professionally managed mutual fund, while the Indices are not available for investment and are unmanaged. The returns for the Indices do not reflect charges, expenses or taxes, but do include the reinvestment of dividends. The comparison is shown for illustrative purposes only.
| Comparison of a Change in Value of a $10,000 Investment in the Value Line Core Bond Fund, the Barclays Capital U.S. Corporate High Yield Index* and the Barclays Capital Aggregate Bond Index** |
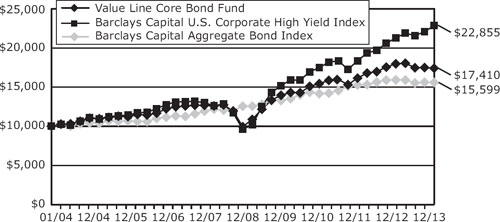
| Performance Data: *** | | | | | | | | |
| | | | | | | | | |
| | | Average Annual Total Return | | | Growth of an Assumed
Investment of $10,000 | |
| | (3.16 | )% | | | | $ | 9,684 | | |
| | 11.86 | % | | | | $ | 17,511 | | |
| | 5.70 | % | | | | $ | 17,410 | | |
| * | The Barclays Capital U.S. Corporate High Yield Index is representative of the broad based fixed-income market. It includes noninvestment grade corporate bonds. The returns for the Index do not reflect charges, expenses, or taxes, which are deducted from the Fund’s returns, and it is not possible to directly invest in this unmanaged Index. |
| ** | The Barclay’s Capital U.S. Aggregate Bond Index is a broad-based benchmark that measures the investment grade, U.S. dollar denominated, fixed-rate taxable bond market, including Treasuries, government-related and corporate securities, MBS (agency fixed-rate and hybrid ARM pass-through’s), ABS, and CMBS. This is an unmanaged index and does not reflect charges, expenses or taxes. It is not possible to directly invest in this Index. |
| *** | The performance data quoted represent past performance and are no guarantee of future performance. The average annual total returns and growth of an assumed investment of $10,000 include dividends reinvested and capital gains distributions accepted in shares. The investment return and principal value of an investment will fluctuate so that an investment, when redeemed, may be worth more or less than its original cost. The performance data and graph do not reflect the deduction of taxes that a shareholder would pay on fund distributions or the redemption of fund shares. |
Value Line Core Bond Fund |
| Schedule of Investments |
| | | | | | | | |
Principal
Amount | | | | Value | |
| CORPORATE BONDS & NOTES (30.8%) | | | | |
| | | | | | | | |
| | | | BASIC MATERIALS (0.6%) | | | | |
| $ | 250,000 | | Celanese U.S. Holdings LLC, Guaranteed Notes, 4.63%, 11/15/22 | | $ | 239,375 | |
| | 300,000 | | LYB International Finance B.V., Guaranteed Notes, 4.00%, 7/15/23 | | | 296,116 | |
| | | | | | | 535,491 | |
| | | | COMMUNICATIONS (3.3%) | | | | |
| | 250,000 | | America Movil S.A.B. de C.V., Guaranteed Notes, 5.00%, 3/30/20 | | | 270,766 | |
| | 500,000 | | Comcast Corp., Guaranteed Notes, 4.25%, 1/15/33 | | | 464,460 | |
| | 500,000 | | DIRECTV Holdings LLC / DIRECTV Financing Co., Inc., Guaranteed Notes, 3.80%, 3/15/22 | | | 480,318 | |
| | 500,000 | | MetroPCS Wireless, Inc., Guaranteed Notes, 6.63%, 11/15/20 | | | 530,000 | |
| | 400,000 | | Motorola Solutions, Inc., Senior Unsecured Notes, 6.00%, 11/15/17 | | | 454,982 | |
| | 250,000 | | Time Warner, Inc., Guaranteed Notes, 3.15%, 7/15/15 | | | 258,998 | |
| | 350,000 | | Verizon Communications, Inc., Senior Unsecured Notes, 1.25%, 11/3/14 | | | 352,039 | |
| | | | | | | 2,811,563 | |
| | | | CONSUMER, CYCLICAL (5.0%) | | | | |
| | 300,000 | | CVS Caremark Corp., Senior Unsecured Notes, 6.60%, 3/15/19 | | | 355,015 | |
| | 500,000 | | D.R. Horton, Inc., Guaranteed Notes, 6.50%, 4/15/16 | | | 546,250 | |
| | 150,000 | | Delphi Corp., Guaranteed Notes, 6.13%, 5/15/21 | | | 166,313 | |
| | 250,000 | | Ford Motor Co., Senior Unsecured Notes, 7.45%, 7/16/31 | | | 306,167 | |
| | 200,000 | | Hanesbrands, Inc., Guaranteed Notes, 6.38%, 12/15/20 | | | 218,500 | |
| | 500,000 | | Home Depot, Inc. (The), Senior Unsecured Notes, 3.95%, 9/15/20 | | | 533,447 | |
| | | | | | | | |
Principal Amount | | | | Value | |
| $ | 115,000 | | Lennar Corp., Series B, Guaranteed Notes, 6.50%, 4/15/16 | | $ | 125,350 | |
| | 200,000 | | Macy’s Retail Holdings, Inc., Guaranteed Notes, 8.13%, 8/15/35 | | | 218,431 | |
| | 300,000 | | Royal Caribbean Cruises Ltd., Senior Unsecured Notes, 7.50%, 10/15/27 | | | 320,250 | |
| | 500,000 | | Starwood Hotels & Resorts Worldwide, Inc., Senior Unsecured Notes, 3.13%, 2/15/23 | | | 454,088 | |
| | 500,000 | | Toyota Motor Credit Corp., Senior Unsecured Notes, 0.80%, 5/17/16 | | | 500,533 | |
| | 250,000 | | Wyndham Worldwide Corp., Senior Unsecured Notes, 3.90%, 3/1/23 | | | 235,492 | |
| | 200,000 | | Wynn Las Vegas LLC / Wynn Las Vegas Capital Corp., 7.75%, 8/15/20 | | | 224,500 | |
| | | | | | | 4,204,336 | |
| | | | CONSUMER, NON-CYCLICAL (3.4%) | | | | |
| | 400,000 | | Amgen, Inc., Senior Unsecured Notes, 2.50%, 11/15/16 | | | 413,982 | |
| | 500,000 | | Celgene Corp., Senior Unsecured Notes, 4.00%, 8/15/23 | | | 492,299 | |
| | 450,000 | | Cigna Corp., Senior Unsecured Notes, 2.75%, 11/15/16 | | | 468,370 | |
| | 250,000 | | Constellation Brands, Inc., Guaranteed Notes, 4.25%, 5/1/23 | | | 233,125 | |
| | 250,000 | | Hawk Acquisition Sub, Inc., Secured Notes, 4.25%, 10/15/20 (1) | | | 241,875 | |
| | 250,000 | | Humana, Inc., Senior Unsecured Notes, 3.15%, 12/1/22 | | | 231,428 | |
| | 500,000 | | Kroger Co. (The), Senior Unsecured Notes, 5.15%, 8/1/43 | | | 487,752 | |
| | 350,000 | | Mylan, Inc., Senior Unsecured Notes, 1.35%, 11/29/16 | | | 349,358 | |
| | | | | | | 2,918,189 | |
| | | | ENERGY (1.5%) | | | | |
| | 500,000 | | Enterprise Products Operating LLC, Guaranteed Notes, 4.85%, 8/15/42 | | | 470,883 | |
| | | | | | | | |
Principal Amount | | | | Value | |
| $ | 500,000 | | Kinder Morgan Energy Partners L.P., Senior Unsecured Notes, 2.65%, 2/1/19 | | $ | 494,455 | |
| | 250,000 | | Phillips 66, Guaranteed Notes, 4.30%, 4/1/22 | | | 254,054 | |
| | | | | | | 1,219,392 | |
| | | | FINANCIAL (13.0%) | | | | |
| | 250,000 | | ACE INA Holdings, Inc., Guaranteed Notes, 2.70%, 3/13/23 | | | 229,081 | |
| | 250,000 | | Aircastle, Ltd., Senior Unsecured Notes, 4.63%, 12/15/18 | | | 251,875 | |
| | 250,000 | | American Express Co., Senior Unsecured Notes, 0.83%, 5/22/18 (2) | | | 249,827 | |
| | 500,000 | | American International Group, Inc. MTN, Senior Unsecured Notes, 5.85%, 1/16/18 | | | 573,525 | |
| | 500,000 | | Bank of America Corp. MTN, Senior Unsecured Notes, 3.30%, 1/11/23 | | | 473,134 | |
| | 250,000 | | Bank of Montreal MTN, Senior Unsecured Notes, 2.38%, 1/25/19 | | | 249,276 | |
| | 350,000 | | BlackRock, Inc., Series 2, Senior Unsecured Notes, 5.00%, 12/10/19 | | | 395,182 | |
| | 250,000 | | BRE Properties, Inc., REIT, Senior Unsecured Notes, 3.38%, 1/15/23 | | | 229,558 | |
| | 350,000 | | Capital One NA/Mclean VA, Senior Notes, 1.50%, 3/22/18 | | | 340,367 | |
| | 350,000 | | CIT Group, Inc., Senior Unsecured Notes, 5.00%, 8/15/22 | | | 341,250 | |
| | 500,000 | | Citigroup, Inc., Senior Unsecured Notes, 1.70%, 7/25/16 | | | 504,711 | |
| | 500,000 | | Cooperatieve Centrale Raiffeisen- Boerenleenbank BA, Guaranteed Notes, 3.95%, 11/9/22 | | | 484,495 | |
| | 250,000 | | Credit Agricole S.A., Senior Unsecured Notes, 2.13%, 4/17/18 (1) | | | 248,373 | |
| | 250,000 | | Fifth Third Bank, Senior Unsecured Notes, 1.45%, 2/28/18 | | | 243,603 | |
| | 250,000 | | General Electric Capital Corp. MTN, Senior Unsecured Notes, 1.00%, 8/11/15 (2) | | | 251,904 | |
| See Notes to Financial Statements. |
| 40 |
| | | | | | | | |
Principal
Amount | | | | Value | |
| $ | 250,000 | | General Motors Financial Co., Inc., Senior Unsecured Notes, 2.75%, 5/15/16 (1) | | $ | 253,125 | |
| | 500,000 | | Goldman Sachs Group, Inc. (The), Senior Unsecured Notes, 3.63%, 1/22/23 | | | 484,176 | |
| | 500,000 | | HSBC Holdings PLC, Senior Unsecured Notes, 4.00%, 3/30/22 | | | 513,924 | |
| | 250,000 | | Icahn Enterprises L.P. / Icahn Enterprises Finance Corp., Guaranteed Notes, 8.00%, 1/15/18 | | | 260,000 | |
| | 350,000 | | John Deere Capital Corp., Senior Unsecured Notes, 1.05%, 10/11/16 | | | 351,007 | |
| | 500,000 | | KeyCorp. MTN, Senior Unsecured Notes, 5.10%, 3/24/21 | | | 546,456 | |
| | 500,000 | | Morgan Stanley, Senior Unsecured Notes, 4.75%, 3/22/17 | | | 545,659 | |
| | 500,000 | | PNC Funding Corp., Guaranteed Notes, 5.13%, 2/8/20 | | | 561,579 | |
| | 500,000 | | ProLogis L.P., Guaranteed Notes, 2.75%, 2/15/19 | | | 496,540 | |
| | 250,000 | | Prudential Financial, Inc. MTN, Senior Unsecured Notes, 2.30%, 8/15/18 | | | 248,520 | |
| | 250,000 | | Societe Generale S.A., Senior Unsecured Notes, 5.20%, 4/15/21 | | | 274,814 | |
| | 250,000 | | State Street Corp., Subordinated Notes, 3.10%, 5/15/23 | | | 232,452 | |
| | 250,000 | | Sumitomo Mitsui Trust Bank, Ltd., Guaranteed Notes, 2.95%, 9/14/18 (1) (3) | | | 254,318 | |
| | 500,000 | | Wells Fargo & Co., Series M, Subordinated Notes, 3.45%, 2/13/23 | | | 472,718 | |
| | 250,000 | | Weyerhaeuser Co., Senior Unsecured Notes, 7.38%, 10/1/19 | | | 303,097 | |
| | 200,000 | | XLIT, Ltd., Guaranteed Notes, 5.25%, 12/15/43 | | | 201,340 | |
| | | | | | | 11,065,886 | |
| | | | | | | | |
Principal
Amount | | | | | Value | |
| | | | INDUSTRIAL (2.4%) | | | | |
| $ | 350,000 | | Alliant Techsystems, Inc., Guaranteed Notes, 6.88%, 9/15/20 | | $ | 377,563 | |
| | 500,000 | | Briggs & Stratton Corp., Guaranteed Notes, 6.88%, 12/15/20 | | | 549,375 | |
| | 350,000 | | Burlington Northern Santa Fe LLC, Senior Unsecured Notes, 3.05%, 3/15/22 | | | 331,742 | |
| | 500,000 | | Canadian National Railway Co., Senior Unsecured Notes, 5.55%, 3/1/19 | | | 573,755 | |
| | 200,000 | | Masco Corp., Senior Unsecured Notes, 7.13%, 3/15/20 | | | 228,302 | |
| | | | | | | 2,060,737 | |
| | | | TECHNOLOGY (0.9%) | | | | |
| | 200,000 | | Microsoft Corp., Senior Unsecured Notes, 3.63%, 12/15/23 | | | 200,313 | |
| | 500,000 | | Oracle Corp., Senior Unsecured Notes, 5.00%, 7/8/19 | | | 566,043 | |
| | | | | | | 766,356 | |
| | | | UTILITIES (0.7%) | | | | |
| | 250,000 | | Alabama Power Co., Senior Unsecured Notes, 3.85%, 12/1/42 | | | 213,246 | |
| | 380,000 | | Florida Power & Light Co., 4.95%, 6/1/35 | | | 398,250 | |
| | | | | | | 611,496 | |
| | | | TOTAL CORPORATE BONDS & NOTES
(Cost $26,501,267) (30.8%) | | | 26,193,446 | |
| | | | | |
| COMMERCIAL MORTGAGE-BACKED SECURITIES (3.7%) | | | | |
| | 350,000 | | Commercial Mortgage Pass-Through Certificates, Series 2012-CR4, Class A3, 2.85%, 10/15/45 | | | 328,254 | |
| | 500,000 | | FHLMC, Multifamily Structured Pass-Through Certificates, Series K704, Class A2, 2.41%, 8/25/18 | | | 509,507 | |
| | | | | | | | |
Principal
Amount | | | | | Value | |
| $ | 454,000 | | FNMA, Series 2012-M3, Class 2A2, 2.43%, 1/25/19 | | $ | 460,313 | |
| | 300,000 | | GNMA Series 2010-155, Class B, 2.53%, 6/16/39 | | | 307,517 | |
| | 345,110 | | GNMA Series 2013-12, Class AB, 1.83%, 11/16/52 | | | 329,073 | |
| | 600,000 | | GNMA, Series 2013-12, Class B, 2.45%, 11/16/52 (2) | | | 553,180 | |
| | 441,683 | | GNMA Series 2012-125, Class AB, 2.11%, 2/16/53 (2) | | | 417,099 | |
| | 250,000 | | Morgan Stanley Bank of America Merrill Lynch Trust, Series 2013-C8, Class A2, 1.69%, 12/15/48 | | | 244,639 | |
| | | | TOTAL COMMERCIAL MORTGAGE-BACKED SECURITIES
(Cost $3,343,344) (3.7%) | | | 3,149,582 | |
| | | | | | | | |
| FOREIGN GOVERNMENT OBLIGATIONS (0.7%) | | | | |
| | 250,000 | | International Bank for Reconstruction & Development, Senior Unsecured Notes, 0.50%, 4/15/16 | | | 249,604 | |
| | 300,000 | | Mexico Government International Bond, Senior Unsecured Notes, 5.13%, 1/15/20 | | | 332,400 | |
| | | | TOTAL FOREIGN GOVERNMENT OBLIGATIONS
(Cost $581,849) (0.7%) | | | 582,004 | |
| | | | | |
| LONG-TERM MUNICIPAL SECURITIES (1.1%) | | | | |
| | | | CALIFORNIA (0.3%) | | | | |
| | 350,000 | | San Francisco Bay Area Rapid Transit District, Revenue Bonds, Series B, 4.09%, 7/1/32 | | | 318,027 | |
| | | | NEW YORK (0.3%) | | | | |
| | 250,000 | | City of New York, General Obligation Unlimited, Subser. D2, 2.60%, 8/1/20 | | | 243,625 | |
| See Notes to Financial Statements. |
| 41 |
| |
| Schedule of Investments (continued) |
| Principal | | | | | | |
| Amount | | | | | Value | |
| | | | TEXAS (0.5%) | | | | |
| $ | 500,000 | | Tarrant County Cultural Education Facilities Finance Corp., Revenue Bonds, Baylor Health Care System Project, Series C, 4.45%, 11/15/43 | | $ | 423,865 | |
| | | | TOTAL LONG-TERM MUNICIPAL SECURITIES
(Cost $1,099,943) (1.1%) | | | 985,517 | |
| | U.S. TREASURY OBLIGATIONS (25.0%) | | | | |
| | | | U.S. TREASURY NOTES & BONDS (25.0%) | | | | |
| | 700,000 | | U.S. Treasury Bonds, 7.88%, 2/15/21 | | | 952,437 | |
| | 588,395 | | U.S. Treasury Bonds, 2.00%, 1/15/26 (4) | | | 651,372 | |
| | 700,000 | | U.S. Treasury Bonds, 6.00%, 2/15/26 | | | 893,593 | |
| | 250,000 | | U.S. Treasury Bonds, 4.38%, 5/15/40 | | | 271,563 | |
| | 450,000 | | U.S. Treasury Bonds, 3.75%, 8/15/41 | | | 438,680 | |
| | 900,000 | | U.S. Treasury Bonds, 3.63%, 8/15/43 | | | 849,937 | |
| | 200,000 | | U.S. Treasury Notes, 0.25%, 1/31/15 | | | 200,164 | |
| | 450,000 | | U.S. Treasury Notes, 0.25%, 3/31/15 | | | 450,246 | |
| | 450,000 | | U.S. Treasury Notes, 0.25%, 7/31/15 | | | 449,982 | |
| | 100,000 | | U.S. Treasury Notes, 0.25%, 8/15/15 | | | 99,961 | |
| | 500,000 | | U.S. Treasury Notes, 0.25%, 10/15/15 | | | 499,356 | |
| | 1,250,000 | | U.S. Treasury Notes, 1.38%, 11/30/15 | | | 1,274,170 | |
| | 1,000,000 | | U.S. Treasury Notes, 0.38%, 1/15/16 | | | 999,609 | |
| | 100,000 | | U.S. Treasury Notes, 1.50%, 6/30/16 | | | 102,305 | |
| | 900,000 | | U.S. Treasury Notes, 1.50%, 7/31/16 | | | 920,531 | |
| | 1,500,000 | | U.S. Treasury Notes, 1.00%, 8/31/16 | | | 1,514,062 | |
| | 1,650,000 | | U.S. Treasury Notes, 0.88%, 12/31/16 | | | 1,653,610 | |
| | 300,000 | | U.S. Treasury Notes, 1.00%, 3/31/17 | | | 300,656 | |
| | 150,000 | | U.S. Treasury Notes, 1.88%, 9/30/17 | | | 153,832 | |
| Principal | | | | | | |
| Amount | | | | | Value | |
| $ | 200,000 | | U.S. Treasury Notes, 0.63%, 11/30/17 | | $ | 195,000 | |
| | 1,500,000 | | U.S. Treasury Notes, 0.75%, 12/31/17 | | | 1,466,718 | |
| | 500,000 | | U.S. Treasury Notes, 2.38%, 5/31/18 | | | 519,024 | |
| | 500,000 | | U.S. Treasury Notes, 1.38%, 9/30/18 | | | 493,906 | |
| | 400,000 | | U.S. Treasury Notes, 1.38%, 11/30/18 | | | 394,000 | |
| | 500,000 | | U.S. Treasury Notes, 1.38%, 12/31/18 | | | 491,680 | |
| | 1,050,000 | | U.S. Treasury Notes, 1.38%, 2/28/19 | | | 1,028,344 | |
| | 750,000 | | U.S. Treasury Notes, 1.25%, 4/30/19 | | | 726,621 | |
| | 800,000 | | U.S. Treasury Notes, 3.13%, 5/15/19 | | | 852,500 | |
| | 700,000 | | U.S. Treasury Notes, 2.63%, 8/15/20 | | | 714,218 | |
| | 400,000 | | U.S. Treasury Notes, 2.13%, 8/15/21 | | | 387,500 | |
| | 1,400,000 | | U.S. Treasury Notes, 2.00%, 2/15/22 | | | 1,328,578 | |
| | | | | | | 21,274,155 | |
| | | | TOTAL U.S. TREASURY OBLIGATIONS
(Cost $21,887,446) (25.0%) | | | 21,274,155 | |
| | U.S. GOVERNMENT AGENCY OBLIGATIONS (37.2%) | | | | |
| | 1,500,000 | | FHLB, 5.00%, 12/21/15 | | | 1,634,504 | |
| | 1,000,000 | | FHLMC, 2.00%, 8/25/16 | | | 1,034,112 | |
| | 600,000 | | FHLMC, 1.25%, 5/12/17 | | | 604,115 | |
| | 139,999 | | FHLMC Gold PC Pool #A29526, 5.00%, 1/1/35 | | | 150,929 | |
| | 59,798 | | FHLMC Gold PC Pool #A29633, 5.00%,1/1/35 | | | 64,435 | |
| | 62,042 | | FHLMC Gold PC Pool #A56491, 5.00%, 1/1/37 | | | 66,791 | |
| | 775,481 | | FHLMC Gold PC Pool #A95803, 4.00%, 12/1/40 | | | 797,841 | |
| | 192,608 | | FHLMC Gold PC Pool #A97264, 4.00%, 2/1/41 | | | 197,966 | |
| | 21,030 | | FHLMC Gold PC Pool #B12822, 5.00%, 3/1/19 | | | 22,591 | |
| | 10,029 | | FHLMC Gold PC Pool #B17398, 4.50%, 12/1/19 | | | 10,654 | |
| Principal | | | | | | |
| Amount | | | | | Value | |
| $ | 46,914 | | FHLMC Gold PC Pool #B18034, 4.50%, 4/1/20 | | $ | 50,609 | |
| | 455,555 | | FHLMC Gold PC Pool #C03516, 4.00%, 9/1/40 | | | 468,181 | |
| | 1,883,353 | | FHLMC Gold PC Pool #C09004, 3.50%, 7/1/42 | | | 1,870,822 | |
| | 23,976 | | FHLMC Gold PC Pool #C91413, 3.50%, 12/1/31 | | | 24,437 | |
| | 2,211 | | FHLMC Gold PC Pool #E92226, 5.00%, 11/1/17 | | | 2,340 | |
| | 3,023 | | FHLMC Gold PC Pool #E92829, 5.00%, 12/1/17 | | | 3,200 | |
| | 34,265 | | FHLMC Gold PC Pool #E93499, 5.00%, 12/1/17 | | | 36,272 | |
| | 3,864 | | FHLMC Gold PC Pool #E98960, 5.00%, 9/1/18 | | | 4,092 | |
| | 274,092 | | FHLMC Gold PC Pool #G06224, 3.50%, 1/1/41 | | | 272,269 | |
| | 46,559 | | FHLMC Gold PC Pool #G08184, 5.00%, 1/1/37 | | | 50,151 | |
| | 6,419 | | FHLMC Gold PC Pool #G11986, 5.00%, 4/1/21 | | | 6,933 | |
| | 9,219 | | FHLMC Gold PC Pool #G12319, 5.00%, 6/1/21 | | | 9,786 | |
| | 494,942 | | FHLMC Gold PC Pool #G14216, 3.50%, 7/1/21 | | | 519,892 | |
| | 54,289 | | FHLMC Gold PC Pool #G18044, 4.50%, 3/1/20 | | | 57,680 | |
| | 7,873 | | FHLMC Gold PC Pool #J00118, 5.00%,10/1/20 | | | 8,339 | |
| | 156,368 | | FHLMC Gold PC Pool #J00139, 5.00%, 10/1/20 | | | 166,603 | |
| | 48,971 | | FHLMC Gold PC Pool #J03233, 5.00%, 8/1/21 | | | 52,877 | |
| | 421,654 | | FHLMC Gold PC Pool #J11587, 4.00%, 1/1/25 | | | 451,654 | |
| | 40,308 | | FHLMC Gold PC Pool #Q01181, 4.50%, 6/1/41 | | | 42,721 | |
| See Notes to Financial Statements. |
| 42 |
| Principal | | | | | | |
| Amount | | | | | Value | |
| $ | 139,207 | | FHLMC Gold PC Pool #Q06307, 3.50%, 2/1/42 | | $ | 138,280 | |
| | 218,751 | | FHLMC Gold PC Pool #Q08903, 3.50%, 6/1/42 | | | 217,295 | |
| | 463,151 | | FHLMC Gold PC Pool #Q11556, 3.00%, 10/1/42 | | | 439,327 | |
| | 830,396 | | FHLMC Gold PC Pool #Q11908, 3.50%, 10/1/42 | | | 824,871 | |
| | 478,168 | | FHLMC Gold PC Pool #Q14593, 3.00%, 1/1/43 | | | 453,572 | |
| | 162,576 | | FHLMC, Pool #783022, 2.40%, 2/1/35 (2) | | | 172,889 | |
| | 127,648 | | FHLMC, REMIC Trust Series 2643, Class ME, 3.50%, 3/15/18 | | | 130,837 | |
| | 3,899 | | FHLMC, REMIC Trust Series 2645, Class NA, 3.50%, 9/15/31 | | | 3,904 | |
| | 854,732 | | FHLMC, REMIC Trust Series 3632, Class AP, 3.00%, 2/15/40 | | | 883,182 | |
| | 500,000 | | FNMA, 1.10%, 7/11/17 | | | 495,382 | |
| | 500,000 | | FNMA, 1.10%, 3/12/18 | | | 484,615 | |
| | 1,000,000 | | FNMA, 7.25%, 5/15/30 | | | 1,372,718 | |
| | 18,947 | | FNMA Pool #254383, 7.50%, 6/1/32 | | | 21,067 | |
| | 53,505 | | FNMA Pool #254476, 5.50%, 9/1/32 | | | 58,952 | |
| | 49,006 | | FNMA Pool #254684, 5.00%, 3/1/18 | | | 52,207 | |
| | 113,103 | | FNMA Pool #255496, 5.00%, 11/1/34 | | | 122,801 | |
| | 8,996 | | FNMA Pool #255580, 5.50%, 2/1/35 | | | 9,897 | |
| | 6,119 | | FNMA Pool #258149, 5.50%, 9/1/34 | | | 6,757 | |
| | 33,560 | | FNMA Pool #412682, 6.00%, 3/1/28 | | | 37,697 | |
| | 5,765 | | FNMA Pool #511823, 5.50%, 5/1/16 | | | 6,118 | |
| | 193 | | FNMA Pool #568625, 7.50%, 1/1/31 | | | 199 | |
| | 30,702 | | FNMA Pool #571090, 7.50%, 1/1/31 | | | 31,390 | |
| | 1,690 | | FNMA Pool #573935, 7.50%, 3/1/31 | | | 1,810 | |
| | 19,018 | | FNMA Pool #622373, 5.50%, 12/1/16 | | | 20,199 | |
| | 32,829 | | FNMA Pool #623503, 6.00%, 2/1/17 | | | 34,239 | |
| Principal | | | | | | |
| Amount | | | | | Value | |
| $ | 126,963 | | FNMA Pool #626440, 7.50%, 2/1/32 | | $ | 144,295 | |
| | 17,932 | | FNMA Pool #631328, 5.50%, 2/1/17 | | | 19,159 | |
| | 2,165 | | FNMA Pool #638247, 5.50%, 5/1/17 | | | 2,300 | |
| | 1,575 | | FNMA Pool #643277, 5.50%, 4/1/17 | | | 1,673 | |
| | 14,690 | | FNMA Pool #685183, 5.00%, 3/1/18 | | | 15,649 | |
| | 2,060 | | FNMA Pool #688539, 5.50%, 3/1/33 | | | 2,269 | |
| | 24,876 | | FNMA Pool #703936, 5.00%, 5/1/18 | | | 26,512 | |
| | 49,835 | | FNMA Pool #726889, 5.50%, 7/1/33 | | | 54,879 | |
| | 113,109 | | FNMA Pool #735224, 5.50%, 2/1/35 | | | 124,525 | |
| | 43,232 | | FNMA Pool #763393, 5.50%, 2/1/34 | | | 47,458 | |
| | 5,651 | | FNMA Pool #769682, 5.00%, 3/1/34 | | | 6,142 | |
| | 71,250 | | FNMA Pool #769862, 5.50%, 2/1/34 | | | 78,247 | |
| | 1,401 | | FNMA Pool #778141, 5.00%, 5/1/34 | | | 1,524 | |
| | 302,069 | | FNMA Pool #780956, 4.50%, 5/1/19 | | | 328,511 | |
| | 990 | | FNMA Pool #789150, 5.00%, 10/1/34 | | | 1,082 | |
| | 15,819 | | FNMA Pool #797154, 5.50%, 11/1/34 | | | 17,518 | |
| | 44,073 | | FNMA Pool #801063, 5.50%, 11/1/34 | | | 48,455 | |
| | 29,809 | | FNMA Pool #803675, 5.50%, 12/1/34 | | | 32,775 | |
| | 29,231 | | FNMA Pool #804683, 5.50%, 12/1/34 | | | 32,112 | |
| | 190,655 | | FNMA Pool #815813, 2.57%, 2/1/35 (2) | | | 202,307 | |
| | 201,676 | | FNMA Pool #919584, 6.00%, 6/1/37 | | | 223,344 | |
| | 32,076 | | FNMA Pool #AA2531, 4.50%, 3/1/39 | | | 33,974 | |
| | 437,136 | | FNMA Pool #AB2346, 4.50%, 2/1/41 | | | 463,305 | |
| | 865,216 | | FNMA Pool #AB5231, 2.50%, 5/1/27 | | | 859,276 | |
| | 422,540 | | FNMA Pool #AB5716, 3.00%, 7/1/27 | | | 431,687 | |
| | 398,395 | | FNMA Pool #AB9386, 4.00%, 5/1/43 | | | 410,384 | |
| | 475,501 | | FNMA Pool #AC8908, 4.50%, 1/1/40 | | | 503,579 | |
| | 37,819 | | FNMA Pool #AD1035, 4.50%, 2/1/40 | | | 40,071 | |
| Principal | | | | | | |
| Amount | | | | | Value | |
| $ | 200,000 | | FNMA Pool #AD6374, 5.00%, 5/1/40 | | $ | 217,919 | |
| | 230,241 | | FNMA Pool #AD7136, 5.00%, 7/1/40 | | | 250,550 | |
| | 183,564 | | FNMA Pool #AD8536, 5.00%, 8/1/40 | | | 200,520 | |
| | 978,906 | | FNMA Pool #AE1853, 4.00%, 8/1/40 | | | 1,008,143 | |
| | 568,125 | | FNMA Pool #AH5575, 4.00%, 2/1/41 | | | 585,191 | |
| | 595,009 | | FNMA Pool #AH8932, 4.50%, 4/1/41 | | | 630,747 | |
| | 55,000 | | FNMA Pool #AI0620, 4.50%, 5/1/41 | | | 58,289 | |
| | 480,925 | | FNMA Pool #AI5011, 4.50%, 6/1/41 | | | 509,656 | |
| | 266,164 | | FNMA Pool #AJ5888, 4.50%, 11/1/41 | | | 281,975 | |
| | 397,499 | | FNMA Pool #AJ9278, 3.50%, 12/1/41 | | | 395,281 | |
| | 879,869 | | FNMA Pool #AO7977, 3.00%, 6/1/27 | | | 898,921 | |
| | 424,719 | | FNMA Pool #AQ0287, 3.00%, 10/1/42 | | | 403,636 | |
| | 484,075 | | FNMA Pool #AR2174, 3.00%, 4/1/43 | | | 460,041 | |
| | 420,311 | | FNMA Pool #AR6394, 3.00%, 2/1/43 | | | 399,491 | |
| | 895,950 | | FNMA Pool #AT8849, 4.00%, 6/1/43 | | | 922,859 | |
| | 549,060 | | FNMA Pool #AU7025, 3.00%, 11/1/43 | | | 521,857 | |
| | 529,279 | | FNMA Pool #MA0641, 4.00%, 2/1/31 | | | 552,946 | |
| | 1,390,018 | | FNMA Pool #MA1107, 3.50%, 7/1/32 | | | 1,415,535 | |
| | 7,222 | | FNMA REMIC Trust Series 2003-17, Class ED, 4.25%, 9/25/22 | | | 7,228 | |
| | 37,821 | | FNMA REMIC Trust Series 2003-38, Class TC, 5.00%, 3/25/23 | | | 39,679 | |
| | 238,872 | | FNMA REMIC Trust Series 2004-60, Class LB, 5.00%, 4/25/34 | | | 258,800 | |
| | 473,613 | | FNMA REMIC Trust Series 2009-88, Class MA, 4.50%, 10/25/39 | | | 508,568 | |
| | 188,689 | | FNMA REMIC Trust Series 2013-18, Class AE, 2.00%, 3/25/28 | | | 179,493 | |
See Notes to Financial Statements. |
| 43 |
| |
| Schedule of Investments (continued) |
| Principal | | | | | | |
| Amount | | | | | Value | |
| $ | 43,343 | | GNMA Pool #003645, 4.50%, 12/20/19 | | $ | 46,277 | |
| | 2,114 | | GNMA Pool #429786, 6.00%, 12/15/33 | | | 2,414 | |
| | 42,230 | | GNMA Pool #548880, 6.00%, 12/15/31 | | | 46,971 | |
| | 28,670 | | GNMA Pool #551762, 6.00%, 4/15/32 | | | 31,899 | |
| | 3,177 | | GNMA Pool #557681, 6.00%, 8/15/31 | | | 3,534 | |
| | 15,232 | | GNMA Pool #582415, 6.00%, 11/15/32 | | | 17,164 | |
| | 66,995 | | GNMA Pool #583008, 5.50%, 6/15/34 | | | 74,321 | |
| | 58,302 | | GNMA Pool #605025, 6.00%, 2/15/34 | | | 65,691 | |
| | 18,507 | | GNMA Pool #605245, 5.50%, 6/15/34 | | | 20,318 | |
| | 32,646 | | GNMA Pool #610944, 5.50%, 4/15/34 | | | 35,840 | |
| | 51,366 | | GNMA Pool #622603, 6.00%, 11/15/33 | | | 57,137 | |
| | 5,456 | | GNMA Pool #626480, 6.00%, 2/15/34 | | | 6,160 | |
| | 663,934 | | GNMA Series 2010-151, Class KA, 3.00%, 9/16/39 | | | 674,597 | |
| | 476,238 | | GNMA Series 2011-136, Class GB, 2.50%, 5/20/40 | | | 462,423 | |
| | 256,211 | | GNMA Series 2011-17, Class EP, 3.50%, 12/16/39 | | | 265,196 | |
| | 250,000 | | GNMA, TBA, 3.00%,1/1/44 | | | 241,543 | |
| | | | TOTAL U.S. GOVERNMENT AGENCY OBLIGATIONS
(Cost $31,631,699) (37.2%) | | | 31,614,823 | |
| Principal | | | | | | |
| Amount | | | | | Value | |
| SHORT-TERM INVESTMENTS (0.3%) | | | | |
| | | | JOINT REPURCHASE AGREEMENTS (INVESTMENTS OF CASH COLLATERAL FOR SECURITIES ON LOAN)(0.3%) | | | | |
| $ | 86,636 | | Joint Repurchase Agreement with Morgan Stanley, 0.02%, dated 12/31/13, due 01/02/14, delivery value $86,636 (collateralized by $88,369 U.S. Treasury Bonds 4.250% - 8.000% due 11/15/21 - 11/15/40 and U.S. Treasury Notes 2.625% - 2.750% due 11/15/20 - 11/15/23, with a value of $87,919) | | $ | 86,636 | |
| | 127,892 | | Joint Repurchase Agreement with Barclays, 0.01%, dated 12/31/13, due01/02/14, delivery value $127,892 (collateralized by $130,450 U.S. Treasury Inflation Indexed Notes 1.250% -1.875% due 04/15/14 - 07/15/15, with a value of $129,464) | | | 127,892 | |
| | 20,628 | | Joint Repurchase Agreement with Citigroup, 0.01%, dated 12/31/13, due 01/02/14, delivery value $20,628 (collateralized by $21,040 U.S. Treasury Bills 0.000% due 02/20/14, with a value of $21,040) | | | 20,628 | |
| | | | | | | 235,156 | |
| Principal | | | | | | |
| Amount | | | | | Value | |
| | | | | | | | |
| | | | TOTAL SHORT-TERM INVESTMENTS
(Cost $235,156) (0.3%) | | $ | 235,156 | |
| | | | TOTAL INVESTMENT SECURITIES (98.8%) (Cost $85,280,704) | | $ | 84,034,683 | |
| CASH AND OTHER ASSETS IN EXCESS OF LIABILITIES (1.2%) | | | 1,010,476 | |
| NET ASSETS (100%) | | $ | 85,045,159 | |
| NET ASSET VALUE OFFERING AND REDEMPTION PRICE, PER OUTSTANDING SHARE ($85,045,159 ÷ 17,529,435 shares outstanding) | | $ | 4.85 | |
| (1) | | | Pursuant to Rule 144A under the Securities Act of 1933, this security can only be sold to qualified institutional investors. | |
| (2) | | | The rate shown on floating rate and discount securities represents the yield or rate at the end of the reporting period. | |
| (3) | | | A portion or all of the security was held on loan. As of December 31, 2013, the market value of the securities on loan was $257,657. | |
| (4) | | | Treasury Inflation Protected Security (TIPS). | |
| FHLB | | Federal Home Loan Bank. | |
| FHLMC. | | Federal Home Loan Mortgage Corp | |
| FNMA | | Federal National Mortgage Association. | |
| GNMA | | Government National Mortgage Association. | |
| MTN | | Medium Term Note. | |
| REIT | | Real Estate Investment Trust. | |
| TBA | | To Be Announced. | |
The following table summarizes the inputs used to value the Fund’s investments in securities as of December 31, 2013 (See Note 1B):
| | | | | | | | | | | | | |
| Value Line Core Bond Fund | | Level 1 | | | Level 2 | | | Level 3 | | | Total | |
| Assets: | | | | | | | | | | | | |
| Corporate Bonds & Notes | | $ | — | | | $ | 26,193,446 | | | $ | — | | | $ | 26,193,446 | |
| Commercial Mortgage-Backed Securities | | | — | | | | 3,149,582 | | | | — | | | | 3,149,582 | |
| Foreign Government Obligations | | | — | | | | 582,004 | | | | — | | | | 582,004 | |
| Long-Term Municipal Securities | | | — | | | | 985,517 | | | | — | | | | 985,517 | |
| U.S. Treasury Obligations | | | — | | | | 21,274,155 | | | | — | | | | 21,274,155 | |
| U.S. Government Agency Obligations | | | — | | | | 31,614,823 | | | | — | | | | 31,614,823 | |
| Short-Term Investments | | | — | | | | 235,156 | | | | — | | | | 235,156 | |
| Total | | $ | — | | | $ | 84,034,683 | | | $ | — | | | $ | 84,034,683 | |
| See Notes to Financial Statements. |
| 44 |
[This Page Intentionally Left Blank.]
Statements of Assets and Liabilities
at December 31, 2013 |
| | | | | | | | | | | | | | | | | | | | | |
| | | Value Line Premier Growth Fund, Inc. | | | The Value Line Fund, Inc. | | | Value Line Income and Growth Fund, Inc. | | | Value Line Larger Companies Fund, Inc. | | | Value Line Core Bond Fund | |
| Assets: | | | | | | | | | | | | | | | |
| Investment securities, at value* | | | | | | | | | | | | | | | |
Investments(1) | | $ | 396,539,636 | | | $ | 122,830,976 | | | $ | 303,413,375 | | | $ | 205,308,622 | | | $ | 83,799,527 | |
Repurchase agreements(2) | | | 18,615,511 | | | | 2,456,822 | | | | 36,599,560 | | | | 13,108,098 | | | | 235,156 | |
| Total investments, at value | | $ | 415,155,147 | | | $ | 125,287,798 | | | $ | 340,012,935 | | | $ | 218,416,720 | | | $ | 84,034,683 | |
| Cash | | | 2,013,536 | | | | 374,469 | | | | 1,638,295 | | | | 1,118,917 | | | | 1,279,222 | |
| Receivable for securities sold | | | 1,065,278 | | | | 696,193 | | | | 1,105,484 | | | | — | | | | — | |
| Interest and dividends receivable | | | 371,826 | | | | 94,511 | | | | 805,654 | | | | 213,793 | | | | 545,431 | |
| Receivable for capital shares sold | | | 295,901 | | | | 20,070 | | | | 201,223 | | | | 120 | | | | 28 | |
| Prepaid expenses | | | 7,675 | | | | 7,136 | | | | 15,895 | | | | 8,902 | | | | 4,264 | |
| Receivable for securities lending income | | | 5,565 | | | | 588 | | | | 8,330 | | | | 4,708 | | | | 54 | |
| Other receivables | | | 2,247 | | | | — | | | | — | | | | — | | | | 74,130 | |
| Total Assets | | | 418,917,175 | | | | 126,480,765 | | | | 343,787,816 | | | | 219,763,160 | | | | 85,937,812 | |
| Liabilities: | | | | | | | | | | | | | | | | | | | | |
| Payable upon return of securities on loan | | | 16,241,965 | | | | 1,070,625 | | | | 11,524,575 | | | | 7,953,525 | | | | 263,125 | |
| Payable for securities purchased | | | — | | | | — | | | | 1,119,611 | | | | — | | | | 461,425 | |
| Payable for capital shares redeemed | | | 181,297 | | | | — | | | | 126,176 | | | | 91,421 | | | | 77,534 | |
| Dividends payable to shareholders | | | — | | | | — | | | | — | | | | — | | | | 9,727 | |
| Accrued expenses: | | | | | | | | | | | | | | | | | | | | |
| Advisory fee | | | 251,297 | | | | 72,153 | | | | 184,561 | | | | 131,617 | | | | 29,228 | |
| Service and distribution plan fees | | | 83,766 | | | | 26,118 | | | | 55,481 | | | | 26,323 | | | | 14,614 | |
| Directors’ fees and expenses | | | 204 | | | | 347 | | | | 1,059 | | | | 403 | | | | 184 | |
| Other | | | 85,694 | | | | 43,487 | | | | 78,250 | | | | 51,403 | | | | 36,816 | |
| Total Liabilities | | | 16,844,223 | | | | 1,212,730 | | | | 13,089,713 | | | | 8,254,692 | | | | 892,653 | |
| Net Assets | | $ | 402,072,952 | | | $ | 125,268,035 | | | $ | 330,698,103 | | | $ | 211,508,468 | | | $ | 85,045,159 | |
| Net assets consist of: | | | | | | | | | | | | | | | | | | | | |
| Capital stock, at $1.00, $1.00, $1.00, $1.00 and $0.01 par value, respectively (authorized 100,000,000, 50,000,000, 75,000,000, 50,000,000 and unlimited shares, respectively) | | $ | 11,828,557 | | | $ | 9,278,231 | | | $ | 33,679,337 | | | $ | 8,270,759 | | | $ | 175,294 | |
| Additional paid-in capital | | | 180,771,820 | | | | 101,953,997 | | | | 216,551,661 | | | | 151,129,623 | | | | 86,998,377 | |
| Undistributed/(distributions in excess of) net investment income | | | — | | | | 56,121 | | | | 142,003 | | | | 936,119 | | | | (9,727 | ) |
| Accumulated net realized gain/(loss) on investments, foreign currency and written options | | | 1,752,692 | | | | (42,937,235 | ) | | | 2,807,028 | | | | (34,978,877 | ) | | | (872,764 | ) |
| Net unrealized appreciation/(depreciation) of: | | | | | | | | | | | | | | | | | | | | |
| Investments and foreign currency translations | | | 207,719,883 | | | | 56,916,921 | | | | 77,518,074 | | | | 86,150,844 | | | | (1,246,021 | ) |
| Net Assets | | $ | 402,072,952 | | | $ | 125,268,035 | | | $ | 330,698,103 | | | $ | 211,508,468 | | | $ | 85,045,159 | |
| Shares Outstanding | | | 11,828,557 | | | | 9,278,231 | | | | 33,679,337 | | | | 8,270,759 | | | | 17,529,435 | |
| Net Asset Value, Offering and Redemption Price per Outstanding Share | | $ | 33.99 | | | $ | 13.50 | | | $ | 9.82 | | | $ | 25.57 | | | $ | 4.85 | |
* Includes securities on loan of | | $ | 15,893,168 | | | $ | 1,048,806 | | | $ | 11,304,497 | | | $ | 7,803,401 | | | $ | 257,657 | |
(1) Cost of investments | | $ | 188,819,815 | | | $ | 65,914,055 | | | $ | 225,895,371 | | | $ | 119,157,923 | | | $ | 85,045,548 | |
(2) Cost of repurchase agreements | | $ | 18,615,511 | | | $ | 2,456,822 | | | $ | 36,599,560 | | | $ | 13,108,098 | | | $ | 235,156 | |
See Notes to Financial Statements. |
| 46 |
Statements of Operations
for the Year Ended December 31, 2013 |
| | | | | | | | | | | | | | | | | | | | | | | | | |
| | | Value
Line Premier
Growth
Fund, Inc. | | | The Value Line Fund, Inc. | | | Value Line Income and Growth Fund, Inc. | | | Value Line Larger Companies Fund, Inc. | | | Value Line Core Bond Fund(1) | | | Value Line Core Bond Fund(2) | |
| Investment Income: | | | | | | | | | | | | | | | | | | |
| Dividends (net of foreign withholding tax of $116,207, $21,586, $84,761, $64,762, $0 and $0, respectively) | | $ | 4,432,076 | | | $ | 1,332,281 | | | $ | 5,331,036 | | | $ | 2,956,465 | | | $ | — | | | $ | 27,995 | |
| Interest | | | 6,821 | | | | 1,063 | | | | 2,018,105 | | | | 3,598 | | | | 1,777,021 | | | | 2,008,525 | |
| Securities lending income | | | 98,053 | | | | 24,664 | | | | 81,076 | | | | 32,895 | | | | 517 | | | | 22,017 | |
| Total Income | | | 4,536,950 | | | | 1,358,008 | | | | 7,430,217 | | | | 2,992,958 | | | | 1,777,538 | | | | 2,058,537 | |
| Expenses: | | | | | | | | | | | | | | | | | | | | | | | | |
| Advisory fee | | | 2,798,432 | | | | 807,293 | | | | 2,095,572 | | | | 1,458,201 | | | | 382,486 | | | | 237,606 | |
| Service and distribution plan fees | | | 932,811 | | | | 291,282 | | | | 785,503 | | | | 486,089 | | | | 191,271 | | | | 79,202 | |
| Sub-transfer agent fees | | | 110,726 | | | | 7,527 | | | | 61,727 | | | | 13,109 | | | | — | | | | — | |
| Custodian fees | | | 74,110 | | | | 31,440 | | | | 85,969 | | | | 39,052 | | | | 47,476 | | | | 21,656 | |
| Auditing and legal fees | | | 197,719 | | | | 65,496 | | | | 168,994 | | | | 102,728 | | | | 147,569 | | | | 50,119 | |
| Transfer agent fees | | | 149,941 | | | | 90,097 | | | | 130,393 | | | | 101,270 | | | | 72,093 | | | | 31,422 | |
| Directors’ fees and expenses | | | 76,483 | | | | 24,032 | | | | 65,129 | | | | 40,159 | | | | 15,577 | | | | 7,021 | |
| Printing and postage | | | 143,469 | | | | 84,042 | | | | 118,060 | | | | 93,745 | | | | 89,546 | | | | 42,994 | |
| Registration and filing fees | | | 42,004 | | | | 29,348 | | | | 33,131 | | | | 33,326 | | | | 27,854 | | | | 33,221 | |
| Insurance | | | 40,958 | | | | 13,329 | | | | 36,057 | | | | 22,369 | | | | 5,067 | | | | 3,823 | |
| Other | | | 57,168 | | | | 21,353 | | | | 47,422 | | | | 31,503 | | | | 15,050 | | | | 7,185 | |
| Total Expenses Before Fees Waived and Custody Credits | | | 4,623,821 | | | | 1,465,239 | | | | 3,627,957 | | | | 2,421,551 | | | | 993,989 | | | | 514,249 | |
| Less: Service and Distribution Plan Fees Waived | | | — | | | | (165,777 | ) | | | (156,915 | ) | | | (360,818 | ) | | | (38,265 | ) | | | (31,681 | ) |
| Less: Advisory Fees Waived | | | — | | | | — | | | | — | | | | — | | | | (76,530 | ) | | | (63,362 | ) |
| Less: Custody Credits | | | — | | | | — | | | | — | | | | — | | | | — | | | | (287 | ) |
| Net Expenses | | | 4,623,821 | | | | 1,299,462 | | | | 3,471,042 | | | | 2,060,733 | | | | 879,194 | | | | 418,919 | |
| Net Investment Income/(Loss) | | | (86,871 | ) | | | 58,546 | | | | 3,959,175 | | | | 932,225 | | | | 898,344 | | | | 1,639,618 | |
| Net Realized and Unrealized Gain/(Loss) on Investments, Foreign Exchange Transactions and Written Options: | | | | | | | | | | | | | | | | | | | | | | | | |
| Net Realized Gain/(Loss) From: | | | | | | | | | | | | | | | | | | | | | | | | |
| Investments | | | 25,560,730 | | | | 9,276,079 | | | | 14,331,770 | | | | 12,204,713 | | | | (866,870 | ) | | | 1,779,984 | |
| Written options | | | — | | | | — | | | | 69,248 | | | | — | | | | — | | | | — | |
| Foreign currency transactions | | | 4,396 | | | | (585 | ) | | | (1,051 | ) | | | 744 | | | | — | | | | — | |
| | | | 25,565,126 | | | | 9,275,494 | | | | 14,399,967 | | | | 12,205,457 | | | | (866,870 | ) | | | 1,779,984 | |
| Change in Net Unrealized Appreciation/(Depreciation) of: | | | | | | | | | | | | | | | | | | | | | | | | |
| Investments | | | 62,182,310 | | | | 22,101,193 | | | | 37,461,920 | | | | 38,251,563 | | | | (3,263,603 | ) | | | (866,255 | ) |
| Foreign currency transactions | | | 82 | | | | 11 | | | | 274 | | | | 453 | | | | — | | | | — | |
| | | | 62,182,392 | | | | 22,101,204 | | | | 37,462,194 | | | | 38,252,016 | | | | (3,263,603 | ) | | | (866,255 | ) |
| Net Realized Gain and Change in Net Unrealized Appreciation/(Depreciation) on Investments, Foreign Exchange Transactions and Written Options | | | 87,747,518 | | | | 31,376,698 | | | | 51,862,161 | | | | 50,457,473 | | | | (4,130,473 | ) | | | 913,729 | |
| Net Increase/(Decrease) in Net Assets from Operations | | $ | 87,660,647 | | | $ | 31,435,244 | | | $ | 55,821,336 | | | $ | 51,389,698 | | | $ | (3,232,129 | ) | | $ | 2,553,347 | |
(1) Period from February 1, 2013 to December 31, 2013.
(2) Year Ended January 31, 2013.
See Notes to Financial Statements. |
| 47 |
Statement of Changes in Net Assets
for the Years Ended December 31, 2013 and 2012 |
| | | | | | | | | |
| | | Value Line Premier Growth Fund, Inc. | |
| | | Year Ended | | | Year Ended | |
| | | December 31, | | | December 31, | |
| | | 2013 | | | 2012 | |
| | | | | | | |
| Operations: | | | | | | |
| Net investment income/(loss) | | $ | (86,871 | ) | | $ | 916,159 | |
| Net realized gain on investments, written options and foreign currency | | | 25,565,126 | | | | 24,763,062 | |
| Change in net unrealized appreciation/(depreciation) on investments and foreign currency | | | 62,182,392 | | | | 26,967,212 | |
| Net increase in net assets from operations | | | 87,660,647 | | | | 52,646,433 | |
| | | | | | | | | |
| Distributions to Shareholders from: | | | | | | | | |
| Net investment income | | | — | | | | (1,001,240 | ) |
| Net realized gain from investment transactions | | | (27,662,900 | ) | | | (24,163,438 | ) |
| Total Distributions | | | (27,662,900 | ) | | | (25,164,678 | ) |
| | | | | | | | | |
| Capital Share Transactions: | | | | | | | | |
| Proceeds from sale of shares | | | 36,026,126 | | | | 59,483,434 | |
| Proceeds from reinvestment of dividends and distributions to shareholders | | | 26,690,717 | | | | 24,174,754 | |
| Cost of shares redeemed | | | (58,077,559 | ) | | | (72,131,660 | ) |
| Net increase/(decrease) in net assets from capital share transactions | | | 4,639,284 | | | | 11,526,528 | |
| Total Increase/(Decrease) in Net Assets | | | 64,637,031 | | | | 39,008,283 | |
| | | | | | | | | |
| Net Assets: | | | | | | | | |
| Beginning of year | | | 337,435,921 | | | | 298,427,638 | |
| End of year | | $ | 402,072,952 | | | $ | 337,435,921 | |
| Undistributed/(distributions in excess of) net investment income included in net assets, at end of year | | $ | — | | | $ | (2,029 | ) |
See Notes to Financial Statements. |
| 48 |
| | | | | | | | | | | | | | | | | | | | | | | |
| The Value Line Fund, Inc. | | | Value Line Income and Growth Fund, Inc. | | | Value Line Larger Companies Fund, Inc. | |
| Year Ended | | | Year Ended | | | Year Ended | | | Year Ended | | | Year Ended | | | Year Ended | |
| December 31, | | | December 31, | | | December 31, | | | December 31, | | | December 31, | | | December 31, | |
| 2013 | | | 2012 | | | 2013 | | | 2012 | | | 2013 | | | 2012 | |
| $ | 58,546 | | | $ | 558,673 | | | $ | 3,959,175 | | | $ | 4,498,399 | | | $ | 932,225 | | | $ | 1,359,399 | |
| | 9,275,494 | | | | 13,414,151 | | | | 14,399,967 | | | | 13,218,671 | | | | 12,205,457 | | | | 3,786,520 | |
| | | | | | | | | | | | | | | | | | | | | | | |
| | 22,101,204 | | | | 3,749,359 | | | | 37,462,194 | | | | 13,315,963 | | | | 38,252,016 | | | | 20,499,383 | |
| | 31,435,244 | | | | 17,722,183 | | | | 55,821,336 | | | | 31,033,033 | | | | 51,389,698 | | | | 25,645,302 | |
| | | | | | | | | | | | | | | | | | | | | | | |
| | (526,843 | ) | | | — | | | | (3,803,097 | ) | | | (4,463,988 | ) | | | (1,253,220 | ) | | | (1,087,423 | ) |
| | — | | | | — | | | | (13,525,713 | ) | | | (11,203,043 | ) | | | — | | | | — | |
| | (526,843 | ) | | | — | | | | (17,328,810 | ) | | | (15,667,031 | ) | | | (1,253,220 | ) | | | (1,087,423 | ) |
| | | | | | | | | | | | | | | | | | | | | | | |
| | 2,105,661 | | | | 3,226,854 | | | | 17,287,138 | | | | 7,178,813 | | | | 1,455,686 | | | | 2,278,669 | |
| | 497,705 | | | | — | | | | 15,889,436 | | | | 14,279,164 | | | | 1,190,112 | | | | 1,033,051 | |
| | (18,041,621 | ) | | | (44,487,216 | ) | | | (36,676,256 | ) | | | (47,345,268 | ) | | | (25,516,390 | ) | | | (22,410,433 | ) |
| | | | | | | | | | | | | | | | | | | | | | | |
| | (15,438,255 | ) | | | (41,260,362 | ) | | | (3,499,682 | ) | | | (25,887,291 | ) | | | (22,870,592 | ) | | | (19,098,713 | ) |
| | 15,470,146 | | | | (23,538,179 | ) | | | 34,992,844 | | | | (10,521,289 | ) | | | 27,265,886 | | | | 5,459,166 | |
| | | | | | | | | | | | | | | | | | | | | | | |
| | 109,797,889 | | | | 133,336,068 | | | | 295,705,259 | | | | 306,226,548 | | | | 184,242,582 | | | | 178,783,416 | |
| $ | 125,268,035 | | | $ | 109,797,889 | | | $ | 330,698,103 | | | $ | 295,705,259 | | | $ | 211,508,468 | | | $ | 184,242,582 | |
| | | | | | | | | | | | | | | | | | | | | | | |
| $ | 56,121 | | | $ | 556,189 | | | $ | 142,003 | | | $ | (13,378 | ) | | $ | 936,119 | | | $ | 1,359,830 | |
Statement of Changes in Net Assets
for the Years Ended December 31, 2013, January 31, 2013 and January 31, 2012 |
| | | | | | | | | | | | | |
| | | Value Line Core Bond Fund | |
| | | Period from | | | Year Ended | | | Year Ended | |
| | | February 1, 2013 to | | | January 31, | | | January 31, | |
| | | December 31, 2013 | | | 2013 | | | 2012 | |
| Operations: | | | | | | | | | |
| Net investment income | | $ | 898,344 | | | $ | 1,639,618 | | | $ | 1,950,280 | |
| Net realized gain/(loss) on investments | | | (866,870 | ) | | | 1,779,984 | | | | 1,085,696 | |
| Change in net unrealized appreciation/(depreciation) on investments | | | (3,263,603 | ) | | | (866,255 | ) | | | (1,326,754 | ) |
| Net increase/ (decrease) in net assets from operations | | | (3,232,129 | ) | | | 2,553,347 | | | | 1,709,222 | |
| | | | | | | | | | | | | |
| Distributions to Shareholders from: | | | | | | | | | | | | |
| Net investment income | | | (893,166 | ) | | | (1,614,009 | ) | | | (1,950,884 | ) |
| Return of capital | | | (155,298 | ) | | | — | | | | — | |
| Net realized gain from investment transactions | | | — | | | | (25,662 | ) | | | — | |
| Total Distributions | | | (1,048,464 | ) | | | (1,639,671 | ) | | | (1,950,884 | ) |
| | | | | | | | | | | | | |
| Capital Share Transactions: | | | | | | | | | | | | |
| Proceeds from sale of shares | | | 1,687,477 | | | | 2,261,091 | | | | 2,010,996 | |
| Net assets of shares issued in connection with reorganization (Note 4) | | | 73,396,078 | | | | — | | | | — | |
| Proceeds from reinvestment of dividends and distributions to shareholders | | | 915,474 | | | | 1,273,759 | | | | 1,495,168 | |
| Cost of shares redeemed | | | (17,223,654 | ) | | | (6,101,213 | ) | | | (5,946,471 | ) |
| Net increase/(decrease) in net assets from capital share transactions | | | 58,775,375 | | | | (2,566,363 | ) | | | (2,440,307 | ) |
| Total Increase/(Decrease) in Net Assets | | | 54,494,782 | | | | (1,652,687 | ) | | | (2,681,969 | ) |
| | | | | | | | | | | | | |
| Net Assets: | | | | | | | | | | | | |
| Beginning of period | | | 30,550,377 | | | | 32,203,064 | | | | 34,885,033 | |
| End of period | | $ | 85,045,159 | | | $ | 30,550,377 | | | $ | 32,203,064 | |
| Distributions in excess of net investment income included in net assets, at end of period | | $ | (9,727 | ) | | $ | (9,655 | ) | | $ | (37,870 | ) |
See Notes to Financial Statements. |
| 50 |
[This Page Intentionally Left Blank.]
Selected data for a share of capital stock outstanding throughout each year:
| | | | | | | | | | | | | | | | | | | | | | | | | | | | | | |
| | | | Income/(loss) from investment operations | | Less distributions: | |
| | | Net asset value, beginning of year | | Net investment income/ (loss) | | Net gains/ (losses) on securities (both realized and unrealized) | | Total from investment operations | | Redemption fees | | Dividends from net investment income | | Distributions from net realized gains | | Distributions from return of capital | | Total distributions | | |
| Value Line Premier Growth Fund, Inc. | | | | | | | | | | | | | | | | | | | | | | | | | | | | | |
| Year ended December 31, 2013 | | $ | 28.84 | | | 0.00 | (1) | | 7.64 | | | 7.64 | | | — | | | — | | | (2.49 | ) | | — | | | (2.49 | ) | |
| Year ended December 31, 2012 | | | 26.48 | | | 0.09 | | | 4.59 | | | 4.68 | | | — | | | (0.09 | ) | | (2.23 | ) | | — | | | (2.32 | ) | |
| Year ended December 31, 2011 | | | 26.82 | | | (0.08 | ) | | 1.30 | | | 1.22 | | | — | | | — | | | (1.56 | ) | | — | | | (1.56 | ) | |
| Year ended December 31, 2010 | | | 22.07 | | | (0.01 | )(3) | | 4.79 | | | 4.78 | | | — | | | (0.03 | ) | | — | | | — | | | (0.03 | ) | |
| Year ended December 31, 2009 | | | 16.69 | | | 0.02 | | | 5.37 | | | 5.39 | | | — | | | (0.01 | ) | | — | | | — | | | (0.01 | ) | |
| The Value Line Fund, Inc. | | | | | | | | | | | | | | | | | | | | | | | | | | | | | |
| Year ended December 31, 2013 | | | 10.36 | | | 0.01 | | | 3.19 | | | 3.20 | | | — | | | (0.06 | ) | | — | | | — | | | (0.06 | ) | |
| Year ended December 31, 2012 | | | 9.04 | | | 0.05 | | | 1.27 | | | 1.32 | | | — | | | — | | | — | | | — | | | — | | |
| Year ended December 31, 2011 | | | 8.55 | | | (0.00 | )(1) | | 0.49 | | | 0.49 | | | — | | | (0.00 | )(1) | | — | | | — | | | (0.00 | )(1) | |
| Year ended December 31, 2010 | | | 6.81 | | | 0.00 | (1) | | 1.74 | | | 1.74 | | | — | | | — | | | — | | | — | | | — | | |
| Year ended December 31, 2009 | | | 6.22 | | | (0.01 | ) | | 0.60 | | | 0.59 | | | — | | | — | | | — | | | — | | | — | | |
| Value Line Income and Growth Fund, Inc. | | | | | | | | | | | | | | | | | | | | | | | | | | | | | |
| Year ended December 31, 2013 | | | 8.67 | | | 0.12 | | | 1.57 | | | 1.69 | | | — | | | (0.12 | ) | | (0.42 | ) | | — | | | (0.54 | ) | |
| Year ended December 31, 2012 | | | 8.27 | | | 0.13 | | | 0.74 | | | 0.87 | | | — | | | (0.13 | ) | | (0.34 | ) | | — | | | (0.47 | ) | |
| Year ended December 31, 2011 | | | 8.46 | | | 0.11 | | | (0.19 | ) | | (0.08 | ) | | — | | | (0.11 | ) | | — | | | — | | | (0.11 | ) | |
| Year ended December 31, 2010 | | | 7.75 | | | 0.10 | | | 0.71 | | | 0.81 | | | — | | | (0.10 | ) | | — | | | — | | | (0.10 | ) | |
| Year ended December 31, 2009 | | | 6.39 | | | 0.10 | | | 1.36 | | | 1.46 | | | — | | | (0.10 | ) | | — | | | — | | | (0.10 | ) | |
| Value Line Larger Companies Fund, Inc. | | | | | | | | | | | | | | | | | | | | | | | | | | | | | |
| Year ended December 31, 2013 | | | 19.78 | | | 0.13 | | | 5.81 | | | 5.94 | | | — | | | (0.15 | ) | | — | | | — | | | (0.15 | ) | |
| Year ended December 31, 2012 | | | 17.34 | | | 0.16 | | | 2.40 | | | 2.56 | | | — | | | (0.12 | ) | | — | | | — | | | (0.12 | ) | |
| Year ended December 31, 2011 | | | 17.47 | | | 0.12 | | | (0.17 | ) | | (0.05 | ) | | — | | | (0.08 | ) | | — | | | — | | | (0.08 | ) | |
| Year ended December 31, 2010 | | | 15.40 | | | 0.09 | | | 2.08 | | | 2.17 | | | — | | | (0.10 | ) | | — | | | — | | | (0.10 | ) | |
| Year ended December 31, 2009 | | | 13.18 | | | 0.10 | | | 2.22 | | | 2.32 | | | — | | | (0.10 | ) | | — | | | — | | | (0.10 | ) | |
| Value Line Core Bond Fund | | | | | | | | | | | | | | | | | | | | | | | | | | | | | |
Period ended December 31, 2013(6) | | | 5.07 | | | 0.06 | | | (0.22 | ) | | (0.16 | ) | | — | | | (0.05 | ) | | — | | | (0.01 | ) | | (0.06 | ) | |
| Year ended January 31, 2013 | | | 4.92 | | | 0.26 | | | 0.15 | | | 0.41 | | | 0.00 | (1) | | (0.26 | ) | | (0.00 | )(1) | | — | | | (0.26 | ) | |
| Year ended January 31, 2012 | | | 4.95 | | | 0.29 | | | (0.03 | ) | | 0.26 | | | 0.00 | (1) | | (0.29 | ) | | — | | | — | | | (0.29 | ) | |
| Year ended January 31, 2011 | | | 4.70 | | | 0.30 | | | 0.25 | | | 0.55 | | | 0.00 | (1) | | (0.30 | ) | | — | | | — | | | (0.30 | ) | |
| Year ended January 31, 2010 | | | 3.89 | | | 0.28 | | | 0.81 | | | 1.09 | | | 0.00 | (1) | | (0.28 | ) | | — | | | — | | | (0.28 | ) | |
| Year ended January 31, 2009 | | | 4.83 | | | 0.32 | | | (0.95 | ) | | (0.63 | ) | | 0.00 | (1) | | (0.31 | ) | | — | | | — | | | (0.31 | ) | |
| * | Ratio reflects expenses grossed up for the custody credit arrangement, waiver of the advisory fees by the Adviser and the service and distribution plan fees by the Distributor. The custody credit arrangement was discontinued as of January 1, 2013. |
| ** | Ratio reflects expenses net of the custody credit arrangement, waiver of the advisory fees by the Adviser and the service and distribution plan fees by the Distributor. The custody credit arrangement was discontinued as of January 1, 2013. |
| (1) | Amount is less than $0.01 per share. |
| (2) | Amount rounds to less than 0.005%. |
| (3) | Based on average shares outstanding. |
| (4) | Ratio reflects expenses grossed up for the reimbursement by Value Line, Inc. of certain expenses incurred by the Fund. |
| (5) | Ratio reflects expenses net of the reimbursement by Value Line, Inc. of certain expenses incurred by the Fund. |
| (6) | Period from February 1, 2013 to December 31, 2013. |
| (7) | Not Annualized. |
| (8) | Annualized. |
| (9) | The ratio of expenses to average net assets, net of custody credits, but exclusive of the fee waivers would have been 1.48%. |
See Notes to Financial Statements. |
| 52 |
| Ratios/Supplemental Data | |
| | | | | | | | | | Ratio of | | | Ratio of | | | Ratio of | | | | |
| | | | | | | Net assets, | | | gross expenses | | | net expenses | | | net investment | | | | |
| | Net asset | | | | | end of | | | to average | | | to average | | | income/(loss) to | | | Portfolio | |
| | value, end | | Total | | | year | | | net | | | net | | | average net | | | turnover | |
| | of year | | return | | | (in thousands) | | | assets* | | | assets** | | | assets | | | rate | |
| | | | | | | | | | | | | | | | | | | | |
| | | | | | | | | | | | | | | | | | | | |
| $ | 33.99 | | | 26.56 | % | | $ | 402,073 | | | | 1.24 | % | | | 1.24 | % | | | (0.02 | )%(2) | | | 11 | % |
| | 28.84 | | | 17.80 | % | | | 337,436 | | | | 1.25 | % | | | 1.25 | % | | | 0.28 | % | | | 15 | % |
| | 26.48 | | | 4.59 | % | | | 298,428 | | | | 1.24 | % | | | 1.24 | % | | | (0.28 | )% | | | 20 | % |
| | 26.82 | | | 21.66 | % | | | 311,829 | | | | 1.23 | %(4) | | | 1.19 | %(5) | | | (0.02 | )% | | | 16 | % |
| | 22.07 | | | 32.29 | % | | | 347,938 | | | | 1.22 | % | | | 1.22 | % | | | 0.11 | % | | | 8 | % |
| | | | | | | | | | | | | | | | | | | | | | | | | | |
| | 13.50 | | | 30.86 | % | | | 125,268 | | | | 1.26 | % | | | 1.12 | % | | | 0.05 | % | | | 7 | % |
| | 10.36 | | | 14.60 | % | | | 109,798 | | | | 1.28 | % | | | 1.03 | % | | | 0.46 | % | | | 6 | % |
| | 9.04 | | | 5.75 | % | | | 133,336 | | | | 1.29 | % | | | 0.94 | % | | | (0.02 | )% | | | 18 | % |
| | 8.55 | | | 25.55 | % | | | 104,200 | | | | 1.31 | %(4) | | | 0.91 | %(5) | | | 0.02 | % | | | 27 | % |
| | 6.81 | | | 9.49 | % | | | 92,680 | | | | 1.36 | % | | | 1.04 | % | | | (0.22 | )% | | | 122 | % |
| | | | | | | | | | | | | | | | | | | | | | | | | | |
| | 9.82 | | | 19.55 | % | | | 330,698 | | | | 1.16 | % | | | 1.11 | % | | | 1.26 | % | | | 27 | % |
| | 8.67 | | | 10.62 | % | | | 295,705 | | | | 1.19 | % | | | 1.14 | % | | | 1.48 | % | | | 31 | % |
| | 8.27 | | | (0.90 | )% | | | 306,227 | | | | 1.20 | % | | | 1.15 | % | | | 1.25 | % | | | 57 | % |
| | 8.46 | | | 10.55 | % | | | 332,695 | | | | 1.14 | %(4) | | | 1.05 | %(5) | | | 1.22 | % | | | 46 | % |
| | 7.75 | | | 23.07 | % | | | 340,210 | | | | 1.13 | % | | | 1.09 | % | | | 1.49 | % | | | 56 | % |
| | | | | | | | | | | | | | | | | | | | | | | | | | |
| | 25.57 | | | 30.05 | % | | | 211,508 | | | | 1.25 | % | | | 1.06 | % | | | 0.48 | % | | | 8 | % |
| | 19.78 | | | 14.82 | % | | | 184,243 | | | | 1.27 | % | | | 1.02 | % | | | 0.72 | % | | | 17 | % |
| | 17.34 | | | (0.27 | )% | | | 178,783 | | | | 1.25 | % | | | 1.00 | % | | | 0.60 | % | | | 30 | % |
| | 17.47 | | | 14.09 | % | | | 199,524 | | | | 1.21 | %(4) | | | 0.92 | %(5) | | | 0.44 | % | | | 153 | % |
| | 15.40 | | | 17.62 | % | | | 202,454 | | | | 1.26 | % | | | 1.01 | % | | | 0.62 | % | | | 157 | % |
| | | | | | | | | | | | | | | | | | | | | | | | | | |
| | 4.85 | | | (3.13 | )%(7) | | | 85,045 | | | | 1.30 | %(8) | | | 1.15 | %(8) | | | 1.17 | %(8) | | | 61 | %(7) |
| | 5.07 | | | 8.49 | % | | | 30,550 | | | | 1.62 | % | | | 1.32 | % | | | 5.18 | % | | | 103 | % |
| | 4.92 | | | 5.48 | % | | | 32,203 | | | | 1.55 | % | | | 1.25 | % | | | 5.95 | % | | | 50 | % |
| | 4.95 | | | 12.01 | % | | | 34,885 | | | | 1.48 | %(4) | | | 1.13 | %(5) | | | 6.20 | % | | | 42 | % |
| | 4.70 | | | 28.92 | % | | | 37,787 | | | | 1.56 | % | | | 1.13 | % | | | 6.51 | % | | | 51 | % |
| | 3.89 | | | (13.42 | )% | | | 25,924 | | | | 1.50 | %(9) | | | 0.98 | % | | | 7.17 | % | | | 39 | % |
| Notes to Financial Statements |
1. Significant Accounting Policies
Value Line Premier Growth Fund, Inc., The Value Line Fund, Inc., Value Line Income and Growth Fund, Inc., Value Line Larger Companies Fund, Inc., and Value Line Core Bond Fund, (individually a “Fund” and collectively, the “Funds”) are each registered under the Investment Company Act of 1940, as amended, as diversified, open-end management investment companies. The primary investment objective of the Value Line Premier Growth Fund, Inc. and The Value Line Fund, Inc. is long-term growth of capital. The primary investment objective of the Value Line Income and Growth Fund, Inc. is income, as high and dependable as is consistent with reasonable risk and capital growth to increase total return is a secondary objective. The sole investment objective of the Value Line Larger Companies Fund, Inc. is to realize capital growth. The primary investment objective of the Value Line Core Bond Fund is to maximize current income. As a secondary investment objective, the Fund will seek capital appreciation, but only when consistent with its primary objective. The Value Line Funds (the “Value Line Funds”) is a family of 10 mutual funds that includes a wide range of solutions designed to meet virtually any investment goal and consists of a variety of equity, fixed income, and hybrid funds.
The preparation of financial statements in conformity with generally accepted accounting principles requires management to make estimates and assumptions that affect the reported amounts of assets and liabilities and disclosure of contingent assets and liabilities at the date of the financial statements and the reported amounts of revenues and expenses during the reporting period. Actual results could differ from those estimates. The following is a summary of significant accounting policies consistently followed by the Funds in the preparation of their financial statements.
(A) Security Valuation: Securities listed on a securities exchange are valued at the closing sales prices on the date as of which the net asset value is being determined. Securities traded on the NASDAQ Stock Market are valued at the NASDAQ Official Closing Price. In the absence of closing sales prices for such securities and for securities traded in the over-the-counter market, the security is valued at the midpoint between the latest available and representative asked and bid prices. Short-term instruments with maturities of 60 days or less at the date of purchase are valued at amortized cost, which approximates fair value. Short-term instruments with maturities greater than 60 days at the date of purchase are valued at the midpoint between the latest available and representative asked and bid prices, and commencing 60 days prior to maturity such securities are valued at amortized cost.
The Board of Directors (the “Board”) has determined that the value of bonds and other fixed income corporate securities be calculated on the valuation date by reference to valuations obtained from an independent pricing service that determines valuations for normal institutional-size trading units of debt securities, without exclusive reliance upon quoted prices. This service takes into account appropriate factors such as institutional-size trading in similar groups of securities, yield, quality, coupon rate, maturity, type of issue, trading characteristics and other market data in determining valuations. Bonds and fixed income securities are valued at the evaluated bid on the date as of which the net asset value is being determined. Securities, other than bonds and other fixed income securities, not priced in this manner are valued at the midpoint between the latest available and representative bid and asked prices or, when stock valuations are used, at the latest quoted sale price as of the regular close of business of the New York Stock Exchange on the valuation date.
The Board has adopted procedures for valuing portfolio securities in circumstances where market quotes are not readily available, and has delegated the responsibility for applying the valuation methods to the Adviser. A valuation committee (the “Valuation Committee”) was established by the Board to oversee the implementation of the Funds’ valuation methods and to make fair value determinations on behalf of the Board, as instructed. The Adviser monitors the continued appropriateness of methods applied and determines if adjustments should be made in light of market changes, events affecting the issuer, or other factors. If the Adviser determines that a valuation method may no longer be appropriate, another valuation method may be selected, or the Valuation Committee will be convened to consider the matter and take any appropriate action in accordance with procedures set forth by the Board. The Board shall review the appropriateness of the valuation methods and these methods may be amended or supplemented from time to time by the Valuation Committee. In addition, the Funds may use the fair value of a security when the closing market price on the primary exchange where the security is traded no longer reflects the value of a security due to factors affecting one or more relevant securities markets or the specific issuer.
(B) Fair Value Measurements: The Funds follow fair valuation accounting standards (FASB ASC 820-10) which establishes a definition of fair value and set out a hierarchy for measuring fair value. These standards require additional disclosures about the various inputs and valuation techniques used to develop the measurements of fair value and a discussion of changes in valuation techniques and related inputs during the period. These inputs are summarized in the three broad levels listed below:
| ● | Level 1 – Inputs that reflect unadjusted quoted prices in active markets for identical assets or liabilities that the Fund has the ability to access at the measurement date; |
| ● | Level 2 – Inputs other than quoted prices that are observable for the asset or liability either directly or indirectly, including inputs in markets that are not considered to be active; |
| ● | Level 3 – Inputs that are unobservable. |
Transfers between investment levels may occur as the markets fluctuate and/or the availability of data used in an investment’s valuation changes. The inputs or methodologies used for valuing securities are not necessarily an indication of the risk associated with investing in those securities.
The Funds follow the updated provisions surrounding fair value measurements and disclosures on transfers in and out of all levels of the fair value hierarchy on a gross basis and the reasons for the transfers as well as to disclosures about the valuation techniques and inputs used to measure fair value for investments that fall in either Level 2 or Level 3 of the fair value hierarchy.
The Funds’ policy is to recognize transfers between levels at the beginning of the reporting period.
The amounts and reasons for all transfers in and out of each level within the three-tier hierarchy are disclosed when the Funds had an amount of total transfers during the reporting period that were meaningful in relation to their net assets as of the end of the reporting period (e.g. greater than 1%). An investment asset’s or liability’s level within the fair value hierarchy is based on the lowest level input, individually or in aggregate, that is significant to fair value measurement. The objective of fair value measurement remains the same even when there is a significant decrease in the volume and level of activity for an asset or liability and regardless of the valuation techniques used.
For the year ended December 31, 2013 there were no Level 3 investments. The Schedule of Investments includes a breakdown of the Funds’ investments by category.
(C) Repurchase Agreements: Each Fund may enter into repurchase agreements, under the terms of a Master Repurchase Agreement, with selected commercial banks and broker-dealers, under which the Funds acquire securities as collateral and agrees to resell the securities at an agreed upon time and at an agreed upon price. Each Fund, through the custodian or a sub-custodian, receives delivery of the underlying securities collateralizing repurchase agreements. The Funds’ custodian takes possession of the underlying collateral securities, the value of which exceeds the principal amount of the repurchase transaction, including accrued interest. To the extent that any repurchase transaction exceeds one business day, it is the Funds’ policy to mark-to-market the value of the underlying securities daily to ensure the adequacy of the collateral. In the event of default by either the seller or the Funds, the Master Repurchase Agreement may permit the non-defaulting party to net and close out all transactions. The Funds have the right to liquidate the collateral and apply the proceeds in satisfaction of the obligation. Under certain circumstances, in the event of default or bankruptcy by the other party to the agreement, realization and/or retention of the collateral or proceeds may be subject to legal proceedings. The repurchase and joint repurchase agreements held by the Funds at the year end had been entered into on December 31, 2013.
At year end, Value Line Premier Growth Fund, Inc., The Value Line Fund, Inc., Value Line Income and Growth Fund, Inc., and Value Line Larger Companies Fund, Inc., respectively, had investments in repurchase agreements with a gross value of $4,100,000, $1,500,000, $26,300,000 and $6,000,000 on the Statements of Assets and Liabilities. The value of each Fund’s related collateral exceeded the value of the repurchase agreements at year end. There were no open repurchase agreements for Value Line Core Bond Fund at December 31, 2013.
At year end, Value Line Premier Growth Fund, Inc., The Value Line Fund, Inc., Value Line Income and Growth Fund, Inc., Value Line Larger Companies Fund, Inc., and Value Line Core Bond Fund, respectively, had investments in joint repurchase agreements with a gross value of $14,515,511, $956,822, $10,299,560, $7,108,098 and $235,156 on the Statements of Assets and Liabilities. The value of each Fund’s related collateral exceeded the value of the joint repurchase agreements at year end.
(D) Federal Income Taxes: It is the policy of the Funds to each qualify as a regulated investment company by complying with the provisions available to regulated investment companies, as defined in applicable sections of the Internal Revenue Code, and to distribute all of their investment income and capital gains to its shareholders. Therefore, no provision for federal income tax is required.
| Notes to Financial Statements (continued) |
Management has analyzed the Funds’ tax positions taken on federal and state income tax returns for all open tax years (fiscal years ended December 31, 2010 through December 31, 2013), and has concluded that no provision for federal or state income tax is required in the Funds’ financial statements. The Funds’ federal and state income tax returns for tax years for which the applicable statutes of limitations have not expired are subject to examination by the Internal Revenue Service and state departments of revenue.
(E) Security Transactions and Distributions: Security transactions are accounted for on the date the securities are purchased or sold. Realized gains and losses on sales of securities are calculated for financial accounting and federal income tax purposes on the basis of the first in first out contention (“FIFO”). Dividend income and distributions to shareholders are recorded on the ex-dividend date. Distributions are determined in accordance with income tax regulations, which may differ from generally accepted accounting principles. Interest income, adjusted for the amortization of discount and premium, is earned from settlement date and recognized on the accrual basis. Gains and losses realized on prepayments received on mortgage-related securities are recorded as interest income.
The Funds may purchase mortgage pass-through securities on a to-be-announced (“TBA”) basis, with payment and delivery scheduled for a future date. The Funds may enter into a TBA agreement, sell the obligation to purchase the pools stipulated in the TBA agreement prior to the stipulated settlement date and enter into a new TBA agreement for future delivery of pools of mortgage pass-through securities (a “TBA roll”). A TBA roll is treated by the Funds as a purchase transaction and a sale transaction in which the Funds realize a gain or loss. The Funds’ use of TBA rolls may cause the Funds to experience higher portfolio turnover and higher transaction costs. The Funds could be exposed to possible risk if there is an adverse market action, expenses or delays in connection with TBA transactions, or if the counterparty fails to complete the transaction.
The Value Line Core Bond Fund may invest in Treasury Inflation-Protection Securities (“TIPS”). The principal value and interest payout of TIPS are periodically adjusted according to the rate of inflation based on the Consumer Price Index. The adjustments for principal and income due to inflation are reflected in interest income in the Statements of Operations.
Dividends from net investment income will be declared daily and paid monthly for the Value Line Core Bond Fund. Income dividends and capital gains distributions are automatically reinvested in additional shares of the Fund unless the shareholder has requested otherwise. Income earned by the Fund on weekends, holidays and other days on which the Fund is closed for business is declared as a dividend on the next day on which the Fund is open for business. The Value Line Income and Growth Fund, Inc. distributes all of its net investment income quarterly and the Value Line Premier Growth Fund, Inc., The Value Line Fund, Inc., and the Value Line Larger Companies Fund, Inc. distribute all of their net investment income annually. Net realized capital gains, if any, are distributed to shareholders annually or more frequently if necessary to comply with the Internal Revenue Code.
(F) Foreign Currency Translation: The books and records of the Funds are maintained in U.S. dollars. Assets and liabilities which are denominated in foreign currencies are translated to U.S. dollars at the prevailing rates of exchange at the valuation date. The Funds do not isolate changes in the value of investments caused by foreign exchange rate differences from the changes due to other circumstances.
Income and expenses are translated to U.S. dollars based upon the rates of exchange on the respective dates of such transactions.
Net realized foreign exchange gains or losses arise from currency fluctuations realized between the trade and settlement dates on securities transactions, the differences between the U.S. dollar amounts of dividends, interest, and foreign withholding taxes recorded by the Funds, and the U.S. dollar equivalent of the amounts actually received or paid. Net unrealized foreign exchange gains and losses arise from changes in the value of assets and liabilities, other than investments, at the end of the fiscal period, resulting from changes in the exchange rates. The effect of the change in foreign exchange rates on the value of investments is included in realized gain/ (loss) on investments and change in net unrealized appreciation/(depreciation) on investments.
(G) Representations and Indemnifications: In the normal course of business, the Funds enter into contracts that contain a variety of representations and warranties which provide general indemnifications. The Funds’ maximum exposure under these arrangements is unknown, as this would involve future claims that may be made against the Funds that have not yet occurred. However, based on experience, the Funds expect the risk of loss to be remote.
(H) Accounting for Real Estate Investment Trusts: The Funds own shares of Real Estate Investment Trusts (“REITs”) which report information on the source of their distributions annually. Distributions received from REITs during the year which represent a return of capital are recorded as a reduction of cost and distributions which represent a capital gain dividend are recorded as a realized long-term capital gain on investments.
(I) Foreign Taxes: The Funds may be subject to foreign taxes on income, gains on investments, or currency repatriation, a portion of which may be recoverable. The Funds will accrue such taxes and recoveries as applicable, based upon its current interpretation of tax rules and regulations that exist in the markets in which it invests.
(J) Securities Lending: Under an agreement with State Street Bank & Trust (“State Street”), the Funds can lend their securities to brokers, dealers and other financial institutions approved by the Board. By lending their investment securities, the Funds attempt to increase their net investment income through receipt of interest on the loan. Any gain or loss in the market price of the securities loaned that might occur and any interest or dividends declared during the term of the loan would accrue to the account of the Funds. Risks of delay in recovery of the securities or even loss of rights in the collateral may occur should the borrower of the securities fail financially. Generally, in the event of a counter-party default, the Funds have the right to use the collateral to offset the losses incurred. The lending fees received and the Funds’ portion of the interest income earned on the cash collateral are included in the Statements of Operations.
Upon entering into a securities lending transaction, the Funds receive cash or other securities as collateral in an amount equal to or exceeding 102% of the current market value of the loaned securities. Any cash received as collateral is invested by State Street Global Advisors, acting in its capacity as securities lending agent (the “Agent”), in The Value Line Funds collateral account, which is subsequently invested into joint repurchase agreements. A portion of the dividends received on the collateral is rebated to the borrower of the securities and the remainder is split between the Agent and the Funds.
The Funds enter into joint repurchase agreements whereby their uninvested cash collateral from securities lending is deposited into a joint cash account with other funds managed by the Adviser and is used to invest in one or more repurchase agreements. The value and face amount of the joint repurchase agreement are allocated to the funds based on their pro-rata interest in the repurchase agreement. A repurchase agreement is accounted for as a loan by the funds to the seller, collateralized by securities which are delivered to the Fund’s custodian. The market value, including accrued interest, of the initial collateralization is required to be at least 102% of the dollar amount invested by the funds, with the value of the underlying securities marked to market daily to maintain coverage of at least 100%.
As of December 31, 2013, the Funds loaned securities which were collateralized by cash. The value of the securities on loan and the value of the related collateral were as follows:
| | | | | | | | | | |
| Fund | | Value of Securities Loaned | | | Value of Collateral | | | Total Collateral (including Calculated Mark)* | |
| Value Line Premier Growth Fund, Inc. | | $ | 15,893,168 | | | $ | 16,241,965 | | | $ | 16,274,746 | |
| The Value Line Fund, Inc. | | | 1,048,806 | | | | 1,070,625 | | | | 1,070,625 | |
| Value Line Income and Growth Fund, Inc. | | | 11,304,497 | | | | 11,524,575 | | | | 11,547,888 | |
| Value Line Larger Companies Fund, Inc. | | | 7,803,401 | | | | 7,953,525 | | | | 7,972,775 | |
| Value Line Core Bond Fund | | | 257,657 | | | | 263,125 | | | | 263,125 | |
| * | Balances represent the end of day mark-to-market of securities lending collateral that will be reflected by the Funds as of the next business day. |
Additionally refer to Note 1(c) for details on joint repurchase agreements which were entered into using security lending cash collateral.
(K) Options: The Value Line Income and Growth Fund, Inc.’s investment strategy allows the use of options. The Fund utilizes options to hedge against changes in market conditions or to provide market exposure while trying to reduce transaction costs.
When the Fund writes a put or call option, an amount equal to the premiums received is included on the Statement of Assets and Liabilities as a liability. The amount of the liability is subsequently marked-to-market to reflect the current market value of the option. If an option expires on its stipulated expiration date or if the Fund enters into a closing purchase transaction, a gain or loss is realized. If a written call option on an individual security is exercised, a gain or loss is realized for the sale of the underlying security, and the proceeds from the sale are increased by the premium originally received. If a written put option on an individual security is exercised, the cost of the security acquired is decreased by the premium originally received. As a writer of an option, a Fund bears the market risk of an unfavorable change in the price of the individual security underlying the written option. Additionally, written call options may involve the risk of limited gains.
| Notes to Financial Statements (continued) |
The Fund may also purchase put and call options. When a Fund purchases a put or call option, an amount equal to the premium paid is included on the Fund’s Statement of Assets and Liabilities as an investment, and is subsequently marked-to-market to reflect the current market value of the option. If an option expires on the stipulated expiration date or if the Fund enters into a closing sale transaction, a gain or loss is realized. If the Fund exercises a call option on an individual security, the cost of the security acquired is increased by the premium paid for the call. If the Fund exercises a put option on an individual security, a gain or loss is realized from the sale of the underlying security, and the proceeds from such a sale are decreased by the premium originally paid. Written and purchased options are non-income producing securities.
As of December 31, 2013, the Value Line Income and Growth Fund, Inc. had no open options contracts at December 31, 2013.
The Value Line Income and Growth Fund, Inc.’s written options are collateralized securities held at the Options Clearing Corporation’s account at the Fund’s custodian. The securities pledged as collateral are included on the Schedule of Investments. Such collateral is restricted from the Fund’s use.
The number of options contracts written and the premiums received by the Value Line Income and Growth Fund, Inc. during the year ended December 31, 2013, were as follows:
| | | | | | | | |
| Purchased Options | | Number of Contracts | | Premiums Received | |
| Options outstanding at December 31, 2012 | | | — | | $ | 0 | |
| Options purchased | | | 400 | | | 45,018 | |
| Options expired/closed | | | (400 | ) | | (45,018 | ) |
| Options outstanding at December 31, 2013 | | | — | | $ | 0 | |
| | | | | | | | |
| Written Options | | Number of Contracts | | Premiums Received | |
| Options outstanding at December 31, 2012 | | | — | | $ | 0 | |
| Options written | | | 630 | | | 69,248 | |
| Options assigned | | | (300 | ) | | (29,318 | ) |
| Options expired/closed | | | (330 | ) | | (39,930 | ) |
| Options outstanding at December 31, 2013 | | | — | | $ | 0 | |
The following is a summary of how these derivatives are treated in the financial statements and their impact on the Fund:
| | | | | | | | | |
| | | Gain or (Loss) Derivative Recognized in Income | |
| Risk Type | | Realized Gain (Loss)(a) | | | Change in Appreciation(b) | |
| Equity - Purchased options | | | (45,018 | ) | | $ | 0 | |
| Equity - Written options | | | 69,248 | | | | 0 | |
For the year ended December 31, 2013, the Fund's quarterly holdings of written options contracts were as follows:
| | | | | | | | | |
| Quarter Ended | | Number of Purchased Options Contracts Outstanding | | | Number of Written Options Contracts Outstanding | |
| March 31, 2013 | | | — | | | | — | |
| June 30, 2013 | | | — | | | | 200 | |
| September 30, 2013 | | | — | | | | 30 | |
| December 31, 2013 | | | — | | | | — | |
(a) Statements of Operations location: Net Realized Gain (Loss) from: Investments and Written options.
(b) Statements of Operations location: Change in Net Unrealized Appreciation/(Depreciation) of: Investments and Written options
(L) Subsequent Events: Management has evaluated all subsequent transactions and events through the date on which these financial statements were issued and has determined that no additional items require disclosure.
2. Investment Risks
Securities issued by U.S. Government agencies or government-sponsored enterprises may not be guaranteed by the U.S. Treasury. The Government National Mortgage Association (“GNMA” or “Ginnie Mae”), a wholly-owned U.S. Government corporation, is authorized to guarantee, with the full faith and credit of the U.S. Government, the timely payment of principal and interest on securities issued by institutions approved by GNMA and backed by pools of mortgages insured by the Federal Housing Administration or guaranteed by the Department of Veterans Affairs. Government-related guarantors (i.e., not backed by the full faith and credit of the U.S. Government) include the Federal National Mortgage Association (“FNMA” or “Fannie Mae”) and the Federal Home Loan Mortgage Corporation (“FHLMC” or “Freddie Mac”). Pass-through securities issued by FNMA are guaranteed as to timely payment of principal and interest by FNMA, but are not backed by the full faith and credit of the U.S. Government. FHLMC guarantees the timely payment of interest and ultimate collection of principal, but its participation certificates are not backed by the full faith and credit of the U.S. Government.
3. Capital Share Transactions, Dividends and Distributions to Shareholders
Transactions in capital stock were as follows:
| | | | | | | |
| | | Year Ended December 31, 2013 | | | Year Ended December 31, 2012 | |
| Value Line Premier Growth Fund, Inc. | | | | | | |
| Shares sold | | | 1,144,091 | | | | 2,042,295 | |
| Shares issued to shareholders in reinvestment of dividends and distributions | | | 790,836 | | | | 850,616 | |
| Shares redeemed | | | (1,807,035 | ) | | | (2,463,509 | ) |
| Net increase | | | 127,892 | | | | 429,402 | |
| Dividends per share from net investment income | | $ | — | | | $ | 0.0925 | |
| Distributions per share from net realized gains | | $ | 2.4934 | | | $ | 2.2262 | |
| | | | | | | | | |
| The Value Line Fund, Inc. | | | | | | | | |
| Shares sold | | | 178,945 | | | | 328,898 | |
| Shares issued to shareholders in reinvestment of dividends and distributions | | | 37,142 | | | | — | |
| Shares redeemed | | | (1,537,052 | ) | | | (4,481,149 | ) |
| Net decrease | | | (1,320,965 | ) | | | (4,152,251 | ) |
| Dividends per share from net investment income | | $ | 0.0570 | | | $ | — | |
| | | | | | | | | |
| Value Line Income and Growth Fund, Inc. | | | | | | | | |
| Shares sold | | | 1,821,122 | | | | 821,795 | |
| Shares issued to shareholders in reinvestment of dividends and distributions | | | 1,639,843 | | | | 1,657,336 | |
| Shares redeemed | | | (3,887,583 | ) | | | (5,417,424 | ) |
| Net decrease | | | (426,618 | ) | | | (2,938,293 | ) |
| Dividends per share from net investment income | | $ | 0.1157 | | | $ | 0.1303 | |
| Distributions per share from net realized gains | | $ | 0.4174 | | | $ | 0.3403 | |
| | | | | | | | | |
| Value Line Larger Companies Fund, Inc. | | | | | | | | |
| Shares sold | | | 65,511 | | | | 119,348 | |
| Shares issued to shareholders in reinvestment of dividends | | | 47,005 | | | | 53,004 | |
| Shares redeemed | | | (1,157,543 | ) | | | (1,169,950 | ) |
| Net decrease | | | (1,045,027 | ) | | | (997,598 | ) |
| Dividends per share from net investment income | | $ | 0.1521 | | | $ | 0.1173 | |
| Notes to Financial Statements (continued) |
| | | | | | | | | | |
| | | Period from February 1, 2013 to December 31, 2013 | | | Year Ended January 31, 2013 | | | Year Ended January 31, 2012 | |
| Value Line Core Bond Fund | | | | | | | | | |
| Shares sold | | | 338,817 | | | | 452,862 | | | | 413,006 | |
Shares issued in connection with merger | | | 14,453,737 | | | | — | | | | — | |
Shares issued to shareholders in reinvestment of dividends | | | 185,136 | | | | 255,621 | | | | 307,024 | |
| Shares redeemed | | | (3,475,528 | ) | | | (1,222,950 | ) | | | (1,220,003 | ) |
| Net increase/(decrease) | | | 11,502,162 | | | | (514,467 | ) | | | (499,973 | ) |
Dividends per share from net investment income | | $ | 0.0537 | | | $ | 0.2531 | | | $ | 0.2899 | |
Distributions per share from return of capital | | $ | 0.0089 | | | $ | — | | | $ | — | |
Distributions per share from net realized gains | | $ | — | | | $ | 0.0040 | | | $ | — | |
4. Reorganization
On December 13, 2012, the Board approved an agreement and plan of reorganization (the “Reorganization”) pursuant to which the Value Line U.S. Government Securities Fund, Inc. (the “Acquired Fund”) would merge into and become shareholders of the Value Line Core Bond Fund (the “Surviving Fund”). The Board believes the reorganization would be advantageous to the shareholders of both Funds for the reason that both Funds have similar investment objectives, improved performance and a larger and more diverse investment universe, potentially allowing for economies of scale to be realized over time.
On March 22, 2013, the Surviving Fund acquired all of the assets and assumed the liabilities of the Acquired Fund, in a tax-free exchange for Federal tax purposes, pursuant to the Reorganization approved by the Board of both Funds and shareholders of record of the Acquired Fund as of the applicable record date. All of the expenses incurred in connection with the Reorganization were paid by both the Acquired and Surviving Funds proportionately based on the Funds’ respective net assets. The total Reorganization costs are $172,439. The value of shares issued by the Surviving Fund is presented in the Statement of Changes in Net Assets. The following table sets forth the number of shares issued by the Surviving Fund, the net assets and unrealized appreciation or depreciation of the Acquired Fund immediately prior to the Reorganization, and the net assets of the Surviving Fund immediately prior to and after the Reorganization:
| | | | | | | | | | | |
Date of Reorganization | Surviving Fund | | Shares Issued In Acquisition | | | Net Assets Before Reorganization | | | Net Assets After Reorganization | |
| 3-22-13 | Value Line Core Bond Fund | | | 14,453,737 | | | $ | 29,565,559 | | | $ | 102,961,637 | |
| | | | | | | | | | | |
| | | | | | | | | | Acquired | |
| | | | | | | Acquired | | | Portfolio | |
| Date of | Acquired | | Shares | | | Portfolio | | | Unrealized | |
| Reorganization | Fund | | Outstanding | | | Net Assets | | | Depreciation | |
| 3-22-13 | Value Line U.S. Government Securities Fund, Inc. | | | 6,308,486 | | | $ | 73,396,078 | | | $ | 1,483,441 | |
Assuming the Reorganization had been completed on February 1, 2013, the beginning of the period for the Surviving Fund, the Surviving Fund’s pro forma results of operations for the year ended December 31, 2013 would have been as follows:
| | | | |
| Net investment income | | $ | 1,580,309 | |
| Net loss on investments | | $ | (4,057,854 | ) |
Net decrease in net assets from operations | | $ | (2,477,545 | ) |
Because the combined investment portfolios have been managed as a single integrated portfolio since the closing of the Reorganization, it is not practicable to separate the amounts of revenue and earnings of the Acquired Fund that have been included in the Surviving Fund’s Statement of Operations since March 22, 2013.
5. Purchases and Sales of Securities
Purchases and sales of securities, excluding short-term investments, were as follows:
| | | | | | | | | | | | | |
| Fund | | Purchases of Investment Securities | | | Sales of Investment Securities | | | Purchases of U.S. Government Agency Obligations | | | Sales of U.S. Government Agency Obligations | |
| Value Line Premier Growth Fund, Inc. | | $ | 39,674,376 | | | $ | 58,797,318 | | | $ | — | | | $ | — | |
| The Value Line Fund, Inc. | | | 8,190,659 | | | | 24,430,107 | | | | — | | | | — | |
| Value Line Income and Growth Fund, Inc. | | | 45,871,025 | | | | 72,514,502 | | | | 33,049,685 | | | | 38,736,132 | |
| Value Line Larger Companies Fund, Inc. | | | 14,937,961 | | | | 40,117,920 | | | | — | | | | — | |
| Value Line Core Bond Fund* | | | 30,832,806 | | | | 13,532,506 | | | | 18,652,139 | | | | 40,689,173 | |
| * | Period from February 1, 2013 to December 31, 2013. |
6. Income Taxes
At December 31, 2013, information on the tax components of capital is as follows:
| | | | | | | | | | | | | | | | | | | |
| Fund | | Cost of investments for tax purposes | | | Gross tax unrealized appreciation | | | Gross tax unrealized depreciation | | | Net tax unrealized appreciation (depreciation) on investments | | | Undistributed ordinary income | | | Undistributed long-term gain | |
Value Line Premier Growth Fund, Inc. | | $ | 207,410,240 | | | $ | 208,166,767 | | | $ | (421,860 | ) | | $ | 207,744,907 | | | $ | 61,037 | | | $ | 1,666,569 | |
| The Value Line Fund, Inc. | | | 68,457,649 | | | | 56,889,504 | | | | (59,355 | ) | | | 56,830,149 | | | | 56,121 | | | | — | |
| Value Line Income and Growth Fund, Inc. | | | 262,790,014 | | | | 79,242,189 | | | | (2,019,268 | ) | | | 77,222,921 | | | | 162,848 | | | | 3,102,111 | |
Value Line Larger Companies Fund, Inc. | | | 132,109,136 | | | | 86,323,590 | | | | (16,006 | ) | | | 86,307,584 | | | | 933,119 | | | | — | |
| Value Line Core Bond Fund | | | 85,295,569 | | | | 1,075,489 | | | | (2,336,375 | ) | | | (1,260,886 | ) | | | — | | | | — | |
On December 22, 2010, the Regulated Investment Company Modernization Act of 2010 (“the Act”) was signed by the President of the United States of America. Under the Act, net capital losses recognized by the Funds after December 31, 2010 may get carried forward indefinitely, and retain their character as short-term and/or long term losses. Prior to this Act, pre-enactment net capital losses incurred by the Funds were carried forward for eight years and treated as short-term losses. The Act requires under the transition that post-enactment net capital losses are used before pre-enactment net capital losses.
As of December 31, 2013, the following Funds had a realized capital loss carryforward, for federal income tax purposes, available to be used to offset future realized capital gains:
| | | | | | | | | | |
| Fund | | Expiring December 31, 2016 | | | Expiring December 31, 2017 | | | Unlimited Short-Term Losses | |
| Value Line Premier Growth Fund, Inc. | | $ | — | | | $ | — | | | $ | — | |
| The Value Line Fund, Inc. | | | 1,132,225 | | | | 41,718,238 | | | | — | |
| Value Line Income and Growth Fund, Inc. | | | — | | | | — | | | | — | |
| Value Line Larger Companies Fund, Inc. | | | — | | | | 35,132,762 | | | | — | |
| Value Line Core Bond Fund | | | — | | | | — | | | | 684,299 | |
| Notes to Financial Statements (continued) |
During the year ended December 31, 2013, the following Funds utilized capital loss carryforwards:
| | | | | |
| Fund | | Amount | |
| Value Line Premier Growth Fund, Inc. | | $ | — | |
| The Value Line Fund, Inc. | | | 9,219,454 | |
| Value Line Income and Growth Fund, Inc. | | | — | |
| Value Line Larger Companies Fund, Inc. | | | 12,204,530 | |
Value Line Core Bond Fund* | | | — | |
| * | Period from February 1, 2013 to December 31, 2013. |
To the extent that current or future capital gains are offset by capital losses, the Funds do not anticipate distributing any such gains to shareholders.
It is uncertain whether the Funds will be able to realize the benefits of the losses before they expire.
Net realized gain (loss) differs from financial statements and tax purposes primarily due to wash sales, contingent payment debt instruments, return of capital from investments in REITs, and investments in partnerships.
Permanent book-tax differences relating to the current year were reclassified within the composition of the net asset accounts.
A reclassification has been made on the Statements of Assets and Liabilities to increase/(decrease) undistributed net investment income, accumulated net realized gain, and additional paid-in capital for the Funds as follows:
| | | | | | | | | | |
| Fund | | Undistributed Net Investment Income (Loss) | | | Accumulated Net Realized Gains (Losses) | | | Additional Paid-In Capital | |
| Value Line Premier Growth Fund, Inc. | | $ | 88,900 | | | $ | (88,900 | ) | | $ | — | |
| The Value Line Fund, Inc. | | | (31,771 | ) | | | 31,769 | | | | 2 | |
| Value Line Income and Growth Fund, Inc. | | | (697 | ) | | | 1,026 | | | | (329 | ) |
| Value Line Larger Companies Fund, Inc. | | | (102,716 | ) | | | 102,843 | | | | (127 | ) |
| Value Line Core Bond Fund | | | (5,250 | ) | | | (5,894 | ) | | | 11,144 | |
These reclassifications were primarily due to differing treatments of foreign currency gains/(losses) and litigation interest. Net assets were not affected by these reclassifications.
During the period ended December 31, 2013, as permitted under federal income tax regulations, the Value Line Core Bond Fund elected to defer $173,600 of post October short-term losses.
The tax composition of distributions paid to shareholders during fiscal 2013 and 2012, were as follows:
| | | | | | | | | | | | | |
| | | | | Year Ended December 31, 2013 Distributions Paid from | |
| Fund | Ordinary Income | | Long-Term Capital Gain | | Return of Capital | | Total Distributions Paid | |
| Value Line Premier Growth Fund, Inc. | | $ | 822,653 | | | $ | 26,840,247 | | | $ | — | | | $ | 27,662,900 | |
| The Value Line Fund, Inc. | | | 526,843 | | | | — | | | | — | | | | 526,843 | |
| Value Line Income and Growth Fund, Inc. | | | 3,803,097 | | | | 13,525,713 | | | | — | | | | 17,328,810 | |
| Value Line Larger Companies Fund, Inc. | | | 1,253,220 | | | | — | | | | — | | | | 1,253,220 | |
| Value Line Core Bond Fund* | | | 893,166 | | | | — | | | | 155,298 | | | | 1,048,464 | |
| * | Period from February 1, 2013 to December 31, 2013. |
| | Year Ended December 31, 2012 Distributions Paid from | |
| Fund | Ordinary Income | | Long-Term Capital Gain | | Total Distributions Paid | |
| Value Line Premier Growth Fund, Inc. | | $ | 2,146,661 | | | $ | 23,018,017 | | | $ | 25,164,678 | |
| The Value Line Fund, Inc. | | | — | | | | — | | | | — | |
| Value Line Income and Growth Fund, Inc. | | | 4,450,666 | | | | 11,216,365 | | | | 15,667,031 | |
| Value Line Larger Companies Fund, Inc. | | | 1,087,423 | | | | — | | | | 1,087,423 | |
| Value Line Core Bond Fund | | | 1,614,009 | | | | 25,662 | | | | 1,639,671 | |
| * | Year ended January 31, 2013. |
| | | Year Ended January 31, 2012 Distributions Paid from | |
| Fund | | Ordinary Income | |
| Value Line Core Bond Fund | | $ | 1,950,884 | |
7. Investment Advisory Fee, Service and Distribution Fees and Transactions With Affiliates
Advisory fees of $2,798,432, $807,293, $2,095,572, $1,458,201 and $382,486 for the Value Line Premier Growth Fund, Inc., The Value Line Fund, Inc., Value Line Income and Growth Fund, Inc., Value Line Larger Companies Fund, Inc., and Value Line Core Bond Fund, respectively, were paid or payable to the Adviser for the period ended December 31, 2013. For the year ended January 31, 2013, advisory fees of $237,606 were paid or payable to the Adviser for the Value Line Core Bond Fund. For the Value Line Premier Growth Fund, Inc. and Value Line Larger Companies Fund, Inc. advisory fees were computed at an annual rate of 0.75% of the daily net assets during the period. For The Value Line Fund, Inc. and Value Line Income and Growth Fund, Inc. advisory fees were computed at an annual rate of 0.70% of the first $100 million of the Fund’s average daily net assets plus 0.65% of the excess thereof. For the Value Line Core Bond Fund, for the period ended December 31, 2013, this was computed at an annual rate of 0.50% of the Fund’s average daily net assets during the period prior to any fee waivers, and for the year ended January 31, 2013, the Fund’s advisory fees were computed at an annual rate of 0.75% of the first $100 million of the Fund’s average daily net assets during the period and 0.50% on the average daily net assets in excess thereof prior to any fee waivers. The Funds advisory fees are paid monthly. The Adviser provides research, investment programs, and supervision of the investment portfolio and pays costs of administrative services, office space, equipment and compensation of administrative, bookkeeping, and clerical personnel necessary for managing the affairs of the Funds. The Adviser also provides persons, satisfactory to the Funds’ Board, to act as officers and employees of the Funds and pays their salaries. Effective June 1, 2010 and voluntarily renewed annually through January 31, 2013, the Adviser contractually agreed to waive 0.20% of the advisory fee for the Value Line Core Bond Fund. Fees waived amounted to $63,362 for the year ended January 31, 2013. Effective February 1, 2013, and voluntarily renewed annually through June 30, 2014, the Adviser contractually agreed to waive 0.10% of the advisory fee for the Value Line Core Bond Fund. The fees waived amounted to $76,530 for the period ended December 31, 2013. The Adviser has no right to recoup previously waived amounts.
The Funds have a Service and Distribution Plan (the “Plan”), adopted pursuant to Rule 12b-1 under the Investment Company Act of 1940, which compensates EULAV Securities LLC (the “Distributor”) for advertising, marketing and distributing the Funds’ shares and for servicing the Funds’ shareholders at an annual rate of 0.25% of the Funds’ average daily net assets. For the period ended December 31, 2013, fees amounting to $932,811, $291,282, $785,503, $486,089 and $191,271 before fee waivers for the Value Line Premier Growth Fund, Inc., The Value Line Fund, Inc., Value Line Income and Growth Fund, Inc., Value Line Larger Companies Fund, Inc., and Value Line Core Bond Fund, respectively, were accrued under this Plan. For the year ended January 31, 2013, fees amounting to $79,202 before fee waivers were accrued under this Plan for the Value Line Core Bond Fund. Effective May 1, 2009, and voluntarily renewed annually through July 31, 2013, the Distributor contractually agreed to waive The Value Line Fund, Inc.’s 12b-1 fee by 0.25%; effective August 1, 2013, the Distributor discontinued to waive The Value Line Fund, Inc.’s 12b-1 fee. Effective March 1, 2009, and voluntarily renewed annually, the Distributor contractually agreed to reduce the fee for the Value Line Income and Growth Fund, Inc. by 0.05%. Effective May 1, 2007, and voluntarily renewed annually through July 31, 2013, the Distributor contractually agreed to waive Value Line Larger Companies Fund, Inc.’s 12b-1 fee by 0.25%; effective August 1, 2013 and voluntarily renewed annually, the Distributor contractually agreed to waive the Value Line Larger Companies Fund, Inc.’s 12b-1 fee by 0.10%. Effective June 1, 2007 and voluntarily renewed annually through January 31, 2013, the Distributor contractually agreed to reduce the 12b-1 fee by 0.10% for the Value Line Core Bond Fund; effective February 1, 2013, and voluntarily renewed annually, the Distributor contractually agreed to reduce the 12b-1 fee by 0.05% for the Value Line Core Bond Fund. The Value Line Fund, Inc., Value Line Income and Growth Fund, Inc., Value Line Larger Companies Fund, Inc. and Value Line Core Bond Fund’s fees waived amounted to $165,777, $156,915, $360,818, and $38,265, respectively, for the period ended December 31, 2013. For the year ended January 31, 2013, the Value Line Core Bond Fund’s fees waived amounted to $31,681. The Distributor has no right to recoup previously waived amounts.
| |
| Notes to Financial Statements (continued) |
Effective July 5, 2012, the Funds have a Sub-Transfer Agent Plan (the “sub TA plan”) which compensates financial intermediaries that provide sub-transfer agency and related services to investors that hold their Fund shares in omnibus accounts maintained by the financial intermediaries with the Funds. The sub-transfer agency fee, which may be paid directly to the financial intermediary or indirectly via the Distributor, is equal to the lower of (i) the aggregate amount of additional transfer agency fees and expenses that the Funds would otherwise pay to the transfer agent if each subaccount in the omnibus account maintained by the financial intermediary with the Funds were a direct account with the Funds and (ii) the amount by which the fees charged by the financial intermediary for including the Funds on its platform and providing shareholder, sub-transfer agency and related services exceed the amount paid under the Funds’ Plan with respect to each Fund’s assets attributable to shares held by the financial intermediary in the omnibus account. In addition, the amount of sub-transfer agency fees payable by the Fund’s to all financial intermediaries in the aggregate is subject to a maximum cap of 0.05% of each Fund’s average daily net assets. If the sub-transfer agency fee is paid to financial intermediaries indirectly via the Distributor, the Distributor does not retain any amount thereof and such fee otherwise reduces the amount that the Distributor is contractually obligated to pay to the financial intermediary. For the year ended December 31, 2013, fees amounting to $110,726, $7,527, $61,727 and $13,109 for the Value Line Premier Growth Fund, Inc., The Value Line Fund, Inc., Value Line Income and Growth Fund, Inc., and Value Line Larger Companies Fund, Inc., respectively, were paid under the sub TA plan.
Each Fund bears direct expenses incurred specifically on its behalf while common expenses of the Value Line Funds are allocated proportionately based upon each Fund’s respective net assets. The Funds bear all other costs and expenses.
Certain officers and a trustee of the Adviser are also officers and a director of the Funds. At December 31, 2013, the officers and directors of the Value Line Premier Growth Fund, Inc., The Value Line Fund, Inc., Value Line Income and Growth Fund, Inc., Value Line Larger Companies Fund, Inc., and Value Line Core Bond Fund as a group owned less than 1% of the outstanding shares of each Fund.
8. Other
The Value Line Income and Growth Fund, Inc. received notice that it has been named as a defendant in In re: Tribune Company Fraudulent Conveyance Litigation, Consol. MDL 11 MD 2296 (RJS), which includes two specific cases in which the Fund is named, Kirschner, as Litigation Trustee for the Tribune Litigation Trust v. Fitzsimone, et al., 12 CV 02652 (RJS) (The “Trustee Litigation”) and Deutsche Bank Trust Company Americas, in its Capacity as Successor Indenture Trustee for Certain Series of Senior Notes, et al. v. Adaly Opportunity Fund TD Securities Inc. c/o Adaly Investment Management Co., et al., No. 1:11-cv-04784-RJH (S.D.N.Y.) (the “Adaly Action”). The Adaly Action is part of a larger group of noteholder and individual creditor complaints, which were dismissed by the lower federal district court on September 23, 2013, but are now part of an appeal by counsel for some of the individual creditors. Both the Adaly Action and Trustee Litigation seek to recover alleged transfers received in connection with the purchase, repurchase or redemption of Tribune stock as a result of a 2007 leveraged buyout and tender offer. The alleged value of the proceeds received by the Fund is $490,522 (less than 1% of net assets) and the Fund will incur legal expenses in the defense of these actions. Management continues to assess the actions and has made no determination about the effect, if any, on the Fund’s net assets and results of operations.
| |
| Report of Independent Registered Public Accounting Firm |
To the Board of Directors and Shareholders of Value Line Premier Growth Fund, Inc., The Value Line Fund, Inc., Value Line Income and Growth Fund, Inc., Value Line Larger Companies Fund, Inc. and Value Line Core Bond Fund:
In our opinion, the accompanying statements of assets and liabilities, including the schedules of investments, and the related statements of operations and of changes in net assets and the financial highlights present fairly, in all material respects, the financial position of Value Line Premier Growth Fund, Inc., The Value Line Fund, Inc., Value Line Income and Growth Fund, Inc., Value Line Larger Companies Fund, Inc. and Value Line Core Bond Fund (the “Funds”) at December 31, 2013, the results of their operations, the changes in their net assets and the financial highlights for the periods presented, in conformity with accounting principles generally accepted in the United States of America. These financial statements and financial highlights (hereafter referred to as “financial statements”) are the responsibility of the Funds’ management. Our responsibility is to express an opinion on these financial statements based on our audits. We conducted our audits of these financial statements in accordance with the standards of the Public Company Accounting Oversight Board (United States). Those standards require that we plan and perform the audit to obtain reasonable assurance about whether the financial statements are free of material misstatement. An audit includes examining, on a test basis, evidence supporting the amounts and disclosures in the financial statements, assessing the accounting principles used and significant estimates made by management, and evaluating the overall financial statement presentation. We believe that our audits, which included confirmation of securities at December 31, 2013 by correspondence with the custodian and brokers, provide a reasonable basis for our opinion.
| |
| PricewaterhouseCoopers LLP |
| New York, New York |
| |
| February 24, 2014 |
| |
| Fund Expenses (unaudited) |
Example
As a shareholder of the Funds, you incur ongoing costs, including management fees, distribution and service (12b-1) fees, and other Fund expenses. This Example is intended to help you understand your ongoing costs (in dollars) of investing in each Fund and to compare these costs with the ongoing costs of investing in other mutual funds.
The Example is based on an investment of $1,000 invested at the beginning of the period and held for the entire period (July 1, 2013 through December 31, 2013).
Actual Expenses
The first line in the table below for each Fund provides information about actual account values and actual expenses. You may use this information, together with the amount you invested, to estimate the expenses that you paid over the period. Simply divide your account value by $1,000 (for example an $8,600 account value divided by $1,000 = 8.6), then multiply the result by the number in the first line for each Fund under the heading “Expenses Paid During Period” to estimate the expenses you paid on your account during this period.
Hypothetical Example for Comparison Purposes
The second line in the table for each Fund provides information about hypothetical account values and hypothetical expenses based on the Funds’ actual expense ratio and an assumed rate of return of 5% per year before expenses, which is not the Funds’ actual return. The hypothetical account values and expenses may not be used to estimate the actual ending account balance or expenses you paid for the period. You may use this information to compare the ongoing costs of investing in the Fund and other funds. To do so, compare this 5% hypothetical example with the 5% hypothetical examples that appear in the shareholder reports of other funds.
Please note that the expenses shown in the table are meant to highlight your ongoing costs only and do not reflect any transactional costs, such as sales charges (loads), redemption fees, or exchange fees. Therefore, the table is useful in comparing ongoing costs only and will not help you determine the relative total costs of owning different funds. In addition, if transactional costs were included, your costs would have been higher.
| | | | | | | | | | | | |
| | | | | | | | | Expenses | |
| | | Beginning | | Ending | | paid during | |
| | | account value | | account value | | period 7/1/13 | |
| | | 7/1/13 | | 12/31/13 | | thru 12/31/13* | |
| Actual | | | | | | | | | | |
| Value Line Premier Growth Fund, Inc. | | $ | 1,000.00 | | $ | 1,160.24 | | $ | 6.82 | |
| The Value Line Fund, Inc. | | | 1,000.00 | | | 1,180.96 | | | 6.61 | |
| Value Line Income and Growth Fund, Inc. | | | 1,000.00 | | | 1,106.36 | | | 5.91 | |
| Value Line Larger Companies Fund, Inc. | | | 1,000.00 | | | 1,192.01 | | | 6.19 | |
| Value Line Core Bond Fund | | | 1,000.00 | | | 996.55 | | | 6.44 | |
| Hypothetical (5% return before expenses) | | | | | | | | | | |
| Value Line Premier Growth Fund, Inc. | | | 1,000.00 | | | 1,018.89 | | | 6.38 | |
| The Value Line Fund, Inc. | | | 1,000.00 | | | 1,019.14 | | | 6.12 | |
| Value Line Income and Growth Fund, Inc. | | | 1,000.00 | | | 1,019.59 | | | 5.67 | |
| Value Line Larger Companies Fund, Inc. | | | 1,000.00 | | | 1,019.56 | | | 5.70 | |
| Value Line Core Bond Fund | | | 1,000.00 | | | 1,018.75 | | | 6.51 | |
| | | | | | | | | | | |
| * | Expenses are equal to the Funds’ annualized expense ratio of 1.25%, 1.20%, 1.11%, 1.12%, and 1.28%, respectively, multiplied by the average account value over the period, multiplied by 184/365 to reflect the one-half year period. These expense ratios may differ from the expense ratios shown in the Financial Highlights | |
| |
| Federal Tax Notice (unaudited) |
Each Fund designates the following amounts distributed during the fiscal year ended December 31, 2013, if any, as capital gain dividends, dividends eligible for the corporate dividends received deduction and/or qualified dividend income:
| | | | | | | | | | | |
| | | | | | % of Dividends | | | | |
| | | | | | Eligible for the | | | | |
| | | % of Qualifying | | Corporate Dividends | | Long-Term | |
| Fund | | Dividend Income | | Received Deduction | | Capital Gains | |
| Value Line Premier Growth Fund, Inc. | | | 100 | % | | 100 | % | $ | 26,840,247 | |
| The Value Line Fund, Inc. | | | 100 | | | 100 | | | — | |
| Value Line Income and Growth Fund, Inc. | | | 100 | | | 100 | | | 13,525,713 | |
| Value Line Larger Companies Fund, Inc. | | | 100 | | | 100 | | | — | |
| Value Line Core Bond Fund | | | — | | | — | | | — | |
The Funds file their complete schedule of portfolio holdings with the Securities and Exchange Commission (“SEC”) for the first and third quarters of each fiscal year on Form N-Q. The Funds’ Form N-Q is available on the SEC’s website at http://www.sec.gov and may be reviewed and copied at the SEC’s Public Reference Room in Washington, D.C. Information on the operation of the Public Reference Room may be obtained by calling 1-800-SEC-0330.
A description of the policies and procedures that the Funds use to determine how to vote proxies relating to portfolio securities, and information regarding how the Funds voted these proxies for the 12-month period ended June 30 is available through the Funds’ website at http://www.vlfunds.com and on the SEC’s website at http://www.sec.gov. The description of the policies and procedures is also available without charge, upon request, by calling 1-800-243-2729.
MANAGEMENT INFORMATION
The business and affairs of the Funds are managed by the Funds’ officers under the direction of the Board. The following table sets forth information on each Director and Officer of the Funds. Each Director serves as a director or trustee of each of the 10 Value Line Funds. Each Director serves until his or her successor is elected and qualified.
| | | | | |
| Name, Address, and | | Position | | Principal Occupation |
| Year of Birth | | (Since) | | During the Past 5 Years |
Interested Director* Mitchell E. Appel 1970 Other Directorships: Forethought Variable Insurance Trust, since 2013 | | Director (2010) | | President of each of the Value Line Funds since June 2008; Chief Financial Officer of the Distributor since April 2008 and President since February 2009; President of the Adviser since February 2009, Trustee since December 2010 and Treasurer since January 2011; Chief Financial Officer of Value Line, Inc. (“Value Line”) from April 2008 to December 2010 and from September 2005 to November 2007; Director from February 2010 to December 2010. |
| | | | | |
| | | | | |
| Non-Interested Directors | | | | |
Joyce E. Heinzerling 500 East 77th Street New York, NY 10162 1956 Other Directorships: None | | Director (2008) | | President, Meridian Fund Advisers LLC (consultants) since 2009; General Counsel, Archery Capital LLC (private invest- ment fund) until 2009. |
| | | | | |
| | | | | |
Francis C. Oakley 54 Scott Hill Road Williamstown, MA 01267 1931 Other Directorships: None | | Director (2000) | | Professor of History, Williams College (1961-2002). Professor Emeritus since 2002; President Emeritus since 1994 and President (1985-1994); Chairman (1993-1997) and Interim President (2002-2003) of the American Council of Learned Societies. Trustee since 1997 and Chairman of the Board since 2005, National Humanities Center. |
| | | | | |
| | | | | |
David H. Porter 5 Birch Run Drive Saratoga Springs, NY 12866 1935 Other Directorships: None | | Director (1997) | | Professor, Skidmore College since 2008; Visiting Professor of Classics, Williams College (1999-2008); President Emeritus, Skidmore College since 1999 and President (1987-1998). |
| | | | | |
| | | | | |
Paul Craig Roberts 169 Pompano St. Panama City Beach, FL 32413 1939 Other Directorships: None | | Director (1983)** | | Chairman, Institute for Political Economy. |
| | | | | |
| | | | | |
Nancy-Beth Sheerr 1409 Beaumont Drive Gladwyne, PA 19035 1949 Other Directorships: None | | Director (1996) | | Senior Financial Consultant, Veritable L.P. (Investment Advisor until December 2013). |
| | | | | |
| | | | | |
Daniel S. Vandivort 59 Indian Head Road Riverside, CT 06878 1954 Other Directorships: None | | Director (2008) Chairman of Board (2010) | | President, Chief Investment Officer, Weiss, Peck and Greer/Robeco Investment Management (2005-2007); Managing Director, Weiss, Peck and Greer (1995-2005). |
| | | | | |
| | | | | | |
| (continued) |
| | | | | |
| Name, Address, and | | Position | | Principal Occupation |
| Year of Birth | | (Since) | | During the Past 5 Years |
| Officers | | | | |
Mitchell E. Appel 1970 | | President (2008) | | President of each of the Value Line Funds since June 2008; Chief Financial Officer of the Distributor since April 2008 and President since February 2009; President of the Adviser since February 2009, Trustee since December 2010 and Treasurer since January 2011; Chief Financial Officer of Value Line from April 2008 to December 2010 and from September 2005 to November 2007; Director from February 2010 to December 2010. |
| | | | | |
| | | | | |
Michael J. Wagner 1950 | | Chief Compliance Officer (2009) | | Chief Compliance Officer of Value Line Funds since June 2009; President of Northern Lights Compliance Service, LLC (formerly Fund Compliance Services, LLC (2006 – present)) and Senior Vice President (2004 – 2006) and President and Chief Operations Officer (2003 – 2006) of Gemini Fund Services, LLC; Director of Constellation Trust Company until 2008. |
| | | | | |
| | | | | |
Emily D. Washington 1979 | | Treasurer and Secretary (2008) | | Treasurer and Chief Financial Officer (Principal Financial and Accounting Officer) of each of the Value Line Funds since 2008 and Secretary since 2010; Secretary of the Adviser since 2011. |
| | | | | |
| | | | | |
| * | Mr. Appel is an “interested person” as defined in the Investment Company Act of 1940 by virtue of his position with the Adviser and Distributor. |
| ** | Mr. Roberts has served as a trustee of the Value Line Core Bond Fund since 1986. |
| | | | | |
| Unless otherwise indicated, the address for each of the above officers is c/o Value Line Funds, 7 Times Square, New York, NY 10036. |
| | | | | |
| | | |
| | The Funds’ Statement of Additional Information (SAI) includes additional information about the Funds’ Directors and is available, without charge, upon request by calling 1-800-243-2729 or on the Funds’ website, www.vlfunds.com. | |
| | | |
| | 69 |
[This Page Intentionally Left Blank.]

The Value Line Family of Funds
In 1950, Value Line started its first mutual fund. Since then, knowledgeable investors have been relying on the Value Line Funds to help them build their financial futures. Over the years, Value Line Funds has evolved into what we are today – a diversified family of no-load mutual funds with a wide range of investment objectives – ranging from small, mid and large capitalization equities to fixed income. We also provide strategies that effectively combine both equities and fixed income, diligently taking into account the potential risk and reward of each investment.
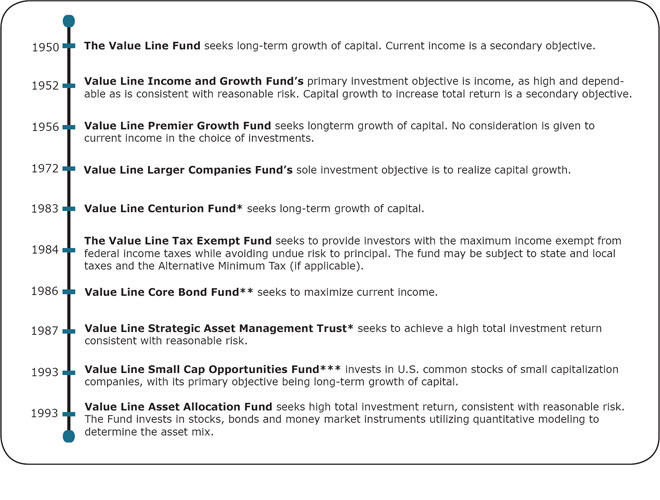
| * | | Only available through the purchase of Guardian Investor, a tax deferred variable annuity, or ValuePlus, a variable life insurance policy. |
| ** | | Formerly known as the Value Line Aggressive Income Trust. |
| *** | | Formerly known as the Value Line Emerging Opportunities Fund, Inc. |
| | | |
| | | For more complete information about any of the Value Line Funds, including charges and expenses, send for a prospectus from EULAV Securities LLC, 7 Times Square, New York, New York 10036-6524 or call 1-800-243-2729, 9am – 5pm CST, Monday – Friday, or visit us at www.vlfunds.com. Read the prospectus carefully before you invest or send money. |
Item 2 Code of Ethics
(a) The Registrant has adopted a Code of Ethics that applies to its principal executive officer, and principal financial officer and principal accounting officer.
(f) Pursuant to item 12(a), the Registrant is attaching as an exhibit a copy of its Code of Ethics that applies to its principal executive officer, and principal financial officer and principal accounting officer.
Item 3 Audit Committee Financial Expert
(a)(1)The Registrant has an Audit Committee Financial Expert serving on its Audit Committee.
(2) The Registrant’s Board has designated Daniel S. Vandivort, a member of the Registrant’s Audit Committee, as the Registrant’s Audit Committee Financial Expert. Mr. Vandivort is an independent director who has served as President, Chief Investment Officer to Weis, Peck and Greer/Robeco Investment Management. He has also previously served as Managing Director for Weis, Peck and Greer (1995-2005).
A person who is designated as an “audit committee financial expert” shall not make such person an "expert" for any purpose, including without limitation under Section 11 of the Securities Act of 1933 or under applicable fiduciary laws, as a result of being designated or identified as an audit committee financial expert. The designation or identification of a person as an audit committee financial expert does not impose on such person any duties, obligations, or liabilities that are greater than the duties, obligations, and liabilities imposed on such person as a member of the audit committee and Board of Trustees in the absence of such designation or identification.
Item 4 Principal Accountant Fees and Services
| | (a) | | Audit Fees for the 11 months ended December 2013 - $31,335 |
| | | | Audit Fees for the 12 months ended January 2013 - $ 6,111 |
| | | | |
| | (b) | | Audit-Related fees – None. |
| | | | |
| | (c) | | Tax Preparation for the 11 months ended December Fees 2013 - $9,958 |
| | | | Tax Preparation for the 12 months ended January Fees 2013 - $3,662 |
| | | | |
| | (d) | | All Other Fees – None |
| | | | |
| | (e) | (1) | Audit Committee Pre-Approval Policy. All services to be performed for the Registrant by PricewaterhouseCoopers LLP must be pre-approved by the audit committee. All services performed were pre-approved by the committee. |
| | | | |
| | (e) | (2) | Not applicable. |
| | | | |
| | (f) | | Not applicable. |
| | | | |
| | (g) | | Aggregate Non-Audit for the 11 months ended December Fees 2013 - $1,550 |
| | | | Aggregate Non-Audit for the 12 months ended January Fees 2013 - $2,400 |
| | | | |
| | (h) | | Not applicable. |
| | | | |
Item 5. Audit Committee of Listed Registrants
Not Applicable.
Item 6. Investments
Not Applicable
Item 7. Disclosure of Proxy Voting Policies and Procedures for Closed-End Management Investment Companies
Not Applicable
Item 8. Portfolio Managers of Closed-End Management Investment Companies
Not Applicable
Item 9. Purchases of Equity Securities by Closed-End Management Investment Company and Affiliated Purchasers
Not Applicable
Item 10 Submission of Matters to a Vote of Security Holders
Not Applicable
Item 11 Controls and Procedures
| (a) | The registrant’s principal executive officer and principal financial officer have concluded that the registrant’s disclosure controls and procedures (as defined in rule 30a-2(c) under the Act (17 CFR 270.30a-2(c) ) based on their evaluation of these controls and procedures as of a date within 90 days of the filing date of this report, are appropriately designed to ensure that material information relating to the registrant is made known to such officers and are operating effectively. |
| | | |
| | (b) | The registrant’s principal executive officer and principal financial officer have determined that there have been no significant changes in the registrant’s internal controls or in other factors that could significantly affect these controls subsequent to the date of their evaluation, including corrective actions with regard to significant deficiencies and material weaknesses. |
Item 12. Exhibits.
| (a) | Code of Business Conduct and Ethics for Principal Executive and Senior Financial Officers attached hereto as Exhibit 100.COE |
| (b) | (1) Certification pursuant to Rule 30a-2(a) under the Investment Company Act of 1940 (17 CFR 270.30a-2) attached hereto as Exhibit 99.CERT. |
| | | |
| | | (2) Certification pursuant to Section 906 of the Sarbanes-Oxley Act of 2002 attached hereto as Exhibit 99.906.CERT. |
| | | |
SIGNATURES
Pursuant to the requirements of the Securities Exchange Act of 1934 and the Investment Company Act of 1940, the registrant has duly caused this report to be signed on its behalf by the undersigned, thereunto duly authorized.
| By | /s/ Mitchell E. Appel | |
| | Mitchell E. Appel, President |
| | |
| Date: | March 11, 2014 | | |
Pursuant to the requirements of the Securities Exchange Act of 1934 and the Investment Company Act of 1940, this report has been signed below by the following persons on behalf of the registrant and in the capacities and on the dates indicated.
| By: | /s/ Mitchell E. Appel | |
| | Mitchell E. Appel, President, Principal Executive Officer | |
| By: | /s/ Emily D. Washington | |
| | Emily D. Washington, Treasurer, Principal Financial Officer | |