Washington, D.C. 20549
220 East 42nd Street, New York, N.Y. 10017
| | | | | | |
| | | | | | |
| | INVESTMENT ADVISER | EULAV Asset Management | | A N N U A L R E P O R T | |
| | | 220 East 42nd Street, 6th Floor | | J a n u a r y 31, 2011 | |
| | | New York, NY 10017-5891 | | | |
| | DISTRIBUTOR | EULAV Securities LLC | | | |
| | | 220 East 42nd Street, 6th Floor | | | |
| | | New York, NY 10017-5891 | | | |
| | CUSTODIAN BANK | State Street Bank and Trust Co. | | | |
| | | 225 Franklin Street | | | |
| | | Boston, MA 02110 | | | |
| | SHAREHOLDER | State Street Bank and Trust Co. | | | |
| | SERVICING AGENT | c/o BFDS | | | |
| | | P.O. Box 219729 | | | |
| | | Kansas City, MO 64121-9729 | | | |
| | INDEPENDENT | PricewaterhouseCoopers LLP | | | |
| | REGISTERED PUBLIC | 300 Madison Avenue | | Value Line Aggressive Income Trust | |
| | ACCOUNTING FIRM | New York, NY 10017 | | |
| | LEGAL COUNSEL | Peter D. Lowenstein, Esq. | | |
| | | 496 Valley Road | | |
| | | Cos Cob, CT 06807-0272 | | |
| | DIRECTORS | Mitchell E. Appel | | |
| | | Joyce E. Heinzerling | | |
| | | Francis C. Oakley | | |
| | | David H. Porter | | |
| | | Paul Craig Roberts | | |
| | | Nancy-Beth Sheerr | | |
| | | Daniel S. Vandivort | | |
| | OFFICERS | Mitchell E. Appel | | |
| | | President | | |
| | | Michael J. Wagner | | |
| | | Chief Compliance Officer | | |
| | | Emily D. Washington | | |
| | | Treasurer and Secretary | | |
| | | | | | |
| | | | |  | |
| | | | | | |
| | This audited report is issued for information to shareholders. It is not authorized for distribution to prospective investors unless preceded or accompanied by a currently effective prospectus of the Trust (obtainable from the Distributor). | | | |
| | | #00079255 | | | |
Value Line Aggressive Income Trust
| To Our Value Line Aggressive |
To Our Shareholders (unaudited):
Enclosed is your annual report for the period ended January 31, 2011. We encourage you to carefully review this report, which includes economic observations, your Trust’s performance data and highlights, schedule of investments, and financial statements.
Though not as strong as 2010, high-yield fixed income securities continued to generate excellent returns. GDP growth rose to healthy levels and liquidity improved as the Federal Reserve added more stimulus to the economy through its policy of buying high quality fixed income securities. This encouraged many investors to purchase riskier asset classes, such as high yield securities, and sell higher quality U.S. Treasuries, which lost value. Corporate profits strengthened and helped reduce default rates to low levels, further providing confidence to investors.
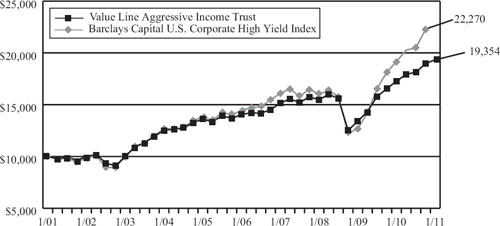
Despite the improvement in GDP growth we believed that the economic recovery was tenuous. Unemployment remained high, banks were still struggling from the 2008 financial meltdown, and the housing market was weak. Therefore, we continued to take a conservative stance with the portfolio by not purchasing the lower rated bonds, CCC and below. By doing this we are maintaining a higher grade portfolio within the high yield market universe. However, this year the lower rated bonds outperformed, thus your Trust underperformed. During the past year, the Trust’s total return was 12.01%, which trailed the return of the High Current Yield Bond Funds Average, as measured by Lipper Inc.(1), which gained 15.30% and the Barclay’s Capital U.S. Corporate High Yield Index(2), a proxy for the overall market, which rose 16.19% for the same period. However, on a longer term basis, the Trust remains competitive with its peer group over the last five-year period.
The Trust continues to seek good risk/reward investment opportunities in an effort to maintain the current yield of the Trust in a low interest environment. We have reduced the cash position of the Trust, a step which has already added yield to the portfolio. We have taken advantage of newer issues in the market which have offered above average yields at relatively low prices. All of this in an effort to improve the total return of the Trust.
Preserving capital in difficult market environments, while allowing for an attractive dividend yield, remains our goal. We thank you for your continued investment with us.
As always, your confidence in Value Line Funds is appreciated and we look forward to serving your future investment needs.
| | | |
| | Sincerely, | |
| | | |
| | /s/ Mitchell Appel | |
| | Mitchell Appel, President | |
| | | |
| | /s/ Jeff Geffen | |
| | Jeff Geffen, Portfolio Manager |
| | March 4, 2011 | |
| (1) | The Lipper High Current Yield Bond Funds Average aims at high (relative) current yield from fixed income securities, has no quality or maturity restrictions, and tends to invest in lower grade debt issues. An investment cannot be made in Peer Group Average. |
| | |
| (2) | The Barclay’s Capital U.S. Corporate High Yield Index is representative of the broad based fixed-income market. It includes non-investment grade corporate bonds. The returns for the Index do not reflect charges, expenses, or taxes, and it is not possible to directly invest in this unmanaged Index. |
Value Line Aggressive Income Trust
| |
| Income Trust Shareholders |
| |
| Economic Highlights (unaudited) |
After a strong rebound in economic growth in the final quarter of 2009, expectations in 2010 for a robust recovery were tempered by the persistence of several economic constraints. Heavy household debt, weak housing prices, and strained state and local budgets all contributed to a disappointing economic performance, and by the 3rd quarter of 2010, GDP growth had slowed to 2.60%.
Part of what had changed was a growing belief that unlike in previous recoveries, the economy was not about to ignite. After a more “normal” recession, once the recovery starts the economy is back to where it started in about six months. Generally, an accommodative Federal Reserve policy like the one that has been in place for several years would have had a far greater impact on economic growth than what has been seen in this cycle. This time, other factors have been contributing to a lackluster economy, including debt crises in several European countries, and the expiration of federal stimulus programs like the tax credit for first time home buyers. There have also been meaningful productivity gains among US workers, allowing the economy to grow without significant job creation. Still, while the stock market’s performance in 2010 slowed considerably from the previous year, investors were still rewarded with returns from the S&P 500 at 15.06%. Additionally, Dec. housing numbers were a clear bright spot, with purchases of new homes in the U.S. surging 18% for the month, the biggest jump since 1992. This unexpected surge in housing at yearend did push the economy slightly higher in the final quarter of 2010.
The economic crosscurrents from 2010 have continued into the new year. The consumer is increasingly positive, and investor sentiment is decidedly more upbeat. By the end of January 2011, the Dow Jones Industrial Average crossed 12,000 for the first time since June 2008. Within fixed income, investors proved to be less risk averse as investment flows shifted from Treasuries into corporate bonds. However, the Fed’s assessment of the nation’s economy delivered after the January FOMC meeting was measured. Chairman Bernanke, while acknowledging signs of a strengthening economy, indicated that gains in manufacturing and household spending have not been matched by a decline in the jobless rate. The Fed was unanimous in its decision to continue its quantitative easing by buying $600 billion of U.S. Treasuries by June of this year. The Fed also left its benchmark interest rate unchanged in a range of zero to 0.25%, where it’s been since December 2008. It is clear that the Fed is prepared to keep short rates low for an extended period of time in pursuit of meeting its twin mandates for full employment and stable prices.
On balance, we believe that economic trends generally are improving, and should provide opportunities for solid returns this year in the capital markets.
Value Line Aggressive Income Trust
The following graph compares the performance of the Value Line Aggressive Income Trust to that of the Barclays Capital U.S. Corporate High Yield Index. The Value Line Aggressive Income Trust is a professionally managed mutual fund, while the Index is not available for investment and is unmanaged. The returns for the Index does not reflect charges, expenses or taxes, but does include the reinvestment of dividends. The comparison is shown for illustrative purposes only.
Comparison of a Change in Value of a $10,000 Investment in the
Value Line Aggressive Income Trust and the Barclays Capital
U.S. Corporate High Yield Index*
Performance Data: **
| | | Average Annual Total Return | | | Growth of an Assumed Investment of $10,000 | |
| 1 year ended 1/31/11 | | | 12.01 | % | | $ | 11,201 | |
| 5 years ended 1/31/11 | | | 6.60 | % | | $ | 13,766 | |
| 10 years ended 1/31/11 | | | 6.83 | % | | $ | 19,354 | |
| * | The Barclays Capital U.S. Corporate High Yield Index is representative of the broad based fixed-income market. It includes non-investment grade corporate bonds. The returns for the Index do not reflect charges, expenses, or taxes, which are deducted from the Trust’s returns, and it is not possible to directly invest in this unmanaged Index. |
| | |
| ** | The performance data quoted represent past performance and are no guarantee of future performance. The average annual total returns and growth of an assumed investment of $10,000 include dividends reinvested and capital gains distributions accepted in shares. The investment return and principal value of an investment will fluctuate so that an investment, when redeemed, may be worth more or less than its original cost. The performance data and graph do not reflect the deduction of taxes that a shareholder would pay on trust distributions or the redemption of trust shares. |
| Value Line Aggressive Income Trust |
| |
| |
| TRUST EXPENSES (unaudited): |
Example
As a shareholder of the Trust, you incur ongoing costs, including management fees, distribution and service (12b-1) fees, and other Trust expenses. This Example is intended to help you understand your ongoing costs (in dollars) of investing in the Trust and to compare these costs with the ongoing costs of investing in other mutual funds.
The Example is based on an investment of $1,000 invested at the beginning of the period and held for the entire period (August 1, 2010 through January 31, 2011).
Actual Expenses
The first line of the table below provides information about actual account values and actual expenses. You may use the information in this line, together with the amount you invested, to estimate the expenses that you paid over the period. Simply divide your account value by $1,000 (for example an $8,600 account value divided by $1,000 = 8.6), then multiply the result by the number in the first line under the heading “Expenses Paid During Period” to estimate the expenses you paid on your account during this period.
Hypothetical Example for Comparison Purposes
The second line of the table below provides information about hypothetical account values and hypothetical expenses based on the Trust’s actual expense ratio and an assumed rate of return of 5% per year before expenses, which is not the Trust’s actual return. The hypothetical account values and expenses may not be used to estimate the actual ending account balance or expenses you paid for the period. You may use this information to compare the ongoing costs of investing in the Trust and other funds. To do so, compare this 5% hypothetical example with the 5% hypothetical examples that appear in the shareholder reports of other funds.
Please note that the expenses shown in the table are meant to highlight your ongoing costs only and do not reflect any transactional costs, such as sales charges (loads), redemption fees, or exchange fees. Therefore, the table is useful in comparing ongoing costs only and will not help you determine the relative total costs of owning different funds. In addition, if transactional costs were included, your costs would have been higher.
| | | Beginning account value 8/1/10 | | | Ending account value 1/31/11 | | | Expenses paid during period 8/1/10 thru 1/31/11* | |
| | | | | | | | | | | | | |
| Actual | | $ | 1,000.00 | | | $ | 1,066.37 | | | $ | 5.91 | |
| Hypothetical (5% return before expenses) | | $ | 1,000.00 | | | $ | 1,019.48 | | | $ | 5.78 | |
| * | Expenses are equal to the Trust’s annualized expense ratio of 1.14% multiplied by the average account value over the period, multiplied by 184/365 to reflect the one-half year period. This expense ratio may differ from the expense ratio shown in the Financial Highlights. The annualized expense ratio would have been 1.15% gross of nonrecurring legal fee reimbursement. |
| Value Line Aggressive Income Trust |
| Portfolio Highlights at January 31, 2011 (unaudited) |
Ten Largest Holdings
| | | | | | | | | | |
| Issue | | Principal Amount | | | Value | | | Percentage of Net Assets | |
| Briggs & Stratton Corp., 6.88%, 12/15/20 | | $ | 1,000,000 | | | $ | 1,045,000 | | | | 3.0 | % |
| Ford Motor Co., Global Landmark Securities, Senior Notes, 7.45%, 07/16/31 | | $ | 500,000 | | | $ | 545,821 | | | | 1.6 | % |
| EchoStar DBS Corp., Senior Notes, 6.63%, 10/1/14 | | $ | 500,000 | | | $ | 523,750 | | | | 1.5 | % |
| Plains Exploration & Production Co., Senior Notes, 7.75%, 06/15/15 | | $ | 500,000 | | | $ | 523,750 | | | | 1.5 | % |
| Leucadia National Corp., Senior Notes, 7.13%, 03/15/17 | | $ | 500,000 | | | $ | 520,000 | | | | 1.5 | % |
| Gulfmark Offshore, Inc., Guaranteed Notes, 7.75%, 07/15/14 | | $ | 500,000 | | | $ | 508,750 | | | | 1.5 | % |
| Boyd Gaming Corp., Senior Subordinated Notes, 6.75%, 04/15/14 | | $ | 500,000 | | | $ | 502,500 | | | | 1.4 | % |
| KCS Energy, Inc., Senior Notes, 7.13%, 04/1/12 | | $ | 500,000 | | �� | $ | 501,250 | | | | 1.4 | % |
| Ball Corp., 5.75%, 05/15/21 | | $ | 500,000 | | | $ | 490,000 | | | | 1.4 | % |
| Community Health Systems, Inc., Senior Notes, 8.88%, 07/15/15 | | $ | 450,000 | | | $ | 475,312 | | | | 1.4 | % |
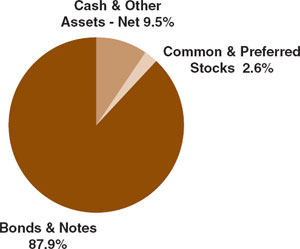
Asset Allocation – Percentage of Total Net Assets
| |
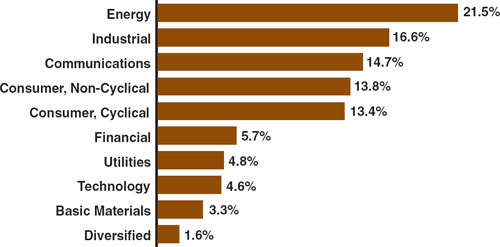
| Sector Weightings – Percentage of Total Investment Securities |
| Value Line Aggressive Income Trust |
| Schedule of Investments | January 31, 2011 |
Principal Amount | | | | Value | |
| CORPORATE BONDS & NOTES (76.8%) | | | | |
| | | | | |
| | | | BASIC MATERIALS (1.8%) | | | | |
| $ | 250,000 | | FMG Resources Pty Ltd., Senior Notes, 7.00%, 11/1/15 | | $ | 258,125 | |
| | 346,000 | | United States Steel Corp., Senior Notes, 5.65%, 6/1/13 | | | 358,542 | |
| | | | | | | 616,667 | |
| | | | | | | | |
| | | | COMMUNICATIONS (12.0%) | | | | |
| | 400,000 | | American Tower Corp., Senior Notes, 7.00%, 10/15/17 | | | 451,926 | |
| | 250,000 | | Cablevision Systems Corp., 7.75%, 4/15/18 | | | 265,625 | |
| | 300,000 | | Crown Castle International Corp., Senior Notes, 9.00%, 1/15/15 | | | 334,500 | |
| | 350,000 | | DirecTV Holdings LLC/DirecTV Financing Co., Senior Notes, 6.38%, 6/15/15 | | | 361,813 | |
| | 500,000 | | EchoStar DBS Corp., Senior Notes, 6.63%, 10/1/14 | | | 523,750 | |
| | 400,000 | | Hughes Network Systems LLC, Senior Notes, 9.50%, 4/15/14 | | | 413,000 | |
| | 300,000 | | Intelsat Jackson Holdings SA, Senior Notes, 7.25%, 10/15/20 | | | 306,750 | |
| | 350,000 | | MetroPCS Wireless, Inc., 6.63%, 11/15/20 | | | 337,750 | |
| | 400,000 | | Qwest Corp., Senior Notes, 8.88%, 3/15/12 | | | 431,000 | |
| | 350,000 | | Sprint Capital Corp., 8.75%, 3/15/32 | | | 364,437 | |
| | 350,000 | | Windstream Corp., Senior Notes, 8.13%, 8/1/13 | | | 385,000 | |
| | | | | | | 4,175,551 | |
| | | | | | | | |
| | | | CONSUMER, CYCLICAL (11.9%) | | | | |
| | 300,000 | | ArvinMeritor, Inc., Senior Notes, 8.13%, 9/15/15 | | | 319,875 | |
| | 500,000 | | Boyd Gaming Corp., Senior Subordinated Notes, 6.75%, 4/15/14 | | | 502,500 | |
| | | | | | | | |
Principal Amount | | | | Value | |
| $ | 500,000 | | Ford Motor Co., Global Landmark Securities, Senior Notes, 7.45%, 7/16/31 | | $ | 545,821 | |
| | 350,000 | | Goodyear Tire & Rubber Co. (The), Senior Notes, 10.50%, 5/15/16 | | | 397,250 | |
| | 400,000 | | Inergy LP/Inergy Finance Corp., Senior Notes, 8.25%, 3/1/16 | | | 418,000 | |
| | 350,000 | | Lear Corp., 7.88%, 3/15/18 | | | 379,750 | |
| | 115,000 | | Lennar Corp., Senior Notes, 6.50%, 4/15/16 | | | 115,000 | |
| | 300,000 | | MGM Resorts International, Senior Notes, 7.50%, 6/1/16 | | | 285,000 | |
| | 300,000 | | PEP Boys-Manny, Moe & Jack, Senior Subordinated Notes, 7.50%, 12/15/14 | | | 306,750 | |
| | 300,000 | | Royal Caribbean Cruises Ltd., Senior Notes, 6.88%, 12/1/13 | | | 322,875 | |
| | 297,130 | | United Air Lines, Inc., 12.75%, 7/15/12 | | | 334,271 | |
| | 200,000 | | Wynn Las Vegas Ltd., 7.75%, 8/15/20 | | | 212,000 | |
| | | | | | | 4,139,092 | |
| | | | | | | | |
| | | | CONSUMER, NON-CYCLICAL (10.3%) | | | | |
| | 350,000 | | Alere, Inc., Senior Notes, 9.00%, 5/15/16 | | | 368,812 | |
| | 250,000 | | Avis Budget Car Rental LLC / Avis Budget Finance, Inc., Senior Notes, 7.75%, 5/15/16 | | | 258,438 | |
| | 400,000 | | Bausch & Lomb, Inc., Senior Notes, 9.88%, 11/1/15 | | | 432,000 | |
| | 300,000 | | Chiquita Brands International, Inc., Senior Notes, 7.50%, 11/1/14 | | | 302,250 | |
| | 450,000 | | Community Health Systems, Inc., Senior Notes, 8.88%, 7/15/15 | | | 475,312 | |
| | 400,000 | | Constellation Brands, Inc., Senior Notes, 7.25%, 5/15/17 | | | 428,000 | |
| | 300,000 | | Dean Foods Co., Senior Notes, 7.00%, 6/1/16 | | | 288,000 | |
| | 300,000 | | Humana, Inc., Senior Notes, 6.45%, 6/1/16 | | | 331,350 | |
See Notes to Financial Statements.
| Value Line Aggressive Income Trust |
| |
| January 31, 2011 |
Principal Amount | | | | Value |
| $ | 300,000 | | Reynolds Group Holdings Ltd., 8.50%, 5/15/18 | | $ | 312,750 |
| | 350,000 | | Tyson Foods, Inc., Senior Notes, 7.35%, 4/1/16 | | | 384,125 |
| | | | | | | 3,581,037 |
| | | | DIVERSIFIED (1.5%) | | | |
| | 500,000 | | Leucadia National Corp., Senior Notes, 7.13%, 3/15/17 | | | 520,000 |
| | | | ENERGY (16.6%) | | | |
| | 200,000 | | Arch Coal, Inc., 7.25%, 10/1/20 | | | 210,500 |
| | 166,000 | | Arch Western Finance LLC, Guaranteed Senior Notes, 6.75%, 7/1/13 | | | 167,660 |
| | 400,000 | | Bill Barrett Corp., Senior Notes, 9.88%, 7/15/16 | | | 447,000 |
| | 400,000 | | Cie Generale de Geophysique- Veritas, 7.75%, 5/15/17 | | | 421,000 |
| | 350,000 | | Cimarex Energy Co., Senior Notes, 7.13%, 5/1/17 | | | 369,250 |
| | 400,000 | | Complete Production Services, Inc., Senior Notes, 8.00%, 12/15/16 | | | 421,000 |
| | 260,000 | | Covanta Holding Corp., Senior Notes, 7.25%, 12/1/20 | | | 267,294 |
| | 350,000 | | Forest Oil Corp., 8.50%, 2/15/14 | | | 387,625 |
| | 300,000 | | Frontier Oil Corp., 8.50%, 9/15/16 | | | 324,000 |
| | 500,000 | | KCS Energy, Inc., Senior Notes, 7.13%, 4/1/12 | | | 501,250 |
| | 250,000 | | Linn Energy LLC, 7.75%, 2/1/21 | | | 264,375 |
| | 300,000 | | McMoRan Exploration Co., Senior Notes, 11.88%, 11/15/14 | | | 329,250 |
| | 400,000 | | Newfield Exploration Co., Senior Notes, 6.63%, 9/1/14 | | | 409,000 |
| | 400,000 | | Peabody Energy Corp., Senior Notes, 7.38%, 11/1/16 | | | 448,000 |
| | 300,000 | | PetroHawk Energy Corp., Senior Notes, 7.88%, 6/1/15 | | | 318,000 |
Principal Amount | | | | Value |
| $ | 500,000 | | Plains Exploration & Production Co., Senior Notes, 7.75%, 6/15/15 | | $ | 523,750 |
| | | | | | | 5,808,954 |
| | | | FINANCIAL (3.4%) | | | |
| | 400,000 | | Ally Financial, Inc., 8.00%, 3/15/20 | | | 452,000 |
| | 400,000 | | CIT Group, Inc., 7.00%, 5/1/16 | | | 404,000 |
| | 300,000 | | Ford Motor Credit Co. LLC, Senior Notes, 8.00%, 12/15/16 | | | 340,281 |
| | | | | | | 1,196,281 |
| | | | INDUSTRIAL (13.4%) | | | |
| | 350,000 | | Alliant Techsystems, Inc., Senior Subordinated Notes, 6.75%, 4/1/16 | | | 360,500 |
| | 400,000 | | Baldor Electric Co., Senior Notes, 8.63%, 2/15/17 | | | 446,000 |
| | 500,000 | | Ball Corp., 5.75%, 5/15/21 | | | 490,000 |
| | 200,000 | | BE Aerospace, Inc., Senior Notes, 8.50%, 7/1/18 | | | 218,000 |
| | 1,000,000 | | Briggs & Stratton Corp., 6.88%, 12/15/20 | | | 1,045,000 |
| | 400,000 | | General Cable Corp., Senior Notes, 7.13%, 4/1/17 | | | 412,000 |
| | 500,000 | | Gulfmark Offshore, Inc., Guaranteed Notes, 7.75%, 7/15/14 | | | 508,750 |
| | 400,000 | | L-3 Communications Corp., Senior Subordinated Notes, 5.88%, 1/15/15 | | | 408,000 |
| | 400,000 | | Terex Corp., Senior Subordinated Notes, 8.00%, 11/15/17 | | | 414,000 |
| | 400,000 | | USG Corp., Senior Notes, 6.30%, 11/15/16 | | | 372,000 |
| | | | | | | 4,674,250 |
| | | | TECHNOLOGY (2.1%) | | | |
| | 81,000 | | Broadridge Financial Solutions, Inc., Senior Notes, 6.13%, 6/1/17 | | | 82,457 |
| | 350,000 | | First Data Corp., Senior Notes, 9.88%, 9/24/15 | | | 349,125 |
See Notes to Financial Statements.
| Value Line Aggressive Income Trust |
| |
| Schedule of Investments |
Principal Amount | | | | Value |
| $ | 300,000 | | Seagate Technology HDD Holdings, 6.80%, 10/1/16 | | $ | 309,000 |
| | | | | | | 740,582 |
| | | | UTILITIES (3.8%) | | | |
| | 350,000 | | AES Corp. (The), Senior Notes, 8.00%, 10/15/17 | | | 378,875 |
| | 400,000 | | NRG Energy, Inc., Senior Notes, 7.38%, 2/1/16 | | | 414,000 |
| | 350,000 | | RRI Energy, Inc., Senior Notes, 7.63%, 6/15/14 | | | 367,500 |
| | 300,000 | | Texas Competitive Electric Holdings Co. LLC, 10.25%, 11/1/15 | | | 184,500 |
| | | | | | | 1,344,875 |
| | | | | | | |
| | | | TOTAL CORPORATE BONDS & NOTES (Cost $24,743,785) (76.8%) | | | 26,797,289 |
| | | | | | | |
| CONVERTIBLE CORPORATE BONDS & NOTES (11.1%) | | | |
| | | | | | | |
| | | | BASIC MATERIALS (1.2%) | | | |
| | 400,000 | | Ferro Corp., Senior Notes, 6.50%, 8/15/13 | | | 421,500 |
| | | | | | | |
| | | | COMMUNICATIONS (1.4%) | | | |
| | 250,000 | | Leap Wireless International, Inc. 4.50%, 7/15/14 | | | 231,250 |
| | 250,000 | | NII Holdings, Inc. 3.13%, 6/15/12 | | | 246,250 |
| | | | | | | 477,500 |
| | | | | | | |
| | | | CONSUMER, CYCLICAL (0.3%) | | | |
| | 100,000 | | AMR Corp., 6.25%, 10/15/14 | | | 110,875 |
| | | | | | | |
| | | | CONSUMER, NON-CYCLICAL (2.2%) | | | |
| | 150,000 | | Avis Budget Group, Inc., Convertible Fixed, 3.50%, 10/1/14 | | | 173,063 |
| | 250,000 | | Charles River Laboratories International, Inc., Senior Notes, 2.25%, 6/15/13 | | | 256,875 |
| | 250,000 | | LifePoint Hospitals, Inc., Senior Subordinated Debentures, 3.50%, 5/15/14 | | | 251,875 |
Principal Amount | | | | Value |
| $ | 89,000 | | Omnicare, Inc., 3.25%, 12/15/35 | | $ | 81,435 |
| | | | | | | 763,248 |
| | | | ENERGY (2.4%) | | | |
| | 300,000 | | Global Industries Ltd., Senior Debentures, 2.75%, 8/1/27 | | | 231,750 |
| | 350,000 | | Helix Energy Solutions Group, Inc. 3.25%, 12/15/25 | | | 343,000 |
| | 250,000 | | SESI LLC, Guaranteed Senior Notes, 1.50%, 12/15/26 | | | 256,562 |
| | | | | | | 831,312 |
| | | | INDUSTRIAL (1.6%) | | | |
| | 250,000 | | SunPower Corp., Senior Debentures Convertible, 1.25%, 2/15/27 | | | 241,875 |
| | 350,000 | | Suntech Power Holdings Co., Ltd., Senior Notes, 3.00%, 3/15/13 | | | 321,125 |
| | | | | | | 563,000 |
| | | | TECHNOLOGY (2.0%) | | | |
| | 400,000 | | Micron Technology, Inc., Senior Notes, 1.88%, 6/1/14 | | | 412,500 |
| | 300,000 | | SanDisk Corp., Senior Notes, 1.00%, 5/15/13 | | | 290,250 |
| | | | | | | 702,750 |
| | | | | | | |
| | | | TOTAL CONVERTIBLE CORPORATE BONDS & NOTES (Cost $3,381,269) (11.1%) | | | 3,870,185 |
| | | | | | | |
| Shares | | | | | |
| COMMON STOCKS (1.7%) | | | |
| | | | | | | |
| | | | ENERGY (0.4%) | | | |
| | 2,500 | | Energy Transfer Partners L.P. | | | 134,800 |
| | | | | | | |
| | | | FINANCIALS (0.8%) | | | |
| | 3,000 | | Equity Residential | | | 162,570 |
| | 5,000 | | Hospitality Properties Trust | | | 124,350 |
| | | | | | | 286,920 |
See Notes to Financial Statements.
| Value Line Aggressive Income Trust |
| |
| January 31, 2011 |
| Shares | | | | Value |
| | | | UTILITIES (0.5%) | | | |
| | 4,000 | | FirstEnergy Corp. | | $ | 156,480 |
| | | | | | | |
| | | | TOTAL COMMON STOCKS (Cost $413,215) (1.7%) | | | 578,200 |
| | | | | | | |
| PREFERRED STOCKS (0.9%) | | | |
| | | | | | | |
| | | | FINANCIALS (0.9%) | | | |
| | 100 | | Bank of America Corp. Series L, 7.25% | | | 99,050 |
| | 3,000 | | Ford Motor Company Capital Trust II 6.50% | | | 156,840 |
| | 3,000 | | Health Care REIT, Inc. Series F, 7.625% | | | 75,900 |
| | | | | | | 331,790 |
| | | | | | | |
| | | | TOTAL PREFERRED STOCKS (Cost $312,045) (0.9%) | | | 331,790 |
| | | | | | | |
| | | | TOTAL INVESTMENT SECURITIES (90.5%) (Cost $28,850,314) | | | 31,577,464 |
Principal Amount | | | | Value |
| REPURCHASE AGREEMENT (9.5%) | | | |
| $ | 3,300,000 | | With Morgan Stanley, 0.17%, dated 01/31/11, due 02/01/11, delivery value $3,300,016 (collateralized by $3,195,000 U.S. Treasury Notes 3.6250%, due 02/15/20, with a value of $3,361,012) | | $ | 3,300,000 |
| | | | | | | |
| | | | TOTAL REPURCHASE AGREEMENTS (Cost $3,300,000) (9.5%) | | | 3,300,000 |
| | | | | | | |
| | | | | | | |
| CASH AND OTHER ASSETS IN EXCESS OF LIABILITIES (0.0%) | | | |
| | | | | | | 7,569 |
| NET ASSETS (100%) | | $ | 34,885,033 |
| | | | | | | |
NET ASSET VALUE OFFERING AND REDEMPTION PRICE, PER OUTSTANDING SHARE ($34,885,033 ÷ 7,041,713 shares outstanding) | | $ | 4.95 |
| | | | | | | |
| REIT Real Estate Investment Trust | | | |
See Notes to Financial Statements.
Value Line Aggressive Income Trust
| | | | | |
Statement of Assets and Liabilities at January 31, 2011 | | | | |
| | | | | |
| Assets: | | | | |
| Investment securities, at value (Cost - $28,850,314) | | $ | 31,577,464 | |
| Repurchase agreement (Cost - $3,300,000) | | | 3,300,000 | |
| Cash | | | 77,951 | |
| Interest and dividends receivable | | | 520,819 | |
| Prepaid expenses | | | 18,067 | |
| Receivable for trust shares sold | | | 3,270 | |
Total Assets. | | | 35,497,571 | |
| | | | | |
| Liabilities: | | | | |
| Payable for securities purchased | | | 493,574 | |
| Dividends payable to shareholders | | | 38,748 | |
| Payable for trust shares redeemed | | | 34,311 | |
| Accrued expenses: | | | | |
| Advisory fee | | | 16,355 | |
| Service and distribution plan fees | | | 4,471 | |
| Other | | | 25,079 | |
| Total Liabilities | | | 612,538 | |
| Net Assets | | $ | 34,885,033 | |
| | | | | |
| Net assets consist of: | | | | |
| Shares of beneficial interest, at $0.01 par value (authorized unlimited, outstanding 7,041,713 shares) | | $ | 70,417 | |
| Additional paid-in capital | | | 34,979,356 | |
| Distributions in excess of net investment income | | | (38,747 | ) |
| Accumulated net realized loss on investments and foreign currency | | | (2,853,143 | ) |
| Net unrealized appreciation of investments | | | 2,727,150 | |
| Net Assets | | $ | 34,885,033 | |
| | | | | |
| Net Asset Value, Offering and Redemption Price per Outstanding Share ($34,885,033 ÷ 7,041,713 shares outstanding) | | $ | 4.95 | |
Statement of Operations for the Year Ended January 31, 2011 | | | | |
| | | | | |
| Investment Income: | | | | |
| Interest | | $ | 2,547,063 | |
| Dividends | | | 67,618 | |
| Total Income | | | 2,614,681 | |
| Expenses: | | | | |
| Advisory fee | | | 267,291 | |
| Service and distribution plan fees | | | 89,097 | |
| Printing and postage | | | 38,324 | |
| Transfer agent fees | | | 33,440 | |
| Registration and filing fees | | | 28,318 | |
| Custodian fees | | | 28,113 | |
| Auditing and legal fees | | | 24,478 | |
| Trustees’ fees and expenses | | | 5,736 | |
| Insurance | | | 4,695 | |
| Other | | | 6,944 | |
| Total Expenses Before Custody Credits and Fees Waived | | | 526,436 | |
| Less: Advisory Fees Waived | | | (83,342 | ) |
| Less: Service and Distribution Plan Fees Waived | | | (35,639 | ) |
| Less: Legal Fee Reimbursement | | | (2,854 | ) |
| Less: Custody Credits | | | (150 | ) |
| Net Expenses | | | 404,451 | |
| Net Investment Income | | | 2,210,230 | |
| | | | | |
| Net Realized and Unrealized Gain/ (Loss) on Investments: | | | | |
| Net Realized Gain | | | 1,419,052 | |
| Change in Net Unrealized | | | | |
| Appreciation/(Depreciation) | | | 387,736 | |
Net Realized Gain and Change in Net Unrealized Appreciation/ (Depreciation) on Investments and Foreign Exchange Transactions | | | 1,806,788 | |
| | | | | |
| Net Increase in Net Assets from Operations | | $ | 4,017,018 | |
See Notes to Financial Statements.
Value Line Aggressive Income Trust
| | | | | | | |
Statement of Changes in Net Assets for the Years Ended January 31, 2011 and 2010 | | | | | | |
| | | | | | | |
| | | Year Ended January 31, 2011 | | | Year Ended January 31, 2010 | |
| | | | | | | |
| Operations: | | | | | | |
| Net investment income | | $ | 2,210,230 | | | $ | 2,288,088 | |
| Net realized gain/(loss) on investments | | | 1,419,052 | | | | (1,479,744 | ) |
| Change in net unrealized appreciation/(depreciation) | | | 387,736 | | | | 8,228,511 | |
| Increase from payment by affiliate . | | | — | | | | 4,043 | |
Net increase in net assets from operations . | | | 4,017,018 | | | | 9,040,898 | |
| | | | | | | | | |
| Distributions to Shareholders: | | | | | | | | |
| Net investment income . | | | (2,207,166 | ) | | | (2,273,909 | ) |
| | | | | | | | | |
| Trust Share Transactions: | | | | | | | | |
| Proceeds from sale of shares | | | 2,439,245 | | | | 14,135,221 | |
| Proceeds from reinvestment of dividends to shareholders | | | 1,743,738 | | | | 1,856,215 | |
| Cost of shares redeemed* | | | (8,894,522 | ) | | | (10,895,800 | ) |
| Net increase/(decrease) in net assets from trust share transactions | | | (4,711,539 | ) | | | 5,095,636 | |
| Total Increase/(Decrease) in Net Assets | | | (2,901,687 | ) | | | 11,862,625 | |
| | | | | | | | | |
| Net Assets: | | | | | | | | |
| Beginning of year | | | 37,786,720 | | | | 25,924,095 | |
| End of year | | $ | 34,885,033 | | | $ | 37,786,720 | |
| Distributions in excess of net investment income, at end of year | | $ | (38,747 | ) | | $ | (32,419 | ) |
* Net of redemption fees (see Note 1K and Note 2).
See Notes to Financial Statements.
| Value Line Aggressive Income Trust |
| |
| Notes to Financial Statements |
1. Significant Accounting Policies
Value Line Aggressive Income Trust (the “Trust”) is registered under the Investment Company Act of 1940, as amended, as a diversified, open-end management investment company. The primary investment objective of the Trust is to maximize current income through investment in a diversified portfolio of high-yield fixed-income securities. As a secondary investment objective, the Trust will seek capital appreciation, but only when consistent with its primary objective. Lower rated or unrated (i.e., high-yield) securities are more likely to react to developments affecting market risk (general market liquidity) and credit risk (issuers’ inability to meet principal and interest payments on their obligations) than are more highly rated securities, which react primarily to movements in the general level of interest rates. The ability of issuers of debt securities held by the Trust to meet their obligations may be affected by economic developments in a specific industry.
The following significant accounting policies are in conformity with generally accepted accounting principles for investment companies. Such policies are consistently followed by the Trust in the preparation of its financial statements. Generally accepted accounting principles require management to make estimates and assumptions that affect the reported amounts and disclosure in the financial statements. Actual results may differ from those estimates.
(A) Security Valuation: The Trustees have determined that the value of bonds and other fixed income corporate securities be calculated on the valuation date by reference to valuations obtained from an independent pricing service that determines valuations for normal institutional-size trading units of debt securities, without exclusive reliance upon quoted prices. This service takes into account appropriate factors such as institutional-size trading in similar groups of securities, yield, quality, coupon rate, maturity, type of issue, trading characteristics and other market data in determining valuations. Securities, other than bonds and other fixed income securities, not priced in this manner are valued at the midpoint between the latest available and representative bid and asked prices or, when stock valuations are used, at the latest quoted sale price as of the regular close of business of the New York Stock Exchange on the valuation date. Other assets and securities for which market valuations are not readily available are valued at their fair value as the Trustees may determine. In addition, the Trust may use the fair value of a security when the closing price on the primary exchange where the security is traded no longer reflects the value of a security due to factors affecting one or more relevant securities markets or the specific issuer. Short term instruments with maturities of 60 days or less, at the date of purchase, are valued at amortized cost which approximates market value.
(B) Fair Value Measurements: The Trust follows fair valuation accounting standards (FASB ASC 820-10) which establish a definition of fair value and set out a hierarchy for measuring fair value. These standards require additional disclosures about the various inputs and valuation techniques used to develop the measurements of fair value and a discussion in changes in valuation techniques and related inputs during the period. These inputs are summarized in the three broad levels listed below:
| | |
| ● | Level 1 – Inputs that reflect unadjusted quoted prices in active markets for identical assets or liabilities that the Trust has the ability to access at the measurement date; |
| ● | Level 2 – Inputs other than quoted prices that are observable for the asset or liability either directly or indirectly, including inputs in markets that are not considered to be active; |
| ● | Level 3 – Inputs that are unobservable. |
Transfers between investment levels may occur as the markets fluctuate and/or the availability of data used in an investment’s valuation changes. The inputs or methodologies used for valuing securities are not necessarily an indication of the risk associated with investing in those securities.
| Value Line Aggressive Income Trust |
| |
| January 31, 2011 |
The following table summarizes the inputs used to value the Trust’s net assets as of January 31, 2011:
| Investments in Securities: | | Level 1 | | | Level 2 | | | Level 3 | | | Total | |
| Assets | | | | | | | | | | | | |
| Corporate Bonds & Notes | | $ | 0 | | | $ | 26,797,289 | | | $ | 0 | | | $ | 26,797,289 | |
| Convertible Corporate Bonds & Notes | | | 0 | | | | 3,870,185 | | | | 0 | | | | 3,870,185 | |
| Short-Term Investments | | | 0 | | | | 3,300,000 | | | | 0 | | | | 3,300,000 | |
| Common Stocks | | | 578,200 | | | | 0 | | | | 0 | | | | 578,200 | |
| Preferred Stocks | | | 331,790 | | | | 0 | | | | 0 | | | | 331,790 | |
| Total Investments in Securities | | $ | 909,990 | | | $ | 33,967,474 | | | $ | 0 | | | $ | 34,877,464 | |
The Trust follows the updated provisions surrounding fair value measurements and disclosures on transfers in and out of all levels of the fair value hierarchy on a gross basis and the reasons for the transfers as well as the disclosures about the valuation techniques and inputs used to measure fair value for investments that fall in either Level 2 or Level 3 fair value hierarchy.
For the year ended January 31, 2011, there was no significant transfer activity between Level 1 and Level 2.
For the year ended January 31, 2011, there were no Level 3 investments. The Schedule of Investments includes a breakdown of the Schedule’s investments by category.
(C) Repurchase Agreements: In connection with transactions in repurchase agreements, the Trust’s custodian takes possession of the underlying collateral securities, the value of which exceeds the principal amount of the repurchase transaction, including accrued interest. To the extent that any repurchase transaction exceeds one business day, it is the Trust’s policy to mark-to-market the collateral on a daily basis to ensure the adequacy of the collateral. In the event of default of the obligation to repurchase, the Trust has the right to liquidate the collateral and apply the proceeds in satisfaction of the obligation. Under certain circumstances, in the event of default or bankruptcy by the other party to the agreement, realization and/or retention of the collateral or proceeds may be subject to legal proceedings.
(D) Distributions: It is the policy of the Trust to distribute all of its net investment income to shareholders. Dividends from net investment income will be declared daily and paid monthly. Net realized capital gains, if any, are distributed to shareholders annually or more frequently if necessary to comply with the Internal Revenue Code. Income dividends and capital gains distributions are automatically reinvested in additional shares of the Trust unless the shareholder has requested otherwise. Income earned by the Trust on weekends, holidays and other days on which the Trust is closed for business is declared as a dividend on the next day on which the Trust is open for business.
(E) Federal Income Taxes: It is the Trust’s policy to comply with the requirements of the Internal Revenue Code applicable to regulated investment companies, including the distribution requirements of the Tax Reform Act of 1986, and to distribute all of its taxable income to its shareholders. Therefore, no federal income tax provision is required.
(F) Foreign Currency Translation: The books and records of the Trust are maintained in U.S. dollars. Assets and liabilities which are denominated in foreign currencies are translated to U.S. dollars at the prevailing rates of exchange. The Trust does not isolate changes in the value of investments caused by foreign exchange rate differences from the changes due to other circumstances.
Income and expenses are translated to U.S. dollars based upon the rates of exchange on the respective dates of such transactions.
Net realized foreign exchange gains or losses arise from currency fluctuations realized between the trade and settlement dates on securities transactions, the differences between the U.S. dollar amounts of dividends, interest, and foreign withholding taxes recorded by the Trust, and the U.S. dollar equivalent of the amounts actually received or paid. Net unrealized foreign exchange gains and losses arise from changes in the value of assets and liabilities, other than investments, at the end of the fiscal period, resulting from changes in the exchange rates. The effect of the change in foreign exchange rates on the value of investments is included in realized gain/loss on investments and change in net unrealized appreciation/ (depreciation) on investments.
| Value Line Aggressive Income Trust |
| |
| Notes to Financial Statements |
(G) Representations and Indemnifications: In the normal course of business, the Trust enters into contracts that contain a variety of representations and warranties which provide general indemnifications. The Trust’s maximum exposure under these arrangements is unknown, as this would involve future claims that may be made against the Trust that have not yet occurred. However, based on experience, the Trust expects the risk of loss to be remote.
(H) Security Transactions: Securities transactions are recorded on a trade date basis. Realized gains and losses from security transactions are recorded on the identified-cost basis. Interest income, adjusted for amortization of discount and premium, is earned from settlement date and recognized on the accrual basis. Dividend income is recorded on the ex-dividend date.
(I) Accounting for Real Estate Investment Trusts: The Trust owns shares of Real Estate Investment Trusts (“REITs”) which report information on the source of their distributions annually. Distributions received from REITs during the year which represent a return of capital are recorded as a reduction of cost and distributions which represent a capital gain dividend are recorded as a realized long-term capital gain on investments.
(J) Foreign Taxes: The Trust may be subject to foreign taxes on income, gains on investments, or currency repatriation, a portion of which may be recoverable. The Trust will accrue such taxes and recoveries as applicable, based upon its current interpretation of tax rules and regulations that exist in the markets in which it invests.
(K) Redemption Fees: The Trust charges a 2% redemption fee on shares held for less than 120 days. Such fees are retained by the Trust and accounted for as paid in capital.
(L) Other: On March 11, 2010, certain affected Value Line Funds and Value Line, Inc. (“VLI”) entered into an agreement pursuant to which VLI agreed to reimburse those Funds in the aggregate amount of $917,302 for various expenses incurred by those Funds in connection with the subject matter of the settlement, dated November 4, 2009, between the Securities and Exchange Commission and VLI, Value Line Securities, Inc. (currently EULAV Securities LLC (the “Distributor”)) and two former directors and officers of VLI. The agreement required VLI to reimburse those Funds in twelve monthly installments commencing April 1, 2010 and those Funds accrued a related receivable. Accordingly, the Trust accrued $2,854 in expense reimbursements from VLI. In November 2010, VLI accelerated its payment obligations and paid in full the outstanding balance.
On December 23, 2010, EULAV Asset Management, LLC (the “Adviser”) was restructured so that it is no longer a wholly-owned subsidiary of VLI. As part of the restructuring, the Adviser converted to a Delaware statutory trust named EULAV Asset Management and the Distributor merged into EULAV Securities LLC and became a wholly-owned subsidiary of the Adviser. VLI has stated that as a result of the restructuring it no longer “controls” (as that term is defined in the Investment Company Act of 1940) the Adviser or the Distributor. On July 20, 2010, the Board approved a new investment advisory agreement between each Fund and the restructured Adviser to take effect upon the closing of the restructuring. The effectiveness of each investment advisory agreement was also contingent upon approval by shareholders of the applicable Fund. Toward this end, each Fund held special shareholder meetings in the Fall of 2010 at which shareholders approved the new investment advisory agreements with the restructured Adviser. In addition, the shareholders of each Fund elected three persons as members of the Board at the special shareholder meetings. Please see “Proxy Results” later in this annual report for the voting results of those shareholder meetings.
| Value Line Aggressive Income Trust |
| |
| January 31, 2011 |
(M) Subsequent Events: Management has evaluated all subsequent transactions and events through the date on which these financial statements were issued, and except as already included in the notes to these financial statements, has determined that no additional items require disclosure.
2. Trust Share Transactions and Distributions to Shareholders
Transactions in shares of beneficial interest in the Trust were as follows:
| | | | | | | |
| | | Year Ended January 31, 2011 | | | Year Ended January 31, 2010 | |
| Shares sold | | | 510,978 | | | | 3,455,006 | |
| Shares issued to shareholders in reinvestment of dividends and distributions | | | 364,174 | | | | 427,536 | |
| Shares redeemed | | | (1,867,909 | ) | | | (2,514,225 | ) |
| Net increase/ (decrease) | | | (992,757 | ) | | | 1,368,317 | |
| Dividends per share from net investment income | | $ | 0.2960 | | | $ | 0.2812 | |
Redemption fees of $5,016 and $24,940 were retained by the Trust for the year ended January 31, 2011 and the year ended January 31, 2010, respectively.
3. Purchases and Sales of Securities
Purchases and sales of investment securities, excluding short-term securities, were as follows:
| | | | | |
| | | Year Ended January 31, 2011 | |
| Purchases: | | | | |
| Investment Securities | | $ | 13,641,327 | |
| Sales: | | | | |
| Investment Securities | | $ | 17,486,103 | |
At January 31, 2011, information on the tax components of capital is as follows:
| | | | | |
| Cost of investments for tax purposes | | $ | 32,133,026 | |
| Gross tax unrealized appreciation | | $ | 2,864,511 | |
| Gross tax unrealized depreciation | | $ | (120,073 | ) |
| Net tax unrealized appreciation on investments | | $ | 2,744,438 | |
| Capital loss carryforward, expires | | | | |
| January 31, 2017 | | $ | (911,547 | ) |
| January 31, 2018 | | $ | (1,958,884 | ) |
During the year ended January 31, 2011, as permitted under federal income tax regulations, the Trust utilized $1,446,481 of capital loss carryforwards.
During the year ended January 31, 2011, $4,178,286 of the Trust’s capital loss carryforwards expired.
To the extent future capital gains are offset by capital losses, the Trust does not anticipate distributing any such gains to shareholders.
| Value Line Aggressive Income Trust |
| |
| Notes to Financial Statements |
It is uncertain whether the Trust will be able to realize the benefits of the losses before they expire.
The tax composition of dividends to shareholders for the years ended January 31, 2011 and January 31, 2010 were as follows:
| | | | | | | |
| | | 2011 | | | 2010 | |
| Ordinary income | | $ | 2,207,166 | | | $ | 2,273,909 | |
Permanent book-tax differences relating to the classifications of certain distributions and income in the current year were reclassified within the composition of the net asset accounts. The Trust increased distributions in excess of net investment income by $9,392, decreased accumulated realized loss on investments by $4,225,058, and decreased additional paid-in-capital by $4,215,666. Net assets were not affected by these reclassifications. These reclassifications are primarily due to differing treatments for tax purposes of expired capital loss carryforward, distributions in excess of current earnings, Fair Fund settlements, investments in partnerships and consent payments.
5. Investment Advisory Fee, Service and Distribution Fees and Transactions With Affiliates
An advisory fee of $267,291 was paid or payable to EULAV Asset Management (the “Adviser”) for the year ended January 31, 2011. This was computed at an annual rate of 0.75% on the first $100 million of the Trust’s average daily net assets during the period, and 0.50 % on the average daily net assets in excess thereof prior to any fee waivers. The Adviser provides research, investment programs, supervision of the investment portfolio and pays costs of administrative services and office space. The Adviser also provides persons, satisfactory to the Trust’s Trustees, to act as officers of the Trust and pays their salaries. Effective June 1, 2007 and 2008, the Adviser contractually agreed to reduce the Trust’s advisory fee by 0.40% for one year periods. Effective June 1, 2009, the Adviser contractually agreed to waive 0.30% of the advisory fee for a one year period. On March 11, 2010, with an effective date of June 1, 2010, the Adviser contractually agreed to waive 0.20% of the advisory fee for a one year period. The fees waived amounted to $83,342 for the year ended January 31, 2011. The Adviser has no right to recoup previously waived amounts.
The Trust has a Service and Distribution Plan (the “Plan”), adopted pursuant to Rule 12b-1 under the Investment Company Act of 1940, which compensates EULAV Securities LLC. (the “Distributor”) for advertising, marketing and distributing the Trust’s shares and for servicing the Trust’s shareholders at an annual rate of 0.25% of the Trust’s average daily net assets. Fees amounting to $89,097 before fee waivers were accrued under the Plan for the year ended January 31, 2011. Effective June 1, 2007, 2008, 2009 and 2010, the Distributor contractually agreed to reduce the 12b-1 fee by 0.10% for one year periods. The fees waived amounted to $35,639 for the year ended January 31, 2011. The Distributor has no right to recoup previously waived amounts.
For the year ended January 31, 2011, the Trust’s expenses were reduced by $150 under a custody credit arrangement with the custodian.
Direct expenses of the Trust are charged to the Trust while common expenses of the Value Line Funds are allocated proportionately based upon the Funds’ respective net assets. The Trust bears all other costs and expenses.
Certain officers and a Trustee of the Adviser are also officers and a Trustee of the Trust. At January 31, 2011, the officers and Trustee as a group owned 1,019 shares of beneficial interest in the Trust, representing less than 1% of the outstanding shares.
Value Line Aggressive Income Trust
Selected data for a share of beneficial interest outstanding throughout each year:
| | | | | | | | | | | | | | | | |
| | | Years Ended January 31, | |
| | | 2011 | | | 2010 | | | 2009 | | | 2008 | | | 2007 | |
| Net asset value, beginning of year | | $ | 4.70 | | | $ | 3.89 | | | $ | 4.83 | | | $ | 5.06 | | | $ | 5.01 | |
| | | | | | | | | | | | | | | | | | | | | |
| Income from investment operations: | | | | | | | | | | | | | | | | | | | | |
| Net investment income | | | 0.30 | | | | 0.28 | | | | 0.32 | | | | 0.34 | | | | 0.32 | |
| Net gains or (losses) on securities (both realized and unrealized) | | | 0.25 | | | | 0.81 | | | | (0.95 | ) | | | (0.23 | ) | | | 0.05 | |
| Total from investment operations | | | 0.55 | | | | 1.09 | | | | (0.63 | ) | | | 0.11 | | | | 0.37 | |
| Redemption fees | | | 0.00 | (3) | | | 0.00 | (3) | | | 0.00 | (3) | | | 0.00 | (3) | | | 0.00 | (3) |
| | | | | | | | | | | | | | | | | | | | | |
| Less distributions: | | | | | | | | | | | | | | | | | | | | |
| Dividends from net investment income | | | (0.30 | ) | | | (0.28 | ) | | | (0.31 | ) | | | (0.34 | ) | | | (0.32 | ) |
| | | | | | | | | | | | | | | | | | | | | |
| Net asset value, end of year | | $ | 4.95 | | | $ | 4.70 | | | $ | 3.89 | | | $ | 4.83 | | | $ | 5.06 | |
| | | | | | | | | | | | | | | | | | | | | |
| Total return | | | 12.01 | % | | | 28.92 | % | | | (13.42 | )% | | | 2.14 | % | | | 7.80 | % |
| | | | | | | | | | | | | | | | | | | | | |
| Ratios/Supplemental Data: | | | | | | | | | | | | | | | | | | | | |
| Net assets, end of year (in thousands) | | $ | 34,885 | | | $ | 37,787 | | | $ | 25,924 | | | $ | 32,459 | | | $ | 37,340 | |
Ratio of expenses to average net assets(1) | | | 1.48 | % | | | 1.56 | % | | | 1.50 | % | | | 1.28 | % | | | 1.50 | % |
Ratio of expenses to average net assets(2) | | | 1.13 | % | | | 1.13 | % | | | 0.98 | % | | | 0.77 | % | | | 1.04 | % |
| Ratio of net investment income to average net assets | | | 6.20 | % | | | 6.51 | % | | | 7.17 | % | | | 6.76 | % | | | 6.54 | % |
| Portfolio turnover rate | | | 42 | % | | | 51 | % | | | 39 | % | | | 30 | % | | | 31 | % |
| (1) | Ratio reflects expenses grossed up for custody credit arrangement and grossed up for the waivers of a portion of the advisory fee by the Adviser, a portion of the service and distribution plan fees by the Distributor, and the reimbursement by Value Line of certain expenses incurred by the Trust (“Expenses”) in connection with a settlement with the Securities and Exchange Commission related to brokerage commissions charged by the Distributor to the Trust. The ratio of expenses to average net assets, net of custody credits, but exclusive of the fee waivers and reimbursement of Expenses would have been 1.48% for the year ended January 31, 2009, 1.27% for the year ended January 31, 2008, 1.49% for the year ended January 31, 2007 and would have been unchanged for the other years shown. |
| | |
| (2) | Ratio reflects expenses net of the custody credit arrangement and net of the waivers of a portion of the advisory fee by the Adviser, a portion of the service and distribution plan fees by the Distributor, and the reimbursement of Expenses by Value Line. |
| | |
| (3) | Amount is less than $.01 per share. |
See Notes to Financial Statements.
Value Line Aggressive Income Trust
| Report of Independent Registered Public Accounting Firm |
To the Board of Trustees and Shareholders of Value Line Aggressive Income Trust
In our opinion, the accompanying statement of assets and liabilities, including the schedule of investments, and the related statements of operations and of changes in net assets and the financial highlights present fairly, in all material respects, the financial position of Value Line Aggressive Income Trust (the “Trust”) at January 31, 2011, the results of its operations for the year then ended, the changes in its net assets for each of the two years in the period then ended and the financial highlights for each of the five years in the period then ended, in conformity with accounting principles generally accepted in the United States of America. These financial statements and financial highlights (hereafter referred to as “financial statements”) are the responsibility of the Trust’s management; our responsibility is to express an opinion on these financial statements based on our audits. We conducted our audits of these financial statements in accordance with the standards of the Public Company Accounting Oversight Board (United States). Those standards require that we plan and perform the audit to obtain reasonable assurance about whether the financial statements are free of material misstatement. An audit includes examining, on a test basis, evidence supporting the amounts and disclosures in the financial statements, assessing the accounting principles used and significant estimates made by management, and evaluating the overall financial statement presentation. We believe that our audits, which included confirmation of securities at January 31, 2011 by correspondence with the custodian and brokers, provide a reasonable basis for our opinion.
PricewaterhouseCoopers LLP
New York, New York
March 22, 2011
Value Line Aggressive Income Trust
PROXY RESULTS
FOR VALUE LINE AGGRESSIVE INCOME TRUST
Two Special Meetings of Shareholders were held on October 26, 2010 for shareholders of record on August 25, 2010 to elect three nominees for Trustees of the Trust and to approve a new investment advisory agreement between the Trust and EULAV Asset Management. Each vote represents one dollar of value of shares outstanding on the record date.
Approved the Trustees as follows:
| NOMINEE | | | VOTES FOR | | | VOTES WITHHELD | |
| Ms. Joyce Heinzerling | | | | 5,149,492 | | | | 493,379 | |
| Mr. Mitchell E. Appel | | | | 5,148,430 | | | | 464,441 | |
| Daniel S. Vandivort | | | | 5,166,688 | | | | 476,183 | |
Following their October 26, 2010 approval, Ms. Heinzerling and Mr. Vandivort continued to serve as Trustees along with Ms. Nancy-Beth Sheerr and Messrs. Francis C. Oakley, David H. Porter, Thomas Sarkany and Paul Craig Roberts. Effective with the resignation of Mr. Thomas Sarkany on December 23, 2010, Mr. Appel became a Trustee.
Approved the new investment advisory agreement as follows:
| | | | | | | | | | | |
| VOTES FOR | | | VOTES AGAINST | | | VOTES ABSTAINING | | | BROKER NON-VOTES* | |
| | 3,272,414 | | | | 115,396 | | | | 171,806 | | | | 389,509 | |
*Broker non-votes are proxies received from brokers or nominees indicating that such persons have not received instructions from the beneficial owners or other persons entitled to vote such shares as to a particular matter with respect to which the brokers or nominees do not have discretionary power to vote.
Value Line Aggressive Income Trust
| |
| 2011 Annual Report (unaudited) |
FACTORS CONSIDERED BY THE BOARD IN APPROVING
THE INVESTMENT ADVISORY AGREEMENT
FOR VALUE LINE AGGRESSIVE INCOME TRUST
The Investment Company Act of 1940 (the “1940 Act”) requires the Board of Trustees, including a majority of Trustees who are not “interested persons” of Value Line Aggressive Income Trust (the “Trust”), as that term is defined in the 1940 Act (the “Independent Trustees”), initially and annually thereafter consider the approval of an investment advisory agreement between the Trust and its investment adviser.
The Trust’s former investment advisory agreement with EULAV Asset Management, LLC (the “Former Agreement”) terminated by operation of law on December 23, 2010 when EULAV Asset Management, LLC was restructured as a Delaware statutory trust and renamed EULAV Asset Management (the “Adviser”).1 In its consideration of whether the new investment advisory agreement between the Trust and the Adviser (“Agreement”) was in the best interests of the Trust and its shareholders, the Board requested and the Adviser provided such information as the Board deemed to be reasonably necessary to evaluate the terms of the Agreement.
Among the factors considered by the Board was the fact that all terms under the Agreement, including the advisory services provided and fee rate charged, are identical to those under the Former Agreement, with the sole exception of the date of execution, the two-year initial term, and immaterial changes in form and updates. The Board, including the Independent Trustees, also took into account that it had recently performed a full annual review of the Former Agreement and approved the selection of the Adviser and the continuance of the Former Agreement based on a thorough examination of qualitative and quantitative information provided by the Adviser. At meetings held throughout the year, including the meeting specifically focused upon the review of the Agreement and Former Agreement, the Independent Trustees met in executive sessions separately from the non-Independent Trustee of the Trust and any officers of the Adviser. In selecting the restructured Adviser and approving the Agreement, the Independent Trustees relied upon the assistance of counsel to the Independent Trustees.
Both in the meetings which specifically addressed the approval of the Agreement and the Former Agreement and at other meetings, the Board, including the Independent Trustees, received materials relating to the Adviser’s investment and management services under the Former Agreement and as planned under the Agreement. These materials included information on: (i) the investment performance of the Trust, compared to a peer group of funds consisting of the Trust and all retail and institutional high current yield funds regardless of asset size or primary channel of distribution (the “Performance Universe”), and its benchmark index, each as classified by Lipper Inc., an independent evaluation service (“Lipper”); (ii) the investment process, portfolio holdings, investment restrictions, valuation procedures, and financial statements for the Trust; (iii) sales and redemption data with respect to the Trust; (iv) the general investment outlook in the markets in which the Trust invests; (v) arrangements with respect to the distribution of the Trust’s shares; (vi) the allocation and cost of the Trust’s brokerage (none of which was effected through any affiliate of the Adviser); and (vii) the overall nature, quality and extent of services provided by the Adviser.
1 Unless otherwise indicated, for periods prior to December 23, 2010, the term “Adviser” should be understood to refer to EULAV Asset Management, LLC and its predecessor, Value Line, Inc. (“VLI”).
Value Line Aggressive Income Trust
| |
| 2011 Annual Report (unaudited) |
As part of the review of the Agreement, the Board requested, and the Adviser provided, additional information in order to evaluate the quality of the Adviser’s services and the reasonableness of its fees under the Former Agreement and as planned under the Agreement. In a separate executive session, the Independent Trustees reviewed information, which included data comparing: (i) the Trust’s management fee rate, transfer agent and custodian fee rates, service fee (including 12b-1 fees) rates, and the rate of the Trust’s other non-management fees, to those incurred by a peer group of funds consisting of the Trust and 16 other retail no-load high current yield funds (excluding outliers), as selected objectively by Lipper (“Expense Group”), and a peer group of funds consisting of the Trust, the Expense Group and all other retail no-load high current yield funds (excluding outliers), as selected objectively by Lipper (“Expense Universe”); (ii) the Trust’s expense ratio to those of its Expense Group and Expense Universe; and (iii) the Trust’s investment performance over various time periods to the average performance of the Performance Universe as well as the appropriate Lipper Index, as selected objectively by Lipper (the “Lipper Index”).
In the separate executive session, the Independent Trustees also reviewed information regarding: (a) the financial results and condition of the Adviser’s parent company, the financial results and condition of the Adviser both before and as projected after the restructuring, the Adviser’s and certain of its affiliates’ profitability from the services that have been performed for the Trust and the Value Line family of funds, as well as the projected profitability after the restructuring; (b) the Adviser’s current and anticipated investment management staffing and resources; (c) the proposed ownership, control and day-to-day management of the Adviser after the restructuring; and (d) the Trust’s potential for achieving economies of scale. In support of its review of the statistical information, the Board was provided with a detailed description of the methodology used by Lipper to determine the Expense Group, the Expense Universe and the Performance Universe to prepare its information. The Independent Trustees also requested and reviewed information provided by the Adviser related to the settlement of a matter brought by the Securities and Exchange Commission regarding Value Line Securities, Inc., formerly the Trust’s principal underwriter and affiliate of the Adviser (the “Distributor”),2 VLI and two former directors and officers of VLI. The Board also relied upon representations by VLI that (i) as a result of the restructuring, VLI will no longer “control” (as that term is defined in the 1940 Act) the restructured Adviser or the Distributor and (ii) the settlement of this matter was not likely to have a materially adverse effect on the resources or ability of the Adviser or the Distributor to perform their respective contracts with the Trust.
The following summarizes matters considered by the Board in connection with its approval of the Agreement. However, the Board did not identify any single factor as all-important or controlling, and the summary does not detail all the matters that were considered.
The Board noted that the Agreement’s terms are identical in all material respect to those of the Former Agreement. The Board also considered representations by VLI and the Adviser that, after giving effect to the restructuring, the Adviser and Distributor would have adequate resources to perform their respective services, that there would be no diminution in the nature, quality and extent of such services, and that the Value Line Timeliness rankings would continue to be provided to the Adviser without cost. The Board reviewed the resources and effectiveness of the Adviser’s overall compliance program and viewed favorably the fact that Mr. Appel would continue as Chief Executive Officer of the Adviser with responsibility for day-to-day management following the restructuring. The Board also viewed favorably the increased emphasis being placed by the Adviser on its overall compliance program as well as steps being undertaken to enhance the shareholders’ experience with the Trust, such as a more robust website. The Board reviewed the services provided by the Adviser and its affiliates in supervising third party service providers. Based on these considerations, and in significant reliance on the representations of VLI and the Adviser, the Board concluded that there was not likely to be an adverse change in the nature, quality and extent of services provided by the Adviser and its affiliates under the Agreement following the restructuring, and that the quality of such services would continue to be appropriate.
2 On May 5, 2009, Value Line Securities, Inc. changed its name to EULAV Securities, Inc. As part of the restructuring on December 23, 2010, EULAV Securities, Inc. was restructured as a Delaware limited liability company with the name EULAV Securities LLC and became a wholly-owned subsidiary of the Adviser. No other changes were made to the Distributor’s organization, including its operations and personnel.
Value Line Aggressive Income Trust
| 2011 Annual Report (unaudited) |
Investment Performance. The Board reviewed the Trust’s overall investment performance and compared it to its Performance Universe and the Lipper Index. The Board noted that the Trust outperformed both the Performance Universe average and the Lipper Index for the three-year and five-year periods ended December 31, 2009. The Board also noted that the Trust’s performance for the one-year and ten-year periods ended December 31, 2009 was below the performance of the Performance Universe average and above the Lipper Index.
The Adviser’s Personnel and Methods. The Board reviewed the background of the portfolio managers responsible for the daily management of the Trust’s portfolio, seeking to achieve the Trust’s investment objective and adhering to the Trust’s investment strategies. The Independent Trustees also engaged in discussions with the Adviser’s senior management responsible for the overall functioning of the Trust’s investment operations. The Board took into account the fact that no change was expected in the Trust’s portfolio managers or other employees of the Adviser in connection with the restructuring. The Board concluded that the Trust’s management team and the Adviser’s overall resources were adequate and that the Adviser had investment management capabilities and personnel essential to performing its duties under the Agreement.
Management Fee and Expenses. The Board considered the Adviser’s fee under the Agreement relative to the management fees charged by its Expense Group and Expense Universe averages. The Board noted that the Adviser and the Board previously agreed that the Adviser would contractually waive a portion of the Trust’s management fee, thereby reducing the management fee rate from 0.75% to 0.55% of the Trust’s average daily net assets for the one-year period ending May 31, 2011. In connection with the restructuring, the Adviser and the Board have agreed to extend this contractual management fee waiver, which would otherwise terminate with the Former Agreement, through May 31, 2012. Such waiver cannot be changed without the Board’s approval during the contractual waiver period. The Board noted that, for the fiscal year ended December 31, 2009, the Trust’s management fee rate after giving effect to the contractual management fee waiver was less than that of both the Expense Group average and the Expense Universe average. The Board concluded that the Trust’s management fee was satisfactory for the purpose of approving the Agreement.
The Board also considered the Trust’s total expense ratio relative to its Expense Group and Expense Universe averages. The Board noted that the Distributor and the Board previously agreed that the Distributor would contractually waive a portion of the Trust’s Rule 12b-l fee, effectively reducing the Trust’s Rule 12b-l fee rate from 0.25% to 0.15% of the Trust’s average daily net assets for the one-year period ending May 31, 2011. In connection with the restructuring, the Distributor and the Board have agreed to extend this contractual Rule 12b-l fee waiver through May 31, 2012. Such waiver can not be changed during the contractual waiver period without the Board’s approval. The Board noted that the Trust’s total expense ratio after giving effect to these waivers was higher than that of the Expense Group average and the Expense Universe average. The Board concluded that the average expense ratio was satisfactory for the purpose of approving the Agreement.
The Board took into account the fact that the fee rate under the Agreement was identical to that under the Former Agreement, that the expense structure of the Trust would not increase as a result of the restructuring, and that no alteration of the management or Rule 12b-1 fee rates or any waivers or expense reimbursement arrangements was intended by VLI or the Adviser in connection with the restructuring or during the two years thereafter.
Value Line Aggressive Income Trust
| |
| 2011 Annual Report (unaudited) |
Nature, Extent and Quality of Services. The Board considered the nature, extent and quality of other services provided by the Adviser and the Distributor.
Profitability. The Board considered the level of historical and projected profitability of the Adviser and its affiliates with respect to the Trust individually and in the aggregate for all the funds within the Value Line group of funds, including the impact of the restructuring and certain actions taken during prior years. These actions included the reduction (voluntary in some instances and contractual in other instances) of management and/or Rule 12b-1 fees for certain funds, the Adviser’s termination of the use of soft dollar research, and the cessation of trading through the Distributor. The Board noted that the Trust’s fee rates under the Agreement and Former Agreement would be identical and considered representations by VLI and the Adviser that the Adviser had no present intention to alter the advisory fee rates, expense waivers or expense reimbursement arrangements for any of the funds within the Value Line group of funds for a period of two years from the closing of the restructuring. The Board concluded that the profitability of the Adviser and its affiliates with respect to the Trust, including the financial results derived from the Trust’s Agreement, were within a range the Board considered reasonable.
Other Benefits. The Board also considered the character and amount of other direct and incidental benefits received by the Adviser and its affiliates from their association with the Trust. The Board concluded that potential “fallout” benefits that the Adviser and its affiliates may receive, such as greater name recognition, appear to be reasonable, and may in some cases benefit the Trust.
Economies of Scale. The Board considered that, given the current and anticipated size of the Trust, any perceived and potential economies of scale were not yet a significant consideration for the Trust and that the addition of break points to the fee structure were not currently necessary. It was noted that, although it was not yet possible to evaluate opportunities for additional economies of scale resulting from the restructuring, the Board did not expect economies of scale to be significant given the size of the Trust.
Fees and Services Provided for Other Comparable Funds/Accounts Managed by the Adviser and its Affiliates. In addition to comparing the Trust’s management fee rate to unaffiliated mutual funds included in the Trust’s Expense Group and Expense Universe, the Board was informed by the Adviser that it manages non-mutual fund asset management accounts that have similar objectives and policies to certain of the funds in the Value Line family of funds, but that are not generally comparable for a number of reasons (including different services provided).
Conclusion. The Board examined the totality of the information it was provided at the meeting specifically addressing approval of the Agreement and at other meetings held during the past year and did not identify any single controlling factor. Based on their evaluation of all material factors deemed relevant, and with the advice of independent counsel, the Board concluded that the Trust’s management fee rate payable to the Adviser under the Agreement does not constitute a fee that is so disproportionately large as to bear no reasonable relationship to the services rendered and that could not have been the product of arm’s-length bargaining. Further, the Board concluded that the Trust’s Agreement, and the management fee rate thereunder, is fair and reasonable and voted to approve the Agreement as in the best interest of the Trust and its shareholders.
Value Line Aggressive Income Trust
| Federal Tax Notice (unaudited) |
| For corporate taxpayers 1.87% of the ordinary income distributions paid during the fiscal year ended January 31, 2011 qualify for the corporate dividends received deduction. |
| |
| During the fiscal year ended January 31, 2011, 1.87% of the ordinary income distributions are treated as qualified dividends. |
The Trust files its complete schedule of portfolio holdings with the Securities and Exchange Commission (“SEC”) for the first and third quarters of each fiscal year on Form N-Q. The Trust’s Forms N-Q are available on the SEC’s website at http://www.sec.gov and may be reviewed and copied at the SEC’s Public Reference Room in Washington, D.C. Information on the operation of the Public Reference Room may be obtained by calling 1-800-SEC-0330.
A description of the policies and procedures that the Trust uses to determine how to vote proxies relating to portfolio securities, and information regarding how the Trust voted these proxies for the 12-month period ended June 30 is available through the Trust’s website at http://www.vlfunds.com and on the SEC’s website at http://www.sec.gov. The description of the policies and procedures is also available without charge, upon request, by calling 1-800-243-2729.
Value Line Aggressive Income Trust
MANAGEMENT INFORMATION
The business and affairs of the Trust are managed by the Trust’s officers under the direction of the Board of Trustees. The following table sets forth information on each Trustee and Officer of the Trust. Each Trustee serves as a director or trustee of each of the 14 Value Line Funds. Each Trustee serves until his or her successor is elected and qualified.
| Name, Address, and YOB | | Position | | Length of Time Served | | Principal Occupation During the Past 5 Years | | Other Directorships Held by Trustee | |
| Interested Trustee* | | | | | | | | | |
Mitchell E. Appel YOB: 1970 | | Trustee | | Since 2010 | | President of each of the Value Line Funds since June 2008; President of the Adviser and Distributor since February 2009; Chief Financial Officer of Value Line, Inc. (“Value Line”) from April 2008 to December 2010 and from September 2005 to November 2007; Director of Value Line, Inc. February 2010 to December 2010 and Treasurer from June 2005 to September 2005; Chief Financial Officer of XTF Asset Management from November 2007 to April 2008. | | None | |
| Non-Interested Trustee | | | | | | | | | |
Joyce E. Heinzerling 500 East 77th Street New York, NY 10162 YOB: 1956 | | Trustee | | Since 2008 | | President, Meridian Fund Advisers LLC. (consultants) since April 2009; General Counsel, Archery Capital LLC (private investment fund) until April 2009. | | Burnham Investors Trust, since 2004
(4 funds). | |
Francis C. Oakley
54 Scott Hill Road Williamstown, MA 01267 YOB: 1931 | | Trustee | | Since 2000 | | Professor of History, Williams College, (1961-2002). Professor Emeritus since 2002; President Emeritus since 1994 and President, (1985-1994); Chairman (1993-1997) and Interim President (2002-2003) of the American Council of Learned Societies. Trustee since 1997 and Chairman of the Board since 2005, National Humanities Center. | | None | |
David H. Porter 5 Birch Run Drive Saratoga Springs, NY 12866 YOB: 1935 | | Trustee | | Since 1997 | | Professor, Skidmore College since 2008; Visiting Professor of Classics, Williams College, (1999-2008); President Emeritus, Skidmore College since 1999 and President, (1987-1998). | | None | |
Paul Craig Roberts 169 Pompano St. Panama City Beach, FL 32413 YOB: 1939 | | Trustee | | Since 1986 | | Chairman, Institute for Political Economy. | | None | |
Value Line Aggressive Income Trust
| Name, Address, and YOB | | Position | | Length of Time Served | | Principal Occupation During the Past 5 Years | | Other Directorships Held by Trustee |
Nancy-Beth Sheerr 1409 Beaumont Drive Gladwyne, PA 19035 YOB: 1949 | | Trustee | | Since 1996 | | Senior Financial Advisor, Veritable L.P. (Investment Adviser). | | None |
Daniel S. Vandivort 59 Indian Head Road Riverside, CT 06878 YOB: 1954 | | Trustee (Lead Independent Trustee since 2010) | | Since 2008 | | President, Chief Investment Officer, Weiss, Peck and Greer/Robeco Investment Management (2005-2007); Managing Director, Weiss, Peck and Greer, (1995-2005). | | None |
| Officers | | | | | | |
Mitchell E. Appel YOB: 1970 | | President | | Since 2008 | | President of each of the Value Line Funds since June 2008; President of the Adviser and Distributor since February 2009; Chief Financial Officer of Value Line, Inc. (“Value Line”) from April 2008 to December 2010 and from September 2005 to November 2007; Director of Value Line, Inc. February 2010 to December 2010 and Treasurer from June 2005 to September 2005; Chief Financial Officer of XTF Asset Management from November 2007 to April 2008. |
Michael J. Wagner YOB: 1950 | | Chief Compliance Officer | | Since 2009 | | Chief Compliance Officer of Value Line Funds since June 2009; President of Northern Lights Compliance Services, LLC (formerly Fund Compliance Services, LLC (2006 - present)) and Senior Vice President (2004-2006) and President and Chief Operations Officer (2003-2006) of Gemini Fund Services, LLC; Director of Constellation Trust Company until 2008. |
Emily D. Washington YOB: 1979 | | Treasurer and Secretary | | Since 2008 | | Treasurer and Chief Financial Officer (Principal Financial and Accounting Officer) of each of the Value Line Funds since August 2008 and Secretary since 2010; Associate Director of Mutual Fund Accounting at Value Line until August 2008. |
| * | Mr. Appel is an “interested person” as defined in the Investment Company Act of 1940 by virtue of his position with the Adviser and Distributor. |
Unless otherwise indicated, the address for each of the above officers is c/o Value Line Funds, 220 East 42nd Street, New York, NY 10017.
| The Trust’s Statement of Additional Information (SAI) includes additional information about the Trust’s Trustees and is available, without charge, upon request by calling 1-800-243-2729 or on the Trust’s website, www.vlfunds.com |
Value Line Aggressive Income Trust
| |
| The Value Line Family of Funds |
1950 — The Value Line Fund seeks long-term growth of capital. Current income is a secondary objective.
1952 — Value Line Income and Growth Fund’s primary investment objective is income, as high and dependable as is consistent with reasonable risk. Capital growth to increase total return is a secondary objective.
1956 — Value Line Premier Growth Fund seeks long-term growth of capital. No consideration is given to current income in the choice of investments.
1972 — Value Line Larger Companies Fund’s sole investment objective is to realize capital growth.
1979 — Value Line U.S. Government Money Market Fund**, a money market fund, seeks to secure as high a level of current income as is consistent with maintaining liquidity and preserving capital. An investment in the Fund is not insured or guaranteed by the Federal Deposit Insurance Corporation or any other government agency. Although the Fund seeks to preserve the value of your investment at $1.00 per share, it is possible to lose money by investing in the Fund.
1981 — Value Line U.S. Government Securities Fund seeks maximum income without undue risk to capital. Under normal conditions, at least 80% of the value of its net assets will be invested in securities issued or guaranteed by the U.S. Government and its agencies and instrumentalities.
1983 — Value Line Centurion Fund* seeks long-term growth of capital.
1984 — The Value Line Tax Exempt Fund seeks to provide investors with the maximum income exempt from federal income taxes while avoiding undue risk to principal. The fund may be subject to state and local taxes and the Alternative Minimum Tax (if applicable).
1985 — Value Line Convertible Fund seeks high current income together with capital appreciation primarily from convertible securities ranked 1, 2 or 3 for the year-ahead performance by the Value Line Convertible Ranking System.
1986 — Value Line Aggressive Income Trust seeks to maximize current income.
1987 — Value Line New York Tax Exempt Trust seeks to provide New York taxpayers with the maximum income exempt from New York State, New York City and federal income taxes while avoiding undue risk to principal. The Trust may be subject to state and local taxes and the Alternative Minimum Tax (if applicable).
1987 — Value Line Strategic Asset Management Trust* seeks to achieve a high total investment return consistent with reasonable risk.
1993 — Value Line Emerging Opportunities Fund invests in US common stocks of small capitalization companies, with its primary objective being long-term growth of capital.
1993 — Value Line Asset Allocation Fund seeks high total investment return, consistent with reasonable risk. The Fund invests in stocks, bonds and money market instruments utilizing quantitative modeling to determine the asset mix.
| | |
| * | Only available through the purchase of Guardian Investor, a tax deferred variable annuity, or ValuePlus, a variable life insurance policy. |
| | |
| ** | Effective August 19, 2009, The Value Line Cash Fund, Inc. changed its name to the Value Line U.S. Government Money Market Fund, Inc. |
| | |
| For more complete information about any of the Value Line Funds, including charges and expenses, send for a prospectus from EULAV Securities LLC, 220 East 42nd Street, New York, New York 10017-5891 or call 1-800-243-2729, 9am-5pm CST, Monday-Friday, or visit us at www.vlfunds.com. Read the prospectus carefully before you invest or send money. |
(f) Pursuant to item 12(a), the Registrant is attaching as an exhibit a copy of its Code of Ethics that applies to its principal executive officer, and principal financial officer and principal accounting officer.
Item 3. Audit Committee Financial Expert.
(2) The Registrant’s Board has designated Daniel S. Vandivort, a member of the Registrant’s Audit Committee, as the Registrant’s Audit Committee Financial Expert. Mr. Vandivort is an independent director who has served as President, Chief Investment Officer to Weis, Peck and Greer/Robeco Investment Management. He has also previously served as Managing Director for Weis, Peck and Greer (1995-2005).
A person who is designated as an “audit committee financial expert” shall not make such person an "expert" for any purpose, including without limitation under Section 11 of the Securities Act of 1933 or under applicable fiduciary laws, as a result of being designated or identified as an audit committee financial expert. The designation or identification of a person as an audit committee financial expert does not impose on such person any duties, obligations, or liabilities that are greater than the duties, obligations, and liabilities imposed on such person as a member of the audit committee and Board of Trustees in the absence of such designation or identification.
(b) Audit-Related fees – None.
(e) (1) Audit Committee Pre-Approval Policy. All services to be performed for the Registrant by PricewaterhouseCoopers LLP must be pre-approved by the audit committee.
(e) (2) Not applicable.
(f) Not applicable.
(h) Not applicable.
Item 11. Controls and Procedures.
Item 12. Exhibits.
(2) Certification pursuant to Section 906 of the Sarbanes-Oxley Act of 2002 attached hereto as Exhibit 99.906.CERT.
Pursuant to the requirements of the Securities Exchange Act of 1934 and the Investment Company Act of 1940, the registrant has duly caused this report to be signed on its behalf by the undersigned, thereunto duly authorized.