UNITED STATES
SECURITIES AND EXCHANGE COMMISSION
Washington, D.C. 20549
FORM N-CSR
CERTIFIED SHAREHOLDER REPORT
OF
REGISTERED MANAGEMENT INVESTMENT COMPANIES
Investment Company Act file number: 811-4474
Name of Registrant: Vanguard California Tax-Free Funds
Address of Registrant:
P.O. Box 2600
Valley Forge, PA 19482
Name and address of agent for service:
Heidi Stam, Esquire
P.O. Box 876
Valley Forge, PA 19482
Registrant’s telephone number, including area code: (610) 669-1000
Date of fiscal year end: November 30
Date of reporting period: December 1, 2009 – November 30, 2010
Item 1: Reports to Shareholders
 |
|
|
| Vanguard California Tax-Exempt Funds |
| Annual Report |
|
|
| November 30, 2010 |
 |
| |
| Vanguard California Tax-Exempt Money Market Fund |
| Vanguard California Intermediate-Term Tax-Exempt Fund |
| Vanguard California Long-Term Tax-Exempt Fund |
|
> As the Federal Reserve continued to keep short-term interest rates near zero during the fiscal year ended November 30, 2010, Vanguard California Tax-Exempt Money Market Fund returned 0.11%, a record annual low.
> Investor Shares of Vanguard California Intermediate-Term Tax-Exempt Fund returned 4.43%, ahead of the average return of competitive funds but trailing the benchmark index.
> Vanguard California Long-Term Tax-Exempt Fund Investor Shares returned 4.63%, trailing the fund’s benchmark and the average return of peer funds.
| |
| Contents | |
| Your Fund’s Total Returns. | 1 |
| Chairman’s Letter. | 2 |
| Advisor’s Report. | 9 |
| California Tax-Exempt Money Market Fund. | 12 |
| California Intermediate-Term Tax-Exempt Fund. | 31 |
| California Long-Term Tax-Exempt Fund. | 67 |
| About Your Fund’s Expenses. | 95 |
| Glossary. | 97 |
Please note: The opinions expressed in this report are just that—informed opinions. They should not be considered promises or advice. Also, please keep in mind that the information and opinions cover the period through the date on the front of this report. Of course, the risks of investing in your fund are spelled out in the prospectus.
See the Glossary for definitions of investment terms used in this report.
Cover photograph: Jean Maher.
Your Fund’s Total Returns
Fiscal Year Ended November 30, 2010
| | | | | |
| | | Taxable- | | | |
| | SEC | Equivalent | Income | Capital | Total |
| | Yields | Yields | Returns | Returns | Returns |
| Vanguard California Tax-Exempt Money | | | | | |
| Market Fund | 0.15% | 0.26% | 0.11% | 0.00% | 0.11% |
| California Tax-Exempt Money Market Funds | | | | | |
| Average | | | | | 0.01 |
| California Tax-Exempt Money Market Funds Average: Derived from data provided by Lipper Inc. |
| Vanguard California Intermediate-Term Tax-Exempt Fund | | | | |
| Investor Shares | 3.02% | 5.19% | 3.79% | 0.64% | 4.43% |
| Admiral™ Shares | 3.10 | 5.33 | 3.88 | 0.64 | 4.52 |
| Barclays Capital 7 Year Municipal Bond Index | | | | | 5.52 |
| California Intermediate Municipal Debt Funds | | | | | |
| Average | | | | | 4.28 |
| California Intermediate Municipal Debt Funds Average: Derived from data provided by Lipper Inc. |
| Vanguard California Long-Term Tax-Exempt Fund | | | | | |
| Investor Shares | 3.81% | 6.55% | 4.36% | 0.27% | 4.63% |
| Admiral™ Shares | 3.89 | 6.69 | 4.45 | 0.27 | 4.72 |
| Barclays Capital 10 Year Municipal Bond Index | | | | | 5.51 |
| California Municipal Debt Funds Average | | | | | 5.20 |
| California Municipal Debt Funds Average: Derived from data provided by Lipper Inc. |
7-day SEC yield for the California Tax-Exempt Money Market Fund; 30-day SEC yield for the California Intermediate-Term Tax-Exempt Fund and California Long-Term Tax-Exempt Fund.
The calculation of taxable-equivalent yield assumes a typical itemized tax return and is based on the maximum federal tax rate of 35% and the maximum income tax rate for the state. Local taxes were not considered. Please see the prospectus for a detailed explanation of the calculation.
Admiral Shares carry lower expenses and are available to investors who meet certain account-balance requirements.
1

Chairman’s Letter
Dear Shareholder,
Traditionally, municipal bonds have often been seen as the investing equivalent of your grandfather’s sedan—staid but generally safe and reliable. After staging an impressive recovery a year ago, munis were indeed fairly steady in the 2010 fiscal year—until a late-summer rally, followed by a sharp reversal that was precipitated by an unusual convergence of factors. November was the most volatile month in the municipals market since the financial crisis erupted in the fall of 2008.
Reflecting this, the Vanguard California Intermediate-Term and Long-Term Tax-Exempt Funds declined about 2% and 3%, respectively, in the closing month of the 2010 fiscal year. The funds returned solid results for the 12 months as a whole, however, mostly because of income from the funds’ bond holdings. Investor Shares of the Intermediate-Term Fund returned 4.43% and the Long-Term Fund returned 4.63%. On November 30, the 30-day SEC yields for the funds’ Investor Shares were 3.02% for the Intermediate-Term Fund and 3.81% for the Long-Term Fund; both were down from a year earlier.
With short-term interest rates anchored near zero for almost two years by Federal Reserve policy, Vanguard California Tax-Exempt Money Market Fund returned 0.11%, its lowest fiscal-year return ever. The fund’s ending yield of 0.15% was almost unchanged from a year ago.
2
On a taxable-equivalent basis, each fund’s yield was higher, as shown on page 1. Note: The funds are permitted to invest in securities whose income is subject to the alternative minimum tax (AMT). As of November 30, neither the Intermediate-Term nor the Long-Term Fund owned securities that would generate income distributions subject to the AMT, but the Money Market Fund did.
Also note that as part of our ongoing efforts to lower the cost of investing for all of our clients, we have broadened the availability of our lower-cost Admiral Shares, reducing the Admiral minimums for most of our actively managed funds from $100,000 to $50,000.
Bonds produced good returns amid fiscal and monetary drama
Although global stock markets produced superior returns, bond markets were the more dramatic setting in the past year. The yield of the 10-year U.S. Treasury note declined sharply as a variety of forces—including Europe’s sovereign debt crisis and anticipation that the Federal Reserve would begin a new round of Treasury buying—drove investors into low-yielding government bonds.
The municipal bond market contended with somewhat sensational headlines about the strains on state and local budgets, and also with changes in the composition of the bond supply resulting
Market Barometer
| | | |
| | | Average Annual Total Returns |
| | | Periods Ended November 30, 2010 |
| | One | Three | Five |
| | Year | Years | Years |
| Bonds | | | |
| Barclays Capital U.S. Aggregate Bond Index (Broad | | | |
| taxable market) | 6.02% | 6.39% | 6.23% |
| Barclays Capital Municipal Bond Index (Broad tax-exempt | | | |
| market) | 4.76 | 4.86 | 4.67 |
| Citigroup Three-Month U.S. Treasury Bill Index | 0.12 | 0.79 | 2.36 |
| |
| Stocks | | | |
| Russell 1000 Index (Large-caps) | 11.48% | -4.66% | 1.30% |
| Russell 2000 Index (Small-caps) | 26.98 | -0.37 | 2.79 |
| Dow Jones U.S. Total Stock Market Index | 13.39 | -3.88 | 1.84 |
| MSCI All Country World Index ex USA (International) | 5.69 | -7.41 | 4.69 |
| |
| CPI | | | |
| Consumer Price Index | 1.14% | 1.35% | 2.06% |
3
largely from the fast-growing issuance of Build America Bonds (BABs). The broad U.S. bond market returned about 6% for the full year, while the tax-exempt municipal market returned almost 5%.
As bond prices rise and yields decline, the opportunity for continued strength in the bond market diminishes. Near the end of the period, prices retreated in both the taxable and tax-exempt markets.
Periods of strength and weakness added up to solid stock returns
Stock prices followed a tortuous path to solid 12-month gains. Strength at the start of the year was followed by a summer of weakness and then an autumn revival. The broad U.S. stock market returned more than 13% for the period. Non-U.S. markets had a more modest return approaching 6%, restrained by the fiscal and political dramas in Europe and the dollar’s gains relative to the euro.
A volatile second half crimped full-year returns
It was an uneventful year for money market funds. Their rock-bottom interest rates kept investors generally focused on the higher yields available on longer-term securities. With the help of its low expense ratio, the California Tax-Exempt Money Market Fund stayed a step ahead of its peer group’s average return.
In contrast, after a relatively stable first half, the municipal bond market encountered some turbulence. Municipal bond prices rallied in July and even more
Expense Ratios
Your Fund Compared With Its Peer Group
| | | |
| | Investor | Admiral | Peer Group |
| | Shares | Shares | Average |
| California Tax-Exempt Money Market | | | |
| Fund | 0.17% | — | 0.52% |
| California Intermediate-Term | | | |
| Tax-Exempt Fund | 0.20 | 0.12% | 0.87 |
| California Long-Term Tax-Exempt Fund | 0.20 | 0.12 | 1.06 |
The fund expense ratios shown are from the prospectus dated April 22, 2010, and represent estimated costs for the current fiscal year. For the fiscal year ended November 30, 2010, the funds’ expense ratios were: for the California Tax-Exempt Money Market Fund, 0.17%; for the California Intermediate-Term Tax-Exempt Fund, 0.20% for Investor Shares and 0.12% for Admiral Shares; and for the California Long-Term Tax-Exempt Fund, 0.20% for Investor Shares and 0.12% for Admiral Shares. Peer-group expense ratios are derived from data provided by Lipper Inc. and capture information through year-end 2009.
Peer groups: For the California Tax-Exempt Money Market Fund, California Tax-Exempt Money Market Funds; for the California Intermediate-Term Tax-Exempt Fund, California Intermediate Municipal Debt Funds; and for the California Long-Term Tax-Exempt Fund, California Municipal Debt Funds.
4
in August—driving yields lower—thanks in part to relatively light new tax-exempt supply, the possibility of higher federal income tax rates after 2010, and slow economic growth (which kept a lid on interest rates). In late August, yields fell to three-decade lows across many maturities in the broad municipal market.
November saw a dramatic turnabout, driven in part by the potential implications of election results and the Fed’s second round of Treasury bond purchases, which were aimed at stimulating the economy. Other factors included the prospect of an abundant supply of tax-exempt issues and some (briefly) encouraging jobs reports pointing to a stronger economy and possibly higher interest rates. As Treasury yields rose, tax-exempt bond yields also climbed and prices fell. In November, the tax-exempt yields of several maturities of AAA-rated general-obligation bonds rose above those of comparable-term taxable Treasuries—an atypical relationship—for the first time since spring 2009.
In this environment, the Investor Shares of the Intermediate-Term Tax-Exempt Fund returned 4.43%, ahead of its peer-group average return of 4.28%. The primary driver of the fund’s return was its portfolio income: Capital return—the change in net asset value over the period—was less than
Total Returns
Ten Years Ended November 30, 2010
| |
| | Average |
| | Annual Return |
| California Tax-Exempt Money Market Fund | 1.74% |
| California Tax-Exempt Money Market Funds Average | 1.37 |
| California Tax-Exempt Money Market Funds Average: Derived from data provided by Lipper Inc. |
| California Intermediate-Term Tax-Exempt Fund Investor Shares | 4.32% |
| Barclays Capital 7 Year Municipal Bond Index | 5.50 |
| California Intermediate Municipal Debt Funds Average | 3.85 |
| California Intermediate Municipal Debt Funds Average: Derived from data provided by Lipper Inc. |
| California Long-Term Tax-Exempt Fund Investor Shares | 4.47% |
| Barclays Capital 10 Year Municipal Bond Index | 5.57 |
| California Municipal Debt Funds Average | 3.98 |
| California Municipal Debt Funds Average: Derived from data provided by Lipper Inc. |
The figures shown represent past performance, which is not a guarantee of future results. (Current performance may be lower or higher than the performance data cited. For performance data current to the most recent month-end, visit our website at vanguard.com/performance.) Note, too, that both investment returns and principal value can fluctuate widely, so an investor’s shares, when sold, could be worth more or less than their original cost.
5
1%. The Long-Term Tax-Exempt Fund’s Investor Shares returned 4.63%, trailing the average return of its competitive peers. Again, income from the fund’s bond holdings was responsible for almost all of its total return.
Fiscal strains posed challenges; BABs helped ease the pain
The muni market’s ups and downs took place against a backdrop of fiscal challenges. Even as revenue collections in California and other states began to improve after the worst financial setbacks since the Great Depression, the budget gaps faced by many states and local governments remained sobering. The recession has compounded a budgetary process in California that, as you know, is normally difficult, and produced a fiscal 2011 budget that was a record 100 days late.
The fiscal crunch has been tempered somewhat by generous federal interest rate subsidies available through the BABs program, which has its roots in the difficulties faced by state and local borrowers in issuing bonds during the nation’s financial crisis. (Your funds do not hold these bonds because they are taxable)
More than $165 billion of BABs have been issued nationwide since the program was introduced in early 2009 as part of the federal stimulus package, and California—including the state and local governments—was the top issuer of them. BABs have affected your portfolio because they have diminished the availability of new tax-exempt bonds: In calendar year 2010 through November, tax-exempt supply fell to its lowest level in about a decade. This shortage, especially in bonds of longer maturities, led investors to bid up tax-exempt prices—at least, until November. [Congress allowed the BABs program to expire as scheduled on December 31. With borrowers rushing to beat the deadline, taxable municipal bond issuance during December appeared on target to exceed tax-exempt issuance for the first month ever.]
For more information on the funds’ positioning and performance during the past year, please see the Advisor’s Report following this letter.
Conservative approach has proven its worth
Over the years, the funds’ advisor, Vanguard Fixed Income Group, has focused on high-quality tax-exempt securities. This approach—executed with disciplined portfolio management and at low costs—has rewarded shareholders. For the ten years ended November 30, 2010, the average annual returns of the California Tax-Exempt Funds exceeded the average returns of their respective peers by margins considered significant in the world of fixed income investing.
6
Shareholders have also benefited from the advisor’s stringent and independent credit analysis, a Vanguard hallmark. As fiscal fortunes have diverged, it has become increasingly difficult for individual investors to evaluate the creditworthiness of a wide range of municipal borrowers. Because there are no remaining AAA-rated insurance companies, investors can’t look to guarantees to provide assurance. In addition, a nationwide “recalibration” of municipal bond ratings by two major credit-rating agencies has blurred some of the distinctions among issuers. These factors underscore the importance of the objective insights of Vanguard’s experienced team of credit analysts, who work closely with our portfolio managers and traders.
Diversification and credit analysis aren’t likely to go out of style
Because twists and turns in the bond markets are often as unpredictable as those in the stock markets, we encourage you to diversify your bond holdings, consistent with the investment objectivesand principles you consider in managing all of your assets. And always keep in mind the importance of skilled credit analysis. The Vanguard Tax-Exempt Funds can help—by offering you low-cost portfolios of California securities that meet the high standards of our credit analysts.
Many investors are concerned about what may happen to their bond portfolios if interest rates rise. Conventional wisdom might suggest reallocating some of those assets into shorter-maturity bond funds, which are often thought to be less sensitive to changes in interest rates. Recent Vanguard research, however, underscores the benefits of maintaining a broadly diversified fixed income portfolio regardless of the future direction of interest rates. In fact, our research suggests that greater uncertainty about the outlook for economic growth, the deficit, inflation, and interest rates supports more fixed income diversification, not less.
Thank you for entrusting your assets to Vanguard.
Sincerely,

F. William McNabb III
Chairman and Chief Executive Officer
December 14, 2010
7
Your Fund’s Performance at a Glance
November 30, 2009 , Through November 30, 2010
| | | | |
| | | | Distributions Per Share |
| | Starting | Ending | Income | Capital |
| | Share Price | Share Price | Dividends | Gains |
| Vanguard California Tax-Exempt Money Market | | | | |
| Fund | $1.00 | $1.00 | $0.001 | $0.000 |
| Vanguard California Intermediate-Term | | | | |
| Tax-Exempt Fund | | | | |
| Investor Shares | $10.86 | $10.93 | $0.408 | $0.000 |
| Admiral Shares | 10.86 | 10.93 | 0.417 | 0.000 |
| Vanguard California Long-Term Tax-Exempt | | | | |
| Fund | | | | |
| Investor Shares | $10.98 | $11.01 | $0.476 | $0.000 |
| Admiral Shares | 10.98 | 11.01 | 0.485 | 0.000 |
8
Advisor’s Report
For the fiscal year ended November 30, 2010, Vanguard California Tax-Exempt Money Market Fund returned 0.11%, ahead of the 0.01% average return of its peer group. The California Intermediate-Term Tax-Exempt Fund returned 4.43% for Investor Shares and 4.52% for Admiral Shares, outpacing the average return of competing California funds and trailing the result for its diversified national benchmark index. The California Long-Term Tax-Exempt Fund returned 4.63% for Investor Shares and 4.72% for Admiral Shares, trailing the 5.20% average return of peer-group funds and its national benchmark.
The investment environment
A look at changes in tax-exempt yields for the fiscal year as a whole—shown in the table below—does not do justice to the unusual degree of volatility that the municipal bond market experienced as the year drew to a close.
Until November, the period was characterized by a general slide in yields across the maturity curve, but for different reasons. The Federal Reserve kept interest rates—and, in effect, the returns on money market funds—near zero throughout the year. Scrambling for higher yields, investors turned to intermediate-term municipals, pushing up their prices and pushing down their yields. (As you know, bond prices and yields are inversely related.)
Among the longest-term tax-exempt bonds, demand clashed with a shortage of supply as states and local governments took advantage of federal subsidies to issue
Yields of Tax-Exempt Municipal Bonds
(AAA-Rated General-Obligation Issues)
| | |
| | November 30, | November 30, |
| Maturity | 2009 | 2010 |
| 2 years | 0.61% | 0.60% |
| 5 years | 1.50 | 1.36 |
| 10 years | 2.78 | 2.79 |
| 30 years | 4.28 | 4.28 |
| Source: Vanguard. |
9
taxable municipal bonds, known as Build America Bonds (BABs). Somewhat more than a third of the $60 billion in California bonds issued by the state and local governments during the fiscal year were BABs. The temporary BABs program, designed to help fiscally stressed states and municipalities reduce debt financing costs, came into existence because of the early-2009 federal stimulus program and was designed to expire on December 31, 2010. Another December 31 deadline—the scheduled expiration of federal tax breaks—spurred demand for tax-exempt securities as uncertainty persisted about what Congress might do. [The BABs program ended on schedule, while the reduced tax rates were extended for two years.]
In August and September, municipal yields reached historical lows. In the final month of the fiscal year, however, the slide in yields (money market funds excepted) abruptly reversed, erasing all or much of the decline, depending on maturity, of the preceding 11 months. November turned out to be the most volatile month for municipal bonds since the height of the financial crisis in the fall of 2008. A new mix of factors led to a sell-off, with many investors moving assets from municipal bond funds to alternatives such as tax-exempt money market funds, despite their scant yields. The volatility and fund outflows continued in December.
November opened with the midterm elections. The results led many investors to expect that federal tax cuts would be extended. Immediately afterward, the Federal Reserve announced its widely anticipated program to purchase huge quantities of Treasury bonds, an action intended to stimulate the economy by lowering long-term interest rates. Nonetheless, Treasury yields rose in response to economic data suggesting a possibility of inflation to come. Muni yields followed.
Further upward pressure on yields in November came from expectations of swelling new-issue supply and sales of bonds by mutual funds that needed to raise cash for redemptions. (The Vanguard municipal bond funds have had adequate reserves to meet redemptions.) As of November 30, the yields of longer-term tax-exempt bonds had risen above those of taxable Treasuries, an inversion of the typical pattern.
Management of the funds
The turbulence that characterized the municipal bond market as the fiscal year ended did not reflect a material change in the credit fundamentals of bond issuers. State and local governments remain under great fiscal stress, of course, although the recession technically ended in June 2009. As in previous economic recoveries, the municipal sector tends to lag the general
10
economy because time is needed for higher personal and business income to flow through the tax system. The road to improvement is likely to be longer than usual because of the depth of the recent recession, the worst since the Great Depression.
For this and other reasons, investors are understandably concerned about the health of muni-bond issuers and their ability to make principal and interest payments on time. That is why close monitoring of the financial condition of state and local governments has always been a crucial component of our investment activities. Vanguard’s highly experienced credit analysts review each potential addition to our portfolios and reject those that don’t pass our rigorous evaluation process.
In view of the uncertainties surrounding the pace of the economic recovery, we held the California Intermediate-Term and Long-Term Tax-Exempt Funds at neutral average weighted durations compared with their benchmark indexes. As a consequence, interest rate positioning had no significant impact on the funds’ performances during this fiscal year.
Outlook
We expect to see more headlines citing the plight of state and local governments, and more comparisons between the states and fiscally stretched European nations. We are confident, however, that states and municipalities will make the tough and unpleasant decisions about tax and service levels necessary to balance their budgets in the short term and address longer-term challenges, such as adequately funding retiree benefits. It’s a process that likely won’t be smooth in the give-and-take of the political arena.
Nonrenewal of the BABs program would imply more tax-exempt issuance in 2011, especially in the long-term portion of the municipal market. If this happens, the additional supply could produce lower prices and higher yields at the long end of the yield curve.
Pamela Wisehaupt Tynan, Principal,
Portfolio Manager
John M. Carbone, Principal,
Portfolio Manager
Christopher W. Alwine, CFA, Principal,
Head of Municipal Money Market and Bond Groups
Vanguard Fixed Income Group
December 21, 2010
11
California Tax-Exempt Money Market Fund
Fund Profile
As of November 30, 2010
| |
| Financial Attributes | |
| Ticker Symbol | VCTXX |
| Expense Ratio1 | 0.17% |
| 7-Day SEC Yield | 0.15% |
| Average Weighted | |
| Maturity | 39 days |
| |
| Distribution by Credit Quality (% of portfolio) | |
| First Tier | 100.0% |
| For information about these ratings, see the Glossary entry for Credit Quality. |
1 The expense ratio shown is from the prospectus dated April 22, 2010, and represents estimated costs for the current fiscal year. For the fiscal year ended November 30, 2010, the expense ratio was 0.17%.
12
California Tax-Exempt Money Market Fund
Performance Summary
Investment returns will fluctuate. All of the returns in this report represent past performance, which is not a guarantee of future results that may be achieved by the fund. (Current performance may be lower or higher than the performance data cited. For performance data current to the most recent month-end, visit our website at vanguard.com/performance.) The returns shown do not reflect taxes that a shareholder would pay on fund distributions. An investment in a money market fund is not insured or guaranteed by the Federal Deposit Insurance Corporation or any other government agency. Although the fund seeks to preserve the value of your investment at $1 per share, it is possible to lose money by investing in the fund. The fund’s 7-day SEC yield reflects its current earnings more closely than do the average annual returns.
Cumulative Performance: November 30, 2000, Through November 30, 2010
Initial Investment of $10,000
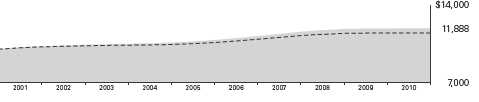
| | | | |
| | Average Annual Total Returns | |
| | Periods Ended November 30, 2010 | |
| | | | | Final Value |
| | One | Five | Ten | of a $10,000 |
| | Year | Years | Years | Investment |
| California Tax-Exempt Money Market | | | | |
| Fund | 0.11% | 1.89% | 1.74% | $11,888 |
| California Tax-Exempt Money Market | | | | |
| Funds Average | 0.01 | 1.56 | 1.37 | 11,461 |
| California Tax-Exempt Money Market Funds Average: Derived from data provided by Lipper Inc. |
See Financial Highlights for dividend information.
13
California Tax-Exempt Money Market Fund
Fiscal-Year Total Returns (%): November 30, 2000, Through November 30, 2010
| | |
| | | CA Tax-Exempt |
| | | Money Mkt |
| | | Funds Avg |
| Fiscal Year | Total Returns | Total Returns |
| 2001 | 2.57% | 2.17% |
| 2002 | 1.33 | 0.92 |
| 2003 | 0.91 | 0.54 |
| 2004 | 1.05 | 0.60 |
| 2005 | 2.17 | 1.70 |
| 2006 | 3.24 | 2.78 |
| 2007 | 3.55 | 3.06 |
| 2008 | 2.21 | 1.81 |
| 2009 | 0.37 | 0.17 |
| 2010 | 0.11 | 0.01 |
| 7-day SEC yield (11/30/2010): 0.15% |
| California Tax-Exempt Money Market Funds Average: Derived from data provided by Lipper Inc. |
Average Annual Total Returns: Periods Ended September 30, 2010
This table presents average annual total returns through the latest calendar quarter—rather than through the end of the fiscal period. Securities and Exchange Commission rules require that we provide this information.
| | | | |
| | Inception | One | Five | Ten |
| | Date | Year | Years | Years |
| California Tax-Exempt Money | | | | |
| Market Fund | 6/1/1987 | 0.12% | 1.97% | 1.81% |
14
California Tax-Exempt Money Market Fund
Financial Statements
Statement of Net Assets
As of November 30, 2010
The fund reports a complete list of its holdings in regulatory filings four times in each fiscal year, at the quarter-ends. For the second and fourth fiscal quarters, the lists appear in the fund’s semiannual and annual reports to shareholders. For the first and third fiscal quarters, the fund files the lists with the Securities and Exchange Commission on Form N-Q. Shareholders can look up the fund’s Forms N-Q on the SEC’s website at sec.gov. Forms N-Q may also be reviewed and copied at the SEC’s Public Reference Room (see the back cover of this report for further information). In addition, the fund publishes its holdings on a monthly basis at vanguard.com.
| | | | |
| | | | Face | Market |
| | | Maturity | Amount | Value |
| | Coupon | Date | ($000) | ($000) |
| Tax-Exempt Municipal Bonds (99.4%) | | | | |
| California (99.4%) | | | | |
| ABAG Finance Authority for Nonprofit Corps. | | | | |
| California Revenue (Computer History Museum) | | | | |
| VRDO | 0.270% | 12/7/10 LOC | 7,000 | 7,000 |
| ABAG Finance Authority for Nonprofit Corps. | | | | |
| California Revenue | | | | |
| (Institute for Defense Analyses) VRDO | 0.280% | 12/7/10 LOC | 11,945 | 11,945 |
| 1 Anaheim CA Public Financing Authority Lease | | | | |
| Revenue (Anaheim Public Improvements Project) | | | | |
| TOB VRDO | 0.290% | 12/7/10 (14)LOC | 47,305 | 47,305 |
| 1 Bay Area Toll Authority | | | | |
| California Toll Bridge Revenue | | | | |
| (San Francisco Bay Area) TOB PUT | 0.430% | 7/28/11 | 9,865 | 9,865 |
| 1 Bay Area Toll Authority | | | | |
| California Toll Bridge Revenue | | | | |
| (San Francisco Bay Area) TOB VRDO | 0.300% | 12/7/10 | 41,910 | 41,910 |
| 1 Bay Area Toll Authority | | | | |
| California Toll Bridge Revenue | | | | |
| (San Francisco Bay Area) TOB VRDO | 0.310% | 12/7/10 | 7,500 | 7,500 |
| Bay Area Toll Authority | | | | |
| California Toll Bridge Revenue | | | | |
| (San Francisco Bay Area) VRDO | 0.260% | 12/7/10 LOC | 12,500 | 12,500 |
| Bay Area Toll Authority | | | | |
| California Toll Bridge Revenue | | | | |
| (San Francisco Bay Area) VRDO | 0.260% | 12/7/10 LOC | 35,000 | 35,000 |
| Bay Area Toll Authority | | | | |
| California Toll Bridge Revenue | | | | |
| (San Francisco Bay Area) VRDO | 0.280% | 12/7/10 LOC | 45,000 | 45,000 |
| Berkeley CA Revenue (Berkeley-Albany YMCA) | | | | |
| VRDO | 0.250% | 12/7/10 LOC | 12,315 | 12,315 |
| California Department of Water Resources | | | | |
| Power Supply Revenue VRDO | 0.300% | 12/7/10 | 25,000 | 25,000 |
| California Department of Water Resources | | | | |
| Power Supply Revenue VRDO | 0.300% | 12/7/10 | 10,000 | 10,000 |
| California Economic Recovery Bonds GO | 5.000% | 3/1/11 (Prere.) | 37,220 | 37,660 |
| California Economic Recovery Bonds GO PUT | 5.000% | 7/1/11 (Prere.) | 16,000 | 16,432 |
15
California Tax-Exempt Money Market Fund
| | | | |
| | | | Face | Market |
| | | Maturity | Amount | Value |
| | Coupon | Date | ($000) | ($000) |
| 1 California Educational Facilities Authority Revenue | | | | |
| (California Institute of Technology) TOB VRDO | 0.300% | 12/7/10 | 6,430 | 6,430 |
| California Educational Facilities Authority Revenue | | | | |
| (California Institute of Technology) VRDO | 0.260% | 12/7/10 | 47,300 | 47,300 |
| 1 California Educational Facilities Authority Revenue | | | | |
| (Loyola Marymount University) TOB VRDO | 0.300% | 12/7/10 LOC | 3,998 | 3,998 |
| California Educational Facilities Authority Revenue | | | | |
| (Stanford University) CP | 0.290% | 12/17/10 | 14,100 | 14,100 |
| California Educational Facilities Authority Revenue | | | | |
| (Stanford University) CP | 0.360% | 3/30/11 | 40,000 | 40,000 |
| 1 California Educational Facilities Authority Revenue | | | | |
| (Stanford University) TOB PUT | 0.430% | 8/11/11 | 37,310 | 37,310 |
| 1 California Educational Facilities Authority Revenue | | | | |
| (Stanford University) TOB VRDO | 0.270% | 12/7/10 | 9,850 | 9,850 |
| 1 California Educational Facilities Authority Revenue | | | | |
| (Stanford University) TOB VRDO | 0.270% | 12/7/10 | 11,130 | 11,130 |
| 1 California Educational Facilities Authority Revenue | | | | |
| (Stanford University) TOB VRDO | 0.270% | 12/7/10 | 12,000 | 12,000 |
| 1 California Educational Facilities Authority Revenue | | | | |
| (Stanford University) TOB VRDO | 0.290% | 12/7/10 | 4,465 | 4,465 |
| 1 California Educational Facilities Authority Revenue | | | | |
| (University of Southern California) TOB PUT | 0.450% | 5/19/11 | 15,045 | 15,045 |
| 1 California Educational Facilities Authority Revenue | | | | |
| (University of Southern California) TOB VRDO | 0.300% | 12/1/10 | 2,750 | 2,750 |
| 1 California Educational Facilities Authority Revenue | | | | |
| (University of Southern California) TOB VRDO | 0.300% | 12/7/10 | 4,860 | 4,860 |
| 1 California Educational Facilities Authority Revenue | | | | |
| (University of Southern California) TOB VRDO | 0.300% | 12/7/10 | 5,335 | 5,335 |
| California GO | 5.000% | 6/1/11 (Prere.) | 7,375 | 7,544 |
| California Health Facilities Financing Authority | | | | |
| Revenue (Adventist Health System/West) VRDO | 0.240% | 12/1/10 LOC | 5,505 | 5,505 |
| California Health Facilities Financing Authority | | | | |
| Revenue (Children’s Hospital of Orange County) | | | | |
| VRDO | 0.290% | 12/7/10 LOC | 42,900 | 42,900 |
| California Health Facilities Financing Authority | | | | |
| Revenue (Children’s Hospital of Orange County) | | | | |
| VRDO | 0.290% | 12/7/10 LOC | 7,100 | 7,100 |
| California Health Facilities Financing Authority | | | | |
| Revenue (Children’s Hospital of Orange County) | | | | |
| VRDO | 0.290% | 12/7/10 LOC | 13,950 | 13,950 |
| California Health Facilities Financing Authority | | | | |
| Revenue (Lucile Salter Packard Children’s | | | | |
| Hospital at Stanford) | 0.230% | 12/7/10 | 18,450 | 18,450 |
| California Health Facilities Financing Authority | | | | |
| Revenue (Lucile Salter Packard Children’s | | | | |
| Hospital at Stanford) | 0.280% | 12/7/10 | 5,850 | 5,850 |
| California Health Facilities Financing Authority | | | | |
| Revenue (Lucile Salter Packard Children’s | | | | |
| Hospital at Stanford) | 0.280% | 12/7/10 | 10,250 | 10,250 |
| California Health Facilities Financing Authority | | | | |
| Revenue (Memorial Health Services) VRDO | 0.290% | 12/7/10 | 61,275 | 61,275 |
| California Health Facilities Financing Authority | | | | |
| Revenue (Scripps Health) VRDO | 0.250% | 12/7/10 LOC | 13,490 | 13,490 |
| California Health Facilities Financing Authority | | | | |
| Revenue (Scripps Health) VRDO | 0.270% | 12/7/10 LOC | 4,645 | 4,645 |
16
California Tax-Exempt Money Market Fund
| | | | |
| | | | Face | Market |
| | | Maturity | Amount | Value |
| | Coupon | Date | ($000) | ($000) |
| 1 California Health Facilities Financing Authority | | | | |
| Revenue (Sutter Health) TOB VRDO | 0.300% | 12/7/10 | 6,700 | 6,700 |
| 1 California Health Facilities Financing Authority | | | | |
| Revenue (Sutter Health) TOB VRDO | 0.300% | 12/7/10 | 14,995 | 14,995 |
| 1 California Health Facilities Financing Authority | | | | |
| Revenue (Sutter Health) TOB VRDO | 0.300% | 12/7/10 | 10,000 | 10,000 |
| California Housing Finance Agency | | | | |
| Home Mortgage Revenue VRDO | 0.250% | 12/7/10 LOC | 8,680 | 8,680 |
| California Housing Finance Agency | | | | |
| Home Mortgage Revenue VRDO | 0.250% | 12/7/10 LOC | 19,010 | 19,010 |
| California Housing Finance Agency | | | | |
| Home Mortgage Revenue VRDO | 0.250% | 12/7/10 LOC | 55,300 | 55,300 |
| California Housing Finance Agency | | | | |
| Home Mortgage Revenue VRDO | 0.250% | 12/7/10 LOC | 32,125 | 32,125 |
| California Housing Finance Agency | | | | |
| Home Mortgage Revenue VRDO | 0.300% | 12/7/10 LOC | 16,300 | 16,300 |
| California Housing Finance Agency | | | | |
| Home Mortgage Revenue VRDO | 0.310% | 12/7/10 LOC | 12,540 | 12,540 |
| California Housing Finance Agency | | | | |
| Home Mortgage Revenue VRDO | 0.310% | 12/7/10 LOC | 14,200 | 14,200 |
| California Housing Finance Agency | | | | |
| Home Mortgage Revenue VRDO | 0.310% | 12/7/10 LOC | 13,130 | 13,130 |
| California Housing Finance Agency | | | | |
| Home Mortgage Revenue VRDO | 0.310% | 12/7/10 LOC | 24,500 | 24,500 |
| California Housing Finance Agency | | | | |
| Multifamily Housing Revenue VRDO | 0.250% | 12/7/10 LOC | 24,400 | 24,400 |
| California Infrastructure & | | | | |
| Economic Development Bank Revenue | | | | |
| (Academy of Motion Picture Arts & | | | | |
| Sciences Obligated Group) VRDO | 0.270% | 12/7/10 LOC | 35,000 | 35,000 |
| California Infrastructure & | | | | |
| Economic Development Bank Revenue | | | | |
| (Academy of Sciences) VRDO | 0.260% | 12/1/10 LOC | 14,125 | 14,125 |
| California Infrastructure & | | | | |
| Economic Development Bank Revenue | | | | |
| (American National Red Cross) VRDO | 0.290% | 12/7/10 LOC | 14,575 | 14,575 |
| 1 California Infrastructure & | | | | |
| Economic Development Bank Revenue | | | | |
| (Bay Area Toll Bridges Seismic Retrofit) | | | | |
| TOB VRDO | 0.300% | 12/7/10 (2)(Prere.) | 15,000 | 15,000 |
| California Infrastructure & | | | | |
| Economic Development Bank Revenue | | | | |
| (Buck Institute for Age Research) VRDO | 0.290% | 12/7/10 LOC | 28,800 | 28,800 |
| California Infrastructure & | | | | |
| Economic Development Bank Revenue | | | | |
| (JSerra Catholic High School Project) | 0.250% | 12/7/10 LOC | 3,100 | 3,100 |
| California Infrastructure & | | | | |
| Economic Development Bank Revenue | | | | |
| (Los Angeles County Museum of | | | | |
| Natural History Foundation) VRDO | 0.260% | 12/1/10 LOC | 4,300 | 4,300 |
| California Infrastructure & | | | | |
| Economic Development Bank Revenue | | | | |
| (Prinsco Inc. Project) VRDO | 0.560% | 12/7/10 LOC | 8,100 | 8,100 |
17
California Tax-Exempt Money Market Fund
| | | | |
| | | | Face | Market |
| | | Maturity | Amount | Value |
| | Coupon | Date | ($000) | ($000) |
| California Infrastructure & | | | | |
| Economic Development Bank Revenue | | | | |
| (SRI International) VRDO | 0.280% | 12/7/10 LOC | 5,000 | 5,000 |
| California Infrastructure & | | | | |
| Economic Development Bank Revenue | | | | |
| (SRI International) VRDO | 0.280% | 12/7/10 LOC | 4,385 | 4,385 |
| California Municipal Finance Authority | | | | |
| Recovery Zone Revenue (Chevron USA) VRDO | 0.210% | 12/1/10 | 1,400 | 1,400 |
| California Municipal Finance Authority | | | | |
| Recovery Zone Revenue (Chevron USA) VRDO | 0.230% | 12/1/10 | 25,000 | 25,000 |
| California Municipal Finance Authority Revenue | | | | |
| (Notre Dame High School, San Jose) VRDO | 0.400% | 12/7/10 LOC | 6,090 | 6,090 |
| California Municipal Finance Authority Revenue | | | | |
| (Westmont College) VRDO | 0.280% | 12/7/10 LOC | 9,600 | 9,600 |
| 1 California Public Works Board Lease Revenue | | | | |
| (Regents of The University of California) | | | | |
| TOB VRDO | 0.300% | 12/7/10 | 11,110 | 11,110 |
| 1 California State University Revenue Systemwide | | | | |
| TOB VRDO | 0.320% | 12/7/10 (4) | 20,475 | 20,475 |
| California Statewide Communities Development | | | | |
| Authority Gas Supply Revenue VRDO | 0.290% | 12/7/10 | 80,000 | 80,000 |
| California Statewide Communities Development | | | | |
| Authority Industrial Development Revenue | | | | |
| (Fiorella Investments LLC Project) VRDO | 1.000% | 12/7/10 LOC | 8,430 | 8,430 |
| California Statewide Communities Development | | | | |
| Authority Multifamily Housing Revenue | | | | |
| (Canyon Springs Apartment Projects) VRDO | 0.300% | 12/7/10 LOC | 10,105 | 10,105 |
| California Statewide Communities Development | | | | |
| Authority Multifamily Housing Revenue | | | | |
| (Knolls Apartments) VRDO | 0.300% | 12/7/10 LOC | 12,715 | 12,715 |
| California Statewide Communities Development | | | | |
| Authority Multifamily Housing Revenue | | | | |
| (Ridgeway Apartments) VRDO | 0.260% | 12/7/10 LOC | 7,200 | 7,200 |
| California Statewide Communities Development | | | | |
| Authority Multifamily Housing Revenue | | | | |
| (Village Green Apartments) VRDO | 0.310% | 12/7/10 LOC | 5,800 | 5,800 |
| California Statewide Communities Development | | | | |
| Authority Revenue (Kaiser Permanente) VRDO | 0.260% | 12/7/10 | 20,000 | 20,000 |
| California Statewide Communities Development | | | | |
| Authority Revenue (Motion Picture & | | | | |
| Television Fund) VRDO | 0.310% | 12/7/10 LOC | 17,200 | 17,200 |
| California Statewide Communities Development | | | | |
| Authority Revenue (Rady Children’s Hospital - | | | | |
| San Diego) VRDO | 0.280% | 12/7/10 LOC | 25,000 | 25,000 |
| 1 California Statewide Communities Development | | | | |
| Authority Revenue (Sutter Health) TOB VRDO | 0.300% | 12/7/10 | 21,565 | 21,565 |
| Castaic Lake CA Water Agency Revenue | | | | |
| COP VRDO | 0.260% | 12/7/10 LOC | 19,975 | 19,975 |
| 1 Central Basin Municipal Water District California | | | | |
| COP TOB VRDO | 0.310% | 12/7/10 (4) | 7,500 | 7,500 |
| 1 Cerritos CA Community College District | | | | |
| GO TOB VRDO | 0.300% | 12/7/10 | 7,845 | 7,845 |
| 1 Chino Basin CA Regional Financing Authority | | | | |
| Revenue (Inland Empire Utilities Agency) | | | | |
| TOB VRDO | 0.300% | 12/7/10 | 10,795 | 10,795 |
18
California Tax-Exempt Money Market Fund
| | | | |
| | | | Face | Market |
| | | Maturity | Amount | Value |
| | Coupon | Date | ($000) | ($000) |
| Chula Vista CA Multifamily Housing Revenue | | | | |
| (Teresina Apartments) VRDO | 0.280% | 12/7/10 LOC | 18,970 | 18,970 |
| City of San Diego CA TRAN | 2.000% | 1/31/11 | 25,000 | 25,066 |
| City of San Diego CA TRAN | 2.000% | 4/29/11 | 10,000 | 10,063 |
| City of San Jose CA Financing Authority Lease | | | | |
| Revenue CP | 0.310% | 2/4/11 LOC | 34,630 | 34,630 |
| 1 Contra Costa CA Community College District | | | | |
| GO TOB VRDO | 0.300% | 12/7/10 (4) | 5,110 | 5,110 |
| 1 Contra Costa CA Community College District | | | | |
| GO TOB VRDO | 0.340% | 12/7/10 | 5,200 | 5,200 |
| 1 Contra Costa CA Transportation Authority | | | | |
| Sales Tax Revenue TOB VRDO | 0.300% | 12/7/10 | 20,000 | 20,000 |
| Contra Costa County CA Multifamily Housing | | | | |
| Revenue (Park Regency) VRDO | 0.260% | 12/7/10 LOC | 47,200 | 47,200 |
| Contra Costa County CA Multifamily Housing | | | | |
| Revenue (Pleasant Hill BART Transit Village | | | | |
| Apartments Project) VRDO | 0.310% | 12/7/10 LOC | 43,800 | 43,800 |
| 1 Desert CA Community College District | | | | |
| GO TOB VRDO | 0.300% | 12/7/10 (4) | 12,375 | 12,375 |
| East Bay CA Municipal Utility District | | | | |
| Water System Revenue PUT | 0.300% | 12/1/10 | 24,750 | 24,750 |
| Eastern California Municipal Water District | | | | |
| Water & Sewer COP | 5.000% | 7/1/11 (3)(Prere.) | 21,370 | 21,952 |
| 1 Eastern California Municipal Water District | | | | |
| Water & Sewer COP TOB VRDO | 0.300% | 12/7/10 | 1,590 | 1,590 |
| 1 Eastern California Municipal Water District | | | | |
| Water & Sewer Revenue TOB VRDO | 0.310% | 12/7/10 | 3,940 | 3,940 |
| Eastern California Municipal Water District | | | | |
| Water & Sewer Revenue VRDO | 0.250% | 12/7/10 | 27,200 | 27,200 |
| Eastern California Municipal Water District | | | | |
| Water & Sewer Revenue VRDO | 0.290% | 12/7/10 | 35,000 | 35,000 |
| Escondido CA Community Development | | | | |
| (Escondido Promenade Project) COP VRDO | 0.560% | 12/7/10 LOC | 9,400 | 9,400 |
| Fresno County CA TRAN | 2.000% | 6/30/11 | 50,000 | 50,465 |
| Garden Grove CA Housing Authority | | | | |
| Multifamily Housing Revenue | | | | |
| (Valley View Senior Villas Project) VRDO | 0.320% | 12/7/10 LOC | 9,100 | 9,100 |
| 1 Grossmont CA Union High School District | | | | |
| GO TOB VRDO | 0.300% | 12/7/10 | 24,967 | 24,967 |
| Hayward CA Housing Authority | | | | |
| Multifamily Housing Revenue | | | | |
| (Barrington Hills Apartments) VRDO | 0.280% | 12/7/10 LOC | 6,150 | 6,150 |
| Hemet CA Unified School District COP VRDO | 0.260% | 12/7/10 LOC | 10,000 | 10,000 |
| Irvine CA Assessment District No. 89-10 | | | | |
| Improvement Revenue (Northwest Irvine) VRDO | 0.270% | 12/1/10 LOC | 2,715 | 2,715 |
| 1 Irvine CA Unified School District | | | | |
| Special Tax Revenue TOB VRDO | 0.410% | 12/7/10 LOC | 22,695 | 22,695 |
| Kern County CA TRAN | 1.500% | 6/30/11 | 42,200 | 42,451 |
| Livermore CA COP VRDO | 0.260% | 12/7/10 LOC | 14,500 | 14,500 |
| Livermore CA Redevelopment Agency | | | | |
| Multi-Family Housing Revenue | | | | |
| (Livermore Independent Senior Apartments) | | | | |
| VRDO | 0.280% | 12/7/10 LOC | 6,640 | 6,640 |
| 1 Long Beach CA Harbor Revenue TOB VRDO | 0.480% | 12/7/10 | 16,005 | 16,005 |
| Long Beach CA TRAN | 2.000% | 9/30/11 | 20,000 | 20,268 |
| Long Beach CA Water Revenue CP | 0.300% | 2/8/11 | 11,000 | 11,000 |
19
California Tax-Exempt Money Market Fund
| | | | |
| | | | Face | Market |
| | | Maturity | Amount | Value |
| | Coupon | Date | ($000) | ($000) |
| 1 Los Angeles CA Community College District | | | | |
| GO TOB VRDO | 0.300% | 12/7/10 | 16,130 | 16,130 |
| Los Angeles CA Community Redevelopment | | | | |
| Agency Multifamily Housing Revenue | | | | |
| (Hollywood & Vine Apartments) VRDO | 0.290% | 12/7/10 LOC | 25,000 | 25,000 |
| 1 Los Angeles CA Department of Airports | | | | |
| International Airport Revenue TOB VRDO | 0.270% | 12/7/10 | 14,000 | 14,000 |
| 1 Los Angeles CA Department of Airports | | | | |
| International Airport Revenue TOB VRDO | 0.300% | 12/7/10 | 5,530 | 5,530 |
| 1 Los Angeles CA Department of Airports | | | | |
| International Airport Revenue TOB VRDO | 0.380% | 12/7/10 | 18,880 | 18,880 |
| 1 Los Angeles CA Department of Airports | | | | |
| International Airport Revenue TOB VRDO | 0.380% | 12/7/10 | 7,975 | 7,975 |
| 1 Los Angeles CA Department of | | | | |
| Water & Power Revenue TOB VRDO | 0.290% | 12/7/10 LOC | 10,290 | 10,290 |
| 1 Los Angeles CA Department of | | | | |
| Water & Power Revenue TOB VRDO | 0.300% | 12/7/10 | 7,495 | 7,495 |
| Los Angeles CA Department of | | | | |
| Water & Power Revenue VRDO | 0.240% | 12/7/10 | 55,015 | 55,015 |
| Los Angeles CA Department of | | | | |
| Water & Power Revenue VRDO | 0.250% | 12/7/10 | 7,675 | 7,675 |
| Los Angeles CA Department of | | | | |
| Water & Power Revenue VRDO | 0.250% | 12/7/10 | 32,400 | 32,400 |
| Los Angeles CA Department of | | | | |
| Water & Power Revenue VRDO | 0.260% | 12/7/10 | 86,500 | 86,500 |
| Los Angeles CA Department of | | | | |
| Water & Power Revenue VRDO | 0.260% | 12/7/10 | 14,400 | 14,400 |
| 1 Los Angeles CA Harbor TOB VRDO | 0.300% | 12/7/10 | 4,020 | 4,020 |
| Los Angeles CA Multifamily Housing Revenue | | | | |
| (Beverly Park Apartments) VRDO | 0.280% | 12/7/10 LOC | 15,500 | 15,500 |
| Los Angeles CA Multifamily Housing Revenue | | | | |
| (Fountain Park Project) VRDO | 0.280% | 12/7/10 LOC | 40,000 | 40,000 |
| Los Angeles CA Multifamily Housing Revenue | | | | |
| (Queen Portfolio Apartments Project) VRDO | 0.310% | 12/7/10 LOC | 6,895 | 6,895 |
| Los Angeles CA Multifamily Housing Revenue | | | | |
| (San Regis Project) VRDO | 0.300% | 12/7/10 LOC | 23,600 | 23,600 |
| Los Angeles CA TRAN | 2.000% | 3/31/11 | 25,000 | 25,119 |
| Los Angeles CA TRAN | 2.000% | 4/21/11 | 50,000 | 50,269 |
| 1 Los Angeles CA Unified School District | | | | |
| GO TOB VRDO | 0.300% | 12/7/10 | 6,660 | 6,660 |
| 1 Los Angeles CA Unified School District | | | | |
| GO TOB VRDO | 0.300% | 12/7/10 | 9,995 | 9,995 |
| 1 Los Angeles CA Unified School District | | | | |
| GO TOB VRDO | 0.320% | 12/7/10 | 8,985 | 8,985 |
| 1 Los Angeles CA Wastewater System Revenue | | | | |
| TOB VRDO | 0.300% | 12/7/10 | 25,000 | 25,000 |
| 1 Los Angeles CA Wastewater System Revenue | | | | |
| TOB VRDO | 0.300% | 12/7/10 | 7,500 | 7,500 |
| Los Angeles CA Wastewater System Revenue | | | | |
| VRDO | 0.280% | 12/7/10 LOC | 11,685 | 11,685 |
| Los Angeles County CA Capital Asset | | | | |
| Leasing Corp. Revenue CP | 0.320% | 12/8/10 LOC | 16,000 | 16,000 |
| Los Angeles County CA Metropolitan | | | | |
| Transportation Authority Sales Tax Revenue | | | | |
| VRDO | 0.260% | 12/1/10 | 60,875 | 60,875 |
20
California Tax-Exempt Money Market Fund
| | | | |
| | | | Face | Market |
| | | Maturity | Amount | Value |
| | Coupon | Date | ($000) | ($000) |
| Los Angeles County CA Metropolitan | | | | |
| Transportation Authority Sales Tax Revenue | | | | |
| VRDO | 0.260% | 12/1/10 | 32,790 | 32,790 |
| Los Angeles County CA TRAN | 2.000% | 6/30/11 | 25,000 | 25,165 |
| 1 Los Angeles County CA Unified School District | | | | |
| GO TOB VRDO | 0.300% | 12/7/10 | 5,000 | 5,000 |
| Los Angeles County CA Unified School District | | | | |
| TRAN | 2.000% | 6/30/11 | 55,000 | 55,421 |
| Manteca CA Redevelopment Agency | | | | |
| Tax Allocation Revenue VRDO | 0.290% | 12/1/10 LOC | 21,835 | 21,835 |
| 1 Metropolitan Water District of | | | | |
| Southern California Revenue TOB VRDO | 0.300% | 12/7/10 (13) | 7,525 | 7,525 |
| 1 Metropolitan Water District of | | | | |
| Southern California Revenue TOB VRDO | 0.300% | 12/7/10 | 5,000 | 5,000 |
| 1 Metropolitan Water District of | | | | |
| Southern California Revenue TOB VRDO | 0.300% | 12/7/10 (4) | 6,435 | 6,435 |
| Metropolitan Water District of | | | | |
| Southern California Revenue VRDO | 0.270% | 12/1/10 | 22,100 | 22,100 |
| Metropolitan Water District of | | | | |
| Southern California Revenue VRDO | 0.270% | 12/1/10 | 11,800 | 11,800 |
| Metropolitan Water District of | | | | |
| Southern California Revenue VRDO | 0.250% | 12/7/10 | 50,000 | 50,000 |
| Metropolitan Water District of | | | | |
| Southern California Revenue VRDO | 0.280% | 12/7/10 | 26,900 | 26,900 |
| Mission Viejo CA Community Development | | | | |
| Financing Authority Revenue | | | | |
| (Mission Viejo Mall Improvement) VRDO | 0.250% | 12/7/10 LOC | 24,900 | 24,900 |
| 1 New Haven CA Unified School District | | | | |
| GO TOB VRDO | 0.300% | 12/7/10 LOC | 11,302 | 11,302 |
| Newport Beach CA Revenue | | | | |
| (Hoag Memorial Hospital Presbyterian) VRDO | 0.250% | 12/7/10 | 28,795 | 28,795 |
| 1 Nuveen California Municipal Market | | | | |
| Opportunity Fund VRDP VRDO | 0.480% | 12/7/10 LOC | 20,000 | 20,000 |
| 1 Nuveen California Quality Income | | | | |
| Municipal Fund VRDP VRDO | 0.550% | 12/7/10 LOC | 26,000 | 26,000 |
| 1 Oakland CA Redevelopment Agency | | | | |
| Tax Allocation Revenue (Central District Project) | | | | |
| TOB VRDO | 0.290% | 12/7/10 LOC | 13,710 | 13,710 |
| Oakland CA TRAN | 2.000% | 3/30/11 | 41,000 | 41,200 |
| Oakland-Alameda County CA Coliseum Authority | | | | |
| Lease Revenue (Oakland Coliseum Project) | | | | |
| VRDO | 0.270% | 12/7/10 LOC | 70,300 | 70,300 |
| Orange County CA | | | | |
| Apartment Development Revenue VRDO | 0.350% | 12/7/10 LOC | 8,150 | 8,150 |
| 1 Orange County CA Sanitation District | | | | |
| COP TOB VRDO | 0.350% | 12/7/10 | 10,925 | 10,925 |
| Orange County CA TRAN | 2.000% | 3/15/11 | 16,000 | 16,076 |
| Orange County CA TRAN | 2.000% | 5/13/11 | 16,000 | 16,117 |
| Orange County CA TRAN | 2.000% | 6/30/11 | 21,000 | 21,194 |
| Orange County CA Water District COP VRDO | 0.250% | 12/7/10 | 37,550 | 37,550 |
| Otay CA Water District (Capital Project) | | | | |
| COP VRDO | 0.300% | 12/7/10 LOC | 8,500 | 8,500 |
| 1 Palomar Pomerado Health System | | | | |
| California Revenue GO TOB VRDO | 0.290% | 12/7/10 (12) | 19,800 | 19,800 |
| 1 Piedmont CA Unified School District | | | | |
| GO TOB VRDO | 0.300% | 12/7/10 | 6,445 | 6,445 |
21
California Tax-Exempt Money Market Fund
| | | | |
| | | | Face | Market |
| | | Maturity | Amount | Value |
| | Coupon | Date | ($000) | ($000) |
| Pittsburg CA Redevelopment Agency | | | | |
| Tax Allocation Revenue (Los Medanos | | | | |
| Community Development Project) VRDO | 0.290% | 12/1/10 LOC | 104,455 | 104,455 |
| 1 Port of Oakland CA Revenue TOB VRDO | 0.350% | 12/7/10 (13) | 13,665 | 13,665 |
| 1 Rancho Santiago CA Community College District | | | | |
| GO TOB VRDO | 0.290% | 12/7/10 (4) | 9,655 | 9,655 |
| 1 Riverside CA Electric Revenue TOB VRDO | 0.300% | 12/1/10 (4) | 2,800 | 2,800 |
| Riverside CA Electric Revenue VRDO | 0.320% | 12/7/10 LOC | 23,700 | 23,700 |
| Riverside County CA Industrial Development | | | | |
| Authority Empowerment Zone Facility Revenue | | | | |
| (Guy Evans Inc. Project) VRDO | 0.270% | 12/7/10 LOC | 5,450 | 5,450 |
| Riverside County CA Public Facility Project | | | | |
| COP VRDO | 0.260% | 12/7/10 LOC | 10,700 | 10,700 |
| Riverside County CA TRAN | 2.000% | 3/31/11 | 40,000 | 40,206 |
| Riverside County CA Transportation Commission | | | | |
| Sales Tax Revenue VRDO | 0.270% | 12/7/10 | 4,885 | 4,885 |
| Riverside County CA Transportation Commission | | | | |
| Sales Tax Revenue VRDO | 0.310% | 12/7/10 | 9,975 | 9,975 |
| Sacramento CA Municipal Utility District Revenue | | | | |
| CP | 0.300% | 2/7/11 LOC | 7,000 | 7,000 |
| 1 Sacramento CA Municipal Utility District Revenue | | | | |
| TOB VRDO | 0.320% | 12/7/10 (4) | 13,510 | 13,510 |
| Sacramento CA Suburban Water District | | | | |
| COP VRDO | 0.270% | 12/7/10 LOC | 21,005 | 21,005 |
| Sacramento CA Transportation Authority | | | | |
| Sales Tax Revenue VRDO | 0.250% | 12/7/10 | 47,300 | 47,300 |
| Sacramento County CA Sanitation Districts | | | | |
| Financing Authority Revenue VRDO | 0.280% | 12/7/10 LOC | 5,000 | 5,000 |
| 1 San Bernardino CA Community College District | | | | |
| GO TOB VRDO | 0.300% | 12/7/10 (4) | 7,500 | 7,500 |
| 1 San Bernardino CA Community College District | | | | |
| GO TOB VRDO | 0.340% | 12/7/10 | 40,050 | 40,050 |
| San Bernardino County CA TRAN | 2.000% | 6/30/11 | 57,500 | 58,033 |
| 1 San Diego CA Community College District | | | | |
| GO TOB VRDO | 0.290% | 12/7/10 | 5,000 | 5,000 |
| 1 San Diego CA Community College District | | | | |
| GO TOB VRDO | 0.300% | 12/7/10 | 5,000 | 5,000 |
| 1 San Diego CA Community College District | | | | |
| GO TOB VRDO | 0.300% | 12/7/10 | 3,995 | 3,995 |
| San Diego CA County & School District TRAN | 2.000% | 1/31/11 | 5,000 | 5,011 |
| San Diego CA County & School District TRAN | 2.000% | 6/30/11 | 62,500 | 63,083 |
| San Diego CA Housing Authority | | | | |
| Multifamily Housing Revenue | | | | |
| (Bay Vista Apartments Project) VRDO | 0.290% | 12/7/10 LOC | 9,690 | 9,690 |
| San Diego CA Housing Authority | | | | |
| Multifamily Housing Revenue | | | | |
| (Canyon Rim Apartments) VRDO | 0.280% | 12/7/10 LOC | 32,440 | 32,440 |
| 1 San Diego CA Public Facilities Financing Authority | | | | |
| Water Revenue TOB VRDO | 0.300% | 12/7/10 | 7,495 | 7,495 |
| 1 San Diego CA Public Facilities Financing Authority | | | | |
| Water Revenue TOB VRDO | 0.300% | 12/7/10 | 10,310 | 10,310 |
| 1 San Diego CA Unified School District GO | | | | |
| TOB PUT | 0.450% | 5/19/11 | 23,960 | 23,960 |
| San Diego County CA COP VRDO | 0.250% | 12/7/10 LOC | 9,670 | 9,670 |
| San Diego County CA Regional Transportation | | | | |
| Authority Sales Tax Revenue VRDO | 0.260% | 12/7/10 | 5,000 | 5,000 |
22
California Tax-Exempt Money Market Fund
| | | | |
| | | | Face | Market |
| | | Maturity | Amount | Value |
| | Coupon | Date | ($000) | ($000) |
| 1 San Diego County CA Water Authority Revenue | | | | |
| COP TOB VRDO | 0.290% | 12/7/10 (4) | 50,585 | 50,585 |
| 1 San Diego County CA Water Authority Revenue | | | | |
| COP TOB VRDO | 0.300% | 12/7/10 | 10,100 | 10,100 |
| 1 San Diego County CA Water Authority Revenue | | | | |
| COP TOB VRDO | 0.300% | 12/7/10 (4) | 6,840 | 6,840 |
| 1 San Diego County CA Water Authority Revenue | | | | |
| COP TOB VRDO | 0.300% | 12/7/10 (4) | 9,500 | 9,500 |
| 1 San Diego County CA Water Authority Revenue | | | | |
| COP TOB VRDO | 0.300% | 12/7/10 (4) | 4,825 | 4,825 |
| 1 San Diego County CA Water Authority Revenue | | | | |
| COP TOB VRDO | 0.310% | 12/7/10 (4) | 9,800 | 9,800 |
| 1 San Diego County CA Water Authority Revenue | | | | |
| COP TOB VRDO | 0.310% | 12/7/10 (4) | 6,100 | 6,100 |
| San Diego County CA Water Authority Revenue | | | | |
| CP | 0.270% | 12/7/10 | 5,000 | 5,000 |
| San Diego County CA Water Authority Revenue | | | | |
| CP | 0.290% | 12/7/10 | 5,000 | 5,000 |
| 1 San Francisco CA Bay Area Rapid Transit District | | | | |
| Sales Tax Revenue TOB VRDO | 0.290% | 12/7/10 LOC | 10,000 | 10,000 |
| 1 San Francisco CA Bay Area Rapid Transit District | | | | |
| Sales Tax Revenue TOB VRDO | 0.300% | 12/7/10 | 13,595 | 13,595 |
| San Francisco CA City & County Finance Corp. | | | | |
| Lease Revenue (Moscone Center Expansion) | | | | |
| VRDO | 0.290% | 12/7/10 LOC | 8,850 | 8,850 |
| San Francisco CA City & County International | | | | |
| Airport Revenue VRDO | 0.260% | 12/7/10 LOC | 16,000 | 16,000 |
| San Francisco CA City & County Redevelopment | | | | |
| Agency Multifamily Housing Revenue | | | | |
| (Third & Mission Streets) VRDO | 0.250% | 12/7/10 LOC | 65,200 | 65,200 |
| San Francisco CA City & County Unified | | | | |
| School District TRAN | 2.000% | 6/30/11 | 25,000 | 25,226 |
| San Joaquin County CA Transportation Authority | | | | |
| Sales Tax Revenue | 5.000% | 4/1/11 | 10,000 | 10,153 |
| 1 San Jose CA Financing Authority Lease Revenue | | | | |
| TOB VRDO | 0.300% | 12/7/10 (13) | 25,960 | 25,960 |
| San Jose CA Multifamily Housing Revenue | | | | |
| (Cinnabar Commons) VRDO | 0.290% | 12/7/10 LOC | 16,600 | 16,600 |
| San Jose CA Redevelopment Agency | | | | |
| Tax Allocation Revenue | 6.000% | 8/1/11 (14)(ETM) | 2,915 | 3,026 |
| 1 San Jose CA Unified School District | | | | |
| GO TOB VRDO | 0.300% | 12/7/10 | 7,310 | 7,310 |
| 1 San Jose CA Unified School District | | | | |
| Santa Clara County GO TOB VRDO | 0.310% | 12/7/10 LOC | 5,000 | 5,000 |
| 1 San Marcos CA Public Facilities Authority | | | | |
| Tax Allocation Revenue TOB VRDO | 0.310% | 12/7/10 (13) | 8,690 | 8,690 |
| San Mateo CA Redevelopment Authority | | | | |
| Tax Allocation Revenue | 5.000% | 8/1/11 (Prere.) | 1,000 | 1,031 |
| San Mateo CA Redevelopment Authority | | | | |
| Tax Allocation Revenue | 5.200% | 8/1/11 (Prere.) | 2,045 | 2,111 |
| San Mateo CA Redevelopment Authority | | | | |
| Tax Allocation Revenue | 5.400% | 8/1/11 (Prere.) | 2,575 | 2,661 |
| San Mateo CA Redevelopment Authority | | | | |
| Tax Allocation Revenue | 5.400% | 8/1/11 (Prere.) | 1,000 | 1,033 |
| San Mateo CA Redevelopment Authority | | | | |
| Tax Allocation Revenue | 5.500% | 8/1/11 (Prere.) | 2,635 | 2,725 |
23
California Tax-Exempt Money Market Fund
| | | | | |
| | | | | Face | Market |
| | | | Maturity | Amount | Value |
| | | Coupon | Date | ($000) | ($000) |
| 1 | San Mateo County CA Community College District | | | | |
| | GO TOB VRDO | 0.300% | 12/7/10 | 4,315 | 4,315 |
| 1 | San Mateo County CA Community College District | | | | |
| | GO TOB VRDO | 0.310% | 12/7/10 | 11,660 | 11,660 |
| | Santa Clara County CA El Camino Hospital | | | | |
| | District Facilities Authority Revenue | | | | |
| | (Valley Medical Center Project) VRDO | 0.260% | 12/7/10 LOC | 14,150 | 14,150 |
| | Santa Clara County CA El Camino Hospital | | | | |
| | District Facilities Authority Revenue | | | | |
| | (Valley Medical Center Project) VRDO | 0.260% | 12/7/10 LOC | 14,900 | 14,900 |
| | Santa Clara County CA | | | | |
| | Financing Authority Lease Revenue | | | | |
| | (VMC Facility Replacement Project) VRDO | 0.290% | 12/7/10 | 27,430 | 27,430 |
| 1 | Sequoia CA Unified School District GO TOB VRDO | 0.300% | 12/7/10 (4) | 5,860 | 5,860 |
| 1 | Sonoma County CA Junior College District | | | | |
| | GO TOB VRDO | 0.290% | 12/7/10 | 30,945 | 30,945 |
| | South Coast CA Local Education Agencies TRAN | 2.000% | 8/9/11 | 10,000 | 10,094 |
| | South Placer CA Wastewater Authority Revenue | | | | |
| | VRDO | 0.280% | 12/7/10 LOC | 40,350 | 40,350 |
| | Southern California Home Financing Authority | | | | |
| | Single Family Mortgage Revenue VRDO | 0.250% | 12/7/10 LOC | 33,560 | 33,560 |
| | Southern California Home Financing Authority | | | | |
| | Single Family Mortgage Revenue VRDO | 0.250% | 12/7/10 LOC | 15,085 | 15,085 |
| 1 | Sweetwater CA Unified School District | | | | |
| | GO TOB VRDO | 0.300% | 12/7/10 (13) | 16,445 | 16,445 |
| | Torrance CA Hospital Revenue | | | | |
| | (Torrance Memorial Medical Center) VRDO | 0.270% | 12/7/10 LOC | 10,000 | 10,000 |
| | Torrance CA Hospital Revenue | | | | |
| | (Torrance Memorial Medical Center) VRDO | 0.270% | 12/7/10 LOC | 10,000 | 10,000 |
| | University of California Regents CP | 0.290% | 2/7/11 | 5,000 | 5,000 |
| 1 | University of California Revenue TOB VRDO | 0.270% | 12/7/10 | 6,665 | 6,665 |
| 1 | University of California Revenue TOB VRDO | 0.290% | 12/7/10 | 29,195 | 29,195 |
| 1 | University of California Revenue TOB VRDO | 0.300% | 12/7/10 | 1,890 | 1,890 |
| 1 | University of California Revenue TOB VRDO | 0.300% | 12/7/10 | 3,495 | 3,495 |
| 1 | University of California Revenue TOB VRDO | 0.300% | 12/7/10 | 6,000 | 6,000 |
| 1 | University of California Revenue TOB VRDO | 0.300% | 12/7/10 | 5,995 | 5,995 |
| 1 | University of California Revenue TOB VRDO | 0.300% | 12/7/10 | 3,470 | 3,470 |
| | Ventura County CA TRAN | 2.000% | 7/1/11 | 18,935 | 19,113 |
| 1 | Vista CA Unified School District GO TOB VRDO | 0.340% | 12/7/10 (4) | 9,475 | 9,475 |
| | Western Municipal Water District Facilities | | | | |
| | Authority California Water Revenue VRDO | 0.270% | 12/7/10 LOC | 8,400 | 8,400 |
| | Whittier CA Health Facility Revenue | | | | |
| | (Presbyterian Intercommunity Hospital) VRDO | 0.250% | 12/7/10 LOC | 15,600 | 15,600 |
| | | | | | 4,582,120 |
| Total Tax-Exempt Municipal Bonds (Cost $4,582,120) | | | | 4,582,120 |
| Other Assets and Liabilities (0.6%) | | | | |
| Other Assets | | | | 49,337 |
| Liabilities | | | | (21,669) |
| | | | | | 27,668 |
| Net Assets (100%) | | | | |
| Applicable to 4,609,268,094 outstanding $.001 par value shares of | | | |
| beneficial interest (unlimited authorization) | | | | 4,609,788 |
| Net Asset Value Per Share | | | | $1.00 |
24
California Tax-Exempt Money Market Fund
At November 30, 2010, net assets consisted of:
| |
| | Amount |
| | ($000) |
| Paid-in Capital | 4,609,790 |
| Undistributed Net Investment Income | — |
| Accumulated Net Realized Losses | (2) |
| Net Assets | 4,609,788 |
See Note A in Notes to Financial Statements.
1 Security exempt from registration under Rule 144A of the Securities Act of 1933. Such securities may be sold in transactions exempt from registration, normally to qualified institutional buyers. At November 30, 2010, the aggregate value of these securities was $1,178,877,000, representing 25.6% of net assets.
A key to abbreviations and other references follows the Statement of Net Assets.
See accompanying Notes, which are an integral part of the Financial Statements.
25
California Tax-Exempt Money Market Fund
Key to Abbreviations
ARS—Auction Rate Security.
BAN—Bond Anticipation Note.
COP—Certificate of Participation.
CP—Commercial Paper.
FR—Floating Rate.
GAN—Grant Anticipation Note.
GO—General Obligation Bond.
IDA—Industrial Development Authority Bond.
IDR—Industrial Development Revenue Bond.
PCR—Pollution Control Revenue Bond.
PUT—Put Option Obligation.
RAN—Revenue Anticipation Note.
TAN—Tax Anticipation Note.
TOB—Tender Option Bond.
TRAN—Tax Revenue Anticipation Note.
UFSD—Union Free School District.
USD—United School District.
VRDO—Variable Rate Demand Obligation.
VRDP—Variable Rate Demand Preferred.
(ETM)—Escrowed to Maturity.
(Prere.)—Prerefunded.
Scheduled principal and interest payments are guaranteed by:
(1) MBIA (Municipal Bond Investors Assurance).
(2) AMBAC (Ambac Assurance Corporation).
(3) FGIC (Financial Guaranty Insurance Company).
(4) AGM (Assured Guaranty Municipal Corporation).
(5) BIGI (Bond Investors Guaranty Insurance).
(6) Connie Lee Inc.
(7) FHA (Federal Housing Authority).
(8) CapMAC (Capital Markets Assurance Corporation).
(9) American Capital Access Financial Guaranty Corporation.
(10) XL Capital Assurance Inc.
(11) CIFG (CDC IXIS Financial Guaranty).
(12) Assured Guaranty Corp.
(13) Berkshire Hathaway Assurance Corp.
(14) National Public Finance Guarantee Corp.
The insurance does not guarantee the market value of the municipal bonds.
LOC—Scheduled principal and interest payments are guaranteed by bank letter of credit.
26
California Tax-Exempt Money Market Fund
Statement of Operations
| |
| | Year Ended |
| | November 30, 2010 |
| | ($000) |
| Investment Income | |
| Income | |
| Interest | 13,937 |
| Total Income | 13,937 |
| Expenses | |
| The Vanguard Group—Note B | |
| Investment Advisory Services | 1,076 |
| Management and Administrative | 5,674 |
| Marketing and Distribution | 1,547 |
| Custodian Fees | 36 |
| Auditing Fees | 21 |
| Shareholders’ Reports | 26 |
| Trustees’ Fees and Expenses | 7 |
| Total Expenses | 8,387 |
| Net Investment Income | 5,550 |
| Realized Net Gain (Loss) on Investment Securities Sold | 6 |
| Net Increase (Decrease) in Net Assets Resulting from Operations | 5,556 |
See accompanying Notes, which are an integral part of the Financial Statements.
27
California Tax-Exempt Money Market Fund
Statement of Changes in Net Assets
| | |
| | Year Ended November 30, |
| | 2010 | 2009 |
| | ($000) | ($000) |
| Increase (Decrease) in Net Assets | | |
| Operations | | |
| Net Investment Income | 5,550 | 23,796 |
| Realized Net Gain (Loss) | 6 | 506 |
| Net Increase (Decrease) in Net Assets Resulting from Operations | 5,556 | 24,302 |
| Distributions | | |
| Net Investment Income | (5,550) | (23,796) |
| Realized Capital Gain | — | — |
| Total Distributions | (5,550) | (23,796) |
| Capital Share Transactions (at $1.00) | | |
| Issued | 2,982,771 | 3,668,931 |
| Issued in Lieu of Cash Distributions | 5,359 | 22,754 |
| Redeemed | (3,733,806) | (5,842,322) |
| Net Increase (Decrease) from Capital Share Transactions | (745,676) | (2,150,637) |
| Total Increase (Decrease) | (745,670) | (2,150,131) |
| Net Assets | | |
| Beginning of Period | 5,355,458 | 7,505,589 |
| End of Period | 4,609,788 | 5,355,458 |
See accompanying Notes, which are an integral part of the Financial Statements.
28
California Tax-Exempt Money Market Fund
Financial Highlights
| | | | | |
| For a Share Outstanding | | | Year Ended November 30, |
| Throughout Each Period | 2010 | 2009 | 2008 | 2007 | 2006 |
| Net Asset Value, Beginning of Period | $1.00 | $1.00 | $1.00 | $1.00 | $1.00 |
| Investment Operations | | | | | |
| Net Investment Income | .001 | .004 | .022 | .035 | .032 |
| Net Realized and Unrealized Gain (Loss) | | | | | |
| on Investments | — | — | — | — | — |
| Total from Investment Operations | .001 | .004 | .022 | .035 | .032 |
| Distributions | | | | | |
| Dividends from Net Investment Income | (.001) | (.004) | (.022) | (.035) | (.032) |
| Distributions from Realized Capital Gains | — | — | — | — | — |
| Total Distributions | (.001) | (.004) | (.022) | (.035) | (.032) |
| Net Asset Value, End of Period | $1.00 | $1.00 | $1.00 | $1.00 | $1.00 |
| |
| Total Return1 | 0.11% | 0.37% | 2.21% | 3.55% | 3.24% |
| |
| Ratios/Supplemental Data | | | | | |
| Net Assets, End of Period (Millions) | $4,610 | $5,355 | $7,506 | $8,623 | $7,220 |
| Ratio of Total Expenses to | | | | | |
| Average Net Assets | 0.17% | 0.17%2 | 0.11%2 | 0.10% | 0.13% |
| Ratio of Net Investment Income to | | | | | |
| Average Net Assets | 0.11% | 0.39% | 2.19% | 3.49% | 3.20% |
1 Total returns do not include account service fees that may have applied in the periods shown. Fund prospectuses provide information about any applicable account service fees.
2 Includes fees to participate in the Treasury Temporary Guarantee Program for Money Market Funds of 0.04% for 2009 and 0.01% for 2008.
See accompanying Notes, which are an integral part of the Financial Statements.
29
California Tax-Exempt Money Market Fund
Notes to Financial Statements
Vanguard California Tax-Exempt Money Market Fund is registered under the Investment Company Act of 1940 as an open-end investment company, or mutual fund. The fund invests in debt instruments of municipal issuers whose ability to meet their obligations may be affected by economic and political developments in the state.
A. The following significant accounting policies conform to generally accepted accounting principles for U.S. mutual funds. The fund consistently follows such policies in preparing its financial statements.
1. Security Valuation: Securities are valued at amortized cost, which approximates market value.
2. Federal Income Taxes: The fund intends to continue to qualify as a regulated investment company and distribute all of its income. Management has analyzed the fund’s tax positions taken for all open federal income tax years (November 30, 2007–2010), and has concluded that no provision for federal income tax is required in the fund’s financial statements.
3. Distributions: Distributions from net investment income are declared daily and paid on the first business day of the following month.
4. Other: Interest income is accrued daily. Premiums and discounts on debt securities purchased are amortized and accreted, respectively, to interest income over the lives of the respective securities. Security transactions are accounted for on the date securities are bought or sold. Costs used to determine realized gains (losses) on the sale of investment securities are those of the specific securities sold.
B. The Vanguard Group furnishes at cost investment advisory, corporate management, administrative, marketing, and distribution services. The costs of such services are allocated to the fund under methods approved by the board of trustees. The fund has committed to provide up to 0.40% of its net assets in capital contributions to Vanguard. At November 30, 2010, the fund had contributed capital of $816,000 to Vanguard (included in Other Assets), representing 0.02% of the fund’s net assets and 0.33% of Vanguard’s capitalization. The fund’s trustees and officers are also directors and officers of Vanguard.
C. Various inputs may be used to determine the value of the fund’s investments. These inputs are summarized in three broad levels for financial statement purposes. The inputs or methodologies used to value securities are not necessarily an indication of the risk associated with investing in those securities.
Level 1—Quoted prices in active markets for identical securities.
Level 2—Other significant observable inputs (including quoted prices for similar securities, interest rates, prepayment speeds, credit risk, etc.).
Level 3—Significant unobservable inputs (including the fund’s own assumptions used to determine the fair value of investments).
At November 30, 2010, 100% of the fund’s investments were valued using amortized cost, in accordance with rules under the Investment Company Act of 1940. Amortized cost approximates the current fair value of a security, but since the value is not obtained from a quoted price in an active market, securities valued at amortized cost are considered to be valued using Level 2 inputs.
D. In preparing the financial statements as of November 30, 2010, management considered the impact of subsequent events for potential recognition or disclosure in these financial statements.
30
California Intermediate-Term Tax-Exempt Fund
Fund Profile
As of November 30, 2010
| | | |
| Share-Class Characteristics | | |
| | | Investor | Admiral |
| | | Shares | Shares |
| Ticker Symbol | | VCAIX | VCADX |
| Expense Ratio1 | | 0.20% | 0.12% |
| 30-Day SEC Yield | | 3.02% | 3.10% |
| |
| Financial Attributes | | | |
| | | Barclays | Barclays |
| | | 7 Year | Municipal |
| | | Municipal | Bond |
| | Fund | Index | Index |
| Number of Bonds | 719 | 4,765 | 46,372 |
| Yield to Maturity | | | |
| (before expenses) | 3.5% | 2.6% | 3.5% |
| Average Coupon | 4.4% | 4.9% | 5.0% |
| Average Duration | 5.8 years | 5.1 years | 8.4 years |
| Average Effective | | | |
| Maturity | 6.3 years | 7.0 years | 13.4 years |
| Short-Term | | | |
| Reserves | 3.6% | — | — |
| | |
| Volatility Measures | | |
| | Barclays | |
| | 7 Year | Barclays |
| | Municipal | Municipal |
| | Index | Bond Index |
| R-Squared | 0.80 | 0.96 |
| Beta | 0.97 | 0.93 |
| These measures show the degree and timing of the fund’s fluctuations compared with the indexes over 36 months. |
|
| |
| Distribution by Maturity (% of portfolio) |
| Under 1 Year | | 9.4% |
| 1 - 3 Years | | 18.4 |
| 3 - 5 Years | | 14.1 |
| 5 - 10 Years | | 45.5 |
| 10 - 20 Years | | 11.6 |
| 20 - 30 Years | | 1.0 |
| |
| Distribution by Credit Quality (% of portfolio) |
| AAA | | 9.0% |
| AA | | 48.2 |
| A | | 37.6 |
| BBB | | 4.2 |
| BB | | 0.1 |
| Not Rated | | 0.9 |
| For information about these ratings, see the Glossary entry for Credit Quality. |
Investment Focus

1 The expense ratios shown are from the prospectus dated April 22, 2010, and represent estimated costs for the current fiscal year. For the fiscal year ended November 30, 2010, the expense ratios were 0.20% for Investor Shares and 0.12% for Admiral Shares.
31
California Intermediate-Term Tax-Exempt Fund
Performance Summary
All of the returns in this report represent past performance, which is not a guarantee of future results that may be achieved by the fund. (Current performance may be lower or higher than the performance data cited. For performance data current to the most recent month-end, visit our website at vanguard.com/performance.) Note, too, that both investment returns and principal value can fluctuate widely, so an investor’s shares, when sold, could be worth more or less than their original cost. The returns shown do not reflect taxes that a shareholder would pay on fund distributions or on the sale of fund shares.
Cumulative Performance: November 30, 2000, Through November 30, 2010
Initial Investment of $10,000

| | | | |
| | Average Annual Total Returns | |
| | Periods Ended November 30, 2010 | |
| | | | | Final Value |
| | One | Five | Ten | of a $10,000 |
| | Year | Years | Years | Investment |
| California Intermediate-Term | | | | |
| Tax-Exempt Fund Investor Shares | 4.43% | 3.94% | 4.32% | $15,266 |
| Barclays Capital Municipal Bond Index | 4.76 | 4.67 | 5.30 | 16,754 |
| Barclays Capital 7 Year Municipal Bond | | | | |
| Index | 5.52 | 5.60 | 5.50 | 17,083 |
| California Intermediate Municipal Debt | | | | |
| Funds Average | 4.28 | 3.55 | 3.85 | 14,593 |
California Intermediate Municipal Debt Funds Average: Derived from data provided by Lipper Inc.
See Financial Highlights for dividend and capital gains information.
32
California Intermediate-Term Tax-Exempt Fund
| | | | |
| | | Average Annual Total Returns | |
| | | Periods Ended November 30, 2010 | |
| | | | Since | Final Value |
| | One | Five | Inception | of a $50,000 |
| | Year | Years | (11/12/2001) | Investment |
| California Intermediate-Term | | | | |
| Tax-Exempt Fund Admiral Shares | 4.52% | 4.02% | 3.81% | $70,120 |
| Barclays Capital Municipal Bond | | | | |
| Index | 4.76 | 4.67 | 4.67 | 75,564 |
| Barclays Capital 7 Year Municipal | | | | |
| Bond Index | 5.52 | 5.60 | 4.96 | 77,494 |
"Since Inception" performance is calculated from the Admiral Shares’ inception date for both the fund and its comparative standards.
Fiscal-Year Total Returns (%): November 30, 2000, Through November 30, 2010
| | | | |
| | | | | Barclays |
| | | | | 7 Year |
| | | | | Municipal |
| | | | Investor Shares | Index |
| Fiscal Year | Income Returns | Capital Returns | Total Returns | Total Returns |
| 2001 | 4.67% | 2.77% | 7.44% | 8.13% |
| 2002 | 4.35 | 1.53 | 5.88 | 7.02 |
| 2003 | 4.12 | 1.66 | 5.78 | 6.97 |
| 2004 | 3.93 | -1.52 | 2.41 | 2.89 |
| 2005 | 3.90 | -1.79 | 2.11 | 2.16 |
| 2006 | 4.12 | 1.28 | 5.40 | 5.09 |
| 2007 | 3.99 | -1.53 | 2.46 | 4.19 |
| 2008 | 3.79 | -6.50 | -2.71 | 2.91 |
| 2009 | 4.19 | 6.37 | 10.56 | 10.43 |
| 2010 | 3.79 | 0.64 | 4.43 | 5.52 |
33
California Intermediate-Term Tax-Exempt Fund
Average Annual Total Returns: Periods Ended September 30, 2010
This table presents average annual total returns through the latest calendar quarter—rather than through the end of the fiscal period. Securities and Exchange Commission rules require that we provide this information.
| | | | | | |
| | | | | | | Ten Years |
| | Inception Date | One Year | Five Years | Income | Capital | Total |
| Investor Shares | 3/4/1994 | 5.37% | 4.42% | 4.12% | 0.59% | 4.71% |
| Admiral Shares | 11/12/2001 | 5.46 | 4.50 | 4.111 | 0.061 | 4.171 |
| 1 Return since inception. |
34
California Intermediate-Term Tax-Exempt Fund
Financial Statements
Statement of Net Assets
As of November 30, 2010
The fund reports a complete list of its holdings in regulatory filings four times in each fiscal year, at the quarter-ends. For the second and fourth fiscal quarters, the lists appear in the fund’s semiannual and annual reports to shareholders. For the first and third fiscal quarters, the fund files the lists with the Securities and Exchange Commission on Form N-Q. Shareholders can look up the fund’s Forms N-Q on the SEC’s website at sec.gov. Forms N-Q may also be reviewed and copied at the SEC’s Public Reference Room (see the back cover of this report for further information).
| | | | |
| | | | Face | Market |
| | | Maturity | Amount | Value |
| | Coupon | Date | ($000) | ($000) |
| Tax-Exempt Municipal Bonds (99.6%) | | | | |
| California (98.1%) | | | | |
| ABAG Finance Authority for Nonprofit Corps. | | | | |
| California Revenue (899 Charleston Project) | | | | |
| VRDO | 0.290% | 12/1/10 LOC | 34,620 | 34,620 |
| ABAG Finance Authority for Nonprofit Corps. | | | | |
| California Revenue | | | | |
| (Acacia Creek at Union City Project) | 0.290% | 12/1/10 | 22,575 | 22,575 |
| ABAG Finance Authority for Nonprofit Corps. | | | | |
| California Revenue (Valley Christian Schools) | | | | |
| VRDO | 0.340% | 12/7/10 LOC | 16,200 | 16,200 |
| Alameda CA | | | | |
| Corridor Transportation Authority Revenue | 5.125% | 10/1/14 (14) | 10,150 | 10,223 |
| Alameda CA | | | | |
| Corridor Transportation Authority Revenue | 0.000% | 10/1/20 (2) | 12,250 | 6,765 |
| Alameda CA | | | | |
| Corridor Transportation Authority Revenue | 0.000% | 10/1/29 (2) | 30,000 | 8,421 |
| Alameda CA | | | | |
| Corridor Transportation Authority Revenue | 0.000% | 10/1/30 (2) | 8,000 | 2,075 |
| Alameda County CA (Medical Center Project) COP | 5.250% | 6/1/12 (ETM) | 1,595 | 1,666 |
| Alameda County CA (Medical Center Project) COP | 5.250% | 6/1/13 (ETM) | 1,785 | 1,864 |
| Alameda County CA (Medical Center Project) COP | 5.375% | 6/1/14 (ETM) | 1,880 | 1,978 |
| Alameda County CA (Medical Center Project) COP | 5.375% | 6/1/15 (ETM) | 3,960 | 4,167 |
| Alameda County CA COP | 5.375% | 12/1/10 (14) | 2,000 | 2,000 |
| Alameda County CA COP | 5.375% | 12/1/12 (14) | 11,000 | 11,542 |
| Alameda County CA COP | 5.375% | 12/1/13 (14) | 13,930 | 14,552 |
| Alameda County CA COP | 5.375% | 12/1/14 (14) | 4,790 | 4,990 |
| Alameda County CA COP | 5.375% | 12/1/15 (14) | 1,500 | 1,558 |
| Alvord CA Unified School District GO | 5.900% | 2/1/24 (4) | 3,865 | 4,272 |
| Anaheim CA Public Financing Authority Revenue | | | | |
| (Electric System) | 5.000% | 10/1/20 (14) | 4,210 | 4,582 |
| Anaheim CA Public Financing Authority Revenue | | | | |
| (Electric System) | 5.000% | 10/1/21 (14) | 4,425 | 4,745 |
| Anaheim CA Public Financing Authority Revenue | | | | |
| (Electric System) | 5.000% | 10/1/22 (14) | 4,660 | 4,948 |
| Anaheim CA Public Financing Authority Revenue | | | | |
| (Electric System) | 5.000% | 10/1/24 (14) | 5,175 | 5,402 |
| Anaheim CA Public Financing Authority Revenue | | | | |
| (Electric System) | 5.000% | 10/1/25 (14) | 5,450 | 5,659 |
| Anaheim CA Union High School District GO | 5.375% | 8/1/12 (Prere.) | 1,250 | 1,348 |
35
California Intermediate-Term Tax-Exempt Fund
| | | | |
| | | | Face | Market |
| | | Maturity | Amount | Value |
| | Coupon | Date | ($000) | ($000) |
| Antioch CA Public Financing Authority | | | | |
| Reassessment Revenue | 5.000% | 9/2/13 (2) | 6,535 | 6,548 |
| Bakersfield CA Wastewater Revenue | 5.000% | 9/15/24 (4) | 7,600 | 7,914 |
| Bay Area CA | | | | |
| Infrastructure Financing Authority Revenue | 5.000% | 8/1/17 (10) | 5,000 | 5,232 |
| Bay Area CA | | | | |
| Infrastructure Financing Authority Revenue | 5.000% | 8/1/17 (2) | 32,610 | 33,137 |
| Bay Area CA | | | | |
| Infrastructure Financing Authority Revenue | 5.000% | 8/1/17 (14) | 50,000 | 51,520 |
| Bay Area Toll Authority California | | | | |
| Toll Bridge Revenue (San Francisco Bay Area) | 5.000% | 4/1/17 | 9,500 | 10,872 |
| Bay Area Toll Authority | | | | |
| California Toll Bridge Revenue | | | | |
| (San Francisco Bay Area) | 5.000% | 4/1/18 | 5,665 | 6,365 |
| Bay Area Toll Authority | | | | |
| California Toll Bridge Revenue | | | | |
| (San Francisco Bay Area) | 5.000% | 4/1/23 | 11,625 | 12,148 |
| Bay Area Toll Authority | | | | |
| California Toll Bridge Revenue | | | | |
| (San Francisco Bay Area) | 5.000% | 4/1/25 | 3,000 | 3,076 |
| Bay Area Toll Authority | | | | |
| California Toll Bridge Revenue | | | | |
| (San Francisco Bay Area) | 5.000% | 4/1/26 | 10,000 | 10,215 |
| Bay Area Toll Authority | | | | |
| California Toll Bridge Revenue | | | | |
| (San Francisco Bay Area) | 5.250% | 4/1/29 | 11,080 | 11,605 |
| Burbank CA Public Financing Authority Revenue | | | | |
| (Golden State Redevelopment Project) | 5.250% | 12/1/12 (2) | 3,540 | 3,734 |
| Burbank CA Public Financing Authority Revenue | | | | |
| (Golden State Redevelopment Project) | 5.250% | 12/1/13 (2) | 4,615 | 4,947 |
| Cabrillo CA Community College District Revenue | 0.000% | 8/1/11 (14) | 2,465 | 2,441 |
| Cabrillo CA Community College District Revenue | 0.000% | 8/1/12 (14) | 2,525 | 2,449 |
| Cabrillo CA Community College District Revenue | 0.000% | 8/1/13 (14) | 2,590 | 2,446 |
| Cabrillo CA Community College District Revenue | 0.000% | 8/1/14 (14) | 2,655 | 2,426 |
| Cabrillo CA Community College District Revenue | 5.000% | 8/1/27 (14) | 8,710 | 8,848 |
| California County CA | | | | |
| Tobacco Securitization Agency | 0.000% | 6/1/21 | 15,000 | 13,647 |
| California Department of Water Resources | | | | |
| Power Supply Revenue | 5.500% | 5/1/11 | 7,000 | 7,149 |
| California Department of Water Resources | | | | |
| Power Supply Revenue | 6.000% | 5/1/12 (Prere.) | 13,970 | 15,196 |
| California Department of Water Resources | | | | |
| Power Supply Revenue | 6.000% | 5/1/12 (Prere.) | 12,500 | 13,597 |
| California Department of Water Resources | | | | |
| Power Supply Revenue | 5.500% | 5/1/13 (2) | 18,335 | 19,688 |
| California Department of Water Resources | | | | |
| Power Supply Revenue | 5.000% | 5/1/15 | 15,000 | 17,112 |
| California Department of Water Resources | | | | |
| Power Supply Revenue | 5.000% | 5/1/16 | 5,000 | 5,775 |
| California Department of Water Resources | | | | |
| Power Supply Revenue | 5.000% | 5/1/16 | 17,000 | 19,635 |
| California Department of Water Resources | | | | |
| Power Supply Revenue | 5.000% | 5/1/17 | 14,600 | 16,957 |
| California Department of Water Resources | | | | |
| Power Supply Revenue | 5.000% | 5/1/17 | 25,000 | 29,036 |
36
California Intermediate-Term Tax-Exempt Fund
| | | | |
| | | | Face | Market |
| | | Maturity | Amount | Value |
| | Coupon | Date | ($000) | ($000) |
| California Department of Water Resources | | | | |
| Power Supply Revenue | 5.000% | 5/1/18 | 5,475 | 6,326 |
| California Department of Water Resources | | | | |
| Power Supply Revenue | 5.000% | 5/1/18 | 17,950 | 20,740 |
| California Department of Water Resources | | | | |
| Power Supply Revenue | 5.000% | 5/1/19 | 19,590 | 22,586 |
| California Department of Water Resources | | | | |
| Power Supply Revenue | 5.000% | 5/1/19 | 1,215 | 1,401 |
| California Department of Water Resources | | | | |
| Power Supply Revenue | 5.000% | 5/1/20 | 37,290 | 42,822 |
| California Department of Water Resources | | | | |
| Power Supply Revenue | 5.000% | 5/1/20 | 3,660 | 4,203 |
| California Department of Water Resources | | | | |
| Power Supply Revenue | 5.000% | 5/1/21 | 5,000 | 5,646 |
| California Department of Water Resources | | | | |
| Power Supply Revenue | 5.000% | 5/1/21 | 20,000 | 22,102 |
| California Department of Water Resources | | | | |
| Power Supply Revenue | 5.000% | 5/1/21 | 50,000 | 55,254 |
| California Department of Water Resources | | | | |
| Power Supply Revenue | 5.000% | 5/1/22 | 14,675 | 16,022 |
| California Department of Water Resources | | | | |
| Water System Revenue (Central Valley Project) | 5.000% | 12/1/12 (3)(ETM) | 90 | 98 |
| California Department of Water Resources | | | | |
| Water System Revenue (Central Valley Project) | 5.000% | 12/1/12 (14) | 3,550 | 3,857 |
| California Department of Water Resources | | | | |
| Water System Revenue (Central Valley Project) | 5.000% | 12/1/24 | 5,000 | 5,413 |
| California Department of Water Resources | | | | |
| Water System Revenue (Central Valley Project) | 5.000% | 12/1/26 (14) | 3,535 | 3,806 |
| California Department of Water Resources | | | | |
| Water System Revenue (Central Valley Project) | 5.000% | 12/1/26 | 8,465 | 9,060 |
| California Department of Water Resources | | | | |
| Water System Revenue (Central Valley Project) | 5.000% | 12/1/27 | 8,300 | 8,994 |
| California Department of Water Resources | | | | |
| Water System Revenue (Central Valley Project) | 5.250% | 12/1/27 | 3,900 | 4,326 |
| California Department of Water Resources | | | | |
| Water System Revenue (Central Valley Project) | 5.250% | 12/1/28 | 4,505 | 4,958 |
| California Department of Water Resources | | | | |
| Water System Revenue (Central Valley Project) | 5.250% | 12/1/29 | 4,640 | 5,058 |
| California Department of Water Resources | | | | |
| Water System Revenue (Central Valley Project) | 5.250% | 12/1/30 | 1,850 | 2,003 |
| California Economic Recovery Bonds GO | 5.250% | 7/1/13 | 74,420 | 81,911 |
| California Economic Recovery Bonds GO | 5.250% | 7/1/14 (14) | 5,155 | 5,812 |
| California Economic Recovery Bonds GO | 5.250% | 7/1/14 (ETM) | 3,385 | 3,888 |
| California Economic Recovery Bonds GO | 5.250% | 7/1/14 | 11,615 | 13,095 |
| California Economic Recovery Bonds GO | 5.000% | 7/1/17 (14) | 28,000 | 28,591 |
| California Economic Recovery Bonds GO | 5.000% | 7/1/18 | 27,090 | 30,763 |
| California Economic Recovery Bonds GO | 5.000% | 7/1/19 | 28,530 | 31,782 |
| California Economic Recovery Bonds GO | 5.000% | 7/1/20 | 48,810 | 53,534 |
| California Economic Recovery Bonds GO | 5.250% | 7/1/21 | 45,385 | 50,219 |
| California Economic Recovery Bonds GO | 5.000% | 7/1/22 | 16,280 | 17,141 |
| California Educational Facilities Authority Revenue | | | | |
| (College of Arts & Crafts) | 6.875% | 6/1/14 | 360 | 396 |
| California Educational Facilities Authority Revenue | | | | |
| (College of Arts & Crafts) | 6.875% | 6/1/15 | 380 | 423 |
| California Educational Facilities Authority Revenue | | | | |
| (College of Arts & Crafts) | 6.875% | 6/1/16 | 400 | 451 |
37
California Intermediate-Term Tax-Exempt Fund
| | | | |
| | | | Face | Market |
| | | Maturity | Amount | Value |
| | Coupon | Date | ($000) | ($000) |
| California Educational Facilities Authority Revenue | | | | |
| (Stanford University) | 5.000% | 3/15/26 | 20,000 | 23,015 |
| California GO | 5.750% | 2/1/11 (14) | 6,500 | 6,554 |
| California GO | 5.000% | 2/1/12 (Prere.) | 9,400 | 9,895 |
| California GO | 5.000% | 4/1/12 | 2,000 | 2,101 |
| California GO | 5.000% | 3/1/13 | 20,640 | 22,132 |
| California GO | 5.000% | 3/1/14 | 5,000 | 5,464 |
| California GO | 5.000% | 10/1/14 | 2,000 | 2,207 |
| California GO | 5.000% | 11/1/14 | 1,390 | 1,536 |
| California GO | 5.000% | 3/1/15 | 1,000 | 1,106 |
| California GO | 5.375% | 4/1/15 | 125 | 130 |
| California GO | 5.000% | 12/1/15 | 1,470 | 1,615 |
| California GO | 5.000% | 4/1/17 | 4,520 | 5,041 |
| California GO | 5.000% | 4/1/17 | 11,000 | 12,268 |
| California GO | 5.250% | 2/1/18 (14) | 8,000 | 8,994 |
| California GO | 6.000% | 2/1/18 (2) | 6,240 | 7,278 |
| California GO | 5.000% | 3/1/18 | 1,850 | 2,051 |
| California GO | 5.000% | 4/1/18 | 10,000 | 11,083 |
| California GO | 5.500% | 4/1/18 | 34,680 | 39,531 |
| California GO | 5.000% | 8/1/18 | 1,895 | 2,063 |
| California GO | 5.000% | 10/1/18 | 20,000 | 22,133 |
| California GO | 5.500% | 4/1/19 | 11,245 | 12,731 |
| California GO | 5.000% | 5/1/19 | 10,000 | 10,545 |
| California GO | 5.000% | 8/1/19 | 30,000 | 31,656 |
| California GO | 5.000% | 10/1/19 (14) | 14,800 | 15,774 |
| California GO | 5.250% | 2/1/20 | 7,500 | 8,280 |
| California GO | 5.000% | 3/1/20 | 55,285 | 57,643 |
| California GO | 5.000% | 8/1/20 | 14,890 | 15,738 |
| California GO | 5.000% | 3/1/21 | 2,250 | 2,393 |
| California GO | 5.500% | 4/1/21 | 2,000 | 2,186 |
| California GO | 5.000% | 6/1/22 | 12,000 | 12,280 |
| California GO | 5.000% | 9/1/23 | 12,120 | 12,357 |
| California GO | 5.000% | 10/1/23 | 12,500 | 12,746 |
| California GO | 5.000% | 12/1/23 | 7,500 | 7,670 |
| California GO | 5.000% | 3/1/24 | 3,000 | 3,060 |
| California GO | 5.000% | 8/1/24 | 10,000 | 10,119 |
| California GO | 5.000% | 8/1/24 (4) | 33,025 | 33,930 |
| California GO | 5.000% | 10/1/24 | 16,940 | 17,116 |
| 1 California GO | 5.000% | 11/1/24 | 5,000 | 5,077 |
| California GO | 5.000% | 11/1/24 | 10,000 | 10,115 |
| California GO | 5.000% | 12/1/24 | 2,000 | 2,022 |
| California GO | 5.000% | 8/1/25 | 10,000 | 10,052 |
| California GO | 5.000% | 12/1/25 | 21,015 | 21,138 |
| California GO | 5.000% | 3/1/26 | 8,500 | 8,518 |
| California GO | 5.000% | 3/1/26 | 5,000 | 5,007 |
| California GO | 5.000% | 4/1/26 | 37,480 | 37,546 |
| 1 California GO | 5.000% | 11/1/26 | 7,500 | 7,517 |
| California GO | 5.000% | 4/1/27 | 24,285 | 24,203 |
| California GO | 5.750% | 4/1/27 | 31,455 | 32,979 |
| California GO | 4.500% | 8/1/27 | 6,000 | 5,516 |
| California GO | 5.000% | 3/1/28 | 10,855 | 10,682 |
| California GO | 5.750% | 4/1/28 | 30,000 | 31,226 |
| California GO | 5.000% | 6/1/28 | 10,005 | 9,845 |
| California GO | 5.250% | 3/1/30 | 20,000 | 20,042 |
| California GO | 4.500% | 8/1/30 | 5,000 | 4,487 |
| California GO | 5.000% | 3/1/31 | 5,535 | 5,370 |
38
California Intermediate-Term Tax-Exempt Fund
| | | | |
| | | | Face | Market |
| | | Maturity | Amount | Value |
| | Coupon | Date | ($000) | ($000) |
| California GO | 5.750% | 4/1/31 | 41,000 | 42,394 |
| California GO | 6.000% | 3/1/33 | 12,000 | 12,806 |
| California GO | 6.500% | 4/1/33 | 20,000 | 22,066 |
| 2 California GO TOB VRDO | 0.360% | 12/1/10 LOC | 8,595 | 8,595 |
| California Health Facilities Financing Authority | | | | |
| Revenue (Adventist Health System/West) | 5.000% | 3/1/16 | 2,170 | 2,244 |
| California Health Facilities Financing Authority | | | | |
| Revenue (Adventist Health System/West) | 5.000% | 3/1/19 | 1,025 | 1,039 |
| California Health Facilities Financing Authority | | | | |
| Revenue (Adventist Health System/West) | 5.000% | 3/1/33 | 2,000 | 1,836 |
| California Health Facilities Financing Authority | | | | |
| Revenue (California-Nevada Methodist Homes) | 5.000% | 7/1/26 | 1,740 | 1,681 |
| California Health Facilities Financing Authority | | | | |
| Revenue (Catholic Healthcare West) | 5.500% | 7/1/11 (14) | 2,675 | 2,684 |
| California Health Facilities Financing Authority | | | | |
| Revenue (Catholic Healthcare West) | 5.500% | 7/1/12 (14) | 2,465 | 2,472 |
| California Health Facilities Financing Authority | | | | |
| Revenue (Catholic Healthcare West) | 5.000% | 7/1/19 | 1,000 | 1,070 |
| California Health Facilities Financing Authority | | | | |
| Revenue (Catholic Healthcare West) | 5.500% | 7/1/25 | 5,000 | 5,191 |
| California Health Facilities Financing Authority | | | | |
| Revenue (Catholic Healthcare West) | 5.625% | 7/1/25 | 19,820 | 20,887 |
| California Health Facilities Financing Authority | | | | |
| Revenue (Catholic Healthcare West) | 6.000% | 7/1/29 | 3,000 | 3,173 |
| California Health Facilities Financing Authority | | | | |
| Revenue (Catholic Healthcare West) PUT | 5.000% | 7/2/12 | 8,000 | 8,390 |
| California Health Facilities Financing Authority | | | | |
| Revenue (Catholic Healthcare West) PUT | 5.000% | 7/1/14 | 39,000 | 43,043 |
| California Health Facilities Financing Authority | | | | |
| Revenue (Catholic Healthcare West) PUT | 5.000% | 7/1/14 | 9,000 | 9,738 |
| California Health Facilities Financing Authority | | | | |
| Revenue (Cedars-Sinai Medical Center) | 5.000% | 11/15/14 | 4,000 | 4,401 |
| California Health Facilities Financing Authority | | | | |
| Revenue (Cedars-Sinai Medical Center) | 5.000% | 11/15/16 | 2,000 | 2,169 |
| California Health Facilities Financing Authority | | | | |
| Revenue (Cedars-Sinai Medical Center) | 5.000% | 11/15/17 | 4,585 | 4,919 |
| California Health Facilities Financing Authority | | | | |
| Revenue (Children’s Hospital of Orange County) | 6.250% | 11/1/29 | 5,000 | 5,193 |
| California Health Facilities Financing Authority | | | | |
| Revenue (Kaiser Permanente) | 5.250% | 6/1/11 (ETM) | 7,250 | 7,250 |
| California Health Facilities Financing Authority | | | | |
| Revenue (Lucile Salter Packard Children’s | | | | |
| Hospital at Stanford) | 5.000% | 8/15/14 (2) | 2,280 | 2,446 |
| California Health Facilities Financing Authority | | | | |
| Revenue (Lucile Salter Packard Children’s | | | | |
| Hospital at Stanford) | 5.000% | 8/15/15 (2) | 2,245 | 2,387 |
| California Health Facilities Financing Authority | | | | |
| Revenue (Lucile Salter Packard Children’s | | | | |
| Hospital at Stanford) | 5.000% | 8/15/16 (2) | 2,515 | 2,652 |
| California Health Facilities Financing Authority | | | | |
| Revenue (Lucile Salter Packard Children’s | | | | |
| Hospital at Stanford) | 5.000% | 8/15/17 (2) | 2,630 | 2,747 |
| California Health Facilities Financing Authority | | | | |
| Revenue (Providence Health & Services) | 6.250% | 10/1/24 | 3,000 | 3,418 |
| California Health Facilities Financing Authority | | | | |
| Revenue (Providence Health & Services) | 6.250% | 10/1/28 | 4,000 | 4,472 |
39
California Intermediate-Term Tax-Exempt Fund
| | | | |
| | | | Face | Market |
| | | Maturity | Amount | Value |
| | Coupon | Date | ($000) | ($000) |
| California Health Facilities Financing Authority | | | | |
| Revenue (Scripps Health) | 5.000% | 10/1/17 | 2,515 | 2,780 |
| California Health Facilities Financing Authority | | | | |
| Revenue (Scripps Health) | 5.000% | 10/1/18 | 3,000 | 3,306 |
| California Health Facilities Financing Authority | | | | |
| Revenue (St. Joseph Health System) | 5.500% | 7/1/29 | 10,000 | 10,289 |
| California Health Facilities Financing Authority | | | | |
| Revenue (St. Joseph Health System) PUT | 5.000% | 10/16/14 | 15,000 | 16,518 |
| 2 California Health Facilities Financing Authority | | | | |
| Revenue (St. Joseph Health System) TOB VRDO | 0.300% | 12/7/10 | 7,500 | 7,500 |
| California Health Facilities Financing Authority | | | | |
| Revenue (Stanford Hospital) | 5.000% | 11/15/14 | 2,715 | 2,931 |
| California Health Facilities Financing Authority | | | | |
| Revenue (Stanford Hospital) | 5.000% | 11/15/15 | 3,000 | 3,206 |
| California Health Facilities Financing Authority | | | | |
| Revenue (Stanford Hospital) | 5.000% | 11/15/16 | 6,275 | 6,650 |
| California Health Facilities Financing Authority | | | | |
| Revenue (Stanford Hospital) PUT | 3.450% | 6/15/11 | 10,000 | 10,166 |
| California Health Facilities Financing Authority | | | | |
| Revenue (Sutter Health) | 5.500% | 8/15/12 (4) | 3,705 | 3,718 |
| 2 California Health Facilities Financing Authority | | | | |
| Revenue (Sutter Health) TOB VRDO | 0.300% | 12/7/10 | 17,500 | 17,500 |
| California Infrastructure & | | | | |
| Economic Development Bank Revenue | | | | |
| (Academy of Sciences) VRDO | 0.260% | 12/1/10 LOC | 12,900 | 12,900 |
| California Infrastructure & | | | | |
| Economic Development Bank Revenue | | | | |
| (Clean Water State Revolving Fund) | 5.000% | 10/1/14 | 2,500 | 2,686 |
| California Infrastructure & | | | | |
| Economic Development Bank Revenue | | | | |
| (Independent System Operator Corp. Project) | 5.000% | 2/1/11 | 10,000 | 10,063 |
| California Infrastructure & | | | | |
| Economic Development Bank Revenue | | | | |
| (Independent System Operator Corp. Project) | 5.000% | 2/1/13 | 8,325 | 8,865 |
| California Infrastructure & | | | | |
| Economic Development Bank Revenue | | | | |
| (J. David Gladstone Institutes Project) | 5.000% | 10/1/11 | 1,275 | 1,313 |
| California Infrastructure & | | | | |
| Economic Development Bank Revenue | | | | |
| (J. David Gladstone Institutes Project) | 5.000% | 10/1/12 | 2,950 | 3,065 |
| California Infrastructure & | | | | |
| Economic Development Bank Revenue | | | | |
| (J. David Gladstone Institutes Project) | 5.000% | 10/1/13 | 2,350 | 2,438 |
| California Infrastructure & | | | | |
| Economic Development Bank Revenue | | | | |
| (J. David Gladstone Institutes Project) | 5.500% | 10/1/14 | 2,250 | 2,338 |
| California Infrastructure & | | | | |
| Economic Development Bank Revenue | | | | |
| (J. David Gladstone Institutes Project) | 5.500% | 10/1/15 | 2,430 | 2,518 |
| California Infrastructure & | | | | |
| Economic Development Bank Revenue | | | | |
| (J. David Gladstone Institutes Project) | 5.500% | 10/1/16 | 3,620 | 3,742 |
| California Infrastructure & | | | | |
| Economic Development Bank Revenue | | | | |
| (J. David Gladstone Institutes Project) | 5.500% | 10/1/17 | 3,820 | 3,937 |
40
California Intermediate-Term Tax-Exempt Fund
| | | | |
| | | | Face | Market |
| | | Maturity | Amount | Value |
| | Coupon | Date | ($000) | ($000) |
| 3 California Infrastructure & | | | | |
| Economic Development Bank Revenue | | | | |
| (J. Paul Getty Trust) PUT | 3.900% | 12/1/11 | 9,000 | 9,285 |
| California Infrastructure & | | | | |
| Economic Development Bank Revenue | | | | |
| (J. Paul Getty Trust) PUT | 4.000% | 12/1/11 | 15,745 | 16,259 |
| California Infrastructure & | | | | |
| Economic Development Bank Revenue | | | | |
| (J. Paul Getty Trust) VRDO | 0.230% | 12/1/10 | 2,800 | 2,800 |
| California Infrastructure & | | | | |
| Economic Development Bank Revenue | | | | |
| (J. Paul Getty Trust) VRDO | 0.230% | 12/1/10 | 2,200 | 2,200 |
| California Infrastructure & | | | | |
| Economic Development Bank Revenue | | | | |
| (J. Paul Getty Trust) VRDO | 2.742% | 12/1/10 | 1,385 | 1,385 |
| California Infrastructure & | | | | |
| Economic Development Bank Revenue | | | | |
| (Pacific Gas & Electric Co.) VRDO | 0.270% | 12/1/10 LOC | 4,600 | 4,600 |
| California Infrastructure & | | | | |
| Economic Development Bank Revenue | | | | |
| (Science Center Phase II Project) | 5.000% | 5/1/18 (14) | 1,785 | 1,854 |
| California Infrastructure & | | | | |
| Economic Development Bank Revenue | | | | |
| (Science Center Phase II Project) | 5.000% | 5/1/19 (14) | 1,040 | 1,067 |
| California Infrastructure & | | | | |
| Economic Development Bank Revenue | | | | |
| (Science Center Phase II Project) | 5.000% | 5/1/21 (14) | 1,145 | 1,149 |
| California Infrastructure & | | | | |
| Economic Development Bank Revenue | | | | |
| (State Revolving Fund) | 5.000% | 10/1/29 | 7,000 | 7,129 |
| California Infrastructure & | | | | |
| Economic Development Bank Revenue | | | | |
| (Workers’ Compensation Relief) | 5.250% | 10/1/13 (2) | 18,000 | 19,872 |
| California Infrastructure & | | | | |
| Economic Development Bank Revenue | | | | |
| (Workers’ Compensation Relief) | 5.250% | 10/1/14 (2) | 25,815 | 28,242 |
| California Municipal Finance Authority | | | | |
| (Community Hospitals of Central California | | | | |
| Obligated Group) COP | 5.375% | 2/1/29 | 16,600 | 15,565 |
| California Pollution Control Financing Authority | | | | |
| Environmental Improvement Revenue | | | | |
| (BP West Coast Products LLC Project) PUT | 2.600% | 9/2/14 | 13,550 | 13,550 |
| California Pollution Control Financing Authority | | | | |
| Revenue (San Diego Gas & Electric Co.) | 5.900% | 6/1/14 (14) | 17,135 | 19,387 |
| California Public Works Board Lease Revenue | | | | |
| (Butterfield State Office Complex) | 5.000% | 6/1/20 | 3,895 | 4,059 |
| California Public Works Board Lease Revenue | | | | |
| (Department of Corrections) | 5.000% | 6/1/11 | 3,500 | 3,568 |
| California Public Works Board Lease Revenue | | | | |
| (Department of Corrections) | 5.000% | 6/1/12 | 5,000 | 5,224 |
| California Public Works Board Lease Revenue | | | | |
| (Department of Corrections) | 5.000% | 12/1/12 (14) | 10,625 | 11,234 |
| California Public Works Board Lease Revenue | | | | |
| (Department of Corrections) | 5.000% | 1/1/18 (2) | 27,790 | 29,384 |
| California Public Works Board Lease Revenue | | | | |
| (Department of Corrections) | 5.000% | 1/1/21 | 3,975 | 4,028 |
41
California Intermediate-Term Tax-Exempt Fund
| | | | |
| | | | Face | Market |
| | | Maturity | Amount | Value |
| | Coupon | Date | ($000) | ($000) |
| California Public Works Board Lease Revenue | | | | |
| (Department of Corrections) | 5.500% | 6/1/21 | 10,000 | 10,312 |
| California Public Works Board Lease Revenue | | | | |
| (Department of Corrections) | 5.500% | 6/1/22 | 10,000 | 10,245 |
| California Public Works Board Lease Revenue | | | | |
| (Department of General Services) | 6.000% | 4/1/27 | 5,000 | 5,257 |
| California Public Works Board Lease Revenue | | | | |
| (Department of Mental Health) | 5.500% | 6/1/15 | 1,500 | 1,628 |
| California Public Works Board Lease Revenue | | | | |
| (Department of Mental Health) | 5.500% | 6/1/17 | 8,000 | 8,515 |
| California Public Works Board Lease Revenue | | | | |
| (Department of Mental Health) | 5.500% | 6/1/18 | 5,000 | 5,263 |
| California Public Works Board Lease Revenue | | | | |
| (Regents of The University of California) | 5.500% | 6/1/14 | 9,750 | 10,513 |
| California Public Works Board Lease Revenue | | | | |
| (Regents of The University of California) | 5.000% | 6/1/18 (14) | 10,310 | 11,764 |
| California Public Works Board Lease Revenue | | | | |
| (Regents of The University of California) | 5.000% | 6/1/20 (14) | 7,670 | 8,613 |
| California Public Works Board Lease Revenue | | | | |
| (Regents of The University of California) | 5.000% | 4/1/25 | 5,765 | 5,976 |
| California Public Works Board Lease Revenue | | | | |
| (Regents of The University of California) | 5.250% | 11/1/26 (14) | 9,010 | 9,303 |
| California Public Works Board Lease Revenue | | | | |
| (Trustees of The California State University) | 5.300% | 10/1/15 (2) | 6,655 | 6,667 |
| California Public Works Board Lease Revenue | | | | |
| (Trustees of The California State University) | 5.375% | 10/1/16 (14) | 4,750 | 4,758 |
| California Public Works Board Lease Revenue | | | | |
| (Various Capital Projects) | 5.000% | 11/1/13 | 2,000 | 2,141 |
| California Public Works Board Lease Revenue | | | | |
| (Various Capital Projects) | 5.000% | 11/1/14 | 4,745 | 5,138 |
| California Public Works Board Lease Revenue | | | | |
| (Various Capital Projects) | 5.000% | 11/1/16 | 6,395 | 6,983 |
| California Public Works Board Lease Revenue | | | | |
| (Various Capital Projects) | 5.000% | 11/1/18 | 4,000 | 4,295 |
| California Public Works Board Lease Revenue | | | | |
| (Various Capital Projects) | 5.250% | 11/1/20 | 5,000 | 5,262 |
| California State University Revenue Systemwide | 5.375% | 11/1/14 (14) | 5,390 | 5,897 |
| California State University Revenue Systemwide | 5.000% | 11/1/22 (2) | 18,440 | 19,261 |
| California State University Revenue Systemwide | 5.000% | 11/1/24 | 8,690 | 9,152 |
| California State University Revenue Systemwide | 5.000% | 11/1/25 | 11,820 | 12,371 |
| California State University Revenue Systemwide | 5.000% | 11/1/26 | 12,530 | 13,025 |
| California State University Revenue Systemwide | 5.000% | 11/1/27 | 5,000 | 5,169 |
| 2 California State University Revenue Systemwide | | | | |
| TOB VRDO | 0.300% | 12/7/10 (12) | 5,000 | 5,000 |
| California Statewide Communities | | | | |
| Development Authority Health Facility Revenue | | | | |
| (Adventist Health System/West) | 5.000% | 3/1/25 | 14,975 | 14,656 |
| California Statewide Communities | | | | |
| Development Authority Health Facility Revenue | | | | |
| (Memorial Health Services) | 6.000% | 10/1/13 | 6,920 | 7,637 |
| California Statewide Communities | | | | |
| Development Authority Health Facility Revenue | | | | |
| (Memorial Health Services) | 6.000% | 10/1/14 | 5,335 | 5,846 |
| California Statewide Communities | | | | |
| Development Authority Health Facility Revenue | | | | |
| (Memorial Health Services) | 6.000% | 10/1/15 | 7,780 | 8,455 |
42
California Intermediate-Term Tax-Exempt Fund
| | | | |
| | | | Face | Market |
| | | Maturity | Amount | Value |
| | Coupon | Date | ($000) | ($000) |
| California Statewide Communities | | | | |
| Development Authority Health Facility Revenue | | | | |
| (Memorial Health Services) | 6.000% | 10/1/23 | 10,000 | 10,437 |
| California Statewide Communities | | | | |
| Development Authority Pollution Control Revenue | | | | |
| (Southern California Edison Co.) PUT | 4.250% | 11/1/16 (3) | 15,000 | 16,302 |
| California Statewide Communities | | | | |
| Development Authority Pollution Control Revenue | | | | |
| (Southern California Edison Co.) PUT | 4.250% | 11/1/16 (3) | 25,000 | 27,170 |
| California Statewide Communities | | | | |
| Development Authority Revenue | | | | |
| (Children’s Hospital of Los Angeles) | 6.000% | 6/1/11 (14) | 2,365 | 2,411 |
| California Statewide Communities | | | | |
| Development Authority Revenue | | | | |
| (Cottage Health System Obligated Group) | 5.250% | 11/1/30 | 10,000 | 10,084 |
| California Statewide Communities | | | | |
| Development Authority Revenue | | | | |
| (Daughters of Charity Health System - | | | | |
| St. Francis Medical Center) | 5.250% | 7/1/25 | 2,100 | 1,939 |
| California Statewide Communities | | | | |
| Development Authority Revenue | | | | |
| (Daughters of Charity Health System - | | | | |
| St. Francis Medical Center) | 5.250% | 7/1/11 | 1,740 | 1,762 |
| California Statewide Communities | | | | |
| Development Authority Revenue | | | | |
| (Daughters of Charity Health System - | | | | |
| St. Francis Medical Center) | 5.250% | 7/1/12 | 1,500 | 1,545 |
| California Statewide Communities | | | | |
| Development Authority Revenue | | | | |
| (Daughters of Charity Health System - | | | | |
| St. Francis Medical Center) | 5.250% | 7/1/13 | 1,250 | 1,300 |
| California Statewide Communities | | | | |
| Development Authority Revenue | | | | |
| (Daughters of Charity Health System - | | | | |
| St. Francis Medical Center) | 5.000% | 7/1/22 | 5,155 | 4,911 |
| California Statewide Communities | | | | |
| Development Authority Revenue | | | | |
| (Huntington Memorial Hospital) | 5.000% | 7/1/18 | 6,190 | 6,481 |
| California Statewide Communities | | | | |
| Development Authority Revenue | | | | |
| (Kaiser Permanente) | 5.000% | 4/1/13 | 14,000 | 15,053 |
| California Statewide Communities | | | | |
| Development Authority Revenue | | | | |
| (Kaiser Permanente) | 5.000% | 4/1/16 | 6,970 | 7,721 |
| California Statewide Communities | | | | |
| Development Authority Revenue | | | | |
| (Kaiser Permanente) | 5.000% | 4/1/19 | 3,900 | 4,243 |
| California Statewide Communities | | | | |
| Development Authority Revenue | | | | |
| (Kaiser Permanente) PUT | 3.450% | 5/1/11 | 8,750 | 8,859 |
| California Statewide Communities | | | | |
| Development Authority Revenue | | | | |
| (Lodi Memorial Hospital) | 5.000% | 12/1/22 | 8,000 | 8,076 |
43
California Intermediate-Term Tax-Exempt Fund
| | | | |
| | | | Face | Market |
| | | Maturity | Amount | Value |
| | Coupon | Date | ($000) | ($000) |
| California Statewide Communities | | | | |
| Development Authority Revenue | | | | |
| (Los Angeles Orthopaedic Hospital | | | | |
| Foundation & Orthopaedic Hospital) | 5.125% | 6/1/13 (2) | 1,530 | 1,532 |
| California Statewide Communities | | | | |
| Development Authority Revenue | | | | |
| (Los Angeles Orthopaedic Hospital | | | | |
| Foundation & Orthopaedic Hospital) | 5.250% | 6/1/14 (2) | 1,610 | 1,612 |
| California Statewide Communities | | | | |
| Development Authority Revenue | | | | |
| (Proposition 1A Receivables Program) | 5.000% | 6/15/13 | 28,000 | 30,132 |
| California Statewide Communities | | | | |
| Development Authority Revenue | | | | |
| (Sherman Oaks Project) | 5.500% | 8/1/15 (2) | 4,685 | 5,126 |
| California Statewide Communities | | | | |
| Development Authority Revenue | | | | |
| (St. Joseph Health System) | 4.500% | 7/1/18 (4) | 13,395 | 14,071 |
| 2 California Statewide Communities | | | | |
| Development Authority Revenue | | | | |
| (Sutter Health) TOB VRDO | 0.300% | 12/7/10 | 17,240 | 17,240 |
| California Statewide Communities | | | | |
| Development Authority Senior Living Revenue | | | | |
| (Southern California Presbyterian Homes) | 7.000% | 11/15/29 | 2,000 | 2,121 |
| California Statewide Communities | | | | |
| Development Authority Student Housing | | | | |
| Revenue (CHF-Irvine LLC - UCI East Campus | | | | |
| Apartments Phase II) | 5.500% | 5/15/26 | 5,000 | 4,938 |
| Central CA Unified School District GO | 5.500% | 8/1/29 (12) | 3,000 | 3,236 |
| Central Valley CA Financing Authority | | | | |
| Cogeneration Project Revenue | | | | |
| (Carson Ice-Gen Project) | 5.000% | 7/1/17 | 1,000 | 1,124 |
| Central Valley CA Financing Authority | | | | |
| Cogeneration Project Revenue | | | | |
| (Carson Ice-Gen Project) | 5.000% | 7/1/19 | 765 | 848 |
| Central Valley CA Financing Authority | | | | |
| Cogeneration Project Revenue | | | | |
| (Carson Ice-Gen Project) | 5.250% | 7/1/20 | 1,025 | 1,143 |
| Chabot-Las Positas CA | | | | |
| Community College District GO | 5.000% | 8/1/29 (2) | 5,335 | 5,406 |
| Clovis CA Unified School District GO | 0.000% | 8/1/12 (14) | 4,715 | 4,582 |
| Clovis CA Unified School District GO | 0.000% | 8/1/18 (14) | 3,645 | 2,669 |
| Compton CA Unified School District GO | 5.250% | 9/1/13 (Prere.) | 1,295 | 1,455 |
| Compton CA Unified School District GO | 5.250% | 9/1/13 (Prere.) | 1,460 | 1,640 |
| Compton CA Unified School District GO | 5.250% | 9/1/13 (Prere.) | 1,645 | 1,848 |
| Contra Costa County CA Public Financing | | | | |
| Authority Lease Revenue | 5.000% | 6/1/22 (14) | 15,300 | 15,808 |
| Corona-Norco CA Unified School District GO | 0.000% | 8/1/20 (12) | 1,825 | 1,155 |
| Corona-Norco CA Unified School District GO | 0.000% | 8/1/21 (12) | 2,010 | 1,183 |
| Corona-Norco CA Unified School District GO | 0.000% | 8/1/22 (12) | 1,700 | 903 |
| Corona-Norco CA Unified School District GO | 0.000% | 8/1/23 (12) | 1,000 | 494 |
| Corona-Norco CA Unified School District GO | 0.000% | 8/1/25 (12) | 1,325 | 560 |
| Corona-Norco CA Unified School District GO | 0.000% | 8/1/26 (12) | 1,530 | 599 |
| Corona-Norco CA Unified School District GO | 0.000% | 8/1/27 (12) | 1,500 | 543 |
| Corona-Norco CA Unified School District GO | 0.000% | 8/1/28 (12) | 1,290 | 433 |
| Culver City CA Redevelopment Agency | | | | |
| Tax Allocation Revenue | 5.375% | 11/1/16 (4) | 3,260 | 3,303 |
44
California Intermediate-Term Tax-Exempt Fund
| | | | |
| | | | Face | Market |
| | | Maturity | Amount | Value |
| | Coupon | Date | ($000) | ($000) |
| East Bay CA Regional Park District Revenue | 5.000% | 9/1/28 | 4,415 | 4,718 |
| Eastern California Municipal Water District | | | | |
| Water & Sewer COP | 5.000% | 7/1/26 | 5,245 | 5,467 |
| Eastern California Municipal Water District | | | | |
| Water & Sewer COP | 5.000% | 7/1/27 | 6,220 | 6,434 |
| Eastern California Municipal Water District | | | | |
| Water & Sewer COP | 5.000% | 7/1/28 | 1,000 | 1,028 |
| Fontana CA Public Financing Authority | | | | |
| Subordinate Lien Tax Allocation Revenue | 5.000% | 10/1/21 (2) | 3,335 | 3,353 |
| Fontana CA Public Financing Authority | | | | |
| Subordinate Lien Tax Allocation Revenue | 5.000% | 10/1/23 (2) | 2,875 | 2,829 |
| Fontana CA Public Financing Authority | | | | |
| Subordinate Lien Tax Allocation Revenue | 5.000% | 10/1/24 (2) | 3,475 | 3,377 |
| Fontana CA Public Financing Authority | | | | |
| Subordinate Lien Tax Allocation Revenue | 5.000% | 10/1/26 (2) | 4,480 | 4,268 |
| Fontana CA Unified School District GO | 5.250% | 8/1/26 (4) | 4,350 | 4,585 |
| Foothill-De Anza CA | | | | |
| Community College District GO | 6.000% | 8/1/11 | 1,330 | 1,349 |
| Foothill/Eastern Corridor Agency | | | | |
| California Toll Road Revenue | 5.250% | 1/15/13 (14) | 5,000 | 5,002 |
| Foothill/Eastern Corridor Agency | | | | |
| California Toll Road Revenue | 5.375% | 1/15/15 (14) | 5,000 | 4,952 |
| Foothill/Eastern Corridor Agency | | | | |
| California Toll Road Revenue | 0.000% | 1/1/27 (ETM) | 10,000 | 5,157 |
| Foothill/Eastern Corridor Agency | | | | |
| California Toll Road Revenue | 0.000% | 1/1/28 (ETM) | 7,655 | 3,725 |
| Fresno CA Sewer Revenue | 5.000% | 9/1/24 (12) | 830 | 876 |
| Golden State Tobacco Securitization Corp. | | | | |
| California | 5.000% | 6/1/13 (Prere.) | 1,930 | 2,117 |
| Golden State Tobacco Securitization Corp. | | | | |
| California | 5.500% | 6/1/13 (Prere.) | 7,530 | 8,352 |
| Golden State Tobacco Securitization Corp. | | | | |
| California | 5.500% | 6/1/13 (Prere.) | 5,000 | 5,546 |
| Golden State Tobacco Securitization Corp. | | | | |
| California | 6.250% | 6/1/33 (Prere.) | 78,395 | 86,025 |
| Golden State Tobacco Securitization Corp. | | | | |
| California | 7.800% | 6/1/13 (Prere.) | 25,170 | 29,323 |
| Golden State Tobacco Securitization Corp. | | | | |
| California | 4.500% | 6/1/27 | 76,935 | 64,595 |
| Golden State Tobacco Securitization Corp. | | | | |
| California | 5.000% | 6/1/33 | 17,500 | 12,931 |
| Golden State Tobacco Securitization Corp. | | | | |
| California | 0.000% | 6/1/37 | 30,000 | 18,105 |
| Grossmont CA Union High School District GO | 0.000% | 8/1/28 | 3,210 | 1,078 |
| Grossmont CA Union High School District GO | 0.000% | 8/1/29 | 6,965 | 2,184 |
| Grossmont-Cuyamaca CA | | | | |
| Community College District GO | 0.000% | 8/1/25 (12) | 14,010 | 6,117 |
| Grossmont-Cuyamaca CA | | | | |
| Community College District GO | 0.000% | 8/1/28 (12) | 21,875 | 7,501 |
| Huntington Beach CA Union High School District | | | | |
| GO | 5.000% | 8/1/27 (4) | 3,530 | 3,586 |
| Inland Empire Tobacco Securitization Authority | | | | |
| California Revenue | 4.625% | 6/1/21 | 9,210 | 7,366 |
| Intermodal Container Transfer Facility | | | | |
| Joint Power Authority California Revenue | | | | |
| (Union Pacific Railroad Co.) | 5.000% | 11/1/11 (2) | 1,665 | 1,727 |
45
California Intermediate-Term Tax-Exempt Fund
| | | | |
| | | | Face | Market |
| | | Maturity | Amount | Value |
| | Coupon | Date | ($000) | ($000) |
| Intermodal Container Transfer Facility | | | | |
| Joint Power Authority California Revenue | | | | |
| (Union Pacific Railroad Co.) | 5.125% | 11/1/12 (2) | 2,540 | 2,729 |
| Intermodal Container Transfer Facility | | | | |
| Joint Power Authority California Revenue | | | | |
| (Union Pacific Railroad Co.) | 5.125% | 11/1/13 (2) | 1,870 | 2,063 |
| Irvine CA Assessment District No. 89-10 | | | | |
| Improvement Revenue (Northwest Irvine) VRDO | 0.270% | 12/1/10 LOC | 6,700 | 6,700 |
| Irvine CA Assessment District No. 97-17 | | | | |
| Improvement Revenue VRDO | 0.270% | 12/1/10 LOC | 3,000 | 3,000 |
| Irvine CA Public Facilities & | | | | |
| Infrastructure Authority Assessment Revenue | 4.600% | 9/2/15 (2) | 2,855 | 2,905 |
| Irvine CA Public Facilities & | | | | |
| Infrastructure Authority Assessment Revenue | 4.700% | 9/2/16 (2) | 2,965 | 3,010 |
| Irvine CA Unified School District | | | | |
| Financing Authority Special Tax Revenue | 5.000% | 9/1/25 (2) | 8,645 | 8,407 |
| Kings River Conservation District California COP | 5.000% | 5/1/12 | 2,715 | 2,829 |
| Kings River Conservation District California COP | 5.000% | 5/1/13 | 2,315 | 2,461 |
| Kings River Conservation District California COP | 5.000% | 5/1/14 | 3,500 | 3,773 |
| Kings River Conservation District California COP | 5.000% | 5/1/15 (ETM) | 2,590 | 2,996 |
| Kings River Conservation District California COP | 5.000% | 5/1/15 | 1,755 | 1,908 |
| Loma Linda CA Hospital Revenue | | | | |
| (Loma Linda University) | 5.000% | 12/1/18 | 8,665 | 8,830 |
| Long Beach CA Community College District GO | 0.000% | 6/1/29 (4) | 6,380 | 2,020 |
| Long Beach CA Finance Authority Lease Revenue | 6.000% | 11/1/17 (2) | 3,670 | 4,019 |
| Long Beach CA Finance Authority Lease Revenue | | | | |
| (Aquarium of the South Pacific) | 5.500% | 11/1/14 (2) | 3,435 | 3,506 |
| Long Beach CA Finance Authority | | | | |
| Natural Gas Purchase Revenue | 5.250% | 11/15/20 | 3,000 | 3,098 |
| Long Beach CA Finance Authority | | | | |
| Natural Gas Purchase Revenue | 1.601% | 11/15/25 | 16,845 | 12,410 |
| Long Beach CA Finance Authority | | | | |
| Natural Gas Purchase Revenue | 1.621% | 11/15/26 | 22,025 | 16,031 |
| Los Angeles CA Community College District GO | 5.000% | 8/1/21 (4) | 10,000 | 10,543 |
| Los Angeles CA Community College District GO | 5.000% | 8/1/24 | 6,500 | 6,825 |
| Los Angeles CA Community College District GO | 5.000% | 8/1/25 | 5,000 | 5,216 |
| Los Angeles CA Community College District GO | 5.500% | 8/1/25 | 5,000 | 5,445 |
| Los Angeles CA Community College District GO | 5.000% | 8/1/26 | 6,630 | 6,869 |
| Los Angeles CA Community College District GO | 5.000% | 8/1/27 | 4,250 | 4,372 |
| Los Angeles CA Community College District GO | 5.000% | 8/1/27 | 6,960 | 7,182 |
| 2 Los Angeles CA Community College District | | | | |
| GO TOB VRDO | 0.280% | 12/1/10 | 2,500 | 2,500 |
| Los Angeles CA Convention & | | | | |
| Exhibit Center Authority Lease Revenue | 6.125% | 8/15/11 (14) | 1,300 | 1,349 |
| Los Angeles CA COP | 5.000% | 4/1/14 (2) | 1,435 | 1,489 |
| Los Angeles CA COP | 5.000% | 4/1/15 (2) | 1,560 | 1,609 |
| Los Angeles CA COP | 5.000% | 4/1/16 (2) | 1,725 | 1,774 |
| Los Angeles CA COP | 5.000% | 4/1/18 (2) | 1,950 | 1,994 |
| Los Angeles CA Department of Airports | | | | |
| International Airport Revenue | 5.000% | 5/15/13 (14) | 10,500 | 11,364 |
| Los Angeles CA Department of Airports | | | | |
| International Airport Revenue | 5.000% | 5/15/24 | 4,000 | 4,187 |
| Los Angeles CA Department of Airports | | | | |
| International Airport Revenue | 5.250% | 5/15/25 | 3,000 | 3,168 |
| Los Angeles CA Department of Airports | | | | |
| International Airport Revenue | 5.250% | 5/15/28 | 5,000 | 5,208 |
46
California Intermediate-Term Tax-Exempt Fund
| | | | |
| | | | Face | Market |
| | | Maturity | Amount | Value |
| | Coupon | Date | ($000) | ($000) |
| Los Angeles CA Department of Airports | | | | |
| International Airport Revenue | 5.000% | 5/15/29 | 4,385 | 4,374 |
| Los Angeles CA Department of Airports | | | | |
| International Airport Revenue | 5.250% | 5/15/29 | 5,000 | 5,177 |
| Los Angeles CA Department of Airports | | | | |
| International Airport Revenue | 5.000% | 5/15/30 | 10,000 | 10,188 |
| Los Angeles CA Department of | | | | |
| Water & Power Revenue | 5.000% | 7/1/23 | 1,335 | 1,467 |
| Los Angeles CA Department of | | | | |
| Water & Power Revenue | 5.000% | 7/1/23 (4) | 20,605 | 21,868 |
| Los Angeles CA Department of | | | | |
| Water & Power Revenue | 5.000% | 7/1/24 | 2,770 | 3,007 |
| Los Angeles CA Department of | | | | |
| Water & Power Revenue | 5.000% | 7/1/26 | 2,000 | 2,141 |
| Los Angeles CA Department of | | | | |
| Water & Power Revenue | 5.000% | 7/1/26 | 2,350 | 2,518 |
| Los Angeles CA Department of | | | | |
| Water & Power Revenue | 5.000% | 7/1/27 | 5,000 | 5,318 |
| Los Angeles CA Department of | | | | |
| Water & Power Revenue | 5.000% | 7/1/27 | 1,655 | 1,767 |
| Los Angeles CA Department of | | | | |
| Water & Power Revenue | 5.000% | 7/1/28 | 2,000 | 2,123 |
| Los Angeles CA Department of | | | | |
| Water & Power Revenue | 5.000% | 7/1/29 | 1,670 | 1,760 |
| Los Angeles CA Department of | | | | |
| Water & Power Revenue VRDO | 3.050% | 12/1/10 | 5,000 | 5,000 |
| Los Angeles CA GO | 5.250% | 9/1/12 (3) | 2,000 | 2,154 |
| Los Angeles CA GO | 5.000% | 9/1/19 (14) | 4,055 | 4,486 |
| Los Angeles CA Municipal Improvement Corp. | | | | |
| Lease Revenue | 5.000% | 9/1/12 (14) | 7,480 | 7,957 |
| Los Angeles CA Municipal Improvement Corp. | | | | |
| Lease Revenue | 5.000% | 8/1/25 (14) | 7,725 | 7,781 |
| Los Angeles CA Municipal Improvement Corp. | | | | |
| Lease Revenue | 5.000% | 8/1/28 (14) | 8,980 | 9,000 |
| Los Angeles CA Municipal Improvement Corp. | | | | |
| Lease Revenue (Police Headquarters Facility) | 5.000% | 1/1/21 (14) | 10,830 | 11,249 |
| Los Angeles CA Municipal Improvement Corp. | | | | |
| Lease Revenue (Police Headquarters Facility) | 5.000% | 1/1/22 (14) | 6,500 | 6,664 |
| Los Angeles CA Municipal Improvement Corp. | | | | |
| Lease Revenue (Police Headquarters Facility) | 5.000% | 1/1/23 (14) | 14,700 | 14,977 |
| Los Angeles CA Unified School District GO | 5.500% | 7/1/12 (14) | 5,240 | 5,606 |
| Los Angeles CA Unified School District GO | 6.000% | 7/1/12 (3) | 1,470 | 1,582 |
| Los Angeles CA Unified School District GO | 5.000% | 7/1/13 (Prere.) | 3,900 | 4,318 |
| Los Angeles CA Unified School District GO | 5.000% | 7/1/13 | 5,000 | 5,461 |
| Los Angeles CA Unified School District GO | 5.000% | 7/1/13 (4) | 4,650 | 5,079 |
| Los Angeles CA Unified School District GO | 6.000% | 7/1/13 (3) | 3,745 | 4,173 |
| Los Angeles CA Unified School District GO | 5.000% | 7/1/14 | 5,000 | 5,572 |
| Los Angeles CA Unified School District GO | 5.000% | 7/1/14 (ETM) | 5,000 | 5,705 |
| Los Angeles CA Unified School District GO | 6.000% | 7/1/14 (3) | 1,440 | 1,649 |
| Los Angeles CA Unified School District GO | 5.000% | 7/1/15 | 6,350 | 7,178 |
| Los Angeles CA Unified School District GO | 5.000% | 7/1/16 (3) | 2,000 | 2,292 |
| Los Angeles CA Unified School District GO | 5.000% | 7/1/16 (4) | 3,000 | 3,266 |
| Los Angeles CA Unified School District GO | 5.000% | 7/1/17 (4) | 3,765 | 4,323 |
| Los Angeles CA Unified School District GO | 5.000% | 7/1/17 (4) | 5,000 | 5,429 |
| Los Angeles CA Unified School District GO | 5.500% | 7/1/17 (3) | 5,000 | 5,886 |
| Los Angeles CA Unified School District GO | 5.000% | 7/1/18 | 8,360 | 9,538 |
47
California Intermediate-Term Tax-Exempt Fund
| | | | |
| | | | Face | Market |
| | | Maturity | Amount | Value |
| | Coupon | Date | ($000) | ($000) |
| Los Angeles CA Unified School District GO | 5.000% | 7/1/18 (2) | 5,000 | 5,621 |
| Los Angeles CA Unified School District GO | 5.000% | 7/1/18 (2) | 4,000 | 4,427 |
| Los Angeles CA Unified School District GO | 5.000% | 7/1/19 (3) | 5,000 | 5,452 |
| Los Angeles CA Unified School District GO | 5.000% | 7/1/19 (3) | 5,000 | 5,475 |
| Los Angeles CA Unified School District GO | 5.000% | 7/1/20 (3) | 5,000 | 5,380 |
| Los Angeles CA Unified School District GO | 5.000% | 7/1/20 (3) | 10,000 | 10,760 |
| Los Angeles CA Unified School District GO | 5.000% | 7/1/20 (2) | 14,135 | 15,224 |
| Los Angeles CA Unified School District GO | 5.000% | 7/1/21 (2) | 15,940 | 16,939 |
| Los Angeles CA Unified School District GO | 5.000% | 7/1/22 (2) | 16,760 | 17,647 |
| Los Angeles CA Unified School District GO | 4.500% | 7/1/23 (4) | 30,825 | 30,902 |
| Los Angeles CA Unified School District GO | 5.000% | 7/1/23 (2) | 6,000 | 6,307 |
| Los Angeles CA Unified School District GO | 5.000% | 7/1/23 (4) | 12,975 | 13,639 |
| Los Angeles CA Unified School District GO | 5.000% | 7/1/24 (4) | 17,210 | 17,939 |
| Los Angeles CA Unified School District GO | 5.000% | 7/1/25 (2) | 10,235 | 10,556 |
| Los Angeles CA Unified School District GO | 5.250% | 7/1/25 | 1,600 | 1,701 |
| Los Angeles CA Unified School District GO | 4.500% | 7/1/26 (2) | 10,000 | 9,727 |
| Los Angeles CA Unified School District GO | 5.000% | 7/1/26 | 6,270 | 6,509 |
| Los Angeles CA Unified School District GO | 5.000% | 7/1/26 | 5,710 | 5,928 |
| Los Angeles CA Unified School District GO | 5.000% | 7/1/27 | 1,595 | 1,643 |
| Los Angeles CA Unified School District GO | 4.500% | 1/1/28 (14) | 7,725 | 7,259 |
| Los Angeles CA Unified School District GO | 5.000% | 7/1/28 (2) | 7,845 | 7,971 |
| Los Angeles CA Unified School District GO | 5.250% | 7/1/28 | 5,000 | 5,222 |
| Los Angeles CA Unified School District GO | 5.000% | 7/1/30 (2) | 6,485 | 6,538 |
| Los Angeles CA Unified School District GO | 5.000% | 7/1/30 (2) | 6,000 | 6,041 |
| Los Angeles CA Wastewater System Revenue | 5.000% | 6/1/26 (14) | 26,785 | 27,466 |
| 2 Los Angeles California | | | | |
| Harbor Department Revenue TOB VRDO | 0.290% | 12/7/10 | 5,395 | 5,395 |
| Los Angeles County CA | | | | |
| Capital Asset Leasing Corp. Revenue | 6.000% | 12/1/11 (2) | 2,360 | 2,433 |
| Los Angeles County CA | | | | |
| Capital Asset Leasing Corp. Revenue | 6.000% | 12/1/13 (2) | 2,760 | 2,940 |
| Los Angeles County CA Metropolitan | | | | |
| Transportation Authority Sales Tax Revenue | 6.000% | 7/1/11 (2) | 2,745 | 2,835 |
| Los Angeles County CA Metropolitan | | | | |
| Transportation Authority Sales Tax Revenue | 5.000% | 7/1/13 (12) | 1,450 | 1,600 |
| Los Angeles County CA Metropolitan | | | | |
| Transportation Authority Sales Tax Revenue | 5.000% | 7/1/17 (4) | 10,000 | 10,985 |
| Los Angeles County CA Metropolitan | | | | |
| Transportation Authority Sales Tax Revenue | 5.000% | 7/1/20 | 4,000 | 4,579 |
| Los Angeles County CA Metropolitan | | | | |
| Transportation Authority Sales Tax Revenue | | | | |
| VRDO | 0.260% | 12/1/10 | 3,150 | 3,150 |
| Los Angeles County CA Public Works | | | | |
| Financing Authority Lease Revenue | 5.000% | 12/1/14 (14) | 24,180 | 26,776 |
| Los Angeles County CA Public Works | | | | |
| Financing Authority Lease Revenue | 5.000% | 12/1/15 (14) | 8,540 | 9,547 |
| Los Angeles County CA Public Works | | | | |
| Financing Authority Lease Revenue | 5.000% | 12/1/19 (14) | 4,860 | 5,135 |
| Los Angeles County CA Public Works | | | | |
| Financing Authority Lease Revenue | 5.000% | 12/1/20 (14) | 6,155 | 6,423 |
| Los Angeles County CA Public Works | | | | |
| Financing Authority Lease Revenue | 5.000% | 12/1/21 (14) | 6,460 | 6,674 |
| Los Angeles County CA Public Works | | | | |
| Financing Authority Lease Revenue | 5.000% | 12/1/22 (14) | 6,790 | 6,963 |
| Los Angeles County CA Public Works | | | | |
| Financing Authority Lease Revenue | 5.000% | 12/1/23 (14) | 2,175 | 2,219 |
48
California Intermediate-Term Tax-Exempt Fund
| | | | |
| | | | Face | Market |
| | | Maturity | Amount | Value |
| | Coupon | Date | ($000) | ($000) |
| Los Angeles County CA Public Works | | | | |
| Financing Authority Lease Revenue | 5.000% | 12/1/24 (14) | 3,095 | 3,135 |
| Los Angeles County CA Public Works | | | | |
| Financing Authority Revenue | | | | |
| (Regional Park & Open Space District) | 5.250% | 10/1/17 (4) | 1,000 | 1,182 |
| Los Angeles County CA Schools Regionalized | | | | |
| Business Services Corp. COP | 0.000% | 8/1/11 (ETM) | 1,945 | 1,913 |
| Los Angeles County CA Schools Regionalized | | | | |
| Business Services Corp. COP | 0.000% | 8/1/13 (ETM) | 2,010 | 1,838 |
| M-S-R California Energy Authority Revenue | 7.000% | 11/1/34 | 7,000 | 8,049 |
| M-S-R California Public Power Agency Revenue | | | | |
| (San Juan Project) | 5.000% | 7/1/13 (14) | 1,500 | 1,531 |
| Metropolitan Water District of | | | | |
| Southern California Revenue VRDO | 3.600% | 12/1/10 | 3,900 | 3,900 |
| Metropolitan Water District of | | | | |
| Southern California Waterworks Revenue | 5.000% | 1/1/31 | 1,150 | 1,209 |
| Modesto CA Irrigation District COP | 5.000% | 7/1/17 (14) | 3,165 | 3,327 |
| Modesto CA Irrigation District COP | 5.000% | 10/1/21 (2) | 2,030 | 2,132 |
| Modesto CA Irrigation District COP | 5.000% | 10/1/22 (2) | 2,515 | 2,623 |
| Modesto CA Irrigation District COP | 5.000% | 10/1/23 (2) | 2,645 | 2,741 |
| Modesto CA Irrigation District COP | 5.000% | 7/1/27 | 3,855 | 3,930 |
| Modesto CA Irrigation District Financing Authority | | | | |
| Revenue (Domestic Water Project) | 5.125% | 9/1/15 (2) | 4,365 | 4,373 |
| New Haven CA Unified School District GO | 12.000% | 8/1/12 (4)(ETM) | 600 | 710 |
| New Haven CA Unified School District GO | 12.000% | 8/1/12 (4) | 2,840 | 3,357 |
| New Haven CA Unified School District GO | 12.000% | 8/1/15 (4) | 2,905 | 4,213 |
| Newport Beach CA Revenue | | | | |
| (Hoag Memorial Hospital Presbyterian) PUT | 5.000% | 2/7/13 | 5,000 | 5,386 |
| Northern California Gas Authority No. 1 Revenue | 0.644% | 7/1/13 | 19,770 | 18,912 |
| Northern California Gas Authority No. 1 Revenue | 0.794% | 7/1/17 | 23,385 | 20,227 |
| Northern California Power Agency | | | | |
| Capital Facilities Revenue | 5.000% | 8/1/17 | 1,500 | 1,690 |
| Northern California Power Agency | | | | |
| Capital Facilities Revenue | 5.000% | 8/1/18 | 2,140 | 2,390 |
| Northern California Power Agency | | | | |
| Capital Facilities Revenue | 5.000% | 8/1/19 | 1,195 | 1,318 |
| Northern California Power Agency | | | | |
| Capital Facilities Revenue | 5.000% | 8/1/20 | 1,000 | 1,086 |
| Northern California Power Agency Revenue | | | | |
| (Hydroelectric Project) | 5.000% | 7/1/16 | 1,745 | 1,990 |
| Northern California Power Agency Revenue | | | | |
| (Hydroelectric Project) | 5.000% | 7/1/17 | 3,290 | 3,758 |
| Northern California Power Agency Revenue | | | | |
| (Hydroelectric Project) | 5.000% | 7/1/19 | 1,500 | 1,694 |
| Northern California Power Agency Revenue | | | | |
| (Hydroelectric Project) | 5.000% | 7/1/20 | 3,500 | 3,851 |
| Northern California Power Agency Revenue | | | | |
| (Hydroelectric Project) | 5.000% | 7/1/21 | 2,500 | 2,710 |
| Northern California Power Agency Revenue | | | | |
| (Hydroelectric Project) | 5.000% | 7/1/22 | 3,395 | 3,642 |
| Oakland CA COP | 5.000% | 4/1/11 (2) | 1,855 | 1,869 |
| Oakland CA Joint Powers Financing Authority | | | | |
| Lease Revenue (Administration Buildings) | 5.000% | 8/1/23 (12) | 5,000 | 5,196 |
| Oakland CA Joint Powers Financing Authority | | | | |
| Lease Revenue (Administration Buildings) | 5.000% | 8/1/24 (12) | 3,695 | 3,838 |
49
California Intermediate-Term Tax-Exempt Fund
| | | | |
| | | | Face | Market |
| | | Maturity | Amount | Value |
| | Coupon | Date | ($000) | ($000) |
| Oakland CA Joint Powers Financing Authority | | | | |
| Lease Revenue (Administration Buildings) | 5.000% | 8/1/25 (12) | 5,405 | 5,578 |
| Oakland CA Joint Powers Financing Authority | | | | |
| Lease Revenue (Administration Buildings) | 5.000% | 8/1/26 (12) | 4,190 | 4,289 |
| Oakland CA Joint Powers Financing Authority | | | | |
| Lease Revenue (Convention Center) | 5.500% | 10/1/12 (2) | 3,000 | 3,164 |
| Oakland CA Joint Powers Financing Authority | | | | |
| Lease Revenue (Convention Center) | 5.500% | 10/1/13 (2) | 1,500 | 1,611 |
| Oakland CA Redevelopment Agency | | | | |
| Tax Allocation Revenue (Central District Project) | 5.500% | 9/1/13 (14) | 3,990 | 4,208 |
| Oakland CA Redevelopment Agency | | | | |
| Tax Allocation Revenue (Central District Project) | 5.500% | 9/1/15 (14) | 3,790 | 3,969 |
| Oakland CA Redevelopment Agency | | | | |
| Tax Allocation Revenue (Central District Project) | 5.500% | 9/1/16 (14) | 6,210 | 6,475 |
| Oakland CA Redevelopment Agency | | | | |
| Tax Allocation Revenue (Central District Project) | 5.000% | 9/1/20 (2) | 12,870 | 12,638 |
| Oakland CA Unified School District GO | 5.000% | 8/1/19 (4) | 13,425 | 14,520 |
| Orange County CA Airport Revenue | 5.000% | 7/1/11 (4) | 3,165 | 3,243 |
| Orange County CA Airport Revenue | 5.000% | 7/1/17 (4) | 1,725 | 1,870 |
| Orange County CA Development Agency | | | | |
| Tax Allocation Revenue | 5.250% | 9/1/14 (14) | 1,415 | 1,455 |
| Orange County CA Development Agency | | | | |
| Tax Allocation Revenue | 5.250% | 9/1/15 (14) | 1,485 | 1,525 |
| Orange County CA Development Agency | | | | |
| Tax Allocation Revenue | 5.375% | 9/1/16 (14) | 1,570 | 1,610 |
| Palo Alto CA Unified School District GO | 0.000% | 8/1/24 | 15,890 | 8,004 |
| Palomar Pomerado Health System | | | | |
| California Revenue | 5.375% | 11/1/12 (14) | 7,080 | 7,087 |
| Palomar Pomerado Health System | | | | |
| California Revenue COP | 6.625% | 11/1/29 | 5,000 | 5,041 |
| Pasadena CA Electric Revenue | 5.000% | 6/1/12 (14)(Prere.) | 2,320 | 2,474 |
| Pasadena CA Electric Revenue | 5.000% | 6/1/12 (14)(Prere.) | 2,535 | 2,703 |
| Pomona CA Single Family Mortgage Revenue | 7.600% | 5/1/23 (ETM) | 10,805 | 14,203 |
| Port of Oakland CA Revenue | 5.000% | 11/1/11 (14) | 5,160 | 5,335 |
| Port of Oakland CA Revenue | 5.000% | 11/1/12 (14) | 2,650 | 2,826 |
| Port of Oakland CA Revenue | 5.000% | 11/1/19 (14) | 7,750 | 8,366 |
| Port of Oakland CA Revenue | 5.000% | 11/1/19 (14) | 8,000 | 8,636 |
| Port of Oakland CA Revenue | 5.000% | 11/1/20 (14) | 6,400 | 6,795 |
| Port of Oakland CA Revenue | 5.000% | 11/1/26 (14) | 9,700 | 9,790 |
| Poway CA Unified School District GO | 0.000% | 8/1/17 | 2,000 | 1,581 |
| Poway CA Unified School District GO | 0.000% | 8/1/18 | 4,565 | 3,393 |
| Poway CA Unified School District GO | 0.000% | 8/1/19 | 5,425 | 3,790 |
| Poway CA Unified School District GO | 0.000% | 8/1/20 | 3,280 | 2,021 |
| Poway CA Unified School District GO | 0.000% | 8/1/28 | 9,070 | 3,047 |
| Rancho CA Water District | | | | |
| Finance Authority Revenue | 5.500% | 11/1/16 (10) | 5,480 | 6,442 |
| Rancho CA Water District | | | | |
| Finance Authority Revenue | 5.500% | 11/1/17 (10) | 5,855 | 6,891 |
| Rancho Cucamonga CA Redevelopment Agency | | | | |
| Tax Allocation Revenue | | | | |
| (Rancho Redevelopment Project) | 5.000% | 9/1/15 (2) | 2,835 | 3,043 |
| Rancho Cucamonga CA Redevelopment Agency | | | | |
| Tax Allocation Revenue | | | | |
| (Rancho Redevelopment Project) | 5.000% | 9/1/16 (2) | 5,100 | 5,423 |
| Rancho Mirage CA Joint Powers Financing | | | | |
| Authority Revenue (Eisenhower Medical Center) | 5.000% | 7/1/27 | 12,000 | 11,058 |
50
California Intermediate-Term Tax-Exempt Fund
| | | | |
| | | | Face | Market |
| | | Maturity | Amount | Value |
| | Coupon | Date | ($000) | ($000) |
| Regents of The University of California | | | | |
| Hospital Revenue (San Diego Medical Center) | 5.125% | 12/1/14 (4) | 4,290 | 4,346 |
| Regents of The University of California | | | | |
| Hospital Revenue (San Diego Medical Center) | 5.125% | 12/1/15 (4) | 4,515 | 4,573 |
| Regents of The University of California Revenue | | | | |
| (Multiple Purpose Project) | 5.000% | 9/1/11 (4)(Prere.) | 4,820 | 5,037 |
| Riverside CA Electric Revenue | 5.000% | 10/1/24 (4) | 1,000 | 1,045 |
| Riverside CA Electric Revenue | 5.000% | 10/1/25 (4) | 2,000 | 2,077 |
| Riverside CA Electric Revenue | 5.000% | 10/1/26 (4) | 2,500 | 2,580 |
| Riverside CA Electric Revenue | 5.000% | 10/1/27 (4) | 3,570 | 3,656 |
| Riverside CA Electric Revenue VRDO | 0.320% | 12/7/10 LOC | 5,300 | 5,300 |
| Rocklin CA Unified School District GO | 0.000% | 8/1/23 (14) | 7,030 | 3,472 |
| Rocklin CA Unified School District GO | 0.000% | 8/1/24 (14) | 2,965 | 1,368 |
| Roseville CA Electric System Revenue | 5.000% | 2/1/30 | 6,120 | 6,182 |
| Roseville CA Natural Gas Financing Authority | | | | |
| Gas Revenue | 5.000% | 2/15/18 | 4,180 | 4,375 |
| Roseville CA Natural Gas Financing Authority | | | | |
| Gas Revenue | 5.000% | 2/15/19 | 10,000 | 10,338 |
| Roseville CA Natural Gas Financing Authority | | | | |
| Gas Revenue | 5.000% | 2/15/20 | 2,000 | 2,032 |
| Sacramento CA Cogeneration Authority Revenue | 5.000% | 7/1/17 | 1,250 | 1,418 |
| Sacramento CA Cogeneration Authority Revenue | 5.000% | 7/1/18 | 725 | 819 |
| Sacramento CA Cogeneration Authority Revenue | 5.000% | 7/1/19 | 900 | 1,009 |
| Sacramento CA Cogeneration Authority Revenue | 5.250% | 7/1/20 | 1,250 | 1,411 |
| Sacramento CA Cogeneration Authority Revenue | 5.250% | 7/1/21 | 1,000 | 1,120 |
| Sacramento CA Financing Authority | | | | |
| Lease Revenue | 5.375% | 12/1/12 (Prere.) | 4,395 | 4,805 |
| Sacramento CA Financing Authority | | | | |
| Lease Revenue | 5.000% | 11/1/14 (14) | 2,910 | 3,043 |
| Sacramento CA Financing Authority | | | | |
| Lease Revenue | 5.375% | 12/1/14 (4) | 1,630 | 1,756 |
| Sacramento CA Financing Authority | | | | |
| Lease Revenue | 5.000% | 12/1/19 (14) | 12,860 | 13,534 |
| Sacramento CA Financing Authority | | | | |
| Lease Revenue | 5.000% | 12/1/20 (14) | 13,670 | 14,211 |
| Sacramento CA Municipal Utility District | | | | |
| Financing Authority Revenue | 5.000% | 7/1/21 (14) | 7,710 | 7,946 |
| Sacramento CA Municipal Utility District Revenue | 5.000% | 11/15/12 (14) | 2,185 | 2,342 |
| Sacramento CA Municipal Utility District Revenue | 5.250% | 8/15/13 (4) | 1,000 | 1,029 |
| Sacramento CA Municipal Utility District Revenue | 5.250% | 8/15/14 (4) | 2,500 | 2,566 |
| Sacramento CA Municipal Utility District Revenue | 5.000% | 8/15/16 (4) | 7,800 | 9,100 |
| Sacramento CA Municipal Utility District Revenue | 5.000% | 7/1/17 (14) | 4,000 | 4,343 |
| Sacramento CA Municipal Utility District Revenue | 5.250% | 7/1/24 (2) | 10,000 | 10,918 |
| Sacramento County CA Airport Revenue | 5.000% | 7/1/23 (4) | 2,000 | 2,112 |
| Sacramento County CA Airport Revenue | 5.000% | 7/1/24 (4) | 2,500 | 2,611 |
| Sacramento County CA Airport Revenue | 5.000% | 7/1/24 (4) | 1,785 | 1,865 |
| Sacramento County CA Airport Revenue | 5.000% | 7/1/26 | 2,650 | 2,692 |
| Sacramento County CA Airport Revenue | 5.000% | 7/1/28 | 1,250 | 1,257 |
| Sacramento County CA Airport Revenue | 5.000% | 7/1/30 | 3,615 | 3,645 |
| Sacramento County CA Sanitation Districts | | | | |
| Financing Authority Revenue | 6.000% | 12/1/13 | 2,500 | 2,525 |
| Sacramento County CA Sanitation Districts | | | | |
| Financing Authority Revenue | 6.000% | 12/1/15 | 2,500 | 2,525 |
| Sacramento County CA Sanitation Districts | | | | |
| Financing Authority Revenue | 5.000% | 12/1/21 (14) | 1,850 | 1,998 |
51
California Intermediate-Term Tax-Exempt Fund
| | | | |
| | | | Face | Market |
| | | Maturity | Amount | Value |
| | Coupon | Date | ($000) | ($000) |
| Sacramento County CA Sanitation Districts | | | | |
| Financing Authority Revenue | 5.000% | 12/1/22 (14) | 5,495 | 5,886 |
| Sacramento County CA Sanitation Districts | | | | |
| Financing Authority Revenue | 5.000% | 12/1/23 (14) | 7,030 | 7,468 |
| Sacramento County CA Water Financing Authority | | | | |
| Revenue (Agency Zones 40 & 41) | 5.000% | 6/1/13 (Prere.) | 1,235 | 1,364 |
| San Bernardino CA Community College District | | | | |
| GO | 5.000% | 8/1/27 (4) | 11,580 | 11,890 |
| San Bernardino County CA | | | | |
| Justice Center & Airport COP | 5.000% | 7/1/14 (14) | 5,585 | 6,000 |
| San Bernardino County CA Medical Center COP | 5.500% | 8/1/17 (14) | 4,710 | 4,888 |
| San Bernardino County CA Medical Center COP | 6.500% | 8/1/17 (14) | 5,000 | 5,359 |
| San Bernardino County CA Medical Center COP | 5.500% | 8/1/22 (14) | 8,940 | 9,443 |
| San Bernardino County CA Transportation | | | | |
| Authority Sales Tax RAN | 5.000% | 5/1/12 | 5,000 | 5,278 |
| San Diego CA Financing Authority Lease Revenue | 5.250% | 4/1/12 (2) | 3,000 | 3,008 |
| San Diego CA Financing Authority Lease Revenue | 5.250% | 4/1/14 (2) | 5,680 | 5,691 |
| San Diego CA Public Facilities Financing Authority | | | | |
| Sewer Revenue | 5.000% | 5/15/19 | 5,000 | 5,736 |
| San Diego CA Public Facilities Financing Authority | | | | |
| Sewer Revenue | 5.000% | 5/15/24 | 3,000 | 3,254 |
| San Diego CA Public Facilities Financing Authority | | | | |
| Sewer Revenue | 5.250% | 5/15/25 | 2,000 | 2,187 |
| San Diego CA Public Facilities Financing Authority | | | | |
| Sewer Revenue | 5.250% | 5/15/26 | 5,000 | 5,463 |
| San Diego CA Public Facilities Financing Authority | | | | |
| Sewer Revenue | 5.000% | 5/15/27 | 6,000 | 6,361 |
| San Diego CA Public Facilities Financing Authority | | | | |
| Sewer Revenue | 5.250% | 5/15/27 | 5,000 | 5,427 |
| San Diego CA Public Facilities Financing Authority | | | | |
| Sewer Revenue | 5.000% | 5/15/28 | 1,825 | 1,921 |
| San Diego CA Public Facilities Financing Authority | | | | |
| Water Revenue | 5.000% | 8/1/27 | 4,215 | 4,414 |
| San Diego CA Public Facilities Financing Authority | | | | |
| Water Revenue | 5.125% | 8/1/28 | 5,000 | 5,255 |
| San Diego CA Unified School District GO | 0.000% | 7/1/14 (14) | 3,400 | 3,137 |
| San Diego CA Unified School District GO | 5.500% | 7/1/17 (14) | 2,595 | 2,988 |
| San Diego CA Unified School District GO | 0.000% | 7/1/18 (14) | 9,500 | 7,037 |
| San Diego CA Unified School District GO | 5.500% | 7/1/20 (4) | 9,490 | 11,279 |
| San Diego CA Unified School District GO | 5.500% | 7/1/21 (4) | 11,470 | 13,017 |
| San Diego CA Unified School District GO | 5.500% | 7/1/22 (4) | 12,790 | 14,447 |
| San Diego CA Unified School District GO | 5.500% | 7/1/23 (4) | 9,210 | 10,366 |
| San Diego CA Unified School District GO | 0.000% | 7/1/26 | 8,425 | 3,388 |
| San Diego CA Unified School District GO | 5.500% | 7/1/26 (4) | 7,490 | 8,394 |
| San Diego CA Unified School District GO | 0.000% | 7/1/27 | 8,500 | 3,168 |
| San Diego CA Unified School District GO | 0.000% | 7/1/28 | 8,000 | 2,767 |
| San Diego CA Unified School District GO | 0.000% | 7/1/30 | 9,985 | 2,974 |
| San Diego CA Unified School District GO | 0.000% | 7/1/30 | 2,500 | 745 |
| San Diego County CA COP | 5.000% | 2/1/22 (2) | 2,000 | 2,077 |
| San Diego County CA COP | 5.000% | 2/1/24 (2) | 1,500 | 1,539 |
| San Diego County CA COP | 5.000% | 2/1/26 (2) | 1,000 | 1,017 |
| San Diego County CA COP VRDO | 0.340% | 12/7/10 LOC | 15,455 | 15,455 |
| San Diego County CA Regional Building Authority | | | | |
| Lease Revenue (County Operations Center & | | | | |
| Annex Redevelopment Project) | 5.000% | 2/1/27 | 2,420 | 2,502 |
52
California Intermediate-Term Tax-Exempt Fund
| | | | |
| | | | Face | Market |
| | | Maturity | Amount | Value |
| | Coupon | Date | ($000) | ($000) |
| San Diego County CA Regional Building Authority | | | | |
| Lease Revenue (County Operations Center & | | | | |
| Annex Redevelopment Project) | 5.000% | 2/1/23 | 4,285 | 4,583 |
| San Diego County CA Regional Building Authority | | | | |
| Lease Revenue (County Operations Center & | | | | |
| Annex Redevelopment Project) | 5.000% | 2/1/25 | 4,820 | 5,060 |
| San Diego County CA Regional Building Authority | | | | |
| Lease Revenue (County Operations Center & | | | | |
| Annex Redevelopment Project) | 5.250% | 2/1/26 | 1,140 | 1,207 |
| San Diego County CA Regional Building Authority | | | | |
| Lease Revenue (County Operations Center & | | | | |
| Annex Redevelopment Project) | 5.500% | 2/1/28 | 5,780 | 6,159 |
| San Diego County CA Regional Transportation | | | | |
| Authority Sales Tax Revenue VRDO | 0.270% | 12/7/10 | 15,740 | 15,740 |
| San Diego County CA Water Authority | | | | |
| Financing Agency Water Revenue | 5.000% | 5/1/27 | 2,000 | 2,146 |
| San Diego County CA Water Authority Revenue | | | | |
| COP | 5.250% | 5/1/15 (14) | 6,215 | 7,138 |
| San Diego County CA Water Authority Revenue | | | | |
| COP | 5.250% | 5/1/16 (14) | 7,880 | 9,220 |
| San Diego County CA Water Authority Revenue | | | | |
| COP | 5.250% | 5/1/21 (14) | 6,725 | 7,665 |
| San Diego County CA Water Authority Revenue | | | | |
| COP | 5.250% | 5/1/22 (14) | 7,075 | 8,021 |
| San Francisco CA Bay Area Rapid Transit District | | | | |
| Sales Tax Revenue | 5.000% | 7/1/23 | 9,560 | 10,563 |
| San Francisco CA City & County | | | | |
| (Laguna Honda Hospital) GO | 5.000% | 6/15/16 (2) | 8,000 | 8,624 |
| San Francisco CA City & County | | | | |
| International Airport Revenue | 5.250% | 5/1/12 (14)(Prere.) | 2,430 | 2,575 |
| San Francisco CA City & County | | | | |
| International Airport Revenue | 5.250% | 5/1/12 (14)(Prere.) | 3,185 | 3,375 |
| San Francisco CA City & County | | | | |
| International Airport Revenue | 5.250% | 5/1/12 (14)(Prere.) | 4,015 | 4,283 |
| San Francisco CA City & County | | | | |
| International Airport Revenue | 5.000% | 5/1/18 | 15,000 | 16,919 |
| San Francisco CA City & County | | | | |
| International Airport Revenue | 5.250% | 5/1/20 (14) | 12,620 | 14,217 |
| San Francisco CA City & County | | | | |
| International Airport Revenue | 5.000% | 5/1/24 (14) | 10,000 | 10,364 |
| San Francisco CA City & County | | | | |
| International Airport Revenue | 5.000% | 5/1/25 (14)(3) | 2,000 | 2,063 |
| San Francisco CA City & County | | | | |
| International Airport Revenue | 5.250% | 5/1/26 | 25,000 | 26,155 |
| San Francisco CA City & County | | | | |
| International Airport Revenue | 5.000% | 5/1/27 (14) | 13,075 | 13,424 |
| San Francisco CA City & County | | | | |
| Public Utility Commission Revenue | 5.000% | 11/1/29 | 10,000 | 10,431 |
| San Francisco CA City & County | | | | |
| Public Utility Commission Revenue | 5.000% | 11/1/29 | 2,460 | 2,566 |
| San Francisco CA City & County | | | | |
| Public Utility Commission Revenue | 5.000% | 11/1/30 | 2,705 | 2,813 |
| San Francisco CA City & County | | | | |
| Public Utility Commission Water Revenue | 5.000% | 11/1/26 | 2,995 | 3,188 |
53
California Intermediate-Term Tax-Exempt Fund
| | | | |
| | | | Face | Market |
| | | Maturity | Amount | Value |
| | Coupon | Date | ($000) | ($000) |
| San Francisco CA City & County | | | | |
| Redevelopment Agency Lease Revenue | | | | |
| (Moscone Center) | 5.000% | 7/1/16 (4) | 3,270 | 3,380 |
| San Francisco CA City & County Water Revenue | 5.000% | 11/1/12 (14)(Prere.) | 4,865 | 5,267 |
| San Joaquin County CA | | | | |
| Delta Community College District Election GO | 0.000% | 8/1/26 (4) | 15,500 | 5,882 |
| San Joaquin County CA | | | | |
| Delta Community College District Election GO | 0.000% | 8/1/27 (4) | 15,500 | 5,441 |
| San Joaquin Hills CA | | | | |
| Transportation Corridor Agency | | | | |
| Toll Road Revenue | 0.000% | 1/15/11 (14) | 7,140 | 7,096 |
| San Joaquin Hills CA | | | | |
| Transportation Corridor Agency | | | | |
| Toll Road Revenue | 0.000% | 1/15/14 (14) | 5,500 | 4,545 |
| San Joaquin Hills CA | | | | |
| Transportation Corridor Agency | | | | |
| Toll Road Revenue | 0.000% | 1/1/20 (ETM) | 2,500 | 1,884 |
| San Joaquin Hills CA | | | | |
| Transportation Corridor Agency | | | | |
| Toll Road Revenue | 0.000% | 1/1/23 (ETM) | 16,000 | 10,346 |
| San Joaquin Hills CA | | | | |
| Transportation Corridor Agency | | | | |
| Toll Road Revenue | 0.000% | 1/15/24 (14) | 7,000 | 2,516 |
| San Joaquin Hills CA | | | | |
| Transportation Corridor Agency | | | | |
| Toll Road Revenue | 0.000% | 1/1/25 (ETM) | 17,750 | 10,273 |
| San Joaquin Hills CA | | | | |
| Transportation Corridor Agency | | | | |
| Toll Road Revenue | 0.000% | 1/1/26 (ETM) | 14,350 | 7,849 |
| San Jose CA Airport Revenue | 5.375% | 3/1/13 (4) | 4,945 | 5,281 |
| San Jose CA Airport Revenue | 5.375% | 3/1/14 (4) | 7,550 | 8,021 |
| San Jose CA Airport Revenue | 5.375% | 3/1/15 (4) | 7,950 | 8,405 |
| San Jose CA Airport Revenue | 5.000% | 3/1/24 (2) | 2,035 | 2,076 |
| San Jose CA Airport Revenue | 5.000% | 3/1/25 (2) | 3,385 | 3,437 |
| San Jose CA Airport Revenue | 5.000% | 3/1/26 (2) | 3,850 | 3,893 |
| San Jose CA Financing Authority Lease Revenue | 5.000% | 9/1/13 (14) | 9,570 | 9,834 |
| San Jose CA Redevelopment Agency | | | | |
| Tax Allocation Revenue | 5.250% | 8/1/13 (14) | 5,000 | 5,339 |
| San Jose CA Redevelopment Agency | | | | |
| Tax Allocation Revenue | 5.250% | 8/1/14 (14) | 5,000 | 5,413 |
| San Jose CA Redevelopment Agency | | | | |
| Tax Allocation Revenue | 5.000% | 8/1/21 | 1,270 | 1,313 |
| San Jose CA Redevelopment Agency | | | | |
| Tax Allocation Revenue | 5.000% | 8/1/23 | 1,140 | 1,147 |
| San Jose CA Redevelopment Agency | | | | |
| Tax Allocation Revenue | 5.000% | 8/1/24 (14) | 16,360 | 15,979 |
| San Jose CA Redevelopment Agency | | | | |
| Tax Allocation Revenue | 5.000% | 8/1/25 (14) | 13,505 | 13,041 |
| San Jose CA Redevelopment Agency | | | | |
| Tax Allocation Revenue | 5.125% | 8/1/25 | 570 | 565 |
| San Jose CA Redevelopment Agency | | | | |
| Tax Allocation Revenue | 5.250% | 8/1/26 | 800 | 795 |
| San Jose CA Redevelopment Agency | | | | |
| Tax Allocation Revenue | 5.375% | 8/1/29 | 1,355 | 1,343 |
| San Mateo CA Union High School District GO | 0.000% | 9/1/12 (14) | 1,180 | 1,145 |
| San Mateo CA Union High School District GO | 0.000% | 9/1/13 (14) | 1,715 | 1,621 |
54
California Intermediate-Term Tax-Exempt Fund
| | | | |
| | | | Face | Market |
| | | Maturity | Amount | Value |
| | Coupon | Date | ($000) | ($000) |
| San Mateo CA Union High School District GO | 0.000% | 9/1/14 (14) | 1,500 | 1,372 |
| San Mateo County CA | | | | |
| Community College District GO | 5.375% | 9/1/15 (14) | 1,300 | 1,389 |
| San Mateo County CA | | | | |
| Community College District GO | 0.000% | 9/1/21 (14) | 4,645 | 2,809 |
| San Mateo County CA | | | | |
| Community College District GO | 0.000% | 9/1/22 (14) | 5,675 | 3,223 |
| San Mateo County CA | | | | |
| Community College District GO | 0.000% | 9/1/24 (14) | 2,825 | 1,417 |
| San Mateo County CA | | | | |
| Community College District GO | 0.000% | 9/1/25 (14) | 4,000 | 1,866 |
| San Mateo County CA | | | | |
| Community College District GO | 5.000% | 9/1/26 | 3,170 | 3,311 |
| San Mateo County CA | | | | |
| Joint Powers Financing Authority Lease Revenue | | | | |
| (Youth Services Campus) | 4.625% | 7/15/25 | 2,455 | 2,500 |
| San Mateo County CA | | | | |
| Joint Powers Financing Authority Lease Revenue | | | | |
| (Youth Services Campus) | 5.250% | 7/15/28 | 2,000 | 2,076 |
| Santa Ana CA Community Redevelopment Agency | | | | |
| Tax Allocation Revenue (South Main Street) | 5.000% | 9/1/18 (14) | 2,685 | 2,723 |
| Santa Barbara County CA COP | 5.250% | 12/1/12 (2) | 1,000 | 1,063 |
| Santa Barbara County CA COP | 5.250% | 12/1/13 (2) | 2,355 | 2,503 |
| Santa Barbara County CA COP | 5.250% | 12/1/15 (2) | 1,065 | 1,132 |
| Santa Barbara County CA COP | 5.250% | 12/1/16 (2) | 1,760 | 1,870 |
| Santa Clara CA Electric Revenue | 5.250% | 7/1/18 (14) | 1,720 | 1,851 |
| Santa Clara County CA Financing Authority Lease | | | | |
| Revenue (Multiple Facilities Projects) | 5.000% | 11/15/17 | 11,540 | 13,247 |
| Santa Clara County CA Financing Authority Lease | | | | |
| Revenue (Multiple Facilities Projects) | 5.000% | 11/15/18 | 7,920 | 9,033 |
| Santa Clara County CA Financing Authority Lease | | | | |
| Revenue (Multiple Facilities Projects) | 5.000% | 5/15/28 | 10,000 | 10,168 |
| 2 Santa Clara County CA Financing Authority Lease | | | | |
| Revenue (Multiple Facilities Projects) TOB VRDO | 0.310% | 12/7/10 | 6,915 | 6,915 |
| Santa Clara County CA Financing Authority Lease | | | | |
| Revenue (VMC Facility Replacement Project) | 7.750% | 11/15/11 (2) | 1,000 | 1,068 |
| Santa Monica CA Community College District GO | 5.000% | 8/1/20 | 1,000 | 1,151 |
| Santa Monica CA Community College District GO | 0.000% | 8/1/26 | 11,025 | 4,697 |
| Santa Rosa CA Wastewater Revenue | 0.000% | 9/1/28 (4) | 11,095 | 3,657 |
| Simi Valley CA Unified School District GO | 0.000% | 8/1/26 (4) | 3,030 | 1,164 |
| Simi Valley CA Unified School District GO | 0.000% | 8/1/27 (4) | 2,900 | 1,029 |
| Solano County CA COP | 5.000% | 11/1/17 (14) | 4,110 | 4,598 |
| Solano County CA COP | 5.000% | 11/1/18 (14) | 3,810 | 4,184 |
| Solano County CA COP | 5.000% | 11/1/19 (14) | 3,995 | 4,323 |
| Solano County CA COP | 5.000% | 11/1/20 (14) | 4,195 | 4,464 |
| Solano County CA COP | 5.000% | 11/1/21 (14) | 4,405 | 4,632 |
| South Orange County CA | | | | |
| Public Financing Authority Special Tax Revenue | 7.000% | 9/1/11 (14) | 3,490 | 3,634 |
| South Orange County CA | | | | |
| Public Financing Authority Special Tax Revenue | 5.375% | 8/15/12 (4) | 5,605 | 5,625 |
| South Orange County CA | | | | |
| Public Financing Authority Special Tax Revenue | | | | |
| (Portola Hills/Lomas Laguna) | 5.250% | 8/15/13 (2) | 2,290 | 2,295 |
| South San Francisco CA Redevelopment Agency | | | | |
| Tax Allocation Revenue | 5.000% | 9/1/31 (14) | 7,255 | 6,503 |
55
California Intermediate-Term Tax-Exempt Fund
| | | | |
| | | | Face | Market |
| | | Maturity | Amount | Value |
| | Coupon | Date | ($000) | ($000) |
| Southern California Public Power | | | | |
| Authority Revenue | 5.000% | 7/1/28 | 10,000 | 10,385 |
| Southern California Public Power | | | | |
| Authority Revenue | 5.000% | 7/1/29 | 5,000 | 5,161 |
| Southern California Public Power | | | | |
| Authority Revenue (Linden Windenergy Project) | 5.000% | 7/1/28 | 3,500 | 3,635 |
| Southern California Public Power | | | | |
| Authority Revenue (Linden Windenergy Project) | 5.000% | 7/1/29 | 2,500 | 2,581 |
| Southern California Public Power | | | | |
| Authority Revenue (Linden Windenergy Project) | 5.000% | 7/1/30 | 2,500 | 2,567 |
| Southern California Public Power | | | | |
| Authority Revenue (Milford Wind Corridor | | | | |
| Phase I Project) | 5.000% | 7/1/29 | 5,000 | 5,154 |
| Southern California Public Power | | | | |
| Authority Revenue (Natural Gas Project) | 5.000% | 11/1/18 | 1,040 | 1,079 |
| Southern California Public Power | | | | |
| Authority Revenue (Natural Gas Project) | 5.250% | 11/1/23 | 5,250 | 5,452 |
| Southern California Public Power | | | | |
| Authority Revenue (Natural Gas Project) | 5.250% | 11/1/24 | 5,000 | 5,185 |
| Southern California Public Power | | | | |
| Authority Revenue (Natural Gas Project) | 5.250% | 11/1/25 | 10,280 | 10,646 |
| Southern California Public Power | | | | |
| Authority Revenue (Natural Gas Project) | 5.250% | 11/1/26 | 2,500 | 2,557 |
| Southern California Public Power | | | | |
| Authority Revenue (San Juan Unit 3) | 5.500% | 1/1/13 (4) | 3,500 | 3,817 |
| Southern California Public Power | | | | |
| Authority Revenue (Transmission Project) | 5.000% | 7/1/23 | 5,000 | 5,337 |
| 2 Sunnyvale California Wastewater Revenue | | | | |
| TOB VRDO | 0.290% | 12/7/10 | 13,320 | 13,320 |
| Tobacco Securitization Authority Revenue | | | | |
| (Southern California Tobacco Settlement) | 4.750% | 6/1/25 | 8,790 | 7,830 |
| Tulare County CA COP | 5.000% | 8/15/15 (14) | 6,460 | 7,096 |
| Turlock CA Irrigation District Revenue | 5.000% | 1/1/21 | 3,805 | 4,153 |
| Turlock CA Irrigation District Revenue | 5.000% | 1/1/22 | 5,415 | 5,837 |
| University of California Regents | | | | |
| Medical Center Revenue | 5.000% | 5/15/19 (14) | 5,075 | 5,493 |
| University of California Regents | | | | |
| Medical Center Revenue | 5.000% | 5/15/20 (14) | 5,065 | 5,421 |
| University of California Regents | | | | |
| Medical Center Revenue | 5.000% | 5/15/25 | 19,385 | 20,043 |
| University of California Regents | | | | |
| Medical Center Revenue | 5.000% | 5/15/26 | 14,095 | 14,486 |
| University of California Revenue | 3.000% | 5/15/11 | 1,235 | 1,250 |
| University of California Revenue | 3.000% | 5/15/12 | 2,000 | 2,068 |
| University of California Revenue | 5.000% | 5/15/17 (4) | 20,620 | 23,531 |
| University of California Revenue | 5.000% | 5/15/18 (4) | 10,000 | 11,366 |
| University of California Revenue | 5.000% | 5/15/19 (4) | 4,275 | 4,804 |
| University of California Revenue | 5.000% | 5/15/20 (4) | 30,900 | 33,871 |
| University of California Revenue | 5.000% | 5/15/21 (4) | 14,915 | 16,176 |
| University of California Revenue | 4.750% | 5/15/23 (14) | 11,185 | 11,332 |
| University of California Revenue | 5.750% | 5/15/25 | 3,000 | 3,443 |
| University of California Revenue | 4.750% | 5/15/26 | 21,320 | 21,414 |
| University of California Revenue | 5.000% | 5/15/26 (14) | 10,000 | 10,473 |
| 2 University of California Revenue TOB VRDO | 0.310% | 12/7/10 (4) | 5,000 | 5,000 |
| Ventura County CA | | | | |
| Community College District GO | 5.000% | 8/1/16 (14) | 3,100 | 3,314 |
56
California Intermediate-Term Tax-Exempt Fund
| | | | |
| | | | Face | Market |
| | | Maturity | Amount | Value |
| | Coupon | Date | ($000) | ($000) |
| Ventura County CA | | | | |
| Community College District GO | 5.000% | 8/1/17 (14) | 2,300 | 2,459 |
| Ventura County CA | | | | |
| Community College District GO | 0.000% | 8/1/28 | 15,000 | 5,351 |
| Vista CA Unified School District GO | 5.375% | 8/1/12 (4)(Prere.) | 1,695 | 1,831 |
| Vista CA Unified School District GO | 5.375% | 8/1/12 (4)(Prere.) | 1,455 | 1,572 |
| Vista CA Unified School District GO | 5.375% | 8/1/15 (4) | 150 | 160 |
| Vista CA Unified School District GO | 5.375% | 8/1/16 (4) | 190 | 202 |
| Vista CA Unified School District GO | 5.375% | 8/1/17 (4) | 160 | 170 |
| Washington Township CA | | | | |
| Health Care District Revenue | 6.000% | 7/1/29 | 1,000 | 1,044 |
| West Contra Costa CA Unified School District GO | 6.000% | 8/1/26 | 5,000 | 5,408 |
| | | | | 5,370,453 |
| Puerto Rico (1.5%) | | | | |
| Puerto Rico Aqueduct & Sewer Authority Revenue | 6.250% | 7/1/12 (14)(ETM) | 1,000 | 1,088 |
| Puerto Rico Electric Power Authority Revenue | 5.000% | 7/1/11 | 12,500 | 12,790 |
| Puerto Rico Electric Power Authority Revenue | 6.000% | 7/1/12 (14) | 8,235 | 8,819 |
| Puerto Rico GO | 6.500% | 7/1/11 (14) | 2,500 | 2,578 |
| Puerto Rico Highway & | | | | |
| Transportation Authority Revenue | 5.500% | 7/1/13 (14) | 2,250 | 2,362 |
| Puerto Rico Infrastructure Financing Authority | | | | |
| Special Tax Revenue | 5.500% | 7/1/21 (3) | 5,000 | 5,279 |
| Puerto Rico Infrastructure Financing Authority | | | | |
| Special Tax Revenue | 5.500% | 7/1/23 (3) | 1,585 | 1,670 |
| Puerto Rico Municipal Finance Agency GO | 5.750% | 8/1/11 (4) | 13,560 | 13,678 |
| Puerto Rico Municipal Finance Agency GO | 5.750% | 8/1/11 (4) | 7,750 | 7,817 |
| Puerto Rico Municipal Finance Agency GO | 5.000% | 7/1/14 (11) | 1,360 | 1,455 |
| Puerto Rico Municipal Finance Agency GO | 5.250% | 7/1/16 (11) | 1,400 | 1,497 |
| Puerto Rico Municipal Finance Agency GO | 5.250% | 7/1/18 (11) | 1,000 | 1,058 |
| Puerto Rico Public Finance Corp. Revenue PUT | 5.750% | 2/1/12 LOC | 20,000 | 20,519 |
| | | | | 80,610 |
| Virgin Islands (0.0%) | | | | |
| Virgin Islands Public Finance Authority Revenue | 5.250% | 10/1/15 | 2,200 | 2,380 |
| Total Tax-Exempt Municipal Bonds (Cost $5,372,970) | | | | 5,453,443 |
| Other Assets and Liabilities (0.4%) | | | | |
| Other Assets | | | | 76,269 |
| Liabilities | | | | (56,757) |
| | | | | 19,512 |
| Net Assets (100%) | | | | 5,472,955 |
57
California Intermediate-Term Tax-Exempt Fund
At November 30, 2010, net assets consisted of:
| |
| | Amount |
| | ($000) |
| Paid-in Capital | 5,490,683 |
| Undistributed Net Investment Income | — |
| Accumulated Net Realized Losses | (98,188) |
| Unrealized Appreciation (Depreciation) | |
| Investment Securities | 80,473 |
| Futures Contracts | (13) |
| Net Assets | 5,472,955 |
| |
| |
| Investor Shares—Net Assets | |
| Applicable to 120,243,542 outstanding $.001 par value shares of | |
| beneficial interest (unlimited authorization) | 1,314,209 |
| Net Asset Value Per Share—Investor Shares | $10.93 |
| |
| |
| Admiral Shares—Net Assets | |
| Applicable to 380,503,658 outstanding $.001 par value shares of | |
| beneficial interest (unlimited authorization) | 4,158,746 |
| Net Asset Value Per Share—Admiral Shares | $10.93 |
See Note A in Notes to Financial Statements.
1 Security purchased on a when-issued or delayed-delivery basis for which the fund has not taken delivery as of November 30, 2010.
2 Security exempt from registration under Rule 144A of the Securities Act of 1933. Such securities may be sold in transactions exempt from registration, normally to qualified institutional buyers. At November 30, 2010, the aggregate value of these securities was $88,965,000, representing 1.6% of net assets.
3 Securities with a value of $2,889,000 have been segregated as initial margin for open futures contracts.
A key to abbreviations and other references follows the Statement of Net Assets.
See accompanying Notes, which are an integral part of the Financial Statements.
58
California Intermediate-Term Tax-Exempt Fund
Key to Abbreviations
ARS—Auction Rate Security.
BAN—Bond Anticipation Note.
COP—Certificate of Participation.
CP—Commercial Paper.
FR—Floating Rate.
GAN—Grant Anticipation Note.
GO—General Obligation Bond.
IDA—Industrial Development Authority Bond.
IDR—Industrial Development Revenue Bond.
PCR—Pollution Control Revenue Bond.
PUT—Put Option Obligation.
RAN—Revenue Anticipation Note.
TAN—Tax Anticipation Note.
TOB—Tender Option Bond.
TRAN—Tax Revenue Anticipation Note.
UFSD—Union Free School District.
USD—United School District.
VRDO—Variable Rate Demand Obligation.
VRDP—Variable Rate Demand Preferred.
(ETM)—Escrowed to Maturity.
(Prere.)—Prerefunded.
Scheduled principal and interest payments are guaranteed by:
(1) MBIA (Municipal Bond Investors Assurance).
(2) AMBAC (Ambac Assurance Corporation).
(3) FGIC (Financial Guaranty Insurance Company).
(4) AGM (Assured Guaranty Municipal Corporation).
(5) BIGI (Bond Investors Guaranty Insurance).
(6) Connie Lee Inc.
(7) FHA (Federal Housing Authority).
(8) CapMAC (Capital Markets Assurance Corporation).
(9) American Capital Access Financial Guaranty Corporation.
(10) XL Capital Assurance Inc.
(11) CIFG (CDC IXIS Financial Guaranty).
(12) Assured Guaranty Corp.
(13) Berkshire Hathaway Assurance Corp.
(14) National Public Finance Guarantee Corp.
The insurance does not guarantee the market value of the municipal bonds.
LOC—Scheduled principal and interest payments are guaranteed by bank letter of credit.
59
California Intermediate-Term Tax-Exempt Fund
Statement of Operations
| |
| | Year Ended |
| | November 30, 2010 |
| | ($000) |
| Investment Income | |
| Income | |
| Interest | 210,994 |
| Total Income | 210,994 |
| Expenses | |
| The Vanguard Group—Note B | |
| Investment Advisory Services | 479 |
| Management and Administrative—Investor Shares | 2,334 |
| Management and Administrative—Admiral Shares | 3,329 |
| Marketing and Distribution—Investor Shares | 444 |
| Marketing and Distribution—Admiral Shares | 989 |
| Custodian Fees | 37 |
| Auditing Fees | 27 |
| Shareholders’ Reports—Investor Shares | 23 |
| Shareholders’ Reports—Admiral Shares | 8 |
| Trustees’ Fees and Expenses | 7 |
| Total Expenses | 7,677 |
| Net Investment Income | 203,317 |
| Realized Net Gain (Loss) | |
| Investment Securities Sold | 4,575 |
| Futures Contracts | (5,183) |
| Realized Net Gain (Loss) | (608) |
| Change in Unrealized Appreciation (Depreciation) | |
| Investment Securities | 31,499 |
| Futures Contracts | 196 |
| Change in Unrealized Appreciation (Depreciation) | 31,695 |
| Net Increase (Decrease) in Net Assets Resulting from Operations | 234,404 |
See accompanying Notes, which are an integral part of the Financial Statements.
60
California Intermediate-Term Tax-Exempt Fund
Statement of Changes in Net Assets
| | |
| | Year Ended November 30, |
| | 2010 | 2009 |
| | ($000) | ($000) |
| Increase (Decrease) in Net Assets | | |
| Operations | | |
| Net Investment Income | 203,317 | 184,035 |
| Realized Net Gain (Loss) | (608) | (43,677) |
| Change in Unrealized Appreciation (Depreciation) | 31,695 | 316,607 |
| Net Increase (Decrease) in Net Assets Resulting from Operations | 234,404 | 456,965 |
| Distributions | | |
| Net Investment Income | | |
| Investor Shares | (54,632) | (52,260) |
| Admiral Shares | (148,685) | (131,775) |
| Realized Capital Gain | | |
| Investor Shares | — | — |
| Admiral Shares | — | — |
| Total Distributions | (203,317) | (184,035) |
| Capital Share Transactions | | |
| Investor Shares | (133,336) | 36,291 |
| Admiral Shares | 514,047 | 221,926 |
| Net Increase (Decrease) from Capital Share Transactions | 380,711 | 258,217 |
| Total Increase (Decrease) | 411,798 | 531,147 |
| Net Assets | | |
| Beginning of Period | 5,061,157 | 4,530,010 |
| End of Period | 5,472,955 | 5,061,157 |
See accompanying Notes, which are an integral part of the Financial Statements.
61
California Intermediate-Term Tax-Exempt Fund
Financial Highlights
Investor Shares
| | | | | |
| For a Share Outstanding | | | Year Ended November 30, |
| Throughout Each Period | 2010 | 2009 | 2008 | 2007 | 2006 |
| Net Asset Value, Beginning of Period | $10.86 | $10.21 | $10.92 | $11.09 | $10.95 |
| Investment Operations | | | | | |
| Net Investment Income | .408 | .412 | .425 | .435 | .438 |
| Net Realized and Unrealized Gain (Loss) | | | | | |
| on Investments | .070 | .650 | (.710) | (.170) | .140 |
| Total from Investment Operations | .478 | 1.062 | (.285) | .265 | .578 |
| Distributions | | | | | |
| Dividends from Net Investment Income | (.408) | (.412) | (.425) | (.435) | (.438) |
| Distributions from Realized Capital Gains | — | — | — | — | — |
| Total Distributions | (.408) | (.412) | (.425) | (.435) | (.438) |
| Net Asset Value, End of Period | $10.93 | $10.86 | $10.21 | $10.92 | $11.09 |
| |
| Total Return1 | 4.43% | 10.56% | -2.71% | 2.46% | 5.40% |
| |
| Ratios/Supplemental Data | | | | | |
| Net Assets, End of Period (Millions) | $1,314 | $1,435 | $1,320 | $1,243 | $1,068 |
| Ratio of Total Expenses to | | | | | |
| Average Net Assets | 0.20% | 0.20% | 0.15% | 0.15% | 0.16% |
| Ratio of Net Investment Income to | | | | | |
| Average Net Assets | 3.70% | 3.88% | 3.96% | 3.97% | 4.00% |
| Portfolio Turnover Rate | 10% | 17% | 25% | 11% | 7% |
1 Total returns do not include account service fees that may have applied in the periods shown. Fund prospectuses provide information about any applicable account service fees.
See accompanying Notes, which are an integral part of the Financial Statements.
62
California Intermediate-Term Tax-Exempt Fund
Financial Highlights
Admiral Shares
| | | | | |
| For a Share Outstanding | | | Year Ended November 30, |
| Throughout Each Period | 2010 | 2009 | 2008 | 2007 | 2006 |
| Net Asset Value, Beginning of Period | $10.86 | $10.21 | $10.92 | $11.09 | $10.95 |
| Investment Operations | | | | | |
| Net Investment Income | .417 | .421 | .432 | .443 | .446 |
| Net Realized and Unrealized Gain (Loss) | | | | | |
| on Investments | .070 | .650 | (.710) | (.170) | .140 |
| Total from Investment Operations | .487 | 1.071 | (.278) | .273 | .586 |
| Distributions | | | | | |
| Dividends from Net Investment Income | (.417) | (.421) | (.432) | (.443) | (.446) |
| Distributions from Realized Capital Gains | — | — | — | — | — |
| Total Distributions | (.417) | (.421) | (.432) | (.443) | (.446) |
| Net Asset Value, End of Period | $10.93 | $10.86 | $10.21 | $10.92 | $11.09 |
| |
| Total Return | 4.52% | 10.65% | -2.64% | 2.53% | 5.48% |
| |
| Ratios/Supplemental Data | | | | | |
| Net Assets, End of Period (Millions) | $4,159 | $3,626 | $3,210 | $3,116 | $2,388 |
| Ratio of Total Expenses to | | | | | |
| Average Net Assets | 0.12% | 0.12% | 0.08% | 0.08% | 0.09% |
| Ratio of Net Investment Income to | | | | | |
| Average Net Assets | 3.78% | 3.96% | 4.03% | 4.04% | 4.07% |
| Portfolio Turnover Rate | 10% | 17% | 25% | 11% | 7% |
See accompanying Notes, which are an integral part of the Financial Statements.
63
California Intermediate-Term Tax-Exempt Fund
Notes to Financial Statements
Vanguard California Intermediate-Term Tax-Exempt Fund is registered under the Investment Company Act of 1940 as an open-end investment company, or mutual fund. The fund invests in debt instruments of municipal issuers whose ability to meet their obligations may be affected by economic and political developments in the state. The fund offers two classes of shares: Investor Shares and Admiral Shares. Investor Shares are available to any investor who meets the fund’s minimum purchase requirements. Admiral Shares are designed for investors who meet certain administrative, service, and account-size criteria.
A. The following significant accounting policies conform to generally accepted accounting principles for U.S. mutual funds. The fund consistently follows such policies in preparing its financial statements.
1. Security Valuation: Bonds, and temporary cash investments acquired over 60 days to maturity, are valued using the latest bid prices or using valuations based on a matrix system (which considers such factors as security prices, yields, maturities, and ratings), both as furnished by independent pricing services. Other temporary cash investments are valued at amortized cost, which approximates market value. Securities for which market quotations are not readily available, or whose values have been affected by events occurring before the fund’s pricing time but after the close of the securities’ primary markets, are valued by methods deemed by the board of trustees to represent fair value.
2. Futures Contracts: The fund uses futures contracts to invest in fixed income asset classes with greater efficiency and lower cost than is possible through direct investment, to add value when these instruments are attractively priced, or to adjust sensitivity to changes in interest rates. The primary risks associated with the use of futures contracts are imperfect correlation between changes in market values of bonds held by the fund and the prices of futures contracts, and the possibility of an illiquid market.
Futures contracts are valued based upon their quoted daily settlement prices. The aggregate principal amounts of the contracts are not recorded in the Statement of Net Assets. Fluctuations in the value of the contracts are recorded in the Statement of Net Assets as an asset (liability) and in the Statement of Operations as unrealized appreciation (depreciation) until the contracts are closed, when they are recorded as realized futures gains (losses).
3. Federal Income Taxes: The fund intends to continue to qualify as a regulated investment company and distribute all of its income. Management has analyzed the fund’s tax positions taken for all open federal income tax years (November 30, 2007–2010), and has concluded that no provision for federal income tax is required in the fund’s financial statements.
4. Distributions: Distributions from net investment income are declared daily and paid on the first business day of the following month. Annual distributions from realized capital gains, if any, are recorded on the ex-dividend date.
5. Other: Interest income is accrued daily. Premiums and discounts on debt securities purchased are amortized and accreted, respectively, to interest income over the lives of the respective securities. Security transactions are accounted for on the date securities are bought or sold. Costs used to determine realized gains (losses) on the sale of investment securities are those of the specific securities sold.
Each class of shares has equal rights as to assets and earnings, except that each class separately bears certain class-specific expenses related to maintenance of shareholder accounts (included in Management and Administrative expenses) and shareholder reporting. Marketing and distribution expenses are allocated to each class of shares based on a method approved by the board of trustees. Income, other non-class-specific expenses, and gains and losses on investments are allocated to each class of shares based on its relative net assets.
64
California Intermediate-Term Tax-Exempt Fund
B. The Vanguard Group furnishes at cost investment advisory, corporate management, administrative, marketing, and distribution services. The costs of such services are allocated to the fund under methods approved by the board of trustees. The fund has committed to provide up to 0.40% of its net assets in capital contributions to Vanguard. At November 30, 2010, the fund had contributed capital of $998,000 to Vanguard (included in Other Assets), representing 0.02% of the fund’s net assets and 0.40% of Vanguard’s capitalization. The fund’s trustees and officers are also directors and officers of Vanguard.
C. Various inputs may be used to determine the value of the fund’s investments. These inputs are summarized in three broad levels for financial statement purposes. The inputs or methodologies used to value securities are not necessarily an indication of the risk associated with investing in those securities.
Level 1—Quoted prices in active markets for identical securities.
Level 2—Other significant observable inputs (including quoted prices for similar securities, interest rates, prepayment speeds, credit risk, etc.).
Level 3—Significant unobservable inputs (including the fund’s own assumptions used to determine the fair value of investments).
The following table summarizes the fund’s investments as of November 30, 2010, based on the inputs used to value them:
| | | |
| | Level 1 | Level 2 | Level 3 |
| Investments | ($000) | ($000) | ($000) |
| Tax-Exempt Municipal Bonds | — | 5,453,443 | — |
| Futures Contracts—Assets1 | 242 | — | — |
| Total | 242 | 5,453,443 | — |
| 1 Represents variation margin on the last day of the reporting period. |
D. At November 30, 2010, the aggregate settlement value of open futures contracts and the related unrealized appreciation (depreciation) were:
| | | | |
| | | | | ($000) |
| | | | Aggregate | |
| | | Number of | Settlement | Unrealized |
| | | Long (Short) | Value | Appreciation |
| Futures Contracts | Expiration | Contracts | Long (Short) | (Depreciation) |
| 2-Year United States Treasury Note | March 2011 | 374 | 82,046 | (13) |
Unrealized appreciation (depreciation) on open futures contracts is required to be treated as realized gain (loss) for tax purposes.
E. Capital gain distributions are determined on a tax basis and may differ from realized capital gains for financial reporting purposes. Differences may be permanent or temporary. Permanent differences are reclassified among capital accounts in the financial statements to reflect their tax character. Temporary differences arise when gains or losses are recognized in different periods for financial statement and tax purposes; these differences will reverse at some time in the future.
65
California Intermediate-Term Tax-Exempt Fund
For tax purposes, at November 30, 2010, the fund had available capital loss carryforwards totaling $95,137,000 to offset future net capital gains of $4,253,000 through November 30, 2012, $2,524,000 through November 30, 2013, $6,523,000 through November 30, 2014, $3,936,000 through November 30, 2015, $38,505,000 through November 30, 2016, $38,406,000 through November 30, 2017, and $990,000 through November 30, 2018.
The fund had realized losses totaling $3,023,000 through November 30, 2010, which are deferred for tax purposes and reduce the amount of tax-basis unrealized appreciation on investment securities.
At November 30, 2010, the cost of investment securities for tax purposes was $5,376,033,000. Net unrealized appreciation of investment securities for tax purposes was $77,410,000, consisting of unrealized gains of $138,505,000 on securities that had risen in value since their purchase and $61,095,000 in unrealized losses on securities that had fallen in value since their purchase.
F. During the year ended November 30, 2010, the fund purchased $904,585,000 of investment securities and sold $531,536,000 of investment securities, other than temporary cash investments.
G. Capital share transactions for each class of shares were:
| | | | |
| | | | Year Ended November 30, |
| | | 2010 | | 2009 |
| | Amount | Shares | Amount | Shares |
| | ($000) | (000) | ($000) | (000) |
| Investor Shares | | | | |
| Issued | 502,321 | 45,661 | 589,941 | 55,526 |
| Issued in Lieu of Cash Distributions | 48,290 | 4,382 | 46,196 | 4,343 |
| Redeemed | (683,947) | (62,030) | (599,846) | (56,887) |
| Net Increase (Decrease)—Investor Shares | (133,336) | (11,987) | 36,291 | 2,982 |
| Admiral Shares | | | | |
| Issued | 1,327,526 | 120,454 | 1,170,338 | 110,060 |
| Issued in Lieu of Cash Distributions | 114,894 | 10,422 | 99,608 | 9,362 |
| Redeemed | (928,373) | (84,379) | (1,048,020) | (99,670) |
| Net Increase (Decrease)—Admiral Shares | 514,047 | 46,497 | 221,926 | 19,752 |
H. In preparing the financial statements as of November 30, 2010, management considered the impact of subsequent events for potential recognition or disclosure in these financial statements.
66
California Long-Term Tax-Exempt Fund
Fund Profile
As of November 30, 2010
| | | |
| Share-Class Characteristics | | |
| | | Investor | Admiral |
| | | Shares | Shares |
| Ticker Symbol | | VCITX | VCLAX |
| Expense Ratio1 | | 0.20% | 0.12% |
| 30-Day SEC Yield | | 3.81% | 3.89% |
| |
| Financial Attributes | | |
| | | Barclays | Barclays |
| | | 10 Year | Municipal |
| | | Municipal | Bond |
| | Fund | Index | Index |
| Number of Bonds | 443 | 8,595 | 46,372 |
| Yield to Maturity | | | |
| (before expenses) | 4.2% | 3.3% | 3.5% |
| Average Coupon | 4.5% | 4.9% | 5.0% |
| Average Duration | 7.4 years | 7.3 years | 8.4 years |
| Average Effective | | | |
| Maturity | 10.5 years | 9.9 years | 13.4 years |
| Short-Term | | | |
| Reserves | 4.0% | — | — |
| | |
| Volatility Measures | | |
| | Barclays | |
| | 10 Year | Barclays |
| | Municipal | Municipal |
| | Index | Bond Index |
| R-Squared | 0.81 | 0.94 |
| Beta | 1.04 | 1.15 |
| These measures show the degree and timing of the fund’s fluctuations compared with the indexes over 36 months. |
|
| |
| Distribution by Maturity (% of portfolio) |
| Under 1 Year | | 8.4% |
| 1 - 3 Years | | 12.5 |
| 3 - 5 Years | | 11.3 |
| 5 - 10 Years | | 38.6 |
| 10 - 20 Years | | 10.3 |
| 20 - 30 Years | | 15.0 |
| Over 30 Years | | 3.9 |
| |
| Distribution by Credit Quality (% of portfolio) |
| AAA | | 8.2% |
| AA | | 38.5 |
| A | | 43.9 |
| BBB | | 8.3 |
| Not Rated | | 1.1 |
| For information about these ratings, see the Glossary entry for Credit Quality. |
Investment Focus
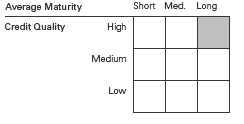
1 The expense ratios shown are from the prospectus dated April 22, 2010, and represent estimated costs for the current fiscal year. For the fiscal year ended November 30, 2010, the expense ratios were 0.20% for Investor Shares and 0.12% for Admiral Shares.
67
California Long-Term Tax-Exempt Fund
Performance Summary
All of the returns in this report represent past performance, which is not a guarantee of future results that may be achieved by the fund. (Current performance may be lower or higher than the performance data cited. For performance data current to the most recent month-end, visit our website at vanguard.com/performance.) Note, too, that both investment returns and principal value can fluctuate widely, so an investor’s shares, when sold, could be worth more or less than their original cost. The returns shown do not reflect taxes that a shareholder would pay on fund distributions or on the sale of fund shares.
Cumulative Performance: November 30, 2000, Through November 30, 2010
Initial Investment of $10,000
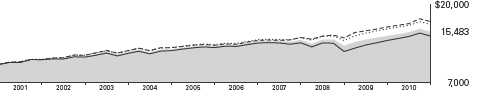
| | | | |
| | Average Annual Total Returns | |
| | Periods Ended November 30, 2010 | |
| | | | | Final Value |
| | One | Five | Ten | of a $10,000 |
| | Year | Years | Years | Investment |
| California Long-Term Tax-Exempt Fund | | | | |
| Investor Shares | 4.63% | 3.44% | 4.47% | $15,483 |
| Barclays Capital Municipal Bond Index | 4.76 | 4.67 | 5.30 | 16,754 |
| Barclays Capital 10 Year Municipal | | | | |
| Bond Index | 5.51 | 5.40 | 5.57 | 17,200 |
| California Municipal Debt Funds | | | | |
| Average | 5.20 | 2.85 | 3.98 | 14,773 |
California Municipal Debt Funds Average: Derived from data provided by Lipper Inc.
See Financial Highlights for dividend and capital gains information.
68
California Long-Term Tax-Exempt Fund
| | | | |
| | | Average Annual Total Returns | |
| | | Periods Ended November 30, 2010 | |
| | | | Since | Final Value |
| | One | Five | Inception | of a $50,000 |
| | Year | Years | (11/12/2001) | Investment |
| California Long-Term Tax-Exempt | | | | |
| Fund Admiral Shares | 4.72% | 3.52% | 3.90% | $70,713 |
| Barclays Capital Municipal Bond | | | | |
| Index | 4.76 | 4.67 | 4.64 | 75,346 |
| Barclays Capital 10 Year Municipal | | | | |
| Bond Index | 5.51 | 5.40 | 5.00 | 77,731 |
"Since Inception" performance is calculated from the Admiral Shares’ inception date for both the fund and its comparative standards.
Fiscal-Year Total Returns (%): November 30, 2000, Through November 30, 2010
| | | | |
| | | | | Barclays |
| | | | | 10 Year |
| | | | | Municipal |
| | | | Investor Shares | Index |
| Fiscal Year | Income Returns | Capital Returns | Total Returns | Total Returns |
| 2001 | 5.12% | 2.63% | 7.75% | 8.22% |
| 2002 | 4.85 | 0.51 | 5.36 | 6.67 |
| 2003 | 4.73 | 2.22 | 6.95 | 6.88 |
| 2004 | 4.65 | -1.33 | 3.32 | 4.03 |
| 2005 | 4.54 | -0.32 | 4.22 | 3.01 |
| 2006 | 4.71 | 1.99 | 6.70 | 6.17 |
| 2007 | 4.52 | -3.37 | 1.15 | 3.51 |
| 2008 | 4.13 | -11.08 | -6.95 | -0.42 |
| 2009 | 4.96 | 7.75 | 12.71 | 12.67 |
| 2010 | 4.36 | 0.27 | 4.63 | 5.51 |
69
California Long-Term Tax-Exempt Fund
Average Annual Total Returns: Periods Ended September 30, 2010
This table presents average annual total returns through the latest calendar quarter—rather than through the end of the fiscal period. Securities and Exchange Commission rules require that we provide this information.
| | | | | | |
| | | | | | | Ten Years |
| | Inception Date | One Year | Five Years | Income | Capital | Total |
| Investor Shares | 4/7/1986 | 5.01% | 4.05% | 4.68% | 0.32% | 5.00% |
| Admiral Shares | 11/12/2001 | 5.09 | 4.13 | 4.681 | -0.351 | 4.331 |
| 1 Return since inception. |
70
California Long-Term Tax-Exempt Fund
Financial Statements
Statement of Net Assets
As of November 30, 2010
The fund reports a complete list of its holdings in regulatory filings four times in each fiscal year, at the quarter-ends. For the second and fourth fiscal quarters, the lists appear in the fund’s semiannual and annual reports to shareholders. For the first and third fiscal quarters, the fund files the lists with the Securities and Exchange Commission on Form N-Q. Shareholders can look up the fund’s Forms N-Q on the SEC’s website at sec.gov. Forms N-Q may also be reviewed and copied at the SEC’s Public Reference Room (see the back cover of this report for further information).
| | | | |
| | | | Face | Market |
| | | Maturity | Amount | Value |
| | Coupon | Date | ($000) | ($000) |
| Tax-Exempt Municipal Bonds (99.4%) | | | | |
| California (98.6%) | | | | |
| ABAG Finance Authority for Nonprofit Corps. | | | | |
| California Revenue (899 Charleston Project) | | | | |
| VRDO | 0.290% | 12/1/10 LOC | 11,000 | 11,000 |
| ABAG Finance Authority for Nonprofit Corps. | | | | |
| California Revenue (Acacia Creek at | | | | |
| Union City Project) | 0.290% | 12/1/10 | 9,450 | 9,450 |
| ABAG Finance Authority for Nonprofit Corps. | | | | |
| California Revenue (School of the | | | | |
| Mechanical Arts-Lick-Wilmerding High School) | 5.250% | 10/1/26 | 1,000 | 1,002 |
| ABAG Finance Authority for Nonprofit Corps. | | | | |
| California Revenue (School of the Mechanical | | | | |
| Arts-Lick-Wilmerding High School) | 5.300% | 10/1/32 | 3,180 | 3,099 |
| Alameda CA | | | | |
| Corridor Transportation Authority Revenue | 5.125% | 10/1/17 (14) | 5,000 | 5,032 |
| Alameda CA | | | | |
| Corridor Transportation Authority Revenue | 5.125% | 10/1/18 (14) | 2,000 | 2,012 |
| Alameda CA | | | | |
| Corridor Transportation Authority Revenue | 0.000% | 10/1/30 (2) | 30,375 | 7,879 |
| Alameda County CA Unified School District GO | 0.000% | 8/1/24 (4) | 3,510 | 1,598 |
| Alameda County CA Unified School District GO | 0.000% | 8/1/29 (4) | 5,000 | 1,568 |
| Anaheim CA Public Financing Authority Revenue | | | | |
| (Distribution System) | 5.000% | 10/1/21 (14) | 3,390 | 3,591 |
| Bay Area CA | | | | |
| Infrastructure Financing Authority Revenue | 5.000% | 8/1/17 (14) | 4,000 | 4,187 |
| Bay Area Toll Authority California Toll Bridge | | | | |
| Revenue (San Francisco Bay Area) | 5.000% | 4/1/31 | 2,395 | 2,423 |
| Bay Area Toll Authority California Toll Bridge | | | | |
| Revenue (San Francisco Bay Area) | 5.000% | 4/1/34 | 7,000 | 7,025 |
| Bay Area Toll Authority California Toll Bridge | | | | |
| Revenue (San Francisco Bay Area) | 5.000% | 4/1/39 | 18,285 | 18,174 |
| Bay Area Toll Authority California Toll Bridge | | | | |
| Revenue (San Francisco Bay Area) | 5.000% | 10/1/42 | 5,000 | 4,770 |
| Bay Area Toll Authority California Toll Bridge | | | | |
| Revenue (San Francisco Bay Area) | 5.625% | 4/1/44 | 10,000 | 10,498 |
| Cabrillo CA Community College District Revenue | 0.000% | 5/1/26 (2) | 9,000 | 3,593 |
| Cabrillo CA Community College District Revenue | 0.000% | 8/1/28 (14) | 2,250 | 803 |
| California County CA | | | | |
| Tobacco Securitization Agency | 0.000% | 6/1/28 | 7,500 | 6,026 |
71
California Long-Term Tax-Exempt Fund
| | | | |
| | | | Face | Market |
| | | Maturity | Amount | Value |
| | Coupon | Date | ($000) | ($000) |
| California County CA | | | | |
| Tobacco Securitization Agency | 0.000% | 6/1/36 | 7,500 | 5,651 |
| California Department of Water Resources | | | | |
| Power Supply Revenue | 6.000% | 5/1/12 (Prere.) | 13,000 | 14,140 |
| California Department of Water Resources | | | | |
| Power Supply Revenue | 5.000% | 5/1/15 | 7,500 | 8,556 |
| California Department of Water Resources | | | | |
| Power Supply Revenue | 5.000% | 5/1/16 | 7,500 | 8,663 |
| California Department of Water Resources | | | | |
| Power Supply Revenue | 5.000% | 5/1/18 | 8,000 | 9,243 |
| California Department of Water Resources | | | | |
| Power Supply Revenue | 5.000% | 5/1/20 | 10,000 | 11,483 |
| California Department of Water Resources | | | | |
| Power Supply Revenue | 5.000% | 5/1/21 | 5,000 | 5,646 |
| California Department of Water Resources | | | | |
| Power Supply Revenue | 5.000% | 5/1/22 | 30,000 | 32,753 |
| California Department of Water Resources | | | | |
| Water System Revenue (Central Valley Project) | 5.000% | 12/1/25 | 8,810 | 9,629 |
| California Economic Recovery Bonds GO | 5.000% | 7/1/17 (14) | 25,000 | 25,528 |
| California Economic Recovery Bonds GO | 5.000% | 7/1/18 | 15,850 | 17,999 |
| California Economic Recovery Bonds GO | 5.000% | 7/1/19 | 9,290 | 10,349 |
| California Economic Recovery Bonds GO | 5.000% | 7/1/20 | 19,855 | 21,777 |
| California Economic Recovery Bonds GO | 5.250% | 7/1/21 | 16,985 | 18,794 |
| California Economic Recovery Bonds GO | 5.000% | 7/1/22 | 5,000 | 5,265 |
| California Economic Recovery Bonds GO PUT | 5.000% | 7/1/11 (Prere.) | 16,000 | 16,442 |
| California Educational Facilities Authority Revenue | | | | |
| (California Institute of Technology) | 5.000% | 10/1/39 | 1,500 | 1,535 |
| California Educational Facilities Authority Revenue | | | | |
| (California Institute of Technology) | 5.000% | 11/1/39 | 3,000 | 3,150 |
| California Educational Facilities Authority Revenue | | | | |
| (College of Arts & Crafts) | 6.875% | 6/1/19 | 1,615 | 1,813 |
| California Educational Facilities Authority Revenue | | | | |
| (College of Arts & Crafts) | 5.750% | 6/1/25 | 2,000 | 2,000 |
| California Educational Facilities Authority Revenue | | | | |
| (Pomona College) | 0.000% | 7/1/34 | 3,155 | 784 |
| California Educational Facilities Authority Revenue | | | | |
| (Pomona College) | 0.000% | 7/1/35 | 3,155 | 717 |
| 1 California Educational Facilities Authority Revenue | | | | |
| (Pomona College) | 0.000% | 7/1/36 | 3,155 | 670 |
| 1 California Educational Facilities Authority Revenue | | | | |
| (Pomona College) | 0.000% | 7/1/37 | 3,155 | 629 |
| 1 California Educational Facilities Authority Revenue | | | | |
| (Pomona College) | 0.000% | 7/1/39 | 2,805 | 494 |
| California Educational Facilities Authority Revenue | | | | |
| (Pomona College) | 0.000% | 7/1/40 | 1,580 | 260 |
| California Educational Facilities Authority Revenue | | | | |
| (Stanford University) | 5.000% | 3/15/26 | 5,330 | 6,133 |
| California Educational Facilities Authority Revenue | | | | |
| (University of Southern California) | 4.750% | 10/1/37 | 1,650 | 1,601 |
| California Educational Facilities Authority Revenue | | | | |
| (University of Southern California) | 5.250% | 10/1/38 | 3,250 | 3,392 |
| California Educational Facilities Authority Revenue | | | | |
| (University of the Pacific) | 5.000% | 11/1/25 | 2,000 | 2,054 |
| California GO | 6.250% | 9/1/12 (3) | 6,070 | 6,364 |
| California GO | 7.000% | 11/1/13 (14) | 65 | 66 |
| California GO | 5.000% | 10/1/14 | 1,900 | 2,097 |
72
California Long-Term Tax-Exempt Fund
| | | | |
| | | | Face | Market |
| | | Maturity | Amount | Value |
| | Coupon | Date | ($000) | ($000) |
| California GO | 5.250% | 10/1/14 (14)(3) | 1,955 | 1,975 |
| California GO | 5.000% | 11/1/14 | 32,840 | 36,286 |
| California GO | 5.000% | 11/1/15 | 1,000 | 1,116 |
| California GO | 5.000% | 3/1/19 | 1,250 | 1,372 |
| California GO | 6.000% | 4/1/19 | 1,690 | 1,967 |
| California GO | 6.000% | 8/1/19 (3) | 210 | 212 |
| California GO | 5.000% | 4/1/20 | 1,460 | 1,572 |
| California GO | 5.500% | 4/1/21 | 2,000 | 2,186 |
| California GO | 5.000% | 11/1/22 | 1,000 | 1,032 |
| California GO | 5.000% | 3/1/25 | 7,000 | 7,051 |
| California GO | 5.000% | 9/1/25 | 16,950 | 17,033 |
| California GO | 5.125% | 2/1/26 | 15,325 | 15,397 |
| California GO | 5.000% | 6/1/26 (14) | 30,000 | 30,049 |
| California GO | 5.000% | 9/1/28 | 11,650 | 11,461 |
| California GO | 5.000% | 10/1/29 | 1,400 | 1,365 |
| California GO | 5.250% | 10/1/29 | 4,700 | 4,713 |
| California GO | 4.500% | 8/1/30 | 5,000 | 4,487 |
| California GO | 5.750% | 4/1/31 | 15,000 | 15,510 |
| California GO | 5.000% | 6/1/32 | 35,000 | 33,836 |
| California GO | 6.000% | 3/1/33 | 7,000 | 7,470 |
| California GO | 6.500% | 4/1/33 | 33,000 | 36,409 |
| California GO | 5.000% | 6/1/34 | 32,500 | 31,030 |
| California GO | 4.500% | 3/1/35 (2) | 2,320 | 2,000 |
| California GO | 6.000% | 11/1/35 | 10,000 | 10,506 |
| California GO | 5.250% | 3/1/38 | 13,565 | 13,237 |
| California GO | 6.000% | 4/1/38 | 36,840 | 38,531 |
| California GO | 5.250% | 8/1/38 | 10,000 | 9,757 |
| California GO | 6.000%�� | 11/1/39 | 2,700 | 2,829 |
| California GO | 5.500% | 3/1/40 | 12,000 | 12,016 |
| 2 California GO | 5.250% | 11/1/40 | 13,500 | 13,123 |
| 3 California GO TOB VRDO | 0.360% | 12/1/10 LOC | 8,350 | 8,350 |
| California Health Facilities Financing Authority | | | | |
| Revenue (Adventist Health System/West) | 5.000% | 3/1/33 | 7,950 | 7,299 |
| California Health Facilities Financing Authority | | | | |
| Revenue (California-Nevada Methodist Homes) | 5.000% | 7/1/36 | 2,075 | 1,852 |
| California Health Facilities Financing Authority | | | | |
| Revenue (Casa Colina) | 6.125% | 4/1/32 | 10,000 | 9,946 |
| California Health Facilities Financing Authority | | | | |
| Revenue (Catholic Healthcare West) | 4.750% | 7/1/19 (14) | 765 | 765 |
| California Health Facilities Financing Authority | | | | |
| Revenue (Catholic Healthcare West) | 5.625% | 7/1/25 | 5,000 | 5,269 |
| California Health Facilities Financing Authority | | | | |
| Revenue (Catholic Healthcare West) | 6.000% | 7/1/39 | 5,000 | 5,207 |
| California Health Facilities Financing Authority | | | | |
| Revenue (Catholic Healthcare West) PUT | 5.000% | 7/1/14 | 10,000 | 11,037 |
| California Health Facilities Financing Authority | | | | |
| Revenue (Cedars-Sinai Medical Center) | 5.000% | 11/15/27 | 7,000 | 6,960 |
| California Health Facilities Financing Authority | | | | |
| Revenue (Cedars-Sinai Medical Center) | 5.000% | 8/15/39 | 7,000 | 6,507 |
| California Health Facilities Financing Authority | | | | |
| Revenue (Children’s Hospital of Orange County) | 6.500% | 11/1/38 | 3,000 | 3,125 |
| California Health Facilities Financing Authority | | | | |
| Revenue (Providence Health & Services) | 6.500% | 10/1/33 | 2,000 | 2,251 |
| California Health Facilities Financing Authority | | | | |
| Revenue (Providence Health & Services) | 5.500% | 10/1/39 | 5,500 | 5,530 |
73
California Long-Term Tax-Exempt Fund
| | | | |
| | | | Face | Market |
| | | Maturity | Amount | Value |
| | Coupon | Date | ($000) | ($000) |
| California Health Facilities Financing Authority | | | | |
| Revenue (St. Joseph Health System) | 5.750% | 7/1/39 | 5,000 | 5,150 |
| California Health Facilities Financing Authority | | | | |
| Revenue (Stanford Hospital) PUT | 3.450% | 6/15/11 | 5,000 | 5,083 |
| California Health Facilities Financing Authority | | | | |
| Revenue (Sutter Health) | 5.250% | 8/15/22 | 5,000 | 5,241 |
| California Health Facilities Financing Authority | | | | |
| Revenue (Sutter Health) | 5.250% | 11/15/46 | 20,500 | 19,632 |
| California Infrastructure & | | | | |
| Economic Development Bank Revenue | | | | |
| (Academy of Sciences) VRDO | 0.240% | 12/1/10 LOC | 3,500 | 3,500 |
| California Infrastructure & | | | | |
| Economic Development Bank Revenue | | | | |
| (Academy of Sciences) VRDO | 0.260% | 12/1/10 LOC | 7,200 | 7,200 |
| California Infrastructure & | | | | |
| Economic Development Bank Revenue | | | | |
| (Bay Area Toll Bridges Seismic Retrofit) | 5.000% | 1/1/28 (Prere.) | 7,500 | 8,522 |
| California Infrastructure & | | | | |
| Economic Development Bank Revenue | | | | |
| (Independent System Operator Corp. Project) | 5.000% | 2/1/13 | 8,000 | 8,519 |
| California Infrastructure & | | | | |
| Economic Development Bank Revenue | | | | |
| (J. David Gladstone Institutes Project) | 5.500% | 10/1/18 | 3,905 | 4,015 |
| California Infrastructure & | | | | |
| Economic Development Bank Revenue | | | | |
| (J. David Gladstone Institutes Project) | 5.500% | 10/1/20 | 1,500 | 1,536 |
| California Infrastructure & | | | | |
| Economic Development Bank Revenue | | | | |
| (J. David Gladstone Institutes Project) | 5.250% | 10/1/34 | 20,040 | 18,576 |
| California Infrastructure & | | | | |
| Economic Development Bank Revenue | | | | |
| (J. Paul Getty Trust) VRDO | 0.230% | 12/1/10 | 24,630 | 24,630 |
| California Infrastructure & | | | | |
| Economic Development Bank Revenue | | | | |
| (Kaiser Hospital Assistance I-LLC) | 5.500% | 8/1/31 | 7,610 | 7,681 |
| California Infrastructure & | | | | |
| Economic Development Bank Revenue | | | | |
| (Kaiser Hospital Assistance I-LLC) | 5.550% | 8/1/31 | 5,500 | 5,569 |
| California Infrastructure & | | | | |
| Economic Development Bank Revenue | | | | |
| (Pacific Gas & Electric Co.) VRDO | 0.270% | 12/1/10 LOC | 3,200 | 3,200 |
| California Infrastructure & | | | | |
| Economic Development Bank Revenue | | | | |
| (Science Center Phase II Project) | 5.000% | 5/1/31 (14) | 7,635 | 6,875 |
| California Infrastructure & | | | | |
| Economic Development Bank Revenue | | | | |
| (YMCA of Metropolitan Los Angeles Project) | 5.250% | 2/1/26 (2) | 4,750 | 4,759 |
| California Municipal Finance Authority | | | | |
| (Community Hospitals of | | | | |
| Central California Obligated Group) COP | 5.500% | 2/1/39 | 11,000 | 9,992 |
| California Public Works Board Lease Revenue | | | | |
| (Community Colleges) | 5.000% | 3/1/27 (14) | 6,220 | 5,979 |
| California Public Works Board Lease Revenue | | | | |
| (Department of Corrections) | 5.000% | 1/1/15 (2) | 3,900 | 4,215 |
| California Public Works Board Lease Revenue | | | | |
| (Department of Corrections) | 5.000% | 1/1/17 | 6,000 | 6,436 |
74
California Long-Term Tax-Exempt Fund
| | | | |
| | | | Face | Market |
| | | Maturity | Amount | Value |
| | Coupon | Date | ($000) | ($000) |
| California Public Works Board Lease Revenue | | | | |
| (Department of Corrections) | 6.500% | 9/1/17 (2) | 25,000 | 27,830 |
| California Public Works Board Lease Revenue | | | | |
| (Department of Corrections) | 5.000% | 12/1/17 (14) | 13,835 | 14,667 |
| California Public Works Board Lease Revenue | | | | |
| (Department of Corrections) | 5.000% | 12/1/19 (14) | 15,230 | 15,820 |
| California Public Works Board Lease Revenue | | | | |
| (Department of General Services) | 6.000% | 4/1/25 | 6,000 | 6,371 |
| California Public Works Board Lease Revenue | | | | |
| (Department of General Services) | 6.250% | 4/1/34 | 6,975 | 7,250 |
| California Public Works Board Lease Revenue | | | | |
| (Office of Emergency Services) | 5.000% | 3/1/27 (14) | 8,950 | 8,603 |
| California Public Works Board Lease Revenue | | | | |
| (Regents of The University of California) | 5.250% | 11/1/27 (14) | 9,045 | 9,353 |
| California Public Works Board Lease Revenue | | | | |
| (Regents of The University of California) | 5.000% | 5/1/30 | 17,000 | 17,140 |
| California Public Works Board Lease Revenue | | | | |
| (Various Capital Projects) | 5.000% | 11/1/17 | 5,000 | 5,416 |
| California Public Works Board Lease Revenue | | | | |
| (Various Capital Projects) | 6.250% | 11/1/24 | 5,000 | 5,459 |
| California State University Revenue Systemwide | 5.250% | 11/1/19 (4) | 5,000 | 5,545 |
| California State University Revenue Systemwide | 5.250% | 11/1/20 (4) | 4,745 | 5,252 |
| California State University Revenue Systemwide | 5.000% | 11/1/21 (2) | 17,215 | 18,086 |
| California State University Revenue Systemwide | 5.750% | 11/1/27 | 4,500 | 4,927 |
| California State University Revenue Systemwide | 5.250% | 11/1/34 | 5,000 | 5,168 |
| California Statewide Communities | | | | |
| Development Authority Health Facility Revenue | | | | |
| (Adventist Health System/West) | 5.000% | 3/1/35 | 14,500 | 13,209 |
| California Statewide Communities | | | | |
| Development Authority Health Facility Revenue | | | | |
| (Henry Mayo Newhall Memorial Hospital) | 5.000% | 10/1/18 | 5,875 | 5,880 |
| California Statewide Communities | | | | |
| Development Authority Health Facility Revenue | | | | |
| (Memorial Health Services) | 6.000% | 10/1/23 | 8,500 | 8,871 |
| California Statewide Communities | | | | |
| Development Authority Revenue | | | | |
| (Cottage Health System Obligated Group) | 5.000% | 11/1/40 | 15,000 | 14,009 |
| California Statewide Communities | | | | |
| Development Authority Revenue | | | | |
| (Daughters of Charity Health System) | 5.250% | 7/1/30 | 5,000 | 4,465 |
| California Statewide Communities | | | | |
| Development Authority Revenue | | | | |
| (John Muir Health) | 5.000% | 8/15/34 | 7,390 | 6,903 |
| California Statewide Communities | | | | |
| Development Authority Revenue | | | | |
| (Kaiser Permanente) | 5.500% | 11/1/32 | 18,250 | 18,325 |
| California Statewide Communities | | | | |
| Development Authority Revenue | | | | |
| (Kaiser Permanente) | 5.250% | 3/1/45 | 24,000 | 23,185 |
| California Statewide Communities | | | | |
| Development Authority Revenue | | | | |
| (Los Angeles Orthopaedic Hospital | | | | |
| Foundation & Orthopaedic Hospital) | 5.750% | 6/1/30 (2) | 6,680 | 6,452 |
| California Statewide Communities | | | | |
| Development Authority Revenue | | | | |
| (Proposition 1A Receivables Program) | 5.000% | 6/15/13 | 9,000 | 9,685 |
75
California Long-Term Tax-Exempt Fund
| | | | |
| | | | Face | Market |
| | | Maturity | Amount | Value |
| | Coupon | Date | ($000) | ($000) |
| California Statewide Communities | | | | |
| Development Authority Revenue | | | | |
| (Rady Children’s Hospital - San Diego) VRDO | 0.250% | 12/1/10 LOC | 5,000 | 5,000 |
| California Statewide Communities | | | | |
| Development Authority Revenue (Sutter Health) | 5.500% | 8/15/34 | 10,885 | 10,905 |
| California Statewide Communities | | | | |
| Development Authority Senior Living Revenue | | | | |
| (Southern California Presbyterian Homes) | 4.875% | 11/15/36 | 7,230 | 5,945 |
| California Statewide Communities | | | | |
| Development Authority Senior Living Revenue | | | | |
| (Southern California Presbyterian Homes) | 7.250% | 11/15/41 | 3,000 | 3,205 |
| California Statewide Communities | | | | |
| Development Authority Student Housing | | | | |
| Revenue (CHF-Irvine LLC - UCI East Campus | | | | |
| Apartments Phase II) | 5.000% | 5/15/38 | 18,000 | 15,635 |
| Chabot-Las Positas CA | | | | |
| Community College District GO | 5.000% | 8/1/29 (2) | 12,605 | 12,772 |
| Clovis CA Unified School District GO | 0.000% | 8/1/13 (14) | 4,935 | 4,673 |
| Clovis CA Unified School District GO | 0.000% | 8/1/15 (14) | 2,770 | 2,424 |
| Clovis CA Unified School District GO | 0.000% | 8/1/16 (14) | 2,865 | 2,382 |
| East Bay CA Municipal Utility District | | | | |
| Water System Revenue | 5.000% | 6/1/32 (14) | 15,765 | 16,169 |
| East Bay CA Municipal Utility District | | | | |
| Water System Revenue | 5.000% | 6/1/36 | 10,000 | 10,368 |
| East Bay CA Regional Park District Revenue | 5.000% | 9/1/25 | 2,000 | 2,180 |
| East Bay CA Regional Park District Revenue | 5.000% | 9/1/27 | 4,070 | 4,374 |
| Eastern California Municipal Water District | | | | |
| Water & Sewer Revenue | 6.750% | 7/1/12 (14) | 4,530 | 4,757 |
| Escondido CA Union High School District GO | 0.000% | 11/1/20 (14) | 4,000 | 2,366 |
| Fontana CA Public Financing Authority | | | | |
| Subordinate Lien Tax Allocation Revenue | 5.000% | 10/1/29 (2) | 9,450 | 8,640 |
| Fontana CA Public Financing Authority | | | | |
| Subordinate Lien Tax Allocation Revenue | 5.000% | 10/1/32 (2) | 12,575 | 11,512 |
| Fontana CA Unified School District GO | 5.250% | 8/1/27 (4) | 6,700 | 6,842 |
| Fontana CA Unified School District GO | 5.250% | 8/1/31 (4) | 6,115 | 6,318 |
| Foothill-De Anza CA | | | | |
| Community College District GO | 0.000% | 8/1/17 (14) | 3,000 | 2,396 |
| Foothill-De Anza CA | | | | |
| Community College District GO | 0.000% | 8/1/22 (14) | 3,850 | 2,286 |
| Foothill-De Anza CA | | | | |
| Community College District GO | 0.000% | 8/1/23 (14) | 3,590 | 1,969 |
| Foothill-De Anza CA | | | | |
| Community College District GO | 0.000% | 8/1/25 (14) | 2,390 | 1,158 |
| Foothill/Eastern Corridor Agency California | | | | |
| Toll Road Revenue | 0.000% | 1/15/26 | 10,000 | 9,769 |
| Foothill/Eastern Corridor Agency California | | | | |
| Toll Road Revenue | 0.000% | 1/1/29 (ETM) | 7,460 | 3,413 |
| Foothill/Eastern Corridor Agency California | | | | |
| Toll Road Revenue | 0.000% | 1/15/33 | 10,000 | 2,008 |
| Foothill/Eastern Corridor Agency California | | | | |
| Toll Road Revenue | 0.000% | 1/15/34 | 10,000 | 1,847 |
| Fresno CA Airport Revenue | 5.500% | 7/1/30 (4) | 1,500 | 1,503 |
| Galivan CA Joint Community College District GO | 5.500% | 8/1/28 (2) | 3,405 | 3,515 |
| Golden State Tobacco Securitization Corp. | | | | |
| California | 5.500% | 6/1/13 (Prere.) | 4,000 | 4,437 |
76
California Long-Term Tax-Exempt Fund
| | | | |
| | | | Face | Market |
| | | Maturity | Amount | Value |
| | Coupon | Date | ($000) | ($000) |
| Golden State Tobacco Securitization Corp. | | | | |
| California | 6.250% | 6/1/13 (Prere.) | 35,105 | 38,522 |
| Golden State Tobacco Securitization Corp. | | | | |
| California | 4.500% | 6/1/27 | 26,780 | 22,485 |
| Golden State Tobacco Securitization Corp. | | | | |
| California | 5.000% | 6/1/30 (2) | 20,000 | 18,699 |
| Golden State Tobacco Securitization Corp. | | | | |
| California | 5.000% | 6/1/33 | 13,525 | 9,993 |
| Golden State Tobacco Securitization Corp. | | | | |
| California | 5.125% | 6/1/47 | 19,735 | 12,681 |
| Golden State Tobacco Securitization Corp. | | | | |
| California | 5.750% | 6/1/47 | 13,500 | 9,646 |
| Hartnell CA Community College District GO | 5.000% | 8/1/13 (Prere.) | 1,550 | 1,726 |
| Hartnell CA Community College District GO | 5.000% | 8/1/13 (Prere.) | 1,735 | 1,932 |
| Hartnell CA Community College District GO | 5.000% | 8/1/13 (Prere.) | 2,370 | 2,639 |
| Irvine CA Unified School District | | | | |
| Financing Authority Special Tax Revenue | 5.000% | 9/1/30 (2) | 8,000 | 7,421 |
| Kern CA High School District GO | 6.400% | 8/1/14 (ETM) | 1,490 | 1,781 |
| Kern CA High School District GO | 6.400% | 8/1/15 (ETM) | 1,645 | 2,028 |
| Kern CA High School District GO | 6.400% | 8/1/16 (ETM) | 1,815 | 2,291 |
| Kern County CA GO | 5.750% | 8/1/35 (12) | 2,000 | 2,071 |
| La Mesa-Spring Valley CA School District GO | 5.375% | 8/1/12 (Prere.) | 1,570 | 1,696 |
| La Mesa-Spring Valley CA School District GO | 5.375% | 8/1/12 (Prere.) | 1,775 | 1,918 |
| La Mesa-Spring Valley CA School District GO | 5.375% | 8/1/12 (Prere.) | 2,000 | 2,161 |
| La Mesa-Spring Valley CA School District GO | 5.375% | 8/1/12 (Prere.) | 1,890 | 2,042 |
| Loma Linda CA Hospital Revenue | | | | |
| (Loma Linda University) | 5.000% | 12/1/20 | 6,155 | 6,102 |
| Loma Linda CA Hospital Revenue | | | | |
| (Loma Linda University) | 5.000% | 12/1/21 | 2,500 | 2,430 |
| Long Beach CA Finance Authority | | | | |
| Lease Revenue (Aquarium of the South Pacific) | 5.500% | 11/1/13 (2) | 3,680 | 3,765 |
| Long Beach CA Finance Authority Lease Revenue | | | | |
| (Aquarium of the South Pacific) | 5.500% | 11/1/18 (2) | 4,675 | 4,723 |
| Long Beach CA Finance Authority Lease Revenue | | | | |
| (Temple & Willow Facility) | 5.500% | 10/1/18 (14) | 5,030 | 5,067 |
| Long Beach CA Finance Authority Natural Gas | | | | |
| Purchase Revenue | 1.641% | 11/15/27 | 16,130 | 11,584 |
| Long Beach CA Finance Authority Natural Gas | | | | |
| Purchase Revenue | 5.500% | 11/15/37 | 5,500 | 5,394 |
| Long Beach CA Finance Authority Tax Revenue | 5.500% | 8/1/26 (2) | 7,570 | 7,368 |
| Long Beach CA Finance Authority Tax Revenue | 5.500% | 8/1/31 (2) | 4,015 | 3,677 |
| Long Beach CA Harbor Revenue | 5.000% | 5/15/17 (14) | 3,655 | 4,035 |
| Los Angeles CA Community College District GO | 5.500% | 8/1/25 | 3,980 | 4,334 |
| Los Angeles CA Community College District GO | 5.000% | 8/1/32 (14) | 7,340 | 7,381 |
| Los Angeles CA Community College District GO | 5.000% | 8/1/33 | 10,000 | 9,999 |
| Los Angeles CA Community College District GO | 6.000% | 8/1/33 | 5,000 | 5,466 |
| Los Angeles CA Community College District GO | 5.250% | 8/1/39 | 5,000 | 5,091 |
| Los Angeles CA Department of Airports | | | | |
| International Airport Revenue | 5.250% | 5/15/17 (14) | 6,800 | 7,194 |
| Los Angeles CA Department of Airports | | | | |
| International Airport Revenue | 5.000% | 5/15/22 | 2,000 | 2,152 |
| Los Angeles CA Department of Airports | | | | |
| International Airport Revenue | 5.250% | 5/15/27 | 5,000 | 5,247 |
| Los Angeles CA Department of Airports | | | | |
| International Airport Revenue | 5.000% | 5/15/29 | 15,000 | 15,248 |
77
California Long-Term Tax-Exempt Fund
| | | | |
| | | | Face | Market |
| | | Maturity | Amount | Value |
| | Coupon | Date | ($000) | ($000) |
| Los Angeles CA Department of Airports | | | | |
| International Airport Revenue | 5.000% | 5/15/30 | 3,195 | 3,229 |
| Los Angeles CA Department of Airports | | | | |
| International Airport Revenue | 5.000% | 5/15/40 | 2,215 | 2,175 |
| Los Angeles CA Department of | | | | |
| Water & Power Revenue | 5.000% | 7/1/25 | 4,070 | 4,389 |
| Los Angeles CA Department of | | | | |
| Water & Power Revenue | 5.000% | 7/1/29 (2) | 10,000 | 10,386 |
| Los Angeles CA Department of | | | | |
| Water & Power Revenue | 5.000% | 7/1/30 (2) | 16,000 | 16,497 |
| Los Angeles CA Department of | | | | |
| Water & Power Revenue | 5.000% | 7/1/32 (2) | 5,000 | 5,095 |
| Los Angeles CA Department of | | | | |
| Water & Power Revenue | 5.250% | 7/1/32 | 7,000 | 7,348 |
| Los Angeles CA Department of | | | | |
| Water & Power Revenue | 5.000% | 7/1/34 (14) | 5,995 | 6,046 |
| Los Angeles CA Department of | | | | |
| Water & Power Revenue | 5.375% | 7/1/34 | 3,000 | 3,133 |
| Los Angeles CA Department of | | | | |
| Water & Power Revenue | 5.000% | 7/1/36 (14) | 2,000 | 2,008 |
| Los Angeles CA Department of | | | | |
| Water & Power Revenue | 5.250% | 7/1/38 | 1,890 | 1,957 |
| Los Angeles CA Department of | | | | |
| Water & Power Revenue | 5.000% | 7/1/39 (2) | 8,875 | 8,954 |
| Los Angeles CA Harbor Department Revenue | 5.250% | 8/1/39 | 4,000 | 4,089 |
| Los Angeles CA Unified School District GO | 5.000% | 7/1/13 (Prere.) | 10,000 | 11,073 |
| Los Angeles CA Unified School District GO | 5.000% | 7/1/14 | 5,000 | 5,572 |
| Los Angeles CA Unified School District GO | 5.500% | 7/1/17 (3) | 5,000 | 5,886 |
| Los Angeles CA Unified School District GO | 5.000% | 7/1/19 | 3,950 | 4,480 |
| Los Angeles CA Unified School District GO | 5.000% | 7/1/20 (3) | 6,655 | 7,161 |
| Los Angeles CA Unified School District GO | 5.000% | 7/1/21 | 3,500 | 3,820 |
| Los Angeles CA Unified School District GO | 5.000% | 7/1/24 (2) | 9,745 | 10,102 |
| Los Angeles CA Unified School District GO | 5.000% | 7/1/24 (2) | 7,500 | 7,775 |
| Los Angeles CA Unified School District GO | 5.250% | 7/1/24 | 6,275 | 6,720 |
| Los Angeles CA Unified School District GO | 5.250% | 7/1/25 | 5,000 | 5,316 |
| Los Angeles CA Unified School District GO | 5.250% | 7/1/28 | 7,000 | 7,311 |
| Los Angeles CA Unified School District GO | 5.000% | 7/1/30 (3) | 7,500 | 7,554 |
| Los Angeles CA Unified School District GO | 5.000% | 7/1/30 (2) | 10,875 | 10,950 |
| Los Angeles CA Unified School District GO | 5.000% | 7/1/32 (4) | 8,000 | 8,044 |
| Los Angeles CA Unified School District GO | 5.000% | 1/1/34 | 5,000 | 4,979 |
| Los Angeles CA Unified School District GO | 5.250% | 7/1/34 | 10,000 | 10,165 |
| Los Angeles CA Wastewater System Revenue | 4.750% | 6/1/30 (4) | 4,645 | 4,645 |
| Los Angeles County CA Public Works | | | | |
| Financing Authority Lease Revenue | 5.000% | 12/1/23 (14) | 4,000 | 4,080 |
| Los Angeles County CA Public Works | | | | |
| Financing Authority Lease Revenue | 5.000% | 12/1/24 (14) | 4,000 | 4,051 |
| Los Angeles County CA Public Works | | | | |
| Financing Authority Lease Revenue | 5.000% | 12/1/25 (14) | 2,165 | 2,183 |
| Los Angeles County CA Public Works | | | | |
| Financing Authority Revenue | 5.500% | 10/1/18 (4) | 2,110 | 2,412 |
| Los Angeles County CA Sanitation Districts | | | | |
| Financing Authority Capital Projects Revenue | 4.500% | 10/1/42 (2) | 15,000 | 12,856 |
| Los Angeles County CA Schools Regionalized | | | | |
| Business Services Corp. COP | 0.000% | 8/1/14 (ETM) | 1,000 | 875 |
| Los Angeles County CA Schools Regionalized | | | | |
| Business Services Corp. COP | 0.000% | 8/1/20 (2) | 2,095 | 1,199 |
78
California Long-Term Tax-Exempt Fund
| | | | |
| | | | Face | Market |
| | | Maturity | Amount | Value |
| | Coupon | Date | ($000) | ($000) |
| M-S-R California Energy Authority Revenue | 7.000% | 11/1/34 | 7,000 | 8,049 |
| M-S-R California Energy Authority Revenue | 6.500% | 11/1/39 | 7,000 | 7,589 |
| M-S-R California Public Power Agency Revenue | | | | |
| (San Juan Project) | 6.125% | 7/1/13 (2) | 5,080 | 5,332 |
| M-S-R California Public Power Agency Revenue | | | | |
| (San Juan Project) | 6.750% | 7/1/20 (ETM) | 13,225 | 16,466 |
| Metropolitan Water District of | | | | |
| Southern California Revenue | 5.000% | 7/1/25 | 3,410 | 3,677 |
| Metropolitan Water District of | | | | |
| Southern California Revenue | 5.000% | 7/1/28 | 4,235 | 4,456 |
| Metropolitan Water District of | | | | |
| Southern California Revenue | 5.000% | 7/1/31 | 6,000 | 6,277 |
| Metropolitan Water District of | | | | |
| Southern California Revenue VRDO | 3.600% | 12/1/10 | 6,500 | 6,500 |
| Modesto CA High School District GO | 0.000% | 8/1/15 (14) | 5,000 | 4,310 |
| Modesto CA High School District GO | 0.000% | 8/1/17 (14) | 3,000 | 2,278 |
| Modesto CA High School District GO | 0.000% | 8/1/18 (14) | 3,225 | 2,271 |
| Modesto CA Irrigation District COP | 5.500% | 7/1/35 | 3,000 | 3,115 |
| Modesto CA Irrigation District COP | 5.000% | 10/1/36 (2) | 4,795 | 4,607 |
| Modesto CA Irrigation District | | | | |
| Financing Authority Revenue (Woodland Project) | 6.500% | 10/1/11 (ETM) | 1,585 | 1,652 |
| Modesto CA Irrigation District | | | | |
| Financing Authority Revenue (Woodland Project) | 6.500% | 10/1/22 (ETM) | 9,750 | 12,122 |
| Monterey Park CA Redevelopment Agency | | | | |
| Tax Allocation Revenue | 5.000% | 9/1/16 (4) | 1,010 | 1,052 |
| Monterey Park CA Redevelopment Agency | | | | |
| Tax Allocation Revenue | 5.000% | 9/1/17 (4) | 1,060 | 1,097 |
| Monterey Park CA Redevelopment Agency | | | | |
| Tax Allocation Revenue | 5.000% | 9/1/18 (4) | 1,115 | 1,148 |
| Monterey Park CA Redevelopment Agency | | | | |
| Tax Allocation Revenue | 5.000% | 9/1/19 (4) | 1,120 | 1,148 |
| Monterey Park CA Redevelopment Agency | | | | |
| Tax Allocation Revenue | 5.000% | 9/1/20 (4) | 1,180 | 1,204 |
| Mount San Antonio CA | | | | |
| Community College District GO | 5.250% | 8/1/14 (Prere.) | 3,170 | 3,649 |
| Mount San Antonio CA | | | | |
| Community College District GO | 5.250% | 8/1/14 (Prere.) | 3,335 | 3,839 |
| Mount San Antonio CA | | | | |
| Community College District GO | 5.250% | 8/1/14 (Prere.) | 3,010 | 3,465 |
| Napa Valley CA Unified School District Election | | | | |
| GO | 4.500% | 8/1/42 (4) | 4,790 | 4,211 |
| New Haven CA Unified School District GO | 12.000% | 8/1/16 (4) | 2,480 | 3,793 |
| New Haven CA Unified School District GO | 12.000% | 8/1/17 (4) | 1,500 | 2,382 |
| Newark CA Unified School District GO | 0.000% | 8/1/11 (4) | 1,670 | 1,659 |
| Newark CA Unified School District GO | 0.000% | 8/1/12 (4) | 1,820 | 1,777 |
| Newark CA Unified School District GO | 0.000% | 8/1/13 (4) | 2,050 | 1,941 |
| North Orange County CA | | | | |
| Community College District GO | 5.375% | 8/1/12 (Prere.) | 5,080 | 5,513 |
| Northern California Gas Authority No. 1 Revenue | 0.644% | 7/1/13 | 14,000 | 13,393 |
| Northern California Gas Authority No. 1 Revenue | 0.794% | 7/1/17 | 17,000 | 14,704 |
| Northern California Power Agency Revenue | | | | |
| (Hydroelectric Project) | 5.000% | 7/1/11 | 2,000 | 2,049 |
| Northern California Power Agency Revenue | | | | |
| (Hydroelectric Project) | 5.000% | 7/1/12 | 2,935 | 3,112 |
| Northern California Power Agency Revenue | | | | |
| (Hydroelectric Project) | 5.000% | 7/1/18 | 3,500 | 3,982 |
79
California Long-Term Tax-Exempt Fund
| | | | |
| | | | Face | Market |
| | | Maturity | Amount | Value |
| | Coupon | Date | ($000) | ($000) |
| Northern California Power Agency Revenue | | | | |
| (Hydroelectric Project) | 6.300% | 7/1/18 (14) | 10,000 | 11,478 |
| Northern California Power Agency Revenue | | | | |
| (Hydroelectric Project) | 7.500% | 7/1/21 (Prere.) | 1,810 | 2,420 |
| Northern California Power Agency Revenue | | | | |
| (Hydroelectric Project) | 5.000% | 7/1/28 (14) | 11,140 | 10,935 |
| Oakland CA Redevelopment Agency | | | | |
| Tax Allocation Revenue (Central District Project) | 5.500% | 2/1/14 (2) | 3,745 | 3,797 |
| Oakland CA Redevelopment Agency | | | | |
| Tax Allocation Revenue (Coliseum Area Project) | 5.250% | 3/1/13 (Prere.) | 2,380 | 2,620 |
| Oakland CA Redevelopment Agency | | | | |
| Tax Allocation Revenue (Coliseum Area Project) | 5.250% | 3/1/13 (Prere.) | 3,730 | 4,105 |
| Oceanside CA Community Development | | | | |
| Commission Multifamily Rental Housing Revenue | | | | |
| (Vista Del Oro Apartments) PUT | 4.450% | 4/1/11 | 4,260 | 4,273 |
| Oceanside CA Unified School District GO | 0.000% | 8/1/25 (12) | 6,865 | 2,851 |
| Orange County CA Water District Revenue | 5.000% | 8/15/41 | 6,855 | 7,008 |
| Palmdale CA COP | 5.250% | 9/1/19 (14) | 1,310 | 1,409 |
| Palmdale CA COP | 5.250% | 9/1/20 (14) | 1,450 | 1,560 |
| Palmdale CA COP | 5.250% | 9/1/21 (14) | 1,605 | 1,708 |
| Palmdale CA COP | 5.250% | 9/1/22 (14) | 1,765 | 1,834 |
| Palo Alto CA Improvement Revenue | | | | |
| (University Avenue Area Parking) | 5.700% | 9/2/18 | 890 | 910 |
| Palo Alto CA Improvement Revenue | | | | |
| (University Avenue Area Parking) | 5.700% | 9/2/19 | 895 | 915 |
| Palo Alto CA Improvement Revenue | | | | |
| (University Avenue Area Parking) | 5.750% | 9/2/20 | 890 | 909 |
| Palo Alto CA Improvement Revenue | | | | |
| (University Avenue Area Parking) | 5.750% | 9/2/26 | 4,460 | 4,483 |
| Palomar Pomerado Health System | | | | |
| California Revenue | 5.375% | 11/1/11 (14) | 3,865 | 3,870 |
| Palomar Pomerado Health System | | | | |
| California Revenue | 5.375% | 11/1/13 (14) | 6,730 | 6,736 |
| Palomar Pomerado Health System | | | | |
| California Revenue COP | 6.000% | 11/1/41 | 3,000 | 2,847 |
| Palomar Pomerado Health System | | | | |
| California Revenue GO | 4.500% | 8/1/32 (14) | 12,500 | 11,415 |
| Peralta CA Community College District Revenue | 5.000% | 8/1/39 | 4,000 | 3,934 |
| Pittsburg CA Redevelopment Agency | | | | |
| Tax Allocation Revenue | | | | |
| (Los Medanos Community Development Project) | 5.700% | 8/1/13 (4)(Prere.) | 7,000 | 8,063 |
| Pittsburg CA Redevelopment Agency | | | | |
| Tax Allocation Revenue | | | | |
| (Los Medanos Community Development Project) | 0.000% | 8/1/19 (2) | 1,150 | 701 |
| Pittsburg CA Redevelopment Agency | | | | |
| Tax Allocation Revenue | | | | |
| (Los Medanos Community Development Project) | 0.000% | 8/1/21 (2) | 2,575 | 1,354 |
| Pittsburg CA Redevelopment Agency | | | | |
| Tax Allocation Revenue | | | | |
| (Los Medanos Community Development Project) | 0.000% | 8/1/22 (2) | 3,755 | 1,833 |
| Pittsburg CA Redevelopment Agency | | | | |
| Tax Allocation Revenue | | | | |
| (Los Medanos Community Development Project) | 0.000% | 8/1/24 (2) | 1,000 | 422 |
| Pomona CA Unified School District GO | 5.600% | 8/1/14 (ETM) | 1,585 | 1,849 |
| Pomona CA Unified School District GO | 5.600% | 8/1/15 (ETM) | 2,000 | 2,393 |
| Pomona CA Unified School District GO | 5.600% | 8/1/16 (ETM) | 1,000 | 1,219 |
80
California Long-Term Tax-Exempt Fund
| | | | |
| | | | Face | Market |
| | | Maturity | Amount | Value |
| | Coupon | Date | ($000) | ($000) |
| Pomona CA Unified School District GO | 7.500% | 8/1/17 (ETM) | 2,540 | 3,422 |
| Port of Oakland CA Revenue | 5.000% | 11/1/16 (14) | 8,160 | 9,140 |
| Port of Oakland CA Revenue | 5.000% | 11/1/17 (14) | 5,000 | 5,564 |
| Rancho Mirage CA Joint Powers | | | | |
| Financing Authority Revenue | | | | |
| (Eisenhower Medical Center) | 5.625% | 7/1/14 (Prere.) | 12,000 | 13,918 |
| Rancho Mirage CA Joint Powers | | | | |
| Financing Authority Revenue | | | | |
| (Eisenhower Medical Center) | 5.000% | 7/1/47 | 15,900 | 13,242 |
| Rancho Mirage CA Redevelopment Agency | | | | |
| Tax Allocation Revenue | 5.125% | 4/1/21 (14) | 2,650 | 2,668 |
| Rancho Mirage CA Redevelopment Agency | | | | |
| Tax Allocation Revenue | 5.250% | 4/1/26 (14) | 2,905 | 2,881 |
| Rancho Mirage CA Redevelopment Agency | | | | |
| Tax Allocation Revenue | 5.250% | 4/1/33 (14) | 3,000 | 2,820 |
| Regents of The University of California Hospital | | | | |
| Revenue (San Diego Medical Center) | 5.125% | 12/1/18 (4) | 3,695 | 3,741 |
| Regents of The University of California Hospital | | | | |
| Revenue (San Diego Medical Center) | 5.125% | 12/1/19 (4) | 3,000 | 3,035 |
| Rio Hondo CA Community College District GO | 5.000% | 8/1/30 | 6,655 | 6,743 |
| 3 Riverside CA Electric Revenue TOB VRDO | 0.300% | 12/1/10 (4) | 3,950 | 3,950 |
| Riverside CA Electric Revenue VRDO | 0.320% | 12/7/10 LOC | 18,700 | 18,700 |
| Riverside CA Unified School District | | | | |
| Community Facilities District No. 7 | | | | |
| (Victoria Grove) Special Tax Revenue | 5.000% | 9/1/31 (2) | 7,295 | 6,539 |
| Riverside CA Unified School District GO | 5.250% | 8/1/38 (12) | 10,000 | 10,094 |
| Riverside County CA Asset Leasing Corp. | | | | |
| Leasehold Revenue | | | | |
| (Riverside County Hospital Project) | 0.000% | 6/1/13 (14) | 5,000 | 4,602 |
| Riverside County CA Asset Leasing Corp. | | | | |
| Leasehold Revenue | | | | |
| (Riverside County Hospital Project) | 0.000% | 6/1/14 (14) | 2,000 | 1,762 |
| Riverside County CA Asset Leasing Corp. | | | | |
| Leasehold Revenue | | | | |
| (Riverside County Hospital Project) | 0.000% | 6/1/15 (14) | 2,000 | 1,677 |
| Roseville CA Electric System Revenue | 5.000% | 2/1/37 | 4,500 | 4,467 |
| Roseville CA Natural Gas Financing Authority | | | | |
| Gas Revenue | 5.000% | 2/15/22 | 1,440 | 1,438 |
| Roseville CA Natural Gas Financing Authority | | | | |
| Gas Revenue | 5.000% | 2/15/28 | 2,450 | 2,328 |
| Sacramento CA | | | | |
| Financing Authority Lease Revenue | 5.375% | 11/1/14 (2) | 6,835 | 7,209 |
| Sacramento CA | | | | |
| Financing Authority Lease Revenue | 5.400% | 11/1/20 (2) | 6,785 | 7,268 |
| Sacramento CA Municipal Utility District Revenue | 5.900% | 7/1/20 (2) | 15,850 | 18,659 |
| Sacramento County CA Airport Revenue | 5.250% | 7/1/12 (Prere.) | 2,305 | 2,478 |
| Sacramento County CA Sanitation Districts | | | | |
| Financing Authority Revenue | 5.000% | 12/1/26 (14) | 5,000 | 5,227 |
| Sacramento County CA Sanitation Districts | | | | |
| Financing Authority Revenue | 5.000% | 12/1/30 (14) | 5,650 | 5,775 |
| Sacramento County CA Water Financing Authority | | | | |
| Revenue (Agency Zones 40 & 41) | 5.000% | 6/1/21 (14) | 2,000 | 2,118 |
| San Bernardino County CA Medical Center COP | 6.500% | 8/1/17 (14) | 17,915 | 19,202 |
| San Diego CA Community College District GO | 5.250% | 8/1/33 | 2,500 | 2,613 |
| San Diego CA Public Facilities Financing Authority | | | | |
| Sewer Revenue | 5.250% | 5/15/34 | 6,000 | 6,249 |
81
California Long-Term Tax-Exempt Fund
| | | | |
| | | | Face | Market |
| | | Maturity | Amount | Value |
| | Coupon | Date | ($000) | ($000) |
| San Diego CA Public Facilities Financing Authority | | | | |
| Sewer Revenue | 5.250% | 5/15/39 | 2,000 | 2,077 |
| San Diego CA Public Facilities Financing Authority | | | | |
| Water Revenue | 5.750% | 8/1/35 | 2,500 | 2,692 |
| San Diego CA Public Facilities Financing Authority | | | | |
| Water Revenue | 5.500% | 8/1/39 | 5,000 | 5,246 |
| San Diego CA Unified School District GO | 0.000% | 7/1/15 (14) | 2,770 | 2,458 |
| San Diego CA Unified School District GO | 5.500% | 7/1/24 (14) | 10,000 | 11,116 |
| San Diego CA Unified School District GO | 5.500% | 7/1/24 (4) | 14,015 | 15,754 |
| San Diego CA Unified School District GO | 5.500% | 7/1/25 (14) | 9,000 | 9,955 |
| San Diego County CA COP | 5.250% | 10/1/21 | 1,485 | 1,496 |
| San Diego County CA COP | 5.000% | 2/1/28 (2) | 2,000 | 2,019 |
| San Diego County CA COP | 5.250% | 10/1/28 | 2,745 | 2,745 |
| San Diego County CA COP | 5.000% | 2/1/30 (2) | 2,345 | 2,353 |
| San Diego County CA COP | 5.375% | 10/1/41 | 8,545 | 8,300 |
| San Diego County CA Water Authority Revenue | | | | |
| COP | 5.000% | 5/1/26 (4) | 7,275 | 7,619 |
| San Francisco CA Bay Area Rapid Transit District | | | | |
| GO | 5.000% | 8/1/35 | 10,000 | 10,285 |
| San Francisco CA City & County | | | | |
| International Airport Revenue | 5.250% | 5/1/12 (14)(Prere.) | 5,020 | 5,355 |
| San Francisco CA City & County | | | | |
| International Airport Revenue | 5.250% | 5/1/12 (14)(Prere.) | 4,305 | 4,592 |
| San Francisco CA City & County | | | | |
| International Airport Revenue | 5.250% | 5/1/12 (14)(Prere.) | 4,770 | 5,088 |
| San Francisco CA City & County | | | | |
| International Airport Revenue | 5.000% | 5/1/18 | 6,300 | 7,106 |
| San Francisco CA City & County | | | | |
| International Airport Revenue | 5.000% | 5/1/19 | 12,000 | 13,443 |
| San Francisco CA City & County | | | | |
| International Airport Revenue | 5.000% | 5/1/20 | 5,150 | 5,700 |
| San Francisco CA City & County | | | | |
| International Airport Revenue | 5.000% | 5/1/24 (14)(3) | 3,445 | 3,570 |
| San Francisco CA City & County | | | | |
| Public Utility Commission Revenue | 5.000% | 11/1/35 | 2,605 | 2,661 |
| San Francisco CA City & County | | | | |
| Public Utility Commission Revenue | 4.750% | 11/1/36 (4) | 5,000 | 4,722 |
| San Francisco CA City & County Redevelopment | | | | |
| Financing Authority Tax Allocation Revenue | | | | |
| (Mission Bay North) | 6.500% | 8/1/39 | 2,000 | 2,118 |
| San Francisco CA City & County | | | | |
| Unified School District GO | 5.250% | 6/15/24 | 4,000 | 4,268 |
| San Joaquin Hills CA Transportation | | | | |
| Corridor Agency Toll Road Revenue | 0.000% | 1/15/24 (14) | 6,000 | 2,157 |
| San Joaquin Hills CA Transportation | | | | |
| Corridor Agency Toll Road Revenue | 0.000% | 1/15/25 (14) | 6,000 | 1,968 |
| San Joaquin Hills CA Transportation | | | | |
| Corridor Agency Toll Road Revenue | 0.000% | 1/15/30 (14) | 7,000 | 1,491 |
| San Joaquin Hills CA Transportation | | | | |
| Corridor Agency Toll Road Revenue | 0.000% | 1/15/31 (14) | 11,950 | 2,348 |
| San Jose CA Airport Revenue | 5.000% | 3/1/33 (2) | 13,000 | 12,542 |
| San Jose CA Redevelopment Agency | | | | |
| Tax Allocation Revenue | 6.000% | 8/1/11 (14) | 5,930 | 6,089 |
| San Jose CA Redevelopment Agency | | | | |
| Tax Allocation Revenue | 5.000% | 8/1/26 (14) | 5,000 | 4,765 |
82
California Long-Term Tax-Exempt Fund
| | | | |
| | | | Face | Market |
| | | Maturity | Amount | Value |
| | Coupon | Date | ($000) | ($000) |
| San Jose CA Redevelopment Agency | | | | |
| Tax Allocation Revenue | 5.500% | 8/1/30 | 850 | 856 |
| San Jose CA Redevelopment Agency | | | | |
| Tax Allocation Revenue | 5.500% | 8/1/35 | 2,750 | 2,713 |
| San Juan CA Unified School District GO | 0.000% | 8/1/13 (4) | 2,220 | 2,102 |
| San Juan CA Unified School District GO | 0.000% | 8/1/14 (4) | 2,610 | 2,385 |
| San Juan CA Unified School District GO | 0.000% | 8/1/16 (4) | 2,000 | 1,663 |
| San Juan CA Unified School District GO | 0.000% | 8/1/18 (4) | 1,785 | 1,307 |
| San Juan CA Unified School District GO | 0.000% | 8/1/19 (4) | 2,210 | 1,518 |
| San Juan CA Unified School District GO | 0.000% | 8/1/20 (4) | 4,930 | 3,121 |
| San Juan CA Unified School District GO | 0.000% | 8/1/23 (4) | 4,540 | 2,370 |
| San Mateo County CA | | | | |
| Community College District GO | 5.000% | 9/1/31 | 5,000 | 5,037 |
| San Mateo County CA Joint Powers | | | | |
| Financing Authority Lease Revenue | | | | |
| (Capital Project Program) | 6.500% | 7/1/13 (14) | 9,280 | 9,962 |
| San Mateo County CA Joint Powers | | | | |
| Financing Authority Lease Revenue | | | | |
| (Capital Project Program) | 5.000% | 7/1/21 (14) | 3,500 | 3,618 |
| San Ramon Valley CA Unified School District GO | 0.000% | 7/1/12 (14) | 6,645 | 6,468 |
| San Ramon Valley CA Unified School District GO | 0.000% | 7/1/13 (14) | 3,680 | 3,528 |
| San Ramon Valley CA Unified School District GO | 0.000% | 7/1/14 (14) | 8,290 | 7,594 |
| San Ramon Valley CA Unified School District GO | 0.000% | 7/1/15 (14) | 2,005 | 1,765 |
| Santa Ana CA Financing Authority Police | | | | |
| Administration & Holding Facility Lease Revenue | 6.250% | 7/1/16 (14) | 5,345 | 6,156 |
| Santa Ana CA Financing Authority Police | | | | |
| Administration & Holding Facility Lease Revenue | 6.250% | 7/1/17 (14) | 2,000 | 2,305 |
| Santa Clara CA Electric Revenue | 5.000% | 7/1/21 (14) | 4,895 | 5,029 |
| Santa Clara County CA Financing Authority | | | | |
| Lease Revenue (Multiple Facilities Projects) | 5.250% | 5/15/36 | 5,000 | 5,133 |
| Santa Rosa CA Wastewater Revenue | 6.000% | 7/2/15 (2) | 5,995 | 6,576 |
| Santa Rosa CA Wastewater Revenue | 6.000% | 9/1/15 (4) | 4,780 | 5,232 |
| Solano County CA COP | 5.250% | 11/1/12 (Prere.) | 3,785 | 4,119 |
| Solano County CA COP | 5.250% | 11/1/12 (Prere.) | 3,770 | 4,103 |
| South San Francisco CA Redevelopment Agency | | | | |
| Tax Allocation Revenue | 5.000% | 9/1/35 (14) | 8,610 | 7,467 |
| Southern California Public Power | | | | |
| Authority Revenue | 5.000% | 7/1/29 | 5,000 | 5,161 |
| Southern California Public Power | | | | |
| Authority Revenue | | | | |
| (Milford Wind Corridor Phase I Project) | 5.000% | 7/1/30 | 5,000 | 5,128 |
| Southern California Public Power | | | | |
| Authority Revenue (Natural Gas Project) | 5.000% | 11/1/17 | 1,865 | 1,963 |
| Southern California Public Power | | | | |
| Authority Revenue (Natural Gas Project) | 5.000% | 11/1/33 | 5,400 | 5,011 |
| Southern California Public Power | | | | |
| Authority Revenue (Transmission Project) | 5.750% | 7/1/21 (14) | 220 | 221 |
| Southern California Public Power | | | | |
| Authority Revenue (Transmission Project) | 5.000% | 7/1/23 | 5,000 | 5,337 |
| Tobacco Securitization Authority Revenue | | | | |
| (Northern California Tobacco Settlement) | 5.375% | 6/1/38 | 4,500 | 3,414 |
| Tobacco Securitization Authority Revenue | | | | |
| (Southern California Tobacco Settlement) | 4.750% | 6/1/25 | 9,790 | 8,720 |
| Tobacco Securitization Authority Revenue | | | | |
| (Southern California Tobacco Settlement) | 5.000% | 6/1/37 | 2,155 | 1,578 |
83
California Long-Term Tax-Exempt Fund
| | | | |
| | | | Face | Market |
| | | Maturity | Amount | Value |
| | Coupon | Date | ($000) | ($000) |
| Torrance CA Hospital Revenue | | | | |
| (Torrance Memorial Medical Center) | 5.000% | 9/1/40 | 3,000 | 2,823 |
| Turlock CA Irrigation District Revenue | 5.000% | 1/1/35 | 3,000 | 2,971 |
| Ukiah CA Electric Revenue | 6.250% | 6/1/18 (14) | 5,085 | 5,507 |
| Union CA Elementary School District GO | 0.000% | 9/1/15 (14) | 3,860 | 3,378 |
| Union CA Elementary School District GO | 0.000% | 9/1/16 (14) | 1,500 | 1,247 |
| Union CA Elementary School District GO | 0.000% | 9/1/17 (14) | 2,295 | 1,807 |
| Union CA Elementary School District GO | 0.000% | 9/1/18 (14) | 1,630 | 1,197 |
| Union CA Elementary School District GO | 0.000% | 9/1/19 (14) | 1,750 | 1,197 |
| Union CA Elementary School District GO | 0.000% | 9/1/20 (14) | 2,300 | 1,463 |
| Union CA Elementary School District GO | 0.000% | 9/1/21 (14) | 2,000 | 1,197 |
| University of California Regents | | | | |
| Medical Center Revenue VRDO | 0.270% | 12/1/10 | 4,600 | 4,600 |
| University of California Regents | | | | |
| Medical Center Revenue VRDO | 0.280% | 12/1/10 | 3,500 | 3,500 |
| University of California Revenue | 5.750% | 5/15/25 | 7,000 | 8,034 |
| University of California Revenue | 4.750% | 5/15/33 | 12,425 | 12,189 |
| University of California Revenue | 5.000% | 5/15/33 (2) | 30,790 | 30,937 |
| University of California Revenue | 5.000% | 5/15/34 | 3,220 | 3,321 |
| University of California Revenue | 5.000% | 5/15/40 | 1,905 | 1,930 |
| University of California Revenue TOB VRDO | 0.300% | 12/7/10 | 9,935 | 9,935 |
| University of California Revenue TOB VRDO | 0.310% | 12/7/10 (4) | 2,300 | 2,300 |
| Vallejo CA Sanitation & Flood Control COP | 5.000% | 7/1/19 (14) | 4,279 | 4,358 |
| Ventura County CA Community College District | | | | |
| GO | 5.500% | 8/1/33 | 8,000 | 8,455 |
| Walnut CA Energy Center Authority Revenue | 5.000% | 1/1/35 | 2,000 | 1,927 |
| Walnut CA Energy Center Authority Revenue | 5.000% | 1/1/40 | 5,000 | 4,764 |
| Walnut Valley CA Unified School District GO | 6.000% | 8/1/14 (2)(ETM) | 2,205 | 2,593 |
| Walnut Valley CA Unified School District GO | 6.000% | 8/1/15 (2)(ETM) | 2,470 | 2,985 |
| Walnut Valley CA Unified School District GO | 6.000% | 8/1/16 (2)(ETM) | 2,690 | 3,322 |
| Washington Township CA | | | | |
| Health Care District Revenue | 5.000% | 7/1/32 | 3,000 | 2,748 |
| Washington Township CA | | | | |
| Health Care District Revenue | 5.000% | 7/1/37 | 3,500 | 3,071 |
| Yuba City CA Unified School District GO | 0.000% | 9/1/15 (14) | 1,870 | 1,585 |
| Yuba City CA Unified School District GO | 0.000% | 9/1/17 (14) | 2,060 | 1,518 |
| Yuba City CA Unified School District GO | 0.000% | 9/1/19 (14) | 2,270 | 1,452 |
| | | | | 2,810,754 |
| Puerto Rico (0.8%) | | | | |
| Puerto Rico Municipal Finance Agency GO | 5.250% | 7/1/19 (11) | 2,250 | 2,362 |
| Puerto Rico Municipal Finance Agency GO | 5.250% | 7/1/20 (11) | 1,300 | 1,355 |
| Puerto Rico Municipal Finance Agency GO | 5.250% | 8/1/20 (11) | 2,255 | 2,351 |
| Puerto Rico Public Buildings Authority | | | | |
| Government Facilities Revenue | 5.250% | 7/1/14 (Prere.) | 75 | 85 |
| Puerto Rico Public Finance Corp. Revenue PUT | 5.750% | 2/1/12 LOC | 16,000 | 16,415 |
| | | | | 22,568 |
| Total Tax-Exempt Municipal Bonds (Cost $2,816,329) | | | | 2,833,322 |
| Other Assets and Liabilities (0.6%) | | | | |
| Other Assets | | | | 42,210 |
| Liabilities | | | | (25,987) |
| | | | | 16,223 |
| Net Assets (100%) | | | | 2,849,545 |
84
California Long-Term Tax-Exempt Fund
At November 30, 2010, net assets consisted of:
| |
| | Amount |
| | ($000) |
| Paid-in Capital | 2,934,207 |
| Undistributed Net Investment Income | — |
| Accumulated Net Realized Losses | (101,648) |
| Unrealized Appreciation (Depreciation) | |
| Investment Securities | 16,993 |
| Futures Contracts | (7) |
| Net Assets | 2,849,545 |
| |
| |
| Investor Shares—Net Assets | |
| Applicable to 48,019,300 outstanding $.001 par value shares of | |
| beneficial interest (unlimited authorization) | 528,753 |
| Net Asset Value Per Share—Investor Shares | $11.01 |
| |
| |
| Admiral Shares—Net Assets | |
| Applicable to 210,765,495 outstanding $.001 par value shares of | |
| beneficial interest (unlimited authorization) | 2,320,792 |
| Net Asset Value Per Share—Admiral Shares | $11.01 |
See Note A in Notes to Financial Statements.
1 Securities with a value of $1,591,000 have been segregated as initial margin for open futures contracts.
2 Security purchased on a when-issued or delayed-delivery basis for which the fund has not taken delivery as of November 30, 2010.
3 Security exempt from registration under Rule 144A of the Securities Act of 1933. Such securities may be sold in transactions exempt from registration, normally to qualified institutional buyers. At November 30, 2010, the aggregate value of these securities was $24,535,000, representing 0.9% of net assets.
A key to abbreviations and other references follows the Statement of Net Assets.
See accompanying Notes, which are an integral part of the Financial Statements.
85
California Long-Term Tax-Exempt Fund
Key to Abbreviations
ARS—Auction Rate Security.
BAN—Bond Anticipation Note.
COP—Certificate of Participation.
CP—Commercial Paper.
FR—Floating Rate.
GAN—Grant Anticipation Note.
GO—General Obligation Bond.
IDA—Industrial Development Authority Bond.
IDR—Industrial Development Revenue Bond.
PCR—Pollution Control Revenue Bond.
PUT—Put Option Obligation.
RAN—Revenue Anticipation Note.
TAN—Tax Anticipation Note.
TOB—Tender Option Bond.
TRAN—Tax Revenue Anticipation Note.
UFSD—Union Free School District.
USD—United School District.
VRDO—Variable Rate Demand Obligation.
VRDP—Variable Rate Demand Preferred.
(ETM)—Escrowed to Maturity.
(Prere.)—Prerefunded.
Scheduled principal and interest payments are guaranteed by:
(1) MBIA (Municipal Bond Investors Assurance).
(2) AMBAC (Ambac Assurance Corporation).
(3) FGIC (Financial Guaranty Insurance Company).
(4) AGM (Assured Guaranty Municipal Corporation).
(5) BIGI (Bond Investors Guaranty Insurance).
(6) Connie Lee Inc.
(7) FHA (Federal Housing Authority).
(8) CapMAC (Capital Markets Assurance Corporation).
(9) American Capital Access Financial Guaranty Corporation.
(10) XL Capital Assurance Inc.
(11) CIFG (CDC IXIS Financial Guaranty).
(12) Assured Guaranty Corp.
(13) Berkshire Hathaway Assurance Corp.
(14) National Public Finance Guarantee Corp.
The insurance does not guarantee the market value of the municipal bonds.
LOC—Scheduled principal and interest payments are guaranteed by bank letter of credit.
86
California Long-Term Tax-Exempt Fund
Statement of Operations
| |
| | Year Ended |
| | November 30, 2010 |
| | ($000) |
| Investment Income | |
| Income | |
| Interest | 131,312 |
| Total Income | 131,312 |
| Expenses | |
| The Vanguard Group—Note B | |
| Investment Advisory Services | 263 |
| Management and Administrative—Investor Shares | 1,069 |
| Management and Administrative—Admiral Shares | 1,970 |
| Marketing and Distribution—Investor Shares | 199 |
| Marketing and Distribution—Admiral Shares | 501 |
| Custodian Fees | 22 |
| Auditing Fees | 27 |
| Shareholders’ Reports—Investor Shares | 14 |
| Shareholders’ Reports—Admiral Shares | 5 |
| Trustees’ Fees and Expenses | 4 |
| Total Expenses | 4,074 |
| Net Investment Income | 127,238 |
| Realized Net Gain (Loss) | |
| Investment Securities Sold | (7,727) |
| Futures Contracts | (2,640) |
| Realized Net Gain (Loss) | (10,367) |
| Change in Unrealized Appreciation (Depreciation) | |
| Investment Securities | 16,681 |
| Futures Contracts | 139 |
| Change in Unrealized Appreciation (Depreciation) | 16,820 |
| Net Increase (Decrease) in Net Assets Resulting from Operations | 133,691 |
See accompanying Notes, which are an integral part of the Financial Statements.
87
California Long-Term Tax-Exempt Fund
Statement of Changes in Net Assets
| | |
| | Year Ended November 30, |
| | 2010 | 2009 |
| | ($000) | ($000) |
| Increase (Decrease) in Net Assets | | |
| Operations | | |
| Net Investment Income | 127,238 | 128,250 |
| Realized Net Gain (Loss) | (10,367) | (43,646) |
| Change in Unrealized Appreciation (Depreciation) | 16,820 | 250,592 |
| Net Increase (Decrease) in Net Assets Resulting from Operations | 133,691 | 335,196 |
| Distributions | | |
| Net Investment Income | | |
| Investor Shares | (28,895) | (31,296) |
| Admiral Shares | (98,343) | (96,954) |
| Realized Capital Gain | | |
| Investor Shares | — | — |
| Admiral Shares | — | — |
| Total Distributions | (127,238) | (128,250) |
| Capital Share Transactions | | |
| Investor Shares | (166,988) | (30,482) |
| Admiral Shares | 136,419 | (51,025) |
| Net Increase (Decrease) from Capital Share Transactions | (30,569) | (81,507) |
| Total Increase (Decrease) | (24,116) | 125,439 |
| Net Assets | | |
| Beginning of Period | 2,873,661 | 2,748,222 |
| End of Period | 2,849,545 | 2,873,661 |
See accompanying Notes, which are an integral part of the Financial Statements.
88
California Long-Term Tax-Exempt Fund
Financial Highlights
Investor Shares
| | | | | |
| For a Share Outstanding | | | Year Ended November 30, |
| Throughout Each Period | 2010 | 2009 | 2008 | 2007 | 2006 |
| Net Asset Value, Beginning of Period | $10.98 | $10.19 | $11.46 | $11.86 | $11.65 |
| Investment Operations | | | | | |
| Net Investment Income | .476 | .481 | .499 | .531 | .528 |
| Net Realized and Unrealized Gain (Loss) | | | | | |
| on Investments | .030 | .790 | (1.270) | (.400) | .232 |
| Total from Investment Operations | .506 | 1.271 | (.771) | .131 | .760 |
| Distributions | | | | | |
| Dividends from Net Investment Income | (.476) | (.481) | (.499) | (.531) | (.528) |
| Distributions from Realized Capital Gains | — | — | — | — | (.022) |
| Total Distributions | (.476) | (.481) | (.499) | (.531) | (.550) |
| Net Asset Value, End of Period | $11.01 | $10.98 | $10.19 | $11.46 | $11.86 |
| |
| Total Return1 | 4.63% | 12.71% | -6.95% | 1.15% | 6.70% |
| |
| Ratios/Supplemental Data | | | | | |
| Net Assets, End of Period (Millions) | $529 | $691 | $670 | $732 | $678 |
| Ratio of Total Expenses to | | | | | |
| Average Net Assets | 0.20% | 0.20% | 0.15% | 0.15% | 0.16% |
| Ratio of Net Investment Income to | | | | | |
| Average Net Assets | 4.26% | 4.51% | 4.51% | 4.58% | 4.52% |
| Portfolio Turnover Rate | 18% | 18% | 27% | 23% | 13% |
1 Total returns do not include account service fees that may have applied in the periods shown. Fund prospectuses provide information about any applicable account service fees.
See accompanying Notes, which are an integral part of the Financial Statements.
89
California Long-Term Tax-Exempt Fund
Financial Highlights
Admiral Shares
| | | | | |
| For a Share Outstanding | | | Year Ended November 30, |
| Throughout Each Period | 2010 | 2009 | 2008 | 2007 | 2006 |
| Net Asset Value, Beginning of Period | $10.98 | $10.19 | $11.46 | $11.86 | $11.65 |
| Investment Operations | | | | | |
| Net Investment Income | .485 | .490 | .507 | .540 | .536 |
| Net Realized and Unrealized Gain (Loss) | | | | | |
| on Investments | .030 | .790 | (1.270) | (.400) | .232 |
| Total from Investment Operations | .515 | 1.280 | (.763) | .140 | .768 |
| Distributions | | | | | |
| Dividends from Net Investment Income | (.485) | (.490) | (.507) | (.540) | (.536) |
| Distributions from Realized Capital Gains | — | — | — | — | (.022) |
| Total Distributions | (.485) | (.490) | (.507) | (.540) | (.558) |
| Net Asset Value, End of Period | $11.01 | $10.98 | $10.19 | $11.46 | $11.86 |
| |
| Total Return | 4.72% | 12.80% | -6.88% | 1.22% | 6.78% |
| |
| Ratios/Supplemental Data | | | | | |
| Net Assets, End of Period (Millions) | $2,321 | $2,183 | $2,078 | $2,251 | $1,972 |
| Ratio of Total Expenses to | | | | | |
| Average Net Assets | 0.12% | 0.12% | 0.08% | 0.08% | 0.09% |
| Ratio of Net Investment Income to | | | | | |
| Average Net Assets | 4.34% | 4.59% | 4.58% | 4.65% | 4.59% |
| Portfolio Turnover Rate | 18% | 18% | 27% | 23% | 13% |
See accompanying Notes, which are an integral part of the Financial Statements.
90
California Long-Term Tax-Exempt Fund
Notes to Financial Statements
Vanguard California Long-Term Tax-Exempt Fund is registered under the Investment Company Act of 1940 as an open-end investment company, or mutual fund. The fund invests in debt instruments of municipal issuers whose ability to meet their obligations may be affected by economic and political developments in the state. The fund offers two classes of shares: Investor Shares and Admiral Shares. Investor Shares are available to any investor who meets the fund’s minimum purchase requirements. Admiral Shares are designed for investors who meet certain administrative, service, and account-size criteria.
A. The following significant accounting policies conform to generally accepted accounting principles for U.S. mutual funds. The fund consistently follows such policies in preparing its financial statements.
1. Security Valuation: Bonds, and temporary cash investments acquired over 60 days to maturity, are valued using the latest bid prices or using valuations based on a matrix system (which considers such factors as security prices, yields, maturities, and ratings), both as furnished by independent pricing services. Other temporary cash investments are valued at amortized cost, which approximates market value. Securities for which market quotations are not readily available, or whose values have been affected by events occurring before the fund’s pricing time but after the close of the securities’ primary markets, are valued by methods deemed by the board of trustees to represent fair value.
2. Futures Contracts: The fund uses futures contracts to invest in fixed income asset classes with greater efficiency and lower cost than is possible through direct investment, to add value when these instruments are attractively priced, or to adjust sensitivity to changes in interest rates. The primary risks associated with the use of futures contracts are imperfect correlation between changes in market values of bonds held by the fund and the prices of futures contracts, and the possibility of an illiquid market.
Futures contracts are valued based upon their quoted daily settlement prices. The aggregate principal amounts of the contracts are not recorded in the Statement of Net Assets. Fluctuations in the value of the contracts are recorded in the Statement of Net Assets as an asset (liability) and in the Statement of Operations as unrealized appreciation (depreciation) until the contracts are closed, when they are recorded as realized futures gains (losses).
3. Federal Income Taxes: The fund intends to continue to qualify as a regulated investment company and distribute all of its income. Management has analyzed the fund’s tax positions taken for all open federal income tax years (November 30, 2007–2010), and has concluded that no provision for federal income tax is required in the fund’s financial statements.
4. Distributions: Distributions from net investment income are declared daily and paid on the first business day of the following month. Annual distributions from realized capital gains, if any, are recorded on the ex-dividend date.
5. Other: Interest income is accrued daily. Premiums and discounts on debt securities purchased are amortized and accreted, respectively, to interest income over the lives of the respective securities. Security transactions are accounted for on the date securities are bought or sold. Costs used to determine realized gains (losses) on the sale of investment securities are those of the specific securities sold.
Each class of shares has equal rights as to assets and earnings, except that each class separately bears certain class-specific expenses related to maintenance of shareholder accounts (included in Management and Administrative expenses) and shareholder reporting. Marketing and distribution expenses are allocated to each class of shares based on a method approved by the board of trustees. Income, other non-class-specific expenses, and gains and losses on investments are allocated to each class of shares based on its relative net assets.
91
California Long-Term Tax-Exempt Fund
B. The Vanguard Group furnishes at cost investment advisory, corporate management, administrative, marketing, and distribution services. The costs of such services are allocated to the fund under methods approved by the board of trustees. The fund has committed to provide up to 0.40% of its net assets in capital contributions to Vanguard. At November 30, 2010, the fund had contributed capital of $528,000 to Vanguard (included in Other Assets), representing 0.02% of the fund’s net assets and 0.21% of Vanguard’s capitalization. The fund’s trustees and officers are also directors and officers of Vanguard.
C. Various inputs may be used to determine the value of the fund’s investments. These inputs are summarized in three broad levels for financial statement purposes. The inputs or methodologies used to value securities are not necessarily an indication of the risk associated with investing in those securities.
Level 1—Quoted prices in active markets for identical securities.
Level 2—Other significant observable inputs (including quoted prices for similar securities, interest rates, prepayment speeds, credit risk, etc.).
Level 3—Significant unobservable inputs (including the fund’s own assumptions used to determine the fair value of investments).
The following table summarizes the fund’s investments as of November 30, 2010, based on the inputs used to value them:
| | | |
| | Level 1 | Level 2 | Level 3 |
| Investments | ($000) | ($000) | ($000) |
| Tax-Exempt Municipal Bonds | — | 2,833,322 | — |
| Futures Contracts—Assets1 | 128 | — | — |
| Total | 128 | 2,833,322 | — |
| 1 Represents variation margin on the last day of the reporting period. |
D. At November 30, 2010, the aggregate settlement value of open futures contracts and the related unrealized appreciation (depreciation) were:
| | | | |
| | | | | ($000) |
| | | | Aggregate | |
| | | Number of | Settlement | Unrealized |
| | | Long (Short) | Value | Appreciation |
| Futures Contracts | Expiration | Contracts | Long (Short) | (Depreciation) |
| 2-Year U.S. Treasury Note | March 2011 | 195 | 42,778 | (7) |
Unrealized appreciation (depreciation) on open futures contracts is required to be treated as realized gain (loss) for tax purposes.
E. Capital gain distributions are determined on a tax basis and may differ from realized capital gains for financial reporting purposes. Differences may be permanent or temporary. Permanent differences are reclassified among capital accounts in the financial statements to reflect their tax character. Temporary differences arise when gains or losses are recognized in different periods for financial statement and tax purposes; these differences will reverse at some time in the future.
For tax purposes, at November 30, 2010, the fund had available capital loss carryforwards totaling $95,056,000 to offset future net capital gains of $971,000 through November 30, 2014, $18,323,000 through November 30, 2015, $22,521,000 through November 30, 2016, $40,669,000 through November 30, 2017, and $12,572,000 through November 30, 2018.
92
California Long-Term Tax-Exempt Fund
The fund had realized losses totaling $6,599,000 through November 30, 2010, which are deferred for tax purposes and reduce the amount of tax-basis unrealized appreciation on investment securities.
At November 30, 2010, the cost of investment securities for tax purposes was $2,822,928,000. Net unrealized appreciation of investment securities for tax purposes was $10,394,000, consisting of unrealized gains of $78,773,000 on securities that had risen in value since their purchase and $68,379,000 in unrealized losses on securities that had fallen in value since their purchase.
F. During the year ended November 30, 2010, the fund purchased $511,865,000 of investment securities and sold $520,519,000 of investment securities, other than temporary cash investments.
G. Capital share transactions for each class of shares were:
| | | | |
| | | | Year Ended November 30, |
| | | 2010 | | 2009 |
| | Amount | Shares | Amount | Shares |
| | ($000) | (000) | ($000) | (000) |
| Investor Shares | | | | |
| Issued | 142,311 | 12,760 | 213,322 | 20,082 |
| Issued in Lieu of Cash Distributions | 22,678 | 2,031 | 24,680 | 2,309 |
| Redeemed | (331,977) | (29,690) | (268,484) | (25,247) |
| Net Increase (Decrease)—Investor Shares | (166,988) | (14,899) | (30,482) | (2,856) |
| Admiral Shares | | | | |
| Issued | 540,819 | 48,360 | 444,783 | 41,585 |
| Issued in Lieu of Cash Distributions | 65,497 | 5,863 | 64,828 | 6,062 |
| Redeemed | (469,897) | (42,160) | (560,636) | (52,828) |
| Net Increase (Decrease)—Admiral Shares | 136,419 | 12,063 | (51,025) | (5,181) |
H. In preparing the financial statements as of November 30, 2010, management considered the impact of subsequent events for potential recognition or disclosure in these financial statements.
93
Report of Independent Registered Public Accounting Firm
To the Trustees of Vanguard California Tax-Free Funds and the Shareholders of Vanguard California Tax-Exempt Money Market Fund, Vanguard California Intermediate-Term Tax-Exempt Fund and Vanguard California Long-Term Tax-Exempt Fund:
In our opinion, the accompanying statements of net assets and the related statements of operations and of changes in net assets and the financial highlights present fairly, in all material respects, the financial position of Vanguard California Tax-Exempt Money Market Fund, Vanguard California Intermediate-Term Tax-Exempt Fund and Vanguard California Long-Term Tax-Exempt Fund (constituting three separate portfolios of Vanguard California Tax-Free Funds, hereafter referred to as the “Funds”) at November 30, 2010, the results of each of their operations for the year then ended, the changes in each of their net assets for each of the two years in the period then ended and the financial highlights for each of the five years in the period then ended, in conformity with accounting principles generally accepted in the United States of America. These financial statements and financial highlights (hereafter referred to as “financial statements”) are the responsibility of the Funds’ management; our responsibility is to express an opinion on these financial statements based on our audits. We conducted our audits of these financial statements in accordance with the standards of the Public Company Accounting Oversight Board (United States). Those standards require that we plan and perform the audit to obtain reasonable assurance about whether the financial statements are free of material misstatement. An audit includes examining, on a test basis, evidence supporting the amounts and disclosures in the financial statements, assessing the accounting principles used and significant estimates made by management, and evaluating the overall financial statement presentation.
We believe that our audits, which included confirmation of securities at November 30, 2010 by correspondence with the custodian and broker, provide a reasonable basis for our opinion.
PricewaterhouseCoopers LLP
Philadelphia, Pennsylvania
January 13, 2011
|
| Special 2010 tax information (unaudited) for Vanguard California Tax-Exempt Funds |
This information for the fiscal year ended November 30, 2010, is included pursuant to provisions of the Internal Revenue Code.
Each fund designates 100% of its income dividends as exempt-interest dividends.
94
About Your Fund’s Expenses
As a shareholder of the fund, you incur ongoing costs, which include costs for portfolio management, administrative services, and shareholder reports (like this one), among others. Operating expenses, which are deducted from a fund’s gross income, directly reduce the investment return of the fund.
A fund’s expenses are expressed as a percentage of its average net assets. This figure is known as the expense ratio. The following examples are intended to help you understand the ongoing costs (in dollars) of investing in your fund and to compare these costs with those of other mutual funds. The examples are based on an investment of $1,000 made at the beginning of the period shown and held for the entire period.
The accompanying table illustrates your fund’s costs in two ways:
• Based on actual fund return. This section helps you to estimate the actual expenses that you paid over the period. The ”Ending Account Value“ shown is derived from the fund‘s actual return, and the third column shows the dollar amount that would have been paid by an investor who started with $1,000 in the fund. You may use the information here, together with the amount you invested, to estimate the expenses that you paid over the period.
To do so, simply divide your account value by $1,000 (for example, an $8,600 account value divided by $1,000 = 8.6), then multiply the result by the number given for your fund under the heading ”Expenses Paid During Period.“
• Based on hypothetical 5% yearly return. This section is intended to help you compare your fund‘s costs with those of other mutual funds. It assumes that the fund had a yearly return of 5% before expenses, but that the expense ratio is unchanged. In this case—because the return used is not the fund’s actual return—the results do not apply to your investment. The example is useful in making comparisons because the Securities and Exchange Commission requires all mutual funds to calculate expenses based on a 5% return. You can assess your fund’s costs by comparing this hypothetical example with the hypothetical examples that appear in shareholder reports of other funds.
Note that the expenses shown in the table are meant to highlight and help you compare ongoing costs only and do not reflect transaction costs incurred by the fund for buying and selling securities. Further, the expenses do not include the account service fee described in the prospectus. If such a fee were applied to your account, your costs would be higher. Your fund does not charge transaction fees, such as purchase or redemption fees, nor does it carry a “sales load.” The calculations assume no shares were bought or sold during the period. Your actual costs may have been higher or lower, depending on the amount of your investment and the timing of any purchases or redemptions.
You can find more information about the fund’s expenses, including annual expense ratios, in the Financial Statements section of this report. For additional information on operating expenses and other shareholder costs, please refer to your fund’s current prospectus.
95
Six Months Ended November 30, 2010
| | | |
| | Beginning | Ending | Expenses |
| | Account Value | Account Value | Paid During |
| | 5/31/2010 | 11/30/2010 | Period |
| Based on Actual Fund Return | | | |
| California Tax-Exempt Money Market Fund | $1,000.00 | $1,000.60 | $0.85 |
| California Intermediate-Term Tax-Exempt Fund | | | |
| Investor Shares | $1,000.00 | $1,009.97 | $1.01 |
| Admiral Shares | 1,000.00 | 1,010.37 | 0.60 |
| California Long-Term Tax-Exempt Fund | | | |
| Investor Shares | $1,000.00 | $1,003.93 | $1.00 |
| Admiral Shares | 1,000.00 | 1,004.33 | 0.60 |
| Based on Hypothetical 5% Yearly Return | | | |
| California Tax-Exempt Money Market Fund | $1,000.00 | $1,024.22 | $0.86 |
| California Intermediate-Term Tax-Exempt Fund | | | |
| Investor Shares | $1,000.00 | $1,024.07 | $1.01 |
| Admiral Shares | 1,000.00 | 1,024.47 | 0.61 |
| California Long-Term Tax-Exempt Fund | | | |
| Investor Shares | $1,000.00 | $1,024.07 | $1.01 |
| Admiral Shares | 1,000.00 | 1,024.47 | 0.61 |
The calculations are based on expenses incurred in the most recent six-month period. The funds’ annualized six-month expense ratios for that period are: for the California Tax-Exempt Money Market Fund, 0.17%; for the California Intermediate-Term Tax-Exempt Fund, 0.20% for Investor Shares and 0.12% for Admiral Shares; and for the California Long-Term Tax-Exempt Fund, 0.20% for Investor Shares and 0.12% for Admiral Shares. The dollar amounts shown as “Expenses Paid” are equal to the annualized expense ratio multiplied by the average account value over the period, multiplied by the number of days in the most recent six-month period, then divided by the number of days in the most recent 12-month period.
96
Glossary
7-Day SEC Yield and 30-Day SEC Yield. A money market fund’s 7-day SEC yield is calculated by annualizing its income distributions for the previous seven days, as required by the U.S. Securities and Exchange Commission. For other funds, 30-day SEC yield is derived using a formula specified by the commission. Under the formula, data related to the fund’s security holdings in the previous 30 days are used to calculate the fund’s hypothetical net income for that period, which is then annualized and divided by the fund’s estimated average net assets over the calculation period. For the purposes of this calculation, a security’s income is based on its current market yield to maturity (in the case of bonds) or its projected dividend yield (for stocks). Because the SEC yield represents hypothetical annualized income, it will differ—at times significantly—from the fund’s actual experience. As a result, the fund ’s income distributions may be higher or lower than implied by the SEC yield.
Average Coupon. The average interest rate paid on the fixed income securities held by a fund. It is expressed as a percentage of face value.
Average Duration. An estimate of how much the value of the bonds held by a fund will fluctuate in response to a change in interest rates. To see how the value could change, multiply the average duration by the change in rates. If interest rates rise by 1 percentage point, the value of the bonds in a fund with an average duration of five years would decline by about 5%. If rates decrease by a percentage point, the value would rise by 5%.
Average Effective Maturity. The average length of time until fixed income securities held by a fund reach maturity and are repaid, taking into consideration the possibility that the issuer may call the bond before its maturity date. The figure reflects the proportion of fund assets represented by each security; it also reflects any futures contracts held. In general, the longer the average effective maturity, the more a fund’s share price will fluctuate in response to changes in market interest rates.
Average Weighted Maturity. The average length of time until fixed income securities held by a fund reach maturity and are repaid. The figure reflects the proportion of fund assets represented by each security.
Beta. A measure of the magnitude of a fund’s past share-price fluctuations in relation to the ups and downs of a given market index. The index is assigned a beta of 1.00. Compared with a given index, a fund with a beta of 1.20 typically would have seen its share price rise or fall by 12% when the index rose or fell by 10%. For this report, beta is based on returns over the past 36 months for both the fund and the index. Note that a fund’s beta should be reviewed in conjunction with its R-squared (see definition). The lower the R-squared, the less correlation there is between the fund and the index, and the less reliable beta is as an indicator of volatility.
97
Credit Quality. The credit ratings assigned to fixed income securities are an indicator of risk. They represent a rating agency’s assessment of the issuer’s ability to meet its obligations. For Vanguard tax-exempt money market funds, the Distribution by Credit Quality table was revised to include tier ratings for consistency with SEC Rule 2a-7 under the Investment Company Act of 1940, which governs money market funds. A First Tier security is a security that is eligible for money market funds and has received a short-term rating from the requisite nationally recognized statistical rating organizations in the highest short-term rating category for debt obligations. An unrated security is First Tier if it represents quality comparable to that of a rated security as determined in accordance with SEC Rule 2a-7. A Second Tier security is a security that is eligible for money market funds and is not a First Tier security. For Vanguard ta x-exempt bond funds, credit-quality ratings for each issue are obtained from Moody’s Investors Service and Standard & Poor’s, and the higher rating for each issue is used.
Expense Ratio. The percentage of a fund’s average net assets used to pay its annual administrative and advisory expenses. These expenses directly reduce returns to investors.
Inception Date. The date on which the assets of a fund (or one of its share classes) are first invested in accordance with the fund’s investment objective. For funds with a subscription period, the inception date is the day after that period ends. Investment performance is measured from the inception date.
R-Squared. A measure of how much of a fund’s past returns can be explained by the returns from the market in general, as measured by a given index. If a fund’s total returns were precisely synchronized with an index’s returns, its R-squared would be 1.00. If the fund’s returns bore no relationship to the index’s returns, its R-squared would be 0. For this report, R-squared is based on returns over the past 36 months for both the fund and the index.
Short-Term Reserves. The percentage of a fund invested in highly liquid, short-term securities that can be readily converted to cash.
Yield to Maturity. The rate of return an investor would receive if the fixed income securities held by a fund were held to their maturity dates.
98
This page intentionally left blank.
The People Who Govern Your Fund
The trustees of your mutual fund are there to see that the fund is operated and managed in your best interests since, as a shareholder, you are a part owner of the fund. Your fund’s trustees also serve on the board of directors of The Vanguard Group, Inc., which is owned by the Vanguard funds and provides services to them on an at-cost basis.
A majority of Vanguard’s board members are independent, meaning that they have no affiliation with Vanguard or the funds they oversee, apart from the sizable personal investments they have made as private individuals. The independent board members have distinguished backgrounds in business, academia, and public service. Each of the trustees and executive officers oversees 179 Vanguard funds.
The following table provides information for each trustee and executive officer of the fund. More information about the trustees is in the Statement of Additional Information, which can be obtained, without charge, by contacting Vanguard at 800-662-7447, or online at vanguard.com.
| |
| Interested Trustee1 | Amy Gutmann |
| | Born 1949. Trustee Since June 2006. Principal |
| F. William McNabb III | Occupation(s) During the Past Five Years: President |
| Born 1957. Trustee Since July 2009. Chairman of the | of the University of Pennsylvania; Christopher H. |
| Board. Principal Occupation(s) During the Past Five | Browne Distinguished Professor of Political Science |
| Years: Chairman of the Board of The Vanguard Group, | in the School of Arts and Sciences with secondary |
| Inc., and of each of the investment companies served | appointments at the Annenberg School for Commu- |
| by The Vanguard Group, since January 2010; Director | nication and the Graduate School of Education |
| of The Vanguard Group since 2008; Chief Executive | of the University of Pennsylvania; Director of |
| Officer and President of The Vanguard Group and of | Carnegie Corporation of New York, Schuylkill River |
| each of the investment companies served by The | Development Corporation, and Greater Philadelphia |
| Vanguard Group since 2008; Director of Vanguard | Chamber of Commerce; Trustee of the National |
| Marketing Corporation; Managing Director of The | Constitution Center; Chair of the Presidential |
| Vanguard Group (1995–2008). | Commission for the Study of Bioethical Issues. |
| |
| | JoAnn Heffernan Heisen |
| Independent Trustees | Born 1950. Trustee Since July 1998. Principal |
| | Occupation(s) During the Past Five Years: Corporate |
| Emerson U. Fullwood | Vice President and Chief Global Diversity Officer |
| Born 1948. Trustee Since January 2008. Principal | since 2006 (retired 2008) and Member of the |
| Occupation(s) During the Past Five Years: Executive | Executive Committee (retired 2008) of Johnson & |
| Chief Staff and Marketing Officer for North America | Johnson (pharmaceuticals/consumer products); Vice |
| and Corporate Vice President (retired 2008) of Xerox | President and Chief Information Officer of Johnson & |
| Corporation (document management products and | Johnson (1997–2005); Director of the University |
| services); Director of SPX Corporation (multi-industry | Medical Center at Princeton and Women’s Research |
| manufacturing), the United Way of Rochester, | and Education Institute; Member of the Advisory |
| Amerigroup Corporation (managed health care), | Board of the Maxwell School of Citizenship and Public |
| the University of Rochester Medical Center, and | Affairs at Syracuse University. |
| Monroe Community College Foundation. | |
| | F. Joseph Loughrey |
| Rajiv L. Gupta | Born 1949. Trustee Since October 2009. Principal |
| Born 1945. Trustee Since December 2001.2 | Occupation(s) During the Past Five Years: President |
| Principal Occupation(s) During the Past Five Years: | and Chief Operating Officer since 2005 (retired 2009) |
| Chairman and Chief Executive Officer (retired 2009) | and Vice Chairman of the Board (2008–2009) of |
| and President (2006–2008) of Rohm and Haas Co. | Cummins Inc. (industrial machinery); Director of |
| (chemicals); Director of Tyco International, Ltd. | SKF AB (industrial machinery), Hillenbrand, Inc. |
| (diversified manufacturing and services) and Hewlett- | (specialized consumer services), Sauer-Danfoss Inc. |
| Packard Co. (electronic computer manufacturing); | (machinery), the Lumina Foundation for Education, |
| Trustee of The Conference Board; Member of the | and Oxfam America; Chairman of the Advisory |
| Board of Managers of Delphi Automotive LLP | Council for the College of Arts and Letters at the |
| (automotive components). | University of Notre Dame. |
| | |
| André F. Perold | Kathryn J. Hyatt | |
| Born 1952. Trustee Since December 2004. Principal | Born 1955. Treasurer Since November 2008. Principal |
| Occupation(s) During the Past Five Years: George | Occupation(s) During the Past Five Years: Principal |
| Gund Professor of Finance and Banking at the Harvard | of The Vanguard Group, Inc.; Treasurer of each of |
| Business School; Chair of the Investment Committee | the investment companies served by The Vanguard |
| of HighVista Strategies LLC (private investment firm). | Group since 2008; Assistant Treasurer of each of the |
| | investment companies served by The Vanguard Group |
| Alfred M. Rankin, Jr. | (1988–2008). | |
| Born 1941. Trustee Since January 1993. Principal | | |
| Occupation(s) During the Past Five Years: Chairman, | Heidi Stam | |
| President, and Chief Executive Officer of NACCO | Born 1956. Secretary Since July 2005. Principal |
| Industries, Inc. (forklift trucks/housewares/lignite); | Occupation(s) During the Past Five Years: Managing |
| Director of Goodrich Corporation (industrial products/ | Director of The Vanguard Group, Inc., since 2006; |
| aircraft systems and services); Chairman of the | General Counsel of The Vanguard Group since 2005; |
| Federal Reserve Bank of Cleveland; Trustee of The | Secretary of The Vanguard Group and of each of the |
| Cleveland Museum of Art. | investment companies served by The Vanguard Group |
| | since 2005; Director and Senior Vice President of |
| Peter F. Volanakis | Vanguard Marketing Corporation since 2005; |
| Born 1955. Trustee Since July 2009. Principal | Principal of The Vanguard Group (1997–2006). |
| Occupation(s) During the Past Five Years: President | | |
| since 2007 and Chief Operating Officer since 2005 | | |
| of Corning Incorporated (communications equipment); | Vanguard Senior Management Team |
| President of Corning Technologies (2001–2005); | | |
| Director of Corning Incorporated and Dow Corning; | R. Gregory Barton | Michael S. Miller |
| Trustee of the Corning Incorporated Foundation and | Mortimer J. Buckley | James M. Norris |
| the Corning Museum of Glass; Overseer of the | Kathleen C. Gubanich | Glenn W. Reed |
| Amos Tuck School of Business Administration at | Paul A. Heller | George U. Sauter |
| Dartmouth College. | | |
| |
| | Chairman Emeritus and Senior Advisor |
| Executive Officers | | |
| | John J. Brennan | |
| Glenn Booraem | Chairman, 1996–2009 | |
| Born 1967. Controller Since July 2010. Principal | Chief Executive Officer and President, 1996–2008 |
| Occupation(s) During the Past Five Years: Principal | | |
| of The Vanguard Group, Inc.; Controller of each of | | |
| the investment companies served by The Vanguard | Founder | |
| Group since 2010; Assistant Controller of each of | | |
| the investment companies served by The Vanguard | John C. Bogle | |
| Group (2001–2010). | Chairman and Chief Executive Officer, 1974–1996 |
| |
| Thomas J. Higgins | | |
| Born 1957. Chief Financial Officer Since September | | |
| 2008. Principal Occupation(s) During the Past Five | | |
| Years: Principal of The Vanguard Group, Inc.; Chief | | |
| Financial Officer of each of the investment companies | | |
| served by The Vanguard Group since 2008; Treasurer | | |
| of each of the investment companies served by The | | |
| Vanguard Group (1998–2008). | | |
1 Mr. McNabb is considered an “interested person,” as defined in the Investment Company Act of 1940, because he is an officer of the Vanguard funds.
2 December 2002 for Vanguard Equity Income Fund, Vanguard Growth Equity Fund, the Vanguard Municipal Bond Funds, and the Vanguard State Tax-Exempt Funds.
|  |
| P.O. Box 2600 |
| Valley Forge, PA 19482-2600 |
Connect with Vanguard® > vanguard.com
| |
| Fund Information > 800-662-7447 | CFA® is a trademark owned by CFA Institute. |
| Direct Investor Account Services > 800-662-2739 | |
| Institutional Investor Services > 800-523-1036 | |
| Text Telephone for People | |
| With Hearing Impairment > 800-749-7273 | |
| |
| This material may be used in conjunction | |
| with the offering of shares of any Vanguard | |
| fund only if preceded or accompanied by | |
| the fund’s current prospectus. | |
| |
| All comparative mutual fund data are from Lipper Inc. or | |
| Morningstar, Inc., unless otherwise noted. | |
| |
| You can obtain a free copy of Vanguard’s proxy voting | |
| guidelines by visiting vanguard.com/proxyreporting or by | |
| calling Vanguard at 800-662-2739. The guidelines are | |
| also available from the SEC’s website, sec.gov. In | |
| addition, you may obtain a free report on how your fund | |
| voted the proxies for securities it owned during the 12 | |
| months ended June 30. To get the report, visit either | |
| vanguard.com/proxyreporting or sec.gov. | |
| |
| You can review and copy information about your fund at | |
| the SEC’s Public Reference Room in Washington, D.C. To | |
| find out more about this public service, call the SEC at | |
| 202-551-8090. Information about your fund is also | |
| available on the SEC’s website, and you can receive | |
| copies of this information, for a fee, by sending a | |
| request in either of two ways: via e-mail addressed to | |
| publicinfo@sec.gov or via regular mail addressed to the | |
| Public Reference Section, Securities and Exchange | |
| Commission, Washington, DC 20549-1520. | |
| |
| |
| | © 2011 The Vanguard Group, Inc. |
| | All rights reserved. |
| | Vanguard Marketing Corporation, Distributor. |
| |
| | Q750 012011 |
Item 2: Code of Ethics. The Registrant has adopted a code of ethics that applies to the Registrant’s principal executive officer, principal financial officer, principal accounting officer or controller or persons performing similar functions. The Code of Ethics was amended during the reporting period covered by this report to make certain technical, non-material changes.
Item 3: Audit Committee Financial Expert. The following members of the Audit Committee have been determined by the Registrant’s Board of Trustees to be Audit Committee Financial Experts serving on its Audit Committee, and to be independent: Charles D. Ellis, Rajiv L. Gupta, JoAnn Heffernan Heisen, André F. Perold, and Alfred M. Rankin, Jr.
Item 4: Principal Accountant Fees and Services.
(a) Audit Fees.
Audit Fees of the Registrant
Fiscal Year Ended November 30, 2010: $75,000
Fiscal Year Ended November 30, 2009: $67,000
Aggregate Audit Fees of Registered Investment Companies in the Vanguard Group.
Fiscal Year Ended November 30, 2010: $3,607,060
Fiscal Year Ended November 30, 2009: $3,354,640
(b) Audit-Related Fees.
Fiscal Year Ended November 30, 2010: $791,350
Fiscal Year Ended November 30, 2009: $876,210
Includes fees billed in connection with assurance and related services provided to the Registrant, The Vanguard Group, Inc., Vanguard Marketing Corporation, and other registered investment companies in the Vanguard Group.
(c) Tax Fees.
Fiscal Year Ended November 30, 2010: $336,090
Fiscal Year Ended November 30, 2009: $423,070
Includes fees billed in connection with tax compliance, planning and advice services provided to the Registrant, The Vanguard Group, Inc., Vanguard Marketing Corporation, and other registered investment companies in the Vanguard Group and related to income and excise taxes.
(d) All Other Fees.
Fiscal Year Ended November 30, 2010: $16,000
Fiscal Year Ended November 30, 2009: $0
Includes fees billed for services related to risk management and privacy matters. Services were provided to the Registrant, The Vanguard Group, Inc., Vanguard Marketing Corporation, and other registered investment companies in the Vanguard Group.
(e) (1) Pre-Approval Policies. The policy of the Registrant’s Audit Committee is to consider and, if appropriate, approve before the principal accountant is engaged for such services, all specific audit and non-audit services provided to: (1) the Registrant; (2) The Vanguard Group, Inc.; (3) other entities controlled by The Vanguard Group, Inc. that provide ongoing services to the Registrant; and (4) other registered investment
companies in the Vanguard Group. In making a determination, the Audit Committee considers whether the services are consistent with maintaining the principal accountant’s independence.
In the event of a contingency situation in which the principal accountant is needed to provide services in between scheduled Audit Committee meetings, the Chairman of the Audit Committee would be called on to consider and, if appropriate, pre-approve audit or permitted non-audit services in an amount sufficient to complete services through the next Audit Committee meeting, and to determine if such services would be consistent with maintaining the accountant’s independence. At the next scheduled Audit Committee meeting, services and fees would be presented to the Audit Committee for formal consideration, and, if appropriate, approval by the entire Audit Committee. The Audit Committee would again consider whether such services and fees are consistent with maintaining the principal accountant’s independence.
The Registrant’s Audit Committee is informed at least annually of all audit and non-audit services provided by the principal accountant to the Vanguard complex, whether such services are provided to: (1) the Registrant; (2) The Vanguard Group, Inc.; (3) other entities controlled by The Vanguard Group, Inc. that provide ongoing services to the Registrant; or (4) other registered investment companies in the Vanguard Group.
(2) No percentage of the principal accountant’s fees or services were approved pursuant to the waiver provision of paragraph (c)(7)(i)(C) of Rule 2-01 of Regulation S-X.
(f) For the most recent fiscal year, over 50% of the hours worked under the principal accountant’s engagement were not performed by persons other than full-time, permanent employees of the principal accountant.
(g) Aggregate Non-Audit Fees.
Fiscal Year Ended November 30, 2010: $352,090
Fiscal Year Ended November 30, 2009: $423,070
Includes fees billed for non-audit services provided to the Registrant, The Vanguard Group, Inc., Vanguard Marketing Corporation, and other registered investment companies in the Vanguard Group.
(h) For the most recent fiscal year, the Audit Committee has determined that the provision of all non-audit services was consistent with maintaining the principal accountant’s independence.
Item 5: Audit Committee of Listed Registrants.
Not Applicable.
Item 6: Investments.
Not Applicable.
Item 7: Disclosure of Proxy Voting Policies and Procedures for Closed-End Management Investment Companies.
Not Applicable.
Item 8: Portfolio Managers of Closed-End Management Investment Companies.
Not Applicable.
Item 9: Purchase of Equity Securities by Closed-End Management Investment Company and Affiliated Purchasers.
Not Applicable.
Item 10: Submission of Matters to a Vote of Security Holders.
Not Applicable.
Item 11: Controls and Procedures.
(a) Disclosure Controls and Procedures. The Principal Executive and Financial Officers concluded that the Registrant's Disclosure Controls and Procedures are effective based on their evaluation of the Disclosure Controls and Procedures as of a date within 90 days of the filing date of this report.
(b) Internal Control Over Financial Reporting. There were no significant changes in Registrant’s Internal Control Over Financial Reporting or in other factors that could significantly affect this control subsequent to the date of the evaluation, including any corrective actions with regard to significant deficiencies and material weaknesses.
Item 12: Exhibits.
(a) Code of Ethics.
(b) Certifications.
Pursuant to the requirements of the Securities Exchange Act of 1934 and the Investment Company Act of 1940, the registrant has duly caused this report to be signed on its behalf by the undersigned, thereunto duly authorized.
| |
| | VANGUARD CALIFORNIA TAX-FREE FUNDS |
| |
| By: | /s/ F. WILLIAM MCNABB III* |
| | F. WILLIAM MCNABB III |
| | CHIEF EXECUTIVE OFFICER |
| |
| Date: January 25, 2011 |
Pursuant to the requirements of the Securities Exchange Act of 1934 and the Investment Company Act of 1940, this report has been signed below by the following persons on behalf of the registrant and in the capacities and on the dates indicated.
| |
| | VANGUARD CALIFORNIA TAX-FREE FUNDS |
| |
| By: | /s/ F. WILLIAM MCNABB III* |
| | F. WILLIAM MCNABB III |
| | CHIEF EXECUTIVE OFFICER |
| |
| Date: January 25, 2011 |
| |
| | VANGUARD CALIFORNIA TAX-FREE FUNDS |
| |
| By: | /s/ THOMAS J. HIGGINS* |
| | THOMAS J. HIGGINS |
| | CHIEF FINANCIAL OFFICER |
| |
| Date: January 25, 2011 |
* By: /s/ Heidi Stam
Heidi Stam, pursuant to a Power of Attorney filed on April 26, 2010, see file Number 33-53683, Incorporated by Reference.