UNITED STATES
SECURITIES AND EXCHANGE COMMISSION
Washington, D.C. 20549
FORM N-CSR
CERTIFIED SHAREHOLDER REPORT
OF
REGISTERED MANAGEMENT INVESTMENT COMPANIES
| | |
| Investment Company Act file number: 811-04474 |
Name of Registrant: | Vanguard California Tax-Free Funds |
Address of Registrant: | P.O. Box 2600 |
| | Valley Forge, PA 19482 |
Name and address of agent for service: | Heidi Stam, Esquire |
| | P.O. Box 876 |
| | Valley Forge, PA 19482 |
Registrant’s telephone number, including area code: (610) 669-1000 |
Date of fiscal year end: November 30 | |
Date of reporting period: December 1, 2011 – November 30, 2012 |
Item 1: Reports to Shareholders | |

Annual Report | November 30, 2012
Vanguard California Tax-Exempt Funds

Vanguard California Tax-Exempt Money Market Fund
Vanguard California Intermediate-Term Tax-Exempt Fund
Vanguard California Long-Term Tax-Exempt Fund
> For the 12 months ended November 30, 2012, Vanguard California Tax-Exempt
Money Market Fund returned 0.03%, a consequence of the Federal Reserve’s
low-interest-rate policy.
> Investor Shares of Vanguard California Intermediate-Term Tax-Exempt Fund
returned 10.14%, well ahead of the return of the fund’s benchmark index and
the average result for its peers.
> For Vanguard California Long-Term Tax-Exempt Fund, Investor Shares returned
13.20%, outpacing the result for the fund’s benchmark index but lagging the
average return of peer-group funds.
| |
| Contents | |
| Your Fund’s Total Returns. | 1 |
| Chairman’s Letter. | 2 |
| Advisor’s Report. | 10 |
| California Tax-Exempt Money Market Fund. | 13 |
| California Intermediate-Term Tax-Exempt Fund. | 32 |
| California Long-Term Tax-Exempt Fund. | 75 |
| About Your Fund’s Expenses. | 105 |
| Glossary. | 107 |
Please note: The opinions expressed in this report are just that—informed opinions. They should not be considered promises or advice.
Also, please keep in mind that the information and opinions cover the period through the date on the front of this report. Of course, the
risks of investing in your fund are spelled out in the prospectus.
See the Glossary for definitions of investment terms used in this report.
About the cover: Our cover photograph shows rigging on the HMSSurprise, a replica of an 18th-century Royal Navy frigate. It
was featured in the 2003 movie Master and Commander: The Far Side of the World, which was based on Patrick O’Brian’s sea
novels, set amid the Napoleonic Wars. Vanguard was named for another ship of that era, the HMSVanguard, which was the
flagship of British Admiral Horatio Nelson at the Battle of the Nile.
Your Fund’s Total Returns
| | | | | |
| Fiscal Year Ended November 30, 2012 | | | | | |
| | | Taxable- | | | |
| | SEC | Equivalent | Income | Capital | Total |
| | Yield | Yield | Returns | Returns | Returns |
| Vanguard California Tax-Exempt Money Market | | | | | |
| Fund | 0.03% | 0.05% | 0.03% | 0.00% | 0.03% |
| California Tax-Exempt Money Market Funds | | | | | |
| Average | | | | | 0.00 |
| California Tax-Exempt Money Market Funds Average: Derived from data provided by Lipper Inc. | | | |
| Vanguard California Intermediate-Term Tax-Exempt Fund | | | | |
| Investor Shares | 1.46% | 2.50% | 3.52% | 6.62% | 10.14% |
| Admiral™ Shares | 1.54 | 2.64 | 3.61 | 6.62 | 10.23 |
| Barclays Municipal California Intermediate Bond | | | | | |
| Index | | | | | 9.08 |
| California Intermediate Municipal Debt Funds | | | | | |
| Average | | | | | 8.35 |
| California Intermediate Municipal Debt Funds Average: Derived from data provided by Lipper Inc. | | | |
| Vanguard California Long-Term Tax-Exempt Fund | | | | | |
| Investor Shares | 2.10% | 3.60% | 4.30% | 8.90% | 13.20% |
| Admiral Shares | 2.18 | 3.74 | 4.39 | 8.90 | 13.29 |
| Barclays CA Municipal Bond Index | | | | | 11.80 |
| California Municipal Debt Funds Average | | | | | 14.50 |
California Municipal Debt Funds Average: Derived from data provided by Lipper Inc.
7-day SEC yield for the California Tax-Exempt Money Market Fund; 30-day SEC yield for the California Intermediate-Term Tax-Exempt Fund
and California Long-Term Tax-Exempt Fund.
The calculation of taxable-equivalent yield assumes a typical itemized tax return and is based on the maximum federal tax rate of 35% and
the maximum income tax rate for the state. Local taxes were not considered. Please see the prospectus for a detailed explanation of the
calculation.
Admiral Shares carry lower expenses and are available to investors who meet certain account-balance requirements.
1

Chairman’s Letter
Dear Shareholder,
Vanguard California Intermediate-Term Tax-Exempt Fund returned 10.14% for Investor Shares and 10.23% for Admiral Shares for the 12 months ended November 30, 2012. Over the same period, Vanguard California Long-Term Tax-Exempt Fund returned 13.20% for Investor Shares and 13.29% for Admiral Shares. Both funds exceeded the returns of their benchmark indexes by more than 1 percentage point.
The Intermediate-Term Fund outpaced the average return of its peers by almost 2 percentage points. The Long-Term Fund lagged its peers’ average return by more than 1 percentage point, in part because the maturity and credit quality of its holdings were more conservative.
Both funds performed strongly from a historical perspective, but keep in mind that, for reasons I’ll discuss later in this letter, we anticipate a more challenging environment in coming years for investors in both municipal and taxable bonds.
The California Tax-Exempt Money Market Fund, meanwhile, returned 0.03% for the period as short-term interest rates hovered just above zero.
As demand for municipal bonds drove prices higher, yields fell. (Bond yields and prices move in opposite directions.) The 30-day SEC yield for Investor Shares of the Intermediate-Term Fund dropped to 1.46%
2
as of November 30, 2012, from 2.63% a year earlier. For Investor Shares of the Long-Term Fund, the yield fell to 2.10% from 3.42%. The 7-day SEC yield of the Money Market Fund, which invests in short-term securities, inched up to 0.03% as of November 30, 2012, from 0.01% 12 months earlier.
Note: The funds are permitted to invest in securities whose income is subject to the alternative minimum tax (AMT). As of November 30, 2012, neither the Intermediate-Term Fund nor the Long-Term Fund owned securities that would generate income distributions subject to the AMT, but the Money Market Fund did.
Bonds notched solid results, but challenges lie ahead
The broad U.S. taxable bond market returned more than 5% for the 12 months. Municipal bonds performed more robustly, with returns of about 10%.
As bond prices rose, the yield of the 10-year U.S. Treasury note slipped to a record low in July, closing below 1.5%. By the end of the period, the yield had climbed, but it still remained exceptionally low by historical standards.
After years of relatively high bond returns, investors shouldn’t be surprised if future results are much more modest. The low yields mean the opportunity for similarly strong returns has diminished.
| | | |
| Market Barometer | | | |
| | Average Annual Total Returns |
| | Periods Ended November 30, 2012 |
| | One | Three | Five |
| | Year | Years | Years |
| Bonds | | | |
| Barclays U.S. Aggregate Bond Index (Broad taxable | | | |
| market) | 5.51% | 5.68% | 6.04% |
| Barclays Municipal Bond Index (Broad tax-exempt market) | 10.17 | 7.13 | 6.23 |
| Citigroup Three-Month U.S. Treasury Bill Index | 0.07 | 0.08 | 0.50 |
| |
| Stocks | | | |
| Russell 1000 Index (Large-caps) | 16.19% | 11.63% | 1.57% |
| Russell 2000 Index (Small-caps) | 13.09 | 13.85 | 2.82 |
| Russell 3000 Index (Broad U.S. market) | 15.95 | 11.80 | 1.67 |
| MSCI All Country World Index ex USA (International) | 11.65 | 3.41 | -3.84 |
| |
| CPI | | | |
| Consumer Price Index | 1.76% | 2.10% | 1.84% |
3
As it has since late 2008, the Federal Reserve held its target for short-term interest rates between 0% and 0.25%, which kept a tight lid on returns from money market funds and savings accounts. Shortly after the period closed, the Fed announced it would not boost interest rates until unemployment fell to 6.5% or lower, provided the long-term inflation outlook remains about 2% or less. Based on current Fed projections, short-term interest rates are expected to remain near zero into 2015.
Stocks weathered turbulence to record a healthy advance
Global stock markets seesawed through the 12 months ended November 30, ultimately finishing with double-digit gains. U.S. stocks led the way, returning about
16%, followed by European and emerging markets stocks. Stocks in the developed markets of the Pacific region had the smallest return but still rose about 10%.
The gains masked a significant level of apprehension during the period, with investors concerned about U.S. economic growth and the finances of European governments and banks. Worries about Europe, in particular, flared up in the spring and then quieted in the summer. The president of the European Central Bank declared in July that policymakers would do whatever was needed to preserve the euro common currency.
Although investors’ worries have eased, Europe’s financial troubles aren’t resolved. Vanguard economists believe the most
| | | |
| Expense Ratios | | | |
| Your Fund Compared With Its Peer Group | | | |
| | Investor | Admiral | Peer Group |
| | Shares | Shares | Average |
| California Tax-Exempt Money Market | | | |
| Fund | 0.17% | — | 0.29% |
| California Intermediate-Term | | | |
| Tax-Exempt Fund | 0.20 | 0.12% | 0.82 |
| California Long-Term Tax-Exempt Fund | 0.20 | 0.12 | 0.98 |
The fund expense ratios shown are from the prospectus dated March 28, 2012, and represent estimated costs for the current fiscal year. For
the fiscal year ended November 30, 2012, the funds’ expense ratios were: for the California Tax-Exempt Money Market Fund, 0.15%; for the
California Intermediate-Term Tax-Exempt Fund, 0.20% for Investor Shares and 0.12% for Admiral Shares; and for the California Long-Term
Tax-Exempt Fund, 0.20% for Investor Shares and 0.12% for Admiral Shares. The expense ratio for the California Tax-Exempt Money Market
Fund reflects a temporary reduction in operating expenses (described in Note B of the Notes to Financial Statements). Before the reduction,
the expense ratio was 0.16%. Peer-group expense ratios are derived from data provided by Lipper Inc. and capture information through
year-end 2011.
Peer groups: For the California Tax-Exempt Money Market Fund, California Tax-Exempt Money Market Funds; for the California
Intermediate-Term Tax-Exempt Fund, California Intermediate Municipal Debt Funds; for the California Long-Term Tax-Exempt Fund, California
Municipal Debt Funds.
4
likely scenario is that the Eurozone will “muddle through” for several years, with occasional spikes in market volatility, as fiscal tightening persists in the face of weak economic growth.
As the period drew to a close soon after the U.S. elections, attention to the United States’s considerable budgetary challenges intensified. The near-term focus on the “fiscal cliff” led to unsettling headlines and nervousness in the markets. But it also sparked serious debate about spending
and tax policy options, and such attention could prove a first step to a long-term solution that resolves the nation’s fiscal imbalance and opens the way for growth.
Investors’ search for yield helped boost muni returns
California has struggled with many of the same postrecession economic challenges facing the rest of the country. As the chart on page 6 illustrates, total state tax collection for the states rebounded from recession lows, but the pace of growth has
| |
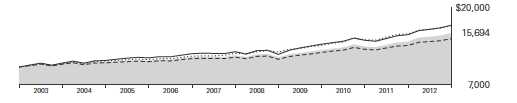
| Total Returns | |
| Ten Years Ended November 30, 2012 | |
| | Average |
| | Annual Return |
| California Tax-Exempt Money Market Fund | 1.36% |
| California Tax-Exempt Money Market Funds Average | 1.06 |
| California Tax-Exempt Money Market Funds Average: Derived from data provided by Lipper Inc. |
| |
| California Intermediate-Term Tax-Exempt Fund Investor Shares | 4.61% |
| Barclays Municipal California Intermediate Bond Index | 5.43 |
| California Intermediate Municipal Debt Funds Average | 3.96 |
| California Intermediate Municipal Debt Funds Average: Derived from data provided by Lipper Inc. |
| |
| California Long-Term Tax-Exempt Fund Investor Shares | 5.11% |
| Barclays CA Municipal Bond Index | 5.61 |
| California Municipal Debt Funds Average | 4.82 |
| California Municipal Debt Funds Average: Derived from data provided by Lipper Inc. |
The figures shown represent past performance, which is not a guarantee of future results. (Current performance may be
lower or higher than the performance data cited. For performance data current to the most recent month-end, visit our
website at vanguard.com/performance.) Note, too, that both investment returns and principal value can fluctuate widely, so
an investor’s shares, when sold, could be worth more or less than their original cost.
5
been trending down in recent quarters, and California has fared even worse because of a sharp drop in corporate income tax revenues. And California’s payrolls, though rising at a good clip lately, remain well below prerecession levels; that depresses revenues from personal income and sales taxes. The November 6 passage by California voters of two tax measures, Propositions 30 and 39, was a step toward addressing some of the state’s fiscal challenges.
On the cost side, shrinking revenues and increasing pension obligations left the state and local governments with little appetite to take on new capital projects. Many did, however, strengthen their finances by refinancing debt at today’s exceptionally low interest rates. As a result, total California tax-exempt bond issuance rose for the 12-month period, but much of it represented refinancing activity.
| Investment insight |
| An unclear revenue picture keeps state issuers cautious |
| After a steep falloff associated with the financial crisis, tax revenue for the states |
| rebounded. But the pace of recovery for many states has slowed, and collections in |
| California have actually fallen. The difficult revenue picture has generally produced |
| austerity budgets, and state governments have become selective in the bonds they |
| issue to finance capital improvements and general spending. |
| |
| Year-over-year percentage change (rolling four quarters) in tax collections |
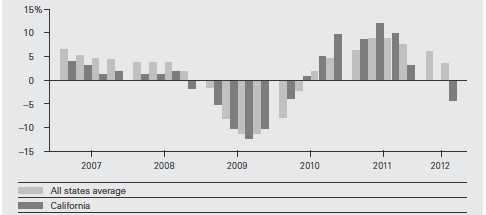
| Sources: Vanguard and The Nelson A. Rockefeller Institute of Government. |
Overall demand for municipal bonds ran high, despite the fiscal challenges facing California’s state and local governments and the headline-grabbing news of some defaults. Part of the reason was limited new supply (described in the Advisor’s Report that follows this letter). Muni returns were also attractive compared with those of U.S. Treasury bonds. Bonds with longer maturities were especially in favor with yield-hungry investors, despite the potential for sharp price declines should interest rates rise. The same was true for bonds with lower credit ratings—again, despite the potential for sharp price declines should investors rein in their tolerance for risk.
The tilt of the California Intermediate-Term and Long-Term Tax-Exempt Funds toward longer-maturity and lower-quality, investment-grade bonds boosted their performance. So, too, did their holdings in essential-service bonds. Such bonds, which typically finance projects such as water and sewer facilities, benefit from an income stream dedicated to servicing debt and are less affected by economic cycles or general tax revenues. Security selection added to the funds’ relative performance.
Over the decade, the funds have surpassed their peers
In March, we changed the benchmarks for the California Intermediate-Term and Long-Term Tax-Exempt Funds from national
indexes to state-specific ones. For the ten years ended November 30, 2012, the Intermediate-Term Fund returned 4.61% and the Long-Term Fund 5.11% for Investor Shares—a step or two behind the returns of their benchmarks.
Although we keep an eye on benchmark indexes, our most important measure of relative success is how a fund performs compared with peers operating in the same market. Over the past ten years, all three funds have delivered on our expectations of superior performance. The California Tax-Exempt Money Market Fund’s average annual return of 1.36% as of November 30, 2012, was 0.30 percentage point ahead of the average annual return of its peer group. The average annual return of the Intermediate-Term Fund (4.61%) exceeded that of its peers by 0.65 percentage point, and the average annual return of the Long-Term Fund (5.11%) exceeded that of its peers by 0.29 percentage point. The results reflect the skilled management of the funds’ investment advisor, Vanguard Fixed Income Group. Our funds’ low cost profile helped as well.
Tuning out the “noise” is always a good practice
Municipal bonds have made headlines periodically since the financial crisis, with a handful of issuers filing for bankruptcy protection. But headlines can be flashier than the underlying reality. Such
7
defaults aren’t necessarily unusual, but they represent only a tiny fraction of the dollar amount of the overall muni market (and typically occur among the types of bonds we steer away from). Moreover, state and municipal debt burdens remain manageable relative to the size of their economies—and the last thing that issuers want is to default and have the door to the muni market closed to them by investors shunning future bond issues.
At Vanguard, our seasoned team of credit analysts continually monitors the underlying realities of the municipal bond market, independent of the hubbub generated by instant reactions to events or decisions made by credit-rating agencies. Our analysts conduct in-depth reviews of securities we’re considering purchasing, and they keep an eye on changes in the credit quality of those already in our portfolios.
Returns from bonds, both municipal and taxable, have been impressive of late. But, as I mentioned, with current interest rates at very low levels, we anticipate that future bond returns will be lower. I point this out to help set realistic expectations, not to encourage you to abandon a sensible bond allocation. Bonds have an important role to play in a portfolio because of the diversification benefits they provide.
Stepping back from the latest headlines or the latest returns and gaining some perspective before making a decision is a good practice for any investor, in any environment.
Thank you for entrusting your assets to Vanguard.
Sincerely,

F. William McNabb III
Chairman and Chief Executive Officer
December 14, 2012
| | | | |
| Your Fund’s Performance at a Glance | | | | |
| November 30, 2011, Through November 30, 2012 | | | | |
| | | | Distributions Per Share |
| | Starting | Ending | Income | Capital |
| | Share Price | Share Price | Dividends | Gains |
| Vanguard California Tax-Exempt Money Market | | | | |
| Fund | $1.00 | $1.00 | $0.000 | $0.000 |
| Vanguard California Intermediate-Term | | | | |
| Tax-Exempt Fund | | | | |
| Investor Shares | $11.18 | $11.92 | $0.379 | $0.000 |
| Admiral Shares | 11.18 | 11.92 | 0.388 | 0.000 |
| Vanguard California Long-Term Tax-Exempt | | | | |
| Fund | | | | |
| Investor Shares | $11.24 | $12.24 | $0.459 | $0.000 |
| Admiral Shares | 11.24 | 12.24 | 0.468 | 0.000 |
9
Advisor’s Report
For the fiscal year ended November 30, 2012, Vanguard California Tax-Exempt Money Market Fund returned 0.03%, compared with an average return of 0.00% for peer-group funds. Vanguard California Intermediate-Term Tax-Exempt Fund returned 10.14% for Investor Shares and 10.23% for Admiral Shares, outpacing both the 9.08% return of its benchmark, the Barclays Municipal California Intermediate Bond Index, and the 8.35% average return of its peers. Vanguard California Long-Term Tax-Exempt Fund returned 13.20% for Investor Shares and 13.29% for Admiral Shares, surpassing the 11.80% return of its benchmark, the Barclays California Municipal Bond Index, but lagging the 14.50% average return of its peers.
The investment environment
The period was marked by another round of untraditional Federal Reserve strategies aimed at lowering interest rates and spurring economic growth. Shortly before the fiscal year began, the Fed launched “Operation Twist,” its attempt to reduce longer-term interest rates by purchasing Treasury bonds. The program was extended during the year, and the Fed added another bond-buying program that aims to lower mortgage rates. (Throughout the period, the Fed maintained a three-year-old policy that has kept short-term yields, including those of securities purchased by Vanguard California Tax-Exempt Money Market Fund, anchored at historic lows.) Then, shortly after the fiscal
| | |
| Yields of Tax-Exempt Municipal Securities | | |
| (AAA-Rated General-Obligation Issues) | | |
| | November 30, | November 30, |
| Maturity | 2011 | 2012 |
| 2 years | 0.42% | 0.30% |
| 5 years | 1.12 | 0.64 |
| 10 years | 2.22 | 1.47 |
| 30 years | 3.84 | 2.47 |
| Source: Vanguard. |
10
year ended, the central bank said it would tie its monetary program to specific levels of employment improvement—an announcement aimed at making Fed decisions more transparent than they had been historically.
In addition to lowering longer-term yields generally, the impact of the Fed’s policies can be seen in the “flattening” of the yield curve—the spectrum of yields from lowest to highest. For example, yields of 30-year municipal bonds declined during the fiscal year by 1.37 percentage points to 2.47%, and those of 10-year bonds declined by 0.75 percentage point to 1.47%. The slide in yields helped boost bond prices and returns (prices and yields move in opposite directions).
California state and local governments have taken advantage of the lower interest rates to issue refunding bonds, which are designed to reduce debt costs. Nationally, even though about 20% more bonds were issued in fiscal 2012 than in fiscal 2011 (in California the increase was lower, at almost 9%), about 60% of these were earmarked for refunding, the highest ratio in at least 15 years. By contrast, bonds to finance new and upgraded infrastructure projects were issued more selectively by California and other states as they wrestled with the effect on their budgets of the recession’s continuing legacy.
State and local governments typically lag in recovering from recessions, as taxes from revived levels of income begin percolating through the system. But the depth of the Great Recession, the tribulations of the housing market, and the weaker-than-
hoped-for pace of the national economic recovery have extended the lag. This has been true for California. Overall, however, the state has been recovering from its 2009 low point somewhat faster than the nation has as a whole, according to an index of state economic conditions published by the Federal Reserve Bank of Philadelphia. California’s economy grew by 8.1% from November 2009 through November 2012, compared with 7.6% for the national economy over the same period.
Management of the funds
The strength of the California municipal bond market stemmed from several factors. The decline in yields helped boost prices and fund returns. So did a shortage of new issues compared with the supply of maturing bonds and other redemptions. Such a period of “net negative supply” made it challenging for us to execute our strategy, given how selective we are about the bonds we add to our portfolios.
The reduced supply met strong demand from investors, who were more comfortable with munis this year after many were spooked by unwarranted fears of systemwide problems in late 2010 and early 2011. In a scramble for yield as the Fed continued pushing interest rates downward, many investors favored longer-term and high-yield bonds, which provide more yield to compensate for their greater interest rate and credit risks. The relative valuation of municipal bonds was also attractive. Yields of 10-year munis, for example, stood roughly on a par with those of 10-year Treasuries; historically, their average annual yield has been about 85%
11
of the yield for comparable Treasuries. Uncertainty over government tax policy also whetted investor demand.
The bond funds surpassed their benchmark indexes through careful bond selection—the product of a team effort by portfolio managers, traders, and credit analysts. The role of credit analysts, always important at Vanguard, has grown in significance as state and local governments have struggled in the recession’s aftermath. In extreme examples of those struggles, two California cities, San Bernardino and Stockton, challenged by sizable pension and other obligations and the decline in revenues due to the fall in real estate prices, filed for bankruptcy protection. It’s important to keep in mind, however, that events like those, in California or elsewhere, are isolated.
The performance of Vanguard California Long-Term Tax-Exempt Fund was helped by a focus on bonds with maturities at the longer end of its investable universe, a tilt toward lower-quality bonds (as of November 30, about 43% of the portfolio was rated A or BBB; about 55% was rated higher), and a slightly longer duration aimed at taking advantage of declining interest rates (duration measures the sensitivity of a bond’s price to changes in interest rates).
For the Intermediate-Term Fund, major drivers of performance were a focus on bonds with maturities of 10 to 15 years and an emphasis on lower-quality securities (as of November 30, almost 40% of the portfolio was rated A or lower; 60% was rated higher). An underweight
position in pre-refunded and escrowed-to-maturity bonds helped. These are bonds that are retired and replaced by newly issued lower-interest-rate bonds whose proceeds have been temporarily invested in Treasury securities.
The immediate outlook for California bonds improved (and the bonds immediately rallied) with the November 6 passage by state voters of Proposition 30, which raises $6 billion through temporary increases in wealthier individuals’ income taxes and in the sales tax, and Proposition 39, a more modest corporate tax measure. These offer the potential for the state to end its fiscal year without a deficit for the first time in five years. Proposition 30’s goal of averting major cuts in education spending reinforced our strategy of investing during the year in general-obligation bonds issued by school districts. We believed the market had overly discounted their value despite their structural protections.
James M. D’Arcy, Portfolio Manager
Pamela Wisehaupt Tynan, Principal,
Head of Municipal Money Market Funds
Christopher W. Alwine, CFA, Principal,
Head of Municipal Bond Funds
Vanguard Fixed Income Group
December 21, 2012
12
California Tax-Exempt Money Market Fund
Fund Profile
As of November 30, 2012
| |
| Financial Attributes | |
| Ticker Symbol | VCTXX |
| Expense Ratio1 | 0.17% |
| 7-Day SEC Yield | 0.03% |
| Average Weighted | |
| Maturity | 44 days |
| |
| Distribution by Credit Quality (% of portfolio) |
| First Tier | 100.0% |
| For information about these ratings, see the Glossary entry for Credit Quality. |
1 The expense ratio shown is from the prospectus dated March 28, 2012, and represents estimated costs for the current fiscal year. For the
fiscal year ended November 30, 2012, the expense ratio was 0.15%, reflecting a temporary reduction in operating expenses (described in
Note B of the Notes to Financial Statements). Before this reduction, the expense ratio was 0.16%.
13
Performance Summary
Investment returns will fluctuate. All of the returns in this report represent past performance, which is not a guarantee of future results that may be achieved by the fund. (Current performance may be lower or higher than the performance data cited. For performance data current to the most recent month-end, visit our website at vanguard.com/performance.) The returns shown do not reflect taxes that a shareholder would pay on fund distributions. An investment in a money market fund is not insured or guaranteed by the Federal Deposit Insurance Corporation or any other government agency. Although the fund seeks to preserve the value of your investment at $1 per share, it is possible to lose money by investing in the fund. The fund’s 7-day SEC yield reflects its current earnings more closely than do the average annual returns.
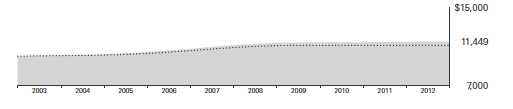
Cumulative Performance: November 30, 2002, Through November 30, 2012
Initial Investment of $10,000
| | | | |
| | Average Annual Total Returns | |
| | Periods Ended November 30, 2012 | |
| |
| | | | | Final Value |
| | One | Five | Ten | of a $10,000 |
| | Year | Years | Years | Investment |
| |
| California Tax-Exempt Money Market | | | | |
| Fund | 0.03% | 0.55% | 1.36% | $11,449 |
| •••••••• California Tax-Exempt Money Market | | | | |
| Funds Average | 0.00 | 0.40 | 1.06 | 11,116 |
| California Tax-Exempt Money Market Funds Average: Derived from data provided by Lipper Inc. |
See Financial Highlights for dividend information.
14
California Tax-Exempt Money Market Fund
| | |
| Fiscal-Year Total Returns (%): November 30, 2002, Through November 30, 2012 | |
| | | CA Tax-Exempt |
| | | Money Mkt |
| | | Funds Avg |
| Fiscal Year | Total Returns | Total Returns |
| 2003 | 0.91% | 0.54% |
| 2004 | 1.05 | 0.60 |
| 2005 | 2.17 | 1.70 |
| 2006 | 3.24 | 2.78 |
| 2007 | 3.55 | 3.06 |
| 2008 | 2.21 | 1.81 |
| 2009 | 0.37 | 0.17 |
| 2010 | 0.11 | 0.01 |
| 2011 | 0.07 | 0.01 |
| 2012 | 0.03 | 0.00 |
| 7-day SEC yield (11/30/2012): 0.03% | | |
| California Tax-Exempt Money Market Funds Average: Derived from data provided by Lipper Inc. |
Average Annual Total Returns: Periods Ended September 30, 2012
This table presents returns through the latest calendar quarter—rather than through the end of the fiscal period.
Securities and Exchange Commission rules require that we provide this information.
| | | | |
| | Inception | One | Five | Ten |
| | Date | Year | Years | Years |
| California Tax-Exempt Money | | | | |
| Market Fund | 6/1/1987 | 0.02% | 0.67% | 1.38% |
15
California Tax-Exempt Money Market Fund
Financial Statements
Statement of Net Assets
As of November 30, 2012
The fund reports a complete list of its holdings in various monthly and quarterly regulatory filings. The fund publishes its holdings on a monthly basis at vanguard.com and files them with the Securities and Exchange Commission on Form N-MFP. The fund’s Form N-MFP filings become public 60 days after the relevant month-end, and may be viewed at sec.gov or via a link on the “Portfolio Holdings” page on vanguard.com. For the second and fourth fiscal quarters, the lists appear in the fund’s semiannual and annual reports to shareholders. For the first and third fiscal quarters, the fund files the lists with the SEC on Form N-Q. Shareholders can look up the fund’s Forms N-Q on the SEC’s website at sec.gov. Forms N-Q may also be reviewed and copied at the SEC’s Public Reference Room (see the back cover of this report for further information).
| | | | |
| | | | Face | Market |
| | | Maturity | Amount | Value |
| | Coupon | Date | ($000) | ($000) |
| Tax-Exempt Municipal Bonds (99.1%) | | | | |
| California (99.0%) | | | | |
| ABAG Finance Authority for Nonprofit Corps. | | | | |
| California Revenue (Branson School) VRDO | 0.160% | 12/7/12 LOC | 2,600 | 2,600 |
| ABAG Finance Authority for Nonprofit Corps. | | | | |
| California Revenue (Francis Parker School | | | | |
| Project) VRDO | 0.180% | 12/7/12 LOC | 16,880 | 16,880 |
| ABAG Finance Authority for Nonprofit Corps. | | | | |
| California Revenue (Institute for Defense | | | | |
| Analyses) VRDO | 0.140% | 12/7/12 LOC | 11,945 | 11,945 |
| ABAG Finance Authority for Nonprofit Corps. | | | | |
| California Revenue (Lakeside Village | | | | |
| Apartments) VRDO | 0.150% | 12/7/12 LOC | 55,000 | 55,000 |
| ABAG Finance Authority for Nonprofit Corps. | | | | |
| California Revenue (Marin Country Day | | | | |
| School) VRDO | 0.140% | 12/7/12 LOC | 22,175 | 22,175 |
| ABAG Finance Authority for Nonprofit Corps. | | | | |
| California Revenue (Public Policy Institute) | | | | |
| VRDO | 0.200% | 12/7/12 LOC | 12,705 | 12,705 |
| Anaheim CA Housing Finance Agency Home | | | | |
| Mortgage Revenue VRDO | 0.190% | 12/7/12 LOC | 5,485 | 5,485 |
| 1 Bay Area Toll Authority California Toll Bridge | | | | |
| Revenue (San Francisco Bay Area) TOB PUT | 0.300% | 1/23/13 | 9,865 | 9,865 |
| 1 Bay Area Toll Authority California Toll Bridge | | | | |
| Revenue (San Francisco Bay Area) TOB VRDO | 0.170% | 12/7/12 | 43,640 | 43,640 |
| 1 Bay Area Toll Authority California Toll Bridge | | | | |
| Revenue (San Francisco Bay Area) TOB VRDO | 0.220% | 12/7/12 | 5,000 | 5,000 |
| Bay Area Toll Authority California Toll Bridge | | | | |
| Revenue (San Francisco Bay Area) VRDO | 0.130% | 12/7/12 LOC | 22,000 | 22,000 |
| 1 California Department of Water Resources | | | | |
| Water System Revenue (Central Valley Project) | | | | |
| TOB VRDO | 0.160% | 12/7/12 | 4,100 | 4,100 |
| California Educational Facilities Authority Revenue | | | | |
| (California Institute of Technology) VRDO | 0.130% | 12/7/12 | 55,800 | 55,800 |
| California Educational Facilities Authority Revenue | | | | |
| (Stanford Hospital) CP | 0.180% | 1/15/13 | 12,050 | 12,050 |
| 1 California Educational Facilities Authority Revenue | | | | |
| (Stanford Hospital) TOB VRDO | 0.150% | 12/7/12 | 14,000 | 14,000 |
16
California Tax-Exempt Money Market Fund
| | | | | |
| | | | | Face | Market |
| | | | Maturity | Amount | Value |
| | | Coupon | Date | ($000) | ($000) |
| 1 | California Educational Facilities Authority Revenue | | | | |
| | (Stanford Hospital) TOB VRDO | 0.190% | 12/7/12 | 5,800 | 5,800 |
| | California Educational Facilities Authority Revenue | | | | |
| | (Stanford University) CP | 0.210% | 5/3/13 | 40,000 | 40,000 |
| 1 | California Educational Facilities Authority Revenue | | | | |
| | (Stanford University) TOB PUT | 0.300% | 8/8/13 | 37,140 | 37,140 |
| 1 | California Educational Facilities Authority Revenue | | | | |
| | (Stanford University) TOB VRDO | 0.160% | 12/7/12 | 4,445 | 4,445 |
| 1 | California Educational Facilities Authority Revenue | | | | |
| | (Stanford University) TOB VRDO | 0.190% | 12/7/12 | 7,640 | 7,640 |
| 1 | California Educational Facilities Authority Revenue | | | | |
| | (University of Southern California) TOB PUT | 0.260% | 5/9/13 | 15,035 | 15,035 |
| 1 | California Educational Facilities Authority Revenue | | | | |
| | (University of Southern California) TOB VRDO | 0.160% | 12/7/12 | 14,800 | 14,800 |
| 1 | California Educational Facilities Authority Revenue | | | | |
| | (University of Southern California) TOB VRDO | 0.170% | 12/7/12 | 4,135 | 4,135 |
| 1 | California GO TOB VRDO | 0.180% | 12/3/12 | 25,500 | 25,500 |
| | California GO VRDO | 0.160% | 12/3/12 LOC | 11,525 | 11,525 |
| | California GO VRDO | 0.150% | 12/7/12 LOC | 6,000 | 6,000 |
| | California Health Facilities Financing Authority | | | | |
| | Revenue (Catholic Healthcare West) VRDO | 0.160% | 12/7/12 LOC | 6,725 | 6,725 |
| | California Health Facilities Financing Authority | | | | |
| | Revenue (Children’s Hospital of Orange | | | | |
| | County) VRDO | 0.150% | 12/7/12 LOC | 21,700 | 21,700 |
| | California Health Facilities Financing Authority | | | | |
| | Revenue (Children’s Hospital of Orange | | | | |
| | County) VRDO | 0.150% | 12/7/12 LOC | 16,000 | 16,000 |
| 1,2 | California Health Facilities Financing Authority | | | | |
| | Revenue (Kaiser Foundation Hospitals) | | | | |
| | TOB PUT | 0.200% | 1/2/13 LOC | 35,000 | 35,000 |
| | California Health Facilities Financing Authority | | | | |
| | Revenue (Memorial Health Services) VRDO | 0.150% | 12/7/12 | 60,500 | 60,500 |
| | California Health Facilities Financing Authority | | | | |
| | Revenue (Scripps Health) VRDO | 0.130% | 12/7/12 LOC | 12,020 | 12,020 |
| | California Health Facilities Financing Authority | | | | |
| | Revenue (Scripps Health) VRDO | 0.150% | 12/7/12 LOC | 4,200 | 4,200 |
| 1 | California Health Facilities Financing Authority | | | | |
| | Revenue (Sutter Health) TOB VRDO | 0.150% | 12/7/12 (13) | 12,210 | 12,210 |
| 1 | California Health Facilities Financing Authority | | | | |
| | Revenue (Sutter Health) TOB VRDO | 0.180% | 12/7/12 | 6,700 | 6,700 |
| | California Housing Finance Agency Home | | | | |
| | Mortgage Revenue VRDO | 0.150% | 12/7/12 LOC | 32,510 | 32,510 |
| | California Housing Finance Agency Home | | | | |
| | Mortgage Revenue VRDO | 0.150% | 12/7/12 LOC | 22,200 | 22,200 |
| | California Housing Finance Agency Home | | | | |
| | Mortgage Revenue VRDO | 0.170% | 12/7/12 LOC | 10,300 | 10,300 |
| | California Housing Finance Agency Multifamily | | | | |
| | Housing Revenue VRDO | 0.170% | 12/7/12 LOC | 8,400 | 8,400 |
| | California Infrastructure & Economic Development | | | | |
| | Bank Revenue (Academy of Motion Picture Arts | | | | |
| | & Sciences Obligated Group) VRDO | 0.150% | 12/7/12 LOC | 35,000 | 35,000 |
| | California Infrastructure & Economic Development | | | | |
| | Bank Revenue (Academy of Sciences) VRDO | 0.140% | 12/3/12 LOC | 10,325 | 10,325 |
| | California Infrastructure & Economic Development | | | | |
| | Bank Revenue (American National Red Cross) | | | | |
| | VRDO | 0.150% | 12/7/12 LOC | 8,665 | 8,665 |
17
California Tax-Exempt Money Market Fund
| | | | |
| | | | Face | Market |
| | | Maturity | Amount | Value |
| | Coupon | Date | ($000) | ($000) |
| 1 California Infrastructure & Economic Development | | | | |
| Bank Revenue (Bay Area Toll Bridges Seismic | | | | |
| Retrofit) TOB VRDO | 0.180% | 12/3/12 (ETM) | 49,380 | 49,380 |
| California Infrastructure & Economic Development | | | | |
| Bank Revenue (Buck Institute for Age Research) | | | | |
| VRDO | 0.150% | 12/7/12 LOC | 22,800 | 22,800 |
| California Infrastructure & Economic Development | | | | |
| Bank Revenue (Clean Water Revolving Fund) | 3.000% | 10/1/13 | 13,000 | 13,302 |
| California Infrastructure & Economic Development | | | | |
| Bank Revenue (Prinsco Inc. Project) VRDO | 0.270% | 12/7/12 LOC | 6,200 | 6,200 |
| California Municipal Finance Authority Revenue | | | | |
| (Notre Dame High School, San Jose) VRDO | 0.220% | 12/7/12 LOC | 5,425 | 5,425 |
| California Pollution Control Financing Authority | | | | |
| Revenue (Pacific Gas & Electric Co.) VRDO | 0.190% | 12/3/12 LOC | 37,750 | 37,750 |
| 1 California Public Works Board Lease Revenue | | | | |
| (Regents of The University of California) | | | | |
| TOB VRDO | 0.190% | 12/7/12 | 6,655 | 6,655 |
| California RAN | 2.500% | 6/20/13 | 58,000 | 58,659 |
| California Statewide Communities Development | | | | |
| Authority Gas Supply Revenue VRDO | 0.150% | 12/7/12 | 102,820 | 102,820 |
| California Statewide Communities Development | | | | |
| Authority Multifamily Housing Revenue | | | | |
| (Canyon Springs Apartments Project) VRDO | 0.220% | 12/7/12 LOC | 10,105 | 10,105 |
| California Statewide Communities Development | | | | |
| Authority Multifamily Housing Revenue | | | | |
| (Knolls Apartments) VRDO | 0.150% | 12/7/12 LOC | 12,715 | 12,715 |
| California Statewide Communities Development | | | | |
| Authority Multifamily Housing Revenue | | | | |
| (Ridgeway Apartments) VRDO | 0.150% | 12/7/12 LOC | 8,545 | 8,545 |
| California Statewide Communities Development | | | | |
| Authority Multifamily Housing Revenue | | | | |
| (Village Green Apartments) VRDO | 0.160% | 12/7/12 LOC | 5,800 | 5,800 |
| California Statewide Communities Development | | | | |
| Authority Revenue (Community Hospital of the | | | | |
| Monterey Peninsula) VRDO | 0.150% | 12/7/12 LOC | 9,150 | 9,150 |
| California Statewide Communities Development | | | | |
| Authority Revenue (Kaiser Permanente) VRDO | 0.160% | 12/7/12 | 13,700 | 13,700 |
| California Statewide Communities Development | | | | |
| Authority Revenue (Los Angeles County | | | | |
| Museum of Art Project) VRDO | 0.160% | 12/7/12 LOC | 32,700 | 32,700 |
| California Statewide Communities Development | | | | |
| Authority Revenue (Rady Children’s Hospital - | | | | |
| San Diego) VRDO | 0.140% | 12/7/12 LOC | 25,000 | 25,000 |
| 1 California Statewide Communities Development | | | | |
| Authority Revenue (Sutter Health) TOB VRDO | 0.160% | 12/7/12 | 35,274 | 35,274 |
| 1 California Statewide Communities Development | | | | |
| Authority Revenue (Trinity Health) TOB VRDO | 0.160% | 12/7/12 | 2,175 | 2,175 |
| California Statewide Communities Development | | | | |
| Authority Revenue (University of San Diego) | | | | |
| VRDO | 0.170% | 12/7/12 LOC | 23,280 | 23,280 |
| 1 Central Basin Municipal Water District California | | | | |
| COP TOB VRDO | 0.220% | 12/7/12 (4) | 7,500 | 7,500 |
| 1 Cerritos CA Community College District GO | | | | |
| TOB VRDO | 0.170% | 12/7/12 | 7,845 | 7,845 |
| 1 Chabot-Las Positas CA Community College | | | | |
| District GO TOB VRDO | 0.190% | 12/7/12 | 6,000 | 6,000 |
18
| | | | | |
| California Tax-Exempt Money Market Fund | | | | |
| |
| |
| |
| | | | | Face | Market |
| | | | Maturity | Amount | Value |
| | | Coupon | Date | ($000) | ($000) |
| 1 | Chabot-Las Positas CA Community College | | | | |
| | District GO TOB VRDO | 0.300% | 12/7/12 | 8,725 | 8,725 |
| | Chula Vista CA Multifamily Housing Revenue | | | | |
| | (Teresina Apartments) VRDO | 0.140% | 12/7/12 LOC | 18,970 | 18,970 |
| 1 | Contra Costa CA Community College District | | | | |
| | GO TOB VRDO | 0.250% | 12/7/12 | 5,200 | 5,200 |
| | Contra Costa CA Municipal Water District | | | | |
| | Revenue (Extendible) CP | 0.220% | 6/17/13 | 15,000 | 15,000 |
| 1 | Contra Costa CA Transportation Authority | | | | |
| | Sales Tax Revenue TOB VRDO | 0.160% | 12/7/12 | 20,000 | 20,000 |
| | Contra Costa County CA Multifamily Housing | | | | |
| | Revenue (Park Regency) VRDO | 0.140% | 12/7/12 LOC | 47,200 | 47,200 |
| 1 | Desert CA Community College District GO | | | | |
| | TOB VRDO | 0.160% | 12/7/12 | 22,000 | 22,000 |
| 2 | East Bay CA Municipal Utility District Waste | | | | |
| | Water System Revenue PUT | 0.160% | 2/1/13 | 23,435 | 23,435 |
| | East Bay CA Municipal Utility District Water | | | | |
| | System Revenue | 2.000% | 6/1/13 | 18,625 | 18,793 |
| | East Bay CA Municipal Utility District Water | | | | |
| | System Revenue (Extendible) CP | 0.240% | 6/9/13 | 20,000 | 20,000 |
| | East Bay CA Municipal Utility District Water | | | | |
| | System Revenue (Extendible) CP | 0.240% | 6/15/13 | 1,500 | 1,500 |
| | East Bay CA Municipal Utility District Water | | | | |
| | System Revenue (Extendible) CP | 0.240% | 7/12/13 | 20,000 | 20,000 |
| | East Bay CA Municipal Utility District Water | | | | |
| | System Revenue (Extendible) CP | 0.240% | 7/12/13 | 20,800 | 20,800 |
| | East Bay CA Municipal Utility District Water | | | | |
| | System Revenue (Extendible) CP | 0.240% | 7/29/13 | 16,600 | 16,600 |
| | East Bay CA Municipal Utility District Water | | | | |
| | System Revenue (Extendible) CP | 0.250% | 7/29/13 | 13,500 | 13,500 |
| | East Bay CA Municipal Utility District Water | | | | |
| | System Revenue (Extendible) CP | 0.240% | 8/2/13 | 26,300 | 26,300 |
| | East Bay CA Municipal Utility District Water | | | | |
| | System Revenue (Extendible) CP | 0.240% | 8/4/13 | 12,200 | 12,200 |
| 2 | East Bay CA Municipal Utility District Water | | | | |
| | System Revenue PUT | 0.160% | 12/3/12 | 11,800 | 11,800 |
| 2 | East Bay CA Municipal Utility District Water | | | | |
| | System Revenue PUT | 0.170% | 3/1/13 | 12,900 | 12,900 |
| 2,3 | East Bay CA Municipal Utility District Water | | | | |
| | System Revenue PUT | 0.160% | 12/3/13 | 11,000 | 11,000 |
| 1 | East Bay CA Municipal Utility District Water | | | | |
| | System Revenue TOB VRDO | 0.150% | 12/7/12 | 4,300 | 4,300 |
| 1 | Eastern California Municipal Water District | | | | |
| | Water & Sewer COP TOB VRDO | 0.170% | 12/7/12 | 1,590 | 1,590 |
| 2 | Eastern Municipal Water District CA Water | | | | |
| | & Sewer Revenue PUT | 0.180% | 7/19/13 | 14,000 | 14,000 |
| | Escondido CA Community Development | | | | |
| | (Escondido Promenade Project) COP VRDO | 0.190% | 12/7/12 LOC | 9,400 | 9,400 |
| | Escondido CA Community Development | | | | |
| | Multifamily Revenue (Heritage Park | | | | |
| | Apartments) VRDO | 0.190% | 12/7/12 LOC | 4,250 | 4,250 |
| | Freemont CA Union High School District TRAN | 1.500% | 6/28/13 | 10,500 | 10,576 |
| | Fremont CA COP VRDO | 0.140% | 12/7/12 LOC | 8,945 | 8,945 |
| | Fremont CA COP VRDO | 0.160% | 12/7/12 LOC | 5,000 | 5,000 |
| 1 | Fresno CA Unified School District Revenue | | | | |
| | TOB VRDO | 0.190% | 12/7/12 | 8,960 | 8,960 |
19
| | | | |
| California Tax-Exempt Money Market Fund | | | | |
| |
| |
| |
| | | | Face | Market |
| | | Maturity | Amount | Value |
| | Coupon | Date | ($000) | ($000) |
| Garden Grove CA Housing Authority Multifamily | | | | |
| Housing Revenue (Valley View Senior Villas | | | | |
| Project) VRDO | 0.170% | 12/7/12 LOC | 9,100 | 9,100 |
| 1 Grossmont CA Healthcare District Revenue | | | | |
| TOB VRDO | 0.190% | 12/7/12 | 10,200 | 10,200 |
| Irvine CA Assessment District No. 89-10 | | | | |
| Improvement Revenue (Northwest Irvine) | | | | |
| VRDO | 0.150% | 12/3/12 LOC | 4,916 | 4,916 |
| Irvine CA Assessment District No. 97-17 | | | | |
| Improvement Revenue VRDO | 0.150% | 12/3/12 LOC | 2,654 | 2,654 |
| Irvine CA Public Facilities & Infrastructure | | | | |
| Authority Assessment Revenue VRDO | 0.150% | 12/3/12 LOC | 6,472 | 6,472 |
| 2 Irvine CA Ranch Water District Revenue PUT | 0.150% | 3/1/13 | 9,700 | 9,700 |
| Irvine CA Reassessment District No. 05-21 | | | | |
| Improvement Revenue VRDO | 0.150% | 12/3/12 LOC | 21,900 | 21,900 |
| Irvine CA Reassessment District No. 85-7A | | | | |
| Improvement Revenue VRDO | 0.150% | 12/3/12 LOC | 22,045 | 22,045 |
| Kern County CA TRAN | 2.500% | 6/28/13 | 25,000 | 25,325 |
| Livermore CA COP VRDO | 0.160% | 12/7/12 LOC | 13,515 | 13,515 |
| Livermore CA Redevelopment Agency | | | | |
| Multi-Family Housing Revenue | | | | |
| (Richards Manor) VRDO | 0.190% | 12/7/12 LOC | 4,770 | 4,770 |
| 1 Long Beach CA Harbor Revenue TOB VRDO | 0.370% | 12/7/12 | 15,740 | 15,740 |
| Los Altos CA Union High School District TRAN | 1.500% | 6/28/13 | 5,500 | 5,540 |
| 1 Los Angeles CA Community College District | | | | |
| GO TOB VRDO | 0.150% | 12/7/12 | 3,500 | 3,500 |
| 1 Los Angeles CA Community College District | | | | |
| GO TOB VRDO | 0.190% | 12/7/12 | 9,575 | 9,575 |
| Los Angeles CA Community Redevelopment | | | | |
| Agency Multifamily Housing Revenue | | | | |
| (Academy Village Apartments) VRDO | 0.140% | 12/7/12 LOC | 3,300 | 3,300 |
| Los Angeles CA Community Redevelopment | | | | |
| Agency Multifamily Housing Revenue | | | | |
| (Hollywood & Vine Apartments) VRDO | 0.150% | 12/7/12 LOC | 19,200 | 19,200 |
| 1 Los Angeles CA Department of Airports | | | | |
| International Airport Revenue TOB VRDO | 0.150% | 12/7/12 | 8,750 | 8,750 |
| 1 Los Angeles CA Department of Airports | | | | |
| International Airport Revenue TOB VRDO | 0.170% | 12/7/12 | 5,000 | 5,000 |
| 1 Los Angeles CA Department of Airports | | | | |
| International Airport Revenue TOB VRDO | 0.190% | 12/7/12 | 6,000 | 6,000 |
| 1 Los Angeles CA Department of Airports | | | | |
| International Airport Revenue TOB VRDO | 0.220% | 12/7/12 | 18,880 | 18,880 |
| 1 Los Angeles CA Department of Airports | | | | |
| International Airport Revenue TOB VRDO | 0.220% | 12/7/12 | 7,975 | 7,975 |
| 1 Los Angeles CA Department of Water | | | | |
| & Power Revenue TOB VRDO | 0.180% | 12/3/12 | 1,300 | 1,300 |
| 1 Los Angeles CA Department of Water | | | | |
| & Power Revenue TOB VRDO | 0.160% | 12/7/12 LOC | 10,355 | 10,355 |
| 1 Los Angeles CA Department of Water | | | | |
| & Power Revenue TOB VRDO | 0.170% | 12/7/12 | 7,495 | 7,495 |
| 1 Los Angeles CA Department of Water | | | | |
| & Power Revenue TOB VRDO | 0.190% | 12/7/12 | 5,450 | 5,450 |
| 1 Los Angeles CA Department of Water | | | | |
| & Power Revenue TOB VRDO | 0.190% | 12/7/12 | 4,360 | 4,360 |
| Los Angeles CA Department of Water | | | | |
| & Power Revenue VRDO | 0.130% | 12/7/12 | 39,700 | 39,700 |
20
| | | | | |
| California Tax-Exempt Money Market Fund | | | | |
| |
| |
| |
| | | | | Face | Market |
| | | | Maturity | Amount | Value |
| | | Coupon | Date | ($000) | ($000) |
| | Los Angeles CA Department of Water | | | | |
| | & Power Revenue VRDO | 0.130% | 12/7/12 | 32,400 | 32,400 |
| | Los Angeles CA Department of Water | | | | |
| | & Power Revenue VRDO | 0.130% | 12/7/12 | 21,175 | 21,175 |
| | Los Angeles CA Department of Water | | | | |
| | & Power Revenue VRDO | 0.150% | 12/7/12 | 12,750 | 12,750 |
| | Los Angeles CA Department of Water | | | | |
| | & Power Revenue VRDO | 0.150% | 12/7/12 | 19,600 | 19,600 |
| | Los Angeles CA Harbor Department Revenue | | | | |
| | (Extendible) CP | 0.230% | 2/21/13 | 22,000 | 22,000 |
| | Los Angeles CA Harbor Department Revenue | | | | |
| | (Extendible) CP | 0.220% | 3/6/13 | 20,000 | 20,000 |
| 1 | Los Angeles CA Harbor Department Revenue | | | | |
| | TOB VRDO | 0.170% | 12/7/12 | 2,680 | 2,680 |
| 1 | Los Angeles CA Harbor Department Revenue | | | | |
| | TOB VRDO | 0.190% | 12/7/12 | 5,395 | 5,395 |
| | Los Angeles CA Multifamily Housing Revenue | | | | |
| | (Beverly Park Apartments) VRDO | 0.150% | 12/7/12 LOC | 15,500 | 15,500 |
| | Los Angeles CA Multifamily Housing Revenue | | | | |
| | (Fountain Park Project) VRDO | 0.140% | 12/7/12 LOC | 40,000 | 40,000 |
| | Los Angeles CA Multifamily Housing Revenue | | | | |
| | (Queen Portfolio Apartments Project) VRDO | 0.180% | 12/7/12 LOC | 6,895 | 6,895 |
| | Los Angeles CA Multifamily Housing Revenue | | | | |
| | (San Regis Project) VRDO | 0.170% | 12/7/12 LOC | 23,600 | 23,600 |
| | Los Angeles CA TRAN | 2.000% | 2/28/13 | 106,000 | 106,466 |
| | Los Angeles CA Unified School District GO | 5.000% | 7/1/13 (Prere.) | 1,300 | 1,336 |
| | Los Angeles CA Unified School District GO | 5.000% | 7/1/13 (Prere.) | 4,575 | 4,704 |
| | Los Angeles CA Unified School District GO | 5.000% | 7/1/13 (Prere.) | 1,000 | 1,028 |
| 1 | Los Angeles CA Unified School District GO | | | | |
| | TOB VRDO | 0.160% | 12/7/12 | 9,060 | 9,060 |
| 1 | Los Angeles CA Unified School District GO | | | | |
| | TOB VRDO | 0.170% | 12/7/12 | 9,995 | 9,995 |
| 1 | Los Angeles CA Unified School District GO | | | | |
| | TOB VRDO | 0.170% | 12/7/12 | 6,660 | 6,660 |
| | Los Angeles CA Wastewater System | | | | |
| | Revenue CP | 0.200% | 12/6/12 | 28,000 | 28,000 |
| 1 | Los Angeles CA Wastewater System | | | | |
| | Revenue TOB VRDO | 0.170% | 12/7/12 | 7,500 | 7,500 |
| | Los Angeles CA Wastewater System | | | | |
| | Revenue VRDO | 0.170% | 12/7/12 LOC | 1,390 | 1,390 |
| 1,2 | Los Angeles County CA Metropolitan | | | | |
| | Transportation Authority Sales Tax Revenue | | | | |
| | TOB PUT | 0.200% | 12/3/12 LOC | 29,800 | 29,800 |
| | Los Angeles County CA Multifamily Housing | | | | |
| | Revenue (Valencia Village Project) VRDO | 0.180% | 12/7/12 | 6,325 | 6,325 |
| 1 | Los Angeles County CA Sanitation Districts | | | | |
| | Financing Authority Capital Projects Revenue | | | | |
| | TOB VRDO | 0.160% | 12/7/12 LOC | 10,440 | 10,440 |
| | Los Angeles County CA TRAN | 2.000% | 2/28/13 | 40,000 | 40,176 |
| | Los Angeles County CA TRAN | 2.000% | 3/29/13 | 22,500 | 22,632 |
| | Los Angeles County CA TRAN | 2.000% | 6/28/13 | 75,000 | 75,771 |
| 1 | Los Angeles County CA Unified School | | | | |
| | District GO TOB VRDO | 0.170% | 12/7/12 | 5,000 | 5,000 |
| | Manteca CA Redevelopment Agency Tax | | | | |
| | Allocation Revenue VRDO | 0.170% | 12/3/12 LOC | 13,050 | 13,050 |
21
California Tax-Exempt Money Market Fund
| | | | |
| | | | Face | Market |
| | | Maturity | Amount | Value |
| | Coupon | Date | ($000) | ($000) |
| 2 Metropolitan Water District of Southern | | | | |
| California Revenue PUT | 0.160% | 6/10/13 | 18,020 | 18,020 |
| 1 Metropolitan Water District of Southern | | | | |
| California Revenue TOB VRDO | 0.170% | 12/7/12 | 5,000 | 5,000 |
| 1 Metropolitan Water District of Southern | | | | |
| California Revenue TOB VRDO | 0.170% | 12/7/12 | 6,435 | 6,435 |
| Metropolitan Water District of Southern | | | | |
| California Revenue VRDO | 0.150% | 12/7/12 | 26,900 | 26,900 |
| Mission Viejo CA Community Development | | | | |
| Financing Authority Revenue (Mission Viejo | | | | |
| Mall Improvement) VRDO | 0.160% | 12/7/12 LOC | 22,900 | 22,900 |
| Newport Beach CA Revenue (Hoag Memorial | | | | |
| Hospital Presbyterian) VRDO | 0.200% | 12/7/12 LOC | 12,300 | 12,300 |
| 1 Nuveen California Investment Quality | | | | |
| Municipal Fund VRDP VRDO | 0.260% | 12/7/12 LOC | 18,000 | 18,000 |
| 1 Nuveen California Performance Plus | | | | |
| Municipal Fund VRDP VRDO | 0.260% | 12/7/12 LOC | 15,000 | 15,000 |
| 1 Nuveen California Quality Income | | | | |
| Municipal Fund VRDP VRDO | 0.260% | 12/7/12 LOC | 26,000 | 26,000 |
| Nuveen Insured California AMT-Free | | | | |
| Municipal Income Fund VRDP VRDO | 0.260% | 12/7/12 LOC | 27,000 | 27,000 |
| Orange County CA Apartment Development | | | | |
| Revenue VRDO | 0.140% | 12/7/12 LOC | 41,300 | 41,300 |
| Orange County CA Apartment Development | | | | |
| Revenue VRDO | 0.150% | 12/7/12 LOC | 9,550 | 9,550 |
| Orange County CA Sanitation District COP | 5.250% | 8/1/13 (Prere.) | 8,000 | 8,268 |
| Orange County CA Sanitation District | | | | |
| Wastewater Revenue | 3.000% | 8/1/13 | 3,000 | 3,056 |
| 1 Orange County CA Sanitation District | | | | |
| Wastewater Revenue TOB VRDO | 0.190% | 12/7/12 | 4,110 | 4,110 |
| 1 Orange County CA Water District Revenue | | | | |
| TOB VRDO | 0.200% | 12/7/12 | 9,000 | 9,000 |
| Otay CA Water District (Capital Project) | | | | |
| COP VRDO | 0.160% | 12/7/12 LOC | 8,010 | 8,010 |
| 1 Palomar Pomerado Health California GO | | | | |
| TOB VRDO | 0.190% | 12/7/12 LOC | 4,600 | 4,600 |
| 1 Peralta CA Community College District | | | | |
| Revenue TOB VRDO | 0.160% | 12/7/12 | 15,000 | 15,000 |
| Pittsburg CA Redevelopment Agency Tax | | | | |
| Allocation Revenue (Los Medanos Community | | | | |
| Development Project) VRDO | 0.170% | 12/3/12 LOC | 30,500 | 30,500 |
| Riverside County CA Industrial Development | | | | |
| Authority Empowerment Zone Facility Revenue | | | | |
| (Guy Evans Inc. Project) VRDO | 0.190% | 12/7/12 LOC | 5,030 | 5,030 |
| Riverside County CA Public Facility Project | | | | |
| COP VRDO | 0.160% | 12/7/12 LOC | 7,500 | 7,500 |
| Riverside County CA Teeter Notes | 2.000% | 10/16/13 | 40,000 | 40,610 |
| Riverside County CA TRAN | 2.000% | 3/29/13 | 31,000 | 31,182 |
| Riverside County CA Transportation | | | | |
| Commission Sales Tax Revenue VRDO | 0.160% | 12/7/12 | 1,100 | 1,100 |
| Sacramento CA Municipal Utility District | | | | |
| Revenue VRDO | 0.140% | 12/7/12 LOC | 33,000 | 33,000 |
| Sacramento County CA Multifamily Housing | | | | |
| Revenue (River Pointe Apartments) VRDO | 0.180% | 12/7/12 LOC | 12,300 | 12,300 |
| Sacramento County CA Multifamily Housing | | | | |
| Revenue (River Pointe Apartments) VRDO | 0.180% | 12/7/12 LOC | 10,200 | 10,200 |
22
| | | | |
| California Tax-Exempt Money Market Fund | | | | |
| |
| |
| |
| | | | Face | Market |
| | | Maturity | Amount | Value |
| | Coupon | Date | ($000) | ($000) |
| San Bernardino County CA TRAN | 2.000% | 6/28/13 | 28,000 | 28,286 |
| 1 San Diego CA Community College District | | | | |
| GO TOB VRDO | 0.150% | 12/7/12 | 5,710 | 5,710 |
| 1 San Diego CA Community College District | | | | |
| GO TOB VRDO | 0.160% | 12/7/12 | 5,000 | 5,000 |
| 1 San Diego CA Community College District | | | | |
| GO TOB VRDO | 0.170% | 12/7/12 | 5,000 | 5,000 |
| 1 San Diego CA Community College District | | | | |
| GO TOB VRDO | 0.190% | 12/7/12 | 4,100 | 4,100 |
| San Diego CA County TRAN | 2.000% | 6/28/13 | 13,000 | 13,135 |
| San Diego CA Housing Authority Multifamily | | | | |
| Housing Revenue (Bay Vista Apartments Project) | | | | |
| VRDO | 0.150% | 12/7/12 LOC | 9,690 | 9,690 |
| San Diego CA Housing Authority Multifamily | | | | |
| Housing Revenue (Canyon Rim Apartments) | | | | |
| VRDO | 0.150% | 12/7/12 LOC | 32,440 | 32,440 |
| 1 San Diego CA Public Facilities Financing | | | | |
| Authority Sewer Revenue TOB VRDO | 0.190% | 12/7/12 | 8,280 | 8,280 |
| 1 San Diego CA Public Facilities Financing | | | | |
| Authority Water Revenue TOB VRDO | 0.170% | 12/7/12 | 7,495 | 7,495 |
| 1 San Diego CA Unified School District | | | | |
| GO TOB PUT | 0.260% | 5/9/13 | 27,060 | 27,060 |
| San Diego CA Unified School District TRAN | 2.000% | 1/31/13 | 6,250 | 6,269 |
| 1 San Diego County CA Regional Transportation | | | | |
| Commission Sales Tax Revenue TOB VRDO | 0.190% | 12/7/12 | 2,675 | 2,675 |
| 1 San Diego County CA Regional Transportation | | | | |
| Commission Sales Tax Revenue TOB VRDO | 0.190% | 12/7/12 | 5,260 | 5,260 |
| San Diego County CA Regional Transportation | | | | |
| Commission Sales Tax Revenue VRDO | 0.150% | 12/7/12 | 8,925 | 8,925 |
| 1 San Diego County CA Water Authority | | | | |
| Revenue COP TOB VRDO | 0.160% | 12/7/12 | 6,100 | 6,100 |
| 1 San Diego County CA Water Authority | | | | |
| Revenue COP TOB VRDO | 0.170% | 12/7/12 | 4,825 | 4,825 |
| 1 San Diego County CA Water Authority | | | | |
| Revenue COP TOB VRDO | 0.170% | 12/7/12 | 9,500 | 9,500 |
| 1 San Diego County CA Water Authority | | | | |
| Revenue COP TOB VRDO | 0.170% | 12/7/12 | 6,840 | 6,840 |
| 1 San Diego County CA Water Authority | | | | |
| Revenue COP TOB VRDO | 0.220% | 12/7/12 | 6,500 | 6,500 |
| 1 San Diego County CA Water Authority | | | | |
| Revenue COP TOB VRDO | 0.220% | 12/7/12 | 6,100 | 6,100 |
| 1 San Diego County CA Water Authority | | | | |
| Revenue COP TOB VRDO | 0.220% | 12/7/12 | 9,800 | 9,800 |
| San Diego County CA Water Authority | | | | |
| Revenue CP | 0.200% | 12/5/12 | 10,000 | 10,000 |
| San Diego County CA Water Authority | | | | |
| Revenue CP | 0.190% | 1/17/13 | 7,000 | 7,000 |
| San Diego County CA Water Authority | | | | |
| Revenue CP | 0.190% | 1/22/13 | 15,900 | 15,900 |
| 1 San Francisco CA Bay Area Rapid Transit | | | | |
| District Sales Tax Revenue TOB VRDO | 0.170% | 12/7/12 | 5,700 | 5,700 |
| 1 San Francisco CA City & County | | | | |
| (Laguna Honda Hospital) GO TOB VRDO | 0.190% | 12/7/12 | 6,700 | 6,700 |
| San Francisco CA City & County Airport | | | | |
| Commission International Airport Revenue | | | | |
| VRDO | 0.170% | 12/7/12 LOC | 8,000 | 8,000 |
23
| | | | |
| California Tax-Exempt Money Market Fund | | | | |
| |
| |
| |
| | | | Face | Market |
| | | Maturity | Amount | Value |
| | Coupon | Date | ($000) | ($000) |
| San Francisco CA City & County Finance Corp. | | | | |
| Lease Revenue (Moscone Center Expansion) | | | | |
| VRDO | 0.150% | 12/7/12 LOC | 46,145 | 46,145 |
| San Francisco CA City & County International | | | | |
| Airport Revenue VRDO | 0.170% | 12/7/12 LOC | 5,000 | 5,000 |
| San Francisco CA City & County International | | | | |
| Airport Revenue VRDO | 0.170% | 12/7/12 LOC | 2,400 | 2,400 |
| 1 San Francisco CA City & County Public Utilities | | | | |
| Commission Water Revenue TOB VRDO | 0.170% | 12/7/12 | 6,900 | 6,900 |
| San Francisco CA City & County Redevelopment | | | | |
| Agency Multifamily Housing Revenue | | | | |
| (Third & Mission Streets) VRDO | 0.150% | 12/7/12 LOC | 40,000 | 40,000 |
| San Francisco Public Utility Commission CP | 0.200% | 12/6/12 | 6,700 | 6,700 |
| San Francisco Public Utility Commission CP | 0.180% | 12/10/12 | 12,500 | 12,500 |
| San Francisco Public Utility Commission CP | 0.200% | 1/8/13 | 10,000 | 10,000 |
| San Jose CA Financing Authority Lease | | | | |
| Revenue CP | 0.180% | 12/12/12 LOC | 26,255 | 26,255 |
| 1 San Jose CA Financing Authority Lease | | | | |
| Revenue TOB VRDO | 0.170% | 12/7/12 (13) | 21,360 | 21,360 |
| San Jose CA Multifamily Housing Revenue | | | | |
| (Cinnabar Commons) VRDO | 0.150% | 12/7/12 LOC | 16,300 | 16,300 |
| San Jose CA Multifamily Housing Revenue | | | | |
| (Raintree Apartments) VRDO | 0.170% | 12/7/12 LOC | 10,000 | 10,000 |
| 1 San Jose CA Unified School District Santa | | | | |
| Clara County GO TOB VRDO | 0.190% | 12/7/12 | 7,310 | 7,310 |
| 1 San Mateo County CA Community College | | | | |
| District GO TOB VRDO | 0.170% | 12/7/12 | 4,315 | 4,315 |
| 1 San Mateo County CA Community College | | | | |
| District GO TOB VRDO | 0.190% | 12/7/12 | 4,965 | 4,965 |
| Santa Barbara County CA TRAN | 2.000% | 6/28/13 | 10,000 | 10,103 |
| 1 Sequoia CA Unified School District GO | | | | |
| TOB VRDO | 0.190% | 12/7/12 | 5,860 | 5,860 |
| 1 Sonoma County CA Junior College District | | | | |
| GO TOB VRDO | 0.160% | 12/7/12 LOC | 30,585 | 30,585 |
| 1 Sunnyvale CA Wastewater Revenue TOB VRDO | 0.190% | 12/7/12 | 4,220 | 4,220 |
| 1 Torrance CA Hospital Revenue (Torrance | | | | |
| Memorial Medical Center) TOB VRDO | 0.190% | 12/7/12 LOC | 7,100 | 7,100 |
| University of California Regents CP | 0.180% | 1/9/13 | 8,341 | 8,341 |
| University of California Regents CP | 0.200% | 2/7/13 | 22,500 | 22,500 |
| University of California Regents Medical | | | | |
| Center Revenue VRDO | 0.160% | 12/3/12 | 3,500 | 3,500 |
| University of California Revenue | 4.750% | 5/15/13 (Prere.) | 7,950 | 8,195 |
| University of California Revenue | 5.000% | 5/15/13 (ETM) | 315 | 322 |
| University of California Revenue | 5.000% | 5/15/13 | 5,145 | 5,258 |
| 1 University of California Revenue TOB VRDO | 0.180% | 12/3/12 | 800 | 800 |
| 1 University of California Revenue TOB VRDO | 0.150% | 12/7/12 | 10,875 | 10,875 |
| 1 University of California Revenue TOB VRDO | 0.170% | 12/7/12 | 3,470 | 3,470 |
| 1 University of California Revenue TOB VRDO | 0.170% | 12/7/12 | 6,000 | 6,000 |
| 1 University of California Revenue TOB VRDO | 0.170% | 12/7/12 | 3,495 | 3,495 |
| 1 University of California Revenue TOB VRDO | 0.170% | 12/7/12 | 2,190 | 2,190 |
| 1 University of California Revenue TOB VRDO | 0.180% | 12/7/12 | 15,195 | 15,195 |
| 1 University of California Revenue TOB VRDO | 0.190% | 12/7/12 | 7,300 | 7,300 |
| 1 University of California Revenue TOB VRDO | 0.190% | 12/7/12 | 6,655 | 6,655 |
| 1 University of California Revenue TOB VRDO | 0.220% | 12/7/12 | 9,579 | 9,579 |
| Ventura CA Public Financing Authority Lease | | | | |
| Revenue CP | 0.200% | 12/13/12 LOC | 13,100 | 13,100 |
24
| | | | |
| California Tax-Exempt Money Market Fund | | | | |
| |
| |
| |
| | | | Face | Market |
| | | Maturity | Amount | Value |
| | Coupon | Date | ($000) | ($000) |
| Western Municipal Water District Facilities | | | | |
| Authority California Water Revenue VRDO | 0.140% | 12/7/12 LOC | 19,275 | 19,275 |
| Westlands CA Water District COP VRDO | 0.140% | 12/7/12 LOC | 25,700 | 25,700 |
| Whittier CA Health Facility Revenue | | | | |
| (Presbyterian Intercommunity Hospital) VRDO | 0.140% | 12/7/12 LOC | 4,900 | 4,900 |
| Whittier CA Health Facility Revenue | | | | |
| (Presbyterian Intercommunity Hospital) VRDO | 0.150% | 12/7/12 LOC | 9,200 | 9,200 |
| | | | | 3,775,518 |
| Puerto Rico (0.1%) | | | | |
| 1 Puerto Rico Sales Tax Financing Corp. | | | | |
| Revenue TOB VRDO | 0.170% | 12/7/12 | 2,400 | 2,400 |
| Total Tax-Exempt Municipal Bonds (Cost $3,777,918) | | | | 3,777,918 |
| Other Assets and Liabilities (0.9%) | | | | |
| Other Assets | | | | 94,513 |
| Liabilities | | | | (59,907) |
| | | | | 34,606 |
| Net Assets (100%) | | | | |
| Applicable to 3,811,974,110 outstanding $.001 par value shares of | | | |
| beneficial interest (unlimited authorization) | | | | 3,812,524 |
| Net Asset Value Per Share | | | | $1.00 |
| |
| |
| At November 30, 2012, net assets consisted of: | | | | |
| | | | | Amount |
| | | | | ($000) |
| Paid-in Capital | | | | 3,812,520 |
| Undistributed Net Investment Income | | | | — |
| Accumulated Net Realized Gains | | | | 4 |
| Net Assets | | | | 3,812,524 |
See Note A in Notes to Financial Statements.
1 Security exempt from registration under Rule 144A of the Securities Act of 1933. Such securities may be sold in transactions exempt from
registration, normally to qualified institutional buyers. At November 30, 2012, the aggregate value of these securities was $1,028,088,000,
representing 27.0% of net assets.
2 Adjustable-rate security.
3 Security purchased on a when-issued or delayed-delivery basis for which the fund has not taken delivery as of November 30, 2012.
A key to abbreviations and other references follows the Statement of Net Assets.
See accompanying Notes, which are an integral part of the Financial Statements.
25
California Tax-Exempt Money Market Fund
Key to Abbreviations
ARS—Auction Rate Security.
BAN—Bond Anticipation Note.
COP—Certificate of Participation.
CP—Commercial Paper.
FR—Floating Rate.
GAN—Grant Anticipation Note.
GO—General Obligation Bond.
PUT—Put Option Obligation.
RAN—Revenue Anticipation Note.
TAN—Tax Anticipation Note.
TOB—Tender Option Bond.
TRAN—Tax Revenue Anticipation Note.
VRDO—Variable Rate Demand Obligation.
VRDP—Variable Rate Demand Preferred.
(ETM)—Escrowed to Maturity.
(Prere.)—Prerefunded.
Scheduled principal and interest payments are guaranteed by:
(1) MBIA (Municipal Bond Investors Assurance).
(2) AMBAC (Ambac Assurance Corporation).
(3) FGIC (Financial Guaranty Insurance Company).
(4) AGM (Assured Guaranty Municipal Corporation).
(5) BIGI (Bond Investors Guaranty Insurance).
(6) Connie Lee Inc.
(7) FHA (Federal Housing Authority).
(8) CapMAC (Capital Markets Assurance Corporation).
(9) American Capital Access Financial Guaranty Corporation.
(10) XL Capital Assurance Inc.
(11) CIFG (CDC IXIS Financial Guaranty).
(12) Assured Guaranty Corporation.
(13) Berkshire Hathaway Assurance Corporation.
(14) National Public Finance Guarantee Corporation.
The insurance does not guarantee the market value of the municipal bonds.
LOC—Scheduled principal and interest payments are guaranteed by bank letter of credit.
26
California Tax-Exempt Money Market Fund
Statement of Operations
| |
| | Year Ended |
| | November 30, 2012 |
| | ($000) |
| Investment Income | |
| Income | |
| Interest | 7,193 |
| Total Income | 7,193 |
| Expenses | |
| The Vanguard Group—Note B | |
| Investment Advisory Services | 679 |
| Management and Administrative | 4,431 |
| Marketing and Distribution | 1,155 |
| Custodian Fees | 48 |
| Auditing Fees | 23 |
| Shareholders’ Reports | 23 |
| Trustees’ Fees and Expenses | 4 |
| Total Expenses | 6,363 |
| Expense Reduction—Note B | (337) |
| Net Expenses | 6,026 |
| Net Investment Income | 1,167 |
| Realized Net Gain (Loss) on Investment Securities Sold | 5 |
| Net Increase (Decrease) in Net Assets Resulting from Operations | 1,172 |
See accompanying Notes, which are an integral part of the Financial Statements.
27
California Tax-Exempt Money Market Fund
Statement of Changes in Net Assets
| | |
| | Year Ended November 30, |
| | 2012 | 2011 |
| | ($000) | ($000) |
| Increase (Decrease) in Net Assets | | |
| Operations | | |
| Net Investment Income | 1,167 | 2,969 |
| Realized Net Gain (Loss) | 5 | 26 |
| Net Increase (Decrease) in Net Assets Resulting from Operations | 1,172 | 2,995 |
| Distributions | | |
| Net Investment Income | (1,167) | (2,969) |
| Realized Capital Gain | — | — |
| Total Distributions | (1,167) | (2,969) |
| Capital Share Transactions (at $1.00) | | |
| Issued | 2,456,850 | 2,863,192 |
| Issued in Lieu of Cash Distributions | 1,111 | 2,862 |
| Redeemed | (2,776,686) | (3,344,624) |
| Net Increase (Decrease) from Capital Share Transactions | (318,725) | (478,570) |
| Total Increase (Decrease) | (318,720) | (478,544) |
| Net Assets | | |
| Beginning of Period | 4,131,244 | 4,609,788 |
| End of Period | 3,812,524 | 4,131,244 |
See accompanying Notes, which are an integral part of the Financial Statements.
28
California Tax-Exempt Money Market Fund
Financial Highlights
| | | | | |
| For a Share Outstanding | Year Ended November 30, |
| Throughout Each Period | 2012 | 2011 | 2010 | 2009 | 2008 |
| Net Asset Value, Beginning of Period | $1.00 | $1.00 | $1.00 | $1.00 | $1.00 |
| Investment Operations | | | | | |
| Net Investment Income | .0003 | .001 | .001 | .004 | .022 |
| Net Realized and Unrealized Gain (Loss) | | | | | |
| on Investments | — | — | — | — | — |
| Total from Investment Operations | .0003 | .001 | .001 | .004 | .022 |
| Distributions | | | | | |
| Dividends from Net Investment Income | (.0003) | (.001) | (.001) | (.004) | (.022) |
| Distributions from Realized Capital Gains | — | — | — | — | — |
| Total Distributions | (.0003) | (.001) | (.001) | (.004) | (.022) |
| Net Asset Value, End of Period | $1.00 | $1.00 | $1.00 | $1.00 | $1.00 |
| |
| Total Return1 | 0.03% | 0.07% | 0.11% | 0.37% | 2.21% |
| |
| Ratios/Supplemental Data | | | | | |
| Net Assets, End of Period (Millions) | $3,813 | $4,131 | $4,610 | $5,355 | $7,506 |
| Ratio of Expenses to Average Net Assets | 0.15%2 | 0.16%2 | 0.17% | 0.17%3 | 0.11%3 |
| Ratio of Net Investment Income to | | | | | |
| Average Net Assets | 0.03% | 0.07% | 0.11% | 0.39% | 2.19% |
1 Total returns do not include account service fees that may have applied in the periods shown. Fund prospectuses provide information about
any applicable account service fees.
2 The ratio of total expenses to average net assets before an expense reduction was 0.16% for 2012 and 0.17% for 2011. See Note B in
Notes to Financial Statements.
3 Includes fees to participate in the Treasury Temporary Guarantee Program for Money Market Funds of 0.04% for 2009 and 0.01% for 2008.
See accompanying Notes, which are an integral part of the Financial Statements.
29
California Tax-Exempt Money Market Fund
Notes to Financial Statements
Vanguard California Tax-Exempt Money Market Fund is registered under the Investment Company Act of 1940 as an open-end investment company, or mutual fund. The fund invests in debt instruments of municipal issuers whose ability to meet their obligations may be affected by economic and political developments in the state.
A. The following significant accounting policies conform to generally accepted accounting principles for U.S. mutual funds. The fund consistently follows such policies in preparing its financial statements.
1. Security Valuation: Securities are valued at amortized cost, which approximates market value.
2. Federal Income Taxes: The fund intends to continue to qualify as a regulated investment company and distribute all of its income. Management has analyzed the fund’s tax positions taken for all open federal income tax years (November 30, 2009–2012), and has concluded that no provision for federal income tax is required in the fund’s financial statements.
3. Distributions: Distributions from net investment income are declared daily and paid on the first business day of the following month.
4. Other: Interest income is accrued daily. Premiums and discounts on debt securities purchased are amortized and accreted, respectively, to interest income over the lives of the respective securities. Security transactions are accounted for on the date securities are bought or sold. Costs used to determine realized gains (losses) on the sale of investment securities are those of the specific securities sold.
B. The Vanguard Group furnishes at cost investment advisory, corporate management, administrative, marketing, and distribution services. The costs of such services are allocated to the fund under methods approved by the board of trustees. The fund has committed to provide up to 0.40% of its net assets in capital contributions to Vanguard. At November 30, 2012, the fund had contributed capital of $530,000 to Vanguard (included in Other Assets), representing 0.01% of the fund’s net assets and 0.21% of Vanguard’s capitalization. The fund’s trustees and officers are also directors and officers of Vanguard. Vanguard and the board of trustees have agreed to temporarily limit certain net operating expenses in excess of the fund’s daily yield so as to maintain a zero or positive yield for the fund. Vanguard and the board of trustees may terminate the temporary expense limitation at any time. For the year ended November 30, 2012, Vanguard’s expenses were reduced by $337,000 (an effective annual rate of 0.01% of the fund’s average net assets).
C. Various inputs may be used to determine the value of the fund’s investments. These inputs are summarized in three broad levels for financial statement purposes. The inputs or methodologies used to value securities are not necessarily an indication of the risk associated with investing in those securities.
Level 1—Quoted prices in active markets for identical securities.
Level 2—Other significant observable inputs (including quoted prices for similar securities, interest
rates, prepayment speeds, credit risk, etc.).
Level 3—Significant unobservable inputs (including the fund’s own assumptions used to determine
the fair value of investments).
30
California Tax-Exempt Money Market Fund
At November 30, 2012, 100% of the market value of the fund’s investments was determined using amortized cost, in accordance with rules under the Investment Company Act of 1940. Amortized cost approximates the current fair value of a security, but since the value is not obtained from a quoted price in an active market, securities valued at amortized cost are considered to be valued using Level 2 inputs.
D. In preparing the financial statements as of November 30, 2012, management considered the impact of subsequent events for potential recognition or disclosure in these financial statements.
31
California Intermediate-Term Tax-Exempt Fund
Fund Profile
As of November 30, 2012
| | |
| Share-Class Characteristics | |
| | Investor | Admiral |
| | Shares | Shares |
| Ticker Symbol | VCAIX | VCADX |
| Expense Ratio1 | 0.20% | 0.12% |
| 30-Day SEC Yield | 1.46% | 1.54% |
| | | |
| Financial Attributes | | | |
| |
| | | Barclays | |
| | | Muni | Barclays |
| | | CA IT | Municipal |
| | | Bond | Bond |
| | Fund | Index | Index |
| |
| Number of Bonds | 1,008 | 1,524 | 46,378 |
| |
| Yield to Maturity | | | |
| (before expenses) | 1.6% | 1.3% | 1.9% |
| |
| Average Coupon | 4.3% | 4.8% | 4.9% |
| |
| Average Duration | 4.9 years | 4.8 years | 6.1 years |
| |
| Average Effective | | | |
| Maturity | 5.5 years | 5.5 years | 5.8 years |
| |
| Short-Term | | | |
| Reserves | 5.8% | — | — |
| | |
| Volatility Measures | | |
| | | Barclays |
| | Barclays Muni | Municipal |
| | CA IT | Bond |
| | Bond Index | Index |
| R-Squared | 0.88 | 0.97 |
| Beta | 0.91 | 0.99 |
| These measures show the degree and timing of the fund’s |
| fluctuations compared with the indexes over 36 months. |
| |
| Distribution by Effective Maturity (% of | |
| portfolio) | |
| Under 1 Year | 14.2% |
| 1 - 3 Years | 13.0 |
| 3 - 5 Years | 18.0 |
| 5 - 10 Years | 49.3 |
| 10 - 20 Years | 5.1 |
| 20 - 30 Years | 0.4 |
| |
| Distribution by Credit Quality (% of portfolio) |
| AAA | 7.9% |
| AA | 52.5 |
| A | 33.9 |
| BBB | 4.2 |
| B | 1.0 |
| Not Rated | 0.5 |
| For information about these ratings, see the Glossary entry for Credit Quality. |
Investment Focus
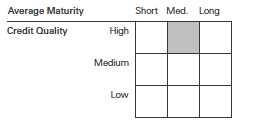
1 The expense ratios shown are from the prospectus dated March 28, 2012, and represent estimated costs for the current fiscal year. For the
fiscal year ended November 30, 2012, the expense ratios were 0.20% for Investor Shares and 0.12% for Admiral Shares.
32
California Intermediate-Term Tax-Exempt Fund
Performance Summary
All of the returns in this report represent past performance, which is not a guarantee of future
results that may be achieved by the fund. (Current performance may be lower or higher than
the performance data cited. For performance data current to the most recent month-end, visit
our website at vanguard.com/performance.) Note, too, that both investment returns and principal
value can fluctuate widely, so an investor’s shares, when sold, could be worth more or less than
their original cost. The returns shown do not reflect taxes that a shareholder would pay on fund
distributions or on the sale of fund shares.
Cumulative Performance: November 30, 2002, Through November 30, 2012
Initial Investment of $10,000
| | | | | |
| | | Average Annual Total Returns |
| | | Periods Ended November 30, 2012 |
| |
| | | | | | Final Value |
| | | One | Five | Ten | of a $10,000 |
| | | Year | Years | Years | Investment |
| | California Intermediate-Term | | | | |
| | Tax-Exempt Fund Investor Shares | 10.14% | 5.61% | 4.61% | $15,694 |
| •••••••• | Barclays Municipal California | | | | |
| | Intermediate Bond Index | 9.08 | 6.69 | 5.43 | 16,968 |
| – – – – | California Intermediate Municipal | | | | |
| |
| | Debt Funds Average | 8.35 | 4.85 | 3.96 | 14,749 |
| | Barclays Municipal Bond Index | 10.17 | 6.23 | 5.45 | 17,005 |
| California Intermediate Municipal Debt Funds Average: Derived from data provided by Lipper Inc. | | |
| | | | |
| | | | | Final Value |
| | One | Five | Ten | of a $50,000 |
| | Year | Years | Years | Investment |
| California Intermediate-Term Tax-Exempt | | | | |
| Fund Admiral Shares | 10.23% | 5.69% | 4.69% | $79,036 |
| Barclays Municipal California Intermediate | | | | |
| Bond Index | 9.08 | 6.69 | 5.43 | 84,842 |
| Barclays Municipal Bond Index | 10.17 | 6.23 | 5.45 | 85,027 |
See Financial Highlights for dividend and capital gains information.
33
California Intermediate-Term Tax-Exempt Fund
| | | | |
| Fiscal-Year Total Returns (%): November 30, 2002, Through November 30, 2012 | |
| | | | | Barclays Muni |
| | | | | CA IT |
| | | | Investor Shares | Bond Index |
| Fiscal Year | Income Returns | Capital Returns | Total Returns | Total Returns |
| 2003 | 4.12% | 1.66% | 5.78% | 5.62% |
| 2004 | 3.93 | -1.52 | 2.41 | 4.05 |
| 2005 | 3.90 | -1.79 | 2.11 | 2.37 |
| 2006 | 4.12 | 1.28 | 5.40 | 5.07 |
| 2007 | 3.99 | -1.53 | 2.46 | 3.84 |
| 2008 | 3.79 | -6.50 | -2.71 | 1.84 |
| 2009 | 4.19 | 6.37 | 10.56 | 9.03 |
| 2010 | 3.79 | 0.64 | 4.43 | 6.89 |
| 2011 | 3.88 | 2.29 | 6.17 | 6.79 |
| 2012 | 3.52 | 6.62 | 10.14 | 9.08 |
Average Annual Total Returns: Periods Ended September 30, 2012
This table presents returns through the latest calendar quarter—rather than through the end of the fiscal period.
Securities and Exchange Commission rules require that we provide this information.
| | | | | | |
| | | | | Ten Years |
| | Inception Date | One Year | Five Years | Income | Capital | Total |
| Investor Shares | 3/4/1994 | 8.47% | 5.38% | 3.92% | 0.20% | 4.12% |
| Admiral Shares | 11/12/2001 | 8.56 | 5.46 | 4.00 | 0.20 | 4.20 |
34
California Intermediate-Term Tax-Exempt Fund
Financial Statements
Statement of Net Assets
As of November 30, 2012
The fund reports a complete list of its holdings in regulatory filings four times in each fiscal year, at the quarter-ends. For the second and fourth fiscal quarters, the lists appear in the fund’s semiannual and annual reports to shareholders. For the first and third fiscal quarters, the fund files the lists with the Securities and Exchange Commission on Form N-Q. Shareholders can look up the fund’s Forms N-Q on the SEC’s website at sec.gov. Forms N-Q may also be reviewed and copied at the SEC’s Public Reference Room (see the back cover of this report for further information).
| | | | |
| | | | Face | Market |
| | | Maturity | Amount | Value |
| | Coupon | Date | ($000) | ($000) |
| Tax-Exempt Municipal Bonds (100.2%) | | | | |
| California (100.0%) | | | | |
| ABAG Finance Authority for Nonprofit Corps. | | | | |
| California Revenue (899 Charleston Project) | | | | |
| VRDO | 0.250% | 12/3/12 LOC | 8,390 | 8,390 |
| ABAG Finance Authority for Nonprofit Corps. | | | | |
| California Revenue (Branson School) VRDO | 0.160% | 12/7/12 LOC | 4,150 | 4,150 |
| ABAG Finance Authority for Nonprofit Corps. | | | | |
| California Revenue (Episcopal Senior | | | | |
| Communities) | 6.000% | 7/1/31 | 2,750 | 3,231 |
| ABAG Finance Authority for Nonprofit Corps. | | | | |
| California Revenue (Jackson Laboratory) | 5.000% | 7/1/20 | 850 | 1,037 |
| ABAG Finance Authority for Nonprofit Corps. | | | | |
| California Revenue (Jackson Laboratory) | 5.000% | 7/1/22 | 555 | 686 |
| ABAG Finance Authority for Nonprofit Corps. | | | | |
| California Revenue (Jackson Laboratory) | 5.000% | 7/1/23 | 1,000 | 1,228 |
| ABAG Finance Authority for Nonprofit Corps. | | | | |
| California Revenue (Jackson Laboratory) | 5.000% | 7/1/24 | 1,265 | 1,534 |
| ABAG Finance Authority for Nonprofit Corps. | | | | |
| California Revenue (Odd Fellows Home) | 5.000% | 4/1/32 | 7,250 | 8,397 |
| ABAG Finance Authority for Nonprofit Corps. | | | | |
| California Revenue (San Francisco Friends) | | | | |
| VRDO | 0.210% | 12/7/12 LOC | 2,800 | 2,800 |
| ABAG Finance Authority for Nonprofit Corps. | | | | |
| California Revenue (Sharp Healthcare) | 5.000% | 8/1/24 | 960 | 1,143 |
| ABAG Finance Authority for Nonprofit Corps. | | | | |
| California Revenue (Sharp Healthcare) | 5.000% | 8/1/26 | 1,000 | 1,175 |
| ABAG Finance Authority for Nonprofit Corps. | | | | |
| California Revenue (Sharp Healthcare) | 5.000% | 8/1/28 | 400 | 466 |
| ABAG Finance Authority for Nonprofit Corps. | | | | |
| California Revenue (Sharp Healthcare) | 6.000% | 8/1/30 | 1,120 | 1,405 |
| Alameda CA Corridor Transportation Authority | | | | |
| Revenue | 0.000% | 10/1/14 (2) | 325 | 312 |
| Alameda CA Corridor Transportation Authority | | | | |
| Revenue | 0.000% | 10/1/16 (2) | 4,305 | 3,914 |
| Alameda CA Corridor Transportation Authority | | | | |
| Revenue | 0.000% | 10/1/20 (2) | 12,250 | 9,419 |
| Alameda CA Corridor Transportation Authority | | | | |
| Revenue | 0.000% | 10/1/29 (2) | 30,000 | 12,703 |
| Alameda CA Corridor Transportation Authority | | | | |
| Revenue | 5.000% | 10/1/29 (14) | 1,000 | 1,025 |
35
| | | | |
| California Intermediate-Term Tax-Exempt Fund | | | | |
| |
| |
| |
| | | | Face | Market |
| | | Maturity | Amount | Value |
| | Coupon | Date | ($000) | ($000) |
| Alameda CA Corridor Transportation Authority | | | | |
| Revenue | 0.000% | 10/1/30 (2) | 9,110 | 3,627 |
| Alameda County CA (Medical Center Project) COP | 5.250% | 6/1/13 (ETM) | 1,785 | 1,825 |
| Alameda County CA (Medical Center Project) COP | 5.375% | 6/1/14 (ETM) | 1,880 | 1,983 |
| Alameda County CA (Medical Center Project) COP | 5.375% | 6/1/15 (ETM) | 3,960 | 4,177 |
| Alvord CA Unified School District GO | 5.900% | 2/1/21 (14) | 2,230 | 2,773 |
| Alvord CA Unified School District GO | 5.900% | 2/1/24 (4) | 3,865 | 4,904 |
| Anaheim CA Public Financing Authority Revenue | | | | |
| (Electric System) | 5.000% | 10/1/21 (14) | 4,425 | 5,092 |
| Anaheim CA Public Financing Authority Revenue | | | | |
| (Electric System) | 5.000% | 10/1/22 (14) | 4,660 | 5,312 |
| Anaheim CA Public Financing Authority Revenue | | | | |
| (Electric System) | 5.000% | 10/1/24 (14) | 5,175 | 5,836 |
| Anaheim CA Public Financing Authority Revenue | | | | |
| (Electric System) | 5.000% | 10/1/25 (14) | 5,450 | 6,123 |
| Anaheim CA Public Financing Authority Revenue | | | | |
| (Electric System) | 5.250% | 10/1/30 | 5,585 | 6,776 |
| Antioch CA Public Financing Authority | | | | |
| Reassessment Revenue | 5.000% | 9/2/13 (2) | 2,275 | 2,280 |
| Bakersfield CA Wastewater Revenue | 5.000% | 9/15/24 (4) | 7,600 | 8,632 |
| Bakersfield CA Wastewater Revenue VRDO | 0.190% | 12/7/12 | 5,600 | 5,600 |
| Bay Area CA Infrastructure Financing | | | | |
| Authority Revenue | 5.000% | 8/1/17 (10) | 5,000 | 5,136 |
| Bay Area CA Infrastructure Financing | | | | |
| Authority Revenue | 5.000% | 8/1/17 (14) | 6,910 | 6,933 |
| Bay Area Toll Authority California Toll Bridge | | | | |
| Revenue (San Francisco Bay Area) | 5.000% | 4/1/16 (Prere.) | 3,000 | 3,438 |
| Bay Area Toll Authority California Toll Bridge | | | | |
| Revenue (San Francisco Bay Area) | 5.000% | 4/1/16 (Prere.) | 11,625 | 13,322 |
| Bay Area Toll Authority California Toll Bridge | | | | |
| Revenue (San Francisco Bay Area) | 5.000% | 4/1/16 (Prere.) | 10,000 | 11,460 |
| Bay Area Toll Authority California Toll Bridge | | | | |
| Revenue (San Francisco Bay Area) | 5.000% | 4/1/16 (Prere.) | 300 | 344 |
| Bay Area Toll Authority California Toll Bridge | | | | |
| Revenue (San Francisco Bay Area) | 5.000% | 4/1/16 (Prere.) | 2,190 | 2,510 |
| Bay Area Toll Authority California Toll Bridge | | | | |
| Revenue (San Francisco Bay Area) | 5.000% | 4/1/17 (Prere.) | 3,055 | 3,616 |
| Bay Area Toll Authority California Toll Bridge | | | | |
| Revenue (San Francisco Bay Area) | 5.000% | 4/1/17 (Prere.) | 3,000 | 3,551 |
| Bay Area Toll Authority California Toll Bridge | | | | |
| Revenue (San Francisco Bay Area) | 5.000% | 4/1/18 | 2,610 | 3,097 |
| Bay Area Toll Authority California Toll Bridge | | | | |
| Revenue (San Francisco Bay Area) | 5.000% | 4/1/25 | 6,250 | 7,908 |
| Bay Area Toll Authority California Toll Bridge | | | | |
| Revenue (San Francisco Bay Area) | 5.000% | 4/1/28 | 15,000 | 18,684 |
| Bay Area Toll Authority California Toll Bridge | | | | |
| Revenue (San Francisco Bay Area) | 5.000% | 4/1/29 | 7,000 | 8,686 |
| Bay Area Toll Authority California Toll Bridge | | | | |
| Revenue (San Francisco Bay Area) | 5.250% | 4/1/29 | 11,280 | 13,774 |
| Bay Area Toll Authority California Toll Bridge | | | | |
| Revenue (San Francisco Bay Area) | 5.000% | 4/1/30 | 15,000 | 18,527 |
| Bay Area Toll Authority California Toll Bridge | | | | |
| Revenue (San Francisco Bay Area) | 5.000% | 4/1/31 | 8,000 | 9,813 |
| Bay Area Toll Authority California Toll Bridge | | | | |
| Revenue (San Francisco Bay Area) PUT | 1.041% | 8/1/17 | 25,000 | 25,059 |
36
| | | | |
| California Intermediate-Term Tax-Exempt Fund | | | | |
| |
| |
| |
| | | | Face | Market |
| | | Maturity | Amount | Value |
| | Coupon | Date | ($000) | ($000) |
| Bay Area Toll Authority California Toll Bridge | | | | |
| Revenue (San Francisco Bay Area) PUT | 1.450% | 8/1/17 | 12,500 | 12,841 |
| Bay Area Toll Authority California Toll Bridge | | | | |
| Revenue (San Francisco Bay Area) VRDO | 0.150% | 12/7/12 LOC | 38,000 | 38,000 |
| Burbank CA Public Financing Authority Revenue | | | | |
| (Golden State Redevelopment Project) | 5.250% | 12/1/12 (2) | 3,540 | 3,540 |
| Burbank CA Public Financing Authority Revenue | | | | |
| (Golden State Redevelopment Project) | 5.250% | 12/1/13 (2) | 4,615 | 4,809 |
| Cabrillo CA Community College District Revenue | 0.000% | 8/1/13 (14) | 2,590 | 2,584 |
| Cabrillo CA Community College District Revenue | 0.000% | 8/1/14 (14) | 2,655 | 2,621 |
| 1 Cabrillo CA Community College District Revenue | | | | |
| TOB VRDO | 0.190% | 12/7/12 | 5,305 | 5,305 |
| California Community College Financing | | | | |
| Authority TRAN | 2.000% | 6/28/13 | 8,000 | 8,058 |
| California County CA Tobacco Securitization | | | | |
| Agency Revenue | 5.250% | 6/1/21 | 13,390 | 13,407 |
| California Department of Water Resources | | | | |
| Power Supply Revenue | 5.000% | 5/1/13 | 1,185 | 1,209 |
| California Department of Water Resources | | | | |
| Power Supply Revenue | 5.000% | 5/1/15 | 15,000 | 16,647 |
| California Department of Water Resources | | | | |
| Power Supply Revenue | 5.000% | 5/1/16 | 5,000 | 5,750 |
| California Department of Water Resources | | | | |
| Power Supply Revenue | 5.000% | 5/1/16 | 19,625 | 22,567 |
| California Department of Water Resources | | | | |
| Power Supply Revenue | 5.000% | 5/1/17 | 25,000 | 29,734 |
| California Department of Water Resources | | | | |
| Power Supply Revenue | 5.000% | 5/1/17 | 14,600 | 17,365 |
| California Department of Water Resources | | | | |
| Power Supply Revenue | 5.000% | 5/1/18 | 5,475 | 6,701 |
| California Department of Water Resources | | | | |
| Power Supply Revenue | 5.000% | 5/1/18 | 17,950 | 21,969 |
| California Department of Water Resources | | | | |
| Power Supply Revenue | 5.000% | 5/1/18 | 2,525 | 3,090 |
| California Department of Water Resources | | | | |
| Power Supply Revenue | 5.000% | 5/1/19 | 19,590 | 24,612 |
| California Department of Water Resources | | | | |
| Power Supply Revenue | 5.000% | 5/1/19 | 1,215 | 1,527 |
| California Department of Water Resources | | | | |
| Power Supply Revenue | 5.000% | 5/1/20 | 22,890 | 29,284 |
| California Department of Water Resources | | | | |
| Power Supply Revenue | 5.000% | 5/1/20 | 3,660 | 4,682 |
| California Department of Water Resources | | | | |
| Power Supply Revenue | 5.000% | 5/1/20 | 18,000 | 23,028 |
| California Department of Water Resources | | | | |
| Power Supply Revenue | 5.000% | 5/1/21 | 50,000 | 60,589 |
| California Department of Water Resources | | | | |
| Power Supply Revenue | 5.000% | 5/1/21 | 20,000 | 24,060 |
| California Department of Water Resources | | | | |
| Power Supply Revenue | 5.000% | 5/1/21 | 5,000 | 6,311 |
| California Department of Water Resources | | | | |
| Power Supply Revenue | 5.000% | 5/1/21 | 6,500 | 8,422 |
| California Department of Water Resources | | | | |
| Power Supply Revenue | 5.000% | 5/1/22 | 14,675 | 17,654 |
| California Department of Water Resources | | | | |
| Power Supply Revenue | 5.000% | 5/1/22 | 10,825 | 13,557 |
37
| | | | |
| California Intermediate-Term Tax-Exempt Fund | | | | |
| |
| |
| |
| | | | Face | Market |
| | | Maturity | Amount | Value |
| | Coupon | Date | ($000) | ($000) |
| California Department of Water Resources Water | | | | |
| System Revenue (Central Valley Project) | 5.000% | 12/1/12 (ETM) | 90 | 90 |
| California Department of Water Resources Water | | | | |
| System Revenue (Central Valley Project) | 5.000% | 12/1/13 | 7,000 | 7,337 |
| California Department of Water Resources Water | | | | |
| System Revenue (Central Valley Project) | 5.000% | 12/1/14 (Prere.) | 180 | 197 |
| California Department of Water Resources Water | | | | |
| System Revenue (Central Valley Project) | 5.000% | 12/1/14 (Prere.) | 3,355 | 3,664 |
| California Department of Water Resources Water | | | | |
| System Revenue (Central Valley Project) | 5.000% | 12/1/20 | 1,250 | 1,618 |
| California Department of Water Resources Water | | | | |
| System Revenue (Central Valley Project) | 5.000% | 12/1/21 | 5,645 | 7,409 |
| California Department of Water Resources Water | | | | |
| System Revenue (Central Valley Project) | 5.000% | 12/1/22 | 6,000 | 7,949 |
| California Department of Water Resources Water | | | | |
| System Revenue (Central Valley Project) | 5.000% | 12/1/24 | 5,000 | 6,073 |
| California Department of Water Resources Water | | | | |
| System Revenue (Central Valley Project) | 5.000% | 12/1/26 | 8,565 | 10,353 |
| California Department of Water Resources Water | | | | |
| System Revenue (Central Valley Project) | 5.000% | 12/1/27 | 8,800 | 10,880 |
| California Department of Water Resources Water | | | | |
| System Revenue (Central Valley Project) | 5.250% | 12/1/27 | 3,900 | 4,962 |
| California Department of Water Resources Water | | | | |
| System Revenue (Central Valley Project) | 5.000% | 12/1/28 | 3,350 | 4,234 |
| California Department of Water Resources Water | | | | |
| System Revenue (Central Valley Project) | 5.250% | 12/1/28 | 4,505 | 5,732 |
| California Department of Water Resources Water | | | | |
| System Revenue (Central Valley Project) | 5.000% | 12/1/29 | 3,530 | 4,445 |
| California Department of Water Resources Water | | | | |
| System Revenue (Central Valley Project) | 5.250% | 12/1/29 | 4,640 | 5,899 |
| California Department of Water Resources Water | | | | |
| System Revenue (Central Valley Project) | 5.000% | 12/1/30 | 2,720 | 3,410 |
| California Department of Water Resources Water | | | | |
| System Revenue (Central Valley Project) | 5.250% | 12/1/30 | 1,850 | 2,352 |
| California Department of Water Resources Water | | | | |
| System Revenue (Central Valley Project) | 5.000% | 12/1/31 | 3,910 | 4,872 |
| California Economic Recovery GO | 5.250% | 7/1/13 | 20,000 | 20,586 |
| California Economic Recovery GO | 5.250% | 7/1/14 (ETM) | 3,385 | 3,650 |
| California Economic Recovery GO | 5.250% | 7/1/14 | 11,615 | 12,514 |
| California Economic Recovery GO | 5.000% | 7/1/18 | 29,770 | 36,569 |
| California Economic Recovery GO | 5.000% | 7/1/19 | 32,330 | 40,647 |
| California Economic Recovery GO | 5.000% | 7/1/20 | 43,810 | 54,605 |
| California Economic Recovery GO | 5.250% | 7/1/21 | 45,385 | 56,554 |
| California Economic Recovery GO | 5.000% | 7/1/22 | 16,280 | 18,756 |
| California Educational Facilities Authority Revenue | | | | |
| (College of Arts & Crafts) | 6.875% | 6/1/14 | 360 | 384 |
| California Educational Facilities Authority Revenue | | | | |
| (College of Arts & Crafts) | 6.875% | 6/1/15 | 380 | 421 |
| California Educational Facilities Authority Revenue | | | | |
| (College of Arts & Crafts) | 6.875% | 6/1/16 | 400 | 457 |
| California Educational Facilities Authority Revenue | | | | |
| (College of Arts) | 5.000% | 6/1/20 | 790 | 888 |
| California Educational Facilities Authority Revenue | | | | |
| (College of Arts) | 5.000% | 6/1/23 | 1,195 | 1,325 |
| California Educational Facilities Authority Revenue | | | | |
| (College of Arts) | 5.000% | 6/1/24 | 380 | 419 |
38
| | | | |
| California Intermediate-Term Tax-Exempt Fund | | | | |
| |
| |
| |
| | | | Face | Market |
| | | Maturity | Amount | Value |
| | Coupon | Date | ($000) | ($000) |
| California Educational Facilities Authority Revenue | | | | |
| (Stanford University) | 5.000% | 3/15/26 | 10,000 | 13,716 |
| California GO | 5.000% | 3/1/13 | 20,640 | 20,887 |
| California GO | 5.000% | 10/1/14 | 2,000 | 2,167 |
| California GO | 5.000% | 11/1/14 | 1,390 | 1,511 |
| California GO | 5.000% | 3/1/15 | 1,000 | 1,099 |
| California GO | 5.000% | 4/1/15 | 15,400 | 16,979 |
| California GO | 5.000% | 12/1/15 | 1,470 | 1,571 |
| California GO | 5.000% | 4/1/17 | 11,000 | 12,935 |
| California GO | 5.250% | 2/1/18 (14) | 8,000 | 9,743 |
| California GO | 6.000% | 2/1/18 (2) | 6,240 | 7,850 |
| California GO | 5.000% | 3/1/18 | 1,850 | 2,235 |
| California GO | 5.500% | 4/1/18 | 20,000 | 24,747 |
| 2 California GO | 1.060% | 5/1/18 | 9,000 | 9,021 |
| California GO | 5.000% | 8/1/18 | 1,895 | 2,217 |
| California GO | 5.000% | 10/1/18 | 20,000 | 24,588 |
| California GO | 5.000% | 10/1/18 | 14,095 | 17,328 |
| California GO | 5.500% | 4/1/19 | 11,245 | 14,315 |
| California GO | 5.000% | 5/1/19 | 10,000 | 11,023 |
| California GO | 5.000% | 8/1/19 | 30,000 | 33,372 |
| California GO | 5.000% | 10/1/19 (14) | 14,800 | 17,194 |
| California GO | 5.000% | 10/1/19 | 21,000 | 26,391 |
| California GO | 5.000% | 2/1/20 | 2,950 | 3,698 |
| California GO | 5.250% | 2/1/20 | 7,500 | 9,529 |
| California GO | 5.000% | 3/1/20 | 55,285 | 60,487 |
| California GO | 5.000% | 8/1/20 | 14,890 | 17,344 |
| California GO | 5.000% | 9/1/20 | 26,810 | 34,027 |
| California GO | 5.000% | 9/1/20 | 9,970 | 12,654 |
| California GO | 5.000% | 10/1/20 | 10,555 | 13,419 |
| California GO | 5.000% | 3/1/21 | 2,250 | 2,790 |
| California GO | 5.000% | 4/1/21 | 2,240 | 2,851 |
| California GO | 5.500% | 4/1/21 | 2,000 | 2,492 |
| California GO | 5.000% | 9/1/21 | 13,700 | 17,550 |
| California GO | 5.000% | 9/1/21 | 1,310 | 1,678 |
| California GO | 5.000% | 10/1/21 | 2,575 | 3,303 |
| California GO | 5.000% | 2/1/22 | 8,125 | 10,410 |
| California GO | 5.000% | 6/1/22 | 12,000 | 13,208 |
| California GO | 5.000% | 9/1/22 | 12,710 | 16,416 |
| California GO | 5.250% | 9/1/22 | 17,400 | 22,917 |
| California GO | 5.000% | 9/1/23 | 12,120 | 13,934 |
| California GO | 5.000% | 9/1/23 | 7,000 | 8,869 |
| California GO | 5.000% | 10/1/23 | 12,500 | 14,409 |
| California GO | 5.000% | 12/1/23 | 7,500 | 8,876 |
| California GO | 5.000% | 3/1/24 | 3,000 | 3,646 |
| California GO | 5.000% | 8/1/24 | 10,100 | 11,653 |
| California GO | 5.000% | 8/1/24 (4) | 31,275 | 34,554 |
| California GO | 5.000% | 10/1/24 | 13,440 | 15,454 |
| California GO | 5.000% | 11/1/24 | 6,000 | 7,085 |
| California GO | 5.000% | 11/1/24 | 5,000 | 6,141 |
| California GO | 5.000% | 12/1/24 | 2,000 | 2,367 |
| California GO | 5.125% | 3/1/25 | 2,000 | 2,344 |
| California GO | 5.000% | 8/1/25 | 10,000 | 11,450 |
| California GO | 5.000% | 9/1/25 | 1,500 | 1,769 |
| California GO | 5.000% | 11/1/25 | 1,500 | 1,831 |
| California GO | 5.000% | 12/1/25 | 21,015 | 24,870 |
| California GO | 5.000% | 3/1/26 | 5,000 | 5,591 |
39
| | | | |
| California Intermediate-Term Tax-Exempt Fund | | | | |
| |
| |
| |
| | | | Face | Market |
| | | Maturity | Amount | Value |
| | Coupon | Date | ($000) | ($000) |
| California GO | 5.000% | 3/1/26 | 5,000 | 6,008 |
| California GO | 5.000% | 4/1/26 | 27,480 | 32,010 |
| California GO | 5.000% | 9/1/26 | 2,500 | 2,943 |
| California GO | 5.000% | 11/1/26 | 7,500 | 9,140 |
| California GO | 5.000% | 4/1/27 | 24,285 | 28,195 |
| California GO | 5.750% | 4/1/27 | 31,455 | 38,462 |
| California GO | 4.500% | 8/1/27 | 6,000 | 6,620 |
| California GO | 5.000% | 9/1/27 | 5,500 | 6,451 |
| California GO | 5.250% | 10/1/27 | 5,000 | 6,115 |
| California GO | 5.000% | 3/1/28 | 10,855 | 11,579 |
| California GO | 5.750% | 4/1/28 | 30,000 | 36,663 |
| California GO | 5.000% | 6/1/28 | 10,005 | 10,947 |
| California GO | 5.000% | 9/1/28 | 6,250 | 7,316 |
| California GO | 5.250% | 9/1/28 | 6,000 | 7,321 |
| California GO | 5.000% | 9/1/29 | 6,000 | 7,152 |
| California GO | 5.000% | 9/1/29 | 4,750 | 5,552 |
| California GO | 5.250% | 3/1/30 | 20,000 | 24,367 |
| California GO | 4.500% | 8/1/30 | 11,000 | 12,058 |
| California GO | 5.000% | 9/1/30 | 10,000 | 11,876 |
| California GO | 5.000% | 9/1/30 | 6,865 | 8,003 |
| California GO | 5.000% | 3/1/31 | 5,535 | 6,130 |
| California GO | 5.750% | 4/1/31 | 30,000 | 36,603 |
| California GO | 5.000% | 2/1/32 | 2,540 | 3,021 |
| California GO | 6.000% | 3/1/33 | 12,000 | 15,422 |
| California GO | 5.125% | 4/1/33 | 6,550 | 7,492 |
| California GO | 6.500% | 4/1/33 | 20,000 | 25,687 |
| 1 California GO TOB VRDO | 0.180% | 12/3/12 | 2,200 | 2,200 |
| 1 California GO TOB VRDO | 0.180% | 12/4/12 | 10,800 | 10,800 |
| California GO VRDO | 0.140% | 12/3/12 LOC | 2,800 | 2,800 |
| California GO VRDO | 0.150% | 12/3/12 LOC | 5,470 | 5,470 |
| California GO VRDO | 0.150% | 12/7/12 LOC | 4,200 | 4,200 |
| California GO VRDO | 0.160% | 12/7/12 LOC | 10,200 | 10,200 |
| California Health Facilities Financing Authority | | | | |
| Revenue (Adventist Health System/West) | 5.000% | 3/1/16 | 2,170 | 2,193 |
| California Health Facilities Financing Authority | | | | |
| Revenue (Adventist Health System/West) | 5.000% | 3/1/19 | 1,025 | 1,035 |
| California Health Facilities Financing Authority | | | | |
| Revenue (California-Nevada Methodist Homes) | 5.000% | 7/1/26 | 1,740 | 1,846 |
| California Health Facilities Financing Authority | | | | |
| Revenue (Catholic Healthcare West) | 5.000% | 7/1/19 | 1,000 | 1,191 |
| California Health Facilities Financing Authority | | | | |
| Revenue (Catholic Healthcare West) | 5.000% | 3/1/20 | 4,750 | 5,709 |
| California Health Facilities Financing Authority | | | | |
| Revenue (Catholic Healthcare West) | 5.000% | 3/1/21 | 3,810 | 4,599 |
| California Health Facilities Financing Authority | | | | |
| Revenue (Catholic Healthcare West) | 5.250% | 3/1/22 | 8,000 | 9,706 |
| California Health Facilities Financing Authority | | | | |
| Revenue (Catholic Healthcare West) | 5.500% | 7/1/25 | 5,000 | 5,784 |
| California Health Facilities Financing Authority | | | | |
| Revenue (Catholic Healthcare West) | 5.625% | 7/1/25 | 19,820 | 23,394 |
| California Health Facilities Financing Authority | | | | |
| Revenue (Catholic Healthcare West) | 5.250% | 3/1/27 | 7,500 | 8,821 |
| California Health Facilities Financing Authority | | | | |
| Revenue (Catholic Healthcare West) | 6.000% | 7/1/29 | 4,250 | 5,165 |
| California Health Facilities Financing Authority | | | | |
| Revenue (Catholic Healthcare West) PUT | 5.000% | 7/1/14 | 9,000 | 9,536 |
40
| | | | |
| California Intermediate-Term Tax-Exempt Fund | | | | |
| |
| |
| |
| | | | Face | Market |
| | | Maturity | Amount | Value |
| | Coupon | Date | ($000) | ($000) |
| California Health Facilities Financing Authority | | | | |
| Revenue (Catholic Healthcare West) PUT | 5.000% | 7/1/14 | 39,000 | 41,737 |
| California Health Facilities Financing Authority | | | | |
| Revenue (Cedars-Sinai Medical Center) | 5.000% | 11/15/14 | 4,000 | 4,329 |
| California Health Facilities Financing Authority | | | | |
| Revenue (Cedars-Sinai Medical Center) | 5.000% | 11/15/16 | 2,000 | 2,228 |
| California Health Facilities Financing Authority | | | | |
| Revenue (Cedars-Sinai Medical Center) | 5.000% | 11/15/17 | 4,585 | 5,082 |
| California Health Facilities Financing Authority | | | | |
| Revenue (Cedars-Sinai Medical Center) | 5.000% | 8/15/19 | 1,000 | 1,222 |
| California Health Facilities Financing Authority | | | | |
| Revenue (Cedars-Sinai Medical Center) | 5.000% | 8/15/20 | 2,100 | 2,581 |
| California Health Facilities Financing Authority | | | | |
| Revenue (Cedars-Sinai Medical Center) | 5.000% | 8/15/21 | 2,000 | 2,461 |
| California Health Facilities Financing Authority | | | | |
| Revenue (Children’s Hospital of Los Angeles) | 5.000% | 11/15/22 | 2,000 | 2,356 |
| California Health Facilities Financing Authority | | | | |
| Revenue (Children’s Hospital of Los Angeles) | 5.000% | 11/15/23 | 1,370 | 1,592 |
| California Health Facilities Financing Authority | | | | |
| Revenue (Children’s Hospital of Los Angeles) | 5.000% | 11/15/24 | 2,910 | 3,360 |
| California Health Facilities Financing Authority | | | | |
| Revenue (Children’s Hospital of Los Angeles) | 5.000% | 11/15/29 | 2,890 | 3,280 |
| 2 California Health Facilities Financing Authority | | | | |
| Revenue (Children’s Hospital of Los Angeles) | | | | |
| PUT | 1.960% | 7/1/17 | 5,255 | 5,301 |
| California Health Facilities Financing Authority | | | | |
| Revenue (Children’s Hospital of Orange County) | 6.250% | 11/1/29 | 5,000 | 6,137 |
| California Health Facilities Financing Authority | | | | |
| Revenue (Children’s Hospital of Orange County) | 5.000% | 11/1/31 | 2,000 | 2,296 |
| California Health Facilities Financing Authority | | | | |
| Revenue (Chinese Hospital Association) | 4.000% | 6/1/16 | 735 | 805 |
| California Health Facilities Financing Authority | | | | |
| Revenue (Chinese Hospital Association) | 5.000% | 6/1/19 | 300 | 357 |
| California Health Facilities Financing Authority | | | | |
| Revenue (Chinese Hospital Association) | 5.000% | 6/1/21 | 450 | 543 |
| California Health Facilities Financing Authority | | | | |
| Revenue (Chinese Hospital Association) | 5.000% | 6/1/22 | 875 | 1,060 |
| California Health Facilities Financing Authority | | | | |
| Revenue (Chinese Hospital Association) | 5.000% | 6/1/23 | 760 | 911 |
| California Health Facilities Financing Authority | | | | |
| Revenue (Chinese Hospital Association) | 5.000% | 6/1/25 | 310 | 368 |
| California Health Facilities Financing Authority | | | | |
| Revenue (Chinese Hospital Association) | 5.000% | 6/1/26 | 805 | 950 |
| California Health Facilities Financing Authority | | | | |
| Revenue (City of Hope Medical Center) | 5.000% | 11/15/14 | 730 | 792 |
| California Health Facilities Financing Authority | | | | |
| Revenue (City of Hope Medical Center) | 5.000% | 11/15/19 | 800 | 975 |
| California Health Facilities Financing Authority | | | | |
| Revenue (City of Hope Medical Center) | 4.000% | 11/15/20 | 750 | 870 |
| California Health Facilities Financing Authority | | | | |
| Revenue (City of Hope Medical Center) | 5.000% | 11/15/21 | 1,400 | 1,737 |
| California Health Facilities Financing Authority | | | | |
| Revenue (City of Hope Medical Center) | 5.000% | 11/15/23 | 1,500 | 1,840 |
| California Health Facilities Financing Authority | | | | |
| Revenue (City of Hope Medical Center) | 5.000% | 11/15/24 | 1,700 | 2,074 |
41
| | | | |
| California Intermediate-Term Tax-Exempt Fund | | | | |
| |
| |
| |
| | | | Face | Market |
| | | Maturity | Amount | Value |
| | Coupon | Date | ($000) | ($000) |
| California Health Facilities Financing Authority | | | | |
| Revenue (City of Hope Medical Center) | 5.000% | 11/15/25 | 2,250 | 2,737 |
| California Health Facilities Financing Authority | | | | |
| Revenue (City of Hope Medical Center) | 5.000% | 11/15/32 | 12,500 | 14,744 |
| California Health Facilities Financing Authority | | | | |
| Revenue (Lucile Salter Packard Children’s | | | | |
| Hospital at Stanford) | 5.000% | 8/15/13 (Prere.) | 2,515 | 2,599 |
| California Health Facilities Financing Authority | | | | |
| Revenue (Lucile Salter Packard Children’s | | | | |
| Hospital at Stanford) | 5.000% | 8/15/13 (Prere.) | 2,630 | 2,718 |
| California Health Facilities Financing Authority | | | | |
| Revenue (Lucile Salter Packard Children’s | | | | |
| Hospital at Stanford) | 5.000% | 8/15/13 (Prere.) | 2,280 | 2,356 |
| California Health Facilities Financing Authority | | | | |
| Revenue (Lucile Salter Packard Children’s | | | | |
| Hospital at Stanford) | 5.000% | 8/15/13 (Prere.) | 2,245 | 2,320 |
| California Health Facilities Financing Authority | | | | |
| Revenue (Lucile Salter Packard Children’s | | | | |
| Hospital at Stanford) | 4.000% | 8/15/19 | 500 | 584 |
| California Health Facilities Financing Authority | | | | |
| Revenue (Lucile Salter Packard Children’s | | | | |
| Hospital at Stanford) | 5.000% | 8/15/21 | 800 | 1,006 |
| California Health Facilities Financing Authority | | | | |
| Revenue (Lucile Salter Packard Children’s | | | | |
| Hospital at Stanford) | 5.000% | 8/15/22 | 500 | 634 |
| California Health Facilities Financing Authority | | | | |
| Revenue (Memorial Health Services) | 3.000% | 10/1/14 | 550 | 576 |
| California Health Facilities Financing Authority | | | | |
| Revenue (Memorial Health Services) | 5.000% | 10/1/18 | 1,320 | 1,610 |
| California Health Facilities Financing Authority | | | | |
| Revenue (Memorial Health Services) | 4.000% | 10/1/19 | 1,500 | 1,769 |
| California Health Facilities Financing Authority | | | | |
| Revenue (Memorial Health Services) | 5.000% | 10/1/19 | 1,000 | 1,245 |
| California Health Facilities Financing Authority | | | | |
| Revenue (Memorial Health Services) | 4.000% | 10/1/20 | 1,800 | 2,129 |
| California Health Facilities Financing Authority | | | | |
| Revenue (Memorial Health Services) | 5.000% | 10/1/20 | 1,000 | 1,256 |
| California Health Facilities Financing Authority | | | | |
| Revenue (Memorial Health Services) | 4.000% | 10/1/21 | 1,000 | 1,180 |
| California Health Facilities Financing Authority | | | | |
| Revenue (Memorial Health Services) | 5.000% | 10/1/21 | 1,000 | 1,264 |
| California Health Facilities Financing Authority | | | | |
| Revenue (Memorial Health Services) | 4.000% | 10/1/22 | 2,250 | 2,626 |
| California Health Facilities Financing Authority | | | | |
| Revenue (Memorial Health Services) | 5.000% | 10/1/22 | 2,400 | 3,033 |
| California Health Facilities Financing Authority | | | | |
| Revenue (Memorial Health Services) | 5.000% | 10/1/24 | 5,000 | 6,177 |
| California Health Facilities Financing Authority | | | | |
| Revenue (Memorial Health Services) | 5.000% | 10/1/25 | 5,000 | 6,148 |
| California Health Facilities Financing Authority | | | | |
| Revenue (Providence Health & Services) | 6.250% | 10/1/24 | 3,000 | 3,753 |
| California Health Facilities Financing Authority | | | | |
| Revenue (Providence Health & Services) | 6.250% | 10/1/28 | 4,000 | 4,902 |
| California Health Facilities Financing Authority | | | | |
| Revenue (Rady Children’s Hospital) | 5.000% | 8/15/20 | 500 | 607 |
42
| | | | |
| California Intermediate-Term Tax-Exempt Fund | | | | |
| |
| |
| |
| | | | Face | Market |
| | | Maturity | Amount | Value |
| | Coupon | Date | ($000) | ($000) |
| California Health Facilities Financing Authority | | | | |
| Revenue (Rady Children’s Hospital) | 5.500% | 8/15/26 | 6,000 | 7,200 |
| California Health Facilities Financing Authority | | | | |
| Revenue (Rady Children’s Hospital) | 5.000% | 8/15/31 | 2,115 | 2,363 |
| California Health Facilities Financing Authority | | | | |
| Revenue (Scripps Health) | 5.000% | 10/1/17 | 2,515 | 2,976 |
| California Health Facilities Financing Authority | | | | |
| Revenue (Scripps Health) | 5.000% | 10/1/18 | 3,000 | 3,641 |
| California Health Facilities Financing Authority | | | | |
| Revenue (Scripps Health) | 5.000% | 11/15/25 | 750 | 914 |
| California Health Facilities Financing Authority | | | | |
| Revenue (Scripps Health) | 5.000% | 11/15/27 | 850 | 1,026 |
| California Health Facilities Financing Authority | | | | |
| Revenue (Scripps Health) | 5.000% | 11/15/28 | 1,175 | 1,408 |
| California Health Facilities Financing Authority | | | | |
| Revenue (Scripps Health) | 5.000% | 11/15/32 | 1,000 | 1,178 |
| California Health Facilities Financing Authority | | | | |
| Revenue (Scripps Health) VRDO | 0.150% | 12/7/12 LOC | 3,800 | 3,800 |
| California Health Facilities Financing Authority | | | | |
| Revenue (St. Joseph Health System) | 5.500% | 7/1/29 | 10,000 | 11,864 |
| California Health Facilities Financing Authority | | | | |
| Revenue (St. Joseph Health System) PUT | 5.000% | 10/16/14 | 15,000 | 16,130 |
| 1 California Health Facilities Financing Authority | | | | |
| Revenue (St. Joseph Health System) TOB VRDO | 0.160% | 12/7/12 | 15,000 | 15,000 |
| California Health Facilities Financing Authority | | | | |
| Revenue (Stanford Hospital) | 5.000% | 11/15/13 (Prere.) | 2,715 | 2,837 |
| California Health Facilities Financing Authority | | | | |
| Revenue (Stanford Hospital) | 5.000% | 11/15/13 (Prere.) | 3,000 | 3,135 |
| California Health Facilities Financing Authority | | | | |
| Revenue (Stanford Hospital) | 5.000% | 11/15/13 (Prere.) | 6,275 | 6,557 |
| California Health Facilities Financing Authority | | | | |
| Revenue (Stanford Hospital) | 5.000% | 8/15/19 | 2,000 | 2,482 |
| California Health Facilities Financing Authority | | | | |
| Revenue (Stanford Hospital) | 4.000% | 8/15/21 | 2,250 | 2,650 |
| California Health Facilities Financing Authority | | | | |
| Revenue (Stanford Hospital) | 5.000% | 8/15/23 | 1,830 | 2,296 |
| California Health Facilities Financing Authority | | | | |
| Revenue (Sutter Health) | 5.000% | 8/15/20 | 2,200 | 2,771 |
| California Health Facilities Financing Authority | | | | |
| Revenue (Sutter Health) | 5.000% | 8/15/21 | 1,275 | 1,617 |
| California Health Facilities Financing Authority | | | | |
| Revenue (Sutter Health) | 5.000% | 8/15/22 | 1,090 | 1,364 |
| California Health Facilities Financing Authority | | | | |
| Revenue (Sutter Health) | 5.500% | 8/15/26 | 4,750 | 5,819 |
| California Health Facilities Financing Authority | | | | |
| Revenue (Sutter Health) | 5.250% | 8/15/31 | 4,500 | 5,424 |
| California Health Facilities Financing Authority | | | | |
| Revenue (Sutter Health) | 5.875% | 8/15/31 | 5,000 | 6,180 |
| 1 California Health Facilities Financing Authority | | | | |
| Revenue (Sutter Health) TOB VRDO | 0.170% | 12/7/12 | 1,160 | 1,160 |
| California Infrastructure & Economic | | | | |
| Development Bank Revenue | | | | |
| (American National Red Cross) VRDO | 0.150% | 12/7/12 LOC | 3,365 | 3,365 |
| 1 California Infrastructure & Economic | | | | |
| Development Bank Revenue (Bay Area Toll | | | | |
| Bridges Seismic Retrofit) TOB VRDO | 0.180% | 12/3/12 (ETM) | 18,770 | 18,770 |
43
| | | | |
| California Intermediate-Term Tax-Exempt Fund | | | | |
| |
| |
| |
| | | | Face | Market |
| | | Maturity | Amount | Value |
| | Coupon | Date | ($000) | ($000) |
| California Infrastructure & Economic | | | | |
| Development Bank Revenue (Clean Water | | | | |
| State Revolving Fund) | 5.000% | 10/1/14 | 2,500 | 2,510 |
| California Infrastructure & Economic | | | | |
| Development Bank Revenue | | | | |
| (J. Paul Getty Trust) | 4.000% | 10/1/15 | 1,400 | 1,543 |
| 2 California Infrastructure & Economic | | | | |
| Development Bank Revenue | | | | |
| (J. Paul Getty Trust) PUT | 0.660% | 4/1/14 | 5,000 | 5,013 |
| California Infrastructure & Economic | | | | |
| Development Bank Revenue | | | | |
| (Los Angeles County Museum of | | | | |
| Natural History Foundation) VRDO | 0.140% | 12/3/12 LOC | 2,800 | 2,800 |
| California Infrastructure & Economic | | | | |
| Development Bank Revenue | | | | |
| (Science Center Phase II Project) | 5.000% | 5/1/18 (14) | 1,785 | 1,909 |
| California Infrastructure & Economic | | | | |
| Development Bank Revenue | | | | |
| (Science Center Phase II Project) | 5.000% | 5/1/19 (14) | 1,040 | 1,105 |
| California Infrastructure & Economic | | | | |
| Development Bank Revenue | | | | |
| (Science Center Phase II Project) | 5.000% | 5/1/21 (14) | 1,145 | 1,200 |
| California Infrastructure & Economic | | | | |
| Development Bank Revenue | | | | |
| (SRI International) VRDO | 0.170% | 12/7/12 LOC | 4,700 | 4,700 |
| California Infrastructure & Economic | | | | |
| Development Bank Revenue | | | | |
| (State Revolving Fund) | 5.000% | 10/1/29 | 7,000 | 7,469 |
| California Infrastructure & Economic | | | | |
| Development Bank Revenue | | | | |
| (Workers’ Compensation Relief) | 5.250% | 10/1/13 (2) | 18,000 | 18,707 |
| California Infrastructure & Economic | | | | |
| Development Bank Revenue | | | | |
| (Workers’ Compensation Relief) | 5.250% | 10/1/14 (2) | 25,815 | 26,842 |
| California Municipal Finance Authority | | | | |
| (Community Hospitals of Central | | | | |
| California Obligated Group) COP | 5.375% | 2/1/29 | 16,600 | 18,227 |
| California Municipal Finance Authority | | | | |
| Revenue (University of La Verne) | 5.000% | 6/1/16 | 1,000 | 1,110 |
| California Municipal Finance Authority | | | | |
| Revenue (University of La Verne) | 4.750% | 6/1/18 | 2,325 | 2,647 |
| California Municipal Finance Authority | | | | |
| Revenue (University of La Verne) | 5.000% | 6/1/19 | 2,375 | 2,784 |
| California Municipal Finance Authority | | | | |
| Solid Waste Revenue (Republic | | | | |
| Services Inc. Project) PUT | 0.450% | 1/2/13 | 17,000 | 17,000 |
| California Pollution Control Financing | | | | |
| Authority Environmental Improvement | | | | |
| Revenue (BP West Coast Products | | | | |
| LLC Project) PUT | 2.600% | 9/2/14 | 13,550 | 14,011 |
| California Pollution Control Financing | | | | |
| Authority Revenue (Pacific Gas & | | | | |
| Electric Co.) VRDO | 0.140% | 12/3/12 LOC | 6,900 | 6,900 |
| California Pollution Control Financing | | | | |
| Authority Revenue (San Diego Gas | | | | |
| & Electric Co.) | 5.900% | 6/1/14 (14) | 17,135 | 18,520 |
44
| | | | |
| California Intermediate-Term Tax-Exempt Fund | | | | |
| |
| |
| |
| | | | Face | Market |
| | | Maturity | Amount | Value |
| | Coupon | Date | ($000) | ($000) |
| California Public Works Board Lease Revenue | | | | |
| (Butterfield State Office Complex) | 5.000% | 6/1/20 | 3,895 | 4,246 |
| California Public Works Board Lease Revenue | | | | |
| (Department of Corrections) | 5.000% | 12/1/12 (14) | 10,625 | 10,626 |
| California Public Works Board Lease Revenue | | | | |
| (Department of Corrections) | 5.500% | 12/1/13 (Prere.) | 10,000 | 10,523 |
| California Public Works Board Lease Revenue | | | | |
| (Department of Corrections) | 5.500% | 12/1/13 (Prere.) | 10,000 | 10,523 |
| California Public Works Board Lease Revenue | | | | |
| (Department of Corrections) | 5.000% | 6/1/15 | 1,250 | 1,379 |
| California Public Works Board Lease Revenue | | | | |
| (Department of Corrections) | 5.000% | 6/1/16 | 7,160 | 8,132 |
| California Public Works Board Lease Revenue | | | | |
| (Department of Corrections) | 5.000% | 10/1/16 | 3,785 | 4,342 |
| California Public Works Board Lease Revenue | | | | |
| (Department of Corrections) | 5.000% | 1/1/18 (2) | 27,790 | 31,187 |
| California Public Works Board Lease Revenue | | | | |
| (Department of Corrections) | 5.000% | 1/1/21 | 3,975 | 4,394 |
| California Public Works Board Lease Revenue | | | | |
| (Department of Corrections) | 5.000% | 6/1/21 | 5,000 | 6,163 |
| California Public Works Board Lease Revenue | | | | |
| (Department of Corrections) | 5.000% | 6/1/22 | 5,210 | 6,437 |
| California Public Works Board Lease Revenue | | | | |
| (Department of Corrections) | 5.750% | 10/1/31 | 6,000 | 7,329 |
| California Public Works Board Lease Revenue | | | | |
| (Department of General Services) | 6.000% | 4/1/27 | 5,000 | 6,134 |
| California Public Works Board Lease Revenue | | | | |
| (Department of Mental Health) | 5.500% | 6/1/15 | 1,500 | 1,610 |
| California Public Works Board Lease Revenue | | | | |
| (Department of Mental Health) | 5.500% | 6/1/17 | 8,000 | 8,557 |
| California Public Works Board Lease Revenue | | | | |
| (Department of Mental Health) | 5.500% | 6/1/18 | 5,000 | 5,342 |
| California Public Works Board Lease Revenue | | | | |
| (Judicial Council Projects) | 5.000% | 12/1/27 | 7,000 | 8,206 |
| California Public Works Board Lease Revenue | | | | |
| (Judicial Council Projects) | 5.000% | 12/1/28 | 4,980 | 5,816 |
| California Public Works Board Lease Revenue | | | | |
| (Judicial Council Projects) | 5.000% | 12/1/29 | 5,000 | 5,818 |
| California Public Works Board Lease Revenue | | | | |
| (Regents of The University of California) | 5.500% | 6/1/14 | 5,140 | 5,358 |
| California Public Works Board Lease Revenue | | | | |
| (Regents of The University of California) | 5.000% | 6/1/18 (14) | 10,310 | 12,512 |
| California Public Works Board Lease Revenue | | | | |
| (Regents of The University of California) | 5.000% | 6/1/20 (14) | 7,670 | 9,622 |
| California Public Works Board Lease Revenue | | | | |
| (Regents of The University of California) | 5.000% | 10/1/20 | 2,015 | 2,573 |
| California Public Works Board Lease Revenue | | | | |
| (Regents of The University of California) | 5.000% | 10/1/21 | 1,650 | 2,123 |
| California Public Works Board Lease Revenue | | | | |
| (Regents of The University of California) | 5.000% | 4/1/25 | 5,765 | 6,275 |
| California Public Works Board Lease Revenue | | | | |
| (Regents of The University of California) | 5.250% | 11/1/26 (14) | 9,010 | 10,117 |
| California Public Works Board Lease Revenue | | | | |
| (Trustees of The California State University) | 5.300% | 10/1/15 (2) | 6,655 | 6,681 |
| California Public Works Board Lease Revenue | | | | |
| (Trustees of The California State University) | 5.375% | 10/1/16 (14) | 4,750 | 4,769 |
45
| | | | |
| California Intermediate-Term Tax-Exempt Fund | | | | |
| |
| |
| |
| | | | Face | Market |
| | | Maturity | Amount | Value |
| | Coupon | Date | ($000) | ($000) |
| California Public Works Board Lease Revenue | | | | |
| (Various Capital Projects) | 5.000% | 11/1/13 | 2,000 | 2,082 |
| California Public Works Board Lease Revenue | | | | |
| (Various Capital Projects) | 5.000% | 11/1/14 | 4,745 | 5,134 |
| California Public Works Board Lease Revenue | | | | |
| (Various Capital Projects) | 4.000% | 11/1/15 | 1,500 | 1,635 |
| California Public Works Board Lease Revenue | | | | |
| (Various Capital Projects) | 5.000% | 11/1/16 | 6,395 | 7,353 |
| California Public Works Board Lease Revenue | | | | |
| (Various Capital Projects) | 5.000% | 11/1/18 | 4,000 | 4,799 |
| California Public Works Board Lease Revenue | | | | |
| (Various Capital Projects) | 5.250% | 11/1/20 | 5,000 | 6,102 |
| California Public Works Board Lease Revenue | | | | |
| (Various Capital Projects) | 5.000% | 12/1/21 | 5,400 | 6,946 |
| California Public Works Board Lease Revenue | | | | |
| (Various Capital Projects) | 5.000% | 11/1/22 | 1,500 | 1,860 |
| California Public Works Board Lease Revenue | | | | |
| (Various Capital Projects) | 5.000% | 12/1/22 | 2,645 | 3,383 |
| California Public Works Board Lease Revenue | | | | |
| (Various Capital Projects) | 5.000% | 4/1/23 | 4,180 | 5,078 |
| California Public Works Board Lease Revenue | | | | |
| (Various Capital Projects) | 5.000% | 11/1/23 | 1,000 | 1,221 |
| California Public Works Board Lease Revenue | | | | |
| (Various Capital Projects) | 5.000% | 11/1/24 | 2,000 | 2,405 |
| California Public Works Board Lease Revenue | | | | |
| (Various Capital Projects) | 5.000% | 11/1/25 | 3,560 | 4,258 |
| California Public Works Board Lease Revenue | | | | |
| (Various Capital Projects) | 5.000% | 9/1/30 | 3,000 | 3,503 |
| California Public Works Board Lease Revenue | | | | |
| (Various Capital Projects) | 5.000% | 9/1/31 | 3,000 | 3,489 |
| California Public Works Board Lease Revenue | | | | |
| (Various Capital Projects) | 5.000% | 12/1/31 | 5,000 | 6,110 |
| California Public Works Board Lease Revenue | | | | |
| (Various Capital Projects) | 5.000% | 11/1/32 | 11,465 | 13,323 |
| California RAN | 2.500% | 6/20/13 | 64,000 | 64,798 |
| California State University Revenue Systemwide | 5.375% | 5/1/13 (Prere.) | 5,390 | 5,506 |
| California State University Revenue Systemwide | 5.000% | 11/1/20 | 5,000 | 6,359 |
| California State University Revenue Systemwide | 5.250% | 11/1/20 | 3,515 | 4,330 |
| California State University Revenue Systemwide | 5.000% | 11/1/22 (2) | 18,440 | 20,326 |
| California State University Revenue Systemwide | 5.000% | 11/1/24 | 8,690 | 10,308 |
| California State University Revenue Systemwide | 5.000% | 11/1/24 | 2,915 | 3,606 |
| California State University Revenue Systemwide | 5.000% | 11/1/25 | 11,820 | 13,933 |
| California State University Revenue Systemwide | 5.000% | 11/1/26 | 12,530 | 14,770 |
| California State University Revenue Systemwide | 5.000% | 11/1/27 | 5,000 | 5,789 |
| California State University Revenue Systemwide | 5.000% | 11/1/27 | 5,740 | 6,942 |
| 1 California State University Revenue Systemwide | | | | |
| TOB VRDO | 0.250% | 12/7/12 (12) | 5,000 | 5,000 |
| California Statewide Communities Development | | | | |
| Authority Health Facility Revenue | | | | |
| (Adventist Health System/ West) | 5.000% | 3/1/25 | 14,975 | 16,156 |
| California Statewide Communities Development | | | | |
| Authority Health Facility Revenue | | | | |
| (Memorial Health Services) | 6.000% | 4/1/13 (Prere.) | 10,000 | 10,194 |
| California Statewide Communities Development | | | | |
| Authority Health Facility Revenue | | | | |
| (Memorial Health Services) | 6.000% | 4/1/13 (Prere.) | 6,920 | 7,055 |
46
| | | | |
| California Intermediate-Term Tax-Exempt Fund | | | | |
| |
| |
| |
| | | | Face | Market |
| | | Maturity | Amount | Value |
| | Coupon | Date | ($000) | ($000) |
| California Statewide Communities Development | | | | |
| Authority Health Facility Revenue | | | | |
| (Memorial Health Services) | 6.000% | 4/1/13 (Prere.) | 5,335 | 5,439 |
| California Statewide Communities Development | | | | |
| Authority Health Facility Revenue | | | | |
| (Memorial Health Services) | 6.000% | 4/1/13 (Prere.) | 7,780 | 7,931 |
| California Statewide Communities Development | | | | |
| Authority Pollution Control Revenue | | | | |
| (Southern California Edison Co.) | 4.500% | 9/1/29 | 1,825 | 2,010 |
| California Statewide Communities Development | | | | |
| Authority Pollution Control Revenue | | | | |
| (Southern California Edison Co.) PUT | 4.250% | 11/1/16 (3) | 15,000 | 16,639 |
| California Statewide Communities Development | | | | |
| Authority Pollution Control Revenue | | | | |
| (Southern California Edison Co.) PUT | 4.250% | 11/1/16 (3) | 25,000 | 27,822 |
| California Statewide Communities Development | | | | |
| Authority Revenue (Cottage Health System | | | | |
| Obligated Group) | 5.250% | 11/1/30 | 10,000 | 11,721 |
| California Statewide Communities Development | | | | |
| Authority Revenue (Daughters of Charity | | | | |
| Health System - St. Francis Medical Center) | 5.250% | 7/1/13 | 1,250 | 1,278 |
| California Statewide Communities Development | | | | |
| Authority Revenue (Daughters of Charity | | | | |
| Health System - St. Francis Medical Center) | 5.000% | 7/1/22 | 5,155 | 5,413 |
| California Statewide Communities Development | | | | |
| Authority Revenue (Daughters of Charity | | | | |
| Health System - St. Francis Medical Center) | 5.250% | 7/1/25 | 1,890 | 1,980 |
| 3 California Statewide Communities Development | | | | |
| Authority Revenue (Episcopal Communities | | | | |
| & Services) | 5.000% | 5/15/27 | 500 | 576 |
| 3 California Statewide Communities Development | | | | |
| Authority Revenue (Episcopal Communities | | | | |
| & Services) | 5.000% | 5/15/32 | 680 | 771 |
| California Statewide Communities Development | | | | |
| Authority Revenue (Huntington | | | | |
| Memorial Hospital) | 5.000% | 7/1/18 | 6,190 | 6,793 |
| California Statewide Communities Development | | | | |
| Authority Revenue (Institute for | | | | |
| Defense Analyses) VRDO | 0.160% | 12/7/12 (2)LOC | 3,265 | 3,265 |
| California Statewide Communities Development | | | | |
| Authority Revenue (Kaiser Permanente) | 5.000% | 4/1/14 | 14,890 | 15,777 |
| California Statewide Communities Development | | | | |
| Authority Revenue (Kaiser Permanente) | 5.250% | 8/1/31 | 3,200 | 3,580 |
| California Statewide Communities Development | | | | |
| Authority Revenue (Kaiser Permanente) PUT | 5.000% | 5/1/17 | 6,000 | 6,964 |
| California Statewide Communities Development | | | | |
| Authority Revenue (Lodi Memorial Hospital) | 5.000% | 12/1/22 | 8,000 | 8,800 |
| California Statewide Communities Development | | | | |
| Authority Revenue (Los Angeles County | | | | |
| Museum of Art Project) VRDO | 0.160% | 12/7/12 LOC | 16,000 | 16,000 |
| California Statewide Communities Development | | | | |
| Authority Revenue (Proposition 1A | | | | |
| Receivables Program) | 5.000% | 6/15/13 | 28,000 | 28,729 |
| California Statewide Communities Development | | | | |
| Authority Revenue (Rady Children’s Hospital - | | | | |
| San Diego) | 5.000% | 8/15/20 (14) | 2,440 | 2,667 |
47
| | | | |
| California Intermediate-Term Tax-Exempt Fund | | | | |
| |
| |
| |
| | | | Face | Market |
| | | Maturity | Amount | Value |
| | Coupon | Date | ($000) | ($000) |
| California Statewide Communities Development | | | | |
| Authority Revenue (Rady Children’s Hospital - | | | | |
| San Diego) | 5.000% | 8/15/23 (14) | 5,285 | 5,910 |
| California Statewide Communities Development | | | | |
| Authority Revenue (Sherman Oaks Project) | 5.500% | 8/1/15 (2) | 4,685 | 5,118 |
| California Statewide Communities Development | | | | |
| Authority Revenue (St. Joseph Health System) | 4.500% | 7/1/18 (4) | 10,615 | 11,430 |
| California Statewide Communities Development | | | | |
| Authority Revenue (Sutter Health) | 5.000% | 8/15/19 | 530 | 650 |
| California Statewide Communities Development | | | | |
| Authority Revenue (Sutter Health) | 5.000% | 8/15/20 | 500 | 621 |
| California Statewide Communities Development | | | | |
| Authority Revenue (Sutter Health) | 5.000% | 8/15/22 | 1,050 | 1,316 |
| California Statewide Communities Development | | | | |
| Authority Revenue (Sutter Health) | 5.250% | 8/15/31 | 7,500 | 9,040 |
| California Statewide Communities Development | | | | |
| Authority Revenue (Sutter Health) | 5.000% | 8/15/32 | 11,820 | 13,711 |
| 1 California Statewide Communities Development | | | | |
| Authority Revenue (Sutter Health) TOB VRDO | 0.160% | 12/7/12 | 4,038 | 4,038 |
| California Statewide Communities Development | | | | |
| Authority Senior Living Revenue | | | | |
| (Southern California Presbyterian Homes) | 7.000% | 11/15/29 | 2,000 | 2,341 |
| California Statewide Communities Development | | | | |
| Authority Student Housing Revenue | | | | |
| (CHF-Irvine LLC - UCI East Campus | | | | |
| Apartments Phase II) | 5.500% | 5/15/26 | 5,000 | 5,527 |
| California Statewide Communities Development | | | | |
| Authority Student Housing Revenue | | | | |
| (CHF-Irvine LLC - UCI East Campus | | | | |
| Apartments Phase II) | 5.125% | 5/15/31 | 7,000 | 7,810 |
| Central CA Unified School District GO | 5.500% | 8/1/29 (12) | 3,000 | 3,556 |
| Central Valley CA Financing Authority | | | | |
| Cogeneration Project Revenue | | | | |
| (Carson Ice-Gen Project) | 5.000% | 7/1/17 | 1,000 | 1,152 |
| Central Valley CA Financing Authority | | | | |
| Cogeneration Project Revenue | | | | |
| (Carson Ice-Gen Project) | 5.000% | 7/1/19 | 765 | 919 |
| Central Valley CA Financing Authority | | | | |
| Cogeneration Project Revenue | | | | |
| (Carson Ice-Gen Project) | 5.250% | 7/1/20 | 1,025 | 1,265 |
| Cerritos CA Community College District GO | 0.000% | 8/1/20 | 500 | 404 |
| Cerritos CA Community College District GO | 0.000% | 8/1/22 | 500 | 359 |
| Cerritos CA Community College District GO | 0.000% | 8/1/23 | 500 | 340 |
| 1 Cerritos CA Community College District GO | | | | |
| TOB VRDO | 0.190% | 12/7/12 | 5,500 | 5,500 |
| 1 Chabot-Las Positas CA Community College | | | | |
| District GO TOB VRDO | 0.190% | 12/7/12 | 3,000 | 3,000 |
| Chula Vista CA Industrial Development Revenue | | | | |
| (San Diego Gas & Electric Co.) | 1.650% | 7/1/18 | 1,000 | 1,018 |
| Clovis CA Unified School District GO | 0.000% | 8/1/18 (14) | 3,645 | 3,236 |
| Colton CA Public Financing Authority | | | | |
| Electric Revenue | 5.000% | 4/1/23 | 2,065 | 2,492 |
| Colton CA Public Financing Authority | | | | |
| Electric Revenue | 5.000% | 4/1/24 | 1,665 | 1,987 |
| Compton CA Unified School District GO | 5.250% | 9/1/13 (Prere.) | 1,295 | 1,344 |
| Compton CA Unified School District GO | 5.250% | 9/1/13 (Prere.) | 1,460 | 1,515 |
48
| | | | |
| California Intermediate-Term Tax-Exempt Fund | | | | |
| |
| |
| |
| | | | Face | Market |
| | | Maturity | Amount | Value |
| | Coupon | Date | ($000) | ($000) |
| Compton CA Unified School District GO | 5.250% | 9/1/13 (Prere.) | 1,645 | 1,707 |
| Contra Costa CA Community College District GO | 5.000% | 8/1/24 | 4,140 | 5,322 |
| 1 Contra Costa CA Community College District GO | | | | |
| TOB VRDO | 0.170% | 12/7/12 | 6,000 | 6,000 |
| Contra Costa County CA Public Financing | | | | |
| Authority Lease Revenue | 5.000% | 6/1/22 (14) | 15,300 | 17,172 |
| Corona-Norco CA Unified School District GO | 0.000% | 8/1/20 (12) | 1,825 | 1,497 |
| Corona-Norco CA Unified School District GO | 0.000% | 8/1/21 (12) | 2,010 | 1,558 |
| Corona-Norco CA Unified School District GO | 0.000% | 8/1/22 (12) | 1,700 | 1,237 |
| Corona-Norco CA Unified School District GO | 0.000% | 8/1/23 (12) | 1,000 | 686 |
| Corona-Norco CA Unified School District GO | 0.000% | 8/1/25 (12) | 1,325 | 832 |
| Corona-Norco CA Unified School District GO | 0.000% | 8/1/26 (12) | 1,530 | 916 |
| Corona-Norco CA Unified School District GO | 0.000% | 8/1/27 (12) | 1,500 | 850 |
| Corona-Norco CA Unified School District GO | 0.000% | 8/1/28 (12) | 1,290 | 696 |
| Culver City CA Redevelopment Agency | | | | |
| Tax Allocation Revenue | 5.375% | 11/1/16 (4) | 3,260 | 3,273 |
| 3 East Bay CA Municipal Utility District Water | | | | |
| System Revenue | 5.000% | 6/1/14 | 2,000 | 2,108 |
| East Bay CA Municipal Utility District Water | | | | |
| System Revenue | 5.000% | 6/1/30 | 2,005 | 2,438 |
| East Bay CA Municipal Utility District Water | | | | |
| System Revenue | 5.000% | 6/1/31 | 16,020 | 19,353 |
| 1 East Bay CA Municipal Utility District Water | | | | |
| System Revenue TOB VRDO | 0.150% | 12/7/12 | 4,960 | 4,960 |
| East Bay CA Regional Park District Revenue | 5.000% | 9/1/28 | 4,415 | 5,319 |
| Eastern California Municipal Water District | | | | |
| Water & Sewer COP | 5.000% | 7/1/26 | 5,245 | 6,131 |
| Eastern California Municipal Water District | | | | |
| Water & Sewer COP | 5.000% | 7/1/27 | 6,220 | 7,235 |
| Eastern California Municipal Water District | | | | |
| Water & Sewer COP | 5.000% | 7/1/28 | 1,000 | 1,144 |
| El Camino CA Community College District GO | 0.000% | 8/1/29 | 8,065 | 4,127 |
| El Camino CA Community College District GO | 0.000% | 8/1/32 | 10,000 | 4,306 |
| El Camino CA Community College District GO | 0.000% | 8/1/33 | 3,500 | 1,424 |
| El Dorado CA Irrigation District Revenue | 4.500% | 3/1/19 (4) | 2,000 | 2,350 |
| El Dorado CA Irrigation District Revenue | 4.750% | 3/1/20 (4) | 1,500 | 1,805 |
| El Dorado CA Irrigation District Revenue | 5.000% | 3/1/21 (4) | 2,280 | 2,797 |
| El Dorado County CA Community Facilities | | | | |
| District No. 92-1 Special Tax Revenue | 5.000% | 9/1/21 | 2,000 | 2,379 |
| Encinitas CA Community Facilities District No. 1 | | | | |
| Special Tax Revenue | 5.000% | 9/1/28 | 1,000 | 1,147 |
| Encinitas CA Community Facilities District No. 1 | | | | |
| Special Tax Revenue | 5.000% | 9/1/29 | 800 | 912 |
| Fontana CA Public Financing Authority Tax | | | | |
| Allocation Revenue | 5.000% | 10/1/21 (2) | 3,335 | 3,621 |
| Fontana CA Public Financing Authority Tax | | | | |
| Allocation Revenue | 5.000% | 10/1/23 (2) | 2,875 | 3,122 |
| Fontana CA Public Financing Authority Tax | | | | |
| Allocation Revenue | 5.000% | 10/1/24 (2) | 3,475 | 3,753 |
| Fontana CA Public Financing Authority Tax | | | | |
| Allocation Revenue | 5.000% | 10/1/26 (2) | 4,480 | 4,813 |
| Fontana CA Unified School District GO | 5.250% | 8/1/26 (4) | 4,350 | 5,217 |
| Foothill/Eastern Corridor Agency California | | | | |
| Toll Road Revenue | 5.250% | 1/15/13 (14) | 5,000 | 5,011 |
| Foothill/Eastern Corridor Agency California | | | | |
| Toll Road Revenue | 5.375% | 1/15/15 (14) | 5,000 | 5,010 |
49
| | | | |
| California Intermediate-Term Tax-Exempt Fund | | | | |
| |
| |
| |
| | | | Face | Market |
| | | Maturity | Amount | Value |
| | Coupon | Date | ($000) | ($000) |
| Fresno CA Sewer Revenue | 5.000% | 9/1/24 (12) | 830 | 995 |
| 1 Fresno CA Sewer Revenue TOB VRDO | 0.180% | 12/7/12 (12) | 5,170 | 5,170 |
| Fullerton CA Community Facilities District No. 1 | | | | |
| Special Tax Revenue (Amerige Heights) | 5.000% | 9/1/26 | 1,000 | 1,143 |
| Fullerton CA Community Facilities District No. 1 | | | | |
| Special Tax Revenue (Amerige Heights) | 5.000% | 9/1/32 | 1,600 | 1,788 |
| Golden State Tobacco Securitization Corp. | | | | |
| California | 5.000% | 6/1/13 (Prere.) | 1,930 | 1,976 |
| Golden State Tobacco Securitization Corp. | | | | |
| California | 5.500% | 6/1/13 (Prere.) | 7,530 | 7,728 |
| Golden State Tobacco Securitization Corp. | | | | |
| California | 5.500% | 6/1/13 (Prere.) | 5,000 | 5,131 |
| * Golden State Tobacco Securitization Corp. | | | | |
| California | 6.250% | 6/1/13 (Prere.) | 53,600 | 55,145 |
| Golden State Tobacco Securitization Corp. | | | | |
| California | 7.800% | 6/1/13 (Prere.) | 25,170 | 26,127 |
| Golden State Tobacco Securitization Corp. | | | | |
| California | 4.500% | 6/1/27 | 31,715 | 29,170 |
| Golden State Tobacco Securitization Corp. | | | | |
| California | 0.000% | 6/1/37 | 20,000 | 17,864 |
| Grossmont CA Union High School District GO | 0.000% | 8/1/28 | 3,210 | 1,731 |
| Grossmont CA Union High School District GO | 0.000% | 8/1/29 | 6,965 | 3,483 |
| Grossmont-Cuyamaca CA Community | | | | |
| College District GO | 0.000% | 8/1/25 (12) | 14,010 | 8,798 |
| Grossmont-Cuyamaca CA Community | | | | |
| College District GO | 0.000% | 8/1/28 (12) | 21,875 | 11,671 |
| Huntington Beach CA Union High School | | | | |
| District GO | 5.000% | 8/1/27 (4) | 3,530 | 3,768 |
| Inland Empire Tobacco Securitization Authority | | | | |
| California Revenue | 4.625% | 6/1/21 | 8,295 | 7,703 |
| Intermodal Container Transfer Facility Joint | | | | |
| Power Authority California Revenue | | | | |
| (Union Pacific Railroad Co.) | 5.125% | 11/1/13 (2) | 1,870 | 1,947 |
| Irvine CA Public Facilities & Infrastructure | | | | |
| Authority Assessment Revenue VRDO | 0.150% | 12/3/12 LOC | 4,000 | 4,000 |
| Irvine CA Public Facilities & Infrastructure | | | | |
| Authority Assessment Revenue VRDO | 0.150% | 12/3/12 LOC | 3,535 | 3,535 |
| Irvine CA Reassessment District No. 05-21 | | | | |
| Improvement Revenue VRDO | 0.150% | 12/3/12 LOC | 15,300 | 15,300 |
| Irvine CA Reassessment District No. 12-1 | | | | |
| Improvement Revenue | 4.000% | 9/2/18 | 1,350 | 1,530 |
| Irvine CA Reassessment District No. 12-1 | | | | |
| Improvement Revenue | 4.000% | 9/2/19 | 2,000 | 2,290 |
| Irvine CA Reassessment District No. 12-1 | | | | |
| Improvement Revenue | 4.000% | 9/2/20 | 1,000 | 1,145 |
| Irvine CA Reassessment District No. 12-1 | | | | |
| Improvement Revenue | 4.000% | 9/2/21 | 1,750 | 2,009 |
| Irvine CA Reassessment District No. 12-1 | | | | |
| Improvement Revenue | 5.000% | 9/2/23 | 400 | 484 |
| Irvine CA Reassessment District No. 85-7A | | | | |
| Improvement Revenue VRDO | 0.150% | 12/3/12 LOC | 1,770 | 1,770 |
| Irvine CA Unified School District Financing | | | | |
| Authority Special Tax Revenue | 5.000% | 9/1/25 (2) | 8,645 | 9,318 |
| Kaweah CA Delta Health Care District Revenue | 4.000% | 6/1/14 | 2,000 | 2,086 |
| Kaweah CA Delta Health Care District Revenue | 4.000% | 6/1/15 | 1,750 | 1,865 |
| Kaweah CA Delta Health Care District Revenue | 4.000% | 6/1/16 | 2,500 | 2,707 |
50
| | | | |
| California Intermediate-Term Tax-Exempt Fund | | | | |
| |
| |
| |
| | | | Face | Market |
| | | Maturity | Amount | Value |
| | Coupon | Date | ($000) | ($000) |
| Kaweah CA Delta Health Care District Revenue | 5.000% | 6/1/17 | 1,110 | 1,263 |
| Kaweah CA Delta Health Care District Revenue | 5.000% | 6/1/18 | 3,255 | 3,744 |
| Kaweah CA Delta Health Care District Revenue | 5.000% | 6/1/19 | 3,415 | 3,958 |
| Kaweah CA Delta Health Care District Revenue | 5.000% | 6/1/20 | 1,585 | 1,860 |
| Kaweah CA Delta Health Care District Revenue | 5.000% | 6/1/21 | 1,755 | 2,060 |
| Kaweah CA Delta Health Care District Revenue | 5.000% | 6/1/22 | 3,950 | 4,654 |
| Kings River Conservation District California COP | 5.000% | 5/1/13 | 2,315 | 2,356 |
| Kings River Conservation District California COP | 5.000% | 5/1/14 | 3,500 | 3,691 |
| Kings River Conservation District California COP | 5.000% | 5/1/15 (ETM) | 2,590 | 2,876 |
| Kings River Conservation District California COP | 5.000% | 5/1/15 | 1,755 | 1,911 |
| Loma Linda CA Hospital Revenue | | | | |
| (Loma Linda University) | 5.000% | 12/1/18 | 8,665 | 9,101 |
| Long Beach CA Community College District GO | 0.000% | 6/1/29 (4) | 6,380 | 3,250 |
| Long Beach CA Finance Authority Lease Revenue | 6.000% | 11/1/17 (2) | 2,775 | 2,945 |
| Long Beach CA Finance Authority Natural Gas | | | | |
| Purchase Revenue | 5.250% | 11/15/20 | 3,000 | 3,526 |
| Long Beach CA Finance Authority Natural Gas | | | | |
| Purchase Revenue | 1.618% | 11/15/25 | 16,845 | 14,377 |
| Long Beach CA Finance Authority Natural Gas | | | | |
| Purchase Revenue | 1.638% | 11/15/26 | 10,025 | 8,491 |
| Long Beach CA Unified School District GO | 5.000% | 8/1/29 | 7,760 | 9,499 |
| Long Beach CA Unified School District GO | 5.000% | 8/1/30 | 5,000 | 6,077 |
| Los Angeles CA Community College District GO | 5.000% | 8/1/21 (4) | 10,000 | 11,183 |
| Los Angeles CA Community College District GO | 5.000% | 8/1/24 | 6,500 | 7,873 |
| Los Angeles CA Community College District GO | 5.000% | 8/1/25 | 5,000 | 6,020 |
| Los Angeles CA Community College District GO | 5.500% | 8/1/25 | 5,000 | 6,242 |
| Los Angeles CA Community College District GO | 5.000% | 8/1/27 | 6,960 | 8,471 |
| Los Angeles CA Community College District GO | 5.000% | 8/1/27 | 4,250 | 5,048 |
| Los Angeles CA Community College District GO | 5.000% | 8/1/31 (4) | 5,000 | 5,632 |
| Los Angeles CA Community College District GO | 5.000% | 8/1/32 (4) | 5,000 | 5,769 |
| 1 Los Angeles CA Community College District GO | | | | |
| TOB VRDO | 0.190% | 12/7/12 | 5,200 | 5,200 |
| Los Angeles CA Department of Airports | | | | |
| International Airport Revenue | 5.000% | 5/15/13 (ETM) | 10,500 | 10,728 |
| Los Angeles CA Department of Airports | | | | |
| International Airport Revenue | 5.000% | 5/15/24 | 4,000 | 4,701 |
| Los Angeles CA Department of Airports | | | | |
| International Airport Revenue | 5.250% | 5/15/25 | 3,000 | 3,553 |
| Los Angeles CA Department of Airports | | | | |
| International Airport Revenue | 5.000% | 5/15/26 | 4,000 | 4,809 |
| Los Angeles CA Department of Airports | | | | |
| International Airport Revenue | 5.250% | 5/15/28 | 10,000 | 12,156 |
| Los Angeles CA Department of Airports | | | | |
| International Airport Revenue | 5.000% | 5/15/29 | 4,385 | 5,104 |
| Los Angeles CA Department of Airports | | | | |
| International Airport Revenue | 5.250% | 5/15/29 | 10,000 | 12,072 |
| Los Angeles CA Department of Airports | | | | |
| International Airport Revenue | 5.000% | 5/15/30 | 1,835 | 2,129 |
| Los Angeles CA Department of Water | | | | |
| & Power Revenue | 4.000% | 1/1/16 | 7,500 | 8,234 |
| Los Angeles CA Department of Water | | | | |
| & Power Revenue | 5.000% | 1/1/16 | 8,300 | 9,371 |
| Los Angeles CA Department of Water | | | | |
| & Power Revenue | 5.000% | 7/1/22 | 10,000 | 12,819 |
| Los Angeles CA Department of Water | | | | |
| & Power Revenue | 5.000% | 7/1/22 | 1,000 | 1,305 |
51
| | | | |
| California Intermediate-Term Tax-Exempt Fund | | | | |
| |
| |
| |
| | | | Face | Market |
| | | Maturity | Amount | Value |
| | Coupon | Date | ($000) | ($000) |
| Los Angeles CA Department of Water | | | | |
| & Power Revenue | 5.000% | 7/1/23 | 1,335 | 1,609 |
| Los Angeles CA Department of Water | | | | |
| & Power Revenue | 5.000% | 7/1/23 (4) | 20,605 | 22,970 |
| Los Angeles CA Department of Water | | | | |
| & Power Revenue | 5.000% | 7/1/23 | 5,605 | 7,238 |
| Los Angeles CA Department of Water | | | | |
| & Power Revenue | 5.000% | 7/1/24 | 2,770 | 3,353 |
| Los Angeles CA Department of Water | | | | |
| & Power Revenue | 5.000% | 7/1/25 | 5,000 | 6,375 |
| Los Angeles CA Department of Water | | | | |
| & Power Revenue | 5.000% | 7/1/26 | 2,350 | 2,795 |
| Los Angeles CA Department of Water | | | | |
| & Power Revenue | 5.000% | 7/1/26 | 2,000 | 2,365 |
| Los Angeles CA Department of Water | | | | |
| & Power Revenue | 5.000% | 7/1/26 | 1,500 | 1,903 |
| Los Angeles CA Department of Water | | | | |
| & Power Revenue | 5.000% | 7/1/27 | 5,000 | 5,911 |
| Los Angeles CA Department of Water | | | | |
| & Power Revenue | 5.000% | 7/1/27 | 1,655 | 1,968 |
| Los Angeles CA Department of Water | | | | |
| & Power Revenue | 5.000% | 7/1/28 | 2,000 | 2,375 |
| Los Angeles CA Department of Water | | | | |
| & Power Revenue | 5.000% | 7/1/29 | 1,670 | 1,978 |
| Los Angeles CA Department of Water | | | | |
| & Power Revenue | 5.000% | 7/1/32 (2) | 1,940 | 2,227 |
| 1 Los Angeles CA Department of Water | | | | |
| & Power Revenue TOB VRDO | 0.170% | 12/3/12 | 9,500 | 9,500 |
| 1 Los Angeles CA Department of Water | | | | |
| & Power Revenue TOB VRDO | 0.170% | 12/3/12 | 5,730 | 5,730 |
| 1 Los Angeles CA Department of Water | | | | |
| & Power Revenue TOB VRDO | 0.180% | 12/3/12 | 1,875 | 1,875 |
| Los Angeles CA Department of Water | | | | |
| & Power Revenue VRDO | 0.140% | 12/3/12 | 24,600 | 24,600 |
| Los Angeles CA Department of Water | | | | |
| & Power Revenue VRDO | 0.150% | 12/7/12 | 5,100 | 5,100 |
| Los Angeles CA Department of Water | | | | |
| & Power Revenue VRDO | 0.150% | 12/7/12 | 12,000 | 12,000 |
| Los Angeles CA GO | 5.000% | 9/1/14 (Prere.) | 4,055 | 4,386 |
| Los Angeles CA GO | 5.000% | 9/1/22 | 10,000 | 12,760 |
| Los Angeles CA GO | 5.000% | 9/1/28 | 5,850 | 7,147 |
| Los Angeles CA GO | 5.000% | 9/1/29 | 5,850 | 7,121 |
| Los Angeles CA GO | 5.000% | 9/1/30 | 5,850 | 7,085 |
| Los Angeles CA Harbor Department Revenue | 5.000% | 8/1/23 | 2,250 | 2,823 |
| Los Angeles CA Harbor Department Revenue | 5.000% | 8/1/25 | 3,795 | 4,708 |
| Los Angeles CA Municipal Improvement Corp. | | | | |
| Lease Revenue (Figueroa Plaza) | 5.000% | 8/1/14 (Prere.) | 345 | 371 |
| Los Angeles CA Municipal Improvement Corp. | | | | |
| Lease Revenue (Figueroa Plaza) | 5.000% | 8/1/28 (14)(3) | 8,635 | 9,207 |
| Los Angeles CA Municipal Improvement Corp. | | | | |
| Lease Revenue (Police Headquarters Facility) | 5.000% | 1/1/21 (14) | 10,830 | 12,099 |
| Los Angeles CA Municipal Improvement Corp. | | | | |
| Lease Revenue (Police Headquarters Facility) | 5.000% | 1/1/22 (14) | 6,500 | 7,197 |
| Los Angeles CA Municipal Improvement Corp. | | | | |
| Lease Revenue (Police Headquarters Facility) | 5.000% | 1/1/23 (14) | 14,700 | 16,215 |
| Los Angeles CA TRAN | 2.000% | 6/27/13 | 34,000 | 34,347 |
52
| | | | |
| California Intermediate-Term Tax-Exempt Fund | | | | |
| |
| |
| |
| | | | Face | Market |
| | | Maturity | Amount | Value |
| | Coupon | Date | ($000) | ($000) |
| Los Angeles CA Unified School District GO | 5.000% | 7/1/13 (Prere.) | 3,000 | 3,084 |
| Los Angeles CA Unified School District GO | 5.000% | 7/1/13 (Prere.) | 5,000 | 5,140 |
| Los Angeles CA Unified School District GO | 5.000% | 7/1/13 (4) | 4,650 | 4,782 |
| Los Angeles CA Unified School District GO | 5.000% | 7/1/13 (Prere.) | 3,900 | 4,009 |
| Los Angeles CA Unified School District GO | 6.000% | 7/1/13 (3) | 3,745 | 3,870 |
| Los Angeles CA Unified School District GO | 5.000% | 7/1/14 (ETM) | 5,000 | 5,372 |
| Los Angeles CA Unified School District GO | 5.000% | 7/1/14 | 5,000 | 5,367 |
| Los Angeles CA Unified School District GO | 6.000% | 7/1/14 (3) | 1,440 | 1,567 |
| Los Angeles CA Unified School District GO | 5.000% | 7/1/15 | 6,350 | 7,089 |
| Los Angeles CA Unified School District GO | 5.000% | 7/1/16 (3) | 2,000 | 2,314 |
| Los Angeles CA Unified School District GO | 5.000% | 7/1/17 (4) | 3,515 | 4,191 |
| Los Angeles CA Unified School District GO | 5.500% | 7/1/17 (3) | 2,800 | 3,401 |
| Los Angeles CA Unified School District GO | 5.000% | 7/1/18 (2) | 5,000 | 5,935 |
| Los Angeles CA Unified School District GO | 5.000% | 7/1/18 (2) | 4,000 | 4,608 |
| Los Angeles CA Unified School District GO | 5.000% | 7/1/18 | 8,360 | 10,228 |
| Los Angeles CA Unified School District GO | 5.000% | 7/1/19 (3) | 5,000 | 5,751 |
| Los Angeles CA Unified School District GO | 5.000% | 7/1/19 (3) | 5,000 | 5,356 |
| Los Angeles CA Unified School District GO | 5.000% | 7/1/20 (2) | 14,135 | 16,225 |
| Los Angeles CA Unified School District GO | 5.000% | 7/1/20 (3) | 9,000 | 10,331 |
| Los Angeles CA Unified School District GO | 5.000% | 7/1/20 (3) | 5,000 | 5,739 |
| Los Angeles CA Unified School District GO | 5.000% | 7/1/21 (2) | 15,940 | 18,297 |
| Los Angeles CA Unified School District GO | 5.000% | 7/1/22 (2) | 16,760 | 19,238 |
| Los Angeles CA Unified School District GO | 4.500% | 7/1/23 (4) | 30,825 | 34,903 |
| Los Angeles CA Unified School District GO | 5.000% | 7/1/23 (2) | 6,000 | 7,057 |
| Los Angeles CA Unified School District GO | 5.000% | 7/1/23 (4) | 12,975 | 15,262 |
| Los Angeles CA Unified School District GO | 5.000% | 7/1/24 (4) | 17,210 | 20,294 |
| Los Angeles CA Unified School District GO | 5.000% | 7/1/25 (2) | 10,235 | 11,651 |
| Los Angeles CA Unified School District GO | 5.000% | 7/1/25 | 7,000 | 8,614 |
| Los Angeles CA Unified School District GO | 5.250% | 7/1/25 | 1,600 | 1,968 |
| Los Angeles CA Unified School District GO | 4.500% | 7/1/26 (2) | 10,000 | 11,277 |
| Los Angeles CA Unified School District GO | 5.000% | 7/1/26 | 5,710 | 6,852 |
| Los Angeles CA Unified School District GO | 5.000% | 7/1/27 | 1,595 | 1,914 |
| Los Angeles CA Unified School District GO | 5.000% | 7/1/27 | 8,375 | 10,174 |
| Los Angeles CA Unified School District GO | 4.500% | 1/1/28 (14) | 7,725 | 8,673 |
| Los Angeles CA Unified School District GO | 5.000% | 1/1/28 | 8,395 | 10,150 |
| Los Angeles CA Unified School District GO | 5.000% | 7/1/28 (2) | 7,845 | 8,778 |
| Los Angeles CA Unified School District GO | 5.250% | 7/1/28 | 5,000 | 6,119 |
| Los Angeles CA Unified School District GO | 5.000% | 7/1/30 (2) | 6,485 | 7,237 |
| Los Angeles CA Wastewater System Revenue | 5.000% | 6/1/20 | 3,000 | 3,827 |
| Los Angeles CA Wastewater System Revenue | 5.000% | 6/1/26 | 13,045 | 16,296 |
| Los Angeles County CA Capital Asset | | | | |
| Leasing Corp. Revenue | 6.000% | 12/1/13 (2) | 2,760 | 2,885 |
| Los Angeles County CA Metropolitan | | | | |
| Transportation Authority Sales Tax Revenue | 4.000% | 7/1/13 | 3,910 | 3,998 |
| 3 Los Angeles County CA Metropolitan | | | | |
| Transportation Authority Sales Tax Revenue | 5.000% | 7/1/15 | 3,300 | 3,630 |
| 3 Los Angeles County CA Metropolitan | | | | |
| Transportation Authority Sales Tax Revenue | 5.000% | 7/1/16 | 3,250 | 3,706 |
| Los Angeles County CA Metropolitan | | | | |
| Transportation Authority Sales Tax Revenue | 5.000% | 7/1/17 (4) | 10,000 | 10,276 |
| Los Angeles County CA Metropolitan | | | | |
| Transportation Authority Sales Tax Revenue | 5.000% | 7/1/20 | 4,000 | 5,032 |
| 3 Los Angeles County CA Metropolitan | | | | |
| Transportation Authority Sales Tax Revenue | 5.000% | 7/1/20 | 6,000 | 7,529 |
| 3 Los Angeles County CA Metropolitan | | | | |
| Transportation Authority Sales Tax Revenue | 5.000% | 7/1/21 | 3,000 | 3,816 |
53
| | | | |
| California Intermediate-Term Tax-Exempt Fund | | | | |
| |
| |
| |
| | | | Face | Market |
| | | Maturity | Amount | Value |
| | Coupon | Date | ($000) | ($000) |
| Los Angeles County CA Metropolitan | | | | |
| Transportation Authority Sales Tax Revenue | 5.000% | 7/1/22 | 10,000 | 12,856 |
| Los Angeles County CA Metropolitan | | | | |
| Transportation Authority Sales Tax Revenue | 5.000% | 7/1/22 | 5,075 | 6,603 |
| Los Angeles County CA Metropolitan | | | | |
| Transportation Authority Sales Tax Revenue | 5.000% | 7/1/23 | 10,000 | 12,731 |
| Los Angeles County CA Public Works | | | | |
| Financing Authority Lease Revenue | 5.000% | 12/1/14 (14) | 24,180 | 26,038 |
| Los Angeles County CA Public Works | | | | |
| Financing Authority Lease Revenue | 5.000% | 12/1/15 (14) | 8,940 | 9,927 |
| Los Angeles County CA Public Works | | | | |
| Financing Authority Lease Revenue | 5.000% | 12/1/19 (14) | 4,860 | 5,378 |
| Los Angeles County CA Public Works | | | | |
| Financing Authority Lease Revenue | 5.000% | 12/1/20 (14) | 5,000 | 5,533 |
| Los Angeles County CA Public Works | | | | |
| Financing Authority Lease Revenue | 5.000% | 8/1/21 | 1,000 | 1,236 |
| Los Angeles County CA Public Works | | | | |
| Financing Authority Lease Revenue | 5.000% | 12/1/21 (14) | 6,460 | 7,128 |
| Los Angeles County CA Public Works | | | | |
| Financing Authority Lease Revenue | 5.000% | 8/1/22 | 1,000 | 1,245 |
| Los Angeles County CA Public Works | | | | |
| Financing Authority Lease Revenue | 5.000% | 12/1/22 (14) | 6,790 | 7,492 |
| Los Angeles County CA Public Works | | | | |
| Financing Authority Lease Revenue | 5.000% | 8/1/23 | 1,500 | 1,829 |
| Los Angeles County CA Public Works | | | | |
| Financing Authority Lease Revenue | 5.000% | 12/1/23 (14) | 2,175 | 2,392 |
| Los Angeles County CA Public Works | | | | |
| Financing Authority Lease Revenue | 5.000% | 8/1/24 | 1,515 | 1,828 |
| Los Angeles County CA Public Works | | | | |
| Financing Authority Lease Revenue | 5.000% | 12/1/24 (14) | 3,095 | 3,404 |
| Los Angeles County CA Public Works | | | | |
| Financing Authority Lease Revenue | 5.000% | 8/1/25 | 1,325 | 1,589 |
| Los Angeles County CA Public Works | | | | |
| Financing Authority Revenue | | | | |
| (Regional Park & Open Space District) | 5.250% | 10/1/17 (4) | 1,000 | 1,216 |
| Los Angeles County CA Schools Regionalized | | | | |
| Business Services Corp. COP | 0.000% | 8/1/13 (ETM) | 2,010 | 1,967 |
| Los Angeles County CA TRAN | 2.000% | 6/28/13 | 10,000 | 10,104 |
| Los Angeles County CA Unified | | | | |
| School District GO | 5.000% | 7/1/21 | 12,500 | 16,047 |
| M-S-R California Energy Authority Revenue | 7.000% | 11/1/34 | 7,000 | 10,339 |
| Marysville CA Revenue (Fremont-Rideout | | | | |
| Health Group) | 5.250% | 1/1/23 | 1,035 | 1,214 |
| Marysville CA Revenue (Fremont-Rideout | | | | |
| Health Group) | 5.250% | 1/1/25 | 2,630 | 3,038 |
| Marysville CA Revenue (Fremont-Rideout | | | | |
| Health Group) | 5.250% | 1/1/28 | 1,500 | 1,709 |
| Metropolitan Water District of Southern | | | | |
| California Revenue | 5.000% | 7/1/17 | 15,000 | 17,989 |
| Metropolitan Water District of Southern | | | | |
| California Revenue | 5.000% | 7/1/18 | 20,000 | 24,667 |
| Metropolitan Water District of Southern | | | | |
| California Revenue | 5.000% | 7/1/20 | 4,000 | 5,148 |
| Metropolitan Water District of Southern | | | | |
| California Revenue | 5.000% | 7/1/21 | 2,700 | 3,526 |
54
| | | | |
| California Intermediate-Term Tax-Exempt Fund | | | | |
| |
| |
| |
| | | | Face | Market |
| | | Maturity | Amount | Value |
| | Coupon | Date | ($000) | ($000) |
| 3 Metropolitan Water District of Southern | | | | |
| California Revenue | 5.000% | 7/1/30 | 2,000 | 2,517 |
| Metropolitan Water District of Southern | | | | |
| California Revenue | 5.000% | 10/1/30 | 8,585 | 10,752 |
| Metropolitan Water District of Southern | | | | |
| California Revenue | 5.000% | 1/1/31 | 1,150 | 1,355 |
| 3 Metropolitan Water District of Southern | | | | |
| California Revenue | 5.000% | 7/1/31 | 2,250 | 2,816 |
| Metropolitan Water District of Southern | | | | |
| California Revenue | 5.000% | 7/1/31 | 2,930 | 3,500 |
| Metropolitan Water District of Southern | | | | |
| California Revenue | 5.000% | 10/1/31 | 11,065 | 13,783 |
| Metropolitan Water District of Southern | | | | |
| California Revenue | 5.000% | 10/1/32 | 9,965 | 12,346 |
| Metropolitan Water District of Southern | | | | |
| California Revenue PUT | 2.500% | 10/1/14 | 5,000 | 5,158 |
| 2 Metropolitan Water District of Southern | | | | |
| California Revenue PUT | 0.510% | 5/1/15 | 10,000 | 10,000 |
| Metropolitan Water District of Southern | | | | |
| California Revenue VRDO | 0.150% | 12/7/12 | 610 | 610 |
| Modesto CA Irrigation District COP | 5.000% | 7/1/13 (Prere.) | 3,165 | 3,253 |
| Modesto CA Irrigation District COP | 5.000% | 10/1/21 (2) | 2,030 | 2,243 |
| Modesto CA Irrigation District COP | 5.000% | 10/1/22 (2) | 2,515 | 2,758 |
| Modesto CA Irrigation District COP | 5.000% | 10/1/23 (2) | 2,645 | 2,893 |
| Modesto CA Irrigation District COP | 5.000% | 7/1/27 | 3,855 | 4,286 |
| Modesto CA Irrigation District Electric Revenue | 5.000% | 7/1/21 | 1,000 | 1,239 |
| Modesto CA Irrigation District Electric Revenue | 5.000% | 7/1/22 | 1,000 | 1,248 |
| Modesto CA Irrigation District Financing | | | | |
| Authority Revenue (Domestic Water Project) | 5.125% | 9/1/15 (2) | 4,365 | 4,383 |
| Mount Diablo CA Unified School District GO | 5.000% | 8/1/24 | 1,555 | 1,926 |
| New Haven CA Unified School District GO | 12.000% | 8/1/15 (4) | 2,905 | 3,771 |
| Newport Beach CA Revenue (Hoag Memorial | | | | |
| Hospital Presbyterian) | 5.875% | 12/1/30 | 5,150 | 6,563 |
| Newport Beach CA Revenue (Hoag Memorial | | | | |
| Hospital Presbyterian) PUT | 5.000% | 2/7/13 | 5,000 | 5,041 |
| Newport Beach CA Revenue (Hoag Memorial | | | | |
| Hospital Presbyterian) VRDO | 0.200% | 12/7/12 LOC | 5,635 | 5,635 |
| Newport Mesa CA Unified School District GO | 0.000% | 8/1/29 | 4,000 | 2,094 |
| Newport Mesa CA Unified School District GO | 0.000% | 8/1/30 | 3,000 | 1,490 |
| Newport Mesa CA Unified School District GO | 0.000% | 8/1/31 | 1,500 | 706 |
| Newport Mesa CA Unified School District GO | 0.000% | 8/1/32 | 14,000 | 6,265 |
| Northern California Gas Authority No. 1 Revenue | 0.691% | 7/1/13 | 9,845 | 9,840 |
| Northern California Gas Authority No. 1 Revenue | 0.841% | 7/1/17 | 23,385 | 22,447 |
| Northern California Power Agency Capital | | | | |
| Facilities Revenue | 5.000% | 8/1/20 | 1,000 | 1,209 |
| Northern California Power Agency Revenue | | | | |
| (Hydroelectric Project) | 5.000% | 7/1/16 | 1,745 | 2,005 |
| Northern California Power Agency Revenue | | | | |
| (Hydroelectric Project) | 5.000% | 7/1/17 | 3,290 | 3,882 |
| Northern California Power Agency Revenue | | | | |
| (Hydroelectric Project) | 5.000% | 7/1/19 | 1,500 | 1,848 |
| Northern California Power Agency Revenue | | | | |
| (Hydroelectric Project) | 5.000% | 7/1/20 | 3,500 | 4,254 |
| Northern California Power Agency Revenue | | | | |
| (Hydroelectric Project) | 5.000% | 7/1/21 | 2,500 | 3,012 |
55
| | | | |
| California Intermediate-Term Tax-Exempt Fund | | | | |
| |
| |
| |
| | | | Face | Market |
| | | Maturity | Amount | Value |
| | Coupon | Date | ($000) | ($000) |
| Northern California Power Agency Revenue | | | | |
| (Hydroelectric Project) | 5.000% | 7/1/22 | 3,395 | 4,048 |
| Northern California Power Agency Revenue | | | | |
| (Hydroelectric Project) | 5.000% | 7/1/28 | 5,000 | 6,088 |
| Northern California Power Agency Revenue | | | | |
| (Hydroelectric Project) | 5.000% | 7/1/29 | 3,000 | 3,630 |
| Northern California Power Agency Revenue | | | | |
| (Hydroelectric Project) | 5.000% | 7/1/30 | 1,605 | 1,934 |
| Northern California Power Agency Revenue | | | | |
| (Hydroelectric Project) | 5.000% | 7/1/31 | 1,600 | 1,918 |
| Oakland CA GO | 5.000% | 1/15/31 | 3,000 | 3,467 |
| Oakland CA Joint Powers Financing Authority | | | | |
| Lease Revenue (Administration Buildings) | 5.000% | 8/1/23 (12) | 5,000 | 5,682 |
| Oakland CA Joint Powers Financing Authority | | | | |
| Lease Revenue (Administration Buildings) | 5.000% | 8/1/24 (12) | 3,695 | 4,196 |
| Oakland CA Joint Powers Financing Authority | | | | |
| Lease Revenue (Administration Buildings) | 5.000% | 8/1/25 (12) | 5,405 | 6,107 |
| Oakland CA Joint Powers Financing Authority | | | | |
| Lease Revenue (Administration Buildings) | 5.000% | 8/1/26 (12) | 4,190 | 4,718 |
| Oakland CA Joint Powers Financing Authority | | | | |
| Lease Revenue (Convention Center) | 5.500% | 10/1/13 (2) | 1,500 | 1,539 |
| Oakland CA Redevelopment Agency Tax | | | | |
| Allocation Revenue (Central District Project) | 5.500% | 9/1/13 (14) | 3,990 | 4,027 |
| Oakland CA Redevelopment Agency Tax | | | | |
| Allocation Revenue (Central District Project) | 5.500% | 9/1/15 (14) | 3,790 | 3,827 |
| Oakland CA Redevelopment Agency Tax | | | | |
| Allocation Revenue (Central District Project) | 5.500% | 9/1/16 (14) | 6,210 | 6,268 |
| Oakland CA Redevelopment Agency Tax | | | | |
| Allocation Revenue (Central District Project) | 5.000% | 9/1/20 (2) | 12,870 | 13,266 |
| Oakland CA Unified School District GO | 5.000% | 8/1/19 (4) | 13,425 | 15,019 |
| Ohlone CA Community College District GO | 5.000% | 8/1/22 | 750 | 975 |
| Ohlone CA Community College District GO | 5.000% | 8/1/23 | 1,500 | 1,929 |
| Ohlone CA Community College District GO | 5.000% | 8/1/31 | 1,770 | 2,111 |
| Orange County CA Airport Revenue | 5.000% | 7/1/17 (4) | 1,725 | 1,774 |
| Orange County CA Development Agency | | | | |
| Tax Allocation Revenue | 5.250% | 9/1/14 (14) | 1,415 | 1,420 |
| Orange County CA Development Agency | | | | |
| Tax Allocation Revenue | 5.250% | 9/1/15 (14) | 1,485 | 1,489 |
| Orange County CA Development Agency | | | | |
| Tax Allocation Revenue | 5.375% | 9/1/16 (14) | 1,570 | 1,574 |
| Orange County CA Water District COP | 5.000% | 8/15/29 | 6,925 | 8,324 |
| Palm Springs CA Unified School District GO | 5.000% | 8/1/28 | 1,000 | 1,222 |
| Palm Springs CA Unified School District GO | 5.000% | 8/1/29 | 1,500 | 1,823 |
| Palm Springs CA Unified School District GO | 5.000% | 8/1/30 | 1,500 | 1,813 |
| Palm Springs CA Unified School District GO | 5.000% | 8/1/31 | 1,500 | 1,800 |
| Palo Alto CA Improvement Revenue | | | | |
| (University Avenue Area Parking) | 4.000% | 9/2/19 | 1,000 | 1,101 |
| Palo Alto CA Improvement Revenue | | | | |
| (University Avenue Area Parking) | 4.000% | 9/2/20 | 250 | 274 |
| Palo Alto CA Improvement Revenue | | | | |
| (University Avenue Area Parking) | 4.000% | 9/2/21 | 400 | 435 |
| Palo Alto CA Improvement Revenue | | | | |
| (University Avenue Area Parking) | 5.000% | 9/2/27 | 1,000 | 1,143 |
| Palo Alto CA Unified School District GO | 0.000% | 8/1/24 | 15,890 | 11,177 |
| Palomar Pomerado Health California COP | 6.625% | 11/1/29 | 5,000 | 5,818 |
| Palomar Pomerado Health California GO | 0.000% | 8/1/22 (14) | 3,000 | 2,167 |
56
| | | | |
| California Intermediate-Term Tax-Exempt Fund | | | | |
| |
| |
| |
| | | | Face | Market |
| | | Maturity | Amount | Value |
| | Coupon | Date | ($000) | ($000) |
| Pasadena CA Unified School District GO | 5.000% | 5/1/30 | 3,695 | 4,504 |
| Pasadena CA Unified School District GO | 5.000% | 5/1/31 | 1,500 | 1,810 |
| Pasadena CA Unified School District GO | 5.000% | 5/1/32 | 2,000 | 2,399 |
| Pittsburg CA Redevelopment Agency Tax | | | | |
| Allocation Revenue (Los Medanos | | | | |
| Community Development Project) VRDO | 0.170% | 12/3/12 LOC | 8,515 | 8,515 |
| Pomona CA Single Family Mortgage Revenue | 7.600% | 5/1/23 (ETM) | 9,680 | 12,954 |
| Port of Oakland CA Revenue | 5.000% | 11/1/20 (14) | 4,825 | 5,562 |
| Port of Oakland CA Revenue | 5.000% | 11/1/26 (14) | 9,800 | 10,892 |
| Poway CA Unified School District GO | 4.000% | 9/1/16 | 250 | 271 |
| Poway CA Unified School District GO | 0.000% | 8/1/17 | 2,000 | 1,848 |
| Poway CA Unified School District GO | 4.000% | 9/1/17 | 250 | 274 |
| Poway CA Unified School District GO | 0.000% | 8/1/18 | 4,565 | 4,076 |
| Poway CA Unified School District GO | 4.000% | 9/1/18 | 450 | 498 |
| Poway CA Unified School District GO | 0.000% | 8/1/19 | 5,425 | 4,670 |
| Poway CA Unified School District GO | 5.000% | 9/1/19 | 1,015 | 1,192 |
| Poway CA Unified School District GO | 0.000% | 8/1/20 | 3,280 | 2,691 |
| Poway CA Unified School District GO | 5.000% | 9/1/20 | 625 | 741 |
| Poway CA Unified School District GO | 5.000% | 9/1/21 | 325 | 385 |
| Poway CA Unified School District GO | 5.000% | 9/1/22 | 460 | 544 |
| Poway CA Unified School District GO | 5.000% | 9/1/23 | 1,575 | 1,820 |
| Poway CA Unified School District GO | 5.000% | 8/1/26 | 5,125 | 6,336 |
| Poway CA Unified School District GO | 5.000% | 9/1/26 | 1,000 | 1,138 |
| Poway CA Unified School District GO | 0.000% | 8/1/28 | 9,070 | 4,891 |
| Poway CA Unified School District GO | 5.000% | 9/1/29 | 1,210 | 1,356 |
| Poway CA Unified School District GO | 5.000% | 9/1/30 | 2,570 | 2,864 |
| Rancho Cucamonga CA Redevelopment | | | | |
| Agency Tax Allocation Revenue | | | | |
| (Rancho Redevelopment Project) | 5.000% | 9/1/15 (2) | 2,835 | 3,036 |
| Rancho Cucamonga CA Redevelopment | | | | |
| Agency Tax Allocation Revenue | | | | |
| (Rancho Redevelopment Project) | 5.000% | 9/1/16 (2) | 5,100 | 5,443 |
| Rancho Mirage CA Joint Powers Financing | | | | |
| Authority Revenue (Eisenhower Medical Center) | 5.000% | 7/1/27 | 12,000 | 12,714 |
| Rio Hondo CA Community College District GO | 0.000% | 8/1/31 | 2,000 | 897 |
| Riverside CA Electric Revenue | 5.000% | 10/1/24 (4) | 1,000 | 1,160 |
| Riverside CA Electric Revenue | 5.000% | 10/1/25 (4) | 2,000 | 2,308 |
| Riverside CA Electric Revenue | 5.000% | 10/1/26 (4) | 2,500 | 2,873 |
| Riverside CA Electric Revenue | 5.000% | 10/1/27 (4) | 3,570 | 4,087 |
| 1 Riverside CA Electric Revenue TOB VRDO | 0.180% | 12/3/12 | 4,695 | 4,695 |
| Riverside CA Electric Revenue VRDO | 0.160% | 12/7/12 LOC | 12,200 | 12,200 |
| Riverside CA Unified School District Financing | | | | |
| Authority Revenue | 5.000% | 9/1/19 | 1,220 | 1,427 |
| Riverside CA Unified School District Financing | | | | |
| Authority Revenue | 5.000% | 9/1/20 | 1,280 | 1,513 |
| Riverside CA Unified School District Financing | | | | |
| Authority Revenue | 5.000% | 9/1/23 | 1,410 | 1,664 |
| Riverside CA Unified School District Financing | | | | |
| Authority Revenue | 5.000% | 9/1/25 | 1,555 | 1,803 |
| Riverside CA Unified School District Financing | | | | |
| Authority Revenue | 5.000% | 9/1/26 | 1,615 | 1,860 |
| Riverside CA Unified School District Financing | | | | |
| Authority Revenue | 5.000% | 9/1/27 | 1,710 | 1,966 |
| Riverside County CA Asset Leasing Corp. | | | | |
| Leasehold Revenue (Riverside County | | | | |
| Hospital Project) | 5.000% | 6/1/15 | 3,000 | 3,290 |
57
| | | | |
| California Intermediate-Term Tax-Exempt Fund | | | | |
| |
| |
| |
| | | | Face | Market |
| | | Maturity | Amount | Value |
| | Coupon | Date | ($000) | ($000) |
| Riverside County CA Asset Leasing Corp. | | | | |
| Leasehold Revenue (Riverside County | | | | |
| Hospital Project) | 5.000% | 6/1/19 | 3,660 | 4,363 |
| Riverside County CA Teeter Notes | 2.000% | 10/16/13 | 10,000 | 10,151 |
| Riverside County CA Transportation Commission | | | | |
| Sales Tax Revenue VRDO | 0.160% | 12/7/12 | 6,500 | 6,500 |
| Rocklin CA Unified School District GO | 0.000% | 8/1/23 (14) | 7,030 | 4,821 |
| Rocklin CA Unified School District GO | 0.000% | 8/1/24 (14) | 2,965 | 1,945 |
| Roseville CA Electric System Revenue | 5.000% | 2/1/30 | 6,120 | 7,036 |
| Roseville CA Natural Gas Financing Authority | | | | |
| Gas Revenue | 5.000% | 2/15/18 | 4,180 | 4,698 |
| Roseville CA Natural Gas Financing Authority | | | | |
| Gas Revenue | 5.000% | 2/15/19 | 10,000 | 11,381 |
| Roseville CA Natural Gas Financing Authority | | | | |
| Gas Revenue | 5.000% | 2/15/20 | 2,000 | 2,303 |
| Sacramento CA Cogeneration Authority Revenue | 5.000% | 7/1/17 | 1,250 | 1,462 |
| Sacramento CA Cogeneration Authority Revenue | 5.000% | 7/1/18 | 725 | 869 |
| Sacramento CA Cogeneration Authority Revenue | 5.000% | 7/1/19 | 1,155 | 1,410 |
| Sacramento CA Cogeneration Authority Revenue | 5.250% | 7/1/20 | 1,250 | 1,570 |
| Sacramento CA Cogeneration Authority Revenue | 5.250% | 7/1/21 | 1,000 | 1,273 |
| Sacramento CA Financing Authority | | | | |
| Lease Revenue | 5.375% | 12/1/12 (Prere.) | 4,395 | 4,396 |
| Sacramento CA Financing Authority | | | | |
| Lease Revenue | 5.000% | 11/1/14 (14) | 1,520 | 1,592 |
| Sacramento CA Financing Authority | | | | |
| Lease Revenue | 5.375% | 12/1/14 (4) | 1,630 | 1,637 |
| Sacramento CA Financing Authority | | | | |
| Lease Revenue | 5.000% | 12/1/19 (14) | 12,860 | 14,116 |
| Sacramento CA Financing Authority | | | | |
| Lease Revenue | 5.000% | 12/1/20 (14) | 13,670 | 14,978 |
| Sacramento CA Municipal Utility District | | | | |
| Financing Authority Revenue | 5.000% | 7/1/21 (14) | 7,710 | 8,452 |
| Sacramento CA Municipal Utility District Revenue | 5.000% | 7/1/17 (14) | 4,000 | 4,424 |
| Sacramento CA Municipal Utility District Revenue | 5.250% | 7/1/24 (2) | 10,085 | 12,751 |
| Sacramento CA Municipal Utility District Revenue | 5.000% | 8/15/24 (4) | 7,550 | 8,852 |
| Sacramento CA Municipal Utility District Revenue | 5.000% | 8/15/24 | 2,660 | 3,373 |
| Sacramento CA Municipal Utility District Revenue | 5.000% | 8/15/25 (4) | 15,275 | 17,817 |
| Sacramento CA Municipal Utility District Revenue | 5.000% | 8/15/25 | 5,455 | 6,849 |
| Sacramento CA Municipal Utility District Revenue | 5.000% | 8/15/26 (4) | 5,000 | 5,806 |
| Sacramento CA Municipal Utility District Revenue | 5.000% | 8/15/30 | 6,435 | 7,771 |
| Sacramento CA Regional Transit District | | | | |
| Farebox Revenue | 5.000% | 3/1/22 | 1,000 | 1,192 |
| Sacramento CA Regional Transit District | | | | |
| Farebox Revenue | 5.000% | 3/1/28 | 2,500 | 2,879 |
| Sacramento CA Regional Transit District | | | | |
| Farebox Revenue | 5.000% | 3/1/29 | 2,635 | 3,021 |
| Sacramento CA Regional Transit District | | | | |
| Farebox Revenue | 5.000% | 3/1/30 | 2,975 | 3,395 |
| Sacramento CA Regional Transit District | | | | |
| Farebox Revenue | 5.000% | 3/1/31 | 3,125 | 3,552 |
| Sacramento CA Transportation Authority | | | | |
| Sales Tax Revenue | 5.000% | 10/1/21 | 2,300 | 2,976 |
| Sacramento County CA Airport Revenue | 5.000% | 7/1/23 (4) | 2,000 | 2,382 |
| Sacramento County CA Airport Revenue | 5.000% | 7/1/24 (4) | 2,500 | 2,947 |
| Sacramento County CA Airport Revenue | 5.000% | 7/1/24 (4) | 1,785 | 2,053 |
| Sacramento County CA Airport Revenue | 5.000% | 7/1/28 | 1,250 | 1,457 |
58
| | | | |
| California Intermediate-Term Tax-Exempt Fund | | | | |
| |
| |
| |
| | | | Face | Market |
| | | Maturity | Amount | Value |
| | Coupon | Date | ($000) | ($000) |
| Sacramento County CA Airport Revenue | 5.000% | 7/1/30 | 3,615 | 4,185 |
| Sacramento County CA Sanitation Districts | | | | |
| Financing Authority Revenue | 5.000% | 12/1/21 (14) | 1,850 | 2,122 |
| Sacramento County CA Sanitation Districts | | | | |
| Financing Authority Revenue | 5.000% | 12/1/22 (14) | 5,495 | 6,321 |
| Sacramento County CA Sanitation Districts | | | | |
| Financing Authority Revenue | 5.000% | 12/1/23 (14) | 7,030 | 8,087 |
| Sacramento County CA Water Financing | | | | |
| Authority Revenue (Agency Zones 40 & 41) | 5.000% | 6/1/13 (Prere.) | 1,235 | 1,265 |
| San Bernardino County CA Justice Center | | | | |
| & Airport COP | 5.000% | 7/1/14 (14) | 5,585 | 5,818 |
| San Bernardino County CA Medical Center COP | 5.500% | 8/1/17 (14) | 3,540 | 3,728 |
| San Bernardino County CA Medical Center COP | 6.500% | 8/1/17 (14) | 3,800 | 4,069 |
| San Bernardino County CA Medical Center COP | 5.500% | 8/1/22 (14) | 8,940 | 10,635 |
| San Bernardino County CA Transportation | | | | |
| Authority Revenue | 5.000% | 3/1/31 | 3,355 | 4,109 |
| San Diego CA Community College District GO | 5.000% | 8/1/23 | 10,000 | 13,080 |
| San Diego CA Community College District GO | 5.000% | 8/1/28 | 4,000 | 5,022 |
| San Diego CA Community College District GO | 5.000% | 8/1/29 | 5,000 | 6,091 |
| San Diego CA Community College District GO | 5.000% | 8/1/30 | 9,830 | 11,896 |
| San Diego CA Community College District GO | 5.000% | 8/1/30 | 8,670 | 10,493 |
| San Diego CA Community College District GO | 5.000% | 8/1/31 | 3,380 | 4,070 |
| San Diego CA Community College District GO | 5.000% | 8/1/32 | 2,000 | 2,400 |
| 1 San Diego CA Community College District GO | | | | |
| TOB VRDO | 0.170% | 12/7/12 | 3,290 | 3,290 |
| San Diego CA Community Facilities District No. 1 | | | | |
| (Miramar Ranch North) Special Tax Revenue | 4.000% | 9/1/17 | 500 | 557 |
| San Diego CA Community Facilities District No. 1 | | | | |
| (Miramar Ranch North) Special Tax Revenue | 4.000% | 9/1/18 | 3,260 | 3,679 |
| San Diego CA Community Facilities District No. 1 | | | | |
| (Miramar Ranch North) Special Tax Revenue | 5.000% | 9/1/20 | 3,470 | 4,228 |
| San Diego CA Public Facilities Financing | | | | |
| Authority Sewer Revenue | 5.000% | 5/15/24 | 3,000 | 3,644 |
| San Diego CA Public Facilities Financing | | | | |
| Authority Sewer Revenue | 5.250% | 5/15/25 | 2,000 | 2,445 |
| San Diego CA Public Facilities Financing | | | | |
| Authority Sewer Revenue | 5.000% | 5/15/27 | 6,000 | 7,141 |
| San Diego CA Public Facilities Financing | | | | |
| Authority Sewer Revenue | 5.250% | 5/15/27 | 5,000 | 6,121 |
| San Diego CA Public Facilities Financing | | | | |
| Authority Sewer Revenue | 5.000% | 5/15/28 | 1,825 | 2,156 |
| San Diego CA Public Facilities Financing | | | | |
| Authority Water Revenue | 5.000% | 8/1/27 | 4,215 | 5,030 |
| San Diego CA Public Facilities Financing | | | | |
| Authority Water Revenue | 5.125% | 8/1/28 | 5,000 | 6,012 |
| San Diego CA Public Facilities Financing | | | | |
| Authority Water Revenue | 5.250% | 8/1/28 | 5,355 | 6,557 |
| San Diego CA Public Facilities Financing | | | | |
| Authority Water Revenue | 5.000% | 8/1/32 | 4,190 | 5,101 |
| San Diego CA Unified School District GO | 0.000% | 7/1/14 (14) | 3,400 | 3,364 |
| San Diego CA Unified School District GO | 0.000% | 7/1/18 (14) | 9,500 | 8,366 |
| San Diego CA Unified School District GO | 5.500% | 7/1/20 (4) | 9,490 | 12,309 |
| San Diego CA Unified School District GO | 5.500% | 7/1/22 (4) | 12,790 | 16,953 |
| San Diego CA Unified School District GO | 5.500% | 7/1/23 (4) | 4,210 | 5,643 |
| San Diego CA Unified School District GO | 0.000% | 7/1/26 | 8,425 | 5,059 |
| San Diego CA Unified School District GO | 5.500% | 7/1/26 (4) | 7,490 | 9,978 |
59
| | | | |
| California Intermediate-Term Tax-Exempt Fund | | | | |
| |
| |
| |
| | | | Face | Market |
| | | Maturity | Amount | Value |
| | Coupon | Date | ($000) | ($000) |
| San Diego CA Unified School District GO | 0.000% | 7/1/27 | 8,500 | 4,832 |
| San Diego CA Unified School District GO | 0.000% | 7/1/28 | 8,000 | 4,328 |
| San Diego CA Unified School District GO | 0.000% | 7/1/29 | 3,250 | 1,631 |
| San Diego CA Unified School District GO | 0.000% | 7/1/30 | 9,985 | 4,758 |
| San Diego CA Unified School District GO | 0.000% | 7/1/30 | 2,500 | 1,191 |
| San Diego County CA COP | 5.000% | 2/1/22 (2) | 2,000 | 2,194 |
| San Diego County CA Regional Airport | | | | |
| Authority Revenue | 5.000% | 7/1/25 | 9,000 | 10,693 |
| San Diego County CA Regional Airport | | | | |
| Authority Revenue | 5.000% | 7/1/26 | 3,000 | 3,543 |
| San Diego County CA Regional Airport | | | | |
| Authority Revenue | 5.000% | 7/1/28 | 3,000 | 3,493 |
| San Diego County CA Regional Building | | | | |
| Authority Lease Revenue (County Operations | | | | |
| Center & Annex Redevelopment Project) | 5.000% | 2/1/23 | 4,285 | 5,015 |
| San Diego County CA Regional Building | | | | |
| Authority Lease Revenue (County Operations | | | | |
| Center & Annex Redevelopment Project) | 5.000% | 2/1/25 | 4,820 | 5,558 |
| San Diego County CA Regional Building | | | | |
| Authority Lease Revenue (County Operations | | | | |
| Center & Annex Redevelopment Project) | 5.250% | 2/1/26 | 1,140 | 1,324 |
| San Diego County CA Regional Building | | | | |
| Authority Lease Revenue (County Operations | | | | |
| Center & Annex Redevelopment Project) | 5.000% | 2/1/27 | 2,420 | 2,758 |
| San Diego County CA Regional Building Authority | | | | |
| Lease Revenue (County Operations Center | | | | |
| & Annex Redevelopment Project) | 5.500% | 2/1/28 | 5,780 | 6,747 |
| San Diego County CA Water Authority | | | | |
| Financing Agency Water Revenue | 5.000% | 5/1/27 | 2,000 | 2,467 |
| San Diego County CA Water Authority | | | | |
| Revenue | 5.000% | 5/1/30 | 5,000 | 6,092 |
| San Diego County CA Water Authority | | | | |
| Revenue COP | 5.250% | 5/1/15 (14) | 6,215 | 6,914 |
| San Diego County CA Water Authority | | | | |
| Revenue COP | 5.250% | 5/1/16 (14) | 7,880 | 9,096 |
| San Diego County CA Water Authority | | | | |
| Revenue COP | 5.250% | 5/1/21 (14) | 6,725 | 8,746 |
| San Diego County CA Water Authority | | | | |
| Revenue COP | 5.250% | 5/1/22 (14) | 7,075 | 9,250 |
| San Francisco CA Bay Area Rapid Transit | | | | |
| District GO | 5.000% | 8/1/35 | 15,500 | 17,855 |
| San Francisco CA Bay Area Rapid Transit | | | | |
| District Sales Tax Revenue | 5.000% | 7/1/23 | 9,560 | 11,777 |
| San Francisco CA Bay Area Rapid Transit | | | | |
| District Sales Tax Revenue | 5.000% | 7/1/23 | 1,070 | 1,373 |
| San Francisco CA City & County GO | 5.000% | 6/15/21 | 7,450 | 9,655 |
| San Francisco CA City & County GO | 5.000% | 6/15/22 | 2,595 | 3,351 |
| San Francisco CA City & County GO | 5.000% | 6/15/23 | 4,000 | 5,113 |
| San Francisco CA City & County International | | | | |
| Airport Revenue | 5.250% | 5/1/20 (14) | 5,000 | 6,336 |
| San Francisco CA City & County International | | | | |
| Airport Revenue | 5.000% | 5/1/21 | 5,000 | 6,172 |
| San Francisco CA City & County International | | | | |
| Airport Revenue | 5.000% | 5/1/22 | 5,000 | 6,083 |
| San Francisco CA City & County International | | | | |
| Airport Revenue | 5.000% | 5/1/24 (14) | 10,000 | 11,217 |
60
| | | | |
| California Intermediate-Term Tax-Exempt Fund | | | | |
| |
| |
| |
| | | | Face | Market |
| | | Maturity | Amount | Value |
| | Coupon | Date | ($000) | ($000) |
| San Francisco CA City & County International | | | | |
| Airport Revenue | 5.000% | 5/1/25 (14) | 2,000 | 2,243 |
| San Francisco CA City & County International | | | | |
| Airport Revenue | 5.250% | 5/1/26 | 22,000 | 26,089 |
| San Francisco CA City & County International | | | | |
| Airport Revenue | 5.000% | 5/1/27 (14) | 13,075 | 14,696 |
| San Francisco CA City & County International | | | | |
| Airport Revenue | 5.000% | 5/1/28 | 7,500 | 9,121 |
| San Francisco CA City & County International | | | | |
| Airport Revenue | 5.000% | 5/1/30 | 5,940 | 7,051 |
| San Francisco CA City & County Public Utilities | | | | |
| Commission Water Revenue | 5.000% | 11/1/26 | 2,995 | 3,644 |
| San Francisco CA City & County Public Utilities | | | | |
| Commission Water Revenue | 5.000% | 11/1/28 | 1,000 | 1,212 |
| San Francisco CA City & County Public Utilities | | | | |
| Commission Water Revenue | 5.000% | 11/1/29 | 10,000 | 12,045 |
| San Francisco CA City & County Public Utilities | | | | |
| Commission Water Revenue | 5.000% | 11/1/29 | 2,960 | 3,565 |
| San Francisco CA City & County Public Utilities | | | | |
| Commission Water Revenue | 5.000% | 11/1/29 | 11,000 | 13,562 |
| San Francisco CA City & County Public Utilities | | | | |
| Commission Water Revenue | 5.000% | 11/1/29 | 6,530 | 8,084 |
| San Francisco CA City & County Public Utilities | | | | |
| Commission Water Revenue | 5.000% | 11/1/30 | 2,705 | 3,230 |
| San Francisco CA City & County Public Utilities | | | | |
| Commission Water Revenue | 5.000% | 11/1/30 | 10,335 | 12,695 |
| San Francisco CA City & County Public Utilities | | | | |
| Commission Water Revenue | 5.000% | 11/1/31 | 5,730 | 7,006 |
| San Francisco CA City & County Unified | | | | |
| School District GO | 4.000% | 6/15/30 | 2,470 | 2,716 |
| San Francisco CA City & County Unified | | | | |
| School District GO | 5.000% | 6/15/31 | 7,965 | 9,682 |
| San Joaquin County CA Delta Community | | | | |
| College District Election GO | 0.000% | 8/1/26 (4) | 15,500 | 7,827 |
| San Joaquin County CA Delta Community | | | | |
| College District Election GO | 0.000% | 8/1/27 (4) | 15,500 | 7,301 |
| San Joaquin Hills CA Transportation Corridor | | | | |
| Agency Toll Road Revenue | 0.000% | 1/15/14 (14) | 5,500 | 5,342 |
| San Joaquin Hills CA Transportation Corridor | | | | |
| Agency Toll Road Revenue | 0.000% | 1/15/15 (14) | 1,920 | 1,807 |
| San Joaquin Hills CA Transportation Corridor | | | | |
| Agency Toll Road Revenue | 0.000% | 1/1/23 (ETM) | 16,000 | 13,208 |
| San Joaquin Hills CA Transportation Corridor | | | | |
| Agency Toll Road Revenue | 0.000% | 1/15/24 (14) | 7,000 | 4,054 |
| San Joaquin Hills CA Transportation Corridor | | | | |
| Agency Toll Road Revenue | 0.000% | 1/1/25 (ETM) | 17,750 | 13,724 |
| San Jose CA Airport Revenue | 5.000% | 3/1/24 (2) | 2,035 | 2,242 |
| San Jose CA Airport Revenue | 5.000% | 3/1/25 (2) | 3,385 | 3,714 |
| San Jose CA Airport Revenue | 5.000% | 3/1/26 (2) | 3,850 | 4,212 |
| San Jose CA Financing Authority Lease Revenue | 5.000% | 9/1/13 (14) | 9,570 | 9,608 |
| San Jose CA Redevelopment Agency | | | | |
| Tax Allocation Revenue | 5.250% | 8/1/13 (14) | 5,000 | 5,073 |
| San Jose CA Redevelopment Agency | | | | |
| Tax Allocation Revenue | 5.250% | 8/1/14 (14) | 5,000 | 5,151 |
| San Jose CA Redevelopment Agency | | | | |
| Tax Allocation Revenue | 5.000% | 8/1/21 | 1,270 | 1,359 |
61
| | | | |
| California Intermediate-Term Tax-Exempt Fund | | | | |
| |
| |
| |
| | | | Face | Market |
| | | Maturity | Amount | Value |
| | Coupon | Date | ($000) | ($000) |
| San Jose CA Redevelopment Agency | | | | |
| Tax Allocation Revenue | 5.000% | 8/1/23 | 1,140 | 1,195 |
| San Jose CA Redevelopment Agency | | | | |
| Tax Allocation Revenue | 5.000% | 8/1/24 (14) | 16,360 | 16,742 |
| San Jose CA Redevelopment Agency | | | | |
| Tax Allocation Revenue | 5.000% | 8/1/25 (14) | 11,505 | 11,807 |
| San Jose CA Redevelopment Agency | | | | |
| Tax Allocation Revenue | 5.125% | 8/1/25 | 570 | 598 |
| San Jose CA Redevelopment Agency | | | | |
| Tax Allocation Revenue | 5.250% | 8/1/26 | 800 | 844 |
| San Jose CA Redevelopment Agency | | | | |
| Tax Allocation Revenue | 5.375% | 8/1/29 | 1,355 | 1,428 |
| San Jose CA Special Hotel Tax Revenue | | | | |
| (Convention Center Expansion | | | | |
| & Renovation Project) | 6.125% | 5/1/31 | 4,000 | 4,917 |
| San Juan CA Unified School District GO | 0.000% | 8/1/25 (4) | 10,000 | 6,280 |
| San Juan CA Unified School District GO | 0.000% | 8/1/26 (4) | 12,215 | 7,311 |
| San Marcos CA Unified School District GO | 0.000% | 8/1/30 | 2,000 | 929 |
| San Marcos CA Unified School District GO | 0.000% | 8/1/31 | 2,000 | 875 |
| San Marcos CA Unified School District GO | 0.000% | 8/1/32 | 2,500 | 1,034 |
| San Mateo CA Union High School District GO | 0.000% | 9/1/13 (14) | 1,715 | 1,712 |
| San Mateo CA Union High School District GO | 0.000% | 9/1/14 (14) | 1,500 | 1,487 |
| San Mateo County CA Community College | | | | |
| District GO | 0.000% | 9/1/21 (14) | 4,645 | 3,733 |
| San Mateo County CA Community College | | | | |
| District GO | 0.000% | 9/1/22 (14) | 5,675 | 4,346 |
| San Mateo County CA Community College | | | | |
| District GO | 0.000% | 9/1/24 (14) | 2,825 | 1,982 |
| San Mateo County CA Community College | | | | |
| District GO | 0.000% | 9/1/25 (14) | 4,000 | 2,663 |
| San Mateo County CA Community College | | | | |
| District GO | 5.000% | 9/1/26 | 3,170 | 3,640 |
| 1 San Mateo County CA Community College | | | | |
| District GO TOB VRDO | 0.190% | 12/7/12 | 10,280 | 10,280 |
| 1 San Mateo County CA Community College | | | | |
| District GO TOB VRDO | 0.190% | 12/7/12 | 10,160 | 10,160 |
| San Mateo County CA Joint Powers Financing | | | | |
| Authority Lease Revenue | | | | |
| (Youth Services Campus) | 4.625% | 7/15/25 | 2,455 | 2,816 |
| San Mateo County CA Joint Powers Financing | | | | |
| Authority Lease Revenue | | | | |
| (Youth Services Campus) | 5.250% | 7/15/28 | 2,000 | 2,353 |
| San Ramon Valley CA Unified School District GO | 4.000% | 8/1/19 | 10,050 | 12,011 |
| San Ramon Valley CA Unified School District GO | 4.000% | 8/1/21 | 10,000 | 12,160 |
| Santa Ana CA Community Redevelopment | | | | |
| Agency Tax Allocation Revenue | | | | |
| (South Main Street) | 5.000% | 9/1/18 (14) | 2,685 | 2,729 |
| Santa Clara CA Electric Revenue | 5.250% | 7/1/18 (14) | 1,720 | 1,770 |
| Santa Clara CA Electric Revenue | 5.000% | 7/1/30 | 1,000 | 1,171 |
| Santa Clara CA Electric Revenue | 5.250% | 7/1/32 | 2,500 | 2,954 |
| Santa Clara CA Unified School District GO | 5.000% | 7/1/28 | 3,775 | 4,530 |
| Santa Clara CA Unified School District GO | 5.000% | 7/1/29 | 4,115 | 4,916 |
| Santa Clara CA Unified School District GO | 5.000% | 7/1/30 | 4,405 | 5,232 |
| Santa Clara CA Unified School District GO | 5.000% | 7/1/31 | 4,715 | 5,564 |
| Santa Clara County CA Financing Authority | | | | |
| Lease Revenue (Multiple Facilities Projects) | 5.000% | 11/15/17 | 11,540 | 13,549 |
62
| | | | |
| California Intermediate-Term Tax-Exempt Fund | | | | |
| |
| |
| |
| | | | Face | Market |
| | | Maturity | Amount | Value |
| | Coupon | Date | ($000) | ($000) |
| Santa Clara County CA Financing Authority | | | | |
| Lease Revenue (Multiple Facilities Projects) | 5.000% | 11/15/18 | 7,920 | 9,511 |
| Santa Clara County CA Financing Authority | | | | |
| Lease Revenue (Multiple Facilities Projects) | 5.000% | 5/15/28 | 10,000 | 11,589 |
| Santa Clara Valley CA Transportation Authority | | | | |
| Sales Tax Revenue | 5.000% | 4/1/32 (2) | 4,000 | 4,591 |
| Santa Clarita CA Community College District GO | 5.000% | 8/1/32 | 5,450 | 6,541 |
| Santa Monica CA Community College District GO | 0.000% | 8/1/26 | 11,025 | 6,898 |
| Santa Rosa CA Wastewater Revenue | 0.000% | 9/1/28 (4) | 11,095 | 5,774 |
| Santa Rosa CA Wastewater Revenue | 5.000% | 9/1/29 | 2,870 | 3,507 |
| Santa Rosa CA Wastewater Revenue | 5.000% | 9/1/30 | 3,055 | 3,706 |
| Simi Valley CA Unified School District GO | 0.000% | 8/1/26 (4) | 3,030 | 1,814 |
| Simi Valley CA Unified School District GO | 0.000% | 8/1/27 (4) | 2,900 | 1,643 |
| 3 Solana Beach CA School District Special | | | | |
| Tax Revenue | 5.000% | 9/1/29 | 2,125 | 2,381 |
| 3 Solana Beach CA School District Special | | | | |
| Tax Revenue | 5.000% | 9/1/32 | 2,665 | 2,960 |
| Solano County CA COP | 5.000% | 11/1/17 (14) | 4,110 | 4,777 |
| Solano County CA COP | 5.000% | 11/1/18 (14) | 3,810 | 4,385 |
| Solano County CA COP | 5.000% | 11/1/19 (14) | 3,995 | 4,585 |
| Solano County CA COP | 5.000% | 11/1/20 (14) | 4,195 | 4,783 |
| Solano County CA COP | 5.000% | 11/1/21 (14) | 4,405 | 4,987 |
| Sonoma-Marin Area Rail Transportation District | | | | |
| California Sales & Use Tax Revenue | 5.000% | 3/1/21 | 1,750 | 2,216 |
| Sonoma-Marin Area Rail Transportation District | | | | |
| California Sales & Use Tax Revenue | 5.000% | 3/1/22 | 3,000 | 3,793 |
| South Orange County CA Public Financing | | | | |
| Authority Special Tax Revenue | | | | |
| (Portola Hills/Lomas Laguna) | 5.250% | 8/15/13 (2) | 2,290 | 2,296 |
| South San Francisco CA Redevelopment | | | | |
| Agency Tax Allocation Revenue | 5.000% | 9/1/31 (14) | 13,255 | 13,905 |
| Southern California Public Power | | | | |
| Authority Revenue | 5.000% | 7/1/28 | 10,000 | 12,126 |
| Southern California Public Power | | | | |
| Authority Revenue | 5.000% | 7/1/29 | 5,000 | 6,086 |
| Southern California Public Power | | | | |
| Authority Revenue | 5.000% | 7/1/30 | 10,750 | 13,076 |
| Southern California Public Power | | | | |
| Authority Revenue (Canyon Power Project) | 5.250% | 7/1/27 | 6,950 | 8,389 |
| Southern California Public Power Authority | | | | |
| Revenue (Linden Wind Energy Project) | 5.000% | 7/1/28 | 3,500 | 4,203 |
| Southern California Public Power Authority | | | | |
| Revenue (Linden Wind Energy Project) | 5.000% | 7/1/29 | 2,500 | 2,989 |
| Southern California Public Power Authority | | | | |
| Revenue (Linden Wind Energy Project) | 5.000% | 7/1/30 | 2,500 | 2,977 |
| Southern California Public Power Authority | | | | |
| Revenue (Milford Wind Corridor Phase I Project) | 5.000% | 7/1/28 | 5,000 | 5,943 |
| Southern California Public Power Authority | | | | |
| Revenue (Milford Wind Corridor Phase I Project) | 5.000% | 7/1/29 | 5,000 | 5,917 |
| Southern California Public Power Authority | | | | |
| Revenue (Natural Gas Project) | 5.000% | 11/1/18 | 1,040 | 1,176 |
| Southern California Public Power Authority | | | | |
| Revenue (Natural Gas Project) | 5.250% | 11/1/23 | 5,250 | 6,156 |
| Southern California Public Power Authority | | | | |
| Revenue (Natural Gas Project) | 5.250% | 11/1/24 | 5,000 | 5,858 |
63
| | | | |
| California Intermediate-Term Tax-Exempt Fund | | | | |
| |
| |
| |
| | | | Face | Market |
| | | Maturity | Amount | Value |
| | Coupon | Date | ($000) | ($000) |
| Southern California Public Power Authority | | | | |
| Revenue (Natural Gas Project) | 5.250% | 11/1/25 | 7,000 | 8,241 |
| Southern California Public Power Authority | | | | |
| Revenue (Natural Gas Project) | 5.250% | 11/1/26 | 2,500 | 2,970 |
| Southern California Public Power Authority | | | | |
| Revenue (San Juan Unit 3) | 5.500% | 1/1/13 (4) | 3,500 | 3,516 |
| Southern California Public Power Authority | | | | |
| Revenue (Transmission Project) | 5.000% | 7/1/23 | 5,000 | 6,008 |
| 1 Sweetwater CA Unified School District | | | | |
| GO TOB VRDO | 0.180% | 12/7/12 (13) | 3,300 | 3,300 |
| 1 Torrance CA Hospital Revenue | | | | |
| (Torrance Memorial Medical Center) | | | | |
| TOB VRDO | 0.190% | 12/7/12 LOC | 2,000 | 2,000 |
| Tulare County CA COP | 5.000% | 8/15/15 (14) | 6,460 | 7,102 |
| Turlock CA Irrigation District Revenue | 5.000% | 1/1/21 | 3,805 | 4,634 |
| Turlock CA Irrigation District Revenue | 5.000% | 1/1/22 | 5,415 | 6,475 |
| Turlock CA Irrigation District Revenue | 5.000% | 1/1/28 | 7,020 | 8,032 |
| Turlock CA Irrigation District Revenue | 5.000% | 1/1/29 | 6,400 | 7,328 |
| Turlock CA Irrigation District Revenue | 5.000% | 1/1/30 | 7,770 | 8,866 |
| University of California Regents | | | | |
| Medical Center Revenue | 5.000% | 5/15/19 (14) | 5,075 | 5,680 |
| University of California Regents | | | | |
| Medical Center Revenue | 5.000% | 5/15/20 (14) | 5,065 | 5,663 |
| University of California Regents | | | | |
| Medical Center Revenue | 5.000% | 5/15/25 | 19,385 | 22,167 |
| University of California Regents | | | | |
| Medical Center Revenue | 5.000% | 5/15/26 | 10,095 | 11,484 |
| University of California Regents | | | | |
| Medical Center Revenue | 4.750% | 5/15/31 (14) | 2,300 | 2,489 |
| University of California Regents | | | | |
| Medical Center Revenue VRDO | 0.140% | 12/3/12 | 12,115 | 12,115 |
| University of California Regents | | | | |
| Medical Center Revenue VRDO | 0.160% | 12/3/12 | 900 | 900 |
| University of California Revenue | 4.750% | 5/15/13 (Prere.) | 21,320 | 21,974 |
| University of California Revenue | 5.000% | 5/15/15 (Prere.) | 1,185 | 1,330 |
| University of California Revenue | 5.000% | 5/15/15 (Prere.) | 555 | 623 |
| University of California Revenue | 5.000% | 5/15/15 (Prere.) | 240 | 269 |
| University of California Revenue | 5.000% | 5/15/17 (4) | 19,435 | 21,752 |
| University of California Revenue | 5.000% | 5/15/18 (4) | 9,445 | 10,549 |
| University of California Revenue | 5.000% | 5/15/19 (4) | 4,035 | 4,500 |
| University of California Revenue | 5.000% | 5/15/20 (4) | 30,900 | 34,462 |
| University of California Revenue | 5.000% | 5/15/21 (4) | 14,915 | 16,634 |
| University of California Revenue | 5.000% | 5/15/22 | 5,420 | 6,933 |
| University of California Revenue | 5.750% | 5/15/25 | 3,000 | 3,765 |
| University of California Revenue | 5.000% | 5/15/26 (14) | 10,000 | 11,392 |
| University of California Revenue | 5.000% | 5/15/27 | 10,900 | 13,564 |
| University of California Revenue | 5.000% | 5/15/28 | 11,680 | 14,476 |
| University of California Revenue | 5.000% | 5/15/32 | 14,020 | 17,221 |
| 1 University of California Revenue TOB VRDO | 0.180% | 12/3/12 | 4,400 | 4,400 |
| 1 University of California Revenue TOB VRDO | 0.180% | 12/3/12 | 7,295 | 7,295 |
| 1 University of California Revenue TOB VRDO | 0.180% | 12/3/12 | 300 | 300 |
| 1 University of California Revenue TOB VRDO | 0.220% | 12/7/12 | 7,299 | 7,299 |
| Upland CA Community Facilities District | | | | |
| No. 2003-2 Improvement Area No. 1 | | | | |
| Special Tax Revenue | 5.000% | 9/1/31 | 1,110 | 1,178 |
64
| | | | |
| California Intermediate-Term Tax-Exempt Fund | | | | |
| |
| |
| |
| | | | Face | Market |
| | | Maturity | Amount | Value |
| | Coupon | Date | ($000) | ($000) |
| Ventura County CA Community College | | | | |
| District GO | 5.000% | 8/1/16 (14) | 360 | 367 |
| Ventura County CA Community College | | | | |
| District GO | 5.000% | 8/1/17 (14) | 270 | 275 |
| Ventura County CA Community College | | | | |
| District GO | 5.000% | 8/1/24 | 1,210 | 1,528 |
| Ventura County CA Community College | | | | |
| District GO | 5.000% | 8/1/25 | 1,915 | 2,400 |
| Ventura County CA Community College | | | | |
| District GO | 5.000% | 8/1/27 | 2,205 | 2,729 |
| Ventura County CA Community College | | | | |
| District GO | 0.000% | 8/1/28 | 15,000 | 8,089 |
| Vista CA Unified School District GO | 5.000% | 8/1/23 | 2,500 | 3,167 |
| Vista CA Unified School District GO | 5.000% | 8/1/24 | 5,000 | 6,281 |
| Walnut CA Energy Center Authority Revenue | 5.000% | 1/1/30 | 2,000 | 2,275 |
| Washington Township CA Health Care | | | | |
| District Revenue | 6.000% | 7/1/29 | 1,000 | 1,166 |
| West Basin CA Municipal Water District Revenue | 5.000% | 8/1/22 | 2,000 | 2,557 |
| West Basin CA Municipal Water District Revenue | 5.000% | 8/1/23 | 1,500 | 1,881 |
| West Contra Costa CA Unified School District GO | 6.000% | 8/1/26 | 5,000 | 6,811 |
| Westlands CA Water District Revenue | 5.000% | 9/1/21 (4) | 750 | 929 |
| Westlands CA Water District Revenue | 5.000% | 9/1/22 (4) | 750 | 931 |
| Westlands CA Water District Revenue | 5.000% | 9/1/23 (4) | 1,705 | 2,104 |
| Westlands CA Water District Revenue | 5.000% | 9/1/24 (4) | 1,000 | 1,218 |
| Westlands CA Water District Revenue | 5.000% | 9/1/25 (4) | 1,250 | 1,512 |
| William S. Hart CA Union High School District GO | 5.000% | 9/1/24 | 1,425 | 1,815 |
| William S. Hart CA Union High School District GO | 5.000% | 9/1/25 | 1,735 | 2,192 |
| William S. Hart CA Union High School District GO | 5.000% | 9/1/26 | 1,085 | 1,362 |
| William S. Hart CA Union High School District GO | 5.000% | 9/1/27 | 1,500 | 1,871 |
| | | | | 6,883,001 |
| Puerto Rico (0.2%) | | | | |
| Puerto Rico Highway & Transportation | | | | |
| Authority Revenue | 5.500% | 7/1/13 (ETM) | 660 | 680 |
| Puerto Rico Infrastructure Financing Authority | | | | |
| Special Tax Revenue | 5.500% | 7/1/21 (3) | 5,000 | 5,529 |
| Puerto Rico Infrastructure Financing Authority | | | | |
| Special Tax Revenue | 5.500% | 7/1/23 (3) | 1,585 | 1,726 |
| Puerto Rico Municipal Finance Agency GO | 5.000% | 7/1/14 (11) | 1,360 | 1,435 |
| Puerto Rico Municipal Finance Agency GO | 5.250% | 7/1/16 (11) | 1,400 | 1,564 |
| | | | | 10,934 |
| Virgin Islands (0.0%) | | | | |
| Virgin Islands Public Finance Authority Revenue | 5.250% | 10/1/15 | 2,200 | 2,338 |
| Total Tax-Exempt Municipal Bonds (Cost $6,308,912) | | | | 6,896,273 |
| Other Assets and Liabilities (-0.2%) | | | | |
| Other Assets | | | | 80,432 |
| Liabilities | | | | (95,104) |
| | | | | (14,672) |
| Net Assets (100%) | | | | 6,881,601 |
65
California Intermediate-Term Tax-Exempt Fund
| |
| At November 30, 2012, net assets consisted of: | |
| | Amount |
| | ($000) |
| Paid-in Capital | 6,392,640 |
| Undistributed Net Investment Income | — |
| Accumulated Net Realized Losses | (98,380) |
| Unrealized Appreciation (Depreciation) | |
| Investment Securities | 587,361 |
| Futures Contracts | (20) |
| Net Assets | 6,881,601 |
| |
| |
| Investor Shares—Net Assets | |
| Applicable to 115,320,689 outstanding $.001 par value shares of | |
| beneficial interest (unlimited authorization) | 1,374,913 |
| Net Asset Value Per Share—Investor Shares | $11.92 |
| |
| |
| Admiral Shares—Net Assets | |
| Applicable to 461,873,143 outstanding $.001 par value shares of | |
| beneficial interest (unlimited authorization) | 5,506,688 |
| Net Asset Value Per Share—Admiral Shares | $11.92 |
See Note A in Notes to Financial Statements.
1 Security exempt from registration under Rule 144A of the Securities Act of 1933. Such securities may be sold in transactions exempt from
registration, normally to qualified institutional buyers. At November 30, 2012, the aggregate value of these securities was $162,227,000,
representing 2.4% of net assets.
2 Adjustable-rate security.
3 Security purchased on a when-issued or delayed-delivery basis for which the fund has not taken delivery as of November 30, 2012.
* Securities with a value of $517,000 have been segregated as initial margin for open futures contracts.
A key to abbreviations and other references follows the Statement of Net Assets.
See accompanying Notes, which are an integral part of the Financial Statements.
66
California Intermediate-Term Tax-Exempt Fund
Key to Abbreviations
ARS—Auction Rate Security.
BAN—Bond Anticipation Note.
COP—Certificate of Participation.
CP—Commercial Paper.
FR—Floating Rate.
GAN—Grant Anticipation Note.
GO—General Obligation Bond.
PUT—Put Option Obligation.
RAN—Revenue Anticipation Note.
TAN—Tax Anticipation Note.
TOB—Tender Option Bond.
TRAN—Tax Revenue Anticipation Note.
VRDO—Variable Rate Demand Obligation.
VRDP—Variable Rate Demand Preferred.
(ETM)—Escrowed to Maturity.
(Prere.)—Prerefunded.
Scheduled principal and interest payments are guaranteed by:
(1) MBIA (Municipal Bond Investors Assurance).
(2) AMBAC (Ambac Assurance Corporation).
(3) FGIC (Financial Guaranty Insurance Company).
(4) AGM (Assured Guaranty Municipal Corporation).
(5) BIGI (Bond Investors Guaranty Insurance).
(6) Connie Lee Inc.
(7) FHA (Federal Housing Authority).
(8) CapMAC (Capital Markets Assurance Corporation).
(9) American Capital Access Financial Guaranty Corporation.
(10) XL Capital Assurance Inc.
(11) CIFG (CDC IXIS Financial Guaranty).
(12) Assured Guaranty Corporation.
(13) Berkshire Hathaway Assurance Corporation.
(14) National Public Finance Guarantee Corporation.
The insurance does not guarantee the market value of the municipal bonds.
LOC—Scheduled principal and interest payments are guaranteed by bank letter of credit.
67
California Intermediate-Term Tax-Exempt Fund
Statement of Operations
| |
| | Year Ended |
| | November 30, 2012 |
| | ($000) |
| Investment Income | |
| Income | |
| Interest | 215,745 |
| Total Income | 215,745 |
| Expenses | |
| The Vanguard Group—Note B | |
| Investment Advisory Services | 332 |
| Management and Administrative—Investor Shares | 2,123 |
| Management and Administrative—Admiral Shares | 4,556 |
| Marketing and Distribution—Investor Shares | 362 |
| Marketing and Distribution—Admiral Shares | 1,010 |
| Custodian Fees | 70 |
| Auditing Fees | 29 |
| Shareholders’ Reports—Investor Shares | 25 |
| Shareholders’ Reports—Admiral Shares | 13 |
| Trustees’ Fees and Expenses | 5 |
| Total Expenses | 8,525 |
| Net Investment Income | 207,220 |
| Realized Net Gain (Loss) | |
| Investment Securities Sold | 7,229 |
| Futures Contracts | 40 |
| Realized Net Gain (Loss) | 7,269 |
| Change in Unrealized Appreciation (Depreciation) | |
| Investment Securities | 386,555 |
| Futures Contracts | (20) |
| Change in Unrealized Appreciation (Depreciation) | 386,535 |
| Net Increase (Decrease) in Net Assets Resulting from Operations | 601,024 |
See accompanying Notes, which are an integral part of the Financial Statements.
68
California Intermediate-Term Tax-Exempt Fund
Statement of Changes in Net Assets
| | |
| | Year Ended November 30, |
| | 2012 | 2011 |
| | ($000) | ($000) |
| Increase (Decrease) in Net Assets | | |
| Operations | | |
| Net Investment Income | 207,220 | 200,070 |
| Realized Net Gain (Loss) | 7,269 | (7,461) |
| Change in Unrealized Appreciation (Depreciation) | 386,535 | 120,346 |
| Net Increase (Decrease) in Net Assets Resulting from Operations | 601,024 | 312,955 |
| Distributions | | |
| Net Investment Income | | |
| Investor Shares | (42,464) | (43,985) |
| Admiral Shares | (164,756) | (156,085) |
| Realized Capital Gain | | |
| Investor Shares | — | — |
| Admiral Shares | — | — |
| Total Distributions | (207,220) | (200,070) |
| Capital Share Transactions | | |
| Investor Shares | 100,368 | (144,605) |
| Admiral Shares | 820,026 | 126,168 |
| Net Increase (Decrease) from Capital Share Transactions | 920,394 | (18,437) |
| Total Increase (Decrease) | 1,314,198 | 94,448 |
| Net Assets | | |
| Beginning of Period | 5,567,403 | 5,472,955 |
| End of Period | 6,881,601 | 5,567,403 |
See accompanying Notes, which are an integral part of the Financial Statements.
69
California Intermediate-Term Tax-Exempt Fund
Financial Highlights
| | | | | |
| Investor Shares | | | | | |
| |
| For a Share Outstanding | Year Ended November 30, |
| Throughout Each Period | 2012 | 2011 | 2010 | 2009 | 2008 |
| Net Asset Value, Beginning of Period | $11.18 | $10.93 | $10.86 | $10.21 | $10.92 |
| Investment Operations | | | | | |
| Net Investment Income | .379 | .408 | .408 | .412 | .425 |
| Net Realized and Unrealized Gain (Loss) | | | | | |
| on Investments | .740 | .250 | .070 | .650 | (.710) |
| Total from Investment Operations | 1.119 | .658 | .478 | 1.062 | (.285) |
| Distributions | | | | | |
| Dividends from Net Investment Income | (.379) | (.408) | (.408) | (.412) | (.425) |
| Distributions from Realized Capital Gains | — | — | — | — | — |
| Total Distributions | (.379) | (.408) | (.408) | (.412) | (.425) |
| Net Asset Value, End of Period | $11.92 | $11.18 | $10.93 | $10.86 | $10.21 |
| |
| Total Return1 | 10.14% | 6.17% | 4.43% | 10.56% | -2.71% |
| |
| Ratios/Supplemental Data | | | | | |
| Net Assets, End of Period (Millions) | $1,375 | $1,193 | $1,314 | $1,435 | $1,320 |
| Ratio of Total Expenses to | | | | | |
| Average Net Assets | 0.20% | 0.20% | 0.20% | 0.20% | 0.15% |
| Ratio of Net Investment Income to | | | | | |
| Average Net Assets | 3.26% | 3.73% | 3.70% | 3.88% | 3.96% |
| Portfolio Turnover Rate | 9% | 13% | 10% | 17% | 25% |
| 1 Total returns do not include account service fees that may have applied in the periods shown. Fund prospectuses provide information about |
| any applicable account service fees. |
See accompanying Notes, which are an integral part of the Financial Statements.
70
California Intermediate-Term Tax-Exempt Fund
Financial Highlights
| | | | | |
| Admiral Shares | | | | | |
| |
| |
| For a Share Outstanding | Year Ended November 30, |
| Throughout Each Period | 2012 | 2011 | 2010 | 2009 | 2008 |
| Net Asset Value, Beginning of Period | $11.18 | $10.93 | $10.86 | $10.21 | $10.92 |
| Investment Operations | | | | | |
| Net Investment Income | .388 | .417 | .417 | .421 | .432 |
| Net Realized and Unrealized Gain (Loss) | | | | | |
| on Investments | .740 | .250 | .070 | .650 | (.710) |
| Total from Investment Operations | 1.128 | .667 | .487 | 1.071 | (.278) |
| Distributions | | | | | |
| Dividends from Net Investment Income | (.388) | (.417) | (.417) | (.421) | (.432) |
| Distributions from Realized Capital Gains | — | — | — | — | — |
| Total Distributions | (.388) | (.417) | (.417) | (.421) | (.432) |
| Net Asset Value, End of Period | $11.92 | $11.18 | $10.93 | $10.86 | $10.21 |
| |
| Total Return1 | 10.23% | 6.26% | 4.52% | 10.65% | -2.64% |
| |
| Ratios/Supplemental Data | | | | | |
| Net Assets, End of Period (Millions) | $5,507 | $4,375 | $4,159 | $3,626 | $3,210 |
| Ratio of Total Expenses to | | | | | |
| Average Net Assets | 0.12% | 0.12% | 0.12% | 0.12% | 0.08% |
| Ratio of Net Investment Income to | | | | | |
| Average Net Assets | 3.34% | 3.81% | 3.78% | 3.96% | 4.03% |
| Portfolio Turnover Rate | 9% | 13% | 10% | 17% | 25% |
| 1 Total returns do not include account service fees that may have applied in the periods shown. Fund prospectuses provide information about |
| any applicable account service fees. |
See accompanying Notes, which are an integral part of the Financial Statements.
71
California Intermediate-Term Tax-Exempt Fund
Notes to Financial Statements
Vanguard California Intermediate-Term Tax-Exempt Fund is registered under the Investment Company Act of 1940 as an open-end investment company, or mutual fund. The fund invests in debt instruments of municipal issuers whose ability to meet their obligations may be affected by economic and political developments in the state. The fund offers two classes of shares: Investor Shares and Admiral Shares. Investor Shares are available to any investor who meets the fund’s minimum purchase requirements. Admiral Shares are designed for investors who meet certain administrative, service, and account-size criteria.
A. The following significant accounting policies conform to generally accepted accounting principles for U.S. mutual funds. The fund consistently follows such policies in preparing its financial statements.
1. Security Valuation: Bonds, and temporary cash investments acquired over 60 days to maturity, are valued using the latest bid prices or using valuations based on a matrix system (which considers such factors as security prices, yields, maturities, and ratings), both as furnished by independent pricing services. Other temporary cash investments are valued at amortized cost, which approximates market value. Securities for which market quotations are not readily available, or whose values have been affected by events occurring before the fund’s pricing time but after the close of the securities’ primary markets, are valued by methods deemed by the board of trustees to represent fair value.
2. Futures Contracts: The fund uses futures contracts to invest in fixed income asset classes with greater efficiency and lower cost than is possible through direct investment, to add value when these instruments are attractively priced, or to adjust sensitivity to changes in interest rates. The primary risks associated with the use of futures contracts are imperfect correlation between changes in market values of bonds held by the fund and the prices of futures contracts, and the possibility of an illiquid market.
Futures contracts are valued based upon their quoted daily settlement prices. The aggregate principal amounts of the contracts are not recorded in the Statement of Net Assets. Fluctuations in the value of the contracts are recorded in the Statement of Net Assets as an asset (liability) and in the Statement of Operations as unrealized appreciation (depreciation) until the contracts are closed, when they are recorded as realized futures gains (losses).
During the year ended November 30, 2012, the fund’s average investments in long and short futures contracts each represented less than 1% of net assets, based on quarterly average aggregate settlement values.
3. Federal Income Taxes: The fund intends to continue to qualify as a regulated investment company and distribute all of its income. Management has analyzed the fund’s tax positions taken for all open federal income tax years (November 30, 2009–2012), and has concluded that no provision for federal income tax is required in the fund’s financial statements.
4. Distributions: Distributions from net investment income are declared daily and paid on the first business day of the following month. Annual distributions from realized capital gains, if any, are recorded on the ex-dividend date.
5. Other: Interest income is accrued daily. Premiums and discounts on debt securities purchased are amortized and accreted, respectively, to interest income over the lives of the respective securities. Security transactions are accounted for on the date securities are bought or sold. Costs used to determine realized gains (losses) on the sale of investment securities are those of the specific securities sold.
72
California Intermediate-Term Tax-Exempt Fund
Each class of shares has equal rights as to assets and earnings, except that each class separately bears certain class-specific expenses related to maintenance of shareholder accounts (included in Management and Administrative expenses) and shareholder reporting. Marketing and distribution expenses are allocated to each class of shares based on a method approved by the board of trustees. Income, other non-class-specific expenses, and gains and losses on investments are allocated to each class of shares based on its relative net assets.
B. The Vanguard Group furnishes at cost investment advisory, corporate management, administrative, marketing, and distribution services. The costs of such services are allocated to the fund under methods approved by the board of trustees. The fund has committed to provide up to 0.40% of its net assets in capital contributions to Vanguard. At November 30, 2012, the fund had contributed capital of $930,000 to Vanguard (included in Other Assets), representing 0.01% of the fund’s net assets and 0.37% of Vanguard’s capitalization. The fund’s trustees and officers are also directors and officers of Vanguard.
C. Various inputs may be used to determine the value of the fund’s investments. These inputs are summarized in three broad levels for financial statement purposes. The inputs or methodologies used to value securities are not necessarily an indication of the risk associated with investing in those securities.
Level 1—Quoted prices in active markets for identical securities.
Level 2—Other significant observable inputs (including quoted prices for similar securities, interest
rates, prepayment speeds, credit risk, etc.).
Level 3—Significant unobservable inputs (including the fund’s own assumptions used to determine
the fair value of investments).
The following table summarizes the market value of the fund’s investments as of November 30, 2012, based on the inputs used to value them:
| | | |
| | Level 1 | Level 2 | Level 3 |
| Investments | ($000) | ($000) | ($000) |
| Tax-Exempt Municipal Bonds | — | 6,896,273 | — |
| Futures Contracts—Liabilities1 | (20) | — | — |
| Total | (20) | 6,896,273 | — |
| 1 Represents variation margin on the last day of the reporting period. |
D. At November 30, 2012, the aggregate settlement value of open futures contracts and the related unrealized appreciation (depreciation) were:
| | | | |
| | | | ($000) |
| | | | Aggregate | |
| | | Number of | Settlement | Unrealized |
| | | Long (Short) | Value | Appreciation |
| Futures Contracts | Expiration | Contracts | Long (Short) | (Depreciation) |
| 10-Year U.S. Treasury Note | March 2013 | (404) | (53,991) | (20) |
Unrealized appreciation (depreciation) on open futures contracts is required to be treated as realized gain (loss) for tax purposes.
73
California Intermediate-Term Tax-Exempt Fund
E. Capital gain distributions are determined on a tax basis and may differ from realized capital gains for financial reporting purposes. Differences may be permanent or temporary. Permanent differences are reclassified among capital accounts in the financial statements to reflect their tax character. Temporary differences arise when gains or losses are recognized in different periods for financial statement and tax purposes; these differences will reverse at some time in the future.
For tax purposes, the fund used capital loss carryforwards of $5,993,000 to offset taxable capital gains realized during the year ended November 30, 2012. At November 30, 2012, the fund had available capital loss carryforwards totaling $95,229,000 to offset future net capital gains of $784,000 through November 30, 2013, $6,523,000 through November 30, 2014, $3,936,000 through November 30, 2015, $38,506,000 through November 30, 2016, $38,406,000 through November 30, 2017, $990,000 through November 30, 2018, and $6,084,000 through November 30, 2019.
At November 30, 2012, the cost of investment securities for tax purposes was $6,312,083,000. Net unrealized appreciation of investment securities for tax purposes was $584,190,000, consisting of unrealized gains of $590,943,000 on securities that had risen in value since their purchase and $6,753,000 in unrealized losses on securities that had fallen in value since their purchase.
F. During the year ended November 30, 2012, the fund purchased $1,335,339,000 of investment securities and sold $539,298,000 of investment securities, other than temporary cash investments.
G. Capital share transactions for each class of shares were:
| | | | |
| | Year Ended November 30, |
| | 2012 | 2011 |
| | Amount | Shares | Amount | Shares |
| | ($000) | (000) | ($000) | (000) |
| Investor Shares | | | | |
| Issued | 472,315 | 40,682 | 340,985 | 31,243 |
| Issued in Lieu of Cash Distributions | 37,178 | 3,195 | 39,355 | 3,602 |
| Redeemed | (409,125) | (35,242) | (524,945) | (48,403) |
| Net Increase (Decrease)—Investor Shares | 100,368 | 8,635 | (144,605) | (13,558) |
| Admiral Shares | | | | |
| Issued | 1,336,171 | 115,038 | 1,028,223 | 94,169 |
| Issued in Lieu of Cash Distributions | 125,251 | 10,761 | 119,408 | 10,923 |
| Redeemed | (641,396) | (55,252) | (1,021,463) | (94,270) |
| Net Increase (Decrease) —Admiral Shares | 820,026 | 70,547 | 126,168 | 10,822 |
H. In preparing the financial statements as of November 30, 2012, management considered the impact of subsequent events for potential recognition or disclosure in these financial statements.
74
California Long-Term Tax-Exempt Fund
Fund Profile
As of November 30, 2012
| | |
| Share-Class Characteristics | |
| | Investor | Admiral |
| | Shares | Shares |
| Ticker Symbol | VCITX | VCLAX |
| Expense Ratio1 | 0.20% | 0.12% |
| 30-Day SEC Yield | 2.10% | 2.18% |
| | | |
| Financial Attributes | | | |
| |
| | | Barclays | |
| | | CA Barclays |
| | | Muni | Municipal |
| | | Bond | Bond |
| | Fund | Index | Index |
| |
| Number of Bonds | 551 | 6,225 | 46,378 |
| |
| Yield to Maturity | | | |
| (before expenses) | 2.1% | 1.9% | 1.9% |
| |
| Average Coupon | 4.4% | 4.9% | 4.9% |
| |
| Average Duration | 6.2 years | 5.8 years | 6.1 years |
| |
| Average Effective | | | |
| Maturity | 6.6 years | 5.7 years | 5.8 years |
| |
| Short-Term | | | |
| Reserves | 4.4% | — | — |
| | |
| Volatility Measures | | |
| | | Barclays |
| | Barclays CA | Municipal |
| | Muni Bond | Bond |
| | Index | Index |
| R-Squared | 0.98 | 0.96 |
| Beta | 1.00 | 1.19 |
| These measures show the degree and timing of the fund’s |
| fluctuations compared with the indexes over 36 months. |
| |
| Distribution by Effective Maturity (% of | |
| portfolio) | |
| Under 1 Year | 9.6% |
| 1 - 3 Years | 9.2 |
| 3 - 5 Years | 18.1 |
| 5 - 10 Years | 56.0 |
| 10 - 20 Years | 4.4 |
| 20 - 30 Years | 2.2 |
| Over 30 Years | 0.5 |
| |
| Distribution by Credit Quality (% of portfolio) |
| AAA | 6.6% |
| AA | 48.2 |
| A | 35.3 |
| BBB | 7.7 |
| BB | 0.1 |
| B | 0.8 |
| Not Rated | 1.3 |
| For information about these ratings, see the Glossary entry for Credit Quality. |
Investment Focus
1 The expense ratios shown are from the prospectus dated March 28, 2012, and represent estimated costs for the current fiscal year. For the fiscal year ended November 30, 2012, the expense ratios were 0.20% for Investor Shares and 0.12% for Admiral Shares.
75
California Long-Term Tax-Exempt Fund
Performance Summary
All of the returns in this report represent past performance, which is not a guarantee of future results that may be achieved by the fund. (Current performance may be lower or higher than the performance data cited. For performance data current to the most recent month-end, visit our website at vanguard.com/performance.) Note, too, that both investment returns and principal value can fluctuate widely, so an investor’s shares, when sold, could be worth more or less than their original cost. The returns shown do not reflect taxes that a shareholder would pay on fund distributions or on the sale of fund shares.
Cumulative Performance: November 30, 2002, Through November 30, 2012
Initial Investment of $10,000
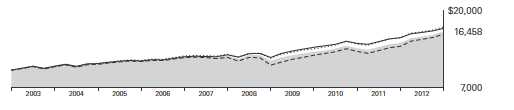
| | | | | |
| | | Average Annual Total Returns | |
| | | Periods Ended November 30, 2012 | |
| | | | | | Final Value |
| | | One | Five | Ten | of a $10,000 |
| | | Year | Years | Years | Investment |
| | California Long-Term Tax-Exempt | | | | |
| | Fund Investor Shares | 13.20% | 5.78% | 5.11% | $16,458 |
| •••••••• | Barclays CA Municipal Bond Index | 11.80 | 6.42 | 5.61 | 17,260 |
| – – – – | California Municipal Debt Funds | | | | |
| |
| | Average | 14.50 | 5.72 | 4.82 | 16,018 |
| | Barclays Municipal Bond Index | 10.17 | 6.23 | 5.45 | 17,005 |
| California Municipal Debt Funds Average: Derived from data provided by Lipper Inc. | | |
| | | | |
| | | | | Final Value |
| | One | Five | Ten | of a $50,000 |
| | Year | Years | Years | Investment |
| California Long-Term Tax-Exempt Fund | | | | |
| Admiral Shares | 13.29% | 5.86% | 5.18% | $82,884 |
| Barclays CA Municipal Bond Index | 11.80 | 6.42 | 5.61 | 86,300 |
| Barclays Municipal Bond Index | 10.17 | 6.23 | 5.45 | 85,027 |
See Financial Highlights for dividend and capital gains information.
76
California Long-Term Tax-Exempt Fund
| | | | |
| Fiscal-Year Total Returns (%): November 30, 2002, Through November 30, 2012 | |
| | | | | Barclays CA |
| | | | | Muni Bond |
| | | | Investor Shares | Index |
| Fiscal Year | Income Returns | Capital Returns | Total Returns | Total Returns |
| 2003 | 4.73% | 2.22% | 6.95% | 5.91% |
| 2004 | 4.65 | -1.33 | 3.32 | 4.99 |
| 2005 | 4.54 | -0.32 | 4.22 | 4.59 |
| 2006 | 4.71 | 1.99 | 6.70 | 6.44 |
| 2007 | 4.52 | -3.37 | 1.15 | 2.17 |
| 2008 | 4.13 | -11.08 | -6.95 | -5.18 |
| 2009 | 4.96 | 7.75 | 12.71 | 13.21 |
| 2010 | 4.36 | 0.27 | 4.63 | 5.80 |
| 2011 | 4.51 | 2.09 | 6.60 | 7.49 |
| 2012 | 4.30 | 8.90 | 13.20 | 11.80 |
Average Annual Total Returns: Periods Ended September 30, 2012
This table presents returns through the latest calendar quarter—rather than through the end of the fiscal period.
Securities and Exchange Commission rules require that we provide this information.
| | | | | | |
| | | | | | | Ten Years |
| | Inception Date | One Year | Five Years | Income | Capital | Total |
| Investor Shares | 4/7/1986 | 10.37% | 5.33% | 4.53% | -0.05% | 4.48% |
| Admiral Shares | 11/12/2001 | 10.46 | 5.41 | 4.60 | -0.05 | 4.55 |
77
California Long-Term Tax-Exempt Fund
Financial Statements
Statement of Net Assets
As of November 30, 2012
The fund reports a complete list of its holdings in regulatory filings four times in each fiscal year, at the quarter-ends. For the second and fourth fiscal quarters, the lists appear in the fund’s semiannual and annual reports to shareholders. For the first and third fiscal quarters, the fund files the lists with the Securities and Exchange Commission on Form N-Q. Shareholders can look up the fund’s Forms N-Q on the SEC’s website at sec.gov. Forms N-Q may also be reviewed and copied at the SEC’s Public Reference Room (see the back cover of this report for further information).
| | | | |
| | | | Face | Market |
| | | Maturity | Amount | Value |
| | Coupon | Date | ($000) | ($000) |
| Tax-Exempt Municipal Bonds (100.0%) | | | | |
| California (99.9%) | | | | |
| ABAG Finance Authority for Nonprofit Corps. | | | | |
| California Revenue (899 Charleston Project) | | | | |
| VRDO | 0.250% | 12/3/12 LOC | 2,540 | 2,540 |
| ABAG Finance Authority for Nonprofit Corps. | | | | |
| California Revenue (Jackson Laboratory) | 5.000% | 7/1/37 | 4,565 | 5,222 |
| ABAG Finance Authority for Nonprofit Corps. | | | | |
| California Revenue (Odd Fellows Home) | 5.000% | 4/1/42 | 1,000 | 1,120 |
| ABAG Finance Authority for Nonprofit Corps. | | | | |
| California Revenue (Sharp Healthcare) | 4.000% | 8/1/21 | 500 | 571 |
| ABAG Finance Authority for Nonprofit Corps. | | | | |
| California Revenue (Sharp Healthcare) | 5.000% | 8/1/23 | 650 | 774 |
| Alameda CA Corridor Transportation Authority | | | | |
| Revenue | 0.000% | 10/1/30 (2) | 30,375 | 12,095 |
| Alameda County CA Unified School District GO | 0.000% | 8/1/24 (4) | 3,510 | 2,302 |
| Alameda County CA Unified School District GO | 0.000% | 8/1/29 (4) | 5,000 | 2,529 |
| Anaheim CA Public Financing Authority Revenue | | | | |
| (Distribution System) | 5.000% | 10/1/21 (14) | 3,390 | 3,505 |
| Bay Area CA Infrastructure Financing Authority | | | | |
| Revenue | 5.000% | 8/1/17 (14) | 4,750 | 5,077 |
| Bay Area Toll Authority California Toll Bridge | | | | |
| Revenue (San Francisco Bay Area) | 5.000% | 4/1/24 | 5,500 | 6,999 |
| Bay Area Toll Authority California Toll Bridge | | | | |
| Revenue (San Francisco Bay Area) | 5.000% | 4/1/25 | 6,250 | 7,908 |
| Bay Area Toll Authority California Toll Bridge | | | | |
| Revenue (San Francisco Bay Area) | 5.000% | 4/1/34 | 1,500 | 1,766 |
| Bay Area Toll Authority California Toll Bridge | | | | |
| Revenue (San Francisco Bay Area) | 5.000% | 4/1/34 | 5,000 | 5,775 |
| Bay Area Toll Authority California Toll Bridge | | | | |
| Revenue (San Francisco Bay Area) | 5.000% | 4/1/39 | 15,050 | 17,382 |
| Bay Area Toll Authority California Toll Bridge | | | | |
| Revenue (San Francisco Bay Area) | 5.000% | 10/1/42 | 5,000 | 5,705 |
| Bay Area Toll Authority California Toll Bridge | | | | |
| Revenue (San Francisco Bay Area) | 5.625% | 4/1/44 | 10,000 | 11,911 |
| Cabrillo CA Community College District Revenue | 0.000% | 5/1/26 (2) | 9,000 | 4,915 |
| California County CA Tobacco Securitization | | | | |
| Agency Revenue | 5.450% | 6/1/28 | 7,500 | 7,301 |
| California Department of Water Resources | | | | |
| Power Supply Revenue | 5.000% | 5/1/18 | 8,000 | 9,791 |
78
| | | | |
| California Long-Term Tax-Exempt Fund | | | | |
| |
| |
| |
| | | | Face | Market |
| | | Maturity | Amount | Value |
| | Coupon | Date | ($000) | ($000) |
| California Department of Water Resources | | | | |
| Power Supply Revenue | 5.000% | 5/1/20 | 10,000 | 12,793 |
| California Department of Water Resources | | | | |
| Power Supply Revenue | 5.000% | 5/1/20 | 9,500 | 12,154 |
| California Department of Water Resources | | | | |
| Power Supply Revenue | 5.000% | 5/1/21 | 5,000 | 6,311 |
| California Department of Water Resources | | | | |
| Power Supply Revenue | 5.000% | 5/1/22 | 30,000 | 36,090 |
| California Department of Water Resources Water | | | | |
| System Revenue (Central Valley Project) | 5.000% | 12/1/25 | 8,810 | 10,669 |
| California Department of Water Resources Water | | | | |
| System Revenue (Central Valley Project) | 5.000% | 12/1/35 | 4,000 | 4,868 |
| California Economic Recovery GO | 5.000% | 7/1/18 | 12,000 | 14,741 |
| California Economic Recovery GO | 5.000% | 7/1/19 | 6,000 | 7,544 |
| California Economic Recovery GO | 5.000% | 7/1/20 | 15,000 | 18,696 |
| California Economic Recovery GO | 5.250% | 7/1/21 | 16,985 | 21,165 |
| California Economic Recovery GO | 5.000% | 7/1/22 | 5,000 | 5,760 |
| California Educational Facilities Authority Revenue | | | | |
| (California Institute of Technology) | 5.000% | 10/1/39 | 7,730 | 9,160 |
| California Educational Facilities Authority Revenue | | | | |
| (California Institute of Technology) | 5.000% | 11/1/39 | 3,000 | 3,490 |
| California Educational Facilities Authority Revenue | | | | |
| (Claremont McKenna College) | 5.000% | 1/1/42 | 4,000 | 4,761 |
| California Educational Facilities Authority Revenue | | | | |
| (College of Arts & Crafts) | 6.875% | 6/1/19 | 1,615 | 1,984 |
| California Educational Facilities Authority Revenue | | | | |
| (College of Arts) | 5.250% | 6/1/30 | 1,125 | 1,251 |
| California Educational Facilities Authority Revenue | | | | |
| (Pepperdine College) | 5.000% | 9/1/33 | 3,000 | 3,628 |
| California Educational Facilities Authority Revenue | | | | |
| (Pomona College) | 0.000% | 7/1/34 | 3,155 | 1,317 |
| California Educational Facilities Authority Revenue | | | | |
| (Pomona College) | 0.000% | 7/1/35 | 3,155 | 1,234 |
| California Educational Facilities Authority Revenue | | | | |
| (Pomona College) | 0.000% | 7/1/36 | 3,155 | 1,178 |
| California Educational Facilities Authority Revenue | | | | |
| (Pomona College) | 0.000% | 7/1/37 | 3,155 | 1,127 |
| California Educational Facilities Authority Revenue | | | | |
| (Pomona College) | 0.000% | 7/1/39 | 2,805 | 907 |
| California Educational Facilities Authority Revenue | | | | |
| (Pomona College) | 0.000% | 7/1/40 | 1,580 | 487 |
| California Educational Facilities Authority Revenue | | | | |
| (Stanford University) | 5.000% | 3/15/26 | 5,330 | 7,311 |
| California Educational Facilities Authority Revenue | | | | |
| (University of San Francisco) | 6.125% | 10/1/36 | 1,250 | 1,571 |
| California Educational Facilities Authority Revenue | | | | |
| (University of Southern California) | 4.750% | 10/1/37 | 1,650 | 1,886 |
| California Educational Facilities Authority Revenue | | | | |
| (University of Southern California) | 5.000% | 10/1/38 | 5,445 | 6,452 |
| California Educational Facilities Authority Revenue | | | | |
| (University of Southern California) | 5.250% | 10/1/38 | 3,420 | 4,149 |
| California Educational Facilities Authority Revenue | | | | |
| (University of the Pacific) | 5.000% | 11/1/25 | 2,000 | 2,164 |
| California GO | 7.000% | 11/1/13 (14) | 65 | 67 |
| California GO | 5.250% | 10/1/14 (14) | 1,955 | 1,988 |
| California GO | 5.000% | 10/1/18 | 9,000 | 11,064 |
79
| | | | |
| California Long-Term Tax-Exempt Fund | | | | |
| |
| |
| |
| | | | Face | Market |
| | | Maturity | Amount | Value |
| | Coupon | Date | ($000) | ($000) |
| California GO | 5.000% | 3/1/19 | 1,250 | 1,550 |
| California GO | 6.000% | 4/1/19 | 1,690 | 2,207 |
| California GO | 6.000% | 8/1/19 (3) | 210 | 212 |
| California GO | 5.000% | 10/1/19 | 10,070 | 12,655 |
| California GO | 5.000% | 4/1/20 | 1,460 | 1,788 |
| California GO | 5.000% | 9/1/21 | 11,000 | 14,091 |
| California GO | 5.250% | 9/1/22 | 3,000 | 3,951 |
| California GO | 5.000% | 11/1/22 | 1,000 | 1,184 |
| California GO | 5.250% | 9/1/23 | 10,100 | 12,782 |
| California GO | 5.000% | 3/1/25 | 7,000 | 8,430 |
| California GO | 5.125% | 2/1/26 | 15,325 | 16,087 |
| California GO | 5.000% | 6/1/26 (14) | 20,000 | 23,287 |
| California GO | 5.250% | 10/1/27 | 5,000 | 6,115 |
| California GO | 5.100% | 11/1/27 | 1,475 | 1,802 |
| California GO | 5.000% | 9/1/28 | 10,650 | 12,073 |
| California GO | 5.000% | 10/1/29 | 1,400 | 1,657 |
| California GO | 5.250% | 10/1/29 | 4,700 | 5,668 |
| California GO | 5.250% | 3/1/30 | 10,000 | 12,184 |
| California GO | 4.500% | 8/1/30 | 5,000 | 5,481 |
| California GO | 5.250% | 9/1/30 | 6,000 | 7,311 |
| California GO | 5.750% | 4/1/31 | 15,875 | 19,369 |
| California GO | 5.000% | 6/1/32 | 25,000 | 28,202 |
| California GO | 5.000% | 9/1/32 | 1,045 | 1,235 |
| California GO | 6.000% | 3/1/33 | 7,000 | 8,996 |
| California GO | 5.125% | 4/1/33 | 8,500 | 9,722 |
| California GO | 6.500% | 4/1/33 | 33,000 | 42,384 |
| California GO | 5.000% | 6/1/34 | 7,000 | 7,501 |
| California GO | 5.250% | 4/1/35 | 5,000 | 6,014 |
| California GO | 6.000% | 11/1/35 | 10,000 | 12,654 |
| California GO | 5.000% | 9/1/36 | 8,500 | 10,014 |
| California GO | 5.250% | 3/1/38 | 13,565 | 15,455 |
| California GO | 6.000% | 4/1/38 | 21,190 | 26,296 |
| California GO | 5.250% | 8/1/38 | 10,000 | 11,496 |
| California GO | 5.500% | 11/1/39 | 3,690 | 4,420 |
| California GO | 6.000% | 11/1/39 | 2,700 | 3,407 |
| California GO | 5.500% | 3/1/40 | 11,500 | 13,868 |
| California GO | 5.250% | 11/1/40 | 11,000 | 13,170 |
| California GO | 5.000% | 10/1/41 | 10,000 | 11,559 |
| California GO | 5.000% | 9/1/42 | 5,750 | 6,721 |
| 1 California GO TOB VRDO | 0.180% | 12/4/12 | 3,700 | 3,700 |
| California GO VRDO | 0.140% | 12/3/12 LOC | 2,600 | 2,600 |
| California Health Facilities Financing Authority | | | | |
| Revenue (Adventist Health System/West) | 5.000% | 3/1/33 | 2,500 | 2,514 |
| California Health Facilities Financing Authority | | | | |
| Revenue (Casa Colina) | 6.125% | 4/1/32 | 10,000 | 10,018 |
| California Health Facilities Financing Authority | | | | |
| Revenue (Catholic Healthcare West) | 5.625% | 7/1/25 | 5,000 | 5,902 |
| California Health Facilities Financing Authority | | | | |
| Revenue (Catholic Healthcare West) | 5.250% | 3/1/27 | 2,500 | 2,940 |
| California Health Facilities Financing Authority | | | | |
| Revenue (Catholic Healthcare West) | 6.000% | 7/1/39 | 5,000 | 6,016 |
| California Health Facilities Financing Authority | | | | |
| Revenue (Catholic Healthcare West) | 5.250% | 3/1/41 | 9,000 | 10,265 |
| California Health Facilities Financing Authority | | | | |
| Revenue (Catholic Healthcare West) VRDO | 0.180% | 12/7/12 LOC | 2,800 | 2,800 |
80
| | | | |
| California Long-Term Tax-Exempt Fund | | | | |
| |
| |
| |
| | | | Face | Market |
| | | Maturity | Amount | Value |
| | Coupon | Date | ($000) | ($000) |
| California Health Facilities Financing Authority | | | | |
| Revenue (Cedars-Sinai Medical Center) | 5.000% | 11/15/27 | 7,000 | 7,666 |
| California Health Facilities Financing Authority | | | | |
| Revenue (Cedars-Sinai Medical Center) | 5.000% | 8/15/34 | 2,415 | 2,696 |
| California Health Facilities Financing Authority | | | | |
| Revenue (Cedars-Sinai Medical Center) | 5.000% | 8/15/39 | 10,245 | 11,389 |
| California Health Facilities Financing Authority | | | | |
| Revenue (Children’s Hospital of Los Angeles) | 5.000% | 11/15/29 | 3,000 | 3,405 |
| California Health Facilities Financing Authority | | | | |
| Revenue (Children’s Hospital of Los Angeles) | 5.000% | 11/15/34 | 2,475 | 2,750 |
| California Health Facilities Financing Authority | | | | |
| Revenue (Children’s Hospital of Orange County) | 6.500% | 11/1/38 | 3,000 | 3,715 |
| California Health Facilities Financing Authority | | | | |
| Revenue (Children’s Hospital of Orange County) | 5.250% | 11/1/41 | 4,025 | 4,580 |
| California Health Facilities Financing Authority | | | | |
| Revenue (Chinese Hospital Association) | 5.000% | 6/1/37 | 2,000 | 2,249 |
| California Health Facilities Financing Authority | | | | |
| Revenue (Chinese Hospital Association) | 5.000% | 6/1/42 | 5,000 | 5,671 |
| California Health Facilities Financing Authority | | | | |
| Revenue (City of Hope Medical Center) | 5.000% | 11/15/35 | 6,250 | 7,209 |
| California Health Facilities Financing Authority | | | | |
| Revenue (City of Hope Medical Center) | 5.000% | 11/15/39 | 4,465 | 5,170 |
| California Health Facilities Financing Authority | | | | |
| Revenue (Lucile Salter Packard Children’s | | | | |
| Hospital at Stanford) | 5.000% | 8/15/51 | 12,000 | 13,790 |
| California Health Facilities Financing Authority | | | | |
| Revenue (Memorial Health Services) | 5.000% | 10/1/25 | 2,750 | 3,381 |
| California Health Facilities Financing Authority | | | | |
| Revenue (Memorial Health Services) | 5.000% | 10/1/26 | 5,000 | 6,124 |
| California Health Facilities Financing Authority | | | | |
| Revenue (Memorial Health Services) | 5.000% | 10/1/33 | 2,500 | 2,939 |
| California Health Facilities Financing Authority | | | | |
| Revenue (Providence Health & Services) | 6.500% | 10/1/33 | 2,000 | 2,462 |
| California Health Facilities Financing Authority | | | | |
| Revenue (Providence Health & Services) | 5.500% | 10/1/39 | 6,500 | 7,558 |
| California Health Facilities Financing Authority | | | | |
| Revenue (Rady Children’s Hospital) | 5.500% | 8/15/33 | 3,920 | 4,565 |
| California Health Facilities Financing Authority | | | | |
| Revenue (Scripps Health) | 5.000% | 11/15/40 | 6,000 | 6,911 |
| California Health Facilities Financing Authority | | | | |
| Revenue (St. Joseph Health System) | 5.750% | 7/1/39 | 7,000 | 8,220 |
| California Health Facilities Financing Authority | | | | |
| Revenue (Stanford Hospital) | 5.000% | 8/15/51 | 16,675 | 19,132 |
| California Health Facilities Financing Authority | | | | |
| Revenue (Sutter Health) | 5.250% | 8/15/22 | 5,000 | 5,922 |
| California Health Facilities Financing Authority | | | | |
| Revenue (Sutter Health) | 5.875% | 8/15/31 | 4,000 | 4,944 |
| California Health Facilities Financing Authority | | | | |
| Revenue (Sutter Health) | 5.250% | 11/15/46 | 20,500 | 22,944 |
| California Infrastructure & Economic | | | | |
| Development Bank Revenue | | | | |
| (American National Red Cross) VRDO | 0.150% | 12/7/12 LOC | 1,990 | 1,990 |
| 1 California Infrastructure & Economic | | | | |
| Development Bank Revenue | | | | |
| (Bay Area Toll Bridges Seismic Retrofit) | | | | |
| TOB VRDO | 0.180% | 12/3/12 (ETM) | 2,000 | 2,000 |
81
| | | | |
| California Long-Term Tax-Exempt Fund | | | | |
| |
| |
| |
| | | | Face | Market |
| | | Maturity | Amount | Value |
| | Coupon | Date | ($000) | ($000) |
| California Infrastructure & Economic Development | | | | |
| Bank Revenue (Los Angeles County Museum of | | | | |
| Natural History Foundation) VRDO | 0.140% | 12/3/12 LOC | 4,300 | 4,300 |
| California Infrastructure & Economic Development | | | | |
| Bank Revenue (Science Center Phase II Project) | 5.000% | 5/1/31 (14) | 4,135 | 4,298 |
| California Municipal Finance Authority (Community | | | | |
| Hospitals of Central California Obligated Group) | | | | |
| COP | 5.500% | 2/1/39 | 11,000 | 12,026 |
| California Municipal Finance Authority Revenue | | | | |
| (University of La Verne) | 5.250% | 6/1/20 | 2,420 | 2,903 |
| California Public Works Board Lease Revenue | | | | |
| (Community Colleges) | 5.000% | 3/1/27 (14) | 2,970 | 3,295 |
| California Public Works Board Lease Revenue | | | | |
| (Department of Corrections) | 5.000% | 1/1/17 | 6,000 | 6,689 |
| California Public Works Board Lease Revenue | | | | |
| (Department of Corrections) | 6.500% | 9/1/17 (2) | 18,995 | 21,142 |
| California Public Works Board Lease Revenue | | | | |
| (Department of Corrections) | 5.000% | 12/1/17 (14) | 13,835 | 14,912 |
| California Public Works Board Lease Revenue | | | | |
| (Department of Corrections) | 5.000% | 12/1/19 (14) | 15,230 | 16,368 |
| California Public Works Board Lease Revenue | | | | |
| (Department of General Services) | 6.000% | 4/1/25 | 6,000 | 7,390 |
| California Public Works Board Lease Revenue | | | | |
| (Department of General Services) | 6.250% | 4/1/34 | 8,250 | 9,945 |
| California Public Works Board Lease Revenue | | | | |
| (Office of Emergency Services) | 5.000% | 3/1/27 (14) | 8,950 | 9,929 |
| California Public Works Board Lease Revenue | | | | |
| (Regents of The University of California) | 5.250% | 11/1/27 (14) | 9,045 | 10,112 |
| California Public Works Board Lease Revenue | | | | |
| (Regents of The University of California) | 5.000% | 5/1/30 | 17,000 | 18,523 |
| California Public Works Board Lease Revenue | | | | |
| (Various Capital Projects) | 5.000% | 4/1/23 | 4,180 | 5,078 |
| California Public Works Board Lease Revenue | | | | |
| (Various Capital Projects) | 5.000% | 11/1/23 | 2,000 | 2,442 |
| California Public Works Board Lease Revenue | | | | |
| (Various Capital Projects) | 6.250% | 11/1/24 | 5,000 | 6,317 |
| California Public Works Board Lease Revenue | | | | |
| (Various Capital Projects) | 5.000% | 11/1/26 | 5,000 | 5,961 |
| California Public Works Board Lease Revenue | | | | |
| (Various Capital Projects) | 5.000% | 11/1/37 | 5,000 | 5,660 |
| California State University Revenue Systemwide | 5.250% | 5/1/14 (Prere.) | 3,510 | 3,753 |
| California State University Revenue Systemwide | 5.250% | 5/1/14 (Prere.) | 3,045 | 3,256 |
| California State University Revenue Systemwide | 5.250% | 11/1/19 (4) | 1,490 | 1,589 |
| California State University Revenue Systemwide | 5.250% | 11/1/20 (4) | 1,700 | 1,813 |
| California State University Revenue Systemwide | 5.000% | 11/1/21 (2) | 17,215 | 19,002 |
| California State University Revenue Systemwide | 5.000% | 11/1/24 | 2,000 | 2,474 |
| California State University Revenue Systemwide | 5.750% | 11/1/27 | 4,500 | 5,419 |
| California State University Revenue Systemwide | 5.250% | 11/1/34 | 5,000 | 5,769 |
| California State University Revenue Systemwide | 5.000% | 11/1/35 (14) | 5,000 | 5,496 |
| California State University Revenue Systemwide | 5.000% | 11/1/37 | 10,000 | 11,708 |
| California State University Revenue Systemwide | 5.250% | 11/1/38 | 3,280 | 3,774 |
| California Statewide Communities Development | | | | |
| Authority Gas Supply Revenue VRDO | 0.150% | 12/7/12 | 8,550 | 8,550 |
| California Statewide Communities Development | | | | |
| Authority Health Facility Revenue | | | | |
| (Adventist Health System/ West) | 5.000% | 3/1/35 | 8,000 | 8,561 |
82
| | | | |
| California Long-Term Tax-Exempt Fund | | | | |
| |
| |
| |
| | | | Face | Market |
| | | Maturity | Amount | Value |
| | Coupon | Date | ($000) | ($000) |
| California Statewide Communities Development | | | | |
| Authority Health Facility Revenue | | | | |
| (Henry Mayo Newhall Memorial Hospital) | 5.000% | 10/1/18 | 4,615 | 4,626 |
| California Statewide Communities Development | | | | |
| Authority Health Facility Revenue | | | | |
| (Memorial Health Services) | 6.000% | 4/1/13 (Prere.) | 8,500 | 8,665 |
| California Statewide Communities Development | | | | |
| Authority Revenue (Cottage Health System | | | | |
| Obligated Group) | 5.000% | 11/1/40 | 7,000 | 7,896 |
| California Statewide Communities Development | | | | |
| Authority Revenue (Daughters of Charity | | | | |
| Health System) | 5.250% | 7/1/30 | 5,000 | 5,196 |
| 2 California Statewide Communities Development | | | | |
| Authority Revenue (Episcopal Communities | | | | |
| & Services) | 5.000% | 5/15/42 | 1,500 | 1,675 |
| 2 California Statewide Communities Development | | | | |
| Authority Revenue (Episcopal Communities | | | | |
| & Services) | 5.000% | 5/15/47 | 2,000 | 2,213 |
| California Statewide Communities Development | | | | |
| Authority Revenue (John Muir Health) | 5.000% | 8/15/34 | 5,390 | 5,988 |
| California Statewide Communities Development | | | | |
| Authority Revenue (Kaiser Permanente) | 4.750% | 4/1/33 | 4,185 | 4,600 |
| California Statewide Communities Development | | | | |
| Authority Revenue (Kaiser Permanente) | 5.000% | 3/1/41 | 4,925 | 5,405 |
| California Statewide Communities Development | | | | |
| Authority Revenue (Kaiser Permanente) | 5.000% | 4/1/42 | 21,000 | 24,397 |
| California Statewide Communities Development | | | | |
| Authority Revenue (Kaiser Permanente) | 5.250% | 3/1/45 | 10,250 | 11,261 |
| California Statewide Communities Development | | | | |
| Authority Revenue (Los Angeles County | | | | |
| Museum of Art Project) VRDO | 0.160% | 12/7/12 LOC | 2,800 | 2,800 |
| California Statewide Communities Development | | | | |
| Authority Revenue (Proposition 1A Receivables | | | | |
| Program) | 5.000% | 6/15/13 | 9,000 | 9,234 |
| California Statewide Communities Development | | | | |
| Authority Revenue (Redlands Community | | | | |
| Hospital) VRDO | 0.150% | 12/7/12 LOC | 4,400 | 4,400 |
| California Statewide Communities Development | | | | |
| Authority Revenue (Sutter Health) | 5.250% | 8/15/31 | 2,500 | 3,013 |
| California Statewide Communities Development | | | | |
| Authority Revenue (Sutter Health) | 5.000% | 8/15/32 | 11,000 | 12,760 |
| California Statewide Communities Development | | | | |
| Authority Revenue (Sutter Health) | 5.000% | 8/15/38 (2) | 2,900 | 3,313 |
| California Statewide Communities Development | | | | |
| Authority Revenue (Sutter Health) | 5.000% | 8/15/38 (2) | 3,490 | 3,987 |
| California Statewide Communities Development | | | | |
| Authority Revenue (Sutter Health) | 5.000% | 11/15/38 | 4,250 | 4,880 |
| California Statewide Communities Development | | | | |
| Authority Revenue (Trinity Health) | 5.000% | 12/1/41 | 7,500 | 8,657 |
| California Statewide Communities Development | | | | |
| Authority Senior Living Revenue (Southern | | | | |
| California Presbyterian Homes) | 4.875% | 11/15/36 | 3,730 | 3,779 |
| California Statewide Communities Development | | | | |
| Authority Senior Living Revenue (Southern | | | | |
| California Presbyterian Homes) | 7.250% | 11/15/41 | 3,000 | 3,492 |
83
| | | | |
| California Long-Term Tax-Exempt Fund | | | | |
| |
| |
| |
| | | | Face | Market |
| | | Maturity | Amount | Value |
| | Coupon | Date | ($000) | ($000) |
| California Statewide Communities Development | | | | |
| Authority Student Housing Revenue (CHF-Irvine | | | | |
| LLC - UCI East Campus Apartments Phase II) | 5.000% | 5/15/38 | 13,000 | 13,403 |
| Cerritos CA Community College District GO | 0.000% | 8/1/34 | 4,000 | 1,480 |
| Cerritos CA Community College District GO | 0.000% | 8/1/35 | 1,730 | 608 |
| Cerritos CA Community College District GO | 5.000% | 8/1/38 | 7,000 | 8,180 |
| 1 Cerritos CA Community College District GO | | | | |
| TOB VRDO | 0.190% | 12/7/12 | 7,500 | 7,500 |
| Chula Vista CA Industrial Development Revenue | | | | |
| (San Diego Gas & Electric Co.) | 1.650% | 7/1/18 | 2,000 | 2,036 |
| Clovis CA Unified School District GO | 0.000% | 8/1/13 (14) | 4,935 | 4,925 |
| Clovis CA Unified School District GO | 0.000% | 8/1/15 (14) | 2,770 | 2,710 |
| Clovis CA Unified School District GO | 0.000% | 8/1/16 (14) | 2,865 | 2,719 |
| East Bay CA Municipal Utility District Waste | | | | |
| Water System Revenue | 5.000% | 6/1/33 (2) | 1,350 | 1,556 |
| East Bay CA Municipal Utility District Water | | | | |
| System Revenue | 5.000% | 6/1/32 (14) | 15,765 | 18,173 |
| East Bay CA Municipal Utility District Water | | | | |
| System Revenue | 5.000% | 6/1/36 | 10,000 | 11,942 |
| East Bay CA Regional Park District Revenue | 5.000% | 9/1/25 | 2,000 | 2,435 |
| East Bay CA Regional Park District Revenue | 5.000% | 9/1/27 | 4,070 | 4,920 |
| East Side CA Union High School District GO | 5.000% | 8/1/37 | 5,655 | 6,460 |
| El Camino CA Community College District GO | 0.000% | 8/1/33 | 3,500 | 1,424 |
| El Camino CA Community College District GO | 0.000% | 8/1/34 | 5,000 | 1,927 |
| Encinitas CA Community Facilities District No. 1 | | | | |
| Special Tax Revenue | 5.000% | 9/1/27 | 1,000 | 1,152 |
| Escondido CA Union High School District GO | 0.000% | 11/1/20 (14) | 4,000 | 3,064 |
| Fontana CA Public Financing Authority Tax | | | | |
| Allocation Revenue | 5.000% | 10/1/29 (2) | 9,450 | 9,814 |
| Fontana CA Public Financing Authority Tax | | | | |
| Allocation Revenue | 5.000% | 10/1/32 (2) | 5,000 | 5,176 |
| Fontana CA Unified School District GO | 5.250% | 8/1/14 (Prere.) | 5,875 | 6,356 |
| Fontana CA Unified School District GO | 5.250% | 8/1/31 (4) | 240 | 256 |
| Foothill-De Anza CA Community College | | | | |
| District GO | 0.000% | 8/1/17 (14) | 3,000 | 2,788 |
| Foothill-De Anza CA Community College | | | | |
| District GO | 0.000% | 8/1/22 (14) | 3,850 | 2,908 |
| Foothill-De Anza CA Community College | | | | |
| District GO | 0.000% | 8/1/23 (14) | 3,590 | 2,557 |
| Foothill-De Anza CA Community College | | | | |
| District GO | 0.000% | 8/1/25 (14) | 2,390 | 1,564 |
| Foothill-De Anza CA Community College | | | | |
| District GO | 5.000% | 8/1/40 | 10,000 | 11,860 |
| Foothill/Eastern Corridor Agency California | | | | |
| Toll Road Revenue | 5.875% | 1/15/26 | 10,000 | 10,377 |
| Fresno CA Airport Revenue | 5.500% | 7/1/30 (4) | 1,500 | 1,503 |
| Gavilan CA Joint Community College District GO | 5.500% | 8/1/14 (Prere.) | 3,315 | 3,600 |
| Gavilan CA Joint Community College District GO | 5.500% | 8/1/28 (2) | 90 | 97 |
| Golden State Tobacco Securitization Corp. | | | | |
| California | 5.500% | 6/1/13 (Prere.) | 4,000 | 4,105 |
| * Golden State Tobacco Securitization Corp. | | | | |
| California | 6.250% | 6/1/13 (Prere.) | 24,000 | 24,692 |
| Golden State Tobacco Securitization Corp. | | | | |
| California | 5.125% | 6/1/47 | 7,785 | 6,542 |
| Golden State Tobacco Securitization Corp. | | | | |
| California | 5.750% | 6/1/47 | 8,500 | 7,890 |
84
| | | | |
| California Long-Term Tax-Exempt Fund | | | | |
| |
| |
| |
| | | | Face | Market |
| | | Maturity | Amount | Value |
| | Coupon | Date | ($000) | ($000) |
| Grossmont CA Healthcare District GO | 6.125% | 7/15/40 | 2,500 | 3,149 |
| Grossmont CA Union High School District GO | 0.000% | 8/1/30 | 6,600 | 3,134 |
| Hartnell CA Community College District GO | 5.000% | 8/1/13 (Prere.) | 2,370 | 2,445 |
| Hartnell CA Community College District GO | 5.000% | 8/1/13 (Prere.) | 1,735 | 1,790 |
| Hartnell CA Community College District GO | 5.000% | 8/1/13 (Prere.) | 1,550 | 1,599 |
| Hayward CA Housing Authority Multifamily | | | | |
| Housing Revenue (Barrington Hills Apartments) | | | | |
| VRDO | 0.150% | 12/7/12 LOC | 2,900 | 2,900 |
| Huntington Beach CA Union High School | | | | |
| District GO | 0.000% | 8/1/30 (4) | 8,340 | 4,043 |
| Irvine CA Reassessment District No. 05-21 | | | | |
| Improvement Revenue VRDO | 0.150% | 12/3/12 LOC | 6,400 | 6,400 |
| Irvine CA Unified School District Financing | | | | |
| Authority Special Tax Revenue | 5.000% | 9/1/30 (2) | 5,500 | 5,760 |
| Kern CA High School District GO | 6.400% | 8/1/14 (ETM) | 1,490 | 1,641 |
| Kern CA High School District GO | 6.400% | 8/1/15 (ETM) | 1,645 | 1,908 |
| Kern CA High School District GO | 6.400% | 8/1/16 (ETM) | 1,815 | 2,215 |
| Kern County CA GO | 5.750% | 8/1/35 (12) | 2,000 | 2,305 |
| Las Virgenes CA Unified School District GO | 0.000% | 9/1/26 (14) | 6,140 | 3,703 |
| Loma Linda CA Hospital Revenue | | | | |
| (Loma Linda University) | 5.000% | 12/1/20 | 6,155 | 6,404 |
| Loma Linda CA Hospital Revenue | | | | |
| (Loma Linda University) | 5.000% | 12/1/21 | 2,500 | 2,589 |
| 2 Long Beach CA Community College District GO | 0.000% | 8/1/34 | 2,520 | 948 |
| Long Beach CA Finance Authority Lease Revenue | | | | |
| (Temple & Willow Facility) | 5.500% | 10/1/18 (14) | 5,030 | 5,116 |
| Long Beach CA Finance Authority Natural Gas | | | | |
| Purchase Revenue | 1.638% | 11/15/26 | 1,800 | 1,524 |
| Long Beach CA Finance Authority Natural Gas | | | | |
| Purchase Revenue | 5.500% | 11/15/37 | 2,500 | 3,121 |
| Long Beach CA Finance Authority Tax Revenue | 5.500% | 8/1/26 (2) | 7,570 | 8,304 |
| Long Beach CA Finance Authority Tax Revenue | 5.500% | 8/1/31 (2) | 4,015 | 4,338 |
| Long Beach CA Harbor Revenue | 5.000% | 5/15/17 (14) | 3,655 | 3,904 |
| Los Angeles CA Community College District GO | 5.500% | 8/1/25 | 3,980 | 4,969 |
| Los Angeles CA Community College District GO | 5.000% | 8/1/31 (4) | 5,000 | 5,632 |
| Los Angeles CA Community College District GO | 5.000% | 8/1/32 (14) | 7,340 | 8,469 |
| Los Angeles CA Community College District GO | 6.000% | 8/1/33 | 5,160 | 6,598 |
| Los Angeles CA Community College District GO | 5.250% | 8/1/39 | 5,000 | 6,247 |
| Los Angeles CA Department of Airports | | | | |
| International Airport Revenue | 5.000% | 5/15/22 | 2,000 | 2,469 |
| Los Angeles CA Department of Airports | | | | |
| International Airport Revenue | 5.250% | 5/15/27 | 5,000 | 6,109 |
| Los Angeles CA Department of Airports | | | | |
| International Airport Revenue | 5.000% | 5/15/29 | 5,000 | 5,951 |
| Los Angeles CA Department of Airports | | | | |
| International Airport Revenue | 5.000% | 5/15/30 | 14,590 | 17,276 |
| Los Angeles CA Department of Airports | | | | |
| International Airport Revenue | 5.000% | 5/15/30 | 3,195 | 3,707 |
| 1 Los Angeles CA Department of Airports | | | | |
| International Airport Revenue TOB VRDO | 0.190% | 12/7/12 | 1,440 | 1,440 |
| Los Angeles CA Department of Water | | | | |
| & Power Revenue | 5.000% | 7/1/25 | 4,070 | 4,851 |
| Los Angeles CA Department of Water | | | | |
| & Power Revenue | 5.000% | 7/1/25 | 2,500 | 3,188 |
| Los Angeles CA Department of Water | | | | |
| & Power Revenue | 5.000% | 7/1/29 (2) | 10,000 | 11,481 |
85
| | | | |
| California Long-Term Tax-Exempt Fund | | | | |
| |
| |
| |
| | | | Face | Market |
| | | Maturity | Amount | Value |
| | Coupon | Date | ($000) | ($000) |
| Los Angeles CA Department of Water | | | | |
| & Power Revenue | 5.000% | 7/1/30 (2) | 16,000 | 18,369 |
| Los Angeles CA Department of Water | | | | |
| & Power Revenue | 5.000% | 7/1/32 (2) | 5,000 | 5,726 |
| Los Angeles CA Department of Water | | | | |
| & Power Revenue | 5.250% | 7/1/32 | 7,000 | 8,360 |
| Los Angeles CA Department of Water | | | | |
| & Power Revenue | 5.000% | 7/1/34 (14) | 5,995 | 6,386 |
| Los Angeles CA Department of Water | | | | |
| & Power Revenue | 5.375% | 7/1/34 | 3,000 | 3,608 |
| Los Angeles CA Department of Water | | | | |
| & Power Revenue | 5.000% | 7/1/36 | 5,000 | 5,894 |
| Los Angeles CA Department of Water | | | | |
| & Power Revenue | 5.000% | 7/1/36 | 10,000 | 11,987 |
| Los Angeles CA Department of Water | | | | |
| & Power Revenue | 5.000% | 7/1/36 | 3,000 | 3,596 |
| Los Angeles CA Department of Water | | | | |
| & Power Revenue | 5.000% | 7/1/37 | 1,545 | 1,843 |
| Los Angeles CA Department of Water | | | | |
| & Power Revenue | 5.000% | 7/1/38 | 7,365 | 8,773 |
| Los Angeles CA Department of Water | | | | |
| & Power Revenue | 5.250% | 7/1/38 | 1,890 | 2,250 |
| Los Angeles CA Department of Water | | | | |
| & Power Revenue | 5.250% | 7/1/39 | 2,000 | 2,422 |
| 1 Los Angeles CA Department of Water | | | | |
| & Power Revenue TOB VRDO | 0.170% | 12/3/12 | 5,855 | 5,855 |
| 1 Los Angeles CA Department of Water | | | | |
| & Power Revenue TOB VRDO | 0.170% | 12/3/12 | 12,265 | 12,265 |
| Los Angeles CA Department of Water | | | | |
| & Power Revenue VRDO | 0.140% | 12/3/12 | 8,700 | 8,700 |
| Los Angeles CA Department of Water | | | | |
| & Power Revenue VRDO | 0.150% | 12/7/12 | 300 | 300 |
| Los Angeles CA GO | 5.000% | 9/1/22 | 11,155 | 14,234 |
| Los Angeles CA GO | 5.000% | 9/1/31 | 5,785 | 6,961 |
| Los Angeles CA TRAN | 2.000% | 6/27/13 | 16,000 | 16,163 |
| Los Angeles CA Unified School District GO | 5.000% | 7/1/13 (Prere.) | 10,000 | 10,279 |
| Los Angeles CA Unified School District GO | 5.000% | 7/1/20 (3) | 2,655 | 3,048 |
| Los Angeles CA Unified School District GO | 5.000% | 7/1/21 | 3,500 | 4,325 |
| Los Angeles CA Unified School District GO | 5.000% | 7/1/24 (2) | 9,745 | 11,119 |
| Los Angeles CA Unified School District GO | 5.000% | 7/1/24 (2) | 7,500 | 8,557 |
| Los Angeles CA Unified School District GO | 5.250% | 7/1/24 | 6,275 | 7,744 |
| Los Angeles CA Unified School District GO | 5.250% | 7/1/25 | 5,000 | 6,149 |
| Los Angeles CA Unified School District GO | 5.250% | 7/1/28 | 7,000 | 8,566 |
| Los Angeles CA Unified School District GO | 5.000% | 7/1/30 (3) | 7,500 | 8,345 |
| Los Angeles CA Unified School District GO | 5.000% | 7/1/32 (4) | 8,000 | 9,097 |
| Los Angeles CA Unified School District GO | 5.000% | 1/1/34 | 5,000 | 5,833 |
| Los Angeles CA Unified School District GO | 5.250% | 7/1/34 | 10,000 | 11,966 |
| 2 Los Angeles County CA Metropolitan | | | | |
| Transportation Authority Sales Tax Revenue | 5.000% | 7/1/21 | 4,000 | 5,087 |
| Los Angeles County CA Metropolitan | | | | |
| Transportation Authority Sales Tax Revenue | 5.000% | 7/1/23 | 5,000 | 6,366 |
| 1 Los Angeles County CA Metropolitan | | | | |
| Transportation Authority Sales Tax Revenue | | | | |
| TOB VRDO | 0.180% | 12/3/12 | 7,730 | 7,730 |
| Los Angeles County CA Public Works | | | | |
| Financing Authority Lease Revenue | 5.000% | 12/1/23 (14) | 4,000 | 4,399 |
86
| | | | |
| California Long-Term Tax-Exempt Fund | | | | |
| |
| |
| |
| | | | Face | Market |
| | | Maturity | Amount | Value |
| | Coupon | Date | ($000) | ($000) |
| Los Angeles County CA Public Works Financing | | | | |
| Authority Lease Revenue | 5.000% | 12/1/24 (14) | 4,000 | 4,399 |
| Los Angeles County CA Public Works Financing | | | | |
| Authority Lease Revenue | 5.000% | 12/1/25 (14) | 1,265 | 1,391 |
| Los Angeles County CA Public Works Financing | | | | |
| Authority Lease Revenue | 5.000% | 8/1/37 | 2,750 | 3,151 |
| Los Angeles County CA Public Works Financing | | | | |
| Authority Lease Revenue | 5.000% | 8/1/42 | 3,400 | 3,908 |
| Los Angeles County CA Public Works Financing | | | | |
| Authority Revenue | 5.500% | 10/1/18 (4) | 1,660 | 1,884 |
| Los Angeles County CA Sanitation Districts | | | | |
| Financing Authority Capital Projects Revenue | 4.500% | 10/1/42 (2) | 2,500 | 2,631 |
| Los Angeles County CA Schools Regionalized | | | | |
| Business Services Corp. COP | 0.000% | 8/1/14 (ETM) | 1,000 | 944 |
| Los Angeles County CA Schools Regionalized | | | | |
| Business Services Corp. COP | 0.000% | 8/1/20 (2) | 2,095 | 1,520 |
| Los Angeles County CA TRAN | 2.000% | 6/28/13 | 5,000 | 5,052 |
| M-S-R California Energy Authority Revenue | 7.000% | 11/1/34 | 7,000 | 10,338 |
| M-S-R California Energy Authority Revenue | 6.500% | 11/1/39 | 7,000 | 10,047 |
| M-S-R California Public Power Agency Revenue | | | | |
| (San Juan Project) | 6.125% | 7/1/13 (2) | 1,795 | 1,845 |
| M-S-R California Public Power Agency Revenue | | | | |
| (San Juan Project) | 6.750% | 7/1/20 (ETM) | 11,220 | 13,965 |
| Marin CA Municipal Water District Financing | | | | |
| Authority Water Revenue | 5.000% | 7/1/44 | 4,000 | 4,750 |
| Metropolitan Water District of Southern | | | | |
| California Revenue | 5.000% | 7/1/21 | 2,500 | 3,265 |
| Metropolitan Water District of Southern | | | | |
| California Revenue | 5.000% | 7/1/25 | 3,410 | 4,021 |
| Metropolitan Water District of Southern | | | | |
| California Revenue | 5.000% | 10/1/26 | 4,000 | 5,042 |
| Metropolitan Water District of Southern | | | | |
| California Revenue | 5.000% | 7/1/28 | 4,235 | 4,820 |
| 2 Metropolitan Water District of Southern | | | | |
| California Revenue | 5.000% | 7/1/28 | 4,000 | 5,074 |
| Metropolitan Water District of Southern | | | | |
| California Revenue | 5.000% | 7/1/31 | 3,000 | 3,584 |
| Metropolitan Water District of Southern | | | | |
| California Revenue | 5.000% | 10/1/33 | 7,535 | 9,314 |
| Metropolitan Water District of Southern | | | | |
| California Revenue | 5.000% | 10/1/35 | 2,855 | 3,497 |
| 1 Metropolitan Water District of Southern | | | | |
| California Water Revenue TOB VRDO | 0.180% | 12/3/12 | 1,300 | 1,300 |
| Modesto CA High School District GO | 0.000% | 8/1/15 (14) | 5,000 | 4,885 |
| Modesto CA High School District GO | 0.000% | 8/1/17 (14) | 3,000 | 2,730 |
| Modesto CA High School District GO | 0.000% | 8/1/18 (14) | 3,225 | 2,833 |
| Modesto CA Irrigation District COP | 5.500% | 7/1/35 | 1,000 | 1,112 |
| Modesto CA Irrigation District COP | 5.000% | 10/1/36 (2) | 4,795 | 5,063 |
| Modesto CA Irrigation District Electric Revenue | 5.000% | 7/1/23 | 2,050 | 2,558 |
| Modesto CA Irrigation District Financing | | | | |
| Authority Revenue (Woodland Project) | 6.500% | 10/1/22 (ETM) | 9,115 | 11,590 |
| Monterey Park CA Redevelopment Agency | | | | |
| Tax Allocation Revenue | 5.000% | 9/1/16 (4) | 1,010 | 1,013 |
| Monterey Park CA Redevelopment Agency | | | | |
| Tax Allocation Revenue | 5.000% | 9/1/17 (4) | 1,060 | 1,063 |
87
| | | | |
| California Long-Term Tax-Exempt Fund | | | | |
| |
| |
| |
| | | | Face | Market |
| | | Maturity | Amount | Value |
| | Coupon | Date | ($000) | ($000) |
| Monterey Park CA Redevelopment Agency | | | | |
| Tax Allocation Revenue | 5.000% | 9/1/18 (4) | 1,115 | 1,118 |
| Monterey Park CA Redevelopment Agency | | | | |
| Tax Allocation Revenue | 5.000% | 9/1/19 (4) | 1,120 | 1,123 |
| Monterey Park CA Redevelopment Agency | | | | |
| Tax Allocation Revenue | 5.000% | 9/1/20 (4) | 1,180 | 1,183 |
| Mount Diablo CA Unified School District GO | 5.000% | 6/1/37 | 1,915 | 2,222 |
| Mount San Antonio CA Community College | | | | |
| District GO | 5.250% | 8/1/14 (Prere.) | 3,335 | 3,609 |
| Mount San Antonio CA Community College | | | | |
| District GO | 5.250% | 8/1/14 (Prere.) | 3,170 | 3,431 |
| Mount San Antonio CA Community College | | | | |
| District GO | 5.250% | 8/1/14 (Prere.) | 3,010 | 3,258 |
| New Haven CA Unified School District GO | 12.000% | 8/1/17 (4) | 1,500 | 2,245 |
| Newark CA Unified School District GO | 0.000% | 8/1/13 (4) | 2,050 | 2,044 |
| Newport Beach CA Revenue (Hoag Memorial | | | | |
| Hospital Presbyterian) | 6.000% | 12/1/40 | 3,500 | 4,408 |
| Newport Mesa CA Unified School District GO | 0.000% | 8/1/35 | 4,000 | 1,542 |
| Newport Mesa CA Unified School District GO | 0.000% | 8/1/36 | 1,000 | 369 |
| Newport Mesa CA Unified School District GO | 0.000% | 8/1/37 | 2,000 | 708 |
| Newport Mesa CA Unified School District GO | 0.000% | 8/1/38 | 1,000 | 336 |
| Northern California Gas Authority No. 1 Revenue | 0.841% | 7/1/17 | 17,000 | 16,318 |
| Northern California Power Agency Revenue | | | | |
| (Hydroelectric Project) | 6.300% | 7/1/18 (14) | 10,000 | 11,406 |
| Northern California Power Agency Revenue | | | | |
| (Hydroelectric Project) | 7.500% | 7/1/21 (Prere.) | 1,810 | 2,531 |
| Northern California Power Agency Revenue | | | | |
| (Hydroelectric Project) | 5.000% | 7/1/27 | 2,255 | 2,754 |
| Northern California Power Agency Revenue | | | | |
| (Hydroelectric Project) | 5.000% | 7/1/32 | 1,155 | 1,376 |
| Oakland CA GO | 5.000% | 1/15/31 | 3,550 | 4,103 |
| Oakland CA Redevelopment Agency Tax | | | | |
| Allocation Revenue (Central District Project) | 5.500% | 2/1/14 (2) | 1,980 | 2,035 |
| Oceanside CA Unified School District GO | 0.000% | 8/1/25 (12) | 6,865 | 4,311 |
| Ohlone CA Community College District GO | 5.250% | 8/1/41 | 5,000 | 5,950 |
| Orange County CA Water District Revenue | 5.000% | 8/15/41 | 6,855 | 8,055 |
| Palmdale CA COP | 5.250% | 9/1/19 (14) | 1,310 | 1,340 |
| Palmdale CA COP | 5.250% | 9/1/20 (14) | 1,450 | 1,483 |
| Palmdale CA COP | 5.250% | 9/1/21 (14) | 1,605 | 1,641 |
| Palmdale CA COP | 5.250% | 9/1/22 (14) | 1,765 | 1,805 |
| Palo Alto CA Improvement Revenue | | | | |
| (University Avenue Area Parking) | 4.250% | 9/2/22 | 200 | 220 |
| Palo Alto CA Improvement Revenue | | | | |
| (University Avenue Area Parking) | 5.000% | 9/2/26 | 1,000 | 1,149 |
| Palomar Pomerado Health California COP | 6.000% | 11/1/41 | 3,000 | 3,301 |
| Palomar Pomerado Health California GO | 4.500% | 8/1/32 (14) | 12,500 | 13,577 |
| Palomar Pomerado Health California GO | 0.000% | 8/1/33 (12) | 4,000 | 1,547 |
| Palomar Pomerado Health System | | | | |
| California Revenue | 5.375% | 11/1/13 (14) | 6,730 | 6,743 |
| Pasadena CA Unified School District GO | 5.000% | 5/1/34 | 4,000 | 4,750 |
| Peralta CA Community College District Revenue | 5.000% | 8/1/39 | 4,000 | 4,452 |
| Pittsburg CA Redevelopment Agency Tax | | | | |
| Allocation Revenue (Los Medanos Community | | | | |
| Development Project) | 5.700% | 8/1/13 (Prere.) | 7,000 | 7,393 |
88
| | | | |
| California Long-Term Tax-Exempt Fund | | | | |
| |
| |
| |
| | | | Face | Market |
| | | Maturity | Amount | Value |
| | Coupon | Date | ($000) | ($000) |
| Pittsburg CA Redevelopment Agency Tax | | | | |
| Allocation Revenue (Los Medanos Community | | | | |
| Development Project) | 0.000% | 8/1/19 (2) | 1,150 | 884 |
| Pittsburg CA Redevelopment Agency Tax | | | | |
| Allocation Revenue (Los Medanos Community | | | | |
| Development Project) | 0.000% | 8/1/21 (2) | 2,575 | 1,758 |
| Pittsburg CA Redevelopment Agency Tax | | | | |
| Allocation Revenue (Los Medanos Community | | | | |
| Development Project) | 0.000% | 8/1/22 (2) | 3,755 | 2,409 |
| Pittsburg CA Redevelopment Agency Tax | | | | |
| Allocation Revenue (Los Medanos Community | | | | |
| Development Project) | 0.000% | 8/1/24 (2) | 1,000 | 568 |
| Pomona CA Unified School District GO | 5.600% | 8/1/14 (ETM) | 1,585 | 1,725 |
| Pomona CA Unified School District GO | 5.600% | 8/1/15 (ETM) | 2,000 | 2,276 |
| Pomona CA Unified School District GO | 5.600% | 8/1/16 (ETM) | 1,000 | 1,188 |
| Pomona CA Unified School District GO | 7.500% | 8/1/17 (ETM) | 2,540 | 3,342 |
| Port of Oakland CA Revenue | 5.000% | 11/1/16 (14) | 8,160 | 9,419 |
| Port of Oakland CA Revenue | 5.000% | 11/1/17 (14) | 5,000 | 5,926 |
| Poway CA Unified School District GO | 5.000% | 9/1/25 | 1,840 | 2,102 |
| Poway CA Unified School District GO | 5.000% | 8/1/27 | 5,575 | 6,855 |
| Poway CA Unified School District GO | 5.000% | 9/1/27 | 2,060 | 2,322 |
| Poway CA Unified School District GO | 5.000% | 9/1/31 | 1,375 | 1,525 |
| Poway CA Unified School District GO | 0.000% | 8/1/33 | 5,010 | 2,074 |
| Poway CA Unified School District GO | 5.000% | 9/1/33 | 1,000 | 1,105 |
| Poway CA Unified School District GO | 0.000% | 8/1/34 | 8,130 | 3,140 |
| Poway CA Unified School District GO | 5.000% | 9/1/36 | 700 | 764 |
| Rancho Mirage CA Joint Powers Financing | | | | |
| Authority Revenue (Eisenhower Medical Center) | 5.000% | 7/1/47 | 15,900 | 16,519 |
| Rancho Mirage CA Redevelopment Agency | | | | |
| Tax Allocation Revenue | 5.125% | 4/1/21 (14) | 2,650 | 2,657 |
| Rancho Mirage CA Redevelopment Agency | | | | |
| Tax Allocation Revenue | 5.250% | 4/1/26 (14) | 2,905 | 2,910 |
| Rancho Mirage CA Redevelopment Agency | | | | |
| Tax Allocation Revenue | 5.250% | 4/1/33 (14) | 3,000 | 3,004 |
| Rio Hondo CA Community College District GO | 5.000% | 8/1/30 | 6,655 | 7,706 |
| Rio Hondo CA Community College District GO | 0.000% | 8/1/36 | 16,650 | 5,804 |
| 1 Riverside CA Electric Revenue TOB VRDO | 0.180% | 12/3/12 | 5,300 | 5,300 |
| Riverside CA Unified School District Community | | | | |
| Facilities District No. 7 (Victoria Grove) Special | | | | |
| Tax Revenue | 5.000% | 9/1/31 (2) | 4,000 | 4,196 |
| Riverside CA Unified School District Financing | | | | |
| Authority Revenue | 5.000% | 9/1/21 | 1,280 | 1,523 |
| Riverside CA Unified School District Financing | | | | |
| Authority Revenue | 5.000% | 9/1/22 | 1,335 | 1,589 |
| Riverside CA Unified School District Financing | | | | |
| Authority Revenue | 5.000% | 9/1/24 | 1,440 | 1,680 |
| Riverside CA Unified School District Financing | | | | |
| Authority Revenue | 5.000% | 9/1/28 | 1,795 | 2,051 |
| Riverside CA Unified School District Financing | | | | |
| Authority Revenue | 5.000% | 9/1/29 | 1,880 | 2,150 |
| Riverside CA Unified School District Financing | | | | |
| Authority Revenue | 5.000% | 9/1/32 | 1,375 | 1,548 |
| Riverside County CA Asset Leasing Corp. | | | | |
| Leasehold Revenue (Riverside County | | | | |
| Hospital Project) | 0.000% | 6/1/13 (14) | 5,000 | 4,958 |
89
| | | | |
| California Long-Term Tax-Exempt Fund | | | | |
| |
| |
| |
| | | | Face | Market |
| | | Maturity | Amount | Value |
| | Coupon | Date | ($000) | ($000) |
| Riverside County CA Asset Leasing Corp. | | | | |
| Leasehold Revenue (Riverside County | | | | |
| Hospital Project) | 0.000% | 6/1/14 (14) | 2,000 | 1,924 |
| Riverside County CA Asset Leasing Corp. | | | | |
| Leasehold Revenue (Riverside County | | | | |
| Hospital Project) | 0.000% | 6/1/15 (14) | 2,000 | 1,868 |
| Riverside County CA Transportation | | | | |
| Commission Sales Tax Revenue VRDO | 0.160% | 12/7/12 | 2,775 | 2,775 |
| Roseville CA Electric System Revenue | 5.000% | 2/1/37 | 4,500 | 5,073 |
| Roseville CA Natural Gas Financing Authority | | | | |
| Gas Revenue | 5.000% | 2/15/22 | 1,440 | 1,685 |
| Roseville CA Natural Gas Financing Authority | | | | |
| Gas Revenue | 5.000% | 2/15/28 | 2,450 | 2,887 |
| Sacramento CA Financing Authority | | | | |
| Lease Revenue | 5.375% | 11/1/14 (2) | 3,595 | 3,785 |
| Sacramento CA Financing Authority | | | | |
| Lease Revenue | 5.400% | 11/1/20 (2) | 6,785 | 7,922 |
| Sacramento CA Municipal Utility District Revenue | 5.900% | 7/1/20 (2) | 15,850 | 20,560 |
| Sacramento CA Municipal Utility District Revenue | 5.000% | 8/15/31 | 1,175 | 1,416 |
| Sacramento CA Municipal Utility District Revenue | 5.000% | 8/15/32 | 1,195 | 1,432 |
| Sacramento CA Municipal Utility District Revenue | 5.000% | 8/15/33 | 1,450 | 1,730 |
| Sacramento CA Regional Transit District Farebox | | | | |
| Revenue | 5.000% | 3/1/36 | 3,000 | 3,366 |
| Sacramento CA Regional Transit District Farebox | | | | |
| Revenue | 5.000% | 3/1/42 | 5,000 | 5,573 |
| Sacramento County CA Sanitation Districts | | | | |
| Financing Authority Revenue | 5.000% | 12/1/26 (14) | 5,000 | 5,724 |
| Sacramento County CA Sanitation Districts | | | | |
| Financing Authority Revenue | 5.000% | 12/1/30 (14) | 5,650 | 6,351 |
| Sacramento County CA Sanitation Districts | | | | |
| Financing Authority Revenue VRDO | 0.160% | 12/7/12 LOC | 5,000 | 5,000 |
| San Bernardino County CA Medical Center COP | 6.500% | 8/1/17 (14) | 13,610 | 14,575 |
| San Bernardino County CA Transportation | | | | |
| Authority Revenue | 5.000% | 3/1/32 | 4,035 | 4,919 |
| San Diego CA Community College District GO | 5.250% | 8/1/33 | 2,500 | 3,080 |
| San Diego CA Community College District GO | 0.000% | 8/1/36 | 8,000 | 2,803 |
| San Diego CA Community College District GO | 5.000% | 8/1/36 | 2,500 | 2,959 |
| San Diego CA Community College District GO | 0.000% | 8/1/38 | 3,510 | 1,112 |
| San Diego CA Community College District GO | 5.000% | 8/1/41 | 3,000 | 3,545 |
| San Diego CA Public Facilities Financing | | | | |
| Authority Sewer Revenue | 5.250% | 5/15/34 | 6,000 | 7,025 |
| San Diego CA Public Facilities Financing | | | | |
| Authority Sewer Revenue | 5.250% | 5/15/39 | 7,000 | 8,137 |
| San Diego CA Public Facilities Financing | | | | |
| Authority Water Revenue | 5.750% | 8/1/35 | 2,500 | 3,058 |
| San Diego CA Public Facilities Financing | | | | |
| Authority Water Revenue | 5.250% | 8/1/38 | 1,500 | 1,718 |
| San Diego CA Public Facilities Financing | | | | |
| Authority Water Revenue | 5.500% | 8/1/39 | 5,000 | 5,974 |
| San Diego CA Unified School District GO | 0.000% | 7/1/15 (14) | 2,770 | 2,712 |
| San Diego CA Unified School District GO | 5.500% | 7/1/24 (14) | 10,000 | 13,066 |
| San Diego CA Unified School District GO | 5.500% | 7/1/25 (14) | 9,000 | 11,843 |
| San Diego CA Unified School District GO | 0.000% | 7/1/29 | 8,150 | 4,090 |
| San Diego CA Unified School District GO | 0.000% | 7/1/30 | 1,500 | 715 |
| San Diego CA Unified School District GO | 0.000% | 7/1/38 | 4,890 | 1,489 |
| San Diego County CA COP | 5.000% | 2/1/28 (2) | 2,000 | 2,171 |
90
| | | | |
| California Long-Term Tax-Exempt Fund | | | | |
| |
| |
| |
| | | | Face | Market |
| | | Maturity | Amount | Value |
| | Coupon | Date | ($000) | ($000) |
| San Diego County CA COP | 5.000% | 2/1/30 (2) | 2,345 | 2,527 |
| San Diego County CA Regional Airport | | | | |
| Authority Revenue | 5.000% | 7/1/26 | 4,000 | 4,723 |
| San Diego County CA Regional Airport | | | | |
| Authority Revenue | 5.000% | 7/1/28 | 3,200 | 3,726 |
| San Diego County CA Regional Airport | | | | |
| Authority Revenue | 5.000% | 7/1/34 | 2,715 | 3,071 |
| San Diego County CA Regional Airport | | | | |
| Authority Revenue | 5.000% | 4/1/37 | 1,500 | 1,797 |
| San Diego County CA Regional Airport | | | | |
| Authority Revenue | 5.000% | 4/1/38 | 2,000 | 2,392 |
| San Diego County CA Regional Airport | | | | |
| Authority Revenue | 5.000% | 7/1/40 | 3,000 | 3,383 |
| San Diego County CA Regional Airport | | | | |
| Authority Revenue | 5.000% | 4/1/48 | 3,000 | 3,532 |
| San Diego County CA Water Authority | | | | |
| Revenue | 5.000% | 5/1/31 | 4,700 | 5,678 |
| San Diego County CA Water Authority | | | | |
| Revenue COP | 5.000% | 5/1/26 (4) | 7,275 | 8,409 |
| San Francisco CA Bay Area Rapid Transit | | | | |
| District GO | 5.000% | 8/1/35 | 15,000 | 17,279 |
| San Francisco CA Bay Area Rapid Transit | | | | |
| District Sales Tax Revenue | 5.000% | 7/1/36 | 2,625 | 3,179 |
| San Francisco CA City & County GO | 5.000% | 6/15/23 | 6,000 | 7,669 |
| San Francisco CA City & County International | | | | |
| Airport Revenue | 5.000% | 5/1/19 | 7,500 | 9,261 |
| San Francisco CA City & County International | | | | |
| Airport Revenue | 5.000% | 5/1/20 | 5,315 | 6,642 |
| San Francisco CA City & County International | | | | |
| Airport Revenue | 5.000% | 5/1/25 | 5,220 | 6,336 |
| San Francisco CA City & County International | | | | |
| Airport Revenue | 5.000% | 5/1/29 | 2,065 | 2,502 |
| San Francisco CA City & County Public Utilities | | | | |
| Commission Water Revenue | 5.000% | 11/1/29 | 8,430 | 10,393 |
| San Francisco CA City & County Public Utilities | | | | |
| Commission Water Revenue | 5.000% | 11/1/31 | 1,100 | 1,342 |
| San Francisco CA City & County Public Utilities | | | | |
| Commission Water Revenue | 5.000% | 11/1/31 | 1,205 | 1,470 |
| San Francisco CA City & County Public Utilities | | | | |
| Commission Water Revenue | 5.000% | 11/1/34 | 1,275 | 1,527 |
| San Francisco CA City & County Public Utilities | | | | |
| Commission Water Revenue | 5.000% | 11/1/35 | 2,605 | 3,141 |
| San Francisco CA City & County Public Utilities | | | | |
| Commission Water Revenue | 5.000% | 11/1/35 | 5,000 | 5,969 |
| San Francisco CA City & County Public Utilities | | | | |
| Commission Water Revenue | 4.750% | 11/1/36 (4) | 4,500 | 4,971 |
| San Francisco CA City & County Public Utilities | | | | |
| Commission Water Revenue | 5.000% | 11/1/43 | 10,000 | 11,774 |
| San Francisco CA City & County Redevelopment | | | | |
| Financing Authority Tax Allocation Revenue | | | | |
| (Mission Bay North) | 6.500% | 8/1/39 | 2,000 | 2,368 |
| San Francisco CA City & County Redevelopment | | | | |
| Financing Authority Tax Allocation Revenue | | | | |
| (Mission Bay North) | 6.750% | 8/1/41 | 1,000 | 1,212 |
| San Francisco CA City & County Unified | | | | |
| School District GO | 5.250% | 6/15/24 | 4,000 | 4,928 |
91
| | | | |
| California Long-Term Tax-Exempt Fund | | | | |
| |
| |
| |
| | | | Face | Market |
| | | Maturity | Amount | Value |
| | Coupon | Date | ($000) | ($000) |
| San Francisco CA City & County Unified | | | | |
| School District GO | 5.000% | 6/15/32 | 8,365 | 10,130 |
| San Joaquin Hills CA Transportation Corridor | | | | |
| Agency Toll Road Revenue | 0.000% | 1/15/24 (14) | 6,000 | 3,475 |
| San Joaquin Hills CA Transportation Corridor | | | | |
| Agency Toll Road Revenue | 0.000% | 1/15/25 (14) | 6,000 | 3,309 |
| San Joaquin Hills CA Transportation Corridor | | | | |
| Agency Toll Road Revenue | 0.000% | 1/15/31 (14) | 11,950 | 4,755 |
| San Jose CA Airport Revenue | 5.000% | 3/1/33 (2) | 4,000 | 4,281 |
| San Jose CA Redevelopment Agency Tax | | | | |
| Allocation Revenue | 5.000% | 8/1/19 (14) | 1,000 | 1,043 |
| San Jose CA Redevelopment Agency Tax | | | | |
| Allocation Revenue | 5.500% | 8/1/30 | 850 | 898 |
| San Jose CA Redevelopment Agency Tax | | | | |
| Allocation Revenue | 5.500% | 8/1/35 | 2,750 | 2,865 |
| San Jose CA Special Hotel Tax Revenue | | | | |
| (Convention Center Expansion | | | | |
| & Renovation Project) | 6.500% | 5/1/42 | 5,000 | 6,147 |
| San Juan CA Unified School District GO | 0.000% | 8/1/13 (4) | 2,220 | 2,215 |
| San Juan CA Unified School District GO | 0.000% | 8/1/14 (4) | 2,610 | 2,576 |
| San Juan CA Unified School District GO | 0.000% | 8/1/16 (4) | 2,000 | 1,875 |
| San Juan CA Unified School District GO | 0.000% | 8/1/18 (4) | 1,785 | 1,568 |
| San Juan CA Unified School District GO | 0.000% | 8/1/19 (4) | 2,210 | 1,880 |
| San Juan CA Unified School District GO | 0.000% | 8/1/20 (4) | 4,930 | 4,014 |
| San Juan CA Unified School District GO | 0.000% | 8/1/23 (4) | 4,540 | 3,113 |
| San Marcos CA Public Facilities Authority Tax | | | | |
| Allocation Revenue (Project Areas No. 2 | | | | |
| & No. 3 Financing Project) | 5.000% | 8/1/35 (2) | 5,000 | 5,133 |
| San Marcos CA Unified School District GO | 0.000% | 8/1/32 | 2,600 | 1,076 |
| San Marcos CA Unified School District GO | 5.000% | 8/1/34 | 5,620 | 6,528 |
| San Marcos CA Unified School District GO | 5.000% | 8/1/38 | 2,835 | 3,265 |
| San Mateo County CA Community College | | | | |
| District GO | 5.000% | 9/1/31 | 5,000 | 5,662 |
| San Mateo County CA Joint Powers Financing | | | | |
| Authority Lease Revenue | | | | |
| (Capital Project Program) | 6.500% | 7/1/13 (14) | 3,290 | 3,387 |
| San Mateo County CA Joint Powers Financing | | | | |
| Authority Lease Revenue | | | | |
| (Capital Project Program) | 5.000% | 7/1/21 (14) | 3,500 | 4,161 |
| San Ramon Valley CA Unified School District GO | 0.000% | 7/1/13 (14) | 3,680 | 3,675 |
| San Ramon Valley CA Unified School District GO | 0.000% | 7/1/14 (14) | 8,290 | 8,225 |
| San Ramon Valley CA Unified School District GO | 0.000% | 7/1/15 (14) | 2,005 | 1,968 |
| San Ramon Valley CA Unified School District GO | 4.000% | 8/1/20 | 3,620 | 4,375 |
| San Ramon Valley CA Unified School District GO | 5.000% | 8/1/22 | 4,000 | 5,215 |
| Santa Ana CA Financing Authority Police | | | | |
| Administration & Holding Facility Lease Revenue | 6.250% | 7/1/16 (14) | 5,345 | 6,064 |
| Santa Ana CA Financing Authority Police | | | | |
| Administration & Holding Facility Lease Revenue | 6.250% | 7/1/17 (14) | 2,000 | 2,323 |
| Santa Clara CA Electric Revenue | 5.000% | 7/1/21 (14) | 2,000 | 2,054 |
| Santa Clara CA Electric Revenue | 6.000% | 7/1/31 | 3,000 | 3,762 |
| Santa Clara CA Unified School District GO | 5.000% | 7/1/34 | 4,000 | 4,618 |
| Santa Clara County CA Financing Authority | | | | |
| Lease Revenue (Multiple Facilities Projects) | 5.250% | 5/15/36 | 5,000 | 5,822 |
| Santa Rosa CA Wastewater Revenue | 6.000% | 7/2/15 (2) | 3,805 | 4,046 |
| Santa Rosa CA Wastewater Revenue | 6.000% | 9/1/15 (4) | 3,030 | 3,256 |
| Santa Rosa CA Wastewater Revenue | 5.000% | 9/1/28 | 4,845 | 5,953 |
92
| | | | |
| California Long-Term Tax-Exempt Fund | | | | |
| |
| |
| |
| | | | Face | Market |
| | | Maturity | Amount | Value |
| | Coupon | Date | ($000) | ($000) |
| Santa Rosa CA Wastewater Revenue | 5.000% | 9/1/33 | 1,000 | 1,194 |
| 2 Solana Beach CA School District Special | | | | |
| Tax Revenue | 5.000% | 9/1/32 | 1,000 | 1,111 |
| 2 Solana Beach CA School District Special | | | | |
| Tax Revenue | 5.000% | 9/1/35 | 2,500 | 2,751 |
| Sonoma-Marin Area Rail Transportation District | | | | |
| California Sales & Use Tax Revenue | 5.000% | 3/1/28 | 3,500 | 4,283 |
| South San Francisco CA Redevelopment Agency | | | | |
| Tax Allocation Revenue | 5.000% | 9/1/35 (14) | 16,110 | 16,774 |
| Southern California Public Power Authority | | | | |
| Revenue | 5.000% | 7/1/29 | 5,000 | 6,086 |
| Southern California Public Power Authority | | | | |
| Revenue (Milford Wind Corridor Phase I Project) | 5.000% | 7/1/30 | 5,000 | 5,896 |
| Southern California Public Power Authority | | | | |
| Revenue (Natural Gas Project) | 5.000% | 11/1/17 | 1,865 | 2,100 |
| Southern California Public Power Authority | | | | |
| Revenue (Natural Gas Project) | 5.000% | 11/1/33 | 3,000 | 3,386 |
| Southern California Public Power Authority | | | | |
| Revenue (Transmission Project) | 5.750% | 7/1/21 (14) | 220 | 221 |
| Southern California Public Power Authority | | | | |
| Revenue (Transmission Project) | 5.000% | 7/1/23 | 5,000 | 6,008 |
| 1 Sweetwater CA Unified School District GO | | | | |
| TOB VRDO | 0.180% | 12/7/12 (13) | 700 | 700 |
| Tobacco Securitization Authority Revenue | | | | |
| (Northern California Tobacco Settlement) | 5.375% | 6/1/38 | 4,500 | 3,884 |
| Tobacco Securitization Authority Revenue | | | | |
| (Southern California Tobacco Settlement) | 5.000% | 6/1/37 | 2,155 | 1,868 |
| Torrance CA Hospital Revenue | | | | |
| (Torrance Memorial Medical Center) | 5.000% | 9/1/40 | 3,000 | 3,303 |
| Turlock CA Irrigation District Revenue | 5.000% | 1/1/31 | 2,000 | 2,276 |
| Turlock CA Irrigation District Revenue | 5.000% | 1/1/35 | 3,000 | 3,372 |
| Turlock CA Irrigation District Revenue | 5.500% | 1/1/41 | 3,445 | 4,008 |
| Ukiah CA Electric Revenue | 6.250% | 6/1/18 (14) | 4,050 | 4,413 |
| Ukiah CA Unified School District GO | 0.000% | 8/1/32 (10) | 6,425 | 2,432 |
| Union CA Elementary School District GO | 0.000% | 9/1/15 (14) | 3,860 | 3,782 |
| Union CA Elementary School District GO | 0.000% | 9/1/16 (14) | 1,500 | 1,430 |
| Union CA Elementary School District GO | 0.000% | 9/1/17 (14) | 2,295 | 2,119 |
| Union CA Elementary School District GO | 0.000% | 9/1/18 (14) | 1,630 | 1,463 |
| Union CA Elementary School District GO | 0.000% | 9/1/19 (14) | 1,750 | 1,521 |
| Union CA Elementary School District GO | 0.000% | 9/1/20 (14) | 2,300 | 1,910 |
| Union CA Elementary School District GO | 0.000% | 9/1/21 (14) | 2,000 | 1,584 |
| University of California Regents Medical | | | | |
| Center Revenue VRDO | 0.140% | 12/3/12 | 4,500 | 4,500 |
| University of California Revenue | 5.750% | 5/15/25 | 7,000 | 8,785 |
| University of California Revenue | 4.750% | 5/15/33 | 9,425 | 10,512 |
| University of California Revenue | 5.000% | 5/15/33 (2) | 10,000 | 10,207 |
| University of California Revenue | 5.000% | 5/15/34 | 3,220 | 3,747 |
| University of California Revenue | 5.000% | 5/15/34 | 5,205 | 6,222 |
| University of California Revenue | 5.000% | 5/15/35 | 3,640 | 4,330 |
| University of California Revenue | 5.000% | 5/15/37 | 5,000 | 5,991 |
| University of California Revenue | 5.000% | 5/15/37 (13) | 6,000 | 6,784 |
| University of California Revenue | 5.250% | 5/15/39 | 7,000 | 8,362 |
| University of California Revenue | 5.000% | 5/15/40 | 2,395 | 2,776 |
| University of California Revenue | 5.000% | 5/15/41 | 5,000 | 5,885 |
| 1 University of California Revenue TOB VRDO | 0.180% | 12/3/12 | 18,000 | 18,000 |
| 1 University of California Revenue TOB VRDO | 0.180% | 12/3/12 | 3,400 | 3,400 |
93
| | | | |
| California Long-Term Tax-Exempt Fund | | | | |
| |
| |
| |
| | | | Face | Market |
| | | Maturity | Amount | Value |
| | Coupon | Date | ($000) | ($000) |
| 1 University of California Revenue TOB VRDO | 0.220% | 12/7/12 | 2,699 | 2,699 |
| Vallejo CA Sanitation & Flood Control COP | 5.000% | 7/1/19 (14) | 3,484 | 3,647 |
| Ventura County CA Community College | | | | |
| District GO | 5.500% | 8/1/33 | 8,500 | 10,274 |
| Vista CA Unified School District GO | 0.000% | 8/1/28 (14) | 7,425 | 3,754 |
| Walnut CA Energy Center Authority Revenue | 5.000% | 1/1/35 | 2,000 | 2,237 |
| Walnut CA Energy Center Authority Revenue | 5.000% | 1/1/40 | 10,000 | 11,140 |
| Walnut Valley CA Unified School District GO | 6.000% | 8/1/14 (ETM) | 2,205 | 2,414 |
| Walnut Valley CA Unified School District GO | 6.000% | 8/1/15 (ETM) | 2,470 | 2,826 |
| Walnut Valley CA Unified School District GO | 6.000% | 8/1/16 (ETM) | 2,690 | 3,210 |
| Washington Township CA Health Care | | | | |
| District Revenue | 5.000% | 7/1/32 | 3,000 | 3,154 |
| Washington Township CA Health Care | | | | |
| District Revenue | 5.000% | 7/1/37 | 3,500 | 3,680 |
| West Contra Costa CA Unified School District GO | 5.250% | 8/1/35 (4) | 7,000 | 8,229 |
| Westlands CA Water District Revenue | 5.000% | 9/1/34 (4) | 2,000 | 2,334 |
| Yuba City CA Unified School District GO | 0.000% | 9/1/15 (14) | 1,870 | 1,802 |
| Yuba City CA Unified School District GO | 0.000% | 9/1/17 (14) | 2,060 | 1,871 |
| Yuba City CA Unified School District GO | 0.000% | 9/1/19 (14) | 2,270 | 1,837 |
| | | | | 3,073,470 |
| Puerto Rico (0.1%) | | | | |
| Puerto Rico Municipal Finance Agency GO | 5.250% | 7/1/19 (11) | 2,250 | 2,604 |
| Puerto Rico Public Buildings Authority | | | | |
| Government Facilities Revenue | 5.250% | 7/1/14 (Prere.) | 75 | 81 |
| 1 Puerto Rico Sales Tax Financing Corp. | | | | |
| Revenue TOB VRDO | 0.220% | 12/7/12 LOC | 1,510 | 1,510 |
| | | | | 4,195 |
| Total Tax-Exempt Municipal Bonds (Cost $2,762,516) | | | | 3,077,665 |
| Other Assets and Liabilities (0.0%) | | | | |
| Other Assets | | | | 35,101 |
| Liabilities | | | | (36,292) |
| | | | | (1,191) |
| Net Assets (100%) | | | | 3,076,474 |
94
| |
| California Long-Term Tax-Exempt Fund | |
| |
| |
| |
| At November 30, 2012, net assets consisted of: | |
| | Amount |
| | ($000) |
| Paid-in Capital | 2,869,454 |
| Undistributed Net Investment Income | — |
| Accumulated Net Realized Losses | (108,120) |
| Unrealized Appreciation (Depreciation) | |
| Investment Securities | 315,149 |
| Futures Contracts | (9) |
| Net Assets | 3,076,474 |
| |
| |
| Investor Shares—Net Assets | |
| Applicable to 39,783,831 outstanding $.001 par value shares of | |
| beneficial interest (unlimited authorization) | 486,980 |
| Net Asset Value Per Share—Investor Shares | $12.24 |
| |
| |
| Admiral Shares—Net Assets | |
| Applicable to 211,548,256 outstanding $.001 par value shares of | |
| beneficial interest (unlimited authorization) | 2,589,494 |
| Net Asset Value Per Share—Admiral Shares | $12.24 |
See Note A in Notes to Financial Statements.
1 Security exempt from registration under Rule 144A of the Securities Act of 1933. Such securities may be sold in transactions exempt from
registration, normally to qualified institutional buyers. At November 30, 2012, the aggregate value of these securities was $73,399,000,
representing 2.4% of net assets.
2 Security purchased on a when-issued or delayed-delivery basis for which the fund has not taken delivery as of November 30, 2012.
* Securities with a value of $310,000 have been segregated as initial margin for open futures contracts.
A key to abbreviations and other references follows the Statement of Net Assets.
See accompanying Notes, which are an integral part of the Financial Statements.
95
California Long-Term Tax-Exempt Fund
Key to Abbreviations
ARS—Auction Rate Security.
BAN—Bond Anticipation Note.
COP—Certificate of Participation.
CP—Commercial Paper.
FR—Floating Rate.
GAN—Grant Anticipation Note.
GO—General Obligation Bond.
PUT—Put Option Obligation.
RAN—Revenue Anticipation Note.
TAN—Tax Anticipation Note.
TOB—Tender Option Bond.
TRAN—Tax Revenue Anticipation Note.
VRDO—Variable Rate Demand Obligation.
VRDP—Variable Rate Demand Preferred.
(ETM)—Escrowed to Maturity.
(Prere.)—Prerefunded.
Scheduled principal and interest payments are guaranteed by:
(1) MBIA (Municipal Bond Investors Assurance).
(2) AMBAC (Ambac Assurance Corporation).
(3) FGIC (Financial Guaranty Insurance Company).
(4) AGM (Assured Guaranty Municipal Corporation).
(5) BIGI (Bond Investors Guaranty Insurance).
(6) Connie Lee Inc.
(7) FHA (Federal Housing Authority).
(8) CapMAC (Capital Markets Assurance Corporation).
(9) American Capital Access Financial Guaranty Corporation.
(10) XL Capital Assurance Inc.
(11) CIFG (CDC IXIS Financial Guaranty).
(12) Assured Guaranty Corporation.
(13) Berkshire Hathaway Assurance Corporation.
(14) National Public Finance Guarantee Corporation.
The insurance does not guarantee the market value of the municipal bonds.
LOC—Scheduled principal and interest payments are guaranteed by bank letter of credit.
96
California Long-Term Tax-Exempt Fund
Statement of Operations
| |
| | Year Ended |
| | November 30, 2012 |
| | ($000) |
| Investment Income | |
| Income | |
| Interest | 117,901 |
| Total Income | 117,901 |
| Expenses | |
| The Vanguard Group—Note B | |
| Investment Advisory Services | 156 |
| Management and Administrative—Investor Shares | 774 |
| Management and Administrative—Admiral Shares | 2,228 |
| Marketing and Distribution—Investor Shares | 119 |
| Marketing and Distribution—Admiral Shares | 472 |
| Custodian Fees | 36 |
| Auditing Fees | 29 |
| Shareholders’ Reports—Investor Shares | 11 |
| Shareholders’ Reports—Admiral Shares | 7 |
| Trustees’ Fees and Expenses | 2 |
| Total Expenses | 3,834 |
| Net Investment Income | 114,067 |
| Realized Net Gain (Loss) | |
| Investment Securities Sold | 10,538 |
| Futures Contracts | 20 |
| Realized Net Gain (Loss) | 10,558 |
| Change in Unrealized Appreciation (Depreciation) | |
| Investment Securities | 232,141 |
| Futures Contracts | (9) |
| Change in Unrealized Appreciation (Depreciation) | 232,132 |
| Net Increase (Decrease) in Net Assets Resulting from Operations | 356,757 |
See accompanying Notes, which are an integral part of the Financial Statements.
97
California Long-Term Tax-Exempt Fund
Statement of Changes in Net Assets
| | |
| | Year Ended November 30, |
| | 2012 | 2011 |
| | ($000) | ($000) |
| Increase (Decrease) in Net Assets | | |
| Operations | | |
| Net Investment Income | 114,067 | 115,255 |
| Realized Net Gain (Loss) | 10,558 | (17,030) |
| Change in Unrealized Appreciation (Depreciation) | 232,132 | 66,022 |
| Net Increase (Decrease) in Net Assets Resulting from Operations | 356,757 | 164,247 |
| Distributions | | |
| Net Investment Income | | |
| Investor Shares | (18,335) | (19,336) |
| Admiral Shares | (95,732) | (95,919) |
| Realized Capital Gain | | |
| Investor Shares | — | — |
| Admiral Shares | — | — |
| Total Distributions | (114,067) | (115,255) |
| Capital Share Transactions | | |
| Investor Shares | 7,143 | (95,102) |
| Admiral Shares | 152,383 | (129,177) |
| Net Increase (Decrease) from Capital Share Transactions | 159,526 | (224,279) |
| Total Increase (Decrease) | 402,216 | (175,287) |
| Net Assets | | |
| Beginning of Period | 2,674,258 | 2,849,545 |
| End of Period | 3,076,474 | 2,674,258 |
See accompanying Notes, which are an integral part of the Financial Statements.
98
California Long-Term Tax-Exempt Fund
Financial Highlights
| | | | | |
| Investor Shares | | | | | |
| |
| For a Share Outstanding | Year Ended November 30, |
| Throughout Each Period | 2012 | 2011 | 2010 | 2009 | 2008 |
| Net Asset Value, Beginning of Period | $11.24 | $11.01 | $10.98 | $10.19 | $11.46 |
| Investment Operations | | | | | |
| Net Investment Income | .459 | .473 | .476 | .481 | .499 |
| Net Realized and Unrealized Gain (Loss) | | | | | |
| on Investments | 1.000 | .230 | .030 | .790 | (1.270) |
| Total from Investment Operations | 1.459 | .703 | .506 | 1.271 | (.771) |
| Distributions | | | | | |
| Dividends from Net Investment Income | (.459) | (.473) | (.476) | (.481) | (.499) |
| Distributions from Realized Capital Gains | — | — | — | — | — |
| Total Distributions | (.459) | (.473) | (.476) | (.481) | (.499) |
| Net Asset Value, End of Period | $12.24 | $11.24 | $11.01 | $10.98 | $10.19 |
| |
| Total Return1 | 13.20% | 6.60% | 4.63% | 12.71% | -6.95% |
| |
| Ratios/Supplemental Data | | | | | |
| Net Assets, End of Period (Millions) | $487 | $441 | $529 | $691 | $670 |
| Ratio of Total Expenses to | | | | | |
| Average Net Assets | 0.20% | 0.20% | 0.20% | 0.20% | 0.15% |
| Ratio of Net Investment Income to | | | | | |
| Average Net Assets | 3.89% | 4.33% | 4.26% | 4.51% | 4.51% |
| Portfolio Turnover Rate | 16% | 14% | 18% | 18% | 27% |
| 1 Total returns do not include account service fees that may have applied in the periods shown. Fund prospectuses provide information about |
| any applicable account service fees. |
See accompanying Notes, which are an integral part of the Financial Statements.
99
California Long-Term Tax-Exempt Fund
Financial Highlights
| | | | | |
| Admiral Shares | | | | | |
| |
| For a Share Outstanding | Year Ended November 30, |
| Throughout Each Period | 2012 | 2011 | 2010 | 2009 | 2008 |
| Net Asset Value, Beginning of Period | $11.24 | $11.01 | $10.98 | $10.19 | $11.46 |
| Investment Operations | | | | | |
| Net Investment Income | .468 | .482 | .485 | .490 | .507 |
| Net Realized and Unrealized Gain (Loss) | | | | | |
| on Investments | 1.000 | .230 | .030 | .790 | (1.270) |
| Total from Investment Operations | 1.468 | .712 | .515 | 1.280 | (.763) |
| Distributions | | | | | |
| Dividends from Net Investment Income | (.468) | (.482) | (.485) | (.490) | (.507) |
| Distributions from Realized Capital Gains | — | — | — | — | — |
| Total Distributions | (.468) | (.482) | (.485) | (.490) | (.507) |
| Net Asset Value, End of Period | $12.24 | $11.24 | $11.01 | $10.98 | $10.19 |
| |
| Total Return1 | 13.29% | 6.68% | 4.72% | 12.80% | -6.88% |
| |
| Ratios/Supplemental Data | | | | | |
| Net Assets, End of Period (Millions) | $2,589 | $2,234 | $2,321 | $2,183 | $2,078 |
| Ratio of Total Expenses to | | | | | |
| Average Net Assets | 0.12% | 0.12% | 0.12% | 0.12% | 0.08% |
| Ratio of Net Investment Income to | | | | | |
| Average Net Assets | 3.97% | 4.41% | 4.34% | 4.59% | 4.58% |
| Portfolio Turnover Rate | 16% | 14% | 18% | 18% | 27% |
| 1 Total returns do not include account service fees that may have applied in the periods shown. Fund prospectuses provide information about |
| any applicable account service fees. |
See accompanying Notes, which are an integral part of the Financial Statements.
100
California Long-Term Tax-Exempt Fund
Notes to Financial Statements
Vanguard California Long-Term Tax-Exempt Fund is registered under the Investment Company Act of 1940 as an open-end investment company, or mutual fund. The fund invests in debt instruments of municipal issuers whose ability to meet their obligations may be affected by economic and political developments in the state. The fund offers two classes of shares: Investor Shares and Admiral Shares. Investor Shares are available to any investor who meets the fund’s minimum purchase requirements. Admiral Shares are designed for investors who meet certain administrative, service, and account-size criteria.
A. The following significant accounting policies conform to generally accepted accounting principles for U.S. mutual funds. The fund consistently follows such policies in preparing its financial statements.
1. Security Valuation: Bonds, and temporary cash investments acquired over 60 days to maturity, are valued using the latest bid prices or using valuations based on a matrix system (which considers such factors as security prices, yields, maturities, and ratings), both as furnished by independent pricing services. Other temporary cash investments are valued at amortized cost, which approximates market value. Securities for which market quotations are not readily available, or whose values have been affected by events occurring before the fund’s pricing time but after the close of the securities’ primary markets, are valued by methods deemed by the board of trustees to represent fair value.
2. Futures Contracts: The fund uses futures contracts to invest in fixed income asset classes with greater efficiency and lower cost than is possible through direct investment, to add value when these instruments are attractively priced, or to adjust sensitivity to changes in interest rates. The primary risks associated with the use of futures contracts are imperfect correlation between changes in market values of bonds held by the fund and the prices of futures contracts, and the possibility of an illiquid market.
Futures contracts are valued based upon their quoted daily settlement prices. The aggregate principal amounts of the contracts are not recorded in the Statement of Net Assets. Fluctuations in the value of the contracts are recorded in the Statement of Net Assets as an asset (liability) and in the Statement of Operations as unrealized appreciation (depreciation) until the contracts are closed, when they are recorded as realized futures gains (losses).
During the year ended November 30, 2012, the fund’s average investments in long and short futures contracts each represented less than 1% of net assets, based on quarterly average aggregate settlement values.
3. Federal Income Taxes: The fund intends to continue to qualify as a regulated investment company and distribute all of its income. Management has analyzed the fund’s tax positions taken for all open federal income tax years (November 30, 2009–2012), and has concluded that no provision for federal income tax is required in the fund’s financial statements.
4. Distributions: Distributions from net investment income are declared daily and paid on the first business day of the following month. Annual distributions from realized capital gains, if any, are recorded on the ex-dividend date.
5. Other: Interest income is accrued daily. Premiums and discounts on debt securities purchased are amortized and accreted, respectively, to interest income over the lives of the respective securities. Security transactions are accounted for on the date securities are bought or sold. Costs used to determine realized gains (losses) on the sale of investment securities are those of the specific securities sold.
101
California Long-Term Tax-Exempt Fund
Each class of shares has equal rights as to assets and earnings, except that each class separately bears certain class-specific expenses related to maintenance of shareholder accounts (included in Management and Administrative expenses) and shareholder reporting. Marketing and distribution expenses are allocated to each class of shares based on a method approved by the board of trustees. Income, other non-class-specific expenses, and gains and losses on investments are allocated to each class of shares based on its relative net assets.
B. The Vanguard Group furnishes at cost investment advisory, corporate management, administrative, marketing, and distribution services. The costs of such services are allocated to the fund under methods approved by the board of trustees. The fund has committed to provide up to 0.40% of its net assets in capital contributions to Vanguard. At November 30, 2012, the fund had contributed capital of $414,000 to Vanguard (included in Other Assets), representing 0.01% of the fund’s net assets and 0.17% of Vanguard’s capitalization. The fund’s trustees and officers are also directors and officers of Vanguard.
C. Various inputs may be used to determine the value of the fund’s investments. These inputs are summarized in three broad levels for financial statement purposes. The inputs or methodologies used to value securities are not necessarily an indication of the risk associated with investing in those securities.
Level 1—Quoted prices in active markets for identical securities.
Level 2—Other significant observable inputs (including quoted prices for similar securities, interest
rates, prepayment speeds, credit risk, etc.).
Level 3—Significant unobservable inputs (including the fund’s own assumptions used to determine
the fair value of investments).
The following table summarizes the market value of the fund’s investments as of November 30, 2012, based on the inputs used to value them:
| | | |
| | Level 1 | Level 2 | Level 3 |
| Investments | ($000) | ($000) | ($000) |
| Tax-Exempt Municipal Bonds | — | 3,077,665 | — |
| Futures Contracts—Liabilities1 | (9) | — | — |
| Total | (9) | 3,077,665 | — |
| 1 Represents variation margin on the last day of the reporting period. |
D. At November 30, 2012, the aggregate settlement value of open futures contracts and the related unrealized appreciation (depreciation) were:
| | | | |
| | | | ($000) |
| | | | Aggregate | |
| | | Number of | Settlement | Unrealized |
| | | Long (Short) | Value | Appreciation |
| Futures Contracts | Expiration | Contracts | Long (Short) | (Depreciation) |
| 10-Year U.S. Treasury Note | March 2013 | (181) | (24,189) | (9) |
Unrealized appreciation (depreciation) on open futures contracts is required to be treated as realized gain (loss) for tax purposes.
102
California Long-Term Tax-Exempt Fund
E. Capital gain distributions are determined on a tax basis and may differ from realized capital gains for financial reporting purposes. Differences may be permanent or temporary. Permanent differences are reclassified among capital accounts in the financial statements to reflect their tax character. Temporary differences arise when gains or losses are recognized in different periods for financial statement and tax purposes; these differences will reverse at some time in the future.
For tax purposes, the fund used capital loss carryforwards of $9,201,000 to offset taxable capital gains realized during the year ended November 30, 2012. At November 30, 2012, the fund had available capital loss carryforwards totaling $102,792,000 to offset future net capital gains of $10,093,000 through November 30, 2015, $22,521,000 through November 30, 2016, $40,669,000 through November 30, 2017, $12,572,000 through November 30, 2018, and $16,937,000 through November 30, 2019.
The fund had realized losses totaling $5,337,000 through November 30, 2012, which are deferred for tax purposes and reduce the amount of tax-basis unrealized appreciation on investment securities.
At November 30, 2012, the cost of investment securities for tax purposes was $2,767,853,000. Net unrealized appreciation of investment securities for tax purposes was $309,812,000, consisting of unrealized gains of $311,306,000 on securities that had risen in value since their purchase and $1,494,000 in unrealized losses on securities that had fallen in value since their purchase.
F. During the year ended November 30, 2012, the fund purchased $626,907,000 of investment securities and sold $440,591,000 of investment securities, other than temporary cash investments.
| | | | |
| G. Capital share transactions for each class of shares were: | | | |
| | Year Ended November 30, |
| | 2012 | 2011 |
| | Amount | Shares | Amount | Shares |
| | ($000) | (000) | ($000) | (000) |
| Investor Shares | | | | |
| Issued | 114,182 | 9,668 | 74,491 | 6,831 |
| Issued in Lieu of Cash Distributions | 14,280 | 1,207 | 15,333 | 1,404 |
| Redeemed | (121,319) | (10,283) | (184,926) | (17,063) |
| Net Increase (Decrease) —Investor Shares | 7,143 | 592 | (95,102) | (8,828) |
| Admiral Shares | | | | |
| Issued | 387,105 | 32,846 | 381,777 | 35,101 |
| Issued in Lieu of Cash Distributions | 62,043 | 5,243 | 62,988 | 5,765 |
| Redeemed | (296,765) | (25,201) | (573,942) | (52,971) |
| Net Increase (Decrease) —Admiral Shares | 152,383 | 12,888 | (129,177) | (12,105) |
H. In preparing the financial statements as of November 30, 2012, management considered the impact of subsequent events for potential recognition or disclosure in these financial statements.
103
Report of Independent Registered
Public Accounting Firm
To the Trustees of Vanguard California Tax-Free Funds and the Shareholders of Vanguard California Tax-Exempt Money Market Fund, Vanguard California Intermediate-Term Tax-Exempt Fund and Vanguard California Long-Term Tax-Exempt Fund:
In our opinion, the accompanying statements of net assets and the related statements of operations and of changes in net assets and the financial highlights present fairly, in all material respects, the financial position of Vanguard California Tax-Exempt Money Market Fund, Vanguard California Intermediate-Term Tax-Exempt Fund and Vanguard California Long-Term Tax-Exempt Fund (constituting separate portfolios of Vanguard California Tax-Free Funds, hereafter referred to as the “Funds”) at November 30, 2012, the results of each of their operations for the year then ended, the changes in each of their net assets for each of the two years in the period then ended and the financial highlights for each of the five years in the period then ended, in conformity with accounting principles generally accepted in the United States of America. These financial statements and financial highlights (hereafter referred to as “financial statements”) are the responsibility of the Funds’ management; our responsibility is to express an opinion on these financial statements based on our audits. We conducted our audits of these financial statements in accordance with the standards of the Public Company Accounting Oversight Board (United States). Those standards require that we plan and perform the audit to obtain reasonable assurance about whether the financial statements are free of material misstatement. An audit includes examining, on a test basis, evidence supporting the amounts and disclosures in the financial statements, assessing the accounting principles used and significant estimates made by management, and evaluating the overall financial statement presentation. We believe that our audits, which included confirmation of securities at November 30, 2012 by correspondence with the custodian and broker, provide a reasonable basis for our opinion.
PricewaterhouseCoopers LLP
Philadelphia, Pennsylvania
January 14, 2013
Special 2012 tax information (unaudited) for Vanguard California Tax-Exempt Funds
This information for the fiscal year ended November 30, 2012, is included pursuant to provisions of
the Internal Revenue Code.
Each fund designates 100% of its income dividends as exempt-interest dividends.
104
About Your Fund’s Expenses
As a shareholder of the fund, you incur ongoing costs, which include costs for portfolio management, administrative services, and shareholder reports (like this one), among others. Operating expenses, which are deducted from a fund’s gross income, directly reduce the investment return of the fund.
A fund’s expenses are expressed as a percentage of its average net assets. This figure is known as the expense ratio. The following examples are intended to help you understand the ongoing costs (in dollars) of investing in your fund and to compare these costs with those of other mutual funds. The examples are based on an investment of $1,000 made at the beginning of the period shown and held for the entire period.
The accompanying table illustrates your fund’s costs in two ways:
• Based on actual fund return. This section helps you to estimate the actual expenses that you paid over the period. The ”Ending Account Value“ shown is derived from the fund‘s actual return, and the third column shows the dollar amount that would have been paid by an investor who started with $1,000 in the fund. You may use the information here, together with the amount you invested, to estimate the expenses that you paid over the period.
To do so, simply divide your account value by $1,000 (for example, an $8,600 account value divided by $1,000 = 8.6), then multiply the result by the number given for your fund under the heading ”Expenses Paid During Period.“
• Based on hypothetical 5% yearly return. This section is intended to help you compare your fund‘s costs with those of other mutual funds. It assumes that the fund had a yearly return of 5% before expenses, but that the expense ratio is unchanged. In this case—because the return used is not the fund’s actual return—the results do not apply to your investment. The example is useful in making comparisons because the Securities and Exchange Commission requires all mutual funds to calculate expenses based on a 5% return. You can assess your fund’s costs by comparing this hypothetical example with the hypothetical examples that appear in shareholder reports of other funds.
Note that the expenses shown in the table are meant to highlight and help you compare ongoing costs only and do not reflect transaction costs incurred by the fund for buying and selling securities. Further, the expenses do not include any purchase, redemption, or account service fees described in the fund prospectus. If such fees were applied to your account, your costs would be higher. Your fund does not carry a “sales load.”
The calculations assume no shares were bought or sold during the period. Your actual costs may have been higher or lower, depending on the amount of your investment and the timing of any purchases or redemptions.
You can find more information about the fund’s expenses, including annual expense ratios, in the Financial Statements section of this report. For additional information on operating expenses and other shareholder costs, please refer to your fund’s current prospectus.
105
| | | |
| Six Months Ended November 30, 2012 | | | |
| | Beginning | Ending | Expenses |
| | Account Value | Account Value | Paid During |
| | 5/31/2012 | 11/30/2012 | Period |
| Based on Actual Fund Return | | | |
| California Tax-Exempt Money Market Fund | $1,000.00 | $1,000.13 | $0.80 |
| California Intermediate-Term Tax-Exempt Fund | | | |
| Investor Shares | $1,000.00 | $1,041.19 | $1.02 |
| Admiral Shares | 1,000.00 | 1,041.60 | 0.61 |
| California Long-Term Tax-Exempt Fund | | | |
| Investor Shares | $1,000.00 | $1,055.44 | $1.03 |
| Admiral Shares | 1,000.00 | 1,055.86 | 0.62 |
| Based on Hypothetical 5% Yearly Return | | | |
| California Tax-Exempt Money Market Fund | $1,000.00 | $1,024.27 | $0.81 |
| California Intermediate-Term Tax-Exempt Fund | | | |
| Investor Shares | $1,000.00 | $1,024.07 | $1.01 |
| Admiral Shares | 1,000.00 | 1,024.47 | 0.61 |
| California Long-Term Tax-Exempt Fund | | | |
| Investor Shares | $1,000.00 | $1,024.07 | $1.01 |
| Admiral Shares | 1,000.00 | 1,024.47 | 0.61 |
The calculations are based on expenses incurred in the most recent six-month period. The funds’ annualized six-month expense ratios for that
period are: for the California Tax-Exempt Money Market Fund, 0.16%; for the California Intermediate-Term Tax-Exempt Fund, 0.20% for
Investor Shares and 0.12% for Admiral Shares; and for the California Long-Term Tax-Exempt Fund, 0.20% for Investor Shares and 0.12% for
Admiral Shares. The dollar amounts shown as “Expenses Paid” are equal to the annualized expense ratio multiplied by the average account
value over the period, multiplied by the number of days in the most recent six-month period, then divided by the number of days in the most
recent 12-month period.
106
Glossary
7-Day SEC Yield and 30-Day SEC Yield. A money market fund’s 7-day SEC yield is calculated by annualizing its income distributions for the previous seven days, as required by the U.S. Securities and Exchange Commission. For other funds, 30-day SEC yield is derived using a formula specified by the commission. Under the formula, data related to the fund’s security holdings in the previous 30 days are used to calculate the fund’s hypothetical net income for that period, which is then annualized and divided by the fund’s estimated average net assets over the calculation period. For the purposes of this calculation, a security’s income is based on its current market yield to maturity (for bonds), its actual income (for asset-backed securities), or its projected dividend yield (for stocks). Because the SEC yield represents hypothetical annualized income, it will differ—at times significantly—from the fund’s actual experience. As a result, the fund’s income distributions may be higher or lower than implied by the SEC yield.
Average Coupon. The average interest rate paid on the fixed income securities held by a fund. It is expressed as a percentage of face value.
Average Duration. An estimate of how much the value of the bonds held by a fund will fluctuate in response to a change in interest rates. To see how the value could change, multiply the average duration by the change in rates. If interest rates rise by 1 percentage point, the value of the bonds in a fund with an average duration of five years would decline by about 5%. If rates decrease by a percentage point, the value would rise by 5%.
Average Effective Maturity. The average length of time until fixed income securities held by a fund reach maturity and are repaid, taking into consideration the possibility that the issuer may call the bond before its maturity date. The figure reflects the proportion of fund assets represented by each security; it also reflects any futures contracts held. In general, the longer the average effective maturity, the more a fund’s share price will fluctuate in response to changes in market interest rates.
Average Weighted Maturity. The average length of time until fixed income securities held by a fund reach maturity and are repaid. The figure reflects the proportion of fund assets represented by each security.
Beta. A measure of the magnitude of a fund’s past share-price fluctuations in relation to the ups and downs of a given market index. The index is assigned a beta of 1.00. Compared with a given index, a fund with a beta of 1.20 typically would have seen its share price rise or fall by 12% when the index rose or fell by 10%. For this report, beta is based on returns over the past 36 months for both the fund and the index. Note that a fund’s beta should be reviewed in conjunction with its R-squared (see definition). The lower the R-squared, the less correlation there is between the fund and the index, and the less reliable beta is as an indicator of volatility.
107
Credit Quality. For Vanguard money market funds, the Distribution by Credit Quality table includes tier ratings for consistency with SEC Rule 2a-7 under the Investment Company Act of 1940, which governs money market funds. A First Tier security is one that is eligible for money market funds and has been rated in the highest short-term rating category for debt obligations by the requisite nationally recognized statistical rating organizations. An unrated security is First Tier if it represents quality comparable to that of a rated security, as determined in accordance with SEC Rule 2a-7. A Second Tier security is one that is eligible for money market funds and is not a First Tier security. For Vanguard tax-exempt bond funds, credit-quality ratings are measured on a scale that generally ranges from AAA (highest) to D (lowest). “Not Rated” is used to classify securities for which a rating is not available. Credit-quality ratings are obtained from Moody’s and S&P, and the higher rating for each issue is used.
Expense Ratio. A fund’s total annual operating expenses expressed as a percentage of the fund’s average net assets. The expense ratio includes management and administrative expenses, but does not include the transaction costs of buying and selling portfolio securities.
Inception Date. The date on which the assets of a fund (or one of its share classes) are first invested in accordance with the fund’s investment objective. For funds with a subscription period, the inception date is the day after that period ends. Investment performance is measured from the inception date.
R-Squared. A measure of how much of a fund’s past returns can be explained by the returns from the market in general, as measured by a given index. If a fund’s total returns were precisely synchronized with an index’s returns, its R-squared would be 1.00. If the fund’s returns bore no relationship to the index’s returns, its R-squared would be 0. For this report, R-squared is based on returns over the past 36 months for both the fund and the index.
Short-Term Reserves. The percentage of a fund invested in highly liquid, short-term securities that can be readily converted to cash.
Yield to Maturity. The rate of return an investor would receive if the fixed income securities held by a fund were held to their maturity dates.
108
This page intentionally left blank.
This page intentionally left blank.
This page intentionally left blank.
The People Who Govern Your Fund
The trustees of your mutual fund are there to see that the fund is operated and managed in your best interests since, as a shareholder, you are a part owner of the fund. Your fund’s trustees also serve on the board of directors of The Vanguard Group, Inc., which is owned by the Vanguard funds and provides services to them on an at-cost basis.
A majority of Vanguard’s board members are independent, meaning that they have no affiliation with Vanguard or the funds they oversee, apart from the sizable personal investments they have made as private individuals. The independent board members have distinguished backgrounds in business, academia, and public service. Each of the trustees and executive officers oversees 180 Vanguard funds.
The following table provides information for each trustee and executive officer of the fund. More information about the trustees is in the Statement of Additional Information, which can be obtained, without charge, by contacting Vanguard at 800-662-7447, or online at vanguard.com.
| |
| InterestedTrustee1 | and Delphi Automotive LLP (automotive components); |
| | Senior Advisor at New Mountain Capital; Trustee of |
| F. William McNabb III | The Conference Board. |
| Born 1957. Trustee Since July 2009. Chairman of the | |
| Board. Principal Occupation(s) During the Past Five | Amy Gutmann |
| Years: Chairman of the Board of The Vanguard Group, | Born 1949. Trustee Since June 2006. Principal |
| Inc., and of each of the investment companies served | Occupation(s) During the Past Five Years: President |
| by The Vanguard Group, since January 2010; Director | of the University of Pennsylvania; Christopher H. |
| of The Vanguard Group since 2008; Chief Executive | Browne Distinguished Professor of Political Science |
| Officer and President of The Vanguard Group and of | in the School of Arts and Sciences with secondary |
| each of the investment companies served by The | appointments at the Annenberg School for |
| Vanguard Group since 2008; Director of Vanguard | Communication and the Graduate School of Education |
| Marketing Corporation; Managing Director of The | of the University of Pennsylvania; Member of the |
| Vanguard Group (1995–2008). | National Commission on the Humanities and Social |
| | Sciences; Trustee of Carnegie Corporation of New |
| Independent Trustees | York and of the National Constitution Center; Chair |
| of the U. S. Presidential Commission for the Study |
| of Bioethical Issues. |
| Emerson U. Fullwood | |
| Born 1948. Trustee Since January 2008. Principal | JoAnn Heffernan Heisen |
| Occupation(s) During the Past Five Years: Executive | Born 1950. Trustee Since July 1998. Principal |
| Chief Staff and Marketing Officer for North America | Occupation(s) During the Past Five Years: Corporate |
| and Corporate Vice President (retired 2008) of Xerox | Vice President and Chief Global Diversity Officer |
| Corporation (document management products and | (retired 2008) and Member of the Executive |
| services); Executive in Residence and 2010 | Committee (1997–2008) of Johnson & Johnson |
| Distinguished Minett Professor at the Rochester | (pharmaceuticals/medical devices/consumer |
| Institute of Technology; Director of SPX Corporation | products); Director of Skytop Lodge Corporation |
| (multi-industry manufacturing), the United Way of | (hotels), the University Medical Center at Princeton, |
| Rochester, Amerigroup Corporation (managed health | the Robert Wood Johnson Foundation, and the Center |
| care), the University of Rochester Medical Center, | for Talent Innovation; Member of the Advisory Board |
| Monroe Community College Foundation, and North | of the Maxwell School of Citizenship and Public Affairs |
| Carolina A&T University. | at Syracuse University. |
| |
| Rajiv L. Gupta | F. Joseph Loughrey |
| Born 1945. Trustee Since December 2001.2 | Born 1949. Trustee Since October 2009. Principal |
| Principal Occupation(s) During the Past Five Years: | Occupation(s) During the Past Five Years: President |
| Chairman and Chief Executive Officer (retired 2009) | and Chief Operating Officer (retired 2009) of Cummins |
| and President (2006–2008) of Rohm and Haas Co. | Inc. (industrial machinery); Director of SKF AB |
| (chemicals); Director of Tyco International, Ltd. | (industrial machinery), Hillenbrand, Inc. (specialized |
| (diversified manufacturing and services), Hewlett- | consumer services), the Lumina Foundation for |
| Packard Co. (electronic computer manufacturing), | |
| | |
| Education, and Oxfam America; Chairman of the | Executive Officers | |
| Advisory Council for the College of Arts and Letters | | |
| and Member of the Advisory Board to the Kellogg | Glenn Booraem | |
| Institute for International Studies at the University | Born 1967. Controller Since July 2010. Principal |
| of Notre Dame. | Occupation(s) During the Past Five Years: Principal |
| | of The Vanguard Group, Inc.; Controller of each of |
| Mark Loughridge | the investment companies served by The Vanguard |
| Born 1953. Trustee Since March 2012. Principal | Group; Assistant Controller of each of the investment |
| Occupation(s) During the Past Five Years: Senior Vice | companies served by The Vanguard Group (2001–2010). |
| President and Chief Financial Officer at IBM (information | | |
| technology services); Fiduciary Member of IBM’s | Thomas J. Higgins | |
| Retirement Plan Committee. | Born 1957. Chief Financial Officer Since September |
| | 2008. Principal Occupation(s) During the Past Five |
| Scott C. Malpass | Years: Principal of The Vanguard Group, Inc.; Chief |
| Born 1962. Trustee Since March 2012. Principal | Financial Officer of each of the investment companies |
| Occupation(s) During the Past Five Years: Chief | served by The Vanguard Group; Treasurer of each of |
| Investment Officer and Vice President at the University | the investment companies served by The Vanguard |
| of Notre Dame; Assistant Professor of Finance at the | Group (1998–2008). | |
| Mendoza College of Business at Notre Dame; Member | | |
| of the Notre Dame 403(b) Investment Committee; | Kathryn J. Hyatt | |
| Director of TIFF Advisory Services, Inc. (investment | Born 1955. Treasurer Since November 2008. Principal |
| advisor); Member of the Investment Advisory | Occupation(s) During the Past Five Years: Principal of |
| Committees of the Financial Industry Regulatory | The Vanguard Group, Inc.; Treasurer of each of the |
| Authority (FINRA) and of Major League Baseball. | investment companies served by The Vanguard |
| | Group; Assistant Treasurer of each of the investment |
| André F. Perold | companies served by The Vanguard Group (1988–2008). |
| Born 1952. Trustee Since December 2004. Principal | | |
| Occupation(s) During the Past Five Years: George | Heidi Stam | |
| Gund Professor of Finance and Banking at the Harvard | Born 1956. Secretary Since July 2005. Principal |
| Business School (retired 2011); Chief Investment | Occupation(s) During the Past Five Years: Managing |
| Officer and Managing Partner of HighVista Strategies | Director of The Vanguard Group, Inc.; General Counsel |
| LLC (private investment firm); Director of Rand | of The Vanguard Group; Secretary of The Vanguard |
| Merchant Bank; Overseer of the Museum of Fine | Group and of each of the investment companies |
| Arts Boston. | served by The Vanguard Group; Director and Senior |
| | Vice President of Vanguard Marketing Corporation. |
| | |
| Alfred M. Rankin, Jr. | | |
| Born 1941. Trustee Since January 1993. Principal | Vanguard Senior ManagementTeam |
| Occupation(s) During the Past Five Years: Chairman, | | |
| President, and Chief Executive Officer of NACCO | Mortimer J. Buckley | Michael S. Miller |
| Industries, Inc. (forklift trucks/housewares/lignite); | Kathleen C. Gubanich | James M. Norris |
| Director of Goodrich Corporation (industrial products/ | Paul A. Heller | Glenn W. Reed |
| aircraft systems and services) and the National | Martha G. King | George U. Sauter |
| Association of Manufacturers; Chairman of the Board | Chris D. McIsaac | |
| of the Federal Reserve Bank of Cleveland and of | | |
| University Hospitals of Cleveland; Advisory Chairman | | |
| of the Board of The Cleveland Museum of Art. | Chairman Emeritus and Senior Advisor |
| | |
| | John J. Brennan | |
| Chairman, 1996–2009 | |
| | Chief Executive Officer and President, 1996–2008 |
| Peter F. Volanakis | | |
| Born 1955. Trustee Since July 2009. Principal | |
| Occupation(s) During the Past Five Years: President | | |
| and Chief Operating Officer (retired 2010) of Corning | Founder | |
| Incorporated (communications equipment); Director | John C. Bogle | |
| of SPX Corporation (multi-industry manufacturing); | Chairman and Chief Executive Officer, 1974–1996 |
| Overseer of the Amos Tuck School of Business | | |
| Administration at Dartmouth College; Advisor to the | | |
| Norris Cotton Cancer Center. | |
1 Mr. McNabb is considered an “interested person,” as defined in the Investment Company Act of 1940, because he is an officer of the
Vanguard funds.
2 December 2002 for Vanguard Equity Income Fund, Vanguard Growth Equity Fund, the Vanguard Municipal Bond Funds, and the Vanguard
State Tax-Exempt Funds.

| |
| | P.O. Box 2600 |
| | Valley Forge, PA 19482-2600 |
| |
| |
| |
| Connect with Vanguard® > vanguard.com | |
| |
| |
| |
| Fund Information > 800-662-7447 | CFA® is a trademark owned by CFA Institute. |
| Direct Investor Account Services > 800-662-2739 | |
| Institutional Investor Services > 800-523-1036 | |
| Text Telephone for People | |
| With Hearing Impairment > 800-749-7273 | |
| |
| This material may be used in conjunction | |
| with the offering of shares of any Vanguard | |
| fund only if preceded or accompanied by | |
| the fund’s current prospectus. | |
| |
| All comparative mutual fund data are from Lipper Inc. or | |
| Morningstar, Inc., unless otherwise noted. | |
| |
| You can obtain a free copy of Vanguard’s proxy voting | |
| guidelines by visiting vanguard.com/proxyreporting or by | |
| calling Vanguard at 800-662-2739. The guidelines are | |
| also available from the SEC’s website, sec.gov. In | |
| addition, you may obtain a free report on how your fund | |
| voted the proxies for securities it owned during the 12 | |
| months ended June 30. To get the report, visit either | |
| vanguard.com/proxyreporting or sec.gov. | |
| |
| You can review and copy information about your fund at | |
| the SEC’s Public Reference Room in Washington, D.C. To | |
| find out more about this public service, call the SEC at | |
| 202-551-8090. Information about your fund is also | |
| available on the SEC’s website, and you can receive | |
| copies of this information, for a fee, by sending a | |
| request in either of two ways: via e-mail addressed to | |
| publicinfo@sec.gov or via regular mail addressed to the | |
| Public Reference Section, Securities and Exchange | |
| Commission, Washington, DC 20549-1520. | |
| |
| | © 2013 The Vanguard Group, Inc. |
| | All rights reserved. |
| | Vanguard Marketing Corporation, Distributor. |
| |
| | Q750 012013 |
Item 2: Code of Ethics. The Registrant has adopted a code of ethics that applies to the Registrant’s principal executive officer, principal financial officer, principal accounting officer or controller or persons performing similar functions. The Code of Ethics was amended during the reporting period covered by this report to make certain technical, non-material changes.
Item 3: Audit Committee Financial Expert. The following members of the Audit Committee have been determined by the Registrant’s Board of Trustees to be Audit Committee Financial Experts serving on its Audit Committee, and to be independent: Rajiv L. Gupta, Amy Gutmann, JoAnn Heffernan Heisen, F. Joseph Loughrey, Mark Loughridge, Scott C. Malpass, André F. Perold, and Alfred M. Rankin, Jr.
Item 4: Principal Accountant Fees and Services.
(a) Audit Fees.
Audit Fees of the Registrant
Fiscal Year Ended November 30, 2012: $81,000
Fiscal Year Ended November 30, 2011: $81,000
Aggregate Audit Fees of Registered Investment Companies in the Vanguard Group.
Fiscal Year Ended November 30, 2012: $4,809,780
Fiscal Year Ended November 30, 2011: $3,978,540
(b) Audit-Related Fees.
Fiscal Year Ended November 30, 2012: $1,812,565
Fiscal Year Ended November 30, 2011: $1,341,750
Includes fees billed in connection with assurance and related services provided to the Registrant, The Vanguard Group, Inc., Vanguard Marketing Corporation, and other registered investment companies in the Vanguard Group.
(c) Tax Fees.
Fiscal Year Ended November 30, 2012: $490,518
Fiscal Year Ended November 30, 2011: $373,830
Includes fees billed in connection with tax compliance, planning and advice services provided to the Registrant, The Vanguard Group, Inc., Vanguard Marketing Corporation, and other registered investment companies in the Vanguard Group and related to income and excise taxes.
(d) All Other Fees.
Fiscal Year Ended November 30, 2012: $16,000
Fiscal Year Ended November 30, 2011: $16,000
Includes fees billed for services related to risk management and privacy matters. Services were provided to the Registrant, The Vanguard Group, Inc., Vanguard Marketing Corporation, and other registered investment companies in the Vanguard Group.
(e) (1) Pre-Approval Policies. The policy of the Registrant’s Audit Committee is to consider and, if appropriate, approve before the principal accountant is engaged for such services, all specific audit and non-audit services provided to: (1) the Registrant; (2) The Vanguard Group, Inc.; (3) other entities controlled by The Vanguard Group, Inc. that provide ongoing services to the Registrant; and (4) other registered investment companies in the Vanguard Group. In making a determination, the Audit Committee considers whether the services are consistent with maintaining the principal accountant’s independence.
In the event of a contingency situation in which the principal accountant is needed to provide services in between scheduled Audit Committee meetings, the Chairman of the Audit Committee would be called on to consider and, if appropriate, pre-approve audit or permitted non-audit services in an amount sufficient to complete services through the next Audit Committee meeting, and to determine if such services would be consistent with maintaining the accountant’s independence. At the next scheduled Audit Committee meeting, services and fees would be presented to the Audit Committee for formal consideration, and, if appropriate, approval by the entire Audit Committee. The Audit Committee would again consider whether such services and fees are consistent with maintaining the principal accountant’s independence.
The Registrant’s Audit Committee is informed at least annually of all audit and non-audit services provided by the principal accountant to the Vanguard complex, whether such services are provided to: (1) the Registrant; (2) The Vanguard Group, Inc.; (3) other entities controlled by The Vanguard Group, Inc. that provide ongoing services to the Registrant; or (4) other registered investment companies in the Vanguard Group.
(2) No percentage of the principal accountant’s fees or services were approved pursuant to the waiver provision of paragraph (c)(7)(i)(C) of Rule 2-01 of Regulation S-X.
(f) For the most recent fiscal year, over 50% of the hours worked under the principal accountant’s engagement were not performed by persons other than full-time, permanent employees of the principal accountant.
(g) Aggregate Non-Audit Fees.
Fiscal Year Ended November 30, 2012: $506,518
Fiscal Year Ended November 30, 2011: $389,830
Includes fees billed for non-audit services provided to the Registrant, The Vanguard Group, Inc., Vanguard Marketing Corporation, and other registered investment companies in the Vanguard Group.
(h) For the most recent fiscal year, the Audit Committee has determined that the provision of all non-audit services was consistent with maintaining the principal accountant’s independence.
Item 5: Audit Committee of Listed Registrants.
Not Applicable.
Item 6: Investments.
Not Applicable.
Item 7: Disclosure of Proxy Voting Policies and Procedures for Closed-End Management
Investment Companies.
Not Applicable.
Item 8: Portfolio Managers of Closed-End Management Investment Companies.
Not Applicable.
Item 9: Purchase of Equity Securities by Closed-End Management Investment Company and
Affiliated Purchasers.
Not Applicable.
Item 10: Submission of Matters to a Vote of Security Holders.
Not Applicable.
Item 11: Controls and Procedures.
(a) Disclosure Controls and Procedures. The Principal Executive and Financial Officers concluded that the Registrant's Disclosure Controls and Procedures are effective based on their evaluation of the Disclosure Controls and Procedures as of a date within 90 days of the filing date of this report.
(b) Internal Control Over Financial Reporting. There were no significant changes in Registrant’s Internal Control Over Financial Reporting or in other factors that could significantly affect this control subsequent to the date of the evaluation, including any corrective actions with regard to significant deficiencies and material weaknesses.
Item 12: Exhibits.
(a) Code of Ethics.
(b) Certifications.
Pursuant to the requirements of the Securities Exchange Act of 1934 and the Investment Company Act of 1940, the registrant has duly caused this report to be signed on its behalf by the undersigned, thereunto duly authorized.
| |
| | VANGUARD CALIFORNIA TAX-FREE FUNDS |
| |
| |
| BY: | /s/ F. WILLIAM MCNABB III* |
| | F. WILLIAM MCNABB III |
| | CHIEF EXECUTIVE OFFICER |
| |
| Date: January 21, 2013 |
Pursuant to the requirements of the Securities Exchange Act of 1934 and the Investment Company Act of 1940, this report has been signed below by the following persons on behalf of the registrant and in the capacities and on the dates indicated.
| |
| | VANGUARD CALIFORNIA TAX-FREE FUNDS |
BY: | /s/ F. WILLIAM MCNABB III* |
| | F. WILLIAM MCNABB III |
| | CHIEF EXECUTIVE OFFICER |
Date: January 21, 2013 |
| | VANGUARD CALIFORNIA TAX-FREE FUNDS |
BY: | /s/ THOMAS J. HIGGINS* |
| | THOMAS J. HIGGINS |
| | CHIEF FINANCIAL OFFICER |
Date: January 21, 2013 |
* By: /s/ Heidi Stam
Heidi Stam, pursuant to a Power of Attorney filed on March 27, 2012 see file Number
2-11444, Incorporated by Reference.