UNITED STATES
SECURITIES AND EXCHANGE COMMISSION
Washington, D.C. 20549
FORM N-CSR
CERTIFIED SHAREHOLDER REPORT
OF
REGISTERED MANAGEMENT INVESTMENT COMPANIES
| | |
| Investment Company Act file number: | 811-04474 |
Name of Registrant: | Vanguard California Tax-Free Funds |
Address of Registrant: | P.O. Box 2600 |
| | Valley Forge, PA 19482 |
Name and address of agent for service: | Heidi Stam, Esquire |
| | P.O. Box 876 |
| | Valley Forge, PA 19482 |
Registrant’s telephone number, including area code: (610) 669-1000 |
Date of fiscal year end: November 30 | |
Date of reporting period: December 1, 2012 – November 30, 2013 |
Item 1: Reports to Shareholders | |

Annual Report | November 30, 2013
Vanguard California Tax-Exempt Funds
Vanguard’s Principles for Investing Success
We want to give you the best chance of investment success. These principles, grounded in Vanguard’s research and experience, can put you on the right path.
Goals. Create clear, appropriate investment goals.
Balance. Develop a suitable asset allocation using broadly diversified funds. Cost. Minimize cost.
Discipline. Maintain perspective and long-term discipline.
A single theme unites these principles: Focus on the things you can control.
We believe there is no wiser course for any investor.
| |
| Contents | |
| Your Fund’s Total Returns. | 1 |
| Chairman’s Letter. | 2 |
| Advisor’s Report. | 10 |
| California Tax-Exempt Money Market Fund. | 14 |
| California Intermediate-Term Tax-Exempt Fund. | 33 |
| California Long-Term Tax-Exempt Fund. | 81 |
| About Your Fund’s Expenses. | 111 |
| Glossary. | 113 |
Please note: The opinions expressed in this report are just that—informed opinions. They should not be considered promises or advice.
Also, please keep in mind that the information and opinions cover the period through the date on the front of this report. Of course, the
risks of investing in your fund are spelled out in the prospectus.
See the Glossary for definitions of investment terms used in this report.
About the cover: The ship's wheel represents leadership and guidance, essential qualities in navigating difficult seas.
This one is a replica based on an 18th-century British vessel. The HMS Vanguard, another ship of that era, served as the
flagship for Admiral Horatio Nelson when he defeated a French fleet at the Battle of the Nile.
| | | | | |
| Your Fund’s Total Returns | | | | | |
| |
| |
| |
| |
| Fiscal Year Ended November 30, 2013 | | | | | |
| | | Taxable- | | | |
| | SEC | Equivalent | Income | Capital | Total |
| | Yield | Yield | Returns | Returns | Returns |
| Vanguard California Tax-Exempt Money Market | | | | | |
| Fund | 0.01% | 0.02% | 0.01% | 0.00% | 0.01% |
| California Tax-Exempt Money Market Funds | | | | | |
| Average | | | | | 0.00 |
| California Tax-Exempt Money Market Funds Average: Derived from data provided by Lipper, a Thomson Reuters Company. | |
Vanguard California Intermediate-Term Tax-Exempt Fund | | | | |
| Investor Shares | 2.24% | 4.51% | 3.12% | -5.03% | -1.91% |
| Admiral™ Shares | 2.32 | 4.67 | 3.20 | -5.03 | -1.83 |
| Barclays Municipal California Intermediate Bond | | | | | |
| Index | | | | | -1.15 |
| California Intermediate Municipal Debt Funds | | | | | |
| Average | | | | | -2.51 |
| California Intermediate Municipal Debt Funds Average: Derived from data provided by Lipper, a Thomson Reuters Company. | |
Vanguard California Long-Term Tax-Exempt Fund | | | | | |
| Investor Shares | 3.29% | 6.63% | 3.64% | -7.60% | -3.96% |
| Admiral Shares | 3.37 | 6.79 | 3.72 | -7.60 | -3.88 |
| Barclays CA Municipal Bond Index | | | | | -2.92 |
| California Municipal Debt Funds Average | | | | | -5.00 |
California Municipal Debt Funds Average: Derived from data provided by Lipper, a Thomson Reuters Company.
7-day SEC yield for the California Tax-Exempt Money Market Fund; 30-day SEC yield for the California Intermediate-Term Tax-Exempt Fund
and California Long-Term Tax-Exempt Fund.
The calculation of taxable-equivalent yield assumes a typical itemized tax return and is based on the maximum federal tax rate of 43.4% and
the maximum income tax rate for the state. Local taxes were not considered. Please see the prospectus for a detailed explanation of the
calculation.
Admiral Shares carry lower expenses and are available to investors who meet certain account-balance requirements.
1

Chairman’s Letter
Dear Shareholder,
The 12 months ended November 30, 2013, marked a difficult period for both taxable and tax-exempt bonds, mainly because of summer setbacks stemming from concerns about the next steps in the Federal Reserve’s bond-buying stimulus program. Muni investors were further rattled by Detroit’s July bankruptcy filing and Puerto Rico’s ongoing financial struggles.
Against this backdrop, Vanguard California Intermediate-Term Tax-Exempt Fund returned –1.91% for Investor Shares and –1.83% for Admiral Shares for the fiscal year. Vanguard California Long-Term Tax-Exempt Fund returned –3.96% for Investor Shares and –3.88% for Admiral Shares. Interest income cushioned a large portion of the decline in both funds’ bond prices, as you can see in the table on page 1.
The funds lagged the returns of their state-specific benchmark indexes. However, they bested the average returns of California peer funds, largely because the Vanguard portfolios had minimal holdings of Puerto Rican bonds and also had generally higher-quality holdings, as rated by independent agencies. (Because interest on Puerto Rico’s bonds is tax-free not only at the federal level but also at the state and local levels, they are included in many tax-exempt bond funds.)
2
As bond prices fell during the period, yields of course rose. The 30-day SEC yield for Investor Shares of the Intermediate-Term Fund climbed to 2.24% as of November 30, 2013, from 1.46% a year earlier. Yields rose more than a full percentage point for Investor Shares in the Long-Term Fund, to 3.29% from 2.10%.
Consistent with the Fed’s stimulative policy of keeping short-term interest rates at 0% to 0.25%, Vanguard California Tax-Exempt Money Market Fund returned 0.01%, just ahead of its peer group’s 0.00% average return.
Please note that the funds are permitted to invest in securities whose income is subject to the alternative minimum tax (AMT). As of November 30, neither the Intermediate-Term Fund nor the Long-Term Fund owned securities that would generate income distributions subject to the AMT, but the Money Market Fund did.
Before reviewing capital markets and fund performance, I want to mention an important transition at Vanguard. As we announced in early November, Robert F. Auwaerter, principal and head of Vanguard Fixed Income Group, intends to retire in March 2014. At the conclusion of this letter, I’ll have more to say about Bob’s important contributions to Vanguard in his 32-year career, and I’ll introduce his successor, Gregory Davis.
| | | |
| Market Barometer | | | |
| | Average Annual Total Returns |
| | Periods Ended November 30, 2013 |
| | One | Three | Five |
| | Year | Years | Years |
| Bonds | | | |
| Barclays U.S. Aggregate Bond Index (Broad taxable | | | |
| market) | -1.61% | 3.09% | 5.33% |
| Barclays Municipal Bond Index (Broad tax-exempt market) | -3.51 | 4.23 | 6.26 |
| Citigroup Three-Month U.S. Treasury Bill Index | 0.05 | 0.07 | 0.10 |
| |
| Stocks | | | |
| Russell 1000 Index (Large-caps) | 30.96% | 17.78% | 18.33% |
| Russell 2000 Index (Small-caps) | 40.99 | 17.89 | 20.97 |
| Russell 3000 Index (Broad U.S. market) | 31.71 | 17.78 | 18.54 |
| MSCI All Country World Index ex USA (International) | 18.24 | 7.50 | 13.87 |
| |
| CPI | | | |
| Consumer Price Index | 1.24% | 2.13% | 1.87% |
3
After making small gains early on, bond prices fell across the market
Bond prices seesawed notably during the 12 months, after an inauspicious start in December, when concerns about the federal government’s fiscal cliff weighed on bond markets. After a few months of recovery, bond prices fell again from May through August because of concerns about Fed tapering. Reassuring comments then sparked sizable rallies in September and October. (In mid-December, the Fed announced it would begin scaling back its bond purchases in January 2014.)
For the full period, the broad U.S. taxable bond market returned –1.61%. The yield of the 10-year Treasury note closed at 2.74%, up from 1.61% at the end of November 2012. The broad municipal
bond market returned –3.51%, losing more ground in the second half of the fiscal year than in the first six months. Returns of money market funds and savings accounts continued to be restrained by the Fed’s 0%–0.25% target for short-term interest rates.
International bond markets (as measured by the Barclays Global Aggregate Index ex USD) returned –2.93%.
Despite some jolts, U.S. stocks notched an impressive 12-month gain
The U.S. stock market powered to a return of about 32% for the fiscal year, despite encountering a few bumps along the way. Uncertainty surrounding Fed policy contributed to market declines in June and August. But stocks bounced back
| | | |
| Expense Ratios | | | |
| Your Fund Compared With Its Peer Group | | | |
| | Investor | Admiral | Peer Group |
| | Shares | Shares | Average |
| California Tax-Exempt Money Market | | | |
| Fund | 0.16% | — | 0.20% |
| California Intermediate-Term | | | |
| Tax-Exempt Fund | 0.20 | 0.12% | 0.78 |
| California Long-Term Tax-Exempt Fund | 0.20 | 0.12 | 0.97 |
The fund expense ratios shown are from the prospectus dated March 28, 2013, and represent estimated costs for the current fiscal year. For
the fiscal year ended November 30, 2013, the funds’ expense ratios were: for the California Tax-Exempt Money Market Fund, 0.11%; for the
California Intermediate-Term Tax-Exempt Fund, 0.20% for Investor Shares and 0.12% for Admiral Shares; and for the California Long-Term
Tax-Exempt Fund, 0.20% for Investor Shares and 0.12% for Admiral Shares. The expense ratio for the California Tax-Exempt Money Market
Fund reflects a temporary reduction in operating expenses (described in Note B of the Notes to Financial Statements). Before the reduction,
the expense ratio was 0.16%. Peer-group expense ratios are derived from data provided by Lipper, a Thomson Reuters Company, and capture
information through year-end 2012.
Peer groups: For the California Tax-Exempt Money Market Fund, California Tax-Exempt Money Market Funds; for the California
Intermediate-Term Tax-Exempt Fund, California Intermediate Municipal Debt Funds; for the California Long-Term Tax-Exempt Fund, California
Municipal Debt Funds.
4
in September when the Fed announced it had no plans at that time to reduce its bond-buying program. Corporate profit growth, though not robust, was generally solid during the fiscal year.
International stocks returned about 18% in aggregate. While the developed markets of Europe and the Pacific region performed well for the period, gains were modest for emerging-market stocks.
The bond market’s downturn, coupled with the upswing in stocks, provides an occasion for investors to review their portfolio’s asset allocation. In a powerful stock market rally, a portfolio’s mix of stocks and bonds can drift away from its target allocation, as Fran Kinniry, a principal in our Investment Strategy Group, recently reminded clients in an article on our website.
“Buying stocks now may actually run counter to what many prudent investors should be doing,” he noted. “If you have an equity-heavy portfolio, you will most likely need to direct new cash flows to bond mutual funds, or sell stock mutual funds to maintain your target asset allocation.”
| |
| Total Returns | |
| Ten Years Ended November 30, 2013 | |
| | Average |
| | Annual Return |
| California Tax-Exempt Money Market Fund | 1.27% |
| California Tax-Exempt Money Market Funds Average | 1.01 |
| California Tax-Exempt Money Market Funds Average: Derived from data provided by Lipper, a Thomson Reuters Company. |
| |
| |
| California Intermediate-Term Tax-Exempt Fund Investor Shares | 3.82% |
| Barclays Municipal California Intermediate Bond Index | 4.73 |
| California Intermediate Municipal Debt Funds Average | 3.23 |
| California Intermediate Municipal Debt Funds Average: Derived from data provided by Lipper, a Thomson Reuters Company. |
| |
| |
| California Long-Term Tax-Exempt Fund Investor Shares | 3.98% |
| Barclays CA Municipal Bond Index | 4.69 |
| California Municipal Debt Funds Average | 3.72 |
| California Municipal Debt Funds Average: Derived from data provided by Lipper, a Thomson Reuters Company. |
The figures shown represent past performance, which is not a guarantee of future results. (Current performance may be
lower or higher than the performance data cited. For performance data current to the most recent month-end, visit our
website at vanguard.com/performance.) Note, too, that both investment returns and principal value can fluctuate widely, so
an investor’s shares, when sold, could be worth more or less than their original cost.
5
|
| Muni yields exceed Treasury yields: What does it mean? |
| |
| At times over the 12 months ended November 30, 10-year municipal bonds nationwide yielded |
| substantially more than their Treasury counterparts, even before factoring in munis’ tax-favored |
| status. This reversal of what had been the historical relationship between Treasuries and munis |
| has occurred often in recent years. The turmoil started with the 2008–2009 financial crisis and |
| continued amid dire headlines about state and local finances. |
| |
| Through June, July, and August, a time when investor concerns mounted over Detroit’s |
| bankruptcy filing and the financial health of Puerto Rico, 10-year municipal yields averaged |
| 31 basis points, or about 12%, more than 10-year Treasuries. By the end of November, the |
| gap had closed significantly, but 10-year muni yields were still averaging about 8 basis points, |
| or 3%, more. Over the past decade, however, muni yields have averaged 5% less than their |
| Treasury equivalents. |
| |
| We believe investors shouldn’t be unduly swayed by this turnabout. Will it vanish if they chase |
| it? Or do investors now perceive muni bonds to be riskier? Rather than speculate, we believe |
| investors should carefully evaluate the role of tax-exempt bonds in a diversified portfolio. For |
| any investor, the proportion of muni holdings (if any) should be based on long-term goals, risk |
| tolerance, and tax considerations—not on what may be transient yield trends. |
| |
| 10-year municipal bond yields have topped their Treasury counterparts |

| Note: One basis point equals .01 percentage point. |
| Source: Vanguard. |
6
Advisor’s strategy helped cushion the impact of rising interest rates
Clearly, state and local governments face many financial challenges as they strive to emerge from the effects of the Great Recession. Across much of the United States, restrained budgets have generally been passed on time, and post-recession tax revenues have been steadily rising at the state level and, more recently, the local level too. The much-publicized situations in Detroit and Puerto Rico can, in our opinion, be viewed as outliers from the general improving trend. And, although some California cities are dealing with bankruptcies, your state’s overall fiscal condition has improved markedly.
Given the extremely low level of interest rates in recent years, the funds’ advisor, Vanguard Fixed Income Group, has positioned the California Long-Term and Intermediate-Term Tax-Exempt Funds to be prepared for an eventual rise in bond yields and the accompanying decline in their prices. For example, the advisor generally shortened the funds’ durations relative to their benchmarks. Duration is a gauge of the sensitivity of bond prices to changes in interest rates; shorter durations (measured in months and years) can mitigate price declines when rates rise.
Compared with their peers, both funds benefited from having little to no exposure to Puerto Rico during the year. (The Long-Term Fund had a small holding at the end of November, while the Intermediate-Term Fund had none.)
For the California Tax-Exempt Money Market Fund, as with other short-term investments and savings accounts, returns remained nearly flat given the Fed’s policy, since 2008, of setting its short-term interest rate target near zero. The fund’s 7-day SEC yield as of November 30 was 0.01%, almost unchanged from 0.03% a year earlier.
For more about the funds’ strategy and performance during the fiscal year, please see the Advisor’s Report that follows this letter.
A decade-long perspective on the funds’ performance
Over the ten years ended November 30, the Intermediate-Term Fund had an average annual return of 3.82% for Investor Shares; the Long-Term Fund’s average annual return was a bit higher at 3.98% for that share class. Both funds trailed their benchmark index (which incurs no expenses) by nearly one percentage point.
For these actively managed funds, however, a more important measure of relative success is that they outperformed their peer-group averages. And the Money Market Fund’s 10-year average annual return of 1.27%, although modest, was also ahead of its peer-group average.
The funds’ results highlight the skill of Vanguard’s experienced portfolio managers, traders, and credit analysts—and reflect the competitive advantage of Vanguard’s low costs. Our focus on low
7
costs means that our funds don’t have to pursue the higher yields offered by riskier assets to offset the drain of high costs.
Bob Auwaerter’s retirement marks the end of a remarkable era
In mid-September 2008, about two weeks after I succeeded Jack Brennan as Vanguard’s chief executive officer, Lehman Brothers went bankrupt, igniting the nation’s worst financial crisis in 70 years. It was, to put it mildly, an extremely challenging time. Through it all, I was able to depend on Bob Auwaerter’s strong command of the Fixed Income Group, which persevered under these treacherous conditions. Although that was a difficult period for Vanguard and the industry, it was far from the only time I was grateful to have Bob at the helm of our bond group
Bob, who joined Vanguard in 1981, was an original member of the three-person Fixed Income Group, headed by Ian MacKinnon. Over the years, he held various leadership roles in the department, and he eventually succeeded Ian as its head in 2003. He earned a reputation at Vanguard and within the industry as an extremely dedicated, honest, and insightful decision-maker and leader.
The Fixed Income Group that Bob helped start had total assets of about $1.3 billion in seven funds. He tracked his positions in the two funds he managed then on index cards stored in a small metal box. Thirty-two years later, the 120-person group oversees $750 billion, which represents nearly one-third of Vanguard’s assets under management.
On behalf of our clients, I thank Bob for more than three decades of exemplary service and wish him the best in his retirement.
We’re fortunate that Greg Davis will become the head of the Fixed Income Group. Greg currently serves as chief investment officer for the Asia-Pacific region and as a director of Vanguard Investments Australia. He joined Vanguard in 1999 and had been head of bond indexing and a senior portfolio manager in the Fixed Income Group. Greg is an eminently qualified successor and has a strong commitment to the Vanguard way of investing. I couldn’t be more confident in his ability to lead the Fixed Income Group and its deep and talented team.
As always, thank you for investing with Vanguard.
Sincerely,

F. William McNabb III
Chairman and Chief Executive Officer
December 19, 2013
8
| | | | |
| Your Fund’s Performance at a Glance | | | | |
| November 30, 2012, Through November 30, 2013 | | | | |
| | | | Distributions Per Share |
| | Starting | Ending | Income | Capital |
| | Share Price | Share Price | Dividends | Gains |
| Vanguard California Tax-Exempt Money Market | | | | |
| Fund | $1.00 | $1.00 | $0.000 | $0.000 |
| Vanguard California Intermediate-Term | | | | |
| Tax-Exempt Fund | | | | |
| Investor Shares | $11.92 | $11.32 | $0.373 | $0.000 |
| Admiral Shares | 11.92 | 11.32 | 0.382 | 0.000 |
| Vanguard California Long-Term Tax-Exempt | | | | |
| Fund | | | | |
| Investor Shares | $12.24 | $11.31 | $0.450 | $0.000 |
| Admiral Shares | 12.24 | 11.31 | 0.459 | 0.000 |
9
Advisor’s Report
For the fiscal year ended November 30, 2013, Vanguard California Tax-Exempt Money Market Fund returned 0.01%, compared with the 0.00% average return of peer-group funds.
Vanguard California Intermediate-Term Tax-Exempt Fund returned –1.91% for Investor Shares and –1.83% for Admiral Shares; Vanguard California Long-Term Tax-Exempt Fund returned –3.96% for Investor Shares and –3.88 % for Admiral Shares. Both funds trailed their state-specific benchmarks but outperformed the average returns of their peers.
The investment environment
Some uncertainty is natural in the financial markets, but conditions during the 12 months were more unsettled than usual. This largely stemmed from fiscal battles in Washington—starting with the late-2012 “fiscal cliff” showdown over scheduled tax increases and spending cuts, and capped by October’s temporary government shutdown and struggle over the debt ceiling—along with concern over what the Federal Reserve might do next.
The focus on Fed policy intensified in late May, when—with unemployment falling, the housing market improving, and the stock market soaring—the Fed openly
| | |
| Yields of Tax-Exempt Municipal Securities | | |
| (AAA-Rated General-Obligation Issues) | | |
| | November 30, | November 30, |
| Maturity | 2012 | 2013 |
| 2 years | 0.30% | 0.33% |
| 5 years | 0.64 | 1.16 |
| 10 years | 1.47 | 2.65 |
| 30 years | 2.47 | 4.10 |
| Source: Vanguard. |
10
contemplated reducing its aggressive program of buying $85 billion of bonds each month. The possibility of “tapering” surprised the bond markets, leading to a broad decline in prices over the summer as yields increased, especially for longer-term bonds. (In mid-December, the Fed ended several months of speculation by announcing that it would begin scaling back bond purchases in January 2014.)
With no indication of changes to the Fed’s target for short-term interest rates, the national muni yield curve (the spread between shorter- and longer-term yields) steepened, as you can see in the table on page 10: Although the short end of the yield curve remained anchored near 0.3%, the yield on 30-year munis increased by more than 1.5 percentage points during the fiscal year.
Aside from the uncertainty about Fed policy, municipal bond markets were rattled by news reports detailing the largest municipal bankruptcy filing to date—by Detroit—and fresh coverage of Puerto Rico’s well-known financial problems. The California funds had no Detroit holdings, of course. Puerto Rican bonds, because of their triple-tax-exempt status, are held in many state-specific as well as national municipal bond funds. However, the California funds had virtually no Puerto Rico holdings; at the end of November, the Long-Term Fund held one, very small stake in a Puerto Rican bond issue, but faced no Puerto Rico credit risk because of the bond’s structure.
Still, there were bright spots at the national and state levels. Nationwide, the unemployment rate dropped from 7.8% in November 2012 to 7.0% in November 2013. California’s unemployment rate—which stayed stubbornly above 12% during the Great Recession—improved from 9.9% in November 2012 to 8.5% in November 2013.
And state tax revenues have been growing, after declines during and after the recession that were steeper than in the two previous downturns. According to data from the Nelson A. Rockefeller Institute of Government, aggregate state tax revenues across the United States increased more than 6% in the 12 months through June 2013 compared with the previous 12-month period. (Most state fiscal years, including California’s, end in June.) In California, where voters approved temporary tax increases in November 2012, state tax revenues increased more than 15% over the 12 months through June.
California has come a long way from the unflattering comparisons to Greece made just a few years ago. After many years of budget deficits, multibillion-dollar surpluses are projected for state fiscal years 2013 and 2014, according to the nonpartisan Legislative Analyst’s Office. In part, these surpluses reflect the stock market boom. California taxes capital gains at the same rate as other income and has highly progressive rates on personal income, which contribute to volatility in tax collections.
11
The state’s future fiscal health depends on how two key questions are answered: Will the projected surpluses materialize? And if so, how will the funds be used? Governor Jerry Brown has proposed to pay down the state’s “Wall of Debt”—several years of accumulated state budgetary borrowings that total at least an estimated $28 billion. If the Wall of Debt starts to come down, this would be a positive credit development. Alternatively, if surpluses are used to restore some cuts to various programs or for new programs, the implications for the state’s finances—especially when the temporary tax increases expire—are less clear.
A brief word about muni bond supply: Nationwide, the total issuance of tax-exempt bonds in the first 11 months of calendar 2013 was down about 15% from the same period a year earlier. With interest rates rising, opportunities to lower borrowing costs by replacing existing bonds were less attractive, resulting in a significant drop in refundings. California, however, bucked the national trend, with about a 13% increase in the total volume of municipal financing over the first 11 months of 2013 compared with the same period in 2012. Among our purchases during the fiscal year were state general-obligation bonds and issues from the Bay Area Toll Authority and the University of California.
Management of the funds
As the fiscal year began, we structured the California Intermediate-Term and Long-Term Funds to benefit from rising interest rates. For example, we generally
shortened the funds’ durations relative to their benchmarks, a step that should reduce their price sensitivity to changes in interest rates. (Because of the call provisions in some municipal bonds, true measures of responsiveness to interest rate moves are not always readily apparent.) We also favored bonds with features designed to provide some defense against rising rates. And we maintained above-average levels of liquidity by holding bonds that we can sell easily without affecting the fund’s core positioning. This in effect gives us “dry powder” available when we see opportunities to buy bonds that the market has undervalued, especially during volatile periods.
With many investors across the country switching from longer-maturity to shorter-term bonds, which can be less volatile when interest rates rise, shorter maturities were among the top performers nationwide—as was the case in California. This accounts for some of the gap in returns between our funds and their benchmarks. Despite our duration-shortening strategy, the Long-Term Fund was underweighted in the better-performing shorter maturities and overweighted in longer-term bonds, which held back relative performance. And, unlike its benchmark, the Intermediate-Term Fund holds some bonds maturing in more than ten years. However, our focus on higher-quality bonds (as determined by independent credit-rating agencies) generally served investors well, as did our security selection.
12
For the Money Market Fund, the Fed’s policy of anchoring short-term rates near zero continued to present a challenge. Nevertheless, we were able to improve returns using several relative value and income strategies involving credit sectors, security selection, and structural opportunities—such as adding floating-rate notes.
A look ahead
We expect U.S. economic growth to approach 3% in 2014 and the U.S. unemployment rate to keep falling. With some unresolved federal fiscal uncertainties continuing into 2014, we wouldn’t be surprised if talk of tax reform, a subject that can include muni bonds, resurfaces. And the Fed’s gradual reduction of its bond-buying program set to begin in January should allow it to wind down its purchases by the end of 2014.
As tapering starts, and if economic growth picks up, we expect that interest rates will move higher and lower-credit-quality bonds will outperform. To try to defend against this, we plan to gradually upgrade the credit quality of the portfolios, as lower-quality bonds are likely to become overvalued. We also plan to continue to maintain higher levels of liquidity so that we can take advantage of attractive opportunities if volatility increases in the municipal market. As usual, our experienced team will seek outperformance by identifying bonds that are mispriced by the market.
Christopher W. Alwine, CFA, Principal,
Head of Municipal Bond Funds
Pamela Wisehaupt Tynan, Principal,
Head of Municipal Money Market Funds
James M. D’Arcy, CFA, Portfolio Manager
Adam M. Ferguson, CFA,
Portfolio Manager
John M. Carbone, Principal,
Portfolio Manager
Vanguard Fixed Income Group
December 20, 2013
13
California Tax-Exempt Money Market Fund
Fund Profile
As of November 30, 2013
| |
| Financial Attributes | |
| Ticker Symbol | VCTXX |
| Expense Ratio1 | 0.16% |
| 7-Day SEC Yield | 0.01% |
| Average Weighted | |
| Maturity | 41 days |
| |
| Distribution by Credit Quality (% of portfolio) |
| First Tier | 100.0% |
| For information about these ratings, see the Glossary entry for Credit Quality. |
1 The expense ratio shown is from the prospectus dated March 28, 2013, and represents estimated costs for the current fiscal year. For the
fiscal year ended November 30, 2013, the expense ratio was 0.11%, reflecting a temporary reduction in operating expenses (described in
Note B of the Notes to Financial Statements). Before this reduction, the expense ratio was 0.16%.
14
California Tax-Exempt Money Market Fund
Performance Summary
Investment returns will fluctuate. All of the returns in this report represent past performance, which is not a guarantee of future results that may be achieved by the fund. (Current performance may be lower or higher than the performance data cited. For performance data current to the most recent month-end, visit our website at vanguard.com/performance.) The returns shown do not reflect taxes that a shareholder would pay on fund distributions. An investment in a money market fund is not insured or guaranteed by the Federal Deposit Insurance Corporation or any other government agency. Although the fund seeks to preserve the value of your investment at $1 per share, it is possible to lose money by investing in the fund. The fund’s 7-day SEC yield reflects its current earnings more closely than do the average annual returns.
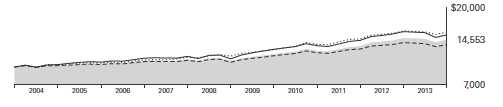
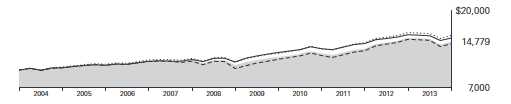
Cumulative Performance: November 30, 2003, Through November 30, 2013
Initial Investment of $10,000
| | | | |
| | Average Annual Total Returns | |
| | Periods Ended November 30, 2013 | |
| |
| | | | | Final Value |
| | One | Five | Ten | of a $10,000 |
| | Year | Years | Years | Investment |
| |
| California Tax-Exempt Money Market | | | | |
| Fund | 0.01% | 0.12% | 1.27% | $11,348 |
| •••••••• California Tax-Exempt Money Market | | | | |
| Funds Average | 0.00 | 0.04 | 1.01 | 11,056 |
| California Tax-Exempt Money Market Funds Average: Derived from data provided by Lipper, a Thomson Reuters Company. |
See Financial Highlights for dividend information.
15
California Tax-Exempt Money Market Fund
| | |
| Fiscal-Year Total Returns (%): November 30, 2003, Through November 30, 2013 | |
| | | CA Tax-Exempt |
| | | Money Mkt |
| | | Funds Avg |
| Fiscal Year | Total Returns | Total Returns |
| 2004 | 1.05% | 0.60% |
| 2005 | 2.17 | 1.70 |
| 2006 | 3.24 | 2.78 |
| 2007 | 3.55 | 3.06 |
| 2008 | 2.21 | 1.81 |
| 2009 | 0.37 | 0.17 |
| 2010 | 0.11 | 0.01 |
| 2011 | 0.07 | 0.01 |
| 2012 | 0.03 | 0.00 |
| 2013 | 0.01 | 0.00 |
| 7-day SEC yield (11/30/2013): 0.01% |
| California Tax-Exempt Money Market Funds Average: Derived from data provided by Lipper, a Thomson Reuters Company. |
Average Annual Total Returns: Periods Ended September 30, 2013
This table presents returns through the latest calendar quarter—rather than through the end of the fiscal period.
Securities and Exchange Commission rules require that we provide this information.
| | | | |
| | Inception | One | Five | Ten |
| | Date | Year | Years | Years |
| California Tax-Exempt Money | | | | |
| Market Fund | 6/1/1987 | 0.02% | 0.18% | 1.29% |
16
California Tax-Exempt Money Market Fund
Financial Statements
Statement of Net Assets
As of November 30, 2013
The fund reports a complete list of its holdings in various monthly and quarterly regulatory filings. The fund publishes its holdings on a monthly basis at vanguard.com and files them with the Securities and Exchange Commission on Form N-MFP. The fund’s Form N-MFP filings become public 60 days after the relevant month-end, and may be viewed at sec.gov or via a link on the “Portfolio Holdings” page on vanguard.com. For the second and fourth fiscal quarters, the lists appear in the fund’s semiannual and annual reports to shareholders. For the first and third fiscal quarters, the fund files the lists with the SEC on Form N-Q. Shareholders can look up the fund’s Forms N-Q on the SEC’s website at sec.gov. Forms N-Q may also be reviewed and copied at the SEC’s Public Reference Room (see the back cover of this report for further information).
| | | | |
| | | | Face | Market |
| | | Maturity | Amount | Value |
| | Coupon | Date | ($000) | ($000) |
| Tax-Exempt Municipal Bonds (99.8%) | | | | |
| California (99.8%) | | | | |
| ABAG Finance Authority for Nonprofit Corps. | | | | |
| California Revenue (Branson School) VRDO | 0.060% | 12/6/13 LOC | 6,750 | 6,750 |
| ABAG Finance Authority for Nonprofit Corps. | | | | |
| California Revenue (Institute for Defense | | | | |
| Analyses) VRDO | 0.030% | 12/6/13 LOC | 11,945 | 11,945 |
| ABAG Finance Authority for Nonprofit Corps. | | | | |
| California Revenue (Lakeside Village | | | | |
| Apartments) VRDO | 0.040% | 12/6/13 LOC | 55,000 | 55,000 |
| ABAG Finance Authority for Nonprofit Corps. | | | | |
| California Revenue (Marin Country Day | | | | |
| School) VRDO | 0.050% | 12/6/13 LOC | 22,175 | 22,175 |
| ABAG Finance Authority for Nonprofit Corps. | | | | |
| California Revenue (Public Policy Institute) VRDO | 0.070% | 12/6/13 LOC | 12,705 | 12,705 |
| Anaheim CA Housing Finance Agency Home | | | | |
| Mortgage Revenue VRDO | 0.060% | 12/6/13 LOC | 5,485 | 5,485 |
| 1 Bay Area Toll Authority California Toll Bridge | | | | |
| Revenue (San Francisco Bay Area) TOB VRDO | 0.070% | 12/6/13 | 5,000 | 5,000 |
| 1 Bay Area Toll Authority California Toll Bridge | | | | |
| Revenue (San Francisco Bay Area) TOB VRDO | 0.080% | 12/6/13 | 9,865 | 9,865 |
| Bay Area Toll Authority California Toll Bridge | | | | |
| Revenue (San Francisco Bay Area) VRDO | 0.030% | 12/6/13 LOC | 10,000 | 10,000 |
| Berkeley CA TRAN | 1.000% | 7/10/14 | 12,500 | 12,560 |
| Beverly Hills CA Public Financing Authority | | | | |
| Lease Revenue | 3.000% | 6/1/14 | 2,500 | 2,535 |
| California Community College Financing | | | | |
| Authority TRAN | 2.000% | 12/31/13 | 30,000 | 30,044 |
| California Community College Financing | | | | |
| Authority TRAN | 2.000% | 12/31/13 | 14,000 | 14,020 |
| California Community College Financing | | | | |
| Authority TRAN | 2.000% | 12/31/13 | 7,500 | 7,510 |
| 1 California Department of Water Resources | | | | |
| Water System Revenue (Central Valley | | | | |
| Project) TOB VRDO | 0.050% | 12/6/13 | 4,100 | 4,100 |
17
California Tax-Exempt Money Market Fund
| | | | | |
| | | | | Face | Market |
| | | | Maturity | Amount | Value |
| | | Coupon | Date | ($000) | ($000) |
| | California Educational Facilities Authority | | | | |
| | Revenue (California Institute of Technology) | | | | |
| | VRDO | 0.020% | 12/6/13 | 55,800 | 55,800 |
| 1 | California Educational Facilities Authority | | | | |
| | Revenue (Stanford University) TOB VRDO | 0.050% | 12/6/13 | 4,435 | 4,435 |
| 1 | California Educational Facilities Authority | | | | |
| | Revenue (Stanford University) TOB VRDO | 0.070% | 12/6/13 | 3,000 | 3,000 |
| 1 | California Educational Facilities Authority | | | | |
| | Revenue (University of Southern California) | | | | |
| | TOB VRDO | 0.050% | 12/6/13 | 14,800 | 14,800 |
| 1 | California Educational Facilities Authority | | | | |
| | Revenue (University of Southern California) | | | | |
| | TOB VRDO | 0.060% | 12/6/13 | 4,135 | 4,135 |
| 1 | California Educational Facilities Authority | | | | |
| | Revenue (University of Southern California) | | | | |
| | TOB VRDO | 0.060% | 12/6/13 | 15,025 | 15,025 |
| | California GO | 5.125% | 2/1/14 (Prere.) | 15,000 | 15,125 |
| | California GO | 5.250% | 4/1/14 (Prere.) | 6,000 | 6,101 |
| | California GO | 5.250% | 4/1/14 (Prere.) | 3,845 | 3,910 |
| | California GO | 5.300% | 4/1/14 (Prere.) | 2,450 | 2,492 |
| | California GO | 5.500% | 4/1/14 (Prere.) | 2,550 | 2,595 |
| | California GO | 5.500% | 4/1/14 (Prere.) | 2,900 | 2,951 |
| | California GO | 5.250% | 6/1/14 (Prere.) | 4,800 | 4,920 |
| | California GO CP | 0.110% | 12/3/13 LOC | 11,000 | 11,000 |
| | California GO VRDO | 0.030% | 12/2/13 LOC | 20,625 | 20,625 |
| | California GO VRDO | 0.040% | 12/2/13 LOC | 11,080 | 11,080 |
| | California GO VRDO | 0.040% | 12/6/13 LOC | 19,400 | 19,400 |
| | California GO VRDO | 0.050% | 12/6/13 LOC | 15,000 | 15,000 |
| 2 | California Health Facilities Financing Authority | | | | |
| | (Memorial Health) PUT | 0.120% | 6/27/14 | 15,000 | 15,000 |
| | California Health Facilities Financing Authority | | | | |
| | Revenue (Adventist Health System/West) VRDO | 0.050% | 12/2/13 LOC | 7,000 | 7,000 |
| | California Health Facilities Financing Authority | | | | |
| | Revenue (Catholic Healthcare West) VRDO | 0.030% | 12/6/13 LOC | 6,725 | 6,725 |
| | California Health Facilities Financing Authority | | | | |
| | Revenue (Catholic Healthcare West) VRDO | 0.040% | 12/6/13 LOC | 800 | 800 |
| | California Health Facilities Financing Authority | | | | |
| | Revenue (Children’s Hospital of Orange | | | | |
| | County) VRDO | 0.040% | 12/6/13 LOC | 5,000 | 5,000 |
| | California Health Facilities Financing Authority | | | | |
| | Revenue (Children’s Hospital of Orange | | | | |
| | County) VRDO | 0.040% | 12/6/13 LOC | 13,495 | 13,495 |
| 1,2 | California Health Facilities Financing Authority | | | | |
| | Revenue (Kaiser Foundation Hospitals) | | | | |
| | TOB VRDO | 0.050% | 12/6/13 LOC | 35,000 | 35,000 |
| | California Health Facilities Financing Authority | | | | |
| | Revenue (Memorial Health Services) VRDO | 0.040% | 12/6/13 | 56,100 | 56,100 |
| | California Health Facilities Financing Authority | | | | |
| | Revenue (Memorial Health Services) VRDO | 0.040% | 12/6/13 | 10,000 | 10,000 |
| | California Health Facilities Financing Authority | | | | |
| | Revenue (Scripps Health) VRDO | 0.030% | 12/6/13 LOC | 8,000 | 8,000 |
| | California Health Facilities Financing Authority | | | | |
| | Revenue (Scripps Health) VRDO | 0.030% | 12/6/13 LOC | 10,820 | 10,820 |
| | California Health Facilities Financing Authority | | | | |
| | Revenue (Scripps Health) VRDO | 0.030% | 12/6/13 LOC | 12,020 | 12,020 |
18
California Tax-Exempt Money Market Fund
| | | | |
| | | | Face | Market |
| | | Maturity | Amount | Value |
| | Coupon | Date | ($000) | ($000) |
| California Health Facilities Financing Authority | | | | |
| Revenue (Scripps Health) VRDO | 0.050% | 12/6/13 LOC | 14,225 | 14,225 |
| 1 California Health Facilities Financing Authority | | | | |
| Revenue (St. Joseph Health System) TOB VRDO | 0.050% | 12/6/13 | 15,000 | 15,000 |
| 1 California Health Facilities Financing Authority | | | | |
| Revenue (Sutter Health) TOB VRDO | 0.050% | 12/6/13 (13) | 12,210 | 12,210 |
| 1 California Health Facilities Financing Authority | | | | |
| Revenue (Sutter Health) TOB VRDO | 0.050% | 12/6/13 | 6,700 | 6,700 |
| 1 California Health Facilities Financing Authority | | | | |
| Revenue (Sutter Health) TOB VRDO | 0.060% | 12/6/13 | 23,400 | 23,400 |
| California Housing Finance Agency Home | | | | |
| Mortgage Revenue (Woolf House Apartments) | 1.050% | 1/1/14 | 5,950 | 5,951 |
| California Housing Finance Agency Home | | | | |
| Mortgage Revenue VRDO | 0.040% | 12/6/13 LOC | 21,600 | 21,600 |
| California Housing Finance Agency Home | | | | |
| Mortgage Revenue VRDO | 0.040% | 12/6/13 LOC | 23,800 | 23,800 |
| California Housing Finance Agency Home | | | | |
| Mortgage Revenue VRDO | 0.060% | 12/6/13 LOC | 7,700 | 7,700 |
| California Infrastructure & Economic Development | | | | |
| Bank Revenue (Academy of Motion Picture Arts | | | | |
| & Sciences Obligated Group) VRDO | 0.040% | 12/6/13 LOC | 35,000 | 35,000 |
| California Infrastructure & Economic Development | | | | |
| Bank Revenue (Academy of Sciences) VRDO | 0.040% | 12/2/13 LOC | 10,325 | 10,325 |
| California Infrastructure & Economic Development | | | | |
| Bank Revenue (American National Red Cross) | | | | |
| VRDO | 0.040% | 12/6/13 LOC | 13,470 | 13,470 |
| California Infrastructure & Economic Development | | | | |
| Bank Revenue (Buck Institute for Age Research) | | | | |
| VRDO | 0.040% | 12/6/13 LOC | 23,300 | 23,300 |
| California Infrastructure & Economic Development | | | | |
| Bank Revenue (Los Angeles County Museum of | | | | |
| Natural History Foundation) VRDO | 0.040% | 12/2/13 LOC | 6,100 | 6,100 |
| California Municipal Finance Authority Recovery | | | | |
| Zone Revenue (Chevron USA Inc. Project) VRDO | 0.030% | 12/2/13 | 50,040 | 50,040 |
| California Municipal Finance Authority Revenue | | | | |
| (Notre Dame High School, San Jose) VRDO | 0.080% | 12/6/13 LOC | 5,125 | 5,125 |
| California Pollution Control Financing Authority | | | | |
| Revenue (Pacific Gas & Electric Co.) VRDO | 0.040% | 12/2/13 LOC | 13,500 | 13,500 |
| California Pollution Control Financing Authority | | | | |
| Revenue (Pacific Gas & Electric Co.) VRDO | 0.040% | 12/2/13 LOC | 400 | 400 |
| California Pollution Control Financing Authority | | | | |
| Revenue (Pacific Gas & Electric Co.) VRDO | 0.070% | 12/2/13 LOC | 16,950 | 16,950 |
| California Public Works Board Lease Revenue | | | | |
| (Department of Mental Health) | 5.000% | 6/1/14 (Prere.) | 3,000 | 3,071 |
| California Public Works Board Lease Revenue | | | | |
| (Department of Mental Health) | 5.125% | 6/1/14 (Prere.) | 5,000 | 5,122 |
| California Public Works Board Lease Revenue | | | | |
| (Department of Mental Health) | 5.500% | 6/1/14 (Prere.) | 1,000 | 1,026 |
| California Public Works Board Lease Revenue | | | | |
| (Department of Mental Health) | 5.500% | 6/1/14 (Prere.) | 9,980 | 10,242 |
| California Public Works Board Lease Revenue | | | | |
| (Department of Mental Health) | 5.500% | 6/1/14 (Prere.) | 2,000 | 2,053 |
| California RAN | 2.000% | 5/28/14 | 36,000 | 36,314 |
| California RAN | 2.000% | 6/23/14 | 71,400 | 72,109 |
19
| | | | |
| California Tax-Exempt Money Market Fund | | | | |
| |
| |
| |
| | | | Face | Market |
| | | Maturity | Amount | Value |
| | Coupon | Date | ($000) | ($000) |
| California School Cash Reserve Program | | | | |
| Authority Pool TRAN | 2.000% | 12/31/13 | 2,500 | 2,504 |
| California School Cash Reserve Program | | | | |
| Authority Pool TRAN | 2.000% | 6/2/14 | 5,300 | 5,348 |
| California School Cash Reserve Program | | | | |
| Authority Pool TRAN | 2.000% | 6/2/14 | 7,650 | 7,719 |
| California School Cash Reserve Program | | | | |
| Authority Pool TRAN | 2.000% | 6/2/14 | 5,600 | 5,650 |
| California State University CP | 0.120% | 1/7/14 LOC | 5,765 | 5,765 |
| California State University CP | 0.110% | 2/4/14 LOC | 5,000 | 5,000 |
| California Statewide Communities Development | | | | |
| Authority Gas Supply Revenue VRDO | 0.050% | 12/6/13 | 124,510 | 124,510 |
| California Statewide Communities Development | | | | |
| Authority Multifamily Housing Revenue | | | | |
| (Canyon Springs Apartments Project) VRDO | 0.090% | 12/6/13 LOC | 10,105 | 10,105 |
| California Statewide Communities Development | | | | |
| Authority Multifamily Housing Revenue | | | | |
| (Ridgeway Apartments) VRDO | 0.040% | 12/6/13 LOC | 8,505 | 8,505 |
| California Statewide Communities Development | | | | |
| Authority Multifamily Housing Revenue | | | | |
| (Village Green Apartments) VRDO | 0.050% | 12/6/13 LOC | 5,800 | 5,800 |
| California Statewide Communities Development | | | | |
| Authority Revenue (Community Hospital of the | | | | |
| Monterey Peninsula) VRDO | 0.040% | 12/6/13 LOC | 14,150 | 14,150 |
| California Statewide Communities Development | | | | |
| Authority Revenue (Kaiser Permanente) VRDO | 0.030% | 12/6/13 | 31,500 | 31,500 |
| California Statewide Communities Development | | | | |
| Authority Revenue (Kaiser Permanente) VRDO | 0.030% | 12/6/13 | 81,050 | 81,050 |
| California Statewide Communities Development | | | | |
| Authority Revenue (Kaiser Permanente) VRDO | 0.040% | 12/6/13 | 17,100 | 17,100 |
| California Statewide Communities Development | | | | |
| Authority Revenue (Rady Children’s Hospital - | | | | |
| San Diego) VRDO | 0.030% | 12/6/13 LOC | 25,000 | 25,000 |
| 1 California Statewide Communities Development | | | | |
| Authority Revenue (Sutter Health) TOB VRDO | 0.050% | 12/6/13 | 39,313 | 39,313 |
| 1 California Statewide Communities Development | | | | |
| Authority Revenue (Sutter Health) TOB VRDO | 0.080% | 12/6/13 | 1,690 | 1,690 |
| 1 California Statewide Communities Development | | | | |
| Authority Revenue (Trinity Health) TOB VRDO | 0.050% | 12/6/13 | 2,175 | 2,175 |
| California Statewide Communities Development | | | | |
| Authority Revenue (University of San Diego) | | | | |
| VRDO | 0.050% | 12/6/13 LOC | 23,125 | 23,125 |
| Calleguas-Las Virgenes CA Public Financing | | | | |
| Authority Revenue (Municipal Water District | | | | |
| Project) VRDO | 0.030% | 12/6/13 LOC | 3,100 | 3,100 |
| 1 Cerritos CA Community College District | | | | |
| GO TOB VRDO | 0.070% | 12/6/13 | 7,845 | 7,845 |
| Chula Vista CA Multifamily Housing Revenue | | | | |
| (Teresina Apartments) VRDO | 0.040% | 12/6/13 LOC | 18,970 | 18,970 |
| Contra Costa CA Municipal Water District | | | | |
| Revenue (Extendible) CP | 0.140% | 6/7/14 | 9,000 | 9,000 |
| Desert Sands CA Unified School District GO | 5.000% | 6/1/14 (Prere.) | 4,290 | 4,393 |
| East Bay CA Municipal Utility District Water | | | | |
| System Revenue (Extendible) CP | 0.130% | 12/5/13 | 15,000 | 15,000 |
20
| | | | |
| California Tax-Exempt Money Market Fund | | | | |
| |
| |
| |
| | | | Face | Market |
| | | Maturity | Amount | Value |
| | Coupon | Date | ($000) | ($000) |
| East Bay CA Municipal Utility District Water | | | | |
| System Revenue (Extendible) CP | 0.140% | 2/6/14 | 17,000 | 17,000 |
| East Bay CA Municipal Utility District Water | | | | |
| System Revenue (Extendible) CP | 0.130% | 6/28/14 | 20,800 | 20,800 |
| East Bay CA Municipal Utility District Water | | | | |
| System Revenue (Extendible) CP | 0.130% | 7/6/14 | 12,200 | 12,200 |
| East Bay CA Municipal Utility District Water | | | | |
| System Revenue (Extendible) CP | 0.140% | 7/20/14 | 13,500 | 13,500 |
| East Bay CA Municipal Utility District Water | | | | |
| System Revenue (Extendible) CP | 0.120% | 8/2/14 | 5,000 | 5,000 |
| 2 East Bay CA Municipal Utility District Water | | | | |
| System Revenue PUT | 0.050% | 12/3/13 | 11,000 | 11,000 |
| 2 East Bay CA Municipal Utility District Water | | | | |
| System Revenue PUT | 0.050% | 2/28/14 | 13,000 | 13,000 |
| 1 East Bay CA Municipal Utility District Water | | | | |
| System Revenue TOB VRDO | 0.050% | 12/6/13 | 9,260 | 9,260 |
| 1 Eastern California Municipal Water District Water | | | | |
| & Sewer COP TOB VRDO | 0.060% | 12/6/13 | 1,590 | 1,590 |
| Eastern California Municipal Water District Water | | | | |
| & Sewer Revenue VRDO | 0.040% | 12/6/13 | 2,245 | 2,245 |
| Eastern California Municipal Water District Water | | | | |
| & Sewer Revenue VRDO | 0.040% | 12/6/13 | 16,400 | 16,400 |
| 2 Eastern Municipal Water District CA Water | | | | |
| & Sewer Revenue PUT | 0.070% | 7/3/14 | 12,000 | 12,000 |
| Escondido CA Community Development | | | | |
| (Escondido Promenade Project) COP VRDO | 0.070% | 12/6/13 LOC | 9,400 | 9,400 |
| Escondido CA Community Development | | | | |
| Multifamily Revenue (Heritage Park | | | | |
| Apartments) VRDO | 0.060% | 12/6/13 LOC | 4,250 | 4,250 |
| Freemont CA Union High School District TRAN | 1.000% | 6/30/14 | 7,000 | 7,033 |
| Fremont CA COP VRDO | 0.040% | 12/6/13 LOC | 5,000 | 5,000 |
| Fremont CA COP VRDO | 0.040% | 12/6/13 LOC | 8,565 | 8,565 |
| Fremont CA COP VRDO | 0.050% | 12/6/13 LOC | 25,190 | 25,190 |
| Fresno County CA TRAN | 1.250% | 6/30/14 | 50,000 | 50,308 |
| Garden Grove CA Housing Authority Multifamily | | | | |
| Housing Revenue (Valley View Senior Villas | | | | |
| Project) VRDO | 0.060% | 12/6/13 LOC | 9,100 | 9,100 |
| Irvine CA Assessment District No. 97-17 | | | | |
| Improvement Revenue VRDO | 0.040% | 12/2/13 LOC | 9,054 | 9,054 |
| Irvine CA Public Facilities & Infrastructure | | | | |
| Authority Assessment Revenue VRDO | 0.040% | 12/2/13 LOC | 16,092 | 16,092 |
| Irvine CA Public Facilities & Infrastructure | | | | |
| Authority Assessment Revenue VRDO | 0.040% | 12/2/13 LOC | 14,557 | 14,557 |
| 2 Irvine CA Ranch Water District Revenue PUT | 0.050% | 3/4/14 | 8,330 | 8,330 |
| 2 Irvine CA Ranch Water District Revenue PUT | 0.050% | 3/4/14 | 8,365 | 8,365 |
| Irvine CA Ranch Water District Revenue VRDO | 0.050% | 12/2/13 LOC | 15,335 | 15,335 |
| Irvine CA Reassessment District No. 05-21 | | | | |
| Improvement Revenue VRDO | 0.040% | 12/2/13 LOC | 14,500 | 14,500 |
| Irvine CA Reassessment District No. 85-7A | | | | |
| Improvement Revenue VRDO | 0.040% | 12/2/13 LOC | 26,448 | 26,448 |
| Livermore CA COP VRDO | 0.040% | 12/6/13 LOC | 12,995 | 12,995 |
| Livermore CA Redevelopment Agency | | | | |
| Multi-Family Housing Revenue (Richards | | | | |
| Manor) VRDO | 0.060% | 12/6/13 LOC | 4,770 | 4,770 |
| 1 Long Beach CA Harbor Revenue TOB VRDO | 0.240% | 12/6/13 | 15,635 | 15,635 |
21
| | | | |
| California Tax-Exempt Money Market Fund | | | | |
| |
| |
| |
| | | | Face | Market |
| | | Maturity | Amount | Value |
| | Coupon | Date | ($000) | ($000) |
| 1 Los Angeles CA Community College District | | | | |
| GO TOB VRDO | 0.050% | 12/6/13 | 3,500 | 3,500 |
| 1 Los Angeles CA Community College District | | | | |
| GO TOB VRDO | 0.050% | 12/6/13 | 15,940 | 15,940 |
| Los Angeles CA Community Redevelopment | | | | |
| Agency Multifamily Housing Revenue | | | | |
| (Academy Village Apartments) VRDO | 0.040% | 12/6/13 LOC | 11,300 | 11,300 |
| Los Angeles CA Community Redevelopment | | | | |
| Agency Multifamily Housing Revenue | | | | |
| (Hollywood & Vine Apartments) VRDO | 0.050% | 12/6/13 LOC | 19,200 | 19,200 |
| 1 Los Angeles CA Department of Airports | | | | |
| International Airport Revenue TOB VRDO | 0.060% | 12/6/13 | 6,400 | 6,400 |
| 1 Los Angeles CA Department of Airports | | | | |
| International Airport Revenue TOB VRDO | 0.060% | 12/6/13 | 5,000 | 5,000 |
| 1 Los Angeles CA Department of Airports | | | | |
| International Airport Revenue TOB VRDO | 0.060% | 12/6/13 | 5,100 | 5,100 |
| 1 Los Angeles CA Department of Airports | | | | |
| International Airport Revenue TOB VRDO | 0.100% | 12/6/13 | 7,975 | 7,975 |
| 1 Los Angeles CA Department of Airports | | | | |
| International Airport Revenue TOB VRDO | 0.100% | 12/6/13 | 18,880 | 18,880 |
| Los Angeles CA Department of Water | | | | |
| & Power Revenue | 5.000% | 7/1/14 | 2,500 | 2,570 |
| 1 Los Angeles CA Department of Water | | | | |
| & Power Revenue TOB VRDO | 0.060% | 12/2/13 | 23,610 | 23,610 |
| 1 Los Angeles CA Department of Water | | | | |
| & Power Revenue TOB VRDO | 0.060% | 12/6/13 | 7,495 | 7,495 |
| Los Angeles CA Department of Water | | | | |
| & Power Revenue VRDO | 0.040% | 12/2/13 | 10,700 | 10,700 |
| Los Angeles CA Department of Water | | | | |
| & Power Revenue VRDO | 0.030% | 12/6/13 | 21,175 | 21,175 |
| Los Angeles CA Department of Water | | | | |
| & Power Revenue VRDO | 0.030% | 12/6/13 | 14,900 | 14,900 |
| Los Angeles CA Department of Water | | | | |
| & Power Revenue VRDO | 0.030% | 12/6/13 | 8,650 | 8,650 |
| Los Angeles CA Department of Water | | | | |
| & Power Revenue VRDO | 0.030% | 12/6/13 | 7,300 | 7,300 |
| Los Angeles CA Department of Water | | | | |
| & Power Revenue VRDO | 0.030% | 12/6/13 | 43,900 | 43,900 |
| Los Angeles CA Department of Water | | | | |
| & Power Revenue VRDO | 0.040% | 12/6/13 | 26,950 | 26,950 |
| Los Angeles CA Harbor Department Revenue CP | 0.120% | 12/5/13 | 20,000 | 20,000 |
| Los Angeles CA Harbor Department Revenue CP | 0.130% | 3/19/14 | 25,000 | 25,000 |
| 1 Los Angeles CA Harbor Department Revenue | | | | |
| TOB VRDO | 0.060% | 12/6/13 | 2,680 | 2,680 |
| Los Angeles CA Multifamily Housing Revenue | | | | |
| (Beverly Park Apartments) VRDO | 0.060% | 12/6/13 LOC | 15,500 | 15,500 |
| Los Angeles CA Multifamily Housing Revenue | | | | |
| (Fountain Park Project) VRDO | 0.040% | 12/6/13 LOC | 40,000 | 40,000 |
| Los Angeles CA Multifamily Housing Revenue | | | | |
| (Queen Portfolio Apartments Project) VRDO | 0.070% | 12/6/13 LOC | 6,595 | 6,595 |
| Los Angeles CA Multifamily Housing | | | | |
| Revenue (San Regis Project) VRDO | 0.060% | 12/6/13 LOC | 23,600 | 23,600 |
| Los Angeles CA TRAN | 2.000% | 2/27/14 | 40,000 | 40,176 |
| Los Angeles CA TRAN | 2.000% | 5/1/14 | 40,000 | 40,303 |
| Los Angeles CA TRAN | 2.000% | 6/26/14 | 20,000 | 20,206 |
22
| | | | | |
| California Tax-Exempt Money Market Fund | | | | |
| |
| |
| |
| | | | | Face | Market |
| | | | Maturity | Amount | Value |
| | | Coupon | Date | ($000) | ($000) |
| 1 | Los Angeles CA Unified School District | | | | |
| | GO TOB VRDO | 0.060% | 12/6/13 | 6,660 | 6,660 |
| 1 | Los Angeles CA Unified School District | | | | |
| | GO TOB VRDO | 0.060% | 12/6/13 | 9,995 | 9,995 |
| 1 | Los Angeles CA Unified School District | | | | |
| | GO TOB VRDO | 0.060% | 12/6/13 | 9,105 | 9,105 |
| 1 | Los Angeles CA Wastewater System Revenue | | | | |
| | TOB VRDO | 0.060% | 12/6/13 | 7,500 | 7,500 |
| | Los Angeles County CA Metropolitan | | | | |
| | Transportation Authority Sales Tax Revenue | 2.000% | 7/1/14 | 11,070 | 11,186 |
| 1 | Los Angeles County CA Metropolitan | | | | |
| | Transportation Authority Sales Tax Revenue | | | | |
| | TOB VRDO | 0.040% | 12/6/13 LOC | 29,600 | 29,600 |
| | Los Angeles County CA Multifamily Housing | | | | |
| | Revenue (Valencia Village Project) VRDO | 0.060% | 12/6/13 | 6,325 | 6,325 |
| | Los Angeles County CA Schools Pooled | | | | |
| | Financing Program TRAN | 2.000% | 12/31/13 | 3,500 | 3,505 |
| | Los Angeles County CA Schools Pooled | | | | |
| | Financing Program TRAN | 2.000% | 1/31/14 | 5,000 | 5,015 |
| | Los Angeles County CA TRAN | 2.000% | 2/28/14 | 50,000 | 50,223 |
| | Los Angeles County CA TRAN | 2.000% | 6/30/14 | 13,500 | 13,642 |
| 1 | Los Angeles County CA Unified School | | | | |
| | District GO TOB VRDO | 0.060% | 12/6/13 | 5,000 | 5,000 |
| | Manteca CA Redevelopment Agency | | | | |
| | Tax Allocation Revenue VRDO | 0.050% | 12/2/13 LOC | 12,840 | 12,840 |
| 1 | Metropolitan Water District of Southern | | | | |
| | California Revenue TOB VRDO | 0.060% | 12/6/13 | 5,000 | 5,000 |
| 1 | Metropolitan Water District of Southern | | | | |
| | California Revenue TOB VRDO | 0.060% | 12/6/13 | 6,435 | 6,435 |
| | Metropolitan Water District of Southern | | | | |
| | California Revenue VRDO | 0.040% | 12/6/13 | 21,515 | 21,515 |
| | Metropolitan Water District of Southern | | | | |
| | California Revenue VRDO | 0.040% | 12/6/13 | 27,900 | 27,900 |
| | Mount Diablo CA Unified School District GO | 5.000% | 6/1/14 (Prere.) | 12,000 | 12,404 |
| 1 | Nuveen California Dividend Advantage | | | | |
| | Municipal Fund 2 VRDP VRDO | 0.150% | 12/6/13 LOC | 25,000 | 25,000 |
| 1 | Nuveen California Dividend Advantage | | | | |
| | Municipal Fund 3 VRDP VRDO | 0.140% | 12/6/13 LOC | 15,000 | 15,000 |
| 1 | Nuveen California Investment Quality | | | | |
| | Municipal Fund VRDP VRDO | 0.130% | 12/6/13 LOC | 18,000 | 18,000 |
| 1 | Nuveen California Performance Plus | | | | |
| | Municipal Fund VRDP VRDO | 0.120% | 12/6/13 LOC | 21,000 | 21,000 |
| 1,2 | Nuveen California Quality Income | | | | |
| | Municipal Fund VRDP VRDO | 0.120% | 12/6/13 LOC | 34,600 | 34,600 |
| 1,2 | Nuveen California Select Quality | | | | |
| | Municipal Fund VRDP VRDO | 0.120% | 12/6/13 LOC | 6,000 | 6,000 |
| | Nuveen Insured California AMT-Free | | | | |
| | Municipal Income Fund VRDP VRDO | 0.110% | 12/6/13 LOC | 39,500 | 39,500 |
| | Orange County CA Apartment Development | | | | |
| | Revenue VRDO | 0.030% | 12/6/13 LOC | 41,300 | 41,300 |
| | Orange County CA Apartment Development | | | | |
| | Revenue VRDO | 0.060% | 12/6/13 LOC | 9,550 | 9,550 |
| | Orange County CA Sanitation District COP BAN | 2.000% | 10/16/14 | 15,000 | 15,239 |
| | Orange County CA Water District COP VRDO | 0.050% | 12/6/13 | 8,600 | 8,600 |
23
| | | | |
| California Tax-Exempt Money Market Fund | | | | |
| |
| |
| |
| | | | Face | Market |
| | | Maturity | Amount | Value |
| | Coupon | Date | ($000) | ($000) |
| 1 Orange County CA Water District Revenue | | | | |
| TOB VRDO | 0.090% | 12/6/13 | 9,000 | 9,000 |
| Otay CA Water District (Capital Project) | | | | |
| COP VRDO | 0.030% | 12/6/13 LOC | 7,710 | 7,710 |
| 1 Peralta CA Community College District | | | | |
| Revenue TOB VRDO | 0.050% | 12/6/13 | 19,645 | 19,645 |
| 1 Riverside CA Electric Revenue TOB VRDO | 0.060% | 12/2/13 | 5,400 | 5,400 |
| Riverside County CA Industrial Development | | | | |
| Authority Empowerment Zone Facility | | | | |
| Revenue (Guy Evans Inc. Project) VRDO | 0.070% | 12/6/13 LOC | 4,820 | 4,820 |
| Riverside County CA Public Facility Project | | | | |
| COP VRDO | 0.060% | 12/6/13 LOC | 5,600 | 5,600 |
| Riverside County CA Teeter Notes | 2.000% | 10/15/14 | 20,000 | 20,313 |
| Riverside County CA TRAN | 2.000% | 3/31/14 | 39,000 | 39,236 |
| Riverside County CA Transportation | | | | |
| Commission Sales Tax Revenue VRDO | 0.050% | 12/6/13 | 6,930 | 6,930 |
| 3 Sacramento CA Municipal Utility District | | | | |
| Revenue VRDO | 0.040% | 12/6/13 LOC | 3,000 | 3,000 |
| Sacramento CA Municipal Utility District | | | | |
| Revenue VRDO | 0.040% | 12/6/13 LOC | 33,000 | 33,000 |
| Sacramento CA Municipal Utility District | | | | |
| Revenue VRDO | 0.040% | 12/6/13 LOC | 6,000 | 6,000 |
| Sacramento County CA Multifamily Housing | | | | |
| Revenue (River Pointe Apartments) VRDO | 0.050% | 12/6/13 LOC | 10,200 | 10,200 |
| Sacramento County CA Multifamily Housing | | | | |
| Revenue (River Pointe Apartments) VRDO | 0.050% | 12/6/13 LOC | 12,300 | 12,300 |
| 1 Sacramento County CA Sanitation Districts | | | | |
| Financing Authority Revenue TOB VRDO | 0.040% | 12/6/13 LOC | 7,550 | 7,550 |
| 1 San Bernardino CA Community College District | | | | |
| GO TOB VRDO | 0.060% | 12/6/13 | 4,620 | 4,620 |
| San Bernardino County CA TRAN | 2.000% | 6/30/14 | 26,700 | 26,980 |
| 1 San Diego CA Community College District | | | | |
| GO TOB VRDO | 0.050% | 12/6/13 | 5,710 | 5,710 |
| 1 San Diego CA Community College District | | | | |
| GO TOB VRDO | 0.050% | 12/6/13 | 5,000 | 5,000 |
| 1 San Diego CA Community College District | | | | |
| GO TOB VRDO | 0.070% | 12/6/13 | 5,000 | 5,000 |
| San Diego CA County TRAN | 2.000% | 4/30/14 | 3,515 | 3,541 |
| San Diego CA County TRAN | 2.000% | 6/30/14 | 20,000 | 20,211 |
| San Diego CA Housing Authority Multifamily | | | | |
| Housing Revenue (Bay Vista Apartments | | | | |
| Project) VRDO | 0.050% | 12/6/13 LOC | 9,690 | 9,690 |
| San Diego CA Housing Authority Multifamily | | | | |
| Housing Revenue (Canyon Rim Apartments) | | | | |
| VRDO | 0.050% | 12/6/13 LOC | 32,440 | 32,440 |
| 1 San Diego CA Public Facilities Financing | | | | |
| Authority Sewer Revenue TOB VRDO | 0.050% | 12/6/13 | 8,280 | 8,280 |
| 1 San Diego CA Public Facilities Financing | | | | |
| Authority Water Revenue TOB VRDO | 0.060% | 12/6/13 | 7,495 | 7,495 |
| 1 San Diego CA Unified School District | | | | |
| GO TOB VRDO | 0.060% | 12/6/13 | 28,880 | 28,880 |
| San Diego CA USD TRAN | 2.000% | 1/31/14 | 1,400 | 1,404 |
| San Diego CA USD TRAN | 2.000% | 6/30/14 | 10,000 | 10,105 |
| San Diego County CA Regional Transportation | | | | |
| Commission Sales Tax Revenue VRDO | 0.040% | 12/6/13 | 45,845 | 45,845 |
24
| | | | |
| California Tax-Exempt Money Market Fund | | | | |
| |
| |
| |
| | | | Face | Market |
| | | Maturity | Amount | Value |
| | Coupon | Date | ($000) | ($000) |
| 1 San Diego County CA Water Authority | | | | |
| Revenue COP TOB VRDO | 0.060% | 12/6/13 | 6,840 | 6,840 |
| 1 San Diego County CA Water Authority | | | | |
| Revenue COP TOB VRDO | 0.060% | 12/6/13 | 4,825 | 4,825 |
| 1 San Diego County CA Water Authority | | | | |
| Revenue COP TOB VRDO | 0.100% | 12/6/13 | 6,100 | 6,100 |
| 1 San Diego County CA Water Authority | | | | |
| Revenue COP TOB VRDO | 0.100% | 12/6/13 | 6,500 | 6,500 |
| 1 San Francisco CA Bay Area Rapid Transit | | | | |
| District Sales Tax Revenue TOB VRDO | 0.060% | 12/6/13 | 9,500 | 9,500 |
| 1 San Francisco CA Bay Area Rapid Transit | | | | |
| District Sales Tax Revenue TOB VRDO | 0.060% | 12/6/13 | 6,300 | 6,300 |
| 1 San Francisco CA City & County COP TOB VRDO | 0.070% | 12/6/13 | 3,325 | 3,325 |
| San Francisco CA City & County Finance Corp. | | | | |
| Lease Revenue (Moscone Center Expansion) | | | | |
| VRDO | 0.050% | 12/6/13 LOC | 43,250 | 43,250 |
| San Francisco CA City & County GO | 4.000% | 6/15/14 | 4,395 | 4,485 |
| San Francisco CA City & County GO | 4.000% | 6/15/14 | 1,895 | 1,934 |
| San Francisco CA City & County GO | 4.000% | 6/15/14 | 7,915 | 8,078 |
| San Francisco CA City & County International | | | | |
| Airport Revenue VRDO | 0.050% | 12/6/13 LOC | 26,300 | 26,300 |
| San Francisco CA City & County International | | | | |
| Airport Revenue VRDO | 0.060% | 12/6/13 LOC | 9,000 | 9,000 |
| San Francisco CA City & County International | | | | |
| Airport Revenue VRDO | 0.060% | 12/6/13 LOC | 18,310 | 18,310 |
| 1 San Francisco CA City & County Public Utilities | | | | |
| Commission Water Revenue TOB VRDO | 0.060% | 12/6/13 | 6,800 | 6,800 |
| San Francisco CA City & County Redevelopment | | | | |
| Agency Multifamily Housing Revenue | | | | |
| (Third & Mission Streets) VRDO | 0.040% | 12/6/13 LOC | 41,200 | 41,200 |
| San Francisco CA City & County Unified School | | | | |
| District TRAN | 2.000% | 8/14/14 | 20,000 | 20,255 |
| San Jose CA Financing Authority Lease | | | | |
| Revenue CP | 0.120% | 2/3/14 LOC | 14,004 | 14,004 |
| San Jose CA Financing Authority Lease | | | | |
| Revenue CP | 0.120% | 2/3/14 LOC | 14,005 | 14,005 |
| San Jose CA Multifamily Housing Revenue | | | | |
| (Cinnabar Commons) VRDO | 0.050% | 12/6/13 LOC | 16,100 | 16,100 |
| San Jose CA Multifamily Housing Revenue | | | | |
| (Raintree Apartments) VRDO | 0.060% | 12/6/13 LOC | 10,000 | 10,000 |
| 1 San Jose CA Unified School District Santa | | | | |
| Clara County GO TOB VRDO | 0.080% | 12/6/13 | 7,310 | 7,310 |
| San Juan California Unified School District | | | | |
| Election 2002 Ser A - Revenue | 5.000% | 8/1/14 (Prere.) | 1,785 | 1,842 |
| 1 San Mateo County CA Community College | | | | |
| District GO TOB VRDO | 0.060% | 12/6/13 | 6,455 | 6,455 |
| 1 San Mateo County CA Community College | | | | |
| District GO TOB VRDO | 0.070% | 12/6/13 | 4,315 | 4,315 |
| Santa Barbara County CA TRAN | 2.000% | 6/30/14 | 13,850 | 13,995 |
| 1 Sequoia CA Unified School District GO TOB VRDO | 0.080% | 12/6/13 | 5,860 | 5,860 |
| 1 Sonoma County CA Junior College District | | | | |
| GO TOB VRDO | 0.050% | 12/6/13 LOC | 30,390 | 30,390 |
| 1 Sunnyvale CA Wastewater Revenue TOB PUT | 0.180% | 2/6/14 | 8,720 | 8,720 |
| 1 University of California Medical Centers | | | | |
| Revenue TOB VRDO | 0.060% | 12/6/13 | 4,100 | 4,100 |
25
| | | | | |
| California Tax-Exempt Money Market Fund | | | | |
| |
| |
| |
| | | | | Face | Market |
| | | | Maturity | Amount | Value |
| | | Coupon | Date | ($000) | ($000) |
| | University of California Regents Medical | | | | |
| | Center Pooled Revenue VRDO | 0.030% | 12/6/13 | 5,000 | 5,000 |
| 1 | University of California Revenue TOB VRDO | 0.060% | 12/2/13 | 25,100 | 25,100 |
| 1 | University of California Revenue TOB VRDO | 0.060% | 12/2/13 | 14,500 | 14,500 |
| 1 | University of California Revenue TOB VRDO | 0.050% | 12/6/13 | 29,195 | 29,195 |
| 1 | University of California Revenue TOB VRDO | 0.060% | 12/6/13 | 3,400 | 3,400 |
| 1 | University of California Revenue TOB VRDO | 0.060% | 12/6/13 | 2,190 | 2,190 |
| 1 | University of California Revenue TOB VRDO | 0.060% | 12/6/13 | 3,495 | 3,495 |
| 1 | University of California Revenue TOB VRDO | 0.060% | 12/6/13 | 6,000 | 6,000 |
| 1 | University of California Revenue TOB VRDO | 0.060% | 12/6/13 | 3,470 | 3,470 |
| 1 | University of California Revenue TOB VRDO | 0.060% | 12/6/13 | 3,700 | 3,700 |
| 1 | University of California Revenue TOB VRDO | 0.060% | 12/6/13 | 5,125 | 5,125 |
| 1 | University of California Revenue TOB VRDO | 0.070% | 12/6/13 | 19,577 | 19,577 |
| | University of California Revenue VRDO | 0.030% | 12/6/13 | 20,000 | 20,000 |
| | University of California Revenue VRDO | 0.030% | 12/6/13 | 10,000 | 10,000 |
| | University of California Revenue VRDO | 0.030% | 12/6/13 | 20,000 | 20,000 |
| | Western Municipal Water District Facilities | | | | |
| | Authority California Water Revenue VRDO | 0.030% | 12/6/13 LOC | 19,275 | 19,275 |
| | Westlands CA Water District COP VRDO | 0.030% | 12/6/13 LOC | 24,530 | 24,530 |
| | | | | | 3,862,824 |
| Total Tax-Exempt Municipal Bonds (Cost $3,862,824) | | | 3,862,824 |
| Other Assets and Liabilities (0.2%) | | | | |
| Other Assets | | | | 25,960 |
| Liabilities | | | | (16,757) |
| | | | | | 9,203 |
| Net Assets (100%) | | | | |
| Applicable to 3,871,365,899 outstanding $.001 par value shares of | | | |
| beneficial interest (unlimited authorization) | | | | 3,872,027 |
| Net Asset Value Per Share | | | | $1.00 |
| |
| |
| At November 30, 2013, net assets consisted of: | | | | |
| | | | | | Amount |
| | | | | | ($000) |
| Paid-in Capital | | | | 3,871,995 |
| Undistributed Net Investment Income | | | | — |
| Accumulated Net Realized Gains | | | | 32 |
| Net Assets | | | | 3,872,027 |
See Note A in Notes to Financial Statements.
1 Security exempt from registration under Rule 144A of the Securities Act of 1933. Such securities may be sold in transactions exempt from
registration, normally to qualified institutional buyers. At November 30, 2013, the aggregate value of these securities was $865,325,000,
representing 22.3% of net assets.
2 Adjustable-rate security.
3 Security purchased on a when-issued or delayed-delivery basis for which the fund has not taken delivery as of November 30, 2013.
A key to abbreviations and other references follows the Statement of Net Assets.
See accompanying Notes, which are an integral part of the Financial Statements.
26
California Tax-Exempt Money Market Fund
Key to Abbreviations
ARS—Auction Rate Security.
BAN—Bond Anticipation Note.
COP—Certificate of Participation.
CP—Commercial Paper.
FR—Floating Rate.
GAN—Grant Anticipation Note.
GO—General Obligation Bond.
PUT—Put Option Obligation.
RAN—Revenue Anticipation Note.
TAN—Tax Anticipation Note.
TOB—Tender Option Bond.
TRAN—Tax Revenue Anticipation Note.
VRDO—Variable Rate Demand Obligation.
VRDP—Variable Rate Demand Preferred.
(ETM)—Escrowed to Maturity.
(Prere.)—Prerefunded.
Scheduled principal and interest payments are guaranteed by:
(1) MBIA (Municipal Bond Investors Assurance).
(2) AMBAC (Ambac Assurance Corporation).
(3) FGIC (Financial Guaranty Insurance Company).
(4) AGM (Assured Guaranty Municipal Corporation).
(5) BIGI (Bond Investors Guaranty Insurance).
(6) Connie Lee Inc.
(7) FHA (Federal Housing Authority).
(8) CapMAC (Capital Markets Assurance Corporation).
(9) American Capital Access Financial Guaranty Corporation.
(10) XL Capital Assurance Inc.
(11) CIFG (CDC IXIS Financial Guaranty).
(12) Assured Guaranty Corporation.
(13) Berkshire Hathaway Assurance Corporation.
(14) National Public Finance Guarantee Corporation.
(15) Build America Mutual Assurance Company.
The insurance does not guarantee the market value of the municipal bonds.
LOC—Scheduled principal and interest payments are guaranteed by bank letter of credit.
27
| |
| California Tax-Exempt Money Market Fund | |
| |
| |
| Statement of Operations | |
| |
| | Year Ended |
| | November 30, 2013 |
| | ($000) |
| Investment Income | |
| Income | |
| Interest | 4,775 |
| Total Income | 4,775 |
| Expenses | |
| The Vanguard Group—Note B | |
| Investment Advisory Services | 949 |
| Management and Administrative | 4,014 |
| Marketing and Distribution | 1,016 |
| Custodian Fees | 47 |
| Auditing Fees | 23 |
| Shareholders’ Reports | 26 |
| Trustees’ Fees and Expenses | 5 |
| Total Expenses | 6,080 |
| Expenses Reduction—Note B | (1,823) |
| Net Expenses | 4,257 |
| Net Investment Income | 518 |
| Realized Net Gain (Loss) on Investment Securities Sold | 111 |
| Net Increase (Decrease) in Net Assets Resulting from Operations | 629 |
See accompanying Notes, which are an integral part of the Financial Statements.
28
| | |
| California Tax-Exempt Money Market Fund | | |
| |
| |
| Statement of Changes in Net Assets | | |
| |
| | Year Ended November 30, |
| | 2013 | 2012 |
| | ($000) | ($000) |
| Increase (Decrease) in Net Assets | | |
| Operations | | |
| Net Investment Income | 518 | 1,167 |
| Realized Net Gain (Loss) | 111 | 5 |
| Net Increase (Decrease) in Net Assets Resulting from Operations | 629 | 1,172 |
| Distributions | | |
| Net Investment Income | (518) | (1,167) |
| Realized Capital Gain | — | — |
| Total Distributions | (518) | (1,167) |
| Capital Share Transactions (at $1.00 per share) | | |
| Issued | 2,993,616 | 2,456,850 |
| Issued in Lieu of Cash Distributions | 493 | 1,111 |
| Redeemed | (2,934,717) | (2,776,686) |
| Net Increase (Decrease) from Capital Share Transactions | 59,392 | (318,725) |
| Total Increase (Decrease) | 59,503 | (318,720) |
| Net Assets | | |
| Beginning of Period | 3,812,524 | 4,131,244 |
| End of Period | 3,872,027 | 3,812,524 |
See accompanying Notes, which are an integral part of the Financial Statements.
29
California Tax-Exempt Money Market Fund
Financial Highlights
| | | | | |
| For a Share Outstanding | Year Ended November 30, |
| Throughout Each Period | 2013 | 2012 | 2011 | 2010 | 2009 |
| Net Asset Value, Beginning of Period | $1.00 | $1.00 | $1.00 | $1.00 | $1.00 |
| Investment Operations | | | | | |
| Net Investment Income | .0001 | .0003 | .001 | .001 | .004 |
| Net Realized and Unrealized Gain (Loss) | | | | | |
| on Investments | — | — | — | — | — |
| Total from Investment Operations | .0001 | .0003 | .001 | .001 | .004 |
| Distributions | | | | | |
| Dividends from Net Investment Income | (.0001) | (.0003) | (.001) | (.001) | (.004) |
| Distributions from Realized Capital Gains | — | — | — | — | — |
| Total Distributions | (.0001) | (.0003) | (.001) | (.001) | (.004) |
| Net Asset Value, End of Period | $1.00 | $1.00 | $1.00 | $1.00 | $1.00 |
| |
| Total Return1 | 0.01% | 0.03% | 0.07% | 0.11% | 0.37% |
| |
| Ratios/Supplemental Data | | | | | |
| Net Assets, End of Period (Millions) | $3,872 | $3,813 | $4,131 | $4,610 | $5,355 |
| Ratio of Expenses to | | | | | |
| Average Net Assets | 0.11%2 | 0.15%2 | 0.16%2 | 0.17% | 0.17%3 |
| Ratio of Net Investment Income to | | | | | |
| Average Net Assets | 0.01% | 0.03% | 0.07% | 0.11% | 0.39% |
1 Total returns do not include account service fees that may have applied in the periods shown. Fund prospectuses provide information about
any applicable account service fees.
2 The ratio of total expenses to average net assets before an expense reduction was 0.16% for 2013, 0.16% for 2012, and 0.17% for 2011.
See Note B in Notes to Financial Statements.
3 Includes fees to participate in the Treasury Temporary Guarantee Program for Money Market Funds of 0.04% for 2009.
See accompanying Notes, which are an integral part of the Financial Statements.
30
California Tax-Exempt Money Market Fund
Notes to Financial Statements
Vanguard California Tax-Exempt Money Market Fund is registered under the Investment Company Act of 1940 as an open-end investment company, or mutual fund. The fund invests in debt instruments of municipal issuers whose ability to meet their obligations may be affected by economic and political developments in the state.
A. The following significant accounting policies conform to generally accepted accounting principles for U.S. mutual funds. The fund consistently follows such policies in preparing its financial statements.
1. Security Valuation: Securities are valued at amortized cost, which approximates market value.
2. Federal Income Taxes: The fund intends to continue to qualify as a regulated investment company and distribute all of its income. Management has analyzed the fund’s tax positions taken for all open federal income tax years (November 30, 2010–2013), and has concluded that no provision for federal income tax is required in the fund’s financial statements.
3. Distributions: Distributions from net investment income are declared daily and paid on the first business day of the following month.
4. Other: Interest income is accrued daily. Premiums and discounts on debt securities purchased are amortized and accreted, respectively, to interest income over the lives of the respective securities. Security transactions are accounted for on the date securities are bought or sold. Costs used to determine realized gains (losses) on the sale of investment securities are those of the specific securities sold.
B. The Vanguard Group furnishes at cost investment advisory, corporate management, administrative, marketing, and distribution services. The costs of such services are allocated to the fund under methods approved by the board of trustees. The fund has committed to provide up to 0.40% of its net assets in capital contributions to Vanguard. At November 30, 2013, the fund had contributed capital of $442,000 to Vanguard (included in Other Assets), representing 0.01% of the fund’s net assets and 0.18% of Vanguard’s capitalization. The fund’s trustees and officers are also directors and officers of Vanguard. Vanguard and the board of trustees have agreed to temporarily limit certain net operating expenses in excess of the fund’s daily yield so as to maintain a zero or positive yield for the fund. Vanguard and the board of trustees may terminate the temporary expense limitation at any time. For the year ended November 30, 2013, Vanguard’s expenses were reduced by $1,823,000 (an effective annual rate of 0.05% of the fund’s average net assets).
C. Various inputs may be used to determine the value of the fund’s investments. These inputs are summarized in three broad levels for financial statement purposes. The inputs or methodologies used to value securities are not necessarily an indication of the risk associated with investing in those securities.
Level 1—Quoted prices in active markets for identical securities.
Level 2—Other significant observable inputs (including quoted prices for similar securities, interest rates, prepayment speeds, credit risk, etc.).
Level 3—Significant unobservable inputs (including the fund’s own assumptions used to determine the fair value of investments).
31
California Tax-Exempt Money Market Fund
At November 30, 2013, 100% of the market value of the fund’s investments was determined using amortized cost, in accordance with rules under the Investment Company Act of 1940. Amortized cost approximates the current fair value of a security, but since the value is not obtained from a quoted price in an active market, securities valued at amortized cost are considered to be valued using Level 2 inputs.
D. Management has determined that no material events or transactions occurred subsequent to November 30, 2013, that would require recognition or disclosure in these financial statements.
32
California Intermediate-Term Tax-Exempt Fund
Fund Profile
As of November 30, 2013
| | |
| Share-Class Characteristics | |
| | Investor | Admiral |
| | Shares | Shares |
| Ticker Symbol | VCAIX | VCADX |
| Expense Ratio1 | 0.20% | 0.12% |
| 30-Day SEC Yield | 2.24% | 2.32% |
| | | |
| Financial Attributes | | | |
| | | Barclays | |
| | | Muni | Barclays |
| | | CA IT | Municipal |
| | | Bond | Bond |
| | Fund | Index | Index |
| |
| Number of Bonds | 1,149 | 1,569 | 46,517 |
| |
| Yield to Maturity | | | |
| (before expenses) | 2.5% | 2.2% | 3.1% |
| |
| Average Coupon | 4.3% | 4.7% | 4.9% |
| |
| Average Duration | 5.7 years | 5.4 years | 8.4 years |
| |
| Average Effective | | | |
| Maturity | 5.6 years | 5.5 years | 7.1 years |
| |
| Short-Term | | | |
| Reserves | 5.6% | — | — |
| | |
| Volatility Measures | | |
| | Barclays Muni | Barclays |
| | CA IT | Municipal |
| | Bond Index | Bond Index |
| R-Squared | 0.91 | 0.97 |
| Beta | 0.99 | 0.93 |
| These measures show the degree and timing of the fund’s fluctuations compared with the indexes over 36 months. |
| |
| Distribution by Effective Maturity | |
| (% of portfolio) | |
| Under 1 Year | 8.7% |
| 1 - 3 Years | 17.4 |
| 3 - 5 Years | 20.6 |
| 5 - 10 Years | 48.2 |
| 10 - 20 Years | 4.9 |
| 20 - 30 Years | 0.2 |
| |
| Distribution by Credit Quality (% of portfolio) |
| AAA | 6.7% |
| AA | 54.4 |
| A | 34.0 |
| BBB | 3.8 |
| B | 0.7 |
| Not Rated | 0.4 |
| For information about these ratings, see the Glossary entry for Credit Quality. |
Investment Focus
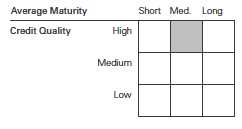
1 The expense ratios shown are from the prospectus dated March 28, 2013, and represent estimated costs for the current fiscal year. For the fiscal year ended November 30, 2013, the expense ratios were 0.20% for Investor Shares and 0.12% for Admiral Shares.
33
California Intermediate-Term Tax-Exempt Fund
Performance Summary
All of the returns in this report represent past performance, which is not a guarantee of future results that may be achieved by the fund. (Current performance may be lower or higher than the performance data cited. For performance data current to the most recent month-end, visit our website at vanguard.com/performance.) Note, too, that both investment returns and principal value can fluctuate widely, so an investor’s shares, when sold, could be worth more or less than their original cost. The returns shown do not reflect taxes that a shareholder would pay on fund distributions or on the sale of fund shares.
Cumulative Performance: November 30, 2003, Through November 30, 2013
Initial Investment of $10,000
| | | | | |
| | | Average Annual Total Returns | |
| | | Periods Ended November 30, 2013 | |
| |
| | | | | | Final Value |
| | | One | Five | Ten | of a $10,000 |
| | | Year | Years | Years | Investment |
| | California Intermediate-Term | | | | |
| | Tax-Exempt Fund Investor Shares | -1.91% | 5.78% | 3.82% | $14,553 |
| •••••••• | Barclays Municipal California | | | | |
| | Intermediate Bond Index | -1.15 | 6.06 | 4.73 | 15,879 |
| – – – – | California Intermediate Municipal Debt | | | | |
| |
| | Funds Average | -2.51 | 4.95 | 3.23 | 13,744 |
| | Barclays Municipal Bond Index | -3.51 | 6.26 | 4.40 | 15,385 |
| California Intermediate Municipal Debt Funds Average: Derived from data provided by Lipper, a Thomson Reuters Company. | |
| | | | |
| | | | | Final Value |
| | One | Five | Ten | of a $50,000 |
| | Year | Years | Years | Investment |
| California Intermediate-Term Tax-Exempt | | | | |
| Fund Admiral Shares | -1.83% | 5.87% | 3.90% | $73,308 |
| Barclays Municipal California Intermediate | | | | |
| Bond Index | -1.15 | 6.06 | 4.73 | 79,397 |
| Barclays Municipal Bond Index | -3.51 | 6.26 | 4.40 | 76,924 |
See Financial Highlights for dividend and capital gains information.
34
California Intermediate-Term Tax-Exempt Fund
| | | | |
| Fiscal-Year Total Returns (%): November 30, 2003, Through November 30, 2013 | |
| | | | | Barclays Muni |
| | | | | CA IT |
| | | | Investor Shares | Bond Index |
| Fiscal Year | Income Returns | Capital Returns | Total Returns | Total Returns |
| 2004 | 3.93% | -1.52% | 2.41% | 4.05% |
| 2005 | 3.90 | -1.79 | 2.11 | 2.37 |
| 2006 | 4.12 | 1.28 | 5.40 | 5.07 |
| 2007 | 3.99 | -1.53 | 2.46 | 3.84 |
| 2008 | 3.79 | -6.50 | -2.71 | 1.84 |
| 2009 | 4.19 | 6.37 | 10.56 | 9.03 |
| 2010 | 3.79 | 0.64 | 4.43 | 6.89 |
| 2011 | 3.88 | 2.29 | 6.17 | 6.79 |
| 2012 | 3.52 | 6.62 | 10.14 | 9.08 |
| 2013 | 3.12 | -5.03 | -1.91 | -1.15 |
Average Annual Total Returns: Periods Ended September 30, 2013
This table presents returns through the latest calendar quarter—rather than through the end of the fiscal period.
Securities and Exchange Commission rules require that we provide this information.
| | | | | | |
| | | | | Ten Years |
| | Inception Date | One Year | Five Years | Income | Capital | Total |
| Investor Shares | 3/4/1994 | -0.51% | 5.50% | 3.84% | -0.02% | 3.82% |
| Admiral Shares | 11/12/2001 | -0.43 | 5.59 | 3.91 | -0.02 | 3.89 |
35
California Intermediate-Term Tax-Exempt Fund
Financial Statements
Statement of Net Assets
As of November 30, 2013
The fund reports a complete list of its holdings in regulatory filings four times in each fiscal year, at the quarter-ends. For the second and fourth fiscal quarters, the lists appear in the fund’s semiannual and annual reports to shareholders. For the first and third fiscal quarters, the fund files the lists with the Securities and Exchange Commission on Form N-Q. Shareholders can look up the fund’s Forms N-Q on the SEC’s website at sec.gov. Forms N-Q may also be reviewed and copied at the SEC’s Public Reference Room (see the back cover of this report for further information).
| | | | |
| | | | Face | Market |
| | | Maturity | Amount | Value |
| | Coupon | Date | ($000) | ($000) |
| Tax-Exempt Municipal Bonds (101.6%) | | | | |
| California (101.5%) | | | | |
| ABAG Finance Authority for Nonprofit Corps. | | | | |
| California Revenue (899 Charleston Project) | | | | |
| VRDO | 0.120% | 12/2/13 LOC | 7,740 | 7,740 |
| ABAG Finance Authority for Nonprofit Corps. | | | | |
| California Revenue (Episcopal Senior | | | | |
| Communities) | 2.150% | 7/1/19 | 7,500 | 7,248 |
| ABAG Finance Authority for Nonprofit Corps. | | | | |
| California Revenue (Episcopal Senior | | | | |
| Communities) | 2.500% | 7/1/19 | 2,140 | 2,110 |
| ABAG Finance Authority for Nonprofit Corps. | | | | |
| California Revenue (Episcopal Senior | | | | |
| Communities) | 3.000% | 7/1/19 | 2,000 | 2,005 |
| ABAG Finance Authority for Nonprofit Corps. | | | | |
| California Revenue (Episcopal Senior | | | | |
| Communities) | 6.000% | 7/1/31 | 2,750 | 2,906 |
| ABAG Finance Authority for Nonprofit Corps. | | | | |
| California Revenue (Eskaton Properties Inc. | | | | |
| Obligated Group) | 3.000% | 11/15/16 | 1,220 | 1,265 |
| ABAG Finance Authority for Nonprofit Corps. | | | | |
| California Revenue (Eskaton Properties Inc. | | | | |
| Obligated Group) | 5.000% | 11/15/35 | 3,250 | 2,959 |
| ABAG Finance Authority for Nonprofit Corps. | | | | |
| California Revenue (Jackson Laboratory) | 5.000% | 7/1/20 | 850 | 960 |
| ABAG Finance Authority for Nonprofit Corps. | | | | |
| California Revenue (Jackson Laboratory) | 5.000% | 7/1/22 | 555 | 622 |
| ABAG Finance Authority for Nonprofit Corps. | | | | |
| California Revenue (Jackson Laboratory) | 5.000% | 7/1/23 | 1,000 | 1,106 |
| ABAG Finance Authority for Nonprofit Corps. | | | | |
| California Revenue (Jackson Laboratory) | 5.000% | 7/1/24 | 1,265 | 1,375 |
| ABAG Finance Authority for Nonprofit Corps. | | | | |
| California Revenue (Odd Fellows Home) | 5.000% | 4/1/32 | 7,250 | 7,325 |
| ABAG Finance Authority for Nonprofit Corps. | | | | |
| California Revenue (Sharp Healthcare) | 5.250% | 8/1/23 | 1,000 | 1,123 |
| ABAG Finance Authority for Nonprofit Corps. | | | | |
| California Revenue (Sharp Healthcare) | 5.000% | 8/1/24 | 960 | 1,045 |
| ABAG Finance Authority for Nonprofit Corps. | | | | |
| California Revenue (Sharp Healthcare) | 5.000% | 8/1/25 | 950 | 1,021 |
36
| | | | |
| California Intermediate-Term Tax-Exempt Fund | | | | |
| |
| |
| |
| | | | Face | Market |
| | | Maturity | Amount | Value |
| | Coupon | Date | ($000) | ($000) |
| ABAG Finance Authority for Nonprofit Corps. | | | | |
| California Revenue (Sharp Healthcare) | 5.000% | 8/1/26 | 1,400 | 1,489 |
| ABAG Finance Authority for Nonprofit Corps. | | | | |
| California Revenue (Sharp Healthcare) | 5.000% | 8/1/28 | 400 | 417 |
| ABAG Finance Authority for Nonprofit Corps. | | | | |
| California Revenue (Sharp Healthcare) | 6.000% | 8/1/30 | 1,120 | 1,260 |
| ABAG Finance Authority for Nonprofit Corps. | | | | |
| California Revenue (Sharp Healthcare) | 6.375% | 8/1/34 | 2,500 | 2,577 |
| Alameda CA Corridor Transportation Authority | | | | |
| Revenue | 0.000% | 10/1/14 (2) | 540 | 537 |
| Alameda CA Corridor Transportation Authority | | | | |
| Revenue | 0.000% | 10/1/15 (2) | 910 | 890 |
| Alameda CA Corridor Transportation Authority | | | | |
| Revenue | 0.000% | 10/1/16 (2) | 4,305 | 4,111 |
| Alameda CA Corridor Transportation Authority | | | | |
| Revenue | 0.000% | 10/1/20 (2) | 12,835 | 10,204 |
| Alameda CA Corridor Transportation Authority | | | | |
| Revenue | 5.000% | 10/1/22 | 2,190 | 2,525 |
| Alameda CA Corridor Transportation Authority | | | | |
| Revenue | 5.000% | 10/1/23 | 2,160 | 2,475 |
| Alameda CA Corridor Transportation Authority | | | | |
| Revenue | 5.400% | 10/1/24 (2) | 3,805 | 4,067 |
| Alameda CA Corridor Transportation Authority | | | | |
| Revenue | 0.000% | 10/1/29 (2) | 30,000 | 12,261 |
| Alameda CA Corridor Transportation Authority | | | | |
| Revenue | 0.000% | 10/1/30 (2) | 9,110 | 3,456 |
| Alameda County CA (Medical Center Project) COP | 5.375% | 6/1/14 (ETM) | 1,880 | 1,885 |
| Alameda County CA (Medical Center Project) COP | 5.375% | 6/1/15 (ETM) | 3,960 | 4,030 |
| Alameda County CA Joint Powers Authority | | | | |
| Lease Revenue | 5.000% | 12/1/32 | 3,500 | 3,668 |
| Alameda County CA Joint Powers Authority | | | | |
| Lease Revenue | 5.000% | 12/1/33 | 8,415 | 8,785 |
| Alameda County CA Joint Powers Authority | | | | |
| Lease Revenue | 5.000% | 12/1/34 | 4,640 | 4,810 |
| Alvord CA Unified School District GO | 5.900% | 2/1/21 (14) | 2,230 | 2,638 |
| Alvord CA Unified School District GO | 5.900% | 2/1/24 (4) | 3,865 | 4,480 |
| Anaheim CA Public Financing Authority Revenue | | | | |
| (Electric System) | 5.000% | 10/1/21 (14) | 4,425 | 4,794 |
| Anaheim CA Public Financing Authority Revenue | | | | |
| (Electric System) | 5.000% | 10/1/22 (14) | 4,660 | 5,012 |
| Anaheim CA Public Financing Authority Revenue | | | | |
| (Electric System) | 5.000% | 10/1/24 (14) | 5,175 | 5,485 |
| Anaheim CA Public Financing Authority Revenue | | | | |
| (Electric System) | 5.000% | 10/1/25 (14) | 5,450 | 5,743 |
| Anaheim CA Public Financing Authority Revenue | | | | |
| (Electric System) | 5.250% | 10/1/30 | 5,585 | 6,040 |
| Bakersfield CA Wastewater Revenue | 5.000% | 9/15/24 (4) | 7,600 | 8,329 |
| Bay Area Toll Authority California Toll Bridge | | | | |
| Revenue (San Francisco Bay Area) | 5.000% | 4/1/16 (Prere.) | 11,625 | 12,873 |
| Bay Area Toll Authority California Toll Bridge | | | | |
| Revenue (San Francisco Bay Area) | 5.000% | 4/1/16 (Prere.) | 300 | 332 |
| Bay Area Toll Authority California Toll Bridge | | | | |
| Revenue (San Francisco Bay Area) | 5.000% | 4/1/16 (Prere.) | 2,455 | 2,719 |
| Bay Area Toll Authority California Toll Bridge | | | | |
| Revenue (San Francisco Bay Area) | 5.000% | 4/1/16 (Prere.) | 3,100 | 3,433 |
37
| | | | |
| California Intermediate-Term Tax-Exempt Fund | | | | |
| |
| |
| |
| | | | Face | Market |
| | | Maturity | Amount | Value |
| | Coupon | Date | ($000) | ($000) |
| Bay Area Toll Authority California Toll Bridge | | | | |
| Revenue (San Francisco Bay Area) | 5.000% | 4/1/16 (Prere.) | 10,000 | 11,073 |
| Bay Area Toll Authority California Toll Bridge | | | | |
| Revenue (San Francisco Bay Area) | 5.000% | 4/1/17 (Prere.) | 3,055 | 3,495 |
| Bay Area Toll Authority California Toll Bridge | | | | |
| Revenue (San Francisco Bay Area) | 5.000% | 4/1/17 (Prere.) | 3,000 | 3,432 |
| Bay Area Toll Authority California Toll Bridge | | | | |
| Revenue (San Francisco Bay Area) | 5.000% | 4/1/18 | 2,610 | 2,960 |
| Bay Area Toll Authority California Toll Bridge | | | | |
| Revenue (San Francisco Bay Area) | 5.000% | 4/1/25 | 6,250 | 7,070 |
| Bay Area Toll Authority California Toll Bridge | | | | |
| Revenue (San Francisco Bay Area) | 5.000% | 4/1/27 | 3,750 | 4,121 |
| Bay Area Toll Authority California Toll Bridge | | | | |
| Revenue (San Francisco Bay Area) | 5.000% | 4/1/28 | 15,000 | 16,475 |
| Bay Area Toll Authority California Toll Bridge | | | | |
| Revenue (San Francisco Bay Area) | 5.000% | 4/1/28 | 5,000 | 5,443 |
| Bay Area Toll Authority California Toll Bridge | | | | |
| Revenue (San Francisco Bay Area) | 5.000% | 4/1/29 | 7,000 | 7,626 |
| Bay Area Toll Authority California Toll Bridge | | | | |
| Revenue (San Francisco Bay Area) | 5.000% | 4/1/29 | 8,000 | 8,605 |
| Bay Area Toll Authority California Toll Bridge | | | | |
| Revenue (San Francisco Bay Area) | 5.250% | 4/1/29 | 11,280 | 12,514 |
| Bay Area Toll Authority California Toll Bridge | | | | |
| Revenue (San Francisco Bay Area) | 5.000% | 4/1/30 | 16,700 | 18,058 |
| Bay Area Toll Authority California Toll Bridge | | | | |
| Revenue (San Francisco Bay Area) | 5.000% | 4/1/31 | 21,125 | 22,687 |
| Bay Area Toll Authority California Toll Bridge | | | | |
| Revenue (San Francisco Bay Area) | 5.000% | 4/1/31 | 7,645 | 8,053 |
| Bay Area Toll Authority California Toll Bridge | | | | |
| Revenue (San Francisco Bay Area) PUT | 0.966% | 8/1/17 | 25,000 | 24,957 |
| Bay Area Toll Authority California Toll Bridge | | | | |
| Revenue (San Francisco Bay Area) PUT | 1.450% | 8/1/17 | 12,500 | 12,634 |
| 1 Bay Area Toll Authority California Toll Bridge | | | | |
| Revenue (San Francisco Bay Area) PUT | 0.750% | 10/1/19 | 5,000 | 4,958 |
| 1 Bay Area Toll Authority California Toll Bridge | | | | |
| Revenue (San Francisco Bay Area) PUT | 0.750% | 10/1/19 | 5,500 | 5,454 |
| 1 Bay Area Toll Authority California Toll Bridge | | | | |
| Revenue (San Francisco Bay Area) PUT | 0.950% | 5/1/23 | 7,000 | 6,940 |
| 1 Bay Area Toll Authority California Toll Bridge | | | | |
| Revenue (San Francisco Bay Area) PUT | 1.150% | 4/1/24 | 5,000 | 5,026 |
| 2 Brea CA Redevelopment Agency Successor | | | | |
| Agency Tax Allocation Revenue | | | | |
| (Redevelopment Project AB) | 5.000% | 8/1/21 | 5,500 | 6,337 |
| 2 Brea CA Redevelopment Agency Successor | | | | |
| Agency Tax Allocation Revenue | | | | |
| (Redevelopment Project AB) | 5.000% | 8/1/22 | 7,295 | 8,360 |
| 2 Brea CA Redevelopment Agency Successor | | | | |
| Agency Tax Allocation Revenue | | | | |
| (Redevelopment Project AB) | 5.000% | 8/1/23 | 6,150 | 7,015 |
| 2 Brea CA Redevelopment Agency Successor | | | | |
| Agency Tax Allocation Revenue | | | | |
| (Redevelopment Project AB) | 5.000% | 8/1/24 | 5,110 | 5,700 |
| 2 Brea CA Redevelopment Agency Successor | | | | |
| Agency Tax Allocation Revenue | | | | |
| (Redevelopment Project AB) | 5.000% | 8/1/25 | 4,020 | 4,435 |
38
| | | | |
| California Intermediate-Term Tax-Exempt Fund | | | | |
| |
| |
| |
| | | | Face | Market |
| | | Maturity | Amount | Value |
| | Coupon | Date | ($000) | ($000) |
| 2 Brea CA Redevelopment Agency Successor | | | | |
| Agency Tax Allocation Revenue | | | | |
| (Redevelopment Project AB) | 5.000% | 8/1/26 | 2,285 | 2,490 |
| Burbank CA Public Financing Authority Revenue | | | | |
| (Golden State Redevelopment Project) | 5.250% | 12/1/13 (2) | 4,615 | 4,616 |
| Cabrillo CA Community College District Revenue | 0.000% | 8/1/14 (14) | 2,655 | 2,651 |
| California County CA Tobacco Securitization | | | | |
| Agency Revenue | 5.250% | 6/1/21 | 10,750 | 10,325 |
| California Department of Water Resources | | | | |
| Power Supply Revenue | 5.000% | 5/1/15 | 26,850 | 28,676 |
| California Department of Water Resources | | | | |
| Power Supply Revenue | 5.000% | 5/1/16 | 5,000 | 5,555 |
| California Department of Water Resources | | | | |
| Power Supply Revenue | 5.000% | 5/1/16 | 19,625 | 21,802 |
| California Department of Water Resources | | | | |
| Power Supply Revenue | 5.000% | 5/1/17 | 25,000 | 28,721 |
| California Department of Water Resources | | | | |
| Power Supply Revenue | 5.000% | 5/1/17 | 14,600 | 16,773 |
| California Department of Water Resources | | | | |
| Power Supply Revenue | 5.000% | 5/1/18 | 17,950 | 21,100 |
| California Department of Water Resources | | | | |
| Power Supply Revenue | 5.000% | 5/1/18 | 5,475 | 6,436 |
| California Department of Water Resources | | | | |
| Power Supply Revenue | 5.000% | 5/1/18 | 2,525 | 2,968 |
| California Department of Water Resources | | | | |
| Power Supply Revenue | 5.000% | 5/1/19 | 19,590 | 23,205 |
| California Department of Water Resources | | | | |
| Power Supply Revenue | 5.000% | 5/1/19 | 1,215 | 1,439 |
| California Department of Water Resources | | | | |
| Power Supply Revenue | 5.000% | 5/1/20 | 22,890 | 27,298 |
| California Department of Water Resources | | | | |
| Power Supply Revenue | 5.000% | 5/1/20 | 18,000 | 21,467 |
| California Department of Water Resources | | | | |
| Power Supply Revenue | 5.000% | 5/1/20 | 3,660 | 4,365 |
| California Department of Water Resources | | | | |
| Power Supply Revenue | 5.000% | 5/1/21 | 5,000 | 5,881 |
| California Department of Water Resources | | | | |
| Power Supply Revenue | 5.000% | 5/1/21 | 6,500 | 7,811 |
| California Department of Water Resources | | | | |
| Power Supply Revenue | 5.000% | 5/1/21 | 50,000 | 57,960 |
| California Department of Water Resources | | | | |
| Power Supply Revenue | 5.000% | 5/1/21 | 20,000 | 23,184 |
| California Department of Water Resources | | | | |
| Power Supply Revenue | 5.000% | 5/1/22 | 14,675 | 16,909 |
| California Department of Water Resources | | | | |
| Power Supply Revenue | 5.000% | 5/1/22 | 10,825 | 12,544 |
| California Department of Water Resources | | | | |
| Water System Revenue (Central Valley Project) | 5.000% | 12/1/13 | 7,000 | 7,002 |
| California Department of Water Resources | | | | |
| Water System Revenue (Central Valley Project) | 5.000% | 12/1/14 (Prere.) | 180 | 189 |
| California Department of Water Resources | | | | |
| Water System Revenue (Central Valley Project) | 5.000% | 12/1/14 (Prere.) | 3,355 | 3,517 |
| California Department of Water Resources | | | | |
| Water System Revenue (Central Valley Project) | 5.000% | 12/1/20 | 1,250 | 1,506 |
39
| | | | |
| California Intermediate-Term Tax-Exempt Fund | | | | |
| |
| |
| |
| | | | Face | Market |
| | | Maturity | Amount | Value |
| | Coupon | Date | ($000) | ($000) |
| California Department of Water Resources | | | | |
| Water System Revenue (Central Valley Project) | 5.000% | 12/1/21 | 5,645 | 6,798 |
| California Department of Water Resources | | | | |
| Water System Revenue (Central Valley Project) | 5.000% | 12/1/22 | 6,000 | 7,241 |
| California Department of Water Resources | | | | |
| Water System Revenue (Central Valley Project) | 5.000% | 12/1/24 | 5,000 | 5,703 |
| California Department of Water Resources | | | | |
| Water System Revenue (Central Valley Project) | 5.000% | 12/1/26 | 8,565 | 9,728 |
| California Department of Water Resources | | | | |
| Water System Revenue (Central Valley Project) | 5.000% | 12/1/27 | 8,800 | 9,847 |
| California Department of Water Resources | | | | |
| Water System Revenue (Central Valley Project) | 5.250% | 12/1/27 | 3,900 | 4,446 |
| California Department of Water Resources | | | | |
| Water System Revenue (Central Valley Project) | 5.000% | 12/1/28 | 3,350 | 3,743 |
| California Department of Water Resources | | | | |
| Water System Revenue (Central Valley Project) | 5.250% | 12/1/28 | 4,505 | 5,119 |
| California Department of Water Resources | | | | |
| Water System Revenue (Central Valley Project) | 5.000% | 12/1/29 | 3,530 | 3,918 |
| California Department of Water Resources | | | | |
| Water System Revenue (Central Valley Project) | 5.000% | 12/1/29 | 8,255 | 9,225 |
| California Department of Water Resources | | | | |
| Water System Revenue (Central Valley Project) | 5.250% | 12/1/29 | 4,640 | 5,238 |
| California Department of Water Resources | | | | |
| Water System Revenue (Central Valley Project) | 5.000% | 12/1/30 | 2,720 | 2,999 |
| California Department of Water Resources | | | | |
| Water System Revenue (Central Valley Project) | 5.250% | 12/1/30 | 1,850 | 2,075 |
| California Department of Water Resources | | | | |
| Water System Revenue (Central Valley Project) | 5.000% | 12/1/31 | 3,910 | 4,279 |
| California Economic Recovery GO | 5.250% | 7/1/14 (ETM) | 3,385 | 3,486 |
| California Economic Recovery GO | 5.250% | 7/1/14 | 11,615 | 11,964 |
| California Economic Recovery GO | 5.000% | 7/1/18 | 29,770 | 35,055 |
| California Economic Recovery GO | 5.000% | 7/1/19 | 32,330 | 38,414 |
| California Economic Recovery GO | 5.000% | 7/1/20 | 43,745 | 51,398 |
| California Economic Recovery GO | 5.250% | 7/1/21 | 45,385 | 53,755 |
| California Economic Recovery GO | 5.000% | 7/1/22 | 16,280 | 17,880 |
| California Educational Facilities Authority | | | | |
| Revenue (College of Arts & Crafts) | 6.875% | 6/1/14 | 360 | 370 |
| California Educational Facilities Authority | | | | |
| Revenue (College of Arts & Crafts) | 6.875% | 6/1/15 | 380 | 408 |
| California Educational Facilities Authority | | | | |
| Revenue (College of Arts & Crafts) | 6.875% | 6/1/16 | 400 | 446 |
| California Educational Facilities Authority | | | | |
| Revenue (College of Arts) | 5.000% | 6/1/20 | 790 | 869 |
| California Educational Facilities Authority | | | | |
| Revenue (College of Arts) | 5.000% | 6/1/23 | 1,195 | 1,267 |
| California Educational Facilities Authority | | | | |
| Revenue (College of Arts) | 5.000% | 6/1/24 | 380 | 399 |
| California Educational Facilities Authority | | | | |
| Revenue (College of Arts) | 5.250% | 6/1/30 | 1,125 | 1,143 |
| California Educational Facilities Authority | | | | |
| Revenue (Stanford University) | 5.000% | 3/15/26 | 10,000 | 11,984 |
| 3 California Educational Facilities Authority | | | | |
| Revenue (University of Southern California) | | | | |
| TOB VRDO | 0.060% | 12/2/13 | 614 | 614 |
| California GO | 5.000% | 10/1/14 | 2,000 | 2,081 |
40
| | | | |
| California Intermediate-Term Tax-Exempt Fund | | | | |
| |
| |
| |
| | | | Face | Market |
| | | Maturity | Amount | Value |
| | Coupon | Date | ($000) | ($000) |
| California GO | 5.000% | 11/1/14 | 1,390 | 1,452 |
| California GO | 5.000% | 3/1/15 | 1,000 | 1,059 |
| California GO | 5.000% | 4/1/15 | 15,400 | 16,376 |
| California GO | 5.000% | 12/1/15 | 1,470 | 1,505 |
| California GO | 5.000% | 4/1/17 | 11,000 | 12,549 |
| California GO | 5.250% | 2/1/18 (14) | 8,000 | 9,362 |
| California GO | 6.000% | 2/1/18 (2) | 6,240 | 7,504 |
| California GO | 5.000% | 3/1/18 | 1,850 | 2,150 |
| California GO | 5.500% | 4/1/18 | 20,000 | 23,705 |
| 1 California GO | 0.950% | 5/1/18 | 9,000 | 9,097 |
| California GO | 5.000% | 8/1/18 | 1,895 | 2,131 |
| California GO | 5.000% | 10/1/18 | 14,095 | 16,558 |
| California GO | 5.000% | 10/1/18 | 20,000 | 23,495 |
| California GO | 5.500% | 4/1/19 | 11,245 | 13,465 |
| California GO | 5.000% | 5/1/19 | 10,000 | 10,615 |
| California GO | 5.000% | 8/1/19 | 30,000 | 32,147 |
| California GO | 5.000% | 10/1/19 | 21,000 | 24,753 |
| California GO | 5.000% | 10/1/19 (14) | 14,800 | 16,482 |
| California GO | 5.000% | 2/1/20 | 2,950 | 3,452 |
| California GO | 5.250% | 2/1/20 | 7,500 | 8,884 |
| California GO | 5.000% | 3/1/20 | 55,285 | 58,184 |
| California GO | 5.000% | 8/1/20 | 14,890 | 16,701 |
| California GO | 5.000% | 9/1/20 | 15,000 | 17,626 |
| California GO | 5.000% | 9/1/20 | 9,970 | 11,715 |
| California GO | 5.000% | 10/1/20 | 10,555 | 12,409 |
| California GO | 5.000% | 3/1/21 | 2,250 | 2,588 |
| California GO | 5.000% | 4/1/21 | 2,240 | 2,605 |
| California GO | 5.500% | 4/1/21 | 2,000 | 2,331 |
| California GO | 5.000% | 9/1/21 | 13,700 | 15,971 |
| California GO | 5.000% | 9/1/21 | 1,310 | 1,527 |
| California GO | 5.000% | 10/1/21 | 2,575 | 3,003 |
| California GO | 5.000% | 2/1/22 | 8,125 | 9,398 |
| California GO | 5.000% | 4/1/22 | 4,550 | 5,270 |
| California GO | 5.000% | 6/1/22 | 12,000 | 12,696 |
| California GO | 5.000% | 9/1/22 | 12,710 | 14,764 |
| California GO | 5.250% | 9/1/22 | 17,400 | 20,546 |
| California GO | 5.000% | 2/1/23 | 23,000 | 26,647 |
| California GO | 5.000% | 9/1/23 | 12,120 | 13,319 |
| California GO | 5.000% | 9/1/23 | 7,000 | 8,032 |
| California GO | 5.250% | 9/1/23 | 2,455 | 2,824 |
| California GO | 5.000% | 10/1/23 | 12,500 | 13,768 |
| California GO | 5.000% | 10/1/23 | 10,000 | 11,623 |
| California GO | 5.000% | 12/1/23 | 7,500 | 8,542 |
| California GO | 5.000% | 3/1/24 | 3,000 | 3,356 |
| California GO | 5.000% | 8/1/24 (4) | 31,275 | 33,568 |
| California GO | 5.000% | 8/1/24 | 10,100 | 11,251 |
| California GO | 5.000% | 9/1/24 | 10,000 | 11,259 |
| California GO | 5.000% | 10/1/24 | 13,440 | 14,752 |
| California GO | 5.000% | 10/1/24 | 9,790 | 10,850 |
| California GO | 5.000% | 11/1/24 | 6,000 | 6,759 |
| California GO | 5.000% | 11/1/24 | 5,000 | 5,627 |
| California GO | 5.000% | 12/1/24 | 2,000 | 2,254 |
| California GO | 5.000% | 2/1/25 | 12,940 | 14,368 |
| California GO | 5.125% | 3/1/25 | 2,000 | 2,214 |
| California GO | 5.000% | 8/1/25 | 10,000 | 11,097 |
41
| | | | |
| California Intermediate-Term Tax-Exempt Fund | | | | |
| |
| |
| |
| | | | Face | Market |
| | | Maturity | Amount | Value |
| | Coupon | Date | ($000) | ($000) |
| California GO | 5.000% | 9/1/25 | 1,500 | 1,664 |
| California GO | 5.000% | 9/1/25 | 2,185 | 2,431 |
| California GO | 5.000% | 10/1/25 | 6,000 | 6,600 |
| California GO | 5.000% | 10/1/25 | 13,865 | 15,503 |
| California GO | 5.000% | 11/1/25 | 1,500 | 1,662 |
| California GO | 5.000% | 12/1/25 | 21,015 | 23,677 |
| California GO | 5.000% | 3/1/26 | 5,000 | 5,394 |
| California GO | 5.000% | 3/1/26 | 5,000 | 5,461 |
| California GO | 5.000% | 4/1/26 | 27,480 | 29,933 |
| California GO | 5.000% | 9/1/26 | 2,500 | 2,743 |
| California GO | 5.000% | 10/1/26 | 5,000 | 5,515 |
| California GO | 5.000% | 11/1/26 | 7,500 | 8,212 |
| California GO | 5.000% | 4/1/27 | 24,285 | 26,185 |
| California GO | 5.750% | 4/1/27 | 31,455 | 35,609 |
| California GO | 4.500% | 8/1/27 | 6,000 | 6,202 |
| California GO | 5.000% | 9/1/27 | 5,500 | 5,946 |
| California GO | 5.000% | 10/1/27 | 13,875 | 15,136 |
| California GO | 5.250% | 10/1/27 | 5,000 | 5,562 |
| California GO | 5.000% | 3/1/28 | 10,855 | 11,132 |
| California GO | 5.750% | 4/1/28 | 30,000 | 33,883 |
| California GO | 5.000% | 6/1/28 | 10,005 | 10,477 |
| California GO | 5.000% | 9/1/28 | 17,500 | 18,719 |
| California GO | 5.250% | 9/1/28 | 6,000 | 6,593 |
| California GO | 5.250% | 2/1/29 | 2,790 | 3,025 |
| California GO | 5.000% | 9/1/29 | 6,000 | 6,434 |
| California GO | 5.000% | 9/1/29 | 16,000 | 17,028 |
| California GO | 5.250% | 3/1/30 | 20,000 | 21,879 |
| California GO | 4.500% | 8/1/30 | 3,100 | 3,115 |
| California GO | 5.000% | 9/1/30 | 10,000 | 10,654 |
| California GO | 5.000% | 9/1/30 | 10,180 | 10,808 |
| California GO | 5.250% | 9/1/30 | 5,000 | 5,425 |
| California GO | 5.000% | 3/1/31 | 5,535 | 5,745 |
| California GO | 5.750% | 4/1/31 | 30,000 | 33,399 |
| California GO | 5.000% | 2/1/32 | 2,540 | 2,651 |
| California GO | 6.000% | 3/1/33 | 12,000 | 13,935 |
| California GO | 5.125% | 4/1/33 | 6,550 | 6,902 |
| California GO | 6.500% | 4/1/33 | 22,715 | 26,966 |
| 1 California GO PUT | 0.948% | 12/3/18 | 1,000 | 1,000 |
| California GO VRDO | 0.040% | 12/2/13 LOC | 39,250 | 39,250 |
| California GO VRDO | 0.050% | 12/6/13 LOC | 5,000 | 5,000 |
| California Health Facilities Financing Authority | | | | |
| Revenue (Adventist Health System/West) | 5.000% | 3/1/25 | 5,700 | 6,131 |
| California Health Facilities Financing Authority | | | | |
| Revenue (Adventist Health System/West) | 5.000% | 3/1/26 | 2,000 | 2,128 |
| California Health Facilities Financing Authority | | | | |
| Revenue (California-Nevada Methodist Homes) | 5.000% | 7/1/26 | 1,740 | 1,795 |
| California Health Facilities Financing Authority | | | | |
| Revenue (Catholic Healthcare West) | 5.000% | 7/1/19 | 1,000 | 1,145 |
| California Health Facilities Financing Authority | | | | |
| Revenue (Catholic Healthcare West) | 5.000% | 3/1/20 | 4,750 | 5,405 |
| California Health Facilities Financing Authority | | | | |
| Revenue (Catholic Healthcare West) | 5.000% | 3/1/21 | 3,810 | 4,309 |
| California Health Facilities Financing Authority | | | | |
| Revenue (Catholic Healthcare West) | 5.250% | 3/1/22 | 8,000 | 9,075 |
42
| | | | |
| California Intermediate-Term Tax-Exempt Fund | | | | |
| |
| |
| |
| | | | Face | Market |
| | | Maturity | Amount | Value |
| | Coupon | Date | ($000) | ($000) |
| California Health Facilities Financing Authority | | | | |
| Revenue (Catholic Healthcare West) | 5.500% | 7/1/25 | 5,300 | 5,850 |
| California Health Facilities Financing Authority | | | | |
| Revenue (Catholic Healthcare West) | 5.625% | 7/1/25 | 19,820 | 21,501 |
| California Health Facilities Financing Authority | | | | |
| Revenue (Catholic Healthcare West) | 5.250% | 3/1/27 | 7,500 | 7,957 |
| California Health Facilities Financing Authority | | | | |
| Revenue (Catholic Healthcare West) | 6.000% | 7/1/29 | 4,250 | 4,696 |
| California Health Facilities Financing Authority | | | | |
| Revenue (Catholic Healthcare West) PUT | 5.000% | 7/1/14 | 49,000 | 50,374 |
| California Health Facilities Financing Authority | | | | |
| Revenue (Catholic Healthcare West) PUT | 5.000% | 7/1/14 | 9,000 | 9,252 |
| California Health Facilities Financing Authority | | | | |
| Revenue (Cedars-Sinai Medical Center) | 5.000% | 11/15/14 | 4,000 | 4,184 |
| California Health Facilities Financing Authority | | | | |
| Revenue (Cedars-Sinai Medical Center) | 5.000% | 11/15/16 | 2,000 | 2,168 |
| California Health Facilities Financing Authority | | | | |
| Revenue (Cedars-Sinai Medical Center) | 5.000% | 11/15/17 | 4,585 | 4,937 |
| California Health Facilities Financing Authority | | | | |
| Revenue (Cedars-Sinai Medical Center) | 5.000% | 8/15/19 | 1,000 | 1,171 |
| California Health Facilities Financing Authority | | | | |
| Revenue (Cedars-Sinai Medical Center) | 5.000% | 8/15/20 | 2,100 | 2,462 |
| California Health Facilities Financing Authority | | | | |
| Revenue (Cedars-Sinai Medical Center) | 5.000% | 8/15/21 | 2,000 | 2,331 |
| California Health Facilities Financing Authority | | | | |
| Revenue (Children’s Hospital of Los Angeles) | 5.000% | 11/15/22 | 2,000 | 2,165 |
| California Health Facilities Financing Authority | | | | |
| Revenue (Children’s Hospital of Los Angeles) | 5.000% | 11/15/23 | 1,370 | 1,458 |
| California Health Facilities Financing Authority | | | | |
| Revenue (Children’s Hospital of Los Angeles) | 5.000% | 11/15/24 | 2,910 | 3,053 |
| California Health Facilities Financing Authority | | | | |
| Revenue (Children’s Hospital of Los Angeles) | 5.000% | 11/15/29 | 2,890 | 2,890 |
| 1 California Health Facilities Financing Authority | | | | |
| Revenue (Children’s Hospital of Los Angeles) PUT | 1.850% | 7/1/17 | 5,255 | 5,286 |
| California Health Facilities Financing Authority | | | | |
| Revenue (Children’s Hospital of Orange County) | 6.250% | 11/1/29 | 5,000 | 5,579 |
| California Health Facilities Financing Authority | | | | |
| Revenue (Children’s Hospital of Orange County) | 5.000% | 11/1/31 | 2,000 | 2,008 |
| California Health Facilities Financing Authority | | | | |
| Revenue (Chinese Hospital Association) | 4.000% | 6/1/16 | 735 | 792 |
| California Health Facilities Financing Authority | | | | |
| Revenue (Chinese Hospital Association) | 5.000% | 6/1/19 | 300 | 343 |
| California Health Facilities Financing Authority | | | | |
| Revenue (Chinese Hospital Association) | 5.000% | 6/1/21 | 450 | 507 |
| California Health Facilities Financing Authority | | | | |
| Revenue (Chinese Hospital Association) | 5.000% | 6/1/22 | 875 | 979 |
| California Health Facilities Financing Authority | | | | |
| Revenue (Chinese Hospital Association) | 5.000% | 6/1/23 | 760 | 834 |
| California Health Facilities Financing Authority | | | | |
| Revenue (Chinese Hospital Association) | 5.000% | 6/1/25 | 310 | 330 |
| California Health Facilities Financing Authority | | | | |
| Revenue (Chinese Hospital Association) | 5.000% | 6/1/26 | 805 | 848 |
| California Health Facilities Financing Authority | | | | |
| Revenue (City of Hope Medical Center) | 5.000% | 11/15/14 | 730 | 762 |
43
| | | | |
| California Intermediate-Term Tax-Exempt Fund | | | | |
| |
| |
| |
| | | | Face | Market |
| | | Maturity | Amount | Value |
| | Coupon | Date | ($000) | ($000) |
| California Health Facilities Financing Authority | | | | |
| Revenue (City of Hope Medical Center) | 5.000% | 11/15/19 | 800 | 934 |
| California Health Facilities Financing Authority | | | | |
| Revenue (City of Hope Medical Center) | 4.000% | 11/15/20 | 750 | 825 |
| California Health Facilities Financing Authority | | | | |
| Revenue (City of Hope Medical Center) | 5.000% | 11/15/21 | 1,400 | 1,615 |
| California Health Facilities Financing Authority | | | | |
| Revenue (City of Hope Medical Center) | 5.000% | 11/15/23 | 1,500 | 1,697 |
| California Health Facilities Financing Authority | | | | |
| Revenue (City of Hope Medical Center) | 5.000% | 11/15/24 | 1,700 | 1,887 |
| California Health Facilities Financing Authority | | | | |
| Revenue (City of Hope Medical Center) | 5.000% | 11/15/25 | 2,250 | 2,466 |
| California Health Facilities Financing Authority | | | | |
| Revenue (City of Hope Medical Center) | 5.000% | 11/15/32 | 12,500 | 12,689 |
| California Health Facilities Financing Authority | | | | |
| Revenue (Lucile Salter Packard Children’s | | | | |
| Hospital at Stanford) | 4.000% | 8/15/19 | 500 | 560 |
| California Health Facilities Financing Authority | | | | |
| Revenue (Lucile Salter Packard Children’s | | | | |
| Hospital at Stanford) | 5.000% | 8/15/21 | 800 | 931 |
| California Health Facilities Financing Authority | | | | |
| Revenue (Lucile Salter Packard Children’s | | | | |
| Hospital at Stanford) | 5.000% | 8/15/22 | 500 | 580 |
| California Health Facilities Financing Authority | | | | |
| Revenue (Memorial Health Services) | 3.000% | 10/1/14 | 550 | 563 |
| California Health Facilities Financing Authority | | | | |
| Revenue (Memorial Health Services) | 5.000% | 10/1/18 | 1,320 | 1,550 |
| California Health Facilities Financing Authority | | | | |
| Revenue (Memorial Health Services) | 4.000% | 10/1/19 | 1,500 | 1,677 |
| California Health Facilities Financing Authority | | | | |
| Revenue (Memorial Health Services) | 5.000% | 10/1/19 | 1,000 | 1,182 |
| California Health Facilities Financing Authority | | | | |
| Revenue (Memorial Health Services) | 4.000% | 10/1/20 | 1,800 | 1,977 |
| California Health Facilities Financing Authority | | | | |
| Revenue (Memorial Health Services) | 5.000% | 10/1/20 | 1,000 | 1,171 |
| California Health Facilities Financing Authority | | | | |
| Revenue (Memorial Health Services) | 4.000% | 10/1/21 | 1,000 | 1,079 |
| California Health Facilities Financing Authority | | | | |
| Revenue (Memorial Health Services) | 5.000% | 10/1/21 | 1,000 | 1,158 |
| California Health Facilities Financing Authority | | | | |
| Revenue (Memorial Health Services) | 4.000% | 10/1/22 | 2,250 | 2,393 |
| California Health Facilities Financing Authority | | | | |
| Revenue (Memorial Health Services) | 5.000% | 10/1/22 | 2,400 | 2,760 |
| California Health Facilities Financing Authority | | | | |
| Revenue (Memorial Health Services) | 5.000% | 10/1/24 | 5,000 | 5,592 |
| California Health Facilities Financing Authority | | | | |
| Revenue (Memorial Health Services) | 5.000% | 10/1/25 | 5,000 | 5,521 |
| California Health Facilities Financing Authority | | | | |
| Revenue (Providence Health & Services) | 6.250% | 10/1/24 | 3,000 | 3,540 |
| California Health Facilities Financing Authority | | | | |
| Revenue (Providence Health & Services) | 6.250% | 10/1/28 | 4,000 | 4,591 |
| California Health Facilities Financing Authority | | | | |
| Revenue (Rady Children’s Hospital) | 5.000% | 8/15/20 | 500 | 574 |
| California Health Facilities Financing Authority | | | | |
| Revenue (Rady Children’s Hospital) | 5.500% | 8/15/26 | 6,000 | 6,581 |
44
| | | | |
| California Intermediate-Term Tax-Exempt Fund | | | | |
| |
| |
| |
| | | | Face | Market |
| | | Maturity | Amount | Value |
| | Coupon | Date | ($000) | ($000) |
| California Health Facilities Financing Authority | | | | |
| Revenue (Rady Children’s Hospital) | 5.000% | 8/15/31 | 2,115 | 2,178 |
| California Health Facilities Financing Authority | | | | |
| Revenue (Scripps Health) | 5.000% | 10/1/17 | 2,515 | 2,903 |
| California Health Facilities Financing Authority | | | | |
| Revenue (Scripps Health) | 5.000% | 10/1/18 | 3,000 | 3,518 |
| California Health Facilities Financing Authority | | | | |
| Revenue (Scripps Health) | 5.000% | 11/15/25 | 750 | 815 |
| California Health Facilities Financing Authority | | | | |
| Revenue (Scripps Health) | 5.000% | 11/15/27 | 850 | 906 |
| California Health Facilities Financing Authority | | | | |
| Revenue (Scripps Health) | 5.000% | 11/15/28 | 1,175 | 1,238 |
| California Health Facilities Financing Authority | | | | |
| Revenue (Scripps Health) | 5.000% | 11/15/32 | 1,000 | 1,024 |
| California Health Facilities Financing Authority | | | | |
| Revenue (St. Joseph Health System) | 5.000% | 7/1/29 | 4,970 | 5,253 |
| California Health Facilities Financing Authority | | | | |
| Revenue (St. Joseph Health System) | 5.500% | 7/1/29 | 10,000 | 11,005 |
| California Health Facilities Financing Authority | | | | |
| Revenue (St. Joseph Health System) | 5.000% | 7/1/33 | 6,250 | 6,437 |
| California Health Facilities Financing Authority | | | | |
| Revenue (St. Joseph Health System) PUT | 5.000% | 10/16/14 | 15,000 | 15,625 |
| California Health Facilities Financing Authority | | | | |
| Revenue (St. Joseph Health System) PUT | 5.000% | 10/15/20 | 12,500 | 14,535 |
| California Health Facilities Financing Authority | | | | |
| Revenue (Stanford Hospital) | 5.000% | 8/15/19 | 2,000 | 2,369 |
| California Health Facilities Financing Authority | | | | |
| Revenue (Stanford Hospital) | 4.000% | 8/15/21 | 2,250 | 2,455 |
| California Health Facilities Financing Authority | | | | |
| Revenue (Stanford Hospital) | 5.000% | 8/15/23 | 1,830 | 2,104 |
| California Health Facilities Financing Authority | | | | |
| Revenue (Stanford Hospital) | 5.250% | 11/15/31 | 2,000 | 2,092 |
| California Health Facilities Financing Authority | | | | |
| Revenue (Sutter Health) | 5.000% | 8/15/20 | 2,200 | 2,589 |
| California Health Facilities Financing Authority | | | | |
| Revenue (Sutter Health) | 5.000% | 8/15/21 | 1,275 | 1,483 |
| California Health Facilities Financing Authority | | | | |
| Revenue (Sutter Health) | 5.000% | 8/15/22 | 1,090 | 1,246 |
| California Health Facilities Financing Authority | | | | |
| Revenue (Sutter Health) | 5.500% | 8/15/26 | 4,750 | 5,257 |
| California Health Facilities Financing Authority | | | | |
| Revenue (Sutter Health) | 5.250% | 8/15/31 | 4,500 | 4,772 |
| California Health Facilities Financing Authority | | | | |
| Revenue (Sutter Health) | 5.875% | 8/15/31 | 5,000 | 5,649 |
| 3 California Infrastructure & Economic Development | | | | |
| Bank Revenue (Bay Area Toll Bridges Seismic | | | | |
| Retrofit) TOB VRDO | 0.120% | 12/2/13 (ETM) | 46,870 | 46,870 |
| California Infrastructure & Economic Development | | | | |
| Bank Revenue (Independent System Operator | | | | |
| Corp. Project) | 5.000% | 2/1/34 | 10,000 | 10,303 |
| 1 California Infrastructure & Economic Development | | | | |
| Bank Revenue (Index-Museum Art Project) PUT | 1.868% | 8/1/18 | 6,000 | 5,982 |
| California Infrastructure & Economic Development | | | | |
| Bank Revenue (J. Paul Getty Trust) | 4.000% | 10/1/15 | 1,400 | 1,496 |
45
| | | | |
| California Intermediate-Term Tax-Exempt Fund | | | | |
| |
| |
| |
| | | | Face | Market |
| | | Maturity | Amount | Value |
| | Coupon | Date | ($000) | ($000) |
| 1 California Infrastructure & Economic Development | | | | |
| Bank Revenue (J. Paul Getty Trust) PUT | 0.550% | 4/1/14 | 5,000 | 5,005 |
| 1 California Infrastructure & Economic Development | | | | |
| Bank Revenue (J. Paul Getty Trust) PUT | 0.350% | 4/1/15 | 10,050 | 10,047 |
| 1 California Infrastructure & Economic Development | | | | |
| Bank Revenue (J. Paul Getty Trust) PUT | 0.330% | 4/1/16 | 3,190 | 3,190 |
| California Infrastructure & Economic Development | | | | |
| Bank Revenue (Science Center Phase II Project) | 5.000% | 5/1/18 (14) | 1,785 | 1,881 |
| California Infrastructure & Economic Development | | | | |
| Bank Revenue (Science Center Phase II Project) | 5.000% | 5/1/19 (14) | 1,040 | 1,085 |
| California Infrastructure & Economic Development | | | | |
| Bank Revenue (Science Center Phase II Project) | 5.000% | 5/1/21 (14) | 1,145 | 1,175 |
| California Infrastructure & Economic Development | | | | |
| Bank Revenue (SRI International) VRDO | 0.060% | 12/6/13 LOC | 4,500 | 4,500 |
| California Infrastructure & Economic Development | | | | |
| Bank Revenue (State Revolving Fund) | 5.000% | 10/1/29 | 7,000 | 7,196 |
| California Infrastructure & Economic Development | | | | |
| Bank Revenue (Workers’ Compensation Relief) | 5.250% | 10/1/14 (2) | 25,815 | 25,888 |
| California Municipal Finance Authority | | | | |
| (Community Hospitals of Central California | | | | |
| Obligated Group) COP | 5.375% | 2/1/29 | 16,600 | 16,722 |
| California Municipal Finance Authority Pollution | | | | |
| Control Revenue (Chevron USA Inc. Project) | | | | |
| VRDO | 0.030% | 12/2/13 | 1,400 | 1,400 |
| California Municipal Finance Authority Recovery | | | | |
| Zone Revenue (Chevron USA Inc. Project) VRDO | 0.030% | 12/2/13 | 14,550 | 14,550 |
| 1 California Municipal Finance Authority Revenue | | | | |
| (NorthBay Healthcare Group) PUT | 2.150% | 11/1/16 | 5,000 | 5,018 |
| California Municipal Finance Authority Revenue | | | | |
| (University of La Verne) | 5.000% | 6/1/16 | 1,000 | 1,085 |
| California Municipal Finance Authority Revenue | | | | |
| (University of La Verne) | 4.750% | 6/1/18 | 2,325 | 2,556 |
| California Municipal Finance Authority Revenue | | | | |
| (University of La Verne) | 5.000% | 6/1/19 | 2,375 | 2,641 |
| California Pollution Control Financing Authority | | | | |
| Environmental Improvement Revenue | | | | |
| (BP West Coast Products LLC Project) PUT | 2.600% | 9/2/14 | 13,550 | 13,763 |
| California Pollution Control Financing Authority | | | | |
| Revenue (Pacific Gas & Electric Co.) VRDO | 0.040% | 12/2/13 LOC | 17,200 | 17,200 |
| California Pollution Control Financing Authority | | | | |
| Revenue (Pacific Gas & Electric Co.) VRDO | 0.040% | 12/2/13 LOC | 5,100 | 5,100 |
| California Pollution Control Financing Authority | | | | |
| Revenue (Pacific Gas & Electric Co.) VRDO | 0.040% | 12/2/13 LOC | 12,900 | 12,900 |
| California Pollution Control Financing Authority | | | | |
| Revenue (San Diego Gas & Electric Co.) | 5.900% | 6/1/14 (14) | 2,025 | 2,082 |
| California Public Works Board Lease Revenue | | | | |
| (Butterfield State Office Complex) | 5.000% | 6/1/20 | 3,895 | 4,150 |
| California Public Works Board Lease Revenue | | | | |
| (Department of Corrections) | 5.500% | 12/1/13 (Prere.) | 10,000 | 10,003 |
| California Public Works Board Lease Revenue | | | | |
| (Department of Corrections) | 5.500% | 12/1/13 (Prere.) | 10,000 | 10,003 |
| California Public Works Board Lease Revenue | | | | |
| (Department of Corrections) | 5.000% | 6/1/15 | 1,250 | 1,337 |
| California Public Works Board Lease Revenue | | | | |
| (Department of Corrections) | 5.000% | 6/1/16 | 7,160 | 7,933 |
46
| | | | |
| California Intermediate-Term Tax-Exempt Fund | | | | |
| |
| |
| |
| | | | Face | Market |
| | | Maturity | Amount | Value |
| | Coupon | Date | ($000) | ($000) |
| California Public Works Board Lease Revenue | | | | |
| (Department of Corrections) | 5.000% | 10/1/16 | 3,785 | 4,242 |
| California Public Works Board Lease Revenue | | | | |
| (Department of Corrections) | 5.000% | 1/1/18 (2) | 27,790 | 30,257 |
| California Public Works Board Lease Revenue | | | | |
| (Department of Corrections) | 5.000% | 1/1/21 | 3,975 | 4,313 |
| California Public Works Board Lease Revenue | | | | |
| (Department of Corrections) | 5.000% | 6/1/21 | 5,000 | 5,724 |
| California Public Works Board Lease Revenue | | | | |
| (Department of Corrections) | 5.000% | 6/1/22 | 9,425 | 10,704 |
| California Public Works Board Lease Revenue | | | | |
| (Department of Corrections) | 5.750% | 10/1/31 | 6,000 | 6,519 |
| California Public Works Board Lease Revenue | | | | |
| (Department of General Services) | 6.000% | 4/1/27 | 5,000 | 5,706 |
| California Public Works Board Lease Revenue | | | | |
| (Department of Mental Health) | 5.500% | 6/1/14 (Prere.) | 8,000 | 8,214 |
| California Public Works Board Lease Revenue | | | | |
| (Department of Mental Health) | 5.500% | 6/1/14 (Prere.) | 5,000 | 5,134 |
| California Public Works Board Lease Revenue | | | | |
| (Department of Mental Health) | 5.500% | 6/1/14 (Prere.) | 1,500 | 1,540 |
| California Public Works Board Lease Revenue | | | | |
| (Department of State Hospitals) | 5.000% | 6/1/27 | 5,000 | 5,339 |
| California Public Works Board Lease Revenue | | | | |
| (Department of State Hospitals) | 5.000% | 6/1/28 | 5,825 | 6,150 |
| California Public Works Board Lease Revenue | | | | |
| (Department of State Hospitals) | 5.000% | 6/1/29 | 5,000 | 5,231 |
| California Public Works Board Lease Revenue | | | | |
| (Judicial Council Projects) | 5.000% | 3/1/25 | 1,500 | 1,645 |
| California Public Works Board Lease Revenue | | | | |
| (Judicial Council Projects) | 5.000% | 3/1/26 | 1,500 | 1,619 |
| California Public Works Board Lease Revenue | | | | |
| (Judicial Council Projects) | 5.000% | 12/1/27 | 7,000 | 7,412 |
| California Public Works Board Lease Revenue | | | | |
| (Judicial Council Projects) | 5.000% | 3/1/28 | 2,860 | 3,016 |
| California Public Works Board Lease Revenue | | | | |
| (Judicial Council Projects) | 5.000% | 12/1/28 | 4,980 | 5,221 |
| California Public Works Board Lease Revenue | | | | |
| (Judicial Council Projects) | 5.000% | 3/1/29 | 2,500 | 2,613 |
| California Public Works Board Lease Revenue | | | | |
| (Judicial Council Projects) | 5.000% | 12/1/29 | 5,000 | 5,201 |
| California Public Works Board Lease Revenue | | | | |
| (Judicial Council Projects) | 5.000% | 3/1/32 | 1,350 | 1,386 |
| California Public Works Board Lease Revenue | | | | |
| (Judicial Council Projects) | 5.000% | 3/1/33 | 1,650 | 1,685 |
| California Public Works Board Lease Revenue | | | | |
| (Regents of The University of California) | 5.500% | 6/1/14 (ETM) | 2,635 | 2,706 |
| California Public Works Board Lease Revenue | | | | |
| (Regents of The University of California) | 5.000% | 4/1/15 (Prere.) | 5,765 | 6,129 |
| California Public Works Board Lease Revenue | | | | |
| (Regents of The University of California) | 5.250% | 11/1/15 (Prere.) | 9,010 | 9,860 |
| California Public Works Board Lease Revenue | | | | |
| (Regents of The University of California) | 5.000% | 6/1/20 (ETM) | 7,670 | 9,187 |
| California Public Works Board Lease Revenue | | | | |
| (Regents of The University of California) | 5.000% | 10/1/20 (ETM) | 2,015 | 2,418 |
47
| | | | |
| California Intermediate-Term Tax-Exempt Fund | | | | |
| |
| |
| |
| | | | Face | Market |
| | | Maturity | Amount | Value |
| | Coupon | Date | ($000) | ($000) |
| California Public Works Board Lease Revenue | | | | |
| (Regents of The University of California) | 5.000% | 10/1/21 (ETM) | 1,650 | 1,986 |
| California Public Works Board Lease Revenue | | | | |
| (Trustees of The California State University) | 5.300% | 10/1/15 (2) | 6,655 | 6,682 |
| California Public Works Board Lease Revenue | | | | |
| (Trustees of The California State University) | 5.375% | 10/1/16 (14) | 4,750 | 4,769 |
| California Public Works Board Lease Revenue | | | | |
| (Various Capital Projects) | 5.000% | 11/1/14 | 4,745 | 4,953 |
| California Public Works Board Lease Revenue | | | | |
| (Various Capital Projects) | 4.000% | 11/1/15 | 1,500 | 1,602 |
| California Public Works Board Lease Revenue | | | | |
| (Various Capital Projects) | 5.000% | 11/1/16 | 6,395 | 7,188 |
| California Public Works Board Lease Revenue | | | | |
| (Various Capital Projects) | 5.000% | 11/1/18 | 4,000 | 4,664 |
| California Public Works Board Lease Revenue | | | | |
| (Various Capital Projects) | 5.250% | 11/1/20 | 5,000 | 5,757 |
| California Public Works Board Lease Revenue | | | | |
| (Various Capital Projects) | 5.000% | 12/1/21 (Prere.) | 5,000 | 6,045 |
| California Public Works Board Lease Revenue | | | | |
| (Various Capital Projects) | 5.000% | 12/1/21 (ETM) | 5,400 | 6,507 |
| California Public Works Board Lease Revenue | | | | |
| (Various Capital Projects) | 5.000% | 12/1/21 (Prere.) | 2,645 | 3,198 |
| California Public Works Board Lease Revenue | | | | |
| (Various Capital Projects) | 5.000% | 11/1/22 | 1,500 | 1,707 |
| California Public Works Board Lease Revenue | | | | |
| (Various Capital Projects) | 5.375% | 3/1/23 | 9,065 | 10,210 |
| California Public Works Board Lease Revenue | | | | |
| (Various Capital Projects) | 5.000% | 4/1/23 | 4,180 | 4,670 |
| California Public Works Board Lease Revenue | | | | |
| (Various Capital Projects) | 5.000% | 11/1/23 | 1,000 | 1,119 |
| California Public Works Board Lease Revenue | | | | |
| (Various Capital Projects) | 5.000% | 11/1/24 | 2,000 | 2,203 |
| California Public Works Board Lease Revenue | | | | |
| (Various Capital Projects) | 5.000% | 11/1/25 | 3,560 | 3,874 |
| California Public Works Board Lease Revenue | | | | |
| (Various Capital Projects) | 5.000% | 9/1/30 | 3,000 | 3,115 |
| California Public Works Board Lease Revenue | | | | |
| (Various Capital Projects) | 5.500% | 11/1/30 | 5,360 | 5,848 |
| California Public Works Board Lease Revenue | | | | |
| (Various Capital Projects) | 5.000% | 9/1/31 | 3,000 | 3,092 |
| California Public Works Board Lease Revenue | | | | |
| (Various Capital Projects) | 5.000% | 11/1/31 | 1,650 | 1,703 |
| California Public Works Board Lease Revenue | | | | |
| (Various Capital Projects) | 5.500% | 11/1/31 | 7,000 | 7,590 |
| California Public Works Board Lease Revenue | | | | |
| (Various Capital Projects) | 5.000% | 11/1/32 | 11,465 | 11,763 |
| California Public Works Board Lease Revenue | | | | |
| (Various Capital Projects) | 5.500% | 11/1/33 | 4,670 | 5,048 |
| California State University Revenue Systemwide | 5.000% | 5/1/15 (Prere.) | 11,955 | 12,760 |
| California State University Revenue Systemwide | 5.000% | 11/1/15 | 1,040 | 1,133 |
| California State University Revenue Systemwide | 5.250% | 11/1/20 | 3,515 | 4,102 |
| California State University Revenue Systemwide | 5.000% | 11/1/22 (2) | 6,485 | 6,855 |
| California State University Revenue Systemwide | 5.000% | 11/1/23 | 3,960 | 4,571 |
| California State University Revenue Systemwide | 5.000% | 11/1/23 | 5,605 | 6,628 |
| California State University Revenue Systemwide | 5.000% | 11/1/24 | 2,915 | 3,320 |
48
| | | | |
| California Intermediate-Term Tax-Exempt Fund | | | | |
| |
| |
| |
| | | | Face | Market |
| | | Maturity | Amount | Value |
| | Coupon | Date | ($000) | ($000) |
| California State University Revenue Systemwide | 5.000% | 11/1/24 | 8,690 | 9,739 |
| California State University Revenue Systemwide | 5.000% | 11/1/25 | 11,820 | 12,943 |
| California State University Revenue Systemwide | 5.000% | 11/1/26 | 12,530 | 13,685 |
| California State University Revenue Systemwide | 5.000% | 11/1/27 | 5,740 | 6,351 |
| California State University Revenue Systemwide | 5.000% | 11/1/27 | 5,000 | 5,374 |
| California State University Revenue Systemwide | 4.000% | 11/1/29 | 3,900 | 3,846 |
| 3 California State University Revenue Systemwide | | | | |
| TOB VRDO | 0.130% | 12/6/13 (4) | 5,000 | 5,000 |
| California Statewide Communities Development | | | | |
| Authority Health Facility Revenue (Adventist | | | | |
| Health System/West) | 5.000% | 3/1/25 | 14,975 | 15,625 |
| California Statewide Communities Development | | | | |
| Authority Revenue (American Baptist Homes) | 2.100% | 10/1/19 | 5,455 | 5,409 |
| California Statewide Communities Development | | | | |
| Authority Revenue (American Baptist Homes) | 2.400% | 10/1/20 | 1,450 | 1,406 |
| California Statewide Communities Development | | | | |
| Authority Revenue (Cottage Health System | | | | |
| Obligated Group) | 5.250% | 11/1/30 | 11,500 | 11,918 |
| California Statewide Communities Development | | | | |
| Authority Revenue (Daughters of Charity Health | | | | |
| System - St. Francis Medical Center) | 5.000% | 7/1/22 | 5,155 | 5,243 |
| California Statewide Communities Development | | | | |
| Authority Revenue (Daughters of Charity Health | | | | |
| System - St. Francis Medical Center) | 5.250% | 7/1/25 | 1,775 | 1,792 |
| California Statewide Communities Development | | | | |
| Authority Revenue (Episcopal Communities | | | | |
| & Services) | 5.000% | 5/15/27 | 500 | 502 |
| California Statewide Communities Development | | | | |
| Authority Revenue (Episcopal Communities | | | | |
| & Services) | 5.000% | 5/15/32 | 680 | 648 |
| California Statewide Communities Development | | | | |
| Authority Revenue (Eskaton Properties Inc. | | | | |
| Obligated Group) | 5.250% | 11/15/34 | 4,350 | 4,107 |
| California Statewide Communities Development | | | | |
| Authority Revenue (Huntington Memorial | | | | |
| Hospital) | 5.000% | 7/1/18 | 6,190 | 6,568 |
| California Statewide Communities Development | | | | |
| Authority Revenue (Institute for Defense | | | | |
| Analyses) VRDO | 0.050% | 12/6/13 (2)LOC | 3,155 | 3,155 |
| California Statewide Communities Development | | | | |
| Authority Revenue (John Muir Health) VRDO | 0.030% | 12/2/13 LOC | 2,850 | 2,850 |
| California Statewide Communities Development | | | | |
| Authority Revenue (Kaiser Permanente) | 5.250% | 8/1/31 | 3,200 | 3,252 |
| California Statewide Communities Development | | | | |
| Authority Revenue (Kaiser Permanente) PUT | 5.000% | 5/1/17 | 6,000 | 6,824 |
| California Statewide Communities Development | | | | |
| Authority Revenue (Kaiser Permanente) VRDO | 0.030% | 12/6/13 | 5,700 | 5,700 |
| California Statewide Communities Development | | | | |
| Authority Revenue (Lodi Memorial Hospital) | 5.000% | 12/1/22 | 8,000 | 8,682 |
| California Statewide Communities Development | | | | |
| Authority Revenue (Lodi Memorial Hospital) | 5.000% | 12/1/27 | 7,500 | 7,879 |
| California Statewide Communities Development | | | | |
| Authority Revenue (Rady Children’s Hospital - | | | | |
| San Diego) | 5.000% | 8/15/20 (14) | 2,440 | 2,645 |
49
| | | | |
| California Intermediate-Term Tax-Exempt Fund | | | | |
| |
| |
| |
| | | | Face | Market |
| | | Maturity | Amount | Value |
| | Coupon | Date | ($000) | ($000) |
| California Statewide Communities Development | | | | |
| Authority Revenue (Rady Children’s Hospital - | | | | |
| San Diego) | 5.000% | 8/15/23 (14) | 5,285 | 5,661 |
| California Statewide Communities Development | | | | |
| Authority Revenue (Sherman Oaks Project) | 5.500% | 8/1/15 (2) | 4,685 | 5,046 |
| California Statewide Communities Development | | | | |
| Authority Revenue (St. Joseph Health System) | 4.500% | 7/1/18 (4) | 9,100 | 9,828 |
| California Statewide Communities Development | | | | |
| Authority Revenue (Sutter Health) | 5.000% | 8/15/19 | 530 | 624 |
| California Statewide Communities Development | | | | |
| Authority Revenue (Sutter Health) | 5.000% | 8/15/20 | 500 | 583 |
| California Statewide Communities Development | | | | |
| Authority Revenue (Sutter Health) | 5.000% | 8/15/22 | 1,050 | 1,206 |
| California Statewide Communities Development | | | | |
| Authority Revenue (Sutter Health) | 5.250% | 8/15/31 | 7,500 | 7,833 |
| California Statewide Communities Development | | | | |
| Authority Revenue (Sutter Health) | 5.000% | 8/15/32 | 11,820 | 12,082 |
| California Statewide Communities Development | | | | |
| Authority Senior Living Revenue (Southern | | | | |
| California Presbyterian Homes) | 7.000% | 11/15/29 | 2,000 | 2,181 |
| California Statewide Communities Development | | | | |
| Authority Student Housing Revenue (CHF-Irvine | | | | |
| LLC - UCI East Campus Apartments Phase II) | 5.500% | 5/15/26 | 5,000 | 5,194 |
| California Statewide Communities Development | | | | |
| Authority Student Housing Revenue (CHF-Irvine | | | | |
| LLC - UCI East Campus Apartments Phase II) | 5.125% | 5/15/31 | 7,000 | 7,032 |
| Calleguas-Las Virgenes CA Public Financing | | | | |
| Authority Revenue (Municipal Water District | | | | |
| Project) VRDO | 0.030% | 12/6/13 LOC | 3,000 | 3,000 |
| 3 Central Basin Municipal Water District California | | | | |
| COP TOB VRDO | 0.070% | 12/6/13 (4) | 7,500 | 7,500 |
| Central CA Unified School District GO | 5.500% | 8/1/29 (12) | 3,000 | 3,225 |
| Central Valley CA Financing Authority | | | | |
| Cogeneration Project Revenue (Carson | | | | |
| Ice-Gen Project) | 5.000% | 7/1/17 | 1,000 | 1,142 |
| Central Valley CA Financing Authority | | | | |
| Cogeneration Project Revenue (Carson | | | | |
| Ice-Gen Project) | 5.000% | 7/1/19 | 765 | 894 |
| Central Valley CA Financing Authority | | | | |
| Cogeneration Project Revenue (Carson | | | | |
| Ice-Gen Project) | 5.250% | 7/1/20 | 1,025 | 1,211 |
| Cerritos CA Community College District GO | 0.000% | 8/1/20 | 500 | 412 |
| Cerritos CA Community College District GO | 0.000% | 8/1/22 | 500 | 364 |
| Cerritos CA Community College District GO | 0.000% | 8/1/23 | 500 | 341 |
| Chabot-Las Positas CA Community College | | | | |
| District GO | 5.000% | 8/1/23 | 2,225 | 2,584 |
| Chabot-Las Positas CA Community College | | | | |
| District GO | 5.000% | 8/1/25 | 5,000 | 5,585 |
| Chabot-Las Positas CA Community College | | | | |
| District GO | 5.000% | 8/1/27 | 3,000 | 3,268 |
| Chabot-Las Positas CA Community College | | | | |
| District GO | 5.000% | 8/1/30 | 7,500 | 7,948 |
| Chabot-Las Positas CA Community College | | | | |
| District GO | 5.000% | 8/1/31 | 7,500 | 7,905 |
50
| | | | |
| California Intermediate-Term Tax-Exempt Fund | | | | |
| |
| |
| |
| | | | Face | Market |
| | | Maturity | Amount | Value |
| | Coupon | Date | ($000) | ($000) |
| Chabot-Las Positas CA Community College | | | | |
| District GO | 5.000% | 8/1/32 | 13,000 | 13,629 |
| Chula Vista CA Municipal Financing Authority | | | | |
| Special Tax Revenue | 5.000% | 9/1/23 | 2,700 | 2,893 |
| Chula Vista CA Municipal Financing Authority | | | | |
| Special Tax Revenue | 5.250% | 9/1/24 | 3,330 | 3,590 |
| Chula Vista CA Municipal Financing Authority | | | | |
| Special Tax Revenue | 5.500% | 9/1/25 | 3,605 | 3,935 |
| Chula Vista CA Municipal Financing Authority | | | | |
| Special Tax Revenue | 5.500% | 9/1/26 | 3,800 | 4,117 |
| Chula Vista CA Municipal Financing Authority | | | | |
| Special Tax Revenue | 5.500% | 9/1/27 | 1,000 | 1,071 |
| Clovis CA Unified School District GO | 0.000% | 8/1/18 (14) | 3,645 | 3,305 |
| Coast CA Community College District GO | 5.000% | 8/1/26 | 5,255 | 5,970 |
| Coast CA Community College District GO | 5.000% | 8/1/28 | 6,595 | 7,317 |
| Colton CA Joint Unified School District GO | 4.000% | 8/1/16 (4) | 1,000 | 1,088 |
| Colton CA Joint Unified School District GO | 5.000% | 8/1/23 (4) | 765 | 875 |
| Colton CA Joint Unified School District GO | 5.000% | 8/1/24 (4) | 1,050 | 1,181 |
| Colton CA Joint Unified School District GO | 5.000% | 8/1/25 (4) | 1,000 | 1,112 |
| Colton CA Joint Unified School District GO | 5.000% | 8/1/26 (4) | 1,120 | 1,232 |
| Colton CA Public Financing Authority Electric | | | | |
| Revenue | 5.000% | 4/1/23 | 2,065 | 2,276 |
| Colton CA Public Financing Authority Electric | | | | |
| Revenue | 5.000% | 4/1/24 | 1,665 | 1,815 |
| Contra Costa CA Community College District GO | 5.000% | 8/1/24 | 4,140 | 4,792 |
| Contra Costa CA Community College District GO | 5.000% | 8/1/32 | 3,000 | 3,206 |
| Contra Costa CA Community College District GO | 5.000% | 8/1/33 | 4,000 | 4,272 |
| Contra Costa CA Transportation Authority Sales | | | | |
| Tax Revenue | 5.000% | 3/1/24 | 1,080 | 1,222 |
| 1 Contra Costa CA Transportation Authority Sales | | | | |
| Tax Revenue PUT | 0.483% | 12/15/15 | 12,000 | 11,981 |
| Contra Costa County CA Public Financing | | | | |
| Authority Lease Revenue | 5.000% | 6/1/22 (14) | 15,300 | 16,841 |
| Corona-Norco CA School District Public Financing | | | | |
| Authority Special Tax Revenue | 5.000% | 9/1/21 | 500 | 542 |
| Corona-Norco CA School District Public Financing | | | | |
| Authority Special Tax Revenue | 5.000% | 9/1/23 | 500 | 532 |
| Corona-Norco CA Unified School District GO | 0.000% | 8/1/20 (12) | 1,825 | 1,510 |
| Corona-Norco CA Unified School District GO | 0.000% | 8/1/21 (12) | 2,010 | 1,561 |
| Corona-Norco CA Unified School District GO | 0.000% | 8/1/22 (12) | 1,700 | 1,243 |
| Corona-Norco CA Unified School District GO | 0.000% | 8/1/23 (12) | 1,000 | 682 |
| Corona-Norco CA Unified School District GO | 0.000% | 8/1/25 (12) | 1,325 | 809 |
| Corona-Norco CA Unified School District GO | 0.000% | 8/1/26 (12) | 1,530 | 869 |
| Corona-Norco CA Unified School District GO | 0.000% | 8/1/27 (12) | 1,500 | 782 |
| Corona-Norco CA Unified School District GO | 0.000% | 8/1/28 (12) | 1,290 | 633 |
| Corona-Norco CA Unified School District Special | | | | |
| Tax Revenue (Community Facilities District | | | | |
| No. 98-1) | 5.000% | 9/1/23 | 1,145 | 1,241 |
| Corona-Norco CA Unified School District Special | | | | |
| Tax Revenue (Community Facilities District | | | | |
| No. 98-1) | 5.000% | 9/1/24 | 1,325 | 1,412 |
| Corona-Norco CA Unified School District Special | | | | |
| Tax Revenue (Community Facilities District | | | | |
| No. 98-1) | 5.000% | 9/1/25 | 2,525 | 2,657 |
51
| | | | | |
| California Intermediate-Term Tax-Exempt Fund | | | | |
| |
| |
| |
| | | | | Face | Market |
| | | | Maturity | Amount | Value |
| | | Coupon | Date | ($000) | ($000) |
| | Corona-Norco CA Unified School District Special | | | | |
| | Tax Revenue (Community Facilities District | | | | |
| | No. 98-1) | 5.000% | 9/1/27 | 1,000 | 1,032 |
| | Corona-Norco CA Unified School District Special | | | | |
| | Tax Revenue (Community Facilities District | | | | |
| | No. 98-1) | 5.000% | 9/1/28 | 1,590 | 1,622 |
| | Covina-Valley CA Unified School District GO | 5.000% | 8/1/27 | 2,000 | 2,194 |
| | Covina-Valley CA Unified School District GO | 5.000% | 8/1/28 | 2,000 | 2,174 |
| | Covina-Valley CA Unified School District GO | 5.000% | 8/1/29 | 2,080 | 2,240 |
| | Culver City CA Redevelopment Agency Tax | | | | |
| | Allocation Revenue | 5.375% | 11/1/16 (4) | 3,260 | 3,273 |
| | Cupertino CA Union School District GO | 5.000% | 8/1/25 | 3,235 | 3,705 |
| | Cupertino CA Union School District GO | 5.000% | 8/1/26 | 3,500 | 3,960 |
| 1,2 | East Bay CA Municipal Utility District Waste | | | | |
| | Water System Revenue PUT | 0.000% | 12/1/15 | 11,000 | 11,000 |
| 1,2 | East Bay CA Municipal Utility District Waste | | | | |
| | Water System Revenue PUT | 0.000% | 12/1/15 | 9,000 | 9,000 |
| | East Bay CA Municipal Utility District Water | | | | |
| | System Revenue | 5.000% | 6/1/14 | 2,000 | 2,050 |
| | East Bay CA Municipal Utility District Water | | | | |
| | System Revenue | 5.000% | 6/1/30 | 2,005 | 2,180 |
| | East Bay CA Municipal Utility District Water | | | | |
| | System Revenue | 5.000% | 6/1/31 | 16,020 | 17,185 |
| | East Bay CA Regional Park District Revenue | 5.000% | 9/1/28 | 4,415 | 4,810 |
| | East Side CA Union High School District | | | | |
| | Santa Clara County GO | 5.000% | 8/1/29 | 6,000 | 6,447 |
| | Eastern California Municipal Water District | | | | |
| | Water & Sewer COP | 5.000% | 7/1/26 | 5,245 | 5,724 |
| | Eastern California Municipal Water District | | | | |
| | Water & Sewer COP | 5.000% | 7/1/27 | 6,220 | 6,724 |
| | Eastern California Municipal Water District | | | | |
| | Water & Sewer COP | 5.000% | 7/1/28 | 1,000 | 1,070 |
| | El Camino CA Community College District GO | 0.000% | 8/1/29 | 8,065 | 3,803 |
| | El Camino CA Community College District GO | 0.000% | 8/1/32 | 10,000 | 3,800 |
| | El Camino CA Community College District GO | 0.000% | 8/1/33 | 3,500 | 1,252 |
| | El Dorado CA Irrigation District Revenue | 4.500% | 3/1/19 (4) | 2,000 | 2,251 |
| | El Dorado CA Irrigation District Revenue | 4.750% | 3/1/20 (4) | 1,500 | 1,700 |
| | El Dorado CA Irrigation District Revenue | 5.000% | 3/1/21 (4) | 2,280 | 2,597 |
| | El Dorado County CA Community Facilities | | | | |
| | District No. 92-1 Special Tax Revenue | 5.000% | 9/1/21 | 2,000 | 2,208 |
| | Encinitas CA Community Facilities District | | | | |
| | No. 1 Special Tax Revenue | 5.000% | 9/1/28 | 1,000 | 1,030 |
| | Encinitas CA Community Facilities | | | | |
| | District No. 1 Special Tax Revenue | 5.000% | 9/1/29 | 800 | 818 |
| | Fontana CA Public Financing Authority | | | | |
| | Tax Allocation Revenue | 5.000% | 10/1/21 (2) | 3,335 | 3,523 |
| | Fontana CA Public Financing Authority | | | | |
| | Tax Allocation Revenue | 5.000% | 10/1/23 (2) | 2,875 | 3,037 |
| | Fontana CA Public Financing Authority | | | | |
| | Tax Allocation Revenue | 5.000% | 10/1/24 (2) | 3,575 | 3,735 |
| | Fontana CA Public Financing Authority | | | | |
| | Tax Allocation Revenue | 5.000% | 10/1/26 (2) | 4,480 | 4,529 |
| | Fontana CA Unified School District GO | 5.250% | 8/1/26 (4) | 4,350 | 4,864 |
| | Foothill/Eastern Corridor Agency California | | | | |
| | Toll Road Revenue | 5.375% | 1/15/15 (14) | 5,000 | 5,011 |
52
| | | | |
| California Intermediate-Term Tax-Exempt Fund | | | | |
| |
| |
| |
| | | | Face | Market |
| | | Maturity | Amount | Value |
| | Coupon | Date | ($000) | ($000) |
| Fresno CA Sewer Revenue | 5.000% | 9/1/24 (12) | 830 | 934 |
| Fullerton CA Community Facilities District | | | | |
| No. 1 Special Tax Revenue (Amerige Heights) | 5.000% | 9/1/26 | 1,000 | 1,058 |
| Fullerton CA Community Facilities District | | | | |
| No. 1 Special Tax Revenue (Amerige Heights) | 5.000% | 9/1/32 | 1,600 | 1,613 |
| Gilroy CA School Facilities Finance Authority | | | | |
| Revenue | 5.000% | 8/1/33 | 2,400 | 2,461 |
| Glendale CA Redevelopment Agency Successor | | | | |
| Agency Tax Allocation Revenue (Central | | | | |
| Glendale Redevelopment Project) | 2.000% | 12/1/14 (4) | 1,750 | 1,775 |
| Golden State Tobacco Securitization Corp. | | | | |
| California Revenue | 4.500% | 6/1/27 | 33,020 | 27,509 |
| Grossmont CA Union High School District GO | 0.000% | 8/1/28 | 3,210 | 1,592 |
| Grossmont CA Union High School District GO | 0.000% | 8/1/29 | 6,965 | 3,207 |
| Grossmont-Cuyamaca CA Community College | | | | |
| District GO | 0.000% | 8/1/25 (12) | 14,010 | 8,549 |
| Grossmont-Cuyamaca CA Community College | | | | |
| District GO | 0.000% | 8/1/28 (12) | 21,875 | 10,621 |
| Huntington Beach CA Union High School | | | | |
| District GO | 5.000% | 8/1/14 (Prere.) | 3,530 | 3,644 |
| Imperial CA Irrigation District Electric Revenue | 5.000% | 11/1/26 | 1,500 | 1,612 |
| Inland Empire Tobacco Securitization Authority | | | | |
| California Revenue | 4.625% | 6/1/21 | 7,245 | 6,544 |
| Irvine CA Assessment District No. 89-10 | | | | |
| Improvement Revenue (Northwest Irvine) VRDO | 0.040% | 12/2/13 LOC | 3,659 | 3,659 |
| Irvine CA Assessment District No. 94-13 | | | | |
| Improvement Revenue (Oak Creek) VRDO | 0.040% | 12/2/13 LOC | 4,200 | 4,200 |
| Irvine CA Assessment District No. 97-17 | | | | |
| Improvement Revenue VRDO | 0.040% | 12/2/13 LOC | 5,600 | 5,600 |
| Irvine CA Ranch Water District Revenue VRDO | 0.030% | 12/2/13 LOC | 2,400 | 2,400 |
| Irvine CA Ranch Water District Revenue VRDO | 0.050% | 12/2/13 LOC | 2,300 | 2,300 |
| Irvine CA Reassessment District No. 05-21 | | | | |
| Improvement Revenue VRDO | 0.040% | 12/2/13 LOC | 23,365 | 23,365 |
| Irvine CA Reassessment District No. 12-1 | | | | |
| Improvement Revenue | 4.000% | 9/2/18 | 1,350 | 1,478 |
| Irvine CA Reassessment District No. 12-1 | | | | |
| Improvement Revenue | 4.000% | 9/2/19 | 2,000 | 2,164 |
| Irvine CA Reassessment District No. 12-1 | | | | |
| Improvement Revenue | 4.000% | 9/2/20 | 2,425 | 2,566 |
| Irvine CA Reassessment District No. 12-1 | | | | |
| Improvement Revenue | 4.000% | 9/2/21 | 1,750 | 1,827 |
| Irvine CA Reassessment District No. 12-1 | | | | |
| Improvement Revenue | 5.000% | 9/2/23 | 400 | 442 |
| Irvine CA Reassessment District No. 13-1 | | | | |
| Improvement Revenue | 5.000% | 9/2/20 | 350 | 394 |
| Irvine CA Reassessment District No. 13-1 | | | | |
| Improvement Revenue | 5.000% | 9/2/22 | 1,125 | 1,223 |
| Irvine CA Reassessment District No. 85-7A | | | | |
| Improvement Revenue VRDO | 0.040% | 12/2/13 LOC | 1,200 | 1,200 |
| Irvine CA Unified School District Financing | | | | |
| Authority Special Tax Revenue | 5.000% | 9/1/25 (2) | 8,645 | 8,908 |
| Kaweah CA Delta Health Care District Revenue | 4.000% | 6/1/14 | 2,000 | 2,035 |
| Kaweah CA Delta Health Care District Revenue | 4.000% | 6/1/15 | 1,750 | 1,829 |
| Kaweah CA Delta Health Care District Revenue | 4.000% | 6/1/16 | 2,500 | 2,682 |
| Kaweah CA Delta Health Care District Revenue | 5.000% | 6/1/17 | 1,110 | 1,236 |
53
| | | | |
| California Intermediate-Term Tax-Exempt Fund | | | | |
| |
| |
| |
| | | | Face | Market |
| | | Maturity | Amount | Value |
| | Coupon | Date | ($000) | ($000) |
| Kaweah CA Delta Health Care District Revenue | 5.000% | 6/1/18 | 3,255 | 3,649 |
| Kaweah CA Delta Health Care District Revenue | 5.000% | 6/1/19 | 3,415 | 3,808 |
| Kaweah CA Delta Health Care District Revenue | 5.000% | 6/1/20 | 1,585 | 1,752 |
| Kaweah CA Delta Health Care District Revenue | 5.000% | 6/1/21 | 3,755 | 4,104 |
| Kaweah CA Delta Health Care District Revenue | 5.000% | 6/1/22 | 3,950 | 4,298 |
| Kings River Conservation District California COP | 5.000% | 5/1/14 | 3,500 | 3,564 |
| Kings River Conservation District California COP | 5.000% | 5/1/15 (ETM) | 2,590 | 2,764 |
| Kings River Conservation District California COP | 5.000% | 5/1/15 | 1,755 | 1,856 |
| Lee Lake CA Public Financing Authority Revenue | 5.000% | 9/1/21 | 1,810 | 1,960 |
| Lee Lake CA Public Financing Authority Revenue | 5.000% | 9/1/23 | 2,190 | 2,343 |
| Loma Linda CA Hospital Revenue (Loma Linda | | | | |
| University) | 5.000% | 12/1/18 | 8,665 | 8,918 |
| Long Beach CA Community College District GO | 0.000% | 6/1/29 (4) | 6,380 | 2,935 |
| Long Beach CA Finance Authority Lease Revenue | 6.000% | 11/1/17 (2) | 2,285 | 2,426 |
| Long Beach CA Finance Authority Natural Gas | | | | |
| Purchase Revenue | 5.250% | 11/15/20 | 3,060 | 3,400 |
| Long Beach CA Finance Authority Natural Gas | | | | |
| Purchase Revenue | 1.571% | 11/15/25 | 16,845 | 14,091 |
| Long Beach CA Finance Authority Natural Gas | | | | |
| Purchase Revenue | 1.591% | 11/15/26 | 10,025 | 8,334 |
| Long Beach CA Unified School District GO | 5.000% | 8/1/30 | 5,000 | 5,397 |
| Los Angeles CA Community College District GO | 4.000% | 8/1/14 | 3,500 | 3,590 |
| Los Angeles CA Community College District GO | 5.000% | 8/1/21 (4) | 10,000 | 10,733 |
| Los Angeles CA Community College District GO | 5.000% | 8/1/24 | 6,500 | 7,315 |
| Los Angeles CA Community College District GO | 5.000% | 8/1/25 | 5,000 | 5,549 |
| Los Angeles CA Community College District GO | 5.500% | 8/1/25 | 5,000 | 5,774 |
| Los Angeles CA Community College District GO | 5.000% | 8/1/27 | 6,960 | 7,664 |
| Los Angeles CA Community College District GO | 5.000% | 8/1/27 | 4,250 | 4,615 |
| Los Angeles CA Community College District GO | 4.000% | 8/1/31 | 6,145 | 5,918 |
| Los Angeles CA Community College District GO | 5.000% | 8/1/31 (4) | 5,000 | 5,290 |
| Los Angeles CA Community College District GO | 5.000% | 8/1/32 (4) | 5,000 | 5,248 |
| Los Angeles CA Department of Airports | | | | |
| International Airport Revenue | 5.000% | 5/15/22 | 1,000 | 1,160 |
| Los Angeles CA Department of Airports | | | | |
| International Airport Revenue | 5.000% | 5/15/23 | 1,420 | 1,619 |
| Los Angeles CA Department of Airports | | | | |
| International Airport Revenue | 5.000% | 5/15/24 | 1,700 | 1,908 |
| Los Angeles CA Department of Airports | | | | |
| International Airport Revenue | 5.000% | 5/15/24 | 4,000 | 4,381 |
| Los Angeles CA Department of Airports | | | | |
| International Airport Revenue | 5.000% | 5/15/25 | 1,500 | 1,667 |
| Los Angeles CA Department of Airports | | | | |
| International Airport Revenue | 5.250% | 5/15/25 | 3,000 | 3,330 |
| Los Angeles CA Department of Airports | | | | |
| International Airport Revenue | 5.000% | 5/15/26 | 4,000 | 4,430 |
| Los Angeles CA Department of Airports | | | | |
| International Airport Revenue | 5.250% | 5/15/28 | 10,000 | 10,800 |
| Los Angeles CA Department of Airports | | | | |
| International Airport Revenue | 5.000% | 5/15/29 | 1,115 | 1,197 |
| Los Angeles CA Department of Airports | | | | |
| International Airport Revenue | 5.000% | 5/15/29 | 4,385 | 4,643 |
| Los Angeles CA Department of Airports | | | | |
| International Airport Revenue | 5.250% | 5/15/29 | 10,000 | 10,729 |
| Los Angeles CA Department of Airports | | | | |
| International Airport Revenue | 5.000% | 5/15/30 | 1,835 | 1,930 |
54
| | | | |
| California Intermediate-Term Tax-Exempt Fund | | | | |
| |
| |
| |
| | | | Face | Market |
| | | Maturity | Amount | Value |
| | Coupon | Date | ($000) | ($000) |
| Los Angeles CA Department of Airports | | | | |
| International Airport Revenue | 5.000% | 5/15/30 | 1,200 | 1,278 |
| Los Angeles CA Department of Airports | | | | |
| International Airport Revenue | 5.000% | 5/15/31 | 1,190 | 1,258 |
| Los Angeles CA Department of Airports | | | | |
| International Airport Revenue | 5.000% | 5/15/32 | 1,700 | 1,785 |
| Los Angeles CA Department of Airports | | | | |
| International Airport Revenue | 5.000% | 5/15/33 | 1,510 | 1,579 |
| Los Angeles CA Department of Airports | | | | |
| International Airport Revenue | 5.000% | 5/15/34 | 4,135 | 4,302 |
| Los Angeles CA Department of Water | | | | |
| & Power Revenue | 4.000% | 1/1/16 | 9,075 | 9,701 |
| Los Angeles CA Department of Water | | | | |
| & Power Revenue | 5.000% | 1/1/16 | 8,300 | 9,024 |
| Los Angeles CA Department of Water | | | | |
| & Power Revenue | 5.000% | 7/1/22 | 1,000 | 1,197 |
| Los Angeles CA Department of Water | | | | |
| & Power Revenue | 5.000% | 7/1/22 | 10,000 | 11,760 |
| Los Angeles CA Department of Water | | | | |
| & Power Revenue | 5.000% | 7/1/23 (4) | 20,605 | 22,072 |
| Los Angeles CA Department of Water | | | | |
| & Power Revenue | 5.000% | 7/1/23 | 1,335 | 1,520 |
| Los Angeles CA Department of Water | | | | |
| & Power Revenue | 5.000% | 7/1/23 | 5,605 | 6,578 |
| Los Angeles CA Department of Water | | | | |
| & Power Revenue | 5.000% | 7/1/24 | 2,770 | 3,133 |
| Los Angeles CA Department of Water | | | | |
| & Power Revenue | 5.000% | 7/1/25 | 10,000 | 11,393 |
| Los Angeles CA Department of Water | | | | |
| & Power Revenue | 5.000% | 7/1/25 | 5,000 | 5,675 |
| Los Angeles CA Department of Water | | | | |
| & Power Revenue | 5.000% | 7/1/26 | 2,350 | 2,604 |
| Los Angeles CA Department of Water | | | | |
| & Power Revenue | 5.000% | 7/1/26 | 2,000 | 2,227 |
| Los Angeles CA Department of Water | | | | |
| & Power Revenue | 5.000% | 7/1/26 | 1,500 | 1,684 |
| Los Angeles CA Department of Water | | | | |
| & Power Revenue | 5.000% | 7/1/27 | 5,000 | 5,449 |
| Los Angeles CA Department of Water | | | | |
| & Power Revenue | 5.000% | 7/1/27 | 1,655 | 1,836 |
| Los Angeles CA Department of Water | | | | |
| & Power Revenue | 5.000% | 7/1/28 | 2,000 | 2,215 |
| Los Angeles CA Department of Water | | | | |
| & Power Revenue | 5.000% | 7/1/29 | 1,670 | 1,809 |
| Los Angeles CA Department of Water | | | | |
| & Power Revenue | 5.000% | 7/1/31 (4) | 7,305 | 7,629 |
| Los Angeles CA Department of Water | | | | |
| & Power Revenue | 5.000% | 7/1/31 | 15,000 | 16,160 |
| Los Angeles CA Department of Water | | | | |
| & Power Revenue | 5.000% | 7/1/32 (2) | 1,940 | 2,049 |
| 2 Los Angeles CA Department of Water | | | | |
| & Power Revenue | 5.000% | 7/1/32 | 7,000 | 7,547 |
| Los Angeles CA Department of Water | | | | |
| & Power Revenue | 5.000% | 7/1/32 | 6,055 | 6,478 |
55
| | | | |
| California Intermediate-Term Tax-Exempt Fund | | | | |
| |
| |
| |
| | | | Face | Market |
| | | Maturity | Amount | Value |
| | Coupon | Date | ($000) | ($000) |
| 2 Los Angeles CA Department of Water | | | | |
| & Power Revenue | 5.000% | 7/1/33 | 5,000 | 5,370 |
| 3 Los Angeles CA Department of Water | | | | |
| & Power Revenue TOB VRDO | 0.060% | 12/2/13 | 17,500 | 17,500 |
| Los Angeles CA Department of Water | | | | |
| & Power Revenue VRDO | 0.030% | 12/2/13 | 4,300 | 4,300 |
| Los Angeles CA Department of Water | | | | |
| & Power Revenue VRDO | 0.040% | 12/2/13 | 10,800 | 10,800 |
| Los Angeles CA GO | 5.000% | 9/1/14 (Prere.) | 4,055 | 4,203 |
| Los Angeles CA GO | 5.000% | 9/1/22 | 10,000 | 11,729 |
| Los Angeles CA GO | 5.000% | 9/1/28 | 5,850 | 6,430 |
| Los Angeles CA GO | 5.000% | 9/1/29 | 5,850 | 6,383 |
| Los Angeles CA GO | 5.000% | 9/1/30 | 5,850 | 6,334 |
| Los Angeles CA Harbor Department Revenue | 5.000% | 8/1/23 | 2,250 | 2,580 |
| Los Angeles CA Harbor Department Revenue | 5.000% | 8/1/25 | 3,795 | 4,238 |
| Los Angeles CA Municipal Improvement Corp. | | | | |
| Lease Revenue (Figueroa Plaza) | 5.000% | 8/1/14 (Prere.) | 345 | 356 |
| Los Angeles CA Municipal Improvement Corp. | | | | |
| Lease Revenue (Figueroa Plaza) | 5.000% | 8/1/28 (14)(3) | 8,635 | 8,822 |
| Los Angeles CA Municipal Improvement Corp. | | | | |
| Lease Revenue (Police Headquarters Facility) | 5.000% | 1/1/21 (14) | 10,830 | 11,843 |
| Los Angeles CA Municipal Improvement Corp. | | | | |
| Lease Revenue (Police Headquarters Facility) | 5.000% | 1/1/22 (14) | 6,500 | 7,087 |
| Los Angeles CA Municipal Improvement Corp. | | | | |
| Lease Revenue (Police Headquarters Facility) | 5.000% | 1/1/23 (14) | 14,700 | 15,915 |
| Los Angeles CA Unified School District GO | 5.000% | 7/1/14 | 5,000 | 5,142 |
| Los Angeles CA Unified School District GO | 5.000% | 7/1/14 (ETM) | 5,000 | 5,142 |
| Los Angeles CA Unified School District GO | 6.000% | 7/1/14 (3) | 1,440 | 1,489 |
| Los Angeles CA Unified School District GO | 5.000% | 7/1/15 | 6,350 | 6,832 |
| Los Angeles CA Unified School District GO | 5.000% | 7/1/16 (3) | 2,000 | 2,236 |
| Los Angeles CA Unified School District GO | 5.000% | 7/1/17 (4) | 3,515 | 4,054 |
| Los Angeles CA Unified School District GO | 5.500% | 7/1/17 (3) | 2,800 | 3,279 |
| Los Angeles CA Unified School District GO | 5.000% | 7/1/18 (2) | 4,000 | 4,455 |
| Los Angeles CA Unified School District GO | 5.000% | 7/1/18 (2) | 5,000 | 5,714 |
| Los Angeles CA Unified School District GO | 5.000% | 7/1/19 (3) | 5,000 | 5,136 |
| Los Angeles CA Unified School District GO | 5.000% | 7/1/19 (3) | 5,000 | 5,557 |
| Los Angeles CA Unified School District GO | 5.000% | 7/1/20 (2) | 14,135 | 15,693 |
| Los Angeles CA Unified School District GO | 5.000% | 7/1/20 (3) | 9,000 | 9,992 |
| Los Angeles CA Unified School District GO | 5.000% | 7/1/20 (3) | 5,000 | 5,551 |
| Los Angeles CA Unified School District GO | 5.000% | 7/1/21 (2) | 15,940 | 17,623 |
| Los Angeles CA Unified School District GO | 5.000% | 7/1/22 (2) | 16,760 | 18,516 |
| Los Angeles CA Unified School District GO | 4.500% | 7/1/23 (4) | 30,825 | 33,844 |
| Los Angeles CA Unified School District GO | 5.000% | 7/1/23 (2) | 6,000 | 6,795 |
| Los Angeles CA Unified School District GO | 5.000% | 7/1/23 (4) | 12,975 | 14,695 |
| Los Angeles CA Unified School District GO | 4.500% | 7/1/24 (4) | 6,600 | 7,149 |
| Los Angeles CA Unified School District GO | 5.000% | 7/1/24 (4) | 17,210 | 19,443 |
| Los Angeles CA Unified School District GO | 5.000% | 7/1/25 (2) | 10,235 | 11,241 |
| Los Angeles CA Unified School District GO | 5.250% | 7/1/25 | 1,600 | 1,846 |
| Los Angeles CA Unified School District GO | 4.500% | 7/1/26 (2) | 10,000 | 10,582 |
| Los Angeles CA Unified School District GO | 5.000% | 7/1/26 | 5,710 | 6,473 |
| Los Angeles CA Unified School District GO | 5.000% | 7/1/27 | 8,375 | 9,251 |
| Los Angeles CA Unified School District GO | 5.000% | 7/1/27 | 1,595 | 1,772 |
| Los Angeles CA Unified School District GO | 4.500% | 1/1/28 (14) | 21,405 | 22,013 |
| Los Angeles CA Unified School District GO | 5.000% | 1/1/28 | 8,395 | 9,185 |
| Los Angeles CA Unified School District GO | 5.000% | 7/1/28 (2) | 7,845 | 8,395 |
56
| | | | |
| California Intermediate-Term Tax-Exempt Fund | | | | |
| |
| |
| |
| | | | Face | Market |
| | | Maturity | Amount | Value |
| | Coupon | Date | ($000) | ($000) |
| Los Angeles CA Unified School District GO | 5.250% | 7/1/28 | 5,000 | 5,703 |
| Los Angeles CA Unified School District GO | 5.000% | 7/1/30 (2) | 6,485 | 6,890 |
| Los Angeles CA Wastewater System Revenue | 5.000% | 6/1/15 | 2,650 | 2,845 |
| Los Angeles CA Wastewater System Revenue | 5.000% | 6/1/16 | 2,500 | 2,794 |
| Los Angeles CA Wastewater System Revenue | 5.000% | 6/1/20 | 3,000 | 3,572 |
| Los Angeles CA Wastewater System Revenue | 5.000% | 6/1/26 | 13,045 | 14,700 |
| Los Angeles CA Wastewater System Revenue | 5.000% | 6/1/32 | 10,880 | 11,778 |
| Los Angeles CA Wastewater System Revenue | 5.000% | 6/1/33 | 16,925 | 18,211 |
| Los Angeles County CA Capital Asset Leasing | | | | |
| Corp. Revenue | 6.000% | 12/1/13 (2) | 2,760 | 2,761 |
| Los Angeles County CA Metropolitan | | | | |
| Transportation Authority Sales Tax Revenue | 5.000% | 7/1/16 | 3,250 | 3,640 |
| Los Angeles County CA Metropolitan | | | | |
| Transportation Authority Sales Tax Revenue | 5.000% | 7/1/20 | 6,000 | 7,186 |
| Los Angeles County CA Metropolitan | | | | |
| Transportation Authority Sales Tax Revenue | 5.000% | 7/1/20 | 4,000 | 4,667 |
| Los Angeles County CA Metropolitan | | | | |
| Transportation Authority Sales Tax Revenue | 5.000% | 7/1/21 | 3,000 | 3,596 |
| Los Angeles County CA Metropolitan | | | | |
| Transportation Authority Sales Tax Revenue | 5.000% | 7/1/22 | 10,000 | 11,905 |
| Los Angeles County CA Metropolitan | | | | |
| Transportation Authority Sales Tax Revenue | 5.000% | 7/1/22 | 5,075 | 6,035 |
| Los Angeles County CA Metropolitan | | | | |
| Transportation Authority Sales Tax Revenue | 5.000% | 7/1/23 | 10,000 | 11,726 |
| Los Angeles County CA Public Works Financing | | | | |
| Authority Lease Revenue | 5.000% | 12/1/14 (14) | 24,180 | 25,207 |
| Los Angeles County CA Public Works Financing | | | | |
| Authority Lease Revenue | 5.000% | 12/1/15 (14) | 8,940 | 9,648 |
| Los Angeles County CA Public Works Financing | | | | |
| Authority Lease Revenue | 5.000% | 12/1/19 (14) | 4,860 | 5,227 |
| Los Angeles County CA Public Works Financing | | | | |
| Authority Lease Revenue | 5.000% | 12/1/20 (14) | 5,000 | 5,378 |
| Los Angeles County CA Public Works Financing | | | | |
| Authority Lease Revenue | 5.000% | 8/1/21 | 1,000 | 1,163 |
| Los Angeles County CA Public Works Financing | | | | |
| Authority Lease Revenue | 5.000% | 12/1/21 (14) | 6,460 | 6,928 |
| Los Angeles County CA Public Works Financing | | | | |
| Authority Lease Revenue | 5.000% | 8/1/22 | 1,000 | 1,158 |
| Los Angeles County CA Public Works Financing | | | | |
| Authority Lease Revenue | 5.000% | 12/1/22 (14) | 6,790 | 7,282 |
| Los Angeles County CA Public Works Financing | | | | |
| Authority Lease Revenue | 5.000% | 8/1/23 | 1,500 | 1,694 |
| Los Angeles County CA Public Works Financing | | | | |
| Authority Lease Revenue | 5.000% | 12/1/23 (14) | 2,175 | 2,325 |
| Los Angeles County CA Public Works Financing | | | | |
| Authority Lease Revenue | 5.000% | 8/1/24 | 1,515 | 1,689 |
| Los Angeles County CA Public Works Financing | | | | |
| Authority Lease Revenue | 5.000% | 12/1/24 (14) | 3,095 | 3,301 |
| Los Angeles County CA Public Works Financing | | | | |
| Authority Lease Revenue | 5.000% | 8/1/25 | 1,325 | 1,462 |
| Los Angeles County CA Public Works Financing | | | | |
| Authority Revenue (Regional Park & Open | | | | |
| Space District) | 5.250% | 10/1/17 (4) | 1,000 | 1,167 |
| Los Angeles County CA Unified School District GO | 5.000% | 7/1/21 | 12,500 | 14,843 |
| M-S-R California Energy Authority Revenue | 7.000% | 11/1/34 | 7,000 | 8,596 |
57
| | | | |
| California Intermediate-Term Tax-Exempt Fund | | | | |
| |
| |
| |
| | | | Face | Market |
| | | Maturity | Amount | Value |
| | Coupon | Date | ($000) | ($000) |
| Marysville CA Revenue (Fremont-Rideout | | | | |
| Health Group) | 5.250% | 1/1/23 | 1,035 | 1,120 |
| Marysville CA Revenue (Fremont-Rideout | | | | |
| Health Group) | 5.250% | 1/1/25 | 2,630 | 2,786 |
| Marysville CA Revenue (Fremont-Rideout | | | | |
| Health Group) | 5.250% | 1/1/28 | 1,500 | 1,546 |
| Metropolitan Water District of Southern | | | | |
| California Revenue | 5.000% | 7/1/17 | 15,000 | 17,352 |
| Metropolitan Water District of Southern | | | | |
| California Revenue | 5.000% | 7/1/18 | 20,000 | 23,570 |
| Metropolitan Water District of Southern | | | | |
| California Revenue | 5.000% | 7/1/20 | 4,000 | 4,799 |
| Metropolitan Water District of Southern | | | | |
| California Revenue | 5.000% | 7/1/21 | 2,700 | 3,236 |
| Metropolitan Water District of Southern | | | | |
| California Revenue | 5.000% | 7/1/30 | 2,120 | 2,338 |
| Metropolitan Water District of Southern | | | | |
| California Revenue | 5.000% | 10/1/30 | 8,585 | 9,444 |
| Metropolitan Water District of Southern | | | | |
| California Revenue | 5.000% | 1/1/31 | 1,150 | 1,253 |
| Metropolitan Water District of Southern | | | | |
| California Revenue | 5.000% | 7/1/31 | 2,250 | 2,460 |
| Metropolitan Water District of Southern | | | | |
| California Revenue | 5.000% | 7/1/31 | 2,930 | 3,196 |
| Metropolitan Water District of Southern | | | | |
| California Revenue | 5.000% | 10/1/31 | 11,065 | 12,072 |
| Metropolitan Water District of Southern | | | | |
| California Revenue | 5.000% | 10/1/32 | 9,965 | 10,812 |
| Metropolitan Water District of Southern | | | | |
| California Revenue PUT | 2.500% | 10/1/14 | 5,000 | 5,066 |
| 1 Metropolitan Water District of Southern | | | | |
| California Revenue PUT | 0.200% | 5/1/15 | 5,000 | 4,995 |
| 1 Metropolitan Water District of Southern | | | | |
| California Revenue PUT | 0.200% | 5/1/15 | 5,000 | 4,995 |
| 1 Metropolitan Water District of Southern | | | | |
| California Revenue PUT | 0.400% | 5/1/15 | 10,000 | 10,001 |
| Metropolitan Water District of Southern | | | | |
| California Revenue VRDO | 0.040% | 12/6/13 | 1,500 | 1,500 |
| Modesto CA Irrigation District COP | 5.000% | 10/1/21 (2) | 2,030 | 2,161 |
| Modesto CA Irrigation District COP | 5.000% | 10/1/22 (2) | 2,515 | 2,665 |
| Modesto CA Irrigation District COP | 5.000% | 10/1/23 (2) | 2,645 | 2,788 |
| Modesto CA Irrigation District COP | 5.000% | 7/1/27 | 3,855 | 4,066 |
| Modesto CA Irrigation District Electric Revenue | 5.000% | 7/1/21 | 1,000 | 1,167 |
| Modesto CA Irrigation District Electric Revenue | 5.000% | 7/1/22 | 1,000 | 1,162 |
| 2 Morgan Hill CA Redevelopment Agency | | | | |
| Successor Agency Tax Allocation Revenue | 5.000% | 9/1/27 | 3,000 | 3,249 |
| 2 Morgan Hill CA Redevelopment Agency | | | | |
| Successor Agency Tax Allocation Revenue | 5.000% | 9/1/28 | 5,075 | 5,422 |
| 2 Morgan Hill CA Redevelopment Agency | | | | |
| Successor Agency Tax Allocation Revenue | 5.000% | 9/1/29 | 5,430 | 5,757 |
| 2 Morgan Hill CA Redevelopment Agency | | | | |
| Successor Agency Tax Allocation Revenue | 5.000% | 9/1/30 | 5,705 | 5,997 |
| 2 Morgan Hill CA Redevelopment Agency | | | | |
| Successor Agency Tax Allocation Revenue | 5.000% | 9/1/31 | 2,990 | 3,128 |
58
| | | | |
| California Intermediate-Term Tax-Exempt Fund | | | | |
| |
| |
| |
| | | | Face | Market |
| | | Maturity | Amount | Value |
| | Coupon | Date | ($000) | ($000) |
| 2 Morgan Hill CA Redevelopment Agency | | | | |
| Successor Agency Tax Allocation Revenue | 5.000% | 9/1/32 | 4,315 | 4,484 |
| 2 Morgan Hill CA Redevelopment Agency | | | | |
| Successor Agency Tax Allocation Revenue | 5.000% | 9/1/33 | 2,000 | 2,070 |
| Mount San Antonio CA Community College | | | | |
| District GO | 0.000% | 8/1/28 | 3,000 | 2,013 |
| New Haven CA Unified School District GO | 12.000% | 8/1/15 (4) | 2,905 | 3,460 |
| Newport Beach CA Revenue (Hoag Memorial | | | | |
| Hospital Presbyterian) | 5.875% | 12/1/21 (Prere.) | 5,150 | 6,522 |
| Newport Mesa CA Unified School District GO | 0.000% | 8/1/29 | 4,000 | 1,982 |
| Newport Mesa CA Unified School District GO | 0.000% | 8/1/30 | 3,000 | 1,399 |
| Newport Mesa CA Unified School District GO | 0.000% | 8/1/31 | 1,500 | 641 |
| Newport Mesa CA Unified School District GO | 0.000% | 8/1/32 | 14,000 | 5,629 |
| Northern California Gas Authority No. 1 Revenue | 0.766% | 7/1/17 | 23,385 | 22,605 |
| Northern California Power Agency Capital | | | | |
| Facilities Revenue | 5.000% | 8/1/20 | 1,000 | 1,138 |
| Northern California Power Agency Revenue | | | | |
| (Hydroelectric Project) | 5.000% | 7/1/16 | 1,745 | 1,943 |
| Northern California Power Agency Revenue | | | | |
| (Hydroelectric Project) | 5.000% | 7/1/17 | 3,290 | 3,766 |
| Northern California Power Agency Revenue | | | | |
| (Hydroelectric Project) | 5.000% | 7/1/19 | 1,500 | 1,760 |
| Northern California Power Agency Revenue | | | | |
| (Hydroelectric Project) | 5.000% | 7/1/20 | 3,500 | 3,992 |
| Northern California Power Agency Revenue | | | | |
| (Hydroelectric Project) | 5.000% | 7/1/21 | 2,500 | 2,800 |
| Northern California Power Agency Revenue | | | | |
| (Hydroelectric Project) | 5.000% | 7/1/22 | 3,395 | 3,751 |
| Northern California Power Agency Revenue | | | | |
| (Hydroelectric Project) | 5.000% | 7/1/28 | 5,000 | 5,360 |
| Northern California Power Agency Revenue | | | | |
| (Hydroelectric Project) | 5.000% | 7/1/29 | 3,000 | 3,194 |
| Northern California Power Agency Revenue | | | | |
| (Hydroelectric Project) | 5.000% | 7/1/30 | 1,605 | 1,701 |
| Northern California Power Agency Revenue | | | | |
| (Hydroelectric Project) | 5.000% | 7/1/31 | 1,600 | 1,684 |
| Oakland CA GO | 5.000% | 1/15/31 | 3,000 | 3,107 |
| Oakland CA Joint Powers Financing Authority | | | | |
| Lease Revenue (Administration Buildings) | 5.000% | 8/1/23 (12) | 5,000 | 5,406 |
| Oakland CA Joint Powers Financing Authority | | | | |
| Lease Revenue (Administration Buildings) | 5.000% | 8/1/24 (12) | 3,695 | 3,941 |
| Oakland CA Joint Powers Financing Authority | | | | |
| Lease Revenue (Administration Buildings) | 5.000% | 8/1/25 (12) | 5,405 | 5,729 |
| Oakland CA Joint Powers Financing Authority | | | | |
| Lease Revenue (Administration Buildings) | 5.000% | 8/1/26 (12) | 4,190 | 4,420 |
| Oakland CA Redevelopment Agency Tax | | | | |
| Allocation Revenue (Central District Project) | 5.000% | 9/1/15 (Prere.) | 12,870 | 13,870 |
| Oakland CA Redevelopment Agency Tax | | | | |
| Allocation Revenue (Central District Project) | 5.000% | 9/1/21 | 3,000 | 3,394 |
| Oakland CA Unified School District GO | 5.000% | 8/1/19 (4) | 13,425 | 14,635 |
| Oakland CA Unified School District GO | 5.500% | 8/1/23 | 1,000 | 1,087 |
| Oakland CA Unified School District GO | 6.250% | 8/1/28 | 2,000 | 2,171 |
| Ohlone CA Community College District GO | 5.000% | 8/1/22 | 750 | 891 |
| Ohlone CA Community College District GO | 5.000% | 8/1/23 | 1,500 | 1,753 |
| Ohlone CA Community College District GO | 5.000% | 8/1/31 | 1,770 | 1,871 |
59
| | | | |
| California Intermediate-Term Tax-Exempt Fund | | | | |
| |
| |
| |
| | | | Face | Market |
| | | Maturity | Amount | Value |
| | Coupon | Date | ($000) | ($000) |
| Ontario Public Financing Authority Water Revenue | 5.250% | 7/1/27 | 1,285 | 1,444 |
| Ontario Public Financing Authority Water Revenue | 5.250% | 7/1/28 | 1,765 | 1,964 |
| Ontario Public Financing Authority Water Revenue | 5.250% | 7/1/29 | 2,280 | 2,518 |
| Ontario Public Financing Authority Water Revenue | 5.250% | 7/1/30 | 1,400 | 1,538 |
| Ontario Public Financing Authority Water Revenue | 5.250% | 7/1/31 | 2,525 | 2,755 |
| Ontario Public Financing Authority Water Revenue | 5.250% | 7/1/32 | 2,660 | 2,885 |
| Ontario Public Financing Authority Water Revenue | 5.250% | 7/1/33 | 2,165 | 2,348 |
| Orange County CA Development Agency Tax | | | | |
| Allocation Revenue | 5.250% | 9/1/14 (14) | 1,415 | 1,420 |
| Orange County CA Development Agency Tax | | | | |
| Allocation Revenue | 5.250% | 9/1/15 (14) | 1,485 | 1,489 |
| Orange County CA Development Agency Tax | | | | |
| Allocation Revenue | 5.375% | 9/1/16 (14) | 1,570 | 1,574 |
| Orange County CA Transportation Authority | | | | |
| Toll Road Revenue | 5.000% | 8/15/22 | 1,000 | 1,156 |
| Orange County CA Transportation Authority | | | | |
| Toll Road Revenue | 5.000% | 8/15/27 | 2,500 | 2,733 |
| Orange County CA Transportation Authority | | | | |
| Toll Road Revenue | 5.000% | 8/15/28 | 2,545 | 2,754 |
| Orange County CA Water District COP | 5.000% | 8/15/29 | 6,925 | 7,482 |
| Orange County CA Water District Revenue | 5.000% | 8/15/33 | 8,000 | 8,685 |
| Palm Springs CA Unified School District GO | 5.000% | 8/1/28 | 1,000 | 1,085 |
| Palm Springs CA Unified School District GO | 5.000% | 8/1/29 | 1,500 | 1,614 |
| Palm Springs CA Unified School District GO | 5.000% | 8/1/30 | 1,500 | 1,602 |
| Palm Springs CA Unified School District GO | 5.000% | 8/1/31 | 1,500 | 1,593 |
| Palo Alto CA Improvement Revenue (University | | | | |
| Avenue Area Parking) | 4.000% | 9/2/19 | 1,000 | 1,069 |
| Palo Alto CA Improvement Revenue (University | | | | |
| Avenue Area Parking) | 4.000% | 9/2/20 | 250 | 264 |
| Palo Alto CA Improvement Revenue (University | | | | |
| Avenue Area Parking) | 4.000% | 9/2/21 | 400 | 414 |
| Palo Alto CA Improvement Revenue (University | | | | |
| Avenue Area Parking) | 5.000% | 9/2/27 | 1,000 | 1,028 |
| Palo Alto CA Unified School District GO | 0.000% | 8/1/24 | 15,890 | 10,681 |
| Palomar Pomerado Health California COP | 6.625% | 11/1/29 | 5,000 | 5,174 |
| Palomar Pomerado Health California GO | 0.000% | 8/1/22 (14) | 3,000 | 2,153 |
| Palomar Pomerado Health California GO | 0.000% | 8/1/24 (12) | 5,130 | 3,212 |
| Palomar Pomerado Health California GO | 0.000% | 8/1/27 (12) | 3,095 | 1,562 |
| Pasadena CA Unified School District GO | 5.000% | 5/1/30 | 3,695 | 3,938 |
| Pasadena CA Unified School District GO | 5.000% | 5/1/31 | 1,500 | 1,589 |
| Pasadena CA Unified School District GO | 5.000% | 5/1/32 | 2,000 | 2,110 |
| Pittsburg CA Redevelopment Agency Tax | | | | |
| Allocation Revenue (Los Medanos | | | | |
| Community Development Project) | 0.000% | 8/1/20 (2) | 2,460 | 1,880 |
| Pittsburg CA Redevelopment Agency Tax | | | | |
| Allocation Revenue (Los Medanos | | | | |
| Community Development Project) | 4.750% | 8/1/24 (14) | 3,050 | 3,051 |
| Pittsburg CA Redevelopment Agency Tax | | | | |
| Allocation Revenue (Los Medanos | | | | |
| Community Development Project) | 0.000% | 8/1/25 (2) | 2,930 | 1,573 |
| Pomona CA Single Family Mortgage Revenue | 7.600% | 5/1/23 (ETM) | 9,050 | 11,650 |
| Port of Oakland CA Revenue | 5.000% | 11/1/20 (14) | 4,825 | 5,358 |
| Port of Oakland CA Revenue | 5.000% | 11/1/26 (14) | 9,800 | 10,449 |
| Poway CA Unified School District GO | 4.000% | 9/1/16 | 250 | 268 |
| Poway CA Unified School District GO | 0.000% | 8/1/17 | 2,000 | 1,889 |
60
| | | | |
| California Intermediate-Term Tax-Exempt Fund | | | | |
| |
| |
| |
| | | | Face | Market |
| | | Maturity | Amount | Value |
| | Coupon | Date | ($000) | ($000) |
| Poway CA Unified School District GO | 4.000% | 9/1/17 | 250 | 270 |
| Poway CA Unified School District GO | 0.000% | 8/1/18 | 4,565 | 4,140 |
| Poway CA Unified School District GO | 4.000% | 9/1/18 | 450 | 486 |
| Poway CA Unified School District GO | 0.000% | 8/1/19 | 5,425 | 4,707 |
| Poway CA Unified School District GO | 5.000% | 9/1/19 | 995 | 1,134 |
| Poway CA Unified School District GO | 0.000% | 8/1/20 | 3,280 | 2,714 |
| Poway CA Unified School District GO | 5.000% | 9/1/20 | 615 | 699 |
| Poway CA Unified School District GO | 5.000% | 9/1/21 | 325 | 368 |
| Poway CA Unified School District GO | 5.000% | 9/1/22 | 460 | 519 |
| Poway CA Unified School District GO | 5.000% | 9/1/23 | 1,575 | 1,753 |
| Poway CA Unified School District GO | 5.000% | 8/1/26 | 5,125 | 5,674 |
| Poway CA Unified School District GO | 5.000% | 9/1/26 | 1,000 | 1,072 |
| Poway CA Unified School District GO | 0.000% | 8/1/28 | 9,070 | 4,448 |
| Poway CA Unified School District GO | 5.000% | 9/1/29 | 1,210 | 1,256 |
| Poway CA Unified School District GO | 5.000% | 9/1/30 | 2,570 | 2,647 |
| Poway CA Unified School District GO | 0.000% | 8/1/31 | 1,095 | 439 |
| Poway CA Unified School District Public | | | | |
| Financing Authority Special Tax Revenue | 4.000% | 9/15/22 | 435 | 441 |
| Poway CA Unified School District Public | | | | |
| Financing Authority Special Tax Revenue | 5.000% | 9/15/30 | 1,000 | 1,004 |
| Poway CA Unified School District Public | | | | |
| Financing Authority Special Tax Revenue | 5.000% | 9/15/32 | 1,000 | 995 |
| Rancho Cucamonga CA Redevelopment | | | | |
| Agency Tax Allocation Revenue (Rancho | | | | |
| Redevelopment Project) | 5.000% | 9/1/15 (2) | 2,835 | 2,930 |
| Rancho Cucamonga CA Redevelopment | | | | |
| Agency Tax Allocation Revenue (Rancho | | | | |
| Redevelopment Project) | 5.000% | 9/1/16 (2) | 5,100 | 5,263 |
| Rancho Mirage CA Joint Powers Financing | | | | |
| Authority Revenue (Eisenhower Medical Center) | 5.000% | 7/1/27 | 12,000 | 12,078 |
| Redwood City CA Redevelopment Agency | | | | |
| Redevelopment Project Area No. 2 Tax | | | | |
| Allocation Revenue | 0.000% | 7/15/25 (2) | 3,350 | 1,816 |
| Rio Hondo CA Community College District GO | 0.000% | 8/1/31 | 2,000 | 794 |
| Riverside CA Electric Revenue | 5.000% | 10/1/24 (4) | 1,000 | 1,086 |
| Riverside CA Electric Revenue | 5.000% | 10/1/25 (4) | 2,000 | 2,155 |
| Riverside CA Electric Revenue | 5.000% | 10/1/26 (4) | 2,500 | 2,674 |
| Riverside CA Electric Revenue | 5.000% | 10/1/27 (4) | 3,570 | 3,794 |
| 3 Riverside CA Electric Revenue TOB VRDO | 0.060% | 12/2/13 | 1,595 | 1,595 |
| Riverside CA Electric Revenue VRDO | 0.030% | 12/6/13 LOC | 10,200 | 10,200 |
| Riverside CA Unified School District Financing | | | | |
| Authority Revenue | 5.000% | 9/1/19 | 1,220 | 1,364 |
| Riverside CA Unified School District Financing | | | | |
| Authority Revenue | 5.000% | 9/1/20 | 1,280 | 1,423 |
| Riverside CA Unified School District Financing | | | | |
| Authority Revenue | 5.000% | 9/1/23 | 1,410 | 1,530 |
| Riverside CA Unified School District Financing | | | | |
| Authority Revenue | 5.000% | 9/1/25 | 1,555 | 1,636 |
| Riverside CA Unified School District Financing | | | | |
| Authority Revenue | 5.000% | 9/1/26 | 1,615 | 1,684 |
| Riverside CA Unified School District Financing | | | | |
| Authority Revenue | 5.000% | 9/1/27 | 1,710 | 1,775 |
| Riverside County CA Asset Leasing Corp. | | | | |
| Leasehold Revenue (Riverside County | | | | |
| Hospital Project) | 5.000% | 6/1/15 | 3,000 | 3,195 |
61
| | | | |
| California Intermediate-Term Tax-Exempt Fund | | | | |
| |
| |
| |
| | | | Face | Market |
| | | Maturity | Amount | Value |
| | Coupon | Date | ($000) | ($000) |
| Riverside County CA Asset Leasing Corp. | | | | |
| Leasehold Revenue (Riverside County | | | | |
| Hospital Project) | 5.000% | 6/1/19 | 3,660 | 4,186 |
| Riverside County CA Transportation Commission | | | | |
| Sales Tax Revenue | 5.250% | 6/1/30 | 3,000 | 3,329 |
| Riverside County CA Transportation Commission | | | | |
| Sales Tax Revenue | 5.250% | 6/1/31 | 4,000 | 4,409 |
| Riverside County CA Transportation Commission | | | | |
| Sales Tax Revenue | 5.250% | 6/1/32 | 3,000 | 3,287 |
| Riverside County CA Transportation Commission | | | | |
| Sales Tax Revenue | 5.250% | 6/1/33 | 2,000 | 2,193 |
| Riverside County CA Transportation Commission | | | | |
| Sales Tax Revenue VRDO | 0.030% | 12/6/13 | 9,810 | 9,810 |
| Riverside County CA Transportation Commission | | | | |
| Toll Revenue | 0.000% | 6/1/22 | 2,500 | 1,620 |
| Riverside County CA Transportation Commission | | | | |
| Toll Revenue | 0.000% | 6/1/23 | 3,630 | 2,196 |
| Riverside County CA Transportation Commission | | | | |
| Toll Revenue | 0.000% | 6/1/24 | 6,985 | 3,957 |
| Riverside County CA Transportation Commission | | | | |
| Toll Revenue | 0.000% | 6/1/31 | 5,000 | 1,643 |
| Riverside County CA Transportation Commission | | | | |
| Toll Revenue | 0.000% | 6/1/32 | 4,000 | 1,244 |
| Riverside County CA Transportation Commission | | | | |
| Toll Revenue | 0.000% | 6/1/33 | 5,500 | 1,595 |
| Riverside County CA Transportation Commission | | | | |
| Toll Revenue | 0.000% | 6/1/34 | 3,500 | 947 |
| Rocklin CA Unified School District GO | 0.000% | 8/1/23 (14) | 7,030 | 4,796 |
| Rocklin CA Unified School District GO | 0.000% | 8/1/24 (14) | 2,965 | 1,919 |
| Roseville CA Electric System Revenue | 5.000% | 2/1/30 | 6,120 | 6,373 |
| Roseville CA Natural Gas Financing Authority | | | | |
| Gas Revenue | 5.000% | 2/15/18 | 4,180 | 4,581 |
| Roseville CA Natural Gas Financing Authority | | | | |
| Gas Revenue | 5.000% | 2/15/19 | 10,000 | 11,013 |
| Roseville CA Natural Gas Financing Authority | | | | |
| Gas Revenue | 5.000% | 2/15/20 | 2,000 | 2,189 |
| Sacramento CA Cogeneration Authority Revenue | 5.000% | 7/1/17 | 1,250 | 1,427 |
| Sacramento CA Cogeneration Authority Revenue | 5.000% | 7/1/18 | 725 | 842 |
| Sacramento CA Cogeneration Authority Revenue | 5.000% | 7/1/19 | 1,155 | 1,350 |
| Sacramento CA Cogeneration Authority Revenue | 5.250% | 7/1/20 | 1,250 | 1,476 |
| Sacramento CA Cogeneration Authority Revenue | 5.250% | 7/1/21 | 1,000 | 1,177 |
| Sacramento CA Financing Authority Lease | | | | |
| Revenue | 5.000% | 11/1/14 (14) | 780 | 804 |
| Sacramento CA Financing Authority Lease | | | | |
| Revenue | 5.375% | 12/1/14 (4) | 1,630 | 1,637 |
| Sacramento CA Financing Authority Lease | | | | |
| Revenue | 5.000% | 12/1/19 (14) | 12,860 | 13,628 |
| Sacramento CA Financing Authority Lease | | | | |
| Revenue | 5.000% | 12/1/20 (14) | 13,670 | 14,353 |
| Sacramento CA Municipal Utility District Financing | | | | |
| Authority Revenue | 5.000% | 7/1/21 (14) | 7,710 | 8,344 |
| Sacramento CA Municipal Utility District Financing | | | | |
| Authority Revenue (Cosumnes Project) | 4.750% | 7/1/23 (14) | 1,500 | 1,578 |
| Sacramento CA Municipal Utility District Revenue | 5.000% | 8/15/14 | 2,810 | 2,906 |
| Sacramento CA Municipal Utility District Revenue | 5.000% | 8/15/15 | 2,640 | 2,848 |
62
| | | | |
| California Intermediate-Term Tax-Exempt Fund | | | | |
| |
| |
| |
| | | | Face | Market |
| | | Maturity | Amount | Value |
| | Coupon | Date | ($000) | ($000) |
| Sacramento CA Municipal Utility District Revenue | 5.000% | 7/1/17 (14) | 4,000 | 4,393 |
| Sacramento CA Municipal Utility District Revenue | 5.250% | 7/1/24 (2) | 10,085 | 11,692 |
| Sacramento CA Municipal Utility District Revenue | 5.000% | 8/15/24 (4) | 7,550 | 8,456 |
| Sacramento CA Municipal Utility District Revenue | 5.000% | 8/15/24 | 2,660 | 3,021 |
| Sacramento CA Municipal Utility District Revenue | 5.000% | 8/15/25 (4) | 15,275 | 16,907 |
| Sacramento CA Municipal Utility District Revenue | 5.000% | 8/15/25 | 5,455 | 6,120 |
| Sacramento CA Municipal Utility District Revenue | 5.000% | 8/15/26 (4) | 5,000 | 5,505 |
| Sacramento CA Municipal Utility District Revenue | 5.000% | 8/15/27 | 4,905 | 5,407 |
| Sacramento CA Municipal Utility District Revenue | 5.000% | 8/15/28 | 2,000 | 2,181 |
| Sacramento CA Municipal Utility District Revenue | 5.000% | 8/15/30 | 6,435 | 6,836 |
| 2 Sacramento CA Municipal Utility District Revenue | | | | |
| VRDO | 0.040% | 12/6/13 LOC | 44,500 | 44,500 |
| Sacramento CA Regional Transit District Farebox | | | | |
| Revenue | 5.000% | 3/1/22 | 1,000 | 1,093 |
| Sacramento CA Regional Transit District Farebox | | | | |
| Revenue | 5.000% | 3/1/28 | 2,500 | 2,585 |
| Sacramento CA Regional Transit District Farebox | | | | |
| Revenue | 5.000% | 3/1/29 | 2,635 | 2,700 |
| Sacramento CA Regional Transit District Farebox | | | | |
| Revenue | 5.000% | 3/1/30 | 2,975 | 3,047 |
| Sacramento CA Regional Transit District Farebox | | | | |
| Revenue | 5.000% | 3/1/31 | 3,125 | 3,182 |
| Sacramento CA Transportation Authority Sales | | | | |
| Tax Revenue | 5.000% | 10/1/21 | 2,300 | 2,732 |
| Sacramento CA Transportation Authority Sales | | | | |
| Tax Revenue VRDO | 0.040% | 12/6/13 | 15,000 | 15,000 |
| Sacramento CA Water Revenue | 5.000% | 9/1/27 | 3,210 | 3,589 |
| Sacramento County CA Airport Revenue | 5.000% | 7/1/23 (4) | 2,000 | 2,231 |
| Sacramento County CA Airport Revenue | 5.000% | 7/1/24 (4) | 2,500 | 2,739 |
| Sacramento County CA Airport Revenue | 5.000% | 7/1/24 (4) | 1,785 | 1,917 |
| Sacramento County CA Airport Revenue | 5.000% | 7/1/28 | 1,250 | 1,325 |
| Sacramento County CA Airport Revenue | 5.000% | 7/1/30 | 3,615 | 3,797 |
| Sacramento County CA Sanitation Districts | | | | |
| Financing Authority Revenue | 5.000% | 12/1/21 (14) | 1,850 | 2,038 |
| Sacramento County CA Sanitation Districts | | | | |
| Financing Authority Revenue | 5.000% | 12/1/22 (14) | 5,495 | 6,046 |
| Sacramento County CA Sanitation Districts | | | | |
| Financing Authority Revenue | 5.000% | 12/1/23 (14) | 7,030 | 7,709 |
| 2 Saddleback Valley CA Unified School | | | | |
| District GO | 5.000% | 8/1/29 | 3,000 | 3,256 |
| San Bernardino CA City Unified School | | | | |
| District GO | 5.000% | 8/1/20 (4) | 765 | 880 |
| San Bernardino CA City Unified School | | | | |
| District GO | 5.000% | 8/1/21 (4) | 1,230 | 1,404 |
| San Bernardino CA City Unified School | | | | |
| District GO | 5.000% | 8/1/22 (4) | 1,500 | 1,702 |
| San Bernardino CA City Unified School | | | | |
| District GO | 5.000% | 8/1/23 (4) | 1,100 | 1,241 |
| San Bernardino CA City Unified School | | | | |
| District GO | 5.000% | 8/1/24 (4) | 1,400 | 1,554 |
| San Bernardino CA Community College | | | | |
| District GO | 5.000% | 8/1/24 | 4,375 | 5,014 |
| San Bernardino CA Community College | | | | |
| District GO | 5.000% | 8/1/25 | 4,550 | 5,122 |
63
| | | | |
| California Intermediate-Term Tax-Exempt Fund | | | | |
| |
| |
| |
| | | | Face | Market |
| | | Maturity | Amount | Value |
| | Coupon | Date | ($000) | ($000) |
| San Bernardino CA Community College | | | | |
| District GO | 5.000% | 8/1/26 | 4,150 | 4,581 |
| San Bernardino County CA Justice Center | | | | |
| & Airport COP | 5.000% | 7/1/14 (14) | 5,585 | 5,690 |
| San Bernardino County CA Medical Center COP | 5.500% | 8/1/17 (14) | 2,905 | 3,021 |
| San Bernardino County CA Medical Center COP | 6.500% | 8/1/17 (14) | 3,135 | 3,307 |
| San Bernardino County CA Medical Center COP | 5.500% | 8/1/22 (14) | 8,940 | 9,756 |
| San Bernardino County CA Transportation | | | | |
| Authority Revenue | 5.000% | 3/1/31 | 3,355 | 3,616 |
| San Diego CA Community College District GO | 5.000% | 8/1/28 | 4,000 | 4,415 |
| San Diego CA Community College District GO | 5.000% | 8/1/29 | 5,000 | 5,427 |
| San Diego CA Community College District GO | 5.000% | 8/1/30 | 8,670 | 9,362 |
| San Diego CA Community College District GO | 5.000% | 8/1/30 | 9,830 | 10,615 |
| San Diego CA Community College District GO | 5.000% | 8/1/30 | 1,250 | 1,371 |
| San Diego CA Community College District GO | 5.000% | 8/1/31 | 3,380 | 3,629 |
| San Diego CA Community College District GO | 5.000% | 8/1/31 | 1,000 | 1,090 |
| San Diego CA Community College District GO | 5.000% | 8/1/32 | 2,000 | 2,138 |
| San Diego CA Community College District GO | 5.000% | 8/1/32 | 2,150 | 2,330 |
| 3 San Diego CA Community College District GO | | | | |
| TOB VRDO | 0.070% | 12/6/13 | 3,290 | 3,290 |
| San Diego CA Community Facilities | | | | |
| District No. 1 (Miramar Ranch North) | | | | |
| Special Tax Revenue | 4.000% | 9/1/17 | 500 | 548 |
| San Diego CA Community Facilities | | | | |
| District No. 1 (Miramar Ranch North) | | | | |
| Special Tax Revenue | 4.000% | 9/1/18 | 3,260 | 3,574 |
| San Diego CA Community Facilities | | | | |
| District No. 1 (Miramar Ranch North) | | | | |
| Special Tax Revenue | 5.000% | 9/1/20 | 3,470 | 3,954 |
| San Diego CA Public Facilities Financing | | | | |
| Authority Sewer Revenue | 5.000% | 5/15/24 | 3,000 | 3,374 |
| San Diego CA Public Facilities Financing | | | | |
| Authority Sewer Revenue | 5.250% | 5/15/25 | 2,000 | 2,269 |
| San Diego CA Public Facilities Financing | | | | |
| Authority Sewer Revenue | 5.000% | 5/15/27 | 6,000 | 6,483 |
| San Diego CA Public Facilities Financing | | | | |
| Authority Sewer Revenue | 5.250% | 5/15/27 | 5,000 | 5,563 |
| San Diego CA Public Facilities Financing | | | | |
| Authority Sewer Revenue | 5.000% | 5/15/28 | 1,825 | 1,943 |
| San Diego CA Public Facilities Financing | | | | |
| Authority Water Revenue | 5.000% | 8/1/27 | 4,215 | 4,577 |
| San Diego CA Public Facilities Financing | | | | |
| Authority Water Revenue | 5.125% | 8/1/28 | 5,000 | 5,428 |
| San Diego CA Public Facilities Financing | | | | |
| Authority Water Revenue | 5.250% | 8/1/28 | 5,355 | 5,933 |
| San Diego CA Public Facilities Financing | | | | |
| Authority Water Revenue | 5.000% | 8/1/32 | 4,190 | 4,485 |
| San Diego CA Unified School District GO | 0.000% | 7/1/14 (14) | 3,400 | 3,394 |
| San Diego CA Unified School District GO | 0.500% | 7/1/15 | 3,500 | 3,507 |
| San Diego CA Unified School District GO | 0.000% | 7/1/18 (14) | 9,500 | 8,640 |
| San Diego CA Unified School District GO | 5.500% | 7/1/20 (4) | 9,490 | 11,557 |
| San Diego CA Unified School District GO | 5.500% | 7/1/22 (4) | 12,790 | 15,717 |
| San Diego CA Unified School District GO | 5.500% | 7/1/25 (14) | 4,800 | 5,716 |
| San Diego CA Unified School District GO | 0.000% | 7/1/26 | 8,425 | 4,953 |
| San Diego CA Unified School District GO | 5.500% | 7/1/26 (4) | 7,490 | 8,833 |
64
| | | | |
| California Intermediate-Term Tax-Exempt Fund | | | | |
| |
| |
| |
| | | | Face | Market |
| | | Maturity | Amount | Value |
| | Coupon | Date | ($000) | ($000) |
| San Diego CA Unified School District GO | 0.000% | 7/1/27 | 8,500 | 4,680 |
| San Diego CA Unified School District GO | 0.000% | 7/1/28 | 8,000 | 4,123 |
| San Diego CA Unified School District GO | 0.000% | 7/1/29 | 3,250 | 1,559 |
| San Diego CA Unified School District GO | 0.000% | 7/1/30 | 9,985 | 4,495 |
| San Diego CA Unified School District GO | 0.000% | 7/1/30 | 2,500 | 1,125 |
| San Diego County CA COP | 5.000% | 2/1/22 (2) | 2,000 | 2,093 |
| San Diego County CA Regional Airport Authority | | | | |
| Revenue | 5.000% | 7/1/23 | 3,900 | 4,276 |
| San Diego County CA Regional Airport Authority | | | | |
| Revenue | 5.000% | 7/1/25 | 9,000 | 9,651 |
| San Diego County CA Regional Airport Authority | | | | |
| Revenue | 5.000% | 7/1/26 | 6,000 | 6,391 |
| San Diego County CA Regional Airport Authority | | | | |
| Revenue | 5.000% | 7/1/28 | 3,000 | 3,132 |
| San Diego County CA Regional Building Authority | | | | |
| Lease Revenue (County Operations Center & | | | | |
| Annex Redevelopment Project) | 5.000% | 2/1/23 | 4,285 | 4,773 |
| San Diego County CA Regional Building Authority | | | | |
| Lease Revenue (County Operations Center & | | | | |
| Annex Redevelopment Project) | 5.000% | 2/1/25 | 4,820 | 5,276 |
| San Diego County CA Regional Building Authority | | | | |
| Lease Revenue (County Operations Center & | | | | |
| Annex Redevelopment Project) | 5.250% | 2/1/26 | 1,140 | 1,265 |
| San Diego County CA Regional Building Authority | | | | |
| Lease Revenue (County Operations Center & | | | | |
| Annex Redevelopment Project) | 5.000% | 2/1/27 | 2,420 | 2,612 |
| San Diego County CA Regional Building Authority | | | | |
| Lease Revenue (County Operations Center & | | | | |
| Annex Redevelopment Project) | 5.500% | 2/1/28 | 5,780 | 6,432 |
| San Diego County CA Water Authority | | | | |
| Financing Agency Water Revenue | 5.000% | 5/1/27 | 2,000 | 2,208 |
| San Diego County CA Water Authority Revenue | 5.000% | 5/1/30 | 5,000 | 5,422 |
| San Diego County CA Water Authority Revenue | | | | |
| COP | 5.250% | 5/1/15 (14) | 6,215 | 6,643 |
| San Diego County CA Water Authority Revenue | | | | |
| COP | 5.250% | 5/1/16 (14) | 7,880 | 8,764 |
| San Diego County CA Water Authority Revenue | | | | |
| COP | 5.250% | 5/1/21 (14) | 6,725 | 8,016 |
| San Diego County CA Water Authority Revenue | | | | |
| COP | 5.250% | 5/1/22 (14) | 7,075 | 8,438 |
| 3 San Diego County CA Water Authority Revenue | | | | |
| COP TOB VRDO | 0.050% | 12/6/13 | 6,100 | 6,100 |
| San Francisco CA Bay Area Rapid Transit | | | | |
| District GO | 5.000% | 8/1/35 | 15,500 | 16,388 |
| San Francisco CA Bay Area Rapid Transit | | | | |
| District Sales Tax Revenue | 5.000% | 7/1/23 | 1,070 | 1,256 |
| San Francisco CA Bay Area Rapid Transit | | | | |
| District Sales Tax Revenue | 5.000% | 7/1/23 | 9,560 | 10,867 |
| San Francisco CA City & County GO | 5.000% | 6/15/21 | 7,450 | 8,887 |
| San Francisco CA City & County GO | 5.000% | 6/15/22 | 2,595 | 3,072 |
| San Francisco CA City & County GO | 5.000% | 6/15/23 | 4,000 | 4,666 |
| San Francisco CA City & County International | | | | |
| Airport Revenue | 5.250% | 5/1/20 (14) | 5,000 | 5,939 |
| San Francisco CA City & County International | | | | |
| Airport Revenue | 5.000% | 5/1/21 | 5,000 | 5,747 |
65
| | | | |
| California Intermediate-Term Tax-Exempt Fund | | | | |
| |
| |
| |
| | | | Face | Market |
| | | Maturity | Amount | Value |
| | Coupon | Date | ($000) | ($000) |
| San Francisco CA City & County International | | | | |
| Airport Revenue | 5.000% | 5/1/22 | 5,000 | 5,651 |
| San Francisco CA City & County International | | | | |
| Airport Revenue | 5.000% | 5/1/24 (14) | 10,000 | 10,884 |
| San Francisco CA City & County International | | | | |
| Airport Revenue | 5.000% | 5/1/25 (14) | 2,000 | 2,177 |
| San Francisco CA City & County International | | | | |
| Airport Revenue | 5.250% | 5/1/26 | 22,000 | 25,047 |
| San Francisco CA City & County International | | | | |
| Airport Revenue | 5.000% | 5/1/27 (14) | 13,075 | 14,001 |
| San Francisco CA City & County International | | | | |
| Airport Revenue | 5.000% | 5/1/28 | 2,855 | 3,037 |
| San Francisco CA City & County International | | | | |
| Airport Revenue | 5.000% | 5/1/28 | 7,500 | 8,032 |
| San Francisco CA City & County International | | | | |
| Airport Revenue | 5.000% | 5/1/30 | 5,940 | 6,229 |
| San Francisco CA City & County Public Utilities | | | | |
| Commission Wastewater Revenue | 5.000% | 10/1/30 | 13,170 | 14,295 |
| San Francisco CA City & County Public Utilities | | | | |
| Commission Water Revenue | 5.000% | 11/1/26 | 2,995 | 3,367 |
| San Francisco CA City & County Public Utilities | | | | |
| Commission Water Revenue | 5.000% | 10/1/28 | 10,235 | 11,289 |
| San Francisco CA City & County Public Utilities | | | | |
| Commission Water Revenue | 5.000% | 11/1/28 | 1,000 | 1,097 |
| San Francisco CA City & County Public Utilities | | | | |
| Commission Water Revenue | 5.000% | 11/1/29 | 10,000 | 10,873 |
| San Francisco CA City & County Public Utilities | | | | |
| Commission Water Revenue | 5.000% | 11/1/29 | 6,530 | 7,105 |
| San Francisco CA City & County Public Utilities | | | | |
| Commission Water Revenue | 5.000% | 11/1/29 | 11,000 | 12,021 |
| San Francisco CA City & County Public Utilities | | | | |
| Commission Water Revenue | 5.000% | 11/1/29 | 2,960 | 3,218 |
| San Francisco CA City & County Public Utilities | | | | |
| Commission Water Revenue | 5.000% | 11/1/30 | 10,335 | 11,206 |
| San Francisco CA City & County Public Utilities | | | | |
| Commission Water Revenue | 5.000% | 11/1/30 | 2,705 | 2,934 |
| San Francisco CA City & County Public Utilities | | | | |
| Commission Water Revenue | 5.000% | 10/1/31 | 14,015 | 15,103 |
| San Francisco CA City & County Public Utilities | | | | |
| Commission Water Revenue | 5.000% | 11/1/31 | 5,730 | 6,149 |
| San Francisco CA City & County Public Utilities | | | | |
| Commission Water Revenue | 5.000% | 11/1/33 | 9,000 | 9,559 |
| San Francisco CA City & County Public Utilities | | | | |
| Commission Water Revenue | 5.000% | 11/1/34 | 5,000 | 5,292 |
| 3 San Francisco CA City & County Public Utilities | | | | |
| Commission Water Revenue TOB VRDO | 0.060% | 12/6/13 | 2,700 | 2,700 |
| San Francisco CA City & County Unified School | | | | |
| District GO | 5.000% | 6/15/15 | 1,200 | 1,288 |
| San Francisco CA City & County Unified School | | | | |
| District GO | 4.000% | 6/15/30 | 2,470 | 2,423 |
| San Francisco CA City & County Unified School | | | | |
| District GO | 5.000% | 6/15/31 | 7,965 | 8,494 |
| 2 San Francisco CA Municipal Transportation | | | | |
| Agency Revenue | 5.000% | 3/1/27 | 1,425 | 1,558 |
66
| | | | |
| California Intermediate-Term Tax-Exempt Fund | | | | |
| |
| |
| |
| | | | Face | Market |
| | | Maturity | Amount | Value |
| | Coupon | Date | ($000) | ($000) |
| 2 San Francisco CA Municipal Transportation | | | | |
| Agency Revenue | 5.000% | 3/1/29 | 1,585 | 1,703 |
| 2 San Francisco CA Municipal Transportation | | | | |
| Agency Revenue | 5.000% | 3/1/32 | 2,170 | 2,278 |
| 2 San Francisco CA Municipal Transportation | | | | |
| Agency Revenue | 5.000% | 3/1/33 | 3,025 | 3,169 |
| San Joaquin County CA Delta Community | | | | |
| College District Election GO | 0.000% | 8/1/26 (4) | 15,500 | 8,231 |
| San Joaquin County CA Delta Community | | | | |
| College District Election GO | 0.000% | 8/1/27 (4) | 15,500 | 7,561 |
| San Joaquin Hills CA Transportation Corridor | | | | |
| Agency Toll Road Revenue | 0.000% | 1/15/14 (14) | 5,500 | 5,480 |
| San Joaquin Hills CA Transportation Corridor | | | | |
| Agency Toll Road Revenue | 0.000% | 1/15/15 (14) | 1,920 | 1,850 |
| San Joaquin Hills CA Transportation Corridor | | | | |
| Agency Toll Road Revenue | 0.000% | 1/1/23 (ETM) | 16,000 | 12,327 |
| San Joaquin Hills CA Transportation Corridor | | | | |
| Agency Toll Road Revenue | 0.000% | 1/15/24 (14) | 7,000 | 3,866 |
| San Joaquin Hills CA Transportation Corridor | | | | |
| Agency Toll Road Revenue | 0.000% | 1/1/25 (ETM) | 14,750 | 10,272 |
| San Jose CA Airport Revenue | 5.000% | 3/1/24 (2) | 2,035 | 2,123 |
| San Jose CA Airport Revenue | 5.000% | 3/1/25 (2) | 3,385 | 3,507 |
| San Jose CA Airport Revenue | 5.000% | 3/1/26 (2) | 3,850 | 3,976 |
| San Jose CA Redevelopment Agency Tax | | | | |
| Allocation Revenue | 5.000% | 8/1/20 (2) | 8,000 | 8,432 |
| San Jose CA Redevelopment Agency Tax | | | | |
| Allocation Revenue | 5.000% | 8/1/21 (2) | 2,495 | 2,600 |
| San Jose CA Redevelopment Agency Tax | | | | |
| Allocation Revenue | 5.000% | 8/1/21 | 1,270 | 1,353 |
| San Jose CA Redevelopment Agency Tax | | | | |
| Allocation Revenue | 5.000% | 8/1/22 (2) | 5,100 | 5,251 |
| San Jose CA Redevelopment Agency Tax | | | | |
| Allocation Revenue | 5.000% | 8/1/23 | 1,140 | 1,183 |
| San Jose CA Redevelopment Agency Tax | | | �� | |
| Allocation Revenue | 5.000% | 8/1/24 (14) | 16,360 | 16,627 |
| San Jose CA Redevelopment Agency Tax | | | | |
| Allocation Revenue | 5.000% | 8/1/25 (14) | 11,505 | 11,635 |
| San Jose CA Redevelopment Agency Tax | | | | |
| Allocation Revenue | 5.125% | 8/1/25 | 570 | 583 |
| San Jose CA Redevelopment Agency Tax | | | | |
| Allocation Revenue | 5.250% | 8/1/26 | 800 | 823 |
| San Jose CA Redevelopment Agency Tax | | | | |
| Allocation Revenue | 5.375% | 8/1/29 | 1,355 | 1,377 |
| 2 San Jose CA Redevelopment Agency Tax | | | | |
| Allocation Revenue (Merged Area | | | | |
| Redevelopment Project) | 5.000% | 8/1/14 (2) | 3,490 | 3,584 |
| 2 San Jose CA Redevelopment Agency Tax | | | | |
| Allocation Revenue (Merged Area | | | | |
| Redevelopment Project) | 5.250% | 8/1/14 (14) | 6,175 | 6,338 |
| 2 San Jose CA Redevelopment Agency Tax | | | | |
| Allocation Revenue (Merged Area | | | | |
| Redevelopment Project) | 5.000% | 8/1/17 (14) | 600 | 630 |
| San Jose CA Special Hotel Tax Revenue | | | | |
| (Convention Center Expansion & | | | | |
| Renovation Project) | 6.125% | 5/1/31 | 4,000 | 4,476 |
67
| | | | |
| California Intermediate-Term Tax-Exempt Fund | | | | |
| |
| |
| |
| | | | Face | Market |
| | | Maturity | Amount | Value |
| | Coupon | Date | ($000) | ($000) |
| 3 San Jose CA Unified School District Santa Clara | | | | |
| County GO TOB VRDO | 0.100% | 12/6/13 | 3,600 | 3,600 |
| San Juan CA Unified School District GO | 0.000% | 8/1/25 (4) | 10,000 | 6,102 |
| San Juan CA Unified School District GO | 0.000% | 8/1/26 (4) | 12,215 | 6,941 |
| San Luis & Delta Mendota CA Water | | | | |
| Authority Revenue | 5.000% | 3/1/24 (15) | 855 | 927 |
| San Luis & Delta Mendota CA Water | | | | |
| Authority Revenue | 5.000% | 3/1/25 (15) | 970 | 1,041 |
| San Luis & Delta Mendota CA Water | | | | |
| Authority Revenue | 5.000% | 3/1/26 (15) | 500 | 531 |
| San Luis & Delta Mendota CA Water | | | | |
| Authority Revenue | 5.000% | 3/1/27 (15) | 1,070 | 1,120 |
| San Luis & Delta Mendota CA Water | | | | |
| Authority Revenue | 5.000% | 3/1/28 (15) | 600 | 621 |
| San Luis & Delta Mendota CA Water | | | | |
| Authority Revenue | 5.000% | 3/1/33 (15) | 2,790 | 2,844 |
| San Marcos CA Unified School District GO | 0.000% | 8/1/30 | 2,000 | 847 |
| San Marcos CA Unified School District GO | 0.000% | 8/1/31 | 2,000 | 794 |
| San Marcos CA Unified School District GO | 0.000% | 8/1/32 | 2,500 | 929 |
| San Mateo CA Union High School District GO | 0.000% | 9/1/14 (14) | 1,500 | 1,497 |
| San Mateo County CA Community College | | | | |
| District GO | 0.000% | 9/1/21 (14) | 4,645 | 3,711 |
| San Mateo County CA Community College | | | | |
| District GO | 0.000% | 9/1/22 (14) | 5,675 | 4,287 |
| San Mateo County CA Community College | | | | |
| District GO | 0.000% | 9/1/24 (14) | 2,825 | 1,892 |
| San Mateo County CA Community College | | | | |
| District GO | 0.000% | 9/1/25 (14) | 4,000 | 2,530 |
| San Mateo County CA Community College | | | | |
| District GO | 5.000% | 9/1/26 | 3,170 | 3,484 |
| San Mateo County CA Joint Powers Financing | | | | |
| Authority Lease Revenue | | | | |
| (Youth Services Campus) | 4.625% | 7/15/25 | 2,455 | 2,556 |
| San Mateo County CA Joint Powers Financing | | | | |
| Authority Lease Revenue | | | | |
| (Youth Services Campus) | 5.250% | 7/15/28 | 2,000 | 2,157 |
| Santa Ana CA Community Redevelopment | | | | |
| Agency Tax Allocation Revenue | | | | |
| (South Main Street) | 5.000% | 9/1/18 (14) | 2,685 | 2,690 |
| Santa Clara CA Electric Revenue | 5.000% | 7/1/30 | 1,000 | 1,049 |
| Santa Clara CA Electric Revenue | 5.250% | 7/1/32 | 2,500 | 2,641 |
| Santa Clara CA Unified School District GO | 5.000% | 7/1/28 | 3,775 | 4,084 |
| Santa Clara CA Unified School District GO | 5.000% | 7/1/29 | 4,115 | 4,410 |
| Santa Clara CA Unified School District GO | 5.000% | 7/1/30 | 4,405 | 4,700 |
| Santa Clara CA Unified School District GO | 5.000% | 7/1/31 | 4,715 | 5,005 |
| Santa Clara County CA Financing Authority | | | | |
| Lease Revenue (Multiple Facilities Projects) | 5.000% | 11/15/17 | 11,540 | 13,313 |
| Santa Clara County CA Financing Authority | | | | |
| Lease Revenue (Multiple Facilities Projects) | 5.000% | 11/15/18 | 7,920 | 9,257 |
| Santa Clara County CA Financing Authority | | | | |
| Lease Revenue (Multiple Facilities Projects) | 5.000% | 5/15/28 | 10,000 | 10,748 |
| Santa Clara County CA GO | 5.000% | 8/1/28 | 8,830 | 9,795 |
| Santa Clara Valley CA Transportation Authority | | | | |
| Sales Tax Revenue | 5.000% | 4/1/32 (2) | 4,000 | 4,258 |
| Santa Clarita CA Community College District GO | 5.000% | 8/1/32 | 5,450 | 5,740 |
68
| | | | |
| California Intermediate-Term Tax-Exempt Fund | | | | |
| |
| |
| |
| | | | Face | Market |
| | | Maturity | Amount | Value |
| | Coupon | Date | ($000) | ($000) |
| Santa Monica CA Community College District GO | 0.000% | 8/1/24 | 4,500 | 3,025 |
| Santa Monica CA Community College District GO | 0.000% | 8/1/26 | 11,025 | 6,624 |
| Santa Rosa CA Wastewater Revenue | 0.000% | 9/1/28 (4) | 11,095 | 5,272 |
| Santa Rosa CA Wastewater Revenue | 5.000% | 9/1/29 | 2,870 | 3,082 |
| Santa Rosa CA Wastewater Revenue | 5.000% | 9/1/30 | 3,055 | 3,244 |
| Simi Valley CA Unified School District GO | 0.000% | 8/1/26 (4) | 3,030 | 1,705 |
| Simi Valley CA Unified School District GO | 0.000% | 8/1/27 (4) | 2,900 | 1,511 |
| Solana Beach CA School District Special | | | | |
| Tax Revenue | 5.000% | 9/1/29 | 2,125 | 2,140 |
| Solana Beach CA School District Special | | | | |
| Tax Revenue | 5.000% | 9/1/32 | 2,665 | 2,680 |
| Solano County CA COP | 5.000% | 11/1/17 (14) | 4,110 | 4,663 |
| Solano County CA COP | 5.000% | 11/1/18 (14) | 3,810 | 4,311 |
| Solano County CA COP | 5.000% | 11/1/19 (14) | 3,995 | 4,493 |
| Solano County CA COP | 5.000% | 11/1/20 (14) | 4,195 | 4,696 |
| Solano County CA COP | 5.000% | 11/1/21 (14) | 4,405 | 4,880 |
| Sonoma County CA Junior College District GO | 5.000% | 8/1/28 | 3,000 | 3,323 |
| Sonoma County CA Junior College District GO | 5.000% | 8/1/29 | 2,000 | 2,196 |
| South San Francisco CA Redevelopment Agency | | | | |
| Tax Allocation Revenue | 5.000% | 9/1/31 (14) | 9,255 | 9,313 |
| Southern California Public Power Authority | | | | |
| Revenue | 5.000% | 7/1/28 | 10,000 | 10,831 |
| Southern California Public Power Authority | | | | |
| Revenue | 5.000% | 7/1/29 | 5,000 | 5,383 |
| Southern California Public Power Authority | | | | |
| Revenue | 5.000% | 7/1/30 | 10,750 | 11,543 |
| Southern California Public Power Authority | | | | |
| Revenue (Canyon Power Project) | 5.000% | 7/1/23 | 4,175 | 4,698 |
| Southern California Public Power Authority | | | | |
| Revenue (Canyon Power Project) | 5.250% | 7/1/27 | 6,950 | 7,776 |
| Southern California Public Power Authority | | | | |
| Revenue (Linden Wind Energy Project) | 5.000% | 7/1/28 | 3,500 | 3,791 |
| Southern California Public Power Authority | | | | |
| Revenue (Linden Wind Energy Project) | 5.000% | 7/1/29 | 2,500 | 2,691 |
| Southern California Public Power Authority | | | | |
| Revenue (Linden Wind Energy Project) | 5.000% | 7/1/30 | 2,500 | 2,684 |
| Southern California Public Power Authority | | | | |
| Revenue (Milford Wind Corridor Phase I Project) | 5.000% | 7/1/28 | 5,000 | 5,416 |
| Southern California Public Power Authority | | | | |
| Revenue (Milford Wind Corridor Phase I Project) | 5.000% | 7/1/29 | 5,000 | 5,383 |
| Southern California Public Power Authority | | | | |
| Revenue (Natural Gas Project) | 5.000% | 11/1/18 | 1,040 | 1,151 |
| Southern California Public Power Authority | | | | |
| Revenue (Natural Gas Project) | 5.250% | 11/1/23 | 5,270 | 5,777 |
| Southern California Public Power Authority | | | | |
| Revenue (Natural Gas Project) | 5.250% | 11/1/24 | 5,000 | 5,450 |
| Southern California Public Power Authority | | | | |
| Revenue (Natural Gas Project) | 5.250% | 11/1/25 | 7,000 | 7,557 |
| Southern California Public Power Authority | | | | |
| Revenue (Natural Gas Project) | 5.250% | 11/1/26 | 2,500 | 2,672 |
| Southern California Public Power Authority | | | | |
| Revenue (Transmission Project) | 5.000% | 7/1/23 | 5,000 | 5,627 |
| Southern California Public Power Authority | | | | |
| Revenue (Transmission Project) VRDO | 0.050% | 12/6/13 (4) | 4,500 | 4,500 |
69
| | | | |
| California Intermediate-Term Tax-Exempt Fund | | | | |
| |
| |
| |
| | | | Face | Market |
| | | Maturity | Amount | Value |
| | Coupon | Date | ($000) | ($000) |
| Stockton CA Public Financing Authority Water | | | | |
| Revenue (Delta Water Supply Project) | 6.125% | 10/1/35 | 1,000 | 1,063 |
| 3 Sweetwater CA Unified School District | | | | |
| GO TOB VRDO | 0.070% | 12/6/13 (13) | 3,300 | 3,300 |
| Temecula Valley CA Unified School District GO | 0.000% | 8/1/32 | 2,000 | 1,267 |
| Tulare County CA COP | 5.000% | 8/15/15 (14) | 6,460 | 6,899 |
| Tuolumne CA Wind Project Authority Revenue | 5.250% | 1/1/24 | 5,115 | 5,747 |
| Turlock CA Irrigation District Revenue | 5.000% | 1/1/21 | 3,805 | 4,305 |
| Turlock CA Irrigation District Revenue | 5.000% | 1/1/22 | 5,415 | 6,010 |
| Turlock CA Irrigation District Revenue | 5.000% | 1/1/28 | 7,020 | 7,374 |
| Turlock CA Irrigation District Revenue | 5.000% | 1/1/29 | 6,400 | 6,671 |
| Turlock CA Irrigation District Revenue | 5.000% | 1/1/30 | 7,770 | 8,046 |
| University of California Regents Medical | | | | |
| Center Revenue | 5.000% | 5/15/19 (14) | 5,075 | 5,458 |
| University of California Regents Medical | | | | |
| Center Revenue | 5.000% | 5/15/20 (14) | 5,065 | 5,442 |
| University of California Regents Medical | | | | |
| Center Revenue | 5.000% | 5/15/25 | 19,385 | 21,416 |
| University of California Regents Medical | | | | |
| Center Revenue | 5.000% | 5/15/26 | 10,095 | 11,098 |
| University of California Regents Medical | | | | |
| Center Revenue | 5.000% | 5/15/32 | 14,940 | 15,616 |
| University of California Regents Medical | | | | |
| Center Revenue | 5.000% | 5/15/33 | 5,000 | 5,156 |
| University of California Regents Medical | | | | |
| Center Revenue VRDO | 0.030% | 12/2/13 | 11,850 | 11,850 |
| University of California Regents Medical | | | | |
| Center Revenue VRDO | 0.030% | 12/2/13 | 6,905 | 6,905 |
| University of California Revenue | 5.000% | 5/15/15 (Prere.) | 1,185 | 1,279 |
| University of California Revenue | 5.000% | 5/15/15 (Prere.) | 555 | 599 |
| University of California Revenue | 5.000% | 5/15/15 (Prere.) | 240 | 259 |
| University of California Revenue | 5.000% | 5/15/17 (4) | 19,435 | 20,919 |
| University of California Revenue | 5.000% | 5/15/18 (4) | 9,445 | 10,157 |
| University of California Revenue | 5.000% | 5/15/19 (4) | 4,035 | 4,339 |
| University of California Revenue | 5.000% | 5/15/20 (4) | 30,900 | 33,202 |
| University of California Revenue | 5.000% | 5/15/21 (4) | 14,915 | 15,965 |
| University of California Revenue | 5.000% | 5/15/22 | 5,420 | 6,319 |
| University of California Revenue | 5.000% | 5/15/22 | 9,000 | 10,717 |
| University of California Revenue | 5.000% | 5/15/23 | 6,465 | 7,695 |
| University of California Revenue | 5.750% | 5/15/25 | 3,000 | 3,538 |
| University of California Revenue | 5.000% | 5/15/26 (14) | 10,000 | 10,850 |
| University of California Revenue | 5.000% | 5/15/27 | 10,900 | 11,984 |
| University of California Revenue | 5.000% | 5/15/28 | 11,680 | 12,683 |
| University of California Revenue | 5.000% | 5/15/28 | 1,000 | 1,105 |
| University of California Revenue | 5.000% | 5/15/32 | 14,020 | 14,822 |
| University of California Revenue | 5.000% | 5/15/32 | 13,500 | 14,401 |
| University of California Revenue | 5.000% | 5/15/33 | 10,110 | 10,736 |
| University of California Revenue | 5.000% | 5/15/33 | 15,240 | 16,183 |
| University of California Revenue | 5.000% | 5/15/34 | 15,900 | 16,808 |
| University of California Revenue PUT | 5.000% | 5/15/23 | 30,000 | 35,107 |
| 3 University of California Revenue TOB VRDO | 0.060% | 12/2/13 | 6,550 | 6,550 |
| Upland CA Community Facilities District | | | | |
| No. 2003-2 Improvement Area No. 1 | | | | |
| Special Tax Revenue | 5.000% | 9/1/31 | 1,110 | 1,087 |
70
| | | | | |
| California Intermediate-Term Tax-Exempt Fund | | | | |
| |
| |
| |
| | | | | Face | Market |
| | | | Maturity | Amount | Value |
| | | Coupon | Date | ($000) | ($000) |
| | Ventura County CA Community College | | | | |
| | District GO | 5.000% | 8/1/16 (14) | 360 | 363 |
| | Ventura County CA Community College | | | | |
| | District GO | 5.000% | 8/1/17 (14) | 270 | 272 |
| | Ventura County CA Community College | | | | |
| | District GO | 5.000% | 8/1/24 | 1,210 | 1,381 |
| | Ventura County CA Community College | | | | |
| | District GO | 5.000% | 8/1/25 | 1,915 | 2,159 |
| | Ventura County CA Community College | | | | |
| | District GO | 5.000% | 8/1/27 | 2,205 | 2,433 |
| | Ventura County CA Community College | | | | |
| | District GO | 0.000% | 8/1/28 | 15,000 | 7,356 |
| | Ventura County CA Public Financing Authority | | | | |
| | Lease Revenue | 5.000% | 11/1/24 | 1,200 | 1,343 |
| | Ventura County CA Public Financing Authority | | | | |
| | Lease Revenue | 5.000% | 11/1/29 | 1,000 | 1,064 |
| | Ventura County CA Public Financing Authority | | | | |
| | Lease Revenue | 5.000% | 11/1/32 | 2,000 | 2,077 |
| | Ventura County CA Public Financing Authority | | | | |
| | Lease Revenue | 5.000% | 11/1/33 | 1,250 | 1,281 |
| | Vista CA Unified School District GO | 5.000% | 8/1/24 | 5,000 | 5,681 |
| | Walnut CA Energy Center Authority Revenue | 5.000% | 1/1/30 | 2,000 | 2,062 |
| | Washington Township CA Health Care District | | | | |
| | Revenue | 6.000% | 7/1/29 | 1,000 | 1,059 |
| | West Basin CA Municipal Water District Revenue | 4.000% | 8/1/15 | 4,810 | 5,111 |
| | West Basin CA Municipal Water District Revenue | 5.000% | 8/1/22 | 2,000 | 2,338 |
| | West Contra Costa CA Unified School District GO | 6.000% | 8/1/26 | 5,000 | 5,998 |
| | Westlands CA Water District Revenue | 5.000% | 9/1/21 (4) | 750 | 867 |
| | Westlands CA Water District Revenue | 5.000% | 9/1/22 (4) | 750 | 864 |
| | Westlands CA Water District Revenue | 5.000% | 9/1/24 (4) | 1,000 | 1,118 |
| | Westlands CA Water District Revenue | 5.000% | 9/1/25 (4) | 1,250 | 1,376 |
| | William S. Hart CA Union High School District GO | 5.000% | 9/1/25 | 1,735 | 1,957 |
| | William S. Hart CA Union High School District GO | 5.000% | 9/1/26 | 1,085 | 1,209 |
| | William S. Hart CA Union High School District GO | 5.000% | 9/1/27 | 1,500 | 1,649 |
| | | | | | 6,978,222 |
| Guam (0.1%) | | | | |
| 2 | Guam Government Waterworks Authority Water | | | | |
| | & Waste Water System Revenue | 5.000% | 7/1/28 | 1,250 | 1,235 |
| 2 | Guam Government Waterworks Authority Water | | | | |
| | & Waste Water System Revenue | 5.250% | 7/1/33 | 4,000 | 3,919 |
| | | | | | 5,154 |
| Virgin Islands (0.0%) | | | | |
| | Virgin Islands Public Finance Authority Revenue | 5.250% | 10/1/14 (Prere.) | 2,200 | 2,293 |
| Total Tax-Exempt Municipal Bonds (Cost $6,760,645) | | | 6,985,669 |
| Other Assets and Liabilities (-1.6%) | | | | |
| Other Assets | | | | 79,797 |
| Liabilities | | | | (186,555) |
| | | | | | (106,758) |
| Net Assets (100%) | | | | 6,878,911 |
71
| |
| California Intermediate-Term Tax-Exempt Fund | |
| |
| |
| At November 30, 2013, net assets consisted of: | |
| | Amount |
| | ($000) |
| Paid-in Capital | 6,752,344 |
| Undistributed Net Investment Income | — |
| Accumulated Net Realized Losses | (98,457) |
| Unrealized Appreciation (Depreciation) | 225,024 |
| Net Assets | 6,878,911 |
| |
| Investor Shares—Net Assets | |
| Applicable to 108,347,953 outstanding $.001 par value shares of | |
| beneficial interest (unlimited authorization) | 1,226,990 |
| Net Asset Value Per Share—Investor Shares | $11.32 |
| |
| Admiral Shares—Net Assets | |
| Applicable to 499,086,690 outstanding $.001 par value shares of | |
| beneficial interest (unlimited authorization) | 5,651,921 |
| Net Asset Value Per Share—Admiral Shares | $11.32 |
See Note A in Notes to Financial Statements.
1 Adjustable-rate security.
2 Security purchased on a when-issued or delayed-delivery basis for which the fund has not taken delivery as of November 30, 2013.
3 Security exempt from registration under Rule 144A of the Securities Act of 1933. Such securities may be sold in transactions exempt from
registration, normally to qualified institutional buyers. At November 30, 2013, the aggregate value of these securities was $104,619,000,
representing 1.5% of net assets.
A key to abbreviations and other references follows the Statement of Net Assets.
See accompanying Notes, which are an integral part of the Financial Statements.
72
California Intermediate-Term Tax-Exempt Fund
Key to Abbreviations
ARS—Auction Rate Security.
BAN—Bond Anticipation Note.
COP—Certificate of Participation.
CP—Commercial Paper.
FR—Floating Rate.
GAN—Grant Anticipation Note.
GO—General Obligation Bond.
PUT—Put Option Obligation.
RAN—Revenue Anticipation Note.
TAN—Tax Anticipation Note.
TOB—Tender Option Bond.
TRAN—Tax Revenue Anticipation Note.
VRDO—Variable Rate Demand Obligation.
VRDP—Variable Rate Demand Preferred.
(ETM)—Escrowed to Maturity.
(Prere.)—Prerefunded.
Scheduled principal and interest payments are guaranteed by:
(1) MBIA (Municipal Bond Investors Assurance).
(2) AMBAC (Ambac Assurance Corporation).
(3) FGIC (Financial Guaranty Insurance Company).
(4) AGM (Assured Guaranty Municipal Corporation).
(5) BIGI (Bond Investors Guaranty Insurance).
(6) Connie Lee Inc.
(7) FHA (Federal Housing Authority).
(8) CapMAC (Capital Markets Assurance Corporation).
(9) American Capital Access Financial Guaranty Corporation.
(10) XL Capital Assurance Inc.
(11) CIFG (CDC IXIS Financial Guaranty).
(12) Assured Guaranty Corporation.
(13) Berkshire Hathaway Assurance Corporation.
(14) National Public Finance Guarantee Corporation.
(15) Build America Mutual Assurance Company.
The insurance does not guarantee the market value of the municipal bonds.
LOC—Scheduled principal and interest payments are guaranteed by bank letter of credit.
73
| |
| California Intermediate-Term Tax-Exempt Fund | |
| |
| |
| Statement of Operations | |
| |
| | Year Ended |
| | November 30, 2013 |
| | ($000) |
| Investment Income | |
| Income | |
| Interest | 236,621 |
| Total Income | 236,621 |
| Expenses | |
| The Vanguard Group—Note B | |
| Investment Advisory Services | 520 |
| Management and Administrative—Investor Shares | 2,152 |
| Management and Administrative—Admiral Shares | 5,021 |
| Marketing and Distribution—Investor Shares | 360 |
| Marketing and Distribution—Admiral Shares | 1,116 |
| Custodian Fees | 78 |
| Auditing Fees | 29 |
| Shareholders’ Reports—Investor Shares | 20 |
| Shareholders’ Reports—Admiral Shares | 15 |
| Trustees’ Fees and Expenses | 8 |
| Total Expenses | 9,319 |
| Net Investment Income | 227,302 |
| Realized Net Gain (Loss) | |
| Investment Securities Sold | 995 |
| Futures Contracts | (1,825) |
| Options on Futures Contracts | (31) |
| Realized Net Gain (Loss) | (861) |
| Change in Unrealized Appreciation (Depreciation) | |
| Investment Securities | (362,337) |
| Futures Contracts | 20 |
| Change in Unrealized Appreciation (Depreciation) | (362,317) |
| Net Increase (Decrease) in Net Assets Resulting from Operations | (135,876) |
See accompanying Notes, which are an integral part of the Financial Statements.
74
| | |
| California Intermediate-Term Tax-Exempt Fund | | |
| |
| |
| Statement of Changes in Net Assets | | |
| |
| | Year Ended November 30, |
| | 2013 | 2012 |
| | ($000) | ($000) |
| Increase (Decrease) in Net Assets | | |
| Operations | | |
| Net Investment Income | 227,302 | 207,220 |
| Realized Net Gain (Loss) | (861) | 7,269 |
| Change in Unrealized Appreciation (Depreciation) | (362,317) | 386,535 |
| Net Increase (Decrease) in Net Assets Resulting from Operations | (135,876) | 601,024 |
| Distributions | | |
| Net Investment Income | | |
| Investor Shares | (43,005) | (42,464) |
| Admiral Shares | (184,297) | (164,756) |
| Realized Capital Gain | | |
| Investor Shares | — | — |
| Admiral Shares | — | — |
| Total Distributions | (227,302) | (207,220) |
| Capital Share Transactions | | |
| Investor Shares | (75,625) | 100,368 |
| Admiral Shares | 436,113 | 820,026 |
| Net Increase (Decrease) from Capital Share Transactions | 360,488 | 920,394 |
| Total Increase (Decrease) | (2,690) | 1,314,198 |
| Net Assets | | |
| Beginning of Period | 6,881,601 | 5,567,403 |
| End of Period | 6,878,911 | 6,881,601 |
See accompanying Notes, which are an integral part of the Financial Statements.
75
| | | | | |
| California Intermediate-Term Tax-Exempt Fund | | | | | |
| |
| |
| Financial Highlights | | | | | |
| |
| |
| Investor Shares | | | | | |
| |
| For a Share Outstanding | Year Ended November 30, |
| Throughout Each Period | 2013 | 2012 | 2011 | 2010 | 2009 |
| Net Asset Value, Beginning of Period | $11.92 | $11.18 | $10.93 | $10.86 | $10.21 |
| Investment Operations | | | | | |
| Net Investment Income | . 373 | .379 | .408 | .408 | .412 |
| Net Realized and Unrealized Gain (Loss) | | | | | |
| on Investments | (.600) | .740 | .250 | .070 | .650 |
| Total from Investment Operations | (.227) | 1.119 | .658 | .478 | 1.062 |
| Distributions | | | | | |
| Dividends from Net Investment Income | (.373) | (. 379) | (.408) | (.408) | (.412) |
| Distributions from Realized Capital Gains | — | — | — | — | — |
| Total Distributions | (.373) | (. 379) | (.408) | (.408) | (.412) |
| Net Asset Value, End of Period | $11.32 | $11.92 | $11.18 | $10.93 | $10.86 |
| |
| Total Return1 | -1.91% | 10.14% | 6.17% | 4.43% | 10.56% |
| |
| Ratios/Supplemental Data | | | | | |
| Net Assets, End of Period (Millions) | $1,227 | $1,375 | $1,193 | $1,314 | $1,435 |
| Ratio of Total Expenses to | | | | | |
| Average Net Assets | 0.20% | 0.20% | 0.20% | 0.20% | 0.20% |
| Ratio of Net Investment Income to | | | | | |
| Average Net Assets | 3.24% | 3.26% | 3.73% | 3.70% | 3.88% |
| Portfolio Turnover Rate | 12% | 9% | 13% | 10% | 17% |
1 Total returns do not include account service fees that may have applied in the periods shown. Fund prospectuses provide information about
any applicable account service fees.
See accompanying Notes, which are an integral part of the Financial Statements.
76
| | | | | |
| California Intermediate-Term Tax-Exempt Fund | | | | | |
| |
| |
| Financial Highlights | | | | | |
| |
| |
| Admiral Shares | | | | | |
| |
| For a Share Outstanding | Year Ended November 30, |
| Throughout Each Period | 2013 | 2012 | 2011 | 2010 | 2009 |
| Net Asset Value, Beginning of Period | $11.92 | $11.18 | $10.93 | $10.86 | $10.21 |
| Investment Operations | | | | | |
| Net Investment Income | . 382 | .388 | .417 | .417 | .421 |
| Net Realized and Unrealized Gain (Loss) | | | | | |
| on Investments | (.600) | .740 | .250 | .070 | .650 |
| Total from Investment Operations | (.218) | 1.128 | .667 | .487 | 1.071 |
| Distributions | | | | | |
| Dividends from Net Investment Income | (.382) | (. 388) | (.417) | (.417) | (.421) |
| Distributions from Realized Capital Gains | — | — | — | — | — |
| Total Distributions | (.382) | (. 388) | (.417) | (.417) | (.421) |
| Net Asset Value, End of Period | $11.32 | $11.92 | $11.18 | $10.93 | $10.86 |
| |
| Total Return | -1.83% | 10.23% | 6.26% | 4.52% | 10.65% |
| |
| Ratios/Supplemental Data | | | | | |
| Net Assets, End of Period (Millions) | $5,652 | $5,507 | $4,375 | $4,159 | $3,626 |
| Ratio of Total Expenses to | | | | | |
| Average Net Assets | 0.12% | 0.12% | 0.12% | 0.12% | 0.12% |
| Ratio of Net Investment Income to | | | | | |
| Average Net Assets | 3.32% | 3.34% | 3.81% | 3.78% | 3.96% |
| Portfolio Turnover Rate | 12% | 9% | 13% | 10% | 17% |
See accompanying Notes, which are an integral part of the Financial Statements.
77
California Intermediate-Term Tax-Exempt Fund
Notes to Financial Statements
Vanguard California Intermediate-Term Tax-Exempt Fund is registered under the Investment Company Act of 1940 as an open-end investment company, or mutual fund. The fund invests in debt instruments of municipal issuers whose ability to meet their obligations may be affected by economic and political developments in the state. The fund offers two classes of shares: Investor Shares and Admiral Shares. Investor Shares are available to any investor who meets the fund’s minimum purchase requirements. Admiral Shares are designed for investors who meet certain administrative, service, and account-size criteria.
A. The following significant accounting policies conform to generally accepted accounting principles for U.S. mutual funds. The fund consistently follows such policies in preparing its financial statements.
1. Security Valuation: Bonds, and temporary cash investments acquired over 60 days to maturity, are valued using the latest bid prices or using valuations based on a matrix system (which considers such factors as security prices, yields, maturities, and ratings), both as furnished by independent pricing services. Other temporary cash investments are valued at amortized cost, which approximates market value. Securities for which market quotations are not readily available, or whose values have been affected by events occurring before the fund’s pricing time but after the close of the securities’ primary markets, are valued by methods deemed by the board of trustees to represent fair value.
2. Futures and Options: The fund may use futures contracts and options on futures contracts to invest in fixed income asset classes with greater efficiency and lower cost than is possible through direct investment, to add value when these instruments are attractively priced, or to adjust sensitivity to changes in interest rates. The primary risks associated with the use of futures contracts are imperfect correlation between changes in market values of bonds held by the fund and the prices of futures contracts, and the possibility of an illiquid market. The primary risk associated with purchasing options is that interest rates move in such a way that the option is out-of-the-money, the position is worthless at expiration, and the fund loses the premium paid. The primary risk associated with writing options is that interest rates move in such a way that the option is in-the-money, the counterparty exercises the option, and the fund loses an amount equal to the market value of the option written less the premium received. Counterparty risk involving futures and exchange-traded options is mitigated because a regulated clearinghouse is the counterparty instead of the clearing broker. To further mitigate counterparty risk, the fund trades futures and options on an exchange, monitors the financial strength of its clearing brokers and clearinghouse, and has entered into clearing agreements with its clearing brokers. The clearinghouse imposes initial margin requirements to secure the fund’s performance and requires daily settlement of variation margin representing changes in the market value of each contract.
Futures contracts are valued at their quoted daily settlement prices. The aggregate notional amounts of the contracts are not recorded in the Statement of Net Assets. Fluctuations in the value of the contracts are recorded in the Statement of Net Assets as an asset (liability) and in the Statement of Operations as unrealized appreciation (depreciation) until the contracts are closed, when they are recorded as realized futures gains (losses).
During the year ended November 30, 2013, the fund’s average investments in long and short futures contracts represented 1% and less than 1% of net assets, respectively, based on quarterly average aggregate settlement values. The fund had no open futures contracts at November 30, 2013.
Options on futures contracts are also valued at their quoted daily settlement prices. The premium paid for a purchased option is recorded as an asset that is subsequently adjusted daily to the current market value of the option purchased. The premium received for a written option is recorded as an
78
California Intermediate-Term Tax-Exempt Fund
asset with an equal liability that is subsequently adjusted daily to the current market value of the option written. Fluctuations in the value of the options are recorded as unrealized appreciation (depreciation) until expired, closed, or exercised, at which time realized gains (losses) are recognized.
During the year ended November 30, 2013, the fund’s average value of options purchased and options written represented less than 1% and 0% of net assets, respectively, based on quarterly average market values. The fund had no open options on futures contracts at November 30, 2013.
3. Federal Income Taxes: The fund intends to continue to qualify as a regulated investment company and distribute all of its income. Management has analyzed the fund’s tax positions taken for all open federal income tax years (November 30, 2010–2013), and has concluded that no provision for federal income tax is required in the fund’s financial statements.
4. Distributions: Distributions from net investment income are declared daily and paid on the first business day of the following month. Annual distributions from realized capital gains, if any, are recorded on the ex-dividend date.
5. Other: Interest income is accrued daily. Premiums and discounts on debt securities purchased are amortized and accreted, respectively, to interest income over the lives of the respective securities. Security transactions are accounted for on the date securities are bought or sold. Costs used to determine realized gains (losses) on the sale of investment securities are those of the specific securities sold.
Each class of shares has equal rights as to assets and earnings, except that each class separately bears certain class-specific expenses related to maintenance of shareholder accounts (included in Management and Administrative expenses) and shareholder reporting. Marketing and distribution expenses are allocated to each class of shares based on a method approved by the board of trustees. Income, other non-class-specific expenses, and gains and losses on investments are allocated to each class of shares based on its relative net assets.
B. The Vanguard Group furnishes at cost investment advisory, corporate management, administrative, marketing, and distribution services. The costs of such services are allocated to the fund under methods approved by the board of trustees. The fund has committed to provide up to 0.40% of its net assets in capital contributions to Vanguard. At November 30, 2013, the fund had contributed capital of $787,000 to Vanguard (included in Other Assets), representing 0.01% of the fund’s net assets and 0.31% of Vanguard’s capitalization. The fund’s trustees and officers are also directors and officers of Vanguard.
C. Various inputs may be used to determine the value of the fund’s investments. These inputs are summarized in three broad levels for financial statement purposes. The inputs or methodologies used to value securities are not necessarily an indication of the risk associated with investing in those securities.
Level 1—Quoted prices in active markets for identical securities.
Level 2—Other significant observable inputs (including quoted prices for similar securities, interest rates, prepayment speeds, credit risk, etc.).
Level 3—Significant unobservable inputs (including the fund’s own assumptions used to determine the fair value of investments).
At November 30, 2013, 100% of the market value of the fund’s investments was determined based on Level 2 inputs.
79
California Intermediate-Term Tax-Exempt Fund
D. Capital gain distributions are determined on a tax basis and may differ from realized capital gains for financial reporting purposes. Differences may be permanent or temporary. Permanent differences are reclassified among capital accounts in the financial statements to reflect their tax character. Temporary differences arise when gains or losses are recognized in different periods for financial statement and tax purposes. These differences will reverse at some time in the future.
For tax purposes, at November 30, 2013, the fund had available capital losses totaling $96,051,000 to offset future net capital gains. Of this amount, $94,445,000 is subject to expiration dates; $6,523,000 may be used to offset future net capital gains through November 30, 2014, $3,936,000 through November 30, 2015, $38,506,000 through November 30, 2016, $38,406,000 through November 30, 2017, $990,000 through November 30, 2018, and $6,084,000 through November 30, 2019. Capital losses of $1,606,000 realized beginning in fiscal 2012 may be carried forward indefinitely under the Regulated Investment Company Modernization Act of 2010, but must be used before any expiring loss carryforwards. Capital loss carryforwards of $784,000 expired on November 30, 2013; accordingly, such losses have been reclassified from accumulated net realized losses to paid-in capital.
At November 30, 2013, the cost of investment securities for tax purposes was $6,763,052,000. Net unrealized appreciation of investment securities for tax purposes was $222,617,000, consisting of unrealized gains of $294,727,000 on securities that had risen in value since their purchase and $72,110,000 in unrealized losses on securities that had fallen in value since their purchase.
E. During the year ended November 30, 2013, the fund purchased $1,382,054,000 of investment securities and sold $784,036,000 of investment securities, other than temporary cash investments.
F. Capital share transactions for each class of shares were:
| | | | |
| | Year Ended November 30, |
| | 2013 | 2012 |
| | Amount | Shares | Amount | Shares |
| | ($000) | (000) | ($000) | (000) |
| Investor Shares | | | | |
| Issued | 448,231 | 38,640 | 472,315 | 40,682 |
| Issued in Lieu of Cash Distributions | 36,801 | 3,197 | 37,178 | 3,195 |
| Redeemed | (560,657) | (48,810) | (409,125) | (35,242) |
| Net Increase (Decrease)—Investor Shares | (75,625) | (6,973) | 100,368 | 8,635 |
| Admiral Shares | | | | |
| Issued | 1,726,707 | 149,761 | 1,336,171 | 115,038 |
| Issued in Lieu of Cash Distributions | 137,664 | 11,969 | 125,251 | 10,761 |
| Redeemed | (1,428,258) | (124,516) | (641,396) | (55,252) |
| Net Increase (Decrease) —Admiral Shares | 436,113 | 37,214 | 820,026 | 70,547 |
G. Management has determined that no material events or transactions occurred subsequent to November 30, 2013, that would require recognition or disclosure in these financial statements.
80
California Long-Term Tax-Exempt Fund
Fund Profile
As of November 30, 2013
| | |
| Share-Class Characteristics | |
| | Investor | Admiral |
| | Shares | Shares |
| Ticker Symbol | VCITX | VCLAX |
| Expense Ratio1 | 0.20% | 0.12% |
| 30-Day SEC Yield | 3.29% | 3.37% |
| | | |
| Financial Attributes | | | |
| | | Barclays | |
| | | CA Barclays |
| | | Muni | Municipal |
| | | Bond | Bond |
| | Fund | Index | Index |
| |
| Number of Bonds | 547 | 6,345 | 46,517 |
| |
| Yield to Maturity | | | |
| (before expenses) | 3.4% | 3.1% | 3.1% |
| |
| Average Coupon | 4.3% | 4.8% | 4.9% |
| |
| Average Duration | 7.6 years | 8.9 years | 8.4 years |
| |
| Average Effective | | | |
| Maturity | 8.1 years | 7.3 years | 7.1 years |
| |
| Short-Term | | | |
| Reserves | 4.7% | — | — |
| | |
| Volatility Measures | | |
| | Barclays CA | Barclays |
| | Muni Bond | Municipal |
| | Index | Bond Index |
| R-Squared | 0.98 | 0.98 |
| Beta | 1.09 | 1.20 |
| These measures show the degree and timing of the fund’s fluctuations compared with the indexes over 36 months. |
| |
| Distribution by Effective Maturity | |
| (% of portfolio) | |
| Under 1 Year | 8.3% |
| 1 - 3 Years | 9.0 |
| 3 - 5 Years | 16.2 |
| 5 - 10 Years | 52.0 |
| 10 - 20 Years | 5.2 |
| 20 - 30 Years | 8.3 |
| Over 30 Years | 1.0 |
| |
| Distribution by Credit Quality (% of portfolio) |
| AAA | 7.8% |
| AA | 49.3 |
| A | 36.2 |
| BBB | 4.8 |
| BB | 0.1 |
| B | 0.6 |
| Not Rated | 1.2 |
| For information about these ratings, see the Glossary entry for Credit Quality. |
Investment Focus
1 The expense ratios shown are from the prospectus dated March 28, 2013, and represent estimated costs for the current fiscal year. For the
fiscal year ended November 30, 2013, the expense ratios were 0.20% for Investor Shares and 0.12% for Admiral Shares.
81
California Long-Term Tax-Exempt Fund
Performance Summary
All of the returns in this report represent past performance, which is not a guarantee of future results that may be achieved by the fund. (Current performance may be lower or higher than the performance data cited. For performance data current to the most recent month-end, visit our website at vanguard.com/performance.) Note, too, that both investment returns and principal value can fluctuate widely, so an investor’s shares, when sold, could be worth more or less than their original cost. The returns shown do not reflect taxes that a shareholder would pay on fund distributions or on the sale of fund shares.
Cumulative Performance: November 30, 2003, Through November 30, 2013
Initial Investment of $10,000
| | | | | |
| | | Average Annual Total Returns | |
| | | Periods Ended November 30, 2013 | |
| | | | | | Final Value |
| | | One | Five | Ten | of a $10,000 |
| | | Year | Years | Years | Investment |
| | California Long-Term Tax-Exempt Fund | | | | |
| | Investor Shares | -3.96% | 6.45% | 3.98% | $14,779 |
| •••••••• | Barclays CA Municipal Bond Index | -2.92 | 6.92 | 4.69 | 15,822 |
| – – – – | California Municipal Debt Funds | | | | |
| |
| | Average | -5.00 | 7.03 | 3.72 | 14,409 |
| | Barclays Municipal Bond Index | -3.51 | 6.26 | 4.40 | 15,385 |
| California Municipal Debt Funds Average: Derived from data provided by Lipper, a Thomson Reuters Company. |
| | | | |
| | | | | Final Value |
| | One | Five | Ten | of a $50,000 |
| | Year | Years | Years | Investment |
| California Long-Term Tax-Exempt Fund | | | | |
| Admiral Shares | -3.88% | 6.53% | 4.06% | $74,445 |
| Barclays CA Municipal Bond Index | -2.92 | 6.92 | 4.69 | 79,109 |
| Barclays Municipal Bond Index | -3.51 | 6.26 | 4.40 | 76,924 |
See Financial Highlights for dividend and capital gains information.
82
California Long-Term Tax-Exempt Fund
| | | | |
| Fiscal-Year Total Returns (%): November 30, 2003, Through November 30, 2013 | |
| | | | | Barclays CA |
| | | | | Muni Bond |
| | | | Investor Shares | Index |
| Fiscal Year | Income Returns | Capital Returns | Total Returns | Total Returns |
| 2004 | 4.65% | -1.33% | 3.32% | 4.99% |
| 2005 | 4.54 | -0.32 | 4.22 | 4.59 |
| 2006 | 4.71 | 1.99 | 6.70 | 6.44 |
| 2007 | 4.52 | -3.37 | 1.15 | 2.17 |
| 2008 | 4.13 | -11.08 | -6.95 | -5.18 |
| 2009 | 4.96 | 7.75 | 12.71 | 13.21 |
| 2010 | 4.36 | 0.27 | 4.63 | 5.80 |
| 2011 | 4.51 | 2.09 | 6.60 | 7.49 |
| 2012 | 4.30 | 8.90 | 13.20 | 11.80 |
| 2013 | 3.64 | -7.60 | -3.96 | -2.92 |
Average Annual Total Returns: Periods Ended September 30, 2013
This table presents returns through the latest calendar quarter—rather than through the end of the fiscal period.
Securities and Exchange Commission rules require that we provide this information.
| | | | | | |
| | | | | Ten Years |
| | Inception Date | One Year | Five Years | Income | Capital | Total |
| Investor Shares | 4/7/1986 | -2.07% | 5.66% | 4.44% | -0.46% | 3.98% |
| Admiral Shares | 11/12/2001 | -1.99 | 5.74 | 4.51 | -0.46 | 4.05 |
83
California Long-Term Tax-Exempt Fund
Financial Statements
Statement of Net Assets
As of November 30, 2013
The fund reports a complete list of its holdings in regulatory filings four times in each fiscal year, at the quarter-ends. For the second and fourth fiscal quarters, the lists appear in the fund’s semiannual and annual reports to shareholders. For the first and third fiscal quarters, the fund files the lists with the Securities and Exchange Commission on Form N-Q. Shareholders can look up the fund’s Forms N-Q on the SEC’s website at sec.gov. Forms N-Q may also be reviewed and copied at the SEC’s Public Reference Room (see the back cover of this report for further information).
| | | | |
| | | | Face | Market |
| | | Maturity | Amount | Value |
| | Coupon | Date | ($000) | ($000) |
| Tax-Exempt Municipal Bonds (99.4%) | | | | |
| California (99.4%) | | | | |
| ABAG Finance Authority for Nonprofit Corps. | | | | |
| California Revenue (899 Charleston Project) | | | | |
| VRDO | 0.120% | 12/2/13 LOC | 2,095 | 2,095 |
| ABAG Finance Authority for Nonprofit Corps. | | | | |
| California Revenue (Episcopal Senior | | | | |
| Communities) | 5.000% | 7/1/42 | 1,000 | 878 |
| ABAG Finance Authority for Nonprofit Corps. | | | | |
| California Revenue (Eskaton Properties Inc. | | | | |
| Obligated Group) | 5.000% | 11/15/35 | 3,250 | 2,959 |
| ABAG Finance Authority for Nonprofit Corps. | | | | |
| California Revenue (Jackson Laboratory) | 5.000% | 7/1/37 | 7,565 | 7,401 |
| ABAG Finance Authority for Nonprofit Corps. | | | | |
| California Revenue (Odd Fellows Home) | 5.000% | 4/1/42 | 1,000 | 981 |
| ABAG Finance Authority for Nonprofit Corps. | | | | |
| California Revenue (Sharp Healthcare) | 4.000% | 8/1/21 | 500 | 537 |
| ABAG Finance Authority for Nonprofit Corps. | | | | |
| California Revenue (Sharp Healthcare) | 5.000% | 8/1/23 | 650 | 721 |
| Alameda CA Corridor Transportation Authority | | | | |
| Revenue | 0.000% | 10/1/30 (2) | 30,375 | 11,523 |
| Alameda County CA Unified School District GO | 0.000% | 8/1/24 (4) | 3,510 | 2,272 |
| Alameda County CA Unified School District GO | 0.000% | 8/1/29 (4) | 5,000 | 2,281 |
| Anaheim CA Public Financing Authority Revenue | | | | |
| (Distribution System) | 5.000% | 10/1/21 (14) | 3,390 | 3,402 |
| Bakersfield CA Wastewater Revenue VRDO | 0.060% | 12/6/13 | 4,500 | 4,500 |
| Bay Area Toll Authority California Toll Bridge | | | | |
| Revenue (San Francisco Bay Area) | 5.000% | 4/1/24 | 5,500 | 6,295 |
| Bay Area Toll Authority California Toll Bridge | | | | |
| Revenue (San Francisco Bay Area) | 5.000% | 4/1/25 | 6,250 | 7,070 |
| Bay Area Toll Authority California Toll Bridge | | | | |
| Revenue (San Francisco Bay Area) | 5.000% | 4/1/31 | 4,000 | 4,213 |
| Bay Area Toll Authority California Toll Bridge | | | | |
| Revenue (San Francisco Bay Area) | 5.000% | 4/1/34 | 5,000 | 5,207 |
| Bay Area Toll Authority California Toll Bridge | | | | |
| Revenue (San Francisco Bay Area) | 5.000% | 4/1/34 | 1,500 | 1,571 |
| Bay Area Toll Authority California Toll Bridge | | | | |
| Revenue (San Francisco Bay Area) | 5.000% | 4/1/39 | 15,050 | 15,558 |
84
| | | | |
| California Long-Term Tax-Exempt Fund | | | | |
| |
| |
| |
| | | | Face | Market |
| | | Maturity | Amount | Value |
| | Coupon | Date | ($000) | ($000) |
| Bay Area Toll Authority California Toll Bridge | | | | |
| Revenue (San Francisco Bay Area) | 5.000% | 10/1/42 | 5,000 | 5,054 |
| Bay Area Toll Authority California Toll Bridge | | | | |
| Revenue (San Francisco Bay Area) | 5.000% | 4/1/43 | 4,000 | 4,032 |
| Bay Area Toll Authority California Toll Bridge | | | | |
| Revenue (San Francisco Bay Area) | 5.625% | 4/1/44 | 10,000 | 10,719 |
| Bay Area Toll Authority California Toll Bridge | | | | |
| Revenue (San Francisco Bay Area) | 5.250% | 4/1/53 | 3,350 | 3,349 |
| Cabrillo CA Community College District Revenue | 0.000% | 5/1/26 (2) | 9,000 | 4,760 |
| California County CA Tobacco Securitization | | | | |
| Agency Revenue | 5.450% | 6/1/28 | 7,500 | 6,538 |
| California Department of Water Resources | | | | |
| Power Supply Revenue | 5.000% | 5/1/18 | 8,000 | 9,404 |
| California Department of Water Resources | | | | |
| Power Supply Revenue | 5.000% | 5/1/20 | 4,500 | 5,367 |
| California Department of Water Resources | | | | |
| Power Supply Revenue | 5.000% | 5/1/20 | 10,000 | 11,926 |
| California Department of Water Resources | | | | |
| Power Supply Revenue | 5.000% | 5/1/21 | 5,000 | 5,881 |
| California Department of Water Resources | | | | |
| Power Supply Revenue | 5.000% | 5/1/22 | 30,000 | 34,567 |
| California Department of Water Resources | | | | |
| Water System Revenue (Central Valley Project) | 5.000% | 12/1/25 | 8,810 | 9,981 |
| California Department of Water Resources | | | | |
| Water System Revenue (Central Valley Project) | 5.000% | 12/1/35 | 4,000 | 4,280 |
| California Economic Recovery GO | 5.000% | 7/1/18 | 12,000 | 14,130 |
| California Economic Recovery GO | 5.000% | 7/1/19 | 6,000 | 7,129 |
| California Economic Recovery GO | 5.000% | 7/1/20 | 10,000 | 11,749 |
| California Economic Recovery GO | 5.250% | 7/1/21 | 11,985 | 14,195 |
| California Economic Recovery GO | 5.000% | 7/1/22 | 5,000 | 5,491 |
| California Educational Facilities Authority Revenue | | | | |
| (California Institute of Technology) | 5.000% | 10/1/39 | 7,730 | 8,110 |
| California Educational Facilities Authority Revenue | | | | |
| (California Institute of Technology) | 5.000% | 11/1/39 | 3,000 | 3,158 |
| California Educational Facilities Authority Revenue | | | | |
| (Claremont McKenna College) | 5.000% | 1/1/42 | 4,000 | 4,097 |
| California Educational Facilities Authority Revenue | | | | |
| (College of Arts & Crafts) | 6.875% | 6/1/19 | 1,615 | 1,911 |
| California Educational Facilities Authority Revenue | | | | |
| (College of Arts) | 5.250% | 6/1/30 | 1,125 | 1,143 |
| California Educational Facilities Authority Revenue | | | | |
| (Pepperdine College) | 5.000% | 9/1/33 | 3,000 | 3,158 |
| California Educational Facilities Authority Revenue | | | | |
| (Pomona College) | 0.000% | 7/1/34 | 3,155 | 1,137 |
| California Educational Facilities Authority Revenue | | | | |
| (Pomona College) | 0.000% | 7/1/35 | 3,155 | 1,057 |
| California Educational Facilities Authority Revenue | | | | |
| (Pomona College) | 0.000% | 7/1/36 | 3,155 | 998 |
| California Educational Facilities Authority Revenue | | | | |
| (Pomona College) | 0.000% | 7/1/37 | 3,155 | 944 |
| California Educational Facilities Authority Revenue | | | | |
| (Pomona College) | 0.000% | 7/1/39 | 2,805 | 747 |
| California Educational Facilities Authority Revenue | | | | |
| (Pomona College) | 0.000% | 7/1/40 | 1,580 | 399 |
85
| | | | |
| California Long-Term Tax-Exempt Fund | | | | |
| |
| |
| |
| | | | Face | Market |
| | | Maturity | Amount | Value |
| | Coupon | Date | ($000) | ($000) |
| California Educational Facilities Authority Revenue | | | | |
| (Stanford University) | 5.000% | 3/15/26 | 5,330 | 6,387 |
| California Educational Facilities Authority Revenue | | | | |
| (University of San Francisco) | 6.125% | 10/1/36 | 1,250 | 1,424 |
| California Educational Facilities Authority Revenue | | | | |
| (University of Southern California) | 5.000% | 10/1/38 | 5,445 | 5,699 |
| California Educational Facilities Authority Revenue | | | | |
| (University of Southern California) | 5.250% | 10/1/38 | 3,420 | 3,647 |
| California Educational Facilities Authority Revenue | | | | |
| (University of the Pacific) | 5.000% | 11/1/25 | 2,000 | 2,059 |
| California GO | 5.125% | 2/1/14 (Prere.) | 15,325 | 15,456 |
| California GO | 5.250% | 10/1/14 (14) | 1,880 | 1,913 |
| California GO | 5.000% | 3/1/19 | 1,250 | 1,464 |
| California GO | 6.000% | 4/1/19 | 1,690 | 2,071 |
| California GO | 6.000% | 8/1/19 (3) | 210 | 212 |
| California GO | 5.000% | 10/1/19 | 10,070 | 11,870 |
| California GO | 5.000% | 4/1/20 | 1,460 | 1,673 |
| California GO | 5.000% | 9/1/21 | 11,000 | 12,823 |
| California GO | 5.250% | 9/1/22 | 3,000 | 3,542 |
| California GO | 5.000% | 11/1/22 | 1,000 | 1,144 |
| California GO | 5.250% | 9/1/23 | 10,100 | 11,616 |
| California GO | 5.000% | 3/1/25 | 7,000 | 7,752 |
| California GO | 5.000% | 6/1/26 (14) | 20,000 | 22,156 |
| California GO | 5.250% | 10/1/27 | 5,000 | 5,562 |
| California GO | 5.100% | 11/1/27 | 1,475 | 1,612 |
| California GO | 5.000% | 9/1/28 | 10,650 | 11,242 |
| California GO | 5.000% | 9/1/28 | 2,500 | 2,674 |
| California GO | 5.000% | 9/1/29 | 5,125 | 5,454 |
| California GO | 5.000% | 10/1/29 | 1,400 | 1,483 |
| California GO | 5.250% | 10/1/29 | 4,700 | 5,038 |
| California GO | 5.250% | 3/1/30 | 10,000 | 10,940 |
| California GO | 4.500% | 8/1/30 | 1,440 | 1,447 |
| California GO | 5.250% | 9/1/30 | 6,000 | 6,504 |
| California GO | 5.750% | 4/1/31 | 15,875 | 17,673 |
| California GO | 5.000% | 6/1/32 | 25,000 | 26,026 |
| California GO | 5.000% | 9/1/32 | 1,045 | 1,099 |
| California GO | 6.000% | 3/1/33 | 7,000 | 8,129 |
| California GO | 5.125% | 4/1/33 | 8,500 | 8,957 |
| California GO | 6.500% | 4/1/33 | 33,000 | 39,176 |
| California GO | 5.000% | 6/1/34 | 7,000 | 7,117 |
| California GO | 5.250% | 4/1/35 | 5,000 | 5,294 |
| California GO | 6.000% | 11/1/35 | 10,000 | 11,499 |
| California GO | 5.000% | 9/1/36 | 8,500 | 8,755 |
| California GO | 5.000% | 4/1/37 | 5,000 | 5,139 |
| California GO | 5.250% | 3/1/38 | 8,000 | 8,311 |
| California GO | 6.000% | 4/1/38 | 21,190 | 24,035 |
| California GO | 5.250% | 8/1/38 | 10,000 | 10,423 |
| California GO | 5.500% | 11/1/39 | 3,690 | 3,967 |
| California GO | 6.000% | 11/1/39 | 2,700 | 3,099 |
| California GO | 5.500% | 3/1/40 | 11,500 | 12,419 |
| California GO | 5.250% | 11/1/40 | 11,000 | 11,439 |
| California GO | 5.000% | 10/1/41 | 5,000 | 5,081 |
| California GO | 5.000% | 4/1/42 | 2,000 | 2,033 |
| California GO | 5.000% | 2/1/43 | 5,000 | 5,084 |
| California GO | 5.000% | 4/1/43 | 5,000 | 5,086 |
86
| | | | |
| California Long-Term Tax-Exempt Fund | | | | |
| |
| |
| |
| | | | Face | Market |
| | | Maturity | Amount | Value |
| | Coupon | Date | ($000) | ($000) |
| California Health Facilities Financing Authority | | | | |
| Revenue (Adventist Health System/West) | 5.000% | 3/1/25 | 3,000 | 3,227 |
| California Health Facilities Financing Authority | | | | |
| Revenue (Catholic Healthcare West) | 5.625% | 7/1/25 | 5,000 | 5,424 |
| California Health Facilities Financing Authority | | | | |
| Revenue (Catholic Healthcare West) | 5.250% | 3/1/27 | 2,500 | 2,652 |
| California Health Facilities Financing Authority | | | | |
| Revenue (Catholic Healthcare West) | 6.000% | 7/1/39 | 5,000 | 5,382 |
| California Health Facilities Financing Authority | | | | |
| Revenue (Catholic Healthcare West) | 5.250% | 3/1/41 | 9,000 | 9,097 |
| California Health Facilities Financing Authority | | | | |
| Revenue (Cedars-Sinai Medical Center) | 5.000% | 11/15/27 | 7,000 | 7,352 |
| California Health Facilities Financing Authority | | | | |
| Revenue (Cedars-Sinai Medical Center) | 5.000% | 8/15/34 | 2,415 | 2,420 |
| California Health Facilities Financing Authority | | | | |
| Revenue (Cedars-Sinai Medical Center) | 5.000% | 8/15/39 | 3,245 | 3,217 |
| California Health Facilities Financing Authority | | | | |
| Revenue (Children’s Hospital of Los Angeles) | 5.000% | 11/15/29 | 3,500 | 3,500 |
| California Health Facilities Financing Authority | | | | |
| Revenue (Children’s Hospital of Orange County) | 6.500% | 11/1/38 | 3,000 | 3,337 |
| California Health Facilities Financing Authority | | | | |
| Revenue (Children’s Hospital of Orange County) | 5.250% | 11/1/41 | 4,025 | 4,056 |
| California Health Facilities Financing Authority | | | | |
| Revenue (Children’s Hospital of Orange County) | | | | |
| VRDO | 0.040% | 12/6/13 LOC | 4,755 | 4,755 |
| California Health Facilities Financing Authority | | | | |
| Revenue (Chinese Hospital Association) | 5.000% | 6/1/37 | 2,000 | 1,973 |
| California Health Facilities Financing Authority | | | | |
| Revenue (Chinese Hospital Association) | 5.000% | 6/1/42 | 5,000 | 4,788 |
| California Health Facilities Financing Authority | | | | |
| Revenue (City of Hope Medical Center) | 5.000% | 11/15/35 | 7,750 | 7,755 |
| California Health Facilities Financing Authority | | | | |
| Revenue (City of Hope Medical Center) | 5.000% | 11/15/39 | 4,465 | 4,426 |
| California Health Facilities Financing Authority | | | | |
| Revenue (Lucile Salter Packard Children’s | | | | |
| Hospital at Stanford) | 5.000% | 8/15/51 | 10,000 | 9,718 |
| California Health Facilities Financing Authority | | | | |
| Revenue (Memorial Health Services) | 5.000% | 10/1/25 | 2,750 | 3,036 |
| California Health Facilities Financing Authority | | | | |
| Revenue (Memorial Health Services) | 5.000% | 10/1/26 | 5,000 | 5,453 |
| California Health Facilities Financing Authority | | | | |
| Revenue (Memorial Health Services) | 5.000% | 10/1/33 | 2,500 | 2,546 |
| California Health Facilities Financing Authority | | | | |
| Revenue (Providence Health & Services) | 6.500% | 10/1/33 | 2,000 | 2,286 |
| California Health Facilities Financing Authority | | | | |
| Revenue (Providence Health & Services) | 5.500% | 10/1/39 | 6,500 | 7,098 |
| California Health Facilities Financing Authority | | | | |
| Revenue (Rady Children’s Hospital) | 5.500% | 8/15/33 | 3,920 | 4,121 |
| California Health Facilities Financing Authority | | | | |
| Revenue (Scripps Health) | 5.000% | 11/15/40 | 6,000 | 6,000 |
| California Health Facilities Financing Authority | | | | |
| Revenue (St. Joseph Health System) | 5.000% | 7/1/37 | 4,500 | 4,548 |
| California Health Facilities Financing Authority | | | | |
| Revenue (St. Joseph Health System) | 5.750% | 7/1/39 | 7,000 | 7,754 |
87
| | | | |
| California Long-Term Tax-Exempt Fund | | | | |
| |
| |
| |
| | | | Face | Market |
| | | Maturity | Amount | Value |
| | Coupon | Date | ($000) | ($000) |
| California Health Facilities Financing Authority | | | | |
| Revenue (Stanford Hospital) | 5.000% | 8/15/42 | 5,000 | 4,954 |
| California Health Facilities Financing Authority | | | | |
| Revenue (Sutter Health) | 5.250% | 8/15/22 | 5,000 | 5,780 |
| California Health Facilities Financing Authority | | | | |
| Revenue (Sutter Health) | 5.875% | 8/15/31 | 4,000 | 4,519 |
| California Health Facilities Financing Authority | | | | |
| Revenue (Sutter Health) | 5.250% | 11/15/46 | 10,000 | 10,018 |
| California Health Facilities Financing Authority | | | | |
| Revenue (Sutter Health) | 5.000% | 8/15/52 | 5,000 | 4,778 |
| 1 California Infrastructure & Economic Development | | | | |
| Bank Revenue (Bay Area Toll Bridges Seismic | | | | |
| Retrofit) TOB VRDO | 0.120% | 12/2/13 (ETM) | 12,400 | 12,400 |
| California Infrastructure & Economic Development | | | | |
| Bank Revenue (Independent System Operator | | | | |
| Corp. Project) | 5.000% | 2/1/39 | 5,000 | 5,069 |
| California Infrastructure & Economic Development | | | | |
| Bank Revenue (Los Angeles County Museum of | | | | |
| Natural History Foundation) VRDO | 0.040% | 12/2/13 LOC | 900 | 900 |
| California Infrastructure & Economic Development | | | | |
| Bank Revenue (Science Center Phase II Project) | 5.000% | 5/1/31 (14) | 4,135 | 4,136 |
| California Municipal Finance Authority (Community | | | | |
| Hospitals of Central California Obligated Group) | | | | |
| COP | 5.500% | 2/1/39 | 11,000 | 10,750 |
| California Municipal Finance Authority (Community | | | | |
| Hospitals of Central California Obligated Group) | | | | |
| COP | 5.250% | 2/1/46 | 3,650 | 3,358 |
| California Municipal Finance Authority Revenue | | | | |
| (Biola University) | 5.000% | 10/1/38 | 1,255 | 1,197 |
| California Municipal Finance Authority Revenue | | | | |
| (Biola University) | 5.000% | 10/1/42 | 2,500 | 2,365 |
| California Municipal Finance Authority Revenue | | | | |
| (University of La Verne) | 5.250% | 6/1/20 | 2,420 | 2,713 |
| California Public Works Board Lease Revenue | | | | |
| (Community Colleges) | 5.000% | 3/1/27 (14) | 2,970 | 3,088 |
| California Public Works Board Lease Revenue | | | | |
| (Department of Corrections) | 6.500% | 9/1/17 (2) | 15,645 | 17,077 |
| California Public Works Board Lease Revenue | | | | |
| (Department of General Services) | 6.000% | 4/1/25 | 6,000 | 6,984 |
| California Public Works Board Lease Revenue | | | | |
| (Department of General Services) | 6.250% | 4/1/34 | 8,250 | 9,340 |
| California Public Works Board Lease Revenue | | | | |
| (Judicial Council Projects) | 5.000% | 3/1/29 | 2,500 | 2,613 |
| California Public Works Board Lease Revenue | | | | |
| (Judicial Council Projects) | 5.000% | 3/1/34 | 1,300 | 1,321 |
| California Public Works Board Lease Revenue | | | | |
| (Judicial Council Projects) | 5.000% | 3/1/38 | 3,375 | 3,370 |
| California Public Works Board Lease Revenue | | | | |
| (Office of Emergency Services) | 5.000% | 3/1/27 (14) | 8,950 | 9,304 |
| California Public Works Board Lease Revenue | | | | |
| (Regents of The University of California) | 5.000% | 5/1/15 (Prere.) | 17,000 | 18,137 |
| California Public Works Board Lease Revenue | | | | |
| (Regents of The University of California) | 5.250% | 11/1/15 (Prere.) | 9,045 | 9,899 |
| California Public Works Board Lease Revenue | | | | |
| (Various Capital Projects) | 5.000% | 4/1/23 | 4,180 | 4,670 |
88
| | | | |
| California Long-Term Tax-Exempt Fund | | | | |
| |
| |
| |
| | | | Face | Market |
| | | Maturity | Amount | Value |
| | Coupon | Date | ($000) | ($000) |
| California Public Works Board Lease Revenue | | | | |
| (Various Capital Projects) | 5.000% | 11/1/23 | 2,000 | 2,239 |
| California Public Works Board Lease Revenue | | | | |
| (Various Capital Projects) | 6.250% | 11/1/24 | 5,000 | 5,752 |
| California Public Works Board Lease Revenue | | | | |
| (Various Capital Projects) | 5.000% | 11/1/26 | 5,000 | 5,352 |
| California Public Works Board Lease Revenue | | | | |
| (Various Capital Projects) | 5.500% | 11/1/33 | 2,330 | 2,519 |
| California Public Works Board Lease Revenue | | | | |
| (Various Capital Projects) | 5.000% | 11/1/37 | 5,000 | 5,011 |
| California State University Revenue Systemwide | 5.250% | 5/1/14 (Prere.) | 3,510 | 3,585 |
| California State University Revenue Systemwide | 5.250% | 5/1/14 (Prere.) | 3,045 | 3,110 |
| California State University Revenue Systemwide | 5.000% | 11/1/24 | 2,000 | 2,278 |
| California State University Revenue Systemwide | 5.750% | 11/1/27 | 4,500 | 5,086 |
| California State University Revenue Systemwide | 5.250% | 11/1/34 | 5,000 | 5,322 |
| California State University Revenue Systemwide | 5.000% | 11/1/35 (14) | 5,000 | 5,134 |
| California State University Revenue Systemwide | 5.000% | 11/1/37 | 10,000 | 10,343 |
| California State University Revenue Systemwide | 5.000% | 11/1/37 | 3,750 | 3,864 |
| California State University Revenue Systemwide | 5.250% | 11/1/38 | 3,280 | 3,478 |
| California State University Revenue Systemwide | 5.000% | 11/1/42 | 1,355 | 1,385 |
| California Statewide Communities Development | | | | |
| Authority Health Facility Revenue (Adventist | | | | |
| Health System/West) | 5.000% | 3/1/35 | 8,000 | 8,001 |
| California Statewide Communities Development | | | | |
| Authority Health Facility Revenue (Henry Mayo | | | | |
| Newhall Memorial Hospital) | 5.000% | 10/1/18 | 3,935 | 3,944 |
| California Statewide Communities Development | | | | |
| Authority Revenue (Cottage Health System | | | | |
| Obligated Group) | 5.000% | 11/1/40 | 7,000 | 6,928 |
| California Statewide Communities Development | | | | |
| Authority Revenue (Covenant Retirement | | | | |
| Communities Inc.) | 5.625% | 12/1/36 | 4,000 | 3,833 |
| California Statewide Communities Development | | | | |
| Authority Revenue (Daughters of Charity | | | | |
| Health System) | 5.250% | 7/1/30 | 5,000 | 5,007 |
| California Statewide Communities Development | | | | |
| Authority Revenue (Episcopal Communities | | | | |
| & Services) | 5.000% | 5/15/42 | 2,500 | 2,229 |
| California Statewide Communities Development | | | | |
| Authority Revenue (Episcopal Communities | | | | |
| & Services) | 5.000% | 5/15/47 | 2,000 | 1,748 |
| California Statewide Communities Development | | | | |
| Authority Revenue (Kaiser Permanente) | 4.750% | 4/1/33 | 4,185 | 4,148 |
| California Statewide Communities Development | | | | |
| Authority Revenue (Kaiser Permanente) | 5.000% | 4/1/42 | 30,425 | 30,014 |
| California Statewide Communities Development | | | | |
| Authority Revenue (Kaiser Permanente) | 5.250% | 3/1/45 | 5,000 | 5,027 |
| California Statewide Communities Development | | | | |
| Authority Revenue (Kaiser Permanente) VRDO | 0.030% | 12/6/13 | 2,200 | 2,200 |
| California Statewide Communities Development | | | | |
| Authority Revenue (Sutter Health) | 5.250% | 8/15/31 | 2,500 | 2,611 |
| California Statewide Communities Development | | | | |
| Authority Revenue (Sutter Health) | 5.000% | 8/15/32 | 11,000 | 11,244 |
| California Statewide Communities Development | | | | |
| Authority Revenue (Sutter Health) | 5.000% | 8/15/38 (2) | 2,900 | 2,896 |
89
| | | | |
| California Long-Term Tax-Exempt Fund | | | | |
| |
| |
| |
| | | | Face | Market |
| | | Maturity | Amount | Value |
| | Coupon | Date | ($000) | ($000) |
| California Statewide Communities Development | | | | |
| Authority Revenue (Sutter Health) | 5.000% | 11/15/38 | 4,250 | 4,190 |
| California Statewide Communities Development | | | | |
| Authority Revenue (Trinity Health) | 5.000% | 12/1/41 | 11,000 | 10,983 |
| California Statewide Communities Development | | | | |
| Authority Senior Living Revenue (Southern | | | | |
| California Presbyterian Homes) | 4.875% | 11/15/36 | 3,730 | 3,169 |
| California Statewide Communities Development | | | | |
| Authority Senior Living Revenue (Southern | | | | |
| California Presbyterian Homes) | 7.250% | 11/15/41 | 3,000 | 3,243 |
| California Statewide Communities Development | | | | |
| Authority Student Housing Revenue (CHF-Irvine | | | | |
| LLC - UCI East Campus Apartments Phase II) | 5.000% | 5/15/38 | 13,000 | 12,298 |
| Centinela Valley CA Union High School District GO | 6.000% | 8/1/36 | 3,000 | 3,347 |
| Cerritos CA Community College District GO | 0.000% | 8/1/34 | 4,000 | 1,329 |
| Cerritos CA Community College District GO | 0.000% | 8/1/35 | 1,730 | 542 |
| Cerritos CA Community College District GO | 5.000% | 8/1/38 | 7,000 | 7,279 |
| Chabot-Las Positas CA Community College | | | | |
| District GO | 5.000% | 8/1/25 | 5,000 | 5,585 |
| Chabot-Las Positas CA Community College | | | | |
| District GO | 5.000% | 8/1/30 | 3,500 | 3,709 |
| Coast CA Community College District GO | 5.000% | 8/1/27 | 5,700 | 6,393 |
| Colton CA Joint Unified School District GO | 5.000% | 8/1/27 (4) | 2,535 | 2,749 |
| Contra Costa CA Community College District GO | 5.000% | 8/1/38 | 3,600 | 3,771 |
| Contra Costa CA Transportation Authority Sales | | | | |
| Tax Revenue | 5.000% | 3/1/24 | 1,085 | 1,227 |
| East Bay CA Municipal Utility District Waste | | | | |
| Water System Revenue | 5.000% | 6/1/33 (2) | 1,350 | 1,454 |
| East Bay CA Municipal Utility District Water | | | | |
| System Revenue | 5.000% | 6/1/32 (14) | 15,765 | 16,789 |
| East Bay CA Municipal Utility District Water | | | | |
| System Revenue | 5.000% | 6/1/36 | 10,000 | 10,747 |
| East Bay CA Regional Park District Revenue | 5.000% | 9/1/25 | 2,000 | 2,252 |
| East Bay CA Regional Park District Revenue | 5.000% | 9/1/27 | 4,070 | 4,484 |
| East Side CA Union High School District | | | | |
| Santa Clara County GO | 5.000% | 8/1/37 | 5,655 | 5,738 |
| Encinitas CA Community Facilities District | | | | |
| No. 1 Special Tax Revenue | 5.000% | 9/1/27 | 1,000 | 1,040 |
| Escondido CA Union High School District GO | 0.000% | 11/1/20 (14) | 4,000 | 3,116 |
| Fontana CA Public Financing Authority Tax | | | | |
| Allocation Revenue | 5.000% | 10/1/29 (2) | 9,450 | 9,461 |
| Fontana CA Public Financing Authority Tax | | | | |
| Allocation Revenue | 5.000% | 10/1/32 (2) | 5,000 | 4,928 |
| Fontana CA Unified School District GO | 5.250% | 8/1/14 (Prere.) | 5,875 | 6,075 |
| Fontana CA Unified School District GO | 5.250% | 8/1/31 (4) | 240 | 245 |
| Foothill-De Anza CA Community College | | | | |
| District GO | 0.000% | 8/1/17 (14) | 3,000 | 2,867 |
| Foothill-De Anza CA Community College | | | | |
| District GO | 0.000% | 8/1/22 (14) | 3,850 | 2,901 |
| Foothill-De Anza CA Community College | | | | |
| District GO | 0.000% | 8/1/23 (14) | 3,590 | 2,553 |
| Foothill-De Anza CA Community College | | | | |
| District GO | 0.000% | 8/1/25 (14) | 2,390 | 1,508 |
| Foothill-De Anza CA Community College | | | | |
| District GO | 5.000% | 8/1/40 | 10,000 | 10,433 |
90
| | | | |
| California Long-Term Tax-Exempt Fund | | | | |
| |
| |
| |
| | | | Face | Market |
| | | Maturity | Amount | Value |
| | Coupon | Date | ($000) | ($000) |
| Gavilan CA Joint Community College | | | | |
| District GO | 5.500% | 8/1/14 (Prere.) | 3,315 | 3,434 |
| Gavilan CA Joint Community College | | | | |
| District GO | 5.500% | 8/1/28 (2) | 90 | 92 |
| Gilroy CA School Facilities Finance Authority | | | | |
| Revenue | 5.000% | 8/1/46 | 5,000 | 4,918 |
| Golden State Tobacco Securitization Corp. | | | | |
| California Revenue | 5.125% | 6/1/47 | 7,785 | 5,348 |
| Grossmont CA Healthcare District GO | 6.125% | 7/15/40 | 2,500 | 2,815 |
| Grossmont CA Union High School District GO | 0.000% | 8/1/30 | 6,600 | 2,795 |
| Huntington Beach CA Union High School | | | | |
| District GO | 0.000% | 8/1/30 (4) | 8,340 | 3,532 |
| Irvine CA Ranch Water District Revenue VRDO | 0.050% | 12/2/13 LOC | 600 | 600 |
| Irvine CA Reassessment District No. 05-21 | | | | |
| Improvement Revenue VRDO | 0.040% | 12/2/13 LOC | 15,300 | 15,300 |
| Irvine CA Unified School District Financing | | | | |
| Authority Special Tax Revenue | 5.000% | 9/1/30 (2) | 5,500 | 5,571 |
| Kern CA High School District GO | 6.400% | 8/1/14 (ETM) | 1,490 | 1,552 |
| Kern CA High School District GO | 6.400% | 8/1/15 (ETM) | 1,645 | 1,813 |
| Kern CA High School District GO | 6.400% | 8/1/16 (ETM) | 1,815 | 2,107 |
| Kern County CA GO | 5.750% | 8/1/35 (12) | 2,000 | 2,201 |
| Las Virgenes CA Unified School District GO | 0.000% | 9/1/26 (14) | 6,140 | 3,473 |
| Loma Linda CA Hospital Revenue | | | | |
| (Loma Linda University) | 5.000% | 12/1/20 | 6,155 | 6,246 |
| Loma Linda CA Hospital Revenue | | | | |
| (Loma Linda University) | 5.000% | 12/1/21 | 2,500 | 2,521 |
| Long Beach CA Airport Revenue | 5.000% | 6/1/40 | 4,440 | 4,389 |
| Long Beach CA Community College District GO | 0.000% | 8/1/34 | 2,520 | 790 |
| Long Beach CA Finance Authority Natural Gas | | | | |
| Purchase Revenue | 1.591% | 11/15/26 | 1,800 | 1,496 |
| Long Beach CA Finance Authority Tax Revenue | 5.500% | 8/1/26 (2) | 7,570 | 7,434 |
| Long Beach CA Finance Authority Tax Revenue | 5.500% | 8/1/31 (2) | 4,015 | 3,715 |
| Los Angeles CA Community College District GO | 5.500% | 8/1/25 | 3,980 | 4,596 |
| Los Angeles CA Community College District GO | 5.000% | 8/1/31 (4) | 5,000 | 5,290 |
| Los Angeles CA Community College District GO | 5.000% | 8/1/32 (14) | 7,340 | 7,705 |
| Los Angeles CA Community College District GO | 6.000% | 8/1/33 | 5,160 | 5,918 |
| Los Angeles CA Community College District GO | 5.250% | 8/1/39 | 5,000 | 5,345 |
| Los Angeles CA Department of Airports | | | | |
| International Airport Revenue | 5.000% | 5/15/22 | 2,000 | 2,297 |
| Los Angeles CA Department of Airports | | | | |
| International Airport Revenue | 5.250% | 5/15/27 | 5,000 | 5,436 |
| Los Angeles CA Department of Airports | | | | |
| International Airport Revenue | 5.000% | 5/15/29 | 5,000 | 5,316 |
| Los Angeles CA Department of Airports | | | | |
| International Airport Revenue | 5.000% | 5/15/30 | 3,195 | 3,360 |
| Los Angeles CA Department of Airports | | | | |
| International Airport Revenue | 5.000% | 5/15/30 | 14,590 | 15,467 |
| Los Angeles CA Department of Airports | | | | |
| International Airport Revenue | 5.000% | 5/15/35 | 16,000 | 16,626 |
| Los Angeles CA Department of Airports | | | | |
| International Airport Revenue | 5.000% | 5/15/35 | 7,745 | 8,035 |
| Los Angeles CA Department of Airports | | | | |
| International Airport Revenue | 5.000% | 5/15/38 | 4,000 | 4,109 |
| Los Angeles CA Department of Water | | | | |
| & Power Revenue | 5.000% | 7/1/25 | 4,070 | 4,553 |
91
| | | | |
| California Long-Term Tax-Exempt Fund | | | | |
| |
| |
| |
| | | | Face | Market |
| | | Maturity | Amount | Value |
| | Coupon | Date | ($000) | ($000) |
| Los Angeles CA Department of Water | | | | |
| & Power Revenue | 5.000% | 7/1/25 | 2,500 | 2,838 |
| Los Angeles CA Department of Water | | | | |
| & Power Revenue | 5.000% | 7/1/27 | 10,000 | 11,134 |
| Los Angeles CA Department of Water | | | | |
| & Power Revenue | 5.000% | 7/1/29 (2) | 10,000 | 10,636 |
| Los Angeles CA Department of Water | | | | |
| & Power Revenue | 5.000% | 7/1/30 (2) | 16,000 | 17,063 |
| Los Angeles CA Department of Water | | | | |
| & Power Revenue | 5.000% | 7/1/32 (2) | 5,000 | 5,235 |
| Los Angeles CA Department of Water | | | | |
| & Power Revenue | 5.250% | 7/1/32 | 7,000 | 7,555 |
| Los Angeles CA Department of Water | | | | |
| & Power Revenue | 5.375% | 7/1/34 | 3,000 | 3,294 |
| Los Angeles CA Department of Water | | | | |
| & Power Revenue | 5.000% | 7/1/36 | 5,000 | 5,224 |
| Los Angeles CA Department of Water | | | | |
| & Power Revenue | 5.000% | 7/1/36 | 10,000 | 10,527 |
| Los Angeles CA Department of Water | | | | |
| & Power Revenue | 5.000% | 7/1/37 | 1,545 | 1,624 |
| Los Angeles CA Department of Water | | | | |
| & Power Revenue | 5.000% | 7/1/38 | 12,365 | 12,863 |
| Los Angeles CA Department of Water | | | | |
| & Power Revenue | 5.250% | 7/1/38 | 1,890 | 1,998 |
| Los Angeles CA Department of Water | | | | |
| & Power Revenue | 5.250% | 7/1/39 | 2,000 | 2,128 |
| Los Angeles CA Department of Water | | | | |
| & Power Revenue | 5.000% | 7/1/43 | 2,000 | 2,072 |
| 1 Los Angeles CA Department of Water | | | | |
| & Power Revenue TOB VRDO | 0.060% | 12/2/13 | 5,200 | 5,200 |
| Los Angeles CA Department of Water | | | | |
| & Power Revenue VRDO | 0.030% | 12/2/13 | 4,400 | 4,400 |
| Los Angeles CA Department of Water | | | | |
| & Power Revenue VRDO | 0.040% | 12/2/13 | 10,000 | 10,000 |
| Los Angeles CA GO | 5.000% | 9/1/22 | 6,155 | 7,219 |
| Los Angeles CA GO | 5.000% | 9/1/31 | 5,785 | 6,223 |
| Los Angeles CA Unified School District GO | 5.000% | 7/1/20 (3) | 2,655 | 2,948 |
| Los Angeles CA Unified School District GO | 5.000% | 7/1/21 | 3,500 | 4,054 |
| Los Angeles CA Unified School District GO | 5.000% | 7/1/24 (2) | 9,745 | 10,713 |
| Los Angeles CA Unified School District GO | 5.000% | 7/1/24 (2) | 7,500 | 8,245 |
| Los Angeles CA Unified School District GO | 5.250% | 7/1/24 | 6,275 | 7,259 |
| Los Angeles CA Unified School District GO | 5.250% | 7/1/25 | 5,000 | 5,770 |
| Los Angeles CA Unified School District GO | 5.250% | 7/1/28 | 7,000 | 7,985 |
| Los Angeles CA Unified School District GO | 5.000% | 7/1/30 (3) | 7,675 | 8,154 |
| Los Angeles CA Unified School District GO | 5.000% | 7/1/32 (4) | 8,000 | 8,366 |
| Los Angeles CA Unified School District GO | 5.000% | 1/1/34 | 5,000 | 5,267 |
| Los Angeles CA Unified School District GO | 5.250% | 7/1/34 | 10,000 | 10,874 |
| Los Angeles CA Wastewater System Revenue | 5.000% | 6/1/27 | 7,000 | 7,822 |
| Los Angeles CA Wastewater System Revenue | 5.000% | 6/1/43 | 5,000 | 5,243 |
| 1 Los Angeles CA Wastewater System Revenue | | | | |
| TOB VRDO | 0.060% | 12/6/13 | 4,500 | 4,500 |
| Los Angeles County CA Metropolitan | | | | |
| Transportation Authority Sales Tax Revenue | 5.000% | 7/1/21 | 4,000 | 4,794 |
| Los Angeles County CA Metropolitan | | | | |
| Transportation Authority Sales Tax Revenue | 5.000% | 7/1/23 | 5,000 | 5,863 |
92
| | | | |
| California Long-Term Tax-Exempt Fund | | | | |
| |
| |
| |
| | | | Face | Market |
| | | Maturity | Amount | Value |
| | Coupon | Date | ($000) | ($000) |
| Los Angeles County CA Public Works Financing | | | | |
| Authority Lease Revenue | 5.000% | 12/1/23 (14) | 4,000 | 4,277 |
| Los Angeles County CA Public Works Financing | | | | |
| Authority Lease Revenue | 5.000% | 12/1/24 (14) | 4,000 | 4,267 |
| Los Angeles County CA Public Works Financing | | | | |
| Authority Lease Revenue | 5.000% | 12/1/25 (14) | 1,265 | 1,349 |
| Los Angeles County CA Public Works Financing | | | | |
| Authority Lease Revenue | 5.000% | 8/1/37 | 2,750 | 2,777 |
| Los Angeles County CA Public Works Financing | | | | |
| Authority Lease Revenue | 5.000% | 8/1/42 | 5,940 | 5,956 |
| Los Angeles County CA Public Works Financing | | | | |
| Authority Revenue | 5.500% | 10/1/18 (4) | 1,420 | 1,579 |
| Los Angeles County CA Sanitation Districts | | | | |
| Financing Authority Capital Projects Revenue | 4.500% | 10/1/42 (2) | 2,500 | 2,365 |
| Los Angeles County CA Schools Regionalized | | | | |
| Business Services Corp. COP | 0.000% | 8/1/14 (2) | 1,000 | 978 |
| Los Angeles County CA Schools Regionalized | | | | |
| Business Services Corp. COP | 0.000% | 8/1/20 (2) | 2,095 | 1,541 |
| M-S-R California Energy Authority Revenue | 7.000% | 11/1/34 | 7,000 | 8,596 |
| M-S-R California Energy Authority Revenue | 6.500% | 11/1/39 | 7,000 | 8,222 |
| M-S-R California Public Power Agency Revenue | | | | |
| (San Juan Project) | 6.750% | 7/1/20 (ETM) | 10,120 | 12,300 |
| Metropolitan Water District of Southern | | | | |
| California Revenue | 5.000% | 7/1/21 | 2,500 | 2,997 |
| Metropolitan Water District of Southern | | | | |
| California Revenue | 5.000% | 7/1/25 | 3,410 | 3,814 |
| Metropolitan Water District of Southern | | | | |
| California Revenue | 5.000% | 10/1/26 | 4,000 | 4,544 |
| Metropolitan Water District of Southern | | | | |
| California Revenue | 5.000% | 7/1/28 | 4,000 | 4,481 |
| Metropolitan Water District of Southern | | | | |
| California Revenue | 5.000% | 7/1/28 | 4,235 | 4,536 |
| Metropolitan Water District of Southern | | | | |
| California Revenue | 5.000% | 7/1/31 | 3,000 | 3,273 |
| Metropolitan Water District of Southern | | | | |
| California Revenue | 5.000% | 10/1/33 | 7,535 | 8,148 |
| Metropolitan Water District of Southern | | | | |
| California Revenue | 5.000% | 10/1/35 | 2,855 | 3,062 |
| Modesto CA High School District GO | 0.000% | 8/1/18 (14) | 3,225 | 2,906 |
| Modesto CA Irrigation District COP | 5.500% | 7/1/35 | 1,000 | 1,049 |
| Modesto CA Irrigation District COP | 5.000% | 10/1/36 (2) | 4,795 | 4,867 |
| Modesto CA Irrigation District Financing Authority | | | | |
| Revenue (Woodland Project) | 6.500% | 10/1/22 (ETM) | 8,440 | 10,345 |
| Monterey Park CA Redevelopment Agency Tax | | | | |
| Allocation Revenue | 5.000% | 9/1/16 (4) | 1,010 | 1,013 |
| Monterey Park CA Redevelopment Agency Tax | | | | |
| Allocation Revenue | 5.000% | 9/1/17 (4) | 1,060 | 1,063 |
| Monterey Park CA Redevelopment Agency Tax | | | | |
| Allocation Revenue | 5.000% | 9/1/18 (4) | 1,115 | 1,117 |
| Monterey Park CA Redevelopment Agency Tax | | | | |
| Allocation Revenue | 5.000% | 9/1/19 (4) | 1,120 | 1,122 |
| Monterey Park CA Redevelopment Agency Tax | | | | |
| Allocation Revenue | 5.000% | 9/1/20 (4) | 1,180 | 1,182 |
| Mount Diablo CA Unified School District GO | 5.000% | 6/1/37 | 1,915 | 1,987 |
93
| | | | |
| California Long-Term Tax-Exempt Fund | | | | |
| |
| |
| |
| | | | Face | Market |
| | | Maturity | Amount | Value |
| | Coupon | Date | ($000) | ($000) |
| Mount San Antonio CA Community College | | | | |
| District GO | 5.250% | 8/1/14 (Prere.) | 3,010 | 3,113 |
| Mount San Antonio CA Community College | | | | |
| District GO | 5.250% | 8/1/14 (Prere.) | 3,170 | 3,278 |
| Mount San Antonio CA Community College | | | | |
| District GO | 5.250% | 8/1/14 (Prere.) | 3,335 | 3,449 |
| Newport Beach CA Revenue (Hoag Memorial | | | | |
| Hospital Presbyterian) | 6.000% | 12/1/21 (Prere.) | 3,500 | 4,464 |
| Newport Mesa CA Unified School District GO | 0.000% | 8/1/35 | 4,000 | 1,334 |
| Newport Mesa CA Unified School District GO | 0.000% | 8/1/36 | 1,000 | 315 |
| Newport Mesa CA Unified School District GO | 0.000% | 8/1/37 | 2,000 | 596 |
| Newport Mesa CA Unified School District GO | 0.000% | 8/1/38 | 1,000 | 281 |
| Northern California Gas Authority No. 1 Revenue | 0.766% | 7/1/17 | 17,000 | 16,433 |
| Northern California Power Agency Revenue | | | | |
| (Hydroelectric Project) | 6.300% | 7/1/18 (14) | 7,200 | 8,181 |
| Northern California Power Agency Revenue | | | | |
| (Hydroelectric Project) | 7.500% | 7/1/21 (Prere.) | 1,810 | 2,389 |
| Northern California Power Agency Revenue | | | | |
| (Hydroelectric Project) | 5.000% | 7/1/27 | 3,255 | 3,509 |
| Northern California Power Agency Revenue | | | | |
| (Hydroelectric Project) | 5.000% | 7/1/32 | 1,155 | 1,210 |
| Oakland CA GO | 5.000% | 1/15/31 | 3,550 | 3,677 |
| Oakland CA Redevelopment Agency Tax | | | | |
| Allocation Revenue (Central District Project) | 5.500% | 2/1/14 (2) | 1,020 | 1,025 |
| Oakland CA Unified School District GO | 6.625% | 8/1/38 | 1,000 | 1,066 |
| Oceanside CA Unified School District GO | 0.000% | 8/1/25 (12) | 6,865 | 4,118 |
| Ohlone CA Community College District GO | 5.250% | 8/1/41 | 5,000 | 5,307 |
| Ontario Public Financing Authority Water Revenue | 5.000% | 7/1/43 | 2,325 | 2,405 |
| Orange County CA Water District Revenue | 5.000% | 8/15/41 | 6,855 | 7,182 |
| Palmdale CA COP | 5.250% | 9/1/19 (14) | 1,310 | 1,327 |
| Palmdale CA COP | 5.250% | 9/1/20 (14) | 1,450 | 1,468 |
| Palmdale CA COP | 5.250% | 9/1/21 (14) | 1,605 | 1,624 |
| Palmdale CA COP | 5.250% | 9/1/22 (14) | 1,765 | 1,786 |
| Palo Alto CA Improvement Revenue | | | | |
| (University Avenue Area Parking) | 4.250% | 9/2/22 | 200 | 206 |
| Palo Alto CA Improvement Revenue | | | | |
| (University Avenue Area Parking) | 5.000% | 9/2/26 | 1,000 | 1,044 |
| Palomar CA Community College District GO | 0.000% | 8/1/24 | 5,125 | 3,318 |
| Palomar Pomerado Health California COP | 6.000% | 11/1/41 | 3,000 | 2,867 |
| Palomar Pomerado Health California GO | 4.500% | 8/1/32 (14) | 12,000 | 11,806 |
| Palomar Pomerado Health California GO | 0.000% | 8/1/33 (12) | 4,000 | 1,337 |
| Palomar Pomerado Health California GO | 0.000% | 8/1/35 | 10,330 | 2,942 |
| Pasadena CA Unified School District GO | 5.000% | 5/1/34 | 4,000 | 4,213 |
| Peralta CA Community College District Revenue | 5.000% | 8/1/39 | 4,000 | 4,111 |
| Pittsburg CA Redevelopment Agency Tax | | | | |
| Allocation Revenue (Los Medanos | | | | |
| Community Development Project) | 0.000% | 8/1/19 (2) | 1,800 | 1,461 |
| Pittsburg CA Redevelopment Agency Tax | | | | |
| Allocation Revenue (Los Medanos | | | | |
| Community Development Project) | 0.000% | 8/1/21 (2) | 2,920 | 2,088 |
| Pittsburg CA Redevelopment Agency Tax | | | | |
| Allocation Revenue (Los Medanos | | | | |
| Community Development Project) | 0.000% | 8/1/22 (2) | 4,125 | 2,745 |
94
| | | | |
| California Long-Term Tax-Exempt Fund | | | | |
| |
| |
| |
| | | | Face | Market |
| | | Maturity | Amount | Value |
| | Coupon | Date | ($000) | ($000) |
| Pittsburg CA Redevelopment Agency Tax | | | | |
| Allocation Revenue (Los Medanos | | | | |
| Community Development Project) | 0.000% | 8/1/24 (2) | 1,000 | 581 |
| Pomona CA Unified School District GO | 5.600% | 8/1/14 (ETM) | 1,585 | 1,643 |
| Pomona CA Unified School District GO | 5.600% | 8/1/15 (ETM) | 2,000 | 2,178 |
| Pomona CA Unified School District GO | 5.600% | 8/1/16 (ETM) | 1,000 | 1,138 |
| Pomona CA Unified School District GO | 7.500% | 8/1/17 (ETM) | 2,540 | 3,168 |
| Poway CA Unified School District GO | 5.000% | 9/1/25 | 1,840 | 1,989 |
| Poway CA Unified School District GO | 5.000% | 8/1/27 | 5,575 | 6,103 |
| Poway CA Unified School District GO | 5.000% | 9/1/27 | 2,060 | 2,187 |
| Poway CA Unified School District GO | 5.000% | 9/1/31 | 1,375 | 1,394 |
| Poway CA Unified School District GO | 0.000% | 8/1/33 | 5,010 | 1,753 |
| Poway CA Unified School District GO | 5.000% | 9/1/33 | 1,000 | 999 |
| Poway CA Unified School District GO | 0.000% | 8/1/34 | 8,130 | 2,670 |
| Poway CA Unified School District GO | 5.000% | 9/1/36 | 700 | 685 |
| Poway CA Unified School District Public | | | | |
| Financing Authority Special Tax Revenue | 5.000% | 9/15/24 | 785 | 840 |
| Poway CA Unified School District Public | | | | |
| Financing Authority Special Tax Revenue | 5.000% | 9/15/27 | 1,035 | 1,062 |
| Rancho Mirage CA Joint Powers Financing | | | | |
| Authority Revenue (Eisenhower Medical Center) | 5.000% | 7/1/47 | 10,725 | 9,963 |
| Redwood City CA Redevelopment Agency | | | | |
| Redevelopment Project Area No. 2 Tax | | | | |
| Allocation Revenue | 0.000% | 7/15/26 (2) | 3,445 | 1,718 |
| Rio Hondo CA Community College District GO | 5.000% | 8/1/30 | 6,655 | 7,098 |
| Rio Hondo CA Community College District GO | 0.000% | 8/1/36 | 16,650 | 4,834 |
| 1 Riverside CA Electric Revenue TOB VRDO | 0.060% | 12/2/13 | 3,000 | 3,000 |
| Riverside CA Unified School District Community | | | | |
| Facilities District No. 7 (Victoria Grove) | | | | |
| Special Tax Revenue | 5.000% | 9/1/31 (2) | 4,000 | 4,008 |
| Riverside CA Unified School District Financing | | | | |
| Authority Revenue | 5.000% | 9/1/21 | 1,280 | 1,413 |
| Riverside CA Unified School District Financing | | | | |
| Authority Revenue | 5.000% | 9/1/22 | 1,335 | 1,469 |
| Riverside CA Unified School District Financing | | | | |
| Authority Revenue | 5.000% | 9/1/24 | 1,440 | 1,535 |
| Riverside CA Unified School District Financing | | | | |
| Authority Revenue | 5.000% | 9/1/28 | 1,795 | 1,849 |
| Riverside CA Unified School District Financing | | | | |
| Authority Revenue | 5.000% | 9/1/29 | 1,880 | 1,916 |
| Riverside CA Unified School District Financing | | | | |
| Authority Revenue | 5.000% | 9/1/32 | 1,375 | 1,393 |
| Riverside County CA Asset Leasing Corp. | | | | |
| Leasehold Revenue (Riverside County | | | | |
| Hospital Project) | 0.000% | 6/1/14 (14) | 2,000 | 1,985 |
| Riverside County CA Asset Leasing Corp. | | | | |
| Leasehold Revenue (Riverside County | | | | |
| Hospital Project) | 0.000% | 6/1/15 (14) | 2,000 | 1,936 |
| Riverside County CA Transportation Commission | | | | |
| Sales Tax Revenue | 5.250% | 6/1/39 | 2,500 | 2,682 |
| Riverside County CA Transportation Commission | | | | |
| Sales Tax Revenue VRDO | 0.050% | 12/6/13 | 1,490 | 1,490 |
| Riverside County CA Transportation Commission | | | | |
| Toll Revenue | 0.000% | 6/1/41 | 6,710 | 1,114 |
95
| | | | |
| California Long-Term Tax-Exempt Fund | | | | |
| |
| |
| |
| | | | Face | Market |
| | | Maturity | Amount | Value |
| | Coupon | Date | ($000) | ($000) |
| Riverside County CA Transportation Commission | | | | |
| Toll Revenue | 0.000% | 6/1/42 | 2,975 | 460 |
| Riverside County CA Transportation Commission | | | | |
| Toll Revenue | 0.000% | 6/1/43 | 7,500 | 1,084 |
| Riverside County CA Transportation Commission | | | | |
| Toll Revenue | 5.750% | 6/1/48 | 2,000 | 1,985 |
| Roseville CA Electric System Revenue | 5.000% | 2/1/37 | 4,500 | 4,593 |
| Roseville CA Natural Gas Financing Authority | | | | |
| Gas Revenue | 5.000% | 2/15/18 | 620 | 679 |
| Roseville CA Natural Gas Financing Authority | | | | |
| Gas Revenue | 5.000% | 2/15/22 | 1,565 | 1,689 |
| Roseville CA Natural Gas Financing Authority | | | | |
| Gas Revenue | 5.000% | 2/15/28 | 2,450 | 2,482 |
| Sacramento CA Financing Authority Lease | | | | |
| Revenue | 5.375% | 11/1/14 (2) | 1,845 | 1,908 |
| Sacramento CA Financing Authority Lease | | | | |
| Revenue | 5.400% | 11/1/20 (2) | 6,785 | 7,625 |
| Sacramento CA Municipal Utility District Revenue | 5.900% | 7/1/20 (2) | 10,000 | 12,360 |
| Sacramento CA Municipal Utility District Revenue | 5.000% | 8/15/28 | 2,000 | 2,181 |
| Sacramento CA Municipal Utility District Revenue | 5.000% | 8/15/31 | 1,175 | 1,239 |
| Sacramento CA Municipal Utility District Revenue | 5.000% | 8/15/32 | 1,195 | 1,253 |
| Sacramento CA Municipal Utility District Revenue | 5.000% | 8/15/33 | 1,450 | 1,514 |
| 2 Sacramento CA Municipal Utility District Revenue | | | | |
| VRDO | 0.040% | 12/6/13 LOC | 5,000 | 5,000 |
| Sacramento CA Regional Transit District Farebox | | | | |
| Revenue | 5.000% | 3/1/36 | 3,000 | 3,005 |
| Sacramento CA Regional Transit District Farebox | | | | |
| Revenue | 5.000% | 3/1/42 | 5,000 | 4,992 |
| Sacramento CA Transportation Authority Sales | | | | |
| Tax Revenue VRDO | 0.040% | 12/6/13 | 35,000 | 35,000 |
| Sacramento County CA Sanitation Districts | | | | |
| Financing Authority Revenue | 5.000% | 12/1/26 (14) | 5,000 | 5,439 |
| Sacramento County CA Sanitation Districts | | | | |
| Financing Authority Revenue | 5.000% | 12/1/30 (14) | 5,650 | 5,959 |
| San Bernardino CA City Unified School District GO | 5.000% | 8/1/27 (4) | 1,060 | 1,135 |
| San Bernardino County CA Medical Center COP | 6.500% | 8/1/17 (14) | 11,235 | 11,851 |
| San Bernardino County CA Transportation | | | | |
| Authority Revenue | 5.000% | 3/1/32 | 4,035 | 4,322 |
| San Diego CA Community College District GO | 5.250% | 8/1/33 | 2,500 | 2,778 |
| San Diego CA Community College District GO | 0.000% | 8/1/36 | 8,000 | 2,359 |
| San Diego CA Community College District GO | 5.000% | 8/1/36 | 2,500 | 2,638 |
| San Diego CA Community College District GO | 0.000% | 8/1/38 | 3,510 | 916 |
| San Diego CA Community College District GO | 5.000% | 8/1/41 | 3,000 | 3,134 |
| San Diego CA Community College District GO | 5.000% | 8/1/43 | 5,000 | 5,262 |
| San Diego CA Public Facilities Financing Authority | | | | |
| Sewer Revenue | 5.250% | 5/15/34 | 6,000 | 6,398 |
| San Diego CA Public Facilities Financing Authority | | | | |
| Sewer Revenue | 5.250% | 5/15/39 | 7,000 | 7,365 |
| San Diego CA Public Facilities Financing Authority | | | | |
| Water Revenue | 5.750% | 8/1/35 | 2,500 | 2,791 |
| San Diego CA Public Facilities Financing Authority | | | | |
| Water Revenue | 5.250% | 8/1/38 | 1,500 | 1,581 |
| San Diego CA Public Facilities Financing Authority | | | | |
| Water Revenue | 5.500% | 8/1/39 | 5,000 | 5,397 |
| San Diego CA Unified School District GO | 5.500% | 7/1/24 (14) | 5,000 | 5,996 |
96
| | | | |
| California Long-Term Tax-Exempt Fund | | | | |
| |
| |
| |
| | | | Face | Market |
| | | Maturity | Amount | Value |
| | Coupon | Date | ($000) | ($000) |
| San Diego CA Unified School District GO | 5.500% | 7/1/25 (14) | 4,000 | 4,763 |
| San Diego CA Unified School District GO | 0.000% | 7/1/29 | 8,150 | 3,908 |
| San Diego CA Unified School District GO | 0.000% | 7/1/30 | 1,500 | 667 |
| San Diego CA Unified School District GO | 0.000% | 7/1/38 | 4,890 | 1,243 |
| San Diego County CA COP | 5.000% | 2/1/28 (2) | 2,000 | 2,075 |
| San Diego County CA COP | 5.000% | 2/1/30 (2) | 2,345 | 2,419 |
| San Diego County CA Regional Airport Authority | | | | |
| Revenue | 5.000% | 7/1/26 | 4,000 | 4,261 |
| San Diego County CA Regional Airport Authority | | | | |
| Revenue | 5.000% | 7/1/28 | 3,200 | 3,340 |
| San Diego County CA Regional Airport Authority | | | | |
| Revenue | 5.000% | 7/1/34 | 2,715 | 2,748 |
| San Diego County CA Regional Airport Authority | | | | |
| Revenue | 5.000% | 4/1/37 | 1,500 | 1,589 |
| San Diego County CA Regional Airport Authority | | | | |
| Revenue | 5.000% | 4/1/38 | 2,000 | 2,114 |
| San Diego County CA Regional Airport Authority | | | | |
| Revenue | 5.000% | 7/1/40 | 3,000 | 3,012 |
| San Diego County CA Regional Airport Authority | | | | |
| Revenue | 5.000% | 7/1/43 | 3,540 | 3,564 |
| San Diego County CA Water Authority Revenue | 5.000% | 5/1/31 | 4,700 | 5,068 |
| San Diego County CA Water Authority Revenue | | | | |
| COP | 5.000% | 5/1/26 (4) | 7,275 | 7,937 |
| San Francisco CA Bay Area Rapid Transit District | | | | |
| GO | 5.000% | 8/1/35 | 15,000 | 15,859 |
| San Francisco CA Bay Area Rapid Transit District | | | | |
| Sales Tax Revenue | 5.000% | 7/1/30 | 2,120 | 2,311 |
| San Francisco CA City & County GO | 5.000% | 6/15/23 | 6,000 | 6,999 |
| San Francisco CA City & County International | | | | |
| Airport Revenue | 5.000% | 5/1/25 | 5,220 | 5,752 |
| San Francisco CA City & County International | | | | |
| Airport Revenue | 5.000% | 5/1/29 | 2,065 | 2,190 |
| San Francisco CA City & County International | | | | |
| Airport Revenue | 5.000% | 5/1/43 | 10,000 | 10,082 |
| San Francisco CA City & County Public Utilities | | | | |
| Commission Water Revenue | 5.000% | 10/1/29 | 12,680 | 13,872 |
| San Francisco CA City & County Public Utilities | | | | |
| Commission Water Revenue | 5.000% | 11/1/29 | 8,430 | 9,213 |
| San Francisco CA City & County Public Utilities | | | | |
| Commission Water Revenue | 5.000% | 11/1/31 | 1,100 | 1,185 |
| San Francisco CA City & County Public Utilities | | | | |
| Commission Water Revenue | 5.000% | 11/1/31 | 1,205 | 1,298 |
| San Francisco CA City & County Public Utilities | | | | |
| Commission Water Revenue | 5.000% | 11/1/33 | 4,000 | 4,248 |
| San Francisco CA City & County Public Utilities | | | | |
| Commission Water Revenue | 5.000% | 11/1/34 | 1,275 | 1,355 |
| San Francisco CA City & County Public Utilities | | | | |
| Commission Water Revenue | 5.000% | 11/1/34 | 5,000 | 5,292 |
| San Francisco CA City & County Public Utilities | | | | |
| Commission Water Revenue | 5.000% | 11/1/35 | 2,810 | 2,962 |
| San Francisco CA City & County Public Utilities | | | | |
| Commission Water Revenue | 5.000% | 11/1/35 | 2,605 | 2,719 |
| San Francisco CA City & County Public Utilities | | | | |
| Commission Water Revenue | 5.000% | 11/1/43 | 10,000 | 10,354 |
97
| | | | |
| California Long-Term Tax-Exempt Fund | | | | |
| |
| |
| |
| | | | Face | Market |
| | | Maturity | Amount | Value |
| | Coupon | Date | ($000) | ($000) |
| San Francisco CA City & County Redevelopment | | | | |
| Financing Authority Tax Allocation Revenue | | | | |
| (Mission Bay North) | 6.500% | 8/1/39 | 2,000 | 2,193 |
| San Francisco CA City & County Redevelopment | | | | |
| Financing Authority Tax Allocation Revenue | | | | |
| (Mission Bay North) | 6.750% | 8/1/41 | 1,000 | 1,121 |
| San Francisco CA City & County Unified School | | | | |
| District GO | 5.250% | 6/15/24 | 4,000 | 4,602 |
| San Francisco CA City & County Unified School | | | | |
| District GO | 5.000% | 6/15/32 | 8,365 | 8,822 |
| San Joaquin Hills CA Transportation Corridor | | | | |
| Agency Toll Road Revenue | 0.000% | 1/15/24 (14) | 6,000 | 3,313 |
| San Joaquin Hills CA Transportation Corridor | | | | |
| Agency Toll Road Revenue | 0.000% | 1/15/25 (14) | 6,000 | 3,091 |
| San Joaquin Hills CA Transportation Corridor | | | | |
| Agency Toll Road Revenue | 0.000% | 1/15/31 (14) | 11,950 | 4,009 |
| San Jose CA Airport Revenue | 5.000% | 3/1/33 (2) | 4,000 | 4,026 |
| San Jose CA Redevelopment Agency Tax | | | | |
| Allocation Revenue | 5.000% | 8/1/19 (14) | 1,270 | 1,316 |
| San Jose CA Redevelopment Agency Tax | | | | |
| Allocation Revenue | 5.000% | 8/1/20 (2) | 3,415 | 3,600 |
| San Jose CA Redevelopment Agency Tax | | | | |
| Allocation Revenue | 5.000% | 8/1/21 (2) | 2,300 | 2,397 |
| San Jose CA Redevelopment Agency Tax | | | | |
| Allocation Revenue | 5.000% | 8/1/22 (2) | 3,375 | 3,475 |
| San Jose CA Redevelopment Agency Tax | | | | |
| Allocation Revenue | 5.500% | 8/1/30 | 850 | 867 |
| San Jose CA Redevelopment Agency Tax | | | | |
| Allocation Revenue | 5.500% | 8/1/35 | 2,750 | 2,793 |
| San Jose CA Special Hotel Tax Revenue | | | | |
| (Convention Center Expansion & | | | | |
| Renovation Project) | 6.500% | 5/1/42 | 5,000 | 5,642 |
| San Juan CA Unified School District GO | 0.000% | 8/1/14 (4) | 2,610 | 2,606 |
| San Juan CA Unified School District GO | 0.000% | 8/1/16 (4) | 2,000 | 1,939 |
| San Juan CA Unified School District GO | 0.000% | 8/1/18 (4) | 1,785 | 1,619 |
| San Juan CA Unified School District GO | 0.000% | 8/1/19 (4) | 2,210 | 1,918 |
| San Juan CA Unified School District GO | 0.000% | 8/1/20 (4) | 4,930 | 4,079 |
| San Juan CA Unified School District GO | 0.000% | 8/1/23 (4) | 4,540 | 3,097 |
| San Luis & Delta Mendota CA Water | | | | |
| Authority Revenue | 5.000% | 3/1/38 (15) | 3,500 | 3,513 |
| San Marcos CA Public Facilities Authority | | | | |
| Tax Allocation Revenue (Project Areas | | | | |
| No. 2 & No. 3 Financing Project) | 5.000% | 8/1/35 (2) | 5,000 | 4,890 |
| San Marcos CA Unified School District GO | 0.000% | 8/1/32 | 2,600 | 977 |
| San Marcos CA Unified School District GO | 5.000% | 8/1/34 | 5,620 | 5,897 |
| San Marcos CA Unified School District GO | 5.000% | 8/1/38 | 2,835 | 2,937 |
| San Mateo County CA Community College | | | | |
| District GO | 5.000% | 9/1/31 | 5,000 | 5,290 |
| San Mateo County CA Joint Powers Financing | | | | |
| Authority Lease Revenue (Capital Project | | | | |
| Program) | 5.000% | 7/1/21 (14) | 3,500 | 3,888 |
| San Ramon Valley CA Unified School District GO | 0.000% | 7/1/14 (14) | 8,290 | 8,279 |
| San Ramon Valley CA Unified School District GO | 0.000% | 7/1/15 (14) | 2,005 | 1,990 |
| San Ramon Valley CA Unified School District GO | 5.000% | 8/1/22 | 4,000 | 4,775 |
98
| | | | |
| California Long-Term Tax-Exempt Fund | | | | |
| |
| |
| |
| | | | Face | Market |
| | | Maturity | Amount | Value |
| | Coupon | Date | ($000) | ($000) |
| Santa Ana CA Financing Authority Police | | | | |
| Administration & Holding Facility Lease Revenue | 6.250% | 7/1/16 (14) | 5,345 | 5,897 |
| Santa Ana CA Financing Authority Police | | | | |
| Administration & Holding Facility Lease Revenue | 6.250% | 7/1/17 (14) | 2,000 | 2,253 |
| Santa Barbara CA Secondary/High School | | | | |
| District GO | 0.000% | 8/1/40 | 2,050 | 435 |
| Santa Clara CA Electric Revenue | 6.000% | 7/1/31 | 3,000 | 3,344 |
| Santa Clara CA Unified School District GO | 5.000% | 7/1/34 | 4,000 | 4,218 |
| Santa Clara County CA Financing Authority Lease | | | | |
| Revenue (Multiple Facilities Projects) | 5.250% | 5/15/36 | 5,000 | 5,401 |
| Santa Clara County CA GO | 5.000% | 8/1/28 | 9,000 | 9,984 |
| Santa Rosa CA Wastewater Revenue | 6.000% | 7/2/15 (2) | 2,610 | 2,733 |
| Santa Rosa CA Wastewater Revenue | 6.000% | 9/1/15 (4) | 2,080 | 2,188 |
| Santa Rosa CA Wastewater Revenue | 5.000% | 9/1/28 | 4,845 | 5,257 |
| Santa Rosa CA Wastewater Revenue | 5.000% | 9/1/33 | 1,000 | 1,048 |
| Solana Beach CA School District Special | | | | |
| Tax Revenue | 5.000% | 9/1/32 | 1,000 | 1,006 |
| Solana Beach CA School District Special | | | | |
| Tax Revenue | 5.000% | 9/1/35 | 2,500 | 2,474 |
| Sonoma County CA Junior College District GO | 5.000% | 8/1/27 | 2,000 | 2,240 |
| Sonoma-Marin Area Rail Transportation District | | | | |
| California Sales & Use Tax Revenue | 5.000% | 3/1/28 | 3,500 | 3,789 |
| South San Francisco CA Redevelopment Agency | | | | |
| Tax Allocation Revenue | 5.000% | 9/1/35 (14) | 16,110 | 16,088 |
| Southern California Public Power Authority | | | | |
| Revenue | 5.000% | 7/1/29 | 5,000 | 5,383 |
| Southern California Public Power Authority | | | | |
| Revenue (Milford Wind Corridor Phase I Project) | 5.000% | 7/1/30 | 5,000 | 5,369 |
| Southern California Public Power Authority | | | | |
| Revenue (Natural Gas Project) | 5.000% | 11/1/17 | 1,865 | 2,048 |
| Southern California Public Power Authority | | | | |
| Revenue (Natural Gas Project) | 5.000% | 11/1/33 | 3,000 | 2,897 |
| Southern California Public Power Authority | | | | |
| Revenue (Transmission Project) | 5.750% | 7/1/21 (14) | 220 | 221 |
| Southern California Public Power Authority | | | | |
| Revenue (Transmission Project) | 5.000% | 7/1/23 | 5,000 | 5,627 |
| Stockton CA Public Financing Authority Water | | | | |
| Revenue (Delta Water Supply Project) | 6.250% | 10/1/38 | 2,150 | 2,296 |
| 1 Sweetwater CA Unified School District | | | | |
| GO TOB VRDO | 0.070% | 12/6/13 (13) | 700 | 700 |
| Temecula Valley CA Unified School District GO | 0.000% | 8/1/35 | 3,000 | 1,856 |
| Temecula Valley CA Unified School District GO | 0.000% | 8/1/37 | 3,785 | 2,312 |
| Tobacco Securitization Authority Revenue | | | | |
| (Northern California Tobacco Settlement) | 5.375% | 6/1/38 | 4,500 | 3,292 |
| Tobacco Securitization Authority Revenue | | | | |
| (Southern California Tobacco Settlement) | 5.000% | 6/1/37 | 2,155 | 1,562 |
| Torrance CA Hospital Revenue (Torrance | | | | |
| Memorial Medical Center) | 5.000% | 9/1/40 | 3,000 | 3,022 |
| Turlock CA Irrigation District Revenue | 5.000% | 1/1/31 | 2,000 | 2,064 |
| Turlock CA Irrigation District Revenue | 5.000% | 1/1/35 | 3,000 | 3,045 |
| Turlock CA Irrigation District Revenue | 5.500% | 1/1/41 | 3,445 | 3,590 |
| Ukiah CA Electric Revenue | 6.250% | 6/1/18 (14) | 3,480 | 3,736 |
| Ukiah CA Unified School District GO | 0.000% | 8/1/32 (10) | 6,425 | 2,217 |
| Union CA Elementary School District GO | 0.000% | 9/1/15 (14) | 3,860 | 3,826 |
| Union CA Elementary School District GO | 0.000% | 9/1/16 (14) | 1,500 | 1,468 |
99
| | | | | |
| California Long-Term Tax-Exempt Fund | | | | |
| |
| |
| |
| | | | | Face | Market |
| | | | Maturity | Amount | Value |
| | | Coupon | Date | ($000) | ($000) |
| | Union CA Elementary School District GO | 0.000% | 9/1/17 (14) | 2,295 | 2,190 |
| | Union CA Elementary School District GO | 0.000% | 9/1/18 (14) | 1,630 | 1,507 |
| | Union CA Elementary School District GO | 0.000% | 9/1/19 (14) | 1,750 | 1,548 |
| | Union CA Elementary School District GO | 0.000% | 9/1/20 (14) | 2,300 | 1,936 |
| | Union CA Elementary School District GO | 0.000% | 9/1/21 (14) | 2,000 | 1,572 |
| | University of California Regents Medical | | | | |
| | Center Revenue | 5.250% | 5/15/38 | 5,000 | 5,208 |
| | University of California Revenue | 5.750% | 5/15/25 | 7,000 | 8,255 |
| | University of California Revenue | 5.000% | 5/15/28 | 5,000 | 5,526 |
| | University of California Revenue | 4.750% | 5/15/33 | 9,425 | 9,476 |
| | University of California Revenue | 5.000% | 5/15/33 | 5,000 | 5,310 |
| | University of California Revenue | 5.000% | 5/15/34 | 5,205 | 5,514 |
| | University of California Revenue | 5.000% | 5/15/34 | 3,220 | 3,425 |
| | University of California Revenue | 5.000% | 5/15/35 | 3,640 | 3,813 |
| | University of California Revenue | 5.000% | 5/15/37 (13) | 6,000 | 6,280 |
| | University of California Revenue | 5.000% | 5/15/38 | 12,000 | 12,524 |
| | University of California Revenue | 5.250% | 5/15/39 | 7,000 | 7,460 |
| | University of California Revenue | 5.000% | 5/15/40 | 2,395 | 2,496 |
| 1 | University of California Revenue TOB VRDO | 0.060% | 12/2/13 | 9,195 | 9,195 |
| 1 | University of California Revenue TOB VRDO | 0.060% | 12/2/13 | 4,765 | 4,765 |
| 1 | University of California Revenue TOB VRDO | 0.060% | 12/6/13 | 1,600 | 1,600 |
| | Vallejo CA Sanitation & Flood Control COP | 5.000% | 7/1/19 (14) | 3,057 | 3,162 |
| | Ventura County CA Community College | | | | |
| | District GO | 5.500% | 8/1/33 | 8,500 | 9,424 |
| | Ventura County CA Public Financing Authority | | | | |
| | Lease Revenue | 5.000% | 11/1/38 | 3,000 | 3,019 |
| | Vista CA Unified School District GO | 0.000% | 8/1/28 (14) | 7,425 | 3,544 |
| | Walnut CA Energy Center Authority Revenue | 5.000% | 1/1/35 | 2,000 | 2,027 |
| | Walnut CA Energy Center Authority Revenue | 5.000% | 1/1/40 | 10,000 | 10,078 |
| | Washington Township CA Health Care District GO | 5.500% | 8/1/40 | 5,000 | 5,302 |
| | Washington Township CA Health Care District | | | | |
| | Revenue | 5.000% | 7/1/32 | 3,000 | 2,887 |
| | Washington Township CA Health Care District | | | | |
| | Revenue | 5.000% | 7/1/37 | 3,500 | 3,346 |
| | West Contra Costa CA Unified School District GO | 5.250% | 8/1/35 (4) | 7,000 | 7,305 |
| | Westlands CA Water District Revenue | 5.000% | 9/1/34 (4) | 2,000 | 2,061 |
| | Yuba City CA Unified School District GO | 0.000% | 9/1/15 (14) | 1,870 | 1,843 |
| | Yuba City CA Unified School District GO | 0.000% | 9/1/17 (14) | 2,060 | 1,918 |
| | Yuba City CA Unified School District GO | 0.000% | 9/1/19 (14) | 2,270 | 1,917 |
| | | | | | 2,687,449 |
| Puerto Rico (0.0%) | | | | |
| | Puerto Rico Public Buildings Authority | | | | |
| | Government Facilities Revenue | 5.250% | 7/1/14 (Prere.) | 75 | 77 |
| Total Tax-Exempt Municipal Bonds (Cost $2,615,714) | | | 2,687,526 |
| Other Assets and Liabilities (0.6%) | | | | |
| Other Assets | | | | 31,609 |
| Liabilities | | | | (15,443) |
| | | | | | 16,166 |
| Net Assets (100%) | | | | 2,703,692 |
100
| |
| California Long-Term Tax-Exempt Fund | |
| |
| |
| At November 30, 2013, net assets consisted of: | |
| | Amount |
| | ($000) |
| Paid-in Capital | 2,727,938 |
| Undistributed Net Investment Income | — |
| Accumulated Net Realized Losses | (96,058) |
| Unrealized Appreciation (Depreciation) | 71,812 |
| Net Assets | 2,703,692 |
| |
| Investor Shares—Net Assets | |
| Applicable to 34,463,034 outstanding $.001 par value shares of | |
| beneficial interest (unlimited authorization) | 389,948 |
| Net Asset Value Per Share—Investor Shares | $11.31 |
| |
| Admiral Shares—Net Assets | |
| Applicable to 204,485,210 outstanding $.001 par value shares of | |
| beneficial interest (unlimited authorization) | 2,313,744 |
| Net Asset Value Per Share—Admiral Shares | $11.31 |
See Note A in Notes to Financial Statements.
1 Security exempt from registration under Rule 144A of the Securities Act of 1933. Such securities may be sold in transactions exempt from
registration, normally to qualified institutional buyers. At November 30, 2013, the aggregate value of these securities was $41,360,000,
representing 1.5% of net assets.
2 Security purchased on a when-issued or delayed-delivery basis for which the fund has not taken delivery as of November 30, 2013.
A key to abbreviations and other references follows the Statement of Net Assets.
See accompanying Notes, which are an integral part of the Financial Statements.
101
California Long-Term Tax-Exempt Fund
Key to Abbreviations
ARS—Auction Rate Security.
BAN—Bond Anticipation Note.
COP—Certificate of Participation.
CP—Commercial Paper.
FR—Floating Rate.
GAN—Grant Anticipation Note.
GO—General Obligation Bond.
PUT—Put Option Obligation.
RAN—Revenue Anticipation Note.
TAN—Tax Anticipation Note.
TOB—Tender Option Bond.
TRAN—Tax Revenue Anticipation Note.
VRDO—Variable Rate Demand Obligation.
VRDP—Variable Rate Demand Preferred.
(ETM)—Escrowed to Maturity.
(Prere.)—Prerefunded.
Scheduled principal and interest payments are guaranteed by:
(1) MBIA (Municipal Bond Investors Assurance).
(2) AMBAC (Ambac Assurance Corporation).
(3) FGIC (Financial Guaranty Insurance Company).
(4) AGM (Assured Guaranty Municipal Corporation).
(5) BIGI (Bond Investors Guaranty Insurance).
(6) Connie Lee Inc.
(7) FHA (Federal Housing Authority).
(8) CapMAC (Capital Markets Assurance Corporation).
(9) American Capital Access Financial Guaranty Corporation.
(10) XL Capital Assurance Inc.
(11) CIFG (CDC IXIS Financial Guaranty).
(12) Assured Guaranty Corporation.
(13) Berkshire Hathaway Assurance Corporation.
(14) National Public Finance Guarantee Corporation.
(15) Build America Mutual Assurance Company.
The insurance does not guarantee the market value of the municipal bonds.
LOC—Scheduled principal and interest payments are guaranteed by bank letter of credit.
102
| |
| California Long-Term Tax-Exempt Fund | |
| |
| |
| Statement of Operations | |
| |
| | Year Ended |
| | November 30, 2013 |
| | ($000) |
| Investment Income | |
| Income | |
| Interest | 116,122 |
| Total Income | 116,122 |
| Expenses | |
| The Vanguard Group—Note B | |
| Investment Advisory Services | 219 |
| Management and Administrative—Investor Shares | 714 |
| Management and Administrative—Admiral Shares | 2,233 |
| Marketing and Distribution—Investor Shares | 103 |
| Marketing and Distribution—Admiral Shares | 430 |
| Custodian Fees | 37 |
| Auditing Fees | 29 |
| Shareholders’ Reports—Investor Shares | 9 |
| Shareholders’ Reports—Admiral Shares | 8 |
| Trustees’ Fees and Expenses | 3 |
| Total Expenses | 3,785 |
| Net Investment Income | 112,337 |
| Realized Net Gain (Loss) | |
| Investment Securities Sold | 12,837 |
| Futures Contracts | (761) |
| Options on Futures Contracts | (14) |
| Realized Net Gain (Loss) | 12,062 |
| Change in Unrealized Appreciation (Depreciation) | |
| Investment Securities | (243,337) |
| Futures Contracts | 9 |
| Change in Unrealized Appreciation (Depreciation) | (243,328) |
| Net Increase (Decrease) in Net Assets Resulting from Operations | (118,929) |
See accompanying Notes, which are an integral part of the Financial Statements.
103
| | |
| California Long-Term Tax-Exempt Fund | | |
| |
| |
| Statement of Changes in Net Assets | | |
| |
| | Year Ended November 30, |
| | 2013 | 2012 |
| | ($000) | ($000) |
| Increase (Decrease) in Net Assets | | |
| Operations | | |
| Net Investment Income | 112,337 | 114,067 |
| Realized Net Gain (Loss) | 12,062 | 10,558 |
| Change in Unrealized Appreciation (Depreciation) | (243,328) | 232,132 |
| Net Increase (Decrease) in Net Assets Resulting from Operations | (118,929) | 356,757 |
| Distributions | | |
| Net Investment Income | | |
| Investor Shares | (16,753) | (18,335) |
| Admiral Shares | (95,584) | (95,732) |
| Realized Capital Gain | | |
| Investor Shares | — | — |
| Admiral Shares | — | — |
| Total Distributions | (112,337) | (114,067) |
| Capital Share Transactions | | |
| Investor Shares | (61,475) | 7,143 |
| Admiral Shares | (80,041) | 152,383 |
| Net Increase (Decrease) from Capital Share Transactions | (141,516) | 159,526 |
| Total Increase (Decrease) | (372,782) | 402,216 |
| Net Assets | | |
| Beginning of Period | 3,076,474 | 2,674,258 |
| End of Period | 2,703,692 | 3,076,474 |
See accompanying Notes, which are an integral part of the Financial Statements.
104
| | | | | |
| California Long-Term Tax-Exempt Fund | | | | | |
| |
| |
| Financial Highlights | | | | | |
| |
| |
| Investor Shares | | | | | |
| |
| For a Share Outstanding | Year Ended November 30, |
| Throughout Each Period | 2013 | 2012 | 2011 | 2010 | 2009 |
| Net Asset Value, Beginning of Period | $12.24 | $11.24 | $11.01 | $10.98 | $10.19 |
| Investment Operations | | | | | |
| Net Investment Income | . 450 | .459 | .473 | .476 | .481 |
| Net Realized and Unrealized Gain (Loss) | | | | | |
| on Investments | (.930) | 1.000 | .230 | .030 | .790 |
| Total from Investment Operations | (.480) | 1.459 | .703 | .506 | 1.271 |
| Distributions | | | | | |
| Dividends from Net Investment Income | (.450) | (.459) | (.473) | (. 476) | (.481) |
| Distributions from Realized Capital Gains | — | — | — | — | — |
| Total Distributions | (.450) | (.459) | (.473) | (. 476) | (.481) |
| Net Asset Value, End of Period | $11.31 | $12.24 | $11.24 | $11.01 | $10.98 |
| |
| Total Return1 | -3.96% | 13.20% | 6.60% | 4.63% | 12.71% |
| |
| Ratios/Supplemental Data | | | | | |
| Net Assets, End of Period (Millions) | $390 | $487 | $441 | $529 | $691 |
| Ratio of Total Expenses to | | | | | |
| Average Net Assets | 0.20% | 0.20% | 0.20% | 0.20% | 0.20% |
| Ratio of Net Investment Income to | | | | | |
| Average Net Assets | 3.86% | 3.89% | 4.33% | 4.26% | 4.51% |
| Portfolio Turnover Rate | 14% | 16% | 14% | 18% | 18% |
1 Total returns do not include account service fees that may have applied in the periods shown. Fund prospectuses provide information about
any applicable account service fees.
See accompanying Notes, which are an integral part of the Financial Statements.
105
| | | | | |
| California Long-Term Tax-Exempt Fund | | | | | |
| |
| |
| Financial Highlights | | | | | |
| |
| |
| Admiral Shares | | | | | |
| |
| For a Share Outstanding | Year Ended November 30, |
| Throughout Each Period | 2013 | 2012 | 2011 | 2010 | 2009 |
| Net Asset Value, Beginning of Period | $12.24 | $11.24 | $11.01 | $10.98 | $10.19 |
| Investment Operations | | | | | |
| Net Investment Income | . 459 | .468 | .482 | .485 | .490 |
| Net Realized and Unrealized Gain (Loss) | | | | | |
| on Investments | (.930) | 1.000 | .230 | .030 | .790 |
| Total from Investment Operations | (.471) | 1.468 | .712 | .515 | 1.280 |
| Distributions | | | | | |
| Dividends from Net Investment Income | (.459) | (.468) | (.482) | (. 485) | (. 490) |
| Distributions from Realized Capital Gains | — | — | — | — | — |
| Total Distributions | (.459) | (.468) | (.482) | (. 485) | (. 490) |
| Net Asset Value, End of Period | $11.31 | $12.24 | $11.24 | $11.01 | $10.98 |
| |
| Total Return | -3.88% | 13.29% | 6.68% | 4.72% | 12.80% |
| |
| Ratios/Supplemental Data | | | | | |
| Net Assets, End of Period (Millions) | $2,314 | $2,589 | $2,234 | $2,321 | $2,183 |
| Ratio of Total Expenses to | | | | | |
| Average Net Assets | 0.12% | 0.12% | 0.12% | 0.12% | 0.12% |
| Ratio of Net Investment Income to | | | | | |
| Average Net Assets | 3.94% | 3.97% | 4.41% | 4.34% | 4.59% |
| Portfolio Turnover Rate | 14% | 16% | 14% | 18% | 18% |
See accompanying Notes, which are an integral part of the Financial Statements.
106
California Long-Term Tax-Exempt Fund
Notes to Financial Statements
Vanguard California Long-Term Tax-Exempt Fund is registered under the Investment Company Act of 1940 as an open-end investment company, or mutual fund. The fund invests in debt instruments of municipal issuers whose ability to meet their obligations may be affected by economic and political developments in the state. The fund offers two classes of shares: Investor Shares and Admiral Shares. Investor Shares are available to any investor who meets the fund’s minimum purchase requirements. Admiral Shares are designed for investors who meet certain administrative, service, and account-size criteria.
A. The following significant accounting policies conform to generally accepted accounting principles for U.S. mutual funds. The fund consistently follows such policies in preparing its financial statements.
1. Security Valuation: Bonds, and temporary cash investments acquired over 60 days to maturity, are valued using the latest bid prices or using valuations based on a matrix system (which considers such factors as security prices, yields, maturities, and ratings), both as furnished by independent pricing services. Other temporary cash investments are valued at amortized cost, which approximates market value. Securities for which market quotations are not readily available, or whose values have been affected by events occurring before the fund’s pricing time but after the close of the securities’ primary markets, are valued by methods deemed by the board of trustees to represent fair value.
2. Futures and Options: The fund may use futures contracts and options on futures contracts to invest in fixed income asset classes with greater efficiency and lower cost than is possible through direct investment, to add value when these instruments are attractively priced, or to adjust sensitivity to changes in interest rates. The primary risks associated with the use of futures contracts are imperfect correlation between changes in market values of bonds held by the fund and the prices of futures contracts, and the possibility of an illiquid market. The primary risk associated with purchasing options is that interest rates move in such a way that the option is out-of-the-money, the position is worthless at expiration, and the fund loses the premium paid. The primary risk associated with writing options is that interest rates move in such a way that the option is in-the-money, the counterparty exercises the option, and the fund loses an amount equal to the market value of the option written less the premium received. Counterparty risk involving futures and exchange-traded options is mitigated because a regulated clearinghouse is the counterparty instead of the clearing broker. To further mitigate counterparty risk, the fund trades futures and options on an exchange, monitors the financial strength of its clearing brokers and clearinghouse, and has entered into clearing agreements with its clearing brokers. The clearinghouse imposes initial margin requirements to secure the fund’s performance and requires daily settlement of variation margin representing changes in the market value of each contract.
Futures contracts are valued at their quoted daily settlement prices. The aggregate notional amounts of the contracts are not recorded in the Statement of Net Assets. Fluctuations in the value of the contracts are recorded in the Statement of Net Assets as an asset (liability) and in the Statement of Operations as unrealized appreciation (depreciation) until the contracts are closed, when they are recorded as realized futures gains (losses).
During the year ended November 30, 2013, the fund’s average investments in long and short futures contracts represented 1% and less than 1% of net assets, respectively, based on quarterly average aggregate settlement values. The fund had no open futures contracts at November 30, 2013.
Options on futures contracts are also valued at their quoted daily settlement prices. The premium paid for a purchased option is recorded as an asset that is subsequently adjusted daily to the current market value of the option purchased. The premium received for a written option is recorded as an
107
California Long-Term Tax-Exempt Fund
asset with an equal liability that is subsequently adjusted daily to the current market value of the option written. Fluctuations in the value of the options are recorded as unrealized appreciation (depreciation) until expired, closed, or exercised, at which time realized gains (losses) are recognized.
During the year ended November 30, 2013, the fund’s average value of options purchased and options written represented less than 1% and 0% of net assets, respectively, based on quarterly average market values. The fund had no open options on futures contracts at November 30, 2013.
3. Federal Income Taxes: The fund intends to continue to qualify as a regulated investment company and distribute all of its income. Management has analyzed the fund’s tax positions taken for all open federal income tax years (November 30, 2010–2013), and has concluded that no provision for federal income tax is required in the fund’s financial statements.
4. Distributions: Distributions from net investment income are declared daily and paid on the first business day of the following month. Annual distributions from realized capital gains, if any, are recorded on the ex-dividend date.
5. Other: Interest income is accrued daily. Premiums and discounts on debt securities purchased are amortized and accreted, respectively, to interest income over the lives of the respective securities. Security transactions are accounted for on the date securities are bought or sold. Costs used to determine realized gains (losses) on the sale of investment securities are those of the specific securities sold.
Each class of shares has equal rights as to assets and earnings, except that each class separately bears certain class-specific expenses related to maintenance of shareholder accounts (included in Management and Administrative expenses) and shareholder reporting. Marketing and distribution expenses are allocated to each class of shares based on a method approved by the board of trustees. Income, other non-class-specific expenses, and gains and losses on investments are allocated to each class of shares based on its relative net assets.
B. The Vanguard Group furnishes at cost investment advisory, corporate management, administrative, marketing, and distribution services. The costs of such services are allocated to the fund under methods approved by the board of trustees. The fund has committed to provide up to 0.40% of its net assets in capital contributions to Vanguard. At November 30, 2013, the fund had contributed capital of $312,000 to Vanguard (included in Other Assets), representing 0.01% of the fund’s net assets and 0.12% of Vanguard’s capitalization. The fund’s trustees and officers are also directors and officers of Vanguard.
C. Various inputs may be used to determine the value of the fund’s investments. These inputs are summarized in three broad levels for financial statement purposes. The inputs or methodologies used to value securities are not necessarily an indication of the risk associated with investing in those securities.
Level 1—Quoted prices in active markets for identical securities.
Level 2—Other significant observable inputs (including quoted prices for similar securities, interest rates, prepayment speeds, credit risk, etc.).
Level 3—Significant unobservable inputs (including the fund’s own assumptions used to determine the fair value of investments).
At November 30, 2013, 100% of the market value of the fund’s investments was determined based on Level 2 inputs.
108
California Long-Term Tax-Exempt Fund
D. Capital gain distributions are determined on a tax basis and may differ from realized capital gains for financial reporting purposes. Differences may be permanent or temporary. Permanent differences are reclassified among capital accounts in the financial statements to reflect their tax character. Temporary differences arise when gains or losses are recognized in different periods for financial statement and tax purposes. These differences will reverse at some time in the future.
For tax purposes, at November 30, 2013, the fund used capital loss carryforwards of $10,562,000 to offset taxable capital gains realized during the year ended November 30, 2013. At November 30, 2013, the fund had available capital losses totaling $92,230,000 to offset future net capital gains of $22,052,000 through November 30, 2016, $40,669,000 through November 30, 2017, $12,572,000 through November 30, 2018, and $16,937,000 through November 30, 2019.
At November 30, 2013, the cost of investment securities for tax purposes was $2,619,542,000. Net unrealized appreciation of investment securities for tax purposes was $67,984,000, consisting of unrealized gains of $115,090,000 on securities that had risen in value since their purchase and $47,106,000 in unrealized losses on securities that had fallen in value since their purchase.
E. During the year ended November 30, 2013, the fund purchased $391,783,000 of investment securities and sold $521,912,000 of investment securities, other than temporary cash investments.
| | | | |
| F. Capital share transactions for each class of shares were: | | | |
| | Year Ended November 30, |
| | 2013 | 2012 |
| | Amount | Shares | Amount | Shares |
| | ($000) | (000) | ($000) | (000) |
| Investor Shares | | | | |
| Issued | 87,345 | 7,476 | 114,182 | 9,668 |
| Issued in Lieu of Cash Distributions | 13,162 | 1,131 | 14,280 | 1,207 |
| Redeemed | (161,982) | (13,928) | (121,319) | (10,283) |
| Net Increase (Decrease)—Investor Shares | (61,475) | (5,321) | 7,143 | 592 |
| Admiral Shares | | | | |
| Issued | 405,689 | 34,787 | 387,105 | 32,846 |
| Issued in Lieu of Cash Distributions | 60,908 | 5,238 | 62,043 | 5,243 |
| Redeemed | (546,638) | (47,088) | (296,765) | (25,201) |
| Net Increase (Decrease) —Admiral Shares | (80,041) | (7,063) | 152,383 | 12,888 |
G. Management has determined that no material events or transactions occurred subsequent to November 30, 2013, that would require recognition or disclosure in these financial statements.
109
Report of Independent Registered
Public Accounting Firm
To the Trustees of Vanguard California Tax-Free Funds and the Shareholders of Vanguard California Tax-Exempt Money Market Fund, Vanguard California Intermediate-Term Tax-Exempt Fund and Vanguard California Long-Term Tax-Exempt Fund: In our opinion, the accompanying statements of net assets and the related statements of operations and of changes in net assets and the financial highlights present fairly, in all material respects, the financial position of Vanguard California Tax-Exempt Money Market Fund, Vanguard California Intermediate-Term Tax-Exempt Fund and Vanguard California Long-Term Tax-Exempt Fund (constituting separate portfolios of Vanguard California Tax-Free Funds, hereafter referred to as the “Funds”) at November 30, 2013, the results of each of their operations for the year then ended, the changes in each of their net assets for each of the two years in the period then ended, and the financial highlights for each of the five years in the period then ended, in conformity with accounting principles generally accepted in the United States of America. These financial statements and financial highlights (hereafter referred to as “financial statements”) are the responsibility of the Funds’ management; our responsibility is to express an opinion on these financial statements based on our audits. We conducted our audits of these financial statements in accordance with the standards of the Public Company Accounting Oversight Board (United States). Those standards require that we plan and perform the audit to obtain reasonable assurance about whether the financial statements are free of material misstatement. An audit includes examining, on a test basis, evidence supporting the amounts and disclosures in the financial statements, assessing the accounting principles used and significant estimates made by management, and evaluating the overall financial statement presentation. We believe that our audits, which included confirmation of securities at November 30, 2013 by correspondence with the custodian, provide a reasonable basis for our opinion.
/s/PricewaterhouseCoopers LLP
Philadelphia, Pennsylvania
January 15, 2014
Special 2013 tax information (unaudited) for Vanguard California Tax-Exempt Funds
This information for the fiscal year ended November 30, 2013, is included pursuant to provisions of
the Internal Revenue Code.
Each fund designates 100% of its income dividends as exempt-interest dividends.
110
About Your Fund’s Expenses
As a shareholder of the fund, you incur ongoing costs, which include costs for portfolio management, administrative services, and shareholder reports (like this one), among others. Operating expenses, which are deducted from a fund’s gross income, directly reduce the investment return of the fund.
A fund’s expenses are expressed as a percentage of its average net assets. This figure is known as the expense ratio. The following examples are intended to help you understand the ongoing costs (in dollars) of investing in your fund and to compare these costs with those of other mutual funds. The examples are based on an investment of $1,000 made at the beginning of the period shown and held for the entire period.
The accompanying table illustrates your fund’s costs in two ways:
• Based on actual fund return. This section helps you to estimate the actual expenses that you paid over the period. The ”Ending Account Value“ shown is derived from the fund‘s actual return, and the third column shows the dollar amount that would have been paid by an investor who started with $1,000 in the fund. You may use the information here, together with the amount you invested, to estimate the expenses that you paid over the period.
To do so, simply divide your account value by $1,000 (for example, an $8,600 account value divided by $1,000 = 8.6), then multiply the result by the number given for your fund under the heading ”Expenses Paid During Period.“
• Based on hypothetical 5% yearly return. This section is intended to help you compare your fund‘s costs with those of other mutual funds. It assumes that the fund had a yearly return of 5% before expenses, but that the expense ratio is unchanged. In this case—because the return used is not the fund’s actual return—the results do not apply to your investment. The example is useful in making comparisons because the Securities and Exchange Commission requires all mutual funds to calculate expenses based on a 5% return. You can assess your fund’s costs by comparing this hypothetical example with the hypothetical examples that appear in shareholder reports of other funds.
Note that the expenses shown in the table are meant to highlight and help you compare ongoing costs only and do not reflect transaction costs incurred by the fund for buying and selling securities. Further, the expenses do not include any purchase, redemption, or account service fees described in the fund prospectus. If such fees were applied to your account, your costs would be higher. Your fund does not carry a “sales load.”
The calculations assume no shares were bought or sold during the period. Your actual costs may have been higher or lower, depending on the amount of your investment and the timing of any purchases or redemptions.
You can find more information about the fund’s expenses, including annual expense ratios, in the Financial Statements section of this report. For additional information on operating expenses and other shareholder costs, please refer to your fund’s current prospectus.
111
| | | |
| Six Months Ended November 30, 2013 | | | |
| | Beginning | Ending | Expenses |
| | Account Value | Account Value | Paid During |
| | 5/31/2013 | 11/30/2013 | Period |
| Based on Actual Fund Return | | | |
| California Tax-Exempt Money Market Fund | $1,000.00 | $1,000.05 | $0.40 |
| California Intermediate-Term Tax-Exempt Fund | | | |
| Investor Shares | $1,000.00 | $990.11 | $1.00 |
| Admiral Shares | 1,000.00 | 990.51 | 0.60 |
| California Long-Term Tax-Exempt Fund | | | |
| Investor Shares | $1,000.00 | $973.56 | $0.99 |
| Admiral Shares | 1,000.00 | 973.95 | 0.59 |
| Based on Hypothetical 5% Yearly Return | | | |
| California Tax-Exempt Money Market Fund | $1,000.00 | $1,024.67 | $0.41 |
| California Intermediate-Term Tax-Exempt Fund | | | |
| Investor Shares | $1,000.00 | $1,024.07 | $1.01 |
| Admiral Shares | 1,000.00 | 1,024.47 | 0.61 |
| California Long-Term Tax-Exempt Fund | | | |
| Investor Shares | $1,000.00 | $1,024.07 | $1.01 |
| Admiral Shares | 1,000.00 | 1,024.47 | 0.61 |
The calculations are based on expenses incurred in the most recent six-month period. The funds’ annualized six-month expense ratios for that
period are: for the California Tax-Exempt Money Market Fund, 0.08%; for the California Intermediate-Term Tax-Exempt Fund, 0.20% for
Investor Shares and 0.12% for Admiral Shares; and for the California Long-Term Tax-Exempt Fund, 0.20% for Investor Shares and 0.12% for
Admiral Shares. (The six-month expense ratio for the California Tax-Exempt Money Market Fund reflects a temporary reduction in operating
expenses, described in Note B of the Notes to Financial Statements. Before this reduction, the fund’s annualized six-month expense ratio was
0.16%.) The dollar amounts shown as “Expenses Paid” are equal to the annualized expense ratio multiplied by the average account value
over the period, multiplied by the number of days in the most recent six-month period, then divided by the number of days in the most recent
12-month period.
112
Glossary
7-Day SEC Yield and 30-Day SEC Yield. A money market fund’s 7-day SEC yield is calculated by annualizing its income distributions for the previous seven days, as required by the U.S. Securities and Exchange Commission. For other funds, 30-day SEC yield is derived using a formula specified by the commission. Under the formula, data related to the fund’s security holdings in the previous 30 days are used to calculate the fund’s hypothetical net income for that period, which is then annualized and divided by the fund’s estimated average net assets over the calculation period. For the purposes of this calculation, a security’s income is based on its current market yield to maturity (for bonds), its actual income (for asset-backed securities), or its projected dividend yield (for stocks). Because the SEC yield represents hypothetical annualized income, it will differ—at times significantly—from the fund’s actual experience. As a result, the fund’s income distributions may be higher or lower than implied by the SEC yield.
Average Coupon. The average interest rate paid on the fixed income securities held by a fund. It is expressed as a percentage of face value.
Average Duration. An estimate of how much the value of the bonds held by a fund will fluctuate in response to a change in interest rates. To see how the value could change, multiply the average duration by the change in rates. If interest rates rise by 1 percentage point, the value of the bonds in a fund with an average duration of five years would decline by about 5%. If rates decrease by a percentage point, the value would rise by 5%.
Average Effective Maturity. The average length of time until fixed income securities held by a fund reach maturity and are repaid, taking into consideration the possibility that the issuer may call the bond before its maturity date. The figure reflects the proportion of fund assets represented by each security; it also reflects any futures contracts held. In general, the longer the average effective maturity, the more a fund’s share price will fluctuate in response to changes in market interest rates.
Average Weighted Maturity. The average length of time until fixed income securities held by a fund reach maturity and are repaid. The figure reflects the proportion of fund assets represented by each security.
Beta. A measure of the magnitude of a fund’s past share-price fluctuations in relation to the ups and downs of a given market index. The index is assigned a beta of 1.00. Compared with a given index, a fund with a beta of 1.20 typically would have seen its share price rise or fall by 12% when the index rose or fell by 10%. For this report, beta is based on returns over the past 36 months for both the fund and the index. Note that a fund’s beta should be reviewed in conjunction with its R-squared (see definition). The lower the R-squared, the less correlation there is between the fund and the index, and the less reliable beta is as an indicator of volatility.
113
Credit Quality. For Vanguard money market funds, the Distribution by Credit Quality table includes tier ratings for consistency with SEC Rule 2a-7 under the Investment Company Act of 1940, which governs money market funds. A First Tier security is one that is eligible for money market funds and has been rated in the highest short-term rating category for debt obligations by the requisite nationally recognized statistical rating organizations. An unrated security is First Tier if it represents quality comparable to that of a rated security, as determined in accordance with SEC Rule 2a-7. A Second Tier security is one that is eligible for money market funds and is not a First Tier security. For Vanguard tax-exempt bond funds, credit-quality ratings are measured on a scale that generally ranges from AAA (highest) to D (lowest). “Not Rated” is used to classify securities for which a rating is not available. Credit-quality ratings are obtained from Moody’s and S&P, and the higher rating for each issue is used.
Expense Ratio. A fund’s total annual operating expenses expressed as a percentage of the fund’s average net assets. The expense ratio includes management and administrative expenses, but does not include the transaction costs of buying and selling portfolio securities.
Inception Date. The date on which the assets of a fund (or one of its share classes) are first invested in accordance with the fund’s investment objective. For funds with a subscription period, the inception date is the day after that period ends. Investment performance is measured from the inception date.
R-Squared. A measure of how much of a fund’s past returns can be explained by the returns from the market in general, as measured by a given index. If a fund’s total returns were precisely synchronized with an index’s returns, its R-squared would be 1.00. If the fund’s returns bore no relationship to the index’s returns, its R-squared would be 0. For this report, R-squared is based on returns over the past 36 months for both the fund and the index.
Short-Term Reserves. The percentage of a fund invested in highly liquid, short-term securities that can be readily converted to cash.
Yield to Maturity. The rate of return an investor would receive if the fixed income securities held by a fund were held to their maturity dates.
114
This page intentionally left blank.
The People Who Govern Your Fund
The trustees of your mutual fund are there to see that the fund is operated and managed in your best interests since, as a shareholder, you are a part owner of the fund. Your fund’s trustees also serve on the board of directors of The Vanguard Group, Inc., which is owned by the Vanguard funds and provides services to them on an at-cost basis.
A majority of Vanguard’s board members are independent, meaning that they have no affiliation with Vanguard or the funds they oversee, apart from the sizable personal investments they have made as private individuals. The independent board members have distinguished backgrounds in business, academia, and public service. Each of the trustees and executive officers oversees 181 Vanguard funds.
The following table provides information for each trustee and executive officer of the fund. More information about the trustees is in the Statement of Additional Information, which can be obtained, without charge, by contacting Vanguard at 800-662-7447, or online at vanguard.com.
| |
| InterestedTrustee1 | and Delphi Automotive LLP (automotive components); |
| | Senior Advisor at New Mountain Capital; Trustee of |
| F. William McNabb III | The Conference Board. |
| Born 1957. Trustee Since July 2009. Chairman of the | |
| Board. Principal Occupation(s) During the Past Five | Amy Gutmann |
| Years: Chairman of the Board of The Vanguard Group, | Born 1949. Trustee Since June 2006. Principal |
| Inc., and of each of the investment companies served | Occupation(s) During the Past Five Years: President |
| by The Vanguard Group, since January 2010; Director | of the University of Pennsylvania; Christopher H. |
| of The Vanguard Group since 2008; Chief Executive | Browne Distinguished Professor of Political Science |
| Officer and President of The Vanguard Group and of | in the School of Arts and Sciences with secondary |
| each of the investment companies served by The | appointments at the Annenberg School for |
| Vanguard Group since 2008; Director of Vanguard | Communication and the Graduate School of Education |
| Marketing Corporation; Managing Director of The | of the University of Pennsylvania; Member of the |
| Vanguard Group (1995–2008). | National Commission on the Humanities and Social |
| | Sciences; Trustee of Carnegie Corporation of New |
| IndependentTrustees | York and of the National Constitution Center; Chair |
| of the U.S. Presidential Commission for the Study |
| of Bioethical Issues. |
| Emerson U. Fullwood |
| Born 1948. Trustee Since January 2008. Principal | JoAnn Heffernan Heisen |
| Occupation(s) During the Past Five Years: Executive | Born 1950. Trustee Since July 1998. Principal |
| Chief Staff and Marketing Officer for North America | Occupation(s) During the Past Five Years: Corporate |
| and Corporate Vice President (retired 2008) of Xerox | Vice President and Chief Global Diversity Officer |
| Corporation (document management products and | (retired 2008) and Member of the Executive |
| services); Executive in Residence and 2010 | Committee (1997–2008) of Johnson & Johnson |
| Distinguished Minett Professor at the Rochester | (pharmaceuticals/medical devices/consumer |
| Institute of Technology; Director of SPX Corporation | products); Director of Skytop Lodge Corporation |
| (multi-industry manufacturing), the United Way of | (hotels), the University Medical Center at Princeton, |
| Rochester, Amerigroup Corporation (managed health | the Robert Wood Johnson Foundation, and the Center |
| care), the University of Rochester Medical Center, | for Talent Innovation; Member of the Advisory Board |
| Monroe Community College Foundation, and North | of the Maxwell School of Citizenship and Public Affairs |
| Carolina A&T University. | at Syracuse University. |
| |
| Rajiv L. Gupta | F. Joseph Loughrey |
| Born 1945. Trustee Since December 2001.2 | Born 1949. Trustee Since October 2009. Principal |
| Principal Occupation(s) During the Past Five Years: | Occupation(s) During the Past Five Years: President |
| Chairman and Chief Executive Officer (retired 2009) | and Chief Operating Officer (retired 2009) of Cummins |
| and President (2006–2008) of Rohm and Haas Co. | Inc. (industrial machinery); Chairman of the Board of |
| (chemicals); Director of Tyco International, Ltd. | Hillenbrand, Inc. (specialized consumer services) and |
| (diversified manufacturing and services), Hewlett- | of Oxfam America; Director of SKF AB (industrial |
| Packard Co. (electronic computer manufacturing), | |
| | |
| machinery), Hyster-Yale Materials Handling, Inc. | Executive Officers | |
| (forklift trucks), and the Lumina Foundation for | | |
| Education; Member of the Advisory Council for the | Glenn Booraem | |
| College of Arts and Letters and of the Advisory Board | Born 1967. Controller Since July 2010. Principal |
| to the Kellogg Institute for International Studies, both | Occupation(s) During the Past Five Years: Principal |
| at the University of Notre Dame. | of The Vanguard Group, Inc.; Controller of each of |
| | the investment companies served by The Vanguard |
| Mark Loughridge | Group; Assistant Controller of each of the investment |
| Born 1953. Trustee Since March 2012. Principal | companies served by The Vanguard Group (2001–2010). |
| Occupation(s) During the Past Five Years: Senior Vice | | |
| President and Chief Financial Officer at IBM (information | Thomas J. Higgins | |
| technology services); Fiduciary Member of IBM’s | Born 1957. Chief Financial Officer Since September |
| Retirement Plan Committee. | 2008. Principal Occupation(s) During the Past Five |
| | Years: Principal of The Vanguard Group, Inc.; Chief |
| Scott C. Malpass | Financial Officer of each of the investment companies |
| Born 1962. Trustee Since March 2012. Principal | served by The Vanguard Group; Treasurer of each of |
| Occupation(s) During the Past Five Years: Chief | the investment companies served by The Vanguard |
| Investment Officer and Vice President at the University | Group (1998–2008). | |
| of Notre Dame; Assistant Professor of Finance at the | | |
| Mendoza College of Business at Notre Dame; Member | Kathryn J. Hyatt | |
| of the Notre Dame 403(b) Investment Committee; | Born 1955. Treasurer Since November 2008. Principal |
| Director of TIFF Advisory Services, Inc. (investment | Occupation(s) During the Past Five Years: Principal of |
| advisor); Member of the Investment Advisory | The Vanguard Group, Inc.; Treasurer of each of the |
| Committees of the Financial Industry Regulatory | investment companies served by The Vanguard |
| Authority (FINRA) and of Major League Baseball. | Group; Assistant Treasurer of each of the investment |
| | companies served by The Vanguard Group (1988–2008). |
| André F. Perold | | |
| Born 1952. Trustee Since December 2004. Principal | Heidi Stam | |
| Occupation(s) During the Past Five Years: George | Born 1956. Secretary Since July 2005. Principal |
| Gund Professor of Finance and Banking at the Harvard | Occupation(s) During the Past Five Years: Managing |
| Business School (retired 2011); Chief Investment | Director of The Vanguard Group, Inc.; General Counsel |
| Officer and Managing Partner of HighVista Strategies | of The Vanguard Group; Secretary of The Vanguard |
| LLC (private investment firm); Director of Rand | Group and of each of the investment companies |
| Merchant Bank; Overseer of the Museum of Fine | served by The Vanguard Group; Director and Senior |
| Arts Boston. | Vice President of Vanguard Marketing Corporation. |
| |
| | |
| Alfred M. Rankin, Jr. | Vanguard Senior ManagementTeam |
| Born 1941. Trustee Since January 1993. Principal | | |
| Occupation(s) During the Past Five Years: Chairman, | Mortimer J. Buckley | Chris D. McIsaac |
| President, and Chief Executive Officer of NACCO | Kathleen C. Gubanich | Michael S. Miller |
| Industries, Inc. (housewares/lignite) and of Hyster-Yale | Paul A. Heller | James M. Norris |
| Materials Handling, Inc. (forklift trucks); Director of | Martha G. King | Glenn W. Reed |
| the National Association of Manufacturers; Chairman | John T. Marcante | |
| of the Board of University Hospitals of Cleveland; | | |
| Advisory Chairman of the Board of The Cleveland | | |
| Museum of Art. | Chairman Emeritus and Senior Advisor |
| | |
| | John J. Brennan | |
| Peter F. Volanakis | Chairman, 1996–2009 | |
| Born 1955. Trustee Since July 2009. Principal | Chief Executive Officer and President, 1996–2008 |
| Occupation(s) During the Past Five Years: President | | |
| and Chief Operating Officer (retired 2010) of Corning | | |
| Incorporated (communications equipment); Director | Founder | |
| of SPX Corporation (multi-industry manufacturing); | John C. Bogle | |
| Overseer of the Amos Tuck School of Business | Chairman and Chief Executive Officer, 1974–1996 |
| Administration at Dartmouth College; Advisor to the | | |
| Norris Cotton Cancer Center. | |
1 Mr. McNabb is considered an “interested person,” as defined in the Investment Company Act of 1940, because he is an officer of the
Vanguard funds.
2 December 2002 for Vanguard Equity Income Fund, Vanguard Growth Equity Fund, the Vanguard Municipal Bond Funds, and the Vanguard
State Tax-Exempt Funds.
|  |
| | P.O. Box 2600 |
| | Valley Forge, PA 19482-2600 |
| |
| |
| |
| Connect with Vanguard® > vanguard.com | |
| |
| |
| |
| Fund Information > 800-662-7447 | CFA® is a trademark owned by CFA Institute. |
| Direct Investor Account Services > 800-662-2739 | |
| Institutional Investor Services > 800-523-1036 | |
| Text Telephone for People | |
| With Hearing Impairment > 800-749-7273 | |
| |
| This material may be used in conjunction | |
| with the offering of shares of any Vanguard | |
| fund only if preceded or accompanied by | |
| the fund’s current prospectus. | |
| |
| All comparative mutual fund data are from Lipper, a | |
| Thomson Reuters Company, or Morningstar, Inc., unless | |
| otherwise noted. | |
| |
| You can obtain a free copy of Vanguard’s proxy voting | |
| guidelines by visiting vanguard.com/proxyreporting or by | |
| calling Vanguard at 800-662-2739. The guidelines are | |
| also available from the SEC’s website, sec.gov. In | |
| addition, you may obtain a free report on how your fund | |
| voted the proxies for securities it owned during the 12 | |
| months ended June 30. To get the report, visit either | |
| vanguard.com/proxyreporting or sec.gov. | |
| |
| You can review and copy information about your fund at | |
| the SEC’s Public Reference Room in Washington, D.C. To | |
| find out more about this public service, call the SEC at | |
| 202-551-8090. Information about your fund is also | |
| available on the SEC’s website, and you can receive | |
| copies of this information, for a fee, by sending a | |
| request in either of two ways: via e-mail addressed to | |
| publicinfo@sec.gov or via regular mail addressed to the | |
| Public Reference Section, Securities and Exchange | |
| Commission, Washington, DC 20549-1520. | |
| |
| | © 2014 The Vanguard Group, Inc. |
| | All rights reserved. |
| | Vanguard Marketing Corporation, Distributor. |
| |
| | Q750 012014 |
Item 2: Code of Ethics. The Registrant has adopted a code of ethics that applies to the Registrant’s principal executive officer, principal financial officer, principal accounting officer or controller or persons performing similar functions. The Code of Ethics was amended during the reporting period covered by this report to make certain technical, non-material changes.
Item 3: Audit Committee Financial Expert. The following members of the Audit Committee have been determined by the Registrant’s Board of Trustees to be Audit Committee Financial Experts serving on its Audit Committee, and to be independent: Rajiv L. Gupta, Amy Gutmann, JoAnn Heffernan Heisen, F. Joseph Loughrey, Mark Loughridge, Scott C. Malpass, André F. Perold, and Alfred M. Rankin, Jr.
Item 4: Principal Accountant Fees and Services.
(a) Audit Fees.
Audit Fees of the Registrant
Fiscal Year Ended November 30, 2013: $81,000
Fiscal Year Ended November 30, 2012: $81,000
Aggregate Audit Fees of Registered Investment Companies in the Vanguard Group.
Fiscal Year Ended November 30, 2013: $5,714,113
Fiscal Year Ended November 30, 2012: $4,809,780
Includes fees billed in connection with audits of the Registrant and other registered investment companies in the Vanguard complex. Also includes fees billed in connection with audits of The Vanguard Group, Inc. and Vanguard Marketing Corporation for Fiscal Year Ended November 30, 2013.
(b) Audit-Related Fees.
Fiscal Year Ended November 30, 2013: $1,552,950
Fiscal Year Ended November 30, 2012: $1,812,565
Includes fees billed in connection with assurance and related services provided to the Registrant, other registered investment companies in the Vanguard complex, The Vanguard Group, Inc., and Vanguard Marketing Corporation.
(c) Tax Fees.
Fiscal Year Ended November 30, 2013: $110,000
Fiscal Year Ended November 30, 2012: $490,518
Includes fees billed in connection with tax compliance, planning, and advice services provided to the Registrant, other registered investment companies in the Vanguard complex,
The Vanguard Group, Inc., and Vanguard Marketing Corporation. Also includes fees billed in connection with certain tax services related to audits of the Registrant and other registered investment companies in the Vanguard complex for Fiscal Year Ended November 30, 2012.
(d) All Other Fees.
Fiscal Year Ended November 30, 2013: $132,000
Fiscal Year Ended November 30, 2012: $16,000
Includes fees billed for services related to tax reported information provided to the Registrant, other registered investment companies in the Vanguard complex, The Vanguard Group, Inc., and Vanguard Marketing Corporation.
(e) (1) Pre-Approval Policies. The policy of the Registrant’s Audit Committee is to consider and, if appropriate, approve before the principal accountant is engaged for such services, all specific audit and non-audit services provided to: the Registrant, other registered investment companies in the Vanguard complex, The Vanguard Group, Inc., and entities controlled by The Vanguard Group, Inc. that provide ongoing services to the Registrant. In making a determination, the Audit Committee considers whether the services are consistent with maintaining the principal accountant’s independence.
In the event of a contingency situation in which the principal accountant is needed to provide services in between scheduled Audit Committee meetings, the Chairman of the Audit Committee would be called on to consider and, if appropriate, pre-approve audit or permitted non-audit services in an amount sufficient to complete services through the next Audit Committee meeting, and to determine if such services would be consistent with maintaining the accountant’s independence. At the next scheduled Audit Committee meeting, services and fees would be presented to the Audit Committee for formal consideration, and, if appropriate, approval by the entire Audit Committee. The Audit Committee would again consider whether such services and fees are consistent with maintaining the principal accountant’s independence.
The Registrant’s Audit Committee is informed at least annually of all audit and non-audit services provided by the principal accountant to the Vanguard complex, whether such services are provided to: the Registrant, other registered investment companies in the Vanguard complex, The Vanguard Group, Inc., or other entities controlled by The Vanguard Group, Inc. that provide ongoing services to the Registrant.
(2) No percentage of the principal accountant’s fees or services were approved pursuant to the waiver provision of paragraph (c)(7)(i)(C) of Rule 2-01 of Regulation S-X.
(f) For the most recent fiscal year, over 50% of the hours worked under the principal accountant’s engagement were not performed by persons other than full-time, permanent employees of the principal accountant.
(g) Aggregate Non-Audit Fees.
Fiscal Year Ended November 30, 2013: $242,000
Fiscal Year Ended November 30, 2012: $506,518
Includes fees billed for non-audit services provided to the Registrant, other registered investment companies in the Vanguard complex, The Vanguard Group, Inc., and Vanguard Marketing Corporation.
(h) For the most recent fiscal year, the Audit Committee has determined that the provision of all non-audit services was consistent with maintaining the principal accountant’s independence.
Item 5: Audit Committee of Listed Registrants.
Not Applicable.
Item 6: Investments.
Not Applicable.
Item 7: Disclosure of Proxy Voting Policies and Procedures for Closed-End Management
Investment Companies.
Not Applicable.
Item 8: Portfolio Managers of Closed-End Management Investment Companies.
Not Applicable.
Item 9: Purchase of Equity Securities by Closed-End Management Investment Company and
Affiliated Purchasers.
Not Applicable.
Item 10: Submission of Matters to a Vote of Security Holders.
Not Applicable.
Item 11: Controls and Procedures.
(a) Disclosure Controls and Procedures. The Principal Executive and Financial Officers concluded that the Registrant’s Disclosure Controls and Procedures are effective based on their evaluation of the Disclosure Controls and Procedures as of a date within 90 days of the filing date of this report.
(b) Internal Control Over Financial Reporting. There were no significant changes in Registrant’s Internal Control Over Financial Reporting or in other factors that could
significantly affect this control subsequent to the date of the evaluation, including any corrective actions with regard to significant deficiencies and material weaknesses.
Item 12: Exhibits.
(a) Code of Ethics.
(b) Certifications.
Pursuant to the requirements of the Securities Exchange Act of 1934 and the Investment Company Act of 1940, the registrant has duly caused this report to be signed on its behalf by the undersigned, thereunto duly authorized.
| |
| | VANGUARD CALIFORNIA TAX-FREE FUNDS |
| |
| |
| BY: | /s/ F. WILLIAM MCNABB III* |
| | F. WILLIAM MCNABB III |
| | CHIEF EXECUTIVE OFFICER |
| |
| Date: January 21, 2014 |
Pursuant to the requirements of the Securities Exchange Act of 1934 and the Investment Company Act of 1940, this report has been signed below by the following persons on behalf of the registrant and in the capacities and on the dates indicated.
| |
| | VANGUARD CALIFORNIA TAX-FREE FUNDS |
| |
BY: | /s/ F. WILLIAM MCNABB III* |
| | F. WILLIAM MCNABB III |
| | CHIEF EXECUTIVE OFFICER |
Date: January 21, 2014 |
| VANGUARD CALIFORNIA TAX-FREE FUNDS |
| |
BY: | /s/ THOMAS J. HIGGINS* |
| | THOMAS J. HIGGINS |
| | CHIEF FINANCIAL OFFICER |
Date: January 21, 2014 |
* By: /s/ Heidi Stam
Heidi Stam, pursuant to a Power of Attorney filed on March 27, 2012 see file Number 2-11444, Incorporated by Reference.