UNITED STATES
SECURITIES AND EXCHANGE COMMISSION
Washington, D.C. 20549
FORM N-CSR
CERTIFIED SHAREHOLDER REPORT OF REGISTERED
MANAGEMENT INVESTMENT COMPANIES
Investment Company Act file number: 811-04537
Liberty All-Star Growth Fund, Inc.
(exact name of registrant as specified in charter)
1290 Broadway, Suite 1100, Denver, Colorado 80203
(Address of principal executive offices) (Zip code)
Tane T. Tyler, General Counsel
ALPS Fund Services, Inc.
1290 Broadway, Suite 1100
Denver, Colorado 80203
(Name and address of agent for service)
Registrant’s telephone number, including area code: 303-623-2577
| Date of fiscal year end: | December 31 | |||
| Date of reporting period: | January 1 - December 31, 2010 | |||
Item 1. Reports to Stockholders.
| LIBERTY ALL-STAR® GROWTH FUND | 1 | |||||
PRESIDENT’S LETTER (UNAUDITED) |
Fellow Shareholders:
Equity investors generally enjoyed a rewarding year in 2010, as stocks built on 2009’s momentum, posting gains in three out of four quarters and finishing the year with a strong December.
For the year, the S&P 500 Index rose 15.06 percent on top of the 26.46 percent advance in 2009. The S&P 500 Index gained 10.76 percent in the final quarter and headed into 2011 on the strength of a 6.68 percent return in December. The technology-oriented NASDAQ Composite Index and the Russell 3000® Growth Index rose 18.02 percent and 17.64 percent, respectively, in 2010. Reinforcing the patience and long-term commitment that is often required of investors—especially as they suffered through the financial crisis of 2008 and early 2009—the S&P 500 Index returned 93.08 percent from its low in March 2009 through year-end 2010. The NASDAQ Composite Index has returned 109.11 percent since early March 2009 and the Russell 3000® Growth has increased 97.00 percent.
The stock market performed well in 2010 in spite of a lack of enthusiasm, periodic bouts of doubt, continued problems with employment and housing on the home front, and nervousness over sovereign debt abroad. Many economists gave little credence to the durability of the recovery even as it made progress through the year, and some high profile strategists continued to believe that the economy was vulnerable to a double dip recession. Given the depths to which the economy had plunged, however, a slow but steady recovery was acceptable, even if not warmly embraced. Despite the lackluster economy, the major source of strength for the stock market has been the strong rebound in corporate profits. Profitability was driven by surging productivity and a reasonable pickup in demand. During the recession, companies lowered their break even points by shuttering inefficient plants, reducing capacity and lowering unit labor costs—setting up a scenario in which even a modest rebound in economic activity would produce a strong recovery in corporate profitability.
February 2011
As it turned out, the only negative period was the second quarter, when the S&P 500 Index retreated 11.43 percent and the Russell 3000® Growth Index declined 11.55 percent. Many factors contributed to the retracement: chief among them were the previously mentioned sovereign debt problems, and one unnerving event, the so-called “flash crash” on May 6, when the Dow Jones Industrial Average briefly and inexplicably fell 1,000 points. Stocks continued to drift lower through June before rallying in July, only to weaken again in August. On August 26, however, Federal Reserve Chairman Ben Bernanke opened the door for another round of bond purchases to boost the economy. From that point, the trajectory was higher through the end of the year, with the November 3 announcement of another round of quantitative easing.
For the year, Liberty All-Star® Growth Fund returned 21.47 percent with shares valued at net asset value (“NAV”), 21.79 percent with shares valued at NAV with dividends reinvested and 34.84 percent with shares valued at market price with dividends reinvested. These returns were strong on both an absolute and a relative basis, as all three measures topped the Russell 3000® Growth Index (+17.64 percent), the NASDAQ Composite Index (+18.02 percent) and the S&P 500 Index (+15.06 percent). Similarly, they also topped the Fund’s primary benchmark, the Lipper Multi-Cap Growth Mutual Fund Average, which advanced 18.62 percent. The Fund’s NAV reinvested return ranked in the 29th percentile of all funds in that universe for 2010. Longer term, off the March 2009 low, the Fund’s NAV with dividends reinvested advanced 99.40 percent by year-end 2010, while Fund shares valued at market price with dividends reinvested gained 145.66 percent over the same period.
Over the course of the year, the discount at which Fund shares traded relative to their underlying NAV ranged from 6.3 percent to 16.2 percent versus a range of 13.9 percent to 24.6 percent in 2009. We are pleased that the discount narrowed over the year, even though it remains above the Fund’s historical average. We believe
www.all-starfunds.com | ASG |
| 2 | LIBERTY ALL-STAR® GROWTH FUND | |||||
PRESIDENT’S LETTER (UNAUDITED) |
that the discount range of closed-end domestic equity funds remains relatively wide as investors have favored bond and international equities, particularly emerging markets. We believe those investment flows may be in the process of reversing and if the current direction holds we should see discounts continue to narrow.
Once again, in this annual report we offer a question and answer session with the Fund’s three growth style investment managers. We believe you will find the comments of these leading investment managers to be both interesting and insightful. As we have also done in recent annual reports, we once again offer a brief summary of the Fund’s attributes (on pages 4 and 5). I urge you to revisit these attributes, as they help to make the Fund a unique and attractive investment vehicle.
One of those attributes is the Fund’s distribution policy. This policy is a major component of the Fund’s total return. Often, however, these distributions—either in cash or reinvested in additional Fund shares—are overlooked. As you will see in the table on the facing page, these distributions add up over time—a total of $5.54 per share over the past 10 years. We would emphasize that shareholders need to include these distributions when determining the return on their investment in the Fund.
We are pleased that the Fund demonstrated its value as a high quality, growth equity holding by allowing shareholders to fully participate in the stock market’s rebound since the March 2009 low. We would also point out that the Fund’s NAV reinvested return ranks in the top third of its primary benchmark for the trailing three years, which includes the worst financial crisis since the 1930s. This is testament to the quality of the Fund’s three growth style investment managers. For our part, we at Liberty All-Star® Growth Fund will continue to diligently manage the Fund with the best long-term interests of shareholders first and foremost.
Sincerely,

William R. Parmentier, Jr.
President and Chief Executive Officer
Liberty All-Star® Growth Fund, Inc.
ANNUAL REPORT |
 DECEMBER 31, 2010
| LIBERTY ALL-STAR® GROWTH FUND | 3 | |||||
PRESIDENT’S LETTER (UNAUDITED) |
FUND STATISTICS AND SHORT-TERM PERFORMANCE PERIODS ENDING DECEMBER 31, 2010 |
| |||||||||||||
FUND STATISTICS: | ||||||||||||||
Net Asset Value (NAV) | $4.57 | |||||||||||||
Market Price | $4.25 | |||||||||||||
Discount | 7.0% | |||||||||||||
| Quarter | 2010 | |||||||||||||
Distributions | $0.07 | $0.25 | ||||||||||||
Market Price Trading Range | $3.75 to $4.33 | $2.95 to $4.33 | ||||||||||||
Discount Range | 6.3% to 9.6% | 6.3% to 16.2% | ||||||||||||
PERFORMANCE: | ||||||||||||||
Shares Valued at NAV | 11.00% | 21.47% | ||||||||||||
Shares Valued at NAV with Dividends Reinvested | 11.10% | 21.79% | ||||||||||||
Shares Valued at Market Price with Dividends Reinvested | 13.35% | 34.84% | ||||||||||||
NASDAQ Composite Index | 12.32% | 18.02% | ||||||||||||
Russell 3000® Growth Index | 12.26% | 17.64% | ||||||||||||
S&P 500 Index | 10.76% | 15.06% | ||||||||||||
Lipper Multi-Cap Growth Mutual Fund Average* | 11.97% | 18.62% | ||||||||||||
NAV Reinvested Percentile Rank (1 = best; 100 = worst) | 67th | 29th | ||||||||||||
Number of Funds in Category | 467 | 433 | ||||||||||||
LONG-TERM PERFORMANCE SUMMARY AND DISTRIBUTIONS | ANNUALIZED RATES OF RETURN | |||||||||||||
PERIODS ENDING DECEMBER 31, 2010 | 3 YEARS | 5 YEARS | 10 YEARS | |||||||||||
LIBERTY ALL-STAR® GROWTH FUND, INC. | ||||||||||||||
Distributions | $0.96 | $2.16 | $5.54 | |||||||||||
Shares Valued at NAV | (1.35%) | 3.56% | 1.01% | |||||||||||
Shares Valued at NAV with Dividends Reinvested | (0.59%) | 4.27% | 1.46% | |||||||||||
Shares Valued at Market Price with Dividends Reinvested | (2.59%) | 4.70% | 2.15% | |||||||||||
NASDAQ Composite Index | 0.98% | 4.69% | 1.41% | |||||||||||
Russell 3000® Growth Index | (0.26%) | 3.88% | 0.30% | |||||||||||
S&P 500 Index | (2.86%) | 2.29% | 1.41% | |||||||||||
Lipper Multi-Cap Growth Mutual Fund Average* | (1.92%) | 3.46% | 1.20% | |||||||||||
NAV Reinvested Percentile Rank (1 = best; 100 = worst) | 33rd | 38th | 53rd | |||||||||||
Number of Funds in Category | 359 | 298 | 202 | |||||||||||
* Percentile ranks calculated using the Fund’s NAV Reinvested results within the Lipper Multi-Cap Growth Open-end Mutual Fund Universe.
Figures shown for the Fund and the Lipper Multi-Cap Growth Mutual Fund Average are total returns, which include dividends, after deducting Fund expenses. The Fund’s performance is calculated assuming that a shareholder exercised all primary rights in the Fund’s rights offerings. Figures shown for the unmanaged NASDAQ Composite Index, the Russell 3000®Growth Index and the S&P 500 Index are total returns, including dividends. A description of the Lipper benchmark and the market indices can be found on page 35.
Past performance cannot predict future results. Performance will fluctuate with market conditions. Current performance may be lower or higher than the performance data shown. Performance information does not reflect the deduction of taxes that shareholders would pay on Fund distributions or the sale of Fund shares. An investment in the Fund involves risk, including loss of principal.
Shares of closed-end funds frequently trade at a discount to net asset value. The price of the Fund’s shares is determined by a number of factors, several of which are beyond the control of the Fund. Therefore, the Fund cannot predict whether its shares will trade at, below or above net asset value.
www.all-starfunds.com | ASG |
| 4 | LIBERTY ALL-STAR® GROWTH FUND | |||||
UNIQUE FUND ATTRIBUTES (UNAUDITED) |

| Multi-management for Individual Investors
| |||
Large institutional investors have traditionally employed multiple investment managers. With three investment managers investing across the full capitalization range of growth stocks, the Fund brings multi-management to individual investors. | ||||
| Real-time Trading and Liquidity
| |||
The Fund has a fixed number of shares that trade on the New York Stock Exchange and other exchanges. Share pricing is continuous—not just end-of-day, as it is with open-end mutual funds. In addition, Fund shares offer immediate liquidity and there are no annual sales fees. | ||||


ANNUAL REPORT |
| LIBERTY ALL-STAR® GROWTH FUND | 5 | |||||
UNIQUE FUND ATTRIBUTES (UNAUDITED) |
| Access to Institutional Managers
| |||
The Fund’s investment managers invest primarily for pension funds, endowments, foundations and other institutions. Because institutional managers are closely monitored by their clients, they tend to be more disciplined and consistent in their investment process. | ||||
| Monitoring and Rebalancing
| |||
ALPS Advisors continuously monitors these investment managers to ensure that they are performing as expected and adhering to their style and strategy, and will replace the managers when warranted. Periodic rebalancing maintains the Fund’s structural integrity and is a well-recognized investment discipline. | ||||
| Alignment and Objectivity
| |||
Alignment with shareholders’ best interests and objective decision-making help to ensure that the Fund is managed openly and equitably. In addition, the Fund is governed by a Board of Directors that is elected by and responsible to shareholders. | ||||
| Distribution Policy
| |||
Since 1997, the Fund has followed a policy of paying annual distributions on its shares at a rate that approximates historical equity market returns. The current annual distribution rate is 6 percent of the Fund’s net asset value (paid quarterly at 1.5 percent per quarter), providing a systematic mechanism for distributing funds to shareholders.
| ||||


www.all-starfunds.com | ASG |
| 6 | LIBERTY ALL-STAR® GROWTH FUND | |||||
INVESTMENT MANAGERS/PORTFOLIO CHARACTERISTICS (UNAUDITED) | ||||||
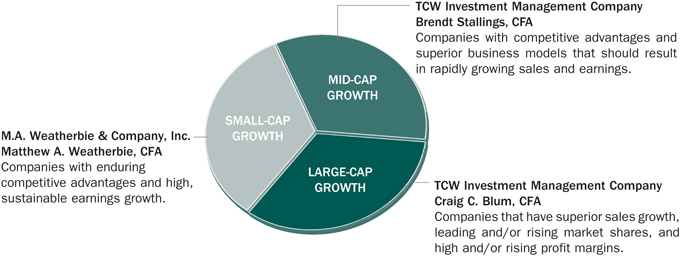
THE FUND’S THREE GROWTH INVESTMENT MANAGERS AND THE MARKET CAPITALIZATION ON WHICH EACH FOCUSES: |
| |||||||||||||||||||||||||||||
|
| |||||||||||||||||||||||||||||
MANAGERS’ DIFFERING INVESTMENT STRATEGIES ARE REFLECTED IN PORTFOLIO CHARACTERISTICS |
| |||||||||||||||||||||||||||||
The portfolio characteristics table below is a regular feature of the Fund’s shareholder reports. It serves as a useful tool for understanding the value of the Fund’s multi-managed portfolio. The characteristics are different for each of the Fund’s three investment managers. These differences are a reflection of the fact that each has a different capitalization focus and investment strategy. The shaded column highlights the characteristics of the Fund as a whole, while the first three columns show portfolio characteristics for the Russell Smallcap, Midcap and Largecap Growth indices. See page 35 for a description of these indices.
|
| |||||||||||||||||||||||||||||
| MARKET CAPITALIZATION SPECTRUM | ||||||||||||||||||||||||||||||
PORTFOLIO CHARACTERISTICS | SMALL | LARGE | ||||||||||||||||||||||||||||
AS OF DECEMBER 31, 2010 |  | |||||||||||||||||||||||||||||
RUSSELL GROWTH: | ||||||||||||||||||
| Smallcap Index | Midcap Index | Largecap Index | M.A. Weatherbie | TCW (Mid-Cap) | TCW (Large-Cap) | Total Fund | ||||||||||||
Number of Holdings | 1269 | 493 | 627 | 60 | 55 | 32 | 131* | |||||||||||
| Weighted Average Market Capitalization (billions) | $1.4 | $8.1 | $83.9 | $2.6 | $6.7 | $60.4 | $22.7 | |||||||||||
| Average Five-Year Earnings Per Share Growth | 10% | 11% | 11% | 9% | 16% | 23% | 16% | |||||||||||
| Dividend Yield | 0.5% | 0.9% | 1.4% | 0.3% | 0.4% | 0.7% | 0.4% | |||||||||||
| Price/Earnings Ratio** | 22x | 22x | 18x | 25x | 28x | 24x | 26x | |||||||||||
| Price/Book Value Ratio | 4.4x | 5.0x | 4.8x | 5.0x | 7.0x | 5.4x | 5.8x | |||||||||||
* Certain holdings are held by more than one manager.
** Excludes negative earnings.
ANNUAL REPORT |
| LIBERTY ALL-STAR® GROWTH FUND | 7 | |||||
MANAGER ROUNDTABLE (UNAUDITED) |
Investment Manager Roundtable
The Fund’s growth style investment managers look at markets in 2010 and at what they expect in 2011 through the lens of their capitalization focus
Liberty All-Star® Growth Fund’s investment managers bring long experience, deep knowledge, a proven track record and a firm commitment to growth style investing. Once again, therefore, we are grateful to be able to call upon this resource to provide Fund shareholders with commentary and insight. The Fund’s Investment Advisor, ALPS Advisors, serves as moderator of the roundtable. Participating investment management firms, the portfolio manager for each and their respective capitalization ranges are:
M. A. WEATHERBIE & CO., INC.
Portfolio Manager/Matthew A. Weatherbie, CFA
President and Founder
Capitalization Focus/Small-Cap Growth – M.A. Weatherbie practices a small capitalization growth investment style focusing on high quality companies that demonstrate superior earnings growth prospects, yet are reasonably priced relative to their intrinsic value. The firm seeks to provide superior returns relative to small capitalization growth indices over a full market cycle.
TCW INVESTMENT MANAGEMENT COMPANY
Portfolio Manager/Brendt Stallings, CFA
Managing Director
Capitalization Focus/Mid-Cap Growth – TCW seeks capital appreciation through investment in the securities of rapidly growing companies whose business prospects, in TCW’s view, are not properly perceived by consensus research.
TCW Investment Management Company
Portfolio Manager/Craig C. Blum, CFA
Group Managing Director
Capitalization Focus/Large-Cap Growth – TCW seeks large-cap companies that have superior sales growth, leading and/or rising market shares, and high and/or rising profit margins. TCW’s concentrated growth equity strategy seeks companies with distinct advantages in their business model.
Thank you for your participation in this year’s roundtable. To start, a question related to growth style investing: Across the capitalization spectrum—and especially in the small and mid-cap space—growth outperformed value in 2010. Reflecting your own capitalization focus, to what do you attribute this? Do you believe growth is poised to lead again in 2011 and why? Let’s start with Matt Weatherbie and small-cap growth stocks and go up through the capitalization range.
Weatherbie (M.A. Weatherbie – Small-Cap Growth): In small caps over the past decade, there have been two distinct cycles. The first was from March 2000, which was the peak of the dotcom/telecom mania, to June 2007 and it was a period when value trounced growth. Note that this was a seven-plus-year time period. The second cycle began in June 2007; since then growth has outperformed value. In the current subpar economic recovery, we believe growth companies will show stronger relative earnings growth because they control their destiny to a greater extent. Thus, we expect growth to continue to lead in 2011.
Stallings (TCW – Mid-Cap Growth): In 2009, market values rebounded from crisis levels, as it became clear the economy was not falling into a depression. In 2010, with the economy in a slow, grinding recovery, investors turned their attention to finding companies where the underlying growth of the business—even in a slow-growth environment—would support further stock price appreciation, even absent expansion of earnings multiples. This naturally plays to the advantage of growth stocks, as does investors’ increased risk appetite. We are actually surprised that the performance gap between growth and value was not bigger in 2010, and are hopeful that growth will again outperform in 2011.
Blum (TCW – Large-Cap Growth): Market returns in 2009 were heavily driven by multiple expansion, setting up 2010 to be a proving ground for earnings. While earnings were generally more than supportive of the expectations being priced in during the latter part of 2009, the market began to differentiate between companies generating top line growth versus those merely cutting costs. Many growth companies, therefore, saw additional multiple expansion in addition to better-than-expected earnings in 2010. In 2011, we believe the market will continue to reward
companies producing attractive top line growth amid a less-than-robust recovery, leading to continued outperformance of growth stocks. | ‘If you can keep your head when all about you are losing theirs... yours is the Earth and everything that’s in it.’
—Craig Blum (TCW – Large-Cap Growth... with a bow to Rudyard Kipling) |
www.all-starfunds.com | ASG |
| 8 | LIBERTY ALL-STAR® GROWTH FUND | |||||
MANAGER ROUNDTABLE (UNAUDITED) |
Good thoughts, thank you. Again from the perspective of your capitalization focus, please summarize what produced the best results for you in 2010 and what, in retrospect, didn’t play out the way you thought. Let’s reverse the order and ask Craig Blum to start.
Blum (TCW – Large-Cap Growth): Strong secular tailwinds in combination with leverage to a recovering economy in a host of key holdings drove the outperformance of our portfolio in 2010. Our holdings in technology—including Internet names—energy and industrials were particularly strong. Our outperformance was tempered, however, by the defensive growth portion of our portfolio that we continue to hold in light of our structural concerns. Specifically, we note the unusually weak recovery in U.S. employment, even after accounting for historical lags, supports a modest exposure to extremely resilient businesses. Although the caution represented in the construction of the portfolio held back our performance last year, we continue to believe it makes for a more robust portfolio that should outperform in a variety of macro environments.
Stallings (TCW – Mid-Cap Growth): Our best stock-picking in 2010 was in the technology sector. With the economy showing improvement, corporations were more willing to invest back into their businesses. Given that technology is roughly half of capital spending—and it often provides the most immediate return on investment—this environment favored technology revenues. Our biggest winners were companies with leading market shares in areas experiencing rapid secular growth, such as server virtualization and cloud computing. Our poorest performance was in the consumer sector. We underestimated the degree to which retailers would grow revenues in 2010, and as a result were underexposed to the best performing sector of our benchmark.
Weatherbie (M.A. Weatherbie – Small-Cap Growth): We are bottom-up stock pickers, not thematic investors. As a result, 2010’s strong returns were driven by individual security selection. Our biggest winners included top 10 holdings Verifone, Signature Bank, IHS, Monster World-wide and Solera Holdings. They are all in
very different businesses and each is a leader in its field. Our poorest performers included for-profit education stocks Capella and Strayer Education, which encountered unanticipated negative government proposals impacting their future |
‘Dollar cost averaging was one of the first truisms I learned about investing and I continue to believe it is one of the best.’
—Matt Weatherbie (M.A. Weatherbie – Small-Cap Growth) |
enrollment, and tech stock FormFactor, whose revenue recovery following the recession did not materialize as its memory chip customers postponed their transition to new FormFactor products.
What will you be focused on going into 2011, once again, from your own perspective, and what is a stock in the portion of the All-Star portfolio that you manage that reflects your point of view? Let’s stay with Matt Weatherbie.
Weatherbie (M.A. Weatherbie – Small-Cap Growth): In 2011, we will remain focused on investing in companies that we believe can show strong earnings growth even in an economic recovery that remains weak by historic standards. One recent purchase is Under Armour, the technical clothing company, whose growth will be propelled by the expansion of its product line in the U.S. to include footwear as well as continued rapid growth in the European technical clothing market, where the company is rapidly gaining share.
Stallings (TCW – Mid-Cap Growth): Aruba Networks provides enterprise-class wireless local area networks, enabling companies to migrate from existing wired networks to wireless networks. A stronger economy will certainly help Aruba’s revenues, but the company grew revenues even at the depths of the “great recession” owing
to the strength of its products—and the resulting market share—as well as the secular shift to wireless data. | ‘In investing, as in driving, it’s best to not spend too much time peering in the rear-view mirror.’
—Brendt Stallings (TCW – Mid-Cap Growth) |
Blum (TCW – Large-Cap Growth): We continue to be cyclically bullish but structurally have our eyes wide open. As a result, we are maintaining a barbell approach to our portfolio construction. Two-thirds of the portfolio is in more aggressive growth names that have strong secular tailwinds, such as Salesforce.com, while one-third of the portfolio is in more defensive growth names, like American Tower, which enjoys huge competitive barriers, long-term contracts with price escalators and secular tailwinds around wireless data, giving it superior revenue and cash flow visibility.
Lacking confidence, many individual investors have shunned stocks and missed two good years. What’s a piece of advice that you received at some point in your career that you’d pass along to individual investors? This time we’ll ask Brendt Stallings to lead off, followed by Craig Blum and Matt Weatherbie.
ANNUAL REPORT |
| LIBERTY ALL-STAR® GROWTH FUND | 9 | |||||
MANAGER ROUNDTABLE (UNAUDITED) |
Stallings (TCW – Mid-Cap Growth): In investing, as in driving, it’s best to not spend too much time peering in the rear-view mirror. Even with a good two years, equities have had one of their worst decades ever, just as bonds have had one of their best. With our human propensity to anchor on recent events, it is little wonder investors continue to shun equities in favor of bonds. But performance moves in long cycles, and equities still provide one of the best long-term opportunities for benefiting from the power of compounding—in this case by owning real companies, with real assets and products, and the potential to grow cash flows.
Blum (TCW – Large-Cap Growth): To quote Rudyard Kipling, “If you can keep your head when all about you are losing theirs … yours is the Earth and everything that’s in it.” Markets cycle through pessimism and euphoria but rarely are things as bad as they seem during the dark days nor as good as they seem during the booms. And opportunity rarely comes in nice packaging.
Weatherbie (M.A. Weatherbie – Small-Cap Growth): I have learned that it is important to invest for the long term. Timing investments is always tricky and 2010 was admittedly a good year for smaller cap growth stocks. By dollar cost averaging an investment—investing the same amount periodically so as to buy more shares at lower prices—you can ease into the market in a disciplined way. Dollar cost averaging was one of the first truisms I learned about investing and I continue to believe it is one of the best.
Sound thinking from experienced, knowledgeable investment managers and we thank you all. Let’s hope that a year from now we can look back on a good 2011.
www.all-starfunds.com | ASG |
| 10 | LIBERTY ALL-STAR® GROWTH FUND | |||||
INVESTMENT GROWTH (UNAUDITED) | ||||||
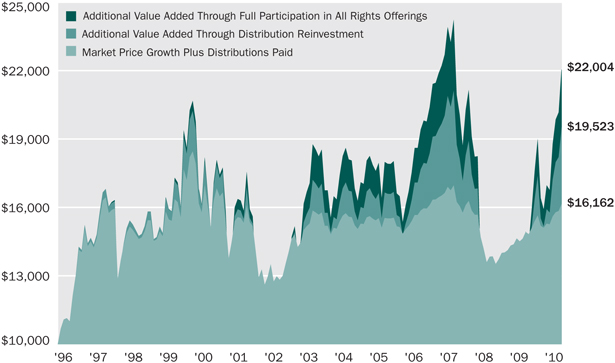
GROWTH OF A HYPOTHETICAL $10,000 INVESTMENT | ||
The graph below illustrates the growth of a hypothetical $10,000 investment assuming the purchase of shares of common stock at the closing market price (NYSE: ASG) of $9.25 on December 31, 1996, and tracking its progress through December 31, 2010. For certain information, it also assumes that a shareholder exercised all primary rights in the Fund’s rights offerings (see below). This graph covers the period since the Fund commenced its 10 percent distribution policy in 1997. Effective with the 2009 second quarter distribution, the annual distribution rate was changed from 10 percent to 6 percent. | ||
| ||
 | The growth of the investment assuming all distributions were received in cash and not reinvested back into the Fund. The value of the investment under this scenario grew to $16,162 (including the December 31, 2010 value of the original investment of $4,595, plus distributions during the period of $11,567). | |
 | The additional value realized through reinvestment of all distributions. The value of the investment under this scenario grew to $19,523. | |
 | The additional value realized by exercising all primary rights in the Fund’s rights offerings. The value of the investment under this scenario grew to $22,004 excluding the cost to exercise all primary rights in the rights offerings which was $5,299. | |
Past performance cannot predict future results. Performance will fluctuate with changes in market conditions. Current performance may be lower or higher than the performance data shown. Performance information does not reflect the deduction of taxes that shareholders would pay on Fund distributions or the sale of Fund shares. An investment in the Fund involves risk, including loss of principal. | ||
ANNUAL REPORT |
LIBERTY ALL-STAR® GROWTH FUND | 11 | |||||
TABLE OF DISTRIBUTIONS AND RIGHTS OFFERINGS (UNAUDITED) |
RIGHTS OFFERINGS | ||||||||||||||||||
YEAR | PER SHARE DISTRIBUTIONS | MONTH COMPLETED | SHARES NEEDED TO PURCHASE | SUBSCRIPTION PRICE | ||||||||||||||
1997 | $1.24 | |||||||||||||||||
1998 | 1.35 | July | 10 | $12.41 | ||||||||||||||
1999 | 1.23 | |||||||||||||||||
2000 | 1.34 | |||||||||||||||||
2001 | 0.92 | September | 8 | 6.64 | ||||||||||||||
2002 | 0.67 | |||||||||||||||||
2003 | 0.58 | September | 8* | 5.72 | ||||||||||||||
2004 | 0.63 | |||||||||||||||||
2005 | 0.58 | |||||||||||||||||
2006 | 0.59 | |||||||||||||||||
2007 | 0.61 | |||||||||||||||||
2008 | 0.47 | |||||||||||||||||
2009** | 0.24 | |||||||||||||||||
2010 | 0.25 | |||||||||||||||||
* The number of shares offered was increased by an additional 25% to cover a portion of the over-subscription requests.
** Effective with the second quarter distribution, the annual distribution rate was changed from 10 percent to 6 percent.
DISTRIBUTION POLICY
Liberty All-Star® Growth Fund, Inc.’s current policy is to pay distributions on its shares totaling approximately 6 percent of its net asset value per year, payable in four quarterly installments of 1.5 percent of the Fund’s net asset value at the close of the New York Stock Exchange on the Friday prior to each quarterly declaration date. The fixed distributions are not related to the amount of the Fund’s net investment income or net realized capital gains or losses and may be taxed as ordinary income up to the amount of the Fund’s current and accumulated earnings and profits. If, for any calendar year, the total distributions made under the distribution policy exceed the Fund’s net investment income and net realized capital gains, the excess will generally be treated as a non-taxable return of capital, reducing the shareholder’s adjusted basis in his or her shares. If the Fund’s net investment income and net realized capital gains for any year exceed the amount distributed under the distribution policy, the Fund may, in its discretion, retain and not distribute net realized capital gains and pay income tax thereon to the extent of such excess.
www.all-starfunds.com | ASG |
| 12 | LIBERTY ALL-STAR® GROWTH FUND | |||||
TOP 20 HOLDINGS AND ECONOMIC SECTORS (UNAUDITED) | ||||||
December 31, 2010 |
| TOP 20 HOLDINGS* | PERCENT OF NET ASSETS | |
C.H. Robinson Worldwide, Inc. | 2.39% | |
Salesforce.com, Inc. | 2.13 | |
Apple, Inc. | 2.13 | |
Expeditors International of Washington, Inc. | 1.72 | |
QUALCOMM, Inc. | 1.72 | |
Rockwell Automation, Inc. | 1.70 | |
Core Laboratories N.V. | 1.60 | |
Google, Inc., Class A | 1.59 | |
FMC Technologies, Inc. | 1.47 | |
Oceaneering International, Inc. | 1.46 | |
ACE Ltd. | 1.45 | |
IHS, Inc., Class A | 1.43 | |
Resources Connection, Inc. | 1.42 | |
Rue21, Inc. | 1.41 | |
Intuitive Surgical, Inc. | 1.37 | |
MSCI, Inc., Class A | 1.36 | |
Amazon.com, Inc. | 1.34 | |
VeriFone Systems, Inc. | 1.30 | |
Cognizant Technology Solutions Corp., Class A | 1.23 | |
Varian Medical Systems, Inc. | 1.16 | |
| 31.38% | ||
ECONOMIC SECTORS* | PERCENT OF NET ASSETS | |
Information Technology | 25.21% | |
Industrials | 17.66 | |
Health Care | 15.02 | |
Financials | 12.24 | |
Consumer Discretionary | 11.92 | |
Energy | 9.36 | |
Consumer Staples | 3.23 | |
Materials | 1.55 | |
Telecommunication Services | 1.01 | |
Utilities | 0.61 | |
Other Net Assets | 2.19 | |
| 100.00% | ||
| * | Because the Fund is actively managed, there can be no guarantee that the Fund will continue to hold securities of the indicated issuers and sectors in the future. |
ANNUAL REPORT |
| LIBERTY ALL-STAR® GROWTH FUND | 13 | |||||
MAJOR STOCK CHANGES IN THE QUARTER (UNAUDITED) | ||||||
December 31, 2010 |
The following are the major ($500,000 or more) stock changes - both purchases and sales - that were made in the Fund’s portfolio during the fourth quarter of 2010.
|
| |||||||
| SECURITY NAME | PURCHASES (SALES) | SHARES AS OF 12/31/10 | ||||||
PURCHASES | ||||||||
athenahealth, Inc. | 22,983 | 22,983 | ||||||
Brigham Exploration Co. | 30,200 | 30,200 | ||||||
E-Commerce China Dangdang, Inc. | 29,673 | 29,673 | ||||||
Gildan Activewear, Inc. | 23,800 | 23,800 | ||||||
Green Dot Corp., Class A | 13,311 | 15,500 | ||||||
Green Mountain Coffee Roasters, Inc. | 28,307 | 28,307 | ||||||
Harman International Industries, Inc. | 20,004 | 20,004 | ||||||
Precision Castparts Corp. | 6,400 | 6,400 | ||||||
QLIK Technologies, Inc. | 31,872 | 31,872 | ||||||
Rue21, Inc. | 19,360 | 66,277 | ||||||
Under Armour, Inc., Class A | 13,050 | 13,050 | ||||||
Youku.com, Inc. | 20,964 | 20,964 | ||||||
SALES | ||||||||
Clean Harbors, Inc. | (8,900) | 0 | ||||||
Contango Oil & Gas Co. | (15,800) | 0 | ||||||
Flowserve Corp. | (8,200) | 0 | ||||||
Martek Biosciences Corp. | (28,579) | 0 | ||||||
Marvell Technology Group Ltd. | (49,600) | 0 | ||||||
Quanta Services, Inc. | (39,000) | 0 | ||||||
Spirit Aerosystems Holdings, Inc., | (35,100) | 0 | ||||||
Venoco, Inc. | (32,411) | 0 | ||||||
www.all-starfunds.com | ASG |
| 14 | LIBERTY ALL-STAR® GROWTH FUND | |||||
SCHEDULE OF INVESTMENTS
| ||||||
as of December 31, 2010 |
| COMMON STOCKS (97.81%) | SHARES | MARKET VALUE | ||||||
u CONSUMER DISCRETIONARY (11.92%) | ||||||||
Automobiles (0.51%) | ||||||||
Thor Industries, Inc. | 20,704 | $ | 703,108 | |||||
Distributors (1.16%) | ||||||||
LKQ Corp.(a) | 70,194 | 1,594,808 | ||||||
Diversified Consumer Services (2.10%) | ||||||||
Capella Education Co.(a) | 17,638 | 1,174,338 | ||||||
Global Education & Technology Group Ltd.(a)(b) | 44,918 | 424,924 | ||||||
Strayer Education, Inc. | 6,500 | 989,430 | ||||||
Xueda Education Group(a)(b) | 26,254 | 295,883 | ||||||
| 2,884,575 | ||||||||
Hotels, Restaurants & Leisure (1.02%) | ||||||||
BJ’s Restaurants, Inc.(a) | 21,050 | 745,801 | ||||||
Ctrip.com International Ltd.(a)(b) | 16,066 | 649,870 | ||||||
| 1,395,671 | ||||||||
Household Durables (0.67%) | ||||||||
Harman International Industries, Inc.(a) | 20,004 | 926,185 | ||||||
Internet & Catalog Retail (2.71%) | ||||||||
Amazon.com, Inc.(a) | 10,240 | 1,843,200 | ||||||
E-Commerce China Dangdang, Inc.(a)(b) | 29,673 | 803,248 | ||||||
priceline. com, Inc.(a) | 2,700 | 1,078,785 | ||||||
| 3,725,233 | ||||||||
Specialty Retail (2.74%) | ||||||||
CarMax, Inc.(a) | 29,600 | 943,648 | ||||||
Monro Muffler Brake, Inc. | 10,635 | 367,847 | ||||||
Rue21, Inc.(a) | 66,277 | 1,942,579 | ||||||
Ulta Salon, Cosmetics & Fragrance, Inc.(a) | 14,884 | 506,056 | ||||||
| 3,760,130 | ||||||||
Textiles, Apparel & Luxury Goods (1.01%) | ||||||||
Gildan Activewear, Inc.(a) | 23,800 | 678,062 | ||||||
Under Armour, Inc., Class A(a) | 13,050 | 715,662 | ||||||
| 1,393,724 | ||||||||
u CONSUMER STAPLES (3.23%) | ||||||||
Food & Staples Retailing (1.36%) | ||||||||
Costco Wholesale Corp. | 12,700 | 917,067 | ||||||
CVS Caremark Corp. | 27,300 | 949,221 | ||||||
| 1,866,288 | ||||||||
Food Products (1.32%) | ||||||||
Green Mountain Coffee Roasters, Inc.(a) | 28,307 | 930,168 | ||||||
Mead Johnson Nutrition Co. | 14,200 | 883,950 | ||||||
| 1,814,118 | ||||||||
Household Products (0.55%) | ||||||||
The Procter & Gamble Co. | 11,870 | 763,597 | ||||||
See Notes to Schedule of Investments and Financial Statements
ANNUAL REPORT |
| LIBERTY ALL-STAR® GROWTH FUND | 15 | |||||
SCHEDULE OF INVESTMENTS |
as of December 31, 2010
| COMMON STOCKS (continued) | SHARES | MARKET VALUE | ||||||
u ENERGY (9.36%) | ||||||||
Energy Equipment & Services (6.21%) | ||||||||
Core Laboratories N.V. | 24,646 | $ | 2,194,726 | |||||
Dril-Quip, Inc.(a) | 10,973 | 852,822 | ||||||
FMC Technologies, Inc.(a) | 22,800 | 2,027,148 | ||||||
Oceaneering International, Inc.(a) | 27,200 | 2,002,736 | ||||||
Schlumberger Ltd. | 17,495 | 1,460,832 | ||||||
| 8,538,264 | ||||||||
Oil, Gas & Consumable Fuels (3.15%) | ||||||||
Brigham Exploration Co.(a) | 30,200 | 822,648 | ||||||
Occidental Petroleum Corp. | 15,900 | 1,559,790 | ||||||
Plains Exploration & Production Co.(a) | 37,100 | 1,192,394 | ||||||
Ultra Petroleum Corp.(a) | 15,900 | 759,543 | ||||||
| 4,334,375 | ||||||||
u FINANCIALS (12.24%) | ||||||||
Banks (0.05%) | ||||||||
First Republic Bank(a) | 2,300 | 66,976 | ||||||
Capital Markets (4.65%) | ||||||||
Affiliated Managers Group, Inc.(a) | 14,457 | 1,434,424 | ||||||
The Charles Schwab Corp. | 50,100 | 857,211 | ||||||
Duff & Phelps Corp., Class A | 23,325 | 393,259 | ||||||
FXCM, Inc., Class A(a) | 16,628 | 220,321 | ||||||
Janus Capital Group, Inc. | 77,700 | 1,007,769 | ||||||
LPL Investment Holdings, Inc.(a) | 1,700 | 61,829 | ||||||
optionsXpress Holdings, Inc. | 23,220 | 363,857 | ||||||
SEI Investments Co. | 40,600 | 965,874 | ||||||
T. Rowe Price Group, Inc. | 16,800 | 1,084,272 | ||||||
| 6,388,816 | ||||||||
Commercial Banks (1.11%) | ||||||||
SignatureBank(a) | 30,521 | 1,526,050 | ||||||
Consumer Finance (0.64%) | ||||||||
Green Dot Corp., Class A(a) | 15,500 | 879,470 | ||||||
Diversified Financial Services (2.82%) | ||||||||
IntercontinentalExchange, Inc.(a) | 5,000 | 595,750 | ||||||
MSCI, Inc., Class A(a) | 48,103 | 1,874,093 | ||||||
Portfolio Recovery Associates, Inc.(a) | 18,726 | 1,408,195 | ||||||
| 3,878,038 | ||||||||
Insurance (2.07%) | ||||||||
ACE Ltd. | 32,100 | 1,998,225 | ||||||
Greenlight Capital Re Ltd., Class A(a) | 31,484 | 844,086 | ||||||
| 2,842,311 | ||||||||
Real Estate Management & Development (0.90%) | ||||||||
China Real Estate Information Corp.(a)(b) | 53,969 | 518,103 | ||||||
FirstService Corp.(a) | 24,022 | 727,386 | ||||||
| 1,245,489 | ||||||||
See Notes to Schedule of Investments and Financial Statements
www.all-starfunds.com | ASG |
| 16 | LIBERTY ALL-STAR® GROWTH FUND | |||||
SCHEDULE OF INVESTMENTS
| ||||||
as of December 31, 2010 |
| COMMON STOCKS (continued) | SHARES | MARKET VALUE | ||||||
u HEALTH CARE (15.02%) | ||||||||
Biotechnology (2.97%) | ||||||||
BioMarin Pharmaceutical, Inc.(a) | 48,522 | $ | 1,306,698 | |||||
Dendreon Corp.(a) | 18,800 | 656,496 | ||||||
Genzyme Corp.(a) | 11,500 | 818,800 | ||||||
Human Genome Sciences, Inc.(a) | 21,088 | 503,792 | ||||||
Ironwood Pharmaceuticals, Inc.(a) | 20,300 | 210,105 | ||||||
Vertex Pharmaceuticals, Inc.(a) | 16,800 | 588,504 | ||||||
| 4,084,395 | ||||||||
Health Care Equipment & Supplies (5.05%) | ||||||||
Accuray, Inc.(a) | 57,082 | 385,304 | ||||||
Intuitive Surgical, Inc.(a) | 7,300 | 1,881,575 | ||||||
Masimo Corp. | 54,992 | 1,598,617 | ||||||
ResMed, Inc.(a) | 21,300 | 737,832 | ||||||
Varian Medical Systems, Inc.(a) | 23,100 | 1,600,368 | ||||||
Volcano Corp.(a) | 27,100 | 740,101 | ||||||
| 6,943,797 | ||||||||
Health Care Providers & Services (1.80%) | ||||||||
IPC The Hospitalist Co., Inc.(a) | 6,483 | 252,902 | ||||||
Lincare Holdings, Inc. | 26,825 | 719,715 | ||||||
PSS World Medical, Inc.(a) | 32,547 | 735,562 | ||||||
VCA Antech, Inc.(a) | 32,967 | 767,801 | ||||||
| 2,475,980 | ||||||||
Health Care Technology (1.74%) | ||||||||
athenahealth, Inc.(a) | 22,983 | 941,844 | ||||||
Cerner Corp.(a) | 15,300 | 1,449,522 | ||||||
| 2,391,366 | ||||||||
Life Sciences Tools & Services (1.06%) | ||||||||
Life Technologies Corp.(a) | 26,100 | 1,448,550 | ||||||
Pharmaceuticals (2.40%) | ||||||||
Allergan, Inc. | 18,300 | 1,256,661 | ||||||
Mylan, Inc.(a) | 39,500 | 834,635 | ||||||
Teva Pharmaceutical Industries Ltd.(b) | 23,210 | 1,209,937 | ||||||
| 3,301,233 | ||||||||
u INDUSTRIALS (17.66%) | ||||||||
Aerospace & Defense (2.41%) | ||||||||
Aerovironment, Inc.(a) | 27,700 | 743,191 | ||||||
HEICO Corp. | 16,155 | 824,389 | ||||||
Precision Castparts Corp. | 6,400 | 890,944 | ||||||
TransDigm Group, Inc.(a) | 11,979 | 862,608 | ||||||
| 3,321,132 | ||||||||
Air Freight & Logistics (4.11%) | ||||||||
C.H. Robinson Worldwide, Inc. | 41,000 | 3,287,790 | ||||||
Expeditors International of Washington, Inc. | 43,300 | 2,364,180 | ||||||
| 5,651,970 | ||||||||
See Notes to Schedule of Investments and Financial Statements | ||||||||
ANNUAL REPORT |
| LIBERTY ALL-STAR® GROWTH FUND | 17 | |||||
SCHEDULE OF INVESTMENTS
| ||||||
| as of December 31, 2010 |
| COMMON STOCKS (continued) | SHARES | MARKET VALUE | ||||||
Commercial Services & Supplies (2.17%) | ||||||||
American Reprographics Co.(a) | 67,082 | $ | 509,152 | |||||
Ritchie Bros. Auctioneers, Inc. | 17,140 | 395,077 | ||||||
Stericycle, Inc.(a) | 14,654 | 1,185,802 | ||||||
Waste Connections, Inc. | 32,318 | 889,715 | ||||||
| 2,979,746 | ||||||||
Electrical Equipment (2.20%) | ||||||||
II-VI, Inc.(a) | 14,960 | 693,546 | ||||||
Rockwell Automation, Inc. | 32,500 | 2,330,575 | ||||||
| 3,024,121 | ||||||||
Machinery (0.81%) | ||||||||
Graco, Inc. | 21,287 | 839,772 | ||||||
Watts Water Technologies, Inc., Class A | 7,367 | 269,559 | ||||||
| 1,109,331 | ||||||||
Professional Services (4.97%) | ||||||||
Huron Consulting Group, Inc.(a) | 29,883 | 790,405 | ||||||
ICF International, Inc.(a) | 17,970 | 462,188 | ||||||
IHS, Inc., Class A(a) | 24,537 | 1,972,530 | ||||||
Resources Connection, Inc. | 105,312 | 1,957,750 | ||||||
Robert Half International, Inc. | 33,100 | 1,012,860 | ||||||
Stantec, Inc.(a) | 22,616 | 632,570 | ||||||
| 6,828,303 | ||||||||
Road & Rail (0.99%) | ||||||||
Knight Transportation, Inc. | 27,402 | 520,638 | ||||||
Landstar System, Inc. | 20,507 | 839,556 | ||||||
| 1,360,194 | ||||||||
| u INFORMATION TECHNOLOGY (25.21%) | ||||||||
Communications Equipment (3.76%) | ||||||||
Aruba Networks, Inc.(a) | 31,800 | 663,984 | ||||||
Cisco Systems, Inc.(a) | 59,405 | 1,201,763 | ||||||
Polycom, Inc.(a) | 24,198 | 943,238 | ||||||
QUALCOMM, Inc. | 47,665 | 2,358,941 | ||||||
| 5,167,926 | ||||||||
Computers & Peripherals (2.13%) | ||||||||
Apple, Inc.(a) | 9,060 | 2,922,393 | ||||||
Electronic Equipment & Instruments (0.99%) | ||||||||
FARO Technologies, Inc.(a) | 2,460 | 80,786 | ||||||
FLIR Systems, Inc.(a) | 20,202 | 601,010 | ||||||
National Instruments Corp. | 18,030 | 678,649 | ||||||
| 1,360,445 | ||||||||
See Notes to Schedule of Investments and Financial Statements
www.all-starfunds.com | ASG |
| 18 | LIBERTY ALL-STAR® GROWTH FUND | |||||
SCHEDULE OF INVESTMENTS
| ||||||
as of December 31, 2010 |
| COMMON STOCKS (continued) | SHARES | MARKET VALUE | ||||||
Internet Software & Services (5.05%) | ||||||||
Akamai Technologies, Inc.(a) | 16,200 | $ | 762,210 | |||||
Baidu, Inc.(a)(b) | 9,100 | 878,423 | ||||||
comScore, Inc.(a) | 16,655 | 371,573 | ||||||
Google, Inc., Class A(a) | 3,675 | 2,182,840 | ||||||
Monster Worldwide, Inc.(a) | 52,488 | 1,240,291 | ||||||
VistaPrint Ltd.(a) | 16,759 | 770,914 | ||||||
Youku.com, Inc.(a)(b) | 20,964 | 733,950 | ||||||
| 6,940,201 | ||||||||
IT Services (4.09%) | ||||||||
Alliance Data Systems Corp.(a) | 13,400 | 951,802 | ||||||
Cognizant Technology Solutions Corp., Class A(a) | 23,100 | 1,692,999 | ||||||
FleetCor Technologies, Inc.(a) | 9,310 | 287,865 | ||||||
VeriFone Systems, Inc.(a) | 46,366 | 1,787,873 | ||||||
Visa, Inc., Class A | 12,915 | 908,958 | ||||||
| 5,629,497 | ||||||||
Semiconductors & Semiconductor Equipment (2.25%) | ||||||||
ARM Holdings Plc(b) | 54,200 | 1,124,650 | ||||||
Cavium Networks, Inc.(a) | 26,388 | 994,300 | ||||||
Hittite Microwave Corp.(a) | 16,024 | 978,105 | ||||||
| 3,097,055 | ||||||||
Software (6.94%) | ||||||||
ANSYS, Inc.(a) | 23,333 | 1,214,949 | ||||||
Concur Technologies, Inc.(a) | 12,992 | 674,675 | ||||||
QLIK Technologies, Inc.(a) | 31,872 | 822,616 | ||||||
RealPage, Inc.(a) | 13,925 | 430,700 | ||||||
Salesforce. com, Inc.(a) | 22,200 | 2,930,400 | ||||||
SMART Technologies, Inc., Class A(a) | 77,200 | 728,768 | ||||||
Solera Holdings, Inc. | 23,763 | 1,219,517 | ||||||
VMware, Inc., Class A(a) | 17,160 | 1,525,696 | ||||||
| 9,547,321 | ||||||||
u MATERIALS (1.55%) | ||||||||
Chemicals (1.55%) | ||||||||
CF Industries Holdings, Inc. | 6,400 | 864,960 | ||||||
Praxair, Inc. | 13,300 | 1,269,751 | ||||||
| 2,134,711 | ||||||||
Mining (0.00%)* | ||||||||
Contango ORE, Inc.(a) | 47 | 494 | ||||||
| u TELECOMMUNICATION SERVICES (1.01%) | ||||||||
Wireless Telecommunication Services (1.01%) | ||||||||
American TowerCorp., Class A(a) | 26,800 | 1,383,952 | ||||||
| u UTILITIES (0.61%) | ||||||||
Electric Utilities (0.61%) | ||||||||
ITC Holdings Corp. | 13,493 | 836,296 | ||||||
| TOTAL COMMON STOCKS | ||||||||
(COST OF $108,124,927) | 134,467,635 | |||||||
See Notes to Schedule of Investments and Financial Statements | ||||||||
ANNUAL REPORT |
| LIBERTY ALL-STAR® GROWTH FUND | 19 | |||||
SCHEDULE OF INVESTMENTS | ||||||
as of December 31, 2010 |
| SHORT TERM INVESTMENT (2.33%) | PAR VALUE | MARKET VALUE | ||||||
u REPURCHASE AGREEMENT (2.33%) | ||||||||
Repurchase agreement with State Street Bank & Trust Co., dated 12/31/10, due 01/03/11 at 0.010%, collateralized by several Fannie Mae and Freddie Mac instruments with various maturity dates, market value of $3,265,421 (Repurchase proceeds of $3,196,003) (COST OF $3,196,000) | $ | 3,196,000 | $ | 3,196,000 | ||||
TOTAL INVESTMENTS (100.14%) | ||||||||
(COST OF $111,320,927)(c) | 137,663,635 | |||||||
LIABILITIES IN EXCESS OF OTHER ASSETS (-0.14%) | (190,888) | |||||||
NET ASSETS (100.00%) | $ | 137,472,747 | ||||||
NET ASSET VALUE PER SHARE | ||||||||
(30,080,350 SHARES OUTSTANDING) | $ | 4.57 | ||||||
Notes to Schedule of Investments:
| * | Less than 0.005% of net assets. |
| (a) | Non-income producing security. |
| (b) | American Depositary Receipt. |
| (c) | Cost of investments for federal income tax purposes is $111,710,194. |
Gross unrealized appreciation and depreciation at December 31, 2010 based on cost of investments for federal income tax purposes is as follows:
Gross unrealized appreciation | $ | 30,353,004 | ||||||
Gross unrealized depreciation | (4,399,563 | ) | ||||||
Net unrealized appreciation | $ | 25,953,441 | ||||||
For Fund compliance purposes, the Fund’s industry classifications refer to any one or more of the industry sub-classifications used by one or more widely recognized market indexes or ratings group indexes, and/or as defined by Fund management. This definition may not apply for purposes of this report, which may combine industry sub-classifications for reporting ease. Industries are shown as a percent of net assets. These industry classifications are unaudited.
| See Notes to Financial Statements | ||
www.all-starfunds.com | ASG |
| 20 | LIBERTY ALL-STAR® GROWTH FUND | |||||
STATEMENT OF ASSETS AND LIABILITIES | ||||||
December 31, 2010 |
ASSETS: | ||||
Investments at market value (Cost $111,320,927) | $ | 137,663,635 | ||
Cash | 612 | |||
Receivable for investment securities sold | 2,659,062 | |||
Dividends and interest receivable | 42,316 | |||
Prepaid and other assets | 31 | |||
TOTAL ASSETS | 140,365,656 | |||
LIABILITIES: | ||||
Payable for investments purchased | 564,202 | |||
Distributions payable to shareholders | 2,105,625 | |||
Investment advisory fee payable | 93,437 | |||
Payable for administration, pricing and bookkeeping fees | 29,725 | |||
Accrued expenses | 99,920 | |||
TOTAL LIABILITIES | 2,892,909 | |||
NET ASSETS | $ | 137,472,747 | ||
NET ASSETS REPRESENTED BY: | ||||
Paid-in capital | $ | 113,600,217 | ||
Overdistributed net investment income | (62,208) | |||
Accumulated net realized loss on investments | (2,407,970) | |||
Net unrealized appreciation on investments | 26,342,708 | |||
NET ASSETS | $ | 137,472,747 | ||
Shares of common stock outstanding | ||||
(authorized 60,000,000 shares at $0.10 par) | 30,080,350 | |||
NET ASSET VALUE PER SHARE | $ | 4.57 | ||
See Notes to Financial Statements | ||||
ANNUAL REPORT |
| LIBERTY ALL-STAR® GROWTH FUND | 21 | |||||
STATEMENT OF OPERATIONS | ||||||
For the Year Ended December 31, 2010 |
INVESTMENT INCOME: | ||||
Dividends (Net of foreign taxes withheld at source which amounted to $8,526) | $ | 1,050,010 | ||
Interest | 271 | |||
TOTAL INVESTMENT INCOME | 1,050,281 | |||
EXPENSES: | ||||
Investment advisory fee | 993,074 | |||
Administration fee | 248,268 | |||
Pricing and bookkeeping fees | 70,995 | |||
Custodian fee | 46,360 | |||
Directors’ fees and expenses | 74,493 | |||
Insurance expense | 8,909 | |||
Legal fees | 138,816 | |||
Proxy solicitation and related legal expenses(a) | 468,113 | |||
NYSE fee | 24,472 | |||
Shareholder communication expenses | 79,633 | |||
Transfer agent fees | 37,608 | |||
Miscellaneous expenses | 35,107 | |||
TOTAL EXPENSES | 2,225,848 | |||
NET INVESTMENT LOSS | (1,175,567) | |||
REALIZED AND UNREALIZED GAIN ON INVESTMENTS: | ||||
Net realized gain on investment transactions | 5,137,175 | |||
Net unrealized appreciation on investments: | ||||
Beginning of year | 5,722,007 | |||
End of year | 26,342,708 | |||
Net change in unrealized appreciation | 20,620,701 | |||
NET REALIZED AND UNREALIZED GAIN ON INVESTMENTS | 25,757,876 | |||
NET INCREASE IN NET ASSETS FROM OPERATIONS | $ | 24,582,309 | ||
| (a) | See Note 8 to Financial Statements |
| See Notes to Financial Statements | ||
www.all-starfunds.com | ASG |
| 22 | LIBERTY ALL-STAR® GROWTH FUND | |||||
STATEMENTS OF CHANGES IN NET ASSETS |
| Year Ended December 31, | ||||||||||
| 2010 | 2009 | |||||||||
FROM OPERATIONS: | ||||||||||
Net investment loss | $ | (1,175,567) | $ | (601,322) | ||||||
Net realized gain/(loss) on investment transactions | 5,137,175 | (1,607,219) | ||||||||
Net change in unrealized appreciation/(depreciation) | 20,620,701 | 32,715,240 | ||||||||
Net Increase in Net Assets From Operations | 24,582,309 | 30,506,699 | ||||||||
DISTRIBUTIONS TO SHAREHOLDERS: | ||||||||||
From net investment income | (5,615,921) | – | ||||||||
Tax return of capital | (1,904,168) | (7,157,268) | ||||||||
Total Distributions | (7,520,089) | (7,157,268) | ||||||||
CAPITAL SHARE TRANSACTIONS: | ||||||||||
Dividend reinvestments | – | 1,531,661 | ||||||||
Net Increase in net assets from capital share transactions | – | 1,531,661 | ||||||||
Total Increase in Net Assets | 17,062,220 | 24,881,092 | ||||||||
NET ASSETS: | ||||||||||
Beginning of period | 120,410,527 | 95,529,435 | ||||||||
End of period (includes overdistributed net investment income of $(62,208) and $0, respectively) | $ | 137,472,747 | $ | 120,410,527 | ||||||
See Notes to Financial Statements
ANNUAL REPORT |
| LIBERTY ALL-STAR® GROWTH FUND | 23 | |||||
FINANCIAL HIGHLIGHTS |
| Year Ended December 31, | ||||||||||||||||||||||||
| 2010 | 2009 | 2008 | 2007 | 2006 | ||||||||||||||||||||
PER SHARE OPERATING PERFORMANCE: | ||||||||||||||||||||||||
Net asset value at beginning of year | $ | 4.00 | $ | 3.24 | $ | 6.03 | $ | 5.69 | $ | 5.97 | ||||||||||||||
INCOME FROM INVESTMENT OPERATIONS: | ||||||||||||||||||||||||
Net investment loss(a) | (0.04 | ) | (0.02 | ) | (0.03 | ) | (0.03 | ) | (0.04 | ) | ||||||||||||||
Net realized and unrealized gain/(loss) | 0.86 | 1.02 | (2.29 | ) | 0.98 | 0.35 | ||||||||||||||||||
Total from Investment Operations | 0.82 | 1.00 | (2.32 | ) | 0.95 | 0.31 | ||||||||||||||||||
LESS DISTRIBUTIONS TO SHAREHOLDERS: | ||||||||||||||||||||||||
Net investment income | (0.19 | ) | – | – | – | – | ||||||||||||||||||
Net realized gain on investments | – | – | (0.02 | ) | (0.61 | ) | (0.47 | ) | ||||||||||||||||
Tax return of capital | (0.06 | ) | (0.24 | ) | (0.45 | ) | – | (0.12 | ) | |||||||||||||||
Total Distributions | (0.25 | ) | (0.24 | ) | (0.47 | ) | (0.61 | ) | (0.59 | ) | ||||||||||||||
Net asset value at end of year | $ | 4. 57 | $ | 4.00 | $ | 3.24 | $ | 6.03 | $ | 5.69 | ||||||||||||||
Market price at end of year | $ | 4. 25 | $ | 3.36 | $ | 2.60 | $ | 5.96 | $ | 5.37 | ||||||||||||||
TOTAL INVESTMENT RETURN FOR SHAREHOLDERS:(b) | ||||||||||||||||||||||||
Based on net asset value | 21.8 | % | 34.6 | % | (40.0 | %) | 17.9 | % | 6.4 | % | ||||||||||||||
Based on market price | 34.8 | % | 40.8 | % | (51.3 | %) | 23.5 | % | 10.2 | % | ||||||||||||||
RATIOS AND SUPPLEMENTAL DATA: | ||||||||||||||||||||||||
Net assets at end of year (millions) | $ | 137 | $ | 120 | $ | 96 | $ | 172 | 157 | |||||||||||||||
Ratio of expenses to average net assets | 1.79 | % | 1.44 | % | 1.46 | % | 1.28 | %(c) | 1.40 | %(c) | ||||||||||||||
Ratio of net investment loss to average net assets | (0.95 | %) | (0.58 | %) | (0.74 | %) | (0.51 | %)(c) | (0.73 | %)(c) | ||||||||||||||
Portfolio turnover rate | 80 | % | 135 | % | 97 | % | 60 | % | 52 | % | ||||||||||||||
| (a) | Calculated using average shares outstanding during the year. |
| (b) | Calculated assuming all distributions are reinvested at actual reinvestment prices. The net asset value and market price returns will differ depending upon the level of any discount from or premium to net asset value at which the Fund’s shares traded during the period. Past performance is not a guarantee of future results. |
| (c) | The benefits derived from custody credits and directed brokerage arrangements, if any, had an impact of less than 0.01%. |
| See Notes to Financial Statements | ||
www.all-starfunds.com | ASG |
| 24 | LIBERTY ALL-STAR® GROWTH FUND | |||||
NOTES TO FINANCIAL STATEMENTS | ||||||
December 31, 2010 |
NOTE 1. ORGANIZATION
Liberty All-Star® Growth Fund, Inc. (the “Fund”) is a Maryland corporation registered under the Investment Company Act of 1940 (the “Act”), as amended, as a diversified, closed-end management investment company.
Investment Goal
The Fund seeks long-term capital appreciation.
Fund Shares
The Fund may issue 60,000,000 shares of common stock at $0.10 par.
NOTE 2. SIGNIFICANT ACCOUNTING POLICIES
Use of Estimates
The preparation of financial statements in conformity with accounting principles generally accepted in the United States of America (“GAAP”) requires management to make estimates and assumptions that affect the reported amounts and disclosures in the financial statements. Actual results could differ from these estimates. The following is a summary of significant accounting policies consistently followed by the Fund in the preparation of its financial statements.
Security Valuation
Equity securities including common stocks and exchange traded funds are valued at the last sale price at the close of the principal exchange on which they trade, except for securities listed on the National Association of Securities Dealers Automated Quotations (“NASDAQ”) exchange, which are valued at the NASDAQ official closing price. Unlisted securities or listed securities for which there were no sales during the day are valued at the closing bid price on such exchanges or over-the-counter markets.
Short-term debt obligations maturing in more than 60 days for which market quotations are readily available are valued at current market value. Short-term debt obligations maturing within 60 days are valued at amortized cost, which approximates market value.
Investments for which market quotations are not readily available are valued at fair value as determined in good faith under consistently applied procedures approved by and under the general supervision of the Fund’s Board of Directors.
Foreign Securities
The Fund invests in foreign securities including American Depositary Receipts, which may involve a number of risk factors and special considerations not present with investments in securities of U.S. corporations.
Security Transactions
Security transactions are recorded on trade date. Cost is determined and gains/(losses) are based upon the specific identification method for both financial statement and federal income tax purposes.
Repurchase Agreements
The Fund may engage in repurchase agreement transactions with institutions that the Fund’s investment advisor has determined are creditworthy. The Fund, through its custodian, receives delivery of underlying securities collateralizing a repurchase agreement. Collateral is at least equal, at all times, to the value of the repurchase obligation including interest. A repurchase agreement transaction involves certain risks in the event of default or insolvency of the counterparty. These risks include possible delays or restrictions upon a Fund’s ability to dispose of the underlying securities and a possible decline in the value of the underlying securities during the period while the Fund seeks to assert its rights.
Income Recognition
Interest income is recorded on the accrual basis. Corporate actions and dividend income are recorded on the ex-date.
New Accounting Pronouncements
In January 2010, the Financial Accounting Standards Board (“FASB”) issued Accounting Standards Update No. 2010-06, “Improving Disclosures About Fair Value Measurements” (“ASU”). The ASU requires enhanced disclosures about (1) transfers into and out of Levels 1 and 2; and (2) purchases, sales, issuances, and settlements on a gross basis relating to Level 3 measurements. Certain disclosures were effective for the first reporting period (including interim periods) beginning after December 15, 2009, and the second disclosure will be effective for fiscal years beginning after December 15, 2010, and for interim periods within those fiscal years.
Fair Value Measurements
The Fund discloses the classification of its fair value measurements following a three-tier hierarchy based on the inputs used to measure fair value. Inputs refer broadly to the assumptions that market participants would use in pricing the asset or liability, including assumptions about risk. Inputs may be observable or unobservable. Observable inputs reflect the assumptions market participants would use in pricing the asset or liability that are developed based on market data obtained from sources independent of the reporting entity. Unobservable inputs reflect the reporting entity’s own assumptions about the assumptions market participants would use in pricing the asset or liability that are developed based on the best information available.
Various inputs are used in determining the value of the Fund’s investments as of the end of the reporting period. When inputs used fall into different levels of the fair value hierarchy, the level in the hierarchy within which the fair value measurement falls is determined based on the lowest level input that is significant to the fair value measurement in its entirety. The designated input levels are not necessarily an indication of the risk or liquidity associated with these investments. These inputs are categorized in the following hierarchy under applicable financial accounting standards:
ANNUAL REPORT |
| LIBERTY ALL-STAR® GROWTH FUND | 25 | |||||
NOTES TO FINANCIAL STATEMENTS | ||||||
December 31, 2010 |
Level 1 | – | Unadjusted quoted prices in active markets for identical investments | ||
Level 2 | – | Other significant observable inputs (including quoted prices for similar investments, interest rates, prepayment speeds, credit risk, etc.) | ||
Level 3 | – | Significant unobservable inputs (including the Fund’s own assumptions in determining the fair value of investments) | ||
The following is a summary of the inputs used to value the Fund’s investments as of December 31, 2010:
| Valuation inputs | Investments in Securities at Value* | |||
Level 1 - Unadjusted Quoted Prices Common Stocks | $ | 134,467,635 | ||
Level 2 - Other Significant Observable Inputs Short Term Investment | 3,196,000 | |||
Level 3 - Significant Unobservable Inputs | – | |||
Total | $ | 137,663,635 | ||
*See Schedule of Investments for industry classification.
For the year ended December 31, 2010, the Fund did not have any significant transfers between Level 1 and Level 2 securities. The Fund did not have any securities which used significant unobservable inputs (Level 3) in determining fair value.
Distributions to Shareholders
The Fund currently has a policy of paying distributions on its common shares totaling approximately 6% of its net asset value per year. The distributions are payable in four quarterly distributions of 1.5% of the Fund’s net asset value at the close of the New York Stock Exchange on the Friday prior to each quarterly declaration date. Distributions to shareholders are recorded on ex-date.
NOTE 3. FEDERAL TAX INFORMATION
The timing and character of income and capital gain distributions are determined in accordance with income tax regulations, which may differ from GAAP. Reclassifications are made to the Fund’s capital accounts for permanent tax differences to reflect income and gains available for distribution (or available capital loss carryforwards) under income tax regulations. If, for any calendar year, the total distributions made under the distribution policy exceed the Fund’s net investment income and net realized capital gains, the excess will generally be treated as a non-taxable return of capital, reducing the shareholder’s adjusted basis in his or her shares. If the Fund’s net investment income and net
realized capital gains for any year exceed the amount distributed under the distribution policy, the Fund may, in its discretion, retain and not distribute net
realized capital gains and pay income tax thereon to the extent of such excess.
For the year ended December 31, 2010, permanent book and tax basis differences resulting primarily from excess distributions were identified and reclassified among the components of the Fund’s net assets as follows:
Accumulated Net Investment Income | Accumulated Net Realized Gain | Paid-In Capital | ||
$6,729,280 | $41,416 | ($6,770,696) |
Net investment income and net realized gains/(losses), as disclosed on the Statement of Operations, and net assets were not affected by this reclassification.
Included in the amount reclassified was a net operating loss offset to Paid-In Capital of $1,154,775.
Classification of Distributions to Shareholders
Net investment income/(loss) and net realized gain/(loss) may differ for financial statement and tax purposes. The character of distributions made during the year from net investment income or net realized gains may differ from its ultimate characterization for federal income tax purposes. Also, due to the timing of dividend distributions, the fiscal year in which amounts are distributed may differ from the fiscal year in which the income or realized gain was recorded by the Funds.
The tax character of distributions paid during the years ended December 31, 2010, and December 31, 2009 was as follows:
| 12/31/10 | 12/31/09 | |||||||
Distributions paid from: | ||||||||
Ordinary income | $ | 5,615,921 | $ | – | ||||
Tax return of capital | 1,904,168 | 7,708,298 | ||||||
| $ | 7,520,089 | $ | 7,708,298 | |||||
The following capital loss carryforwards are available to reduce taxable income arising from future net realized gains on investments, if any to the extent permitted by the Internal Revenue Code:
Year of Expiration | Capital Loss Carryforward | |
2017 | $1,769,353 |
The Fund used capital loss carry forwards of $5,615,921 to offset taxable capital gains during the period ended December 31, 2010.
Future realized gains offset by the loss carryforwards are not required to be distributed to shareholders. However, under the Fund’s distribution policy, such gains may be distributed to shareholders in the year the gains are realized. Any such gains distributed may be taxable to shareholders as ordinary income.
www.all-starfunds.com | ASG |
| 26 | LIBERTY ALL-STAR® GROWTH FUND | |||||
NOTES TO FINANCIAL STATEMENTS | ||||||
December 31, 2010 |
As of December 31, 2010, the components of distributable earnings on a tax basis were as follows:
Accumulated Capital Losses | Net Unrealized Appreciation | Other Cumulative Effect of Timing Differences | ||||
($2,080,911) | $ | 25,953,441 | 0 | |||
The differences between book-basis and tax-basis are primarily due to adjustments related to partnerships, passive foreign investment companies, and deferral of losses from wash sales.
Under current tax regulations, capital losses on securities transactions realized after October 31 may be deferred and treated as occurring on the first day of the following fiscal year.
As of December 31, 2010, for federal income tax purposes, the Fund elected to defer post-October losses of $311,558 to December 31, 2011.
Federal Income Tax Status
For federal income tax purposes, the Fund currently qualifies, and intends to remain qualified, as a regulated investment company under the provisions of Subchapter M of the Internal Revenue Code by distributing substantially all of its investment company taxable net income including realized gain, not offset by capital loss carryforwards, if any, to its shareholders. Accordingly, no provision for federal income or excise taxes has been made.
Management has concluded that the Fund has taken no uncertain tax positions that require recognition in the financial statements. The Fund files income tax returns in the U.S. federal jurisdiction and Colorado. For the years ended December 31, 2007, December 31, 2008, December 31, 2009, and December 31, 2010 the Fund’s returns are still open to examination by the appropriate taxing authorities.
NOTE 4. FEES AND COMPENSATION PAID TO AFFILIATES
Investment Advisory Fee
ALPS Advisors, Inc. (“AAI”) serves as the investment advisor to the Fund. AAI receives a monthly investment advisory fee based on the Fund’s average daily net assets at the following annual rates:
Average Daily Net Assets | Annual Fee Rate | |||||
First $300 million | 0.80% | |||||
Over $300 million | 0.72% |
AAI retains multiple Portfolio Managers to manage the Fund’s investments in various asset classes. AAI pays each Portfolio Manager a portfolio management fee based on the assets of the investment portfolio that they manage. The portfolio management fee is paid from the investment advisory fees collected by AAI and is based
on the Fund’s average daily net assets at the following annual rates:
Average Daily Net Assets | Annual Fee Rate | |||||
First $300 million | 0.40 | |||||
Over $300 million | 0.36% |
Administration, Bookkeeping and Pricing
Services Agreement
ALPS Fund Services, Inc. (“ALPS”) provides administrative and other services to the Fund for a monthly administration fee based on the Fund’s average daily net assets at the following annual rates:
Average Daily Net Assets | Annual Fee Rate | |||||
First $300 million | 0.20% | |||||
Over $300 million | 0.18% |
In addition, ALPS provides bookkeeping and pricing services to the Fund for an annual fee consisting of: (i) $38,000 paid monthly plus 0.015% on the average daily net assets for the month; and (ii) a multi-manager fee based on the number of portfolio managers; provided that during any 12-month period, the aggregate amount of (i) shall not exceed $140,000 (exclusive of out-of-pocket expenses and charges). The Fund also reimburses ALPS for out-of-pocket expenses and charges, including fees payable to third parties for pricing the Fund’s portfolio securities and direct internal costs incurred by ALPS in connection with providing fund accounting oversight and monitoring and certain other services.
Fees Paid to Officers
All officers of the Fund, including the Fund’s Chief Compliance Officer, are employees of AAI or its affiliates, and receive no compensation from the Fund. The Board of Directors has appointed a Chief Compliance Officer to the Fund in accordance with federal securities regulations.
NOTE 5. PORTFOLIO INFORMATION
Purchases and Sales of Securities
For the year ended December 31, 2010, the cost of purchases and proceeds from sales of securities, excluding short-term obligations, were $97,180,419 and $106,672,993, respectively.
NOTE 6. CAPITAL TRANSACTIONS
During the year ended December 31, 2009, distributions in the amount of $1,531,661 were paid in newly issued shares valued at market value or net asset value, but not less than 95% of market value. Such distributions resulted in the issuance of 632,213 shares.
Under the Fund’s Automatic Dividend Reinvestment and Direct Purchase Plan (the “Plan”), shareholders automatically participate and have all their Fund dividends
ANNUAL REPORT |
| LIBERTY ALL-STAR® GROWTH FUND | 27 | |||||
NOTES TO FINANCIAL STATEMENTS | ||||||
December 31, 2010 |
and distributions reinvested. Under the Plan, all dividends and distributions will be reinvested in additional shares of the Fund. Distributions declared payable in cash will be reinvested for the accounts of participants in the Plan in additional shares purchased by the Plan Agent on the open market at prevailing market prices, subject to certain limitations as described more fully in the Plan. Distributions declared payable in shares are paid to participants in the Plan entirely in newly issued full and fractional shares valued at the lower of market value or net asset value per share on the valuation date for the distribution (but not at a discount of more than 5 percent from market price). Dividends and distributions are subject to taxation, whether received in cash or in shares.
NOTE 7. INDEMNIFICATION
In the normal course of business, the Fund enters into contracts that contain a variety of representations and warranties and which provide general indemnities. The Fund’s maximum exposure under these arrangements is unknown, as this would involve future claims against the Fund. Also, under the Fund’s organizational documents and by contract, the Directors and Officers of the Fund are indemnified against certain liabilities that may arise out of their duties to the Fund. However, based on experience, the Fund expects the risk of loss due to these warranties and indemnities to be minimal.
NOTE 8. OTHER MATTERS
Maryland Statutes
By resolution of the Board of Directors, the Fund has opted into the Maryland Control Share Acquisition Act and the Maryland Business Combination Act. In general, the Maryland Control Share Acquisition Act provides that “control shares” of a Maryland corporation acquired in a control share acquisition may not be voted except to the extent approved by shareholders at a meeting by a vote of two-thirds of the votes entitled to be cast on the matter (excluding shares owned by the acquiror and by officers or directors who are employees of the corporation). “Control shares” are voting shares of stock which, if aggregated with all other shares of stock owned by the acquiror or in respect of which the acquiror is able to exercise or direct the exercise of voting power (except solely by virtue of a revocable proxy), would entitle the acquiror to exercise voting power in electing directors within certain statutorily defined ranges (one-tenth but less than one-third, one-third but less than a majority, and more than a majority of the voting power). In general, the Maryland Business Combination Act prohibits an interested shareholder (a shareholder that holds 10% or more of the voting power of the outstanding stock of the corporation) of a Maryland corporation from engaging in a business combination (generally defined to include a merger, consolidation, share exchange, sale of a substantial amount of assets, a transfer of the corporation’s securities and similar transactions to or with the interested shareholder or an entity affiliated with the interested shareholder) with
the corporation for a period of five years after the most recent date on which the interested shareholder became an interested shareholder. At the time of adoption, March 19, 2009, the Board and the Fund were not aware, and currently are not aware, of any shareholder that held control shares or that was an interested shareholder under the statutes.
Expense Disclosure
Proxy solicitation and related legal expenses include additional expenses as a result of the proxy solicitation by dissident shareholders.
www.all-starfunds.com | ASG |
| 28 | LIBERTY ALL-STAR® GROWTH FUND | |||||
REPORT OF INDEPENDENT REGISTERED PUBLIC ACCOUNTING FIRM |
TO THE BOARD OF DIRECTORS AND SHAREHOLDERS OF LIBERTY ALL-STAR®GROWTH FUND, INC.:
We have audited the accompanying statement of assets and liabilities of Liberty All-Star® Growth Fund, Inc. (the “Fund”), including the schedule of investments, as of December 31, 2010, and the related statements of operations for the year then ended, the statements of changes in net assets for each of the two years in the period then ended, and the financial highlights for each of the four years in the period then ended. These financial statements and financial highlights are the responsibility of the Fund’s management. Our responsibility is to express an opinion on these financial statements and financial highlights based on our audits. The financial highlights of the Fund for the year ended December 31, 2006 were audited by other auditors whose report, dated February 20, 2007, expressed an unqualified opinion on the financial highlights.
We conducted our audits in accordance with the standards of the Public Company Accounting Oversight Board (United States). Those standards require that we plan and perform the audit to obtain reasonable assurance about whether the financial statements and financial highlights are free of material misstatement. The Fund is not required to have, nor were we engaged to perform, an audit of its internal control over financial reporting. Our audits included consideration of internal control over financial reporting as a basis for designing audit procedures that are appropriate in the circumstances, but not for the purpose of expressing an opinion on the effectiveness of the Fund’s internal control over financial reporting. Accordingly, we express no such opinion. An audit also includes examining, on a test basis, evidence supporting the amounts and disclosures in the financial statements, assessing the accounting principles used and significant estimates made by management, as well as evaluating the overall financial statement presentation. Our procedures included confirmation of securities owned as of December 31, 2010, by correspondence with the custodian and brokers where replies were not received from brokers, we performed other auditing procedures. We believe that our audits provide a reasonable basis for our opinion.
In our opinion, the financial statements and financial highlights referred to above present fairly, in all material respects, the financial position of the Liberty All-Star® Growth Fund, Inc., as of December 31, 2010, the results of its operations for the year then ended, the changes in its net assets for each of the two years in the period then ended, and the financial highlights for each of the four years in the period then ended, in conformity with accounting principles generally accepted in the United States of America.
DELOITTE & TOUCHE LLP
Denver, Colorado
February 17, 2011
ANNUAL REPORT |
LIBERTY ALL-STAR® GROWTH FUND | 29 | |||||
AUTOMATIC DIVIDEND REINVESTMENT AND DIRECT PURCHASE PLAN (UNAUDITED) |
Under the Fund’s Automatic Dividend Reinvestment and Direct Purchase Plan (the “Plan”), shareholders automatically participate and have all their Fund dividends and distributions reinvested by Computershare Trust Company, N.A., as agent for participants in the Plan (the “Plan Agent”), in additional shares of the Fund. For further information, call Investor Assistance at 1-800-LIB-FUND (1-800-542-3863) weekdays between 9 a.m. and 5 p.m. Eastern Time.
Shareholders whose shares are held in the name of a brokerage firm, bank or other nominee can participate in the Plan only if their brokerage firm, bank or nominee is able to do so on their behalf. Shareholders participating in the Plan through a brokerage firm may not be able to transfer their shares to another brokerage firm and continue to participate in the Plan.
Under the Plan, all dividends and distributions will be reinvested in additional shares of the Fund. Distributions declared payable in cash will be reinvested for the accounts of participants in the Plan in additional shares purchased by the Plan Agent on the open market at prevailing market prices. If, prior to the Plan Agent’s completion of such open market purchases, the market price of a share plus estimated brokerage commissions exceeds the net asset value, the remainder of the distribution will be paid in newly issued shares valued at net asset value (but not at a discount of more than 5% from market price). Distributions declared payable in shares (or cash at the option of shareholders) are paid to participants in the Plan entirely in newly issued full and fractional shares valued at the lower of market value or net asset value per share on the valuation date for the distribution (but not at a discount of more than 5 percent from market price). Dividends and distributions are subject to taxation, whether received in cash or in shares.
Plan participants have the option of making additional investments of $100 or more on a monthly basis up to a maximum of $120,000 in a calendar year. These direct purchases will be invested on or shortly after the 15th of each month and direct purchases should be sent so as to be received by the Plan Agent at least two business days prior to the next investment date. Barring suspension of trading, direct purchases will be invested within 35 days after such date. Alternatively, participants can authorize an automatic monthly deduction from a checking or savings account at a U.S. bank or other financial institution. A participant may withdraw a direct purchase by written notice received by the Plan Agent at least two business days before such payment is to be invested.
The Plan Agent maintains all shareholder accounts in the Plan and furnishes confirmations of all transactions in the account, including information needed by shareholders for tax records. Shares in the account of each Plan participant will be held by the Plan Agent in book-entry or noncertificated form in the name of the participant, and each shareholder’s proxy will include those shares purchased or received pursuant to the Plan.
There is no charge to participants for reinvesting distributions pursuant to the Plan. The Plan Agent’s fees are paid by the Fund, therefore indirectly by shareholders. There are no brokerage charges with respect to shares issued directly by the Fund as a result of dividends or distributions declared payable in shares. However, each participant bears a per share fee (which includes any brokerage commissions the Plan Agent is required to pay) incurred with respect to the Plan Agent’s open market purchases in connection with the reinvestment of distributions declared payable in cash.
With respect to direct purchases, the Plan Agent will charge $1.25 for purchase by check and $2.00 for automatic investment transactions, plus a per share fee (which includes any brokerage commissions the Plan Agent is required to pay). Sales of shares held in the Plan will also be subject to a service fee of $2.50 and a per share fee currently $0.10. All fees described in this summary are subject to change. Please contact the Plan Agent for the current fees.
Shareholders may terminate their participation in the Plan by notifying the Plan Agent by telephone, through the Internet or in writing. Such termination will be effective immediately if notice is received by The Plan Agent prior to any dividend record date and all subsequent dividends and distributions will be paid in cash instead of shares.
The Fund reserves the right to amend or terminate the Plan.
The full text of the Plan may be found on the Fund’s website at www.all-starfunds.com.
www.all-starfunds.com | ASG |
| 30 | LIBERTY ALL-STAR® GROWTH FUND | |||||
TAX INFORMATION (UNAUDITED)
|
| All 2010 distributions whether received in cash or shares of the Fund consist of the following: | ||||||||||||
(1) ordinary dividends, and | ||||||||||||
(2) return of capital | ||||||||||||
| The table below details the breakdown of each 2010 distribution for federal income tax purposes. | ||||||||||||
| TAX STATUS OF 2010 DISTRIBUTIONS | ||||||||||||
| ORDINARY DIVIDENDS | ||||||||||||
| DATE PAID | AMOUNT PER SHARE | QUALIFIED | NON-QUALIFIED | LONG-TERM CAPITAL GAINS | RETURN OF CAPITAL | |||||||
01/04/10* | $0.06 | — | 77.79% | — | 22.21% | |||||||
03/15/10 | $0.06 | — | 77.79% | — | 22.21% | |||||||
06/14/10 | $0.06 | — | 77.79% | — | 22.21% | |||||||
09/13/10 | $0.06 | — | 77.79% | — | 22.21% | |||||||
01/03/11** | $0.07 | — | — | — | — | |||||||
* Pursuant to Section 852 of the Internal Revenue Code, the taxability of this distribution will be reported in the Form 1099-DIV for 2010 | ||||||||
** Pursuant to Section 852 of the Internal Revenue Code, the taxability of this distribution will be reported in the Form 1099-DIV for 2011 | ||||||||
| TAX DESIGNATIONS | ||||||||
The Fund designates the following amounts for the fiscal year ended December 31, 2010:
| ||||||||
Qualified Dividend Income | 0.00% | |||||||
Corporate Dividends Received Deduction | 0.00% | |||||||
ANNUAL REPORT |
| LIBERTY ALL-STAR® GROWTH FUND | 31 | |||||
DIRECTORS AND OFFICERS (UNAUDITED) |
The names of the Directors and Officers of the Liberty All-Star® Growth Fund, Inc., the date each was first elected or appointed to office, their term of office, their principal business occupations and other directorships they have held during at least the last five years, are shown below.
INDEPENDENT DIRECTORS
NAME AND ADDRESS*
| POSITION WITH GROWTH AND TERM OF OFFICE
| PRINCIPAL OCCUPATION(S) DURING PAST FIVE YEARS
| NUMBER OF PORTFOLIOS IN FUND COMPLEX OVERSEEN BY DIRECTOR
| OTHER DIRECTORSHIPS HELD
| ||||
John A. Benning (Age 76) | Director Since 2002; Term expires 2011 | Retired | 2 | Trustee, Liberty All-Star Equity Fund (since 2002).
| ||||
Thomas W. Brock (Age 63) | Director Since 2005; Term expires 2012 | CEO, StoneHarbor Investment Partners LP (since April, 2006); Adjunct Professor, Columbia University Graduate School of Business (1998-2006). | 2 | Trustee, Liberty All-Star Equity Fund (since 2005); Trustee and Chairman, Stone Harbor Investment Funds (since 2007)
| ||||
George R. Gaspari (Age 70) | Director Since 2006; Term Expires 2013 | Financial Services Consultant (since 1996) | 2 | Trustee and Chairman, The Select Sector SPDR Trust (since 1999); Trustee, Liberty All-Star Equity Fund (since 2006).
| ||||
Richard W. Lowry (Age 74) | Director Since 1994; Term Expires 2013; Chairman since 2004
| Private Investor (since 1987) | 2 | Trustee and Chairman, Liberty All-Star Equity Fund (since 1986).
| ||||
John J. Neuhauser (Age 67) | Director Since 1998; Term Expires 2012 | President, St. Michael’s College (since August, 2007); University Professor December 2005-2007, Boston College (formerly Academic Vice President and Dean of Faculties, from August 1999 to December 2005, Boston College)
| 2 | Trustee, Liberty All-Star Equity Fund (since 1998); Trustee, Columbia Funds Series Trust I (66 funds). | ||||
Richard C. Rantzow (Age 72) | Director Since 2006; Term expires 2011 | Retired; Chairman of the Board of First Funds (from 1992 to July, 2006) | 2 | Director, Clough Global Allocation Fund (since 2004), Clough Global Equity Fund (since 2005) and Clough Global Opportunities Fund (since 2006); Trustee, Liberty All-Star Equity Fund (since 2006). | ||||
| * | The address for all Directors and Officers is: c/o ALPS Fund Services, Inc., 1290 Broadway, Suite 1100; Denver, CO 80203. |
www.all-starfunds.com | ASG |
| 32 | LIBERTY ALL-STAR® GROWTH FUND | |||||
DIRECTORS AND OFFICERS (UNAUDITED) |
INTERESTED DIRECTOR
NAME AND ADDRESS*
| POSITION WITH GROWTH FUND, LENGTH OF SERVICE AND TERM OF OFFICE
| PRINCIPAL OCCUPATION(S) DURING PAST FIVE YEARS
| NUMBER OF PORTFOLIOS IN FUND COMPLEX OVERSEEN BY DIRECTOR
| OTHER DIRECTORSHIPS HELD
| ||||
Edmund J. Burke (Age 50)** | Director Since 2006; Term expires 2012 | CEO and a Director of ALPS Holdings, Inc. (since 2005); Director, ALPS Advisors (since 2001), ALPS Distributors, Inc. (since 2000) and ALPS (since 2000); President and a Director of ALPS Financial Services, Inc. (1991-2005) | 2 | President (since 2001), Trustee and Chairman (since 2009), Financial Investors Trust; Trustee and President, Clough Global Allocation Fund (Trustee since 2006, President since 2004); Trustee and President, Clough Global Equity Fund (Trustee since 2006, President since 2005); Trustee and President Clough Global Opportunities Fund (since 2006); Trustee, Liberty All-Star Equity Fund (since 2006); formerly, President Reaves Utility Income Fund and Financial Investors Variable Insurance Trust. | ||||
| OFFICERS | ||||||||
NAME AND ADDRESS*
| POSITION WITH GROWTH FUND
| YEAR FIRST ELECTED OR APPOINTED TO OFFICE
|
PRINCIPAL OCCUPATION(S) DURING PAST FIVE YEARS
| |||||
William R. Parmentier, Jr. (Age 57) | President | 1999 | Chief Investment Officer, ALPS Advisors, Inc. (since 2006); President and Chief Executive Officer of the Liberty All-Star Funds (since April, 1999); Senior Vice President (2005-2006), Banc of America Investment Advisors, Inc.
| |||||
Mark T. Haley, CFA (Age 46) | Senior Vice President | 1999 | Senior Vice President of the Liberty All-Star Funds (since January, 1999). Vice President, ALPS Advisors, Inc. (since 2006); Vice President, Banc of America Investment Advisors (1999-2006).
| |||||
Edmund J. Burke (Age 50) | Vice President | 2006 | Director of ALPS (since 2005), Director of ALPS Advisors (since 2001), President and a Director of ALPS Financial Services, Inc. (1991-2005). See above for other Directorships held.
| |||||
| * | The address for all Directors and Officers is: c/o ALPS Fund Services, Inc., 1290 Broadway, Suite 1100; Denver, CO 80203. |
| ** | Mr. Burke is an “interested person” of the Fund as defined in the Investment Company Act, because he is an officer of ALPS and ALPS Advisors. |
ANNUAL REPORT |
| LIBERTY ALL-STAR® GROWTH FUND | 33 | |||||
DIRECTORS AND OFFICERS (UNAUDITED) |
OFFICERS (continued)
NAME AND ADDRESS*
| POSITION WITH GROWTH FUND
| YEAR FIRST ELECTED OR APPOINTED TO OFFICE
| PRINCIPAL OCCUPATION(S) DURING PAST FIVE YEARS
| |||
Jeremy O. May (Age 40) | Treasurer | 2006 | Mr. May is a President and Director of ALPS. Mr. May joined ALPS in 1995. Because of his position with ALPS, Mr. May is deemed an affiliate of the Fund as defined under the 1940 Act. Mr. May is currently the Treasurer of Liberty All-Star Equity Fund, Reaves Utility Income Fund, Clough Global Equity Fund, Clough Global Allocation Fund, Clough Global Opportunities Fund, Financial Investors Trust, and Financial Investors Variable Insurance Trust. Mr. May is also on the Board of Directors of the University of Colorado Foundation.
| |||
Kimberly R. Storms (Age 38) | Assistant Treasurer | 2006 | Ms. Storms is Director of Fund Administration and Vice- President of ALPS. Ms. Storms joined ALPS in 1998. Because of her position with ALPS, Ms. Storms is deemed an affiliate of the Fund as defined under the 1940 Act. Ms. Storms is also Assistant Treasurer of the Liberty All-Star Equity Fund, and Financial Investors Trust and Assistant Secretary of Ameristock Mutual Fund, Inc.She is Treasurer of ALPS ETF Trust and ALPS Variable Insurance Trust. Ms. Storms was previously Assistant Treasurer of the Clough Global Equity, Clough Global Allocation, Clough Global Opportunities and Reaves Utility Income Funds.
| |||
Melanie H. Zimdars (Age 34) | Chief Compliance Officer | 2009 | Deputy Chief Compliance Officer with ALPS Fund Services, Inc. since September 2009. Principal Financial Officer, Treasurer and Secretary, Wasatch Funds, February 2007 to December 2008. Assistant Treasurer, Wasatch Funds, November 2006 to February 2007. Senior Compliance Officer, Wasatch Advisors, Inc., 2005 to 2008. Ms. Zimdars is currently the CCO for Liberty All- Star Equity Fund, Financial Investors Variable Insurance Trust, ALPS ETF Trust, Grail Advisors ETF Trust, EGA Emerging Global Shares Trust and ALPS Variable Insurance Trust.
| |||
Stephanie Barres (Age 44) | Secretary | 2008 | Ms. Barres is Senior Paralegal with ALPS, since 2005. Secretary, Liberty All-Star Growth Fund, Inc. since December 2008. Director, Broker Dealer Compliance, INVESCO Funds Group, Inc., 1997-2004. | |||
| * | The address for all Officers is: c/o ALPS Fund Services, Inc., 1290 Broadway, Suite 1100; Denver, CO 80203. |
www.all-starfunds.com | ASG |
| 34 | LIBERTY ALL-STAR® GROWTH FUND | |||||
PRIVACY POLICY (UNAUDITED) |
This Privacy Policy Notice discloses the privacy policies of the Liberty All-Star® Funds, which are advised by ALPS Advisors, Inc. and serviced by ALPS Fund Services, Inc. (the “Companies”). The Companies and the Funds are referred to herein collectively as “we” or “us.”
PROTECTING YOUR PRIVACY IS A TOP PRIORITY
We realize that our ability to offer superior products and services depends on the personal and financial information we collect from you. We value your business and are committed to maintaining your trust. That is why we have made your privacy a top priority.
THE INFORMATION WE HAVE AND WHERE WE GET IT
We collect information about you from a variety of sources, including:
| • | Information we receive from you on applications or other forms, such as your name, address and phone number; your social security number; and your assets, income and other household information; |
| • | Information about your other transactions with us, our affiliates or others, such as your account balances and transactions history; and |
| • | Information from visitors to our websites provided through online forms, site visitorship data and online information-collecting devices known as “cookies.” |
We do not solicit personal or financial information from minors without written parental consent, nor do we knowingly market products and services to minors.
HOW WE USE THIS INFORMATION
We may share all of the information we collect with the Companies as part of the ordinary course of providing financial products and services to you, for the purpose of offering you new products and services to address your financial needs, for product development purposes and as otherwise required or permitted by law.
To assist in our business dealings with you, we may also share this information with companies (other than the Companies) that perform services, including marketing services, on our behalf (such as vendors that package and mail our investor statements and marketing research firms that enhance our ability to market our products and services). We do not share your information with mailing list or direct marketing companies. Thus, the information you provide to us will not result in unwanted solicitations from third-party marketers.
Finally, we may share this information with other entities outside of the Companies for the following purposes, including among others:
| • | To respond to a subpoena or court order, judicial process or regulatory inquiry; |
| • | To report suspicious transactions to government agencies and law enforcement officials; |
| • | To protect against fraud; |
| • | To provide products and services with the consent or the direction of a customer; or |
| • | In connection with the proposed or actual sale or merger of all or a portion of a business or operating unit. |
Except as described above, and except for information we provide to nonaffiliated third parties as otherwise required or permitted by law, we do not share information about you with nonaffiliated third parties.
SECURITY OF PERSONAL FINANCIAL INFORMATION
We restrict access to information about you to those employees we determine need to know that information to provide products and services to you. We maintain physical, electronic and procedural safeguards to protect this information.
If you provide information to us via our websites in order to view your account activity or conduct transactions, we use 128-bit SSL encryption security with passwords to ensure a safe transmission of data between you and us. Information you provide is stored and transmitted in a secure environment, accessible only by a select group of people who are given a secure passcode to access the information.
We continuously assess new technology for protecting information and upgrade our systems where appropriate.
IF YOU HAVE ANY QUESTIONS OR CONCERNS ABOUT THIS PRIVACY POLICY NOTICE, PLEASE WRITE TO US AT:
ALPS Advisors, Inc.
Attn: Compliance Department
1290 Broadway, Suite 1100
Denver, CO 80203
FORMER CUSTOMERS
If, for whatever reason, our customer relationship with you ends, we will preserve your information as necessary to comply with applicable laws. The measures we take to protect the privacy of customer information, as described in this Privacy Policy Notice, will continue to apply to you. We also will comply with more restrictive state laws to the extent they apply.
We reserve the right to change this Privacy Policy Notice, and any of the policies described herein, at any time. The examples contained in this Privacy Policy Notice are illustrations; they are not intended to be exclusive.
ANNUAL REPORT |
| LIBERTY ALL-STAR® GROWTH FUND | 35 | |||||
DESCRIPTION OF LIPPER BENCHMARK AND MARKET INDICES (UNAUDITED) ) |
Lipper Multi-Cap Growth Mutual Fund Average
The average of funds that, by portfolio practice, invest in a variety of market capitalization ranges without concentrating 75% of their equity assets in any one market capitalization range over an extended period of time. Multi-Cap growth funds typically have an above-average price-to-earnings ratio, price-to-book ratio, and three-year sales-per-share growth value, compared to the S&P SuperComposite 1500 Index.
NASDAQ Composite Index
Measures all NASDAQ domestic and international based common type stocks listed on the NASDAQ Stock Market.
Russell 3000® Growth Index
Measures the performance of those Russell 3000® companies with higher price-to-book-ratios and higher forecasted growth values. The Russell 3000® Index measures the performance of the 3,000 largest U.S. companies based on total market capitalization, which represents approximately 98% of the investable U.S. equity market.
Russell 1000® Growth Index (Largecap)
Measures the performance of those Russell 1000® companies with higher price-to-book ratios and higher forecasted growth values. The Russell 1000® Index measures the performance of the 1,000 largest companies in the Russell 3000® Index.
Russell Midcap® Growth Index
Measures the performance of those Russell Midcap® companies with higher price-to-book ratios and higher forecasted growth values. The Russell Midcap® Index measures the performance of the 800 smallest companies in the Russell 1000® Index.
Russell 2000® Growth Index (Smallcap)
Measures the performance of those Russell 2000® companies with higher price-to-book ratios and higher forecasted growth values. The Russell 2000® Index measures the performance of the 2,000 smallest companies in the Russell 3000® Index.
S&P 500 Index
A representative sample of 500 leading companies in leading industries of the U.S. economy. Focuses on the large-cap segment of the market with approximately 75% coverage of U.S. equities.
www.all-starfunds.com | ASG |
| 36 | LIBERTY ALL-STAR® GROWTH FUND | |||||
NOTES |
|
|
|
|
|
|
|
|
|
|
|
|
|
|
|
|
|
|
|
|
|
|
|
|
|
|
|
|
|
|
|
|
|
|
|
|
ANNUAL REPORT |
Item 2. Code of Ethics.
| (a) | The registrant has, as of the end of the period covered by this report, adopted a code of ethics that applies to the registrant’s principal executive officer, principal financial officer, principal accounting officer or controller, or persons performing similar functions, regardless of whether these individuals are employed by the registrant or a third party. |
| (b) | The registrant’s Board adopted, effective December 10, 2007, a revised code of ethics described in 2(a) above. There have been no revisions to the code since that date. |
| (c) | During the period covered by this report, there were not any waivers or implicit waivers to a provision of the code of ethics adopted in 2(a) above. |
Item 3. Audit Committee Financial Expert.
The registrant’s Audit Committee is composed of six of the registrant’s independent directors who are not affiliated with the registrant’s investment advisor. The Board has determined that each of the audit committee members is “financially literate” and that at least one member has “accounting or related financial management expertise” as used in the New York Stock Exchange definitions of the terms.
Under the Sarbanes-Oxley Act, if the Board has not determined that a “financial expert,” a term based on criteria contained in the Sarbanes-Oxley Act, is serving on the audit committee, it must disclose this fact and explain why the committee does not have such an expert. The Board has determined that none of the members of its audit committee meets the technical requirements of the definition. Moreover, it believes that for the following reasons it is not necessary for a registered investment company such as the registrant, with an audit committee that meets the New York Stock Exchange requirements of financial literacy, to have a “financial expert” as a member of the committee.
| 1. | The financial statements of and accounting principles applying to the registrant are relatively straightforward and transparent compared to those of operating companies. The significant accounting issues are valuation of securities and other assets (regulated under the Investment Company Act of 1940 (the “1940 Act”) and computed daily), accrual of expenses, allocation of joint expenses shared with other entities, such as insurance premiums, and disclosures of all related party transactions. Equally important is knowledge of the tax laws applying to registered investment companies. None of the accounting issues involving corporate America that have received recent publicity, such as sophisticated derivative transactions and special purpose entities, are present in financial reporting for this registered investment company. |
| 2. | During the years that the registrant has been filing financial reports under the 1940 Act since its inception in 1986 there has never been a requirement for a financial report or statement to be restated. |
| 3. | The current members of the audit committee have many years of aggregate experience serving on this audit committee and/or in the Board’s judgment, through this experience and experience with other public corporation’s financial affairs, they have an understanding of the relevant generally accepted accounting principles governing the registrant’s financial statements, tax laws applying to the registrant, the registrant’s internal accounting controls and audit committee functions necessary to satisfy the objectives of the Sarbanes-Oxley Act with respect to the financial statements, auditing process and internal controls of the registrant. |
| 4. | The audit committee has the capability of employing a consultant who satisfies the technical definition of a “financial expert” and will do so from time to time if circumstances warrant. |
Item 4. Principal Accountant Fees and Services.
(a) Audit Fees. Aggregate Audit Fees billed by the principal accountant for professional services rendered during the fiscal years ended December 31, 2009 and December 31, 2010 are approximately $24,000 and $24,700, respectively.
Audit Fees include amounts related to the audit of the registrant’s annual financial statements or services that are normally provided by the accountant in connection with statutory and regulatory filings or engagements for those fiscal years.
(b) Audit-Related Fees. Aggregate Audit-Related Fees billed to the registrant by the principal accountant for professional services rendered during the fiscal years ended December 31, 2009 and December 31, 2008 are approximately $200 and $0, respectively.
Audit-Related Fees include amounts for assurance and related services by the principal accountant that are reasonably related to the performance of the audit of the registrant’s financial statements and are not reported in Audit Fees above
(c) Tax Fees. Aggregate Tax Fees billed by the principal accountant to the registrant for professional services rendered during the fiscal years ended December 31, 2009 and December 31, 2010 are approximately $3,460 and $3,560, respectively.
(d) All Other Fees. Aggregate All Other Fees billed by the principal accountant to the registrant for professional services rendered during the fiscal years ended December 31, 2009and December 31, 2010 are $0 and $0, respectively.
All Other Fees include amounts for products and services provided by the principal accountant, other than the services reported in paragraphs (a) through (c) above.
None of the amounts described in paragraphs (a) through (d) above were approved pursuant to the “de minimis” exception under paragraph (c)(7)(i)(C) of Rule 2-01 of Regulation S-X. During the fiscal years ended December 31, 2009 and December 31, 2010, there were no Audit-Related Fees, Tax Fees and All Other Fees that were approved for services related directly to the operations and financial reporting of the registrant to the investment advisor (not including any sub-advisor whose role is primarily portfolio management and is subcontracted with or overseen by another investment advisor) and any entity controlling, controlled by, or under common control with such investment advisor that provides ongoing services to the registrant under paragraph (c)(7)(ii) of Rule 2-01 of Regulation S-X.
(e)(1) Audit Committee Pre-Approval Policies and Procedures
The registrant’s Audit Committee is required to pre-approve the engagement of the registrant’s independent accountants to provide audit and non-audit services to the registrant and non-audit services to its investment advisor (not including any sub-advisor whose role is primarily portfolio management and is subcontracted with or overseen by another investment advisor) or any entity controlling, controlled by or under common control with such investment advisor that provides ongoing services to the registrant (“Advisor Affiliates”), if the engagement relates directly to the operations or financial reporting of the registrant, including the fees and other compensation to be paid to the independent accountants.
The Audit Committee has adopted a Policy for Engagement of Independent Accountants for Audit and Non-Audit Services (“Policy”). The Policy sets forth the understanding of the Audit Committees regarding the engagement of the registrant’s independent accountants to provide (i) audit and permissible audit-related, tax and other services to the registrant; (ii) non-audit services to the registrant’s investment advisor (not including any sub-advisor whose role is primarily portfolio management and is subcontracted with or overseen by another investment advisor) and Advisor Affiliates, if the engagement relates directly to the operations or financial reporting of a Fund; and (iii) other audit and non-audit services to the registrant’s investment advisor (not including any sub-advisor whose role is primarily portfolio management and is subcontracted with or overseen by another investment advisor) and Advisor Affiliates. Unless a type of service receives general pre-approval under the Policy, it requires specific pre-approval by the Audit Committee if it is to be provided by the independent accountants. Pre-approval of non-audit services to the registrant, the registrant’s investment advisor (not including any sub-advisor whose role is primarily portfolio management and is subcontracted with or overseen by another investment advisor) and Advisor Affiliates may be waived provided that the “de minimis” requirements set forth in the SEC’s rules relating to pre-approval of non-audit services are met.
Under the Policy, the Audit Committee may delegate pre-approval authority to any pre-designated member or members who are Independent Directors. The member(s) to whom such authority is delegated must report, for informational purposes only, any pre-approval decisions to the Audit Committee at its next regular meeting. The Audit Committee’s responsibilities with respect to the pre-approval of services performed by the independent accountants may not be delegated to management.
The Policy requires the Fund Treasurer and/or Director of Board Administration to submit to the Audit Committee, on an annual basis, a schedule of the types of services that are subject to general pre-approval. The schedule(s) provide a description of each type of service that is subject to general pre-approval and, where possible, will provide estimated fee caps for each instance of providing each service. The Audit Committees will review and approve the types of services and review the projected fees for the next fiscal year and may add to, or subtract from, the list of general pre-approved services from time to time based on subsequent determinations. That approval acknowledges that each Audit Committee is in agreement with the specific types of services that the independent accountants will be permitted to perform.
(e)(2) The percentage of services described in paragraphs (b) through (d) of this Item approved pursuant to the “de minimis” exception under paragraph (c)(7)(i)(C) of Rule 2-01 of Regulation S-X during both fiscal years ended December 31, 2009 and December 31, 2010 was zero.
(f) Not applicable.
(g) The aggregate non-audit fees billed by the registrant’s accountant in each of the last two fiscal years of the Registrant were $176,460 in 2009 and $198,560 in 2010. These fees consisted of non-audit fees billed to (i) the Registrant of $3,460 in 2009 and $3,560 in 2010 as described in response to paragraph (c) above and (ii) to ALPS Fund Services, Inc., (“AFS”), an entity under common control with the ALPS Advisors, Inc., the Registrant’s investment advisor, $173,000 in 2009 and $195,000 in 2010. The non-audit fees billed to AFS related to SAS 70 services and other compliance related matters.
(h) The registrant’s Audit Committee has considered whether the provision of non-audit services that were rendered to the registrant’s advisor (not including any sub-advisor whose role is primarily portfolio management and is subcontracted with or overseen by another investment advisor), and any entity controlling, controlled by, or under common control with the investment advisor that provides ongoing services to the registrant that were not pre-approved pursuant to paragraph (c)(7)(ii) of Rule 2-01 of Regulation S-X, is compatible with maintaining the principal accountant’s independence. The Audit Committee determined that the provision of such services is compatible with maintaining the principal accountant’s independence.
Item 5. Audit Committee of Listed Registrants.
The registrant has a separately-designated standing audit committee established in accordance with Section 3(a)(58)(A) of the Securities Exchange Act of 1934 (15 U.S.C. 78c(a)(58)(A)).
As of December 31, 2010, John A. Benning, Thomas W. Brock, George R. Gaspari Richard W. Lowry, John J. Neuhauser, and Richard C. Rantzow are each an independent director and collectively constitute the entire Audit Committee.
Item 6. Schedule.
The registrant’s “Schedule I – Investments in securities of unaffiliated issuers” (as set forth in 17 CFR 210.12-12) is included in Item 1 of this Form N-CSR.
Item 7. Disclosure of Proxy Voting Policies and Procedures for Closed-End Management Investment Companies.
The Fund has delegated to ALPS Advisors, Inc. (the “Advisor”) the responsibility to vote proxies relating to portfolio securities held by the Fund. In deciding to delegate this responsibility to the Advisor, the Fund’s Board reviewed and approved the policies and procedures adopted by the Advisor. These included the procedures that the Advisor follows when a vote presents a conflict between the interests of the Fund and its shareholders and the Advisor, its affiliates, its other clients or other persons.
The Advisor’s policy is to vote all proxies for Fund securities in a manner considered by the Advisor to be in the best interest of the Fund and its shareholders without regard to any benefit to the Advisor, its affiliates, its other clients or other persons. The Advisor or an affiliate examines each proposal and votes against the proposal, if, in its judgment,
approval or adoption of the proposal would be expected to impact adversely the current or potential market value of the issuer’s securities. The Advisor or an affiliate also examines each proposal and votes the proxies against the proposal, if, in its judgment, the proposal would be expected to affect adversely the best interest of the Fund. The Advisor or an affiliate determines the best interest of the Fund in light of the potential economic return on the Fund’s investment.
The Advisor addresses potential material conflicts of interest by having predetermined voting guidelines. For those proposals that require special consideration or in instances where special circumstances may require varying from the predetermined guideline, a Proxy Committee determines the vote in the best interest of the Fund, without consideration of any benefit to the Advisor, its affiliates, its other clients or other persons. The Proxy Committee is composed of representatives of equity investments, equity research, compliance, legal and fund administration functions. In addition to the responsibilities described above, the Proxy Committee has the responsibility to review, on a semi-annual basis, the Advisor’s proxy voting policies to ensure consistency with internal and regulatory agency policies and to develop additional predetermined voting guidelines to assist in the review of proxy proposals.
The Proxy Committee may vary from a predetermined guideline if it determines that voting on the proposal according to the predetermined guideline would be expected to impact adversely the current or potential market value of the issuer’s securities or to affect adversely the best interest of the client. References to the best interest of a client refer to the interest of the client in terms of the potential economic return on the client’s investment. In determining the vote on any proposal, the Proxy Committee does not consider any benefit other than benefits to the owner of the securities to be voted. A member of the Proxy Committee is prohibited from voting on any proposal for which he or she has a conflict of interest by reason of a direct relationship with the issuer or other party affected by a given proposal. Persons making recommendations to the Proxy Committee or its members are required to disclose to the Committee any relationship with a party making a proposal or other matter known to the person that would create a potential conflict of interest.
The Advisor has retained Institutional Shareholder Services (“ISS”), a third party vendor, to implement its proxy voting process. ISS provides proxy analysis, record keeping services and vote disclosure services.
Item 8. Portfolio Managers of Closed-End Management Investment Companies.
M.A. Weatherbie & Co., Inc. (“M.A. Weatherbie”)
MANAGEMENT. Matthew A. Weatherbie, CFA is the person responsible for managing the portion of the Fund allocated to M.A. Weatherbie. Mr. Weatherbie is the Chief Investment Officer, President and Portfolio Manager of M.A. Weatherbie, which he founded in December 1995. Mr. Weatherbie’s prior experience as a portfolio manager was at Putnam Investments from 1983-1995 where he managed the Putnam Voyager Fund. Between 1973 and 1983, he was a securities analyst and then a portfolio manager of MFS (Massachusetts Financial Services) Emerging Growth Trust. He has earned the right to use the CFA Institute Chartered Financial Analyst designation.
OTHER ACCOUNTS. The table below provides information regarding the other accounts managed by Matthew A. Weatherbie as of December 31, 2010:
Type of Account | Number of Accounts Managed | Total Assets Managed (in millions) | Number of Accounts Managed For which Advisory Fee is Performance Based | Assets Managed for (in millions) | ||||||||
Matthew A.Weatherbie | ||||||||||||
Registered Investment Companies | 1 | $48.7 | 0 | N/A | ||||||||
Other Pooled Investment Vehicles | 2 | $113.2 | 2 | $113.2 | ||||||||
Other Accounts | 26 | $845.2 | 0 | N/a | ||||||||
COMPENSATION STRUCTURE. As the sole owner of M.A. Weatherbie, Matthew A. Weatherbie’s compensation is directly related to the overall profitability of M.A. Weatherbie. Mr. Weatherbie receives a fixed base salary, profit sharing (pre-tax/deferred compensation) and earnings from the company, if any, at year end under the rules of Sub-Chapter S of the Internal Revenue Code. All compensation is pre-tax. There is no difference between the method used to determine compensation with respect to the Fund and the other accounts managed by Mr. Weatherbie, except that a performance allocation may be payable by the other pooled investment vehicles managed by M.A. Weatherbie.
OWNERSHIP BY PORTFOLIO MANAGER. Mr. Weatherbie does not own any shares of the Fund.
CONFLICTS OF INTEREST: None
TCW Investment Management Company (“TCW”)
MANAGEMENT. The first portion of the Fund allocated to TCW is managed by Brendt Stallings and Husam Nazer.
R. Brendt Stallings, CFA, Group Managing Director, U.S. Equities – Mr. Stallings is the Senior Portfolio Manager of TCW’s Growth Equities strategy and co-head of TCW’s Small and Mid-Cap Growth Equities team. Mr. Stallings co-founded Growth Equities in 1999 and has been its lead manager since January 2003. He came to TCW in 1996, joining the U.S. Equity Research Department as an Analyst, and in 1998 joined the Small and Mid-Cap Growth Equities team. On the team, his analytic responsibilities have included many of the group’s investments in the business services, retail, financial services and technology industries. Prior to TCW, he worked for Chancellor LGT Asset Management (GT Global) and Andersen Consulting’s Strategic Services Division. He is a Director of Inglewood Park Cemetery, a Director of the Roosevelt Memorial Park Association (where he chairs its Investment Committee), and is a Trustee of the Laurence School. Mr. Stallings holds a BA in Decision Analysis and Political Science from Stanford University (1990) and an MBA from the Amos Tuck School at Dartmouth College (1995). He is a CFA charterholder.
Husam H. Nazer, Group Managing Director, U.S. Equities – Mr. Nazer is the Senior Portfolio Manager of the Small Cap Growth and SMID Cap Growth strategies. Mr. Nazer founded the SMID Cap Growth strategy in 2003 and in January 2005 began leading the Small Cap Growth strategy. Mr. Nazer has been a member of the Small and Mid-Cap Growth Equities team since 2000. He joined TCW’s U.S. Equity Research Department in 1995 where he made substantial contributions analyzing the health care, retail and technology industries. Mr. Nazer graduated with a BS in Biomedical Engineering from Boston University in 1994 and earned an MBA at the University of Southern California in 1997.
The second portion of the Fund allocated to TCW is managed by Craig C. Blum, CFA, Portfolio Manager, Group Managing Director, U.S. Equities – Mr. Blum is portfolio manager of the TCW Concentrated Core strategy and the TCW Select Equities Fund. He joined TCW in 1999 as a research analyst in the U.S. Equity Research group covering data networking, communications equipment, and enterprise technology companies. In 2002, Mr. Blum became a member of the Concentrated Core/Select Equities group and was subsequently named portfolio manager in 2004. Prior to TCW, Mr. Blum was a commercial mortgage-backed securities analyst at FMAC Capital Markets and PaineWebber. Mr. Blum began his investment career in 1994 as a financial advisor for Merrill Lynch. He received his BS in Applied Mathematics and Computer Science from the University of California at Los Angeles (UCLA), and his MBA from the UCLA Anderson Graduate School of Management. Mr. Blum is a CFA charterholder.
OTHER ACCOUNTS. The table below provides information about the other accounts managed by Messrs. Stallings and Nazer and Blum, as of December 31, 2010:
| Type of Account | Number of Accounts Managed | Total Assets (in millions) | Number of Accounts Managed for which Advisory Fee is Performance Based | Assets Managed for which (in millions) | ||||
R. Brendt Stallings | ||||||||
Registered Investment Companies | 4 | $375.5 | 0 | 0 | ||||
Other Pooled Investment Vehicles | 8 | $215.5 | 1 | $60.8 | ||||
Other Accounts | 18 | $1,954.4 | 1 | $623.4 | ||||
Husan Nazer | ||||||||
Registered Investment Companies | 5 | $1,154.7 | 0 | 0 | ||||
Other Pooled Investment Vehicles | 3 | $244.5 | 0 | 0 | ||||
Other Accounts | 19 | $1,600.2 | 1 | $623.4 | ||||
Craig C. Blum | ||||||||
Registered Investment Companies | 3 | $788.4 | 0 | 0 | ||||
Other Pooled Investment Vehicles | 6 | $421.6 | 2 | $43.2 | ||||
Other Accounts | 52 | $2,713.5 | 2 | $330.1 |
Portfolio Managers Compensation
The overall objective of the compensation program for portfolio managers is for the Advisor to attract what it considers competent and expert investment professionals and to retain them over the long-term. Compensation is comprised of several components which, in the aggregate are designed to achieve these objectives and to reward the portfolio managers for their contribution to the success of their clients and the Advisor and its affiliates within The TCW Group (collectively, “TCW”). Portfolio managers are compensated through a combination of base salary, profit sharing based compensation (“profit sharing”), bonus and equity incentive participation in the Advisor’s immediate parent, The TCW Group, Inc. and/or ultimate parent, Société Générale (“equity incentives”). Profit sharing and equity incentives generally represent most of the portfolio managers’ compensation. In some cases, portfolio managers are eligible for discretionary bonuses.
Salary. Salary is agreed to with managers at time of employment and is reviewed from time to time. It does not change significantly and often does not constitute a significant part of the portfolio manager’s compensation.
Profit Sharing. Profit sharing is linked quantitatively to a fixed percentage of income relating to accounts in the investment strategy area for which the portfolio managers are responsible and is paid quarterly. Profit sharing may be determined on a gross basis, without the deduction of expenses; in other cases, revenues are allocated to a pool and profit sharing compensation is paid out after the deduction of group expenses. The profit sharing percentage used to compensate a portfolio manager for management of the Fund is generally the same as that used to compensate them for all other client accounts they manage in the same strategy for TCW, with limited exceptions involving grandfathered accounts (accounts that become clients of TCW before or after a specified date or former clients of a manager that joined TCW from another firm), firm capital of TCW or accounts sourced through a distinct distribution channel. Income included in a profit sharing pool will relate to the products managed by the portfolio manager. In some cases, the pool includes revenues related to more than one equity or fixed income product where the portfolio managers work together as a team, in which case each participant in the pool is entitled to profit sharing derived from all the included products. In certain cases, a portfolio manager may also participate in a profit sharing pool that includes revenues from products besides the strategy offered in the Fund, including alternative investment products (as described below); the portfolio manager would be entitled to participate in such pool where he or she supervises, is involved in the management of, or is associated with a group, other members of which manage, such products. Profit sharing arrangements are generally the result of agreement between the portfolio manager and TCW, although in some cases they may be discretionary based on supervisor allocation.
In some cases, the profit sharing percentage is subject to increase based on the relative pre-tax performance of the investment strategy composite returns, net of fees and expenses, to that of the benchmark. The measurement of performance relative to the benchmark can be based on single year or multiple year metrics, or a combination thereof. The benchmark used is the one associated with the Fund managed by the portfolio manager as disclosed in the prospectus. Benchmarks vary from strategy to strategy but, within a given strategy, the same benchmark applies to all accounts, including the Fund.
Certain accounts of TCW (but not the Fund) have a performance (or incentive) fee in addition to or in lieu of an asset-based fee. For these accounts, the profit sharing pool from which the portfolio managers’ profit sharing compensation is paid will include the performance fees. For investment strategies investing in marketable securities such as those employed in the Fund, the performance fee normally consists of an increased asset-based fee, the increased percentage of which is tied to the performance of the account relative to a benchmark (usually the benchmark associated with the strategy). In these marketable securities strategies, the profit sharing percentage applied relative to performance fees is generally the same as it is for the asset-based fees chargeable to the Fund. In the case of alternative investment strategies, performance fees are based on the account achieving net gains over a specified rate of return to the account or to a class of securities in the account. Profit sharing for alternative investment strategies may also include structuring or transaction fees. “Alternative investment strategies” include (a) mezzanine or other forms of privately placed financing, distressed investing, private equity, project finance, real estate investments, leveraged strategies (including short sales) and other similar strategies not employed by the Fund or (b) strategies employed by the Funds that are offered in structured vehicles, such as collateralized loan obligations or collateralized debt obligations or in private funds (sometimes referred to as hedge funds). In the case of certain alternative investment products in which a portfolio manager may be entitled to profit sharing compensation, the profit sharing percentage for performance fees may be lower or higher than the percentage applicable to the asset-based fees.
Discretionary Bonus/Guaranteed Minimums. In general, portfolio managers do not receive discretionary bonuses. However, in some cases bonuses may be paid on a discretionary bonus out of a departmental profit sharing pool, as determined by the supervisor(s) in the department. In other cases, where portfolio managers do not receive profit sharing or where the company has determined the combination of salary and profit sharing does not adequately compensate the portfolio manager, discretionary
bonuses may be paid by TCW. Also, pursuant to contractual arrangements, some portfolio managers may be entitled to a mandatory bonus if the sum of their salary and profit sharing does not meet certain minimum thresholds.
Equity Incentives. Many portfolio managers participate in equity incentives based on overall firm performance of TCW and its affiliates, through stock ownership or participation in stock option or stock appreciation plans of TCW and/or Société Générale. The TCW 2005 TCW Stock Option Plan provides eligible portfolio managers the opportunity to participate in an effective economic interest in TCW, the value of which is tied to TCW’s annual financial performance as a whole. Participation is generally determined in the discretion of TCW, taking into account factors relevant to the portfolio manager’s contribution to the success of TCW. Portfolio managers participating in the TCW 2005 TCW Stock Option Plan also generally participate in Société Générale’s Stock Option Plan which grants options on its common stock, the value of which may be realized after certain vesting requirements are met. The TCW 2005 Stock Option Plan has been closed for new issuances and TCW is in the process of establishing a new equity-based plan in which portfolio managers will have an opportunity to participate. In connection with TCW’s acquisition of Metropolitan West Asset Management LLC (the “MW Acquisition”) in 2010, a Retention Award Plan was established pursuant to which certain portfolio managers in the fixed income area will be entitled to awards in the form of cash and/or TCW stock, either on a contractually-determined basis or on a discretionary basis. Also, in connection with the MW Acquisition, certain portfolio managers will receive TCW stock as part of a contingent deferred purchase price. Some portfolio managers are direct stockholders of Société Générale, as well.
Other Plans and Compensation Vehicles. Portfolio managers may also participate in a deferred compensation plan that is generally available to a wide-range of officers of TCW, the purpose of which is to allow the participant to defer portions of income to a later date while accruing earnings on a tax-deferred basis based on performance of TCW-managed products selected by the participant. Portfolio managers may also elect to participate in TCW’s 401(k) plan, to which they may contribute a portion of their pre- and post-tax compensation to the plan for investment on a tax-deferred basis.
Potential conflicts of interest in managing multiple accounts
Like other investment professionals with multiple clients, a portfolio manager for a Fund may face certain potential conflicts of interest in connection with managing both the Fund and other accounts at the same time. The paragraphs below describe some of these potential conflicts, which may be faced by investment professionals at most major financial firms. ALPS Advisors, Inc. and the Fund have adopted compliance policies and procedures that attempt to address certain of these potential conflicts.
The management of accounts with different advisory fee rates and/or fee structures, including accounts that pay advisory fees based on account performance (“performance fee accounts”), may raise potential conflicts of interest by creating an incentive to favor higher-fee accounts. These potential conflicts may include, among others:
| • | The most attractive investments could be allocated to higher-fee accounts or performance fee accounts. |
| • | The trading of higher-fee accounts could be favored as to timing and/or execution price. For example, higher-fee accounts could be permitted to sell securities earlier than other accounts when a prompt sale is desirable or to buy securities at an earlier and more opportune time. |
| • | The trading of other accounts could be used to benefit higher-fee accounts (front- running). |
| • | The investment management team could focus their time and efforts primarily on higher-fee accounts due to a personal stake in compensation. |
Potential conflicts of interest may also arise when the portfolio managers have personal investments in other accounts that may create an incentive to favor those accounts.
A potential conflict of interest may arise when a Fund and other accounts purchase or sell the same securities. On occasions when a portfolio manager considers the purchase or sale of a security to be in the best interests of a Fund as well as other accounts, the adviser’s trading desk may, to the extent permitted by applicable laws and regulations, aggregate the securities to be sold or purchased in order to obtain the best execution and lower brokerage commissions, if any. Aggregation of trades may create the potential for unfairness to a Fund or another account if one account is favored over another in allocating the securities purchased or sold – for example, by allocating a disproportionate amount of a security that is likely to increase in value to a favored account.
“Cross trades,” in which one account sells a particular security to another account (potentially saving transaction costs for both accounts), may also pose a potential conflict of interest. Cross trades may be seen to involve a potential conflict of interest if, for example, one account is permitted to sell a security to another account at a higher price than an independent third party would pay. The Fund has adopted compliance procedures that provide that any transactions between a Fund and another advised account are to be made at an independent current market price, as required by law.
Another potential conflict of interest may arise based on the different investment objectives and strategies of a Fund and other accounts. For example, another account may have a shorter-term investment horizon or different investment objectives, policies or restrictions than a Fund. Depending on another account’s objectives or other factors, a portfolio manager may give advice and make decisions that may differ from advice given, or the timing or nature of decisions made, with respect to a Fund. In addition, investment decisions are the product of many factors in addition to basic suitability for the particular account involved. Thus, a particular security may be bought or sold for certain accounts even though it could have been bought or sold for other accounts at the same time. More rarely, a particular security may be bought for one or more accounts managed by a portfolio manager when one or more other accounts are selling the security (including short sales). There may be circumstances when purchases or sales of portfolio securities for one or more accounts may have an adverse effect on other accounts.
A Fund’s portfolio manager who is responsible for managing multiple funds and/or accounts may devote unequal time and attention to the management of those funds and/or accounts. As a result, the portfolio manager may not be able to formulate as complete a strategy or identify equally attractive investment opportunities for each of those accounts as might be the case if he or she were to devote substantially more attention to the management of a single fund. The effects of this potential conflict may be more pronounced where funds and/or accounts overseen by a particular portfolio manager have different investment strategies.
A Fund’s portfolio managers may be able to select or influence the selection of the brokers and dealers that are used to execute securities transactions for the Fund. In addition to executing trades, some brokers and dealers provide portfolio managers with brokerage and research services (as those terms are defined in Section 28(e) of the Securities Exchange Act of 1934), which may result in the payment of higher brokerage fees than might have otherwise be available. These services may be more beneficial to certain funds or accounts than to others. Although the payment of brokerage commissions is subject to the requirement that the portfolio manager determine in good faith that the commissions are reasonable in relation to the value of the brokerage and research services provided to the fund, a portfolio manager’s decision as to the selection of brokers and dealers could yield disproportionate costs and benefits among the funds and/or accounts that he or she manages.
The adviser or an affiliate may provide more services (such as distribution or recordkeeping) for some types of funds or accounts than for others. In such cases, a portfolio manager may benefit, either directly or indirectly, by devoting disproportionate attention to the management of fund and/or accounts that provide greater overall returns to the investment manager and its affiliates.
A Fund’s portfolio manager(s) may also face other potential conflicts of interest in managing the Fund, and the description above is not a complete description of every conflict that could be deemed to exist in managing both a Fund and other accounts. In addition, a Fund’s portfolio manager may also manage other accounts (including their personal assets or the assets of family members) in their personal capacity. The management of these accounts may also involve certain of the potential conflicts described above. Investment personnel at the advisers, including each Fund’s portfolio manager, are subject to restrictions on engaging in personal securities transactions pursuant to Codes of Ethics adopted by the adviser.
Each of the Fund’s sub-advisers has trade allocation and other policies and procedures that it believes are reasonably designed to address these and other potential conflicts of interest.
Item 9. Purchases of Equity Securities by Closed-End Management Investment Company and Affiliated Purchasers.
During the fiscal year ended December 31, 2010, there were no purchases made by or on behalf of the registrant or any “affiliated purchaser”, as defined in Rule 10b-18(a)(3) under the Securities Exchange Act of 1934 (“Exchange Act”), of shares or other units of any class of the registrant’s equity securities that are registered by the registrant pursuant to Section 12 of the Exchange Act.
Item 10. Submission of Matters to a Vote of Security Holders.
There have not been any material changes to the procedures by which shareholders may recommend nominees to the registrant’s board of directors, since those procedures were last disclosed in response to the requirements of Item 7(d)(2)(ii)(G) of Schedule 14A or this Item.
Item 11. Controls and Procedures.
| (a) | The registrant’s principal executive officer and principal financial officers, based on their evaluation of the registrant’s disclosure controls and procedures as of a date within 90 days of the filing of this report, have concluded that such controls and procedures are adequately designed to ensure that information required to be disclosed by the registrant in Form N-CSR is accumulated and communicated to the registrant’s management, including the principal executive officer and principal financial officer, or persons performing similar functions, as appropriate to allow timely decisions regarding required disclosure. |
| (b) | There were no changes in the registrant’s internal control over financial reporting that occurred during the registrant’s second fiscal quarter of the period covered by this report that has materially affected, or is reasonably likely to materially affect, the registrant’s internal control over financial reporting. |
Item 12. Exhibits.
(a)(1) The registrant’s Code of Ethics for Principal Executive and Senior Financial Officers that applies to the registrant’s principal executive officer and principal financial officer and as described in Item 2 hereof is incorporated by reference to Exhibit-99-12(a)(1) to the registrant’s Form N-CSR for its fiscal year ended December 31, 2007, filed electronically with the Securities and Exchange Commission on March 7, 2008.
(a)(2) Certifications pursuant to Rule 30a-2(a) under the Investment Company Act of 1940 (17 CFR 270.30a-2(a)) attached hereto as Exhibit 99.CERT.
(a)(3) Not applicable.
(b) Certification pursuant to Rule 30a-2(b) under the Investment Company Act of 1940 (17 CFR 270.30a-2(b)) attached hereto as Exhibit 99.906CERT.
SIGNATURES
Pursuant to the requirements of the Securities Exchange Act of 1934 and the Investment Company Act of 1940, the registrant has duly caused this report to be signed on its behalf by the undersigned, thereunto duly authorized.
| LIBERTY ALL-STAR GROWTH FUND, INC. | ||||
| By: | /s/ William R. Parmentier, Jr. | |||
| William R. Parmentier, Jr. (Principal Executive Officer) | ||||
| President | ||||
| Date: | March 7, 2011 | |||
Pursuant to the requirements of the Securities Exchange Act of 1934 and the Investment Company Act of 1940, the registrant has duly caused this report to be signed on its behalf by the undersigned, thereunto duly authorized.
| LIBERTY ALL-STAR GROWTH FUND, INC. | ||||
| By: | /s/William R. Parmentier, Jr. | |||
| William R. Parmentier, Jr. (Principal Executive Officer) | ||||
| President | ||||
| Date: | March 7, 2011 | |||
| By: | /s/ Jeremy O. May | |||
| Jeremy O. May (Principal Financial Officer) | ||||
| Treasurer | ||||
| Date: | March 7, 2011 | |||