UNITED STATES
SECURITIES AND EXCHANGE COMMISSION
Washington, D.C. 20549
FORM N-CSR
CERTIFIED SHAREHOLDER REPORT OF REGISTERED
MANAGEMENT INVESTMENT COMPANIES
Investment Company Act file number: 811-04537
Liberty All-Star Growth Fund, Inc.
(exact name of registrant as specified in charter)
1290 Broadway, Suite 1100, Denver, Colorado 80203
(Address of principal executive offices) (Zip code)
Tane T. Tyler, General Counsel
ALPS Fund Services, Inc.
1290 Broadway, Suite 1100
Denver, Colorado 80203
(Name and address of agent for service)
Registrant’s telephone number, including area code: 303-623-2577
Date of fiscal year end: December 31
Date of reporting period: January 1 - December 31, 2011
Item 1. Reports to Stockholders.
A SINGLE INVESTMENT...
A DIVERSIFIED GROWTH PORTFOLIO
A single fund that offers:
| Ÿ | A diversified, multi-managed portfolio of small, mid- and large cap growth stocks |
| Ÿ | Exposure to many of the industries that make the U.S. economy one of the world’s most dynamic |
| Ÿ | Access to institutional quality investment managers |
| Ÿ | Objective and ongoing manager evaluation |
| Ÿ | Active portfolio rebalancing |
| Ÿ | A quarterly fixed distribution policy |
| Ÿ | Actively managed, exchange traded fund listed on the New York Stock Exchange (ticker symbol: ASG) |
LIBERTY ALL-STAR® GROWTH FUND, INC.
The views expressed in the President’s Letter, Unique Fund Attributes and Manager Roundtable reflect the current views of the respective parties. These views are not guarantees of future performance and involve certain risks, uncertainties and assumptions that are difficult to predict, so actual outcomes and results may differ significantly from the views expressed. These views are subject to change at any time based upon economic, market or other conditions, and the respective parties disclaim any responsibility to update such views. These views may not be relied on as investment advice and, because investment decisions for the Fund are based on numerous factors, may not be relied on as an indication of trading intent. References to specific company securities should not be construed as a recommendation or investment advice.
Contents
| LIBERTY ALL-STAR® GROWTH FUND | 1 | |||||
| PRESIDENT’S LETTER (UNAUDITED) | ||||||
| Fellow Shareholders: | February 2012 |
The stock market was essentially unchanged over the span of 12 months in 2011, but that doesn’t mean it was a smooth ride. Quite the contrary, the market fluctuated wildly during a year in which investors seemed to develop a split personality-optimistic one day, fearful the next. In an attempt to explain the volatility, the media even coined the term “risk-on/risk-off,” as if repeated changes in direction could be likened to the flip of a switch.
The greatest volatility came during the second half of the year. The S&P 500® Index moved up or down by 1 percent or more on 22 percent of the trading days during the first half of the year. That rate more than doubled in the second half, rising to 57 percent of trading days, approaching the 69 percent of trading days with similar moves in the first quarter of 2009. That period marked the capitulation phase of the market decline triggered by the most severe financial crisis since the Great Depression.
When the dust finally settled, the S&P 500® Index gained 2.11 percent for the year. The first and fourth quarters of the year were positive, as they returned 5.92 percent and 11.82 percent, respectively. However, the second quarter was flat (+0.10 percent) and the third quarter was very poor, as the index declined 13.87 percent. Among key growth benchmarks, the Russell 3000® Growth Index returned 2.18 percent for the year, while the NASDAQ Composite Index declined 0.51 percent.
Behind the uneven performance of the stock market and its extreme volatility was a mix of factors. On the positive side, corporate earnings were strong, balance sheets continued to recover nicely and managements did a good job of managing costs. The offsets to good corporate performance were an anemic housing and job market. But it was macro concerns on both sides of the Atlantic that created the turmoil as investors lost confidence in governments’ ability to deal with fiscal crises. In the U.S., concerns were driven by the size of the federal
budget deficit and the political infighting that prevented Washington from coming up with any meaningful solution. The federal debt, just $1 trillion in 1981, skyrocketed 15-fold by 2011. It didn’t help when Standard & Poor’s downgraded U.S. debt from AAA to AA+. It was the first-ever downgrade of U.S. debt. Sovereign debt woes plagued the European Union as well. Greece, a relatively small economy, was at the eye of the storm, but the real worry was that debt problems could result in defaults in Italy, Ireland, Spain or Portugal-and could even lead to the demise of the euro. Not even a core euro-zone economy like France was immune to the concerns. Like their counterparts in Washington, Europe’s leaders have proved ineffectual in dealing with the problem.
For the year, Liberty All-Star Growth Fund declined 1.59 percent with shares valued at net asset value (NAV), 1.04 percent with shares valued at NAV with dividends reinvested and 4.38 percent with shares valued at market price (with dividends reinvested). Fund returns were mixed compared to its primary benchmark, the Lipper Multi-Cap Growth Mutual Fund Average, which declined 3.62 percent for the year. Overall, the Fund’s NAV reinvested performance ranked it in the top one-third of the 506 funds in the Lipper Multi-Cap Growth universe. For the trailing three-year period the Fund ranks in the top half of funds in its peer group (45th percentile) and for the trailing five-year period the Fund is in the top one-third (31st percentile).
For most of the year, the discount at which Fund shares traded relative to their underlying NAV narrowed, although it widened in the fourth quarter. For the year, the discount ranged from 2.7 percent to 11.7 percent compared with 6.3 percent to 16.2 percent in 2010. Also, although the Fund’s expense ratio has declined, it was still negatively impacted by higher expenses associated with actions by dissident shareholders.
Fund distributions totaled $0.27 per share in 2011, up from $0.25 in 2010. The Fund’s distribution policy has
www.all-starfunds.com |
ASG |
| 2 | LIBERTY ALL-STAR® GROWTH FUND | |||||
| PRESIDENT’S LETTER (UNAUDITED) | ||||||
been in place since 1997 and is a major component of the Fund’s total return. Since 1997, the Fund has paid distributions totaling $10.97 per share and we would emphasize that shareholders need to include these distributions when determining the return on their investment in the Fund.
Once again, in this annual report we offer a question and answer session with the Fund’s three growth style investment managers. We believe you will find the comments of these leading investors to be both interesting and insightful. As we have also done in recent annual reports, we once again offer a brief summary of the Fund’s attributes on pages 4 and 5. I urge you to revisit these attributes, as they help to make the Fund a unique and attractive vehicle for investment in quality growth stocks.
In closing, 2011 was a challenging year. While Fund performance was in line with relevant benchmarks, we are always hoping for better returns and are constructive about prospects for 2012. For certain, as its top third ranking within the Lipper peer group for the past five years attests, the Fund weathered the volatility of the greatest financial crisis since the Great Depression well. The Fund has continued to demonstrate its worth as a way to own predictable, sustainable quality growth companies of all sizes.
We thank you for your ongoing support of the Fund. Please remain assured that we at Liberty All-Star Growth Fund will continue to monitor markets and our managers closely, and will keep the best long-term interests of shareholders first and foremost in all that we do.
Sincerely,

William R. Parmentier, Jr.
President and Chief Executive Officer
Liberty All-Star Growth Fund, Inc.
 |
| LIBERTY ALL-STAR® GROWTH FUND | 3 | |||||
| PRESIDENT’S LETTER (UNAUDITED) | ||||||
FUND STATISTICS AND SHORT-TERM PERFORMANCE PERIODS ENDING DECEMBER 31, 2011 | ||||
| FUND STATISTICS: | ||||
Net Asset Value (NAV) | $4.24 | |||
Market Price | $3.81 | |||
Discount | 10.1% | |||
| Quarter | 2011 | |||||||
Distributions | $0.07 | $0.27 | ||||||
Market Price Trading Range | $3.31 to $4.09 | $3.31 to $4.70 | ||||||
Discount Range | 8.6% to 11.7% | 2. 7% to 11.7% | ||||||
| PERFORMANCE: | ||||||||
Shares Valued at NAV | 9.11% | (1.59%) | ||||||
Shares Valued at NAV with Dividends Reinvested | 9.26% | (1.04%) | ||||||
Shares Valued at Market Price with Dividends Reinvested | 7.72% | (4.38%) | ||||||
NASDAQ Composite Index | 8.53% | (0.51%) | ||||||
Russell 3000® Growth Index | 10.94% | 2.18% | ||||||
S&P 500® Index | 11.82% | 2.11% | ||||||
Lipper Multi-Cap Growth Mutual Fund Average* | 8.91% | (3.62%) | ||||||
NAV Reinvested Percentile Rank (1 = best; 100 = worst) | 57th | 32nd | ||||||
Number of Funds in Category | 541 | 506 | ||||||
LONG-TERM PERFORMANCE SUMMARY AND DISTRIBUTIONS |
ANNUALIZED RATES OF RETURN | |||||||||||||||||
| PERIODS ENDING DECEMBER 31, 2011 | 3 YEARS | 5 YEARS | 10 YEARS | INCEPTION** | ||||||||||||||
| LIBERTY ALL-STAR® GROWTH FUND, INC. | ||||||||||||||||||
Distributions | $0.76 | $1.84 | $4.89 | $6.18 | ||||||||||||||
Shares Valued at NAV | 16.65% | 2.10% | 2.43% | (0.80%) | ||||||||||||||
Shares Valued at NAV with Dividends Reinvested | 17.49% | 2.77% | 2.86% | (0.30%) | ||||||||||||||
Shares Valued at Market Price with Dividends Reinvested | 22.00% | 1.77% | 1.74% | 0.99% | ||||||||||||||
NASDAQ Composite Index | 19.51% | 2.54% | 3.75% | (2.62%) | ||||||||||||||
Russell 3000® Growth Index | 18.09% | 2.46% | 2.74% | (1.86%) | ||||||||||||||
S&P 500® Index | 14.11% | (0.25%) | 2.92% | 0.63% | ||||||||||||||
Lipper Multi-Cap Growth Mutual Fund Average* | 16.84% | 1.27% | 3.25% | (0.93%) | ||||||||||||||
NAV Reinvested Percentile Rank (1 = best; 100 = worst) | 45th | 31st | 62nd | 47th | ||||||||||||||
Number of Funds in Category | 425 | 347 | 236 | 193 | ||||||||||||||
| * | Percentile ranks calculated using the Fund’s NAV Reinvested results within the Lipper Multi-Cap Growth Mutual Fund Universe. |
| ** | Since restructuring to a multi-cap growth fund on May 1, 2000. |
Figures shown for the Fund and the Lipper Multi-Cap Growth Mutual Fund Average are total returns, which include dividends, after deducting Fund expenses. The Fund’s performance is calculated assuming that a shareholder exercised all primary rights in the Fund’s rights offerings. Figures shown for the unmanaged NASDAQ Composite Index, the Russell 3000® Growth Index and the S&P 500® Index are total returns, including dividends. A description of the Lipper benchmark and the market indices can be found on page 35.
Past performance cannot predict future results. Performance will fluctuate with market conditions. Current performance may be lower or higher than the performance data shown. Performance information does not reflect the deduction of taxes that shareholders would pay on Fund distributions or the sale of Fund shares. An investment in the Fund involves risk, including loss of principal.
Shares of closed-end funds frequently trade at a discount to net asset value. The price of the Fund’s shares is determined by a number of factors, several of which are beyond the control of the Fund. Therefore, the Fund cannot predict whether its shares will trade at, below or above net asset value.
www.all-starfunds.com |
ASG |
| 4 | LIBERTY ALL-STAR® GROWTH FUND | |||||
| UNIQUE FUND ATTRIBUTES (UNAUDITED) | ||||||

| Multi-management for Individual Investors
| |||
Large institutional investors have traditionally employed multiple investment managers. With three investment managers investing across the full capitalization range of growth stocks, the Fund brings multi-management to individual investors. | ||||
| Real-time Trading and Liquidity
| |||
The Fund has a fixed number of shares that trade on the New York Stock Exchange and other exchanges. Share pricing is continuous—not just end-of-day, as it is with open-end mutual funds. In addition, Fund shares offer immediate liquidity and there are no annual sales fees. | ||||


|
| LIBERTY ALL-STAR® GROWTH FUND | 5 | |||||
| UNIQUE FUND ATTRIBUTES (UNAUDITED) | ||||||
| Access to Institutional Managers
| |||
The Fund’s investment managers invest primarily for pension funds, endowments, foundations and other institutions. Because institutional managers are closely monitored by their clients, they tend to be more disciplined and consistent in their investment process. | ||||
| Monitoring and Rebalancing
| |||
ALPS Advisors continuously monitors these investment managers to ensure that they are performing as expected and adhering to their style and strategy, and will replace the managers when warranted. Periodic rebalancing maintains the Fund’s structural integrity and is a well-recognized investment discipline. | ||||
| Alignment and Objectivity
| |||
Alignment with shareholders’ best interests and objective decision-making help to ensure that the Fund is managed openly and equitably. In addition, the Fund is governed by a Board of Directors that is elected by and responsible to shareholders. | ||||
| Distribution Policy
| |||
Since 1997, the Fund has followed a policy of paying annual distributions on its shares at a rate that approximates historical equity market returns. The current annual distribution rate is 6 percent of the Fund’s net asset value (paid quarterly at 1.5 percent per quarter), providing a systematic mechanism for distributing funds to shareholders. | ||||


www.all-starfunds.com |
ASG |
| 6 | LIBERTY ALL-STAR® GROWTH FUND | |||||
| INVESTMENT MANAGERS/PORTFOLIO CHARACTERISTICS (UNAUDITED) | ||||||
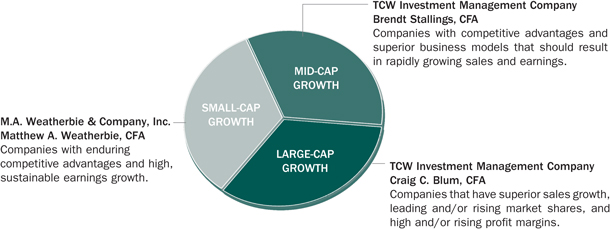
THE FUND’S THREE GROWTH INVESTMENT MANAGERS AND THE MARKET CAPITALIZATION ON WHICH EACH FOCUSES:
MANAGERS’ DIFFERING INVESTMENT STRATEGIES ARE REFLECTED IN PORTFOLIO CHARACTERISTICS
The portfolio characteristics table below is a regular feature of the Fund’s shareholder reports. It serves as a useful tool for understanding the value of the Fund’s multi-managed portfolio. The characteristics are different for each of the Fund’s three investment managers. These differences are a reflection of the fact that each has a different capitalization focus and investment strategy. The shaded column highlights the characteristics of the Fund as a whole, while the first three columns show portfolio characteristics for the Russell Smallcap, Midcap and Largecap Growth indices. See page 35 for a description of these indices.

| RUSSELL GROWTH: | ||||||||||||||
Smallcap Index | Midcap Index | Largecap Index | M .A. Weatherbie | TCW (Mid-Cap) | TCW (Large-Cap) | Total Fund | ||||||||
| Number of Holdings | 1162 | 466 | 588 | 62 | 51 | 31 | 128* | |||||||
| Weighted Average Market Capitalization (billions) | $1.4 | $7.9 | $97.1 | $2.5 | $8.2 | $68.3 | $26.2 | |||||||
| Average Five-Year Earnings Per Share Growth | 15% | 13% | 14% | 14% | 21% | 21% | 19% | |||||||
| Average Five-Year Sales Per Share Growth | 9% | 9% | 11% | 13% | 17% | 17% | 16% | |||||||
| Price/Earnings Ratio** | 19x | 18x | 16x | 23x | 25x | 23x | 23x | |||||||
| Price/Book Value Ratio | 4.0x | 4.5x | 4.9x | 4.8x | 6.0x | 4.9x | 5.2x | |||||||
* Certain holdings are held by more than one manager.
** Excludes negative earnings.
|
| LIBERTY ALL-STAR® GROWTH FUND | 7 | |||||
| MANAGER ROUNDTABLE (UNAUDITED) | ||||||
Investment Manager Roundtable
The Fund’s growth style investment managers summarize their strategy, look back at 2011 and identify stocks that exemplify their investment approach
Liberty All-Star Growth Fund’s investment managers bring long experience, deep knowledge, a proven track record and a firm commitment to growth style investing. Once again, therefore, we are grateful to be able to call upon this resource to provide Fund shareholders with commentary and insight. The Fund’s Investment Advisor, ALPS Advisors, Inc., serves as moderator of the roundtable. Participating investment management firms, the portfolio manager for each and their respective capitalization ranges are:
M. A. WEATHERBIE & CO., INC.
Portfolio Manager/Matthew A. Weatherbie, CFA
President and Founder
Capitalization Focus/Small-Cap Growth – M.A. Weatherbie practices a small capitalization growth investment style focusing on high quality companies that demonstrate superior earnings growth prospects, yet are reasonably priced relative to their intrinsic value. The firm seeks to provide superior returns relative to small capitalization growth indices over a full market cycle.
TCW INVESTMENT MANAGEMENT COMPANY
Portfolio Manager/Brendt Stallings, CFA
Managing Director
Capitalization Focus/Mid-Cap Growth – TCW seeks capital appreciation through investment in the securities of rapidly growing companies whose business prospects, in TCW’s view, are not properly perceived by consensus research.
TCW INVESTMENT MANAGEMENT COMPANY
Portfolio Manager/Craig C. Blum, CFA
Group Managing Director
Capitalization Focus/Large-Cap Growth – TCW seeks large-cap companies that have superior sales growth, leading and/or rising market shares, and high and/or rising profit margins. TCW’s concentrated growth equity strategy seeks companies with distinct advantages in their business model.
With all three managers contributing to the roundtable, it’s a good opportunity for shareholders to compare the various approaches to growth stock investing that each of you represent. Can you summarize your investment style, strategy and process, as well as any factors that are distinct to your firm? Let’s start with Matt Weatherbie and small-cap growth stocks and go up through the capitalization range.
Weatherbie (M.A. Weatherbie – Small-Cap Growth): We invest in high quality smaller cap growth stocks on a bottom-up basis, employing stringent quality criteria. We do pay attention to valuation. We do company-specific research that includes management interviews and preparation of our own models of future earnings and cash flows. One distinct feature of our process is that we invest in what we call Foundation stocks, characterized by consistent growth, as well as Opportunity stocks, which are cyclical or re-emergent growth stocks.
Stallings (TCW – Mid-Cap Growth): Our mid-cap growth strategy is a stock-picking strategy – we seek to earn our performance by assembling a portfolio of 40-60 mid-size companies where we have an out-of-consensus opinion on each company’s three- to five- year free cash flow potential. The only way we can achieve this is by doing our own fundamental research, which we view as a key competitive advantage. For each of our investments, we perform our own primary research, interview management and develop our own proprietary financial forecasts. Wall Street expectations are consulted only as a benchmark. We develop a best, worst and base-case cash flow estimate, using these three estimates to produce best, worst and base-case stock price targets. These targets drive every buy and sell decision in the portfolio. When we assemble the portfolio, we pay close attention to sector diversification. It has been our experience that we can find promising growth companies across most, if not all, major sectors of the economy. We believe that it is possible to achieve our investment objective in the long term by focusing the scope of analysis on companies with businesses that demonstrate strong competitive advantages, clean balance sheets, proven management teams and large market opportunities.
Blum (TCW – Large-Cap Growth): We are a quality-focused, concentrated, large-cap growth manager. In our view, four attributes set the strategy apart from many others. First, our definition of quality is unique in that we focus squarely on large and attractive end markets that face each company and then combine that with research around business model advantage. Second, we own a concentrated portfolio of approximately 25 to 35 stocks, allowing us to focus our efforts strictly on our best ideas.
www.all-starfunds.com |
ASG |
| 8 | LIBERTY ALL-STAR® GROWTH FUND | |||||
| MANAGER ROUNDTABLE (UNAUDITED) | ||||||
Third, we embrace a long-term orientation, which typically translates into a holding period of between three and five years. This enables the strategy to | ||
remain invested in the most attractive opportunities given our belief that the best businesses tend to repeat their successes for long time periods. Finally, we employ what we refer to as |
“The team’s investment process is a proprietary, fundamental, bottom-up approach designed to identify attractive opportunities and then move those names through an exhaustive, fundamental research process.”
Craig Blum (TCW – Large-Cap Growth) | |
a “light macro overlay” that aligns our current portfolio construction with our current macro view. The team’s investment process is a proprietary, fundamental, bottom-up approach designed to identify attractive opportunities and then move those names through an exhaustive, fundamental research process. Our focus is on evaluating and modeling industry dynamics, modeling company-specific fundamentals, conducting competitor analysis, identifying sustainable competitive advantages, meeting with and evaluating management, and performing all related valuation work. | ||
Please summarize what produced the best results for you in 2011 and what, in retrospect, didn’t play out the way you thought. Let’s reverse the order and ask Craig Blum to start.
Blum (TCW – Large-Cap Growth): From a portfolio attribution perspective, our information technology holdings contributed most to our results during the year. Solid fundamental developments continued to support names such as QUALCOMM and Apple, while Visa continued to execute well and post respectable growth following the poor sentiment that developed after the debit-interchange legislation of 2010. Intuitive Surgical, a leader in robotically-assisted minimally invasive surgery, was our single best performing name, with performance driven by procedure growth, profitability and innovation that continued to exceed expectations.
One of our disappointments was mainly isolated to poor sentiment and industry dynamics that continue to pressure C.H. Robinson. Third-party logistics provider C.H. Robinson struggled throughout the year with anemic growth in freight volumes combined with a reduced ability to raise prices. While it was a disappointment for the year, we still believe the company to be meaningfully underpriced longer term and we are maintaining our current exposure.
Stallings (TCW – Mid-Cap Growth): Our investments in the energy and technology sectors were our best performers in 2011. In energy, our focus on energy services firms served us well. With oil prices remaining high and the U.S. in the middle of an energy exploration boom due to the abundance of both shale oil and gas, energy services companies did well. We have a bias towards services companies with relatively differentiated, high-margin offerings. Additionally, the portfolio benefitted from M&A activity in the energy sector, with Brigham Exploration being acquired by StatOil. The technology sector remains very fertile ground for mid-cap growth investors. With the increasing ubiquity and speed of the Internet (especially wireless) and the proliferation of both devices (e.g., iPads) and applications (e.g., Facebook, software-as-a-service models), there is plenty of innovation to invest in. It is somewhat surprising, then, that the technology sector was one of the worst performing sectors within our benchmark. Owing to some good stock picking, especially in semiconductors and software, our investments did relatively well against the benchmark. In the consumer staples sector, Green Mountain helped performance for the year, despite the stock’s decline at year-end. We had a more difficult year in the consumer discretionary sector. Our investments in the for-profit educational industry dragged down performance, and we sold these from the portfolio. Conversely, we did not own enough of the traditional retailers, which hurt our relative performance. Healthcare was a challenge for us as new products launched more slowly than expected at some of our largest biotech companies in the portfolio. In several cases, we have added to these biotech positions.
Weatherbie (M.A. Weatherbie – Small-Cap Growth): Individual stock selection across several different indus-try sectors created our 2011 outperformance versus our benchmark. Notable positive contributors included LKQ Corp., the largest provider of recycled original equipment manufacturer (OEM) auto replacement parts; | ||
Bio-marin Pharmaceutical, a biotech company that develops therapeutic en-zyme-based drugs for rare diseases; and Ulta Salon Cosmetics, a fragrances retailer. Detractors to per-formance included |
“One distinct feature of our process is that we invest in what we call Foundation stocks, characterized by consistent growth, as well as opportunity stocks, which are cyclical or re-emergent growth stocks.”
Matt Weatherbie (M.A. Weatherbie –Small-Cap Growth) | |
Monster Worldwide, an online recruitment company, and Masimo Corporation, a healthcare company focused on blood tests. We continue to own both as we expect earnings growth to pick up while their shares are now undervalued. | ||
|
| LIBERTY ALL-STAR® GROWTH FUND | 9 | |||||
| MANAGER ROUNDTABLE (UNAUDITED)) | ||||||
What is a stock in the portion of the All-Star Growth Fund portfolio that you manage that is a long-term holding that reflects your strategy and process as summarized in the first question? And what is a recent addition to your portion of the portfolio about which you are optimistic, and why? Matt, please start off.
Weatherbie (M.A. Weatherbie – Small-Cap Growth):
Signature Bank (SBNY) is a metropolitan New York-based full-service commercial bank with proven management whose steadily growing private client offices serve the diverse financial needs of privately-owned businesses, their owners and senior managers. SBNY’s sophisticated services and one-stop shopping approach have filled a void created by the mergers of prior competitors into giant banks, whose unspecialized service is anathema to busy entrepreneurs. SBNY is “deposit-rich” and can grow for years, we believe, by prudently growing its loan portfolio.
Liquidity Services (LQDT), a recent purchase, is a leader in providing internet-based auctions that enable retailers, other businesses, and federal and state government agencies to dispose of surplus inventory, capital equipment, office furniture, scrap metal and other unwanted items. Among its many clients, LQDT is a trusted partner of Wal-Mart, Target and the U.S. Department of Defense. It enjoys a first-mover advantage and economies of scale versus its non-web-based competitors. We believe this market has significant longer-term growth potential.
Stallings (TCW – Mid-Cap Growth): A long-term holding that we would mention is F5 Networks. F5 designs and markets IT solutions that enable managers to optimize data center investments. Among other products, the company is a leading provider of application delivery controllers (ADCs). These are utilized to manage and accelerate data traffic into and out of data centers. We believe that the adoption of cloud-based services is in its infancy and that F5 will be a beneficiary of a very long adoption cycle. Consistent with our discipline, we took advantage of the stock’s weakness during the year to add to our position.
An example of recent addition is Arcos Dorados, which is McDonald’s largest franchisee, representing over 5 percent of McDonald’s 2010 sales. The company operates nearly 1,800 restaurants and has a master franchise agreement with McDonald’s covering Latin
America. Arcos Dorados provides us the opportunity to invest in a company experiencing both rapid unit growth and positive same-store sales in a region undergoing above-average economic growth.
Blum (TCW – Large-Cap Growth): Precision Castparts Corp. (PCP) remains a relatively long term holding for the portfolio. PCP manufactures specialized metal components and engineered composite products for the global aerospace, infrastructure and power markets. We | ||
believe a multi year cycle has developed, defined by increasing demand for lighter, stronger, cleaner and more energy efficient materials to be used across a wide variety of industrial end markets. PCP is thus benefiting from rising demand |
“We earn our performance by assembling a portfolio of 40-60 midsize companies where we have an out-of-consensus opinion... the only way we can achieve (our goal) is by doing our own fundamental research, which we view as a key competitive advantage.”
Brendt Stallings (TCW - Mid-Cap Growth) | |
strength-to-weight ratio products that are forged and cast with proprietary materials and technology. In particular, we believe the commercial aerospace market represents a significant long-term opportunity for the company as high-margin composite products continue to increase as a share of total aircraft content. Additionally, the company is nicely leveraged to emerging market infrastructure growth and is a best-of-breed operator with industry leading margins and returns on capital. | ||
A recent addition to the portfolio is VMware. VMware is the dominant provider of server virtualization software and virtualization-based cloud infrastructure solutions. We believe the financial and operational benefits of server virtualization will continue to drive penetration of workloads in the enterprise, with VMware being the primary beneficiary. Increased virtualization penetration is also driving an increased need for management and automation software, another significant opportunity that VMware is well positioned to exploit. The company has also amassed a portfolio of technologies, including desktop virtualization, cloud-based applications and cloud-related development platforms, that is expanding its addressable market. In our opinion, the current valuation does not adequately reflect these growth opportunities.
Great insights from experienced investment managers and we thank you all. It should be an interesting year ahead. We’ll check in again next year.
www.all-starfunds.com |
ASG |
| 10 | LIBERTY ALL-STAR® GROWTH FUND | |||||
| TABLE OF DISTRIBUTIONS AND RIGHTS OFFERINGS (UNAUDITED) | ||||||
| RIGHTS OFFERINGS | ||||||||||||||
| YEAR | PER SHARE DISTRIBUTION | MONTH COMPLETED | SHARES NEEDED TO PURCHASE ONE ADDITIONAL SHARES | SUBSCRIPTION PRICE | ||||||||||
1997 | $1.24 | |||||||||||||
1998 | 1.35 | July | 10 | $12.41 | ||||||||||
1999 | 1.23 | |||||||||||||
2000 | 1.34 | |||||||||||||
2001 | 0.92 | September | 8 | 6.64 | ||||||||||
2002 | 0.67 | |||||||||||||
2003 | 0.58 | September | 8* | 5.72 | ||||||||||
2004 | 0.63 | |||||||||||||
2005 | 0.58 | |||||||||||||
2006 | 0.59 | |||||||||||||
2007 | 0.61 | |||||||||||||
2008 | 0.47 | |||||||||||||
2009** | 0.24 | |||||||||||||
2010 | 0.25 | |||||||||||||
2011 | 0.27 | |||||||||||||
Total | $10.97 | |||||||||||||
| * | The number of shares offered was increased by an additional 25% to cover a portion of the over-subscription requests. |
| ** | Effective with the second quarter distribution, the annual distribution rate was changed from 10 percent to 6 percent. |
DISTRIBUTION POLICY
Liberty All-Star® Growth Fund, Inc.’s current policy is to pay distributions on its shares totaling approximately 6 percent of its net asset value per year, payable in four quarterly installments of 1.5 percent of the Fund’s net asset value at the close of the New York Stock Exchange on the Friday prior to each quarterly declaration date. The fixed distributions are not related to the amount of the Fund’s net investment income or net realized capital gains or losses and may be taxed as ordinary income up to the amount of the Fund’s current and accumulated earnings and profits. If, for any calendar year, the total distributions made under the distribution policy exceed the Fund’s net investment income and net realized capital gains, the excess will generally be treated as a non-taxable return of capital, reducing the shareholder’s adjusted basis in his or her shares. If the Fund’s net investment income and net realized capital gains for any year exceed the amount distributed under the distribution policy, the Fund may, in its discretion, retain and not distribute net realized capital gains and pay income tax thereon to the extent of such excess.
|
| LIBERTY ALL-STAR® GROWTH FUND | 11 | |||||
| TOP 20 HOLDINGS AND ECONOMIC SECTORS (UNAUDITED) | ||||||
December 31, 2011 | ||||||
| TOP 20 HOLDINGS* | PERCENT OF NET ASSETS | |||||
Apple, Inc. | 2.34% | |||||
C.H. Robinson Worldwide, Inc. | 2.15 | |||||
FMC Technologies, Inc. | 2.04 | |||||
ACE Ltd. | 2.00 | |||||
IHS, Inc., Class A | 1.92 | |||||
QUALCOMM, Inc. | 1.90 | |||||
Intuitive Surgical, Inc. | 1.86 | |||||
Oceaneering International, Inc. | 1.85 | |||||
Core Laboratories N.V. | 1.78 | |||||
American Tower Corp., Class A | 1.74 | |||||
Salesforce.com, Inc. | 1.72 | |||||
ARM Holdings PLC | 1.69 | |||||
Google, Inc., Class A | 1.60 | |||||
Rockwell Automation, Inc. | 1.53 | |||||
LKQ Corp. | 1.47 | |||||
BioMarin Pharmaceutical, Inc. | 1.45 | |||||
Expeditors International of Washington, Inc. | 1.43 | |||||
VMware, Inc., Class A | 1.42 | |||||
Signature Bank | 1.37 | |||||
Occidental Petroleum Corp. | 1.36 | |||||
| 34.62% | ||||||
| ECONOMIC SECTORS* | PERCENT OF NET ASSETS | |||||
Information Technology | 28.31% | |||||
Industrials | 15.51 | |||||
Health Care | 13.12 | |||||
Consumer Discretionary | 12.27 | |||||
Energy | 10.16 | |||||
Financials | 9.63 | |||||
Materials | 2.97 | |||||
Consumer Staples | 2.63 | |||||
Telecommunication Services | 1.74 | |||||
Utilities | 0.69 | |||||
Other Net Assets | 2.97 | |||||
| 100.00% | ||||||
* Because the Fund is actively managed, there can be no guarantee that the Fund will continue to hold securities of the indicated issuers and sectors in the future. | ||||||
www.all-starfunds.com |
ASG |
| 12 | LIBERTY ALL-STAR® GROWTH FUND | |||||
| MAJOR STOCK CHANGES IN THE QUARTER (UNAUDITED) | ||||||
December 31, 2011 | ||||||
The following are the major ($300,000 or more) stock changes - both purchases and sales - that were made in the Fund’s portfolio during the fourth quarter of 2011.
| 00000000000000 | 00000000000000 | |||
| SECURITY NAME | PURCHASES (SALES) | SHARES AS OF 12/31/11 | ||
| PURCHASES | ||||
Arcos Dorados Holdings, Inc., Class A | 32,300 | 32,300 | ||
Human Genome Sciences, Inc. | 33,500 | 88,888 | ||
Linkedln Corp., Class A | 6,200 | 6,200 | ||
Shutterfly, Inc. | 15,360 | 15,360 | ||
| SALES | ||||
Brigham Exploration Co. | (15,700) | 0 | ||
ICF International, Inc. | (14,139) | 0 | ||
Pharmasset Inc. | (4200) | 0 | ||
SuccessFactors, Inc. | (25,581) | 21,500 | ||
Urban Outfitters, Inc. | (25,100) | 0 | ||
Varian Medical Systems, Inc. | (5,900) | 16,700 | ||
|
| LIBERTY ALL-STAR® GROWTH FUND | 13 | |||||
| SCHEDULE OF INVESTMENTS | ||||||
| as of December 31, 2011 | ||||||
| COMMON STOCKS (97.03%) | SHARES | MARKET VALUE | ||||||
u CONSUMER DISCRETIONARY (12.27%) | ||||||||
Auto Components (0.62%) | ||||||||
BorgWarner, lnc.(a) | 12,500 | $ | 796,750 | |||||
|
| |||||||
Automobiles (0.51%) | ||||||||
Thor Industries, Inc. | 23,752 | 651,517 | ||||||
|
| |||||||
Distributors (1.47%) | ||||||||
LKQ Corp.(a) | 62,490 | 1,879,699 | ||||||
|
| |||||||
Hotels, Restaurants & Leisure (1.49%) | ||||||||
Arcos Dorados Holdings, Inc., Class A | 32,300 | 663,119 | ||||||
BJ’s Restaurants, lnc.(a) | 14,588 | 661,128 | ||||||
Ctrip.com International Ltd.(a)(b) | 24,366 | 570,165 | ||||||
|
| |||||||
| 1,894,412 | ||||||||
|
| |||||||
Household Durables (0.20%) | ||||||||
Harman International Industries, Inc. | 6,667 | 253,613 | ||||||
|
| |||||||
Internet & Catalog Retail (2.50%) | ||||||||
Amazon.com, lnc.(a) | 6,465 | 1,119,091 | ||||||
priceline.com, lnc.(a) | 2,575 | 1,204,353 | ||||||
Shutter-fly, lnc.(a) | 15,360 | 349,594 | ||||||
TripAdvisor, lnc.(a) | 20,600 | 519,326 | ||||||
|
| |||||||
| 3,192,364 | ||||||||
|
| |||||||
Specialty Retail (3.77%) | ||||||||
CarMax, lnc.(a) | 32,100 | 978,408 | ||||||
Dick’s Sporting Goods, Inc. | 19,300 | 711,784 | ||||||
Francesca’s Holdings Corp.(a) | 17,803 | 307,992 | ||||||
Monro Muffler Brake, Inc. | 19,431 | 753,728 | ||||||
Rue21, lnc.(a) | 54,490 | 1,176,984 | ||||||
Teavana Holdings, lnc.(a) | 20,756 | 389,798 | ||||||
Ulta Salon, Cosmetics & Fragrance, lnc.(a) | 7,563 | 490,990 | ||||||
|
| |||||||
| 4,809,684 | ||||||||
|
| |||||||
Textiles, Apparel & Luxury Goods (1.71%) | ||||||||
Fossil, lnc.(a) | 10,200 | 809,472 | ||||||
Gildan Activewear, Inc. | 31,100 | 584,369 | ||||||
Michael Kors Holdings Ltd.(a) | 2,000 | 54,500 | ||||||
Under Armour, Inc., Class A(a) | 10,248 | 735,704 | ||||||
|
| |||||||
| 2,184,045 | ||||||||
|
| |||||||
u CONSUMER STAPLES (2.63%) | ||||||||
Food & Staples Retailing (0.91%) | ||||||||
Costco Wholesale Corp. | 11,750 | 979,010 | ||||||
The Fresh Market, lnc.(a) | 4,645 | 185,336 | ||||||
|
| |||||||
| 1,164,346 | ||||||||
|
| |||||||
Food Products (1.72%) | ||||||||
Green Mountain Coffee Roasters, lnc.(a) | 20,600 | 923,910 | ||||||
Mead Johnson Nutrition Co. | 18,500 | 1,271,505 | ||||||
|
| |||||||
| 2,195,415 | ||||||||
|
| |||||||
See Notes to Schedule of Investments and Financial Statements
| ||
www.all-starfunds.com |
ASG |
| 14 | LIBERTY ALL-STAR® GROWTH FUND | |||||
| SCHEDULE OF INVESTMENTS | ||||||
| as of December 31, 2011 | ||||||
| COMMON STOCKS (continued) | SHARES | MARKET VALUE | ||||||
u ENERGY (10.16%) | ||||||||
Energy Equipment & Services (8.80%) | ||||||||
CARBO Ceramics, Inc. | 6,200 | $ | 764,646 | |||||
Core Laboratories N.V. | 19,909 | 2,268,631 | ||||||
Dril-Quip, lnc. (a) | 9,967 | 656,028 | ||||||
FMC Technologies, lnc. (a) | 49,800 | 2,601,054 | ||||||
Lufkin Industries, Inc. | 16,232 | 1,092,576 | ||||||
Oceaneering International, Inc. | 51,250 | 2,364,162 | ||||||
Schlumberger Ltd. | 21,795 | 1,488,816 | ||||||
|
| |||||||
| 11,235,913 | ||||||||
|
| |||||||
Oil, Gas & Consumable Fuels (1.36%) | ||||||||
Occidental Petroleum Corp. | 18,500 | 1,733,450 | ||||||
|
| |||||||
u FINANCIALS (9.63%) | ||||||||
Capital Markets (3.33%) | ||||||||
Affiliated Managers Group, lnc. (a) | 14,005 | 1,343,780 | ||||||
The Charles Schwab Corp. | 62,900 | 708,254 | ||||||
Financial Engines, lnc. (a) | 9,586 | 214,055 | ||||||
FXCM, Inc., Class A | 37,470 | 365,333 | ||||||
T. Rowe Price Group, Inc. | 16,700 | 951,065 | ||||||
Virtus Investment Partners, lnc. (a) | 8,718 | 662,655 | ||||||
|
| |||||||
| 4,245,142 | ||||||||
|
| |||||||
Commercial Banks (1.37%) | ||||||||
Signature Bank (a) | 29,148 | 1,748,589 | ||||||
|
| |||||||
Consumer Finance (0.58%) | ||||||||
Green Dot Corp., Class A (a) | 23,800 | 743,036 | ||||||
|
| |||||||
Diversified Financial Services (1.15%) | ||||||||
MSCI, Inc., Class A (a) | 21,867 | 720,080 | ||||||
Portfolio Recovery Associates, lnc. (a) | 11,006 | 743,125 | ||||||
|
| |||||||
| 1,463,205 | ||||||||
|
| |||||||
Insurance (2.55%) | ||||||||
ACE Ltd. | 36,400 | 2,552,368 | ||||||
Greenlight Capital Re Ltd., Class A (a) | 29,869 | 706,999 | ||||||
|
| |||||||
| 3,259,367 | ||||||||
|
| |||||||
Real Estate Management & Development (0.65%) | ||||||||
FirstService Corp. (a) | 31,154 | 825,269 | ||||||
|
| |||||||
u HEALTH CARE (13.12%) | ||||||||
Biotechnology (2.97%) | ||||||||
BioMarin Pharmaceutical, lnc. (a) | 53,670 | 1,845,175 | ||||||
Dendreon Corp. (a) | 55,200 | 419,520 | ||||||
Human Genome Sciences, lnc. (a) | 88,888 | 656,882 | ||||||
Ironwood Pharmaceuticals, lnc. (a) | 19,200 | 229,824 | ||||||
Vertex Pharmaceuticals, lnc. (a) | 19,300 | 640,953 | ||||||
|
| |||||||
| 3,792,354 | ||||||||
|
| |||||||
Health Care Equipment & Supplies (3.78%) | ||||||||
Accuray, lnc. (a) | 42,336 | 179,081 | ||||||
Intuitive Surgical, lnc. (a) | 5,125 | 2,372,926 | ||||||
Masimo Corp. (a) | 28,488 | 532,299 | ||||||
Varian Medical Systems, lnc. (a) | 16,700 | 1,121,071 | ||||||
Volcano Corp. (a) | 25,800 | 613,782 | ||||||
|
| |||||||
| 4,819,159 | ||||||||
|
| |||||||
| See Notes to Schedule of Investments and Financial Statements
| ||||
| | ||||
| LIBERTY ALL-STAR® GROWTH FUND | 15 | |||||
| SCHEDULE OF INVESTMENTS | ||||||
| as of December 31, 2011 | ||||||
| COMMON STOCKS (continued) | SHARES | MARKET VALUE | ||||||
Health Care Providers & Services (1.55%) | ||||||||
IPC The Hospitalist Co., lnc.(a) | 10,143 | $ | 463,738 | |||||
PSS World Medical, lnc.(a) | 34,151 | 826,112 | ||||||
VCA Antech, lnc.(a) | 34,665 | 684,634 | ||||||
|
| |||||||
| 1,974,484 | ||||||||
|
| |||||||
Health Care Technology (1.94%) | ||||||||
athena health, lnc.(a) | 15,683 | 770,349 | ||||||
Cerner Corp.(a) | 27,800 | 1,702,750 | ||||||
|
| |||||||
| 2,473,099 | ||||||||
|
| |||||||
Life Sciences Tools & Services (0.87%) | ||||||||
Life Technologies Corp.(a) | 28,650 | 1,114,772 | ||||||
|
| |||||||
Pharmaceuticals (2.01%) | ||||||||
Allergan, Inc. | 18,250 | 1,601,255 | ||||||
Mylan, lnc.(a) | 45,100 | 967,846 | ||||||
|
| |||||||
| 2,569,101 | ||||||||
|
| |||||||
u INDUSTRIALS (15.51%) | ||||||||
Aerospace & Defense (2.95%) | ||||||||
Aerovironment, lnc.(a) | 18,020 | 567,089 | ||||||
HEICO Corp. | 16,190 | 946,791 | ||||||
Precision Castparts Corp. | 8,400 | 1,384,236 | ||||||
TransDigm Group, lnc.(a) | 9,098 | 870,497 | ||||||
|
| |||||||
| 3,768,613 | ||||||||
|
| |||||||
Air Freight & Logistics (3.59%) | ||||||||
C.H. Robinson Worldwide, Inc. | 39,400 | 2,749,332 | ||||||
Expeditor International of Washington, Inc. | 44,700 | 1,830,912 | ||||||
|
| |||||||
| 4,580,244 | ||||||||
|
| |||||||
Commercial Services & Supplies (0.92%) | ||||||||
American Reprographics Co.(a) | 47,644 | 218,686 | ||||||
Waste Connections, Inc. | 28,864 | 956,553 | ||||||
|
| |||||||
| 1,175,239 | ||||||||
|
| |||||||
Electrical Equipment (1.96%) | ||||||||
II-VI, lnc.(a) | 29,769 | 546,559 | ||||||
Rockwell Automation, Inc. | 26,650 | 1,955,310 | ||||||
|
| |||||||
| 2,501,869 | ||||||||
|
| |||||||
Machinery (1.07%) | ||||||||
Graco, Inc. | 17,077 | 698,278 | ||||||
Middleby Corp.(a) | 7,072 | 665,051 | ||||||
|
| |||||||
| 1,363,329 | ||||||||
|
| |||||||
Professional Services (4.33%) | ||||||||
Huron Consulting Group, lnc.(a) | 21,472 | 831,825 | ||||||
IMS, Inc., Class A(a) | 28,499 | 2,455,474 | ||||||
Resources Connection, Inc. | 55,983 | 592,860 | ||||||
Robert Half International, Inc. | 37,400 | 1,064,404 | ||||||
Stantec, lnc.(a) | 21,250 | 575,875 | ||||||
|
| |||||||
| 5,520,438 | ||||||||
|
| |||||||
See Notes to Schedule of Investments and Financial Statements | ||
www.all-starfunds.com |
ASG |
| 16 | LIBERTY ALL-STAR® GROWTH FUND | |||||
| SCHEDULE OF INVESTMENTS | ||||||
| as of December 31, 2011 | ||||||
| COMMON STOCKS (continued) | SHARES | MARKET VALUE | ||||||
Road & Rail (0.69%) | ||||||||
Landstar System, Inc. | 18,482 | $ | 885,658 | |||||
|
| |||||||
u INFORMATION TECHNOLOGY (28.31%) | ||||||||
Communications Equipment (4.23%) | ||||||||
Aruba Networks, lnc.(a) | 37,483 | 694,185 | ||||||
F5 Networks, Inc.(a) | 9,100 | 965,692 | ||||||
InterDigital, Inc. | 13,750 | 599,088 | ||||||
Polycom, lnc.(a) | 44,225 | 720,868 | ||||||
QUALCOMM, Inc. | 44,265 | 2,421,295 | ||||||
|
| |||||||
| 5,401,128 | ||||||||
|
| |||||||
Computers & Peripherals (2.82%) | ||||||||
Apple, lnc.(a) | 7,360 | 2,980,800 | ||||||
Fusion-io, lnc.(a) | 25,702 | 621,988 | ||||||
|
| |||||||
| 3,602,788 | ||||||||
|
| |||||||
Electronic Equipment & Instruments (1.76%) | ||||||||
FARO Technologies, lnc.(a) | 21,488 | 988,448 | ||||||
FLIR Systems, Inc. | 9,102 | 228,187 | ||||||
IPG Photonics Corp.(a) | 5,459 | 184,896 | ||||||
National Instruments Corp. | 24,024 | 623,423 | ||||||
Universal Display Corp.(a) | 5,900 | 216,471 | ||||||
|
| |||||||
| 2,241,425 | ||||||||
|
| |||||||
Internet Software & Services (5.49%) | ||||||||
Baidu, lnc.(a)(b) | 14,725 | 1,715,021 | ||||||
Google, Inc., Class A(a) | 3,160 | 2,041,044 | ||||||
Linkedln Corp., Class A(a) | 6,200 | 390,662 | ||||||
Liquidity Services, lnc.(a) | 27,491 | 1,014,418 | ||||||
Monster Worldwide, lnc.(a) | 59,017 | 468,005 | ||||||
SINA Corp.(a) | 5,400 | 280,800 | ||||||
VistaPrint Ltd.(a) | 19,431 | 594,588 | ||||||
Youku, lnc.(a)(b) | 31,864 | 499,309 | ||||||
|
| |||||||
| 7,003,847 | ||||||||
|
| |||||||
IT Services (3.29%) | ||||||||
Cognizant Technology Solutions Corp., Class A(a) | 19,150 | 1,231,536 | ||||||
FleetCor Technologies, lnc.(a) | 9,265 | 276,746 | ||||||
ServiceSource International, lnc.(a) | 35,930 | 563,742 | ||||||
VeriFone Systems, lnc.(a) | 27,162 | 964,794 | ||||||
Visa, Inc., Class A | 11,415 | 1,158,965 | ||||||
|
| |||||||
| 4,195,783 | ||||||||
|
| |||||||
Semiconductors & Semiconductor Equipment (2.73%) | ||||||||
ARM Holdings PLC(b) | 77,817 | 2,153,196 | ||||||
Cavium, lnc.(a) | 29,388 | 835,501 | ||||||
Hittite Microwave Corp.(a) | 9,932 | 490,442 | ||||||
|
| |||||||
| 3,479,139 | ||||||||
|
| |||||||
Software (7.99%) | ||||||||
ANSYS, lnc.(a) | 17,131 | 981,264 | ||||||
Concur Technologies, lnc.(a) | 15,873 | 806,190 | ||||||
QLIK Technologies, lnc.(a) | 36,577 | 885,163 | ||||||
RealPage, lnc.(a) | 29,925 | 756,205 | ||||||
Salesforce.com, lnc.(a) | 21,650 | 2,196,609 | ||||||
See Notes to Schedule of Investments and Financial Statements | ||||
| | ||||
| LIBERTY ALL-STAR® GROWTH FUND | 17 | |||||
| SCHEDULE OF INVESTMENTS | ||||||
| as of December 31, 2011 | ||||||
| COMMON STOCKS (continued) | SHARES | MARKET VALUE | ||||||
Software (continued) | ||||||||
Solera Holdings, Inc. | 24,143 | $ | 1,075,329 | |||||
SuccessFactors, lnc.(a) | 21,500 | 857,205 | ||||||
Ultimate Software Group, lnc.(a) | 12,713 | 827,871 | ||||||
VMware, Inc., Class A(a) | 21,750 | 1,809,382 | ||||||
|
| |||||||
| 10,195,218 | ||||||||
|
| |||||||
u MATERIALS (2.97%) | ||||||||
Chemicals (1.71%) | ||||||||
CF Industries Holdings, Inc. | 4,700 | 681,406 | ||||||
Praxair, Inc. | 13,975 | 1,493,928 | ||||||
|
| |||||||
| 2,175,334 | ||||||||
|
| |||||||
Metals & Mining (1.26%) | ||||||||
Allegheny Technologies, Inc. | 17,900 | 855,620 | ||||||
Silver Wheaton Corp. | 26,000 | 752,960 | ||||||
|
| |||||||
| 1,608,580 | ||||||||
|
| |||||||
u TELECOMMUNICATION SERVICES (1.74%) | ||||||||
Wireless Telecommunication Services (1.74%) | ||||||||
American Tower Corp., Class A | 36,900 | 2,214,369 | ||||||
|
| |||||||
u UTILITIES (0.69%) | ||||||||
Electric Utilities (0.69%) | ||||||||
ITC Holdings Corp. | 11,636 | 882,940 | ||||||
|
| |||||||
TOTAL COMMON STOCKS | ||||||||
(COST OF $107,089,109) | 123,814,726 | |||||||
|
| |||||||
| SHORT TERM INVESTMENTS (2.93%) | PAR VALUE | |||||||
u REPURCHASE AGREEMENT (2.93%) | ||||||||
Repurchase agreement with State Street Bank & Trust Co., dated 12/30/11, due 01/03/12 at 0.01%, collateralized by several Fannie Mae and Freddie Mac instruments with various maturity dates, market value of $3,825,774 (Repurchase proceeds of $3,743,004) (COST OF $3,743,000) | $ | 3,743,000 | 3,743,000 | |||||
|
| |||||||
TOTAL INVESTMENTS (99.96%) | ||||||||
(COST OF $110,832,109)(C) | 127,557,726 | |||||||
|
| |||||||
OTHER ASSETS IN EXCESS OF LIABILITIES (0.04%) | 44,671 | |||||||
|
| |||||||
NET ASSETS (100.00%) | $ | 127,602,397 | ||||||
|
| |||||||
NET ASSET VALUE PER SHARE | ||||||||
(30,080,350 SHARES OUTSTANDING) | $ | 4.24 | ||||||
|
| |||||||
Notes to Schedule of Investments:
| (a) | Non-income producing security. |
| (b) | American Depositary Receipt. |
| (c) | Cost of investments for federal income tax purposes is $111,121,709. |
See Notes to Financial Statements | ||
www.all-starfunds.com |
ASG |
| 18 | LIBERTY ALL-STAR® GROWTH FUND | |||||
| SCHEDULE OF INVESTMENTS | ||||||
| as of December 31, 2011 | ||||||
Gross unrealized appreciation and depreciation at December 31, 2011 based on cost of investments for federal income tax purposes is as follows:
Gross unrealized appreciation | $ | 26,642,370 | ||
Gross unrealized depreciation | (10,206,353 | ) | ||
Net unrealized appreciation | $ | 16,436,017 | ||
See Notes to Financial Statements | ||||
| | ||||
| LIBERTY ALL-STAR® GROWTH FUND | 19 | |||||
| STATEMENT OF ASSETS AND LIABILITIES | ||||||
| December 31, 2011 | ||||||
ASSETS: | ||||
Investments at market value (Cost $110,832,109) | $ | 127,557,726 | ||
Cash | 804 | |||
Receivable for investment securities sold | 2,814,870 | |||
Dividends and interest receivable | 40,193 | |||
Prepaid assets | 225 | |||
TOTAL ASSETS | 130,413,818 | |||
LIABILITIES: | ||||
Payable for investments purchased | 471,544 | |||
Distributions payable to shareholders | 2,105,625 | |||
Investment advisory fee payable | 87,871 | |||
Payable for administration, pricing and bookkeeping fees | 28,767 | |||
Accrued expenses | 117,614 | |||
TOTAL LIABILITIES | 2,811,421 | |||
NET ASSETS | $ | 127,602,397 | ||
NET ASSETS REPRESENTED BY: | ||||
Paid-in capital | $ | 111,166,380 | ||
Overdistributed net investment income | (26,710 | ) | ||
Accumulated net realized loss on investments | (262,890 | ) | ||
Net unrealized appreciation on investments | 16,725,617 | |||
NET ASSETS | $ | 127,602,397 | ||
Shares of common stock outstanding | 30,080,350 | |||
NET ASSET VALUE PER SHARE | $ | 4.24 | ||
See Notes to Financial Statements | ||
www.all-starfunds.com |
ASG |
| 20 | LIBERTY ALL-STAR® GROWTH FUND | |||||
| STATEMENT OF OPERATIONS | ||||||
| Year Ended December 31, 2011 | ||||||
INVESTMENT INCOME: | ||||
Dividends (Net of foreign taxes withheld at source which amounted to $7,421) | $ | 659,288 | ||
Interest | 328 | |||
TOTAL INVESTMENT INCOME | 659,616 | |||
EXPENSES: | ||||
Investment advisory fee | 1,095,426 | |||
Administration fee | 273,856 | |||
Pricing and bookkeeping fees | 74,398 | |||
Audit fee | 32,881 | |||
Custodian fee | 48,971 | |||
Directors’ fees and expenses | 68,541 | |||
Insurance expense | 7,927 | |||
Legal fees | 320,936 | |||
NYSE fee | 27,975 | |||
Shareholder communication expenses | 71,088 | |||
Transfer agent fees | 54,828 | |||
Miscellaneous expenses | 5,891 | |||
TOTAL EXPENSES | 2,082,718 | |||
NET INVESTMENT LOSS | (1,423,102 | ) | ||
REALIZED AND UNREALIZED GAIN ON INVESTMENTS: | ||||
Net realized gain on investment transactions | 9,291,538 | |||
Net change in unrealized appreciation/(depreciation) on investments | (9,617,091 | ) | ||
NET REALIZED AND UNREALIZED LOSS ON INVESTMENTS | (325,553 | ) | ||
NET DECREASE IN NET ASSETS RESULTING FROM OPERATIONS | $ | (1,748,655 | ) | |
See Notes to Financial Statements | ||||
| | ||||
| LIBERTY ALL-STAR® GROWTH FUND | 21 | |||||
| STATEMENTS OF CHANGES IN NET ASSETS | ||||||
| Year Ended December 31, | ||||||||||
| 2011 | 2010 | |||||||||
FROM OPERATIONS: | ||||||||||
Net investment loss | $ | (1,423,102 | ) | $ | (1,175,567 | ) | ||||
Net realized gain on investment transactions | 9,291,538 | 5,137,175 | ||||||||
Net change in unrealized appreciation/(depreciation) on investments | (9,617,091 | ) | 20,620,701 | |||||||
Net Increase/(Decrease) in Net Assets From Operations | (1,748,655 | ) | 24,582,309 | |||||||
DISTRIBUTIONS TO SHAREHOLDERS: | ||||||||||
From net investment income | (1,994,479 | ) | (5,615,921 | ) | ||||||
From net realized gains | (6,127,216 | ) | — | |||||||
Tax return of capital | — | (1,904,168 | ) | |||||||
Total Distributions | (8,121,695 | ) | (7,520,089 | ) | ||||||
Total Increase/(Decrease) in Net Assets | (9,870,350 | ) | 17,062,220 | |||||||
NET ASSETS: | ||||||||||
Beginning of year | 137,472,747 | 120,410,527 | ||||||||
End of year (Includes overdistributed net investment income of $(26,710) and $(62,208), respectively) | $ | 127,602,397 | $ | 137,472,747 | ||||||
See Notes to Financial Statements
www.all-starfunds.com |
ASG |
| 22 | LIBERTY ALL-STAR® GROWTH FUND | |||||
| FINANCIAL HIGHLIGHTS | ||||||
| Year Ended December 31, | ||||||||||||||||||||
| 2011 | 2010 | 2009 | 2008 | 2007 | ||||||||||||||||
|
| |||||||||||||||||||
PER SHARE OPERATING PERFORMANCE: | ||||||||||||||||||||
Net asset value at beginning of year | $ | 4.57 | $ | 4.00 | $ | 3.24 | $ | 6.03 | $ | 5.69 | ||||||||||
|
| |||||||||||||||||||
INCOME FROM INVESTMENT OPERATIONS: | ||||||||||||||||||||
Net investment loss(a) | (0.05 | ) | (0.04 | ) | (0.02 | ) | (0.03 | ) | (0.03 | ) | ||||||||||
Net realized and unrealized gain/loss) on investments | (0.01 | ) | 0.86 | 1.02 | (2.29 | ) | 0.98 | |||||||||||||
|
| |||||||||||||||||||
Total from Investment Operations | (0.06 | ) | 0.82 | 1.00 | (2.32 | ) | 0.95 | |||||||||||||
|
| |||||||||||||||||||
LESS DISTRIBUTIONS TO SHAREHOLDERS: | ||||||||||||||||||||
Net investment income | (0.07 | ) | (0.19 | ) | — | — | — | |||||||||||||
Net realized gain on investments | (0.20 | ) | — | — | (0.02 | ) | (0.61 | ) | ||||||||||||
Tax return of capital | — | (0.06 | ) | (0.24 | ) | (0.45 | ) | — | ||||||||||||
|
| |||||||||||||||||||
Total Distributions | (0.27 | ) | (0.25 | ) | (0.24 | ) | (0.47 | ) | (0.61 | ) | ||||||||||
|
| |||||||||||||||||||
Net asset value at end of year | $ | 4.24 | $ | 4.57 | $ | 4.00 | $ | 3.24 | $ | 6.03 | ||||||||||
|
| |||||||||||||||||||
Market price at end of year | $ | 3.81 | $ | 4.25 | $ | 3.36 | $ | 2.60 | $ | 5.96 | ||||||||||
|
| |||||||||||||||||||
TOTAL INVESTMENT RETURN | ||||||||||||||||||||
FOR SHAREHOLDERS:(b) | ||||||||||||||||||||
Based on net asset value | (1.0 | %) | 21.8 | % | 34.6 | % | (40.0 | %) | 17.9 | % | ||||||||||
Based on market price | (4.4 | %) | 34.8 | % | 40.8 | % | (51.3 | %) | 23.5 | % | ||||||||||
RATIOS AND SUPPLEMENTAL DATA: | ||||||||||||||||||||
Net assets at end of year (millions) | $ | 128 | $ | 137 | $ | 120 | $ | 96 | $ | 172 | ||||||||||
Ratio of expenses to average net assets | 1.52 | % | 1.79 | % | 1.44 | % | 1.46 | % | 1.28 | %(C) | ||||||||||
Ratio of net investment loss to average net assets | (1.04 | %) | (0.95 | %) | (0.58 | %) | (0.74 | %) | (0.51 | %)(C) | ||||||||||
Portfolio turnover rate | 32 | % | 80 | % | 135 | % | 97 | % | 60 | % | ||||||||||
| (a) | Calculated using average shares outstanding during the period. |
| (b) | Calculated assuming all distributions are reinvested at actual reinvestment prices. The net asset value and market price returns will differ depending upon the level of any discount from or premium to net asset value at which the Fund’s shares traded during the period. Past performance is not a guarantee of future results. |
| (c) | The benefits derived from custody credits and directed brokerage arrangements, if any, had an impact of less that 0.01%. |
See Notes to Financial Statements
|
| LIBERTY ALL-STAR® GROWTH FUND | 23 | |||||
| NOTES TO FINANCIAL STATEMENTS | ||||||
| December 31, 2011 | ||||||
NOTE 1. ORGANIZATION
Liberty All-Star® Growth Fund, Inc. (the “Fund”) is a Maryland corporation registered under the Investment Company Act of 1940 (the “Act”), as amended, as a diversified, closed-end management investment company.
Investment Goal
The Fund seeks long-term capital appreciation.
Fund Shares
The Fund may issue 60,000,000 shares of common stock at $0.10 par.
NOTE 2. SIGNIFICANT ACCOUNTING POLICIES
Use of Estimates
The preparation of financial statements in conformity with accounting principles generally accepted in the United States of America (“GAAP”) requires management to make estimates and assumptions that affect the reported amounts and disclosures in the financial statements. Actual results could differ from these estimates. The following is a summary of significant accounting policies consistently followed by the Fund in the preparation of its financial statements.
Security Valuation
Equity securities including common stocks and exchange traded funds are valued at the last sale price at the close of the principal exchange on which they trade, except for securities listed on the National Association of Securities Dealers Automated Quotations (“NASDAQ”) exchange, which are valued at the NASDAQ official closing price. Unlisted securities or listed securities for which there were no sales during the day are valued at the closing bid price on such exchanges or over-the-counter markets.
Short-term debt obligations maturing in more than 60 days for which market quotations are readily available are valued at current market value. Short-term debt obligations maturing within 60 days are valued at amortized cost, which approximates market value.
Investments for which market quotations are not readily available are valued at fair value as determined in good faith under consistently applied procedures approved by and under the general supervision of the Fund’s Board of Directors.
Foreign Securities
The Fund may directly purchase securities of foreign issuers. Investing in securities of foreign issuers involves special risks not typically associated with investing in securities of U.S. issuers. The risks include possible reevaluation of currencies, the inability to repatriate foreign currency, less complete financial information about companies and possible future adverse political and economic developments. Moreover, securities of many foreign issuers and their markets may be less liquid and their prices more volatile than those of securities of com parable U.S. issuers. For the year ended December 31, 2011, the Fund only held American Depository Receipts and did not hold any securities denominated in foreign currencies.
Security Transactions
Security transactions are recorded on trade date. Cost is determined and gains/flosses) are based upon the specific identification method for both financial statement and federal income tax purposes.
Repurchase Agreements
The Fund engages in repurchase agreement transactions with institutions that the Fund’s investment advisor has determined are creditworthy. The Fund, through its custodian, receives delivery of underlying securities collateralizing a repurchase agreement. Collateral is at least equal, at all times, to the value of the repurchase obligation including interest. A repurchase agreement transaction involves certain risks in the event of default or insolvency of the counterparty. These risks include possible delays or restrictions upon a Fund’s ability to dispose of the underlying securities and a possible decline in the value of the underlying securities during the period while the Fund seeks to assert its rights.
Income Recognition
Interest income is recorded on the accrual basis. Corporate actions and dividend income are recorded on the ex-date.
Recent Accounting Pronouncements
In April 2011, the Financial Accounting Standards Board (“FASB”) issued Accounting Standards Update (ASU) No. 2011-03 “Transfers and Servicing (Topic 860): Reconsideration of Effective Control for Repurchase Agreements.” The ASU 2011-03 is intended to improve financial reporting of repurchase agreements and other agreements that both entitle and obligate a transferor to repurchase or redeem the financial assets before their maturity. The ASU is effective for the first interim or annual period beginning on or after December 15, 2011. Management is currently evaluating the impact this ASU may have on the Fund’s financial statements.
In May 2011, the FASB issued ASU No. 2011-04 “Amendments to Achieve Common Fair Value Measurement and Disclosure Requirements” in U.S. GAAP and International Financial Reporting Standards (“IFRSs”). ASU 2011-04 includes common requirements for measurement of and disclosure about fair value between U.S. GAAP and IFRS. ASU 2011-04 will require reporting entities to disclose quantitative information about the unobservable inputs used in the fair value measurements categorized within Level 3 of the fair value hierarchy. In addition, ASU 2011-04 will require reporting entities to make disclosures about amounts and reasons for all transfers in and out of Level 1 and Level 2 fair value measurements. The new and revised disclosures are effective for interim and annual reporting periods beginning after December 15, 2011. Management is currently evaluating the impact this ASU may have on the Fund’s financial statements.
Fair Value Measurements
The Fund discloses the classification of its fair value measurements following a three-tier hierarchy based on the
www.all-starfunds.com |
ASG |
| 24 | LIBERTY ALL-STAR® GROWTH FUND | |||||
| NOTES TO FINANCIAL STATEMENTS | ||||||
| December 31, 2011 | ||||||
inputs used to measure fair value. Inputs refer broadly to the assumptions that market participants would use in pricing the asset or liability, including assumptions about risk. Inputs may be observable or unobservable. Observable inputs reflect the assumptions market participants would use in pricing the asset or liability that are developed based on market data obtained from sources independent of the reporting entity. Unobservable inputs reflect the reporting entity’s own assumptions about the assumptions market participants would use in pricing the asset or liability that are developed based on the best information available.
Various inputs are used in determining the value of the Fund’s investments as of the end of the reporting period. When inputs used fall into different levels of the fair value hierarchy, the level in the hierarchy within which the fair value measurement falls is determined based on the lowest level input that is significant to the fair value measurement in its entirety. The designated input levels are not necessarily an indication of the risk or liquidity associated with these investments. These inputs are categorized in the following hierarchy under applicable financial accounting standards:
Level 1 |
| – |
| Unadjusted quoted prices in active markets for identical investments, unrestricted assets or liabilities that a Fund has the ability to access at the measurement date; | ||
Level 2 | – | Quoted prices which are not active, quoted prices for similar assets or liabilities in active markets or inputs other than quoted prices that are observable (either directly or indirectly) for substantially the full term of the asset or liability; and | ||||
Level 3 | – | Significant unobservable prices or inputs (including the Fund’s own assumptions in determining the fair value of investments) where there is little or no market activity for the asset or liability at the measurement date. | ||||
The following is a summary of the inputs used to value the Fund’s investments as of December 31, 2011. The Fund recognizes transfers between the levels as of the beginning of the annual period in which the tranfer occurred.
| Valuation inputs | Investments in Securities at Value* | |||
Level 1 - Unadjusted Quoted Prices | $ | 123,814,726 | ||
Level 2 - Other Significant Observable Inputs | 3,743,000 | |||
Level 3 - Significant | – | |||
TOTAL | $ | 127,557,726 | ||
*See Schedule of Investments for industry classification.
For the year ended December 31, 2011, the Fund did not have any significant transfers between Level 1 and Level 2 securities. The Fund did not have any securities which used significant unobservable inputs (Level 3) in determining fair value.
Distributions to Shareholders
The Fund currently has a policy of paying distributions on its common shares totaling approximately 6% of its net asset value per year. The distributions are payable in four quarterly distributions of 1.5% of the Fund’s net asset value at the close of the New York Stock Exchange on the Friday prior to each quarterly declaration date. Distributions to shareholders are recorded on ex-date.
NOTE 3. FEDERAL TAX INFORMATION
The timing and character of income and capital gain distributions are determined in accordance with income tax regulations, which may differ from GAAP. Reclassifications are made to the Fund’s capital accounts for permanent tax differences to reflect income and gains available for distribution (or available capital loss carryforwards) under income tax regulations. If, for any calendar year, the total distributions made under the distribution policy exceed the Fund’s net investment income and net realized capital gains, the excess will generally be treated as a non-taxable return of capital, reducing the shareholder’s adjusted basis in his or her shares. If the Fund’s net investment income and net realized capital gains for any year exceed the amount distributed under the distribution policy, the Fund may, in its discretion, retain and not distribute net realized capital gains and pay income tax thereon to the extent of such excess.
For the year ended December 31, 2011, permanent book and tax basis differences resulting primarily from a net operating loss and excess distributions were identified and reclassified among the components of the Fund’s net assets as follows:
| Accumulated Net Investment Income | Accumulated Net Realized Loss | Paid-in Capital | ||
$3,453,079 | ($1,019,242) | ($2,433,837) |
Net investment loss and net realized gain, as disclosed on the Statement of Operations, and net assets were not affected by this reclassification.
Classification of Distributions to Shareholders
Net investment income/loss) and net realized gain/loss) may differ for financial statement and tax purposes. The character of distributions made during the year from net investment income or net realized gains may differ from its ultimate characterization for federal income tax purposes. Also, due to the timing of dividend distributions, the fiscal year in which amounts are distributed may differ from the fiscal year in which the income or realized gain was recorded by the Funds.
| | ||||
| LIBERTY ALL-STAR® GROWTH FUND | 25 | |||||
| NOTES TO FINANCIAL STATEMENTS | ||||||
| December 31, 2011 | ||||||
The tax character of distributions paid during the years ended December 31, 2011, and December 31, 2010 was as follows:
| 12/31/11 | 12/31/10 | |||||||
Distributions paid from: | ||||||||
Ordinary income | $ | 1,994,479 | $ | 5,615,921 | ||||
Long-term capital gain | 6,127,216 | — | ||||||
Tax return of capital | — | 1,904,168 | ||||||
| $ | 8,121,695 | $ | 7,520,089 | |||||
The Fund used capital loss carry forwards of $1,800,878 to offset taxable capital gains during the period ended December 31, 2011.
Future realized gains offset by the loss carryforwards are not required to be distributed to shareholders. However, under the Fund’s distribution policy, such gains may be distributed to shareholders in the year the gains are realized. Any such gains distributed may be taxable to shareholders as ordinary income.
Under the Regulated Investment Company Modernization Act of 2010 (“the Modernization Act”), net capital losses recognized in tax years beginning after December 22, 2010 may be carried forward indefinitely, and the character of the losses is retained as short-term and/or long-term. Under the law in effect prior to the Modernization Act, net capital losses were carried forward for eight years and treated as short-term. As a transition rule, the Modernization Act requires that post-enactment net capital losses be used before pre-enactment net capital losses. Additionally, post-enactment capital losses that are carried forward will retain their character as either short-term or long-term losses rather than being considered all short-term as under previous law.
As of December 31, 2011, the components of distributable earnings on a tax basis were as follows:
Accumulated Capital Gains/Losses | Net Unrealized Appreciation | Undistributed Net Investment Income | ||
$0 | $16,436,017 | $0 |
The differences between book-basis and tax-basis are primarily due to adjustments related to passive foreign investment companies and deferral of losses from wash sales.
Federal Income Tax Status
For federal income tax purposes, the Fund currently qualifies, and intends to remain qualified, as a regulated investment company under the provisions of Subchapter M of the Internal Revenue Code by distributing substantially all of its investment company taxable net income including realized gain, not offset by capital loss carryforwards, if any, to its shareholders. Accordingly, no provision for federal income or excise taxes has been made.
Management has concluded that the Fund has taken no uncertain tax positions that require recognition in the fi-
nancial statements. The Fund files income tax returns in the U.S. federal jurisdiction and Colorado. For the years ended December 31, 2008, December 31, 2009, December 31, 2010, and December 31, 2011 the Fund’s returns are still open to examination by the appropriate taxing authorities.
NOTE 4. FEES AND COMPENSATION PAID TO AFFILIATES
Investment Advisory Fee
ALPS Advisors, Inc. (“AAI”) serves as the investment advisor to the Fund. AAI receives a monthly investment advisory fee based on the Fund’s average daily net assets at the following annual rates:
Average Daily Net Assets | Annual Fee Rate | |
First $300 million | 0.80% | |
Over $300 million | 0.72% |
AAI retains multiple Portfolio Managers to manage the Fund’s investments in various asset classes. AAI pays each Portfolio Manager a portfolio management fee based on the assets of the investment portfolio that they manage. The portfolio management fee is paid from the investment advisory fees collected by AAI and is based on the Fund’s average daily net assets at the following annual rates:
Average Daily Net Assets | Annual Fee Rate | |
First $300 million | 0.40% | |
Over $300 million | 0.36% |
Administration, Bookkeeping and Pricing Services Agreement
ALPS Fund Services, Inc. (“ALPS”) provides administrative and other services to the Fund for a monthly administration fee based on the Fund’s average daily net assets at the following annual rates:
Average Daily Net Assets | Annual Fee Rate | |
First $300 million | 0.20% | |
Over $300 million | 0.18% |
In addition, ALPS provides bookkeeping and pricing services to the Fund for an annual fee consisting of: (i) $38,000 paid monthly plus 0.015% on the average daily net assets for the month; and (ii) a multi-manager fee based on the number of portfolio managers; provided that during any 12-month period, the aggregate amount of (i) shall not exceed $140,000 (exclusive of out-of-pocket expenses and charges). The Fund also reimburses ALPS for out-of-pocket expenses and charges, including fees payable to third parties for pricing the Fund’s portfolio securities and direct internal costs incurred by ALPS in connection with providing fund accounting oversight and monitoring and certain other services.
Fees Paid to Officers
All officers of the Fund, including the Fund’s Chief Compliance Officer, are employees of AAI or its affiliates, and receive no compensation from the Fund. The Board of Directors has appointed a Chief Compliance Officer to the Fund in accordance with federal securities regulations.
www.all-starfunds.com |
ASG |
| 26 | LIBERTY ALL-STAR® GROWTH FUND | |||||
| NOTES TO FINANCIAL STATEMENTS | ||||||
| December 31, 2011 | ||||||
NOTE 5. PORTFOLIO INFORMATION
Purchases and Sales of Securities
For the year ended December 31, 2011, the cost of purchases and proceeds from sales of securities, excluding short-term obligations, were $42,567,605 and $52,892,885, respectively.
NOTE 6. INDEMNIFICATION
In the normal course of business, the Fund enters into contracts that contain a variety of representations and warranties and which provide general indemnities. The Fund’s maximum exposure under these arrangements is unknown, as this would involve future claims against the Fund. Also, under the Fund’s organizational documents and by contract, the Directors and Officers of the Fund are indemnified against certain liabilities that may arise out of their duties to the Fund. However, based on experience, the Fund expects the risk of loss due to these warranties and indemnities to be minimal.
NOTE 7. OTHER MATTERS
Maryland Statutes
By resolution of the Board of Directors, the Fund has opted into the Maryland Control Share Acquisition Act and the Maryland Business Combination Act. In general, the Maryland Control Share Acquisition Act provides that “control shares” of a Maryland corporation acquired in a control share acquisition may not be voted except to the extent approved by shareholders at a meeting by a vote of two-thirds of the votes entitled to be cast on the matter (excluding shares owned by the acquirer and by officers or directors who are employees of the corporation). “Control shares” are voting shares of stock which, if aggregated with all other shares of stock owned by the acquirer or in respect of which the acquirer is able to exercise or direct the exercise of voting power (except solely by virtue of a revocable proxy), would entitle the acquirer to exercise voting power in electing directors within certain statutorily defined ranges (one-tenth but less than one-third, one-third but less than a majority, and more than a majority of the voting power). In general, the Maryland Business Combination Act prohibits an interested shareholder (a shareholder that holds 10% or more of the voting power of the outstanding stock of the corporation) of a Maryland corporation from engaging in a business combination (generally defined to include a merger, consolidation, share exchange, sale of a substantial amount of assets, a transfer of the corporation’s securities and similar transactions to or with the interested shareholder or an entity affiliated with the interested shareholder) with the corporation for a period of five years after the most recent date on which the interested shareholder became an interested shareholder. At the time of adoption, March 19, 2009, the Board and the Fund were not aware, and currently are not aware, of any shareholder that held control shares or that was an interested shareholder under the statutes.
| | ||||
| LIBERTY ALL-STAR® GROWTH FUND | 27 | |||||
| REPORT OF INDEPENDENT REGISTERED PUBLIC ACCOUNTING FIRM | ||||||
TO THE BOARD OF DIRECTORS AND SHAREHOLDERS OF LIBERTY ALL-STAR® GROWTH FUND, INC.:
We have audited the accompanying statement of assets and liabilities of Liberty All-Star® Growth Fund, Inc. (the “Fund”), including the schedule of investments, as of December 31, 2011, and the related statement of operations for the year then ended, the statements of changes in net assets for each of the two years in the period then ended, and the financial highlights for each of the five years in the period then ended. These financial statements and financial highlights are the responsibility of the Fund’s management. Our responsibility is to express an opinion on these financial statements and financial highlights based on our audits.
We conducted our audits in accordance with the standards of the Public Company Accounting Oversight Board (United States). Those standards require that we plan and perform the audit to obtain reasonable assurance about whether the financial statements and financial highlights are free of material misstatement. The Fund is not required to have, nor were we engaged to perform, an audit of its internal control over financial reporting. Our audits included consideration of internal control over financial reporting as a basis for designing audit procedures that are appropriate in the circumstances, but not for the purpose of expressing an opinion on the effectiveness of the Fund’s internal control over financial reporting. Accordingly, we express no such opinion. An audit also includes examining, on a test basis, evidence supporting the amounts and disclosures in the financial statements, assessing the accounting principles used and significant estimates made by management, as well as evaluating the overall financial statement presentation. Our procedures included confirmation of securities owned as of December 31, 2011, by correspondence with the custodian and brokers; where replies were not received from brokers, we performed other auditing procedures. We believe that our audits provide a reasonable basis for our opinion.
In our opinion, such financial statements and financial highlights referred to above present fairly, in all material respects, the financial position of Liberty All-Star® Growth Fund, Inc. as of December 31, 2011, the results of its operations for the year then ended, the changes in its net assets for each of the two years in the period then ended, and the financial highlights for each of the five years in the period then ended, in conformity with accounting principles generally accepted in the United States of America.
DELOITTE & TOUCHE LLP
Denver, Colorado
February 16, 2012
www.all-starfunds.com |
ASG |
| 28 | LIBERTY ALL-STAR® GROWTH FUND | |||||
| AUTOMATIC DIVIDEND REINVESTMENT AND DIRECT PURCHASE PLAN (UNAUDITED) | ||||||
Under the Fund’s Automatic Dividend Reinvestment and Direct Purchase Plan (the “Plan”), shareholders automatically participate and have all their Fund dividends and distributions reinvested by Computer share Trust Company, N.A., as agent for participants in the Plan (the “Plan Agent”), in additional shares of the Fund. For further information, call Investor Assistance at 1-800-LIB-FUND (1-800-542-3863) weekdays between 9 a.m. and 5 p.m. Eastern Time.
Shareholders whose shares are held in the name of a brokerage firm, bank or other nominee can participate in the Plan only if their brokerage firm, bank or nominee is able to do so on their behalf. Shareholders participating in the Plan through a brokerage firm may not be able to transfer their shares to another brokerage firm and continue to participate in the Plan.
Under the Plan, all dividends and distributions will be reinvested in additional shares of the Fund. Distributions declared payable in cash will be reinvested for the accounts of participants in the Plan in additional shares purchased by the Plan Agent on the open market at prevailing market prices. If, prior to the Plan Agent’s completion of such open market purchases, the market price of a share plus estimated brokerage commissions exceeds the net asset value, the remainder of the distribution will be paid in newly issued shares valued at net asset value (but not at a discount of more than 5% from market price). Distributions declared payable in shares (or cash at the option of shareholders) are paid to participants in the Plan entirely in newly issued full and fractional shares valued at the lower of market value or net asset value per share on the valuation date for the distribution (but not at a discount of more than 5 percent from market price). Dividends and distributions are subject to taxation, whether received in cash or in shares.
Plan participants have the option of making additional investments of $100 or more on a monthly basis up to a maximum of $120,000 in a calendar year. These direct purchases will be invested on or shortly after the 15th of each month and direct purchases should be sent so as to be received by the Plan Agent at least two business days prior to the next investment date. Barring suspension of trading, direct purchases will be invested within 35 days after such date. Alternatively, participants can authorize an automatic monthly deduction from a checking or savings account at a U.S. bank or other financial institution. A
participant may withdraw a direct purchase by written notice received by the Plan Agent at least two business days before such payment is to be invested.
The Plan Agent maintains all shareholder accounts in the Plan and furnishes confirmations of all transactions in the account, including information needed by shareholders for tax records. Shares in the account of each Plan participant will be held by the Plan Agent in book-entry or non certificated form in the name of the participant, and each shareholder’s proxy will include those shares purchased or received pursuant to the Plan.
There is no charge to participants for reinvesting distributions pursuant to the Plan. The Plan Agent’s fees are paid by the Fund, therefore indirectly by shareholders. There are no brokerage charges with respect to shares issued directly by the Fund as a result of dividends or distributions declared payable in shares. However, each participant bears a per share fee (which includes any brokerage commissions the Plan Agent is required to pay) incurred with respect to the Plan Agent’s open market purchases in connection with the reinvestment of distributions declared payable in cash.
With respect to direct purchases, the Plan Agent will charge $1.25 for purchase by check and $2.00 for automatic investment transactions, plus a per share fee (which includes any brokerage commissions the Plan Agent is required to pay). Sales of shares held in the Plan will also be subject to a service fee of $2.50 and a per share fee currently $0.10. All fees described in this summary are subject to change. Please contact the Plan Agent for the current fees.
Shareholders may terminate their participation in the Plan by notifying the Plan Agent by telephone, through the Internet or in writing. Such termination will be effective immediately if notice is received by The Plan Agent prior to any dividend record date and all subsequent dividends and distributions will be paid in cash instead of shares.
The Fund reserves the right to amend or terminate the Plan.
The full text of the Plan may be found on the Fund’s website at www.all-starfunds.com.
| | ||||
| LIBERTY ALL-STAR® GROWTH FUND | 29 | |||||
| TAX INFORMATION (UNAUDITED) | ||||||
All 2011 distributions whether received in cash or shares of the Fund consist of the following:
(1) ordinary dividends, and
(2) long-term capital gains
The table below details the breakdown of each 2011 distribution for federal income tax purposes.
TAX STATUS OF 2011 DISTRIBUTIONS
| ORDINARY DIVIDENTS | ||||||||||
| DATE PAID | AMOUNT PER SHARE | QUALIFIED | NON-QUALIFIED | LONG-TERM CAPITAL GAINS | RETURN OF CAPITAL | |||||
01/03/11* | $0.07 | — | 31.29% | 68.71% | — | |||||
03/14/11 | $0.07 | — | 31.29% | 68.71% | — | |||||
06/13/11 | $0.07 | — | 31.29% | 68.71% | — | |||||
09/12/11 | $0.06 | — | 31.29% | 68.71% | — | |||||
01/03/12 | $0.026453 | — | 31.29% | 68.71% | — | |||||
01/03/12** | $0.043547 | — | — | — | — | |||||
| * | Pursuant to Section 852 of the Internal Revenue Code, the taxability of this distribution will be reported in the Form 1099-DIV for 2011 |
| ** | Pursuant to Section 852 of the Internal Revenue Code, the taxability of this distribution will be reported in the Form 1099-DIV for 2012 |
TAX DESIGNATIONS
The Fund designates the following amounts for the fiscal year ended December 31, 2011:
Qualified Dividend Income | 0.00% | |
Corporate Dividends Received Deduction | 0.00% | |
www.all-starfunds.com |
ASG |
| 30 | LIBERTY ALL-STAR® GROWTH FUND | |||||
| DIRECTORS AND OFFICERS (UNAUDITED) | ||||||
The names of the Directors and Officers of the Liberty All-Star® Growth Fund, Inc., the date each was first elected or appointed to office, their term of office, their principal business occupations and other directorships they have held during at least the last five years, are shown below.
INDEPENDENT DIRECTORS
NAME AND ADDRESS*
| POSITION WITH GROWTH FUND, LENGTH OF SERVICE AND TERM OF OFFICE
| PRINCIPAL OCCUPATION(S) DURING PAST FIVE YEARS
| NUMBER OF PORTFOLIOS IN FUND COMPLEX OVERSEEN BY DIRECTOR
| OTHER DIRECTORSHIPS HELD
| ||||
John A. Benning (Age 77) |
Director Since 2002; Term expires 2014
|
Retired (since December 1999) |
2 |
Trustee, Liberty All-Star Equity Fund (since 2002). | ||||
Thomas W. Brock (Age 64) |
Director Since 2005; Term expires 2012 |
CEO, StoneHarbor Investment Partners LP (since April, 2006); Adjunct Professor, Columbia University Graduate School of Business (1998-2006).
|
2 |
Trustee, Liberty All-Star Equity Fund (since 2005); Trustee and Chairman, Stone Harbor Investment Funds (since 2007). | ||||
George R. Gaspari (Age 71) |
Director Since 2006; Term Expires 2013 |
Financial Services Consultant (since 1996) |
2 |
Trustee and Chairman, The Select Sector SPDR Trust (since 1999); Trustee, Liberty All-Star Equity Fund (since 2006).
| ||||
Richard W. Lowry (Age 75) |
Director Since 1994; Term Expires 2013; Chairman since 2004
|
Private Investor (since 1987) |
2 |
Trustee and Chairman, Liberty All-Star Equity Fund (since 1986). | ||||
John J. Neuhauser (Age 68) |
Director Since 1998; Term Expires 2012 |
President, St. Michael’s College (since August, 2007); University Professor December 2005-2007, Boston College (formerly Academic Vice President and Dean of Faculties, from August 1999 to December 2005, Boston College)
|
2 |
Trustee, Liberty All-Star Equity Fund (since 1998); Trustee, Columbia Funds Series Trust I (66 funds). | ||||
Richard C. Rantzow (Age 73) |
Director Since 2006; Term expires 2014 |
Retired; Chairman of the Board of First Funds (from 1992 to July, 2006) |
2 |
Director, Clough Global Allocation Fund (since 2004), Clough Global Equity Fund (since 2005) and Clough Global Opportunities Fund (since 2006); Trustee, Liberty All-Star Equity Fund (since 2006). |
| * | The address for all Directors and Officers is: c/o ALPS Fund Services, Inc., 1290 Broadway, Suite 1100; Denver, CO 80203. |
| | ||||
| LIBERTY ALL-STAR® GROWTH FUND | 31 | |||||
| DIRECTORS AND OFFICERS (UNAUDITED) | ||||||
INTERESTED DIRECTOR
NAME AND ADDRESS*
| POSITION WITH GROWTH FUND, LENGTH OF SERVICE AND TERM OF OFFICE
| PRINCIPAL OCCUPATION(S) DURING PAST FIVE YEARS
| NUMBER OF PORTFOLIOS IN FUND COMPLEX OVERSEEN BY DIRECTOR
| OTHER DIRECTORSHIPS HELD
| ||||
Edmund J. Burke (Age 51)** |
Director Since 2006; Term expires 2012 |
President of ALPS, a DST Company since November 2011. CEO and a Director of ALPS Holdings, Inc. (since 2005); Director, ALPS Advisors (since 2001), ALPS Distributors, Inc. (since 2000) and ALPS (since 2000); President and a Director of ALPS Financial Services, Inc. (1991-2005) |
2 |
President (since 2001), Trustee and Chairman (since 2009), Financial Investors Trust; Trustee and President, Clough Global Allocation Fund (Trustee since 2006, President since 2004); Trustee and President, Clough Global Equity Fund (Trustee since 2006, President since 2005); Trustee and President Clough Global Opportunities Fund (since 2006); Trustee, Liberty All-Star Equity Fund (since 2006); formerly, President Reaves Utility Income Fund and Financial Investors Variable Insurance Trust. |
OFFICERS
NAME AND ADDRESS*
| POSITION WITH GROWTH FUND
| FIRST YEAR ELECTED OR APPOINTED TO OFFICE
| PRINCIPAL OCCUPATION(S) DURING PAST FIVE YEARS
| |||
William R. Parmentier, Jr. (Age 58) |
President |
1999 |
Chief Investment Officer, ALPS Advisors, Inc. (since 2006); President and Chief Executive Officer of the Liberty All-Star Funds (since April, 1999); Senior Vice President (2005-2006), Banc of America Investment Advisors, Inc.
| |||
Mark T. Haley, CFA (Age 47) |
Senior Vice President |
1999 |
Senior Vice President of the Liberty All-Star Funds (since January, 1999). Vice President, ALPS Advisors, Inc. (since 2006); Vice President, Banc of America Investment Advisors (1999-2006).
| |||
Edmund J. Burke (Age 51) |
Vice President |
2006 |
President of ALPS, a DST Company since November 2011. CEO and a Director of ALPS Holdings, Inc. (since 2005); Director, ALPS Advisors (since 2001), ALPS Distributors, Inc. (since 2000) and ALPS (since 2000); President and a Director of ALPS Financial Services, Inc. (1991-2005) |
| * | The address for all Directors and Officers is: c/o ALPS Fund Services, Inc., 1290 Broadway, Suite 1100; Denver, CO 80203. |
| ** | Mr. Burke is an “interested person” of the Fund as defined in the Investment Company Act, because he is an officer of ALPS and ALPS Advisors. |
www.all-starfunds.com |
ASG |
| 32 | LIBERTY ALL-STAR® GROWTH FUND | |||||
| DIRECTORS AND OFFICERS (UNAUDITED) | ||||||
OFFICERS (continued)
NAME AND ADDRESS*
| POSITION WITH GROWTH FUND
| FIRST YEAR ELECTED OR APPOINTED TO OFFICE
| PRINCIPAL OCCUPATION(S) DURING PAST FIVE YEARS
| |||
Jeremy O. May (Age 41) |
Treasurer |
2006 |
President and Director of ALPS Fund Services, Inc. Mr. May joined ALPS in 1995. Because of his position with ALPS, Mr. May is deemed an affiliate of the Fund as defined under the 1940 Act. Mr. May is currently a Director of Reaves Utility Income Fund and Treasurer of the Liberty All-Star Equity Fund, Clough Global Opportunities Fund, Financial Investors Trust, and Financial Investors Variable Insurance Trust. Mr. May is also on the Board of Directors of the University of Colorado Foundation.
| |||
Kimberly R. Storms (Age 39) |
Assistant Treasurer |
2006 |
Director of Fund Administration and Senior Vice-President of ALPS Fund Services, Inc. Ms. Storms joined ALPS in 1998. Because of her position with ALPS, Ms. Storms is deemed an affiliate of the Fund as defined under the 1940 Act. Ms. Storms is also Assistant Treasurer of the Liberty All-Star Equity Fund, and Financial Investors Trust and Assistant Secretary of Ameristock Mutual Fund, Inc. She is Treasurer of ALPS ETF Trust and BPV Family of Funds. Ms. Storms is also Chief Financial Officer for the Arbitrage Funds. Ms. Storms was previously Assistant Treasurer of the Clough Global Equity, Clough Global Allocation, Clough Global Opportunities and Reaves Utility Income Funds.
| |||
Melanie H. Zimdars (Age 35) |
Chief Compliance Officer |
2009 |
Deputy Chief Compliance Officer with ALPS Fund Services, Inc. since September 2009. Principal Financial Officer, Treasurer and Secretary, Wasatch Funds, February 2007 to December 2008. Assistant Treasurer, Wasatch Funds, November 2006 to February 2007. Senior Compliance Officer, Wasatch Advisors, Inc., 2005 to 2008. Ms. Zimdars is currently the CCO for Liberty All-Star Equity Fund, Financial Investors Variable Insurance Trust, ALPS ETF Trust, EGA Emerging Global Shares Trust and BPV Family of Funds.
| |||
Tané T. Tyler (Age 45) |
Secretary |
2011 |
Senior Vice President, General Counsel and Secretary of ALPS Holdings, Inc.; ALPS Advisors, Inc.; ALPS Distributors, Inc. and ALPS Fund Services, Inc. Ms. Tyler joined ALPS in 2004. She also serves as Secretary of the ALPS ETF Trust since December 2008 and the Liberty All-Star Equity Fund since 2011. She also served as Secretary, Liberty All-Star Equity Fund and Liberty All-Star Growth Fund from December 2006-2008; Secretary, Reaves Utility Income Fund from December 2004-2007; Secretary, Westcore Funds from February 2005-2007; Secretary, Rrst Funds from November 2004 to January 2007; Secretary, Financial Investors Variable Insurance Trust from December 2004-December 2006. She was previously Vice President and Associate Counsel, Oppenheimer Funds from January 2004 to August 2004 and Vice President and Assistant General Counsel, INVESCO Funds from September 1991 to December 2003.
| |||
Alex J. Marks (Age 37) |
Assistant Secretary |
2011 |
Employee of ALPS Fund Services, Inc. since June 2011. Mr. Marks also serves as Assistant Secretary of the Liberty All-Star Equity Fund. Mr. Marks was previously Secretary of the Financial Investors Variable Insurance Trust from December 2008 to June 2010. |
| * | The address for all Officers is: c/o ALPS Fund Services, Inc., 1290 Broadway, Suite 1100; Denver, CO 80203. |
|
| LIBERTY ALL-STAR® GROWTH FUND | 33 | |||||
| RESULTS OF SHAREHOLDER MEETING (UNAUDITED) | ||||||
A Special Meeting of shareholders of the Liberty All-Star Growth Fund (the “Fund”) was held on September 30, 2011 (the “Meeting”). On July 19, 2011, the record date of the Meeting, the Fund had outstanding 30,080,350 shares of common stock. The meeting was held as a result of the acquisition of ALPS Holdings, Inc., ALPS Advisors’ parent company, by DST Systems, Inc. At the Meeting, the following matters were voted on and approved by the shareholders. The results of the Special Meeting of shareholders are noted below.
PROPOSAL 1 - To approve a new Investment Advisory Agreement between the Fund and ALPS Advisors, Inc.:
| NUMBER OF VOTES | ||||||||
| ADVISOR | TOTAL RECORD DATE VOTES | AFFIRMATIVE | AGAINST | ABSTAIN | ||||
ALPS Advisors, Inc. | 19,449,748.171 | 16,226,187.214 | 2,481,739.641 | 741,821.316 |
| PERCENTAGE OF TOTAL OUTSTANDING SHARES | ||||||
| ADVISOR | AFFIRMATIVE | AGAINST | ABSTAIN | |||
ALPS Advisors, Inc. | 53.943% | 8.250% | 2.466% | |||
| PERCENTAGE OF VOTES |
| |||||
| ADVISOR | AFFIRMATIVE | AGAINST | ABSTAIN | |||
ALPS Advisors, Inc. | 83.427% | 12.759% | 3.814% | |||
PROPOSAL 2 - To approve a new Portfolio Management Agreement for the Fund with ALPS Advisors, Inc. and each of the following Sub-Advisers:
| NUMBER OF VOTES | ||||||||
| SUB-ADVISER | TOTAL RECORD DATE VOTES | AFFIRMATIVE | AGAINST | ABSTAIN | ||||
TCW Investment Management Co. | 19,449,748.171 | 16,249,995.078 | 2,461,925.838 | 737,827.255 | ||||
M.A. Weatherbie & Co., Inc. | 19,449,748.171 | 16,240,450.165 | 2,467,008.838 | 742,289.168 |
| PERCENTAGE OF TOTAL OUTSTANDING SHARES | ||||||
| SUB-ADVISER | AFFIRMATIVE | AGAINST | ABSTAIN | |||
TCW Investment Management Co. | 54.022% | 8.184% | 2.453% | |||
M.A. Weatherbie & Co., Inc. | 53.990% | 8.201% | 2.468% | |||
| PERCENTAGE OF VOTES | ||||||
| SUB-ADVISER | AFFIRMATIVE | AGAINST | ABSTAIN | |||
TCW Investment Management Co. | 83.549% | 12.658% | 3.793% | |||
M.A. Weatherbie & Co., Inc. | 83.500% | 12.684% | 3.816% | |||
www.all-starfunds.com |
ASG |
| 34 | LIBERTY ALL-STAR® GROWTH FUND | |||||
| PRIVACY POLICY (UNAUDITED) | ||||||
This Privacy Policy Notice discloses the privacy policies of the Liberty All-Star® Funds, which are advised by ALPS Advisors, Inc. and serviced by ALPS Fund Services, Inc. (the “Companies”). The Companies and the Funds are referred to herein collectively as “we” or “us.”
PROTECTING YOUR PRIVACY IS A TOP PRIORITY
We realize that our ability to offer superior products and services depends on the personal and financial information we collect from you. We value your business and are committed to maintaining your trust. That is why we have made your privacy a top priority.
THE INFORMATION WE HAVE AND WHERE WE GET IT
We collect information about you from a variety of sources, including:
| • | Information we receive from you on applications or other forms, such as your name, address and phone number; your social security number; and your assets, income and other household information; |
| • | Information about your other transactions with us, our affiliates or others, such as your account balances and transactions history; and |
| • | Information from visitors to our websites provided through online forms, site visitorship data and online information-collecting devices known as “cookies.” |
We do not solicit personal or financial information from minors without written parental consent, nor do we knowingly market products and services to minors.
HOW WE USE THIS INFORMATION
We may share all of the information we collect with the Companies as part of the ordinary course of providing financial products and services to you, for the purpose of offering you new products and services to address your financial needs, for product development purposes and as otherwise required or permitted by law.
To assist in our business dealings with you, we may also share this information with companies (other than the Companies) that perform services, including marketing services, on our behalf (such as vendors that package and mail our investor statements and marketing research firms that enhance our ability to market our products and services). We do not share your information with mailing list or direct marketing companies. Thus, the information you provide to us will not result in unwanted solicitations from third-party marketers.
Finally, we may share this information with other entities outside of the Companies for the following purposes, including among others:
| • | To respond to a subpoena or court order, judicial process or regulatory inquiry; |
| • | To report suspicious transactions to government agencies and law enforcement officials; |
| • | To protect against fraud; |
| • | To provide products and services with the consent or the direction of a customer; or |
| • | In connection with the proposed or actual sale or merger of all or a portion of a business or operating unit. |
Except as described above, and except for information we provide to nonaffiliated third parties as otherwise required or permitted by law, we do not share information about you with nonaffiliated third parties.
SECURITY OF PERSONAL FINANCIAL INFORMATION
We restrict access to information about you to those employees we determine need to know that information to provide products and services to you. We maintain physical, electronic and procedural safeguards to protect this information.
If you provide information to us via our websites in order to view your account activity or conduct transactions, we use 128-bit SSL encryption security with passwords to ensure a safe transmission of data between you and us. Information you provide is stored and transmitted in a secure environment, accessible only by a select group of people who are given a secure passcode to access the information.
We continuously assess new technology for protecting information and upgrade our systems where appropriate.
IF YOU HAVE ANY QUESTIONS OR CONCERNS ABOUT THIS PRIVACY POLICY NOTICE, PLEASE WRITE TO US AT:
ALPS Advisors, Inc.
Attn: Compliance Department
1290 Broadway, Suite 1100
Denver, CO 80203
FORMER CUSTOMERS
If, for whatever reason, our customer relationship with you ends, we will preserve your information as necessary to comply with applicable laws. The measures we take to protect the privacy of customer information, as described in this Privacy Policy Notice, will continue to apply to you. We also will comply with more restrictive state laws to the extent they apply.
We reserve the right to change this Privacy Policy Notice, and any of the policies described herein, at any time. The examples contained in this Privacy Policy Notice are illustrations; they are not intended to be exclusive.
|
| LIBERTY ALL-STAR® GROWTH FUND | 35 | |||||
| DESCRIPTION OF LIPPER BENCHMARK AND MARKET INDICES (UNAUDITED) | ||||||
Lipper Multi-Cap Growth Mutual Fund Average
The average of funds that, by portfolio practice, invest in a variety of market capitalization ranges without concentrating 75% of their equity assets in any one market capitalization range over an extended period of time. Multi-Cap growth funds typically have an above-average price-to-earnings ratio, price-to-book ratio, and three-year sales-per-share growth value, compared to the S&P SuperComposite 1500® Index.
NASDAQ Composite Index
Measures all NASDAQ domestic and international based common type stocks listed on the NASDAQ Stock Market.
Russell 3000® Growth Index
Measures the performance of those Russell 3000® companies with higher price-to-book-ratios and higher forecasted growth values. The Russell 3000® Index measures the performance of the 3,000 largest U.S. companies based on total market capitalization, which represents approximately 98% of the investable U.S. equity market.
Russell 1000® Growth Index (Largecap)
Measures the performance of those Russell 1000® companies with higher price-to-book ratios and higher forecasted growth values. The Russell 1000® Index measures the performance of the 1,000 largest companies in the Russell 3000® Index.
Russell Midcap® Growth Index
Measures the performance of those Russell Midcap® companies with higher price-to-book ratios and higher forecasted growth values. The Russell Midcap® Index measures the performance of the 800 smallest companies in the Russell 1000® Index.
Russell 2000® Growth Index (Smallcap)
Measures the performance of those Russell 2000® companies with higher price-to-book ratios and higher forecasted growth values. The Russell 2000® Index measures the performance of the 2,000 smallest companies in the Russell 3000® Index.
S&P 500® Index
A representative sample of 500 leading companies in leading industries of the U.S. economy. Focuses on the large-cap segment of the market with approximately 75% coverage of U.S. equities. You cannot invest directly in an index.
www.all-starfunds.com |
ASG |
| 36 | LIBERTY ALL-STAR® GROWTH FUND | |||||
| NOTES | ||||||
|
|
|
|
|
|
|
|
|
|
|
|
|
|
|
|
|
|
|
|
|
|
|
|
|
|
|
|
|
|
|
|
|
|
|
|
|

Item 2. Code of Ethics.
| (a) | The registrant has, as of the end of the period covered by this report, adopted a code of ethics that applies to the registrant’s principal executive officer, principal financial officer, principal accounting officer or controller, or persons performing similar functions, regardless of whether these individuals are employed by the registrant or a third party. |
| (b) | The registrant’s Board adopted, effective December 10, 2007, a revised code of ethics described in 2(a) above. There have been no revisions to the code since that date. |
| (c) | During the period covered by this report, there were not any waivers or implicit waivers to a provision of the code of ethics adopted in 2(a) above. |
Item 3. Audit Committee Financial Expert.
The registrant’s Audit Committee is composed of six of the registrant’s independent directors who are not affiliated with the registrant’s investment advisor. The Board has determined that each of the audit committee members is “financially literate” and that at least one member has “accounting or related financial management expertise” as used in the New York Stock Exchange definitions of the terms.
Under the Sarbanes-Oxley Act, if the Board has not determined that a “financial expert,” a term based on criteria contained in the Sarbanes-Oxley Act, is serving on the audit committee, it must disclose this fact and explain why the committee does not have such an expert. The Board has determined that none of the members of its audit committee meets the technical requirements of the definition. Moreover, it believes that for the following reasons it is not necessary for a registered investment company such as the registrant, with an audit committee that meets the New York Stock Exchange requirements of financial literacy, to have a “financial expert” as a member of the committee.
| 1. | The financial statements of and accounting principles applying to the registrant are relatively straightforward and transparent compared to those of operating companies. The significant accounting issues are valuation of securities and other assets (regulated under the Investment Company Act of 1940 (the “1940 Act”) and computed daily), accrual of expenses, allocation of joint expenses shared with other entities, such as insurance premiums, and disclosures of all related party transactions. Equally important is knowledge of the tax laws applying to registered investment companies. None of the accounting issues involving corporate America that have received recent publicity, such as sophisticated derivative transactions and special purpose entities, are present in financial reporting for this registered investment company. |
| 2. | During the years that the registrant has been filing financial reports under the 1940 Act since its inception in 1986 there has never been a requirement for a financial report or statement to be restated. |
| 3. | The current members of the audit committee have many years of aggregate experience serving on this audit committee and/or in the Board’s judgment, through this experience and experience with other public corporation’s financial affairs, they have an understanding of the relevant generally accepted accounting principles governing the registrant’s financial statements, tax laws applying to the registrant, the registrant’s internal accounting controls and audit committee functions necessary to satisfy the objectives of the Sarbanes-Oxley Act with respect to the financial statements, auditing process and internal controls of the registrant. |
| 4. | The audit committee has the capability of employing a consultant who satisfies the technical definition of a “financial expert” and will do so from time to time if circumstances warrant. |
Item 4. Principal Accountant Fees and Services.
(a) Audit Fees. Aggregate Audit Fees billed by the principal accountant for professional services rendered during the fiscal years ended December 31, 2010 and December 31, 2011 are approximately $24,700 and $24,700, respectively.
Audit Fees include amounts related to the audit of the registrant’s annual financial statements or services that are normally provided by the accountant in connection with statutory and regulatory filings or engagements for those fiscal years.
(b) Audit-Related Fees. Aggregate Audit-Related Fees billed to the registrant by the principal accountant for professional services rendered during the fiscal years ended December 31, 2010 and December 31, 2011 are approximately $0 and $0, respectively.
Audit-Related Fees include amounts for assurance and related services by the principal accountant that are reasonably related to the performance of the audit of the registrant’s financial statements and are not reported in Audit Fees above
(c) Tax Fees. Aggregate Tax Fees billed by the principal accountant to the registrant for professional services rendered during the fiscal years ended December 31, 2010 and December 31, 2011 are approximately $3,560 and $3,685, respectively.
(d) All Other Fees. Aggregate All Other Fees billed by the principal accountant to the registrant for professional services rendered during the fiscal years ended December 31, 2010 and December 31, 2011 are $0 and $0, respectively.
All Other Fees include amounts for products and services provided by the principal accountant, other than the services reported in paragraphs (a) through (c) above.
None of the amounts described in paragraphs (a) through (d) above were approved pursuant to the “de minimis” exception under paragraph (c)(7)(i)(C) of Rule 2-01 of Regulation S-X. During the fiscal years ended December 31, 2010 and December 31, 2011, there were no Audit-Related Fees, Tax Fees and All Other Fees that were approved for services related directly to the operations and financial reporting of the registrant to the investment advisor (not including any sub-advisor whose role is primarily portfolio management and is subcontracted with or overseen by another investment advisor) and any entity controlling, controlled by, or under common control with such investment advisor that provides ongoing services to the registrant under paragraph (c)(7)(ii) of Rule 2-01 of Regulation S-X.
(e)(1) Audit Committee Pre-Approval Policies and Procedures
The registrant’s Audit Committee is required to pre-approve the engagement of the registrant’s independent accountants to provide audit and non-audit services to the registrant and non-audit services to its investment advisor (not including any sub-advisor whose role is primarily portfolio management and is subcontracted with or overseen by another investment advisor) or any entity controlling, controlled by or under common control with such investment advisor that provides ongoing services to the registrant (“Advisor Affiliates”), if the engagement relates directly to the operations or financial reporting of the registrant, including the fees and other compensation to be paid to the independent accountants.
The Audit Committee has adopted a Policy for Engagement of Independent Accountants for Audit and Non-Audit Services (“Policy”). The Policy sets forth the understanding of the Audit Committees regarding the engagement of the registrant’s independent accountants to provide (i) audit and permissible audit-related, tax and other services to the registrant; (ii) non-audit services to the registrant’s investment advisor (not including any sub-advisor whose role is primarily portfolio management and is subcontracted with or overseen by another investment advisor) and Advisor Affiliates, if the engagement relates directly to the operations or financial reporting of a Fund; and (iii) other audit and non-audit services to the registrant’s investment advisor (not including any sub-advisor whose role is primarily portfolio management and is subcontracted with or overseen by another investment advisor) and Advisor Affiliates. Unless a type of service receives general pre-approval under the Policy, it requires specific pre-approval by the Audit Committee if it is to be provided by the independent accountants. Pre-approval of non-audit services to the registrant, the registrant’s investment advisor (not including any sub-advisor whose role is primarily portfolio management and is subcontracted with or overseen by another investment advisor) and Advisor Affiliates may be waived provided that the “de minimis” requirements set forth in the SEC’s rules relating to pre-approval of non-audit services are met.
Under the Policy, the Audit Committee may delegate pre-approval authority to any pre-designated member or members who are Independent Directors. The member(s) to whom such authority is delegated must report, for informational purposes only, any pre-approval decisions to the Audit Committee at its next regular meeting. The Audit Committee’s responsibilities with respect to the pre-approval of services performed by the independent accountants may not be delegated to management.
The Policy requires the Fund Treasurer and/or Director of Board Administration to submit to the Audit Committee, on an annual basis, a schedule of the types of services that are subject to general pre-approval. The schedule(s) provide a description of each type of service that is subject to general pre-approval and, where possible, will provide estimated fee caps for each instance of providing each service. The Audit Committees will review and approve the types of services and review the projected fees for the next fiscal year and may add to, or subtract from, the list of general pre-approved services from time to time based on subsequent determinations. That approval acknowledges that each Audit Committee is in agreement with the specific types of services that the independent accountants will be permitted to perform.
(e)(2) The percentage of services described in paragraphs (b) through (d) of this Item approved pursuant to the “de minimis” exception under paragraph (c)(7)(i)(C) of Rule 2-01 of Regulation S-X during both fiscal years ended December 31, 2010 and December 31, 2011 was zero.
(f) Not applicable.
(g) The aggregate non-audit fees billed by the registrant’s accountant in each of the last two fiscal years of the Registrant were $198,560 in 2010 and $166,685 in 2011. These fees consisted of non-audit fees billed to (i) the Registrant of $3,560 in 2010 and $3,685 in 2011 as described in response to paragraph (c) above and (ii) to ALPS Fund Services, Inc., (“AFS”), an entity under common control with the ALPS Advisors, Inc., the Registrant’s investment advisor, $195,000 in 2010 and $163,000 in 2011. The non-audit fees billed to AFS related to SAS 70 services and other compliance related matters.
(h) The registrant’s Audit Committee has considered whether the provision of non-audit services that were rendered to the registrant’s advisor (not including any sub-advisor whose role is primarily portfolio management and is subcontracted with or overseen by another investment advisor), and any entity controlling, controlled by, or under common control with the investment advisor that provides ongoing services to the registrant that were not pre-approved pursuant to paragraph (c)(7)(ii) of Rule 2-01 of Regulation S-X, is compatible with maintaining the principal accountant’s independence. The Audit Committee determined that the provision of such services is compatible with maintaining the principal accountant’s independence.
Item 5. Audit Committee of Listed Registrants.
The registrant has a separately-designated standing audit committee established in accordance with Section 3(a)(58)(A) of the Securities Exchange Act of 1934 (15 U.S.C. 78c(a)(58)(A)).
As of December 31, 2011, John A. Benning, Thomas W. Brock, George R. Gaspari Richard W. Lowry, John J. Neuhauser, and Richard C. Rantzow are each an independent director and collectively constitute the entire Audit Committee.
Item 6. Schedule.
The registrant’s “Schedule I – Investments in securities of unaffiliated issuers” (as set forth in 17 CFR 210.12-12) is included in Item 1 of this Form N-CSR.
Item 7. Disclosure of Proxy Voting Policies and Procedures for Closed-End Management Investment Companies.
The Fund has delegated to ALPS Advisors, Inc. (the “Advisor”) the responsibility to vote proxies relating to portfolio securities held by the Fund. In deciding to delegate this responsibility to the Advisor, the Fund’s Board reviewed and approved the policies and procedures adopted by the Advisor. These included the procedures that the Advisor follows when a vote presents a conflict between the interests of the Fund and its shareholders and the Advisor, its affiliates, its other clients or other persons.
The Advisor’s policy is to vote all proxies for Fund securities in a manner considered by the Advisor to be in the best interest of the Fund and its shareholders without regard to any benefit to the Advisor, its affiliates, its other clients or other persons. The Advisor or an affiliate examines each proposal and votes against the proposal, if, in its judgment,
approval or adoption of the proposal would be expected to impact adversely the current or potential market value of the issuer’s securities. The Advisor or an affiliate also examines each proposal and votes the proxies against the proposal, if, in its judgment, the proposal would be expected to affect adversely the best interest of the Fund. The Advisor or an affiliate determines the best interest of the Fund in light of the potential economic return on the Fund’s investment.
The Advisor addresses potential material conflicts of interest by having predetermined voting guidelines. For those proposals that require special consideration or in instances where special circumstances may require varying from the predetermined guideline, a Proxy Committee determines the vote in the best interest of the Fund, without consideration of any benefit to the Advisor, its affiliates, its other clients or other persons. The Proxy Committee is composed of representatives of equity investments, equity research, compliance, legal and fund administration functions. In addition to the responsibilities described above, the Proxy Committee has the responsibility to review, on a semi-annual basis, the Advisor’s proxy voting policies to ensure consistency with internal and regulatory agency policies and to develop additional predetermined voting guidelines to assist in the review of proxy proposals.
The Proxy Committee may vary from a predetermined guideline if it determines that voting on the proposal according to the predetermined guideline would be expected to impact adversely the current or potential market value of the issuer’s securities or to affect adversely the best interest of the client. References to the best interest of a client refer to the interest of the client in terms of the potential economic return on the client’s investment. In determining the vote on any proposal, the Proxy Committee does not consider any benefit other than benefits to the owner of the securities to be voted. A member of the Proxy Committee is prohibited from voting on any proposal for which he or she has a conflict of interest by reason of a direct relationship with the issuer or other party affected by a given proposal. Persons making recommendations to the Proxy Committee or its members are required to disclose to the Committee any relationship with a party making a proposal or other matter known to the person that would create a potential conflict of interest.
The Advisor has retained Institutional Shareholder Services (“ISS”), a third party vendor, to implement its proxy voting process. ISS provides proxy analysis, record keeping services and vote disclosure services.
Item 8. Portfolio Managers of Closed-End Management Investment Companies.
M.A. Weatherbie & Co., Inc. (“M.A. Weatherbie”)
MANAGEMENT. Matthew A. Weatherbie, CFA is the person responsible for managing the portion of the Fund allocated to M.A. Weatherbie. Mr. Weatherbie is the Chief Investment Officer, President and Lead Portfolio Manager of M.A. Weatherbie, which he founded in December 1995. Mr. Weatherbie’s prior experience as a portfolio manager was at Putnam Investments from 1983-1995 where he managed the Putnam Voyager Fund. Between 1973 and 1983, he was a securities analyst and then a portfolio manager of MFS (Massachusetts Financial Services) Emerging Growth Trust. He has earned the right to use the CFA Institute Chartered Financial Analyst designation.
OTHER ACCOUNTS. The table below provides information regarding the other accounts managed by Matthew A. Weatherbie as of December 31, 2011:
| Type of Account | Number of Accounts | Total Assets Managed (in millions) | Number of Accounts Managed For which Advisory Fee is Performance Based | Assets Managed for which Advisory Fee is Performance Based (in millions) | ||||
|
|
| ||||||
Matthew A.Weatherbie | ||||||||
Registered Investment Companies | 2 | $71 | 0 | N/A | ||||
Other pooled investment vehicles | 2 | $109 | 2 | $109 | ||||
Other accounts | 24 | $730 | 0 | N/A | ||||
COMPENSATION STRUCTURE. As the sole owner of M.A. Weatherbie, Matthew A. Weatherbie’s compensation is directly related to the overall profitability of M.A. Weatherbie. Mr. Weatherbie receives a fixed base salary, profit sharing (pre-tax/deferred compensation) and earnings from the company, if any, at year end under the rules of Sub-Chapter S of the Internal Revenue Code. All compensation is pre-tax. There is no difference between the method used to determine compensation with respect to the Fund and the other accounts managed by Mr. Weatherbie, except that a performance allocation may be payable by the other pooled investment vehicles managed by M.A. Weatherbie.
OWNERSHIP BY PORTFOLIO MANAGER: None
MATERIAL CONFLICTS OF INTEREST: None
TCW Investment Management Company (“TCW”)
MANAGEMENT. Matthew A. Weatherbie, CFA is the person responsible for managing the portion of the Fund allocated to M.A. Weatherbie. Mr. Weatherbie is the Chief Investment Officer, President and Lead Portfolio Manager of M.A. Weatherbie, which he founded in December 1995. Mr. Weatherbie’s prior experience as a portfolio manager was at Putnam Investments from 1983-1995 where he managed the Putnam Voyager Fund. Between 1973 and 1983, he was a securities analyst and then a portfolio manager of MFS (Massachusetts Financial Services) Emerging Growth Trust. He has earned the right to use the CFA Institute Chartered Financial Analyst designation.
OTHER ACCOUNTS. The table below provides information regarding the other accounts managed by Matthew A. Weatherbie as of December 31, 2011:
| Type of Account | Number of Accounts | Total Assets Managed (in millions) | Number of Accounts Managed For which Advisory Fee is Performance Based | Assets Managed for which Advisory Fee is Performance Based (in millions) | ||||
|
|
| ||||||
Matthew A.Weatherbie | ||||||||
Registered Investment Companies | 2 | $71 | 0 | N/A | ||||
Other pooled investment vehicles | 2 | $109 | 2 | $109 | ||||
Other accounts | 24 | $730 | 0 | N/A | ||||
COMPENSATION STRUCTURE. As the sole owner of M.A. Weatherbie, Matthew A. Weatherbie’s compensation is directly related to the overall profitability of M.A. Weatherbie. Mr. Weatherbie receives a fixed base salary, profit sharing (pre-tax/deferred compensation) and earnings from the company, if any, at year end under the rules of Sub-Chapter S of the Internal Revenue Code. All compensation is pre-tax. There is no difference between the method used to determine compensation with respect to the Fund and the other accounts managed by Mr. Weatherbie, except that a performance allocation may be payable by the other pooled investment vehicles managed by M.A. Weatherbie.
OWNERSHIP BY PORTFOLIO MANAGER: None
MATERIAL CONFLICTS OF INTEREST: None
Item 9. Purchases of Equity Securities by Closed-End Management Investment Company and Affiliated Purchasers.
During the fiscal year ended December 31, 2011, there were no purchases made by or on behalf of the registrant or any “affiliated purchaser”, as defined in Rule 10b-18(a)(3) under the Securities Exchange Act of 1934 (“Exchange Act”), of shares or other units of any class of the registrant’s equity securities that are registered by the registrant pursuant to Section 12 of the Exchange Act.
Item 10. Submission of Matters to a Vote of Security Holders.
There have not been any material changes to the procedures by which shareholders may recommend nominees to the registrant’s board of directors, since those procedures were last disclosed in response to the requirements of Item 7(d)(2)(ii)(G) of Schedule 14A or this Item.
Item 11. Controls and Procedures.
| (a) | The registrant’s principal executive officer and principal financial officers, based on their evaluation of the registrant’s disclosure controls and procedures as of a date within 90 days of the filing of this report, have concluded that such controls and procedures are adequately designed to ensure that information required to be disclosed by the registrant in Form N-CSR is accumulated and communicated to the registrant’s management, including the principal executive officer and principal financial officer, or persons performing similar functions, as appropriate to allow timely decisions regarding required disclosure. |
| (b) | There were no changes in the registrant’s internal control over financial reporting that occurred during the registrant’s second fiscal quarter of the period covered by this report that has materially affected, or is reasonably likely to materially affect, the registrant’s internal control over financial reporting. |
Item 12. Exhibits.
(a)(1) The registrant’s Code of Ethics for Principal Executive and Senior Financial Officers that applies to the registrant’s principal executive officer and principal financial officer and as described in Item 2 hereof is incorporated by reference to Exhibit-99-12(a)(1) to the registrant’s Form N-CSR for its fiscal year ended December 31, 2007, filed electronically with the Securities and Exchange Commission on March 7, 2008.
(a)(2) Certifications pursuant to Rule 30a-2(a) under the Investment Company Act of 1940 (17 CFR 270.30a-2(a)) attached hereto as Exhibit 99.CERT.
(a)(3) Not applicable.
(b) Certification pursuant to Rule 30a-2(b) under the Investment Company Act of 1940 (17 CFR 270.30a-2(b)) attached hereto as Exhibit 99.906CERT.
SIGNATURES
Pursuant to the requirements of the Securities Exchange Act of 1934 and the Investment Company Act of 1940, the registrant has duly caused this report to be signed on its behalf by the undersigned, thereunto duly authorized.
| LIBERTY ALL-STAR GROWTH FUND, INC. | ||
| By: | /s/ William R. Parmentier, Jr. | |
| William R. Parmentier, Jr. (Principal Executive Officer) | ||
| President | ||
| Date: | March 5, 2012 | |
| By: | /s/ Jeremy O. May | |
| Jeremy O. May (Principal Financial Officer) | ||
| Treasurer | ||
| Date: | March 5, 2012 | |