UNITED STATES
SECURITIES AND EXCHANGE COMMISSION
Washington, D.C. 20549
Form N-CSR
CERTIFIED SHAREHOLDER REPORT OF REGISTERED
MANAGEMENT INVESTMENT COMPANIES
Investment Company Act File Number 811-04550
THE MAINSTAY FUNDS
(Exact name of Registrant as specified in charter)
51 Madison Avenue, New York, NY 10010
(Address of principal executive offices) (Zip code)
J. Kevin Gao, Esq.
169 Lackawanna Avenue
Parsippany, New Jersey 07054
(Name and address of agent for service)
Registrant’s telephone number, including area code: (212) 576-7000
Date of fiscal year end: October 31
Date of reporting period: October 31, 2012
FORM N-CSR
| Item 1. | Reports to Stockholders. |

MainStay Flexible Bond Opportunities Fund
Message from the President and Annual Report
October 31, 2012
This Page Intentionally Left Blank
Message from the President
Most major equity markets delivered positive results for the 12 months ended October 31, 2012. In the United States, stocks provided solid double-digit returns. With a few notable exceptions, international stock markets generally ended the reporting period in positive territory.
The stock market’s advance, however, was far from uniform. After rising to an early peak at the end of March 2012, domestic and international stocks lost ground until the beginning of June. After that, stocks generally rose, reaching their high point for the reporting period in mid-September. Although stocks remained relatively buoyant through mid-October, they drifted lower as the reporting period came to a close.
A variety of forces converged to help fuel these market movements. Investors kept a close eye on developments in the European sovereign debt crisis. The European Central Bank’s Long Term Refinancing Operations helped stabilize European credit markets and provide needed liquidity. Although private holders of Greek sovereign debt had to accept a reduction in their recovery value, the anticipated voluntary exchange provided a positive spark to the markets. Rising unemployment and new austerity measures may impede economic growth as the European Union seeks to strike a delicate balance between fiscal and monetary policies.
In the United States, the Federal Reserve announced an open-ended agency mortgage-backed security purchase program, which helped calm market concerns. The Federal Reserve also continued its maturity extension program (referred to by some as “operation twist”), which seeks to put downward pressure on longer-term interest rates. At the short end of the yield curve, the Federal Reserve maintained the federal funds rate in a near-zero range. In September 2012, the Federal Open Market Committee anticipated that “exceptionally low levels for the federal funds rate” were “likely to be warranted at least through mid-2015.”
With markets stabilizing and short-term interest rates at very low levels, yield-hungry investors had incentives to lengthen maturities and accept higher risk. Domestic high-yield bonds provided double-digit returns for the reporting period, municipal bonds and convertible securities provided high single-digit returns, and domestic corporate bonds provided positive overall returns.
While most investors are pleased when markets rise, MainStay portfolio managers know that long-term results depend on more than short-term market movements. They also depend on the consistent application of well-defined investment strategies and risk-management techniques over longer periods. Our long-term perspective gives our portfolio managers the ability to look past the daily ups and downs of the market as they pursue the specific investment objectives of their individual Funds.
At MainStay, we believe that a long-term perspective can help investors as well. Instead of trying to capitalize on short-term market movements, you may prefer to focus on the long-term potential that can come from getting invested, staying invested and adding to your investments over time. Of course, past performance is no guarantee of future results.
The following pages contain more specific information on the securities, market events and investment decisions that affected your MainStay Fund(s) during the 12 months ended October 31, 2012. We invite you to read the information carefully and use it as part of your ongoing portfolio evaluation and investment review.
Sincerely,

Stephen P. Fisher
President
The opinions expressed are as of the date of this report and are subject to change. There is no guarantee that any forecast made will come to pass. This material does not constitute investment advice and is not intended as an endorsement of any specific investment.
Not part of the Annual Report
Table of Contents
Investors should refer to the Fund’s Summary Prospectus and/or Prospectus and consider the Fund’s investment objectives, strategies, risks, charges and expenses carefully before investing. The Summary Prospectus and/or Prospectus contain this and other information about the Fund. You may obtain copies of the Fund’s Summary Prospectus, Prospectus and Statement of Additional Information free of charge, upon request, by calling toll-free 800-MAINSTAY (624-6782), by writing to NYLIFE Distributors LLC, Attn: MainStay Marketing Department, 169 Lackawanna Avenue, Parsippany, New Jersey 07054 or by sending an e-mail to MainStayShareholderServices@nylim.com. These documents are also available via the MainStay Funds’ website at mainstayinvestments.com/documents. Please read the Summary Prospectus and/or Prospectus carefully before investing.
Investment and Performance Comparison1 (Unaudited)
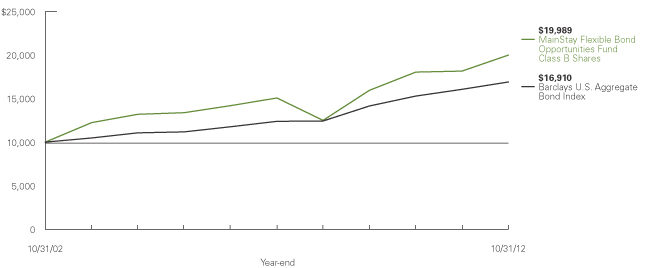
Performance data quoted represents past performance. Past performance is no guarantee of future results. Because of market volatility, current performance may be lower or higher than the figures shown. Investment return and principal value will fluctuate, and as a result, when shares are redeemed, they may be worth more or less than their original cost. The graph below depicts the historical performance of Class B shares of the Fund. Performance will vary from class to class based on differences in class-specific expenses and sales charges. For performance information current to the most recent month-end, please call 800-MAINSTAY (624-6782) or visit mainstayinvestments.com.
(With sales charges)
Average Annual Total Returns for the Year Ended October 31, 2012
| | | | | | | | | | | | | | | | | | | | |
| Class | | Sales Charge | | | | One Year | | | Five Years | | | Ten Years | | | Gross
Expense
Ratio2 | |
| Investor Class Shares3 | | Maximum 4.5% Initial Sales Charge | | With sales charges Excluding sales charges | |
| 5.98
10.98 | %
| |
| 5.64
6.62 | %
| |
| 7.48
7.97 | %
| |
| 1.42
1.42 | %
|
| Class A Shares | | Maximum 4.5% Initial Sales Charge | | With sales charges Excluding sales charges | |
| 6.26
11.26 |
| |
| 5.81
6.79 |
| |
| 7.57
8.06 |
| |
| 1.22
1.22 |
|
| Class B Shares | | Maximum 5% CDSC
if Redeemed Within the First Six Years of Purchase | | With sales charges Excluding sales charges | |
| 5.15
10.15 |
| |
| 5.50
5.82 |
| |
| 7.17
7.17 |
| |
| 2.16
2.16 |
|
| Class C Shares | | Maximum 1% CDSC if Redeemed Within One Year of Purchase | | With sales charges Excluding sales charges | |
| 9.16
10.16 |
| |
| 5.80
5.80 |
| |
| 7.16
7.16 |
| |
| 2.19
2.19 |
|
| Class I Shares4 | | No Sales Charge | | | | | 11.41 | | | | 7.08 | | | | 8.38 | | | | 1.02 | |
| 1. | The performance table and graph do not reflect the deduction of taxes that a shareholder would pay on distributions or Fund-share redemptions. Total returns reflect maximum applicable sales charges as indicated in the table above, changes in share price, and reinvestment of dividend and capital gain distributions. The graph assumes the initial investment amount shown above and reflects the deduction of all sales charges that would have applied for the period of investment. Performance figures reflect certain fee waivers and/or expense limitations, without which total returns may have been lower. For more information on share classes and current fee waivers and/or expense limitations, please refer to the notes to the financial statements. |
| 2. | The gross expense ratios presented reflect the Fund’s “Total Annual Fund Operating Expenses” from the most recent Prospectus and may differ from other expense ratios disclosed in this report. |
| 3. | Performance figures for Investor Class shares, first offered on February 28, 2008, include the historical performance of Class A shares through February 27, 2008, adjusted for differences in certain expenses and fees. Unadjusted, the performance shown for Investor Class shares might have been different. |
| 4. | Performance figures for Class I shares, first offered on January 2, 2004, include the historical performance of Class A shares through January 1, 2004, adjusted for differences in certain expenses and fees. Unadjusted, the performance shown for Class I shares might have been different. |
The footnotes on the next page are an integral part of the table and graph and should be carefully read in conjunction with them.
| | | | |
| mainstayinvestments.com | | | 5 | |
| | | | | | | | | | | | |
| Benchmark Performance | | One
Year | | | Five
Years | | | Ten
Years | |
Barclays U.S. Aggregate Bond Index5 | | | 5.25 | % | | | 6.38 | % | | | 5.39 | % |
Average Lipper Multi-Sector Income Fund6 | | | 9.75 | | | | 6.47 | | | | 7.63 | |
| 5. | The Barclays U.S. Aggregate Bond Index is a broad-based benchmark that measures the investment grade, U.S. dollar-denominated, fixed-rate taxable bond market, including Treasurys, government-related and corporate securities, mortgage-backed securities (agency fixed-rate and hybrid adjustable rate mortgage pass-throughs), asset-backed securities, and commercial mortgage-backed securities. The Barclays U.S. Aggregate Bond Index is the Fund’s broad-based securities market index for comparison purposes. Total returns assume reinvestment of all dividends and capital gains. An investment cannot be made directly in an index. |
| 6. | The average Lipper multi-sector income fund is representative of funds that seek current income by allocating assets among several different fixed income securities sectors (with no more than 65% in any one sector except for defensive purposes), including U.S. government and foreign governments, with a significant portion of assets in securities rated below investment-grade. This benchmark is a product of Lipper Inc. Lipper Inc. is an independent monitor of fund performance. Results are based on average total returns of similar funds with all dividend and capital gain distributions reinvested. |
The footnotes on the preceding page are an integral part of the table and graph and should be carefully read in conjunction with them.
| | |
| 6 | | MainStay Flexible Bond Opportunities Fund |
Cost in Dollars of a $1,000 Investment in MainStay Flexible Bond Opportunities Fund (Unaudited)
The example below is intended to describe the fees and expenses borne by shareholders during the six-month period from May 1, 2012, to October 31, 2012, and the impact of those costs on your investment.
Example
As a shareholder of the Fund, you incur two types of costs: (1) transaction costs, including exchange fees and sales charges (loads) on purchases (as applicable), and (2) ongoing costs, including management fees, distribution and/or service (12b-1) fees, and other Fund expenses (as applicable). This example is intended to help you understand your ongoing costs (in dollars) of investing in the Fund and to compare these costs with the ongoing costs of investing in other mutual funds. The example is based on an investment of $1,000 made at the beginning of the six-month period and held for the entire period from May 1, 2012, to October 31, 2012.
This example illustrates your Fund’s ongoing costs in two ways:
Actual Expenses
The second and third data columns in the table below provide information about actual account values and actual expenses. You may use the information in these columns, together with the amount you invested, to estimate the expenses that you paid during the six months ended October 31, 2012. Simply divide your account value by $1,000 (for example, an $8,600 account value divided by $1,000 = 8.6), then
multiply the result by the number under the heading entitled “Expenses Paid During Period” to estimate the expenses you paid on your account during this period.
Hypothetical Example for Comparison Purposes
The fourth and fifth data columns in the table below provide information about hypothetical account values and hypothetical expenses based on the Fund’s actual expense ratio and an assumed rate of return of 5% per year before expenses, which is not the Fund’s actual return. The hypothetical account values and expenses may not be used to estimate the actual ending account balances or expenses you paid for the six-month period shown. You may use this information to compare the ongoing costs of investing in the Fund with the ongoing costs of investing in other Funds. To do so, compare this 5% hypothetical example with the 5% hypothetical examples that appear in the shareholder reports of the other Funds.
Please note that the expenses shown in the table are meant to highlight your ongoing costs only and do not reflect any transactional costs, such as exchange fees or sales charges (loads). Therefore, the fourth and fifth data columns of the table are useful in comparing ongoing costs only and will not help you determine the relative total costs of owning different funds. In addition, if these transactional costs were included, your costs would have been higher.
| | | | | | | | | | | | | | | | | | | | |
| | | | | | | | | | | | | | | | |
| Share Class | | Beginning
Account
Value
5/1/12 | | | Ending Account
Value (Based
on Actual
Returns and
Expenses)
10/31/12 | | | Expenses
Paid
During
Period1 | | | Ending Account
Value (Based
on Hypothetical
5% Annualized
Return and
Actual Expenses)
10/31/12 | | | Expenses
Paid
During
Period1 | |
| | | | | |
| Investor Class Shares | | $ | 1,000.00 | | | $ | 1,054.00 | | | $ | 7.90 | | | $ | 1,017.40 | | | $ | 7.76 | |
| | | | | |
| Class A Shares | | $ | 1,000.00 | | | $ | 1,054.10 | | | $ | 6.97 | | | $ | 1,018.30 | | | $ | 6.85 | |
| | | | | |
| Class B Shares | | $ | 1,000.00 | | | $ | 1,049.50 | | | $ | 11.75 | | | $ | 1,013.70 | | | $ | 11.54 | |
| | | | | |
| Class C Shares | | $ | 1,000.00 | | | $ | 1,048.40 | | | $ | 11.74 | | | $ | 1,013.70 | | | $ | 11.54 | |
| | | | | |
| Class I Shares | | $ | 1,000.00 | | | $ | 1,055.40 | | | $ | 5.63 | | | $ | 1,019.70 | | | $ | 5.53 | |
| 1. | Expenses are equal to the Fund’s annualized expense ratio of each class (1.53% for Investor Class, 1.35% for Class A, 2.28% for Class B and Class C and 1.09% for Class I) multiplied by the average account value over the period, divided by 366 and multiplied by 184 (to reflect the six-month period). The table above represents the actual expenses incurred during the six-month period. |
| | | | |
| mainstayinvestments.com | | | 7 | |
Portfolio Composition as of October 31, 2012 (Unaudited)
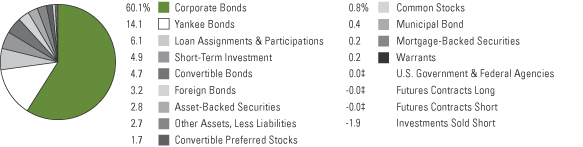
See Portfolio of Investments beginning on page 11 for specific holdings within these categories.
| ‡ | Less than one-tenth of a percent. |
Top Ten Holdings or Issuers Held as of October 31, 2012 (excluding short-term investment)
| 1. | Bank of America Corp., 5.625%–7.625%, due 6/1/19–7/1/20 |
| 2. | Caesars Entertainment Operating Co., Inc., 4.461%–10.00%, due 1/26/18–12/15/18 |
| 3. | Ford Motor Credit Co. LLC, 8.00%–8.125%, due 12/15/16–1/15/20 |
| 4. | First Data Corp., 7.375%–8.875%, due 6/15/19–8/15/20 |
| 5. | Avis Budget Car Rental LLC / Avis Budget Finance, Inc., 8.25%–9.625%, due 3/15/18–1/15/19 |
| 6. | Canada Square Operations PLC, 7.50%, due 5/29/49 |
| 7. | Novelis, Inc., 4.00%–8.75%, due 3/10/17–12/15/20 |
| 8. | Lincoln National Corp., 7.00%, due 5/17/66 |
| 9. | Reynolds Group Issuer, Inc., 7.875%–9.875%, due 8/15/19 |
| 10. | MGM Resorts International, 4.25%–8.625%, due 4/15/15–10/1/20 |
| | |
| 8 | | MainStay Flexible Bond Opportunities Fund |
Portfolio Management Discussion and Analysis (Unaudited)
Questions answered by portfolio managers Dan Roberts, PhD, Michael Kimble, Louis N. Cohen and Taylor Wagenseil of MacKay Shields LLC, the Fund’s Subadvisor.
How did MainStay Flexible Bond Opportunities Fund perform relative to its peers and its benchmark during the 12 months ended October 31, 2012?
Excluding all sales charges, MainStay Flexible Bond Opportunities Fund returned 10.98% for Investor Class shares, 11.26% for Class A shares, 10.15% for Class B shares and 10.16% for Class C shares for the 12 months ended October 31, 2012. Over the same period, the Fund’s Class I shares returned 11.41%. All share classes outperformed the 9.75% return of the average Lipper1 multi-sector income fund and the 5.25% return of the Barclays U.S. Aggregate Bond Index2 for the 12 months ended October 31, 2012. The Barclays U.S. Aggregate Bond Index is the Fund’s broad-based securities-market index. See page 5 for Fund returns with applicable sales charges.
What factors affected the Fund’s relative performance during the reporting period?
The Fund’s outperformance of the Barclays U.S. Aggregate Bond Index was primarily driven by an overweight position in spread3 products, specifically high-yield corporate bonds. Assets with higher risk profiles provided strong results during the reporting period, largely in response to accommodative monetary policies among the world’s central banks. In particular, the European Central Bank’s Long Term Refinancing Operation offered in late December 2011 and February 2012 helped recapitalize the European banking system. In the last quarter of the reporting period, the European Central Bank president’s proclamation to “preserve the euro”—along with the U.S. Federal Reserve’s announcement that it would engage in an open-ended mortgage purchase program—calmed market fears and kept the “risk rally” alive as investors continued to search for yield. A stronger appetite for risk benefited the Fund’s overweight positions in high-yield corporate bonds and convertible bonds.
High-yield corporate bonds made up the Fund’s largest overweight position in relation to the Barclays U.S. Aggregate Bond Index. (The Index consists entirely of investment-grade bonds.) Within high-yield corporate bonds, holdings in sectors that are more cyclical—such as financials, gaming and housing—were among the Fund’s strongest performers.
Lower-risk assets, such as U.S. Treasury securities and agency mortgages, underperformed the Barclays U.S. Aggregate Bond Index. Fortunately, the Fund’s underweight positions in these asset classes helped the Fund’s performance relative to the Index.
What was the Fund’s duration4 strategy during the reporting period?
The Fund’s duration was shorter than that of the Barclays U.S. Aggregate Bond Index, in large part because of the Fund’s overweight position in high-yield corporate bonds. These bonds tend to have shorter durations than investment-grade corporate bonds. They also tend to have a low correlation to U.S. Treasury securities, so they have a lower sensitivity to interest rates. To further insulate the Fund from a potential rise in interest rates, we maintained a short position in U.S. Treasury futures to keep the Fund’s duration shorter than that of the Index.
What specific factors, risks or market forces prompted significant decisions for the Fund during the reporting period?
There were many macro factors to consider, and the Fund experienced some periods of volatility. Nevertheless, we did not make any material changes to the Fund’s positioning. Prior to the reporting period, we had judged the Federal Reserve’s accommodative monetary policy, along with improving economic data, to be a positive for spread products such as high-yield corporate bonds. For this reason, we maintained a risk profile that was higher than that of the Barclays U.S. Aggregate Bond Index.
During the reporting period, we saw several reasons to believe that the market would continue to favor spread products. The low interest-rate environment sparked healthy demand for higher-yielding securities. Improving profitability signaled that many corporations were doing more with less: less leverage, less short-term debt and smaller funding gaps. In our opinion, improving credit fundamentals would support narrower spreads—or less compensation for assuming credit risk—alongside a favorable balance of supply and demand for corporate debt.
During the reporting period, which market segments were the strongest positive contributors to the Fund’s performance and which market segments were particularly weak?
An overweight position in high-yield corporate bonds was the driving force behind the Fund’s outperformance of the Barclays U.S. Aggregate Bond Index. The Barclays U.S. Aggregate Bond Index was up 5.25%, while high-yield corporate bonds, as measured by the Bank of America Merrill Lynch High Yield
| 1. | See footnote on page 6 for more information on Lipper Inc. |
| 2. | See footnote on page 6 for more information on the Barclays U.S. Aggregate Bond Index. |
| 3. | The terms “spread” and “yield spread” may refer to the difference in yield between a security or type of security and comparable U.S. Treasury issues. The terms may also refer to the difference in yield between two specific securities or types of securities at a given time. |
| 4. | Duration is a measure of the price sensitivity of a fixed-income investment to changes in interest rates. Duration is expressed as a number of years and is considered a more accurate sensitivity gauge than average maturity. |
| | | | |
| mainstayinvestments.com | | | 9 | |
Master II Constrained Index,5 were up 13.15%. Within high-yield corporate bonds, the Fund’s financials and real estate securities were the best performers. Of course, not all of the Fund’s high-yield securities were strong performers. Within the high-yield asset class, energy and utilities holdings were among the Fund’s weakest performers.
The Fund’s position in convertible bonds had a positive impact on its performance during the reporting period.
With an overweight position in high-yield corporate bonds came underweight positions in U.S. Treasury securities and agency mortgages. These underweight sector positions contributed positively to the Fund’s relative performance as investors continued their search for higher-yielding assets and were willing to assume higher levels of risk to pursue their yield objectives.
Did the Fund make any significant purchases or sales during the reporting period?
Through October 31, the year 2012 brought robust new issuance in the high-yield corporate bond market. Year-to-date volume exceeded the previous record set in 2010. The majority of new issuance (61% year-to-date) was for refinancing. As a result, several companies in which the Fund held positions, including privatized correctional and detention facilities operator Corrections Corporation of America and residential home builder Meritage Homes, redeemed their bonds from the Fund during the reporting period.
During the reporting period, some companies whose bonds the Fund had previously owned issued new securities that fit our process, and we bought them for the Fund. Among these companies were oil and gas producer Chesapeake Energy, gaming facilities operator Mohegan Tribal Gaming Authority and residential home builder KB Home.
How did the Fund’s sector weightings change during the reporting period?
During the reporting period, we slightly increased the Fund’s exposure to high-yield corporate bonds and bank loans. Over the same period, we decreased the Fund’s exposure to U.S.
Treasury securities.
How was the Fund positioned at the end of the reporting period?
As of October 31, 2012, the Fund’s most substantially overweight sector relative to the Barclays U.S. Aggregate Bond Index was high-yield corporate bonds. The Fund also held overweight positions in bank loans and convertible securities.
As of the same date, the Fund held underweight positions relative to the Index in U.S. Treasury securities, agency debentures and agency mortgage-backed securities. As of October 31, 2012, the Fund had a shorter duration than the Barclays U.S. Aggregate Bond Index.
| 5. | The Bank of America Merrill Lynch U.S. High Yield Master II Constrained Index is a market value-weighted index of all domestic and Yankee high-yield bonds, including deferred interest bonds and payment-in-kind securities. Issuers included in the Index have maturities of one year or more and have a credit rating lower than BBB–/Baa3, but are not in default. No single issuer may constitute greater than 2% of the Index. Total returns assume reinvestment of all dividends and capital gains. An investment cannot be made directly in an index. |
The opinions expressed are those of the portfolio managers as of the date of this report and are subject to change. There is no guarantee that any forecast made will come to pass. This material does not constitute investment advice and is not intended as an endorsement of any specific investment.
| | |
| 10 | | MainStay Flexible Bond Opportunities Fund |
Portfolio of Investments††† October 31, 2012
| | | | | | | | |
| | | Principal
Amount | | | Value | |
| | | | | | | | |
| Long-Term Bonds 91.6%† Asset-Backed Securities 2.8% | | | | | | | | |
Airlines 0.5% | | | | | | | | |
American Airlines Pass-Through Trust
Series 2001-1, Class A1
6.977%, due 5/23/21 (a) | | $ | 673,668 | | | $ | 666,931 | |
Continental Airlines, Inc.
Series 2004-ERJ1, Class A
9.558%, due 9/1/19 | | | 105,116 | | | | 111,423 | |
Northwest Airlines, Inc.
Series 2007-1, Class A
7.027%, due 11/1/19 | | | 363,466 | | | | 401,630 | |
United Air Lines, Inc.
Series 2009-2, Class A
9.75%, due 1/15/17 | | | 649,826 | | | | 752,174 | |
| | | | | | | | |
| | | | 1,932,158 | |
| | | | | | | | |
Home Equity 1.7% | |
Carrington Mortgage Loan Trust
Series 2006-NC4, Class A5
0.271%, due 10/25/36 (b)(c) | | | 654,138 | | | | 464,123 | |
Citicorp Residential Mortgage Securities, Inc.
Series 2006-1, Class A3
5.706%, due 7/25/36 (c) | | | 2,349 | | | | 2,345 | |
Citigroup Mortgage Loan Trust, Inc.
Series 2007-AHL2, Class A3A
0.281%, due 5/25/37 (b)(c) | | | 410,970 | | | | 308,390 | |
Equifirst Loan Securitization Trust
Series 2007-1, Class A2A
0.271%, due 4/25/37 (b)(c) | | | 174,369 | | | | 163,187 | |
First NLC Trust
Series 2007-1, Class A1
0.281%, due 8/25/37 (b)(c)(d) | | | 482,208 | | | | 201,131 | |
GSAA Home Equity Trust
Series 2006-14, Class A1
0.261%, due 9/25/36 (b) | | | 1,023,817 | | | | 509,923 | |
Home Equity Loan Trust
Series 2007-FRE1, Class 2AV1
0.341%, due 4/25/37 (b)(c) | | | 293,169 | | | | 242,669 | |
HSI Asset Securitization Corp. Trust
Series 2007-NC1, Class A1
0.311%, due 4/25/37 (b)(c) | | | 555,089 | | | | 470,266 | |
JP Morgan Mortgage Acquisition Corp.
Series 2007-HE1, Class AF1
0.311%, due 3/25/47 (b)(c) | | | 362,149 | | | | 250,915 | |
Master Asset Backed Securities Trust
Series 2006-HE4, Class A1
0.261%, due 11/25/36 (b)(c) | | | 128,605 | | | | 51,096 | |
| | | | | | | | |
| | | Principal
Amount | | | Value | |
| | | | | | | | |
Home Equity (continued) | | | | | | | | |
Merrill Lynch Mortgage Investors Trust
Series 2007-MLN1, Class A2A
0.321%, due 3/25/37 (b)(c) | | $ | 872,975 | | | $ | 614,932 | |
Morgan Stanley ABS Capital I, Inc. | |
Series 2006-HE6, Class A2B 0.311%, due 9/25/36 (b)(c) | | | 591,165 | | | | 375,600 | |
Series 2006-HE8, Class A2B 0.311%, due 10/25/36 (b)(c) | | | 247,241 | | | | 130,924 | |
Series 2007-HE4, Class A2A 0.321%, due 2/25/37 (b)(c) | | | 111,922 | | | | 43,332 | |
Series 2007-NC2, Class A2FP 0.361%, due 2/25/37 (b)(c) | | | 475,573 | | | | 241,656 | |
Renaissance Home Equity Loan Trust
Series 2007-2, Class AF1
5.893%, due 6/25/37 (c) | | | 917,007 | | | | 450,482 | |
Securitized Asset Backed Receivables LLC Trust
Series 2007-BR4, Class A2A
0.301%, due 5/25/37 (b)(c) | | | 566,727 | | | | 270,507 | |
Soundview Home Equity Loan Trust | | | | | | | | |
Series 2007-OPT1, Class 2A1 0.291%, due 6/25/37 (b)(c) | | | 759,679 | | | | 703,220 | |
Series 2006-EQ2, Class A2 0.321%, due 1/25/37 (b)(c) | | | 371,299 | | | | 212,590 | |
Specialty Underwriting & Residential Finance
Series 2006-BC4, Class A2B
0.321%, due 9/25/37 (b)(c) | | | 1,550,558 | | | | 1,238,209 | |
| | | | | | | | |
| | | | | | | 6,945,497 | |
| | | | | | | | |
Student Loans 0.6% | | | | | | | | |
Keycorp Student Loan Trust
Series 2000-A, Class A2
0.747%, due 5/25/29 (b) | | | 2,498,724 | | | | 2,288,631 | |
| | | | | | | | |
Total Asset-Backed Securities
(Cost $12,107,724) | | | | 11,166,286 | |
| | | | | | | | |
| | |
| Convertible Bonds 4.7% | | | | | | | | |
Apparel 0.1% | | | | | | | | |
Iconix Brand Group, Inc.
2.50%, due 6/1/16 (d) | | | 323,000 | | | | 323,202 | |
| | | | | | | | |
| | |
Auto Manufacturers 0.1% | | | | | | | | |
Ford Motor Co.
4.25%, due 11/15/16 | | | 266,000 | | | | 392,849 | |
| | | | | | | | |
| | |
Auto Parts & Equipment 0.2% | | | | | | | | |
Meritor, Inc.
4.00%, due 2/15/27 (e) | | | 855,000 | | | | 635,906 | |
| | | | | | | | |
| † | Percentages indicated are based on Fund net assets. |
| ¨ | | Among the Fund’s 10 largest holdings or issuers held as of October 31, 2012, excluding short-term investments. May be subject to change daily. |
| | | | | | |
The notes to the financial statements are an integral part of,
and should be read in conjunction with, the financial statements. | | mainstayinvestments.com | | | 11 | |
Portfolio of Investments††† October 31, 2012 (continued)
| | | | | | | | |
| | | Principal
Amount | | | Value | |
| | | | | | | | |
| Convertible Bonds (continued) | |
Biotechnology 0.2% | | | | | | | | |
Amgen, Inc.
0.375%, due 2/1/13 | | $ | 182,000 | | | $ | 206,343 | |
Gilead Sciences, Inc.
1.00%, due 5/1/14 | | | 488,000 | | | | 742,675 | |
| | | | | | | | |
| | | | | | | 949,018 | |
| | | | | | | | |
Coal 0.2% | | | | | | | | |
Alpha Natural Resources, Inc.
2.375%, due 4/15/15 | | | 246,000 | | | | 224,475 | |
Peabody Energy Corp.
4.75%, due 12/15/66 | | | 565,000 | | | | 514,856 | |
| | | | | | | | |
| | | | | | | 739,331 | |
| | | | | | | | |
Commercial Services 0.0%‡ | | | | | | | | |
Hertz Global Holdings, Inc.
5.25%, due 6/1/14 | | | 93,000 | | | | 160,716 | |
| | | | | | | | |
| | |
Computers 0.3% | | | | | | | | |
EMC Corp.
1.75%, due 12/1/13 | | | 411,000 | | | | 638,079 | |
Mentor Graphics Corp.
4.00%, due 4/1/31 | | | 331,000 | | | | 376,306 | |
SanDisk Corp.
1.50%, due 8/15/17 | | | 245,000 | | | | 273,328 | |
| | | | | | | | |
| | | | | | | 1,287,713 | |
| | | | | | | | |
Distribution & Wholesale 0.2% | | | | | | | | |
WESCO International, Inc.
6.00%, due 9/15/29 | | | 355,000 | | | | 847,563 | |
| | | | | | | | |
| | |
Electronics 0.1% | | | | | | | | |
TTM Technologies, Inc.
3.25%, due 5/15/15 | | | 541,000 | | | | 547,424 | |
| | | | | | | | |
| | |
Entertainment 0.1% | | | | | | | | |
International Game Technology
3.25%, due 5/1/14 | | | 470,000 | | | | 490,563 | |
| | | | | | | | |
| | |
Environmental Controls 0.3% | | | | | | | | |
Covanta Holding Corp.
3.25%, due 6/1/14 | | | 1,080,000 | | | | 1,313,550 | |
| | | | | | | | |
| | |
Health Care—Products 0.3% | | | | | | | | |
Teleflex, Inc.
3.875%, due 8/1/17 | | | 788,000 | | | | 973,672 | |
| | | | | | | | |
| | |
Health Care—Services 0.1% | | | | | | | | |
WellPoint, Inc.
2.75%, due 10/15/42 (d) | | | 276,000 | | | | 289,110 | |
| | | | | | | | |
| | | | | | | | |
| | | Principal
Amount | | | Value | |
| | | | | | | | |
Household Products & Wares 0.1% | | | | | | | | |
Jarden Corp.
1.875%, due 9/15/18 (d) | | $ | 389,000 | | | $ | 390,945 | |
| | | | | | | | |
| | |
Internet 0.1% | | | | | | | | |
At Home Corp.
4.75%, due 12/31/49 (a)(f)(g)(h) | | | 504,238 | | | | 50 | |
DealerTrack Holdings, Inc.
1.50%, due 3/15/17 | | | 39,000 | | | | 40,731 | |
Symantec Corp.
Series B
1.00%, due 6/15/13 | | | 270,000 | | | | 293,625 | |
VeriSign, Inc.
3.25%, due 8/15/37 | | | 186,000 | | | | 231,221 | |
| | | | | | | | |
| | | | | | | 565,627 | |
| | | | | | | | |
Iron & Steel 0.4% | | | | | | | | |
Allegheny Technologies, Inc.
4.25%, due 6/1/14 | | | 730,000 | | | | 802,544 | |
ArcelorMittal
5.00%, due 5/15/14 | | | 398,000 | | | | 405,711 | |
Steel Dynamics, Inc.
5.125%, due 6/15/14 | | | 36,000 | | | | 38,452 | |
United States Steel Corp.
4.00%, due 5/15/14 | | | 190,000 | | | | 194,869 | |
| | | | | | | | |
| | | | | | | 1,441,576 | |
| | | | | | | | |
Lodging 0.1% | | | | | | | | |
¨MGM Resorts International
4.25%, due 4/15/15 | | | 317,000 | | | | 325,718 | |
| | | | | | | | |
| | |
Machinery—Diversified 0.1% | | | | | | | | |
Chart Industries, Inc.
2.00%, due 8/1/18 | | | 224,000 | | | | 286,440 | |
| | | | | | | | |
| | |
Media 0.0%‡ | | | | | | | | |
Central European Media Enterprises, Ltd.
5.00%, due 11/15/15 | | | 149,000 | | | | 135,590 | |
| | | | | | | | |
| | |
Mining 0.0%‡ | | | | | | | | |
Alcoa, Inc.
5.25%, due 3/15/14 | | | 76,000 | | | | 109,773 | |
| | | | | | | | |
| | |
Miscellaneous—Manufacturing 0.2% | | | | | | | | |
Danaher Corp.
(zero coupon), due 1/22/21 | | | 484,000 | | | | 730,235 | |
| | | | | | | | |
| | |
Oil & Gas 0.0%‡ | | | | | | | | |
Transocean, Inc.
Series C
1.50%, due 12/15/37 | | | 126,000 | | | | 126,236 | |
| | | | | | | | |
| | | | |
| 12 | | MainStay Flexible Bond Opportunities Fund | | The notes to the financial statements are an integral part of,
and should be read in conjunction with, the financial statements. |
| | | | | | | | |
| | | Principal
Amount | | | Value | |
| | | | | | | | |
| Convertible Bonds (continued) | |
Oil & Gas Services 0.1% | | | | | | | | |
JPMorgan Chase & Co.
(Convertible into Schlumberger, Ltd.)
1.50%, due 6/25/15 (d) | | $ | 129,375 | | | $ | 165,134 | |
Subsea 7 S.A.
3.50%, due 10/13/14 | | | 200,000 | | | | 289,120 | |
| | | | | | | | |
| | | | | | | 454,254 | |
| | | | | | | | |
Pharmaceuticals 0.3% | | | | | | | | |
BioMarin Pharmaceutical, Inc.
1.875%, due 4/23/17 | | | 187,000 | | | | 361,377 | |
Salix Pharmaceuticals, Ltd.
1.50%, due 3/15/19 (d) | | | 143,000 | | | | 136,744 | |
2.75%, due 5/15/15 | | | 238,000 | | | | 271,171 | |
Teva Pharmaceutical Finance Co. LLC
0.25%, due 2/1/26 | | | 456,000 | | | | 485,925 | |
| | | | | | | | |
| | | | | | | 1,255,217 | |
| | | | | | | | |
Real Estate Investment Trusts 0.1% | | | | | | | | |
SL Green Operating Partnership, L.P.
3.00%, due 10/15/17 (d) | | | 454,000 | | | | 504,791 | |
| | | | | | | | |
| | |
Semiconductors 0.3% | | | | | | | | |
Microchip Technology, Inc.
2.125%, due 12/15/37 | | | 277,000 | | | | 336,382 | |
ON Semiconductor Corp.
Series B
2.625%, due 12/15/26 | | | 473,000 | | | | 488,077 | |
Xilinx, Inc.
2.625%, due 6/15/17 | | | 309,000 | | | | 401,700 | |
| | | | | | | | |
| | | | | | | 1,226,159 | |
| | | | | | | | |
Software 0.1% | | | | | | | | |
Microsoft Corp.
(zero coupon), due 6/15/13 (d) | | | 131,000 | | | | 134,439 | |
Nuance Communications, Inc.
2.75%, due 8/15/27 | | | 46,000 | | | | 61,237 | |
| | | | | | | | |
| | | | | | | 195,676 | |
| | | | | | | | |
Telecommunications 0.6% | | | | | | | | |
Anixter International, Inc.
1.00%, due 2/15/13 | | | 509,000 | | | | 549,084 | |
Ciena Corp.
4.00%, due 3/15/15 (d) | | | 243,000 | | | | 256,669 | |
InterDigital, Inc.
2.50%, due 3/15/16 | | | 159,000 | | | | 166,851 | |
SBA Communications Corp.
1.875%, due 5/1/13 | | | 419,000 | | | | 676,423 | |
4.00%, due 10/1/14 | | | 318,000 | | | | 712,916 | |
| | | | | | | | |
| | | | | | | 2,361,943 | |
| | | | | | | | |
Total Convertible Bonds
(Cost $19,989,455) | | | | | | | 19,060,797 | |
| | | | | | | | |
| | | | | | | | |
| | | Principal
Amount | | | Value | |
| | | | | | | | |
| Corporate Bonds 60.1% | |
Aerospace & Defense 1.4% | | | | | | | | |
B/E Aerospace, Inc.
5.25%, due 4/1/22 | | $ | 1,850,000 | | | $ | 1,928,625 | |
Ducommun, Inc.
9.75%, due 7/15/18 | | | 1,190,000 | | | | 1,258,425 | |
TransDigm, Inc.
7.75%, due 12/15/18 | | | 815,000 | | | | 898,538 | |
Triumph Group, Inc.
8.625%, due 7/15/18 | | | 1,305,000 | | | | 1,464,862 | |
| | | | | | | | |
| | | | | | | 5,550,450 | |
| | | | | | | | |
Airlines 1.9% | | | | | | | | |
Continental Airlines, Inc.
7.875%, due 1/2/20 | | | 537,981 | | | | 555,465 | |
9.798%, due 10/1/22 | | | 700,981 | | | | 764,069 | |
Delta Air Lines, Inc.
Series 2011-1 Class A Pass Through Trust
5.30%, due 10/15/20 | | | 1,410,347 | | | | 1,544,330 | |
Series 2010-1 Class A Pass Through Trust
6.20%, due 1/2/20 | | | 382,571 | | | | 424,654 | |
Series 2010-2 Class B Pass Through Trust
6.75%, due 5/23/17 | | | 612,000 | | | | 636,480 | |
U.S. Airways, Inc. Class A
Class A Series 2012-1, Pass-Through Trust 5.90%, due 4/1/26 | | | 2,891,000 | | | | 3,151,190 | |
United Air Lines, Inc.
9.875%, due 8/1/13 (d) | | | 667,000 | | | | 680,340 | |
| | | | | | | | |
| | | | | | | 7,756,528 | |
| | | | | | | | |
Auto Manufacturers 1.1% | | | | | | | | |
Chrysler Group LLC / CG Co-Issuer, Inc.
8.25%, due 6/15/21 | | | 2,190,000 | | | | 2,340,562 | |
Ford Motor Co.
6.625%, due 10/1/28 | | | 229,000 | | | | 260,417 | |
General Motors Corp. (Escrow Shares)
8.375%, due 7/15/33 (f)(g)(i) | | | 11,365,000 | | | | 1,137 | |
Navistar International Corp.
8.25%, due 11/1/21 | | | 2,156,000 | | | | 2,018,555 | |
| | | | | | | | |
| | | | | | | 4,620,671 | |
| | | | | | | | |
Auto Parts & Equipment 0.4% | | | | | | | | |
Commercial Vehicle Group, Inc.
7.875%, due 4/15/19 | | | 1,000,000 | | | | 983,750 | |
Tomkins LLC / Tomkins, Inc.
9.00%, due 10/1/18 | | | 594,000 | | | | 665,280 | |
| | | | | | | | |
| | | | | | | 1,649,030 | |
| | | | | | | | |
Banks 3.6% | | | | | | | | |
AgriBank FCB
9.125%, due 7/15/19 | | | 500,000 | | | | 661,769 | |
¨Bank of America Corp.
5.625%, due 7/1/20 | | | 3,590,000 | | | | 4,188,478 | |
7.625%, due 6/1/19 | | | 420,000 | | | | 532,606 | |
| | | | | | |
The notes to the financial statements are an integral part of,
and should be read in conjunction with, the financial statements. | | mainstayinvestments.com | | | 13 | |
Portfolio of Investments††† October 31, 2012 (continued)
| | | | | | | | |
| | | Principal
Amount | | | Value | |
| | | | | | | | |
| Corporate Bonds (continued) | |
Banks (continued) | |
CIT Group, Inc.
4.25%, due 8/15/17 | | $ | 330,000 | | | $ | 338,516 | |
5.00%, due 5/15/17 | | | 2,003,000 | | | | 2,110,762 | |
Discover Bank
7.00%, due 4/15/20 | | | 2,445,000 | | | | 2,996,829 | |
JPMorgan Chase & Co.
7.90%, due 4/29/49 (b) | | | 2,200,000 | | | | 2,533,806 | |
Morgan Stanley
4.875%, due 11/1/22 | | | 1,287,000 | | | | 1,301,068 | |
| | | | | | | | |
| | | | | | | 14,663,834 | |
| | | | | | | | |
Biotechnology 0.6% | | | | | | | | |
Life Technologies Corp.
5.00%, due 1/15/21 | | | 2,050,000 | | | | 2,340,061 | |
| | | | | | | | |
| | |
Building Materials 1.6% | | | | | | | | |
Associated Materials LLC /AMH New Finance, Inc.
9.125%, due 11/1/17 | | | 1,223,000 | | | | 1,210,770 | |
Boise Cascade LLC
7.125%, due 10/15/14 | | | 859,000 | | | | 860,632 | |
Masco Corp.
7.125%, due 3/15/20 | | | 2,250,000 | | | | 2,609,415 | |
Texas Industries, Inc.
9.25%, due 8/15/20 | | | 840,000 | | | | 896,700 | |
USG Corp. | | | | | | | | |
6.30%, due 11/15/16 | | | 615,000 | | | | 625,762 | |
9.75%, due 1/15/18 | | | 363,000 | | | | 396,578 | |
| | | | | | | | |
| | | | | | | 6,599,857 | |
| | | | | | | | |
Chemicals 1.8% | | | | | | | | |
Dow Chemical Co. (The)
8.55%, due 5/15/19 | | | 1,084,000 | | | | 1,470,020 | |
Hexion U.S. Finance Corp. / Hexion Nova Scotia Finance ULC
8.875%, due 2/1/18 | | | 1,223,000 | | | | 1,235,230 | |
Huntsman International LLC
8.625%, due 3/15/21 | | | 2,000,000 | | | | 2,275,000 | |
Momentive Performance Materials, Inc.
9.00%, due 1/15/21 | | | 815,000 | | | | 562,350 | |
Rockwood Specialties Group, Inc.
4.625%, due 10/15/20 | | | 1,753,000 | | | | 1,805,590 | |
Vertellus Specialties, Inc.
9.375%, due 10/1/15 (d) | | | 102,000 | | | | 81,600 | |
| | | | | | | | |
| | | | | | | 7,429,790 | |
| | | | | | | | |
Coal 1.6% | | | | | | | | |
Alpha Natural Resources, Inc.
6.00%, due 6/1/19 | | | 1,560,000 | | | | 1,368,900 | |
Arch Coal, Inc.
7.25%, due 10/1/20 | | | 1,630,000 | | | | 1,442,550 | |
| | | | | | | | |
| | | Principal
Amount | | | Value | |
| | | | | | | | |
Coal (continued) | | | | | | | | |
Cloud Peak Energy Resources LLC / Cloud Peak Energy Finance Corp.
8.25%, due 12/15/17 (j) | | $ | 2,162,000 | | | $ | 2,340,365 | |
Peabody Energy Corp.
7.375%, due 11/1/16 | | | 1,025,000 | | | | 1,173,625 | |
| | | | | | | | |
| | | | | | | 6,325,440 | |
| | | | | | | | |
Commercial Services 2.7% | | | | | | | | |
¨Avis Budget Car Rental LLC / Avis Budget Finance, Inc.
8.25%, due 1/15/19 | | | 1,223,000 | | | | 1,334,599 | |
9.625%, due 3/15/18 | | | 2,375,000 | | | | 2,645,156 | |
Geo Group, Inc. (The)
6.625%, due 2/15/21 | | | 1,223,000 | | | | 1,317,782 | |
Hertz Corp. (The)
7.375%, due 1/15/21 | | | 1,630,000 | | | | 1,754,287 | |
Iron Mountain, Inc. | | | | | | | | |
7.75%, due 10/1/19 | | | 431,000 | | | | 485,953 | |
8.375%, due 8/15/21 | | | 1,293,000 | | | | 1,428,765 | |
Quebecor World, Inc.
(Litigation Recovery Trust - Escrow Shares) | | | | | | | | |
6.50%, due 8/1/49 (f)(g)(i) | | | 5,000 | | | | 80 | |
9.75%, due 1/15/49 (f)(g)(i) | | | 160,000 | | | | 2,560 | |
UR Merger Sub Corp.
8.375%, due 9/15/20 | | | 1,849,000 | | | | 2,024,655 | |
| | | | | | | | |
| | | | | | | 10,993,837 | |
| | | | | | | | |
Computers 0.8% | | | | | | | | |
NCR Corp.
5.00%, due 7/15/22 (d) | | | 1,565,000 | | | | 1,598,256 | |
SunGard Data Systems, Inc.
6.625%, due 11/1/19 (d) | | | 1,050,000 | | | | 1,059,188 | |
10.25%, due 8/15/15 | | | 572,000 | | | | 585,156 | |
| | | | | | | | |
| | | | 3,242,600 | |
| | | | | | | | |
Diversified Financial Services 0.8% | |
Ford Holdings LLC
9.30%, due 3/1/30 | | | 127,000 | | | | 178,276 | |
GE Capital Trust IV
Series Reg S
4.625%, due 9/15/66 (b) | | € | 1,223,000 | | | | 1,515,943 | |
General Electric Capital Corp.
6.50%, due 9/15/67 (b) | | £ | 815,000 | | | | 1,331,317 | |
| | | | | | | | |
| | | | 3,025,536 | |
| | | | | | | | |
Electric 1.6% | |
CMS Energy Corp. | |
6.25%, due 2/1/20 | | $ | 98,000 | | | | 116,920 | |
8.75%, due 6/15/19 | | | 533,000 | | | | 702,906 | |
Energy Future Intermediate Holding Co. LLC / EFIH Finance, Inc.
10.00%, due 12/1/20 | | | 1,724,000 | | | | 1,883,470 | |
| | | | |
| 14 | | MainStay Flexible Bond Opportunities Fund | | The notes to the financial statements are an integral part of,
and should be read in conjunction with, the financial statements. |
| | | | | | | | |
| | | Principal
Amount | | | Value | |
| | | | | | | | |
| Corporate Bonds (continued) | |
Electric (continued) | |
Great Plains Energy, Inc.
4.85%, due 6/1/21 | | $ | 750,000 | | | $ | 851,991 | |
NRG Energy, Inc.
8.50%, due 6/15/19 | | | 1,970,000 | | | | 2,132,525 | |
Wisconsin Energy Corp.
6.25%, due 5/15/67 (b) | | | 833,280 | | | | 893,693 | |
| | | | | | | | |
| | | | 6,581,505 | |
| | | | | | | | |
Entertainment 0.2% | |
Mohegan Tribal Gaming Authority
10.50%, due 12/15/16 (d) | | | 815,000 | | | | 768,138 | |
United Artists Theatre Circuit, Inc.
Series BA7
9.30%, due 7/1/15 (f)(g) | | | 35,016 | | | | 24,511 | |
| | | | | | | | |
| | | | 792,649 | |
| | | | | | | | |
Environmental Controls 0.1% | |
EnergySolutions, Inc. / EnergySolutions LLC
10.75%, due 8/15/18 (j) | | | 550,000 | | | | 510,125 | |
| | | | | | | | |
|
Finance—Auto Loans 1.1% | |
¨Ford Motor Credit Co. LLC | |
8.00%, due 12/15/16 | | | 22,000 | | | | 26,643 | |
8.125%, due 1/15/20 | | | 3,361,000 | | | | 4,271,656 | |
| | | | | | | | |
| | | | 4,298,299 | |
| | | | | | | | |
Finance—Commercial 0.4% | |
Textron Financial Corp.
6.00%, due 2/15/67 (b)(d) | | | 1,860,000 | | | | 1,599,600 | |
| | | | | | | | |
|
Finance—Consumer Loans 1.1% | |
HSBC Finance Capital Trust IX
5.911%, due 11/30/35 (b)(j) | | | 2,425,000 | | | | 2,417,022 | |
SLM Corp. | |
4.75%, due 3/17/14 | | € | 815,000 | | | | 1,070,923 | |
6.25%, due 1/25/16 | | $ | 408,000 | | | | 440,660 | |
8.00%, due 3/25/20 | | | 408,000 | | | | 472,513 | |
| | | | | | | | |
| | | | 4,401,118 | |
| | | | | | | | |
Finance—Credit Card 1.4% | |
American Express Co.
6.80%, due 9/1/66 (b)(j) | | | 2,139,000 | | | | 2,323,489 | |
Capital One Capital III
7.686%, due 8/1/66 | | | 3,097,000 | | | | 3,141,597 | |
| | | | | | | | |
| | | | | | | 5,465,086 | |
| | | | | | | | |
Finance—Other Services 0.6% | | | | | | | | |
Icahn Enterprises, L.P. / Icahn Enterprises Finance Corp.
7.75%, due 1/15/16 (j) | | | 2,180,000 | | | | 2,278,100 | |
| | | | | | | | |
| | | | | | | | |
| | | Principal
Amount | | | Value | |
| | | | | | | | |
Food 0.8% | | | | | | | | |
JBS USA LLC / JBS USA Finance, Inc.
8.25%, due 2/1/20 (d) | | $ | 672,000 | | | $ | 693,840 | |
Smithfield Foods, Inc.
7.75%, due 7/1/17 | | | 2,206,000 | | | | 2,492,780 | |
| | | | | | | | |
| | | | | | | 3,186,620 | |
| | | | | | | | |
Forest Products & Paper 1.0% | | | | | | | | |
Domtar Corp.
10.75%, due 6/1/17 | | | 734,000 | | | | 950,335 | |
International Paper Co.
7.30%, due 11/15/39 | | | 693,000 | | | | 962,554 | |
MeadWestvaco Corp.
7.375%, due 9/1/19 | | | 1,800,000 | | | | 2,284,252 | |
| | | | | | | | |
| | | | | | | 4,197,141 | |
| | | | | | | | |
Gas 0.2% | | | | | | | | |
Southern Union Co.
7.60%, due 2/1/24 | | | 662,000 | | | | 851,186 | |
| | | | | | | | |
| | |
Hand & Machine Tools 0.4% | | | | | | | | |
Mcron Finance Sub LLC / Mcron Finance Corp.
8.375%, due 5/15/19 (d) | | | 1,635,000 | | | | 1,679,962 | |
| | | | | | | | |
| | |
Health Care—Products 1.1% | | | | | | | | |
Alere, Inc.
8.625%, due 10/1/18 | | | 1,323,000 | | | | 1,389,150 | |
Kinetic Concepts, Inc. / KCI U.S.A., Inc.
10.50%, due 11/1/18 (d) | | | 2,825,000 | | | | 3,008,625 | |
| | | | | | | | |
| | | | | | | 4,397,775 | |
| | | | | | | | |
Health Care—Services 1.2% | | | | | | | | |
Fresenius Medical Care U.S. Finance, Inc.
6.50%, due 9/15/18 (d) | | | 2,500,000 | | | | 2,800,000 | |
HCA, Inc.
6.50%, due 2/15/16 | | | 2,000,000 | | | | 2,187,500 | |
| | | | | | | | |
| | | | | | | 4,987,500 | |
| | | | | | | | |
Home Builders 2.7% | | | | | | | | |
Beazer Homes USA, Inc. | | | | | | | | |
8.125%, due 6/15/16 (j) | | | 819,000 | | | | 864,045 | |
9.125%, due 6/15/18 | | | 1,700,000 | | | | 1,782,875 | |
K Hovnanian Enterprises, Inc.
7.25%, due 10/15/20 (d) | | | 1,460,000 | | | | 1,540,300 | |
KB Home
8.00%, due 3/15/20 | | | 2,250,000 | | | | 2,514,375 | |
Lennar Corp.
6.95%, due 6/1/18 | | | 204,000 | | | | 229,245 | |
MDC Holdings, Inc.
5.625%, due 2/1/20 | | | 693,000 | | | | 772,526 | |
| | | | | | |
The notes to the financial statements are an integral part of,
and should be read in conjunction with, the financial statements. | | mainstayinvestments.com | | | 15 | |
Portfolio of Investments††† October 31, 2012 (continued)
| | | | | | | | |
| | | Principal
Amount | | | Value | |
| | | | | | | | |
| Corporate Bonds (continued) | |
Home Builders (continued) | |
Shea Homes, L.P. / Shea Homes Funding Corp.
8.625%, due 5/15/19 | | $ | 2,000,000 | | | $ | 2,225,000 | |
Standard Pacific Corp.
8.375%, due 5/15/18 | | | 815,000 | | | | 949,475 | |
| | | | | | | | |
| | | | 10,877,841 | |
| | | | | | | | |
Household Products & Wares 1.8% | | | | | | | | |
Jarden Corp. | | | | | | | | |
7.50%, due 5/1/17 | | | 500,000 | | | | 567,500 | |
7.50%, due 1/15/20 | | | 1,223,000 | | | | 1,339,185 | |
Mead Products LLC / ACCO Brands Corp.
6.75%, due 4/30/20 (d) | | | 2,002,000 | | | | 2,044,543 | |
¨Reynolds Group Issuer, Inc. | |
7.875%, due 8/15/19 | | | 1,025,000 | | | | 1,112,125 | |
9.875%, due 8/15/19 | | | 2,089,000 | | | | 2,188,227 | |
| | | | | | | | |
| | | | 7,251,580 | |
| | | | | | | | |
Insurance 3.3% | | | | | | | | |
Allstate Corp. (The)
6.50%, due 5/15/67 (b) | | | 713,000 | | | | 766,475 | |
American International Group, Inc. | | | | | | | | |
4.875%, due 3/15/67 (b) | | € | 1,250,000 | | | | 1,400,651 | |
Series A2
5.75%, due 3/15/67 (b) | | £ | 450,000 | | | | 663,009 | |
Chubb Corp. (The)
6.375%, due 3/29/67 (b) | | $ | 1,955,000 | | | | 2,121,175 | |
Farmers Exchange Capital
7.20%, due 7/15/48 (d) | | | 603,000 | | | | 742,078 | |
Liberty Mutual Group, Inc. | | | | | | | | |
7.80%, due 3/7/87 (d) | | | 453,000 | | | | 508,493 | |
10.75%, due 6/15/88 (b)(d) | | | 938,000 | | | | 1,397,620 | |
¨Lincoln National Corp.
7.00%, due 5/17/66 (b) | | | 3,443,000 | | | | 3,529,075 | |
Pacific Life Insurance Co. | | | | | | | | |
7.90%, due 12/30/23 (d) | | | 1,150,000 | | | | 1,405,120 | |
9.25%, due 6/15/39 (d) | | | 204,000 | | | | 288,590 | |
Progressive Corp. (The)
6.70%, due 6/15/67 (b) | | | 612,000 | | | | 666,315 | |
| | | | | | | | |
| | | | 13,488,601 | |
| | | | | | | | |
Iron & Steel 0.2% | | | | | | | | |
Allegheny Ludlum Corp.
6.95%, due 12/15/25 | | | 693,000 | | | | 830,234 | |
| | | | | | | | |
| | |
Leisure Time 0.1% | | | | | | | | |
Harley-Davidson Funding Corp.
6.80%, due 6/15/18 (d) | | | 408,000 | | | | 506,182 | |
| | | | | | | | |
| | | | | | | | |
| | | Principal
Amount | | | Value | |
| | | | | | | | |
Lodging 1.6% | | | | | | | | |
¨Caesars Entertainment Operating Co., Inc. 10.00%, due 12/15/18 | | $ | 2,250,000 | | | $ | 1,406,250 | |
¨MGM Resorts International | |
6.75%, due 10/1/20 (d) | | | 1,994,000 | | | | 1,979,045 | |
8.625%, due 2/1/19 (d) | | | 825,000 | | | | 892,031 | |
Starwood Hotels & Resorts Worldwide, Inc.
7.15%, due 12/1/19 | | | 1,700,000 | | | | 2,090,973 | |
| | | | | | | | |
| | | | | | | 6,368,299 | |
| | | | | | | | |
Machinery—Construction & Mining 0.3% | |
Terex Corp.
8.00%, due 11/15/17 | | | 1,182,000 | | | | 1,233,712 | |
| | | | | | | | |
| | |
Media 2.0% | | | | | | | | |
CCO Holdings LLC / CCO Holdings Capital Corp.
7.00%, due 1/15/19 (j) | | | 978,000 | | | | 1,051,350 | |
Cequel Communications Holdings I LLC / Cequel Capital Corp.
8.625%, due 11/15/17 (d) | | | 938,000 | | | | 1,003,660 | |
Clear Channel Communications, Inc.
9.00%, due 3/1/21 | | | 1,405,000 | | | | 1,225,862 | |
COX Communications, Inc.
6.95%, due 6/1/38 (d) | | | 2,241,000 | | | | 3,055,601 | |
DISH DBS Corp. | | | | | | | | |
6.75%, due 6/1/21 | | | 765,000 | | | | 852,019 | |
7.125%, due 2/1/16 (j) | | | 815,000 | | | | 910,763 | |
| | | | | | | | |
| | | | | | | 8,099,255 | |
| | | | | | | | |
Metal Fabricate & Hardware 0.2% | | | | | | | | |
Mueller Water Products, Inc.
8.75%, due 9/1/20 | | | 627,000 | | | | 719,483 | |
| | | | | | | | |
| | |
Mining 0.9% | | | | | | | | |
Alcoa, Inc.
6.15%, due 8/15/20 (j) | | | 1,426,000 | | | | 1,560,644 | |
Old AII, Inc. | | | | | | | | |
7.625%, due 2/15/18 | | | 1,426,000 | | | | 1,447,390 | |
7.875%, due 11/1/20 (d) | | | 475,000 | | | | 472,625 | |
| | | | | | | | |
| | | | | | | 3,480,659 | |
| | | | | | | | |
Miscellaneous—Manufacturing 0.4% | | | | | | | | |
American Railcar Industries, Inc.
7.50%, due 3/1/14 | | | 729,000 | | | | 736,290 | |
Polypore International, Inc.
7.50%, due 11/15/17 | | | 815,000 | | | | 880,200 | |
| | | | | | | | |
| | | | | | | 1,616,490 | |
| | | | | | | | |
Office Furnishings 0.4% | | | | | | | | |
Interface, Inc.
7.625%, due 12/1/18 | | | 1,674,000 | | | | 1,810,012 | |
| | | | | | | | |
| | | | |
| 16 | | MainStay Flexible Bond Opportunities Fund | | The notes to the financial statements are an integral part of,
and should be read in conjunction with, the financial statements. |
| | | | | | | | |
| | | Principal
Amount | | | Value | |
| | | | | | | | |
| Corporate Bonds (continued) | |
Oil & Gas 5.2% | | | | | | | | |
Berry Petroleum Co.
6.75%, due 11/1/20 (j) | | $ | 1,223,000 | | | $ | 1,296,380 | |
Chesapeake Energy Corp.
6.625%, due 8/15/20 | | | 2,445,000 | | | | 2,567,250 | |
Concho Resources, Inc. | | | | | | | | |
6.50%, due 1/15/22 | | | 750,000 | | | | 823,125 | |
7.00%, due 1/15/21 | | | 2,002,000 | | | | 2,222,220 | |
Denbury Resources, Inc.
6.375%, due 8/15/21 (j) | | | 815,000 | | | | 892,425 | |
Frontier Oil Corp.
6.875%, due 11/15/18 | | | 571,000 | | | | 608,115 | |
Hilcorp Energy I, L.P. / Hilcorp Finance Co.
7.625%, due 4/15/21 (d) | | | 1,223,000 | | | | 1,333,070 | |
8.00%, due 2/15/20 (d) | | | 1,000,000 | | | | 1,095,000 | |
Linn Energy LLC / Linn Energy Finance Corp.
6.50%, due 5/15/19 | | | 2,250,000 | | | | 2,266,875 | |
7.75%, due 2/1/21 | | | 815,000 | | | | 870,013 | |
Nabors Industries, Inc.
5.00%, due 9/15/20 (j) | | | 2,853,000 | | | | 3,178,784 | |
Plains Exploration & Production Co.
6.125%, due 6/15/19 | | | 2,250,000 | | | | 2,244,375 | |
Swift Energy Co.
7.125%, due 6/1/17 | | | 750,000 | | | | 770,625 | |
8.875%, due 1/15/20 | | | 658,000 | | | | 710,640 | |
| | | | | | | | |
| | | | | | | 20,878,897 | |
| | | | | | | | |
Oil & Gas Services 1.3% | | | | | | | | |
Basic Energy Services, Inc.
7.75%, due 2/15/19 | | | 1,600,000 | | | | 1,592,000 | |
Dresser-Rand Group, Inc.
6.50%, due 5/1/21 | | | 1,292,000 | | | | 1,356,600 | |
Helix Energy Solutions Group, Inc.
9.50%, due 1/15/16 (d)(j) | | | 625,000 | | | | 646,094 | |
Hornbeck Offshore Services, Inc.
5.875%, due 4/1/20 | | | 848,000 | | | | 862,840 | |
8.00%, due 9/1/17 | | | 815,000 | | | | 872,050 | |
| | | | | | | | |
| | | | | | | 5,329,584 | |
| | | | | | | | |
Packaging & Containers 0.7% | | | | | | | | |
Ball Corp.
6.75%, due 9/15/20 (j) | | | 2,648,000 | | | | 2,906,180 | |
| | | | | | | | |
| | |
Pipelines 2.1% | | | | | | | | |
Energy Transfer Partners, L.P.
4.65%, due 6/1/21 | | | 1,490,000 | | | | 1,654,836 | |
MarkWest Energy Partners, L.P. / MarkWest Energy Finance Corp.
6.75%, due 11/1/20 | | | 1,223,000 | | | | 1,333,070 | |
| | | | | | | | |
| | | Principal
Amount | | | Value | |
| | | | | | | | |
Pipelines (continued) | | | | | | | | |
Panhandle Eastern Pipe Line Co., L.P.
8.125%, due 6/1/19 | | $ | 2,037,000 | | | $ | 2,526,831 | |
Regency Energy Partners, L.P. / Regency Energy Finance Corp.
6.875%, due 12/1/18 | | | 1,750,000 | | | | 1,881,250 | |
Targa Resources Partners, L.P. / Targa Resources Partners Finance Corp.
7.875%, due 10/15/18 | | | 1,170,000 | | | | 1,281,150 | |
| | | | | | | | |
| | | | | | | 8,677,137 | |
| | | | | | | | |
Real Estate Investment Trusts 0.3% | | | | | | | | |
Host Hotels & Resorts, L.P.
5.875%, due 6/15/19 | | | 1,000,000 | | | | 1,100,000 | |
| | | | | | | | |
| | |
Retail 1.6% | | | | | | | | |
AmeriGas Partners, L.P. / AmeriGas Finance Corp.
6.25%, due 8/20/19 | | | 1,460,000 | | | | 1,533,000 | |
6.50%, due 5/20/21 | | | 741,000 | | | | 785,460 | |
CVS Caremark Corp.
4.75%, due 5/18/20 | | | 2,445,000 | | | | 2,880,237 | |
5.789%, due 1/10/26 (d)(f) | | | 80,983 | | | | 90,612 | |
Suburban Propane Partners L.P. / Suburban Energy Finance Corp.
7.50%, due 10/1/18 (d) | | | 934,000 | | | | 1,004,050 | |
| | | | | | | | |
| | | | | | | 6,293,359 | |
| | | | | | | | |
Semiconductors 0.5% | | | | | | | | |
Freescale Semiconductor, Inc.
9.25%, due 4/15/18 (d) | | | 1,934,000 | | | | 2,069,380 | |
| | | | | | | | |
| | |
Software 1.6% | | | | | | | | |
Fidelity National Information Services, Inc.
7.625%, due 7/15/17 (j) | | | 1,549,000 | | | | 1,690,346 | |
7.875%, due 7/15/20 | | | 489,000 | | | | 546,458 | |
¨First Data Corp.
7.375%, due 6/15/19 (d) | | | 3,502,000 | | | | 3,624,570 | |
8.875%, due 8/15/20 (d) | | | 550,000 | | | | 599,500 | |
| | | | | | | | |
| | | | | | | 6,460,874 | |
| | | | | | | | |
Telecommunications 3.2% | | | | | | | | |
CommScope, Inc.
8.25%, due 1/15/19 (d) | | | 2,930,000 | | | | 3,157,075 | |
Frontier Communications Corp.
8.50%, due 4/15/20 (j) | | | 1,489,000 | | | | 1,719,795 | |
Hughes Satellite Systems Corp.
7.625%, due 6/15/21 | | | 1,695,000 | | | | 1,885,687 | |
MetroPCS Wireless, Inc.
7.875%, due 9/1/18 | | | 1,386,000 | | | | 1,517,670 | |
| | | | | | |
The notes to the financial statements are an integral part of,
and should be read in conjunction with, the financial statements. | | mainstayinvestments.com | | | 17 | |
Portfolio of Investments††† October 31, 2012 (continued)
| | | | | | | | |
| | | Principal
Amount | | | Value | |
| | | | | | | | |
| Corporate Bonds (continued) | |
Telecommunications (continued) | |
Nextel Communications, Inc.
5.95%, due 3/15/14 (j) | | $ | 1,630,000 | | | $ | 1,632,038 | |
Sprint Capital Corp.
6.90%, due 5/1/19 | | | 612,000 | | | | 665,550 | |
8.75%, due 3/15/32 | | | 2,060,000 | | | | 2,430,800 | |
| | | | | | | | |
| | | | | | | 13,008,615 | |
| | | | | | | | |
Transportation 0.2% | | | | | | | | |
PHI, Inc.
8.625%, due 10/15/18 | | | 669,000 | | | | 705,795 | |
| | | | | | | | |
Total Corporate Bonds
(Cost $230,521,309) | | | | | | | 243,136,469 | |
| | | | | | | | |
|
| Foreign Bonds 3.2% | |
Cayman Islands 0.1% | | | | | | | | |
Government of the Cayman Islands
5.95%, due 11/24/19 (d) | | | 200,000 | | | | 233,000 | |
| | | | | | | | |
| | |
Colombia 0.1% | | | | | | | | |
Republic of Colombia
7.375%, due 3/18/19 | | | 200,000 | | | | 264,000 | |
| | | | | | | | |
| | |
El Salvador 0.1% | | | | | | | | |
Republic of El Salvador
7.65%, due 6/15/35 | | | 163,000 | | | | 189,487 | |
8.25%, due 4/10/32 (d) | | | 163,000 | | | | 199,675 | |
| | | | | | | | |
| | | | | | | 389,162 | |
| | | | | | | | |
Germany 0.2% | | | | | | | | |
IKB Deutsche Industriebank A.G.
4.50%, due 7/9/13 | | € | 734,000 | | | | 913,319 | |
| | | | | | | | |
| | |
Indonesia 0.1% | | | | | | | | |
Republic of Indonesia
5.875%, due 3/13/20 (d) | | $ | 300,000 | | | | 360,375 | |
| | | | | | | | |
| | |
Liberia 0.1% | | | | | | | | |
Royal Caribbean Cruises, Ltd.
Series Reg S
5.625%, due 1/27/14 | | € | 525,000 | | | | 708,909 | |
| | | | | | | | |
| | |
Philippines 0.1% | | | | | | | | |
Republic of Philippines
6.50%, due 1/20/20 | | $ | 300,000 | | | | 383,625 | |
| | | | | | | | |
| | | | | | | | |
| | | Principal
Amount | | | Value | |
| | | | | | | | |
Portugal 0.8% | | | | | | | | |
Portugal Obrigacoes do Tesouro OT
Series Reg S
4.95%, due 10/25/23 | | € | 3,190,000 | | | $ | 3,194,064 | |
| | | | | | | | |
| | |
Turkey 0.1% | | | | | | | | |
Republic of Turkey
5.125%, due 3/25/22 | | $ | 200,000 | | | | 224,500 | |
| | | | | | | | |
| | |
United Kingdom 1.5% | | | | | | | | |
Barclays Bank PLC
Series Reg S
10.00%, due 5/21/21 | | £ | 449,000 | | | | 908,022 | |
¨Canada Square Operations PLC
7.50%, due 5/29/49 (b) | | | 2,450,000 | | | | 3,948,941 | |
Rexam PLC
6.75%, due 6/29/67 (b) | | € | 978,000 | | | | 1,305,169 | |
| | | | | | | | |
| | | | | | | 6,162,132 | |
| | | | | | | | |
Total Foreign Bonds
(Cost $11,193,608) | | | | | | | 12,833,086 | |
| | | | | | | | |
|
| Loan Assignments & Participations 6.1% (k) | |
Airlines 0.5% | | | | | | | | |
U.S. Airways Group, Inc.
Term Loan
2.711%, due 3/21/14 | | $ | 1,944,444 | | | | 1,896,238 | |
| | | | | | | | |
| | |
Auto Manufacturers 0.4% | | | | | | | | |
Federal-Mogul Corp. | | | | | | | | |
Term Loan B
2.148%, due 12/29/14 | | | 1,032,363 | | | | 968,486 | |
Term Loan C
2.148%, due 12/28/15 | | | 526,716 | | | | 494,125 | |
| | | | | | | | �� |
| | | | | | | 1,462,611 | |
| | | | | | | | |
Beverage, Food & Tobacco 0.4% | | | | | | | | |
Del Monte Corp.
Term Loan
4.50%, due 3/8/18 | | | 1,725,767 | | | | 1,720,589 | |
| | | | | | | | |
| | |
Buildings & Real Estate 0.2% | | | | | | | | |
Realogy Corp. | | | | | | | | |
Extended Term Loan 4.464%, due 10/10/16 | | | 852,913 | | | | 850,070 | |
Extended Letter of Credit 4.465%, due 10/10/16 | | | 120,093 | | | | 119,693 | |
| | | | | | | | |
| | | | | | | 969,763 | |
| | | | | | | | |
| | | | |
| 18 | | MainStay Flexible Bond Opportunities Fund | | The notes to the financial statements are an integral part of,
and should be read in conjunction with, the financial statements. |
| | | | | | | | |
| | | Principal
Amount | | | Value | |
| | | | | | | | |
| Loan Assignments & Participations (continued) | |
Chemicals 0.2% | | | | | | | | |
PQ Corp.
Term Loan B
3.962%, due 7/30/14 | | $ | 768,808 | | | $ | 766,337 | |
| | | | | | | | |
| | |
Electric 0.3% | | | | | | | | |
Calpine Corp.
New Term Loan
4.50%, due 4/2/18 | | | 1,083,500 | | | | 1,084,731 | |
| | | | | | | | |
| | |
Finance—Consumer Loans 0.5% | | | | | | | | |
Springleaf Finance Corp.
Term Loan
5.50%, due 5/10/17 | | | 2,000,000 | | | | 1,967,500 | |
| | | | | | | | |
| | |
Healthcare, Education & Childcare 0.3% | | | | | | | | |
Community Health Systems, Inc. Extended Term Loan
3.921%, due 1/25/17 | | | 172,741 | | | | 173,268 | |
Warner Chilcott Co., LLC
New Term Loan B2
4.25%, due 3/15/18 | | | 191,840 | | | | 192,319 | |
Warner Chilcott Corp. | | | | | | | | |
Incremental Term Loan B1
4.25%, due 3/15/18 | | | 145,706 | | | | 146,070 | |
New Term Loan B1
4.25%, due 3/15/18 | | | 383,679 | | | | 384,639 | |
WC Luxco S.A.R.L.
New Term Loan B3
4.25%, due 3/15/18 | | | 263,780 | | | | 264,439 | |
| | | | | | | | |
| | | | | | | 1,160,735 | |
| | | | | | | | |
Lodging 0.7% | | | | | | | | |
¨Caesars Entertainment Operating Co., Inc. Extended Term Loan B5
4.461%, due 1/26/18 | | | 3,500,000 | | | | 3,028,750 | |
| | | | | | | | |
| | |
Machinery 0.2% | | | | | | | | |
Edwards (Cayman Islands II), Ltd.
Term Loan B
5.50%, due 5/31/16 | | | 857,311 | | | | 858,919 | |
| | | | | | | | |
|
Media 0.4% | |
Charter Communications Operating LLC
Extended Term Loan C
3.47%, due 9/6/16 | | | 66,466 | | | | 66,653 | |
Clear Channel Communications, Inc.
Term Loan B
3.862%, due 1/29/16 | | | 2,862,028 | | | | 1,578,664 | |
| | | | | | | | |
| | | | 1,645,317 | |
| | | | | | | | |
| | | | | | | | |
| | | Principal
Amount | | | Value | |
| | | | | | | | |
Metals & Mining 0.7% | |
FMG America Finance, Inc.
Term Loan
5.25%, due 10/18/17 | | $ | 1,850,000 | | | $ | 1,840,461 | |
Walter Energy, Inc.
Term Loan B
4.00%, due 4/2/18 | | | 909,519 | | | | 895,119 | |
| | | | | | | | |
| | | | 2,735,580 | |
| | | | | | | | |
Mining 0.4% | |
¨Novelis, Inc.
Term Loan
4.00%, due 3/10/17 | | | 1,572,000 | | | | 1,568,397 | |
| | | | | | | | |
|
Oil & Gas 0.7% | |
MEG Energy Corp.
New Term Loan B
4.00%, due 3/16/18 | | | 2,970,000 | | | | 2,976,032 | |
| | | | | | | | |
|
Telecommunications 0.2% | |
MetroPCS Wireless, Inc.
Incremental Term Loan B3
4.00%, due 3/16/18 | | | 982,525 | | | | 982,729 | |
| | | | | | | | |
Total Loan Assignments & Participations
(Cost $25,021,655) | | | | 24,824,228 | |
| | | | | | | | |
|
| Mortgage-Backed Securities 0.2% | |
Commercial Mortgage Loans
(Collateralized Mortgage Obligations) 0.2% | |
Banc of America Commercial Mortgage, Inc. Series 2005-J, Class 1A1
2.905%, due 11/25/35 (l) | | | 459,396 | | | | 389,160 | |
Bayview Commercial Asset Trust
Series 2006-4A, Class A1
0.441%, due 12/25/36 (b)(d)(g) | | | 61,490 | | | | 47,558 | |
Deutsche ALT-A Securities, Inc.
Alternate Loan Trust
Series 2005-5, Class 1A3
5.50%, due 11/25/35 (b) | | | 180,874 | | | | 161,066 | |
WaMu Mortgage Pass-Through Certificates
Series 2006-AR14, Class 1A1
2.298%, due 11/25/36 (l) | | | 226,197 | | | | 179,569 | |
Wells Fargo Mortgage Backed Securities Trust
Series 2006-AR10, Class 5A2
2.614%, due 7/25/36 (l) | | | 282,257 | | | | 241,947 | |
| | | | | | | | |
Total Mortgage-Backed Securities
(Cost $1,067,394) | | | | 1,019,300 | |
| | | | | | | | |
| | | | | | |
The notes to the financial statements are an integral part of,
and should be read in conjunction with, the financial statements. | | mainstayinvestments.com | | | 19 | |
Portfolio of Investments††† October 31, 2012 (continued)
| | | | | | | | |
| | | Principal
Amount | | | Value | |
| | | | | | | | |
| Municipal Bond 0.4% | |
New York 0.4% | |
New York City Industrial Development Agency, JFK International Airport, Revenue Bonds
Series A
8.00%, due 8/1/12 (a)(m) | | $ | 1,430,000 | | | $ | 1,428,198 | |
| | | | | | | | |
Total Municipal Bond
(Cost $1,454,084) | | | | 1,428,198 | |
| | | | | | | | |
|
| U.S. Government & Federal Agencies 0.0%‡ | |
Government National Mortgage Association
(Mortgage Pass-Through Securities) 0.0%‡ | |
6.00%, due 8/15/32 | | | 1 | | | | 1 | |
| | | | | | | | |
United States Treasury Note 0.0%‡ | | | | | | | | |
2.125%, due 8/15/21 | | | 70,000 | | | | 73,659 | |
| | | | | | | | |
Total U.S. Government & Federal Agencies
(Cost $71,957) | | | | 73,660 | |
| | | | | | | | |
|
| Yankee Bonds 14.1% (n) | |
Banks 1.6% | |
Bangkok Bank PCL
4.80%, due 10/18/20 (d) | | | 250,000 | | | | 274,462 | |
Barclays Bank PLC
5.14%, due 10/14/20 | | | 2,037,000 | | | | 2,130,665 | |
BBVA Bancomer S.A.
6.75%, due 9/30/22 (d) | | | 1,685,000 | | | | 1,908,262 | |
Mizuho Capital Investment, Ltd.
14.95%, due 12/31/49 (b)(d) | | | 1,092,000 | | | | 1,312,650 | |
Royal Bank of Scotland Group PLC
6.40%, due 10/21/19 | | | 856,000 | | | | 995,357 | |
| | | | | | | | |
| | | | | | | 6,621,396 | |
| | | | | | | | |
Building Materials 1.4% | | | | | | | | |
Cemex Espana Luxembourg
9.25%, due 5/12/20 (d) | | | 1,560,000 | | | | 1,622,400 | |
Desarrolladora Homex S.A.B. de C.V.
9.50%, due 12/11/19 (d) | | | 2,000,000 | | | | 1,997,600 | |
Urbi Desarrollos Urbanos S.A.B. de C.V.
9.50%, due 1/21/20 (d) | | | 2,250,000 | | | | 2,070,000 | |
| | | | | | | | |
| | | | | | | 5,690,000 | |
| | | | | | | | |
Cosmetics & Personal Care 0.5% | | | | | | | | |
Albea Beauty Holdings S.A.
8.375%, due 11/1/19 (d) | | | 1,985,000 | | | | 2,014,775 | |
| | | | | | | | |
Electric 0.2% | | | | | | | | |
InterGen N.V.
9.00%, due 6/30/17 (d) | | | 685,000 | | | | 649,038 | |
| | | | | | | | |
| | | | | | | | |
| | | Principal
Amount | | | Value | |
| | | | | | | | |
Finance—Leasing Companies 0.4% | | | | | | | | |
Banque PSA Finance S.A.
5.75%, due 4/4/21 (d) | | $ | 1,900,000 | | | $ | 1,828,121 | |
| | | | | | | | |
| | |
Food 1.8% | | | | | | | | |
Grupo Bimbo S.A.B. de C.V.
4.50%, due 1/25/22 (d) | | | 2,504,000 | | | | 2,754,515 | |
JBS Finance II, Ltd.
8.25%, due 1/29/18 (d) | | | 650,000 | | | | 677,625 | |
Minerva Luxembourg S.A.
12.25%, due 2/10/22 (d) | | | 1,240,000 | | | | 1,475,600 | |
Virgolino de Oliveira Finance, Ltd.
11.75%, due 2/9/22 (d) | | | 2,250,000 | | | | 2,193,750 | |
| | | | | | | | |
| | | | | | | 7,101,490 | |
| | | | | | | | |
Forest Products & Paper 0.1% | | | | | | | | |
Norske Skogindustrier A.S.A.
7.125%, due 10/15/33 (d) | | | 815,000 | | | | 489,000 | |
| | | | | | | | |
| | |
Insurance 0.3% | | | | | | | | |
Oil Insurance, Ltd.
3.342%, due 12/29/49 (b)(d) | | | 652,000 | | | | 582,255 | |
Swiss Re Capital I, L.P.
6.854%, due 5/29/49 (b)(d) | | | 571,000 | | | | 595,683 | |
| | | | | | | | |
| | | | | | | 1,177,938 | |
| | | | | | | | |
Iron & Steel 0.4% | | | | | | | | |
APERAM
7.375%, due 4/1/16 (d) | | | 2,075,000 | | | | 1,805,250 | |
| | | | | | | | |
| | |
Leisure Time 0.2% | | | | | | | | |
Royal Caribbean Cruises, Ltd.
7.25%, due 3/15/18 | | | 675,000 | | | | 751,781 | |
| | | | | | | | |
| |
Machinery—Construction & Mining 0.4% | | | | | |
Boart Longyear Management Pty, Ltd.
7.00%, due 4/1/21 (d) | | | 1,606,000 | | | | 1,626,075 | |
| | | | | | | | |
| | |
Mining 2.2% | | | | | | | | |
¨Novelis, Inc.
8.375%, due 12/15/17 | | | 734,000 | | | | 798,225 | |
8.75%, due 12/15/20 | | | 1,223,000 | | | | 1,348,358 | |
Teck Resources, Ltd.
2.50%, due 2/1/18 | | | 1,421,000 | | | | 1,437,388 | |
10.75%, due 5/15/19 | | | 500,000 | | | | 602,072 | |
Vedanta Resources PLC
8.25%, due 6/7/21 (d) | | | 2,565,000 | | | | 2,635,537 | |
Xstrata Finance Canada, Ltd.
5.80%, due 11/15/16 (d) | | | 1,877,000 | | | | 2,127,165 | |
| | | | | | | | |
| | | | | | | 8,948,745 | |
| | | | | | | | |
| | | | |
| 20 | | MainStay Flexible Bond Opportunities Fund | | The notes to the financial statements are an integral part of,
and should be read in conjunction with, the financial statements. |
| | | | | | | | |
| | | Principal
Amount | | | Value | |
| | | | | | | | |
| Yankee Bonds (continued) | |
Oil & Gas 2.3% | | | | | | | | |
CITIC Resources Finance, Ltd.
6.75%, due 5/15/14 (d) | | $ | 200,000 | | | $ | 209,450 | |
ENI S.p.A.
4.15%, due 10/1/20 (d) | | | 1,630,000 | | | | 1,669,739 | |
MEG Energy Corp.
6.50%, due 3/15/21 (d) | | | 1,862,000 | | | | 1,996,995 | |
OGX Austria GmbH
8.50%, due 6/1/18 (d) | | | 2,740,000 | | | | 2,390,650 | |
Precision Drilling Corp.
6.50%, due 12/15/21 | | | 643,000 | | | | 679,973 | |
6.625%, due 11/15/20 (j) | | | 1,630,000 | | | | 1,744,100 | |
TNK-BP Finance S.A.
7.875%, due 3/13/18 (d) | | | 400,000 | | | | 474,972 | |
| | | | | | | | |
| | | | | | | 9,165,879 | |
| | | | | | | | |
Oil & Gas Services 0.6% | | | | | | | | |
Cie Generale de Geophysique—Veritas
6.50%, due 6/1/21 | | | 600,000 | | | | 633,000 | |
9.50%, due 5/15/16 | | | 1,675,000 | | | | 1,809,000 | |
| | | | | | | | |
| | | | | | | 2,442,000 | |
| | | | | | | | |
Packaging & Containers 0.3% | | | | | | | | |
Ardagh Packaging Finance PLC
9.125%, due 10/15/20 (d) | | | 1,000,000 | | | | 1,045,000 | |
| | | | | | | | |
| | |
Savings & Loans 0.6% | | | | | | | | |
RBS Citizens Financial Group, Inc.
4.15%, due 9/28/22 (d) | | | 2,270,000 | | | | 2,281,652 | |
| | | | | | | | |
| | |
Telecommunications 0.2% | | | | | | | | |
Intelsat Luxembourg S.A.
11.25%, due 2/4/17 | | | 815,000 | | | | 855,750 | |
| | | | | | | | |
| | |
Transportation 0.6% | | | | | | | | |
CHC Helicopter S.A.
9.25%, due 10/15/20 | | | 2,109,000 | | | | 2,140,635 | |
Hapag-Lloyd A.G.
9.75%, due 10/15/17 (d) | | | 500,000 | | | | 487,500 | |
| | | | | | | | |
| | | | | | | 2,628,135 | |
| | | | | | | | |
Total Yankee Bonds
(Cost $56,247,462) | | | | | | | 57,122,025 | |
| | | | | | | | |
Total Long-Term Bonds
(Cost $357,674,648) | | | | | | | 370,664,049 | |
| | | | | | | | |
| | | | | | | | |
| | |
Shares | | | Value | |
| | | | | | | | |
| Common Stocks 0.8% | |
Auto Manufacturers 0.4% | | | | | | | | |
General Motors Co. (i) | | | 45,730 | | | $ | 1,166,115 | |
Motors Liquidation Co. GUC Trust (i) | | | 11,598 | | | | 231,380 | |
| | | | | | | | |
| | | | | | | 1,397,495 | |
| | | | | | | | |
Banks 0.4% | | | | | | | | |
CIT Group, Inc. (i) | | | 6,479 | | | | 241,149 | |
Citigroup, Inc. | | | 41,400 | | | | 1,547,946 | |
| | | | | | | | |
| | | | | | | 1,789,095 | |
| | | | | | | | |
Building Materials 0.0%‡ | | | | | | | | |
U.S. Concrete, Inc. (g)(i) | | | 19,613 | | | | 150,824 | |
| | | | | | | | |
| | |
Media 0.0%‡ | | | | | | | | |
Adelphia Contingent Value Vehicle (f)(g)(h)(i) | | | 100,330 | | | | 1,003 | |
| | | | | | | | |
Total Common Stocks
(Cost $3,899,283) | | | | | | | 3,338,417 | |
| | | | | | | | |
|
| Convertible Preferred Stocks 1.7% | |
Aerospace & Defense 0.1% | | | | | | | | |
United Technologies Corp. (i)
7.50% | | | 7,400 | | | | 402,412 | |
| | | | | | | | |
| | |
Auto Manufacturers 0.1% | | | | | | | | |
General Motors Co.
4.75% | | | 6,850 | | | | 278,247 | |
| | | | | | | | |
| | |
Auto Parts & Equipment 0.1% | | | | | | | | |
Goodyear Tire & Rubber Co. (The)
5.875% | | | 5,900 | | | | 248,095 | |
| | | | | | | | |
| | |
Banks 0.7% | | | | | | | | |
¨Bank of America Corp.
7.25% Series L | | | 781 | | | | 870,604 | |
Citigroup, Inc.
7.50% | | | 8,700 | | | | 889,140 | |
Wells Fargo & Co.
7.50% Series L | | | 800 | | | | 1,000,000 | |
| | | | | | | | |
| | | | | | | 2,759,744 | |
| | | | | | | | |
Hand & Machine Tools 0.1% | | | | | | | | |
Stanley Black & Decker, Inc.
4.75% | | | 5,600 | | | | 677,992 | |
| | | | | | | | |
| | |
Insurance 0.1% | | | | | | | | |
Hartford Financial Services Group, Inc.
7.25% | | | 16,100 | | | | 329,245 | |
MetLife, Inc.
5.00% | | | 4,275 | | | | 198,745 | |
| | | | | | | | |
| | | | | | | 527,990 | |
| | | | | | | | |
| | | | | | |
The notes to the financial statements are an integral part of,
and should be read in conjunction with, the financial statements. | | mainstayinvestments.com | | | 21 | |
Portfolio of Investments††† October 31, 2012 (continued)
| | | | | | | | |
| | |
Shares | | | Value | |
| | | | | | | | |
| Convertible Preferred Stocks (continued) | |
Media 0.1% | | | | | | | | |
Nielsen Holdings N.V.
6.25% | | | 5,300 | | | $ | 289,678 | |
| | | | | | | | |
| | |
Oil & Gas 0.4% | | | | | | | | |
Apache Corp.
6.00% | | | 21,600 | | | | 1,007,856 | |
Energy XXI Bermuda, Ltd.
5.625% | | | 1,100 | | | | 392,906 | |
Sanchez Energy Corp. (d)(i)
4.875% | | | 2,700 | | | | 133,074 | |
| | | | | | | | |
| | | | | | | 1,533,836 | |
| | | | | | | | |
Total Convertible Preferred Stocks
(Cost $7,375,624) | | | | | | | 6,717,994 | |
| | | | | | | | |
| | |
| | | Number of
Warrants | | | | |
| | | | | | | | |
| Warrants 0.2% | |
| Auto Manufacturers 0.2% | |
General Motors Co. | | | | | | | | |
Strike Price $10.00
Expires 7/10/16 (i) | | | 34,575 | | | | 568,759 | |
Strike Price $18.33
Expires 7/10/19 (i) | | | 34,575 | | | | 355,085 | |
| | | | | | | | |
| | | | | | | 923,844 | |
| | | | | | | | |
Media 0.0%‡ | | | | | | | | |
ION Media Networks, Inc. | | | | | | | | |
Second Lien
Expires 12/18/39 (f)(g)(h)(i) | | | 11 | | | | 0 | (o) |
Unsecured Debt
Expires 12/18/16 (f)(g)(h)(i) | | | 11 | | | | 0 | (o) |
| | | | | | | | |
| | | | | | | 0 | (o) |
| | | | | | | | |
Total Warrants
(Cost $1,526,502) | | | | 923,844 | |
| | | | | | | | |
| | | | | | | | |
| | | Principal
Amount | | | Value | |
| | | | | | | | |
| Short-Term Investment 4.9% | |
Repurchase Agreement 4.9% | | | | | | | | |
State Street Bank and Trust Co.
0.01%, dated 10/31/12
due 11/1/12
Proceeds at Maturity $19,746,802 (Collateralized by a Federal National Mortgage Association security with a rate of 2.10% and a maturity date of 10/17/22, with a Principal Amount of $20,140,000 and a Market Value of $20,146,384) | | $ | 19,746,796 | | | $ | 19,746,796 | |
| | | | | | | | |
Total Short-Term Investment
(Cost $19,746,796) | | | | 19,746,796 | |
| | | | | | | | |
Total Investments, Before Investments Sold Short
(Cost $390,222,853) (r) | | | 99.2 | % | | | 401,391,100 | |
| | | | | | | | |
|
| Long-Term Bond Sold Short (1.9%) | |
Corporate Bond Sold Short (1.9%) | | | | | | | | |
Apparel (1.9%) | | | | | | | | |
Levi Strauss & Co.
7.625%, due 5/15/20 | | | (6,800,000 | ) | | | (7,429,000 | ) |
| | | | | | | | |
Total Investments Sold Short
(Proceeds $6,811,104) | | | (1.9 | )% | | | (7,429,000 | ) |
| | | | | | | | |
Total Investments, Net of Investments Sold Short
(Cost $383,411,749) | | | 97.3 | | | | 393,962,100 | |
Other Assets, Less Liabilities | | | 2.7 | | | | 10,782,898 | |
Net Assets | | | 100.0 | % | | $ | 404,744,998 | |
| | | | | | | | |
| | |
| | | | | | | | |
| | | Contracts
Long | | | Unrealized
Appreciation
(Depreciation) (p) | |
| Futures Contracts (0.0%)‡ | | | | | | | | |
United States Treasury Bond
December 2012 (30 Year) (q) | | | 160 | | | $ | (81,650 | ) |
| | | | | | | | |
Total Futures Contracts Long
(Settlement Value $23,890,000) | | | | (81,650 | ) |
| | | | |
| 22 | | MainStay Flexible Bond Opportunities Fund | | The notes to the financial statements are an integral part of,
and should be read in conjunction with, the financial statements. |
| | | | | | | | |
| | | Contracts
Short | | | Unrealized
Appreciation
(Depreciation) (p) | |
| Futures Contracts (continued) | |
United States Treasury Notes
December 2012 (10 Year) (q) | | | (130 | ) | | $ | (40,950 | ) |
United States Treasury Notes
December 2012 (5 Year) (q) | | | (580 | ) | | | (69,419 | ) |
| | | | | | | | |
Total Futures Contracts Short
(Settlement Value $89,359,063) | | | | (110,369 | ) |
| | | | | | | | |
Total Futures Contracts
(Settlement Value $65,469,063) | | | $ | (192,019 | ) |
| ††† | On a daily basis New York Life Investments confirms that the value of the Fund’s liquid assets (liquid portfolio securities and cash) is sufficient to cover its potential senior securities (e.g., futures, swaps, options). |
| ‡ | Less than one-tenth of a percent. |
| (b) | Floating rate—Rate shown is the rate in effect as of October 31, 2012. |
| (c) | Subprime mortgage investment and other asset-backed securities. The total market value of these securities as of October 31, 2012 is $6,435,574, which represents 1.6% of the Fund’s net assets. |
| (d) | May be sold to institutional investors only under Rule 144A or securities offered pursuant to Section 4(2) of the Securities Act of 1933, as amended. |
| (e) | Step coupon. Rate shown is the rate in effect as of October 31, 2012. |
| (f) | Fair valued security. The total market value of these securities as of October 31, 2012 is $119,953, which represents less than one-tenth of a percent of the Fund’s net assets. |
| (g) | Illiquid security. The total market value of these securities as of October 31, 2012 is $227,723, which represents 0.1% of the Fund’s net assets. |
| (i) | Non-income producing security. |
| (j) | Security, or a portion thereof, is maintained in a segregated account at the Fund’s custodian as collateral for securities sold short (See Note 2(O)). |
| (k) | Floating Rate Loan—generally pays interest at rates which are periodically re-determined at a margin above the London InterBank Offered Rate or other short-term rates. The rate shown is the rate(s) in effect as of October 31, 2012. Floating Rate Loans are generally considered restrictive in that the Fund is ordinarily contractually obligated to receive consent from the Agent Bank and/or borrower prior to disposition of a Floating Rate Loan. |
| (l) | Collateral strip rate—Bond whose interest is based on the weighted net interest rate of the collateral. Coupon rate adjusts periodically based on a predetermined schedule. Rate shown is the rate in effect as of October 31, 2012. |
| (m) | Interest on these securities is subject to alternative minimum tax. |
| (n) | Yankee Bond—Dollar-denominated bond issued in the United States by a foreign bank or corporation. |
| (p) | Represents the difference between the value of the contracts at the time they were opened and the value as of October 31, 2012. |
| (q) | As of October 31, 2012, cash in the amount of $148,400 is on deposit with a broker for futures transactions. |
| (r) | As of October 31, 2012, cost is $390,457,916 for federal income tax purposes and net unrealized appreciation is as follows: |
| | | | |
Gross unrealized appreciation | | $ | 20,708,104 | |
Gross unrealized depreciation | | | (9,774,920 | ) |
| | | | |
Net unrealized appreciation | | $ | 10,933,184 | |
| | | | |
The following abbreviations are used in the above portfolio:
€—Euro
£—British Pound Sterling
As of October 31, 2012, the Fund held the following foreign currency forward contracts:
| | | | | | | | | | | | | | | | | | | | | | | | |
Foreign Currency Sale Contracts | | Expiration
Date | | | Counterparty | | | Contract
Amount Sold | | | Contract
Amount
Purchased | | | Unrealized
Appreciation
(Depreciation) | |
Euro vs. U.S. Dollar | | | 12/6/12 | | | | JPMorgan Chase Bank | | | | EUR 10,245,000 | | | | USD 13,291,761 | | | | USD | | | | 8,633 | |
Pound Sterling vs. U.S. Dollar | | | 12/6/12 | | | | JPMorgan Chase Bank | | | | GBP 4,404,000 | | | | 7,014,075 | | | | | | | | (92,071 | ) |
Net unrealized appreciation (depreciation) on foreign currency forward contracts | | | | | | | | | | | | | | | | | | | USD | | | | (83,438 | ) |
| | | | | | |
The notes to the financial statements are an integral part of,
and should be read in conjunction with, the financial statements. | | mainstayinvestments.com | | | 23 | |
Portfolio of Investments††† October 31, 2012 (continued)
The following is a summary of the fair valuations according to the inputs used as of October 31, 2012, for valuing the Fund’s assets and liabilities.
Asset Valuation Inputs
| | | | | | | | | | | | | | | | |
Description | | Quoted
Prices in
Active
Markets for
Identical
Assets (Level 1) | | | Significant
Other
Observable
Inputs (Level 2) | | | Significant
Unobservable
Inputs (Level 3) | | | Total | |
| Investments in Securities (a) | | | | | | | | | | | | | | | | |
| Long-Term Bonds | | | | | | | | | | | | | | | | |
Asset-Backed Securities | | $ | — | | | $ | 11,166,286 | | | $ | — | | | $ | 11,166,286 | |
Convertible Bonds (b) | | | — | | | | 19,060,747 | | | | 50 | | | | 19,060,797 | |
Corporate Bonds (c) | | | — | | | | 243,017,569 | | | | 118,900 | | | | 243,136,469 | |
Foreign Bonds | | | — | | | | 12,833,086 | | | | — | | | | 12,833,086 | |
Loan Assignments & Participations | | | — | | | | 24,824,228 | | | | — | | | | 24,824,228 | |
Mortgage-Backed Securities | | | — | | | | 1,019,300 | | | | — | | | | 1,019,300 | |
Municipal Bond | | | — | | | | 1,428,198 | | | | — | | | | 1,428,198 | |
U.S. Government & Federal Agencies | | | — | | | | 73,660 | | | | — | | | | 73,660 | |
Yankee Bonds | | | — | | | | 57,122,025 | | | | — | | | | 57,122,025 | |
| | | | | | | | | | | | | | | | |
| Total Long-Term Bonds | | | — | | | | 370,545,099 | | | | 118,950 | | | | 370,664,049 | |
| | | | | | | | | | | | | | | | |
| Common Stocks (d) | | | 3,337,414 | | | | — | | | | 1,003 | | | | 3,338,417 | |
| Convertible Preferred Stocks | | | 6,717,994 | | | | — | | | | — | | | | 6,717,994 | |
| Warrants (e) | | | 923,844 | | | | — | | | | 0 | (e) | | | 923,844 | |
| Short-Term Investment | | | | | | | | | | | | | | | | |
Repurchase Agreement | | | — | | | | 19,746,796 | | | | — | | | | 19,746,796 | |
| | | | | | | | | | | | | | | | |
| Total Investments in Securities | | | 10,979,252 | | | | 390,291,895 | | | | 119,953 | | | | 401,391,100 | |
| | | | | | | | | | | | | | | | |
| Other Financial Instruments | | | | | | | | | | | | | | | | |
| Foreign Currency Forward Contracts (f) | | | — | | | | 8,633 | | | | — | | | | 8,633 | |
| | | | | | | | | | | | | | | | |
| Total Investments in Securities and Other Financial Instruments | | $ | 10,979,252 | | | $ | 390,300,528 | | | $ | 119,953 | | | $ | 401,399,733 | |
| | | | | | | | | | | | | | | | |
Liability Valuation Inputs
| | | | | | | | | | | | | | | | |
Description | | Quoted
Prices in
Active
Markets for
Identical
Assets (Level 1) | | | Significant
Other
Observable
Inputs (Level 2) | | | Significant
Unobservable
Inputs (Level 3) | | | Total | |
| Investments in Securities Sold Short (a) | | | | | | | | | | | | | | | | |
| Long-Term Bond Sold Short | | | | | | | | | | | | | | | | |
Corporate Bond Sold Short | | $ | — | | | $ | (7,429,000 | ) | | $ | — | | | $ | (7,429,000 | ) |
| | | | | | | | | | | | | | | | |
| Total Investments in Securities Sold Short | | | — | | | | (7,429,000 | ) | | | — | | | | (7,429,000 | ) |
| | | | | | | | | | | | | | | | |
| Other Financial Instruments | | | | | | | | | | | | | | | | |
Foreign Currency Forward Contracts (f) | | | — | | | | (92,071 | ) | | | — | | | | (92,071 | ) |
Futures Contracts Long (f) | | | (81,650 | ) | | | — | | | | — | | | | (81,650 | ) |
Futures Contracts Short (f) | | | (110,369 | ) | | | — | | | | — | | | | (110,369 | ) |
| | | | | | | | | | | | | | | | |
| Total Other Financial Instruments | | | (192,019 | ) | | | (92,071 | ) | | | — | | | | (284,090 | ) |
| | | | | | | | | | | | | | | | |
| Total Investments in Securities Sold Short and Other Financial Instruments | | $ | (192,019 | ) | | $ | (7,521,071 | ) | | $ | — | | | $ | (7,713,090 | ) |
| | | | | | | | | | | | | | | | |
| (a) | For a complete listing of investments and their industries, see the Portfolio of Investments. |
| (b) | The Level 3 security valued at $50 is held in Internet within the Convertible Bonds section of the Portfolio of Investments. |
| (c) | The Level 3 securities valued at $1,137, $2,640, $24,511 and $90,612 are held in Auto Manufacturers, Commercial Services, Entertainment and Retail, respectively, within the Corporate Bonds section of the Portfolio of Investments. |
| (d) | The Level 3 security valued at $1,003 is held in Media within the Common Stocks section of the Portfolio of Investments. |
| (e) | The Level 3 securities valued at less than one dollar are held in Media within the Warrants section of the Portfolio of Investments. |
| (f) | The value listed for these securities reflects unrealized appreciation (depreciation) as shown on the Portfolio of Investments. |
The Fund recognizes transfers between the levels as of the beginning of the period.
For the year ended October 31, 2012, the Fund did not have any transfers between Level 1 and Level 2 fair value measurements. (See Note 2)
| | | | |
| 24 | | MainStay Flexible Bond Opportunities Fund | | The notes to the financial statements are an integral part of,
and should be read in conjunction with, the financial statements. |
The following is a reconciliation of investments in which significant unobservable inputs (Level 3) were used in determining value:
| | | | | | | | | | | | | | | | | | | | | | | | | | | | | | | | | | | | | | | | |
Investments in Securities | | Balance
as of
October 31,
2011 | | | Accrued
Discounts
(Premiums) | | | Realized
Gain
(Loss) | | | Change in
Unrealized
Appreciation
(Depreciation) | | | Purchases | | | Sales | | | Transfers
in to
Level 3 | | | Transfers
out of
Level 3 | | | Balance
as of
October 31,
2012 | | | Change in
Unrealized
Appreciation
(Depreciation)
from
Investments
Still Held at
October 31,
2012 (a) | |
| Long-Term Bonds | | | | | | | | | | | | | | | | | | | | | | | | | | | | | | | | | | | | | | | | |
Convertible Bonds | | | | | | | | | | | | | | | | | | | | | | | | | | | | | | | | | | | | | | | | |
Internet | | $ | 50 | | | $ | — | | | $ | — | | | $ | — | | | $ | — | | | $ | — | | | $ | — | | | $ | — | | | $ | 50 | | | $ | — | |
Corporate Bonds | | | | | | | | | | | | | | | | | | | | | | | | | | | | | | | | | | | | | | | | |
Auto Manufacturers | | | 140,584 | | | | — | | | | — | | | | 62,235 | | | | — | | | | (201,682 | ) | | | — | | | | — | | | | 1,137 | | | | (136,953 | ) |
Commercial Services | | | 2,640 | | | | — | | | | — | | | | — | | | | — | | | | — | | | | — | | | | — | | | | 2,640 | | | | — | |
Entertainment | | | 33,545 | | | | 1,072 | | | | 1,389 | | | | 1,411 | | | | — | | | | (12,906 | ) | | | — | | | | — | | | | 24,511 | | | | (1,071 | ) |
Retail | | | 88,676 | | | | (108 | ) | | | (109 | ) | | | 6,260 | | | | — | | | | (4,107 | ) | | | — | | | | — | | | | 90,612 | | | | 6,325 | |
Loan Assignments & Participations | | | | | | | | | | | | | | | | | | | | | | | | | | | | | | | | | | | | | | | | |
Machinery | | | 521 | | | | (5,071 | ) | | | (125,173 | ) | | | 129,723 | | | | — | | | | — | | | | — | | | | — | | | | — | | | | — | |
Yankee Bonds | | | | | | | | | | | | | | | | | | | | | | | | | | | | | | | | | | | | | | | | |
Food | | | 70 | | | | — | | | | (93,028 | ) | | | 92,958 | | | | — | | | | — | | | | — | | | | — | | | | — | | | | — | |
Common Stocks | | | | | | | | | | | — | | | | | | | | | | | | — | | | | | | | | | | | | | | | | | |
Media | | | 1,003 | | | | — | | | | — | | | | — | | | | — | | | | — | | | | — | | | | — | | | | 1,003 | | | | — | |
Warrants | | | | | | | | | | | | | | | | | | | | | | | | | | | | | | | | | | | | | | | | |
Media | | | 0 | (b) | | | — | | | | — | | | | — | | | | — | | | | — | | | | — | | | | — | | | | 0 | (b) | | | — | |
| | | | | | | | | | | | | | | | | | | | | | | | | | | | | | | | | | | | | | | | |
Total | | $ | 267,089 | | | $ | (4,107 | ) | | $ | (216,921 | ) | | $ | 292,587 | | | $ | — | | | $ | (218,695 | ) | | $ | — | | | $ | — | | | $ | 119,953 | | | $ | (131,699 | ) |
| | | | | | | | | | | | | | | | | | | | | | | | | | | | | | | | | | | | | | | | |
| (a) | Included in “Net change in unrealized appreciation (depreciation) on investments” in the Statement of Operations. |
| | | | | | |
The notes to the financial statements are an integral part of,
and should be read in conjunction with, the financial statements. | | mainstayinvestments.com | | | 25 | |
Statement of Assets and Liabilities as of October 31, 2012
| | | | |
| Assets | | | | |
Investment in securities, at value (identified cost $390,222,853) | | $ | 401,391,100 | |
Cash denominated in foreign currencies (identified cost $3,226,326) | | | 3,223,148 | |
Cash collateral on deposit at broker | | | 148,400 | |
Receivables: | | | | |
Dividends and interest | | | 6,333,197 | |
Fund shares sold | | | 3,867,406 | |
Investment securities sold | | | 997,932 | |
Other assets | | | 25,233 | |
Unrealized appreciation on foreign currency forward contracts | | | 8,633 | |
| | | | |
Total assets | | | 415,995,049 | |
| | | | |
| |
| Liabilities | | | | |
Investments sold short (proceeds $6,811,104) | | | 7,429,000 | |
Payables: | | | | |
Investment securities purchased | | | 1,988,137 | |
Fund shares redeemed | | | 615,928 | |
Interest on investments sold short | | | 239,086 | |
Manager (See Note 3) | | | 208,302 | |
NYLIFE Distributors (See Note 3) | | | 109,781 | |
Transfer agent (See Note 3) | | | 108,000 | |
Variation margin on futures contracts | | | 81,719 | |
Shareholder communication | | | 24,783 | |
Professional fees | | | 16,810 | |
Broker fees and charges on short sales | | | 6,839 | |
Custodian | | | 4,819 | |
Trustees | | | 1,192 | |
Accrued expenses | | | 5,055 | |
Dividend payable | | | 318,529 | |
Unrealized depreciation on foreign currency forward contracts | | | 92,071 | |
| | | | |
Total liabilities | | | 11,250,051 | |
| | | | |
Net assets | | $ | 404,744,998 | |
| | | | |
| |
| Composition of Net Assets | | | | |
Shares of beneficial interest outstanding (par value of $.01 per share) unlimited number of shares authorized | | $ | 439,221 | |
Additional paid-in capital | | | 394,875,915 | |
| | | | |
| | | 395,315,136 | |
Distributions in excess of net investment income | | | (307,796 | ) |
Accumulated net realized gain (loss) on investments, investments sold short, futures transactions, swap transactions and foreign currency transactions | | | (542,978 | ) |
Net unrealized appreciation (depreciation) on investments and futures contracts | | | 10,976,228 | |
Net unrealized appreciation (depreciation) on investments sold short | | | (617,896 | ) |
Net unrealized appreciation (depreciation) on translation of other assets and liabilities in foreign currencies and foreign currency forward contracts | | | (77,696 | ) |
| | | | |
Net assets | | $ | 404,744,998 | |
| | | | |
| | | | |
Investor Class | | | | |
Net assets applicable to outstanding shares | | $ | 24,551,240 | |
| | | | |
Shares of beneficial interest outstanding | | | 2,645,978 | |
| | | | |
Net asset value per share outstanding | | $ | 9.28 | |
Maximum sales charge (4.50% of offering price) | | | 0.44 | |
| | | | |
Maximum offering price per share outstanding | | $ | 9.72 | |
| | | | |
Class A | | | | |
Net assets applicable to outstanding shares | | $ | 192,008,934 | |
| | | | |
Shares of beneficial interest outstanding | | | 20,832,877 | |
| | | | |
Net asset value per share outstanding | | $ | 9.22 | |
Maximum sales charge (4.50% of offering price) | | | 0.43 | |
| | | | |
Maximum offering price per share outstanding | | $ | 9.65 | |
| | | | |
Class B | | | | |
Net assets applicable to outstanding shares | | $ | 17,590,691 | |
| | | | |
Shares of beneficial interest outstanding | | | 1,915,815 | |
| | | | |
Net asset value and offering price per share outstanding | | $ | 9.18 | |
| | | | |
Class C | | | | |
Net assets applicable to outstanding shares | | $ | 59,158,764 | |
| | | | |
Shares of beneficial interest outstanding | | | 6,447,757 | |
| | | | |
Net asset value and offering price per share outstanding | | $ | 9.18 | |
| | | | |
Class I | | | | |
Net assets applicable to outstanding shares | | $ | 111,435,369 | |
| | | | |
Shares of beneficial interest outstanding | | | 12,079,688 | |
| | | | |
Net asset value and offering price per share outstanding | | $ | 9.23 | |
| | | | |
| | | | |
| 26 | | MainStay Flexible Bond Opportunities Fund | | The notes to the financial statements are an integral part of,
and should be read in conjunction with, the financial statements. |
Statement of Operations for the year ended October 31, 2012
| | | | |
| Investment Income (Loss) | | | | |
Income | | | | |
Interest (a) | | $ | 25,324,808 | |
Dividends (b) | | | 411,855 | |
| | | | |
Total income | | | 25,736,663 | |
| | | | |
Expenses | | | | |
Manager (See Note 3) | | | 2,477,774 | |
Distribution/Service—Investor Class (See Note 3) | | | 55,073 | |
Distribution/Service—Class A (See Note 3) | | | 444,959 | |
Distribution/Service—Class B (See Note 3) | | | 158,800 | |
Distribution/Service—Class C (See Note 3) | | | 542,408 | |
Interest on investments sold short | | | 729,171 | |
Broker fees and charges on short sales | | | 583,938 | |
Transfer agent (See Note 3) | | | 426,039 | |
Registration | | | 114,878 | |
Professional fees | | | 66,026 | |
Shareholder communication | | | 55,035 | |
Custodian | | | 27,760 | |
Trustees | | | 10,787 | |
Miscellaneous | | | 20,209 | |
| | | | |
Total expenses | | | 5,712,857 | |
| | | | |
Net investment income (loss) | | | 20,023,806 | |
| | | | |
|
| Realized and Unrealized Gain (Loss) on Investments, Futures Contracts, Swap Contracts and Foreign Currency Transactions | |
Net realized gain (loss) on: | | | | |
Security transactions | | | 3,991,909 | |
Investments sold short | | | (460,875 | ) |
Futures transactions | | | (637,791 | ) |
Swap transactions | | | 65,903 | |
Foreign currency transactions | | | (20,234 | ) |
| | | | |
Net realized gain (loss) on investments, investments sold short, futures transactions, swap transactions and foreign currency transactions | | | 2,938,912 | |
| | | | |
Net change in unrealized appreciation (depreciation) on: | | | | |
Investments | | | 19,771,994 | |
Investments sold short | | | (768,230 | ) |
Futures contracts | | | (47,900 | ) |
Swap contracts | | | 63,990 | |
Translation of other assets and liabilities in foreign currencies and foreign currency forward contracts | | | 475,663 | |
| | | | |
Net change in unrealized appreciation (depreciation) on investments, investments sold short, futures contracts, swap contracts and foreign currency transactions | | | 19,495,517 | |
| | | | |
Net realized and unrealized gain (loss) on investments, investments sold short, futures transactions, swap transactions and foreign currency transactions | | | 22,434,429 | |
| | | | |
Net increase (decrease) in net assets resulting from operations | | $ | 42,458,235 | |
| | | | |
| (a) | Interest recorded net of foreign withholding taxes in the amount of $1,109. |
| (b) | Dividends recorded net of foreign withholding taxes in the amount of $301. |
| | | | | | |
The notes to the financial statements are an integral part of,
and should be read in conjunction with, the financial statements. | | mainstayinvestments.com | | | 27 | |
Statements of Changes in Net Assets
for the years ended October 31, 2012 and October 31, 2011
| | | | | | | | |
| | | 2012 | | | 2011 | |
| Increase (Decrease) in Net Assets | |
Operations: | | | | | | | | |
Net investment income (loss) | | $ | 20,023,806 | | | $ | 16,164,764 | |
Net realized gain (loss) on investments, futures transactions, investments sold short, swap transactions and foreign currency transactions | | | 2,938,912 | | | | 6,229,115 | (a) |
Net change in unrealized appreciation (depreciation) on investments, investments sold short, futures contracts, swap contracts and foreign currency transactions | | | 19,495,517 | | | | (19,578,617 | ) |
| | | | |
Net increase (decrease) in net assets resulting from operations | | | 42,458,235 | | | | 2,815,262 | |
| | | | |
Dividends to shareholders: | | | | | | | | |
From net investment income: | | | | | | | | |
Investor Class | | | (1,099,420 | ) | | | (933,654 | ) |
Class A | | | (9,264,000 | ) | | | (7,477,966 | ) |
Class B | | | (684,741 | ) | | | (781,827 | ) |
Class C | | | (2,334,598 | ) | | | (1,693,424 | ) |
Class I | | | (7,148,524 | ) | | | (5,674,370 | ) |
| | | | |
Total dividends to shareholders | | | (20,531,283 | ) | | | (16,561,241 | ) |
| | | | |
Capital share transactions: | | | | | | | | |
Net proceeds from sale of shares | | | 150,767,499 | | | | 414,223,323 | |
Net asset value of shares issued to shareholders in reinvestment of dividends | | | 16,294,896 | | | | 13,090,401 | |
Cost of shares redeemed | | | (204,697,285 | ) | | | (172,331,003 | )(b) |
| | | | |
Increase (decrease) in net assets derived from capital share transactions | | | (37,634,890 | ) | | | 254,982,721 | |
| | | | |
Net increase (decrease) in net assets | | | (15,707,938 | ) | | | 241,236,742 | |
| | |
| Net Assets | | | | | | | | |
Beginning of year | | | 420,452,936 | | | | 179,216,194 | |
| | | | |
End of year | | $ | 404,744,998 | | | $ | 420,452,936 | |
| | | | |
Undistributed (distributions in excess of) net investment income at end of year | | $ | (307,796 | ) | | $ | 588,017 | |
| | | | |
| (a) | Includes realized gain of $1,774,490 due to an in-kind redemption during the year ended October 31, 2011. (See Note 11) |
| (b) | Includes an in-kind redemption in the amount of $79,972,617 during the year ended October 31, 2011. (See Note 11) |
| | | | |
| 28 | | MainStay Flexible Bond Opportunities Fund | | The notes to the financial statements are an integral part of,
and should be read in conjunction with, the financial statements. |
Financial Highlights selected per share data and ratios
| | | | | | | | | | | | | | | | | | | | |
| | | Investor Class | |
| | | Year ended October 31, | | | February 28,
2008** through
October 31, | |
| | | 2012 | | | 2011 | | | 2010 | | | 2009 | | | 2008 | |
Net asset value at beginning of period | | $ | 8.78 | | | $ | 9.12 | | | $ | 8.47 | | | $ | 7.20 | | | $ | 8.86 | |
| | | | | | | | | | | | | | | | | | | | |
Net investment income (loss) (a) | | | 0.44 | | | | 0.43 | | | | 0.52 | | | | 0.40 | | | | 0.29 | |
Net realized and unrealized gain (loss) on investments | | | 0.50 | | | | (0.32 | ) | | | 0.68 | | | | 1.50 | | | | (1.77 | ) |
Net realized and unrealized gain (loss) on foreign currency transactions | | | 0.01 | | | | (0.00 | )‡ | | | (0.05 | ) | | | 0.02 | | | | 0.11 | |
| | | | | | | | | | | | | | | | | | | | |
Total from investment operations | | | 0.95 | | | | 0.11 | | | | 1.15 | | | | 1.92 | | | | (1.37 | ) |
| | | | | | | | | | | | | | | | | | | | |
Less dividends and distributions: | | | | | | | | | | | | | | | | | | | | |
From net investment income | | | (0.45 | ) | | | (0.45 | ) | | | (0.50 | ) | | | (0.62 | ) | | | (0.29 | ) |
Return of capital | | | — | | | | — | | | | — | | | | (0.03 | ) | | | — | |
| | | | | | | | | | | | | | | | | | | | |
Total dividends and distributions | | | (0.45 | ) | | | (0.45 | ) | | | (0.50 | ) | | | (0.65 | ) | | | (0.29 | ) |
| | | | | | | | | | | | | | | | | | | | |
Net asset value at end of period | | $ | 9.28 | | | $ | 8.78 | | | $ | 9.12 | | | $ | 8.47 | | | $ | 7.20 | |
| | | | | | | | | | | | | | | | | | | | |
Total investment return (b) | | | 10.98 | % | | | 1.33 | % | | | 13.97 | % | | | 28.35 | % | | | (15.88 | %)(c) |
Ratios (to average net assets)/Supplemental Data: | | | | | | | | | | | | | | | | | | | | |
Net investment income (loss) | | | 4.89 | % | | | 4.85 | % | | | 5.93 | % | | | 5.26 | % | | | 5.07 | % †† |
Net expenses (excluding short sale expenses) | | | 1.19 | % | | | 1.24 | % | | | 1.41 | % | | | 1.42 | % | | | 1.40 | % †† |
Expenses (including short sales expenses, before waiver/reimbursement) | | | 1.52 | % | | | 1.42 | % | | | 1.45 | % | | | 1.70 | % | | | 1.51 | % †† |
Short sale expenses | | | 0.33 | % | | | 0.18 | % | | | — | | | | — | | | | — | |
Portfolio turnover rate | | | 25 | % | | | 26 | % | | | 80 | % | | | 154 | %(d) | | | 81 | % (d) |
Net assets at end of period (in 000’s) | | $ | 24,551 | | | $ | 20,415 | | | $ | 16,654 | | | $ | 12,200 | | | $ | 9,990 | |
| ** | Commencement of operations. |
| ‡ | Less than one cent per share. |
| (a) | Per share data based on average shares outstanding during the period. |
| (b) | Total investment return is calculated exclusive of sales charges and assumes the reinvestment of dividends and distributions. |
| (c) | Total investment return is not annualized. |
| (d) | The portfolio turnover rates not including mortgage dollar rolls were 117% and 72% for the years ended October 31, 2009 and 2008, respectively. |
| | | | | | |
The notes to the financial statements are an integral part of,
and should be read in conjunction with, the financial statements. | | mainstayinvestments.com | | | 29 | |
Financial Highlights selected per share data and ratios
| | | | | | | | | | | | | | | | | | | | |
| | | Class A | |
| | | Year ended October 31, | |
| | | 2012 | | | 2011 | | | 2010 | | | 2009 | | | 2008 | |
Net asset value at beginning of year | | $ | 8.73 | | | $ | 9.06 | | | $ | 8.42 | | | $ | 7.16 | | | $ | 9.02 | |
| | | | | | | | | | | | | | | | | | | | |
Net investment income (loss) (a) | | | 0.45 | | | | 0.45 | | | | 0.54 | | | | 0.41 | | | | 0.44 | |
Net realized and unrealized gain (loss) on investments | | | 0.49 | | | | (0.31 | ) | | | 0.67 | | | | 1.49 | | | | (1.96 | ) |
Net realized and unrealized gain (loss) on foreign currency transactions | | | 0.01 | | | | (0.00 | )‡ | | | (0.05 | ) | | | 0.02 | | | | 0.12 | |
| | | | | | | | | | | | | | | | | | | | |
Total from investment operations | | | 0.95 | | | | 0.14 | | | | 1.16 | | | | 1.92 | | | | (1.40 | ) |
| | | | | | | | | | | | | | | | | | | | |
Less dividends and distributions: | | | | | | | | | | | | | | | | | | | | |
From net investment income | | | (0.46 | ) | | | (0.47 | ) | | | (0.52 | ) | | | (0.62 | ) | | | (0.46 | ) |
Return of capital | | | — | | | | — | | | | — | | | | (0.04 | ) | | | — | |
| | | | | | | | | | | | | | | | | | | | |
Total dividends and distributions | | | (0.46 | ) | | | (0.47 | ) | | | (0.52 | ) | | | (0.66 | ) | | | (0.46 | ) |
| | | | | | | | | | | | | | | | | | | | |
Net asset value at end of year | | $ | 9.22 | | | $ | 8.73 | | | $ | 9.06 | | | $ | 8.42 | | | $ | 7.16 | |
| | | | | | | | | | | | | | | | | | | | |
Total investment return (b) | | | 11.26 | % | | | 1.54 | % | | | 14.19 | % | | | 28.56 | % | | | (16.27 | %) |
Ratios (to average net assets)/Supplemental Data: | | | | | | | | | | | | | | | | | | | | |
Net investment income (loss) | | | 5.08 | % | | | 5.04 | % | | | 6.19 | % | | | 5.41 | % | | | 5.13 | % |
Net expenses (excluding short sales expenses) | | | 1.00 | % | | | 1.03 | % | | | 1.18 | % | | | 1.27 | % | | | 1.30 | % |
Expenses (including short sales expenses, before waiver/reimbursement) | | | 1.33 | % | | | 1.22 | % | | | 1.21 | % | | | 1.37 | % | | | 1.34 | % |
Short sale expenses | | | 0.33 | % | | | 0.19 | % | | | — | | | | — | | | | — | |
Portfolio turnover rate | | | 25 | % | | | 26 | % | | | 80 | % | | | 154 | %(c) | | | 81 | % (c) |
Net assets at end of year (in 000’s) | | $ | 192,009 | | | $ | 169,649 | | | $ | 109,694 | | | $ | 60,555 | | | $ | 45,293 | |
| ‡ | Less than one cent per share. |
| (a) | Per share data based on average shares outstanding during the year. |
| (b) | Total investment return is calculated exclusive of sales charges and assumes the reinvestment of dividends and distributions. |
| (c) | The portfolio turnover rates not including mortgage dollar rolls were 117% and 72% for the years ended October 31, 2009 and 2008, respectively. |
| | | | |
| 30 | | MainStay Flexible Bond Opportunities Fund | | The notes to the financial statements are an integral part of,
and should be read in conjunction with, the financial statements. |
Financial Highlights selected per share data and ratios
| | | | | | | | | | | | | | | | | | | | |
| | | Class B | |
| | | Year ended October 31, | |
| | | 2012 | | | 2011 | | | 2010 | | | 2009 | | | 2008 | |
Net asset value at beginning of year | | $ | 8.70 | | | $ | 9.03 | | | $ | 8.39 | | | $ | 7.14 | | | $ | 8.99 | |
| | | | | | | | | | | | | | | | | | | | |
Net investment income (loss) (a) | | | 0.37 | | | | 0.36 | | | | 0.45 | | | | 0.34 | | | | 0.37 | |
Net realized and unrealized gain (loss) on investments | | | 0.48 | | | | (0.31 | ) | | | 0.68 | | | | 1.48 | | | | (1.95 | ) |
Net realized and unrealized gain (loss) on foreign currency transactions | | | 0.01 | | | | (0.00 | )‡ | | | (0.05 | ) | | | 0.02 | | | | 0.12 | |
| | | | | | | | | | | | | | | | | | | | |
Total from investment operations | | | 0.86 | | | | 0.05 | | | | 1.08 | | | | 1.84 | | | | (1.46 | ) |
| | | | | | | | | | | | | | | | | | | | |
Less dividends and distributions: | | | | | | | | | | | | | | | | | | | | |
From net investment income | | | (0.38 | ) | | | (0.38 | ) | | | (0.44 | ) | | | (0.56 | ) | | | (0.39 | ) |
Return of capital | | | — | | | | — | | | | — | | | | (0.03 | ) | | | — | |
| | | | | | | | | | | | | | | | | | | | |
Total dividends and distributions | | | (0.38 | ) | | | (0.38 | ) | | | (0.44 | ) | | | (0.59 | ) | | | (0.39 | ) |
| | | | | | | | | | | | | | | | | | | | |
Net asset value at end of year | | $ | 9.18 | | | $ | 8.70 | | | $ | 9.03 | | | $ | 8.39 | | | $ | 7.14 | |
| | | | | | | | | | | | | | | | | | | | |
Total investment return (b) | | | 10.15 | % | | | 0.59 | % | | | 13.13 | % | | | 27.35 | % | | | (16.88 | %) |
Ratios (to average net assets)/Supplemental Data: | | | | | | | | | | | | | | | | | | | | |
Net investment income (loss) | | | 4.14 | % | | | 4.10 | % | | | 5.15 | % | | | 4.54 | % | | | 4.32 | % |
Net expenses (excluding short sales expenses) | | | 1.94 | % | �� | | 1.99 | % | | | 2.16 | % | | | 2.17 | % | | | 2.11 | % |
Expenses (including short sales expenses, before waiver/reimbursement) | | | 2.27 | % | | | 2.16 | % | | | 2.20 | % | | | 2.46 | % | | | 2.20 | % |
Short sale expenses | | | 0.33 | % | | | 0.17 | % | | | — | | | | — | | | | — | |
Portfolio turnover rate | | | 25 | % | | | 26 | % | | | 80 | % | | | 154 | %(c) | | | 81 | % (c) |
Net assets at end of year (in 000’s) | | $ | 17,591 | | | $ | 16,754 | | | $ | 19,352 | | | $ | 19,176 | | | $ | 18,567 | |
| ‡ | Less than one cent per share. |
| (a) | Per share data based on average shares outstanding during the year. |
| (b) | Total investment return is calculated exclusive of sales charges and assumes the reinvestment of dividends and distributions. |
| (c) | The portfolio turnover rates not including mortgage dollar rolls were 117% and 72% for the years ended October 31, 2009 and 2008, respectively. |
| | | | | | |
The notes to the financial statements are an integral part of,
and should be read in conjunction with, the financial statements. | | mainstayinvestments.com | | | 31 | |
Financial Highlights selected per share data and ratios
| | | | | | | | | | | | | | | | | | | | |
| | | Class C | |
| | | Year ended October 31, | |
| | | 2012 | | | 2011 | | | 2010 | | | 2009 | | | 2008 | |
Net asset value at beginning of year | | $ | 8.69 | | | $ | 9.03 | | | $ | 8.39 | | | $ | 7.14 | | | $ | 8.99 | |
| | | | | | | | | | | | | | | | | | | | |
Net investment income (loss) (a) | | | 0.37 | | | | 0.36 | | | | 0.46 | | | | 0.34 | | | | 0.37 | |
Net realized and unrealized gain (loss) on investments | | | 0.49 | | | | (0.32 | ) | | | 0.67 | | | | 1.48 | | | | (1.95 | ) |
Net realized and unrealized gain (loss) on foreign currency transactions | | | 0.01 | | | | (0.00 | )‡ | | | (0.05 | ) | | | 0.02 | | | | 0.12 | |
| | | | | | | | | | | | | | | | | | | | |
Total from investment operations | | | 0.87 | | | | 0.04 | | | | 1.08 | | | | 1.84 | | | | (1.46 | ) |
| | | | | | | | | | | | | | | | | | | | |
Less dividends and distributions: | | | | | | | | | | | | | | | | | | | | |
From net investment income | | | (0.38 | ) | | | (0.38 | ) | | | (0.44 | ) | | | (0.56 | ) | | | (0.39 | ) |
Return of capital | | | — | | | | — | | | | — | | | | (0.03 | ) | | | — | |
| | | | | | | | | | | | | | | | | | | | |
Total dividends and distributions | | | (0.38 | ) | | | (0.38 | ) | | | (0.44 | ) | | | (0.59 | ) | | | (0.39 | ) |
| | | | | | | | | | | | | | | | | | | | |
Net asset value at end of year | | $ | 9.18 | | | $ | 8.69 | | | $ | 9.03 | | | $ | 8.39 | | | $ | 7.14 | |
| | | | | | | | | | | | | | | | | | | | |
Total investment return (b) | | | 10.16 | % | | | 0.48 | % | | | 13.14 | % | | | 27.36 | % | | | (16.88 | %) |
Ratios (to average net assets)/Supplemental Data: | | | | | | | | | | | | | | | | | | | | |
Net investment income (loss) | | | 4.14 | % | | | 4.09 | % | | | 5.23 | % | | | 4.50 | % | | | 4.32 | % |
Net expenses (excluding short sale expenses) | | | 1.94 | % | | | 1.99 | % | | | 2.16 | % | | | 2.17 | % | | | 2.11 | % |
Expenses (including short sales expenses, before waiver/reimbursement) | | | 2.27 | % | | | 2.19 | % | | | 2.20 | % | | | 2.45 | % | | | 2.20 | % |
Short sale expenses | | | 0.33 | % | | | 0.20 | % | | | — | | | | — | | | | — | |
Portfolio turnover rate | | | 25 | % | | | 26 | % | | | 80 | % | | | 154 | %(c) | | | 81 | % (c) |
Net assets at end of year (in 000’s) | | $ | 59,159 | | | $ | 50,280 | | | $ | 28,334 | | | $ | 12,948 | | | $ | 9,484 | |
| ‡ | Less than one cent per share. |
| (a) | Per share data based on average shares outstanding during the year. |
| (b) | Total investment return is calculated exclusive of sales charges and assumes the reinvestment of dividends and distributions. |
| (c) | The portfolio turnover rates not including mortgage dollar rolls were 117% and 72% for the years ended October 31, 2009 and 2008, respectively. |
| | | | |
| 32 | | MainStay Flexible Bond Opportunities Fund | | The notes to the financial statements are an integral part of,
and should be read in conjunction with, the financial statements. |
Financial Highlights selected per share data and ratios
| | | | | | | | | | | | | | | | | | | | |
| | | Class I | |
| | | Year ended October 31, | |
| | | 2012 | | | 2011 | | | 2010 | | | 2009 | | | 2008 | |
Net asset value at beginning of year | | $ | 8.73 | | | $ | 9.07 | | | $ | 8.42 | | | $ | 7.17 | | | $ | 9.02 | |
| | | | | | | | | | | | | | | | | | | | |
Net investment income (loss) (a) | | | 0.47 | | | | 0.46 | | | | 0.58 | | | | 0.43 | | | | 0.47 | |
Net realized and unrealized gain (loss) on investments | | | 0.51 | | | | (0.31 | ) | | | 0.66 | | | | 1.48 | | | | (1.94 | ) |
Net realized and unrealized gain (loss) on foreign currency transactions | | | 0.01 | | | | (0.00 | )‡ | | | (0.05 | ) | | | 0.02 | | | | 0.11 | |
| | | | | | | | | | | | | | | | | | | | |
Total from investment operations | | | 0.99 | | | | 0.15 | | | | 1.19 | | | | 1.93 | | | | (1.36 | ) |
| | | | | | | | | | | | | | | | | | | | |
Less dividends and distributions: | | | | | | | | | | | | | | | | | | | | |
From net investment income | | | (0.49 | ) | | | (0.49 | ) | | | (0.54 | ) | | | (0.64 | ) | | | (0.49 | ) |
Return of capital | | | — | | | | — | | | | — | | | | (0.04 | ) | | | — | |
| | | | | | | | | | | | | | | | | | | | |
Total dividends and distributions | | | (0.49 | ) | | | (0.49 | ) | | | (0.54 | ) | | | (0.68 | ) | | | (0.49 | ) |
| | | | | | | | | | | | | | | | | | | | |
Net asset value at end of year | | $ | 9.23 | | | $ | 8.73 | | | $ | 9.07 | | | $ | 8.42 | | | $ | 7.17 | |
| | | | | | | | | | | | | | | | | | | | |
Total investment return (b) | | | 11.41 | % | | | 1.79 | % | | | 14.59 | % | | | 28.78 | % | | | (15.86 | %) |
Ratios (to average net assets)/Supplemental Data: | | | | | | | | | | | | | | | | | | | | |
Net investment income (loss) | | | 5.32 | % | | | 5.20 | % | | | 6.57 | % | | | 5.75 | % | | | 5.49 | % |
Net expenses (excluding short sale expenses) | | | 0.76 | % | | | 0.78 | % | | | 0.92 | % | | | 0.95 | % | | | 0.96 | % |
Expenses (including short sales expenses, before waiver/reimbursement) | | | 1.08 | % | | | 1.02 | % | | | 0.95 | % | | | 1.12 | % | | | 1.03 | % |
Short sale expenses | | | 0.32 | % | | | 0.24 | % | | | — | | | | — | | | | — | |
Portfolio turnover rate | | | 25 | % | | | 26 | % | | | 80 | % | | | 154 | %(c) | | | 81 | %(c) |
Net assets at end of year (in 000’s) | | $ | 111,435 | | | $ | 163,356 | | | $ | 5,183 | | | $ | 319 | | | $ | 259 | |
| ‡ | Less than one cent per share. |
| (a) | Per share data based on average shares outstanding during the year. |
| (b) | Total investment return is calculated exclusive of sales charges and assumes the reinvestment of dividends and distributions. Class I shares are not subject to sales charges. |
| (c) | The portfolio turnover rates not including mortgage dollar rolls were 117% and 72% for the years ended October 31, 2009 and 2008, respectively. |
| | | | | | |
The notes to the financial statements are an integral part of,
and should be read in conjunction with, the financial statements. | | mainstayinvestments.com | | | 33 | |
Notes to Financial Statements
Note 1–Organization and Business
The MainStay Funds (the “Trust”) were organized on January 9, 1986, as a Massachusetts business trust. The Trust is registered under the Investment Company Act of 1940, as amended (the “1940 Act”), as an open-end investment management company, and is comprised of twelve funds (collectively referred to as the “Funds”). These financial statements and notes relate only to the MainStay Flexible Bond Opportunities Fund (the “Fund”).
The Fund currently offers five classes of shares. Class A and Class B shares commenced operations on February 28, 1997. Class C shares commenced operations on September 1, 1998. Class I shares commenced operations on January 2, 2004. Investor Class shares commenced operations on February 28, 2008. Investor Class and Class A shares are offered at net asset value (“NAV”) per share plus an initial sales charge. No sales charge applies to investments of $1 million or more (and certain other qualified purchases) in Investor Class and Class A shares, but a contingent deferred sales charge (“CDSC”) is imposed on certain redemptions made within one year of the date of purchase. Class B and Class C shares are offered at NAV without an initial sales charge, although a declining CDSC may be imposed on redemptions made within six years of the date of purchase of Class B shares and a 1.00% CDSC may be imposed on redemptions made within one year of the date of purchase of Class C shares. Class I shares are offered at NAV and are not subject to a sales charge. Depending upon eligibility, Class B shares convert to either Investor Class or Class A shares at the end of the calendar quarter eight years after the date they were purchased. Additionally, depending upon eligibility, Investor Class shares may convert to Class A shares and Class A shares may convert to Investor Class shares. The five classes of shares have the same voting (except for issues that relate solely to one class), dividend, liquidation and other rights, and the same terms and conditions, except that Class B and Class C shares are subject to higher distribution and/or service fee rates than Investor Class and Class A shares under a distribution plan pursuant to Rule 12b-1 under the 1940 Act. Class I shares are not subject to a distribution and/or service fee.
The Fund’s investment objective is to seek current income and total return by investing primarily in domestic and foreign debt securities.
Note 2–Significant Accounting Policies
The Fund prepares its financial statements in accordance with generally accepted accounting principles (“GAAP”) in the United States of America and follows the significant accounting policies described below.
(A) Securities Valuation. Investments are valued as of the close of regular trading on the New York Stock Exchange (“Exchange”) (generally 4:00 p.m. Eastern time) on each day the Fund is open for business (“valuation date”).
The Board of Trustees (the “Board”) has adopted procedures for the valuation of the Fund’s securities and has delegated the responsibility for valuation determination under those procedures to the Valuation Committee of the Fund (the “Valuation Committee”). The Board has authorized the Valuation Committee to appoint a Valuation Sub-Committee (the “Sub-Committee”) to deal in the first instance with questions that arise or cannot be resolved under these procedures. The Sub-Committee will meet (in person, via electronic mail or via
teleconference) on an as-needed basis. The Valuation Committee shall meet at a later time, as necessary, to ensure that actions taken by the Sub-Committee were appropriate. The procedures recognize that, subject to the oversight of the Board and unless otherwise noted, the responsibility for day-to-day valuation of portfolio assets (including securities for which market prices are not readily available) rests with New York Life Investment Management LLC (“New York Life Investments” or the “Manager”), aided to whatever extent necessary by the Subadvisor (as defined in Note 3(A)) of the Fund. These procedures shall be reviewed by the Board no less frequently than annually. Any revisions to these procedures deemed necessary shall be reported to the Board at its next regularly scheduled meeting.
Securities are valued using unadjusted market prices, when available, as supplied primarily by third party pricing services or dealers. To assess the appropriateness of security valuations, the Manager or the Fund’s third party service provider who is subject to oversight by the Manager, regularly compares prior day prices, prices on comparable securities and the sale prices to the prior and current day prices and challenges prices exceeding certain tolerance levels with third party pricing services or broker sources. For those securities valued by recommendation, whether through a standardized fair valuation methodology or a fair valuation determination, the Valuation Committee reviews and affirms the reasonableness of the valuation based on such methodologies and determinations on a regular basis after considering all relevant information that is reasonably available.
“Fair value” is defined as the price that the Fund would receive upon selling an investment in an orderly transaction to an independent buyer in the principal or most advantageous market of the investment. Fair value measurements are determined within a framework that has established a three-tier hierarchy which maximizes the use of observable market data and minimizes the use of unobservable inputs to establish classification of fair value measurements for disclosure purposes. “Inputs” refer broadly to the assumptions that market participants would use in pricing the asset or liability, including assumptions about risk, such as the risk inherent in a particular valuation technique used to measure fair value using a pricing model and/or the risk inherent in the inputs for the valuation technique. Inputs may be observable or unobservable. Observable inputs reflect the assumptions market participants would use in pricing the asset or liability based on market data obtained from sources independent of the Fund. Unobservable inputs reflect the Fund’s own assumptions about the assumptions market participants would use in pricing the asset or liability developed based on the information available in the circumstances. The inputs or methodology used for valuing securities may not be an indication of the risks associated with investing in those securities. The three-tier hierarchy of inputs is summarized in the three broad Levels listed below.
| • | | Level 1—quoted prices in active markets for identical investments |
| • | | Level 2—other significant observable inputs (including quoted prices for similar investments in active markets, interest rates and yield curves, prepayment speeds, credit risks, etc.) |
| • | | Level 3—significant unobservable inputs (including the Fund’s own assumptions about the assumptions that market participants would use in determining the fair value of investments) |
| | |
| 34 | | MainStay Flexible Bond Opportunities Fund |
The aggregate value by input level, as of October 31, 2012, for the Fund’s investments is included at the end of the Fund’s Portfolio of Investments.
The valuation techniques used by the Fund to measure fair value maximize the use of observable inputs and minimize the use of unobservable inputs. The Fund may utilize third party vendor evaluations, whose prices may be derived from one or more of the following standard inputs:
| | |
• Benchmark Yields | | • Reported Trades |
• Broker Dealer Quotes | | • Issuer Spreads |
• Two-sided markets | | • Benchmark securities |
• Bids / Offers | | • Reference Data (corporate actions or material event notices) |
• Industry and economic events | | • Comparable bonds |
• Equity and credit default swap curves | | • Monthly payment information |
Securities for which market value cannot be determined using the methodologies described above are valued by methods deemed in good faith by the Fund’s Valuation Committee, following the procedures established by the Board, to represent fair value. Under these procedures, the Fund primarily employs a market-based approach which may use related or comparable assets or liabilities, recent transactions, market multiples, book values, and other relevant information. The Fund may also use an income-based valuation approach in which the anticipated future cash flows of the investment are discounted to calculate fair value. Discounts may also be applied due to the nature or duration of any restrictions on the disposition of the investments. Due to the inherent uncertainty of valuations of such investments, the fair values may differ significantly from the values that would have been used had an active market existed. For the year ended October 31, 2012, there have been no changes to the fair value methodologies.
Equity and non-equity securities which may be valued in this manner include, but are not limited to: (i) a security for which the trading has been halted or suspended; (ii) a debt security that has recently gone into default and for which there is not a current market quotation; (iii) a security of an issuer that has entered into a restructuring; (iv) a security that has been de-listed from a national exchange; (v) a security for which the market price is not available from a third party pricing source or, if so provided, does not, in the opinion of the Fund’s Manager or Subadvisor reflect the security’s market value; and (vi) a security whose principal market has been temporarily closed at a time when, under normal conditions, it would be open. Securities for which market quotations or observable inputs are not readily available are generally categorized as Level 3 in the hierarchy. As of October 31, 2012, the Fund held securities with a value of $119,953 that were fair valued in such a manner.
Certain events may occur between the time that foreign markets close, on which securities held by the Fund principally trade, and the time at which the Fund’s NAV is calculated. These events may include, but are not limited to, situations relating to a single issuer in a market sector, significant fluctuations in U.S. or foreign markets, natural disasters, armed conflicts, governmental actions or other developments not tied directly to the securities markets. Should the Manager or Subadvisor conclude that such events may have affected the accuracy of the last price of such securities reported on the local foreign market, the
Manager or Subadvisor may, pursuant to procedures adopted by the Fund’s Board, adjust the value of the local price to reflect the impact on the price of such securities as a result of such events. In this instance, securities are generally categorized as Level 3 in the hierarchy. Additionally, foreign equity securities are also fair valued whenever the movement of a particular index exceeds certain thresholds. In such cases, the securities are fair valued by applying factors provided by a third party vendor in accordance with the Fund’s policies and procedures and are generally categorized as Level 2 in the hierarchy. As of October 31, 2012, the Fund did not hold any foreign equity securities.
Equity securities and Exchange Traded Funds are valued at the latest quoted sales prices as of the close of regular trading on the Exchange on each valuation date. Securities that are not traded on the valuation date are valued at the mean of the latest quoted bid and ask prices. Prices normally are taken from the principal market in which each security trades. Futures contracts are valued at the last posted settlement price on the market where such futures are primarily traded. Options contracts are valued at the last posted settlement price on the market where such options are principally traded. Investments in other mutual funds are valued at their respective NAV as of the close of the Exchange on the valuation date. These securities are generally categorized as Level 1 in the hierarchy.
Debt securities (other than municipal debt securities) are valued at the evaluated bid prices (evaluated mean prices in the case of municipal debt securities) supplied by a pricing agent or broker selected by the Fund’s Manager in consultation with the Fund’s Subadvisor if any, whose prices reflect broker/dealer supplied valuations and electronic data processing techniques, if such prices are deemed by the Fund’s Manager, in consultation with the Fund’s Subadvisor, if any, to be representative of market values, at the regular close of trading of the Exchange on each valuation date. Debt securities, including corporate bonds, U.S. government and federal agency bonds, municipal bonds, foreign bonds, Yankee bonds, convertible bonds, asset-backed securities and mortgage-backed securities are generally categorized as Level 2 in the hierarchy.
Temporary cash investments acquired over 60 days to maturity are valued using the latest bid prices or using valuations based on a matrix system (which considers such factors as security prices, yields, maturities, and ratings), both as furnished by independent pricing services. Other temporary cash investments which mature in 60 days or less (“Short-Term Investments”) are valued at amortized cost. The amortized cost method involves valuing a security at its cost on the date of purchase and thereafter assuming a constant amortization to maturity of the difference between such cost and the value on maturity date. Amortized cost approximates the current fair value of a security. Securities valued at amortized cost are not valued using a quoted price in an active market. These securities are generally categorized as Level 2 in the hierarchy.
Foreign currency forward contracts are valued at their fair market values determined on the basis of the mean between the last current bid and ask prices based on dealer or exchange quotations and are generally categorized as Level 2 in the hierarchy.
Loan assignments, participations and commitments are valued at the average of bid quotations obtained from the engaged independent pricing service, and are generally categorized as Level 2 in the hierarchy.
| | | | |
| mainstayinvestments.com | | | 35 | |
Notes to Financial Statements (continued)
Credit default swaps are valued at prices supplied by a pricing agent or brokers selected by the Fund’s Manager in consultation with the Fund’s Subadvisor whose prices reflect broker/dealer supplied valuations and electronic data processing techniques. Swaps are marked-to-market daily and the change in value, if any, is recorded as unrealized appreciation or depreciation. These securities are generally categorized as Level 2 in the hierarchy.
Generally, a security is considered illiquid if it cannot be sold or disposed of in the ordinary course of business at approximately the price at which it is valued. Its illiquidity might prevent the sale of such security at a time when the Manager or Subadvisor might wish to sell, and these securities could have the effect of decreasing the overall level of a Fund’s liquidity. Further, the lack of an established secondary market may make it more difficult to value illiquid securities, requiring the Fund to rely on judgments that may be somewhat subjective in determining value, which could vary from the amount that a Fund could realize upon disposition. Difficulty in selling illiquid securities may result in a loss or may be costly to the Fund. Under the supervision of the Board, the Manager or Subadvisor determines the liquidity of the Fund’s investments; in doing so, the Manager or Subadvisor may consider various factors, including (i) the frequency of trades and quotations, (ii) the number of dealers and prospective purchasers, (iii) dealer undertakings to make a market, and (iv) the nature of the security and the market in which it trades (e.g., the time needed to dispose of the security, the method of soliciting offers and the mechanics of transfer). Illiquid securities generally will be valued in good faith in such a manner as the Board deems appropriate to reflect their fair value.
(B) Income Taxes. The Fund’s policy is to comply with the requirements of the Internal Revenue Code of 1986, as amended (the “Internal Revenue Code”), applicable to regulated investment companies and to distribute all of the taxable income to the shareholders of the Fund within the allowable time limits. Therefore, no federal, state and local income tax provision is required.
Management evaluates its tax positions to determine if the tax positions taken meet the minimum recognition threshold in connection with accounting for uncertainties in income tax positions taken or expected to be taken for the purposes of measuring and recognizing tax liabilities in the financial statements. Recognition of tax benefits of an uncertain tax position is required only when the position is “more likely than not” to be sustained assuming examination by taxing authorities. Management has analyzed the Fund’s tax positions taken on federal, state and local income tax returns for all open tax years (for up to three tax years), and has concluded that no provision for federal, state and local income tax are required in the Fund’s financial statements. The Fund’s federal, state and local income and federal excise tax returns for tax years for which the applicable statutes of limitations have not expired are subject to examination by the Internal Revenue Service and state and local departments of revenue.
(C) Foreign Taxes. Investment income received by the Fund from foreign sources may be subject to foreign income taxes. These foreign income taxes are generally withheld at the source, and a portion of which may be recoverable. The Fund will accrue such taxes and recoveries as applicable, based upon its current interpretation of tax rules and regulations that exist in the markets in which it invests.
(D) Dividends and Distributions to Shareholders. Dividends and distributions are recorded on the ex-dividend date. The Fund intends to declare and pay dividends of net investment income, if any, at least monthly and distributions of net realized capital and currency gains, if any, at least annually. Unless the shareholder elects otherwise, all dividends and distributions are reinvested in the same class of shares of the Fund, at NAV. Dividends and distributions to shareholders are determined in accordance with federal income tax regulations and may differ from GAAP.
(E) Security Transactions and Investment Income. The Fund records security transactions on the trade date. Realized gains and losses on security transactions are determined using the identified cost method. Dividend income is recognized on the ex-dividend date and interest income is accrued as earned using the effective interest rate method. Discounts and premiums on securities purchased, other than Short-Term Investments, for the Fund are accreted and amortized, respectively, on the effective interest rate method over the life of the respective securities or, in the case of a callable security, over the period to the first date of call. Discounts and premiums on Short-Term Investments are accreted and amortized, respectively, on the straight-line method.
Investment income and realized and unrealized gains and losses on investments of the Fund are allocated to separate classes of shares pro rata based upon their relative net assets on the date the income is earned or realized and unrealized gains and losses are incurred.
(F) Expenses. Expenses of the Trust are allocated to the individual Funds in proportion to the net assets of the respective Funds when the expenses are incurred, except where direct allocations of expenses can be made. Expenses (other than transfer agent expenses and fees incurred under the shareholder services plans and the distribution plans further discussed in Note 3(B)) are allocated to separate classes of shares pro rata based upon their relative net assets on the date the expenses are incurred. The expenses borne by the Fund, including those of related parties to the Fund, are shown in the Statement of Operations.
(G) Use of Estimates. In preparing financial statements in conformity with GAAP, management makes estimates and assumptions that affect the reported amounts and disclosures in the financial statements. Actual results could differ from those estimates.
(H) Repurchase Agreements. The Fund may enter into repurchase agreements to earn income. The Fund may enter into repurchase agreements only with financial institutions that are deemed by the Manager or Subadvisor to be creditworthy, pursuant to guidelines established by the Fund’s Board. During the term of any repurchase agreement, the Manager will continue to monitor the creditworthiness of the seller. Under the 1940 Act, repurchase agreements are considered to be collateralized loans by a Fund to the seller secured by the securities transferred to the Fund.
When the Fund invests in repurchase agreements, the Fund’s custodian takes possession of the collateral pledged for investments in the repurchase agreement. The underlying collateral is valued daily on a mark-to-market basis to determine that the value, including accrued interest, exceeds the repurchase price. In the event of the seller’s default on the obligation to repurchase, the Fund has the right to liqui-
| | |
| 36 | | MainStay Flexible Bond Opportunities Fund |
date the collateral and apply the proceeds in satisfaction of the obligation. Under certain circumstances, such as in the event of default or bankruptcy by the counterparty to the agreement, realization and/or retention of the collateral may be subject to legal proceedings and possible realized loss to the Fund.
(I) Futures Contracts. A futures contract is an agreement to purchase or sell a specified quantity of an underlying instrument at a specified future date and price, or to make or receive a cash payment based on the value of a financial instrument (e.g., foreign currency, interest rate, security, or securities index). The Fund is subject to equity price risk and/or interest rate risk in the normal course of investing in these transactions. During the period the futures contract is open, changes in the value of the contract are recognized as unrealized appreciation or depreciation by “marking-to-market” such contract on a daily basis to reflect the market value of the contract at the end of each day’s trading. The Fund agrees to receive from or pay to the broker an amount of cash equal to the daily fluctuation in the value of the contract. Such receipts or payments are known as “variation margin.” When the futures contract is closed, the Fund records a realized gain or loss equal to the difference between the proceeds from (or cost of) the closing transaction and the Fund’s basis in the contract.
The use of futures contracts involves, to varying degrees, elements of market risk in excess of the amount recognized in the Statement of Assets and Liabilities. The contract or notional amounts and variation margin reflect the extent of the Fund’s involvement in open futures positions. Risks arise from the possible imperfect correlation in movements in the price of futures contracts, interest rates and the underlying hedged assets, and the possible inability of counterparties to meet the terms of their contracts. However, the Fund’s activities in futures contracts have minimal counterparty risk as they are conducted through regulated exchanges that guarantee the futures against default by the counterparty. In the event of a bankruptcy or insolvency of a futures commission merchant that holds margin on behalf of the Fund, the Fund may not be entitled to the return of all of the margin owed to the Fund, potentially resulting in a loss. The Fund may invest in futures contracts to help manage the duration and yield curve of the portfolio while minimizing the exposure to wider bid/ask spreads in traditional bonds. The Fund’s investment in futures contracts and other derivatives may increase the volatility of the Fund’s NAV and may result in a loss to the Fund.
(J) Loan Assignments, Participations and Commitments. The Fund invests in loan assignments and loan participations. Loan assignments and participations (“loans”) are agreements to make money available (a “commitment”) to a borrower in a specified amount, at a specified rate and within a specified time. Such loans are typically senior, secured and collateralized in nature. The Fund records an investment when the borrower withdraws money and records interest as earned. These loans pay interest at rates that are periodically reset by reference to a base lending rate plus a spread. These base lending rates are generally the prime rate offered by a designated U.S. bank or the London InterBank Offered Rate.
The loans in which the Fund invests are generally readily marketable, but may be subject to some restrictions on resale. For example, the Fund may be contractually obligated to receive approval from the agent bank and/or borrower prior to the sale of these investments.
The Fund assumes the credit risk of the borrower, the selling participant and any other persons interpositioned between the Fund and the borrower (“intermediate participants”). In the event that the borrower, selling participant or intermediate participants become insolvent or enters into bankruptcy, the Fund may incur certain costs and delays in realizing payment, or may suffer a loss of principal and/or interest.
Unfunded commitments represent the remaining obligation of the Fund to the borrower. At any point in time, up to the maturity date of the issue, the borrower may demand the unfunded portion. These unfunded amounts are marked to market and recorded in the Statement of Assets and Liabilities. As of October 31, 2012, the Fund did not hold any unfunded commitments.
(K) Swap Contracts. The Fund may enter into credit default, interest rate, index and currency exchange rate contracts (“swaps”) for the purpose of attempting to obtain a desired return at a lower cost to the Fund, rather than directly investing in an instrument yielding that desired return or to hedge against credit risk. In a typical swap transaction, two parties agree to exchange the returns (or differentials in rates of returns) earned or realized on a particular investment or instruments. The gross returns to be exchanged or “swapped” between the parties are calculated with respect to a notional amount. The payments may be adjusted for transaction costs, interest payments, the amount of interest paid on the investment or instrument or other factors. Collateral, in the form of cash or securities, may be required to be held in segregated accounts with the custodian bank or broker in accordance with the swap.
Credit default swaps, in particular, are contracts whereby one party makes periodic payments to a counterparty in exchange for the right to receive a specified return in the event of a default by a third party on its obligation. Such periodic payments are accrued daily and recorded as a realized gain or loss. Credit default swaps may be used to provide a measure of protection against defaults of sovereign or corporate issuers.
Swaps are “marked-to-market” daily based upon quotations from pricing agents, brokers, or market makers and the change in value, if any, is recorded as unrealized appreciation or depreciation. Any payments made or received upon entering a swap would be amortized or accreted over the life of the swap and recorded as a realized gain or loss. Early termination of a swap is recorded as a realized gain or loss.
The Fund bears the risk of loss of the amount expected to be received under a swap in the event of the default or bankruptcy of the swap counterparty. The Fund may be able to eliminate its exposure under a swap either by assignment or other disposition, or by entering into an offsetting swap with the same party or a similar creditworthy party. Swaps are not actively traded on financial markets. Entering into swaps involves elements of credit, market, and documentation risk in excess of the amounts recognized on the Statement of Assets and Liabilities. Such risks involve the possibilities that there will be no liquid market for these swaps, that the counterparty to the swaps may default on its obligation to perform or disagree as to the meaning of the contractual terms in the swaps and that there may be unfavorable changes in interest rates, the price of the index or the security underlying these transactions. As of October 31, 2012, the Fund did not hold any swap contracts.
(L) Foreign Currency Forward Contracts. The Fund may enter into foreign currency forward contracts, which are agreements to buy or
| | | | |
| mainstayinvestments.com | | | 37 | |
Notes to Financial Statements (continued)
sell currencies of different countries on a specified future date at a specified rate. The Fund is subject to foreign currency exchange rate risk in the normal course of investing in these transactions. During the period the forward contract is open, changes in the value of the contract are recognized as unrealized appreciation or depreciation by “marking-to-market” such contract on a daily basis to reflect the market value of the contract at the end of each day’s trading. Cash movement occurs on settlement date. When the forward contract is closed, the Fund records a realized gain or loss equal to the difference between the proceeds from (or cost of) the closing transaction and the Fund’s basis in the contract. The Fund may enter into foreign currency forward contracts to reduce currency risk versus the benchmark or for trade settlement.
The use of foreign currency forward contracts involves, to varying degrees, elements of market risk in excess of the amount recognized in the Statement of Assets and Liabilities. The contract amount reflects the extent of the Fund’s involvement in these financial instruments. Risks arise from the possible movements in the foreign exchange rates underlying these instruments. While the Fund may enter into forward contracts to reduce currency exchange risks, changes in currency exchange rates may result in poorer overall performance for the Fund than if it had not engaged in such transactions. Exchange rate movements can be large, depending on the currency, and can last for extended periods of time, affecting the value of the Fund’s assets. Moreover, there may be an imperfect correlation between the Fund’s holdings of securities denominated in a particular currency and the forward contracts entered into by the Fund. Such imperfect correlation may prevent the Fund from achieving the intended hedge or expose the Fund to the risk of currency exchange loss. The unrealized appreciation (depreciation) on forward contracts reflects the Fund’s exposure at valuation date to credit loss in the event of a counterparty’s failure to perform its obligations.
(M) Foreign Currency Transactions. The books and records of the Fund are kept in U.S. dollars. Prices of securities denominated in foreign currency amounts are translated into U.S. dollars at the mean between the buying and selling rates last quoted by any major U.S. bank at the following dates:
| (i) | market value of investment securities, other assets and liabilities—at the valuation date, and |
| (ii) | purchases and sales of investment securities, income and expenses—at the date of such transactions. |
The assets and liabilities that are denominated in foreign currency amounts are presented at the exchange rates and market values at the close of the period. The realized and unrealized changes in net assets arising from fluctuations in exchange rates and market prices of securities are not separately presented.
Net realized gain (loss) on foreign currency transactions represents net gains and losses on foreign currency forward contracts, net currency gains or losses realized as a result of differences between the amounts of securities sale proceeds or purchase cost, dividends, interest and withholding taxes as recorded on the Fund’s books, and the U.S. dollar equivalent amount actually received or paid. Net currency gains or losses from valuing such foreign currency denominated assets and liabilities, other than investments at valuation date exchange rates, are reflected in unrealized foreign exchange gains or losses.
(N) Mortgage Dollar Rolls. The Fund may enter into mortgage dollar roll (“MDR”) transactions in which it sells mortgage-backed securities (“MBS”) from its portfolio to a counterparty from whom it simultaneously agrees to buy a similar security on a delayed delivery basis. The MDR transactions of the Fund are classified as purchase and sale transactions. The securities sold in connection with the MDRs are removed from the portfolio and a realized gain or loss is recognized. The securities the Fund has agreed to acquire are included at market value in the Portfolio of Investments and liabilities for such purchase commitments are included as payables for investments purchased. During the roll period, the Fund foregoes principal and interest paid on the securities. The Fund is compensated by the difference between the current sales price and the forward price for the future as well as by the earnings on the cash proceeds of the initial sale. MDRs may be renewed without physical delivery of the securities subject to the contract. The Fund maintains liquid assets from its portfolio having a value not less than the repurchase price, including accrued interest. MDR transactions involve certain risks, including the risk that the MBS returned to the Fund at the end of the roll period, while substantially similar, could be inferior to what was initially sold to the counterparty.
(O) Securities Sold Short. The Fund engages in short sales as part of its investment strategy. When the Fund enters into a short sale, it must segregate the cash proceeds from the security sold short or other securities as collateral for its obligation to deliver the security upon conclusion of the sale. During the period a short position is open, depending on the nature and type of security, short positions held are reflected as liabilities and are marked to market in accordance with the valuation methodologies previously detailed (See Note 2(A)). Liabilities for securities sold short are closed out by purchasing the applicable securities for delivery to the counterparty broker. A gain, limited to the price at which the Fund sold the security short, or a loss, unlimited as to dollar amount, will be recognized upon termination of a short sale if the market price on the date the short position is closed out is less or greater, respectively, than the proceeds originally received. Any such gain or loss may be offset, completely or in part, by the change in the value of the hedged investments. Interest on short positions held is accrued daily while dividends declared on short positions existing on the record date are recorded on the ex-dividend date. Both the interest and dividends paid on short sales are recorded as expenses on the Statement of Operations.
(P) Securities Lending. In order to realize additional income, the Fund may engage in securities lending, subject to the limitations set forth in the 1940 Act, and relevant guidance by the staff of the Securities and Exchange Commission. In the event the Fund does engage in securities lending, the Fund will lend through its custodian, State Street Bank and Trust Company (“State Street”). State Street will manage the Fund’s cash collateral in accordance with the Lending Agreement between the Fund and State Street, and indemnify the Fund’s portfolio against counterparty risk. The loans will be collateralized by cash or securities at least equal at all times to the market value of the securities loaned. Collateral will consist of U.S. government securities, cash equivalents or irrevocable letters of credit. The Fund may bear the risk of delay in recovery of, or loss of rights in, the securities loaned should the borrower of the securities experience financial difficulty. The Fund may also record realized gain or loss on securities deemed sold due to a borrower’s inability to return securities on loan. The Fund will receive
| | |
| 38 | | MainStay Flexible Bond Opportunities Fund |
compensation for lending its securities in the form of fees or the retention of a portion of the interest on the investment of any cash received as collateral. The Fund also will continue to receive interest and dividends on the securities loaned and any gain or loss in the market price of the securities loaned that may occur during the term of the loan will be for the account of the Fund.
Although the Fund and New York Life Investments have temporarily suspended securities lending, the Fund and New York Life Investments reserve the right to reinstitute lending when deemed appropriate. The Fund had no portfolio securities on loan as of October 31, 2012.
(Q) Restricted Securities. A restricted security is a security which has been purchased through a private offering and cannot be resold to the general public without prior registration under the Securities Act of 1933, as amended. The Fund may not have the right to demand that such securities be registered. Disposal of these securities may involve time-consuming negotiations and expenses and it may be difficult to obtain a prompt sale at an acceptable price. (See Note 6)
(R) Concentration of Risk. The Fund invests in high-yield securities (sometimes called “junk bonds”), which are generally considered speculative because they present a greater risk of loss, including default, than higher quality debt securities. These securities pay investors a premium—a high interest rate or yield—because of the increased risk of loss. These securities can also be subject to greater price volatility.
The Fund invests in foreign securities, which carry certain risks that are in addition to the usual risks inherent in domestic instruments. These
risks include those resulting from currency fluctuations, future adverse political and economic developments and possible imposition of currency exchange blockages or other foreign governmental laws or restrictions. These risks are likely to be greater in emerging markets than in developed markets. The ability of issuers of debt securities held by the Fund to meet their obligations may be affected by economic or political developments in a specific country, industry or region.
(S) Indemnifications. Under the Trust’s organizational documents, its officers and trustees are indemnified against certain liabilities that may arise out of performance of their duties to the Trust. Additionally, in the normal course of business, the Fund enters into contracts with third-party service providers that contain a variety of representations and warranties and which may provide general indemnifications. The Fund’s maximum exposure under these arrangements is unknown, as this would involve future claims that may be made against the Fund that have not yet occurred. Based on experience, management is of the view that the risk of loss in connection with these potential indemnification obligations is remote. However, there can be no assurance that material liabilities related to such obligations will not arise in the future, which could adversely impact the Fund.
(T) Quantitative Disclosure of Derivative Holdings. The following tables show additional disclosures about the Fund’s derivative and hedging activities, including how such activities are accounted for and their effect on the Fund’s financial positions, performance and cash flows. These derivatives are not accounted for as hedging instruments.
Fair value of derivatives instruments as of October 31, 2012:
Asset Derivatives
| | | | | | | | | | | | | | | | | | | | | | |
| | | Statement of
Assets and Liabilities
Location | | Credit
Contracts
Risk | | | Foreign
Exchange
Contracts
Risk | | | Equity
Contracts
Risk | | | Interest
Rate
Contracts
Risk | | | Total | |
Warrants | | Investments in securities, at value | | $ | — | | | $ | — | | | $ | 923,844 | | | $ | — | | | $ | 923,844 | |
Forward Contracts | | Unrealized appreciation on foreign currency forward contracts | | | — | | | | 8,633 | | | | — | | | | — | | | | 8,633 | |
| | | | | | | | | | |
Total Fair Value | | | | $ | — | | | $ | 8,633 | | | $ | 923,844 | | | $ | — | | | $ | 932,477 | |
| | | | | | | | | | |
Liability Derivatives
| | | | | | | | | | | | | | | | | | | | | | |
| | | Statement of
Assets and Liabilities
Location | | Credit
Contracts
Risk | | | Foreign
Exchange
Contracts
Risk | | | Equity
Contracts
Risk | | | Interest
Rate
Contracts
Risk | | | Total | |
Futures Contracts | | Net Assets—Net unrealized appreciation (depreciation) on investments and futures contracts (a) | | $ | — | | | $ | — | | | $ | — | | | $ | (192,019 | ) | | $ | (192,019 | ) |
Forward Contracts | | Unrealized depreciation on foreign currency forward contracts | | | — | | | | (92,071 | ) | | | — | | | | — | | | | (92,071 | ) |
| | | | | | | | | | |
Total Fair Value | | | | $ | — | | | $ | (92,071 | ) | | $ | — | | | $ | (192,019 | ) | | $ | (284,090 | ) |
| | | | | | | | | | |
| (a) | Includes cumulative appreciation (depreciation) of futures contracts as reported in the Portfolio of Investments. Only current day’s variation margin is reported within the Statement of Assets and Liabilities. |
| | | | |
| mainstayinvestments.com | | | 39 | |
Notes to Financial Statements (continued)
The effect of derivative instruments on the Statement of Operations for the year ended October 31, 2012:
Realized Gain (Loss)
| | | | | | | | | | | | | | | | | | | | | | |
| | | Statement of
Operations
Location | | Credit
Contracts
Risk | | | Foreign
Exchange
Contracts
Risk | | | Equity
Contracts
Risk | | | Interest
Rate
Contracts
Risk | | | Total | |
Warrants | | Net realized gain (loss) on security transactions | | $ | — | | | $ | — | | | $ | 3 | | | $ | — | | | $ | 3 | |
Futures Contracts | | Net realized gain (loss) on futures transactions | | | — | | | | — | | | | — | | | | (637,791 | ) | | | (637,791 | ) |
Swap Contracts | | Net realized gain (loss) on swap transactions | | | 65,903 | | | | — | | | | — | | | | — | | | | 65,903 | |
Forward Contracts | | Net realized gain (loss) on foreign currency transactions | | | — | | | | 61,838 | | | | — | | | | — | | | | 61,838 | |
| | | | | | | | | | |
Total Realized Gain (Loss) | | $ | 65,903 | | | $ | 61,838 | | | $ | 3 | | | $ | (637,791 | ) | | $ | (510,047 | ) |
| | | | | | | | | | |
Change in Unrealized Appreciation (Depreciation)
| | | | | | | | | | | | | | | | | | | | | | |
| | | Statement of Operations Location | | Credit
Contracts
Risk | | | Foreign
Exchange
Contracts
Risk | | | Equity
Contracts
Risk | | | Interest Rate
Contracts
Risk | | | Total | |
Warrants | | Net change in unrealized appreciation (depreciation) on investments | | $ | — | | | $ | — | | | $ | (70,187 | ) | | $ | — | | | $ | (70,187 | ) |
Futures Contracts | | Net change in unrealized appreciation (depreciation) on futures contracts | | | — | | | | — | | | | — | | | | (47,900 | ) | | | (47,900 | ) |
Swap Contracts | | Net change in unrealized appreciation (depreciation) on swap contracts | | | 63,990 | | | | — | | | | — | | | | — | | | | 63,990 | |
Forward Contracts | | Net change in unrealized appreciation (depreciation) on translation of other assets and liabilities in foreign currencies and foreign currency forward contracts | | | — | | | | 492,599 | | | | — | | | | — | | | | 492,599 | |
| | | | | | |
Total Change in Unrealized Appreciation (Depreciation) | | | | $ | 63,990 | | | $ | 492,599 | | | $ | (70,187 | ) | | $ | (47,900 | ) | | $ | 438,502 | |
| | | | | | |
Number of Contracts, Notional Amounts or Shares/Units
| | | | | | | | | | | | | | | | | | | | |
| | | Credit
Contracts
Risk | | | Foreign
Exchange
Contracts
Risk | | | Equity
Contracts
Risk | | | Interest Rate
Contracts
Risk | | | Total | |
Warrants (1) | | | — | | | | — | | | | 69,172 | | | | — | | | | 69,172 | |
Futures Contracts Long (1) | | | | | | | | | | | | | | | 160 | | | | 160 | |
Futures Contracts Short (1) | | | — | | | | — | | | | — | | | | (710 | ) | | | (710 | ) |
Swap Contracts (2) | | $ | 7,700,000 | | | | — | | | | — | | | | — | | | $ | 7,700,000 | |
Forward Contracts Long (1) | | $ | — | | | $ | 1,050,033 | | | $ | — | | | $ | — | | | $ | 1,050,033 | |
Forward Contracts Short (1) | | $ | — | | | $ | (17,750,593 | ) | | $ | — | | | $ | — | | | $ | (17,750,593 | ) |
| | | | | | | | |
| (1) | Amount disclosed represents the weighted average held during the year ended October 31, 2012. |
| (2) | Amount disclosed represents the actual average held during the year ended October 31, 2012. |
Note 3–Fees and Related Party Transactions
(A) Manager and Subadvisor. New York Life Investments, a registered investment adviser and an indirect, wholly-owned subsidiary of New York Life Insurance Company (“New York Life”), serves as the Fund’s Manager, pursuant to an Amended and Restated Management Agreement (“Management Agreement”). The Manager provides offices, conducts clerical, recordkeeping and bookkeeping services, and keeps most of the financial and accounting records required to be maintained by the Fund. Except for the portion of salaries and expenses that are the
responsibility of the Fund, the Manager pays the salaries and expenses of all personnel affiliated with the Fund and certain operational expenses of the Fund. The Fund reimburses New York Life Investments in an amount equal to a portion of the salary of the Chief Compliance Officer (“CCO”) of the Fund. MacKay Shields LLC (“MacKay Shields” or the “Subadvisor”), a registered investment adviser and an indirect, wholly-owned subsidiary of New York Life, serves as Subadvisor to the Fund and is responsible for the day-to-day portfolio management of the Fund. Pursuant to the terms of an Amended and Restated Subadvisory Agreement (“Subadvisory Agreement”) between New York Life
| | |
| 40 | | MainStay Flexible Bond Opportunities Fund |
Investments and MacKay Shields, New York Life Investments pays for the services of the Subadvisor.
The Fund pays the Manager a monthly fee for services performed and facilities furnished at an annual rate of the Fund’s average daily net assets as follows: 0.60% up to $500 million; 0.55% from $500 million to $1 billion; and 0.50% in excess of $1 billion, plus a fee for fund accounting services previously provided by New York Life Investments under a separate fund accounting agreement furnished at an annual rate of the Fund’s average daily net assets as follows: 0.05% up to $20 million; 0.0333% from $20 million to $100 million; and 0.01% in excess of $100 million. The effective management fee rate (exclusive of any applicable waivers/reimbursements) was 0.62% for the year ended October 31, 2012, inclusive of a fee for fund accounting services of 0.02% of the Fund’s average daily net assets.
Prior to February 28, 2012, New York Life Investments had contractually agreed to waive fees and/or reimburse expenses so that Total Annual Fund Operating Expenses for Class A shares did not exceed 1.16% of its average daily net assets. New York Life Investments agreed to apply an equivalent waiver or reimbursement, in an equal number of basis points, to the other share classes of the Fund. Total Annual Fund Operating Expenses excludes taxes, interest, litigation, extraordinary expenses, brokerage and other transaction expenses relating to the purchase or sale of portfolio investments, and acquired (underlying) fund fees and expenses.
For the year ended October 31, 2012, New York Life Investments earned fees from the Fund in the amount of $2,477,774.
State Street, 1 Lincoln Street, Boston, Massachusetts 02111, provides sub-administration and sub-accounting services to the Fund pursuant to an agreement with New York Life Investments. These services include calculating the daily NAVs of the Fund, maintaining the general ledger and sub-ledger accounts for the calculation of the Fund’s respective NAVs, and assisting New York Life Investments in conducting various aspects of the Fund’s administrative operations. For providing these services to the Fund, State Street is compensated by New York Life Investments.
(B) Distribution and Service Fees. The Trust, on behalf of the Fund, has entered into a distribution agreement with NYLIFE Distributors LLC (the “Distributor”), an indirect, wholly-owned subsidiary of New York Life. The Fund has adopted distribution plans (the “Plans”) in accordance with the provisions of Rule 12b-1 under the 1940 Act.
Pursuant to the Investor Class and Class A Plans, the Distributor receives a monthly distribution fee from the Investor Class and Class A shares at an annual rate of 0.25% of the average daily net assets of the Investor Class and Class A shares for distribution and/or service activities as designated by the Distributor. Pursuant to the Class B and Class C Plans, Class B and Class C shares pay the Distributor a monthly distribution fee at an annual rate of 0.75% of the average daily net assets of the Class B and Class C shares along with a service fee at an annual rate of 0.25% of the average daily net assets of the Class B and Class C shares, for a total 12b-1 fee of 1.00%. Class I shares are not subject to a distribution and/or service fee.
The Plans provide that the distribution and service fees are payable to the Distributor regardless of the amounts actually expended by the Distributor for distribution of the Fund’s shares and service activities.
(C) Sales Charges. The Fund was advised by the Distributor that the amount of sales charges retained on sales of Investor Class and Class A shares were $20,279 and $93,434, respectively, for the year ended October 31, 2012. The Fund was also advised that the Distributor retained CDSCs on redemptions of Class A, Class B and Class C shares of $191, $21,301 and $12,121, respectively, for the year ended October 31, 2012.
(D) Transfer, Dividend Disbursing and Shareholder Servicing Agent. NYLIM Service Company LLC, an affiliate of New York Life Investments, is the Fund’s transfer, dividend disbursing and shareholder servicing agent pursuant to an agreement between NYLIM Service Company LLC and the Trust. NYLIM Service Company LLC has entered into an agreement with Boston Financial Data Services, Inc. (“BFDS”) pursuant to which BFDS performs certain transfer agent services on behalf of NYLIM Service Company LLC. Transfer agent expenses incurred by the Fund for the year ended October 31, 2012, were as follows:
| | | | |
Investor Class | | $ | 55,172 | |
Class A | | | 112,789 | |
Class B | | | 39,796 | |
Class C | | | 135,845 | |
Class I | | | 82,437 | |
(E) Small Account Fee. Shareholders with small accounts adversely impact the cost of providing transfer agency services. In an effort to reduce total transfer agency expenses, the Fund has implemented a small account fee on certain types of accounts. Certain shareholders with an account balance of less than $1,000 are charged an annual per account fee of $20 (assessed semi-annually), the proceeds from which offset transfer agent fees as reflected in the Statement of Operations.
(F) Capital. As of October 31, 2012, New York Life and its affiliates beneficially held shares of the Fund with the following values and percentages of net assets as follows:
Note 4–Federal Income Tax
As of October 31, 2012, the components of accumulated gain (loss) on a tax basis were as follows:
| | | | | | | | | | | | | | | | |
Ordinary
Income | | Accumulated
Capital and
Other Gain
(Loss) | | | Other
Temporary
Differences | | | Unrealized
Appreciation
(Depreciation) | | | Total
Accumulated Gain (Loss) | |
$21,288 | | $ | (473,003 | ) | | $ | (329,084 | ) | | $ | 10,210,661 | | | $ | 9,429,862 | |
The difference between book basis and tax basis unrealized appreciation (depreciation) is primarily due to wash sale adjustments, mark to market of foreign forward contracts, mark to market of futures contracts, straddle adjustments, modified debt instruments and contingent payment debt instruments (CPDI).
The other temporary differences are primarily due to dividends payable.
The following table discloses the current year reclassifications between undistributed net investment income (loss), accumulated net realized
| | | | |
| mainstayinvestments.com | | | 41 | |
Notes to Financial Statements (continued)
gain (loss) on investments, and additional paid-in capital arising from permanent differences; net assets as of October 31, 2012 were not affected.
| | | | |
Undistributed Net Investment
Income (Loss) | | Accumulated Net
Realized Gain (Loss)
on Investments | | Additional Paid-In Capital |
$(388,336) | | $336,081 | | $52,255 |
The reclassifications for the Fund are primarily due to mark to market on foreign currency gain (loss), reclassification of consent fees, interest income on defaulted securities, contingent payment debt instruments and municipal income received.
Under the Regulated Investment Company Modernization Act of 2010,
the Fund is permitted to carry forward capital losses incurred in taxable years beginning after December 22, 2010, for an unlimited period. However, any losses incurred during those future years will be required to be utilized prior to the losses incurred in pre-enactment tax years. As a result of this ordering rule, pre-enactment capital loss carryforwards may be more likely to expire unused. Additionally, post-enactment capital losses that are carried forward will retain their character as either short-term or long-term capital losses rather than being considered all short-term as under previous law.
As of October 31, 2012, for federal income tax purposes, capital loss carryforwards of $473,003 were available as shown in the table below, to the extent provided by the regulations to offset future realized gains of the Fund through the years indicated. To the extent that these capital loss carryforwards are used to offset future capital gains, it is probable
that the capital gains so offset will not be distributed to shareholders. No capital gain distributions shall be made until any capital loss carryforwards have been fully utilized or expired.
| | | | | | | | |
Capital Loss
Available Through | | Short-Term
Capital Loss
Amounts (000’s) | | | Long-Term
Capital Loss
Amounts (000’s) | |
| 2017 | | $ | 473 | | | $ | — | |
The Fund utilized $3,987,646 of capital loss carryforwards during the year ended October 31, 2012.
The tax character of distributions paid during the years ended October 31, 2012 and October 31, 2011 shown in the Statements of Changes in Net Assets was as follows:
| | | | | | | | |
| | | 2012 | | | 2011 | |
Distributions paid from: | | | | | | | | |
Ordinary Income | | $ | 20,531,283 | | | $ | 16,561,241 | |
Note 5–Foreign Currency Transactions
As of October 31, 2012, the Fund held the following foreign currencies:
| | | | | | | | | | | | | | | | | | | | | | | | |
| | | | | | Currency | | | | | | Cost | | | | | | Value | |
Canadian Dollar | | | CAD | | | | 2 | | | | USD | | | | 2 | | | | USD | | | | 2 | |
Euro | | | EUR | | | | 2,434,046 | | | | | | | | 3,158,943 | | | | | | | | 3,154,887 | |
Pound Sterling | | | GBP | | | | 42,298 | | | | | | | | 67,381 | | | | | | | | 68,259 | |
Total | | | | | | | | | | | USD | | | | 3,226,326 | | | | USD | | | | 3,223,148 | |
Note 6–Restricted Securities
As of October 31, 2012, the Fund held the following restricted securities:
| | | | | | | | | | | | | | | | | | | | |
Security | | Date(s) of
Acquisition | | | Shares/Principal
Amount/Number
of Warrants | | | Cost | | | 10/31/12
Value | | | Percent of
Net Assets | |
Adelphia Contingent Value Vehicle
Common Stock | | | 5/17/02-5/29/05 | | | | 100,330 | | | $ | 31,487 | | | $ | 1,003 | | | | 0.0 | %‡ |
At Home Corp.
Convertible Bond 4.75%, due 12/31/49 | | | 7/25/01 | | | $ | 504,238 | | | | 8,348 | | | | 50 | | | | 0.0 | ‡ |
ION Media Networks, Inc. | | | | | | | | | | | | | | | | | | | | |
Warrant, Second Lien, Expires 12/18/39 | | | 12/20/10 | | | | 11 | | | | — | | | | 0 | (a) | | | 0.0 | ‡ |
Warrant, Unsecured Debt, Expires 12/18/16 | | | 3/12/10 | | | | 11 | | | | 34 | | | | 0 | (a) | | | 0.0 | ‡ |
Total | | | | | | | | | | $ | 39,869 | | | $ | 1,053 | | | | 0.0 | %‡ |
| ‡ | Less than one-tenth of a percent. |
Note 7–Custodian
State Street is the custodian of the cash and the securities of the Fund. Custodial fees are charged to the Fund based on the market value of securities in the Fund and the number of certain cash transactions incurred by the Fund.
Note 8–Line of Credit
The Fund and certain affiliated funds maintain a line of credit with a syndicate of banks in order to secure a source of funds for temporary purposes to meet unanticipated or excessive redemption requests.
Effective August 29, 2012, under an amended credit agreement, the aggregate commitment amount is $200,000,000 with an optional maximum amount of $250,000,000. The commitment fee is an annual
| | |
| 42 | | MainStay Flexible Bond Opportunities Fund |
rate of 0.08% of the average commitment amount payable quarterly, regardless of usage, to Bank of New York Mellon, which serves as the agent to the syndicate. The commitment fee is allocated among certain MainStay Funds based upon net assets and other factors. Interest on any revolving credit loan is charged based upon the Federal Funds Advances rate or the one month London InterBank Offered Rate, whichever is higher. The amended credit agreement expires on August 28, 2013, although the MainStay Funds and the syndicate of banks may renew the amended credit agreement for an additional year on the same or different terms. Prior to August 29, 2012, the aggregate commitment amount was $125,000,000 with an optional maximum amount of $175,000,000. There were no borrowings made or outstanding with respect to the Fund on the amended credit agreement during the year ended October 31, 2012.
Note 9–Purchases and Sales of Securities (in 000’s)
During the year ended October 31, 2012, purchases and sales of U.S. government securities were $1,925 and $17,305, respectively. Purchases and sales of securities, other than U.S. government securities and short-term securities, were $95,345 and $141,125, respectively.
Note 10–Capital Share Transactions
| | | | | | | | |
Investor Class | | Shares | | | Amount | |
Year ended October 31, 2012: | | | | | | | | |
Shares sold | | | 645,626 | | | $ | 5,806,996 | |
Shares issued to shareholders in reinvestment of dividends | | | 117,500 | | | | 1,052,185 | |
Shares redeemed | | | (386,730 | ) | | | (3,460,373 | ) |
| | | | |
Net increase (decrease) in shares outstanding before conversion | | | 376,396 | | | | 3,398,808 | |
Shares converted into Investor Class (See Note 1) | | | 267,436 | | | | 2,409,801 | |
Shares converted from Investor Class (See Note 1) | | | (322,045 | ) | | | (2,917,361 | ) |
| | | | |
Net increase (decrease) | | | 321,787 | | | $ | 2,891,248 | |
| | | | |
Year ended October 31, 2011: | | | | | | | | |
Shares sold | | | 732,673 | | | $ | 6,584,750 | |
Shares issued to shareholders in reinvestment of dividends | | | 99,140 | | | | 885,391 | |
Shares redeemed | | | (416,607 | ) | | | (3,722,451 | ) |
| | | | |
Net increase (decrease) in shares outstanding before conversion | | | 415,206 | | | | 3,747,690 | |
Shares converted into Investor Class (See Note 1) | | | 286,997 | | | | 2,538,354 | |
Shares converted from Investor Class (See Note 1) | | | (204,553 | ) | | | (1,834,596 | ) |
| | | | |
Net increase (decrease) | | | 497,650 | | | $ | 4,451,448 | |
| | | | |
| | | | | | | | |
Class A | | Shares | | | Amount | |
Year ended October 31, 2012: | | | | | | | | |
Shares sold | | | 6,407,382 | | | $ | 57,237,916 | |
Shares issued to shareholders in reinvestment of dividends | | | 783,280 | | | | 6,966,213 | |
Shares redeemed | | | (6,213,341 | ) | | | (55,242,568 | ) |
| | | | |
Net increase (decrease) in shares outstanding before conversion | | | 977,321 | | | | 8,961,561 | |
Shares converted into Class A (See Note 1) | | | 510,146 | | | | 4,547,209 | |
Shares converted from Class A (See Note 1) | | | (92,202 | ) | | | (841,580 | ) |
| | | | |
Net increase (decrease) | | | 1,395,265 | | | $ | 12,667,190 | |
| | | | |
Year ended October 31, 2011: | | | | | | | | |
Shares sold | | | 11,147,011 | | | $ | 99,470,341 | |
Shares issued to shareholders in reinvestment of dividends | | | 624,512 | | | | 5,538,122 | |
Shares redeemed | | | (4,779,519 | ) | | | (42,055,799 | ) |
| | | | |
Net increase (decrease) in shares outstanding before conversion | | | 6,992,004 | | | | 62,952,664 | |
Shares converted into Class A (See Note 1) | | | 457,252 | | | | 4,068,740 | |
Shares converted from Class A (See Note 1) | | | (116,034 | ) | | | (1,003,656 | ) |
| | | | |
Net increase (decrease) | | | 7,333,222 | | | $ | 66,017,748 | |
| | | | |
|
| |
Class B | | Shares | | | Amount | |
Year ended October 31, 2012: | | | | | | | | |
Shares sold | | | 622,150 | | | $ | 5,562,910 | |
Shares issued to shareholders in reinvestment of dividends | | | 64,184 | | | | 567,924 | |
Shares redeemed | | | (332,778 | ) | | | (2,938,588 | ) |
| | | | |
Net increase (decrease) in shares outstanding before conversion | | | 353,556 | | | | 3,192,246 | |
| | | | |
Shares converted from Class B (See Note 1) | | | (364,335 | ) | | | (3,198,069 | ) |
| | | | |
Net increase (decrease) | | | (10,779 | ) | | $ | (5,823 | ) |
| | | | |
Year ended October 31, 2011: | | | | | | | | |
Shares sold | | | 568,420 | | | $ | 5,060,244 | |
Shares issued to shareholders in reinvestment of dividends | | | 72,326 | | | | 640,413 | |
Shares redeemed | | | (431,109 | ) | | | (3,817,407 | ) |
| | | | |
Net increase (decrease) in shares outstanding before conversion | | | 209,637 | | | | 1,883,250 | |
Shares converted from Class B (See Note 1) | | | (425,734 | ) | | | (3,768,842 | ) |
| | | | |
Net increase (decrease) | | | (216,097 | ) | | $ | (1,885,592 | ) |
| | | | |
|
| |
Class C | | Shares | | | Amount | |
Year ended October 31, 2012: | | | | | | | | |
Shares sold | | | 1,767,987 | | | $ | 15,711,137 | |
Shares issued to shareholders in reinvestment of dividends | | | 173,766 | | | | 1,539,397 | |
Shares redeemed | | | (1,279,580 | ) | | | (11,345,180 | ) |
| | | | |
Net increase (decrease) | | | 662,173 | | | $ | 5,905,354 | |
| | | | |
Year ended October 31, 2011: | | | | | | | | |
Shares sold | | | 3,601,891 | | | $ | 32,052,109 | |
Shares issued to shareholders in reinvestment of dividends | | | 118,075 | | | | 1,042,195 | |
Shares redeemed | | | (1,073,723 | ) | | | (9,447,059 | ) |
| | | | |
Net increase (decrease) | | | 2,646,243 | | | $ | 23,647,245 | |
| | | | |
| | | | |
| mainstayinvestments.com | | | 43 | |
Notes to Financial Statements (continued)
| | | | | | | | |
Class I | | Shares | | | Amount | |
Year ended October 31, 2012: | | | | | | | | |
Shares sold | | | 7,440,219 | | | $ | 66,448,540 | |
Shares issued to shareholders in reinvestment of dividends | | | 696,110 | | | | 6,169,177 | |
Shares redeemed | | | (14,758,457 | ) | | | (131,710,576 | ) |
| | | | |
Net increase (decrease) | | | (6,622,128 | ) | | $ | (59,092,859 | ) |
| | | | |
Year ended October 31, 2011: | | | | | | | | |
Shares sold | | | 30,160,101 | | | $ | 271,055,879 | |
Shares issued to shareholders in reinvestment of dividends | | | 563,026 | | | | 4,984,280 | |
Shares redeemed (a) | | | (12,592,913 | ) | | | (113,288,287 | ) |
| | | | |
Net increase (decrease) | | | 18,130,214 | | | $ | 162,751,872 | |
| | | | |
(a) Includes the redemption of 8,805,520 shares through an in-kind transfer of securities in the amount of $79,972,617. (See Note 11) | |
Note 11–In-Kind Transfer of Securities
During the year ended October 31, 2011, the Fund redeemed shares of beneficial interest in exchange for securities. The securities were transferred at their current value on the date of transaction.
| | | | | | | | | | |
| Transaction Date | | Shares | | | Redeemed Value | | Gain (Loss) | |
| 5/5/11 | | | 8,805,520 | | | $79,972,617 | | $ | 1,774,490 | |
Note 12–Subsequent Events
In connection with the preparation of the financial statements of the Fund as of and for the year ended October 31, 2012, events and transactions subsequent to October 31, 2012 through the date the financial statements were issued have been evaluated by the Fund’s management for possible adjustment and/or disclosure. No subsequent events requiring financial statement adjustment or disclosure have been identified, other than the following:
At a meeting of the Board of the MainStay Funds on December 12, 2012, the Board approved a change to the name of the Fund and modifications to its investment objectives and principal investment strategies.
| | |
| 44 | | MainStay Flexible Bond Opportunities Fund |
Report of Independent Registered Public Accounting Firm
The Board of Trustees and Shareholders of
The MainStay Funds:
We have audited the accompanying statement of assets and liabilities, including the portfolio of investments, of the MainStay Flexible Bond Opportunities Fund (the “Fund”), one of the funds constituting The MainStay Funds, as of October 31, 2012, and the related statement of operations for the year then ended, the statements of changes in net assets for each of the years in the two-year period then ended, and the financial highlights for each of the years or periods in the five-year period then ended. These financial statements and financial highlights are the responsibility of the Fund’s management. Our responsibility is to express an opinion on these financial statements and financial highlights based on our audits.
We conducted our audits in accordance with the standards of the Public Company Accounting Oversight Board (United States). Those standards require that we plan and perform the audit to obtain reasonable assurance about whether the financial statements and financial highlights are free of material misstatement. An audit includes examining, on a test basis, evidence supporting the amounts and disclosures in the financial statements. Our procedures included confirmation of securities owned as of October 31, 2012, by correspondence with the custodian and brokers or by other appropriate auditing procedures where replies from brokers were not received. An audit also includes assessing the accounting principles used and significant estimates made by management, as well as evaluating the overall financial statement presentation. We believe that our audits provide a reasonable basis for our opinion.
In our opinion, the financial statements and financial highlights referred to above present fairly, in all material respects, the financial position of the MainStay Flexible Bond Opportunities Fund of The MainStay Funds as of October 31, 2012, the results of its operations for the year then ended, the changes in its net assets for each of the years in the two-year period then ended, and the financial highlights for each of the years or periods in the five-year period then ended, in conformity with U.S. generally accepted accounting principles.

Philadelphia, Pennsylvania
December 21, 2012
| | | | |
| mainstayinvestments.com | | | 45 | |
Federal Income Tax Information
(Unaudited)
The Fund is required under the Internal Revenue Code to advise shareholders in a written statement as to the federal tax status of dividends paid by the Fund during such fiscal years.
For the fiscal year ended October 31, 2012, the Fund designated approximately $391,818 under the Internal Revenue Code as qualified dividend income eligible for reduced tax rates.
The dividends paid by the Fund during the fiscal year ended October 31, 2012, should be multiplied by 2.0% to arrive at the amount eligible for the corporate dividends received deduction.
In February 2013, shareholders will receive an IRS Form 1099-DIV or substitute Form 1099 which will show the federal tax status of the distributions received by shareholders in calendar year 2012. The amounts that will be reported on such 1099-DIV or subsitute Form 1099 will be the amounts you are to use on your federal income tax return and will differ from the amounts which we must report for the Fund’s fiscal year ended October 31, 2012.
Proxy Voting Policies and Procedures
and Proxy Voting Record
A description of the policies and procedures that New York Life Investments uses to vote proxies related to the Fund’s securities is available without charge, upon request, (i) by visiting the Fund’s website at mainstayinvestments.com; or (ii) on the SEC’s website at www.sec.gov.
The Fund is required to file with the SEC its proxy voting record for the 12-month period ending June 30 on Form N-PX. The Fund’s most recent Form N-PX is available free of charge upon request (i) by calling 800-MAINSTAY (624-6782); (ii) by visiting the Fund’s website at mainstayinvestments.com; or (iii) on the SEC’s website at www.sec.gov.
Shareholder Reports and Quarterly Portfolio Disclosure
The Fund is required to file its complete schedule of portfolio holdings with the SEC for its first and third fiscal quarters on Form N-Q. The Fund’s Form N-Q is available without charge on the SEC’s website at www.sec.gov or by calling MainStay Investments at 800-MAINSTAY (624-6782). You also can obtain and review copies of Form N-Q by visiting the SEC’s Public Reference Room in Washington, DC (information on the operation of the Public Reference Room may be obtained by calling 1-800-SEC-0330).
| | |
| 46 | | MainStay Flexible Bond Opportunities Fund |
Board Members and Officers (Unaudited)
The Board Members oversee the MainStay Group of Funds (which is comprised of Funds that are series of The MainStay Funds, Eclipse Trust, Eclipse Funds Inc., MainStay Funds Trust, MainStay VP Funds Trust, Private Advisors Alternative Strategies Master Fund, Private Advisors Alternative Strategies Fund, and MainStay Defined Term Municipal Opportunities Fund) (collectively, the “Fund Complex”), the Manager and, when applicable, the Subadvisor(s) and other service providers to the Fund Complex. Each Board Member serves until his or her successor is elected and qualified or until his or her resignation, death or removal. The Retirement Policy provides that a Board Member
shall tender his or her resignation by the end of the calendar year during which he or she reaches the age of 75.
Officers serve a term of one year and are elected annually by the Board Members. The business address of each Board Member and officer listed below is 51 Madison Avenue, New York, New York 10010.
The Statement of Additional Information applicable to the Fund includes additional information about the Board Members and is available without charge, upon request, by calling 800-MAINSTAY (624-6782) or by going online to mainstayinvestments.com.
| | | | | | | | | | | | |
| | | | | Name and
Date of Birth | | Term of Office,
Position(s) Held
with the Fund
Complex and
Length of Service | | Principal Occupation(s)
During Past Five Years | | Number of
Funds in
Fund Complex
Overseen by
Board Member | | Other Directorships
Held by Board Member |
| Interested Board Member* | | | | John Y. Kim
9/24/60 | | Indefinite;
Eclipse Trust: Trustee since 2008;
Eclipse Funds Inc.:
Director since 2008 (1 fund);
The MainStay Funds: Trustee since 2008 (12 funds);
MainStay Funds Trust: Trustee since 2009 (31 funds); and
MainStay VP Funds Trust: Trustee since 2011 and its predecessor, MainStay VP Series Fund, Inc. since 2008 (28 portfolios). Private Advisors Alternative Strategies Master Fund: Trustee since 2011
Private Advisors Alternative Strategies Fund: Trustee since 2011
MainStay DefinedTerm Municipal Opportunities Fund: Trustee since 2011 | | Member of the Board of Managers, President and Chief Executive Officer (since 2008), New York Life Investment Management LLC and New York Life Investment Management Holdings LLC; Member of the Board, MacKay Shields LLC since 2008; Chairman of the Board, Institutional Capital LLC, Madison Capital Funding LLC, Madison Square Investors LLC and McMorgan & Company LLC; Chairman of the Board, NYLIFE Distributors LLC and Chairman of the Board, NYLCAP Manager LLC (since 2008) President, Prudential Retirement, a business unit of Prudential Financial, Inc. (2002 to 2007) | | 75 | | None |
| | * | This Board Member is considered to be an “interested person” of the MainStay Group of Funds within the meaning of the 1940 Act because of his affiliation with New York Life Insurance Company, New York Life Investment Management LLC, Madison Square Investors LLC, MacKay Shields LLC, Private Advisors LLC, Institutional Capital LLC, NYLIFE Securities LLC and/or NYLIFE Distributors LLC, as described in detail above in the column entitled “Principal Occupation(s) During the Past Five Years.” |
| | | | |
| mainstayinvestments.com | | | 47 | |
| | | | | | | | | | | | |
| | | | | Name and
Date of Birth | | Term of Office, Position(s) Held with the Fund Complex and Length of Service | | Principal Occupation(s)
During Past Five Years | | Number of
Funds in
Fund Complex
Overseen by
Board Member | | Other Directorships
Held by Board Member |
| Non-Interested Board Members | | | | Susan B. Kerley 8/12/51 | | Indefinite;
Eclipse Trust: Chairman since 2005, and Trustee since 2000;
Eclipse Funds Inc.: Chairman since 2005 and Director since 1990 (1 fund); The MainStay Funds: Chairman and Board Member since 2007 (12 funds);
MainStay Funds Trust: Chairman and Trustee since 2009 (31 funds); and MainStay VP Funds Trust: Chairman and Trustee since 2011 and its predecessor, MainStay VP Series Fund, Inc., since 2007 (28 portfolios). Private Advisors Alternative Strategies Master Fund: Chairman and Trustee since 2011 Private Advisors Alternative Strategies Fund: Chairman and Trustee since 2011 MainStay DefinedTerm Municipal Opportunities Fund: Chairman and Trustee since 2011. | | President, Strategic Management Advisors LLC (since 1990) | | 75 | | Trustee, Legg Mason Partners Funds, since 1992 (51 portfolios) |
| | |
| 48 | | MainStay Flexible Bond Opportunities Fund |
| | | | | | | | | | | | |
| | | | | Name and
Date of Birth | | Term of Office,
Position(s) Held
with the Fund
Complex and
Length of Service | | Principal Occupation(s)
During Past Five Years | | Number of
Funds in
Fund Complex
Overseen by
Board Member | | Other Directorships
Held by Board Member |
| Non-Interested Board Members | | | | Alan R. Latshaw 3/27/51 | | Indefinite;
Eclipse Trust: Trustee and Audit Committee Financial Expert since 2007;
Eclipse Funds Inc.:
Director and Audit Committee Financial Expert since 2007 (1 fund);
The MainStay Funds: Trustee and Audit Committee Financial Expert since 2006 (12 funds);
MainStay Funds Trust: Trustee and Audit Committee Financial Expert since 2009 (31 funds); and
MainStay VP Funds Trust: Trustee and Audit Committee Financial Expert since 2011 and its predecessor, MainStay VP Series Fund, Inc., since 2007 (28 portfolios). Private Advisors Alternative Strategies Master Fund: Trustee and Audit Committee Financial Expert since 2011 Private Advisors Alternative Strategies Fund: Trustee and Audit Committee Financial Expert since 2011. MainStay DefinedTerm Municipal Opportunities Fund: Trustee and Audit Committee Financial Expert since 2011. | | Retired; Partner, Ernst & Young LLP (2002 to 2003); Partner, Arthur Andersen LLP (1989 to 2002); Consultant to the MainStay Funds Audit and Compliance Committee (2004 to 2006) | | 75 | | Trustee, State Farm Associates Funds Trusts since 2005 (4 portfolios); Trustee, State Farm Mutual Fund Trust since 2005 (15 portfolios); Trustee, State Farm Variable Product Trust since 2005 (9 portfolios) |
| | | | |
| mainstayinvestments.com | | | 49 | |
| | | | | | | | | | | | |
| | | | | Name and Date of Birth | | Term of Office, Position(s) Held with the Fund Complex and Length of Service | | Principal Occupation(s)
During Past Five Years | | Number of
Funds in
Fund Complex
Overseen by
Board Member | | Other Directorships Held by Board Member |
| Non-Interested Board Members | | | | Peter Meenan
12/5/41 | | Indefinite;
Eclipse Funds: Trustee since 2002;
Eclipse Funds Inc.:
Director since 2002
(1 fund); The MainStay Funds:
Trustee since 2007 (12 funds);
MainStay Funds Trust: Trustee since 2009
(31 funds); and
MainStay VP Funds Trust: Trustee since 2011 and its predecessor, MainStay VP Series Fund, Inc., since 2007 (28 portfolios).
Private Advisors Alternative Strategies Master Fund: Trustee since 2011. Private Advisors Alternative Strategies Fund: Trustee since 2011
MainStay DefinedTerm Municipal Opportunities Fund: Trustee since 2011. | | Independent Consultant; President and Chief Executive Officer, Babson—United, Inc. (financial services firm) (2000 to 2004); Independent Consultant (1999 to 2000); Head of Global Funds, Citicorp (1995 to 1999) | | 75 | | None |
| | | | Richard H. Nolan, Jr.
11/16/46 | | Indefinite;
Eclipse Trust: Trustee since 2007;
Eclipse Funds Inc.:
Director since 2007 (1 fund);
The MainStay Funds: Trustee since 2007 (12 funds);
MainStay Funds Trust: Trustee since 2009 (31 funds); and
MainStay VP Funds Trust: Trustee since 2011 and its predecessor, MainStay VP Series Fund, Inc., since 2006 (28 portfolios).
Private Advisors Alternative Strategies Master Fund: Trustee since 2011. Private Advisors Alternative Strategies Fund: Trustee since 2011
MainStay DefinedTerm Municipal Opportunities Fund: Trustee since 2011. | | Managing Director, ICC Capital Management; President—Shields/Alliance, Alliance Capital Management (1994 to 2004) | | 75 | | None |
| | |
| 50 | | MainStay Flexible Bond Opportunities Fund |
| | | | | | | | | | | | |
| | | | | Name and Date of Birth | | Term of Office, Position(s) Held with the Fund Complex and Length of Service | | Principal Occupation(s)
During Past Five Years | | Number of
Funds in
Fund Complex
Overseen by
Board Member | | Other Directorships Held by Board Member |
| Non-Interested Board Members | | | | Richard S. Trutanic 2/13/52 | | Indefinite;
Eclipse Trust: Trustee since 2007;
Eclipse Funds Inc.:
Director since 2007 (1 fund);
The MainStay Funds:
Trustee since 1994 (12 funds);
MainStay Funds Trust:
Trustee since 2009 (31 funds); and
MainStay VP Funds Trust: Trustee since 2011 and its predecessor, MainStay VP Series Fund, Inc., since 2007 (28 portfolios).
Private Advisors Alternative Strategies Master Fund: Trustee since 2011.
Private Advisors Alternative Strategies Fund: Trustee since 2011
MainStay DefinedTerm Municipal Opportunities Fund: Trustee since 2011. | | Chairman and Chief Executive Officer, Somerset & Company (financial advisory firm) (since 2004); Managing Director, The Carlyle Group (private investment firm) (2002 to 2004); Senior Managing Director, Partner and Board Member, Groupe Arnault S.A. (private investment firm) (1999 to 2002) | | 75 | | None |
| | | | |
| mainstayinvestments.com | | | 51 | |
| | | | | | | | | | | | |
| | | | | Name and Date of Birth | | Term of Office, Position(s) Held with the Fund Complex and Length of Service | | Principal Occupation(s)
During Past Five Years | | Number of
Funds in
Fund Complex
Overseen by
Board Member | | Other Directorships Held by Board Member |
| Non-Interested Board Members | | | | Roman L. Weil
5/22/40 | | Indefinite;
Eclipse Trust: Trustee and Audit Committee Financial Expert since 2007; Eclipse Funds Inc.: Director and Audit Committee Financial Expert since 2007 (1 fund); The MainStay Funds: Trustee and Audit Committee Financial Expert since 2007 (12 funds); MainStay Funds Trust: Trustee since 2009 (31 funds); and MainStay VP Funds Trust: Trustee and Audit Committee Financial Expert since 2011 and its predecessor, MainStay VP Series Fund, Inc., since 1994 and Audit Committee Financial Expert since 2003 (28 portfolios).
Private Advisors Alternative Strategies Master Fund: Trustee and Audit Committee Financial Expert since 2011 Private Advisors Alternative Strategies Fund: Trustee and Audit Committee Financial Expert since 2011. MainStay DefinedTerm Municipal Opportunities Fund: Trustee and Audit Committee Financial Expert since 2011. | | Visiting Professor, University of California—San Diego (since October 2012); Visiting Professor, Southern Methodist University (2011); Visiting Professor, NYU Stem School of Business, New York University (2011); President, Roman L. Weil Associates, Inc. (consulting firm) (since 1981); V. Duane Rath Professor Emeritus of Accounting, Chicago Booth School of Business, University of Chicago (1965-2008) | | 75 | | None |
| | |
| 52 | | MainStay Flexible Bond Opportunities Fund |
| | | | | | | | | | | | |
| | | | | Name and Date of Birth | | Term of Office, Position(s) Held with the Fund Complex and Length of Service | | Principal Occupation(s)
During Past Five Years | | Number of
Funds in
Fund Complex
Overseen by
Board Member | | Other Directorships Held by Board Member |
| Non-Interested Board Members | | | | John A. Weisser 10/22/41 | | Indefinite; Eclipse Trust: Trustee since 2007; Eclipse Funds Inc.: Director since 2007 (1 fund); The MainStay Funds: Trustee since 2007 (12 funds); MainStay Funds Trust: Trustee since 2009 (31 funds); and MainStay VP Funds Trust: Trustee since 2011 and its predecessor, MainStay VP Series Fund, Inc., since 1997 (28 portfolios).
Private Advisors Alternative Strategies Master Fund: Trustee since 2011.
Private Advisors Alternative Strategies Fund: Trustee since 2011
MainStay DefinedTerm Municipal Opportunities Fund: Trustee since 2011. | | Retired. Managing Director of Salomon Brothers, Inc. (1971 to 1995) | | 75 | | Trustee, Direxion Funds since 2007 (21 portfolios); Direxion Insurance Trust since 2007 (1 portfolio); Trustee, Direxion Shares ETF Trust, since 2008 (47 portfolios) |
| | | | |
| mainstayinvestments.com | | | 53 | |
The following individuals have been appointed by the Board Members to serve as Officers of the MainStay Group of Funds.
| | | | | | | | |
| | | | | Name and
Date of Birth | | Positions(s) Held with the Funds and Length of Service | | Principal Occupation(s) During Past Five Years |
| Officers | | | | Jack R. Benintende 5/12/64 | | Treasurer and Principal Financial and Accounting Officer, Eclipse Trust, Eclipse Funds, Inc. and The MainStay Funds (since 2007), MainStay Funds Trust (since 2009) | | Assistant Treasurer, New York Life Investment Management Holdings LLC (since 2008); Managing Director, New York Life Investment Management LLC (since 2007); Treasurer and Principal Financial Accounting Officer, Private Advisors Alternative Strategies Master Fund, Private Advisors Alternative Strategies Fund and MainStay DefinedTerm Municipal Opportunities Fund (since 2011); Treasurer and Principal Financial and Accounting Officer, MainStay VP Funds Trust and its predecessor, MainStay VP Series Fund, Inc. (since 2007) |
| | | | Jeffrey A. Engelsman 9/28/67 | | Vice President and Chief Compliance Officer, Eclipse Trust, Eclipse Funds, Inc., The MainStay Funds and MainStay Funds Trust (since 2009) | | Managing Director, Compliance (since 2009), Director and Associate General Counsel, New York Life Investment Management LLC (2005 to 2008); Assistant Secretary, NYLIFE Distributors LLC (2006 to 2008); Vice President and Chief Compliance Officer, Private Advisors Alternative Strategies Master Fund, Private Advisors Alternative Strategies Fund, DefinedTerm Municipal Opportunities Fund (since 2011); MainStay VP Funds Trust and its predecessor, MainStay VP Series Fund, Inc. (since 2009); Assistant Secretary, The MainStay Funds (2006 to 2008); Assistant Secretary, Eclipse Trust, Eclipse Funds, Inc. and MainStay VP Series Fund, Inc. (2005 to 2008) |
| | | | Stephen P. Fisher 2/22/59 | | President, Eclipse Trust, Eclipse Funds, Inc. and The MainStay Funds (since 2007), MainStay Funds Trust (since 2009) | | Director, Senior Vice President, New York Life Insurance and Annuity Corporation (since 2011); Manager, President and Chief Operating Officer, NYLIFE Distributors LLC (since 2008); Chairman of the Board, NYLIM Service Company LLC (since 2008); Senior Managing Director and Chief Marketing Officer, New York Life Investment Management LLC (since 2005); President, Private Advisors Alternative Strategies Master Fund, Private Advisors Alternative Strategies Fund and MainStay DefinedTerm Municipal Opportunities Fund (since 2011); MainStay VP Funds Trust and its predecessor, MainStay VP Series Fund, Inc. (since 2007) |
| | | | J. Kevin Gao 10/13/67 | | Secretary and Chief Legal Officer, Eclipse Trust, Eclipse Funds, Inc., The MainStay Funds and MainStay Funds Trust (since 2010) | | Managing Director and Associate General Counsel, New York Life Investment Management LLC (since 2010); Secretary and Chief Legal Officer, Private Advisors Alternative Strategies Master Fund, Private Advisors Alternative Strategies Fund and MainStay DefinedTerm Municipal Opportunities Fund (since 2011); MainStay VP Funds Trust and its predecessor, MainStay VP Series Fund, Inc. (since 2010); Director and Counsel of Credit Suisse, Chief Legal Officer and Secretary of Credit Suisse Asset Management, LLC and Credit Suisse Funds (2003 to 2010) |
| | | | Scott T. Harrington 2/8/59 | | Vice President—Administration, Eclipse Trust, Eclipse Funds, Inc. and The MainStay Funds (since 2005), MainStay Funds Trust (since 2009) | | Director, New York Life Investment Management LLC (including predecessor advisory organizations) (since 2000); Executive Vice President, New York Life Trust Company and New York Life Trust Company FSB (since 2006); Vice President—Administration, Private Advisors Alternative Strategies Master Fund, Private Advisors Alternative Strategies Fund and MainStay DefinedTerm Municipal Opportunities Fund (since 2011); MainStay VP Funds Trust and its predecessor, MainStay VP Series Fund, Inc. (since 2005) |
| | * | The Officers listed above are considered to be “interested persons” of the MainStay Group of Funds within the meaning of the 1940 Act because of their affiliation with New York Life Insurance Company, New York Life Investment Management LLC, Madison Square Investors LLC, MacKay Shields LLC, Private Advisors LLC, Institutional Capital LLC, Epoch Investment Partners, Inc., Markston International, LLC, Winslow Capital Management, Inc., NYLIFE Securities LLC and/or NYLIFE Distributors LLC, as described in detail above in the column captioned “Principal Occupation(s) During Past Five Years.” Officers are elected annually by the Board to serve a one-year term. |
| | |
| 54 | | MainStay Flexible Bond Opportunities Fund |
MainStay Funds
MainStay offers a wide range of Funds for virtually any investment need. The full array of MainStay open-end offerings is listed here, with information about the manager, subadvisors, legal counsel and independent registered public accounting firms.
Equity
U.S. Equity
MainStay Common Stock Fund
MainStay Epoch U.S. All Cap Fund
MainStay Epoch U.S. Equity Yield Fund
MainStay Growth Equity Fund
MainStay ICAP Equity Fund
MainStay ICAP Select Equity Fund
MainStay Large Cap Growth Fund1
MainStay MAP Fund
MainStay S&P 500 Index Fund
MainStay U.S. Small Cap Fund
MainStay 130/30 Core Fund
International/Global Equity
MainStay Epoch Global Choice Fund
MainStay Epoch Global Equity Yield Fund
MainStay Epoch International Small Cap Fund
MainStay ICAP Global Fund
MainStay ICAP International Fund
MainStay International Equity Fund
MainStay 130/30 International Fund
Income
Taxable Bond
MainStay Flexible Bond Opportunities Fund
MainStay Floating Rate Fund
MainStay Global High Income Fund
MainStay Government Fund
MainStay High Yield Corporate Bond Fund
MainStay High Yield Opportunities Fund
MainStay Indexed Bond Fund
MainStay Intermediate Term Bond Fund
MainStay Short Term Bond Fund
MainStay Money Market Fund
Municipal Bond
MainStay High Yield Municipal Bond Fund
MainStay New York Tax Free Opportunities Fund2
MainStay Tax Free Bond Fund
Mixed Asset
MainStay Balanced Fund
MainStay Convertible Fund
MainStay Income Builder Fund
MainStay Marketfield Fund
Asset Allocation/Target Date
MainStay Conservative Allocation Fund
MainStay Growth Allocation Fund
MainStay Moderate Allocation Fund
MainStay Moderate Growth Allocation Fund
MainStay Retirement 2010 Fund
MainStay Retirement 2020 Fund
MainStay Retirement 2030 Fund
MainStay Retirement 2040 Fund
MainStay Retirement 2050 Fund
Manager
New York Life Investment Management LLC
New York, New York
Subadvisors
Epoch Investment Partners, Inc.
New York, New York
Institutional Capital LLC3
Chicago, Illinois
MacKay Shields LLC3
New York, New York
Madison Square Investors LLC3
New York, New York
Marketfield Asset Management LLC
New York, New York
Markston International LLC
White Plains, New York
Winslow Capital Management, Inc.
Minneapolis, Minnesota
Legal Counsel
Dechert LLP
Independent Registered Public Accounting Firms
KPMG LLP
PricewaterhouseCoopers LLP
1. Effective January 13, 2012, the Fund was closed to new investors with certain exceptions.
2. The Fund is only registered for sale in CT, DE, FL, MA, NJ, NY, and VT.
3. An affiliate of New York Life Investment Management LLC.
Not part of the Annual Report
mainstayinvestments.com
The MainStay Funds are managed by New York Life Investment Management LLC and distributed through NYLIFE Distributors LLC,
169 Lackawanna Avenue, Parsippany, NJ 07054, a wholly owned subsidiary of New York Life Insurance Company. NYLIFE Distributors is a Member FINRA/SIPC.
MainStay Investments is a service mark and name under which New York Life Investment Management LLC does business.
MainStay Investments, an indirect subsidiary of New York Life Insurance Company, New York , NY 10010, provides investment
advisory products and services.
This report may be distributed only when preceded or accompanied by a current Fund prospectus.
© 2013 by NYLIFE Distributors LLC. All rights reserved.
| | | | | | | | |
| Not FDIC/NCUA Insured | | Not a Deposit | | May Lose Value | | No Bank Guarantee | | Not Insured by Any Government Agency |
| | | | |
| NYLIM-28249 MS265-12 | |
| MSFB11-12/12
NL016 |
|

MainStay Government Fund
Message from the President and Annual Report
October 31, 2012
This page intentionally left blank
Message from the President
Most major equity markets delivered positive results for the 12 months ended October 31, 2012. In the United States, stocks provided solid double-digit returns. With a few notable exceptions, international stock markets generally ended the reporting period in positive territory.
The stock market’s advance, however, was far from uniform. After rising to an early peak at the end of March 2012, domestic and international stocks lost ground until the beginning of June. After that, stocks generally rose, reaching their high point for the reporting period in mid-September. Although stocks remained relatively buoyant through mid-October, they drifted lower as the reporting period came to a close.
A variety of forces converged to help fuel these market movements. Investors kept a close eye on developments in the European sovereign debt crisis. The European Central Bank’s Long Term Refinancing Operations helped stabilize European credit markets and provide needed liquidity. Although private holders of Greek sovereign debt had to accept a reduction in their recovery value, the anticipated voluntary exchange provided a positive spark to the markets. Rising unemployment and new austerity measures may impede economic growth as the European Union seeks to strike a delicate balance between fiscal and monetary policies.
In the United States, the Federal Reserve announced an open-ended agency mortgage-backed security purchase program, which helped calm market concerns. The Federal Reserve also continued its maturity extension program (referred to by some as “operation twist”), which seeks to put downward pressure on longer-term interest rates. At the short end of the yield curve, the Federal Reserve maintained the federal funds rate in a near-zero range. In September 2012, the Federal Open Market Committee anticipated that “exceptionally low levels for the federal funds rate” were “likely to be warranted at least through mid-2015.”
With markets stabilizing and short-term interest rates at very low levels, yield-hungry investors had incentives to lengthen maturities and accept higher risk. Domestic high-yield bonds provided double-digit returns for the reporting period, municipal bonds and convertible securities provided high single-digit returns, and domestic corporate bonds provided positive overall returns.
While most investors are pleased when markets rise, MainStay portfolio managers know that long-term results depend on more than short-term market movements. They also depend on the consistent application of well-defined investment strategies and risk-management techniques over longer periods. Our long-term perspective gives our portfolio managers the ability to look past the daily ups and downs of the market as they pursue the specific investment objectives of their individual Funds.
At MainStay, we believe that a long-term perspective can help investors as well. Instead of trying to capitalize on short-term market movements, you may prefer to focus on the long-term potential that can come from getting invested, staying invested and adding to your investments over time. Of course, past performance is no guarantee of future results.
The following pages contain more specific information on the securities, market events and investment decisions that affected your MainStay Fund(s) during the 12 months ended October 31, 2012. We invite you to read the information carefully and use it as part of your ongoing portfolio evaluation and investment review.
Sincerely,

Stephen P. Fisher
President
The opinions expressed are as of the date of this report and are subject to change. There is no guarantee that any forecast made will come to pass. This material does not constitute investment advice and is not intended as an endorsement of any specific investment.
Not part of the Annual Report
Table of Contents
Investors should refer to the Fund’s Summary Prospectus and/or Prospectus and consider the Fund’s investment objectives, strategies, risks, charges and expenses carefully before investing. The Summary Prospectus and/or Prospectus contain this and other information about the Fund. You may obtain copies of the Fund’s Summary Prospectus, Prospectus and Statement of Additional Information free of charge, upon request, by calling toll-free 800-MAINSTAY (624-6782), by writing to NYLIFE Distributors LLC, Attn: MainStay Marketing Department, 169 Lackawanna Avenue, Parsippany, New Jersey 07054 or by sending an
e-mail to MainStayShareholderServices@nylim.com. These documents are also available via the MainStay Funds’ website at mainstayinvestments.com/documents. Please read the Summary Prospectus and/or Prospectus carefully before investing.
Investment and Performance Comparison1 (Unaudited)
Performance data quoted represents past performance. Past performance is no guarantee of future results. Because of market volatility, current performance may be lower or higher than the figures shown. Investment return and principal value will fluctuate, and as a result, when shares are redeemed, they may be worth more or less than their original cost. The graph below depicts the historical performance of Class B shares of the Fund. Performance will vary from class to class based on differences in class-specific expenses and sales charges. For performance information current to the most recent month-end, please call 800-MAINSTAY (624-6782) or visit mainstayinvestments.com.
(With sales charges)
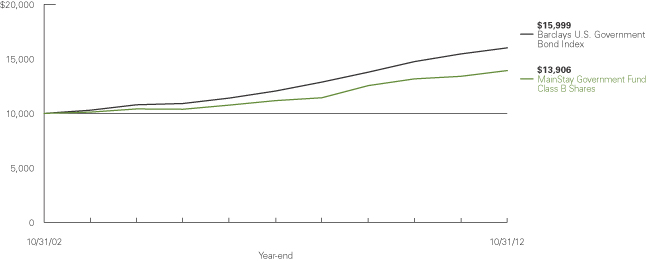
Average Annual Total Returns for the Year Ended October 31, 2012
| | | | | | | | | | | | | | | | | | | | |
| Class | | Sales Charge | | | | One Year | | | Five Years | | | Ten Years | | | Gross
Expense
Ratio2 | |
| Investor Class Shares3 | | Maximum 4.5% Initial Sales Charge | | With sales charges Excluding sales charges | |
| –0.28
4.42 | %
| |
| 4.28
5.25 | %
| |
| 3.64
4.12 | %
| |
| 1.31
1.31 | %
|
| Class A Shares | | Maximum 4.5% Initial Sales Charge | | With sales charges Excluding sales charges | |
| –0.01
4.70 |
| |
| 4.42
5.38 |
| |
| 3.70
4.18 |
| |
| 1.17
1.17 |
|
| Class B Shares | | Maximum 5% CDSC if Redeemed Within the First
Six Years of Purchase | | With sales charges Excluding sales charges | |
| –1.23
3.77 |
| |
| 4.16
4.50 |
| |
| 3.35
3.35 |
| |
| 2.06
2.06 |
|
| Class C Shares | | Maximum 1% CDSC if Redeemed Within One Year of Purchase | | With sales charges Excluding sales charges | |
| 2.66
3.66 |
| |
| 4.48
4.48 |
| |
| 3.34
3.34 |
| |
| 2.06
2.06 |
|
| Class I Shares4 | | No Sales Charge | | | | | 4.92 | | | | 5.75 | | | | 4.58 | | | | 0.92 | |
| 1. | The performance table and graph do not reflect the deduction of taxes that a shareholder would pay on dividends/distributions or Fund-share redemptions. Total returns reflect maximum applicable sales charges as indicated in the table above, changes in share price, and reinvestment of dividend and capital gain distributions. The graph assumes the initial investment amount shown above and reflects the deduction of all sales charges that would have applied for the period of investment. Performance figures reflect certain fee waivers and/or expense limitations, without which total returns may have been lower. For more information on share classes and current fee waivers and/or expense limitations, please refer to the notes to the financial statements. |
| 2. | The gross expense ratios presented reflect the Fund’s “Total Annual Fund Operating Expenses” from the most recent Prospectus and may differ from other expense ratios disclosed in this report. |
| 3. | Performance figures for Investor Class shares, first offered on February 28, 2008, include the historical performance of Class A shares through February 27, 2008, adjusted for differences in certain expenses and fees. Unadjusted the performance shown for Investor Class shares might have been different. |
| 4. | Performance figures for Class I shares, first offered on January 2, 2004, include the historical performance of Class B shares through January 1, 2004, adjusted for differences in certain expenses and fees. Unadjusted, the performance shown for Class I shares might have been different. |
The footnotes on the next page are an integral part of the table and graph and should be carefully read in conjunction with them.
| | | | |
| mainstayinvestments.com | | | 5 | |
| | | | | | | | | | | | |
| Benchmark Performance | | One
Year | | | Five
Years | | | Ten
Years | |
Barclays U.S. Government Bond Index5 | | | 3.53 | % | | | 5.83 | % | | | 4.81 | % |
Morningstar Intermediate Government Category Average6 | | | 3.79 | | | | 5.49 | | | | 4.29 | |
| 5. | The Barclays U.S. Government Bond Index consists of publicly issued debt of the U.S. Treasury and government agencies. The Barclays U.S. Government Bond Index is the Fund’s broad-based securities market index for comparison purposes. Total returns assume the reinvestment of all income and capital gains. An investment cannot be made directly in an Index. |
| 6. | The Morningstar intermediate government category average is representative of funds that have at least 90% of their bond holdings in bonds backed by U.S. government or by government-linked agencies. These funds have durations between 3.5 and 6 years and/or average effective maturities between 4 and 10 years. Results are based on total returns with all dividends and capital gain distributions reinvested. |
The footnotes on the preceding page are an integral part of the table and graph and should be carefully read in conjunction with them.
| | |
| 6 | | MainStay Government Fund |
Cost in Dollars of a $1,000 Investment in MainStay Government Fund (Unaudited)
The example below is intended to describe the fees and expenses borne by shareholders during the six-month period from May 1, 2012, to October 31, 2012, and the impact of those costs on your investment.
Example
As a shareholder of the Fund, you incur two types of costs: (1) transaction costs, including exchange fees and sales charges (loads) on purchases (as applicable), and (2) ongoing costs, including management fees, distribution and/or service (12b-1) fees, and other Fund expenses (as applicable). This example is intended to help you understand your ongoing costs (in dollars) of investing in the Fund and to compare these costs with the ongoing costs of investing in other mutual funds. The example is based on an investment of $1,000 made at the beginning of the six-month period and held for the entire period from May 1, 2012, to October 31, 2012.
This example illustrates your Fund’s ongoing costs in two ways:
Actual Expenses
The second and third data columns in the table below provide information about actual account values and actual expenses. You may use the information in these columns, together with the amount you invested, to estimate the expenses that you paid during the six months ended October 31, 2012. Simply divide your account value by $1,000 (for example, an $8,600 account value divided by $1,000 = 8.6), then
multiply the result by the number under the heading entitled “Expenses Paid During Period” to estimate the expenses you paid on your account during this period.
Hypothetical Example for Comparison Purposes
The fourth and fifth data columns in the table below provide information about hypothetical account values and hypothetical expenses based on the Fund’s actual expense ratio and an assumed rate of return of 5% per year before expenses, which is not the Fund’s actual return. The hypothetical account values and expenses may not be used to estimate the actual ending account balances or expenses you paid for the six-month period shown. You may use this information to compare the ongoing costs of investing in the Fund with the ongoing costs of investing in other Funds. To do so, compare this 5% hypothetical example with the 5% hypothetical examples that appear in the shareholder reports of the other Funds.
Please note that the expenses shown in the table are meant to highlight your ongoing costs only and do not reflect any transactional costs, such as exchange fees or sales charges (loads). Therefore, the fourth and fifth data columns of the table are useful in comparing ongoing costs only and will not help you determine the relative total costs of owning different funds. In addition, if these transactional costs were included, your costs would have been higher.
| | | | | | | | | | | | | | | | | | | | |
| | | | | | | | | | | | | | | | |
| Share Class | | Beginning
Account
Value
5/1/12 | | | Ending Account
Value (Based
on Actual
Returns and
Expenses)
10/31/12 | | | Expenses
Paid
During
Period1 | | | Ending Account
Value (Based
on Hypothetical
5% Annualized
Return and
Actual Expenses)
10/31/12 | | | Expenses
Paid
During
Period1 | |
| | | | | |
| Investor Class Shares | | $ | 1,000.00 | | | $ | 1,021.40 | | | $ | 5.94 | | | $ | 1,019.30 | | | $ | 5.94 | |
| | | | | |
| Class A Shares | | $ | 1,000.00 | | | $ | 1,022.20 | | | $ | 5.24 | | | $ | 1,020.00 | | | $ | 5.23 | |
| | | | | |
| Class B Shares | | $ | 1,000.00 | | | $ | 1,017.60 | | | $ | 9.74 | | | $ | 1,015.50 | | | $ | 9.73 | |
| | | | | |
| Class C Shares | | $ | 1,000.00 | | | $ | 1,017.60 | | | $ | 9.74 | | | $ | 1,015.50 | | | $ | 9.73 | |
| | | | | |
| Class I Shares | | $ | 1,000.00 | | | $ | 1,023.20 | | | $ | 3.97 | | | $ | 1,021.20 | | | $ | 3.96 | |
| 1. | Expenses are equal to the Fund’s annualized expense ratio of each class (1.17% for Investor Class, 1.03% for Class A, 1.92% for Class B and Class C and 0.78% for Class I) multiplied by the average account value over the period, divided by 366 and multiplied by 184 (to reflect the six-month period). The table above represents the actual expenses incurred during the six-month period. |
| | | | |
| mainstayinvestments.com | | | 7 | |
Portfolio Composition as of October 31, 2012 (Unaudited)
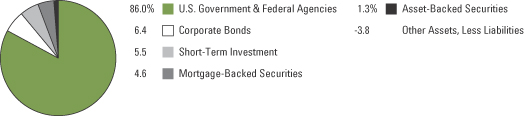
See Portfolio of Investments beginning on page 12 for specific holdings within these categories.
Top Ten Holdings as of October 31, 2012 (excluding short-term investment)
| 1. | Federal National Mortgage Association (Mortgage Pass-Through Securities), 3.50%, due 11/1/25 |
| 2. | Federal Home Loan Mortgage Corporation (Mortgage Pass-Through Securities), 4.00%, due 3/1/41 |
| 3. | Federal Home Loan Mortgage Corporation (Mortgage Pass-Through Securities), 4.00%, due 2/1/41 |
| 4. | Overseas Private Investment Corporation, 5.142%, due 12/15/23 |
| 5. | Tennessee Valley Authority, 4.65%, due 6/15/35 |
| 6. | Federal National Mortgage Association (Mortgage Pass-Through Securities), 6.00%, due 6/1/35 TBA |
| 7. | Federal National Mortgage Association (Mortgage Pass-Through Securities), 4.50%, due 1/1/41 |
| 8. | Government National Mortgage Association (Mortgage Pass-Through Securities), 4.50%, due 5/20/40 |
| 9. | Federal Home Loan Mortgage Corporation (Mortgage Pass-Through Securities), 4.00%, due 12/1/40 |
| 10. | Federal Home Loan Mortgage Corporation (Mortgage Pass-Through Securities), 3.50%, due 11/1/25 |
| | |
| 8 | | MainStay Government Fund |
Portfolio Management Discussion and Analysis (Unaudited)
Questions answered by portfolio managers Dan Roberts, PhD, Louis N. Cohen and Stephen H. Rich, PhD, of MacKay Shields LLC, the Fund’s Subadvisor.
How did MainStay Government Fund perform relative to its peers and its benchmark during the 12 months ended October 31, 2012?
Excluding all sales charges, MainStay Government Fund returned 4.42% for Investor Class shares, 4.70% for Class A shares, 3.77% for Class B shares and 3.66% for Class C shares for the 12 months ended October 31, 2012. Over the same period, the Fund’s Class I shares returned 4.92%. Investor Class, Class A and Class I shares outperformed—and Class B and Class C shares underperformed—the 3.79% return of the Morningstar1 intermediate government category average for the same period. All share classes outperformed the 3.53% return of the Barclays U.S. Government Bond Index2 for the 12 months ended October 31, 2012. The Barclays U.S. Government Bond Index is the Fund’s broad-based securities-market index. See page 5 for Fund returns with applicable sales charges.
What factors affected the Fund’s relative performance during the reporting period?
The Fund outperformed the Barclays U.S. Government Bond Index and most of the Fund’s share classes outperformed peer funds primarily because of three factors—yield-curve3 posture, sector weightings and issue selection. Duration4 positioning detracted from the Fund’s relative performance.
During the reporting period, yields fell faster in the center of the curve than they did at the short end or the long end. As a result, the yield spread5 between the two-year and 10-year benchmark points on the curve narrowed, while the yield spread between the 10-year and 30-year benchmark points widened. By emph-asizing intermediate-term maturities, the Fund benefited from the curve reshaping more than peer funds less concentrated in the center of the curve.
The Fund’s largest sector allocation was to agency mortgage pass-through securities.6 Our commitment to agency mortgage pass-through securities imparted a yield advantage relative to lower-yielding government-related securities, such as U.S. Treasury securities and agency debentures. This effect was a positive contributor to the Fund’s absolute return.
On average, agency mortgage pass-through securities outperformed comparable-duration U.S. Treasury securities for two
reasons—better yield and better price appreciation. A narrowing of the spread between agency mortgage pass-through yields and U.S. Treasury yields explains the price effect. A favorable supply/demand balance helped spreads narrow. Net supply was muted because of low housing turnover and few cash-out refinancings, while investor demand remained robust. Several catalysts drove demand during the reporting period. First, the Federal Reserve recycled prepayments of its mortgage holdings and bought an additional $40 billion of mortgage holdings each month. Second, investors were attracted to the sector’s yield. Third, banks purchased mortgages for their investment portfolios as deposits grew faster than loans.
Issue selection also proved effective during the reporting period. Over the medium term, we have emphasized call protection7 when purchasing mortgage-backed securities for the Fund. We sought to moderate the impact of prepayments in a low interest-rate environment by owning securities with limited borrower incentives to refinance. This included securities backed by 15-year loan terms, securities backed by lower-balance mortgages and securities backed by newer-production lower-rate loans. In securitizations of higher-rate loans, we focused attention on mortgages originated in 2003 and earlier, where elevated loan-to-value ratios may have limited refinancing incentives. During the reporting period, securities with call protection tended to outperform securities with generic mortgage collateral.
Low turnover helped the Fund relative to its peers by limiting transaction costs. We also sought to preserve yield by keeping the Fund nearly fully invested and avoiding large cash balances.
Duration positioning detracted from the Fund’s performance relative to the Barclays U.S. Government Bond Index. The average duration of agency mortgage pass-throughs is 2.9 years. This is shorter than the 5.3 year duration of the Barclays U.S. Government Bond Index and left the Fund less sensitive to changes in U.S. Treasury yields. This positioning hurt relative performance as yields fell during the reporting period. Peer funds with longer durations had an advantage relative to the Fund.
| 1. | See footnote on page 6 for more information on Morningstar, Inc. |
| 2. | See footnote on page 6 for more information on the Barclays U.S. Government Bond Index. |
| 3. | The yield curve is a line that plots the yields of various securities of similar quality–typically U.S. Treasury issues–across a range of maturities. The U.S. Treasury yield curve serves as a benchmark for other debt and is used in economic forecasting. |
| 4. | Duration is a measure of the price sensitivity of a fixed-income investment to changes in interest rates. Duration is expressed as a number of years and is considered a more accurate sensitivity gauge than average maturity. |
| 5. | The terms “spread” and “yield spread” may refer to the difference in yield between a security or type of security and comparable U.S. Treasury issues. The term may also refer to the difference in yield between two specific securities or types of securities at a given time. |
| 6. | Mortgage pass-through securities consist of a pool of residential mortgage loans in which homeowners’ monthly payments of principal, interest and prepayments pass from the original bank through a government agency or investment bank to investors. |
| 7. | Call protection is a provision that prohibits the issuer of a callable security from forcing redemption early in the security’s life. Regardless of how poorly the market performs, call protection gives investors a minimum period during which they can reap the benefits of the security. |
| | | | |
| mainstayinvestments.com | | | 9 | |
What was the Fund’s duration strategy during the reporting period?
The Fund normally maintains an intermediate duration between 3.5 and 4.5 years. During the reporting period, the Fund’s duration fell by six-tenths of a year to 3.1 years. The shortening resulted from the drift in mortgage durations as U.S. Treasury yields and mortgage rates fell. When rates are lower, homeowners have more opportunities to refinance, which tends to accelerate prepayment rates in mortgage loan pools.
The durations of mortgage-backed securities usually shorten as mortgage rates follow U.S. Treasury yields lower, and refinancings tend to accelerate in response to the lower yields. We often allow the Fund’s duration to drift with the change in mortgage duration rather than compensate by buying or selling U.S. Treasurys. Given the vagaries of Treasury yields, this approach typically avoids the need to swiftly react to rate changes and then reverse the trade should U.S. Treasury yields abruptly turn around.
What specific factors, risks or market forces prompted significant decisions for the Fund during the reporting period?
The Fund’s largest allocation is agency mortgage pass-throughs because we believed that they offered better relative value than comparable-duration U.S. Treasury or agency debentures. Agency mortgage pass-throughs enjoyed attractive carry,8 and balanced supply/demand technicals worked to the sector’s advantage. Our emphasis on this sector introduced incremental yield to the Fund, and it also positioned the Fund to benefit should the yield spread between mortgage-backed securities and comparable-duration U.S. Treasurys compress.
The Fund’s residential mortgage exposure was primarily among mortgage pass-throughs rather than collateralized mortgage obligations (CMOs). We believed that the compensation demanded by the market for the better convexity9 of CMOs was excessive as long as U.S. Treasury yields remained range-bound.
We maintained the Fund’s moderate exposure to credit risk as a secondary driver of Fund performance for two reasons. First, we believed that the prospects of the credit-related sectors (investment-grade corporate bonds, commercial mortgage-backed securities and asset-backed securities) were aligned with the decision of the Federal Reserve’s monetary policymaking committee to maintain the federal funds target rate in a range close to zero.
Second, we felt that low interest rates would probably spark healthy demand for higher-yielding products. The Fund ended the period with a 12% allocation to non-government-related securities.
During the reporting period, which market segments were the strongest positive contributors to the Fund’s performance and which market segments were particularly weak?
Agency mortgage pass-throughs collateralized by loans less apt to refinance were the best performers during the reporting period. Lower-balance loans often provide a measure of call protection, because the lower balance limits the borrower’s incentive to refinance. Mortgage pass-throughs whose durations are longer than average, such as newer-production lower-coupon securities, also performed well as U.S. Treasury yields declined. Among the Fund’s non-government-related assets, commercial mortgage-backed securities had the best performance. In an environment where investors were clamoring for higher-yielding high-quality securities, commercial mortgage-backed securities gained increased attention.
During the reporting period, the Fund’s weakest performers were less-liquid securities, such as a securitization of reverse residential mortgages insured by the Federal Housing Administration. Investors placed a premium on liquidity during the reporting period, and they preferred names that were more conventional, such as Fannie Mae.
How did the Fund’s sector weightings change during the reporting period?
The Fund’s sector weightings remained relatively stable during the reporting period. The bulk of our trading activity focused on keeping the Fund fully invested by reinvesting principal payments from the Fund’s mortgage securities. With the new purchases, we emphasized mortgage securities whose underlying loans were less likely to be refinanced. We also undertook several mortgage dollar rolls10 for security types in which the Fund maintains exposure in generic pools of mortgage loans rather than in specified pools. A small rotation trade using runoff from maturing asset-backed securities and called agency debentures to purchase corporate bonds and commercial mortgage-backed securities modestly increased the Fund’s exposure to non-government-related securities during the reporting period.
| 8. | Carry is the interest cost of financing securities. A positive carry occurs when the return from a security exceeds the financing cost. A negative carry occurs when the financing cost exceeds the return on the security that has been financed. |
| 9. | Convexity is a mathematical measure of the sensitivity of an interest-bearing bond to changes in interest rates. |
| 10. | A mortgage dollar roll is a transaction in which a Fund sells mortgage-related securities from its portfolio to a counterparty from whom it simultaneously agrees to buy a similar security on a delayed delivery basis. A Fund is required to segregate assets having a value not less than the repurchase price. Mortgage dollar roll transactions involve certain risks, including the risk that the mortgage-backed security returned to the Fund at the end of the roll, while substantially similar, could be inferior to what was initially sold to the counterparty. |
| | |
| 10 | | MainStay Government Fund |
How was the Fund positioned at the end of the reporting period?
As of October 31, 2012, the Fund held underweight positions relative to the Barclays U.S. Government Bond Index in U.S. Treasurys and agency debentures and an overweight position in agency mortgage pass-throughs. As of the same date, the Fund also held modestly overweight positions in asset-backed securities, corporate bonds and commercial mortgage-backed securities.
The majority of the Fund’s assets have durations between two and seven years. To maintain a duration of close to four years, about 3% of the Fund’s total net assets were invested in longer-duration agency debentures to balance the Fund’s allocation to assets with shorter durations. The shorter-duration investments consisted mostly of seasoned mortgage-backed securities.
The opinions expressed are those of the portfolio managers as of the date of this report and are subject to change. There is no guarantee that any forecast made will come to pass. This material does not constitute investment advice and is not intended as an endorsement of any specific investment.
| | | | |
| mainstayinvestments.com | | | 11 | |
Portfolio of Investments††† October 31, 2012
| | | | | | | | |
| | | Principal Amount | | | Value | |
| | | | | | | | |
Long-Term Bonds 98.3%† Asset-Backed Securities 1.3% | |
Home Equity 0.0%‡ | | | | | | | | |
Citicorp Residential Mortgage Securities, Inc.
Series 2006-1, Class A3
5.706%, due 7/25/36 (a)(b) | | $ | 23,299 | | | $ | 23,255 | |
| | | | | | | | |
| | |
Utilities 1.3% | | | | | | | | |
Atlantic City Electric Transition Funding LLC
Series 2002-1, Class A4
5.55%, due 10/20/23 | | | 2,525,000 | | | | 3,070,534 | |
Massachusetts RRB Special Purpose Trust
Series 2001-1, Class A
6.53%, due 6/1/15 | | | 583,293 | | | | 592,461 | |
| | | | | | | | |
| | | | | | | 3,662,995 | |
| | | | | | | | |
Total Asset-Backed Securities
(Cost $3,160,399) | | | | | | | 3,686,250 | |
| | | | | | | | |
| | |
| Corporate Bonds 6.4% | | | | | | | | |
Agriculture 1.0% | | | | | | | | |
Altria Group, Inc. | | | | | | | | |
2.85%, due 8/9/22 | | | 1,110,000 | | | | 1,113,173 | |
9.70%, due 11/10/18 | | | 1,149,000 | | | | 1,638,726 | |
| | | | | | | | |
| | | | | | | 2,751,899 | |
| | | | | | | | |
Auto Manufacturers 1.1% | | | | | | | | |
DaimlerChrysler N.A. Holding Corp.
6.50%, due 11/15/13 | | | 2,920,000 | | | | 3,093,381 | |
| | | | | | | | |
| | |
Electric 1.1% | | | | | | | | |
Great Plains Energy, Inc.
2.75%, due 8/15/13 | | | 3,030,000 | | | | 3,075,226 | |
| | | | | | | | |
| | |
Pipelines 0.9% | | | | | | | | |
Plains All American Pipeline, L.P. / PAA Finance Corp.
5.00%, due 2/1/21 | | | 2,300,000 | | | | 2,724,522 | |
| | | | | | | | |
| |
Real Estate Investment Trusts 1.2% | | | | | |
Duke Realty, L.P.
6.75%, due 3/15/20 | | | 2,150,000 | | | | 2,638,074 | |
ProLogis, L.P.
7.375%, due 10/30/19 | | | 600,000 | | | | 745,995 | |
| | | | | | | | |
| | | | | | | 3,384,069 | |
| | | | | | | | |
| | | | | | | | |
| | | Principal Amount | | | Value | |
| | | | | | | | |
Telecommunications 1.1% | | | | | | | | |
Crown Castle Towers LLC
4.883%, due 8/15/20 (c) | | $ | 2,900,000 | | | $ | 3,313,897 | |
| | | | | | | | |
Total Corporate Bonds
(Cost $16,826,272) | | | | | | | 18,342,994 | |
| | | | | | | | |
|
| Mortgage-Backed Securities 4.6% | |
Commercial Mortgage Loans
(Collateralized Mortgage Obligations) 4.0% | |
Bear Stearns Commercial Mortgage Securities
Series 2005-PW10, Class A4
5.405%, due 12/11/40 (d) | | | 1,970,000 | | | | 2,212,371 | |
CD 2006-CD3 Mortgage Trust
Series 2006-CD3, Class A5
5.617%, due 10/15/48 | | | 710,000 | | | | 820,115 | |
CD 2007-CD5 Mortgage Trust
Series 2007-CD5, Class A4
5.886%, due 11/15/44 (d) | | | 1,462,870 | | | | 1,737,236 | |
DBUBS Mortgage Trust
Series 2011-LC2A, Class A2
3.386%, due 7/10/44 (c) | | | 520,000 | | | | 562,330 | |
Four Times Square Trust
Series 2006-4TS, Class A
5.401%, due 12/13/28 (c) | | | 620,000 | | | | 734,578 | |
GE Capital Commercial Mortgage Corp.
Series 2004-C2, Class A4
4.893%, due 3/10/40 | | | 1,000,000 | | | | 1,047,693 | |
GS Mortgage Securities Corp. II
Series 2011-GC5, Class A2
2.999%, due 8/10/44 | | | 800,000 | | | | 855,858 | |
JP Morgan Chase Commercial Mortgage Securities Corp. | | | | | | | | |
Series 2011-C4, Class A3 | | | | | | | | |
4.106%, due 7/15/46 (c) | | | 1,055,000 | | | | 1,182,814 | |
Series 2007-CB20, Class A3 | | | | | | | | |
5.819%, due 2/12/51 | | | 600,000 | | | | 626,265 | |
Merrill Lynch Mortgage Trust
Series 2003-KEY1, Class A4
5.236%, due 11/12/35 (d) | | | 950,000 | | | | 983,359 | |
RBSCF Trust
Series 2010-MB1, Class A2
3.686%, due 4/15/24 (c) | | | 800,000 | | | | 851,981 | |
| | | | | | | | |
| | | | | | | 11,614,600 | |
| | | | | | | | |
Residential Mortgages
(Collateralized Mortgage Obligations) 0.6% | |
Citigroup Mortgage Loan Trust, Inc.
Series 2006-AR6, Class 1A1
5.797%, due 8/25/36 (e) | | | 548,595 | | | | 504,836 | |
| † | Percentages indicated are based on Fund net assets. |
| ¨ | | Among the Fund’s 10 largest holdings, as of October 31, 2012, excluding short-term investment. May be subject to change daily. |
| | | | |
| 12 | | MainStay Government Fund | | The notes to the financial statements are an integral part of,
and should be read in conjunction with, the financial statements. |
| | | | | | | | |
| | | Principal Amount | | | Value | |
| | | | | | | | |
| Mortgage-Backed Securities (continued) | |
Residential Mortgages
(Collateralized Mortgage Obligations) (continued) | |
Mortgage Equity Conversion Asset Trust
Series 2007-FF2, Class A
0.65%, due 2/25/42 (c)(d)(f)(g) | | $ | 1,374,089 | | | $ | 1,101,621 | |
| | | | | | | | |
| | | | | | | 1,606,457 | |
| | | | | | | | |
Total Mortgage-Backed Securities
(Cost $12,749,680) | | | | | | | 13,221,057 | |
| | | | | | | | |
|
| U.S. Government & Federal Agencies 86.0% | |
Fannie Mae Grantor Trust (Collateralized Mortgage Obligation) 1.3% | |
Series 2003-T1, Class B | | | | | | | | |
4.491%, due 11/25/12 | | | 3,865,000 | | | | 3,862,492 | |
| | | | | | | | |
|
Fannie Mae Strip (Collateralized Mortgage Obligations) 0.0%‡ | |
Series 360, Class 2, IO | | | | | | | | |
5.00%, due 8/1/35 (h) | | | 789,737 | | | | 106,310 | |
Series 361, Class 2, IO | | | | | | | | |
6.00%, due 10/1/35 (h) | | | 145,850 | | | | 25,105 | |
| | | | | | | | |
| | | | | | | 131,415 | |
| | | | | | | | |
Federal Home Loan Mortgage Corporation
(Mortgage Pass-Through Securities) 18.5% | |
2.375%, due 6/1/35 (d) | | | 369,274 | | | | 398,926 | |
2.377%, due 2/1/37 (d) | | | 103,611 | | | | 111,087 | |
2.726%, due 3/1/35 (d) | | | 55,097 | | | | 59,005 | |
3.50%, due 10/1/25 | | | 957,197 | | | | 1,024,684 | |
¨3.50%, due 11/1/25 | | | 4,914,102 | | | | 5,260,857 | |
4.00%, due 3/1/25 | | | 2,880,950 | | | | 3,111,082 | |
4.00%, due 7/1/25 | | | 959,061 | | | | 1,035,671 | |
4.00%, due 8/1/31 | | | 326,892 | | | | 352,100 | |
4.00%, due 8/1/39 | | | 503,104 | | | | 558,959 | |
¨4.00%, due 12/1/40 | | | 4,827,149 | | | | 5,340,249 | |
¨4.00%, due 2/1/41 | | | 7,652,389 | | | | 8,424,490 | |
¨4.00%, due 3/1/41 | | | 8,824,536 | | | | 9,771,166 | |
4.00%, due 4/1/41 | | | 848,524 | | | | 923,240 | |
4.00%, due 1/1/42 | | | 3,938,425 | | | | 4,360,910 | |
4.50%, due 3/1/41 | | | 1,312,934 | | | | 1,475,161 | |
4.50%, due 8/1/41 | | | 1,978,107 | | | | 2,182,972 | |
5.00%, due 1/1/20 | | | 303,298 | | | | 328,757 | |
5.00%, due 6/1/33 | | | 1,361,659 | | | | 1,481,875 | |
5.00%, due 8/1/33 | | | 1,174,439 | | | | 1,283,280 | |
5.00%, due 5/1/36 | | | 1,229,453 | | | | 1,333,787 | |
5.00%, due 10/1/39 | | | 1,696,108 | | | | 1,891,987 | |
5.50%, due 1/1/21 | | | 780,652 | | | | 850,954 | |
5.50%, due 11/1/35 | | | 918,519 | | | | 1,026,538 | |
5.50%, due 11/1/36 | | | 247,209 | | | | 275,810 | |
6.50%, due 4/1/37 | | | 214,429 | | | | 243,880 | |
| | | | | | | | |
| | | | | | | 53,107,427 | |
| | | | | | | | |
| | | | | | | | |
| | | Principal Amount | | | Value | |
| | | | | | | | |
Federal National Mortgage Association
(Mortgage Pass-Through Securities) 49.9% | |
2.31%, due 11/1/34 (d) | | $ | 326,867 | | | $ | 348,684 | |
2.731%, due 4/1/34 (d) | | | 643,802 | | | | 687,541 | |
3.00%, due 10/1/32 | | | 1,366,028 | | | | 1,437,657 | |
3.50%, due 11/1/20 | | | 4,637,147 | | | | 4,922,068 | |
3.50%, due 10/1/25 | | | 2,160,568 | | | | 2,327,754 | |
¨3.50%, due 11/1/25 | | | 15,099,248 | | | | 16,272,785 | |
3.50%, due 2/1/41 | | | 3,855,442 | | | | 4,110,120 | |
3.50%, due 11/1/41 | | | 3,398,170 | | | | 3,675,739 | |
3.50%, due 12/1/41 | | | 391,267 | | | | 421,270 | |
3.50%, due 1/1/42 | | | 2,560,815 | | | | 2,782,392 | |
3.50%, due 8/1/42 | | | 1,864,034 | | | | 2,022,117 | |
4.00%, due 9/1/31 | | | 3,460,981 | | | | 3,733,692 | |
4.00%, due 2/1/41 | | | 1,246,313 | | | | 1,382,296 | |
4.00%, due 3/1/41 | | | 3,254,234 | | | | 3,619,468 | |
4.00%, due 10/1/41 | | | 802,499 | | | | 892,566 | |
4.00%, due 3/1/42 | | | 2,103,695 | | | | 2,350,976 | |
4.00%, due 4/1/42 | | | 983,943 | | | | 1,099,602 | |
4.00%, due 7/1/42 | | | 2,298,557 | | | | 2,557,251 | |
4.50%, due 7/1/18 | | | 3,793,768 | | | | 4,097,705 | |
4.50%, due 11/1/18 | | | 2,566,403 | | | | 2,772,010 | |
4.50%, due 6/1/23 | | | 1,577,119 | | | | 1,700,020 | |
4.50%, due 6/1/39 | | | 4,528,301 | | | | 5,065,983 | |
4.50%, due 7/1/39 | | | 3,599,264 | | | | 4,057,972 | |
4.50%, due 8/1/39 | | | 2,584,502 | | | | 2,900,961 | |
4.50%, due 9/1/40 | | | 2,318,911 | | | | 2,614,444 | |
4.50%, due 12/1/40 | | | 3,621,741 | | | | 3,984,847 | |
¨4.50%, due 1/1/41 | | | 5,098,099 | | | | 5,747,826 | |
4.50%, due 2/1/41 | | | 1,251,315 | | | | 1,404,532 | |
5.00%, due 9/1/17 | | | 1,179,043 | | | | 1,285,614 | |
5.00%, due 9/1/20 | | | 121,704 | | | | 132,724 | |
5.00%, due 11/1/33 | | | 1,415,471 | | | | 1,554,989 | |
5.00%, due 6/1/35 | | | 1,392,163 | | | | 1,530,112 | |
5.00%, due 10/1/35 | | | 648,609 | | | | 710,853 | |
5.00%, due 1/1/36 | | | 340,933 | | | | 373,684 | |
5.00%, due 2/1/36 | | | 2,431,892 | | | | 2,663,329 | |
5.00%, due 5/1/36 | | | 1,676,518 | | | | 1,837,476 | |
5.00%, due 6/1/36 | | | 369,035 | | | | 402,641 | |
5.00%, due 9/1/36 | | | 436,143 | | | | 476,952 | |
5.00%, due 3/1/40 | | | 2,466,538 | | | | 2,782,880 | |
5.00%, due 2/1/41 | | | 3,877,386 | | | | 4,418,296 | |
5.50%, due 1/1/17 | | | 84,340 | | | | 91,329 | |
5.50%, due 2/1/17 | | | 1,845,682 | | | | 1,995,599 | |
5.50%, due 6/1/19 | | | 1,043,778 | | | | 1,147,398 | |
5.50%, due 11/1/19 | | | 1,115,556 | | | | 1,226,302 | |
5.50%, due 4/1/21 | | | 1,743,822 | | | | 1,898,138 | |
5.50%, due 6/1/33 | | | 4,221,318 | | | | 4,684,769 | |
5.50%, due 11/1/33 | | | 2,367,210 | | | | 2,627,103 | |
5.50%, due 12/1/33 | | | 2,831,940 | | | | 3,142,854 | |
5.50%, due 6/1/34 | | | 657,165 | | | | 725,618 | |
5.50%, due 12/1/34 | | | 304,797 | | | | 336,546 | |
| | | | | | |
The notes to the financial statements are an integral part of,
and should be read in conjunction with, the financial statements. | | mainstayinvestments.com | | | 13 | |
Portfolio of Investments††† October 31, 2012 (continued)
| | | | | | | | |
| | | Principal Amount | | | Value | |
| | | | | | | | |
U.S. Government & Federal
Agencies (continued) | |
Federal National Mortgage Association
(Mortgage Pass-Through
Securities) (continued) | |
5.50%, due 3/1/35 | | $ | 1,198,781 | | | $ | 1,323,650 | |
5.50%, due 12/1/35 | | | 327,313 | | | | 360,998 | |
5.50%, due 4/1/36 | | | 1,081,696 | | | | 1,193,017 | |
5.50%, due 9/1/36 | | | 312,014 | | | | 346,269 | |
5.50%, due 7/1/37 | | | 458,511 | | | | 525,041 | |
6.00%, due 12/1/16 | | | 131,505 | | | | 139,992 | |
6.00%, due 11/1/32 | | | 673,005 | | | | 762,877 | |
6.00%, due 1/1/33 | | | 534,581 | | | | 607,304 | |
6.00%, due 3/1/33 | | | 630,449 | | | | 716,215 | |
6.00%, due 9/1/34 | | | 195,393 | | | | 220,448 | |
¨6.00%, due 6/1/35 TBA (i) | | | 5,300,000 | | | | 5,873,890 | |
6.00%, due 9/1/35 | | | 1,920,323 | | | | 2,153,916 | |
6.00%, due 10/1/35 | | | 501,106 | | | | 567,516 | |
6.00%, due 6/1/36 | | | 934,477 | | | | 1,038,240 | |
6.00%, due 11/1/36 | | | 1,367,466 | | | | 1,540,119 | |
6.00%, due 4/1/37 | | | 326,286 | | | | 358,438 | |
6.50%, due 10/1/31 | | | 355,546 | | | | 411,665 | |
6.50%, due 2/1/37 | | | 160,504 | | | | 190,787 | |
| | | | | | | | �� |
| | | | | | | 143,365,866 | |
| | | | | | | | |
Government National Mortgage Association
(Mortgage Pass-Through
Securities) 9.2% | |
4.00%, due 7/15/39 | | | 1,064,341 | | | | 1,166,960 | |
4.00%, due 9/20/40 | | | 3,419,847 | | | | 3,797,439 | |
4.00%, due 11/20/40 | | | 359,113 | | | | 398,764 | |
4.00%, due 1/15/41 | | | 3,482,698 | | | | 3,818,485 | |
4.00%, due 10/15/41 | | | 4,348,562 | | | | 4,845,291 | |
¨4.50%, due 5/20/40 | | | 4,902,799 | | | | 5,432,955 | |
5.00%, due 2/20/41 | | | 1,208,593 | | | | 1,340,445 | |
5.50%, due 1/1/36 TBA (i) | | | 2,950,000 | | | | 3,259,289 | |
6.00%, due 8/15/32 | | | 713,910 | | | | 814,238 | |
6.00%, due 12/15/32 | | | 364,309 | | | | 417,341 | |
6.50%, due 8/15/28 | | | 241,584 | | | | 282,513 | |
6.50%, due 4/15/31 | | | 663,621 | | | | 770,679 | |
| | | | | | | | |
| | | | | | | 26,344,399 | |
| | | | | | | | |
¨Overseas Private Investment
Corporation 2.5% | |
5.142%, due 12/15/23 | | | 6,212,022 | | | | 7,290,616 | |
| | | | | | | | |
| |
Tennessee Valley Authority 4.6% | | | | | |
3.875%, due 2/15/21 | | | 2,250,000 | | | | 2,632,977 | |
¨4.65%, due 6/15/35 | | | 5,605,000 | | | | 6,870,827 | |
6.25%, due 12/15/17 | | | 2,980,000 | | | | 3,780,601 | |
| | | | | | | | |
| | | | | | | 13,284,405 | |
| | | | | | | | |
Total U.S. Government & Federal Agencies
(Cost $230,296,811) | | | | | | | 247,386,620 | |
| | | | | | | | |
Total Long-Term Bonds
(Cost $263,033,162) | | | | | | | 282,636,921 | |
| | | | | | | | |
| | | | | | | | |
| | | Principal Amount | | | Value | |
| | | | | | | | |
| Short-Term Investment 5.5% | |
Repurchase Agreement 5.5% | |
State Street Bank and Trust Co.
0.01%, dated 10/31/12
due 11/1/12
Proceeds at Maturity $15,774,386
(Collateralized by a Federal National
Mortgage Association security with a
rate of 2.17% and a maturity date of
10/17/22, with a Principal Amount of
$16,030,000 and a Market Value of
$16,093,222) | | $ | 15,774,382 | | | $ | 15,774,382 | |
| | | | | | | | |
Total Short-Term Investment
(Cost $15,774,382) | | | | | | | 15,774,382 | |
| | | | | | | | |
Total Investments
(Cost $278,807,544) (j) | | | 103.8 | % | | | 298,411,303 | |
Other Assets, Less Liabilities | | | (3.8 | ) | | | (10,935,614 | ) |
Net Assets | | | 100.0 | % | | $ | 287,475,689 | |
| ††† | On a daily basis New York Life Investments confirms that the value of the Fund’s liquid assets (liquid portfolio securities and cash) is sufficient to cover its potential senior securities (e.g., futures, swaps, options). |
| ‡ | Less than one-tenth of a percent. |
| (a) | Subprime mortgage investment or other asset-backed security. The total market value of this security as of October 31, 2012 is $23,255, which represents less than one-tenth of a percent of the Fund’s net assets. |
| (b) | Step coupon. Rate shown is the rate in effect as of October 31, 2012. |
| (c) | May be sold to institutional investors only under Rule 144A or securities offered pursuant to Section 4(2) of the Securities Act of 1933, as amended. |
| (d) | Floating rate—Rate shown is the rate in effect as of October 31, 2012. |
| (e) | Collateral strip rate—Bond whose interest is based on the weighted net interest rate of the collateral. Coupon rate adjusts periodically based on a predetermined schedule. Rate shown is the rate in effect as of October 31, 2012. |
| (f) | Fair valued security. The total market value of this security as of October 31, 2012 is $1,101,621, which represents 0.4% of the Fund’s net assets. |
| (g) | Illiquid security. The total market value of this security as of October 31, 2012 is $1,101,621, which represents 0.4% of the Fund’s net assets. |
| (h) | Collateralized Mortgage Obligation Interest Only Strip—Pays a fixed or variable rate of interest based on mortgage loans or mortgage pass-through securities. The principal amount of the underlying pool represents the notional amount on which the current interest is calculated. The value of these stripped securities may be particularly sensitive to changes in prevailing interest rates and are typically more sensitive to changes in prepayment rates than traditional mortgage-backed securities. |
| | | | |
| 14 | | MainStay Government Fund | | The notes to the financial statements are an integral part of,
and should be read in conjunction with, the financial statements. |
| (i) | TBA—Securities purchased on a forward commitment basis with an approximate principal amount and maturity date. The actual principal amount and maturity date will be determined upon settlement. The market value of these securities as of October 31, 2012 is $9,133,179, which represents 3.2% of the Fund’s net assets. All or a portion of these securities were acquired under a mortgage dollar roll agreement. |
| (j) | As of October 31, 2012, cost is $278,807,544 for federal income tax purposes and net unrealized appreciation is as follows: |
| | | | |
Gross unrealized appreciation | | $ | 19,938,081 | |
Gross unrealized depreciation | | | (334,322 | ) |
| | | | |
Net unrealized appreciation | | $ | 19,603,759 | |
| | | | |
The notes to the financial statements are an integral part of, and should be read in conjunction with, the financial statements.
The following is a summary of the fair valuations according to the inputs used as of October 31, 2012, for valuing the Fund’s assets.
Asset Valuation Inputs
| | | | | | | | | | | | | | | | |
Description | | Quoted
Prices in
Active
Markets for
Identical
Assets (Level 1) | | | Significant
Other
Observable
Inputs (Level 2) | | | Significant
Unobservable
Inputs (Level 3) | | | Total | |
| Investments in Securities (a) | | | | | | | | | | | | | | | | |
| Long-Term Bonds | | | | | | | | | | | | | | | | |
Asset-Backed Securities | | $ | — | | | $ | 3,686,250 | | | $ | — | | | $ | 3,686,250 | |
Corporate Bonds | | | — | | | | 18,342,994 | | | | — | | | | 18,342,994 | |
Mortgage-Backed Securities (b) | | | — | | | | 12,119,436 | | | | 1,101,621 | | | | 13,221,057 | |
U.S. Government & Federal Agencies | | | — | | | | 247,386,620 | | | | — | | | | 247,386,620 | |
| | | | | | | | | | | | | | | | |
| Total Long-Term Bonds | | | — | | | | 281,535,300 | | | | 1,101,621 | | | | 282,636,921 | |
| | | | | | | | | | | | | | | | |
| Short-Term Investment | | | | | | | | | | | | | | | | |
Repurchase Agreement | | | — | | | | 15,774,382 | | | | — | | | | 15,774,382 | |
| | | | | | | | | | | | | | | | |
| Total Investments in Securities | | $ | — | | | $ | 297,309,682 | | | $ | 1,101,621 | | | $ | 298,411,303 | |
| | | | | | | | | | | | | | | | |
| (a) | For a complete listing of investments and their industries, see the Portfolio of Investments. |
| (b) | The Level 3 security valued at $1,101,621 is held in Residential Mortgage (Collateralized Mortgage Obligation) within the Mortgage-Backed Securities section of the Portfolio of Investments. |
The Fund recognizes transfers between the levels as of the beginning of the period.
For the year ended October 31, 2012, the Fund did not have any transfers between Level 1 and Level 2 fair value measurements. (See Note 2)
The following is a reconciliation of investments in which significant unobservable inputs (Level 3) were used in determining value:
| | | | | | | | | | | | | | | | | | | | | | | | | | | | | | | | | | | | | | | | |
Investments in Securities | | Balance
as of
October 31,
2011 | | | Accrued
Discounts
(Premiums) | | | Realized
Gain
(Loss) | | | Change in
Unrealized
Appreciation
(Depreciation) | | | Purchases | | | Sales | | | Transfers
in to
Level 3 | | | Transfers
out of
Level 3 | | | Balance as of
October 31,
2012 | | | Change in
Unrealized
Appreciation
(Depreciation)
from
Investments
Still Held at
October 31,
2012 (a) | |
| Long-Term Bonds | | | | | | | | | | | | | | | | | | | | | | | | | | | | | | | | | | | | | | | | |
Mortgage-Backed Securities | | | | | | | | | | | | | | | | | | | | | | | | | | | | | | | | | | | | | | | | |
Residential Mortgage (Collateralized Mortgage Obligation) | | | | | | | | | | | | | | | | | | | | | | | | | | | | | | | | | | | | | | | | |
| | $ | 1,281,268 | | | $ | 613 | | | $ | 730 | | | $ | (131,448 | ) | | $ | — | | | $ | (49,542 | )(b) | | $ | — | | | $ | — | | | $ | 1,101,621 | | | $ | (135,673 | ) |
| | | | | | | | | | | | | | | | | | | | | | | | | | | | | | | | | | | | | | | | |
| Total | | $ | 1,281,268 | | | $ | 613 | | | $ | 730 | | | $ | (131,448 | ) | | $ | — | | | $ | (49,542 | ) | | $ | — | | | $ | — | | | $ | 1,101,621 | | | $ | (135,673 | ) |
| | | | | | | | | | | | | | | | | | | | | | | | | | | | | | | | | | | | | | | | |
| (a) | Included in “Net change in unrealized appreciation (depreciation) on investments” in the Statement of Operations. |
| (b) | Sales include principal reductions. |
| | | | | | |
The notes to the financial statements are an integral part of,
and should be read in conjunction with, the financial statements. | | mainstayinvestments.com | | | 15 | |
Statement of Assets and Liabilities as of October 31, 2012
| | | | |
| Assets | |
Investment in securities, at value
(identified cost $278,807,544) | | $ | 298,411,303 | |
Receivables: | | | | |
Interest | | | 1,237,495 | |
Fund shares sold | | | 443,438 | |
Investment securities sold | | | 1,190 | |
Other assets | | | 23,207 | |
| | | | |
Total assets | | | 300,116,633 | |
| | | | |
| |
| Liabilities | | | | |
Payables: | | | | |
Investment securities purchased | | | 11,973,753 | |
Transfer agent (See Note 3) | | | 188,472 | |
Fund shares redeemed | | | 158,962 | |
Manager (See Note 3) | | | 123,900 | |
NYLIFE Distributors (See Note 3) | | | 91,362 | |
Shareholder communication | | | 20,376 | |
Professional fees | | | 15,077 | |
Custodian | | | 2,707 | |
Trustees | | | 874 | |
Accrued expenses | | | 4,368 | |
Dividend payable | | | 61,093 | |
| | | | |
Total liabilities | | | 12,640,944 | |
| | | | |
Net assets | | $ | 287,475,689 | |
| | | | |
| |
| Composition of Net Assets | | | | |
Shares of beneficial interest outstanding (par value of
$.01 per share) unlimited number of shares authorized | | $ | 318,422 | |
Additional paid-in capital | | | 266,525,605 | |
| | | | |
| | | 266,844,027 | |
Undistributed net investment income | | | 37,350 | |
Accumulated net realized gain (loss) on investments | | | 990,553 | |
Net unrealized appreciation (depreciation) on investments | | | 19,603,759 | |
| | | | |
Net assets | | $ | 287,475,689 | |
| | | | |
| | | | |
Investor Class | | | | |
Net assets applicable to outstanding shares | | $ | 57,665,761 | |
| | | | |
Shares of beneficial interest outstanding | | | 6,369,406 | |
| | | | |
Net asset value per share outstanding | | $ | 9.05 | |
Maximum sales charge (4.50% of offering price) | | | 0.43 | |
| | | | |
Maximum offering price per share outstanding | | $ | 9.48 | |
| | | | |
Class A | | | | |
Net assets applicable to outstanding shares | | $ | 174,620,717 | |
| | | | |
Shares of beneficial interest outstanding | | | 19,357,701 | |
| | | | |
Net asset value per share outstanding | | $ | 9.02 | |
Maximum sales charge (4.50% of offering price) | | | 0.43 | |
| | | | |
Maximum offering price per share outstanding | | $ | 9.45 | |
| | | | |
Class B | | | | |
Net assets applicable to outstanding shares | | $ | 21,825,813 | |
| | | | |
Shares of beneficial interest outstanding | | | 2,420,206 | |
| | | | |
Net asset value and offering price per share outstanding | | $ | 9.02 | |
| | | | |
Class C | | | | |
Net assets applicable to outstanding shares | | $ | 27,610,391 | |
| | | | |
Shares of beneficial interest outstanding | | | 3,062,951 | |
| | | | |
Net asset value and offering price per share outstanding | | $ | 9.01 | |
| | | | |
Class I | | | | |
Net assets applicable to outstanding shares | | $ | 5,753,007 | |
| | | | |
Shares of beneficial interest outstanding | | | 631,908 | |
| | | | |
Net asset value and offering price per share outstanding | | $ | 9.10 | |
| | | | |
| | | | |
| 16 | | MainStay Government Fund | | The notes to the financial statements are an integral part of,
and should be read in conjunction with, the financial statements. |
Statement of Operations for the year ended October 31, 2012
| | | | |
| Investment Income (Loss) | |
Income | | | | |
Interest | | $ | 10,270,454 | |
| | | | |
Expenses | | | | |
Manager (See Note 3) | | | 1,823,183 | |
Distribution/Service—Investor Class (See Note 3) | | | 147,546 | |
Distribution/Service—Class A (See Note 3) | | | 446,128 | |
Distribution/Service—Class B (See Note 3) | | | 234,671 | |
Distribution/Service—Class C (See Note 3) | | | 291,674 | |
Transfer agent (See Note 3) | | | 744,999 | |
Registration | | | 71,413 | |
Professional fees | | | 60,594 | |
Shareholder communication | | | 39,930 | |
Custodian | | | 17,340 | |
Trustees | | | 8,005 | |
Miscellaneous | | | 16,054 | |
| | | | |
Total expenses before waiver/reimbursement | | | 3,901,537 | |
Expense waiver/reimbursement from Manager (See Note 3) | | | (330,502 | ) |
| | | | |
Net expenses | | | 3,571,035 | |
| | | | |
Net investment income (loss) | | | 6,699,419 | |
| | | | |
|
Realized and Unrealized Gain (Loss) on
Investments | |
Net realized gain (loss) on investments | | | 1,112,552 | |
Net change in unrealized appreciation (depreciation) on investments | | | 5,113,508 | |
| | | | |
Net realized and unrealized gain (loss) on investments | | | 6,226,060 | |
| | | | |
Net increase (decrease) in net assets resulting from operations | | $ | 12,925,479 | |
| | | | |
| | | | | | |
The notes to the financial statements are an integral part of,
and should be read in conjunction with, the financial statements. | | mainstayinvestments.com | | | 17 | |
Statements of Changes in Net Assets
for the years ended October 31, 2012 and October 31, 2011
| | | | | | | | |
| | | 2012 | | | 2011 | |
| Increase (Decrease) in Net Assets | |
Operations: | | | | | | | | |
Net investment income (loss) | | $ | 6,699,419 | | | $ | 7,475,756 | |
Net realized gain (loss) on investments | | | 1,112,552 | | | | 987,044 | |
Net change in unrealized appreciation (depreciation) on investments | | | 5,113,508 | | | | (1,949,853 | ) |
| | | | |
Net increase (decrease) in net assets resulting from operations | | | 12,925,479 | | | | 6,512,947 | |
| | | | |
Dividends and distributions to shareholders: | | | | | | | | |
From net investment income: | | | | | | | | |
Investor Class | | | (1,402,870 | ) | | | (1,848,261 | ) |
Class A | | | (4,505,357 | ) | | | (5,676,902 | ) |
Class B | | | (386,316 | ) | | | (703,945 | ) |
Class C | | | (479,756 | ) | | | (634,595 | ) |
Class I | | | (123,869 | ) | | | (116,464 | ) |
| | | | |
| | | (6,898,168 | ) | | | (8,980,167 | ) |
| | | | |
From net realized gain on investments: | | | | | | | | |
Investor Class | | | (160,179 | ) | | | (627,647 | ) |
Class A | | | (479,452 | ) | | | (1,869,468 | ) |
Class B | | | (69,111 | ) | | | (346,140 | ) |
Class C | | | (81,368 | ) | | | (314,704 | ) |
Class I | | | (10,359 | ) | | | (40,882 | ) |
| | | | |
| | | (800,469 | ) | | | (3,198,841 | ) |
| | | | |
Total dividends and distributions to shareholders | | | (7,698,637 | ) | | | (12,179,008 | ) |
| | | | |
Capital share transactions: | | | | | | | | |
Net proceeds from sale of shares | | | 45,617,984 | | | | 36,073,606 | |
Net asset value of shares issued to shareholders in reinvestment of dividends | | | 6,706,090 | | | | 10,603,969 | |
Cost of shares redeemed | | | (64,943,577 | ) | | | (70,986,403 | ) |
| | | | |
Increase (decrease) in net assets derived from capital share transactions | | | (12,619,503 | ) | | | (24,308,828 | ) |
| | | | |
Net increase (decrease) in net assets | | | (7,392,661 | ) | | | (29,974,889 | ) |
|
| Net Assets | |
Beginning of year | | | 294,868,350 | | | | 324,843,239 | |
| | | | |
End of year | | $ | 287,475,689 | | | $ | 294,868,350 | |
| | | | |
Undistributed net investment income at end of year | | $ | 37,350 | | | $ | 114,418 | |
| | | | |
| | | | |
| 18 | | MainStay Government Fund | | The notes to the financial statements are an integral part of,
and should be read in conjunction with, the financial statements. |
Financial Highlights selected per share data and ratios
| | | | | | | | | | | | | | | | | | | | |
| | | Investor Class | |
| | | Year ended October 31, | | | February 28,
2008**
through
October 31, | |
| | | 2012 | | | 2011 | | | 2010 | | | 2009 | | | 2008 | |
Net asset value at beginning of period | | $ | 8.90 | | | $ | 9.03 | | | $ | 8.75 | | | $ | 8.16 | | | $ | 8.41 | |
| | | | | | | | | | | | | | | | | | | | |
Net investment income (loss) (a) | | | 0.21 | | | | 0.23 | | | | 0.21 | | | | 0.26 | | | | 0.22 | |
Net realized and unrealized gain (loss) on investments | | | 0.17 | | | | (0.00 | )‡ | | | 0.28 | | | | 0.59 | | | | (0.26 | ) |
| | | | | | | | | | | | | | | | | | | | |
Total from investment operations | | | 0.38 | | | | 0.23 | | | | 0.49 | | | | 0.85 | | | | (0.04 | ) |
| | | | | | | | | | | | | | | | | | | | |
Less dividends and distributions: | | | | | | | | | | | | | | | | | | | | |
From net investment income | | | (0.21 | ) | | | (0.27 | ) | | | (0.21 | ) | | | (0.26 | ) | | | (0.21 | ) |
From net realized gain on investments | | | (0.02 | ) | | | (0.09 | ) | | | — | | | | — | | | | — | |
| | | | | | | | | | | | | | | | | | | | |
Total dividends and distributions | | | (0.23 | ) | | | (0.36 | ) | | | (0.21 | ) | | | (0.26 | ) | | | (0.21 | ) |
| | | | | | | | | | | | | | | | | | | | |
Net asset value at end of period | | $ | 9.05 | | | $ | 8.90 | | | $ | 9.03 | | | $ | 8.75 | | | $ | 8.16 | |
| | | | | | | | | | | | | | | | | | | | |
Total investment return (b) | | | 4.42 | % | | | 2.73 | % | | | 5.67 | % | | | 10.67 | % | | | (0.57 | %)(c) |
Ratios (to average net assets)/Supplemental Data: | | | | | | | | | | | | | | | | | | | | |
Net investment income (loss) | | | 2.32 | % | | | 2.61 | % | | | 2.37 | % | | | 2.99 | % | | | 3.89 | % †† |
Net expenses | | | 1.17 | % | | | 1.17 | % | | | 1.15 | % | | | 1.04 | % | | | 1.07 | % †† |
Expenses (before waiver/reimbursement) | | | 1.28 | % | | | 1.31 | % | | | 1.32 | % | | | 1.34 | % | | | 1.38 | % †† |
Portfolio turnover rate (d) | | | 37 | % | | | 62 | % | | | 132 | % | | | 103 | % | | | 51 | % |
Net assets at end of period (in 000’s) | | $ | 57,666 | | | $ | 59,533 | | | $ | 62,350 | | | $ | 63,591 | | | $ | 61,147 | |
| ** | Commencement of operations. |
| ‡ | Less than one cent per share. |
| (a) | Per share data based on average shares outstanding during the period. |
| (b) | Total investment return is calculated exclusive of sales charges and assumes the reinvestment of dividends and distributions. |
| (c) | Total investment return is not annualized. |
| (d) | The portfolio turnover rates not including mortgage dollar rolls were 16%, 43%, 19%, 45% and 43% for the years ended October 31, 2012, 2011, 2010, 2009 and 2008, respectively. |
| | | | | | | | | | | | | | | | | | | | |
| | | Class A | |
| | | Year ended October 31, | |
| | | 2012 | | | 2011 | | | 2010 | | | 2009 | | | 2008 | |
Net asset value at beginning of year | | $ | 8.86 | | | $ | 9.00 | | | $ | 8.72 | | | $ | 8.13 | | | $ | 8.21 | |
| | | | | | | | | | | | | | | | | | | | |
Net investment income (loss) (a) | | | 0.22 | | | | 0.24 | | | | 0.22 | | | | 0.27 | | | | 0.33 | |
Net realized and unrealized gain (loss) on investments | | | 0.19 | | | | (0.01 | ) | | | 0.28 | | | | 0.59 | | | | (0.07 | ) |
| | | | | | | | | | | | | | | | | | | | |
Total from investment operations | | | 0.41 | | | | 0.23 | | | | 0.50 | | | | 0.86 | | | | 0.26 | |
| | | | | | | | | | | | | | | | | | | | |
Less dividends and distributions: | | | | | | | | | | | | | | | | | | | | |
From net investment income | | | (0.23 | ) | | | (0.28 | ) | | | (0.22 | ) | | | (0.27 | ) | | | (0.34 | ) |
From net realized gain on investments | | | (0.02 | ) | | | (0.09 | ) | | | — | | | | — | | | | — | |
| | | | | | | | | | | | | | | | | | | | |
Total dividends and distributions | | | (0.25 | ) | | | (0.37 | ) | | | (0.22 | ) | | | (0.27 | ) | | | (0.34 | ) |
| | | | | | | | | | | | | | | | | | | | |
Net asset value at end of year | | $ | 9.02 | | | $ | 8.86 | | | $ | 9.00 | | | $ | 8.72 | | | $ | 8.13 | |
| | | | | | | | | | | | | | | | | | | | |
Total investment return (b) | | | 4.70 | % | | | 2.76 | % | | | 5.81 | % | | | 10.71 | % | | | 3.12 | % |
Ratios (to average net assets)/Supplemental Data: | | | | | | | | | | | | | | | | | | | | |
Net investment income (loss) | | | 2.46 | % | | | 2.74 | % | | | 2.49 | % | | | 3.11 | % | | | 4.00 | % |
Net expenses | | | 1.03 | % | | | 1.03 | % | | | 1.03 | % | | | 0.92 | % | | | 0.97 | % |
Expenses (before waiver/reimbursement) | | | 1.14 | % | | | 1.17 | % | | | 1.20 | % | | | 1.21 | % | | | 1.28 | % |
Portfolio turnover rate (c) | | | 37 | % | | | 62 | % | | | 132 | % | | | 103 | % | | | 51 | % |
Net assets at end of year (in 000’s) | | $ | 174,621 | | | $ | 176,253 | | | $ | 187,828 | | | $ | 187,771 | | | $ | 182,621 | |
| (a) | Per share data based on average shares outstanding during the year. |
| (b) | Total investment return is calculated exclusive of sales charges and assumes the reinvestment of dividends and distributions. |
| (c) | The portfolio turnover rates not including mortgage dollar rolls were 16%, 43%, 19%, 45% and 43% for the years ended October 31, 2012, 2011, 2010, 2009 and 2008, respectively. |
| | | | | | |
The notes to the financial statements are an integral part of,
and should be read in conjunction with, the financial statements. | | mainstayinvestments.com | | | 19 | |
Financial Highlights selected per share data and ratios
| | | | | | | | | | | | | | | | | | | | |
| | | Class B | |
| | | Year ended October 31, | |
| | | 2012 | | | 2011 | | | 2010 | | | 2009 | | | 2008 | |
Net asset value at beginning of year | | $ | 8.86 | | | $ | 9.00 | | | $ | 8.71 | | | $ | 8.13 | | | $ | 8.20 | |
| | | | | | | | | | | | | | | | | | | | |
Net investment income (loss) (a) | | | 0.14 | | | | 0.16 | | | | 0.14 | | | | 0.19 | | | | 0.26 | |
Net realized and unrealized gain (loss) on investments | | | 0.19 | | | | (0.00 | )‡ | | | 0.29 | | | | 0.59 | | | | (0.06 | ) |
| | | | | | | | | | | | | | | | | | | | |
Total from investment operations | | | 0.33 | | | | 0.16 | | | | 0.43 | | | | 0.78 | | | | 0.20 | |
| | | | | | | | | | | | | | | | | | | | |
Less dividends and distributions: | | | | | | | | | | | | | | | | | | | | |
From net investment income | | | (0.15 | ) | | | (0.21 | ) | | | (0.14 | ) | | | (0.20 | ) | | | (0.27 | ) |
From net realized gain on investments | | | (0.02 | ) | | | (0.09 | ) | | | — | | | | — | | | | — | |
| | | | | | | | | | | | | | | | | | | | |
Total dividends and distributions | | | (0.17 | ) | | | (0.30 | ) | | | (0.14 | ) | | | (0.20 | ) | | | (0.27 | ) |
| | | | | | | | | | | | | | | | | | | | |
Net asset value at end of year | | $ | 9.02 | | | $ | 8.86 | | | $ | 9.00 | | | $ | 8.71 | | | $ | 8.13 | |
| | | | | | | | | | | | | | | | | | | | |
Total investment return (b) | | | 3.77 | % | | | 1.85 | % | | | 5.02 | % | | | 9.62 | % | | | 2.41 | % |
Ratios (to average net assets)/Supplemental Data: | | | | | | | | | | | | | | | | | | | | |
Net investment income (loss) | | | 1.57 | % | | | 1.85 | % | | | 1.62 | % | | | 2.24 | % | | | 3.18 | % |
Net expenses | | | 1.92 | % | | | 1.92 | % | | | 1.90 | % | | | 1.79 | % | | | 1.79 | % |
Expenses (before waiver/reimbursement) | | | 2.03 | % | | | 2.06 | % | | | 2.07 | % | | | 2.09 | % | | | 2.10 | % |
Portfolio turnover rate (c) | | | 37 | % | | | 62 | % | | | 132 | % | | | 103 | % | | | 51 | % |
Net assets at end of year (in 000’s) | | $ | 21,826 | | | $ | 25,644 | | | $ | 36,859 | | | $ | 45,178 | | | $ | 51,826 | |
| ‡ | Less than one cent per share. |
| (a) | Per share data based on average shares outstanding during the year. |
| (b) | Total investment return is calculated exclusive of sales charges and assumes the reinvestment of dividends and distributions. |
| (c) | The portfolio turnover rates not including mortgage dollar rolls were 16%, 43%, 19%, 45% and 43% for the years ended October 31, 2012, 2011, 2010, 2009 and 2008, respectively. |
| | | | | | | | | | | | | | | | | | | | |
| | | Class C | |
| | | Year ended October 31, | |
| | | 2012 | | | 2011 | | | 2010 | | | 2009 | | | 2008 | |
Net asset value at beginning of year | | $ | 8.86 | | | $ | 9.00 | | | $ | 8.71 | | | $ | 8.12 | | | $ | 8.20 | |
| | | | | | | | | | | | | | | | | | | | |
Net investment income (loss) (a) | | | 0.14 | | | | 0.16 | | | | 0.14 | | | | 0.19 | | | | 0.26 | |
Net realized and unrealized gain (loss) on investments | | | 0.18 | | | | (0.00 | )‡ | | | 0.29 | | | | 0.60 | | | | (0.07 | ) |
| | | | | | | | | | | | | | | | | | | | |
Total from investment operations | | | 0.32 | | | | 0.16 | | | | 0.43 | �� | | | 0.79 | | | | 0.19 | |
| | | | | | | | | | | | | | | | | | | | |
Less dividends and distributions: | | | | | | | | | | | | | | | | | | | | |
From net investment income | | | (0.15 | ) | | | (0.21 | ) | | | (0.14 | ) | | | (0.20 | ) | | | (0.27 | ) |
From net realized gain on investments | | | (0.02 | ) | | | (0.09 | ) | | | — | | | | — | | | | — | |
| | | | | | | | | | | | | | | | | | | | |
Total dividends and distributions | | | (0.17 | ) | | | (0.30 | ) | | | (0.14 | ) | | | (0.20 | ) | | | (0.27 | ) |
| | | | | | | | | | | | | | | | | | | | |
Net asset value at end of year | | $ | 9.01 | | | $ | 8.86 | | | $ | 9.00 | | | $ | 8.71 | | | $ | 8.12 | |
| | | | | | | | | | | | | | | | | | | | |
Total investment return (b) | | | 3.66 | % | | | 1.85 | % | | | 5.02 | % | | | 9.75 | % | | | 2.28 | % |
Ratios (to average net assets)/Supplemental Data: | | | | | | | | | | | | | | | | | | | | |
Net investment income (loss) | | | 1.57 | % | | | 1.86 | % | | | 1.62 | % | | | 2.23 | % | | | 3.16 | % |
Net expenses | | | 1.92 | % | | | 1.92 | % | | | 1.90 | % | | | 1.80 | % | | | 1.80 | % |
Expenses (before waiver/reimbursement) | | | 2.03 | % | | | 2.06 | % | | | 2.07 | % | | | 2.09 | % | | | 2.11 | % |
Portfolio turnover rate (c) | | | 37 | % | | | 62 | % | | | 132 | % | | | 103 | % | | | 51 | % |
Net assets at end of year (in 000’s) | | $ | 27,610 | | | $ | 29,441 | | | $ | 33,523 | | | $ | 32,659 | | | $ | 25,967 | |
| ‡ | Less than one cent per share. |
| (a) | Per share data based on average shares outstanding during the year. |
| (b) | Total investment return is calculated exclusive of sales charges and assumes the reinvestment of dividends and distributions. |
| (c) | The portfolio turnover rates not including mortgage dollar rolls were 16%, 43%, 19%, 45% and 43% for the years ended October 31, 2012, 2011, 2010, 2009 and 2008, respectively. |
| | | | |
| 20 | | MainStay Government Fund | | The notes to the financial statements are an integral part of,
and should be read in conjunction with, the financial statements. |
Financial Highlights selected per share data and ratios
| | | | | | | | | | | | | | | | | | | | |
| | | Class I | |
| | | Year ended October 31, | |
| | | 2012 | | | 2011 | | | 2010 | | | 2009 | | | 2008 | |
Net asset value at beginning of year | | $ | 8.94 | | | $ | 9.08 | | | $ | 8.79 | | | $ | 8.19 | | | $ | 8.26 | |
| | | | | | | | | | | | | | | | | | | | |
Net investment income (loss) (a) | | | 0.24 | | | | 0.26 | | | | 0.24 | | | | 0.30 | | | | 0.35 | |
Net realized and unrealized gain (loss) on investments | | | 0.19 | | | | (0.00 | )‡ | | | 0.29 | | | | 0.61 | | | | (0.04 | ) |
| | | | | | | | | | | | | | | | | | | | |
Total from investment operations | | | 0.43 | | | | 0.26 | | | | 0.53 | | | | 0.91 | | | | 0.31 | |
| | | | | | | | | | | | | | | | | | | | |
Less dividends and distributions: | | | | | | | | | | | | | | | | | | | | |
From net investment income | | | (0.25 | ) | | | (0.31 | ) | | | (0.24 | ) | | | (0.31 | ) | | | (0.38 | ) |
From net realized gain on investments | | | (0.02 | ) | | | (0.09 | ) | | | — | | | | — | | | | — | |
| | | | | | | | | | | | | | | | | | | | |
Total dividends and distributions | | | (0.27 | ) | | | (0.40 | ) | | | (0.24 | ) | | | (0.31 | ) | | | (0.38 | ) |
| | | | | | | | | | | | | | | | | | | | |
Net asset value at end of year | | $ | 9.10 | | | $ | 8.94 | | | $ | 9.08 | | | $ | 8.79 | | | $ | 8.19 | |
| | | | | | | | | | | | | | | | | | | | |
Total investment return (b) | | | 4.92 | % | | | 2.99 | % | | | 6.14 | % | | | 11.21 | % | | | 3.68 | % |
Ratios (to average net assets)/Supplemental Data: | | | | | | | | | | | | | | | | | | | | |
Net investment income (loss) | | | 2.69 | % | | | 2.99 | % | | | 2.74 | % | | | 3.52 | % | | | 4.24 | % |
Net expenses | | | 0.78 | % | | | 0.78 | % | | | 0.78 | % | | | 0.51 | % | | | 0.40 | % |
Expenses (before waiver/reimbursement) | | | 0.89 | % | | | 0.92 | % | | | 0.95 | % | | | 0.97 | % | | | 0.99 | % |
Portfolio turnover rate (c) | | | 37 | % | | | 62 | % | | | 132 | % | | | 103 | % | | | 51 | % |
Net assets at end of year (in 000’s) | | $ | 5,753 | | | $ | 3,998 | | | $ | 4,284 | | | $ | 1,746 | | | $ | 1,332 | |
| ‡ | Less than one cent per share. |
| (a) | Per share data based on average shares outstanding during the year. |
| (b) | Total investment return is calculated exclusive of sales charges and assumes the reinvestment of dividends and distributions. Class I shares are not subject to sales charges. |
| (c) | The portfolio turnover rates not including mortgage dollar rolls were 16%, 43%, 19%, 45% and 43% for the years ended October 31, 2012, 2011, 2010, 2009 and 2008, respectively. |
| | | | | | |
The notes to the financial statements are an integral part of,
and should be read in conjunction with, the financial statements. | | mainstayinvestments.com | | | 21 | |
Notes to Financial Statements
Note 1–Organization and Business
The MainStay Funds (the “Trust”) were organized on January 9, 1986, as a Massachusetts business trust. The Trust is registered under the Investment Company Act of 1940, as amended (the “1940 Act”), as an open-end investment management company, and is comprised of twelve funds (collectively referred to as the “Funds”). These financial statements and notes relate only to the MainStay Government Fund (the “Fund”), a diversified fund.
The Fund currently offers five classes of shares. Class A shares commenced operations on January 3, 1995. Class B shares commenced operations on May 1, 1986. Class C shares commenced operations on September 1, 1998. Class I shares commenced operations on January 2, 2004. Investor Class shares commenced operations on February 28, 2008. Investor Class and Class A shares are offered at net asset value (“NAV”) per share plus an initial sales charge. No sales charge applies to investments of $1 million or more (and certain other qualified purchases) in Investor Class and Class A shares, but a contingent deferred sales charge (“CDSC”) is imposed on certain redemptions made within one year of the date of purchase. Class B and Class C shares are offered at NAV without an initial sales charge, although a declining CDSC may be imposed on redemptions made within six years of the date of purchase of Class B shares and a 1.00% CDSC may be imposed on redemptions made within one year of the date of purchase of Class C shares. Class I shares are offered at NAV and are not subject to a sales charge. Depending upon eligibility, Class B shares convert to either Investor Class or Class A shares at the end of the calendar quarter eight years after the date they were purchased. Additionally, depending upon eligibility, Investor Class shares may convert to Class A shares and Class A shares may convert to Investor Class shares. The five classes of shares have the same voting (except for issues that relate solely to one class), dividend, liquidation and other rights, and the same terms and conditions, except that Class B and Class C shares are subject to higher distribution and/or service fee rates than Investor Class and Class A shares under a distribution plan pursuant to Rule 12b-1 under the 1940 Act. Class I shares are not subject to a distribution and/or service fee.
The Fund’s investment objective is to seek current income.
Prior to February 28, 2012, the Fund’s investment objective was to seek a high level of current income, consistent with safety of principal.
Note 2–Significant Accounting Policies
The Fund prepares its financial statements in accordance with generally accepted accounting principles (“GAAP”) in the United States of America and follows the significant accounting policies described below.
(A) Securities Valuation. Investments are valued as of the close of regular trading on the New York Stock Exchange (“Exchange”) (generally 4:00 p.m. Eastern time) on each day the Fund is open for business (“valuation date”).
The Board of Trustees (the “Board”) has adopted procedures for the valuation of the Fund’s securities and has delegated the responsibility for valuation determination under those procedures to the Valuation Committee of the Fund (the “Valuation Committee”). The Board has authorized the Valuation Committee to appoint a Valuation Sub-Committee (the “Sub-Committee”) to deal in the first instance with
questions that arise or cannot be resolved under these procedures. The Sub-Committee will meet (in person, via electronic mail or via teleconference) on an as-needed basis. The Valuation Committee shall meet at a later time, as necessary, to ensure that actions taken by the Sub-Committee were appropriate. The procedures recognize that, subject to the oversight of the Board and unless otherwise noted, the responsibility for day-to-day valuation of portfolio assets (including securities for which market prices are not readily available) rests with New York Life Investment Management LLC (“New York Life Investments” or the “Manager”), aided to whatever extent necessary by the Subadvisor (as defined in Note 3(A)) of the Fund. These procedures shall be reviewed by the Board no less frequently than annually. Any revisions to these procedures deemed necessary shall be reported to the Board at its next regularly scheduled meeting.
Securities are valued using unadjusted market prices, when available, as supplied primarily by third party pricing services or dealers. To assess the appropriateness of security valuations, the Manager or the Fund’s third party service provider who is subject to oversight by the Manager, regularly compares prior day prices, prices on comparable securities and the sale prices to the prior and current day prices and challenges prices exceeding certain tolerance levels with third party pricing services or broker sources. For those securities valued by recommendation, whether through a standardized fair valuation methodology or a fair valuation determination, the Valuation Committee reviews and affirms the reasonableness of the valuation based on such methodologies and determinations on a regular basis after considering all relevant information that is reasonably available.
“Fair value” is defined as the price that the Fund would receive upon selling an investment in an orderly transaction to an independent buyer in the principal or most advantageous market of the investment. Fair value measurements are determined within a framework that has established a three-tier hierarchy which maximizes the use of observable market data and minimizes the use of unobservable inputs to establish classification of fair value measurements for disclosure purposes. “Inputs” refer broadly to the assumptions that market participants would use in pricing the asset or liability, including assumptions about risk, such as the risk inherent in a particular valuation technique used to measure fair value using a pricing model and/or the risk inherent in the inputs for the valuation technique. Inputs may be observable or unobservable. Observable inputs reflect the assumptions market participants would use in pricing the asset or liability based on market data obtained from sources independent of the Fund. Unobservable inputs reflect the Fund’s own assumptions about the assumptions market participants would use in pricing the asset or liability developed based on the information available in the circumstances. The inputs or methodology used for valuing securities may not be an indication of the risks associated with investing in those securities. The three-tier hierarchy of inputs is summarized in the three broad Levels listed below.
| • | | Level 1—quoted prices in active markets for identical investments |
| • | | Level 2—other significant observable inputs (including quoted prices for similar investments in active markets, interest rates and yield curves, prepayment speeds, credit risks, etc.) |
| • | | Level 3—significant unobservable inputs (including the Fund’s own assumptions about the assumptions that market participants would use in determining the fair value of investments) |
| | |
| 22 | | MainStay Government Fund |
The aggregate value by input level, as of October 31, 2012, for the Fund’s investments is included at the end of the Fund’s Portfolio of Investments.
The valuation techniques used by the Fund to measure fair value maximize the use of observable inputs and minimize the use of unobservable inputs. The Fund may utilize third party vendor evaluations, whose prices may be derived from one or more of the following standard inputs:
| | |
• Benchmark Yields | | • Reported Trades |
• Broker Dealer Quotes | | • Issuer Spreads |
• Two-sided markets | | • Benchmark securities |
• Bids/Offers | | • Reference Data (corporate actions or material event notices) |
• Industry and economic events | | • Comparable bonds |
• Equity and credit default swap curves | | • Monthly payment information |
Securities for which market value cannot be determined using the methodologies described above are valued by methods deemed in good faith by the Fund’s Valuation Committee, following the procedures established by the Board, to represent fair value. Under these procedures, the Fund primarily employs a market-based approach which may use related or comparable assets or liabilities, recent transactions, market multiples, book values, and other relevant information. The Fund may also use an income-based valuation approach in which the anticipated future cash flows of the investment are discounted to calculate fair value. Discounts may also be applied due to the nature or duration of any restrictions on the disposition of the investments. Due to the inherent uncertainty of valuations of such investments, the fair values may differ significantly from the values that would have been used had an active market existed. For the year ended October 31, 2012, there have been no changes to the fair value methodologies.
Equity and non-equity securities which may be valued in this manner include, but are not limited to: (i) a security for which the trading has been halted or suspended; (ii) a debt security that has recently gone into default and for which there is not a current market quotation; (iii) a security of an issuer that has entered into a restructuring; (iv) a security that has been de-listed from a national exchange; (v) a security for which the market price is not available from a third party pricing source or, if so provided, does not, in the opinion of the Fund’s Manager or Subadvisor reflect the security’s market value; and (vi) a security whose principal market has been temporarily closed at a time when, under normal conditions, it would be open. Securities for which market quotations or observable inputs are not readily available are generally categorized as Level 3 in the hierarchy. As of October 31, 2012, the Fund held a security with a value of $1,101,621 that was fair valued in such a manner.
Debt securities (other than convertible bonds and municipal debt securities) are valued at the evaluated bid prices (evaluated mean prices in the case of convertible bonds and municipal debt securities) supplied by a pricing agent or broker selected by the Fund’s Manager in consultation with the Fund’s Subadvisor if any, whose prices reflect broker/dealer supplied valuations and electronic data processing techniques, if such prices are deemed by the Fund’s Manager, in consultation with the Fund’s Subadvisor, if any, to be representative of market values, at the
regular close of trading of the Exchange on each valuation date. Debt securities, including corporate bonds, U.S. government and federal agency bonds, municipal bonds, foreign bonds, Yankee bonds, convertible bonds, asset-backed securities and mortgage-backed securities are generally categorized as Level 2 in the hierarchy.
Temporary cash investments acquired over 60 days to maturity are valued using the latest bid prices or using valuations based on a matrix system (which considers such factors as security prices, yields, maturities, and ratings), both as furnished by independent pricing services. Other temporary cash investments which mature in 60 days or less (“Short-Term Investments”) are valued at amortized cost. The amortized cost method involves valuing a security at its cost on the date of purchase and thereafter assuming a constant amortization to maturity of the difference between such cost and the value on maturity date. Amortized cost approximates the current fair value of a security. Securities valued at amortized cost are not valued using a quoted price in an active market. These securities are generally categorized as Level 2 in the hierarchy.
Generally, a security is considered illiquid if it cannot be sold or disposed of in the ordinary course of business at approximately the price at which it is valued. Its illiquidity might prevent the sale of such security at a time when the Manager or Subadvisor might wish to sell, and these securities could have the effect of decreasing the overall level of a Fund’s liquidity. Further, the lack of an established secondary market may make it more difficult to value illiquid securities, requiring the Fund to rely on judgments that may be somewhat subjective in determining value, which could vary from the amount that the Fund could realize upon disposition. Difficulty in selling illiquid securities may result in a loss or may be costly to the Fund. Under the supervision of the Board, the Manager or Subadvisor determines the liquidity of the Fund’s investments; in doing so, the Manager or Subadvisor may consider various factors, including (i) the frequency of trades and quotations, (ii) the number of dealers and prospective purchasers, (iii) dealer undertakings to make a market, and (iv) the nature of the security and the market in which it trades (e.g., the time needed to dispose of the security, the method of soliciting offers and the mechanics of transfer). Illiquid securities generally will be valued in good faith in such a manner as the Board deems appropriate to reflect their fair value.
(B) Income Taxes. The Fund’s policy is to comply with the requirements of the Internal Revenue Code of 1986, as amended (the “Internal Revenue Code”), applicable to regulated investment companies and to distribute all of the taxable income to the shareholders of the Fund within the allowable time limits. Therefore, no federal, state and local income tax provision is required.
Management evaluates its tax positions to determine if the tax positions taken meet the minimum recognition threshold in connection with accounting for uncertainties in income tax positions taken or expected to be taken for the purposes of measuring and recognizing tax liabilities in the financial statements. Recognition of tax benefits of an uncertain tax position is required only when the position is “more likely than not” to be sustained assuming examination by taxing authorities. Management has analyzed the Fund’s tax positions taken on federal, state and local income tax returns for all open tax years (for up to three tax years), and has concluded that no provision for federal, state and local income tax are required in the Fund’s financial statements. The Fund’s federal,
| | | | |
| mainstayinvestments.com | | | 23 | |
Notes to Financial Statements (continued)
state and local income and federal excise tax returns for tax years for which the applicable statutes of limitations have not expired are subject to examination by the Internal Revenue Service and state and local departments of revenue.
(C) Dividends and Distributions to Shareholders. Dividends and distributions are recorded on the ex-dividend date. The Fund intends to declare and pay dividends of net investment income, if any, at least monthly and distributions of net realized capital and currency gains, if any, at least annually. Unless the shareholder elects otherwise, all dividends and distributions are reinvested in the same class of shares of the Fund, at NAV. Dividends and distributions to shareholders are determined in accordance with federal income tax regulations and may differ from GAAP.
(D) Security Transactions and Investment Income. The Fund records security transactions on the trade date. Realized gains and losses on security transactions are determined using the identified cost method and include gains and losses from repayments of principal on mortgage-backed securities. Interest income is accrued as earned using the effective interest rate method. Discounts and premiums on securities purchased, other than Short-Term Investments, for the Fund are accreted and amortized, respectively, on the effective interest rate method over the life of the respective securities or, in the case of a callable security, over the period to the first date of call. Discounts and premiums on Short-Term Investments are accreted and amortized, respectively, on the straight-line method. Income from payment-in-kind securities is recorded daily based on the effective interest method of accrual.
Investment income and realized and unrealized gains and losses on investments of the Fund are allocated to separate classes of shares pro rata based upon their relative net assets on the date the income is earned or realized and unrealized gains and losses are incurred.
(E) Expenses. Expenses of the Trust are allocated to the individual Funds in proportion to the net assets of the respective Funds when the expenses are incurred, except where direct allocations of expenses can be made. Expenses (other than transfer agent expenses and fees incurred under the shareholder services plans and the distribution plans further discussed in Note 3(B)) are allocated to separate classes of shares pro rata based upon their relative net assets on the date the expenses are incurred. The expenses borne by the Fund, including those of related parties to the Fund, are shown in the Statement of Operations.
(F) Use of Estimates. In preparing financial statements in conformity with GAAP, management makes estimates and assumptions that affect the reported amounts and disclosures in the financial statements. Actual results could differ from those estimates.
(G) Repurchase Agreements. The Fund may enter into repurchase agreements to earn income. The Fund may enter into repurchase agreements only with financial institutions that are deemed by the Manager or Subadvisor to be creditworthy, pursuant to guidelines established by the Fund’s Board. During the term of any repurchase agreement, the Manager will continue to monitor the creditworthiness of the seller. Under the 1940 Act, repurchase agreements are considered to be collateralized loans by a Fund to the seller secured by the securities transferred to the Fund.
When the Fund invests in repurchase agreements, the Fund’s custodian takes possession of the collateral pledged for investments in the repurchase agreement. The underlying collateral is valued daily on a mark-to-market basis to determine that the value, including accrued interest, exceeds the repurchase price. In the event of the seller’s default on the obligation to repurchase, the Fund has the right to liquidate the collateral and apply the proceeds in satisfaction of the obligation. Under certain circumstances, such as in the event of default or bankruptcy by the counterparty to the agreement, realization and/or retention of the collateral may be subject to legal proceedings and possible realized loss to the Fund.
(H) Mortgage Dollar Rolls. The Fund may enter into mortgage dollar roll (“MDR”) transactions in which it sells mortgage-backed securities (“MBS”) from its portfolio to a counterparty from whom it simultaneously agrees to buy a similar security on a delayed delivery basis. The MDR transactions of the Fund are classified as purchase and sale transactions. The securities sold in connection with the MDRs are removed from the portfolio and a realized gain or loss is recognized. The securities the Fund has agreed to acquire are included at market value in the Portfolio of Investments and liabilities for such purchase commitments are included as payables for investments purchased. During the roll period, the Fund foregoes principal and interest paid on the securities. The Fund is compensated by the difference between the current sales price and the forward price for the future as well as by the earnings on the cash proceeds of the initial sale. MDRs may be renewed without physical delivery of the securities subject to the contract. The Fund maintains liquid assets from its portfolio having a value not less than the repurchase price, including accrued interest. MDR transactions involve certain risks, including the risk that the MBS returned to the Fund at the end of the roll period, while substantially similar, could be inferior to what was initially sold to the counterparty.
(I) Securities Lending. In order to realize additional income, the Fund may engage in securities lending, subject to the limitations set forth in the 1940 Act, and relevant guidance by the staff of the Securities and Exchange Commission. In the event the Fund does engage in securities lending, the Fund will lend through its custodian, State Street Bank and Trust Company (“State Street”). State Street will manage the Fund’s cash collateral in accordance with the Lending Agreement between the Fund and State Street, and indemnify the Fund’s portfolio against counterparty risk. The loans will be collateralized by cash or securities at least equal at all times to the market value of the securities loaned. Collateral will consist of U.S. government securities, cash equivalents or irrevocable letters of credit. The Fund may bear the risk of delay in recovery of, or loss of rights in, the securities loaned should the borrower of the securities experience financial difficulty. The Fund may also record realized gain or loss on securities deemed sold due to a borrower’s inability to return securities on loan. The Fund will receive compensation for lending its securities in the form of fees or the retention of a portion of the interest on the investment of any cash received as collateral. The Fund also will continue to receive interest and dividends on the securities loaned and any gain or loss in the market price of the securities loaned that may occur during the term of the loan will be for the account of the Fund.
Although the Fund and New York Life Investments have temporarily suspended securities lending, the Fund and New York Life Investments
| | |
| 24 | | MainStay Government Fund |
reserve the right to reinstitute lending when deemed appropriate. The Fund had no portfolio securities on loan as of October 31, 2012.
(J) Concentration of Risk. The ability of issuers of debt securities held by the Fund to meet their obligations may be affected by economic or political developments in a specific country, industry or region.
(K) Indemnifications. Under the Trust’s organizational documents, its officers and trustees are indemnified against certain liabilities that may arise out of performance of their duties to the Trust. Additionally, in the normal course of business, the Fund enters into contracts with third-party service providers that contain a variety of representations and warranties and which may provide general indemnifications. The Fund’s maximum exposure under these arrangements is unknown, as this would involve future claims that may be made against the Fund that have not yet occurred. Based on experience, management is of the view that the risk of loss in connection with these potential indemnification obligations is remote. However, there can be no assurance that material liabilities related to such obligations will not arise in the future, which could adversely impact the Fund.
Note 3–Fees and Related Party Transactions
(A) Manager and Subadvisor. New York Life Investments, a registered investment adviser and an indirect, wholly-owned subsidiary of New York Life Insurance Company (“New York Life”), serves as the Fund’s Manager, pursuant to an Amended and Restated Management Agreement (“Management Agreement”). The Manager provides offices, conducts clerical, recordkeeping and bookkeeping services, and keeps most of the financial and accounting records required to be maintained by the Fund. Except for the portion of salaries and expenses that are the responsibility of the Fund, the Manager pays the salaries and expenses of all personnel affiliated with the Fund and certain operational expenses of the Fund. The Fund reimburses New York Life Investments in an amount equal to a portion of the salary of the Chief Compliance Officer (“CCO”) of the Fund. MacKay Shields LLC (“MacKay Shields” or the “Subadvisor”), a registered investment adviser and an indirect, wholly-owned subsidiary of New York Life, serves as Subadvisor to the Fund and is responsible for the day-to-day portfolio management of the Fund. Pursuant to the terms of an Amended and Restated Subadvisory Agreement (“Subadvisory Agreement”) between New York Life Investments and MacKay Shields, New York Life Investments pays for the services of the Subadvisor.
The Fund pays the Manager a monthly fee for services performed and facilities furnished at an annual rate of the Fund’s average daily net assets as follows: 0.60% up to $500 million; 0.575% from $500 million to $1 billion; and 0.55% in excess of $1 billion, plus a fee for fund accounting services previously provided by New York Life Investments under a separate fund accounting agreement, furnished at an annual rate of the Fund’s average daily net assets as follows: 0.05% up to $20 million; 0.0333% from $20 million to $100 million; and 0.01% in excess of $100 million.
New York Life Investments has contractually agreed to waive fees and/or reimburse expenses so that the management fee does not exceed 0.50% up to $500 million; 0.475% from $500 million to $1 billion; and 0.45% in excess of $1 billion. This agreement will remain in effect until February 28, 2013, and shall renew automatically for one-year terms
unless New York Life Investments provides written notice of termination prior to the start of the next term or upon approval of the Board. The effective management fee rate (exclusive of any applicable waivers/reimbursements) was 0.62% for the year ended October 31, 2012, inclusive of a fee for fund accounting services of 0.02% of the Fund’s average daily net assets.
New York Life Investments has contractually agreed to waive fees and/or reimburse expenses so that Total Annual Fund Operating Expenses for the Fund’s Class A shares do not exceed 1.03% of its average daily net assets. New York Life Investments will apply an equivalent waiver or reimbursement, in an equal number of basis points, to the other share classes of the Fund. This agreement will remain in effect until February 28, 2013, and shall renew automatically for one-year terms unless New York Life Investments provides written notice of termination prior to the start of the next term or upon approval of the Board. Total Annual Fund Operating Expenses excludes taxes, interest, litigation, extraordinary expenses, brokerage and other transaction expenses relating to the purchase or sale of portfolio investments, and acquired (underlying) fund fees and expenses.
For the year ended October 31, 2012, New York Life Investments earned fees from the Fund in the amount of $1,823,183 and waived its fees and/or reimbursed expenses in the amount of $330,502.
State Street, 1 Lincoln Street, Boston, Massachusetts 02111, provides sub-administration and sub-accounting services to the Fund pursuant to an agreement with New York Life Investments. These services include calculating the daily NAVs of the Fund, maintaining the general ledger and sub-ledger accounts for the calculation of the Fund’s respective NAVs, and assisting New York Life Investments in conducting various aspects of the Fund’s administrative operations. For providing these services to the Fund, State Street is compensated by New York Life Investments.
(B) Distribution and Service Fees. The Trust, on behalf of the Fund, has entered into a distribution agreement with NYLIFE Distributors LLC (the “Distributor”), an indirect, wholly-owned subsidiary of New York Life. The Fund has adopted distribution plans (the “Plans”) in accordance with the provisions of Rule 12b-1 under the 1940 Act.
Pursuant to the Investor Class and Class A Plans, the Distributor receives a monthly distribution fee from the Investor Class and Class A shares at an annual rate of 0.25% of the average daily net assets of the Investor Class and Class A shares for distribution and/or service activities as designated by the Distributor. Pursuant to the Class B and Class C Plans, Class B and Class C shares pay the Distributor a monthly distribution fee at an annual rate of 0.75% of the average daily net assets of the Class B and Class C shares along with a service fee at an annual rate of 0.25% of the average daily net assets of the Class B and Class C shares, for a total 12b-1 fee of 1.00%. Class I shares are not subject to a distribution and/or service fee.
The Plans provide that the distribution and service fees are payable to the Distributor regardless of the amounts actually expended by the Distributor for distribution of the Fund’s shares and service activities.
(C) Sales Charges. The Fund was advised by the Distributor that the amount of sales charges retained on sales of Investor Class and Class A shares were $8,889 and $22,853, respectively, for the year ended October 31, 2012. The Fund was also advised that the
| | | | |
| mainstayinvestments.com | | | 25 | |
Notes to Financial Statements (continued)
Distributor retained CDSCs on redemptions of Investor Class, Class A, Class B and Class C shares of $12, $13,900, $27,589 and $5,326, respectively, for the year ended October 31, 2012.
(D) Transfer, Dividend Disbursing and Shareholder Servicing Agent. NYLIM Service Company LLC, an affiliate of New York Life Investments, is the Fund’s transfer, dividend disbursing and shareholder servicing agent pursuant to an agreement between NYLIM Service Company LLC and the Trust. NYLIM Service Company LLC has entered into an agreement with Boston Financial Data Services, Inc. (“BFDS”) pursuant to which BFDS performs certain transfer agent services on behalf of NYLIM Service Company LLC. Transfer agent expenses incurred by the Fund for the year ended October 31, 2012, were as follows:
| | | | |
Investor Class | | $ | 199,602 | |
Class A | | | 358,542 | |
Class B | | | 79,371 | |
Class C | | | 98,642 | |
Class I | | | 8,842 | |
(E) Small Account Fee. Shareholders with small accounts adversely impact the cost of providing transfer agency services. In an effort to reduce total transfer agency expenses, the Fund has implemented a small account fee on certain types of accounts. Certain shareholders with an account balance of less than $1,000 are charged an annual per account fee of $20 (assessed semi-annually), the proceeds from which offset transfer agent fees as reflected in the Statement of Operations.
Note 4–Federal Income Tax
As of October 31, 2012, the components of accumulated gain (loss) on a tax basis were as follows:
| | | | | | | | | | | | | | | | | | |
Ordinary
Income | | | Accumulated
Capital and
Other Gain
(Loss) | | | Other
Temporary
Differences | | | Unrealized
Appreciation
(Depreciation) | | | Total
Accumulated Gain (Loss) | |
| | $119,698 | | | $ | 969,298 | | | $ | (61,093 | ) | | $ | 19,603,759 | | | $ | 20,631,662 | |
The other temporary differences are primarily due to dividends payable.
The following table discloses the current year reclassifications between undistributed net investment income (loss), accumulated net realized gain (loss) on investments, and additional paid-in capital arising from permanent differences; net assets as of October 31, 2012 were not affected.
| | | | | | | | | | |
Undistributed
Net Investment Income (Loss) | | | Accumulated
Net Realized
Gain (Loss)
on Investments | | | Additional Paid-In Capital | |
| | $121,681 | | | $ | (121,681 | ) | | $ | — | |
The reclassifications for the Fund are primarily due to mortgage dollar roll adjustments.
The tax character of distributions paid during the years ended October 31, 2012 and October 31, 2011 shown in the Statements of Changes in Net Assets was as follows:
| | | | | | | | |
| | | 2012 | | | 2011 | |
Distributions paid from: | | | | | | | | |
Ordinary Income | | $ | 6,898,168 | | | $ | 10,772,458 | |
Long-Term Capital Gain | | | 800,469 | | | | 1,406,550 | |
Total | | $ | 7,698,637 | | | $ | 12,179,008 | |
Note 5–Custodian
State Street is the custodian of the cash and the securities of the Fund. Custodial fees are charged to the Fund based on the market value of securities in the Fund and the number of certain cash transactions incurred by the Fund.
Note 6–Line of Credit
The Fund and certain affiliated funds maintain a line of credit with a syndicate of banks in order to secure a source of funds for temporary purposes to meet unanticipated or excessive redemption requests.
Effective August 29, 2012, under an amended credit agreement, the aggregate commitment amount is $200,000,000 with an optional maximum amount of $250,000,000. The commitment fee is an annual rate of 0.08% of the average commitment amount payable quarterly, regardless of usage, to Bank of New York Mellon, which serves as the agent to the syndicate. The commitment fee is allocated among certain MainStay Funds based upon net assets and other factors. Interest on any revolving credit loan is charged based upon the Federal Funds Advances rate or the one month London InterBank Offered Rate, whichever is higher. The amended credit agreement expires on August 28, 2013, although the MainStay Funds and the syndicate of banks may renew the amended credit agreement for an additional year on the same or different terms. Prior to August 29, 2012, the aggregate commitment amount was $125,000,000 with an optional maximum amount of $175,000,000. There were no borrowings made or outstanding with respect to the Fund on the amended credit agreement during the year ended October 31, 2012.
Note 7–Purchases and Sales of Securities (in 000’s)
During the year ended October 31, 2012, purchases and sales of U.S. government securities were $103,101 and $125,023, respectively. Purchases and sales of securities, other than U.S. government securities and short-term securities, were $5,330 and $4,601, respectively.
| | |
| 26 | | MainStay Government Fund |
Note 8–Capital Share Transactions
| | | | | | | | |
Investor Class | | Shares | | | Amount | |
Year ended October 31, 2012: | | | | | | | | |
Shares sold | | | 412,800 | | | $ | 3,701,825 | |
Shares issued to shareholders in reinvestment of dividends and distributions | | | 165,025 | | | | 1,479,583 | |
Shares redeemed | | | (979,647 | ) | | | (8,792,514 | ) |
| | | | |
Net increase (decrease) in shares outstanding before conversion | | | (401,822 | ) | | | (3,611,106 | ) |
Shares converted into Investor Class (See Note 1) | | | 426,787 | | | | 3,827,336 | |
Shares converted from Investor Class (See Note 1) | | | (347,894 | ) | | | (3,123,154 | ) |
| | | | |
Net increase (decrease) | | | (322,929 | ) | | $ | (2,906,924 | ) |
| | | | |
Year ended October 31, 2011: | | | | | | | | |
Shares sold | | | 343,721 | | | $ | 3,025,097 | |
Shares issued to shareholders in reinvestment of dividends and distributions | | | 267,408 | | | | 2,336,563 | |
Shares redeemed | | | (1,100,521 | ) | | | (9,665,253 | ) |
| | | | |
Net increase (decrease) in shares outstanding before conversion | | | (489,392 | ) | | | (4,303,593 | ) |
Shares converted into Investor Class (See Note 1) | | | 608,534 | | | | 5,358,070 | |
Shares converted from Investor Class (See Note 1) | | | (328,281 | ) | | | (2,896,937 | ) |
| | | | |
Net increase (decrease) | | | (209,139 | ) | | $ | (1,842,460 | ) |
| | | | |
| | |
| | | | | | | | |
Class A | | Shares | | | Amount | |
Year ended October 31, 2012: | | | | | | | | |
Shares sold | | | 2,981,393 | | | $ | 26,634,948 | |
Shares issued to shareholders in reinvestment of dividends and distributions | | | 486,925 | | | | 4,350,002 | |
Shares redeemed | | | (4,423,774 | ) | | | (39,645,645 | ) |
| | | | |
Net increase (decrease) in shares outstanding before conversion | | | (955,456 | ) | | | (8,660,695 | ) |
Shares converted into Class A (See Note 1) | | | 554,513 | | | | 4,951,502 | |
Shares converted from Class A (See Note 1) | | | (124,452 | ) | | | (1,117,443 | ) |
| | | | |
Net increase (decrease) | | | (525,395 | ) | | $ | (4,826,636 | ) |
| | | | |
Year ended October 31, 2011: | | | | | | | | |
Shares sold | | | 1,914,964 | | | $ | 16,878,805 | |
Shares issued to shareholders in reinvestment of dividends and distributions | | | 757,731 | | | | 6,598,175 | |
Shares redeemed | | | (4,207,878 | ) | | | (36,808,755 | ) |
| | | | |
Net increase (decrease) in shares outstanding before conversion | | | (1,535,183 | ) | | | (13,331,775 | ) |
Shares converted into Class A (See Note 1) | | | 710,048 | | | | 6,229,812 | |
Shares converted from Class A (See Note 1) | | | (151,756 | ) | | | (1,336,414 | ) |
| | | | |
Net increase (decrease) | | | (976,891 | ) | | $ | (8,438,377 | ) |
| | | | |
| | |
| | | | | | | | |
| | | | | | | | |
Class B | | Shares | | | Amount | |
Year ended October 31, 2012: | | | | | | | | |
Shares sold | | | 460,007 | | | $ | 4,114,324 | |
Shares issued to shareholders in reinvestment of dividends and distributions | | | 45,752 | | | | 408,147 | |
Shares redeemed | | | (470,076 | ) | | | (4,205,073 | ) |
| | | | |
Net increase (decrease) in shares outstanding before conversion | | | 35,683 | | | | 317,398 | |
Shares converted from Class B (See Note 1) | | | (509,203 | ) | | | (4,538,241 | ) |
| | | | |
Net increase (decrease) | | | (473,520 | ) | | $ | (4,220,843 | ) |
| | | | |
Year ended October 31, 2011: | | | | | | | | |
Shares sold | | | 445,347 | | | $ | 3,921,619 | |
Shares issued to shareholders in reinvestment of dividends and distributions | | | 109,970 | | | | 955,825 | |
Shares redeemed | | | (916,747 | ) | | | (8,020,044 | ) |
| | | | |
Net increase (decrease) in shares outstanding before conversion | | | (361,430 | ) | | | (3,142,600 | ) |
Shares converted from Class B (See Note 1) | | | (840,071 | ) | | | (7,354,531 | ) |
| | | | |
Net increase (decrease) | | | (1,201,501 | ) | | $ | (10,497,131 | ) |
| | | | |
| | |
| | | | | | | | |
Class C | | Shares | | | Amount | |
Year ended October 31, 2012: | | | | | | | | |
Shares sold | | | 786,623 | | | $ | 7,017,951 | |
Shares issued to shareholders in reinvestment of dividends and distributions | | | 39,185 | | | | 349,640 | |
Shares redeemed | | | (1,086,482 | ) | | | (9,710,415 | ) |
| | | | |
Net increase (decrease) | | | (260,674 | ) | | $ | (2,342,824 | ) |
| | | | |
Year ended October 31, 2011: | | | | | | | | |
Shares sold | | | 1,140,103 | | | $ | 10,110,598 | |
Shares issued to shareholders in reinvestment of dividends and distributions | | | 68,135 | | | | 591,811 | |
Shares redeemed | | | (1,610,748 | ) | | | (14,044,322 | ) |
| | | | |
Net increase (decrease) | | | (402,510 | ) | | $ | (3,341,913 | ) |
| | | | |
| | |
| | | | | | | | |
Class I | | Shares | | | Amount | |
Year ended October 31, 2012: | | | | | | | | |
Shares sold | | | 459,198 | | | $ | 4,148,936 | |
Shares issued to shareholders in reinvestment of dividends and distributions | | | 13,153 | | | | 118,718 | |
Shares redeemed | | | (287,451 | ) | | | (2,589,930 | ) |
| | | | |
Net increase (decrease) | | | 184,900 | | | $ | 1,677,724 | |
| | | | |
Year ended October 31, 2011: | | | | | | | | |
Shares sold | | | 239,647 | | | $ | 2,137,487 | |
Shares issued to shareholders in reinvestment of dividends and distributions | | | 13,825 | | | | 121,595 | |
Shares redeemed | | | (278,226 | ) | | | (2,448,029 | ) |
| | | | |
Net increase (decrease) | | | (24,754 | ) | | $ | (188,947 | ) |
| | | | |
Note 9–Subsequent Events
In connection with the preparation of the financial statements of the Fund as of and for the year ended October 31, 2012, events and transactions subsequent to October 31, 2012 through the date the financial statements were issued have been evaluated by the Fund’s management for possible adjustment and/or disclosure. No subsequent events requiring financial statement adjustment or disclosure have been identified.
| | | | |
| mainstayinvestments.com | | | 27 | |
Report of Independent Registered Public Accounting Firm
The Board of Trustees and Shareholders of
The MainStay Funds:
We have audited the accompanying statement of assets and liabilities, including the portfolio of investments, of the MainStay Government Fund (the “Fund”), one of the funds constituting The MainStay Funds, as of October 31, 2012, and the related statement of operations for the year then ended, the statements of changes in net assets for each of the years in the two-year period then ended, and the financial highlights for each of the years or periods in the five-year period then ended. These financial statements and financial highlights are the responsibility of the Fund’s management. Our responsibility is to express an opinion on these financial statements and financial highlights based on our audits.
We conducted our audits in accordance with the standards of the Public Company Accounting Oversight Board (United States). Those standards require that we plan and perform the audit to obtain reasonable assurance about whether the financial statements and financial highlights are free of material misstatement. An audit includes examining, on a test basis, evidence supporting the amounts and disclosures in the financial statements. Our procedures included confirmation of securities owned as of October 31, 2012, by correspondence with the custodian and brokers or by other appropriate auditing procedures where replies from brokers were not received. An audit also includes assessing the accounting principles used and significant estimates made by management, as well as evaluating the overall financial statement presentation. We believe that our audits provide a reasonable basis for our opinion.
In our opinion, the financial statements and financial highlights referred to above present fairly, in all material respects, the financial position of the MainStay Government Fund of The MainStay Funds as of October 31, 2012, the results of its operations for the year then ended, the changes in its net assets for each of the years in the two-year period then ended, and the financial highlights for each of the years or periods in the five-year period then ended, in conformity with U.S. generally accepted accounting principles.

Philadelphia, Pennsylvania
December 21, 2012
| | |
| 28 | | MainStay Government Fund |
Federal Income Tax Information
(Unaudited)
The Fund is required under the Internal Revenue Code to advise shareholders in a written statement as to the federal tax status of dividends paid by the Fund during such fiscal years. Accordingly, the Fund paid $800,469 as a long term capital gain distribution.
In February 2013 shareholders will receive an IRS Form 1099-DIV or substitute Form 1099 which will show the federal tax status of the distributions received by shareholders in calendar year 2012. The amounts that will be reported on such 1099-DIV or substitute From 1099 will be the amounts you are to use on your federal income tax return and will differ from the amounts which we must report for the Fund’s fiscal year ended October 31, 2012.
Proxy Voting Policies and Procedures and Proxy Voting Record
A description of the policies and procedures that New York Life Investments uses to vote proxies related to the Fund’s securities is available without charge, upon request, (i) by visiting the Fund’s website at mainstayinvestments.com; or (ii) on the SEC’s website at www.sec.gov.
The Fund is required to file with the SEC its proxy voting record for the 12-month period ending June 30 on Form N-PX. The Fund’s most recent Form N-PX is available free of charge upon request (i) by calling 800-MAINSTAY (624-6782); (ii) by visiting the Fund’s website at mainstayinvestments.com; or (iii) on the SEC’s website at www.sec.gov.
Shareholder Reports and Quarterly Portfolio Disclosure
The Fund is required to file its complete schedule of portfolio holdings with the SEC for its first and third fiscal quarters on Form N-Q. The Fund’s Form N-Q is available without charge on the SEC’s website at www.sec.gov or by calling MainStay Investments at 800-MAINSTAY (624-6782). You also can obtain and review copies of Form N-Q by visiting the SEC’s Public Reference Room in Washington, DC (information on the operation of the Public Reference Room may be obtained by calling 1-800-SEC-0330).
| | | | |
| mainstayinvestments.com | | | 29 | |
Board Members and Officers (Unaudited)
The Board Members oversee the MainStay Group of Funds (which is comprised of Funds that are series of The MainStay Funds, Eclipse Trust, Eclipse Funds Inc., MainStay Funds Trust, MainStay VP Funds Trust, Private Advisors Alternative Strategies Master Fund, Private Advisors Alternative Strategies Fund, and MainStay Defined Term Municipal Opportunities Fund) (collectively, the “Fund Complex”), the Manager and, when applicable, the Subadvisor(s) and other service providers to the Fund Complex. Each Board Member serves until his or her successor is elected and qualified or until his or her resignation, death or removal. The Retirement Policy provides that a Board Member
shall tender his or her resignation by the end of the calendar year during which he or she reaches the age of 75.
Officers serve a term of one year and are elected annually by the Board Members. The business address of each Board Member and officer listed below is 51 Madison Avenue, New York, New York 10010.
The Statement of Additional Information applicable to the Fund includes additional information about the Board Members and is available without charge, upon request, by calling 800-MAINSTAY (624-6782) or by going online to mainstayinvestments.com.
| | | | | | | | | | | | |
| | | | | Name and
Date of Birth | | Term of Office,
Position(s) Held
with the Fund
Complex and
Length of Service | | Principal Occupation(s)
During Past Five Years | | Number of
Funds in
Fund Complex
Overseen by
Board Member | | Other Directorships
Held by Board Member |
| Interested Board Member* | | | | John Y. Kim
9/24/60 | | Indefinite;
Eclipse Trust: Trustee since 2008;
Eclipse Funds Inc.:
Director since 2008 (1 fund);
The MainStay Funds: Trustee since 2008 (12 funds);
MainStay Funds Trust: Trustee since 2009 (31 funds); and
MainStay VP Funds Trust: Trustee since 2011 and its predecessor, MainStay VP Series Fund, Inc. since 2008 (28 portfolios). Private Advisors Alternative Strategies Master Fund: Trustee since 2011
Private Advisors Alternative Strategies Fund: Trustee since 2011
MainStay DefinedTerm Municipal Opportunities Fund: Trustee since 2011 | | Member of the Board of Managers, President and Chief Executive Officer (since 2008), New York Life Investment Management LLC and New York Life Investment Management Holdings LLC; Member of the Board, MacKay Shields LLC since 2008; Chairman of the Board, Institutional Capital LLC, Madison Capital Funding LLC, Madison Square Investors LLC and McMorgan & Company LLC; Chairman of the Board, NYLIFE Distributors LLC and Chairman of the Board, NYLCAP Manager LLC (since 2008) President, Prudential Retirement, a business unit of Prudential Financial, Inc. (2002 to 2007) | | 75 | | None |
| | * | This Board Member is considered to be an “interested person” of the MainStay Group of Funds within the meaning of the 1940 Act because of his affiliation with New York Life Insurance Company, New York Life Investment Management LLC, Madison Square Investors LLC, MacKay Shields LLC, Private Advisors LLC, Institutional Capital LLC, NYLIFE Securities LLC and/or NYLIFE Distributors LLC, as described in detail above in the column entitled “Principal Occupation(s) During the Past Five Years.” |
| | |
| 30 | | MainStay Government Fund |
| | | | | | | | | | | | |
| | | | | Name and
Date of Birth | | Term of Office, Position(s) Held with the Fund Complex and Length of Service | | Principal Occupation(s)
During Past Five Years | | Number of
Funds in
Fund Complex
Overseen by
Board Member | | Other Directorships
Held by Board Member |
| Non-Interested Board Members | | | | Susan B. Kerley 8/12/51 | | Indefinite;
Eclipse Trust: Chairman since 2005, and Trustee since 2000;
Eclipse Funds Inc.: Chairman since 2005 and Director since 1990 (1 fund); The MainStay Funds: Chairman and Board Member since 2007 (12 funds);
MainStay Funds Trust: Chairman and Trustee since 2009 (31 funds); and MainStay VP Funds Trust: Chairman and Trustee since 2011 and its predecessor, MainStay VP Series Fund, Inc., since 2007 (28 portfolios). Private Advisors Alternative Strategies Master Fund: Chairman and Trustee since 2011 Private Advisors Alternative Strategies Fund: Chairman and Trustee since 2011 MainStay DefinedTerm Municipal Opportunities Fund: Chairman and Trustee since 2011. | | President, Strategic Management Advisors LLC (since 1990) | | 75 | | Trustee, Legg Mason Partners Funds, since 1992 (51 portfolios) |
| | | | |
| mainstayinvestments.com | | | 31 | |
| | | | | | | | | | | | |
| | | | | Name and
Date of Birth | | Term of Office,
Position(s) Held
with the Fund
Complex and
Length of Service | | Principal Occupation(s)
During Past Five Years | | Number of
Funds in
Fund Complex
Overseen by
Board Member | | Other Directorships
Held by Board Member |
| Non-Interested Board Members | | | | Alan R. Latshaw 3/27/51 | | Indefinite;
Eclipse Trust: Trustee and Audit Committee Financial Expert since 2007;
Eclipse Funds Inc.:
Director and Audit Committee Financial Expert since 2007 (1 fund);
The MainStay Funds: Trustee and Audit Committee Financial Expert since 2006 (12 funds);
MainStay Funds Trust: Trustee and Audit Committee Financial Expert since 2009 (31 funds); and
MainStay VP Funds Trust: Trustee and Audit Committee Financial Expert since 2011 and its predecessor, MainStay VP Series Fund, Inc., since 2007 (28 portfolios). Private Advisors Alternative Strategies Master Fund: Trustee and Audit Committee Financial Expert since 2011 Private Advisors Alternative Strategies Fund: Trustee and Audit Committee Financial Expert since 2011. MainStay DefinedTerm Municipal Opportunities Fund: Trustee and Audit Committee Financial Expert since 2011. | | Retired; Partner, Ernst & Young LLP (2002 to 2003); Partner, Arthur Andersen LLP (1989 to 2002); Consultant to the MainStay Funds Audit and Compliance Committee (2004 to 2006) | | 75 | | Trustee, State Farm Associates Funds Trusts since 2005 (4 portfolios); Trustee, State Farm Mutual Fund Trust since 2005 (15 portfolios); Trustee, State Farm Variable Product Trust since 2005 (9 portfolios) |
| | |
| 32 | | MainStay Government Fund |
| | | | | | | | | | | | |
| | | | | Name and Date of Birth | | Term of Office, Position(s) Held with the Fund Complex and Length of Service | | Principal Occupation(s)
During Past Five Years | | Number of
Funds in
Fund Complex
Overseen by
Board Member | | Other Directorships Held by Board Member |
| Non-Interested Board Members | | | | Peter Meenan
12/5/41 | | Indefinite;
Eclipse Funds: Trustee since 2002;
Eclipse Funds Inc.:
Director since 2002
(1 fund); The MainStay Funds:
Trustee since 2007 (12 funds);
MainStay Funds Trust: Trustee since 2009
(31 funds); and
MainStay VP Funds Trust: Trustee since 2011 and its predecessor, MainStay VP Series Fund, Inc., since 2007 (28 portfolios).
Private Advisors Alternative Strategies Master Fund: Trustee since 2011. Private Advisors Alternative Strategies Fund: Trustee since 2011
MainStay DefinedTerm Municipal Opportunities Fund: Trustee since 2011. | | Independent Consultant; President and Chief Executive Officer, Babson—United, Inc. (financial services firm) (2000 to 2004); Independent Consultant (1999 to 2000); Head of Global Funds, Citicorp (1995 to 1999) | | 75 | | None |
| | | | Richard H. Nolan, Jr.
11/16/46 | | Indefinite;
Eclipse Trust: Trustee since 2007;
Eclipse Funds Inc.:
Director since 2007 (1 fund);
The MainStay Funds: Trustee since 2007 (12 funds);
MainStay Funds Trust: Trustee since 2009 (31 funds); and
MainStay VP Funds Trust: Trustee since 2011 and its predecessor, MainStay VP Series Fund, Inc., since 2006 (28 portfolios).
Private Advisors Alternative Strategies Master Fund: Trustee since 2011. Private Advisors Alternative Strategies Fund: Trustee since 2011
MainStay DefinedTerm Municipal Opportunities Fund: Trustee since 2011. | | Managing Director, ICC Capital Management; President—Shields/Alliance, Alliance Capital Management (1994 to 2004) | | 75 | | None |
| | | | |
| mainstayinvestments.com | | | 33 | |
| | | | | | | | | | | | |
| | | | | Name and Date of Birth | | Term of Office, Position(s) Held with the Fund Complex and Length of Service | | Principal Occupation(s)
During Past Five Years | | Number of
Funds in
Fund Complex
Overseen by
Board Member | | Other Directorships Held by Board Member |
| Non-Interested Board Members | | | | Richard S. Trutanic 2/13/52 | | Indefinite;
Eclipse Trust: Trustee since 2007;
Eclipse Funds Inc.:
Director since 2007 (1 fund);
The MainStay Funds:
Trustee since 1994 (12 funds);
MainStay Funds Trust:
Trustee since 2009 (31 funds); and
MainStay VP Funds Trust: Trustee since 2011 and its predecessor, MainStay VP Series Fund, Inc., since 2007 (28 portfolios).
Private Advisors Alternative Strategies Master Fund: Trustee since 2011.
Private Advisors Alternative Strategies Fund: Trustee since 2011
MainStay DefinedTerm Municipal Opportunities Fund: Trustee since 2011. | | Chairman and Chief Executive Officer, Somerset & Company (financial advisory firm) (since 2004); Managing Director, The Carlyle Group (private investment firm) (2002 to 2004); Senior Managing Director, Partner and Board Member, Groupe Arnault S.A. (private investment firm) (1999 to 2002) | | 75 | | None |
| | |
| 34 | | MainStay Government Fund |
| | | | | | | | | | | | |
| | | | | Name and Date of Birth | | Term of Office, Position(s) Held with the Fund Complex and Length of Service | | Principal Occupation(s)
During Past Five Years | | Number of
Funds in
Fund Complex
Overseen by
Board Member | | Other Directorships Held by Board Member |
| Non-Interested Board Members | | | | Roman L. Weil
5/22/40 | | Indefinite;
Eclipse Trust: Trustee and Audit Committee Financial Expert since 2007; Eclipse Funds Inc.: Director and Audit Committee Financial Expert since 2007 (1 fund); The MainStay Funds: Trustee and Audit Committee Financial Expert since 2007 (12 funds); MainStay Funds Trust: Trustee since 2009 (31 funds); and MainStay VP Funds Trust: Trustee and Audit Committee Financial Expert since 2011 and its predecessor, MainStay VP Series Fund, Inc., since 1994 and Audit Committee Financial Expert since 2003 (28 portfolios).
Private Advisors Alternative Strategies Master Fund: Trustee and Audit Committee Financial Expert since 2011 Private Advisors Alternative Strategies Fund: Trustee and Audit Committee Financial Expert since 2011. MainStay DefinedTerm Municipal Opportunities Fund: Trustee and Audit Committee Financial Expert since 2011. | | Visiting Professor, University of California—San Diego (since October 2012); Visiting Professor, Southern Methodist University (2011); Visiting Professor, NYU Stem School of Business, New York University (2011); President, Roman L. Weil Associates, Inc. (consulting firm) (since 1981); V. Duane Rath Professor Emeritus of Accounting, Chicago Booth School of Business, University of Chicago (1965-2008) | | 75 | | None |
| | | | |
| mainstayinvestments.com | | | 35 | |
| | | | | | | | | | | | |
| | | | | Name and Date of Birth | | Term of Office, Position(s) Held with the Fund Complex and Length of Service | | Principal Occupation(s)
During Past Five Years | | Number of
Funds in
Fund Complex
Overseen by
Board Member | | Other Directorships Held by Board Member |
| Non-Interested Board Members | | | | John A. Weisser 10/22/41 | | Indefinite; Eclipse Trust: Trustee since 2007; Eclipse Funds Inc.: Director since 2007 (1 fund); The MainStay Funds: Trustee since 2007 (12 funds); MainStay Funds Trust: Trustee since 2009 (31 funds); and MainStay VP Funds Trust: Trustee since 2011 and its predecessor, MainStay VP Series Fund, Inc., since 1997 (28 portfolios).
Private Advisors Alternative Strategies Master Fund: Trustee since 2011.
Private Advisors Alternative Strategies Fund: Trustee since 2011
MainStay DefinedTerm Municipal Opportunities Fund: Trustee since 2011. | | Retired. Managing Director of Salomon Brothers, Inc. (1971 to 1995) | | 75 | | Trustee, Direxion Funds since 2007 (21 portfolios); Direxion Insurance Trust since 2007 (1 portfolio); Trustee, Direxion Shares ETF Trust, since 2008 (47 portfolios) |
| | |
| 36 | | MainStay Government Fund |
The following individuals have been appointed by the Board Members to serve as Officers of the MainStay Group of Funds.
| | | | | | | | |
| | | | | Name and
Date of Birth | | Positions(s) Held with the Funds and Length of Service | | Principal Occupation(s) During Past Five Years |
| Officers | | | | Jack R. Benintende 5/12/64 | | Treasurer and Principal Financial and Accounting Officer, Eclipse Trust, Eclipse Funds, Inc. and The MainStay Funds (since 2007), MainStay Funds Trust (since 2009) | | Assistant Treasurer, New York Life Investment Management Holdings LLC (since 2008); Managing Director, New York Life Investment Management LLC (since 2007); Treasurer and Principal Financial Accounting Officer, Private Advisors Alternative Strategies Master Fund, Private Advisors Alternative Strategies Fund and MainStay DefinedTerm Municipal Opportunities Fund (since 2011); Treasurer and Principal Financial and Accounting Officer, MainStay VP Funds Trust and its predecessor, MainStay VP Series Fund, Inc. (since 2007) |
| | | | Jeffrey A. Engelsman 9/28/67 | | Vice President and Chief Compliance Officer, Eclipse Trust, Eclipse Funds, Inc., The MainStay Funds and MainStay Funds Trust (since 2009) | | Managing Director, Compliance (since 2009), Director and Associate General Counsel, New York Life Investment Management LLC (2005 to 2008); Assistant Secretary, NYLIFE Distributors LLC (2006 to 2008); Vice President and Chief Compliance Officer, Private Advisors Alternative Strategies Master Fund, Private Advisors Alternative Strategies Fund, DefinedTerm Municipal Opportunities Fund (since 2011); MainStay VP Funds Trust and its predecessor, MainStay VP Series Fund, Inc. (since 2009); Assistant Secretary, The MainStay Funds (2006 to 2008); Assistant Secretary, Eclipse Trust, Eclipse Funds, Inc. and MainStay VP Series Fund, Inc. (2005 to 2008) |
| | | | Stephen P. Fisher 2/22/59 | | President, Eclipse Trust, Eclipse Funds, Inc. and The MainStay Funds (since 2007), MainStay Funds Trust (since 2009) | | Director, Senior Vice President, New York Life Insurance and Annuity Corporation (since 2011); Manager, President and Chief Operating Officer, NYLIFE Distributors LLC (since 2008); Chairman of the Board, NYLIM Service Company LLC (since 2008); Senior Managing Director and Chief Marketing Officer, New York Life Investment Management LLC (since 2005); President, Private Advisors Alternative Strategies Master Fund, Private Advisors Alternative Strategies Fund and MainStay DefinedTerm Municipal Opportunities Fund (since 2011); MainStay VP Funds Trust and its predecessor, MainStay VP Series Fund, Inc. (since 2007) |
| | | | J. Kevin Gao 10/13/67 | | Secretary and Chief Legal Officer, Eclipse Trust, Eclipse Funds, Inc., The MainStay Funds and MainStay Funds Trust (since 2010) | | Managing Director and Associate General Counsel, New York Life Investment Management LLC (since 2010); Secretary and Chief Legal Officer, Private Advisors Alternative Strategies Master Fund, Private Advisors Alternative Strategies Fund and MainStay DefinedTerm Municipal Opportunities Fund (since 2011); MainStay VP Funds Trust and its predecessor, MainStay VP Series Fund, Inc. (since 2010); Director and Counsel of Credit Suisse, Chief Legal Officer and Secretary of Credit Suisse Asset Management, LLC and Credit Suisse Funds (2003 to 2010) |
| | | | Scott T. Harrington 2/8/59 | | Vice President—Administration, Eclipse Trust, Eclipse Funds, Inc. and The MainStay Funds (since 2005), MainStay Funds Trust (since 2009) | | Director, New York Life Investment Management LLC (including predecessor advisory organizations) (since 2000); Executive Vice President, New York Life Trust Company and New York Life Trust Company FSB (since 2006); Vice President—Administration, Private Advisors Alternative Strategies Master Fund, Private Advisors Alternative Strategies Fund and MainStay DefinedTerm Municipal Opportunities Fund (since 2011); MainStay VP Funds Trust and its predecessor, MainStay VP Series Fund, Inc. (since 2005) |
| | * | The Officers listed above are considered to be “interested persons” of the MainStay Group of Funds within the meaning of the 1940 Act because of their affiliation with New York Life Insurance Company, New York Life Investment Management LLC, Madison Square Investors LLC, MacKay Shields LLC, Private Advisors LLC, Institutional Capital LLC, Epoch Investment Partners, Inc., Markston International, LLC, Winslow Capital Management, Inc., NYLIFE Securities LLC and/or NYLIFE Distributors LLC, as described in detail above in the column captioned “Principal Occupation(s) During Past Five Years.” Officers are elected annually by the Board to serve a one-year term. |
| | | | |
| mainstayinvestments.com | | | 37 | |
This page intentionally left blank
MainStay Funds
MainStay offers a wide range of Funds for virtually any investment need. The full array of MainStay open-end offerings is listed here, with information about the manager, subadvisors, legal counsel and independent registered public accounting firms.
Equity
U.S. Equity
MainStay Common Stock Fund
MainStay Epoch U.S. All Cap Fund
MainStay Epoch U.S. Equity Yield Fund
MainStay Growth Equity Fund
MainStay ICAP Equity Fund
MainStay ICAP Select Equity Fund
MainStay Large Cap Growth Fund1
MainStay MAP Fund
MainStay S&P 500 Index Fund
MainStay U.S. Small Cap Fund
MainStay 130/30 Core Fund
International/Global Equity
MainStay Epoch Global Choice Fund
MainStay Epoch Global Equity Yield Fund
MainStay Epoch International Small Cap Fund
MainStay ICAP Global Fund
MainStay ICAP International Fund
MainStay International Equity Fund
MainStay 130/30 International Fund
Income
Taxable Bond
MainStay Flexible Bond Opportunities Fund
MainStay Floating Rate Fund
MainStay Global High Income Fund
MainStay Government Fund
MainStay High Yield Corporate Bond Fund
MainStay High Yield Opportunities Fund
MainStay Indexed Bond Fund
MainStay Intermediate Term Bond Fund
MainStay Short Term Bond Fund
MainStay Money Market Fund
Municipal Bond
MainStay High Yield Municipal Bond Fund
MainStay New York Tax Free Opportunities Fund2
MainStay Tax Free Bond Fund
Mixed Asset
MainStay Balanced Fund
MainStay Convertible Fund
MainStay Income Builder Fund
MainStay Marketfield Fund
Asset Allocation/Target Date
MainStay Conservative Allocation Fund
MainStay Growth Allocation Fund
MainStay Moderate Allocation Fund
MainStay Moderate Growth Allocation Fund
MainStay Retirement 2010 Fund
MainStay Retirement 2020 Fund
MainStay Retirement 2030 Fund
MainStay Retirement 2040 Fund
MainStay Retirement 2050 Fund
Manager
New York Life Investment Management LLC
New York, New York
Subadvisors
Epoch Investment Partners, Inc.
New York, New York
Institutional Capital LLC3
Chicago, Illinois
MacKay Shields LLC3
New York, New York
Madison Square Investors LLC3
New York, New York
Marketfield Asset Management LLC
New York, New York
Markston International LLC
White Plains, New York
Winslow Capital Management, Inc.
Minneapolis, Minnesota
Legal Counsel
Dechert LLP
Independent Registered Public Accounting Firms
KPMG LLP
PricewaterhouseCoopers LLP
1. Effective January 13, 2012, the Fund was closed to new investors with certain exceptions.
2. The Fund is only registered for sale in CT, DE, FL, MA, NJ, NY, and VT.
3. An affiliate of New York Life Investment Management LLC.
Not part of the Annual Report
mainstayinvestments.com
The MainStay Funds are managed by New York Life Investment Management LLC and distributed through NYLIFE Distributors LLC,
169 Lackawanna Avenue, Parsippany, NJ 07054, a wholly owned subsidiary of New York Life Insurance Company.
NYLIFE Distributors is a Member FINRA/SIPC.
MainStay Investments is a service mark and name under which New York Life Investment Management LLC does business.
MainStay Investments, an indirect subsidiary of New York Life Insurance Company, New York, NY 10010, provides investment
advisory products and services.
This report may be distributed only when preceded or accompanied by a current Fund prospectus.
© 2013 by NYLIFE Distributors LLC. All rights reserved.
| | | | | | | | |
| Not FDIC/NCUA Insured | | Not a Deposit | | May Lose Value | | No Bank Guarantee | | Not Insured by Any Government Agency |
| | | | |
| NYLIM-28264 MS265-12 | | | MSG11-12/12 | |
NL007

MainStay High Yield Corporate Bond Fund
Message from the President and Annual Report
October 31, 2012
This page intentionally left blank
Message from the President
Most major equity markets delivered positive results for the 12 months ended October 31, 2012. In the United States, stocks provided solid double-digit returns. With a few notable exceptions, international stock markets generally ended the reporting period in positive territory.
The stock market’s advance, however, was far from uniform. After rising to an early peak at the end of March 2012, domestic and international stocks lost ground until the beginning of June. After that, stocks generally rose, reaching their high point for the reporting period in mid-September. Although stocks remained relatively buoyant through mid-October, they drifted lower as the reporting period came to a close.
A variety of forces converged to help fuel these market movements. Investors kept a close eye on developments in the European sovereign debt crisis. The European Central Bank’s Long Term Refinancing Operations helped stabilize European credit markets and provide needed liquidity. Although private holders of Greek sovereign debt had to accept a reduction in their recovery value, the anticipated voluntary exchange provided a positive spark to the markets. Rising unemployment and new austerity measures may impede economic growth as the European Union seeks to strike a delicate balance between fiscal and monetary policies.
In the United States, the Federal Reserve announced an open-ended agency mortgage-backed security purchase program, which helped calm market concerns. The Federal Reserve also continued its maturity extension program (referred to by some as “operation twist”), which seeks to put downward pressure on longer-term interest rates. At the short end of the yield curve, the Federal Reserve maintained the federal funds rate in a near-zero range. In September 2012, the Federal Open Market Committee anticipated that “exceptionally low levels for the federal funds rate” were “likely to be warranted at least through mid-2015.”
With markets stabilizing and short-term interest rates at very low levels, yield-hungry investors had incentives to lengthen maturities and accept higher risk. Domestic high-yield bonds provided double-digit returns for the reporting period, municipal bonds and convertible securities provided high single-digit returns, and domestic corporate bonds provided positive overall returns.
While most investors are pleased when markets rise, MainStay portfolio managers know that long-term results depend on more than short-term market movements. They also depend on the consistent application of well-defined investment strategies and risk-management techniques over longer periods. Our long-term perspective gives our portfolio managers the ability to look past the daily ups and downs of the market as they pursue the specific investment objectives of their individual Funds.
At MainStay, we believe that a long-term perspective can help investors as well. Instead of trying to capitalize on short-term market movements, you may prefer to focus on the long-term potential that can come from getting invested, staying invested and adding to your investments over time. Of course, past performance is no guarantee of future results.
The following pages contain more specific information on the securities, market events and investment decisions that affected your MainStay Fund(s) during the 12 months ended October 31, 2012. We invite you to read the information carefully and use it as part of your ongoing portfolio evaluation and investment review.
Sincerely,

Stephen P. Fisher
President
The opinions expressed are as of the date of this report and are subject to change. There is no guarantee that any forecast made will come to pass. This material does not constitute investment advice and is not intended as an endorsement of any specific investment.
Not part of the Annual Report
Table of Contents
Investors should refer to the Fund’s Summary Prospectus and/or Prospectus and consider the Fund’s investment objectives, strategies, risks, charges and expenses carefully before investing. The Summary Prospectus and/or Prospectus contain this and other information about the Fund. You may obtain copies of the Fund’s Summary Prospectus, Prospectus and Statement of Additional Information free of charge, upon request, by calling toll-free 800-MAINSTAY (624-6782), by writing to NYLIFE Distributors LLC, Attn: MainStay Marketing Department, 169 Lackawanna Avenue, Parsippany, New Jersey 07054 or by sending an e-mail to MainStayShareholderServices@nylim.com. These documents are also available via the MainStay Funds’ website at mainstayinvestments.com/documents. Please read the Summary Prospectus and/or Prospectus carefully before investing.
Investment and Performance Comparison1 (Unaudited)
Performance data quoted represents past performance. Past performance is no guarantee of future results. Because of market volatility, current performance may be lower or higher than the figures shown. Investment return and principal value will fluctuate, and as a result, when shares are redeemed, they may be worth more or less than their original cost. The graph below depicts the historical performance of Class B shares of the Fund. Performance will vary from class to class based on differences in class-specific expenses and sales charges. For performance information current to the most recent month-end, please call 800-MAINSTAY (624-6782) or visit mainstayinvestments.com.
(With sales charges)
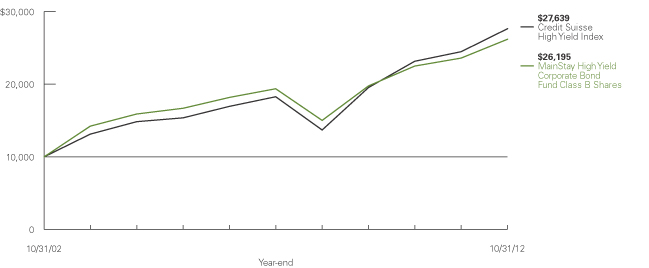
Average Annual Total Returns for the Year Ended October 31, 2012
| | | | | | | | | | | | | | | | | | | | |
| Class | | Sales Charge | | | | One Year | | | Five Years | | | Ten Years | | | Gross
Expense Ratio2,6 | |
| Investor Class Shares3 | | Maximum 4.5% Initial Sales Charge | | With sales charges Excluding sales charges | |
| 6.79
11.82 | %
| |
| 6.01
6.99 | %
| |
| 10.44
10.95 | %
| |
| 1.05
1.05 | %
|
| Class A Shares | | Maximum 4.5% Initial Sales Charge | | With sales charges Excluding sales charges | |
| 6.73
11.76 |
| |
| 6.07
7.05 |
| |
| 10.47
10.98 |
| |
| 0.99
0.99 |
|
| Class B Shares | | Maximum 5% CDSC if Redeemed Within the First Six Years of Purchase | | With sales charges Excluding sales charges | |
| 5.94
10.94 |
| |
| 5.91
6.21 |
| |
| 10.11
10.11 |
| |
| 1.80
1.80 |
|
| Class C Shares | | Maximum 1% CDSC if Redeemed Within One Year of Purchase | | With sales charges Excluding sales charges | |
| 9.93
10.93 |
| |
| 6.17
6.17 |
| |
| 10.11
10.11 |
| |
| 1.80
1.80 |
|
| Class I Shares4 | | No Sales Charge | | | | | 12.02 | | | | 7.32 | | | | 11.25 | | | | 0.74 | |
| Class R2 Shares5 | | No Sales Charge | | | | | 11.66 | | | | 6.98 | | | | 10.86 | | | | 1.09 | |
| 1. | The performance table and graph do not reflect the deduction of taxes that a shareholder would pay on distributions or Fund-share redemptions. Total returns reflect maximum applicable sales charges as indicated in the table above, changes in share price, and reinvestment of dividend and capital gain distributions. The graph assumes the initial investment amount shown above and reflects the deduction of all sales charges that would have applied for the period of investment. Performance figures reflect certain fee waivers and/or expense limitations, without which total returns may have been lower. For more information on share classes and current fee waivers and/or expense limitations, please refer to the notes to the financial statements. |
| 2. | The gross expense ratios presented reflect the Fund’s “Total Annual Fund Operating Expenses” from the most recent Prospectus and may differ from other expense ratios disclosed in this report. |
| 3. | Performance figures for Investor Class shares, first offered on February 28, 2008, include the historical performance of Class A shares through February 27, 2008, adjusted for differences in certain fees and expenses. Unadjusted, the performance shown for Investor Class shares might have been different. |
| 4. | Performance figures for Class I shares, first offered on January 2, 2004, include the historical performance of Class B shares through January 1, 2004, adjusted for differences in certain fees and expenses. Unadjusted, the performance shown for Class I shares might have been different. |
| 5. | Class R2 shares, first offered on December 14, 2007, but did not commence investment operations until May 1, 2008. Performance figures for Class R2 shares include the historical performance of Class B shares through April 30, 2008, adjusted for differences in certain fees and expenses. Unadjusted, the performance shown for Class R2 shares might have been different. |
| 6. | No performance information is provided for Class R1 shares as these shares only commenced operations on June 29, 2012. |
The footnotes on the next page are an integral part of the table and graph and should be carefully read in conjunction with them.
| | | | |
| mainstayinvestments.com | | | 5 | |
| | | | | | | | | | | | |
| Benchmark Performance | | One
Year | | | Five
Years | | | Ten
Years | |
Credit Suisse High Yield Index7 | | | 12.86 | % | | | 8.63 | % | | | 10.69 | % |
Average Lipper High Yield Fund8 | | | 12.26 | | | | 7.09 | | | | 9.35 | |
| 7. | The Credit Suisse High Yield Index is a market-weighted index that includes publicly traded bonds rated below BBB by Standard & Poor’s and below Baa by Moody’s. The Credit Suisse High Yield Index is the Fund’s broad-based securities market index for comparison purposes. Total returns assume reinvestment of all income and capital gains. An investment cannot be made directly in an index. |
| 8. | The average Lipper high yield fund is representative of funds that, by portfolio practice, aim at high (relative) current yield from fixed income securities, have no quality or maturity restrictions, and tend to invest in lower-grade debt issues. This benchmark is a product of Lipper Inc. Lipper Inc. is an independent monitor of fund performance. Results are based on average total returns of similar funds with all dividend and capital gain distributions reinvested. |
The footnotes on the preceding page are an integral part of the table and graph and should be carefully read in conjunction with them.
| | |
| 6 | | MainStay High Yield Corporate Bond Fund |
Cost in Dollars of a $1,000 Investment in MainStay High Yield Corporate Bond Fund (Unaudited)
The example below is intended to describe the fees and expenses borne by shareholders during the six-month period from May 1, 2012, to October 31, 2012, and the impact of those costs on your investment.
Example
As a shareholder of the Fund, you incur two types of costs: (1) transaction costs, including exchange fees and sales charges (loads) on purchases (as applicable), and (2) ongoing costs, including management fees, distribution and/or service (12b-1) fees, and other Fund expenses (as applicable). This example is intended to help you understand your ongoing costs (in dollars) of investing in the Fund and to compare these costs with the ongoing costs of investing in other mutual funds. The example is based on an investment of $1,000 made at the beginning of the six-month period and held for the entire period from May 1, 2012, to October 31, 2012.
This example illustrates your Fund’s ongoing costs in two ways:
Actual Expenses
The second and third data columns in the table below provide information about actual account values and actual expenses. You may use the information in these columns, together with the amount you invested, to estimate the expenses that you paid during the six months ended October 31, 2012. Simply divide your account value by $1,000 (for example, an $8,600 account value divided by $1,000 = 8.6), then
multiply the result by the number under the heading entitled “Expenses Paid During Period” to estimate the expenses you paid on your account during this period.
Hypothetical Example for Comparison Purposes
The fourth and fifth data columns in the table below provide information about hypothetical account values and hypothetical expenses based on the Fund’s actual expense ratio and an assumed rate of return of 5% per year before expenses, which is not the Fund’s actual return. The hypothetical account values and expenses may not be used to estimate the actual ending account balances or expenses you paid for the six-month period shown. You may use this information to compare the ongoing costs of investing in the Fund with the ongoing costs of investing in other Funds. To do so, compare this 5% hypothetical example with the 5% hypothetical examples that appear in the shareholder reports of the other Funds.
Please note that the expenses shown in the table are meant to highlight your ongoing costs only and do not reflect any transactional costs, such as exchange fees or sales charges (loads). Therefore, the fourth and fifth data columns of the table are useful in comparing ongoing costs only and will not help you determine the relative total costs of owning different funds. In addition, if these transactional costs were included, your costs would have been higher.
| | | | | | | | | | | | | | | | | | | | |
| | | | | | | | | | | | | | | | |
| Share Class | | Beginning
Account
Value
5/1/123 | | | Ending Account
Value (Based
on Actual
Returns and
Expenses)
10/31/12 | | | Expenses
Paid
During
Period1 | | | Ending Account
Value (Based
on Hypothetical
5% Annualized
Return and
Actual Expenses)
10/31/12 | | | Expenses
Paid
During
Period1 | |
| | | | | |
| Investor Class Shares | | $ | 1,000.00 | | | $ | 1,057.70 | | | $ | 5.28 | | | $ | 1,020.00 | | | $ | 5.18 | |
| | | | | |
| Class A Shares | | $ | 1,000.00 | | | $ | 1,058.30 | | | $ | 5.23 | | | $ | 1,020.10 | | | $ | 5.13 | |
| | | | | |
| Class B Shares | | $ | 1,000.00 | | | $ | 1,054.50 | | | $ | 9.14 | | | $ | 1,016.20 | | | $ | 8.97 | |
| | | | | |
| Class C Shares | | $ | 1,000.00 | | | $ | 1,054.50 | | | $ | 9.14 | | | $ | 1,016.20 | | | $ | 8.97 | |
| | | | | |
| Class I Shares | | $ | 1,000.00 | | | $ | 1,059.60 | | | $ | 3.93 | | | $ | 1,021.30 | | | $ | 3.86 | |
| | | | | |
| Class R1 Shares2 | | $ | 1,000.00 | | | $ | 1,051.70 | | | $ | 3.02 | | | $ | 1,014.00 | | | $ | 2.97 | |
| | | | | |
| Class R2 Shares | | $ | 1,000.00 | | | $ | 1,057.90 | | | $ | 5.74 | | | $ | 1,019.60 | | | $ | 5.64 | |
| 1. | Expenses are equal to the Fund’s annualized expense ratio of each class (1.02% for Investor Class, 1.01% for Class A, 1.77% for Class B and C, 0.76% for Class I, 0.87% for Class R1 and 1.11% for Class R2) multiplied by the average account value over the period, divided by 366 and multiplied by 184 days for Investor Class, Class A, Class B, Class C, Class I and Class R2 (to reflect the six month period) and 124 days for Class R1 (to reflect the since-inception period). The table above represents actual expenses incurred during the six month period. |
| 2. | Expenses paid during the period reflect ongoing costs for the period from inception through October 31, 2012. Had these shares been offered for the full six-month period ended October 31, 2012, and had the Fund provided a hypothetical 5% annualized return, expenses paid during the period would have been $4.42 for Class R1 and the ending account value would have been $1,020.80 for Class R1. |
| 3. | The inception date for Class R1 shares was on June 29, 2012. |
| | | | |
| mainstayinvestments.com | | | 7 | |
Portfolio Composition as of October 31, 2012 (Unaudited)
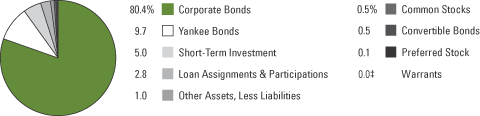
See Portfolio of Investments beginning on page 10 for specific holdings within these categories.
| ‡ | Less than one-tenth of a percent. |
Top Ten Holdings or Issuers Held as of October 31, 2012 (excluding short-term investment)
| 1. | Ally Financial, Inc., (zero coupon)–8.30%, due 12/1/12–11/1/31 |
| 2. | HCA, Inc., 4.75%–9.875%, due 3/15/14–9/15/25 |
| 3. | Texas Industries, Inc., 9.25%, due 8/15/20 |
| 4. | Host Hotels & Resorts, L.P., 4.75%–6.75%, due 6/1/16–3/1/23 |
| 5. | Nationstar Mortgage LLC /Nationstar Capital Corp., 7.875%–10.875%, due 4/1/15–10/1/20 |
| 6. | Crown Castle International Corp., 5.25%–9.00%, due 1/15/15–1/15/23 |
| 7. | Schaeffler Finance B.V., 7.75%–8.50%, due 2/15/17–2/15/19 |
| 8. | Reliant Energy, Inc., 7.625%–7.875%, due 6/15/14–6/15/17 |
| 9. | Concho Resources, Inc., 5.50%–8.625%, due 10/1/17–4/1/23 |
| 10. | CCO Holdings LLC / CCO Holdings Capital Corp., 6.625%–7.875%, due 10/30/17–1/31/22 |
| | |
| 8 | | MainStay High Yield Corporate Bond Fund |
Portfolio Management Discussion and Analysis (Unaudited)
Questions answered by portfolio manager J. Matthew Philo, CFA, of MacKay Shields LLC, the Fund’s Subadvisor.
How did MainStay High Yield Corporate Bond Fund perform relative to its peers and its benchmark during the 12 months ended October 31, 2012?
Excluding all sales charges, MainStay High Yield Corporate Bond Fund returned 11.82% for Investor Class shares, 11.76% for Class A shares, 10.94% for Class B shares and 10.93% for Class C shares for the 12 months ended October 31, 2012. Over the same period, Class I shares returned 12.02% and Class R2 shares returned 11.66%. All share classes underperformed the 12.26% return of the average Lipper1 high yield fund and the 12.86% return of the Credit Suisse High Yield Index2 for the 12 months ended October 31, 2012. The Credit Suisse High Yield Index is the Fund’s broad-based securities-market index. See page 5 for Fund returns with applicable sales charges.
What factors affected the Fund’s relative performance during the reporting period?
The Fund’s performance relative to the Credit Suisse High Yield Index resulted from our bottom-up investment style, which focuses on individual companies to determine risk-group weightings in the context of historical yields and spreads.3 The Fund remained conservatively positioned throughout the reporting period because we believed that there were more attractive risk-adjusted yields and spreads in the higher-quality part of the market. In addition, we viewed valuations in the higher-risk segment of the high-yield market as generally unattractive. We believe that this segment of the market is particularly vulnerable because of weak corporate earnings outlooks and challenging growth conditions in global economies. Nonetheless, the higher risk segment of the market slightly outperformed during the reporting period.
What specific factors, risks or market forces prompted significant decisions for the Fund during the reporting period?
The U.S. high-yield corporate bond market generated strong returns for the 12 months ended October 31, 2012, as market liquidity and exceptionally low interest rates continued to fuel demand for income-generating investment assets. Global economic growth challenges have increased investor interest in the U.S. high-yield corporate bond market. High-yield mutual funds and high-yield Exchange Traded Funds (ETFs) have experienced record inflows. Year-to-date through October 31, 2012, inflows of $34.0 billion were more than twice the $15.6 billion inflows for the entire year 2011.
Because the Fund uses a bottom-up investment style, the factors that prompt significant decisions are specific to each individual company. During the reporting period, we generally believed that valuations for most of the riskier high-yield bonds were unattractive, and we positioned the Fund more conservatively.
During the reporting period, which industry positions were the strongest positive contributors to the Fund’s absolute performance and which industry positions were particularly weak?
The most significant positive contributors to the Fund’s absolute performance were investments in the health care, energy and transportation industries. Although no industries generated negative absolute returns during the reporting period, the Fund’s positions in the retail, food and drug, and aerospace industries contributed the least to the Fund’s absolute performance.
Did the Fund make any significant purchases or sales during the reporting period?
The Fund purchased bonds of Schaeffler, a leading manufacturer of automotive and industrial components. We found the bonds attractive because of the company’s low leverage and ability to generate free cash flow. The Fund also initiated a position in travel agency Carlson Wagonlit. During the reporting period, the Fund sold its positions in entertainment company American Casino and food production company Tyson Foods.
How did the Fund’s industry weightings change during the reporting period?
The Fund increased its weighting relative to the Credit Suisse High Yield Index in the metals/minerals and service industries because of valuations and yields that we felt were attractive. The Fund decreased its weighting relative to the Credit Suisse High Yield Index in the utility and food/tobacco industries.
How was the Fund positioned at the end of the reporting period?
As of October 31, 2012, the Fund held overweight positions relative to the Credit Suisse High Yield Index in the transportation, financials and gaming/leisure industries. As of the same date, the Fund was underweight relative to the Credit Suisse High Yield Index in the retail, information technology and media industries.
| 1. | See footnote on page 6 for more information on Lipper Inc. |
| 2. | See footnote on page 6 for more information on the Credit Suisse High Yield Index. |
| 3. | The terms “spread” and “yield spread” may refer to the difference in yield between a security or type of security and comparable U.S. Treasury issues. The terms may also refer to the difference in yield between two specific securities or types of securities at a given time. |
The opinions expressed are those of the portfolio manager as of the date of this report and are subject to change. There is no guarantee that any forecast made will come to pass. This material does not constitute investment advice and is not intended as an endorsement of any specific investment.
| | | | |
| mainstayinvestments.com | | | 9 | |
Portfolio of Investments October 31, 2012
| | | | | | | | |
| | | Principal
Amount | | | Value | |
| | | | | | | | |
Long-Term Bonds 93.4%† Convertible Bonds 0.5% | |
Holding Companies—Diversified 0.5% | |
Icahn Enterprises, L.P.
4.00%, due 8/15/13 (a) | | $ | 700,000 | | | $ | 705,600 | |
4.00%, due 8/15/13 | | | 38,250,000 | | | | 38,556,000 | |
| | | | | | | | |
| | | | | | | 39,261,600 | |
| | | | | | | | |
Internet 0.0%‡ | |
At Home Corp.
4.75%, due 12/31/49 (b)(c)(d)(e) | | | 61,533,853 | | | | 6,154 | |
| | | | | | | | |
|
Packaging & Containers 0.0%‡ | |
Owens-Brockway Glass Container, Inc.
3.00%, due 6/1/15 (a) | | | 890,000 | | | | 880,544 | |
| | | | | | | | |
Total Convertible Bonds
(Cost $38,815,498) | | | | | | | 40,148,298 | |
| | | | | | | | |
|
| Corporate Bonds 80.4% | |
Advertising 0.4% | |
Lamar Media Corp.
5.875%, due 2/1/22 | | | 11,000,000 | | | | 11,660,000 | |
7.875%, due 4/15/18 | | | 7,490,000 | | | | 8,239,000 | |
9.75%, due 4/1/14 | | | 9,780,000 | | | | 10,855,800 | |
| | | | | | | | |
| | | | | | | 30,754,800 | |
| | | | | | | | |
Aerospace & Defense 1.3% | |
AAR Corp.
7.25%, due 1/15/22 (a) | | | 20,565,000 | | | | 21,336,187 | |
Alliant Techsystems, Inc.
6.875%, due 9/15/20 | | | 12,270,000 | | | | 13,435,650 | |
B/E Aerospace, Inc.
5.25%, due 4/1/22 | | | 29,690,000 | | | | 30,951,825 | |
DAE Aviation Holdings, Inc.
11.25%, due 8/1/15 (a) | | | 14,700,000 | | | | 15,104,250 | |
TransDigm, Inc.
5.50%, due 10/15/20 (a) | | | 3,060,000 | | | | 3,098,250 | |
7.75%, due 12/15/18 | | | 24,730,000 | | | | 27,264,825 | |
| | | | | | | | |
| | | | | | | 111,190,987 | |
| | | | | | | | |
Apparel 0.2% | |
Hanesbrands, Inc.
8.00%, due 12/15/16 | | | 13,830,000 | | | | 15,265,001 | |
Wolverine World Wide, Inc.
6.125%, due 10/15/20 (a) | | | 2,245,000 | | | | 2,337,606 | |
| | | | | | | | |
| | | | | | | 17,602,607 | |
| | | | | | | | |
Auto Manufacturers 0.3% | |
Chrysler Group LLC / CG Co-Issuer, Inc.
8.25%, due 6/15/21 | | | 7,245,000 | | | | 7,743,094 | |
Ford Motor Co.
6.50%, due 8/1/18 | | | 2,645,000 | | | | 3,018,606 | |
| | | | | | | | |
| | | Principal
Amount | | | Value | |
| | | | | | | | |
Auto Manufacturers (continued) | |
Oshkosh Corp.
8.25%, due 3/1/17 | | $ | 9,144,000 | | | $ | 9,955,530 | |
8.50%, due 3/1/20 | | | 2,010,000 | | | | 2,213,513 | |
| | | | | | | | |
| | | | | | | 22,930,743 | |
| | | | | | | | |
Auto Parts & Equipment 2.8% | |
Affinia Group, Inc.
9.00%, due 11/30/14 | | | 17,230,000 | | | | 17,316,322 | |
Allison Transmission, Inc.
7.125%, due 5/15/19 (a) | | | 26,715,000 | | | | 28,418,081 | |
Continental Rubber of America Corp.
4.50%, due 9/15/19 (a) | | | 20,600,000 | | | | 21,042,900 | |
Cooper-Standard Automotive, Inc.
8.50%, due 5/1/18 | | | 42,029,000 | | | | 45,023,566 | |
Dana Holding Corp.
6.50%, due 2/15/19 | | | 18,469,000 | | | | 19,277,019 | |
6.75%, due 2/15/21 | | | 6,871,000 | | | | 7,266,083 | |
Delphi Corp.
5.875%, due 5/15/19 | | | 24,780,000 | | | | 26,483,625 | |
6.125%, due 5/15/21 | | | 1,300,000 | | | | 1,436,500 | |
Exide Technologies
8.625%, due 2/1/18 | | | 25,913,000 | | | | 21,021,921 | |
Lear Corp. (Escrow Shares)
8.75%, due 12/1/16 (b)(d)(e)(f) | | | 15,444,000 | | | | 23,166 | |
Tenneco, Inc.
6.875%, due 12/15/20 | | | 10,225,000 | | | | 11,132,469 | |
7.75%, due 8/15/18 | | | 1,300,000 | | | | 1,415,375 | |
Titan International, Inc.
7.875%, due 10/1/17 | | | 9,280,000 | | | | 9,813,600 | |
TRW Automotive, Inc.
7.00%, due 3/15/14 (a) | | | 7,680,000 | | | | 8,112,000 | |
7.25%, due 3/15/17 (a) | | | 4,400,000 | | | | 5,010,500 | |
8.875%, due 12/1/17 (a) | | | 11,595,000 | | | | 12,740,006 | |
| | | | | | | | |
| | | | | | | 235,533,133 | |
| | | | | | | | |
Banks 1.7% | |
¨Ally Financial, Inc.
(zero coupon), due 12/1/12 | | | 11,960,000 | | | | 11,885,250 | |
(zero coupon), due 6/15/15 | | | 1,640,000 | | | | 1,480,100 | |
4.625%, due 6/26/15 | | | 14,735,000 | | | | 15,307,823 | |
5.50%, due 2/15/17 | | | 2,800,000 | | | | 2,962,887 | |
6.25%, due 12/1/17 | | | 2,180,000 | | | | 2,394,172 | |
7.50%, due 9/15/20 | | | 11,372,000 | | | | 13,404,745 | |
8.00%, due 11/1/31 | | | 34,299,000 | | | | 40,838,753 | |
8.30%, due 2/12/15 | | | 27,551,000 | | | | 30,864,008 | |
Provident Funding Associates, L.P.
10.125%, due 2/15/19 (a) | | | 7,725,000 | | | | 8,034,000 | |
10.25%, due 4/15/17 (a) | | | 12,155,000 | | | | 13,294,531 | |
| | | | | | | | |
| | | | | | | 140,466,269 | |
| | | | | | | | |
| † | Percentages indicated are based on Fund net assets. |
| ¨ | | Among the Fund’s 10 largest holdings or issuers held, as of October 31, 2012, excluding short-term investment. May be subject to change daily. |
| | | | |
| 10 | | MainStay High Yield Corporate Bond Fund | | The notes to the financial statements are an integral part of,
and should be read in conjunction with, the financial statements. |
| | | | | | | | |
| | | Principal
Amount | | | Value | |
| | | | | | | | |
| Corporate Bonds (continued) | |
Beverages 0.5% | |
Cott Beverages, Inc.
8.125%, due 9/1/18 | | $ | 10,215,000 | | | $ | 11,338,650 | |
8.375%, due 11/15/17 | | | 32,284,000 | | | | 35,350,980 | |
| | | | | | | | |
| | | | | | | 46,689,630 | |
| | | | | | | | |
Biotechnology 0.1% | |
Bio Rad Labs
8.00%, due 9/15/16 | | | 7,810,000 | | | | 8,532,425 | |
| | | | | | | | |
| | |
Building Materials 2.7% | | | | | | | | |
Building Materials Corp. of America
6.75%, due 5/1/21 (a) | | | 11,681,000 | | | | 12,732,290 | |
6.875%, due 8/15/18 (a) | | | 17,498,000 | | | | 18,766,605 | |
7.00%, due 2/15/20 (a) | | | 8,265,000 | | | | 8,967,525 | |
7.50%, due 3/15/20 (a) | | | 18,875,000 | | | | 20,526,562 | |
Headwaters, Inc.
7.625%, due 4/1/19 | | | 18,665,000 | | | | 19,084,962 | |
Jeld-Wen Escrow Corp.
12.25%, due 10/15/17 (a) | | | 12,835,000 | | | | 14,792,338 | |
Taylor Morrison Communities, Inc.
7.75%, due 4/15/20 (a) | | | 19,450,000 | | | | 20,714,250 | |
¨Texas Industries, Inc.
9.25%, due 8/15/20 | | | 86,205,000 | | | | 92,023,837 | |
USG Corp.
6.30%, due 11/15/16 | | | 6,565,000 | | | | 6,679,888 | |
7.875%, due 3/30/20 (a) | | | 13,850,000 | | | | 15,096,500 | |
| | | | | | | | |
| | | | | | | 229,384,757 | |
| | | | | | | | |
Chemicals 2.2% | |
CF Industries, Inc.
6.875%, due 5/1/18 | | | 9,351,000 | | | | 11,482,878 | |
7.125%, due 5/1/20 | | | 820,000 | | | | 1,039,319 | |
Georgia Gulf Corp.
9.00%, due 1/15/17 (a) | | | 20,916,000 | | | | 23,216,760 | |
Huntsman International LLC
5.50%, due 6/30/16 | | | 10,251,000 | | | | 10,276,628 | |
Kraton Polymers LLC / Kraton Polymers Capital Corp.
6.75%, due 3/1/19 | | | 16,150,000 | | | | 16,634,500 | |
Nexeo Solutions LLC / Nexeo Solutions Finance Corp.
8.375%, due 3/1/18 | | | 13,610,000 | | | | 13,405,850 | |
Olin Corp.
5.50%, due 8/15/22 | | | 12,924,000 | | | | 13,344,030 | |
8.875%, due 8/15/19 | | | 23,156,000 | | | | 26,282,060 | |
Phibro Animal Health Corp.
9.25%, due 7/1/18 (a) | | | 43,985,000 | | | | 42,665,450 | |
| | | | | | | | |
| | | Principal
Amount | | | Value | |
| | | | | | | | |
Chemicals (continued) | |
PolyOne Corp.
7.375%, due 9/15/20 | | $ | 726,000 | | | $ | 782,265 | |
Rockwood Specialties Group, Inc.
4.625%, due 10/15/20 | | | 25,090,000 | | | | 25,842,700 | |
| | | | | | | | |
| | | | | | | 184,972,440 | |
| | | | | | | | |
Coal 2.2% | | | | | | | | |
Arch Coal, Inc.
7.00%, due 6/15/19 | | | 27,048,000 | | | | 24,005,100 | |
7.25%, due 10/1/20 | | | 6,520,000 | | | | 5,770,200 | |
8.75%, due 8/1/16 | | | 4,240,000 | | | | 4,293,000 | |
CONSOL Energy, Inc.
8.00%, due 4/1/17 | | | 48,731,000 | | | | 51,533,033 | |
Peabody Energy Corp.
6.00%, due 11/15/18 | | | 25,040,000 | | | | 25,979,000 | |
6.25%, due 11/15/21 | | | 14,950,000 | | | | 15,435,875 | |
6.50%, due 9/15/20 | | | 21,690,000 | | | | 22,991,400 | |
7.375%, due 11/1/16 | | | 2,185,000 | | | | 2,501,825 | |
7.875%, due 11/1/26 | | | 1,642,000 | | | | 1,756,940 | |
Penn Virginia Resource Partners, L.P. / Penn Virginia Resource Finance Corp.
8.25%, due 4/15/18 | | | 16,531,000 | | | | 17,171,576 | |
Penn Virginia Resource Partners, L.P. / Penn Virginia Resource Finance Corp. II
8.375%, due 6/1/20 (a) | | | 7,236,000 | | | | 7,597,800 | |
Somerset Cayuga Holding Co., Inc.
20.00%, due 6/15/17 (a)(b)(d)(e)(g) | | | 3,440,000 | | | | 4,644,000 | |
| | | | | | | | |
| | | | | | | 183,679,749 | |
| | | | | | | | |
Commercial Services 4.0% | |
Alliance Data Systems Corp.
6.375%, due 4/1/20 (a) | | | 18,230,000 | | | | 19,346,588 | |
Avis Budget Car Rental LLC / Avis Budget Finance, Inc. | | | | | | | | |
8.25%, due 1/15/19 | | | 2,780,000 | | | | 3,033,675 | |
9.625%, due 3/15/18 | | | 2,191,000 | | | | 2,440,226 | |
9.75%, due 3/15/20 | | | 9,080,000 | | | | 10,339,850 | |
Catalent Pharma Solutions, Inc.
7.875%, due 10/15/18 (a) | | | 5,265,000 | | | | 5,317,650 | |
Cenveo Corp.
8.875%, due 2/1/18 | | | 16,760,000 | | | | 15,125,900 | |
Corrections Corporation of America
7.75%, due 6/1/17 | | | 7,745,000 | | | | 8,277,469 | |
Great Lakes Dredge & Dock Corp.
7.375%, due 2/1/19 | | | 20,255,000 | | | | 21,520,937 | |
H&E Equipment Services, Inc.
7.00%, due 9/1/22 (a) | | | 14,500,000 | | | | 15,080,000 | |
HDTFS, Inc.
5.875%, due 10/15/20 (a) | | | 2,385,000 | | | | 2,408,850 | |
Iron Mountain, Inc.
5.75%, due 8/15/24 | | | 20,000,000 | | | | 19,950,000 | |
| | | | | | |
The notes to the financial statements are an integral part of,
and should be read in conjunction with, the financial statements. | | mainstayinvestments.com | | | 11 | |
Portfolio of Investments October 31, 2012 (continued)
| | | | | | | | |
| | | Principal
Amount | | | Value | |
| | | | | | | | |
| Corporate Bonds (continued) | |
Commercial Services (continued) | |
Jaguar Holding Co. I
9.375%, due 10/15/17 (a)(g) | | $ | 12,570,000 | | | $ | 12,758,550 | |
Knowledge Universe Education LLC
7.75%, due 2/1/15 (a) | | | 27,325,000 | | | | 24,046,000 | |
Laureate Education, Inc.
9.25%, due 9/1/19 (a) | | | 11,430,000 | | | | 11,258,550 | |
PHH Corp. | | | | | | | | |
7.375%, due 9/1/19 | | | 9,650,000 | | | | 10,325,500 | |
9.25%, due 3/1/16 | | | 13,485,000 | | | | 15,575,175 | |
Quebecor World, Inc. (Litigation Recovery Trust—Escrow Shares) | | | | | | | | |
6.50% (b)(d)(f) | | | 460,000 | | | | 7,360 | |
9.75% (a)(b)(d)(f) | | | 26,020,000 | | | | 416,320 | |
Rent-A-Center, Inc.
6.625%, due 11/15/20 | | | 2,965,000 | | | | 3,205,906 | |
Sotheby’s
5.25%, due 10/1/22 (a) | | | 7,835,000 | | | | 7,952,525 | |
Speedy Cash Intermediate Holdings Corp.
10.75%, due 5/15/18 (a) | | | 17,230,000 | | | | 18,306,875 | |
Sunstate Equipment Co. LLC / Sunstate Equipment Co., Inc.
12.00%, due 6/15/16 (a)(g) | | | 33,225,000 | | | | 35,052,375 | |
United Rentals North America, Inc.
6.125%, due 6/15/23 | | | 845,000 | | | | 855,563 | |
UR Merger Sub Corp. | | | | | | | | |
5.75%, due 7/15/18 (a) | | | 12,005,000 | | | | 12,905,375 | |
7.375%, due 5/15/20 (a) | | | 19,930,000 | | | | 21,574,225 | |
7.625%, due 4/15/22 (a) | | | 19,217,000 | | | | 21,042,615 | |
Valassis Communications, Inc.
6.625%, due 2/1/21 | | | 16,510,000 | | | | 17,005,300 | |
| | | | | | | | |
| | | | | | | 335,129,359 | |
| | | | | | | | |
Computers 0.4% | | | | | | | | |
iGATE Corp.
9.00%, due 5/1/16 | | | 19,286,000 | | | | 21,069,955 | |
NCR Corp.
5.00%, due 7/15/22 (a) | | | 5,600,000 | | | | 5,719,000 | |
SunGard Data Systems, Inc.
4.875%, due 1/15/14 | | | 8,070,000 | | | | 8,312,100 | |
| | | | | | | | |
| | | | | | | 35,101,055 | |
| | | | | | | | |
| | |
Distribution & Wholesale 0.4% | | | | | | | | |
American Tire Distributors, Inc.
9.75%, due 6/1/17 | | | 33,645,000 | | | | 35,537,531 | |
| | | | | | | | |
| | |
Diversified Financial Services 1.1% | | | | | | | | |
CNG Holdings, Inc.
9.375%, due 5/15/20 (a) | | | 15,314,000 | | | | 15,773,420 | |
Community Choice Financial, Inc. | | | | | | | | |
10.75%, due 5/1/19 (a) | | | 24,240,000 | | | | 23,573,400 | |
12.75%, due 5/1/20 (a)(b) | | | 9,500,000 | | | | 9,666,250 | |
| | | | | | | | |
| | | Principal
Amount | | | Value | |
| | | | | | | | |
Diversified Financial Services (continued) | |
Ford Holdings LLC | | | | | | | | |
9.30%, due 3/1/30 | | $ | 18,155,000 | | | $ | 25,485,081 | |
9.375%, due 3/1/20 | | | 1,695,000 | | | | 2,137,819 | |
ROC Finance LLC / ROC Finance 1 Corp.
12.125%, due 9/1/18 (a) | | | 15,570,000 | | | | 17,983,350 | |
| | | | | | | | |
| | | | 94,619,320 | |
| | | | | | | | |
Electric 3.2% | |
AES Eastern Energy, L.P. (Escrow Shares)
Series 1999-A
9.00%, due 1/2/17 (b)(c)(d)(e) | | | 9,320,076 | | | | 1,584,413 | |
Calpine Construction Finance Co., L.P. / CCFC Finance Corp.
8.00%, due 6/1/16 (a) | | | 49,185,000 | | | | 52,504,987 | |
Calpine Corp.
7.25%, due 10/15/17 (a) | | | 32,614,000 | | | | 34,570,840 | |
Cedar Brakes II LLC
9.875%, due 9/1/13 (a) | | | 3,074,115 | | | | 3,170,581 | |
Energy Future Intermediate Holding Co. LLC / EFIH Finance, Inc.
10.00%, due 12/1/20 | | | 30,555,000 | | | | 33,381,337 | |
GenOn Energy, Inc.
9.50%, due 10/15/18 | | | 32,230,000 | | | | 36,742,200 | |
GenOn REMA LLC
Series C
9.681%, due 7/2/26 | | | 6,425,000 | | | | 6,874,750 | |
Ipalco Enterprises, Inc.
7.25%, due 4/1/16 (a) | | | 5,925,000 | | | | 6,598,975 | |
PNM Resources, Inc.
9.25%, due 5/15/15 | | | 6,241,000 | | | | 7,130,342 | |
Public Service Co. of New Mexico
7.95%, due 5/15/18 | | | 9,965,000 | | | | 12,083,978 | |
¨Reliant Energy, Inc. | |
7.625%, due 6/15/14 | | | 4,625,000 | | | | 4,948,750 | |
7.875%, due 6/15/17 | | | 64,420,000 | | | | 69,573,600 | |
| | | | | | | | |
| | | | 269,164,753 | |
| | | | | | | | |
Electrical Components & Equipment 0.7% | |
Anixter, Inc.
5.625%, due 5/1/19 | | | 8,110,000 | | | | 8,535,775 | |
Belden, Inc.
5.50%, due 9/1/22 (a) | | | 34,750,000 | | | | 35,358,125 | |
General Cable Corp.
5.75%, due 10/1/22 (a) | | | 12,545,000 | | | | 12,764,537 | |
| | | | | | | | |
| | | | 56,658,437 | |
| | | | | | | | |
Electronics 0.2% | |
Kemet Corp.
10.50%, due 5/1/18 | | | 15,594,000 | | | | 15,535,523 | |
| | | | | | | | |
|
Engineering & Construction 0.5% | |
New Enterprise Stone & Lime Co., Inc. | |
11.00%, due 9/1/18 | | | 30,510,000 | | | | 22,272,300 | |
13.00%, due 3/15/18 (a)(g) | | | 22,451,825 | | | | 22,900,862 | |
| | | | | | | | |
| | | | 45,173,162 | |
| | | | | | | | |
| | | | |
| 12 | | MainStay High Yield Corporate Bond Fund | | The notes to the financial statements are an integral part of,
and should be read in conjunction with, the financial statements. |
| | | | | | | | |
| | | Principal
Amount | | | Value | |
| | | | | | | | |
| Corporate Bonds (continued) | |
Entertainment 2.0% | |
Affinity Gaming LLC / Affinity Gaming Finance Corp.
9.00%, due 5/15/18 (a) | | $ | 32,315,000 | | | $ | 33,526,812 | |
Greektown Superholdings, Inc.
13.00%, due 7/1/15 | | | 16,426,000 | | | | 17,637,417 | |
Mohegan Tribal Gaming Authority
10.50%, due 12/15/16 (a) | | | 3,940,000 | | | | 3,713,450 | |
NAI Entertainment Holdings LLC
8.25%, due 12/15/17 (a) | | | 25,178,000 | | | | 28,010,525 | �� |
Peninsula Gaming LLC | |
8.375%, due 8/15/15 | | | 10,095,000 | | | | 10,536,656 | |
10.75%, due 8/15/17 | | | 26,775,000 | | | | 30,155,344 | |
Pinnacle Entertainment, Inc.
8.625%, due 8/1/17 | | | 5,041,000 | | | | 5,444,280 | |
Production Resource Group, Inc.
8.875%, due 5/1/19 | | | 13,441,000 | | | | 9,543,110 | |
Speedway Motorsports, Inc.
8.75%, due 6/1/16 | | | 11,035,000 | | | | 11,890,213 | |
United Artists Theatre Circuit, Inc.
Series BA7
9.30%, due 7/1/15 (b)(d) | | | 859,959 | | | | 601,972 | |
Vail Resorts, Inc.
6.50%, due 5/1/19 | | | 12,590,000 | | | | 13,660,150 | |
WMG Acquisition Corp.
9.50%, due 6/15/16 | | | 5,000,000 | | | | 5,493,750 | |
| | | | | | | | |
| | | | 170,213,679 | |
| | | | | | | | |
Environmental Controls 0.4% | |
Clean Harbors, Inc.
5.25%, due 8/1/20 (a) | | | 17,015,000 | | | | 17,440,375 | |
Heckmann Corp.
9.875%, due 4/15/18 | | | 10,460,000 | | | | 10,486,150 | |
Rough Rider Escrow, Inc.
9.875%, due 4/15/18 (a) | | | 2,800,000 | | | | 2,810,500 | |
| | | | | | | | |
| | | | 30,737,025 | |
| | | | | | | | |
Finance—Auto Loans 1.5% | |
Credit Acceptance Corp.
9.125%, due 2/1/17 | | | 15,005,000 | | | | 16,467,988 | |
Ford Motor Credit Co. LLC
| |
4.25%, due 2/3/17 | | | 6,080,000 | | | | 6,481,742 | |
7.00%, due 4/15/15 | | | 23,530,000 | | | | 26,177,125 | |
12.00%, due 5/15/15 | | | 16,960,000 | | | | 20,903,200 | |
General Motors Financial Co., Inc. | |
4.75%, due 8/15/17 (a) | | | 23,985,000 | | | | 24,555,819 | |
6.75%, due 6/1/18 | | | 30,400,000 | | | | 33,702,990 | |
| | | | | | | | |
| | | | 128,288,864 | |
| | | | | | | | |
Finance—Consumer Loans 0.3% | |
SLM Corp. | |
8.00%, due 3/25/20 | | | 10,130,000 | | | | 11,731,756 | |
8.45%, due 6/15/18 | | | 12,005,000 | | | | 14,267,102 | |
| | | | | | | | |
| | | | 25,998,858 | |
| | | | | | | | |
| | | | | | | | |
| | | Principal
Amount | | | Value | |
| | | | | | | | |
Finance—Other Services 1.2% | |
¨Nationstar Mortgage LLC / Nationstar
Capital Corp. | | | | | | | | |
7.875%, due 10/1/20 (a) | | $ | 15,290,000 | | | $ | 15,748,700 | |
9.625%, due 5/1/19 (a) | | | 20,419,000 | | | | 22,527,995 | |
10.875%, due 4/1/15 | | | 44,722,000 | | | | 48,355,662 | |
SquareTwo Financial Corp.
11.625%, due 4/1/17 | | | 17,290,000 | | | | 15,604,225 | |
| | | | | | | | |
| | | | 102,236,582 | |
| | | | | | | | |
Food 1.7% | |
American Seafoods Group LLC / American Seafoods Finance, Inc.
10.75%, due 5/15/16 (a) | | | 17,678,000 | | | | 17,987,365 | |
American Stores Co.
8.00%, due 6/1/26 | | | 38,084,000 | | | | 34,085,180 | |
ASG Consolidated LLC / ASG Finance, Inc.
15.00%, due 5/15/17 (a)(g) | | | 16,758,522 | | | | 14,621,810 | |
B&G Foods, Inc.
7.625%, due 1/15/18 | | | 10,895,000 | | | | 11,739,363 | |
C&S Group Enterprises LLC
8.375%, due 5/1/17 (a) | | | 9,194,000 | | | | 9,688,178 | |
Harmony Foods Corp.
10.00%, due 5/1/16 (a) | | | 9,100,000 | | | | 9,691,500 | |
Smithfield Foods, Inc.
6.625%, due 8/15/22 | | | 13,155,000 | | | | 13,779,862 | |
TreeHouse Foods, Inc. | | | | | | | | |
6.03%, due 9/30/13 (b)(d) | | | 23,700,000 | | | | 24,114,750 | |
7.75%, due 3/1/18 | | | 8,120,000 | | | | 8,891,400 | |
| | | | | | | | |
| | | | 144,599,408 | |
| | | | | | | | |
Forest Products & Paper 1.1% | | | | | | | | |
Boise Cascade LLC/Boise Cascade Finance Corp.
6.375%, due 11/1/20 (a) | | | 17,300,000 | | | | 17,559,500 | |
Clearwater Paper Corp.
7.125%, due 11/1/18 | | | 9,720,000 | | | | 10,600,875 | |
Georgia-Pacific Corp. | | | | | | | | |
7.25%, due 6/1/28 | | | 2,370,000 | | | | 3,067,709 | |
7.75%, due 11/15/29 | | | 1,174,000 | | | | 1,618,590 | |
8.875%, due 5/15/31 | | | 29,615,000 | | | | 45,963,102 | |
Resolute Forest Products
10.25%, due 10/15/18 | | | 10,173,000 | | | | 11,597,220 | |
| | | | | | | | |
| | | | 90,406,996 | |
| | | | | | | | |
Health Care—Products 1.0% | | | | | | | | |
Alere, Inc. | | | | | | | | |
8.625%, due 10/1/18 | | | 5,130,000 | | | | 5,386,500 | |
9.00%, due 5/15/16 | | | 2,270,000 | | | | 2,397,687 | |
Hanger, Inc.
7.125%, due 11/15/18 | | | 18,850,000 | | | | 19,698,250 | |
Hologic, Inc.
6.25%, due 8/1/20 (a) | | | 11,205,000 | | | | 11,877,300 | |
| | | | | | |
The notes to the financial statements are an integral part of,
and should be read in conjunction with, the financial statements. | | mainstayinvestments.com | | | 13 | |
Portfolio of Investments October 31, 2012 (continued)
| | | | | | | | |
| | | Principal
Amount | | | Value | |
| | | | | | | | |
| Corporate Bonds (continued) | |
Health Care—Products (continued) | |
Teleflex, Inc.
6.875%, due 6/1/19 | | $ | 15,330,000 | | | $ | 16,479,750 | |
Universal Hospital Services, Inc. | | | | | | | | |
4.111%, due 6/1/15 (h) | | | 930,000 | | | | 917,213 | |
7.625%, due 8/15/20 (a) | | | 23,000,000 | | | | 23,862,500 | |
| | | | | | | | |
| | | | 80,619,200 | |
| | | | | | | | |
Health Care—Services 4.2% | | | | | | | | |
Alliance HealthCare Services, Inc.
8.00%, due 12/1/16 | | | 4,790,000 | | | | 4,119,400 | |
American Renal Associates Holdings, Inc. 9.75%, due 3/1/16 (g) | | | 8,632,122 | | | | 9,150,049 | |
American Renal Holdings Co., Inc.
8.375%, due 5/15/18 | | | 13,150,000 | | | | 13,906,125 | |
AMERIGROUP Corp.
7.50%, due 11/15/19 | | | 25,245,000 | | | | 29,473,537 | |
Centene Corp.
5.75%, due 6/1/17 | | | 14,370,000 | | | | 15,447,750 | |
CHS / Community Health Systems, Inc. | | | | | | | | |
5.125%, due 8/15/18 | | | 10,335,000 | | | | 10,722,562 | |
7.125%, due 7/15/20 | | | 12,650,000 | | | | 13,377,375 | |
DaVita, Inc. | | | | | | | | |
6.375%, due 11/1/18 | | | 14,650,000 | | | | 15,638,875 | |
6.625%, due 11/1/20 | | | 6,850,000 | | | | 7,312,375 | |
Fresenius Medical Care U.S. Finance, Inc.
6.50%, due 9/15/18 (a) | | | 4,730,000 | | | | 5,297,600 | |
Fresenius Medical Care U.S. Finance II, Inc. | | | | | | | | |
5.625%, due 7/31/19 (a) | | | 11,680,000 | | | | 12,293,200 | |
5.875%, due 1/31/22 (a) | | | 8,100,000 | | | | 8,616,375 | |
HCA Holdings, Inc.
7.75%, due 5/15/21 | | | 7,863,000 | | | | 8,472,383 | |
¨HCA, Inc. | |
4.75%, due 5/1/23 | | | 4,525,000 | | | | 4,525,000 | |
5.75%, due 3/15/14 | | | 3,615,000 | | | | 3,777,675 | |
5.875%, due 3/15/22 | | | 24,280,000 | | | | 26,040,300 | |
6.375%, due 1/15/15 | | | 5,995,000 | | | | 6,444,625 | |
6.50%, due 2/15/16 | | | 2,225,000 | | | | 2,433,594 | |
6.50%, due 2/15/20 | | | 9,224,000 | | | | 10,192,520 | |
7.19%, due 11/15/15 | | | 6,277,000 | | | | 6,904,700 | |
7.25%, due 9/15/20 | | | 3,450,000 | | | | 3,816,563 | |
7.50%, due 2/15/22 | | | 5,451,000 | | | | 6,091,493 | |
7.58%, due 9/15/25 | | | 1,920,000 | | | | 1,920,000 | |
7.69%, due 6/15/25 | | | 705,000 | | | | 712,050 | |
7.875%, due 2/15/20 | | | 2,120,000 | | | | 2,369,100 | |
8.00%, due 10/1/18 | | | 390,000 | | | | 450,450 | |
8.36%, due 4/15/24 | | | 2,494,000 | | | | 2,593,760 | |
8.50%, due 4/15/19 | | | 7,912,000 | | | | 8,891,110 | |
9.00%, due 12/15/14 | | | 3,930,000 | | | | 4,372,125 | |
9.875%, due 2/15/17 | | | 2,369,000 | | | | 2,534,830 | |
| | | | | | | | |
| | | Principal
Amount | | | Value | |
| | | | | | | | |
Health Care—Services (continued) | |
Health Management Associates, Inc.
7.375%, due 1/15/20 | | $ | 8,190,000 | | | $ | 8,824,725 | |
INC Research LLC
11.50%, due 7/15/19 (a) | | | 22,420,000 | | | | 22,532,100 | |
MultiPlan, Inc.
9.875%, due 9/1/18 (a) | | | 34,020,000 | | | | 37,422,000 | |
ResCare, Inc.
10.75%, due 1/15/19 | | | 14,300,000 | | | | 15,944,500 | |
Vanguard Health Holding Co. II LLC / Vanguard Holding Co. II, Inc. | | | | | | | | |
7.75%, due 2/1/19 | | | 8,090,000 | | | | 8,393,375 | |
8.00%, due 2/1/18 | | | 12,755,000 | | | | 13,265,200 | |
| | | | | | | | |
| | | | 354,279,401 | |
| | | | | | | | |
Holding Companies—Diversified 0.8% | |
Alphabet Holding Co., Inc.
7.75%, due 11/1/17 (a)(g) | | | 21,555,000 | | | | 21,743,606 | |
Leucadia National Corp.
8.125%, due 9/15/15 | | | 14,255,000 | | | | 16,054,694 | |
Susser Holdings LLC /
Susser Finance Corp.
8.50%, due 5/15/16 | | | 28,139,000 | | | | 30,108,730 | |
| | | | | | | | |
| | | | 67,907,030 | |
| | | | | | | | |
Home Builders 0.3% | | | | | | | | |
Meritage Homes Corp.
7.00%, due 4/1/22 | | | 6,240,000 | | | | 6,739,200 | |
Ryland Group, Inc. (The)
5.375%, due 10/1/22 | | | 6,120,000 | | | | 6,211,800 | |
Standard Pacific Corp.
8.375%, due 1/15/21 | | | 1,815,000 | | | | 2,105,400 | |
Taylor Morrison Communities, Inc. / Monarch Communities, Inc.
7.75%, due 4/15/20 (a) | | | 8,183,000 | | | | 8,714,895 | |
| | | | | | | | |
| | | | 23,771,295 | |
| | | | | | | | |
Home Furnishing 0.1% | |
Sealy Mattress Co.
10.875%, due 4/15/16 (a) | | | 5,865,000 | | | | 6,385,519 | |
| | | | | | | | |
|
Household Products & Wares 0.9% | |
Central Garden and Pet Co.
8.25%, due 3/1/18 | | | 9,775,000 | | | | 10,312,625 | |
Jarden Corp.
7.50%, due 5/1/17 | | | 19,505,000 | | | | 22,138,175 | |
Prestige Brands, Inc. | |
8.125%, due 2/1/20 | | | 290,000 | | | | 325,888 | |
8.25%, due 4/1/18 | | | 3,866,000 | | | | 4,247,768 | |
Scotts Miracle-Gro Co. (The)
6.625%, due 12/15/20 | | | 2,000,000 | | | | 2,172,500 | |
| | | | |
| 14 | | MainStay High Yield Corporate Bond Fund | | The notes to the financial statements are an integral part of,
and should be read in conjunction with, the financial statements. |
| | | | | | | | |
| | | Principal
Amount | | | Value | |
| | | | | | | | |
| Corporate Bonds (continued) | |
Household Products & Wares (continued) | |
Spectrum Brands, Inc. | |
6.75%, due 3/15/20 (a) | | $ | 2,195,000 | | | $ | 2,241,644 | |
9.50%, due 6/15/18 | | | 23,717,000 | | | | 26,622,332 | |
9.50%, due 6/15/18 (a) | | | 5,575,000 | | | | 6,257,937 | |
| | | | | | | | |
| | | | 74,318,869 | |
| | | | | | | | |
Housewares 0.2% | |
Libbey Glass, Inc.
6.875%, due 5/15/20 (a) | | | 19,485,000 | | | | 20,751,525 | |
| | | | | | | | |
|
Insurance 0.8% | |
CNO Financial Group, Inc.
6.375%, due 10/1/20 (a) | | | 7,345,000 | | | | 7,602,075 | |
HUB International, Ltd.
8.125%, due 10/15/18 (a) | | | 9,115,000 | | | | 9,365,662 | |
Ironshore Holdings (U.S.), Inc.
8.50%, due 5/15/20 (a) | | | 16,890,000 | | | | 19,031,821 | |
Lumbermens Mutual Casualty Co. | |
8.30%, due 12/1/37 (a)(b)(c)(d) | | | 8,525,000 | | | | 5,328 | |
8.45%, due 12/1/97 (a)(b)(c)(d) | | | 2,575,000 | | | | 1,609 | |
9.15%, due 7/1/26 (b)(c)(d) | | | 42,123,000 | | | | 26,327 | |
SunAmerica Financial Group, Inc. | |
6.625%, due 2/15/29 | | | 4,500,000 | | | | 5,786,969 | |
7.50%, due 7/15/25 | | | 8,000,000 | | | | 10,268,608 | |
USI Holdings Corp. | |
4.31%, due 11/15/14 (a)(h) | | | 1,675,000 | | | | 1,624,750 | |
9.75%, due 5/15/15 (a) | | | 13,900,000 | | | | 14,108,500 | |
| | | | | | | | |
| | | | 67,821,649 | |
| | | | | | | | |
Internet 0.2% | |
Cogent Communications Group, Inc.
8.375%, due 2/15/18 (a) | | | 10,635,000 | | | | 11,538,975 | |
Equinix, Inc.
7.00%, due 7/15/21 | | | 2,000,000 | | | | 2,220,000 | |
| | | | | | | | |
| | | | 13,758,975 | |
| | | | | | | | |
Investment Management/Advisory Services 0.3% | |
Janus Capital Group, Inc.
6.70%, due 6/15/17 | | | 19,105,000 | | | | 21,936,437 | |
| | | | | | | | |
|
Iron & Steel 0.3% | |
Allegheny Ludlum Corp.
6.95%, due 12/15/25 | | | 6,860,000 | | | | 8,218,479 | |
Allegheny Technologies, Inc.
9.375%, due 6/1/19 | | | 7,475,000 | | | | 9,559,389 | |
Steel Dynamics, Inc. | |
6.125%, due 8/15/19 (a) | | | 1,780,000 | | | | 1,860,100 | |
6.375%, due 8/15/22 (a) | | | 8,905,000 | | | | 9,305,725 | |
| | | | | | | | |
| | | | 28,943,693 | |
| | | | | | | | |
| | | | | | | | |
| | | Principal
Amount | | | Value | |
| | | | | | | | |
Leisure Time 0.1% | |
Brunswick Corp.
11.25%, due 11/1/16 (a) | | $ | 11,240,000 | | | $ | 12,813,600 | |
| | | | | | | | |
|
Lodging 1.5% | |
Choice Hotels International, Inc. | |
5.70%, due 8/28/20 | | | 2,480,000 | | | | 2,684,600 | |
5.75%, due 7/1/22 | | | 28,100,000 | | | | 30,769,500 | |
Eldorado Resorts LLC / Eldorado Capital Corp.
8.625%, due 6/15/19 (a) | | | 21,205,000 | | | | 20,568,850 | |
MGM Mirage, Inc.
13.00%, due 11/15/13 | | | 5,364,000 | | | | 5,980,860 | |
MGM Resorts International
10.375%, due 5/15/14 | | | 3,250,000 | | | | 3,652,188 | |
MTR Gaming Group, Inc.
11.50%, due 8/1/19 | | | 20,191,720 | | | | 21,100,347 | |
Seminole Hard Rock Entertainment, Inc.
2.889%, due 3/15/14 (a)(h) | | | 13,461,000 | | | | 13,360,042 | |
Sheraton Holding Corp.
7.375%, due 11/15/15 | | | 1,490,000 | | | | 1,727,481 | |
Starwood Hotels & Resorts Worldwide, Inc.
6.75%, due 5/15/18 | | | 3,485,000 | | | | 4,214,191 | |
Station Casinos LLC
3.66%, due 6/18/18 (a)(i) | | | 30,090,000 | | | | 25,576,500 | |
| | | | | | | | |
| | | | 129,634,559 | |
| | | | | | | | |
Machinery—Diversified 0.3% | |
Briggs & Stratton Corp.
6.875%, due 12/15/20 | | | 7,945,000 | | | | 8,779,225 | |
SPL Logistics Escrow LLC / SPL Logistics Finance Corp.
8.875%, due 8/1/20 (a) | | | 15,600,000 | | | | 16,575,000 | |
| | | | | | | | |
| | | | 25,354,225 | |
| | | | | | | | |
Media 3.1% | |
AMC Networks, Inc.
7.75%, due 7/15/21 | | | 8,305,000 | | | | 9,405,413 | |
Cablevision Systems Corp.
8.625%, due 9/15/17 | | | 18,635,000 | | | | 21,756,362 | |
¨CCO Holdings LLC / CCO
Holdings Capital Corp. | |
6.625%, due 1/31/22 | | | 10,000,000 | | | | 10,850,000 | |
7.00%, due 1/15/19 | | | 16,260,000 | | | | 17,479,500 | |
7.25%, due 10/30/17 | | | 5,405,000 | | | | 5,904,963 | |
7.375%, due 6/1/20 | | | 26,250,000 | | | | 29,400,000 | |
7.875%, due 4/30/18 | | | 6,875,000 | | | | 7,425,000 | |
Crown Media Holdings, Inc.
10.50%, due 7/15/19 | | | 20,365,000 | | | | 22,961,537 | |
| | | | | | |
The notes to the financial statements are an integral part of,
and should be read in conjunction with, the financial statements. | | mainstayinvestments.com | | | 15 | |
Portfolio of Investments October 31, 2012 (continued)
| | | | | | | | |
| | | Principal
Amount | | | Value | |
| | | | | | | | |
| Corporate Bonds (continued) | |
Media (continued) | |
DISH DBS Corp. | | | | | | | | |
4.625%, due 7/15/17 | | $ | 24,720,000 | | | $ | 25,492,500 | |
5.875%, due 7/15/22 | | | 4,490,000 | | | | 4,714,500 | |
6.75%, due 6/1/21 | | | 13,630,000 | | | | 15,180,412 | |
7.125%, due 2/1/16 | | | 3,995,000 | | | | 4,464,413 | |
Nielsen Finance LLC / Nielsen Finance Co. | | | | | | | | |
4.50%, due 10/1/20 (a) | | | 22,595,000 | | | | 22,482,025 | |
7.75%, due 10/15/18 | | | 32,338,000 | | | | 36,380,250 | |
ProQuest LLC / ProQuest Notes Co.
9.00%, due 10/15/18 (a) | | | 29,430,000 | | | | 27,369,900 | |
| | | | | | | | |
| | | | 261,266,775 | |
| | | | | | | | |
Metal Fabricate & Hardware 1.1% | | | | | | | | |
A. M. Castle & Co.
12.75%, due 12/15/16 | | | 32,661,000 | | | | 37,396,845 | |
Mueller Water Products, Inc. | | | | | | | | |
7.375%, due 6/1/17 | | | 19,525,000 | | | | 20,110,750 | |
8.75%, due 9/1/20 | | | 13,622,000 | | | | 15,631,245 | |
Neenah Foundry Co.
15.00%, due 7/29/15 (b)(g) | | | 5,410,147 | | | | 4,936,759 | |
Shale-Inland Holdings Llc / Shale-Inland Finance Corp.
8.75%, due 11/15/19 (a) | | | 14,460,000 | | | | 14,423,850 | |
| | | | | | | | |
| | | | 92,499,449 | |
| | | | | | | | |
Mining 0.8% | | | | | | | | |
Kaiser Aluminum Corp.
8.25%, due 6/1/20 | | | 25,465,000 | | | | 27,565,862 | |
Vulcan Materials Co. | | | | | | | | |
6.40%, due 11/30/17 | | | 2,579,000 | | | | 2,824,005 | |
6.50%, due 12/1/16 | | | 32,345,000 | | | | 35,579,500 | |
7.50%, due 6/15/21 | | | 2,655,000 | | | | 3,000,150 | |
| | | | | | | | |
| | | | 68,969,517 | |
| | | | | | | | |
Miscellaneous—Manufacturing 1.7% | |
Actuant Corp.
5.625%, due 6/15/22 | | | 9,720,000 | | | | 10,035,900 | |
Amsted Industries, Inc.
8.125%, due 3/15/18 (a) | | | 31,152,000 | | | | 33,488,400 | |
FGI Operating Co. LLC / FGI Finance, Inc.
7.875%, due 5/1/20 (a) | | | 23,190,000 | | | | 25,161,150 | |
Griffon Corp.
7.125%, due 4/1/18 | | | 6,185,000 | | | | 6,525,175 | |
Koppers, Inc.
7.875%, due 12/1/19 | | | 12,155,000 | | | | 13,340,112 | |
Polypore International, Inc.
7.50%, due 11/15/17 | | | 21,740,000 | | | | 23,479,200 | |
SPX Corp. | | | | | | | | |
6.875%, due 9/1/17 | | | 25,425,000 | | | | 28,603,125 | |
7.625%, due 12/15/14 | | | 5,235,000 | | | | 5,784,675 | |
| | | | | | | | |
| | | | 146,417,737 | |
| | | | | | | | |
| | | | | | | | |
| | | Principal
Amount | | | Value | |
| | | | | | | | |
Office Furnishings 0.3% | | | | | | | | |
Interface, Inc.
7.625%, due 12/1/18 | | $ | 23,280,000 | | | $ | 25,171,500 | |
| | | | | | | | |
| | |
Oil & Gas 10.1% | | | | | | | | |
Berry Petroleum Co. | | | | | | | | |
6.75%, due 11/1/20 | | | 1,690,000 | | | | 1,791,400 | |
10.25%, due 6/1/14 | | | 9,915,000 | | | | 11,055,225 | |
Bill Barrett Corp.
7.625%, due 10/1/19 | | | 6,515,000 | | | | 6,905,900 | |
BreitBurn Energy Partners, L.P.
8.625%, due 10/15/20 | | | 18,360,000 | | | | 19,874,700 | |
Calumet Specialty Products Partners, L.P. / Calumet Finance Corp. | | | | | | | | |
9.375%, due 5/1/19 | | | 34,845,000 | | | | 37,458,375 | |
9.625%, due 8/1/20 (a) | | | 14,000,000 | | | | 15,225,000 | |
Chesapeake Energy Corp. | | | | | | | | |
6.50%, due 8/15/17 | | | 30,590,000 | | | | 32,463,637 | |
6.775%, due 3/15/19 | | | 15,000,000 | | | | 15,037,500 | |
7.625%, due 7/15/13 | | | 7,562,000 | | | | 7,826,670 | |
Chesapeake Oilfield Operating LLC / Chesapeake Oilfield Finance, Inc.
6.625%, due 11/15/19 (a) | | | 22,110,000 | | | | 21,059,775 | |
Comstock Resources, Inc. | | | | | | | | |
7.75%, due 4/1/19 | | | 5,127,000 | | | | 5,203,905 | |
8.375%, due 10/15/17 | | | 18,238,000 | | | | 19,104,305 | |
9.50%, due 6/15/20 | | | 13,700,000 | | | | 14,659,000 | |
¨Concho Resources, Inc. | |
5.50%, due 10/1/22 | | | 9,145,000 | | | | 9,579,388 | |
5.50%, due 4/1/23 | | | 16,185,000 | | | | 16,953,787 | |
6.50%, due 1/15/22 | | | 24,386,000 | | | | 26,763,635 | |
7.00%, due 1/15/21 | | | 10,325,000 | | | | 11,460,750 | |
8.625%, due 10/1/17 | | | 8,441,000 | | | | 9,242,895 | |
Continental Resources, Inc. | | | | | | | | |
5.00%, due 9/15/22 | | | 6,500,000 | | | | 6,841,250 | |
5.00%, due 9/15/22 (a) | | | 17,975,000 | | | | 18,963,625 | |
7.125%, due 4/1/21 | | | 8,775,000 | | | | 9,871,875 | |
7.375%, due 10/1/20 | | | 15,775,000 | | | | 17,746,875 | |
Denbury Resources, Inc. | | | | | | | | |
8.25%, due 2/15/20 | | | 7,978,000 | | | | 9,035,085 | |
9.75%, due 3/1/16 | | | 6,980,000 | | | | 7,451,150 | |
Forest Oil Corp.
8.50%, due 2/15/14 | | | 1,002,000 | | | | 1,079,655 | |
Frontier Oil Corp.
6.875%, due 11/15/18 | | | 8,390,000 | | | | 8,935,350 | |
Halcon Resources Corp.
8.875%, due 5/15/21 (a) | | | 15,000,000 | | | | 15,206,250 | |
Holly Corp.
9.875%, due 6/15/17 | | | 18,512,000 | | | | 20,178,080 | |
Linn Energy LLC
9.875%, due 7/1/18 | | | 2,906,000 | | | | 3,189,335 | |
| | | | |
| 16 | | MainStay High Yield Corporate Bond Fund | | The notes to the financial statements are an integral part of,
and should be read in conjunction with, the financial statements. |
| | | | | | | | |
| | | Principal
Amount | | | Value | |
| | | | | | | | |
| Corporate Bonds (continued) | |
Oil & Gas (continued) | |
Linn Energy LLC / Linn Energy Finance Corp. | | | | | | | | |
6.50%, due 5/15/19 | | $ | 11,580,000 | | | $ | 11,666,850 | |
11.75%, due 5/15/17 | | | 8,710,000 | | | | 9,581,000 | |
Newfield Exploration Co. | | | | | | | | |
5.625%, due 7/1/24 | | | 15,000,000 | | | | 16,012,500 | |
7.125%, due 5/15/18 | | | 12,520,000 | | | | 13,146,000 | |
Oasis Petroleum, Inc. | | | | | | | | |
6.50%, due 11/1/21 | | | 11,600,000 | | | | 12,267,000 | |
7.25%, due 2/1/19 | | | 18,840,000 | | | | 20,158,800 | |
PDC Energy, Inc.
7.75%, due 10/15/22 (a) | | | 18,825,000 | | | | 19,154,437 | |
Penn Virginia Corp.
7.25%, due 4/15/19 | | | 7,855,000 | | | | 7,540,800 | |
10.375%, due 6/15/16 | | | 19,750,000 | | | | 20,836,250 | |
PetroHawk Energy Corp.
7.25%, due 8/15/18 | | | 15,995,000 | | | | 18,233,676 | |
10.50%, due 8/1/14 | | | 3,478,000 | | | | 3,747,545 | |
Petroquest Energy, Inc.
10.00%, due 9/1/17 | | | 35,635,000 | | | | 36,882,225 | |
Pioneer Energy Services Corp.
9.875%, due 3/15/18 | | | 25,620,000 | | | | 27,733,650 | |
Plains Exploration & Production Co.
10.00%, due 3/1/16 | | | 19,230,000 | | | | 20,479,950 | |
Quicksilver Resources, Inc.
11.75%, due 1/1/16 | | | 22,229,000 | | | | 22,895,870 | |
Range Resources Corp.
5.00%, due 8/15/22 | | | 5,600,000 | | | | 5,852,000 | |
7.25%, due 5/1/18 | | | 2,500,000 | | | | 2,637,500 | |
8.00%, due 5/15/19 | | | 9,425,000 | | | | 10,414,625 | |
SM Energy Co.
6.50%, due 11/15/21 | | | 9,490,000 | | | | 9,988,225 | |
6.50%, due 1/1/23 | | | 2,535,000 | | | | 2,649,075 | |
6.625%, due 2/15/19 | | | 17,149,000 | | | | 17,963,577 | |
Stone Energy Corp.
6.75%, due 12/15/14 | | | 13,375,000 | | | | 13,435,188 | |
7.50%, due 11/15/22 | | | 15,450,000 | | | | 15,256,875 | |
8.625%, due 2/1/17 | | | 10,470,000 | | | | 11,124,375 | |
W&T Offshore, Inc.
8.50%, due 6/15/19 | | | 14,805,000 | | | | 15,582,263 | |
8.50%, due 6/15/19 (a) | | | 13,800,000 | | | | 14,524,500 | |
Whiting Petroleum Corp.
6.50%, due 10/1/18 | | | 12,970,000 | | | | 13,991,388 | |
7.00%, due 2/1/14 | | | 27,634,000 | | | | 29,015,700 | |
WPX Energy, Inc.
6.00%, due 1/15/22 | | | 23,425,000 | | | | 25,064,750 | |
| | | | | | | | |
| | | | | | | 848,000,971 | |
| | | | | | | | |
| | | | | | | | |
| | | Principal
Amount | | | Value | |
| | | | | | | | |
Oil & Gas Services 0.3% | |
American Petroleum Tankers LLC / AP Tankers Co.
10.25%, due 5/1/15 | | $ | 13,084,000 | | | $ | 13,672,780 | |
Hiland Partners, L.P. / Hiland Partners Finance Corp.
7.25%, due 10/1/20 (a) | | | 12,375,000 | | | | 12,870,000 | |
| | | | | | | | |
| | | | | | | 26,542,780 | |
| | | | | | | | |
Packaging & Containers 2.1% | |
AEP Industries, Inc.
8.25%, due 4/15/19 | | | 20,344,000 | | | | 21,564,640 | |
Ball Corp.
5.00%, due 3/15/22 | | | 13,900,000 | | | | 14,664,500 | |
6.75%, due 9/15/20 | | | 1,630,000 | | | | 1,788,925 | |
7.125%, due 9/1/16 | | | 6,625,000 | | | | 7,121,875 | |
Greif, Inc.
6.75%, due 2/1/17 | | | 170,000 | | | | 187,425 | |
7.75%, due 8/1/19 | | | 8,100,000 | | | | 9,294,750 | |
Owens-Brockway Glass Container, Inc.
7.375%, due 5/15/16 | | | 4,910,000 | | | | 5,621,950 | |
Plastipak Holdings, Inc.
10.625%, due 8/15/19 (a) | | | 35,895,000 | | | | 40,920,300 | |
Sealed Air Corp.
8.125%, due 9/15/19 (a) | | | 6,815,000 | | | | 7,445,387 | |
8.375%, due 9/15/21 (a) | | | 7,885,000 | | | | 8,673,500 | |
Silgan Holdings, Inc.
5.00%, due 4/1/20 | | | 33,680,000 | | | | 34,606,200 | |
Tekni-Plex, Inc.
9.75%, due 6/1/19 (a) | | | 22,400,000 | | | | 23,968,000 | |
| | | | | | | | |
| | | | | | | 175,857,452 | |
| | | | | | | | |
Pharmaceuticals 2.6% | |
BioScrip, Inc.
10.25%, due 10/1/15 | | | 7,480,000 | | | | 8,003,600 | |
Catalent Pharma Solutions, Inc.
9.50%, due 4/15/15 | | | 20,322,575 | | | | 20,856,043 | |
Endo Health Solutions, Inc.
7.00%, due 7/15/19 | | | 8,610,000 | | | | 9,298,800 | |
Grifols, Inc.
8.25%, due 2/1/18 | | | 36,155,000 | | | | 40,132,050 | |
Lantheus Medical Imaging, Inc.
9.75%, due 5/15/17 | | | 25,210,000 | | | | 23,256,225 | |
Mylan, Inc.
7.625%, due 7/15/17 (a) | | | 5,850,000 | | | | 6,522,750 | |
7.875%, due 7/15/20 (a) | | | 18,680,000 | | | | 21,085,050 | |
NBTY, Inc.
9.00%, due 10/1/18 | | | 13,725,000 | | | | 15,372,000 | |
Valeant Pharmaceuticals International
6.375%, due 10/15/20 (a) | | | 22,755,000 | | | | 23,949,637 | |
6.50%, due 7/15/16 (a) | | | 12,471,000 | | | | 13,125,727 | |
6.75%, due 10/1/17 (a) | | | 7,875,000 | | | | 8,445,938 | |
| | | | | | |
The notes to the financial statements are an integral part of,
and should be read in conjunction with, the financial statements. | | mainstayinvestments.com | | | 17 | |
Portfolio of Investments October 31, 2012 (continued)
| | | | | | | | |
| | | Principal
Amount | | | Value | |
| | | | | | | | |
| Corporate Bonds (continued) | |
Pharmaceuticals (continued) | |
Valeant Pharmaceuticals International (continued) | | | | | | | | |
6.875%, due 12/1/18 (a) | | $ | 8,359,000 | | | $ | 8,912,784 | |
7.00%, due 10/1/20 (a) | | | 2,760,000 | | | | 2,970,450 | |
VPI Escrow Corp.
6.375%, due 10/15/20 (a) | | | 17,699,000 | | | | 18,628,197 | |
| | | | | | | | |
| | | | | | | 220,559,251 | |
| | | | | | | | |
Pipelines 1.7% | |
ANR Pipeline Co.
7.375%, due 2/15/24 | | | 2,555,000 | | | | 3,435,003 | |
9.625%, due 11/1/21 | | | 16,206,000 | | | | 24,965,408 | |
Atlas Pipeline Partners, L.P. / Atlas Pipeline Finance Corp.
6.625%, due 10/1/20 (a) | | | 16,385,000 | | | | 16,958,475 | |
Chesapeake Midstream Partners, L.P. / CHKM Finance Corp.
6.125%, due 7/15/22 | | | 7,284,000 | | | | 7,702,830 | |
Copano Energy LLC / Copano Energy Finance Corp.
7.125%, due 4/1/21 | | | 17,395,000 | | | | 18,308,238 | |
7.75%, due 6/1/18 | | | 29,645,000 | | | | 31,127,250 | |
MarkWest Energy Partners, L.P. / MarkWest Energy Finance Corp.
5.50%, due 2/15/23 | | | 16,000,000 | | | | 16,800,000 | |
6.75%, due 11/1/20 | | | 21,170,000 | | | | 23,075,300 | |
| | | | | | | | |
| | | | | | | 142,372,504 | |
| | | | | | | | |
Real Estate 0.2% | |
Crescent Resources LLC / Crescent Ventures, Inc.
10.25%, due 8/15/17 (a) | | | 16,860,000 | | | | 17,555,475 | |
| | | | | | | | |
| | |
Real Estate Investment Trusts 1.5% | | | | | | | | |
¨Host Hotels & Resorts, L.P.
4.75%, due 3/1/23 | | | 18,205,000 | | | | 19,297,300 | |
5.25%, due 3/15/22 | | | 13,645,000 | | | | 15,077,725 | |
6.00%, due 10/1/21 | | | 21,920,000 | | | | 25,427,200 | |
Series Q
6.75%, due 6/1/16 | | | 29,620,000 | | | | 30,416,038 | |
Sabra Health Care, L.P. / Sabra Capital Corp.
8.125%, due 11/1/18 (a) | | | 2,935,000 | | | | 3,140,450 | |
8.125%, due 11/1/18 | | | 11,951,000 | | | | 12,817,448 | |
Weyerhaeuser Co.
6.95%, due 10/1/27 | | | 3,695,000 | | | | 4,495,529 | |
7.375%, due 10/1/19 | | | 6,670,000 | | | | 8,319,117 | |
7.375%, due 3/15/32 | | | 1,655,000 | | | | 2,106,522 | |
8.50%, due 1/15/25 | | | 4,130,000 | | | | 5,635,992 | |
| | | | | | | | |
| | | | | | | 126,733,321 | |
| | | | | | | | |
| | | | | | | | |
| | | Principal
Amount | | | Value | |
| | | | | | | | |
Retail 3.7% | |
AmeriGas Finance LLC / AmeriGas Finance Corp.
6.75%, due 5/20/20 | | $ | 3,795,000 | | | $ | 4,079,625 | |
7.00%, due 5/20/22 | | | 9,697,000 | | | | 10,533,366 | |
AmeriGas Partners, L.P. / AmeriGas Finance Corp.
6.25%, due 8/20/19 | | | 13,025,000 | | | | 13,676,250 | |
6.50%, due 5/20/21 | | | 4,828,000 | | | | 5,117,680 | |
Asbury Automotive Group, Inc.
7.625%, due 3/15/17 | | | 11,473,000 | | | | 11,860,214 | |
8.375%, due 11/15/20 | | | 37,365,000 | | | | 41,288,325 | |
AutoNation, Inc.
6.75%, due 4/15/18 | | | 18,661,000 | | | | 20,946,973 | |
DineEquity, Inc.
9.50%, due 10/30/18 | | | 42,845,000 | | | | 48,254,181 | |
J.C. Penney Corp., Inc.
7.125%, due 11/15/23 | | | 16,185,000 | | | | 15,881,531 | |
Limited Brands, Inc.
5.625%, due 2/15/22 | | | 4,660,000 | | | | 5,026,975 | |
6.625%, due 4/1/21 | | | 12,715,000 | | | | 14,542,781 | |
8.50%, due 6/15/19 | | | 3,395,000 | | | | 4,112,194 | |
Penske Automotive Group, Inc.
5.75%, due 10/1/22 (a) | | | 25,430,000 | | | | 25,906,812 | |
PVH Corp.
7.375%, due 5/15/20 | | | 10,230,000 | | | | 11,457,600 | |
Radio Systems Corp.
8.375%, due 11/1/19 (a) | | | 14,000,000 | | | | 14,280,000 | |
Sally Holdings LLC / Sally Capital, Inc.
5.75%, due 6/1/22 | | | 13,640,000 | | | | 14,577,750 | |
6.875%, due 11/15/19 | | | 12,650,000 | | | | 14,025,688 | |
Sonic Automotive, Inc.
7.00%, due 7/15/22 (a) | | | 17,165,000 | | | | 18,388,006 | |
9.00%, due 3/15/18 | | | 14,365,000 | | | | 15,639,894 | |
| | | | | | | | |
| | | | | | | 309,595,845 | |
| | | | | | | | |
Semiconductors 0.2% | |
MEMC Electronic Materials, Inc.
7.75%, due 4/1/19 | | | 18,425,000 | | | | 13,749,656 | |
| | | | | | | | |
|
Shipbuilding 0.2% | |
Huntington Ingalls Industries, Inc.
6.875%, due 3/15/18 | | | 10,605,000 | | | | 11,453,400 | |
7.125%, due 3/15/21 | | | 6,905,000 | | | | 7,422,875 | |
| | | | | | | | |
| | | | | | | 18,876,275 | |
| | | | | | | | |
Software 0.5% | |
Fidelity National Information Services, Inc.
7.625%, due 7/15/17 | | | 10,800,000 | | | | 11,785,500 | |
7.875%, due 7/15/20 | | | 3,565,000 | | | | 3,983,888 | |
| | | | |
| 18 | | MainStay High Yield Corporate Bond Fund | | The notes to the financial statements are an integral part of,
and should be read in conjunction with, the financial statements. |
| | | | | | | | |
| | | Principal
Amount | | | Value | |
| | | | | | | | |
| Corporate Bonds (continued) | |
Software (continued) | |
Legend Acquisition Sub, Inc.
10.75%, due 8/15/20 (a) | | $ | 6,061,000 | | | $ | 5,909,475 | |
Nuance Communications, Inc.
5.375%, due 8/15/20 (a) | | | 18,750,000 | | | | 19,125,000 | |
| | | | | | | | |
| | | | | | | 40,803,863 | |
| | | | | | | | |
Storage & Warehousing 0.1% | | | | | | | | |
Mobile Mini, Inc.
7.875%, due 12/1/20 | | | 4,285,000 | | | | 4,633,156 | |
| | | | | | | | |
|
Telecommunications 4.6% | |
CC Holdings GS V LLC / Crown
Castle GS III Corp.
7.75%, due 5/1/17 (a) | | | 33,700,000 | | | | 35,890,500 | |
Clearwire Communications LLC / Clearwire Finance, Inc.
12.00%, due 12/1/15 (a) | | | 5,825,000 | | | | 6,203,625 | |
¨Crown Castle International Corp. | | | | | | | | |
5.25%, due 1/15/23 (a) | | | 44,100,000 | | | | 45,643,500 | |
7.125%, due 11/1/19 | | | 21,153,000 | | | | 23,215,418 | |
9.00%, due 1/15/15 | | | 11,080,000 | | | | 11,855,600 | |
Frontier Communications Corp. | | | | | | | | |
8.25%, due 4/15/17 | | | 5,000,000 | | | | 5,762,500 | |
9.25%, due 7/1/21 | | | 13,800,000 | | | | 16,318,500 | |
GCI, Inc. | | | | | | | | |
6.75%, due 6/1/21 | | | 4,855,000 | | | | 4,855,000 | |
8.625%, due 11/15/19 | | | 22,911,000 | | | | 24,743,880 | |
Hughes Satellite Systems Corp. | | | | | | | | |
6.50%, due 6/15/19 | | | 18,430,000 | | | | 19,720,100 | |
7.625%, due 6/15/21 | | | 22,995,000 | | | | 25,581,937 | |
Nextel Communications, Inc.
7.375%, due 8/1/15 | | | 2,825,000 | | | | 2,828,531 | |
NII Capital Corp.
7.625%, due 4/1/21 | | | 35,430,000 | | | | 27,989,700 | |
8.875%, due 12/15/19 | | | 7,151,000 | | | | 6,006,840 | |
SBA Telecommunications, Inc.
5.75%, due 7/15/20 (a) | | | 27,640,000 | | | | 28,745,600 | |
8.25%, due 8/15/19 | | | 9,721,000 | | | | 10,863,218 | |
Sprint Capital Corp.
6.875%, due 11/15/28 | | | 53,423,000 | | | | 54,625,017 | |
8.75%, due 3/15/32 | | | 4,378,000 | | | | 5,166,040 | |
Sprint Nextel Corp.
9.125%, due 3/1/17 | | | 11,835,000 | | | | 13,906,125 | |
9.25%, due 4/15/22 | | | 13,690,000 | | | | 16,359,550 | |
tw telecom holdings, Inc.
5.375%, due 10/1/22 (a) | | | 3,035,000 | | | | 3,118,463 | |
| | | | | | | | |
| | | | | | | 389,399,644 | |
| | | | | | | | |
| | | | | | | | |
| | | Principal
Amount | | | Value | |
| | | | | | | | |
Transportation 1.0% | |
Florida East Coast Holdings Corp.
10.50%, due 8/1/17 (g) | | $ | 3,795,034 | | | $ | 3,643,233 | |
Florida East Coast Railway Corp.
8.125%, due 2/1/17 | | | 41,104,000 | | | | 43,570,240 | |
KAR Holdings, Inc.
4.445%, due 5/1/14 (h) | | | 11,780,000 | | | | 11,780,118 | |
Syncreon Global Ireland, Ltd. / Syncreon Global Finance US, Inc.
9.50%, due 5/1/18 (a) | | | 25,870,000 | | | | 27,001,812 | |
| | | | | | | | |
| | | | | | | 85,995,403 | |
| | | | | | | | |
Trucking & Leasing 0.5% | | | | | | | | |
NESCO LLC / NESCO Holdings Corp.
11.75%, due 4/15/17 (a) | | | 17,155,000 | | | | 18,098,525 | |
TRAC Intermodal LLC / TRAC Intermodal Corp.
11.00%, due 8/15/19 (a) | | | 25,970,000 | | | | 26,327,088 | |
| | | | | | | | |
| | | | | | | 44,425,613 | |
| | | | | | | | |
Total Corporate Bonds
(Cost $6,368,847,991) | | | | | | | 6,778,860,256 | |
| | | | | | | | |
|
| Loan Assignments & Participations 2.8% (j) | |
Aerospace & Defense 0.3% | |
TransDigm, Inc. | | | | | | | | |
Add On Term Loan B2
4.00%, due 2/14/17 | | | 1,500,000 | | | | 1,503,214 | |
New Term Loan B
4.00%, due 2/14/17 | | | 19,848,611 | | | | 19,877,551 | |
| | | | | | | | |
| | | | | | | 21,380,765 | |
| | | | | | | | |
Apparel 0.1% | |
Unifi, Inc.
Term Loan
8.75%, due 5/1/17 (b)(d)(e) | | | 10,580,000 | | | | 10,897,400 | |
| | | | | | | | |
|
Auto Manufacturers 0.5% | |
Chrysler Group LLC
Term Loan
6.00%, due 5/24/17 | | | 23,404,282 | | | | 23,901,623 | |
Fleetpride Corp.
New Term Loan
6.75%, due 12/6/17 | | | 14,427,500 | | | | 14,409,466 | |
| | | | | | | | |
| | | | | | | 38,311,089 | |
| | | | | | | | |
Auto Parts & Equipment 0.1% | | | | | | | | |
Allison Transmission, Inc.
Term Loan B
2.72%, due 8/7/14 | | | 4,080,619 | | | | 4,081,161 | |
| | | | | | | | |
| | | | | | |
The notes to the financial statements are an integral part of,
and should be read in conjunction with, the financial statements. | | mainstayinvestments.com | | | 19 | |
Portfolio of Investments October 31, 2012 (continued)
| | | | | | | | |
| | | Principal
Amount | | | Value | |
| | | | | | | | |
| Loan Assignments & Participations (continued) | |
Finance 0.1% | |
Ocwen Financial Corp.
Term Loan B
7.00%, due 9/1/16 | | $ | 9,311,347 | | | $ | 9,311,347 | |
| | | | | | | | |
|
Finance—Investment Banker/Broker 0.2% | |
VFH Parent LLC
Term Loan
7.50%, due 7/8/16 | | | 19,435,681 | | | | 19,532,859 | |
| | | | | | | | |
|
Health Care—Services 0.1% | |
Sun Healthcare Group, Inc.
New Term Loan B
8.75%, due 10/15/16 | | | 11,064,444 | | | | 11,009,122 | |
| | | | | | | | |
| | |
Lodging 0.9% | | | | | | | | |
Cannery Casino Resorts LLC | | | | | | | | |
New Term Loan B
6.00%, due 10/2/18 | | | 8,700,000 | | | | 8,721,750 | |
New 2nd Lien Term Loan
10.00%, due 9/20/19 | | | 11,155,000 | | | | 10,820,350 | |
Station Casinos, Inc.
2012 Term Loan B2
4.212%, due 6/17/16 | | | 48,125,110 | | | | 46,440,731 | |
New Term Loan B
5.50%, due 9/7/19 | | | 5,450,000 | | | | 5,460,219 | |
| | | | | | | | |
| | | | | | | 71,443,050 | |
| | | | | | | | |
Media 0.0%‡ | |
Nielsen Finance LLC
Class A Term Loan
2.219%, due 8/9/13 | | | 2,296,187 | | | | 2,296,187 | |
| | | | | | | | |
|
Metal Fabricate & Hardware 0.2% | |
Neenah Corp.
Exit Term Loan
11.00%, due 1/29/15 (b)(d) | | | 18,367,500 | | | | 18,367,500 | |
| | | | | | | | |
|
Mining 0.1% | |
Novelis, Inc.
Term Loan
4.00%, due 3/10/17 | | | 9,899,244 | | | | 9,876,555 | |
| | | | | | | | |
|
Miscellaneous—Manufacturing 0.2% | |
FGI Operating Co. LLC
Term Loan
5.50%, due 4/19/19 | | | 16,965,370 | | | | 17,014,858 | |
| | | | | | | | |
Total Loan Assignments & Participations
(Cost $227,133,525) | | | | | | | 233,521,893 | |
| | | | | | | | |
| | | | | | | | |
| | | Principal
Amount | | | Value | |
| | | | | | | | |
| Yankee Bonds 9.7% (k) | |
Auto Manufacturers 0.2% | |
Jaguar Land Rover PLC
7.75%, due 5/15/18 (a) | | $ | 5,080,000 | | | $ | 5,410,200 | |
8.125%, due 5/15/21 (a) | | | 11,050,000 | | | | 11,906,375 | |
| | | | | | | | |
| | | | | | | 17,316,575 | |
| | | | | | | | |
Auto Parts & Equipment 1.0% | | | | | | | | |
International Automotive Components Group S.A.
9.125%, due 6/1/18 (a) | | | 12,100,000 | | | | 11,661,375 | |
¨Schaeffler Finance B.V.
7.75%, due 2/15/17 (a) | | | 51,440,000 | | | | 56,776,900 | |
8.50%, due 2/15/19 (a) | | | 16,575,000 | | | | 18,501,844 | |
| | | | | | | | |
| | | | | | | 86,940,119 | |
| | | | | | | | |
Chemicals 0.6% | |
Ineos Finance PLC
7.50%, due 5/1/20 (a) | | | 16,495,000 | | | | 16,701,187 | |
8.375%, due 2/15/19 (a) | | | 13,805,000 | | | | 14,495,250 | |
NOVA Chemicals Corp.
8.375%, due 11/1/16 | | | 13,850,000 | | | | 15,269,625 | |
8.625%, due 11/1/19 | | | 7,035,000 | | | | 7,967,138 | |
| | | | | | | | |
| | | | | | | 54,433,200 | |
| | | | | | | | |
Computers 0.3% | |
Seagate HDD Cayman
7.00%, due 11/1/21 | | | 10,110,000 | | | | 10,564,950 | |
7.75%, due 12/15/18 | | | 14,435,000 | | | | 15,661,975 | |
| | | | | | | | |
| | | | | | | 26,226,925 | |
| | | | | | | | |
Diversified Financial Services 0.8% | |
National Money Mart Co.
10.375%, due 12/15/16 | | | 23,490,000 | | | | 26,220,713 | |
Smurfit Capital Funding PLC
7.50%, due 11/20/25 | | | 37,630,000 | | | | 38,758,900 | |
| | | | | | | | |
| | | | | | | 64,979,613 | |
| | | | | | | | |
Entertainment 0.3% | |
MU Finance PLC
8.375%, due 2/1/17 (a) | | | 20,388,900 | | | | 22,223,901 | |
| | | | | | | | |
| | |
Forest Products & Paper 0.3% | | | | | | | | |
Sappi Papier Holding GmbH
6.625%, due 4/15/21 (a) | | | 6,795,000 | | | | 6,421,275 | |
8.375%, due 6/15/19 (a) | | | 10,400,000 | | | | 10,972,000 | |
Smurfit Kappa Acquisitions
4.875%, due 9/15/18 (a) | | | 8,105,000 | | | | 8,105,000 | |
| | | | | | | | |
| | | | | | | 25,498,275 | |
| | | | | | | | |
Holding Company—Diversified 0.2% | | | | | | | | |
CFG Holdings, Ltd. / CFG Finance LLC
11.50%, due 11/15/19 (a) | | | 17,300,000 | | | | 17,127,000 | |
| | | | | | | | |
| | | | |
| 20 | | MainStay High Yield Corporate Bond Fund | | The notes to the financial statements are an integral part of,
and should be read in conjunction with, the financial statements. |
| | | | | | | | |
| | | Principal
Amount | | | Value | |
| | | | | | | | |
| Yankee Bonds (continued) | |
Insurance 0.3% | | | | | | | | |
Fairfax Financial Holdings, Ltd.
7.375%, due 4/15/18 | | $ | 9,497,000 | | | $ | 10,893,401 | |
7.75%, due 7/15/37 | | | 4,810,000 | | | | 5,534,530 | |
8.30%, due 4/15/26 | | | 5,395,000 | | | | 6,324,731 | |
| | | | | | | | |
| | | | | | | 22,752,662 | |
| | | | | | | | |
Iron & Steel 0.1% | |
APERAM
7.75%, due 4/1/18 (a) | | | 13,035,000 | | | | 10,688,700 | |
| | | | | | | | |
|
Leisure Time 0.6% | |
Carlson Wagonlit B.V.
6.875%, due 6/15/19 (a) | | | 49,072,000 | | | | 51,280,240 | |
| | | | | | | | |
|
Media 0.8% | |
Quebecor Media, Inc.
5.75%, due 1/15/23 (a) | | | 28,340,000 | | | | 28,906,800 | |
7.75%, due 3/15/16 | | | 29,039,000 | | | | 29,789,077 | |
Videotron Ltee
5.00%, due 7/15/22 | | | 12,525,000 | | | | 12,963,375 | |
| | | | | | | | |
| | | | | | | 71,659,252 | |
| | | | | | | | |
Mining 0.7% | | | | | | | | |
New Gold, Inc.
7.00%, due 4/15/20 (a) | | | 33,015,000 | | | | 34,995,900 | |
Novelis, Inc.
8.375%, due 12/15/17 | | | 15,425,000 | | | | 16,774,688 | |
8.75%, due 12/15/20 | | | 7,350,000 | | | | 8,103,375 | |
| | | | | | | | |
| | | | | | | 59,873,963 | |
| | | | | | | | |
Oil & Gas 0.3% | | | | | | | | |
OGX Austria GmbH
8.50%, due 6/1/18 (a) | | | 25,860,000 | | | | 22,562,850 | |
| | | | | | | | |
|
Oil & Gas Services 0.3% | |
Expro Finance Luxembourg SCA
8.50%, due 12/15/16 (a) | | | 23,855,000 | | | | 24,451,375 | |
| | | | | | | | |
|
Pharmaceuticals 0.4% | |
ConvaTec Healthcare E S.A.
10.50%, due 12/15/18 (a) | | | 21,019,000 | | | | 22,805,615 | |
Warner Chilcott Co., LLC / Warner Chilcott Co., LLC
7.75%, due 9/15/18 | | | 12,910,000 | | | | 13,620,050 | |
| | | | | | | | |
| | | | | | | 36,425,665 | |
| | | | | | | | |
Storage & Warehousing 0.6% | | | | | | | | |
Algeco Scotsman Global Finance PLC
8.50%, due 10/15/18 (a) | | | 45,100,000 | | | | 46,453,000 | |
| | | | | | | | |
| | | | | | | | |
| | | Principal
Amount | | | Value | |
| | | | | | | | |
Telecommunications 1.9% | |
Inmarsat Finance PLC
7.375%, due 12/1/17 (a) | | $ | 948,000 | | | $ | 1,021,470 | |
Intelsat Jackson Holdings S.A.
6.625%, due 12/15/22 (a) | | | 10,095,000 | | | | 10,019,287 | |
7.25%, due 4/1/19 | | | 15,530,000 | | | | 16,655,925 | |
7.25%, due 10/15/20 (a) | | | 21,420,000 | | | | 22,705,200 | |
7.50%, due 4/1/21 | | | 13,280,000 | | | | 14,242,800 | |
Intelsat Luxembourg S.A.
11.25%, due 2/4/17 | | | 16,215,000 | | | | 17,025,750 | |
Sable International Finance, Ltd.
7.75%, due 2/15/17 (a) | | | 24,285,000 | | | | 25,984,950 | |
8.75%, due 2/1/20 (a) | | | 9,650,000 | | | | 11,001,000 | |
Satmex Escrow S.A. de C.V.
9.50%, due 5/15/17 | | | 23,276,000 | | | | 24,672,560 | |
Virgin Media Finance PLC
8.375%, due 10/15/19 | | | 15,258,000 | | | | 17,546,700 | |
| | | | | | | | |
| | | | | | | 160,875,642 | |
| | | | | | | | |
Total Yankee Bonds
(Cost $778,440,701) | | | | | | | 821,768,957 | |
| | | | | | | | |
Total Long-Term Bonds
(Cost $7,413,237,715) | | | | | | | 7,874,299,404 | |
| | | | | | | | |
| | |
| | | | | | | | |
| | |
| | | Shares | | | | |
| Common Stocks 0.5% | | | | | | | | |
Coal 0.0%‡ | | | | | | | | |
Upstate NY Power Producers (b)(d)(e) | | | 51,473 | | | | 875,041 | |
| | | | | | | | |
| | |
Lodging 0.0%‡ | | | | | | | | |
Majestic Star Casino LLC Membership Units (b)(d)(e) | | | 446,020 | | | | 892,040 | |
| | | | | | | | |
| | |
Media 0.0%‡ | | | | | | | | |
Adelphia Contingent Value Vehicle (b)(d)(e)(f) | | | 15,507,390 | | | | 155,074 | |
| | | | | | | | |
|
Metal Fabricate & Hardware 0.1% | |
Neenah Enterprises, Inc. (b)(d)(f) | | | 717,799 | | | | 4,263,726 | |
| | | | | | | | |
| | |
Mining 0.4% | | | | | | | | |
Goldcorp, Inc. | | | 745,700 | | | | 33,728,011 | |
| | | | | | | | |
Total Common Stocks
(Cost $42,183,264) | | | | 39,913,892 | |
| | | | | | | | |
| | | | | | |
The notes to the financial statements are an integral part of,
and should be read in conjunction with, the financial statements. | | mainstayinvestments.com | | | 21 | |
Portfolio of Investments October 31, 2012 (continued)
| | | | | | | | |
| | |
| | | Shares | | | Value | |
| | | | | | | | |
| Preferred Stock 0.1% | | | | | | | | |
Savings & Loans 0.1% | | | | | | | | |
GMAC Capital Trust I
8.125% | | | 414,600 | | | $ | 10,837,644 | |
| | | | | | | | |
Total Preferred Stock
(Cost $10,172,918) | | | | 10,837,644 | |
| | | | | | | | |
| | |
| | | | | | | | |
| | | Number of
Warrants | | | | |
| Warrants 0.0%‡ | | | | | | | | |
Food 0.0%‡ | | | | | | | | |
ASG Corp.
Expires 5/15/18 (b)(f) | | | 12,510 | | | | 375,300 | |
| | | | | | | | |
| | |
Media 0.0%‡ | | | | | | | | |
ION Media Networks, Inc. | | | | | | | | |
Second Lien
Expires 12/18/16 (b)(d)(e)(f) | | | 1,141 | | | | 12 | |
Unsecured Debt
Expires 12/18/39 (b)(d)(e)(f) | | | 1,126 | | | | 11 | |
| | | | | | | | |
| | | | | | | 23 | |
| | | | | | | | |
Total Warrants
(Cost $3,435) | | | | 375,323 | |
| | | | | | | | |
| | |
| | | | | | | | |
| | | Principal
Amount | | | | |
| Short-Term Investment 5.0% | |
Repurchase Agreement 5.0% | |
State Street Bank and Trust Co.
0.01%, dated 10/31/12
due 11/1/12
Proceeds at Maturity $418,672,151 (Collateralized by Government Agency securities with rates between 0.75% and 2.17% and maturity dates between 6/4/15 and 10/17/22, with a Principal Amount of $426,685,000 and a Market Value of $427,047,279) | | $ | 418,672,035 | | | | 418,672,035 | |
| | | | | | | | |
Total Short-Term Investment
(Cost $418,672,035) | | | | 418,672,035 | |
| | | | | | | | |
Total Investments (Cost $7,884,269,367) (l) | | | 99.0 | % | | | 8,344,098,298 | |
Other Assets, Less Liabilities | | | 1.0 | | | | 81,472,227 | |
Net Assets | | | 100.0 | % | | $ | 8,425,570,525 | |
| ‡ | Less than one-tenth of a percent. |
| (a) | May be sold to institutional investors only under Rule 144A or securities offered pursuant to Section 4(2) of the Securities Act of 1933, as amended. |
| (b) | Illiquid security. The total market value of these securities as of October 31, 2012 is $81,860,512, which represents 1.0% of the Fund’s net assets. |
| (d) | Fair valued security. The total market value of these securities as of October 31, 2012 is $66,882,203, which represents 0.8% of the Fund’s net assets. |
| (f) | Non-income producing security. |
| (g) | PIK (“Payment in Kind”)—interest or dividend payment is made with additional securities. |
| (h) | Floating rate—Rate shown is the rate in effect as of October 31, 2012. |
| (i) | Step coupon—Rate shown is the rate in effect as of October 31, 2012. |
| (j) | Floating Rate Loan—generally pays interest at rates which are periodically re-determined at a margin above the London InterBank Offered Rate or other short-term rates. The rate shown is the rate(s) in effect as of October 31, 2012. Floating Rate Loans are generally considered restrictive in that the Fund is ordinarily contractually obligated to receive consent from the Agent Bank and/or borrower prior to disposition of a Floating Rate Loan. |
| (k) | Yankee Bond—Dollar-denominated bond issued in the United States by a foreign bank or corporation. |
| (l) | As of October 31, 2012, cost is $7,893,912,932 for federal income tax purposes and net unrealized appreciation is as follows: |
| | | | |
Gross unrealized appreciation | | $ | 514,561,724 | |
Gross unrealized depreciation | | | (64,376,358 | ) |
| | | | |
Net unrealized appreciation | | $ | 450,185,366 | |
| | | | |
| | | | |
| 22 | | MainStay High Yield Corporate Bond Fund | | The notes to the financial statements are an integral part of,
and should be read in conjunction with, the financial statements. |
The following is a summary of the fair valuations according to the inputs used as of October 31, 2012, for valuing the Fund’s assets.
Asset Valuation Inputs
| | | | | | | | | | | | | | | | |
Description | | Quoted
Prices in
Active
Markets for
Identical
Assets
(Level 1) | | | Significant
Other
Observable
Inputs
(Level 2) | | | Significant
Unobservable
Inputs
(Level 3) | | | Total | |
| Investments in Securities (a) | | | | | | | | | | | | | | | | |
| Long-Term Bonds | | | | | | | | | | | | | | | | |
Convertible Bonds (b) | | $ | — | | | $ | 40,142,144 | | | $ | 6,154 | | | $ | 40,148,298 | |
Corporate Bonds (c) | | | — | | | | 6,747,435,011 | | | | 31,425,245 | | | | 6,778,860,256 | |
Loan Assignments & Participations (d) | | | — | | | | 184,125,296 | | | | 49,396,597 | (e) | | | 233,521,893 | |
Yankee Bonds | | | — | | | | 821,768,957 | | | | — | | | | 821,768,957 | |
| | | | | | | | | | | | | | | | |
| Total Long-Term Bonds | | | — | | | | 7,793,471,408 | | | | 80,827,996 | | | | 7,874,299,404 | |
| | | | | | | | | | | | | | | | |
| Common Stocks (f) | | | 33,728,011 | | | | — | | | | 6,185,881 | | | | 39,913,892 | |
| Preferred Stock | | | 10,837,644 | | | | — | | | | — | | | | 10,837,644 | |
| Warrants (g) | | | 375,300 | | | | — | | | | 23 | | | | 375,323 | |
| Short-Term Investment | | | | | | | | | | | | | | | | |
Repurchase Agreement | | | — | | | | 418,672,035 | | | | — | | | | 418,672,035 | |
| | | | | | | | | | | | | | | | |
| Total Investments in Securities | | $ | 44,940,955 | | | $ | 8,212,143,443 | | | $ | 87,013,900 | | | $ | 8,344,098,298 | |
| | | | | | | | | | | | | | | | |
| (a) | For a complete listing of investments and their industries, see the Portfolio of Investments. |
| (b) | The Level 3 security valued at $6,154 is held in Internet within the Convertible Bonds section of the Portfolio of Investments. |
| (c) | The Level 3 securities valued at $23,166, $4,644,000, $423,680, $1,584,413, $601,972, $24,114,750 and $33,264 are held in Auto Parts & Equipment, Coal, Commercial Services, Electric, Entertainment, Food and Insurance, respectively, within the Corporate Bonds section of the Portfolio of Investments. |
| (d) | The Level 3 securities valued at $10,897,400 and $18,367,500 are held in Apparel and Metal Fabricate & Hardware within the Loan Assignments & Participations section of the Portfolio of Investments. |
| (e) | Includes $20,131,697 of Level 3 security which represents a Loan Assignment & Participation whose value was obtained from an independent pricing service which utilized a single broker quote to determine such value with significant unobservable inputs. |
| (f) | The Level 3 securities valued at $875,041, $892,040, $155,074 and $4,263,726 are held in Coal, Lodging, Media and Metal Fabricate & Hardware, respectively, within the Common Stocks section of the Portfolio of Investments. |
| (g) | The Level 3 securities valued at $23 are held in Media within the Warrants section of the Portfolio of Investments. |
The Fund recognizes transfers between the levels as of the beginning of the period.
For the year ended October 31, 2012, the Fund did not have any transfers between Level 1 and Level 2 fair value measurements. (See Note 2)
During the year ended October 31, 2012, a loan participation and assignment with a total value of $14,367,746 transferred from Level 2 to Level 3. The transfer occurred as a result of the value for the loan participation and assignment being obtained from the independent pricing service utilizing a single broker quote with significant unobservable inputs as of October 31, 2012. The fair value obtained for this loan from the independent pricing service as of October 31, 2011 utilized the average of multiple bid quotations.
During the year ended October 31, 2012, a corporate bond with a total value of $8,665,360 transferred from Level 2 to Level 3. The transfer occurred as a result of the corporate bond being valued by methods deemed in good faith by the Fund’s Valuation Committee utilizing significant unobservable inputs as of October 31, 2012. The fair value obtained for this corporate bond from the independent pricing service as of October 31, 2011 utilized observable inputs.
| | | | | | |
The notes to the financial statements are an integral part of,
and should be read in conjunction with, the financial statements. | | mainstayinvestments.com | | | 23 | |
Portfolio of Investments October 31, 2012 (continued)
The following is a reconciliation of investments in which significant unobservable inputs (Level 3) were used in determining value:
| | | | | | | | | | | | | | | | | | | | | | | | | | | | | | | | | | | | | | | | | | | | | | | | | | |
Investments in
Securities | | Balance
as of
October 31,
2011 | | Accrued
Discounts
(Premiums) | | Realized
Gain
(Loss) | | Change in
Unrealized
Appreciation
(Depreciation) | | Purchases | | Sales | | Transfers
in to
Level 3 | | Transfers
out of
Level 3 | | Balance
as of
October 31,
2012 | | Change in
Unrealized
Appreciation
(Depreciation)
from
Investments
Still Held
as of
October 31,
2012 (a) |
| Long-Term Bonds | | | | | | | | | | | | | | | | | | | | | | | | | | | | | | | | | | | | | | | | | | | | | | | | | | |
Convertible Bonds | | | | | | | | | | | | | | | | | | | | | | | | | | | | | | | | | | | | | | | | | | | | | | | | | | |
Internet | | | $ | 6,154 | | | | $ | — | | | | $ | — | | | | $ | — | | | | $ | — | | | | $ | — | | | | $ | — | | | | $ | — | | | | $ | 6,154 | | | | $ | — | |
Corporate Bonds | | | | | | | | | | | | | | | | | | | | | | | | | | | | | | | | | | | | | | | | | | | | | | | | | | |
Auto Parts & Equipment | | | | 23,166 | | | | | — | | | | | — | | | | | — | | | | | — | | | | | — | | | | | — | | | | | — | | | | | 23,166 | | | | | — | |
Coal | | | | — | | | | | — | | | | | — | | | | | 1,204,000 | | | | | 3,440,000 | (b) | | | | — | | | | | — | | | | | — | | | | | 4,644,000 | | | | | 1,204,000 | |
Commercial Services | | | | 2,003,436 | | | | | — | | | | | — | | | | | (1,532,206 | ) | | | | — | | | | | (47,550 | ) (c) | | | | — | | | | | — | | | | | 423,680 | | | | | — | |
Electric | | | | — | | | | | 2,732 | | | | | (13,067,246 | ) | | | | 6,858,609 | | | | | 1,584,413 | (b) | | | | (2,459,455 | ) (c) | | | | 8,665,360 | | | | | — | | | | | 1,584,413 | | | | | (453 | ) |
Entertainment | | | | 823,839 | | | | | 31,908 | | | | | 42,036 | | | | | 21,142 | | | | | — | | | | | (316,953 | ) (c) | | | | — | | | | | — | | | | | 601,972 | | | | | (31,908 | ) |
Food | | | | 23,818,500 | | | | | — | | | | | — | | | | | 296,250 | | | | | — | | | | | — | | | | | — | | | | | — | | | | | 24,114,750 | | | | | 296,250 | |
Insurance | | | | 532,230 | | | | | — | | | | | — | | | | | (498,966 | ) | | | | — | | | | | — | | | | | — | | | | | — | | | | | 33,264 | | | | | (498,966 | ) |
Loan Assignments & Participations | | | | | | | | | | | | | | | | | | | | | | | | | | | | | | | | | | | | | | | | | | | | | | | | | | |
Apparel | | | | — | | | | | 12,241 | | | | | 494,006 | | | | | 413,753 | | | | | 22,770,000 | | | | | (12,792,600 | ) (c) | | | | — | | | | | — | | | | | 10,897,400 | | | | | 413,753 | |
Finance | | | | — | | | | | 52,048 | | | | | 86,863 | | | | | 6,218 | | | | | — | | | | | (5,201,528 | ) (c) | | | | 14,367,746 | | | | | — | | | | | 9,311,347 | | | | | 41,065 | |
Lodging | | | | — | | | | | 689 | | | | | — | | | | | (135,427 | ) | | | | 10,955,088 | | | | | — | | | | | — | | | | | — | | | | | 10,820,350 | | | | | — | |
Machinery | | | | 38,675 | | | | | (385,062 | ) | | | | (9,375,082 | ) | | | | 9,721,469 | | | | | — | | | | | — | | | | | — | | | | | — | | | | | — | | | | | — | |
Metal, Fabricate & Hardware | | | | 18,553,500 | | | | | — | | | | | — | | | | | — | | | | | — | | | | | (186,000 | ) (c) | | | | — | | | | | — | | | | | 18,367,500 | | | | | — | |
| Common Stocks | | | | | | | | | | | | | | | | | | | | | | | | | | | | | | | | | | | | | | | | | | | | | | | | | | |
Coal | | | | — | | | | | — | | | | | — | | | | | — | | | | | 875,041 | (b) | | | | — | | | | | — | | | | | — | | | | | 875,041 | | | | | — | |
Lodging | | | | — | | | | | — | | | | | — | | | | | — | | | | | 892,040 | (b) | | | | — | | | | | — | | | | | — | | | | | 892,040 | | | | | — | |
Media | | | | 155,074 | | | | | — | | | | | — | | | | | — | | | | | — | | | | | — | | | | | — | | | | | — | | | | | 155,074 | | | | | — | |
Metal, Fabricate &
Hardware | | | | 4,191,946 | | | | | — | | | | | — | | | | | 71,780 | | | | | — | | | | | — | | | | | — | | | | | — | | | | | 4,263,726 | | | | | 71,780 | |
| Warrants | | | | | | | | | | | | | | | | | | | | | | | | | | | | | | | | | | | | | | | | | | | | | | | | | | |
Media | | | | 23 | | | | | — | | | | | — | | | | | — | | | | | — | | | | | — | | | | | — | | | | | — | | | | | 23 | | | | | — | |
| | | | | | | | | | | | | | | | | | | | | | | | | | | | | | | | | | | | | | | | | | | | | | | | | | |
| Total | | | $ | 50,146,543 | | | | $ | (285,444 | ) | | | $ | (21,819,423 | ) | | | $ | 16,426,622 | | | | $ | 40,516,582 | | | | $ | (21,004,086 | ) | | | $ | 23,033,106 | | | | $ | — | | | | $ | 87,013,900 | | | | $ | 1,495,521 | |
| | | | | | | | | | | | | | | | | | | | | | | | | | | | | | | | | | | | | | | | | | | | | | | | | | |
| (a) | Included in “Net change in unrealized appreciation (depreciation) on investments and unfunded commitments” in the Statement of Operations. |
| (b) | Purchases include securities received from a restructure. |
| (c) | Sales include principal reductions. |
| | | | |
| 24 | | MainStay High Yield Corporate Bond Fund | | The notes to the financial statements are an integral part of,
and should be read in conjunction with, the financial statements. |
Statement of Assets and Liabilities as of October 31, 2012
| | | | |
| Assets | |
Investment in securities, at value
(identified cost $7,884,269,367) | | $ | 8,344,098,298 | |
Cash | | | 11,725,634 | |
Receivables: | | | | |
Dividends and interest | | | 155,839,555 | |
Fund shares sold | | | 22,571,230 | |
Investment securities sold | | | 8,313,997 | |
Other assets | | | 132,661 | |
| | | | |
Total assets | | | 8,542,681,375 | |
| | | | |
| |
| Liabilities | | | | |
Payables: | | | | |
Investment securities purchased | | | 84,463,932 | |
Fund shares redeemed | | | 12,553,710 | |
Manager (See Note 3) | | | 3,910,804 | |
Transfer agent (See Note 3) | | | 3,638,791 | |
NYLIFE Distributors (See Note 3) | | | 1,812,025 | |
Shareholder communication | | | 278,151 | |
Professional fees | | | 98,117 | |
Trustees | | | 25,263 | |
Custodian | | | 10,894 | |
Accrued expenses | | | 22,270 | |
Dividend payable | | | 10,296,893 | |
| | | | |
Total liabilities | | | 117,110,850 | |
| | | | |
Net assets | | $ | 8,425,570,525 | |
| | | | |
| |
| Composition of Net Assets | | | | |
Shares of beneficial interest outstanding (par value of $.01 per share) unlimited number of shares authorized | | $ | 13,862,827 | |
Additional paid-in capital | | | 8,278,198,571 | |
| | | | |
| | | 8,292,061,398 | |
Distributions in excess of net investment income | | | (10,568,229 | ) |
Accumulated net realized gain (loss) on investments and foreign currency transactions | | | (315,751,575 | ) |
Net unrealized appreciation (depreciation) on investments | | | 459,828,931 | |
| | | | |
Net assets | | $ | 8,425,570,525 | |
| | | | |
| | | | |
Investor Class | | | | |
Net assets applicable to outstanding shares | | $ | 301,074,490 | |
| | | | |
Shares of beneficial interest outstanding | | | 49,113,659 | |
| | | | |
Net asset value per share outstanding | | $ | 6.13 | |
Maximum sales charge (4.50% of offering price) | | | 0.29 | |
| | | | |
Maximum offering price per share outstanding | | $ | 6.42 | |
| | | | |
Class A | | | | |
Net assets applicable to outstanding shares | | $ | 4,086,134,113 | |
| | | | |
Shares of beneficial interest outstanding | | | 672,259,146 | |
| | | | |
Net asset value per share outstanding | | $ | 6.08 | |
Maximum sales charge (4.50% of offering price) | | | 0.29 | |
| | | | |
Maximum offering price per share outstanding | | $ | 6.37 | |
| | | | |
Class B | | | | |
Net assets applicable to outstanding shares | | $ | 221,723,481 | |
| | | | |
Shares of beneficial interest outstanding | | | 36,649,961 | |
| | | | |
Net asset value and offering price per share outstanding | | $ | 6.05 | |
| | | | |
Class C | | | | |
Net assets applicable to outstanding shares | | $ | 819,806,630 | |
| | | | |
Shares of beneficial interest outstanding | | | 135,469,068 | |
| | | | |
Net asset value and offering price per share outstanding | | $ | 6.05 | |
| | | | |
Class I | | | | |
Net assets applicable to outstanding shares | | $ | 2,982,525,899 | |
| | | | |
Shares of beneficial interest outstanding | | | 490,438,285 | |
| | | | |
Net asset value and offering price per share outstanding | | $ | 6.08 | |
| | | | |
Class R1 | | | | |
Net assets applicable to outstanding shares | | $ | 26,282 | |
| | | | |
Shares of beneficial interest outstanding | | | 4,324 | |
| | | | |
Net asset value and offering price per share outstanding | | $ | 6.08 | |
| | | | |
Class R2 | | | | |
Net assets applicable to outstanding shares | | $ | 14,279,630 | |
| | | | |
Shares of beneficial interest outstanding | | | 2,348,248 | |
| | | | |
Net asset value and offering price per share outstanding | | $ | 6.08 | |
| | | | |
| | | | | | |
The notes to the financial statements are an integral part of,
and should be read in conjunction with, the financial statements. | | mainstayinvestments.com | | | 25 | |
Statement of Operations for the year ended October 31, 2012
| | | | |
| Investment Income (Loss) | |
Income | | | | |
Interest | | $ | 544,920,618 | |
Dividends (a) | | | 2,373,825 | |
| | | | |
Total income | | | 547,294,443 | |
| | | | |
Expenses | | | | |
Manager (See Note 3) | | | 40,189,446 | |
Distribution/Service—Investor Class (See Note 3) | | | 729,804 | |
Distribution/Service—Class A (See Note 3) | | | 9,223,529 | |
Distribution/Service—Class B (See Note 3) | | | 2,402,492 | |
Distribution/Service—Class C (See Note 3) | | | 7,336,823 | |
Distribution/Service—Class R2 (See Note 3) | | | 28,056 | |
Transfer agent (See Note 3) | | | 12,212,389 | |
Shareholder communication | | | 1,066,284 | |
Professional fees | | | 355,268 | |
Registration | | | 219,471 | |
Trustees | | | 200,399 | |
Custodian | | | 66,594 | |
Shareholder service (See Note 3) | | | 11,232 | |
Miscellaneous | | | 235,219 | |
| | | | |
Total expenses | | | 74,277,006 | |
| | | | |
Net investment income (loss) | | | 473,017,437 | |
| | | | |
|
| Realized and Unrealized Gain (Loss) on Investments and Foreign Currency Transactions | |
Net realized gain (loss) on: | | | | |
Security transactions | | | 71,388,023 | |
Foreign currency transactions | | | (151 | ) |
| | | | |
Net realized gain (loss) on investments and foreign currency transactions | | | 71,387,872 | |
| | | | |
Net change in unrealized appreciation (depreciation) on: | | | | |
Investments | | | 277,786,557 | |
Translation of other assets and liabilities in foreign currencies | | | 110 | |
| | | | |
Net change in unrealized appreciation (depreciation) on investments and foreign currency transactions | | | 277,786,667 | |
| | | | |
Net realized and unrealized gain (loss) on investments and foreign currency transactions | | | 349,174,539 | |
| | | | |
Net increase (decrease) in net assets resulting from operations | | $ | 822,191,976 | |
| | | | |
| (a) | Dividends recorded net of foreign withholding taxes in the amount of $73,874. |
| | | | |
| 26 | | MainStay High Yield Corporate Bond Fund | | The notes to the financial statements are an integral part of,
and should be read in conjunction with, the financial statements. |
Statements of Changes in Net Assets
for the years ended October 31, 2012 and October 31, 2011
| | | | | | | | |
| | | 2012 | | | 2011 | |
| Increase (Decrease) in Net Assets | |
Operations: | | | | | | | | |
Net investment income (loss) | | $ | 473,017,437 | | | $ | 445,295,269 | |
Net realized gain (loss) on investments and foreign currency transactions | | | 71,387,872 | | | | 195,223,410 | |
Net change in unrealized appreciation (depreciation) on investments, unfunded commitments and foreign currency transactions | | | 277,786,667 | | | | (278,420,151 | ) |
| | | | |
Net increase (decrease) in net assets resulting from operations | | | 822,191,976 | | | | 362,098,528 | |
| | | | |
Dividends to shareholders: | | | | | | | | |
From net investment income: | | | | | | | | |
Investor Class | | | (20,410,149 | ) | | | (19,786,004 | ) |
Class A | | | (262,174,237 | ) | | | (240,811,722 | ) |
Class B | | | (15,149,227 | ) | | | (20,335,389 | ) |
Class C | | | (46,677,653 | ) | | | (42,822,088 | ) |
Class I | | | (169,537,188 | ) | | | (137,624,961 | ) |
Class R1 | | | (612 | ) | | | — | |
Class R2 | | | (796,551 | ) | | | (729,452 | ) |
| | | | |
Total dividends to shareholders | | | (514,745,617 | ) | | | (462,109,616 | ) |
| | | | |
Capital share transactions: | | | | | | | | |
Net proceeds from sale of shares | | | 3,214,367,404 | | | | 2,014,794,074 | |
Net asset value of shares issued to shareholders in reinvestment of dividends | | | 395,312,467 | | | | 335,298,083 | |
Cost of shares redeemed | | | (1,839,351,086 | ) | | | (2,413,537,264 | ) |
| | | | |
Increase (decrease) in net assets derived from capital share transactions | | | 1,770,328,785 | | | | (63,445,107 | ) |
| | | | |
Net increase (decrease) in net assets | | | 2,077,775,144 | | | | (163,456,195 | ) |
|
| Net Assets | |
Beginning of year | | | 6,347,795,381 | | | | 6,511,251,576 | |
| | | | |
End of year | | $ | 8,425,570,525 | | | $ | 6,347,795,381 | |
| | | | |
Distributions in excess of net investment income at end of year | | $ | (10,568,229 | ) | | $ | (11,812,622 | ) |
| | | | |
| | | | | | |
The notes to the financial statements are an integral part of,
and should be read in conjunction with, the financial statements. | | mainstayinvestments.com | | | 27 | |
Financial Highlights selected per share data and ratios
| | | | | | | | | | | | | | | | | | | | |
| | | Investor Class | |
| | | Year ended October 31, | | | February 28,
2008**
through
October 31, | |
| | | 2012 | | | 2011 | | | 2010 | | | 2009 | | | 2008 | |
Net asset value at beginning of period | | $ | 5.88 | | | $ | 5.97 | | | $ | 5.60 | | | $ | 4.63 | | | $ | 5.97 | |
| | | | | | | | | | | | | | | | | | | | |
Net investment income (loss) (a) | | | 0.39 | | | | 0.41 | | | | 0.41 | | | | 0.40 | | | | 0.28 | |
Net realized and unrealized gain (loss) on investments | | | 0.28 | | | | (0.08 | ) | | | 0.38 | | | | 1.01 | | | | (1.33 | ) |
Net realized and unrealized gain (loss) on foreign currency transactions | | | 0.00 | ‡ | | | 0.00 | ‡ | | | 0.00 | ‡ | | | 0.00 | ‡ | | | 0.00 | ‡ |
| | | | | | | | | | | | | | | | | | | | |
Total from investment operations | | | 0.67 | | | | 0.33 | | | | 0.79 | | | | 1.41 | | | | (1.05 | ) |
| | | | | | | | | | | | | | | | | | | | |
Less dividends and distributions: | | | | | | | | | | | | | | | | | | | | |
From net investment income | | | (0.42 | ) | | | (0.42 | ) | | | (0.41 | ) | | | (0.41 | ) | | | (0.28 | ) |
Return of capital | | | — | | | | — | | | | (0.01 | ) | | | (0.03 | ) | | | (0.01 | ) |
| | | | | | | | | | | | | | | | | | | | |
Total dividends and distributions | | | (0.42 | ) | | | (0.42 | ) | | | (0.42 | ) | | | (0.44 | ) | | | (0.29 | ) |
| | | | | | | | | | | | | | | | | | | | |
Redemption fee (a)(b) | | | — | | | | — | | | | 0.00 | ‡ | | | 0.00 | ‡ | | | 0.00 | ‡ |
| | | | | | | | | | | | | | | | | | | | |
Net asset value at end of period | | $ | 6.13 | | | $ | 5.88 | | | $ | 5.97 | | | $ | 5.60 | | | $ | 4.63 | |
| | | | | | | | | | | | | | | | | | | | |
Total investment return (c) | | | 11.82 | % | | | 5.69 | % | | | 14.73 | % | | | 32.60 | % | | | (18.54 | %)(d) |
Ratios (to average net assets)/Supplemental Data: | | | | | | | | | | | | | | | | | | | | |
Net investment income (loss) | | | 6.53 | % | | | 6.80 | % | | | 7.03 | % | | | 8.18 | % | | | 7.31 | % †† |
Net expenses | | | 1.03 | % | | | 1.05 | % | | | 1.08 | % | | | 1.15 | % | | | 1.16 | % †† |
Portfolio turnover rate | | | 29 | % | | | 45 | % | | | 41 | % | | | 41 | % | | | 29 | % |
Net assets at end of period (in 000’s) | | $ | 301,074 | | | $ | 285,656 | | | $ | 282,489 | | | $ | 265,507 | | | $ | 201,850 | |
| ** | Commencement of operations. |
| ‡ | Less than one cent per share. |
| (a) | Per share data based on average shares outstanding during the period. |
| (b) | The redemption fee was discontinued as of April 1, 2010. |
| (c) | Total investment return is calculated exclusive of sales charges and assumes the reinvestment of dividends and distributions. |
| (d) | Total investment return is not annualized. |
| | | | |
| 28 | | MainStay High Yield Corporate Bond Fund | | The notes to the financial statements are an integral part of,
and should be read in conjunction with, the financial statements. |
Financial Highlights selected per share data and ratios
| | | | | | | | | | | | | | | | | | | | |
| | | Class A | |
| | | Year ended October 31, | |
| | | 2012 | | | 2011 | | | 2010 | | | 2009 | | | 2008 | |
Net asset value at beginning of year | | $ | 5.84 | | | $ | 5.92 | | | $ | 5.56 | | | $ | 4.60 | | | $ | 6.35 | |
| | | | | | | | | | | | | | | | | | | | |
Net investment income (loss) (a) | | | 0.39 | | | | 0.41 | | | | 0.40 | | | | 0.40 | | | | 0.43 | |
Net realized and unrealized gain (loss) on investments | | | 0.27 | | | | (0.07 | ) | | | 0.39 | | | | 1.00 | | | | (1.74 | ) |
Net realized and unrealized gain (loss) on foreign currency transactions | | | 0.00 | ‡ | | | 0.00 | ‡ | | | 0.00 | ‡ | | | 0.00 | ‡ | | | 0.00 | ‡ |
| | | | | | | | | | | | | | | | | | | | |
Total from investment operations | | | 0.66 | | | | 0.34 | | | | 0.79 | | | | 1.40 | | | | (1.31 | ) |
| | | | | | | | | | | | | | | | | | | | |
Less dividends and distributions: | | | | | | | | | | | | | | | | | | | | |
From net investment income | | | (0.42 | ) | | | (0.42 | ) | | | (0.42 | ) | | | (0.41 | ) | | | (0.43 | ) |
Return of capital | | | — | | | | — | | | | (0.01 | ) | | | (0.03 | ) | | | (0.01 | ) |
| | | | | | | | | | | | | | | | | | | | |
Total dividends and distributions | | | (0.42 | ) | | | (0.42 | ) | | | (0.43 | ) | | | (0.44 | ) | | | (0.44 | ) |
| | | | | | | | | | | | | | | | | | | | |
Redemption fee (a)(b) | | | — | | | | — | | | | 0.00 | ‡ | | | 0.00 | ‡ | | | 0.00 | ‡ |
| | | | | | | | | | | | | | | | | | | | |
Net asset value at end of year | | $ | 6.08 | | | $ | 5.84 | | | $ | 5.92 | | | $ | 5.56 | | | $ | 4.60 | |
| | | | | | | | | | | | | | | | | | | | |
Total investment return (c) | | | 11.76 | % | | | 5.94 | % | | | 14.69 | % | | | 32.74 | % | | | (22.00 | %) |
Ratios (to average net assets)/Supplemental Data: | | | | | | | | | | | | | | | | | | | | |
Net investment income (loss) | | | 6.56 | % | | | 6.86 | % | | | 7.07 | % | | | 8.19 | % | | | 7.33 | % |
Net expenses | | | 1.00 | % | | | 0.99 | % | | | 1.03 | % | | | 1.08 | % | | | 1.07 | % |
Portfolio turnover rate | | | 29 | % | | | 45 | % | | | 41 | % | | | 41 | % | | | 29 | % |
Net assets at end of year (in 000’s) | | $ | 4,086,134 | | | $ | 3,355,007 | | | $ | 3,409,419 | | | $ | 3,169,962 | | | $ | 1,835,090 | |
| ‡ | Less than one cent per share. |
| (a) | Per share data based on average shares outstanding during the year. |
| (b) | The redemption fee was discontinued as of April 1, 2010. |
| (c) | Total investment return is calculated exclusive of sales charges and assumes the reinvestment of dividends and distributions. |
| | | | | | | | | | | | | | | | | | | | |
| | | Class B | |
| | | Year ended October 31, | |
| | | 2012 | | | 2011 | | | 2010 | | | 2009 | | | 2008 | |
Net asset value at beginning of year | | $ | 5.81 | | | $ | 5.90 | | | $ | 5.54 | | | $ | 4.57 | | | $ | 6.31 | |
| | | | | | | | | | | | | | | | | | | | |
Net investment income (loss) (a) | | | 0.34 | | | | 0.36 | | | | 0.36 | | | | 0.36 | | | | 0.38 | |
Net realized and unrealized gain (loss) on investments | | | 0.27 | | | | (0.08 | ) | | | 0.38 | | | | 1.00 | | | | (1.73 | ) |
Net realized and unrealized gain (loss) on foreign currency transactions | | | 0.00 | ‡ | | | 0.00 | ‡ | | | 0.00 | ‡ | | | 0.00 | ‡ | | | 0.00 | ‡ |
| | | | | | | | | | | | | | | | | | | | |
Total from investment operations | | | 0.61 | | | | 0.28 | | | | 0.74 | | | | 1.36 | | | | (1.35 | ) |
| | | | | | | | | | | | | | | | | | | | |
Less dividends and distributions: | | | | | | | | | | | | | | | | | | | | |
From net investment income | | | (0.37 | ) | | | (0.37 | ) | | | (0.37 | ) | | | (0.36 | ) | | | (0.38 | ) |
Return of capital | | | — | | | | — | | | | (0.01 | ) | | | (0.03 | ) | | | (0.01 | ) |
| | | | | | | | | | | | | | | | | | | | |
Total dividends and distributions | | | (0.37 | ) | | | (0.37 | ) | | | (0.38 | ) | | | (0.39 | ) | | | (0.39 | ) |
| | | | | | | | | | | | | | | | | | | | |
Redemption fee (a)(b) | | | — | | | | — | | | | 0.00 | ‡ | | | 0.00 | ‡ | | | 0.00 | ‡ |
| | | | | | | | | | | | | | | | | | | | |
Net asset value at end of year | | $ | 6.05 | | | $ | 5.81 | | | $ | 5.90 | | | $ | 5.54 | | | $ | 4.57 | |
| | | | | | | | | | | | | | | | | | | | |
Total investment return (c) | | | 10.94 | % | | | 4.95 | % | | | 13.81 | % | | | 31.57 | % | | | (22.47 | %) |
Ratios (to average net assets)/Supplemental Data: | | | | | | | | | | | | | | | | | | | | |
Net investment income (loss) | | | 5.78 | % | | | 6.05 | % | | | 6.27 | % | | | 7.49 | % | | | 6.53 | % |
Net expenses | | | 1.78 | % | | | 1.80 | % | | | 1.83 | % | | | 1.91 | % | | | 1.86 | % |
Portfolio turnover rate | | | 29 | % | | | 45 | % | | | 41 | % | | | 41 | % | | | 29 | % |
Net assets at end of year (in 000’s) | | $ | 221,723 | | | $ | 267,752 | | | $ | 375,368 | | | $ | 453,918 | | | $ | 431,398 | |
| ‡ | Less than one cent per share. |
| (a) | Per share data based on average shares outstanding during the year. |
| (b) | The redemption fee was discontinued as of April 1, 2010. |
| (c) | Total investment return is calculated exclusive of sales charges and assumes the reinvestment of dividends and distributions. |
| | | | | | |
The notes to the financial statements are an integral part of,
and should be read in conjunction with, the financial statements. | | mainstayinvestments.com | | | 29 | |
Financial Highlights selected per share data and ratios
| | | | | | | | | | | | | | | | | | | | |
| | | Class C | |
| | | Year ended October 31, | |
| | | 2012 | | | 2011 | | | 2010 | | | 2009 | | | 2008 | |
Net asset value at beginning of year | | $ | 5.81 | | | $ | 5.90 | | | $ | 5.54 | | | $ | 4.57 | | | $ | 6.31 | |
| | | | | | | | | | | | | | | | | | | | |
Net investment income (loss) (a) | | | 0.34 | | | | 0.36 | | | | 0.36 | | | | 0.36 | | | | 0.38 | |
Net realized and unrealized gain (loss) on investments | | | 0.27 | | | | (0.08 | ) | | | 0.38 | | | | 1.00 | | | | (1.73 | ) |
Net realized and unrealized gain (loss) on foreign currency transactions | | | 0.00 | ‡ | | | 0.00 | ‡ | | | 0.00 | ‡ | | | 0.00 | ‡ | | | 0.00 | ‡ |
| | | | | | | | | | | | | | | | | | | | |
Total from investment operations | | | 0.61 | | | | 0.28 | | | | 0.74 | | | | 1.36 | | | | (1.35 | ) |
| | | | | | | | | | | | | | | | | | | | |
Less dividends and distributions: | | | | | | | | | | | | | | | | | | | | |
From net investment income | | | (0.37 | ) | | | (0.37 | ) | | | (0.37 | ) | | | (0.36 | ) | | | (0.38 | ) |
Return of capital | | | — | | | | — | | | | (0.01 | ) | | | (0.03 | ) | | | (0.01 | ) |
| | | | | | | | | | | | | | | | | | | | |
Total dividends and distributions | | | (0.37 | ) | | | (0.37 | ) | | | (0.38 | ) | | | (0.39 | ) | | | (0.39 | ) |
| | | | | | | | | | | | | | | | | | | | |
Redemption fee (a)(b) | | | — | | | | — | | | | 0.00 | ‡ | | | 0.00 | ‡ | | | 0.00 | ‡ |
| | | | | | | | | | | | | | | | | | | | |
Net asset value at end of year | | $ | 6.05 | | | $ | 5.81 | | | $ | 5.90 | | | $ | 5.54 | | | $ | 4.57 | |
| | | | | | | | | | | | | | | | | | | | |
Total investment return (c) | | | 10.93 | % | | | 4.95 | % | | | 13.81 | % | | | 31.57 | % | | | (22.60 | %) |
Ratios (to average net assets)/Supplemental Data: | | | | | | | | | | | | | | | | | | | | |
Net investment income (loss) | | | 5.78 | % | | | 6.05 | % | | | 6.28 | % | | | 7.29 | % | | | 6.54 | % |
Net expenses | | | 1.78 | % | | | 1.80 | % | | | 1.83 | % | | | 1.90 | % | | | 1.86 | % |
Portfolio turnover rate | | | 29 | % | | | 45 | % | | | 41 | % | | | 41 | % | | | 29 | % |
Net assets at end of year (in 000’s) | | $ | 819,807 | | | $ | 654,224 | | | $ | 698,491 | | | $ | 651,209 | | | $ | 276,418 | |
| ‡ | Less than one cent per share. |
| (a) | Per share data based on average shares outstanding during the year. |
| (b) | The redemption fee was discontinued as of April 1, 2010. |
| (c) | Total investment return is calculated exclusive of sales charges and assumes the reinvestment of dividends and distributions. |
| | | | | | | | | | | | | | | | | | | | |
| | | Class I | |
| | | Year ended October 31, | |
| | | 2012 | | | 2011 | | | 2010 | | | 2009 | | | 2008 | |
Net asset value at beginning of year | | $ | 5.84 | | | $ | 5.92 | | | $ | 5.56 | | | $ | 4.60 | | | $ | 6.35 | |
| | | | | | | | | | | | | | | | | | | | |
Net investment income (loss) (a) | | | 0.40 | | | | 0.42 | | | | 0.42 | | | | 0.41 | | | | 0.44 | |
Net realized and unrealized gain (loss) on investments | | | 0.28 | | | | (0.06 | ) | | | 0.38 | | | | 1.00 | | | | (1.73 | ) |
Net realized and unrealized gain (loss) on foreign currency transactions | | | 0.00 | ‡ | | | 0.00 | ‡ | | | 0.00 | ‡ | | | 0.00 | ‡ | | | 0.00 | ‡ |
| | | | | | | | | | | | | | | | | | | | |
Total from investment operations | | | 0.68 | | | | 0.36 | | | | 0.80 | | | | 1.41 | | | | (1.29 | ) |
| | | | | | | | | | | | | | | | | | | | |
Less dividends and distributions: | | | | | | | | | | | | | | | | | | | | |
From net investment income | | | (0.44 | ) | | | (0.44 | ) | | | (0.43 | ) | | | (0.42 | ) | | | (0.45 | ) |
Return of capital | | | — | | | | — | | | | (0.01 | ) | | | (0.03 | ) | | | (0.01 | ) |
| | | | | | | | | | | | | | | | | | | | |
Total dividends and distributions | | | (0.44 | ) | | | (0.44 | ) | | | (0.44 | ) | | | (0.45 | ) | | | (0.46 | ) |
| | | | | | | | | | | | | | | | | | | | |
Redemption fee (a)(b) | | | — | | | | — | | | | 0.00 | ‡ | | | 0.00 | ‡ | | | 0.00 | ‡ |
| | | | | | | | | | | | | | | | | | | | |
Net asset value at end of year | | $ | 6.08 | | | $ | 5.84 | | | $ | 5.92 | | | $ | 5.56 | | | $ | 4.60 | |
| | | | | | | | | | | | | | | | | | | | |
Total investment return (c) | | | 12.02 | % | | | 6.19 | % | | | 14.98 | % | | | 32.84 | % | | | (21.63 | %) |
Ratios (to average net assets)/Supplemental Data: | | | | | | | | | | | | | | | | | | | | |
Net investment income (loss) | | | 6.81 | % | | | 7.11 | % | | | 7.34 | % | | | 8.38 | % | | | 7.57 | % |
Net expenses | | | 0.75 | % | | | 0.74 | % | | | 0.78 | % | | | 0.83 | % | | | 0.87 | % |
Portfolio turnover rate | | | 29 | % | | | 45 | % | | | 41 | % | | | 41 | % | | | 29 | % |
Net assets at end of year (in 000’s) | | $ | 2,982,526 | | | $ | 1,775,230 | | | $ | 1,736,365 | | | $ | 1,141,889 | | | $ | 508,239 | |
| ‡ | Less than one cent per share. |
| (a) | Per share data based on average shares outstanding during the year. |
| (b) | The redemption fee was discontinued as of April 1, 2010. |
| (c) | Total investment return is calculated exclusive of sales charges and assumes the reinvestment of dividends and distributions. Class I shares are not subject to sales charges. |
| | | | |
| 30 | | MainStay High Yield Corporate Bond Fund | | The notes to the financial statements are an integral part of,
and should be read in conjunction with, the financial statements. |
Financial Highlights selected per share data and ratios
| | | | |
| | | Class R1 | |
| | | June 29,
2012**
through
October 31, | |
| | | 2012 | |
Net asset value at beginning of period | | $ | 5.92 | |
| | | | |
Net investment income (loss) (a) | | | 0.14 | |
Net realized and unrealized gain (loss) on investments | | | 0.16 | |
Net realized and unrealized gain (loss) on foreign currency transactions | | | 0.00 | ‡ |
| | | | |
Total from investment operations | | | 0.30 | |
| | | | |
Less dividends: | | | | |
From net investment income | | | (0.14 | ) |
| | | | |
Net asset value at end of period | | $ | 6.08 | |
| | | | |
Total investment return (b) | | | 5.17 | %(c) |
Ratios (to average net assets)/Supplemental Data: | | | | |
Net investment income (loss) | | | 6.49 | %†† |
Net expenses | | | 0.87 | %†† |
Portfolio turnover rate | | | 29 | % |
Net assets at end of period (in 000’s) | | $ | 26 | |
| ** | Commencement of operations. |
| ‡ | Less than one cent per share. |
| (a) | Per share data based on average shares outstanding during the period. |
| (b) | Total investment return is calculated exclusive of sales charges and assumes the reinvestment of dividends and distributions. Class R1 shares are not subject to sales charges. |
| (c) | Total investment return is not annualized. |
| | | | | | |
The notes to the financial statements are an integral part of,
and should be read in conjunction with, the financial statements. | | mainstayinvestments.com | | | 31 | |
Financial Highlights selected per share data and ratios
| | | | | | | | | | | | | | | | | | | | |
| | | Class R2 | |
| | | Year ended October 31, | | | May 1,
2008**
through
October 31, | |
| | | 2012 | | | 2011 | | | 2010 | | | 2009 | | | 2008 | |
Net asset value at beginning of period | | $ | 5.84 | | | $ | 5.93 | | | $ | 5.56 | | | $ | 4.60 | | | $ | 5.99 | |
| | | | | | | | | | | | | | | | | | | | |
Net investment income (loss) (a) | | | 0.38 | | | | 0.40 | | | | 0.40 | | | | 0.39 | | | | 0.21 | |
Net realized and unrealized gain (loss) on investments | | | 0.28 | | | | (0.07 | ) | | | 0.39 | | | | 1.01 | | | | (1.38 | ) |
Net realized and unrealized gain (loss) on foreign currency transactions | | | 0.00 | ‡ | | | 0.00 | ‡ | | | 0.00 | ‡ | | | 0.00 | ‡ | | | 0.00 | ‡ |
| | | | | | | | | | | | | | | | | | | | |
Total from investment operations | | | 0.66 | | | | 0.33 | | | | 0.79 | | | | 1.40 | | | | (1.17 | ) |
| | | | | | | | | | | | | | | | | | | | |
Less dividends and distributions: | | | | | | | | | | | | | | | | | | | | |
From net investment income | | | (0.42 | ) | | | (0.42 | ) | | | (0.41 | ) | | | (0.41 | ) | | | (0.21 | ) |
Return of capital | | | — | | | | — | | | | (0.01 | ) | | | (0.03 | ) | | | (0.01 | ) |
| | | | | | | | | | | | | | | | | | | | |
Total dividends and distributions | | | (0.42 | ) | | | (0.42 | ) | | | (0.42 | ) | | | (0.44 | ) | | | (0.22 | ) |
| | | | | | | | | | | | | | | | | | | | |
Redemption fee (a)(b) | | | — | | | | — | | | | 0.00 | ‡ | | | 0.00 | ‡ | | | 0.00 | ‡ |
| | | | | | | | | | | | | | | | | | | | |
Net asset value at end of period | | $ | 6.08 | | | $ | 5.84 | | | $ | 5.93 | | | $ | 5.56 | | | $ | 4.60 | |
| | | | | | | | | | | | | | | | | | | | |
Total investment return (c) | | | 11.66 | % | | | 5.67 | % | | | 14.78 | % | | | 32.31 | % | | | (20.13 | %)(d) |
Ratios (to average net assets)/Supplemental Data: | | | | | | | | | | | | | | | | | | | | |
Net investment income (loss) | | | 6.46 | % | | | 6.76 | % | | | 6.99 | % | | | 7.59 | % | | | 7.48 | % †† |
Net expenses | | | 1.10 | % | | | 1.09 | % | | | 1.13 | % | | | 1.18 | % | | | 1.20 | % †† |
Portfolio turnover rate | | | 29 | % | | | 45 | % | | | 41 | % | | | 41 | % | | | 29 | % |
Net assets at end of period (in 000’s) | | $ | 14,280 | | | $ | 9,927 | | | $ | 9,120 | | | $ | 6,240 | | | $ | 41 | |
| ** | Commencement of operations. |
| ‡ | Less than one cent per share. |
| (a) | Per share data based on average shares outstanding during the period. |
| (b) | The redemption fee was discontinued as of April 1, 2010. |
| (c) | Total investment return is calculated exclusive of sales charges and assumes the reinvestment of dividends and distributions. Class R2 shares are not subject to sales charges. |
| (d) | Total investment return is not annualized. |
| | | | |
| 32 | | MainStay High Yield Corporate Bond Fund | | The notes to the financial statements are an integral part of,
and should be read in conjunction with, the financial statements. |
Notes to Financial Statements
Note 1–Organization and Business
The MainStay Funds (the “Trust”) were organized on January 9, 1986, as a Massachusetts business trust. The Trust is registered under the Investment Company Act of 1940, as amended (the “1940 Act”), as an open-end investment management company, and is comprised of twelve funds (collectively referred to as the “Funds”). These financial statements and notes relate only to the MainStay High Yield Corporate Bond Fund (the “Fund”), a diversified fund.
The Fund currently offers seven classes of shares. Class A shares commenced operations on January 3, 1995. Class B shares commenced operations on May 1, 1986. Class C shares commenced operations on September 1, 1998. Class I shares commenced operations on January 2, 2004. Class R2 shares were first offered to the public on December 14, 2007, but did not commence operations until May 1, 2008. Investor Class shares commenced operations on February 28, 2008. Class R1 shares commenced operations on June 29, 2012. Investor Class and Class A shares are offered at net asset value (“NAV”) per share plus an initial sales charge. No sales charge applies to investments of $1 million or more (and certain other qualified purchases) in Investor Class and Class A shares, but a contingent deferred sales charge (“CDSC”) is imposed on certain redemptions of such shares made within one year of the date of purchase. Class B and Class C shares are offered at NAV without an initial sales charge, although a declining CDSC may be imposed on redemptions made within six years of the date of purchase of Class B shares and a 1.00% CDSC may be imposed on redemptions made within one year of the date of purchase of Class C shares. Class I, Class R1 and Class R2 shares are offered at NAV and are not subject to a sales charge. Depending upon eligibility, Class B shares convert to either Investor Class or Class A shares at the end of the calendar quarter eight years after the date they were purchased. Additionally, depending upon eligibility, Investor Class shares may convert to Class A shares and Class A shares may convert to Investor Class shares. The seven classes of shares have the same voting (except for issues that relate solely to one class), dividend, liquidation and other rights, and the same terms and conditions, except that Class B and Class C shares are subject to higher distribution and/or service fee rates than Investor Class, Class A and Class R2 shares under a distribution plan pursuant to Rule 12b-1 under the 1940 Act. Class I and Class R1 shares are not subject to a distribution and/or service fee. Class R1 and Class R2 shares are subject to a shareholder service fee. This is in addition to any fees paid under a distribution plan, where applicable.
The Fund’s investment objective is to seek maximum current income through investment in a diversified portfolio of high-yield debt securities. Capital appreciation is a secondary objective.
Note 2–Significant Accounting Policies
The Fund prepares its financial statements in accordance with generally accepted accounting principles (“GAAP”) in the United States of America and follows the significant accounting policies described below.
(A) Securities Valuation. Investments are valued as of the close of regular trading on the New York Stock Exchange (“Exchange”) (generally 4:00 p.m. Eastern time) on each day the Fund is open for business (“valuation date”).
The Board of Trustees (the “Board”) has adopted procedures for the valuation of the Fund’s securities and has delegated the responsibility for valuation determination under those procedures to the Valuation Committee of the Fund (the “Valuation Committee”). The Board has authorized the Valuation Committee to appoint a Valuation Sub-Committee (the “Sub-Committee”) to deal in the first instance with questions that arise or cannot be resolved under these procedures. The Sub-Committee will meet (in person, via electronic mail or via teleconference) on an as-needed basis. The Valuation Committee shall meet at a later time, as necessary, to ensure that actions taken by the Sub-Committee were appropriate. The procedures recognize that, subject to the oversight of the Board and unless otherwise noted, the responsibility for day-to-day valuation of portfolio assets (including securities for which market prices are not readily available) rests with New York Life Investment Management LLC (“New York Life Investments” or the “Manager”), aided to whatever extent necessary by the Subadvisor (as defined in Note 3(A)) of the Fund. These procedures shall be reviewed by the Board no less frequently than annually. Any revisions to these procedures deemed necessary shall be reported to the Board at its next regularly scheduled meeting.
Securities are valued using unadjusted market prices, when available, as supplied primarily by third party pricing services or dealers. To assess the appropriateness of security valuations, the Manager or the Fund’s third party service provider who is subject to oversight by the Manager, regularly compares prior day prices, prices on comparable securities and the sale prices to the prior and current day prices and challenges prices exceeding certain tolerance levels with third party pricing services or broker sources. For those securities valued by recommendation, whether through a standardized fair valuation methodology or a fair valuation determination, the Valuation Committee reviews and affirms the reasonableness of the valuation based on such methodologies and determinations on a regular basis after considering all relevant information that is reasonably available.
“Fair value” is defined as the price that the Fund would receive upon selling an investment in an orderly transaction to an independent buyer in the principal or most advantageous market of the investment. Fair value measurements are determined within a framework that has established a three-tier hierarchy which maximizes the use of observable market data and minimizes the use of unobservable inputs to establish classification of fair value measurements for disclosure purposes. “Inputs” refer broadly to the assumptions that market participants would use in pricing the asset or liability, including assumptions about risk, such as the risk inherent in a particular valuation technique used to measure fair value using a pricing model and/or the risk inherent in the inputs for the valuation technique. Inputs may be observable or unobservable. Observable inputs reflect the assumptions market participants would use in pricing the asset or liability based on market data obtained from sources independent of the Fund. Unobservable inputs reflect the Fund’s own assumptions about the assumptions market participants would use in pricing the asset or liability developed based on the information available in the circumstances. The inputs or methodology used for valuing securities may not be an indication of the
| | | | |
| mainstayinvestments.com | | | 33 | |
Notes to Financial Statements (continued)
risks associated with investing in those securities. The three-tier hierarchy of inputs is summarized in the three broad Levels listed below.
| • | | Level 1—quoted prices in active markets for identical investments |
| • | | Level 2—other significant observable inputs (including quoted prices for similar investments in active markets, interest rates and yield curves, prepayment speeds, credit risks, etc.) |
| • | | Level 3—significant unobservable inputs (including the Fund’s own assumptions about the assumptions that market participants would use in determining the fair value of investments) |
The aggregate value by input level, as of October 31, 2012, for the Fund’s investments is included at the end of the Fund’s Portfolio of Investments.
The valuation techniques used by the Fund to measure fair value maximize the use of observable inputs and minimize the use of unobservable inputs. The Fund may utilize third party vendor evaluations, whose prices may be derived from one or more of the following standard inputs:
| | |
• Benchmark Yields | | • Reported Trades |
• Broker Dealer Quotes | | • Issuer Spreads |
• Two-sided markets | | • Benchmark securities |
• Bids/Offers | | • Reference Data (corporate actions or material event notices) |
• Industry and economic events | | • Comparable bonds |
• Equity and credit default swap curves | | • Monthly payment information |
Securities for which market value cannot be determined using the methodologies described above are valued by methods deemed in good faith by the Fund’s Valuation Committee, following the procedures established by the Board, to represent fair value. Under these procedures, the Fund primarily employs a market-based approach which may use related or comparable assets or liabilities, recent transactions, market multiples, book values, and other relevant information. The Fund may also use an income-based valuation approach in which the anticipated future cash flows of the investment are discounted to calculate fair value. Discounts may also be applied due to the nature or duration of any restrictions on the disposition of the investments. Due to the inherent uncertainty of valuations of such investments, the fair values may differ significantly from the values that would have been used had an active market existed. For the year ended October 31, 2012, there have been no changes to the fair value methodologies.
Equity and non-equity securities which may be valued in this manner include, but are not limited to: (i) a security for which the trading has been halted or suspended; (ii) a debt security that has recently gone into default and for which there is not a current market quotation; (iii) a security of an issuer that has entered into a restructuring; (iv) a security that has been de-listed from a national exchange; (v) a security for which the market price is not available from a third party pricing source or, if so provided, does not, in the opinion of the Fund’s Manager or Subadvisor reflect the security’s market value; and (vi) a security whose principal market has been temporarily closed at a time when, under normal conditions, it would be open. Securities for which market quotations or observable inputs are not readily available are generally categorized as
Level 3 in the hierarchy. As of October 31, 2012, the Fund held securities with a value of $66,882,203 that were fair valued in such a manner.
Certain events may occur between the time that foreign markets close, on which securities held by the Fund principally trade, and the time at which the Fund’s NAV is calculated. These events may include, but are not limited to, situations relating to a single issuer in a market sector, significant fluctuations in U.S. or foreign markets, natural disasters, armed conflicts, governmental actions or other developments not tied directly to the securities markets. Should the Manager or Subadvisor conclude that such events may have affected the accuracy of the last price of such securities reported on the local foreign market, the Manager or Subadvisor may, pursuant to procedures adopted by the Fund’s Board, adjust the value of the local price to reflect the impact on the price of such securities as a result of such events. In this instance, securities are generally categorized as Level 3 in the hierarchy. Additionally, foreign equity securities are also fair valued whenever the movement of a particular index exceeds certain thresholds. In such cases, the securities are fair valued by applying factors provided by a third party vendor in accordance with the Fund’s policies and procedures and are generally categorized as Level 2 in the hierarchy. As of October 31, 2012, the Fund did not hold any foreign equity securities.
Equity securities and Exchange Traded Funds are valued at the latest quoted sales prices as of the close of regular trading on the Exchange on each valuation date. Securities that are not traded on the valuation date are valued at the mean of the latest quoted bid and ask prices. Prices normally are taken from the principal market in which each security trades. Investments in other mutual funds are valued at their respective NAV as of the close of the Exchange on the valuation date. These securities are generally categorized as Level 1 in the hierarchy.
Debt securities (other than convertible bonds and municipal debt securities) are valued at the evaluated bid prices (evaluated mean prices in the case of convertible bonds and municipal debt securities) supplied by a pricing agent or broker selected by the Fund’s Manager in consultation with the Fund’s Subadvisor if any, whose prices reflect broker/dealer supplied valuations and electronic data processing techniques, if such prices are deemed by the Fund’s Manager, in consultation with the Fund’s Subadvisor, if any, to be representative of market values, at the regular close of trading of the Exchange on each valuation date. Debt securities, including corporate bonds, U.S. government and federal agency bonds, municipal bonds, foreign bonds, Yankee bonds, convertible bonds, asset-backed securities and mortgage-backed securities are generally categorized as Level 2 in the hierarchy.
Temporary cash investments acquired over 60 days to maturity are valued using the latest bid prices or using valuations based on a matrix system (which considers such factors as security prices, yields, maturities, and ratings), both as furnished by independent pricing services. Other temporary cash investments which mature in 60 days or less (“Short-Term Investments”) are valued at amortized cost. The amortized cost method involves valuing a security at its cost on the date of purchase and thereafter assuming a constant amortization to maturity of the difference between such cost and the value on maturity date. Amortized cost approximates the current fair value of a security. Securities valued at amortized cost are not valued using a quoted price in an active market. These securities are generally categorized as Level 2 in the hierarchy.
| | |
| 34 | | MainStay High Yield Corporate Bond Fund |
Loan assignments, participations and commitments are valued at the average of bid quotations obtained from the engaged independent pricing service, and are generally categorized as Level 2 in the hierarchy. Certain loan assignments, participations and commitments may be valued by single broker quotes obtained from the engaged independent pricing service with significant unobservable inputs and are generally categorized as Level 3 in the hierarchy. For these loan assignments, participations and commitments, the Manager may consider additional factors such as liquidity of the Fund’s investments.
As of October 31, 2012, the Fund held securities with a value of $20,131,697 that were valued by a single broker quote and/or deemed to be illiquid.
The valuation techniques and significant amounts of unobservable inputs used in the fair valuation measurement of the Fund’s Level 3 securities are outlined in the tables below. A significant increase or decrease in any of those inputs in isolation would result in a significantly higher or lower fair value measurement.
| | | | | | | | | | |
Asset Class | | Fair Value at
10/31/12 | | | Valuation Technique | | Unobservable Inputs | | Input Amount /
Range |
Convertible Bond (1 position) | | $ | 6,154 | | | Income Approach | | Estimated Recovery Rate | | $0.00 - $0.01 |
Corporate Bonds (9 positions) | | | 31,402,079 | | | Income/Market Approach | | Estimated Remaining Cash/Collateral | | $324M |
| | | | | | | | Liquidity Discount | | 15% - 20% |
| | | | | | | | Offered Quotes | | $0.0625 - $101.75 |
| | | | | | | | Discount Rate | | 9% - 30% |
| | | | | | | | Distribution Percentage | | 73% |
| | | | | | | | Probability of Success | | 20% - 50% |
| | | | | | | | EBITDA Multiple | | 12 |
Loan Assignments & Participations (4 positions) | | | 49,396,597 | | | Income/Market Approach | | Asset Coverage | | 1.83x - 3.26x |
| | | | | | | | Offered Quotes | | $97 - $100 |
| | | | | | | | Call Price | | $103 |
Common Stocks (4 positions) | | | 6,185,881 | | | Income/Market Approach | | Estimated Remaining Claims/Value | | $0.01 |
| | | | | | | | Liquidity Discount | | 10% - 20% |
| | | | | | | | Offered Quote | | $2 |
| | | | | | | | Discount Rate | | 12% |
| | | | | | | | EBITDA Multiple | | 5.5 |
Warrants (2 positions) | | | 23 | | | Income Approach | | Probability of Liquidity Event | | 0% |
| | | | | | | | | | |
| | $ | 86,990,734 | | | | | | | |
| | | | | | | | | | |
Generally, a security is considered illiquid if it cannot be sold or disposed of in the ordinary course of business at approximately the price at which it is valued. Its illiquidity might prevent the sale of such security at a time when the Manager or Subadvisor might wish to sell, and these securities could have the effect of decreasing the overall level of a Fund’s liquidity. Further, the lack of an established secondary market may make it more difficult to value illiquid securities, requiring the Fund to rely on judgments that may be somewhat subjective in determining value, which could vary from the amount that the Fund could realize upon disposition. Difficulty in selling illiquid securities may result in a loss or may be costly to the Fund. Under the supervision of the Board, the Manager or Subadvisor determines the liquidity of the Fund’s investments; in doing so, the Manager or Subadvisor may consider various factors, including (i) the frequency of trades and quotations, (ii) the number of dealers and prospective purchasers, (iii) dealer undertakings to make a market, and (iv) the nature of the security and the market in which it trades (e.g., the time needed to dispose of the security, the method of soliciting offers and the mechanics of transfer). Illiquid securities generally will be valued in good faith in such a manner as the Board deems appropriate to reflect their fair value.
(B) Income Taxes. The Fund’s policy is to comply with the requirements of the Internal Revenue Code of 1986, as amended (the “Internal Revenue Code”), applicable to regulated investment companies and to distribute all of the taxable income to the shareholders of the Fund within the allowable time limits. Therefore, no federal, state and local income tax provision is required.
Management evaluates its tax positions to determine if the tax positions taken meet the minimum recognition threshold in connection with
accounting for uncertainties in income tax positions taken or expected to be taken for the purposes of measuring and recognizing tax liabilities in the financial statements. Recognition of tax benefits of an uncertain tax position is required only when the position is “more likely than not” to be sustained assuming examination by taxing authorities. Management has analyzed the Fund’s tax positions taken on federal, state and local income tax returns for all open tax years (for up to three tax years), and has concluded that no provision for federal, state and local income tax are required in the Fund’s financial statements. The Fund’s federal, state and local income and federal excise tax returns for tax years for which the applicable statutes of limitations have not expired are subject to examination by the Internal Revenue Service and state and local departments of revenue.
(C) Dividends and Distributions to Shareholders. Dividends and distributions are recorded on the ex-dividend date. The Fund intends to declare and pay dividends of net investment income, if any, at least monthly and distributions of net realized capital and currency gains, if any, at least annually. Unless the shareholder elects otherwise, all dividends and distributions are reinvested in the same class of shares of the Fund, at NAV. Dividends and distributions to shareholders are determined in accordance with federal income tax regulations and may differ from GAAP.
(D) Security Transactions and Investment Income. The Fund records security transactions on the trade date. Realized gains and losses on security transactions are determined using the identified cost method. Dividend income is recognized on the ex-dividend date and interest income is accrued as earned using the effective interest rate
| | | | |
| mainstayinvestments.com | | | 35 | |
Notes to Financial Statements (continued)
method. Discounts and premiums on securities purchased, other than Short-Term Investments, for the Fund are accreted and amortized, respectively, on the effective interest rate method over the life of the respective securities or, in the case of a callable security, over the period to the first date of call. Discounts and premiums on Short-Term Investments are accreted and amortized, respectively, on the straight-line method.
Investment income and realized and unrealized gains and losses on investments of the Fund are allocated to separate classes of shares pro rata based upon their relative net assets on the date the income is earned or realized and unrealized gains and losses are incurred.
The Fund may place a debt obligation on non-accrual status and reduce related interest income by ceasing current accruals and writing off interest receivables when the collection of all or a portion of interest has become doubtful based on consistently applied procedures. A debt obligation is removed from non-accrual status when the issuer resumes interest payments or when collectability of interest is reasonably assured.
(E) Expenses. Expenses of the Trust are allocated to the individual Funds in proportion to the net assets of the respective Funds when the expenses are incurred, except where direct allocations of expenses can be made. Expenses (other than transfer agent expenses and fees incurred under the shareholder services plans and the distribution plans further discussed in Note 3(B)) are allocated to separate classes of shares pro rata based upon their relative net assets on the date the expenses are incurred. The expenses borne by the Fund, including those of related parties to the Fund, are shown in the Statement of Operations.
(F) Use of Estimates. In preparing financial statements in conformity with GAAP, management makes estimates and assumptions that affect the reported amounts and disclosures in the financial statements. Actual results could differ from those estimates.
(G) Repurchase Agreements. The Fund may enter into repurchase agreements to earn income. The Fund may enter into repurchase agreements only with financial institutions that are deemed by the Manager or Subadvisor to be creditworthy, pursuant to guidelines established by the Fund’s Board. During the term of any repurchase agreement, the Manager will continue to monitor the creditworthiness of the seller. Under the 1940 Act, repurchase agreements are considered to be collateralized loans by a Fund to the seller secured by the securities transferred to the Fund.
When the Fund invests in repurchase agreements, the Fund’s custodian takes possession of the collateral pledged for investments in the repurchase agreement. The underlying collateral is valued daily on a mark-to-market basis to determine that the value, including accrued interest, exceeds the repurchase price. In the event of the seller’s default on the obligation to repurchase, the Fund has the right to liquidate the collateral and apply the proceeds in satisfaction of the obligation. Under certain circumstances, such as in the event of default or bankruptcy by the counterparty to the agreement, realization and/or retention of the collateral may be subject to legal proceedings and possible realized loss to the Fund.
(H) Loan Assignments, Participations and Commitments. The Fund invests in loan assignments and loan participations. Loan assignments
and participations (“loans”) are agreements to make money available (a “commitment”) to a borrower in a specified amount, at a specified rate and within a specified time. Such loans are typically senior, secured and collateralized in nature. The Fund records an investment when the borrower withdraws money and records interest as earned. These loans pay interest at rates that are periodically reset by reference to a base lending rate plus a spread. These base lending rates are generally the prime rate offered by a designated U.S. bank or the London InterBank Offered Rate.
The loans in which the Fund invests are generally readily marketable, but may be subject to some restrictions on resale. For example, the Fund may be contractually obligated to receive approval from the agent bank and/or borrower prior to the sale of these investments.
The Fund assumes the credit risk of the borrower, the selling participant and any other persons interpositioned between the Fund and the borrower (“intermediate participants”). In the event that the borrower, selling participant or intermediate participants become insolvent or enters into bankruptcy, the Fund may incur certain costs and delays in realizing payment, or may suffer a loss of principal and/or interest.
Unfunded commitments represent the remaining obligation of the Fund to the borrower. At any point in time, up to the maturity date of the issue, the borrower may demand the unfunded portion. These unfunded amounts are marked to market and recorded in the Statement of Assets and Liabilities. As of October 31, 2012, the Fund did not hold any unfunded commitments.
(I) Foreign Currency Transactions. The books and records of the Fund are kept in U.S. dollars. Prices of securities denominated in foreign currency amounts are translated into U.S. dollars at the mean between the buying and selling rates last quoted by any major U.S. bank at the following dates:
| (i) market | value of investment securities, other assets and liabilities—at the valuation date, and |
| (ii) | purchases and sales of investment securities, income and expenses—at the date of such transactions. |
The assets and liabilities that are denominated in foreign currency amounts are presented at the exchange rates and market values at the close of the period. The realized and unrealized changes in net assets arising from fluctuations in exchange rates and market prices of securities are not separately presented.
Net realized gain (loss) on foreign currency transactions represents net gains and losses on foreign currency forward contracts, net currency gains or losses realized as a result of differences between the amounts of securities sale proceeds or purchase cost, dividends, interest and withholding taxes as recorded on the Fund’s books, and the U.S. dollar equivalent amount actually received or paid. Net currency gains or losses from valuing such foreign currency denominated assets and liabilities, other than investments at valuation date exchange rates, are reflected in unrealized foreign exchange gains or losses.
(J) Rights and Warrants. A right is a certificate that permits the holder to purchase a certain number of shares, or a fractional share, of a new stock from the issuer at a specific price. A warrant is an instrument that entitles the holder to buy an equity security at a specific price
| | |
| 36 | | MainStay High Yield Corporate Bond Fund |
for a specific period of time. The Fund may enter into rights and warrants when securities are acquired through a corporate action. With respect to warrants in international markets, the securities are only purchased when the underlying security cannot be purchased due to the many restrictions an industry and/or country might place on foreign investors. These investments can provide a greater potential for profit or loss than an equivalent investment in the underlying security. Prices of these investments do not necessarily move in tandem with the prices of the underlying securities.
There is risk involved in the purchase of rights and warrants in that these investments are speculative investments. The Fund could also lose the entire value of its investment in warrants if the warrant is not exercised by the date of its expiration. The securities are sold as soon as the opportunity becomes available. The Fund is exposed to risk until each sale is completed. As of October 31, 2012, the Fund did not hold any rights.
(K) Securities Lending. In order to realize additional income, the Fund may engage in securities lending, subject to the limitations set forth in the 1940 Act, and relevant guidance by the staff of the Securities and Exchange Commission. In the event the Fund does engage in securities lending, the Fund will lend through its custodian, State Street Bank and Trust Company (“State Street”). State Street will manage the Fund’s cash collateral in accordance with the Lending Agreement between the Fund and State Street, and indemnify the Fund’s portfolio against counterparty risk. The loans will be collateralized by cash or securities at least equal at all times to the market value of the securities loaned. Collateral will consist of U.S. government securities, cash equivalents or irrevocable letters of credit. The Fund may bear the risk of delay in recovery of, or loss of rights in, the securities loaned should the borrower of the securities experience financial difficulty. The Fund may also record realized gain or loss on securities deemed sold due to a borrower’s inability to return securities on loan. The Fund will receive compensation for lending its securities in the form of fees or the retention of a portion of the interest on the investment of any cash received as collateral. The Fund also will continue to receive interest and dividends on the securities loaned and any gain or loss in the market price of the securities loaned that may occur during the term of the loan will be for the account of the Fund.
Although the Fund and New York Life Investments have temporarily suspended securities lending, the Fund and New York Life Investments reserve the right to reinstitute lending when deemed appropriate. The Fund had no portfolio securities on loan as of October 31, 2012.
(L) Restricted Securities. A restricted security is a security which has been purchased through a private offering and cannot be resold to the general public without prior registration under the Securities Act of 1933, as amended. The Fund may not have the right to demand that such securities be registered. Disposal of these securities may involve time-consuming negotiations and expenses and it may be difficult to obtain a prompt sale at an acceptable price. (See Note 6)
(M) Concentration of Risk. The Fund invests in high-yield securities (sometimes called “junk bonds”), which are generally considered speculative because they present a greater risk of loss, including default, than higher quality debt securities. These securities pay investors a premium—a high interest rate or yield—because of the
increased risk of loss. These securities can also be subject to greater price volatility.
The Fund invests in foreign securities, which carry certain risks that are in addition to the usual risks inherent in domestic instruments. These risks include those resulting from currency fluctuations, future adverse political and economic developments and possible imposition of currency exchange blockages or other foreign governmental laws or restrictions. These risks are likely to be greater in emerging markets than in developed markets. The ability of issuers of debt securities held by the Fund to meet their obligations may be affected by economic or political developments in a specific country, industry or region.
(N) Indemnifications. Under the Trust’s organizational documents, its officers and trustees are indemnified against certain liabilities that may arise out of performance of their duties to the Trust. Additionally, in the normal course of business, the Fund enters into contracts with third-party service providers that contain a variety of representations and warranties and which may provide general indemnifications. The Fund’s maximum exposure under these arrangements is unknown, as this would involve future claims that may be made against the Fund that have not yet occurred. Based on experience, management is of the view that the risk of loss in connection with these potential indemnification obligations is remote. However, there can be no assurance that material liabilities related to such obligations will not arise in the future, which could adversely impact the Fund.
(O) Quantitative Disclosure of Derivative Holdings. The following tables show additional disclosures about the Fund’s derivative and hedging activities, including how such activities are accounted for and their effect on the Fund’s financial positions, performance and cash flows. These derivatives are not accounted for as hedging instruments.
Fair value of derivatives instruments as of October 31, 2012:
Asset Derivatives
| | | | | | | | | | |
| | | Statement of
Assets and
Liabilities
Location | | Equity
Contracts
Risk | | | Total | |
Warrants | | Investments in securities, at value | | $ | 375,323 | | | $ | 375,323 | |
| | | | | | |
Total Fair Value | | | | $ | 375,323 | | | $ | 375,323 | |
| | | | | | |
The effect of derivative instruments on the Statement of Operations for the year ended October 31, 2012:
Change in Unrealized Appreciation (Depreciation)
| | | | | | | | | | |
| | | Statement of
Operations
Location | | Equity
Contracts
Risk | | | Total | |
Warrants | | Net change in unrealized appreciation (depreciation) on investments | | $ | (1,188,450 | ) | | $ | (1,188,450 | ) |
| | | | | | |
Total Change in Unrealized Appreciation (Depreciation) | | | | $ | (1,188,450 | ) | | $ | (1,188,450 | ) |
| | | | | | |
| | | | |
| mainstayinvestments.com | | | 37 | |
Notes to Financial Statements (continued)
Number of Contracts, Notional Amounts or Shares/Units (1)
| | | | | | | | |
| | | Equity
Contracts
Risk | | | Total | |
Warrants | | | 14,777 | | | | 14,777 | |
| | | | |
| (1) | Amount disclosed represents the actual average held during the year ended October 31, 2012. |
Note 3–Fees and Related Party Transactions
(A) Manager and Subadvisor. New York Life Investments, a registered investment adviser and an indirect, wholly-owned subsidiary of New York Life Insurance Company (“New York Life”), serves as the Fund’s Manager, pursuant to an Amended and Restated Management Agreement (“Management Agreement”). The Manager provides offices, conducts clerical, recordkeeping and bookkeeping services, and keeps most of the financial and accounting records required to be maintained by the Fund. Except for the portion of salaries and expenses that are the responsibility of the Fund, the Manager pays the salaries and expenses of all personnel affiliated with the Fund and certain operational expenses of the Fund. The Fund reimburses New York Life Investments in an amount equal to a portion of the salary of the Chief Compliance Officer (“CCO”) of the Fund. MacKay Shields LLC (“MacKay Shields” or the “Subadvisor”), a registered investment adviser and an indirect, wholly-owned subsidiary of New York Life, serves as Subadvisor to the Fund and is responsible for the day-to-day portfolio management of the Fund. Pursuant to the terms of an Amended and Restated Subadvisory Agreement (“Subadvisory Agreement”) between New York Life Investments and MacKay Shields, New York Life Investments pays for the services of the Subadvisor.
The Fund pays the Manager a monthly fee for services performed and facilities furnished at an annual rate of the Fund’s average daily net assets as follows: 0.60% up to $500 million; 0.55% from $500 million up to $5 billion; 0.525% from $5 billion up to $7 billion; and 0.50% in excess of $7 billion, plus a fee for fund accounting services previously provided by New York Life Investments under a separate fund accounting agreement furnished at an annual rate of the Fund’s average daily net assets as follows: 0.05% up to $20 million; 0.0333% from $20 million to $100 million; and 0.01% in excess of $100 million. The effective management fee rate was 0.55% for the year ended October 31, 2012, inclusive of a fee for fund accounting services of 0.01% of the Fund’s average daily net assets.
For the year ended October 31, 2012, New York Life Investments earned fees from the Fund in the amount of $40,189,446.
State Street, 1 Lincoln Street, Boston, Massachusetts 02111, provides sub-administration and sub-accounting services to the Fund pursuant to an agreement with New York Life Investments. These services include calculating the daily NAVs of the Fund, maintaining the general ledger and sub-ledger accounts for the calculation of the Fund’s respective NAVs, and assisting New York Life Investments in conducting various aspects of the Fund’s administrative operations. For providing these services to the Fund, State Street is compensated by New York Life Investments.
(B) Distribution, Service and Shareholder Service Fees. The Trust, on behalf of the Fund, has entered into a distribution agreement with NYLIFE Distributors LLC (the “Distributor”), an indirect, wholly-owned subsidiary of New York Life. The Fund has adopted distribution plans (the “Plans”) in accordance with the provisions of Rule 12b-1 under the 1940 Act.
Pursuant to the Investor Class, Class A and Class R2 Plans, the Distributor receives a monthly distribution fee from the Investor Class, Class A and Class R2 shares at an annual rate of 0.25% of the average daily net assets of the Investor Class, Class A and Class R2 shares for distribution and/or service activities as designated by the Distributor. Pursuant to the Class B and Class C Plans, Class B and Class C shares pay the Distributor a monthly distribution fee at an annual rate of 0.75% of the average daily net assets of the Class B and Class C shares, along with a service fee at an annual rate of 0.25% of the average daily net assets of the Class B and Class C shares, for a total 12b-1 fee of 1.00%. Class I and Class R1 shares are not subject to a distribution and/or service fee.
The Plans provide that the distribution and service fees are payable to the Distributor regardless of the amounts actually expended by the Distributor for distribution of the Fund’s shares and service activities.
In accordance with the Shareholder Services Plan for the Class R2 shares, the Manager has agreed to provide, through its affiliates or independent third parties, various shareholder and administrative support services to shareholders of the Class R2 shares. For its services, the Manager is entitled to a Shareholder Service Fee accrued daily and paid monthly at an annual rate of 0.10% of the average daily net assets of the Class R2 shares. This is in addition to any fees paid under a distribution plan, where applicable.
For the year ended October 31, 2012, the Fund incurred shareholder service fees of $11,232.
(C) Sales Charges. The Fund was advised by the Distributor that the amount of sales charges retained on sales of Investor Class and Class A shares were $139,233 and $1,234,443, respectively, for the year ended October 31, 2012. The Fund was also advised that the Distributor retained CDSCs on redemptions of Investor Class, Class A, Class B and Class C shares of $31, $26,508, $259,204 and $61,493, respectively, for the year ended October 31, 2012.
(D) Transfer, Dividend Disbursing and Shareholder Servicing Agent. NYLIM Service Company LLC, an affiliate of New York Life Investments, is the Fund’s transfer, dividend disbursing and shareholder servicing agent pursuant to an agreement between NYLIM Service Company LLC and the Trust. NYLIM Service Company LLC has entered into an agreement with Boston Financial Data Services, Inc. (“BFDS”) pursuant to which BFDS performs certain transfer agent services on behalf of NYLIM Service Company LLC. Transfer agent expenses
| | |
| 38 | | MainStay High Yield Corporate Bond Fund |
incurred by the Fund for the year ended October 31, 2012, were as follows:
| | | | |
Investor Class | | $ | 578,409 | |
Class A | | | 5,947,017 | |
Class B | | | 476,847 | |
Class C | | | 1,451,909 | |
Class I | | | 3,739,875 | |
Class R1 | | | 17 | |
Class R2 | | | 18,315 | |
(E) Small Account Fee. Shareholders with small accounts adversely impact the cost of providing transfer agency services. In an effort to reduce total transfer agency expenses, the Fund has implemented a small account fee on certain types of accounts. Certain shareholders with an account balance of less than $1,000 are charged an annual per account fee of $20 (assessed semi-annually), the proceeds from which offset transfer agent fees as reflected in the Statement of Operations.
(F) Capital. As of October 31, 2012, New York Life and its affiliates beneficially held shares of the Fund with the following values and percentages of net assets as follows:
| | | | | | | | |
Class I | | $ | 5,551,069 | | | | 0.2 | % |
Class R1 | | | 26,137 | | | | 99.4 | |
Note 4–Federal Income Tax
As of October 31, 2012, the components of accumulated gain (loss) on a tax basis were as follows:
| | | | | | | | | | | | | | | | | | |
Ordinary
Income | | | Accumulated
Capital and
Other Gain
(Loss) | | | Other
Temporary
Differences | | | Unrealized
Appreciation
(Depreciation) | | | Total
Accumulated Gain (Loss) | |
| | $— | | | $ | (306,142,877 | ) | | $ | (10,296,893 | ) | | $ | 449,948,897 | | | $ | 133,509,127 | |
The difference between book basis and tax basis unrealized appreciation (depreciation) is primarily due to wash sale adjustments, amortization of premium and class actions. The other temporary differences are primarily due to dividends payable, defaulted bond income accruals and modified debt instruments.
The following table discloses the current year reclassifications between undistributed net investment income (loss), accumulated net realized gain (loss) on investments, and additional paid-in capital arising from permanent differences; net assets as of October 31, 2012 were not affected.
| | | | | | | | |
Undistributed
Net Investment
Income (Loss) | | Accumulated
Net Realized
Gain (Loss)
on Investments | | | Additional
Paid-In
Capital | |
| $42,972,573 | | $ | 5,234,105 | | | $ | (48,206,678 | ) |
The reclassifications for the Fund are primarily due to foreign currency gain (loss), defaulted bond income accruals, consent fees and taxable over-distribution.
Under the Regulated Investment Company Modernization Act of 2010, the Fund is permitted to carry forward capital losses incurred in taxable years beginning after December 22, 2010, for an unlimited period. However, any losses incurred during those future years will be required to be utilized prior to the losses incurred in pre-enactment tax years. As a result of this ordering rule, pre-enactment capital loss carryforwards may be more likely to expire unused. Additionally, post-enactment capital losses that are carried forward will retain their character as either short-term or long-term capital losses rather than being considered all short-term as under previous law.
As of October 31, 2012, for federal income tax purposes, capital loss carryforwards of $306,142,877 were available as shown in the table below, to the extent provided by the regulations to offset future realized gains of the Fund through the years indicated. To the extent that these capital loss carryforwards are used to offset future capital gains, it is probable that the capital gains so offset will not be distributed to shareholders. No capital gain distributions shall be made until any capital loss carryforwards have been fully utilized or expired.
| | | | | | | | |
Capital Loss
Available Through | | Short-Term
Capital Loss
Amounts (000’s) | | | Long-Term
Capital Loss
Amounts (000’s) | |
2016
2017 | | $
| 37,519
268,624 |
| | $
| —
— |
|
| Total | | $ | 306,143 | | | $ | — | |
The Fund utilized $81,902,222 of capital loss carryforwards during the year ended October 31, 2012.
The tax character of distributions paid during the years ended October 31, 2012 and October 31, 2011 shown in the Statements of Changes in Net Assets was as follows:
| | | | | | | | |
| | | 2012 | | | 2011 | |
Distributions paid from:
Ordinary Income | | $ | 514,745,617 | | | $ | 462,109,616 | |
| | | | |
| mainstayinvestments.com | | | 39 | |
Notes to Financial Statements (continued)
Note 5–Restricted Securities
As of October 31, 2012, the Fund held the following restricted securities:
| | | | | | | | | | | | | | | | | | | | |
Security | | Date(s) of
Acquisition | | | Principal
Amount/
Number of
Warrants/
Shares | | | Cost | | | 10/31/2012
Value | | | Percent
of Net
Assets | |
Adelphia Contingent Value Vehicle
Common Stock | | | 4/2/02-5/29/02 | | | | 15,507,390 | | | $ | 5,770,382 | | | $ | 155,074 | | | | 0.00 | %‡ |
AES Eastern Energy, L.P. (Escrow Shares)
Corporate Bond
9.00%, due 1/2/17 | | | 6/29/12 | | | $ | 9,320,076 | | | | 1,584,866 | | | | 1,584,413 | | | | 0.02 | |
At Home Corp.
Convertible Bond
4.75%, due 12/31/49 | | | 5/29/01 | | | $ | 61,533,853 | | | | 0 | (a) | | | 6,154 | | | | 0.00 | ‡ |
ION Media Networks, Inc.
Warrant, Unsecured Debt, Expires 12/18/16 | | | 3/12/10 | | | | 1,126 | | | | 3,435 | | | | 11 | | | | 0.00 | ‡ |
Warrant, Second Lien, Expires 12/18/39 | | | 12/20/10 | | | | 1,141 | | | | — | | | | 12 | | | | 0.00 | ‡ |
Lear Corp. (Escrow Shares)
Corporate Bond
8.75%, due 12/1/16 | | | 11/18/09 | | | $ | 15,444,000 | | | | — | | | | 23,166 | | | | 0.00 | ‡ |
Majestic Star Casino LLC Membership Units
Common Stock | | | 12/1/11 | | | | 446,020 | | | | 892,040 | | | | 892,040 | | | | 0.01 | |
Somerset Cayuga Holding Co., Inc. (PIK)
Corporate Bond
20.00%, due 6/15/17 | | | 6/29/12 | | | $ | 3,440,000 | | | | 3,440,000 | | | | 4,644,000 | | | | 0.06 | |
Unifi, Inc.
Loan Assignments & Participations
8.75%, due 5/1/17 | | | 4/24/12 | | | $ | 10,580,000 | | | | 10,483,647 | | | | 10,897,400 | | | | 0.13 | |
Upstate NY Power Producers
Common Stock | | | 5/11/99-2/28/11 | | | | 51,473 | | | | 875,042 | | | | 875,041 | | | | 0.01 | |
Total | | | | | | | | | | $ | 23,049,412 | | | $ | 19,077,311 | | | | 0.23 | % |
| ‡ | Less than one-tenth of a percent. |
Note 6–Custodian
State Street is the custodian of the cash and the securities of the Fund. Custodial fees are charged to the Fund based on the market value of securities in the Fund and the number of certain cash transactions incurred by the Fund.
Note 7–Line of Credit
The Fund and certain affiliated funds maintain a line of credit with a syndicate of banks in order to secure a source of funds for temporary purposes to meet unanticipated or excessive redemption requests.
Effective August 29, 2012, under an amended credit agreement, the aggregate commitment amount is $200,000,000 with an optional maximum amount of $250,000,000. The commitment fee is an annual rate of 0.08% of the average commitment amount payable quarterly, regardless of usage, to Bank of New York Mellon, which serves as the agent to the syndicate. The commitment fee is allocated among certain
MainStay Funds based upon net assets and other factors. Interest on any revolving credit loan is charged based upon the Federal Funds Advances rate or the one month London InterBank Offered Rate, whichever is higher. The amended credit agreement expires on August 28, 2013, although the MainStay Funds and the syndicate of banks may renew the amended credit agreement for an additional year on the same or different terms. Prior to August 29, 2012, the aggregate commitment amount was $125,000,000 with an optional maximum amount of $175,000,000. There were no borrowings made or outstanding with respect to the Fund on the amended credit agreement during the year ended October 31, 2012.
Note 8–Purchases and Sales of Securities (in 000’s)
During the year ended October 31, 2012, purchases and sales of securities, other than short-term securities, were $3,718,033 and $2,003,123, respectively.
| | |
| 40 | | MainStay High Yield Corporate Bond Fund |
Note 9–Capital Share Transactions
| | | | | | | | |
Investor Class | | Shares | | | Amount | |
Year ended October 31, 2012: | | | | | | | | |
Shares sold | | | 7,022,882 | | | $ | 42,082,705 | |
Shares issued to shareholders in reinvestment of dividends | | | 3,071,615 | | | | 18,351,068 | |
Shares redeemed | | | (6,538,943 | ) | | | (39,082,873 | ) |
| | | | |
Net increase (decrease) in shares outstanding before conversion | | | 3,555,554 | | | | 21,350,900 | |
Shares converted into Investor Class (See Note 1) | | | 4,234,891 | | | | 25,323,256 | |
Shares converted from Investor Class (See Note 1) | | | (7,225,762 | ) | | | (43,507,617 | ) |
| | | | |
Net increase (decrease) | | | 564,683 | | | $ | 3,166,539 | |
| | | | |
Year ended October 31, 2011: | | | | | | | | |
Shares sold | | | 5,111,719 | | | $ | 30,485,632 | |
Shares issued to shareholders in reinvestment of dividends | | | 2,960,375 | | | | 17,570,516 | |
Shares redeemed | | | (6,877,828 | ) | | | (40,945,549 | ) |
| | | | |
Net increase (decrease) in shares outstanding before conversion | | | 1,194,266 | | | | 7,110,599 | |
Shares converted into Investor Class (See Note 1) | | | 4,655,768 | | | | 27,587,309 | |
Shares converted from Investor Class (See Note 1) | | | (4,621,430 | ) | | | (27,538,348 | ) |
| | | | |
Net increase (decrease) | | | 1,228,604 | | | $ | 7,159,560 | |
| | | | |
| | |
| | | | | | | | |
Class A | | Shares | | | Amount | |
Year ended October 31, 2012: | | | | | | | | |
Shares sold | | | 193,127,685 | | | $ | 1,146,792,748 | |
Shares issued to shareholders in reinvestment of dividends | | | 32,625,015 | | | | 193,460,933 | |
Shares redeemed | | | (142,057,127 | ) | | | (841,837,904 | ) |
| | | | |
Net increase (decrease) in shares outstanding before conversion | | | 83,695,573 | | | | 498,415,777 | |
Shares converted into Class A (See Note 1) | | | 14,730,943 | | | | 87,433,351 | |
Shares converted from Class A (See Note 1) | | | (1,103,995 | ) | | | (6,662,559 | ) |
| | | | |
Net increase (decrease) | | | 97,322,521 | | | $ | 579,186,569 | |
| | | | |
Year ended October 31, 2011: | | | | | | | | |
Shares sold | | | 129,893,290 | | | $ | 764,766,017 | |
Shares issued to shareholders in reinvestment of dividends | | | 29,996,636 | | | | 176,638,500 | |
Shares redeemed | | | (175,270,496 | ) | | | (1,034,995,857 | ) |
| | | | |
Net increase (decrease) in shares outstanding before conversion | | | (15,380,570 | ) | | | (93,591,340 | ) |
Shares converted into Class A (See Note 1) | | | 16,072,503 | | | | 94,830,428 | |
Shares converted from Class A (See Note 1) | | | (1,567,690 | ) | | | (9,101,467 | ) |
| | | | |
Net increase (decrease) | | | (875,757 | ) | | $ | (7,862,379 | ) |
| | | | |
| | |
| | | | | | | | |
| | | | | | | | |
Class B | | Shares | | | Amount | |
Year ended October 31, 2012: | | | | | | | | |
Shares sold | | | 6,604,436 | | | $ | 38,989,318 | |
Shares issued to shareholders in reinvestment of dividends | | | 2,050,794 | | | | 12,084,707 | |
Shares redeemed | | | (7,427,186 | ) | | | (43,862,277 | ) |
| | | | |
Net increase (decrease) in shares outstanding before conversion | | | 1,228,044 | | | | 7,211,748 | |
Shares converted from Class B (See Note 1) | | | (10,662,616 | ) | | | (62,586,431 | ) |
| | | | |
Net increase (decrease) | | | (9,434,572 | ) | | $ | (55,374,683 | ) |
| | | | |
Year ended October 31, 2011: | | | | | | | | |
Shares sold | | | 5,252,347 | | | $ | 30,812,825 | |
Shares issued to shareholders in reinvestment of dividends | | | 2,589,027 | | | | 15,200,236 | |
Shares redeemed | | | (10,805,068 | ) | | | (63,567,155 | ) |
| | | | |
Net increase (decrease) in shares outstanding before conversion | | | (2,963,694 | ) | | | (17,554,094 | ) |
Shares converted from Class B (See Note 1) | | | (14,601,911 | ) | | | (85,777,922 | ) |
| | | | |
Net increase (decrease) | | | (17,565,605 | ) | | $ | (103,332,016 | ) |
| | | | | | | | |
| | |
| | | | | | | | |
Class C | | Shares | | | Amount | |
Year ended October 31, 2012: | | | | | | | | |
Shares sold | | | 36,115,148 | | | $ | 213,680,344 | |
Shares issued to shareholders in reinvestment of dividends | | | 5,245,653 | | | | 30,986,839 | |
Shares redeemed | | | (18,460,357 | ) | | | (109,192,900 | ) |
| | | | |
Net increase (decrease) | | | 22,900,444 | | | $ | 135,474,283 | |
| | | | |
Year ended October 31, 2011: | | | | | | | | |
Shares sold | | | 21,348,773 | | | $ | 125,338,607 | |
Shares issued to shareholders in reinvestment of dividends | | | 4,508,987 | | | | 26,458,081 | |
Shares redeemed | | | (31,684,597 | ) | | | (186,273,101 | ) |
| | | | |
Net increase (decrease) | | | (5,826,837 | ) | | $ | (34,476,413 | ) |
| | | | |
| | |
| | | | | | | | |
Class I | | Shares | | | Amount | |
Year ended October 31, 2012: | | | | | | | | |
Shares sold | | | 297,440,593 | | | $ | 1,764,443,264 | |
Shares issued to shareholders in reinvestment of dividends | | | 23,496,250 | | | | 139,728,874 | |
Shares redeemed | | | (134,590,051 | ) | | | (800,213,225 | ) |
| | | | |
Net increase (decrease) | | | 186,346,792 | | | $ | 1,103,958,913 | |
| | | | |
Year ended October 31, 2011: | | | | | | | | |
Shares sold | | | 179,083,112 | | | $ | 1,058,162,353 | |
Shares issued to shareholders in reinvestment of dividends | | | 16,764,265 | | | | 98,762,713 | |
Shares redeemed | | | (184,918,979 | ) | | | (1,082,826,471 | ) |
| | | | |
Net increase (decrease) | | | 10,928,398 | | | $ | 74,098,595 | |
| | | | |
| | |
| | | | | | | | |
Class R1 (a) | | Shares | | | Amount | |
Year ended October 31, 2012: | | | | | | | | |
Shares sold | | | 4,223 | | | $ | 25,000 | |
Shares issued to shareholders in reinvestment of dividends | | | 101 | | | | 612 | |
| | | | |
Net increase (decrease) | | | 4,324 | | | $ | 25,612 | |
| | | | |
| | | | |
| mainstayinvestments.com | | | 41 | |
Notes to Financial Statements (continued)
| | | | | | | | |
Class R2 | | Shares | | | Amount | |
Year ended October 31, 2012: | | | | | | | | |
Shares sold | | | 1,402,056 | | | $ | 8,354,025 | |
Shares issued to shareholders in reinvestment of dividends | | | 117,875 | | | | 699,434 | |
Shares redeemed | | | (871,521 | ) | | | (5,161,907 | ) |
| | | | |
Net increase (decrease) | | | 648,410 | | | $ | 3,891,552 | |
| | | | |
Year ended October 31, 2011: | | | | | | | | |
Shares sold | | | 883,838 | | | $ | 5,228,640 | |
Shares issued to shareholders in reinvestment of dividends | | | 113,297 | | | | 668,037 | |
Shares redeemed | | | (836,240 | ) | | | (4,929,131 | ) |
| | | | |
Net increase (decrease) | | | 160,895 | | | $ | 967,546 | |
| | | | |
| (a) | Class R1 shares were first offered on June 29, 2012. |
Note 10–Subsequent Events
In connection with the preparation of the financial statements of the Fund as of and for the year ended October 31, 2012, events and transactions subsequent to October 31, 2012 through the date the financial statements were issued have been evaluated by the Fund’s management for possible adjustment and/or disclosure. No subsequent events requiring financial statement adjustment or disclosure have been identified.
| | |
| 42 | | MainStay High Yield Corporate Bond Fund |
Report of Independent Registered Public Accounting Firm
The Board of Trustees and Shareholders of
The MainStay Funds:
We have audited the accompanying statement of assets and liabilities, including the portfolio of investments, of the MainStay High Yield Corporate Bond Fund (the “Fund”), one of the funds constituting The MainStay Funds, as of October 31, 2012, and the related statement of operations for the year then ended, the statements of changes in net assets for each of the years in the two-year period then ended, and the financial highlights for each of the years or periods in the five-year period then ended. These financial statements and financial highlights are the responsibility of the Fund’s management. Our responsibility is to express an opinion on these financial statements and financial highlights based on our audits.
We conducted our audits in accordance with the standards of the Public Company Accounting Oversight Board (United States). Those standards require that we plan and perform the audit to obtain reasonable assurance about whether the financial statements and financial highlights are free of material misstatement. An audit includes examining, on a test basis, evidence supporting the amounts and disclosures in the financial statements. Our procedures included confirmation of securities owned as of October 31, 2012, by correspondence with the custodian and brokers or by other appropriate auditing procedures where replies from brokers were not received. An audit also includes assessing the accounting principles used and significant estimates made by management, as well as evaluating the overall financial statement presentation. We believe that our audits provide a reasonable basis for our opinion.
In our opinion, the financial statements and financial highlights referred to above present fairly, in all material respects, the financial position of the MainStay High Yield Corporate Bond Fund of The MainStay Funds as of October 31, 2012, the results of its operations for the year then ended, the changes in its net assets for each of the years in the two-year period then ended, and the financial highlights for each of the years or periods in the five-year period then ended, in conformity with U.S. generally accepted accounting principles.

Philadelphia, Pennsylvania
December 21, 2012
| | | | |
| mainstayinvestments.com | | | 43 | |
Federal Income Tax Information
(Unaudited)
The Fund is required under the Internal Revenue Code to advise shareholders in a written statement as to the federal tax status of dividends paid by the Fund during such fiscal years.
For the fiscal year ended October 31, 2012, the Fund designated approximately $2,447,699 under the Internal Revenue Code as qualified dividend income eligible for reduced tax rates.
The dividends paid by the Fund during the fiscal year ended October 31, 2012, should be multiplied by 0.49% to arrive at the corporate dividends received deduction.
In February 2013, shareholders will receive an IRS Form 1099-DIV or substitute Form 1099 which will show the federal tax status of the distributions received by shareholders in calendar year 2012. The amounts that will be reported on such 1099-DIV or substitute Form 1099 will be the amounts you are to use on your federal income tax return and will differ from the amounts which we must report for the Fund’s fiscal year ended October 31, 2012.
Proxy Voting Policies and Procedures and Proxy Voting Record
A description of the policies and procedures that New York Life Investments uses to vote proxies related to the Fund’s securities is available without charge, upon request, (i) by visiting the Fund’s website at mainstayinvestments.com; or (ii) on the SEC’s website at www.sec.gov.
The Fund is required to file with the SEC its proxy voting record for the 12-month period ending June 30 on Form N-PX. The Fund’s most recent Form N-PX is available free of charge upon request (i) by calling 800-MAINSTAY (624-6782); (ii) by visiting the Fund’s website at mainstayinvestments.com; or (iii) on the SEC’s website at www.sec.gov.
Shareholder Reports and Quarterly Portfolio Disclosure
The Fund is required to file its complete schedule of portfolio holdings with the SEC for its first and third fiscal quarters on Form N-Q. The Fund’s Form N-Q is available without charge on the SEC’s website at www.sec.gov or by calling MainStay Investments at 800-MAINSTAY (624-6782). You also can obtain and review copies of Form N-Q by visiting the SEC’s Public Reference Room in Washington, DC (information on the operation of the Public Reference Room may be obtained by calling 1-800-SEC-0330).
| | |
| 44 | | MainStay High Yield Corporate Bond Fund |
Board Members and Officers (Unaudited)
The Board Members oversee the MainStay Group of Funds (which is comprised of Funds that are series of The MainStay Funds, Eclipse Trust, Eclipse Funds Inc., MainStay Funds Trust, MainStay VP Funds Trust, Private Advisors Alternative Strategies Master Fund, Private Advisors Alternative Strategies Fund, and MainStay Defined Term Municipal Opportunities Fund) (collectively, the “Fund Complex”), the Manager and, when applicable, the Subadvisor(s) and other service providers to the Fund Complex. Each Board Member serves until his or her successor is elected and qualified or until his or her resignation, death or removal. The Retirement Policy provides that a Board Member
shall tender his or her resignation by the end of the calendar year during which he or she reaches the age of 75.
Officers serve a term of one year and are elected annually by the Board Members. The business address of each Board Member and officer listed below is 51 Madison Avenue, New York, New York 10010.
The Statement of Additional Information applicable to the Fund includes additional information about the Board Members and is available without charge, upon request, by calling 800-MAINSTAY (624-6782) or by going online to mainstayinvestments.com.
| | | | | | | | | | | | |
| | | | | Name and
Date of Birth | | Term of Office,
Position(s) Held
with the Fund
Complex and
Length of Service | | Principal Occupation(s)
During Past Five Years | | Number of
Funds in
Fund Complex
Overseen by
Board Member | | Other Directorships
Held by Board Member |
| Interested Board Member* | | | | John Y. Kim
9/24/60 | | Indefinite;
Eclipse Trust: Trustee since 2008;
Eclipse Funds Inc.:
Director since 2008 (1 fund);
The MainStay Funds: Trustee since 2008 (12 funds);
MainStay Funds Trust: Trustee since 2009 (31 funds); and
MainStay VP Funds Trust: Trustee since 2011 and its predecessor, MainStay VP Series Fund, Inc. since 2008 (28 portfolios). Private Advisors Alternative Strategies Master Fund: Trustee since 2011
Private Advisors Alternative Strategies Fund: Trustee since 2011
MainStay DefinedTerm Municipal Opportunities Fund: Trustee since 2011 | | Member of the Board of Managers, President and Chief Executive Officer (since 2008), New York Life Investment Management LLC and New York Life Investment Management Holdings LLC; Member of the Board, MacKay Shields LLC since 2008; Chairman of the Board, Institutional Capital LLC, Madison Capital Funding LLC, Madison Square Investors LLC and McMorgan & Company LLC; Chairman of the Board, NYLIFE Distributors LLC and Chairman of the Board, NYLCAP Manager LLC (since 2008) President, Prudential Retirement, a business unit of Prudential Financial, Inc. (2002 to 2007) | | 75 | | None |
| | * | This Board Member is considered to be an “interested person” of the MainStay Group of Funds within the meaning of the 1940 Act because of his affiliation with New York Life Insurance Company, New York Life Investment Management LLC, Madison Square Investors LLC, MacKay Shields LLC, Private Advisors LLC, Institutional Capital LLC, NYLIFE Securities LLC and/or NYLIFE Distributors LLC, as described in detail above in the column entitled “Principal Occupation(s) During the Past Five Years.” |
| | | | |
| mainstayinvestments.com | | | 45 | |
| | | | | | | | | | | | |
| | | | | Name and
Date of Birth | | Term of Office, Position(s) Held with the Fund Complex and Length of Service | | Principal Occupation(s)
During Past Five Years | | Number of
Funds in
Fund Complex
Overseen by
Board Member | | Other Directorships
Held by Board Member |
| Non-Interested Board Members | | | | Susan B. Kerley 8/12/51 | | Indefinite;
Eclipse Trust: Chairman since 2005, and Trustee since 2000;
Eclipse Funds Inc.: Chairman since 2005 and Director since 1990 (1 fund); The MainStay Funds: Chairman and Board Member since 2007 (12 funds);
MainStay Funds Trust: Chairman and Trustee since 2009 (31 funds); and MainStay VP Funds Trust: Chairman and Trustee since 2011 and its predecessor, MainStay VP Series Fund, Inc., since 2007 (28 portfolios). Private Advisors Alternative Strategies Master Fund: Chairman and Trustee since 2011 Private Advisors Alternative Strategies Fund: Chairman and Trustee since 2011 MainStay DefinedTerm Municipal Opportunities Fund: Chairman and Trustee since 2011. | | President, Strategic Management Advisors LLC (since 1990) | | 75 | | Trustee, Legg Mason Partners Funds, since 1992 (51 portfolios) |
| | |
| 46 | | MainStay High Yield Corporate Bond Fund |
| | | | | | | | | | | | |
| | | | | Name and
Date of Birth | | Term of Office,
Position(s) Held
with the Fund
Complex and
Length of Service | | Principal Occupation(s)
During Past Five Years | | Number of
Funds in
Fund Complex
Overseen by
Board Member | | Other Directorships
Held by Board Member |
| Non-Interested Board Members | | | | Alan R. Latshaw 3/27/51 | | Indefinite;
Eclipse Trust: Trustee and Audit Committee Financial Expert since 2007;
Eclipse Funds Inc.:
Director and Audit Committee Financial Expert since 2007 (1 fund);
The MainStay Funds: Trustee and Audit Committee Financial Expert since 2006 (12 funds);
MainStay Funds Trust: Trustee and Audit Committee Financial Expert since 2009 (31 funds); and
MainStay VP Funds Trust: Trustee and Audit Committee Financial Expert since 2011 and its predecessor, MainStay VP Series Fund, Inc., since 2007 (28 portfolios). Private Advisors Alternative Strategies Master Fund: Trustee and Audit Committee Financial Expert since 2011 Private Advisors Alternative Strategies Fund: Trustee and Audit Committee Financial Expert since 2011. MainStay DefinedTerm Municipal Opportunities Fund: Trustee and Audit Committee Financial Expert since 2011. | | Retired; Partner, Ernst & Young LLP (2002 to 2003); Partner, Arthur Andersen LLP (1989 to 2002); Consultant to the MainStay Funds Audit and Compliance Committee (2004 to 2006) | | 75 | | Trustee, State Farm Associates Funds Trusts since 2005 (4 portfolios); Trustee, State Farm Mutual Fund Trust since 2005 (15 portfolios); Trustee, State Farm Variable Product Trust since 2005 (9 portfolios) |
| | | | |
| mainstayinvestments.com | | | 47 | |
| | | | | | | | | | | | |
| | | | | Name and Date of Birth | | Term of Office, Position(s) Held with the Fund Complex and Length of Service | | Principal Occupation(s)
During Past Five Years | | Number of
Funds in
Fund Complex
Overseen by
Board Member | | Other Directorships Held by Board Member |
| Non-Interested Board Members | | | | Peter Meenan
12/5/41 | | Indefinite;
Eclipse Funds: Trustee since 2002;
Eclipse Funds Inc.:
Director since 2002
(1 fund); The MainStay Funds:
Trustee since 2007 (12 funds);
MainStay Funds Trust: Trustee since 2009
(31 funds); and
MainStay VP Funds Trust: Trustee since 2011 and its predecessor, MainStay VP Series Fund, Inc., since 2007 (28 portfolios).
Private Advisors Alternative Strategies Master Fund: Trustee since 2011. Private Advisors Alternative Strategies Fund: Trustee since 2011
MainStay DefinedTerm Municipal Opportunities Fund: Trustee since 2011. | | Independent Consultant; President and Chief Executive Officer, Babson—United, Inc. (financial services firm) (2000 to 2004); Independent Consultant (1999 to 2000); Head of Global Funds, Citicorp (1995 to 1999) | | 75 | | None |
| | | | Richard H. Nolan, Jr.
11/16/46 | | Indefinite;
Eclipse Trust: Trustee since 2007;
Eclipse Funds Inc.:
Director since 2007 (1 fund);
The MainStay Funds: Trustee since 2007 (12 funds);
MainStay Funds Trust: Trustee since 2009 (31 funds); and
MainStay VP Funds Trust: Trustee since 2011 and its predecessor, MainStay VP Series Fund, Inc., since 2006 (28 portfolios).
Private Advisors Alternative Strategies Master Fund: Trustee since 2011. Private Advisors Alternative Strategies Fund: Trustee since 2011
MainStay DefinedTerm Municipal Opportunities Fund: Trustee since 2011. | | Managing Director, ICC Capital Management; President—Shields/Alliance, Alliance Capital Management (1994 to 2004) | | 75 | | None |
| | |
| 48 | | MainStay High Yield Corporate Bond Fund |
| | | | | | | | | | | | |
| | | | | Name and Date of Birth | | Term of Office, Position(s) Held with the Fund Complex and Length of Service | | Principal Occupation(s)
During Past Five Years | | Number of
Funds in
Fund Complex
Overseen by
Board Member | | Other Directorships Held by Board Member |
| Non-Interested Board Members | | | | Richard S. Trutanic 2/13/52 | | Indefinite;
Eclipse Trust: Trustee since 2007;
Eclipse Funds Inc.:
Director since 2007 (1 fund);
The MainStay Funds:
Trustee since 1994 (12 funds);
MainStay Funds Trust:
Trustee since 2009 (31 funds); and
MainStay VP Funds Trust: Trustee since 2011 and its predecessor, MainStay VP Series Fund, Inc., since 2007 (28 portfolios).
Private Advisors Alternative Strategies Master Fund: Trustee since 2011.
Private Advisors Alternative Strategies Fund: Trustee since 2011
MainStay DefinedTerm Municipal Opportunities Fund: Trustee since 2011. | | Chairman and Chief Executive Officer, Somerset & Company (financial advisory firm) (since 2004); Managing Director, The Carlyle Group (private investment firm) (2002 to 2004); Senior Managing Director, Partner and Board Member, Groupe Arnault S.A. (private investment firm) (1999 to 2002) | | 75 | | None |
| | | | |
| mainstayinvestments.com | | | 49 | |
| | | | | | | | | | | | |
| | | | | Name and Date of Birth | | Term of Office, Position(s) Held with the Fund Complex and Length of Service | | Principal Occupation(s)
During Past Five Years | | Number of
Funds in
Fund Complex
Overseen by
Board Member | | Other Directorships Held by Board Member |
| Non-Interested Board Members | | | | Roman L. Weil
5/22/40 | | Indefinite;
Eclipse Trust: Trustee and Audit Committee Financial Expert since 2007; Eclipse Funds Inc.: Director and Audit Committee Financial Expert since 2007 (1 fund); The MainStay Funds: Trustee and Audit Committee Financial Expert since 2007 (12 funds); MainStay Funds Trust: Trustee since 2009 (31 funds); and MainStay VP Funds Trust: Trustee and Audit Committee Financial Expert since 2011 and its predecessor, MainStay VP Series Fund, Inc., since 1994 and Audit Committee Financial Expert since 2003 (28 portfolios).
Private Advisors Alternative Strategies Master Fund: Trustee and Audit Committee Financial Expert since 2011 Private Advisors Alternative Strategies Fund: Trustee and Audit Committee Financial Expert since 2011. MainStay DefinedTerm Municipal Opportunities Fund: Trustee and Audit Committee Financial Expert since 2011. | | Visiting Professor, University of California—San Diego (since October 2012); Visiting Professor, Southern Methodist University (2011); Visiting Professor, NYU Stem School of Business, New York University (2011); President, Roman L. Weil Associates, Inc. (consulting firm) (since 1981); V. Duane Rath Professor Emeritus of Accounting, Chicago Booth School of Business, University of Chicago (1965-2008) | | 75 | | None |
| | |
| 50 | | MainStay High Yield Corporate Bond Fund |
| | | | | | | | | | | | |
| | | | | Name and Date of Birth | | Term of Office, Position(s) Held with the Fund Complex and Length of Service | | Principal Occupation(s)
During Past Five Years | | Number of
Funds in
Fund Complex
Overseen by
Board Member | | Other Directorships Held by Board Member |
| Non-Interested Board Members | | | | John A. Weisser 10/22/41 | | Indefinite; Eclipse Trust: Trustee since 2007; Eclipse Funds Inc.: Director since 2007 (1 fund); The MainStay Funds: Trustee since 2007 (12 funds); MainStay Funds Trust: Trustee since 2009 (31 funds); and MainStay VP Funds Trust: Trustee since 2011 and its predecessor, MainStay VP Series Fund, Inc., since 1997 (28 portfolios).
Private Advisors Alternative Strategies Master Fund: Trustee since 2011.
Private Advisors Alternative Strategies Fund: Trustee since 2011
MainStay DefinedTerm Municipal Opportunities Fund: Trustee since 2011. | | Retired. Managing Director of Salomon Brothers, Inc. (1971 to 1995) | | 75 | | Trustee, Direxion Funds since 2007 (21 portfolios); Direxion Insurance Trust since 2007 (1 portfolio); Trustee, Direxion Shares ETF Trust, since 2008 (47 portfolios) |
| | | | |
| mainstayinvestments.com | | | 51 | |
The following individuals have been appointed by the Board Members to serve as Officers of the MainStay Group of Funds.
| | | | | | | | |
| | | | | Name and
Date of Birth | | Positions(s) Held with the Funds and Length of Service | | Principal Occupation(s) During Past Five Years |
| Officers | | | | Jack R. Benintende 5/12/64 | | Treasurer and Principal Financial and Accounting Officer, Eclipse Trust, Eclipse Funds, Inc. and The MainStay Funds (since 2007), MainStay Funds Trust (since 2009) | | Assistant Treasurer, New York Life Investment Management Holdings LLC (since 2008); Managing Director, New York Life Investment Management LLC (since 2007); Treasurer and Principal Financial Accounting Officer, Private Advisors Alternative Strategies Master Fund, Private Advisors Alternative Strategies Fund and MainStay DefinedTerm Municipal Opportunities Fund (since 2011); Treasurer and Principal Financial and Accounting Officer, MainStay VP Funds Trust and its predecessor, MainStay VP Series Fund, Inc. (since 2007) |
| | | | Jeffrey A. Engelsman 9/28/67 | | Vice President and Chief Compliance Officer, Eclipse Trust, Eclipse Funds, Inc., The MainStay Funds and MainStay Funds Trust (since 2009) | | Managing Director, Compliance (since 2009), Director and Associate General Counsel, New York Life Investment Management LLC (2005 to 2008); Assistant Secretary, NYLIFE Distributors LLC (2006 to 2008); Vice President and Chief Compliance Officer, Private Advisors Alternative Strategies Master Fund, Private Advisors Alternative Strategies Fund, DefinedTerm Municipal Opportunities Fund (since 2011); MainStay VP Funds Trust and its predecessor, MainStay VP Series Fund, Inc. (since 2009); Assistant Secretary, The MainStay Funds (2006 to 2008); Assistant Secretary, Eclipse Trust, Eclipse Funds, Inc. and MainStay VP Series Fund, Inc. (2005 to 2008) |
| | | | Stephen P. Fisher 2/22/59 | | President, Eclipse Trust, Eclipse Funds, Inc. and The MainStay Funds (since 2007), MainStay Funds Trust (since 2009) | | Director, Senior Vice President, New York Life Insurance and Annuity Corporation (since 2011); Manager, President and Chief Operating Officer, NYLIFE Distributors LLC (since 2008); Chairman of the Board, NYLIM Service Company LLC (since 2008); Senior Managing Director and Chief Marketing Officer, New York Life Investment Management LLC (since 2005); President, Private Advisors Alternative Strategies Master Fund, Private Advisors Alternative Strategies Fund and MainStay DefinedTerm Municipal Opportunities Fund (since 2011); MainStay VP Funds Trust and its predecessor, MainStay VP Series Fund, Inc. (since 2007) |
| | | | J. Kevin Gao 10/13/67 | | Secretary and Chief Legal Officer, Eclipse Trust, Eclipse Funds, Inc., The MainStay Funds and MainStay Funds Trust (since 2010) | | Managing Director and Associate General Counsel, New York Life Investment Management LLC (since 2010); Secretary and Chief Legal Officer, Private Advisors Alternative Strategies Master Fund, Private Advisors Alternative Strategies Fund and MainStay DefinedTerm Municipal Opportunities Fund (since 2011); MainStay VP Funds Trust and its predecessor, MainStay VP Series Fund, Inc. (since 2010); Director and Counsel of Credit Suisse, Chief Legal Officer and Secretary of Credit Suisse Asset Management, LLC and Credit Suisse Funds (2003 to 2010) |
| | | | Scott T. Harrington 2/8/59 | | Vice President—Administration, Eclipse Trust, Eclipse Funds, Inc. and The MainStay Funds (since 2005), MainStay Funds Trust (since 2009) | | Director, New York Life Investment Management LLC (including predecessor advisory organizations) (since 2000); Executive Vice President, New York Life Trust Company and New York Life Trust Company FSB (since 2006); Vice President—Administration, Private Advisors Alternative Strategies Master Fund, Private Advisors Alternative Strategies Fund and MainStay DefinedTerm Municipal Opportunities Fund (since 2011); MainStay VP Funds Trust and its predecessor, MainStay VP Series Fund, Inc. (since 2005) |
| | * | The Officers listed above are considered to be “interested persons” of the MainStay Group of Funds within the meaning of the 1940 Act because of their affiliation with New York Life Insurance Company, New York Life Investment Management LLC, Madison Square Investors LLC, MacKay Shields LLC, Private Advisors LLC, Institutional Capital LLC, Epoch Investment Partners, Inc., Markston International, LLC, Winslow Capital Management, Inc., NYLIFE Securities LLC and/or NYLIFE Distributors LLC, as described in detail above in the column captioned “Principal Occupation(s) During Past Five Years.” Officers are elected annually by the Board to serve a one-year term. |
| | |
| 52 | | MainStay High Yield Corporate Bond Fund |
This page intentionally left blank
This page intentionally left blank
MainStay Funds
MainStay offers a wide range of Funds for virtually any investment need. The full array of MainStay open-end offerings is listed here, with information about the manager, subadvisors, legal counsel and independent registered public accounting firms.
Equity
U.S. Equity
MainStay Common Stock Fund
MainStay Epoch U.S. All Cap Fund
MainStay Epoch U.S. Equity Yield Fund
MainStay Growth Equity Fund
MainStay ICAP Equity Fund
MainStay ICAP Select Equity Fund
MainStay Large Cap Growth Fund1
MainStay MAP Fund
MainStay S&P 500 Index Fund
MainStay U.S. Small Cap Fund
MainStay 130/30 Core Fund
International/Global Equity
MainStay Epoch Global Choice Fund
MainStay Epoch Global Equity Yield Fund
MainStay Epoch International Small Cap Fund
MainStay ICAP Global Fund
MainStay ICAP International Fund
MainStay International Equity Fund
MainStay 130/30 International Fund
Income
Taxable Bond
MainStay Flexible Bond Opportunities Fund
MainStay Floating Rate Fund
MainStay Global High Income Fund
MainStay Government Fund
MainStay High Yield Corporate Bond Fund
MainStay High Yield Opportunities Fund
MainStay Indexed Bond Fund
MainStay Intermediate Term Bond Fund
MainStay Short Term Bond Fund
MainStay Money Market Fund
Municipal Bond
MainStay High Yield Municipal Bond Fund
MainStay New York Tax Free Opportunities Fund2
MainStay Tax Free Bond Fund
Mixed Asset
MainStay Balanced Fund
MainStay Convertible Fund
MainStay Income Builder Fund
MainStay Marketfield Fund
Asset Allocation/Target Date
MainStay Conservative Allocation Fund
MainStay Growth Allocation Fund
MainStay Moderate Allocation Fund
MainStay Moderate Growth Allocation Fund
MainStay Retirement 2010 Fund
MainStay Retirement 2020 Fund
MainStay Retirement 2030 Fund
MainStay Retirement 2040 Fund
MainStay Retirement 2050 Fund
Manager
New York Life Investment Management LLC
New York, New York
Subadvisors
Epoch Investment Partners, Inc.
New York, New York
Institutional Capital LLC3
Chicago, Illinois
MacKay Shields LLC3
New York, New York
Madison Square Investors LLC3
New York, New York
Marketfield Asset Management LLC
New York, New York
Markston International LLC
White Plains, New York
Winslow Capital Management, Inc.
Minneapolis, Minnesota
Legal Counsel
Dechert LLP
Independent Registered Public Accounting Firms
KPMG LLP
PricewaterhouseCoopers LLP
1. Effective January 13, 2012, the Fund was closed to new investors with certain exceptions.
2. The Fund is only registered for sale in CT, DE, FL, MA, NJ, NY, and VT.
3. An affiliate of New York Life Investment Management LLC.
Not part of the Annual Report
mainstayinvestments.com
The MainStay Funds are managed by New York Life Investment Management LLC and distributed through NYLIFE Distributors LLC, 169 Lackawanna Avenue, Parsippany, NJ 07054, a wholly owned subsidiary of New York Life Insurance Company. NYLIFE Distributors is a Member FINRA/SIPC.
MainStay Investments is a service mark and name under which New York Life Investment Management LLC does business. MainStay Investments, an indirect subsidiary of New York Life Insurance Company, New York, NY 10010, provides investment advisory products and services.
This report may be distributed only when preceded or accompanied by a current Fund prospectus.
© 2013 by NYLIFE Distributors LLC. All rights reserved.
| | | | | | | | |
| Not FDIC/NCUA Insured | | Not a Deposit | | May Lose Value | | No Bank Guarantee | | Not Insured by Any Government Agency |
| | | | |
| MYLIM-28476 MS265-12 | |
| MSHY11-12/12
NL008 |
|

MainStay Money Market Fund
Message from the President and Annual Report
October 31, 2012
This page intentionally left blank
Message from the President
Most major equity markets delivered positive results for the 12 months ended October 31, 2012. In the United States, stocks provided solid double-digit returns. With a few notable exceptions, international stock markets generally ended the reporting period in positive territory.
The stock market’s advance, however, was far from uniform. After rising to an early peak at the end of March 2012, domes-
tic and international stocks lost ground until the beginning of June. After that, stocks generally rose, reaching their high point for the reporting period in mid-September. Although stocks remained relatively buoyant through mid-October, they drifted lower as the reporting period came to a close.
A variety of forces converged to help fuel these market movements. Investors kept a close eye on developments in the European sovereign debt crisis. The European Central Bank’s Long Term Refinancing Operations helped stabilize European credit markets and provide needed liquidity. Although private holders of Greek sovereign debt had to accept a reduction in their recovery value, the anticipated voluntary exchange provided a positive spark to the markets. Rising unemployment and new austerity measures may impede economic growth as the European Union seeks to strike a delicate balance between fiscal and monetary policies.
In the United States, the Federal Reserve announced an open-ended agency mortgage-backed security purchase program, which helped calm market concerns. The Federal Reserve also continued its maturity extension program (referred to by some as “operation twist”), which seeks to put downward pressure on longer-term interest rates. At the short end of the yield curve, the Federal Reserve maintained the federal funds rate in a near-zero range. In September 2012, the Federal Open Market Committee anticipated that “exceptionally low levels for the federal funds rate” were “likely to be warranted at least through mid-2015.”
With markets stabilizing and short-term interest rates at very low levels, yield-hungry investors had incentives to lengthen maturities and accept higher risk. Domestic high-yield bonds provided double-digit returns for the reporting period, municipal bonds and convertible securities provided high single-digit returns, and domestic corporate bonds provided positive overall returns.
While most investors are pleased when markets rise, MainStay portfolio managers know that long-term results depend on more than short-term market movements. They also depend on the consistent application of well-defined investment strategies and risk-management techniques over longer periods. Our long-term perspective gives our portfolio managers the ability to look past the daily ups and downs of the market as they pursue the specific investment objectives of their individual Funds.
At MainStay, we believe that a long-term perspective can help investors as well. Instead of trying to capitalize on short-term market movements, you may prefer to focus on the long-term potential that can come from getting invested, staying invested and adding to your investments over time. Of course, past performance is no guarantee of future results.
The following pages contain more specific information on the securities, market events and investment decisions that affected your MainStay Fund(s) during the 12 months ended October 31, 2012. We invite you to read the information carefully and use it as part of your ongoing portfolio evaluation and investment review.
Sincerely,

Stephen P. Fisher
President
The opinions expressed are as of the date of this report and are subject to change. There is no guarantee that any forecast made will come to pass. This material does not constitute investment advice and is not intended as an endorsement of any specific investment.
Not part of the Annual Report
Table of Contents
An investment in the Fund is not insured or guaranteed by the Federal Deposit Insurance Corporation or any other government agency. Although the Fund seeks to preserve the value of your investment at $1.00 per share, it is possible to lose money by investing in the Fund.
Investors should refer to the Fund’s Summary Prospectus and/or Prospectus and consider the Fund’s investment objectives, strategies, risks, charges and expenses carefully before investing. The Summary Prospectus and/or Prospectus contain this and other information about the Fund. You may obtain copies of the Fund’s Summary Prospectus, Prospectus and Statement of Additional Information free of charge, upon request, by calling toll-free 800-MAINSTAY (624-6782), by writing to NYLIFE Distributors LLC, Attn: MainStay Marketing Department, 169 Lackawanna Avenue, Parsippany, New Jersey 07054 or by sending an e-mail to MainStayShareholderServices@nylim.com. These documents are also available via the MainStay Funds’ website at mainstayinvestments.com/documents. Please read the Summary Prospectus and/or Prospectus carefully before investing.
Investment and Performance Comparison1 (Unaudited)
Performance data quoted represents past performance. Past performance is no guarantee of future results. Because of market volatility, current performance may be lower or higher than the figures shown. Investment return and principal value will fluctuate, and as a result, when shares are redeemed, they may be worth more or less than their original cost. The graph below depicts the historical performance of Class B shares of the Fund. Performance will vary from class to class based on differences in class-specific expenses. For performance information current to the most recent month-end, please call 800-MAINSTAY (624-6782) or visit mainstayinvestments.com.
An investment in the Fund is not insured or guaranteed by the Federal Deposit Insurance Corporation or any other government agency. Although the Fund seeks to preserve the value of your investment at $1.00 per share, it is possible to lose money by investing in the Fund.
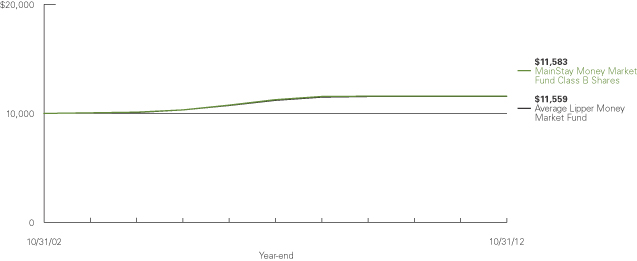
Average Annual Total Returns for the Year Ended October 31, 2012
| | | | | | | | | | | | | | | | | | |
| Class | | Sales Charge | | One Year | | | Five Years | | | Ten Years | | | Gross Expense Ratio2 | |
| Investor Class Shares3,4 | | No Sales Charge | | | 0.01 | % | | | 0.54 | % | | | 1.48 | % | | | 0.91 | % |
| Class A Shares3 | | No Sales Charge | | | 0.01 | | | | 0.57 | | | | 1.49 | | | | 0.71 | |
| Class B Shares3 | | No Sales Charge | | | 0.01 | | | | 0.54 | | | | 1.48 | | | | 0.91 | |
| Class C Shares3 | | No Sales Charge | | | 0.01 | | | | 0.54 | | | | 1.48 | | | | 0.91 | |
| | | | |
| 7-Day Current Yield: 0.01% | | | | | | | | | | | | | | | | |
| 1. | The performance table and graph do not reflect the deduction of taxes that a shareholder would pay on distributions or Fund-share redemptions. Total returns reflect maximum applicable sales charges as indicated in the table above, changes in share price, and reinvestment of dividend and capital gain distributions. The graph assumes the initial investment amount shown above and reflects the deduction of all sales charges that would have applied for the period of investment. Performance figures reflect certain fee waivers and/or expense limitations, without which total returns may have been lower. For more information on share classes and current fee waivers and/or expense limitations, please refer to the notes to the financial statements. |
| 2. | The gross expense ratios presented reflect the Fund’s “Total Annual Fund Operating Expenses” from the most recent Prospectus and may differ from other expense ratios disclosed in this report. |
| 3. | As of October 31, 2012, MainStay Money Market Fund had an effective 7-day yield of 0.01%, for Investor Class, Class A, B and C shares. The 7-day current |
| | yield was 0.01%, for Investor Class, Class A, B and C shares. These yields reflect certain expense limitations. Had these expense limitations not been in effect, the effective 7-day yield would have been –0.64%, –0.33%, –0.64%, and –0.64%, for Investor Class, Class A, B and C shares, respectively, and the 7-day current yield would have been –0.64%, –0.33%, –0.64%, –0.64%, for Investor Class, Class A, B and C shares, respectively. The current yield reflects the Fund’s earnings better than does the Fund’s total return. |
| 4. | Performance figures for Investor Class shares, first offered on February 28, 2008, include the historical performance of Class A Shares through February 27, 2008, adjusted for differences in certain expenses and fees. Unadjusted, the performance shown for Investor Class shares might have been different. |
The footnote on the next page is an integral part of the table and graph and should be carefully read in conjunction with them.
| | | | |
| mainstayinvestments.com | | | 5 | |
| | | | | | | | | | | | |
| Benchmark Performance | | One
Year | | | Five
Years | | | Ten
Years | |
Average Lipper Money Market Fund5 | | | 0.02 | % | | | 0.61 | % | | | 1.45 | % |
| 5. | The average Lipper money market fund is an equally weighted performance average adjusted for capital gains distributions and income dividends of all of the money market funds in the Lipper Universe. Lipper Inc., a wholly-owned subsidiary of Thomson Reuters, is an independent monitor of mutual |
| | fund performance. Results do not reflect any deduction of sales charges. Lipper averages are not class specific. Lipper returns are unaudited. Results are based on average total returns of similar funds with all dividend and capital gain distributions reinvested. |
The footnotes on the preceding page are an integral part of the table and graph and should be carefully read in conjunction with them.
| | |
| 6 | | MainStay Money Market Fund |
Cost in Dollars of a $1,000 Investment in MainStay Money Market Fund (Unaudited)
The example below is intended to describe the fees and expenses borne by shareholders during the six-month period from May 1, 2012, to October 31, 2012, and the impact of those costs on your investment.
Example
As a shareholder of the Fund, you incur two types of costs: (1) transaction costs, including exchange fees and sales charges (loads) on purchases (as applicable), and (2) ongoing costs, including management fees, distribution and/or service (12b-1) fees, and other Fund expenses (as applicable). This example is intended to help you understand your ongoing costs (in dollars) of investing in the Fund and to compare these costs with the ongoing costs of investing in other mutual funds. The example is based on an investment of $1,000 made at the beginning of the six-month period and held for the entire period from May 1, 2012, to October 31, 2012.
This example illustrates your Fund’s ongoing costs in two ways:
Actual Expenses
The second and third data columns in the table below provide information about actual account values and actual expenses. You may use the information in these columns, together with the amount you invested, to estimate the expenses that you paid during the six months ended October 31, 2012. Simply divide your account value by $1,000 (for example, an $8,600 account value divided by $1,000 = 8.6), then
multiply the result by the number under the heading entitled “Expenses Paid During Period” to estimate the expenses you paid on your account during this period.
Hypothetical Example for Comparison Purposes
The fourth and fifth data columns in the table below provide information about hypothetical account values and hypothetical expenses based on the Fund’s actual expense ratio and an assumed rate of return of 5% per year before expenses, which is not the Fund’s actual return. The hypothetical account values and expenses may not be used to estimate the actual ending account balances or expenses you paid for the six-month period shown. You may use this information to compare the ongoing costs of investing in the Fund with the ongoing costs of investing in other Funds. To do so, compare this 5% hypothetical example with the 5% hypothetical examples that appear in the shareholder reports of the other Funds.
Please note that the expenses shown in the table are meant to highlight your ongoing costs only and do not reflect any transactional costs, such as exchange fees or sales charges (loads). Therefore, the fourth and fifth data columns of the table are useful in comparing ongoing costs only and will not help you determine the relative total costs of owning different funds. In addition, if these transactional costs were included, your costs would have been higher.
| | | | | | | | | | | | | | | | | | | | |
| | | | | | | | | | | | | | | | |
| Share Class | | Beginning
Account
Value
5/1/12 | | | Ending Account
Value (Based
on Actual
Returns and
Expenses)
10/31/12 | | | Expenses
Paid
During
Period1 | | | Ending Account
Value (Based
on Hypothetical
5% Annualized
Return and
Actual Expenses)
10/31/12 | | | Expenses
Paid
During
Period1 | |
| | | | | |
| Investor Class Shares | | $ | 1,000.00 | | | $ | 1,000.10 | | | $ | 1.01 | | | $ | 1,024.10 | | | $ | 1.02 | |
| | | | | |
| Class A Shares | | $ | 1,000.00 | | | $ | 1,000.10 | | | $ | 0.96 | | | $ | 1,024.20 | | | $ | 0.97 | |
| | | | | |
| Class B Shares | | $ | 1,000.00 | | | $ | 1,000.10 | | | $ | 1.01 | | | $ | 1,024.10 | | | $ | 1.02 | |
| | | | | |
| Class C Shares | | $ | 1,000.00 | | | $ | 1,000.10 | | | $ | 1.01 | | | $ | 1,024.10 | | | $ | 1.02 | |
| 1. | Expenses are equal to the Fund’s annualized expense ratio of each class (0.20% for Investor Class, 0.19% for Class A and 0.20% for Class B and Class C) multiplied by the average account value over the period, divided by 366 and multiplied by 184 (to reflect the six-month period). The table above represents the actual expenses incurred during the six-month period. |
| | | | |
| mainstayinvestments.com | | | 7 | |
Portfolio Composition as of October 31, 2012 (Unaudited)

See Portfolio of Investments beginning on page 10 for specific holdings within these categories.
| | |
| 8 | | MainStay Money Market Fund |
Portfolio Management Discussion and Analysis (Unaudited)
Questions answered by portfolio managers David E. Clement, CFA, and Thomas J. Girard of New York Life Investments,1 the Fund’s Manager.
How did MainStay Money Market Fund perform relative to its peers during the 12 months ended October 31, 2012?
As of October 31, 2012, MainStay Money Market Fund provided a 7-day current yield of 0.01% for Investor Class, Class A, Class B and Class C shares. As of the same date, the Fund provided a 7-day effective yield of 0.01% for all share classes. For the 12 months ended October 31, 2012, all share classes returned 0.01%. All share classes underperformed the 0.02% return of the average Lipper2 money market fund for the 12 months ended October 31, 2012.
What factors affected the Fund’s performance during the reporting period?
During the reporting period, the Fund’s floating-rate corporate bonds continued to perform well relative to commercial paper. Short-maturity asset-backed securities added to the yield of the Fund but tightened significantly during the reporting period.
Treasury bills and agency discount notes became less expensive relative to commercial paper and helped provide needed liquidity. Higher-yielding repurchase agreements strengthened the Fund’s return.
What was the Fund’s duration3 strategy during the reporting period?
During the reporting period, we kept the Fund’s average weighted duration target around 50 days. This target was on the long side, because a money market fund’s average weighted duration cannot exceed 60 days. This strategy allowed the Fund to benefit from securities with longer maturities and higher yields, such as Treasury coupon securities and asset-backed securities. (Asset-backed securities must be recorded as though they will mature on their legal maturity date even though their average lives are typically much shorter.)
What specific factors, risks or market forces prompted significant decisions for the Fund during the reporting period?
The continued low short-term interest-rate environment kept our strategy weighted toward a longer average weighted duration throughout the reporting period. A weak economic recovery gave us the confidence to continue to emphasize these
longer-dated and higher-yielding securities. In addition, higher repurchase agreement rates increased the attractiveness of these investments. Since we use repurchase agreements to help manage the Fund’s liquidity position, higher rates helped to solidify the Fund’s yield.
During the reporting period, which market segments were the strongest contributors to the Fund’s performance and which market segments were particularly weak?
The strongest contributors to the Fund’s performance included repurchase agreements, agency discount notes, floating rate securities and asset-backed securities. The weakest contributors to the Fund’s performance were its commercial paper holdings, primarily because we continued to limit the majority of our commercial paper investments to industrial issuers.
Did the Fund make any significant purchases or sales during the reporting period?
Significant purchases included a Target Corp. floating-rate note due 1/11/13, a BP Capital Markets floating-rate note due 2/8/13, a Toronto-Dominion Bank floating-rate note due 10/21/13 and a Volvo Financial Equipment asset-backed security due 3/15/13.
Since the Fund typically holds securities until they mature, there were no significant sales during the reporting period.
How did the Fund’s sector weightings change during the reporting period?
During the reporting period, we increased the Fund’s weightings in repurchase agreements and U.S. government agencies. Over the same period, we decreased the Fund’s weightings in commercial paper and Treasury coupon securities.
| 1. | “New York Life Investments” is a service mark used by New York Life Investment Management LLC. |
| 2. | See footnote on page 6 for more information on Lipper Inc. |
| 3. | Duration is a measure of the price sensitivity of a fixed-income investment to changes in interest rates. Duration is expressed as a number of days and is considered a more accurate sensitivity gauge than average maturity. |
The opinions expressed are those of the portfolio managers as of the date of this report and are subject to change. There is no guarantee that any forecast made will come to pass. This material does not constitute investment advice and is not intended as an endorsement of any specific investment.
| | | | |
| mainstayinvestments.com | | | 9 | |
Portfolio of Investments October 31, 2012
| | | | | | | | |
| | | Principal
Amount | | | Amortized
Cost | |
| | | | | | | | |
| Short-Term Investments 100.3%† | |
Certificate of Deposit 1.0% | |
Toronto-Dominion Bank (The)
0.443%, due 2/4/13 (a) | | $ | 4,265,000 | | | $ | 4,265,000 | |
| | | | | | | | |
| | | | | | | 4,265,000 | |
| | | | | | | | |
Financial Company Commercial Paper 17.7% | | | | | |
Bank of Nova Scotia | | | | | | | | |
0.125%, due 11/5/12 (b) | | | 4,165,000 | | | | 4,164,942 | |
0.125%, due 11/9/12 (b) | | | 3,790,000 | | | | 3,789,895 | |
0.205%, due 1/16/13 (b) | | | 4,000,000 | | | | 3,998,269 | |
Caterpillar Financial Services Corp.
0.17%, due 1/17/13 (b) | | | 3,815,000 | | | | 3,813,613 | |
John Deere Bank SA
0.15%, due 11/28/12 (b)(c) | | | 3,835,000 | | | | 3,834,568 | |
JPMorgan Chase & Co. | | | | | | | | |
0.265%, due 11/1/12 (b) | | | 4,775,000 | | | | 4,775,000 | |
0.334%, due 3/13/13 (b) | | | 3,765,000 | | | | 3,765,000 | |
National Rural Utilities Cooperative Finance Corp. | | | | | | | | |
0.13%, due 11/2/12 (b) | | | 3,835,000 | | | | 3,834,986 | |
0.13%, due 11/27/12 (b) | | | 3,795,000 | | | | 3,794,644 | |
0.14%, due 11/20/12 (b) | | | 4,000,000 | | | | 3,999,704 | |
PACCAR Financial Corp. | | | | | | | | |
0.11%, due 11/5/12 (b) | | | 4,200,000 | | | | 4,199,949 | |
0.12%, due 11/15/12 (b) | | | 3,845,000 | | | | 3,844,821 | |
0.12%, due 11/26/12 (b) | | | 3,815,000 | | | | 3,814,682 | |
Private Export Funding Corp.
0.17%, due 1/22/13 (b)(c) | | | 3,815,000 | | | | 3,813,523 | |
Toronto-Dominion Holdings U.S.A., Inc. 0.321%, due 10/21/13 (a)(b)(c) | | | 3,835,000 | | | | 3,835,000 | |
U.S. Bank NA | | | | | | | | |
0.15%, due 11/13/12 (b) | | | 3,835,000 | | | | 3,835,000 | |
0.15%, due 11/16/12 (b) | | | 3,795,000 | | | | 3,795,000 | |
Wells Fargo & Co.
0.15%, due 12/11/12 (b) | | | 3,765,000 | | | | 3,764,372 | |
Westpac Banking Corp.
0.62%, due 5/3/13 (b)(c) | | | 5,545,000 | | | | 5,545,000 | |
| | | | | | | | |
| | | | | | | 76,217,968 | |
| | | | | | | | |
Government Agency Debt 13.7% | | | | | | | | |
Federal Farm Credit Bank
0.12%, due 11/14/12 (b) | | | 4,000,000 | | | | 3,999,826 | |
Federal Home Loan Bank | | | | | | | | |
0.09%, due 11/6/12 (b) | | | 2,000,000 | | | | 1,999,975 | |
0.12%, due 11/14/12 (b) | | | 4,000,000 | | | | 3,999,827 | |
0.13%, due 11/7/12 (b) | | | 3,000,000 | | | | 2,999,935 | |
0.13%, due 11/21/12 (b) | | | 7,739,000 | | | | 7,738,441 | |
0.14%, due 11/28/12 (b) | | | 8,000,000 | | | | 7,999,160 | |
| | | | | | | | |
| | | Principal
Amount | | | Amortized
Cost | |
| | | | | | | | |
Government Agency Debt (contiued) | | | | | |
Federal Home Loan Mortgage Corp. | | | | | | | | |
0.13%, due 11/19/12 (b) | | $ | 2,000,000 | | | $ | 1,999,870 | |
0.13%, due 11/26/12 (b) | | | 7,691,000 | | | | 7,690,306 | |
0.135%, due 11/6/12 (b) | | | 4,000,000 | | | | 3,999,925 | |
Federal National Mortgage Association | | | | | | | | |
0.12%, due 11/19/12 (b) | | | 2,670,000 | | | | 2,669,840 | |
0.13%, due 11/7/12 (b) | | | 10,000,000 | | | | 9,999,783 | |
0.135%, due 11/28/12 (b) | | | 4,000,000 | | | | 3,999,595 | |
| | | | | | | | |
| | | | | | | 59,096,483 | |
| | | | | | | | |
Other Commercial Paper 33.1% | | | | | | | | |
Archer-Daniels-Midland Co. | | | | | | | | |
0.15%, due 11/6/12 (b)(c) | | | 2,865,000 | | | | 2,864,940 | |
0.16%, due 11/1/12 (b)(c) | | | 3,175,000 | | | | 3,175,000 | |
0.16%, due 11/16/12 (b)(c) | | | 4,000,000 | | | | 3,999,733 | |
Baker Hughes, Inc. | | | | | | | | |
0.14%, due 11/19/12 (b)(c) | | | 4,595,000 | | | | 4,594,678 | |
0.15%, due 11/1/12 (b)(c) | | | 2,285,000 | | | | 2,285,000 | |
0.20%, due 11/14/12 (b)(c) | | | 3,635,000 | | | | 3,634,737 | |
BP Capital Markets PLC
0.67%, due 2/8/13 (b)(c) | | | 3,920,000 | | | | 3,920,000 | |
Chevron Corp. | | | | | | | | |
0.11%, due 11/26/12 (b)(c) | | | 3,790,000 | | | | 3,789,711 | |
0.122%, due 11/26/12 (b)(c) | | | 3,815,000 | | | | 3,814,682 | |
Coca-Cola Co. (The)
0.15%, due 12/27/12 (b)(c) | | | 3,830,000 | | | | 3,829,106 | |
E.I. du Pont de Nemours & Co. | | | | | | | | |
0.11%, due 11/7/12 (b)(c) | | | 3,815,000 | | | | 3,814,930 | |
0.13%, due 11/9/12 (b)(c) | | | 2,655,000 | | | | 2,654,923 | |
0.16%, due 12/4/12 (b)(c) | | | 5,040,000 | | | | 5,039,261 | |
Emerson Electric Co.
0.14%, due 12/17/12 (b)(c) | | | 3,815,000 | | | | 3,814,318 | |
Florida Power & Light Co.
0.24%, due 11/13/12 (b) | | | 5,850,000 | | | | 5,849,532 | |
Henkel of America, Inc.
0.15%, due 11/2/12 (b)(c) | | | 3,860,000 | | | | 3,859,984 | |
Honeywell International, Inc.
0.15%, due 12/20/12 (b)(c) | | | 3,830,000 | | | | 3,829,218 | |
Kimberly-Clark Worldwide, Inc. | | | | | | | | |
0.11%, due 11/14/12 (b)(c) | | | 4,575,000 | | | | 4,574,818 | |
0.13%, due 11/27/12 (b)(c) | | | 3,775,000 | | | | 3,774,646 | |
0.14%, due 11/19/12 (b)(c) | | | 3,850,000 | | | | 3,849,731 | |
McDonald’s Corp.
0.15%, due 11/15/12 (b)(c) | | | 1,815,000 | | | | 1,814,894 | |
Parker Hannifin Corp. | | | | | | | | |
0.15%, due 11/6/12 (b)(c) | | | 3,200,000 | | | | 3,199,933 | |
0.16%, due 12/12/12 (b)(c) | | | 3,835,000 | | | | 3,834,301 | |
| † | Percentages indicated are based on Fund net assets. |
| | | | |
| 10 | | MainStay Money Market Fund | | The notes to the financial statements are an integral part of,
and should be read in conjunction with, the financial statements. |
| | | | | | | | |
| | | Principal
Amount | | | Amortized
Cost | |
| | | | | | | | |
| Short-Term Investments (continued) | |
Other Commercial Paper (continued) | | | | | |
Praxair, Inc.
0.11%, due 11/8/12 (b) | | $ | 4,355,000 | | | $ | 4,354,907 | |
Sanofi | | | | | | | | |
0.15%, due 11/6/12 (b)(c) | | | 4,630,000 | | | | 4,629,904 | |
0.15%, due 11/7/12 (b)(c) | | | 3,835,000 | | | | 3,834,904 | |
0.15%, due 11/8/12 (b)(c) | | | 3,835,000 | | | | 3,834,888 | |
Siemens Capital Co., LLC
0.15%, due 11/2/12 (b)(c) | | | 3,835,000 | | | | 3,834,984 | |
Southern Co.
0.27%, due 11/20/12 (b)(c) | | | 3,795,000 | | | | 3,794,459 | |
Southern Co. (The) | | | | | | | | |
0.27%, due 12/11/12 (b)(c) | | | 3,775,000 | | | | 3,773,868 | |
0.30%, due 12/10/12 (b)(c) | | | 3,280,000 | | | | 3,278,934 | |
Toyota Motor Credit Corp.
0.12%, due 11/29/12 (b) | | | 3,815,000 | | | | 3,814,644 | |
Unilever Capital Corp.
0.12%, due 11/2/12 (b)(c) | | | 4,620,000 | | | | 4,619,985 | |
United Technologies Corp. | | | | | | | | |
0.13%, due 11/27/12 (b)(c) | | | 3,815,000 | | | | 3,814,642 | |
0.15%, due 11/1/12 (b)(c) | | | 3,760,000 | | | | 3,760,000 | |
Wal-Mart Stores, Inc. | | | | | | | | |
0.12%, due 11/5/12 (b)(c) | | | 3,815,000 | | | | 3,814,949 | |
0.12%, due 11/9/12 (b)(c) | | | 3,815,000 | | | | 3,814,898 | |
Washington Gas Light Co.
0.20%, due 11/2/12 (b) | | | 1,920,000 | | | | 1,919,989 | |
| | | | | | | | |
| | | | | | | 142,714,031 | |
| | | | | | | | |
Other Notes 7.5% | | | | | | | | |
CNH Equipment Trust | | | | | | | | |
Series 2012-B, Class A1 0.383%, due 7/12/13 | | | 1,355,788 | | | | 1,355,788 | |
Series 2012-A, Class A1 0.425%, due 4/12/13 | | | 755,220 | | | | 755,220 | |
Enterprise Fleet Financing LLC | | | | | | | | |
Series 2012-2, Class A1 0.325%, due 9/20/13 (c) | | | 3,230,626 | | | | 3,230,626 | |
Series 2012-1, Class A1 0.46%, due 5/20/13 (c) | | | 1,093,639 | | | | 1,093,639 | |
GE Equipment Transportation LLC
Series 2012-1, Class A1
0.389%, due 3/22/13 | | | 152,104 | | | | 152,104 | |
Great America Leasing Receivables
Series 2012-1, Class A1
0.512%, due 4/15/13 (c) | | | 413,666 | | | | 413,666 | |
Holmes Master Issuer PLC
Series 2012-1A, Class A1
0.414%, due 1/15/13 (a)(c) | | | 4,525,000 | | | | 4,525,000 | |
Honda Auto Receivables Owner Trust
Series 2012-1, Class A1
0.413%, due 3/15/13 | | | 172,748 | | | | 172,748 | |
| | | | | | | | |
| | | Principal
Amount | | | Amortized
Cost | |
| | | | | | | | |
Other Notes (continued) | | | | | | | | |
Huntington Auto Trust
Series 2012-1, Class A1
0.342%, due 3/15/13 | | $ | 112,416 | | | $ | 112,416 | |
Hyundai Auto Lease Securitization Trust Series 2012-A, Class A1
0.384%, due 6/17/13 (c) | | | 557,852 | | | | 557,852 | |
John Deere Owner Trust | | | | | | | | |
Series 2012-B, Class A1 0.267%, due 9/16/13 | | | 1,767,162 | | | | 1,767,162 | |
Series 2012-A, Class A1 0.379%, due 3/15/13 | | | 128,228 | | | | 128,228 | |
Mercedes-Benz Auto Lease Trust
Series 2012-A, Class A1
0.344%, due 4/15/13 | | | 8,641 | | | | 8,641 | |
MetLife Institutional Funding II | | | | | | | | |
0.481%, due 9/12/13 (a)(c) | | | 3,765,000 | | | | 3,765,000 | |
0.605%, due 4/3/13 (a)(c) | | | 2,000,000 | | | | 2,000,000 | |
MMAF Equipment Finance LLC
Series 2012-AA, Class A1
0.346%, due 7/10/13 (c) | | | 849,968 | | | | 849,968 | |
Navistar Financial Corp. Owner Trust
Series 2012-A, Class A1
0.432%, due 7/18/13 (c) | | | 1,546,605 | | | | 1,546,605 | |
Nissan Auto Lease Trust
Series 2012-A, Class A1
0.344%, due 3/15/13 | | | 22,943 | | | | 22,943 | |
Northern Trust Corp.
5.50%, due 8/15/13 | | | 1,185,000 | | | | 1,232,785 | |
SMART Trust
Series 2012-2USA, Class A1
0.424%, due 6/14/13 (c) | | | 1,167,647 | | | | 1,167,647 | |
Target Corp.
0.377%, due 1/11/13 (a) | | | 4,000,000 | | | | 4,000,000 | |
USAA Auto Owner Trust
Series 2012-1, Class A1
0.23%, due 9/16/13 | | | 2,505,270 | | | | 2,505,270 | |
Volvo Financial Equipment LLC
Series 2012-1A, Class A1
0.353%, due 3/15/13 (c) | | | 254,924 | | | | 254,924 | |
World Omni Automobile Lease Securitization Trust
Series 2012-A, Class A1
0.328%, due 6/17/13 | | | 667,361 | | | | 667,361 | |
| | | | | | | | |
| | | | | | | 32,285,593 | |
| | | | | | | | |
Treasury Debt 15.2% | | | | | | | | |
United States Treasury Bills | | | | | | | | |
0.061%, due 11/15/12 (b) | | | 5,815,000 | | | | 5,814,855 | |
0.108%, due 11/29/12 (b) | | | 7,550,000 | | | | 7,549,354 | |
0.11%, due 11/8/12 (b) | | | 6,075,000 | | | | 6,074,860 | |
| | | | | | |
The notes to the financial statements are an integral part of,
and should be read in conjunction with, the financial statements. | | mainstayinvestments.com | | | 11 | |
Portfolio of Investments October 31, 2012 (continued)
| | | | | | | | |
| | | Principal
Amount | | | Amortized
Cost | |
| | | | | | | | |
| Short-Term Investments (continued) | |
Treasury Debt (continued) | | | | | | | | |
United States Treasury Notes | | | | | | | | |
0.125%, due 8/31/13 | | $ | 3,630,000 | | | $ | 3,627,071 | |
0.125%, due 9/30/13 | | | 3,795,000 | | | | 3,792,104 | |
0.25%, due 10/31/13 | | | 3,835,000 | | | | 3,836,299 | |
0.375%, due 6/30/13 | | | 3,800,000 | | | | 3,803,797 | |
0.375%, due 7/31/13 | | | 3,590,000 | | | | 3,594,873 | |
0.50%, due 5/31/13 | | | 3,600,000 | | | | 3,606,057 | |
0.625%, due 12/31/12 | | | 7,000,000 | | | | 7,005,346 | |
0.625%, due 1/31/13 | | | 5,500,000 | | | | 5,506,326 | |
0.625%, due 2/28/13 | | | 6,000,000 | | | | 6,009,170 | |
0.625%, due 4/30/13 | | | 3,570,000 | | | | 3,577,443 | |
0.75%, due 3/31/13 | | | 2,000,000 | | | | 2,004,542 | |
| | | | | | | | |
| | | | | | | 65,802,097 | |
| | | | | | | | |
Treasury Repurchase Agreements 12.1% | | | | | |
Bank of America N.A.
0.25%, dated 10/31/12
due 11/1/12
Proceeds at Maturity $19,262,134 (Collateralized by a United States Treasury Bill, with a rate of 0.00% and a maturity date of 1/10/13, with a Principal Amount of $19,650,800 and a Market Value of $19,647,263) | | | 19,262,000 | | | | 19,262,000 | |
| | | | | | | | |
| | | Principal
Amount | | | Amortized
Cost | |
| | | | | | | | |
Treasury Repurchase Agreements (continued) | | | | | |
Deutsche Bank Securities, Inc.
0.28%, dated 10/31/12
due 11/1/12
Proceeds at Maturity $33,000,257 (Collateralized by a United States Treasury Note, with a rate of 0.75% and a maturity date of 10/31/17, with a Principal Amount of $33,644,300 and a Market Value of $33,660,079) | | $ | 33,000,000 | | | $ | 33,000,000 | |
| | | | | | | | |
| | | | | | | 52,262,000 | |
| | | | | | | | |
Total Short-Term Investments
(Amortized Cost $432,643,172) (d) | | | 100.3 | % | | | 432,643,172 | |
Other Assets, Less Liabilities | | | (0.3 | ) | | | (1,200,198 | ) |
Net Assets | | | 100.0 | % | | $ | 431,442,974 | |
| (a) | Floating rate—Rate shown is the rate in effect as of October 31, 2012. |
| (b) | Interest rate presented is yield to maturity. |
| (c) | May be sold to institutional investors only under Rule 144A or securities offered pursuant to Section 4(2) of the Securities Act of 1933, as amended. |
| (d) | The amortized cost also represents the aggregate cost for federal income tax purposes. |
The following is a summary of the fair valuations according to the inputs used as of October 31, 2012, for valuing the Fund’s assets.
Asset Valuation Inputs
| | | | | | | | | | | | | | | | |
Description | | Quoted
Prices in
Active
Markets for
Identical
Assets (Level 1) | | | Significant
Other
Observable
Inputs (Level 2) | | | Significant
Unobservable
Inputs (Level 3) | | | Total | |
| Investments in Securities (a) | | | | | | | | | | | | | | | | |
| Short-Term Investments | | | | | | | | | | | | | | | | |
Certificate of Deposit | | $ | — | | | $ | 4,265,000 | | | $ | — | | | $ | 4,265,000 | |
Financial Company Commercial Paper | | | — | | | | 76,217,968 | | | | — | | | | 76,217,968 | |
Government Agency Debt | | | — | | | | 59,096,483 | | | | — | | | | 59,096,483 | |
Other Commercial Paper | | | — | | | | 142,714,031 | | | | — | | | | 142,714,031 | |
Other Notes | | | — | | | | 32,285,593 | | | | — | | | | 32,285,593 | |
Treasury Debt | | | — | | | | 65,802,097 | | | | — | | | | 65,802,097 | |
Treasury Repurchase Agreements | | | — | | | | 52,262,000 | | | | — | | | | 52,262,000 | |
| | | | | | | | | | | | | | | | |
| Total Investments in Securities | | $ | — | | | $ | 432,643,172 | | | $ | — | | | $ | 432,643,172 | |
| | | | | | | | | | | | | | | | |
| (a) | For a complete listing of investments, see the Portfolio of Investments. |
The Fund recognizes transfers between the levels as of the beginning of the period.
For the year ended October 31, 2012, the Fund did not have any transfers between Level 1 and Level 2 fair value measurements. (See Note 2)
As of October 31, 2012, the Fund did not hold any investments with significant unobservable inputs (Level 3). (See Note 2)
| | | | |
| 12 | | MainStay Money Market Fund | | The notes to the financial statements are an integral part of,
and should be read in conjunction with, the financial statements. |
The table below sets forth the diversification of MainStay Money Market Fund investments by industry.
Industry Diversification (Unaudited)
| | | | | | | | |
| | | Amortized Cost | | | Percent † | |
Aerospace & Defense | | $ | 7,574,642 | | | | 1.8 | % |
Agriculture | | | 10,039,673 | | | | 2.3 | |
Auto Manufacturers | | | 3,814,644 | | | | 0.9 | |
Automobile ABS | | | 11,085,748 | | | | 2.6 | |
Banks | | | 46,765,263 | | | | 10.8 | |
Beverages | | | 3,829,106 | | | | 0.9 | |
Chemicals | | | 19,724,005 | | | | 4.6 | |
Cosmetics & Personal Care | | | 12,199,195 | | | | 2.8 | |
Diversified Financial Services | | | 34,950,490 | | | | 8.1 | |
Electric | | | 16,696,793 | | | | 3.9 | |
Electrical Components & Equipment | | | 3,814,318 | | | | 0.9 | |
Electronics | | | 3,829,218 | | | | 0.9 | |
Food | | | 4,619,985 | | | | 1.1 | |
Gas | | | 1,919,989 | | | | 0.4 | |
Insurance | | | 5,765,000 | | | | 1.3 | |
Miscellaneous—Manufacturing | | | 10,869,218 | | | | 2.5 | |
Oil & Gas | | | 11,524,393 | | | | 2.7 | |
Oil & Gas Services | | | 10,514,415 | | | | 2.4 | |
Other ABS | | | 5,677,060 | | | | 1.3 | |
Pharmaceuticals | | | 12,299,696 | | | | 2.9 | |
Repurchase Agreements | | | 52,262,000 | | | | 12.1 | |
Retail | | | 13,444,741 | | | | 3.1 | |
Sovereign | | | 124,898,580 | | | | 29.0 | |
WL Collateral Support CMO | | | 4,525,000 | | | | 1.0 | |
| | | | | | | | |
| | | 432,643,172 | | | | 100.3 | |
Other Assets, Less Liabilities | | | (1,200,198 | ) | | | (0.3 | ) |
| | | | | | | | |
Net Assets | | $ | 431,442,974 | | | | 100.0 | % |
| | | | | | | | |
| † | Percentages indicated are based on Fund net assets. |
| | | | | | |
The notes to the financial statements are an integral part of,
and should be read in conjunction with, the financial statements. | | mainstayinvestments.com | | | 13 | |
Statement of Assets and Liabilities as of October 31, 2012
| | | | |
| Assets | |
Investment in securities, at value (amortized cost $380,381,172) | | $ | 380,381,172 | |
Repurchase agreements, at value
(identified cost $52,262,000) | | | 52,262,000 | |
Receivables: | | | | |
Fund shares sold | | | 1,574,961 | |
Interest | | | 91,502 | |
Manager (See Note 3) | | | 4,411 | |
Other assets | | | 34,130 | |
| | | | |
Total assets | | | 434,348,176 | |
| | | | |
| |
| Liabilities | | | | |
Due to custodian | | | 290,454 | |
Payables: | | | | |
Fund shares redeemed | | | 2,293,872 | |
Transfer agent (See Note 3) | | | 268,972 | |
Shareholder communication | | | 28,231 | |
Professional fees | | | 14,601 | |
Custodian | | | 3,332 | |
Trustees | | | 1,332 | |
Accrued expenses | | | 4,212 | |
Dividend payable | | | 196 | |
| | | | |
Total liabilities | | | 2,905,202 | |
| | | | |
Net assets | | $ | 431,442,974 | |
| | | | |
| |
| Composition of Net Assets | | | | |
Shares of beneficial interest outstanding (par value of $.01 per share) unlimited number of shares authorized | | $ | 4,314,897 | |
Additional paid-in capital | | | 427,125,976 | |
| | | | |
| | | 431,440,873 | |
Undistributed net investment income | | | 387 | |
Accumulated net realized gain (loss) on investments | | | 1,714 | |
| | | | |
Net assets | | $ | 431,442,974 | |
| | | | |
| | | | |
Investor Class | | | | |
Net assets applicable to outstanding shares | | $ | 59,129,224 | |
| | | | |
Shares of beneficial interest outstanding | | | 59,138,647 | |
| | | | |
Net asset value and offering price per share outstanding | | $ | 1.00 | |
| | | | |
Class A | | | | |
Net assets applicable to outstanding shares | | $ | 259,119,368 | |
| | | | |
Shares of beneficial interest outstanding | | | 259,147,249 | |
| | | | |
Net asset value and offering price per share outstanding | | $ | 1.00 | |
| | | | |
Class B | | | | |
Net assets applicable to outstanding shares | | $ | 84,982,252 | |
| | | | |
Shares of beneficial interest outstanding | | | 84,989,360 | |
| | | | |
Net asset value and offering price per share outstanding | | $ | 1.00 | |
| | | | |
Class C | | | | |
Net assets applicable to outstanding shares | | $ | 28,212,130 | |
| | | | |
Shares of beneficial interest outstanding | | | 28,214,479 | |
| | | | |
Net asset value and offering price per share outstanding | | $ | 1.00 | |
| | | | |
| | | | |
| 14 | | MainStay Money Market Fund | | The notes to the financial statements are an integral part of,
and should be read in conjunction with, the financial statements. |
Statement of Operations for the year ended October 31, 2012
| | | | |
| Investment Income (Loss) | |
Income | | | | |
Interest | | $ | 848,043 | |
| | | | |
Expenses | | | | |
Manager (See Note 3) | | | 2,189,535 | |
Transfer agent (See Note 3) | | | 1,164,872 | |
Registration | | | 131,862 | |
Professional fees | | | 60,325 | |
Shareholder communication | | | 56,366 | |
Custodian | | | 21,493 | |
Trustees | | | 12,244 | |
Miscellaneous | | | 16,167 | |
| | | | |
Total expenses before waiver/reimbursement | | | 3,652,864 | |
Expense waiver/reimbursement from Manager (See Note 3) | | | (2,844,602 | ) |
| | | | |
Net expenses | | | 808,262 | |
| | | | |
Net investment income (loss) | | | 39,781 | |
| | | | |
|
| Realized and Unrealized Gain (Loss) on Investments | |
Net realized gain (loss) on investments | | | 1,714 | |
| | | | |
Net increase (decrease) in net assets resulting from operations | | $ | 41,495 | |
| | | | |
| | | | | | |
The notes to the financial statements are an integral part of,
and should be read in conjunction with, the financial statements. | | mainstayinvestments.com | | | 15 | |
Statement of Changes in Net Assets
for the years ended October 31, 2012 and October 31, 2011
| | | | | | | | |
| | | 2012 | | | 2011 | |
| Increase (Decrease) in Net Assets | |
Operations: | | | | | | | | |
Net investment income (loss) | | $ | 39,781 | | | $ | 58,916 | |
Net realized gain (loss) on investments | | | 1,714 | | | | 313 | |
| | | | |
Net increase (decrease) in net assets resulting from operations | | | 41,495 | | | | 59,229 | |
| | | | |
Dividends to shareholders: | | | | | | | | |
From net investment income: | | | | | | | | |
Investor Class | | | (2,729 | ) | | | (6,784 | ) |
Class A | | | (28,256 | ) | | | (36,835 | ) |
Class B | | | (6,389 | ) | | | (12,070 | ) |
Class C | | | (2,410 | ) | | | (3,227 | ) |
| | | | |
Total dividends to shareholders | | | (39,784 | ) | | | (58,916 | ) |
| | | | |
Capital share transactions: | | | | | | | | |
Net proceeds from sale of shares | | | 485,458,380 | | | | 592,279,017 | |
Net asset value of shares issued to shareholders in reinvestment of dividends | | | 39,626 | | | | 54,492 | |
Cost of shares redeemed | | | (627,822,156 | ) | | | (530,560,321 | ) |
| | | | |
Increase (decrease) in net assets derived from capital share transactions | | | (142,324,150 | ) | | | 61,773,188 | |
| | | | |
Net increase (decrease) in net assets | | | (142,322,439 | ) | | | 61,773,501 | |
|
| Net Assets | |
Beginning of year | | | 573,765,413 | | | | 511,991,912 | |
| | | | |
End of year | | $ | 431,442,974 | | | $ | 573,765,413 | |
| | | | |
Undistributed net investment income at end of year | | $ | 387 | | | $ | — | |
| | | | |
| | | | |
| 16 | | MainStay Money Market Fund | | The notes to the financial statements are an integral part of,
and should be read in conjunction with, the financial statements. |
Financial Highlights selected per share data and ratios
| | | | | | | | | | | | | | | | | | | | |
| | | Investor Class | |
| | | Year ended October 31, | | | February 28,
2008**
through
October 31, | |
| | | 2012 | | | 2011 | | | 2010 | | | 2009 | | | 2008 | |
Net asset value at beginning of period | | $ | 1.00 | | | $ | 1.00 | | | $ | 1.00 | | | $ | 1.00 | | | $ | 1.00 | |
| | | | | | | | | | | | | | | | | | | | |
Net investment income (loss) | | | 0.00 | ‡ | | | 0.00 | ‡ | | | 0.00 | ‡ | | | 0.00 | ‡ | | | 0.01 | |
Net realized and unrealized gain (loss) on investments | | | 0.00 | ‡ | | | 0.00 | ‡ | | | 0.00 | ‡ | | | 0.00 | ‡ | | | 0.00 | ‡ |
| | | | | | | | | | | | | | | | | | | | |
Total from investment operations | | | 0.00 | ‡ | | | 0.00 | ‡ | | | 0.00 | ‡ | | | 0.00 | ‡ | | | 0.01 | |
| | | | | | | | | | | | | | | | | | | | |
Less dividends and distributions: | | | | | | | | | | | | | | | | | | | | |
From net investment income | | | (0.00 | )‡ | | | (0.00 | )‡ | | | (0.00 | )‡ | | | (0.00 | )‡ | | | (0.01 | ) |
Return of capital | | | — | | | | — | | | | (0.00 | )‡ | | | — | | | | — | |
| | | | | | | | | | | | | | | | | | | | |
Total dividends and distributions | | | (0.00 | )‡ | | | (0.00 | )‡ | | | (0.00 | )‡ | | | (0.00 | )‡ | | | (0.01 | ) |
| | | | | | | | | | | | | | | | | | | | |
Net asset value at end of period | | $ | 1.00 | | | $ | 1.00 | | | $ | 1.00 | | | $ | 1.00 | | | $ | 1.00 | |
| | | | | | | | | | | | | | | | | | | | |
Total investment return | | | 0.01 | % | | | 0.01 | % | | | 0.02 | % | | | 0.12 | % | | | 1.24 | %(a) |
Ratios (to average net assets)/Supplemental Data: | | | | | | | | | | | | | | | | | | | | |
Net investment income (loss) | | | 0.00 | %‡ | | | 0.01 | % | | | 0.01 | % | | | 0.13 | % | | | 1.67 | %†† |
Net expenses | | | 0.18 | % | | | 0.18 | % | | | 0.25 | % | | | 0.50 | % | | | 0.80 | %†† |
Expenses (before waiver/reimbursement) | | | 0.91 | % | | | 0.91 | % | | | 0.94 | % | | | 0.95 | % | | | 0.88 | %†† |
Net assets at end of period (in 000’s) | | $ | 59,129 | | | $ | 63,169 | | | $ | 64,360 | | | $ | 67,220 | | | $ | 72,721 | |
| ** | Commencement of operations. |
| ‡ | Less than one cent per share. |
| (a) | Total investment return is not annualized. |
| | | | | | | | | | | | | | | | | | | | |
| | | Class A | |
| | | Year ended October 31, | |
| | | 2012 | | | 2011 | | | 2010 | | | 2009 | | | 2008 | |
Net asset value at beginning of year | | $ | 1.00 | | | $ | 1.00 | | | $ | 1.00 | | | $ | 1.00 | | | $ | 1.00 | |
| | | | | | | | | | | | | | | | | | | | |
Net investment income (loss) | | | 0.00 | ‡ | | | 0.00 | ‡ | | | 0.00 | ‡ | | | 0.00 | ‡ | | | 0.03 | |
Net realized and unrealized gain (loss) on investments | | | 0.00 | ‡ | | | 0.00 | ‡ | | | 0.00 | ‡ | | | 0.00 | ‡ | | | 0.00 | ‡ |
| | | | | | | | | | | | | | | | | | | | |
Total from investment operations | | | 0.00 | ‡ | | | 0.00 | ‡ | | | 0.00 | ‡ | | | 0.00 | ‡ | | | 0.03 | |
| | | | | | | | | | | | | | | | | | | | |
Less dividends and distributions: | | | | | | | | | | | | | | | | | | | | |
From net investment income | | | (0.00 | )‡ | | | (0.00 | )‡ | | | (0.00 | )‡ | | | (0.00 | )‡ | | | (0.03 | ) |
Return of capital | | | — | | | | — | | | | (0.00 | )‡ | | | — | | | | — | |
| | | | | | | | | | | | | | | | | | | | |
Total dividends and distributions | | | (0.00 | )‡ | | | (0.00 | )‡ | | | (0.00 | )‡ | | | (0.00 | )‡ | | | (0.03 | ) |
| | | | | | | | | | | | | | | | | | | | |
Net asset value at end of year | | $ | 1.00 | | | $ | 1.00 | | | $ | 1.00 | | | $ | 1.00 | | | $ | 1.00 | |
| | | | | | | | | | | | | | | | | | | | |
Total investment return | | | 0.01 | % | | | 0.01 | % | | | 0.02 | % | | | 0.16 | % | | | 2.65 | % |
Ratios (to average net assets)/Supplemental Data: | | | | | | | | | | | | | | | | | | | | |
Net investment income (loss) | | | 0.01 | % | | | 0.01 | % | | | 0.01 | % | | | 0.18 | % | | | 2.65 | % |
Net expenses | | | 0.17 | % | | | 0.17 | % | | | 0.25 | % | | | 0.47 | % | | | 0.68 | % |
Expenses (before waiver/reimbursement) | | | 0.69 | % | | | 0.71 | % | | | 0.72 | % | | | 0.73 | % | | | 0.71 | % |
Net assets at end of year (in 000’s) | | $ | 259,119 | | | $ | 373,790 | | | $ | 301,795 | | | $ | 279,766 | | | $ | 372,956 | |
| ‡ | Less than one cent per share. |
| | | | | | |
The notes to the financial statements are an integral part of,
and should be read in conjunction with, the financial statements. | | mainstayinvestments.com | | | 17 | |
Financial Highlights selected per share data and ratios
| | | | | | | | | | | | | | | | | | | | |
| | | Class B | |
| | | Year ended October 31, | |
| | | 2012 | | | 2011 | | | 2010 | | | 2009 | | | 2008 | |
Net asset value at beginning of year | | $ | 1.00 | | | $ | 1.00 | | | $ | 1.00 | | | $ | 1.00 | | | $ | 1.00 | |
| | | | | | | | | | | | | | | | | | | | |
Net investment income (loss) | | | 0.00 | ‡ | | | 0.00 | ‡ | | | 0.00 | ‡ | | | 0.00 | ‡ | | | 0.03 | |
Net realized and unrealized gain (loss) on investments | | | 0.00 | ‡ | | | 0.00 | ‡ | | | 0.00 | ‡ | | | 0.00 | ‡ | | | 0.00 | ‡ |
| | | | | | | | | | | | | | | | | | | | |
Total from investment operations | | | 0.00 | ‡ | | | 0.00 | ‡ | | | 0.00 | ‡ | | | 0.00 | ‡ | | | 0.03 | |
| | | | | | | | | | | | | | | | | | | | |
Less dividends: | | | | | | | | | | | | | | | | | | | | |
From net investment income | | | (0.00 | )‡ | | | (0.00 | )‡ | | | (0.00 | )‡ | | | (0.00 | )‡ | | | (0.03 | ) |
Return of capital | | | — | | | | — | | | | (0.00 | )‡ | | | — | | | | — | |
| | | | | | | | | | | | | | | | | | | | |
Total dividends | | | (0.00 | )‡ | | | (0.00 | )‡ | | | (0.00 | )‡ | | | (0.00 | )‡ | | | (0.03 | ) |
| | | | | | | | | | | | | | | | | | | | |
Net asset value at end of year | | $ | 1.00 | | | $ | 1.00 | | | $ | 1.00 | | | $ | 1.00 | | | $ | 1.00 | |
| | | | | | | | | | | | | | | | | | | | |
Total investment return | | | 0.01 | % | | | 0.01 | % | | | 0.02 | % | | | 0.12 | % | | | 2.57 | % |
Ratios (to average net assets)/Supplemental Data: | | | | | | | | | | | | | | | | | | | | |
Net investment income (loss) | | | 0.01 | % | | | 0.01 | % | | | 0.01 | % | | | 0.14 | % | | | 2.54 | % |
Net expenses | | | 0.18 | % | | | 0.18 | % | | | 0.25 | % | | | 0.51 | % | | | 0.76 | % |
Expenses (before waiver/reimbursement) | | | 0.91 | % | | | 0.91 | % | | | 0.94 | % | | | 0.95 | % | | | 0.84 | % |
Net assets at end of year (in 000’s) | | $ | 84,982 | | | $ | 102,908 | | | $ | 118,529 | | | $ | 144,464 | | | $ | 187,237 | |
| ‡ | Less than one cent per share. |
| | | | | | | | | | | | | | | | | | | | |
| | | Class C | |
| | | Year ended October 31, | |
| | | 2012 | | | 2011 | | | 2010 | | | 2009 | | | 2008 | |
Net asset value at beginning of year | | $ | 1.00 | | | $ | 1.00 | | | $ | 1.00 | | | $ | 1.00 | | | $ | 1.00 | |
| | | | | | | | | | | | | | | | | | | | |
Net investment income (loss) | | | 0.00 | ‡ | | | 0.00 | ‡ | | | 0.00 | ‡ | | | 0.00 | ‡ | | | 0.03 | |
Net realized and unrealized gain (loss) on investments | | | 0.00 | ‡ | | | 0.00 | ‡ | | | 0.00 | ‡ | | | 0.00 | ‡ | | | 0.00 | ‡ |
| | | | | | | | | | | | | | | | | | | | |
Total from investment operations | | | 0.00 | ‡ | | | 0.00 | ‡ | | | 0.00 | ‡ | | | 0.00 | ‡ | | | 0.03 | |
| | | | | | | | | | | | | | | | | | | | |
Less dividends and distributions: | | | | | | | | | | | | | | | | | | | | |
From net investment income | | | (0.00 | )‡ | | | (0.00 | )‡ | | | (0.00 | )‡ | | | (0.00 | )‡ | | | (0.03 | ) |
Return of capital | | | — | | | | — | | | | (0.00 | )‡ | | | — | | | | — | |
| | | | | | | | | | | | | | | | | | | | |
Total dividends and distributions | | | (0.00 | )‡ | | | (0.00 | )‡ | | | (0.00 | )‡ | | | (0.00 | )‡ | | | (0.03 | ) |
| | | | | | | | | | | | | | | | | | | | |
Net asset value at end of year | | $ | 1.00 | | | $ | 1.00 | | | $ | 1.00 | | | $ | 1.00 | | | $ | 1.00 | |
| | | | | | | | | | | | | | | | | | | | |
Total investment return | | | 0.01 | % | | | 0.01 | % | | | 0.02 | % | | | 0.12 | % | | | 2.57 | % |
Ratios (to average net assets)/Supplemental Data: | | | | | | | | | | | | | | | | | | | | |
Net investment income (loss) | | | 0.01 | % | | | 0.01 | % | | | 0.01 | % | | | 0.15 | % | | | 2.51 | % |
Net expenses | | | 0.18 | % | | | 0.18 | % | | | 0.25 | % | | | 0.52 | % | | | 0.76 | % |
Expenses (before waiver/reimbursement) | | | 0.91 | % | | | 0.91 | % | | | 0.94 | % | | | 0.95 | % | | | 0.83 | % |
Net assets at end of year (in 000’s) | | $ | 28,212 | | | $ | 33,898 | | | $ | 27,307 | | | $ | 33,194 | | | $ | 56,458 | |
| ‡ | Less than one cent per share. |
| | | | |
| 18 | | MainStay Money Market Fund | | The notes to the financial statements are an integral part of,
and should be read in conjunction with, the financial statements. |
Notes to Financial Statements
Note 1–Organization and Business
The MainStay Funds (the “Trust”) were organized on January 9, 1986, as a Massachusetts business trust. The Trust is registered under the Investment Company Act of 1940, as amended (the “1940 Act”), as an open-end investment management company, and is comprised of twelve funds (collectively referred to as the “Funds”). These financial statements and notes relate only to the MainStay Money Market Fund (the “Fund”), a diversified fund.
The Fund currently offers four classes of shares at net asset value (“NAV”) without the imposition of a front-end sales charge or a contingent deferred sales charge (“CDSC”). Class A shares commenced operations on January 3, 1995. Class B shares commenced operations on May 1, 1986. Class C shares commenced operations on September 1, 1998. Investor Class shares commenced operations on February 28, 2008. Depending upon eligibility, Class B shares convert to either Investor Class or Class A shares at the end of the calendar quarter eight years after the date they were purchased. Additionally, depending upon eligibility, Investor Class shares may convert to Class A shares and Class A shares may convert to Investor Class shares. The four classes of shares have the same voting (except for issues that relate solely to one class), dividend, liquidation and other rights, and the same terms and conditions.
The Fund’s investment objective is to seek a high level of current income while preserving capital and maintaining liquidity.
Note 2–Significant Accounting Policies
The Fund prepares its financial statements in accordance with generally accepted accounting principles (“GAAP”) in the United States of America and follows the significant accounting policies described below.
(A) Valuation of Fund Shares. The Fund seeks to maintain a NAV of $1.00 per share, although there is no assurance that it will be able to do so on a continuous basis, and it has adopted certain investment, portfolio and dividend and distribution policies designed to enable it to do as such. An investment in the Fund is not insured or guaranteed by the Federal Deposit Insurance Corporation or any other government agency.
(B) Securities Valuation. Securities are valued at their amortized cost per the requirements of Rule 2a-7 under the 1940 Act. The amortized cost method involves valuing a security at its cost on the date of purchase and thereafter assuming a constant amortization to maturity of the difference between such cost and the value on maturity date. Amortized cost approximates the current fair value of a security.
The Board of Trustees (the “Board”) has adopted procedures for the valuation of the Fund’s securities and has delegated the responsibility for valuation determination under those procedures to the Valuation Committee of the Fund (the “Valuation Committee”). The Board has authorized the Valuation Committee to appoint a Valuation Sub-Committee (the “Sub-Committee”) to deal in the first instance with questions that arise or cannot be resolved under these procedures. The Sub-Committee will meet (in person, via electronic mail or via teleconference) on an as-needed basis. The Valuation Committee shall meet at a later time, as necessary, to ensure that actions taken by the Sub-Committee were appropriate. The procedures recognize that,
subject to the oversight of the Board and unless otherwise noted, the responsibility for day-to-day valuation of portfolio assets (including securities for which market prices are not readily available) rests with New York Life Investment Management LLC (“New York Life Investments” or the “Manager”). These procedures shall be reviewed by the Board no less frequently than annually. Any revisions to these procedures deemed necessary shall be reported to the Board at its next regularly scheduled meeting.
Securities are valued using unadjusted market prices, when available, as supplied primarily by third party pricing services or dealers. To assess the appropriateness of security valuations, the Manager or the Fund’s third party service provider who is subject to oversight by the Manager, regularly compares prior day prices, prices on comparable securities and the sale prices to the prior and current day prices and challenges prices exceeding certain tolerance levels with third party pricing services or broker sources. For those securities valued by recommendation, whether through a standardized fair valuation methodology or a fair valuation determination, the Valuation Committee reviews and affirms the reasonableness of the valuation based on such methodologies and determinations on a regular basis after considering all relevant information that is reasonably available.
“Fair value” is defined as the price that the Fund would receive upon selling an investment in an orderly transaction to an independent buyer in the principal or most advantageous market of the investment. Fair value measurements are determined within a framework that has established a three-tier hierarchy which maximizes the use of observable market data and minimizes the use of unobservable inputs to establish classification of fair value measurements for disclosure purposes. “Inputs” refer broadly to the assumptions that market participants would use in pricing the asset or liability, including assumptions about risk, such as the risk inherent in a particular valuation technique used to measure fair value using a pricing model and/or the risk inherent in the inputs for the valuation technique. Inputs may be observable or unobservable. Observable inputs reflect the assumptions market participants would use in pricing the asset or liability based on market data obtained from sources independent of the Fund. Unobservable inputs reflect the Fund’s own assumptions about the assumptions market participants would use in pricing the asset or liability developed based on the information available in the circumstances. The inputs or methodology used for valuing securities may not be an indication of the risks associated with investing in those securities. The three-tier hierarchy of inputs is summarized in the three broad Levels listed below.
| • | | Level 1—quoted prices in active markets for identical investments |
| • | | Level 2—other significant observable inputs (including quoted prices for similar investments in active markets, interest rates and yield curves, prepayment speeds, credit risks, etc.) |
| • | | Level 3—significant unobservable inputs (including the Fund’s own assumptions about the assumptions that market participants would use in determining the fair value of investments) |
Securities valued at amortized cost are not obtained from a quoted price in an active market and are generally categorized as Level 2 in the hierarchy. The aggregate value by input level, as of October 31, 2012, for the Fund’s investments is included at the end of the Fund’s Portfolio of Investments.
| | | | |
| mainstayinvestments.com | | | 19 | |
Notes to Financial Statements (continued)
The valuation techniques used by the Fund to measure fair value maximize the use of observable inputs and minimize the use of unobservable inputs. The Fund may utilize third party vendor evaluations, whose prices may be derived from one or more of the following standard inputs:
| | |
• Benchmark Yields | | • Reported Trades |
• Broker Dealer Quotes | | • Issuer Spreads |
• Two-sided markets | | • Benchmark securities |
• Bids / Offers | | • Reference Data (corporate actions or material event notices) |
• Industry and economic events | | • Comparable bonds |
• Equity and credit default swap curves | | • Monthly payment information |
The valuation techniques used by the Fund to measure fair value maximize the use of observable inputs and minimize the use of unobservable inputs. The Fund may utilize some of the following fair value techniques: multi-dimensional relational pricing models and option adjusted spread pricing. For the year ended October 31, 2012, there have been no changes to the fair value methodologies.
(C) Income Taxes. The Fund’s policy is to comply with the requirements of the Internal Revenue Code of 1986, as amended (the “Internal Revenue Code”), applicable to regulated investment companies and to distribute all of the taxable income to the shareholders of the Fund within the allowable time limits. Therefore, no federal, state and local income tax provision is required.
Management evaluates its tax positions to determine if the tax positions taken meet the minimum recognition threshold in connection with accounting for uncertainties in income tax positions taken or expected to be taken for the purposes of measuring and recognizing tax liabilities in the financial statements. Recognition of tax benefits of an uncertain tax position is required only when the position is “more likely than not” to be sustained assuming examination by taxing authorities. Management has analyzed the Fund’s tax positions taken on federal, state and local income tax returns for all open tax years (for up to three tax years), and has concluded that no provision for federal, state and local income tax are required in the Fund’s financial statements. The Fund’s federal, state and local income and federal excise tax returns for tax years for which the applicable statutes of limitations have not expired are subject to examination by the Internal Revenue Service and state and local departments of revenue.
(D) Dividends and Distributions to Shareholders. Dividends and distributions are recorded on the ex-dividend date. The Fund declares dividends of net investment income, if any, at least daily and pays them at least monthly and declares and pays distributions of net realized capital gains, if any, at least annually. Unless the shareholder elects otherwise, all dividends and distributions are reinvested in the same class of shares of the Fund, at NAV. Dividends and distributions to shareholders are determined in accordance with federal income tax regulations and may differ from GAAP.
(E) Security Transactions and Investment Income. The Fund records security transactions on the trade date. Realized gains and losses on security transactions are determined using the identified cost method. Interest income is accrued daily and discounts and premiums
on securities purchased for the Fund are accreted and amortized, respectively, on the straight-line method.
Investment income and realized and unrealized gains and losses on investments of the Fund are allocated to separate classes of shares pro rata based upon their relative net assets on the date the income is earned or realized and unrealized gains and losses are incurred.
(F) Expenses. Expenses of the Trust are allocated to the individual Funds in proportion to the net assets of the respective Funds when the expenses are incurred, except where direct allocations of expenses can be made. Expenses (other than transfer agent expenses) are allocated to separate classes of shares pro rata based upon their relative net assets on the date the expenses are incurred. The expenses borne by the Fund, including those of related parties to the Fund, are shown in the Statement of Operations.
(G) Use of Estimates. In preparing financial statements in conformity with GAAP, management makes estimates and assumptions that affect the reported amounts and disclosures in the financial statements. Actual results could differ from those estimates.
(H) Repurchase Agreements. The Fund may enter into repurchase agreements to earn income. The Fund may enter into repurchase agreements only with financial institutions that are deemed by the Manager to be creditworthy, pursuant to guidelines established by the Fund’s Board. During the term of any repurchase agreement, the Manager will continue to monitor the creditworthiness of the seller. Under the 1940 Act, repurchase agreements are considered to be collateralized loans by a Fund to the seller secured by the securities transferred to the Fund.
When the Fund invests in repurchase agreements, the Fund’s custodian takes possession of the collateral pledged for investments in the repurchase agreement. The underlying collateral is valued daily on a mark-to-market basis to determine that the value, including accrued interest, exceeds the repurchase price. In the event of the seller’s default on the obligation to repurchase, the Fund has the right to liquidate the collateral and apply the proceeds in satisfaction of the obligation. Under certain circumstances, such as in the event of default or bankruptcy by the counterparty to the agreement, realization and/or retention of the collateral may be subject to legal proceedings and possible realized loss to the Fund.
(I) Concentration of Risk. The Fund’s investments may include securities such as variable rate master demand notes, floating-rate notes and mortgage-related and asset-backed securities. If expectations about changes in interest rates, or assessments of an issuer’s credit worthiness or market conditions are incorrect, these types of investments could lose money.
The Fund may also invest in U.S. dollar denominated securities of foreign issuers, which carry certain risks in addition to the usual risks inherent in domestic instruments. These risks include those resulting from future adverse political or economic developments and possible imposition of foreign governmental laws or restrictions. The ability of issuers of debt securities held by the Fund to meet their obligations may be affected by economic or political developments in a specific country, industry or region.
| | |
| 20 | | MainStay Money Market Fund |
(J) Indemnifications. Under the Trust’s organizational documents, its officers and trustees are indemnified against certain liabilities that may arise out of performance of their duties to the Trust. Additionally, in the normal course of business, the Fund enters into contracts with third-party service providers that contain a variety of representations and warranties and which may provide general indemnifications. The Fund’s maximum exposure under these arrangements is unknown, as this would involve future claims that may be made against the Fund that have not yet occurred. Based on experience, management is of the view that the risk of loss in connection with these potential indemnification obligations is remote. However, there can be no assurance that material liabilities related to such obligations will not arise in the future, which could adversely impact the Fund.
Note 3–Fees and Related Party Transactions
(A) Manager. New York Life Investments, a registered investment adviser and an indirect, wholly-owned subsidiary of New York Life Insurance Company (“New York Life”), serves as the Fund’s Manager, pursuant to an Amended and Restated Management Agreement (“Management Agreement”). The Manager provides offices, conducts clerical, recordkeeping and bookkeeping services, and keeps most of the financial and accounting records required to be maintained by the Fund. Except for the portion of salaries and expenses that are the responsibility of the Fund, the Manager pays the salaries and expenses of all personnel affiliated with the Fund and certain operational expenses of the Fund. The Fund reimburses New York Life Investments in an amount equal to a portion of the salary of the Chief Compliance Officer (“CCO”) of the Fund. New York Life Investments is responsible for the day-to-day portfolio management of the Fund.
The Fund pays the Manager a monthly fee for services performed and facilities furnished at an annual rate of the Fund’s average daily net assets as follows: 0.45% up to $500 million; 0.40% from $500 million to $1 billion; and 0.35% in excess of $1 billion, plus a fee for fund accounting services previously provided by New York Life Investments under a separate fund accounting agreement furnished at an annual rate of the Fund’s average daily net assets as follows: 0.05% up to $20 million; 0.0333% on from $20 million to $100 million; and 0.01% in excess of $100 million. The effective management fee rate (exclusive of any applicable waivers/reimbursement) was 0.47% for the year ended October 31, 2012 inclusive of a fee for fund accounting services of 0.02% of the Fund’s average daily net assets.
New York Life Investments has contractually agreed to waive fees and/or reimburse expenses so that Total Annual Fund Operating Expenses do not exceed the following percentages of average daily net assets: Investor Class, 0.80%; Class A, 0.70%; Class B, 0.80%; and Class C, 0.80%. This agreement will remain in effect until February 28, 2013, and shall renew automatically for one-year terms unless New York Life Investments provides written notice of termination prior to the start of the next term or upon approval of the Board. Total Annual Fund Operating Expenses excludes taxes, interest, litigation, extraordinary expenses, brokerage and other transaction expenses relating to the purchase or sale of portfolio investments, and acquired (underlying) fund fees and expenses.
New York Life Investments may limit expenses of the Fund to the extent it deems appropriate to enhance the yield of the Fund, or a particular
class of the Fund, during periods when expenses have a significant impact on the yield of the Fund, or a particular class of the Fund, as applicable, because of low interest rates. This expense limitation policy is voluntary and in addition to any contractual arrangements that may be in place with respect to the Fund and described in the Fund’s prospectus.
For the year ended October 31, 2012, New York Life Investments earned fees from the Fund in the amount of $2,189,535 and waived its fees and/or reimbursed expenses in the amount of $2,844,602.
State Street Bank and Trust Company, 1 Lincoln Street, Boston, Massachusetts 02111, provides sub-administration and sub-accounting services to the Fund pursuant to an agreement with New York Life Investments. These services include calculating the daily NAVs of the Fund, maintaining the general ledger and sub-ledger accounts for the calculation of the Fund’s respective NAVs, and assisting New York Life Investments in conducting various aspects of the Fund’s administrative operations. For providing these services to the Fund, State Street is compensated by New York Life Investments.
(B) Contingent Deferred Sales Charge. Although the Fund does not assess a CDSC upon redemption of Class B or Class C shares of the Fund, the applicable CDSC will be assessed when shares were redeemed from the Fund if the shareholder previously exchanged his or her investment into the Fund from another Fund in the Trust. The Fund was advised that NYLIFE Distributors LLC (the “Distributor”), an indirect wholly owned subsidiary of New York Life, received from shareholders the proceeds from CDSCs of Investor Class, Class A, Class B and Class C of $195, $27,547, $134,941 and $19,293, respectively for the year ended October 31, 2012.
(C) Transfer, Dividend Disbursing and Shareholder Servicing Agent. NYLIM Service Company LLC, an affiliate of New York Life Investments, is the Fund’s transfer, dividend disbursing and shareholder servicing agent pursuant to an agreement between NYLIM Service Company LLC and the Trust. NYLIM Service Company LLC has entered into an agreement with Boston Financial Data Services, Inc. (“BFDS”) pursuant to which BFDS performs certain transfer agent services on behalf of NYLIM Service Company LLC. Transfer agent expenses incurred by the Fund for the year ended October 31, 2012, were as follows:
| | | | |
Investor Class | | $ | 226,079 | |
Class A | | | 472,079 | |
Class B | | | 353,605 | |
Class C | | | 113,109 | |
(D) Small Account Fee. Shareholders with small accounts adversely impact the cost of providing transfer agency services. In an effort to reduce total transfer agency expenses, the Fund has implemented a small account fee on certain types of accounts. Certain shareholders with an account balance of less than $1,000 are charged an annual per account fee of $20 (assessed semi-annually), the proceeds from which offset transfer agent fees as reflected in the Statement of Operations.
| | | | |
| mainstayinvestments.com | | | 21 | |
Notes to Financial Statements (continued)
(E) Capital. As of October 31, 2012, New York Life and its affiliates beneficially held shares of the Fund with the following values and percentages of net assets as follows:
| ‡ | Less than one-tenth of a percent. |
Note 4–Federal Income Tax
As of October 31, 2012, the components of accumulated gain (loss) on a tax basis were as follows:
| | | | | | | | | | | | | | | | |
Ordinary
Income | | Accumulated
Capital and
Other Gain
(Loss) | | | Other
Temporary
Differences | | | Unrealized
Appreciation
(Depreciation) | | | Total
Accumulated Gain (Loss) | |
$2,297 | | $ | — | | | $ | (196 | ) | | $ | — | | | $ | 2,101 | |
The other temporary differences are primarily due to dividends payable.
The following table discloses the current year reclassifications between undistributed net investment income (loss), accumulated net realized gain (loss) on investments, and additional paid-in capital arising from permanent differences; net assets as of October 31, 2012 were not affected.
| | | | | | | | |
Undistributed Net Investment Income (Loss) | | Accumulated Net Realized Gain (Loss)
on Investments | | | Additional Paid-In Capital | |
$390 | | $ | (313 | ) | | $ | (77 | ) |
The reclassifications for the Fund are primarily due to non-deductible expenses and dividend redesignations.
Under the Regulated Investment Company Modernization Act of 2010, the Fund is permitted to carry forward capital losses incurred in taxable years beginning after December 22, 2010, for an unlimited period. However, any losses incurred during those future years will be required to be utilized prior to the losses incurred in pre-enactment tax years. As a result of this ordering rule, pre-enactment capital loss carryforwards may be more likely to expire unused. Additionally, post-enactment capital losses that are carried forward will retain their character as either short-term or long-term capital losses rather than being considered all short-term as under previous law.
The tax character of distributions paid during the years ended October 31, 2012 and October 31, 2011 shown in the Statements of Changes in Net Assets was as follows:
| | | | | | | | |
| | | 2012 | | | 2011 | |
Distributions paid from:
Ordinary Income | | $ | 39,784 | | | $ | 58,916 | |
Note 5–Custodian
State Street is the custodian of the cash and the securities of the Fund. Custodial fees are charged to the Fund based on the market value of securities in the Fund and the number of certain cash transactions incurred by the Fund.
Note 6–Capital Share Transactions
| | | | |
Investor Class (at $1 per share) | | Shares | |
Year ended October 31, 2012: | | | | |
Shares sold | | | 47,190,238 | |
Shares issued to shareholders in reinvestment of dividends | | | 3,611 | |
Shares redeemed | | | (47,219,449 | ) |
| | | | |
Net increase (decrease) in shares outstanding before conversion | | | (25,600 | ) |
Shares converted into Investor Class (See Note 1) | | | 5,001,213 | |
Shares converted from Investor Class (See Note 1) | | | (9,015,937 | ) |
| | | | |
Net increase (decrease) | | | (4,040,324 | ) |
| | | | |
Year ended October 31, 2011: | | | | |
Shares sold | | | 55,640,962 | |
Shares issued to shareholders in reinvestment of dividends | | | 5,556 | |
Shares redeemed | | | (48,995,174 | ) |
| | | | |
Net increase (decrease) in shares outstanding before conversion | | | 6,651,344 | |
Shares converted into Investor Class (See Note 1) | | | 5,265,892 | |
Shares converted from Investor Class (See Note 1) | | | (13,105,669 | ) |
| | | | |
Net increase (decrease) | | | (1,188,433 | ) |
| | | | |
| |
| | | | |
Class A (at $1 per share) | | Shares | |
Year ended October 31, 2012: | | | | |
Shares sold | | | 384,368,212 | |
Shares issued to shareholders in reinvestment of dividends | | | 26,705 | |
Shares redeemed | | | (503,689,928 | ) |
| | | | |
Net increase (decrease) in shares outstanding before conversion | | | (119,295,011 | ) |
Shares converted into Class A (See Note 1) | | | 9,324,253 | |
Shares converted from Class A (See Note 1) | | | (4,701,096 | ) |
| | | | |
Net increase (decrease) | | | (114,671,854 | ) |
| | | | |
Year ended October 31, 2011: | | | | |
Shares sold | | | 448,411,673 | |
Shares issued to shareholders in reinvestment of dividends | | | 35,048 | |
Shares redeemed | | | (385,368,151 | ) |
| | | | |
Net increase (decrease) in shares outstanding before conversion | | | 63,078,570 | |
Shares converted into Class A (See Note 1) | | | 13,866,381 | |
Shares converted from Class A (See Note 1) | | | (4,955,930 | ) |
| | | | |
Net increase (decrease) | | | 71,989,021 | |
| | | | |
| | |
| 22 | | MainStay Money Market Fund |
| | | | |
Class B (at $1 per share) | | Shares | |
Year ended October 31, 2012: | | | | |
Shares sold | | | 22,048,636 | |
Shares issued to shareholders in reinvestment of dividends | | | 6,966 | |
Shares redeemed | | | (39,373,145 | ) |
| | | | |
Net increase (decrease) in shares outstanding before conversion | | | (17,317,543 | ) |
Shares converted from Class B (See Note 1) | | | (608,433 | ) |
| | | | |
Net increase (decrease) | | | (17,925,976 | ) |
| | | | |
Year ended October 31, 2011: | | | | |
Shares sold | | | 36,254,235 | |
Shares issued to shareholders in reinvestment of dividends | | | 10,848 | |
Shares redeemed | | | (50,814,001 | ) |
| | | | |
Net increase (decrease) in shares outstanding before conversion | | | (14,548,918 | ) |
Shares converted from Class B (See Note 1) | | | (1,070,674 | ) |
| | | | |
Net increase (decrease) | | | (15,619,592 | ) |
| | | | |
| | | | |
Class C (at $1 per share) | | Shares | |
Year ended October 31, 2012: | | | | |
Shares sold | | | 31,851,294 | |
Shares issued to shareholders in reinvestment of dividends | | | 2,345 | |
Shares redeemed | | | (37,539,635 | ) |
| | | | |
Net increase (decrease) | | | (5,685,996 | ) |
| | | | |
Year ended October 31, 2011: | | | | |
Shares sold | | | 51,972,218 | |
Shares issued to shareholders in reinvestment of dividends | | | 2,888 | |
Shares redeemed | | | (45,382,993 | ) |
| | | | |
Net increase (decrease) | | | 6,592,113 | |
| | | | |
Note 7–Subsequent Events
In connection with the preparation of the financial statements of the Fund as of and for the year ended October 31, 2012, events and transactions subsequent to October 31, 2012 through the date the financial statements were issued have been evaluated by the Fund’s management for possible adjustment and/or disclosure. No subsequent events requiring financial statement adjustment or disclosure have been identified.
| | | | |
| mainstayinvestments.com | | | 23 | |
Report of Independent Registered Public Accounting Firm
The Board of Trustees and Shareholders of
The MainStay Funds:
We have audited the accompanying statement of assets and liabilities, including the portfolio of investments, of the MainStay Money Market Fund (the “Fund”), one of the funds constituting The MainStay Funds, as of October 31, 2012, and the related statement of operations for the year then ended, the statements of changes in net assets for each of the years in the two-year period then ended, and the financial highlights for each of the years or periods in the five-year period then ended. These financial statements and financial highlights are the responsibility of the Fund’s management. Our responsibility is to express an opinion on these financial statements and financial highlights based on our audits.
We conducted our audits in accordance with the standards of the Public Company Accounting Oversight Board (United States). Those standards require that we plan and perform the audit to obtain reasonable assurance about whether the financial statements and financial highlights are free of material misstatement. An audit includes examining, on a test basis, evidence supporting the amounts and disclosures in the financial statements. Our procedures included confirmation of securities owned as of October 31, 2012, by correspondence with the custodian and brokers or by other appropriate auditing procedures where replies from brokers were not received. An audit also includes assessing the accounting principles used and significant estimates made by management, as well as evaluating the overall financial statement presentation. We believe that our audits provide a reasonable basis for our opinion.
In our opinion, the financial statements and financial highlights referred to above present fairly, in all material respects, the financial position of the MainStay Money Market Fund of The MainStay Funds as of October 31, 2012, the results of its operations for the year then ended, the changes in its net assets for each of the years in the two-year period then ended, and the financial highlights for each of the years or periods in the five-year period then ended, in conformity with U.S. generally accepted accounting principles.

Philadelphia, Pennsylvania
December 21, 2012
| | |
| 24 | | MainStay Money Market Fund |
Federal Income Tax Information
(Unaudited)
In February 2013, shareholders will receive an IRS Form 1099-DIV or substitute Form 1099 which will show the federal tax status of the distributions received by shareholders in calendar year 2012. The amounts that will be reported on such 1099-DIV or substitute Form 1099 will be the amounts you are to use on your federal income tax return.
Proxy Voting Policies and Procedures and Proxy Voting Record
A description of the policies and procedures that New York Life Investments uses to vote proxies related to the Fund’s securities is available without charge, upon request, (i) by visiting the Fund’s website at mainstayinvestments.com; or (ii) on the SEC’s website at www.sec.gov.
The Fund is required to file with the SEC its proxy voting record for the 12-month period ending June 30 on Form N-PX. The Fund’s most recent Form N-PX is available free of charge upon request (i) by calling 800-MAINSTAY (624-6782); (ii) by visiting the Fund’s website at mainstayinvestments.com; or (iii) on the SEC’s website at www.sec.gov.
Shareholder Reports and Quarterly Portfolio Disclosure
The Fund is required to file its complete schedule of portfolio holdings with the SEC for its first and third fiscal quarters on Form N-Q and every month on Form N-MFP. In addition, the Fund will make available its complete schedule of portfolio holdings on its website at www.mainstayinvestments.com, five days after month-end. The Fund’s Form N-Q is available without charge on the SEC’s website at www.sec.gov or by calling MainStay Investments at 800-MAINSTAY (624-6782). Form N-MFP will be made available to the public by the SEC 60 days after the month to which the information pertains, and a link to each of the most recent 12 months of filings on Form N-MFP will be provided on the Fund’s website. You can also obtain and review copies of Forms N-Q and N-MFP by visiting the SEC’s Public Reference Room in Washington, DC (information on the operation of the Public Reference Room may be obtained by calling 1-800-SEC-0330).
| | | | |
| mainstayinvestments.com | | | 25 | |
| | |
| 26 | | MainStay Money Market Fund |
Board Members and Officers (Unaudited)
The Board Members oversee the MainStay Group of Funds (which is comprised of Funds that are series of The MainStay Funds, Eclipse Trust, Eclipse Funds Inc., MainStay Funds Trust, MainStay VP Funds Trust, Private Advisors Alternative Strategies Master Fund, Private Advisors Alternative Strategies Fund, and MainStay Defined Term Municipal Opportunities Fund) (collectively, the “Fund Complex”), the Manager and, when applicable, the Subadvisor(s) and other service providers to the Fund Complex. Each Board Member serves until his or her successor is elected and qualified or until his or her resignation, death or removal. The Retirement Policy provides that a Board Member
shall tender his or her resignation by the end of the calendar year during which he or she reaches the age of 75.
Officers serve a term of one year and are elected annually by the Board Members. The business address of each Board Member and officer listed below is 51 Madison Avenue, New York, New York 10010.
The Statement of Additional Information applicable to the Fund includes additional information about the Board Members and is available without charge, upon request, by calling 800-MAINSTAY (624-6782) or by going online to mainstayinvestments.com.
| | | | | | | | | | | | |
| | | | | Name and
Date of Birth | | Term of Office,
Position(s) Held
with the Fund
Complex and
Length of Service | | Principal Occupation(s)
During Past Five Years | | Number of
Funds in
Fund Complex
Overseen by
Board Member | | Other Directorships
Held by Board Member |
| Interested Board Member* | | | | John Y. Kim
9/24/60 | | Indefinite;
Eclipse Trust: Trustee since 2008;
Eclipse Funds Inc.:
Director since 2008 (1 fund);
The MainStay Funds: Trustee since 2008 (12 funds);
MainStay Funds Trust: Trustee since 2009 (31 funds); and
MainStay VP Funds Trust: Trustee since 2011 and its predecessor, MainStay VP Series Fund, Inc. since 2008 (28 portfolios). Private Advisors Alternative Strategies Master Fund: Trustee since 2011
Private Advisors Alternative Strategies Fund: Trustee since 2011
MainStay DefinedTerm Municipal Opportunities Fund: Trustee since 2011 | | Member of the Board of Managers, President and Chief Executive Officer (since 2008), New York Life Investment Management LLC and New York Life Investment Management Holdings LLC; Member of the Board, MacKay Shields LLC since 2008; Chairman of the Board, Institutional Capital LLC, Madison Capital Funding LLC, Madison Square Investors LLC and McMorgan & Company LLC; Chairman of the Board, NYLIFE Distributors LLC and Chairman of the Board, NYLCAP Manager LLC (since 2008) President, Prudential Retirement, a business unit of Prudential Financial, Inc. (2002 to 2007) | | 75 | | None |
| | * | This Board Member is considered to be an “interested person” of the MainStay Group of Funds within the meaning of the 1940 Act because of his affiliation with New York Life Insurance Company, New York Life Investment Management LLC, Madison Square Investors LLC, MacKay Shields LLC, Private Advisors LLC, Institutional Capital LLC, NYLIFE Securities LLC and/or NYLIFE Distributors LLC, as described in detail above in the column entitled “Principal Occupation(s) During the Past Five Years.” |
| | | | | | | | | | | | |
| | | | | Name and
Date of Birth | | Term of Office, Position(s) Held with the Fund Complex and Length of Service | | Principal Occupation(s)
During Past Five Years | | Number of
Funds in
Fund Complex
Overseen by
Board Member | | Other Directorships
Held by Board Member |
| Non-Interested Board Members | | | | Susan B. Kerley 8/12/51 | | Indefinite;
Eclipse Trust: Chairman since 2005, and Trustee since 2000;
Eclipse Funds Inc.: Chairman since 2005 and Director since 1990 (1 fund); The MainStay Funds: Chairman and Board Member since 2007 (12 funds);
MainStay Funds Trust: Chairman and Trustee since 2009 (31 funds); and MainStay VP Funds Trust: Chairman and Trustee since 2011 and its predecessor, MainStay VP Series Fund, Inc., since 2007 (28 portfolios). Private Advisors Alternative Strategies Master Fund: Chairman and Trustee since 2011 Private Advisors Alternative Strategies Fund: Chairman and Trustee since 2011 MainStay DefinedTerm Municipal Opportunities Fund: Chairman and Trustee since 2011. | | President, Strategic Management Advisors LLC (since 1990) | | 75 | | Trustee, Legg Mason Partners Funds, since 1992 (51 portfolios) |
| | | | |
| mainstayinvestments.com | | | 27 | |
| | | | | | | | | | | | |
| | | | | Name and
Date of Birth | | Term of Office,
Position(s) Held
with the Fund
Complex and
Length of Service | | Principal Occupation(s)
During Past Five Years | | Number of
Funds in
Fund Complex
Overseen by
Board Member | | Other Directorships
Held by Board Member |
| Non-Interested Board Members | | | | Alan R. Latshaw 3/27/51 | | Indefinite;
Eclipse Trust: Trustee and Audit Committee Financial Expert since 2007;
Eclipse Funds Inc.:
Director and Audit Committee Financial Expert since 2007 (1 fund);
The MainStay Funds: Trustee and Audit Committee Financial Expert since 2006 (12 funds);
MainStay Funds Trust: Trustee and Audit Committee Financial Expert since 2009 (31 funds); and
MainStay VP Funds Trust: Trustee and Audit Committee Financial Expert since 2011 and its predecessor, MainStay VP Series Fund, Inc., since 2007 (28 portfolios). Private Advisors Alternative Strategies Master Fund: Trustee and Audit Committee Financial Expert since 2011 Private Advisors Alternative Strategies Fund: Trustee and Audit Committee Financial Expert since 2011. MainStay DefinedTerm Municipal Opportunities Fund: Trustee and Audit Committee Financial Expert since 2011. | | Retired; Partner, Ernst & Young LLP (2002 to 2003); Partner, Arthur Andersen LLP (1989 to 2002); Consultant to the MainStay Funds Audit and Compliance Committee (2004 to 2006) | | 75 | | Trustee, State Farm Associates Funds Trusts since 2005 (4 portfolios); Trustee, State Farm Mutual Fund Trust since 2005 (15 portfolios); Trustee, State Farm Variable Product Trust since 2005 (9 portfolios) |
| | |
| 28 | | MainStay Money Market Fund |
| | | | | | | | | | | | |
| | | | | Name and Date of Birth | | Term of Office, Position(s) Held with the Fund Complex and Length of Service | | Principal Occupation(s)
During Past Five Years | | Number of
Funds in
Fund Complex
Overseen by
Board Member | | Other Directorships Held by Board Member |
| Non-Interested Board Members | | | | Peter Meenan
12/5/41 | | Indefinite;
Eclipse Funds: Trustee since 2002;
Eclipse Funds Inc.:
Director since 2002
(1 fund); The MainStay Funds:
Trustee since 2007 (12 funds);
MainStay Funds Trust: Trustee since 2009
(31 funds); and
MainStay VP Funds Trust: Trustee since 2011 and its predecessor, MainStay VP Series Fund, Inc., since 2007 (28 portfolios).
Private Advisors Alternative Strategies Master Fund: Trustee since 2011. Private Advisors Alternative Strategies Fund: Trustee since 2011
MainStay DefinedTerm Municipal Opportunities Fund: Trustee since 2011. | | Independent Consultant; President and Chief Executive Officer, Babson—United, Inc. (financial services firm) (2000 to 2004); Independent Consultant (1999 to 2000); Head of Global Funds, Citicorp (1995 to 1999) | | 75 | | None |
| | | | Richard H. Nolan, Jr.
11/16/46 | | Indefinite;
Eclipse Trust: Trustee since 2007;
Eclipse Funds Inc.:
Director since 2007 (1 fund);
The MainStay Funds: Trustee since 2007 (12 funds);
MainStay Funds Trust: Trustee since 2009 (31 funds); and
MainStay VP Funds Trust: Trustee since 2011 and its predecessor, MainStay VP Series Fund, Inc., since 2006 (28 portfolios).
Private Advisors Alternative Strategies Master Fund: Trustee since 2011. Private Advisors Alternative Strategies Fund: Trustee since 2011
MainStay DefinedTerm Municipal Opportunities Fund: Trustee since 2011. | | Managing Director, ICC Capital Management; President—Shields/Alliance, Alliance Capital Management (1994 to 2004) | | 75 | | None |
| | | | |
| mainstayinvestments.com | | | 29 | |
| | | | | | | | | | | | |
| | | | | Name and Date of Birth | | Term of Office, Position(s) Held with the Fund Complex and Length of Service | | Principal Occupation(s)
During Past Five Years | | Number of
Funds in
Fund Complex
Overseen by
Board Member | | Other Directorships Held by Board Member |
| Non-Interested Board Members | | | | Richard S. Trutanic 2/13/52 | | Indefinite;
Eclipse Trust: Trustee since 2007;
Eclipse Funds Inc.:
Director since 2007 (1 fund);
The MainStay Funds:
Trustee since 1994 (12 funds);
MainStay Funds Trust:
Trustee since 2009 (31 funds); and
MainStay VP Funds Trust: Trustee since 2011 and its predecessor, MainStay VP Series Fund, Inc., since 2007 (28 portfolios).
Private Advisors Alternative Strategies Master Fund: Trustee since 2011.
Private Advisors Alternative Strategies Fund: Trustee since 2011
MainStay DefinedTerm Municipal Opportunities Fund: Trustee since 2011. | | Chairman and Chief Executive Officer, Somerset & Company (financial advisory firm) (since 2004); Managing Director, The Carlyle Group (private investment firm) (2002 to 2004); Senior Managing Director, Partner and Board Member, Groupe Arnault S.A. (private investment firm) (1999 to 2002) | | 75 | | None |
| | |
| 30 | | MainStay Money Market Fund |
| | | | | | | | | | | | |
| | | | | Name and Date of Birth | | Term of Office, Position(s) Held with the Fund Complex and Length of Service | | Principal Occupation(s)
During Past Five Years | | Number of
Funds in
Fund Complex
Overseen by
Board Member | | Other Directorships Held by Board Member |
| Non-Interested Board Members | | | | Roman L. Weil
5/22/40 | | Indefinite;
Eclipse Trust: Trustee and Audit Committee Financial Expert since 2007; Eclipse Funds Inc.: Director and Audit Committee Financial Expert since 2007 (1 fund); The MainStay Funds: Trustee and Audit Committee Financial Expert since 2007 (12 funds); MainStay Funds Trust: Trustee since 2009 (31 funds); and MainStay VP Funds Trust: Trustee and Audit Committee Financial Expert since 2011 and its predecessor, MainStay VP Series Fund, Inc., since 1994 and Audit Committee Financial Expert since 2003 (28 portfolios).
Private Advisors Alternative Strategies Master Fund: Trustee and Audit Committee Financial Expert since 2011 Private Advisors Alternative Strategies Fund: Trustee and Audit Committee Financial Expert since 2011. MainStay DefinedTerm Municipal Opportunities Fund: Trustee and Audit Committee Financial Expert since 2011. | | Visiting Professor, University of California—San Diego (since October 2012); Visiting Professor, Southern Methodist University (2011); Visiting Professor, NYU Stem School of Business, New York University (2011); President, Roman L. Weil Associates, Inc. (consulting firm) (since 1981); V. Duane Rath Professor Emeritus of Accounting, Chicago Booth School of Business, University of Chicago (1965-2008) | | 75 | | None |
| | | | |
| mainstayinvestments.com | | | 31 | |
| | | | | | | | | | | | |
| | | | | Name and Date of Birth | | Term of Office, Position(s) Held with the Fund Complex and Length of Service | | Principal Occupation(s)
During Past Five Years | | Number of
Funds in
Fund Complex
Overseen by
Board Member | | Other Directorships Held by Board Member |
| Non-Interested Board Members | | | | John A. Weisser 10/22/41 | | Indefinite; Eclipse Trust: Trustee since 2007; Eclipse Funds Inc.: Director since 2007 (1 fund); The MainStay Funds: Trustee since 2007 (12 funds); MainStay Funds Trust: Trustee since 2009 (31 funds); and MainStay VP Funds Trust: Trustee since 2011 and its predecessor, MainStay VP Series Fund, Inc., since 1997 (28 portfolios).
Private Advisors Alternative Strategies Master Fund: Trustee since 2011.
Private Advisors Alternative Strategies Fund: Trustee since 2011
MainStay DefinedTerm Municipal Opportunities Fund: Trustee since 2011. | | Retired. Managing Director of Salomon Brothers, Inc. (1971 to 1995) | | 75 | | Trustee, Direxion Funds since 2007 (21 portfolios); Direxion Insurance Trust since 2007 (1 portfolio); Trustee, Direxion Shares ETF Trust, since 2008 (47 portfolios) |
| | |
| 32 | | MainStay Money Market Fund |
The following individuals have been appointed by the Board Members to serve as Officers of the MainStay Group of Funds.
| | | | | | | | |
| | | | | Name and
Date of Birth | | Positions(s) Held with the Funds and Length of Service | | Principal Occupation(s) During Past Five Years |
| Officers | | | | Jack R. Benintende 5/12/64 | | Treasurer and Principal Financial and Accounting Officer, Eclipse Trust, Eclipse Funds, Inc. and The MainStay Funds (since 2007), MainStay Funds Trust (since 2009) | | Assistant Treasurer, New York Life Investment Management Holdings LLC (since 2008); Managing Director, New York Life Investment Management LLC (since 2007); Treasurer and Principal Financial Accounting Officer, Private Advisors Alternative Strategies Master Fund, Private Advisors Alternative Strategies Fund and MainStay DefinedTerm Municipal Opportunities Fund (since 2011); Treasurer and Principal Financial and Accounting Officer, MainStay VP Funds Trust and its predecessor, MainStay VP Series Fund, Inc. (since 2007) |
| | | | Jeffrey A. Engelsman 9/28/67 | | Vice President and Chief Compliance Officer, Eclipse Trust, Eclipse Funds, Inc., The MainStay Funds and MainStay Funds Trust (since 2009) | | Managing Director, Compliance (since 2009), Director and Associate General Counsel, New York Life Investment Management LLC (2005 to 2008); Assistant Secretary, NYLIFE Distributors LLC (2006 to 2008); Vice President and Chief Compliance Officer, Private Advisors Alternative Strategies Master Fund, Private Advisors Alternative Strategies Fund, DefinedTerm Municipal Opportunities Fund (since 2011); MainStay VP Funds Trust and its predecessor, MainStay VP Series Fund, Inc. (since 2009); Assistant Secretary, The MainStay Funds (2006 to 2008); Assistant Secretary, Eclipse Trust, Eclipse Funds, Inc. and MainStay VP Series Fund, Inc. (2005 to 2008) |
| | | | Stephen P. Fisher 2/22/59 | | President, Eclipse Trust, Eclipse Funds, Inc. and The MainStay Funds (since 2007), MainStay Funds Trust (since 2009) | | Director, Senior Vice President, New York Life Insurance and Annuity Corporation (since 2011); Manager, President and Chief Operating Officer, NYLIFE Distributors LLC (since 2008); Chairman of the Board, NYLIM Service Company LLC (since 2008); Senior Managing Director and Chief Marketing Officer, New York Life Investment Management LLC (since 2005); President, Private Advisors Alternative Strategies Master Fund, Private Advisors Alternative Strategies Fund and MainStay DefinedTerm Municipal Opportunities Fund (since 2011); MainStay VP Funds Trust and its predecessor, MainStay VP Series Fund, Inc. (since 2007) |
| | | | J. Kevin Gao 10/13/67 | | Secretary and Chief Legal Officer, Eclipse Trust, Eclipse Funds, Inc., The MainStay Funds and MainStay Funds Trust (since 2010) | | Managing Director and Associate General Counsel, New York Life Investment Management LLC (since 2010); Secretary and Chief Legal Officer, Private Advisors Alternative Strategies Master Fund, Private Advisors Alternative Strategies Fund and MainStay DefinedTerm Municipal Opportunities Fund (since 2011); MainStay VP Funds Trust and its predecessor, MainStay VP Series Fund, Inc. (since 2010); Director and Counsel of Credit Suisse, Chief Legal Officer and Secretary of Credit Suisse Asset Management, LLC and Credit Suisse Funds (2003 to 2010) |
| | | | Scott T. Harrington 2/8/59 | | Vice President—Administration, Eclipse Trust, Eclipse Funds, Inc. and The MainStay Funds (since 2005), MainStay Funds Trust (since 2009) | | Director, New York Life Investment Management LLC (including predecessor advisory organizations) (since 2000); Executive Vice President, New York Life Trust Company and New York Life Trust Company FSB (since 2006); Vice President—Administration, Private Advisors Alternative Strategies Master Fund, Private Advisors Alternative Strategies Fund and MainStay DefinedTerm Municipal Opportunities Fund (since 2011); MainStay VP Funds Trust and its predecessor, MainStay VP Series Fund, Inc. (since 2005) |
| | * | The Officers listed above are considered to be “interested persons” of the MainStay Group of Funds within the meaning of the 1940 Act because of their affiliation with New York Life Insurance Company, New York Life Investment Management LLC, Madison Square Investors LLC, MacKay Shields LLC, Private Advisors LLC, Institutional Capital LLC, Epoch Investment Partners, Inc., Markston International, LLC, Winslow Capital Management, Inc., NYLIFE Securities LLC and/or NYLIFE Distributors LLC, as described in detail above in the column captioned “Principal Occupation(s) During Past Five Years.” Officers are elected annually by the Board to serve a one-year term. |
| | | | |
| mainstayinvestments.com | | | 33 | |
This page intentionally left blank
MainStay Funds
MainStay offers a wide range of Funds for virtually any investment need. The full array of MainStay open-end offerings is listed here, with information about the manager, subadvisors, legal counsel and independent registered public accounting firms.
Equity
U.S. Equity
MainStay Common Stock Fund
MainStay Epoch U.S. All Cap Fund
MainStay Epoch U.S. Equity Yield Fund
MainStay Growth Equity Fund
MainStay ICAP Equity Fund
MainStay ICAP Select Equity Fund
MainStay Large Cap Growth Fund1
MainStay MAP Fund
MainStay S&P 500 Index Fund
MainStay U.S. Small Cap Fund
MainStay 130/30 Core Fund
International/Global Equity
MainStay Epoch Global Choice Fund
MainStay Epoch Global Equity Yield Fund
MainStay Epoch International Small Cap Fund
MainStay ICAP Global Fund
MainStay ICAP International Fund
MainStay International Equity Fund
MainStay 130/30 International Fund
Income
Taxable Bond
MainStay Flexible Bond Opportunities Fund
MainStay Floating Rate Fund
MainStay Global High Income Fund
MainStay Government Fund
MainStay High Yield Corporate Bond Fund
MainStay High Yield Opportunities Fund
MainStay Indexed Bond Fund
MainStay Intermediate Term Bond Fund
MainStay Short Term Bond Fund
MainStay Money Market Fund
Municipal Bond
MainStay High Yield Municipal Bond Fund
MainStay New York Tax Free Opportunities Fund2
MainStay Tax Free Bond Fund
Mixed Asset
MainStay Balanced Fund
MainStay Convertible Fund
MainStay Income Builder Fund
MainStay Marketfield Fund
Asset Allocation/Target Date
MainStay Conservative Allocation Fund
MainStay Growth Allocation Fund
MainStay Moderate Allocation Fund
MainStay Moderate Growth Allocation Fund
MainStay Retirement 2010 Fund
MainStay Retirement 2020 Fund
MainStay Retirement 2030 Fund
MainStay Retirement 2040 Fund
MainStay Retirement 2050 Fund
Manager
New York Life Investment Management LLC
New York, New York
Subadvisors
Epoch Investment Partners, Inc.
New York, New York
Institutional Capital LLC3
Chicago, Illinois
MacKay Shields LLC3
New York, New York
Madison Square Investors LLC3
New York, New York
Marketfield Asset Management LLC
New York, New York
Markston International LLC
White Plains, New York
Winslow Capital Management, Inc.
Minneapolis, Minnesota
Legal Counsel
Dechert LLP
Independent Registered Public Accounting Firms
KPMG LLP
PricewaterhouseCoopers LLP
1. Effective January 13, 2012, the Fund was closed to new investors with certain exceptions.
2. The Fund is only registered for sale in CT, DE, FL, MA, NJ, NY, and VT.
3. An affiliate of New York Life Investment Management LLC.
Not part of the Annual Report
mainstayinvestments.com
The MainStay Funds are managed by New York Life Investment Management LLC and distributed through NYLIFE Distributors LLC, 169 Lackawanna Avenue, Parsippany, NJ 07054, a wholly owned subsidiary of New York Life Insurance Company. NYLIFE Distributors is a Member FINRA/SIPC.
MainStay Investments is a service mark and name under which New York Life Investment Management LLC does business. MainStay Investments, an indirect subsidiary of New York Life Insurance Company, New York , NY 10010, provides investment advisory products and services.
This report may be distributed only when preceded or accompanied by a current Fund prospectus.
© 2013 by NYLIFE Distributors LLC. All rights reserved.
| | | | | | | | |
| Not FDIC/NCUA Insured | | Not a Deposit | | May Lose Value | | No Bank Guarantee | | Not Insured by Any Government Agency |
| | | | |
| NYLIM-28193 MS265-12 | | | MSMM11-12/12 | |
NL012

MainStay Tax Free Bond Fund
Message from the President and Annual Report
October 31, 2012
This page intentionally left blank
Message from the President
Most major equity markets delivered positive results for the 12 months ended October 31, 2012. In the United States, stocks provided solid double-digit returns. With a few notable exceptions, international stock markets generally ended the reporting period in positive territory.
The stock market’s advance, however, was far from uniform. After rising to an early peak at the end of March 2012, domestic and international stocks lost ground until the beginning of June. After that, stocks generally rose, reaching their high point for the reporting period in mid-September. Although stocks remained relatively buoyant through mid-October, they drifted lower as the reporting period came to a close.
A variety of forces converged to help fuel these market movements. Investors kept a close eye on developments in the European sovereign debt crisis. The European Central Bank’s Long Term Refinancing Operations helped stabilize European credit markets and provide needed liquidity. Although private holders of Greek sovereign debt had to accept a reduction in their recovery value, the anticipated voluntary exchange provided a positive spark to the markets. Rising unemployment and new austerity measures may impede economic growth as the European Union seeks to strike a delicate balance between fiscal and monetary policies.
In the United States, the Federal Reserve announced an open-ended agency mortgage-backed security purchase program, which helped calm market concerns. The Federal Reserve also continued its maturity extension program (referred to by some as “operation twist”), which seeks to put downward pressure on longer-term interest rates. At the short end of the yield curve, the Federal Reserve maintained the federal funds rate in a near-zero range. In September 2012, the Federal Open Market Committee anticipated that “exceptionally low levels for the federal funds rate” were “likely to be warranted at least through mid-2015.”
With markets stabilizing and short-term interest rates at very low levels, yield-hungry investors had incentives to lengthen maturities and accept higher risk. Domestic high-yield bonds provided double-digit returns for the reporting period, municipal bonds and convertible securities provided high single-digit returns, and domestic corporate bonds provided positive overall returns.
While most investors are pleased when markets rise, MainStay portfolio managers know that long-term results depend on more than short-term market movements. They also depend on the consistent application of well-defined investment strategies and risk-management techniques over longer periods. Our long-term perspective gives our portfolio managers the ability to look past the daily ups and downs of the market as they pursue the specific investment objectives of their individual Funds.
At MainStay, we believe that a long-term perspective can help investors as well. Instead of trying to capitalize on short-term market movements, you may prefer to focus on the long-term potential that can come from getting invested, staying invested and adding to your investments over time. Of course, past performance is no guarantee of future results.
The following pages contain more specific information on the securities, market events and investment decisions that affected your MainStay Fund(s) during the 12 months ended October 31, 2012. We invite you to read the information carefully and use it as part of your ongoing portfolio evaluation and investment review.
Sincerely,

Stephen P. Fisher
President
The opinions expressed are as of the date of this report and are subject to change. There is no guarantee that any forecast made will come to pass. This material does not constitute investment advice and is not intended as an endorsement of any specific investment.
Not part of the Annual Report
Table of Contents
Investors should refer to the Fund’s Summary Prospectus and/or Prospectus and consider the Fund’s investment objectives, strategies, risks, charges and expenses carefully before investing. The Summary Prospectus and/or Prospectus contain this and other information about the Fund. You may obtain copies of the Fund’s Summary Prospectus, Prospectus and Statement of Additional Information free of charge, upon request, by calling toll-free 800-MAINSTAY (624-6782), by writing to NYLIFE Distributors LLC, Attn: MainStay Marketing Department, 169 Lackawanna Avenue, Parsippany, New Jersey 07054 or by sending an e-mail to MainStayShareholderServices@nylim.com. These documents are also available via the MainStay Funds’ website at mainstayinvestments.com/documents. Please read the Summary Prospectus and/or Prospectus carefully before investing.
Investment and Performance Comparison1 (Unaudited)
Performance data quoted represents past performance. Past performance is no guarantee of future results. Because of market volatility, current performance may be lower or higher than the figures shown. Investment return and principal value will fluctuate, and as a result, when shares are redeemed, they may be worth more or less than their original cost. The graph below depicts the historical performance of Class B shares of the Fund. Performance will vary from class to class based on differences in class-specific expenses and sales charges. For performance information current to the most recent month-end, please call 800-MAINSTAY (624-6782) or visit mainstayinvestments.com.
(With sales charges)
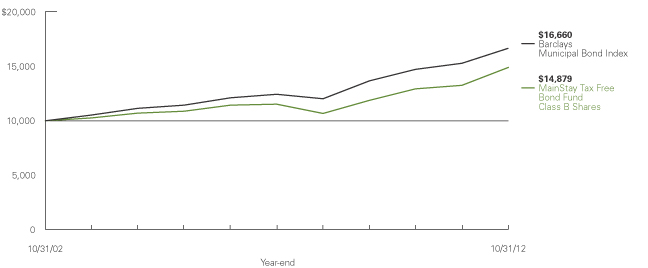
Average Annual Total Returns for the Year Ended October 31, 2012
| | | | | | | | | | | | | | | | | | | | |
| Class | | Sales Charge | | | | One Year | | | Five Years | | | Ten Years | | | Gross
Expense
Ratio2 | |
| Investor Class Shares3 | | Maximum 4.5% Initial Sales Charge | | With sales charges Excluding sales charges | |
| 7.52
12.58 | %
| |
| 4.58
5.54 | %
| |
| 3.84
4.32 | %
| |
| 0.98
0.98 | %
|
| Class A Shares | | Maximum 4.5% Initial Sales Charge | | With sales charges Excluding sales charges | |
| 7.74
12.81 |
| |
| 4.67
5.64 |
| |
| 3.89
4.37 |
| |
| 0.89
0.89 |
|
| Class B Shares | | Maximum 5% CDSC
if Redeemed Within the First Six Years of Purchase | | With sales charges Excluding sales charges | |
| 7.34
12.34 |
| |
| 4.93
5.26 |
| |
| 4.05
4.05 |
| |
| 1.23
1.23 |
|
| Class C Shares | | Maximum 1% CDSC
if Redeemed Within One Year of Purchase | | With sales charges Excluding sales charges | |
| 11.33
12.33 |
| |
| 5.28
5.28 |
| |
| 4.06
4.06 |
| |
| 1.23
1.23 |
|
| Class I Shares4 | | No Sales Charge | | | | | 12.97 | | | | 5.86 | | | | 4.61 | | | | 0.64 | |
| 1. | The performance table and graph do not reflect the deduction of taxes that a shareholder would pay on distributions or Fund-share redemptions. Total returns reflect maximum applicable sales charges as indicated in the table above, changes in share price, and reinvestment of dividend and capital gain distributions. The graph assumes the initial investment amount shown above and reflects the deduction of all sales charges that would have applied for the period of investment. Performance figures reflect certain fee waivers and/or expense limitations, without which total returns may have been lower. For more information on share classes and current fee waivers and/or expense limitations, please refer to the notes to the financial statements. |
| 2. | The gross expense ratios presented reflect the Fund’s “Total Annual Fund Operating Expenses” from the most recent Prospectus and may differ from other expense ratios disclosed in this report. |
| 3. | Performance figures for Investor Class shares, first offered on February 28, 2008, include the historical performance of Class A shares through February 27, 2008, adjusted for differences in certain fees and expenses. Unadjusted, the performance shown for Investor Class shares might have been different. |
| 4. | Performance figures for Class I shares, first offered on December 21, 2009, include the historical performance of Class B shares through December 20, 2009, adjusted for differences in certain fees and expenses. Unadjusted, the performance shown for Class I shares might have been different. |
The footnotes on the next page are an integral part of the table and graph and should be carefully read in conjunction with them.
| | | | |
| mainstayinvestments.com | | | 5 | |
| | | | | | | | | | | | |
| Benchmark Performance | | One Year | | | Five Years | | | Ten
Years | |
Barclays Municipal Bond Index5 | | | 9.03 | % | | | 6.02 | % | | | 5.24 | % |
Average Lipper General & Insured Municipal Debt Fund6 | | | 10.98 | | | | 5.20 | | | | 4.55 | |
| 5. | The Barclays Municipal Bond Index includes approximately 15,000 municipal bonds, rated Baa or better by Moody’s, with a maturity of at least two years. Bonds subject to the alternative minimum tax or with floating or zero coupons are excluded. The Barclays Municipal Bond Index is the Fund’s broad-based securities market index for comparison purposes. Total returns assume the reinvestment of all dividends and capital gains. An investment cannot be made directly in an index. |
| 6. | The average Lipper general & insured municipal debt fund is representative of funds that, by portfolio practice, either invest primarily in municipal debt issues rated in the top four credit ratings or invest primarily in municipal debt issues insured as to timely payment. This benchmark is a product of Lipper Inc. Lipper Inc. is an independent monitor of fund performance. Results are based on average total returns of similar funds with all dividend and capital gain distributions reinvested. |
The footnotes on the preceding page are an integral part of the table and graph and should be carefully read in conjunction with them.
| | |
| 6 | | MainStay Tax Free Bond Fund |
Cost in Dollars of a $1,000 Investment in MainStay Tax Free Bond Fund (Unaudited)
The example below is intended to describe the fees and expenses borne by shareholders during the six-month period from May 1, 2012, to October 31, 2012, and the impact of those costs on your investment.
Example
As a shareholder of the Fund, you incur two types of costs: (1) transaction costs, including exchange fees and sales charges (loads) on purchases (as applicable), and (2) ongoing costs, including management fees, distribution and/or service (12b-1) fees, and other Fund expenses (as applicable). This example is intended to help you understand your ongoing costs (in dollars) of investing in the Fund and to compare these costs with the ongoing costs of investing in other mutual funds. The example is based on an investment of $1,000 made at the beginning of the six-month period and held for the entire period from May 1, 2012, to October 31, 2012.
This example illustrates your Fund’s ongoing costs in two ways:
Actual Expenses
The second and third data columns in the table below provide information about actual account values and actual expenses. You may use the information in these columns, together with the amount you invested, to estimate the expenses that you paid during the six months ended October 31, 2012. Simply divide your account value by $1,000 (for example, an $8,600 account value divided by $1,000 = 8.6), then
multiply the result by the number under the heading entitled “Expenses Paid During Period” to estimate the expenses you paid on your account during this period.
Hypothetical Example for Comparison Purposes
The fourth and fifth data columns in the table below provide information about hypothetical account values and hypothetical expenses based on the Fund’s actual expense ratio and an assumed rate of return of 5% per year before expenses, which is not the Fund’s actual return. The hypothetical account values and expenses may not be used to estimate the actual ending account balances or expenses you paid for the six-month period shown. You may use this information to compare the ongoing costs of investing in the Fund with the ongoing costs of investing in other Funds. To do so, compare this 5% hypothetical example with the 5% hypothetical examples that appear in the shareholder reports of the other Funds.
Please note that the expenses shown in the table are meant to highlight your ongoing costs only and do not reflect any transactional costs, such as exchange fees or sales charges (loads). Therefore, the fourth and fifth data columns of the table are useful in comparing ongoing costs only and will not help you determine the relative total costs of owning different funds. In addition, if these transactional costs were included, your costs would have been higher.
| | | | | | | | | | | | | | | | | | | | |
| | | | | | | | | | | | | | | | |
| Share Class | | Beginning
Account
Value
5/1/12 | | | Ending Account
Value (Based
on Actual
Returns and
Expenses)
10/31/12 | | | Expenses
Paid
During
Period1 | | | Ending Account
Value (Based
on Hypothetical
5% Annualized
Return and
Actual Expenses)
10/31/12 | | | Expenses
Paid
During
Period1 | |
| | | | | |
| Investor Class Shares | | $ | 1,000.00 | | | $ | 1,046.70 | | | $ | 4.37 | | | $ | 1,020.90 | | | $ | 4.32 | |
| | | | | |
| Class A Shares | | $ | 1,000.00 | | | $ | 1,047.10 | | | $ | 4.07 | | | $ | 1,021.20 | | | $ | 4.01 | |
| | | | | |
| Class B Shares | | $ | 1,000.00 | | | $ | 1,044.40 | | | $ | 5.65 | | | $ | 1,019.60 | | | $ | 5.58 | |
| | | | | |
| Class C Shares | | $ | 1,000.00 | | | $ | 1,045.50 | | | $ | 5.71 | | | $ | 1,019.60 | | | $ | 5.64 | |
| | | | | |
| Class I Shares | | $ | 1,000.00 | | | $ | 1,048.40 | | | $ | 2.78 | | | $ | 1,022.40 | | | $ | 2.75 | |
| 1. | Expenses are equal to the Fund’s annualized expense ratio of each class (0.85% for Investor Class, 0.79% for Class A, 1.10% for Class B, 1.11% for Class C and 0.54% for Class I) multiplied by the average account value over the period, divided by 366 and multiplied by 184 (to reflect the six-month period). The table above represents the actual expenses incurred during the six-month period. |
| | | | |
| mainstayinvestments.com | | | 7 | |
Portfolio Composition as of October 31, 2012 (Unaudited)
| | | | |
| California | | | 23.4 | % |
| Texas | | | 9.3 | |
| Michigan | | | 8.6 | |
| New York | | | 7.4 | |
| Florida | | | 6.1 | |
| New Jersey | | | 5.5 | |
| U.S. Virgin Islands | | | 3.8 | |
| Louisiana | | | 3.3 | |
| Pennsylvania | | | 2.9 | |
| Massachusetts | | | 2.7 | |
| Nebraska | | | 2.1 | |
| Ohio | | | 1.9 | |
| Colorado | | | 1.7 | |
| Connecticut | | | 1.7 | |
| Georgia | | | 1.6 | |
| Kansas | | | 1.6 | |
| Indiana | | | 1.5 | |
| Illinois | | | 1.4 | |
| Tennessee | | | 1.3 | |
| District of Columbia | | | 1.1 | |
| South Carolina | | | 0.9 | |
| Alabama | | | 0.7 | |
| | | | |
| Guam | | | 0.7 | % |
| Rhode Island | | | 0.7 | |
| Virginia | | | 0.7 | |
| Wisconsin | | | 0.7 | |
| Missouri | | | 0.6 | |
| Hawaii | | | 0.5 | |
| Maine | | | 0.5 | |
| Mississippi | | | 0.5 | |
| North Carolina | | | 0.5 | |
| North Dakota | | | 0.4 | |
| Minnesota | | | 0.3 | |
| New Hampshire | | | 0.3 | |
| Kentucky | | | 0.2 | |
| Nevada | | | 0.2 | |
| Oregon | | | 0.2 | |
| Wyoming | | | 0.2 | |
| Utah | | | 0.1 | |
| Vermont | | | 0.1 | |
| Washington | | | 0.1 | |
| Other Assets, Less Liabilities | | | 2.0 | |
| | | | |
| | | 100.0 | % |
| | | | |
See Portfolio of Investments beginning on page 11 for specific holdings within these categories.
Top Ten Issuers Held as of October 31, 2012 (excluding short–term investment)
| 1. | Virgin Islands Public Finance Authority, Revenue Bonds, 5.00%–6.75%, due 10/1/32–10/1/37 |
| 2. | Central Plains Energy, Project No. 3, Revenue Bonds, 5.00%–5.25%, due 9/1/27–9/1/37 |
| 3. | Texas Private Activity Bond Surface Transportation Corp., LBJ Infrastructure, Revenue Bonds, 7.00%–7.50%, due 6/30/32–6/30/40 |
| 4. | City of Orlando, Tourist Development Tax, Revenue Bonds, 5.50%, due 11/1/38 |
| 5. | Golden State Tobacco Securitization Corp., Revenue Bonds, 5.00%, due 6/1/35–6/1/45 |
| 6. | Detroit, Michigan Water Supply System Revenue, Revenue Bonds, 5.25%–5.75%, due 7/1/37–7/1/41 |
| 7. | Pennsylvania State Turnpike Commission, Revenue Bonds, 5.00%–5.75%, due 6/1/39–12/1/42 |
| 8. | Detroit, Michigan City School District, Unlimited General Obligation, 5.00%, due 5/1/27–5/1/33 |
| 9. | California State, Unlimited General Obligation, 6.00%–6.50%, due 4/1/33–11/1/35 |
| 10. | Stockton, California Unified School District, Election 2005, Unlimited General Obligation, 4.55%, due 9/1/30 |
| | |
| 8 | | MainStay Tax Free Bond Fund |
Portfolio Management Discussion and Analysis (Unaudited)
Questions answered by portfolio managers John Loffredo, CFA, Robert DiMella, CFA, and Michael Petty of MacKay Shields LLC, the Fund’s Subadvisor.
How did MainStay Tax Free Bond Fund perform relative to its peers and its benchmark during the 12 months ended October 31, 2012?
Excluding all sales charges, MainStay Tax Free Bond Fund returned 12.58% for Investor Class shares, 12.81% for Class A shares, 12.34% for Class B shares and 12.33% for Class C shares for the 12 months ended October 31, 2012. Over the same period, Class I shares returned 12.97%. All share classes outperformed the 10.98% return of the average Lipper1 general & insured municipal debt fund and the 9.03% return of the Barclays Municipal Bond Index2 for the 12 months ended October 31, 2012. The Barclays Municipal Bond Index is the Fund’s broad-based securities-market index. See page 5 for Fund returns with applicable sales charges.
What factors affected the Fund’s relative performance during the reporting period?
The Fund outperformed the Barclays Municipal Bond Index during the reporting period because of an overweight position in securities with maturities greater than 15 years and an overweight position in securities rated BBB.3 These securities outperformed intermediate (10 year) bonds and higher-grade (AAA and AA)4 bonds, largely because low interest rates led many investors to seek higher yield through longer maturities and lower-rated investment-grade credits. The Fund also benefited from an underweight position—zero exposure—to Puerto Rico-backed bonds. The structural imbalances in Puerto Rico have caused the U.S. territory’s debt to start underperforming the general market, and we believe this is likely to continue.
During the reporting period, how was the Fund’s performance materially affected by investments in derivatives?
We used U.S. Treasury futures to shorten the Fund’s duration5 (in line with the Barclays Municipal Bond Index) and to manage price volatility. This strategy enabled the Fund to maintain exposure to what we felt were the most attractive segments of the municipal market—municipal bonds with maturities of
15 years or more that were rated A6 or BBB. This position added to the Fund’s performance.
What was the Fund’s duration strategy during the reporting period?
Overall, our strategy is to keep the Fund’s duration close to that of the Barclays Municipal Bond Index. At times, depending on conditions in the municipal market—such as seasonal supply-and-demand imbalances and our outlook for what lies ahead—we may adjust the Fund’s duration modestly shorter or longer. During the reporting period, the Fund’s duration was longer than that of the Index because of how we viewed the attractiveness of the market in general and the relative value of securities with maturities of 15 years or more.
What specific factors, risks or market forces prompted significant decisions for the Fund during the reporting period?
During the reporting period, excess cash from maturing bonds and continued inflows into municipal funds created strong demand for municipal securities. Midway through the reporting period, however, there was a dearth of supply. These forces produced an attractive technical backdrop for the municipal market. Our decision to overweight the Fund in lower-rated investment-grade bonds and longer-maturity bonds proved beneficial. Interest rates were expected to remain low for an extended period, which gave investors the confidence to reach for incremental yield. As supply returned, we invested the Fund’s cash reserves to maintain a competitive tax-exempt dividend.
During the reporting period, which market segments were the strongest positive contributors to the Fund’s performance and which market segments were partic-ularly weak?
On an absolute basis, the most significant positive contributions to the Fund’s performance came from bonds rated BBB and from bonds with maturities of 20 years or more. (Contributions
| 1. | See footnote on page 6 for more information on Lipper Inc. |
| 2. | See footnote on page 6 for more information on the Barclays Municipal Bond Index. |
| 3. | An obligation rated ‘BBB’ by Standard & Poor’s (“S&P”) is deemed by S&P to exhibit adequate protection parameters. It is the opinion of S&P, however, that adverse economic conditions or changing circumstances are more likely to lead to a weakened capacity of the obligor to meet its financial commitment on the obligation. When applied to Fund holdings, ratings are based solely on the creditworthiness of the bonds in the portfolio and are not meant to represent the security or safety of the Fund. |
| 4. | An obligation rated ‘AAA’ has the highest rating assigned by S&P, and in the opinion of S&P, the obligor’s capacity to meet its financial commitment on the obligation is extremely strong. An obligation rated ‘AA’ by S&P is deemed by S&P to differ from the highest-rated issues only to a small degree. In the opinion of S&P, the obligor’s capacity to meet its financial commitment on the obligation is very strong. When applied to Fund holdings, ratings are based solely on the creditworthiness of the bonds in the portfolio and are not meant to represent the security or safety of the Fund. |
| 5. | Duration is a measure of the price sensitivity of a fixed-income investment to changes in interest rates. Duration is expressed as a number of years and is considered a more accurate sensitivity gauge than average maturity. |
| 6. | An obligation rated ‘A’ by S&P is deemed by S&P to be somewhat more susceptible to the adverse effects of changes in circumstances and economic conditions than obligations in higher-rated categories. In the opinion of S&P, however, the obligor’s capacity to meet its financial commitment on the obligation is still strong. When applied to Fund holdings, ratings are based solely on the creditworthiness of the bonds in the portfolio and are not meant to represent the security or safety of the Fund. |
| | | | |
| mainstayinvestments.com | | | 9 | |
take weightings and total returns into account.) Spread7 tightening and a flattening of the municipal yield curve8 were significant drivers of the municipal market during the reporting period. In addition, the Fund’s increased exposure to zero-coupon bonds9 contributed positively to the Fund’s performance, as spreads were wide compared to historical averages and tightened as interest rates remained low and supply remained relatively light.
During the reporting period, the Fund’s cash position detracted from absolute performance.
Did the Fund make any significant purchases or sales during the reporting period?
We increased the Fund’s exposure to zero-coupon bonds dur-ing the reporting period. Specifically, we increased the Fund’s exposure to local California school district general obligation bonds, which we felt allowed the Fund to earn yields that, in our opinion, were attractive.
We eliminated the Fund’s exposure to Puerto Rico credits during the latter part of the reporting period because we believed that the credit fundamentals of these bonds did not support their strong market prices.
Toward the end of the reporting period, we also began shifting the Fund’s average credit quality higher. Credit spreads in BBB-rated securities, while still above historical averages, narrowed significantly during the reporting period. We felt that it was prudent to reduce the Fund’s overweight position in BBB securities. As we implemented this change, we increased the Fund’s exposure to securities rated A.
How did the Fund’s sector weightings change during the reporting period?
As a general rule, we did not make significant sector changes. We felt that 2012 was going to be about security selection, not sector rotation. During the reporting period, we increased the Fund’s exposure to investments in several states that were subject to negative news reports, primarily Michigan and California, as we consistently sought to uncover opportunities. We also increased the Fund’s exposure to local general obligation bonds and toll road credits. As previously mentioned, we eliminated the Fund’s exposure to Puerto Rico bonds because we believed that spreads on these bonds would widen over time.
How was the Fund positioned at the end of the reporting period?
As of October 31, 2012, the Fund was overweight relative to the Barclays Municipal Bond Index in bonds with maturities of 15 years or longer. The Fund was also overweight relative to the Index in credits rated A and BBB. In addition, the Fund had an overweight position in California securities.
On the same date, the Fund held underweight positions relative to the Index in securities rated AA and higher and in bonds with maturities of less than 10 years. We felt that these sectors could have a higher correlation to inflation and to potentially higher interest rates than the rest of the municipal market. The Fund continued to have a slightly longer duration than the Barclays Municipal Bond Index.
| 7. | The terms “spread” and “yield spread” may refer to the difference in yield between a security or type of security and comparable U.S. Treasury issues. The terms may also refer to the difference in yield between two specific securities or types of securities at a given time. |
| 8. | The yield curve is a line that plots the yields of various securities of similar quality—typically U.S. Treasury issues—across a range of maturities. The U.S. Treasury yield curve serves as a benchmark for other debt and is used in economic forecasting. The municipal yield curve is said to flatten when the spread between short-term and long-term municipal bonds decreases and the yields of intermediate-term municipal bonds remain within that spread. |
| 9. | A zero-coupon bond is a debt security that does not pay interest (a coupon) but is traded at a deep discount. The price of zero-coupon bonds tends to rise as the bonds approach maturity, when they may be redeemed for their full face value. |
The opinions expressed are those of the portfolio managers as of the date of this report and are subject to change. There is no guarantee that any forecast made will come to pass. This material does not constitute investment advice and is not intended as an endorsement of any specific investment.
| | |
| 10 | | MainStay Tax Free Bond Fund |
Portfolio of Investments††† October 31, 2012
| | | | | | | | |
| | | Principal
Amount | | | Value | |
| | | | | | | | |
| Municipal Bonds 98.0%† | | | | | | | | |
Alabama 0.7% | | | | | | | | |
Alabama Water Pollution Control Authority,
Revenue Bonds
Series B, Insured: AMBAC
4.125%, due 2/15/14 | | $ | 1,550,000 | | | $ | 1,529,478 | |
Bessemer, Alabama Medical Clinic Board,
Bessemer Carraway Medical Center,
Revenue Bonds
Series A, Insured: NATL-RE
5.875%, due 5/15/26 | | | 1,000,000 | | | | 1,001,250 | |
Jefferson County, Alabama, Revenue Bonds
Insured: FSA
5.50%, due 1/1/21 | | | 2,380,000 | | | | 2,425,744 | |
| | | | | | | | |
| | | | | | | 4,956,472 | |
| | | | | | | | |
California 23.4% | | | | | | | | |
Alum Rock Union Elementary School District,
Election, Unlimited General Obligation
Series A, Insured: GTY
5.00%, due 8/1/33 | | | 3,040,000 | | | | 3,378,291 | |
Anaheim Public Financing Authority,
Public Improvement Project,
Revenue Bonds
Series A-1, Insured: FGIC, NATL-RE
4.75%, due 9/1/33 | | | 10,000,000 | | | | 10,417,600 | |
Anaheim, California, School District,
Unlimited General Obligation
Insured: AGM
6.25%, due 8/1/40 | | | 2,700,000 | | | | 3,326,319 | |
California Educational Facilities Authority, Revenue Bonds
6.125%, due 10/1/30 | | | 1,525,000 | | | | 1,916,452 | |
California Health Facilities Financing Authority, Catholic Healthcare, Revenue Bonds
Series A
6.00%, due 7/1/34 | | | 3,000,000 | | | | 3,562,920 | |
California Health Facilities Financing Authority,
Revenue Bonds
Series A
6.25%, due 2/1/26 | | | 500,000 | | | | 593,620 | |
California Infrastructure & Economic
Development Bank,
California Independent
System Operator Corp.,
| | | | | |
Revenue Bonds
Series A
5.50%, due 2/1/30 | | | 5,400,000 | | | | 5,819,202 | |
| | | | | | | | |
| | | Principal
Amount | | | Value | |
| | | | | | | | |
California (continued) | | | | | | | | |
California State Public Works Revenue,
Various Capital Project, Revenue Bonds
Series G1
5.75%, due 10/1/30 | | $ | 1,400,000 | | | $ | 1,667,246 | |
¨California State,
Unlimited General Obligation | | | | | | | | |
6.00%, due 11/1/35 | | | 2,500,000 | | | | 3,061,400 | |
6.25%, due 11/1/34 | | | 5,000,000 | | | | 6,163,300 | |
6.50%, due 4/1/33 | | | 2,530,000 | | | | 3,185,422 | |
California Statewide Communities
Development Authority,
Aspire Public Schools,
Revenue Bonds
6.375%, due 7/1/45 | | | 2,000,000 | | | | 2,100,940 | |
California Statewide Communities
Development Authority, Revenue Bonds
5.25%, due 11/1/30 | | | 1,475,000 | | | | 1,696,471 | |
Ceres Unified School District,
Unlimited General Obligation | | | | | | | | |
Series A
(zero coupon), due 8/1/37 | | | 4,150,000 | | | | 824,107 | |
Series A
(zero coupon), due 8/1/46 | | | 8,000,000 | | | | 810,160 | |
Series A
(zero coupon), due 8/1/49 | | | 9,000,000 | | | | 718,470 | |
Dublin-San Ramon Services District, California,
Refunding Water, | | | | | |
Revenue Bonds
5.50%, due 8/1/36 | | | 4,035,000 | | | | 4,663,451 | |
Fontana Unified School District,
Unlimited General Obligation | | | | | | | | |
Series C
(zero coupon), due 8/1/35 | | | 14,800,000 | | | | 4,409,808 | |
Series C
(zero coupon), due 8/1/36 | | | 15,500,000 | | | | 4,229,485 | |
Foothill-Eastern Transportation Corridor
Agency Toll Road, Revenue Bonds | | | | | | | | |
(zero coupon), due 1/15/24 | | | 10,000,000 | | | | 5,151,400 | |
(zero coupon), due 1/15/34 | | | 9,600,000 | | | | 2,695,968 | |
Foothill-Eastern Transportation Corridor Agency,
Revenue Bonds
(zero coupon), due 1/15/31 | | | 13,000,000 | | | | 4,385,030 | |
Fresno, California Unified School District Education,
Unlimited General Obligation | | | | | |
Series G
(zero coupon), due 8/1/32 | | | 6,000,000 | | | | 1,870,140 | |
| † | Percentages indicated are based on Fund net assets. |
| ¨ | | Among the Fund’s 10 largest issuers held, as of October 31, 2012, excluding short-term investment. May be subject to change daily. |
| | | | | | |
The notes to the financial statements are an integral part of,
and should be read in conjunction with, the financial statements. | | mainstayinvestments.com | | | 11 | |
Portfolio of Investments††† October 31, 2012 (continued)
| | | | | | | | |
| | | Principal
Amount | | | Value | |
| | | | | | | | |
| Municipal Bonds (continued) | | | | | | | | |
California (continued) | | | | | | | | |
Fresno, California Unified School District Education,
Unlimited General Obligation (continued) | | | | | |
Series G
(zero coupon), due 8/1/33 | | $ | 10,000,000 | | | $ | 2,887,300 | |
Series G
(zero coupon), due 8/1/41 | | | 23,485,000 | | | | 3,845,434 | |
¨Golden State Tobacco Securitization Corp.,
Revenue Bonds | | | | | | | | |
Series A, Insured: AGC-ICC, FGIC
5.00%, due 6/1/35 | | | 9,000,000 | | | | 9,252,990 | |
¨Golden State Tobacco Securitization Corp., Revenue Bonds (continued) | | | | | | | | |
Series A
5.00%, due 6/1/45 | | | 5,775,000 | | | | 5,879,008 | |
Hayward Unified School District,
Unlimited General Obligation | | | | | | | | |
Series A, Insured: AGM
(zero coupon), due 8/1/36 | | | 12,500,000 | | | | 2,695,125 | |
Series A, Insured: AGM
(zero coupon), due 8/1/37 | | | 7,000,000 | | | | 1,392,790 | |
Lake Tahoe Unified School District Election,
Unlimited General Obligation
Insured: AGM
(zero coupon), due 8/1/45 | | | 6,000,000 | | | | 2,378,640 | |
Merced Union High School District,
Cabs-Election, Unlimited General Obligation
Series C
(zero coupon), due 8/1/46 | | | 53,000,000 | | | | 5,715,520 | |
Morongo, California Unified School District Election,
Unlimited General Obligation
| | | | | |
Series B, Insured: GTY
5.25%, due 8/1/38 | | | 3,880,000 | | | | 4,202,312 | |
Mountain House Public Financing Authority,
California Utility System, Revenue Bonds
5.75%, due 12/1/35 | | | 1,750,000 | | | | 1,955,083 | |
National City Community
Development Commission,
| | | | | |
National City Redevelopment Project,
Tax Allocation
7.00%, due 8/1/32 | | | 3,500,000 | | | | 4,363,800 | |
Oakland Unified School District,
Unlimited General Obligation
Insured: NATL-RE
4.50%, due 8/1/30 | | | 10,000,000 | | | | 10,072,700 | |
Oceanside, California Unified School District,
Capital Appreciation Election,
Unlimited General Obligation
Series B, Insured: AGM
(zero coupon), due 8/1/49 | | | 18,055,000 | | | | 1,641,019 | |
| | | | | | | | |
| | | Principal
Amount | | | Value | |
| | | | | | | | |
California (continued) | | | | | | | | |
Palomar Pomerado Health Election,
Unlimited General Obligation
Series A, Insured: AMBAC
5.00%, due 8/1/34 | | $ | 9,075,000 | | | $ | 9,841,565 | |
Peralta Community College District,
Unlimited General Obligation
Series A, Insured: NATL-RE
5.00%, due 8/1/31 | | | 4,655,000 | | | | 5,026,422 | |
San Joaquin Hills Transportation Corridor Agency,
| | | | | |
Revenue Bonds
Series A, Insured: NATL-RE
(zero coupon), due 1/15/36 | | | 10,000,000 | | | | 2,813,600 | |
San Lorenzo, California Unified School District,
Unlimited General Obligation
Series B 6.00%, due 8/1/41 | | | 4,535,000 | | | | 5,426,354 | |
San Ysidro School District,
Unlimited General Obligation
Series F, Insured: AGM
(zero coupon), due 8/1/48 | | | 25,205,000 | | | | 2,113,691 | |
¨Stockton, California Unified School District,
Election 2005,
Unlimited General Obligation
Insured: FGIC, NATL-RE
4.55%, due 9/1/30 | | | 11,995,000 | | | | 12,307,590 | |
West Contra Costa California Healthcare District,
| | | | | |
Certificates of Participation
6.25%, due 7/1/42 | | | 3,500,000 | | | | 4,034,345 | |
| | | | | | | | |
| | | | | | | 174,492,490 | |
| | | | | | | | |
Colorado 1.7% | | | | | | | | |
Colorado Educational & Cultural Facilities Authority,
National Jewish Federation Bond,
Revenue Bonds | | | | | |
Series C-6
0.23%, due 6/30/36 (a) | | | 380,000 | | | | 380,000 | |
Series D-5
0.23%, due 10/1/38 (a) | | | 500,000 | | | | 500,000 | |
Series A-12
0.27%, due 2/1/38 (a) | | | 1,435,000 | | | | 1,435,000 | |
Denver, Colorado City & County Airport
System Revenue, Revenue Bonds
Series B
4.00%, due 11/15/43 | | | 5,000,000 | | | | 5,055,650 | |
E-470 Public Highway Authority Colorado,
Revenue Bonds
Series B-1, Insured: NATL-RE
5.50%, due 9/1/24 | | | 3,000,000 | | | | 3,287,910 | |
Park Creek Metropolitan District,
Revenue Bonds
Series A, Insured: AGM
6.125%, due 12/1/41 | | | 1,600,000 | | | | 1,882,944 | |
| | | | | | | | |
| | | | | | | 12,541,504 | |
| | | | | | | | |
| | | | |
| 12 | | MainStay Tax Free Bond Fund | | The notes to the financial statements are an integral part of,
and should be read in conjunction with, the financial statements. |
| | | | | | | | |
| | | Principal
Amount | | | Value | |
| | | | | | | | |
| Municipal Bonds (continued) | | | | | | | | |
Connecticut 1.7% | | | | | | | | |
Connecticut Housing Finance Authority,
Housing Mortgage Finance Program,
Revenue Bonds | | | | | | | | |
Series: E
4.30%, due 11/15/35 (b) | | $ | 4,385,000 | | | $ | 4,479,935 | |
Series: B-2
4.40%, due 11/15/43 (b) | | | 3,690,000 | | | | 3,767,675 | |
Hartford, CT,
Unlimited General Obligation | | | | | | | | |
Series A
5.00%, due 4/1/28 | | | 2,500,000 | | | | 2,888,600 | |
Series A
5.00%, due 4/1/29 | | | 1,250,000 | | | | 1,437,688 | |
Series A, Insured: AGM
5.00%, due 4/1/32 | | | 275,000 | | | | 314,124 | |
| | | | | | | | |
| | | | | | | 12,888,022 | |
| | | | | | | | |
District of Columbia 1.1% | | | | | | | | |
District of Columbia,
Friendship Public Charter School, Inc.,
Revenue Bonds | | | | | | | | |
5.00%, due 6/1/32 | | | 1,125,000 | | | | 1,188,844 | |
5.00%, due 6/1/42 | | | 3,500,000 | | | | 3,626,105 | |
District of Columbia, Tax Allocation | | | | | | | | |
5.00%, due 6/1/27 | | | 825,000 | | | | 926,252 | |
5.00%, due 6/1/28 | | | 1,445,000 | | | | 1,615,250 | |
5.00%, due 6/1/31 | | | 750,000 | | | | 835,410 | |
| | | | | | | | |
| | | | | | | 8,191,861 | |
| | | | | | | | |
Florida 6.1% | | | | | | | | |
Citizens Property Insurance Corp.,
Revenue Bonds
Series A-1
5.25%, due 6/1/17 | | | 3,500,000 | | | | 4,006,800 | |
¨City of Orlando, Tourist Development Tax, Revenue Bonds
Insured: GTY
5.50%, due 11/1/38 | | | 15,000,000 | | | | 15,532,650 | |
County of Miami-Dade FL Transit System Sales Surtax Revenue, Sales Tax,
Revenue Bonds
5.00%, due 7/1/42 | | | 4,000,000 | | | | 4,521,600 | |
County of St. Lucie, Pollution Control,
Power & Light Co. Project,
Revenue Bonds
0.26%, due 9/1/28 (a) | | | 900,000 | | | | 900,000 | |
Florida State Board of Governors,
Revenue Bonds
Series A
5.00%, due 7/1/25 | | | 2,405,000 | | | | 2,761,325 | |
Miami-Dade County Florida Solid Waste System,
| | | | | |
Revenue Bonds
Insured: NATL-RE
5.00%, due 10/1/19 | | | 1,735,000 | | | | 1,888,790 | |
| | | | | | | | |
| | | Principal
Amount | | | Value | |
| | | | | | | | |
Florida (continued) | | | | | | | | |
Miami-Dade County Florida, Revenue Bonds
Series A, Insured: NATL-RE
(zero coupon), due 10/1/38 | | $ | 245,000 | | | $ | 59,969 | |
Orlando & Orange County Florida
Expressway Authority,
Revenue Bonds
Series B, Insured: AMBAC
5.00%, due 7/1/30 | | | 8,000,000 | | | | 8,179,200 | |
Pinellas County Health Facilities Authority,
Revenue Bonds
0.28%, due 7/1/34 (a) | | | 4,185,000 | | | | 4,185,000 | |
Sarasota-Manatee Airport Authority,
Revenue Bonds
0.28%, due 8/1/14 (a) | | | 2,990,000 | | | | 2,990,000 | |
| | | | | | | | |
| | | | | | | 45,025,334 | |
| | | | | | | | |
Georgia 1.6% | | | | | | | | |
Atlanta, Georgia Airport Passenger Facility Charge, | | | | | |
Revenue Bonds
Series J, Insured: AGM
5.00%, due 1/1/34 | | | 3,500,000 | | | | 3,673,075 | |
Atlanta, Georgia Water & Wastewater,
Revenue Bonds
Series A
6.25%, due 11/1/39 | | | 4,125,000 | | | | 4,971,574 | |
Bulloch County Development Authority,
Southern Housing Foundation,
Revenue Bonds
Insured: AGM
5.00%, due 7/1/37 | | | 1,475,000 | | | | 1,651,852 | |
Fulton County Georgia Development Authority,
| | | | | |
Piedmont Healthcare, Inc.,
Revenue Bonds
Series A
5.00%, due 6/15/32 | | | 1,700,000 | | | | 1,883,923 | |
| | | | | | | | |
| | | | | | | 12,180,424 | |
| | | | | | | | |
Guam 0.7% | | | | | | | | |
Guam Power Authority, Revenue Bonds
Series A, Insured: AGM
5.00%, due 10/1/30 | | | 4,935,000 | | | | 5,539,587 | |
| | | | | | | | |
| | |
Hawaii 0.5% | | | | | | | | |
Hawaii State Department of Budget and
Finance, Hawaiian Electric Co.,
Revenue Bonds
6.50%, due 7/1/39 | | | 3,000,000 | | | | 3,521,100 | |
| | | | | | | | |
| | |
Illinois 1.4% | | | | | | | | |
Chicago, Illinois Housing Authority Capital Program,
Revenue Bonds
Insured: AGM
5.00%, due 7/1/23 | | | 4,000,000 | | | | 4,378,280 | |
| | | | | | |
The notes to the financial statements are an integral part of,
and should be read in conjunction with, the financial statements. | | mainstayinvestments.com | | | 13 | |
Portfolio of Investments††† October 31, 2012 (continued)
| | | | | | | | |
| | | Principal
Amount | | | Value | |
| | | | | | | | |
| Municipal Bonds (continued) | | | | | | | | |
Illinois (continued) | | | | | | | | |
Chicago, Illinois O’ Hare
International Airport,
Revenue Bonds
Series A Insured: NATL-RE
5.00%, due 1/1/31 | | $ | 2,905,000 | | | $ | 3,043,016 | |
Chicago, lllinois,
Unlimited General Obligation
Series A
5.25%, due 1/1/35 | | | 2,000,000 | | | | 2,256,500 | |
Knox & Warren Counties, Illinois Community
Unit School District No. 205 Galesburg,
Unlimited General Obligation | | | | | | | | |
Series A
4.25%, due 1/1/19 | | | 240,000 | | | | 271,846 | |
Series A
5.00%, due 1/1/20 | | | 205,000 | | | | 243,831 | |
| | | | | | | | |
| | | | | | | 10,193,473 | |
| | | | | | | | |
Indiana 1.5% | | | | | | | | |
Indiana State Finance Authority, Butler
University, Revenue Bonds | | | | | | | | |
Series B
5.00%, due 2/1/24 | | | 2,100,000 | | | | 2,353,134 | |
Series A
5.00%, due 2/1/25 | | | 4,425,000 | | | | 4,958,390 | |
Series B
5.00%, due 2/1/26 | | | 2,320,000 | | | | 2,578,123 | |
Indianapolis, Indiana Public Improvement
Bond Bank, Revenue Bonds
Series A, Insured: GTY
5.50%, due 1/1/38 | | | 1,100,000 | | | | 1,251,404 | |
| | | | | | | | |
| | | | | | | 11,141,051 | |
| | | | | | | | |
Kansas 1.6% | | | | | | | | |
Wyandotte County-Kansas City Unified
Government, Sales Tax, Revenue Bonds
(zero coupon), due 6/1/21 | | | 17,500,000 | | | | 11,739,350 | |
| | | | | | | | |
| | |
Kentucky 0.2% | | | | | | | | |
Lexington-Fayette Urban County Airport Board,
Revenue Bonds
Series B
0.23%, due 7/1/38 (a) | | | 1,420,000 | | | | 1,420,000 | |
| | | | | | | | |
| | |
Louisiana 3.3% | | | | | | | | |
Jefferson Parish, Louisiana Hospital Service District No. 1,
| | | | | |
West Jefferson Medical Center,
Revenue Bonds
Series A, Insured: AGM
6.00%, due 1/1/39 | | | 3,500,000 | | | | 4,109,875 | |
| | | | | | | | |
| | | Principal
Amount | | | Value | |
| | | | | | | | |
Louisiana (continued) | | | | | | | | |
Louisiana Local Government Environmental
Facilities & Community Development Authority,
| | | | | |
Parking Facilities Corp.,
Revenue Bonds
Insured: AGM
4.00%, due 10/1/31 | | $ | 1,000,000 | | | $ | 1,008,200 | |
Louisiana Public Facilities Authority,
Dynamic Fuels LLC Project,
Revenue Bonds
0.24%, due 10/1/33 (a) | | | 700,000 | | | | 700,000 | |
Louisiana Public Facilities Authority,
Franciscan Missionaries, Revenue Bonds
6.75%, due 7/1/39 | | | 3,000,000 | | | | 3,609,690 | |
Louisiana Public Facilities Authority,
Ochsner Clinic, Revenue Bonds
6.25%, due 5/15/31 | | | 5,690,000 | | | | 6,764,557 | |
Louisiana State Citizens Property Insurance Corp.,
Revenue Bonds | | | | | |
Series B, Insured: AMBAC
5.00%, due 6/1/20 | | | 2,340,000 | | | | 2,605,847 | |
Series C-3, Insured: GTY
6.125%, due 6/1/25 | | | 5,000,000 | | | | 5,876,250 | |
| | | | | | | | |
| | | | | | | 24,674,419 | |
| | | | | | | | |
Maine 0.5% | | | | | | | | |
Maine State Housing Authority Mortgage,
Revenue Bonds
Series H
0.30%, due 11/15/40 (a) | | | 3,750,000 | | | | 3,750,000 | |
| | | | | | | | |
| | |
Massachusetts 2.7% | | | | | | | | |
Massachusetts Educational Financing Authority,
Revenue Bonds | | | | | |
Series B
5.70%, due 1/1/31 (b) | | | 2,435,000 | | | | 2,611,367 | |
Series I
6.00%, due 1/1/28 | | | 3,315,000 | | | | 3,862,373 | |
Massachusetts Health & Educational
Facilities Authority, Capital Asset Program,
Revenue Bonds
Series S
0.30%, due 1/1/35 (a) | | | 1,600,000 | | | | 1,600,000 | |
Massachusetts State Health & Educational
Facilities Authority, Suffolk University,
Revenue Bonds | | | | | | | | |
Series A
6.00%, due 7/1/24 | | | 2,000,000 | | | | 2,360,660 | |
Series A
6.25%, due 7/1/30 | | | 6,400,000 | | | | 7,469,120 | |
Metropolitan Boston Transit Parking Corp., Revenue Bonds
5.25%, due 7/1/36 | | | 2,000,000 | | | | 2,286,120 | |
| �� | | | | | | | |
| | | | | | | 20,189,640 | |
| | | | | | | | |
| | | | |
| 14 | | MainStay Tax Free Bond Fund | | The notes to the financial statements are an integral part of,
and should be read in conjunction with, the financial statements. |
| | | | | | | | |
| | | Principal
Amount | | | Value | |
| | | | | | | | |
| Municipal Bonds (continued) | | | | | | | | |
Michigan 8.6% | | | | | | | | |
¨Detroit, Michigan City School District,
Unlimited General Obligation | | | | | | | | |
Series A, Insured: Q-SBLF
5.00%, due 5/1/27 | | $ | 7,500,000 | | | $ | 8,597,100 | |
Series A, Insured: Q-SBLF
5.00%, due 5/1/33 | | | 4,535,000 | | | | 5,071,037 | |
Detroit, Michigan Sewerage Disposal System,
Revenue Bonds | | | | | |
Series A, Insured: AGM
5.00%, due 7/1/39 | | | 2,000,000 | | | | 2,165,600 | |
Series A, Insured: NATL-RE
5.25%, due 7/1/20 | | | 2,000,000 | | | | 2,228,180 | |
Series B, Insured: FGIC, NATL-RE
5.50%, due 7/1/29 | | | 4,170,000 | | | | 4,720,774 | |
Series C-1, Insured: AGM
7.00%, due 7/1/27 | | | 2,500,000 | | | | 3,065,275 | |
¨Detroit, Michigan Water Supply System,
Revenue Bonds | | | | | | | | |
Series A
5.25%, due 7/1/41 | | | 8,015,000 | | | | 8,551,604 | |
Series A
5.75%, due 7/1/37 | | | 5,500,000 | | | | 6,170,945 | |
Detroit, Michigan, City School District,
Improvement School Building and Site,
Unlimited General Obligation | | | | | | | | |
Series A, Insured: Q-SBLF
5.00%, due 5/1/26 | | | 750,000 | | | | 863,287 | |
Series A, Insured: Q-SBLF
5.00%, due 5/1/29 | | | 3,620,000 | | | | 4,097,876 | |
Eastern Michigan University, Revenue Bonds
Series B
0.26%, due 3/1/49 (a) | | | 1,585,000 | | | | 1,585,000 | |
Michigan Finance Authority Revenue,
Local Government Loan Program,
Revenue Bonds
Series C
5.00%, due 11/1/28 | | | 7,290,000 | | | | 7,900,173 | |
Michigan Finance Authority, Revenue Bonds | | | | | | | | |
5.00%, due 6/1/18 | | | 175,000 | | | | 199,229 | |
5.00%, due 6/1/19 | | | 1,300,000 | | | | 1,500,395 | |
5.00%, due 6/1/20 | | | 950,000 | | | | 1,097,497 | |
5.50%, due 6/1/21 | | | 5,000,000 | | | | 5,881,650 | |
Michigan Tobacco Settlement
Finance Authority,
Revenue Bonds
Series A
6.00%, due 6/1/34 | | | 250,000 | | | | 225,950 | |
| | | | | | | | |
| | | | | | | 63,921,572 | |
| | | | | | | | |
| | | | | | | | |
| | | Principal
Amount | | | Value | |
| | | | | | | | |
Minnesota 0.3% | | | | | | | | |
Center City Minnesota, Health Care Facilities,
Hazelden Foundation Project,
Revenue Bonds
0.25%, due 11/1/35 (a) | | $ | 100,000 | | | $ | 100,000 | |
Sherburne County Housing & Redevelopment Authority, Revenue Bonds
0.31%, due 12/1/21 (a)(b) | | | 2,340,000 | | | | 2,340,000 | |
| | | | | | | | |
| | | | | | | 2,440,000 | |
| | | | | | | | |
Mississippi 0.5% | | | | | | | | |
Mississippi Business Finance Corp.,
System Energy Resources, Inc. Project,
Revenue Bonds
5.875%, due 4/1/22 | | | 4,000,000 | | | | 4,012,000 | |
| | | | | | | | |
| | |
Missouri 0.6% | | | | | | | | |
Missouri Development Finance Board,
Revenue Bonds
5.00%, due 6/1/37 | | | 4,255,000 | | | | 4,592,592 | |
| | | | | | | | |
| | |
Nebraska 2.1% | | | | | | | | |
¨Central Plains Energy, Project No. 3,
Revenue Bonds | | | | | | | | |
5.00%, due 9/1/27 | | | 2,010,000 | | | | 2,237,009 | |
5.25%, due 9/1/37 | | | 12,500,000 | | | | 13,724,000 | |
| | | | | | | | |
| | | | | | | 15,961,009 | |
| | | | | | | | |
Nevada 0.2% | | | | | | | | |
Las Vegas Convention and Visitors Authority,
Revenue Bonds
Series E, Insured: AGM
5.50%, due 7/1/40 | | | 1,450,000 | | | | 1,654,436 | |
| | | | | | | | |
| | |
New Hampshire 0.3% | | | | | | | | |
Manchester, NH General Airport,
Revenue Bonds
Series A, Insured: AGM
5.00%, due 1/1/26 | | | 1,800,000 | | | | 2,050,200 | |
| | | | | | | | |
| | |
New Jersey 5.5% | | | | | | | | |
Camden County Improvement Authority,
Heath Care Redevelopment,
Revenue Bonds
Series A
5.75%, due 2/15/34 | | | 3,500,000 | | | | 3,622,570 | |
New Jersey Economic Development Authority,
Cigarette Tax,
Revenue Bonds | | | | | |
5.50%, due 6/15/31 | | | 3,140,000 | | | | 3,404,514 | |
5.75%, due 6/15/29 | | | 4,925,000 | | | | 5,359,779 | |
| | | | | | |
The notes to the financial statements are an integral part of,
and should be read in conjunction with, the financial statements. | | mainstayinvestments.com | | | 15 | |
Portfolio of Investments††† October 31, 2012 (continued)
| | | | | | | | |
| | | Principal
Amount | | | Value | |
| | | | | | | | |
| Municipal Bonds (continued) | | | | | | | | |
New Jersey (continued) | | | | | | | | |
New Jersey Economic Development Authority,
MSU Student Housing Project,
Provident Group-Montclair LLC,
Revenue Bonds
5.375%, due 6/1/25 | | $ | 4,500,000 | | | $ | 5,028,975 | |
New Jersey Economic Development Authority,
MSU Student Housing Project,
Revenue Bonds
5.875%, due 6/1/42 | | | 1,000,000 | | | | 1,118,790 | |
New Jersey Health Care Facilities Financing Authority,
Revenue Bonds | | | | | |
Series A
5.25%, due 7/1/26 | | | 3,710,000 | | | | 4,042,379 | |
Insured: GTY
5.25%, due 1/1/31 | | | 2,760,000 | | | | 3,021,151 | |
New Jersey Higher Education Student
Assistance Authority, Revenue Bonds
Series 1
5.50%, due 12/1/26 (b) | | | 4,130,000 | | | | 4,770,645 | |
New Jersey State Higher Education Student
Assistance Authority, Student Loan,
Revenue Bonds
Series A, Insured: GTY
6.125%, due 6/1/30 (b) | | | 3,870,000 | | | | 4,319,733 | |
Newark, New Jersey Housing Authority,
South Ward Police Facility,
Revenue Bonds | | | | | | | | |
Insured: GTY
5.75%, due 12/1/30 | | | 1,135,000 | | | | 1,347,540 | |
Insured: GTY
6.75%, due 12/1/38 | | | 4,000,000 | | | | 5,040,920 | |
| | | | | | | | |
| | | | | | | 41,076,996 | |
| | | | | | | | |
New York 7.4% | | | | | | | | |
Build NYC Resource Corp., Parking Facility,
Revenue Bonds | | | | | | | | |
Insured: AGM
5.00%, due 12/15/17 | | | 880,000 | | | | 1,008,779 | |
Insured: AGM
5.00%, due 12/15/18 | | | 930,000 | | | | 1,079,470 | |
Insured: AGM
5.00%, due 12/15/19 | | | 975,000 | | | | 1,130,132 | |
Insured: AGM
5.00%, due 12/15/20 | | | 1,025,000 | | | | 1,186,079 | |
Insured: AGM
5.00%, due 12/15/21 | | | 1,075,000 | | | | 1,247,021 | |
Insured: AGM
5.00%, due 12/15/22 | | | 740,000 | | | | 857,838 | |
Build NYC Resource Corp.,
YMCA of Greater New York,
Revenue Bonds
5.00%, due 8/1/42 | | | 1,190,000 | | | | 1,335,168 | |
| | | | | | | | |
| | | Principal
Amount | | | Value | |
| | | | | | | | |
New York (continued) | | | | | | | | |
City of New York,
Unlimited General Obligation | | | | | | | | |
Series A-4
0.25%, due 8/1/22 (a) | | $ | 1,100,000 | | | $ | 1,100,000 | |
Series H-1
0.29%, due 1/1/36 (a) | | | 3,750,000 | | | | 3,750,000 | |
New York City Municipal Water Finance Authority,
Revenue Bonds
| | | | | |
Series AA-2
0.29%, due 6/15/32 (a) | | | 1,050,000 | | | | 1,050,000 | |
New York City Transitional Finance Authority,
Future Tax, Revenue Bonds
Series 2A
0.28%, due 11/1/22 (a) | | | 500,000 | | | | 500,000 | |
New York Convention Center Development Corp.,
Hotel Unit, Revenue Bonds
Insured: AMBAC
5.00%, due 11/15/44 | | | 3,600,000 | | | | 3,906,540 | |
New York Liberty Development Corp.,
Bank of America,
Revenue Bonds Class 3
6.375%, due 7/15/49 | | | 5,000,000 | | | | 5,821,700 | |
New York Liberty Development Corp.,
Revenue Bonds | | | | | | | | |
5.50%, due 10/1/37 | | | 2,090,000 | | | | 2,572,058 | |
5.75%, due 11/15/51 | | | 7,500,000 | | | | 8,858,400 | |
New York Liberty Development Corp.,
World Trade Center, Revenue Bonds | | | | | | | | |
5.00%, due 9/15/40 | | | 7,000,000 | | | | 7,973,560 | |
Class 3
5.00%, due 3/15/44 | | | 4,000,000 | | | | 4,311,520 | |
New York State Dormitory Authority,
Revenue Bonds | | | | | | | | |
5.00%, due 7/1/42 | | | 2,050,000 | | | | 2,322,732 | |
5.50%, due 7/1/40 | | | 540,000 | | | | 620,066 | |
New York State Housing Finance Agency,
Affordable Housing, Revenue Bonds
Series B
4.85%, due 11/1/41 | | | 3,500,000 | | | | 3,791,620 | |
Niagara, New York Development & Revenue,
Niagara University Project,
Revenue Bonds
Series A
5.00%, due 5/1/42 | | | 915,000 | | | | 1,006,857 | |
| | | | | | | | |
| | | | | | | 55,429,540 | |
| | | | | | | | |
North Carolina 0.5% | | | | | | | | |
North Carolina Turnpike Authority,
Revenue Bonds
Series A, Insured: GTY
5.75%, due 1/1/39 | | | 3,000,000 | | | | 3,463,920 | |
| | | | | | | | |
| | | | |
| 16 | | MainStay Tax Free Bond Fund | | The notes to the financial statements are an integral part of,
and should be read in conjunction with, the financial statements. |
| | | | | | | | |
| | | Principal
Amount | | | Value | |
| | | | | | | | |
| Municipal Bonds (continued) | | | | | | | | |
North Dakota 0.4% | | | | | | | | |
McLean County North Dakota Solid Waste Facilities,
Revenue Bonds
| | | | | |
Series A
4.875%, due 7/1/26 | | $ | 2,700,000 | | | $ | 2,959,983 | |
| | | | | | | | |
| | |
Ohio 1.9% | | | | | | | | |
Adams County-Ohio Valley Local School District,
Unlimited General Obligation | | | | | | | | |
(zero coupon), due 12/1/16 | | | 1,385,000 | | | | 1,214,562 | |
3.80%, due 12/1/21 | | | 1,000,000 | | | | 1,021,120 | |
Cleveland-Cuyahoga County Port Authority,
Laurel School Project, Revenue Bonds
0.26%, due 4/1/38 (a) | | | 2,005,000 | | | | 2,005,000 | |
Cleveland-Cuyahoga County Port Authority,
Revenue Bonds
6.00%, due 11/15/25 | | | 1,980,000 | | | | 2,390,316 | |
Hamilton County Health Care Facility,
Revenue Bonds
5.50%, due 6/1/42 | | | 2,000,000 | | | | 2,266,600 | |
Toledo-Lucas County Port Authority,
Revenue Bonds
Series B
6.25%, due 5/15/24 (b) | | | 1,030,000 | | | | 1,052,979 | |
University of Cincinnati, Ohio,
Revenue Bonds
Series A, Insured: AMBAC
5.00%, due 6/1/31 | | | 4,090,000 | | | | 4,324,643 | |
| | | | | | | | |
| | | | | | | 14,275,220 | |
| | | | | | | | |
Oregon 0.2% | | | | | | | | |
Medford Hospital Facilities Authority,
Rogue Valley Manor Project,
Revenue Bonds
0.25%, due 8/15/37 (a) | | | 1,500,000 | | | | 1,500,000 | |
| | | | | | | | |
| | |
Pennsylvania 2.9% | | | | | | | | |
Lancaster County Hospital Authority,
Revenue Bonds
5.00%, due 7/1/42 | | | 1,000,000 | | | | 1,105,560 | |
Montgomery County Industrial
Development Authority,
Revenue Bonds
| | | | | |
5.25%, due 8/1/33 | | | 175,000 | | | | 201,974 | |
¨Pennsylvania State Turnpike Commission,
Revenue Bonds | | | | | | | | |
Series B
5.00%, due 12/1/42 | | | 8,535,000 | | | | 9,470,948 | |
Series B
5.75%, due 6/1/39 | | | 4,000,000 | | | | 4,581,880 | |
Philadelphia, PA,
Unlimited General Obligation
6.50%, due 8/1/41 | | | 5,125,000 | | | | 6,275,409 | |
| | | | | | | | |
| | | | | | | 21,635,771 | |
| | | | | | | | |
| | | | | | | | |
| | | Principal
Amount | | | Value | |
| | | | | | | | |
Rhode Island 0.7% | | | | | | | | |
Rhode Island Housing & Mortgage Finance Corp.,
Revenue Bonds
| | | | | |
Series C
0.39%, due 4/1/47 (a)(b) | | $ | 5,000,000 | | | $ | 5,000,000 | |
| | | | | | | | |
| | |
South Carolina 0.9% | | | | | | | | |
Piedmont Municipal Power Agency,
Revenue Bonds
Series C, Insured: GTY
5.75%, due 1/1/34 | | | 5,320,000 | | | | 6,350,537 | |
| | | | | | | | |
Tennessee 1.3% | | | | | | | | |
Johnson City Tennessee Health &
Educational Facilities Board Hospital,
Revenue Bonds
Series A
6.50%, due 7/1/38 | | | 6,500,000 | | | | 7,803,315 | |
Montgomery County Public Building
Authority, Tennessee County Loan Pool,
Revenue Bonds
0.30%, due 7/1/38 (a) | | | 500,000 | | | | 500,000 | |
Sevier County Public Building Authority,
Revenue Bonds
Series A-4
0.56%, due 6/1/25 (a) | | | 1,550,000 | | | | 1,550,000 | |
| | | | | | | | |
| | | | | | | 9,853,315 | |
| | | | | | | | |
Texas 9.3% | | | | | | | | |
Central Texas Regional Mobility Authority,
Revenue Bonds
5.75%, due 1/1/31 | | | 2,000,000 | | | | 2,341,940 | |
Dallas Performing Arts Cultural Facilities Corp.,
Revenue Bonds
Series B
0.23%, due 9/1/41 (a) | | | 415,000 | | | | 415,000 | |
Dallas-Fort Worth International Airport Revenue,
Revenue Bonds
Series G
5.00%, due 11/1/35 | | | 8,320,000 | | | | 9,379,053 | |
Harris County Cultural Education Facilities
Finance Corp., Baylor College,
Revenue Bonds
5.00%, due 11/15/37 | | | 5,000,000 | | | | 5,664,150 | |
Harris County Cultural Education Facilities
Finance Corp., YMCA Greater Houston,
Revenue Bonds
Series A
0.23%, due 6/1/38 (a) | | | 500,000 | | | | 500,000 | |
Harris County-Houston Sports Authority,
Revenue Bonds
Series G, Insured: NATL-RE
5.25%, due 11/15/30 | | | 555,000 | | | | 555,755 | |
Houston Higher Education Finance Corp.,
Revenue Bonds | | | | | | | | |
Series A
5.00%, due 2/15/42 | | | 1,000,000 | | | | 1,058,580 | |
| | | | | | |
The notes to the financial statements are an integral part of,
and should be read in conjunction with, the financial statements. | | mainstayinvestments.com | | | 17 | |
Portfolio of Investments††† October 31, 2012 (continued)
| | | | | | | | |
| | | Principal
Amount | | | Value | |
| | | | | | | | |
| Municipal Bonds (continued) | | | | | | | | |
Texas (continued) | | | | | | | | |
Series A
6.50%, due 5/15/31 | | $ | 1,050,000 | | | $ | 1,316,910 | |
Series A
6.875%, due 5/15/41 | | | 6,450,000 | | | | 8,247,615 | |
Houston, Texas Hotel Occupancy Tax &
Special Revenue, Revenue Bonds
Series B
5.00%, due 9/1/31 | | | 2,000,000 | | | | 2,216,000 | |
North Texas Tollway Authority,
Revenue Bonds | | | | | | | | |
Series B
5.25%, due 1/1/52 | | | 4,725,000 | | | | 5,303,387 | |
Series F
5.75%, due 1/1/38 | | | 1,800,000 | | | | 1,986,678 | |
Port Freeport, Brazos River Harbor Navigation District,
Revenue Bonds
| | | | | |
Series A
0.30%, due 4/1/21 (a)(b) | | | 600,000 | | | | 600,000 | |
San Juan, Texas Higher Education Finance Authority,
Idea Public Schools,
Revenue Bonds
| | | | | |
Series A
6.70%, due 8/15/40 | | | 1,275,000 | | | | 1,485,706 | |
¨Texas Private Activity Bond Surface Transportation Corp.,
LBJ Infrastructure,
Revenue Bonds | | | | | |
7.00%, due 6/30/40 | | | 2,640,000 | | | | 3,266,472 | |
Series Lien-LBG
7.50%, due 6/30/32 | | | 4,095,000 | | | | 5,283,492 | |
7.50%, due 6/30/33 | | | 5,500,000 | | | | 7,074,650 | |
Texas Private Activity Bond Surface
Transportation Corp., NTE Mobility,
Revenue Bonds
6.875%, due 12/31/39 | | | 7,000,000 | | | | 8,510,390 | |
Texas State Public Finance Authority,
Charter School Finance Corp.,
Revenue Bonds
Series A
6.20%, due 2/15/40 | | | 1,000,000 | | | | 1,191,460 | |
Texas State Turnpike Authority,
Central Texas System,
Revenue Bonds
Insured: AMBAC
(zero coupon), due 8/15/36 | | | 10,000,000 | | | | 2,429,900 | |
| | | | | | | | |
| | | | | | | 68,827,138 | |
| | | | | | | | |
U.S. Virgin Islands 3.8% | | | | | | | | |
Virgin Islands Public Finance Authority,
Matching Fund Loan, Revenue Bonds
5.00%, due 10/1/32 | | | 10,000,000 | | | | 10,850,000 | |
| | | | | | | | |
| | | Principal
Amount | | | Value | |
| | | | | | | | |
U.S. Virgin Islands (continued) | | | | | | | | |
¨Virgin Islands Public Finance Authority,
Revenue Bonds | | | | | | | | |
Insured: AGM
5.00%, due 10/1/32 | | $ | 10,475,000 | | | $ | 11,555,287 | |
Series A
6.75%, due 10/1/37 | | | 5,000,000 | | | | 5,922,300 | |
| | | | | | | | |
| | | | | | | 28,327,587 | |
| | | | | | | | |
Utah 0.1% | | | | | | | | |
Herriman, Utah, Special Assessment | | | | | | | | |
5.00%, due 11/1/24 | | | 575,000 | | | | 629,280 | |
5.00%, due 11/1/29 | | | 425,000 | | | | 467,470 | |
| | | | | | | | |
| | | | | | | 1,096,750 | |
| | | | | | | | |
Vermont 0.1% | | | | | | | | |
Burlington, Vermont Electric System,
Revenue Bonds
Series A
5.375%, due 7/1/27 | | | 610,000 | | | | 696,553 | |
| | | | | | | | |
| | |
Virginia 0.7% | | | | | | | | |
Madison County Industrial Development
Authority, Woodberry Forest School,
Revenue Bonds
0.28%, due 10/1/37 (a) | | | 3,925,000 | | | | 3,925,000 | |
Virginia Commonwealth University,
Revenue Bonds
Series A, Insured: AMBAC
0.21%, due 11/1/30 (a) | | | 1,400,000 | | | | 1,400,000 | |
| | | | | | | | |
| | | | | | | 5,325,000 | |
| | | | | | | | |
Washington 0.1% | | | | | | | | |
Washington State Housing
Finance Commission,
| | | | | |
YMCA Snohomish County Project,
Revenue Bonds
0.23%, due 12/1/33 (a) | | | 800,000 | | | | 800,000 | |
| | | | | | | | |
| | |
Wisconsin 0.7% | | | | | | | | |
Wisconsin Health & Educational
Facilities Authority,
Revenue Bonds | | | | | |
Series A
0.45%, due 5/1/25 (a) | | | 650,000 | | | | 650,000 | |
5.00%, due 7/1/20 | | | 1,785,000 | | | | 1,862,005 | |
5.00%, due 7/1/25 | | | 2,270,000 | | | | 2,342,118 | |
| | | | | | | | |
| | | | | | | 4,854,123 | |
| | | | | | | | |
Wyoming 0.2% | | | | | | | | |
West Park Hospital District, Revenue Bonds
Series A
6.375%, due 6/1/26 | | | 1,000,000 | | | | 1,188,260 | |
| | | | | | | | |
Total Municipal Bonds
(Cost $685,896,770) | | | | | | | 729,737,229 | |
| | | | | | | | |
Total Investments
(Cost $685,896,770) (e) | | | 98.0 | % | | | 729,737,229 | |
Other Assets, Less Liabilities | | | 2.0 | | | | 14,536,304 | |
Net Assets | | | 100.0 | % | | $ | 744,273,533 | |
| | | | |
| 18 | | MainStay Tax Free Bond Fund | | The notes to the financial statements are an integral part of,
and should be read in conjunction with, the financial statements. |
| | | | | | | | |
| | | Contracts
Short | | | Unrealized
Appreciation
(Depreciation) (c) | |
| Futures Contracts 0.0%‡ | | | | | | | | |
United States Treasury Notes
December 2012 (10 Year) (d) | | | (600 | ) | | $ | 223,500 | |
| | | | | | | | |
Total Futures Contracts
(Settlement Value $79,818,750) | | | | | | $ | 223,500 | |
| | | | | | | | |
| ††† | On a daily basis New York Life Investments confirms that the value of the Fund’s liquid assets (liquid portfolio securities and cash) is sufficient to cover its potential senior securities (e.g., futures, swaps, options). |
| ‡ | Less than one-tenth of a percent. |
| (a) | Variable rate securities that may be tendered back to the issuer at any time prior to maturity at par. Rate shown is the rate in effect as of October 31, 2012. |
| (b) | Interest on these securities is subject to alternative minimum tax. |
| (c) | Represents the difference between the value of the contracts at the time they were opened and the value as of October 31, 2012. |
| (d) | As of October 31, 2012, cash in the amount of $660,000 is on deposit with the broker for futures transactions. |
| (e) | As of October 31, 2012, cost is $685,896,770 for federal income tax purposes and net unrealized appreciation is as follows: |
| | | | |
Gross unrealized appreciation | | $ | 44,224,498 | |
Gross unrealized depreciation | | | (384,039 | ) |
| | | | |
Net unrealized appreciation | | $ | 43,840,459 | |
| | | | |
The following abbreviations are used in the above portfolio:
AGC-ICC—Assured Guaranty Corporation—Insured Custody Certificates
AGM—Assured Guaranty Municipal Corp.
AMBAC—Ambac Assurance Corp.
FGIC—Financial Guaranty Insurance Co.
FSA—Financial Security Assurance, Inc.
GTY—Assured Guaranty Corp.
NATL-RE—National Public Finance Guarantee Corp.
Q-SBLF—Qualified School Board Loan Fund
The following is a summary of the fair valuations according to the inputs used as of October 31, 2012, for valuing the Fund’s assets.
Asset Valuation Inputs
| | | | | | | | | | | | | | | | |
Description | | Quoted
Prices in
Active
Markets for
Identical
Assets
(Level 1) | | | Significant
Other
Observable
Inputs
(Level 2) | | | Significant
Unobservable
Inputs
(Level 3) | | | Total | |
| Investments in Securities (a) | | | | | | | | | | | | | | | | |
| Municipal Bonds | | $ | — | | | $ | 729,737,229 | | | $ | — | | | $ | 729,737,229 | |
| | | | | | | | | | | | | | | | |
| Other Financial Instruments | | | | | | | | | | | | | | | | |
Futures Contracts Short (b) | | | 223,500 | | | | — | | | | — | | | | 223,500 | |
| | | | | | | | | | | | | | | | |
| Total Investments in Securities and Other Financial Instruments | | $ | 223,500 | | | $ | 729,737,229 | | | $ | — | | | $ | 729,960,729 | |
| | | | | | | | | | | | | | | | |
| (a) | For a complete listing of investments and their industries, see the Portfolio of Investments. |
| (b) | The value listed for these securities reflects unrealized appreciation (depreciation) as shown on the Portfolio of Investments. |
The Fund recognizes transfers between the levels as of the beginning of the period.
For the year ended October 31, 2012, the Fund did not have any transfers between Level 1 and Level 2 fair value measurements. (See Note 2)
As of October 31, 2012, the Fund did not hold any investments with significant unobservable inputs (Level 3). (See Note 2)
| | | | | | |
The notes to the financial statements are an integral part of,
and should be read in conjunction with, the financial statements. | | mainstayinvestments.com | | | 19 | |
Statement of Assets and Liabilities as of October 31, 2012
| | | | |
| Assets | | | | |
Investment in securities, at value
(identified cost $685,896,770) | | $ | 729,737,229 | |
Cash | | | 2,333,946 | |
Cash collateral on deposit at broker | | | 660,000 | |
Receivables: | | | | |
Interest | | | 9,388,748 | |
Fund shares sold | | | 4,237,715 | |
Other assets | | | 50,680 | |
| | | | |
Total assets | | | 746,408,318 | |
| | | | |
| |
| Liabilities | | | | |
Payables: | | | | |
Fund shares redeemed | | | 510,096 | |
Manager (See Note 3) | | | 280,581 | |
Variation margin on futures contracts | | | 215,625 | |
NYLIFE Distributors (See Note 3) | | | 156,562 | |
Transfer agent (See Note 3) | | | 85,530 | |
Shareholder communication | | | 17,594 | |
Professional fees | | | 17,441 | |
Custodian | | | 2,359 | |
Trustees | | | 2,143 | |
Accrued expenses | | | 5,068 | |
Dividend payable | | | 841,786 | |
| | | | |
Total liabilities | | | 2,134,785 | |
| | | | |
Net assets | | $ | 744,273,533 | |
| | | | |
| |
| Composition of Net Assets | | | | |
Shares of beneficial interest outstanding (par value of $.01 per share) unlimited number of shares authorized | | $ | 741,436 | |
Additional paid-in capital | | | 706,373,217 | |
| | | | |
| | | 707,114,653 | |
Distributions in excess of net investment income | | | (594,288 | ) |
Accumulated net realized gain (loss) on investments and futures transactions | | | (6,310,791 | ) |
Net unrealized appreciation (depreciation) on investments and futures contracts | | | 44,063,959 | |
| | | | |
Net assets | | $ | 744,273,533 | |
| | | | |
| | | | |
Investor Class | | | | |
Net assets applicable to outstanding shares | | $ | 21,436,856 | |
| | | | |
Shares of beneficial interest outstanding | | | 2,125,967 | |
| | | | |
Net asset value per share outstanding | | $ | 10.08 | |
Maximum sales charge (4.50% of offering price) | | | 0.48 | |
| | | | |
Maximum offering price per share outstanding | | $ | 10.56 | |
| | | | |
Class A | | | | |
Net assets applicable to outstanding shares | | $ | 424,757,475 | |
| | | | |
Shares of beneficial interest outstanding | | | 42,326,601 | |
| | | | |
Net asset value per share outstanding | | $ | 10.04 | |
Maximum sales charge (4.50% of offering price) | | | 0.47 | |
| | | | |
Maximum offering price per share outstanding | | $ | 10.51 | |
| | | | |
Class B | | | | |
Net assets applicable to outstanding shares | | $ | 13,229,880 | |
| | | | |
Shares of beneficial interest outstanding | | | 1,318,538 | |
| | | | |
Net asset value and offering price per share outstanding | | $ | 10.03 | |
| | | | |
Class C | | | | |
Net assets applicable to outstanding shares | | $ | 142,246,039 | |
| | | | |
Shares of beneficial interest outstanding | | | 14,167,443 | |
| | | | |
Net asset value and offering price per share outstanding | | $ | 10.04 | |
| | | | |
Class I | | | | |
Net assets applicable to outstanding shares | | $ | 142,603,283 | |
| | | | |
Shares of beneficial interest outstanding | | | 14,205,056 | |
| | | | |
Net asset value and offering price per share outstanding | | $ | 10.04 | |
| | | | |
| | | | |
| 20 | | MainStay Tax Free Bond Fund | | The notes to the financial statements are an integral part of,
and should be read in conjunction with, the financial statements. |
Statement of Operations for the year ended October 31, 2012
| | | | |
| Investment Income (Loss) | | | | |
Income | | | | |
Interest | | $ | 25,920,436 | |
| | | | |
Expenses | | | | |
Manager (See Note 3) | | | 2,826,763 | |
Distribution/Service—Investor Class (See Note 3) | | | 53,810 | |
Distribution/Service—Class A (See Note 3) | | | 836,397 | |
Distribution/Service—Class B (See Note 3) | | | 54,130 | |
Distribution/Service—Class C (See Note 3) | | | 541,549 | |
Transfer agent (See Note 3) | | | 296,453 | |
Registration | | | 98,640 | |
Professional fees | | | 72,383 | |
Shareholder communication | | | 31,968 | |
Trustees | | | 15,881 | |
Custodian | | | 14,728 | |
Miscellaneous | | | 21,937 | |
| | | | |
Total expenses before waiver/reimbursement | | | 4,864,639 | |
Expense waiver/reimbursement from Manager (See Note 3) | | | (276,172 | ) |
| | | | |
Net expenses | | | 4,588,467 | |
| | | | |
Net investment income (loss) | | | 21,331,969 | |
| | | | |
|
| Realized and Unrealized Gain (Loss) on Investments and Futures Contracts | |
Net realized gain (loss) on: | | | | |
Security transactions | | | 14,086,131 | |
Futures transactions | | | (3,223,472 | ) |
| | | | |
Net realized gain (loss) on investments and futures transactions | | | 10,862,659 | |
| | | | |
Net change in unrealized appreciation (depreciation) on: | | | | |
Investments | | | 30,657,011 | |
Futures contracts | | | (367,013 | ) |
| | | | |
Net change in unrealized appreciation (depreciation) on investments and futures contracts | | | 30,289,998 | |
| | | | |
Net realized and unrealized gain (loss) on investments and futures transactions | | | 41,152,657 | |
| | | | |
Net increase (decrease) in net assets resulting from operations | | $ | 62,484,626 | |
| | | | |
| | | | | | |
The notes to the financial statements are an integral part of,
and should be read in conjunction with, the financial statements. | | mainstayinvestments.com | | | 21 | |
Statements of Changes in Net Assets
for the years ended October 31, 2012 and October 31, 2011
| | | | | | | | |
| | | 2012 | | | 2011 | |
| Increase (Decrease) in Net Assets | |
Operations: | | | | | | | | |
Net investment income (loss) | | $ | 21,331,969 | | | $ | 16,791,785 | |
Net realized gain (loss) on investments and futures transactions | | | 10,862,659 | | | | (2,726,252 | ) |
Net change in unrealized appreciation (depreciation) on investments and futures contracts | | | 30,289,998 | | | | (3,424,683 | ) |
| | | | |
Net increase (decrease) in net assets resulting from operations | | | 62,484,626 | | | | 10,640,850 | |
| | | | |
Dividends to shareholders: | | | | | | | | |
From net investment income: | | | | | | | | |
Investor Class | | | (844,342 | ) | | | (986,044 | ) |
Class A | | | (13,126,144 | ) | | | (11,463,796 | ) |
Class B | | | (391,448 | ) | | | (465,160 | ) |
Class C | | | (3,895,004 | ) | | | (3,080,412 | ) |
Class I | | | (3,144,644 | ) | | | (1,034,192 | ) |
| | | | |
Total dividends to shareholders | | | (21,401,582 | ) | | | (17,029,604 | ) |
| | | | |
Capital share transactions: | | | | | | | | |
Net proceeds from sale of shares | | | 373,192,486 | | | | 140,346,273 | |
Net asset value of shares issued to shareholders in reinvestment of dividends | | | 12,240,442 | | | | 9,884,672 | |
Cost of shares redeemed | | | (87,911,281 | ) | | | (100,280,148 | ) |
| | | | |
Increase (decrease) in net assets derived from capital share transactions | | | 297,521,647 | | | | 49,950,797 | |
| | | | |
Net increase (decrease) in net assets | | | 338,604,691 | | | | 43,562,043 | |
| | |
| Net Assets | | | | | | | | |
Beginning of year | | | 405,668,842 | | | | 362,106,799 | |
| | | | |
End of year | | $ | 744,273,533 | | | $ | 405,668,842 | |
| | | | |
Distributions in excess of net investment income at end of year | | $ | (594,288 | ) | | $ | (524,675 | ) |
| | | | |
| | | | |
| 22 | | MainStay Tax Free Bond Fund | | The notes to the financial statements are an integral part of,
and should be read in conjunction with, the financial statements. |
Financial Highlights selected per share data and ratios
| | | | | | | | | | | | | | | | | | | | |
| | | Investor Class | |
| | | Year ended October 31, | | | February 28,
2008**
through
October 31, | |
| | | 2012 | | | 2011 | | | 2010 | | | 2009 | | | 2008 | |
Net asset value at beginning of period | | $ | 9.31 | | | $ | 9.48 | | | $ | 9.08 | | | $ | 8.48 | | | $ | 9.07 | |
| | | | | | | | | | | | | | | | | | | | |
Net investment income (loss) | | | 0.38 | (a) | | | 0.42 | (a) | | | 0.39 | (a) | | | 0.34 | (a) | | | 0.25 | |
Net realized and unrealized gain (loss) on investments | | | 0.77 | | | | (0.16 | ) | | | 0.41 | | | | 0.63 | | | | (0.60 | ) |
| | | | | | | | | | | | | | | | | | | | |
Total from investment operations | | | 1.15 | | | | 0.26 | | | | 0.80 | | | | 0.97 | | | | (0.35 | ) |
| | | | | | | | | | | | | | | | | | | | |
Less dividends: | | | | | | | | | | | | | | | | | | | | |
From net investment income | | | (0.38 | ) | | | (0.43 | ) | | | (0.40 | ) | | | (0.37 | ) | | | (0.24 | ) |
| | | | | | | | | | | | | | | | | | | | |
Net asset value at end of period | | $ | 10.08 | | | $ | 9.31 | | | $ | 9.48 | | | $ | 9.08 | | | $ | 8.48 | |
| | | | | | | | | | | | | | | | | | | | |
Total investment return (b) | | | 12.58 | % | | | 2.93 | % | | | 9.08 | % | | | 11.67 | % | | | (4.03 | %)(c) |
Ratios (to average net assets)/Supplemental Data: | | | | | | | | | | | | | | | | | | | | |
Net investment income (loss) | | | 3.92 | % | | | 4.67 | % | | | 4.24 | % | | | 3.93 | % | | | 3.92 | % †† |
Net expenses | | | 0.86 | % | | | 0.90 | % | | | 0.93 | % | | | 1.02 | % | | | 0.99 | % †† |
Expenses (before waiver/reimbursement) | | | 0.91 | % | | | 0.98 | % | | | 1.03 | % | | | 1.25 | % | | | 1.21 | % †† |
Portfolio turnover rate | | | 125 | % | | | 138 | % | | | 97 | % | | | 94 | % | | | 90 | % |
Net assets at end of period (in 000’s) | | $ | 21,437 | | | $ | 21,547 | | | $ | 22,220 | | | $ | 21,683 | | | $ | 21,450 | |
| ** | Commencement of operations. |
| (a) | Per share data based on average shares outstanding during the period. |
| (b) | Total investment return is calculated exclusive of sales charges and assumes the reinvestment of dividends and distributions. |
| (c) | Total investment return is not annualized. |
| | | | | | | | | | | | | | | | | | | | |
| | | Class A | |
| | | Year ended October 31, | |
| | | 2012 | | | 2011 | | | 2010 | | | 2009 | | | 2008 | |
Net asset value at beginning of year | | $ | 9.26 | | | $ | 9.44 | | | $ | 9.04 | | | $ | 8.45 | | | $ | 9.48 | |
| | | | | | | | | | | | | | | | | | | | |
Net investment income (loss) | | | 0.38 | (a) | | | 0.43 | (a) | | | 0.40 | (a) | | | 0.35 | (a) | | | 0.36 | |
Net realized and unrealized gain (loss) on investments | | | 0.79 | | | | (0.18 | ) | | | 0.42 | | | | 0.62 | | | | (1.02 | ) |
| | | | | | | | | | | | | | | | | | | | |
Total from investment operations | | | 1.17 | | | | 0.25 | | | | 0.82 | | | | 0.97 | | | | (0.66 | ) |
| | | | | | | | | | | | | | | | | | | | |
Less dividends: | | | | | | | | | | | | | | | | | | | | |
From net investment income | | | (0.39 | ) | | | (0.43 | ) | | | (0.42 | ) | | | (0.38 | ) | | | (0.37 | ) |
| | | | | | | | | | | | | | | | | | | | |
Net asset value at end of year | | $ | 10.04 | | | $ | 9.26 | | | $ | 9.44 | | | $ | 9.04 | | | $ | 8.45 | |
| | | | | | | | | | | | | | | | | | | | |
Total investment return (b) | | | 12.81 | % | | | 2.93 | % | | | 9.25 | % | | | 11.72 | % | | | (7.17 | %) |
Ratios (to average net assets)/Supplemental Data: | | | | | | | | | | | | | | | | | | | | |
Net investment income (loss) | | | 3.91 | % | | | 4.76 | % | | | 4.36 | % | | | 4.04 | % | | | 3.94 | % |
Net expenses | | | 0.79 | % | | | 0.81 | % | | | 0.82 | % | | | 0.90 | % | | | 0.88 | % |
Expenses (before waiver/reimbursement) | | | 0.84 | % | | | 0.89 | % | | | 0.92 | % | | | 1.08 | % | | | 1.04 | % |
Portfolio turnover rate | | | 125 | % | | | 138 | % | | | 97 | % | | | 94 | % | | | 90 | % |
Net assets at end of year (in 000’s) | | $ | 424,757 | | | $ | 258,892 | | | $ | 242,891 | | | $ | 162,921 | | | $ | 136,781 | |
| (a) | Per share data based on average shares outstanding during the year. |
| (b) | Total investment return is calculated exclusive of sales charges and assumes the reinvestment of dividends and distributions. |
| | | | | | |
The notes to the financial statements are an integral part of,
and should be read in conjunction with, the financial statements. | | mainstayinvestments.com | | | 23 | |
Financial Highlights selected per share data and ratios
| | | | | | | | | | | | | | | | | | | | |
| | | Class B | |
| | | Year ended October 31, | |
| | | 2012 | | | 2011 | | | 2010 | | | 2009 | | | 2008 | |
Net asset value at beginning of year | | $ | 9.26 | | | $ | 9.44 | | | $ | 9.04 | | | $ | 8.44 | | | $ | 9.48 | |
| | | | | | | | | | | | | | | | | | | | |
Net investment income (loss) | | | 0.35 | (a) | | | 0.40 | (a) | | | 0.37 | (a) | | | 0.32 | (a) | | | 0.33 | |
Net realized and unrealized gain (loss) on investments | | | 0.78 | | | | (0.18 | ) | | | 0.41 | | | | 0.63 | | | | (1.03 | ) |
| | | | | | | | | | | | | | | | | | | | |
Total from investment operations | | | 1.13 | | | | 0.22 | | | | 0.78 | | | | 0.95 | | | | (0.70 | ) |
| | | | | | | | | | | | | | | | | | | | |
Less dividends: | | | | | | | | | | | | | | | | | | | | |
From net investment income | | | (0.36 | ) | | | (0.40 | ) | | | (0.38 | ) | | | (0.35 | ) | | | (0.34 | ) |
| | | | | | | | | | | | | | | | | | | | |
Net asset value at end of year | | $ | 10.03 | | | $ | 9.26 | | | $ | 9.44 | | | $ | 9.04 | | | $ | 8.44 | |
| | | | | | | | | | | | | | | | | | | | |
Total investment return (b) | | | 12.34 | % | | | 2.58 | % | | | 8.85 | % | | | 11.32 | % | | | (7.46 | %) |
Ratios (to average net assets)/Supplemental Data: | | | | | | | | | | | | | | | | | | | | |
Net investment income (loss) | | | 3.59 | % | | | 4.42 | % | | | 3.99 | % | | | 3.68 | % | | | 3.63 | % |
Net expenses | | | 1.11 | % | | | 1.15 | % | | | 1.18 | % | | | 1.26 | % | | | 1.20 | % |
Expenses (before waiver/reimbursement) | | | 1.16 | % | | | 1.23 | % | | | 1.28 | % | | | 1.50 | % | | | 1.40 | % |
Portfolio turnover rate | | | 125 | % | | | 138 | % | | | 97 | % | | | 94 | % | | | 90 | % |
Net assets at end of year (in 000’s) | | $ | 13,230 | | | $ | 9,463 | | | $ | 13,907 | | | $ | 18,219 | | | $ | 23,935 | |
| (a) | Per share data based on average shares outstanding during the year. |
| (b) | Total investment return is calculated exclusive of sales charges and assumes the reinvestment of dividends and distributions. |
| | | | | | | | | | | | | | | | | | | | |
| | | Class C | |
| | | Year ended October 31, | |
| | | 2012 | | | 2011 | | | 2010 | | | 2009 | | | 2008 | |
Net asset value at beginning of year | | $ | 9.27 | | | $ | 9.44 | | | $ | 9.04 | | | $ | 8.45 | | | $ | 9.48 | |
| | | | | | | | | | | | | | | | | | | | |
Net investment income (loss) | | | 0.35 | (a) | | | 0.40 | (a) | | | 0.37 | (a) | | | 0.32 | (a) | | | 0.34 | |
Net realized and unrealized gain (loss) on investments | | | 0.78 | | | | (0.17 | ) | | | 0.41 | | | | 0.61 | | | | (1.03 | ) |
| | | | | | | | | | | | | | | | | | | | |
Total from investment operations | | | 1.13 | | | | 0.23 | | | | 0.78 | | | | 0.93 | | | | (0.69 | ) |
| | | | | | | | | | | | | | | | | | | | |
Less dividends: | | | | | | | | | | | | | | | | | | | | |
From net investment income | | | (0.36 | ) | | | (0.40 | ) | | | (0.38 | ) | | | (0.34 | ) | | | (0.34 | ) |
| | | | | | | | | | | | | | | | | | | | |
Net asset value at end of year | | $ | 10.04 | | | $ | 9.27 | | | $ | 9.44 | | | $ | 9.04 | | | $ | 8.45 | |
| | | | | | | | | | | | | | | | | | | | |
Total investment return (b) | | | 12.33 | % | | | 2.69 | % | | | 8.85 | % | | | 11.31 | % | | | (7.46 | %) |
Ratios (to average net assets)/Supplemental Data: | | | | | | | | | | | | | | | | | | | | |
Net investment income (loss) | | | 3.58 | % | | | 4.42 | % | | | 3.99 | % | | | 3.68 | % | | | 3.64 | % |
Net expenses | | | 1.11 | % | | | 1.15 | % | | | 1.18 | % | | | 1.28 | % | | | 1.20 | % |
Expenses (before waiver/reimbursement) | | | 1.16 | % | | | 1.23 | % | | | 1.28 | % | | | 1.51 | % | | | 1.40 | % |
Portfolio turnover rate | | | 125 | % | | | 138 | % | | | 97 | % | | | 94 | % | | | 90 | % |
Net assets at end of year (in 000’s) | | $ | 142,246 | | | $ | 81,880 | | | $ | 65,695 | | | $ | 22,544 | | | $ | 7,425 | |
| (a) | Per share data based on average shares outstanding during the year. |
| (b) | Total investment return is calculated exclusive of sales charges and assumes the reinvestment of dividends and distributions. |
| | | | |
| 24 | | MainStay Tax Free Bond Fund | | The notes to the financial statements are an integral part of,
and should be read in conjunction with, the financial statements. |
Financial Highlights selected per share data and ratios
| | | | | | | | | | | | |
| | | Class I | |
| | | Year ended October 31, | | | December 21,
2009**
through
October 31, | |
| | | 2012 | | | 2011 | | | 2010 | |
Net asset value at beginning of period | | $ | 9.27 | | | $ | 9.44 | | | $ | 9.07 | |
| | | | | | | | | | | | |
Net investment income (loss) (a) | | | 0.40 | | | | 0.45 | | | | 0.38 | |
Net realized and unrealized gain (loss) on investments | | | 0.78 | | | | (0.16 | ) | | | 0.35 | |
| | | | | | | | | | | | |
Total from investment operations | | | 1.18 | | | | 0.29 | | | | 0.73 | |
| | | | | | | | | | | | |
Less dividends: | | | | | | | | | | | | |
From net investment income | | | (0.41 | ) | | | (0.46 | ) | | | (0.36 | ) |
| | | | | | | | | | | | |
Net asset value at end of period | | $ | 10.04 | | | $ | 9.27 | | | $ | 9.44 | |
| | | | | | | | | | | | |
Total investment return (b) | | | 12.97 | % | | | 3.29 | % | | | 8.25 | %(c) |
Ratios (to average net assets)/Supplemental Data: | | | | | | | | | | | | |
Net investment income (loss) | | | 4.06 | % | | | 4.99 | % | | | 4.64 | %†† |
Net expenses | | | 0.54 | % | | | 0.56 | % | | | 0.57 | %†† |
Expenses (before waiver/reimbursement) | | | 0.59 | % | | | 0.64 | % | | | 0.67 | %†† |
Portfolio turnover rate | | | 125 | % | | | 138 | % | | | 97 | % |
Net assets at end of period (in 000’s) | | $ | 142,603 | | | $ | 33,888 | | | $ | 17,394 | |
| ** | Commencement of operations. |
| (a) | Per share data based on average shares outstanding during the period. |
| (b) | Total investment return is calculated exclusive of sales charges and assumes the reinvestment of dividends and distributions. Class I shares are not subject to sales charges. |
| (c) | Total investment return is not annualized. |
| | | | | | |
The notes to the financial statements are an integral part of,
and should be read in conjunction with, the financial statements. | | mainstayinvestments.com | | | 25 | |
Notes to Financial Statements
Note 1–Organization and Business
The MainStay Funds (the “Trust”) were organized on January 9, 1986, as a Massachusetts business trust. The Trust is registered under the Investment Company Act of 1940, as amended (the “1940 Act”), as an open-end investment management company, and is comprised of twelve funds (collectively referred to as the “Funds”). These financial statements and notes relate only to the MainStay Tax Free Bond Fund (the “Fund”), a diversified fund.
The Fund currently offers five classes of shares. Class A shares commenced operations on January 3, 1995. Class B shares commenced operations on May 1, 1986. Class C shares commenced operations on September 1, 1998. Investor Class shares commenced operations on February 28, 2008. Class I shares commenced operations on December 21, 2009. Investor Class and Class A shares are offered at net asset value (“NAV”) per share plus an initial sales charge. No sales charge applies to investments of $500,000 or more (and certain other qualified purchases) in Investor Class and Class A shares, but a contingent deferred sales charge (“CDSC”) is imposed on certain redemptions made within one year of the date of purchase. Class B and Class C shares are offered at NAV without an initial sales charge, although a declining CDSC may be imposed on redemptions made within six years of the date of purchase of Class B shares and a 1.00% CDSC may be imposed on redemptions made within one year of the date of purchase of Class C shares. Class I shares are offered at NAV and are not subject to a sales charge. Depending upon eligibility, Class B shares convert to either Investor Class or Class A shares at the end of the calendar quarter eight years after the date they were purchased. Additionally, depending upon eligibility, Investor Class shares may convert to Class A shares and Class A shares may convert to Investor Class shares. The five classes of shares have the same voting (except for issues that relate solely to one class), dividend, liquidation and other rights, and the same terms and conditions, except that Class B and Class C shares are subject to higher distribution and/or service fee rates than Investor Class and Class A shares under a distribution plan pursuant to Rule 12b-1 under the 1940 Act. Class I shares are not subject to a distribution and/or service fee.
The Fund’s investment objective is to seek current income exempt from regular federal income tax.
Prior to February 28, 2012, the Fund’s investment objective was to seek to provide a high level of current income free from regular federal income tax, consistent with the preservation of capital.
Note 2–Significant Accounting Policies
The Fund prepares its financial statements in accordance with generally accepted accounting principles (“GAAP”) in the United States of America and follows the significant accounting policies described below.
(A) Securities Valuation. Investments are valued as of the close of regular trading on the New York Stock Exchange (“Exchange”) (generally 4:00 p.m. Eastern time) on each day the Fund is open for business (“valuation date”).
The Board of Trustees (the “Board”) has adopted procedures for the valuation of the Fund’s securities and has delegated the responsibility for valuation determination under those procedures to the Valuation
Committee of the Fund (the “Valuation Committee”). The Board has authorized the Valuation Committee to appoint a Valuation Sub-Committee (the “Sub-Committee”) to deal in the first instance with questions that arise or cannot be resolved under these procedures. The Sub-Committee will meet (in person, via electronic mail or via teleconference) on an as-needed basis. The Valuation Committee shall meet at a later time, as necessary, to ensure that actions taken by the Sub-Committee were appropriate. The procedures recognize that, subject to the oversight of the Board and unless otherwise noted, the responsibility for day-to-day valuation of portfolio assets (including securities for which market prices are not readily available) rests with New York Life Investment Management LLC (“New York Life Investments” or the “Manager”), aided to whatever extent necessary by the Subadvisor (as defined in Note 3(A)) of the Fund. These procedures shall be reviewed by the Board no less frequently than annually. Any revisions to these procedures deemed necessary shall be reported to the Board at its next regularly scheduled meeting.
Securities are valued using unadjusted market prices, when available, as supplied primarily by third party pricing services or dealers. To assess the appropriateness of security valuations, the Manager or the Fund’s third party service provider who is subject to oversight by the Manager, regularly compares prior day prices, prices on comparable securities and the sale prices to the prior and current day prices and challenges prices exceeding certain tolerance levels with third party pricing services or broker sources. For those securities valued by recommendation, whether through a standardized fair valuation methodology or a fair valuation determination, the Valuation Committee reviews and affirms the reasonableness of the valuation based on such methodologies and determinations on a regular basis after considering all relevant information that is reasonably available.
“Fair value” is defined as the price that the Fund would receive upon selling an investment in an orderly transaction to an independent buyer in the principal or most advantageous market of the investment. Fair value measurements are determined within a framework that has established a three-tier hierarchy which maximizes the use of observable market data and minimizes the use of unobservable inputs to establish classification of fair value measurements for disclosure purposes. “Inputs” refer broadly to the assumptions that market participants would use in pricing the asset or liability, including assumptions about risk, such as the risk inherent in a particular valuation technique used to measure fair value using a pricing model and/or the risk inherent in the inputs for the valuation technique. Inputs may be observable or unobservable. Observable inputs reflect the assumptions market participants would use in pricing the asset or liability based on market data obtained from sources independent of the Fund. Unobservable inputs reflect the Fund’s own assumptions about the assumptions market participants would use in pricing the asset or liability developed based on the information available in the circumstances. The inputs or methodology used for valuing securities may not be an indication of the risks associated with investing in those securities. The three-tier hierarchy of inputs is summarized in the three broad Levels listed below.
| • | | Level 1—quoted prices in active markets for identical investments |
| • | | Level 2—other significant observable inputs (including quoted prices for similar investments in active markets, interest rates and yield curves, prepayment speeds, credit risks, etc.) |
| | |
| 26 | | MainStay Tax Free Bond Fund |
| • | | Level 3—significant unobservable inputs (including the Fund’s own assumptions about the assumptions that market participants would use in determining the fair value of investments) |
The aggregate value by input level, as of October 31, 2012, for the Fund’s investments is included at the end of the Fund’s Portfolio of Investments.
The valuation techniques used by the Fund to measure fair value maximize the use of observable inputs and minimize the use of unobservable inputs. The Fund may utilize third party vendor evaluations, whose prices may be derived from one or more of the following standard inputs:
| | |
• Benchmark Yields | | • Reported Trades |
• Broker Dealer Quotes | | • Issuer Spreads |
• Two-sided markets | | • Benchmark securities |
• Bids / Offers | | • Reference Data (corporate actions or material event notices) |
• Industry and economic events | | • Comparable bonds |
• Equity and credit default swap curves | | • Monthly payment information |
Securities for which market value cannot be determined using the methodologies described above are valued by methods deemed in good faith by the Fund’s Valuation Committee, following the procedures established by the Board, to represent fair value. Under these procedures, the Fund primarily employs a market-based approach which may use related or comparable assets or liabilities, recent transactions, market multiples, book values, and other relevant information. The Fund may also use an income-based valuation approach in which the anticipated future cash flows of the investment are discounted to calculate fair value. Discounts may also be applied due to the nature or duration of any restrictions on the disposition of the investments. Due to the inherent uncertainty of valuations of such investments, the fair values may differ significantly from the values that would have been used had an active market existed. For the year ended October 31, 2012, there have been no changes to the fair value methodologies.
Equity and non-equity securities which may be valued in this manner include, but are not limited to: (i) a security for which the trading has been halted or suspended; (ii) a debt security that has recently gone into default and for which there is not a current market quotation; (iii) a security of an issuer that has entered into a restructuring; (iv) a security that has been de-listed from a national exchange; (v) a security for which the market price is not available from a third party pricing source or, if so provided, does not, in the opinion of the Fund’s Manager or Subadvisor reflect the security’s market value; and (vi) a security whose principal market has been temporarily closed at a time when, under normal conditions, it would be open. Securities for which market quotations or observable inputs are not readily available are generally categorized as Level 3 in the hierarchy. As of October 31, 2012, the Fund did not hold any securities that were fair valued in such a manner.
Futures contracts are valued at the last posted settlement price on the market where such futures are primarily traded. Investments in other mutual funds are valued at their respective NAV as of the close of the Exchange on the valuation date. These securities are generally categorized as Level 1 in the hierarchy.
Debt securities are valued at the evaluated mean prices supplied by a pricing agent or brokers selected by the Fund’s Manager in consultation with the Fund’s Subadvisor whose prices reflect broker/dealer supplied valuations and electronic data processing techniques, if such prices are deemed by the Fund’s Manager, in consultation with the Fund’s Subadvisor, to be representative of market values, at the regular close of trading of the Exchange on each valuation date. Debt securities, including corporate bonds, U.S. government and federal agency bonds, municipal bonds, foreign bonds, Yankee bonds, convertible bonds, asset-backed securities and mortgage-backed securities, are generally categorized as Level 2 in the hierarchy.
Temporary cash investments acquired over 60 days to maturity are valued using the latest bid prices or using valuations based on a matrix system (which considers such factors as security prices, yields, maturities, and ratings), both as furnished by independent pricing services. Other temporary cash investments which mature in 60 days or less (“Short-Term Investments”) are valued at amortized cost. The amortized cost method involves valuing a security at its cost on the date of purchase and thereafter assuming a constant amortization to maturity of the difference between such cost and the value on maturity date. Amortized cost approximates the current fair value of a security. Securities valued at amortized cost are not valued using a quoted price in an active market. These securities are generally categorized as Level 2 in the hierarchy.
(B) Income Taxes. The Fund’s policy is to comply with the requirements of the Internal Revenue Code of 1986, as amended (the “Internal Revenue Code”), applicable to regulated investment companies and to distribute all of the taxable income to the shareholders of the Fund within the allowable time limits. Therefore, no federal, state and local income tax provision is required.
Management evaluates its tax positions to determine if the tax positions taken meet the minimum recognition threshold in connection with accounting for uncertainties in income tax positions taken or expected to be taken for the purposes of measuring and recognizing tax liabilities in the financial statements. Recognition of tax benefits of an uncertain tax position is required only when the position is “more likely than not” to be sustained assuming examination by taxing authorities. Management has analyzed the Fund’s tax positions taken on federal, state and local income tax returns for all open tax years (for up to three tax years), and has concluded that no provision for federal, state and local income tax are required in the Fund’s financial statements. The Fund’s federal, state and local income and federal excise tax returns for tax years for which the applicable statutes of limitations have not expired are subject to examination by the Internal Revenue Service and state and local departments of revenue.
(C) Dividends and Distributions to Shareholders. Dividends and distributions are recorded on the ex-dividend date. The Fund declares dividends of net investment income, if any, at least daily and pays them at least monthly and declares and pays distributions of net realized capital gains, if any, at least annually. Unless the shareholder elects otherwise, all dividends and distributions are reinvested in the same class of shares of the Fund, at NAV. Dividends and distributions to shareholders are determined in accordance with federal income tax regulations and may differ from GAAP. Prior to January 1, 2012, the Fund declared and paid dividends from net investment income monthly.
| | | | |
| mainstayinvestments.com | | | 27 | |
Notes to Financial Statements (continued)
(D) Security Transactions and Investment Income. The Fund records security transactions on the trade date. Realized gains and losses on security transactions are determined using the identified cost method. Interest income is accrued as earned using the effective interest rate method. Discounts and premiums on securities purchased, other than Short-Term Investments, for the Fund are accreted and amortized, respectively, on the effective interest rate method over the life of the respective securities or, in the case of a callable security, over the period to the first date of call. Discounts and premiums on Short-Term Investments are accreted and amortized, respectively, on the straight-line method.
Investment income and realized and unrealized gains and losses on investments of the Fund are allocated to separate classes of shares pro rata based upon their relative net assets on the date the income is earned or realized and unrealized gains and losses are incurred.
(E) Expenses. Expenses of the Trust are allocated to the individual Funds in proportion to the net assets of the respective Funds when the expenses are incurred, except where direct allocations of expenses can be made. Expenses (other than transfer agent expenses and fees incurred under the shareholder services plans and the distribution plans further discussed in Note 3(B)) are allocated to separate classes of shares pro rata based upon their relative net assets on the date the expenses are incurred. The expenses borne by the Fund, including those of related parties to the Fund, are shown in the Statement of Operations.
(F) Use of Estimates. In preparing financial statements in conformity with GAAP, management makes estimates and assumptions that affect the reported amounts and disclosures in the financial statements. Actual results could differ from those estimates.
(G) Futures Contracts. A futures contract is an agreement to purchase or sell a specified quantity of an underlying instrument at a specified future date and price, or to make or receive a cash payment based on the value of a financial instrument (e.g., foreign currency, interest rate, security, or securities index). The Fund is subject to equity price risk and/or interest rate risk in the normal course of investing in these transactions. During the period the futures contract is open, changes in the value of the contract are recognized as unrealized appreciation or depreciation by “marking-to-market” such contract on a daily basis to reflect the market value of the contract at the end of each day’s trading. The Fund agrees to receive from or pay to the broker an amount of cash equal to the daily fluctuation in the value of the contract. Such receipts or payments are known as “variation margin.” When the futures contract is closed, the Fund records a realized gain or loss equal to the difference between the proceeds from (or cost of) the closing transaction and the Fund’s basis in the contract.
The use of futures contracts involves, to varying degrees, elements of market risk in excess of the amount recognized in the Statement of Assets and Liabilities. The contract or notional amounts and variation margin reflect the extent of the Fund’s involvement in open futures positions. Risks arise from the possible imperfect correlation in movements in the price of futures contracts, interest rates and the underlying hedged assets, and the possible inability of counterparties to meet the terms of their contracts. However, the Fund’s activities in futures contracts have minimal counterparty risk as they are conducted through
regulated exchanges that guarantee the futures against default by the counterparty. In the event of a bankruptcy or insolvency of a futures commission merchant that holds margin on behalf of the Fund, the Fund may not be entitled to the return of all of the margin owed to the Fund, potentially resulting in a loss. The Fund’s investment in futures contracts and other derivatives may increase the volatility of the Fund’s NAV and may result in a loss to the Fund.
(H) Securities Lending. In order to realize additional income, the Fund may engage in securities lending, subject to the limitations set forth in the 1940 Act, and relevant guidance by the staff of the Securities and Exchange Commission. In the event the Fund does engage in securities lending, the Fund will lend through its custodian, State Street Bank and Trust Company (“State Street”). State Street will manage the Fund’s cash collateral in accordance with the Lending Agreement between the Fund and State Street, and indemnify the Fund’s portfolio against counterparty risk. The loans will be collateralized by cash or securities at least equal at all times to the market value of the securities loaned. Collateral will consist of U.S. government securities, cash equivalents or irrevocable letters of credit. The Fund may bear the risk of delay in recovery of, or loss of rights in, the securities loaned should the borrower of the securities experience financial difficulty. The Fund may also record realized gain or loss on securities deemed sold due to a borrower’s inability to return securities on loan. The Fund will receive compensation for lending its securities in the form of fees or the retention of a portion of the interest on the investment of any cash received as collateral. The Fund also will continue to receive interest and dividends on the securities loaned and any gain or loss in the market price of the securities loaned that may occur during the term of the loan will be for the account of the Fund.
Although the Fund and New York Life Investments have temporarily suspended securities lending, the Fund and New York Life Investments reserve the right to reinstitute lending when deemed appropriate. The Fund had no portfolio securities on loan as of October 31, 2012.
(I) Concentration of Risk. The ability of issuers of debt securities held by the Fund to meet their obligations may be affected by economic or political developments in a specific country, industry or region.
(J) Indemnifications. Under the Trust’s organizational documents, its officers and trustees are indemnified against certain liabilities that may arise out of performance of their duties to the Trust. Additionally, in the normal course of business, the Fund enters into contracts with third-party service providers that contain a variety of representations and warranties and which may provide general indemnifications. The Fund’s maximum exposure under these arrangements is unknown, as this would involve future claims that may be made against the Fund that have not yet occurred. Based on experience, management is of the view that the risk of loss in connection with these potential indemnification obligations is remote. However, there can be no assurance that material liabilities related to such obligations will not arise in the future, which could adversely impact the Fund.
(K) Quantitative Disclosure of Derivative Holdings. The following tables show additional disclosures about the Fund’s derivative and hedging activities, including how such activities are accounted for and their effect on the Fund’s financial positions, performance and cash flows. These derivatives are not accounted for as hedging instruments.
| | |
| 28 | | MainStay Tax Free Bond Fund |
Fair value of derivatives instruments as of October 31, 2012:
Asset Derivatives
| | | | | | | | | | |
| | | Statement of
Assets and
Liabilities
Location | | Interest
Rate
Contracts
Risk | | | Total | |
Futures Contracts | | Net Assets-Net unrealized appreciation (depreciation) on investments and futures contracts (a) | | $ | 223,500 | | | $ | 223,500 | |
| | | | | | |
Total Fair Value | | | | $ | 223,500 | | | $ | 223,500 | |
| | | | | | |
| (a) | Includes cumulative appreciation (depreciation) of futures contracts as reported in the Portfolio of Investments. Only current day’s variation margin is reported within the Statement of Assets and Liabilities. |
The effect of derivative instruments on the Statement of Operations for the year ended October 31, 2012:
Realized Gain (Loss)
| | | | | | | | | | |
| | | Statement of
Operations
Location | | Interest
Rate
Contracts
Risk | | | Total | |
Futures Contracts | | Net realized gain (loss) on futures transactions | | $ | (3,223,472 | ) | | $ | (3,223,472 | ) |
| | | | | | |
Total Realized Gain (Loss) | | | | $ | (3,223,472 | ) | | $ | (3,223,472 | ) |
| | | | | | |
Change in Unrealized Appreciation (Depreciation)
| | | | | | | | | | |
| | | Statement of
Operations
Location | | Interest
Rate
Contracts
Risk | | | Total | |
Futures Contracts | | Net change in unrealized appreciation (depreciation) on futures contracts | | $ | (367,013 | ) | | $ | (367,013 | ) |
| | | | | | |
Total Change in
Unrealized Appreciation (Depreciation) | | | | $ | (367,013 | ) | | $ | (367,013 | ) |
| | | | | | |
Number of Contracts, Notional Amounts or Shares/Units
| | | | | | |
| | | Interest
Rate
Contracts
Risk | | Total | |
Futures Contracts Short (1) | | (521) | | | (521 | ) |
| | | |
| (1) | Amount disclosed represents the weighted average held during the year ended October 31, 2012. |
Note 3–Fees and Related Party Transactions
(A) Manager and Subadvisor. New York Life Investments, a registered investment adviser and an indirect, wholly-owned subsidiary of New York Life Insurance Company (“New York Life”), serves as the Fund’s Manager, pursuant to an Amended and Restated Management Agreement (“Management Agreement”). The Manager provides offices, conducts clerical, recordkeeping and bookkeeping services, and keeps most of the financial and accounting records required to be maintained by the Fund. Except for the portion of salaries and expenses that are the responsibility of the Fund, the Manager pays the salaries and expenses of all personnel affiliated with the Fund and certain operational expenses of the Fund. The Fund reimburses New York Life Investments in an amount equal to a portion of the salary of the Chief Compliance Officer (“CCO”) of the Fund. MacKay Shields LLC (“MacKay Shields” or the “Subadvisor”), a registered investment adviser and an indirect, wholly owned subsidiary of New York Life, serves as Subadvisor and is responsible for the day-to-day portfolio management of the Fund. Pursuant to the terms of an Amended and Restated Subadvisory Agreement (“Subadvisory Agreement”) between New York Life Investments and MacKay Shields, New York Life Investments pays for the services of the Subadvisor.
The Fund pays the Manager a monthly fee for services performed and facilities furnished at an annual rate of the Fund’s average daily net assets as follows: 0.50% up to $500 million; 0.475% from $500 million to $1 billion; and 0.45% in excess of $1 billion, plus a fee for fund accounting services, previously provided by New York Life Investments under a separate fund accounting agreement, furnished at an annual rate of the Fund’s average daily net assets as follows: 0.05% up to $20 million; 0.0333% from $20 million to $100 million; and 0.01% in excess of $100 million.
New York Life Investments has contractually agreed to waive a portion of its management fee so that the management fee does not exceed 0.45% up to $500 million; 0.425% from $500 million to $1 billion; and 0.40% in excess of $1 billion. This agreement will remain in effect until February 28, 2013, and shall renew automatically for one-year terms unless New York Life Investments provides written notice of termination prior to the start of the next term or upon approval of the Board. The effective management fee rate (exclusive of any applicable waivers/reimbursements) was 0.52% for the year ended October 31, 2012, inclusive of a fee for fund accounting services of 0.02% of the Fund’s average daily net assets.
New York Life Investments has contractually agreed to waive fees and/or reimburse expenses so that Total Annual Fund Operating Expenses for Class A shares do not exceed 0.82% of its average daily net assets. New York Life Investments will apply an equivalent waiver or reimbursement, in an equal number of basis points, to the other share classes. This agreement will remain in effect until February 28, 2013, and shall renew automatically for one-year terms unless New York Life Investments provides written notice of termination prior to the start of the next term or upon approval of the Board. Total Annual Fund Operating Expenses excludes taxes, interest, litigation, extraordinary expenses, brokerage and other transaction expenses relating to the purchase or sale of portfolio investments, and acquired (underlying) fund fees and expenses.
| | | | |
| mainstayinvestments.com | | | 29 | |
Notes to Financial Statements (continued)
For the year ended October 31, 2012, New York Life Investments earned fees from the Fund in the amount of $2,826,763 and waived its fees and/or reimbursed expenses in the amount of $276,172.
State Street, 1 Lincoln Street, Boston, Massachusetts 02111, provides sub-administration and sub-accounting services to the Fund pursuant to an agreement with New York Life Investments. These services include calculating the daily NAVs of the Fund, maintaining the general ledger and sub-ledger accounts for the calculation of the Fund’s respective NAVs, and assisting New York Life Investments in conducting various aspects of the Fund’s administrative operations. For providing these services to the Fund, State Street is compensated by New York Life Investments.
(B) Distribution and Service Fees. The Trust, on behalf of the Fund, has entered into a distribution agreement with NYLIFE Distributors LLC (the “Distributor”), an indirect, wholly-owned subsidiary of New York Life. The Fund has adopted distribution plans (the “Plans”) in accordance with the provisions of Rule 12b-1 under the 1940 Act.
Pursuant to the Investor Class and Class A Plans, the Distributor receives a monthly distribution fee from the Investor Class and Class A shares at an annual rate of 0.25% of the average daily net assets of the Investor Class and Class A shares for distribution and/or service activities as designated by the Distributor. Pursuant to the Class B and Class C Plans, Class B and Class C shares pay the Distributor a monthly distribution fee at an annual rate of 0.25% of the average daily net assets of the Class B and Class C shares along with a service fee at an annual rate of 0.25% of the average daily net assets of the Class B and Class C shares, for a total 12b-1 fee of 0.50%. Class I shares are not subject to a distribution and/or service fee.
The Plans provide that the distribution and service fees are payable to the Distributor regardless of the amounts actually expended by the Distributor for distribution of the Fund’s shares and service activities.
(C) Sales Charges. The Fund was advised by the Distributor that the amount of sales charges retained on sales of Investor Class and Class A shares were $11,274 and $177,360, respectively, for the year ended October 31, 2012. The Fund was also advised that the Distributor retained CDSCs on redemptions of Class A, Class B and Class C shares of $23,557, $23,408 and $10,540, respectively, for the year ended October 31, 2012.
(D) Transfer, Dividend Disbursing and Shareholder Servicing Agent. NYLIM Service Company LLC, an affiliate of New York Life Investments, is the Fund’s transfer, dividend disbursing and shareholder servicing agent pursuant to an agreement between NYLIM Service Company LLC and the Trust. NYLIM Service Company LLC has entered into an agreement with Boston Financial Data Services, Inc. (“BFDS”) pursuant to which BFDS performs certain transfer agent services on behalf of NYLIM Service Company LLC. Transfer agent expenses incurred by the Fund for the year ended October 31, 2012, were as follows:
| | | | |
Investor Class | | $ | 22,804 | |
Class A | | | 119,788 | |
Class B | | | 11,418 | |
Class C | | | 114,289 | |
Class I | | | 28,154 | |
(E) Small Account Fee. Shareholders with small accounts adversely impact the cost of providing transfer agency services. In an effort to reduce total transfer agency expenses, the Fund has implemented a small account fee on certain types of accounts. Certain shareholders with an account balance of less than $1,000 are charged an annual per account fee of $20 (assessed semi-annually), the proceeds from which offset transfer agent fees as reflected in the Statement of Operations.
Note 4–Federal Income Tax
As of October 31, 2012, the components of accumulated gain (loss) on a tax basis were as follows:
| | | | | | | | | | | | | | | | | | | | |
Ordinary
Income | | Undistr
ibuted
Tax Exempt
Income | | | Accum
ulated
Capital and
Other Gain
(Loss) | | | Other
Temp
orary
Differ
ences | | | Unrealized
Appre
ciation
(Deprec
iation) | | | Total
Accum
ulated Gain (Loss) | |
| $— | | $ | 247,498 | | | $ | (6,087,291 | ) | | $ | (841,786 | ) | | $ | 43,840,459 | | | $ | 37,158,880 | |
The difference between book basis and tax basis unrealized appreciation (depreciation) is primarily due to mark to market of futures contracts. The other temporary differences are primarily due to dividends payable.
Under the Regulated Investment Company Modernization Act of 2010, the Fund is permitted to carry forward capital losses incurred in taxable years beginning after December 22, 2010, for an unlimited period. However, any losses incurred during those future years will be required to be utilized prior to the losses incurred in pre-enactment tax years. As a result of this ordering rule, pre-enactment capital loss carryforwards may be more likely to expire unused. Additionally, post-enactment capital losses that are carried forward will retain their character as either short-term or long-term capital losses rather than being considered all short-term as under previous law.
As of October 31, 2012, for federal income tax purposes, capital loss carryforwards of $6,087,291 were available as shown in the table below, to the extent provided by the regulations to offset future realized gains of the Fund through the years indicated. To the extent that these capital loss carryforwards are used to offset future capital gains, it is probable that the capital gains so offset will not be distributed to shareholders. No capital gain distributions shall be made until any capital loss carryforwards have been fully utilized or expired.
| | | | | | | | |
Capital Loss
Available Through | | Short-Term Capital
Loss Amounts (000’s) | | | Long-Term Capital
Loss Amounts (000’s) | |
2017
2019 | | $
| 3,951
2,136 |
| | $
| —
— |
|
| Total | | $ | 6,087 | | | $ | — | |
The Fund utilized $10,495,646 of capital loss carryforwards during the year ended October 31, 2012.
| | |
| 30 | | MainStay Tax Free Bond Fund |
The tax character of distributions paid during the years ended October 31, 2012 and October 31, 2011 shown in the Statements of Changes in Net Assets was as follows:
| | | | | | | | |
| | | 2012 | | | 2011 | |
Distributions paid from: | | | | | | | | |
Ordinary Income | | $ | 110,818 | | | $ | 336,245 | |
Exempt Interest Dividends | | | 21,290,764 | | | | 16,693,359 | |
Total | | $ | 21,401,582 | | | $ | 17,029,604 | |
Note 5–Custodian
State Street is the custodian of the cash and the securities of the Fund. Custodial fees are charged to the Fund based on the market value of securities in the Fund and the number of certain cash transactions incurred by the Fund.
Note 6–Line of Credit
The Fund and certain affiliated funds maintain a line of credit with a syndicate of banks in order to secure a source of funds for temporary purposes to meet unanticipated or excessive redemption requests.
Effective August 29, 2012, under an amended credit agreement, the aggregate commitment amount is $200,000,000 with an optional maximum amount of $250,000,000. The commitment fee is an annual rate of 0.08% of the average commitment amount payable quarterly, regardless of usage, to Bank of New York Mellon, which serves as the agent to the syndicate. The commitment fee is allocated among certain MainStay Funds based upon net assets and other factors. Interest on any revolving credit loan is charged based upon the Federal Funds Advances rate or the one month London InterBank Offered Rate, whichever is higher. The amended credit agreement expires on August 28, 2013, although the MainStay Funds and the syndicate of banks may renew the amended credit agreement for an additional year on the same or different terms. Prior to August 29, 2012, the aggregate commitment amount was $125,000,000 with an optional maximum amount of $175,000,000. There were no borrowings made or outstanding with respect to the Fund on the amended credit agreement during the year ended October 31, 2012.
Note 7–Purchases and Sales of Securities (in 000’s)
During the year ended October 31, 2012, purchases and sales of securities, other than short-term securities, were $973,408 and $686,382, respectively.
Note 8–Capital Share Transactions
| | | | | | | | |
Investor Class | | Shares | | | Amount | |
Year ended October 31, 2012: | | | | | | | | |
Shares sold | | | 302,292 | | | $ | 2,969,559 | |
Shares issued to shareholders in reinvestment of dividends | | | 74,537 | | | | 728,718 | |
Shares redeemed | | | (232,083 | ) | | | (2,264,814 | ) |
| | | | | | | | |
Net increase (decrease) in shares outstanding before conversion | | | 144,746 | | | | 1,433,463 | |
Shares converted into Investor Class (See Note 1) | | | 98,094 | | | | 958,281 | |
Shares converted from Investor Class (See Note 1) | | | (431,785 | ) | | | (4,210,943 | ) |
| | | | | | | | |
Net increase (decrease) | | | (188,945 | ) | | $ | (1,819,199 | ) |
| | | | | | | | |
Year ended October 31, 2011: | | | | | | | | |
Shares sold | | | 207,728 | | | $ | 1,893,698 | |
Shares issued to shareholders in reinvestment of dividends | | | 93,473 | | | | 847,262 | |
Shares redeemed | | | (305,859 | ) | | | (2,772,636 | ) |
| | | | | | | | |
Net increase (decrease) in shares outstanding before conversion | | | (4,658 | ) | | | (31,676 | ) |
Shares converted into Investor Class (See Note 1) | | | 191,814 | | | | 1,747,687 | |
Shares converted from Investor Class (See Note 1) | | | (215,776 | ) | | | (1,962,032 | ) |
| | | | | | | | |
Net increase (decrease) | | | (28,620 | ) | | $ | (246,021 | ) |
| | | | | | | | |
| | |
| | | | | | | | |
Class A | | Shares | | | Amount | |
Year ended October 31, 2012: | | | | | | | | |
Shares sold | | | 18,827,755 | | | $ | 184,035,146 | |
Shares issued to shareholders in reinvestment of dividends | | | 816,477 | | | | 7,973,089 | |
Shares redeemed | | | (5,878,933 | ) | | | (57,367,459 | ) |
| | | | | | | | |
Net increase (decrease) in shares outstanding before conversion | | | 13,765,299 | | | | 134,640,776 | |
Shares converted into Class A (See Note 1) | | | 666,672 | | | | 6,460,233 | |
Shares converted from Class A (See Note 1) | | | (49,478 | ) | | | (486,560 | ) |
| | | | | | | | |
Net increase (decrease) | | | 14,382,493 | | | $ | 140,614,449 | |
| | | | | | | | |
Year ended October 31, 2011: | | | | | | | | |
Shares sold | | | 7,914,265 | | | $ | 71,592,911 | |
Shares issued to shareholders in reinvestment of dividends | | | 766,360 | | | | 6,915,977 | |
Shares redeemed | | | (6,967,809 | ) | | | (62,785,852 | ) |
| | | | | | | | |
Net increase (decrease) in shares outstanding before conversion | | | 1,712,816 | | | | 15,723,036 | |
Shares converted into Class A (See Note 1) | | | 599,952 | | | | 5,411,743 | |
Shares converted from Class A (See Note 1) | | | (99,626 | ) | | | (904,882 | ) |
| | | | | | | | |
Net increase (decrease) | | | 2,213,142 | | | $ | 20,229,897 | |
| | | | | | | | |
| | |
| | | | | | | | |
| | | | |
| mainstayinvestments.com | | | 31 | |
Notes to Financial Statements (continued)
| | | | | | | | |
Class B | | Shares | | | Amount | |
Year ended October 31, 2012: | | | | | | | | |
Shares sold | | | 716,260 | | | $ | 7,012,721 | |
Shares issued to shareholders in reinvestment of dividends | | | 30,704 | | | | 299,461 | |
Shares redeemed | | | (168,094 | ) | | | (1,633,570 | ) |
| | | | | | | | |
Net increase (decrease) in shares outstanding before conversion | | | 578,870 | | | | 5,678,612 | |
Shares converted from Class B (See Note 1) | | | (281,939 | ) | | | (2,721,011 | ) |
| | | | | | | | |
Net increase (decrease) | | | 296,931 | | | $ | 2,957,601 | |
| | | | | | | | |
Year ended October 31, 2011: | | | | | | | | |
Shares sold | | | 256,367 | | | $ | 2,333,781 | |
Shares issued to shareholders in reinvestment of dividends | | | 39,803 | | | | 358,511 | |
Shares redeemed | | | (271,830 | ) | | | (2,439,328 | ) |
| | | | | | | | |
Net increase (decrease) in shares outstanding before conversion | | | 24,340 | | | | 252,964 | |
Shares converted from Class B (See Note 1) | | | (476,368 | ) | | | (4,292,516 | ) |
| | | | | | | | |
Net increase (decrease) | | | (452,028 | ) | | $ | (4,039,552 | ) |
| | | | | | | | |
| | |
| | | | | | | | |
Class C | | Shares | | | Amount | |
Year ended October 31, 2012: | | | | | | | | |
Shares sold | | | 6,245,133 | | | $ | 61,118,182 | |
Shares issued to shareholders in reinvestment of dividends | | | 218,599 | | | | 2,138,827 | |
Shares redeemed | | | (1,129,894 | ) | | | (11,018,783 | ) |
| | | | | | | | |
Net increase (decrease) | | | 5,333,838 | | | $ | 52,238,226 | |
| | | | | | | | |
Year ended October 31, 2011: | | | | | | | | |
Shares sold | | | 3,781,769 | | | $ | 34,308,352 | |
Shares issued to shareholders in reinvestment of dividends | | | 164,851 | | | | 1,489,950 | |
Shares redeemed | | | (2,070,656 | ) | | | (18,568,999 | ) |
| | | | | | | | |
Net increase (decrease) | | | 1,875,964 | | | $ | 17,229,303 | |
| | | | | | | | |
| | |
| | | | | | | | |
| | | | | | | | |
Class I | | Shares | | | Amount | |
Year ended October 31, 2012: | | | | | | | | |
Shares sold | | | 12,037,403 | | | $ | 118,056,878 | |
Shares issued to shareholders in reinvestment of dividends | | | 111,693 | | | | 1,100,347 | |
Shares redeemed | | | (1,600,338 | ) | | | (15,626,655 | ) |
| | | | | | | | |
Net increase (decrease) | | | 10,548,758 | | | $ | 103,530,570 | |
| | | | | | | | |
Year ended October 31, 2011 : | | | | | | | | |
Shares sold | | | 3,315,807 | | | $ | 30,217,531 | |
Shares issued to shareholders in reinvestment of dividends | | | 29,900 | | | | 272,972 | |
Shares redeemed | | | (1,531,533 | ) | | | (13,713,333 | ) |
| | | | | | | | |
Net increase (decrease) | | | 1,814,174 | | | $ | 16,777,170 | |
| | | | | | | | |
Note 9–Subsequent Events
In connection with the preparation of the financial statements of the Fund as of and for the year ended October 31, 2012, events and transactions subsequent to October 31, 2012 through the date the financial statements were issued have been evaluated by the Fund’s management for possible adjustment and/or disclosure. No subsequent events requiring financial statement adjustment or disclosure have been identified.
| | |
| 32 | | MainStay Tax Free Bond Fund |
Report of Independent Registered Public Accounting Firm
The Board of Trustees and Shareholders of
The MainStay Funds:
We have audited the accompanying statement of assets and liabilities, including the portfolio of investments, of the MainStay Tax Free Bond Fund (the “Fund”), one of the funds constituting The MainStay Funds, as of October 31, 2012, and the related statement of operations for the year then ended, the statements of changes in net assets for each of the years in the two-year period then ended, and the financial highlights for each of the years or periods in the five-year period then ended. These financial statements and financial highlights are the responsibility of the Fund’s management. Our responsibility is to express an opinion on these financial statements and financial highlights based on our audits.
We conducted our audits in accordance with the standards of the Public Company Accounting Oversight Board (United States). Those standards require that we plan and perform the audit to obtain reasonable assurance about whether the financial statements and financial highlights are free of material misstatement. An audit includes examining, on a test basis, evidence supporting the amounts and disclosures in the financial statements. Our procedures included confirmation of securities owned as of October 31, 2012, by correspondence with the custodian and brokers or by other appropriate auditing procedures where replies from brokers were not received. An audit also includes assessing the accounting principles used and significant estimates made by management, as well as evaluating the overall financial statement presentation. We believe that our audits provide a reasonable basis for our opinion.
In our opinion, the financial statements and financial highlights referred to above present fairly, in all material respects, the financial position of the MainStay Tax Free Bond Fund of The MainStay Funds as of October 31, 2012, the results of its operations for the year then ended, the changes in its net assets for each of the years in the two-year period then ended, and the financial highlights for each of the years or periods in the five-year period then ended, in conformity with U.S. generally accepted accounting principles.

Philadelphia, Pennsylvania
December 21, 2012
| | | | |
| mainstayinvestments.com | | | 33 | |
Federal Income Tax Information
(Unaudited)
The Fund is required under the Internal Revenue Code to advise shareholders in a written statement as to the federal tax status of dividends paid by the Fund during such fiscal years.
For individual federal income tax purposes, the Fund designated 100.0% of the ordinary income dividends paid during the fiscal year ended October 31, 2012 as attributable to interest income from tax exempt municipal bonds. Such dividends are currently exempt from federal income taxes under Section 103 (a) of the Internal Revenue Code.
In February 2013, shareholders will receive an IRS. Form 1099-DIV or substitute Form 1099 which will show the federal tax status of the distributions received by shareholders in calendar year 2012. The amounts that will be reported on such 1099-DIV or substitute Form 1099 will be the amounts you are to use on your federal income tax return and will differ from the amounts which we must report for the Fund’s fiscal year ended October 31, 2012.
Proxy Voting Policies and Procedures and Proxy Voting Record
A description of the policies and procedures that New York Life Investments uses to vote proxies related to the Fund’s securities is available without charge, upon request, (i) by visiting the Fund’s website at mainstayinvestments.com; or (ii) on the SEC’s website at www.sec.gov.
The Fund is required to file with the SEC its proxy voting record for the 12-month period ending June 30 on Form N-PX. The Fund’s most recent Form N-PX is available free of charge upon request (i) by calling 800-MAINSTAY (624-6782); (ii) by visiting the Fund’s website at mainstayinvestments.com; or (iii) on the SEC’s website at www.sec.gov.
Shareholder Reports and Quarterly Portfolio Disclosure
The Fund is required to file its complete schedule of portfolio holdings with the SEC for its first and third fiscal quarters on Form N-Q. The Fund’s Form N-Q is available without charge on the SEC’s website at www.sec.gov or by calling MainStay Investments at 800-MAINSTAY (624-6782). You also can obtain and review copies of Form N-Q by visiting the SEC’s Public Reference Room in Washington, DC (information on the operation of the Public Reference Room may be obtained by calling 1-800-SEC-0330).
| | |
| 34 | | MainStay Tax Free Bond Fund |
Board Members and Officers (Unaudited)
The Board Members oversee the MainStay Group of Funds (which is comprised of Funds that are series of The MainStay Funds, Eclipse Trust, Eclipse Funds Inc., MainStay Funds Trust, MainStay VP Funds Trust, Private Advisors Alternative Strategies Master Fund, Private Advisors Alternative Strategies Fund, and MainStay Defined Term Municipal Opportunities Fund) (collectively, the “Fund Complex”), the Manager and, when applicable, the Subadvisor(s) and other service providers to the Fund Complex. Each Board Member serves until his or her successor is elected and qualified or until his or her resignation, death or removal. The Retirement Policy provides that a Board Member
shall tender his or her resignation by the end of the calendar year during which he or she reaches the age of 75.
Officers serve a term of one year and are elected annually by the Board Members. The business address of each Board Member and officer listed below is 51 Madison Avenue, New York, New York 10010.
The Statement of Additional Information applicable to the Fund includes additional information about the Board Members and is available without charge, upon request, by calling 800-MAINSTAY (624-6782) or by going online to mainstayinvestments.com.
| | | | | | | | | | | | |
| | | | | Name and
Date of Birth | | Term of Office,
Position(s) Held
with the Fund
Complex and
Length of Service | | Principal Occupation(s)
During Past Five Years | | Number of
Funds in
Fund Complex
Overseen by
Board Member | | Other Directorships
Held by Board Member |
| Interested Board Member* | | | | John Y. Kim
9/24/60 | | Indefinite;
Eclipse Trust: Trustee since 2008;
Eclipse Funds Inc.:
Director since 2008 (1 fund);
The MainStay Funds: Trustee since 2008 (12 funds);
MainStay Funds Trust: Trustee since 2009 (31 funds); and
MainStay VP Funds Trust: Trustee since 2011 and its predecessor, MainStay VP Series Fund, Inc. since 2008 (28 portfolios). Private Advisors Alternative Strategies Master Fund: Trustee since 2011
Private Advisors Alternative Strategies Fund: Trustee since 2011
MainStay DefinedTerm Municipal Opportunities Fund: Trustee since 2011 | | Member of the Board of Managers, President and Chief Executive Officer (since 2008), New York Life Investment Management LLC and New York Life Investment Management Holdings LLC; Member of the Board, MacKay Shields LLC since 2008; Chairman of the Board, Institutional Capital LLC, Madison Capital Funding LLC, Madison Square Investors LLC and McMorgan & Company LLC; Chairman of the Board, NYLIFE Distributors LLC and Chairman of the Board, NYLCAP Manager LLC (since 2008) President, Prudential Retirement, a business unit of Prudential Financial, Inc. (2002 to 2007) | | 75 | | None |
| | * | This Board Member is considered to be an “interested person” of the MainStay Group of Funds within the meaning of the 1940 Act because of his affiliation with New York Life Insurance Company, New York Life Investment Management LLC, Madison Square Investors LLC, MacKay Shields LLC, Private Advisors LLC, Institutional Capital LLC, NYLIFE Securities LLC and/or NYLIFE Distributors LLC, as described in detail above in the column entitled “Principal Occupation(s) During the Past Five Years.” |
| | | | |
| mainstayinvestments.com | | | 35 | |
| | | | | | | | | | | | |
| | | | | Name and
Date of Birth | | Term of Office, Position(s) Held with the Fund Complex and Length of Service | | Principal Occupation(s)
During Past Five Years | | Number of
Funds in
Fund Complex
Overseen by
Board Member | | Other Directorships
Held by Board Member |
| Non-Interested Board Members | | | | Susan B. Kerley 8/12/51 | | Indefinite;
Eclipse Trust: Chairman since 2005, and Trustee since 2000;
Eclipse Funds Inc.: Chairman since 2005 and Director since 1990 (1 fund); The MainStay Funds: Chairman and Board Member since 2007 (12 funds);
MainStay Funds Trust: Chairman and Trustee since 2009 (31 funds); and MainStay VP Funds Trust: Chairman and Trustee since 2011 and its predecessor, MainStay VP Series Fund, Inc., since 2007 (28 portfolios). Private Advisors Alternative Strategies Master Fund: Chairman and Trustee since 2011 Private Advisors Alternative Strategies Fund: Chairman and Trustee since 2011 MainStay DefinedTerm Municipal Opportunities Fund: Chairman and Trustee since 2011. | | President, Strategic Management Advisors LLC (since 1990) | | 75 | | Trustee, Legg Mason Partners Funds, since 1992 (51 portfolios) |
| | |
| 36 | | MainStay Tax Free Bond Fund |
| | | | | | | | | | | | |
| | | | | Name and
Date of Birth | | Term of Office,
Position(s) Held
with the Fund
Complex and
Length of Service | | Principal Occupation(s)
During Past Five Years | | Number of
Funds in
Fund Complex
Overseen by
Board Member | | Other Directorships
Held by Board Member |
| Non-Interested Board Members | | | | Alan R. Latshaw 3/27/51 | | Indefinite;
Eclipse Trust: Trustee and Audit Committee Financial Expert since 2007;
Eclipse Funds Inc.:
Director and Audit Committee Financial Expert since 2007 (1 fund);
The MainStay Funds: Trustee and Audit Committee Financial Expert since 2006 (12 funds);
MainStay Funds Trust: Trustee and Audit Committee Financial Expert since 2009 (31 funds); and
MainStay VP Funds Trust: Trustee and Audit Committee Financial Expert since 2011 and its predecessor, MainStay VP Series Fund, Inc., since 2007 (28 portfolios). Private Advisors Alternative Strategies Master Fund: Trustee and Audit Committee Financial Expert since 2011 Private Advisors Alternative Strategies Fund: Trustee and Audit Committee Financial Expert since 2011. MainStay DefinedTerm Municipal Opportunities Fund: Trustee and Audit Committee Financial Expert since 2011. | | Retired; Partner, Ernst & Young LLP (2002 to 2003); Partner, Arthur Andersen LLP (1989 to 2002); Consultant to the MainStay Funds Audit and Compliance Committee (2004 to 2006) | | 75 | | Trustee, State Farm Associates Funds Trusts since 2005 (4 portfolios); Trustee, State Farm Mutual Fund Trust since 2005 (15 portfolios); Trustee, State Farm Variable Product Trust since 2005 (9 portfolios) |
| | | | |
| mainstayinvestments.com | | | 37 | |
| | | | | | | | | | | | |
| | | | | Name and Date of Birth | | Term of Office, Position(s) Held with the Fund Complex and Length of Service | | Principal Occupation(s)
During Past Five Years | | Number of
Funds in
Fund Complex
Overseen by
Board Member | | Other Directorships Held by Board Member |
| Non-Interested Board Members | | | | Peter Meenan
12/5/41 | | Indefinite;
Eclipse Funds: Trustee since 2002;
Eclipse Funds Inc.:
Director since 2002
(1 fund); The MainStay Funds:
Trustee since 2007 (12 funds);
MainStay Funds Trust: Trustee since 2009
(31 funds); and
MainStay VP Funds Trust: Trustee since 2011 and its predecessor, MainStay VP Series Fund, Inc., since 2007 (28 portfolios).
Private Advisors Alternative Strategies Master Fund: Trustee since 2011. Private Advisors Alternative Strategies Fund: Trustee since 2011
MainStay DefinedTerm Municipal Opportunities Fund: Trustee since 2011. | | Independent Consultant; President and Chief Executive Officer, Babson—United, Inc. (financial services firm) (2000 to 2004); Independent Consultant (1999 to 2000); Head of Global Funds, Citicorp (1995 to 1999) | | 75 | | None |
| | | | Richard H. Nolan, Jr.
11/16/46 | | Indefinite;
Eclipse Trust: Trustee since 2007;
Eclipse Funds Inc.:
Director since 2007 (1 fund);
The MainStay Funds: Trustee since 2007 (12 funds);
MainStay Funds Trust: Trustee since 2009 (31 funds); and
MainStay VP Funds Trust: Trustee since 2011 and its predecessor, MainStay VP Series Fund, Inc., since 2006 (28 portfolios).
Private Advisors Alternative Strategies Master Fund: Trustee since 2011. Private Advisors Alternative Strategies Fund: Trustee since 2011
MainStay DefinedTerm Municipal Opportunities Fund: Trustee since 2011. | | Managing Director, ICC Capital Management; President—Shields/Alliance, Alliance Capital Management (1994 to 2004) | | 75 | | None |
| | |
| 38 | | MainStay Tax Free Bond Fund |
| | | | | | | | | | | | |
| | | | | Name and Date of Birth | | Term of Office, Position(s) Held with the Fund Complex and Length of Service | | Principal Occupation(s)
During Past Five Years | | Number of
Funds in
Fund Complex
Overseen by
Board Member | | Other Directorships Held by Board Member |
| Non-Interested Board Members | | | | Richard S. Trutanic 2/13/52 | | Indefinite;
Eclipse Trust: Trustee since 2007;
Eclipse Funds Inc.:
Director since 2007 (1 fund);
The MainStay Funds:
Trustee since 1994 (12 funds);
MainStay Funds Trust:
Trustee since 2009 (31 funds); and
MainStay VP Funds Trust: Trustee since 2011 and its predecessor, MainStay VP Series Fund, Inc., since 2007 (28 portfolios).
Private Advisors Alternative Strategies Master Fund: Trustee since 2011.
Private Advisors Alternative Strategies Fund: Trustee since 2011
MainStay DefinedTerm Municipal Opportunities Fund: Trustee since 2011. | | Chairman and Chief Executive Officer, Somerset & Company (financial advisory firm) (since 2004); Managing Director, The Carlyle Group (private investment firm) (2002 to 2004); Senior Managing Director, Partner and Board Member, Groupe Arnault S.A. (private investment firm) (1999 to 2002) | | 75 | | None |
| | | | |
| mainstayinvestments.com | | | 39 | |
| | | | | | | | | | | | |
| | | | | Name and Date of Birth | | Term of Office, Position(s) Held with the Fund Complex and Length of Service | | Principal Occupation(s)
During Past Five Years | | Number of
Funds in
Fund Complex
Overseen by
Board Member | | Other Directorships Held by Board Member |
| Non-Interested Board Members | | | | Roman L. Weil
5/22/40 | | Indefinite;
Eclipse Trust: Trustee and Audit Committee Financial Expert since 2007; Eclipse Funds Inc.: Director and Audit Committee Financial Expert since 2007 (1 fund); The MainStay Funds: Trustee and Audit Committee Financial Expert since 2007 (12 funds); MainStay Funds Trust: Trustee since 2009 (31 funds); and MainStay VP Funds Trust: Trustee and Audit Committee Financial Expert since 2011 and its predecessor, MainStay VP Series Fund, Inc., since 1994 and Audit Committee Financial Expert since 2003 (28 portfolios).
Private Advisors Alternative Strategies Master Fund: Trustee and Audit Committee Financial Expert since 2011 Private Advisors Alternative Strategies Fund: Trustee and Audit Committee Financial Expert since 2011. MainStay DefinedTerm Municipal Opportunities Fund: Trustee and Audit Committee Financial Expert since 2011. | | Visiting Professor, University of California—San Diego (since October 2012); Visiting Professor, Southern Methodist University (2011); Visiting Professor, NYU Stem School of Business, New York University (2011); President, Roman L. Weil Associates, Inc. (consulting firm) (since 1981); V. Duane Rath Professor Emeritus of Accounting, Chicago Booth School of Business, University of Chicago (1965-2008) | | 75 | | None |
| | |
| 40 | | MainStay Tax Free Bond Fund |
| | | | | | | | | | | | |
| | | | | Name and Date of Birth | | Term of Office, Position(s) Held with the Fund Complex and Length of Service | | Principal Occupation(s)
During Past Five Years | | Number of
Funds in
Fund Complex
Overseen by
Board Member | | Other Directorships Held by Board Member |
| Non-Interested Board Members | | | | John A. Weisser 10/22/41 | | Indefinite; Eclipse Trust: Trustee since 2007; Eclipse Funds Inc.: Director since 2007 (1 fund); The MainStay Funds: Trustee since 2007 (12 funds); MainStay Funds Trust: Trustee since 2009 (31 funds); and MainStay VP Funds Trust: Trustee since 2011 and its predecessor, MainStay VP Series Fund, Inc., since 1997 (28 portfolios).
Private Advisors Alternative Strategies Master Fund: Trustee since 2011.
Private Advisors Alternative Strategies Fund: Trustee since 2011
MainStay DefinedTerm Municipal Opportunities Fund: Trustee since 2011. | | Retired. Managing Director of Salomon Brothers, Inc. (1971 to 1995) | | 75 | | Trustee, Direxion Funds since 2007 (21 portfolios); Direxion Insurance Trust since 2007 (1 portfolio); Trustee, Direxion Shares ETF Trust, since 2008 (47 portfolios) |
| | | | |
| mainstayinvestments.com | | | 41 | |
The following individuals have been appointed by the Board Members to serve as Officers of the MainStay Group of Funds.
| | | | | | | | |
| | | | | Name and
Date of Birth | | Positions(s) Held with the Funds and Length of Service | | Principal Occupation(s) During Past Five Years |
| Officers | | | | Jack R. Benintende 5/12/64 | | Treasurer and Principal Financial and Accounting Officer, Eclipse Trust, Eclipse Funds, Inc. and The MainStay Funds (since 2007), MainStay Funds Trust (since 2009) | | Assistant Treasurer, New York Life Investment Management Holdings LLC (since 2008); Managing Director, New York Life Investment Management LLC (since 2007); Treasurer and Principal Financial Accounting Officer, Private Advisors Alternative Strategies Master Fund, Private Advisors Alternative Strategies Fund and MainStay DefinedTerm Municipal Opportunities Fund (since 2011); Treasurer and Principal Financial and Accounting Officer, MainStay VP Funds Trust and its predecessor, MainStay VP Series Fund, Inc. (since 2007) |
| | | | Jeffrey A. Engelsman 9/28/67 | | Vice President and Chief Compliance Officer, Eclipse Trust, Eclipse Funds, Inc., The MainStay Funds and MainStay Funds Trust (since 2009) | | Managing Director, Compliance (since 2009), Director and Associate General Counsel, New York Life Investment Management LLC (2005 to 2008); Assistant Secretary, NYLIFE Distributors LLC (2006 to 2008); Vice President and Chief Compliance Officer, Private Advisors Alternative Strategies Master Fund, Private Advisors Alternative Strategies Fund, DefinedTerm Municipal Opportunities Fund (since 2011); MainStay VP Funds Trust and its predecessor, MainStay VP Series Fund, Inc. (since 2009); Assistant Secretary, The MainStay Funds (2006 to 2008); Assistant Secretary, Eclipse Trust, Eclipse Funds, Inc. and MainStay VP Series Fund, Inc. (2005 to 2008) |
| | | | Stephen P. Fisher 2/22/59 | | President, Eclipse Trust, Eclipse Funds, Inc. and The MainStay Funds (since 2007), MainStay Funds Trust (since 2009) | | Director, Senior Vice President, New York Life Insurance and Annuity Corporation (since 2011); Manager, President and Chief Operating Officer, NYLIFE Distributors LLC (since 2008); Chairman of the Board, NYLIM Service Company LLC (since 2008); Senior Managing Director and Chief Marketing Officer, New York Life Investment Management LLC (since 2005); President, Private Advisors Alternative Strategies Master Fund, Private Advisors Alternative Strategies Fund and MainStay DefinedTerm Municipal Opportunities Fund (since 2011); MainStay VP Funds Trust and its predecessor, MainStay VP Series Fund, Inc. (since 2007) |
| | | | J. Kevin Gao 10/13/67 | | Secretary and Chief Legal Officer, Eclipse Trust, Eclipse Funds, Inc., The MainStay Funds and MainStay Funds Trust (since 2010) | | Managing Director and Associate General Counsel, New York Life Investment Management LLC (since 2010); Secretary and Chief Legal Officer, Private Advisors Alternative Strategies Master Fund, Private Advisors Alternative Strategies Fund and MainStay DefinedTerm Municipal Opportunities Fund (since 2011); MainStay VP Funds Trust and its predecessor, MainStay VP Series Fund, Inc. (since 2010); Director and Counsel of Credit Suisse, Chief Legal Officer and Secretary of Credit Suisse Asset Management, LLC and Credit Suisse Funds (2003 to 2010) |
| | | | Scott T. Harrington 2/8/59 | | Vice President—Administration, Eclipse Trust, Eclipse Funds, Inc. and The MainStay Funds (since 2005), MainStay Funds Trust (since 2009) | | Director, New York Life Investment Management LLC (including predecessor advisory organizations) (since 2000); Executive Vice President, New York Life Trust Company and New York Life Trust Company FSB (since 2006); Vice President—Administration, Private Advisors Alternative Strategies Master Fund, Private Advisors Alternative Strategies Fund and MainStay DefinedTerm Municipal Opportunities Fund (since 2011); MainStay VP Funds Trust and its predecessor, MainStay VP Series Fund, Inc. (since 2005) |
| | * | The Officers listed above are considered to be “interested persons” of the MainStay Group of Funds within the meaning of the 1940 Act because of their affiliation with New York Life Insurance Company, New York Life Investment Management LLC, Madison Square Investors LLC, MacKay Shields LLC, Private Advisors LLC, Institutional Capital LLC, Epoch Investment Partners, Inc., Markston International, LLC, Winslow Capital Management, Inc., NYLIFE Securities LLC and/or NYLIFE Distributors LLC, as described in detail above in the column captioned “Principal Occupation(s) During Past Five Years.” Officers are elected annually by the Board to serve a one-year term. |
| | |
| 42 | | MainStay Tax Free Bond Fund |
MainStay Funds
MainStay offers a wide range of Funds for virtually any investment need. The full array of MainStay open-end offerings is listed here, with information about the manager, subadvisors, legal counsel and independent registered public accounting firms.
Equity
U.S. Equity
MainStay Common Stock Fund
MainStay Epoch U.S. All Cap Fund
MainStay Epoch U.S. Equity Yield Fund
MainStay Growth Equity Fund
MainStay ICAP Equity Fund
MainStay ICAP Select Equity Fund
MainStay Large Cap Growth Fund1
MainStay MAP Fund
MainStay S&P 500 Index Fund
MainStay U.S. Small Cap Fund
MainStay 130/30 Core Fund
International/Global Equity
MainStay Epoch Global Choice Fund
MainStay Epoch Global Equity Yield Fund
MainStay Epoch International Small Cap Fund
MainStay ICAP Global Fund
MainStay ICAP International Fund
MainStay International Equity Fund
MainStay 130/30 International Fund
Income
Taxable Bond
MainStay Flexible Bond Opportunities Fund
MainStay Floating Rate Fund
MainStay Global High Income Fund
MainStay Government Fund
MainStay High Yield Corporate Bond Fund
MainStay High Yield Opportunities Fund
MainStay Indexed Bond Fund
MainStay Intermediate Term Bond Fund
MainStay Short Term Bond Fund
MainStay Money Market Fund
Municipal Bond
MainStay High Yield Municipal Bond Fund
MainStay New York Tax Free Opportunities Fund2
MainStay Tax Free Bond Fund
Mixed Asset
MainStay Balanced Fund
MainStay Convertible Fund
MainStay Income Builder Fund
MainStay Marketfield Fund
Asset Allocation/Target Date
MainStay Conservative Allocation Fund
MainStay Growth Allocation Fund
MainStay Moderate Allocation Fund
MainStay Moderate Growth Allocation Fund
MainStay Retirement 2010 Fund
MainStay Retirement 2020 Fund
MainStay Retirement 2030 Fund
MainStay Retirement 2040 Fund
MainStay Retirement 2050 Fund
Manager
New York Life Investment Management LLC
New York, New York
Subadvisors
Epoch Investment Partners, Inc.
New York, New York
Institutional Capital LLC3
Chicago, Illinois
MacKay Shields LLC3
New York, New York
Madison Square Investors LLC3
New York, New York
Marketfield Asset Management LLC
New York, New York
Markston International LLC
White Plains, New York
Winslow Capital Management, Inc.
Minneapolis, Minnesota
Legal Counsel
Dechert LLP
Independent Registered Public Accounting Firms
KPMG LLP
PricewaterhouseCoopers LLP
1. Effective January 13, 2012, the Fund was closed to new investors with certain exceptions.
2. The Fund is only registered for sale in CT, DE, FL, MA, NJ, NY, and VT.
3. An affiliate of New York Life Investment Management LLC.
Not part of the Annual Report
mainstayinvestments.com
The MainStay Funds are managed by New York Life Investment Management LLC and distributed through NYLIFE Distributors LLC,
169 Lackawanna Avenue, Parsippany, NJ 07054, a wholly owned subsidiary of New York Life Insurance Company.
NYLIFE Distributors is a Member FINRA/SIPC.
MainStay Investments is a service mark and name under which New York Life Investment Management LLC does business.
MainStay Investments, an indirect subsidiary of New York Life Insurance Company, New York, NY 10010, provides investment advisory products and services.
This report may be distributed only when preceded or accompanied by a current Fund prospectus.
© 2013 by NYLIFE Distributors LLC. All rights reserved.
| | | | | | | | |
| Not FDIC/NCUA Insured | | Not a Deposit | | May Lose Value | | No Bank Guarantee | | Not Insured by Any Government Agency |
| | | | |
| NYLIM-28194 MS265-12 | |
| MST11-12/12
NL013 |
|

MainStay Convertible Fund
Message from the President and Annual Report
October 31, 2012
This page intentionally left blank
Message from the President
Most major equity markets delivered positive results for the 12 months ended October 31, 2012. In the United States, stocks provided solid double-digit returns. With a few notable exceptions, international stock markets generally ended the reporting period in positive territory.
The stock market’s advance, however, was far from uniform. After rising to an early peak at the end of March 2012, domes-
tic and international stocks lost ground until the beginning of June. After that, stocks generally rose, reaching their high point for the reporting period in mid-September. Although stocks remained relatively buoyant through mid-October, they drifted lower as the reporting period came to a close.
A variety of forces converged to help fuel these market movements. Investors kept a close eye on developments in the European sovereign debt crisis. The European Central Bank’s Long Term Refinancing Operations helped stabilize European credit markets and provide needed liquidity. Although private holders of Greek sovereign debt had to accept a reduction in their recovery value, the anticipated voluntary exchange provided a positive spark to the markets. Rising unemployment and new austerity measures may impede economic growth as the European Union seeks to strike a delicate balance between fiscal and monetary policies.
In the United States, the Federal Reserve announced an open-ended agency mortgage-backed security purchase program, which helped calm market concerns. The Federal Reserve also continued its maturity extension program (referred to by some as “operation twist”), which seeks to put downward pressure on longer-term interest rates. At the short end of the yield curve, the Federal Reserve maintained the federal funds rate in a near-zero range. In September 2012, the Federal Open Market Committee anticipated that “exceptionally low levels for the federal funds rate” were “likely to be warranted at least through mid-2015.”
With markets stabilizing and short-term interest rates at very low levels, yield-hungry investors had incentives to lengthen maturities and accept higher risk. Domestic high-yield bonds provided double-digit returns for the reporting period, municipal bonds and convertible securities provided high single-digit returns, and domestic corporate bonds provided positive overall returns.
While most investors are pleased when markets rise, MainStay portfolio managers know that long-term results depend on more than short-term market movements. They also depend on the consistent application of well-defined investment strategies and risk-management techniques over longer periods. Our long-term perspective gives our portfolio managers the ability to look past the daily ups and downs of the market as they pursue the specific investment objectives of their individual Funds.
At MainStay, we believe that a long-term perspective can help investors as well. Instead of trying to capitalize on short-term market movements, you may prefer to focus on the long-term potential that can come from getting invested, staying invested and adding to your investments over time. Of course, past performance is no guarantee of future results.
The following pages contain more specific information on the securities, market events and investment decisions that affected your MainStay Fund(s) during the 12 months ended October 31, 2012. We invite you to read the information carefully and use it as part of your ongoing portfolio evaluation and investment review.
Sincerely,

Stephen P. Fisher
President
The opinions expressed are as of the date of this report and are subject to change. There is no guarantee that any forecast made will come to pass. This material does not constitute investment advice and is not intended as an endorsement of any specific investment.
Not part of the Annual Report
Table of Contents
Investors should refer to the Fund’s Summary Prospectus and/or Prospectus and consider the Fund’s investment objectives, strategies, risks, charges and expenses carefully before investing. The Summary Prospectus and/or Prospectus contain this and other information about the Fund. You may obtain copies of the Fund’s Summary Prospectus, Prospectus and Statement of Additional Information free of charge, upon request, by calling toll-free 800-MAINSTAY (624-6782), by writing to NYLIFE Distributors LLC, Attn: MainStay Marketing Department, 169 Lackawanna Avenue, Parsippany, New Jersey 07054 or by sending an e-mail to MainStayShareholderServices@nylim.com. These documents are also available via the MainStay Funds’ website at mainstayinvestments.com/documents. Please read the Summary Prospectus and/or Prospectus carefully before investing.
Investment and Performance Comparison1 (Unaudited)
Performance data quoted represents past performance. Past performance is no guarantee of future results. Because of market volatility, current performance may be lower or higher than the figures shown. Investment return and principal value will fluctuate, and as a result, when shares are redeemed, they may be worth more or less than their original cost. The graph below depicts the historical performance of Class B shares of the Fund. Performance will vary from class to class based on differences in class-specific expenses and sales charges. For performance information current to the most recent month-end, please call 800-MAINSTAY (624-6782) or visit mainstayinvestments.com.
(With sales charges)
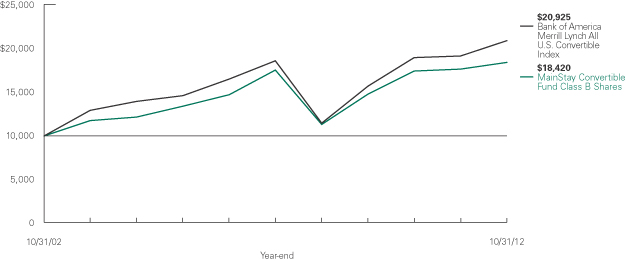
Average Annual Total Returns for the Year Ended October 31, 2012
| | | | | | | | | | | | | | | | | | | | |
| Class | | Sales Charge | | | | One Year | | | Five Years | | | Ten Years | | | Gross
Expense
Ratio2 | |
| Investor Class Shares3 | | Maximum 5.5% Initial Sales Charge | | With sales charges Excluding sales charges | |
| –0.71
5.07 | %
| |
| 0.57
1.72 | %
| |
| 6.48
7.09 | %
| |
| 1.19
1.19 | %
|
| Class A Shares | | Maximum 5.5% Initial Sales Charge | | With sales charges Excluding sales charges | |
| –0.49
5.30 |
| |
| 0.77
1.91 |
| |
| 6.59
7.19 |
| |
| 0.99
0.99 |
|
| Class B Shares | | Maximum 5% CDSC if Redeemed Within the First Six Years of Purchase | | With sales charges Excluding sales charges | |
| –0.58
4.31 |
| |
| 0.64
0.97 |
| |
| 6.30
6.30 |
| |
| 1.94
1.94 |
|
| Class C Shares | | Maximum 1% CDSC
if Redeemed Within One Year of Purchase | | With sales charges Excluding sales charges | |
| 3.27
4.24 |
| |
| 0.96
0.96 |
| |
| 6.29
6.29 |
| |
| 1.94
1.94 |
|
| Class I Shares4 | | No Sales Charge | | | | | 5.56 | | | | 2.14 | | | | 7.45 | | | | 0.74 | |
| 1. | The performance table and graph do not reflect the deduction of taxes that a shareholder would pay on distributions or Fund-share redemptions. Total returns reflect maximum applicable sales charges as indicated in the table above, changes in share price, and reinvestment of dividend and capital gain distributions. The graph assumes the initial investment amount shown above and reflects the deduction of all sales charges that would have applied for the period of investment. Performance figures reflect certain fee waivers and/or expense limitations, without which total returns may have been lower. For more information on share classes and current fee waivers and/or expense limitations, please refer to the notes to the financial statements. |
| 2. | The gross expense ratios presented reflect the Fund’s “Total Annual Fund Operating Expenses” from the most recent Prospectus and may differ from other expense ratios disclosed in this report. |
| 3. | Performance figures for Investor Class shares, first offered on February 28, 2008, include the historical performance of Class A shares through February 27, 2008, adjusted for differences in certain fees and expenses. Unadjusted, the performance shown for Investor Class shares might have been different. |
| 4. | Performance figures for Class I shares, first offered on November 28, 2008, include the historical performance of Class B shares through November 27, 2008, adjusted for differences in certain fees and expenses. Unadjusted, the performance shown for Class I shares might have been different. |
The footnotes on the next page are an integral part of the table and graph and should be carefully read in conjunction with them.
| | | | |
| mainstayinvestments.com | | | 5 | |
| | | | | | | | | | | | |
| Benchmark Performance | | One
Year | | | Five
Years | | | Ten
Years | |
Bank of America Merrill Lynch All U.S. Convertible Index5 | | | 9.15 | % | | | 2.37 | % | | | 7.66 | % |
Average Lipper Convertible Securities Fund6 | | | 6.14 | | | | 1.04 | | | | 7.05 | |
| 5. | The Bank of America Merrill Lynch All U.S. Convertible Index is a market-capitalization weighted index of domestic corporate convertible securities. In order to be included in this Index, bonds and preferred stocks must be convertible only to common stock and have a market value or original par value of at least $50 million. The Bank of America Merrill Lynch All U.S. Convertible Index is the Fund’s broad-based securities market index for comparison purposes. Total returns assume reinvestment of all income and capital gains. An investment cannot be made directly in an index. |
| 6. | The average Lipper convertible securities fund is representative of funds that invest primarily in convertible bonds and/or convertible preferred stock. This benchmark is a product of Lipper Inc. Lipper Inc. is an independent monitor of fund performance. Results are based on average total returns of similar funds with all dividend and capital gain distributions reinvested. |
The footnotes on the preceding page are an integral part of the table and graph and should be carefully read in conjunction with them.
| | |
| 6 | | MainStay Convertible Fund |
Cost in Dollars of a $1,000 Investment in MainStay Convertible Fund (Unaudited)
The example below is intended to describe the fees and expenses borne by shareholders during the six-month period from May 1, 2012, to October 31, 2012, and the impact of those costs on your investment.
Example
As a shareholder of the Fund, you incur two types of costs: (1) transaction costs, including exchange fees and sales charges (loads) on purchases (as applicable), and (2) ongoing costs, including management fees, distribution and/or service (12b-1) fees, and other Fund expenses (as applicable). This example is intended to help you understand your ongoing costs (in dollars) of investing in the Fund and to compare these costs with the ongoing costs of investing in other mutual funds. The example is based on an investment of $1,000 made at the beginning of the six-month period and held for the entire period from May 1, 2012, to October 31, 2012.
This example illustrates your Fund’s ongoing costs in two ways:
Actual Expenses
The second and third data columns in the table below provide information about actual account values and actual expenses. You may use the information in these columns, together with the amount you invested, to estimate the expenses that you paid during the six months ended October 31, 2012. Simply divide your account value by $1,000 (for example, an $8,600 account value divided by $1,000 = 8.6), then
multiply the result by the number under the heading entitled “Expenses Paid During Period” to estimate the expenses you paid on your account during this period.
Hypothetical Example for Comparison Purposes
The fourth and fifth data columns in the table below provide information about hypothetical account values and hypothetical expenses based on the Fund’s actual expense ratio and an assumed rate of return of 5% per year before expenses, which is not the Fund’s actual return. The hypothetical account values and expenses may not be used to estimate the actual ending account balances or expenses you paid for the six-month period shown. You may use this information to compare the ongoing costs of investing in the Fund with the ongoing costs of investing in other Funds. To do so, compare this 5% hypothetical example with the 5% hypothetical examples that appear in the shareholder reports of the other Funds.
Please note that the expenses shown in the table are meant to highlight your ongoing costs only and do not reflect any transactional costs, such as exchange fees or sales charges (loads). Therefore, the fourth and fifth data columns of the table are useful in comparing ongoing costs only and will not help you determine the relative total costs of owning different funds. In addition, if these transactional costs were included, your costs would have been higher.
| | | | | | | | | | | | | | | | | | | | |
| | | | | | | | | | | | | | | | |
| Share Class | | Beginning
Account
Value
5/1/12 | | | Ending Account
Value (Based
on Actual
Returns and
Expenses)
10/31/12 | | | Expenses
Paid
During
Period1 | | | Ending Account
Value (Based
on Hypothetical
5% Annualized
Return and
Actual Expenses)
10/31/12 | | | Expenses
Paid
During
Period1 | |
| | | | | |
| Investor Class Shares | | $ | 1,000.00 | | | $ | 989.80 | | | $ | 6.10 | | | $ | 1,019.00 | | | $ | 6.19 | |
| | | | | |
| Class A Shares | | $ | 1,000.00 | | | $ | 990.30 | | | $ | 4.90 | | | $ | 1,020.20 | | | $ | 4.98 | |
| | | | | |
| Class B Shares | | $ | 1,000.00 | | | $ | 986.00 | | | $ | 9.83 | | | $ | 1,015.20 | | | $ | 9.98 | |
| | | | | |
| Class C Shares | | $ | 1,000.00 | | | $ | 985.30 | | | $ | 9.83 | | | $ | 1,015.20 | | | $ | 9.98 | |
| | | | | |
| Class I Shares | | $ | 1,000.00 | | | $ | 992.30 | | | $ | 3.66 | | | $ | 1,021.50 | | | $ | 3.71 | |
| 1. | Expenses are equal to the Fund’s annualized expense ratio of each class (1.22% for Investor Class, 0.98% for Class A, 1.97% for Class B and Class C and 0.73% for Class I) multiplied by the average account value over the period, divided by 366 and multiplied by 184 (to reflect the six-month period). The table above represents the actual expenses incurred during the six-month period. |
| | | | |
| mainstayinvestments.com | | | 7 | |
Portfolio Composition as of October 31, 2012 (Unaudited)
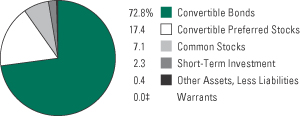
See Portfolio of Investments beginning on page 11 for specific holdings within these categories.
| ‡ | Less than one-tenth of a percent. |
Top Ten Holdings or Issuers Held as of October 31, 2012 (excluding short-term investment)
| 1. | JPMorgan Chase & Co. (Convertible into Schlumberger, Ltd.), 1.50%, due 6/25/15 |
| 3. | Gilead Sciences, Inc., 1.00%, due 5/1/14 |
| 4. | Salix Pharmaceuticals, Ltd., 1.50%–2.75%, due 5/15/15–3/15/19 |
| 5. | Teva Pharmaceutical Finance Co. LLC, 0.25%, due 2/1/26 |
| 7. | Allegheny Technologies, Inc., 4.25%, due 6/1/14 |
| 8. | Peabody Energy Corp., 4.75%, due 12/15/41 |
| 9. | Corsicanto, Ltd., 3.50%, due 1/15/32 |
| 10. | Covanta Holding Corp., 3.25%, due 6/1/14 |
| | |
| 8 | | MainStay Convertible Fund |
Portfolio Management Discussion and Analysis (Unaudited)
Questions answered by portfolio manager Edward Silverstein, CFA, of MacKay Shields LLC, the Fund’s Subadvisor.
How did MainStay Convertible Fund perform relative to its peers and its benchmark during the 12 months ended October 31, 2012?
Excluding all sales charges, MainStay Convertible Fund returned 5.07% for Investor Class shares, 5.30% for Class A shares, 4.31% for Class B shares and 4.24% for Class C shares for the 12 months ended October 31, 2012. Over the same period, Class I shares returned 5.56%. All share classes underperformed the 6.14% return of the average Lipper1 convertible securities fund and the 9.15% return of the Bank of America Merrill Lynch All U.S. Convertible Index2 for the 12 months ended October 31, 2012. The Bank of America Merrill Lynch All U.S. Convertible Index is the Fund’s broad-based securities-market index. See page 5 for Fund returns with applicable sales charges.
What factors affected the Fund’s relative performance during the reporting period?
The Fund’s underperformance of the Bank of America Merrill Lynch All U.S. Convertible Index was driven primarily by sector allocation. The Fund’s underweight position in the financials sector and overweight positions in the energy and materials sectors hurt relative performance. Partially offsetting this weakness was the positive contribution of the Fund’s overweight position in the biotechnology sector.
Speculative-grade convertible bonds rose 9.78% during the reporting period, while investment-grade convertible bonds rose 8.24%. Because the performance differential between these two market segments was not wide, credit quality did not have a meaningful impact on the Fund’s relative performance during the reporting period.
During the reporting period, which market segments were the strongest positive performers and which market segments were the weakest?
During the reporting period, biotechnology was the Fund’s strongest positive performing sector, largely on the strength of Gilead Sciences and Incyte. The second-strongest sector was pharmaceuticals. The Fund’s positions in the convertible bonds and common stock of Valeant Pharmaceuticals International and in the common stock of Merck performed particularly well. Financials was the Fund’s third-strongest sector. The convertible preferred shares of Citigroup performed especially well, as investors broadly bid up the convertible preferred shares of financial companies that provided high current dividend yields.
During the reporting period, energy was the Fund’s worst-performing sector. Holdings of exploration and production com-panies such as SM Energy, Chesapeake Energy and Apache
detracted from the Fund’s performance. The Fund’s second worst-performing market segment was materials, where specialty metals manufacturer Allegheny Technologies was particularly weak. The company’s convertible bonds declined after the company reported that it would not meet earnings expectations because of declin- ing demand for the company’s titanium and alloy products. The information technology sector, specifically the hardware & storage industry, was the Fund’s third-worst-performing market segment. The Fund’s positions in the convertible bonds of Verifone and the common stock of Hewlett-Packard detracted from the Fund’s performance. The convertible bonds of Verifone Systems declined after the company reported that it was having integration problems following the purchase of a large rival, Hypercom. The common stock of Hewlett-Packard declined as the company continued to see a migration away from traditional personal computers toward tablets and smart-phones.
During the reporting period, which individual Fund holdings were the strongest absolute performers and which Fund holdings were particularly weak?
A convertible bond position in Gilead Sciences was the Fund’s best-performing holding on an absolute basis. The company’s convertible bonds rose sharply after Gilead Sciences reported several quarters of earnings that exceeded investor expectations and released trial results that showed efficacy and safety for its novel treatment for hepatitis C. A convertible bond and common stock position in Valeant Pharmaceuticals International was the Fund’s second-strongest performer, as the company continued to consummate acquisitions that were accretive to earnings.
The Fund’s worst-performing holding was a convertible bond position in medical device company China Medical Technologies. The company’s prior years’ financial statements appeared healthy, as they showed the company with solid earnings, positive cash flow, limited debt and a significant amount of cash on its balance sheet. Those financial disclosures, however, later appeared to have been fraudulent, as the company stopped making interest payments on its debt obligations. At the end of the reporting period, the company was being liquidated by creditors. The Fund’s second-weakest performer was a position in the convertible bonds of SM Energy. The company’s profitability was hurt when the price of natural gas in the United States declined sharply because of soft demand during a record warm winter. Bonds issued by JPMorgan Chase convertible into oilfield services company Schlumberger also suffered because of record winter warmth. With high levels of natural gas supply, Schlumberger lagged the overall market when the company’s North American operations saw reduced demand for well-stimulation services.
| 1. | See footnote on page 6 for more information about Lipper Inc. |
| 2. | See footnote on page 6 for more information on the Bank of America Merrill Lynch All U.S. Convertible Index. |
| | | | |
| mainstayinvestments.com | | | 9 | |
Did the Fund make any significant purchases and sales during the reporting period?
We initiated a Fund position in the convertible preferred shares of aerospace & defense company United Technologies after the company issued these securities. The convertible preferred shares pay shareholders a 7.5% dividend yield and offer participation in the performance of the company’s common stock, which we believe will have the potential for appreciation in the next 12 to 18 months. During the reporting period, the Fund purchased convertible bonds of consumer products company Jarden after the securities were sold to investors. The convertible bonds offered an interest rate that we felt was attractive, and we believed that there was meaningful upside potential in the company’s common shares.
During the reporting period, the Fund tendered its convertible bond positions in SM Energy and in Verifone Systems as the securities reached their respective maturities.
Were there any changes in the Fund’s sector weightings during the reporting period?
During the reporting period, there were no meaningful sector-weighting changes in the Fund relative to the Bank of America Merrill Lynch All U.S. Convertible Index.
How was the Fund positioned at the end of the reporting period?
As of October 31, 2012, the Fund was overweight relative to the Bank of America Merrill Lynch All U.S. Convertible Index in the health care, energy and materials sectors. On the same date, the Fund was underweight relative to the Index in financials and information technology and generally held neutral weightings in the various other sectors of the Bank of America Merrill Lynch All U.S. Convertible Index.
The opinions expressed are those of the portfolio manager as of the date of this report and are subject to change. There is no guarantee that any forecast made will come to pass. This material does not constitute investment advice and is not intended as an endorsement of any specific investment.
| | |
| 10 | | MainStay Convertible Fund |
Portfolio of Investments October 31, 2012
| | | | | | | | |
| | | Principal
Amount | | | Value | |
| | | | | | | | |
Convertible Securities 90.2%† Convertible Bonds 72.8% | | | | | | | | |
Aerospace & Defense 1.2% | | | | | | | | |
GenCorp, Inc.
4.063%, due 12/31/39 | | $ | 3,193,000 | | | $ | 3,837,587 | |
Kaman Corp.
3.25%, due 11/15/17 (a) | | | 3,217,000 | | | | 4,095,643 | |
| | | | | | | | |
| | | | | | | 7,933,230 | |
| | | | | | | | |
Airlines 0.7% | | | | | | | | |
Continental Airlines, Inc.
4.50%, due 1/15/15 | | | 3,833,000 | | | | 4,990,087 | |
| | | | | | | | |
| | |
Apparel 0.7% | | | | | | | | |
Iconix Brand Group, Inc.
2.50%, due 6/1/16 (a) | | | 4,637,000 | | | | 4,639,898 | |
| | | | | | | | |
| | |
Auto Manufacturers 1.1% | | | | | | | | |
Wabash National Corp.
3.375%, due 5/1/18 | | | 7,770,000 | | | | 7,400,925 | |
| | | | | | | | |
| | |
Biotechnology 8.8% | | | | | | | | |
Amgen, Inc.
0.375%, due 2/1/13 | | | 9,874,000 | | | | 11,194,647 | |
¨Corsicanto, Ltd.
3.50%, due 1/15/32 (a) | | | 7,440,000 | | | | 12,117,900 | |
Exelixis, Inc.
4.25%, due 8/15/19 | | | 3,867,000 | | | | 4,084,519 | |
¨Gilead Sciences, Inc.
1.00%, due 5/1/14 | | | 9,869,000 | | | | 15,019,384 | |
Incyte Corp., Ltd.
4.75%, due 10/1/15 | | | 3,825,000 | | | | 7,398,984 | |
InterMune, Inc.
2.50%, due 9/15/18 | | | 6,719,000 | | | | 5,085,443 | |
Medicines Co. (The)
1.375%, due 6/1/17 (a) | | | 4,252,000 | | | | 4,430,053 | |
Sequenom, Inc.
5.00%, due 10/1/17 (a) | | | 1,082,000 | | | | 1,053,598 | |
| | | | | | | | |
| | | | | | | 60,384,528 | |
| | | | | | | | |
Coal 1.8% | | | | | | | | |
¨Peabody Energy Corp.
4.75%, due 12/15/41 | | | 13,794,000 | | | | 12,569,782 | |
| | | | | | | | |
| | |
Commercial Services 1.3% | | | | | | | | |
Hertz Global Holdings, Inc.
5.25%, due 6/1/14 | | | 2,348,000 | | | | 4,057,637 | |
Sotheby’s
3.125%, due 6/15/13 | | | 4,656,000 | | | | 5,072,130 | |
| | | | | | | | |
| | | | | | | 9,129,767 | |
| | | | | | | | |
| | | | | | | | |
| | | Principal
Amount | | | Value | |
| | | | | | | | |
Computers 3.5% | | | | | | | | |
EMC Corp.
1.75%, due 12/1/13 | | $ | 6,730,000 | | | $ | 10,448,359 | |
Mentor Graphics Corp.
4.00%, due 4/1/31 | | | 2,249,000 | | | | 2,556,832 | |
Quantum Corp.
3.50%, due 11/15/15 | | | 566,000 | | | | 513,291 | |
SanDisk Corp.
1.50%, due 8/15/17 | | | 9,356,000 | | | | 10,437,787 | |
| | | | | | | | |
| | | | | | | 23,956,269 | |
| | | | | | | | |
Distribution & Wholesale 0.7% | | | | | | | | |
WESCO International, Inc.
6.00%, due 9/15/29 | | | 2,084,000 | | | | 4,975,550 | |
| | | | | | | | |
| | |
Diversified Financial Services 1.3% | | | | | | | | |
Air Lease Corp.
3.875%, due 12/1/18 (a) | | | 8,569,000 | | | | 9,013,517 | |
| | | | | | | | |
| | |
Electronics 1.1% | | | | | | | | |
TTM Technologies, Inc.
3.25%, due 5/15/15 | | | 7,605,000 | | | | 7,695,309 | |
| | | | | | | | |
| | |
Entertainment 1.0% | | | | | | | | |
International Game Technology
3.25%, due 5/1/14 | | | 6,505,000 | | | | 6,789,594 | |
| | | | | | | | |
| | |
Environmental Controls 1.7% | | | | | | | | |
¨ Covanta Holding Corp.
3.25%, due 6/1/14 | | | 9,561,000 | | | | 11,628,566 | |
| | | | | | | | |
| | |
Health Care—Products 4.7% | | | | | | | | |
China Medical Technologies, Inc.
4.00%, due 8/15/13 (b)(c) | | | 12,643,000 | | | | 1,580,375 | |
Hologic, Inc.
2.00%, due 3/1/42 (d) | | | 7,990,000 | | | | 7,905,106 | |
Insulet Corp.
3.75%, due 6/15/16 | | | 6,497,000 | | | | 7,183,246 | |
Teleflex, Inc.
3.875%, due 8/1/17 | | | 8,069,000 | | | | 9,970,258 | |
Wright Medical Group, Inc.
2.00%, due 8/15/17 (a) | | | 5,289,000 | | | | 5,556,756 | |
| | | | | | | | |
| | | | | | | 32,195,741 | |
| | | | | | | | |
Health Care—Services 1.1% | | | | | | | | |
WellPoint, Inc.
2.75%, due 10/15/42 (a) | | | 7,160,000 | | | | 7,500,100 | |
| | | | | | | | |
| † | Percentages indicated are based on Fund net assets. |
| ¨ | | Among the Fund’s 10 largest holdings or issuers held, as of October 31, 2012, excluding short-term investment. May be subject to change daily. |
| | | | | | |
The notes to the financial statements are an integral part of,
and should be read in conjunction with, the financial statements. | | mainstayinvestments.com | | | 11 | |
Portfolio of Investments October 31, 2012 (continued)
| | | | | | | | |
| | | Principal
Amount | | | Value | |
| | | | | | | | |
| Convertible Bonds (continued) | | | | | | | | |
Home Builders 1.4% | |
Lennar Corp.
3.25%, due 11/15/21 (a) | | $ | 5,653,000 | | | $ | 9,910,416 | |
| | | | | | | | |
|
Household Products & Wares 1.5% | |
Jarden Corp.
1.875%, due 9/15/18 (a) | | | 10,228,000 | | | | 10,279,140 | |
| | | | | | | | |
|
Insurance 1.0% | |
American Equity Investment
Life Holding Co. 3.50%, due 9/15/15 (a) | | | 6,174,000 | | | | 6,949,609 | |
| | | | | | | | |
|
Internet 1.0% | |
At Home Corp.
4.75%, due 12/31/49 (b)(c)(e)(f) | | | 9,147,056 | | | | 915 | |
DealerTrack Holdings, Inc.
1.50%, due 3/15/17 (a) | | | 977,000 | | | | 1,020,354 | |
VeriSign, Inc.
3.25%, due 8/15/37 | | | 4,967,000 | | | | 6,174,602 | |
| | | | | | | | |
| | | | | | | 7,195,871 | |
| | | | | | | | |
Investment Company 1.0% | |
Ares Capital Corp.
4.875%, due 3/15/17 (a) | | | 6,564,000 | | | | 6,728,100 | |
| | | | | | | | |
|
Iron & Steel 2.0% | |
¨Allegheny Technologies, Inc.
4.25%, due 6/1/14 | | | 12,231,000 | | | | 13,446,456 | |
| | | | | | | | |
|
Lodging 0.8% | |
MGM Resorts International
4.25%, due 4/15/15 | | | 5,309,000 | | | | 5,454,997 | |
| | | | | | | | |
|
Machinery—Diversified 1.1% | |
Chart Industries, Inc.
2.00%, due 8/1/18 | | | 6,092,000 | | | | 7,790,145 | |
| | | | | | | | |
|
Media 0.6% | |
Central European Media Enterprises, Ltd. 5.00%, due 11/15/15 | | | 4,439,000 | | | | 4,039,490 | |
| | | | | | | | |
|
Miscellaneous—Manufacturing 1.0% | |
Danaher Corp.
(zero coupon), due 1/22/21 | | | 4,548,000 | | | | 6,861,795 | |
| | | | | | | | |
|
Oil & Gas 0.1% | |
BPZ Resources, Inc.
6.50%, due 3/1/15 | | | 652,000 | | | | 533,825 | |
| | | | | | | | |
| | | | | | | | |
| | | Principal
Amount | | | Value | |
| | | | | | | | |
Oil & Gas Services 6.6% | |
Helix Energy Solutions Group, Inc.
3.25%, due 3/15/32 | | $ | 7,642,000 | | | $ | 8,463,515 | |
Hornbeck Offshore Services, Inc.
1.50%, due 9/1/19 (a) | | | 3,683,000 | | | | 3,710,623 | |
¨JPMorgan Chase & Co.
(Convertible into Schlumberger, Ltd.)
1.50%, due 6/25/15 (a) | | | 20,170,427 | | | | 25,745,533 | |
Subsea 7 S.A.
3.50%, due 10/13/14 | | | 5,100,000 | | | | 7,372,560 | |
| | | | | | | | |
| | | | | | | 45,292,231 | |
| | | | | | | | |
Pharmaceuticals 10.4% | |
Akorn, Inc.
3.50%, due 6/1/16 | | | 5,091,000 | | | | 7,852,868 | |
BioMarin Pharmaceutical, Inc.
1.875%, due 4/23/17 | | | 5,180,000 | | | | 10,010,350 | |
Medivation, Inc.
2.625%, due 4/1/17 | | | 7,433,000 | | | | 9,449,201 | |
Mylan, Inc.
3.75%, due 9/15/15 | | | 4,317,000 | | | | 8,555,754 | |
Omnicare, Inc.
3.75%, due 12/15/25 | | | 4,336,000 | | | | 6,173,380 | |
¨ Salix Pharmaceuticals, Ltd. | | | | | | | | |
1.50%, due 3/15/19 (a) | | | 5,121,000 | | | | 4,896,956 | |
2.75%, due 5/15/15 | | | 8,871,000 | | | | 10,107,396 | |
¨Teva Pharmaceutical Finance Co. LLC 0.25%, due 2/1/26 | | | 13,686,000 | | | | 14,584,144 | |
| | | | | | | | |
| | | | | | | 71,630,049 | |
| | | | | | | | |
Real Estate Investment
Trusts 2.7% | |
Host Hotels & Resorts, L.P.
2.50%, due 10/15/29 (a) | | | 6,278,000 | | | | 7,835,729 | |
SL Green Operating Partnership, L.P. 3.00%, due 10/15/17 (a) | | | 9,324,000 | | | | 10,367,122 | |
| | | | | | | | |
| | | | | | | 18,202,851 | |
| | | | | | | | |
Retail 0.8% | |
Coinstar, Inc.
4.00%, due 9/1/14 | | | 4,064,000 | | | | 5,400,040 | |
| | | | | | | | |
|
Semiconductors 4.9% | |
Microchip Technology, Inc.
2.125%, due 12/15/37 | | | 5,604,000 | | | | 6,805,358 | |
Micron Technology, Inc.
3.125%, due 5/1/32 (a) | | | 7,540,000 | | | | 6,738,875 | |
Novellus Systems, Inc.
2.625%, due 5/15/41 | | | 1,501,000 | | | | 1,832,158 | |
ON Semiconductor Corp.
Series B
2.625%, due 12/15/26 | | | 5,869,000 | | | | 6,056,074 | |
Rovi Corp.
2.625%, due 2/15/40 | | | 6,358,000 | | | | 6,330,184 | |
| | | | |
| 12 | | MainStay Convertible Fund | | The notes to the financial statements are an integral part of,
and should be read in conjunction with, the financial statements. |
| | | | | | | | |
| | | Principal
Amount | | | Value | |
| | | | | | | | |
| Convertible Bonds (continued) | | | | | | | | |
Semiconductors (continued) | |
Xilinx, Inc.
2.625%, due 6/15/17 | | $ | 4,666,000 | | | $ | 6,065,800 | |
| | | | | | | | |
| | | | | | | 33,828,449 | |
| | | | | | | | |
Software 1.0% | |
Nuance Communications, Inc.
2.75%, due 11/1/31 | | | 6,365,000 | | | | 6,965,697 | |
| | | | | | | | |
|
Telecommunications 3.6% | |
Anixter International, Inc.
1.00%, due 2/15/13 | | | 6,220,000 | | | | 6,709,825 | |
Ciena Corp.
4.00%, due 3/15/15 (a) | | | 7,321,000 | | | | 7,732,806 | |
SBA Communications Corp.
1.875%, due 5/1/13 | | | 1,163,000 | | | | 1,877,518 | |
4.00%, due 10/1/14 | | | 3,600,000 | | | | 8,070,750 | |
| | | | | | | | |
| | | | | | | 24,390,899 | |
| | | | | | | | |
Transportation 0.6% | | | | | | | | |
XPO Logistics, Inc.
4.50%, due 10/1/17 | | | 3,704,000 | | | | 3,986,430 | |
| | | | | | | | |
Total Convertible Bonds
(Cost $479,222,499) | | | | | | | 499,689,353 | |
| | | | | | | | |
| | |
| | | | | | | | |
| | |
| | | Shares | | | | |
| Convertible Preferred Stocks 17.4% | | | | | |
Aerospace & Defense 1.6% | | | | | | | | |
United Technologies Corp.
7.50% | | | 194,200 | | | | 10,560,596 | |
| | | | | | | | |
| | |
Auto Manufacturers 1.2% | | | | | | | | |
General Motors Co.
4.75% | | | 198,000 | | | | 8,042,760 | |
| | | | | | | | |
| | |
Auto Parts & Equipment 0.6% | | | | | | | | |
Goodyear Tire & Rubber Co. (The)
5.88% | | | 103,400 | | | | 4,347,970 | |
| | | | | | | | |
| | |
Banks 2.1% | | | | | | | | |
¨Citigroup, Inc.
7.50% | | | 137,200 | | | | 14,021,840 | |
| | | | | | | | |
| | |
Electric 0.7% | | | | | | | | |
PPL Corp.
8.75% | | | 92,100 | | | | 5,003,793 | |
| | | | | | | | |
| |
Hand & Machine Tools 1.4% | | | | | |
Stanley Black & Decker, Inc.
4.75% | | | 78,100 | | | | 9,455,567 | |
| | | | | | | | |
| | | | | | | | |
| | |
| | | Shares | | | Value | |
| | | | | | | | |
Insurance 1.6% | | | | | | | | |
Hartford Financial Services
Group, Inc.
7.25% | | | 120,967 | | | $ | 2,473,775 | |
MetLife, Inc.
5.00% | | | 188,300 | | | | 8,754,067 | |
| | | | | | | | |
| | | | | | | 11,227,842 | |
| | | | | | | | |
Media 1.4% | | | | | | | | |
Nielsen Holdings N.V.
6.25% | | | 178,700 | | | | 9,767,063 | |
| | | | | | | | |
| | |
Oil & Gas 5.5% | | | | | | | | |
¨Apache Corp.
6.00% | | | 472,600 | | | | 22,051,516 | |
Energy XXI Bermuda, Ltd.
5.63% | | | 28,500 | | | | 10,179,844 | |
Sanchez Energy Corp. (a)(g)
4.88% | | | 71,500 | | | | 3,523,992 | |
SandRidge Energy, Inc.
7.00% | | | 22,400 | | | | 2,220,212 | |
| | | | | | | | |
| | | | | | | 37,975,564 | |
| | | | | | | | |
Pharmaceuticals 0.9% | | | | | | | | |
Omnicare Capital Trust II
4.00% | | | 133,550 | | | | 6,260,824 | |
| | | | | | | | |
| | |
Real Estate Investment Trusts 0.4% | | | | | | | | |
Health Care REIT, Inc.
6.50% | | | 47,800 | | | | 2,691,140 | |
| | | | | | | | |
Total Convertible Preferred Stocks
(Cost $124,552,737) | | | | | | | 119,354,959 | |
| | | | | | | | |
Total Convertible Securities
(Cost $603,775,236) | | | | | | | 619,044,312 | |
| | | | | | | | |
| | |
| | | | | | | | |
| Common Stocks 7.1% | | | | | | | | |
Auto Manufacturers 0.0%‡ | | | | | | | | |
General Motors Co. (g) | | | 2,621 | | | | 66,835 | |
General Motors Corp. (Escrow
Shares) (c)(f)(g) | | | 569,200 | | | | 57 | |
| | | | | | | | |
| | | | | | | 66,892 | |
| | | | | | | | |
Biotechnology 0.0%‡ | | | | | | | | |
InterMune, Inc. (g) | | | 29,211 | | | | 232,227 | |
| | | | | | | | |
| | |
Electronics 0.0%‡ | | | | | | | | |
TTM Technologies, Inc. (g) | | | 27,753 | | | | 249,777 | |
| | | | | | | | |
| | |
Entertainment 0.1% | | | | | | | | |
International Game Technology | | | 54,700 | | | | 702,348 | |
| | | | | | | | |
| | |
Health Care—Products 0.2% | | | | | | | | |
Hologic, Inc. (g) | | | 60,000 | | | | 1,237,200 | |
| | | | | | | | |
| | | | | | |
The notes to the financial statements are an integral part of,
and should be read in conjunction with, the financial statements. | | mainstayinvestments.com | | | 13 | |
Portfolio of Investments October 31, 2012 (continued)
| | | | | | | | |
| | |
| | | Shares | | | Value | |
| | | | | | | | |
| Common Stocks (continued) | | | | | | | | |
Internet 1.1% | | | | | | | | |
Symantec Corp. (g) | | | 276,700 | | | $ | 5,033,173 | |
TIBCO Software, Inc. (g) | | | 96,566 | | | | 2,434,429 | |
| | | | | | | | |
| | | | | | | 7,467,602 | |
| | | | | | | | |
Lodging 0.4% | | | | | | | | |
MGM Resorts International (g) | | | 248,800 | | | | 2,565,128 | |
| | | | | | | | |
| | |
Oil & Gas 0.3% | | | | | | | | |
Ensco PLC Class A | | | 28,000 | | | | 1,618,960 | |
Forest Oil Corp. (g) | | | 83,100 | | | | 629,898 | |
| | | | | | | | |
| | | | | | | 2,248,858 | |
| | | | | | | | |
Oil & Gas Services 1.8% | |
Baker Hughes, Inc. | | | 124,900 | | | | 5,242,053 | |
Halliburton Co. | | | 113,326 | | | | 3,659,297 | |
ION Geophysical Corp. (g) | | | 530,100 | | | | 3,424,446 | |
| | | | | | | | |
| | | | | | | 12,325,796 | |
| | | | | | | | |
Pharmaceuticals 2.1% | |
Merck & Co., Inc. | | | 191,917 | | | | 8,757,173 | |
Valeant Pharmaceuticals
International, Inc. (g) | | | 94,700 | | | | 5,296,571 | |
| | | | | | | | |
| | | | | | | 14,053,744 | |
| | | | | | | | |
Semiconductors 0.4% | |
Microchip Technology, Inc. | | | 54,600 | | | | 1,711,710 | |
ON Semiconductor Corp. (g) | | | 195,400 | | | | 1,201,710 | |
| | | | | | | | |
| | | | | | | 2,913,420 | |
| | | | | | | | |
Software 0.2% | |
Compuware Corp. (g) | | | 15,580 | | | | 134,923 | |
QLIK Technologies, Inc. (g) | | | 77,700 | | | | 1,430,457 | |
| | | | | | | | |
| | | | | | | 1,565,380 | |
| | | | | | | | |
Transportation 0.5% | |
Tidewater, Inc. | | | 65,800 | | | | 3,126,158 | |
| | | | | | | | |
Total Common Stocks
(Cost $51,045,634) | | | | 48,754,530 | |
| | | | | | | | |
| | |
| | | | | | | | |
| | | Number of
Warrants | | | | |
| Warrants 0.0%‡ | |
Auto Manufacturers 0.0%‡ | | | | | | | | |
General Motors Co.
Strike Price $10.00
Expires 7/10/16 (g) | | | 1,016 | | | | 16,713 | |
Strike Price $18.33
Expires 7/10/19 (g) | | | 1,016 | | | | 10,435 | |
| | | | | | | | |
Total Warrants
(Cost $1,062) | | | | 27,148 | |
| | | | | | | | |
| | |
| | | | | | | | |
| | | | | | | | |
| | | Principal
Amount | | | Value | |
| | | | | | | | |
| Short-Term Investment 2.3% | |
Repurchase Agreement 2.3% | | | | | | | | |
State Street Bank and Trust Co.
0.01%, dated 10/31/12
due 11/1/12 | | | | | | | | |
Proceeds at Maturity $16,043,108 (Collateralized by a Federal National Mortgage Assocation security with a rate 0.75% and a maturity date of 6/4/15, with a Principal Amount of $16,300,000 and a Market Value of $16,366,390) | | $ | 16,043,103 | | | $ | 16,043,103 | |
| | | | | | | | |
Total Short-Term Investment
(Cost $16,043,103) | | | | 16,043,103 | |
| | | | | | | | |
Total Investments
(Cost $670,865,035) (h) | | | 99.6 | % | | | 683,869,093 | |
Other Assets, Less Liabilities | | | 0.4 | | | | 2,507,356 | |
Net Assets | | | 100.0 | % | | $ | 686,376,449 | |
| ‡ | Less than one-tenth of a percent. |
| (a) | May be sold to institutional investors only under Rule 144A or securities offered pursuant to Section 4(2) of the Securities Act of 1933, as amended. |
| (c) | Illiquid security. The total market value of these securities as of October 31, 2012 is $1,581,347, which represents 0.2% of the Fund’s net assets. |
| (d) | Step coupon. Rate shown is the rate in effect as of October 31, 2012. |
| (f) | Fair valued security. The total market value of these securities as of October 31, 2012 is $972, which represents less than one-tenth of a percent of the Fund’s net assets. |
| (g) | Non-income producing security. |
| (h) | As of October 31, 2012, cost is $677,176,406 for federal income tax purposes and net unrealized appreciation is as follows: |
| | | | |
Gross unrealized appreciation | | $ | 45,301,346 | |
Gross unrealized depreciation | | | (39,108,659 | ) |
| | | | |
Net unrealized appreciation | | $ | 6,692,687 | |
| | | | |
| | | | |
| 14 | | MainStay Convertible Fund | | The notes to the financial statements are an integral part of,
and should be read in conjunction with, the financial statements. |
The following is a summary of the fair valuations according to the inputs used as of October 31, 2012, for valuing the Fund’s assets.
Asset Valuation Inputs
| | | | | | | | | | | | | | | | |
Description | | Quoted
Prices in
Active
Markets for
Identical
Assets (Level 1) | | | Significant
Other
Observable
Inputs (Level 2) | | | Significant
Unobservable
Inputs (Level 3) | | | Total | |
| Investments in Securities (a) | | | | | | | | | | | | | | | | |
| Convertible Securities | | | | | | | | | | | | | | | | |
Convertible Bonds (b) | | $ | — | | | $ | 499,688,438 | | | $ | 915 | | | $ | 499,689,353 | |
Convertible Preferred Stocks | | | 119,354,959 | | | | — | | | | — | | | | 119,354,959 | |
| | | | | | | | | | | | | | | | |
| Total Convertible Securities | | | 119,354,959 | | | | 499,688,438 | | | | 915 | | | | 619,044,312 | |
| | | | | | | | | | | | | | | | |
| Common Stocks (c) | | | 48,754,473 | | | | — | | | | 57 | | | | 48,754,530 | |
| Warrants | | | 27,148 | | | | — | | | | — | | | | 27,148 | |
| Short-Term Investment | | | | | | | | | | | | | | | | |
Repurchase Agreement | | | — | | | | 16,043,103 | | | | — | | | | 16,043,103 | |
| | | | | | | | | | | | | | | | |
| Total Investments in Securities | | $ | 168,136,580 | | | $ | 515,731,541 | | | $ | 972 | | | $ | 683,869,093 | |
| | | | | | | | | | | | | | | | |
| (a) | For a complete listing of investments and their industries, see the Portfolio of Investments. |
| (b) | The Level 3 security valued at $915 is held in Internet within the Convertible Bonds section of the Portfolio of Investments. |
| (c) | The Level 3 securities valued at $57 are held in Auto Manufacturers within the Common Stocks section of the Portfolio of Investments. |
The Fund recognizes transfers between the levels as of the beginning of the period.
For the year ended October 31, 2012, the Fund did not have any transfers between Level 1 and Level 2 fair value measurements. (See Note 2)
The following is a reconciliation of investments in which significant unobservable inputs (Level 3) were used in determining value:
| | | | | | | | | | | | | | | | | | | | | | | | | | | | | | | | | | | | | | | | |
Investments in Securities | | Balance
as of
October 31,
2011 | | | Accrued
Discounts
(Premiums) | | | Realized
Gain (Loss) | | | Change in
Unrealized
Appreciation
(Depreciation) | | | Purchases | | | Sales | | | Transfers in to Level 3 | | | Transfers
out of Level 3 | | | Balance as of
October 31,
2012 | | | Change in
Unrealized
Appreciation
(Depreciation)
from
Investments
Still Held as
of October 31,
2012 (a) | |
| Convertible Bonds | | | | | | | | | | | | | | | | | | | | | | | | | | | | | | | | | | | | | | | | |
Internet | | $ | 915 | | | $ | — | | | $ | — | | | $ | — | | | $ | — | | | $ | — | | | $ | — | | | $ | — | | | $ | 915 | | | $ | — | |
| Common Stocks | | | | | | | | | | | | | | | | | | | | | | | | | | | | | | | | | | | | | | | | |
Auto Manufacturers | | | 6,966 | | | | — | | | | — | | | | (6,906 | ) | | | — | | | | (3 | ) | | | — | | | | — | | | | 57 | | | | (6,909 | ) |
| | | | | | | | | | | | | | | | | | | | | | | | | | | | | | | | | | | | | | | | |
| Total | | $ | 7,881 | | | $ | — | | | $ | — | | | $ | (6,906 | ) | | $ | — | | | $ | (3 | ) | | $ | — | | | $ | — | | | $ | 972 | | | $ | (6,909 | ) |
| | | | | | | | | | | | | | | | | | | | | | | | | | | | | | | | | | | | | | | | |
| (a) | Included in “Net change in unrealized appreciation (depreciation) on investments” in the Statement of Operations. |
| | | | | | |
The notes to the financial statements are an integral part of,
and should be read in conjunction with, the financial statements. | | mainstayinvestments.com | | | 15 | |
Statement of Assets and Liabilities as of October 31, 2012
| | | | |
| Assets | | | | |
Investment in securities, at value
(identified cost $670,865,035) | | $ | 683,869,093 | |
Receivables: | | | | |
Dividends and interest | | | 4,133,600 | |
Investment securities sold | | | 3,668,345 | |
Fund shares sold | | | 491,979 | |
Other assets | | | 32,994 | |
| | | | |
Total assets | | | 692,196,011 | |
| | | | |
| |
| Liabilities | | | | |
Payables: | | | | |
Due to custodian | | | 2,202,627 | |
Fund shares redeemed | | | 1,689,393 | |
Investment securities purchased | | | 1,018,583 | |
Manager (See Note 3) | | | 356,966 | |
Transfer agent (See Note 3) | | | 302,885 | |
NYLIFE Distributors (See Note 3) | | | 179,858 | |
Shareholder communication | | | 40,309 | |
Professional fees | | | 19,343 | |
Trustees | | | 2,154 | |
Custodian | | | 2,063 | |
Accrued expenses | | | 5,381 | |
| | | | |
Total liabilities | | | 5,819,562 | |
| | | | |
Net assets | | $ | 686,376,449 | |
| | | | |
| |
| Composition of Net Assets | | | | |
Shares of beneficial interest outstanding (par value of $.01 per share) unlimited number of shares authorized | | $ | 463,710 | |
Additional paid-in capital | | | 650,164,931 | |
| | | | |
| | | 650,628,641 | |
Undistributed net investment income | | | 1,797,462 | |
Accumulated net realized gain (loss) on investments | | | 20,946,288 | |
Net unrealized appreciation (depreciation) on investments | | | 13,004,058 | |
| | | | |
Net assets | | $ | 686,376,449 | |
| | | | |
| | | | |
Investor Class | | | | |
Net assets applicable to outstanding shares | | $ | 80,377,704 | |
| | | | |
Shares of beneficial interest outstanding | | | 5,435,928 | |
| | | | |
Net asset value per share outstanding | | $ | 14.79 | |
Maximum sales charge (5.50% of offering price) | | | 0.86 | |
| | | | |
Maximum offering price per share outstanding | | $ | 15.65 | |
| | | | |
Class A | | | | |
Net assets applicable to outstanding shares | | $ | 317,267,293 | |
| | | | |
Shares of beneficial interest outstanding | | | 21,449,173 | |
| | | | |
Net asset value per share outstanding | | $ | 14.79 | |
Maximum sales charge (5.50% of offering price) | | | 0.86 | |
| | | | |
Maximum offering price per share outstanding | | $ | 15.65 | |
| | | | |
Class B | | | | |
Net assets applicable to outstanding shares | | $ | 33,102,620 | |
| | | | |
Shares of beneficial interest outstanding | | | 2,231,174 | |
| | | | |
Net asset value and offering price per share outstanding | | $ | 14.84 | |
| | | | |
Class C | | | | |
Net assets applicable to outstanding shares | | $ | 75,371,792 | |
| | | | |
Shares of beneficial interest outstanding | | | 5,084,371 | |
| | | | |
Net asset value and offering price per share outstanding | | $ | 14.82 | |
| | | | |
Class I | | | | |
Net assets applicable to outstanding shares | | $ | 180,257,040 | |
| | | | |
Shares of beneficial interest outstanding | | | 12,170,331 | |
| | | | |
Net asset value and offering price per share outstanding | | $ | 14.81 | |
| | | | |
| | | | |
| 16 | | MainStay Convertible Fund | | The notes to the financial statements are an integral part of,
and should be read in conjunction with, the financial statements. |
Statement of Operations for the year ended October 31, 2012
| | | | |
| Investment Income (Loss) | |
Income | | | | |
Interest | | $ | 15,454,463 | |
Dividends (a) | | | 7,037,655 | |
| | | | |
Total income | | | 22,492,118 | |
| | | | |
Expenses | | | | |
Manager (See Note 3) | | | 4,536,197 | |
Distribution/Service—Investor Class (See Note 3) | | | 208,310 | |
Distribution/Service—Class A (See Note 3) | | | 834,607 | |
Distribution/Service—Class B (See Note 3) | | | 382,603 | |
Distribution/Service—Class C (See Note 3) | | | 837,825 | |
Transfer agent (See Note 3) | | | 1,264,946 | |
Professional fees | | | 94,270 | |
Registration | | | 93,498 | |
Shareholder communication | | | 83,008 | |
Trustees | | | 19,292 | |
Custodian | | | 14,154 | |
Miscellaneous | | | 32,629 | |
| | | | |
Total expenses | | | 8,401,339 | |
| | | | |
Net investment income (loss) | | | 14,090,779 | |
| | | | |
|
| Realized and Unrealized Gain (Loss) on Investments | |
Net realized gain (loss) on investments | | | 33,409,121 | |
Net change in unrealized appreciation (depreciation) on investments | | | (8,108,273 | ) |
| | | | |
Net realized and unrealized gain (loss) on investments | | | 25,300,848 | |
| | | | |
Net increase (decrease) in net assets resulting from operations | | $ | 39,391,627 | |
| | | | |
| (a) | Dividends recorded net of foreign withholding taxes in the amount of $4,435. |
| | | | | | |
The notes to the financial statements are an integral part of,
and should be read in conjunction with, the financial statements. | | mainstayinvestments.com | | | 17 | |
Statements of Changes in Net Assets
for the years ended October 31, 2012 and October 31, 2011
| | | | | | | | |
| | | 2012 | | | 2011 | |
| Increase (Decrease) in Net Assets | |
Operations: | | | | | | | | |
Net investment income (loss) | | $ | 14,090,779 | | | $ | 18,739,701 | |
Net realized gain (loss) on investments | | | 33,409,121 | | | | 37,365,006 | |
Net change in unrealized appreciation (depreciation) on investments | | | (8,108,273 | ) | | | (48,029,038 | ) |
| | | | |
Net increase (decrease) in net assets resulting from operations | | | 39,391,627 | | | | 8,075,669 | |
| | | | |
Dividends and distributions to shareholders: | | | | | | | | |
From net investment income: | | | | | | | | |
Investor Class | | | (1,534,966 | ) | | | (1,600,042 | ) |
Class A | | | (7,001,464 | ) | | | (8,287,054 | ) |
Class B | | | (417,670 | ) | | | (528,130 | ) |
Class C | | | (911,844 | ) | | | (1,019,729 | ) |
Class I | | | (5,091,499 | ) | | | (6,486,188 | ) |
| | | | |
| | | (14,957,443 | ) | | | (17,921,143 | ) |
| | | | |
From net realized gain on investments: | | | | | | | | |
Investor Class | | | (4,312,356 | ) | | | — | |
Class A | | | (18,447,914 | ) | | | — | |
Class B | | | (2,175,818 | ) | | | — | |
Class C | | | (4,456,329 | ) | | | — | |
Class I | | | (11,630,815 | ) | | | — | |
| | | | |
| | | (41,023,232 | ) | | | — | |
| | | | |
Total dividends and distributions to shareholders | | | (55,980,675 | ) | | | (17,921,143 | ) |
| | | | |
Capital share transactions: | | | | | | | | |
Net proceeds from sale of shares | | | 163,780,168 | | | | 383,995,667 | |
Net asset value of shares issued to shareholders in reinvestment of dividends | | | 39,617,060 | | | | 12,573,119 | |
Cost of shares redeemed | | | (329,417,252 | ) | | | (363,693,740 | ) |
| | | | |
Increase (decrease) in net assets derived from capital share transactions | | | (126,020,024 | ) | | | 32,875,046 | |
| | | | |
Net increase (decrease) in net assets | | | (142,609,072 | ) | | | 23,029,572 | |
|
| Net Assets | |
Beginning of year | | | 828,985,521 | | | | 805,955,949 | |
| | | | |
End of year | | $ | 686,376,449 | | | $ | 828,985,521 | |
| | | | |
Undistributed net investment income at end of year | | $ | 1,797,462 | | | $ | 1,968,955 | |
| | | | |
| | | | |
| 18 | | MainStay Convertible Fund | | The notes to the financial statements are an integral part of,
and should be read in conjunction with, the financial statements. |
Financial Highlights selected per share data and ratios
| | | | | | | | | | | | | | | | | | | | |
| | | Investor Class | |
| | | Year ended October 31, | | | February 28,
2008**
through
October 31, | |
| | | 2012 | | | 2011 | | | 2010 | | | 2009 | | | 2008 | |
Net asset value at beginning of period | | $ | 15.11 | | | $ | 15.12 | | | $ | 13.02 | | | $ | 10.16 | | | $ | 15.00 | |
| | | | | | | | | | | | | | | | | | | | |
Net investment income (loss) (a) | | | 0.26 | | | | 0.30 | | | | 0.32 | | | | 0.35 | | | | 0.16 | |
Net realized and unrealized gain (loss) on investments | | | 0.47 | | | | (0.02 | ) | | | 2.10 | | | | 2.82 | | | | (4.85 | ) |
| | | | | | | | | | | | | | | | | | | | |
Total from investment operations | | | 0.73 | | | | 0.28 | | | | 2.42 | | | | 3.17 | | | | (4.69 | ) |
| | | | | | | | | | | | | | | | | | | | |
Less dividends and distributions: | | | | | | | | | | | | | | | | | | | | |
From net investment income | | | (0.28 | ) | | | (0.29 | ) | | | (0.32 | ) | | | (0.31 | ) | | | (0.15 | ) |
From net realized gain on investments | | | (0.77 | ) | | | — | | | | — | | | | — | | | | — | |
| | | | | | | | | | | | | | | | | | | | |
Total dividends and distributions | | | (1.05 | ) | | | (0.29 | ) | | | (0.32 | ) | | | (0.31 | ) | | | (0.15 | ) |
| | | | | | | | | | | | | | | | | | | | |
Net asset value at end of period | | $ | 14.79 | | | $ | 15.11 | | | $ | 15.12 | | | $ | 13.02 | | | $ | 10.16 | |
| | | | | | | | | | | | | | | | | | | | |
Total investment return (b) | | | 5.07 | % | | | 1.98 | % | | | 18.78 | % | | | 31.77 | % | | | (31.51 | %)(c) |
Ratios (to average net assets)/Supplemental Data: | | | | | | | | | | | | | | | | | | | | |
Net investment income (loss) | | | 1.74 | % | | | 1.89 | % | | | 2.25 | % | | | 3.16 | % | | | 1.69 | % †† |
Net expenses | | | 1.22 | % | | | 1.19 | % | | | 1.28 | % | | | 1.30 | % | | | 1.28 | % †† |
Expenses (before waiver/reimbursement) | | | 1.22 | % | | | 1.19 | % | | | 1.28 | % | | | 1.43 | % | | | 1.34 | % †† |
Portfolio turnover rate | | | 61 | % | | | 80 | % | | | 80 | % | | | 68 | % | | | 103 | % |
Net assets at end of period (in 000’s) | | $ | 80,378 | | | $ | 85,747 | | | $ | 86,301 | | | $ | 78,734 | | | $ | 61,439 | |
| ** | Commencement of operations. |
| (a) | Per share data based on average shares outstanding during the period. |
| (b) | Total investment return is calculated exclusive of sales charges and assumes the reinvestment of dividends and distributions. |
| (c) | Total investment return is not annualized. |
| | | | | | | | | | | | | | | | | | | | |
| | | Class A | |
| | | Year ended October 31, | |
| | | 2012 | | | 2011 | | | 2010 | | | 2009 | | | 2008 | |
Net asset value at beginning of year | | $ | 15.12 | | | $ | 15.13 | | | $ | 13.03 | | | $ | 10.16 | | | $ | 17.18 | |
| | | | | | | | | | | | | | | | | | | | |
Net investment income (loss) (a) | | | 0.29 | | | | 0.33 | | | | 0.35 | | | | 0.38 | | | | 0.23 | |
Net realized and unrealized gain (loss) on investments | | | 0.46 | | | | (0.02 | ) | | | 2.10 | | | | 2.82 | | | | (5.74 | ) |
| | | | | | | | | | | | | | | | | | | | |
Total from investment operations | | | 0.75 | | | | 0.31 | | | | 2.45 | | | | 3.20 | | | | (5.51 | ) |
| | | | | | | | | | | | | | | | | | | | |
Less dividends and distributions: | | | | | | | | | | | | | | | | | | | | |
From net investment income | | | (0.31 | ) | | | (0.32 | ) | | | (0.35 | ) | | | (0.33 | ) | | | (0.23 | ) |
From net realized gain on investments | | | (0.77 | ) | | | — | | | | — | | | | — | | | | (1.28 | ) |
| | | | | | | | | | | | | | | | | | | | |
Total dividends and distributions | | | (1.08 | ) | | | (0.32 | ) | | | (0.35 | ) | | | (0.33 | ) | | | (1.51 | ) |
| | | | | | | | | | | | | | | | | | | | |
Net asset value at end of year | | $ | 14.79 | | | $ | 15.12 | | | $ | 15.13 | | | $ | 13.03 | | | $ | 10.16 | |
| | | | | | | | | | | | | | | | | | | | |
Total investment return (b) | | | 5.30 | % | | | 2.13 | % | | | 19.05 | % | | | 32.11 | % | | | (35.00 | %) |
Ratios (to average net assets)/Supplemental Data: | | | | | | | | | | | | | | | | | | | | |
Net investment income (loss) | | | 1.96 | % | | | 2.08 | % | | | 2.48 | % | | | 3.34 | % | | | 1.57 | % |
Net expenses | | | 1.00 | % | | | 0.99 | % | | | 1.05 | % | | | 1.10 | % | | | 1.13 | % |
Expenses (before waiver/reimbursement) | | | 1.00 | % | | | 0.99 | % | | | 1.05 | % | | | 1.15 | % | | | 1.13 | % |
Portfolio turnover rate | | | 61 | % | | | 80 | % | | | 80 | % | | | 68 | % | | | 103 | % |
Net assets at end of year (in 000’s) | | $ | 317,267 | | | $ | 367,398 | | | $ | 367,972 | | | $ | 355,311 | | | $ | 217,028 | |
| (a) | Per share data based on average shares outstanding during the year. |
| (b) | Total investment return is calculated exclusive of sales charges and assumes the reinvestment of dividends and distributions. |
| | | | | | |
The notes to the financial statements are an integral part of,
and should be read in conjunction with, the financial statements. | | mainstayinvestments.com | | | 19 | |
Financial Highlights selected per share data and ratios
| | | | | | | | | | | | | | | | | | | | |
| | | Class B | |
| | | Year ended October 31, | |
| | | 2012 | | | 2011 | | | 2010 | | | 2009 | | | 2008 | |
Net asset value at beginning of year | | $ | 15.15 | | | $ | 15.16 | | | $ | 13.05 | | | $ | 10.18 | | | $ | 17.21 | |
| | | | | | | | | | | | | | | | | | | | |
Net investment income (loss) (a) | | | 0.15 | | | | 0.18 | | | | 0.21 | | | | 0.27 | | | | 0.11 | |
Net realized and unrealized gain (loss) on investments | | | 0.47 | | | | (0.02 | ) | | | 2.11 | | | | 2.83 | | | | (5.75 | ) |
| | | | | | | | | | | | | | | | | | | | |
Total from investment operations | | | 0.62 | | | | 0.16 | | | | 2.32 | | | | 3.10 | | | | (5.64 | ) |
| | | | | | | | | | | | | | | | | | | | |
Less dividends and distributions: | | | | | | | | | | | | | | | | | | | | |
From net investment income | | | (0.16 | ) | | | (0.17 | ) | | | (0.21 | ) | | | (0.23 | ) | | | (0.11 | ) |
From net realized gain on investments | | | (0.77 | ) | | | — | | | | — | | | | — | | | | (1.28 | ) |
| | | | | | | | | | | | | | | | | | | | |
Total dividends and distributions | | | (0.93 | ) | | | (0.17 | ) | | | (0.21 | ) | | | (0.23 | ) | | | (1.39 | ) |
| | | | | | | | | | | | | | | | | | | | |
Net asset value at end of year | | $ | 14.84 | | | $ | 15.15 | | | $ | 15.16 | | | $ | 13.05 | | | $ | 10.18 | |
| | | | | | | | | | | | | | | | | | | | |
Total investment return (b) | | | 4.31 | % | | | 1.19 | % | | | 17.93 | % | | | 30.83 | % | | | (35.55 | %) |
Ratios (to average net assets)/Supplemental Data: | | | | | | | | | | | | | | | | | | | | |
Net investment income (loss) | | | 0.99 | % | | | 1.13 | % | | | 1.51 | % | | | 2.42 | % | | | 0.72 | % |
Net expenses | | | 1.97 | % | | | 1.94 | % | | | 2.03 | % | | | 2.05 | % | | | 1.98 | % |
Expenses (before waiver/reimbursement) | | | 1.97 | % | | | 1.94 | % | | | 2.03 | % | | | 2.19 | % | | | 2.01 | % |
Portfolio turnover rate | | | 61 | % | | | 80 | % | | | 80 | % | | | 68 | % | | | 103 | % |
Net assets at end of year (in 000’s) | | $ | 33,103 | | | $ | 43,420 | | | $ | 54,646 | | | $ | 59,041 | | | $ | 59,071 | |
| (a) | Per share data based on average shares outstanding during the year. |
| (b) | Total investment return is calculated exclusive of sales charges and assumes the reinvestment of dividends and distributions. |
| | | | | | | | | | | | | | | | | | | | |
| | | Class C | |
| | | Year ended October 31, | |
| | | 2012 | | | 2011 | | | 2010 | | | 2009 | | | 2008 | |
Net asset value at beginning of year | | $ | 15.14 | | | $ | 15.15 | | | $ | 13.04 | | | $ | 10.18 | | | $ | 17.20 | |
| | | | | | | | | | | | | | | | | | | | |
Net investment income (loss) (a) | | | 0.15 | | | | 0.18 | | | | 0.21 | | | | 0.27 | | | | 0.11 | |
Net realized and unrealized gain (loss) on investments | | | 0.46 | | | | (0.02 | ) | | | 2.11 | | | | 2.82 | | | | (5.74 | ) |
| | | | | | | | | | | | | | | | | | | | |
Total from investment operations | | | 0.61 | | | | 0.16 | | | | 2.32 | | | | 3.09 | | | | (5.63 | ) |
| | | | | | | | | | | | | | | | | | | | |
Less dividends and distributions: | | | | | | | | | | | | | | | | | | | | |
From net investment income | | | (0.16 | ) | | | (0.17 | ) | | | (0.21 | ) | | | (0.23 | ) | | | (0.11 | ) |
From net realized gain on investments | | | (0.77 | ) | | | — | | | | — | | | | — | | | | (1.28 | ) |
| | | | | | | | | | | | | | | | | | | | |
Total dividends and distributions | | | (0.93 | ) | | | (0.17 | ) | | | (0.21 | ) | | | (0.23 | ) | | | (1.39 | ) |
| | | | | | | | | | | | | | | | | | | | |
Net asset value at end of year | | $ | 14.82 | | | $ | 15.14 | | | $ | 15.15 | | | $ | 13.04 | | | $ | 10.18 | |
| | | | | | | | | | | | | | | | | | | | |
Total investment return (b) | | | 4.24 | % | | | 1.20 | % | | | 17.94 | % | | | 30.73 | % | | | (35.51 | %) |
Ratios (to average net assets)/Supplemental Data: | | | | | | | | | | | | | | | | | | | | |
Net investment income (loss) | | | 0.98 | % | | | 1.13 | % | | | 1.49 | % | | | 2.39 | % | | | 0.75 | % |
Net expenses | | | 1.97 | % | | | 1.94 | % | | | 2.03 | % | | | 2.05 | % | | | 2.00 | % |
Expenses (before waiver/reimbursement) | | | 1.97 | % | | | 1.94 | % | | | 2.03 | % | | | 2.18 | % | | | 2.04 | % |
Portfolio turnover rate | | | 61 | % | | | 80 | % | | | 80 | % | | | 68 | % | | | 103 | % |
Net assets at end of year (in 000’s) | | $ | 75,372 | | | $ | 90,273 | | | $ | 90,474 | | | $ | 72,563 | | | $ | 40,498 | |
| (a) | Per share data based on average shares outstanding during the year. |
| (b) | Total investment return is calculated exclusive of sales charges and assumes the reinvestment of dividends and distributions. |
| | | | |
| 20 | | MainStay Convertible Fund | | The notes to the financial statements are an integral part of,
and should be read in conjunction with, the financial statements. |
Financial Highlights selected per share data and ratios
| | | | | | | | | | | | | | | | |
| | | Class I | |
| | | Year ended October 31, | | | November 28,
2008**
through
October 31, | |
| | | 2012 | | | 2011 | | | 2010 | | | 2009 | |
Net asset value at beginning of period | | $ | 15.13 | | | $ | 15.15 | | | $ | 13.04 | | | $ | 9.55 | |
| | | | | | | | | | | | | | | | |
Net investment income (loss) (a) | | | 0.33 | | | | 0.38 | | | | 0.38 | | | | 0.38 | |
Net realized and unrealized gain (loss) on investments | | | 0.47 | | | | (0.04 | ) | | | 2.12 | | | | 3.44 | |
| | | | | | | | | | | | | | | | |
Total from investment operations | | | 0.80 | | | | 0.34 | | | | 2.50 | | | | 3.82 | |
| | | | | | | | | | | | | | | | |
Less dividends and distributions: | | | | | | | | | | | | | | | | |
From net investment income | | | (0.35 | ) | | | (0.36 | ) | | | (0.39 | ) | | | (0.33 | ) |
From net realized gain on investments | | | (0.77 | ) | | | — | | | | — | | | | — | |
| | | | | | | | | | | | | | | | |
Total dividends and distributions | | | (1.12 | ) | | | (0.36 | ) | | | (0.39 | ) | | | (0.33 | ) |
| | | | | | | | | | | | | | | | |
Net asset value at end of period | | $ | 14.81 | | | $ | 15.13 | | | $ | 15.15 | | | $ | 13.04 | |
| | | | | | | | | | | | | | | | |
Total investment return (b) | | | 5.56 | % | | | 2.39 | % | | | 19.41 | % | | | 40.46 | %(c)(d) |
Ratios (to average net assets)/Supplemental Data: | | | | | | | | | | | | | | | | |
Net investment income (loss) | | | 2.21 | % | | | 2.33 | % | | | 2.66 | % | | | 3.33 | %†† |
Net expenses | | | 0.75 | % | | | 0.74 | % | | | 0.80 | % | | | 0.86 | %†† |
Expenses (before waiver/reimbursement) | | | 0.75 | % | | | 0.74 | % | | | 0.80 | % | | | 0.89 | %†† |
Portfolio turnover rate | | | 61 | % | | | 80 | % | | | 80 | % | | | 68 | % |
Net assets at end of period (in 000’s) | | $ | 180,257 | | | $ | 242,147 | | | $ | 206,563 | | | $ | 64,931 | |
| ** | Commencement of operations. |
| (a) | Per share data based on average shares outstanding during the period. |
| (b) | Total investment return is calculated exclusive of sales charges and assumes the reinvestment of dividends and distributions. Class I shares are not subject to sales charges. |
| (c) | Total investment return is not annualized. |
| (d) | Total investment returns may reflect adjustments to conform to generally accepted accounting principles. |
| | | | | | |
The notes to the financial statements are an integral part of,
and should be read in conjunction with, the financial statements. | | mainstayinvestments.com | | | 21 | |
Notes to Financial Statements
Note 1–Organization and Business
The MainStay Funds (the “Trust”) were organized on January 9, 1986, as a Massachusetts business trust. The Trust is registered under the Investment Company Act of 1940, as amended (the “1940 Act”), as an open-end investment management company, and is comprised of twelve funds (collectively referred to as the “Funds”). These financial statements and notes relate only to the MainStay Convertible Fund (the “Fund”), a diversified fund.
The Fund currently offers five classes of shares. Class A shares commenced operations on January 3, 1995. Class B shares commenced operations on May 1, 1986. Class C shares commenced operations on September 1, 1998. Investor Class shares commenced operations on February 28, 2008. Class I shares commenced operations on November 28, 2008. Investor Class and Class A shares are offered at net asset value (“NAV”) per share plus an initial sales charge. No sales charge applies to investments of $1 million or more (and certain other qualified purchases) in Investor Class and Class A shares, but a contingent deferred sales charge (“CDSC”) is imposed on certain redemptions made within one year of the date of purchase. Class B and Class C shares are offered at NAV without an initial sales charge, although a declining CDSC may be imposed on redemptions made within six years of the date of purchase of Class B shares and a 1.00% CDSC may be imposed on redemptions made within one year of the date of purchase of Class C shares. Class I shares are offered at NAV and are not subject to a sales charge. Depending upon eligibility, Class B shares convert to either Investor Class or Class A shares at the end of the calendar quarter eight years after the date they were purchased. Additionally, depending upon eligibility, Investor Class shares may convert to Class A shares and Class A shares may convert to Investor Class shares. The five classes of shares have the same voting (except for issues that relate solely to one class), dividend, liquidation and other rights, and the same terms and conditions, except that Class B and Class C shares are subject to higher distribution and/or service fee rates than Investor Class and Class A shares under a distribution plan pursuant to Rule 12b-1 under the 1940 Act. Class I shares are not subject to a distribution and/or service fee.
The Fund’s investment objective is to seek capital appreciation together with current income.
Note 2–Significant Accounting Policies
The Fund prepares its financial statements in accordance with generally accepted accounting principles (“GAAP”) in the United States of America and follows the significant accounting policies described below.
(A) Securities Valuation. Investments are valued as of the close of regular trading on the New York Stock Exchange (“Exchange”) (generally 4:00 p.m. Eastern time) on each day the Fund is open for business (“valuation date”).
The Board of Trustees (the “Board”) has adopted procedures for the valuation of the Fund’s securities and has delegated the responsibility for valuation determination under those procedures to the Valuation Committee of the Fund (the “Valuation Committee”). The Board has authorized the Valuation Committee to appoint a Valuation
Sub-Committee (the “Sub-Committee”) to deal in the first instance with questions that arise or cannot be resolved under these procedures. The Sub-Committee will meet (in person, via electronic mail or via teleconference) on an as-needed basis. The Valuation Committee shall meet at a later time, as necessary, to ensure that actions taken by the Sub-Committee were appropriate. The procedures recognize that, subject to the oversight of the Board and unless otherwise noted, the responsibility for day-to-day valuation of portfolio assets (including securities for which market prices are not readily available) rests with New York Life Investment Management LLC (“New York Life Investments” or the “Manager”), aided to whatever extent necessary by the Subadvisor (as defined in Note 3(A)) of the Fund. These procedures shall be reviewed by the Board no less frequently than annually. Any revisions to these procedures deemed necessary shall be reported to the Board at its next regularly scheduled meeting.
Securities are valued using unadjusted market prices, when available, as supplied primarily by third party pricing services or dealers. To assess the appropriateness of security valuations, the Manager or the Fund’s third party service provider who is subject to oversight by the Manager, regularly compares prior day prices, prices on comparable securities and the sale prices to the prior and current day prices and challenges prices exceeding certain tolerance levels with third party pricing services or broker sources. For those securities valued by recommendation, whether through a standardized fair valuation methodology or a fair valuation determination, the Valuation Committee reviews and affirms the reasonableness of the valuation based on such methodologies and determinations on a regular basis after considering all relevant information that is reasonably available.
“Fair value” is defined as the price that the Fund would receive upon selling an investment in an orderly transaction to an independent buyer in the principal or most advantageous market of the investment. Fair value measurements are determined within a framework that has established a three-tier hierarchy which maximizes the use of observable market data and minimizes the use of unobservable inputs to establish classification of fair value measurements for disclosure purposes. “Inputs” refer broadly to the assumptions that market participants would use in pricing the asset or liability, including assumptions about risk, such as the risk inherent in a particular valuation technique used to measure fair value using a pricing model and/or the risk inherent in the inputs for the valuation technique. Inputs may be observable or unobservable. Observable inputs reflect the assumptions market participants would use in pricing the asset or liability based on market data obtained from sources independent of the Fund. Unobservable inputs reflect the Fund’s own assumptions about the assumptions market participants would use in pricing the asset or liability developed based on the information available in the circumstances. The inputs or methodology used for valuing securities may not be an indication of the risks associated with investing in those securities. The three-tier hierarchy of inputs is summarized in the three broad Levels listed below.
| • | | Level 1—quoted prices in active markets for identical investments |
| • | | Level 2—other significant observable inputs (including quoted prices for similar investments in active markets, interest rates and yield curves, prepayment speeds, credit risks, etc.) |
| | |
| 22 | | MainStay Convertible Fund |
| • | | Level 3—significant unobservable inputs (including the Fund’s own assumptions about the assumptions that market participants would use in determining the fair value of investments) |
The aggregate value by input level, as of October 31, 2012, for the Fund’s investments is included at the end of the Fund’s Portfolio of Investments.
The valuation techniques used by the Fund to measure fair value maximize the use of observable inputs and minimize the use of unobservable inputs. The Fund may utilize third party vendor evaluations, whose prices may be derived from one or more of the following standard inputs:
| | |
• Benchmark Yields | | • Reported Trades |
• Broker Dealer Quotes | | • Issuer Spreads |
• Two-sided markets | | • Benchmark securities |
• Bids/Offers | | • Reference Data (corporate actions or material event notices) |
• Industry and economic events | | • Comparable bonds |
• Equity and credit default swap curves | | • Monthly payment information |
Securities for which market value cannot be determined using the methodologies described above are valued by methods deemed in good faith by the Fund’s Valuation Committee, following the procedures established by the Board, to represent fair value. Under these procedures, the Fund primarily employs a market-based approach which may use related or comparable assets or liabilities, recent transactions, market multiples, book values, and other relevant information. The Fund may also use an income-based valuation approach in which the anticipated future cash flows of the investment are discounted to calculate fair value. Discounts may also be applied due to the nature or duration of any restrictions on the disposition of the investments. Due to the inherent uncertainty of valuations of such investments, the fair values may differ significantly from the values that would have been used had an active market existed. For the year ended October 31, 2012, there have been no changes to the fair value methodologies.
Equity and non-equity securities which may be valued in this manner include, but are not limited to: (i) a security for which the trading has been halted or suspended; (ii) a debt security that has recently gone into default and for which there is not a current market quotation; (iii) a security of an issuer that has entered into a restructuring; (iv) a security that has been de-listed from a national exchange; (v) a security for which the market price is not available from a third party pricing source or, if so provided, does not, in the opinion of the Fund’s Manager or Subadvisor reflect the security’s market value; and (vi) a security whose principal market has been temporarily closed at a time when, under normal conditions, it would be open. Securities for which market quotations or observable inputs are not readily available are generally categorized as Level 3 in the hierarchy. As of October 31, 2012, the Fund held securities with a value of $972 that were fair valued in such a manner.
Certain events may occur between the time that foreign markets close, on which securities held by the Fund principally trade, and the time at which the Fund’s NAV is calculated. These events may include, but are not limited to, situations relating to a single issuer in a market sector, significant fluctuations in U.S. or foreign markets, natural disasters, armed conflicts, governmental actions or other developments not tied directly to the securities markets. Should the Manager or Subadvisor conclude that such events may have affected the accuracy of the last price of such securities reported on the local foreign market, the Manager or Subadvisor may, pursuant to procedures adopted by the Fund’s Board, adjust the value of the local price to reflect the impact on the price of such securities as a result of such events. In this instance, securities are generally categorized as Level 3 in the hierarchy. Additionally, foreign equity securities are also fair valued whenever the movement of a particular index exceeds certain thresholds. In such cases, the securities are fair valued by applying factors provided by a third party vendor in accordance with the Fund’s policies and procedures and are generally categorized as Level 2 in the hierarchy. As of October 31, 2012, the Fund did not hold any foreign equity securities.
Equity securities and Exchange Traded Funds are valued at the latest quoted sales prices as of the close of regular trading on the Exchange on each valuation date. Securities that are not traded on the valuation date are valued at the mean of the latest quoted bid and ask prices. Prices normally are taken from the principal market in which each security trades. Investments in other mutual funds are valued at their respective NAV as of the close of the Exchange on the valuation date. These securities are generally categorized as Level 1 in the hierarchy.
Debt securities are valued at the evaluated mean prices supplied by a pricing agent or brokers selected by the Fund’s Manager in consultation with the Fund’s Subadvisor whose prices reflect broker/dealer supplied valuations and electronic data processing techniques, if such prices are deemed by the Fund’s Manager, in consultation with the Fund’s Subadvisor, to be representative of market values, at the regular close of trading of the Exchange on each valuation date. Convertible bonds are generally categorized as Level 2 in the hierarchy.
Temporary cash investments acquired over 60 days to maturity are valued using the latest bid prices or using valuations based on a matrix system (which considers such factors as security prices, yields, maturities, and ratings), both as furnished by independent pricing services. Other temporary cash investments which mature in 60 days or less (“Short-Term Investments”) are valued at amortized cost. The amortized cost method involves valuing a security at its cost on the date of purchase and thereafter assuming a constant amortization to maturity of the difference between such cost and the value on maturity date. Amortized cost approximates the current fair value of a security. Securities valued at amortized cost are not valued using a quoted price in an active market. These securities are generally categorized as Level 2 in the hierarchy.
| | | | |
| mainstayinvestments.com | | | 23 | |
Notes to Financial Statements (continued)
Generally, a security is considered illiquid if it cannot be sold or disposed of in the ordinary course of business at approximately the price at which it is valued. Its illiquidity might prevent the sale of such security at a time when the Manager or Subadvisor might wish to sell, and these securities could have the effect of decreasing the overall level of a Fund’s liquidity. Further, the lack of an established secondary market may make it more difficult to value illiquid securities, requiring the Fund to rely on judgments that may be somewhat subjective in determining value, which could vary from the amount that the Fund’s could realize upon disposition. Difficulty in selling illiquid securities may result in a loss or may be costly to the Fund. Under the supervision of the Board, the Manager or Subadvisor determines the liquidity of the Fund’s investments; in doing so, the Manager or Subadvisor may consider various factors, including (i) the frequency of trades and quotations, (ii) the number of dealers and prospective purchasers, (iii) dealer undertakings to make a market, and (iv) the nature of the security and the market in which it trades (e.g., the time needed to dispose of the security, the method of soliciting offers and the mechanics of transfer). Illiquid securities generally will be valued in good faith in such a manner as the Board deems appropriate to reflect their fair value.
(B) Income Taxes. The Fund’s policy is to comply with the requirements of the Internal Revenue Code of 1986, as amended (the “Internal Revenue Code”), applicable to regulated investment companies and to distribute all of the taxable income to the shareholders of the Fund within the allowable time limits. Therefore, no federal, state and local income tax provision is required.
Management evaluates its tax positions to determine if the tax positions taken meet the minimum recognition threshold in connection with accounting for uncertainties in income tax positions taken or expected to be taken for the purposes of measuring and recognizing tax liabilities in the financial statements. Recognition of tax benefits of an uncertain tax position is required only when the position is “more likely than not” to be sustained assuming examination by taxing authorities. Management has analyzed the Fund’s tax positions taken on federal, state and local income tax returns for all open tax years (for up to three tax years), and has concluded that no provision for federal, state and local income tax are required in the Fund’s financial statements. The Fund’s federal, state and local income and federal excise tax returns for tax years for which the applicable statutes of limitations have not expired are subject to examination by the Internal Revenue Service and state and local departments of revenue.
(C) Dividends and Distributions to Shareholders. Dividends and distributions are recorded on the ex-dividend date. The Fund intends to declare and pay dividends of net investment income, if any, at least quarterly and distributions of net realized capital and currency gains, if any, at least annually. Unless the shareholder elects otherwise, all dividends and distributions are reinvested in the same class of shares of the Fund, at NAV. Dividends and distributions to shareholders are determined in accordance with federal income tax regulations and may differ from GAAP.
(D) Security Transactions and Investment Income. The Fund records security transactions on the trade date. Realized gains and losses on security transactions are determined using the identified cost method. Dividend income is recognized on the ex-dividend date and
interest income is accrued as earned using the effective interest rate method. Discounts and premiums on securities purchased, other than Short-Term Investments, for the Fund are accreted and amortized, respectively, on the effective interest rate method over the life of the respective securities or, in the case of a callable security, over the period to the first date of call. Discounts and premiums on Short-Term Investments are accreted and amortized, respectively, on the straight-line method. Income from payment-in-kind securities is recorded daily based on the effective interest method of accrual.
Investment income and realized and unrealized gains and losses on investments of the Fund are allocated to separate classes of shares pro rata based upon their relative net assets on the date the income is earned or realized and unrealized gains and losses are incurred.
(E) Expenses. Expenses of the Trust are allocated to the individual Funds in proportion to the net assets of the respective Funds when the expenses are incurred, except where direct allocations of expenses can be made. Expenses (other than transfer agent expenses and fees incurred under the shareholder services plans and the distribution plans further discussed in Note 3(B)) are allocated to separate classes of shares pro rata based upon their relative net assets on the date the expenses are incurred. The expenses borne by the Fund, including those of related parties to the Fund, are shown in the Statement of Operations.
(F) Use of Estimates. In preparing financial statements in conformity with GAAP, management makes estimates and assumptions that affect the reported amounts and disclosures in the financial statements. Actual results could differ from those estimates.
(G) Repurchase Agreements. The Fund may enter into repurchase agreements to earn income. The Fund may enter into repurchase agreements only with financial institutions that are deemed by the Manager or Subadvisor to be creditworthy, pursuant to guidelines established by the Fund’s Board. During the term of any repurchase agreement, the Manager will continue to monitor the creditworthiness of the seller. Under the 1940 Act, repurchase agreements are considered to be collateralized loans by a Fund to the seller secured by the securities transferred to the Fund.
When the Fund invests in repurchase agreements, the Fund’s custodian takes possession of the collateral pledged for investments in the repurchase agreement. The underlying collateral is valued daily on a mark-to-market basis to determine that the value, including accrued interest, exceeds the repurchase price. In the event of the seller’s default on the obligation to repurchase, the Fund has the right to liquidate the collateral and apply the proceeds in satisfaction of the obligation. Under certain circumstances, such as in the event of default or bankruptcy by the counterparty to the agreement, realization and/or retention of the collateral may be subject to legal proceedings and possible realized loss to the Fund.
(H) Rights and Warrants. A right is a certificate that permits the holder to purchase a certain number of shares, or a fractional share, of a new stock from the issuer at a specific price. A warrant is an instrument that entitles the holder to buy an equity security at a specific price for a specific period of time. The Fund may enter into rights and warrants when securities are acquired through a corporate action. With
| | |
| 24 | | MainStay Convertible Fund |
respect to warrants in international markets, the securities are only purchased when the underlying security cannot be purchased due to the many restrictions an industry and/or country might place on foreign investors. These investments can provide a greater potential for profit or loss than an equivalent investment in the underlying security. Prices of these investments do not necessarily move in tandem with the prices of the underlying securities.
There is risk involved in the purchase of rights and warrants in that these investments are speculative investments. The Fund could also lose the entire value of its investment in warrants if the warrant is not exercised by the date of its expiration. The securities are sold as soon as the opportunity becomes available. The Fund is exposed to risk until each sale is completed. As of October 31, 2012, the Fund did not hold any rights.
(I) Securities Lending. In order to realize additional income, the Fund may engage in securities lending, subject to the limitations set forth in the 1940 Act, and relevant guidance by the staff of the Securities and Exchange Commission. In the event the Fund does engage in securities lending, the Fund will lend through its custodian, State Street Bank and Trust Company (“State Street”). State Street will manage the Fund’s cash collateral in accordance with the Lending Agreement between the Fund and State Street, and indemnify the Fund’s portfolio against counterparty risk. The loans will be collateralized by cash or securities at least equal at all times to the market value of the securities loaned. Collateral will consist of U.S. government securities, cash equivalents or irrevocable letters of credit. The Fund may bear the risk of delay in recovery of, or loss of rights in, the securities loaned should the borrower of the securities experience financial difficulty. The Fund may also record realized gain or loss on securities deemed sold due to a borrower’s inability to return securities on loan. The Fund will receive compensation for lending its securities in the form of fees or the retention of a portion of the interest on the investment of any cash received as collateral. The Fund also will continue to receive interest and dividends on the securities loaned and any gain or loss in the market price of the securities loaned that may occur during the term of the loan will be for the account of the Fund.
Although the Fund and New York Life Investments have temporarily suspended securities lending, the Fund and New York Life Investments reserve the right to reinstitute lending when deemed appropriate. The Fund had no portfolio securities on loan as of October 31, 2012.
(J) Restricted Securities. A restricted security is a security which has been purchased through a private offering and cannot be resold to the general public without prior registration under the Securities Act of 1933, as amended. The Fund may not have the right to demand that such securities be registered. Disposal of these securities may involve time-consuming negotiations and expenses and it may be difficult to obtain a prompt sale at an acceptable price. (See Note 5)
(K) Concentration of Risk. The Fund invests in high-yield securities (sometimes called “junk bonds”), which are generally considered speculative because they present a greater risk of loss, including default, than higher quality debt securities. These securities pay investors a premium—a high interest rate or yield—because of the increased risk of loss. These securities can also be subject to greater price volatility.
The Fund invests in foreign securities, which carry certain risks that are in addition to the usual risks inherent in domestic instruments. These risks include those resulting from currency fluctuations, future adverse political and economic developments and possible imposition of currency exchange blockages or other foreign governmental laws or restrictions. These risks are likely to be greater in emerging markets than in developed markets. The ability of issuers of debt securities held by the Fund to meet their obligations may be affected by economic or political developments in a specific country, industry or region.
(L) Indemnifications. Under the Trust’s organizational documents, its officers and trustees are indemnified against certain liabilities that may arise out of performance of their duties to the Trust. Additionally, in the normal course of business, the Fund enters into contracts with third-party service providers that contain a variety of representations and warranties and which may provide general indemnifications. The Fund’s maximum exposure under these arrangements is unknown, as this would involve future claims that may be made against the Fund that have not yet occurred. Based on experience, management is of the view that the risk of loss in connection with these potential indemnification obligations is remote. However, there can be no assurance that material liabilities related to such obligations will not arise in the future, which could adversely impact the Fund.
(M) Quantitative Disclosure of Derivative Holdings. The following tables show additional disclosures about the Fund’s derivative and hedging activities, including how such activities are accounted for and their effect on the Fund’s financial positions, performance and cash flows. These derivatives are not accounted for as hedging instruments.
Fair value of derivatives instruments as of October 31, 2012:
Asset Derivatives
| | | | | | | | | | |
| | | Statement of
Assets and
Liabilities
Location | | Equity
Contracts
Risk | | | Total | |
Warrants | | Investments in securities,
at value | | $ | 27,148 | | | $ | 27,148 | |
| | | | | | |
Total Fair Value | | $ | 27,148 | | | $ | 27,148 | |
| | | | |
The effect of derivative instruments on the Statement of Operations for the year ended October 31, 2012:
Realized Gain (Loss)
| | | | | | | | | | |
| | | Statement of
Operations
Location | | Equity
Contracts
Risk | | | Total | |
Warrants | | Net realized gain
(loss) on
investments | | $ | 16 | | | $ | 16 | |
| | | | | | |
Total Realized Gain (Loss) | | $ | 16 | | | $ | 16 | |
| | | | | | |
| | | | |
| mainstayinvestments.com | | | 25 | |
Notes to Financial Statements (continued)
Change in Unrealized Appreciation (Depreciation)
| | | | | | | | | | |
| | | Statement of
Operations
Location | | Equity
Contracts
Risk | | | Total | |
Warrants | | Net change in unrealized appreciation (depreciation) on investments | | $ | (2,062 | ) | | $ | (2,062 | ) |
| | | | | | |
Total Change in Unrealized Appreciation (Depreciation) | | $ | (2,062 | ) | | $ | (2,062 | ) |
| | | | | | |
Number of Contracts, Notional Amounts or Shares/Units
| | | | | | | | |
| | | Equity
Contracts
Risk | | | Total | |
Warrants (1) | | | 2,032 | | | | 2,032 | |
| | | | |
| (1) | Amount disclosed represents the weighted average held during the year ended October 31, 2012. |
Note 3–Fees and Related Party Transactions
(A) Manager and Subadvisor. New York Life Investments, a registered investment adviser and an indirect, wholly-owned subsidiary of New York Life Insurance Company (“New York Life”), serves as the Fund’s Manager, pursuant to an Amended and Restated Management Agreement (“Management Agreement”). The Manager provides offices, conducts clerical, recordkeeping and bookkeeping services, and keeps most of the financial and accounting records required to be maintained by the Fund. Except for the portion of salaries and expenses that are the responsibility of the Fund, the Manager pays the salaries and expenses of all personnel affiliated with the Fund and certain operational expenses of the Fund. The Fund reimburses New York Life Investments in an amount equal to a portion of the salary of the Chief Compliance Officer (“CCO”) of the Fund. MacKay Shields LLC (“MacKay Shields” or the “Subadvisor”), a registered investment adviser and an indirect, wholly-owned subsidiary of New York Life, serves as Subadvisor to the Fund and is responsible for the day-to-day portfolio management of the Fund. Pursuant to the terms of an Amended and Restated Subadvisory Agreement (“Subadvisory Agreement”) between New York Life Investments and MacKay Shields, New York Life Investments pays for the services of the Subadvisor.
The Fund pays the Manager a monthly fee for services performed and facilities furnished at an annual rate of the Fund’s average daily net assets as follows: 0.60% up to $500 million; 0.55% from $500 million to $1 billion; and 0.50% in excess of $1 billion, plus a fee for fund accounting services, previously provided by New York Life Investments under a separate fund accounting agreement, furnished at an annual rate of the Fund’s average daily net assets as follows: 0.05% up to $20 million; 0.0333% from $20 million to $100 million; and 0.01% in excess of $100 million. The effective management fee rate was 0.60% for the year ended October 31, 2012, inclusive of a fee for fund accounting services of 0.01% of the Fund’s average daily net assets.
For the year ended October 31, 2012, New York Life Investments earned fees from the Fund in the amount of $4,536,197.
State Street, 1 Lincoln Street, Boston, Massachusetts 02111, provides sub-administration and sub-accounting services to the Fund pursuant to an agreement with New York Life Investments. These services include calculating the daily NAVs of the Fund, maintaining the general ledger and sub-ledger accounts for the calculation of the Fund’s respective NAVs, and assisting New York Life Investments in conducting various aspects of the Fund’s administrative operations. For providing these services to the Fund, State Street is compensated by New York Life Investments.
(B) Distribution and Service Fees. The Trust, on behalf of the Fund, has entered into a distribution agreement with NYLIFE Distributors LLC (the “Distributor”), an indirect, wholly-owned subsidiary of New York Life. The Fund has adopted distribution plans (the “Plans”) in accordance with the provisions of Rule 12b-1 under the 1940 Act.
Pursuant to the Investor Class and Class A Plans, the Distributor receives a monthly distribution fee from the Investor Class and Class A shares at an annual rate of 0.25% of the average daily net assets of the Investor Class and Class A shares for distribution and/or service activities as designated by the Distributor. Pursuant to the Class B and Class C Plans, Class B and Class C shares pay the Distributor a monthly distribution fee at an annual rate of 0.75% of the average daily net assets of the Class B and Class C shares along with a service fee at an annual rate of 0.25% of the average daily net assets of the Class B and Class C shares, for a total 12b-1 fee of 1.00%. Class I shares are not subject to a distribution and/or service fee.
The Plans provide that the distribution and service fees are payable to the Distributor regardless of the amounts actually expended by the Distributor for distribution of the Fund’s shares and service activities.
(C) Sales Charges. The Fund was advised by the Distributor that the amount of sales charges retained on sales of Investor Class and Class A shares were $20,182 and $39,388, respectively, for the year ended October 31, 2012. The Fund was also advised that the Distributor retained CDSCs on redemptions of Investor Class, Class A, Class B and Class C shares of $70, $3,075, $45,999 and $15,331, respectively, for the year ended October 31, 2012.
(D) Transfer, Dividend Disbursing and Shareholder Servicing Agent. NYLIM Service Company LLC, an affiliate of New York Life Investments, is the Fund’s transfer, dividend disbursing and shareholder servicing agent pursuant to an agreement between NYLIM Service Company LLC and the Trust. NYLIM Service Company LLC has entered into an agreement with Boston Financial Data Services, Inc. (“BFDS”) pursuant to which BFDS performs certain transfer agent services on behalf of NYLIM Service Company LLC. Transfer agent expenses incurred by the Fund for the year ended October 31, 2012, were as follows:
| | | | |
Investor Class | | $ | 273,700 | |
Class A | | | 354,198 | |
Class B | | | 125,748 | |
Class C | | | 275,383 | |
Class I | | | 235,917 | |
| | |
| 26 | | MainStay Convertible Fund |
(E) Small Account Fee. Shareholders with small accounts adversely impact the cost of providing transfer agency services. In an effort to reduce total transfer agency expenses, the Fund has implemented a small account fee on certain types of accounts. Certain shareholders with an account balance of less than $1,000 are charged an annual per account fee of $20 (assessed semi-annually), the proceeds from which offset transfer agent fees as reflected in the Statement of Operations.
Note 4–Federal Income Tax
As of October 31, 2012, the components of accumulated gain (loss) on a tax basis were as follows:
| | | | | | | | | | | | | | | | |
Ordinary
Income | | Accumulated
Capital and
Other Gain
(Loss) | | | Other
Temporary
Differences | | | Unrealized
Appreciation
(Depreciation) | | | Total
Accumulated Gain (Loss) | |
$6,276,365 | | $ | 24,852,256 | | | $ | (1,397,498 | ) | | $ | 6,016,685 | | | $ | 35,747,808 | |
The difference between book basis and tax basis unrealized appreciation (depreciation) is primarily due to wash sale adjustments, defaulted bond income accruals, class actions and contingent payment debt instruments (“CPDI”).
The following table discloses the current year reclassifications between undistributed net investment income (loss), accumulated net realized gain (loss) on investments, and additional paid-in capital arising from permanent differences; net assets as of October 31, 2012 were not affected.
| | | | | | | | |
Undistributed
Net Investment Income (loss) | | Accumulated
Net Realized Gain (Loss) on
Investments | | | Additional
Paid-In
Capital | |
| $695,171 | | $ | (8,564,808 | ) | | $ | 7,869,637 | |
The reclassifications for the Fund are primarily due to real estate investment trusts (“REITs”) investments, distribution redesignations, distributions in connection with redemptions of fund shares and CPDI.
The tax character of distributions paid during the years ended October 31, 2012 and October 31, 2011 shown in the Statements of Changes in Net Assets was as follows:
| | | | | | | | |
| | | 2012 | | | 2011 | |
Distributions paid from:
Ordinary Income | | | $24,131,923 | | | | $17,921,143 | |
Long-Term Capital Gain | | | 31,848,752 | | | | — | |
Total | | $ | 55,980,675 | | | $ | 17,921,143 | |
Note 5–Restricted Securities
As of October 31, 2012, the Fund held the following restricted security:
| | | | | | | | | | | | | | | | | | | | |
Security | | Date of
Acquisition | | | Principal Amount | | | Cost | | | 10/31/12 Value | | | Percentage of
Net Assets | |
At Home Corp. Convertible Bond
4.75%, due 12/31/49 | | | 5/4/01 | | | $ | 9,147,056 | | | $ | 674,023 | | | $ | 915 | | | | 0.0 | %‡ |
| ‡ | Less than one-tenth of a percent. |
Note 6–Custodian
State Street is the custodian of the cash and the securities of the Fund. Custodial fees are charged to the Fund based on the market value of securities in the Fund and the number of certain cash transactions incurred by the Fund.
Note 7–Line of Credit
The Fund and certain affiliated funds maintain a line of credit with a syndicate of banks in order to secure a source of funds for temporary purposes to meet unanticipated or excessive redemption requests.
Effective August 29, 2012, under an amended credit agreement, the aggregate commitment amount is $200,000,000 with an optional maximum amount of $250,000,000. The commitment fee is an annual rate of 0.08% of the average commitment amount payable quarterly, regardless of usage, to Bank of New York Mellon, which serves as the agent to the syndicate. The commitment fee is allocated among certain MainStay Funds based upon net assets and other factors. Interest on any revolving credit loan is charged based upon the Federal Funds
Advances rate or the one month London InterBank Offered Rate, whichever is higher. The amended credit agreement expires on August 28, 2013, although the MainStay Funds and the syndicate of banks may renew the amended credit agreement for an additional year on the same or different terms. Prior to August 29, 2012, the aggregate commitment amount was $125,000,000 with an optional maximum amount of $175,000,000. There were no borrowings made or outstanding with respect to the Fund on the amended credit agreement during the year ended October 31, 2012.
Note 8–Purchases and Sales of Securities (in 000’s)
During the year ended October 31, 2012, purchases and sales of securities, other than short-term securities, were $450,956 and $580,594, respectively.
| | | | |
| mainstayinvestments.com | | | 27 | |
Notes to Financial Statements (continued)
Note 9–Capital Share Transactions
| | | | | | | | |
Investor Class | | Shares | | | Amount | |
Year ended October 31, 2012: | | | | | | | | |
Shares sold | | | 315,524 | | | $ | 4,692,773 | |
Shares issued to shareholders in reinvestment of dividends and distributions | | | 415,428 | | | | 5,815,700 | |
Shares redeemed | | | (831,278 | ) | | | (12,361,399 | ) |
| | | | |
Net increase (decrease) in shares outstanding before conversion | | | (100,326 | ) | | | (1,852,926 | ) |
Shares converted into Investor Class
(See Note 1) | | | 430,501 | | | | 6,352,436 | |
Shares converted from Investor Class
(See Note 1) | | | (569,292 | ) | | | (8,576,018 | ) |
| | | | |
Net increase (decrease) | | | (239,117 | ) | | $ | (4,076,508 | ) |
| | | | |
Year ended October 31, 2011: | | | | | | | | |
Shares sold | | | 465,923 | | | $ | 7,551,313 | |
Shares issued to shareholders in reinvestment of dividends | | | 100,782 | | | | 1,584,776 | |
Shares redeemed | | | (757,343 | ) | | | (12,084,811 | ) |
| | | | |
Net increase (decrease) in shares outstanding before conversion | | | (190,638 | ) | | | (2,948,722 | ) |
Shares converted into Investor Class
(See Note 1) | | | 730,964 | | | | 11,038,661 | |
Shares converted from Investor Class
(See Note 1) | | | (572,490 | ) | | | (9,273,397 | ) |
| | | | |
Net increase (decrease) | | | (32,164 | ) | | $ | (1,183,458 | ) |
| | | | |
| | |
| | | | | | | | |
Class A | | Shares | | | Amount | |
Year ended October 31, 2012: | | | | | | | | |
Shares sold | | | 4,620,849 | | | $ | 69,277,054 | |
Shares issued to shareholders in reinvestment of dividends and distributions | | | 1,594,182 | | | | 22,325,718 | |
Shares redeemed | | | (9,794,989 | ) | | | (145,007,590 | ) |
| | | | |
Net increase (decrease) in shares outstanding before conversion | | | (3,579,958 | ) | | | (53,404,818 | ) |
Shares converted into Class A
(See Note 1) | | | 806,991 | | | | 12,070,125 | |
Shares converted from Class A
(See Note 1) | | | (84,644 | ) | | | (1,294,142 | ) |
| | | | |
Net increase (decrease) | | | (2,857,611 | ) | | $ | (42,628,835 | ) |
| | | | |
Year ended October 31, 2011: | | | | | | | | |
Shares sold | | | 8,664,883 | | | $ | 141,118,764 | |
Shares issued to shareholders in reinvestment of dividends | | | 444,595 | | | | 7,025,686 | |
Shares redeemed | | | (9,625,354 | ) | | | (153,223,379 | ) |
| | | | |
Net increase (decrease) in shares outstanding before conversion | | | (515,876 | ) | | | (5,078,929 | ) |
Shares converted into Class A
(See Note 1) | | | 900,197 | | | | 14,526,215 | |
Shares converted from Class A
(See Note 1) | | | (402,213 | ) | | | (5,786,759 | ) |
| | | | |
Net increase (decrease) | | | (17,892 | ) | | $ | 3,660,527 | |
| | | | |
| | | | | | | | |
Class B | | Shares | | | Amount | |
Year ended October 31, 2012: | | | | | | | | |
Shares sold | | | 231,752 | | | $ | 3,443,183 | |
Shares issued to shareholders in reinvestment of dividends and distributions | | | 156,211 | | | | 2,183,308 | |
Shares redeemed | | | (439,861 | ) | | | (6,546,653 | ) |
| | | | |
Net increase (decrease) in shares outstanding before conversion | | | (51,898 | ) | | | (920,162 | ) |
Shares converted from Class B
(See Note 1) | | | (582,297 | ) | | | (8,552,401 | ) |
| | | | |
Net increase (decrease) | | | (634,195 | ) | | $ | (9,472,563 | ) |
| | | | |
Year ended October 31, 2011: | | | | | | | | |
Shares sold | | | 449,232 | | | $ | 7,311,371 | |
Shares issued to shareholders in reinvestment of dividends | | | 28,300 | | | | 447,511 | |
Shares redeemed | | | (560,699 | ) | | | (8,976,981 | ) |
| | | | |
Net increase (decrease) in shares outstanding before conversion | | | (83,167 | ) | | | (1,218,099 | ) |
Shares converted from Class B
(See Note 1) | | | (655,790 | ) | | | (10,504,720 | ) |
| | | | |
Net increase (decrease) | | | (738,957 | ) | | $ | (11,722,819 | ) |
| | | | |
| | |
| | | | | | | | |
Class C | | Shares | | | Amount | |
Year ended October 31, 2012: | | | | | | | | |
Shares sold | | | 622,852 | | | $ | 9,186,755 | |
Shares issued to shareholders in reinvestment of dividends and distributions | | | 270,074 | | | | 3,774,904 | |
Shares redeemed | | | (1,770,212 | ) | | | (26,195,413 | ) |
| | | | |
Net increase (decrease) | | | (877,286 | ) | | $ | (13,233,754 | ) |
| | | | |
Year ended October 31, 2011: | | | | | | | | |
Shares sold | | | 1,626,122 | | | $ | 26,300,062 | |
Shares issued to shareholders in reinvestment of dividends | | | 43,443 | | | | 683,259 | |
Shares redeemed | | | (1,679,437 | ) | | | (26,508,376 | ) |
| | | | |
Net increase (decrease) | | | (9,872 | ) | | $ | 474,945 | |
| | | | |
| | |
| | | | | | | | |
Class I | | Shares | | | Amount | |
Year ended October 31, 2012: | | | | | | | | |
Shares sold | | | 5,186,678 | | | $ | 77,180,403 | |
Shares issued to shareholders in reinvestment of dividends and distributions | | | 392,510 | | | | 5,517,430 | |
Shares redeemed | | | (9,409,185 | ) | | | (139,306,197 | ) |
| | | | |
Net increase (decrease) | | | (3,829,997 | ) | | $ | (56,608,364 | ) |
| | | | |
Year ended October 31, 2011: | | | | | | | | |
Shares sold | | | 12,441,138 | | | $ | 201,714,157 | |
Shares issued to shareholders in reinvestment of dividends | | | 176,106 | | | | 2,831,887 | |
Shares redeemed | | | (10,254,792 | ) | | | (162,900,193 | ) |
| | | | |
Net increase (decrease) | | | 2,362,452 | | | $ | 41,645,851 | |
| | | | |
| | |
| 28 | | MainStay Convertible Fund |
Note 10–Subsequent Events
In connection with the preparation of the financial statements of the Fund as of and for the year ended October 31, 2012, events and transactions subsequent to October 31, 2012 through the date the financial
statements were issued have been evaluated by the Fund’s management for possible adjustment and/or disclosure. No subsequent events requiring financial statement adjustment or disclosure have been identified.
| | | | |
| mainstayinvestments.com | | | 29 | |
Report of Independent Registered Public Accounting Firm
The Board of Trustees and Shareholders of
The MainStay Funds:
We have audited the accompanying statement of assets and liabilities, including the portfolio of investments, of the MainStay Convertible Fund (the “Fund”), one of the funds constituting The MainStay Funds, as of October 31, 2012, and the related statement of operations for the year then ended, the statements of changes in net assets for each of the years in the two-year period then ended, and the financial highlights for each of the years or periods in the five-year period then ended. These financial statements and financial highlights are the responsibility of the Fund’s management. Our responsibility is to express an opinion on these financial statements and financial highlights based on our audits.
We conducted our audits in accordance with the standards of the Public Company Accounting Oversight Board (United States). Those standards require that we plan and perform the audit to obtain reasonable assurance about whether the financial statements and financial highlights are free of material misstatement. An audit includes examining, on a test basis, evidence supporting the amounts and disclosures in the financial statements. Our procedures included confirmation of securities owned as of October 31, 2012, by correspondence with the custodian and brokers or by other appropriate auditing procedures where replies from brokers were not received. An audit also includes assessing the accounting principles used and significant estimates made by management, as well as evaluating the overall financial statement presentation. We believe that our audits provide a reasonable basis for our opinion.
In our opinion, the financial statements and financial highlights referred to above present fairly, in all material respects, the financial position of the MainStay Convertible Fund of The MainStay Funds as of October 31, 2012, the results of its operations for the year then ended, the changes in its net assets for each of the years in the two-year period then ended, and the financial highlights for each of the years or periods in the five-year period then ended, in conformity with U.S. generally accepted accounting principles.

Philadelphia, Pennsylvania
December 21, 2012
| | |
| 30 | | MainStay Convertible Fund |
Federal Income Tax Information
(Unaudited)
The Fund is required under the Internal Revenue Code to advise shareholders in a written statement as to the federal tax status of dividends paid by the Fund during such fiscal years. Accordingly, the Fund paid $31,848,752 as long term capital distribution.
For the fiscal year ended October 31, 2012, the Fund designated approximately $6,207,543 under the Internal Revenue Code as qualified dividend income eligible for reduced tax rates.
The dividends paid by the Fund during the fiscal year ended October 31, 2012, should be multiplied by 27.6% to arrive at the amount eligible for the corporate dividends received deduction.
In February 2013, shareholders will receive an IRS Form 1099-DIV or substitute Form 1099 which will show the federal tax status of the distributions received by shareholders in calendar year 2012. The amounts that will be reported on such 1099-DIV or substitute Form 1099 will be the amounts you are to use on your federal income tax return and will differ from the amounts which we must report for the Fund’s fiscal year ended October 31, 2012.
Proxy Voting Policies and Procedures and Proxy Voting Record
A description of the policies and procedures that New York Life Investments uses to vote proxies related to the Fund’s securities is available without charge, upon request, (i) by visiting the Fund’s website at mainstayinvestments.com; or (ii) on the SEC’s website at www.sec.gov.
The Fund is required to file with the SEC its proxy voting record for the 12-month period ending June 30 on Form N-PX. The Fund’s most recent Form N-PX is available free of charge upon request (i) by calling 800-MAINSTAY (624-6782); (ii) by visiting the Fund’s website at mainstayinvestments.com; or (iii) on the SEC’s website at www.sec.gov.
Shareholder Reports and Quarterly Portfolio Disclosure
The Fund is required to file its complete schedule of portfolio holdings with the SEC for its first and third fiscal quarters on Form N-Q. The Fund’s Form N-Q is available without charge on the SEC’s website at www.sec.gov or by calling MainStay Investments at 800-MAINSTAY (624-6782). You can obtain and review copies of Form N-Q by visiting the SEC’s Public Reference Room in Washington, DC (information on the operation of the Public Reference Room may be obtained by calling 1-800-SEC-0330).
| | | | |
| mainstayinvestments.com | | | 31 | |
Board Members and Officers (Unaudited)
The Board Members oversee the MainStay Group of Funds (which is comprised of Funds that are series of The MainStay Funds, Eclipse Trust, Eclipse Funds Inc., MainStay Funds Trust, MainStay VP Funds Trust, Private Advisors Alternative Strategies Master Fund, Private Advisors Alternative Strategies Fund, and MainStay Defined Term Municipal Opportunities Fund) (collectively, the “Fund Complex”), the Manager and, when applicable, the Subadvisor(s) and other service providers to the Fund Complex. Each Board Member serves until his or her successor is elected and qualified or until his or her resignation, death or removal. The Retirement Policy provides that a Board Member
shall tender his or her resignation by the end of the calendar year during which he or she reaches the age of 75.
Officers serve a term of one year and are elected annually by the Board Members. The business address of each Board Member and officer listed below is 51 Madison Avenue, New York, New York 10010.
The Statement of Additional Information applicable to the Fund includes additional information about the Board Members and is available without charge, upon request, by calling 800-MAINSTAY (624-6782) or by going online to mainstayinvestments.com.
| | | | | | | | | | | | |
| | | | | Name and
Date of Birth | | Term of Office,
Position(s) Held
with the Fund
Complex and
Length of Service | | Principal Occupation(s)
During Past Five Years | | Number of
Funds in
Fund Complex
Overseen by
Board Member | | Other Directorships
Held by Board Member |
| Interested Board Member* | | | | John Y. Kim
9/24/60 | | Indefinite;
Eclipse Trust: Trustee since 2008;
Eclipse Funds Inc.:
Director since 2008 (1 fund);
The MainStay Funds: Trustee since 2008 (12 funds);
MainStay Funds Trust: Trustee since 2009 (31 funds); and
MainStay VP Funds Trust: Trustee since 2011 and its predecessor, MainStay VP Series Fund, Inc. since 2008 (28 portfolios). Private Advisors Alternative Strategies Master Fund: Trustee since 2011
Private Advisors Alternative Strategies Fund: Trustee since 2011
MainStay DefinedTerm Municipal Opportunities Fund: Trustee since 2011 | | Member of the Board of Managers, President and Chief Executive Officer (since 2008), New York Life Investment Management LLC and New York Life Investment Management Holdings LLC; Member of the Board, MacKay Shields LLC since 2008; Chairman of the Board, Institutional Capital LLC, Madison Capital Funding LLC, Madison Square Investors LLC and McMorgan & Company LLC; Chairman of the Board, NYLIFE Distributors LLC and Chairman of the Board, NYLCAP Manager LLC (since 2008) President, Prudential Retirement, a business unit of Prudential Financial, Inc. (2002 to 2007) | | 75 | | None |
| | * | This Board Member is considered to be an “interested person” of the MainStay Group of Funds within the meaning of the 1940 Act because of his affiliation with New York Life Insurance Company, New York Life Investment Management LLC, Madison Square Investors LLC, MacKay Shields LLC, Private Advisors LLC, Institutional Capital LLC, NYLIFE Securities LLC and/or NYLIFE Distributors LLC, as described in detail above in the column entitled “Principal Occupation(s) During the Past Five Years.” |
| | |
| 32 | | MainStay Convertible Fund |
| | | | | | | | | | | | |
| | | | | Name and
Date of Birth | | Term of Office, Position(s) Held with the Fund Complex and Length of Service | | Principal Occupation(s)
During Past Five Years | | Number of
Funds in
Fund Complex
Overseen by
Board Member | | Other Directorships
Held by Board Member |
| Non-Interested Board Members | | | | Susan B. Kerley 8/12/51 | | Indefinite;
Eclipse Trust: Chairman since 2005, and Trustee since 2000;
Eclipse Funds Inc.: Chairman since 2005 and Director since 1990 (1 fund); The MainStay Funds: Chairman and Board Member since 2007 (12 funds);
MainStay Funds Trust: Chairman and Trustee since 2009 (31 funds); and MainStay VP Funds Trust: Chairman and Trustee since 2011 and its predecessor, MainStay VP Series Fund, Inc., since 2007 (28 portfolios). Private Advisors Alternative Strategies Master Fund: Chairman and Trustee since 2011 Private Advisors Alternative Strategies Fund: Chairman and Trustee since 2011 MainStay DefinedTerm Municipal Opportunities Fund: Chairman and Trustee since 2011. | | President, Strategic Management Advisors LLC (since 1990) | | 75 | | Trustee, Legg Mason Partners Funds, since 1992 (51 portfolios) |
| | | | |
| mainstayinvestments.com | | | 33 | |
| | | | | | | | | | | | |
| | | | | Name and
Date of Birth | | Term of Office,
Position(s) Held
with the Fund
Complex and
Length of Service | | Principal Occupation(s)
During Past Five Years | | Number of
Funds in
Fund Complex
Overseen by
Board Member | | Other Directorships
Held by Board Member |
| Non-Interested Board Members | | | | Alan R. Latshaw 3/27/51 | | Indefinite;
Eclipse Trust: Trustee and Audit Committee Financial Expert since 2007;
Eclipse Funds Inc.:
Director and Audit Committee Financial Expert since 2007 (1 fund);
The MainStay Funds: Trustee and Audit Committee Financial Expert since 2006 (12 funds);
MainStay Funds Trust: Trustee and Audit Committee Financial Expert since 2009 (31 funds); and
MainStay VP Funds Trust: Trustee and Audit Committee Financial Expert since 2011 and its predecessor, MainStay VP Series Fund, Inc., since 2007 (28 portfolios). Private Advisors Alternative Strategies Master Fund: Trustee and Audit Committee Financial Expert since 2011 Private Advisors Alternative Strategies Fund: Trustee and Audit Committee Financial Expert since 2011. MainStay DefinedTerm Municipal Opportunities Fund: Trustee and Audit Committee Financial Expert since 2011. | | Retired; Partner, Ernst & Young LLP (2002 to 2003); Partner, Arthur Andersen LLP (1989 to 2002); Consultant to the MainStay Funds Audit and Compliance Committee (2004 to 2006) | | 75 | | Trustee, State Farm Associates Funds Trusts since 2005 (4 portfolios); Trustee, State Farm Mutual Fund Trust since 2005 (15 portfolios); Trustee, State Farm Variable Product Trust since 2005 (9 portfolios) |
| | |
| 34 | | MainStay Convertible Fund |
| | | | | | | | | | | | |
| | | | | Name and Date of Birth | | Term of Office, Position(s) Held with the Fund Complex and Length of Service | | Principal Occupation(s)
During Past Five Years | | Number of
Funds in
Fund Complex
Overseen by
Board Member | | Other Directorships Held by Board Member |
| Non-Interested Board Members | | | | Peter Meenan
12/5/41 | | Indefinite;
Eclipse Funds: Trustee since 2002;
Eclipse Funds Inc.:
Director since 2002
(1 fund); The MainStay Funds:
Trustee since 2007 (12 funds);
MainStay Funds Trust: Trustee since 2009
(31 funds); and
MainStay VP Funds Trust: Trustee since 2011 and its predecessor, MainStay VP Series Fund, Inc., since 2007 (28 portfolios).
Private Advisors Alternative Strategies Master Fund: Trustee since 2011. Private Advisors Alternative Strategies Fund: Trustee since 2011
MainStay DefinedTerm Municipal Opportunities Fund: Trustee since 2011. | | Independent Consultant; President and Chief Executive Officer, Babson—United, Inc. (financial services firm) (2000 to 2004); Independent Consultant (1999 to 2000); Head of Global Funds, Citicorp (1995 to 1999) | | 75 | | None |
| | | | Richard H. Nolan, Jr.
11/16/46 | | Indefinite;
Eclipse Trust: Trustee since 2007;
Eclipse Funds Inc.:
Director since 2007 (1 fund);
The MainStay Funds: Trustee since 2007 (12 funds);
MainStay Funds Trust: Trustee since 2009 (31 funds); and
MainStay VP Funds Trust: Trustee since 2011 and its predecessor, MainStay VP Series Fund, Inc., since 2006 (28 portfolios).
Private Advisors Alternative Strategies Master Fund: Trustee since 2011. Private Advisors Alternative Strategies Fund: Trustee since 2011
MainStay DefinedTerm Municipal Opportunities Fund: Trustee since 2011. | | Managing Director, ICC Capital Management; President—Shields/Alliance, Alliance Capital Management (1994 to 2004) | | 75 | | None |
| | | | |
| mainstayinvestments.com | | | 35 | |
| | | | | | | | | | | | |
| | | | | Name and Date of Birth | | Term of Office, Position(s) Held with the Fund Complex and Length of Service | | Principal Occupation(s)
During Past Five Years | | Number of
Funds in
Fund Complex
Overseen by
Board Member | | Other Directorships Held by Board Member |
| Non-Interested Board Members | | | | Richard S. Trutanic 2/13/52 | | Indefinite;
Eclipse Trust: Trustee since 2007;
Eclipse Funds Inc.:
Director since 2007 (1 fund);
The MainStay Funds:
Trustee since 1994 (12 funds);
MainStay Funds Trust:
Trustee since 2009 (31 funds); and
MainStay VP Funds Trust: Trustee since 2011 and its predecessor, MainStay VP Series Fund, Inc., since 2007 (28 portfolios).
Private Advisors Alternative Strategies Master Fund: Trustee since 2011.
Private Advisors Alternative Strategies Fund: Trustee since 2011
MainStay DefinedTerm Municipal Opportunities Fund: Trustee since 2011. | | Chairman and Chief Executive Officer, Somerset & Company (financial advisory firm) (since 2004); Managing Director, The Carlyle Group (private investment firm) (2002 to 2004); Senior Managing Director, Partner and Board Member, Groupe Arnault S.A. (private investment firm) (1999 to 2002) | | 75 | | None |
| | |
| 36 | | MainStay Convertible Fund |
| | | | | | | | | | | | |
| | | | | Name and Date of Birth | | Term of Office, Position(s) Held with the Fund Complex and Length of Service | | Principal Occupation(s)
During Past Five Years | | Number of
Funds in
Fund Complex
Overseen by
Board Member | | Other Directorships Held by Board Member |
| Non-Interested Board Members | | | | Roman L. Weil
5/22/40 | | Indefinite;
Eclipse Trust: Trustee and Audit Committee Financial Expert since 2007; Eclipse Funds Inc.: Director and Audit Committee Financial Expert since 2007 (1 fund); The MainStay Funds: Trustee and Audit Committee Financial Expert since 2007 (12 funds); MainStay Funds Trust: Trustee since 2009 (31 funds); and MainStay VP Funds Trust: Trustee and Audit Committee Financial Expert since 2011 and its predecessor, MainStay VP Series Fund, Inc., since 1994 and Audit Committee Financial Expert since 2003 (28 portfolios).
Private Advisors Alternative Strategies Master Fund: Trustee and Audit Committee Financial Expert since 2011 Private Advisors Alternative Strategies Fund: Trustee and Audit Committee Financial Expert since 2011. MainStay DefinedTerm Municipal Opportunities Fund: Trustee and Audit Committee Financial Expert since 2011. | | Visiting Professor, University of California—San Diego (since October 2012); Visiting Professor, Southern Methodist University (2011); Visiting Professor, NYU Stem School of Business, New York University (2011); President, Roman L. Weil Associates, Inc. (consulting firm) (since 1981); V. Duane Rath Professor Emeritus of Accounting, Chicago Booth School of Business, University of Chicago (1965-2008) | | 75 | | None |
| | | | |
| mainstayinvestments.com | | | 37 | |
| | | | | | | | | | | | |
| | | | | Name and Date of Birth | | Term of Office, Position(s) Held with the Fund Complex and Length of Service | | Principal Occupation(s)
During Past Five Years | | Number of
Funds in
Fund Complex
Overseen by
Board Member | | Other Directorships Held by Board Member |
| Non-Interested Board Members | | | | John A. Weisser 10/22/41 | | Indefinite; Eclipse Trust: Trustee since 2007; Eclipse Funds Inc.: Director since 2007 (1 fund); The MainStay Funds: Trustee since 2007 (12 funds); MainStay Funds Trust: Trustee since 2009 (31 funds); and MainStay VP Funds Trust: Trustee since 2011 and its predecessor, MainStay VP Series Fund, Inc., since 1997 (28 portfolios).
Private Advisors Alternative Strategies Master Fund: Trustee since 2011.
Private Advisors Alternative Strategies Fund: Trustee since 2011
MainStay DefinedTerm Municipal Opportunities Fund: Trustee since 2011. | | Retired. Managing Director of Salomon Brothers, Inc. (1971 to 1995) | | 75 | | Trustee, Direxion Funds since 2007 (21 portfolios); Direxion Insurance Trust since 2007 (1 portfolio); Trustee, Direxion Shares ETF Trust, since 2008 (47 portfolios) |
| | |
| 38 | | MainStay Convertible Fund |
The following individuals have been appointed by the Board Members to serve as Officers of the MainStay Group of Funds.
| | | | | | | | |
| | | | | Name and
Date of Birth | | Positions(s) Held with the Funds and Length of Service | | Principal Occupation(s) During Past Five Years |
| Officers | | | | Jack R. Benintende 5/12/64 | | Treasurer and Principal Financial and Accounting Officer, Eclipse Trust, Eclipse Funds, Inc. and The MainStay Funds (since 2007), MainStay Funds Trust (since 2009) | | Assistant Treasurer, New York Life Investment Management Holdings LLC (since 2008); Managing Director, New York Life Investment Management LLC (since 2007); Treasurer and Principal Financial Accounting Officer, Private Advisors Alternative Strategies Master Fund, Private Advisors Alternative Strategies Fund and MainStay DefinedTerm Municipal Opportunities Fund (since 2011); Treasurer and Principal Financial and Accounting Officer, MainStay VP Funds Trust and its predecessor, MainStay VP Series Fund, Inc. (since 2007) |
| | | | Jeffrey A. Engelsman 9/28/67 | | Vice President and Chief Compliance Officer, Eclipse Trust, Eclipse Funds, Inc., The MainStay Funds and MainStay Funds Trust (since 2009) | | Managing Director, Compliance (since 2009), Director and Associate General Counsel, New York Life Investment Management LLC (2005 to 2008); Assistant Secretary, NYLIFE Distributors LLC (2006 to 2008); Vice President and Chief Compliance Officer, Private Advisors Alternative Strategies Master Fund, Private Advisors Alternative Strategies Fund, DefinedTerm Municipal Opportunities Fund (since 2011); MainStay VP Funds Trust and its predecessor, MainStay VP Series Fund, Inc. (since 2009); Assistant Secretary, The MainStay Funds (2006 to 2008); Assistant Secretary, Eclipse Trust, Eclipse Funds, Inc. and MainStay VP Series Fund, Inc. (2005 to 2008) |
| | | | Stephen P. Fisher 2/22/59 | | President, Eclipse Trust, Eclipse Funds, Inc. and The MainStay Funds (since 2007), MainStay Funds Trust (since 2009) | | Director, Senior Vice President, New York Life Insurance and Annuity Corporation (since 2011); Manager, President and Chief Operating Officer, NYLIFE Distributors LLC (since 2008); Chairman of the Board, NYLIM Service Company LLC (since 2008); Senior Managing Director and Chief Marketing Officer, New York Life Investment Management LLC (since 2005); President, Private Advisors Alternative Strategies Master Fund, Private Advisors Alternative Strategies Fund and MainStay DefinedTerm Municipal Opportunities Fund (since 2011); MainStay VP Funds Trust and its predecessor, MainStay VP Series Fund, Inc. (since 2007) |
| | | | J. Kevin Gao 10/13/67 | | Secretary and Chief Legal Officer, Eclipse Trust, Eclipse Funds, Inc., The MainStay Funds and MainStay Funds Trust (since 2010) | | Managing Director and Associate General Counsel, New York Life Investment Management LLC (since 2010); Secretary and Chief Legal Officer, Private Advisors Alternative Strategies Master Fund, Private Advisors Alternative Strategies Fund and MainStay DefinedTerm Municipal Opportunities Fund (since 2011); MainStay VP Funds Trust and its predecessor, MainStay VP Series Fund, Inc. (since 2010); Director and Counsel of Credit Suisse, Chief Legal Officer and Secretary of Credit Suisse Asset Management, LLC and Credit Suisse Funds (2003 to 2010) |
| | | | Scott T. Harrington 2/8/59 | | Vice President—Administration, Eclipse Trust, Eclipse Funds, Inc. and The MainStay Funds (since 2005), MainStay Funds Trust (since 2009) | | Director, New York Life Investment Management LLC (including predecessor advisory organizations) (since 2000); Executive Vice President, New York Life Trust Company and New York Life Trust Company FSB (since 2006); Vice President—Administration, Private Advisors Alternative Strategies Master Fund, Private Advisors Alternative Strategies Fund and MainStay DefinedTerm Municipal Opportunities Fund (since 2011); MainStay VP Funds Trust and its predecessor, MainStay VP Series Fund, Inc. (since 2005) |
| | * | The Officers listed above are considered to be “interested persons” of the MainStay Group of Funds within the meaning of the 1940 Act because of their affiliation with New York Life Insurance Company, New York Life Investment Management LLC, Madison Square Investors LLC, MacKay Shields LLC, Private Advisors LLC, Institutional Capital LLC, Epoch Investment Partners, Inc., Markston International, LLC, Winslow Capital Management, Inc., NYLIFE Securities LLC and/or NYLIFE Distributors LLC, as described in detail above in the column captioned “Principal Occupation(s) During Past Five Years.” Officers are elected annually by the Board to serve a one-year term. |
| | | | |
| mainstayinvestments.com | | | 39 | |
This page intentionally left blank
This page intentionally left blank
This page intentionally left blank
MainStay Funds
MainStay offers a wide range of Funds for virtually any investment need. The full array of MainStay open-end offerings is listed here, with information about the manager, subadvisors, legal counsel and independent registered public accounting firms.
Equity
U.S. Equity
MainStay Common Stock Fund
MainStay Epoch U.S. All Cap Fund
MainStay Epoch U.S. Equity Yield Fund
MainStay Growth Equity Fund
MainStay ICAP Equity Fund
MainStay ICAP Select Equity Fund
MainStay Large Cap Growth Fund1
MainStay MAP Fund
MainStay S&P 500 Index Fund
MainStay U.S. Small Cap Fund
MainStay 130/30 Core Fund
International/Global Equity
MainStay Epoch Global Choice Fund
MainStay Epoch Global Equity Yield Fund
MainStay Epoch International Small Cap Fund
MainStay ICAP Global Fund
MainStay ICAP International Fund
MainStay International Equity Fund
MainStay 130/30 International Fund
Income
Taxable Bond
MainStay Flexible Bond Opportunities Fund
MainStay Floating Rate Fund
MainStay Global High Income Fund
MainStay Government Fund
MainStay High Yield Corporate Bond Fund
MainStay High Yield Opportunities Fund
MainStay Indexed Bond Fund
MainStay Intermediate Term Bond Fund
MainStay Short Term Bond Fund
MainStay Money Market Fund
Municipal Bond
MainStay High Yield Municipal Bond Fund
MainStay New York Tax Free Opportunities Fund2
MainStay Tax Free Bond Fund
Mixed Asset
MainStay Balanced Fund
MainStay Convertible Fund
MainStay Income Builder Fund
MainStay Marketfield Fund
Asset Allocation/Target Date
MainStay Conservative Allocation Fund
MainStay Growth Allocation Fund
MainStay Moderate Allocation Fund
MainStay Moderate Growth Allocation Fund
MainStay Retirement 2010 Fund
MainStay Retirement 2020 Fund
MainStay Retirement 2030 Fund
MainStay Retirement 2040 Fund
MainStay Retirement 2050 Fund
Manager
New York Life Investment Management LLC
New York, New York
Subadvisors
Epoch Investment Partners, Inc.
New York, New York
Institutional Capital LLC3
Chicago, Illinois
MacKay Shields LLC3
New York, New York
Madison Square Investors LLC3
New York, New York
Marketfield Asset Management LLC
New York, New York
Markston International LLC
White Plains, New York
Winslow Capital Management, Inc.
Minneapolis, Minnesota
Legal Counsel
Dechert LLP
Independent Registered Public Accounting Firms
KPMG LLP
PricewaterhouseCoopers LLP
1. Effective January 13, 2012, the Fund was closed to new investors with certain exceptions.
2. The Fund is only registered for sale in CT, DE, FL, MA, NJ, NY, and VT.
3. An affiliate of New York Life Investment Management LLC.
Not part of the Annual Report
mainstayinvestments.com
The MainStay Funds are managed by New York Life Investment Management LLC and distributed through NYLIFE Distributors
LLC, 169 Lackawanna Avenue, Parsippany, NJ 07054, a wholly owned subsidiary of New York Life Insurance Company.
NYLIFE Distributors is a Member FINRA/SIPC.
MainStay Investments is a service mark and name under which New York Life Investment Management LLC does business.
MainStay Investments, an indirect subsidiary of New York Life Insurance Company, New York, NY 10010, provides investment
advisory products and services.
This report may be distributed only when preceded or accompanied by a current Fund prospectus.
© 2013 by NYLIFE Distributors LLC. All rights reserved.
| | | | | | | | |
| Not FDIC/NCUA Insured | | Not a Deposit | | May Lose Value | | No Bank Guarantee | | Not Insured by Any Government Agency |
| | | | |
| NYLIM-28263 MS265-12 | |
| MSC11-12/12
NL005 |
|

MainStay Income Builder Fund
Message from the President and Annual Report
October 31, 2012
This page intentionally left blank
Message from the President
Most major equity markets delivered positive results for the 12 months ended October 31, 2012. In the United States, stocks provided solid double-digit returns. With a few notable exceptions, international stock markets generally ended the reporting period in positive territory.
The stock market’s advance, however, was far from uniform. After rising to an early peak at the end of March 2012, domes-
tic and international stocks lost ground until the beginning of June. After that, stocks generally rose, reaching their high point for the reporting period in mid-September. Although stocks remained relatively buoyant through mid-October, they drifted lower as the reporting period came to a close.
A variety of forces converged to help fuel these market movements. Investors kept a close eye on developments in the European sovereign debt crisis. The European Central Bank’s Long Term Refinancing Operations helped stabilize European credit markets and provide needed liquidity. Although private holders of Greek sovereign debt had to accept a reduction in their recovery value, the anticipated voluntary exchange provided a positive spark to the markets. Rising unemployment and new austerity measures may impede economic growth as the European Union seeks to strike a delicate balance between fiscal and monetary policies.
In the United States, the Federal Reserve announced an open-ended agency mortgage-backed security purchase program, which helped calm market concerns. The Federal Reserve also continued its maturity extension program (referred to by some as “operation twist”), which seeks to put downward pressure on longer-term interest rates. At the short end of the yield curve, the Federal Reserve maintained the federal funds rate in a near-zero range. In September 2012, the Federal Open Market Committee anticipated that “exceptionally low levels for the federal funds rate” were “likely to be warranted at least through mid-2015.”
With markets stabilizing and short-term interest rates at very low levels, yield-hungry investors had incentives to lengthen maturities and accept higher risk. Domestic high-yield bonds provided double-digit returns for the reporting period, municipal bonds and convertible securities provided high single-digit returns, and domestic corporate bonds provided positive overall returns.
While most investors are pleased when markets rise, MainStay portfolio managers know that long-term results depend on more than short-term market movements. They also depend on the consistent application of well-defined investment strategies and risk-management techniques over longer periods. Our long-term perspective gives our portfolio managers the ability to look past the daily ups and downs of the market as they pursue the specific investment objectives of their individual Funds.
At MainStay, we believe that a long-term perspective can help investors as well. Instead of trying to capitalize on short-term market movements, you may prefer to focus on the long-term potential that can come from getting invested, staying invested and adding to your investments over time. Of course, past performance is no guarantee of future results.
The following pages contain more specific information on the securities, market events and investment decisions that affected your MainStay Fund(s) during the 12 months ended October 31, 2012. We invite you to read the information carefully and use it as part of your ongoing portfolio evaluation and investment review.
Sincerely,

Stephen P. Fisher
President
The opinions expressed are as of the date of this report and are subject to change. There is no guarantee that any forecast made will come to pass. This material does not constitute investment advice and is not intended as an endorsement of any specific investment.
Not part of the Annual Report
Table of Contents
Investors should refer to the Fund’s Summary Prospectus and/or Prospectus and consider the Fund’s investment objectives, strategies, risks, charges and expenses carefully before investing. The Summary Prospectus and/or Prospectus contain this and other information about the Fund. You may obtain copies of the Fund’s Summary Prospectus, Prospectus and Statement of Additional Information free of charge, upon request, by calling toll-free 800-MAINSTAY (624-6782), by writing to NYLIFE Distributors LLC, Attn: MainStay Marketing Department, 169 Lackawanna Avenue, Parsippany, New Jersey 07054 or by sending an e-mail to MainStayShareholderServices@nylim.com. These documents are also available via the MainStay Funds’ website at mainstayinvestments.com/documents. Please read the Summary Prospectus and/or Prospectus carefully before investing.
Investment and Performance Comparison1 (Unaudited)
Performance data quoted represents past performance. Past performance is no guarantee of future results. Because of market volatility, current performance may be lower or higher than the figures shown. Investment return and principal value will fluctuate, and as a result, when shares are redeemed, they may be worth more or less than their original cost. The graph below depicts the historical performance of Class B shares of the Fund. Performance will vary from class to class based on differences in class-specific expenses and sales charges. For performance information current to the most recent month-end, please call 800-MAINSTAY (624-6782) or visit mainstayinvestments.com.
(With sales charges)
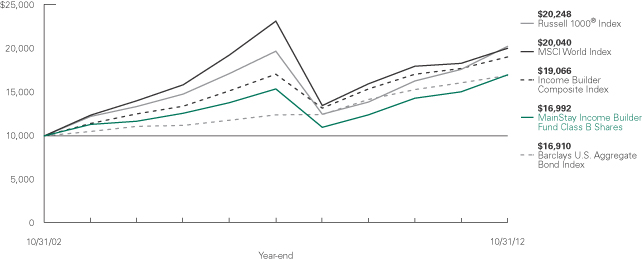
Average Annual Total Returns for the Year Ended October 31, 2012
| | | | | | | | | | | | | | | | | | | | |
| Class | | Sales Charge | | | | One Year | | | Five Years | | | Ten Years | | | Gross
Expense
Ratio2 | |
| Investor Class Shares3 | | Maximum 5.5% Initial Sales Charge | | With sales charges
Excluding sales charges | |
| 7.46
13.72 | %
| |
| 1.63
2.79 | %
| |
| 5.63
6.23 | %
| |
| 1.40
1.40 | %
|
| Class A Shares | | Maximum 5.5% Initial Sales Charge | | With sales charges
Excluding sales charges | |
| 7.88
14.16 |
| |
| 1.89
3.05 |
| |
| 5.77
6.37 |
| |
| 1.08
1.08 |
|
| Class B Shares | | Maximum 5% CDSC
if Redeemed Within the First Six Years of Purchase | | With sales charges Excluding sales charges | |
| 7.87
12.87 |
| |
| 1.69
2.02 |
| |
| 5.44
5.44 |
| |
| 2.15
2.15 |
|
| Class C Shares | | Maximum 1% CDSC
if Redeemed Within One Year of Purchase | | With sales charges
Excluding sales charges | |
| 11.96
12.96 |
| |
| 2.02
2.02 |
| |
| 5.43
5.43 |
| |
| 2.15
2.15 |
|
| Class I Shares4 | | No Sales Charge | | | | | 14.41 | | | | 3.35 | | | | 6.78 | | | | 0.83 | |
| 1. | The performance table and graph do not reflect the deduction of taxes that a shareholder would pay on distributions or Fund-share redemptions. Total returns reflect maximum applicable sales charges as indicated in the table above, changes in share price, and reinvestment of dividend and capital gain distributions. The graph assumes the initial investment amount shown above and reflects the deduction of all sales charges that would have applied for the period of investment. Performance figures reflect certain fee waivers and/or expense limitations, without which total returns may have been lower. For more information on share classes and current fee waivers and/or expense limitations, please refer to the notes to the financial statements. |
| 2. | The gross expense ratios presented reflect the Fund’s “Total Annual Fund Operating Expenses” from the most recent Prospectus and may differ from other expense ratios disclosed in this report. |
| 3. | Performance figures for Investor Class shares, first offered on February 28, 2008, include the performance of Class A shares through February 27, 2008, adjusted for differences in certain fees and expenses. Unadjusted, the performance shown for Investor Class shares might have been different. |
| 4. | Performance figures for Class I shares, first offered on January 2, 2004, include the historical performance of Class B shares through January 1, 2004, adjusted for differences in certain expenses and fees. Unadjusted, the performance shown for Class I shares might have been different. |
The footnotes on the next page are an integral part of the table and graph and should be carefully read in conjunction with them.
| | | | |
| mainstayinvestments.com | | | 5 | |
| | | | | | | | | | | | |
| Benchmark Performance | | One
Year | | | Five
Years | | | Ten
Years | |
MSCI World Index5 | | | 9.45 | % | | | –2.87 | % | | | 7.20 | % |
Russell 1000® Index6 | | | 14.97 | | | | 0.53 | | | | 7.31 | |
Income Builder Composite Index7 | | | 7.59 | | | | 2.22 | | | | 6.67 | |
Barclays U.S. Aggregate Bond Index8 | | | 5.25 | | | | 6.38 | | | | 5.39 | |
Average Lipper Mixed-Asset Target Allocation Growth Fund9 | | | 9.58 | | | | 0.60 | | | | 6.39 | |
| 5. | The MSCI World Index is a free float-adjusted market capitalization weighted index that is designed to measure the equity market performance of developed markets. The MSCI World Index is the Fund’s broad-based securities market index for comparison purposes. Total returns assume reinvestment of all dividends and capital gains. An investment cannot be made directly in an index. |
| 6. | The Russell 1000® Index measures the performance of the large-cap segment of the U.S. equity universe. It is a subset of the Russell 3000® Index and includes approximately 1,000 of the largest securities based on a combination of their market cap and current index membership. The Russell 1000® Index represents approximately 92% of the U.S. market. The Russell 1000® Index is the Fund’s secondary benchmark. Total returns assume reinvestment of all dividends and capital gains. An investment cannot be made directly in an index. |
| 7. | The Income Builder Index consists of the MSCI World Index and the Barclays U.S. Aggregate Bond Index weighted 50%/50% respectively. The Fund has selected the Income Builder Composite Index is an additional benchmark. |
| | Total returns assume reinvestment of all dividends and capital gains. An investment cannot be made directly in an index. |
| 8. | The Barclays U.S. Aggregate Bond Index is a broad-based benchmark that measures the investment grade, U.S. dollar-denominated, fixed-rate taxable bond market, including Treasurys, government-related and corporate securities, mortgage-backed securities (agency fixed-rate and hybrid adjustable rate mortgage pass-throughs), asset-backed securities, and commercial mortgage-backed securities. The Fund has selected the Barclays U.S. Aggregate Bond Index as an additional benchmark. Total returns assume reinvestment of all dividends and capital gains. An investment cannot be made directly in an index. |
| 9. | The average Lipper mixed-asset target allocation growth fund is representative of funds that, by portfolio practice, maintain a mix of between 60%–80% equity securities, with the remainder invested in bonds, cash, and cash equivalents. This benchmark is a product of Lipper Inc. Lipper Inc. is an independent monitor of fund performance. Results are based on average total returns of similar funds with all dividend and capital-gain distributions reinvested. |
The footnotes on the preceding page are an integral part of the table and graph and should be carefully read in conjunction with them.
| | |
| 6 | | MainStay Income Builder Fund |
Cost in Dollars of a $1,000 Investment in MainStay Income Builder Fund (Unaudited)
The example below is intended to describe the fees and expenses borne by shareholders during the six-month period from May 1, 2012, to October 31, 2012, and the impact of those costs on your investment.
Example
As a shareholder of the Fund, you incur two types of costs: (1) transaction costs, including exchange fees and sales charges (loads) on purchases (as applicable), and (2) ongoing costs, including management fees, distribution and/or service (12b-1) fees, and other Fund expenses (as applicable). This example is intended to help you understand your ongoing costs (in dollars) of investing in the Fund and to compare these costs with the ongoing costs of investing in other mutual funds. The example is based on an investment of $1,000 made at the beginning of the six-month period and held for the entire period from May 1, 2012, to October 31, 2012.
This example illustrates your Fund’s ongoing costs in two ways:
Actual Expenses
The second and third data columns in the table below provide information about actual account values and actual expenses. You may use the information in these columns, together with the amount you invested, to estimate the expenses that you paid during the six months ended October 31, 2012. Simply divide your account value by $1,000 (for example, an $8,600 account value divided by $1,000 = 8.6), then
multiply the result by the number under the heading entitled “Expenses Paid During Period” to estimate the expenses you paid on your account during this period.
Hypothetical Example for Comparison Purposes
The fourth and fifth data columns in the table below provide information about hypothetical account values and hypothetical expenses based on the Fund’s actual expense ratio and an assumed rate of return of 5% per year before expenses, which is not the Fund’s actual return. The hypothetical account values and expenses may not be used to estimate the actual ending account balances or expenses you paid for the six-month period shown. You may use this information to compare the ongoing costs of investing in the Fund with the ongoing costs of investing in other Funds. To do so, compare this 5% hypothetical example with the 5% hypothetical examples that appear in the shareholder reports of the other Funds.
Please note that the expenses shown in the table are meant to highlight your ongoing costs only and do not reflect any transactional costs, such as exchange fees or sales charges (loads). Therefore, the fourth and fifth data columns of the table are useful in comparing ongoing costs only and will not help you determine the relative total costs of owning different funds. In addition, if these transactional costs were included, your costs would have been higher.
| | | | | | | | | | | | | | | | | | | | |
| | | | | | | | | | | | | | | | |
| Share Class | | Beginning
Account
Value
5/1/12 | | | Ending Account
Value (Based
on Actual
Returns and
Expenses)
10/31/12 | | | Expenses
Paid
During
Period1 | | | Ending Account
Value (Based
on Hypothetical
5% Annualized
Return and
Actual Expenses)
10/31/12 | | | Expenses
Paid
During
Period1 | |
| | | | | |
| Investor Class Shares | | $ | 1,000.00 | | | $ | 1,051.30 | | | $ | 7.01 | | | $ | 1,018.30 | | | $ | 6.90 | |
| | | | | |
| Class A Shares | | $ | 1,000.00 | | | $ | 1,053.60 | | | $ | 5.42 | | | $ | 1,019.90 | | | $ | 5.33 | |
| | | | | |
| Class B Shares | | $ | 1,000.00 | | | $ | 1,047.70 | | | $ | 10.86 | | | $ | 1,014.50 | | | $ | 10.68 | |
| | | | | |
| Class C Shares | | $ | 1,000.00 | | | $ | 1,047.80 | | | $ | 10.86 | | | $ | 1,014.50 | | | $ | 10.68 | |
| | | | | |
| Class I Shares | | $ | 1,000.00 | | | $ | 1,054.50 | | | $ | 4.13 | | | $ | 1,021.10 | | | $ | 4.06 | |
| 1. | Expenses are equal to the Fund’s annualized expense ratio of each class (1.36% for Investor Class, 1.05% for Class A, 2.11% for Class B and Class C and 0.80% for Class I) multiplied by the average account value over the period, divided by 366 and multiplied by 184 (to reflect the six-month period). The table above represents the actual expenses incurred during the six-month period. |
| | | | |
| mainstayinvestments.com | | | 7 | |
Portfolio Composition as of October 31, 2012 (Unaudited)
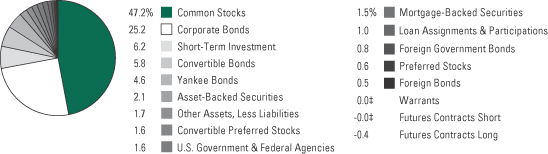
See Portfolio of Investments beginning on page 13 for specific holdings within these categories.
| ‡ | Less than one-tenth of a percent. |
Top Ten Holdings or Issuers Held as of October 31, 2012 (excluding short-term investment)
| 1. | United States Treasury Bonds, 3.00%–4.375%, due 5/15/40–5/15/42 |
| 2. | MGM Resorts International, 4.25%–10.375%, due 5/15/14–10/1/20 |
| 4. | Linn Energy LLC / Linn Energy Finance Corp., 8.625%, due 4/15/20 |
| 6. | Hartford Financial Services Group, Inc., 6.10%–7.25%, due 10/1/41 |
| 9. | USG Corp., 6.30%–9.75%, due 11/15/16–1/15/18 |
| | |
| 8 | | MainStay Income Builder Fund |
Portfolio Management Discussion and Analysis (Unaudited)
Questions answered by portfolio managers Dan Roberts, PhD, Michael Kimble, Louis N. Cohen and Taylor Wagenseil of MacKay Shields LLC, the Subadvisor for the fixed-income portion of the Fund, and Eric Sappenfield, William Priest, CFA, and Michael A. Welhoelter, CFA, of Epoch Investment Partners, Inc., the Subadvisor for the equity portion of the Fund.
How did MainStay Income Builder Fund perform relative to its peers and its benchmark during the 12 months ended October 31, 2012?
Excluding all sales charges, MainStay Income Builder Fund returned 13.72% for Investor Class shares, 14.16% for Class A shares, 12.87% for Class B shares and 12.96% for Class C shares for the 12 months ended October 31, 2012. Over the same period, Class I shares returned 14.41%. All share classes outperformed the 9.58% return of the average Lipper1 mixed-asset target allocation growth fund and the 9.45% return of the MSCI World Index2 for the 12 months ended October 31, 2012. The MSCI World Index is the Fund’s broad-based securities-market index. All share classes also outperformed the 5.25% return of the Barclays U.S. Aggregate Bond Index,3 which is an additional benchmark for the Fund. See page 5 for Fund returns with applicable sales charges.
During the reporting period, how was the Fund materially affected by investments in derivatives?
During the reporting period, Epoch did not use any derivatives. MacKay Shields, however, used S&P equity futures to raise the Fund’s overall equity sensitivity. This position in derivatives had a positive impact on the Fund’s overall performance during the reporting period.
What factors affected the relative performance of the equity portion of the Fund during the reporting period?
The relative performance of the equity portion of the Fund was affected most by stock selection.
In the equity portion of the Fund, which sectors were the strongest positive contributors to the Fund’s relative performance and which sectors detracted the most?
The strongest positive sector contributor to performance relative to the MSCI World Index was consumer staples, which benefited from stock selection and an overweight position. (Contributions take weightings and total returns into account.) Stock selection and underweight positions in energy and materials also contributed positively to the Fund’s relative results.
During the reporting period, weak stock selection in industrials and an underweight position in financials detracted from relative performance in the equity portion of the Fund. A slight underweight position and weak stock performance in the health care sector also negatively affected performance relative to the MSCI World Index.
During the reporting period, which individual stocks made the strongest positive contributions to absolute performance in the equity portion of the Fund and which stocks detracted the most?
Anheuser-Busch InBev, Comcast and Philip Morris International contributed the most to absolute performance in the equity portion of the Fund. Anheuser-Busch InBev, the world’s largest brewer, reported strong operating results, raised its annual dividend by 50% and reduced its debt during the reporting period. The company also announced the acquisition of the unowned half of Mexican brewer Modelo, with which Anheuser-Busch InBev anticipates significant operating synergies. Consistent operating performance and strong return of capital drove the share performance of cable operator Comcast higher during the reporting period. Management increased the company’s cash dividend 44% to yield approximately 2.25% and announced a $3 billion share buyback program (another 4% of market capital) for 2012. Philip Morris International is a U.S.-based international tobacco manufacturer. The company generated significant cash flows driven by leading market positions, pricing power, cost discipline and a highly diversified geographic profile. The company also increased returns to shareholders through dividends and share buybacks.
The most significant detractors from absolute performance in the equity portion of the Fund were bus and train operator FirstGroup, telecommunications company France Telecom and Belgium-based telecommunications company Mobistar. Economic challenges for FirstGroup’s bus businesses in the United States and the U.K. hurt the company’s operating margins and thus its stock price. Further hurting FirstGroup’s stock price was the U.K. transport regulator’s intention to re-let the U.K. rail franchises over the next few years. While FirstGroup was awarded the first U.K. rail franchise, which lifted its stock, the U.K. regulator subsequently canceled the award after finding issues with government procedures. We expect it will take time for the award process to be resolved. In the meantime, the company increased its cash dividend as guided (up 7% year over year) and confirmed its dividend policy through fiscal year 2013. (The company’s fiscal year ends March 31.) Management also made positive comments on both U.K. bus revenue trends and the company’s U.S. bus operation recovery. Even so, FirstGroup generated negative total returns during the reporting period. France Telecom’s share price was down as the result of new competition in the French market. After a change in the company’s capital allocation policy (the company reduced its dividend), we eliminated the stock from the equity portion of the
| 1. | See footnote on page 6 for more information on Lipper Inc. |
| 2. | See footnote on page 6 for more information on the MSCI World Index. |
| 3. | See footnote on page 6 for more information on the Barclays U.S. Aggregate Bond Index. |
| | | | |
| mainstayinvestments.com | | | 9 | |
Fund. Shares of Mobistar declined after the company announced weak results and missed earnings estimates. The miss was driven by increased competition and higher staffing costs. With competitive pressures intensifying and an uncertain regulatory environment, Mobistar no longer fit our investment criteria and we sold the position.
Did the equity portion of the Fund make any significant purchases or sales during the reporting period?
The Fund purchased a position in Telstra, the incumbent telecommunications operator in Australia, during the reporting period. Telstra’s dividend is well covered; and after a meeting with management, we feel that the company is committed to delivering shareholder yield. The Fund also purchased shares of KLA-Tencor, which manufactures semiconductor testing equipment. The company came through our screening process in the past with a free cash flow yield of 10% and a dividend yield of 3.4%. However, with the development of new products, we now have more confidence that the company will generate sustainable cash flows and increase its dividend. The Fund also purchased shares of Deere, a leading global manufacturer of farming and construction equipment. The company’s management has a solid history of delivering shareholder yield. Deere has steadily increased its dividend over the last 20 years and has routinely repurchased shares.
Progress Energy, a regulated utility company, was eliminated from the equity portion of the Fund during the reporting period as a result of the company’s merger with Duke Energy. We sold the Fund’s position in Brazilian electricity generation and distribution company CPFL when the company announced earnings that were below expectations, based on higher costs and interest expense. The company also reduced its dividend. We eliminated the Fund’s position in leading Chinese telecommunications company China Mobile. The company has not materially increased its payout as originally intended or promised.
How did the Fund’s equity sector weightings change during the reporting period?
There were no significant changes to sector weightings in the equity portion of the Fund. The largest increase was in the financials sector, where the equity portion of the Fund remained significantly underweight, but slightly less so, relative to the MSCI World Index. The largest decrease was in telecommunication services, where our overweight position relative to the MSCI World Index, while still meaningful, was reduced slightly. All sector weights are arrived at through stock selection rather than top-down decisions on the attractiveness of specific sectors.
How was the equity portion of the Fund positioned at the end of October 2012?
The Fund’s most substantially overweight sector positions relative to the MSCI World Index in the equity portion of the Fund were in telecommunication services, utilities and consumer staples. As of the same date, the most substantially underweight sector positions relative to the MSCI World Index in the equity portion of the Fund were in financials, information technology and materials.
The equity portion of the Fund continues to focus on companies with strong balance sheets and growing free cash flow that deliver returns to shareholders through significant cash dividends, share repurchases and debt paydowns.
What factors affected relative performance in the fixed-income portion of the Fund during the reporting period?
The fixed-income portion of the Fund outperformed the Barclays U.S. Aggregate Bond Index during the reporting period, primarily because of security selection and overweight positions in spread4 products, specifically high-yield corporate bonds and convertible securities. Assets with higher risk profiles provided strong results during the reporting period, largely in response to the accommodative monetary policies of the world’s central banks. Long Term Refinancing Operations offered by the European Central Bank in late December 2011 and February 2012 helped recapitalize the European banking system and provide needed liquidity. In the last quarter of the reporting period, the European Central Bank president’s proclamation to “preserve the euro,” along with the U.S. Federal Reserve’s announcement that it would engage in an open-ended mortgage purchase program, calmed the markets’ fears and kept the rally in higher-risk assets alive as investors continued to search for yield. A stronger appetite for risk benefited overweight positions in high-yield corporate bonds and convertible bonds in the fixed-income portion of the Fund.
In the fixed-income portion of the Fund, the largest overweight position in relation to the Barclays U.S. Aggregate Index was in high-yield corporate bonds. (The Index consists entirely of investment-grade bonds.) Within the high-yield segment, holdings in sectors that are more cyclical—such as financials, gaming and housing—were among the strongest performers in the fixed-income portion of the Fund.
Lower-risk assets, such as U.S. Treasury securities and agency mortgages, underperformed the Barclays U.S. Aggregate Bond Index. As investors sought incremental yield and return, underweight positions in these asset classes in the fixed-income
| 4. | The terms “spread” and “yield spread” may refer to the difference in yield between a security or type of security and comparable U.S. Treasury issues. The terms may also refer to the difference in yield between two specific securities or types of securities at a given time. |
| | |
| 10 | | MainStay Income Builder Fund |
portion of the Fund helped performance relative to the Barclays U.S. Aggregate Bond Index.
During the reporting period, what was the duration5 strategy of the fixed-income portion of the Fund?
The duration of the fixed-income portion of the Fund was shorter than that of the Barclays U.S. Aggregate Bond Index, in large part because the fixed-income portion of the Fund was overweight in high-yield corporate bonds. These bonds tend to have shorter durations than investment-grade corporate bonds. They also tend to have a low correlation to U.S. Trea-sury securities, so they have a lower sensitivity to interest rates. To further insulate the fixed-income portion of the Fund from a potential rise in interest rates, we maintained a short position in U.S. Treasury futures to keep duration shorter than that of the Barclays U.S. Aggregate Bond Index.
What specific factors, risks or market forces prompted significant decisions in the fixed-income portion of the Fund during the reporting period?
There were many macro factors to consider, and the fixed-income portion of the Fund experienced some periods of volatility. Nevertheless, we did not make any material changes to the positioning of the fixed-income portion of the Fund. Prior to the reporting period, we had judged the Federal Reserve’s accommodative monetary policy, along with improving economic data, to be a positive for spread products such as high-yield corporate bonds. For this reason, we maintained a risk profile that was higher than the Barclays U.S. Aggregate Bond Index in the fixed-income portion of the Fund.
During the reporting period, we saw several reasons to believe that the market would continue to favor spread products. The low interest-rate environment sparked healthy demand for higher-yielding securities. Improving profitability signaled that many corporations were doing more with less: less leverage, less short-term debt and smaller funding gaps. In our opinion, improving credit fundamentals would support narrower spreads (or less compensation for assuming credit risk) alongside a favorable balance of supply and demand for corporate debt.
During the reporting period, which market segments were the strongest positive contributors to performance in the fixed-income portion of the Fund and which market segments were particularly weak?
Within the fixed-income portion of the Fund, an overweight position in high-yield corporate bonds was the driving force behind the outperformance of the Barclays U.S. Aggregate Bond Index. During the reporting period, the Barclays U.S. Aggregate Bond Index was up 5.25%, while high-yield corporate bonds, as measured by the Bank of America Merrill Lynch High Yield Master II Constrained Index,6 were up 13.15%. Within high-yield corporate bonds, financials and housing securities were the best performers in the fixed-income portion of the Fund. Of course, not all of the Fund’s high-yield securities were strong performers. Within the high-yield asset class, energy and utilities holdings were among the weakest performers.
Our position in convertible bonds also had a positive impact on performance in the fixed-income portion of the Fund during the reporting period.
With an overweight position in high-yield corporate bonds came underweight positions in U.S. Treasurys and agency mortgages. These underweight sector positions contributed positively to relative performance in the fixed-income portion of the Fund as investors continued their search for higher-yielding assets and were willing to assume higher levels of risk to pursue their yield objectives.
Did the fixed-income portion of the Fund make any significant purchases or sales during the reporting period?
Through October 31, the year 2012 brought robust new issuance in the high-yield corporate bond market. Year-to-date volume exceeded the previous record set in 2010. The majority of new issuance (61% year-to-date) was for refinancing. As a result, several companies in which the fixed-income portion of the Fund held positions, including privatized correctional and detention facilities operator Corrections Corporation of America and residential home builder Meritage Homes, redeemed their bonds during the reporting period.
| 5. | Duration is a measure of the price sensitivity of a fixed-income investment to changes in interest rates. Duration is expressed as a number of years and is considered a more accurate sensitivity gauge than average maturity. |
| 6. | The Bank of America Merrill Lynch U.S. High Yield Master II Constrained Index is a market value-weighted index of all domestic and Yankee high-yield bonds, including deferred interest bonds and payment-in-kind securities. Issuers included in the Index have maturities of one year or more and have a credit rating lower than BBB–/Baa3, but are not in default. No single issuer may constitute greater than 2% of the Index. Total returns assume reinvestment of all dividends and capital gains. An investment cannot be made directly in an index. |
| | | | |
| mainstayinvestments.com | | | 11 | |
During the reporting period, some companies whose bonds the fixed-income portion of the Fund had previously owned issued new securities that fit our process, and we bought them. Among these companies were oil and gas producer Chesapeake Energy, gaming facilities operator Mohegan Tribal Gaming Authority and residential home builder KB Home.
How did sector weightings change in the fixed-income portion of the Fund’s during the reporting period?
We slightly increased exposure to high-yield corporate bonds and to investment-grade corporate bonds in the fixed-income portion of the Fund. Over the same period, we decreased exposure to convertible securities and to U.S. Treasury securities.
How was the fixed-income portion of the Fund positioned at the end of the reporting period?
As of October 31, 2012, the most substantially overweight sector relative to the Barclays U.S. Aggregate Bond Index in the fixed-income portion of the Fund was high-yield corporate bonds. The fixed-income portion of the Fund also held a meaningful overweight in convertible securities.
As of the same date, the fixed-income portion of the Fund held underweight positions relative to the Barclays U.S. Aggregate Bond Index in U.S. Treasury securities and agency mortgage-backed securities. As of October 31, 2012, the fixed-income portion of the Fund had a shorter duration than the Barclays U.S. Aggregate Bond Index.
The opinions expressed are those of the portfolio managers as of the date of this report and are subject to change. There is no guarantee that any forecast made will come to pass. This material does not constitute investment advice and is not intended as an endorsement of any specific investment.
| | |
| 12 | | MainStay Income Builder Fund |
Portfolio of Investments††† October 31, 2012
| | | | | | | | |
| | | Principal
Amount | | | Value | |
| | | | | | | | |
Long-Term Bonds 43.1%† Asset-Backed Securities 2.1% | |
Home Equity 1.9% | |
Ameriquest Mortgage Securities, Inc.
Series 2003-8, Class AF5
5.14%, due 10/25/33 (a)(b) | | $ | 171,072 | | | $ | 170,096 | |
Carrington Mortgage Loan Trust
Series 2006-NC4, Class A5
0.271%, due 10/25/36 (b)(c) | | | 551,939 | | | | 391,611 | |
Chase Funding Mortgage Loan Asset-Backed Certificates
Series 2002-2, Class 1A5
6.333%, due 4/25/32 (a)(b) | | | 241,287 | | | | 247,282 | |
CIT Group Home Equity Loan Trust
Series 2003-1, Class A4
3.93%, due 3/20/32 (a)(b) | | | 56,272 | | | | 57,743 | |
Citicorp Residential Mortgage Securities, Inc. Series 2006-1, Class A3
5.706%, due 7/25/36 (a)(b) | | | 26,529 | | | | 26,480 | |
Citifinancial Mortgage Securities, Inc.
Series 2003-3, Class AF5
5.053%, due 8/25/33 (a)(b) | | | 250,450 | | | | 248,198 | |
Citigroup Mortgage Loan Trust, Inc.
Series 2007-AHL2, Class A3A
0.281%, due 5/25/37 (b)(c) | | | 1,590,740 | | | | 1,193,687 | |
Countrywide Asset-Backed Certificates
Series 2003-5, Class AF5
5.908%, due 2/25/34 (a)(b) | | | 485,496 | | | | 492,342 | |
Equity One ABS, Inc. | | | | | | | | |
Series 2003-4, Class AF6 4.833%, due 10/25/34 (a)(b) | | | 315,735 | | | | 317,777 | |
Series 2003-3, Class AF4 5.495%, due 12/25/33 (a)(b) | | | 421,722 | | | | 410,470 | |
GSAA Home Equity Trust
Series 2006-14, Class A1
0.261%, due 9/25/36 (c) | | | 6,932,550 | | | | 3,452,833 | |
HSI Asset Securitization Corp. Trust
Series 2007-NC1, Class A1
0.311%, due 4/25/37 (b)(c) | | | 454,172 | | | | 384,770 | |
JP Morgan Mortgage Acquisition Corp.
Series 2007-HE1, Class AF1
0.311%, due 3/25/47 (b)(c) | | | 1,307,246 | | | | 905,725 | |
Master Asset Backed Securities Trust
Series 2006-HE4, Class A1
0.261%, due 11/25/36 (b)(c) | | | 910,591 | | | | 361,791 | |
Merrill Lynch Mortgage Investors Trust
Series 2007-MLN1, Class A2A
0.321%, due 3/25/37 (b)(c) | | | 4,216,763 | | | | 2,970,330 | |
| | | | | | | | |
| | | Principal
Amount | | | Value | |
| | | | | | | | |
Home Equity (continued) | |
RAMP Trust | | | | | | | | |
Series 2003-RZ5, Class A7 4.97%, due 9/25/33 (a) | | $ | 181,949 | | | $ | 187,134 | |
Series 2003-RS7, Class AI6 5.34%, due 8/25/33 (c) | | | 111,473 | | | | 109,549 | |
RASC Trust
Series 2002-KS2, Class AI6
6.228%, due 4/25/32 (b)(c) | | | 121,041 | | | | 124,096 | |
Saxon Asset Securities Trust
Series 2003-1, Class AF5
5.455%, due 6/25/33 (a)(b) | | | 96,707 | | | | 91,701 | |
Soundview Home Equity Loan Trust
Series 2006-EQ2, Class A2
0.321%, due 1/25/37 (b)(c) | | | 1,735,976 | | | | 993,947 | |
Specialty Underwriting & Residential Finance Series 2006-BC4, Class A2B
0.321%, due 9/25/37 (b)(c) | | | 1,218,296 | | | | 972,879 | |
Terwin Mortgage Trust
Series 2005-14HE, Class AF2
4.849%, due 8/25/36 (a)(b) | | | 125,527 | | | | 127,691 | |
| | | | | | | | |
| | | | | | | 14,238,132 | |
| | | | | | | | |
Student Loans 0.2% | |
Keycorp Student Loan Trust
Series 2000-A, Class A2
0.747%, due 5/25/29 (c) | | | 1,234,929 | | | | 1,131,097 | |
| | | | | | | | |
Total Asset-Backed Securities
(Cost $16,610,315) | | | | 15,369,229 | |
| | | | | | | | |
|
| Convertible Bonds 5.8% | |
Aerospace & Defense 0.2% | |
L-3 Communications Corp.
3.00%, due 8/1/35 | | | 1,326,000 | | | | 1,335,945 | |
| | | | | | | | |
|
Apparel 0.1% | |
Iconix Brand Group, Inc.
2.50%, due 6/1/16 (d) | | | 729,000 | | | | 729,456 | |
| | | | | | | | |
|
Auto Parts & Equipment 0.1% | |
Meritor, Inc.
4.00%, due 2/15/27 (a) | | | 1,390,000 | | | | 1,033,812 | |
| | | | | | | | |
|
Biotechnology 0.1% | |
Gilead Sciences, Inc.
1.00%, due 5/1/14 | | | 537,000 | | | | 817,247 | |
| | | | | | | | |
| † | Percentages indicated are based on Fund net assets. |
| ¨ | | Among the Fund’s 10 largest holdings or issuers held, as of October 31, 2012, excluding short-term investment. May be subject to change daily. |
| | | | | | |
The notes to the financial statements are an integral part of,
and should be read in conjunction with, the financial statements. | | mainstayinvestments.com | | | 13 | |
Portfolio of Investments††† October 31, 2012 (continued)
| | | | | | | | |
| | | Principal
Amount | | | Value | |
| | | | | | | | |
| Convertible Bonds (continued) | |
Coal 0.2% | |
Alpha Natural Resources, Inc.
2.375%, due 4/15/15 | | $ | 557,000 | | | $ | 508,262 | |
Peabody Energy Corp.
4.75%, due 12/15/41 | | | 1,143,000 | | | | 1,041,559 | |
| | | | | | | | |
| | | | | | | 1,549,821 | |
| | | | | | | | |
Computers 0.4% | |
EMC Corp.
1.75%, due 12/1/13 | | | 1,051,000 | | | | 1,631,683 | |
Mentor Graphics Corp.
4.00%, due 4/1/31 | | | 747,000 | | | | 849,245 | |
SanDisk Corp.
1.50%, due 8/15/17 | | | 603,000 | | | | 672,722 | |
| | | | | | | | |
| | | | | | | 3,153,650 | |
| | | | | | | | |
Distribution & Wholesale 0.2% | |
WESCO International, Inc.
6.00%, due 9/15/29 | | | 769,000 | | | | 1,835,987 | |
| | | | | | | | |
|
Electronics 0.2% | |
TTM Technologies, Inc.
3.25%, due 5/15/15 | | | 1,356,000 | | | | 1,372,102 | |
| | | | | | | | |
|
Health Care—Products 0.3% | |
Teleflex, Inc.
3.875%, due 8/1/17 | | | 1,726,000 | | | | 2,132,689 | |
| | | | | | | | |
|
Health Care—Services 0.1% | |
WellPoint, Inc.
2.75%, due 10/15/42 (d) | | | 604,000 | | | | 632,690 | |
| | | | | | | | |
|
Household Products & Wares 0.1% | |
Jarden Corp.
1.875%, due 9/15/18 (d) | | | 853,000 | | | | 857,265 | |
| | | | | | | | |
|
Internet 0.2% | |
DealerTrack Holdings, Inc.
1.50%, due 3/15/17 (d) | | | 85,000 | | | | 88,772 | |
Symantec Corp. Series B
1.00%, due 6/15/13 | | | 614,000 | | | | 667,725 | |
VeriSign, Inc.
3.25%, due 8/15/37 | | | 408,000 | | | | 507,195 | |
| | | | | | | | |
| | | | | | | 1,263,692 | |
| | | | | | | | |
Iron & Steel 0.5% | |
Allegheny Technologies, Inc.
4.25%, due 6/1/14 | | | 1,951,000 | | | | 2,144,880 | |
ArcelorMittal
5.00%, due 5/15/14 | | | 975,000 | | | | 993,891 | |
| | | | | | | | |
| | | Principal
Amount | | | Value | |
| | | | | | | | |
Iron & Steel (continued) | |
Steel Dynamics, Inc.
5.125%, due 6/15/14 | | $ | 71,000 | | | $ | 75,837 | |
United States Steel Corp.
4.00%, due 5/15/14 | | | 286,000 | | | | 293,329 | |
| | | | | | | | |
| | | | | | | 3,507,937 | |
| | | | | | | | |
Lodging 0.1% | |
¨ MGM Resorts International
4.25%, due 4/15/15 | | | 717,000 | | | | 736,718 | |
| | | | | | | | |
|
Machinery—Diversified 0.1% | |
Chart Industries, Inc.
2.00%, due 8/1/18 | | | 494,000 | | | | 631,703 | |
| | | | | | | | |
|
Mining 0.4% | |
Newmont Mining Corp.
1.25%, due 7/15/14 | | | 2,247,000 | | | | 2,960,422 | |
| | | | | | | | |
|
Miscellaneous—Manufacturing 0.3% | |
Danaher Corp.
(zero coupon), due 1/22/21 | | | 1,694,000 | | | | 2,555,822 | |
| | | | | | | | |
|
Oil & Gas Services 0.1% | |
Subsea 7 S.A.
3.50%, due 10/13/14 | | | 400,000 | | | | 578,240 | |
| | | | | | | | |
|
Pharmaceuticals 0.4% | |
BioMarin Pharmaceutical, Inc.
1.875%, due 4/23/17 | | | 423,000 | | | | 817,448 | |
Salix Pharmaceuticals, Ltd. | |
1.50%, due 3/15/19 (d) | | | 301,000 | | | | 287,831 | |
2.75%, due 5/15/15 | | | 547,000 | | | | 623,238 | |
Teva Pharmaceutical Finance Co. LLC
0.25%, due 2/1/26 | | | 995,000 | | | | 1,060,297 | |
| | | | | | | | |
| | | | | | | 2,788,814 | |
| | | | | | | | |
Real Estate Investment Trusts 0.2% | |
SL Green Operating Partnership, L.P.
3.00%, due 10/15/17 (d) | | | 1,305,000 | | | | 1,450,997 | |
| | | | | | | | |
|
Retail 0.3% | |
Costco Wholesale Corp.
(zero coupon), due 8/19/17 | | | 926,000 | | | | 2,074,819 | |
| | | | | | | | |
|
Semiconductors 0.6% | |
Intel Corp.
3.25%, due 8/1/39 | | | 1,131,000 | | | | 1,380,527 | |
Microchip Technology, Inc.
2.125%, due 12/15/37 | | | 667,000 | | | | 809,988 | |
| | | | |
| 14 | | MainStay Income Builder Fund | | The notes to the financial statements are an integral part of,
and should be read in conjunction with, the financial statements. |
| | | | | | | | |
| | | Principal
Amount | | | Value | |
| | | | | | | | |
| Convertible Bonds (continued) | |
Semiconductors (continued) | |
ON Semiconductor Corp.
Series B
2.625%, due 12/15/26 | | $ | 1,130,000 | | | $ | 1,166,019 | |
Xilinx, Inc.
2.625%, due 6/15/17 | | | 673,000 | | | | 874,900 | |
| | | | | | | | |
| | | | | | | 4,231,434 | |
| | | | | | | | |
Telecommunications 0.6% | |
Ciena Corp.
4.00%, due 3/15/15 (d) | | | 594,000 | | | | 627,412 | |
InterDigital, Inc.
2.50%, due 3/15/16 | | | 349,000 | | | | 366,232 | |
SBA Communications Corp. | |
1.875%, due 5/1/13 | | | 922,000 | | | | 1,488,454 | |
4.00%, due 10/1/14 | | | 699,000 | | | | 1,567,071 | |
| | | | | | | | |
| | | | | | | 4,049,169 | |
| | | | | | | | |
Total Convertible Bonds
(Cost $40,038,493) | | | | | | | 42,280,431 | |
| | | | | | | | |
| | |
| Corporate Bonds 25.2% | | | | | | | | |
Aerospace & Defense 0.3% | |
B/E Aerospace, Inc.
6.875%, due 10/1/20 | | | 1,805,000 | | | | 2,003,550 | |
| | | | | | | | |
|
Agriculture 0.0%‡ | |
Lorillard Tobacco Co.
8.125%, due 6/23/19 | | | 255,000 | | | | 327,994 | |
| | | | | | | | |
|
Airlines 1.3% | |
Continental Airlines, Inc. | | | | | | | | |
Series A
7.25%, due 11/10/19 | | | 2,010,893 | | | | 2,322,581 | |
7.875%, due 7/2/18 | | | 1,477,970 | | | | 1,526,004 | |
U.S. Airways Group, Inc.
Series A
6.25%, due 4/22/23 | | | 1,354,745 | | | | 1,449,577 | |
U.S. Airways, Inc. Class A
Class A Series 2012-1, Pass-Through Trust
5.90%, due 10/1/24 | | | 2,455,000 | | | | 2,675,950 | |
UAL 2009-1 Pass-Through Trust
10.40%, due 11/1/16 | | | 1,212,192 | | | | 1,392,566 | |
| | | | | | | | |
| | | | | | | 9,366,678 | |
| | | | | | | | |
Auto Manufacturers 0.7% | |
Chrysler Group LLC / CG Co-Issuer, Inc.
8.25%, due 6/15/21 | | | 2,100,000 | | | | 2,244,375 | |
| | | | | | | | |
| | | Principal
Amount | | | Value | |
| | | | | | | | |
Auto Manufacturers (continued) | |
Ford Motor Co. | | | | | | | | |
6.625%, due 10/1/28 | | $ | 1,500,000 | | | $ | 1,705,791 | |
7.45%, due 7/16/31 | | | 450,000 | | | | 569,250 | |
8.90%, due 1/15/32 | | | 215,000 | | | | 285,144 | |
| | | | | | | | |
| | | | | | | 4,804,560 | |
| | | | | | | | |
Auto Parts & Equipment 0.5% | |
Continental Rubber of America Corp.
4.50%, due 9/15/19 (d) | | | 2,200,000 | | | | 2,247,300 | |
Goodyear Tire & Rubber Co. (The)
8.25%, due 8/15/20 | | | 1,200,000 | | | | 1,303,500 | |
| | | | | | | | |
| | | | | | | 3,550,800 | |
| | | | | | | | |
Banks 2.2% | |
AgriBank FCB
9.125%, due 7/15/19 | | | 300,000 | | | | 397,061 | |
Bank of America Corp. | | | | | | | | |
5.625%, due 7/1/20 | | | 1,200,000 | | | | 1,400,048 | |
6.50%, due 8/1/16 | | | 135,000 | | | | 157,014 | |
7.625%, due 6/1/19 | | | 1,015,000 | | | | 1,287,132 | |
8.00%, due 12/31/49 (c) | | | 1,500,000 | | | | 1,670,580 | |
CIT Group, Inc. | | | | | | | | |
4.25%, due 8/15/17 | | | 100,000 | | | | 102,581 | |
5.00%, due 5/15/17 | | | 1,745,000 | | | | 1,838,881 | |
Citigroup, Inc. | | | | | | | | |
6.875%, due 6/1/25 | | | 1,715,000 | | | | 2,247,053 | |
8.50%, due 5/22/19 | | | 85,000 | | | | 113,341 | |
Discover Bank
8.70%, due 11/18/19 | | | 1,955,000 | | | | 2,556,206 | |
Fifth Third Bancorp
6.25%, due 5/1/13 | | | 255,000 | | | | 262,117 | |
JPMorgan Chase & Co.
7.90%, due 12/31/49 (c) | | | 1,500,000 | | | | 1,727,595 | |
Morgan Stanley
4.875%, due 11/1/22 | | | 1,125,000 | | | | 1,137,297 | |
Wells Fargo & Co.
7.98%, due 12/31/49 (c) | | | 1,200,000 | | | | 1,419,000 | |
| | | | | | | | |
| | | | 16,315,906 | |
| | | | | | | | |
Building Materials 1.0% | |
Boise Cascade LLC
7.125%, due 10/15/14 | | | 826,000 | | | | 827,569 | |
¨USG Corp. | |
6.30%, due 11/15/16 | | | 4,695,000 | | | | 4,777,163 | |
9.75%, due 1/15/18 | | | 1,330,000 | | | | 1,453,025 | |
| | | | | | | | |
| | | | 7,057,757 | |
| | | | | | | | |
Chemicals 0.7% | |
Dow Chemical Co. (The) | | | | | | | | |
4.125%, due 11/15/21 | | | 1,605,000 | | | | 1,754,356 | |
8.55%, due 5/15/19 | | | 225,000 | | | | 305,124 | |
Hexion U.S. Finance Corp.
6.625%, due 4/15/20 | | | 1,735,000 | | | | 1,730,663 | |
| | | | | | |
The notes to the financial statements are an integral part of,
and should be read in conjunction with, the financial statements. | | mainstayinvestments.com | | | 15 | |
Portfolio of Investments††† October 31, 2012 (continued)
| | | | | | | | |
| | | Principal
Amount | | | Value | |
| | | | | | | | |
| Corporate Bonds (continued) | |
Chemicals (continued) | |
Huntsman International LLC
5.50%, due 6/30/16 | | $ | 80,000 | | | $ | 80,200 | |
Rockwood Specialties Group, Inc.
4.625%, due 10/15/20 | | | 1,525,000 | | | | 1,570,750 | |
| | | | | | | | |
| | | | 5,441,093 | |
| | | | | | | | |
Coal 0.1% | |
Alpha Natural Resources, Inc. | | | | | | | | |
6.00%, due 6/1/19 | | | 1,100,000 | | | | 965,250 | |
6.25%, due 6/1/21 | | | 110,000 | | | | 95,700 | |
| | | | | | | | |
| | | | 1,060,950 | |
| | | | | | | | |
Commercial Services 0.7% | |
Avis Budget Car Rental LLC / Avis Budget Finance, Inc.
8.25%, due 1/15/19 | | | 2,640,000 | | | | 2,880,900 | |
Hertz Corp. (The)
7.375%, due 1/15/21 | | | 700,000 | | | | 753,375 | |
Quebecor World, Inc. (Litigation Recovery Trust—Escrow Shares)
9.75%, due 11/15/49 (d)(e)(f)(g) | | | 110,000 | | | | 1,760 | |
UR Merger Sub Corp.
8.375%, due 9/15/20 | | | 1,625,000 | | | | 1,779,375 | |
| | | | | | | | |
| | | | 5,415,410 | |
| | | | | | | | |
Computers 0.5% | |
NCR Corp.
5.00%, due 7/15/22 (d) | | | 2,200,000 | | | | 2,246,750 | |
SunGard Data Systems, Inc. | | | | | | | | |
6.625%, due 11/1/19 (d) | | | 1,100,000 | | | | 1,109,625 | |
7.375%, due 11/15/18 | | | 200,000 | | | | 215,250 | |
7.625%, due 11/15/20 | | | 200,000 | | | | 217,250 | |
| | | | | | | | |
| | | | 3,788,875 | |
| | | | | | | | |
Diversified Financial Services 0.3% | |
Alterra Finance LLC
6.25%, due 9/30/20 | | | 200,000 | | | | 221,844 | |
GE Capital Trust II
5.50%, due 9/15/67 (c) | | € | 640,000 | | | | 807,304 | |
General Electric Capital Corp.
6.50%, due 9/15/67 (c) | | £ | 760,000 | | | | 1,241,473 | |
| | | | | | | | |
| | | | | | | 2,270,621 | |
| | | | | | | | |
Electric 0.7% | |
Allegheny Energy Supply Co. LLC
5.75%, due 10/15/19 (d) | | $ | 305,000 | | | | 337,350 | |
CMS Energy Corp. | | | | | | | | |
5.05%, due 3/15/22 | | | 735,000 | | | | 821,031 | |
6.25%, due 2/1/20 | | | 195,000 | | | | 232,647 | |
Energy Future Intermediate Holding Co. LLC / EFIH Finance, Inc.
10.00%, due 12/1/20 | | | 1,563,000 | | | | 1,707,578 | |
| | | | | | | | |
| | | Principal
Amount | | | Value | |
| | | | | | | | |
Electric (continued) | |
Wisconsin Energy Corp.
6.25%, due 5/15/67 (c) | | $ | 1,554,717 | | | $ | 1,667,434 | |
| | | | | | | | |
| | | | | | | 4,766,040 | |
| | | | | | | | |
Entertainment 0.2% | |
Mohegan Tribal Gaming Authority
10.50%, due 12/15/16 (d) | | | 1,370,000 | | | | 1,291,225 | |
Pinnacle Entertainment, Inc.
8.625%, due 8/1/17 | | | 120,000 | | | | 129,600 | |
Tunica-Biloxi Gaming Authority
9.00%, due 11/15/15 (d) | | | 123,000 | | | | 110,700 | |
| | | | | | | | |
| | | | | | | 1,531,525 | |
| | | | | | | | |
Environmental Controls 0.2% | |
EnergySolutions, Inc. / EnergySolutions LLC 10.75%, due 8/15/18 | | | 1,195,000 | | | | 1,108,363 | |
| | | | | | | | |
|
Finance—Auto Loans 0.1% | |
Ford Motor Credit Co. LLC
5.875%, due 8/2/21 | | | 350,000 | | | | 402,991 | |
| | | | | | | | |
|
Finance—Consumer Loans 0.8% | |
HSBC Finance Capital Trust IX
5.911%, due 11/30/35 (c) | | | 2,400,000 | | | | 2,392,104 | |
SLM Corp.
6.25%, due 1/25/16 | | | 1,700,000 | | | | 1,836,085 | |
Springleaf Finance Corp.
6.90%, due 12/15/17 | | | 1,765,000 | | | | 1,553,200 | |
| | | | | | | | |
| | | | | | | 5,781,389 | |
| | | | | | | | |
Finance—Credit Card 0.2% | |
American Express Co.
6.80%, due 9/1/66 (c) | | | 1,600,000 | | | | 1,738,000 | |
| | | | | | | | |
|
Finance—Mortgage Loan/Banker 0.2% | |
Countrywide Financial Corp.
6.25%, due 5/15/16 | | | 1,200,000 | | | | 1,322,641 | |
| | | | | | | | |
|
Food 0.3% | |
JBS USA LLC / JBS USA Finance, Inc.
8.25%, due 2/1/20 (d) | | | 480,000 | | | | 495,600 | |
Smithfield Foods, Inc.
7.75%, due 7/1/17 | | | 1,500,000 | | | | 1,695,000 | |
| | | | | | | | |
| | | | | | | 2,190,600 | |
| | | | | | | | |
Forest Products & Paper 0.2% | |
Boise Paper Holdings LLC / Boise
Co-Issuer Co.
8.00%, due 4/1/20 | | | 1,400,000 | | | | 1,533,000 | |
| | | | | | | | |
| | | | |
| 16 | | MainStay Income Builder Fund | | The notes to the financial statements are an integral part of,
and should be read in conjunction with, the financial statements. |
| | | | | | | | |
| | | Principal
Amount | | | Value | |
| | | | | | | | |
| Corporate Bonds (continued) | |
Gas 0.1% | |
Southern Union Co.
7.60%, due 2/1/24 | | $ | 650,000 | | | $ | 835,757 | |
| | | | | | | | |
|
Health Care—Products 0.2% | |
Kinetic Concepts, Inc. / KCI U.S.A., Inc.
10.50%, due 11/1/18 (d) | | | 1,300,000 | | | | 1,384,500 | |
| | | | | | | | |
|
Health Care—Services 0.6% | |
CHS / Community Health Systems, Inc.
5.125%, due 8/15/18 | | | 1,775,000 | | | | 1,841,562 | |
CIGNA Corp.
4.375%, due 12/15/20 | | | 270,000 | | | | 297,855 | |
HCA, Inc.
8.00%, due 10/1/18 | | | 1,825,000 | | | | 2,107,875 | |
| | | | | | | | |
| | | | | | | 4,247,292 | |
| | | | | | | | |
Home Builders 1.6% | |
Beazer Homes USA, Inc.
6.875%, due 7/15/15 | | | 1,825,000 | | | | 1,834,125 | |
K Hovnanian Enterprises, Inc.
7.25%, due 10/15/20 (d) | | | 5,435,000 | | | | 5,733,925 | |
MDC Holdings, Inc.
5.625%, due 2/1/20 | | | 2,750,000 | | | | 3,065,579 | |
Shea Homes, L.P. / Shea
Homes Funding Corp.
8.625%, due 5/15/19 | | | 1,300,000 | | | | 1,446,250 | |
| | | | | | | | |
| | | | | | | 12,079,879 | |
| | | | | | | | |
Household Products & Wares 0.3% | |
Mead Products LLC / ACCO Brands Corp.
6.75%, due 4/30/20 (d) | | | 1,789,000 | | | | 1,827,016 | |
Reynolds Group Issuer, Inc.
9.875%, due 8/15/19 | | | 260,000 | | | | 272,350 | |
| | | | | | | | |
| | | | | | | 2,099,366 | |
| | | | | | | | |
Insurance 3.3% | |
Allstate Corp. (The)
6.50%, due 5/15/57 (c) | | | 3,790,000 | | | | 4,074,250 | |
American International Group, Inc. | | | | | | | | |
4.875%, due 3/15/67 (c) | | € | 1,300,000 | | | | 1,456,677 | |
Series A2
5.75%, due 3/15/67 (c) | | £ | 700,000 | | | | 1,031,347 | |
Chubb Corp. (The)
6.375%, due 3/29/67 (c) | | $ | 1,660,000 | | | | 1,801,100 | |
¨ Hartford Financial Services Group, Inc.
6.10%, due 10/1/41 | | | 4,100,000 | | | | 4,976,887 | |
Hartford Life, Inc.
7.65%, due 6/15/27 | | | 355,000 | | | | 465,393 | |
Liberty Mutual Group, Inc. | | | | | | | | |
7.80%, due 3/15/37 (d) | | | 1,760,000 | | | | 1,975,600 | |
10.75%, due 6/15/58 (c)(d) | | | 750,000 | | | | 1,117,500 | |
| | | | | | | | |
| | | Principal
Amount | | | Value | |
| | | | | | | | |
Insurance (continued) | |
Pacific Life Insurance Co.
7.90%, due 12/30/23 (d) | | $ | 2,575,000 | | | $ | 3,146,246 | |
Progressive Corp. (The)
6.70%, due 6/15/37 (c) | | | 3,700,000 | | | | 4,028,375 | |
| | | | | | | | |
| | | | | | | 24,073,375 | |
| | | | | | | | |
Lodging 1.6% | |
Caesars Entertainment
Operating Co., Inc.
10.00%, due 12/15/18 | | | 1,800,000 | | | | 1,125,000 | |
Harrah’s Operating Co., Inc.
11.25%, due 6/1/17 | | | 240,000 | | | | 259,800 | |
¨ MGM Resorts International | | | | | | | | |
6.75%, due 10/1/20 (d) | | | 8,531,000 | | | | 8,467,017 | |
8.625%, due 2/1/19 (d) | | | 80,000 | | | | 86,500 | |
10.375%, due 5/15/14 | | | 40,000 | | | | 44,950 | |
Wynn Las Vegas LLC / Wynn
Las Vegas Capital Corp. | | | | | | | | |
7.75%, due 8/15/20 | | | 1,500,000 | | | | 1,683,750 | |
7.875%, due 11/1/17 | | | 240,000 | | | | 262,800 | |
| | | | | | | | |
| | | | | | | 11,929,817 | |
| | | | | | | | |
Machinery—Construction & Mining 0.3% | |
Terex Corp.
8.00%, due 11/15/17 | | | 1,800,000 | | | | 1,878,750 | |
| | | | | | | | |
|
Machinery—Diversified 0.0%‡ | |
Manitowoc Co., Inc. (The)
7.125%, due 11/1/13 | | | 240,000 | | | | 240,000 | |
| | | | | | | | |
|
Media 1.1% | |
Cequel Communications Holdings I
LLC / Cequel Capital Corp.
8.625%, due 11/15/17 (d) | | | 3,625,000 | | | | 3,878,750 | |
Clear Channel Communications, Inc. | | | | | | | | |
5.50%, due 12/15/16 | | | 335,000 | | | | 216,075 | |
6.875%, due 6/15/18 | | | 2,070,000 | | | | 1,293,750 | |
DISH DBS Corp.
7.125%, due 2/1/16 | | | 1,400,000 | | | | 1,564,500 | |
NBC Universal Media LLC
5.15%, due 4/30/20 | | | 160,000 | | | | 191,608 | |
Time Warner Cable, Inc.
8.25%, due 2/14/14 | | | 340,000 | | | | 371,900 | |
Time Warner, Inc.
7.70%, due 5/1/32 | | | 300,000 | | | | 439,614 | |
| | | | | | | | |
| | | | | | | 7,956,197 | |
| | | | | | | | |
Mining 0.4% | |
Century Aluminum Co.
8.00%, due 5/15/14 | | | 1,313,000 | | | | 1,331,054 | |
Old AII, Inc.
7.875%, due 11/1/20 (d) | | | 1,900,000 | | | | 1,890,500 | |
| | | | | | | | |
| | | | | | | 3,221,554 | |
| | | | | | | | |
| | | | | | |
The notes to the financial statements are an integral part of,
and should be read in conjunction with, the financial statements. | | mainstayinvestments.com | | | 17 | |
Portfolio of Investments††† October 31, 2012 (continued)
| | | | | | | | |
| | | Principal
Amount | | | Value | |
| | | | | | | | |
| Corporate Bonds (continued) | |
Miscellaneous—Manufacturing 0.5% | |
Amsted Industries, Inc.
8.125%, due 3/15/18 (d) | | $ | 3,500,000 | | | $ | 3,762,500 | |
| | | | | | | | |
|
Office & Business Equipment 0.0%‡ | |
Xerox Corp.
4.25%, due 2/15/15 | | | 300,000 | | | | 318,679 | |
| | | | | | | | |
|
Oil & Gas 1.8% | |
Chesapeake Energy Corp.
6.625%, due 8/15/20 | | | 2,350,000 | | | | 2,467,500 | |
¨Linn Energy LLC / Linn Energy Finance Corp.
8.625%, due 4/15/20 | | | 6,190,000 | | | | 6,770,312 | |
Nabors Industries, Inc.
5.00%, due 9/15/20 | | | 1,000,000 | | | | 1,114,190 | |
Plains Exploration & Production Co.
6.125%, due 6/15/19 | | | 1,700,000 | | | | 1,695,750 | |
Samson Investment Co.
9.75%, due 2/15/20 (d) | | | 1,270,000 | | | | 1,339,850 | |
| | | | | | | | |
| | | | 13,387,602 | |
| | | | | | | | |
Oil & Gas Services 0.3% | |
Geokinetics Holdings USA, Inc.
9.75%, due 12/15/14 | | | 505,000 | | | | 220,938 | |
Hornbeck Offshore Services, Inc.
5.875%, due 4/1/20 | | | 1,700,000 | | | | 1,729,750 | |
| | | | | | | | |
| | | | 1,950,688 | |
| | | | | | | | |
Pipelines 0.3% | |
Energy Transfer Partners, L.P.
4.65%, due 6/1/21 | | | 1,455,000 | | | | 1,615,964 | |
MarkWest Energy Partners, L.P. / MarkWest Energy Finance Corp.
6.25%, due 6/15/22 | | | 140,000 | | | | 151,550 | |
ONEOK, Inc.
6.00%, due 6/15/35 | | | 350,000 | | | | 411,083 | |
| | | | | | | | |
| | | | 2,178,597 | |
| | | | | | | | |
Real Estate Investment Trusts 0.1% | |
Health Care REIT, Inc.
4.70%, due 9/15/17 | | | 290,000 | | | | 325,163 | |
ProLogis, L.P.
7.375%, due 10/30/19 | | | 195,000 | | | | 242,449 | |
| | | | | | | | |
| | | | 567,612 | |
| | | | | | | | |
Retail 0.1% | |
CVS Caremark Corp.
5.789%, due 1/10/26 (d)(f) | | | 253,990 | | | | 284,193 | |
Wal-Mart Stores, Inc.
6.75%, due 10/15/23 | | | 314,000 | | | | 427,161 | |
| | | | | | | | |
| | | | 711,354 | |
| | | | | | | | |
| | | | | | | | |
| | | Principal
Amount | | | Value | |
| | | | | | | | |
Semiconductors 0.2% | |
Freescale Semiconductor, Inc.
9.25%, due 4/15/18 (d) | | $ | 1,600,000 | | | $ | 1,712,000 | |
| | | | | | | | |
|
Software 0.7% | |
Fidelity National Information Services, Inc.
7.875%, due 7/15/20 | | | 1,485,000 | | | | 1,659,487 | |
First Data Corp. | | | | | | | | |
7.375%, due 6/15/19 (d) | | | 2,535,000 | | | | 2,623,725 | |
8.875%, due 8/15/20 (d) | | | 635,000 | | | | 692,150 | |
| | | | | | | | |
| | | | 4,975,362 | |
| | | | | | | | |
Telecommunications 0.5% | |
CommScope, Inc.
8.25%, due 1/15/19 (d) | | | 1,975,000 | | | | 2,128,062 | |
Hughes Satellite Systems Corp.
7.625%, due 6/15/21 | | | 1,200,000 | | | | 1,335,000 | |
| | | | | | | | |
| | | | | | | 3,463,062 | |
| | | | | | | | |
Total Corporate Bonds
(Cost $170,472,521) | | | | 184,752,686 | |
| | | | | | | | |
|
| Foreign Bonds 0.5% | |
Banks 0.3% | |
Canada Square Operations PLC
7.50%, due 12/31/49 (c) | | £ | 1,035,000 | | | | 1,668,226 | |
| | | | | | | | |
|
Packaging & Containers 0.2% | |
Rexam PLC
6.75%, due 6/29/67 (c) | | € | 1,250,000 | | | | 1,668,161 | |
| | | | | | | | |
Total Foreign Bonds
(Cost $3,297,191) | | | | 3,336,387 | |
| | | | | | | | |
|
| Foreign Government Bonds 0.8% | |
Banks 0.3% | |
Barclays Bank PLC
Series Reg S
10.00%, due 5/21/21 | | £ | 1,186,000 | | | | 2,398,473 | |
| | | | | | | | |
|
Foreign Sovereign 0.5% | |
Portugal Obrigacoes do Tesouro OT
Series Reg S
4.95%, due 10/25/23 | | € | 3,420,000 | | | | 3,424,357 | |
Republic of Venezuela
6.00%, due 12/9/20 | | $ | 309,000 | | | | 235,613 | |
| | | | | | | | |
| | | | | | | 3,659,970 | |
| | | | | | | | |
Total Foreign Government Bonds
(Cost $4,544,939) | | | | 6,058,443 | |
| | | | | | | | |
| | | | |
| 18 | | MainStay Income Builder Fund | | The notes to the financial statements are an integral part of,
and should be read in conjunction with, the financial statements. |
| | | | | | | | |
| | | Principal
Amount | | | Value | |
| | | | | | | | |
| Loan Assignments & Participations 1.0% (h) | |
Airlines 0.3% | |
U.S. Airways Group, Inc.
Term Loan
2.711%, due 3/21/14 | | $ | 1,944,444 | | | $ | 1,896,238 | |
| | | | | | | | |
|
Automobile 0.4% | |
Allison Transmission, Inc.
Extended Term Loan B2
3.72%, due 8/7/17 | | | 2,868,875 | | | | 2,870,668 | |
| | | | | | | | |
|
Media 0.2% | |
Clear Channel Communications, Inc.
Term Loan B
3.862%, due 1/29/16 | | | 1,964,135 | | | | 1,620,718 | |
| | | | | | | | |
|
Metals & Mining 0.1% | |
FMG America Finance, Inc.
Term Loan
5.25%, due 10/18/17 | | | 1,100,000 | | | | 1,094,328 | |
| | | | | | | | |
Total Loan Assignments & Participations
(Cost $7,637,974) | | | | | | | 7,481,952 | |
| | | | | | | | |
|
| Mortgage-Backed Securities 1.5% | |
Commercial Mortgage Loans
(Collateralized Mortgage Obligations) 1.4% | |
Banc of America Commercial Mortgage, Inc.
Series 2007-2, Class A4
5.631%, due 4/10/49 (i) | | | 400,000 | | | | 465,000 | |
Bayview Commercial Asset Trust
Series 2006-4A, Class A1
0.441%, due 12/25/36 (c)(d)(e) | | | 287,883 | | | | 222,656 | |
Bear Stearns Commercial
Mortgage Securities
Series 2006-PW12, Class AAB
5.687%, due 9/11/38 (i) | | | 181,558 | | | | 185,583 | |
Series 2007-PW16, Class A4
5.716%, due 6/11/40 (i) | | | 400,000 | | | | 476,150 | |
Citigroup Commercial Mortgage Trust
Series 2008-C7, Class A4
6.061%, due 12/10/49 (i) | | | 200,000 | | | | 241,989 | |
Citigroup/Deutsche Bank
Commercial Mortgage Trust
Series 2005-CD1, Class AM
5.219%, due 7/15/44 (i) | | | 1,000,000 | | | | 1,105,161 | |
Commercial Mortgage Pass-Through Certificates
Series 2006-C8, Class AAB
5.291%, due 12/10/46 | | | 420,527 | | | | 435,224 | |
| | | | | | | | |
| | | Principal
Amount | | | Value | |
| | | | | | | | |
Commercial Mortgage Loans
(Collateralized Mortgage Obligations) (continued) | |
Four Times Square Trust
Series 2006-4TS, Class A
5.401%, due 12/13/28 (d) | | $ | 860,000 | | | $ | 1,018,931 | |
JP Morgan Chase Commercial Mortgage
Securities Corp.
Series 2004-C3, Class A5
4.878%, due 1/15/42 | | | 510,000 | | | | 550,462 | |
Series 2007-CB20, Class A3
5.819%, due 2/12/51 | | | 500,000 | | | | 521,888 | |
Series 2007-LD12, Class A3
5.971%, due 2/15/51 (i) | | | 500,000 | | | | 533,163 | |
LB-UBS Commercial Mortgage Trust
Series 2006-C7, Class A3
5.347%, due 11/15/38 | | | 500,000 | | | | 576,141 | |
Series 2007-C6, Class AAB
5.855%, due 7/15/40 | | | 469,578 | | | | 503,058 | |
Series 2007-C6, Class A3
5.933%, due 7/15/40 | | | 500,000 | | | | 553,693 | |
Merrill Lynch / Countrywide Commercial
Mortgage Trust
Series 2007-8, Class A2
5.912%, due 8/12/49 (i) | | | 424,095 | | | | 444,681 | |
Morgan Stanley Capital I, Inc.
Series 2007-IQ14, Class AAB
5.654%, due 4/15/49 (c) | | | 459,844 | | | | 498,024 | |
Series 2006-HQ9, Class AM
5.773%, due 7/12/44 (c) | | | 500,000 | | | | 561,264 | |
Timberstar Trust
Series 2006-1, Class A
5.668%, due 10/15/36 (d) | | | 280,000 | | | | 316,030 | |
Wachovia Bank Commercial Mortgage Trust
Series 2006-C29, Class AM
5.339%, due 11/15/48 | | | 500,000 | | | | 552,601 | |
WaMu Mortgage Pass-Through Certificates
Series 2006-AR14, Class 1A1
2.298%, due 11/25/36 (i) | | | 796,621 | | | | 632,407 | |
| | | | | | | | |
| | | | 10,394,106 | |
| | | | | | | | |
Residential Mortgage
(Collateralized Mortgage Obligation) 0.1% | | | | | |
Mortgage Equity Conversion Asset Trust
Series 2007-FF2, Class A
0.65%, due 2/25/42 (c)(d)(e)(f) | | | 678,866 | | | | 544,253 | |
| | | | | | | | |
Total Mortgage-Backed Securities
(Cost $10,006,651) | | | | | | | 10,938,359 | |
| | | | | | | | |
| | | | | | |
The notes to the financial statements are an integral part of,
and should be read in conjunction with, the financial statements. | | mainstayinvestments.com | | | 19 | |
Portfolio of Investments††† October 31, 2012 (continued)
| | | | | | | | |
| | | Principal
Amount | | | Value | |
| | | | | | | | |
| U.S. Government & Federal Agencies 1.6% | |
Federal Home Loan Mortgage Corporation
(Mortgage Pass-Through Securities) 0.1% | |
6.50%, due 11/1/16 | | $ | 18,133 | | | $ | 19,444 | |
6.50%, due 2/1/27 | | | 224 | | | | 256 | |
6.50%, due 5/1/29 | | | 37,012 | | | | 43,336 | |
6.50%, due 6/1/29 | | | 16,476 | | | | 18,991 | |
6.50%, due 7/1/29 | | | 69,698 | | | | 81,466 | |
6.50%, due 8/1/29 | | | 33,676 | | | | 39,421 | |
6.50%, due 9/1/29 | | | 2,506 | | | | 2,934 | |
6.50%, due 6/1/32 | | | 11,762 | | | | 13,640 | |
6.50%, due 1/1/37 | | | 10,007 | | | | 11,375 | |
7.00%, due 3/1/26 | | | 322 | | | | 380 | |
7.00%, due 9/1/26 | | | 11,249 | | | | 13,349 | |
7.00%, due 7/1/32 | | | 32,806 | | | | 38,876 | |
7.50%, due 1/1/16 | | | 2,268 | | | | 2,413 | |
7.50%, due 5/1/32 | | | 16,244 | | | | 19,900 | |
| | | | | | | | |
| | | | 305,781 | |
| | | | | | | | |
Federal National Mortgage Association
(Mortgage Pass-Through Securities) 0.0%‡ | |
4.50%, due 7/1/20 | | | 9,115 | | | | 9,842 | |
4.50%, due 3/1/21 | | | 20,974 | | | | 22,647 | |
6.00%, due 4/1/19 | | | 2,631 | | | | 2,917 | |
7.00%, due 10/1/37 | | | 3,265 | | | | 3,886 | |
7.00%, due 11/1/37 | | | 31,948 | | | | 38,018 | |
7.50%, due 10/1/15 | | | 16,013 | | | | 17,056 | |
| | | | | | | | |
| | | | | | | 94,366 | |
| | | | | | | | |
Government National Mortgage Association
(Mortgage Pass-Through Securities) 0.0%‡ | |
5.00%, due 12/15/37 | | | 14,432 | | | | 15,813 | |
5.50%, due 9/15/35 | | | 43,128 | | | | 47,806 | |
6.50%, due 4/15/29 | | | 159 | | | | 187 | |
6.50%, due 5/15/29 | | | 454 | | | | 536 | |
6.50%, due 10/15/31 | | | 6,678 | | | | 7,768 | |
7.00%, due 9/15/23 | | | 988 | | | | 1,152 | |
7.00%, due 7/15/25 | | | 1,878 | | | | 2,218 | |
7.00%, due 12/15/25 | | | 4,437 | | | | 5,239 | |
7.00%, due 11/15/27 | | | 14,223 | | | | 16,954 | |
7.00%, due 12/15/27 | | | 63,564 | | | | 75,767 | |
7.00%, due 6/15/28 | | | 4,690 | | | | 5,613 | |
7.50%, due 3/15/26 | | | 8,651 | | | | 9,079 | |
7.50%, due 6/15/26 | | | 504 | | | | 604 | |
7.50%, due 10/15/30 | | | 28,612 | | | | 33,233 | |
8.00%, due 8/15/26 | | | 1,955 | | | | 2,023 | |
8.00%, due 9/15/26 | | | 151 | | | | 155 | |
8.00%, due 10/15/26 | | | 13,210 | | | | 15,988 | |
8.50%, due 11/15/26 | | | 23,148 | | | | 23,845 | |
| | | | | | | | |
| | | | 263,980 | |
| | | | | | | | |
| | | | | | | | |
| | | Principal
Amount | | | Value | |
| | | | | | | | |
¨United States Treasury Bonds 1.4% | |
3.00%, due 5/15/42 | | $ | 9,186,000 | | | $ | 9,488,853 | |
4.375%, due 5/15/40 | | | 475,000 | | | | 625,961 | |
| | | | | | | | |
| | | | | | | 10,114,814 | |
| | | | | | | | |
United States Treasury Notes 0.1% | | | | | | | | |
1.25%, due 3/15/14 | | | 235,000 | | | | 238,213 | |
3.625%, due 8/15/19 | | | 385,000 | | | | 449,517 | |
| | | | | | | | |
| | | | | | | 687,730 | |
| | | | | | | | |
Total U.S. Government & Federal Agencies
(Cost $11,460,941) | | | | | | | 11,466,671 | |
| | | | | | | | |
|
| Yankee Bonds 4.6% (j) | |
Banks 0.0%‡ | |
HSBC Holdings PLC
5.10%, due 4/5/21 | | | 115,000 | | | | 135,596 | |
Royal Bank of Scotland Group PLC
2.55%, due 9/18/15 | | | 205,000 | | | | 210,148 | |
| | | | | | | | |
| | | | | | | 345,744 | |
| | | | | | | | |
Building Materials 0.4% | | | | | | | | |
Desarrolladora Homex S.A.B. de C.V.
9.50%, due 12/11/19 (d) | | | 1,650,000 | | | | 1,648,020 | |
Urbi Desarrollos Urbanos S.A.B. de C.V.
9.50%, due 1/21/20 (d) | | | 1,700,000 | | | | 1,564,000 | |
| | | | | | | | |
| | | | | | | 3,212,020 | |
| | | | | | | | |
Cosmetics & Personal Care 0.3% | | | | | | | | |
Albea Beauty Holdings S.A.
8.375%, due 11/1/19 (d) | | | 1,850,000 | | | | 1,877,750 | |
| | | | | | | | |
|
Diversified Financial Services 0.1% | |
Permanent TSB PLC
3.60%, due 1/14/13 (d) | | | 400,000 | | | | 400,000 | |
| | | | | | | | |
|
Finance—Leasing Companies 0.2% | |
Banque PSA Finance S.A.
5.75%, due 4/4/21 (d) | | | 1,800,000 | | | | 1,731,904 | |
| | | | | | | | |
| | |
Food 0.9% | | | | | | | | |
Grupo Bimbo S.A.B. de C.V.
4.50%, due 1/25/22 (d) | | | 1,640,000 | | | | 1,804,075 | |
JBS Finance II, Ltd.
8.25%, due 1/29/18 (d) | | | 675,000 | | | | 703,688 | |
Minerva Luxembourg S.A.
12.25%, due 2/10/22 (d) | | | 2,000,000 | | | | 2,380,000 | |
Virgolino de Oliveira Finance, Ltd.
11.75%, due 2/9/22 (d) | | | 1,700,000 | | | | 1,657,500 | |
| | | | | | | | |
| | | | | | | 6,545,263 | |
| | | | | | | | |
Holding Company—Diversified 0.0%‡ | | | | | | | | |
Hutchison Whampoa International, Ltd.
7.625%, due 4/9/19 (d) | | | 215,000 | | | | 276,566 | |
| | | | | | | | |
| | | | |
| 20 | | MainStay Income Builder Fund | | The notes to the financial statements are an integral part of,
and should be read in conjunction with, the financial statements. |
| | | | | | | | |
| | | Principal
Amount | | | Value | |
| | | | | | | | |
| Yankee Bonds (continued) | |
Insurance 0.4% | | | | | | | | |
Oil Insurance, Ltd.
3.342%, due 12/31/49 (c)(d) | | $ | 1,320,000 | | | $ | 1,178,800 | |
Swiss Re Capital I, L.P.
6.854%, due 12/31/49 (c)(d) | | | 1,350,000 | | | | 1,408,356 | |
| | | | | | | | |
| | | | | | | 2,587,156 | |
| | | | | | | | |
Investment Company 0.4% | |
CDP Financial, Inc.
4.40%, due 11/25/19 (d) | | | 2,300,000 | | | | 2,663,810 | |
| | | | | | | | |
|
Iron & Steel 0.2% | |
Vale S.A.
5.625%, due 9/11/42 | | | 1,545,000 | | | | 1,655,163 | |
| | | | | | | | |
| | |
Mining 1.1% | | | | | | | | |
Anglo American Capital PLC
9.375%, due 4/8/19 (d) | | | 250,000 | | | | 333,670 | |
FMG Resources August 2006 Pty, Ltd.
8.25%, due 11/1/19 (d) | | | 2,000,000 | | | | 2,000,000 | |
Rio Tinto Finance USA, Ltd.
9.00%, due 5/1/19 | | | 1,300,000 | | | | 1,784,869 | |
Vedanta Resources PLC
8.25%, due 6/7/21 (d) | | | 1,690,000 | | | | 1,736,475 | |
Xstrata Finance Canada, Ltd.
5.80%, due 11/15/16 (d) | | | 2,005,000 | | | | 2,272,224 | |
| | | | | | | | |
| | | | | | | 8,127,238 | |
| | | | | | | | |
Miscellaneous—Manufacturing 0.1% | |
Siemens Financieringsmaatschappij N.V.
6.125%, due 8/17/26 (d) | | | 300,000 | | | | 395,744 | |
| | | | | | | | |
|
Oil & Gas 0.2% | |
ENI S.p.A.
4.15%, due 10/1/20 (d) | | | 175,000 | | | | 179,267 | |
Gazprom International S.A.
7.201%, due 2/1/20 (d) | | | 180,733 | | | | 202,421 | |
OGX Austria GmbH
8.50%, due 6/1/18 (d) | | | 1,345,000 | | | | 1,173,512 | |
TNK-BP Finance S.A.
7.50%, due 7/18/16 (d) | | | 200,000 | | | | 228,470 | |
| | | | | | | | |
| | | | | | | 1,783,670 | |
| | | | | | | | |
Transportation 0.3% | |
CHC Helicopter S.A.
9.25%, due 10/15/20 | | | 1,690,000 | | | | 1,715,350 | |
| | | | | | | | |
| | | Principal
Amount | | | Value | |
| | | | | | | | |
Transportation (continued) | |
Hapag-Lloyd A.G.
9.75%, due 10/15/17 (d) | | $ | 375,000 | | | $ | 365,625 | |
| | | | | | | | |
| | | | | | | 2,080,975 | |
| | | | | | | | |
Total Yankee Bonds
(Cost $32,819,671) | | | | | | | 33,683,003 | |
| | | | | | | | |
Total Long-Term Bonds
(Cost $296,888,696) | | | | | | | 315,367,161 | |
| | | | | | | | |
| | |
| | | | | | | | |
| | |
| | | Shares | | | | |
| Common Stocks 47.2% | |
Aerospace & Defense 1.3% | |
BAE Systems PLC | | | 723,950 | | | | 3,647,350 | |
Lockheed Martin Corp. | | | 50,750 | | | | 4,753,753 | |
Meggitt PLC | | | 235,950 | | | | 1,469,749 | |
| | | | | | | | |
| | | | | | | 9,870,852 | |
| | | | | | | | |
Agriculture 3.9% | |
Altria Group, Inc. | | | 176,998 | | | | 5,628,536 | |
British American Tobacco PLC | | | 61,747 | | | | 3,058,578 | |
Imperial Tobacco Group PLC | | | 151,650 | | | | 5,726,566 | |
Lorillard, Inc. | | | 38,090 | | | | 4,418,821 | |
Philip Morris International, Inc. | | | 58,913 | | | | 5,217,335 | |
Reynolds American, Inc. | | | 109,920 | | | | 4,577,069 | |
| | | | | | | | |
| | | | | | | 28,626,905 | |
| | | | | | | | |
Auto Manufacturers 0.8% | |
Daimler A.G. | | | 91,200 | | | | 4,258,473 | |
Ford Motor Co. | | | 125,000 | | | | 1,395,000 | |
| | | | | | | | |
| | | | | | | 5,653,473 | |
| | | | | | | | |
Banks 0.6% | |
CIT Group, Inc. (g) | | | 28,100 | | | | 1,045,882 | |
Citigroup, Inc. | | | 41,000 | | | | 1,532,990 | |
Westpac Banking Corp. | | | 82,606 | | | | 2,187,460 | |
| | | | | | | | |
| | | | | | | 4,766,332 | |
| | | | | | | | |
Beverages 2.1% | |
Anheuser-Busch InBev N.V. | | | 64,097 | | | | 5,359,445 | |
Coca-Cola Co. (The) | | | 53,770 | | | | 1,999,168 | |
Coca-Cola Enterprises, Inc. | | | 65,600 | | | | 2,062,464 | |
Diageo PLC, Sponsored ADR (k) | | | 39,550 | | | | 4,518,192 | |
PepsiCo., Inc. | | | 24,300 | | | | 1,682,532 | |
| | | | | | | | |
| | | | | | | 15,621,801 | |
| | | | | | | | |
Building Materials 0.1% | |
U.S. Concrete, Inc. (e)(g) | | | 83,147 | | | | 639,400 | |
| | | | | | | | |
|
Chemicals 1.6% | |
BASF S.E. | | | 61,944 | | | | 5,132,855 | |
Bayer A.G. | | | 27,750 | | | | 2,416,700 | |
E.I. du Pont de Nemours & Co. | | | 88,616 | | | | 3,945,184 | |
| | | | | | | | |
| | | | | | | 11,494,739 | |
| | | | | | | | |
| | | | | | |
The notes to the financial statements are an integral part of,
and should be read in conjunction with, the financial statements. | | mainstayinvestments.com | | | 21 | |
Portfolio of Investments††† October 31, 2012 (continued)
| | | | | | | | |
| | |
| | | Shares | | | Value | |
| | | | | | | | |
| Common Stocks (continued) | |
Commercial Services 0.6% | |
Automatic Data Processing, Inc. | | | 37,000 | | | $ | 2,138,230 | |
R.R. Donnelley & Sons Co. | | | 210,350 | | | | 2,107,707 | |
| | | | | | | | |
| | | | | | | 4,245,937 | |
| | | | | | | | |
Computers 0.3% | |
Diebold, Inc. | | | 80,850 | | | | 2,405,288 | |
| | | | | | | | |
| | |
Distribution & Wholesale 0.3% | | | | | | | | |
Genuine Parts Co. | | | 35,500 | | | | 2,221,590 | |
| | | | | | | | |
| | |
Electric 4.1% | | | | | | | | |
CMS Energy Corp. | | | 117,650 | | | | 2,861,248 | |
Dominion Resources, Inc. | | | 51,550 | | | | 2,720,809 | |
Duke Energy Corp. | | | 89,673 | | | | 5,890,619 | |
Integrys Energy Group, Inc. | | | 49,130 | | | | 2,654,985 | |
PPL Corp. | | | 60,850 | | | | 1,799,943 | |
SCANA Corp. | | | 45,608 | | | | 2,238,441 | |
Southern Co. (The) | | | 36,550 | | | | 1,712,002 | |
SSE PLC | | | 166,250 | | | | 3,884,778 | |
TECO Energy, Inc. | | | 162,150 | | | | 2,897,621 | |
Terna S.p.A. | | | 897,300 | | | | 3,372,801 | |
| | | | | | | | |
| | | | | | | 30,033,247 | |
| | | | | | | | |
Electrical Components & Equipment 0.5% | |
Emerson Electric Co. | | | 69,673 | | | | 3,374,263 | |
| | | | | | | | |
|
Electronics 0.5% | |
Honeywell International, Inc. | | | 59,350 | | | | 3,634,594 | |
| | | | | | | | |
| | |
Engineering & Construction 0.5% | | | | | | | | |
Vinci S.A. | | | 84,945 | | | | 3,759,413 | |
| | | | | | | | |
|
Entertainment 0.5% | |
Regal Entertainment Group Class A | | | 238,150 | | | | 3,657,984 | |
| | | | | | | | |
|
Environmental Controls 0.3% | |
Waste Management, Inc. | | | 75,500 | | | | 2,471,870 | |
| | | | | | | | |
|
Finance—Other Services 0.5% | |
CME Group, Inc. | | | 32,050 | | | | 1,792,557 | |
NYSE Euronext | | | 91,200 | | | | 2,258,112 | |
| | | | | | | | |
| | | | | | | 4,050,669 | |
| | | | | | | | |
Food 1.6% | |
H.J. Heinz Co. | | | 33,350 | | | | 1,917,959 | |
Nestle S.A. Registered | | | 94,405 | | | | 5,990,911 | |
Unilever PLC | | | 55,300 | | | | 2,062,344 | |
WM Morrison Supermarkets PLC | | | 432,950 | | | | 1,871,744 | |
| | | | | | | | |
| | | | | | | 11,842,958 | |
| | | | | | | | |
| | | | | | | | |
| | |
| | | Shares | | | Value | |
| | | | | | | | |
Food Services 0.4% | |
Compass Group PLC | | | 249,700 | | | $ | 2,740,081 | |
| | | | | | | | |
|
Gas 1.4% | |
¨National Grid PLC | | | 526,750 | | | | 6,005,549 | |
NiSource, Inc. | | | 70,991 | | | | 1,808,141 | |
Vectren Corp. | | | 83,450 | | | | 2,467,617 | |
| | | | | | | | |
| | | | | | | 10,281,307 | |
| | | | | | | | |
Household Products & Wares 1.2% | |
Kimberly-Clark Corp. | | | 69,245 | | | | 5,778,495 | |
Reckitt Benckiser Group PLC | | | 47,550 | | | | 2,877,517 | |
| | | | | | | | |
| | | | | | | 8,656,012 | |
| | | | | | | | |
Insurance 2.1% | |
Arthur J. Gallagher & Co. | | | 105,600 | | | | 3,742,464 | |
Muenchener Rueckversicherungs-Gesellschaft A.G. Registered | | | 29,880 | | | | 4,802,389 | |
SCOR SE | | | 167,350 | | | | 4,466,189 | |
Travelers Cos., Inc. (The) | | | 30,100 | | | | 2,135,294 | |
| | | | | | | | |
| | | | | | | 15,146,336 | |
| | | | | | | | |
Investment Company 0.0%‡ | |
BGP Holdings PLC (e)(f)(g) | | | 20,068 | | | | 3 | |
| | | | | | | | |
| | |
Machinery—Diversified 0.3% | | | | | | | | |
Deere & Co. | | | 22,150 | | | | 1,892,496 | |
| | | | | | | | |
| | |
Media 2.4% | | | | | | | | |
Comcast Corp. Class A | | | 114,650 | | | | 4,177,846 | |
Dex One Corp. (g) | | | 2,323 | | | | 2,323 | |
¨Pearson PLC | | | 329,700 | | | | 6,624,061 | |
Shaw Communications, Inc. | | | 173,800 | | | | 3,786,621 | |
Time Warner, Inc. | | | 66,650 | | | | 2,895,943 | |
| | | | | | | | |
| | | | | | | 17,486,794 | |
| | | | | | | | |
Miscellaneous—Manufacturing 0.3% | |
Orkla ASA | | | 327,800 | | | | 2,593,054 | |
| | | | | | | | |
|
Office & Business Equipment 0.3% | |
Pitney Bowes, Inc. | | | 138,527 | | | | 1,989,248 | |
| | | | | | | | |
| | |
Oil & Gas 2.4% | | | | | | | | |
ConocoPhillips | | | 46,650 | | | | 2,698,703 | |
Diamond Offshore Drilling, Inc. | | | 40,850 | | | | 2,828,454 | |
ExxonMobil Corp. | | | 22,805 | | | | 2,079,132 | |
Royal Dutch Shell PLC, ADR (k) | | | 70,350 | | | | 4,817,568 | |
Total S.A. | | | 97,868 | | | | 4,924,377 | |
| | | | | | | | |
| | | | | | | 17,348,234 | |
| | | | | | | | |
| | | | |
| 22 | | MainStay Income Builder Fund | | The notes to the financial statements are an integral part of,
and should be read in conjunction with, the financial statements. |
| | | | | | | | |
| | |
| | | Shares | | | Value | |
| | | | | | | | |
| Common Stocks (continued) | |
Pharmaceuticals 3.9% | |
Abbott Laboratories | | | 35,900 | | | $ | 2,352,168 | |
AstraZeneca PLC, Sponsored ADR (k) | | | 93,600 | | | | 4,343,040 | |
Bristol-Myers Squibb Co. | | | 75,935 | | | | 2,524,839 | |
GlaxoSmithKline PLC | | | 145,400 | | | | 3,253,272 | |
Johnson & Johnson | | | 39,367 | | | | 2,787,971 | |
Merck & Co., Inc. | | | 65,359 | | | | 2,982,331 | |
Novartis A.G. | | | 59,350 | | | | 3,571,961 | |
Roche Holding A.G., Genusscheine | | | 19,550 | | | | 3,759,696 | |
Sanofi | | | 35,500 | | | | 3,120,622 | |
| | | | | | | | |
| | | | | | | 28,695,900 | |
| | | | | | | | |
Pipelines 1.4% | |
Enterprise Products Partners, L.P. | | | 55,300 | | | | 2,914,863 | |
Kinder Morgan Energy Partners, L.P. | | | 46,050 | | | | 3,852,543 | |
MarkWest Energy Partners, L.P. | | | 34,650 | | | | 1,879,069 | |
Spectra Energy Corp. | | | 63,650 | | | | 1,837,576 | |
| | | | | | | | |
| | | | | | | 10,484,051 | |
| | | | | | | | |
Retail 0.3% | |
McDonald’s Corp. | | | 21,942 | | | | 1,904,566 | |
| | | | | | | | |
|
Semiconductors 1.3% | |
KLA-Tencor Corp. | | | 58,500 | | | | 2,721,420 | |
Microchip Technology, Inc. | | | 128,850 | | | | 4,039,448 | |
Taiwan Semiconductor Manufacturing Co., Ltd., Sponsored ADR (k) | | | 170,350 | | | | 2,708,565 | |
| | | | | | | | |
| | | | | | | 9,469,433 | |
| | | | | | | | |
Software 0.9% | |
Microsoft Corp. | | | 101,723 | | | | 2,902,666 | |
Oracle Corp. | | | 110,353 | | | | 3,426,460 | |
| | | | | | | | |
| | | | | | | 6,329,126 | |
| | | | | | | | |
Telecommunications 7.0% | |
AT&T, Inc. | | | 123,027 | | | | 4,255,504 | |
¨BCE, Inc. | | | 164,750 | | | | 7,201,987 | |
CenturyLink, Inc. | | | 134,401 | | | | 5,158,310 | |
Comverse Technology, Inc. (g) | | | 7,732 | | | | 50,954 | |
Deutsche Telekom A.G. | | | 374,650 | | | | 4,277,671 | |
Philippine Long Distance Telephone Co., Sponsored ADR (k) | | | 26,450 | | | | 1,680,369 | |
Rogers Communications, Inc. Class B | | | 76,950 | | | | 3,377,710 | |
¨Swisscom A.G. | | | 15,270 | | | | 6,343,781 | |
Telstra Corp, Ltd. | | | 628,250 | | | | 2,699,921 | |
Verizon Communications, Inc. | | | 132,274 | | | | 5,904,711 | |
Vivendi S.A. | | | 186,673 | | | | 3,819,277 | |
¨Vodafone Group PLC | | | 2,391,427 | | | | 6,493,042 | |
| | | | | | | | |
| | | | | | | 51,263,237 | |
| | | | | | | | |
Toys, Games & Hobbies 0.6% | |
Mattel, Inc. | | | 111,400 | | | | 4,097,292 | |
| | | | | | | | |
| | | | | | | | |
| | |
| | | Shares | | | Value | |
| | | | | | | | |
Transportation 0.4% | |
FirstGroup PLC | | | 940,450 | | | $ | 2,891,124 | |
| | | | | | | | |
|
Water 0.5% | |
United Utilities Group PLC | | | 341,100 | | | | 3,726,545 | |
| | | | | | | | |
Total Common Stocks
(Cost $295,147,196) | | | | | | | 345,366,154 | |
| | | | | | | | |
|
| Convertible Preferred Stocks 1.6% | |
Aerospace & Defense 0.1% | |
United Technologies Corp.
7.50% | | | 16,100 | | | | 875,518 | |
| | | | | | | | |
|
Auto Manufacturers 0.1% | |
General Motors Co.
4.75% | | | 15,000 | | | | 609,300 | |
| | | | | | | | |
|
Auto Parts & Equipment 0.1% | |
Goodyear Tire & Rubber Co. (The)
5.88% | | | 13,000 | | | | 546,650 | |
| | | | | | | | |
|
Banks 0.6% | |
Bank of America Corp.
7.25% Series L | | | 800 | | | | 891,784 | |
Citigroup, Inc.
7.50% | | | 13,200 | | | | 1,349,040 | |
Wells Fargo & Co.
7.50% Series L | | | 1,800 | | | | 2,250,000 | |
| | | | | | | | |
| | | | | | | 4,490,824 | |
| | | | | | | | |
Hand & Machine Tools 0.1% | |
Stanley Black & Decker, Inc.
4.75% | | | 6,200 | | | | 750,634 | |
| | | | | | | | |
|
Insurance 0.2% | |
¨Hartford Financial Services Group, Inc.
7.25% | | | 75,400 | | | | 1,541,930 | |
| | | | | | | | |
|
Investment Management/Advisory Services 0.2% | |
Affiliated Managers Group, Inc.
5.10% | | | 30,100 | | | | 1,595,300 | |
| | | | | | | | |
|
Media 0.0%‡ | |
Nielsen Holdings N.V.
6.25% | | | 4,600 | | | | 251,419 | |
| | | | | | | | |
|
Oil & Gas 0.2% | |
Energy XXI Bermuda, Ltd.
5.63% | | | 2,400 | | | | 857,250 | |
| | | | | | |
The notes to the financial statements are an integral part of,
and should be read in conjunction with, the financial statements. | | mainstayinvestments.com | | | 23 | |
Portfolio of Investments††† October 31, 2012 (continued)
| | | | | | | | |
| | |
| | | Shares | | | Value | |
| | | | | | | | |
| Convertible Preferred Stocks (continued) | |
Oil & Gas (continued) | |
Sanchez Energy Corp. (d)(g)
4.88% | | | 5,800 | | | $ | 285,862 | |
| | | | | | | | |
| | | | | | | 1,143,112 | |
| | | | | | | | |
Total Convertible Preferred Stocks
(Cost $12,082,412) | | | | | | | 11,804,687 | |
| | | | | | | | |
|
| Preferred Stocks 0.6% | |
Insurance 0.3% | |
MetLife, Inc.
6.50% | | | 89,400 | | | | 2,292,216 | |
| | | | | | | | |
|
Media 0.3% | |
ProSiebenSat.1 Media A.G.
5.34% | | | 84,300 | | | | 2,349,206 | |
| | | | | | | | |
Total Preferred Stocks
(Cost $4,241,971) | | | | | | | 4,641,422 | |
| | | | | | | | |
| | |
| | | | | | | | |
| | | Number of
Warrants | | | | |
| Warrants 0.0%‡ | |
Media 0.0%‡ | |
ION Media Networks, Inc.
Second Lien
Expires 12/18/39 (e)(f)(g)(l) | | | 6 | | | | 0 | (m) |
Unsecured Debt Expires 12/18/16 (e)(f)(g)(l) | | | 6 | | | | 0 | (m) |
| | | | | | | | |
Total Warrants
(Cost $20) | | | | | | | 0 | (m) |
| | | | | | | | |
| | |
| | | | | | | | |
| | | Principal
Amount | | | | |
| Short-Term Investment 6.2% | |
Repurchase Agreement 6.2% | |
State Street Bank and Trust Co.
0.01%, dated 10/31/12
due 11/1/12
proceeds at Maturity $45,264,842 (Federal National Mortgage Association security with a rate of 2.17% and a maturity date of 10/17/22, with Principal Amount of $45,995,000 and Market Value of $46,176,405) | | $ | 45,264,829 | | | $ | 45,264,829 | |
| | | | | | | | |
Total Short-Term Investment
(Cost $45,264,829) | | | | | | | 45,264,829 | |
| | | | | | | | |
Total Investments
(Cost $653,625,124) (p) | | | 98.7 | % | | | 722,444,253 | |
Other Assets, Less Liabilities | | | 1.3 | | | | 9,204,410 | |
Net Assets | | | 100.0 | % | | $ | 731,648,663 | |
| | |
| | | | | | | | |
| | | | | | | | |
| | | Contracts
Long | | | Unrealized
Appreciation
(Depreciation) (n) | |
| Futures Contracts (0.4%) | |
Standard & Poor’s 500 Index
Mini December 2012 (o) | | | 1,400 | | | $ | (3,167,500 | ) |
| | | | | | | | |
Total Futures Contracts Long
(Settlement Value $98,476,000) | | | | | | | (3,167,500 | ) |
| | | | | | | | |
| | |
| | | | | | | | |
| | | Contracts
Short | | | | |
United States Treasury Notes
December 2012 (5 Year) (o) | | | (457 | ) | | | (54,697 | ) |
| | | | | | | | |
Total Futures Contracts Short
(Settlement Value $56,782,250) | | | | | | | (54,697 | ) |
| | | | | | | | |
Total Futures Contracts
(Settlement Value $41,693,750) | | | | | | $ | (3,222,197 | ) |
| | | | | | | | |
| ††† | On a daily basis New York Life Investments confirms that the value of the Fund’s liquid assets (liquid portfolio securities and cash) is sufficient to cover its potential senior securities (e.g., futures, swaps, options). |
| ‡ | Less than one-tenth of a percent. |
| (a) | Step coupon. Rate shown is the rate in effect as of October 31, 2012. |
| (b) | Subprime mortgage investment and other asset-backed securities. The total market value of these securities as of October 31, 2012 is $10,488,616, which represents 1.4% of the Fund’s net assets. |
| (c) | Floating rate—Rate shown is the rate in effect as of October 31, 2012. |
| (d) | May be sold to institutional investors only under Rule 144A or securities offered pursuant to Section 4(2) of the Securities Act of 1933, as amended. |
| (e) | Illiquid security. The total market value of these securities as of October 31, 2012 is $1,408,072, which represents 0.2% of the Fund’s net assets. |
| (f) | Fair valued security. The total market value of these securities as of October 31, 2012 is $830,209, which represents 0.1% of the Fund’s net assets. |
| (g) | Non-income producing security. |
| (h) | Floating Rate Loan—generally pays interest at rates which are periodically re-determined at a margin above the London InterBank Offered Rate or other short-term rates. The rate shown is the rate(s) in effect as of October 31, 2012. Floating Rate Loans are generally considered restrictive in that the Fund is ordinarily contractually obligated to receive consent from the Agent Bank and/or borrower prior to disposition of a Floating Rate Loan. |
| (i) | Collateral strip rate—Bond whose interest is based on the weighted net interest rate of the collateral. Coupon rate adjusts periodically based on a predetermined schedule. Rate shown is the rate in effect as of October 31, 2012. |
| (j) | Yankee Bond—Dollar-denominated bond issued in the United States by a foreign bank or corporation. |
| (k) | ADR—American Depositary Receipt. |
| (n) | Represents the difference between the value of the contracts at the time they were opened and the value as of October 31, 2012. |
| | | | |
| 24 | | MainStay Income Builder Fund | | The notes to the financial statements are an integral part of,
and should be read in conjunction with, the financial statements. |
| (o) | As of October 31, 2012, cash in the amount of $5,151,350 is on deposit with the broker for futures transactions. |
| (p) | As of October 31, 2012, cost is $652,176,731 for federal income tax purposes and net unrealized appreciation is as follows: |
| | | | |
Gross unrealized appreciation | | $ | 89,856,527 | |
Gross unrealized depreciation | | | (19,589,005 | ) |
| | | | |
Net unrealized appreciation | | $ | 70,267,522 | |
| | | | |
The following abbreviations are used in the above portfolio:
€—Euro
£—British Pound Sterling
As of October 31, 2012, the Fund held the following foreign currency forward contracts:
| | | | | | | | | | | | | | | | | | | | | | | | | | | | | | | | |
Foreign Currency Sale Contracts | | Expiration
Date | | | Counterparty | | | Contract
Amount
Sold | | | Contract
Amount
Purchased | | | Unrealized
Appreciation
(Depreciation) | |
Euro vs. U.S. Dollar | | | 12/6/12 | | | | JPMorgan Chase Bank | | | | EUR | | | | 33,482,000 | | | | USD | | | | 43,439,212 | | | | USD | | | | 28,212 | |
Pound Sterling vs. U.S. Dollar | | | 12/6/12 | | | | JPMorgan Chase Bank | | | | GBP | | | | 19,963,000 | | | | | | | | 31,794,272 | | | | | | | | (417,349 | ) |
Net unrealized appreciation (depreciation) on foreign currency forward contracts | | | | USD | | | | (389,137 | ) |
The following is a summary of the fair valuations according to the inputs used as of October 31, 2012, for valuing the Fund’s assets and liabilities.
Asset Valuation Inputs
| | | | | | | | | | | | | | | | |
Description | | Quoted
Prices in
Active
Markets for
Identical
Assets (Level 1) | | | Significant
Other
Observable
Inputs (Level 2) | | | Significant
Unobservable
Inputs (Level 3) | | | Total | |
| Investments in Securities (a) | | | | | | | | | | | | | | | | |
| Long-Term Bonds | | | | | | | | | | | | | | | | |
Asset-Backed Securities | | $ | — | | | $ | 15,369,229 | | | $ | — | | | $ | 15,369,229 | |
Convertible Bonds | | | — | | | | 42,280,431 | | | | — | | | | 42,280,431 | |
Corporate Bonds (b) | | | — | | | | 184,466,733 | | | | 285,953 | | | | 184,752,686 | |
Foreign Bonds | | | — | | | | 3,336,387 | | | | — | | | | 3,336,387 | |
Foreign Government Bonds | | | — | | | | 6,058,443 | | | | — | | | | 6,058,443 | |
Loan Assignments & Participations | | | — | | | | 7,481,952 | | | | — | | | | 7,481,952 | |
Mortgage-Backed Securities (c) | | | — | | | | 10,394,106 | | | | 544,253 | | | | 10,938,359 | |
U.S. Government & Federal Agencies | | | — | | | | 11,466,671 | | | | — | | | | 11,466,671 | |
Yankee Bonds | | | — | | | | 33,683,003 | | | | — | | | | 33,683,003 | |
| | | | | | | | | | | | | | | | |
| Total Long-Term Bonds | | | — | | | | 314,536,955 | | | | 830,206 | | | | 315,367,161 | |
| | | | | | | | | | | | | | | | |
| Common Stocks (d) | | | 345,366,151 | | | | — | | | | 3 | | | | 345,366,154 | |
| Convertible Preferred Stocks | | | 11,804,687 | | | | — | | | | — | | | | 11,804,687 | |
| Preferred Stocks | | | 4,641,422 | | | | — | | | | — | | | | 4,641,422 | |
| Warrants (e) | | | — | | | | — | | | | 0 | (e) | | | 0 | (e) |
| Short-Term Investment | | | | | | | | | | | | | | | | |
Repurchase Agreement | | | — | | | | 45,264,829 | | | | — | | | | 45,264,829 | |
| | | | | | | | | | | | | | | | |
| Total Investments in Securities | | | 361,812,260 | | | | 359,801,784 | | | | 830,209 | | | | 722,444,253 | |
| | | | | | | | | | | | | | | | |
| Other Financial Instruments | | | | | | | | | | | | | | | | |
Foreign Currency Forward Contracts (f) | | | — | | | | 28,212 | | | | — | | | | 28,212 | |
| | | | | | | | | | | | | | | | |
| Total Investments in Securities and Other Financial Instruments | | $ | 361,812,260 | | | $ | 359,829,996 | | | $ | 830,209 | | | $ | 722,472,465 | |
| | | | | | | | | | | | | | | | |
| | | | | | |
The notes to the financial statements are an integral part of,
and should be read in conjunction with, the financial statements. | | mainstayinvestments.com | | | 25 | |
Portfolio of Investments††† October 31, 2012 (continued)
Liability Valuation Inputs
| | | | | | | | | | | | | | | | |
Description | | Quoted
Prices in
Active
Markets for
Identical
Assets (Level 1) | | | Significant
Other
Observable
Inputs (Level 2) | | | Significant
Unobservable
Inputs (Level 3) | | | Total | |
| Other Financial Instruments | | | | | | | | | | | | | | | | |
Foreign Currency Forward Contracts (f) | | $ | — | | | $ | (417,349 | ) | | $ | — | | | $ | (417,349 | ) |
Futures Contracts Long (f) | | | (3,167,500 | ) | | | — | | | | — | | | | (3,167,500 | ) |
Futures Contracts Short (f) | | | (54,697 | ) | | | — | | | | — | | | | (54,697 | ) |
| | | | | | | | | | | | | | | | |
| Total Other Financial Instruments | | $ | (3,222,197 | ) | | $ | (417,349 | ) | | $ | — | | | $ | (3,639,546 | ) |
| | | | | | | | | | | | | | | | |
| (a) | For a complete listing of investments and their industries, see the Portfolio of Investments. |
| (b) | The Level 3 securities valued at $1,760 and $284,193 are held in Commercial Services and Retail, respectively, within the Corporate Bonds section of the Portfolio of Investments. |
| (c) | The Level 3 security valued at $544,253 is held in Residential Mortgage (Collateralized Mortgage Obligation) within the Mortgage-Backed Securities section of the Portfolio of Investments. |
| (d) | The Level 3 security valued at $3 is held in Investment Company within the Common Stocks section of the Portfolio of Investments. |
| (e) | The Level 3 securities valued at less than one dollar are held in Media within the Warrants section of the Portfolio of Investments. |
| (f) | The value listed for these securities reflects unrealized appreciation (depreciation) as shown on the Portfolio of Investments. |
The Fund recognizes transfers between the levels as of the beginning of the period.
For the year ended October 31, 2012, the Fund did not have any transfers between Level 1 and Level 2 fair value measurements. (See Note 2)
The following is a reconciliation of investments in which significant unobservable inputs (Level 3) were used in determining value:
| | | | | | | | | | | | | | | | | | | | | | | | | | | | | | | | | | | | | | | | |
Investments in Securities | | Balance
as of
October 31,
2011 | | | Accrued
Discounts
(Premiums) | | | Realized
Gain
(Loss) | | | Change in
Unrealized
Appreciation
(Depreciation) | | | Purchases | | | Sales | | | Transfers
in to
Level 3 | | | Transfers
out of
Level 3 | | | Balance
as of
October 31,
2012 | | | Change in
Unrealized
Appreciation
(Depreciation)
from
Investments
Still Held at
October 31,
2012 (a) | |
| Long-Term Bonds | | | | | | | | | | | | | | | | | | | | | | | | | | | | | | | | | | | | | | | | |
Corporate Bonds | | | | | | | | | | | | | | | | | | | | | | | | | | | | | | | | | | | | | | | | |
Commercial Services | | $ | 1,760 | | | $ | — | | | $ | — | | | $ | — | | | $ | — | | | $ | — | | | $ | — | | | $ | — | | | $ | 1,760 | | | $ | — | |
Retail | | | 278,122 | | | | (259 | ) | | | (259 | ) | | | 19,472 | | | | — | | | | (12,883 | ) | | | — | | | | — | | | | 284,193 | | | | 19,756 | |
Loan Assignments & Participations Machinery | | | 312 | | | | (3,041 | ) | | | (74,769 | ) | | | 77,498 | | | | — | | | | — | | | | — | | | | — | | | | — | | | | — | |
Mortgage-Backed Securities | | | | | | | | | | | | | | | | | | | | | | | | | | | | | | | | | | | | | | | | |
Residential Mortgage (Collateralized Mortgage Obligation) | | | 633,007 | | | | — | | | | — | | | | (64,278 | ) | | | — | | | | (24,476 | ) | | | — | | | | — | | | | 544,253 | | | | (66,725 | ) |
| Common Stocks | | | | | | | | | | | | | | | | | | | | | | | | | | | | | | | | | | | | | | | | |
Investment Company | | | 3 | | | | — | | | | — | | | | 0 | (b) | | | — | | | | — | | | | — | | | | — | | | | 3 | | | | — | |
| Warrants | | | | | | | | | | | | | | | | | | | | | | | | | | | | | | | | | | | | | | | | |
Media | | | 0 | (b) | | | — | | | | — | | | | — | | | | — | | | | — | | | | — | | | | — | | | | 0 | (b) | | | — | |
| | | | | | | | | | | | | | | | | | | | | | | | | | | | | | | | | | | | | | | | |
| Total | | $ | 913,204 | | | $ | (3,300 | ) | | $ | (75,028 | ) | | $ | 32,692 | | | $ | — | | | $ | (37,359 | ) | | $ | — | | | $ | — | | | $ | 830,209 | | | $ | (46,969 | ) |
| | | | | | | | | | | | | | | | | | | | | | | | | | | | | | | | | | | | | | | | |
| (a) | Included in “Net change in unrealized appreciation (depreciation) on investments” in the Statement of Operations. |
| | | | |
| 26 | | MainStay Income Builder Fund | | The notes to the financial statements are an integral part of,
and should be read in conjunction with, the financial statements. |
Statement of Assets and Liabilities as of October 31, 2012
| | | | |
| Assets | |
Investment in securities, at value
(identified cost $653,625,124) | | $ | 722,444,253 | |
Cash collateral on deposit at broker | | | 5,151,350 | |
Cash denominated in foreign currencies
(identified cost $565,102) | | | 566,816 | |
Receivables: | | | | |
Dividends and interest | | | 5,522,116 | |
Investment securities sold | | | 2,011,576 | |
Fund shares sold | | | 1,016,151 | |
Other assets | | | 26,463 | |
Unrealized appreciation on foreign currency forward contracts | | | 28,212 | |
| | | | |
Total assets | | | 736,766,937 | |
| | | | |
| |
| Liabilities | | | | |
Payables: | | | | |
Investment securities purchased | | | 3,040,230 | |
Fund shares redeemed | | | 472,781 | |
Manager (See Note 3) | | | 398,180 | |
Transfer agent (See Note 3) | | | 373,662 | |
Variation margin on futures contracts | | | 170,250 | |
NYLIFE Distributors (See Note 3) | | | 158,837 | |
Shareholder communication | | | 45,835 | |
Professional fees | | | 22,391 | |
Custodian | | | 8,458 | |
Trustees | | | 2,215 | |
Accrued expenses | | | 8,086 | |
Unrealized depreciation on foreign currency forward contracts | | | 417,349 | |
| | | | |
Total liabilities | | | 5,118,274 | |
| | | | |
Net assets | | $ | 731,648,663 | |
| | | | |
|
| Composition of Net Assets | |
Shares of beneficial interest outstanding (par value of $.01 per share) unlimited number of shares authorized | | $ | 418,136 | |
Additional paid-in capital | | | 697,834,311 | |
| | | | |
| | | 698,252,447 | |
Undistributed net investment income | | | 135,567 | |
Accumulated net realized gain (loss) on investments, futures transactions and foreign currency transactions | | | (31,943,789 | ) |
Net unrealized appreciation (depreciation) on investments and futures contracts | | | 65,596,932 | |
Net unrealized appreciation (depreciation) on translation of other assets and liabilities in foreign currencies and foreign currency forward contracts | | | (392,494 | ) |
| | | | |
Net assets | | $ | 731,648,663 | |
| | | | |
| | | | |
Investor Class | | | | |
Net assets applicable to outstanding shares | | $ | 160,758,248 | |
| | | | |
Shares of beneficial interest outstanding | | | 9,205,930 | |
| | | | |
Net asset value per share outstanding | | $ | 17.46 | |
Maximum sales charge (5.50% of offering price) | | | 1.02 | |
| | | | |
Maximum offering price per share outstanding | | $ | 18.48 | |
| | | | |
Class A | | | | |
Net assets applicable to outstanding shares | | $ | 292,602,597 | |
| | | | |
Shares of beneficial interest outstanding | | | 16,762,065 | |
| | | | |
Net asset value per share outstanding | | $ | 17.46 | |
Maximum sales charge (5.50% of offering price) | | | 1.02 | |
| | | | |
Maximum offering price per share outstanding | | $ | 18.48 | |
| | | | |
Class B | | | | |
Net assets applicable to outstanding shares | | $ | 51,232,757 | |
| | | | |
Shares of beneficial interest outstanding | | | 2,920,609 | |
| | | | |
Net asset value and offering price per share outstanding | | $ | 17.54 | |
| | | | |
Class C | |
Net assets applicable to outstanding shares | | $ | 22,444,286 | |
| | | | |
Shares of beneficial interest outstanding | | | 1,281,403 | |
| | | | |
Net asset value and offering price per share outstanding | | $ | 17.52 | |
| | | | |
Class I | | | | |
Net assets applicable to outstanding shares | | $ | 204,610,775 | |
| | | | |
Shares of beneficial interest outstanding | | | 11,643,551 | |
| | | | |
Net asset value and offering price per share outstanding | | $ | 17.57 | |
| | | | |
| | | | | | |
The notes to the financial statements are an integral part of,
and should be read in conjunction with, the financial statements. | | mainstayinvestments.com | | | 27 | |
Statement of Operations for the year ended October 31, 2012
| | | | |
| Investment Income (Loss) | |
Income | | | | |
Interest | | $ | 18,710,752 | |
Dividends (a) | | | 15,604,546 | |
| | | | |
Total income | | | 34,315,298 | |
| | | | |
Expenses | | | | |
Manager (See Note 3) | | | 4,338,445 | |
Distribution/Service—Investor Class (See Note 3) | | | 406,508 | |
Distribution/Service—Class A (See Note 3) | | | 656,854 | |
Distribution/Service—Class B (See Note 3) | | | 549,980 | |
Distribution/Service—Class C (See Note 3) | | | 139,690 | |
Transfer agent (See Note 3) | | | 1,438,732 | |
Shareholder communication | | | 106,397 | |
Professional fees | | | 92,042 | |
Registration | | | 75,107 | |
Custodian | | | 57,386 | |
Trustees | | | 18,316 | |
Miscellaneous | | | 52,354 | |
| | | | |
Total expenses | | | 7,931,811 | |
| | | | |
Net investment income (loss) | | | 26,383,487 | |
| | | | |
|
| Realized and Unrealized Gain (Loss) on Investments, Futures Contracts and Foreign Currency Transactions | |
Net realized gain (loss) on: | | | | |
Security transactions | | | 4,042,635 | |
Futures transactions | | | 21,313,550 | |
Foreign currency transactions | | | 410,543 | |
| | | | |
Net realized gain (loss) on investments, futures transactions and foreign currency transactions | | | 25,766,728 | |
| | | | |
Net change in unrealized appreciation (depreciation) on: | | | | |
Investments | | | 38,007,126 | |
Futures contracts | | | (7,553,678 | ) |
Translation of other assets and liabilities in foreign currencies and foreign currency forward contracts | | | 5,188,844 | |
| | | | |
Net change in unrealized appreciation (depreciation) on investments, futures contracts and foreign currency transactions | | | 35,642,292 | |
| | | | |
Net realized and unrealized gain (loss) on investments, futures transactions and foreign currency transactions | | | 61,409,020 | |
| | | | |
Net increase (decrease) in net assets resulting from operations | | $ | 87,792,507 | |
| | | | |
| (a) | Dividends recorded net of foreign withholding taxes in the amount of $788,403. |
| | | | |
| 28 | | MainStay Income Builder Fund | | The notes to the financial statements are an integral part of,
and should be read in conjunction with, the financial statements. |
Statements of Changes in Net Assets
for the years ended October 31, 2012 and October 31, 2011
| | | | | | | | |
| | | 2012 | | | 2011 | |
| Increase (Decrease) in Net Assets | |
Operations: | | | | | | | | |
Net investment income (loss) | | $ | 26,383,487 | | | $ | 26,060,639 | |
Net realized gain (loss) on investments, futures transactions and foreign currency transactions | | | 25,766,728 | | | | 41,535,303 | |
Net change in unrealized appreciation (depreciation) on investments, futures contracts and foreign currency transactions | | | 35,642,292 | | | | (27,945,312 | ) |
| | | | |
Net increase (decrease) in net assets resulting from operations | | | 87,792,507 | | | | 39,650,630 | |
| | | | |
Dividends to shareholders: | | | | | | | | |
From net investment income: | | | | | | | | |
Investor Class | | | (5,900,968 | ) | | | (5,865,470 | ) |
Class A | | | (10,557,156 | ) | | | (9,611,379 | ) |
Class B | | | (1,558,486 | ) | | | (1,746,756 | ) |
Class C | | | (417,633 | ) | | | (304,467 | ) |
Class I | | | (7,601,444 | ) | | | (6,884,253 | ) |
| | | | |
Total dividends to shareholders | | | (26,035,687 | ) | | | (24,412,325 | ) |
| | | | |
Capital share transactions: | | | | | | | | |
Net proceeds from sale of shares | | | 102,526,815 | | | | 59,978,153 | |
Net asset value of shares issued to shareholders in reinvestment of dividends | | | 25,166,825 | | | | 23,685,357 | |
Cost of shares redeemed | | | (98,350,492 | ) | | | (114,713,132 | ) |
| | | | |
Increase (decrease) in net assets derived from capital share transactions | | | 29,343,148 | | | | (31,049,622 | ) |
| | | | |
Net increase (decrease) in net assets | | | 91,099,968 | | | | (15,811,317 | ) |
| | |
| Net Assets | | | | | | | | |
Beginning of year | | | 640,548,695 | | | | 656,360,012 | |
| | | | |
End of year | | $ | 731,648,663 | | | $ | 640,548,695 | |
| | | | |
Undistributed net investment income at end of year | | $ | 135,567 | | | $ | 1,671,718 | |
| | | | |
| | | | | | |
The notes to the financial statements are an integral part of,
and should be read in conjunction with, the financial statements. | | mainstayinvestments.com | | | 29 | |
Financial Highlights selected per share data and ratios
| | | | | | | | | | | | | | | | | | | | |
| | | Investor Class | |
| | | Year ended October 31, | | | February 28,
2008**
through
October 31, | |
| | | 2012 | | | 2011 | | | 2010 | | | 2009 | | | 2008 | |
Net asset value at beginning of period | | $ | 15.93 | | | $ | 15.58 | | | $ | 13.89 | | | $ | 12.58 | | | $ | 16.50 | |
| | | | | | | | | | | | | | | | | | | | |
Net investment income (loss) (a) | | | 0.62 | | | | 0.60 | | | | 0.59 | | | | 0.30 | | | | 0.19 | |
Net realized and unrealized gain (loss) on investments | | | 1.39 | | | | 0.37 | | | | 1.81 | | | | 1.36 | | | | (3.89 | ) |
Net realized and unrealized gain (loss) on foreign currency transactions | | | 0.14 | | | | (0.05 | ) | | | (0.16 | ) | | | 0.00 | ‡ | | | 0.01 | |
| | | | | | | | | | | | | | | | | | | | |
Total from investment operations | | | 2.15 | | | | 0.92 | | | | 2.24 | | | | 1.66 | | | | (3.69 | ) |
| | | | | | | | | | | | | | | | | | | | |
Less dividends: | | | | | | | | | | | | | | | | | | | | |
From net investment income | | | (0.62 | ) | | | (0.57 | ) | | | (0.55 | ) | | | (0.35 | ) | | | (0.23 | ) |
| | | | | | | | | | | | | | | | | | | | |
Net asset value at end of period | | $ | 17.46 | | | $ | 15.93 | | | $ | 15.58 | | | $ | 13.89 | | | $ | 12.58 | |
| | | | | | | | | | | | | | | | | | | | |
Total investment return (b) | | | 13.72 | % | �� | | 5.92 | % | | | 16.39 | % | | | 13.57 | % | | | (22.65 | %)(c) |
Ratios (to average net assets)/Supplemental Data: | | | | | | | | | | | | | | | | | | | | |
Net investment income (loss) | | | 3.73 | % | | | 3.73 | % | | | 4.02 | % | | | 2.40 | % | | | 1.84 | % †† |
Net expenses | | | 1.37 | % | | | 1.40 | % | | | 1.50 | % | | | 1.40 | % | | | 1.29 | % †† |
Expenses (before waiver/reimbursement) | | | 1.37 | % | | | 1.40 | % | | | 1.50 | % | | | 1.72 | % | | | 1.50 | % †† |
Portfolio turnover rate | | | 25 | % | | | 33 | % | | | 76 | % | | | 182 | %(d) | | | 101 | % (d) |
Net assets at end of period (in 000’s) | | $ | 160,758 | | | $ | 163,168 | | | $ | 170,852 | | | $ | 161,824 | | | $ | 136,858 | |
| ** | Commencement of operations. |
| ‡ | Less than one cent per share. |
| (a) | Per share data based on average shares outstanding during the period. |
| (b) | Total investment return is calculated exclusive of sales charges and assumes the reinvestment of dividends and distributions. |
| (c) | Total investment return is not annualized. |
| (d) | The portfolio turnover rates not including mortgage dollar rolls were 151% and 86% for the years ended October 31, 2009 and 2008, respectively. |
| | | | |
| 30 | | MainStay Income Builder Fund | | The notes to the financial statements are an integral part of,
and should be read in conjunction with, the financial statements. |
Financial Highlights selected per share data and ratios
| | | | | | | | | | | | | | | | | | | | |
| | | Class A | |
| | | Year ended October 31, | |
| | | 2012 | | | 2011 | | | 2010 | | | 2009 | | | 2008 | |
Net asset value at beginning of year | | $ | 15.92 | | | $ | 15.58 | | | $ | 13.88 | | | $ | 12.57 | | | $ | 20.10 | |
| | | | | | | | | | | | | | | | | | | | |
Net investment income (loss) (a) | | | 0.67 | | | | 0.66 | | | | 0.64 | | | | 0.33 | | | | 0.32 | |
Net realized and unrealized gain (loss) on investments | | | 1.40 | | | | 0.35 | | | | 1.82 | | | | 1.36 | | | | (5.27 | ) |
Net realized and unrealized gain (loss) on foreign currency transactions | | | 0.14 | | | | (0.05 | ) | | | (0.16 | ) | | | 0.00 | ‡ | | | 0.01 | |
| | | | | | | | | | | | | | | | | | | | |
Total from investment operations | | | 2.21 | | | | 0.96 | | | | 2.30 | | | | 1.69 | | | | (4.94 | ) |
| | | | | | | | | | | | | | | | | | | | |
Less dividends and distributions: | | | | | | | | | | | | | | | | | | | | |
From net investment income | | | (0.67 | ) | | | (0.62 | ) | | | (0.60 | ) | | | (0.38 | ) | | | (0.32 | ) |
From net realized gain on investments | | | — | | | | — | | | | — | | | | — | | | | (2.27 | ) |
| | | | | | | | | | | | | | | | | | | | |
Total dividends and distributions | | | (0.67 | ) | | | (0.62 | ) | | | (0.60 | ) | | | (0.38 | ) | | | (2.59 | ) |
| | | | | | | | | | | | | | | | | | | | |
Net asset value at end of year | | $ | 17.46 | | | $ | 15.92 | | | $ | 15.58 | | | $ | 13.88 | | | $ | 12.57 | |
| | | | | | | | | | | | | | | | | | | | |
Total investment return (b) | | | 14.16 | % | | | 6.21 | % | | | 16.80 | % | | | 13.82 | % | | | (27.88 | %) |
Ratios (to average net assets)/Supplemental Data: | | | | | | | | | | | | | | | | | | | | |
Net investment income (loss) | | | 4.03 | % | | | 4.05 | % | | | 4.37 | % | | | 2.60 | % | | | 1.93 | % |
Net expenses | | | 1.06 | % | | | 1.08 | % | | | 1.15 | % | | | 1.20 | % | | | 1.18 | % |
Expenses (before waiver/reimbursement) | | | 1.06 | % | | | 1.08 | % | | | 1.15 | % | | | 1.23 | % | | | 1.26 | % |
Portfolio turnover rate | | | 25 | % | | | 33 | % | | | 76 | % | | | 182 | %(c) | | | 101 | % (c) |
Net assets at end of year (in 000’s) | | $ | 292,603 | | | $ | 242,939 | | | $ | 239,564 | | | $ | 222,648 | | | $ | 185,491 | |
| ‡ | Less than one cent per share. |
| (a) | Per share data based on average shares outstanding during the year. |
| (b) | Total investment return is calculated exclusive of sales charges and assumes the reinvestment of dividends and distributions. |
| (c) | The portfolio turnover rates not including mortgage dollar rolls were 151% and 86% for the years ended October 31, 2009 and 2008, respectively. |
| | | | | | | | | | | | | | | | | | | | |
| | | Class B | |
| | | Year ended October 31, | |
| | | 2012 | | | 2011 | | | 2010 | | | 2009 | | | 2008 | |
Net asset value at beginning of year | | $ | 15.99 | | | $ | 15.64 | | | $ | 13.93 | | | $ | 12.61 | | | $ | 20.15 | |
| | | | | | | | | | | | | | | | | | | | |
Net investment income (loss) (a) | | | 0.50 | | | | 0.49 | | | | 0.48 | | | | 0.21 | | | | 0.18 | |
Net realized and unrealized gain (loss) on investments | | | 1.40 | | | | 0.35 | | | | 1.84 | | | | 1.35 | | | | (5.28 | ) |
Net realized and unrealized gain (loss) on foreign currency transactions | | | 0.14 | | | | (0.05 | ) | | | (0.17 | ) | | | 0.00 | ‡ | | | 0.01 | |
| | | | | | | | | | | | | | | | | | | | |
Total from investment operations | | | 2.04 | | | | 0.79 | | | | 2.15 | | | | 1.56 | | | | (5.09 | ) |
| | | | | | | | | | | | | | | | | | | | |
Less dividends and distributions: | | | | | | | | | | | | | | | | | | | | |
From net investment income | | | (0.49 | ) | | | (0.44 | ) | | | (0.44 | ) | | | (0.24 | ) | | | (0.18 | ) |
From net realized gain on investments | | | — | | | | — | | | | — | | | | — | | | | (2.27 | ) |
| | | | | | | | | | | | | | | | | | | | |
Total dividends and distributions | | | (0.49 | ) | | | (0.44 | ) | | | (0.44 | ) | | | (0.24 | ) | | | (2.45 | ) |
| | | | | | | | | | | | | | | | | | | | |
Net asset value at end of year | | $ | 17.54 | | | $ | 15.99 | | | $ | 15.64 | | | $ | 13.93 | | | $ | 12.61 | |
| | | | | | | | | | | | | | | | | | | | |
Total investment return (b) | | | 12.87 | % | | | 5.14 | % | | | 15.53 | % | | | 12.77 | % | | | (28.53 | %) |
Ratios (to average net assets)/Supplemental Data: | | | | | | | | | | | | | | | | | | | | |
Net investment income (loss) | | | 2.99 | % | | | 2.98 | % | | | 3.25 | % | | | 1.65 | % | | | 1.12 | % |
Net expenses | | | 2.12 | % | | | 2.15 | % | | | 2.24 | % | | | 2.14 | % | | | 1.99 | % |
Expenses (before waiver/reimbursement) | | | 2.12 | % | | | 2.15 | % | | | 2.24 | % | | | 2.47 | % | | | 2.15 | % |
Portfolio turnover rate | | | 25 | % | | | 33 | % | | | 76 | % | | | 182 | %(c) | | | 101 | % (c) |
Net assets at end of year (in 000’s) | | $ | 51,233 | | | $ | 59,225 | | | $ | 71,239 | | | $ | 79,742 | | | $ | 76,420 | |
| ‡ | Less than one cent per share. |
| (a) | Per share data based on average shares outstanding during the year. |
| (b) | Total investment return is calculated exclusive of sales charges and assumes the reinvestment of dividends and distributions. |
| (c) | The portfolio turnover rates not including mortgage dollar rolls were 151% and 86% for the years ended October 31, 2009 and 2008, respectively. |
| | | | | | |
The notes to the financial statements are an integral part of,
and should be read in conjunction with, the financial statements. | | mainstayinvestments.com | | | 31 | |
Financial Highlights selected per share data and ratios
| | | | | | | | | | | | | | | | | | | | |
| | | Class C | |
| | | Year ended October 31, | |
| | | 2012 | | | 2011 | | | 2010 | | | 2009 | | | 2008 | |
Net asset value at beginning of year | | $ | 15.97 | | | $ | 15.62 | | | $ | 13.92 | | | $ | 12.59 | | | $ | 20.12 | |
| | | | | | | | | | | | | | | | | | | | |
Net investment income (loss) (a) | | | 0.49 | | | | 0.48 | | | | 0.48 | | | | 0.22 | | | | 0.18 | |
Net realized and unrealized gain (loss) on investments | | | 1.41 | | | | 0.36 | | | | 1.82 | | | | 1.35 | | | | (5.27 | ) |
Net realized and unrealized gain (loss) on foreign currency transactions | | | 0.14 | | | | (0.05 | ) | | | (0.16 | ) | | | 0.00 | ‡ | | | 0.01 | |
| | | | | | | | | | | | | | | | | | | | |
Total from investment operations | | | 2.04 | | | | 0.79 | | | | 2.14 | | | | 1.57 | | | | (5.08 | ) |
| | | | | | | | | | | | | | | | | | | | |
Less dividends and distributions: | | | | | | | | | | | | | | | | | | | | |
From net investment income | | | (0.49 | ) | | | (0.44 | ) | | | (0.44 | ) | | | (0.24 | ) | | | (0.18 | ) |
From net realized gain on investments | | | — | | | | — | | | | — | | | | — | | | | (2.27 | ) |
| | | | | | | | | | | | | | | | | | | | |
Total dividends and distributions | | | (0.49 | ) | | | (0.44 | ) | | | (0.44 | ) | | | (0.24 | ) | | | (2.45 | ) |
| | | | | | | | | | | | | | | | | | | | |
Net asset value at end of year | | $ | 17.52 | | | $ | 15.97 | | | $ | 15.62 | | | $ | 13.92 | | | $ | 12.59 | |
| | | | | | | | | | | | | | | | | | | | |
Total investment return (b) | | | 12.96 | % | | | 5.08 | % | | | 15.55 | % | | | 12.69 | % | | | (28.47 | %) |
Ratios (to average net assets)/Supplemental Data: | | | | | | | | | | | | | | | | | | | | |
Net investment income (loss) | | | 2.88 | % | | | 2.98 | % | | | 3.27 | % | | | 1.67 | % | | | 1.12 | % |
Net expenses | | | 2.12 | % | | | 2.15 | % | | | 2.24 | % | | | 2.17 | % | | | 1.99 | % |
Expenses (before waiver/reimbursement) | | | 2.12 | % | | | 2.15 | % | | | 2.24 | % | | | 2.47 | % | | | 2.15 | % |
Portfolio turnover rate | | | 25 | % | | | 33 | % | | | 76 | % | | | 182 | %(c) | | | 101 | % (c) |
Net assets at end of year (in 000’s) | | $ | 22,444 | | | $ | 10,899 | | | $ | 10,312 | | | $ | 9,622 | | | $ | 1,563 | |
| ‡ | Less than one cent per share. |
| (a) | Per share data based on average shares outstanding during the year. |
| (b) | Total investment return is calculated exclusive of sales charges and assumes the reinvestment of dividends and distributions. |
| (c) | The portfolio turnover rates not including mortgage dollar rolls were 151% and 86% for the years ended October 31, 2009 and 2008, respectively. |
| | | | | | | | | | | | | | | | | | | | |
| | | Class I | |
| | | Year ended October 31, | |
| | | 2012 | | | 2011 | | | 2010 | | | 2009 | | | 2008 | |
Net asset value at beginning of year | | $ | 16.02 | | | $ | 15.67 | | | $ | 13.97 | | | $ | 12.65 | | | $ | 20.25 | |
| | | | | | | | | | | | | | | | | | | | |
Net investment income (loss) (a) | | | 0.72 | | | | 0.70 | | | | 0.68 | | | | 0.77 | | | | 0.37 | |
Net realized and unrealized gain (loss) on investments | | | 1.40 | | | | 0.36 | | | | 1.82 | | | | 0.97 | | | | (5.33 | ) |
Net realized and unrealized gain (loss) on foreign currency transactions | | | 0.14 | | | | (0.05 | ) | | | (0.16 | ) | | | 0.00 | ‡ | | | 0.01 | |
| | | | | | | | | | | | | | | | | | | | |
Total from investment operations | | | 2.26 | | | | 1.01 | | | | 2.34 | | | | 1.74 | | | | (4.95 | ) |
| | | | | | | | | | | | | | | | | | | | |
Less dividends and distributions: | | | | | | | | | | | | | | | | | | | | |
From net investment income | | | (0.71 | ) | | | (0.66 | ) | | | (0.64 | ) | | | (0.42 | ) | | | (0.38 | ) |
From net realized gain on investments | | | — | | | | — | | | | — | | | | — | | | | (2.27 | ) |
| | | | | | | | | | | | | | | | | | | | |
Total dividends and distributions | | | (0.71 | ) | | | (0.66 | ) | | | (0.64 | ) | | | (0.42 | ) | | | (2.65 | ) |
| | | | | | | | | | | | | | | | | | | | |
Net asset value at end of year | | $ | 17.57 | | | $ | 16.02 | | | $ | 15.67 | | | $ | 13.97 | | | $ | 12.65 | |
| | | | | | | | | | | | | | | | | | | | |
Total investment return (b) | | | 14.41 | % | | | 6.50 | % | | | 17.07 | % | | | 14.14 | % | | | (27.60 | %) |
Ratios (to average net assets)/Supplemental Data: | | | | | | | | | | | | | | | | | | | | |
Net investment income (loss) | | | 4.28 | % | | | 4.30 | % | | | 4.60 | % | | | 3.74 | % | | | 2.31 | % |
Net expenses | | | 0.81 | % | | | 0.83 | % | | | 0.89 | % | | | 0.97 | % | | | 0.79 | % |
Expenses (before waiver/reimbursement) | | | 0.81 | % | | | 0.83 | % | | | 0.89 | % | | | 0.97 | % | | | 0.97 | % |
Portfolio turnover rate | | | 25 | % | | | 33 | % | | | 76 | % | | | 182 | %(c) | | | 101 | % (c) |
Net assets at end of year (in 000’s) | | $ | 204,611 | | | $ | 164,317 | | | $ | 164,393 | | | $ | 189,333 | | | $ | 43 | |
| ‡ | Less than one cent per share. |
| (a) | Per share data based on average shares outstanding during the year. |
| (b) | Total investment return is calculated exclusive of sales charges and assumes the reinvestment of dividends and distributions. Class I shares are not subject to sales charges. |
| (c) | The portfolio turnover rates not including mortgage dollar rolls were 151% and 86% for the years ended October 31, 2009 and 2008, respectively. |
| | | | |
| 32 | | MainStay Income Builder Fund | | The notes to the financial statements are an integral part of,
and should be read in conjunction with, the financial statements. |
Notes to Financial Statements
Note 1–Organization and Business
The MainStay Funds (the “Trust”) were organized on January 9, 1986, as a Massachusetts business trust. The Trust is registered under the Investment Company Act of 1940, as amended (the “1940 Act”), as an open-end investment management company, and is comprised of twelve funds (collectively referred to as the “Funds”). These financial statements and notes relate only to the MainStay Income Builder Fund (the “Fund”), a diversified fund.
The Fund currently offers five classes of shares. Class A shares commenced operations on January 3, 1995. Class B shares commenced operations on December 29, 1987. Class C shares commenced operations on September 1, 1998. Class I shares commenced operations on January 2, 2004. Investor Class shares commenced operations on February 28, 2008. Investor Class and Class A shares are offered at net asset value (“NAV”) per share plus an initial sales charge. No sales charge applies to investments of $1 million or more (and certain other qualified purchases) in Investor Class and Class A shares, but a contingent deferred sales charge (“CDSC”) is imposed on certain redemptions made within one year of the date of purchase. Class B and Class C shares are offered at NAV without an initial sales charge, although a declining CDSC may be imposed on redemptions made within six years of the date of purchase of Class B shares and a 1.00% CDSC may be imposed on redemptions made within one year of the date of purchase of Class C shares. Class I shares are offered at NAV and are not subject to a sales charge. Depending upon eligibility, Class B shares convert to either Investor Class or Class A shares at the end of the calendar quarter eight years after the date they were purchased. Additionally, depending upon eligibility, Investor Class shares may convert to Class A shares and Class A shares may convert to Investor Class shares. The five classes of shares have the same voting (except for issues that relate solely to one class), dividend, liquidation and other rights, and the same terms and conditions, except that Class B and Class C shares are subject to higher distribution and/or service fee rates than Investor Class and Class A shares under a distribution plan pursuant to Rule 12b-1 under the 1940 Act. Class I shares are not subject to a distribution and/or service fee.
The Fund’s investment objective is to seek current income consistent with reasonable opportunity for future growth of capital and income.
Note 2—Significant Accounting Policies
The Fund prepares its financial statements in accordance with generally accepted accounting principles (“GAAP”) in the United States of America and follows the significant accounting policies described below.
(A) Securities Valuation. Investments are valued as of the close of regular trading on the New York Stock Exchange (“Exchange”) (generally 4:00 p.m. Eastern time) on each day the Fund is open for business (“valuation date”).
The Board of Trustees (the “Board”) has adopted procedures for the valuation of the Fund’s securities and has delegated the responsibility for valuation determination under those procedures to the Valuation Committee of the Fund (the “Valuation Committee”). The Board has authorized the Valuation Committee to appoint a Valuation Sub-Committee (the “Sub-Committee”) to deal in the first instance with
questions that arise or cannot be resolved under these procedures. The Sub-Committee will meet (in person, via electronic mail or via teleconference) on an as-needed basis. The Valuation Committee shall meet at a later time, as necessary, to ensure that actions taken by the Sub-Committee were appropriate. The procedures recognize that, subject to the oversight of the Board and unless otherwise noted, the responsibility for day-to-day valuation of portfolio assets (including securities for which market prices are not readily available) rests with New York Life Investment Management LLC (“New York Life Investments” or the “Manager”), aided to whatever extent necessary by the Subadvisors (as defined in Note 3(A)) of the Fund. These procedures shall be reviewed by the Board no less frequently than annually. Any revisions to these procedures deemed necessary shall be reported to the Board at its next regularly scheduled meeting.
Securities are valued using unadjusted market prices, when available, as supplied primarily by third party pricing services or dealers. To assess the appropriateness of security valuations, the Manager or the Fund’s third party service provider who is subject to oversight by the Manager, regularly compares prior day prices, prices on comparable securities and the sale prices to the prior and current day prices and challenges prices exceeding certain tolerance levels with third party pricing services or broker sources. For those securities valued by recommendation, whether through a standardized fair valuation methodology or a fair valuation determination, the Valuation Committee reviews and affirms the reasonableness of the valuation based on such methodologies and determinations on a regular basis after considering all relevant information that is reasonably available.
“Fair value” is defined as the price that the Fund would receive upon selling an investment in an orderly transaction to an independent buyer in the principal or most advantageous market of the investment. Fair value measurements are determined within a framework that has established a three-tier hierarchy which maximizes the use of observable market data and minimizes the use of unobservable inputs to establish classification of fair value measurements for disclosure purposes. “Inputs” refer broadly to the assumptions that market participants would use in pricing the asset or liability, including assumptions about risk, such as the risk inherent in a particular valuation technique used to measure fair value using a pricing model and/or the risk inherent in the inputs for the valuation technique. Inputs may be observable or unobservable. Observable inputs reflect the assumptions market participants would use in pricing the asset or liability based on market data obtained from sources independent of the Fund. Unobservable inputs reflect the Fund’s own assumptions about the assumptions market participants would use in pricing the asset or liability developed based on the information available in the circumstances. The inputs or methodology used for valuing securities may not be an indication of the risks associated with investing in those securities. The three-tier hierarchy of inputs is summarized in the three broad Levels listed below.
| • | | Level 1—quoted prices in active markets for identical investments |
| • | | Level 2—other significant observable inputs (including quoted prices for similar investments in active markets, interest rates and yield curves, prepayment speeds, credit risks, etc.) |
| | | | |
| mainstayinvestments.com | | | 33 | |
Notes to Financial Statements (continued)
| • | | Level 3—significant unobservable inputs (including the Fund’s own assumptions about the assumptions that market participants would use in determining the fair value of investments) |
The aggregate value by input level, as of October 31, 2012, for the Fund’s investments is included at the end of the Fund’s Portfolio of Investments.
The valuation techniques used by the Fund to measure fair value maximize the use of observable inputs and minimize the use of unobservable inputs. The Fund may utilize third party vendor evaluations, whose prices may be derived from one or more of the following standard inputs:
| | |
• Benchmark Yields | | • Reported Trades |
• Broker Dealer Quotes | | • Issuer Spreads |
• Two-sided markets | | • Benchmark securities |
• Bids/Offers | | • Reference Data (corporate actions or material event notices) |
• Industry and economic events | | • Comparable bonds |
• Equity and credit default swap curves | | • Monthly payment information |
Securities for which market value cannot be determined using the methodologies described above are valued by methods deemed in good faith by the Fund’s Valuation Committee, following the procedures established by the Board, to represent fair value. Under these procedures, the Fund primarily employs a market-based approach which may use related or comparable assets or liabilities, recent transactions, market multiples, book values, and other relevant information. The Fund may also use an income-based valuation approach in which the anticipated future cash flows of the investment are discounted to calculate fair value. Discounts may also be applied due to the nature or duration of any restrictions on the disposition of the investments. Due to the inherent uncertainty of valuations of such investments, the fair values may differ significantly from the values that would have been used had an active market existed. For the year ended October 31, 2012, there have been no changes to the fair value methodologies.
Equity and non-equity securities which may be valued in this manner include, but are not limited to: (i) a security for which the trading has been halted or suspended; (ii) a debt security that has recently gone into default and for which there is not a current market quotation; (iii) a security of an issuer that has entered into a restructuring; (iv) a security that has been de-listed from a national exchange; (v) a security for which the market price is not available from a third party pricing source or, if so provided, does not, in the opinion of the Fund’s Manager or Subadvisors reflect the security’s market value; and (vi) a security whose principal market has been temporarily closed at a time when, under normal conditions, it would be open. Securities for which market quotations or observable inputs are not readily available are generally categorized as Level 3 in the hierarchy. As of October 31, 2012, the Fund held securities with a value of $830,209 that were fair valued in such a manner.
Certain events may occur between the time that foreign markets close, on which securities held by the Fund principally trade, and the time at which the Fund’s NAV is calculated. These events may include, but are
not limited to, situations relating to a single issuer in a market sector, significant fluctuations in U.S. or foreign markets, natural disasters, armed conflicts, governmental actions or other developments not tied directly to the securities markets. Should the Manager or Subadvisors conclude that such events may have affected the accuracy of the last price of such securities reported on the local foreign market, the Manager or Subadvisors may, pursuant to procedures adopted by the Fund’s Board, adjust the value of the local price to reflect the impact on the price of such securities as a result of such events. In this instance, securities are generally categorized as Level 3 in the hierarchy. Additionally, foreign equity securities are also fair valued whenever the movement of a particular index exceeds certain thresholds. In such cases, the securities are fair valued by applying factors provided by a third party vendor in accordance with the Fund’s policies and procedures and are generally categorized as Level 2 in the hierarchy. As of October 31, 2012, foreign equity securities held by the Fund were not fair valued in such a manner.
Equity securities and Exchange Traded Funds are valued at the latest quoted sales prices as of the close of regular trading on the Exchange on each valuation date. Securities that are not traded on the valuation date are valued at the mean of the latest quoted bid and ask prices. Prices normally are taken from the principal market in which each security trades. Futures contracts are valued at the last posted settlement price on the market where such futures are primarily traded. Options contracts are valued at the last posted settlement price on the market where such options are principally traded. Investments in other mutual funds are valued at their respective NAV as of the close of the Exchange on the valuation date. These securities are generally categorized as Level 1 in the hierarchy.
Debt securities (other than convertible bonds and municipal debt securities) are valued at the evaluated bid prices (evaluated mean prices in the case of convertible bonds and municipal debt securities) supplied by a pricing agent or broker selected by the Fund’s Manager in consultation with the Fund’s Subadvisor if any, whose prices reflect broker/dealer supplied valuations and electronic data processing techniques, if such prices are deemed by the Fund’s Manager, in consultation with the Fund’s Subadvisor, if any, to be representative of market values, at the regular close of trading of the Exchange on each valuation date. Debt securities, including corporate bonds, U.S. government and federal agency bonds, municipal bonds, foreign bonds, Yankee bonds, convertible bonds, asset-backed securities and mortgage-backed securities are generally categorized as Level 2 in the hierarchy.
Temporary cash investments acquired over 60 days to maturity are valued using the latest bid prices or using valuations based on a matrix system (which considers such factors as security prices, yields, maturities, and ratings), both as furnished by independent pricing services. Other temporary cash investments which mature in 60 days or less (“Short-Term Investments”) are valued at amortized cost. The amortized cost method involves valuing a security at its cost on the date of purchase and thereafter assuming a constant amortization to maturity of the difference between such cost and the value on maturity date. Amortized cost approximates the current fair value of a security. Securities valued at amortized cost are not valued using a quoted price in an active market. These securities are generally categorized as Level 2 in the hierarchy.
| | |
| 34 | | MainStay Income Builder Fund |
Foreign currency forward contracts are valued at their fair market values determined on the basis of the mean between the last current bid and ask prices based on dealer or exchange quotations and are generally categorized as Level 2 in the hierarchy.
Loan assignments, participations and commitments are valued at the average of bid quotations obtained from the engaged independent pricing service, and are generally categorized as Level 2 in the hierarchy. Certain loan assignments, participations and commitments may be valued by single broker quotes obtained from the engaged independent pricing service with significant unobservable inputs and are generally categorized as Level 3 in the hierarchy.
Generally, a security is considered illiquid if it cannot be sold or disposed of in the ordinary course of business at approximately the price at which it is valued. Its illiquidity might prevent the sale of such security at a time when the Manager or Subadvisor might wish to sell, and these securities could have the effect of decreasing the overall level of a Fund’s liquidity. Further, the lack of an established secondary market may make it more difficult to value illiquid securities, requiring the Fund to rely on judgments that may be somewhat subjective in determining value, which could vary from the amount that the Fund could realize upon disposition. Difficulty in selling illiquid securities may result in a loss or may be costly to the Fund. Under the supervision of the Board, the Manager or Subadvisor determines the liquidity of the Fund’s investments; in doing so, the Manager or Subadvisor may consider various factors, including (i) the frequency of trades and quotations, (ii) the number of dealers and prospective purchasers, (iii) dealer undertakings to make a market, and (iv) the nature of the security and the market in which it trades (e.g., the time needed to dispose of the security, the method of soliciting offers and the mechanics of transfer). Illiquid securities generally will be valued in good faith in such a manner as the Board deems appropriate to reflect their fair value.
(B) Income Taxes. The Fund’s policy is to comply with the requirements of the Internal Revenue Code of 1986, as amended (the “Internal Revenue Code”), applicable to regulated investment companies and to distribute all of the taxable income to the shareholders of the Fund within the allowable time limits. Therefore, no federal, state and local income tax provision is required.
Management evaluates its tax positions to determine if the tax positions taken meet the minimum recognition threshold in connection with accounting for uncertainties in income tax positions taken or expected to be taken for the purposes of measuring and recognizing tax liabilities in the financial statements. Recognition of tax benefits of an uncertain tax position is required only when the position is “more likely than not” to be sustained assuming examination by taxing authorities. Management has analyzed the Fund’s tax positions taken on federal, state and local income tax returns for all open tax years (for up to three tax years), and has concluded that no provision for federal, state and local income tax are required in the Fund’s financial statements. The Fund’s federal, state and local income and federal excise tax returns for tax years for which the applicable statutes of limitations have not expired are subject to examination by the Internal Revenue Service and state and local departments of revenue.
(C) Foreign Taxes. Investment income received by the Fund from foreign sources may be subject to foreign income taxes. These foreign
income taxes are generally withheld at the source, and a portion of which may be recoverable. The Fund will accrue such taxes and recoveries as applicable, based upon its current interpretation of tax rules and regulations that exist in the markets in which it invests.
The Fund may be subject to taxation on realized capital gains, repatriation proceeds and other transaction-based taxes imposed by certain countries in which it invests. The Fund will accrue such taxes as applicable based upon their current interpretation of tax rules and regulations that exist in the market in which they invest. Capital gains taxes relating to positions still held are reflected as a liability on the Statement of Assets and Liabilities, as well as an adjustment to the Fund’s net unrealized appreciation (depreciation). Taxes related to capital gains realized during the year ended October 31, 2012, if any, are reflected as part of net realized gain (loss) in the Statement of Operations. Changes in tax liabilities related to capital gains taxes on unrealized investment gains, if any, are reflected as part of the change in net unrealized appreciation (depreciation) on investments in the Statement Operations. Transaction-based charges are generally assessed as a percentage of the transaction amount.
(D) Dividends and Distributions to Shareholders. Dividends and distributions are recorded on the ex-dividend date. The Fund intends to declare and pay dividends of net investment income, if any, at least quarterly and distributions of net realized capital and currency gains, if any, at least annually. Unless the shareholder elects otherwise, all dividends and distributions are reinvested in the same class of shares of the Fund, at NAV. Dividends and distributions to shareholders are determined in accordance with federal income tax regulations and may differ from GAAP.
(E) Security Transactions and Investment Income. The Fund records security transactions on the trade date. Realized gains and losses on security transactions are determined using the identified cost method and include gains and losses from repayments of principal on mortgage-backed securities. Dividend income is recognized on the ex-dividend date and interest income is accrued as earned using the effective interest rate method. Discounts and premiums on securities purchased, other than Short-Term Investments, for the Fund are accreted and amortized, respectively, on the effective interest rate method over the life of the respective securities or, in the case of a callable security, over the period to the first date of call. Discounts and premiums on Short-Term Investments are accreted and amortized, respectively, on the straight-line method.
Investment income and realized and unrealized gains and losses on investments of the Fund are allocated to separate classes of shares pro rata based upon their relative net assets on the date the income is earned or realized and unrealized gains and losses are incurred.
(F) Expenses. Expenses of the Trust are allocated to the individual Funds in proportion to the net assets of the respective Funds when the expenses are incurred, except where direct allocations of expenses can be made. Expenses (other than transfer agent expenses and fees incurred under the shareholder services plans and the distribution plans further discussed in Note 3(B)) are allocated to separate classes of shares pro rata based upon their relative net assets on the date the expenses are incurred. The expenses borne by the Fund, including those of related parties to the Fund, are shown in the Statement of Operations.
| | | | |
| mainstayinvestments.com | | | 35 | |
Notes to Financial Statements (continued)
(G) Use of Estimates. In preparing financial statements in conformity with GAAP, management makes estimates and assumptions that affect the reported amounts and disclosures in the financial statements. Actual results could differ from those estimates.
(H) Repurchase Agreements. The Fund may enter into repurchase agreements to earn income. The Fund may enter into repurchase agreements only with financial institutions that are deemed by the Manager or Subadvisor to be creditworthy, pursuant to guidelines established by the Fund’s Board. During the term of any repurchase agreement, the Manager will continue to monitor the creditworthiness of the seller. Under the 1940 Act, repurchase agreements are considered to be collateralized loans by a Fund to the seller secured by the securities transferred to the Fund.
When the Fund invests in repurchase agreements, the Fund’s custodian takes possession of the collateral pledged for investments in the repurchase agreement. The underlying collateral is valued daily on a mark-to-market basis to determine that the value, including accrued interest, exceeds the repurchase price. In the event of the seller’s default on the obligation to repurchase, the Fund has the right to liquidate the collateral and apply the proceeds in satisfaction of the obligation. Under certain circumstances, such as in the event of default or bankruptcy by the counterparty to the agreement, realization and/or retention of the collateral may be subject to legal proceedings and possible realized loss to the Fund.
(I) Loan Assignments, Participations and Commitments. The Fund invests in loan assignments and loan participations. Loan assignments and participations (“loans”) are agreements to make money available (a “commitment”) to a borrower in a specified amount, at a specified rate and within a specified time. Such loans are typically senior, secured and collateralized in nature. The Fund records an investment when the borrower withdraws money and records interest as earned. These loans pay interest at rates that are periodically reset by reference to a base lending rate plus a spread. These base lending rates are generally the prime rate offered by a designated U.S. bank or the London InterBank Offered Rate.
The loans in which the Fund invests are generally readily marketable, but may be subject to some restrictions on resale. For example, the Fund may be contractually obligated to receive approval from the agent bank and/or borrower prior to the sale of these investments.
The Fund assumes the credit risk of the borrower, the selling participant and any other persons interpositioned between the Fund and the borrower (“intermediate participants”). In the event that the borrower, selling participant or intermediate participants become insolvent or enters into bankruptcy, the Fund may incur certain costs and delays in realizing payment, or may suffer a loss of principal and/or interest.
Unfunded commitments represent the remaining obligation of the Fund to the borrower. At any point in time, up to the maturity date of the issue, the borrower may demand the unfunded portion. These unfunded amounts are marked to market and recorded in the Statement of Assets and Liabilities. As of October 31, 2012, the Fund did not hold any unfunded commitments.
(J) Futures Contracts. A futures contract is an agreement to purchase or sell a specified quantity of an underlying instrument at a specified future date and price, or to make or receive a cash payment
based on the value of a financial instrument (e.g., foreign currency, interest rate, security, or securities index). The Fund is subject to equity price risk and/or interest rate risk in the normal course of investing in these transactions. During the period the futures contract is open, changes in the value of the contract are recognized as unrealized appreciation or depreciation by “marking-to-market” such contract on a daily basis to reflect the market value of the contract at the end of each day’s trading. The Fund agrees to receive from or pay to the broker an amount of cash equal to the daily fluctuation in the value of the contract. Such receipts or payments are known as “variation margin.” When the futures contract is closed, the Fund records a realized gain or loss equal to the difference between the proceeds from (or cost of) the closing transaction and the Fund’s basis in the contract.
The use of futures contracts involves, to varying degrees, elements of market risk in excess of the amount recognized in the Statement of Assets and Liabilities. The contract or notional amounts and variation margin reflect the extent of the Fund’s involvement in open futures positions. Risks arise from the possible imperfect correlation in movements in the price of futures contracts, interest rates and the underlying hedged assets, and the possible inability of counterparties to meet the terms of their contracts. However, the Fund’s activities in futures contracts have minimal counterparty risk as they are conducted through regulated exchanges that guarantee the futures against default by the counterparty. In the event of a bankruptcy or insolvency of a futures commission merchant that holds margin on behalf of the Fund, the Fund may not be entitled to the return of all of the margin owed to the Fund, potentially resulting in a loss. The Fund may invest in futures contracts to help manage the duration and yield curve of the portfolio while minimizing the exposure to wider bid/ask spreads in traditional bonds. The Fund’s investment in futures contracts and other derivatives may increase the volatility of the Fund’s NAV and may result in a loss to the Fund.
(K) Foreign Currency Forward Contracts. The Fund may enter into foreign currency forward contracts, which are agreements to buy or sell currencies of different countries on a specified future date at a specified rate. The Fund is subject to foreign currency exchange rate risk in the normal course of investing in these transactions. During the period the forward contract is open, changes in the value of the contract are recognized as unrealized appreciation or depreciation by “marking-to-market” such contract on a daily basis to reflect the market value of the contract at the end of each day’s trading. Cash movement occurs on settlement date. When the forward contract is closed, the Fund records a realized gain or loss equal to the difference between the proceeds from (or cost of) the closing transaction and the Fund’s basis in the contract. The Fund may enter into foreign currency forward contracts to reduce currency risk versus the benchmark or for trade settlement.
The use of foreign currency forward contracts involves, to varying degrees, elements of market risk in excess of the amount recognized in the Statement of Assets and Liabilities. The contract amount reflects the extent of the Fund’s involvement in these financial instruments. Risks arise from the possible movements in the foreign exchange rates underlying these instruments. While the Fund may enter into forward contracts to reduce currency exchange risks, changes in currency exchange rates may result in poorer overall performance for the Fund than if it had not engaged in such transactions. Exchange rate movements can be
| | |
| 36 | | MainStay Income Builder Fund |
large, depending on the currency, and can last for extended periods of time, affecting the value of the Fund’s assets. Moreover, there may be an imperfect correlation between the Fund’s holdings of securities denominated in a particular currency and the forward contracts entered into by the Fund. Such imperfect correlation may prevent the Fund from achieving the intended hedge or expose the Fund to the risk of currency exchange loss. The unrealized appreciation (depreciation) on forward contracts reflects the Fund’s exposure at valuation date to credit loss in the event of a counterparty’s failure to perform its obligations.
(L) Foreign Currency Transactions. The books and records of the Fund are kept in U.S. dollars. Prices of securities denominated in foreign currency amounts are translated into U.S. dollars at the mean between the buying and selling rates last quoted by any major U.S. bank at the following dates:
| (i) | market value of investment securities, other assets and liabilities—at the valuation date, and |
| (ii) | purchases and sales of investment securities, income and expenses—at the date of such transactions. |
The assets and liabilities that are denominated in foreign currency amounts are presented at the exchange rates and market values at the close of the period. The realized and unrealized changes in net assets arising from fluctuations in exchange rates and market prices of securities are not separately presented.
Net realized gain (loss) on foreign currency transactions represents net gains and losses on foreign currency forward contracts, net currency gains or losses realized as a result of differences between the amounts of securities sale proceeds or purchase cost, dividends, interest and withholding taxes as recorded on the Fund’s books, and the U.S. dollar equivalent amount actually received or paid. Net currency gains or losses from valuing such foreign currency denominated assets and liabilities, other than investments at valuation date exchange rates, are reflected in unrealized foreign exchange gains or losses.
(M) Mortgage Dollar Rolls. The Fund may enter into mortgage dollar roll (“MDR”) transactions in which it sells mortgage-backed securities (“MBS”) from its portfolio to a counterparty from whom it simultaneously agrees to buy a similar security on a delayed delivery basis. The MDR transactions of the Fund are classified as purchase and sale transactions. The securities sold in connection with the MDRs are removed from the portfolio and a realized gain or loss is recognized. The securities the Fund has agreed to acquire are included at market value in the Portfolio of Investments and liabilities for such purchase commitments are included as payables for investments purchased. During the roll period, the Fund foregoes principal and interest paid on the securities. The Fund is compensated by the difference between the current sales price and the forward price for the future as well as by the earnings on the cash proceeds of the initial sale. MDRs may be renewed without physical delivery of the securities subject to the contract. The Fund maintains liquid assets from its portfolio having a value not less than the repurchase price, including accrued interest. MDR transactions involve certain risks, including the risk that the MBS returned to the Fund at the end of the roll period, while substantially similar, could be inferior to what was initially sold to the counterparty.
(N) Rights and Warrants. A right is a certificate that permits the holder to purchase a certain number of shares, or a fractional share, of a new stock from the issuer at a specific price. A warrant is an instrument that entitles the holder to buy an equity security at a specific price for a specific period of time. The Fund may enter into rights and warrants when securities are acquired through a corporate action. With respect to warrants in international markets, the securities are only purchased when the underlying security cannot be purchased due to the many restrictions an industry and/or country might place on foreign investors. These investments can provide a greater potential for profit or loss than an equivalent investment in the underlying security. Prices of these investments do not necessarily move in tandem with the prices of the underlying securities.
There is risk involved in the purchase of rights and warrants in that these investments are speculative investments. The Fund could also lose the entire value of its investment in warrants if the warrant is not exercised by the date of its expiration. The securities are sold as soon as the opportunity becomes available. The Fund is exposed to risk until each sale is completed. As of October 31, 2012, the Fund did not hold any rights.
(O) Securities Lending. In order to realize additional income, the Fund may engage in securities lending, subject to the limitations set forth in the 1940 Act, and relevant guidance by the staff of the Securities and Exchange Commission. In the event the Fund does engage in securities lending, the Fund will lend through its custodian, State Street Bank and Trust Company (“State Street”). State Street will manage the Fund’s cash collateral in accordance with the Lending Agreement between the Fund and State Street, and indemnify the Fund’s portfolio against counterparty risk. The loans will be collateralized by cash or securities at least equal at all times to the market value of the securities loaned. Collateral will consist of U.S. government securities, cash equivalents or irrevocable letters of credit. The Fund may bear the risk of delay in recovery of, or loss of rights in, the securities loaned should the borrower of the securities experience financial difficulty. The Fund may also record realized gain or loss on securities deemed sold due to a borrower’s inability to return securities on loan. The Fund will receive compensation for lending its securities in the form of fees or the retention of a portion of the interest on the investment of any cash received as collateral. The Fund also will continue to receive interest and dividends on the securities loaned and any gain or loss in the market price of the securities loaned that may occur during the term of the loan will be for the account of the Fund.
Although the Fund and New York Life Investments have temporarily suspended securities lending, the Fund and New York Life Investments reserve the right to reinstitute lending when deemed appropriate. The Fund had no portfolio securities on loan as of October 31, 2012.
(P) Restricted Securities. A restricted security is a security which has been purchased through a private offering and cannot be resold to the general public without prior registration under the Securities Act of 1933, as amended. The Fund may not have the right to demand that such securities be registered. Disposal of these securities may involve time-consuming negotiations and expenses and it may be difficult to obtain a prompt sale at an acceptable price. (See Note 6)
| | | | |
| mainstayinvestments.com | | | 37 | |
Notes to Financial Statements (continued)
(Q) Concentration of Risk. The Fund invests in high-yield securities (sometimes called “junk bonds”), which are generally considered speculative because they present a greater risk of loss, including default, than higher quality debt securities. These securities pay investors a premium—a high interest rate or yield—because of the increased risk of loss. These securities can also be subject to greater price volatility.
The Fund invests in foreign securities, which carry certain risks that are in addition to the usual risks inherent in domestic instruments. These risks include those resulting from currency fluctuations, future adverse political and economic developments and possible imposition of currency exchange blockages or other foreign governmental laws or restrictions. These risks are likely to be greater in emerging markets than in developed markets. The ability of issuers of debt securities held by the Fund to meet their obligations may be affected by economic or political developments in a specific country, industry or region.
The Fund invests in floating rate loans. The floating rate loans in which the Fund principally invests are usually rated below investment grade and are generally considered speculative because they present a greater risk of loss, including default, than higher quality debt securities. Moreover, such securities may, under certain circumstances, be less liquid than higher quality debt securities. Although certain floating rate
loans are collateralized, there is no guarantee that the value of the collateral will be sufficient to repay the loan. In the event of a recession or serious credit event, among other eventualities, the Fund’s investments in floating rate loans are more likely to decline.
(R) Indemnifications. Under the Trust’s organizational documents, its officers and trustees are indemnified against certain liabilities that may arise out of performance of their duties to the Trust. Additionally, in the normal course of business, the Fund enters into contracts with third-party service providers that contain a variety of representations and warranties and which may provide general indemnifications. The Fund’s maximum exposure under these arrangements is unknown, as this would involve future claims that may be made against the Fund that have not yet occurred. Based on experience, management is of the view that the risk of loss in connection with these potential indemnification obligations is remote. However, there can be no assurance that material liabilities related to such obligations will not arise in the future, which could adversely impact the Fund.
(S) Quantitative Disclosure of Derivative Holdings. The following tables show additional disclosures about the Fund’s derivative and hedging activities, including how such activities are accounted for and their effect on the Fund’s financial positions, performance and cash flows. These derivatives are not accounted for as hedging instruments.
Fair value of derivatives instruments as of October 31, 2012:
Asset Derivatives
| | | | | | | | | | | | | | | | | | |
| | | Statement of
Assets and Liabilities
Location | | Foreign
Exchange
Contracts
Risk | | | Equity
Contracts
Risk | | | Interest
Rate
Contracts
Risk | | | Total | |
Warrants | | Investments in securities, at value | | $ | — | | | $ | 0 | (a) | | $ | — | | | $ | 0 | (a) |
Forward Contracts | | Unrealized appreciation on foreign currency forward contracts | | | 28,212 | | | | — | | | | — | | | | 28,212 | |
| | | | | | |
Total Fair Value | | | | $ | 28,212 | | | $ | 0 | (a) | | $ | — | | | $ | 28,212 | |
| | | | | | |
Liability Derivatives
| | | | | | | | | | | | | | | | | | |
| | | Statement of
Assets and Liabilities
Location | | Foreign
Exchange
Contracts
Risk | | | Equity
Contracts
Risk | | | Interest
Rate
Contracts
Risk | | | Total | |
Futures Contracts | | Net Assets—Net unrealized appreciation (depreciation) on investments and futures contracts (b) | | $ | — | | | $ | (3,167,500 | ) | | $ | (54,697 | ) | | $ | (3,222,197 | ) |
Forward Contracts | | Unrealized depreciation on foreign currency forward contracts | | | (417,349 | ) | | | — | | | | — | | | | (417,349 | ) |
| | | | | | |
Total Fair Value | | | | $ | (417,349 | ) | | $ | (3,167,500 | ) | | $ | (54,697 | ) | | $ | (3,639,546 | ) |
| | | | | | |
| (b) | Includes cumulative appreciation (depreciation) of futures contracts as reported in the Portfolio of Investments. Only current day’s variation margin is reported within the Statement of Assets and Liabilities. |
| | |
| 38 | | MainStay Income Builder Fund |
The effect of derivative instruments on the Statement of Operations for the year ended October 31, 2012:
Realized Gain (Loss)
| | | | | | | | | | | | | | | | | | |
| | | Statement of
Operations
Location | | Foreign
Exchange
Contracts
Risk | | | Equity
Contracts
Risk | | | Interest
Rate
Contracts
Risk | | | Total | |
Futures Contracts | | Net realized gain (loss) on futures transactions | | $ | — | | | $ | 21,651,574 | | | $ | (338,024 | ) | | $ | 21,313,550 | |
Forward Contracts | | Net realized gain (loss) on foreign currency transactions | | | 605,638 | | | | — | | | | — | | | | 605,638 | |
| | | | | | | | | | |
Total Realized Gain (Loss) | | $ | 605,638 | | | $ | 21,651,574 | | | $ | (338,024 | ) | | $ | 21,919,188 | |
| | | | | | | | | | |
Change in Unrealized Appreciation (Depreciation)
| | | | | | | | | | | | | | | | | | |
| | | Statement of
Operations
Location | | Foreign
Exchange
Contracts
Risk | | | Equity
Contracts
Risk | | | Interest
Rate
Contracts
Risk | | | Total | |
Futures Contracts | | Net change in unrealized appreciation (depreciation) on futures contracts | | $ | — | | | $ | (7,579,750 | ) | | $ | 26,072 | | | $ | (7,553,678 | ) |
Forward Contracts | | Net change in unrealized appreciation (depreciation) on translation of other assets and liabilities in foreign currencies and foreign currency forward contracts | | | 5,228,860 | | | | — | | | | — | | | | 5,228,860 | |
| | | | | | | | | | |
Total Change in Unrealized Appreciation (Depreciation) | | $ | 5,228,860 | | | $ | (7,579,750 | ) | | $ | 26,072 | | | $ | (2,324,818 | ) |
| | | | | | | | | | |
Number of Contracts, Notional Amounts or Shares/Units (1)
| | | | | | | | | | | | | | | | |
| | | Foreign
Exchange
Contracts
Risk | | | Equity
Contracts
Risk | | | Interest
Rate
Contracts
Risk | | | Total | |
Warrants | | | — | | | | 12 | | | | — | | | | 12 | |
Futures Contracts Long | | | — | | | | 1,633 | | | | 95 | | | | 1,728 | |
Futures Contracts Short | | | — | | | | — | | | | (278 | ) | | | (278 | ) |
Forward Contracts Long | | $ | 24,490,185 | | | | — | | | | — | | | $ | 24,490,185 | |
Forward Contracts Short | | $ | (111,641,936 | ) | | | — | | | | — | | | $ | (111,641,936 | ) |
| | | | | | | | |
| (1) | Amount disclosed represents the weighted average held during the year ended October 31, 2012. |
Note 3–Fees and Related Party Transactions
(A) Manager and Subadvisors. New York Life Investments, a registered investment adviser and an indirect, wholly-owned subsidiary of New York Life Insurance Company (“New York Life”), serves as the Fund’s Manager, pursuant to an Amended and Restated Management Agreement (“Management Agreement”). The Manager provides offices, conducts clerical, recordkeeping and bookkeeping services, and keeps most of the financial and accounting records required to be maintained by the Fund. Except for the portion of salaries and expenses that are the responsibility of the Fund, the Manager pays the salaries and expenses of all personnel affiliated with the Fund and certain operational expenses of the Fund. The Fund reimburses New York Life Investments in an amount equal to a portion of the salary of the Chief Compliance Officer (“CCO”) of the Fund. MacKay Shields LLC (“MacKay Shields” or “Subadvisor”), a registered investment adviser and an indirect, wholly-owned subsidiary of New York Life, serves as Subadvisor, pursuant to the terms of an Amended and Restated Subadvisory Agreement between New York Life Investments and MacKay Shields, is responsible for the overall asset allocation decisions of the Fund and is responsible
for the day-to-day portfolio management of the fixed-income portion of the Fund. Epoch Investment Partners, Inc. (“Epoch” or “Subadvisor”), a registered investment advisor, serves as Subadvisor pursuant to the terms of a Subadvisory Agreement between New York Life Investments and Epoch, is responsible for the day-to-day portfolio management of the equity portion of the Fund. New York Life Investments pays for the services of the Subadvisors.
The Fund pays the Manager a monthly fee for services performed and facilities furnished at an annual rate of the Fund’s average daily net assets as follows: 0.64% up to $500 million; 0.60% from $500 million to $1 billion; and 0.575% in excess of $1 billion, plus a fee for fund accounting services previously provided by New York Life Investments under a separate fund accounting agreement furnished at an annual rate of the Fund’s average daily net assets as follows: 0.05% up to $20 million; 0.0333% from $20 million to $100 million; and 0.01% in excess of $100 million. The effective management fee rate was 0.64% for the year ended October 31, 2012, inclusive of a fee for fund accounting services of 0.01% of the Fund’s average daily net assets.
| | | | |
| mainstayinvestments.com | | | 39 | |
Notes to Financial Statements (continued)
For the year ended October 31, 2012, New York Life Investments earned fees from the Fund in the amount of $4,338,445.
State Street, 1 Lincoln Street, Boston, Massachusetts 02111, provides sub-administration and sub-accounting services to the Fund pursuant to an agreement with New York Life Investments. These services include calculating the daily NAVs of the Fund, maintaining the general ledger and sub-ledger accounts for the calculation of the Fund’s respective NAVs, and assisting New York Life Investments in conducting various aspects of the Fund’s administrative operations. For providing these services to the Fund, State Street is compensated by New York Life Investments.
(B) Distribution and Service Fees. The Trust, on behalf of the Fund, has entered into a distribution agreement with NYLIFE Distributors LLC (the “Distributor”), an indirect, wholly-owned subsidiary of New York Life. The Fund has adopted distribution plans (the “Plans”) in accordance with the provisions of Rule 12b-1 under the 1940 Act.
Pursuant to the Investor Class and Class A Plans, the Distributor receives a monthly distribution fee from the Investor Class and Class A shares at an annual rate of 0.25% of the average daily net assets of the Investor Class and Class A shares for distribution and/or service activities as designated by the Distributor. Pursuant to the Class B and Class C Plans, Class B and Class C shares pay the Distributor a monthly distribution fee at an annual rate of 0.75% of the average daily net assets of the Class B and Class C shares along with a service fee at an annual rate of 0.25% of the average daily net assets of the Class B and Class C shares, for a total 12b-1 fee of 1.00%. Class I shares are not subject to a distribution and/or service fee.
The Plans provide that the distribution and service fees are payable to the Distributor regardless of the amounts actually expended by the Distributor for distribution of the Fund’s shares and service activities.
(C) Sales Charges. The Fund was advised by the Distributor that the amount of sales charges retained on sales of Investor Class and Class A shares were $22,194 and $52,966, respectively, for the year ended October 31, 2012. The Fund was also advised that the Distributor retained CDSCs on redemptions of Investor Class, Class A, Class B and Class C shares of $68, $2,913, $55,222 and $2,056, respectively, for the year ended October 31, 2012.
(D) Transfer, Dividend Disbursing and Shareholder Servicing Agent. NYLIM Service Company LLC, an affiliate of New York Life Investments, is the Fund’s transfer, dividend disbursing and shareholder servicing agent pursuant to an agreement between NYLIM Service Company LLC and the Trust. NYLIM Service Company LLC has entered into an agreement with Boston Financial Data Services, Inc. (“BFDS”) pursuant to which BFDS performs certain transfer agent services on behalf of NYLIM Service Company LLC. Transfer agent expenses incurred by the Fund for the year ended October 31, 2012, were as follows:
| | | | |
Investor Class | | $ | 684,906 | |
Class A | | | 275,215 | |
Class B | | | 231,778 | |
Class C | | | 58,555 | |
Class I | | | 188,278 | |
(E) Small Account Fee. Shareholders with small accounts adversely impact the cost of providing transfer agency services. In an effort to reduce total transfer agency expenses, the Fund has implemented a small account fee on certain types of accounts. Certain shareholders with an account balance of less than $1,000 are charged an annual per account fee of $20 (assessed semi-annually), the proceeds from which offset transfer agent fees as reflected in the Statement of Operations.
(F) Capital. As of October 31, 2012, New York Life and its affiliates beneficially held shares of the Fund with the following values and percentages of net assets as follows:
| | | | | | | | |
Class A | | $ | 3,478 | | | | 0.0 | %‡ |
Class I | | | 83,063,114 | | | | 40.6 | |
| ‡ | Less than one-tenth of a percent. |
Note 4–Federal Income Tax
As of October 31, 2012, the components of accumulated gain (loss) on a tax basis were as follows:
| | | | | | | | | | | | | | | | |
Ordinary
Income | | Accumulated
Capital and
Other Gain
(Loss) | | | Other
Temporary
Differences | | | Unrealized
Appreciation
(Depreciation) | | | Total
Accumulated Gain (Loss) | |
$1,760,437 | | $ | (36,949,478 | ) | | $ | — | | | $ | 68,585,257 | | | $ | 33,396,216 | |
The difference between book basis and tax basis unrealized appreciation (depreciation) is primarily due to wash sale adjustments, mark to market of foreign forward contracts and future contracts, partnership investments, straddle adjustments and class actions.
The following table discloses the current year reclassifications between undistributed net investment income (loss), accumulated net realized gain (loss) on investments, and additional paid-in capital arising from permanent differences; net assets as of October 31, 2012 were not affected.
| | | | | | | | | | |
Undistributed
Net Investment
Income (Loss) | | | Accumulated
Net Realized
Gain (Loss)
on Investments | | | Additional
Paid-In
Capital | |
| | $(1,883,951) | | | $ | 1,286,143 | | | $ | 597,808 | |
The reclassifications for the Fund are primarily due to foreign currency gain (loss), partnership investments, reclassification of amendment fees, consent fees, defaulted bond income accruals and contingent payment debt instruments (“CPDI”).
Under the Regulated Investment Company Modernization Act of 2010, the Fund is permitted to carry forward capital losses incurred in taxable years beginning after December 22, 2010, for an unlimited period. However, any losses incurred during those future years will be required to be utilized prior to the losses incurred in pre-enactment tax years. As a result of this ordering rule, pre-enactment capital loss carryforwards may be more likely to expire unused. Additionally, post-enactment capital losses that are carried forward will retain their character as either short-term or long-term capital losses rather than being considered all short-term as under previous law.
| | |
| 40 | | MainStay Income Builder Fund |
As of October 31, 2012, for federal income tax purposes, capital loss carryforwards of $36,949,478 were available as shown in the table below, to the extent provided by the regulations to offset future realized gains of the Fund through the years indicated. To the extent that these capital loss carryforwards are used to offset future capital gains, it is probable that the capital gains so offset will not be distributed to shareholders. No capital gain distributions shall be made until any capital loss carryforwards have been fully utilized or expired.
| | | | | | | | |
Capital Loss
Available Through | | Short-Term Capital Loss
Amounts (000’s) | | | Long-Term Capital Loss
Amounts (000’s) | |
| 2016 | | $ | 19,833 | | | | — | |
| 2017 | | | 17,116 | | | | — | |
| Unlimited | | | — | | | | — | |
| Total | | $ | 36,949 | | | $ | — | |
The Fund utilized $23,386,657 of capital loss carryforwards during the year ended October 31, 2012.
The tax character of distributions paid during the years ended October 31, 2012 and October 31, 2011 shown in the Statements of Changes in Net Assets was as follows:
| | | | | | | | |
| | | 2012 | | | 2011 | |
| Distributions paid from: | | | | | | | | |
Ordinary Income | | $ | 26,035,687 | | | $ | 24,412,325 | |
Note 5–Foreign Currency Transactions
As of October 31, 2012, the Fund held the following foreign currencies:
| | | | | | | | | | | | | | | | | | | | | | | | |
| | | | | | Currency | | | | | | Cost | | | | | | Value | |
Canadian Dollar | | | CAD | | | | 3 | | | | USD | | | | 0 | | | | USD | | | | 3 | |
Euro | | | EUR | | | | 376,142 | | | | | | | | 486,844 | | | | | | | | 487,535 | |
Pound Sterling | | | GBP | | | | 49,126 | | | | | | | | 78,258 | | | | | | | | 79,278 | |
Total | | | | | | | | | | | USD | | | | 565,102 | | | | USD | | | | 566,816 | |
Note 6–Restricted Securities
As of October 31, 2012, the Fund held the following restricted securities:
| | | | | | | | | | | | | | | | | | |
Security | | Date(s) of
Acquisition | | | Number of
Warrants | | | Cost | | 10/31/2012
Value | | | Percent of
Net Assets | |
ION Media Networks, Inc. | | | | | | | | | | | | | | | | | | |
Warrant, Second Lien, Expires 12/18/39 | | | 12/20/10 | | | | 6 | | | $— | | $ | 0 | (a) | | | 0.00 | %‡ |
Warrant, Unsecured Debt, Expires 12/18/16 | | | 3/12/10 | | | | 6 | | | 20 | | | 0 | (a) | | | 0.00 | ‡ |
Total | | | | | | | | | | $20 | | $ | 0 | (a) | | | 0.00 | %‡ |
| ‡ | Less than one-tenth of a percent. |
Note 7–Custodian
State Street is the custodian of the cash and the securities of the Fund. Custodial fees are charged to the Fund based on the market value of securities in the Fund and the number of certain cash transactions incurred by the Fund.
Note 8–Line of Credit
The Fund and certain affiliated funds maintain a line of credit with a syndicate of banks in order to secure a source of funds for temporary purposes to meet unanticipated or excessive redemption requests.
Effective August 29, 2012, under an amended credit agreement, the aggregate commitment amount is $200,000,000 with an optional maximum amount of $250,000,000. The commitment fee is an annual rate of 0.08% of the average commitment amount payable quarterly, regardless of usage, to Bank of New York Mellon, which serves as the agent to the syndicate. The commitment fee is allocated among certain
MainStay Funds based upon net assets and other factors. Interest on any revolving credit loan is charged based upon the Federal Funds Advances rate or the one month London InterBank Offered Rate, whichever is higher. The amended credit agreement expires on August 28, 2013, although the MainStay Funds and the syndicate of banks may renew the amended credit agreement for an additional year on the same or different terms. Prior to August 29, 2012, the aggregate commitment amount was $125,000,000 with an optional maximum amount of $175,000,000. There were no borrowings made or outstanding with respect to the Fund on the amended credit agreement during the year ended October 31, 2012.
Note 9–Purchases and Sales of Securities (in 000’s)
During the year ended October 31, 2012, purchases and sales of U.S. government securities were $14,987 and $20,476, respectively. Purchases and sales of securities, other than U.S. government securities and short-term securities, were $184,238 and $136,247, respectively.
| | | | |
| mainstayinvestments.com | | | 41 | |
Notes to Financial Statements (continued)
Note 10–Capital Share Transactions
| | | | | | | | |
Investor Class | | Shares | | | Amount | |
Year ended October 31, 2012: | | | | | | | | |
Shares sold | | | 300,478 | | | $ | 5,034,969 | |
Shares issued to shareholders in reinvestment of dividends | | | 352,875 | | | | 5,859,051 | |
Shares redeemed | | | (1,157,017 | ) | | | (19,304,664 | ) |
| | | | |
Net increase (decrease) in shares outstanding before conversion | | | (503,664 | ) | | | (8,410,644 | ) |
Shares converted into Investor Class
(See Note 1) | | | 561,420 | | | | 9,379,360 | |
Shares converted from Investor Class
(See Note 1) | | | (1,097,592 | ) | | | (18,805,363 | ) |
| | | | |
Net increase (decrease) | | | (1,039,836 | ) | | $ | (17,836,647 | ) |
| | | | |
Year ended October 31, 2011: | | | | | | | | |
Shares sold | | | 301,623 | | | $ | 4,894,870 | |
Shares issued to shareholders in reinvestment of dividends | | | 362,106 | | | | 5,822,096 | |
Shares redeemed | | | (1,274,246 | ) | | | (20,699,932 | ) |
| | | | |
Net increase (decrease) in shares outstanding before conversion | | | (610,517 | ) | | | (9,982,966 | ) |
Shares converted into Investor Class
(See Note 1) | | | 618,525 | | | | 9,861,583 | |
Shares converted from Investor Class
(See Note 1) | | | (728,615 | ) | | | (11,845,881 | ) |
| | | | |
Net increase (decrease) | | | (720,607 | ) | | $ | (11,967,264 | ) |
| | | | |
| | |
| | | | | | | | |
Class A | | Shares | | | Amount | |
Year ended October 31, 2012: | | | | | | | | |
Shares sold | | | 2,112,879 | | | $ | 35,891,107 | |
Shares issued to shareholders in reinvestment of dividends | | | 601,558 | | | | 10,007,149 | |
Shares redeemed | | | (2,524,241 | ) | | | (42,299,856 | ) |
| | | | |
Net increase (decrease) in shares outstanding before conversion | | | 190,196 | | | | 3,598,400 | |
Shares converted into Class A (See Note 1) | | | 1,371,450 | | | | 23,393,132 | |
Shares converted from Class A (See Note 1) | | | (59,140 | ) | | | (1,036,401 | ) |
| | | | |
Net increase (decrease) | | | 1,502,506 | | | $ | 25,955,131 | |
| | | | |
Year ended October 31, 2011: | | | | | | | | |
Shares sold | | | 961,146 | | | $ | 15,591,460 | |
Shares issued to shareholders in reinvestment of dividends | | | 564,789 | | | | 9,077,397 | |
Shares redeemed | | | (2,421,542 | ) | | | (39,109,362 | ) |
| | | | |
Net increase (decrease) in shares outstanding before conversion | | | (895,607 | ) | | | (14,440,505 | ) |
Shares converted into Class A (See Note 1) | | | 987,670 | | | | 16,038,026 | |
Shares converted from Class A (See Note 1) | | | (211,977 | ) | | | (3,277,620 | ) |
| | | | |
Net increase (decrease) | | | (119,914 | ) | | $ | (1,680,099 | ) |
| | | | |
| | | | | | | | |
Class B | | Shares | | | Amount | |
Year ended October 31, 2012: | | | | | | | | |
Shares sold | | | 362,058 | | | $ | 6,096,769 | |
Shares issued to shareholders in reinvestment of dividends | | | 91,121 | | | | 1,517,631 | |
Shares redeemed | | | (462,521 | ) | | | (7,756,057 | ) |
| | | | |
Net increase (decrease) in shares outstanding before conversion | | | (9,342 | ) | | | (141,657 | ) |
Shares converted from Class B
(See Note 1) | | | (773,238 | ) | | | (12,930,728 | ) |
| | | | |
Net increase (decrease) | | | (782,580 | ) | | $ | (13,072,385 | ) |
| | | | |
Year ended October 31, 2011: | | | | | | | | |
Shares sold | | | 320,728 | | | $ | 5,219,365 | |
Shares issued to shareholders in reinvestment of dividends | | | 105,511 | | | | 1,706,694 | |
Shares redeemed | | | (615,040 | ) | | | (10,014,062 | ) |
| | | | |
Net increase (decrease) in shares outstanding before conversion | | | (188,801 | ) | | | (3,088,003 | ) |
Shares converted from Class B
(See Note 1) | | | (663,457 | ) | | | (10,776,108 | ) |
| | | | |
Net increase (decrease) | | | (852,258 | ) | | $ | (13,864,111 | ) |
| | | | |
| | |
| | | | | | | | |
Class C | | Shares | | | Amount | |
Year ended October 31, 2012: | | | | | | | | |
Shares sold | | | 697,896 | | | $ | 11,977,966 | |
Shares issued to shareholders in reinvestment of dividends | | | 17,535 | | | | 294,626 | |
Shares redeemed | | | (116,451 | ) | | | (1,931,390 | ) |
| | | | |
Net increase (decrease) | | | 598,980 | | | $ | 10,341,202 | |
| | | | |
Year ended October 31, 2011: | | | | | | | | |
Shares sold | | | 135,557 | | | $ | 2,204,643 | |
Shares issued to shareholders in reinvestment of dividends | | | 13,722 | | | | 221,566 | |
Shares redeemed | | | (127,134 | ) | | | (2,065,857 | ) |
| | | | |
Net increase (decrease) | | | 22,145 | | | $ | 360,352 | |
| | | | |
| | |
| | | | | | | | |
Class I | | Shares | | | Amount | |
Year ended October 31, 2012: | | | | | | | | |
Shares sold | | | 2,546,530 | | | $ | 43,526,004 | |
Shares issued to shareholders in reinvestment of dividends | | | 447,441 | | | | 7,488,368 | |
Shares redeemed | | | (1,605,981 | ) | | | (27,058,525 | ) |
| | | | | | | | |
Net increase (decrease) | | | 1,387,990 | | | $ | 23,955,847 | |
| | | | | | | | |
Year ended October 31, 2011: | | | | | | | | |
Shares sold | | | 1,956,364 | | | $ | 32,067,815 | |
Shares issued to shareholders in reinvestment of dividends | | | 424,064 | | | | 6,857,604 | |
Shares redeemed | | | (2,614,201 | ) | | | (42,823,919 | ) |
| | | | | | | | |
Net increase (decrease) | | | (233,773 | ) | | $ | (3,898,500 | ) |
| | | | | | | | |
| | |
| 42 | | MainStay Income Builder Fund |
Note 11–Subsequent Events
In connection with the preparation of the financial statements of the Fund as of and for the year ended October 31, 2012, events and transactions subsequent to October 31, 2012 through the date the financial statements were issued have been evaluated by the Fund’s management for possible adjustment and/or disclosure. No subsequent events requiring financial statement adjustment or disclosure have been identified except as described below.
On December 6, 2012, Epoch Holding Corporation, the parent company of the Fund’s Subadvisor, announced that it has agreed to be acquired by TD Bank. Subject to the approval of Epoch Holding Corporation’s stockholders, receipt of regulatory approvals and satisfaction of other customary closing conditions for a transaction of this type, this transaction is expected to close in the first half of 2013.
| | | | |
| mainstayinvestments.com | | | 43 | |
Report of Independent Registered Public Accounting Firm
The Board of Trustees and Shareholders of
The MainStay Funds:
We have audited the accompanying statement of assets and liabilities, including the portfolio of investments, of the MainStay Income Builder Fund (the “Fund”), one of the funds constituting The MainStay Funds, as of October 31, 2012, and the related statement of operations for the year then ended, the statements of changes in net assets for each of the years in the two-year period then ended, and the financial highlights for each of the years or periods in the five-year period then ended. These financial statements and financial highlights are the responsibility of the Fund’s management. Our responsibility is to express an opinion on these financial statements and financial highlights based on our audits.
We conducted our audits in accordance with the standards of the Public Company Accounting Oversight Board (United States). Those standards require that we plan and perform the audit to obtain reasonable assurance about whether the financial statements and financial highlights are free of material misstatement. An audit includes examining, on a test basis, evidence supporting the amounts and disclosures in the financial statements. Our procedures included confirmation of securities owned as of October 31, 2012, by correspondence with the custodian and brokers or by other appropriate auditing procedures where replies from brokers were not received. An audit also includes assessing the accounting principles used and significant estimates made by management, as well as evaluating the overall financial statement presentation. We believe that our audits provide a reasonable basis for our opinion.
In our opinion, the financial statements and financial highlights referred to above present fairly, in all material respects, the financial position of the MainStay Income Builder Fund of The MainStay Funds as of October 31, 2012, the results of its operations for the year then ended, the changes in its net assets for each of the years in the two-year period then ended, and the financial highlights for each of the years or periods in the five-year period then ended, in conformity with U.S. generally accepted accounting principles.

Philadelphia, Pennsylvania
December 21, 2012
| | |
| 44 | | MainStay Income Builder Fund |
Federal Income Tax Information
(Unaudited)
The Fund is required under the Internal Revenue Code to advise shareholders in a written statement as to the federal tax status of dividends paid by the Fund during such fiscal years.
For the fiscal year ended October 31, 2012, the Fund designated approximately $14,961,838 under the Internal Revenue Code as qualified dividend income eligible for reduced tax rates.
The dividends paid by the Fund during the fiscal year ended October 31, 2012, should be multiplied by 24.9% to arrive at the corporate dividends received deduction.
In February 2013, shareholders will receive an IRS Form 1099-DIV or substitute Form 1099 which will show the federal tax status of the distributions received by shareholders in calendar year 2012. The amounts that will be reported on such 1099-DIV or substitute Form 1099 will be the amounts you are to use on your federal income tax return and will differ from the amounts which we must report for the Fund’s fiscal year ended October 31, 2012.
Proxy Voting Policies and Procedures and Proxy Voting Record
A description of the policies and procedures that New York Life Investments uses to vote proxies related to the Fund’s securities is available without charge, upon request, (i) by visiting the Fund’s website at mainstayinvestments.com; or (ii) on the SEC’s website at www.sec.gov.
The Fund is required to file with the SEC its proxy voting record for the 12-month period ending June 30 on Form N-PX. The Fund’s most recent Form N-PX is available free of charge upon request (i) by calling 800-MAINSTAY (624-6782); (ii) by visiting the Fund’s website at mainstayinvestments.com; or (iii) on the SEC’s website at www.sec.gov.
Shareholder Reports and Quarterly Portfolio Disclosure
The Fund is required to file its complete schedule of portfolio holdings with the SEC for its first and third fiscal quarters on Form N-Q. The Fund’s Form N-Q is available without charge on the SEC’s website at www.sec.gov or by calling MainStay Investments at 800-MAINSTAY (624-6782). You also can obtain and review copies of Form N-Q by visiting the SEC’s Public Reference Room in Washington, DC (information on the operation of the Public Reference Room may be obtained by calling (1-800-SEC-0330).
| | | | |
| mainstayinvestments.com | | | 45 | |
Board Members and Officers (Unaudited)
The Board Members oversee the MainStay Group of Funds (which is comprised of Funds that are series of The MainStay Funds, Eclipse Trust, Eclipse Funds Inc., MainStay Funds Trust, MainStay VP Funds Trust, Private Advisors Alternative Strategies Master Fund, Private Advisors Alternative Strategies Fund, and MainStay Defined Term Municipal Opportunities Fund) (collectively, the “Fund Complex”), the Manager and, when applicable, the Subadvisor(s) and other service providers to the Fund Complex. Each Board Member serves until his or her successor is elected and qualified or until his or her resignation, death or removal. The Retirement Policy provides that a Board Member
shall tender his or her resignation by the end of the calendar year during which he or she reaches the age of 75.
Officers serve a term of one year and are elected annually by the Board Members. The business address of each Board Member and officer listed below is 51 Madison Avenue, New York, New York 10010.
The Statement of Additional Information applicable to the Fund includes additional information about the Board Members and is available without charge, upon request, by calling 800-MAINSTAY (624-6782) or by going online to mainstayinvestments.com.
| | | | | | | | | | | | |
| | | | | Name and
Date of Birth | | Term of Office,
Position(s) Held
with the Fund
Complex and
Length of Service | | Principal Occupation(s)
During Past Five Years | | Number of
Funds in
Fund Complex
Overseen by
Board Member | | Other Directorships
Held by Board Member |
| Interested Board Member* | | | | John Y. Kim
9/24/60 | | Indefinite;
Eclipse Trust: Trustee since 2008;
Eclipse Funds Inc.:
Director since 2008 (1 fund);
The MainStay Funds: Trustee since 2008 (12 funds);
MainStay Funds Trust: Trustee since 2009 (31 funds); and
MainStay VP Funds Trust: Trustee since 2011 and its predecessor, MainStay VP Series Fund, Inc. since 2008 (28 portfolios). Private Advisors Alternative Strategies Master Fund: Trustee since 2011
Private Advisors Alternative Strategies Fund: Trustee since 2011
MainStay DefinedTerm Municipal Opportunities Fund: Trustee since 2011 | | Member of the Board of Managers, President and Chief Executive Officer (since 2008), New York Life Investment Management LLC and New York Life Investment Management Holdings LLC; Member of the Board, MacKay Shields LLC since 2008; Chairman of the Board, Institutional Capital LLC, Madison Capital Funding LLC, Madison Square Investors LLC and McMorgan & Company LLC; Chairman of the Board, NYLIFE Distributors LLC and Chairman of the Board, NYLCAP Manager LLC (since 2008) President, Prudential Retirement, a business unit of Prudential Financial, Inc. (2002 to 2007) | | 75 | | None |
| | * | This Board Member is considered to be an “interested person” of the MainStay Group of Funds within the meaning of the 1940 Act because of his affiliation with New York Life Insurance Company, New York Life Investment Management LLC, Madison Square Investors LLC, MacKay Shields LLC, Private Advisors LLC, Institutional Capital LLC, NYLIFE Securities LLC and/or NYLIFE Distributors LLC, as described in detail above in the column entitled “Principal Occupation(s) During the Past Five Years.” |
| | |
| 46 | | MainStay Income Builder Fund |
| | | | | | | | | | | | |
| | | | | Name and
Date of Birth | | Term of Office, Position(s) Held with the Fund Complex and Length of Service | | Principal Occupation(s)
During Past Five Years | | Number of
Funds in
Fund Complex
Overseen by
Board Member | | Other Directorships
Held by Board Member |
| Non-Interested Board Members | | | | Susan B. Kerley 8/12/51 | | Indefinite;
Eclipse Trust: Chairman since 2005, and Trustee since 2000;
Eclipse Funds Inc.: Chairman since 2005 and Director since 1990 (1 fund); The MainStay Funds: Chairman and Board Member since 2007 (12 funds);
MainStay Funds Trust: Chairman and Trustee since 2009 (31 funds); and MainStay VP Funds Trust: Chairman and Trustee since 2011 and its predecessor, MainStay VP Series Fund, Inc., since 2007 (28 portfolios). Private Advisors Alternative Strategies Master Fund: Chairman and Trustee since 2011 Private Advisors Alternative Strategies Fund: Chairman and Trustee since 2011 MainStay DefinedTerm Municipal Opportunities Fund: Chairman and Trustee since 2011. | | President, Strategic Management Advisors LLC (since 1990) | | 75 | | Trustee, Legg Mason Partners Funds, since 1992 (51 portfolios) |
| | | | |
| mainstayinvestments.com | | | 47 | |
| | | | | | | | | | | | |
| | | | | Name and
Date of Birth | | Term of Office,
Position(s) Held
with the Fund
Complex and
Length of Service | | Principal Occupation(s)
During Past Five Years | | Number of
Funds in
Fund Complex
Overseen by
Board Member | | Other Directorships
Held by Board Member |
| Non-Interested Board Members | | | | Alan R. Latshaw 3/27/51 | | Indefinite;
Eclipse Trust: Trustee and Audit Committee Financial Expert since 2007;
Eclipse Funds Inc.:
Director and Audit Committee Financial Expert since 2007 (1 fund);
The MainStay Funds: Trustee and Audit Committee Financial Expert since 2006 (12 funds);
MainStay Funds Trust: Trustee and Audit Committee Financial Expert since 2009 (31 funds); and
MainStay VP Funds Trust: Trustee and Audit Committee Financial Expert since 2011 and its predecessor, MainStay VP Series Fund, Inc., since 2007 (28 portfolios). Private Advisors Alternative Strategies Master Fund: Trustee and Audit Committee Financial Expert since 2011 Private Advisors Alternative Strategies Fund: Trustee and Audit Committee Financial Expert since 2011. MainStay DefinedTerm Municipal Opportunities Fund: Trustee and Audit Committee Financial Expert since 2011. | | Retired; Partner, Ernst & Young LLP (2002 to 2003); Partner, Arthur Andersen LLP (1989 to 2002); Consultant to the MainStay Funds Audit and Compliance Committee (2004 to 2006) | | 75 | | Trustee, State Farm Associates Funds Trusts since 2005 (4 portfolios); Trustee, State Farm Mutual Fund Trust since 2005 (15 portfolios); Trustee, State Farm Variable Product Trust since 2005 (9 portfolios) |
| | |
| 48 | | MainStay Income Builder Fund |
| | | | | | | | | | | | |
| | | | | Name and Date of Birth | | Term of Office, Position(s) Held with the Fund Complex and Length of Service | | Principal Occupation(s)
During Past Five Years | | Number of
Funds in
Fund Complex
Overseen by
Board Member | | Other Directorships Held by Board Member |
| Non-Interested Board Members | | | | Peter Meenan
12/5/41 | | Indefinite;
Eclipse Funds: Trustee since 2002;
Eclipse Funds Inc.:
Director since 2002
(1 fund); The MainStay Funds:
Trustee since 2007 (12 funds);
MainStay Funds Trust: Trustee since 2009
(31 funds); and
MainStay VP Funds Trust: Trustee since 2011 and its predecessor, MainStay VP Series Fund, Inc., since 2007 (28 portfolios).
Private Advisors Alternative Strategies Master Fund: Trustee since 2011. Private Advisors Alternative Strategies Fund: Trustee since 2011
MainStay DefinedTerm Municipal Opportunities Fund: Trustee since 2011. | | Independent Consultant; President and Chief Executive Officer, Babson—United, Inc. (financial services firm) (2000 to 2004); Independent Consultant (1999 to 2000); Head of Global Funds, Citicorp (1995 to 1999) | | 75 | | None |
| | | | Richard H. Nolan, Jr.
11/16/46 | | Indefinite;
Eclipse Trust: Trustee since 2007;
Eclipse Funds Inc.:
Director since 2007 (1 fund);
The MainStay Funds: Trustee since 2007 (12 funds);
MainStay Funds Trust: Trustee since 2009 (31 funds); and
MainStay VP Funds Trust: Trustee since 2011 and its predecessor, MainStay VP Series Fund, Inc., since 2006 (28 portfolios).
Private Advisors Alternative Strategies Master Fund: Trustee since 2011. Private Advisors Alternative Strategies Fund: Trustee since 2011
MainStay DefinedTerm Municipal Opportunities Fund: Trustee since 2011. | | Managing Director, ICC Capital Management; President—Shields/Alliance, Alliance Capital Management (1994 to 2004) | | 75 | | None |
| | | | |
| mainstayinvestments.com | | | 49 | |
| | | | | | | | | | | | |
| | | | | Name and Date of Birth | | Term of Office, Position(s) Held with the Fund Complex and Length of Service | | Principal Occupation(s)
During Past Five Years | | Number of
Funds in
Fund Complex
Overseen by
Board Member | | Other Directorships Held by Board Member |
| Non-Interested Board Members | | | | Richard S. Trutanic 2/13/52 | | Indefinite;
Eclipse Trust: Trustee since 2007;
Eclipse Funds Inc.:
Director since 2007 (1 fund);
The MainStay Funds:
Trustee since 1994 (12 funds);
MainStay Funds Trust:
Trustee since 2009 (31 funds); and
MainStay VP Funds Trust: Trustee since 2011 and its predecessor, MainStay VP Series Fund, Inc., since 2007 (28 portfolios).
Private Advisors Alternative Strategies Master Fund: Trustee since 2011.
Private Advisors Alternative Strategies Fund: Trustee since 2011
MainStay DefinedTerm Municipal Opportunities Fund: Trustee since 2011. | | Chairman and Chief Executive Officer, Somerset & Company (financial advisory firm) (since 2004); Managing Director, The Carlyle Group (private investment firm) (2002 to 2004); Senior Managing Director, Partner and Board Member, Groupe Arnault S.A. (private investment firm) (1999 to 2002) | | 75 | | None |
| | |
| 50 | | MainStay Income Builder Fund |
| | | | | | | | | | | | |
| | | | | Name and Date of Birth | | Term of Office, Position(s) Held with the Fund Complex and Length of Service | | Principal Occupation(s)
During Past Five Years | | Number of
Funds in
Fund Complex
Overseen by
Board Member | | Other Directorships Held by Board Member |
| Non-Interested Board Members | | | | Roman L. Weil
5/22/40 | | Indefinite;
Eclipse Trust: Trustee and Audit Committee Financial Expert since 2007; Eclipse Funds Inc.: Director and Audit Committee Financial Expert since 2007 (1 fund); The MainStay Funds: Trustee and Audit Committee Financial Expert since 2007 (12 funds); MainStay Funds Trust: Trustee since 2009 (31 funds); and MainStay VP Funds Trust: Trustee and Audit Committee Financial Expert since 2011 and its predecessor, MainStay VP Series Fund, Inc., since 1994 and Audit Committee Financial Expert since 2003 (28 portfolios).
Private Advisors Alternative Strategies Master Fund: Trustee and Audit Committee Financial Expert since 2011 Private Advisors Alternative Strategies Fund: Trustee and Audit Committee Financial Expert since 2011. MainStay DefinedTerm Municipal Opportunities Fund: Trustee and Audit Committee Financial Expert since 2011. | | Visiting Professor, University of California—San Diego (since October 2012); Visiting Professor, Southern Methodist University (2011); Visiting Professor, NYU Stem School of Business, New York University (2011); President, Roman L. Weil Associates, Inc. (consulting firm) (since 1981); V. Duane Rath Professor Emeritus of Accounting, Chicago Booth School of Business, University of Chicago (1965-2008) | | 75 | | None |
| | | | |
| mainstayinvestments.com | | | 51 | |
| | | | | | | | | | | | |
| | | | | Name and Date of Birth | | Term of Office, Position(s) Held with the Fund Complex and Length of Service | | Principal Occupation(s)
During Past Five Years | | Number of
Funds in
Fund Complex
Overseen by
Board Member | | Other Directorships Held by Board Member |
| Non-Interested Board Members | | | | John A. Weisser 10/22/41 | | Indefinite; Eclipse Trust: Trustee since 2007; Eclipse Funds Inc.: Director since 2007 (1 fund); The MainStay Funds: Trustee since 2007 (12 funds); MainStay Funds Trust: Trustee since 2009 (31 funds); and MainStay VP Funds Trust: Trustee since 2011 and its predecessor, MainStay VP Series Fund, Inc., since 1997 (28 portfolios).
Private Advisors Alternative Strategies Master Fund: Trustee since 2011.
Private Advisors Alternative Strategies Fund: Trustee since 2011
MainStay DefinedTerm Municipal Opportunities Fund: Trustee since 2011. | | Retired. Managing Director of Salomon Brothers, Inc. (1971 to 1995) | | 75 | | Trustee, Direxion Funds since 2007 (21 portfolios); Direxion Insurance Trust since 2007 (1 portfolio); Trustee, Direxion Shares ETF Trust, since 2008 (47 portfolios) |
| | |
| 52 | | MainStay Income Builder Fund |
The following individuals have been appointed by the Board Members to serve as Officers of the MainStay Group of Funds.
| | | | | | | | |
| | | | | Name and
Date of Birth | | Positions(s) Held with the Funds and Length of Service | | Principal Occupation(s) During Past Five Years |
| Officers | | | | Jack R. Benintende 5/12/64 | | Treasurer and Principal Financial and Accounting Officer, Eclipse Trust, Eclipse Funds, Inc. and The MainStay Funds (since 2007), MainStay Funds Trust (since 2009) | | Assistant Treasurer, New York Life Investment Management Holdings LLC (since 2008); Managing Director, New York Life Investment Management LLC (since 2007); Treasurer and Principal Financial Accounting Officer, Private Advisors Alternative Strategies Master Fund, Private Advisors Alternative Strategies Fund and MainStay DefinedTerm Municipal Opportunities Fund (since 2011); Treasurer and Principal Financial and Accounting Officer, MainStay VP Funds Trust and its predecessor, MainStay VP Series Fund, Inc. (since 2007) |
| | | | Jeffrey A. Engelsman 9/28/67 | | Vice President and Chief Compliance Officer, Eclipse Trust, Eclipse Funds, Inc., The MainStay Funds and MainStay Funds Trust (since 2009) | | Managing Director, Compliance (since 2009), Director and Associate General Counsel, New York Life Investment Management LLC (2005 to 2008); Assistant Secretary, NYLIFE Distributors LLC (2006 to 2008); Vice President and Chief Compliance Officer, Private Advisors Alternative Strategies Master Fund, Private Advisors Alternative Strategies Fund, DefinedTerm Municipal Opportunities Fund (since 2011); MainStay VP Funds Trust and its predecessor, MainStay VP Series Fund, Inc. (since 2009); Assistant Secretary, The MainStay Funds (2006 to 2008); Assistant Secretary, Eclipse Trust, Eclipse Funds, Inc. and MainStay VP Series Fund, Inc. (2005 to 2008) |
| | | | Stephen P. Fisher 2/22/59 | | President, Eclipse Trust, Eclipse Funds, Inc. and The MainStay Funds (since 2007), MainStay Funds Trust (since 2009) | | Director, Senior Vice President, New York Life Insurance and Annuity Corporation (since 2011); Manager, President and Chief Operating Officer, NYLIFE Distributors LLC (since 2008); Chairman of the Board, NYLIM Service Company LLC (since 2008); Senior Managing Director and Chief Marketing Officer, New York Life Investment Management LLC (since 2005); President, Private Advisors Alternative Strategies Master Fund, Private Advisors Alternative Strategies Fund and MainStay DefinedTerm Municipal Opportunities Fund (since 2011); MainStay VP Funds Trust and its predecessor, MainStay VP Series Fund, Inc. (since 2007) |
| | | | J. Kevin Gao 10/13/67 | | Secretary and Chief Legal Officer, Eclipse Trust, Eclipse Funds, Inc., The MainStay Funds and MainStay Funds Trust (since 2010) | | Managing Director and Associate General Counsel, New York Life Investment Management LLC (since 2010); Secretary and Chief Legal Officer, Private Advisors Alternative Strategies Master Fund, Private Advisors Alternative Strategies Fund and MainStay DefinedTerm Municipal Opportunities Fund (since 2011); MainStay VP Funds Trust and its predecessor, MainStay VP Series Fund, Inc. (since 2010); Director and Counsel of Credit Suisse, Chief Legal Officer and Secretary of Credit Suisse Asset Management, LLC and Credit Suisse Funds (2003 to 2010) |
| | | | Scott T. Harrington 2/8/59 | | Vice President—Administration, Eclipse Trust, Eclipse Funds, Inc. and The MainStay Funds (since 2005), MainStay Funds Trust (since 2009) | | Director, New York Life Investment Management LLC (including predecessor advisory organizations) (since 2000); Executive Vice President, New York Life Trust Company and New York Life Trust Company FSB (since 2006); Vice President—Administration, Private Advisors Alternative Strategies Master Fund, Private Advisors Alternative Strategies Fund and MainStay DefinedTerm Municipal Opportunities Fund (since 2011); MainStay VP Funds Trust and its predecessor, MainStay VP Series Fund, Inc. (since 2005) |
| | * | The Officers listed above are considered to be “interested persons” of the MainStay Group of Funds within the meaning of the 1940 Act because of their affiliation with New York Life Insurance Company, New York Life Investment Management LLC, Madison Square Investors LLC, MacKay Shields LLC, Private Advisors LLC, Institutional Capital LLC, Epoch Investment Partners, Inc., Markston International, LLC, Winslow Capital Management, Inc., NYLIFE Securities LLC and/or NYLIFE Distributors LLC, as described in detail above in the column captioned “Principal Occupation(s) During Past Five Years.” Officers are elected annually by the Board to serve a one-year term. |
| | | | |
| mainstayinvestments.com | | | 53 | |
This page intentionally left blank
MainStay Funds
MainStay offers a wide range of Funds for virtually any investment need. The full array of MainStay open-end offerings is listed here, with information about the manager, subadvisors, legal counsel and independent registered public accounting firms.
Equity
U.S. Equity
MainStay Common Stock Fund
MainStay Epoch U.S. All Cap Fund
MainStay Epoch U.S. Equity Yield Fund
MainStay Growth Equity Fund
MainStay ICAP Equity Fund
MainStay ICAP Select Equity Fund
MainStay Large Cap Growth Fund1
MainStay MAP Fund
MainStay S&P 500 Index Fund
MainStay U.S. Small Cap Fund
MainStay 130/30 Core Fund
International/Global Equity
MainStay Epoch Global Choice Fund
MainStay Epoch Global Equity Yield Fund
MainStay Epoch International Small Cap Fund
MainStay ICAP Global Fund
MainStay ICAP International Fund
MainStay International Equity Fund
MainStay 130/30 International Fund
Income
Taxable Bond
MainStay Flexible Bond Opportunities Fund
MainStay Floating Rate Fund
MainStay Global High Income Fund
MainStay Government Fund
MainStay High Yield Corporate Bond Fund
MainStay High Yield Opportunities Fund
MainStay Indexed Bond Fund
MainStay Intermediate Term Bond Fund
MainStay Short Term Bond Fund
MainStay Money Market Fund
Municipal Bond
MainStay High Yield Municipal Bond Fund
MainStay New York Tax Free Opportunities Fund2
MainStay Tax Free Bond Fund
Mixed Asset
MainStay Balanced Fund
MainStay Convertible Fund
MainStay Income Builder Fund
MainStay Marketfield Fund
Asset Allocation/Target Date
MainStay Conservative Allocation Fund
MainStay Growth Allocation Fund
MainStay Moderate Allocation Fund
MainStay Moderate Growth Allocation Fund
MainStay Retirement 2010 Fund
MainStay Retirement 2020 Fund
MainStay Retirement 2030 Fund
MainStay Retirement 2040 Fund
MainStay Retirement 2050 Fund
Manager
New York Life Investment Management LLC
New York, New York
Subadvisors
Epoch Investment Partners, Inc.
New York, New York
Institutional Capital LLC3
Chicago, Illinois
MacKay Shields LLC3
New York, New York
Madison Square Investors LLC3
New York, New York
Marketfield Asset Management LLC
New York, New York
Markston International LLC
White Plains, New York
Winslow Capital Management, Inc.
Minneapolis, Minnesota
Legal Counsel
Dechert LLP
Independent Registered Public Accounting Firms
KPMG LLP
PricewaterhouseCoopers LLP
1. Effective January 13, 2012, the Fund was closed to new investors with certain exceptions.
2. The Fund is only registered for sale in CT, DE, FL, MA, NJ, NY, and VT.
3. An affiliate of New York Life Investment Management LLC.
Not part of the Annual Report
mainstayinvestments.com
The MainStay Funds are managed by New York Life Investment Management LLC and distributed through NYLIFE Distributors LLC,
169 Lackawanna Avenue, Parsippany, NJ 07054, a wholly owned subsidiary of New York Life Insurance Company.
NYLIFE Distributors is a Member FINRA/SIPC.
MainStay Investments is a service mark and name under which New York Life Investment Management LLC does business.
MainStay Investments, an indirect subsidiary of New York Life Insurance Company, New York, NY 10010, provides investment
advisory products and services.
This report may be distributed only when preceded or accompanied by a current Fund prospectus.
© 2013 by NYLIFE Distributors LLC. All rights reserved.
| | | | | | | | |
| Not FDIC/NCUA Insured | | Not a Deposit | | May Lose Value | | No Bank Guarantee | | Not Insured by Any Government Agency |
| | | | |
| NYLIM-28353 MS265-12 | |
| MSIB11-12/12
NL014 |
|

MainStay Global High Income Fund
Message from the President and Annual Report
October 31, 2012
This page intentionally left blank
Message from the President
Most major equity markets delivered positive results for the 12 months ended October 31, 2012. In the United States, stocks provided solid double-digit returns. With a few notable exceptions, international stock markets generally ended the reporting period in positive territory.
The stock market’s advance, however, was far from uniform. After rising to an early peak at the end of March 2012, domes-
tic and international stocks lost ground until the beginning of June. After that, stocks generally rose, reaching their high point for the reporting period in mid-September. Although stocks remained relatively buoyant through mid-October, they drifted lower as the reporting period came to a close.
A variety of forces converged to help fuel these market movements. Investors kept a close eye on developments in the European sovereign debt crisis. The European Central Bank’s Long Term Refinancing Operations helped stabilize European credit markets and provide needed liquidity. Although private holders of Greek sovereign debt had to accept a reduction in their recovery value, the anticipated voluntary exchange provided a positive spark to the markets. Rising unemployment and new austerity measures may impede economic growth as the European Union seeks to strike a delicate balance between fiscal and monetary policies.
In the United States, the Federal Reserve announced an open-ended agency mortgage-backed security purchase program, which helped calm market concerns. The Federal Reserve also continued its maturity extension program (referred to by some as “operation twist”), which seeks to put downward pressure on longer-term interest rates. At the short end of the yield curve, the Federal Reserve maintained the federal funds rate in a near-zero range. In September 2012, the Federal Open Market Committee anticipated that “exceptionally low levels for the federal funds rate” were “likely to be warranted at least through mid-2015.”
With markets stabilizing and short-term interest rates at very low levels, yield-hungry investors had incentives to lengthen maturities and accept higher risk. Domestic high-yield bonds provided double-digit returns for the reporting period, municipal bonds and convertible securities provided high single-digit returns, and domestic corporate bonds provided positive overall returns.
While most investors are pleased when markets rise, MainStay portfolio managers know that long-term results depend on more than short-term market movements. They also depend on the consistent application of well-defined investment strategies and risk-management techniques over longer periods. Our long-term perspective gives our portfolio managers the ability to look past the daily ups and downs of the market as they pursue the specific investment objectives of their individual Funds.
At MainStay, we believe that a long-term perspective can help investors as well. Instead of trying to capitalize on short-term market movements, you may prefer to focus on the long-term potential that can come from getting invested, staying invested and adding to your investments over time. Of course, past performance is no guarantee of future results.
The following pages contain more specific information on the securities, market events and investment decisions that affected your MainStay Fund(s) during the 12 months ended October 31, 2012. We invite you to read the information carefully and use it as part of your ongoing portfolio evaluation and investment review.
Sincerely,

Stephen P. Fisher
President
The opinions expressed are as of the date of this report and are subject to change. There is no guarantee that any forecast made will come to pass. This material does not constitute investment advice and is not intended as an endorsement of any specific investment.
Not part of the Annual Report
Table of Contents
Investors should refer to the Fund’s Summary Prospectus and/or Prospectus and consider the Fund’s investment objectives, strategies, risks, charges and expenses carefully before investing. The Summary Prospectus and/or Prospectus contain this and other information about the Fund. You may obtain copies of the Fund’s Summary Prospectus, Prospectus and Statement of Additional Information free of charge, upon request, by calling toll-free 800-MAINSTAY (624-6782), by writing to NYLIFE Distributors LLC, Attn: MainStay Marketing Department, 169 Lackawanna Avenue, Parsippany, New Jersey 07054 or by sending an e-mail to MainStayShareholderServices@nylim.com. These documents are also available via the MainStay Funds’ website at mainstayinvestments.com/documents. Please read the Summary Prospectus and/or Prospectus carefully before investing.
Investment and Performance Comparison1 (Unaudited)
Performance data quoted represents past performance. Past performance is no guarantee of future results. Because of market volatility, current performance may be lower or higher than the figures shown. Investment return and principal value will fluctuate, and as a result, when shares are redeemed, they may be worth more or less than their original cost. The graph below depicts the historical performance of Class B shares of the Fund. Performance will vary from class to class based on differences in class-specific expenses and sales charges. For performance information current to the most recent month-end, please call 800-MAINSTAY (624-6782) or visit mainstayinvestments.com.
(With sales charges)
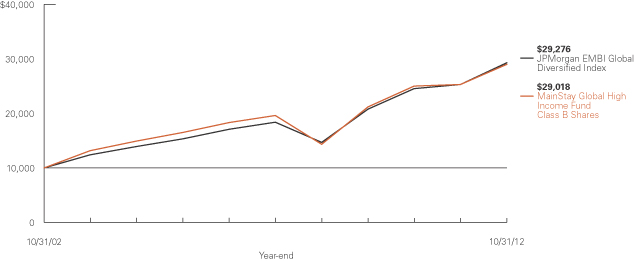
Average Annual Total Returns for the Year Ended October 31, 2012
| | | | | | | | | | | | | | | | | | | | |
| Class | | Sales Charge | | | | One Year | | | Five Years | | | Ten Years | | | Gross
Expense
Ratio2 | |
| Investor Class Shares3 | | Maximum 4.5% Initial Sales Charge | | With sales charges Excluding sales charges | |
| 10.32
15.52 | %
| |
| 7.93
8.93 | %
| |
| 11.57
12.08 | %
| |
| 1.32
1.32 | %
|
| Class A Shares | | Maximum 4.5% Initial Sales Charge | | With sales charges Excluding sales charges | |
| 10.47
15.68 |
| |
| 8.07
9.07 |
| |
| 11.64
12.15 |
| |
| 1.22
1.22 |
|
| Class B Shares | | Maximum 5% CDSC if Redeemed Within the First Six Years of Purchase | | With sales charges Excluding sales charges | |
| 9.60
14.60 |
| |
| 7.82
8.12 |
| |
| 11.24
11.24 |
| |
| 2.07
2.07 |
|
| Class C Shares | | Maximum 1% CDSC if Redeemed Within One Year of Purchase | | With sales charges Excluding sales charges | |
| 13.59
14.59 |
| |
| 8.13
8.13 |
| |
| 11.25
11.25 |
| |
| 2.07
2.07 |
|
| Class I Shares4 | | No Sales Charge | | | | | 15.95 | | | | 9.34 | | | | 12.43 | | | | 0.97 | |
| 1. | The performance table and graph do not reflect the deduction of taxes that a shareholder would pay on distributions or Fund-share redemptions. Total returns reflect maximum applicable sales charges as indicated in the table above, changes in share price, and reinvestment of dividend and capital gain distributions. The graph assumes the initial investment amount shown above and reflects the deduction of all sales charges that would have applied for the period of investment. Performance figures reflect certain fee waivers and/or expense limitations, without which total returns may have been lower. For more information on share classes and current fee waivers and/or expense limitations, please refer to the notes to the financial statements. |
| 2. | The gross expense ratios presented reflect the Fund’s “Total Annual Fund Operating Expenses” from the most recent Prospectus and may differ from other expense ratios disclosed in this report. |
| 3. | Performance figures for Investor Class shares, first offered on February 28, 2008, include the historical performance of Class A shares through February 27, 2008, adjusted for differences in certain fees and expenses. Unadjusted, the performance shown for Investor Class shares might have been different. |
| 4. | Performance figures for Class I shares, first offered on August 31, 2007, include the historical performance of Class A shares through August 30, 2007 adjusted for certain fees and expenses. Unadjusted, the performance shown for Class I shares might have been different. |
The footnotes on the next page are an integral part of the table and graph and should be carefully read in conjunction with them.
| | | | |
| mainstayinvestments.com | | | 5 | |
| | | | | | | | | | | | |
| Benchmark Performance | | One
Year | | | Five
Years | | | Ten
Years | |
JPMorgan EMBI Global Diversified Index5 | | | 15.53 | % | | | 9.73 | % | | | 11.34 | % |
Average Lipper Emerging Markets Debt Fund6 | | | 14.85 | | | | 8.68 | | | | 12.03 | |
| 5. | The JPMorgan EMBI Global Diversified Index is a market-capitalization weighted, total return index tracking the traded market for U.S. dollar-denominated Brady Bonds, Eurobonds, traded loans and local market debt instruments issued by sovereign and quasi-sovereign entities. The JPMorgan EMBI Global Diversified Index is the Fund’s broad-based securities market index for comparison purposes. Total returns assume reinvestment of all dividends and capital gains. An investment cannot be made directly in an Index. |
| 6. | The average Lipper emerging markets debt fund is representative of funds that seek either current income or total return by investing at least 65% of total assets in emerging market debt securities, where “emerging market” is defined by a country’s GNP per capita or other economic measures. This benchmark is a product of Lipper Inc. Lipper Inc. is an independent monitor of fund performance. Results are based on average total returns of similar funds with all dividend and capital gain distributions reinvested. |
The footnotes on the preceding page are an integral part of the table and graph and should be carefully read in conjunction with them.
| | |
| 6 | | MainStay Global High Income Fund |
Cost in Dollars of a $1,000 Investment in MainStay Global High Income Fund (Unaudited)
The example below is intended to describe the fees and expenses borne by shareholders during the six-month period from May 1, 2012, to October 31, 2012, and the impact of those costs on your investment.
Example
As a shareholder of the Fund, you incur two types of costs: (1) transaction costs, including exchange fees and sales charges (loads) on purchases (as applicable), and (2) ongoing costs, including management fees, distribution and/or service (12b-1) fees, and other Fund expenses (as applicable). This example is intended to help you understand your ongoing costs (in dollars) of investing in the Fund and to compare these costs with the ongoing costs of investing in other mutual funds. The example is based on an investment of $1,000 made at the beginning of the six-month period and held for the entire period from May 1, 2012, to October 31, 2012.
This example illustrates your Fund’s ongoing costs in two ways:
Actual Expenses
The second and third data columns in the table below provide information about actual account values and actual expenses. You may use the information in these columns, together with the amount you invested, to estimate the expenses that you paid during the six months ended October 31, 2012. Simply divide your account value by $1,000
(for example, an $8,600 account value divided by $1,000 = 8.6), then
multiply the result by the number under the heading entitled “Expenses Paid During Period” to estimate the expenses you paid on your account during this period.
Hypothetical Example for Comparison Purposes
The fourth and fifth data columns in the table below provide information about hypothetical account values and hypothetical expenses based on the Fund’s actual expense ratio and an assumed rate of return of 5% per year before expenses, which is not the Fund’s actual return. The hypothetical account values and expenses may not be used to estimate the actual ending account balances or expenses you paid for the six-month period shown. You may use this information to compare the ongoing costs of investing in the Fund with the ongoing costs of investing in other Funds. To do so, compare this 5% hypothetical example with the 5% hypothetical examples that appear in the shareholder reports of the other Funds.
Please note that the expenses shown in the table are meant to highlight your ongoing costs only and do not reflect any transactional costs, such as exchange fees or sales charges (loads). Therefore, the fourth and fifth data columns of the table are useful in comparing ongoing costs only and will not help you determine the relative total costs of owning different funds. In addition, if these transactional costs were included, your costs would have been higher.
| | | | | | | | | | | | | | | | | | | | |
| | | | | | | | | | | | | | | | |
| Share Class | | Beginning
Account
Value
5/1/12 | | | Ending Account
Value (Based
on Actual
Returns and
Expenses)
10/31/12 | | | Expenses
Paid
During
Period1 | | | Ending Account
Value (Based
on Hypothetical
5% Annualized
Return and
Actual Expenses)
10/31/12 | | | Expenses
Paid
During
Period1 | |
| | | | | |
| Investor Class Shares | | $ | 1,000.00 | | | $ | 1,087.90 | | | $ | 6.72 | | | $ | 1,018.70 | | | $ | 6.50 | |
| | | | | |
| Class A Shares | | $ | 1,000.00 | | | $ | 1,088.40 | | | $ | 5.98 | | | $ | 1,019.40 | | | $ | 5.79 | |
| | | | | |
| Class B Shares | | $ | 1,000.00 | | | $ | 1,083.90 | | | $ | 10.63 | | | $ | 1,014.90 | | | $ | 10.28 | |
| | | | | |
| Class C Shares | | $ | 1,000.00 | | | $ | 1,082.90 | | | $ | 10.63 | | | $ | 1,014.90 | | | $ | 10.28 | |
| | | | | |
| Class I Shares | | $ | 1,000.00 | | | $ | 1,089.70 | | | $ | 4.67 | | | $ | 1,020.70 | | | $ | 4.52 | |
| 1. | Expenses are equal to the Fund’s annualized expense ratio of each class (1.28% for Investor Class, 1.14% for Class A, 2.03% for Class B and Class C and 0.89% for Class I) multiplied by the average account value over the period, divided by 366 and multiplied by 184 (to reflect the six-month period). The table above represents the actual expenses incurred during the six-month period. |
| | | | |
| mainstayinvestments.com | | | 7 | |
Portfolio Composition as of October 31, 2012 (Unaudited)

See Portfolio of Investments beginning on page 10 for specific holdings within these categories.
Top Ten Issuers Held as of October 31, 2012 (excluding short-term investment)
| 1. | Republic of Turkey, 5.125%–9.00%, due 3/8/17–1/14/41 |
| 2. | Republic of Philippines, 4.00%–9.50%, due 6/17/19–2/2/30 |
| 3. | Republic of Venezuela, 6.00%–9.25%, due 12/9/20–5/7/28 |
| 4. | Republic of Indonesia, 4.875%–6.625%, due 5/5/21–2/17/37 |
| 5. | Republic of Colombia, 4.375%, due 7/12/21 |
| 6. | Majapahit Holding B.V., 8.00%, due 8/7/19 |
| 7. | Republic of Croatia, 6.375%–6.625%, due 7/14/20–3/24/21 |
| 8. | United Mexican States, 7.25%, due 12/15/16 |
| 9. | Republic of Peru, 7.35%, due 7/21/25 |
| 10. | KazMunayGas National, 11.75%, due 1/23/15 |
| | |
| 8 | | MainStay Global High Income Fund |
Portfolio Management Discussion and Analysis (Unaudited)
Questions answered by portfolio managers Dan Roberts, PhD, Michael Kimble and Jakob Bak, PhD, CFA, of MacKay Shields LLC, the Fund’s Subadvisor.
How did MainStay Global High Income Fund perform relative to its peers and its benchmark during the 12 months ended October 31, 2012?
Excluding all sales charges, MainStay Global High Income Fund returned 15.52% for Investor Class shares, 15.68% for Class A shares, 14.60% for Class B shares and 14.59% for Class C shares for the 12 months ended October 31, 2012. Over the same period, the Fund’s Class I shares returned 15.95%. Investor Class, Class A shares and Class I shares outperformed—and Class B and Class C shares underperformed—the 14.85% return of the average Lipper1 emerging markets debt fund for the 12 months ended October 31, 2012. Class A shares and Class I shares outperformed—and Investor Class, Class B and Class C shares underperformed—the 15.53% return of the JPMorgan EMBI Global Diversified Index2 for the reporting period. The JPMorgan EMBI Global Diversified Index is the Fund’s broad- based securities-market index. See page 5 for Fund returns with applicable sales charges.
What factors affected the Fund’s relative performance during the reporting period?
Although there were times of volatility, emerging market debt market fundamentals remained strong throughout the reporting period. From the demand side, investors continued the pursuit for yield, which supported emerging market debt prices throughout the reporting period. The Fund’s strong performance was largely attributable to its positions in corporate bonds and, to a lesser degree, to positions in local currency denominated bonds, neither of which are components of the JPMorgan EMBI Global Diversified Index. The Fund continued to hold an overweight position in corporate debt because we believed that the yield premium corporate bonds offered relative to sovereign debt could add value to the Fund.
What was the Fund’s duration3 strategy during the reporting period?
During the reporting period, the Fund’s duration was shorter than that of JPMorgan EMBI Global Diversified Index, in large part because of the Fund’s corporate bond exposure. Since corporate bonds generally tend to have shorter maturities than sovereign debt, corporate exposure would tend to lower the Fund’s duration. Corporate debt also tends to have a lower sensitivity to interest rates than sovereign debt. As a result, the Fund lowered its exposure to a higher interest-rate environment on two fronts: with shorter duration and with increased credit exposure.
What specific factors, risks or market forces prompted significant decisions for the Fund during the reporting period?
The general improvement in global macroeconomic data during the reporting period led us to increase the Fund’s exposure to corporate debt. In light of the continuing European sovereign debt crisis, we restricted the Fund’s purchases primarily to corporate bonds that we determined to have only minor exposure to Europe. Additionally, we slightly increased the Fund’s exposure to local currency bonds. From a country allocation perspective, we increased the Fund’s exposure to Mexico, while modestly reducing its position in Venezuela and eliminating its allocation to debt issued by the Cayman Islands.
During the reporting period, which countries were the strongest contributors to the Fund’s performance and which countries were particularly weak?
During the reporting period, most of the countries represented in the Fund posted positive performance. Belize, however, was particularly weak, and the Fund’s holdings in that country sold off more than 9% as the government showed a decreased willingness to pay. Venezuela posted strong gains on talk of Hugo Chavez’s deteriorating health, which could lead to a change in power.
How did the Fund’s sector and country weightings change during the reporting period?
During the reporting period, we increased the Fund’s allocation to corporate bonds. From a country perspective, we increased the Fund’s exposure to Mexico, initiated exposure to Portugal and eliminated exposure to the Cayman Islands.
How was the Fund positioned at the end of the reporting period?
As of October 31, 2012, the Fund was overweight relative to the JPMorgan EMBI Global Diversified Index in corporate and local-currency bonds and underweight in sovereign bonds. As of the same date, the Fund held overweight positions relative to the JPMorgan EMBI Global Diversified Index in Mexico and Vene- zuela. As of the same date, the Fund’s most significant under- weight positions relative to the Index were in South Africa, Malaysia and Chile.
| 1. | See page 6 for more information on Lipper Inc. |
| 2. | See page 6 for more information on the JPMorgan EMBI Global Diversified Index. |
| 3. | Duration is a measure of the price sensitivity of a fixed-income investment to changes in interest rates. Duration is expressed as a number of years and is considered a more accurate sensitivity gauge than average maturity. |
The opinions expressed are those of the portfolio managers as of the date of this report and are subject to change. There is no guarantee that any forecast made will come to pass. This material does not constitute investment advice and is not intended as an endorsement of any specific investment.
| | | | |
| mainstayinvestments.com | | | 9 | |
Portfolio of Investments ††† October 31, 2012
| | | | | | | | |
| | | Principal
Amount | | | Value | |
| | | | | | | | |
Long-Term Bonds 96.7%† Corporate Bonds 43.8% | |
Australia 0.7% | |
Mirabela Nickel, Ltd.
8.75%, due 4/15/18 (a) | | $ | 3,000,000 | | | $ | 2,460,000 | |
| | | | | | | | |
|
Austria 0.9% | |
OGX Austria GmbH
8.50%, due 6/1/18 (a) | | | 3,750,000 | | | | 3,271,875 | |
| | | | | | | | |
|
Brazil 1.5% | |
Banco Bradesco S.A.
5.90%, due 1/16/21 (a) | | | 3,000,000 | | | | 3,300,000 | |
Itau Unibanco Holding S.A.
6.20%, due 4/15/20 (a) | | | 2,000,000 | | | | 2,205,000 | |
| | | | | | | | |
| | | | | | | 5,505,000 | |
| | | | | | | | |
British Virgin Islands 0.4% | | | | | | | | |
CITIC Resources Finance, Ltd.
6.75%, due 5/15/14 (a) | | | 1,475,000 | | | | 1,544,694 | |
| | | | | | | | |
|
Cayman Islands 6.1% | |
Braskem Finance, Ltd.
7.00%, due 5/7/20 (a) | | | 3,000,000 | | | | 3,532,500 | |
Fibria Overseas Finance, Ltd.
6.75%, due 3/3/21 (a) | | | 3,000,000 | | | | 3,315,000 | |
Industrial Senior Trust
5.50%, due 11/1/22 (a) | | | 2,200,000 | | | | 2,202,750 | |
JBS Finance II, Ltd.
8.25%, due 1/29/18 (a) | | | 3,000,000 | | | | 3,127,500 | |
Odebrecht Finance, Ltd. | | | | | | | | |
6.00%, due 4/5/23 (a) | | | 500,000 | | | | 578,750 | |
7.00%, due 4/21/20 (a) | | | 3,000,000 | | | | 3,472,500 | |
Petrobras International Finance Co.
5.375%, due 1/27/21 | | | 3,000,000 | | | | 3,402,168 | |
Raizen Fuels Finance, Ltd.
9.50%, due 8/15/14 (a) | | | 2,500,000 | | | | 2,812,500 | |
| | | | | | | | |
| | | | | | | 22,443,668 | |
| | | | | | | | |
Colombia 0.8% | |
Colombia Telecomunicaciones S.A. ESP
5.375%, due 9/27/22 (a) | | | 3,000,000 | | | | 3,067,500 | |
| | | | | | | | |
|
Georgia 1.0% | |
Georgian Oil and Gas Corp.
6.875%, due 5/16/17 (a) | | | 3,500,000 | | | | 3,613,750 | |
| | | | | | | | |
|
Ireland 0.6% | |
Novatek Finance, Ltd.
6.604%, due 2/3/21 (a) | | | 2,000,000 | | | | 2,344,000 | |
| | | | | | | | |
| | | | | | | | |
| | | Principal
Amount | | | Value | |
| | | | | | | | |
Kazakhstan 2.3% | |
¨KazMunayGas National
11.75%, due 1/23/15 (a) | | $ | 7,000,000 | | | $ | 8,394,260 | |
| | | | | | | | |
|
Luxembourg 5.4% | |
ALROSA Finance S.A.
7.75%, due 11/3/20 (a) | | | 1,500,000 | | | | 1,715,700 | |
Evraz Group S.A.
7.40%, due 4/24/17 (a) | | | 3,250,000 | | | | 3,372,850 | |
Gaz Capital S.A. for Gazprom
Series Reg S
9.25%, due 4/23/19 | | | 6,000,000 | | | | 7,830,000 | |
Minerva Luxembourg S.A.
12.25%, due 2/10/22 (a) | | | 3,250,000 | | | | 3,867,500 | |
Virgolino de Oliveira Finance, Ltd.
11.75%, due 2/9/22 (a) | | | 3,000,000 | | | | 2,925,000 | |
| | | | | | | | |
| | | | | | | 19,711,050 | |
| | | | | | | | |
Mexico 6.0% | |
Controladora Mabe S.A. de C.V. | | | | | | | | |
7.875%, due 10/28/19 | | | 1,160,000 | | | | 1,345,600 | |
7.875%, due 10/28/19 (a) | | | 1,600,000 | | | | 1,856,000 | |
Corporacion GEO S.A.B. de C.V.
8.875%, due 3/27/22 (a) | | | 2,000,000 | | | | 2,115,000 | |
Desarrolladora Homex S.A.B. de C.V. 9.75%, due 3/25/20 (a) | | | 3,000,000 | | | | 3,030,000 | |
Empresas ICA S.A.B. de C.V.
8.375%, due 7/24/17 (a) | | | 3,000,000 | | | | 3,202,500 | |
Grupo Bimbo S.A.B. de C.V.
4.50%, due 1/25/22 (a) | | | 3,000,000 | | | | 3,300,138 | |
Petroleos Mexicanos
6.50%, due 6/2/41 | | | 1,000,000 | | | | 1,241,250 | |
Satmex Escrow S.A. de C.V.
9.50%, due 5/15/17 | | | 3,000,000 | | | | 3,180,000 | |
Urbi Desarrollos Urbanos S.A.B. de C.V. 9.75%, due 2/3/22 (a) | | | 3,000,000 | | | | 2,790,000 | |
| | | | | | | | |
| | | | | | | 22,060,488 | |
| | | | | | | | |
Netherlands 5.5% | | | | | | | | |
Kazakhstan Temir Zholy Finance B.V. 6.375%, due 10/6/20 (a) | | | 1,000,000 | | | | 1,199,010 | |
Lukoil International Finance B.V. | | | | | | | | |
6.656%, due 6/7/22 (a) | | | 1,000,000 | | | | 1,207,900 | |
7.25%, due 11/5/19 (a) | | | 2,000,000 | | | | 2,410,840 | |
¨Majapahit Holding B.V.
8.00%, due 8/7/19 (a) | | | 8,300,000 | | | | 10,541,000 | |
Vimpelcom Holdings B.V.
7.504%, due 3/1/22 (a) | | | 3,000,000 | | | | 3,240,000 | |
WPE International Cooperatief UA
10.375%, due 9/30/20 (a) | | | 2,000,000 | | | | 1,720,000 | |
| | | | | | | | |
| | | | | | | 20,318,750 | |
| | | | | | | | |
| † | Percentages indicated are based on Fund net assets. |
| ¨ | | Among the Fund’s 10 largest issuers held, as of October 31, 2012, excluding short-term investment. May be subject to change daily. |
| | | | |
| 10 | | MainStay Global High Income Fund | | The notes to the financial statements are an integral part of,
and should be read in conjunction with, the financial statements. |
| | | | | | | | |
| | | Principal
Amount | | | Value | |
| | | | | | | | |
| Corporate Bonds (continued) | |
Paraguay 1.0% | |
Banco Continental S.A.E.
8.875%, due 10/15/17 (a) | | $ | 3,500,000 | | | $ | 3,640,000 | |
| | | | | | | | |
| | |
Peru 0.9% | | | | | | | | |
BBVA Bancomer S.A.
5.00%, due 8/26/22 (a) | | | 3,000,000 | | | | 3,195,000 | |
| | | | | | | | |
| | |
Republic of Korea 2.9% | | | | | | | | |
Export-Import Bank of Korea
4.375%, due 9/15/21 | | | 2,000,000 | | | | 2,247,958 | |
Korea Finance Corp.
4.625%, due 11/16/21 | | | 3,000,000 | | | | 3,386,664 | |
Korea Gas Corp.
6.25%, due 1/20/42 (a) | | | 2,000,000 | | | | 2,734,910 | |
National Agricultural Cooperative Federation
3.50%, due 2/8/17 (a) | | | 2,000,000 | | | | 2,112,188 | |
| | | | | | | | |
| | | | 10,481,720 | |
| | | | | | | | |
Spain 0.9% | | | | | | | | |
Cemex Espana Luxembourg
9.25%, due 5/12/20 (a) | | | 3,000,000 | | | | 3,120,000 | |
| | | | | | | | |
| | |
Thailand 1.1% | | | | | | | | |
Bangkok Bank PCL
4.80%, due 10/18/20 (a) | | | 3,750,000 | | | | 4,116,926 | |
| | | | | | | | |
| | |
Trinidad and Tobago 1.0% | | | | | | | | |
Petroleum Co. of Trinidad & Tobago, Ltd.
9.75%, due 8/14/19 (a) | | | 2,840,000 | | | | 3,748,800 | |
| | | | | | | | |
| | |
United Arab Emirates 1.0% | | | | | | | | |
Abu Dhabi National Energy Co.
6.25%, due 9/16/19 (a) | | | 3,000,000 | | | | 3,585,000 | |
| | | | | | | | |
| | |
United Kingdom 1.8% | | | | | | | | |
Lloyds TSB Bank PLC
13.00%, due 12/19/21 (b) | | A$ | 3,000,000 | | | | 3,714,115 | |
Vedanta Resources PLC
8.25%, due 6/7/21 (a) | | $ | 2,750,000 | | | | 2,825,625 | |
| | | | | | | | |
| | | | 6,539,740 | |
| | | | | | | | |
United States 0.9% | | | | | | | | |
AES Corp. (The)
8.00%, due 10/15/17 | | | 3,000,000 | | | | 3,431,250 | |
| | | | | | | | |
| | |
Venezuela 1.1% | | | | | | | | |
Petroleos de Venezuela S.A.
Series Reg S
12.75%, due 2/17/22 | | | 4,000,000 | | | | 4,110,000 | |
| | | | | | | | |
Total Corporate Bonds
(Cost $147,171,532) | | | | | | | 160,703,471 | |
| | | | | | | | |
| | | | | | | | |
| | | Principal
Amount | | | Value | |
| | | | | | | | |
| Government & Federal Agencies 52.9% | |
Argentina 1.9% | | | | | | | | |
Republic of Argentina
2.50%, due 12/31/38 (c) | | $ | 17,360,000 | | | $ | 5,642,000 | |
8.28%, due 12/31/33 | | | 2,025,827 | | | | 1,387,691 | |
| | | | | | | | |
| | | | 7,029,691 | |
| | | | | | | | |
Belarus 0.8% | | | | | | | | |
Republic of Belarus
Series Reg S
8.95%, due 1/26/18 | | | 3,000,000 | | | | 2,992,500 | |
| | | | | | | | |
| | |
Colombia 3.0% | | | | | | | | |
¨Republic of Colombia
4.375%, due 7/12/21 | | | 9,500,000 | | | | 10,910,750 | |
| | | | | | | | |
| | |
Croatia 2.6% | | | | | | | | |
¨Republic of Croatia
6.375%, due 3/24/21 (a) | | | 7,000,000 | | | | 7,933,940 | |
6.625%, due 7/14/20 (a) | | | 1,500,000 | | | | 1,715,505 | |
| | | | | | | | |
| | | | 9,649,445 | |
| | | | | | | | |
Dominican Republic 1.1% | | | | | | | | |
Dominican Republic
Series Reg S
7.50%, due 5/6/21 | | | 3,500,000 | | | | 4,112,500 | |
| | | | | | | | |
| | |
El Salvador 2.3% | | | | | | | | |
Republic of El Salvador
Series Reg S | | | | | | | | |
7.375%, due 12/1/19 (a) | | | 3,000,000 | | | | 3,525,000 | |
7.65%, due 6/15/35 | | | 2,450,000 | | | | 2,848,125 | |
8.25%, due 4/10/32 (a) | | | 1,550,000 | | | | 1,898,750 | |
| | | | | | | | |
| | | | 8,271,875 | |
| | | | | | | | |
Gabon 0.7% | | | | | | | | |
Gabonese Republic
8.20%, due 12/12/17 (a) | | | 2,200,000 | | | | 2,667,500 | |
| | | | | | | | |
| | |
Georgia 0.6% | | | | | | | | |
Republic of Georgia
Series Reg S
6.875%, due 4/12/21 | | | 2,000,000 | | | | 2,295,000 | |
| | | | | | | | |
| | |
Ghana 0.8% | | | | | | | | |
Republic of Ghana
Series Reg S
8.50%, due 10/4/17 | | | 2,500,000 | | | | 2,900,000 | |
| | | | | | | | |
| | |
Indonesia 3.2% | | | | | | | | |
¨Republic of Indonesia
4.875%, due 5/5/21 (a) | | | 8,000,000 | | | | 9,120,000 | |
6.625%, due 2/17/37 (a) | | | 2,000,000 | | | | 2,680,000 | |
| | | | | | | | |
| | | | 11,800,000 | |
| | | | | | | | |
| | | | | | |
The notes to the financial statements are an integral part of,
and should be read in conjunction with, the financial statements. | | mainstayinvestments.com | | | 11 | |
Portfolio of Investments††† October 31, 2012 (continued)
| | | | | | | | |
| | | Principal
Amount | | | Value | |
| | | | | | | | |
| Government & Federal Agencies (continued) | |
Jamaica 0.2% | | | | | | | | |
Jamaica Government
8.00%, due 6/24/19 | | $ | 650,000 | | | $ | 650,000 | |
| | | | | | | | |
|
Lebanon 1.9% | |
Lebanon Government
International Bond
Series Reg S
6.00%, due 5/20/19 | | | 6,500,000 | | | | 6,750,250 | |
| | | | | | | | |
|
Lithuania 1.1% | |
Republic of Lithuania
5.125%, due 9/14/17 (a) | | | 3,500,000 | | | | 3,920,000 | |
| | | | | | | | |
|
Mexico 2.5% | |
¨United Mexican States
7.25%, due 12/15/16 | | M$111,250,000 | | | | | 9,165,015 | |
| | | | | | | | |
|
Nigeria 0.6% | |
Nigeria Government
International Bond
Series Reg S
6.75%, due 1/28/21 | | $ | 2,000,000 | | | | 2,305,000 | |
| | | | | | | | |
|
Panama 1.2% | |
Republic of Panama
6.70%, due 1/26/36 | | | 3,058,000 | | | | 4,353,063 | |
| | | | | | | | |
|
Peru 2.4% | |
¨Republic of Peru
7.35%, due 7/21/25 | | | 6,000,000 | | | | 8,730,000 | |
| | | | | | | | |
|
Philippines 4.8% | |
¨Republic of Philippines | | | | | | | | |
4.00%, due 1/15/21 | | | 3,500,000 | | | | 3,924,375 | |
8.375%, due 6/17/19 | | | 4,000,000 | | | | 5,520,000 | |
9.50%, due 2/2/30 | | | 4,660,000 | | | | 8,143,350 | |
| | | | | | | | |
| | | | 17,587,725 | |
| | | | | | | | |
Poland 1.9% | | | | | | | | |
Poland Government Bond
5.75%, due 10/25/21 | | PLN | 20,300,000 | | | | 6,930,606 | |
| | | | | | | | |
|
Portugal 1.2% | |
Portugal Obrigacoes do Tesouro OT
Series Reg S
4.95%, due 10/25/23 | | € | 4,200,000 | | | | 4,205,351 | |
| | | | | | | | |
|
Republic of Korea 1.5% | |
Korea Housing Finance Corp.
3.50%, due 12/15/16 (a) | | $ | 5,000,000 | | | | 5,311,805 | |
| | | | | | | | |
| | | | | | | | |
| | | Principal
Amount | | | Value | |
| | | | | | | | |
Senegal 0.4% | |
Republic of Senegal
8.75%, due 5/13/21 (a) | | $ | 1,250,000 | | | $ | 1,512,500 | |
| | | | | | | | |
|
Sri Lanka 0.9% | |
Republic of Sri Lanka
6.25%, due 10/4/20 (a) | | | 3,000,000 | | | | 3,360,000 | |
| | | | | | | | |
|
Supranational 0.8% | |
International Bank for
Reconstruction
& Development
14.50%, due 3/28/13 (d) | | NGN | 472,000,000 | | | | 2,999,902 | |
| | | | | | | | |
|
Turkey 5.9% | |
¨Republic of Turkey | | | | | | | | |
5.125%, due 3/25/22 | | $ | 1,800,000 | | | | 2,020,500 | |
6.00%, due 1/14/41 | | | 5,000,000 | | | | 5,875,000 | |
7.375%, due 2/5/25 | | | 6,225,000 | | | | 8,139,187 | |
9.00%, due 3/8/17 | | YTL | 9,400,000 | | | | 5,561,339 | |
| | | | | | | | |
| | | | | | | 21,596,026 | |
| | | | | | | | |
Ukraine 2.2% | |
Financing of Infrastructural
Projects State Enterprise
8.375%, due 11/3/17 (a) | | $ | 2,000,000 | | | | 1,900,000 | |
Ukraine Government
7.75%, due 9/23/20 (a) | | | 6,000,000 | | | | 6,261,720 | |
| | | | | | | | |
| | | | | | | 8,161,720 | |
| | | | | | | | |
Uruguay 1.5% | |
Republica Orient Uruguay
4.375%, due 12/15/28 | | UYU | 91,382,077 | | | | 5,464,417 | |
| | | | | | | | |
|
Venezuela 4.3% | |
¨Republic of Venezuela | | | | | | | | |
6.00%, due 12/9/20 | | $ | 7,800,000 | | | | 5,947,500 | |
Series Reg S
9.25%, due 5/7/28 | | | 11,095,000 | | | | 9,791,338 | |
| | | | | | | | |
| | | | | | | 15,738,838 | |
| | | | | | | | |
Vietnam 0.6% | |
Socialist Republic of Vietnam
6.75%, due 1/29/20 (a) | | | 2,000,000 | | | | 2,335,000 | |
| | | | | | | | |
Total Government & Federal Agencies (Cost $167,924,996) | | | | | | | 193,706,479 | |
| | | | | | | | |
Total Long-Term Bonds
(Cost $315,096,528) | | | | | | | 354,409,950 | |
| | | | | | | | |
| | | | |
| 12 | | MainStay Global High Income Fund | | The notes to the financial statements are an integral part of,
and should be read in conjunction with, the financial statements. |
| | | | | | | | |
| | | Principal
Amount | | | Value | |
| | | | | | | | |
| Short-Term Investment 2.2% | | | | | | | | |
Repurchase Agreement 2.2% | | | | | | | | |
State Street Bank and Trust Co.
0.01%, dated 10/31/12
due 11/1/12 | | | | | | | | |
Proceeds at Maturity $8,155,427 (Collateralized by a Federal National Mortgage Association security with a rate of 2.17% and a maturity date of 10/17/22, with a Principal Amount of $8,290,000 and a Market Value of $8,322,696) | | $ | 8,155,425 | | | $ | 8,155,425 | |
| | | | | | | | |
Total Short-Term Investment
(Cost $8,155,425) | | | | | | | 8,155,425 | |
| | | | | | | | |
Total Investments
(Cost $323,251,953) (e) | | | 98.9 | % | | | 362,565,375 | |
Other Assets, Less Liabilities | | | 1.1 | | | | 3,984,606 | |
Net Assets | | | 100.0 | % | | $ | 366,549,981 | |
| ††† | On a daily basis New York Life Investments confirms that the value of the Fund’s liquid assets (liquid portfolio securities and cash) is sufficient to cover its potential senior securities (e.g., futures, swaps, options). |
| (a) | May be sold to institutional investors only under Rule 144A or securities offered pursuant to Section 4(2) of the Securities Act of 1933, as amended. |
| (b) | Floating rate—Rate shown is the rate in effect as of October 31, 2012. |
| (c) | Step coupon. Rate shown is the rate in effect as of October 31, 2012. |
| (d) | Fair valued security. The total market value of this security as of October 31, 2012 is $2,999,902, which represents 0.8% of the Fund’s net assets. |
| (e) | As of October 31, 2012, cost is $323,251,953 for federal income tax purposes and net unrealized appreciation is as follows: |
| | | | |
Gross unrealized appreciation | | $ | 40,367,377 | |
Gross unrealized depreciation | | | (1,053,955 | ) |
| | | | |
Net unrealized appreciation | | $ | 39,313,422 | |
| | | | |
The following abbreviations are used in the above portfolio:
€—Euro
A$—Australian Dollar
M$—Mexican Peso
NGN—Nigerian Naira
PLN—Polish Zloty
UYU—Uruguayan Peso
YTL—Turkish Lira
As of October 31, 2012, the Fund held the following foreign currency forward contracts:
| | | | | | | | | | | | | | | | | | | | | | | | | | | | | | |
Foreign Currency Buy Contracts | | Expiration
Date | | | Counterparty | | | Contract
Amount
Purchased | | | Contract
Amount
Sold | | | Unrealized
Appreciation
(Depreciation) | |
Polish Zloty vs. U.S. Dollar | | | 1/17/13 | | | | Barclays Bank PLC | | | | PLN | | | | 10,674,510 | | | USD | | | 3,300,000 | | | | USD | | | | 16,171 | |
Russian Rubles vs. U.S. Dollar | | | 12/6/12 | | | | HSBC Bank USA | | | | RUB | | | | 196,308,000 | | | | | | 6,000,000 | | | | | | | | 222,349 | |
South Korean Won vs. U.S. Dollar | | | 1/17/13 | | | | HSBC Bank USA | | | | KRW | | | | 7,300,000,000 | | | | | | 6,526,598 | | | | | | | | 140,262 | |
| | | | | | | | | | | | | | | | | | | | | | | | | | | | | | |
Foreign Currency Sales Contracts | | | | | | | | Contract
Amount
Sold | | | Contract
Amount
Purchased | | | | | | | |
Australian Dollar vs. U.S. Dollar | | | 11/15/12 | | | | HSBC Bank USA | | | | AUD | | | | 3,150,000 | | | USD | | | 3,282,930 | | | | USD | | | | 16,433 | |
Euro vs. Polish Zloty | | | 12/17/12 | | | | HSBC Bank USA | | | | EUR | | | | 2,700,000 | | | PLN | | | 11,195,550 | | | | | | | | (11,619 | ) |
Euro vs. U.S. Dollar | | | 11/19/12 | | | | HSBC Bank USA | | | | EUR | | | | 5,000,000 | | | USD | | | 6,146,550 | | | | | | | | (335,157 | ) |
Euro vs. U.S. Dollar | | | 1/17/13 | | | | HSBC Bank USA | | | | EUR | | | | 2,503,437 | | | | | | 3,250,000 | | | | | | | | 2,650 | |
Pound Sterling vs. U.S. Dollar | | | 1/17/13 | | | | HSBC Bank USA | | | | GBP | | | | 2,027,775 | | | | | | 3,250,000 | | | | | | | | (21,536 | ) |
Net unrealized appreciation (depreciation) on foreign currency forward contracts | | | | | | | | | | | | | | | | | | | | | | | | | USD | | | | 29,553 | |
| | | | | | |
The notes to the financial statements are an integral part of,
and should be read in conjunction with, the financial statements. | | mainstayinvestments.com | | | 13 | |
Portfolio of Investments††† October 31, 2012 (continued)
The following is a summary of the fair valuations according to the inputs used as of October 31, 2012, for valuing the Fund’s assets and liabilities.
Asset Valuation Inputs
| | | | | | | | | | | | | | | | |
Description | | Quoted
Prices in
Active
Markets for
Identical
Assets (Level 1) | | | Significant
Other
Observable
Inputs (Level 2) | | | Significant
Unobservable
Inputs (Level 3) | | | Total | |
| Investments in Securities (a) | | | | | | | | | | | | | | | | |
| Long-Term Bonds | | | | | | | | | | | | | | | | |
Corporate Bonds | | $ | — | | | $ | 160,703,471 | | | $ | — | | | $ | 160,703,471 | |
Government & Federal Agencies (b) | | | — | | | | 190,706,577 | | | | 2,999,902 | | | | 193,706,479 | |
| | | | | | | | | | | | | | | | |
| Total Long-Term Bonds | | | — | | | | 351,410,048 | | | | 2,999,902 | | | | 354,409,950 | |
| | | | | | | | | | | | | | | | |
| Short-Term Investment | | | | | | | | | | | | | | | | |
Repurchase Agreement | | | — | | | | 8,155,425 | | | | — | | | | 8,155,425 | |
| | | | | | | | | | | | | | | | |
| Other Financial Instruments | | | | | | | | | | | | | | | | |
Foreign Currency Forward Contracts (c) | | | — | | | | 397,865 | | | | — | | | | 397,865 | |
| | | | | | | | | | | | | | | | |
| Total Investments in Securities and Other Financial Instruments | | $ | — | | | $ | 359,963,338 | | | $ | 2,999,902 | | | $ | 362,963,240 | |
| | | | | | | | | | | | | | | | |
Liability Valuation Inputs
| | | | | | | | | | | | | | | | |
Description | | Quoted
Prices in
Active
Markets for
Identical
Assets (Level 1) | | | Significant
Other
Observable
Inputs (Level 2) | | | Significant
Unobservable
Inputs (Level 3) | | | Total | |
| Other Financial Instruments | | | | | | | | | | | | | | | | |
Foreign Currency Forward Contracts (c) | | $ | — | | | $ | (368,312 | ) | | $ | — | | | $ | (368,312 | ) |
| | | | | | | | | | | | | | | | |
| Total Other Financial Instruments | | $ | — | | | $ | (368,312 | ) | | $ | — | | | $ | (368,312 | ) |
| | | | | | | | | | | | | | | | |
| (a) | For a complete listing of investments and their industries, see the Portfolio of Investments. |
| (b) | The Level 3 security valued at $2,999,902 is held in Supranational within the Government & Federal Agencies section of the Portfolio of Investments. |
| (c) | The value listed for these securities reflects unrealized appreciation (depreciation) as shown on the Portfolio of Investments. |
The Fund recognizes transfers between the levels as of the beginning of the period.
For the year ended October 31, 2012, the Fund did not have any transfers between Level 1 and Level 2 fair value measurements. (See Note 2)
The following is a reconciliation of investments in which significant unobservable inputs (Level 3) were used in determining value:
| | | | | | | | | | | | | | | | | | | | | | | | | | | | | | | | | | | | | | | | |
Investments in
Securities | | Balance
as of
October 31,
2011 | | | Accrued
Discounts
(Premiums) | | | Realized
Gain
(Loss) | | | Change in
Unrealized
Appreciation
(Depreciation) | | | Purchases | | | Sales | | | Transfers
in to
Level 3 | | | Transfers
out of
Level 3 | | | Balance
as of
October 31,
2012 | | | Change in
Unrealized
Appreciation
(Depreciation)
from
Investments
Still Held as of
October 31,
2012 (a) | |
| Long-Term Bonds | | | | | | | | | | | | | | | | | | | | | | | | | | | | | | | | | | | | | | | | |
Corporate Bonds Cayman Islands | | $ | 280 | | | $ | 37,170 | | | $ | (372,048 | ) | | $ | 371,768 | | | $ | — | | | $ | (37,170 | ) | | $ | — | | | $ | — | | | $ | — | | | $ | — | |
Government & Federal Agencies
Supranational | | | — | | | | — | | | | — | | | | (2,643 | ) | | | 3,002,545 | | | | — | | | | — | | | | — | | | | 2,999,902 | | | | (2,643 | ) |
| | | | | | | | | | | | | | | | | | | | | | | | | | | | | | | | | | | | | | | | |
| Total | | $ | 280 | | | $ | 37,170 | | | $ | (372,048 | ) | | $ | 369,125 | | | $ | 3,002,545 | | | $ | (37,170 | ) | | $ | — | | | $ | — | | | $ | 2,999,902 | | | $ | (2,643 | ) |
| | | | | | | | | | | | | | | | | | | | | | | | | | | | | | | | | | | | | | | | |
| (a) | Included in “Net change in unrealized appreciation (depreciation) on investments” in the Statement of Operations. |
| | | | |
| 14 | | MainStay Global High Income Fund | | The notes to the financial statements are an integral part of,
and should be read in conjunction with, the financial statements. |
Statement of Assets and Liabilities as of October 31, 2012
| | | | |
| Assets | | | | |
Investment in securities, at value
(identified cost $323,251,953) | | $ | 362,565,375 | |
Cash denominated in foreign currencies
(identified cost $642,304) | | | 636,412 | |
Receivables: | | | | |
Interest | | | 5,857,312 | |
Fund shares sold | | | 983,400 | |
Other assets | | | 31,242 | |
Unrealized appreciation on foreign currency forward contracts | | | 397,865 | |
| | | | |
Total assets | | | 370,471,606 | |
| | | | |
| |
| Liabilities | | | | |
Payables: | | | | |
Investment securities purchased | | | 2,200,000 | |
Fund shares redeemed | | | 287,861 | |
Manager (See Note 3) | | | 221,658 | |
Transfer agent (See Note 3) | | | 145,436 | |
NYLIFE Distributors (See Note 3) | | | 137,382 | |
Shareholder communication | | | 23,396 | |
Professional fees | | | 17,115 | |
Custodian | | | 5,389 | |
Trustees | | | 1,091 | |
Accrued expenses | | | 4,478 | |
Dividend payable | | | 509,507 | |
Unrealized depreciation on foreign currency forward contracts | | | 368,312 | |
| | | | |
Total liabilities | | | 3,921,625 | |
| | | | |
Net assets | | $ | 366,549,981 | |
| | | | |
| |
| Composition of Net Assets | | | | |
Shares of beneficial interest outstanding (par value of $.01 per share) unlimited number of shares authorized | | $ | 291,413 | |
Additional paid-in capital | | | 322,033,316 | |
| | | | |
| | | 322,324,729 | |
Undistributed net investment income | | | 4,942,861 | |
Accumulated net realized gain (loss) on investments, swap transactions and foreign currency transactions | | | (61,234 | ) |
Net unrealized appreciation (depreciation) on investments | | | 39,313,422 | |
Net unrealized appreciation (depreciation) on translation of other assets and liabilities in foreign currencies and foreign currency forward contracts | | | 30,203 | |
| | | | |
Net assets | | $ | 366,549,981 | |
| | | | |
| | | | |
Investor Class | | | | |
Net assets applicable to outstanding shares | | $ | 27,165,324 | |
| | | | |
Shares of beneficial interest outstanding | | | 2,137,941 | |
| | | | |
Net asset value per share outstanding | | $ | 12.71 | |
Maximum sales charge (4.50% of offering price) | | | 0.60 | |
| | | | |
Maximum offering price per share outstanding | | $ | 13.31 | |
| | | | |
Class A | | | | |
Net assets applicable to outstanding shares | | $ | 179,429,806 | |
| | | | |
Shares of beneficial interest outstanding | | | 14,218,736 | |
| | | | |
Net asset value per share outstanding | | $ | 12.62 | |
Maximum sales charge (4.50% of offering price) | | | 0.59 | |
| | | | |
Maximum offering price per share outstanding | | $ | 13.21 | |
| | | | |
Class B | | | | |
Net assets applicable to outstanding shares | | $ | 20,101,021 | |
| | | | |
Shares of beneficial interest outstanding | | | 1,614,442 | |
| | | | |
Net asset value and offering price per share outstanding | | $ | 12.45 | |
| | | | |
Class C | | | | |
Net assets applicable to outstanding shares | | $ | 91,001,728 | |
| | | | |
Shares of beneficial interest outstanding | | | 7,302,167 | |
| | | | |
Net asset value and offering price per share outstanding | | $ | 12.46 | |
| | | | |
Class I | | | | |
Net assets applicable to outstanding shares | | $ | 48,852,102 | |
| | | | |
Shares of beneficial interest outstanding | | | 3,868,005 | |
| | | | |
Net asset value and offering price per share outstanding | | $ | 12.63 | |
| | | | |
| | | | | | |
The notes to the financial statements are an integral part of,
and should be read in conjunction with, the financial statements. | | mainstayinvestments.com | | | 15 | |
Statement of Operations for the year ended October 31, 2012
| | | | |
| Investment Income (Loss) | |
Income | | | | |
Interest | | $ | 21,080,467 | |
| | | | |
Expenses | | | | |
Manager (See Note 3) | | | 2,368,398 | |
Distribution/Service—Investor Class (See Note 3) | | | 61,933 | |
Distribution/Service—Class A (See Note 3) | | | 394,770 | |
Distribution/Service—Class B (See Note 3) | | | 204,440 | |
Distribution/Service—Class C (See Note 3) | | | 840,882 | |
Transfer agent (See Note 3) | | | 553,227 | |
Registration | | | 82,203 | |
Professional fees | | | 67,289 | |
Shareholder communication | | | 51,074 | |
Custodian | | | 36,223 | |
Trustees | | | 8,880 | |
Miscellaneous | | | 16,720 | |
| | | | |
Total expenses | | | 4,686,039 | |
| | | | |
Net investment income (loss) | | | 16,394,428 | |
| | | | |
|
| Realized and Unrealized Gain (Loss) on Investments, Swap Contracts and Foreign Currency Transactions | |
Net realized gain (loss) on: | | | | |
Security transactions | | | 4,658,287 | |
Swap transactions | | | 55,206 | |
Foreign currency transactions | | | 740,256 | |
| | | | |
Net realized gain (loss) on investments, swap transactions and foreign currency transactions | | | 5,453,749 | |
| | | | |
Net change in unrealized appreciation (depreciation) on: | | | | |
Investments | | | 25,909,744 | |
Swap contracts | | | 53,602 | |
Translation of other assets and liabilities in foreign currencies and foreign currency forward contracts | | | (73,575 | ) |
| | | | |
Net change in unrealized appreciation (depreciation) on investments, swap contracts and foreign currency transactions | | | 25,889,771 | |
| | | | |
Net realized and unrealized gain (loss) on investments, swap transactions and foreign currency transactions | | | 31,343,520 | |
| | | | |
Net increase (decrease) in net assets resulting from operations | | $ | 47,737,948 | |
| | | | |
| | | | |
| 16 | | MainStay Global High Income Fund | | The notes to the financial statements are an integral part of,
and should be read in conjunction with, the financial statements. |
Statements of Changes in Net Assets
for the years ended October 31, 2012 and October 31, 2011
| | | | | | | | |
| | | 2012 | | | 2011 | |
| Increase (Decrease) in Net Assets | |
Operations: | | | | | | | | |
Net investment income (loss) | | $ | 16,394,428 | | | $ | 15,088,682 | |
Net realized gain (loss) on investments, futures transactions, swap transactions and foreign currency transactions | | | 5,453,749 | | | | 8,891,927 | |
Net change in unrealized appreciation (depreciation) on investments, futures contracts, swap contracts and foreign currency transactions | | | 25,889,771 | | | | (20,042,118 | ) |
| | | | |
Net increase (decrease) in net assets resulting from operations | | | 47,737,948 | | | | 3,938,491 | |
| | | | |
Dividends and distributions to shareholders: | | | | | | | | |
From net investment income: | | | | | | | | |
Investor Class | | | (1,279,141 | ) | | | (1,173,686 | ) |
Class A | | | (8,448,828 | ) | | | (7,882,513 | ) |
Class B | | | (920,192 | ) | | | (1,135,158 | ) |
Class C | | | (3,803,138 | ) | | | (3,844,514 | ) |
Class I | | | (2,392,977 | ) | | | (2,356,918 | ) |
| | | | |
| | | (16,844,276 | ) | | | (16,392,789 | ) |
| | | | |
From net realized gain on investments: | | | | | | | | |
Investor Class | | | (630,762 | ) | | | (291,094 | ) |
Class A | | | (3,912,908 | ) | | | (2,027,880 | ) |
Class B | | | (595,783 | ) | | | (351,875 | ) |
Class C | | | (2,218,133 | ) | | | (1,164,949 | ) |
Class I | | | (1,033,355 | ) | | | (693,290 | ) |
| | | | |
| | | (8,390,941 | ) | | | (4,529,088 | ) |
| | | | |
Total dividends and distributions to shareholders | | | (25,235,217 | ) | | | (20,921,877 | ) |
| | | | |
Capital share transactions: | | | | | | | | |
Net proceeds from sale of shares | | | 116,559,348 | | | | 97,940,571 | |
Net asset value of shares issued to shareholders in reinvestment of dividends | | | 17,050,329 | | | | 13,660,011 | |
Cost of shares redeemed | | | (95,612,363 | ) | | | (137,334,007 | ) |
| | | | |
Increase (decrease) in net assets derived from capital share transactions | | | 37,997,314 | | | | (25,733,425 | ) |
| | | | |
Net increase (decrease) in net assets | | | 60,500,045 | | | | (42,716,811 | ) |
| | |
| Net Assets | | | | | | | | |
Beginning of year | | | 306,049,936 | | | | 348,766,747 | |
| | | | |
End of year | | $ | 366,549,981 | | | $ | 306,049,936 | |
| | | | |
Undistributed (distributions in excess of) net investment income at end of year | | $ | 4,942,861 | | | $ | (175,816 | ) |
| | | | |
| | | | | | |
The notes to the financial statements are an integral part of,
and should be read in conjunction with, the financial statements. | | mainstayinvestments.com | | | 17 | |
Financial Highlights selected per share data and ratios
| | | | | | | | | | | | | | | | | | | | |
| | | Investor Class | |
| | | Year ended October 31, | | | February 28,
2008** through
October 31, | |
| | | 2012 | | | 2011 | | | 2010 | | | 2009 | | | 2008 | |
Net asset value at beginning of period | | $ | 11.90 | | | $ | 12.49 | | | $ | 11.16 | | | $ | 8.07 | | | $ | 11.27 | |
| | | | | | | | | | | | | | | | | | | | |
Net investment income (loss) (a) | | | 0.61 | | | | 0.59 | | | | 0.66 | | | | 0.65 | | | | 0.42 | |
Net realized and unrealized gain (loss) on investments | | | 1.12 | | | | (0.41 | ) | | | 1.33 | | | | 3.00 | | | | (3.23 | ) |
Net realized and unrealized gain (loss) on foreign currency transactions | | | 0.02 | | | | 0.03 | | | | 0.05 | | | | 0.13 | | | | 0.02 | |
| | | | | | | | | | | | | | | | | | | | |
Total from investment operations | | | 1.75 | | | | 0.21 | | | | 2.04 | | | | 3.78 | | | | (2.79 | ) |
| | | | | | | | | | | | | | | | | | | | |
Less dividends and distributions: | | | | | | | | | | | | | | | | | | | | |
From net investment income | | | (0.62 | ) | | | (0.64 | ) | | | (0.71 | ) | | | (0.69 | ) | | | (0.41 | ) |
From net realized gain on investments | | | (0.32 | ) | | | (0.16 | ) | | | — | | | | — | | | | — | |
| | | | | | | | | | | | | | | | | | | | |
Total dividends and distributions | | | (0.94 | ) | | | (0.80 | ) | | | (0.71 | ) | | | (0.69 | ) | | | (0.41 | ) |
| | | | | | | | | | | | | | | | | | | | |
Net asset value at end of period | | $ | 12.71 | | | $ | 11.90 | | | $ | 12.49 | | | $ | 11.16 | | | $ | 8.07 | |
| | | | | | | | | | | | | | | | | | | | |
Total investment return (b) | | | 15.52 | % | | | 1.94 | % | | | 18.95 | % | | | 48.62 | % | | | (25.54 | %)(c) |
Ratios (to average net assets)/Supplemental Data: | | | | | | | | | | | | | | | | | | | | |
Net investment income (loss) | | | 5.10 | % | | | 4.93 | % | | | 5.65 | % | | | 6.69 | % | | | 5.79 | % †† |
Net expenses | | | 1.29 | % | | | 1.32 | % | | | 1.37 | % | | | 1.49 | % | | | 1.50 | % †† |
Expenses (before waiver/reimbursement) | | | 1.29 | % | | | 1.32 | % | | | 1.37 | % | | | 1.57 | % | | | 1.53 | % †† |
Portfolio turnover rate | | | 31 | % | | | 65 | % | | | 92 | % | | | 133 | % | | | 55 | % |
Net assets at end of period (in 000’s) | | $ | 27,165 | | | $ | 23,439 | | | $ | 21,834 | | | $ | 17,581 | | | $ | 12,662 | |
| ** | Commencement of operations. |
| (a) | Per share data based on average shares outstanding during the period. |
| (b) | Total investment return is calculated exclusive of sales charges and assumes the reinvestment of dividends and distributions. |
| (c) | Total investment return is not annualized. |
| | | | | | | | | | | | | | | | | | | | |
| | Class A | |
| | | Year ended October 31, | |
| | | 2012 | | | 2011 | | | 2010 | | | 2009 | | | 2008 | |
Net asset value at beginning of year | | $ | 11.83 | | | $ | 12.42 | | | $ | 11.09 | | | $ | 8.02 | | | $ | 11.81 | |
| | | | | | | | | | | | | | | | | | | | |
Net investment income (loss) (a) | | | 0.62 | | | | 0.60 | | | | 0.67 | | | | 0.66 | | | | 0.67 | |
Net realized and unrealized gain (loss) on investments | | | 1.11 | | | | (0.41 | ) | | | 1.33 | | | | 2.99 | | | | (3.59 | ) |
Net realized and unrealized gain (loss) on foreign currency transactions | | | 0.02 | | | | 0.03 | | | | 0.05 | | | | 0.12 | | | | 0.02 | |
| | | | | | | | | | | | | | | | | | | | |
Total from investment operations | | | 1.75 | | | | 0.22 | | | | 2.05 | | | | 3.77 | | | | (2.90 | ) |
| | | | | | | | | | | | | | | | | | | | |
Less dividends and distributions: | | | | | | | | | | | | | | | | | | | | |
From net investment income | | | (0.64 | ) | | | (0.65 | ) | | | (0.72 | ) | | | (0.70 | ) | | | (0.66 | ) |
From net realized gain on investments | | | (0.32 | ) | | | (0.16 | ) | | | — | | | | — | | | | (0.23 | ) |
| | | | | | | | | | | | | | | | | | | | |
Total dividends and distributions | | | (0.96 | ) | | | (0.81 | ) | | | (0.72 | ) | | | (0.70 | ) | | | (0.89 | ) |
| | | | | | | | | | | | | | | | | | | | |
Net asset value at end of year | | $ | 12.62 | | | $ | 11.83 | | | $ | 12.42 | | | $ | 11.09 | | | $ | 8.02 | |
| | | | | | | | | | | | | | | | | | | | |
Total investment return (b) | | | 15.68 | % | | | 1.96 | % | | | 19.09 | % | | | 49.04 | % | | | (26.29 | %) |
Ratios (to average net assets)/Supplemental Data: | | | | | | | | | | | | | | | | | | | | |
Net investment income (loss) | | | 5.22 | % | | | 5.03 | % | | | 5.77 | % | | | 6.77 | % | | | 6.08 | % |
Net expenses | | | 1.17 | % | | | 1.22 | % | | | 1.25 | % | | | 1.32 | % | | | 1.34 | % |
Expenses (before waiver/reimbursement) | | | 1.17 | % | | | 1.22 | % | | | 1.25 | % | | | 1.40 | % | | | 1.37 | % |
Portfolio turnover rate | | | 31 | % | | | 65 | % | | | 92 | % | | | 133 | % | | | 55 | % |
Net assets at end of year (in 000’s) | | $ | 179,430 | | | $ | 144,272 | | | $ | 159,834 | | | $ | 119,132 | | | $ | 59,843 | |
| (a) | Per share data based on average shares outstanding during the year. |
| (b) | Total investment return is calculated exclusive of sales charges and assumes the reinvestment of dividends and distributions. |
| | | | |
| 18 | | MainStay Global High Income Fund | | The notes to the financial statements are an integral part of,
and should be read in conjunction with, the financial statements. |
Financial Highlights selected per share data and ratios
| | | | | | | | | | | | | | | | | | | | |
| | | Class B | |
| | | Year ended October 31, | |
| | | 2012 | | | 2011 | | | 2010 | | | 2009 | | | 2008 | |
Net asset value at beginning of year | | $ | 11.68 | | | $ | 12.28 | | | $ | 10.97 | | | $ | 7.94 | | | $ | 11.70 | |
| | | | | | | | | | | | | | | | | | | | |
Net investment income (loss) (a) | | | 0.51 | | | | 0.49 | | | | 0.56 | | | | 0.57 | | | | 0.56 | |
Net realized and unrealized gain (loss) on investments | | | 1.09 | | | | (0.41 | ) | | | 1.32 | | | | 2.96 | | | | (3.54 | ) |
Net realized and unrealized gain (loss) on foreign currency transactions | | | 0.02 | | | | 0.03 | | | | 0.05 | | | | 0.12 | | | | 0.02 | |
| | | | | | | | | | | | | | | | | | | | |
Total from investment operations | | | 1.62 | | | | 0.11 | | | | 1.93 | | | | 3.65 | | | | (2.96 | ) |
| | | | | | | | | | | | | | | | | | | | |
Less dividends and distributions: | | | | | | | | | | | | | | | | | | | | |
From net investment income | | | (0.53 | ) | | | (0.55 | ) | | | (0.62 | ) | | | (0.62 | ) | | | (0.57 | ) |
From net realized gain on investments | | | (0.32 | ) | | | (0.16 | ) | | | — | | | | — | | | | (0.23 | ) |
| | | | | | | | | | | | | | | | | | | | |
Total dividends and distributions | | | (0.85 | ) | | | (0.71 | ) | | | (0.62 | ) | | | (0.62 | ) | | | (0.80 | ) |
| | | | | | | | | | | | | | | | | | | | |
Net asset value at end of year | | $ | 12.45 | | | $ | 11.68 | | | $ | 12.28 | | | $ | 10.97 | | | $ | 7.94 | |
| | | | | | | | | | | | | | | | | | | | |
Total investment return (b) | | | 14.60 | % | | | 1.13 | % | | | 18.11 | % | | | 47.69 | % | | | (26.92 | %) |
Ratios (to average net assets)/Supplemental Data: | | | | | | | | | | | | | | | | | | | | |
Net investment income (loss) | | | 4.35 | % | | | 4.18 | % | | | 4.90 | % | | | 5.98 | % | | | 5.21 | % |
Net expenses | | | 2.04 | % | | | 2.07 | % | | | 2.12 | % | | | 2.24 | % | | | 2.20 | % |
Expenses (before waiver/reimbursement) | | | 2.04 | % | | | 2.07 | % | | | 2.12 | % | | | 2.32 | % | | | 2.19 | % |
Portfolio turnover rate | | | 31 | % | | | 65 | % | | | 92 | % | | | 133 | % | | | 55 | % |
Net assets at end of year (in 000’s) | | $ | 20,101 | | | $ | 21,961 | | | $ | 27,314 | | | $ | 25,651 | | | $ | 21,006 | |
| (a) | Per share data based on average shares outstanding during the year. |
| (b) | Total investment return is calculated exclusive of sales charges and assumes the reinvestment of dividends and distributions. |
| | | | | | | | | | | | | | | | | | | | |
| | Class C | |
| | | Year ended October 31, | |
| | | 2012 | | | 2011 | | | 2010 | | | 2009 | | | 2008 | |
Net asset value at beginning of year | | $ | 11.69 | | | $ | 12.29 | | | $ | 10.98 | | | $ | 7.95 | | | $ | 11.70 | |
| | | | | | | | | | | | | | | | | | | | |
Net investment income (loss) (a) | | | 0.51 | | | | 0.49 | | | | 0.56 | | | | 0.56 | | | | 0.57 | |
Net realized and unrealized gain (loss) on investments | | | 1.09 | | | | (0.41 | ) | | | 1.32 | | | | 2.97 | | | | (3.54 | ) |
Net realized and unrealized gain (loss) on foreign currency transactions | | | 0.02 | | | | 0.03 | | | | 0.05 | | | | 0.12 | | | | 0.02 | |
| | | | | | | | | | | | | | | | | | | | |
Total from investment operations | | | 1.62 | | | | 0.11 | | | | 1.93 | | | | 3.65 | | | | (2.95 | ) |
| | | | | | | | | | | | | | | | | | | | |
Less dividends and distributions: | | | | | | | | | | | | | | | | | | | | |
From net investment income | | | (0.53 | ) | | | (0.55 | ) | | | (0.62 | ) | | | (0.62 | ) | | | (0.57 | ) |
From net realized gain on investments | | | (0.32 | ) | | | (0.16 | ) | | | — | | | | — | | | | (0.23 | ) |
| | | | | | | | | | | | | | | | | | | | |
Total dividends and distributions | | | (0.85 | ) | | | (0.71 | ) | | | (0.62 | ) | | | (0.62 | ) | | | (0.80 | ) |
| | | | | | | | | | | | | | | | | | | | |
Net asset value at end of year | | $ | 12.46 | | | $ | 11.69 | | | $ | 12.29 | | | $ | 10.98 | | | $ | 7.95 | |
| | | | | | | | | | | | | | | | | | | | |
Total investment return (b) | | | 14.59 | % | | | 1.13 | % | | | 18.20 | % | | | 47.50 | % | | | (26.83 | %) |
Ratios (to average net assets)/Supplemental Data: | | | | | | | | | | | | | | | | | | | | |
Net investment income (loss) | | | 4.35 | % | | | 4.18 | % | | | 4.89 | % | | | 5.85 | % | | | 5.22 | % |
Net expenses | | | 2.04 | % | | | 2.07 | % | | | 2.12 | % | | | 2.23 | % | | | 2.19 | % |
Expenses (before waiver/reimbursement) | | | 2.04 | % | | | 2.07 | % | | | 2.12 | % | | | 2.31 | % | | | 2.20 | % |
Portfolio turnover rate | | | 31 | % | | | 65 | % | | | 92 | % | | | 133 | % | | | 55 | % |
Net assets at end of year (in 000’s) | | $ | 91,002 | | | $ | 80,351 | | | $ | 87,597 | | | $ | 57,731 | | | $ | 27,377 | |
| (a) | Per share data based on average shares outstanding during the year. |
| (b) | Total investment return is calculated exclusive of sales charges and assumes the reinvestment of dividends and distributions. |
| | | | | | |
The notes to the financial statements are an integral part of,
and should be read in conjunction with, the financial statements. | | mainstayinvestments.com | | | 19 | |
Financial Highlights selected per share data and ratios
| | | | | | | | | | | | | | | | | | | | |
| | | Class I | |
| | | Year ended October 31, | |
| | | 2012 | | | 2011 | | | 2010 | | | 2009 | | | 2008 | |
Net asset value at beginning of year | | $ | 11.84 | | | $ | 12.43 | | | $ | 11.10 | | | $ | 8.02 | | | $ | 11.81 | |
| | | | | | | | | | | | | | | | | | | | |
Net investment income (loss) (a) | | | 0.66 | | | | 0.63 | | | | 0.69 | | | | 0.66 | | | | 0.69 | |
Net realized and unrealized gain (loss) on investments | | | 1.10 | | | | (0.41 | ) | | | 1.34 | | | | 3.01 | | | | (3.58 | ) |
Net realized and unrealized gain (loss) on foreign currency transactions | | | 0.02 | | | | 0.03 | | | | 0.05 | | | | 0.13 | | | | 0.02 | |
| | | | | | | | | | | | | | | | | | | | |
Total from investment operations | | | 1.78 | | | | 0.25 | | | | 2.08 | | | | 3.80 | | | | (2.87 | ) |
| | | | | | | | | | | | | | | | | | | | |
Less dividends and distributions: | | | | | | | | | | | | | | | | | | | | |
From net investment income | | | (0.67 | ) | | | (0.68 | ) | | | (0.75 | ) | | | (0.72 | ) | | | (0.69 | ) |
From net realized gain on investments | | | (0.32 | ) | | | (0.16 | ) | | | — | | | | — | | | | (0.23 | ) |
| | | | | | | | | | | | | | | | | | | | |
Total dividends and distributions | | | (0.99 | ) | | | (0.84 | ) | | | (0.75 | ) | | | (0.72 | ) | | | (0.92 | ) |
| | | | | | | | | | | | | | | | | | | | |
Net asset value at end of year | | $ | 12.63 | | | $ | 11.84 | | | $ | 12.43 | | | $ | 11.10 | | | $ | 8.02 | |
| | | | | | | | | | | | | | | | | | | | |
Total investment return (b) | | | 15.95 | % | | | 2.22 | % | | | 19.48 | % | | | 49.31 | % | | | (26.11 | %) |
Ratios (to average net assets)/Supplemental Data: | | | | | | | | | | | | | | | | | | | | |
Net investment income (loss) | | | 5.47 | % | | | 5.31 | % | | | 5.89 | % | | | 6.32 | % | | | 6.28 | % |
Net expenses | | | 0.92 | % | | | 0.97 | % | | | 1.00 | % | | | 1.12 | % | | | 1.14 | % |
Expenses (before waiver/reimbursement) | | | 0.92 | % | | | 0.97 | % | | | 1.00 | % | | | 1.12 | % | | | 1.15 | % |
Portfolio turnover rate | | | 31 | % | | | 65 | % | | | 92 | % | | | 133 | % | | | 55 | % |
Net assets at end of year (in 000’s) | | $ | 48,852 | | | $ | 36,027 | | | $ | 52,188 | | | $ | 3,972 | | | $ | 27 | |
| (a) | Per share data based on average shares outstanding during the year. |
| (b) | Total investment return is calculated exclusive of sales charges and assumes the reinvestment of dividends and distributions. Class I shares are not subject to sales charges. |
| | | | |
| 20 | | MainStay Global High Income Fund | | The notes to the financial statements are an integral part of,
and should be read in conjunction with, the financial statements. |
Notes to Financial Statements
Note 1–Organization and Business
The MainStay Funds (the “Trust”) were organized on January 9, 1986, as a Massachusetts business trust. The Trust is registered under the Investment Company Act of 1940, as amended (the “1940 Act”), as an open-end investment management company, and is comprised of twelve funds (collectively referred to as the “Funds”). These financial statements and notes relate only to the MainStay Global High Income Fund (the “Fund”), a non-diversified fund.
The Fund currently offers five classes of shares. Class A and Class B shares commenced operations on June 1, 1998. Class C shares commenced operations on September 1, 1998. Class I shares commenced operations on August 31, 2007. Investor Class shares commenced operations on February 28, 2008. Investor Class and Class A shares are offered at net asset value (“NAV”) per share plus an initial sales charge. No sales charge applies to investments of $1 million or more (and certain other qualified purchases) in Investor Class and Class A shares, but a contingent deferred sales charge (“CDSC”) is imposed on certain redemptions made within one year of the date of purchase. Class B and Class C shares are offered at NAV without an initial sales charge, although a declining CDSC may be imposed on redemptions made within six years of the date of purchase of Class B shares and a 1.00% CDSC may be imposed on redemptions made within one year of the date of purchase of Class C shares. Class I shares are offered at NAV and are not subject to a sales charge. Depending upon eligibility, Class B shares convert to either Investor Class or Class A shares at the end of the calendar quarter eight years after the date they were purchased. Additionally, depending upon eligibility, Investor Class shares may convert to Class A shares and Class A shares may convert to Investor Class shares. The five classes of shares have the same voting (except for issues that relate solely to one class), dividend, liquidation and other rights, and the same terms and conditions, except that Class B and Class C shares are subject to higher distribution and/or service fee rates than Investor Class and Class A shares under a distribution plan pursuant to Rule 12b-1 under the 1940 Act. Class I shares are not subject to a distribution and/or service fee.
The Fund’s investment objective is to seek maximum current income by investing in high-yield debt securities of non-U.S. issuers. Capital appreciation is a secondary objective.
The Fund is “non-diversified,” which means that it may invest a greater percentage of its assets than diversified funds in a particular issuer. This may make it more susceptible than diversified funds to risks associated with an individual issuer, and to single economic, political or regulatory occurrences.
Note 2–Significant Accounting Policies
The Fund prepares its financial statements in accordance with generally accepted accounting principles (“GAAP”) in the United States of America and follows the significant accounting policies described below.
(A) Securities Valuation. Investments are valued as of the close of regular trading on the New York Stock Exchange (“Exchange”) (generally 4:00 p.m. Eastern time) on each day the Fund is open for business (“valuation date”).
The Board of Trustees (the “Board”) has adopted procedures for the valuation of the Fund’s securities and has delegated the responsibility for valuation determination under those procedures to the Valuation Committee of the Fund (the “Valuation Committee”). The Board has authorized the Valuation Committee to appoint a Valuation Sub-Committee (the “Sub-Committee”) to deal in the first instance with questions that arise or cannot be resolved under these procedures. The Sub-Committee will meet (in person, via electronic mail or via teleconference) on an as-needed basis. The Valuation Committee shall meet at a later time, as necessary, to ensure that actions taken by the Sub-Committee were appropriate. The procedures recognize that, subject to the oversight of the Board and unless otherwise noted, the responsibility for day-to-day valuation of portfolio assets (including securities for which market prices are not readily available) rests with New York Life Investment Management LLC (“New York Life Investments” or the “Manager”), aided to whatever extent necessary by the Subadvisor (as defined in Note 3(A)) of the Fund. These procedures shall be reviewed by the Board no less frequently than annually. Any revisions to these procedures deemed necessary shall be reported to the Board at its next regularly scheduled meeting.
Securities are valued using unadjusted market prices, when available, as supplied primarily by third party pricing services or dealers. To assess the appropriateness of security valuations, the Manager or the Fund’s third party service provider who is subject to oversight by the Manager, regularly compares prior day prices, prices on comparable securities and the sale prices to the prior and current day prices and challenges prices exceeding certain tolerance levels with third party pricing services or broker sources. For those securities valued by recommendation, whether through a standardized fair valuation methodology or a fair valuation determination, the Valuation Committee reviews and affirms the reasonableness of the valuation based on such methodologies and determinations on a regular basis after considering all relevant information that is reasonably available.
“Fair value” is defined as the price that the Fund would receive upon selling an investment in an orderly transaction to an independent buyer in the principal or most advantageous market of the investment. Fair value measurements are determined within a framework that has established a three-tier hierarchy which maximizes the use of observable market data and minimizes the use of unobservable inputs to establish classification of fair value measurements for disclosure purposes. “Inputs” refer broadly to the assumptions that market participants would use in pricing the asset or liability, including assumptions about risk, such as the risk inherent in a particular valuation technique used to measure fair value using a pricing model and/or the risk inherent in the inputs for the valuation technique. Inputs may be observable or unobservable. Observable inputs reflect the assumptions market participants would use in pricing the asset or liability based on market data obtained from sources independent of the Fund. Unobservable inputs reflect the Fund’s own assumptions about the assumptions market participants would use in pricing the asset or liability developed based on the information available in the circumstances. The inputs or methodology used for valuing securities may not be an indication of the risks associated with investing in those securities. The three-tier hierarchy of inputs is summarized in the three broad Levels listed below.
| • | | Level 1—quoted prices in active markets for identical investments |
| | | | |
| mainstayinvestments.com | | | 21 | |
Notes to Financial Statements (continued)
| • | | Level 2—other significant observable inputs (including quoted prices for similar investments in active markets, interest rates and yield curves, prepayment speeds, credit risks, etc.) |
| • | | Level 3—significant unobservable inputs (including the Fund’s own assumptions about the assumptions that market participants would use in determining the fair value of investments) |
The aggregate value by input level, as of October 31, 2012, for the Fund’s investments is included at the end of the Fund’s Portfolio of Investments.
The valuation techniques used by the Fund to measure fair value maximize the use of observable inputs and minimize the use of unobservable inputs. The Fund may utilize third party vendor evaluations, whose prices may be derived from one or more of the following standard inputs:
| | |
• Benchmark Yields | | • Reported Trades |
• Broker Dealer Quotes | | • Issuer Spreads |
• Two-sided markets | | • Benchmark securities |
• Bids/Offers | | • Reference Data (corporate actions or material event notices) |
• Industry and economic events | | • Comparable bonds |
• Equity and credit default swap curves | | • Monthly payment information |
Securities for which market value cannot be determined using the methodologies described above are valued by methods deemed in good faith by the Fund’s Valuation Committee, following the procedures established by the Board, to represent fair value. Under these procedures, the Fund primarily employs a market-based approach which may use related or comparable assets or liabilities, recent transactions, market multiples, book values, and other relevant information. The Fund may also use an income-based valuation approach in which the anticipated future cash flows of the investment are discounted to calculate fair value. Discounts may also be applied due to the nature or duration of any restrictions on the disposition of the investments. Due to the inherent uncertainty of valuations of such investments, the fair values may differ significantly from the values that would have been used had an active market existed. For the year ended October 31, 2012, there have been no changes to the fair value methodologies.
Equity and non-equity securities which may be valued in this manner include, but are not limited to: (i) a security for which the trading has been halted or suspended; (ii) a debt security that has recently gone into default and for which there is not a current market quotation; (iii) a security of an issuer that has entered into a restructuring; (iv) a security that has been de-listed from a national exchange; (v) a security for which the market price is not available from a third party pricing source or, if so provided, does not, in the opinion of the Fund’s Manager or Subadvisor reflect the security’s market value; and (vi) a security whose principal market has been temporarily closed at a time when, under normal conditions, it would be open. Securities for which market quotations or observable inputs are not readily available are generally categorized as Level 3 in the hierarchy. As of October 31, 2012, the Fund held securities with a value of $2,999,902 that were fair valued.
Certain events may occur between the time that foreign markets close, on which securities held by the Fund principally trade, and the time at
which the Fund’s NAV is calculated. These events may include, but are not limited to, situations relating to a single issuer in a market sector, significant fluctuations in U.S. or foreign markets, natural disasters, armed conflicts, governmental actions or other developments not tied directly to the securities markets. Should the Manager or Subadvisor conclude that such events may have affected the accuracy of the last price of such securities reported on the local foreign market, the Manager or Subadvisor may, pursuant to procedures adopted by the Fund’s Board, adjust the value of the local price to reflect the impact on the price of such securities as a result of such events. In this instance, securities are generally categorized as Level 3 in the hierarchy. Additionally, foreign equity securities are also fair valued whenever the movement of a particular index exceeds certain thresholds. In such cases, the securities are fair valued by applying factors provided by a third party vendor in accordance with the Fund’s policies and procedures and are generally categorized as Level 2 in the hierarchy. As of October 31, 2012, foreign equity securities held by the Fund were not fair valued in such a manner.
Futures contracts are valued at the last posted settlement price on the market where such futures are primarily traded. Options contracts are valued at the last posted settlement price on the market where such options are principally traded. Investments in other mutual funds are valued at their respective NAV as of the close of the Exchange on the valuation date. These securities are generally categorized as Level 1 in the hierarchy.
Debt securities (other than convertible bonds and municipal debt securities) are valued at the evaluated bid prices (evaluated mean prices in the case of convertible bonds and municipal debt securities) supplied by a pricing agent or broker selected by the Fund’s Manager in consultation with the Fund’s Subadvisor, if any, whose prices reflect broker/dealer supplied valuations and electronic data processing techniques, if such prices are deemed by the Fund’s Manager, in consultation with the Fund’s Subadvisor, if any, to be representative of market values, at the regular close of trading of the Exchange on each valuation date. Debt securities, including corporate bonds, U.S. government and federal agency bonds, municipal bonds, foreign bonds, Yankee bonds, convertible bonds, asset-backed securities and mortgage-backed securities are generally categorized as Level 2 in the hierarchy.
Temporary cash investments acquired over 60 days to maturity are valued using the latest bid prices or using valuations based on a matrix system (which considers such factors as security prices, yields, maturities, and ratings), both as furnished by independent pricing services. Other temporary cash investments which mature in 60 days or less (“Short-Term Investments”) are valued at amortized cost. The amortized cost method involves valuing a security at its cost on the date of purchase and thereafter assuming a constant amortization to maturity of the difference between such cost and the value on maturity date. Amortized cost approximates the current fair value of a security. Securities valued at amortized cost are not valued using a quoted price in an active market. These securities are generally categorized as Level 2 in the hierarchy.
Foreign currency forward contracts are valued at their fair market values determined on the basis of the mean between the last current bid and ask prices based on dealer or exchange quotations and are generally categorized as Level 2 in the hierarchy.
| | |
| 22 | | MainStay Global High Income Fund |
Credit default swaps are valued at prices supplied by a pricing agent or brokers selected by the Fund’s Manager in consultation with the Fund’s Subadvisor whose prices reflect broker/dealer supplied valuations and electronic data processing techniques. Swaps are marked-to-market daily and the change in value, if any, is recorded as unrealized appreciation or depreciation. These securities are generally categorized as Level 2 in the hierarchy.
Generally, a security is considered illiquid if it cannot be sold or disposed of in the ordinary course of business at approximately the price at which it is valued. Its illiquidity might prevent the sale of such security at a time when the Manager or Subadvisor might wish to sell, and these securities could have the effect of decreasing the overall level of a Fund’s liquidity. Further, the lack of an established secondary market may make it more difficult to value illiquid securities, requiring the Fund to rely on judgments that may be somewhat subjective in determining value, which could vary from the amount that the Fund could realize upon disposition. Difficulty in selling illiquid securities may result in a loss or may be costly to the Fund. Under the supervision of the Board, the Manager or Subadvisor determines the liquidity of the Fund’s investments; in doing so, the Manager or Subadvisor may consider various factors, including (i) the frequency of trades and quotations, (ii) the number of dealers and prospective purchasers, (iii) dealer undertakings to make a market, and (iv) the nature of the security and the market in which it trades (e.g., the time needed to dispose of the security, the method of soliciting offers and the mechanics of transfer). Illiquid securities generally will be valued in good faith in such a manner as the Board deems appropriate to reflect their fair value.
(B) Income Taxes. The Fund’s policy is to comply with the requirements of the Internal Revenue Code of 1986, as amended (the “Internal Revenue Code”), applicable to regulated investment companies and to distribute all of the taxable income to the shareholders of the Fund within the allowable time limits. Therefore, no federal, state and local income tax provision is required.
Management evaluates its tax positions to determine if the tax positions taken meet the minimum recognition threshold in connection with accounting for uncertainties in income tax positions taken or expected to be taken for the purposes of measuring and recognizing tax liabilities in the financial statements. Recognition of tax benefits of an uncertain tax position is required only when the position is “more likely than not” to be sustained assuming examination by taxing authorities. Management has analyzed the Fund’s tax positions taken on federal, state and local income tax returns for all open tax years (for up to three tax years), and has concluded that no provision for federal, state and local income tax are required in the Fund’s financial statements. The Fund’s federal, state and local income and federal excise tax returns for tax years for which the applicable statutes of limitations have not expired are subject to examination by the Internal Revenue Service and state and local departments of revenue.
(C) Foreign Taxes. Investment income received by the Fund from foreign sources may be subject to foreign income taxes. These foreign income taxes are generally withheld at the source, and a portion of which may be recoverable. The Fund will accrue such taxes and recoveries as applicable, based upon its current interpretation of tax rules and regulations that exist in the markets in which it invests.
(D) Dividends and Distributions to Shareholders. Dividends and distributions are recorded on the ex-dividend date. The Fund intends to declare and pay dividends of net investment income, if any, at least monthly and distributions of net realized capital and currency gains, if any, at least annually. Unless the shareholder elects otherwise, all dividends and distributions are reinvested in the same class of shares of the Fund, at NAV. Dividends and distributions to shareholders are determined in accordance with federal income tax regulations and may differ from GAAP.
(E) Security Transactions and Investment Income. The Fund records security transactions on the trade date. Realized gains and losses on security transactions are determined using the identified cost method. Interest income is accrued as earned using the effective interest rate method. Discounts and premiums on securities purchased, other than Short-Term Investments, for the Fund are accreted and amortized, respectively, on the effective interest rate method over the life of the respective securities or, in the case of a callable security, over the period to the first date of call. Discounts and premiums on Short-Term Investments are accreted and amortized, respectively, on the straight-line method.
Investment income and realized and unrealized gains and losses on investments of the Fund are allocated to separate classes of shares pro rata based upon their relative net assets on the date the income is earned or realized and unrealized gains and losses are incurred.
(F) Expenses. Expenses of the Trust are allocated to the individual Funds in proportion to the net assets of the respective Funds when the expenses are incurred, except where direct allocations of expenses can be made. Expenses (other than transfer agent expenses and fees incurred under the shareholder services plans and the distribution plans further discussed in Note 3(B)) are allocated to separate classes of shares pro rata based upon their relative net assets on the date the expenses are incurred. The expenses borne by the Fund, including those of related parties to the Fund, are shown in the Statement of Operations.
(G) Use of Estimates. In preparing financial statements in conformity with GAAP, management makes estimates and assumptions that affect the reported amounts and disclosures in the financial statements. Actual results could differ from those estimates.
(H) Repurchase Agreements. The Fund may enter into repurchase agreements to earn income. The Fund may enter into repurchase agreements only with financial institutions that are deemed by the Manager or Subadvisor to be creditworthy, pursuant to guidelines established by the Fund’s Board. During the term of any repurchase agreement, the Manager will continue to monitor the creditworthiness of the seller. Under the 1940 Act, repurchase agreements are considered to be collateralized loans by a Fund to the seller secured by the securities transferred to the Fund.
When the Fund invests in repurchase agreements, the Fund’s custodian takes possession of the collateral pledged for investments in the repurchase agreement. The underlying collateral is valued daily on a mark-to-market basis to determine that the value, including accrued interest, exceeds the repurchase price. In the event of the seller’s default on the obligation to repurchase, the Fund has the right to liquidate the collateral and apply the proceeds in satisfaction of the obligation. Under certain circumstances, such as in the event of default or
| | | | |
| mainstayinvestments.com | | | 23 | |
Notes to Financial Statements (continued)
bankruptcy by the counterparty to the agreement, realization and/or retention of the collateral may be subject to legal proceedings and possible realized loss to the Fund.
(I) Futures Contracts. A futures contract is an agreement to purchase or sell a specified quantity of an underlying instrument at a specified future date and price, or to make or receive a cash payment based on the value of a financial instrument (e.g., foreign currency, interest rate, security, or securities index). The Fund is subject to equity price risk and/or interest rate risk in the normal course of investing in these transactions. During the period the futures contract is open, changes in the value of the contract are recognized as unrealized appreciation or depreciation by “marking-to-market” such contract on a daily basis to reflect the market value of the contract at the end of each day’s trading. The Fund agrees to receive from or pay to the broker an amount of cash equal to the daily fluctuation in the value of the contract. Such receipts or payments are known as “variation margin.” When the futures contract is closed, the Fund records a realized gain or loss equal to the difference between the proceeds from (or cost of) the closing transaction and the Fund’s basis in the contract.
The use of futures contracts involves, to varying degrees, elements of market risk in excess of the amount recognized in the Statement of Assets and Liabilities. The contract or notional amounts and variation margin reflect the extent of the Fund’s involvement in open futures positions. Risks arise from the possible imperfect correlation in movements in the price of futures contracts, interest rates and the underlying hedged assets, and the possible inability of counterparties to meet the terms of their contracts. However, the Fund’s activities in futures contracts have minimal counterparty risk as they are conducted through regulated exchanges that guarantee the futures against default by the counterparty. In the event of a bankruptcy or insolvency of a futures commission merchant that holds margin on behalf of the Fund, the Fund may not be entitled to the return of all of the margin owed to the Fund, potentially resulting in a loss. The Fund may invest in futures contracts to help manage the duration and yield curve of the portfolio while minimizing the exposure to wider bid/ask spreads in traditional bonds. The Fund’s investment in futures contracts and other derivatives may increase the volatility of the Fund’s NAV and may result in a loss to the Fund. As of October 31, 2012, the Fund did not hold any futures contracts.
(J) Foreign Currency Forward Contracts. The Fund may enter into foreign currency forward contracts, which are agreements to buy or sell currencies of different countries on a specified future date at a specified rate. The Fund is subject to foreign currency exchange rate risk in the normal course of investing in these transactions. During the period the forward contract is open, changes in the value of the contract are recognized as unrealized appreciation or depreciation by “marking-to-market” such contract on a daily basis to reflect the market value of the contract at the end of each day’s trading. Cash movement occurs on settlement date. When the forward contract is closed, the Fund records a realized gain or loss equal to the difference between the proceeds from (or cost of) the closing transaction and the Fund’s basis in the contract. The Fund may enter into foreign currency forward contracts to reduce currency risk versus the benchmark or for trade settlement.
The use of foreign currency forward contracts involves, to varying degrees, elements of market risk in excess of the amount recognized in the Statement of Assets and Liabilities. The contract amount reflects the
extent of the Fund’s involvement in these financial instruments. Risks arise from the possible movements in the foreign exchange rates underlying these instruments. While the Fund may enter into forward contracts to reduce currency exchange risks, changes in currency exchange rates may result in poorer overall performance for the Fund than if it had not engaged in such transactions. Exchange rate movements can be large, depending on the currency, and can last for extended periods of time, affecting the value of the Fund’s assets. Moreover, there may be an imperfect correlation between the Fund’s holdings of securities denominated in a particular currency and the forward contracts entered into by the Fund. Such imperfect correlation may prevent the Fund from achieving the intended hedge or expose the Fund to the risk of currency exchange loss. The unrealized appreciation (depreciation) on forward contracts reflects the Fund’s exposure at valuation date to credit loss in the event of a counterparty’s failure to perform its obligations.
(K) Foreign Currency Transactions. The books and records of the Fund are kept in U.S. dollars. Prices of securities denominated in foreign currency amounts are translated into U.S. dollars at the mean between the buying and selling rates last quoted by any major U.S. bank at the following dates:
| (i) | market value of investment securities, other assets and liabilities—at the valuation date, and |
| (ii) | purchases and sales of investment securities, income and expenses—at the date of such transactions. |
The assets and liabilities that are denominated in foreign currency amounts are presented at the exchange rates and market values at the close of the period. The realized and unrealized changes in net assets arising from fluctuations in exchange rates and market prices of securities are not separately presented.
Net realized gain (loss) on foreign currency transactions represents net gains and losses on foreign currency forward contracts, net currency gains or losses realized as a result of differences between the amounts of securities sale proceeds or purchase cost, dividends, interest and withholding taxes as recorded on the Fund’s books, and the U.S. dollar equivalent amount actually received or paid. Net currency gains or losses from valuing such foreign currency denominated assets and liabilities, other than investments at valuation date exchange rates, are reflected in unrealized foreign exchange gains or losses.
(L) Swap Contracts. The Fund may enter into credit default, interest rate, index and currency exchange rate contracts (“swaps”) for the purpose of attempting to obtain a desired return at a lower cost to the Fund, rather than directly investing in an instrument yielding that desired return or to hedge against credit risk. In a typical swap transaction, two parties agree to exchange the returns (or differentials in rates of returns) earned or realized on a particular investment or instruments. The gross returns to be exchanged or “swapped” between the parties are calculated with respect to a notional amount. The payments may be adjusted for transaction costs, interest payments, the amount of interest paid on the investment or instrument or other factors. Collateral, in the form of cash or securities, may be required to be held in segregated accounts with the custodian bank or broker in accordance with the swap.
Credit default swaps, in particular, are contracts whereby one party makes periodic payments to a counterparty in exchange for the right to
| | |
| 24 | | MainStay Global High Income Fund |
receive a specified return in the event of a default by a third party on its obligation. Such periodic payments are accrued daily and recorded as a realized gain or loss. Credit default swaps may be used to provide a measure of protection against defaults of sovereign or corporate issuers.
Swaps are “marked-to-market” daily based upon quotations from pricing agents, brokers, or market makers and the change in value, if any, is recorded as unrealized appreciation or depreciation. Any payments made or received upon entering a swap would be amortized or accreted over the life of the swap and recorded as a realized gain or loss. Early termination of a swap is recorded as a realized gain or loss.
The Fund bears the risk of loss of the amount expected to be received under a swap in the event of the default or bankruptcy of the swap counterparty. The Fund may be able to eliminate its exposure under a swap either by assignment or other disposition, or by entering into an offsetting swap with the same party or a similar creditworthy party. Swaps are not actively traded on financial markets. Entering into swaps involves elements of credit, market, and documentation risk in excess of the amounts recognized on the Statement of Assets and Liabilities. Such risks involve the possibilities that there will be no liquid market for these swaps, that the counterparty to the swaps may default on its obligation to perform or disagree as to the meaning of the contractual terms in the swaps and that there may be unfavorable changes in interest rates, the price of the index or the security underlying these transactions. As of October 31, 2012, the Fund did not hold any swap contracts.
(M) Securities Lending. In order to realize additional income, the Fund may engage in securities lending, subject to the limitations set forth in the 1940 Act, and relevant guidance by the staff of the Securities and Exchange Commission. In the event the Fund does engage in securities lending, the Fund will lend through its custodian, State Street Bank and Trust Company (“State Street”). State Street will manage the Fund’s cash collateral in accordance with the Lending Agreement between the Fund and State Street, and indemnify the Fund’s portfolio against counterparty risk. The loans will be collateralized by cash or securities at least equal at all times to the market value of the securities loaned. Collateral will consist of U.S. government securities, cash equivalents or irrevocable letters of credit. The Fund may bear the risk of delay in recovery of, or loss of rights in, the securities loaned should the borrower of the securities experience financial difficulty. The Fund may also record realized gain or loss on securities deemed sold due to a borrower’s inability to return securities on loan. The Fund will receive compensation for lending its securities in the form of fees or the retention of a portion of the interest on the investment of any cash received as collateral. The Fund also will continue to receive interest and dividends on the securities loaned and any gain or loss in the market price of the securities loaned that may occur during the term of the loan will be for the account of the Fund.
Although the Fund and New York Life Investments have temporarily suspended securities lending, the Fund and New York Life Investments reserve the right to reinstitute lending when deemed appropriate. The Fund had no portfolio securities on loan as of October 31, 2012.
(N) Concentration of Risk. The Fund’s principal investments include high yield securities (sometimes called “junk bonds”), which are generally considered speculative because they present a greater risk of loss, including default, than higher quality debt securities. These securities pay
investors a premium—a high interest rate or yield—because of the increased risk of loss. These securities can also be subject to greater price volatility.
The Fund invests in foreign securities, which carry certain risks that are in addition to the usual risks inherent in domestic instruments. These risks include those resulting from currency fluctuations, future adverse political and economic developments and possible imposition of currency exchange blockages or other foreign governmental laws or restrictions. These risks are likely to be greater in emerging markets than in developed markets. The ability of issuers of debt securities held by the Fund to meet their obligations may be affected by economic or political developments in a specific country, industry or region.
(O) Indemnifications. Under the Trust’s organizational documents, its officers and trustees are indemnified against certain liabilities that may arise out of performance of their duties to the Trust. Additionally, in the normal course of business, the Fund enters into contracts with third-party service providers that contain a variety of representations and warranties and which may provide general indemnifications. The Fund’s maximum exposure under these arrangements is unknown, as this would involve future claims that may be made against the Fund that have not yet occurred. Based on experience, management is of the view that the risk of loss in connection with these potential indemnification obligations is remote. However, there can be no assurance that material liabilities related to such obligations will not arise in the future, which could adversely impact the Fund.
(P) Quantitative Disclosure of Derivative Holdings. The following tables show additional disclosures about the Fund’s derivative and hedging activities, including how such activities are accounted for and their effect on the Fund’s financial positions, performance and cash flows. These derivatives are not accounted for as hedging instruments.
Fair value of derivatives instruments as of October 31, 2012:
Asset Derivatives
| | | | | | | | | | | | | | |
| | | Statement of Assets and Liabilities Location | | Credit
Contracts
Risk | | | Foreign
Exchange
Contracts
Risk | | | Total | |
Forward Contracts | | Unrealized appreciation on foreign currency forward contracts | | $ | — | | | $ | 397,865 | | | $ | 397,865 | |
| | | | | | |
Total Fair Value | | | | $ | — | | | $ | 397,865 | | | $ | 397,865 | |
| | | | | | |
Liability Derivatives
| | | | | | | | | | | | | | |
| | | Statement of Assets and Liabilities Location | | Credit
Contracts
Risk | | | Foreign
Exchange
Contracts
Risk | | | Total | |
Forward Contracts | | Unrealized depreciation on foreign currency forward contracts | | $ | — | | | $ | (368,312 | ) | | $ | (368,312 | ) |
| | | | | | |
Total Fair Value | | | | $ | — | | | $ | (368,312 | ) | | $ | (368,312 | ) |
| | | | | | |
| | | | |
| mainstayinvestments.com | | | 25 | |
Notes to Financial Statements (continued)
The effect of derivative instruments on the Statement of Operations for the year ended October 31, 2012:
Realized Gain (Loss)
| | | | | | | | | | | | | | |
| | | Statement of Operations Location | | Credit
Contracts
Risk | | | Foreign
Exchange
Contracts
Risk | | | Total | |
Swap Contracts | | Net realized gain (loss) on swap transactions | | $ | 55,206 | | | $ | — | | | $ | 55,206 | |
Forward Contracts | | Net realized gain (loss) on foreign currency transactions | | | — | | | | 668,258 | | | | 668,258 | |
| | | | | | |
Total Realized Gain (Loss) | | | | $ | 55,206 | | | $ | 668,258 | | | $ | 723,464 | |
| | | | | | |
Change in Unrealized Appreciation (Depreciation)
| | | | | | | | | | | | | | |
| | | Statement of Operations Location | | Credit
Contracts
Risk | | | Foreign
Exchange
Contracts
Risk | | | Total | |
Swap Contracts | | Net change in unrealized appreciation (depreciation) on swap contracts | | $ | 53,602 | | | $ | — | | | $ | 53,602 | |
Forward Contracts | | Net change in unrealized appreciation (depreciation) on translation of other assets and liabilities in foreign currencies and foreign currency forward contracts | | | — | | | | (71,331 | ) | | | (71,331 | ) |
| | | | | | |
Total Change in Unrealized Appreciation (Depreciation) | | | | $ | 53,602 | | | $ | (71,331 | ) | | $ | (17,729 | ) |
| | | | | | |
Number of Contracts, Notional Amounts or Shares/Units
| | | | | | | | | | | | |
| | | Credit
Contracts
Risk | | | Foreign
Exchange
Contracts
Risk | | | Total | |
Swap Contracts | | $ | 6,450,000 | | | $ | — | | | $ | 6,450,000 | |
Forward Contracts Long (1) | | | — | | | | 18,366,870 | | | | 18,366,870 | |
Forward Contracts Short (1) | | | — | | | | (19,418,040 | ) | | | (19,418,040 | ) |
| | | | |
| (1) | Amount disclosed represents the weighted average held during the year ended October 31, 2012. |
Note 3–Fees and Related Party Transactions
(A) Manager and Subadvisor. New York Life Investments, a registered investment adviser and an indirect, wholly-owned subsidiary of New York Life Insurance Company (“New York Life”), serves as the Fund’s Manager, pursuant to an Amended and Restated Management Agreement (“Management Agreement”). The Manager provides offices, conducts clerical, recordkeeping and bookkeeping services, and keeps most of the financial and accounting records required to be maintained by the Fund. Except for the portion of salaries and expenses that are the responsibility of the Fund, the Manager pays the salaries and expenses of all personnel affiliated with the Fund and certain operational expenses of the Fund. The Fund reimburses New York Life Investments in an amount equal to a portion of the salary of the Chief Compliance Officer (“CCO”) of the Fund. MacKay Shields LLC (“MacKay Shields” or the “Subadvisor”), a registered investment adviser and an indirect, wholly-owned subsidiary of New York Life, serves as Subadvisor to the Fund and is responsible for the day-to-day portfolio management of the Fund. Pursuant to the terms of an Amended and Restated Subadvisory Agreement (“Subadvisory Agreement”) between New York Life Investments and MacKay Shields, New York Life Investments pays for the services of the Subadvisor.
The Fund pays the Manager a monthly fee for services performed and facilities furnished at an annual rate of the Fund’s average daily net assets as follows: 0.70% to $500 million and 0.65% in excess of $500 million, plus a fee for fund accounting services previously provided by New York Life Investments under a separate fund accounting agreement furnished at an annual rate of the Fund’s average net assets as follows: 0.05% up to $20 million; 0.0333% from $20 million to $100 million; and 0.01% in excess of $100 million. The effective management fee rate was 0.72% for the year ended October 31, 2012, inclusive of a fee for fund accounting services of 0.02% of the Fund’s average daily net assets.
For the year ended October 31, 2012, New York Life Investments earned fees from the Fund in the amount of $2,368,398.
State Street, 1 Lincoln Street, Boston, Massachusetts 02111, provides sub-administration and sub-accounting services to the Fund pursuant to an agreement with New York Life Investments. These services include calculating the daily NAVs of the Fund, maintaining the general ledger and sub-ledger accounts for the calculation of the Fund’s respective NAVs, and assisting New York Life Investments in conducting various aspects of the Fund’s administrative operations. For providing these services to the Fund, State Street is compensated by New York Life Investments.
(B) Distribution and Service Fees. The Trust, on behalf of the Fund, has entered into a distribution agreement with NYLIFE Distributors LLC (the “Distributor”), an indirect, wholly-owned subsidiary of New York Life. The Fund has adopted distribution plans (the “Plans”) in accordance with the provisions of Rule 12b-1 under the 1940 Act.
Pursuant to the Investor Class and Class A Plans, the Distributor receives a monthly distribution fee from the Investor Class and Class A shares at an annual rate of 0.25% of the average daily net assets of the Investor Class and Class A shares for distribution and/or service
| | |
| 26 | | MainStay Global High Income Fund |
activities as designated by the Distributor. Pursuant to the Class B and Class C Plans, Class B and Class C shares pay the Distributor a monthly distribution fee at an annual rate of 0.75% of the average daily net assets of the Class B and Class C shares along with a service fee at an annual rate of 0.25% of the average daily net assets of the Class B and Class C shares, for a total 12b-1 fee of 1.00%. Class I shares are not subject to a distribution and/or service fee.
The Plans provide that the distribution and service fees are payable to the Distributor regardless of the amounts actually expended by the Distributor for distribution of the Fund’s shares and service activities.
(C) Sales Charges. The Fund was advised by the Distributor that the amount of sales charges retained on sales of Investor Class and Class A shares were $15,266 and $64,194, respectively, for the year ended October 31, 2012. The Fund was also advised that the Distributor retained CDSCs on redemptions of Investor Class, Class A, Class B and Class C shares of $4, $997, $29,166 and $14,167, respectively, for the year ended October 31, 2012.
(D) Transfer, Dividend Disbursing and Shareholder Servicing Agent. NYLIM Service Company LLC, an affiliate of New York Life Investments, is the Fund’s transfer, dividend disbursing and shareholder servicing agent pursuant to an agreement between NYLIM Service Company LLC and the Trust. NYLIM Service Company LLC has entered into an agreement with Boston Financial Data Services, Inc. (“BFDS”) pursuant to which BFDS performs certain transfer agent services on behalf of NYLIM Service Company LLC. Transfer agent expenses incurred by the Fund for the year ended October 31, 2012, were as follows:
| | | | |
Investor Class | | $ | 60,471 | |
Class A | | | 187,127 | |
Class B | | | 49,910 | |
Class C | | | 205,263 | |
Class I | | | 50,456 | |
(E) Small Account Fee. Shareholders with small accounts adversely impact the cost of providing transfer agency services. In an effort to reduce total transfer agency expenses, the Fund has implemented a small account fee on certain types of accounts. Certain shareholders with an account balance of less than $1,000 are charged an annual per account fee of $20 (assessed semi-annually), the proceeds from which offset transfer agent fees as reflected in the Statement of Operations.
(F) Capital. As of October 31, 2012, New York Life and its affiliates beneficially held shares of the Fund with the following values and percentages of net assets as follows:
Note 4–Federal Income Tax
As of October 31, 2012, the components of accumulated gain (loss) on a tax basis were as follows:
| | | | | | | | | | | | | | | | |
Ordinary
Income | | Accumulated
Capital and
Other Gain
(Loss) | | | Other
Temporary
Differences | | | Unrealized
Appreciation
(Depreciation) | | | Total
Accumulated Gain (Loss) | |
$5,452,368 | | $ | (31,681 | ) | | $ | (509,507 | ) | | $ | 39,314,072 | | | $ | 44,225,252 | |
The difference between book basis and tax basis unrealized appreciation (depreciation) is primarily due to mark to market of foreign forward contracts.
The other temporary differences are primarily due to dividends payable.
The following table discloses the current year reclassifications between undistributed net investment income (loss), accumulated net realized gain (loss) on investments, and additional paid-in capital arising from permanent differences; net assets as of October 31, 2012 were not affected.
| | | | | | | | |
Undistributed
Net Investment
Income (Loss) | | Accumulated
Net Realized
Gain (Loss)
on Investments | | | Additional
Paid-In
Capital | |
$5,568,525 | | $ | (5,568,525 | ) | | $ | — | |
The reclassifications for the Fund are primarily due to foreign currency gain (loss), defaulted bond income accruals, distribution redesignations and SWAPs.
Under the Regulated Investment Company Modernization Act of 2010, the Fund is permitted to carry forward capital losses incurred in taxable years beginning after December 22, 2010, for an unlimited period. However, any losses incurred during those future years will be required to be utilized prior to the losses incurred in pre-enactment tax years. As a result of this ordering rule, pre-enactment capital loss carryforwards may be more likely to expire unused. Additionally, post-enactment capital losses that are carried forward will retain their character as either short-term or long-term capital losses rather than being considered all short-term as under previous law.
As of October 31, 2012, for federal income tax purposes, capital loss carryforwards of $31,681 were available as shown in the table below, to the extent provided by the regulations to offset future realized gains of the Fund through the years indicated. To the extent that these capital loss carryforwards are used to offset future capital gains, it is probable that the capital gains so offset will not be distributed to shareholders. No capital gain distributions shall be made until any capital loss carryforwards have been fully utilized or expired.
| | | | |
Capital Loss Available Through | | Short-Term
Capital Loss
Amounts (000’s) | | Long-Term
Capital Loss
Amounts (000’s) |
Unlimited | | $ — | | $32 |
Total | | $ — | | $32 |
The tax character of distributions paid during the years ended October 31, 2012 and October 31, 2011 shown in the Statements of Changes in Net Assets was as follows:
| | | | | | | | |
| | | 2012 | | | 2011 | |
Distributions paid from: | | | | | | | | |
Ordinary Income | | $ | 18,673,611 | | | $ | 17,885,269 | |
Long-Term Capital Gain | | | 6,561,606 | | | | 3,036,608 | |
Total | | $ | 25,235,217 | | | $ | 20,921,877 | |
| | | | |
| mainstayinvestments.com | | | 27 | |
Notes to Financial Statements (continued)
Note 5–Foreign Currency Transactions
As of October 31, 2012, the Fund held the following foreign currencies:
| | | | | | | | | | | | | | | | | | | | | | | | |
| | | Currency | | | Cost | | | Value | |
Australian Dollar | | | AUD | | | | 46 | | | | USD | | | | 48 | | | | USD | | | | 48 | |
Euro | | | EUR | | | | 207,900 | | | | | | | | 276,999 | | | | | | | | 269,470 | |
Polish Zloty | | | PLN | | | | 1,167,250 | | | | | | | | 363,975 | | | | | | | | 365,605 | |
Turkish Lira | | | YTL | | | | 2,311 | | | | | | | | 1,282 | | | | | | | | 1,289 | |
Total | | | | | | | | | | | USD | | | | 642,304 | | | | USD | | | | 636,412 | |
Note 6–Custodian
State Street is the custodian of the cash and the securities of the Fund. Custodial fees are charged to the Fund based on the market value of securities in the Fund and the number of certain cash transactions incurred by the Fund.
Note 7–Line of Credit
The Fund and certain affiliated funds maintain a line of credit with a syndicate of banks in order to secure a source of funds for temporary purposes to meet unanticipated or excessive redemption requests.
Effective August 29, 2012, under an amended credit agreement, the aggregate commitment amount is $200,000,000 with an optional maximum amount of $250,000,000. The commitment fee is an annual rate of 0.08% of the average commitment amount payable quarterly, regardless of usage, to Bank of New York Mellon, which serves as the agent to the syndicate. The commitment fee is allocated among certain MainStay Funds based upon net assets and other factors. Interest on any revolving credit loan is charged based upon the Federal Funds Advances rate or the one month London InterBank Offered Rate, whichever is higher. The amended credit agreement expires on August 28, 2013, although the MainStay Funds and the syndicate of banks may renew the amended credit agreement for an additional year on the same or different terms. Prior to August 29, 2012, the aggregate commitment amount was $125,000,000 with an optional maximum amount of $175,000,000. There were no borrowings made or outstanding with respect to the Fund on the amended credit agreement during the year ended October 31, 2012.
Note 8–Purchases and Sales of Securities (in 000’s)
During the year ended October 31, 2012, purchases and sales of securities, other than short-term securities, were $129,296 and $97,993, respectively.
Note 9–Capital Share Transactions
| | | | | | | | |
Investor Class | | Shares | | | Amount | |
Year ended October 31, 2012: | | | | | | | | |
Shares sold | | | 372,134 | | | $ | 4,460,524 | |
Shares issued to shareholders in reinvestment of dividends and distributions | | | 159,077 | | | | 1,875,394 | |
Shares redeemed | | | (317,774 | ) | | | (3,793,141 | ) |
| | | | |
Net increase (decrease) in shares outstanding before conversion | | | 213,437 | | | | 2,542,777 | |
Shares converted into Investor Class
(See Note 1) | | | 172,480 | | | | 2,062,845 | |
Shares converted from Investor Class
(See Note 1) | | | (216,830 | ) | | | (2,612,364 | ) |
| | | | | | | | |
Net increase (decrease) | | | 169,087 | | | $ | 1,993,258 | |
| | | | |
Year ended October 31, 2011: | |
Shares sold | | | 320,111 | | | $ | 3,842,246 | |
Shares issued to shareholders in reinvestment of dividends and distributions | | | 120,590 | | | | 1,432,277 | |
Shares redeemed | | | (323,886 | ) | | | (3,879,385 | ) |
| | | | |
Net increase (decrease) in shares outstanding before conversion | | | 116,815 | | | | 1,395,138 | |
Shares converted into Investor Class (See Note 1) | | | 231,170 | | | | 2,750,835 | |
Shares converted from Investor Class (See Note 1) | | | (126,642 | ) | | | (1,511,546 | ) |
| | | | |
Net increase (decrease) | | | 221,343 | | | $ | 2,634,427 | |
| | | | |
| | |
| | | | | | | | |
Class A | | Shares | | | Amount | |
Year ended October 31, 2012: | |
Shares sold | | | 5,119,258 | | | $ | 61,476,229 | |
Shares issued to shareholders in reinvestment of dividends and distributions | | | 742,513 | | | | 8,700,600 | |
Shares redeemed | | | (4,180,155 | ) | | | (49,963,776 | ) |
| | | | |
Net increase (decrease) in shares outstanding before conversion | | | 1,681,616 | | | | 20,213,053 | |
Shares converted into Class A (See Note 1) | | | 369,189 | | | | 4,390,805 | |
Shares converted from Class A (See Note 1) | | | (27,285 | ) | | | (339,062 | ) |
| | | | |
Net increase (decrease) | | | 2,023,520 | | | $ | 24,264,796 | |
| | | | |
Year ended October 31, 2011: | | | | | | | | |
Shares sold | | | 4,367,359 | | | $ | 52,252,654 | |
Shares issued to shareholders in reinvestment of dividends and distributions | | | 566,677 | | | | 6,688,120 | |
Shares redeemed | | | (5,850,444 | ) | | | (69,677,320 | ) |
| | | | |
Net increase (decrease) in shares outstanding before conversion | | | (916,408 | ) | | | (10,736,546 | ) |
Shares converted into Class A (See Note 1) | | | 322,665 | | | | 3,833,422 | |
Shares converted from Class A (See Note 1) | | | (78,823 | ) | | | (909,011 | ) |
| | | | | | | | |
Net increase (decrease) | | | (672,566 | ) | | $ | (7,812,135 | ) |
| | | | |
| | |
| | | | | | | | |
| | |
| 28 | | MainStay Global High Income Fund |
| | | | | | | | |
Class B | | Shares | | | Amount | |
Year ended October 31, 2012: | |
Shares sold | | | 260,630 | | | $ | 3,060,681 | |
Shares issued to shareholders in reinvestment of dividends and distributions | | | 109,051 | | | | 1,255,122 | |
Shares redeemed | | | (333,617 | ) | | | (3,919,815 | ) |
| | | | |
Net increase (decrease) in shares outstanding before conversion | | | 36,064 | | | | 395,988 | |
Shares converted from Class B (See Note 1) | | | (301,184 | ) | | | (3,502,224 | ) |
| | | | |
Net increase (decrease) | | | (265,120 | ) | | $ | (3,106,236 | ) |
| | | | |
Year ended October 31, 2011: | | | | | | | | |
Shares sold | | | 298,891 | | | $ | 3,526,416 | |
Shares issued to shareholders in reinvestment of dividends and distributions | | | 104,140 | | | | 1,213,553 | |
Shares redeemed | | | (394,873 | ) | | | (4,631,002 | ) |
| | | | |
Net increase (decrease) in shares outstanding before conversion | | | 8,158 | | | | 108,967 | |
Shares converted from Class B (See Note 1) | | | (353,297 | ) | | | (4,163,700 | ) |
| | | | |
Net increase (decrease) | | | (345,139 | ) | | $ | (4,054,733 | ) |
| | | | |
| | |
| | | | | | | | |
Class C | | Shares | | | Amount | |
Year ended October 31, 2012: | |
Shares sold | | | 1,550,892 | | | $ | 18,281,318 | |
Shares issued to shareholders in reinvestment of dividends and distributions | | | 333,307 | | | | 3,849,049 | |
Shares redeemed | | | (1,453,119 | ) | | | (17,017,512 | ) |
| | | | |
Net increase (decrease) | | | 431,080 | | | $ | 5,112,855 | |
| | | | |
Year ended October 31, 2011: | | | | | | | | |
Shares sold | | | 1,581,342 | | | $ | 18,636,471 | |
Shares issued to shareholders in reinvestment of dividends and distributions | | | 246,670 | | | | 2,877,700 | |
Shares redeemed | | | (2,086,275 | ) | | | (24,429,250 | ) |
| | | | |
Net increase (decrease) | | | (258,263 | ) | | $ | (2,915,079 | ) |
| | | | |
| | | | | | | | |
Class I | | Shares | | | Amount | |
Year ended October 31, 2012: | |
Shares sold | | | 2,465,677 | | | $ | 29,280,596 | |
Shares issued to shareholders in reinvestment of dividends and distributions | | | 116,597 | | | | 1,370,164 | |
Shares redeemed | | | (1,757,404 | ) | | | (20,918,119 | ) |
| | | | |
Net increase (decrease) | | | 824,870 | | | $ | 9,732,641 | |
| | | | |
Year ended October 31, 2011: | | | | | | | | |
Shares sold | | | 1,645,798 | | | $ | 19,682,784 | |
Shares issued to shareholders in reinvestment of dividends and distributions | | | 122,866 | | | | 1,448,361 | |
Shares redeemed | | | (2,924,110 | ) | | | (34,717,050 | ) |
| | | | |
Net increase (decrease) | | | (1,155,446 | ) | | $ | (13,585,905 | ) |
| | | | |
Note 10–Subsequent Events
In connection with the preparation of the financial statements of the Fund as of and for the year ended October 31, 2012, events and transactions subsequent to October 31, 2012 through the date the financial statements were issued have been evaluated by the Fund’s management for possible adjustment and/or disclosure. No subsequent events requiring financial statement adjustment or disclosure have been identified.
| | | | |
| mainstayinvestments.com | | | 29 | |
Report of Independent Registered Public Accounting Firm
The Board of Trustees and Shareholders of
The MainStay Funds:
We have audited the accompanying statement of assets and liabilities, including the portfolio of investments, of the MainStay Global High Income Fund (the “Fund”), one of the funds constituting The MainStay Funds, as of October 31, 2012, and the related statement of operations for the year then ended, the statements of changes in net assets for each of the years in the two-year period then ended, and the financial highlights for each of the years or periods in the five-year period then ended. These financial statements and financial highlights are the responsibility of the Fund’s management. Our responsibility is to express an opinion on these financial statements and financial highlights based on our audits.
We conducted our audits in accordance with the standards of the Public Company Accounting Oversight Board (United States). Those standards require that we plan and perform the audit to obtain reasonable assurance about whether the financial statements and financial highlights are free of material misstatement. An audit includes examining, on a test basis, evidence supporting the amounts and disclosures in the financial statements. Our procedures included confirmation of securities owned as of October 31, 2012, by correspondence with the custodian and brokers or by other appropriate auditing procedures where replies from brokers were not received. An audit also includes assessing the accounting principles used and significant estimates made by management, as well as evaluating the overall financial statement presentation. We believe that our audits provide a reasonable basis for our opinion.
In our opinion, the financial statements and financial highlights referred to above present fairly, in all material respects, the financial position of the MainStay Global High Income Fund of The MainStay Funds as of October 31, 2012, the results of its operations for the year then ended, the changes in its net assets for each of the years in the two-year period then ended, and the financial highlights for each of the years or periods in the five-year period then ended, in conformity with U.S. generally accepted accounting principles.

Philadelphia, Pennsylvania
December 21, 2012
| | |
| 30 | | MainStay Global High Income Fund |
Federal Income Tax Information
(Unaudited)
The Fund is required under the Internal Revenue Code to advise shareholders in a written statement as to the federal tax status of dividends paid by the Fund during such fiscal years. Accordingly, the Fund paid $6,561,606 as a long term capital gain distribution.
In February 2013, shareholders will receive an IRS Form 1099-DIV or substitute Form 1099 which will show the federal tax status of the distributions received by shareholders in calendar year 2012. The amounts that will be reported on such 1099-DIV or substitute Form 1099 will be the amounts you are to use on your federal income tax return and will differ from the amounts which we must report for the Fund’s fiscal year ended October 31, 2012.
Proxy Voting Policies and Procedures and Proxy Voting Record
A description of the policies and procedures that New York Life Investments uses to vote proxies related to the Fund’s securities is available without charge, upon request, (i) by visiting the Fund’s website at mainstayinvestments.com; or (ii) on the SEC’s website at www.sec.gov.
The Fund is required to file with the SEC its proxy voting record for the 12-month period ending June 30 on Form N-PX. The Fund’s most recent Form N-PX is available free of charge upon request (i) by calling 800-MAINSTAY (624-6782); (ii) by visiting the Fund’s website at mainstayinvestments.com; or (iii) on the SEC’s website at www.sec.gov.
Shareholder Reports and Quarterly Portfolio Disclosure
The Fund is required to file its complete schedule of portfolio holdings with the SEC for its first and third fiscal quarters on Form N-Q. The Fund’s Form N-Q is available without charge on the SEC’s website at www.sec.gov or by calling MainStay Investments at 800-MAINSTAY (624-6782). You also can obtain and review copies of Form N-Q by visiting the SEC’s Public Reference Room in Washington, DC (information on the operation of the Public Reference Room may be obtained by calling 1-800-SEC-0330).
| | | | |
| mainstayinvestments.com | | | 31 | |
Board Members and Officers (Unaudited)
The Board Members oversee the MainStay Group of Funds (which is comprised of Funds that are series of The MainStay Funds, Eclipse Trust, Eclipse Funds Inc., MainStay Funds Trust, MainStay VP Funds Trust, Private Advisors Alternative Strategies Master Fund, Private Advisors Alternative Strategies Fund, and MainStay Defined Term Municipal Opportunities Fund) (collectively, the “Fund Complex”), the Manager and, when applicable, the Subadvisor(s) and other service providers to the Fund Complex. Each Board Member serves until his or her successor is elected and qualified or until his or her resignation, death or removal. The Retirement Policy provides that a Board Member
shall tender his or her resignation by the end of the calendar year during which he or she reaches the age of 75.
Officers serve a term of one year and are elected annually by the Board Members. The business address of each Board Member and officer listed below is 51 Madison Avenue, New York, New York 10010.
The Statement of Additional Information applicable to the Fund includes additional information about the Board Members and is available without charge, upon request, by calling 800-MAINSTAY (624-6782) or by going online to mainstayinvestments.com.
| | | | | | | | | | | | |
| | | | | Name and
Date of Birth | | Term of Office,
Position(s) Held
with the Fund
Complex and
Length of Service | | Principal Occupation(s)
During Past Five Years | | Number of
Funds in
Fund Complex
Overseen by
Board Member | | Other Directorships
Held by Board Member |
| Interested Board Member* | | | | John Y. Kim
9/24/60 | | Indefinite;
Eclipse Trust: Trustee since 2008;
Eclipse Funds Inc.:
Director since 2008 (1 fund);
The MainStay Funds: Trustee since 2008 (12 funds);
MainStay Funds Trust: Trustee since 2009 (31 funds); and
MainStay VP Funds Trust: Trustee since 2011 and its predecessor, MainStay VP Series Fund, Inc. since 2008 (28 portfolios). Private Advisors Alternative Strategies Master Fund: Trustee since 2011
Private Advisors Alternative Strategies Fund: Trustee since 2011
MainStay DefinedTerm Municipal Opportunities Fund: Trustee since 2011 | | Member of the Board of Managers, President and Chief Executive Officer (since 2008), New York Life Investment Management LLC and New York Life Investment Management Holdings LLC; Member of the Board, MacKay Shields LLC since 2008; Chairman of the Board, Institutional Capital LLC, Madison Capital Funding LLC, Madison Square Investors LLC and McMorgan & Company LLC; Chairman of the Board, NYLIFE Distributors LLC and Chairman of the Board, NYLCAP Manager LLC (since 2008) President, Prudential Retirement, a business unit of Prudential Financial, Inc. (2002 to 2007) | | 75 | | None |
| | * | This Board Member is considered to be an “interested person” of the MainStay Group of Funds within the meaning of the 1940 Act because of his affiliation with New York Life Insurance Company, New York Life Investment Management LLC, Madison Square Investors LLC, MacKay Shields LLC, Private Advisors LLC, Institutional Capital LLC, NYLIFE Securities LLC and/or NYLIFE Distributors LLC, as described in detail above in the column entitled “Principal Occupation(s) During the Past Five Years.” |
| | |
| 32 | | MainStay Global High Income Fund |
| | | | | | | | | | | | |
| | | | | Name and
Date of Birth | | Term of Office, Position(s) Held with the Fund Complex and Length of Service | | Principal Occupation(s)
During Past Five Years | | Number of
Funds in
Fund Complex
Overseen by
Board Member | | Other Directorships
Held by Board Member |
| Non-Interested Board Members | | | | Susan B. Kerley 8/12/51 | | Indefinite;
Eclipse Trust: Chairman since 2005, and Trustee since 2000;
Eclipse Funds Inc.: Chairman since 2005 and Director since 1990 (1 fund); The MainStay Funds: Chairman and Board Member since 2007 (12 funds);
MainStay Funds Trust: Chairman and Trustee since 2009 (31 funds); and MainStay VP Funds Trust: Chairman and Trustee since 2011 and its predecessor, MainStay VP Series Fund, Inc., since 2007 (28 portfolios). Private Advisors Alternative Strategies Master Fund: Chairman and Trustee since 2011 Private Advisors Alternative Strategies Fund: Chairman and Trustee since 2011 MainStay DefinedTerm Municipal Opportunities Fund: Chairman and Trustee since 2011. | | President, Strategic Management Advisors LLC (since 1990) | | 75 | | Trustee, Legg Mason Partners Funds, since 1992 (51 portfolios) |
| | | | |
| mainstayinvestments.com | | | 33 | |
| | | | | | | | | | | | |
| | | | | Name and
Date of Birth | | Term of Office,
Position(s) Held
with the Fund
Complex and
Length of Service | | Principal Occupation(s)
During Past Five Years | | Number of
Funds in
Fund Complex
Overseen by
Board Member | | Other Directorships
Held by Board Member |
| Non-Interested Board Members | | | | Alan R. Latshaw 3/27/51 | | Indefinite;
Eclipse Trust: Trustee and Audit Committee Financial Expert since 2007;
Eclipse Funds Inc.:
Director and Audit Committee Financial Expert since 2007 (1 fund);
The MainStay Funds: Trustee and Audit Committee Financial Expert since 2006 (12 funds);
MainStay Funds Trust: Trustee and Audit Committee Financial Expert since 2009 (31 funds); and
MainStay VP Funds Trust: Trustee and Audit Committee Financial Expert since 2011 and its predecessor, MainStay VP Series Fund, Inc., since 2007 (28 portfolios). Private Advisors Alternative Strategies Master Fund: Trustee and Audit Committee Financial Expert since 2011 Private Advisors Alternative Strategies Fund: Trustee and Audit Committee Financial Expert since 2011. MainStay DefinedTerm Municipal Opportunities Fund: Trustee and Audit Committee Financial Expert since 2011. | | Retired; Partner, Ernst & Young LLP (2002 to 2003); Partner, Arthur Andersen LLP (1989 to 2002); Consultant to the MainStay Funds Audit and Compliance Committee (2004 to 2006) | | 75 | | Trustee, State Farm Associates Funds Trusts since 2005 (4 portfolios); Trustee, State Farm Mutual Fund Trust since 2005 (15 portfolios); Trustee, State Farm Variable Product Trust since 2005 (9 portfolios) |
| | |
| 34 | | MainStay Global High Income Fund |
| | | | | | | | | | | | |
| | | | | Name and Date of Birth | | Term of Office, Position(s) Held with the Fund Complex and Length of Service | | Principal Occupation(s)
During Past Five Years | | Number of
Funds in
Fund Complex
Overseen by
Board Member | | Other Directorships Held by Board Member |
| Non-Interested Board Members | | | | Peter Meenan
12/5/41 | | Indefinite;
Eclipse Funds: Trustee since 2002;
Eclipse Funds Inc.:
Director since 2002
(1 fund); The MainStay Funds:
Trustee since 2007 (12 funds);
MainStay Funds Trust: Trustee since 2009
(31 funds); and
MainStay VP Funds Trust: Trustee since 2011 and its predecessor, MainStay VP Series Fund, Inc., since 2007 (28 portfolios).
Private Advisors Alternative Strategies Master Fund: Trustee since 2011. Private Advisors Alternative Strategies Fund: Trustee since 2011
MainStay DefinedTerm Municipal Opportunities Fund: Trustee since 2011. | | Independent Consultant; President and Chief Executive Officer, Babson—United, Inc. (financial services firm) (2000 to 2004); Independent Consultant (1999 to 2000); Head of Global Funds, Citicorp (1995 to 1999) | | 75 | | None |
| | | | Richard H. Nolan, Jr.
11/16/46 | | Indefinite;
Eclipse Trust: Trustee since 2007;
Eclipse Funds Inc.:
Director since 2007 (1 fund);
The MainStay Funds: Trustee since 2007 (12 funds);
MainStay Funds Trust: Trustee since 2009 (31 funds); and
MainStay VP Funds Trust: Trustee since 2011 and its predecessor, MainStay VP Series Fund, Inc., since 2006 (28 portfolios).
Private Advisors Alternative Strategies Master Fund: Trustee since 2011. Private Advisors Alternative Strategies Fund: Trustee since 2011
MainStay DefinedTerm Municipal Opportunities Fund: Trustee since 2011. | | Managing Director, ICC Capital Management; President—Shields/Alliance, Alliance Capital Management (1994 to 2004) | | 75 | | None |
| | | | |
| mainstayinvestments.com | | | 35 | |
| | | | | | | | | | | | |
| | | | | Name and Date of Birth | | Term of Office, Position(s) Held with the Fund Complex and Length of Service | | Principal Occupation(s)
During Past Five Years | | Number of
Funds in
Fund Complex
Overseen by
Board Member | | Other Directorships Held by Board Member |
| Non-Interested Board Members | | | | Richard S. Trutanic 2/13/52 | | Indefinite;
Eclipse Trust: Trustee since 2007;
Eclipse Funds Inc.:
Director since 2007 (1 fund);
The MainStay Funds:
Trustee since 1994 (12 funds);
MainStay Funds Trust:
Trustee since 2009 (31 funds); and
MainStay VP Funds Trust: Trustee since 2011 and its predecessor, MainStay VP Series Fund, Inc., since 2007 (28 portfolios).
Private Advisors Alternative Strategies Master Fund: Trustee since 2011.
Private Advisors Alternative Strategies Fund: Trustee since 2011
MainStay DefinedTerm Municipal Opportunities Fund: Trustee since 2011. | | Chairman and Chief Executive Officer, Somerset & Company (financial advisory firm) (since 2004); Managing Director, The Carlyle Group (private investment firm) (2002 to 2004); Senior Managing Director, Partner and Board Member, Groupe Arnault S.A. (private investment firm) (1999 to 2002) | | 75 | | None |
| | |
| 36 | | MainStay Global High Income Fund |
| | | | | | | | | | | | |
| | | | | Name and Date of Birth | | Term of Office, Position(s) Held with the Fund Complex and Length of Service | | Principal Occupation(s)
During Past Five Years | | Number of
Funds in
Fund Complex
Overseen by
Board Member | | Other Directorships Held by Board Member |
| Non-Interested Board Members | | | | Roman L. Weil
5/22/40 | | Indefinite;
Eclipse Trust: Trustee and Audit Committee Financial Expert since 2007; Eclipse Funds Inc.: Director and Audit Committee Financial Expert since 2007 (1 fund); The MainStay Funds: Trustee and Audit Committee Financial Expert since 2007 (12 funds); MainStay Funds Trust: Trustee since 2009 (31 funds); and MainStay VP Funds Trust: Trustee and Audit Committee Financial Expert since 2011 and its predecessor, MainStay VP Series Fund, Inc., since 1994 and Audit Committee Financial Expert since 2003 (28 portfolios).
Private Advisors Alternative Strategies Master Fund: Trustee and Audit Committee Financial Expert since 2011 Private Advisors Alternative Strategies Fund: Trustee and Audit Committee Financial Expert since 2011. MainStay DefinedTerm Municipal Opportunities Fund: Trustee and Audit Committee Financial Expert since 2011. | | Visiting Professor, University of California—San Diego (since October 2012); Visiting Professor, Southern Methodist University (2011); Visiting Professor, NYU Stem School of Business, New York University (2011); President, Roman L. Weil Associates, Inc. (consulting firm) (since 1981); V. Duane Rath Professor Emeritus of Accounting, Chicago Booth School of Business, University of Chicago (1965-2008) | | 75 | | None |
| | | | |
| mainstayinvestments.com | | | 37 | |
| | | | | | | | | | | | |
| | | | | Name and Date of Birth | | Term of Office, Position(s) Held with the Fund Complex and Length of Service | | Principal Occupation(s)
During Past Five Years | | Number of
Funds in
Fund Complex
Overseen by
Board Member | | Other Directorships Held by Board Member |
| Non-Interested Board Members | | | | John A. Weisser 10/22/41 | | Indefinite; Eclipse Trust: Trustee since 2007; Eclipse Funds Inc.: Director since 2007 (1 fund); The MainStay Funds: Trustee since 2007 (12 funds); MainStay Funds Trust: Trustee since 2009 (31 funds); and MainStay VP Funds Trust: Trustee since 2011 and its predecessor, MainStay VP Series Fund, Inc., since 1997 (28 portfolios).
Private Advisors Alternative Strategies Master Fund: Trustee since 2011.
Private Advisors Alternative Strategies Fund: Trustee since 2011
MainStay DefinedTerm Municipal Opportunities Fund: Trustee since 2011. | | Retired. Managing Director of Salomon Brothers, Inc. (1971 to 1995) | | 75 | | Trustee, Direxion Funds since 2007 (21 portfolios); Direxion Insurance Trust since 2007 (1 portfolio); Trustee, Direxion Shares ETF Trust, since 2008 (47 portfolios) |
| | |
| 38 | | MainStay Global High Income Fund |
The following individuals have been appointed by the Board Members to serve as Officers of the MainStay Group of Funds.
| | | | | | | | |
| | | | | Name and
Date of Birth | | Positions(s) Held with the Funds and Length of Service | | Principal Occupation(s) During Past Five Years |
| Officers | | | | Jack R. Benintende 5/12/64 | | Treasurer and Principal Financial and Accounting Officer, Eclipse Trust, Eclipse Funds, Inc. and The MainStay Funds (since 2007), MainStay Funds Trust (since 2009) | | Assistant Treasurer, New York Life Investment Management Holdings LLC (since 2008); Managing Director, New York Life Investment Management LLC (since 2007); Treasurer and Principal Financial Accounting Officer, Private Advisors Alternative Strategies Master Fund, Private Advisors Alternative Strategies Fund and MainStay DefinedTerm Municipal Opportunities Fund (since 2011); Treasurer and Principal Financial and Accounting Officer, MainStay VP Funds Trust and its predecessor, MainStay VP Series Fund, Inc. (since 2007) |
| | | | Jeffrey A. Engelsman 9/28/67 | | Vice President and Chief Compliance Officer, Eclipse Trust, Eclipse Funds, Inc., The MainStay Funds and MainStay Funds Trust (since 2009) | | Managing Director, Compliance (since 2009), Director and Associate General Counsel, New York Life Investment Management LLC (2005 to 2008); Assistant Secretary, NYLIFE Distributors LLC (2006 to 2008); Vice President and Chief Compliance Officer, Private Advisors Alternative Strategies Master Fund, Private Advisors Alternative Strategies Fund, DefinedTerm Municipal Opportunities Fund (since 2011); MainStay VP Funds Trust and its predecessor, MainStay VP Series Fund, Inc. (since 2009); Assistant Secretary, The MainStay Funds (2006 to 2008); Assistant Secretary, Eclipse Trust, Eclipse Funds, Inc. and MainStay VP Series Fund, Inc. (2005 to 2008) |
| | | | Stephen P. Fisher 2/22/59 | | President, Eclipse Trust, Eclipse Funds, Inc. and The MainStay Funds (since 2007), MainStay Funds Trust (since 2009) | | Director, Senior Vice President, New York Life Insurance and Annuity Corporation (since 2011); Manager, President and Chief Operating Officer, NYLIFE Distributors LLC (since 2008); Chairman of the Board, NYLIM Service Company LLC (since 2008); Senior Managing Director and Chief Marketing Officer, New York Life Investment Management LLC (since 2005); President, Private Advisors Alternative Strategies Master Fund, Private Advisors Alternative Strategies Fund and MainStay DefinedTerm Municipal Opportunities Fund (since 2011); MainStay VP Funds Trust and its predecessor, MainStay VP Series Fund, Inc. (since 2007) |
| | | | J. Kevin Gao 10/13/67 | | Secretary and Chief Legal Officer, Eclipse Trust, Eclipse Funds, Inc., The MainStay Funds and MainStay Funds Trust (since 2010) | | Managing Director and Associate General Counsel, New York Life Investment Management LLC (since 2010); Secretary and Chief Legal Officer, Private Advisors Alternative Strategies Master Fund, Private Advisors Alternative Strategies Fund and MainStay DefinedTerm Municipal Opportunities Fund (since 2011); MainStay VP Funds Trust and its predecessor, MainStay VP Series Fund, Inc. (since 2010); Director and Counsel of Credit Suisse, Chief Legal Officer and Secretary of Credit Suisse Asset Management, LLC and Credit Suisse Funds (2003 to 2010) |
| | | | Scott T. Harrington 2/8/59 | | Vice President—Administration, Eclipse Trust, Eclipse Funds, Inc. and The MainStay Funds (since 2005), MainStay Funds Trust (since 2009) | | Director, New York Life Investment Management LLC (including predecessor advisory organizations) (since 2000); Executive Vice President, New York Life Trust Company and New York Life Trust Company FSB (since 2006); Vice President—Administration, Private Advisors Alternative Strategies Master Fund, Private Advisors Alternative Strategies Fund and MainStay DefinedTerm Municipal Opportunities Fund (since 2011); MainStay VP Funds Trust and its predecessor, MainStay VP Series Fund, Inc. (since 2005) |
| | * | The Officers listed above are considered to be “interested persons” of the MainStay Group of Funds within the meaning of the 1940 Act because of their affiliation with New York Life Insurance Company, New York Life Investment Management LLC, Madison Square Investors LLC, MacKay Shields LLC, Private Advisors LLC, Institutional Capital LLC, Epoch Investment Partners, Inc., Markston International, LLC, Winslow Capital Management, Inc., NYLIFE Securities LLC and/or NYLIFE Distributors LLC, as described in detail above in the column captioned “Principal Occupation(s) During Past Five Years.” Officers are elected annually by the Board to serve a one-year term. |
| | | | |
| mainstayinvestments.com | | | 39 | |
This page intentionally left blank
This page intentionally left blank
This page intentionally left blank
MainStay Funds
MainStay offers a wide range of Funds for virtually any investment need. The full array of MainStay open-end offerings is listed here, with information about the manager, subadvisors, legal counsel and independent registered public accounting firms.
Equity
U.S. Equity
MainStay Common Stock Fund
MainStay Epoch U.S. All Cap Fund
MainStay Epoch U.S. Equity Yield Fund
MainStay Growth Equity Fund
MainStay ICAP Equity Fund
MainStay ICAP Select Equity Fund
MainStay Large Cap Growth Fund1
MainStay MAP Fund
MainStay S&P 500 Index Fund
MainStay U.S. Small Cap Fund
MainStay 130/30 Core Fund
International/Global Equity
MainStay Epoch Global Choice Fund
MainStay Epoch Global Equity Yield Fund
MainStay Epoch International Small Cap Fund
MainStay ICAP Global Fund
MainStay ICAP International Fund
MainStay International Equity Fund
MainStay 130/30 International Fund
Income
Taxable Bond
MainStay Flexible Bond Opportunities Fund
MainStay Floating Rate Fund
MainStay Global High Income Fund
MainStay Government Fund
MainStay High Yield Corporate Bond Fund
MainStay High Yield Opportunities Fund
MainStay Indexed Bond Fund
MainStay Intermediate Term Bond Fund
MainStay Short Term Bond Fund
MainStay Money Market Fund
Municipal Bond
MainStay High Yield Municipal Bond Fund
MainStay New York Tax Free Opportunities Fund2
MainStay Tax Free Bond Fund
Mixed Asset
MainStay Balanced Fund
MainStay Convertible Fund
MainStay Income Builder Fund
MainStay Marketfield Fund
Asset Allocation/Target Date
MainStay Conservative Allocation Fund
MainStay Growth Allocation Fund
MainStay Moderate Allocation Fund
MainStay Moderate Growth Allocation Fund
MainStay Retirement 2010 Fund
MainStay Retirement 2020 Fund
MainStay Retirement 2030 Fund
MainStay Retirement 2040 Fund
MainStay Retirement 2050 Fund
Manager
New York Life Investment Management LLC
New York, New York
Subadvisors
Epoch Investment Partners, Inc.
New York, New York
Institutional Capital LLC3
Chicago, Illinois
MacKay Shields LLC3
New York, New York
Madison Square Investors LLC3
New York, New York
Marketfield Asset Management LLC
New York, New York
Markston International LLC
White Plains, New York
Winslow Capital Management, Inc.
Minneapolis, Minnesota
Legal Counsel
Dechert LLP
Independent Registered Public Accounting Firms
KPMG LLP
PricewaterhouseCoopers LLP
1. Effective January 13, 2012, the Fund was closed to new investors with certain exceptions.
2. The Fund is only registered for sale in CT, DE, FL, MA, NJ, NY, and VT.
3. An affiliate of New York Life Investment Management LLC.
Not part of the Annual Report
mainstayinvestments.com
The MainStay Funds are managed by New York Life Investment Management LLC and distributed through NYLIFE Distributors
LLC, 169 Lackawanna Avenue, Parsippany, NJ 07054, a wholly owned subsidiary of New York Life Insurance Company.
NYLIFE Distributors is a Member FINRA/SIPC.
MainStay Investments is a service mark and name under which New York Life Investment Management LLC does business.
MainStay Investments, an indirect subsidiary of New York Life Insurance Company, New York, NY 10010, provides investment
advisory products and services.
This report may be distributed only when preceded or accompanied by a current Fund prospectus.
© 2013 by NYLIFE Distributors LLC. All rights reserved.
| | | | | | | | |
| Not FDIC/NCUA Insured | | Not a Deposit | | May Lose Value | | No Bank Guarantee | | Not Insured by Any Government Agency |
| | | | |
| NYLIM-28419 MS265-12 | |
| MSGH11-12/12
NL020 |
|

MainStay International Equity Fund
Message from the President and Annual Report
October 31, 2012
This page intentionally left blank
Message from the President
Most major equity markets delivered positive results for the 12 months ended October 31, 2012. In the United States, stocks provided solid double-digit returns. With a few notable exceptions, international stock markets generally ended the reporting period in positive territory.
The stock market’s advance, however, was far from uniform. After rising to an early peak at the end of March 2012, domes-
tic and international stocks lost ground until the beginning of June. After that, stocks generally rose, reaching their high point for the reporting period in mid-September. Although stocks remained relatively buoyant through mid-October, they drifted lower as the reporting period came to a close.
A variety of forces converged to help fuel these market movements. Investors kept a close eye on developments in the European sovereign debt crisis. The European Central Bank’s Long Term Refinancing Operations helped stabilize European credit markets and provide needed liquidity. Although private holders of Greek sovereign debt had to accept a reduction in their recovery value, the anticipated voluntary exchange provided a positive spark to the markets. Rising unemployment and new austerity measures may impede economic growth as the European Union seeks to strike a delicate balance between fiscal and monetary policies.
In the United States, the Federal Reserve announced an open-ended agency mortgage-backed security purchase program, which helped calm market concerns. The Federal Reserve also continued its maturity extension program (referred to by some as “operation twist”), which seeks to put downward pressure on longer-term interest rates. At the short end of the yield curve, the Federal Reserve maintained the federal funds rate in a near-zero range. In September 2012, the Federal Open Market Committee anticipated that “exceptionally low levels for the federal funds rate” were “likely to be warranted at least through mid-2015.”
With markets stabilizing and short-term interest rates at very low levels, yield-hungry investors had incentives to lengthen maturities and accept higher risk. Domestic high-yield bonds provided double-digit returns for the reporting period, municipal bonds and convertible securities provided high single-digit returns, and domestic corporate bonds provided positive overall returns.
While most investors are pleased when markets rise, MainStay portfolio managers know that long-term results depend on more than short-term market movements. They also depend on the consistent application of well-defined investment strategies and risk-management techniques over longer periods. Our long-term perspective gives our portfolio managers the ability to look past the daily ups and downs of the market as they pursue the specific investment objectives of their individual Funds.
At MainStay, we believe that a long-term perspective can help investors as well. Instead of trying to capitalize on short-term market movements, you may prefer to focus on the long-term potential that can come from getting invested, staying invested and adding to your investments over time. Of course, past performance is no guarantee of future results.
The following pages contain more specific information on the securities, market events and investment decisions that affected your MainStay Fund(s) during the 12 months ended October 31, 2012. We invite you to read the information carefully and use it as part of your ongoing portfolio evaluation and investment review.
Sincerely,

Stephen P. Fisher
President
The opinions expressed are as of the date of this report and are subject to change. There is no guarantee that any forecast made will come to pass. This material does not constitute investment advice and is not intended as an endorsement of any specific investment.
Not part of the Annual Report
Table of Contents
Investors should refer to the Fund’s Summary Prospectus and/or Prospectus and consider the Fund’s investment objectives, strategies, risks, charges and expenses carefully before investing. The Summary Prospectus and/or Prospectus contain this and other information about the Fund. You may obtain copies of the Fund’s Summary Prospectus, Prospectus and Statement of Additional Information free of charge, upon request, by calling toll-free 800-MAINSTAY (624-6782), by writing to NYLIFE Distributors LLC, Attn: MainStay Marketing Department, 169 Lackawanna Avenue, Parsippany, New Jersey 07054 or by sending an e-mail to MainStayShareholderServices@nylim.com. These documents are also available via the MainStay Funds’ website at mainstayinvestments.com/documents. Please read the Summary Prospectus and/or Prospectus carefully before investing.
Investment and Performance Comparison1 (Unaudited)
Performance data quoted represents past performance. Past performance is no guarantee of future results. Because of market volatility, current performance may be lower or higher than the figures shown. Investment return and principal value will fluctuate, and as a result, when shares are redeemed, they may be worth more or less than their original cost. The graph below depicts the historical performance of Class B shares of the Fund. Performance will vary from class to class based on differences in class-specific expenses and sales charges. For performance information current to the most recent month-end, please call 800-MAINSTAY (624-6782) or visit mainstayinvestments.com.
(With sales charges)
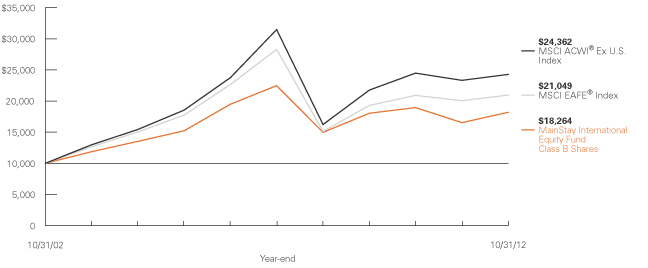
Average Annual Total Returns for the Year Ended October 31, 2012
| | | | | | | | | | | | | | | | | | | | |
| Class | | Sales Charge | | | | One Year | | | Five Years | | | Ten Years | | | Gross
Expense
Ratio2 | |
| Investor Class Shares3 | | Maximum 5.5% Initial Sales Charge | | With sales charges Excluding sales charges | |
| 4.72
10.81 | %
| |
| –4.49
–3.41 | %
| |
| 6.42
7.02 | %
| |
| 1.71
1.71 | %
|
| Class A Shares | | Maximum 5.5% Initial Sales Charge | | With sales charges Excluding sales charges | |
| 5.15
11.27 |
| |
| –4.23
–3.14 |
| |
| 6.56
7.17 |
| |
| 1.46
1.46 |
|
| Class B Shares | | Maximum 5% CDSC
if Redeemed Within the First Six Years of Purchase | | With sales charges Excluding sales charges | |
| 5.05
10.05 |
| |
| –4.45
–4.15 |
| |
| 6.21
6.21 |
| |
| 2.46
2.46 |
|
| Class C Shares | | Maximum 1% CDSC if Redeemed Within One Year of Purchase | | With sales charges Excluding sales charges | |
| 9.05
10.05 |
| |
| –4.14
–4.14 |
| |
| 6.21
6.21 |
| |
| 2.46
2.46 |
|
| Class I Shares4 | | No Sales Charge | | | | | 11.45 | | | | –2.87 | | | | 7.58 | | | | 1.21 | |
| Class R1 Shares4 | | No Sales Charge | | | | | 11.41 | | | | –2.96 | | | | 7.45 | | | | 1.31 | |
| Class R2 Shares4 | | No Sales Charge | | | | | 11.12 | | | | –3.19 | | | | 7.22 | | | | 1.55 | |
| Class R3 Shares5 | | No Sales Charge | | | | | 10.82 | | | | –3.45 | | | | 6.86 | | | | 1.80 | |
| 1. | The performance table and graph do not reflect the deduction of taxes that a shareholder would pay on distributions or Fund-share redemptions. Total returns reflect maximum applicable sales charges as indicated in the table above, changes in share price, and reinvestment of dividend and capital gain distributions. The graph assumes the initial investment amount shown above and reflects the deduction of all sales charges that would have applied for the periods of investment. Performance figures reflect certain fee waivers and/or expense limitations, without which total returns may have been lower. For more information on share classes and current fee waivers and/or expense limitations, please refer to the notes to the financial statements. Performance figures shown reflect non-recurring reimbursements from affiliates for professional fees and losses attributable to shareholder trading arrangements. If these non-recurring reimbursements had not been made the total return (excluding sales charges) would have been 7.14% for Class A, 6.18% for Class B, 6.18% for Class C, 7.56% for Class I, 7.42% for Class R1, and 7.19% for Class R2 for the ten-year period ended October 31, 2012. Investor Class and Class R3 shares were not affected, because the reimbursement occurred prior to the launch of these share classes. |
| 2. | The gross expense ratios presented reflect the Fund’s “Total Annual Fund Operating Expenses” from the most recent Prospectus and may differ from other expense ratios disclosed in this report. |
| 3. | Performance figures for Investor Class shares, first offered on February 28, 2008, include the historical performance of Class A shares through February 27, 2008, adjusted for differences in certain expenses and fees. Unadjusted, the performance shown for Investor Class shares might have been different. |
| 4. | Performance figures for Class I, R1 and R2 shares, each of which was first offered on January 2, 2004, include the historical performance of Class B shares through January 1, 2004, adjusted for differences in certain expenses and fees. Unadjusted, the performance shown for Class I, R1 and R2 shares might have been different. |
| 5. | Performance figures for Class R3 shares, which were first offered on April 28, 2006, include the historical performance of Class B shares through April 27, 2006, adjusted for differences in certain expenses and fees. Unadjusted, the performance shown for Class R3 shares might have been different. |
The footnotes on the next page are an integral part of the table and graph and should be carefully read in conjunction with them.
| | | | |
| mainstayinvestments.com | | | 5 | |
| | | | | | | | | | | | |
| Benchmark Performance | | One
Year | | | Five
Years | | | Ten
Years | |
MSCI EAFE® Index6 | | | 4.61 | % | | | –5.81 | % | | | 7.73 | % |
| MSCI ACWI® Ex U.S. Index7 | | | 3.98 | | | | –5.08 | | | | 9.31 | |
Average Lipper International Multi-Cap Growth Fund8 | | | 6.36 | | | | –5.36 | | | | 8.29 | |
| 6. | The MSCI EAFE® Index consists of international stocks representing the developed world outside of North America. The MSCI EAFE® Index is the Fund’s broad-based securities market index for comparison purposes. Results assume reinvestment of all income and capital gains. An investment cannot be made directly in an index. |
| 7. | The MSCI ACWI® Ex U.S. Index is a free float-adjusted market capitalization weighted index that is designed to measure the equity market performance of developed and emerging markets, excluding the United States. The MSCI ACWI® Ex U.S. Index is the Fund’s secondary benchmark. Results assume reinvestment of all income and capital gains. An investment cannot be made directly in an index. |
| 8. | The average Lipper international multi-cap growth fund is representative of funds that, by portfolio practice, invest in a variety of market capitalization ranges without concentrating 75% of their equity assets in any one market capitalization range over an extended period of time. International multi-cap growth funds typically have an above-average price-to-cash flow ratio, price-to-book ratio, and three-year sales-per-share growth value compared to the S&P/Citigroup World ex-U.S. BMI. This benchmark is a product of Lipper Inc. Lipper Inc. is an independent monitor of fund performance. Results are based on average total returns of similar funds with all dividend and capital gain distributions reinvested. |
The footnotes on the preceding page are an integral part of the table and graph and should be carefully read in conjunction with them.
| | |
| 6 | | MainStay International Equity Fund |
Cost in Dollars of a $1,000 Investment in MainStay International Equity Fund (Unaudited)
The example below is intended to describe the fees and expenses borne by shareholders during the six-month period from May 1, 2012, to October 31, 2012, and the impact of those costs on your investment.
Example
As a shareholder of the Fund, you incur two types of costs: (1) transaction costs, including exchange fees and sales charges (loads) on purchases (as applicable), and (2) ongoing costs, including management fees, distribution and/or service (12b-1) fees, and other Fund expenses (as applicable). This example is intended to help you understand your ongoing costs (in dollars) of investing in the Fund and to compare these costs with the ongoing costs of investing in other mutual funds. The example is based on an investment of $1,000 made at the beginning of the six-month period and held for the entire period from May 1, 2012, to October 31, 2012.
This example illustrates your Fund’s ongoing costs in two ways:
Actual Expenses
The second and third data columns in the table below provide information about actual account values and actual expenses. You may use the information in these columns, together with the amount you invested, to estimate the expenses that you paid during the six months ended October 31, 2012. Simply divide your account value by $1,000 (for example, an $8,600 account value divided by $1,000 = 8.6), then
multiply the result by the number under the heading entitled “Expenses Paid During Period” to estimate the expenses you paid on your account during this period.
Hypothetical Example for Comparison Purposes
The fourth and fifth data columns in the table below provide information about hypothetical account values and hypothetical expenses based on the Fund’s actual expense ratio and an assumed rate of return of 5% per year before expenses, which is not the Fund’s actual return. The hypothetical account values and expenses may not be used to estimate the actual ending account balances or expenses you paid for the six-month period shown. You may use this information to compare the ongoing costs of investing in the Fund with the ongoing costs of investing in other Funds. To do so, compare this 5% hypothetical example with the 5% hypothetical examples that appear in the shareholder reports of the other Funds.
Please note that the expenses shown in the table are meant to highlight your ongoing costs only and do not reflect any transactional costs, such as exchange fees or sales charges (loads). Therefore, the fourth and fifth data columns of the table are useful in comparing ongoing costs only and will not help you determine the relative total costs of owning different funds. In addition, if these transactional costs were included, your costs would have been higher.
| | | | | | | | | | | | | | | | | | | | |
| | | | | | | | | | | | | | | | |
| Share Class | | Beginning
Account
Value
5/1/12 | | | Ending Account
Value (Based
on Actual
Returns and
Expenses)
10/31/12 | | | Expenses
Paid
During
Period1 | | | Ending Account
Value (Based
on Hypothetical
5% Annualized
Return and
Actual Expenses)
10/31/12 | | | Expenses
Paid
During
Period1 | |
| | | | | |
| Investor Class Shares | | $ | 1,000.00 | | | $ | 1,008.70 | | | $ | 8.84 | | | $ | 1,016.30 | | | $ | 8.87 | |
| | | | | |
| Class A Shares | | $ | 1,000.00 | | | $ | 1,010.40 | | | $ | 7.02 | | | $ | 1,018.10 | | | $ | 7.05 | |
| | | | | |
| Class B Shares | | $ | 1,000.00 | | | $ | 1,004.70 | | | $ | 12.60 | | | $ | 1,012.60 | | | $ | 12.65 | |
| | | | | |
| Class C Shares | | $ | 1,000.00 | | | $ | 1,004.70 | | | $ | 12.60 | | | $ | 1,012.60 | | | $ | 12.65 | |
| | | | | |
| Class I Shares | | $ | 1,000.00 | | | $ | 1,011.20 | | | $ | 5.81 | | | $ | 1,019.40 | | | $ | 5.84 | |
| | | | | |
| Class R1 Shares | | $ | 1,000.00 | | | $ | 1,010.40 | | | $ | 6.32 | | | $ | 1,018.90 | | | $ | 6.34 | |
| | | | | |
| Class R2 Shares | | $ | 1,000.00 | | | $ | 1,009.50 | | | $ | 7.58 | | | $ | 1,017.60 | | | $ | 7.61 | |
| | | | | |
| Class R3 Shares | | $ | 1,000.00 | | | $ | 1,007.80 | | | $ | 8.83 | | | $ | 1,016.30 | | | $ | 8.87 | |
| 1. | Expenses are equal to the Fund’s annualized expense ratio of each class (1.75% for Investor Class, 1.39% for Class A, 2.50% for Class B and Class C, 1.15% for Class I, 1.25% for Class R1, 1.50% for Class R2 and 1.75% for Class R3) multiplied by the average account value over the period, divided by 366 and multiplied by 184 (to reflect the six-month period). The table above represents the actual expenses incurred during the six-month period. |
| | | | |
| mainstayinvestments.com | | | 7 | |
Portfolio Composition as of October 31, 2012 (Unaudited)
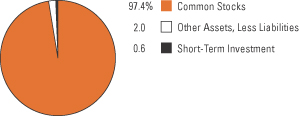
See Portfolio of Investments beginning on page 10 for specific holdings within these categories.
Top Ten Holdings as of October 31, 2012 (excluding short-term investment)
| 3. | Svenska Handelsbanken AB Class A |
| 5. | Teva Pharmaceutical Industries, Ltd., Sponsored ADR |
| 9. | Daito Trust Construction Co., Ltd. |
| | |
| 8 | | MainStay International Equity Fund |
Portfolio Management Discussion and Analysis (Unaudited)
Questions answered by portfolio manager Edward Ramos, CFA, of Madison Square Investors LLC, the Fund’s Subadvisor.
How did MainStay International Equity Fund perform relative to its peers and its benchmark during the 12 months ended October 31, 2012?
Excluding all sales charges, MainStay International Equity Fund returned 10.81% for Investor Class shares, 11.27% for Class A shares and 10.05% for Class B and Class C shares for the 12 months ended October 31, 2012. Over the same period, the Fund’s Class I shares returned 11.45%, Class R1 shares returned 11.41%, Class R2 shares returned 11.12% and Class R3 shares returned 10.82%. All share classes outper-formed the 6.36% return of the average Lipper1 international multi-cap growth fund and the 4.61% return of the MSCI EAFE® Index2 for the 12 months ended October 31, 2012. The MSCI EAFE® Index is the Fund’s broad-based securities-market index. See page 5 for Fund returns with applicable sales charges.
Were there any changes to the Fund in addition to those discussed in the semiannual report?
Effective July 2, 2012, the Fund adjusted its principal investment strategies to limit its investments in securities from countries located in emerging markets. The Fund also selected the MSCI ACWI® (All Country World Index) Ex U.S.3 as its secondary benchmark. For more information on these changes, please refer to the Prospectus Supplement dated July 2, 2012, and the Fund’s current Summary Prospectus.
What factors affected the Fund’s relative performance during the reporting period?
The Fund outperformed the MSCI EAFE® Index primarily because of favorable stock selection. Country allocation—and, to a lesser extent, sector allocation—also benefited the Fund’s relative performance.
During the reporting period, which sectors were the strongest positive contributors to the Fund’s relative performance and which sectors were particularly weak?
The strongest-contributing sectors to the Fund’s relative performance were health care, industrials and materials. (Contri- butions take weightings and total returns into account.) In the health care sector, the Fund benefited from an overweight allocation and favorable stock selection. In the industrials sector, the Fund benefitted primarily from favorable stock selection. In the materials sector, the Fund benefited from an underweight allocation to a poorly performing sector and from favorable stock selection. The Fund’s positions in the consumer discretionary and consumer staples sectors detracted from the Fund’s relative performance, primarily because of poor stock selection.
During the reporting period, which individual stocks made the strongest positive contributions to the Fund’s absolute performance and which stocks detracted the most?
The stocks that made the strongest positive contributions to the Fund’s absolute performance were Spanish plasma therapeutics company Grifols, U.K.-listed testing company Intertek and Danish health care supplies maker Coloplast. Grifols benefited from strong demand for its products and from synergies the company achieved following its acquisition of a competitor. Intertek also benefited from rapid integration of an acquisition, as more companies outsourced testing and inspection services to specialized providers.
The stocks that detracted the most from the Fund’s absolute performance were Chinese pork processor China Yurun, Swedish media conglomerate Modern Times Group and U.K.-listed asset manager Man Group. China Yurun faced food-safety concerns in China, and the company’s average selling price declined. Modern Times Group suffered from increased competition and higher prices for acquired content. China Yurun and Man Group were sold because of concerns about margin pressures that could potentially affect future earnings.
Did the Fund make any significant purchases or sales during the reporting period?
Noteworthy purchases during the reporting period included new positions in Aggreko, a U.K.-listed temporary power solutions provider; Linde, a Germany-listed provider of industrial gases; and Sysmex, a Japanese designer, manufacturer and marketer of diagnostic medical equipment.
Significant sales included the elimination of the Fund’s positions in U.K.-listed asset manager Man Group PLC, Chinese oil & gas firm CNOOC, and Swiss biotechnology company Actelion.
How did the Fund’s sector weightings change during the reporting period?
During the reporting period, the Fund increased its weightings in the consumer discretionary, industrials and information technology sectors. Over the same period, the Fund reduced its weightings in the consumer staples, financials and health care sectors.
How was the Fund positioned at the end of October 2012?
As of October 31, 2012, the Fund held overweight positions in the health care, information technology and industrials sectors. As of the same date, the Fund held underweight positions in the financials, consumer staples and telecommunications sectors.
| 1. | See footnote on page 6 for more information on Lipper Inc. |
| 2. | See footnote on page 6 for more information on the MSCI EAFE® Index. |
| 3. | See footnote on page 6 for more information on the MSCI ACWI® Ex U.S. |
The opinions expressed are those of the portfolio manager as of the date of this report and are subject to change. There is no guarantee that any forecasts made will come to pass. This material does not constitute investment advice and is not intended as an endorsement of any specific investment.
| | | | |
| mainstayinvestments.com | | | 9 | |
Portfolio of Investments October 31, 2012
| | | | | | | | |
| | |
| | | Shares | | | Value | |
| | | | | | | | |
| Common Stocks 97.4%† | |
Australia 1.7% | |
Computershare, Ltd. (IT Services) | | | 611,030 | | | $ | 5,511,889 | |
| | | | | | | | |
|
Bermuda 1.2% | |
Genpact, Ltd. (IT Services) | | | 211,774 | | | | 3,729,340 | |
| | | | | | | | |
|
Brazil 2.0% | |
Cia. Hering (Specialty Retail) | | | 277,500 | | | | 6,375,101 | |
| | | | | | | | |
|
Canada 4.2% | |
IGM Financial, Inc. (Capital Markets) | | | 130,300 | | | | 5,170,252 | |
Open Text Corp. (Internet Software & Services) (a) | | | 93,985 | | | | 5,064,851 | |
Tim Hortons, Inc. (Hotels, Restaurants & Leisure) | | | 61,900 | | | | 3,072,843 | |
| | | | | | | | |
| | | | | | | 13,307,946 | |
| | | | | | | | |
China 1.4% | |
China Shenhua Energy Co., Ltd. (Oil, Gas & Consumable Fuels) | | | 1,005,200 | | | | 4,280,179 | |
| | | | | | | | |
|
Czech Republic 2.3% | |
Komercni Banka A.S. (Commercial Banks) | | | 36,134 | | | | 7,374,286 | |
| | | | | | | | |
|
Denmark 5.1% | |
Coloplast A/S Class B (Health Care Equipment & Supplies) | | | 36,130 | | | | 7,922,378 | |
FLSmidth & Co. A/S (Construction & Engineering) | | | 139,112 | | | | 8,218,107 | |
| | | | | | | | |
| | | | | | | 16,140,485 | |
| | | | | | | | |
France 6.9% | |
Bureau Veritas S.A. (Professional Services) | | | 61,230 | | | | 6,502,229 | |
Dassault Systemes S.A. (Software) | | | 59,083 | | | | 6,225,220 | |
Essilor International S.A. (Health Care Equipment & Supplies) | | | 101,093 | | | | 9,113,250 | |
Ipsen S.A. (Pharmaceuticals) | | | 7,830 | | | | 201,962 | |
| | | | | | | | |
| | | | | | | 22,042,661 | |
| | | | | | | | |
Germany 13.5% | |
¨Adidas A.G. (Textiles, Apparel & Luxury Goods) | | | 140,675 | | | | 11,984,933 | |
Brenntag A.G. (Trading Companies & Distributors) | | | 41,576 | | | | 5,240,138 | |
Fresenius Medical Care A.G. & Co. KGaA (Health Care Providers & Services) | | | 135,460 | | | | 9,514,485 | |
¨Linde A.G. (Chemicals) | | | 57,274 | | | | 9,632,077 | |
United Internet A.G. (Internet Software & Services) | | | 154,216 | | | | 3,085,255 | |
| | | | | | | | |
| | |
| | | Shares | | | Value | |
| | | | | | | | |
Germany (continued) | |
Wirecard A.G. (IT Services) | | | 154,678 | | | $ | 3,534,565 | |
| | | | | | | | |
| | | | | | | 42,991,453 | |
| | | | | | | | |
Hong Kong 2.6% | |
Li & Fung, Ltd. (Distributors) | | | 4,859,200 | | | | 8,150,863 | |
| | | | | | | | |
|
India 0.9% | |
Infosys, Ltd., Sponsored ADR (IT Services) (b) | | | 67,953 | | | | 2,950,519 | |
| | | | | | | | |
|
Indonesia 1.2% | |
Media Nusantara Citra Tbk PT (Media) | | | 12,741,000 | | | | 3,747,353 | |
| | | | | | | | |
|
Ireland 0.5% | |
ICON PLC, Sponsored ADR (Life Sciences Tools & Services) (a)(b) | | | 59,479 | | | | 1,400,136 | |
| | | | | | | | |
|
Israel 5.6% | |
Check Point Software Technologies, Ltd. (Software) (a) | | | 142,495 | | | | 6,345,303 | |
¨Teva Pharmaceutical Industries, Ltd., Sponsored ADR (Pharmaceuticals) (b) | | | 284,127 | | | | 11,484,413 | |
| | | | | | | | |
| | | | 17,829,716 | |
| | | | | | | | |
Japan 7.4% | |
¨Daito Trust Construction Co., Ltd. (Real Estate Management & Development) | | | 97,100 | | | | 9,803,658 | |
FamilyMart Co., Ltd. (Food & Staples Retailing) | | | 91,400 | | | | 4,430,891 | |
Sysmex Corp. (Health Care Equipment & Supplies) | | | 194,300 | | | | 9,139,377 | |
| | | | | | | | |
| | | | 23,373,926 | |
| | | | | | | | |
South Africa 1.2% | |
Clicks Group, Ltd. (Food & Staples Retailing) | | | 541,147 | | | | 3,730,951 | |
| | | | | | | | |
|
Spain 4.3% | |
¨Grifols S.A. (Biotechnology) (a) | | | 395,932 | | | | 13,732,885 | |
| | | | | | | | |
|
Sweden 5.6% | |
Modern Times Group AB Class B (Media) | | | 168,523 | | | | 5,132,242 | |
¨Svenska Handelsbanken AB Class A (Commercial Banks) | | | 372,064 | | | | 12,744,492 | |
| | | | | | | | |
| | | | 17,876,734 | |
| | | | | | | | |
Thailand 3.0% | |
Kasikornbank PCL (Commercial Banks) | | | 1,610,800 | | | | 9,459,837 | |
| | | | | | | | |
| † | Percentages indicated are based on Fund net assets. |
| ¨ | | Among the Fund’s 10 largest holdings, as of October 31, 2012, excluding short-term investment. May be subject to change daily. |
| | | | |
| 10 | | MainStay International Equity Fund | | The notes to the financial statements are an integral part of,
and should be read in conjunction with, the financial statements. |
| | | | | | | | |
| | |
Shares | | | Value | |
| | | | | | | | |
| Common Stocks (continued) | |
United Kingdom 24.1% | |
¨Aggreko PLC (Commercial Services & Supplies) | | | 370,744 | | | $ | 12,863,188 | |
Experian PLC (Professional Services) | | | 458,418 | | | | 7,915,557 | |
¨Intertek Group PLC (Professional Services) | | | 232,675 | | | | 10,584,755 | |
Johnson Matthey PLC (Chemicals) | | | 208,968 | | | | 7,584,121 | |
¨Petrofac, Ltd. (Energy Equipment & Services) | | | 402,384 | | | | 10,415,523 | |
¨SABMiller PLC (Beverages) | | | 246,181 | | | | 10,545,649 | |
Shire PLC (Pharmaceuticals) | | | 205,048 | | | | 5,767,518 | |
Standard Chartered PLC (Commercial Banks) | | | 320,912 | | | | 7,579,049 | |
Telecity Group PLC (Internet Software & Services) | | | 226,301 | | | | 3,292,215 | |
| | | | | | | | |
| | | | 76,547,575 | |
| | | | | | | | |
| United States 2.7% | |
ResMed, Inc. (Health Care Equipment & Supplies) | | | 216,637 | | | | 8,652,482 | |
| | | | | | | | |
Total Common Stocks
(Cost $274,167,269) | | | | 309,206,317 | |
| | | | | | | | |
| | |
| | | | | | | | |
| | | | | | | | |
| | | Principal
Amount | | | Value | |
| | | | | | | | |
| Short-Term Investment 0.6% | |
Repurchase Agreement 0.6% | |
United States 0.6% | | | | | | | | |
State Street Bank and Trust Co.
0.01%, dated 10/31/12
due 11/1/12
Proceeds at Maturity $1,989,193 (Collateralized by a Federal National Mortgage Association security with a rate of 5.00% and a maturity date of 3/15/16, with a Principal Amount of $1,760,000 and a Market Value of $2,032,129) (Capital Markets) | | $ | 1,989,193 | | | $ | 1,989,193 | |
| | | | | | | | |
Total Short-Term Investment
(Cost $1,989,193) | | | | | | | 1,989,193 | |
| | | | | | | | |
Total Investments
(Cost $276,156,462) (c) | | | 98.0 | % | | | 311,195,510 | |
Other Assets, Less Liabilities | | | 2.0 | | | | 6,392,574 | |
Net Assets | | | 100.0 | % | | $ | 317,588,084 | |
| (a) | Non-income producing security. |
| (b) | ADR—American Depositary Receipt. |
| (c) | As of October 31, 2012, cost is $277,221,220 for federal income tax purposes and net unrealized appreciation is as follows: |
| | | | |
Gross unrealized appreciation | | $ | 42,585,904 | |
Gross unrealized depreciation | | | (8,611,614 | ) |
| | | | |
Net unrealized appreciation | | $ | 33,974,290 | |
| | | | |
The following is a summary of the fair valuations according to the inputs used as of October 31, 2012, for valuing the Fund’s assets.
Asset Valuation Inputs
| | | | | | | | | | | | | | | | |
Description | | Quoted
Prices in
Active
Markets for
Identical
Assets
(Level 1) | | | Significant
Other
Observable
Inputs (Level 2) | | | Significant
Unobservable
Inputs (Level 3) | | | Total | |
| Investments in Securities (a) | | | | | | | | | | | | | | | | |
| Common Stocks | | $ | 309,206,317 | | | $ | — | | | $ | — | | | $ | 309,206,317 | |
| Short-Term Investment | | | | | | | | | | | | | | | | |
Repurchase Agreement | | | — | | | | 1,989,193 | | | | — | | | | 1,989,193 | |
| | | | | | | | | | | | | | | | |
| Total Investments in Securities | | $ | 309,206,317 | | | $ | 1,989,193 | | | $ | — | | | $ | 311,195,510 | |
| | | | | | | | | | | | | | | | |
| (a) | For a complete listing of investments and their industries, see the Portfolio of Investments. |
The Fund recognizes transfers between the levels as of the beginning of the period.
As of October 31, 2012, the Fund did not hold any investments with significant unobservable inputs (Level 3). (See Note 2)
As of October 31, 2012, foreign securities with a total value of $208,727,187 were transferred from Level 2 to Level 1 as the prices of these securities were based on quoted prices compared with the prior year prices which were adjusted for events after the market close. The October 31, 2011 prices were adjusted by applying factors provided by a third party vendor in accordance with the Fund’s policies and procedures. Fair values as of October 31, 2012 for these securities are based on quoted prices in active markets for identical investments. (See Note 2)
| | | | | | |
The notes to the financial statements are an integral part of,
and should be read in conjunction with, the financial statements. | | mainstayinvestments.com | | | 11 | |
Portfolio of Investments October 31, 2012 (continued)
The table below sets forth the diversification of MainStay International Equity Fund investments by industry.
Industry Diversification (Unaudited)
| | | | | | | | |
| | | Value | | | Percent † | |
Beverages | | $ | 10,545,649 | | | | 3.3 | % |
Biotechnology | | | 13,732,885 | | | | 4.3 | |
Capital Markets | | | 7,159,445 | | | | 2.3 | |
Chemicals | | | 17,216,198 | | | | 5.4 | |
Commercial Banks | | | 37,157,664 | | | | 11.7 | |
Commercial Services & Supplies | | | 12,863,188 | | | | 4.0 | |
Construction & Engineering | | | 8,218,107 | | | | 2.6 | |
Distributors | | | 8,150,863 | | | | 2.6 | |
Energy Equipment & Services | | | 10,415,523 | | | | 3.3 | |
Food & Staples Retailing | | | 8,161,842 | | | | 2.6 | |
Health Care Equipment & Supplies | | | 34,827,487 | | | | 11.0 | |
Health Care Providers & Services | | | 9,514,485 | | | | 3.0 | |
Hotels, Restaurants & Leisure | | | 3,072,843 | | | | 1.0 | |
Internet Software & Services | | | 11,442,321 | | | | 3.6 | |
IT Services | | | 15,726,313 | | | | 4.9 | |
Life Sciences Tools & Services | | | 1,400,136 | | | | 0.4 | |
Media | | | 8,879,595 | | | | 2.8 | |
Oil, Gas & Consumable Fuels | | | 4,280,179 | | | | 1.3 | |
Pharmaceuticals | | | 17,453,893 | | | | 5.5 | |
Professional Services | | | 25,002,541 | | | | 7.9 | |
Real Estate Management & Development | | | 9,803,658 | | | | 3.1 | |
Software | | | 12,570,523 | | | | 4.0 | |
Specialty Retail | | | 6,375,101 | | | | 2.0 | |
Textiles, Apparel & Luxury Goods | | | 11,984,933 | | | | 3.8 | |
Trading Companies & Distributors | | | 5,240,138 | | | | 1.6 | |
| | | | | | | | |
| | | 311,195,510 | | | | 98.0 | |
Other Assets, Less Liabilities | | | 6,392,574 | | | | 2.0 | |
| | | | | | | | |
Net Assets | | $ | 317,588,084 | | | | 100.0 | % |
| | | | | | | | |
| † | Percentages indicated are based on Fund net assets. |
| | | | |
| 12 | | MainStay International Equity Fund | | The notes to the financial statements are an integral part of,
and should be read in conjunction with, the financial statements. |
Statement of Assets and Liabilities as of October 31, 2012
| | | | |
| Assets | |
Investment in securities, at value
(identified cost $276,156,462) | | $ | 311,195,510 | |
Cash denominated in foreign currencies
(identified cost $6,425,066) | | | 6,448,883 | |
Receivables: | | | | |
Investment securities sold | | | 1,080,663 | |
Dividends and interest | | | 410,613 | |
Fund shares sold | | | 218,357 | |
Other assets | | | 26,382 | |
| | | | |
Total assets | | | 319,380,408 | |
| | | | |
| |
| Liabilities | | | | |
Payables: | | | | |
Fund shares redeemed | | | 940,605 | |
Foreign capital gains tax (See Note 2(B)) | | | 307,203 | |
Manager (See Note 3) | | | 251,921 | |
Transfer agent (See Note 3) | | | 182,824 | |
NYLIFE Distributors (See Note 3) | | | 47,172 | |
Shareholder communication | | | 27,339 | |
Professional fees | | | 18,501 | |
Custodian | | | 10,913 | |
Trustees | | | 984 | |
Accrued expenses | | | 4,862 | |
| | | | |
Total liabilities | | | 1,792,324 | |
| | | | |
Net assets | | $ | 317,588,084 | |
| | | | |
| |
| Composition of Net Assets | | | | |
Shares of beneficial interest outstanding (par value of $.01 per share) unlimited number of shares authorized | | $ | 273,068 | |
Additional paid-in capital | | | 407,824,309 | |
| | | | |
| | | 408,097,377 | |
Undistributed net investment income | | | 2,688,911 | |
Accumulated net realized gain (loss) on investments and foreign currency transactions | | | (128,030,436 | ) |
Net unrealized appreciation (depreciation) on investments (a) | | | 34,731,845 | |
Net unrealized appreciation (depreciation) on translation of other assets and liabilities in foreign currencies | | | 100,387 | |
| | | | |
Net assets | | $ | 317,588,084 | |
| | | | |
| | | | |
Investor Class | | | | |
Net assets applicable to outstanding shares | | $ | 34,821,780 | |
| | | | |
Shares of beneficial interest outstanding | | | 2,986,462 | |
| | | | |
Net asset value per share outstanding | | $ | 11.66 | |
Maximum sales charge (5.50% of offering price) | | | 0.68 | |
| | | | |
Maximum offering price per share outstanding | | $ | 12.34 | |
| | | | |
Class A | | | | |
Net assets applicable to outstanding shares | | $ | 60,303,047 | |
| | | | |
Shares of beneficial interest outstanding | | | 5,163,485 | |
| | | | |
Net asset value per share outstanding | | $ | 11.68 | |
Maximum sales charge (5.50% of offering price) | | | 0.68 | |
| | | | |
Maximum offering price per share outstanding | | $ | 12.36 | |
| | | | |
Class B | | | | |
Net assets applicable to outstanding shares | | $ | 16,185,769 | |
| | | | |
Shares of beneficial interest outstanding | | | 1,507,765 | |
| | | | |
Net asset value and offering price per share outstanding | | $ | 10.73 | |
| | | | |
Class C | | | | |
Net assets applicable to outstanding shares | | $ | 11,111,455 | |
| | | | |
Shares of beneficial interest outstanding | | | 1,034,722 | |
| | | | |
Net asset value and offering price per share outstanding | | $ | 10.74 | |
| | | | |
Class I | | | | |
Net assets applicable to outstanding shares | | $ | 177,726,151 | |
| | | | |
Shares of beneficial interest outstanding | | | 15,122,074 | |
| | | | |
Net asset value and offering price per share outstanding | | $ | 11.75 | |
| | | | |
Class R1 | | | | |
Net assets applicable to outstanding shares | | $ | 4,676,543 | |
| | | | |
Shares of beneficial interest outstanding | | | 400,615 | |
| | | | |
Net asset value and offering price per share outstanding | | $ | 11.67 | |
| | | | |
Class R2 | | | | |
Net assets applicable to outstanding shares | | $ | 10,545,117 | |
| | | | |
Shares of beneficial interest outstanding | | | 901,196 | |
| | | | |
Net asset value and offering price per share outstanding | | $ | 11.70 | |
| | | | |
Class R3 | | | | |
Net assets applicable to outstanding shares | | $ | 2,218,222 | |
| | | | |
Shares of beneficial interest outstanding | | | 190,517 | |
| | | | |
Net asset value and offering price per share outstanding | | $ | 11.64 | |
| | | | |
| (a) | Net of foreign capital gains tax of $307,203. |
| | | | | | |
The notes to the financial statements are an integral part of,
and should be read in conjunction with, the financial statements. | | mainstayinvestments.com | | | 13 | |
Statement of Operations for the year ended October 31, 2012
| | | | |
| Investment Income (Loss) | |
Income | | | | |
Dividends (a) | | $ | 7,313,003 | |
Interest | | | 261 | |
| | | | |
Total income | | | 7,313,264 | |
| | | | |
Expenses | | | | |
Manager (See Note 3) | | | 2,897,372 | |
Transfer agent (See Note 3) | | | 686,151 | |
Distribution/Service—Investor Class (See Note 3) | | | 85,475 | |
Distribution/Service—Class A (See Note 3) | | | 158,475 | |
Distribution/Service—Class B (See Note 3) | | | 178,750 | |
Distribution/Service—Class C (See Note 3) | | | 116,981 | |
Distribution/Service—Class R2 (See Note 3) | | | 29,698 | |
Distribution/Service—Class R3 (See Note 3) | | | 9,486 | |
Registration | | | 96,316 | |
Professional fees | | | 87,810 | |
Custodian | | | 67,058 | |
Shareholder communication | | | 60,900 | |
Shareholder service (See Note 3) | | | 18,454 | |
Trustees | | | 8,077 | |
Miscellaneous | | | 28,301 | |
| | | | |
Total expenses | | | 4,529,304 | |
| | | | |
Net investment income (loss) | | | 2,783,960 | |
| | | | |
|
| Realized and Unrealized Gain (Loss) on Investments and Foreign Currency Transactions | |
Net realized gain (loss) on: | | | | |
Security transactions (b) | | | (8,721,330 | ) |
Foreign currency transactions | | | (13,763 | ) |
| | | | |
Net realized gain (loss) on investments and foreign currency transactions | | | (8,735,093 | ) |
| | | | |
Net change in unrealized appreciation (depreciation) on: | | | | |
Investments (c) | | | 37,412,268 | |
Translation of other assets and liabilities in foreign currencies | | | 30,210 | |
| | | | |
Net change in unrealized appreciation (depreciation) on investments and foreign currency transactions | | | 37,442,478 | |
| | | | |
Net realized and unrealized gain (loss) on investments and foreign currency transactions | | | 28,707,385 | |
| | | | |
Net increase (decrease) in net assets resulting from operations | | $ | 31,491,345 | |
| | | | |
| (a) | Dividends recorded net of foreign withholding taxes in the amount of $603,560. |
| (b) | Net of foreign capital gains tax of $34,045. |
| (c) | Net of foreign capital gains tax of $307,203. |
| | | | |
| 14 | | MainStay International Equity Fund | | The notes to the financial statements are an integral part of,
and should be read in conjunction with, the financial statements. |
Statements of Changes in Net Assets
for the years ended October 31, 2012 and October 31, 2011
| | | | | | | | |
| | | 2012 | | | 2011 | |
| Increase (Decrease) in Net Assets | |
Operations: | | | | | | | | |
Net investment income (loss) | | $ | 2,783,960 | | | $ | 9,127,922 | |
Net realized gain (loss) on investments, futures transactions and foreign currency transactions | | | (8,735,093 | ) | | | (31,844,705 | ) |
Net change in unrealized appreciation (depreciation) on investments, futures contracts and foreign currency transactions | | | 37,442,478 | | | | (24,686,590 | ) |
| | | | |
Net increase (decrease) in net assets resulting from operations | | | 31,491,345 | | | | (47,403,373 | ) |
| | | | |
Dividends to shareholders: | | | | | | | | |
From net investment income: | | | | | | | | |
Investor Class | | | (893,973 | ) | | | (1,105,464 | ) |
Class A | | | (1,933,319 | ) | | | (3,107,422 | ) |
Class B | | | (379,000 | ) | | | (672,597 | ) |
Class C | | | (232,501 | ) | | | (420,464 | ) |
Class I | | | (5,180,205 | ) | | | (10,291,930 | ) |
Class R1 | | | (142,357 | ) | | | (195,343 | ) |
Class R2 | | | (330,290 | ) | | | (322,439 | ) |
Class R3 | | | (39,158 | ) | | | (25,620 | ) |
| | | | |
Total dividends to shareholders | | | (9,130,803 | ) | | | (16,141,279 | ) |
| | | | |
Capital share transactions: | | | | | | | | |
Net proceeds from sale of shares | | | 71,221,509 | | | | 90,448,988 | |
Net asset value of shares issued to shareholders in reinvestment of dividends | | | 8,641,477 | | | | 14,107,001 | |
Cost of shares redeemed | | | (128,600,287 | ) | | | (282,849,754 | ) |
| | | | |
Increase (decrease) in net assets derived from capital share transactions | | | (48,737,301 | ) | | | (178,293,765 | ) |
| | | | |
Net increase (decrease) in net assets | | | (26,376,759 | ) | | | (241,838,417 | ) |
|
| Net Assets | |
Beginning of year | | | 343,964,843 | | | | 585,803,260 | |
| | | | |
End of year | | $ | 317,588,084 | | | $ | 343,964,843 | |
| | | | |
Undistributed net investment income at end of year | | $ | 2,688,911 | | | $ | 9,049,517 | |
| | | | |
| | | | | | |
The notes to the financial statements are an integral part of,
and should be read in conjunction with, the financial statements. | | mainstayinvestments.com | | | 15 | |
Financial Highlights selected per share data and ratios
| | | | | | | | | | | | | | | | | | | | |
| | | Investor Class | |
| | | Year ended October 31, | | | February 28,
2008**
through
October 31, | |
| | | 2012 | | | 2011 | | | 2010 | | | 2009 | | | 2008 | |
Net asset value at beginning of period | | $ | 10.81 | | | $ | 12.66 | | | $ | 12.24 | | | $ | 10.96 | | | $ | 14.70 | |
| | | | | | | | | | | | | | | | | | | | |
Net investment income (loss) (a) | | | 0.06 | | | | 0.21 | | | | 0.22 | (b) | | | 0.23 | | | | 0.36 | |
Net realized and unrealized gain (loss) on investments | | | 1.07 | | | | (1.62 | ) | | | 0.44 | | | | 1.73 | | | | (4.31 | ) |
Net realized and unrealized gain (loss) on foreign currency transactions | | | 0.00 | ‡ | | | (0.09 | ) | | | 0.08 | | | | 0.18 | | | | 0.21 | |
| | | | | | | | | | | | | | | | | | | | |
Total from investment operations | | | 1.13 | | | | (1.50 | ) | | | 0.74 | | | | 2.14 | | | | (3.74 | ) |
| | | | | | | | | | | | | | | | | | | | |
Less dividends: | | | | | | | | | | | | | | | | | | | | |
From net investment income | | | (0.28 | ) | | | (0.35 | ) | | | (0.32 | ) | | | (0.86 | ) | | | — | |
| | | | | | | | | | | | | | | | | | | | |
Redemption fee (a)(c) | | | — | | | | — | | | | 0.00 | ‡ | | | 0.00 | ‡ | | | 0.00 | ‡ |
| | | | | | | | | | | | | | | | | | | | |
Net asset value at end of period | | $ | 11.66 | | | $ | 10.81 | | | $ | 12.66 | | | $ | 12.24 | | | $ | 10.96 | |
| | | | | | | | | | | | | | | | | | | | |
Total investment return (d) | | | 10.81 | % | | | (12.19 | %) | | | 6.11 | % | | | 21.20 | % | | | (25.44 | %)(e) |
Ratios (to average net assets)/Supplemental Data: | | | | | | | | | | | | | | | | | | | | |
Net investment income (loss) | | | 0.54 | % | | | 1.77 | % | | | 1.82 | %(b) | | | 2.19 | % | | | 3.91 | % †† |
Net expenses | | | 1.77 | % | | | 1.71 | % | | | 1.75 | % | | | 1.71 | % | | | 1.70 | % †† |
Expenses (before waiver/reimbursement) | | | 1.77 | % | | | 1.71 | % | | | 1.75 | % | | | 1.86 | % | | | 1.73 | % †† |
Portfolio turnover rate | | | 43 | % | | | 80 | % | | | 54 | % | | | 88 | % | | | 82 | % |
Net assets at end of period (in 000’s) | | $ | 34,822 | | | $ | 34,895 | | | $ | 39,843 | | | $ | 39,969 | | | $ | 35,429 | |
| ** | Commencement of operations. |
| ‡ | Less than one cent per share. |
| (a) | Per share data based on average shares outstanding during the period. |
| (b) | Included in net investment income per share and the ratio of net investment income to average net assets are $0.03 per share and 0.29%, respectively, resulting from a special one-time dividend from Ryanair Holdings PLC that paid $0.30 per share. |
| (c) | The redemption fee was discontinued as of April 1, 2010. |
| (d) | Total investment return is calculated exclusive of sales charges and assumes the reinvestment of dividends and distributions. |
| (e) | Total investment return is not annualized. |
| | | | |
| 16 | | MainStay International Equity Fund | | The notes to the financial statements are an integral part of,
and should be read in conjunction with, the financial statements. |
Financial Highlights selected per share data and ratios
| | | | | | | | | | | | | | | | | | | | |
| | | Class A | |
| | | Year ended October 31, | |
| | | 2012 | | | 2011 | | | 2010 | | | 2009 | | | 2008 | |
Net asset value at beginning of year | | $ | 10.82 | | | $ | 12.66 | | | $ | 12.24 | | | $ | 10.97 | | | $ | 18.09 | |
| | | | | | | | | | | | | | | | | | | | |
Net investment income (loss) (a) | | | 0.10 | | | | 0.26 | | | | 0.25 | (b) | | | 0.26 | | | | 0.41 | |
Net realized and unrealized gain (loss) on investments | | | 1.07 | | | | (1.63 | ) | | | 0.44 | | | | 1.73 | | | | (6.10 | ) |
Net realized and unrealized gain (loss) on foreign currency transactions | | | 0.00 | ‡ | | | (0.09 | ) | | | 0.08 | | | | 0.18 | | | | 0.30 | |
| | | | | | | | | | | | | | | | | | | | |
Total from investment operations | | | 1.17 | | | | (1.46 | ) | | | 0.77 | | | | 2.17 | | | | (5.39 | ) |
| | | | | | | | | | | | | | | | | | | | |
Less dividends and distributions: | | | | | | | | | | | | | | | | | | | | |
From net investment income | | | (0.31 | ) | | | (0.38 | ) | | | (0.35 | ) | | | (0.90 | ) | | | (0.05 | ) |
From net realized gain on investments | | | — | | | | — | | | | — | | | | — | | | | (1.68 | ) |
| | | | | | | | | | | | | | | | | | | | |
Total dividends and distributions | | | (0.31 | ) | | | (0.38 | ) | | | (0.35 | ) | | | (0.90 | ) | | | (1.73 | ) |
| | | | | | | | | | | | | | | | | | | | |
Redemption fee (a)(c) | | | — | | | | — | | | | 0.00 | ‡ | | | 0.00 | ‡ | | | 0.00 | ‡ |
| | | | | | | | | | | | | | | | | | | | |
Net asset value at end of year | | $ | 11.68 | | | $ | 10.82 | | | $ | 12.66 | | | $ | 12.24 | | | $ | 10.97 | |
| | | | | | | | | | | | | | | | | | | | |
Total investment return (d) | | | 11.27 | % | | | (11.96 | %) | | | 6.31 | % | | | 21.57 | % | | | (32.67 | %) |
Ratios (to average net assets)/Supplemental Data: | | | | | | | | | | | | | | | | | | | | |
Net investment income (loss) | | | 0.87 | % | | | 2.11 | % | | | 2.11 | %(b) | | | 2.40 | % | | | 2.79 | % |
Net expenses | | | 1.43 | % | | | 1.46 | % | | | 1.44 | % | | | 1.39 | % | | | 1.47 | % |
Expenses (before waiver/reimbursement) | | | 1.43 | % | | | 1.46 | % | | | 1.44 | % | | | 1.42 | % | | | 1.47 | % |
Portfolio turnover rate | | | 43 | % | | | 80 | % | | | 54 | % | | | 88 | % | | | 82 | % |
Net assets at end of year (in 000’s) | | $ | 60,303 | | | $ | 72,699 | | | $ | 104,169 | | | $ | 117,023 | | | $ | 63,470 | |
| ‡ | Less than one cent per share. |
| (a) | Per share data based on average shares outstanding during the year. |
| (b) | Included in net investment income per share and the ratio of net investment income to average net assets are $0.03 per share and 0.29%, respectively, resulting from a special one-time dividend from Ryanair Holdings PLC that paid $0.30 per share. |
| (c) | The redemption fee was discontinued as of April 1, 2010. |
| (d) | Total investment return is calculated exclusive of sales charges and assumes the reinvestment of dividends and distributions. |
| | | | | | |
The notes to the financial statements are an integral part of,
and should be read in conjunction with, the financial statements. | | mainstayinvestments.com | | | 17 | |
Financial Highlights selected per share data and ratios
| | | | | | | | | | | | | | | | | | | | |
| | | Class B | |
| | | Year ended October 31, | |
| | | 2012 | | | 2011 | | | 2010 | | | 2009 | | | 2008 | |
Net asset value at beginning of year | | $ | 9.95 | | | $ | 11.67 | | | $ | 11.33 | | | $ | 10.17 | | | $ | 16.99 | |
| | | | | | | | | | | | | | | | | | | | |
Net investment income (loss) (a) | | | (0.02 | ) | | | 0.11 | | | | 0.12 | (b) | | | 0.14 | | | | 0.28 | |
Net realized and unrealized gain (loss) on investments | | | 0.99 | | | | (1.49 | ) | | | 0.39 | | | | 1.61 | | | | (5.70 | ) |
Net realized and unrealized gain (loss) on foreign currency transactions | | | 0.00 | ‡ | | | (0.08 | ) | | | 0.07 | | | | 0.16 | | | | 0.28 | |
| | | | | | | | | | | | | | | | | | | | |
Total from investment operations | | | 0.97 | | | | (1.46 | ) | | | 0.58 | | | | 1.91 | | | | (5.14 | ) |
| | | | | | | | | | | | | | | | | | | | |
Less dividends and distributions: | | | | | | | | | | | | | | | | | | | | |
From net investment income | | | (0.19 | ) | | | (0.26 | ) | | | (0.24 | ) | | | (0.75 | ) | | | — | |
From net realized gain on investments | | | — | | | | — | | | | — | | | | — | | | | (1.68 | ) |
| | | | | | | | | | | | | | | | | | | | |
Total dividends and distributions | | | (0.19 | ) | | | (0.26 | ) | | | (0.24 | ) | | | (0.75 | ) | | | (1.68 | ) |
| | | | | | | | | | | | | | | | | | | | |
Redemption fee (a)(c) | | | — | | | | — | | | | 0.00 | ‡ | | | 0.00 | ‡ | | | 0.00 | ‡ |
| | | | | | | | | | | | | | | | | | | | |
Net asset value at end of year | | $ | 10.73 | | | $ | 9.95 | | | $ | 11.67 | | | $ | 11.33 | | | $ | 10.17 | |
| | | | | | | | | | | | | | | | | | | | |
Total investment return (d) | | | 10.05 | % | | | (12.81 | %) | | | 5.17 | % | | | 20.31 | % | | | (33.36 | %) |
Ratios (to average net assets)/Supplemental Data: | | | | | | | | | | | | | | | | | | | | |
Net investment income (loss) | | | (0.22 | %) | | | 1.02 | % | | | 1.04 | %(b) | | | 1.41 | % | | | 2.10 | % |
Net expenses | | | 2.52 | % | | | 2.46 | % | | | 2.50 | % | | | 2.46 | % | | | 2.40 | % |
Expenses (before waiver/reimbursement) | | | 2.52 | % | | | 2.46 | % | | | 2.50 | % | | | 2.62 | % | | | 2.42 | % |
Portfolio turnover rate | | | 43 | % | | | 80 | % | | | 54 | % | | | 88 | % | | | 82 | % |
Net assets at end of year (in 000’s) | | $ | 16,186 | | | $ | 20,509 | | | $ | 31,314 | | | $ | 36,397 | | | $ | 37,098 | |
| ‡ | Less than one cent per share. |
| (a) | Per share data based on average shares outstanding during the year. |
| (b) | Included in net investment income per share and the ratio of net investment income to average net assets are $0.03 per share and 0.29%, respectively, resulting from a special one-time dividend from Ryanair Holdings PLC that paid $0.30 per share. |
| (c) | The redemption fee was discontinued as of April 1, 2010. |
| (d) | Total investment return is calculated exclusive of sales charges and assumes the reinvestment of dividends and distributions. |
| | | | |
| 18 | | MainStay International Equity Fund | | The notes to the financial statements are an integral part of,
and should be read in conjunction with, the financial statements. |
Financial Highlights selected per share data and ratios
| | | | | | | | | | | | | | | | | | | | |
| | | Class C | |
| | | Year ended October 31, | |
| | | 2012 | | | 2011 | | | 2010 | | | 2009 | | | 2008 | |
Net asset value at beginning of year | | $ | 9.96 | | | $ | 11.68 | | | $ | 11.32 | | | $ | 10.17 | | | $ | 16.98 | |
| | | | | | | | | | | | | | | | | | | | |
Net investment income (loss) (a) | | | (0.02 | ) | | | 0.12 | | | | 0.12 | (b) | | | 0.13 | | | | 0.29 | |
Net realized and unrealized gain (loss) on investments | | | 0.99 | | | | (1.50 | ) | | | 0.41 | | | | 1.61 | | | | (5.69 | ) |
Net realized and unrealized gain (loss) on foreign currency transactions | | | 0.00 | ‡ | | | (0.08 | ) | | | 0.07 | | | | 0.16 | | | | 0.27 | |
| | | | | | | | | | | | | | | | | | | | |
Total from investment operations | | | 0.97 | | | | (1.46 | ) | | | 0.60 | | | | 1.90 | | | | (5.13 | ) |
| | | | | | | | | | | | | | | | | | | | |
Less dividends and distributions: | | | | | | | | | | | | | | | | | | | | |
From net investment income | | | (0.19 | ) | | | (0.26 | ) | | | (0.24 | ) | | | (0.75 | ) | | | — | |
From net realized gain on investments | | | — | | | | — | | | | — | | | | — | | | | (1.68 | ) |
| | | | | | | | | | | | | | | | | | | | |
Total dividends and distributions | | | (0.19 | ) | | | (0.26 | ) | | | (0.24 | ) | | | (0.75 | ) | | | (1.68 | ) |
| | | | | | | | | | | | | | | | | | | | |
Redemption fee (a)(c) | | | — | | | | — | | | | 0.00 | ‡ | | | 0.00 | ‡ | | | 0.00 | ‡ |
| | | | | | | | | | | | | | | | | | | | |
Net asset value at end of year | | $ | 10.74 | | | $ | 9.96 | | | $ | 11.68 | | | $ | 11.32 | | | $ | 10.17 | |
| | | | | | | | | | | | | | | | | | | | |
Total investment return (d) | | | 10.05 | % | | | (12.88 | %) | | | 5.23 | % | | | 20.32 | % | | | (33.32 | %) |
Ratios (to average net assets)/Supplemental Data: | | | | | | | | | | | | | | | | | | | | |
Net investment income (loss) | | | (0.21 | %) | | | 1.07 | % | | | 1.09 | %(b) | | | 1.34 | % | | | 2.12 | % |
Net expenses | | | 2.52 | % | | | 2.46 | % | | | 2.50 | % | | | 2.46 | % | | | 2.39 | % |
Expenses (before waiver/reimbursement) | | | 2.52 | % | | | 2.46 | % | | | 2.50 | % | | | 2.60 | % | | | 2.41 | % |
Portfolio turnover rate | | | 43 | % | | | 80 | % | | | 54 | % | | | 88 | % | | | 82 | % |
Net assets at end of year (in 000’s) | | $ | 11,111 | | | $ | 12,960 | | | $ | 19,242 | | | $ | 19,079 | | | $ | 10,976 | |
| ‡ | Less than one cent per share. |
| (a) | Per share data based on average shares outstanding during the year. |
| (b) | Included in net investment income per share and the ratio of net investment income to average net assets are $0.03 per share and 0.29%, respectively, resulting from a special one-time dividend from Ryanair Holdings PLC that paid $0.30 per share. |
| (c) | The redemption fee was discontinued as of April 1, 2010. |
| (d) | Total investment return is calculated exclusive of sales charges and assumes the reinvestment of dividends and distributions. |
| | | | | | |
The notes to the financial statements are an integral part of,
and should be read in conjunction with, the financial statements. | | mainstayinvestments.com | | | 19 | |
Financial Highlights selected per share data and ratios
| | | | | | | | | | | | | | | | | | | | |
| | | Class I | |
| | | Year ended October 31, | |
| | | 2012 | | | 2011 | | | 2010 | | | 2009 | | | 2008 | |
Net asset value at beginning of year | | $ | 10.89 | | | $ | 12.75 | | | $ | 12.33 | | | $ | 11.05 | | | $ | 18.23 | |
| | | | | | | | | | | | | | | | | | | | |
Net investment income (loss) (a) | | | 0.13 | | | | 0.26 | | | | 0.29 | (b) | | | 0.29 | | | | 0.50 | |
Net realized and unrealized gain (loss) on investments | | | 1.07 | | | | (1.62 | ) | | | 0.43 | | | | 1.75 | | | | (6.16 | ) |
Net realized and unrealized gain (loss) on foreign currency transactions | | | 0.00 | ‡ | | | (0.09 | ) | | | 0.08 | | | | 0.18 | | | | 0.30 | |
| | | | | | | | | | | | | | | | | | | | |
Total from investment operations | | | 1.20 | | | | (1.45 | ) | | | 0.80 | | | | 2.22 | | | | (5.36 | ) |
| | | | | | | | | | | | | | | | | | | | |
Less dividends and distributions: | | | | | | | | | | | | | | | | | | | | |
From net investment income | | | (0.34 | ) | | | (0.41 | ) | | | (0.38 | ) | | | (0.94 | ) | | | (0.14 | ) |
From net realized gain on investments | | | — | | | | — | | | | — | | | | — | | | | (1.68 | ) |
| | | | | | | | | | | | | | | | | | | | |
Total dividends and distributions | | | (0.34 | ) | | | (0.41 | ) | | | (0.38 | ) | | | (0.94 | ) | | | (1.82 | ) |
| | | | | | | | | | | | | | | | | | | | |
Redemption fee (a)(c) | | | — | | | | — | | | | 0.00 | ‡ | | | 0.00 | ‡ | | | 0.00 | ‡ |
| | | | | | | | | | | | | | | | | | | | |
Net asset value at end of year | | $ | 11.75 | | | $ | 10.89 | | | $ | 12.75 | | | $ | 12.33 | | | $ | 11.05 | |
| | | | | | | | | | | | | | | | | | | | |
Total investment return (d) | | | 11.45 | % | | | (11.73 | %) | | | 6.61 | % | | | 22.01 | % | | | (32.44 | %) |
Ratios (to average net assets)/Supplemental Data: | | | | | | | | | | | | | | | | | | | | |
Net investment income (loss) | | | 1.15 | % | | | 2.16 | % | | | 2.40 | %(b) | | | 2.70 | % | | | 3.48 | % |
Net expenses | | | 1.18 | % | | | 1.21 | % | | | 1.18 | % | | | 1.08 | % | | | 1.03 | % |
Expenses (before waiver/reimbursement) | | | 1.18 | % | | | 1.21 | % | | | 1.18 | % | | | 1.17 | % | | | 1.05 | % |
Portfolio turnover rate | | | 43 | % | | | 80 | % | | | 54 | % | | | 88 | % | | | 82 | % |
Net assets at end of year (in 000’s) | | $ | 177,726 | | | $ | 184,373 | | | $ | 373,332 | | | $ | 387,245 | | | $ | 371,975 | |
| ‡ | Less than one cent per share. |
| (a) | Per share data based on average shares outstanding during the year. |
| (b) | Included in net investment income per share and the ratio of net investment income to average net assets are $0.03 per share and 0.29%, respectively, resulting from a special one-time dividend from Ryanair Holdings PLC that paid $0.30 per share. |
| (c) | The redemption fee was discontinued as of April 1, 2010. |
| (d) | Total investment return is calculated exclusive of sales charges and assumes the reinvestment of dividends and distributions. Class I shares are not subject to sales charges. |
| | | | |
| 20 | | MainStay International Equity Fund | | The notes to the financial statements are an integral part of,
and should be read in conjunction with, the financial statements. |
Financial Highlights selected per share data and ratios
| | | | | | | | | | | | | | | | | | | | |
| | | Class R1 | |
| | | Year ended October 31, | |
| | | 2012 | | | 2011 | | | 2010 | | | 2009 | | | 2008 | |
Net asset value at beginning of year | | $ | 10.82 | | | $ | 12.67 | | | $ | 12.25 | | | $ | 10.98 | | | $ | 18.13 | |
| | | | | | | | | | | | | | | | | | | | |
Net investment income (loss) (a) | | | 0.11 | | | | 0.26 | | | | 0.27 | (b) | | | 0.28 | | | | 0.49 | |
Net realized and unrealized gain (loss) on investments | | | 1.07 | | | | (1.62 | ) | | | 0.44 | | | | 1.74 | | | | (6.13 | ) |
Net realized and unrealized gain (loss) on foreign currency transactions | | | 0.00 | ‡ | | | (0.09 | ) | | | 0.08 | | | | 0.18 | | | | 0.30 | |
| | | | | | | | | | | | | | | | | | | | |
Total from investment operations | | | 1.18 | | | | (1.45 | ) | | | 0.79 | | | | 2.20 | | | | (5.34 | ) |
| | | | | | | | | | | | | | | | | | | | |
Less dividends and distributions: | | | | | | | | | | | | | | | | | | | | |
From net investment income | | | (0.33 | ) | | | (0.40 | ) | | | (0.37 | ) | | | (0.93 | ) | | | (0.13 | ) |
From net realized gain on investments | | | — | | | | — | | | | — | | | | — | | | | (1.68 | ) |
| | | | | | | | | | | | | | | | | | | | |
Total dividends and distributions | | | (0.33 | ) | | | (0.40 | ) | | | (0.37 | ) | | | (0.93 | ) | | | (1.81 | ) |
| | | | | | | | | | | | | | | | | | | | |
Redemption fee (a)(c) | | | — | | | | — | | | | 0.00 | ‡ | | | 0.00 | ‡ | | | 0.00 | ‡ |
| | | | | | | | | | | | | | | | | | | | |
Net asset value at end of year | | $ | 11.67 | | | $ | 10.82 | | | $ | 12.67 | | | $ | 12.25 | | | $ | 10.98 | |
| | | | | | | | | | | | | | | | | | | | |
Total investment return (d) | | | 11.41 | % | | | (11.89 | %) | | | 6.58 | % | | | 21.89 | % | | | (32.53 | %) |
Ratios (to average net assets)/Supplemental Data: | | | | | | | | | | | | | | | | | | | | |
Net investment income (loss) | | | 1.04 | % | | | 2.12 | % | | | 2.30 | %(b) | | | 2.58 | % | | | 3.40 | % |
Net expenses | | | 1.28 | % | | | 1.31 | % | | | 1.29 | % | | | 1.19 | % | | | 1.13 | % |
Expenses (before waiver/reimbursement) | | | 1.28 | % | | | 1.31 | % | | | 1.29 | % | | | 1.27 | % | | | 1.15 | % |
Portfolio turnover rate | | | 43 | % | | | 80 | % | | | 54 | % | | | 88 | % | | | 82 | % |
Net assets at end of year (in 000’s) | | $ | 4,677 | | | $ | 4,760 | | | $ | 6,225 | | | $ | 5,348 | | | $ | 2,755 | |
| ‡ | Less than one cent per share. |
| (a) | Per share data based on average shares outstanding during the year. |
| (b) | Included in net investment income per share and the ratio of net investment income to average net assets are $0.03 per share and 0.29%, respectively, resulting from a special one-time dividend from Ryanair Holdings PLC that paid $0.30 per share. |
| (c) | The redemption fee was discontinued as of April 1, 2010. |
| (d) | Total investment return is calculated exclusive of sales charges and assumes the reinvestment of dividends and distributions. Class R1 shares are not subject to sales charges. |
| | | | | | |
The notes to the financial statements are an integral part of,
and should be read in conjunction with, the financial statements. | | mainstayinvestments.com | | | 21 | |
Financial Highlights selected per share data and ratios
| | | | | | | | | | | | | | | | | | | | |
| | | Class R2 | |
| | | Year ended October 31, | |
| | | 2012 | | | 2011 | | | 2010 | | | 2009 | | | 2008 | |
Net asset value at beginning of year | | $ | 10.84 | | | $ | 12.69 | | | $ | 12.27 | | | $ | 10.99 | | | $ | 18.14 | |
| | | | | | | | | | | | | | | | | | | | |
Net investment income (loss) (a) | | | 0.09 | | | | 0.24 | | | | 0.25 | (b) | | | 0.16 | | | | 0.46 | |
Net realized and unrealized gain (loss) on investments | | | 1.06 | | | | (1.63 | ) | | | 0.43 | | | | 1.82 | | | | (6.14 | ) |
Net realized and unrealized gain (loss) on foreign currency transactions | | | 0.00 | ‡ | | | (0.09 | ) | | | 0.08 | | | | 0.19 | | | | 0.30 | |
| | | | | | | | | | | | | | | | | | | | |
Total from investment operations | | | 1.15 | | | | (1.48 | ) | | | 0.76 | | | | 2.17 | | | | (5.38 | ) |
| | | | | | | | | | | | | | | | | | | | |
Less dividends and distributions: | | | | | | | | | | | | | | | | | | | | |
From net investment income | | | (0.29 | ) | | | (0.37 | ) | | | (0.34 | ) | | | (0.89 | ) | | | (0.09 | ) |
From net realized gain on investments | | | — | | | | — | | | | — | | | | — | | | | (1.68 | ) |
| | | | | | | | | | | | | | | | | | | | |
Total dividends and distributions | | | (0.29 | ) | | | (0.37 | ) | | | (0.34 | ) | | | (0.89 | ) | | | (1.77 | ) |
| | | | | | | | | | | | | | | | | | | | |
Redemption fee (a)(c) | | | — | | | | — | | | | 0.00 | ‡ | | | 0.00 | ‡ | | | 0.00 | ‡ |
| | | | | | | | | | | | | | | | | | | | |
Net asset value at end of year | | $ | 11.70 | | | $ | 10.84 | | | $ | 12.69 | | | $ | 12.27 | | | $ | 10.99 | |
| | | | | | | | | | | | | | | | | | | | |
Total investment return (d) | | | 11.12 | % | | | (12.09 | %) | | | 6.32 | % | | | 21.53 | % | | | (32.63 | %) |
Ratios (to average net assets)/Supplemental Data: | | | | | | | | | | | | | | | | | | | | |
Net investment income (loss) | | | 0.82 | % | | | 2.02 | % | | | 2.09 | %(b) | | | 1.39 | % | | | 3.24 | % |
Net expenses | | | 1.53 | % | | | 1.55 | % | | | 1.54 | % | | | 1.50 | % | | | 1.38 | % |
Expenses (before waiver/reimbursement) | | | 1.53 | % | | | 1.55 | % | | | 1.54 | % | | | 1.54 | % | | | 1.40 | % |
Portfolio turnover rate | | | 43 | % | | | 80 | % | | | 54 | % | | | 88 | % | | | 82 | % |
Net assets at end of year (in 000’s) | | $ | 10,545 | | | $ | 12,176 | | | $ | 10,942 | | | $ | 7,826 | | | $ | 274 | |
| ‡ | Less than one cent per share. |
| (a) | Per share data based on average shares outstanding during the year. |
| (b) | Included in net investment income per share and the ratio of net investment income to average net assets are $0.03 per share and 0.29%, respectively, resulting from a special one-time dividend from Ryanair Holdings PLC that paid $0.30 per share. |
| (c) | The redemption fee was discontinued as of April 1, 2010. |
| (d) | Total investment return is calculated exclusive of sales charges and assumes the reinvestment of dividends and distributions. Class R2 shares are not subject to sales charges. |
| | | | |
| 22 | | MainStay International Equity Fund | | The notes to the financial statements are an integral part of,
and should be read in conjunction with, the financial statements. |
Financial Highlights selected per share data and ratios
| | | | | | | | | | | | | | | | | | | | |
| | | Class R3 | |
| | | Year ended October 31, | |
| | | 2012 | | | 2011 | | | 2010 | | | 2009 | | | 2008 | |
Net asset value at beginning of year | | $ | 10.79 | | | $ | 12.64 | | | $ | 12.24 | | | $ | 10.95 | | | $ | 18.10 | |
| | | | | | | | | | | | | | | | | | | | |
Net investment income (loss) (a) | | | 0.06 | | | | 0.24 | | | | 0.24 | (b) | | | 0.26 | | | | 0.42 | |
Net realized and unrealized gain (loss) on investments | | | 1.06 | | | | (1.65 | ) | | | 0.41 | | | | 1.72 | | | | (6.13 | ) |
Net realized and unrealized gain (loss) on foreign currency transactions | | | 0.00 | ‡ | | | (0.09 | ) | | | 0.07 | | | | 0.17 | | | | 0.30 | |
| | | | | | | | | | | | | | | | | | | | |
Total from investment operations | | | 1.12 | | | | (1.50 | ) | | | 0.72 | | | | 2.15 | | | | (5.41 | ) |
| | | | | | | | | | | | | | | | | | | | |
Less dividends and distributions: | | | | | | | | | | | | | | | | | | | | |
From net investment income | | | (0.27 | ) | | | (0.35 | ) | | | (0.32 | ) | | | (0.86 | ) | | | (0.06 | ) |
From net realized gain on investments | | | — | | | | — | | | | — | | | | — | | | | (1.68 | ) |
| | | | | | | | | | | | | | | | | | | | |
Total dividends and distributions | | | (0.27 | ) | | | (0.35 | ) | | | (0.32 | ) | | | (0.86 | ) | | | (1.74 | ) |
| | | | | | | | | | | | | | | | | | | | |
Redemption fee (a)(c) | | | — | | | | — | | | | 0.00 | ‡ | | | 0.00 | ‡ | | | 0.00 | ‡ |
| | | | | | | | | | | | | | | | | | | | |
Net asset value at end of year | | $ | 11.64 | | | $ | 10.79 | | | $ | 12.64 | | | $ | 12.24 | | | $ | 10.95 | |
| | | | | | | | | | | | | | | | | | | | |
Total investment return (d) | | | 10.82 | % | | | (12.28 | %) | | | 5.99 | % | | | 21.31 | % | | | (32.86 | %) |
Ratios (to average net assets)/Supplemental Data: | | | | | | | | | | | | | | | | | | | | |
Net investment income (loss) | | | 0.56 | % | | | 1.98 | % | | | 2.00 | %(b) | | | 2.45 | % | | | 2.93 | % |
Net expenses | | | 1.78 | % | | | 1.80 | % | | | 1.79 | % | | | 1.69 | % | | | 1.63 | % |
Expenses (before waiver/reimbursement) | | | 1.78 | % | | | 1.80 | % | | | 1.79 | % | | | 1.77 | % | | | 1.65 | % |
Portfolio turnover rate | | | 43 | % | | | 80 | % | | | 54 | % | | | 88 | % | | | 82 | % |
Net assets at end of year (in 000’s) | | $ | 2,218 | | | $ | 1,592 | | | $ | 737 | | | $ | 322 | | | $ | 37 | |
| ‡ | Less than one cent per share. |
| (a) | Per share data based on average shares outstanding during the year. |
| (b) | Included in net investment income per share and the ratio of net investment income to average net assets are $0.03 per share and 0.29%, respectively, resulting from a special one-time dividend from Ryanair Holdings PLC that paid $0.30 per share. |
| (c) | The redemption fee was discontinued as of April 1, 2010. |
| (d) | Total investment return is calculated exclusive of sales charges and assumes the reinvestment of dividends and distributions. Class R3 shares are not subject to sales charges. |
| | | | | | |
The notes to the financial statements are an integral part of,
and should be read in conjunction with, the financial statements. | | mainstayinvestments.com | | | 23 | |
Notes to Financial Statements
Note 1–Organization and Business
The MainStay Funds (the “Trust”) was organized on January 9, 1986, as a Massachusetts business trust. The Trust is registered under the Investment Company Act of 1940, as amended (the “1940 Act”), as an open-end investment management company, and is comprised of twelve funds (collectively referred to as the “Funds”). These financial statements and notes relate only to the MainStay International Equity Fund (the “Fund”), a diversified fund.
The Fund currently offers eight classes of shares. Class A shares commenced operations on January 3, 1995. Class B shares commenced operations on September 13, 1994. Class C shares commenced operations on September 1, 1998. Class I, Class R1 and Class R2 shares commenced operations on January 2, 2004. Class R3 shares commenced operations on April 28, 2006. Investor Class shares commenced operations on February 28, 2008. Investor Class and Class A shares are offered at net asset value (“NAV”) per share plus an initial sales charge. No sales charge applies to investments of $1 million or more (and certain other qualified purchases) in Investor Class and Class A shares, but a contingent deferred sales charge (“CDSC”) is imposed on certain redemptions made within one year of the date of purchase. Class B and Class C shares are offered at NAV without an initial sales charge, although a declining CDSC may be imposed on redemptions made within six years of the date of purchase of Class B shares and a 1.00% CDSC may be imposed on redemptions made within one year of the date of purchase of Class C shares. Class I, Class R1, Class R2 and Class R3 shares are offered at NAV and are not subject to a sales charge. Depending upon eligibility, Class B shares convert to either Investor Class or Class A shares at the end of the calendar quarter eight years after the date they were purchased. Additionally, depending upon eligibility, Investor Class shares may convert to Class A shares and Class A shares may convert to Investor Class shares. The eight classes of shares have the same voting (except for issues that relate solely to one class), dividend, liquidation and other rights, and the same terms and conditions, except that Class B and Class C shares are subject to higher distribution and/or service fee rates than Investor Class, Class A, Class R2 and Class R3 shares under a distribution plan pursuant to Rule 12b-1 under the 1940 Act. Class I and Class R1 shares are not subject to a distribution and/or service fee. Class R1, Class R2 and Class R3 shares are subject to a shareholder service fee. This is in addition to any fees paid under a distribution plan, where applicable.
The Fund’s investment objective is to seek long-term growth of capital.
Prior to February 28, 2012, the investment objective of the Fund was to seek long-term growth of capital commensurate with an acceptable level of risk by investing in a portfolio consisting primarily of non-U.S. equity securities. Current income was a secondary objective.
Note 2–Significant Accounting Policies
The Fund prepares its financial statements in accordance with generally accepted accounting principles (“GAAP”) in the United States of America and follows the significant accounting policies described below.
(A) Securities Valuation. Investments are valued as of the close of regular trading on the New York Stock Exchange (“Exchange”)
(generally 4:00 p.m. Eastern time) on each day the Fund is open for business (“valuation date”).
The Board of Trustees (the “Board”) has adopted procedures for the valuation of the Fund’s securities and has delegated the responsibility for valuation determination under those procedures to the Valuation Committee of the Fund (the “Valuation Committee”). The Board has authorized the Valuation Committee to appoint a Valuation Sub-Committee (the “Sub-Committee”) to deal in the first instance with questions that arise or cannot be resolved under these procedures. The Sub-Committee will meet (in person, via electronic mail or via teleconference) on an as-needed basis. The Valuation Committee shall meet at a later time, as necessary, to ensure that actions taken by the Sub-Committee were appropriate. The procedures recognize that, subject to the oversight of the Board and unless otherwise noted, the responsibility for day-to-day valuation of portfolio assets (including securities for which market prices are not readily available) rests with New York Life Investment Management LLC (“New York Life Investments” or the “Manager”), aided to whatever extent necessary by the Subadvisor (as defined in Note 3(A)) of the Fund. These procedures shall be reviewed by the Board no less frequently than annually. Any revisions to these procedures deemed necessary shall be reported to the Board at its next regularly scheduled meeting.
Securities are valued using unadjusted market prices, when available, as supplied primarily by third party pricing services or dealers. To assess the appropriateness of security valuations, the Manager or the Fund’s third party service provider who is subject to oversight by the Manager, regularly compares prior day prices, prices on comparable securities and the sale prices to the prior and current day prices and challenges prices exceeding certain tolerance levels with third party pricing services or broker sources. For those securities valued by recommendation, whether through a standardized fair valuation methodology or a fair valuation determination, the Valuation Committee reviews and affirms the reasonableness of the valuation based on such methodologies and determinations on a regular basis after considering all relevant information that is reasonably available.
“Fair value” is defined as the price that the Fund would receive upon selling an investment in an orderly transaction to an independent buyer in the principal or most advantageous market of the investment. Fair value measurements are determined within a framework that has established a three-tier hierarchy which maximizes the use of observable market data and minimizes the use of unobservable inputs to establish classification of fair value measurements for disclosure purposes. “Inputs” refer broadly to the assumptions that market participants would use in pricing the asset or liability, including assumptions about risk, such as the risk inherent in a particular valuation technique used to measure fair value using a pricing model and/or the risk inherent in the inputs for the valuation technique. Inputs may be observable or unobservable. Observable inputs reflect the assumptions market participants would use in pricing the asset or liability based on market data obtained from sources independent of the Fund. Unobservable inputs reflect the Fund’s own assumptions about the assumptions market participants would use in pricing the asset or liability developed based on the information available in the circumstances. The inputs or methodology used for valuing securities may not be an indication of the
| | |
| 24 | | MainStay International Equity Fund |
risks associated with investing in those securities. The three-tier hierarchy of inputs is summarized in the three broad Levels listed below.
| • | | Level 1—quoted prices in active markets for identical investments |
| • | | Level 2—other significant observable inputs (including quoted prices for similar investments in active markets, interest rates and yield curves, prepayment speeds, credit risks, etc.) |
| • | | Level 3—significant unobservable inputs (including the Fund’s own assumptions about the assumptions that market participants would use in determining the fair value of investments) |
The aggregate value by input level, as of October 31, 2012, for the Fund’s investments is included at the end of the Fund’s Portfolio of Investments.
The valuation techniques used by the Fund to measure fair value maximize the use of observable inputs and minimize the use of unobservable inputs. The Fund may utilize third party vendor evaluations, whose prices may be derived from one or more of the following standard inputs:
| | |
• Benchmark Yields | | • Reported Trades |
• Broker Dealer Quotes | | • Issuer Spreads |
• Two-sided markets | | • Benchmark securities |
• Bids/Offers | | • Reference Data (corporate actions or material event notices) |
• Industry and economic events | | • Comparable bonds |
• Equity and credit default swap curves | | • Monthly payment information |
Securities for which market value cannot be determined using the methodologies described above are valued by methods deemed in good faith by the Fund’s Valuation Committee, following the procedures established by the Board, to represent fair value. Under these procedures, the Fund primarily employs a market-based approach which may use related or comparable assets or liabilities, recent transactions, market multiples, book values, and other relevant information. The Fund may also use an income-based valuation approach in which the anticipated future cash flows of the investment are discounted to calculate fair value. Discounts may also be applied due to the nature or duration of any restrictions on the disposition of the investments. Due to the inherent uncertainty of valuations of such investments, the fair values may differ significantly from the values that would have been used had an active market existed. For the year ended October 31, 2012, there have been no changes to the fair value methodologies.
Equity and non-equity securities which may be valued in this manner include, but are not limited to: (i) a security for which the trading has been halted or suspended; (ii) a debt security that has recently gone into default and for which there is not a current market quotation; (iii) a security of an issuer that has entered into a restructuring; (iv) a security that has been de-listed from a national exchange; (v) a security for which the market price is not available from a third party pricing source or, if so provided, does not, in the opinion of the Fund’s Manager or Subadvisor reflect the security’s market value; and (vi) a security whose principal market has been temporarily closed at a time when, under normal conditions, it would be open. Securities for which market quotations or observable inputs are not readily available are generally catego-
rized as Level 3 in the hierarchy. As of October 31, 2012, the Fund did not hold any securities that were fair valued in such a manner.
Certain events may occur between the time that foreign markets close, on which securities held by the Fund principally trade, and the time at which the Fund’s NAV is calculated. These events may include, but are not limited to, situations relating to a single issuer in a market sector, significant fluctuations in U.S. or foreign markets, natural disasters, armed conflicts, governmental actions or other developments not tied directly to the securities markets. Should the Manager or Subadvisor conclude that such events may have affected the accuracy of the last price of such securities reported on the local foreign market, the Manager or Subadvisor may, pursuant to procedures adopted by the Fund’s Board, adjust the value of the local price to reflect the impact on the price of such securities as a result of such events. In this instance, securities are generally categorized as Level 3 in the hierarchy. Additionally, foreign equity securities are also fair valued whenever the movement of a particular index exceeds certain thresholds. In such cases, the securities are fair valued by applying factors provided by a third party vendor in accordance with the Fund’s policies and procedures and are generally categorized as Level 2 in the hierarchy. As of October 31, 2012, foreign equity securities held by the Fund were not fair valued in such a manner.
Equity securities and Exchange Traded Funds are valued at the latest quoted sales prices as of the close of regular trading on the Exchange on each valuation date. Securities that are not traded on the valuation date are valued at the mean of the latest quoted bid and ask prices. Prices normally are taken from the principal market in which each security trades. Futures contracts are valued at the last posted settlement price on the market where such futures are primarily traded. Options contracts are valued at the last posted settlement price on the market where such options are principally traded. Investments in other mutual funds are valued at their respective NAV as of the close of the Exchange on the valuation date. These securities are generally categorized as Level 1 in the hierarchy.
Temporary cash investments acquired over 60 days to maturity are valued using the latest bid prices or using valuations based on a matrix system (which considers such factors as security prices, yields, maturities, and ratings), both as furnished by independent pricing services. Other temporary cash investments which mature in 60 days or less (“Short-Term Investments”) are valued at amortized cost. The amortized cost method involves valuing a security at its cost on the date of purchase and thereafter assuming a constant amortization to maturity of the difference between such cost and the value on maturity date. Amortized cost approximates the current fair value of a security. Securities valued at amortized cost are not valued using a quoted price in an active market. These securities are generally categorized as Level 2 in the hierarchy.
Foreign currency forward contracts are valued at their fair market values determined on the basis of the mean between the last current bid and ask prices based on dealer or exchange quotations and are generally categorized as Level 2 in the hierarchy.
(B) Income Taxes. The Fund’s policy is to comply with the requirements of the Internal Revenue Code of 1986, as amended (the “Internal Revenue Code”), applicable to regulated investment companies and to
| | | | |
| mainstayinvestments.com | | | 25 | |
Notes to Financial Statements (continued)
distribute all of the taxable income to the shareholders of the Fund within the allowable time limits. Therefore, no federal, state and local income tax provision is required.
Management evaluates its tax positions to determine if the tax positions taken meet the minimum recognition threshold in connection with accounting for uncertainties in income tax positions taken or expected to be taken for the purposes of measuring and recognizing tax liabilities in the financial statements. Recognition of tax benefits of an uncertain tax position is required only when the position is “more likely than not” to be sustained assuming examination by taxing authorities. Management has analyzed the Fund’s tax positions taken on federal, state and local income tax returns for all open tax years (for up to three tax years), and has concluded that no provision for federal, state and local income tax are required in the Fund’s financial statements. The Fund’s federal, state and local income and federal excise tax returns for tax years for which the applicable statutes of limitations have not expired are subject to examination by the Internal Revenue Service and state and local departments of revenue.
(C) Foreign Taxes. Investment income received by the Fund from foreign sources may be subject to foreign income taxes. These foreign income taxes are generally withheld at the source, and a portion of which may be recoverable. The Fund will accrue such taxes and recoveries as applicable, based upon its current interpretation of tax rules and regulations that exist in the markets in which it invests.
The Fund may be subject to taxation on realized capital gains, repatriation proceeds and other transaction-based taxes imposed by certain countries in which it invests. The Fund will accrue such taxes as applicable based upon their current interpretation of tax rules and regulations that exist in the market in which they invest. Capital gains taxes relating to positions still held are reflected as a liability on the Statement of Assets and Liabilities, as well as an adjustment to the Fund’s net unrealized appreciation (depreciation). Taxes related to capital gains realized during the year ended October 31, 2012, if any, are reflected as part of net realized gain (loss) in the Statement of Operations. Changes in tax liabilities related to capital gains taxes on unrealized investment gains, if any, are reflected as part of the change in net unrealized appreciation (depreciation) on investments in the Statement Operations. Transaction-based charges are generally assessed as a percentage of the transaction amount.
(D) Dividends and Distributions to Shareholders. Dividends and distributions are recorded on the ex-dividend date. The Fund intends to declare and pay dividends of net investment income and distributions of net realized capital and currency gains, if any, at least annually. Unless the shareholder elects otherwise, all dividends and distributions are reinvested in the same class of shares of the Fund, at NAV. Dividends and distributions to shareholders are determined in accordance with federal income tax regulations and may differ from GAAP.
(E) Security Transactions and Investment Income. The Fund records security transactions on the trade date. Realized gains and losses on security transactions are determined using the identified cost method. Dividend income is recognized on the ex-dividend date and interest income is accrued as earned using the effective interest rate method. Discounts and premiums on securities purchased, other than
Short-Term Investments, for the Fund are accreted and amortized, respectively, on the effective interest rate method over the life of the respective securities or, in the case of a callable security, over the period to the first date of call. Discounts and premiums on Short-Term Investments are accreted and amortized, respectively, on the straight-line method.
Investment income and realized and unrealized gains and losses on investments of the Fund are allocated to separate classes of shares pro rata based upon their relative net assets on the date the income is earned or realized and unrealized gains and losses are incurred.
(F) Expenses. Expenses of the Trust are allocated to the individual Funds in proportion to the net assets of the respective Funds when the expenses are incurred, except where direct allocations of expenses can be made. Expenses (other than transfer agent expenses and fees incurred under the shareholder services plans and the distribution plans further discussed in Note 3(B)) are allocated to separate classes of shares pro rata based upon their relative net assets on the date the expenses are incurred. The expenses borne by the Fund, including those of related parties to the Fund, are shown in the Statement of Operations.
(G) Use of Estimates. In preparing financial statements in conformity with GAAP, management makes estimates and assumptions that affect the reported amounts and disclosures in the financial statements. Actual results could differ from those estimates.
(H) Repurchase Agreements. The Fund may enter into repurchase agreements to earn income. The Fund may enter into repurchase agreements only with financial institutions that are deemed by the Manager or Subadvisor to be creditworthy, pursuant to guidelines established by the Fund’s Board. During the term of any repurchase agreement, the Manager will continue to monitor the creditworthiness of the seller. Under the 1940 Act, repurchase agreements are considered to be collateralized loans by a Fund to the seller secured by the securities transferred to the Fund.
When the Fund invests in repurchase agreements, the Fund’s custodian takes possession of the collateral pledged for investments in the repurchase agreement. The underlying collateral is valued daily on a mark-to-market basis to determine that the value, including accrued interest, exceeds the repurchase price. In the event of the seller’s default on the obligation to repurchase, the Fund has the right to liquidate the collateral and apply the proceeds in satisfaction of the obligation. Under certain circumstances, such as in the event of default or bankruptcy by the counterparty to the agreement, realization and/or retention of the collateral may be subject to legal proceedings and possible realized loss to the Fund.
(I) Written and Purchased Options. The Fund may write covered call and put options on its portfolio securities or foreign currencies. These securities are subject to equity price risk in the normal course of investing in these transactions. An amount equal to the premium received is recorded as a liability and subsequently marked to market to reflect the current value of the option written. The liabilities are subsequently adjusted and unrealized appreciation or depreciation is recorded to reflect the current value of the options written. Premiums received from writing options that expire are treated as realized gains. Premiums received from writing options that are exercised or are cancelled in
| | |
| 26 | | MainStay International Equity Fund |
closing purchase transactions are added to the proceeds or netted against the amount paid on the transaction to determine the realized gain or loss. When writing a covered call option, the Fund, in return for the premium on the option, gives up the opportunity to profit from a price increase in the underlying securities above the exercise price. The Fund, in exchange for the premium, accepts the risk of a decline in the market value of the underlying security or foreign currency below the exercise price. A call option may be covered by the call writer’s owning the underlying security throughout the option period. A call option may also be covered by the call writer’s maintaining liquid assets valued at greater than the exercise price of the call written. However, as long as the obligation as the writer continues, the Fund has retained the risk of loss should the price of the underlying security decline. After writing a put option, the Fund may incur risk exposure equal to the difference between the exercise price of the option and the sum of the market value of the underlying security plus the premium received from the sale of the option. The Fund writes covered call options to try to realize greater return on the sale of a stock. The Fund writes put options to help protect against unanticipated adverse developments.
The Fund may purchase call and put options on its portfolio securities or foreign currencies. The Fund may purchase call options to protect against an increase in the price of the security or foreign currency it anticipates purchasing. The Fund may purchase put options on its securities or foreign currencies to protect against a decline in the value of the security or foreign currency or to close out covered written put positions. The Fund may also purchase options to seek to enhance returns. Risks may arise from an imperfect correlation between the change in market value of the securities or foreign currencies held by the Fund and the prices of options relating to the securities or foreign currencies purchased or sold by the Fund and from the possible lack of a liquid secondary market for an option. The maximum risk exposure for any purchased option is limited to the premium initially paid for the option. As of October 31, 2012, the Fund did not hold any purchased or written options.
(J) Rights and Warrants. A right is a certificate that permits the holder to purchase a certain number of shares, or a fractional share, of a new stock from the issuer at a specific price. A warrant is an instrument that entitles the holder to buy an equity security at a specific price for a specific period of time. The Fund may enter into rights and warrants when securities are acquired through a corporate action. With respect to warrants in international markets, the securities are only purchased when the underlying security cannot be purchased due to the many restrictions an industry and/or country might place on foreign investors. These investments can provide a greater potential for profit or loss than an equivalent investment in the underlying security. Prices of these investments do not necessarily move in tandem with the prices of the underlying securities.
There is risk involved in the purchase of rights and warrants in that these investments are speculative investments. The Fund could also lose the entire value of its investment in warrants if the warrant is not exercised by the date of its expiration. The securities are sold as soon as the opportunity becomes available. The Fund is exposed to risk until each sale is completed. As of October 31, 2012, the Fund did not hold any rights or warrants.
(K) Futures Contracts. A futures contract is an agreement to purchase or sell a specified quantity of an underlying instrument at a specified future date and price, or to make or receive a cash payment based on the value of a financial instrument (e.g., foreign currency, interest rate, security, or securities index). During the period the futures contract is open, changes in the value of the contract are recognized as unrealized appreciation or depreciation by “marking-to-market” such contract on a daily basis to reflect the market value of the contract at the end of each day’s trading. The Fund agrees to receive from or pay to the broker an amount of cash equal to the daily fluctuation in the value of the contract. Such receipts or payments are known as “variation margin.” When the futures contract is closed, the Fund records a realized gain or loss equal to the difference between the proceeds from (or cost of) the closing transaction and the Fund’s basis in the contract. The Fund enters into futures contracts for hedging purposes and market exposure.
The use of futures contracts involves, to varying degrees, elements of market risk in excess of the amount recognized in the Statement of Assets and Liabilities. The contract or notional amounts and variation margin reflect the extent of the Fund’s involvement in open futures positions. Risks arise from the possible imperfect correlation in movements in the price of futures contracts, interest rates and the underlying hedged assets, and the possible inability of counterparties to meet the terms of their contracts. However, the Fund’s activities in futures contracts have minimal counterparty risk as they are conducted through regulated exchanges that guarantee the futures against default by the counterparty. In the event of a bankruptcy or insolvency of a futures commission merchant that holds margin on behalf of the Fund, the Fund may not be entitled to the return of all of the margin owed to the Fund, potentially resulting in a loss. The Fund may also enter into futures contracts traded on foreign futures exchanges such as those located in Frankfurt, Tokyo, London or Paris as long as trading on foreign exchanges does not subject a Fund to risks that are materially greater than the risks associated with trading on U.S. exchanges. The Fund’s investment in futures contracts and other derivatives may increase the volatility of the Fund’s NAV and may result in a loss to the Fund. The Fund invests in futures contracts to reduce the Fund’s return volatility. As of October 31, 2012, the Fund did not hold any futures contracts.
(L) Foreign Currency Forward Contracts. The Fund may enter into foreign currency forward contracts, which are agreements to buy or sell currencies of different countries on a specified future date at a specified rate. The Fund is subject to foreign currency exchange rate risk in the normal course of investing in these transactions. During the period the forward contract is open, changes in the value of the contract are recognized as unrealized appreciation or depreciation by “marking-to-market” such contract on a daily basis to reflect the market value of the contract at the end of each day’s trading. Cash movement occurs on settlement date. When the forward contract is closed, the Fund records a realized gain or loss equal to the difference between the proceeds from (or cost of) the closing transaction and the Fund’s basis in the contract. The Fund may enter into foreign currency forward contracts to reduce currency risk versus the benchmark or for trade settlement.
The use of foreign currency forward contracts involves, to varying degrees, elements of market risk in excess of the amount recognized in the Statement of Assets and Liabilities. The contract amount reflects the
| | | | |
| mainstayinvestments.com | | | 27 | |
Notes to Financial Statements (continued)
extent of the Fund’s involvement in these financial instruments. Risks arise from the possible movements in the foreign exchange rates underlying these instruments. While the Fund may enter into forward contracts to reduce currency exchange risks, changes in currency exchange rates may result in poorer overall performance for the Fund than if it had not engaged in such transactions. Exchange rate movements can be large, depending on the currency, and can last for extended periods of time, affecting the value of the Fund’s assets. Moreover, there may be an imperfect correlation between the Fund’s holdings of securities denominated in a particular currency and the forward contracts entered into by the Fund. Such imperfect correlation may prevent the Fund from achieving the intended hedge or expose the Fund to the risk of currency exchange loss. The unrealized appreciation (depreciation) on forward contracts reflects the Fund’s exposure at valuation date to credit loss in the event of a counterparty’s failure to perform its obligations. As of October 31, 2012, the Fund did not hold any foreign currency forward contracts.
(M) Foreign Currency Transactions. The books and records of the Fund are kept in U.S. dollars. Prices of securities denominated in foreign currency amounts are translated into U.S. dollars at the mean between the buying and selling rates last quoted by any major U.S. bank at the following dates:
| (i) | market value of investment securities, other assets and liabilities—at the valuation date, and |
| (ii) | purchases and sales of investment securities, income and expenses—at the date of such transactions. |
The assets and liabilities that are denominated in foreign currency amounts are presented at the exchange rates and market values at the close of the period. The realized and unrealized changes in net assets arising from fluctuations in exchange rates and market prices of securities are not separately presented.
Net realized gain (loss) on foreign currency transactions represents net gains and losses on foreign currency forward contracts, net currency gains or losses realized as a result of differences between the amounts of securities sale proceeds or purchase cost, dividends, interest and withholding taxes as recorded on the Fund’s books, and the U.S. dollar equivalent amount actually received or paid. Net currency gains or losses from valuing such foreign currency denominated assets and liabilities, other than investments at valuation date exchange rates, are reflected in unrealized foreign exchange gains or losses.
(N) Securities Lending. In order to realize additional income, the Fund may engage in securities lending, subject to the limitations set forth in the 1940 Act, and relevant guidance by the staff of the Securities and Exchange Commission. In the event the Fund does engage in securities lending, the Fund will lend through its custodian, State Street Bank and Trust Company (“State Street”). State Street will manage the Fund’s cash collateral in accordance with the Lending Agreement between the Fund and State Street, and indemnify the Fund’s portfolio against counterparty risk. The loans will be collateralized by cash or securities at least equal at all times to the market value of the securities loaned. Collateral will consist of U.S. government securities, cash equivalents or irrevocable letters of credit. The Fund may bear the risk of delay in recovery of, or loss of rights in, the securities loaned should the borrower of the securities experience financial difficulty. The Fund
may also record realized gain or loss on securities deemed sold due to a borrower’s inability to return securities on loan. The Fund will receive compensation for lending its securities in the form of fees or the retention of a portion of the interest on the investment of any cash received as collateral. The Fund also will continue to receive interest and dividends on the securities loaned and any gain or loss in the market price of the securities loaned that may occur during the term of the loan will be for the account of the Fund.
Although the Fund and New York Life Investments have temporarily suspended securities lending, the Fund and New York Life Investments reserves the right to reinstitute lending when deemed appropriate. The Fund had no portfolio securities on loan as of October 31, 2012.
(O) Concentration of Risk. The Fund invests in foreign securities, which carry certain risks that are in addition to the usual risks inherent in domestic instruments. These risks include those resulting from currency fluctuations, future adverse political and economic developments and possible imposition of currency exchange blockages or other foreign governmental laws or restrictions. These risks are likely to be greater in emerging markets than in developed markets. The ability of issuers of securities held by the Fund to meet their obligations may be affected by economic and political developments in a specific country, industry or region.
(P) Indemnifications. Under the Trust’s organizational documents, its officers and trustees are indemnified against certain liabilities that may arise out of performance of their duties to the Trust. Additionally, in the normal course of business, the Fund enters into contracts with third-party service providers that contain a variety of representations and warranties and which may provide general indemnifications. The Fund’s maximum exposure under these arrangements is unknown, as this would involve future claims that may be made against the Fund that have not yet occurred. Based on experience, management is of the view that the risk of loss in connection with these potential indemnification obligations is remote. However, there can be no assurance that material liabilities related to such obligations will not arise in the future, which could adversely impact the Fund.
Note 3–Fees and Related Party Transactions
(A) Manager and Subadvisor. New York Life Investments, a registered investment adviser and an indirect, wholly-owned subsidiary of New York Life Insurance Company (“New York Life”), serves as the Fund’s Manager, pursuant to an Amended and Restated Management Agreement (“Management Agreement”). The Manager provides offices, conducts clerical, recordkeeping and bookkeeping services, and keeps most of the financial and accounting records required to be maintained by the Fund. Except for the portion of salaries and expenses that are the responsibility of the Fund, the Manager pays the salaries and expenses of all personnel affiliated with the Fund and certain operational expenses of the Fund. The Fund reimburses New York Life Investments in an amount equal to a portion of the salary of the Chief Compliance Officer (“CCO”) of the Fund. Madison Square Investors LLC (“Madison Square Investors” or “Subadvisor”), a registered investment adviser and an indirect, wholly-owned subsidiary of New York Life, serves as Subadvisor to the Fund and is responsible for the day-to-day portfolio management of the Fund. Pursuant to the terms of a Subadvisory Agreement (“Subadvisory Agreement”) between New York Life Investments and Madison Square
| | |
| 28 | | MainStay International Equity Fund |
Investors, New York Life Investments pays for the services of the Subadvisor.
The Fund pays the Manager a monthly fee for services performed and facilities furnished at an annual rate of the Fund’s average daily net assets as follows: 0.90% up to $500 million and 0.85% in excess of $500 million, plus a fee for fund accounting services furnished at an annual rate of the Fund’s average daily net assets as follows: 0.05% up to $20 million; 0.0333% from $20 million to $100 million; and 0.01% in excess of $100 million. The effective management fee rate was 0.92% for the year ended October 31, 2012, inclusive of the effective fund accounting services rate of 0.02% of the Fund’s average daily net assets.
New York Life Investments has voluntarily agreed to waive fees and/or reimburse expenses so that Total Annual Fund Operating Expenses of a class do not exceed the following percentages of average daily net assets: Investor Class, 1.85%; Class B, 2.60%; and Class C, 2.60%. These voluntary waivers or reimbursements may be discontinued at any time. Total Annual Fund Operating Expenses excludes taxes, interest, litigation, extraordinary expenses, brokerage and other transaction expenses relating to the purchase or sale of portfolio investments, and acquired (underlying) fund fees and expenses.
For the year ended October 31, 2012, New York Life Investments earned fees from the Fund in the amount of $2,897,372.
State Street, 1 Lincoln Street, Boston, Massachusetts 02111, provides sub-administration and sub-accounting services to the Fund pursuant to an agreement with New York Life Investments. These services include calculating the daily NAVs of the Fund, maintaining the general ledger and sub-ledger accounts for the calculation of the Fund’s respective NAVs, and assisting New York Life Investments in conducting various aspects of the Fund’s administrative operations. For providing these services to the Fund, State Street is compensated by New York Life Investments.
(B) Distribution, Service and Shareholder Service Fees. The Trust, on behalf of the Fund, has entered into a distribution agreement with NYLIFE Distributors LLC (the “Distributor”), an indirect, wholly-owned subsidiary of New York Life. The Fund has adopted distribution plans (the “Plans”) in accordance with the provisions of Rule 12b-1 under the 1940 Act.
Pursuant to the Investor Class, Class A and Class R2 Plans, the Distributor receives a monthly distribution fee from the Investor Class, Class A and Class R2 shares, at an annual rate of 0.25% of the average daily net assets of the Investor Class, Class A and Class R2 shares for distribution and/or service activities as designated by the Distributor. Pursuant to the Class B and Class C Plans, Class B and Class C shares pay the Distributor a monthly distribution fee at an annual rate of 0.75% of the average daily net assets of the Class B and Class C shares, along with a service fee at an annual rate of 0.25% of the average daily net assets of the Class B and Class C shares, for a total 12b-1 fee of 1.00%. Pursuant to the Class R3 Plan, the Distributor receives a monthly distribution and/or service fee from the Class R3 shares at an annual rate of 0.50% of the average daily net assets of the Class R3 shares. Class I and Class R1 shares are not subject to a distribution and/or service fee.
The Plans provide that the distribution and service fees are payable to the Distributor regardless of the amounts actually expended by the Distributor for distribution of the Fund’s shares and service activities.
In accordance with the Shareholder Services Plans for the Class R1, Class R2 and Class R3 shares, the Manager has agreed to provide, through its affiliates or independent third parties, various shareholder and administrative support services to shareholders of the Class R1, Class R2 and Class R3 shares. For its services, the Manager is entitled to a Shareholder Service Fee accrued daily and paid monthly at an annual rate of 0.10% of the average daily net assets of the Class R1, Class R2 and Class R3 shares. This is in addition to any fees paid under a distribution plan, where applicable.
Shareholder Service Fees incurred by the Fund for the year ended October 31, 2012, were as follows:
| | | | |
Class R1 | | $ | 4,678 | |
Class R2 | | | 11,879 | |
Class R3 | | | 1,897 | |
(C) Sales Charges. The Fund was advised by the Distributor that the amount of sales charges retained on sales of Investor Class and Class A shares were $9,706 and $5,674, respectively, for the year ended October 31, 2012. The Fund was also advised that the Distributor retained CDSCs on redemptions of Investor Class, Class A, Class B and Class C shares of $26, $1,243, $29,122 and $1,613, respectively, for the year ended October 31, 2012.
(D) Transfer, Dividend Disbursing and Shareholder Servicing Agent. NYLIM Service Company LLC, an affiliate of New York Life Investments, is the Fund’s transfer, dividend disbursing and shareholder servicing agent pursuant to an agreement between NYLIM Service Company LLC and the Trust. NYLIM Service Company LLC has entered into an agreement with Boston Financial Data Services, Inc. (“BFDS”) pursuant to which BFDS performs certain transfer agent services on behalf of NYLIM Service Company LLC. Transfer agent expenses incurred by the Fund for the year ended October 31, 2012, were as follows:
| | | | |
Investor Class | | $ | 166,629 | |
Class A | | | 94,699 | |
Class B | | | 87,305 | |
Class C | | | 57,080 | |
Class I | | | 252,883 | |
Class R1 | | | 6,977 | |
Class R2 | | | 17,766 | |
Class R3 | | | 2,812 | |
(E) Small Account Fee. Shareholders with small accounts adversely impact the cost of providing transfer agency services. In an effort to reduce total transfer agency expenses, the Fund has implemented a small account fee on certain types of accounts. Certain shareholders with an account balance of less than $1,000 are charged an annual per account fee of $20 (assessed semi-annually), the proceeds from which offset transfer agent fees as reflected in the Statement of Operations.
| | | | |
| mainstayinvestments.com | | | 29 | |
Notes to Financial Statements (continued)
(F) Capital. As of October 31, 2012, New York Life and its affiliates beneficially held shares of the Fund with the following values and percentages of net assets as follows:
| | | | | | | | |
Class I | | $ | 55,721,253 | | | | 31.4 | % |
Note 4–Federal Income Tax
As of October 31, 2012, the components of accumulated gain (loss) on a tax basis were as follows:
| | | | | | | | | | | | | | | | |
Ordinary Income | | Accumulated
Capital and
Other Gain
(Loss) | | | Other
Temporary
Differences | | | Unrealized
Appreciation
(Depreciation) | | | Total
Accumulated Gain (Loss) | |
| $2,688,911 | | $ | (127,272,881 | ) | | $ | — | | | $ | 34,074,677 | | | $ | (90,509,293 | ) |
The difference between book basis and tax basis unrealized appreciation (depreciation) is primarily due to wash sale adjustments.
The following table discloses the current year reclassifications between undistributed net investment income (loss), accumulated net realized gain (loss) on investments, and additional paid-in capital arising from permanent differences; net assets as of October 31, 2012 were not affected.
| | | | | | | | |
Undistributed Net Investment Income (Loss) | | Accumulated Net Realized Gain (Loss)
on Investments | | | Additional Paid-In Capital | |
| $(13,763) | | $ | 13,763 | | | $ | — | |
The reclassifications for the Fund are primarily due to foreign currency gain (loss).
Under the Regulated Investment Company Modernization Act of 2010, the Fund is permitted to carry forward capital losses incurred in taxable
years beginning after December 22, 2010, for an unlimited period. However, any losses incurred during those future years will be required to be utilized prior to the losses incurred in pre-enactment tax years. As a result of this ordering rule, pre-enactment capital loss carryforwards may be more likely to expire unused. Additionally, post-enactment capital losses that are carried forward will retain their character as either short-term or long-term capital losses rather than being considered all short-term as under previous law.
As of October 31, 2012, for federal income tax purposes, capital loss carryforwards of $127,272,881 were available as shown in the table below, to the extent provided by the regulations to offset future realized gains of the Fund through the years indicated. To the extent that these capital loss carryforwards are used to offset future capital gains, it is probable that the capital gains so offset will not be distributed to shareholders. No capital gain distributions shall be made until any capital loss carryforwards have been fully utilized or expired.
| | | | | | | | |
Capital Loss
Available Through | | Short-Term
Capital Loss
Amounts (000’s) | | | Long-Term
Capital Loss
Amounts (000’s) | |
2016
2017 2019 Unlimited | | $
| 29,857
53,693 35,593 4,261 |
| | $
| —
— — 3,869 |
|
| Total | | $ | 123,404 | | | $ | 3,869 | |
The tax character of distributions paid during the years ended October 31, 2012 and October 31, 2011 shown in the Statements of Changes in Net Assets was as follows:
| | | | | | | | |
| | | 2012 | | | 2011 | |
Distributions paid from:
Ordinary Income | | $ | 9,130,803 | | | $ | 16,141,279 | |
Note 5–Foreign Currency Transactions
As of October 31, 2012, the Fund held the following foreign currencies:
| | | | | | | | | | | | | | | | | | | | | | | | |
| | | Currency | | | Cost | | | Value | |
Australian Dollar | | | AUD | | | | 177 | | | | USD | | | | 184 | | | | USD | | | | 184 | |
Brazilian Real | | | BRL | | | | 168,970 | | | | | | | | 83,103 | | | | | | | | 83,193 | |
Canadian Dollar | | | CAD | | | | 134,908 | | | | | | | | 134,997 | | | | | | | | 135,077 | |
Danish Krone | | | DKK | | | | 6,584,826 | | | | | | | | 1,141,866 | | | | | | | | 1,144,123 | |
Euro | | | EUR | | | | 2,250,291 | | | | | | | | 2,917,390 | | | | | | | | 2,916,713 | |
Hong Kong Dollar | | | HKD | | | | 4,810,863 | | | | | | | | 620,446 | | | | | | | | 620,753 | |
Indonesian Rupiah | | | IDR | | | | 3 | | | | | | | | 0 | (a) | | | | | | | 0 | (a) |
Japanese Yen | | | JPY | | | | 1 | | | | | | | | 0 | (a) | | | | | | | 0 | (a) |
Pound Sterling | | | GBP | | | | 879,268 | | | | | | | | 1,398,111 | | | | | | | | 1,418,919 | |
Singapore Dollar | | | SGD | | | | 32,658 | | | | | | | | 25,904 | | | | | | | | 26,773 | |
Swedish Krona | | | SEK | | | | 474 | | | | | | | | 72 | | | | | | | | 71 | |
Thailand Baht | | | THB | | | | 3,159,315 | | | | | | | | 102,993 | | | | | | | | 103,077 | |
Total | | | | | | | | | | | USD | | | | 6,425,066 | | | | USD | | | | 6,448,883 | |
| | |
| 30 | | MainStay International Equity Fund |
Note 6–Custodian
State Street is the custodian of the cash and the securities of the Fund. Custodial fees are charged to the Fund based on the market value of securities in the Fund and the number of certain cash transactions incurred by the Fund.
Note 7–Line of Credit
The Fund and certain affiliated funds maintain a line of credit with a syndicate of banks in order to secure a source of funds for temporary purposes to meet unanticipated or excessive redemption requests.
Effective August 29, 2012, under an amended credit agreement, the aggregate commitment amount is $200,000,000 with an optional maximum amount of $250,000,000. The commitment fee is an annual rate of 0.08% of the average commitment amount payable quarterly, regardless of usage, to Bank of New York Mellon, which serves as the agent to the syndicate. The commitment fee is allocated among certain MainStay Funds based upon net assets and other factors. Interest on any revolving credit loan is charged based upon the Federal Funds Advances rate or the one month London InterBank Offered Rate, whichever is higher. The amended credit agreement expires on August 28, 2013, although the MainStay Funds and the syndicate of banks may renew the amended credit agreement for an additional year on the same or different terms. Prior to August 29, 2012, the aggregate commitment amount was $125,000,000 with an optional maximum amount of $175,000,000. There were no borrowings made or outstanding with respect to the Fund on the amended credit agreement during the year ended October 31, 2012.
Note 8–Purchases and Sales of Securities (in 000’s)
During the year ended October 31, 2012, purchases and sales of securities, other than short-term securities, were $133,557 and $188,297, respectively.
Note 9–Capital Share Transactions
| | | | | | | | |
Investor Class | | Shares | | | Amount | |
Year ended October 31, 2012: | | | | | | | | |
Shares sold | | | 196,224 | | | $ | 2,141,258 | |
Shares issued to shareholders in reinvestment of dividends | | | 86,352 | | | | 887,712 | |
Shares redeemed | | | (575,649 | ) | | | (6,302,435 | ) |
| | | | |
Net increase (decrease) in shares outstanding before conversion | | | (293,073 | ) | | | (3,273,465 | ) |
Shares converted into Investor Class (See Note 1) | | | 228,238 | | | | 2,472,290 | |
Shares converted from Investor Class (See Note 1) | | | (176,452 | ) | | | (1,974,946 | ) |
| | | | |
Net increase (decrease) | | | (241,287 | ) | | $ | (2,776,121 | ) |
| | | | |
Year ended October 31, 2011: | | | | | | | | |
Shares sold | | | 255,410 | | | $ | 3,104,372 | |
Shares issued to shareholders in reinvestment of dividends | | | 88,910 | | | | 1,098,040 | |
Shares redeemed | | | (549,047 | ) | | | (6,635,729 | ) |
| | | | |
Net increase (decrease) in shares outstanding before conversion | | | (204,727 | ) | | | (2,433,317 | ) |
Shares converted into Investor Class (See Note 1) | | | 373,694 | | | | 4,153,993 | |
Shares converted from Investor Class (See Note 1) | | | (89,414 | ) | | | (1,099,827 | ) |
| | | | |
Net increase (decrease) | | | 79,553 | | | $ | 620,849 | |
| | | | |
| | |
| | | | | | | | |
Class A | | Shares | | | Amount | |
Year ended October 31, 2012: | | | | | | | | |
Shares sold | | | 690,751 | | | $ | 7,565,303 | |
Shares issued to shareholders in reinvestment of dividends | | | 167,449 | | | | 1,719,726 | |
Shares redeemed | | | (2,707,184 | ) | | | (29,445,459 | ) |
| | | | |
Net increase (decrease) in shares outstanding before conversion | | | (1,848,984 | ) | | | (20,160,430 | ) |
Shares converted into Class A (See Note 1) | | | 301,754 | | | | 3,320,325 | |
Shares converted from Class A (See Note 1) | | | (10,161 | ) | | | (118,949 | ) |
| | | | |
Net increase (decrease) | | | (1,557,391 | ) | | $ | (16,959,054 | ) |
| | | | |
Year ended October 31, 2011: | | | | | | | | |
Shares sold | | | 1,961,197 | | | $ | 24,241,634 | |
Shares issued to shareholders in reinvestment of dividends | | | 215,220 | | | | 2,653,664 | |
Shares redeemed | | | (3,688,192 | ) | | | (43,375,045 | ) |
| | | | |
Net increase (decrease) in shares outstanding before conversion | | | (1,511,775 | ) | | | (16,479,747 | ) |
Shares converted into Class A (See Note 1) | | | 201,074 | | | | 2,412,655 | |
Shares converted from Class A (See Note 1) | | | (193,869 | ) | | | (1,973,995 | ) |
| | | | |
Net increase (decrease) | | | (1,504,570 | ) | | $ | (16,041,087 | ) |
| | | | |
| | | | |
| mainstayinvestments.com | | | 31 | |
Notes to Financial Statements (continued)
| | | | | | | | |
Class B | | Shares | | | Amount | |
Year ended October 31, 2012: | | | | | | | | |
Shares sold | | | 145,998 | | | $ | 1,465,620 | |
Shares issued to shareholders in reinvestment of dividends | | | 37,762 | | | | 359,869 | |
Shares redeemed | | | (365,412 | ) | | | (3,685,754 | ) |
| | | | |
Net increase (decrease) in shares outstanding before conversion | | | (181,652 | ) | | | (1,860,265 | ) |
Shares converted from Class B (See Note 1) | | | (371,315 | ) | | | (3,698,720 | ) |
| | | | |
Net increase (decrease) | | | (552,967 | ) | | $ | (5,558,985 | ) |
| | | | |
Year ended October 31, 2011: | | | | | | | | |
Shares sold | | | 215,858 | | | $ | 2,445,662 | |
Shares issued to shareholders in reinvestment of dividends | | | 55,069 | | | | 629,984 | |
Shares redeemed | | | (577,541 | ) | | | (6,436,816 | ) |
| | | | |
Net increase (decrease) in shares outstanding before conversion | | | (306,614 | ) | | | (3,361,170 | ) |
Shares converted from Class B (See Note 1) | | | (314,841 | ) | | | (3,492,826 | ) |
| | | | |
Net increase (decrease) | | | (621,455 | ) | | $ | (6,853,996 | ) |
| | | | |
| | |
| | | | | | | | |
Class C | | Shares | | | Amount | |
Year ended October 31, 2012: | | | | | | | | |
Shares sold | | | 67,205 | | | $ | 672,940 | |
Shares issued to shareholders in reinvestment of dividends | | | 17,749 | | | | 169,161 | |
Shares redeemed | | | (351,969 | ) | | | (3,528,369 | ) |
| | | | |
Net increase (decrease) | | | (267,015 | ) | | $ | (2,686,268 | ) |
| | | | |
Year ended October 31, 2011: | | | | | | | | |
Shares sold | | | 215,489 | | | $ | 2,484,165 | |
Shares issued to shareholders in reinvestment of dividends | | | 26,446 | | | | 302,804 | |
Shares redeemed | | | (588,079 | ) | | | (6,641,709 | ) |
| | | | |
Net increase (decrease) | | | (346,144 | ) | | $ | (3,854,740 | ) |
| | | | |
| | |
| | | | | | | | |
Class I | | Shares | | | Amount | |
Year ended October 31, 2012: | | | | | | | | |
Shares sold | | | 5,017,234 | | | $ | 55,099,791 | |
Shares issued to shareholders in reinvestment of dividends | | | 488,524 | | | | 5,036,688 | |
Shares redeemed | | | (7,310,229 | ) | | | (78,460,736 | ) |
| | | | |
Net increase (decrease) | | | (1,804,471 | ) | | $ | (18,324,257 | ) |
| | | | |
Year ended October 31, 2011: | | | | | | | | |
Shares sold | | | 3,952,695 | | | $ | 48,215,141 | |
Shares issued to shareholders in reinvestment of dividends | | | 721,480 | | | | 8,939,145 | |
Shares redeemed | | | (17,027,206 | ) | | | (212,987,403 | ) |
| | | | |
Net increase (decrease) | | | (12,353,031 | ) | | $ | (155,833,117 | ) |
| | | | |
| | | | | | | | |
Class R1 | | Shares | | | Amount | |
Year ended October 31, 2012: | | | | | | | | |
Shares sold | | | 31,458 | | | $ | 334,344 | |
Shares issued to shareholders in reinvestment of dividends | | | 13,609 | | | | 139,492 | |
Shares redeemed | | | (84,394 | ) | | | (922,049 | ) |
| | | | |
Net increase (decrease) | | | (39,327 | ) | | $ | (448,213 | ) |
| | | | |
Year ended October 31, 2011: | | | | | | | | |
Shares sold | | | 154,670 | | | $ | 1,841,336 | |
Shares issued to shareholders in reinvestment of dividends | | | 15,410 | | | | 189,846 | |
Shares redeemed | | | (221,660 | ) | | | (2,788,670 | ) |
| | | | |
Net increase (decrease) | | | (51,580 | ) | | $ | (757,488 | ) |
| | | | |
| | |
| | | | | | | | |
Class R2 | | Shares | | | Amount | |
Year ended October 31, 2012: | | | | | | | | |
Shares sold | | | 249,216 | | | $ | 2,727,325 | |
Shares issued to shareholders in reinvestment of dividends | | | 28,124 | | | | 289,671 | |
Shares redeemed | | | (499,811 | ) | | | (5,462,254 | ) |
| | | | |
Net increase (decrease) | | | (222,471 | ) | | $ | (2,445,258 | ) |
| | | | |
Year ended October 31, 2011: | | | | | | | | |
Shares sold | | | 532,831 | | | $ | 6,566,352 | |
Shares issued to shareholders in reinvestment of dividends | | | 21,675 | | | | 267,898 | |
Shares redeemed | | | (293,374 | ) | | | (3,497,639 | ) |
| | | | |
Net increase (decrease) | | | 261,132 | | | $ | 3,336,611 | |
| | | | |
| | |
| | | | | | | | |
Class R3 | | Shares | | | Amount | |
Year ended October 31, 2012: | | | | | | | | |
Shares sold | | | 111,377 | | | $ | 1,214,928 | |
Shares issued to shareholders in reinvestment of dividends | | | 3,813 | | | | 39,158 | |
Shares redeemed | | | (72,312 | ) | | | (793,231 | ) |
| | | | |
Net increase (decrease) | | | 42,878 | | | $ | 460,855 | |
| | | | |
Year ended October 31, 2011: | | | | | | | | |
Shares sold | | | 126,679 | | | $ | 1,550,326 | |
Shares issued to shareholders in reinvestment of dividends | | | 2,078 | | | | 25,620 | |
Shares redeemed | | | (39,423 | ) | | | (486,743 | ) |
| | | | |
Net increase (decrease) | | | 89,334 | | | $ | 1,089,203 | |
| | | | |
Note 10–Subsequent Events
In connection with the preparation of the financial statements of the Fund as of and for the year ended October 31, 2012, events and transactions subsequent to October 31, 2012 through the date the financial statements were issued have been evaluated by the Fund’s management for possible adjustment and/or disclosure. No subsequent events requiring financial statement adjustment or disclosure have been identified.
| | |
| 32 | | MainStay International Equity Fund |
Report of Independent Registered Public Accounting Firm
The Board of Trustees and Shareholders of
The MainStay Funds:
We have audited the accompanying statement of assets and liabilities, including the portfolio of investments, of the MainStay International Equity Fund (the “Fund”), one of the funds constituting The MainStay Funds, as of October 31, 2012, and the related statement of operations for the year then ended, the statements of changes in net assets for each of the years in the two-year period then ended, and the financial highlights for each of the years or periods in the five-year period then ended. These financial statements and financial highlights are the responsibility of the Fund’s management. Our responsibility is to express an opinion on these financial statements and financial highlights based on our audits.
We conducted our audits in accordance with the standards of the Public Company Accounting Oversight Board (United States). Those standards require that we plan and perform the audit to obtain reasonable assurance about whether the financial statements and financial highlights are free of material misstatement. An audit includes examining, on a test basis, evidence supporting the amounts and disclosures in the financial statements. Our procedures included confirmation of securities owned as of October 31, 2012, by correspondence with the custodian and brokers or by other appropriate auditing procedures where replies from brokers were not received. An audit also includes assessing the accounting principles used and significant estimates made by management, as well as evaluating the overall financial statement presentation. We believe that our audits provide a reasonable basis for our opinion.
In our opinion, the financial statements and financial highlights referred to above present fairly, in all material respects, the financial position of the MainStay International Equity Fund of The MainStay Funds as of October 31, 2012, the results of its operations for the year then ended, the changes in its net assets for each of the years in the two-year period then ended, and the financial highlights for each of the years or periods in the five-year period then ended, in conformity with U.S. generally accepted accounting principles.

Philadelphia, Pennsylvania
December 21, 2012
| | | | |
| mainstayinvestments.com | | | 33 | |
Federal Income Tax Information
(Unaudited)
The Fund is required under the Internal Revenue Code to advise shareholders in a written statement as to the federal tax status of dividends paid by the Fund during such fiscal years.
For the fiscal year ended October 31, 2012, the Fund designated approximately $6,599,365 under the Internal Revenue Code as qualified dividend income eligible for reduced tax rates.
The dividends paid by the Fund during the fiscal year ended October 31, 2012, should be multiplied by 0.1% to arrive at the amount eligible for the corporate dividends received deduction.
In accordance with federal tax law, the Fund elects to provide each shareholder with their portion of the Fund’s foreign taxes paid and the income sourced from foreign countries. Accordingly, the Fund made the following designations regarding its fiscal year ended October 31, 2012:
— the total amount of taxes paid to foreign countries was $599,171
— the total amount of income sourced from foreign countries was $7,878,162
In February 2013, shareholders will receive an IRS Form 1099-DIV or substitute Form 1099 which will show the federal tax status of the distributions received by shareholders in calendar year 2012. The amounts that will be reported on such 1099-DIV or substitute Form 1099 will be the amounts you are to use on your federal income tax return and will differ from the amounts which we must report for the Fund’s fiscal year ended October 31, 2012.
Proxy Voting Policies and Procedures and Proxy Voting Record
A description of the policies and procedures that New York Life Investments uses to vote proxies related to the Fund’s securities is available without charge, upon request, (i) by visiting the Fund’s website at mainstayinvestments.com; or (ii) on the SEC’s website at www.sec.gov.
The Fund is required to file with the SEC its proxy voting record for the 12-month period ending June 30 on Form N-PX. The Fund’s most recent Form N-PX is available free of charge upon request (i) by calling 800-MAINSTAY (624-6782); (ii) by visiting the Fund’s website at mainstayinvestments.com; or (iii) on the SEC’s website at www.sec.gov.
Shareholder Reports and Quarterly Portfolio Disclosure
The Fund is required to file its complete schedule of portfolio holdings with the SEC for its first and third fiscal quarters on Form N-Q. The Fund’s Form N-Q is available without charge on the SEC’s website at www.sec.gov or by calling MainStay Investments at 800-MAINSTAY (624-6782). You also can obtain and review copies of Form N-Q by visiting the SEC’s Public Reference Room in Washington, DC (information on the operation of the Public Reference Room may be obtained by calling 1-800-SEC-0330).
| | |
| 34 | | MainStay International Equity Fund |
Board Members and Officers (Unaudited)
The Board Members oversee the MainStay Group of Funds (which is comprised of Funds that are series of The MainStay Funds, Eclipse Trust, Eclipse Funds Inc., MainStay Funds Trust, MainStay VP Funds Trust, Private Advisors Alternative Strategies Master Fund, Private Advisors Alternative Strategies Fund, and MainStay Defined Term Municipal Opportunities Fund) (collectively, the “Fund Complex”), the Manager and, when applicable, the Subadvisor(s) and other service providers to the Fund Complex. Each Board Member serves until his or her successor is elected and qualified or until his or her resignation, death or removal. The Retirement Policy provides that a Board Member
shall tender his or her resignation by the end of the calendar year during which he or she reaches the age of 75.
Officers serve a term of one year and are elected annually by the Board Members. The business address of each Board Member and officer listed below is 51 Madison Avenue, New York, New York 10010.
The Statement of Additional Information applicable to the Fund includes additional information about the Board Members and is available without charge, upon request, by calling 800-MAINSTAY (624-6782) or by going online to mainstayinvestments.com.
| | | | | | | | | | | | |
| | | | | Name and
Date of Birth | | Term of Office,
Position(s) Held
with the Fund
Complex and
Length of Service | | Principal Occupation(s)
During Past Five Years | | Number of
Funds in
Fund Complex
Overseen by
Board Member | | Other Directorships
Held by Board Member |
| Interested Board Member* | | | | John Y. Kim
9/24/60 | | Indefinite;
Eclipse Trust: Trustee since 2008;
Eclipse Funds Inc.:
Director since 2008 (1 fund);
The MainStay Funds: Trustee since 2008 (12 funds);
MainStay Funds Trust: Trustee since 2009 (31 funds); and
MainStay VP Funds Trust: Trustee since 2011 and its predecessor, MainStay VP Series Fund, Inc. since 2008 (28 portfolios). Private Advisors Alternative Strategies Master Fund: Trustee since 2011
Private Advisors Alternative Strategies Fund: Trustee since 2011
MainStay DefinedTerm Municipal Opportunities Fund: Trustee since 2011 | | Member of the Board of Managers, President and Chief Executive Officer (since 2008), New York Life Investment Management LLC and New York Life Investment Management Holdings LLC; Member of the Board, MacKay Shields LLC since 2008; Chairman of the Board, Institutional Capital LLC, Madison Capital Funding LLC, Madison Square Investors LLC and McMorgan & Company LLC; Chairman of the Board, NYLIFE Distributors LLC and Chairman of the Board, NYLCAP Manager LLC (since 2008) President, Prudential Retirement, a business unit of Prudential Financial, Inc. (2002 to 2007) | | 75 | | None |
| | * | This Board Member is considered to be an “interested person” of the MainStay Group of Funds within the meaning of the 1940 Act because of his affiliation with New York Life Insurance Company, New York Life Investment Management LLC, Madison Square Investors LLC, MacKay Shields LLC, Private Advisors LLC, Institutional Capital LLC, NYLIFE Securities LLC and/or NYLIFE Distributors LLC, as described in detail above in the column entitled “Principal Occupation(s) During the Past Five Years.” |
| | | | |
| mainstayinvestments.com | | | 35 | |
| | | | | | | | | | | | |
| | | | | Name and
Date of Birth | | Term of Office, Position(s) Held with the Fund Complex and Length of Service | | Principal Occupation(s)
During Past Five Years | | Number of
Funds in
Fund Complex
Overseen by
Board Member | | Other Directorships
Held by Board Member |
| Non-Interested Board Members | | | | Susan B. Kerley 8/12/51 | | Indefinite;
Eclipse Trust: Chairman since 2005, and Trustee since 2000;
Eclipse Funds Inc.: Chairman since 2005 and Director since 1990 (1 fund); The MainStay Funds: Chairman and Board Member since 2007 (12 funds);
MainStay Funds Trust: Chairman and Trustee since 2009 (31 funds); and MainStay VP Funds Trust: Chairman and Trustee since 2011 and its predecessor, MainStay VP Series Fund, Inc., since 2007 (28 portfolios). Private Advisors Alternative Strategies Master Fund: Chairman and Trustee since 2011 Private Advisors Alternative Strategies Fund: Chairman and Trustee since 2011 MainStay DefinedTerm Municipal Opportunities Fund: Chairman and Trustee since 2011. | | President, Strategic Management Advisors LLC (since 1990) | | 75 | | Trustee, Legg Mason Partners Funds, since 1992 (51 portfolios) |
| | |
| 36 | | MainStay International Equity Fund |
| | | | | | | | | | | | |
| | | | | Name and
Date of Birth | | Term of Office,
Position(s) Held
with the Fund
Complex and
Length of Service | | Principal Occupation(s)
During Past Five Years | | Number of
Funds in
Fund Complex
Overseen by
Board Member | | Other Directorships
Held by Board Member |
| Non-Interested Board Members | | | | Alan R. Latshaw 3/27/51 | | Indefinite;
Eclipse Trust: Trustee and Audit Committee Financial Expert since 2007;
Eclipse Funds Inc.:
Director and Audit Committee Financial Expert since 2007 (1 fund);
The MainStay Funds: Trustee and Audit Committee Financial Expert since 2006 (12 funds);
MainStay Funds Trust: Trustee and Audit Committee Financial Expert since 2009 (31 funds); and
MainStay VP Funds Trust: Trustee and Audit Committee Financial Expert since 2011 and its predecessor, MainStay VP Series Fund, Inc., since 2007 (28 portfolios). Private Advisors Alternative Strategies Master Fund: Trustee and Audit Committee Financial Expert since 2011 Private Advisors Alternative Strategies Fund: Trustee and Audit Committee Financial Expert since 2011. MainStay DefinedTerm Municipal Opportunities Fund: Trustee and Audit Committee Financial Expert since 2011. | | Retired; Partner, Ernst & Young LLP (2002 to 2003); Partner, Arthur Andersen LLP (1989 to 2002); Consultant to the MainStay Funds Audit and Compliance Committee (2004 to 2006) | | 75 | | Trustee, State Farm Associates Funds Trusts since 2005 (4 portfolios); Trustee, State Farm Mutual Fund Trust since 2005 (15 portfolios); Trustee, State Farm Variable Product Trust since 2005 (9 portfolios) |
| | | | |
| mainstayinvestments.com | | | 37 | |
| | | | | | | | | | | | |
| | | | | Name and Date of Birth | | Term of Office, Position(s) Held with the Fund Complex and Length of Service | | Principal Occupation(s)
During Past Five Years | | Number of
Funds in
Fund Complex
Overseen by
Board Member | | Other Directorships Held by Board Member |
| Non-Interested Board Members | | | | Peter Meenan
12/5/41 | | Indefinite;
Eclipse Funds: Trustee since 2002;
Eclipse Funds Inc.:
Director since 2002
(1 fund); The MainStay Funds:
Trustee since 2007 (12 funds);
MainStay Funds Trust: Trustee since 2009
(31 funds); and
MainStay VP Funds Trust: Trustee since 2011 and its predecessor, MainStay VP Series Fund, Inc., since 2007 (28 portfolios).
Private Advisors Alternative Strategies Master Fund: Trustee since 2011. Private Advisors Alternative Strategies Fund: Trustee since 2011
MainStay DefinedTerm Municipal Opportunities Fund: Trustee since 2011. | | Independent Consultant; President and Chief Executive Officer, Babson—United, Inc. (financial services firm) (2000 to 2004); Independent Consultant (1999 to 2000); Head of Global Funds, Citicorp (1995 to 1999) | | 75 | | None |
| | | | Richard H. Nolan, Jr.
11/16/46 | | Indefinite;
Eclipse Trust: Trustee since 2007;
Eclipse Funds Inc.:
Director since 2007 (1 fund);
The MainStay Funds: Trustee since 2007 (12 funds);
MainStay Funds Trust: Trustee since 2009 (31 funds); and
MainStay VP Funds Trust: Trustee since 2011 and its predecessor, MainStay VP Series Fund, Inc., since 2006 (28 portfolios).
Private Advisors Alternative Strategies Master Fund: Trustee since 2011. Private Advisors Alternative Strategies Fund: Trustee since 2011
MainStay DefinedTerm Municipal Opportunities Fund: Trustee since 2011. | | Managing Director, ICC Capital Management; President—Shields/Alliance, Alliance Capital Management (1994 to 2004) | | 75 | | None |
| | |
| 38 | | MainStay International Equity Fund |
| | | | | | | | | | | | |
| | | | | Name and Date of Birth | | Term of Office, Position(s) Held with the Fund Complex and Length of Service | | Principal Occupation(s)
During Past Five Years | | Number of
Funds in
Fund Complex
Overseen by
Board Member | | Other Directorships Held by Board Member |
| Non-Interested Board Members | | | | Richard S. Trutanic 2/13/52 | | Indefinite;
Eclipse Trust: Trustee since 2007;
Eclipse Funds Inc.:
Director since 2007 (1 fund);
The MainStay Funds:
Trustee since 1994 (12 funds);
MainStay Funds Trust:
Trustee since 2009 (31 funds); and
MainStay VP Funds Trust: Trustee since 2011 and its predecessor, MainStay VP Series Fund, Inc., since 2007 (28 portfolios).
Private Advisors Alternative Strategies Master Fund: Trustee since 2011.
Private Advisors Alternative Strategies Fund: Trustee since 2011
MainStay DefinedTerm Municipal Opportunities Fund: Trustee since 2011. | | Chairman and Chief Executive Officer, Somerset & Company (financial advisory firm) (since 2004); Managing Director, The Carlyle Group (private investment firm) (2002 to 2004); Senior Managing Director, Partner and Board Member, Groupe Arnault S.A. (private investment firm) (1999 to 2002) | | 75 | | None |
| | | | |
| mainstayinvestments.com | | | 39 | |
| | | | | | | | | | | | |
| | | | | Name and Date of Birth | | Term of Office, Position(s) Held with the Fund Complex and Length of Service | | Principal Occupation(s)
During Past Five Years | | Number of
Funds in
Fund Complex
Overseen by
Board Member | | Other Directorships Held by Board Member |
| Non-Interested Board Members | | | | Roman L. Weil
5/22/40 | | Indefinite;
Eclipse Trust: Trustee and Audit Committee Financial Expert since 2007; Eclipse Funds Inc.: Director and Audit Committee Financial Expert since 2007 (1 fund); The MainStay Funds: Trustee and Audit Committee Financial Expert since 2007 (12 funds); MainStay Funds Trust: Trustee since 2009 (31 funds); and MainStay VP Funds Trust: Trustee and Audit Committee Financial Expert since 2011 and its predecessor, MainStay VP Series Fund, Inc., since 1994 and Audit Committee Financial Expert since 2003 (28 portfolios).
Private Advisors Alternative Strategies Master Fund: Trustee and Audit Committee Financial Expert since 2011 Private Advisors Alternative Strategies Fund: Trustee and Audit Committee Financial Expert since 2011. MainStay DefinedTerm Municipal Opportunities Fund: Trustee and Audit Committee Financial Expert since 2011. | | Visiting Professor, University of California—San Diego (since October 2012); Visiting Professor, Southern Methodist University (2011); Visiting Professor, NYU Stem School of Business, New York University (2011); President, Roman L. Weil Associates, Inc. (consulting firm) (since 1981); V. Duane Rath Professor Emeritus of Accounting, Chicago Booth School of Business, University of Chicago (1965-2008) | | 75 | | None |
| | |
| 40 | | MainStay International Equity Fund |
| | | | | | | | | | | | |
| | | | | Name and Date of Birth | | Term of Office, Position(s) Held with the Fund Complex and Length of Service | | Principal Occupation(s)
During Past Five Years | | Number of
Funds in
Fund Complex
Overseen by
Board Member | | Other Directorships Held by Board Member |
| Non-Interested Board Members | | | | John A. Weisser 10/22/41 | | Indefinite; Eclipse Trust: Trustee since 2007; Eclipse Funds Inc.: Director since 2007 (1 fund); The MainStay Funds: Trustee since 2007 (12 funds); MainStay Funds Trust: Trustee since 2009 (31 funds); and MainStay VP Funds Trust: Trustee since 2011 and its predecessor, MainStay VP Series Fund, Inc., since 1997 (28 portfolios).
Private Advisors Alternative Strategies Master Fund: Trustee since 2011.
Private Advisors Alternative Strategies Fund: Trustee since 2011
MainStay DefinedTerm Municipal Opportunities Fund: Trustee since 2011. | | Retired. Managing Director of Salomon Brothers, Inc. (1971 to 1995) | | 75 | | Trustee, Direxion Funds since 2007 (21 portfolios); Direxion Insurance Trust since 2007 (1 portfolio); Trustee, Direxion Shares ETF Trust, since 2008 (47 portfolios) |
| | | | |
| mainstayinvestments.com | | | 41 | |
The following individuals have been appointed by the Board Members to serve as Officers of the MainStay Group of Funds.
| | | | | | | | |
| | | | | Name and
Date of Birth | | Positions(s) Held with the Funds and Length of Service | | Principal Occupation(s) During Past Five Years |
| Officers | | | | Jack R. Benintende 5/12/64 | | Treasurer and Principal Financial and Accounting Officer, Eclipse Trust, Eclipse Funds, Inc. and The MainStay Funds (since 2007), MainStay Funds Trust (since 2009) | | Assistant Treasurer, New York Life Investment Management Holdings LLC (since 2008); Managing Director, New York Life Investment Management LLC (since 2007); Treasurer and Principal Financial Accounting Officer, Private Advisors Alternative Strategies Master Fund, Private Advisors Alternative Strategies Fund and MainStay DefinedTerm Municipal Opportunities Fund (since 2011); Treasurer and Principal Financial and Accounting Officer, MainStay VP Funds Trust and its predecessor, MainStay VP Series Fund, Inc. (since 2007) |
| | | | Jeffrey A. Engelsman 9/28/67 | | Vice President and Chief Compliance Officer, Eclipse Trust, Eclipse Funds, Inc., The MainStay Funds and MainStay Funds Trust (since 2009) | | Managing Director, Compliance (since 2009), Director and Associate General Counsel, New York Life Investment Management LLC (2005 to 2008); Assistant Secretary, NYLIFE Distributors LLC (2006 to 2008); Vice President and Chief Compliance Officer, Private Advisors Alternative Strategies Master Fund, Private Advisors Alternative Strategies Fund, DefinedTerm Municipal Opportunities Fund (since 2011); MainStay VP Funds Trust and its predecessor, MainStay VP Series Fund, Inc. (since 2009); Assistant Secretary, The MainStay Funds (2006 to 2008); Assistant Secretary, Eclipse Trust, Eclipse Funds, Inc. and MainStay VP Series Fund, Inc. (2005 to 2008) |
| | | | Stephen P. Fisher 2/22/59 | | President, Eclipse Trust, Eclipse Funds, Inc. and The MainStay Funds (since 2007), MainStay Funds Trust (since 2009) | | Director, Senior Vice President, New York Life Insurance and Annuity Corporation (since 2011); Manager, President and Chief Operating Officer, NYLIFE Distributors LLC (since 2008); Chairman of the Board, NYLIM Service Company LLC (since 2008); Senior Managing Director and Chief Marketing Officer, New York Life Investment Management LLC (since 2005); President, Private Advisors Alternative Strategies Master Fund, Private Advisors Alternative Strategies Fund and MainStay DefinedTerm Municipal Opportunities Fund (since 2011); MainStay VP Funds Trust and its predecessor, MainStay VP Series Fund, Inc. (since 2007) |
| | | | J. Kevin Gao 10/13/67 | | Secretary and Chief Legal Officer, Eclipse Trust, Eclipse Funds, Inc., The MainStay Funds and MainStay Funds Trust (since 2010) | | Managing Director and Associate General Counsel, New York Life Investment Management LLC (since 2010); Secretary and Chief Legal Officer, Private Advisors Alternative Strategies Master Fund, Private Advisors Alternative Strategies Fund and MainStay DefinedTerm Municipal Opportunities Fund (since 2011); MainStay VP Funds Trust and its predecessor, MainStay VP Series Fund, Inc. (since 2010); Director and Counsel of Credit Suisse, Chief Legal Officer and Secretary of Credit Suisse Asset Management, LLC and Credit Suisse Funds (2003 to 2010) |
| | | | Scott T. Harrington 2/8/59 | | Vice President—Administration, Eclipse Trust, Eclipse Funds, Inc. and The MainStay Funds (since 2005), MainStay Funds Trust (since 2009) | | Director, New York Life Investment Management LLC (including predecessor advisory organizations) (since 2000); Executive Vice President, New York Life Trust Company and New York Life Trust Company FSB (since 2006); Vice President—Administration, Private Advisors Alternative Strategies Master Fund, Private Advisors Alternative Strategies Fund and MainStay DefinedTerm Municipal Opportunities Fund (since 2011); MainStay VP Funds Trust and its predecessor, MainStay VP Series Fund, Inc. (since 2005) |
| | * | The Officers listed above are considered to be “interested persons” of the MainStay Group of Funds within the meaning of the 1940 Act because of their affiliation with New York Life Insurance Company, New York Life Investment Management LLC, Madison Square Investors LLC, MacKay Shields LLC, Private Advisors LLC, Institutional Capital LLC, Epoch Investment Partners, Inc., Markston International, LLC, Winslow Capital Management, Inc., NYLIFE Securities LLC and/or NYLIFE Distributors LLC, as described in detail above in the column captioned “Principal Occupation(s) During Past Five Years.” Officers are elected annually by the Board to serve a one-year term. |
| | |
| 42 | | MainStay International Equity Fund |
MainStay Funds
MainStay offers a wide range of Funds for virtually any investment need. The full array of MainStay open-end offerings is listed here, with information about the manager, subadvisors, legal counsel and independent registered public accounting firms.
Equity
U.S. Equity
MainStay Common Stock Fund
MainStay Epoch U.S. All Cap Fund
MainStay Epoch U.S. Equity Yield Fund
MainStay Growth Equity Fund
MainStay ICAP Equity Fund
MainStay ICAP Select Equity Fund
MainStay Large Cap Growth Fund1
MainStay MAP Fund
MainStay S&P 500 Index Fund
MainStay U.S. Small Cap Fund
MainStay 130/30 Core Fund
International/Global Equity
MainStay Epoch Global Choice Fund
MainStay Epoch Global Equity Yield Fund
MainStay Epoch International Small Cap Fund
MainStay ICAP Global Fund
MainStay ICAP International Fund
MainStay International Equity Fund
MainStay 130/30 International Fund
Income
Taxable Bond
MainStay Flexible Bond Opportunities Fund
MainStay Floating Rate Fund
MainStay Global High Income Fund
MainStay Government Fund
MainStay High Yield Corporate Bond Fund
MainStay High Yield Opportunities Fund
MainStay Indexed Bond Fund
MainStay Intermediate Term Bond Fund
MainStay Short Term Bond Fund
MainStay Money Market Fund
Municipal Bond
MainStay High Yield Municipal Bond Fund
MainStay New York Tax Free Opportunities Fund2
MainStay Tax Free Bond Fund
Mixed Asset
MainStay Balanced Fund
MainStay Convertible Fund
MainStay Income Builder Fund
MainStay Marketfield Fund
Asset Allocation/Target Date
MainStay Conservative Allocation Fund
MainStay Growth Allocation Fund
MainStay Moderate Allocation Fund
MainStay Moderate Growth Allocation Fund
MainStay Retirement 2010 Fund
MainStay Retirement 2020 Fund
MainStay Retirement 2030 Fund
MainStay Retirement 2040 Fund
MainStay Retirement 2050 Fund
Manager
New York Life Investment Management LLC
New York, New York
Subadvisors
Epoch Investment Partners, Inc.
New York, New York
Institutional Capital LLC3
Chicago, Illinois
MacKay Shields LLC3
New York, New York
Madison Square Investors LLC3
New York, New York
Marketfield Asset Management LLC
New York, New York
Markston International LLC
White Plains, New York
Winslow Capital Management, Inc.
Minneapolis, Minnesota
Legal Counsel
Dechert LLP
Independent Registered Public Accounting Firms
KPMG LLP
PricewaterhouseCoopers LLP
1. Effective January 13, 2012, the Fund was closed to new investors with certain exceptions.
2. The Fund is only registered for sale in CT, DE, FL, MA, NJ, NY, and VT.
3. An affiliate of New York Life Investment Management LLC.
Not part of the Annual Report
mainstayinvestments.com
The MainStay Funds are managed by New York Life Investment Management LLC and distributed through NYLIFE Distributors LLC, 169 Lackawanna Avenue, Parsippany, NJ 07054, a wholly owned subsidiary of New York Life Insurance Company.
NYLIFE Distributors is a Member FINRA/SIPC.
MainStay Investments is a service mark and name under which New York Life Investment Management LLC does business. MainStay Investments, an indirect subsidiary of New York Life Insurance Company, New York, NY 10010, provides investment
advisory products and services.
This report may be distributed only when preceded or accompanied by a current Fund prospectus.
© 2013 by NYLIFE Distributors LLC. All rights reserved.
| | | | | | | | |
| Not FDIC/NCUA Insured | | Not a Deposit | | May Lose Value | | No Bank Guarantee | | Not Insured by Any Government Agency |
| | | | |
| NYLIM-28188 MS265-12 | |
| MSIE11-12/12
NL010 |
|

MainStay Common Stock Fund
Message from the President and Annual Report
October 31, 2012
This page intentionally left blank
Message from the President
Most major equity markets delivered positive results for the 12 months ended October 31, 2012. In the United States, stocks provided solid double-digit returns. With a few notable exceptions, international stock markets generally ended the reporting period in positive territory.
The stock market’s advance, however, was far from uniform. After rising to an early peak at the end of March 2012, domes-
tic and international stocks lost ground until the beginning of June. After that, stocks generally rose, reaching their high point for the reporting period in mid-September. Although stocks remained relatively buoyant through mid-October, they drifted lower as the reporting period came to a close.
A variety of forces converged to help fuel these market movements. Investors kept a close eye on developments in the European sovereign debt crisis. The European Central Bank’s Long Term Refinancing Operations helped stabilize European credit markets and provide needed liquidity. Although private holders of Greek sovereign debt had to accept a reduction in their recovery value, the anticipated voluntary exchange provided a positive spark to the markets. Rising unemployment and new austerity measures may impede economic growth as the European Union seeks to strike a delicate balance between fiscal and monetary policies.
In the United States, the Federal Reserve announced an open-ended agency mortgage-backed security purchase program, which helped calm market concerns. The Federal Reserve also continued its maturity extension program (referred to by some as “operation twist”), which seeks to put downward pressure on longer-term interest rates. At the short end of the yield curve, the Federal Reserve maintained the federal funds rate in a near-zero range. In September 2012, the Federal Open Market Committee anticipated that “exceptionally low levels for the federal funds rate” were “likely to be warranted at least through mid-2015.”
With markets stabilizing and short-term interest rates at very low levels, yield-hungry investors had incentives to lengthen maturities and accept higher risk. Domestic high-yield bonds provided double-digit returns for the reporting period, municipal bonds and convertible securities provided high single-digit returns, and domestic corporate bonds provided positive overall returns.
While most investors are pleased when markets rise, MainStay portfolio managers know that long-term results depend on more than short-term market movements. They also depend on the consistent application of well-defined investment strategies and risk-management techniques over longer periods. Our long-term perspective gives our portfolio managers the ability to look past the daily ups and downs of the market as they pursue the specific investment objectives of their individual Funds.
At MainStay, we believe that a long-term perspective can help investors as well. Instead of trying to capitalize on short-term market movements, you may prefer to focus on the long-term potential that can come from getting invested, staying invested and adding to your investments over time. Of course, past performance is no guarantee of future results.
The following pages contain more specific information on the securities, market events and investment decisions that affected your MainStay Fund(s) during the 12 months ended October 31, 2012. We invite you to read the information carefully and use it as part of your ongoing portfolio evaluation and investment review.
Sincerely,

Stephen P. Fisher
President
The opinions expressed are as of the date of this report and are subject to change. There is no guarantee that any forecast made will come to pass. This material does not constitute investment advice and is not intended as an endorsement of any specific investment.
Not part of the Annual Report
Table of Contents
Investors should refer to the Fund’s Summary Prospectus and/or Prospectus and consider the Fund’s investment objectives, strategies, risks, charges and expenses carefully before investing. The Summary Prospectus and/or Prospectus contain this and other information about the Fund. You may obtain copies of the Fund’s Summary Prospectus, Prospectus and Statement of Additional Information free of charge, upon request, by calling toll-free 800-MAINSTAY (624-6782), by writing to NYLIFE Distributors LLC, Attn: MainStay Marketing Department, 169 Lackawanna Avenue, Parsippany, New Jersey 07054 or by sending an e-mail to MainStayShareholderServices@nylim.com. These documents are also available via the MainStay Funds’ website at mainstayinvestments.com/documents. Please read the Summary Prospectus and/or Prospectus carefully before investing.
Investment and Performance Comparison 1 (Unaudited)
Performance data quoted represents past performance. Past performance is no guarantee of future results. Because of market volatility, current performance may be lower or higher than the figures shown. Investment return and principal value will fluctuate, and as a result, when shares are redeemed, they may be worth more or less than their original cost. The graph below depicts the historical performance of Class B shares of the Fund. Performance will vary from class to class based on differences in class-specific expenses and sales charges. For performance information current to the most recent month-end, please call 800-MAINSTAY (624-6782) or visit mainstayinvestments.com.
(With sales charges)
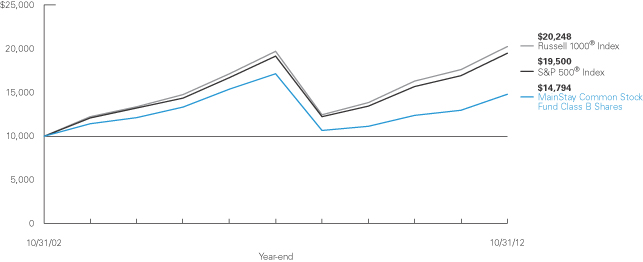
Average Annual Total Returns for the Year Ended October 31, 2012
| | | | | | | | | | | | | | | | | | | | |
| Class | | Sales Charge | | | | One Year | | | Five Years | | | Ten Years | | | Gross
Expense
Ratio2 | |
| Investor Class Shares3 | | Maximum 5.5%
Initial Sales Charge | | With sales charges Excluding sales charges | |
| 8.82
15.15 | %
| |
| –3.26
–2.16 | %
| |
| 4.18
4.77 | %
| |
| 1.54
1.54 | %
|
| Class A Shares | | Maximum 5.5%
Initial Sales Charge | | With sales charges Excluding sales charges | |
| 9.28
15.64 |
| |
| –2.80
–1.70 |
| |
| 4.42
5.02 |
| |
| 0.99
0.99 |
|
| Class B Shares | | Maximum 5% CDSC
if Redeemed Within the
First Six Years of Purchase | | With sales charges Excluding sales charges | |
| 9.23
14.23 |
| |
| –3.25
–2.90 |
| |
| 3.99
3.99 |
| |
| 2.29
2.29 |
|
| Class C Shares | | Maximum 1% CDSC
if Redeemed Within
One Year of Purchase | | With sales charges Excluding sales charges | |
| 13.23
14.23 |
| |
| –2.90
–2.90 |
| |
| 3.99
3.99 |
| |
| 2.29
2.29 |
|
| Class I Shares4 | | No Sales Charge | | | | | 15.89 | | | | –1.40 | | | | 5.42 | | | | 0.74 | |
| Class R2 Shares5 | | No Sales Charge | | | | | 15.52 | | | | –1.80 | | | | 4.92 | | | | 1.09 | |
| 1. | The performance table and graph do not reflect the deduction of taxes that a shareholder would pay on distributions or Fund-share redemptions. Total returns reflect maximum applicable sales charges as indicated in the table above, changes in share price, and reinvestment of dividend and capital gain distributions. The graph assumes the initial investment amount shown above and reflects the deduction of all sales charges that would have applied for the period of investment. Performance figures reflect certain fee waivers and/or expense limitations, without which total returns may have been lower. For more information on share classes and current fee waivers and/or expense limitations, please refer to the notes to the financial statements. |
| 2. | The gross expense ratios presented reflect the Fund’s “Total Annual Fund Operating Expenses” from the most recent Prospectus and may differ from other expense ratios disclosed in this report. |
| 3. | Investor Class shares were first offered on February 28, 2008. Performance figures for Investor Class shares include the historical performance of Class A shares through February 27, 2008, adjusted for differences in certain fees and expenses. Unadjusted, the performance shown for the Investor Class shares might have been different. |
| 4. | Performance figures for Class I shares, first offered on December 28, 2004, include the historical performance of Class A shares through December 27, 2004, adjusted for differences in certain expenses and fees. Unadjusted, the performance shown for Class I shares might have been different. |
| 5. | Performance figures for Class R2 shares, first offered on December 14, 2007, include the historical performance of Class A shares through October 31, 2012, adjusted for differences in certain fees and expenses. Unadjusted, the performance shown for Class R2 shares might have been different. As of October 31, 2012, Class R2 shares had yet to commence investment operations. |
The footnotes on the next page are an integral part of the table and graph and should be carefully read in conjunction with them.
| | | | |
| mainstayinvestments.com | | | 5 | |
| | | | | | | | | | | | |
| Benchmark Performance | | One
Year | | | Five
Years | | | Ten
Years | |
S&P 500® Index6 | | | 15.21 | % | | | 0.36 | % | | | 6.91 | % |
Russell 1000® Index7 | | | 14.97 | | | | 0.53 | | | | 7.31 | |
Average Lipper Large-Cap Core Fund8 | | | 13.15 | | | | –0.64 | | | | 6.33 | |
| 6. | “S&P 500®” is a trademark of the McGraw-Hill Companies, Inc. The S&P 500® Index is widely regarded as the standard index for measuring large-cap U.S. stock market performance. The S&P 500® Index is the Fund’s broad-based securities market index for comparison purposes. Results assume reinvestment of all dividends and capital gains. An investment cannot be made directly in an index. |
| 7. | The Russell 1000® Index measures the performance of the large-cap segment of the U.S. equity universe. It is a subset of the Russell 3000® Index and includes approximately 1,000 of the largest securities based on a combination of their market cap and current index membership. The Russell 1000® represents approximately 92% of the U.S. market. The Russell 1000® Index is the Fund’s secondary benchmark. Results assume |
| | reinvestment of all dividends and capital gains. An investment cannot be made directly in an index. |
| 8. | The average Lipper large-cap core fund is representative of funds that, by portfolio practice, invest at least 75% of their equity assets in companies with market capitalizations (on a three-year weighted basis) above Lipper’s U.S. Diversified Equity large-cap floor. Large-cap core funds have more latitude in the companies in which they invest. These funds typically have an average price-to-earnings ratio, price-to-book ratio, and three-year sales-per-share growth value, compared to the S&P 500® Index. This benchmark is a product of Lipper Inc. Lipper Inc. is an independent monitor of fund performance. Results are based on average total returns of similar funds with all dividend and capital gain distributions reinvested. |
The footnotes on the preceding page are an integral part of the table and graph and should be carefully read in conjunction with them.
| | |
| 6 | | MainStay Common Stock Fund |
Cost in Dollars of a $1,000 Investment in MainStay Common Stock Fund (Unaudited)
The example below is intended to describe the fees and expenses borne by shareholders during the six-month period from May 1, 2012, to October 31, 2012, and the impact of those costs on your investment.
Example
As a shareholder of the Fund, you incur two types of costs: (1) transaction costs, including exchange fees and sales charges (loads) on purchases (as applicable), and (2) ongoing costs, including management fees, distribution and/or service (12b-1) fees, and other Fund expenses (as applicable). This example is intended to help you understand your ongoing costs (in dollars) of investing in the Fund and to compare these costs with the ongoing costs of investing in other mutual funds. The example is based on an investment of $1,000 made at the beginning of the six-month period and held for the entire period from May 1, 2012, to October 31, 2012.
This example illustrates your Fund’s ongoing costs in two ways:
Actual Expenses
The second and third data columns in the table below provide information about actual account values and actual expenses. You may use the information in these columns, together with the amount you invested, to estimate the expenses that you paid during the six months ended October 31, 2012. Simply divide your account value by $1,000 (for example, an $8,600 account value divided by $1,000 = 8.6), then
multiply the result by the number under the heading entitled “Expenses Paid During Period” to estimate the expenses you paid on your account during this period.
Hypothetical Example for Comparison Purposes
The fourth and fifth data columns in the table below provide information about hypothetical account values and hypothetical expenses based on the Fund’s actual expense ratio and an assumed rate of return of 5% per year before expenses, which is not the Fund’s actual return. The hypothetical account values and expenses may not be used to estimate the actual ending account balances or expenses you paid for the six-month period shown. You may use this information to compare the ongoing costs of investing in the Fund with the ongoing costs of investing in other Funds. To do so, compare this 5% hypothetical example with the 5% hypothetical examples that appear in the shareholder reports of the other Funds.
Please note that the expenses shown in the table are meant to highlight your ongoing costs only and do not reflect any transactional costs, such as exchange fees or sales charges (loads). Therefore, the fourth and fifth data columns of the table are useful in comparing ongoing costs only and will not help you determine the relative total costs of owning different funds. In addition, if these transactional costs were included, your costs would have been higher.
| | | | | | | | | | | | | | | | | | | | |
| | | | | | | | | | | | | | | | |
| Share Class | | Beginning
Account
Value
5/1/12 | | | Ending Account
Value (Based
on Actual
Returns and
Expenses)
10/31/12 | | | Expenses
Paid
During
Period1 | | | Ending Account
Value (Based
on Hypothetical
5% Annualized
Return and
Actual Expenses)
10/31/12 | | | Expenses
Paid
During
Period1 | |
| | | | | |
| Investor Class Shares | | $ | 1,000.00 | | | $ | 1,026.30 | | | $ | 7.84 | | | $ | 1,017.40 | | | $ | 7.81 | |
| | | | | |
| Class A Shares | | $ | 1,000.00 | | | $ | 1,028.70 | | | $ | 5.30 | | | $ | 1,019.90 | | | $ | 5.28 | |
| | | | | |
| Class B Shares | | $ | 1,000.00 | | | $ | 1,022.40 | | | $ | 11.64 | | | $ | 1,013.60 | | | $ | 11.59 | |
| | | | | |
| Class C Shares | | $ | 1,000.00 | | | $ | 1,022.40 | | | $ | 11.64 | | | $ | 1,013.60 | | | $ | 11.59 | |
| | | | | |
| Class I Shares | | $ | 1,000.00 | | | $ | 1,030.30 | | | $ | 4.03 | | | $ | 1,021.20 | | | $ | 4.01 | |
| 1. | Expenses are equal to the Fund’s annualized expense ratio of each class (1.54% for Investor Class, 1.04% for Class A, 2.29% for Class B and Class C and 0.79% for Class I) multiplied by the average account value over the period, divided by 366 and multiplied by 184 (to reflect the six-month period). The table above represents the actual expenses incurred during the six-month period. See page 5 for more information on Class R2 shares. |
| | | | |
| mainstayinvestments.com | | | 7 | |
Industry Composition as of October 31, 2012 (Unaudited)
| | | | |
| Oil, Gas & Consumable Fuels | | | 10.4 | % |
| Computers & Peripherals | | | 6.1 | |
| Pharmaceuticals | | | 5.9 | |
| Software | | | 5.1 | |
| Specialty Retail | | | 5.0 | |
| Insurance | | | 4.9 | |
| Food & Staples Retailing | | | 4.4 | |
| Diversified Telecommunication Services | | | 4.3 | |
| IT Services | | | 4.3 | |
| Media | | | 4.3 | |
| Biotechnology | | | 3.6 | |
| Diversified Financial Services | | | 3.4 | |
| Health Care Providers & Services | | | 3.3 | |
| Internet Software & Services | | | 3.3 | |
| Beverages | | | 3.2 | |
| Exchange Traded Fund | | | 2.6 | |
| Chemicals | | | 2.2 | |
| Commercial Services & Supplies | | | 2.2 | |
| Food Products | | | 1.7 | |
| Capital Markets | | | 1.5 | |
| Household Durables | | | 1.5 | |
| Wireless Telecommunication Services | | | 1.5 | |
| Communications Equipment | | | 1.4 | |
| Industrial Conglomerates | | | 1.3 | |
| Aerospace & Defense | | | 1.1 | |
| | | | |
| Semiconductors & Semiconductor Equipment | | | 1.1 | % |
| Commercial Banks | | | 1.0 | |
| Health Care Equipment & Supplies | | | 1.0 | |
| Tobacco | | | 1.0 | |
| Hotels, Restaurants & Leisure | | | 0.9 | |
| Air Freight & Logistics | | | 0.8 | |
| Consumer Finance | | | 0.8 | |
| Household Products | | | 0.8 | |
| Multiline Retail | | | 0.8 | |
| Road & Rail | | | 0.7 | |
| Diversified Consumer Services | | | 0.4 | |
| Internet & Catalog Retail | | | 0.4 | |
| Machinery | | | 0.4 | |
| Airlines | | | 0.2 | |
| Electric Utilities | | | 0.2 | |
| Independent Power Producers & Energy Traders | | | 0.2 | |
| Real Estate Investment Trusts | | | 0.2 | |
| Electrical Equipment | | | 0.1 | |
| Energy Equipment & Services | | | 0.1 | |
| Multi-Utilities | | | 0.1 | |
| Textiles, Apparel & Luxury Goods | | | 0.1 | |
| Thrifts & Mortgage Finance | | | 0.0 | ‡ |
| Short-Term Investment | | | 0.1 | |
| Other Assets, Less Liabilities | | | 0.1 | |
| | | | |
| | | 100.0 | % |
| | | | |
See Portfolio of Investments beginning on page 11 for specific holdings within these categories.
| ‡ | Less than one-tenth of a percent. |
Top Ten Holdings as of October 31, 2012 (excluding short-term investment)
| 3. | S&P 500 Index—SPDR Trust Series 1 |
| 5. | International Business Machines Corp. |
| | |
| 8 | | MainStay Common Stock Fund |
Portfolio Management Discussion and Analysis (Unaudited)
Questions answered by Harvey J. Fram, CFA, and Migene Kim, CFA, of Madison Square Investors LLC, the Fund’s Subadvisor.
How did MainStay Common Stock Fund perform relative to its peers and its benchmark during the 12 months ended October 31, 2012?
Excluding all sales charges, MainStay Common Stock Fund returned 15.15% for Investor Class shares, 15.64% for Class A shares and 14.23% for Class B and Class C shares for the 12 months ended October 31, 2012. Over the same period, the Fund’s Class I shares returned 15.89% and Class R2 shares1 returned 15.52%. All share classes outperformed the 13.15% return of the average Lipper2 large-cap core fund for the same period. Class A, Class I and Class R2 shares outperformed—and Investor Class, Class B and Class C shares underper- formed—the 15.21% return of the S&P 500® Index3 for the 12 months ended October 31, 2012. The S&P 500® Index is the Fund’s broad-based securities-market index. See page 5 for Fund returns with applicable sales charges.
What factors affected the Fund’s relative performance during the reporting period?
The Fund’s stock-selection model performed well during the reporting period, with both price momentum and valuation factors contributing positively to the Fund’s performance relative to the S&P 500® Index. The Fund’s model was particularly successful in identifying stocks that proved to be strong performers during the reporting period.
During the reporting period, which sectors were the strongest positive contributors to the Fund’s relative performance and which sectors were particularly weak?
The sectors that made the strongest positive contributions to the Fund’s performance relative to the S&P 500® Index were consumer discretionary, energy and information technology. (Contributions take weightings and total returns into account.) The Fund’s overweight position in the consumer discretionary sector helped relative performance because of good stock selection within the sector. In energy, the Fund benefited from a tilt toward refiners, which tend to be less sensitive to falling oil and gas prices, and from underweight positions relative to the S&P 500® Index in oil & gas exploration companies and coal producers, which were particularly affected by commodity price declines. In information technology, favorable stock selection helped relative performance.
The weakest sector contributions to the Fund’s relative performance came from industrials, utilities and telecommunication services. While the Fund was prudently underweight in the industrials and utilities sectors, both of which lagged the S&P 500® Index during the reporting period, unfavorable stock
selection within each of these sectors detracted from relative performance. Telecommunication services, with a neutral contribution to Fund performance, was the third-weakest-contributing sector during the reporting period.
During the reporting period, which individual stocks made the strongest positive contributions to the Fund’s absolute performance and which stocks detracted the most?
The individual stocks that made the strongest positive contributions to the Fund’s absolute performance included computers & peripherals company Apple, integrated oil company ExxonMobil and tobacco company Philip Morris International. The Fund held overweight positions in all three stocks. Although Apple’s share price has corrected somewhat since mid-Septem- ber, the company delivered strong financial results during the entire reporting period and the stock provided a total return of approximately 48% for the reporting period. ExxonMobil also reported strong financial results and Philip Morris International built on a strong run in 2011 and continued to deliver solid financial results. In September 2012, the company announced a 10% dividend increase.
The individual stocks that detracted the most from absolute performance included computers & peripherals company EMC, trading company & distributor United Rentals and insurance company MetLife. EMC, which provides enterprise storage systems, performed well after reporting better-than-expected fourth-quarter 2011 earnings. Unfortunately, the company was unable to sustain its momentum, and a weak economy and slower corporate spending led EMC to cut its sales forecast and post disappointing third-quarter 2012 earnings. United Rentals has a network of rental equipment operations that serve indus- tries and individuals in the United States and Canada. The company’s shares sold off in July 2012, after a merger with RSC Holdings led to lower utilization rates. MetLife, which sells life insurance, annuities and other financial services, initially saw its share price trend upward. The Federal Reserve, however, remained highly accommodative and kept the federal funds rate near zero, which exerted pressure on MetLife’s margins and constrained the company’s investment income. MetLife’s share price has recovered somewhat since the second quarter of 2012, but at the end of the reporting period, the stock continued to trade at a deep discount to its book value.
Did the Fund make any significant purchases or sales during the reporting period?
We increased the Fund’s position in computers & peripherals company Apple during the reporting period. The Fund’s stock-
| 1. | See footnote on page 5 for more information on Class R2 shares. |
| 2. | See footnote on page 6 for more information on Lipper Inc. |
| 3. | See footnote on page 6 for more information on the S&P 500® Index. |
| | | | |
| mainstayinvestments.com | | | 9 | |
selection model liked Apple because of its momentum, valuation and quality. We also added to the Fund’s position in home improvement retailer Lowe’s during the reporting period. We made a particularly sizable purchase of shares in April 2012 in light of the stock’s strong price momentum as well as the company’s share buyback program and reasonable valuation.
We began trimming the Fund’s position in railroad company CSX in November 2011 because of a poor revenue multiple and mediocre price momentum. We continued to dispose of the Fund’s shares of CSX as other metrics, such as bond price momentum and short interest, also deteriorated. We complete- ly sold out of the Fund’s position in CSX in June 2012. We eliminated the Fund’s position in mining company Freeport-McMoRan Copper & Gold over the course of the reporting period when our model provided poor scores for momentum, revenue multiples and share issuance. The Fund completely sold its position in the mining company by the end of May 2012.
How did the Fund’s sector weightings change during the reporting period?
The Fund saw its largest sector-weighting increases (on both an absolute and a relative basis) in the telecommunication services, information technology and health care sectors. Over the same period, the Fund’s most substantial weighting decreases relative to the S&P 500® Index were in the utilities and financials sectors.
How was the Fund positioned at the end of October 2012?
As of October 31, 2012, the Fund’s most substantially overweight sector positions relative to the S&P 500® Index were in telecommunication services, consumer discretionary and information technology. As of the same date, the Fund held underweight positions relative to the Index in the financials, utilities and industrials sectors.
The opinions expressed are those of the portfolio managers as of the date of this report and are subject to change. There is no guarantee that any forecast made will come to pass. This material does not constitute investment advice and is not intended as an endorsement of any specific investment.
| | |
| 10 | | MainStay Common Stock Fund |
Portfolio of Investments October 31, 2012
| | | | | | | | |
| | |
| | | Shares | | | Value | |
| | | | | | | | |
| Common Stocks 97.2%† | | | | | | | | |
Aerospace & Defense 1.1% | | | | | | | | |
United Technologies Corp. | | | 16,302 | | | $ | 1,274,164 | |
| | | | | | | | |
| | |
Air Freight & Logistics 0.8% | | | | | | | | |
United Parcel Service, Inc. Class B | | | 12,784 | | | | 936,428 | |
| | | | | | | | |
| | |
Airlines 0.2% | | | | | | | | |
Alaska Air Group, Inc. (a) | | | 5,065 | | | | 193,686 | |
| | | | | | | | |
| | |
Beverages 3.2% | | | | | | | | |
Coca-Cola Co. (The) | | | 41,564 | | | | 1,545,350 | |
Constellation Brands, Inc. Class A (a) | | | 22,312 | | | | 788,506 | |
PepsiCo., Inc. | | | 17,239 | | | | 1,193,628 | |
| | | | | | | | |
| | | | | | | 3,527,484 | |
| | | | | | | | |
Biotechnology 3.6% | | | | | | | | |
Amgen, Inc. | | | 15,126 | | | | 1,309,080 | |
Biogen Idec, Inc. (a) | | | 816 | | | | 112,788 | |
Celgene Corp. (a) | | | 9,535 | | | | 699,106 | |
Gilead Sciences, Inc. (a) | | | 17,065 | | | | 1,146,085 | |
United Therapeutics Corp. (a) | | | 12,879 | | | | 588,184 | |
Vertex Pharmaceuticals, Inc. (a) | | | 2,883 | | | | 139,076 | |
| | | | | | | | |
| | | | | | | 3,994,319 | |
| | | | | | | | |
Capital Markets 1.5% | | | | | | | | |
Bank of New York Mellon Corp. (The) | | | 25,444 | | | | 628,721 | |
BlackRock, Inc. | | | 9 | | | | 1,707 | |
Charles Schwab Corp. (The) | | | 13,168 | | | | 178,822 | |
Northern Trust Corp. | | | 6,030 | | | | 288,113 | |
State Street Corp. | | | 12,475 | | | | 556,011 | |
| | | | | | | | |
| | | | | | | 1,653,374 | |
| | | | | | | | |
Chemicals 2.2% | | | | | | | | |
CF Industries Holdings, Inc. | | | 2,193 | | | | 449,982 | |
Eastman Chemical Co. | | | 7,214 | | | | 427,357 | |
LyondellBasell Industries, N.V., Class A | | | 16,751 | | | | 894,336 | |
PPG Industries, Inc. | | | 5,889 | | | | 689,484 | |
| | | | | | | | |
| | | | | | | 2,461,159 | |
| | | | | | | | |
Commercial Banks 1.0% | | | | | | | | |
KeyCorp | | | 42,040 | | | | 353,977 | |
Wells Fargo & Co. | | | 21,509 | | | | 724,638 | |
| | | | | | | | |
| | | | | | | 1,078,615 | |
| | | | | | | | |
Commercial Services & Supplies 2.2% | | | | | | | | |
ADT Corp. (The) (a) | | | 7,873 | | | | 326,808 | |
Avery Dennison Corp. | | | 22,235 | | | | 719,969 | |
Iron Mountain, Inc. | | | 18,271 | | | | 632,177 | |
Pitney Bowes, Inc. | | | 40,782 | | | | 585,630 | |
| | | | | | | | |
| | |
| | | Shares | | | Value | |
| | | | | | | | |
Commercial Services & Supplies (continued) | |
R.R. Donnelley & Sons Co. | | | 6 | | | $ | 60 | |
Tyco International, Ltd. | | | 5,551 | | | | 149,155 | |
| | | | | | | | |
| | | | | | | 2,413,799 | |
| | | | | | | | |
Communications Equipment 1.4% | | | | | | | | |
Cisco Systems, Inc. | | | 55,112 | | | | 944,620 | |
Harris Corp. | | | 9,005 | | | | 412,249 | |
QUALCOMM, Inc. | | | 2,848 | | | | 166,821 | |
| | | | | | | | |
| | | | | | | 1,523,690 | |
| | | | | | | | |
Computers & Peripherals 6.1% | | | | | | | | |
¨Apple, Inc. | | | 9,082 | | | | 5,404,698 | |
EMC Corp. (a) | | | 7,685 | | | | 187,668 | |
NetApp, Inc. (a) | | | 14,300 | | | | 384,670 | |
Seagate Technology PLC | | | 15,061 | | | | 411,466 | |
Western Digital Corp. | | | 11,265 | | | | 385,601 | |
| | | | | | | | |
| | | | | | | 6,774,103 | |
| | | | | | | | |
Consumer Finance 0.8% | | | | | | | | |
American Express Co. | | | 7,429 | | | | 415,801 | |
Discover Financial Services | | | 11,811 | | | | 484,251 | |
| | | | | | | | |
| | | | | | | 900,052 | |
| | | | | | | | |
Diversified Consumer Services 0.4% | | | | | | | | |
H&R Block, Inc. | | | 25,747 | | | | 455,722 | |
| | | | | | | | |
| | |
Diversified Financial Services 3.4% | | | | | | | | |
Bank of America Corp. | | | 169,625 | | | | 1,580,905 | |
Citigroup, Inc. | | | 4,240 | | | | 158,533 | |
¨JPMorgan Chase & Co. | | | 49,591 | | | | 2,066,953 | |
| | | | | | | | |
| | | | | | | 3,806,391 | |
| | | | | | | | |
Diversified Telecommunication Services 4.3% | |
¨AT&T, Inc. | | | 68,444 | | | | 2,367,478 | |
CenturyLink, Inc. | | | 6,030 | | | | 231,431 | |
Frontier Communications Corp. | | | 86,725 | | | | 409,342 | |
Verizon Communications, Inc. | | | 40,056 | | | | 1,788,100 | |
| | | | | | | | |
| | | | | | | 4,796,351 | |
| | | | | | | | |
Electric Utilities 0.2% | | | | | | | | |
Exelon Corp. | | | 4,449 | | | | 159,185 | |
Southern Co. (The) | | | 2,122 | | | | 99,395 | |
| | | | | | | | |
| | | | | | | 258,580 | |
| | | | | | | | |
Electrical Equipment 0.1% | | | | | | | | |
Cooper Industries PLC | | | 1,356 | | | | 101,619 | |
| | | | | | | | |
| | |
Energy Equipment & Services 0.1% | | | | | | | | |
Helmerich & Payne, Inc. | | | 1,058 | | | | 50,573 | |
Schlumberger, Ltd. | | | 1,553 | | | | 107,980 | |
| | | | | | | | |
| | | | | | | 158,553 | |
| | | | | | | | |
| † | Percentages indicated are based on Fund net assets. |
| ¨ | | Among the Fund’s 10 largest holdings, as of October 31, 2012. May be subject to change daily. |
| | | | | | |
The notes to the financial statements are an integral part of,
and should be read in conjunction with, the financial statements. | | mainstayinvestments.com | | | 11 | |
Portfolio of Investments October 31, 2012 (continued)
| | | | | | | | |
| | |
| | | Shares | | | Value | |
| | | | | | | | |
| Common Stocks (continued) | |
Food & Staples Retailing 4.4% | | | | | | | | |
Costco Wholesale Corp. | | | 6,520 | | | $ | 641,764 | |
CVS Caremark Corp. | | | 25,830 | | | | 1,198,512 | |
Kroger Co. (The) | | | 9,468 | | | | 238,783 | |
¨Wal-Mart Stores, Inc. | | | 23,894 | | | | 1,792,528 | |
Walgreen Co. | | | 27,262 | | | | 960,440 | |
| | | | | | | | |
| | | | | | | 4,832,027 | |
| | | | | | | | |
Food Products 1.7% | | | | | | | | |
Dean Foods Co. (a) | | | 49,226 | | | | 828,966 | |
Mondelez International, Inc. Class A | | | 14,164 | | | | 375,912 | |
Smithfield Foods, Inc. (a) | | | 34,098 | | | | 697,986 | |
| | | | | | | | |
| | | | | | | 1,902,864 | |
| | | | | | | | |
Health Care Equipment & Supplies 1.0% | | | | | | | | |
Boston Scientific Corp. (a) | | | 137,383 | | | | 706,149 | |
Hologic, Inc. (a) | | | 555 | | | | 11,444 | |
Zimmer Holdings, Inc. | | | 6,060 | | | | 389,112 | |
| | | | | | | | |
| | | | | | | 1,106,705 | |
| | | | | | | | |
Health Care Providers & Services 3.3% | | | | | | | | |
Aetna, Inc. | | | 2,412 | | | | 105,404 | |
Community Health Systems, Inc. (a) | | | 25,931 | | | | 711,028 | |
Coventry Health Care, Inc. | | | 1,394 | | | | 60,834 | |
Humana, Inc. | | | 1,357 | | | | 100,784 | |
McKesson Corp. | | | 10,151 | | | | 947,190 | |
Omnicare, Inc. | | | 22,166 | | | | 765,392 | |
UnitedHealth Group, Inc. | | | 15,113 | | | | 846,328 | |
WellPoint, Inc. | | | 1,402 | | | | 85,915 | |
| | | | | | | | |
| | | | | | | 3,622,875 | |
| | | | | | | | |
Hotels, Restaurants & Leisure 0.9% | | | | | | | | |
Brinker International, Inc. | | | 10,415 | | | | 320,782 | |
McDonald’s Corp. | | | 904 | | | | 78,467 | |
Starwood Hotels & Resorts Worldwide, Inc. | | | 8,357 | | | | 433,311 | |
Wyndham Worldwide Corp. | | | 2,416 | | | | 121,766 | |
Wynn Resorts, Ltd. | | | 143 | | | | 17,312 | |
| | | | | | | | |
| | | | | | | 971,638 | |
| | | | | | | | |
Household Durables 1.5% | | | | | | | | |
Leggett & Platt, Inc. | | | 30,039 | | | | 796,935 | |
PulteGroup, Inc. (a) | | | 47,042 | | | | 815,708 | |
| | | | | | | | |
| | | | | | | 1,612,643 | |
| | | | | | | | |
Household Products 0.8% | | | | | | | | |
Procter & Gamble Co. (The) | | | 13,091 | | | | 906,421 | |
| | | | | | | | |
| |
Independent Power Producers & Energy Traders 0.2% | | | | | |
NRG Energy, Inc. | | | 9,682 | | | | 208,744 | |
| | | | | | | | |
| | |
Industrial Conglomerates 1.3% | | | | | | | | |
General Electric Co. | | | 68,672 | | | | 1,446,232 | |
| | | | | | | | |
| | | | | | | | |
| | |
| | | Shares | | | Value | |
| | | | | | | | |
Insurance 4.9% | | | | | | | | |
Aflac, Inc. | | | 18,817 | | | $ | 936,710 | |
Allstate Corp. (The) | | | 21,800 | | | | 871,564 | |
American International Group, Inc. (a) | | | 30,553 | | | | 1,067,216 | |
Berkshire Hathaway, Inc. Class B (a) | | | 7,565 | | | | 653,238 | |
Hartford Financial Services Group, Inc. (The) | | | 1,504 | | | | 32,652 | |
MetLife, Inc. | | | 463 | | | | 16,432 | |
Prudential Financial, Inc. | | | 16,528 | | | | 942,922 | |
Travelers Cos., Inc. (The) | | | 13,691 | | | | 971,240 | |
| | | | | | | | |
| | | | | | | 5,491,974 | |
| | | | | | | | |
Internet & Catalog Retail 0.4% | | | | | | | | |
Amazon.com, Inc. (a) | | | 212 | | | | 49,358 | |
Expedia, Inc. | | | 7,156 | | | | 423,277 | |
| | | | | | | | |
| | | | | | | 472,635 | |
| | | | | | | | |
Internet Software & Services 3.3% | | | | | | | | |
Akamai Technologies, Inc. (a) | | | 20,237 | | | | 768,804 | |
AOL, Inc. (a) | | | 10,695 | | | | 367,159 | |
Equinix, Inc. (a) | | | 1,924 | | | | 347,109 | |
¨Google, Inc. Class A (a) | | | 3,212 | | | | 2,183,421 | |
| | | | | | | | |
| | | | | | | 3,666,493 | |
| | | | | | | | |
IT Services 4.3% | | | | | | | | |
Accenture PLC Class A | | | 16,017 | | | | 1,079,706 | |
Computer Sciences Corp. | | | 12,442 | | | | 378,859 | |
CoreLogic, Inc. (a) | | | 27,193 | | | | 647,193 | |
Global Payments, Inc. | | | 4,346 | | | | 185,792 | |
¨International Business Machines Corp. | | | 12,591 | | | | 2,449,327 | |
| | | | | | | | |
| | | | | | | 4,740,877 | |
| | | | | | | | |
Machinery 0.4% | | | | | | | | |
Cummins, Inc. | | | 4,276 | | | | 400,148 | |
Ingersoll-Rand PLC | | | 36 | | | | 1,693 | |
Pentair, Ltd. | | | 1,012 | | | | 42,747 | |
| | | | | | | | |
| | | | | | | 444,588 | |
| | | | | | | | |
Media 4.3% | | | | | | | | |
Cablevision Systems Corp. Class A | | | 31,584 | | | | 550,193 | |
Comcast Corp. Class A | | | 36,058 | | | | 1,352,536 | |
DIRECTV (a) | | | 19,300 | | | | 986,423 | |
Gannett Co., Inc. | | | 41,638 | | | | 703,682 | |
Interpublic Group of Cos., Inc. (The) | | | 58,030 | | | | 586,103 | |
Time Warner Cable, Inc. | | | 5,138 | | | | 509,227 | |
Walt Disney Co. (The) | | | 1,421 | | | | 69,729 | |
| | | | | | | | |
| | | | | | | 4,757,893 | |
| | | | | | | | |
Multi-Utilities 0.1% | | | | | | | | |
Public Service Enterprise Group, Inc. | | | 2,636 | | | | 84,457 | |
| | | | | | | | |
| | |
Multiline Retail 0.8% | | | | | | | | |
Kohl’s Corp. | | | 2,985 | | | | 159,041 | |
Macy’s, Inc. | | | 19,477 | | | | 741,489 | |
| | | | | | | | |
| | | | | | | 900,530 | |
| | | | | | | | |
| | | | |
| 12 | | MainStay Common Stock Fund | | The notes to the financial statements are an integral part of,
and should be read in conjunction with, the financial statements. |
| | | | | | | | |
| | |
| | | Shares | | | Value | |
| | | | | | | | |
| Common Stocks (continued) | |
Oil, Gas & Consumable Fuels 10.4% | | | | | | | | |
¨Chevron Corp. | | | 21,308 | | | $ | 2,348,355 | |
ConocoPhillips | | | 17,164 | | | | 992,937 | |
¨ExxonMobil Corp. | | | 47,188 | | | | 4,302,130 | |
HollyFrontier Corp. | | | 19,810 | | | | 765,260 | |
Marathon Petroleum Corp. | | | 16,131 | | | | 886,076 | |
Phillips 66 | | | 15,541 | | | | 732,914 | |
Tesoro Corp. | | | 19,058 | | | | 718,677 | |
Valero Energy Corp. | | | 28,256 | | | | 822,250 | |
| | | | | | | | |
| | | | | | | 11,568,599 | |
| | | | | | | | |
Pharmaceuticals 5.9% | | | | | | | | |
Abbott Laboratories | | | 12,305 | | | | 806,224 | |
Eli Lilly & Co. | | | 15,325 | | | | 745,255 | |
Forest Laboratories, Inc. (a) | | | 8,450 | | | | 284,849 | |
Johnson & Johnson | | | 22,148 | | | | 1,568,521 | |
Merck & Co., Inc. | | | 37,877 | | | | 1,728,328 | |
Pfizer, Inc. | | | 54,894 | | | | 1,365,214 | |
| | | | | | | | |
| | | | | | | 6,498,391 | |
| | | | | | | | |
Real Estate Investment Trusts 0.2% | | | | | | | | |
American Tower Corp. | | | 709 | | | | 53,380 | |
OMEGA Healthcare Investors, Inc. | | | 5,988 | | | | 137,365 | |
| | | | | | | | |
| | | | | | | 190,745 | |
| | | | | | | | |
Road & Rail 0.7% | | | | | | | | |
Union Pacific Corp. | | | 6,021 | | | | 740,764 | |
| | | | | | | | |
| |
Semiconductors & Semiconductor Equipment 1.1% | | | | | |
Intel Corp. | | | 38,999 | | | | 843,353 | |
NVIDIA Corp. (a) | | | 28,753 | | | | 344,174 | |
| | | | | | | | |
| | | | | | | 1,187,527 | |
| | | | | | | | |
Software 5.1% | | | | | | | | |
CA, Inc. | | | 12,329 | | | | 277,649 | |
¨Microsoft Corp. | | | 88,372 | | | | 2,521,695 | |
Oracle Corp. | | | 55,256 | | | | 1,715,699 | |
Symantec Corp. (a) | | | 36,474 | | | | 663,462 | |
Synopsys, Inc. (a) | | | 15,193 | | | | 489,215 | |
| | | | | | | | |
| | | | | | | 5,667,720 | |
| | | | | | | | |
Specialty Retail 5.0% | | | | | | | | |
American Eagle Outfitters, Inc. | | | 34,643 | | | | 722,999 | |
Best Buy Co., Inc. | | | 3,475 | | | | 52,855 | |
Chico’s FAS, Inc. | | | 40,195 | | | | 747,627 | |
Foot Locker, Inc. | | | 21,500 | | | | 720,250 | |
GameStop Corp. Class A | | | 16,973 | | | | 387,494 | |
Gap, Inc. (The) | | | 12,460 | | | | 445,071 | |
Home Depot, Inc. (The) | | | 4,874 | | | | 299,166 | |
Lowe’s Cos., Inc. | | | 30,074 | | | | 973,796 | |
PetSmart, Inc. | | | 11,308 | | | | 750,738 | |
TJX Cos., Inc. | | | 11,716 | | | | 487,737 | |
| | | | | | | | |
| | | | | | | 5,587,733 | |
| | | | | | | | |
Textiles, Apparel & Luxury Goods 0.1% | | | | | | | | |
Carter’s, Inc. (a) | | | 1,906 | | | | 103,038 | |
| | | | | | | | |
| | | | | | | | |
| | |
| | | Shares | | | Value | |
| | | | | | | | |
Thrifts & Mortgage Finance 0.0%‡ | | | | | | | | |
Hudson City Bancorp, Inc. | | | 3,945 | | | $ | 33,473 | |
| | | | | | | | |
| | |
Tobacco 1.0% | | | | | | | | |
Philip Morris International, Inc. | | | 11,964 | | | | 1,059,532 | |
| | | | | | | | |
| |
Wireless Telecommunication Services 1.5% | | | | | |
MetroPCS Communications, Inc. (a) | | | 63,886 | | | | 652,276 | |
Sprint Nextel Corp. (a) | | | 150,553 | | | | 834,064 | |
Telephone & Data Systems, Inc. | | | 8,069 | | | | 200,676 | |
| | | | | | | | |
| | | | | | | 1,687,016 | |
| | | | | | | | |
Total Common Stocks
(Cost $99,410,104) | | | | | | | 107,802,223 | |
| | | | | | | | |
| | |
| Exchange Traded Fund 2.6% (b) | | | | | | | | |
¨S&P 500 Index—SPDR Trust Series 1 | | | 20,925 | | | | 2,954,191 | |
| | | | | | | | |
Total Exchange Traded Fund (Cost $3,040,263) | | | | | | | 2,954,191 | |
| | | | | | | | |
| | |
| | | | | | | | |
| | |
| | | Principal
Amount | | | | |
| Short-Term Investment 0.1% | | | | | | | | |
Repurchase Agreement 0.1% | | | | | | | | |
State Street Bank and Trust Co.
0.01%, dated 10/31/12
due 11/1/12
Proceeds at Maturity $62,719 (Collateralized by a Federal National Mortgage Association security with a rate of 5.00% and a maturity date of 3/15/16, with a Principal Amount of $60,000 and a Market Value of $69,277) | | $ | 62,719 | | | | 62,719 | |
| | | | | | | | |
Total Short-Term Investment
(Cost $62,719) | | | | | | | 62,719 | |
| | | | | | | | |
Total Investments
(Cost $102,513,086) (c) | | | 99.9 | % | | | 110,819,133 | |
Other Assets, Less Liabilities | | | 0.1 | | | | 71,289 | |
Net Assets | | | 100.0 | % | | $ | 110,890,422 | |
| ‡ | Less than one-tenth of a percent. |
| (a) | Non-income producing security. |
| (b) | Exchange Traded Fund—An investment vehicle that represents a basket of securities that is traded on an exchange. |
| (c) | As of October 31, 2012, cost is $104,167,663 for federal income tax purposes and net unrealized appreciation is as follows: |
| | | | |
Gross unrealized appreciation | | $ | 8,045,120 | |
Gross unrealized depreciation | | | (1,393,650 | ) |
| | | | |
Net unrealized appreciation | | $ | 6,651,470 | |
| | | | |
The following abbreviation is used in the above portfolio:
SPDR—Standard & Poor’s Depositary Receipt
| | | | | | |
The notes to the financial statements are an integral part of,
and should be read in conjunction with, the financial statements. | | mainstayinvestments.com | | | 13 | |
Portfolio of Investments October 31, 2012 (continued)
The following is a summary of the fair valuations according to the inputs used as of October 31, 2012, for valuing the Fund’s assets.
Asset Valuation Inputs
| | | | | | | | | | | | | | | | |
Description | | Quoted Prices in Active Markets for
Identical Assets (Level 1) | | | Significant
Other
Observable
Inputs (Level 2) | | | Significant
Unobservable
Inputs (Level 3) | | | Total | |
| Investments in Securities (a) | | | | | | | | | | | | | | | | |
| Common Stocks | | $ | 107,802,223 | | | $ | — | | | $ | — | | | $ | 107,802,223 | |
| Exchange Traded Fund | | | 2,954,191 | | | | — | | | | — | | | | 2,954,191 | |
| Short-Term Investment | | | | | | | | | | | | | | | | |
Repurchase Agreement | | | — | | | | 62,719 | | | | — | | | | 62,719 | |
| | | | | | | | | | | | | | | | |
| Total Investments in Securities | | $ | 110,756,414 | | | $ | 62,719 | | | $ | — | | | $ | 110,819,133 | |
| | | | | | | | | | | | | | | | |
| (a) | For a complete listing of investments and their industries, see the Portfolio of Investments. |
The Fund recognizes transfers between the levels as of the beginning of the period.
For the year ended October 31, 2012, the Fund did not have any transfers between Level 1 and Level 2 fair value measurements. (See Note 2)
As of October 31, 2012, the Fund did not hold any investments with significant unobservable inputs (Level 3). (See Note 2)
| | | | |
| 14 | | MainStay Common Stock Fund | | The notes to the financial statements are an integral part of,
and should be read in conjunction with, the financial statements. |
Statement of Assets and Liabilities as of October 31, 2012
| | | | |
| Assets | | | | |
Investment in securities, at value
(identified cost $102,513,086) | | $ | 110,819,133 | |
Receivables: | | | | |
Dividends and interest | | | 193,581 | |
Fund shares sold | | | 37,493 | |
Other assets | | | 23,417 | |
| | | | |
Total assets | | | 111,073,624 | |
| | | | |
| |
| Liabilities | | | | |
Payables: | | | | |
Manager (See Note 3) | | | 54,809 | |
Transfer agent (See Note 3) | | | 49,381 | |
Investment securities purchased | | | 34,599 | |
Shareholder communication | | | 13,246 | |
NYLIFE Distributors (See Note 3) | | | 12,295 | |
Professional fees | | | 12,088 | |
Custodian | | | 3,025 | |
Trustees | | | 331 | |
Accrued expenses | | | 3,428 | |
| | | | |
Total liabilities | | | 183,202 | |
| | | | |
Net assets | | $ | 110,890,422 | |
| | | | |
| |
| Composition of Net Assets | | | | |
Shares of beneficial interest outstanding (par value of $.01 per share) unlimited number of shares authorized | | $ | 86,278 | |
Additional paid-in capital | | | 187,134,681 | |
| | | | |
| | | 187,220,959 | |
Undistributed net investment income | | | 1,360,464 | |
Accumulated net realized gain (loss) on investments | | | (85,997,048 | ) |
Net unrealized appreciation (depreciation) on investments | | | 8,306,047 | |
| | | | |
Net assets | | $ | 110,890,422 | |
| | | | |
| | | | |
Investor Class | | | | |
Net assets applicable to outstanding shares | | $ | 15,092,975 | |
| | | | |
Shares of beneficial interest outstanding | | | 1,171,204 | |
| | | | |
Net asset value per share outstanding | | $ | 12.89 | |
Maximum sales charge (5.50% of offering price) | | | 0.75 | |
| | | | |
Maximum offering price per share outstanding | | $ | 13.64 | |
| | | | |
Class A | | | | |
Net assets applicable to outstanding shares | | $ | 12,401,892 | |
| | | | |
Shares of beneficial interest outstanding | | | 961,143 | |
| | | | |
Net asset value per share outstanding | | $ | 12.90 | |
Maximum sales charge (5.50% of offering price) | | | 0.75 | |
| | | | |
Maximum offering price per share outstanding | | $ | 13.65 | |
| | | | |
Class B | | | | |
Net assets applicable to outstanding shares | | $ | 5,835,818 | |
| | | | |
Shares of beneficial interest outstanding | | | 491,642 | |
| | | | |
Net asset value and offering price per share outstanding | | $ | 11.87 | |
| | | | |
Class C | | | | |
Net assets applicable to outstanding shares | | $ | 1,574,699 | |
| | | | |
Shares of beneficial interest outstanding | | | 132,687 | |
| | | | |
Net asset value and offering price per share outstanding | | $ | 11.87 | |
| | | | |
Class I | | | | |
Net assets applicable to outstanding shares | | $ | 75,985,038 | |
| | | | |
Shares of beneficial interest outstanding | | | 5,871,158 | |
| | | | |
Net asset value and offering price per share outstanding | | $ | 12.94 | |
| | | | |
| | | | | | |
The notes to the financial statements are an integral part of,
and should be read in conjunction with, the financial statements. | | mainstayinvestments.com | | | 15 | |
Statement of Operations for the year ended October 31, 2012
| | | | |
| Investment Income (Loss) | |
Income | | | | |
Dividends | | $ | 2,680,884 | |
Interest | | | 37 | |
| | | | |
Total income | | | 2,680,921 | |
| | | | |
Expenses | | | | |
Manager (See Note 3) | | | 684,775 | |
Transfer agent (See Note 3) | | | 190,287 | |
Distribution/Service—Investor Class (See Note 3) | | | 36,492 | |
Distribution/Service—Class A (See Note 3) | | | 29,222 | |
Distribution/Service—Class B (See Note 3) | | | 63,481 | |
Distribution/Service—Class C (See Note 3) | | | 13,810 | |
Registration | | | 77,344 | |
Professional fees | | | 47,402 | |
Custodian | | | 25,872 | |
Shareholder communication | | | 19,053 | |
Trustees | | | 2,873 | |
Miscellaneous | | | 11,380 | |
| | | | |
Total expenses | | | 1,201,991 | |
| | | | |
Net investment income (loss) | | | 1,478,930 | |
| | | | |
|
| Realized and Unrealized Gain (Loss) on Investments | |
Net realized gain (loss) on investments | | | 10,898,706 | |
Net change in unrealized appreciation (depreciation) on investments | | | 3,860,672 | |
| | | | |
Net realized and unrealized gain (loss) on investments | | | 14,759,378 | |
| | | | |
Net increase (decrease) in net assets resulting from operations | | $ | 16,238,308 | |
| | | | |
| | | | |
| 16 | | MainStay Common Stock Fund | | The notes to the financial statements are an integral part of,
and should be read in conjunction with, the financial statements. |
Statements of Changes in Net Assets
for the years ended October 31, 2012 and October 31, 2011
| | | | | | | | |
| | | 2012 | | | 2011 | |
| Increase (Decrease) in Net Assets | |
Operations: | | | | | | | | |
Net investment income (loss) | | $ | 1,478,930 | | | $ | 2,998,653 | |
Net realized gain (loss) on investments | | | 10,898,706 | | | | 33,497,513 | |
Net change in unrealized appreciation (depreciation) on investments | | | 3,860,672 | | | | (15,466,809 | ) |
| | | | |
Net increase (decrease) in net assets resulting from operations | | | 16,238,308 | | | | 21,029,357 | |
| | | | |
Dividends to shareholders: | | | | | | | | |
From net investment income: | | | | | | | | |
Investor Class | | | (154,586 | ) | | | (49,796 | ) |
Class A | | | (173,110 | ) | | | (117,655 | ) |
Class B | | | (25,337 | ) | | | (2,806 | ) |
Class C | | | (4,598 | ) | | | (441 | ) |
Class I | | | (1,961,353 | ) | | | (3,037,676 | ) |
| | | | |
Total dividends to shareholders | | | (2,318,984 | ) | | | (3,208,374 | ) |
| | | | |
Capital share transactions: | | | | | | | | |
Net proceeds from sale of shares | | | 48,665,925 | | | | 51,838,875 | |
Net asset value of shares issued to shareholders in reinvestment of dividends | | | 1,993,945 | | | | 2,990,464 | |
Cost of shares redeemed | | | (98,399,615 | ) | | | (193,804,634 | ) |
| | | | |
Increase (decrease) in net assets derived from capital share transactions | | | (47,739,745 | ) | | | (138,975,295 | ) |
| | | | |
Net increase (decrease) in net assets | | | (33,820,421 | ) | | | (121,154,312 | ) |
| | |
| Net Assets | | | | | | | | |
Beginning of year | | | 144,710,843 | | | | 265,865,155 | |
| | | | |
End of year | | $ | 110,890,422 | | | $ | 144,710,843 | |
| | | | |
Undistributed net investment income at end of year | | $ | 1,360,464 | | | $ | 2,238,884 | |
| | | | |
| | | | | | |
The notes to the financial statements are an integral part of,
and should be read in conjunction with, the financial statements. | | mainstayinvestments.com | | | 17 | |
Financial Highlights selected per share data and ratios
| | | | | | | | | | | | | | | | | | | | |
| | | Investor Class | |
| | | Year ended October 31, | | | February 28,
2008**
through
October 31, | |
| | | 2012 | | | 2011 | | | 2010 | | | 2009 | | | 2008 | |
Net asset value at beginning of period | | $ | 11.32 | | | $ | 10.77 | | | $ | 9.69 | | | $ | 9.27 | | | $ | 13.17 | |
| | | | | | | | | | | | | | | | | | | | |
Net investment income (loss) (a) | | | 0.09 | | | | 0.06 | | | | 0.03 | | | | 0.07 | | | | 0.03 | |
Net realized and unrealized gain (loss) on investments | | | 1.61 | | | | 0.53 | | | | 1.13 | | | | 0.40 | | | | (3.93 | ) |
| | | | | | | | | | | | | | | | | | | | |
Total from investment operations | | | 1.70 | | | | 0.59 | | | | 1.16 | | | | 0.47 | | | | (3.90 | ) |
| | | | | | | | | | | | | | | | | | | | |
Less dividends: | | | | | | | | | | | | | | | | | | | | |
From net investment income | | | (0.13 | ) | | | (0.04 | ) | | | (0.08 | ) | | | (0.05 | ) | | | — | |
| | | | | | | | | | | | | | | | | | | | |
Net asset value at end of period | | $ | 12.89 | | | $ | 11.32 | | | $ | 10.77 | | | $ | 9.69 | | | $ | 9.27 | |
| | | | | | | | | | | | | | | | | | | | |
Total investment return (b) | | | 15.15 | % | | | 5.47 | % | | | 11.99 | % | | | 5.12 | % | | | (29.61 | %)(c) |
Ratios (to average net assets)/Supplemental Data: | | | | | | | | | | | | | | | | | | | | |
Net investment income (loss) | | | 0.72 | % | | | 0.56 | % | | | 0.25 | % | | | 0.81 | % | | | 0.41 | % †† |
Net expenses | | | 1.56 | % | | | 1.52 | % | | | 1.61 | % | | | 1.46 | % | | | 1.40 | % †† |
Expenses (before waiver/reimbursement) | | | 1.56 | % | | | 1.52 | % | | | 1.61 | % | | | 1.73 | % | | | 1.58 | % †† |
Portfolio turnover rate | | | 182 | % | | | 139 | % | | | 152 | % | | | 138 | % | | | 158 | % |
Net assets at end of period (in 000’s) | | $ | 15,093 | | | $ | 13,917 | | | $ | 13,661 | | | $ | 12,752 | | | $ | 11,811 | |
| ** | Commencement of operations. |
| (a) | Per share data based on average shares outstanding during the period. |
| (b) | Total investment return is calculated exclusive of sales charges and assumes the reinvestment of dividends and distributions. |
| (c) | Total investment return is not annualized. |
| | | | | | | | | | | | | | | | | | | | |
| | | Class A | |
| | | Year ended October 31, | |
| | | 2012 | | | 2011 | | | 2010 | | | 2009 | | | 2008 | |
Net asset value at beginning of year | | $ | 11.34 | | | $ | 10.79 | | | $ | 9.70 | | | $ | 9.28 | | | $ | 16.10 | |
| | | | | | | | | | | | | | | | | | | | |
Net investment income (loss) (a) | | | 0.15 | | | | 0.13 | | | | 0.09 | | | | 0.12 | | | | 0.08 | |
Net realized and unrealized gain (loss) on investments | | | 1.60 | | | | 0.53 | | | | 1.13 | | | | 0.40 | | | | (5.70 | ) |
| | | | | | | | | | | | | | | | | | | | |
Total from investment operations | | | 1.75 | | | | 0.66 | | | | 1.22 | | | | 0.52 | | | | (5.62 | ) |
| | | | | | | | | | | | | | | | | | | | |
Less dividends and distributions: | | | | | | | | | | | | | | | | | | | | |
From net investment income | | | (0.19 | ) | | | (0.11 | ) | | | (0.13 | ) | | | (0.10 | ) | | | (0.06 | ) |
From net realized gain on investments | | | — | | | | — | | | | — | | | | — | | | | (1.14 | ) |
| | | | | | | | | | | | | | | | | | | | |
Total dividends and distributions | | | (0.19 | ) | | | (0.11 | ) | | | (0.13 | ) | | | (0.10 | ) | | | (1.20 | ) |
| | | | | | | | | | | | | | | | | | | | |
Net asset value at end of year | | $ | 12.90 | | | $ | 11.34 | | | $ | 10.79 | | | $ | 9.70 | | | $ | 9.28 | |
| | | | | | | | | | | | | | | | | | | | |
Total investment return (b) | | | 15.64 | % | | | 6.10 | % | | | 12.64 | % | | | 5.80 | % | | | (37.22 | %) |
Ratios (to average net assets)/Supplemental Data: | | | | | | | | | | | | | | | | | | | | |
Net investment income (loss) | | | 1.22 | % | | | 1.12 | % | | | 0.90 | % | | | 1.38 | % | | | 0.65 | % |
Net expenses | | | 1.06 | % | | | 0.97 | % | | | 0.96 | % | | | 0.94 | % | | | 1.15 | % |
Expenses (before waiver/reimbursement) | | | 1.06 | % | | | 0.97 | % | | | 0.96 | % | | | 0.98 | % | | | 1.30 | % |
Portfolio turnover rate | | | 182 | % | | | 139 | % | | | 152 | % | | | 138 | % | | | 158 | % |
Net assets at end of year (in 000’s) | | $ | 12,402 | | | $ | 10,662 | | | $ | 12,140 | | | $ | 11,579 | | | $ | 12,530 | |
| (a) | Per share data based on average shares outstanding during the year. |
| (b) | Total investment return is calculated exclusive of sales charges and assumes the reinvestment of dividends and distributions. |
| | | | |
| 18 | | MainStay Common Stock Fund | | The notes to the financial statements are an integral part of,
and should be read in conjunction with, the financial statements. |
Financial Highlights selected per share data and ratios
| | | | | | | | | | | | | | | | | | | | |
| | | Class B | |
| | | Year ended October 31, | |
| | | 2012 | | | 2011 | | | 2010 | | | 2009 | | | 2008 | |
Net asset value at beginning of year | | $ | 10.43 | | | $ | 9.96 | | | $ | 8.97 | | | $ | 8.60 | | | $ | 15.07 | |
| | | | | | | | | | | | | | | | | | | | |
Net investment income (loss) (a) | | | (0.00 | )‡ | | | (0.02 | ) | | | (0.05 | ) | | | 0.01 | | | | (0.04 | ) |
Net realized and unrealized gain (loss) on investments | | | 1.48 | | | | 0.49 | | | | 1.05 | | | | 0.36 | | | | (5.29 | ) |
| | | | | | | | | | | | | | | | | | | | |
Total from investment operations | | | 1.48 | | | | 0.47 | | | | 1.00 | | | | 0.37 | | | | (5.33 | ) |
| | | | | | | | | | | | | | | | | | | | |
Less dividends and distributions: | | | | | | | | | | | | | | | | | | | | |
From net investment income | | | (0.04 | ) | | | (0.00 | )‡ | | | (0.01 | ) | | | — | | | | — | |
From net realized gain on investments | | | — | | | | — | | | | — | | | | — | | | | (1.14 | ) |
| | | | | | | | | | | | | | | | | | | | |
Total dividends and distributions | | | (0.04 | ) | | | (0.00 | )‡ | | | (0.01 | ) | | | — | | | | (1.14 | ) |
| | | | | | | | | | | | | | | | | | | | |
Net asset value at end of year | | $ | 11.87 | | | $ | 10.43 | | | $ | 9.96 | | | $ | 8.97 | | | $ | 8.60 | |
| | | | | | | | | | | | | | | | | | | | |
Total investment return (b) | | | 14.23 | % | | | 4.75 | % | | | 11.14 | % | | | 4.30 | % | | | (37.77 | %) |
Ratios (to average net assets)/Supplemental Data: | | | | | | | | | | | | | | | | | | | | |
Net investment income (loss) | | | (0.02 | %) | | | (0.17 | %) | | | (0.49 | %) | | | 0.14 | % | | | (0.30 | %) |
Net expenses | | | 2.31 | % | | | 2.27 | % | | | 2.36 | % | | | 2.20 | % | | | 2.10 | % |
Expenses (before waiver/reimbursement) | | | 2.31 | % | | | 2.27 | % | | | 2.36 | % | | | 2.49 | % | | | 2.27 | % |
Portfolio turnover rate | | | 182 | % | | | 139 | % | | | 152 | % | | | 138 | % | | | 158 | % |
Net assets at end of year (in 000’s) | | $ | 5,836 | | | $ | 6,762 | | | $ | 8,466 | | | $ | 10,371 | | | $ | 13,212 | |
| ‡ | Less than one cent per share. |
| (a) | Per share data based on average shares outstanding during the year. |
| (b) | Total investment return is calculated exclusive of sales charges and assumes the reinvestment of dividends and distributions. |
| | | | | | | | | | | | | | | | | | | | |
| | | Class C | |
| | | Year ended October 31, | |
| | | 2012 | | | 2011 | | | 2010 | | | 2009 | | | 2008 | |
Net asset value at beginning of year | | $ | 10.43 | | | $ | 9.96 | | | $ | 8.97 | | | $ | 8.59 | | | $ | 15.07 | |
| | | | | | | | | | | | | | | | | | | | |
Net investment income (loss) (a) | | | (0.00 | )‡ | | | (0.02 | ) | | | (0.05 | ) | | | 0.01 | | | | (0.04 | ) |
Net realized and unrealized gain (loss) on investments | | | 1.48 | | | | 0.49 | | | | 1.05 | | | | 0.37 | | | | (5.30 | ) |
| | | | | | | | | | | | | | | | | | | | |
Total from investment operations | | | 1.48 | | | | 0.47 | | | | 1.00 | | | | 0.38 | | | | (5.34 | ) |
| | | | | | | | | | | | | | | | | | | | |
Less dividends and distributions: | | | | | | | | | | | | | | | | | | | | |
From net investment income | | | (0.04 | ) | | | (0.00 | )‡ | | | (0.01 | ) | | | — | | | | — | |
From net realized gain on investments | | | — | | | | — | | | | — | | | | — | | | | (1.14 | ) |
| | | | | | | | | | | | | | | | | | | | |
Total dividends and distributions | | | (0.04 | ) | | | (0.00 | )‡ | | | (0.01 | ) | | | — | | | | (1.14 | ) |
| | | | | | | | | | | | | | | | | | | | |
Net asset value at end of year | | $ | 11.87 | | | $ | 10.43 | | | $ | 9.96 | | | $ | 8.97 | | | $ | 8.59 | |
| | | | | | | | | | | | | | | | | | | | |
Total investment return (b) | | | 14.23 | % | | | 4.75 | % | | | 11.12 | % | | | 4.42 | % | | | (37.84 | %) |
Ratios (to average net assets)/Supplemental Data: | | | | | | | | | | | | | | | | | | | | |
Net investment income (loss) | | | (0.02 | %) | | | (0.18 | %) | | | (0.49 | %) | | | 0.12 | % | | | (0.30 | %) |
Net expenses | | | 2.31 | % | | | 2.27 | % | | | 2.36 | % | | | 2.21 | % | | | 2.10 | % |
Expenses (before waiver/reimbursement) | | | 2.31 | % | | | 2.27 | % | | | 2.36 | % | | | 2.49 | % | | | 2.27 | % |
Portfolio turnover rate | | | 182 | % | | | 139 | % | | | 152 | % | | | 138 | % | | | 158 | % |
Net assets at end of year (in 000’s) | | $ | 1,575 | | | $ | 1,221 | | | $ | 1,352 | | | $ | 1,357 | | | $ | 1,611 | |
| ‡ | Less than one cent per share. |
| (a) | Per share data based on average shares outstanding during the year. |
| (b) | Total investment return is calculated exclusive of sales charges and assumes the reinvestment of dividends and distributions. |
| | | | | | |
The notes to the financial statements are an integral part of,
and should be read in conjunction with, the financial statements. | | mainstayinvestments.com | | | 19 | |
Financial Highlights selected per share data and ratios
| | | | | | | | | | | | | | | | | | | | |
| | | Class I | |
| | | Year ended October 31, | |
| | | 2012 | | | 2011 | | | 2010 | | | 2009 | | | 2008 | |
Net asset value at beginning of year | | $ | 11.38 | | | $ | 10.82 | | | $ | 9.72 | | | $ | 9.32 | | | $ | 16.19 | |
| | | | | | | | | | | | | | | | | | | | |
Net investment income (loss) (a) | | | 0.18 | | | | 0.16 | | | | 0.12 | | | | 0.15 | | | | 0.15 | |
Net realized and unrealized gain (loss) on investments | | | 1.60 | | | | 0.53 | | | | 1.14 | | | | 0.39 | | | | (5.73 | ) |
| | | | | | | | | | | | | | | | | | | | |
Total from investment operations | | | 1.78 | | | | 0.69 | | | | 1.26 | | | | 0.54 | | | | (5.58 | ) |
| | | | | | | | | | | | | | | | | | | | |
Less dividends and distributions: | | | | | | | | | | | | | | | | | | | | |
From net investment income | | | (0.22 | ) | | | (0.13 | ) | | | (0.16 | ) | | | (0.14 | ) | | | (0.15 | ) |
From net realized gain on investments | | | — | | | | — | | | | — | | | | — | | | | (1.14 | ) |
| | | | | | | | | | | | | | | | | | | | |
Total dividends and distributions | | | (0.22 | ) | | | (0.13 | ) | | | (0.16 | ) | | | (0.14 | ) | | | (1.29 | ) |
| | | | | | | | | | | | | | | | | | | | |
Net asset value at end of year | | $ | 12.94 | | | $ | 11.38 | | | $ | 10.82 | | | $ | 9.72 | | | $ | 9.32 | |
| | | | | | | | | | | | | | | | | | | | |
Total investment return (b) | | | 15.89 | % | | | 6.43 | % | | | 13.00 | % | | | 5.99 | % | | | (36.92 | %) |
Ratios (to average net assets)/Supplemental Data: | | | | | | | | | | | | | | | | | | | | |
Net investment income (loss) | | | 1.48 | % | | | 1.39 | % | | | 1.16 | % | | | 1.69 | % | | | 1.16 | % |
Net expenses | | | 0.81 | % | | | 0.72 | % | | | 0.71 | % | | | 0.65 | % | | | 0.62 | % |
Expenses (before waiver/reimbursement) | | | 0.81 | % | | | 0.72 | % | | | 0.71 | % | | | 0.73 | % | | | 0.80 | % |
Portfolio turnover rate | | | 182 | % | | | 139 | % | | | 152 | % | | | 138 | % | | | 158 | % |
Net assets at end of year (in 000’s) | | $ | 75,985 | | | $ | 112,148 | | | $ | 230,246 | | | $ | 260,081 | | | $ | 336,529 | |
| (a) | Per share data based on average shares outstanding during the year. |
| (b) | Total investment return is calculated exclusive of sales charges and assumes the reinvestment of dividends and distributions. Class I shares are not subject to sales charges. |
| | | | |
| 20 | | MainStay Common Stock Fund | | The notes to the financial statements are an integral part of,
and should be read in conjunction with, the financial statements. |
Notes to Financial Statements
Note 1–Organization and Business
The MainStay Funds (the “Trust”) were organized on January 9, 1986, as a Massachusetts business trust. The Trust is registered under the Investment Company Act of 1940, as amended (the “1940 Act”), as an open-end investment management company, and is comprised of twelve funds (collectively referred to as the “Funds”). These financial statements and notes relate only to the MainStay Common Stock Fund (the “Fund”), a diversified fund.
The Fund currently offers six classes of shares. Class A and Class B shares commenced operations on June 1, 1998. Class C shares commenced operations on September 1, 1998. Class I shares commenced operations on December 28, 2004. Class R2 shares were first offered on December 14, 2007. Investor Class shares commenced operations on February 28, 2008. Investor Class and Class A shares are offered at net asset value (“NAV”) per share plus an initial sales charge. No sales charge applies to investments of $1 million or more (and certain other qualified purchases) in Investor Class and Class A shares, but a contingent deferred sales charge (“CDSC”) is imposed on certain redemptions made within one year of the date of purchase. Class B and Class C shares are offered at NAV without an initial sales charge, although a declining CDSC may be imposed on redemptions made within six years of the date of purchase of Class B shares and a 1.00% CDSC may be imposed on redemptions made within one year of the date of purchase of Class C shares. Class I and Class R2 shares are offered at NAV and are not subject to a sales charge. Depending upon eligibility, Class B shares convert to either Investor Class or Class A shares at the end of the calendar quarter eight years after the date they were purchased. Additionally, depending upon eligibility, Investor Class shares may convert to Class A shares and Class A shares may convert to Investor Class shares. The six classes of shares have the same voting (except for issues that relate solely to one class), dividend, liquidation and other rights, and the same terms and conditions, except that Class B and Class C shares are subject to higher distribution and/or service fee rates than Investor Class, Class A and Class R2 shares under a distribution plan pursuant to Rule 12b-1 under the 1940 Act. Class I shares are not subject to a distribution and/or service fee. Class R2 shares are also subject to a shareholder service fee. This is in addition to any fees paid under a distribution plan, where applicable. There were no investment operations for Class R2 during the year ended October 31, 2012.
The Fund’s investment objective is to seek long-term growth of capital.
Prior to February 28, 2012, the Fund’s investment objective was to seek long-term growth of capital, with income as a secondary consideration.
Note 2–Significant Accounting Policies
The Fund prepares its financial statements in accordance with generally accepted accounting principles (“GAAP”) in the United States of America and follows the significant accounting policies described below.
(A) Securities Valuation. Investments are valued as of the close of regular trading on the New York Stock Exchange (“Exchange”) (generally 4:00 p.m. Eastern time) on each day the Fund is open for business (“valuation date”).
The Board of Trustees (the “Board”) has adopted procedures for the valuation of the Fund’s securities and has delegated the responsibility for valuation determination under those procedures to the Valuation Committee of the Fund (the “Valuation Committee”). The Board has authorized the Valuation Committee to appoint a Valuation Sub-Committee (the “Sub-Committee”) to deal in the first instance with questions that arise or cannot be resolved under these procedures. The Sub-Committee will meet (in person, via electronic mail or via teleconference) on an as-needed basis. The Valuation Committee shall meet at a later time, as necessary, to ensure that actions taken by the Sub-Committee were appropriate. The procedures recognize that, subject to the oversight of the Board and unless otherwise noted, the responsibility for day-to-day valuation of portfolio assets (including securities for which market prices are not readily available) rests with New York Life Investment Management LLC (“New York Life Investments” or the “Manager”), aided to whatever extent necessary by the Subadvisor (as defined in Note 3(A)) of the Fund. These procedures shall be reviewed by the Board no less frequently than annually. Any revisions to these procedures deemed necessary shall be reported to the Board at its next regularly scheduled meeting.
Securities are valued using unadjusted market prices, when available, as supplied primarily by third party pricing services or dealers. To assess the appropriateness of security valuations, the Manager or the Fund’s third party service provider who is subject to oversight by the Manager, regularly compares prior day prices, prices on comparable securities and the sale prices to the prior and current day prices and challenges prices exceeding certain tolerance levels with third party pricing services or broker sources. For those securities valued by recommendation, whether through a standardized fair valuation methodology or a fair valuation determination, the Valuation Committee reviews and affirms the reasonableness of the valuation based on such methodologies and determinations on a regular basis after considering all relevant information that is reasonably available.
“Fair value” is defined as the price that the Fund would receive upon selling an investment in an orderly transaction to an independent buyer in the principal or most advantageous market of the investment. Fair value measurements are determined within a framework that has established a three-tier hierarchy which maximizes the use of observable market data and minimizes the use of unobservable inputs to establish classification of fair value measurements for disclosure purposes. “Inputs” refer broadly to the assumptions that market participants would use in pricing the asset or liability, including assumptions about risk, such as the risk inherent in a particular valuation technique used to measure fair value using a pricing model and/or the risk inherent in the inputs for the valuation technique. Inputs may be observable or unobservable. Observable inputs reflect the assumptions market participants would use in pricing the asset or liability based on market data obtained from sources independent of the Fund. Unobservable inputs reflect the Fund’s own assumptions about the assumptions market participants would use in pricing the asset or liability developed based on the information available in the circumstances. The inputs or methodology used for valuing securities may not be an indication of the risks associated with investing in those securities. The three-tier hierarchy of inputs is summarized in the three broad Levels listed below.
| • | | Level 1—quoted prices in active markets for identical investments |
| | | | |
| mainstayinvestments.com | | | 21 | |
Notes to Financial Statements (continued)
| • | | Level 2—other significant observable inputs (including quoted prices for similar investments in active markets, interest rates and yield curves, prepayment speeds, credit risks, etc.) |
| • | | Level 3—significant unobservable inputs (including the Fund’s own assumptions about the assumptions that market participants would use in determining the fair value of investments) |
The aggregate value by input level, as of October 31, 2012, for the Fund’s investments is included at the end of the Fund’s Portfolio of Investments.
The valuation techniques used by the Fund to measure fair value maximize the use of observable inputs and minimize the use of unobservable inputs. The Fund may utilize third party vendor evaluations, whose prices may be derived from one or more of the following standard inputs:
| | |
• Benchmark Yields | | • Reported Trades |
• Broker Dealer Quotes | | • Issuer Spreads |
• Two-sided markets | | • Benchmark securities |
• Bids/Offers | | • Reference Data (corporate actions or material event notices) |
• Industry and economic events | | • Comparable bonds |
• Equity and credit default swap curves | | • Monthly payment information |
Securities for which market value cannot be determined using the methodologies described above are valued by methods deemed in good faith by the Fund’s Valuation Committee, following the procedures established by the Board, to represent fair value. Under these procedures, the Fund primarily employs a market-based approach which may use related or comparable assets or liabilities, recent transactions, market multiples, book values, and other relevant information. The Fund may also use an income-based valuation approach in which the anticipated future cash flows of the investment are discounted to calculate fair value. Discounts may also be applied due to the nature or duration of any restrictions on the disposition of the investments. Due to the inherent uncertainty of valuations of such investments, the fair values may differ significantly from the values that would have been used had an active market existed. For the year ended October 31, 2012, there have been no changes to the fair value methodologies.
Equity and non-equity securities which may be valued in this manner include, but are not limited to: (i) a security for which the trading has been halted or suspended; (ii) a debt security that has recently gone into default and for which there is not a current market quotation; (iii) a security of an issuer that has entered into a restructuring; (iv) a security that has been de-listed from a national exchange; (v) a security for which the market price is not available from a third party pricing source or, if so provided, does not, in the opinion of the Fund’s Manager or Subadvisor reflect the security’s market value; and (vi) a security whose principal market has been temporarily closed at a time when, under normal conditions, it would be open. Securities for which market quotations or observable inputs are not readily available are generally categorized as Level 3 in the hierarchy. As of October 31, 2012, the Fund did not hold any securities that were fair valued in such a manner.
Certain events may occur between the time that foreign markets close, on which securities held by the Fund principally trade, and the time at
which the Fund’s NAV is calculated. These events may include, but are not limited to, situations relating to a single issuer in a market sector, significant fluctuations in U.S. or foreign markets, natural disasters, armed conflicts, governmental actions or other developments not tied directly to the securities markets. Should the Manager or Subadvisor conclude that such events may have affected the accuracy of the last price of such securities reported on the local foreign market, the Manager or Subadvisor may, pursuant to procedures adopted by the Fund’s Board, adjust the value of the local price to reflect the impact on the price of such securities as a result of such events. In this instance, securities are generally categorized as Level 3 in the hierarchy. Additionally, foreign equity securities are also fair valued whenever the movement of a particular index exceeds certain thresholds. In such cases, the securities are fair valued by applying factors provided by a third party vendor in accordance with the Fund’s policies and procedures and are generally categorized as Level 2 in the hierarchy. As of October 31, 2012, the Fund did not hold any foreign equity securities.
Equity securities and Exchange Traded Funds are valued at the latest quoted sales prices as of the close of regular trading on the Exchange on each valuation date. Securities that are not traded on the valuation date are valued at the mean of the latest quoted bid and ask prices. Prices normally are taken from the principal market in which each security trades. Investments in other mutual funds are valued at their respective NAV as of the close of the Exchange on the valuation date. These securities are generally categorized as Level 1 in the hierarchy.
Temporary cash investments acquired over 60 days to maturity are valued using the latest bid prices or using valuations based on a matrix system (which considers such factors as security prices, yields, maturities, and ratings), both as furnished by independent pricing services. Other temporary cash investments which mature in 60 days or less (“Short-Term Investments”) are valued at amortized cost. The amortized cost method involves valuing a security at its cost on the date of purchase and thereafter assuming a constant amortization to maturity of the difference between such cost and the value on maturity date. Amortized cost approximates the current fair value of a security. Securities valued at amortized cost are not valued using a quoted price in an active market. These securities are generally categorized as Level 2 in the hierarchy.
(B) Income Taxes. The Fund’s policy is to comply with the requirements of the Internal Revenue Code of 1986, as amended (the “Internal Revenue Code”), applicable to regulated investment companies and to distribute all of the taxable income to the shareholders of the Fund within the allowable time limits. Therefore, no federal, state and local income tax provision is required.
Management evaluates its tax positions to determine if the tax positions taken meet the minimum recognition threshold in connection with accounting for uncertainties in income tax positions taken or expected to be taken for the purposes of measuring and recognizing tax liabilities in the financial statements. Recognition of tax benefits of an uncertain tax position is required only when the position is “more likely than not” to be sustained assuming examination by taxing authorities. Management has analyzed the Fund’s tax positions taken on federal, state and local income tax returns for all open tax years (for up to three tax years), and has concluded that no provision for federal, state and local income tax are required in the Fund’s financial statements. The Fund’s federal,
| | |
| 22 | | MainStay Common Stock Fund |
state and local income and federal excise tax returns for tax years for which the applicable statutes of limitations have not expired are subject to examination by the Internal Revenue Service and state and local departments of revenue.
(C) Dividends and Distributions to Shareholders. Dividends and distributions are recorded on the ex-dividend date. The Fund intends to declare and pay dividends of net investment income and distributions of net realized capital and currency gains, if any, at least annually. Unless the shareholder elects otherwise, all dividends and distributions are reinvested in the same class of shares of the Fund, at NAV. Dividends and distributions to shareholders are determined in accordance with federal income tax regulations and may differ from GAAP.
(D) Security Transactions and Investment Income. The Fund records security transactions on the trade date. Realized gains and losses on security transactions are determined using the identified cost method. Dividend income is recognized on the ex-dividend date and interest income is accrued as earned using the effective interest rate method. Discounts and premiums on Short-Term Investments are accreted and amortized, respectively, on the straight-line method.
Investment income and realized and unrealized gains and losses on investments of the Fund are allocated to separate classes of shares pro rata based upon their relative net assets on the date the income is earned or realized and unrealized gains and losses are incurred.
(E) Expenses. Expenses of the Trust are allocated to the individual Funds in proportion to the net assets of the respective Funds when the expenses are incurred, except where direct allocations of expenses can be made. Expenses (other than transfer agent expenses and fees incurred under the shareholder services plans and the distribution plans further discussed in Note 3(B)) are allocated to separate classes of shares pro rata based upon their relative net assets on the date the expenses are incurred. The expenses borne by the Fund, including those of related parties to the Fund, are shown in the Statement of Operations.
(F) Use of Estimates. In preparing financial statements in conformity with GAAP, management makes estimates and assumptions that affect the reported amounts and disclosures in the financial statements. Actual results could differ from those estimates.
(G) Repurchase Agreements. The Fund may enter into repurchase agreements to earn income. The Fund may enter into repurchase agreements only with financial institutions that are deemed by the Manager or Subadvisor to be creditworthy, pursuant to guidelines established by the Fund’s Board. During the term of any repurchase agreement, the Manager will continue to monitor the creditworthiness of the seller. Under the 1940 Act, repurchase agreements are considered to be collateralized loans by a Fund to the seller secured by the securities transferred to the Fund.
When the Fund invests in repurchase agreements, the Fund’s custodian takes possession of the collateral pledged for investments in the repurchase agreement. The underlying collateral is valued daily on a mark-to-market basis to determine that the value, including accrued interest, exceeds the repurchase price. In the event of the seller’s default on the obligation to repurchase, the Fund has the right to liquidate the
collateral and apply the proceeds in satisfaction of the obligation. Under certain circumstances, such as in the event of default or bankruptcy by the counterparty to the agreement, realization and/or retention of the collateral may be subject to legal proceedings and possible realized loss to the Fund.
(H) Securities Lending. In order to realize additional income, the Fund may engage in securities lending, subject to the limitations set forth in the 1940 Act, and relevant guidance by the staff of the Securities and Exchange Commission. In the event the Fund does engage in securities lending, the Fund will lend through its custodian, State Street Bank and Trust Company (“State Street”). State Street will manage the Fund’s cash collateral in accordance with the Lending Agreement between the Fund and State Street, and indemnify the Fund’s portfolio against counterparty risk. The loans will be collateralized by cash or securities at least equal at all times to the market value of the securities loaned. Collateral will consist of U.S. government securities, cash equivalents or irrevocable letters of credit. The Fund may bear the risk of delay in recovery of, or loss of rights in, the securities loaned should the borrower of the securities experience financial difficulty. The Fund may also record realized gain or loss on securities deemed sold due to a borrower’s inability to return securities on loan. The Fund will receive compensation for lending its securities in the form of fees or the retention of a portion of the interest on the investment of any cash received as collateral. The Fund also will continue to receive interest and dividends on the securities loaned and any gain or loss in the market price of the securities loaned that may occur during the term of the loan will be for the account of the Fund.
Although the Fund and New York Life Investments have temporarily suspended securities lending, the Fund and New York Life Investments reserve the right to reinstitute lending when deemed appropriate. The Fund had no portfolio securities on loan as of October 31, 2012.
(I) Indemnifications. Under the Trust’s organizational documents, its officers and trustees are indemnified against certain liabilities that may arise out of performance of their duties to the Trust. Additionally, in the normal course of business, the Fund enters into contracts with third-party service providers that contain a variety of representations and warranties and which may provide general indemnifications. The Fund’s maximum exposure under these arrangements is unknown, as this would involve future claims that may be made against the Fund that have not yet occurred. Based on experience, management is of the view that the risk of loss in connection with these potential indemnification obligations is remote. However, there can be no assurance that material liabilities related to such obligations will not arise in the future, which could adversely impact the Fund.
Note 3–Fees and Related Party Transactions
(A) Manager and Subadvisor. New York Life Investments, a registered investment adviser and an indirect, wholly-owned subsidiary of New York Life Insurance Company (“New York Life”), serves as the Fund’s Manager, pursuant to an Amended and Restated Management Agreement (“Management Agreement”). The Manager provides offices, conducts clerical, recordkeeping and bookkeeping services, and keeps most of the financial and accounting records required to be maintained by the Fund. Except for the portion of salaries and expenses that are the responsibility of the Fund, the Manager pays the salaries and expenses
| | | | |
| mainstayinvestments.com | | | 23 | |
Notes to Financial Statements (continued)
of all personnel affiliated with the Fund and certain operational expenses of the Fund. The Fund reimburses New York Life Investments in an amount equal to a portion of the salary of the Chief Compliance Officer (“CCO”) of the Fund. Madison Square Investors LLC (“Madison Square Investors” or “Subadvisor”), a registered investment adviser and an indirect, wholly-owned subsidiary of New York Life, serves as Subadvisor to the Fund and is responsible for the day-to-day portfolio management of the Fund. Pursuant to the terms of a Subadvisory Agreement (“Subadvisory Agreement”) between New York Life Investments and Madison Square Investors, New York Life Investments pays for the services of the Subadvisor.
The Fund pays the Manager a monthly fee for services performed and facilities furnished at an annual rate of the Fund’s average daily net assets as follows: 0.55% up to $500 million; 0.525% from $500 million to $1 billion; and 0.50% in excess of $1 billion, plus a fee for fund accounting services previously provided by New York Life Investments under a separate fund accounting agreement furnished at an annual rate of the Fund’s average daily net assets as follows: 0.05% up to $20 million; 0.0333% from $20 million to $100 million; and 0.01% in excess of $100 million. The effective management fee rate (exclusive of any applicable waivers/reimbursements) was 0.58% for the year ended October 31, 2012, inclusive of a fee for fund accounting services of 0.03% of the Fund’s average daily net assets.
New York Life Investments has voluntarily agreed to waive fees and/or reimburse expenses so that Total Annual Fund Operating Expenses of a class do not exceed the following percentages of average daily net assets: Investor Class, 1.85%; Class B, 2.60%; and Class C, 2.60%. These voluntary waivers or reimbursements may be discontinued at any time. Total Annual Fund Operating Expenses excludes taxes, interest, litigation, extraordinary expenses, brokerage and other transaction expenses relating to the purchase or sale of portfolio investments, and acquired (underlying) fund fees and expenses.
For the year ended October 31, 2012, New York Life Investments earned fees from the Fund in the amount of $684,775.
State Street, 1 Lincoln Street, Boston, Massachusetts 02111, provides sub-administration and sub-accounting services to the Fund pursuant to an agreement with New York Life Investments. These services include calculating the daily NAVs of the Fund, maintaining the general ledger and sub-ledger accounts for the calculation of the Fund’s respective NAVs, and assisting New York Life Investments in conducting various aspects of the Fund’s administrative operations. For providing these services to the Fund, State Street is compensated by New York Life Investments.
(B) Distribution, Service and Shareholder Service Fees. The Trust, on behalf of the Fund, has entered into a distribution agreement with NYLIFE Distributors LLC (the “Distributor”), an indirect, wholly-owned subsidiary of New York Life. The Fund has adopted distribution plans (the “Plans”) in accordance with the provisions of Rule 12b-1 under the 1940 Act.
Pursuant to the Investor Class, Class A and Class R2 Plans, the Distributor receives a monthly distribution fee from the Investor Class, Class A and Class R2 shares at an annual rate of 0.25% of the average daily net assets of the Investor Class, Class A and Class R2 shares for distribution and/or service activities as designated by the Distributor.
Pursuant to the Class B and Class C Plans, Class B and Class C shares pay the Distributor a monthly distribution fee at an annual rate of 0.75% of the average daily net assets of the Class B and Class C shares, along with a service fee at an annual rate of 0.25% of the average daily net assets of the Class B and Class C shares, for a total 12b-1 fee of 1.00%. Class I shares are not subject to a distribution and/or service fee.
The Plans provide that the distribution and service fees are payable to the Distributor regardless of the amounts actually expended by the Distributor for distribution of the Fund’s shares and service activities.
In accordance with the Shareholder Services Plan for the Class R2 shares, the Manager has agreed to provide, through its affiliates or independent third parties, various shareholder and administrative support services to shareholders of the Class R2 shares. For its services, the Manager is entitled to a Shareholder Service Fee accrued daily and paid monthly at an annual rate of 0.10% of the average daily net assets of the Class R2 shares. This is in addition to any fees paid under a distribution plan, where applicable.
(C) Sales Charges. The Fund was advised by the Distributor that the amount of sales charges retained on sales of Investor Class and Class A shares were $3,708 and $1,313, respectively, for the year ended October 31, 2012. The Fund was also advised that the Distributor retained CDSCs on redemptions of Class A, Class B and Class C shares of $30, $9,401 and $15, respectively, for the year ended October 31, 2012.
(D) Transfer, Dividend Disbursing and Shareholder Servicing Agent. NYLIM Service Company LLC, an affiliate of New York Life Investments, is the Fund’s transfer, dividend disbursing and shareholder servicing agent pursuant to an agreement between NYLIM Service Company LLC and the Trust. NYLIM Service Company LLC has entered into an agreement with Boston Financial Data Services, Inc. (“BFDS”) pursuant to which BFDS performs certain transfer agent services on behalf of NYLIM Service Company LLC. Transfer agent expenses incurred by the Fund for the year ended October 31, 2012, were as follows:
| | | | |
Investor Class | | $ | 82,900 | |
Class A | | | 7,776 | |
Class B | | | 36,119 | |
Class C | | | 7,835 | |
Class I | | | 55,657 | |
(E) Small Account Fee. Shareholders with small accounts adversely impact the cost of providing transfer agency services. In an effort to reduce total transfer agency expenses, the Fund has implemented a small account fee on certain types of accounts. Certain shareholders with an account balance of less than $1,000 are charged an annual per account fee of $20 (assessed semi-annually), the proceeds from which offset transfer agent fees as reflected in the Statement of Operations.
| | |
| 24 | | MainStay Common Stock Fund |
Note 4–Federal Income Tax
As of October 31, 2012, the components of accumulated gain (loss) on a tax basis were as follows:
| | | | | | | | | | | | | | | | | | |
Ordinary
Income | | | Accumulated
Capital and
Other Gain
(Loss) | | | Other
Temporary
Differences | | | Unrealized
Appreciation
(Depreciation) | | | Total
Accumulated Gain (Loss) | |
| | $1,360,464 | | | $ | (84,342,471) | | | $ | — | | | $ | 6,651,470 | | | $ | (76,330,537) | |
The difference between book basis and tax basis unrealized appreciation (depreciation) is primarily due to wash sale adjustments, real estate investment trust (“REIT”) investments and class actions.
The following table discloses the current year reclassifications between undistributed net investment income (loss), accumulated net realized gain (loss) on investments, and additional paid-in capital arising from permanent differences; net assets as of October 31, 2012 were not affected.
| | | | | | | | |
Undistributed
Net Investment
Income (Loss) | | Accumulated
Net Realized
Gain (Loss)
on Investments | | | Additional
Paid-In
Capital | |
| $(38,366) | | $ | 38,366 | | | $ | — | |
The reclassifications for the Fund are primarily due to REIT investments.
Under the Regulated Investment Company Modernization Act of 2010, the Fund is permitted to carry forward capital losses incurred in taxable years beginning after December 22, 2010, for an unlimited period. However, any losses incurred during those future years will be required to be utilized prior to the losses incurred in pre-enactment tax years. As a result of this ordering rule, pre-enactment capital loss carryforwards may be more likely to expire unused. Additionally, post-enactment capital losses that are carried forward will retain their character as either short-term or long-term capital losses rather than being considered all short-term as under previous law.
As of October 31, 2012, for federal income tax purposes, capital loss carryforwards of $84,342,471 were available as shown in the table below, to the extent provided by the regulations to offset future realized gains of the Fund through the years indicated. To the extent that these capital loss carryforwards are used to offset future capital gains, it is probable that the capital gains so offset will not be distributed to shareholders. No capital gain distributions shall be made until any capital loss carryforwards have been fully utilized or expired.
| | | | | | | | |
Capital Loss
Available Through | | Short-Term
Capital Loss
Amounts (000’s) | | | Long-Term
Capital Loss
Amounts (000’s) | |
2017
| | $ | 84,342 | | | $ | — | |
The Fund utilized $8,554,619 of capital loss carryforwards during the year ended October 31, 2012.
The tax character of distributions paid during the years ended October 31, 2012 and October 31, 2011 shown in the Statements of Changes in Net Assets was as follows:
| | | | | | | | |
| | | 2012 | | | 2011 | |
Distributions paid from:
Ordinary Income | | $ | 2,318,984 | | | $ | 3,208,374 | |
Note 5–Custodian
State Street is the custodian of the cash and the securities of the Fund. Custodial fees are charged to the Fund based on the market value of securities in the Fund and the number of certain cash transactions incurred by the Fund.
Note 6–Line of Credit
The Fund and certain affiliated funds maintain a line of credit with a syndicate of banks in order to secure a source of funds for temporary purposes to meet unanticipated or excessive redemption requests.
Effective August 29, 2012, under an amended credit agreement, the aggregate commitment amount is $200,000,000 with an optional maximum amount of $250,000,000. The commitment fee is an annual rate of 0.08% of the average commitment amount payable quarterly, regardless of usage, to Bank of New York Mellon, which serves as the agent to the syndicate. The commitment fee is allocated among certain MainStay Funds based upon net assets and other factors. Interest on any revolving credit loan is charged based upon the Federal Funds Advances rate or the one month London InterBank Offered Rate, whichever is higher. The amended credit agreement expires on August 28, 2013, although the MainStay Funds and the syndicate of banks may renew the amended credit agreement for an additional year on the same or different terms. Prior to August 29, 2012, the aggregate commitment amount was $125,000,000 with an optional maximum amount of $175,000,000. There were no borrowings made or outstanding with respect to the Fund on the amended credit agreement during the year ended October 31, 2012.
Note 7–Purchases and Sales of Securities (in 000’s)
During the year ended October 31, 2012, purchases and sales of securities, other than short-term securities, were $216,181 and $264,434, respectively.
| | | | |
| mainstayinvestments.com | | | 25 | |
Notes to Financial Statements (continued)
Note 8–Capital Share Transactions
| | | | | | | | |
Investor Class | | Shares | | | Amount | |
Year ended October 31, 2012: | | | | | | | | |
Shares sold | | | 85,370 | | | $ | 1,044,806 | |
Shares issued to shareholders in reinvestment of dividends | | | 13,604 | | | | 153,721 | |
Shares redeemed | | | (180,434 | ) | | | (2,192,388 | ) |
| | | | | | | | |
Net increase (decrease) in shares outstanding before conversion | | | (81,460 | ) | | | (993,861 | ) |
Shares converted into Investor Class
(See Note 1) | | | 104,206 | | | | 1,253,282 | |
Shares converted from Investor Class
(See Note 1) | | | (80,491 | ) | | | (1,000,500 | ) |
| | | | | | | | |
Net increase (decrease) | | | (57,745 | ) | | $ | (741,079 | ) |
| | | | | | | | |
Year ended October 31, 2011: | | | | | | | | |
Shares sold | | | 71,504 | | | $ | 823,904 | |
Shares issued to shareholders in reinvestment of dividends | | | 4,376 | | | | 49,461 | |
Shares redeemed | | | (210,907 | ) | | | (2,428,101 | ) |
| | | | | | | | |
Net increase (decrease) in shares outstanding before conversion | | | (135,027 | ) | | | (1,554,736 | ) |
Shares converted into Investor Class
(See Note 1) | | | 126,852 | | | | 1,421,922 | |
Shares converted from Investor Class
(See Note 1) | | | (31,150 | ) | | | (357,045 | ) |
| | | | | | | | |
Net increase (decrease) | | | (39,325 | ) | | $ | (489,859 | ) |
| | | | | | | | |
| | |
| | | | | | | | |
Class A | | Shares | | | Amount | |
Year ended October 31, 2012: | | | | | | | | |
Shares sold | | | 102,868 | | | $ | 1,265,546 | |
Shares issued to shareholders in reinvestment of dividends | | | 14,309 | | | | 161,110 | |
Shares redeemed | | | (190,780 | ) | | | (2,337,511 | ) |
| | | | | | | | |
Net increase (decrease) in shares outstanding before conversion | | | (73,603 | ) | | | (910,855 | ) |
Shares converted into Class A (See Note 1) | | | 98,947 | | | | 1,223,586 | |
Shares converted from Class A (See Note 1) | | | (4,355 | ) | | | (56,206 | ) |
| | | | | | | | |
Net increase (decrease) | | | 20,989 | | | $ | 256,525 | |
| | | | | | | | |
Year ended October 31, 2011: | | | | | | | | |
Shares sold | | | 102,427 | | | $ | 1,167,439 | |
Shares issued to shareholders in reinvestment of dividends | | | 9,773 | | | | 109,994 | |
Shares redeemed | | | (317,081 | ) | | | (3,559,161 | ) |
| | | | | | | | |
Net increase (decrease) in shares outstanding before conversion | | | (204,881 | ) | | | (2,281,728 | ) |
Shares converted into Class A (See Note 1) | | | 47,382 | | | | 541,643 | |
Shares converted from Class A (See Note 1) | | | (27,252 | ) | | | (289,757 | ) |
| | | | | | | | |
Net increase (decrease) | | | (184,751 | ) | | $ | (2,029,842 | ) |
| | | | | | | | |
| | |
| | | | | | | | |
| | | | | | | | |
Class B | | Shares | | | Amount | |
Year ended October 31, 2012: | | | | | | | | |
Shares sold | | | 73,944 | | | $ | 824,547 | |
Shares issued to shareholders in reinvestment of dividends | | | 2,395 | | | | 25,079 | |
Shares redeemed | | | (105,218 | ) | | | (1,180,427 | ) |
| | | | | | | | |
Net increase (decrease) in shares outstanding before conversion | | | (28,879 | ) | | | (330,801 | ) |
Shares converted from Class B (See Note 1) | | | (127,785 | ) | | | (1,420,162 | ) |
| | | | | | | | |
Net increase (decrease) | | | (156,664 | ) | | $ | (1,750,963 | ) |
| | | | | | | | |
Year ended October 31, 2011: | | | | | | | | |
Shares sold | | | 77,494 | | | $ | 821,291 | |
Shares issued to shareholders in reinvestment of dividends | | | 258 | | | | 2,736 | |
Shares redeemed | | | (154,216 | ) | | | (1,633,358 | ) |
| | | | | | | | |
Net increase (decrease) in shares outstanding before conversion | | | (76,464 | ) | | | (809,331 | ) |
Shares converted from Class B (See Note 1) | | | (124,988 | ) | | | (1,316,763 | ) |
| | | | | | | | |
Net increase (decrease) | | | (201,452 | ) | | $ | (2,126,094 | ) |
| | | | | | | | |
| | |
| | | | | | | | |
Class C | | Shares | | | Amount | |
Year ended October 31, 2012: | | | | | | | | |
Shares sold | | | 29,459 | | | $ | 337,801 | |
Shares issued to shareholders in reinvestment of dividends | | | 329 | | | | 3,443 | |
Shares redeemed | | | (14,200 | ) | | | (162,581 | ) |
| | | | | | | | |
Net increase (decrease) | | | 15,588 | | | $ | 178,663 | |
| | | | | | | | |
Year ended October 31, 2011: | | | | | | | | |
Shares sold | | | 18,058 | | | $ | 182,243 | |
Shares issued to shareholders in reinvestment of dividends | | | 32 | | | | 337 | |
Shares redeemed | | | (36,729 | ) | | | (387,586 | ) |
| | | | | | | | |
Net increase (decrease) | | | (18,639 | ) | | $ | (205,006 | ) |
| | | | | | | | |
| | |
| | | | | | | | |
Class I | | Shares | | | Amount | |
Year ended October 31, 2012: | | | | | | | | |
Shares sold | | | 3,579,954 | | | $ | 45,193,225 | |
Shares issued to shareholders in reinvestment of dividends | | | 146,459 | | | | 1,650,592 | |
Shares redeemed | | | (7,712,875 | ) | | | (92,526,708 | ) |
| | | | | | | | |
Net increase (decrease) | | | (3,986,462 | ) | | $ | (45,682,891 | ) |
| | | | | | | | |
Year ended October 31, 2011: | | | | | | | | |
Shares sold | | | 4,289,136 | | | $ | 48,843,998 | |
Shares issued to shareholders in reinvestment of dividends | | | 251,054 | | | | 2,827,936 | |
Shares redeemed | | | (15,953,505 | ) | | | (185,796,428 | ) |
| | | | | | | | |
Net increase (decrease) | | | (11,413,315 | ) | | $ | (134,124,494 | ) |
| | | | | | | | |
Note 9–Litigation
The Fund has been named as a defendant and a putative member of the proposed defendant group of shareholders in the case entitled Official Committee of Unsecured Creditors of the Tribune Company v. FitzSimons, et al. (In re Tribune Company), No. 12-2652 (S.D.N.Y.) (the “FitzSimons action”) as a result of its ownership of shares in the Tribune Company (“Tribune”) in 2007 when Tribune effected a leveraged buyout
| | |
| 26 | | MainStay Common Stock Fund |
transaction (“LBO”) by which Tribune converted to a privately-held company. In its complaint, which was served on the Fund in October 2012, the plaintiff asserts claims against certain insiders, shareholders, professional advisers, and others involved in the LBO. Separately, the complaint also seeks to recover proceeds received by shareholders through the LBO from a putative defendant class comprised of former Tribune shareholders other than the insiders, major shareholders and certain other defendants. The sole claim and cause of action brought against the Fund either as a named defendant or as a member of the putative defendant class is for fraudulent conveyance pursuant to United States Bankruptcy Code Section 548(a)(1)(A).
In June 2011, certain Tribune creditors filed numerous additional actions asserting state law constructive fraudulent conveyance claims (the “SLCFC actions”) against specifically-named former Tribune shareholders and, in some cases, putative defendant classes comprised of former Tribune shareholders. One of the SLCFC actions, entitled Deutsche Bank Trust Co. Americas v. Blackrock Institutional Trust Co., No. 11-9319 (S.D.N.Y.) (the “Deutsche Bank action”), named the Fund as a defendant.
The FitzSimons and Deutsche Bank actions have been consolidated with the majority of the other Tribune LBO-related lawsuits in a multidistrict litigation proceeding entitled In re Tribune Co. Fraudulent Conveyance
Litig., No. 11-md-2296 (S.D.N.Y.) (the “MDL Proceeding”). On November 6, 2012, the defendants moved to dismiss the SLCFC actions. The Court has not yet issued a decision on the motion.
These lawsuits do not allege any misconduct on the part of the Fund. The value of the proceeds received by the Fund in connection with the LBO and the Fund’s cost basis in shares of Tribune was as follows:
| | | | | | | | |
Fund | | Proceeds | | | Cost Basis | |
MainStay Common Stock Fund | | $ | 751,774 | | | $ | 729,369 | |
At this stage of the proceedings, management is not able to assess with any reasonable certainty the probable outcome of the pending litigation or the effect, if any, on the Fund’s net asset values.
Note 10–Subsequent Events
In connection with the preparation of the financial statements of the Fund as of and for the year ended October 31, 2012, events and transactions subsequent to October 31, 2012 through the date the financial statements were issued have been evaluated by the Fund’s management for possible adjustment and/or disclosure. No subsequent events requiring financial statement adjustment or disclosure have been identified.
| | | | |
| mainstayinvestments.com | | | 27 | |
Report of Independent Registered Public Accounting Firm
The Board of Trustees and Shareholders of
The MainStay Funds:
We have audited the accompanying statement of assets and liabilities, including the portfolio of investments, of the MainStay Common Stock Fund (the “Fund”), one of the funds constituting The MainStay Funds, as of October 31, 2012, and the related statement of operations for the year then ended, the statements of changes in net assets for each of the years in the two-year period then ended, and the financial highlights for each of the years or periods in the five-year period then ended. These financial statements and financial highlights are the responsibility of the Fund’s management. Our responsibility is to express an opinion on these financial statements and financial highlights based on our audits.
We conducted our audits in accordance with the standards of the Public Company Accounting Oversight Board (United States). Those standards require that we plan and perform the audit to obtain reasonable assurance about whether the financial statements and financial highlights are free of material misstatement. An audit includes examining, on a test basis, evidence supporting the amounts and disclosures in the financial statements. Our procedures included confirmation of securities owned as of October 31, 2012, by correspondence with the custodian and brokers or by other appropriate auditing procedures where replies from brokers were not received. An audit also includes assessing the accounting principles used and significant estimates made by management, as well as evaluating the overall financial statement presentation. We believe that our audits provide a reasonable basis for our opinion.
In our opinion, the financial statements and financial highlights referred to above present fairly, in all material respects, the financial position of the MainStay Common Stock Fund of The MainStay Funds as of October 31, 2012, the results of its operations for the year then ended, the changes in its net assets for each of the years in the two-year period then ended, and the financial highlights for each of the years or periods in the five-year period then ended, in conformity with U.S. generally accepted accounting principles.

Philadelphia, Pennsylvania
December 21, 2012
| | |
| 28 | | MainStay Common Stock Fund |
Federal Income Tax Information
(Unaudited)
The Fund is required under the Internal Revenue Code to advise shareholders in a written statement as to the federal tax status of dividends paid by the Fund during such fiscal years.
For the fiscal year ended October 31, 2012, the Fund designated approximately $2,406,178 under the Internal Revenue Code as qualified dividend income eligible for reduced tax rates.
The dividends paid by the Fund during the fiscal year ended October 31, 2012, should be multiplied by 100.0% to arrive at the amount eligible for the corporate dividends received deduction.
In February 2013, shareholders will receive an IRS Form 1099-DIV or substitute Form 1099 which will show the federal tax status of the distributions received by shareholders in calendar year 2012. The amounts that will be reported on such 1099-DIV or substitute Form 1099 will be the amounts you are to use on your federal income tax return and will differ from the amounts which we must report for the Fund’s fiscal year ended October 31, 2012.
Proxy Voting Policies and Procedures and Proxy Voting Record
A description of the policies and procedures that New York Life Investments uses to vote proxies related to the Fund’s securities is available without charge, upon request, (i) by visiting the Fund’s website at mainstayinvestments.com; or (ii) on the SEC’s website at www.sec.gov.
The Fund is required to file with the SEC its proxy voting record for the 12-month period ending June 30 on Form N-PX. The Fund’s most recent Form N-PX is available free of charge upon request (i) by calling 800-MAINSTAY (624-6782); (ii) by visiting the Fund’s website at mainstayinvestments.com; or (iii) on the SEC’s website at www.sec.gov.
Shareholder Reports and Quarterly Portfolio Disclosure
The Fund is required to file its complete schedule of portfolio holdings with the SEC for its first and third fiscal quarters on Form N-Q. The Fund’s Form N-Q is available without charge on the SEC’s website at www.sec.gov or by calling MainStay Investments at 800-MAINSTAY (624-6782). You also can obtain and review copies of Form N-Q by visiting the SEC’s Public Reference Room in Washington, DC (information on the operation of the Public Reference Room may be obtained by calling 1-800-SEC-0330).
| | | | |
| mainstayinvestments.com | | | 29 | |
| | |
| 30 | | MainStay Common Stock Fund |
Board Members and Officers (Unaudited)
The Board Members oversee the MainStay Group of Funds (which is comprised of Funds that are series of The MainStay Funds, Eclipse Trust, Eclipse Funds Inc., MainStay Funds Trust, MainStay VP Funds Trust, Private Advisors Alternative Strategies Master Fund, Private Advisors Alternative Strategies Fund, and MainStay Defined Term Municipal Opportunities Fund) (collectively, the “Fund Complex”), the Manager and, when applicable, the Subadvisor(s) and other service providers to the Fund Complex. Each Board Member serves until his or her successor is elected and qualified or until his or her resignation, death or removal. The Retirement Policy provides that a Board Member
shall tender his or her resignation by the end of the calendar year during which he or she reaches the age of 75.
Officers serve a term of one year and are elected annually by the Board Members. The business address of each Board Member and officer listed below is 51 Madison Avenue, New York, New York 10010.
The Statement of Additional Information applicable to the Fund includes additional information about the Board Members and is available without charge, upon request, by calling 800-MAINSTAY (624-6782) or by going online to mainstayinvestments.com.
| | | | | | | | | | | | |
| | | | | Name and
Date of Birth | | Term of Office,
Position(s) Held
with the Fund
Complex and
Length of Service | | Principal Occupation(s)
During Past Five Years | | Number of
Funds in
Fund Complex
Overseen by
Board Member | | Other Directorships
Held by Board Member |
| Interested Board Member* | | | | John Y. Kim
9/24/60 | | Indefinite;
Eclipse Trust: Trustee since 2008;
Eclipse Funds Inc.:
Director since 2008 (1 fund);
The MainStay Funds: Trustee since 2008 (12 funds);
MainStay Funds Trust: Trustee since 2009 (31 funds); and
MainStay VP Funds Trust: Trustee since 2011 and its predecessor, MainStay VP Series Fund, Inc. since 2008 (28 portfolios). Private Advisors Alternative Strategies Master Fund: Trustee since 2011
Private Advisors Alternative Strategies Fund: Trustee since 2011
MainStay DefinedTerm Municipal Opportunities Fund: Trustee since 2011 | | Member of the Board of Managers, President and Chief Executive Officer (since 2008), New York Life Investment Management LLC and New York Life Investment Management Holdings LLC; Member of the Board, MacKay Shields LLC since 2008; Chairman of the Board, Institutional Capital LLC, Madison Capital Funding LLC, Madison Square Investors LLC and McMorgan & Company LLC; Chairman of the Board, NYLIFE Distributors LLC and Chairman of the Board, NYLCAP Manager LLC (since 2008) President, Prudential Retirement, a business unit of Prudential Financial, Inc. (2002 to 2007) | | 75 | | None |
| | * | This Board Member is considered to be an “interested person” of the MainStay Group of Funds within the meaning of the 1940 Act because of his affiliation with New York Life Insurance Company, New York Life Investment Management LLC, Madison Square Investors LLC, MacKay Shields LLC, Private Advisors LLC, Institutional Capital LLC, NYLIFE Securities LLC and/or NYLIFE Distributors LLC, as described in detail above in the column entitled “Principal Occupation(s) During the Past Five Years.” |
| | | | | | | | | | | | |
| | | | | Name and
Date of Birth | | Term of Office, Position(s) Held with the Fund Complex and Length of Service | | Principal Occupation(s)
During Past Five Years | | Number of
Funds in
Fund Complex
Overseen by
Board Member | | Other Directorships
Held by Board Member |
| Non-Interested Board Members | | | | Susan B. Kerley 8/12/51 | | Indefinite;
Eclipse Trust: Chairman since 2005, and Trustee since 2000;
Eclipse Funds Inc.: Chairman since 2005 and Director since 1990 (1 fund); The MainStay Funds: Chairman and Board Member since 2007 (12 funds);
MainStay Funds Trust: Chairman and Trustee since 2009 (31 funds); and MainStay VP Funds Trust: Chairman and Trustee since 2011 and its predecessor, MainStay VP Series Fund, Inc., since 2007 (28 portfolios). Private Advisors Alternative Strategies Master Fund: Chairman and Trustee since 2011 Private Advisors Alternative Strategies Fund: Chairman and Trustee since 2011 MainStay DefinedTerm Municipal Opportunities Fund: Chairman and Trustee since 2011. | | President, Strategic Management Advisors LLC (since 1990) | | 75 | | Trustee, Legg Mason Partners Funds, since 1992 (51 portfolios) |
| | | | |
| mainstayinvestments.com | | | 31 | |
| | | | | | | | | | | | |
| | | | | Name and
Date of Birth | | Term of Office,
Position(s) Held
with the Fund
Complex and
Length of Service | | Principal Occupation(s)
During Past Five Years | | Number of
Funds in
Fund Complex
Overseen by
Board Member | | Other Directorships
Held by Board Member |
| Non-Interested Board Members | | | | Alan R. Latshaw 3/27/51 | | Indefinite;
Eclipse Trust: Trustee and Audit Committee Financial Expert since 2007;
Eclipse Funds Inc.:
Director and Audit Committee Financial Expert since 2007 (1 fund);
The MainStay Funds: Trustee and Audit Committee Financial Expert since 2006 (12 funds);
MainStay Funds Trust: Trustee and Audit Committee Financial Expert since 2009 (31 funds); and
MainStay VP Funds Trust: Trustee and Audit Committee Financial Expert since 2011 and its predecessor, MainStay VP Series Fund, Inc., since 2007 (28 portfolios). Private Advisors Alternative Strategies Master Fund: Trustee and Audit Committee Financial Expert since 2011 Private Advisors Alternative Strategies Fund: Trustee and Audit Committee Financial Expert since 2011. MainStay DefinedTerm Municipal Opportunities Fund: Trustee and Audit Committee Financial Expert since 2011. | | Retired; Partner, Ernst & Young LLP (2002 to 2003); Partner, Arthur Andersen LLP (1989 to 2002); Consultant to the MainStay Funds Audit and Compliance Committee (2004 to 2006) | | 75 | | Trustee, State Farm Associates Funds Trusts since 2005 (4 portfolios); Trustee, State Farm Mutual Fund Trust since 2005 (15 portfolios); Trustee, State Farm Variable Product Trust since 2005 (9 portfolios) |
| | |
| 32 | | MainStay Common Stock Fund |
| | | | | | | | | | | | |
| | | | | Name and Date of Birth | | Term of Office, Position(s) Held with the Fund Complex and Length of Service | | Principal Occupation(s)
During Past Five Years | | Number of
Funds in
Fund Complex
Overseen by
Board Member | | Other Directorships Held by Board Member |
| Non-Interested Board Members | | | | Peter Meenan
12/5/41 | | Indefinite;
Eclipse Funds: Trustee since 2002;
Eclipse Funds Inc.:
Director since 2002
(1 fund); The MainStay Funds:
Trustee since 2007 (12 funds);
MainStay Funds Trust: Trustee since 2009
(31 funds); and
MainStay VP Funds Trust: Trustee since 2011 and its predecessor, MainStay VP Series Fund, Inc., since 2007 (28 portfolios).
Private Advisors Alternative Strategies Master Fund: Trustee since 2011. Private Advisors Alternative Strategies Fund: Trustee since 2011
MainStay DefinedTerm Municipal Opportunities Fund: Trustee since 2011. | | Independent Consultant; President and Chief Executive Officer, Babson—United, Inc. (financial services firm) (2000 to 2004); Independent Consultant (1999 to 2000); Head of Global Funds, Citicorp (1995 to 1999) | | 75 | | None |
| | | | Richard H. Nolan, Jr.
11/16/46 | | Indefinite;
Eclipse Trust: Trustee since 2007;
Eclipse Funds Inc.:
Director since 2007 (1 fund);
The MainStay Funds: Trustee since 2007 (12 funds);
MainStay Funds Trust: Trustee since 2009 (31 funds); and
MainStay VP Funds Trust: Trustee since 2011 and its predecessor, MainStay VP Series Fund, Inc., since 2006 (28 portfolios).
Private Advisors Alternative Strategies Master Fund: Trustee since 2011. Private Advisors Alternative Strategies Fund: Trustee since 2011
MainStay DefinedTerm Municipal Opportunities Fund: Trustee since 2011. | | Managing Director, ICC Capital Management; President—Shields/Alliance, Alliance Capital Management (1994 to 2004) | | 75 | | None |
| | | | |
| mainstayinvestments.com | | | 33 | |
| | | | | | | | | | | | |
| | | | | Name and Date of Birth | | Term of Office, Position(s) Held with the Fund Complex and Length of Service | | Principal Occupation(s)
During Past Five Years | | Number of
Funds in
Fund Complex
Overseen by
Board Member | | Other Directorships Held by Board Member |
| Non-Interested Board Members | | | | Richard S. Trutanic 2/13/52 | | Indefinite;
Eclipse Trust: Trustee since 2007;
Eclipse Funds Inc.:
Director since 2007 (1 fund);
The MainStay Funds:
Trustee since 1994 (12 funds);
MainStay Funds Trust:
Trustee since 2009 (31 funds); and
MainStay VP Funds Trust: Trustee since 2011 and its predecessor, MainStay VP Series Fund, Inc., since 2007 (28 portfolios).
Private Advisors Alternative Strategies Master Fund: Trustee since 2011.
Private Advisors Alternative Strategies Fund: Trustee since 2011
MainStay DefinedTerm Municipal Opportunities Fund: Trustee since 2011. | | Chairman and Chief Executive Officer, Somerset & Company (financial advisory firm) (since 2004); Managing Director, The Carlyle Group (private investment firm) (2002 to 2004); Senior Managing Director, Partner and Board Member, Groupe Arnault S.A. (private investment firm) (1999 to 2002) | | 75 | | None |
| | |
| 34 | | MainStay Common Stock Fund |
| | | | | | | | | | | | |
| | | | | Name and Date of Birth | | Term of Office, Position(s) Held with the Fund Complex and Length of Service | | Principal Occupation(s)
During Past Five Years | | Number of
Funds in
Fund Complex
Overseen by
Board Member | | Other Directorships Held by Board Member |
| Non-Interested Board Members | | | | Roman L. Weil
5/22/40 | | Indefinite;
Eclipse Trust: Trustee and Audit Committee Financial Expert since 2007; Eclipse Funds Inc.: Director and Audit Committee Financial Expert since 2007 (1 fund); The MainStay Funds: Trustee and Audit Committee Financial Expert since 2007 (12 funds); MainStay Funds Trust: Trustee since 2009 (31 funds); and MainStay VP Funds Trust: Trustee and Audit Committee Financial Expert since 2011 and its predecessor, MainStay VP Series Fund, Inc., since 1994 and Audit Committee Financial Expert since 2003 (28 portfolios).
Private Advisors Alternative Strategies Master Fund: Trustee and Audit Committee Financial Expert since 2011 Private Advisors Alternative Strategies Fund: Trustee and Audit Committee Financial Expert since 2011. MainStay DefinedTerm Municipal Opportunities Fund: Trustee and Audit Committee Financial Expert since 2011. | | Visiting Professor, University of California—San Diego (since October 2012); Visiting Professor, Southern Methodist University (2011); Visiting Professor, NYU Stem School of Business, New York University (2011); President, Roman L. Weil Associates, Inc. (consulting firm) (since 1981); V. Duane Rath Professor Emeritus of Accounting, Chicago Booth School of Business, University of Chicago (1965-2008) | | 75 | | None |
| | | | |
| mainstayinvestments.com | | | 35 | |
| | | | | | | | | | | | |
| | | | | Name and Date of Birth | | Term of Office, Position(s) Held with the Fund Complex and Length of Service | | Principal Occupation(s)
During Past Five Years | | Number of
Funds in
Fund Complex
Overseen by
Board Member | | Other Directorships Held by Board Member |
| Non-Interested Board Members | | | | John A. Weisser 10/22/41 | | Indefinite; Eclipse Trust: Trustee since 2007; Eclipse Funds Inc.: Director since 2007 (1 fund); The MainStay Funds: Trustee since 2007 (12 funds); MainStay Funds Trust: Trustee since 2009 (31 funds); and MainStay VP Funds Trust: Trustee since 2011 and its predecessor, MainStay VP Series Fund, Inc., since 1997 (28 portfolios).
Private Advisors Alternative Strategies Master Fund: Trustee since 2011.
Private Advisors Alternative Strategies Fund: Trustee since 2011
MainStay DefinedTerm Municipal Opportunities Fund: Trustee since 2011. | | Retired. Managing Director of Salomon Brothers, Inc. (1971 to 1995) | | 75 | | Trustee, Direxion Funds since 2007 (21 portfolios); Direxion Insurance Trust since 2007 (1 portfolio); Trustee, Direxion Shares ETF Trust, since 2008 (47 portfolios) |
| | |
| 36 | | MainStay Common Stock Fund |
The following individuals have been appointed by the Board Members to serve as Officers of the MainStay Group of Funds.
| | | | | | | | |
| | | | | Name and
Date of Birth | | Positions(s) Held with the Funds and Length of Service | | Principal Occupation(s) During Past Five Years |
| Officers | | | | Jack R. Benintende 5/12/64 | | Treasurer and Principal Financial and Accounting Officer, Eclipse Trust, Eclipse Funds, Inc. and The MainStay Funds (since 2007), MainStay Funds Trust (since 2009) | | Assistant Treasurer, New York Life Investment Management Holdings LLC (since 2008); Managing Director, New York Life Investment Management LLC (since 2007); Treasurer and Principal Financial Accounting Officer, Private Advisors Alternative Strategies Master Fund, Private Advisors Alternative Strategies Fund and MainStay DefinedTerm Municipal Opportunities Fund (since 2011); Treasurer and Principal Financial and Accounting Officer, MainStay VP Funds Trust and its predecessor, MainStay VP Series Fund, Inc. (since 2007) |
| | | | Jeffrey A. Engelsman 9/28/67 | | Vice President and Chief Compliance Officer, Eclipse Trust, Eclipse Funds, Inc., The MainStay Funds and MainStay Funds Trust (since 2009) | | Managing Director, Compliance (since 2009), Director and Associate General Counsel, New York Life Investment Management LLC (2005 to 2008); Assistant Secretary, NYLIFE Distributors LLC (2006 to 2008); Vice President and Chief Compliance Officer, Private Advisors Alternative Strategies Master Fund, Private Advisors Alternative Strategies Fund, DefinedTerm Municipal Opportunities Fund (since 2011); MainStay VP Funds Trust and its predecessor, MainStay VP Series Fund, Inc. (since 2009); Assistant Secretary, The MainStay Funds (2006 to 2008); Assistant Secretary, Eclipse Trust, Eclipse Funds, Inc. and MainStay VP Series Fund, Inc. (2005 to 2008) |
| | | | Stephen P. Fisher 2/22/59 | | President, Eclipse Trust, Eclipse Funds, Inc. and The MainStay Funds (since 2007), MainStay Funds Trust (since 2009) | | Director, Senior Vice President, New York Life Insurance and Annuity Corporation (since 2011); Manager, President and Chief Operating Officer, NYLIFE Distributors LLC (since 2008); Chairman of the Board, NYLIM Service Company LLC (since 2008); Senior Managing Director and Chief Marketing Officer, New York Life Investment Management LLC (since 2005); President, Private Advisors Alternative Strategies Master Fund, Private Advisors Alternative Strategies Fund and MainStay DefinedTerm Municipal Opportunities Fund (since 2011); MainStay VP Funds Trust and its predecessor, MainStay VP Series Fund, Inc. (since 2007) |
| | | | J. Kevin Gao 10/13/67 | | Secretary and Chief Legal Officer, Eclipse Trust, Eclipse Funds, Inc., The MainStay Funds and MainStay Funds Trust (since 2010) | | Managing Director and Associate General Counsel, New York Life Investment Management LLC (since 2010); Secretary and Chief Legal Officer, Private Advisors Alternative Strategies Master Fund, Private Advisors Alternative Strategies Fund and MainStay DefinedTerm Municipal Opportunities Fund (since 2011); MainStay VP Funds Trust and its predecessor, MainStay VP Series Fund, Inc. (since 2010); Director and Counsel of Credit Suisse, Chief Legal Officer and Secretary of Credit Suisse Asset Management, LLC and Credit Suisse Funds (2003 to 2010) |
| | | | Scott T. Harrington 2/8/59 | | Vice President—Administration, Eclipse Trust, Eclipse Funds, Inc. and The MainStay Funds (since 2005), MainStay Funds Trust (since 2009) | | Director, New York Life Investment Management LLC (including predecessor advisory organizations) (since 2000); Executive Vice President, New York Life Trust Company and New York Life Trust Company FSB (since 2006); Vice President—Administration, Private Advisors Alternative Strategies Master Fund, Private Advisors Alternative Strategies Fund and MainStay DefinedTerm Municipal Opportunities Fund (since 2011); MainStay VP Funds Trust and its predecessor, MainStay VP Series Fund, Inc. (since 2005) |
| | * | The Officers listed above are considered to be “interested persons” of the MainStay Group of Funds within the meaning of the 1940 Act because of their affiliation with New York Life Insurance Company, New York Life Investment Management LLC, Madison Square Investors LLC, MacKay Shields LLC, Private Advisors LLC, Institutional Capital LLC, Epoch Investment Partners, Inc., Markston International, LLC, Winslow Capital Management, Inc., NYLIFE Securities LLC and/or NYLIFE Distributors LLC, as described in detail above in the column captioned “Principal Occupation(s) During Past Five Years.” Officers are elected annually by the Board to serve a one-year term. |
| | | | |
| mainstayinvestments.com | | | 37 | |
This page intentionally left blank
MainStay Funds
MainStay offers a wide range of Funds for virtually any investment need. The full array of MainStay open-end offerings is listed here, with information about the manager, subadvisors, legal counsel and independent registered public accounting firms.
Equity
U.S. Equity
MainStay Common Stock Fund
MainStay Epoch U.S. All Cap Fund
MainStay Epoch U.S. Equity Yield Fund
MainStay Growth Equity Fund
MainStay ICAP Equity Fund
MainStay ICAP Select Equity Fund
MainStay Large Cap Growth Fund1
MainStay MAP Fund
MainStay S&P 500 Index Fund
MainStay U.S. Small Cap Fund
MainStay 130/30 Core Fund
International/Global Equity
MainStay Epoch Global Choice Fund
MainStay Epoch Global Equity Yield Fund
MainStay Epoch International Small Cap Fund
MainStay ICAP Global Fund
MainStay ICAP International Fund
MainStay International Equity Fund
MainStay 130/30 International Fund
Income
Taxable Bond
MainStay Flexible Bond Opportunities Fund
MainStay Floating Rate Fund
MainStay Global High Income Fund
MainStay Government Fund
MainStay High Yield Corporate Bond Fund
MainStay High Yield Opportunities Fund
MainStay Indexed Bond Fund
MainStay Intermediate Term Bond Fund
MainStay Short Term Bond Fund
MainStay Money Market Fund
Municipal Bond
MainStay High Yield Municipal Bond Fund
MainStay New York Tax Free Opportunities Fund2
MainStay Tax Free Bond Fund
Mixed Asset
MainStay Balanced Fund
MainStay Convertible Fund
MainStay Income Builder Fund
MainStay Marketfield Fund
Asset Allocation/Target Date
MainStay Conservative Allocation Fund
MainStay Growth Allocation Fund
MainStay Moderate Allocation Fund
MainStay Moderate Growth Allocation Fund
MainStay Retirement 2010 Fund
MainStay Retirement 2020 Fund
MainStay Retirement 2030 Fund
MainStay Retirement 2040 Fund
MainStay Retirement 2050 Fund
Manager
New York Life Investment Management LLC
New York, New York
Subadvisors
Epoch Investment Partners, Inc.
New York, New York
Institutional Capital LLC3
Chicago, Illinois
MacKay Shields LLC3
New York, New York
Madison Square Investors LLC3
New York, New York
Marketfield Asset Management LLC
New York, New York
Markston International LLC
White Plains, New York
Winslow Capital Management, Inc.
Minneapolis, Minnesota
Legal Counsel
Dechert LLP
Independent Registered Public Accounting Firms
KPMG LLP
PricewaterhouseCoopers LLP
1. Effective January 13, 2012, the Fund was closed to new investors with certain exceptions.
2. The Fund is only registered for sale in CT, DE, FL, MA, NJ, NY, and VT.
3. An affiliate of New York Life Investment Management LLC.
Not part of the Annual Report
mainstayinvestments.com
The MainStay Funds are managed by New York Life Investment Management LLC and distributed through NYLIFE Distributors LLC,
169 Lackawanna Avenue, Parsippany, NJ 07054, a wholly owned subsidiary of New York Life Insurance Company.
NYLIFE Distributors is a Member FINRA/SIPC.
MainStay Investments is a service mark and name under which New York Life Investment Management LLC does business.
MainStay Investments, an indirect subsidiary of New York Life Insurance Company, New York, NY 10010, provides investment
advisory products and services.
This report may be distributed only when preceded or accompanied by a current Fund prospectus.
© 2013 by NYLIFE Distributors LLC. All rights reserved.
| | | | | | | | |
| Not FDIC/NCUA Insured | | Not a Deposit | | May Lose Value | | No Bank Guarantee | | Not Insured by Any Government Agency |
| | | | |
| NYLIM-28186 MS265-12 | |
| MSCS11-12/12
NL021 |
|

MainStay Large Cap Growth Fund
Message from the President and Annual Report
October 31, 2012
This page intentionally left blank
Message from the President
Most major equity markets delivered positive results for the 12 months ended October 31, 2012. In the United States, stocks provided solid double-digit returns. With a few notable exceptions, international stock markets generally ended the reporting period in positive territory.
The stock market’s advance, however, was far from uniform. After rising to an early peak at the end of March 2012, domes-
tic and international stocks lost ground until the beginning of June. After that, stocks generally rose, reaching their high point for the reporting period in mid-September. Although stocks remained relatively buoyant through mid-October, they drifted lower as the reporting period came to a close.
A variety of forces converged to help fuel these market movements. Investors kept a close eye on developments in the European sovereign debt crisis. The European Central Bank’s Long Term Refinancing Operations helped stabilize European credit markets and provide needed liquidity. Although private holders of Greek sovereign debt had to accept a reduction in their recovery value, the anticipated voluntary exchange provided a positive spark to the markets. Rising unemployment and new austerity measures may impede economic growth as the European Union seeks to strike a delicate balance between fiscal and monetary policies.
In the United States, the Federal Reserve announced an open-ended agency mortgage-backed security purchase program, which helped calm market concerns. The Federal Reserve also continued its maturity extension program (referred to by some as “operation twist”), which seeks to put downward pressure on longer-term interest rates. At the short end of the yield curve, the Federal Reserve maintained the federal funds rate in a near-zero range. In September 2012, the Federal Open Market Committee anticipated that “exceptionally low levels for the federal funds rate” were “likely to be warranted at least through mid-2015.”
With markets stabilizing and short-term interest rates at very low levels, yield-hungry investors had incentives to lengthen maturities and accept higher risk. Domestic high-yield bonds provided double-digit returns for the reporting period, municipal bonds and convertible securities provided high single-digit returns, and domestic corporate bonds provided positive overall returns.
While most investors are pleased when markets rise, MainStay portfolio managers know that long-term results depend on more than short-term market movements. They also depend on the consistent application of well-defined investment strategies and risk-management techniques over longer periods. Our long-term perspective gives our portfolio managers the ability to look past the daily ups and downs of the market as they pursue the specific investment objectives of their individual Funds.
At MainStay, we believe that a long-term perspective can help investors as well. Instead of trying to capitalize on short-term market movements, you may prefer to focus on the long-term potential that can come from getting invested, staying invested and adding to your investments over time. Of course, past performance is no guarantee of future results.
The following pages contain more specific information on the securities, market events and investment decisions that affected your MainStay Fund(s) during the 12 months ended October 31, 2012. We invite you to read the information carefully and use it as part of your ongoing portfolio evaluation and investment review.
Sincerely,

Stephen P. Fisher
President
The opinions expressed are as of the date of this report and are subject to change. There is no guarantee that any forecast made will come to pass. This material does not constitute investment advice and is not intended as an endorsement of any specific investment.
Not part of the Annual Report
Table of Contents
Investors should refer to the Fund’s Summary Prospectus and/or Prospectus and consider the Fund’s investment objectives, strategies, risks, charges and expenses carefully before investing. The Summary Prospectus and/or Prospectus contain this and other information about the Fund. You may obtain copies of the Fund’s Summary Prospectus, Prospectus and Statement of Additional Information free of charge, upon request, by calling toll-free 800-MAINSTAY (624-6782), by writing to NYLIFE Distributors LLC, Attn: MainStay Marketing Department, 169 Lackawanna Avenue, Parsippany, New Jersey 07054 or by sending an e-mail to MainStayShareholderServices@nylim.com. These documents are also available via the MainStay Funds’ website at mainstayinvestments.com/documents. Please read the Summary Prospectus and/or Prospectus carefully before investing.
Investment and Performance Comparison1 (Unaudited)
Performance data quoted represents past performance. Past performance is no guarantee of future results. Because of market volatility, current performance may be lower or higher than the figures shown. Investment return and principal value will fluctuate, and as a result, when shares are redeemed, they may be worth more or less than their original cost. The graph below depicts the historical performance of Class A shares of the Fund. Performance will vary from class to class based on differences in class-specific expenses and sales charges. For performance information current to the most recent month-end, please call 800-MAINSTAY (624-6782) or visit mainstayinvestments.com.
(With sales charges)
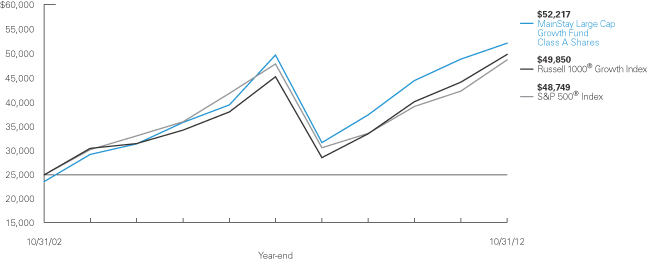
Average Annual Total Returns for the Year Ended October 31, 2012
| | | | | | | | | | | | | | | | | | | | |
| Class | | Sales Charge | | | | One Year | | | Five Years | | | Ten Years | | | Gross
Expense
Ratio2 | |
| Investor Class Shares3 | | Maximum 5.5% Initial Sales Charge | | With sales charges Excluding sales charges | |
| 0.81
6.68 | %
| |
| –0.28
0.86 | %
| |
| 7.59
8.20 | %
| |
| 1.15
1.15 | %
|
| Class A Shares4 | | Maximum 5.5% Initial Sales Charge | | With sales charges Excluding sales charges | |
| 0.92
6.79 |
| |
| –0.17
0.96 |
| |
| 7.64
8.25 |
| |
| 1.07
1.07 |
|
| Class B Shares5 | | Maximum 5% CDSC if Redeemed Within the First Six Years of Purchase | | With sales charges Excluding sales charges | |
| 0.98
5.98 |
| |
| –0.31
0.08 |
| |
| 7.40
7.40 |
| |
| 1.90
1.90 |
|
| Class C Shares5 | | Maximum 1% CDSC if Redeemed Within One Year of Purchase | | With sales charges Excluding sales charges | |
| 4.99
5.99 |
| |
| 0.08
0.08 |
| |
| 7.38
7.38 |
| |
| 1.90
1.90 |
|
| Class I Shares5 | | No Sales Charge | | | | | 7.15 | | | | 1.28 | | | | 8.67 | | | | 0.82 | |
| Class R1 Shares5 | | No Sales Charge | | | | | 6.94 | | | | 1.16 | | | | 8.52 | | | | 0.92 | |
| Class R2 Shares5 | | No Sales Charge | | | | | 6.77 | | | | 0.93 | | | | 8.26 | | | | 1.17 | |
| Class R3 Shares6 | | No Sales Charge | | | | | 6.44 | | | | 0.67 | | | | 7.97 | | | | 1.42 | |
| 1. | The performance table and graph do not reflect the deduction of taxes that a shareholder would pay on distributions or Fund-share redemptions. Total returns reflect maximum applicable sales charges as indicated in the table above, changes in share price, and reinvestment of dividend and capital gain distributions. The graph assumes the initial investment amount shown above and reflects the deduction of all sales charges that would have applied for the period of investment. Performance figures reflect certain fee waivers and/or expense limitations, without which total returns may have been lower. For more information on share classes and current fee waivers and/or expense limitations, please refer to the notes to the financial statements. |
| 2. | The gross expense ratios presented reflect the Fund’s “Total Annual Fund Operating Expenses” from the most recent Prospectus and may differ from other expense ratios disclosed in this report. |
| 3. | Performance figures for Investor Class shares, first offered on February 28, 2008, include the historical performance of Class A shares through February 27, 2008, |
| | adjusted for differences in certain expenses and fees. Unadjusted, the performance shown for Investor Class shares might have been different. |
| 4. | Performance figures for Class A shares include the historical performance of the FMI Winslow Growth Fund (a predecessor to the Fund) through March 31, 2005, adjusted to reflect the current maximum sales charge applicable to Class A shares. Unadjusted, the performance shown for Class A shares might have been different. |
| 5. | Performance figures for Class B, Class C, Class I, Class R1 and Class R2 shares, each of which was first offered on April 1, 2005, include the historical performance of Class A shares through March 31, 2005, adjusted for differences in certain expenses and fees. Unadjusted, the performance shown for Class B, C, I, R1 and R2 shares might have been different. |
| 6. | Performance figures for Class R3 shares, first offered on April 28, 2006, include the historical performance of Class A shares through April 27, 2006, adjusted for differences in certain expenses and fees. Unadjusted, the performance shown for Class R3 shares might have been different. |
The footnotes on the next page are an integral part of the table and graph and should be carefully read in conjunction with them.
| | | | |
| mainstayinvestments.com | | | 5 | |
| | | | | | | | | | | | |
| Benchmark Performance | | One
Year | | | Five
Years | | | Ten
Years | |
Russell 1000® Growth Index7 | | | 13.02 | % | | | 1.95 | % | | | 7.15 | % |
S&P 500® Index8 | | | 15.21 | | | | 0.36 | | | | 6.91 | |
Average Lipper Large-Cap Growth Fund9 | | | 10.12 | | | | –0.12 | | | | 6.13 | |
| 7. | The Russell 1000® Growth Index measures the performance of the large-cap growth segment of the U.S. equity universe. It includes those Russell 1000® Index companies with higher price-to-book ratios and higher forecasted growth values. The Russell 1000® Growth Index is the Fund’s broad-based securities market index for comparison purposes. Results assume reinvestment of all dividends and capital gains. An investment cannot be made directly in an index. |
| 8. | “S&P 500®” is a trademark of The McGraw-Hill Companies, Inc. The S&P 500® Index is widely regarded as the standard for measuring large-cap U.S. stock-market performance. The S&P 500® Index is the Fund’s secondary |
| | benchmark. Results assume reinvestment of all income and capital gains. An investment cannot be made directly in an index. |
| 9. | The average Lipper large-cap growth fund is representative of funds that, by portfolio practice, invest at least 75% of their equity assets in companies with market capitalizations (on a three-year weighted basis) above Lipper’s U.S. Diversified Equity large-cap floor. Large-cap growth funds typically have an above-average price-to-earnings ratio, price-to-book ratio, and three-year sales-per-share growth value, compared to the S&P 500® Index. This benchmark is a product of Lipper Inc. Lipper Inc. is an independent monitor of fund performance. Results are based on average total returns of similar funds with all dividend and capital gain distributions reinvested. |
The footnotes on the preceding page are an integral part of the table and graph and should be carefully read in conjunction with them.
| | |
| 6 | | MainStay Large Cap Growth Fund |
Cost in Dollars of a $1,000 Investment in MainStay Large Cap Growth Fund (Unaudited)
The example below is intended to describe the fees and expenses borne by shareholders during the six-month period from May 1, 2012, to October 31, 2012, and the impact of those costs on your investment.
Example
As a shareholder of the Fund, you incur two types of costs: (1) transaction costs, including exchange fees and sales charges (loads) on purchases (as applicable), and (2) ongoing costs, including management fees, distribution and/or service (12b-1) fees, and other Fund expenses (as applicable). This example is intended to help you understand your ongoing costs (in dollars) of investing in the Fund and to compare these costs with the ongoing costs of investing in other mutual funds. The example is based on an investment of $1,000 made at the beginning of the six-month period and held for the entire period from May 1, 2012, to October 31, 2012.
This example illustrates your Fund’s ongoing costs in two ways:
Actual Expenses
The second and third data columns in the table below provide information about actual account values and actual expenses. You may use the information in these columns, together with the amount you invested, to estimate the expenses that you paid during the six months ended October 31, 2012. Simply divide your account value by $1,000 (for example, an $8,600 account value divided by $1,000 = 8.6), then
multiply the result by the number under the heading entitled “Expenses Paid During Period” to estimate the expenses you paid on your account during this period.
Hypothetical Example for Comparison Purposes
The fourth and fifth data columns in the table below provide information about hypothetical account values and hypothetical expenses based on the Fund’s actual expense ratio and an assumed rate of return of 5% per year before expenses, which is not the Fund’s actual return. The hypothetical account values and expenses may not be used to estimate the actual ending account balances or expenses you paid for the six-month period shown. You may use this information to compare the ongoing costs of investing in the Fund with the ongoing costs of investing in other Funds. To do so, compare this 5% hypothetical example with the 5% hypothetical examples that appear in the shareholder reports of the other Funds.
Please note that the expenses shown in the table are meant to highlight your ongoing costs only and do not reflect any transactional costs, such as exchange fees or sales charges (loads). Therefore, the fourth and fifth data columns of the table are useful in comparing ongoing costs only and will not help you determine the relative total costs of owning different funds. In addition, if these transactional costs were included, your costs would have been higher.
| | | | | | | | | | | | | | | | | | | | |
| | | | | | | | | | | | | | | | |
| Share Class | | Beginning
Account
Value
5/1/12 | | | Ending Account
Value (Based
on Actual
Returns and
Expenses)
10/31/12 | | | Expenses
Paid
During
Period1 | | | Ending Account
Value (Based
on Hypothetical
5% Annualized
Return and
Actual Expenses)
10/31/12 | | | Expenses
Paid
During
Period1 | |
| | | | | |
| Investor Class Shares | | $ | 1,000.00 | | | $ | 950.70 | | | $ | 5.49 | | | $ | 1,019.50 | | | $ | 5.69 | |
| | | | | |
| Class A Shares | | $ | 1,000.00 | | | $ | 950.90 | | | $ | 5.25 | | | $ | 1,019.80 | | | $ | 5.43 | |
| | | | | |
| Class B Shares | | $ | 1,000.00 | | | $ | 947.90 | | | $ | 9.16 | | | $ | 1,015.70 | | | $ | 9.47 | |
| | | | | |
| Class C Shares | | $ | 1,000.00 | | | $ | 946.60 | | | $ | 9.15 | | | $ | 1,015.70 | | | $ | 9.47 | |
| | | | | |
| Class I Shares | | $ | 1,000.00 | | | $ | 952.40 | | | $ | 4.02 | | | $ | 1,021.00 | | | $ | 4.17 | |
| | | | | |
| Class R1 Shares | | $ | 1,000.00 | | | $ | 951.90 | | | $ | 4.46 | | | $ | 1,020.60 | | | $ | 4.62 | |
| | | | | |
| Class R2 Shares | | $ | 1,000.00 | | | $ | 951.10 | | | $ | 5.69 | | | $ | 1,019.30 | | | $ | 5.89 | |
| | | | | |
| Class R3 Shares | | $ | 1,000.00 | | | $ | 949.00 | | | $ | 6.96 | | | $ | 1,018.00 | | | $ | 7.20 | |
| 1. | Expenses are equal to the Fund’s annualized expense ratio of each class (1.12% for Investor Class, 1.07% for Class A, 1.87% for Class B and Class C, 0.82% for Class I, 0.91% for Class R1, 1.16% for Class R2 and 1.42% for Class R3) multiplied by the average account value over the period, divided by 366 and multiplied by 184 (to reflect the six-month period). The table above represents the actual expenses incurred during the six-month period. |
| | | | |
| mainstayinvestments.com | | | 7 | |
Industry Composition as of October 31, 2012 (Unaudited)
| | | | |
| IT Services | | | 9.3 | % |
| Computers & Peripherals | | | 8.0 | |
| Internet Software & Services | | | 5.5 | |
| Biotechnology | | | 4.5 | |
| Chemicals | | | 4.5 | |
| Internet & Catalog Retail | | | 4.5 | |
| Health Care Providers & Services | | | 4.2 | |
| Health Care Equipment & Supplies | | | 4.0 | |
| Road & Rail | | | 4.0 | |
| Hotels, Restaurants & Leisure | | | 3.8 | |
| Specialty Retail | | | 3.6 | |
| Textiles, Apparel & Luxury Goods | | | 3.5 | |
| Aerospace & Defense | | | 3.4 | |
| Software | | | 3.4 | |
| Communications Equipment | | | 3.3 | |
| Oil, Gas & Consumable Fuels | | | 3.3 | |
| Industrial Conglomerates | | | 2.9 | |
| Capital Markets | | | 2.8 | |
| Food & Staples Retailing | | | 2.7 | |
| | | | |
| Energy Equipment & Services | | | 1.8 | % |
| Media | | | 1.8 | |
| Real Estate Investment Trusts | | | 1.6 | |
| Construction & Engineering | | | 1.4 | |
| Health Care Technology | | | 1.4 | |
| Multiline Retail | | | 1.3 | |
| Wireless Telecommunication Services | | | 1.3 | |
| Auto Components | | | 1.1 | |
| Machinery | | | 1.0 | |
| Personal Products | | | 0.8 | |
| Diversified Financial Services | | | 0.6 | |
| Household Durables | | | 0.5 | |
| Trading Companies & Distributors | | | 0.4 | |
| Pharmaceuticals | | | 0.3 | |
| Semiconductors & Semiconductor Equipment | | | 0.3 | |
| Short-Term Investment | | | 3.2 | |
| Other Assets, Less Liabilities | | | –0.0 | ‡ |
| | | | |
| | | 100.0 | % |
| | | | |
See Portfolio of Investments beginning on page 11 for specific holdings within these categories.
| ‡ | Less than one-tenth of a percent. |
Top Ten Holdings as of October 31, 2012 (excluding short-term investment)
| 5. | International Business Machines Corp. |
| 8. | Express Scripts Holding Co. |
| | |
| 8 | | MainStay Large Cap Growth Fund |
Portfolio Management Discussion and Analysis (Unaudited)
Questions answered by portfolio managers Clark J. Winslow, Justin H. Kelly, CFA, and R. Bart Wear, CFA, of Winslow Capital Management, Inc., the Fund’s Subadvisor.
How did MainStay Large Cap Growth Fund perform relative to its peers and its benchmark during the 12 months ended October 31, 2012?
Excluding all sales charges, MainStay Large Cap Growth Fund returned 6.68% for Investor Class shares, 6.79% for Class A shares, 5.98% for Class B shares and 5.99% for Class C shares for the 12 months ended October 31, 2012. Over the same period, the Fund returned 7.15% for Class I shares, 6.94% for Class R1 shares, 6.77% for Class R2 shares and 6.44% for Class R3 shares. All share classes underperformed the 10.12% return of the average Lipper1 large-cap growth fund for the same period. All share classes underperformed the 13.02% return of the Russell 1000® Growth Index2 for the 12 months ended October 31, 2012. The Russell 1000® Growth Index is the Fund’s broad-based securities-market index. See page 5 for Fund returns with applicable sales charges.
What factors affected the Fund’s relative performance during the reporting period?
The Fund’s relative performance was affected by the macro environment, with record-high stock return correlations and clear mispricings. Against this backdrop, the Fund’s positioning was adjusted throughout the reporting period to balance risk. Despite relatively strong performance for defensive stocks, the Fund did not become defensive. Many companies were structurally challenged because of poor business models, which are inconsistent with a growth investment philosophy. In response to deceleration in global economic growth, the Fund reduced the weight of its stocks that demonstrated cyclical patterns of growth, which were dominant for most of the fiscal year. The Fund also added to positions in companies with more unconventional growth, unusual technologies or unique products that grew despite a tepid economic environment.
During the reporting period, which sectors were the strongest positive contributors to the Fund’s relative performance and which sectors were particularly weak?
The Fund’s performance relative to the Russell 1000® Growth Index was primarily driven by stock selection, which detracted across seven sectors and contributed positively in two sectors. (Contributions take weightings and total returns into account.) Stock selection contributed positively to the Fund’s performance relative to the Russell 1000® Growth Index in the materials and telecommunication services sectors. Stock selection detracted the most from relative performance in the consumer discretionary and information technology sectors. The Fund’s con-sumer discretionary holdings also showed negative absolute returns during the reporting period.
Sector weighting decisions hurt relative performance in the long-underweight consumer staples sector but helped relative performance in the underweight energy sector.
During the reporting period, which individual stocks made the strongest positive contributions to the Fund’s absolute performance and which stocks detracted the most?
The strongest positive contributor to absolute performance during the reporting period was computers & peripherals company Apple, a position long held by the Fund. Payments technology company Visa was also a strong contributor, as was railroad company Union Pacific.
The most substantial detractor from the Fund’s absolute performance was software and hardware provider Oracle. Clothing company Abercrombie & Fitch also provided weak results, as did information technology consulting company Cognizant Technology Solutions. All three of these stocks provided negative total returns during the reporting period.
Did the Fund make any significant purchases or sales during the reporting period?
The Fund purchased a position in discount retailer Ross Stores as the company gained domestic share from new store growth and market share from the traditional department store channel. The Fund established a position in oil, gas & consumable fuels company Cabot Oil & Gas in light of improving natural gas fundamentals.
The Fund sold its long-held position in Chinese Internet search engine Baidu when stronger competition and a softer Chinese economy weakened the company’s growth prospects. The Fund sold its position in energy equipment & services company Schlumberger because of weakness in North American land activity. The proceeds were redirected to high-margin international companies and companies involved in deepwater drilling and related activities.
How did the Fund’s sector weightings change during the reporting period?
We increased the Fund’s weighting in the consumer discretionary sector during the reporting period, moving to a more substantially overweight position relative to the Russell 1000® Growth Index.
Overall, energy sector holdings decreased in the Fund and in the Index, with the Fund moving to a slightly overweight posi-tion at the end of the reporting period. The Fund reduced its information technology exposure, moving to an underweight position relative to the Russell 1000® Growth Index.
| 1. | See footnote on page 6 for more information on Lipper Inc. |
| 2. | See footnote on page 6 for more information on the Russell 1000® Growth Index. |
| | | | |
| mainstayinvestments.com | | | 9 | |
How was the Fund positioned at the end of Oct-ober 2012?
As of October 31, 2012, the Fund held an underweight position relative to the Russell 1000® Growth Index in the consumer staples sector. The Fund was most substantially overweight relative to the Index in the consumer discretionary and health care sectors.
The opinions expressed are those of the portfolio managers as of the date of this report and are subject to change. There is no guarantee that any forecasts made will come to pass. This material does not constitute investment advice and is not intended as an endorsement of any specific investment.
| | |
| 10 | | MainStay Large Cap Growth Fund |
Portfolio of Investments October 31, 2012
| | | | | | | | |
| | |
| | | Shares | | | Value | |
| | | | | | | | |
| Common Stocks 96.8%† | | | | | | | | |
Aerospace & Defense 3.4% | | | | | | | | |
Precision Castparts Corp. | | | 1,609,000 | | | $ | 278,469,630 | |
United Technologies Corp. | | | 3,636,900 | | | | 284,260,104 | |
| | | | | | | | |
| | | | | | | 562,729,734 | |
| | | | | | | | |
Auto Components 1.1% | | | | | | | | |
BorgWarner, Inc. (a) | | | 2,777,200 | | | | 182,795,304 | |
| | | | | | | | |
| | |
Biotechnology 4.5% | | | | | | | | |
Biogen Idec, Inc. (a) | | | 1,807,400 | | | | 249,818,828 | |
Celgene Corp. (a) | | | 3,714,000 | | | | 272,310,480 | |
Gilead Sciences, Inc. (a) | | | 3,323,600 | | | | 223,212,976 | |
| | | | | | | | |
| | | | | | | 745,342,284 | |
| | | | | | | | |
Capital Markets 2.8% | | | | | | | | |
BlackRock, Inc. | | | 1,002,900 | | | | 190,230,072 | |
Franklin Resources, Inc. | | | 2,160,100 | | | | 276,060,780 | |
| | | | | | | | |
| | | | | | | 466,290,852 | |
| | | | | | | | |
Chemicals 4.5% | | | | | | | | |
Ecolab, Inc. | | | 3,791,100 | | | | 263,860,560 | |
¨Monsanto Co. | | | 5,454,822 | | | | 469,496,530 | |
| | | | | | | | |
| | | | | | | 733,357,090 | |
| | | | | | | | |
Communications Equipment 3.3% | | | | | | | | |
¨QUALCOMM, Inc. | | | 9,378,600 | | | | 549,351,495 | |
| | | | | | | | |
| | |
Computers & Peripherals 8.0% | | | | | | | | |
¨Apple, Inc. | | | 1,942,075 | | | | 1,155,728,833 | |
EMC Corp. (a) | | | 6,704,300 | | | | 163,719,006 | |
| | | | | | | | |
| | | | | | | 1,319,447,839 | |
| | | | | | | | |
Construction & Engineering 1.4% | | | | | | | | |
Fluor Corp. | | | 4,033,500 | | | | 225,270,975 | |
| | | | | | | | |
| | |
Diversified Financial Services 0.6% | | | | | | | | |
Intercontinental Exchange, Inc. (a) | | | 698,300 | | | | 91,477,300 | |
| | | | | | | | |
| | |
Energy Equipment & Services 1.8% | | | | | | | | |
FMC Technologies, Inc. (a) | | | 2,899,100 | | | | 118,573,190 | |
Schlumberger, Ltd. | | | 2,600,900 | | | | 180,840,577 | |
| | | | | | | | |
| | | | | | | 299,413,767 | |
| | | | | | | | |
Food & Staples Retailing 2.7% | | | | | | | | |
Costco Wholesale Corp. | | | 1,895,600 | | | | 186,583,908 | |
CVS Caremark Corp. | | | 5,631,500 | | | | 261,301,600 | |
| | | | | | | | |
| | | | | | | 447,885,508 | |
| | | | | | | | |
Health Care Equipment & Supplies 4.0% | |
Covidien PLC | | | 3,959,600 | | | | 217,580,020 | |
Edwards Lifesciences Corp. (a) | | | 2,060,900 | | | | 178,947,947 | |
| | | | | | | | |
| | |
| | | Shares | | | Value | |
| | | | | | | | |
Health Care Equipment & Supplies (continued) | |
Intuitive Surgical, Inc. (a) | | | 497,615 | | | $ | 269,816,805 | |
| | | | | | | | |
| | | | | | | 666,344,772 | |
| | | | | | | | |
Health Care Providers & Services 4.2% | |
¨Express Scripts Holding Co. (a) | | | 7,328,800 | | | | 451,014,352 | |
UnitedHealth Group, Inc. | | | 4,420,200 | | | | 247,531,200 | |
| | | | | | | | |
| | | | | | | 698,545,552 | |
| | | | | | | | |
Health Care Technology 1.4% | | | | | | | | |
Cerner Corp. (a) | | | 3,008,700 | | | | 229,232,853 | |
| | | | | | | | |
| | |
Hotels, Restaurants & Leisure 3.8% | | | | | | | | |
Las Vegas Sands Corp. | | | 4,055,600 | | | | 188,342,064 | |
Starbucks Corp. | | | 5,678,400 | | | | 260,638,560 | |
Yum! Brands, Inc. | | | 2,490,600 | | | | 174,615,966 | |
| | | | | | | | |
| | | | | | | 623,596,590 | |
| | | | | | | | |
Household Durables 0.5% | | | | | | | | |
Lennar Corp. Class A | | | 2,203,600 | | | | 82,568,892 | |
| | | | | | | | |
| | |
Industrial Conglomerates 2.9% | | | | | | | | |
¨Danaher Corp. | | | 9,277,100 | | | | 479,904,383 | |
| | | | | | | | |
| | |
Internet & Catalog Retail 4.5% | | | | | | | | |
Amazon.com, Inc. (a) | | | 1,496,600 | | | | 348,438,412 | |
¨Priceline.com, Inc. (a) | | | 688,230 | | | | 394,885,727 | |
| | | | | | | | |
| | | | | | | 743,324,139 | |
| | | | | | | | |
Internet Software & Services 5.5% | | | | | | | | |
eBay, Inc. (a) | | | 5,442,600 | | | | 262,823,154 | |
Facebook, Inc. Class A (a) | | | 4,609,000 | | | | 97,319,035 | |
¨Google, Inc. Class A (a) | | | 606,825 | | | | 412,501,430 | |
VeriSign, Inc. (a) | | | 3,485,400 | | | | 129,203,778 | |
| | | | | | | | |
| | | | | | | 901,847,397 | |
| | | | | | | | |
IT Services 9.3% | | | | | | | | |
¨International Business Machines Corp. | | | 2,574,050 | | | | 500,729,946 | |
MasterCard, Inc. Class A | | | 463,930 | | | | 213,839,255 | |
Teradata Corp. (a) | | | 2,057,500 | | | | 140,547,825 | |
¨Visa, Inc. Class A | | | 4,883,700 | | | | 677,662,212 | |
| | | | | | | | |
| | | | | | | 1,532,779,238 | |
| | | | | | | | |
Machinery 1.0% | | | | | | | | |
Illinois Tool Works, Inc. | | | 2,722,600 | | | | 166,977,058 | |
| | | | | | | | |
| | |
Media 1.8% | | | | | | | | |
CBS Corp. Class B | | | 4,209,900 | | | | 136,400,760 | |
Sirius XM Radio, Inc. (a) | | | 57,696,200 | | | | 161,549,360 | |
| | | | | | | | |
| | | | | | | 297,950,120 | |
| | | | | | | | |
| † | Percentages indicated are based on Fund net assets. |
| ¨ | | Among the Fund’s 10 largest holdings, as of October 31, 2012, excluding short-term investment. May be subject to change daily. |
| | | | | | |
The notes to the financial statements are an integral part of,
and should be read in conjunction with, the financial statements. | | mainstayinvestments.com | | | 11 | |
Portfolio of Investments October 31, 2012 (continued)
| | | | | | | | |
| | |
| | | Shares | | | Value | |
| | | | | | | | |
| Common Stocks (continued) | |
Multiline Retail 1.3% | | | | | | | | |
Dollar General Corp. (a) | | | 4,291,300 | | | $ | 208,643,006 | |
| | | | | | | | |
| | |
Oil, Gas & Consumable Fuels 3.3% | | | | | | | | |
Cabot Oil & Gas Corp. | | | 3,632,900 | | | | 170,673,642 | |
Concho Resources, Inc. (a) | | | 2,314,300 | | | | 199,307,516 | |
Range Resources Corp. | | | 2,556,850 | | | | 167,115,716 | |
| | | | | | | | |
| | | | | | | 537,096,874 | |
| | | | | | | | |
Personal Products 0.8% | | | | | | | | |
Estee Lauder Cos., Inc. (The) Class A | | | 2,215,100 | | | | 136,494,462 | |
| | | | | | | | |
| | |
Pharmaceuticals 0.3% | | | | | | | | |
Allergan, Inc. | | | 547,200 | | | | 49,204,224 | |
| | | | | | | | |
| | |
Real Estate Investment Trusts 1.6% | | | | | | | | |
American Tower Corp. | | | 3,467,800 | | | | 261,090,662 | |
| | | | | | | | |
| | |
Road & Rail 4.0% | | | | | | | | |
¨Union Pacific Corp. | | | 5,312,000 | | | | 653,535,360 | |
| | | | | | | | |
|
Semiconductors & Semiconductor Equipment 0.3% | |
Altera Corp. | | | 1,588,000 | | | | 48,402,240 | |
| | | | | | | | |
| | |
Software 3.4% | | | | | | | | |
Intuit, Inc. | | | 3,019,600 | | | | 179,424,632 | |
Salesforce.com, Inc. (a) | | | 2,561,800 | | | | 373,971,564 | |
| | | | | | | | |
| | | | | | | 553,396,196 | |
| | | | | | | | |
Specialty Retail 3.6% | | | | | | | | |
Gap, Inc. (The) | | | 5,418,000 | | | | 193,530,960 | |
Home Depot, Inc. (The) | | | 1,421,800 | | | | 87,270,084 | |
Ross Stores, Inc. | | | 2,612,800 | | | | 159,250,160 | |
Ulta Salon Cosmetics & Fragrance, Inc. | | | 1,607,700 | | | | 148,262,094 | |
| | | | | | | | |
| | | | | | | 588,313,298 | |
| | | | | | | | |
Textiles, Apparel & Luxury Goods 3.5% | |
Coach, Inc. | | | 3,052,700 | | | | 171,103,835 | |
Michael Kors Holdings, Ltd. (a) | | | 3,317,200 | | | | 181,417,668 | |
Ralph Lauren Corp. | | | 1,416,800 | | | | 217,747,992 | |
| | | | | | | | |
| | | | | | | 570,269,495 | |
| | | | | | | | |
Trading Companies & Distributors 0.4% | |
W.W. Grainger, Inc. | | | 315,900 | | | | 63,625,419 | |
| | | | | | | | |
|
Wireless Telecommunication Services 1.3% | |
SBA Communications Corp. Class A (a) | | | 3,328,200 | | | | 221,757,966 | |
| | | | | | | | |
Total Common Stocks
(Cost $13,268,551,321) | | | | | | | 15,938,262,344 | |
| | | | | | | | |
| | | | | | | | |
| | | Principal
Amount | | | Value | |
| | | | | | | | |
| Short-Term Investment 3.2% | |
Repurchase Agreement 3.2% | | | | | | | | |
State Street Bank and Trust Co.
0.01%, dated 10/31/12
due 11/1/12
Proceeds at Maturity $534,684,553 (Collateralized by United States Treasury and Government Agency securities with rates between 0.74% and 5.25% and maturity dates between 6/4/15 and 2/15/29, with a Principal Amount of $535,140,000 and a Market Value of $545,378,339) | | $ | 534,684,405 | | | $ | 534,684,405 | |
| | | | | | | | |
Total Short-Term Investment
(Cost $534,684,405) | | | | | | | 534,684,405 | |
| | | | | | | | |
Total Investments
(Cost $13,803,235,726) (b) | | | 100.0 | % | | | 16,472,946,749 | |
Other Assets, Less Liabilities | | | (0.0 | )‡ | | | (3,576,937 | ) |
Net Assets | | | 100.0 | % | | $ | 16,469,369,812 | |
| ‡ | Less than one-tenth of a percent. |
| (a) | Non-income producing security. |
| (b) | As of October 31, 2012, cost is $13,836,804,928 for federal income tax purposes and net unrealized appreciation is as follows: |
| | | | |
Gross unrealized appreciation | | $ | 2,724,197,570 | |
Gross unrealized depreciation | | | (88,055,749 | ) |
| | | | |
Net unrealized appreciation | | $ | 2,636,141,821 | |
| | | | |
| | | | |
| 12 | | MainStay Large Cap Growth Fund | | The notes to the financial statements are an integral part of,
and should be read in conjunction with, the financial statements. |
The following is a summary of the fair valuations according to the inputs used as of October 31, 2012, for valuing the Fund’s assets.
Asset Valuation Inputs
| | | | | | | | | | | | | | | | |
Description | | Quoted
Prices in
Active
Markets for
Identical
Assets (Level 1) | | | Significant
Other
Observable
Inputs (Level 2) | | | Significant
Unobservable
Inputs (Level 3) | | | Total | |
| Investments in Securities (a) | | | | | | | | | | | | | | | | |
| Common Stocks | | $ | 15,938,262,344 | | | $ | — | | | $ | — | | | $ | 15,938,262,344 | |
| Short-Term Investment | | | | | | | | | | | | | | | | |
Repurchase Agreement | | | — | | | | 534,684,405 | | | | — | | | | 534,684,405 | |
| | | | | | | | | | | | | | | | |
| Total Investments in Securities | | $ | 15,938,262,344 | | | $ | 534,684,405 | | | $ | — | | | $ | 16,472,946,749 | |
| | | | | | | | | | | | | | | | |
| (a) | For a complete listing of investments and their industries, see the Portfolio of Investments. |
The Fund recognizes transfers between the levels as of the beginning of the period.
For the year ended October 31, 2012, the Fund did not have any transfers between Level 1 and Level 2 fair value measurements. (See Note 2)
As of October 31, 2012, the Fund did not hold any investments with significant unobservable inputs (Level 3). (See Note 2)
| | | | | | |
The notes to the financial statements are an integral part of,
and should be read in conjunction with, the financial statements. | | mainstayinvestments.com | | | 13 | |
Statement of Assets and Liabilities as of October 31, 2012
| | | | |
| Assets | | | | |
Investment in securities, at value
(identified cost $13,803,235,726) | | $ | 16,472,946,749 | |
Receivables: | | | | |
Investment securities sold | | | 91,473,912 | |
Fund shares sold | | | 31,569,414 | |
Dividends and interest | | | 2,896,280 | |
Other assets | | | 105,126 | |
| | | | |
Total assets | | | 16,598,991,481 | |
| | | | |
| |
| Liabilities | | | | |
Payables: | | | | |
Investment securities purchased | | | 81,342,470 | |
Fund shares redeemed | | | 30,872,632 | |
Manager (See Note 3) | | | 8,992,747 | |
Transfer agent (See Note 3) | | | 6,672,517 | |
NYLIFE Distributors (See Note 3) | | | 1,056,703 | |
Shareholder communication | | | 411,297 | |
Professional fees | | | 157,193 | |
Trustees | | | 53,192 | |
Custodian | | | 18,196 | |
Accrued expenses | | | 44,722 | |
| | | | |
Total liabilities | | | 129,621,669 | |
| | | | |
Net assets | | $ | 16,469,369,812 | |
| | | | |
| |
| Composition of Net Assets | | | | |
Shares of beneficial interest outstanding (par value of
$.01 per share) unlimited number of shares authorized | | $ | 21,311,816 | |
Additional paid-in capital | | | 14,340,220,495 | |
| | | | |
| | | 14,361,532,311 | |
Distributions in excess of net investment income | | | (11,181,745 | ) |
Accumulated net realized gain (loss) on investments | | | (550,691,777 | ) |
Net unrealized appreciation (depreciation) on investments | | | 2,669,711,023 | |
| | | | |
Net assets | | $ | 16,469,369,812 | |
| | | | |
| | | | |
Investor Class | | | | |
Net assets applicable to outstanding shares | | $ | 199,156,061 | |
| | | | |
Shares of beneficial interest outstanding | | | 26,484,619 | |
| | | | |
Net asset value per share outstanding | | $ | 7.52 | |
Maximum sales charge (5.50% of offering price) | | | 0.44 | |
| | | | |
Maximum offering price per share outstanding | | $ | 7.96 | |
| | | | |
Class A | | | | |
Net assets applicable to outstanding shares | | $ | 1,611,373,937 | |
| | | | |
Shares of beneficial interest outstanding | | | 213,286,636 | |
| | | | |
Net asset value per share outstanding | | $ | 7.55 | |
Maximum sales charge (5.50% of offering price) | | | 0.44 | |
| | | | |
Maximum offering price per share outstanding | | $ | 7.99 | |
| | | | |
Class B | | | | |
Net assets applicable to outstanding shares | | $ | 58,392,136 | |
| | | | |
Shares of beneficial interest outstanding | | | 8,231,335 | |
| | | | |
Net asset value and offering price per share outstanding | | $ | 7.09 | |
| | | | |
Class C | | | | |
Net assets applicable to outstanding shares | | $ | 375,521,260 | |
| | | | |
Shares of beneficial interest outstanding | | | 52,984,104 | |
| | | | |
Net asset value and offering price per share outstanding | | $ | 7.09 | |
| | | | |
Class I | | | | |
Net assets applicable to outstanding shares | | $ | 11,215,463,746 | |
| | | | |
Shares of beneficial interest outstanding | | | 1,437,177,986 | |
| | | | |
Net asset value and offering price per share outstanding | | $ | 7.80 | |
| | | | |
Class R1 | | | | |
Net assets applicable to outstanding shares | | $ | 1,950,014,570 | |
| | | | |
Shares of beneficial interest outstanding | | | 252,670,886 | |
| | | | |
Net asset value and offering price per share outstanding | | $ | 7.72 | |
| | | | |
Class R2 | | | | |
Net assets applicable to outstanding shares | | $ | 854,119,000 | |
| | | | |
Shares of beneficial interest outstanding | | | 112,772,720 | |
| | | | |
Net asset value and offering price per share outstanding | | $ | 7.57 | |
| | | | |
Class R3 | | | | |
Net assets applicable to outstanding shares | | $ | 205,329,102 | |
| | | | |
Shares of beneficial interest outstanding | | | 27,573,354 | |
| | | | |
Net asset value and offering price per share outstanding | | $ | 7.45 | |
| | | | |
| | | | |
| 14 | | MainStay Large Cap Growth Fund | | The notes to the financial statements are an integral part of,
and should be read in conjunction with, the financial statements. |
Statement of Operations for the year ended October 31, 2012
| | | | |
| Investment Income (Loss) | |
Income | | | | |
Dividends | | $ | 132,775,839 | |
Interest | | | 48,266 | |
| | | | |
Total income | | | 132,824,105 | |
| | | | |
Expenses | | | | |
Manager (See Note 3) | | | 98,732,081 | |
Transfer agent (See Note 3) | | | 25,945,350 | |
Distribution/Service—Investor Class (See Note 3) | | | 469,067 | |
Distribution/Service—Class A (See Note 3) | | | 4,365,669 | |
Distribution/Service—Class B (See Note 3) | | | 669,823 | |
Distribution/Service—Class C (See Note 3) | | | 3,988,587 | |
Distribution/Service—Class R2 (See Note 3) | | | 2,247,969 | |
Distribution/Service—Class R3 (See Note 3) | | | 1,005,569 | |
Shareholder service (See Note 3) | | | 2,900,950 | |
Shareholder communication | | | 1,256,955 | |
Registration | | | 1,011,345 | |
Professional fees | | | 614,763 | |
Trustees | | | 458,928 | |
Custodian | | | 200,196 | |
Miscellaneous | | | 476,097 | |
| | | | |
Total expenses before waiver/reimbursement | | | 144,343,349 | |
Expense waiver/reimbursement from Manager (See Note 3) | | | (337,499 | ) |
| | | | |
Net expenses | | | 144,005,850 | |
| | | | |
Net investment income (loss) | | | (11,181,745 | ) |
| | | | |
|
| Realized and Unrealized Gain (Loss) on Investments | |
Net realized gain (loss) on investments | | | (512,103,447 | ) |
Net change in unrealized appreciation (depreciation) on investments | | | 1,549,658,941 | |
| | | | |
Net realized and unrealized gain (loss) on investments | | | 1,037,555,494 | |
| | | | |
Net increase (decrease) in net assets resulting from operations | | $ | 1,026,373,749 | |
| | | | |
| | | | | | |
The notes to the financial statements are an integral part of,
and should be read in conjunction with, the financial statements. | | mainstayinvestments.com | | | 15 | |
Statements of Changes in Net Assets
for the years ended October 31, 2012 and October 31, 2011
| | | | | | | | |
| | | 2012 | | | 2011 | |
| Increase (Decrease) in Net Assets | |
Operations: | | | | | | | | |
Net investment income (loss) | | $ | (11,181,745 | ) | | $ | (19,203,459 | ) |
Net realized gain (loss) on investments (a) | | | (512,103,447 | ) | | | 454,053,678 | |
Net change in unrealized appreciation (depreciation) on investments | | | 1,549,658,941 | | | | 123,965,023 | |
| | | | |
Net increase (decrease) in net assets resulting from operations | | | 1,026,373,749 | | | | 558,815,242 | |
| | | | |
Distributions to shareholders: | | | | | | | | |
From net realized gain on investments: | | | | | |
Investor Class | | | (3,134,315 | ) | | | — | |
Class A | | | (42,302,237 | ) | | | — | |
Class B | | | (1,683,517 | ) | | | — | |
Class C | | | (9,016,819 | ) | | | — | |
Class I | | | (193,020,340 | ) | | | — | |
Class R1 | | | (29,736,149 | ) | | | — | |
Class R2 | | | (16,672,198 | ) | | | — | |
Class R3 | | | (3,756,927 | ) | | | — | |
| | | | |
Total distributions to shareholders | | | (299,322,502 | ) | | | — | |
| | | | |
Capital share transactions: | | | | | | | | |
Net proceeds from sale of shares | | | 7,252,755,190 | | | | 9,347,727,533 | |
Net asset value of shares issued to shareholders in reinvestment of distributions | | | 218,164,571 | | | | — | |
Cost of shares redeemed (b) | | | (4,644,732,279 | ) | | | (2,744,011,243 | ) |
| | | | |
Increase (decrease) in net assets derived from capital share transactions | | | 2,826,187,482 | | | | 6,603,716,290 | |
| | | | |
Net increase (decrease) in net assets | | | 3,553,238,729 | | | | 7,162,531,532 | |
| | |
| Net Assets | | | | | | | | |
Beginning of year | | | 12,916,131,083 | | | | 5,753,599,551 | |
| | | | |
End of year | | $ | 16,469,369,812 | | | $ | 12,916,131,083 | |
| | | | |
Distributions in excess of net investment income at end of the year | | $ | (11,181,745 | ) | | $ | — | |
| | | | |
| (a) | Includes realized gain of $20,175,242 due to an in-kind redemption during the year ended October 31, 2011. (See Note 9) |
| (b) | Includes an in-kind redemption in the amount of $90,171,285 during the year ended October 31, 2011. (See Note 9) |
| | | | |
| 16 | | MainStay Large Cap Growth Fund | | The notes to the financial statements are an integral part of,
and should be read in conjunction with, the financial statements. |
Financial Highlights selected per share data and ratios
| | | | | | | | | | | | | | | | | | | | |
| | | Investor Class | |
| | | Year ended October 31, | | | February 28,
2008**
through
October 31, | |
| | | 2012 | | | 2011 | | | 2010 | | | 2009 | | | 2008 | |
Net asset value at beginning of period | | $ | 7.21 | | | $ | 6.55 | | | $ | 5.53 | | | $ | 4.70 | | | $ | 6.63 | |
| | | | | | | | | | | | | | | | | | | | |
Net investment income (loss) (a) | | | (0.02 | ) | | | (0.03 | ) | | | (0.04 | ) | | | (0.03 | ) | | | (0.03 | ) |
Net realized and unrealized gain (loss) on investments | | | 0.49 | | | | 0.69 | | | | 1.06 | | | | 0.86 | | | | (1.90 | ) |
| | | | | | | | | | | | | | | | | | | | |
Total from investment operations | | | 0.47 | | | | 0.66 | | | | 1.02 | | | | 0.83 | | | | (1.93 | ) |
| | | | | | | | | | | | | | | | | | | | |
Less distributions: | | | | | | | | | | | | | | | | | | | | |
From net realized gain on investments | | | (0.16 | ) | | | — | | | | — | | | | — | | | | — | |
| | | | | | | | | | | | | | | | | | | | |
Net asset value at end of period | | $ | 7.52 | | | $ | 7.21 | | | $ | 6.55 | | | $ | 5.53 | | | $ | 4.70 | |
| | | | | | | | | | | | | | | | | | | | |
Total investment return (b) | | | 6.68 | % | | | 10.08 | % | | | 18.44 | % | | | 17.66 | % | | | (29.11 | %)(c) |
Ratios (to average net assets)/Supplemental Data: | | | | | | | | | | | | | | | | | | | | |
Net investment income (loss) | | | (0.28 | %) | | | (0.43 | %) | | | (0.64 | %) | | | (0.62 | %) | | | (0.73 | %)†† |
Net expenses | | | 1.10 | % | | | 1.15 | % | | | 1.27 | % | | | 1.45 | % | | | 1.38 | % †† |
Expenses (before waiver/reimbursement) | | | 1.10 | % | | | 1.15 | % | | | 1.28 | % | | | 1.45 | % | | | 1.39 | % †† |
Portfolio turnover rate | | | 60 | % | | | 52 | % | | | 91 | % | | | 62 | % | | | 115 | % |
Net assets at end of period (in 000’s) | | $ | 199,156 | | | $ | 130,140 | | | $ | 93,733 | | | $ | 59,499 | | | $ | 46,762 | |
| ** | Commencement of operations. |
| (a) | Per share data based on average shares outstanding during the period. |
| (b) | Total investment return is calculated exclusive of sales charges and assumes the reinvestment of dividends and distributions. |
| (c) | Total investment return is not annualized. |
| | | | | | | | | | | | | | | | | | | | |
| | | Class A | |
| | | Year ended October 31, | |
| | | 2012 | | | 2011 | | | 2010 | | | 2009 | | | 2008 | |
Net asset value at beginning of year | | $ | 7.24 | | | $ | 6.58 | | | $ | 5.54 | | | $ | 4.70 | | | $ | 7.37 | |
| | | | | | | | | | | | | | | | | | | | |
Net investment income (loss) (a) | | | (0.02 | ) | | | (0.02 | ) | | | (0.03 | ) | | | (0.02 | ) | | | (0.03 | ) |
Net realized and unrealized gain (loss) on investments | | | 0.49 | | | | 0.68 | | | | 1.07 | | | | 0.86 | | | | (2.64 | ) |
| | | | | | | | | | | | | | | | | | | | |
Total from investment operations | | | 0.47 | | | | 0.66 | | | | 1.04 | | | | 0.84 | | | | (2.67 | ) |
| | | | | | | | | | | | | | | | | | | | |
Less distributions: | | | | | | | | | | | | | | | | | | | | |
From net realized gain on investments | | | (0.16 | ) | | | — | | | | — | | | | — | | | | — | |
| | | | | | | | | | | | | | | | | | | | |
Net asset value at end of year | | $ | 7.55 | | | $ | 7.24 | | | $ | 6.58 | | | $ | 5.54 | | | $ | 4.70 | |
| | | | | | | | | | | | | | | | | | | | |
Total investment return (b) | | | 6.79 | % | | | 10.03 | % | | | 18.77 | % | | | 17.87 | % (c) | | | (36.36 | %) |
Ratios (to average net assets)/Supplemental Data: | | | | | | | | | | | | | | | | | | | | |
Net investment income (loss) | | | (0.20 | %) | | | (0.35 | %) | | | (0.52 | %) | | | (0.43 | %) | | | (0.52 | %) |
Net expenses | | | 1.04 | % | | | 1.06 | % | | | 1.17 | % | | | 1.21 | % | | | 1.23 | % |
Expenses (before waiver/reimbursement) | | | 1.04 | % | | | 1.07 | % | | | 1.18 | % | | | 1.24 | % | | | 1.26 | % |
Portfolio turnover rate | | | 60 | % | | | 52 | % | | | 91 | % | | | 62 | % | | | 115 | % |
Net assets at end of year (in 000’s) | | $ | 1,611,374 | | | $ | 1,887,326 | | | $ | 1,131,968 | | | $ | 1,662,622 | | | $ | 495,184 | |
| (a) | Per share data based on average shares outstanding during the year. |
| (b) | Total investment return is calculated exclusive of sales charges and assumes the reinvestment of dividends and distributions. |
| (c) | Total investment returns may reflect adjustments to conform to generally accepted accounting principles. |
| | | | | | |
The notes to the financial statements are an integral part of,
and should be read in conjunction with, the financial statements. | | mainstayinvestments.com | | | 17 | |
Financial Highlights selected per share data and ratios
| | | | | | | | | | | | | | | | | | | | |
| | | Class B | |
| | | Year ended October 31, | |
| | | 2012 | | | 2011 | | | 2010 | | | 2009 | | | 2008 | |
Net asset value at beginning of year | | $ | 6.86 | | | $ | 6.28 | | | $ | 5.34 | | | $ | 4.57 | | | $ | 7.24 | |
| | | | | | | | | | | | | | | | | | | | |
Net investment income (loss) (a) | | | (0.07 | ) | | | (0.08 | ) | | | (0.08 | ) | | | (0.06 | ) | | | (0.09 | ) |
Net realized and unrealized gain (loss) on investments | | | 0.46 | | | | 0.66 | | | | 1.02 | | | | 0.83 | | | | (2.58 | ) |
| | | | | | | | | | | | | | | | | | | | |
Total from investment operations | | | 0.39 | | | | 0.58 | | | | 0.94 | | | | 0.77 | | | | (2.67 | ) |
| | | | | | | | | | | | | | | | | | | | |
Less distributions: | | | | | | | | | | | | | | | | | | | | |
From net realized gain on investments | | | (0.16 | ) | | | — | | | | — | | | | — | | | | — | |
| | | | | | | | | | | | | | | | | | | | |
Net asset value at end of year | | $ | 7.09 | | | $ | 6.86 | | | $ | 6.28 | | | $ | 5.34 | | | $ | 4.57 | |
| | | | | | | | | | | | | | | | | | | | |
Total investment return (b) | | | 5.98 | % | | | 9.24 | % (c) | | | 17.60 | % (c) | | | 16.85 | % | | | (36.88 | %) |
Ratios (to average net assets)/Supplemental Data: | | | | | | | | | | | | | | | | | | | | |
Net investment income (loss) | | | (1.01 | %) | | | (1.18 | %) | | | (1.38 | %) | | | (1.35 | %) | | | (1.34 | %) |
Net expenses | | | 1.84 | % | | | 1.90 | % | | | 2.02 | % | | | 2.20 | % | | | 2.10 | % |
Expenses (before waiver/reimbursement) | | | 1.85 | % | | | 1.90 | % | | | 2.03 | % | | | 2.21 | % | | | 2.12 | % |
Portfolio turnover rate | | | 60 | % | | | 52 | % | | | 91 | % | | | 62 | % | | | 115 | % |
Net assets at end of year (in 000’s) | | $ | 58,392 | | | $ | 72,591 | | | $ | 82,590 | | | $ | 63,327 | | | $ | 65,996 | |
| (a) | Per share data based on average shares outstanding during the year. |
| (b) | Total investment return is calculated exclusive of sales charges and assumes the reinvestment of dividends and distributions. |
| (c) | Total investment returns may reflect adjustments to conform to generally accepted accounting principles. |
| | | | | | | | | | | | | | | | | | | | |
| | | Class C | |
| | | Year ended October 31, | |
| | | 2012 | | | 2011 | | | 2010 | | | 2009 | | | 2008 | |
Net asset value at beginning of year | | $ | 6.85 | | | $ | 6.28 | | | $ | 5.33 | | | $ | 4.57 | | | $ | 7.23 | |
| | | | | | | | | | | | | | | | | | | | |
Net investment income (loss) (a) | | | (0.07 | ) | | | (0.08 | ) | | | (0.08 | ) | | | (0.07 | ) | | | (0.09 | ) |
Net realized and unrealized gain (loss) on investments | | | 0.47 | | | | 0.65 | | | | 1.03 | | | | 0.83 | | | | (2.57 | ) |
| | | | | | | | | | | | | | | | | | | | |
Total from investment operations | | | 0.40 | | | | 0.57 | | | | 0.95 | | | | 0.76 | | | | (2.66 | ) |
| | | | | | | | | | | | | | | | | | | | |
Less distributions: | | | | | | | | | | | | | | | | | | | | |
From net realized gain on investments | | | (0.16 | ) | | | — | | | | — | | | | — | | | | — | |
| | | | | | | | | | | | | | | | | | | | |
Net asset value at end of year | | $ | 7.09 | | | $ | 6.85 | | | $ | 6.28 | | | $ | 5.33 | | | $ | 4.57 | |
| | | | | | | | | | | | | | | | | | | | |
Total investment return (b) | | | 5.99 | % | | | 9.08 | % | | | 17.82 | % (c) | | | 16.63 | % (c) | | | (36.79 | %) |
Ratios (to average net assets)/Supplemental Data: | | | | | | | | | | | | | | | | | | | | |
Net investment income (loss) | | | (1.02 | %) | | | (1.18 | %) | | | (1.39 | %) | | | (1.38 | %) | | | (1.41 | %) |
Net expenses | | | 1.85 | % | | | 1.89 | % | | | 2.02 | % | | | 2.19 | % | | | 2.11 | % |
Expenses (before waiver/reimbursement) | | | 1.85 | % | | | 1.90 | % | | | 2.03 | % | | | 2.20 | % | | | 2.12 | % |
Portfolio turnover rate | | | 60 | % | | | 52 | % | | | 91 | % | | | 62 | % | | | 115 | % |
Net assets at end of year (in 000’s) | | $ | 375,521 | | | $ | 380,186 | | | $ | 262,799 | | | $ | 174,955 | | | $ | 93,249 | |
| (a) | Per share data based on average shares outstanding during the year. |
| (b) | Total investment return is calculated exclusive of sales charges and assumes the reinvestment of dividends and distributions. |
| (c) | Total investment returns may reflect adjustments to conform to generally accepted accounting principles. |
| | | | |
| 18 | | MainStay Large Cap Growth Fund | | The notes to the financial statements are an integral part of,
and should be read in conjunction with, the financial statements. |
Financial Highlights selected per share data and ratios
| | | | | | | | | | | | | | | | | | | | |
| | | Class I | |
| | | Year ended October 31, | |
| | | 2012 | | | 2011 | | | 2010 | | | 2009 | | | 2008 | |
Net asset value at beginning of year | | $ | 7.45 | | | $ | 6.75 | | | $ | 5.67 | | | $ | 4.79 | | | $ | 7.49 | |
| | | | | | | | | | | | | | | | | | | | |
Net investment income (loss) (a) | | | 0.00 | ‡ | | | (0.01 | ) | | | (0.01 | ) | | | 0.00 | ‡ | | | (0.01 | ) |
Net realized and unrealized gain (loss) on investments | | | 0.51 | | | | 0.71 | | | | 1.09 | | | | 0.88 | | | | (2.69 | ) |
| | | | | | | | | | | | | | | | | | | | |
Total from investment operations | | | 0.51 | | | | 0.70 | | | | 1.08 | | | | 0.88 | | | | (2.70 | ) |
| | | | | | | | | | | | | | | | | | | | |
Less distributions: | | | | | | | | | | | | | | | | | | | | |
From net realized gain on investments | | | (0.16 | ) | | | — | | | | — | | | | — | | | | — | |
| | | | | | | | | | | | | | | | | | | | |
Net asset value at end of year | | $ | 7.80 | | | $ | 7.45 | | | $ | 6.75 | | | $ | 5.67 | | | $ | 4.79 | |
| | | | | | | | | | | | | | | | | | | | |
Total investment return (b) | | | 7.15 | % | | | 10.37 | % (c) | | | 19.05 | % (c) | | | 18.37 | % | | | (36.05 | %) |
Ratios (to average net assets)/Supplemental Data: | | | | | | | | | | | | | | | | | | | | |
Net investment income (loss) | | | 0.03 | % | | | (0.09 | %) | | | (0.23 | %) | | | 0.00 | %(d) | | | (0.08 | %) |
Net expenses | | | 0.79 | % | | | 0.81 | % | | | 0.85 | % | | | 0.82 | % | | | 0.79 | % |
Expenses (before waiver/reimbursement) | | | 0.79 | % | | | 0.82 | % | | | 0.94 | % | | | 0.99 | % | | | 0.94 | % |
Portfolio turnover rate | | | 60 | % | | | 52 | % | | | 91 | % | | | 62 | % | | | 115 | % |
Net assets at end of year (in 000’s) | | $ | 11,215,464 | | | $ | 8,465,658 | | | $ | 3,497,859 | | | $ | 1,341,715 | | | $ | 761,458 | |
| ‡ | Less than one cent per share. |
| (a) | Per share data based on average shares outstanding during the year. |
| (b) | Total investment return is calculated exclusive of sales charges and assumes the reinvestment of dividends and distributions. Class I shares are not subject to sales charges. |
| (c) | Total investment returns may reflect adjustments to conform to generally accepted accounting principles. |
| (d) | Less than one-hundredth of a percent. |
| | | | | | | | | | | | | | | | | | | | |
| | | Class R1 | |
| | | Year ended October 31, | |
| | | 2012 | | | 2011 | | | 2010 | | | 2009 | | | 2008 | |
Net asset value at beginning of year | | $ | 7.38 | | | $ | 6.70 | | | $ | 5.63 | | | $ | 4.76 | | | $ | 7.45 | |
| | | | | | | | | | | | | | | | | | | | |
Net investment income (loss) (a) | | | (0.01 | ) | | | (0.02 | ) | | | (0.02 | ) | | | (0.01 | ) | | | (0.01 | ) |
Net realized and unrealized gain (loss) on investments | | | 0.51 | | | | 0.70 | | | | 1.09 | | | | 0.88 | | | | (2.68 | ) |
| | | | | | | | | | | | | | | | | | | | |
Total from investment operations | | | 0.50 | | | | 0.68 | | | | 1.07 | | | | 0.87 | | | | (2.69 | ) |
| | | | | | | | | | | | | | | | | | | | |
Less distributions: | | | | | | | | | | | | | | | | | | | | |
From net realized gain on investments | | | (0.16 | ) | | | — | | | | — | | | | — | | | | — | |
| | | | | | | | | | | | | | | | | | | | |
Net asset value at end of year | | $ | 7.72 | | | $ | 7.38 | | | $ | 6.70 | | | $ | 5.63 | | | $ | 4.76 | |
| | | | | | | | | | | | | | | | | | | | |
Total investment return (b) | | | 6.94 | % | | | 10.15 | % | | | 19.01 | % | | | 18.28 | % | | | (36.11 | %) |
Ratios (to average net assets)/Supplemental Data: | | | | | | | | | | | | | | | | | | | | |
Net investment income (loss) | | | (0.08 | %) | | | (0.21 | %) | | | (0.35 | %) | | | (0.19 | %) | | | (0.16 | %) |
Net expenses | | | 0.89 | % | | | 0.91 | % | | | 0.97 | % | | | 0.98 | % | | | 0.88 | % |
Expenses (before waiver/reimbursement) | | | 0.89 | % | | | 0.92 | % | | | 1.04 | % | | | 1.09 | % | | | 1.03 | % |
Portfolio turnover rate | | | 60 | % | | | 52 | % | | | 91 | % | | | 62 | % | | | 115 | % |
Net assets at end of year (in 000’s) | | $ | 1,950,015 | | | $ | 1,140,164 | | | $ | 418,253 | | | $ | 161,642 | | | $ | 62,344 | |
| (a) | Per share data based on average shares outstanding during the year. |
| (b) | Total investment return is calculated exclusive of sales charges and assumes the reinvestment of dividends and distributions. Class R1 shares are not subject to sales charges. |
| | | | | | |
The notes to the financial statements are an integral part of,
and should be read in conjunction with, the financial statements. | | mainstayinvestments.com | | | 19 | |
Financial Highlights selected per share data and ratios
| | | | | | | | | | | | | | | | | | | | |
| | | Class R2 | |
| | | Year ended October 31, | |
| | | 2012 | | | 2011 | | | 2010 | | | 2009 | | | 2008 | |
Net asset value at beginning of year | | $ | 7.26 | | | $ | 6.61 | | | $ | 5.57 | | | $ | 4.72 | | | $ | 7.40 | |
| | | | | | | | | | | | | | | | | | | | |
Net investment income (loss) (a) | | | (0.02 | ) | | | (0.03 | ) | | | (0.04 | ) | | | (0.02 | ) | | | (0.03 | ) |
Net realized and unrealized gain (loss) on investments | | | 0.49 | | | | 0.68 | | | | 1.08 | | | | 0.87 | | | | (2.65 | ) |
| | | | | | | | | | | | | | | | | | | | |
Total from investment operations | | | 0.47 | | | | 0.65 | | | | 1.04 | | | | 0.85 | | | | (2.68 | ) |
| | | | | | | | | | | | | | | | | | | | |
Less distributions: | | | | | | | | | | | | | | | | | | | | |
From net realized gain on investments | | | (0.16 | ) | | | — | | | | — | | | | — | | | | — | |
| | | | | | | | | | | | | | | | | | | | |
Net asset value at end of year | | $ | 7.57 | | | $ | 7.26 | | | $ | 6.61 | | | $ | 5.57 | | | $ | 4.72 | |
| | | | | | | | | | | | | | | | | | | | |
Total investment return (b) | | | 6.77 | % | | | 9.83 | % | | | 18.67 | % | | | 18.01 | % | | | (36.22 | %) |
Ratios (to average net assets)/Supplemental Data: | | | | | | | | | | | | | | | | | | | | |
Net investment income (loss) | | | (0.32 | %) | | | (0.46 | %) | | | (0.66 | %) | | | (0.45 | %) | | | (0.46 | %) |
Net expenses | | | 1.14 | % | | | 1.16 | % | | | 1.28 | % | | | 1.24 | % | | | 1.14 | % |
Expenses (before waiver/reimbursement) | | | 1.14 | % | | | 1.17 | % | | | 1.29 | % | | | 1.35 | % | | | 1.29 | % |
Portfolio turnover rate | | | 60 | % | | | 52 | % | | | 91 | % | | | 62 | % | | | 115 | % |
Net assets at end of year (in 000’s) | | $ | 854,119 | | | $ | 701,183 | | | $ | 217,002 | | | $ | 113,942 | | | $ | 35,410 | |
| (a) | Per share data based on average shares outstanding during the year. |
| (b) | Total investment return is calculated exclusive of sales charges and assumes the reinvestment of dividends and distributions. Class R2 shares are not subject to sales charges. |
| | | | | | | | | | | | | | | | | | | | |
| | | Class R3 | |
| | | Year ended October 31, | |
| | | 2012 | | | 2011 | | | 2010 | | | 2009 | | | 2008 | |
Net asset value at beginning of year | | $ | 7.16 | | | $ | 6.53 | | | $ | 5.52 | | | $ | 4.69 | | | $ | 7.37 | |
| | | | | | | | | | | | | | | | | | | | |
Net investment income (loss) (a) | | | (0.04 | ) | | | (0.05 | ) | | | (0.06 | ) | | | (0.03 | ) | | | (0.05 | ) |
Net realized and unrealized gain (loss) on investments | | | 0.49 | | | | 0.68 | | | | 1.07 | | | | 0.86 | | | | (2.63 | ) |
| | | | | | | | | | | | | | | | | | | | |
Total from investment operations | | | 0.45 | | | | 0.63 | | | | 1.01 | | | | 0.83 | | | | (2.68 | ) |
| | | | | | | | | | | | | | | | | | | | |
Less distributions: | | | | | | | | | | | | | | | | | | | | |
From net realized gain on investments | | | (0.16 | ) | | | — | | | | — | | | | — | | | | — | |
| | | | | | | | | | | | | | | | | | | | |
Net asset value at end of year | | $ | 7.45 | | | $ | 7.16 | | | $ | 6.53 | | | $ | 5.52 | | | $ | 4.69 | |
| | | | | | | | | | | | | | | | | | | | |
Total investment return (b) | | | 6.44 | % | | | 9.65 | % | | | 18.30 | % | | | 17.70 | % | | | (36.36 | %) |
Ratios (to average net assets)/Supplemental Data: | | | | | | | | | | | | | | | | | | | | |
Net investment income (loss) | | | (0.57 | %) | | | (0.70 | %) | | | (0.92 | %) | | | (0.70 | %) | | | (0.77 | %) |
Net expenses | | | 1.39 | % | | | 1.41 | % | | | 1.53 | % | | | 1.49 | % | | | 1.40 | % |
Expenses (before waiver/reimbursement) | | | 1.39 | % | | | 1.42 | % | | | 1.54 | % | | | 1.59 | % | | | 1.56 | % |
Portfolio turnover rate | | | 60 | % | | | 52 | % | | | 91 | % | | | 62 | % | | | 115 | % |
Net assets at end of year (in 000’s) | | $ | 205,329 | | | $ | 138,883 | | | $ | 49,395 | | | $ | 13,436 | | | $ | 4,689 | |
| (a) | Per share data based on average shares outstanding during the year. |
| (b) | Total investment return is calculated exclusive of sales charges and assumes the reinvestment of dividends and distributions. Class R3 shares are not subject to sales charges. |
| | | | |
| 20 | | MainStay Large Cap Growth Fund | | The notes to the financial statements are an integral part of,
and should be read in conjunction with, the financial statements. |
Notes to Financial Statements
Note 1–Organization and Business
The MainStay Funds (the “Trust”) was organized on January 9, 1986, as a Massachusetts business trust. The Trust is registered under the Investment Company Act of 1940, as amended (the “1940 Act”), as an open-end investment management company, and is comprised of twelve funds (collectively referred to as the “Funds”). These financial statements and notes relate only to the MainStay Large Cap Growth Fund (the “Fund”), a diversified fund.
The Fund currently offers eight classes of shares. Class A shares commenced operations on July 1, 1995. Class B, Class C, Class I, Class R1and Class R2 shares commenced operations on April 1, 2005. Class R3 shares commenced operations on April 28, 2006. Investor Class shares commenced operations on February 28, 2008. Investor Class and Class A shares are offered at net asset value (“NAV”) per share plus an initial sales charge. No sales charge applies to investments of $1 million or more (and certain other qualified purchases) in Investor Class and Class A shares, but a contingent deferred sales charge (“CDSC”) is imposed on certain redemptions made within one year of the date of purchase. Class B and Class C shares are offered at NAV without an initial sales charge, although a declining CDSC may be imposed on redemptions made within six years of the date of purchase of Class B shares and a 1.00% CDSC may be imposed on redemptions made within one year of the date of purchase of Class C shares. Class I, Class R1, Class R2 and Class R3 shares are offered at NAV and are not subject to a sales charge. Depending upon eligibility, Class B shares convert to either Investor Class or Class A shares at the end of the calendar quarter eight years after the date they were purchased. Additionally, depending upon eligibility, Investor Class shares may convert to Class A shares and Class A shares may convert to Investor Class shares. The eight classes of shares have the same voting (except for issues that relate solely to one class), dividend, liquidation and other rights, and the same terms and conditions, except that Class B and Class C shares are subject to higher distribution and/or service fee rates than Investor Class, Class A, Class R2 and Class R3 shares under a distribution plan pursuant to Rule 12b-1 under the 1940 Act. Class I and Class R1 shares are not subject to a distribution and/or service fee. Class R1, Class R2 and Class R3 shares are subject to a shareholder service fee. This is in addition to any fees paid under a distribution plan, where applicable.
The Fund’s investment objective is to seek long-term growth of capital.
As of January 13, 2012, the Fund is closed to new investors with certain exceptions. See the Fund’s prospectus for more information.
Note 2–Significant Accounting Policies
The Fund prepares its financial statements in accordance with generally accepted accounting principles (“GAAP”) in the United States of America and follows the significant accounting policies described below.
(A) Securities Valuation. Investments are valued as of the close of regular trading on the New York Stock Exchange (“Exchange”) (generally 4:00 p.m. Eastern time) on each day the Fund is open for business (“valuation date”).
The Board of Trustees (the “Board”) has adopted procedures for the valuation of the Fund’s securities and has delegated the responsibility
for valuation determination under those procedures to the Valuation Committee of the Fund (the “Valuation Committee”). The Board has authorized the Valuation Committee to appoint a Valuation Sub-Committee (the “Sub-Committee”) to deal in the first instance with questions that arise or cannot be resolved under these procedures. The Sub-Committee will meet (in person, via electronic mail or via teleconference) on an as-needed basis. The Valuation Committee shall meet at a later time, as necessary, to ensure that actions taken by the Sub-Committee were appropriate. The procedures recognize that, subject to the oversight of the Board and unless otherwise noted, the responsibility for day-to-day valuation of portfolio assets (including securities for which market prices are not readily available) rests with New York Life Investment Management LLC (“New York Life Investments” or the “Manager”), aided to whatever extent necessary by the Subadvisor (as defined in Note 3(A)) of the Fund. These procedures shall be reviewed by the Board no less frequently than annually. Any revisions to these procedures deemed necessary shall be reported to the Board at its next regularly scheduled meeting.
Securities are valued using unadjusted market prices, when available, as supplied primarily by third party pricing services or dealers. To assess the appropriateness of security valuations, the Manager or the Fund’s third party service provider who is subject to oversight by the Manager, regularly compares prior day prices, prices on comparable securities and the sale prices to the prior and current day prices and challenges prices exceeding certain tolerance levels with third party pricing services or broker sources. For those securities valued by recommendation, whether through a standardized fair valuation methodology or a fair valuation determination, the Valuation Committee reviews and affirms the reasonableness of the valuation based on such methodologies and determinations on a regular basis after considering all relevant information that is reasonably available.
“Fair value” is defined as the price that the Fund would receive upon selling an investment in an orderly transaction to an independent buyer in the principal or most advantageous market of the investment. Fair value measurements are determined within a framework that has established a three-tier hierarchy which maximizes the use of observable market data and minimizes the use of unobservable inputs to establish classification of fair value measurements for disclosure purposes. “Inputs” refer broadly to the assumptions that market participants would use in pricing the asset or liability, including assumptions about risk, such as the risk inherent in a particular valuation technique used to measure fair value using a pricing model and/or the risk inherent in the inputs for the valuation technique. Inputs may be observable or unobservable. Observable inputs reflect the assumptions market participants would use in pricing the asset or liability based on market data obtained from sources independent of the Fund. Unobservable inputs reflect the Fund’s own assumptions about the assumptions market participants would use in pricing the asset or liability developed based on the information available in the circumstances. The inputs or methodology used for valuing securities may not be an indication of the risks associated with investing in those securities. The three-tier hierarchy of inputs is summarized in the three broad Levels listed below.
| • | | Level 1—quoted prices in active markets for identical investments |
| • | | Level 2—other significant observable inputs (including quoted prices for similar investments in active markets, interest rates and yield curves, prepayment speeds, credit risks, etc.) |
| | | | |
| mainstayinvestments.com | | | 21 | |
Notes to Financial Statements (continued)
| • | | Level 3—significant unobservable inputs (including the Fund’s own assumptions about the assumptions that market participants would use in determining the fair value of investments) |
The aggregate value by input level, as of October 31, 2012, for the Fund’s investments is included at the end of the Fund’s Portfolio of Investments.
The valuation techniques used by the Fund to measure fair value maximize the use of observable inputs and minimize the use of unobservable inputs. The Fund may utilize third party vendor evaluations, whose prices may be derived from one or more of the following standard inputs:
| | |
• Benchmark Yields | | • Reported Trades |
• Broker Dealer Quotes | | • Issuer Spreads |
• Two-sided markets | | • Benchmark securities |
• Bids / Offers | | • Reference Data (corporate actions or material event notices) |
• Industry and economic events | | • Comparable bonds |
• Equity and credit default swap curves | | • Monthly payment information |
Securities for which market value cannot be determined using the methodologies described above are valued by methods deemed in good faith by the Fund’s Valuation Committee, following the procedures established by the Board, to represent fair value. Under these procedures, the Fund primarily employs a market-based approach which may use related or comparable assets or liabilities, recent transactions, market multiples, book values, and other relevant information. The Fund may also use an income-based valuation approach in which the anticipated future cash flows of the investment are discounted to calculate fair value. Discounts may also be applied due to the nature or duration of any restrictions on the disposition of the investments. Due to the inherent uncertainty of valuations of such investments, the fair values may differ significantly from the values that would have been used had an active market existed. For the year ended October 31, 2012, there have been no changes to the fair value methodologies.
Equity and non-equity securities which may be valued in this manner include, but are not limited to: (i) a security for which the trading has been halted or suspended; (ii) a debt security that has recently gone into default and for which there is not a current market quotation; (iii) a security of an issuer that has entered into a restructuring; (iv) a security that has been de-listed from a national exchange; (v) a security for which the market price is not available from a third party pricing source or, if so provided, does not, in the opinion of the Fund’s Manager or Subadvisor reflect the security’s market value; and (vi) a security whose principal market has been temporarily closed at a time when, under normal conditions, it would be open. Securities for which market quotations or observable inputs are not readily available are generally categorized as Level 3 in the hierarchy. As of October 31, 2012, the Fund did not hold any securities that were fair valued in such a manner.
Certain events may occur between the time that foreign markets close, on which securities held by the Fund principally trade, and the time at which the Fund’s NAV is calculated. These events may include, but are not limited to, situations relating to a single issuer in a market sector, significant fluctuations in U.S. or foreign markets, natural disasters,
armed conflicts, governmental actions or other developments not tied directly to the securities markets. Should the Manager or Subadvisor conclude that such events may have affected the accuracy of the last price of such securities reported on the local foreign market, the Manager or Subadvisor may, pursuant to procedures adopted by the Fund’s Board, adjust the value of the local price to reflect the impact on the price of such securities as a result of such events. In this instance, securities are generally categorized as Level 3 in the hierarchy. Additionally, foreign equity securities are also fair valued whenever the movement of a particular index exceeds certain thresholds. In such cases, the securities are fair valued by applying factors provided by a third party vendor in accordance with the Fund’s policies and procedures and are generally categorized as Level 2 in the hierarchy. As of October 31, 2012, the Fund did not hold any foreign equity securities.
Equity securities and Exchange Traded Funds are valued at the latest quoted sales prices as of the close of regular trading on the Exchange on each valuation date. Securities that are not traded on the valuation date are valued at the mean of the latest quoted bid and ask prices. Prices normally are taken from the principal market in which each security trades. Investments in other mutual funds are valued at their respective NAV as of the close of the Exchange on the valuation date. These securities are generally categorized as Level 1 in the hierarchy.
Temporary cash investments acquired over 60 days to maturity are valued using the latest bid prices or using valuations based on a matrix system (which considers such factors as security prices, yields, maturities, and ratings), both as furnished by independent pricing services. Other temporary cash investments which mature in 60 days or less (“Short-Term Investments”) are valued at amortized cost. The amortized cost method involves valuing a security at its cost on the date of purchase and thereafter assuming a constant amortization to maturity of the difference between such cost and the value on maturity date. Amortized cost approximates the current fair value of a security. Securities valued at amortized cost are not valued using a quoted price in an active market. These securities are generally categorized as Level 2 in the hierarchy.
(B) Income Taxes. The Fund’s policy is to comply with the requirements of the Internal Revenue Code of 1986, as amended (the “Internal Revenue Code”), applicable to regulated investment companies and to distribute all of the taxable income to the shareholders of the Fund within the allowable time limits. Therefore, no federal, state and local income tax provision is required.
Management evaluates its tax positions to determine if the tax positions taken meet the minimum recognition threshold in connection with accounting for uncertainties in income tax positions taken or expected to be taken for the purposes of measuring and recognizing tax liabilities in the financial statements. Recognition of tax benefits of an uncertain tax position is required only when the position is “more likely than not” to be sustained assuming examination by taxing authorities. Management has analyzed the Fund’s tax positions taken on federal, state and local income tax returns for all open tax years (for up to three tax years), and has concluded that no provision for federal, state and local income tax are required in the Fund’s financial statements. The Fund’s federal, state and local income and federal excise tax returns for tax years for which the applicable statutes of limitations have not expired are subject to examination by the Internal Revenue Service and state and local departments of revenue.
| | |
| 22 | | MainStay Large Cap Growth Fund |
(C) Dividends and Distributions to Shareholders. Dividends and distributions are recorded on the ex-dividend date. The Fund intends to declare and pay dividends of net investment income and distributions of net realized capital and currency gains, if any, at least annually. Unless the shareholder elects otherwise, all dividends and distributions are reinvested in the same class of shares of the Fund, at NAV. Dividends and distributions to shareholders are determined in accordance with federal income tax regulations and may differ from GAAP.
(D) Security Transactions and Investment Income. The Fund records security transactions on the trade date. Realized gains and losses on security transactions are determined using the identified cost method. Dividend income is recognized on the ex-dividend date and interest income is accrued as earned using the effective interest rate method. Discounts and premiums on Short-Term Investments are accreted and amortized, respectively, on the straight-line method.
Investment income and realized and unrealized gains and losses on investments of the Fund are allocated to separate classes of shares pro rata based upon their relative net assets on the date the income is earned or realized and unrealized gains and losses are incurred.
(E) Expenses. Expenses of the Trust are allocated to the individual Funds in proportion to the net assets of the respective Funds when the expenses are incurred, except where direct allocations of expenses can be made. Expenses (other than transfer agent expenses and fees incurred under the shareholder services plans and the distribution plans further discussed in Note 3(B)) are allocated to separate classes of shares pro rata based upon their relative net assets on the date the expenses are incurred. The expenses borne by the Fund, including those of related parties to the Fund, are shown in the Statement of Operations.
(F) Use of Estimates. In preparing financial statements in conformity with GAAP, management makes estimates and assumptions that affect the reported amounts and disclosures in the financial statements. Actual results could differ from those estimates.
(G) Repurchase Agreements. The Fund may enter into repurchase agreements to earn income. The Fund may enter into repurchase agreements only with financial institutions that are deemed by the Manager or Subadvisor to be creditworthy, pursuant to guidelines established by the Fund’s Board. During the term of any repurchase agreement, the Manager will continue to monitor the creditworthiness of the seller. Under the 1940 Act, repurchase agreements are considered to be collateralized loans by a Fund to the seller secured by the securities transferred to the Fund.
When the Fund invests in repurchase agreements, the Fund’s custodian takes possession of the collateral pledged for investments in the repurchase agreement. The underlying collateral is valued daily on a mark-to-market basis to determine that the value, including accrued interest, exceeds the repurchase price. In the event of the seller’s default on the obligation to repurchase, the Fund has the right to liquidate the collateral and apply the proceeds in satisfaction of the obligation. Under certain circumstances, such as in the event of default or bankruptcy by the counterparty to the agreement, realization and/or retention of the collateral may be subject to legal proceedings and possible realized loss to the Fund.
(H) Securities Lending. In order to realize additional income, the Fund may engage in securities lending, subject to the limitations set forth in the 1940 Act, and relevant guidance by the staff of the Securities and Exchange Commission. In the event the Fund does engage in securities lending, the Fund will lend through its custodian, State Street Bank and Trust Company (“State Street”). State Street will manage the Fund’s cash collateral in accordance with the Lending Agreement between the Fund and State Street, and indemnify the Fund’s portfolio against counterparty risk. The loans will be collateralized by cash or securities at least equal at all times to the market value of the securities loaned. Collateral will consist of U.S. government securities, cash equivalents or irrevocable letters of credit. The Fund may bear the risk of delay in recovery of, or loss of rights in, the securities loaned should the borrower of the securities experience financial difficulty. The Fund may also record realized gain or loss on securities deemed sold due to a borrower’s inability to return securities on loan. The Fund will receive compensation for lending its securities in the form of fees or the retention of a portion of the interest on the investment of any cash received as collateral. The Fund also will continue to receive interest and dividends on the securities loaned and any gain or loss in the market price of the securities loaned that may occur during the term of the loan will be for the account of the Fund.
Although the Fund and New York Life Investments have temporarily suspended securities lending, the Fund and New York Life Investments reserve the right to reinstitute lending when deemed appropriate. The Fund had no portfolio securities on loan as of October 31, 2012.
(I) Indemnifications. Under the Trust’s organizational documents, its officers and trustees are indemnified against certain liabilities that may arise out of performance of their duties to the Trust. Additionally, in the normal course of business, the Fund enters into contracts with third-party service providers that contain a variety of representations and warranties and which may provide general indemnifications. The Fund’s maximum exposure under these arrangements is unknown, as this would involve future claims that may be made against the Fund that have not yet occurred. Based on experience, management is of the view that the risk of loss in connection with these potential indemnification obligations is remote. However, there can be no assurance that material liabilities related to such obligations will not arise in the future, which could adversely impact the Fund.
Note 3–Fees and Related Party Transactions
(A) Manager and Subadvisor. New York Life Investments, a registered investment adviser and an indirect, wholly-owned subsidiary of New York Life Insurance Company (“New York Life”), serves as the Fund’s Manager, pursuant to an Amended and Restated Management Agreement (“Management Agreement”). The Manager provides offices, conducts clerical, recordkeeping and bookkeeping services, and keeps most of the financial and accounting records required to be maintained by the Fund. Except for the portion of salaries and expenses that are the responsibility of the Fund, the Manager pays the salaries and expenses of all personnel affiliated with the Fund and certain operational expenses of the Fund. The Fund reimburses New York Life Investments in an amount equal to a portion of the salary of the Chief Compliance Officer (“CCO”) of the Fund. Winslow Capital Management, Inc. (“Winslow” or “Subadvisor”), a registered investment adviser, serves as Subadvisor to
| | | | |
| mainstayinvestments.com | | | 23 | |
Notes to Financial Statements (continued)
the Fund and is responsible for the day-to-day portfolio management of the Fund. Pursuant to the terms of an Amended and Restated Subadvisory Agreement (“Subadvisory Agreement”) between New York Life Investments and Winslow, New York Life Investments pays for the services of the Subadvisor.
The management fee is an annual percentage of the Fund’s average daily net assets, plus a fee for fund accounting services previously provided by New York Life Investments under a separate fund accounting agreement furnished at an annual rate of the Fund’s average daily net assets as follows: 0.05% up to $20 million; 0.0333% from $20 million to $100 million; and 0.01% in excess of $100 million. New York Life Investments has contractually agreed to waive a portion of its management fee, so that the management fee does not exceed 0.75% up to $500 million. All other management fee breakpoints remain the same. Without this fee waiver, the actual fee would be 0.80% up to $250 million; 0.75% from $250 million to $500 million; 0.725% from $500 million to $750 million; 0.70% from $750 million to $2 billion; 0.65% from $2 billion to $3 billion; 0.60% from $3 billion to $7 billion; 0.575% from $7 billion to $9 billion; and 0.565% in excess of $9 billion. This agreement will remain in effect until February 28, 2013, and shall renew automatically for one-year terms unless New York Life Investments provides written notice of termination prior to the start of the next term or upon approval of the Board.
New York Life Investments has voluntarily agreed to waive a portion of its management fee so that it does not exceed the following percentages of the Fund’s average daily net assets: 0.72% up to $500 million; 0.70% from $500 million to $2 billion. All other management fee breakpoints remain the same. This voluntary waiver may be discontinued at any time.
New York Life Investments has contractually agreed to waive fees and/or reimburse expenses of Class I shares so that Total Annual Fund Operating Expenses of Class I Shares do not exceed 0.88% of the Fund’s average daily net assets. This agreement will remain in effect until February 28, 2013, and shall renew automatically for one-year terms unless New York Life Investments provides written notice of termination prior to the start of the next term or upon approval of the Board.
Additionally, New York Life Investments has agreed to further voluntarily waive fees and/or reimburse the expenses of Class R1 shares so that Total Annual Fund Operating Expenses do not exceed 0.95% of the Fund’s average daily net assets. This voluntary waiver may be discontinued at any time. Total Annual Fund Operating Expenses excludes taxes, interest, litigation, extraordinary expenses, brokerage and other transaction expenses relating to the purchase or sale of portfolio investments, and acquired (underlying) fund fees and expenses.
The effective management fee rate (exclusive of any applicable waivers/reimbursements) was 0.61% for the year ended October 31, 2012, inclusive of a fee for fund accounting services of 0.01% of the Fund’s average daily net assets.
For the year ended October 31, 2012, New York Life Investments earned fees from the Fund in the amount of $98,732,081 and waived its fees and/or reimbursed expenses in the amount of $337,499.
State Street, 1 Lincoln Street, Boston, Massachusetts 02111, provides sub-administration and sub-accounting services to the Fund pursuant to
an agreement with New York Life Investments. These services include calculating the daily NAVs of the Fund, maintaining the general ledger and sub-ledger accounts for the calculation of the Fund’s respective NAVs, and assisting New York Life Investments in conducting various aspects of the Fund’s administrative operations. For providing these services to the Fund, State Street is compensated by New York Life Investments.
(B) Distribution, Service and Shareholder Service Fees. The Trust, on behalf of the Fund, has entered into a distribution agreement with NYLIFE Distributors LLC (the “Distributor”), an indirect, wholly-owned subsidiary of New York Life. The Fund has adopted distribution plans (the “Plans”) in accordance with the provisions of Rule 12b-1 under the 1940 Act.
Pursuant to the Investor Class, Class A and Class R2 Plans, the Distributor receives a monthly distribution fee from the Investor Class, Class A and Class R2 shares, at an annual rate of 0.25% of the average daily net assets of the Investor Class, Class A and Class R2 shares for distribution and/or service activities as designated by the Distributor. Pursuant to the Class B and Class C Plans, Class B and Class C shares pay the Distributor a monthly distribution fee at an annual rate of 0.75% of the average daily net assets of the Class B and Class C shares, along with a service fee at an annual rate of 0.25% of the average daily net assets of the Class B and Class C shares, for a total 12b-1 fee of 1.00%. Pursuant to the Class R3 Plan, the Distributor receives a monthly distribution and/or service fee from the Class R3 shares at an annual rate of 0.50% of the average daily net assets of the Class R3 shares. Class I and Class R1 shares are not subject to a distribution and/or service fee.
The Plans provide that the distribution and service fees are payable to the Distributor regardless of the amounts actually expended by the Distributor for distribution of the Fund’s shares and service activities.
In accordance with the Shareholder Services Plans for the Class R1, Class R2 and Class R3 shares, the Manager has agreed to provide, through its affiliates or independent third parties, various shareholder and administrative support services to shareholders of the Class R1, Class R2 and Class R3 shares. For its services, the Manager is entitled to a Shareholder Service Fee accrued daily and paid monthly at an annual rate of 0.10% of the average daily net assets of the Class R1, Class R2 and Class R3 shares. This is in addition to any fees paid under a distribution plan, where applicable.
Shareholder Service Fees incurred by the Fund for the year ended October 31, 2012, were as follows:
| | | | |
Class R1 | | $ | 1,800,648 | |
Class R2 | | | 899,188 | |
Class R3 | | | 201,114 | |
(C) Sales Charges. The Fund was advised by the Distributor that the amount of sales charges retained on sales of Investor Class and Class A shares were $23,124 and $78,026, respectively, for the year ended October 31, 2012. The Fund was also advised that the Distributor retained CDSCs on redemptions of Investor Class, Class A, Class B and Class C shares of $8, $9,539, $86,320 and $71,955, respectively, for the year ended October 31, 2012.
| | |
| 24 | | MainStay Large Cap Growth Fund |
(D) Transfer, Dividend Disbursing and Shareholder Servicing Agent. NYLIM Service Company LLC, an affiliate of New York Life Investments, is the Fund’s transfer, dividend disbursing and shareholder servicing agent pursuant to an agreement between NYLIM Service Company LLC and the Trust. NYLIM Service Company LLC has entered into an agreement with Boston Financial Data Services, Inc. (“BFDS”) pursuant to which BFDS performs certain transfer agent services on behalf of NYLIM Service Company LLC. Transfer agent expenses incurred by the Fund for the year ended October 31, 2012, were as follows:
| | | | |
Investor Class | | $ | 401,247 | |
Class A | | | 2,758,292 | |
Class B | | | 141,308 | |
Class C | | | 845,669 | |
Class I | | | 17,204,345 | |
Class R1 | | | 2,854,357 | |
Class R2 | | | 1,421,750 | |
Class R3 | | | 318,382 | |
(E) Small Account Fee. Shareholders with small accounts adversely impact the cost of providing transfer agency services. In an effort to reduce total transfer agency expenses, the Fund has implemented a small account fee on certain types of accounts. Certain shareholders with an account balance of less than $1,000 are charged an annual per account fee of $20 (assessed semi-annually), the proceeds from which offset transfer agent fees as reflected in the Statement of Operations.
(F) Capital. As of October 31, 2012, New York Life and its affiliates beneficially held shares of the Fund with the following values and percentages of net assets as follows:
| | | | | | | | |
Class C | | $ | 3,286 | | | | 0.0 | %‡ |
Class I | | | 6,054 | | | | 0.0 | ‡ |
| ‡ | Less than one-tenth of a percent. |
Note 4–Federal Income Tax
As of October 31, 2012, the components of accumulated gain (loss) on a tax basis were as follows:
| | | | | | | | | | | | | | | | |
Ordinary
Income | | Accumulated
Capital and
Other Gain
(Loss) | | | Other
Temporary
Differences | | | Unrealized
Appreciation
(Depreciation) | | | Total
Accumulated Gain (Loss) | |
$— | | $ | (517,122,575 | ) | | $ | (11,181,745 | ) | | $ | 2,636,141,821 | | | $ | 2,107,837,501 | |
The difference between book basis and tax basis unrealized appreciation (depreciation) is primarily due to wash sale adjustments. The other temporary differences are primarily due to qualified late-year losses. The Fund intends to elect to defer qualified late-year losses of $11,181,745, incurred from January 1, 2012 through October 31, 2012 and treat them as arising on the first day of the tax year ended October 31, 2013.
The following table discloses the current year reclassifications between undistributed net investment income (loss), accumulated net realized
gain (loss) on investments, and additional paid-in capital arising from permanent differences; net assets as of October 31, 2012 were not affected.
| | | | |
Undistributed
Net Investment
Income (Loss) | | Accumulated Net
Realized
Gain (Loss) on
Investments | | Additional
Paid-In
Capital |
$ — | | $15,996 | | $(15,996) |
The reclassifications for the Fund are primarily due to taxable overdistribution.
Under the Regulated Investment Company Modernization Act of 2010, the Fund is permitted to carry forward capital losses incurred in taxable years beginning after December 22, 2010, for an unlimited period. However, any losses incurred during those future years will be required to be utilized prior to the losses incurred in pre-enactment tax years. As a result of this ordering rule, pre-enactment capital loss carryforwards may be more likely to expire unused. Additionally, post-enactment capital losses that are carried forward will retain their character as either short-term or long-term capital losses rather than being considered all short-term as under previous law.
As of October 31, 2012, for federal income tax purposes, capital loss carryforwards of $517,122,575 were available as shown in the table below, to the extent provided by the regulations to offset future realized gains of the Fund through the years indicated. To the extent that these capital loss carryforwards are used to offset future capital gains, it is probable that the capital gains so offset will not be distributed to shareholders. No capital gain distributions shall be made until any capital loss carryforwards have been fully utilized or expired.
| | | | | | | | |
Capital Loss
Available Through | | Short-Term Capital Loss
Amounts (000’s) | | | Long-Term Capital Loss
Amounts (000’s) | |
2016 | | $ | 16,533 | | | $ | — | |
Unlimited | | | 500,590 | | | | — | |
Total | | $ | 517,123 | | | $ | — | |
The tax character of distributions paid during the years ended October 31, 2012 and October 31, 2011 shown in the Statements of Changes In Net Assets was as follows:
| | | | | | | | |
| | | 2012 | | | 2011 | |
Distributions paid from: | | | | | | | | |
Long Term Capital Gains | | $ | 299,322,502 | | | $ | — | |
Total | | $ | 299,322,502 | | | $ | — | |
Note 5–Custodian
State Street is the custodian of the cash and the securities of the Fund. Custodial fees are charged to the Fund based on the market value of securities in the Fund and the number of certain cash transactions incurred by the Fund.
Note 6–Line of Credit
The Fund and certain affiliated funds maintain a line of credit with a syndicate of banks in order to secure a source of funds for temporary purposes to meet unanticipated or excessive redemption requests.
Effective August 29, 2012, under an amended credit agreement, the aggregate commitment amount is $200,000,000 with an optional
| | | | |
| mainstayinvestments.com | | | 25 | |
Notes to Financial Statements (continued)
maximum amount of $250,000,000. The commitment fee is an annual rate of 0.08% of the average commitment amount payable quarterly, regardless of usage, to Bank of New York Mellon, which serves as the agent to the syndicate. The commitment fee is allocated among certain MainStay Funds based upon net assets and other factors. Interest on any revolving credit loan is charged based upon the Federal Funds Advances rate or the one month London InterBank Offered Rate, whichever is higher. The amended credit agreement expires on August 28, 2013, although the MainStay Funds and the syndicate of banks may renew the amended credit agreement for an additional year on the same or different terms. Prior to August 29, 2012, the aggregate commitment amount was $125,000,000 with an optional maximum amount of
$175,000,000. There were no borrowings made or outstanding with respect to the Fund on the amended credit agreement during the year ended October 31, 2012.
Note 7–Purchases and Sales of Securities (in 000’s)
During the year ended October 31, 2012, purchases and sales of securities, other than short-term securities, were $11,954,339 and $9,404,365, respectively.
Note 8–Capital Share Transactions
| | | | | | | | |
Investor Class | | Shares | | | Amount | |
Year ended October 31, 2012: | | | | | | | | |
Shares sold | | | 12,391,068 | | | $ | 90,243,593 | |
Shares issued to shareholders in reinvestment of distributions | | | 446,324 | | | | 3,124,635 | |
Shares redeemed | | | (4,719,951 | ) | | | (35,519,415 | ) |
| | | | | | | | |
Net increase (decrease) in shares outstanding before conversion | | | 8,117,441 | | | | 57,848,813 | |
Shares converted into Investor Class (See Note 1) | | | 1,269,652 | | | | 9,384,061 | |
Shares converted from Investor Class (See Note 1) | | | (958,935 | ) | | | (7,360,703 | ) |
| | | | | | | | |
Net increase (decrease) | | | 8,428,158 | | | $ | 59,872,171 | |
| | | | | | | | |
Year ended October 31, 2011: | | | | | | | | |
Shares sold | | | 5,702,548 | | | $ | 38,655,882 | |
Shares redeemed | | | (2,740,989 | ) | | | (19,713,173 | ) |
| | | | | | | | |
Net increase (decrease) in shares outstanding before conversion | | | 2,961,559 | | | | 18,942,709 | |
Shares converted into Investor Class (See Note 1) | | | 1,460,380 | | | | 10,264,041 | |
Shares converted from Investor Class (See Note 1) | | | (669,598 | ) | | | (4,747,092 | ) |
| | | | | | | | |
Net increase (decrease) | | | 3,752,341 | | | $ | 24,459,658 | |
| | | | | | | | |
| | |
| | | | | | | | |
| | | | | | | | |
Class A | | Shares | | | Amount | |
Year ended October 31, 2012: | | | | | | | | |
Shares sold | | | 67,808,598 | | | $ | 498,104,060 | |
Shares issued to shareholders in reinvestment of distributions | | | 5,344,897 | | | | 37,575,729 | |
Shares redeemed | | | (121,882,365 | ) | | | (888,467,676 | ) |
| | | | | | | | |
Net increase (decrease) in shares outstanding before conversion | | | (48,728,870 | ) | | | (352,787,887 | ) |
Shares converted into Class A (See Note 1) | | | 1,370,838 | | | | 10,461,371 | |
Shares converted from Class A (See Note 1) | | | (62,777 | ) | | | (500,454 | ) |
| | | | | | | | |
Net increase (decrease) | | | (47,420,809 | ) | | $ | (342,826,970 | ) |
| | | | | | | | |
Year ended October 31, 2011: | | | | | | | | |
Shares sold | | | 181,470,698 | | | $ | 1,311,688,729 | |
Shares redeemed | | | (93,840,875 | ) | | | (659,903,255 | ) |
| | | | | | | | |
Net increase (decrease) in shares outstanding before conversion | | | 87,629,823 | | | | 651,785,474 | |
Shares converted into Class A (See Note 1) | | | 1,256,201 | | | | 8,956,912 | |
Shares converted from Class A (See Note 1) | | | (304,197 | ) | | | (2,072,144 | ) |
| | | | | | | | |
Net increase (decrease) | | | 88,581,827 | | | $ | 658,670,242 | |
| | | | | | | | |
| | |
| | | | | | | | |
Class B | | Shares | | | Amount | |
Year ended October 31, 2012: | | | | | | | | |
Shares sold | | | 713,830 | | | $ | 4,976,197 | |
Shares issued to shareholders in reinvestment of distributions | | | 219,228 | | | | 1,457,422 | |
Shares redeemed | | | (1,567,164 | ) | | | (11,124,541 | ) |
| | | | | | | | |
Net increase (decrease) in shares outstanding before conversion | | | (634,106 | ) | | | (4,690,922 | ) |
Shares converted from Class B (See Note 1) | | | (1,715,464 | ) | | | (11,984,275 | ) |
| | | | | | | | |
Net increase (decrease) | | | (2,349,570 | ) | | $ | (16,675,197 | ) |
| | | | | | | | |
Year ended October 31, 2011: | | | | | | | | |
Shares sold | | | 1,359,085 | | | $ | 9,347,566 | |
Shares redeemed | | | (2,095,004 | ) | | | (14,349,392 | ) |
| | | | | | | | |
Net increase (decrease) in shares outstanding before conversion | | | (735,919 | ) | | | (5,001,826 | ) |
Shares converted from Class B (See Note 1) | | | (1,827,164 | ) | | | (12,401,717 | ) |
| | | | | | | | |
Net increase (decrease) | | | (2,563,083 | ) | | $ | (17,403,543 | ) |
| | | | | | | | |
| | |
| | | | | | | | |
Class C | | Shares | | | Amount | |
Year ended October 31, 2012: | | | | | | | | |
Shares sold | | | 7,495,431 | | | $ | 50,953,860 | |
Shares issued to shareholders in reinvestment of distributions | | | 464,352 | | | | 3,082,334 | |
Shares redeemed | | | (10,440,443 | ) | | | (73,636,254 | ) |
| | | | | | | | |
Net increase (decrease) | | | (2,480,660 | ) | | $ | (19,600,060 | ) |
| | | | | | | | |
Year ended October 31, 2011: | | | | | | | | |
Shares sold | | | 22,562,736 | | | $ | 155,503,002 | |
Shares redeemed | | | (8,952,657 | ) | | | (60,971,444 | ) |
| | | | | | | | |
Net increase (decrease) | | | 13,610,079 | | | $ | 94,531,558 | |
| | | | | | | | |
| | |
| | | | | | | | |
| | |
| 26 | | MainStay Large Cap Growth Fund |
| | | | | | | | |
Class I | | Shares | | | Amount | |
Year ended October 31, 2012: | | | | | | | | |
Shares sold | | | 654,647,732 | | | $ | 4,998,865,969 | |
Shares issued to shareholders in reinvestment of distributions | | | 17,729,231 | | | | 128,359,572 | |
Shares redeemed | | | (370,957,702 | ) | | | (2,894,036,604 | ) |
| | | | | | | | |
Net increase (decrease) | | | 301,419,261 | | | $ | 2,233,188,937 | |
| | | | | | | | |
Year ended October 31, 2011: | | | | | | | | |
Shares sold | | | 861,822,014 | | | $ | 6,398,461,657 | |
Shares redeemed (a) | | | (243,882,757 | ) | | | (1,761,683,149 | ) |
| | | | | | | | |
Net increase (decrease) | | | 617,939,257 | | | $ | 4,636,778,508 | |
| | | | | | | | |
| | |
| | | | | | | | |
Class R1 | | Shares | | | Amount | |
Year ended October 31, 2012: | | | | | | | | |
Shares sold | | | 137,395,385 | | | $ | 1,040,318,139 | |
Shares issued to shareholders in reinvestment of distributions | | | 4,141,499 | | | | 29,694,545 | |
Shares redeemed | | | (43,352,568 | ) | | | (331,070,740 | ) |
| | | | | | | | |
Net increase (decrease) | | | 98,184,316 | | | $ | 738,941,944 | |
| | | | | | | | |
Year ended October 31, 2011: | | | | | | | | |
Shares sold | | | 108,232,421 | | | $ | 792,700,960 | |
Shares redeemed | | | (16,214,633 | ) | | | (118,246,931 | ) |
| | | | | | | | |
Net increase (decrease) | | | 92,017,788 | | | $ | 674,454,029 | |
| | | | | | | | |
| | |
| | | | | | | | |
Class R2 | | Shares | | | Amount | |
Year ended October 31, 2012: | | | | | | | | |
Shares sold | | | 61,660,981 | | | $ | 458,857,617 | |
Shares issued to shareholders in reinvestment of distributions | | | 1,649,907 | | | | 11,631,846 | |
Shares redeemed | | | (47,072,369 | ) | | | (355,480,673 | ) |
| | | | |
Net increase (decrease) | | | 16,238,519 | | | $ | 115,008,790 | |
| | | | |
Year ended October 31, 2011: | | | | | | | | |
Shares sold | | | 75,569,737 | | | $ | 533,861,744 | |
Shares redeemed | | | (11,888,901 | ) | | | (85,483,044 | ) |
| | | | | | | | |
Net increase (decrease) | | | 63,680,836 | | | $ | 448,378,700 | |
| | | | | | | | |
| | |
| | | | | | | | |
| | | | | | | | |
Class R3 | | Shares | | | Amount | |
Year ended October 31, 2012: | | | | | | | | |
Shares sold | | | 15,178,283 | | | $ | 110,435,755 | |
Shares issued to shareholders in reinvestment of distributions | | | 465,969 | | | | 3,238,488 | |
Shares redeemed | | | (7,463,724 | ) | | | (55,396,376 | ) |
| | | | | | | | |
Net increase (decrease) | | | 8,180,528 | | | $ | 58,277,867 | |
| | | | | | | | |
Year ended October 31, 2011: | | | | | | | | |
Shares sold | | | 15,129,955 | | | $ | 107,507,993 | |
Shares redeemed | | | (3,303,505 | ) | | | (23,660,855 | ) |
| | | | | | | | |
Net increase (decrease) | | | 11,826,450 | | | $ | 83,847,138 | |
| | | | | | | | |
| (a) | Includes the redemption of 13,112,802 shares through an in-kind transfer of securities in the amount of $90,171,285. (See Note 9) |
Note 9–In-Kind Transfer of Securities
During the year ended October 31, 2011, the Fund redeemed shares of beneficial interest in exchange for securities. The securities were transferred at their current value on the date of the transaction.
| | | | | | |
Transaction Date | | Shares | | Redeemed Value | | Gain (Loss) |
9/14/11 | | 13,112,802 | | $90,171,285 | | $20,175,242 |
Note 10–Subsequent Events
In connection with the preparation of the financial statements of the Fund as of and for the year ended October 31, 2012, events and transactions subsequent to October 31, 2012 through the date the financial statements were issued have been evaluated by the Fund’s management for possible adjustment and/or disclosure. No subsequent events requiring financial statement adjustment or disclosure have been identified.
| | | | |
| mainstayinvestments.com | | | 27 | |
Report of Independent Registered Public Accounting Firm
The Board of Trustees and Shareholders of
The MainStay Funds:
We have audited the accompanying statement of assets and liabilities, including the portfolio of investments, of the MainStay Large Cap Growth Fund (the “Fund”), one of the funds constituting The MainStay Funds, as of October 31, 2012, and the related statement of operations for the year then ended, the statements of changes in net assets for each of the years in the two-year period then ended, and the financial highlights for each of the years or periods in the five-year period then ended. These financial statements and financial highlights are the responsibility of the Fund’s management. Our responsibility is to express an opinion on these financial statements and financial highlights based on our audits.
We conducted our audits in accordance with the standards of the Public Company Accounting Oversight Board (United States). Those standards require that we plan and perform the audit to obtain reasonable assurance about whether the financial statements and financial highlights are free of material misstatement. An audit includes examining, on a test basis, evidence supporting the amounts and disclosures in the financial statements. Our procedures included confirmation of securities owned as of October 31, 2012, by correspondence with the custodian and brokers or by other appropriate auditing procedures where replies from brokers were not received. An audit also includes assessing the accounting principles used and significant estimates made by management, as well as evaluating the overall financial statement presentation. We believe that our audits provide a reasonable basis for our opinion.
In our opinion, the financial statements and financial highlights referred to above present fairly, in all material respects, the financial position of the MainStay Large Cap Growth Fund of The MainStay Funds as of October 31, 2012, and the results of its operations for the year then ended, the changes in its net assets for each of the years in the two-year period then ended, and the financial highlights for each of the years or periods in the five-year period then ended, in conformity with U.S. generally accepted accounting principles.

Philadelphia, Pennsylvania
December 21, 2012
| | |
| 28 | | MainStay Large Cap Growth Fund |
Federal Income Tax Information
(Unaudited)
The Fund is required under the Internal Revenue Code to advise share-holders in a written statement as to the federal tax status of dividends paid by the Fund during such fiscal years. Accordingly, the Fund paid $299,322,502 as long-term capital distributions.
In February 2013, shareholders will receive an IRS Form 1099-DIV or substitute Form 1099 which will show the federal tax status of the distributions received by shareholders in calendar year 2012. The amounts that will be reported on such 1099-DIV or substitute Form 1099 will be the amounts you are to use on your federal income tax return.
Proxy Voting Policies and Procedures and Proxy Voting Record
A description of the policies and procedures that New York Life Investments uses to vote proxies related to the Fund’s securities is available without charge, upon request, (i) by visiting the Fund’s website at mainstayinvestments.com; or (ii) on the SEC’s website at www.sec.gov.
The Fund is required to file with the SEC its proxy voting record for the 12-month period ending June 30 on Form N-PX. The Fund’s most recent Form N-PX is available free of charge upon request (i) by calling 800-MAINSTAY (624-6782); (ii) by visiting the Fund’s website at mainstayinvestments.com; or (iii) on the SEC’s website at www.sec.gov.
Shareholder Reports and Quarterly Portfolio Disclosure
The Fund is required to file its complete schedule of portfolio holdings with the SEC for its first and third fiscal quarters on Form N-Q. The Fund’s Form N-Q is available without charge, on the SEC’s website at www.sec.gov or by calling MainStay Investments at 800-MAINSTAY (624-6782). You also can obtain and review copies of Form N-Q by visiting the SEC’s Public Reference Room in Washington, DC (information on the operation of the Public Reference Room may be obtained by calling 1-800-SEC-0330).
| | | | |
| mainstayinvestments.com | | | 29 | |
| | |
| 30 | | MainStay Large Cap Growth Fund |
Board Members and Officers (Unaudited)
The Board Members oversee the MainStay Group of Funds (which is comprised of Funds that are series of The MainStay Funds, Eclipse Trust, Eclipse Funds Inc., MainStay Funds Trust, MainStay VP Funds Trust, Private Advisors Alternative Strategies Master Fund, Private Advisors Alternative Strategies Fund, and MainStay Defined Term Municipal Opportunities Fund) (collectively, the “Fund Complex”), the Manager and, when applicable, the Subadvisor(s) and other service providers to the Fund Complex. Each Board Member serves until his or her successor is elected and qualified or until his or her resignation, death or removal. The Retirement Policy provides that a Board Member
shall tender his or her resignation by the end of the calendar year during which he or she reaches the age of 75.
Officers serve a term of one year and are elected annually by the Board Members. The business address of each Board Member and officer listed below is 51 Madison Avenue, New York, New York 10010.
The Statement of Additional Information applicable to the Fund includes additional information about the Board Members and is available without charge, upon request, by calling 800-MAINSTAY (624-6782) or by going online to mainstayinvestments.com.
| | | | | | | | | | | | |
| | | | | Name and
Date of Birth | | Term of Office,
Position(s) Held
with the Fund
Complex and
Length of Service | | Principal Occupation(s)
During Past Five Years | | Number of
Funds in
Fund Complex
Overseen by
Board Member | | Other Directorships
Held by Board Member |
| Interested Board Member* | | | | John Y. Kim
9/24/60 | | Indefinite;
Eclipse Trust: Trustee since 2008;
Eclipse Funds Inc.:
Director since 2008 (1 fund);
The MainStay Funds: Trustee since 2008 (12 funds);
MainStay Funds Trust: Trustee since 2009 (31 funds); and
MainStay VP Funds Trust: Trustee since 2011 and its predecessor, MainStay VP Series Fund, Inc. since 2008 (28 portfolios). Private Advisors Alternative Strategies Master Fund: Trustee since 2011
Private Advisors Alternative Strategies Fund: Trustee since 2011
MainStay DefinedTerm Municipal Opportunities Fund: Trustee since 2011 | | Member of the Board of Managers, President and Chief Executive Officer (since 2008), New York Life Investment Management LLC and New York Life Investment Management Holdings LLC; Member of the Board, MacKay Shields LLC since 2008; Chairman of the Board, Institutional Capital LLC, Madison Capital Funding LLC, Madison Square Investors LLC and McMorgan & Company LLC; Chairman of the Board, NYLIFE Distributors LLC and Chairman of the Board, NYLCAP Manager LLC (since 2008) President, Prudential Retirement, a business unit of Prudential Financial, Inc. (2002 to 2007) | | 75 | | None |
| | * | This Board Member is considered to be an “interested person” of the MainStay Group of Funds within the meaning of the 1940 Act because of his affiliation with New York Life Insurance Company, New York Life Investment Management LLC, Madison Square Investors LLC, MacKay Shields LLC, Private Advisors LLC, Institutional Capital LLC, NYLIFE Securities LLC and/or NYLIFE Distributors LLC, as described in detail above in the column entitled “Principal Occupation(s) During the Past Five Years.” |
| | | | | | | | | | | | |
| | | | | Name and
Date of Birth | | Term of Office, Position(s) Held with the Fund Complex and Length of Service | | Principal Occupation(s)
During Past Five Years | | Number of
Funds in
Fund Complex
Overseen by
Board Member | | Other Directorships
Held by Board Member |
| Non-Interested Board Members | | | | Susan B. Kerley 8/12/51 | | Indefinite;
Eclipse Trust: Chairman since 2005, and Trustee since 2000;
Eclipse Funds Inc.: Chairman since 2005 and Director since 1990 (1 fund); The MainStay Funds: Chairman and Board Member since 2007 (12 funds);
MainStay Funds Trust: Chairman and Trustee since 2009 (31 funds); and MainStay VP Funds Trust: Chairman and Trustee since 2011 and its predecessor, MainStay VP Series Fund, Inc., since 2007 (28 portfolios). Private Advisors Alternative Strategies Master Fund: Chairman and Trustee since 2011 Private Advisors Alternative Strategies Fund: Chairman and Trustee since 2011 MainStay DefinedTerm Municipal Opportunities Fund: Chairman and Trustee since 2011. | | President, Strategic Management Advisors LLC (since 1990) | | 75 | | Trustee, Legg Mason Partners Funds, since 1992 (51 portfolios) |
| | | | |
| mainstayinvestments.com | | | 31 | |
| | | | | | | | | | | | |
| | | | | Name and
Date of Birth | | Term of Office,
Position(s) Held
with the Fund
Complex and
Length of Service | | Principal Occupation(s)
During Past Five Years | | Number of
Funds in
Fund Complex
Overseen by
Board Member | | Other Directorships
Held by Board Member |
| Non-Interested Board Members | | | | Alan R. Latshaw 3/27/51 | | Indefinite;
Eclipse Trust: Trustee and Audit Committee Financial Expert since 2007;
Eclipse Funds Inc.:
Director and Audit Committee Financial Expert since 2007 (1 fund);
The MainStay Funds: Trustee and Audit Committee Financial Expert since 2006 (12 funds);
MainStay Funds Trust: Trustee and Audit Committee Financial Expert since 2009 (31 funds); and
MainStay VP Funds Trust: Trustee and Audit Committee Financial Expert since 2011 and its predecessor, MainStay VP Series Fund, Inc., since 2007 (28 portfolios). Private Advisors Alternative Strategies Master Fund: Trustee and Audit Committee Financial Expert since 2011 Private Advisors Alternative Strategies Fund: Trustee and Audit Committee Financial Expert since 2011. MainStay DefinedTerm Municipal Opportunities Fund: Trustee and Audit Committee Financial Expert since 2011. | | Retired; Partner, Ernst & Young LLP (2002 to 2003); Partner, Arthur Andersen LLP (1989 to 2002); Consultant to the MainStay Funds Audit and Compliance Committee (2004 to 2006) | | 75 | | Trustee, State Farm Associates Funds Trusts since 2005 (4 portfolios); Trustee, State Farm Mutual Fund Trust since 2005 (15 portfolios); Trustee, State Farm Variable Product Trust since 2005 (9 portfolios) |
| | |
| 32 | | MainStay Large Cap Growth Fund |
| | | | | | | | | | | | |
| | | | | Name and Date of Birth | | Term of Office, Position(s) Held with the Fund Complex and Length of Service | | Principal Occupation(s)
During Past Five Years | | Number of
Funds in
Fund Complex
Overseen by
Board Member | | Other Directorships Held by Board Member |
| Non-Interested Board Members | | | | Peter Meenan
12/5/41 | | Indefinite;
Eclipse Funds: Trustee since 2002;
Eclipse Funds Inc.:
Director since 2002
(1 fund); The MainStay Funds:
Trustee since 2007 (12 funds);
MainStay Funds Trust: Trustee since 2009
(31 funds); and
MainStay VP Funds Trust: Trustee since 2011 and its predecessor, MainStay VP Series Fund, Inc., since 2007 (28 portfolios).
Private Advisors Alternative Strategies Master Fund: Trustee since 2011. Private Advisors Alternative Strategies Fund: Trustee since 2011
MainStay DefinedTerm Municipal Opportunities Fund: Trustee since 2011. | | Independent Consultant; President and Chief Executive Officer, Babson—United, Inc. (financial services firm) (2000 to 2004); Independent Consultant (1999 to 2000); Head of Global Funds, Citicorp (1995 to 1999) | | 75 | | None |
| | | | Richard H. Nolan, Jr.
11/16/46 | | Indefinite;
Eclipse Trust: Trustee since 2007;
Eclipse Funds Inc.:
Director since 2007 (1 fund);
The MainStay Funds: Trustee since 2007 (12 funds);
MainStay Funds Trust: Trustee since 2009 (31 funds); and
MainStay VP Funds Trust: Trustee since 2011 and its predecessor, MainStay VP Series Fund, Inc., since 2006 (28 portfolios).
Private Advisors Alternative Strategies Master Fund: Trustee since 2011. Private Advisors Alternative Strategies Fund: Trustee since 2011
MainStay DefinedTerm Municipal Opportunities Fund: Trustee since 2011. | | Managing Director, ICC Capital Management; President—Shields/Alliance, Alliance Capital Management (1994 to 2004) | | 75 | | None |
| | | | |
| mainstayinvestments.com | | | 33 | |
| | | | | | | | | | | | |
| | | | | Name and Date of Birth | | Term of Office, Position(s) Held with the Fund Complex and Length of Service | | Principal Occupation(s)
During Past Five Years | | Number of
Funds in
Fund Complex
Overseen by
Board Member | | Other Directorships Held by Board Member |
| Non-Interested Board Members | | | | Richard S. Trutanic 2/13/52 | | Indefinite;
Eclipse Trust: Trustee since 2007;
Eclipse Funds Inc.:
Director since 2007 (1 fund);
The MainStay Funds:
Trustee since 1994 (12 funds);
MainStay Funds Trust:
Trustee since 2009 (31 funds); and
MainStay VP Funds Trust: Trustee since 2011 and its predecessor, MainStay VP Series Fund, Inc., since 2007 (28 portfolios).
Private Advisors Alternative Strategies Master Fund: Trustee since 2011.
Private Advisors Alternative Strategies Fund: Trustee since 2011
MainStay DefinedTerm Municipal Opportunities Fund: Trustee since 2011. | | Chairman and Chief Executive Officer, Somerset & Company (financial advisory firm) (since 2004); Managing Director, The Carlyle Group (private investment firm) (2002 to 2004); Senior Managing Director, Partner and Board Member, Groupe Arnault S.A. (private investment firm) (1999 to 2002) | | 75 | | None |
| | |
| 34 | | MainStay Large Cap Growth Fund |
| | | | | | | | | | | | |
| | | | | Name and Date of Birth | | Term of Office, Position(s) Held with the Fund Complex and Length of Service | | Principal Occupation(s)
During Past Five Years | | Number of
Funds in
Fund Complex
Overseen by
Board Member | | Other Directorships Held by Board Member |
| Non-Interested Board Members | | | | Roman L. Weil
5/22/40 | | Indefinite;
Eclipse Trust: Trustee and Audit Committee Financial Expert since 2007; Eclipse Funds Inc.: Director and Audit Committee Financial Expert since 2007 (1 fund); The MainStay Funds: Trustee and Audit Committee Financial Expert since 2007 (12 funds); MainStay Funds Trust: Trustee since 2009 (31 funds); and MainStay VP Funds Trust: Trustee and Audit Committee Financial Expert since 2011 and its predecessor, MainStay VP Series Fund, Inc., since 1994 and Audit Committee Financial Expert since 2003 (28 portfolios).
Private Advisors Alternative Strategies Master Fund: Trustee and Audit Committee Financial Expert since 2011 Private Advisors Alternative Strategies Fund: Trustee and Audit Committee Financial Expert since 2011. MainStay DefinedTerm Municipal Opportunities Fund: Trustee and Audit Committee Financial Expert since 2011. | | Visiting Professor, University of California—San Diego (since October 2012); Visiting Professor, Southern Methodist University (2011); Visiting Professor, NYU Stem School of Business, New York University (2011); President, Roman L. Weil Associates, Inc. (consulting firm) (since 1981); V. Duane Rath Professor Emeritus of Accounting, Chicago Booth School of Business, University of Chicago (1965-2008) | | 75 | | None |
| | | | |
| mainstayinvestments.com | | | 35 | |
| | | | | | | | | | | | |
| | | | | Name and Date of Birth | | Term of Office, Position(s) Held with the Fund Complex and Length of Service | | Principal Occupation(s)
During Past Five Years | | Number of
Funds in
Fund Complex
Overseen by
Board Member | | Other Directorships Held by Board Member |
| Non-Interested Board Members | | | | John A. Weisser 10/22/41 | | Indefinite; Eclipse Trust: Trustee since 2007; Eclipse Funds Inc.: Director since 2007 (1 fund); The MainStay Funds: Trustee since 2007 (12 funds); MainStay Funds Trust: Trustee since 2009 (31 funds); and MainStay VP Funds Trust: Trustee since 2011 and its predecessor, MainStay VP Series Fund, Inc., since 1997 (28 portfolios).
Private Advisors Alternative Strategies Master Fund: Trustee since 2011.
Private Advisors Alternative Strategies Fund: Trustee since 2011
MainStay DefinedTerm Municipal Opportunities Fund: Trustee since 2011. | | Retired. Managing Director of Salomon Brothers, Inc. (1971 to 1995) | | 75 | | Trustee, Direxion Funds since 2007 (21 portfolios); Direxion Insurance Trust since 2007 (1 portfolio); Trustee, Direxion Shares ETF Trust, since 2008 (47 portfolios) |
| | |
| 36 | | MainStay Large Cap Growth Fund |
The following individuals have been appointed by the Board Members to serve as Officers of the MainStay Group of Funds.
| | | | | | | | |
| | | | | Name and
Date of Birth | | Positions(s) Held with the Funds and Length of Service | | Principal Occupation(s) During Past Five Years |
| Officers | | | | Jack R. Benintende 5/12/64 | | Treasurer and Principal Financial and Accounting Officer, Eclipse Trust, Eclipse Funds, Inc. and The MainStay Funds (since 2007), MainStay Funds Trust (since 2009) | | Assistant Treasurer, New York Life Investment Management Holdings LLC (since 2008); Managing Director, New York Life Investment Management LLC (since 2007); Treasurer and Principal Financial Accounting Officer, Private Advisors Alternative Strategies Master Fund, Private Advisors Alternative Strategies Fund and MainStay DefinedTerm Municipal Opportunities Fund (since 2011); Treasurer and Principal Financial and Accounting Officer, MainStay VP Funds Trust and its predecessor, MainStay VP Series Fund, Inc. (since 2007) |
| | | | Jeffrey A. Engelsman 9/28/67 | | Vice President and Chief Compliance Officer, Eclipse Trust, Eclipse Funds, Inc., The MainStay Funds and MainStay Funds Trust (since 2009) | | Managing Director, Compliance (since 2009), Director and Associate General Counsel, New York Life Investment Management LLC (2005 to 2008); Assistant Secretary, NYLIFE Distributors LLC (2006 to 2008); Vice President and Chief Compliance Officer, Private Advisors Alternative Strategies Master Fund, Private Advisors Alternative Strategies Fund, DefinedTerm Municipal Opportunities Fund (since 2011); MainStay VP Funds Trust and its predecessor, MainStay VP Series Fund, Inc. (since 2009); Assistant Secretary, The MainStay Funds (2006 to 2008); Assistant Secretary, Eclipse Trust, Eclipse Funds, Inc. and MainStay VP Series Fund, Inc. (2005 to 2008) |
| | | | Stephen P. Fisher 2/22/59 | | President, Eclipse Trust, Eclipse Funds, Inc. and The MainStay Funds (since 2007), MainStay Funds Trust (since 2009) | | Director, Senior Vice President, New York Life Insurance and Annuity Corporation (since 2011); Manager, President and Chief Operating Officer, NYLIFE Distributors LLC (since 2008); Chairman of the Board, NYLIM Service Company LLC (since 2008); Senior Managing Director and Chief Marketing Officer, New York Life Investment Management LLC (since 2005); President, Private Advisors Alternative Strategies Master Fund, Private Advisors Alternative Strategies Fund and MainStay DefinedTerm Municipal Opportunities Fund (since 2011); MainStay VP Funds Trust and its predecessor, MainStay VP Series Fund, Inc. (since 2007) |
| | | | J. Kevin Gao 10/13/67 | | Secretary and Chief Legal Officer, Eclipse Trust, Eclipse Funds, Inc., The MainStay Funds and MainStay Funds Trust (since 2010) | | Managing Director and Associate General Counsel, New York Life Investment Management LLC (since 2010); Secretary and Chief Legal Officer, Private Advisors Alternative Strategies Master Fund, Private Advisors Alternative Strategies Fund and MainStay DefinedTerm Municipal Opportunities Fund (since 2011); MainStay VP Funds Trust and its predecessor, MainStay VP Series Fund, Inc. (since 2010); Director and Counsel of Credit Suisse, Chief Legal Officer and Secretary of Credit Suisse Asset Management, LLC and Credit Suisse Funds (2003 to 2010) |
| | | | Scott T. Harrington 2/8/59 | | Vice President—Administration, Eclipse Trust, Eclipse Funds, Inc. and The MainStay Funds (since 2005), MainStay Funds Trust (since 2009) | | Director, New York Life Investment Management LLC (including predecessor advisory organizations) (since 2000); Executive Vice President, New York Life Trust Company and New York Life Trust Company FSB (since 2006); Vice President—Administration, Private Advisors Alternative Strategies Master Fund, Private Advisors Alternative Strategies Fund and MainStay DefinedTerm Municipal Opportunities Fund (since 2011); MainStay VP Funds Trust and its predecessor, MainStay VP Series Fund, Inc. (since 2005) |
| | * | The Officers listed above are considered to be “interested persons” of the MainStay Group of Funds within the meaning of the 1940 Act because of their affiliation with New York Life Insurance Company, New York Life Investment Management LLC, Madison Square Investors LLC, MacKay Shields LLC, Private Advisors LLC, Institutional Capital LLC, Epoch Investment Partners, Inc., Markston International, LLC, Winslow Capital Management, Inc., NYLIFE Securities LLC and/or NYLIFE Distributors LLC, as described in detail above in the column captioned “Principal Occupation(s) During Past Five Years.” Officers are elected annually by the Board to serve a one-year term. |
| | | | |
| mainstayinvestments.com | | | 37 | |
This page intentionally left blank
MainStay Funds
MainStay offers a wide range of Funds for virtually any investment need. The full array of MainStay open-end offerings is listed here, with information about the manager, subadvisors, legal counsel and independent registered public accounting firms.
Equity
U.S. Equity
MainStay Common Stock Fund
MainStay Epoch U.S. All Cap Fund
MainStay Epoch U.S. Equity Yield Fund
MainStay Growth Equity Fund
MainStay ICAP Equity Fund
MainStay ICAP Select Equity Fund
MainStay Large Cap Growth Fund1
MainStay MAP Fund
MainStay S&P 500 Index Fund
MainStay U.S. Small Cap Fund
MainStay 130/30 Core Fund
International/Global Equity
MainStay Epoch Global Choice Fund
MainStay Epoch Global Equity Yield Fund
MainStay Epoch International Small Cap Fund
MainStay ICAP Global Fund
MainStay ICAP International Fund
MainStay International Equity Fund
MainStay 130/30 International Fund
Income
Taxable Bond
MainStay Flexible Bond Opportunities Fund
MainStay Floating Rate Fund
MainStay Global High Income Fund
MainStay Government Fund
MainStay High Yield Corporate Bond Fund
MainStay High Yield Opportunities Fund
MainStay Indexed Bond Fund
MainStay Intermediate Term Bond Fund
MainStay Short Term Bond Fund
MainStay Money Market Fund
Municipal Bond
MainStay High Yield Municipal Bond Fund
MainStay New York Tax Free Opportunities Fund2
MainStay Tax Free Bond Fund
Mixed Asset
MainStay Balanced Fund
MainStay Convertible Fund
MainStay Income Builder Fund
MainStay Marketfield Fund
Asset Allocation/Target Date
MainStay Conservative Allocation Fund
MainStay Growth Allocation Fund
MainStay Moderate Allocation Fund
MainStay Moderate Growth Allocation Fund
MainStay Retirement 2010 Fund
MainStay Retirement 2020 Fund
MainStay Retirement 2030 Fund
MainStay Retirement 2040 Fund
MainStay Retirement 2050 Fund
Manager
New York Life Investment Management LLC
New York, New York
Subadvisors
Epoch Investment Partners, Inc.
New York, New York
Institutional Capital LLC3
Chicago, Illinois
MacKay Shields LLC3
New York, New York
Madison Square Investors LLC3
New York, New York
Marketfield Asset Management LLC
New York, New York
Markston International LLC
White Plains, New York
Winslow Capital Management, Inc.
Minneapolis, Minnesota
Legal Counsel
Dechert LLP
Independent Registered Public Accounting Firms
KPMG LLP
PricewaterhouseCoopers LLP
1. Effective January 13, 2012, the Fund was closed to new investors with certain exceptions.
2. The Fund is only registered for sale in CT, DE, FL, MA, NJ, NY, and VT.
3. An affiliate of New York Life Investment Management LLC.
Not part of the Annual Report
mainstayinvestments.com
The MainStay Funds are managed by New York Life Investment Management LLC and distributed through NYLIFE Distributors LLC, 169 Lackawanna Avenue, Parsippany, NJ 07054, a wholly owned subsidiary of New York Life Insurance Company.
NYLIFE Distributors is a Member FINRA/SIPC.
MainStay Investments is a service mark and name under which New York Life Investment Management LLC does business. MainStay Investments, an indirect subsidiary of New York Life Insurance Company, New York, NY 10010, provides investment
advisory products and services.
This report may be distributed only when preceded or accompanied by a current Fund prospectus.
© 2013 by NYLIFE Distributors LLC. All rights reserved.
| | | | | | | | |
| Not FDIC/NCUA Insured | | Not a Deposit | | May Lose Value | | No Bank Guarantee | | Not Insured by Any Government Agency |
| | | | |
| NYLIM-28189 MS265-12 | | | MSLG11-12/12 | |
| | | NL031 | |

MainStay MAP Fund
Message from the President and Annual Report
October 31, 2012
This page intentionally left blank
Message from the President
Most major equity markets delivered positive results for the 12 months ended October 31, 2012. In the United States, stocks provided solid double-digit returns. With a few notable exceptions, international stock markets generally ended the reporting period in positive territory.
The stock market’s advance, however, was far from uniform. After rising to an early peak at the end of March 2012, domes- tic and international stocks lost ground until the beginning of June. After that, stocks generally rose, reaching their high point for the reporting period in mid-September. Although stocks remained relatively buoyant through mid-October, they drifted lower as the reporting period came to a close.
A variety of forces converged to help fuel these market movements. Investors kept a close eye on developments in the European sovereign debt crisis. The European Central Bank’s Long Term Refinancing Operations helped stabilize European credit markets and provide needed liquidity. Although private holders of Greek sovereign debt had to accept a reduction in their recovery value, the anticipated voluntary exchange provided a positive spark to the markets. Rising unemployment and new austerity measures may impede economic growth as the European Union seeks to strike a delicate balance between fiscal and monetary policies.
In the United States, the Federal Reserve announced an open-ended agency mortgage-backed security purchase program, which helped calm market concerns. The Federal Reserve also continued its maturity extension program (referred to by some as “operation twist”), which seeks to put downward pressure on longer-term interest rates. At the short end of the yield curve, the Federal Reserve maintained the federal funds rate in a near-zero range. In September 2012, the Federal Open Market Committee anticipated that “exceptionally low levels for the federal funds rate” were “likely to be warranted at least through mid-2015.”
With markets stabilizing and short-term interest rates at very low levels, yield-hungry investors had incentives to lengthen maturities and accept higher risk. Domestic high-yield bonds provided double-digit returns for the reporting period, municipal bonds and convertible securities provided high single-digit returns, and domestic corporate bonds provided positive overall returns.
While most investors are pleased when markets rise, MainStay portfolio managers know that long-term results depend on more than short-term market movements. They also depend on the consistent application of well-defined investment strategies and risk-management techniques over longer periods. Our long-term perspective gives our portfolio managers the ability to look past the daily ups and downs of the market as they pursue the specific investment objectives of their individual Funds.
At MainStay, we believe that a long-term perspective can help investors as well. Instead of trying to capitalize on short-term market movements, you may prefer to focus on the long-term potential that can come from getting invested, staying invested and adding to your investments over time. Of course, past performance is no guarantee of future results.
The following pages contain more specific information on the securities, market events and investment decisions that affected your MainStay Fund(s) during the 12 months ended October 31, 2012. We invite you to read the information carefully and use it as part of your ongoing portfolio evaluation and investment review.
Sincerely,

Stephen P. Fisher
President
The opinions expressed are as of the date of this report and are subject to change. There is no guarantee that any forecast made will come to pass. This material does not constitute investment advice and is not intended as an endorsement of any specific investment.
Not part of the Annual Report
Table of Contents
Investors should refer to the Fund’s Summary Prospectus and/or Prospectus and consider the Fund’s investment objectives, strategies, risks, charges and expenses carefully before investing. The Summary Prospectus and/or Prospectus contain this and other information about the Fund. You may obtain copies of the Fund’s Summary Prospectus, Prospectus and Statement of Additional Information free of charge, upon request, by calling toll-free 800-MAINSTAY (624-6782), by writing to NYLIFE Distributors LLC, Attn: MainStay Marketing Department, 169 Lackawanna Avenue, Parsippany, New Jersey 07054 or by sending an e-mail to MainStayShareholderServices@nylim.com. These documents are also available via the MainStay Funds’ website at mainstayinvestments.com/documents. Please read the Summary Prospectus and/or Prospectus carefully before investing.
Investment and Performance Comparison1 (Unaudited)
Performance data quoted represents past performance. Past performance is no guarantee of future results. Because of market volatility, current performance may be lower or higher than the figures shown. Investment return and principal value will fluctuate, and as a result, when shares are redeemed, they may be worth more or less than their original cost. The graph below depicts the historical performance of Class I shares of the Fund. Performance will vary from class to class based on differences in class-specific expenses and sales charges. For performance information current to the most recent month-end, please call 800-MAINSTAY (624-6782) or visit mainstayinvestments.com.
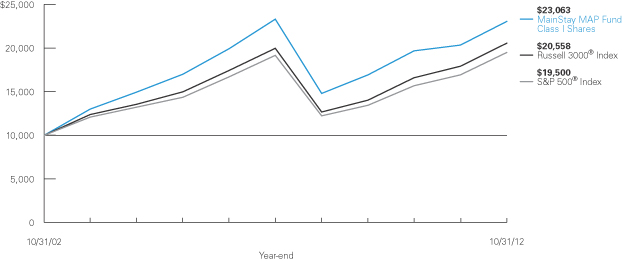
Average Annual Total Returns for the Year Ended October 31, 2012
| | | | | | | | | | | | | | | | | | | | |
| Class | | Sales Charge | | | | One Year | | | Five Years | | | Ten Years | | | Gross
Expense
Ratio2 | |
| Investor Class Shares3 | | Maximum 5.5% Initial Sales Charge | | With sales charges Excluding sales charges | |
| 6.67
12.88 | %
| |
| –1.77
–0.66 | %
| |
| 7.68
8.29 | %
| |
| 1.34
1.34 | %
|
Class A Shares | | Maximum 5.5% Initial Sales Charge | | With sales charges Excluding sales charges | |
| 6.92
13.14 |
| |
| –1.60
–0.48 |
| |
| 7.78
8.39 |
| |
| 1.14
1.14 |
|
| Class B Shares | | Maximum 5% CDSC if Redeemed Within the First Six Years of Purchase | | With sales charges Excluding sales charges | |
| 7.04
12.04 |
| |
| –1.75
–1.41 |
| |
| 7.49
7.49 |
| |
| 2.09
2.09 |
|
| Class C Shares | | Maximum 1% CDSC if Redeemed Within One Year of Purchase | | With sales charges Excluding sales charges | |
| 11.07
12.07 |
| |
| –1.40
–1.40 |
| |
| 7.49
7.49 |
| |
| 2.09
2.09 |
|
| Class I Shares | | No Sales Charge | | | | | 13.40 | | | | –0.22 | | | | 8.72 | | | | 0.89 | |
| Class R1 Shares4 | | No Sales Charge | | | | | 13.26 | | | | –0.34 | | | | 8.59 | | | | 0.99 | |
| Class R2 Shares4 | | No Sales Charge | | | | | 12.99 | | | | –0.56 | | | | 8.33 | | | | 1.24 | |
| Class R3 Shares5 | | No Sales Charge | | | | | 12.72 | | | | –0.82 | | | | 8.03 | | | | 1.49 | |
| 1. | The performance table and graph do not reflect the deduction of taxes that a shareholder would pay on distributions or Fund-share redemptions. Total returns reflect maximum applicable sales charges as indicated in the table above, changes in share price, and reinvestment of dividend and capital gain distributions. The graph assumes the initial investment amount shown above and reflects the deduction of all sales charges that would have applied for the period of investment. Performance figures reflect certain fee waivers and/or expense limitations, without which total returns may have been lower. For more information on share classes and current fee waivers and/or expense limitations, please refer to the notes to the financial statements. |
| 2. | The gross expense ratios presented reflect the Fund’s “Total Annual Fund Operating Expenses” from the most recent Prospectus and may differ from other expense ratios disclosed in this report. |
| 3. | Performance figures for Investor Class shares, first offered on February 28, 2008, include the historical performance of Class A shares through February 27, 2008, adjusted for differences in certain expenses and fees. Unadjusted, the performance shown for Investor Class shares might have been different. |
| 4. | Performance figures for Class R1 and R2 shares, each of which was first offered on January 2, 2004, include the historical performance of Class A shares through January 1, 2004, adjusted for differences in certain expenses and fees. Unadjusted, the performance shown for Class R1 and R2 shares might have been different. |
| 5. | Performance figures for Class R3 shares, which were first offered on April 28, 2006, include the historical performance of Class A shares through April 27, 2006, adjusted for differences in certain expenses and fees. Unadjusted, the performance shown for Class R3 shares might have been different. |
The footnotes on the next page are an integral part of the table and graph and should be carefully read in conjunction with them.
| | | | |
| mainstayinvestments.com | | | 5 | |
| | | | | | | | | | | | |
| Benchmark Performance | | One Year | | | Five Years | | | Ten Years | |
Russell 3000® Index6 | | | 14.75 | % | | | 0.59 | % | | | 7.47 | % |
S&P 500® Index7 | | | 15.21 | | | | 0.36 | | | | 6.91 | |
Average Lipper Large-Cap Core Fund8 | | | 13.15 | | | | –0.64 | | | | 6.33 | |
| 6. | The Russell 3000® Index measures the performance of the largest 3,000 U.S. companies representing approximately 98% of the investable U.S. equity market. The Russell 3000® Index is the Fund’s broad-based securities market index for comparison purposes. Total returns assume reinvestment of all dividends and capital gains. An investment cannot be made directly in an index. |
| 7. | “S&P 500®” is a trademark of The McGraw-Hill Companies, Inc. The S&P 500® Index is widely regarded as the standard index for measuring large-cap U.S. stock market performance. The S&P 500® Index is the Fund’s secondary benchmark. Results assume reinvestment of all income and capital gains. An investment cannot be made directly in an index. |
| 8. | The average Lipper large-cap core fund is representative of funds that, by portfolio practice, invest at least 75% of their equity assets in companies with market capitalizations (on a three-year weighted basis) above Lipper’s U.S. Diversified Equity large-cap floor. Large-cap core funds have more latitude in the companies in which they invest. These funds typically have an average price-to-earnings ratio, price-to-book ratio, and three-year sales-per-share growth value, compared to the S&P 500® Index. This benchmark is a product of Lipper Inc. Lipper Inc. is an independent monitor of fund performance. Results are based on average total returns of similar funds with all dividend and capital gain distributions reinvested. |
The footnotes on the preceding page are an integral part of the table and graph and should be carefully read in conjunction with them.
Cost in Dollars of a $1,000 Investment in MainStay MAP Fund (Unaudited)
The example below is intended to describe the fees and expenses borne by shareholders during the six-month period from May 1, 2012, to October 31, 2012, and the impact of those costs on your investment.
Example
As a shareholder of the Fund, you incur two types of costs: (1) transaction costs, including exchange fees and sales charges (loads) on purchases (as applicable), and (2) ongoing costs, including management fees, distribution and/or service (12b-1) fees, and other Fund expenses (as applicable). This example is intended to help you understand your ongoing costs (in dollars) of investing in the Fund and to compare these costs with the ongoing costs of investing in other mutual funds. The example is based on an investment of $1,000 made at the beginning of the six-month period and held for the entire period from May 1, 2012, to October 31, 2012.
This example illustrates your Fund’s ongoing costs in two ways:
Actual Expenses
The second and third data columns in the table below provide information about actual account values and actual expenses. You may use the information in these columns, together with the amount you invested, to estimate the expenses that you paid during the six months ended October 31, 2012. Simply divide your account value by $1,000 (for example, an $8,600 account value divided by $1,000 = 8.6), then
multiply the result by the number under the heading entitled “Expenses Paid During Period” to estimate the expenses you paid on your account during this period.
Hypothetical Example for Comparison Purposes
The fourth and fifth data columns in the table below provide information about hypothetical account values and hypothetical expenses based on the Fund’s actual expense ratio and an assumed rate of return of 5% per year before expenses, which is not the Fund’s actual return. The hypothetical account values and expenses may not be used to estimate the actual ending account balances or expenses you paid for the six-month period shown. You may use this information to compare the ongoing costs of investing in the Fund with the ongoing costs of investing in other Funds. To do so, compare this 5% hypothetical example with the 5% hypothetical examples that appear in the shareholder reports of the other Funds.
Please note that the expenses shown in the table are meant to highlight your ongoing costs only and do not reflect any transactional costs, such as exchange fees or sales charges (loads). Therefore, the fourth and fifth data columns of the table are useful in comparing ongoing costs only and will not help you determine the relative total costs of owning different funds. In addition, if these transactional costs were included, your costs would have been higher.
| | | | | | | | | | | | | | | | | | | | |
| Share Class | | Beginning
Account
Value
5/1/12 | | | Ending Account
Value (Based
on Actual
Returns and
Expenses)
10/31/12 | | | Expenses
Paid
During
Period1 | | | Ending Account
Value (Based
on Hypothetical
5% Annualized
Return and
Actual Expenses)
10/31/12 | | | Expenses
Paid
During
Period1 | |
| | | | | |
| Investor Class Shares | | $ | 1,000.00 | | | $ | 1,017.90 | | | $ | 6.75 | | | $ | 1,018.50 | | | $ | 6.75 | |
| | | | | |
| Class A Shares | | $ | 1,000.00 | | | $ | 1,019.10 | | | $ | 5.79 | | | $ | 1,019.40 | | | $ | 5.79 | |
| | | | | |
| Class B Shares | | $ | 1,000.00 | | | $ | 1,014.10 | | | $ | 10.53 | | | $ | 1,014.70 | | | $ | 10.53 | |
| | | | | |
| Class C Shares | | $ | 1,000.00 | | | $ | 1,014.50 | | | $ | 10.53 | | | $ | 1,014.70 | | | $ | 10.53 | |
| | | | | |
| Class I Shares | | $ | 1,000.00 | | | $ | 1,020.20 | | | $ | 4.52 | | | $ | 1,020.70 | | | $ | 4.52 | |
| | | | | |
| Class R1 Shares | | $ | 1,000.00 | | | $ | 1,019.70 | | | $ | 5.03 | | | $ | 1,020.20 | | | $ | 5.03 | |
| | | | | |
| Class R2 Shares | | $ | 1,000.00 | | | $ | 1,018.50 | | | $ | 6.29 | | | $ | 1,018.90 | | | $ | 6.29 | |
| | | | | |
| Class R3 Shares | | $ | 1,000.00 | | | $ | 1,017.10 | | | $ | 7.55 | | | $ | 1,017.60 | | | $ | 7.56 | |
| 1. | Expenses are equal to the Fund’s annualized expense ratio of each class (1.33% for Investor Class, 1.14% for Class A, 2.08% for Class B and Class C, 0.89% for Class I, 0.99% for Class R1, 1.24% for Class R2 and 1.49% for Class R3) multiplied by the average account value over the period, divided by 366 and multiplied by 184 (to reflect the six-month period). The table above represents the actual expenses incurred during the six-month period. |
| | | | |
| mainstayinvestments.com | | | 7 | |
Industry Composition as of October 31, 2012 (Unaudited)
| | | | |
| Oil, Gas & Consumable Fuels | | | 10.5 | % |
| Pharmaceuticals | | | 8.1 | |
| Media | | | 7.7 | |
| Commercial Banks | | | 4.2 | |
| Diversified Financial Services | | | 4.1 | |
| Health Care Equipment & Supplies | | | 3.7 | |
| Insurance | | | 3.5 | |
| Software | | | 3.5 | |
| Chemicals | | | 3.4 | |
| Aerospace & Defense | | | 3.3 | |
| Consumer Finance | | | 2.8 | |
| Industrial Conglomerates | | | 2.8 | |
| Internet Software & Services | | | 2.6 | |
| Semiconductors & Semiconductor Equipment | | | 2.2 | |
| Computers & Peripherals | | | 2.0 | |
| Health Care Providers & Services | | | 2.0 | |
| Wireless Telecommunication Services | | | 1.9 | |
| Capital Markets | | | 1.7 | |
| Metals & Mining | | | 1.7 | |
| Auto Components | | | 1.6 | |
| Food & Staples Retailing | | | 1.6 | |
| Machinery | | | 1.6 | |
| Beverages | | | 1.5 | |
| Energy Equipment & Services | | | 1.5 | |
| Communications Equipment | | | 1.4 | |
| Diversified Telecommunication Services | | | 1.4 | |
| Electrical Equipment | | | 1.3 | |
| Food Products | | | 1.3 | |
| | | | |
| Electric Utilities | | | 1.2 | % |
| Specialty Retail | | | 1.2 | |
| Real Estate Investment Trusts | | | 1.1 | |
| Hotels, Restaurants & Leisure | | | 1.0 | |
| IT Services | | | 1.0 | |
| Commercial Services & Supplies | | | 0.7 | |
| Internet & Catalog Retail | | | 0.7 | |
| Road & Rail | | | 0.7 | |
| Construction & Engineering | | | 0.5 | |
| Electronic Equipment & Instruments | | | 0.5 | |
| Household Products | | | 0.5 | |
| Automobiles | | | 0.4 | |
| Biotechnology | | | 0.4 | |
| Diversified Consumer Services | | | 0.4 | |
| Trading Companies & Distributors | | | 0.4 | |
| Gas Utilities | | | 0.3 | |
| Construction Materials | | | 0.2 | |
| Independent Power Producers & Energy Traders | | | 0.2 | |
| Multiline Retail | | | 0.2 | |
| Multi-Utilities | | | 0.1 | |
| Paper & Forest Products | | | 0.1 | |
| Real Estate Management & Development | | | 0.1 | |
| Office Electronics | | | 0.0 | ‡ |
| Thrifts & Mortgage Finance | | | 0.0 | ‡ |
| Short-Term Investment | | | 3.0 | |
| Other Assets, Less Liabilities | | | 0.2 | |
| | | | |
| | | 100.0 | % |
| | | | |
See Portfolio of Investments beginning on page 12 for specific holdings within these categories.
| ‡ | Less than one-tenth of a percent. |
Top Ten Holdings as of October 31, 2012 (excluding short-term investment)
| 6. | Vodafone Group PLC, Sponsored ADR |
| 8. | Honeywell International, Inc. |
| 10. | Liberty Media Corp.—Liberty Capital Class A |
Portfolio Management Discussion and Analysis (Unaudited)
Questions answered by portfolio managers Roger Lob and Christopher Mullarkey of the Fund’s Subadvisor Markston International LLC and by portfolio managers Thomas R. Wenzel, CFA, Jerrold K. Senser, CFA, and Thomas M. Cole, CFA, of the Fund’s Subadvisor Institutional Capital LLC (ICAP).
How did MainStay MAP Fund perform relative to its peers and its benchmark during the 12 months ended October 31, 2012?
Excluding all sales charges, MainStay MAP Fund returned 12.88% for Investor Class shares, 13.14% for Class A shares, 12.04% for Class B shares and 12.07% for Class C shares for the 12 months ended October 31, 2012. Over the same period, Class I shares returned 13.40%, Class R1 shares returned 13.26%, Class R2 shares returned 12.99% and Class R3 shares returned 12.72%. Class I shares and Class R1 shares outperformed—and Investor Class, Class A, Class B, Class C, Class R2 and Class R3 shares underperformed—the 13.15% return of the average Lipper1 large-cap core fund during the reporting period. All share classes underperformed the 14.75% return of the Russell 3000® Index2 and the 15.21% return of the S&P 500® Index3 for the 12 months ended October 31, 2012. The Russell 3000® Index is the Fund’s broad-based securities-market index. The S&P 500® Index is the Fund’s secondary benchmark. See page 5 for Fund returns with applicable sales charges.
Were there any changes to the Fund in addition to those discussed in the semiannual report?
Effective September 28, 2012, Thomas M. Cole became an additional portfolio manager for the ICAP portion of the Fund. Please refer to the Prospectus Supplement dated September 28, 2012, for additional information regarding Mr. Cole.
What factors affected the Fund’s performance during the reporting period?
Markston International
During the reporting period, the performance of our portion of the Fund relative to the Russell 3000® Index resulted primarily from favorable stock selection in the consumer discretionary sector, particularly a large position in media conglomerate Liberty Media.
ICAP
In our portion of the Fund that invests in domestic equities, a number of key drivers affected performance relative to the S&P 500® Index. Favorable stock selection in the financials and health care sectors added to relative performance. Unfavorable stock selection in the information technology and consumer staples sectors detracted from relative performance. Domestic equities benefited from an underweight position in the information technology sector. An underweight position in the industrials sector, however, detracted from relative performance.
In global equities, the health care, financials and materials sectors were the best-performing sectors on an absolute basis. The weakest-performing sectors on an absolute basis were utilities, information technology and telecommunication services.
Which sectors made the strongest contributions to the Fund’s performance and which sectors were particularly weak?
Markston International
In our portion of the Fund, the strongest sector contributions to performance relative to the Russell 3000® Index came from the consumer discretionary, financials and information technology sectors. (Contributions take weightings and total returns into account.) Favorable stock selection and overweight positions in the consumer discretionary and financials sectors made the strongest positive contributions in our portion of the Fund. Favorable stock selection and an underweight allocation to information technology also contributed positively.
The weakest sector contributions to the Fund’s relative performance in our portion of the Fund came from the health care and energy sectors. An underweight position in health care and an overweight allocation to energy detracted from performance relative to the Russell 3000® Index. In addition, a modest cash position in our portion of the Fund detracted from performance relative to the double-digit return of the Russell 3000® Index.
ICAP
In our portion of the Fund that invests in domestic equities, the sectors that contributed most positively to performance relative to the S&P 500® Index were financials, health care and industrials. Favorable stock selection was the primary driver in each case. The sectors that detracted the most from performance relative to the S&P 500® Index were information technology, consumer staples and telecommunication services. Once again, stock selection was the primary driver in each case.
In our portion of the Fund that invests in global equities, the health care, financials and consumer discretionary sectors made the strongest contributions on an absolute basis. The weakest sector contributions on an absolute basis came from consumer staples, utilities and information technology.
During the reporting period, which individual stocks made the strongest contributions to the Fund’s absolute performance and which stocks detracted the most?
Markston International
The strongest contributions to absolute performance in our portion of the Fund came from media conglomerate Liberty
| 1. | See footnote on page 6 for more information on Lipper Inc. |
| 2. | See footnote on page 6 for more information on the Russell 3000® Index. |
| 3. | See footnote on page 6 for more information on the S&P 500® Index. |
| | | | |
| mainstayinvestments.com | | | 9 | |
Media, Internet retailer eBay and computers & peripherals
company Apple. Liberty Media advanced because of its successful investment in Sirius XM Radio, which is benefiting from a renewed ability to generate free cash flow. Shares of eBay appreciated because of strong organic growth in its core platform and its PayPal division. Apple’s shares appreciated because of continued success across its innovative product suite and market share gains from its proprietary operating system.
Stocks that detracted from absolute performance included computers & peripherals company Dell and independent oil and gas companies Apache and Chesapeake Energy. Dell underperformed the Russell 3000® Index as consumers and businesses held off from purchasing personal computers. Apache and Chesapeake Energy suffered because of weak natural gas prices. Natural gas prices remained low because of an oversupplied market, a function of the successful shale gas fracking4 revolution our country is experiencing.
ICAP
During the reporting period, the strongest contributions to absolute performance in our domestic equity portion of the Fund came from pharmaceutical company Pfizer, media company Time Warner and commercial and retail banking firm Wells Fargo. Pfizer advanced during the reporting period, as investors approved of the company’s plan to divest its nutritionals and animal-health businesses. Time Warner’s stock outpaced the S&P 500® Index, as the company reported strong operational performance, returned cash to shareholders through increased dividends and stock buybacks, and announced that it expected growth in affiliate fee revenue. Wells Fargo’s stock benefited from improved revenue and cost control, along with successful integration of the company’s Wachovia acquisition. Wells Fargo increased its quarterly dividend by 83% during the reporting period. All three positions remained in the Fund at the end of the reporting period.
In our domestic equity portion of the Fund, stocks that detracted from absolute performance included auto parts manufacturer Johnson Controls, life insurer MetLife and network equipment maker Cisco Systems. Johnson Controls suffered from a slowdown in European auto sales and from higher-than-expected costs for a product launch. MetLife underperformed as concern about prospects for an extended period of low short-term interest rates weighed on the stock. Cisco Systems was negatively affected by a slowdown in enterprise spending and by economic weakness in Europe. Positions in Johnson Controls and Cisco Systems remained in the Fund at the end of the reporting period, as we believe the companies are well
positioned in their respective industries and have attractive valuation and performance catalysts. We sold the Fund’s position in MetLife in favor of other stocks that we believed had greater upside potential and were more attractive on a relative-valuation basis.
In our portion of the Fund that invests in global equities, the stocks that made the greatest contributions to absolute performance were pharmaceutical company Pfizer, media company Time Warner and German pharmaceutical and chemical company Bayer. Bayer posted strong performance led by its pharmaceutical business. All three positions remained in the Fund at the end of the reporting period.
In our portion of the Fund that invests in global equities, the largest individual detractors from absolute performance were Finnish mobile phone maker Nokia, Dutch telecommunications provider KPN and Spanish bank BBVA. Nokia suffered because of low-cost competitors in emerging markets. We sold the position because we believed the risk was unlikely to go away. KPN underperformed when deteriorating economic conditions led to weak business results and a disappointing outlook. We sold KPN in favor of other positions that we believed had greater potential upside and were more attractive on a relative-valuation basis. BBVA lagged because of ongoing concerns about the Spanish banking and sovereign debt markets. We sold the position to reduce the risk profile in this portion of the Fund.
Did the Fund make any significant purchases or sales during the reporting period?
Markston International
During the reporting period, we initiated positions in IT services company Automatic Data Processing (ADP) and in information technology giant International Business Machines (IBM). Automatic Data Processing has one of the highest corporate credit ratings and has what we believe to be a very strong balance sheet. We view the company’s stock as an equity security with bond-like properties. We purchased its stock because we believe that ADP is likely to benefit over time should employment rates continue to improve. Also, portfolio managers searching for yield may consider ADP to be a proxy for an “infinite duration” bond. We purchased IBM because we believed that its earnings would continue to strengthen as corporations invest in information technology to improve productivity.
During the reporting period, we sold positions in media company AMC Networks and in financial exchange operator CME Group. AMC Networks was a spin-off from Cablevision, and we sold it to lock in profits. We sold a portion of the Fund’s position
| 4. | Fracking, also known as hydraulic fracturing, is a process that forces liquids into small cracks in rock formations. The process seeks to create larger openings that may allow more oil and gas to flow to an existing well. |
in CME Group when we identified an insurance company that we thought would benefit from conservative underwriting and strong pricing.
ICAP
During a reporting period characterized by ongoing volatility and an uncertain economic environment, we continued to look for stocks with attractive valuations and specific catalysts that we believed could trigger appreciation over a 12- to 18-month time frame.
In our domestic and global equity portions of the Fund, we added diversified financial services firm Citigroup because we believe that the company’s investment spending will increase efficiency and generate global operating leverage. We also added a position in consumer finance company Capital One Financial. In our view, the integration of two recent acquisitions—ING Direct bank and the credit card portfolio of HSBC—can enhance Capital One’s long-term earnings power and enable the company’s management to return capital to shareholders.
In our global equity portion of the Fund, we added Singapore-based bank DBS Group Holdings. In our view, the bank’s stock should benefit from the execution of management’s growth strategy, which is focused on building out the company’s non-Singapore banking franchises, trade finance and wealth management.
In addition to the sales already mentioned, we sold our position in household and personal care products company Procter & Gamble in our domestic and global equity portions of the Fund. In our global equity portion of the Fund, we also sold positions in global mining firm Rio Tinto and U.K.-based global commercial bank Standard Chartered. We sold Procter & Gamble and Rio Tinto when we found other stocks that we believed had greater potential upside and were more attractive on a relative-valuation basis. We sold our position in Standard Chartered because of a New York regulator’s allegations regarding the bank’s improper dealings with Iran. We believed that the allegations could threaten the bank’s ability to do business.
How did the Fund’s sector weightings change during the reporting period?
Markston International
In our portion of the Fund, we slightly increased weightings relative to the Russell 3000® Index in the consumer discretionary and industrials sectors. During the reporting period, we modestly decreased sector weightings in energy, materials and utilities.
ICAP
In our portion of the Fund that invests in domestic equities, we increased sector weightings relative to the S&P 500® Index in the industrials and materials sectors during the reporting period. In industrials, our domestic equity portion of the Fund moved from an underweight position to a relatively neutral position relative to the S&P 500® Index. In materials, the Fund moved from an underweight to an overweight position relative to the S&P 500® Index.
Over the same period, our domestic equity portion of the Fund decreased its exposure to the consumer staples and financials sectors. In consumer staples, the Fund moved from an overweight to an underweight position relative to the S&P 500® Index. In financials, the Fund moved from an overweight position to a relatively neutral position relative to the S&P 500® Index.
In our portion of the Fund that invests in global equities, we increased sector weightings in industrials and health care during the reporting period. Over the same period, we decreased the Fund’s global equity exposure to consumer staples and telecommunication services.
How was the Fund positioned at the end of October 2012?
Markston International
As of October 31, 2012, our portion of the Fund maintained overweight positions relative to the Russell 3000® Index in the financials and energy sectors. As of the same date, our portion of the Fund held underweight positions relative to the Russell 3000® Index in the information technology and health care sectors.
ICAP
As of October 31, 2012, the most significantly overweight sectors relative to the S&P 500® Index in our domestic equity portion of the Fund were industrials and health care, and the most significantly underweight sectors were consumer staples and information technology.
As of the same date, the largest sector weightings in our global equity portion of the Fund were in health care and financials, and the smallest sector weightings were in utilities and consumer staples.
This positioning in our domestic and global equity portions of the Fund reflected our view on the prospects for economic growth and the relative attractiveness of individual holdings in these sectors.
The opinions expressed are those of the portfolio managers as of the date of this report and are subject to change. There is no guarantee that any forecast made will come to pass. This material does not constitute investment advice and is not intended as an endorsement of any specific investment.
| | | | |
| mainstayinvestments.com | | | 11 | |
Portfolio of Investments October 31, 2012
| | | | | | | | |
| | |
| | | Shares | | | Value | |
| | | | | | | | |
| Common Stocks 96.7% † | |
Aerospace & Defense 3.3% | |
Boeing Co. (The) | | | 229,695 | | | $ | 16,179,716 | |
GenCorp, Inc. (a) | | | 152,800 | | | | 1,347,696 | |
¨Honeywell International, Inc. | | | 624,202 | | | | 38,226,131 | |
Northrop Grumman Corp. | | | 58,528 | | | | 4,020,288 | |
Orbital Sciences Corp. (a) | | | 156,800 | | | | 2,101,120 | |
Raytheon Co. | | | 64,000 | | | | 3,619,840 | |
United Technologies Corp. | | | 23,650 | | | | 1,848,484 | |
| | | | | | | | |
| | | | | | | 67,343,275 | |
| | | | | | | | |
Auto Components 1.6% | |
Bridgestone Corp. | | | 313,800 | | | | 7,307,456 | |
Johnson Controls, Inc. | | | 1,003,250 | | | | 25,833,687 | |
| | | | | | | | |
| | | | | | | 33,141,143 | |
| | | | | | | | |
Automobiles 0.4% | |
Nissan Motor Co., Ltd. | | | 1,050,450 | | | | 8,789,936 | |
| | | | | | | | |
|
Beverages 1.5% | |
Coca-Cola Co. (The) | | | 434,090 | | | | 16,139,466 | |
PepsiCo., Inc. | | | 210,172 | | | | 14,552,309 | |
| | | | | | | | |
| | | | | | | 30,691,775 | |
| | | | | | | | |
Biotechnology 0.4% | |
Alkermes PLC (a) | | | 74,580 | | | | 1,381,967 | |
Celgene Corp. (a) | | | 85,500 | | | | 6,268,860 | |
| | | | | | | | |
| | | | | | | 7,650,827 | |
| | | | | | | | |
Capital Markets 1.7% | |
Ameriprise Financial, Inc. | | | 96,675 | | | | 5,642,920 | |
Bank of New York Mellon Corp. (The) | | | 112,125 | | | | 2,770,609 | |
Goldman Sachs Group, Inc. (The) | | | 54,644 | | | | 6,687,879 | |
ICG Group, Inc. (a) | | | 47,144 | | | | 494,069 | |
Jefferies Group, Inc. | | | 194,804 | | | | 2,774,009 | |
Knight Capital Group, Inc. Class A (a) | | | 48,964 | | | | 128,775 | |
Legg Mason, Inc. | | | 26,850 | | | | 684,138 | |
State Street Corp. | | | 326,484 | | | | 14,551,392 | |
| | | | | | | | |
| | | | | | | 33,733,791 | |
| | | | | | | | |
Chemicals 3.4% | |
Akzo Nobel N.V. | | | 116,555 | | | | 6,340,521 | |
E.I. du Pont de Nemours & Co. | | | 367,000 | | | | 16,338,840 | |
¨Monsanto Co. | | | 518,759 | | | | 44,649,587 | |
Mosaic Co. (The) | | | 37,230 | | | | 1,948,618 | |
| | | | | | | | |
| | | | | | | 69,277,566 | |
| | | | | | | | |
Commercial Banks 4.2% | |
BB&T Corp. | | | 571,500 | | | | 16,544,925 | |
DBS Group Holdings, Ltd. | | | 943,750 | | | | 10,754,324 | |
DnB NOR ASA | | | 752,500 | | | | 9,397,506 | |
Lloyds Banking Group PLC (a) | | | 10,576,500 | | | | 6,925,267 | |
| | | | | | | | |
| | |
| | | Shares | | | Value | |
| | | | | | | | |
Commercial Banks (continued) | |
Popular, Inc. (a) | | | 46,237 | | | $ | 893,761 | |
U.S. Bancorp | | | 320,000 | | | | 10,627,200 | |
Wells Fargo & Co. | | | 889,624 | | | | 29,971,433 | |
| | | | | | | | |
| | | | | | | 85,114,416 | |
| | | | | | | | |
Commercial Services & Supplies 0.7% | |
ADT Corp. (The) (a) | | | 86,594 | | | | 3,594,517 | |
Covanta Holding Corp. | | | 256,953 | | | | 4,671,406 | |
Tyco International, Ltd. | | | 173,189 | | | | 4,653,588 | |
Waste Management, Inc. | | | 58,400 | | | | 1,912,016 | |
| | | | | | | | |
| | | | | | | 14,831,527 | |
| | | | | | | | |
Communications Equipment 1.4% | |
Cisco Systems, Inc. | | | 1,627,450 | | | | 27,894,493 | |
Infinera Corp. (a) | | | 129,151 | | | | 635,423 | |
Motorola Solutions, Inc. | | | 1,442 | | | | 74,522 | |
| | | | | | | | |
| | | | | | | 28,604,438 | |
| | | | | | | | |
Computers & Peripherals 2.0% | |
Apple, Inc. | | | 55,285 | | | | 32,900,104 | |
Dell, Inc. | | | 340,270 | | | | 3,140,692 | |
SanDisk Corp. (a) | | | 99,591 | | | | 4,158,920 | |
STEC, Inc. (a) | | | 188,200 | | | | 1,104,734 | |
| | | | | | | | |
| | | | | | | 41,304,450 | |
| | | | | | | | |
Construction & Engineering 0.5% | |
China Communications Construction Co., Ltd. Class H | | | 4,656,800 | | | | 4,380,368 | |
Jacobs Engineering Group, Inc. (a) | | | 143,836 | | | | 5,550,631 | |
| | | | | | | | |
| | | | | | | 9,930,999 | |
| | | | | | | | |
Construction Materials 0.2% | |
Holcim, Ltd. (a) | | | 45,950 | | | | 3,135,534 | |
| | | | | | | | |
|
Consumer Finance 2.8% | |
American Express Co. | | | 395,350 | | | | 22,127,739 | |
Capital One Financial Corp. | | | 365,200 | | | | 21,974,084 | |
Discover Financial Services | | | 295,330 | | | | 12,108,530 | |
| | | | | | | | |
| | | | | | | 56,210,353 | |
| | | | | | | | |
Diversified Consumer Services 0.3% | |
Coinstar, Inc. (a) | | | 137,072 | | | | 6,434,160 | |
| | | | | | | | |
|
Diversified Financial Services 4.1% | |
Bank of America Corp. | | | 384,054 | | | | 3,579,384 | |
¨Citigroup, Inc. | | | 995,880 | | | | 37,235,953 | |
CME Group, Inc. | | | 121,440 | | | | 6,792,139 | |
JPMorgan Chase & Co. | | | 794,707 | | | | 33,123,388 | |
Leucadia National Corp. | | | 74,446 | | | | 1,689,924 | |
| | | | | | | | |
| | | | | | | 82,420,788 | |
| | | | | | | | |
| † | Percentages indicated are based on Fund net assets. |
| ¨ | | Among the Fund’s 10 largest holdings, as of October 31, 2012, excluding short-term investment. May be subject to change daily. |
| | | | |
| 12 | | MainStay MAP Fund | | The notes to the financial statements are an integral part of,
and should be read in conjunction with, the financial statements. |
| | | | | | | | |
| | |
| | | Shares | | | Value | |
| | | | | | | | |
| Common Stocks (continued) | |
Diversified Telecommunication Services 1.4% | |
AT&T, Inc. | | | 314,900 | | | $ | 10,892,391 | |
Nippon Telegraph & Telephone Corp. | | | 340,600 | | | | 15,508,969 | |
Verizon Communications, Inc. | | | 48,800 | | | | 2,178,432 | |
| | | | | | | | |
| | | | | | | 28,579,792 | |
| | | | | | | | |
Electric Utilities 1.2% | | | | | | | | |
American Electric Power Co., Inc. | | | 52,765 | | | | 2,344,877 | |
Duke Energy Corp. | | | 345,097 | | | | 22,669,422 | |
| | | | | | | | |
| | | | | | | 25,014,299 | |
| | | | | | | | |
Electrical Equipment 1.3% | | | | | | | | |
ABB, Ltd. (a) | | | 728,700 | | | | 13,129,589 | |
Rockwell Automation, Inc. | | | 129,353 | | | | 9,191,824 | |
Schneider Electric S.A. | | | 75,800 | | | | 4,738,998 | |
| | | | | | | | |
| | | | | | | 27,060,411 | |
| | | | | | | | |
Electronic Equipment & Instruments 0.5% | | | | | |
Corning, Inc. | | | 195,550 | | | | 2,297,713 | |
TE Connectivity, Ltd. | | | 255,541 | | | | 8,223,309 | |
| | | | | | | | |
| | | | | | | 10,521,022 | |
| | | | | | | | |
Energy Equipment & Services 1.5% | | | | | |
Baker Hughes, Inc. | | | 48,822 | | | | 2,049,059 | |
Exterran Holdings, Inc. (a) | | | 74,843 | | | | 1,495,363 | |
Halliburton Co. | | | 547,550 | | | | 17,680,390 | |
Key Energy Services, Inc. (a) | | | 160,455 | | | | 1,049,376 | |
Schlumberger, Ltd. | | | 95,794 | | | | 6,660,557 | |
Weatherford International, Ltd. (a) | | | 111,551 | | | | 1,260,526 | |
| | | | | | | | |
| | | | | | | 30,195,271 | |
| | | | | | | | |
Food & Staples Retailing 1.6% | | | | | |
CVS Caremark Corp. | | | 227,426 | | | | 10,552,566 | |
Wal-Mart Stores, Inc. | | | 177,320 | | | | 13,302,547 | |
Walgreen Co. | | | 230,061 | | | | 8,105,049 | |
| | | | | | | | |
| | | | | | | 31,960,162 | |
| | | | | | | | |
Food Products 1.3% | | | | | | | | |
Archer-Daniels-Midland Co. | | | 436,913 | | | | 11,726,745 | |
Bunge, Ltd. | | | 57,690 | | | | 4,097,721 | |
Danone S.A. | | | 128,600 | | | | 7,905,027 | |
Kraft Foods Group, Inc. (a) | | | 20,733 | | | | 942,937 | |
Mondelez International, Inc. Class A | | | 62,200 | | | | 1,650,788 | |
| | | | | | | | |
| | | | | | | 26,323,218 | |
| | | | | | | | |
Gas Utilities 0.3% | | | | | | | | |
AGL Resources, Inc. | | | 28,708 | | | | 1,172,148 | |
National Fuel Gas Co. | | | 77,735 | | | | 4,096,634 | |
| | | | | | | | |
| | | | | | | 5,268,782 | |
| | | | | | | | |
Health Care Equipment & Supplies 3.7% | | | | | |
Baxter International, Inc. | | | 506,318 | | | | 31,710,696 | |
Boston Scientific Corp. (a) | | | 45,000 | | | | 231,300 | |
CareFusion Corp. (a) | | | 44,612 | | | | 1,184,895 | |
| | | | | | | | |
| | |
| | | Shares | | | Value | |
| | | | | | | | |
Health Care Equipment & Supplies (continued) | | | | | |
Covidien PLC | | | 620,569 | | | $ | 34,100,267 | |
Medtronic, Inc. | | | 184,966 | | | | 7,690,886 | |
| | | | | | | | |
| | | | | | | 74,918,044 | |
| | | | | | | | |
Health Care Providers & Services 2.0% | | | | | |
Aetna, Inc. | | | 434,845 | | | | 19,002,726 | |
Cardinal Health, Inc. | | | 61,070 | | | | 2,511,809 | |
Express Scripts Holding Co. (a) | | | 48,700 | | | | 2,996,998 | |
McKesson Corp. | | | 162,550 | | | | 15,167,541 | |
SunLink Health Systems, Inc. (a) | | | 51,368 | | | | 53,936 | |
| | | | | | | | |
| | | | | | | 39,733,010 | |
| | | | | | | | |
Hotels, Restaurants & Leisure 1.0% | | | | | |
McDonald’s Corp. | | | 118,630 | | | | 10,297,084 | |
Starwood Hotels & Resorts Worldwide, Inc. | | | 181,741 | | | | 9,423,271 | |
| | | | | | | | |
| | | | | | | 19,720,355 | |
| | | | | | | | |
Household Products 0.5% | | | | | | | | |
Colgate-Palmolive Co. | | | 28,512 | | | | 2,992,620 | |
Procter & Gamble Co. (The) | | | 108,100 | | | | 7,484,844 | |
| | | | | | | | |
| | | | | | | 10,477,464 | |
| | | | | | | | |
Independent Power Producers & Energy Traders 0.2% | |
AES Corp. (The) | | | 425,700 | | | | 4,448,565 | |
| | | | | | | | |
|
Industrial Conglomerates 2.8% | |
3M Co. | | | 69,650 | | | | 6,101,340 | |
¨General Electric Co. | | | 1,926,933 | | | | 40,581,209 | |
Siemens A.G. | | | 98,800 | | | | 9,929,738 | |
| | | | | | | | |
| | | | | | | 56,612,287 | |
| | | | | | | | |
Insurance 3.5% | | | | | | | | |
Allstate Corp. (The) | | | 174,709 | | | | 6,984,866 | |
American International Group, Inc. (a) | | | 33,075 | | | | 1,155,310 | |
Aon PLC | | | 99,640 | | | | 5,375,578 | |
Berkshire Hathaway, Inc. Class B (a) | | | 24,249 | | | | 2,093,901 | |
Chubb Corp. (The) | | | 76,156 | | | | 5,862,489 | |
Marsh & McLennan Cos., Inc. | | | 118,596 | | | | 4,035,822 | |
MetLife, Inc. | | | 194,961 | | | | 6,919,166 | |
Tokio Marine Holdings, Inc. | | | 297,100 | | | | 7,863,864 | |
Travelers Cos., Inc. (The) | | | 327,790 | | | | 23,253,423 | |
W.R. Berkley Corp. | | | 197,998 | | | | 7,700,142 | |
| | | | | | | | |
| | | | | | | 71,244,561 | |
| | | | | | | | |
Internet & Catalog Retail 0.7% | | | | | |
Liberty Interactive Corp. Class A (a) | | | 550,690 | | | | 11,013,800 | |
Liberty Ventures (a) | | | 37,036 | | | | 2,107,719 | |
| | | | | | | | |
| | | | | | | 13,121,519 | |
| | | | | | | | |
Internet Software & Services 2.6% | | | | | |
eBay, Inc. (a) | | | 433,825 | | | | 20,949,409 | |
Google, Inc. Class A (a) | | | 24,706 | | | | 16,794,397 | |
Valueclick, Inc. (a) | | | 135,658 | | | | 2,261,419 | |
VeriSign, Inc. (a) | | | 329,495 | | | | 12,214,380 | |
Yahoo!, Inc. (a) | | | 61,000 | | | | 1,025,410 | |
| | | | | | | | |
| | | | | | | 53,245,015 | |
| | | | | | | | |
| | | | | | |
The notes to the financial statements are an integral part of,
and should be read in conjunction with, the financial statements. | | mainstayinvestments.com | | | 13 | |
Portfolio of Investments October 31, 2012 (continued)
| | | | | | | | |
| | |
| | | Shares | | | Value | |
| | | | | | | | |
| Common Stocks (continued) | |
IT Services 1.0% | | | | | | | | |
Automatic Data Processing, Inc. | | | 97,249 | | | $ | 5,620,020 | |
International Business Machines Corp. | | | 70,199 | | | | 13,655,811 | |
| | | | | | | | |
| | | | | | | 19,275,831 | |
| | | | | | | | |
Machinery 1.6% | | | | | | | | |
Accuride Corp. (a) | | | 44,899 | | | | 119,880 | |
Caterpillar, Inc. | | | 111,850 | | | | 9,485,999 | |
Cummins, Inc. | | | 156,500 | | | | 14,645,270 | |
Pentair, Ltd. | | | 41,555 | | | | 1,755,283 | |
Vallourec S.A. | | | 161,550 | | | | 6,645,085 | |
| | | | | | | | |
| | | | | | | 32,651,517 | |
| | | | | | | | |
Media 7.7% | | | | | | | | |
Cablevision Systems Corp. Class A | | | 403,603 | | | | 7,030,764 | |
Comcast Corp. Class A | | | 190,960 | | | | 7,162,910 | |
DIRECTV (a) | | | 28,935 | | | | 1,478,868 | |
¨Liberty Media Corp.—Liberty Capital
Class A (a) | | | 327,759 | | | | 36,600,847 | |
Madison Square Garden Co. Class A (a) | | | 206,321 | | | | 8,492,172 | |
Sirius XM Radio, Inc. (a) | | | 556,700 | | | | 1,558,760 | |
Time Warner Cable, Inc. | | | 15,445 | | | | 1,530,754 | |
¨Time Warner, Inc. | | | 1,308,666 | | | | 56,861,538 | |
Viacom, Inc. Class B | | | 653,700 | | | | 33,515,199 | |
Walt Disney Co. (The) | | | 40,443 | | | | 1,984,538 | |
| | | | | | | | |
| | | | | | | 156,216,350 | |
| | | | | | | | |
Metals & Mining 1.7% | | | | | | | | |
Barrick Gold Corp. | | | 634,400 | | | | 25,693,200 | |
ThyssenKrupp A.G. | | | 347,500 | | | | 7,906,981 | |
| | | | | | | | |
| | | | | | | 33,600,181 | |
| | | | | | | | |
Multi-Utilities 0.1% | | | | | | | | |
Dominion Resources, Inc. | | | 38,600 | | | | 2,037,308 | |
| | | | | | | | |
Multiline Retail 0.2% | | | | | | | | |
J.C. Penney Co., Inc. | | | 48,332 | | | | 1,160,451 | |
Target Corp. | | | 58,590 | | | | 3,735,113 | |
| | | | | | | | |
| | | | | | | 4,895,564 | |
| | | | | | | | |
Office Electronics 0.0%‡ | | | | | | | | |
Xerox Corp. | | | 65,600 | | | | 422,464 | |
| | | | | | | | |
| | |
Oil, Gas & Consumable Fuels 10.5% | | | | | | | | |
Anadarko Petroleum Corp. | | | 143,164 | | | | 9,851,115 | |
Apache Corp. | | | 107,199 | | | | 8,870,717 | |
Chesapeake Energy Corp. | | | 194,124 | | | | 3,932,952 | |
Chevron Corp. | | | 77,329 | | | | 8,522,429 | |
ConocoPhillips | | | 148,476 | | | | 8,589,337 | |
Devon Energy Corp. | | | 195,321 | | | | 11,369,636 | |
Encana Corp. | | | 766,500 | | | | 17,284,575 | |
ENI S.p.A. | | | 615,650 | | | | 14,132,126 | |
EOG Resources, Inc. | | | 76,464 | | | | 8,907,291 | |
| | | | | | | | |
| | |
| | | Shares | | | Value | |
| | | | | | | | |
Oil, Gas & Consumable Fuels (continued) | | | | | |
¨ExxonMobil Corp. | | | 420,950 | | | $ | 38,378,012 | |
Hess Corp. | | | 112,911 | | | | 5,900,729 | |
Marathon Oil Corp. | | | 181,899 | | | | 5,467,884 | |
Marathon Petroleum Corp. | | | 208,623 | | | | 11,459,661 | |
Occidental Petroleum Corp. | | | 250,370 | | | | 19,769,215 | |
Phillips 66 | | | 74,588 | | | | 3,517,570 | |
Southwestern Energy Co. (a) | | | 522,300 | | | | 18,123,810 | |
Spectra Energy Corp. | | | 530,400 | | | | 15,312,648 | |
Williams Cos., Inc. | | | 127,681 | | | | 4,467,558 | |
| | | | | | | | |
| | | | | | | 213,857,265 | |
| | | | | | | | |
Paper & Forest Products 0.1% | | | | | |
MeadWestvaco Corp. | | | 80,405 | | | | 2,387,224 | |
| | | | | | | | |
| | |
Pharmaceuticals 8.1% | | | | | | | | |
Abbott Laboratories | | | 133,827 | | | | 8,768,345 | |
Bayer A.G. | | | 95,100 | | | | 8,282,095 | |
Hospira, Inc. (a) | | | 129,403 | | | | 3,971,378 | |
Johnson & Johnson | | | 494,650 | | | | 35,031,113 | |
Merck & Co., Inc. | | | 149,726 | | | | 6,831,997 | |
Novartis A.G., ADR (b) | | | 234,800 | | | | 14,196,008 | |
Novartis A.G. | | | 307,600 | | | | 18,512,810 | |
¨Pfizer, Inc. | | | 2,205,750 | | | | 54,857,003 | |
Sanofi | | | 108,500 | | | | 9,537,677 | |
Teva Pharmaceutical Industries, Ltd., Sponsored ADR (b) | | | 117,898 | | | | 4,765,437 | |
| | | | | | | | |
| | | | | | | 164,753,863 | |
| | | | | | | | |
Real Estate Investment Trusts 1.1% | | | | | |
HCP, Inc. | | | 197,735 | | | | 8,759,661 | |
UDR, Inc. | | | 446,540 | | | | 10,837,526 | |
Weyerhaeuser Co. | | | 76,705 | | | | 2,123,961 | |
| | | | | | | | |
| | | | | | | 21,721,148 | |
| | | | | | | | |
Real Estate Management & Development 0.1% | | | | | |
St. Joe Co. (The) (a) | | | 91,667 | | | | 1,815,007 | |
| | | | | | | | |
| | |
Road & Rail 0.7% | | | | | | | | |
Celadon Group, Inc. | | | 112,874 | | | | 1,930,146 | |
CSX Corp. | | | 198,526 | | | | 4,063,827 | |
Union Pacific Corp. | | | 58,400 | | | | 7,184,952 | |
| | | | | | | | |
| | | | | | | 13,178,925 | |
| | | | | | | | |
Semiconductors & Semiconductor Equipment 2.2% | |
Applied Materials, Inc. | | | 370,069 | | | | 3,922,731 | |
Intel Corp. | | | 287,595 | | | | 6,219,242 | |
Texas Instruments, Inc. | | | 1,256,800 | | | | 35,303,512 | |
| | | | | | | | |
| | | | | | | 45,445,485 | |
| | | | | | | | |
Software 3.5% | | | | | | | | |
Adobe Systems, Inc. (a) | | | 365,150 | | | | 12,415,100 | |
Electronic Arts, Inc. (a) | | | 31,733 | | | | 391,902 | |
JDA Software Group, Inc. (a) | | | 33,079 | | | | 1,261,633 | |
| | | | |
| 14 | | MainStay MAP Fund | | The notes to the financial statements are an integral part of,
and should be read in conjunction with, the financial statements. |
| | | | | | | | |
| | |
| | | Shares | | | Value | |
| | | | | | | | |
| Common Stocks (continued) | |
Software (continued) | | | | | |
¨Microsoft Corp. | | | 1,713,833 | | | $ | 48,904,225 | |
Oracle Corp. | | | 111,758 | | | | 3,470,086 | |
SAP A.G. | | | 71,350 | | | | 5,197,391 | |
| | | | | | | | |
| | | | | | | 71,640,337 | |
| | | | | | | | |
Specialty Retail 1.2% | |
Home Depot, Inc. (The) | | | 148,453 | | | | 9,112,045 | |
Lowe’s Cos., Inc. | | | 451,112 | | | | 14,607,007 | |
| | | | | | | | |
| | | | | | | 23,719,052 | |
| | | | | | | | |
Thrifts & Mortgage Finance 0.0%‡ | |
New York Community Bancorp, Inc. | | | 23,210 | | | | 321,691 | |
| | | | | | | | |
|
Trading Companies & Distributors 0.4% | |
Mitsubishi Corp. | | | 475,950 | | | | 8,495,913 | |
| | | | | | | | |
|
Wireless Telecommunication Services 1.9% | |
¨Vodafone Group PLC, Sponsored ADR (b) | | | 1,411,050 | | | | 38,408,781 | |
| | | | | | | | |
Total Common Stocks
(Cost $1,680,675,371) | | | | | | | 1,961,902,661 | |
| | | | | | | | |
| | |
| | | | | | | | |
| | | Principal
Amount | | | | |
Long-Term Bonds 0.1%
Convertible Bonds 0.1% | |
Diversified Consumer Services 0.1% | |
Coinstar, Inc.
4.00%, due 9/1/14 | | $ | 900,000 | | | | 1,195,875 | |
| | | | | | | | |
|
Oil, Gas & Consumable Fuels 0.0%‡ | |
Bill Barrett Corp.
5.00%, due 3/15/28 | | | 100,300 | | | | 100,864 | |
| | | | | | | | |
Total Convertible Bonds
(Cost $960,007) | | | | | | | 1,296,739 | |
| | | | | | | | |
|
| Corporate Bond 0.0%‡ | |
Specialty Retail 0.0%‡ | |
PEP Boys-Manny Moe & Jack
7.50%, due 12/15/14 | | | 1,000,000 | | | | 1,006,260 | |
| | | | | | | | |
Total Corporate Bond
(Cost $895,824) | | | | | | | 1,006,260 | |
| | | | | | | | |
Total Long-Term Bonds
(Cost $1,855,831) | | | | | | | 2,302,999 | |
| | | | | | | | |
| | | | | | | | |
| | | Principal
Amount | | | Value | |
| | | | | | | | |
| Short-Term Investment 3.0% | |
Repurchase Agreement 3.0% | |
State Street Bank and Trust Co.
0.01%, dated 10/31/12
due 11/1/12
Proceeds at Maturity $60,089,119 (Collateralized by a Federal National Mortgage Association security with a rate of 0.75% and a maturity date of 6/4/15, with a Principal Amount of $61,050,000 and a Market Value of $61,298,657) | | $ | 60,089,103 | | | $ | 60,089,103 | |
| | | | | | | | |
Total Short-Term Investment
(Cost $60,089,103) | | | | | | | 60,089,103 | |
| | | | | | | | |
Total Investments
(Cost $1,742,620,305) (c) | | | 99.8 | % | | | 2,024,294,763 | |
Other Assets, Less Liabilities | | | 0.2 | | | | 4,678,461 | |
Net Assets | | | 100.0 | % | | $ | 2,028,973,224 | |
| ‡ | Less than one-tenth of a percent. |
| (a) | Non-income producing security. |
| (b) | ADR—American Depositary Receipt. |
| (c) | As of October 31, 2012, cost is $1,755,303,757 for federal income tax purposes and net unrealized appreciation is as follows: |
| | | | |
Gross unrealized appreciation | | $ | 333,834,162 | |
Gross unrealized depreciation | | | (64,843,156 | ) |
| | | | |
Net unrealized appreciation | | $ | 268,991,006 | |
| | | | |
| | | | | | |
The notes to the financial statements are an integral part of,
and should be read in conjunction with, the financial statements. | | mainstayinvestments.com | | | 15 | |
Portfolio of Investments October 31, 2012 (continued)
The following is a summary of the fair valuations according to the inputs used as of October 31, 2012, for valuing the Fund’s assets.
Asset Valuation Inputs
| | | | | | | | | | | | | | | | |
Description | | Quoted
Prices in
Active
Markets for
Identical
Assets (Level 1) | | | Significant
Other
Observable
Inputs (Level 2) | | | Significant
Unobservable
Inputs (Level 3) | | | Total | |
| Investments in Securities (a) | | | | | | | | | | | | | | | | |
| Common Stocks | | $ | 1,961,902,661 | | | $ | — | | | $ | — | | | $ | 1,961,902,661 | |
| Long-Term Bonds | | | | | | | | | | | | | | | | |
Convertible Bonds | | | — | | | | 1,296,739 | | | | — | | | | 1,296,739 | |
Corporate Bond | | | — | | | | 1,006,260 | | | | — | | | | 1,006,260 | |
| | | | | | | | | | | | | | | | |
| Total Long-Term Bonds | | | — | | | | 2,302,999 | | | | — | | | | 2,302,999 | |
| | | | | | | | | | | | | | | | |
| Short-Term Investment | | | | | | | | | | | | | | | | |
Repurchase Agreement | | | — | | | | 60,089,103 | | | | — | | | | 60,089,103 | |
| | | | | | | | | | | | | | | | |
| Total Investments in Securities | | $ | 1,961,902,661 | | | $ | 62,392,102 | | | $ | — | | | $ | 2,024,294,763 | |
| | | | | | | | | | | | | | | | |
| (a) | For a complete listing of investments and their industries, see the Portfolio of Investments. |
The Fund recognizes transfers between the levels as of the beginning of the period.
As of October 31, 2012, the Fund did not hold any investments with significant unobservable inputs (Level 3). (See Note 2)
As of October 31, 2012, foreign securities with a total value of $146,136,008 were transferred from Level 2 to Level 1 as the prices of these securities were based on quoted prices compared with the prior year prices which were adjusted for events after the market close. The October 31, 2011 prices were adjusted by applying factors provided by a third party vendor in accordance with the Fund’s policies and procedures. Fair values as of October 31, 2012 for these securities are based on quoted prices in active markets for identical investments. (See Note 2)
| | | | |
| 16 | | MainStay MAP Fund | | The notes to the financial statements are an integral part of,
and should be read in conjunction with, the financial statements. |
Statement of Assets and Liabilities as of October 31, 2012
| | | | |
| Assets | | | | |
Investment in securities, at value (identified cost $1,742,620,305) | | $ | 2,024,294,763 | |
Receivables: | | | | |
Investment securities sold | | | 6,483,343 | |
Dividends and interest | | | 2,394,761 | |
Fund shares sold | | | 1,902,804 | |
Other assets | | | 33,743 | |
| | | | |
Total assets | | | 2,035,109,414 | |
| | | | |
| |
| Liabilities | | | | |
Payables: | | | | |
Investment securities purchased | | | 2,091,872 | |
Fund shares redeemed | | | 1,611,423 | |
Manager (See Note 3) | | | 1,287,537 | |
Transfer agent (See Note 3) | | | 750,819 | |
NYLIFE Distributors (See Note 3) | | | 278,888 | |
Shareholder communication | | | 59,889 | |
Professional fees | | | 32,523 | |
Custodian | | | 12,205 | |
Trustees | | | 6,250 | |
Accrued expenses | | | 4,784 | |
| | | | |
Total liabilities | | | 6,136,190 | |
| | | | |
Net assets | | $ | 2,028,973,224 | |
| | | | |
| |
| Composition of Net Assets | | | | |
Shares of beneficial interest outstanding (par value of $.01 per share) unlimited number of shares authorized | | $ | 592,458 | |
Additional paid-in capital | | | 1,869,803,441 | |
| | | | |
| | | 1,870,395,899 | |
Undistributed net investment income | | | 20,005,478 | |
Accumulated net realized gain (loss) on investments and foreign currency transactions | | | (143,078,864 | ) |
Net unrealized appreciation (depreciation) on investments | | | 281,674,458 | |
Net unrealized appreciation (depreciation) on translation of other assets and liabilities in foreign currencies | | | (23,747 | ) |
| | | | |
Net assets | | $ | 2,028,973,224 | |
| | | | |
| | | | |
Investor Class | | | | |
Net assets applicable to outstanding shares | | $ | 120,771,311 | |
| | | | |
Shares of beneficial interest outstanding | | | 3,548,439 | |
| | | | |
Net asset value per share outstanding | | $ | 34.04 | |
Maximum sales charge (5.50% of offering price) | | | 1.98 | |
| | | | |
Maximum offering price per share outstanding | | $ | 36.02 | |
| | | | |
Class A | | | | |
Net assets applicable to outstanding shares | | $ | 294,246,849 | |
| | | | |
Shares of beneficial interest outstanding | | | 8,636,525 | |
| | | | |
Net asset value per share outstanding | | $ | 34.07 | |
Maximum sales charge (5.50% of offering price) | | | 1.98 | |
| | | | |
Maximum offering price per share outstanding | | $ | 36.05 | |
| | | | |
Class B | | | | |
Net assets applicable to outstanding shares | | $ | 86,613,455 | |
| | | | |
Shares of beneficial interest outstanding | | | 2,744,984 | |
| | | | |
Net asset value and offering price per share outstanding | | $ | 31.55 | |
| | | | |
Class C | | | | |
Net assets applicable to outstanding shares | | $ | 125,700,155 | |
| | | | |
Shares of beneficial interest outstanding | | | 3,983,161 | |
| | | | |
Net asset value and offering price per share outstanding | | $ | 31.56 | |
| | | | |
Class I | | | | |
Net assets applicable to outstanding shares | | $ | 1,358,999,325 | |
| | | | |
Shares of beneficial interest outstanding | | | 39,084,641 | |
| | | | |
Net asset value and offering price per share outstanding | | $ | 34.77 | |
| | | | |
Class R1 | | | | |
Net assets applicable to outstanding shares | | $ | 21,761,037 | |
| | | | |
Shares of beneficial interest outstanding | | | 635,817 | |
| | | | |
Net asset value and offering price per share outstanding | | $ | 34.23 | |
| | | | |
Class R2 | | | | |
Net assets applicable to outstanding shares | | $ | 19,072,179 | |
| | | | |
Shares of beneficial interest outstanding | | | 558,936 | |
| | | | |
Net asset value and offering price per share outstanding | | $ | 34.12 | |
| | | | |
Class R3 | | | | |
Net assets applicable to outstanding shares | | $ | 1,808,913 | |
| | | | |
Shares of beneficial interest outstanding | | | 53,290 | |
| | | | |
Net asset value and offering price per share outstanding | | $ | 33.94 | |
| | | | |
| | | | | | |
The notes to the financial statements are an integral part of,
and should be read in conjunction with, the financial statements. | | mainstayinvestments.com | | | 17 | |
Statement of Operations for the year ended October 31, 2012
| | | | |
| Investment Income (Loss) | | | | |
Income | | | | |
Dividends (a) | | $ | 45,787,170 | |
Interest | | | 261,533 | |
| | | | |
Total income | | | 46,048,703 | |
| | | | |
Expenses | | | | |
Manager (See Note 3) | | | 14,287,531 | |
Distribution/Service—Investor Class (See Note 3) | | | 295,037 | |
Distribution/Service—Class A (See Note 3) | | | 748,239 | |
Distribution/Service—Class B (See Note 3) | | | 988,596 | |
Distribution/Service—Class C (See Note 3) | | | 1,314,904 | |
Distribution/Service—Class R2 (See Note 3) | | | 51,187 | |
Distribution/Service—Class R3 (See Note 3) | | | 9,704 | |
Transfer agent (See Note 3) | | | 3,004,242 | |
Shareholder communication | | | 158,408 | |
Registration | | | 135,806 | |
Professional fees | | | 135,057 | |
Custodian | | | 73,595 | |
Trustees | | | 52,671 | |
Shareholder service (See Note 3) | | | 43,165 | |
Miscellaneous | | | 93,961 | |
| | | | |
Total expenses | | | 21,392,103 | |
| | | | |
Net investment income (loss) | | | 24,656,600 | |
| | | | |
|
| Realized and Unrealized Gain (Loss) on Investments and Foreign Currency Transactions | |
Net realized gain (loss) on: | | | | |
Security transactions | | | 17,005,477 | |
Foreign currency transactions | | | (118,794 | ) |
| | | | |
Net realized gain (loss) on investments and foreign currency transactions | | | 16,886,683 | |
| | | | |
Net change in unrealized appreciation (depreciation) on: | | | | |
Investments | | | 199,571,101 | |
Translation of other assets and liabilities in foreign currencies | | | 13,998 | |
| | | | |
Net change in unrealized appreciation (depreciation) on investments and foreign currency transactions | | | 199,585,099 | |
| | | | |
Net realized and unrealized gain (loss) on investments and foreign currency transactions | | | 216,471,782 | |
| | | | |
Net increase (decrease) in net assets resulting from operations | | $ | 241,128,382 | |
| | | | |
| (a) | Dividends recorded net of foreign withholding taxes in the amount of $841,246. |
| | | | |
| 18 | | MainStay MAP Fund | | The notes to the financial statements are an integral part of,
and should be read in conjunction with, the financial statements. |
Statements of Changes in Net Assets
for the years ended October 31, 2012 and October 31, 2011
| | | | | | | | |
| | | 2012 | | | 2011 | |
| Increase (Decrease) in Net Assets | |
Operations: | | | | | | | | |
Net investment income (loss) | | $ | 24,656,600 | | | $ | 20,327,795 | |
Net realized gain (loss) on investments and foreign currency transactions | | | 16,886,683 | | | | 53,596,562 | |
Net change in unrealized appreciation (depreciation) on investments and foreign currency transactions | | | 199,585,099 | | | | (50,824,193 | ) |
| | | | |
Net increase (decrease) in net assets resulting from operations | | | 241,128,382 | | | | 23,100,164 | |
| | | | |
Dividends to shareholders: | | | | | | | | |
From net investment income: | | | | | | | | |
Investor Class | | | (1,095,797 | ) | | | (779,156 | ) |
Class A | | | (3,428,788 | ) | | | (3,020,741 | ) |
Class B | | | (195,661 | ) | | | (115,398 | ) |
Class C | | | (237,900 | ) | | | (134,256 | ) |
Class I | | | (17,003,986 | ) | | | (8,102,183 | ) |
Class R1 | | | (272,411 | ) | | | (3,452 | ) |
Class R2 | | | (244,869 | ) | | | (190,054 | ) |
Class R3 | | | (20,629 | ) | | | (9,419 | ) |
| | | | |
Total dividends to shareholders | | | (22,500,041 | ) | | | (12,354,659 | ) |
| | | | |
Capital share transactions: | | | | | | | | |
Net proceeds from sale of shares | | | 335,367,832 | | | | 721,283,538 | |
Net asset value of shares issued to shareholders in reinvestment of dividends | | | 21,744,554 | | | | 11,512,928 | |
Cost of shares redeemed | | | (436,709,049 | ) | | | (401,222,803 | ) |
| | | | |
Increase (decrease) in net assets derived from capital share transactions | | | (79,596,663 | ) | | | 331,573,663 | |
| | | | |
Net increase (decrease) in net assets | | | 139,031,678 | | | | 342,319,168 | |
| | |
| Net Assets | | | | | | | | |
Beginning of year | | | 1,889,941,546 | | | | 1,547,622,378 | |
| | | | |
End of year | | $ | 2,028,973,224 | | | $ | 1,889,941,546 | |
| | | | |
Undistributed net investment income at end of year | | $ | 20,005,478 | | | $ | 18,170,051 | |
| | | | |
| | | | | | |
The notes to the financial statements are an integral part of,
and should be read in conjunction with, the financial statements. | | mainstayinvestments.com | | | 19 | |
Financial Highlights selected per share data and ratios
| | | | | | | | | | | | | | | | | | | | |
| | | Investor Class | |
| | | Year ended October 31, | | | February 28,
2008**
through
October 31, | |
| | | 2012 | | | 2011 | | | 2010 | | | 2009 | | | 2008 | |
Net asset value at beginning of period | | $ | 30.44 | | | $ | 29.76 | | | $ | 25.71 | | | $ | 23.04 | | | $ | 32.90 | |
| | | | | | | | | | | | | | | | | | | | |
Net investment income (loss) (a) | | | 0.34 | | | | 0.31 | | | | 0.19 | | | | 0.22 | | | | 0.17 | |
Net realized and unrealized gain (loss) on investments | | | 3.55 | | | | 0.63 | | | | 3.86 | | | | 2.90 | | | | (10.02 | ) |
Net realized and unrealized gain (loss) on foreign currency transactions | | | (0.00 | )‡ | | | (0.06 | ) | | | (0.00 | )‡ | | | 0.00 | ‡ | | | (0.01 | ) |
| | | | | | | | | | | | | | | | | | | | |
Total from investment operations | | | 3.89 | | | | 0.88 | | | | 4.05 | | | | 3.12 | | | | (9.86 | ) |
| | | | | | | | | | | | | | | | | | | | |
Less dividends: | | | | | | | | | | | | | | | | | | | | |
From net investment income | | | (0.29 | ) | | | (0.20 | ) | | | — | | | | (0.45 | ) | | | — | |
| | | | | | | | | | | | | | | | | | | | |
Net asset value at end of period | | $ | 34.04 | | | $ | 30.44 | | | $ | 29.76 | | | $ | 25.71 | | | $ | 23.04 | |
| | | | | | | | | | | | | | | | | | | | |
Total investment return (b) | | | 12.88 | % | | | 2.96 | % | | | 15.75 | % | | | 13.83 | % | | | (29.97 | %)(c) |
Ratios (to average net assets)/Supplemental Data: | | | | | | | | | | | | | | | | | | | | |
Net investment income (loss) | | | 1.04 | % | | | 0.98 | % | | | 0.69 | % | | | 0.98 | % | | | 0.81 | % †† |
Net expenses | | | 1.34 | % | | | 1.34 | % | | | 1.41 | % | | | 1.44 | % | | | 1.35 | % †† |
Expenses (before waiver/reimbursement) | | | 1.34 | % | | | 1.34 | % | | | 1.41 | % | | | 1.50 | % | | | 1.35 | % †† |
Portfolio turnover rate | | | 40 | % | | | 44 | % | | | 49 | % | | | 60 | % | | | 96 | % |
Net assets at end of period (in 000’s) | | $ | 120,771 | | | $ | 114,786 | | | $ | 113,557 | | | $ | 99,663 | | | $ | 72,709 | |
| ** | Commencement of operations. |
| ‡ | Less than one cent per share. |
| (a) | Per share data based on average shares outstanding during the period. |
| (b) | Total investment return is calculated exclusive of sales charges and assumes the reinvestment of dividends and distributions. |
| (c) | Total investment return is not annualized. |
| | | | |
| 20 | | MainStay MAP Fund | | The notes to the financial statements are an integral part of,
and should be read in conjunction with, the financial statements. |
Financial Highlights selected per share data and ratios
| | | | | | | | | | | | | | | | | | | | |
| | | Class A | |
| | | Year ended October 31, | |
| | | 2012 | | | 2011 | | | 2010 | | | 2009 | | | 2008 | |
Net asset value at beginning of year | | $ | 30.47 | | | $ | 29.79 | | | $ | 25.68 | | | $ | 23.04 | | | $ | 41.39 | |
| | | | | | | | | | | | | | | | | | | | |
Net investment income (loss) (a) | | | 0.40 | | | | 0.37 | | | | 0.25 | | | | 0.28 | | | | 0.31 | |
Net realized and unrealized gain (loss) on investments | | | 3.56 | | | | 0.63 | | | | 3.86 | | | | 2.90 | | | | (13.88 | ) |
Net realized and unrealized gain (loss) on foreign currency transactions | | | (0.00 | )‡ | | | (0.06 | ) | | | (0.00 | )‡ | | | 0.00 | ‡ | | | (0.01 | ) |
| | | | | | | | | | | | | | | | | | | | |
Total from investment operations | | | 3.96 | | | | 0.94 | | | | 4.11 | | | | 3.18 | | | | (13.58 | ) |
| | | | | | | | | | | | | | | | | | | | |
Less dividends and distributions: | | | | | | | | | | | | | | | | | | | | |
From net investment income | | | (0.36 | ) | | | (0.26 | ) | | | — | | | | (0.54 | ) | | | (0.22 | ) |
From net realized gain on investments | | | — | | | | — | | | | — | | | | — | | | | (4.55 | ) |
| | | | | | | | | | | | | | | | | | | | |
Total dividends and distributions | | | (0.36 | ) | | | (0.26 | ) | | | — | | | | (0.54 | ) | | | (4.77 | ) |
| | | | | | | | | | | | | | | | | | | | |
Net asset value at end of year | | $ | 34.07 | | | $ | 30.47 | | | $ | 29.79 | | | $ | 25.68 | | | $ | 23.04 | |
| | | | | | | | | | | | | | | | | | | | |
Total investment return (b) | | | 13.14 | % | | | 3.16 | % | | | 16.00 | % | | | 14.12 | % | | | (36.80 | %) |
Ratios (to average net assets)/Supplemental Data: | | | | | | | | | | | | | | | | | | | | |
Net investment income (loss) | | | 1.24 | % | | | 1.18 | % | | | 0.90 | % | | | 1.25 | % | | | 0.96 | % |
Net expenses | | | 1.14 | % | | | 1.14 | % | | | 1.21 | % | | | 1.20 | % | | | 1.23 | % |
Expenses (before waiver/reimbursement) | | | 1.14 | % | | | 1.14 | % | | | 1.21 | % | | | 1.29 | % | | | 1.25 | % |
Portfolio turnover rate | | | 40 | % | | | 44 | % | | | 49 | % | | | 60 | % | | | 96 | % |
Net assets at end of year (in 000’s) | | $ | 294,247 | | | $ | 296,453 | | | $ | 345,067 | | | $ | 324,421 | | | $ | 291,812 | |
| ‡ | Less than one cent per share. |
| (a) | Per share data based on average shares outstanding during the year. |
| (b) | Total investment return is calculated exclusive of sales charges and assumes the reinvestment of dividends and distributions. |
| | | | | | |
The notes to the financial statements are an integral part of,
and should be read in conjunction with, the financial statements. | | mainstayinvestments.com | | | 21 | |
Financial Highlights selected per share data and ratios
| | | | | | | | | | | | | | | | | | | | |
| | | Class B | |
| | | Year ended October 31, | |
| | | 2012 | | | 2011 | | | 2010 | | | 2009 | | | 2008 | |
Net asset value at beginning of year | | $ | 28.21 | | | $ | 27.63 | | | $ | 24.04 | | | $ | 21.36 | | | $ | 38.79 | |
| | | | | | | | | | | | | | | | | | | | |
Net investment income (loss) (a) | | | 0.10 | | | | 0.07 | | | | (0.01 | ) | | | 0.06 | | | | 0.04 | |
Net realized and unrealized gain (loss) on investments | | | 3.29 | | | | 0.58 | | | | 3.60 | | | | 2.70 | | | | (12.91 | ) |
Net realized and unrealized gain (loss) on foreign
currency transactions | | | (0.00 | )‡ | | | (0.05 | ) | | | (0.00 | )‡ | | | 0.00 | ‡ | | | (0.01 | ) |
| | | | | | | | | | | | | | | | | | | | |
Total from investment operations | | | 3.39 | | | | 0.60 | | | | 3.59 | | | | 2.76 | | | | (12.88 | ) |
| | | | | | | | | | | | | | | | | | | | |
Less dividends and distributions: | | | | | | | | | | | | | | | | | | | | |
From net investment income | | | (0.05 | ) | | | (0.02 | ) | | | — | | | | (0.08 | ) | | | — | |
From net realized gain on investments | | | — | | | | — | | | | — | | | | — | | | | (4.55 | ) |
| | | | | | | | | | | | | | | | | | | | |
Total dividends and distributions | | | (0.05 | ) | | | (0.02 | ) | | | — | | | | (0.08 | ) | | | (4.55 | ) |
| | | | | | | | | | | | | | | | | | | | |
Net asset value at end of year | | $ | 31.55 | | | $ | 28.21 | | | $ | 27.63 | | | $ | 24.04 | | | $ | 21.36 | |
| | | | | | | | | | | | | | | | | | | | |
Total investment return (b) | | | 12.04 | % | | | 2.18 | % | | | 14.93 | % | | | 12.97 | % | | | (37.33 | %) |
Ratios (to average net assets)/Supplemental Data: | | | | | | | | | | | | | | | | | | | | |
Net investment income (loss) | | | 0.33 | % | | | 0.24 | % | | | (0.04 | %) | | | 0.31 | % | | | 0.13 | % |
Net expenses | | | 2.09 | % | | | 2.09 | % | | | 2.16 | % | | | 2.19 | % | | | 2.07 | % |
Expenses (before waiver/reimbursement) | | | 2.09 | % | | | 2.09 | % | | | 2.16 | % | | | 2.26 | % | | | 2.07 | % |
Portfolio turnover rate | | | 40 | % | | | 44 | % | | | 49 | % | | | 60 | % | | | 96 | % |
Net assets at end of year (in 000’s) | | $ | 86,613 | | | $ | 110,794 | | | $ | 140,674 | | | $ | 169,606 | | | $ | 189,015 | |
| ‡ | Less than one cent per share. |
| (a) | Per share data based on average shares outstanding during the year. |
| (b) | Total investment return is calculated exclusive of sales charges and assumes the reinvestment of dividends and distributions. |
| | | | |
| 22 | | MainStay MAP Fund | | The notes to the financial statements are an integral part of,
and should be read in conjunction with, the financial statements. |
Financial Highlights selected per share data and ratios
| | | | | | | | | | | | | | | | | | | | |
| | | Class C | |
| | | Year ended October 31, | |
| | | 2012 | | | 2011 | | | 2010 | | | 2009 | | | 2008 | |
Net asset value at beginning of year | | $ | 28.21 | | | $ | 27.63 | | | $ | 24.05 | | | $ | 21.37 | | | $ | 38.79 | |
| | | | | | | | | | | | | | | | | | | | |
Net investment income (loss) (a) | | | 0.09 | | | | 0.07 | | | | (0.01 | ) | | | 0.06 | | | | 0.04 | |
Net realized and unrealized gain (loss) on investments | | | 3.31 | | | | 0.58 | | | | 3.59 | | | | 2.70 | | | | (12.90 | ) |
Net realized and unrealized gain (loss) on foreign
currency transactions | | | (0.00 | )‡ | | | (0.05 | ) | | | (0.00 | )‡ | | | 0.00 | ‡ | | | (0.01 | ) |
| | | | | | | | | | | | | | | | | | | | |
Total from investment operations | | | 3.40 | | | | 0.60 | | | | 3.58 | | | | 2.76 | | | | (12.87 | ) |
| | | | | | | | | | | | | | | | | | | | |
Less dividends and distributions: | | | | | | | | | | | | | | | | | | | | |
From net investment income | | | (0.05 | ) | | | (0.02 | ) | | | — | | | | (0.08 | ) | | | — | |
From net realized gain on investments | | | — | | | | — | | | | — | | | | — | | | | (4.55 | ) |
| | | | | | | | | | | | | | | | | | | | |
Total dividends and distributions | | | (0.05 | ) | | | (0.02 | ) | | | — | | | | (0.08 | ) | | | (4.55 | ) |
| | | | | | | | | | | | | | | | | | | | |
Net asset value at end of year | | $ | 31.56 | | | $ | 28.21 | | | $ | 27.63 | | | $ | 24.05 | | | $ | 21.37 | |
| | | | | | | | | | | | | | | | | | | | |
Total investment return (b) | | | 12.07 | % | | | 2.18 | % | | | 14.89 | % | | | 12.96 | % | | | (37.30 | %) |
Ratios (to average net assets)/Supplemental Data: | | | | | | | | | | | | | | | | | | | | |
Net investment income (loss) | | | 0.31 | % | | | 0.23 | % | | | (0.05 | %) | | | 0.29 | % | | | 0.13 | % |
Net expenses | | | 2.09 | % | | | 2.09 | % | | | 2.16 | % | | | 2.19 | % | | | 2.07 | % |
Expenses (before waiver/reimbursement) | | | 2.09 | % | | | 2.09 | % | | | 2.16 | % | | | 2.25 | % | | | 2.07 | % |
Portfolio turnover rate | | | 40 | % | | | 44 | % | | | 49 | % | | | 60 | % | | | 96 | % |
Net assets at end of year (in 000’s) | | $ | 125,700 | | | $ | 136,274 | | | $ | 160,098 | | | $ | 167,652 | | | $ | 178,672 | |
| ‡ | Less than one cent per share. |
| (a) | Per share data based on average shares outstanding during the year. |
| (b) | Total investment return is calculated exclusive of sales charges and assumes the reinvestment of dividends and distributions. |
| | | | | | |
The notes to the financial statements are an integral part of,
and should be read in conjunction with, the financial statements. | | mainstayinvestments.com | | | 23 | |
Financial Highlights selected per share data and ratios
| | | | | | | | | | | | | | | | | | | | |
| | | Class I | |
| | | Year ended October 31, | |
| | | 2012 | | | 2011 | | | 2010 | | | 2009 | | | 2008 | |
Net asset value at beginning of year | | $ | 31.10 | | | $ | 30.39 | | | $ | 26.15 | | | $ | 23.51 | | | $ | 42.13 | |
| | | | | | | | | | | | | | | | | | | | |
Net investment income (loss) (a) | | | 0.49 | | | | 0.45 | | | | 0.32 | | | | 0.33 | | | | 0.39 | |
Net realized and unrealized gain (loss) on investments | | | 3.62 | | | | 0.66 | | | | 3.93 | | | | 2.95 | | | | (14.12 | ) |
Net realized and unrealized gain (loss) on foreign
currency transactions | | | (0.00 | )‡ | | | (0.06 | ) | | | (0.00 | )‡ | | | 0.00 | ‡ | | | (0.00 | )‡ |
| | | | | | | | | | | | | | | | | | | | |
Total from investment operations | | | 4.11 | | | | 1.05 | | | | 4.25 | | | | 3.28 | | | | (13.73 | ) |
| | | | | | | | | | | | | | | | | | | | |
Less dividends and distributions: | | | | | | | | | | | | | | | | | | | | |
From net investment income | | | (0.44 | ) | | | (0.34 | ) | | | (0.01 | ) | | | (0.64 | ) | | | (0.34 | ) |
From net realized gain on investments | | | — | | | | — | | | | — | | | | — | | | | (4.55 | ) |
| | | | | | | | | | | | | | | | | | | | |
Total dividends and distributions | | | (0.44 | ) | | | (0.34 | ) | | | (0.01 | ) | | | (0.64 | ) | | | (4.89 | ) |
| | | | | | | | | | | | | | | | | | | | |
Net asset value at end of year | | $ | 34.77 | | | $ | 31.10 | | | $ | 30.39 | | | $ | 26.15 | | | $ | 23.51 | |
| | | | | | | | | | | | | | | | | | | | |
Total investment return (b) | | | 13.40 | % | | | 3.43 | % | | | 16.26 | % | | | 14.38 | % | | | (36.59 | %) |
Ratios (to average net assets)/Supplemental Data: | | | | | | | | | | | | | | | | | | | | |
Net investment income (loss) | | | 1.48 | % | | | 1.42 | % | | | 1.12 | % | | | 1.45 | % | | | 1.22 | % |
Net expenses | | | 0.89 | % | | | 0.89 | % | | | 0.95 | % | | | 0.98 | % | | | 0.96 | % |
Expenses (before waiver/reimbursement) | | | 0.89 | % | | | 0.89 | % | | | 0.95 | % | | | 1.04 | % | | | 0.96 | % |
Portfolio turnover rate | | | 40 | % | | | 44 | % | | | 49 | % | | | 60 | % | | | 96 | % |
Net assets at end of year (in 000’s) | | $ | 1,358,999 | | | $ | 1,188,911 | | | $ | 759,317 | | | $ | 567,720 | | | $ | 425,266 | |
| ‡ | Less than one cent per share. |
| (a) | Per share data based on average shares outstanding during the year. |
| (b) | Total investment return is calculated exclusive of sales charges and assumes the reinvestment of dividends and distributions. Class I shares are not subject to sales charges. |
| | | | |
| 24 | | MainStay MAP Fund | | The notes to the financial statements are an integral part of,
and should be read in conjunction with, the financial statements. |
Financial Highlights selected per share data and ratios
| | | | | | | | | | | | | | | | | | | | |
| | | Class R1 | |
| | | Year ended October 31, | |
| | | 2012 | | | 2011 | | | 2010 | | | 2009 | | | 2008 | |
Net asset value at beginning of year | | $ | 30.63 | | | $ | 29.93 | | | $ | 25.84 | | | $ | 23.23 | | | $ | 41.69 | |
| | | | | | | | | | | | | | | | | | | | |
Net investment income (loss) (a) | | | 0.44 | | | | 0.31 | | | | 0.30 | | | | 0.27 | | | | 0.42 | |
Net realized and unrealized gain (loss) on investments | | | 3.58 | | | | 0.77 | | | | 3.87 | | | | 2.94 | | | | (14.03 | ) |
Net realized and unrealized gain (loss) on foreign
currency transactions | | | (0.00 | )‡ | | | (0.07 | ) | | | (0.00 | )‡ | | | 0.00 | ‡ | | | (0.00 | )‡ |
| | | | | | | | | | | | | | | | | | | | |
Total from investment operations | | | 4.02 | | | | 1.01 | | | | 4.17 | | | | 3.21 | | | | (13.61 | ) |
| | | | | | | | | | | | | | | | | | | | |
Less dividends and distributions: | | | | | | | | | | | | | | | | | | | | |
From net investment income | | | (0.42 | ) | | | (0.31 | ) | | | (0.08 | ) | | | (0.60 | ) | | | (0.30 | ) |
From net realized gain on investments | | | — | | | | — | | | | — | | | | — | | | | (4.55 | ) |
| | | | | | | | | | | | | | | | | | | | |
Total dividends and distributions | | | (0.42 | ) | | | (0.31 | ) | | | (0.08 | ) | | | (0.60 | ) | | | (4.85 | ) |
| | | | | | | | | | | | | | | | | | | | |
Net asset value at end of year | | $ | 34.23 | | | $ | 30.63 | | | $ | 29.93 | | | $ | 25.84 | | | $ | 23.23 | |
| | | | | | | | | | | | | | | | | | | | |
Total investment return (b) | | | 13.26 | % | | | 3.35 | % | | | 16.12 | % | | | 14.20 | % | | | (36.67 | %) |
Ratios (to average net assets)/Supplemental Data: | | | | | | | | | | | | | | | | | | | | |
Net investment income (loss) | | | 1.37 | % | | | 1.02 | % | | | 1.07 | % | | | 1.21 | % | | | 1.24 | % |
Net expenses | | | 0.99 | % | | | 0.99 | % | | | 1.06 | % | | | 1.08 | % | | | 1.01 | % |
Expenses (before waiver/reimbursement) | | | 0.99 | % | | | 0.99 | % | | | 1.06 | % | | | 1.14 | % | | | 1.01 | % |
Portfolio turnover rate | | | 40 | % | | | 44 | % | | | 49 | % | | | 60 | % | | | 96 | % |
Net assets at end of year (in 000’s) | | $ | 21,761 | | | $ | 17,611 | | | $ | 325 | | | $ | 626 | | | $ | 232 | |
| ‡ | Less than one cent per share. |
| (a) | Per share data based on average shares outstanding during the year. |
| (b) | Total investment return is calculated exclusive of sales charges and assumes the reinvestment of dividends and distributions. Class R1 shares are not subject to sales charges. |
| | | | | | |
The notes to the financial statements are an integral part of,
and should be read in conjunction with, the financial statements. | | mainstayinvestments.com | | | 25 | |
Financial Highlights selected per share data and ratios
| | | | | | | | | | | | | | | | | | | | |
| | | Class R2 | |
| | | Year ended October 31, | |
| | | 2012 | | | 2011 | | | 2010 | | | 2009 | | | 2008 | |
Net asset value at beginning of year | | $ | 30.53 | | | $ | 29.85 | | | $ | 25.76 | | | $ | 23.06 | | | $ | 41.40 | |
| | | | | | | | | | | | | | | | | | | | |
Net investment income (loss) (a) | | | 0.38 | | | | 0.34 | | | | 0.22 | | | | 0.23 | | | | 0.28 | |
Net realized and unrealized gain (loss) on investments | | | 3.54 | | | | 0.63 | | | | 3.87 | | | | 2.93 | | | | (13.86 | ) |
Net realized and unrealized gain (loss) on foreign
currency transactions | | | (0.00 | )‡ | | | (0.06 | ) | | | (0.00 | )‡ | | | 0.00 | ‡ | | | (0.00 | )‡ |
| | | | | | | | | | | | | | | | | | | | |
Total from investment operations | | | 3.92 | | | | 0.91 | | | | 4.09 | | | | 3.16 | | | | (13.58 | ) |
| | | | | | | | | | | | | | | | | | | | |
Less dividends and distributions: | | | | | | | | | | | | | | | | | | | | |
From net investment income | | | (0.33 | ) | | | (0.23 | ) | | | — | | | | (0.46 | ) | | | (0.21 | ) |
From net realized gain on investments | | | — | | | | — | | | | — | | | | — | | | | (4.55 | ) |
| | | | | | | | | | | | | | | | | | | | |
Total dividends and distributions | | | (0.33 | ) | | | (0.23 | ) | | | — | | | | (0.46 | ) | | | (4.76 | ) |
| | | | | | | | | | | | | | | | | | | | |
Net asset value at end of year | | $ | 34.12 | | | $ | 30.53 | | | $ | 29.85 | | | $ | 25.76 | | | $ | 23.06 | |
| | | | | | | | | | | | | | | | | | | | |
Total investment return (b) | | | 12.99 | % | | | 3.05 | % | | | 15.88 | % | | | 13.96 | % | | | (36.78 | %) |
Ratios (to average net assets)/Supplemental Data: | | | | | | | | | | | | | | | | | | | | |
Net investment income (loss) | | | 1.16 | % | | | 1.08 | % | | | 0.80 | % | | | 1.01 | % | | | 0.89 | % |
Net expenses | | | 1.24 | % | | | 1.24 | % | | | 1.31 | % | | | 1.33 | % | | | 1.30 | % |
Expenses (before waiver/reimbursement) | | | 1.24 | % | | | 1.24 | % | | | 1.31 | % | | | 1.38 | % | | | 1.30 | % |
Portfolio turnover rate | | | 40 | % | | | 44 | % | | | 49 | % | | | 60 | % | | | 96 | % |
Net assets at end of year (in 000’s) | | $ | 19,072 | | | $ | 22,733 | | | $ | 26,735 | | | $ | 14,006 | | | $ | 6,427 | |
| ‡ | Less than one cent per share. |
| (a) | Per share data based on average shares outstanding during the year. |
| (b) | Total investment return is calculated exclusive of sales charges and assumes the reinvestment of dividends and distributions. Class R2 shares are not subject to sales charges. |
| | | | |
| 26 | | MainStay MAP Fund | | The notes to the financial statements are an integral part of,
and should be read in conjunction with, the financial statements. |
Financial Highlights selected per share data and ratios
| | | | | | | | | | | | | | | | | | | | |
| | | Class R3 | |
| | | Year ended October 31, | |
| | | 2012 | | | 2011 | | | 2010 | | | 2009 | | | 2008 | |
Net asset value at beginning of year | | $ | 30.38 | | | $ | 29.71 | | | $ | 25.70 | | | $ | 22.97 | | | $ | 41.31 | |
| | | | | | | | | | | | | | | | | | | | |
Net investment income (loss) (a) | | | 0.30 | | | | 0.25 | | | | 0.15 | | | | 0.16 | | | | 0.19 | |
Net realized and unrealized gain (loss) on investments | | | 3.53 | | | | 0.64 | | | | 3.86 | | | | 2.93 | | | | (13.82 | ) |
Net realized and unrealized gain (loss) on foreign currency transactions | | | (0.00 | )‡ | | | (0.06 | ) | | | (0.00 | )‡ | | | 0.00 | ‡ | | | (0.00 | )‡ |
| | | | | | | | | | | | | | | | | | | | |
Total from investment operations | | | 3.83 | | | | 0.83 | | | | 4.01 | | | | 3.09 | | | | (13.63 | ) |
| | | | | | | | | | | | | | | | | | | | |
Less dividends and distributions: | | | | | | | | | | | | | | | | | | | | |
From net investment income | | | (0.27 | ) | | | (0.16 | ) | | | — | | | | (0.36 | ) | | | (0.16 | ) |
From net realized gain on investments | | | — | | | | — | | | | — | | | | — | | | | (4.55 | ) |
| | | | | | | | | | | | | | | | | | | | |
Total dividends and distributions | | | (0.27 | ) | | | (0.16 | ) | | | — | | | | (0.36 | ) | | | (4.71 | ) |
| | | | | | | | | | | | | | | | | | | | |
Net asset value at end of year | | $ | 33.94 | | | $ | 30.38 | | | $ | 29.71 | | | $ | 25.70 | | | $ | 22.97 | |
| | | | | | | | | | | | | | | | | | | | |
Total investment return (b) | | | 12.72 | % | | | 2.79 | % | | | 15.60 | % | | | 13.65 | % | | | (36.96 | %) |
Ratios (to average net assets)/Supplemental Data: | | | | | | | | | | | | | | | | | | | | |
Net investment income (loss) | | | 0.94 | % | | | 0.80 | % | | | 0.54 | % | | | 0.72 | % | | | 0.61 | % |
Net expenses | | | 1.49 | % | | | 1.49 | % | | | 1.56 | % | | | 1.58 | % | | | 1.56 | % |
Expenses (before waiver/reimbursement) | | | 1.49 | % | | | 1.49 | % | | | 1.56 | % | | | 1.63 | % | | | 1.56 | % |
Portfolio turnover rate | | | 40 | % | | | 44 | % | | | 49 | % | | | 60 | % | | | 96 | % |
Net assets at end of year (in 000’s) | | $ | 1,809 | | | $ | 2,380 | | | $ | 1,850 | | | $ | 1,484 | | | $ | 310 | |
| ‡ | Less than one cent per share. |
| (a) | Per share data based on average shares outstanding during the year. |
| (b) | Total investment return is calculated exclusive of sales charges and assumes the reinvestment of dividends and distributions. Class R3 shares are not subject to sales charges. |
| | | | | | |
The notes to the financial statements are an integral part of,
and should be read in conjunction with, the financial statements. | | mainstayinvestments.com | | | 27 | |
Notes to Financial Statements
Note 1–Organization and Business
The MainStay Funds (the “Trust”) was organized on January 9, 1986, as a Massachusetts business trust. The Trust is registered under the Investment Company Act of 1940, as amended (the “1940 Act”), as an open-end investment management company, and is comprised of twelve funds (collectively referred to as the “Funds”). These financial statements and notes relate only to the MainStay MAP Fund (the “Fund”), a diversified fund.
The Fund currently offers eight classes of shares. Class A, Class B and Class C shares commenced operations on June 9, 1999. Class I shares commenced operations in 1970 (under a former class designation of MAP-Equity Fund) and were redesignated as Class I shares on June 9, 1999. Class R1 and Class R2 shares commenced operations on January 2, 2004. Class R3 shares commenced operations on April 28, 2006. Investor Class shares commenced operations on February 28, 2008. Investor Class and Class A shares are offered at net asset value (“NAV”) per share plus an initial sales charge. No sales charge applies to investments of $1 million or more (and certain other qualified purchases) in Investor Class and Class A shares, but a contingent deferred sales charge (“CDSC”) is imposed on certain redemptions made within one year of the date of purchase. Class B and Class C shares are offered at NAV without an initial sales charge, although a declining CDSC may be imposed on redemptions made within six years of the date of purchase of Class B shares and a 1.00% CDSC may be imposed on redemptions made within one year of the date of purchase of Class C shares. Class I, Class R1, Class R2 and Class R3 shares are offered at NAV and are not subject to a sales charge. Depending upon eligibility, Class B shares convert to either Investor Class or Class A shares at the end of the calendar quarter eight years after the date they were purchased. Additionally, depending upon eligibility, Investor Class shares may convert to Class A shares and Class A shares may convert to Investor Class shares. The eight classes of shares have the same voting (except for issues that relate solely to one class), dividend, liquidation and other rights, and the same terms and conditions, except that Class B and Class C shares are subject to higher distribution and/or service fee rates than Investor Class, Class A, Class R2 and Class R3 shares under a distribution plan pursuant to Rule 12b-1 under the 1940 Act. Class I and Class R1 shares are not subject to a distribution and/or service fee. Class R1, Class R2 and Class R3 shares are subject to a shareholder service fee. This is in addition to any fees paid under a distribution plan, where applicable.
The Fund’s investment objective is to seek long-term appreciation of capital.
Prior to February 28, 2012, the Fund’s investment objective was to seek long-term appreciation of capital. The Fund also sought to earn income, but that was a secondary objective.
Note 2–Significant Accounting Policies
The Fund prepares its financial statements in accordance with generally accepted accounting principles (“GAAP”) in the United States of America and follows the significant accounting policies described below.
(A) Securities Valuation. Investments are valued as of the close of regular trading on the New York Stock Exchange (“Exchange”) (generally
4:00 p.m. Eastern time) on each day the Fund is open for business (“valuation date”).
The Board of Trustees (the “Board”) has adopted procedures for the valuation of the Fund’s securities and has delegated the responsibility for valuation determination under those procedures to the Valuation Committee of the Fund (the “Valuation Committee”). The Board has authorized the Valuation Committee to appoint a Valuation Sub-Committee (the “Sub-Committee”) to deal in the first instance with questions that arise or cannot be resolved under these procedures. The Sub-Committee will meet (in person, via electronic mail or via teleconference) on an as-needed basis. The Valuation Committee shall meet at a later time, as necessary, to ensure that actions taken by the Sub-Committee were appropriate. The procedures recognize that, subject to the oversight of the Board and unless otherwise noted, the responsibility for day-to-day valuation of portfolio assets (including securities for which market prices are not readily available) rests with New York Life Investment Management LLC (“New York Life Investments” or the “Manager”), aided to whatever extent necessary by the Subadvisors (as defined in Note 3(A)) of the Fund. These procedures shall be reviewed by the Board no less frequently than annually. Any revisions to these procedures deemed necessary shall be reported to the Board at its next regularly scheduled meeting.
Securities are valued using unadjusted market prices, when available, as supplied primarily by third party pricing services or dealers. To assess the appropriateness of security valuations, the Manager or the Fund’s third party service provider who is subject to oversight by the Manager, regularly compares prior day prices, prices on comparable securities and the sale prices to the prior and current day prices and challenges prices exceeding certain tolerance levels with third party pricing services or broker sources. For those securities valued by recommendation, whether through a standardized fair valuation methodology or a fair valuation determination, the Valuation Committee reviews and affirms the reasonableness of the valuation based on such methodologies and determinations on a regular basis after considering all relevant information that is reasonably available.
“Fair value” is defined as the price that the Fund would receive upon selling an investment in an orderly transaction to an independent buyer in the principal or most advantageous market of the investment. Fair value measurements are determined within a framework that has established a three-tier hierarchy which maximizes the use of observable market data and minimizes the use of unobservable inputs to establish classification of fair value measurements for disclosure purposes. “Inputs” refer broadly to the assumptions that market participants would use in pricing the asset or liability, including assumptions about risk, such as the risk inherent in a particular valuation technique used to measure fair value using a pricing model and/or the risk inherent in the inputs for the valuation technique. Inputs may be observable or unobservable. Observable inputs reflect the assumptions market participants would use in pricing the asset or liability based on market data obtained from sources independent of the Fund. Unobservable inputs reflect the Fund’s own assumptions about the assumptions market participants would use in pricing the asset or liability developed based on the information available in the circumstances. The inputs or methodology used for valuing securities may not be an indication of the
risks associated with investing in those securities. The three-tier hierarchy of inputs is summarized in the three broad Levels listed below.
| • | | Level 1—quoted prices in active markets for identical investments |
| • | | Level 2—other significant observable inputs (including quoted prices for similar investments in active markets, interest rates and yield curves, prepayment speeds, credit risks, etc.) |
| • | | Level 3—significant unobservable inputs (including the Fund’s own assumptions about the assumptions that market participants would use in determining the fair value of investments) |
The aggregate value by input level, as of October 31, 2012, for the Fund’s investments is included at the end of the Fund’s Portfolio of Investments.
The valuation techniques used by the Fund to measure fair value maximize the use of observable inputs and minimize the use of unobservable inputs. The Fund may utilize third party vendor evaluations, whose prices may be derived from one or more of the following standard inputs:
| | |
• Benchmark Yields | | • Reported Trades |
• Broker Dealer Quotes | | • Issuer Spreads |
• Two-sided markets | | • Benchmark securities |
• Bids / Offers | | • Reference Data (corporate actions or material event notices) |
• Industry and economic events | | • Comparable bonds |
• Equity and credit default swap curves | | • Monthly payment information |
Securities for which market value cannot be determined using the methodologies described above are valued by methods deemed in good faith by the Fund’s Valuation Committee, following the procedures established by the Board, to represent fair value. Under these procedures, the Fund primarily employs a market-based approach which may use related or comparable assets or liabilities, recent transactions, market multiples, book values, and other relevant information. The Fund may also use an income-based valuation approach in which the anticipated future cash flows of the investment are discounted to calculate fair value. Discounts may also be applied due to the nature or duration of any restrictions on the disposition of the investments. Due to the inherent uncertainty of valuations of such investments, the fair values may differ significantly from the values that would have been used had an active market existed. For the year ended October 31, 2012, there have been no changes to the fair value methodologies.
Equity and non-equity securities which may be valued in this manner include, but are not limited to: (i) a security for which the trading has been halted or suspended; (ii) a debt security that has recently gone into default and for which there is not a current market quotation; (iii) a security of an issuer that has entered into a restructuring; (iv) a security that has been de-listed from a national exchange; (v) a security for which the market price is not available from a third party pricing source or, if so provided, does not, in the opinion of the Fund’s Manager or Subadvisors reflect the security’s market value; and (vi) a security whose principal market has been temporarily closed at a time when, under normal conditions, it would be open. Securities for which market quotations or observable inputs are not readily available are generally
categorized as Level 3 in the hierarchy. As of October 31, 2012, the Fund did not hold any securities that were fair valued in such a manner.
Certain events may occur between the time that foreign markets close, on which securities held by the Fund principally trade, and the time at which the Fund’s NAV is calculated. These events may include, but are not limited to, situations relating to a single issuer in a market sector, significant fluctuations in U.S. or foreign markets, natural disasters, armed conflicts, governmental actions or other developments not tied directly to the securities markets. Should the Manager or Subadvisors conclude that such events may have affected the accuracy of the last price of such securities reported on the local foreign market, the Manager or Subadvisors may, pursuant to procedures adopted by the Fund’s Board, adjust the value of the local price to reflect the impact on the price of such securities as a result of such events. In this instance, securities are generally categorized as Level 3 in the hierarchy. Additionally, foreign equity securities are also fair valued whenever the movement of a particular index exceeds certain thresholds. In such cases, the securities are fair valued by applying factors provided by a third party vendor in accordance with the Fund’s policies and procedures and are generally categorized as Level 2 in the hierarchy. As of October 31, 2012, foreign equity securities held by the Fund were not fair valued in such a manner.
Equity securities and Exchange Traded Funds are valued at the latest quoted sales prices as of the close of regular trading on the Exchange on each valuation date. Securities that are not traded on the valuation date are valued at the mean of the latest quoted bid and ask prices. Prices normally are taken from the principal market in which each security trades. Investments in other mutual funds are valued at their respective NAV as of the close of the Exchange on the valuation date. These securities are generally categorized as Level 1 in the hierarchy.
Debt securities (other than convertible bonds and municipal debt securities) are valued at the evaluated bid prices (evaluated mean prices in the case of convertible bonds and municipal debt securities) supplied by a pricing agent or broker selected by the Fund’s Manager in consultation with the Fund’s Subadvisor if any, whose prices reflect broker/dealer supplied valuations and electronic data processing techniques, if such prices are deemed by the Fund’s Manager, in consultation with the Fund’s Subadvisor, if any, to be representative of market values, at the regular close of trading of the Exchange on each valuation date. Debt securities, including corporate bonds, U.S. government and federal agency bonds, municipal bonds, foreign bonds, Yankee bonds, convertible bonds, asset-backed securities and mortgage-backed securities are generally categorized as Level 2 in the hierarchy.
Temporary cash investments acquired over 60 days to maturity are valued using the latest bid prices or using valuations based on a matrix system (which considers such factors as security prices, yields, maturities, and ratings), both as furnished by independent pricing services. Other temporary cash investments which mature in 60 days or less (“Short-Term Investments”) are valued at amortized cost. The amortized cost method involves valuing a security at its cost on the date of purchase and thereafter assuming a constant amortization to maturity of the difference between such cost and the value on maturity date. Amortized cost approximates the current fair value of a security. Securities valued at amortized cost are not valued using a quoted price in an active market. These securities are generally categorized as Level 2 in the hierarchy.
| | | | |
| mainstayinvestments.com | | | 29 | |
Notes to Financial Statements (continued)
Foreign currency forward contracts are valued at their fair market values determined on the basis of the mean between the last current bid and ask prices based on dealer or exchange quotations and are generally categorized as Level 2 in the hierarchy.
(B) Income Taxes. The Fund’s policy is to comply with the requirements of the Internal Revenue Code of 1986, as amended (the “Internal Revenue Code”), applicable to regulated investment companies and to distribute all of the taxable income to the shareholders of the Fund within the allowable time limits. Therefore, no federal, state and local income tax provision is required.
Management evaluates its tax positions to determine if the tax positions taken meet the minimum recognition threshold in connection with accounting for uncertainties in income tax positions taken or expected to be taken for the purposes of measuring and recognizing tax liabilities in the financial statements. Recognition of tax benefits of an uncertain tax position is required only when the position is “more likely than not” to be sustained assuming examination by taxing authorities. Management has analyzed the Fund’s tax positions taken on federal, state and local income tax returns for all open tax years (for up to three tax years), and has concluded that no provision for federal, state and local income tax are required in the Fund’s financial statements. The Fund’s federal, state and local income and federal excise tax returns for tax years for which the applicable statutes of limitations have not expired are subject to examination by the Internal Revenue Service and state and local departments of revenue.
(C) Foreign Taxes. Investment income received by the Fund from foreign sources may be subject to foreign income taxes. These foreign income taxes are generally withheld at the source, and a portion of which may be recoverable. The Fund will accrue such taxes and recoveries as applicable, based upon its current interpretation of tax rules and regulations that exist in the markets in which it invests.
The Fund may be subject to taxation on realized capital gains, repatriation proceeds and other transaction-based taxes imposed by certain countries in which it invests. The Fund will accrue such taxes as applicable based upon their current interpretation of tax rules and regulations that exist in the market in which they invest. Capital gains taxes relating to positions still held are reflected as a liability on the Statement of Assets and Liabilities, as well as an adjustment to the Fund’s net unrealized appreciation (depreciation). Taxes related to capital gains realized during the year ended October 31, 2012, if any, are reflected as part of net realized gain (loss) in the Statement of Operations. Changes in tax liabilities related to capital gains taxes on unrealized investment gains, if any, are reflected as part of the change in net unrealized appreciation (depreciation) on investments in the Statement Operations. Transaction-based charges are generally assessed as a percentage of the transaction amount.
(D) Dividends and Distributions to Shareholders. Dividends and distributions are recorded on the ex-dividend date. The Fund intends to declare and pay dividends of net investment income and distributions of net realized capital and currency gains, if any, at least annually. Unless the shareholder elects otherwise, all dividends and distributions are reinvested in the same class of shares of the Fund, at NAV. Dividends and distributions to shareholders are determined in accordance with federal income tax regulations and may differ from GAAP.
(E) Security Transactions and Investment Income. The Fund records security transactions on the trade date. Realized gains and losses on security transactions are determined using the identified cost method. Dividend income is recognized on the ex-dividend date and interest income is accrued as earned using the effective interest rate method. Discounts and premiums on securities purchased, other than Short-Term Investments, for the Fund are accreted and amortized, respectively, on the effective interest rate method over the life of the respective securities or, in the case of a callable security, over the period to the first date of call. Discounts and premiums on Short-Term Investments are accreted and amortized, respectively, on the straight-line method. Income from payment-in-kind securities is recorded daily based on the effective interest method of accrual.
Investment income and realized and unrealized gains and losses on investments of the Fund are allocated to separate classes of shares pro rata based upon their relative net assets on the date the income is earned or realized and unrealized gains and losses are incurred.
(F) Expenses. Expenses of the Trust are allocated to the individual Funds in proportion to the net assets of the respective Funds when the expenses are incurred, except where direct allocations of expenses can be made. Expenses (other than transfer agent expenses and fees incurred under the shareholder services plans and the distribution plans further discussed in Note 3(B)) are allocated to separate classes of shares pro rata based upon their relative net assets on the date the expenses are incurred. The expenses borne by the Fund, including those of related parties to the Fund, are shown in the Statement of Operations.
(G) Use of Estimates. In preparing financial statements in conformity with GAAP, management makes estimates and assumptions that affect the reported amounts and disclosures in the financial statements. Actual results could differ from those estimates.
(H) Repurchase Agreements. The Fund may enter into repurchase agreements to earn income. The Fund may enter into repurchase agreements only with financial institutions that are deemed by the Manager or Subadvisor to be creditworthy, pursuant to guidelines established by the Fund’s Board. During the term of any repurchase agreement, the Manager will continue to monitor the creditworthiness of the seller. Under the 1940 Act, repurchase agreements are considered to be collateralized loans by a Fund to the seller secured by the securities transferred to the Fund.
When the Fund invests in repurchase agreements, the Fund’s custodian takes possession of the collateral pledged for investments in the repurchase agreement. The underlying collateral is valued daily on a mark-to-market basis to determine that the value, including accrued interest, exceeds the repurchase price. In the event of the seller’s default on the obligation to repurchase, the Fund has the right to liquidate the collateral and apply the proceeds in satisfaction of the obligation. Under certain circumstances, such as in the event of default or bankruptcy by the counterparty to the agreement, realization and/or retention of the collateral may be subject to legal proceedings and possible realized loss to the Fund.
(I) Rights and Warrants. A right is a certificate that permits the holder to purchase a certain number of shares, or a fractional share, of a new stock from the issuer at a specific price. A warrant is an
instrument that entitles the holder to buy an equity security at a specific price for a specific period of time. The Fund may enter into rights and warrants when securities are acquired through a corporate action. With respect to warrants in international markets, the securities are only purchased when the underlying security cannot be purchased due to the many restrictions an industry and/or country might place on foreign investors. These investments can provide a greater potential for profit or loss than an equivalent investment in the underlying security. Prices of these investments do not necessarily move in tandem with the prices of the underlying securities.
There is risk involved in the purchase of rights and warrants in that these investments are speculative investments. The Fund could also lose the entire value of its investment in warrants if the warrant is not exercised by the date of its expiration. The securities are sold as soon as the opportunity becomes available. The Fund is exposed to risk until each sale is completed. As of October 31, 2012, the Fund did not hold any rights or warrants.
(J) Securities Lending. In order to realize additional income, the Fund may engage in securities lending, subject to the limitations set forth in the 1940 Act, and relevant guidance by the staff of the Securities and Exchange Commission. In the event the Fund does engage in securities lending, the Fund will lend through its custodian, State Street Bank and Trust Company (“State Street”). State Street will manage the Fund’s cash collateral in accordance with the Lending Agreement between the Fund and State Street, and indemnify the Fund’s portfolio against counterparty risk. The loans will be collateralized by cash or securities at least equal at all times to the market value of the securities loaned. Collateral will consist of U.S. government securities, cash equivalents or irrevocable letters of credit. The Fund may bear the risk of delay in recovery of, or loss of rights in, the securities loaned should the borrower of the securities experience financial difficulty. The Fund may also record realized gain or loss on securities deemed sold due to a borrower’s inability to return securities on loan. The Fund will receive compensation for lending its securities in the form of fees or the retention of a portion of the interest on the investment of any cash received as collateral. The Fund also will continue to receive interest and dividends on the securities loaned and any gain or loss in the market price of the securities loaned that may occur during the term of the loan will be for the account of the Fund.
Although the Fund and New York Life Investments have temporarily suspended securities lending, the Fund and New York Life Investments reserve the right to reinstitute lending when deemed appropriate. The Fund had no portfolio securities on loan as of October 31, 2012.
(K) Foreign Currency Forward Contracts. The Fund may enter into foreign currency forward contracts, which are agreements to buy or sell currencies of different countries on a specified future date at a specified rate. The Fund is subject to foreign currency exchange rate risk in the normal course of investing in these transactions. During the period the forward contract is open, changes in the value of the contract are recognized as unrealized appreciation or depreciation by “marking-to-market” such contract on a daily basis to reflect the market value of the contract at the end of each day’s trading. Cash movement occurs on settlement date. When the forward contract is closed, the Fund records a realized gain or loss equal to the difference between the proceeds from (or cost of) the closing transaction and the Fund’s basis in
the contract. The Fund may enter into foreign currency forward contracts to reduce currency risk versus the benchmark or for trade settlement.
The use of foreign currency forward contracts involves, to varying degrees, elements of market risk in excess of the amount recognized in the Statement of Assets and Liabilities. The contract amount reflects the extent of the Fund’s involvement in these financial instruments. Risks arise from the possible movements in the foreign exchange rates underlying these instruments. While the Fund may enter into forward contracts to reduce currency exchange risks, changes in currency exchange rates may result in poorer overall performance for the Fund than if it had not engaged in such transactions. Exchange rate movements can be large, depending on the currency, and can last for extended periods of time, affecting the value of the Fund’s assets. Moreover, there may be an imperfect correlation between the Fund’s holdings of securities denominated in a particular currency and the forward contracts entered into by the Fund. Such imperfect correlation may prevent the Fund from achieving the intended hedge or expose the Fund to the risk of currency exchange loss. The unrealized appreciation (depreciation) on forward contracts reflects the Fund’s exposure at valuation date to credit loss in the event of a counterparty’s failure to perform its obligations.
(L) Foreign Currency Transactions. The books and records of the Fund are kept in U.S. dollars. Prices of securities denominated in foreign currency amounts are translated into U.S. dollars at the mean between the buying and selling rates last quoted by any major U.S. bank at the following dates:
(i) market value of investment securities, other assets and liabilities—at the valuation date, and
(ii) purchases and sales of investment securities, income and expenses—at the date of such transactions.
The assets and liabilities that are denominated in foreign currency amounts are presented at the exchange rates and market values at the close of the period. The realized and unrealized changes in net assets arising from fluctuations in exchange rates and market prices of securities are not separately presented.
Net realized gain (loss) on foreign currency transactions represents net gains and losses on foreign currency forward contracts, net currency gains or losses realized as a result of differences between the amounts of securities sale proceeds or purchase cost, dividends, interest and withholding taxes as recorded on the Fund’s books, and the U.S. dollar equivalent amount actually received or paid. Net currency gains or losses from valuing such foreign currency denominated assets and liabilities, other than investments at valuation date exchange rates, are reflected in unrealized foreign exchange gains or losses.
(M) Concentration of Risk. The Fund invests in foreign securities, which carry certain risks that are in addition to the usual risks inherent in domestic instruments. These risks include those resulting from currency fluctuations, future adverse political and economic developments and possible imposition of currency exchange blockages or other foreign governmental laws or restrictions. These risks are likely to be greater in emerging markets than in developed markets. The ability of issuers of debt securities held by the Fund to meet their obligations may be affected by economic or political developments in a specific country, industry or region.
| | | | |
| mainstayinvestments.com | | | 31 | |
Notes to Financial Statements (continued)
(N) Indemnifications. Under the Trust’s organizational documents, its officers and trustees are indemnified against certain liabilities that may arise out of performance of their duties to the Trust. Additionally, in the normal course of business, the Fund enters into contracts with third-party service providers that contain a variety of representations and warranties and which may provide general indemnifications. The Fund’s maximum exposure under these arrangements is unknown, as this would involve future claims that may be made against the Fund that have not yet occurred. Based on experience, management is of the view that the risk of loss in connection with these potential indemnification obligations is remote. However, there can be no assurance that material liabilities related to such obligations will not arise in the future, which could adversely impact the Fund.
(O) Quantitative Disclosure of Derivative Holdings. The following tables show additional disclosures about the Fund’s derivative and hedging activities, including how such activities are accounted for and their effect on the Fund’s financial positions, performance and cash flows. These derivatives are not accounted for as hedging instruments.
The effect of derivative instruments on the Statement of Operations for the year ended October 31, 2012.
Realized Gain (Loss)
| | | | | | | | | | |
| | | Statement of
Operations Location | | Equity
Contracts
Risk | | | Total | |
Rights | | Net realized gain (loss)
on security transactions | | $ | (93,829 | ) | | $ | (93,829 | ) |
| | | | | | | | | | |
Total Realized Gain (Loss) | | | | $ | (93,829 | ) | | $ | (93,829 | ) |
| | | | | | | | | | |
Change in Unrealized Appreciation (Depreciation)
| | | | | | | | | | |
| | | Statement of
Operations Location | | Equity
Contracts
Risk | | | Total | |
Rights | | Net change in unrealized appreciation (depreciation) on investments | | $ | 126,740 | | | $ | 126,740 | |
| | | | | | | | | | |
Total Change in Unrealized Appreciation (Depreciation) | | | | $ | 126,740 | | | $ | 126,740 | |
| | | | | | | | | | |
Number of Contracts, Notional Amounts or Shares/Units (1)
| | | | | | | | | | |
| | | | | Equity
Contracts
Risk | | | Total | |
Rights | | | | | 61,474 | | | | 61,474 | |
| | | | | | | | | | |
| (1) | Amount disclosed represents the actual average held during the year ended October 31, 2012. |
Note 3–Fees and Related Party Transactions
(A) Manager and Subadvisors. New York Life Investments, a registered investment adviser and an indirect, wholly-owned subsidiary
of New York Life Insurance Company (“New York Life”), serves as the Fund’s Manager, pursuant to an Amended and Restated Management Agreement (“Management Agreement”). The Manager provides offices, conducts clerical, recordkeeping and bookkeeping services, and keeps most of the financial and accounting records required to be maintained by the Fund. Except for the portion of salaries and expenses that are the responsibility of the Fund, the Manager pays the salaries and expenses of all personnel affiliated with the Fund and certain operational expenses of the Fund. The Fund reimburses New York Life Investments in an amount equal to a portion of the salary of the Chief Compliance Officer (“CCO”) of the Fund. Markston International LLC (“Markston”) and Institutional Capital LLC (“ICAP”) (the “Subadvisors”), each registered investment advisers, serve as Subadvisors to the Fund and manage a portion of the Fund’s assets, as designated by New York Life Investments from time to time, subject to the oversight of New York Life Investments. Each Subadvisor is responsible for the day-to-day portfolio management of the Fund with respect to its allocated portion of the Fund’s assets. Pursuant to the terms of an Amended and Restated Subadvisory Agreement between New York Life Investments and ICAP, and pursuant to the terms of a Subadvisory Agreement between New York Life Investments and Markston (“Subadvisors Agreements”), New York Life Investments pays for the services of the Subadvisors.
The Fund pays the Manager a monthly fee for services performed and facilities furnished at an annual rate of the Fund’s average daily net assets as follows: 0.75% up to $1 billion; 0.70% from $1 billion to $3 billion; and 0.675% in excess of $3 billion, plus a fee for fund accounting services previously provided by New York Life Investments under a separate fund accounting agreement furnished at an annual rate of the Fund’s average daily net assets as follows: 0.05% up to $20 million; 0.0333% from $20 million to $100 million; and 0.01% in excess of $100 million.
Prior to February 28, 2012, the Fund paid the Manager a monthly fee for services performed and facilities furnished at an annual rate of the Fund’s average daily net assets as follows: 0.75% up to $1 billion; and 0.70% in excess of $1 billion, plus a fee for fund accounting services previously provided by New York Life Investments under a separate fund accounting agreement furnished at an annual rate of the Fund’s average daily net assets as follows: 0.05% up to $20 million; 0.0333% from $20 million to $100 million; and 0.01% in excess of $100 million.
The effective management fee rate (exclusive of any applicable waivers/reimbursements) was 0.74% for the year ended October 31, 2012, inclusive of a fee for fund accounting services of 0.01% of the Fund’s average daily net assets.
For the year ended October 31, 2012, New York Life Investments earned fees from the Fund in the amount of $14,287,531.
State Street, 1 Lincoln Street, Boston, Massachusetts 02111, provides sub-administration and sub-accounting services to the Fund pursuant to an agreement with New York Life Investments. These services include calculating the daily NAVs of the Fund, maintaining the general ledger and sub-ledger accounts for the calculation of the Fund’s respective NAVs, and assisting New York Life Investments in conducting various aspects of the Fund’s administrative operations. For providing these services to the Fund, State Street is compensated by New York Life Investments.
(B) Distribution, Service and Shareholder Service Fees. The Trust, on behalf of the Fund, has entered into a distribution agreement with NYLIFE Distributors LLC (the “Distributor”), an indirect, wholly-owned subsidiary of New York Life. The Fund has adopted distribution plans (the “Plans”) in accordance with the provisions of Rule 12b-1 under the 1940 Act.
Pursuant to the Investor Class, Class A and Class R2 Plans, the Distributor receives a monthly distribution fee from the Investor Class, Class A and Class R2 shares, at an annual rate of 0.25% of the average daily net assets of the Investor Class, Class A and Class R2 shares for distribution and/or service activities as designated by the Distributor. Pursuant to the Class B and Class C Plans, Class B and Class C shares pay the Distributor a monthly distribution fee at an annual rate of 0.75% of the average daily net assets of the Class B and Class C shares, along with a service fee at an annual rate of 0.25% of the average daily net assets of the Class B and Class C shares, for a total 12b-1 fee of 1.00%. Pursuant to the Class R3 Plan, the Distributor receives a monthly distribution and/or service fee from the Class R3 shares at an annual rate of 0.50% of the average daily net assets of the Class R3 shares. Class I and Class R1 shares are not subject to a distribution and/or service fee.
The Plans provide that the distribution and service fees are payable to the Distributor regardless of the amounts actually expended by the Distributor for distribution of the Fund’s shares and service activities.
In accordance with the Shareholder Services Plans for the Class R1, Class R2 and Class R3 shares, the Manager has agreed to provide, through its affiliates or independent third parties, various shareholder and administrative support services to shareholders of the Class R1, Class R2 and Class R3 shares. For its services, the Manager is entitled to a Shareholder Service Fee accrued daily and paid monthly at an annual rate of 0.10% of the average daily net assets of the Class R1, Class R2 and Class R3 shares. This is in addition to any fees paid under a distribution plan, where applicable.
Shareholder Service Fees incurred by the Fund for the year ended October 31, 2012, were as follows:
| | | | |
Class R1 | | $ | 20,748 | |
Class R2 | | | 20,476 | |
Class R3 | | | 1,941 | |
(C) Sales Charges. The Fund was advised by the Distributor that the amount of sales charges retained on sales of Investor Class and Class A shares were $39,181 and $29,625, respectively, for the year ended October 31, 2012. The Fund was also advised that the Distributor retained CDSCs on redemptions of Investor Class, Class A, Class B and Class C shares of $11, $944, $155,074 and $5,308, respectively, for the year ended October 31, 2012.
(D) Transfer, Dividend Disbursing and Shareholder Servicing Agent. NYLIM Service Company LLC, an affiliate of New York Life Investments, is the Fund’s transfer, dividend disbursing and shareholder servicing agent pursuant to an agreement between NYLIM Service Company LLC and the Trust. NYLIM Service Company LLC has entered into an agreement with Boston Financial Data Services, Inc. (“BFDS”) pursuant to which BFDS performs certain transfer agent
services on behalf of NYLIM Service Company LLC. Transfer agent expenses incurred by the Fund for the year ended October 31, 2012, were as follows:
| | | | |
Investor Class | | $ | 371,778 | |
Class A | | | 358,720 | |
Class B | | | 312,240 | |
Class C | | | 414,744 | |
Class I | | | 1,495,050 | |
Class R1 | | | 24,876 | |
Class R2 | | | 24,509 | |
Class R3 | | | 2,325 | |
(E) Small Account Fee. Shareholders with small accounts adversely impact the cost of providing transfer agency services. In an effort to reduce total transfer agency expenses, the Fund has implemented a small account fee on certain types of accounts. Certain shareholders with an account balance of less than $1,000 are charged an annual per account fee of $20 (assessed semi-annually), the proceeds from which offset transfer agent fees as reflected in the Statement of Operations.
(F) Capital. As of October 31, 2012, New York Life and its affiliates beneficially held shares of the Fund with the following values and percentages of net assets as follows:
| | | | | | | | |
Class A | | $ | 3,244 | | | | 0.0 | %‡ |
Class I | | | 95,933,446 | | | | 7.1 | |
| ‡ | Less than one-tenth of a percent. |
Note 4–Federal Income Tax
As of October 31, 2012, the components of accumulated gain (loss) on a tax basis were as follows:
| | | | | | | | | | | | | | | | |
Ordinary
Income | | Accumulated
Capital and
Other Gain
(Loss) | | | Other
Temporary
Differences | | | Unrealized
Appreciation
(Depreciation) | | | Total
Accumulated Gain (Loss) | |
$20,005,478 | | $ | (130,395,186 | ) | | $ | — | | | $ | 268,967,033 | | | $ | 158,577,325 | |
The difference between book basis and tax basis unrealized appreciation (depreciation) is primarily due to wash sale adjustments, mark to market of foreign forward contracts, real estate investment trusts (“REITs”) investments and class actions.
The following table discloses the current year reclassifications between undistributed net investment income (loss), accumulated net realized gain (loss) on investments, and additional paid-in capital arising from permanent differences; net assets as of October 31, 2012 were not affected.
| | | | | | | | |
Undistributed Net Investment Income (Loss) | | Accumulated Net
Realized Gain (Loss)
on Investments | | | Additional
Paid-In
Capital | |
| $(321,132) | | $ | 321,132 | | | $ | — | |
The reclassifications for the Fund are primarily due to foreign currency gain (loss) and REITs investments.
| | | | |
| mainstayinvestments.com | | | 33 | |
Notes to Financial Statements (continued)
Under the Regulated Investment Company Modernization Act of 2010, the Fund is permitted to carry forward capital losses incurred in taxable years beginning after December 22, 2010, for an unlimited period. However, any losses incurred during those future years will be required to be utilized prior to the losses incurred in pre-enactment tax years. As a result of this ordering rule, pre-enactment capital loss carryforwards may be more likely to expire unused. Additionally, post-enactment capital losses that are carried forward will retain their character as either short-term or long-term capital losses rather than being considered all short-term as under previous law.
As of October 31, 2012, for federal income tax purposes, capital loss carryforwards of $130,395,186 were available as shown in the table below, to the extent provided by the regulations to offset future realized gains of the Fund through the years indicated. To the extent that these capital loss carryforwards are used to offset future capital gains, it is probable that the capital gains so offset will not be distributed to shareholders. No capital gain distributions shall be made until any capital loss carryforwards have been fully utilized or expired.
| | | | | | | | |
Capital Loss
Available Through | | Short-Term
Capital Loss
Amounts (000’s) | | | Long-Term
Capital Loss
Amounts (000’s) | |
2015
2017 Unlimited | | $
| 7,001
123,394 — |
| | $
| —
— — |
|
| Total | | $ | 130,395 | | | $ | — | |
The Fund utilized $18,638,715 of capital loss carryforwards during the year ended October 31, 2012.
The tax character of distributions paid during the years ended October 31, 2012 and October 31, 2011 shown in the Statements of Changes in Net Assets was as follows:
| | | | | | | | |
| | | 2012 | | | 2011 | |
Distributions paid from: | | | | | | | | |
Ordinary Income | | $ | 22,500,041 | | | $ | 12,354,659 | |
Note 5–Custodian
State Street is the custodian of the cash and the securities of the Fund. Custodial fees are charged to the Fund based on the market value of securities in the Fund and the number of certain cash transactions incurred by the Fund.
Note 6–Line of Credit
The Fund and certain affiliated funds maintain a line of credit with a syndicate of banks in order to secure a source of funds for temporary purposes to meet unanticipated or excessive redemption requests.
Effective August 29, 2012, under an amended credit agreement, the aggregate commitment amount is $200,000,000 with an optional maximum amount of $250,000,000. The commitment fee is an annual rate of 0.08% of the average commitment amount payable quarterly, regardless of usage, to Bank of New York Mellon, which serves as the agent to the syndicate. The commitment fee is allocated among certain MainStay Funds based upon net assets and other factors. Interest on any revolving credit loan is charged based upon the Federal Funds
Advances rate or the one month London InterBank Offered Rate, whichever is higher. The amended credit agreement expires on August 28, 2013, although the MainStay Funds and the syndicate of banks may renew the amended credit agreement for an additional year on the same or different terms. Prior to August 29, 2012, the aggregate commitment amount was $125,000,000 with an optional maximum amount of $175,000,000. There were no borrowings made or outstanding with respect to the Fund on the amended credit agreement during the year ended October 31, 2012.
Note 7–Purchases and Sales of Securities (in 000’s)
During the year ended October 31, 2012, purchases and sales of securities, other than short-term securities, were $755,766 and $852,287, respectively.
Note 8–Capital Share Transactions
| | | | | | | | |
Investor Class | | Shares | | | Amount | |
| | | | | | | | |
Year ended October 31, 2012: | | | | | | | | |
Shares sold | | | 244,302 | | | $ | 7,912,675 | |
Shares issued to shareholders in reinvestment of dividends | | | 35,955 | | | | 1,090,857 | |
Shares redeemed | | | (589,239 | ) | | | (19,079,790 | ) |
| | | | | | | | |
Net increase (decrease) in shares outstanding before conversion | | | (308,982 | ) | | | (10,076,258 | ) |
Shares converted into Investor Class (See Note 1) | | | 446,562 | | | | 14,347,291 | |
Shares converted from Investor Class (See Note 1) | | | (359,912 | ) | | | (11,878,827 | ) |
| | | | | | | | |
Net increase (decrease) | | | (222,332 | ) | | $ | (7,607,794 | ) |
| | | | | | | | |
Year ended October 31, 2011: | | | | | | | | |
Shares sold | | | 298,100 | | | $ | 9,451,384 | |
Shares issued to shareholders in reinvestment of dividends | | | 25,049 | | | | 775,600 | |
Shares redeemed | | | (626,775 | ) | | | (19,718,663 | ) |
| | | | | | | | |
Net increase (decrease) in shares outstanding before conversion | | | (303,626 | ) | | | (9,491,679 | ) |
Shares converted into Investor Class (See Note 1) | | | 511,953 | | | | 15,408,443 | |
Shares converted from Investor Class (See Note 1) | | | (253,259 | ) | | | (8,025,300 | ) |
| | | | | | | | |
Net increase (decrease) | | | (44,932 | ) | | $ | (2,108,536 | ) |
| | | | | | | | |
| | | | | | | | |
Class A | | Shares | | | Amount | |
| | | | | | | | |
Year ended October 31, 2012: | | | | | | | | |
Shares sold | | | 596,933 | | | $ | 19,366,654 | |
Shares issued to shareholders in reinvestment of dividends | | | 97,531 | | | | 2,956,499 | |
Shares redeemed | | | (2,377,806 | ) | | | (77,188,057 | ) |
| | | | | | | | |
Net increase (decrease) in shares outstanding before conversion | | | (1,683,342 | ) | | | (54,864,904 | ) |
Shares converted into Class A (See Note 1) | | | 615,901 | | | | 20,108,065 | |
Shares converted from Class A (See Note 1) | | | (23,886 | ) | | | (822,053 | ) |
| | | | | | | | |
Net increase (decrease) | | | (1,091,327 | ) | | $ | (35,578,892 | ) |
| | | | | | | | |
Year ended October 31, 2011: | | | | | | | | |
Shares sold | | | 1,213,692 | | | $ | 38,406,814 | |
Shares issued to shareholders in reinvestment of dividends | | | 84,794 | | | | 2,622,979 | |
Shares redeemed | | | (3,498,006 | ) | | | (111,138,669) | |
| | | | | | | | |
Net increase (decrease) in shares outstanding before conversion | | | (2,199,520 | ) | | | (70,108,876 | ) |
Shares converted into Class A (See Note 1) | | | 534,553 | | | | 16,792,000 | |
Shares converted from Class A (See Note 1) | | | (189,629 | ) | | | (5,372,923 | ) |
| | | | | | | | |
Net increase (decrease) | | | (1,854,596 | ) | | $ | (58,689,799 | ) |
| | | | | | | | |
| | |
| | | | | | | | |
Class B | | Shares | | | Amount | |
| | | | | | | | |
Year ended October 31, 2012: | | | | | | | | |
Shares sold | | | 213,487 | | | $ | 6,423,390 | |
Shares issued to shareholders in reinvestment of dividends | | | 6,439 | | | | 182,293 | |
Shares redeemed | | | (673,595 | ) | | | (20,259,640 | ) |
| | | | | | | | |
Net increase (decrease) in shares outstanding before conversion | | | (453,669 | ) | | | (13,653,957 | ) |
Shares converted from Class B (See Note 1) | | | (729,019 | ) | | | (21,754,476 | ) |
| | | | | | | | |
Net increase (decrease) | | | (1,182,688 | ) | | $ | (35,408,433 | ) |
| | | | | | | | |
Year ended October 31, 2011: | | | | | | | | |
Shares sold | | | 282,720 | | | $ | 8,271,949 | |
Shares issued to shareholders in reinvestment of dividends | | | 3,636 | | | | 106,064 | |
Shares redeemed | | | (802,253 | ) | | | (23,456,286 | ) |
| | | | | | | | |
Net increase (decrease) in shares outstanding before conversion | | | (515,897 | ) | | | (15,078,273 | ) |
Shares converted from Class B (See Note 1) | | | (648,673 | ) | | | (18,802,220 | ) |
| | | | | | | | |
Net increase (decrease) | | | (1,164,570 | ) | | $ | (33,880,493 | ) |
| | | | | | | | |
| | |
| | | | | | | | |
Class C | | Shares | | | Amount | |
| | | | | | | | |
Year ended October 31, 2012: | | | | | | | | |
Shares sold | | | 187,726 | | | $ | 5,614,520 | |
Shares issued to shareholders in reinvestment of dividends | | | 6,452 | | | | 182,715 | |
Shares redeemed | | | (1,041,053 | ) | | | (31,171,633 | ) |
| | | | | | | | |
Net increase (decrease) | | | (846,875 | ) | | $ | (25,374,398 | ) |
| | | | | | | | |
Year ended October 31, 2011: | | | | | | | | |
Shares sold | | | 375,491 | | | $ | 10,995,499 | |
Shares issued to shareholders in reinvestment of dividends | | | 3,439 | | | | 100,340 | |
Shares redeemed | | | (1,342,987 | ) | | | (39,052,558 | ) |
| | | | | | | | |
Net increase (decrease) | | | (964,057 | ) | | $ | (27,956,719 | ) |
| | | | | | | | |
| | | | | | | | |
Class I | | Shares | | | Amount | |
| | | | | | | | |
Year ended October 31, 2012: | | | | | | | | |
Shares sold | | | 8,582,918 | | | $ | 286,653,962 | |
Shares issued to shareholders in reinvestment of dividends | | | 544,655 | | | | 16,813,162 | |
Shares redeemed | | | (8,270,927 | ) | | | (274,064,591 | ) |
| | | | | | | | |
Net increase (decrease) | | | 856,646 | | | $ | 29,402,533 | |
| | | | | | | | |
Year ended October 31, 2011: | | | | | | | | |
Shares sold | | | 19,140,565 | | | $ | 625,643,609 | |
Shares issued to shareholders in reinvestment of dividends | | | 245,293 | | | | 7,723,650 | |
Shares redeemed | | | (6,141,707 | ) | | | (194,014,353 | ) |
| | | | | | | | |
Net increase (decrease) | | | 13,244,151 | | | $ | 439,352,906 | |
| | | | | | | | |
| | |
| | | | | | | | |
Class R1 | | Shares | | | Amount | |
| | | | | | | | |
Year ended October 31, 2012: | | | | | | | | |
Shares sold | | | 163,523 | | | $ | 5,157,490 | |
Shares issued to shareholders in reinvestment of dividends | | | 8,918 | | | | 271,181 | |
Shares redeemed | | | (111,653 | ) | | | (3,635,065 | ) |
| | | | | | | | |
Net increase (decrease) | | | 60,788 | | | $ | 1,793,606 | |
| | | | | | | | |
Year ended October 31, 2011: | | | | | | | | |
Shares sold | | | 590,426 | | | $ | 19,640,232 | |
Shares issued to shareholders in reinvestment of dividends | | | 111 | | | | 3,452 | |
Shares redeemed | | | (26,368 | ) | | | (793,151 | ) |
| | | | | | | | |
Net increase (decrease) | | | 564,169 | | | $ | 18,850,533 | |
| | | | | | | | |
| | |
| | | | | | | | |
Class R2 | | Shares | | | Amount | |
| | | | | | | | |
Year ended October 31, 2012: | | | | | | | | |
Shares sold | | | 113,272 | | | $ | 3,679,467 | |
Shares issued to shareholders in reinvestment of dividends | | | 7,477 | | | | 227,218 | |
Shares redeemed | | | (306,479 | ) | | | (9,969,993 | ) |
| | | | | | | | |
Net increase (decrease) | | | (185,730 | ) | | $ | (6,063,308 | ) |
| | | | | | | | |
Year ended October 31, 2011: | | | | | | | | |
Shares sold | | | 245,828 | | | $ | 7,774,234 | |
Shares issued to shareholders in reinvestment of dividends | | | 5,526 | | | | 171,424 | |
Shares redeemed | | | (402,460 | ) | | | (12,413,836 | ) |
| | | | | | | | |
Net increase (decrease) | | | (151,106 | ) | | $ | (4,468,178 | ) |
| | | | | | | | |
| | |
| | | | | | | | |
Class R3 | | Shares | | | Amount | |
| | | | | | | | |
Year ended October 31, 2012: | | | | | | | | |
Shares sold | | | 17,183 | | | $ | 559,674 | |
Shares issued to shareholders in reinvestment of dividends | | | 681 | | | | 20,629 | |
Shares redeemed | | | (42,901 | ) | | | (1,340,280 | ) |
| | | | | | | | |
Net increase (decrease) | | | (25,037 | ) | | $ | (759,977 | ) |
| | | | | | | | |
Year ended October 31, 2011: | | | | | | | | |
Shares sold | | | 36,769 | | | $ | 1,099,817 | |
Shares issued to shareholders in reinvestment of dividends | | | 304 | | | | 9,419 | |
Shares redeemed | | | (21,016 | ) | | | (635,287 | ) |
| | | | | | | | |
Net increase (decrease) | | | 16,057 | | | $ | 473,949 | |
| | | | | | | | |
| | | | |
| mainstayinvestments.com | | | 35 | |
Notes to Financial Statements (continued)
Note 9–Subsequent Events
In connection with the preparation of the financial statements of the Fund as of and for the year ended October 31, 2012, events and transactions subsequent to October 31, 2012 through the date the financial statements were issued have been evaluated by the Fund’s management for possible adjustment and/or disclosure. No subsequent events requiring financial statement adjustment or disclosure have been identified.
Report of Independent Registered Public Accounting Firm
The Board of Trustees and Shareholders of
The MainStay Funds:
We have audited the accompanying statement of assets and liabilities, including the portfolio of investments, of the MainStay MAP Fund (the “Fund”), one of the funds constituting The MainStay Funds, as of October 31, 2012, and the related statement of operations for the year then ended, the statements of changes in net assets for each of the years in the two-year period then ended, and the financial highlights for each of the years or periods in the five-year period then ended. These financial statements and financial highlights are the responsibility of the Fund’s management. Our responsibility is to express an opinion on these financial statements and financial highlights based on our audits.
We conducted our audits in accordance with the standards of the Public Company Accounting Oversight Board (United States). Those standards require that we plan and perform the audit to obtain reasonable assurance about whether the financial statements and financial highlights are free of material misstatement. An audit includes examining, on a test basis, evidence supporting the amounts and disclosures in the financial statements. Our procedures included confirmation of securities owned as of October 31, 2012, by correspondence with the custodian and brokers or by other appropriate auditing procedures where replies from brokers were not received. An audit also includes assessing the accounting principles used and significant estimates made by management, as well as evaluating the overall financial statement presentation. We believe that our audits provide a reasonable basis for our opinion.
In our opinion, the financial statements and financial highlights referred to above present fairly, in all material respects, the financial position of the MainStay MAP Fund of The MainStay Funds as of October 31, 2012, the results of its operations for the year then ended, the changes in its net assets for each of the years in the two-year period then ended, and the financial highlights for each of the years or periods in the five-year period then ended, in conformity with U.S. generally accepted accounting principles.

Philadelphia, Pennsylvania
December 21, 2012
| | | | |
| mainstayinvestments.com | | | 37 | |
Federal Income Tax Information
(Unaudited)
The Fund is required under the Internal Revenue Code to advise shareholders in a written statement as to the federal tax status of dividends paid by the Fund during such fiscal years.
For the fiscal year ended October 31, 2012, the Fund designated approximately $44,919,807 under the Internal Revenue Code as qualified dividend income eligible for reduced tax rates.
The dividends paid by the Fund during the fiscal year ended October 31, 2012, should be multiplied by 100.0% to arrive at the amount eligible for the corporate dividends received deduction.
In February 2013, shareholders will receive an IRS Form 1099-DIV or substitute Form 1099 which will show the federal tax status of the distributions received by shareholders in calendar year 2012. The amounts that will be reported on such 1099-DIV or substitute Form 1099 will be the amounts you are to use on your federal income tax return and will differ from the amounts which we must report for the Fund’s fiscal year ended October 31, 2012.
Proxy Voting Policies and Procedures and Proxy Voting Record
A description of the policies and procedures that New York Life Investments uses to vote proxies related to the Fund’s securities is available without charge, upon request, (i) by visiting the Fund’s website at mainstayinvestments.com; or (ii) on the SEC’s website at www.sec.gov.
The Fund is required to file with the SEC its proxy voting record for the 12-month period ending June 30 on Form N-PX. The Fund’s most recent Form N-PX is available free of charge upon request (i) by calling 800-MAINSTAY (624-6782); (ii) by visiting the Fund’s website at mainstayinvestments.com; or (iii) on the SEC’s website at www.sec.gov.
Shareholder Reports and Quarterly Portfolio Disclosure
The Fund is required to file its complete schedule of portfolio holdings with the SEC for its first and third fiscal quarters on Form N-Q. The Fund’s Form N-Q is available without charge on the SEC’s website at www.sec.gov or by calling MainStay Investments at 800-MAINSTAY (624-6782). You also can obtain and review copies of Form N-Q by visiting the SEC’s Public Reference Room in Washington, DC (information on the operation of the Public Reference Room may be obtained by calling 1-800-SEC-0330).
Board Members and Officers (Unaudited)
The Board Members oversee the MainStay Group of Funds (which is comprised of Funds that are series of The MainStay Funds, Eclipse Trust, Eclipse Funds Inc., MainStay Funds Trust, MainStay VP Funds Trust, Private Advisors Alternative Strategies Master Fund, Private Advisors Alternative Strategies Fund, and MainStay Defined Term Municipal Opportunities Fund) (collectively, the “Fund Complex”), the Manager and, when applicable, the Subadvisor(s) and other service providers to the Fund Complex. Each Board Member serves until his or her successor is elected and qualified or until his or her resignation, death or removal. The Retirement Policy provides that a Board Member
shall tender his or her resignation by the end of the calendar year during which he or she reaches the age of 75.
Officers serve a term of one year and are elected annually by the Board Members. The business address of each Board Member and officer listed below is 51 Madison Avenue, New York, New York 10010.
The Statement of Additional Information applicable to the Fund includes additional information about the Board Members and is available without charge, upon request, by calling 800-MAINSTAY (624-6782) or by going online to mainstayinvestments.com.
| | | | | | | | | | | | |
| | | | | Name and
Date of Birth | | Term of Office,
Position(s) Held
with the Fund
Complex and
Length of Service | | Principal Occupation(s)
During Past Five Years | | Number of
Funds in
Fund Complex
Overseen by
Board Member | | Other Directorships
Held by Board Member |
| Interested Board Member* | | | | John Y. Kim
9/24/60 | | Indefinite;
Eclipse Trust: Trustee since 2008;
Eclipse Funds Inc.:
Director since 2008 (1 fund);
The MainStay Funds: Trustee since 2008 (12 funds);
MainStay Funds Trust: Trustee since 2009 (31 funds); and
MainStay VP Funds Trust: Trustee since 2011 and its predecessor, MainStay VP Series Fund, Inc. since 2008 (28 portfolios). Private Advisors Alternative Strategies Master Fund: Trustee since 2011
Private Advisors Alternative Strategies Fund: Trustee since 2011
MainStay DefinedTerm Municipal Opportunities Fund: Trustee since 2011 | | Member of the Board of Managers, President and Chief Executive Officer (since 2008), New York Life Investment Management LLC and New York Life Investment Management Holdings LLC; Member of the Board, MacKay Shields LLC since 2008; Chairman of the Board, Institutional Capital LLC, Madison Capital Funding LLC, Madison Square Investors LLC and McMorgan & Company LLC; Chairman of the Board, NYLIFE Distributors LLC and Chairman of the Board, NYLCAP Manager LLC (since 2008) President, Prudential Retirement, a business unit of Prudential Financial, Inc. (2002 to 2007) | | 75 | | None |
| | * | This Board Member is considered to be an “interested person” of the MainStay Group of Funds within the meaning of the 1940 Act because of his affiliation with New York Life Insurance Company, New York Life Investment Management LLC, Madison Square Investors LLC, MacKay Shields LLC, Private Advisors LLC, Institutional Capital LLC, NYLIFE Securities LLC and/or NYLIFE Distributors LLC, as described in detail above in the column entitled “Principal Occupation(s) During the Past Five Years.” |
| | | | |
| mainstayinvestments.com | | | 39 | |
| | | | | | | | | | | | |
| | | | | Name and
Date of Birth | | Term of Office, Position(s) Held with the Fund Complex and Length of Service | | Principal Occupation(s)
During Past Five Years | | Number of
Funds in
Fund Complex
Overseen by
Board Member | | Other Directorships
Held by Board Member |
| Non-Interested Board Members | | | | Susan B. Kerley 8/12/51 | | Indefinite;
Eclipse Trust: Chairman since 2005, and Trustee since 2000;
Eclipse Funds Inc.: Chairman since 2005 and Director since 1990 (1 fund); The MainStay Funds: Chairman and Board Member since 2007 (12 funds);
MainStay Funds Trust: Chairman and Trustee since 2009 (31 funds); and MainStay VP Funds Trust: Chairman and Trustee since 2011 and its predecessor, MainStay VP Series Fund, Inc., since 2007 (28 portfolios). Private Advisors Alternative Strategies Master Fund: Chairman and Trustee since 2011 Private Advisors Alternative Strategies Fund: Chairman and Trustee since 2011 MainStay DefinedTerm Municipal Opportunities Fund: Chairman and Trustee since 2011. | | President, Strategic Management Advisors LLC (since 1990) | | 75 | | Trustee, Legg Mason Partners Funds, since 1992 (51 portfolios) |
| | | | | | | | | | | | |
| | | | | Name and
Date of Birth | | Term of Office,
Position(s) Held
with the Fund
Complex and
Length of Service | | Principal Occupation(s)
During Past Five Years | | Number of
Funds in
Fund Complex
Overseen by
Board Member | | Other Directorships
Held by Board Member |
| Non-Interested Board Members | | | | Alan R. Latshaw 3/27/51 | | Indefinite;
Eclipse Trust: Trustee and Audit Committee Financial Expert since 2007;
Eclipse Funds Inc.:
Director and Audit Committee Financial Expert since 2007 (1 fund);
The MainStay Funds: Trustee and Audit Committee Financial Expert since 2006 (12 funds);
MainStay Funds Trust: Trustee and Audit Committee Financial Expert since 2009 (31 funds); and
MainStay VP Funds Trust: Trustee and Audit Committee Financial Expert since 2011 and its predecessor, MainStay VP Series Fund, Inc., since 2007 (28 portfolios). Private Advisors Alternative Strategies Master Fund: Trustee and Audit Committee Financial Expert since 2011 Private Advisors Alternative Strategies Fund: Trustee and Audit Committee Financial Expert since 2011. MainStay DefinedTerm Municipal Opportunities Fund: Trustee and Audit Committee Financial Expert since 2011. | | Retired; Partner, Ernst & Young LLP (2002 to 2003); Partner, Arthur Andersen LLP (1989 to 2002); Consultant to the MainStay Funds Audit and Compliance Committee (2004 to 2006) | | 75 | | Trustee, State Farm Associates Funds Trusts since 2005 (4 portfolios); Trustee, State Farm Mutual Fund Trust since 2005 (15 portfolios); Trustee, State Farm Variable Product Trust since 2005 (9 portfolios) |
| | | | |
| mainstayinvestments.com | | | 41 | |
| | | | | | | | | | | | |
| | | | | Name and Date of Birth | | Term of Office, Position(s) Held with the Fund Complex and Length of Service | | Principal Occupation(s)
During Past Five Years | | Number of
Funds in
Fund Complex
Overseen by
Board Member | | Other Directorships Held by Board Member |
| Non-Interested Board Members | | | | Peter Meenan
12/5/41 | | Indefinite;
Eclipse Funds: Trustee since 2002;
Eclipse Funds Inc.:
Director since 2002
(1 fund); The MainStay Funds:
Trustee since 2007 (12 funds);
MainStay Funds Trust: Trustee since 2009
(31 funds); and
MainStay VP Funds Trust: Trustee since 2011 and its predecessor, MainStay VP Series Fund, Inc., since 2007 (28 portfolios).
Private Advisors Alternative Strategies Master Fund: Trustee since 2011. Private Advisors Alternative Strategies Fund: Trustee since 2011
MainStay DefinedTerm Municipal Opportunities Fund: Trustee since 2011. | | Independent Consultant; President and Chief Executive Officer, Babson—United, Inc. (financial services firm) (2000 to 2004); Independent Consultant (1999 to 2000); Head of Global Funds, Citicorp (1995 to 1999) | | 75 | | None |
| | | | Richard H. Nolan, Jr.
11/16/46 | | Indefinite;
Eclipse Trust: Trustee since 2007;
Eclipse Funds Inc.:
Director since 2007 (1 fund);
The MainStay Funds: Trustee since 2007 (12 funds);
MainStay Funds Trust: Trustee since 2009 (31 funds); and
MainStay VP Funds Trust: Trustee since 2011 and its predecessor, MainStay VP Series Fund, Inc., since 2006 (28 portfolios).
Private Advisors Alternative Strategies Master Fund: Trustee since 2011. Private Advisors Alternative Strategies Fund: Trustee since 2011
MainStay DefinedTerm Municipal Opportunities Fund: Trustee since 2011. | | Managing Director, ICC Capital Management; President—Shields/Alliance, Alliance Capital Management (1994 to 2004) | | 75 | | None |
| | | | | | | | | | | | |
| | | | | Name and Date of Birth | | Term of Office, Position(s) Held with the Fund Complex and Length of Service | | Principal Occupation(s)
During Past Five Years | | Number of
Funds in
Fund Complex
Overseen by
Board Member | | Other Directorships Held by Board Member |
| Non-Interested Board Members | | | | Richard S. Trutanic 2/13/52 | | Indefinite;
Eclipse Trust: Trustee since 2007;
Eclipse Funds Inc.:
Director since 2007 (1 fund);
The MainStay Funds:
Trustee since 1994 (12 funds);
MainStay Funds Trust:
Trustee since 2009 (31 funds); and
MainStay VP Funds Trust: Trustee since 2011 and its predecessor, MainStay VP Series Fund, Inc., since 2007 (28 portfolios).
Private Advisors Alternative Strategies Master Fund: Trustee since 2011.
Private Advisors Alternative Strategies Fund: Trustee since 2011
MainStay DefinedTerm Municipal Opportunities Fund: Trustee since 2011. | | Chairman and Chief Executive Officer, Somerset & Company (financial advisory firm) (since 2004); Managing Director, The Carlyle Group (private investment firm) (2002 to 2004); Senior Managing Director, Partner and Board Member, Groupe Arnault S.A. (private investment firm) (1999 to 2002) | | 75 | | None |
| | | | |
| mainstayinvestments.com | | | 43 | |
| | | | | | | | | | | | |
| | | | | Name and Date of Birth | | Term of Office, Position(s) Held with the Fund Complex and Length of Service | | Principal Occupation(s)
During Past Five Years | | Number of
Funds in
Fund Complex
Overseen by
Board Member | | Other Directorships Held by Board Member |
| Non-Interested Board Members | | | | Roman L. Weil
5/22/40 | | Indefinite;
Eclipse Trust: Trustee and Audit Committee Financial Expert since 2007; Eclipse Funds Inc.: Director and Audit Committee Financial Expert since 2007 (1 fund); The MainStay Funds: Trustee and Audit Committee Financial Expert since 2007 (12 funds); MainStay Funds Trust: Trustee since 2009 (31 funds); and MainStay VP Funds Trust: Trustee and Audit Committee Financial Expert since 2011 and its predecessor, MainStay VP Series Fund, Inc., since 1994 and Audit Committee Financial Expert since 2003 (28 portfolios).
Private Advisors Alternative Strategies Master Fund: Trustee and Audit Committee Financial Expert since 2011 Private Advisors Alternative Strategies Fund: Trustee and Audit Committee Financial Expert since 2011. MainStay DefinedTerm Municipal Opportunities Fund: Trustee and Audit Committee Financial Expert since 2011. | | Visiting Professor, University of California—San Diego (since October 2012); Visiting Professor, Southern Methodist University (2011); Visiting Professor, NYU Stem School of Business, New York University (2011); President, Roman L. Weil Associates, Inc. (consulting firm) (since 1981); V. Duane Rath Professor Emeritus of Accounting, Chicago Booth School of Business, University of Chicago (1965-2008) | | 75 | | None |
| | | | | | | | | | | | |
| | | | | Name and Date of Birth | | Term of Office, Position(s) Held with the Fund Complex and Length of Service | | Principal Occupation(s)
During Past Five Years | | Number of
Funds in
Fund Complex
Overseen by
Board Member | | Other Directorships Held by Board Member |
| Non-Interested Board Members | | | | John A. Weisser 10/22/41 | | Indefinite; Eclipse Trust: Trustee since 2007; Eclipse Funds Inc.: Director since 2007 (1 fund); The MainStay Funds: Trustee since 2007 (12 funds); MainStay Funds Trust: Trustee since 2009 (31 funds); and MainStay VP Funds Trust: Trustee since 2011 and its predecessor, MainStay VP Series Fund, Inc., since 1997 (28 portfolios).
Private Advisors Alternative Strategies Master Fund: Trustee since 2011.
Private Advisors Alternative Strategies Fund: Trustee since 2011
MainStay DefinedTerm Municipal Opportunities Fund: Trustee since 2011. | | Retired. Managing Director of Salomon Brothers, Inc. (1971 to 1995) | | 75 | | Trustee, Direxion Funds since 2007 (21 portfolios); Direxion Insurance Trust since 2007 (1 portfolio); Trustee, Direxion Shares ETF Trust, since 2008 (47 portfolios) |
| | | | |
| mainstayinvestments.com | | | 45 | |
The following individuals have been appointed by the Board Members to serve as Officers of the MainStay Group of Funds.
| | | | | | | | |
| | | | | Name and
Date of Birth | | Positions(s) Held with the Funds and Length of Service | | Principal Occupation(s) During Past Five Years |
| Officers | | | | Jack R. Benintende 5/12/64 | | Treasurer and Principal Financial and Accounting Officer, Eclipse Trust, Eclipse Funds, Inc. and The MainStay Funds (since 2007), MainStay Funds Trust (since 2009) | | Assistant Treasurer, New York Life Investment Management Holdings LLC (since 2008); Managing Director, New York Life Investment Management LLC (since 2007); Treasurer and Principal Financial Accounting Officer, Private Advisors Alternative Strategies Master Fund, Private Advisors Alternative Strategies Fund and MainStay DefinedTerm Municipal Opportunities Fund (since 2011); Treasurer and Principal Financial and Accounting Officer, MainStay VP Funds Trust and its predecessor, MainStay VP Series Fund, Inc. (since 2007) |
| | | | Jeffrey A. Engelsman 9/28/67 | | Vice President and Chief Compliance Officer, Eclipse Trust, Eclipse Funds, Inc., The MainStay Funds and MainStay Funds Trust (since 2009) | | Managing Director, Compliance (since 2009), Director and Associate General Counsel, New York Life Investment Management LLC (2005 to 2008); Assistant Secretary, NYLIFE Distributors LLC (2006 to 2008); Vice President and Chief Compliance Officer, Private Advisors Alternative Strategies Master Fund, Private Advisors Alternative Strategies Fund, DefinedTerm Municipal Opportunities Fund (since 2011); MainStay VP Funds Trust and its predecessor, MainStay VP Series Fund, Inc. (since 2009); Assistant Secretary, The MainStay Funds (2006 to 2008); Assistant Secretary, Eclipse Trust, Eclipse Funds, Inc. and MainStay VP Series Fund, Inc. (2005 to 2008) |
| | | | Stephen P. Fisher 2/22/59 | | President, Eclipse Trust, Eclipse Funds, Inc. and The MainStay Funds (since 2007), MainStay Funds Trust (since 2009) | | Director, Senior Vice President, New York Life Insurance and Annuity Corporation (since 2011); Manager, President and Chief Operating Officer, NYLIFE Distributors LLC (since 2008); Chairman of the Board, NYLIM Service Company LLC (since 2008); Senior Managing Director and Chief Marketing Officer, New York Life Investment Management LLC (since 2005); President, Private Advisors Alternative Strategies Master Fund, Private Advisors Alternative Strategies Fund and MainStay DefinedTerm Municipal Opportunities Fund (since 2011); MainStay VP Funds Trust and its predecessor, MainStay VP Series Fund, Inc. (since 2007) |
| | | | J. Kevin Gao 10/13/67 | | Secretary and Chief Legal Officer, Eclipse Trust, Eclipse Funds, Inc., The MainStay Funds and MainStay Funds Trust (since 2010) | | Managing Director and Associate General Counsel, New York Life Investment Management LLC (since 2010); Secretary and Chief Legal Officer, Private Advisors Alternative Strategies Master Fund, Private Advisors Alternative Strategies Fund and MainStay DefinedTerm Municipal Opportunities Fund (since 2011); MainStay VP Funds Trust and its predecessor, MainStay VP Series Fund, Inc. (since 2010); Director and Counsel of Credit Suisse, Chief Legal Officer and Secretary of Credit Suisse Asset Management, LLC and Credit Suisse Funds (2003 to 2010) |
| | | | Scott T. Harrington 2/8/59 | | Vice President—Administration, Eclipse Trust, Eclipse Funds, Inc. and The MainStay Funds (since 2005), MainStay Funds Trust (since 2009) | | Director, New York Life Investment Management LLC (including predecessor advisory organizations) (since 2000); Executive Vice President, New York Life Trust Company and New York Life Trust Company FSB (since 2006); Vice President—Administration, Private Advisors Alternative Strategies Master Fund, Private Advisors Alternative Strategies Fund and MainStay DefinedTerm Municipal Opportunities Fund (since 2011); MainStay VP Funds Trust and its predecessor, MainStay VP Series Fund, Inc. (since 2005) |
| | * | The Officers listed above are considered to be “interested persons” of the MainStay Group of Funds within the meaning of the 1940 Act because of their affiliation with New York Life Insurance Company, New York Life Investment Management LLC, Madison Square Investors LLC, MacKay Shields LLC, Private Advisors LLC, Institutional Capital LLC, Epoch Investment Partners, Inc., Markston International, LLC, Winslow Capital Management, Inc., NYLIFE Securities LLC and/or NYLIFE Distributors LLC, as described in detail above in the column captioned “Principal Occupation(s) During Past Five Years.” Officers are elected annually by the Board to serve a one-year term. |
MainStay Funds
MainStay offers a wide range of Funds for virtually any investment need. The full array of MainStay open-end offerings is listed here, with information about the manager, subadvisors, legal counsel and independent registered public accounting firms.
Equity
U.S. Equity
MainStay Common Stock Fund
MainStay Epoch U.S. All Cap Fund
MainStay Epoch U.S. Equity Yield Fund
MainStay Growth Equity Fund
MainStay ICAP Equity Fund
MainStay ICAP Select Equity Fund
MainStay Large Cap Growth Fund1
MainStay MAP Fund
MainStay S&P 500 Index Fund
MainStay U.S. Small Cap Fund
MainStay 130/30 Core Fund
International/Global Equity
MainStay Epoch Global Choice Fund
MainStay Epoch Global Equity Yield Fund
MainStay Epoch International Small Cap Fund
MainStay ICAP Global Fund
MainStay ICAP International Fund
MainStay International Equity Fund
MainStay 130/30 International Fund
Income
Taxable Bond
MainStay Flexible Bond Opportunities Fund
MainStay Floating Rate Fund
MainStay Global High Income Fund
MainStay Government Fund
MainStay High Yield Corporate Bond Fund
MainStay High Yield Opportunities Fund
MainStay Indexed Bond Fund
MainStay Intermediate Term Bond Fund
MainStay Short Term Bond Fund
MainStay Money Market Fund
Municipal Bond
MainStay High Yield Municipal Bond Fund
MainStay New York Tax Free Opportunities Fund2
MainStay Tax Free Bond Fund
Mixed Asset
MainStay Balanced Fund
MainStay Convertible Fund
MainStay Income Builder Fund
MainStay Marketfield Fund
Asset Allocation/Target Date
MainStay Conservative Allocation Fund
MainStay Growth Allocation Fund
MainStay Moderate Allocation Fund
MainStay Moderate Growth Allocation Fund
MainStay Retirement 2010 Fund
MainStay Retirement 2020 Fund
MainStay Retirement 2030 Fund
MainStay Retirement 2040 Fund
MainStay Retirement 2050 Fund
Manager
New York Life Investment Management LLC
New York, New York
Subadvisors
Epoch Investment Partners, Inc.
New York, New York
Institutional Capital LLC3
Chicago, Illinois
MacKay Shields LLC3
New York, New York
Madison Square Investors LLC3
New York, New York
Marketfield Asset Management LLC
New York, New York
Markston International LLC
White Plains, New York
Winslow Capital Management, Inc.
Minneapolis, Minnesota
Legal Counsel
Dechert LLP
Independent Registered Public Accounting Firms
KPMG LLP
PricewaterhouseCoopers LLP
1. Effective January 13, 2012, the Fund was closed to new investors with certain exceptions.
2. The Fund is only registered for sale in CT, DE, FL, MA, NJ, NY, and VT.
3. An affiliate of New York Life Investment Management LLC.
Not part of the Annual Report
mainstayinvestments.com
The MainStay Funds are managed by New York Life Investment Management LLC and distributed through NYLIFE Distributors LLC,
169 Lackawanna Avenue, Parsippany, NJ 07054, a wholly owned subsidiary of New York Life Insurance Company.
NYLIFE Distributors is a Member FINRA/SIPC.
MainStay Investments is a service mark and name under which New York Life Investment Management LLC does business.
MainStay Investments, an indirect subsidiary of New York Life Insurance Company, New York, NY 10010, provides investment advisory products and services.
This report may be distributed only when preceded or accompanied by a current Fund prospectus.
© 2013 by NYLIFE Distributors LLC. All rights reserved.
| | | | | | | | |
| Not FDIC/NCUA Insured | | Not a Deposit | | May Lose Value | | No Bank Guarantee | | Not Insured by Any Government Agency |
| | | | |
| NYLIM-28192 MS265-12 | |
| MSMP11-12/12
NL030 |
|
As of the end of the period covered by this report, the Registrant has adopted a code of ethics (the “Code”) that applies to the Registrant’s principal executive officer (“PEO”) and principal financial officer (“PFO”). A copy of the Code is filed herewith. The Registrant did not grant any waivers, including implicit waivers, from any provisions of the Code to the PEO or PFO during the period covered by this report.
| Item 3. | Audit Committee Financial Expert. |
The Board of Trustees has determined that the Registrant has two audit committee financial experts serving on its Audit Committee. The Audit Committee financial experts are Alan R. Latshaw and Roman L. Weil. Messrs. Latshaw and Weil are “independent” within the meaning of that term under the Investment Company Act of 1940.
| Item 4. | Principal Accountant Fees and Services. |
(a) Audit Fees
The aggregate fees billed for the fiscal year ended October 31, 2012 for professional services rendered by KPMG LLP (“KPMG”) for the audit of the Registrant’s annual financial statements or services that are normally provided by KPMG in connection with statutory and regulatory filings or engagements for that fiscal year were $600,700.
The aggregate fees billed for the fiscal year ended October 31, 2011 for professional services rendered by KPMG for the audit of the Registrant’s annual financial statements or services that are normally provided by KPMG in connection with statutory and regulatory filings or engagements for that fiscal year were $613,305.
(b) Audit-Related Fees
The aggregate fees billed for assurance and related services by KPMG that are reasonably related to the performance of the audit of the Registrant’s financial statements and are not reported under paragraph (a) of this Item were: (i) $2,500 for the fiscal year ended October 31, 2012, and (ii) $0 for the fiscal year ended October 31, 2011. These audit-related services include review of financial highlights for Registrant’s registration statements and issuance of consents to use the auditor’s reports.
(c) Tax Fees
The aggregate fees billed for professional services rendered by KPMG for tax compliance, tax advice, and tax planning were: (i) $63,395 during the fiscal year ended October 31, 2012, and (ii) $63,810 during the fiscal year ended October 31, 2011. These services primarily included preparation of federal, state and local income tax returns and excise tax returns, as well as services relating to excise tax distribution requirements.
(d) All Other Fees
The aggregate fees billed for products and services provided by KPMG, other than the services reported in paragraphs (a) through (c) of this Item were: (i) $0 during the fiscal year ended October 31, 2012, and (ii) $0 during the fiscal year ended October 31, 2011.
(e) Pre-Approval Policies and Procedures
| | (1) | The Registrant’s Audit and Compliance Committee has adopted pre-approval policies and procedures (the “Procedures”) to govern the Committee’s pre-approval of (i) all audit services and permissible non-audit services to be provided to the Registrant by its independent accountant, and (ii) all permissible non-audit services to be provided by such independent accountant to the Registrant’s investment adviser and to any entity controlling, controlled by or under common control with the investment adviser that provides ongoing services to the Registrant (collectively, the “Service Affiliates”) if the services directly relate to the Registrant’s operations and financial reporting. In accordance with the Procedures, the Audit and Compliance Committee is responsible for the engagement of the independent accountant to certify the Registrant’s financial statements for each fiscal year. With respect to the pre-approval of non-audit services provided to the Registrant and its Service Affiliates, the Procedures provide that the Audit and Compliance Committee may annually pre-approve a list of the types of services that may be provided to the Registrant or its Service Affiliates, or the Audit and Compliance Committee may pre-approve such services on a project-by-project basis as they arise. Unless a type of service has received general pre-approval, it will require specific pre-approval by the Audit and Compliance Committee if it is to be provided by the independent accountant. The Procedures also permit the Audit and Compliance Committee to delegate authority to one or more of its members to pre-approve any proposed non-audit services that have not been previously pre-approved by the Audit and Compliance Committee, subject to the ratification by the full Audit and Compliance Committee no later than its next scheduled meeting. To date, the Audit and Compliance Committee has not delegated such authority. |
| | (2) | With respect to the services described in paragraphs (b) through (d) of this Item 4, no amount was approved by the Audit and Compliance Committee pursuant to paragraph (c)(7)(i)(C) of Rule 2-01 of Regulation S-X. |
(f) There were no hours expended on KPMG’s engagement to audit the Registrant’s financial statements for the most recent fiscal year attributable to work performed by persons other than KPMG’s full-time, permanent employees.
(g) All non-audit fees billed by KPMG for services rendered to the Registrant for the fiscal years ended October 31, 2012 and October 31, 2011 are disclosed in 4(b)-(d) above.
The aggregate non-audit fees billed by KPMG for services rendered to the Registrant’s investment adviser (not including any sub-adviser whose role is primarily portfolio management and is subcontracted with or overseen by another investment adviser), and any entity controlling, controlled by, or under common control with the adviser that provides ongoing services to the Registrant were approximately: (i) $0 for the fiscal year ended October 31, 2012, and (ii) $0 for the fiscal year ended October 31, 2011.
(h) The Registrant’s Audit and Compliance Committee has determined that the non-audit services rendered by KPMG for the fiscal year ended October 31, 2012 to the Registrant’s investment adviser and any entity controlling, controlled by, or under common control with the Registrant’s investment adviser that provides ongoing services to the Registrant that were not required to be pre-approved by the Audit and Compliance Committee because they did not relate directly to the operations and financial reporting of the registrant were compatible with maintaining the respective independence of KPMG during the relevant time period.
| Item 5. | Audit Committee of Listed Registrants |
Not applicable.
| Item 6. | Schedule of Investments |
The Schedule of Investments is included as part of Item 1 of this report.
| Item 7. | Disclosure of Proxy Voting Policies and Procedures for Closed-End Management Investment Companies. |
Not applicable.
| Item 8. | Portfolio Managers of Closed-End Management Investment Companies. |
Not applicable.
| Item 9. | Purchases of Equity Securities by Closed-End Management Investment Company and Affiliated Purchasers. |
Not Applicable.
| Item 10. | Submission of Matters to a Vote of Security Holders. |
Since the Registrant’s last response to this Item, there have been no material changes to the procedures by which shareholders may recommend nominees to the Registrant’s Board of Trustees.
| Item 11. | Controls and Procedures. |
(a) Based on an evaluation of the Registrant’s Disclosure Controls and Procedures (as defined in Rule 30a-3(c) under the Investment Company Act of 1940) (the “Disclosure Controls”), as of a date within 90 days prior to the filing date (the “Filing Date”) of this Form N-CSR (the “Report”), the Registrant’s principal executive officer and principal financial officer have concluded that the Disclosure Controls are reasonably designed to ensure that information required to be disclosed by the Registrant in the Report is recorded, processed, summarized and reported by the Filing Date, including ensuring that information required to be disclosed in the Report is accumulated and communicated to the Registrant’s management, including the Registrant’s principal executive officer and principal financial officer, as appropriate to allow timely decisions regarding required disclosure.
(b) There were no changes in the Registrant’s internal control over financial reporting (as defined in Rule 30a-3(d)) under the Investment Company Act of 1940 that occurred during the second fiscal quarter of the period covered by this report that has materially affected, or is reasonably likely to materially affect, the Registrant’s internal control over financial reporting.
| | |
| (a)(1) | | Code of Ethics |
| |
| (a)(2) | | Certifications of principal executive officer and principal financial officer as required by Rule 30a-2 under the Investment Company Act of 1940. |
| |
| (b) | | Certifications of principal executive officer and principal financial officer as required by Section 906 of the Sarbanes-Oxley Act of 2002. |
SIGNATURES
Pursuant to the requirements of the Securities Exchange Act of 1934 and the Investment Company Act of 1940, the Registrant has duly caused this Report to be signed on its behalf by the undersigned, thereunto duly authorized.
THE MAINSTAY FUNDS
| | |
| By: | | /s/ Stephen P. Fisher |
| | Stephen P. Fisher |
| | President and Principal Executive Officer |
|
| Date: January 7, 2013 |
Pursuant to the requirements of the Securities Exchange Act of 1934 and the Investment Company Act of 1940, this Report has been signed below by the following persons on behalf of the Registrant and in the capacities and on the dates indicated.
| | |
| By: | | /s/ Stephen P. Fisher |
| | Stephen P. Fisher |
| | President and Principal Executive Officer |
|
| Date: January 7, 2013 |
| |
| By: | | /s/ Jack R. Benintende |
| | Jack R. Benintende |
| | Treasurer and Principal Financial and Accounting Officer |
|
| Date: January 7, 2013 |
EXHIBIT INDEX
| | |
| |
| (a)(1) | | Code of Ethics |
| |
| (a)(2) | | Certifications of principal executive officer and principal financial officer as required by Rule 30a-2 under the Investment Company Act of 1940. |
| |
| (b) | | Certification of principal executive officer and principal financial officer as required by Section 906 of the Sarbanes-Oxley Act of 2002. |